Embed Size (px)
Citation preview

IAEA-TECDOC-1606
Management of AgroforestrySystems for Enhancing
Resource use Efficiencyand Crop Productivity
prepared by theJoint FAO/IAEA Division of Nuclear Techniques in Food and Agriculture
November 2008

IAEA-TECDOC-1606
Management of AgroforestrySystems for Enhancing
Resource use Efficiencyand Crop Productivity
prepared by theJoint FAO/IAEA Division of Nuclear Techniques in Food and Agriculture
November 2008

The originating Section of this publication in the IAEA was:
Soil and Water Management and Crop Nutrition Section International Atomic Energy Agency
Wagramer Strasse 5 P.O. Box 100
A-1400 Vienna, Austria
MANAGEMENT OF AGROFORESTRY SYSTEMS FOR ENHANCING RESOURCE USE EFFICIENCY AND CROP PRODUCTIVITY
IAEA, VIENNA, 2008 IAEA-TECDOC-1606
ISBN 978-92-0-110908-8 ISSN 1011–4289
© IAEA, 2008
Printed by the IAEA in Austria
November 2008

FOREWORD
Agroforestry is a low-input system which combines trees with crops in various
combinations or sequences. It is an alternative to intensive cropping systems, which rely on
large inputs of manufactured fertilizers and other external inputs to sustain production.
Agroforestry also has the potential to reduce risk through diversification of a variety of
products, including food, fuelwood and animal fodder. Other perceived benefits include
enhanced nutrient and water use efficiencies, reduced nutrient leaching to groundwater and
improved soil physical and biological properties. The use of leguminous or actinorhizal trees
may further enhance these benefits because of their capacity to fix atmospheric nitrogen.
Depending on the type of agroforestry system and the management practices employed, a
substantial portion of this fixed nitrogen can be transferred to companion crops and to the soil.
In considering the overall productivity of agroforestry systems, it is essential to investigate the
competition or complementarity in the capture and partitioning of resources between tree and
crop components. This is especially true for nutrients and water, usually the two most limiting
factors influencing crop growth.
The focus of this coordinated research project (CRP) was to evaluate the efficacy of
various agroforestry systems used in Member States in terms of crop productivity, resource
use efficiency and improvements in soil properties. The use of isotopes and nuclear
techniques was essential for understanding the dynamics of nutrients and water in
agroforestry systems. The contribution of nitrogen from fertilizers and leguminous trees to
soil and crops was studied using both direct and indirect 15
N labelling techniques. The cycling
of carbon from trees or crops to soil was studied using natural variations in the 13
C signatures
of the soils and the different species. The soil moisture neutron probe in conjunction with
tensionics was used to monitor soil water status and balance, and differences in the 18
O
composition of rain, surface and groundwaters were used to identify the sources of water used
by trees and crops.
This CRP was implemented through a research network that initially included nine
contract holders from Benin, China, Chile, Costa Rica, Kenya, Malaysia, Sri Lanka, Uganda
and Zambia, and five agreement holders from Australia, France, Kenya, Nigeria and the UK.
The CRP was conducted in collaboration with National Agricultural Research Systems in
Africa, Asia and Latin America, and with three CGIAR Centres, the International Centre for
Research in Agroforestry (ICRAF, Kenya), the International Institute of Tropical Agriculture
(IITA, Nigeria) and CIAT’s Tropical Soil Biology and Fertility Institute (TSBF, Kenya).
This IAEA-TECDOC contains 15 manuscripts prepared by the project participants and
compiled by P. Chalk, of the Joint FAO/IAEA Division of Nuclear Techniques in Food and
Agriculture. The IAEA officer responsible for this publication was M.L. Nguyen of the Joint
FAO/IAEA Division of Nuclear Techniques in Food and Agriculture.

EDITORIAL NOTE
This publication has been prepared from the original material as submitted by the authors. The views expressed do not necessarily reflect those of the IAEA, the governments of the nominating Member States or the nominating organizations.
The use of particular designations of countries or territories does not imply any judgement by the publisher, the IAEA, as to the legal status of such countries or territories, of their authorities and institutions or of the delimitation of their boundaries.
The mention of names of specific companies or products (whether or not indicated as registered) does not imply any intention to infringe proprietary rights, nor should it be construed as an endorsement or recommendation on the part of the IAEA.
The authors are responsible for having obtained the necessary permission for the IAEA to reproduce, translate or use material from sources already protected by copyrights.

CONTENTS
Summary .................................................................................................................................... 1
Relative contribution of hedgerow leguminous trees, leaf mulch and supplementary urea
to the yield and N nutrition of alley maize crops ................................................................ 15
A.R. Zaharah, R. Chintu, Z.Z. Ziana, A.R. Bah, W.A.K Wan Rashidah
Determination of plant water sources using stable isotopes: a strategic tool
for planning water resource management for agroforestry ................................................. 29
D.M. Smith
Using stable isotopes to understand tree responses.................................................................. 43
to environmental variation and stress
L.E. Cullen, P. Landman, P. Grierson, M. Adams
Assessment of competition for water between peanut (Arachis hypogaea)
and Choerospondias axillaris in an alley cropping system in subtropical China ............... 65
B. Zhang, Y. Zhao, M.Z. Wang
Evaluation of long term agroforestry: Soil fertility management in
the derived savanna in West Africa..................................................................................... 87
A. Bationo, N. Sanginga, B. Vanlauwe, B. Waswa, J. Kihara
Carbon and nitrogen dynamics in soils: Effects of residue quality and localization. .............. 99
S. Recous, F. Coppens, S. Abiven, P. Garnier, R. Merckx
Soil N enrichment using biomass of Gliricidia Sepium injected with labelled
15
N fertilizer and subsequent recovery by Zea Mays in an alley cropping system............ 117
S.P. Nissanka, U.R. Sangakkara
Nutrient cycling, soil properties and physiological and yield responses in
a Gliricidia Maize alley cropping system in the mid-country
intermediate zone of Sri Lanka.......................................................................................... 127
S.P. Nissanka, U.R. Sangakkara
Quantifying the contribution of above — and below ground N in legumes to
soil N pools and subsequent maize in an improved fallow system using
in situ 15
N labelling techniques in western Kenya............................................................. 143
J.K. Ndufa, A. Albrecht, G. Keerthisinghe, G. Cadisch
The effect of legume trees and pastures on the N contribution and productivity of
an agroforestry system in Mediterranean Central Chile.................................................... 157
C.M. Ovalle, J.R. Avendaño, A.L. Del Pozo, E.V. Zagal, J. Aronson, S. Urquiaga
Fertilizer nitrogen recovery from different soil depths in an alley cropping system
consisting of peanut (Arachis hypogaea) and
Choerospondias axillaris in subtropical China ................................................................. 167
B. Zhang, X.X. Wang, M.Z. Wang
Nitrogen management in coffee–legume agroforestry systems in Costa Rica....................... 175
C.A. Cervantes
Integrating leguminous trees and shrubs in cropping systems of Southern Africa................ 185
R. Chintu, K. Linyunga, P.M. Matakala, M. Mwale, T.S. Chirwa,
P.L. Mafongoya, J.M. Matibini
Sustainable maize production through leguminous tree and shrub fallows
in Eastern Zambia.............................................................................................................. 203
P. L. Mafongoya, R. Chintu, G. Sileshi, . Chirwa,
J. Matibini, E. Kuntashula
T.S

Decomposition and nitrogen mineralization of leaves of Paraserianthes falcataria
in an ultisol under field conditions .................................................................................... 221
R. Chintu, P.M. Matakala, A.R. Zaharah
Recent publications on soil and water management
and crop nutrition ................................................................................................................... 233
List of participants.................................................................................................................. 235
IAEA


1
SUMMARY
The studies conducted within the CRP are summarised under three major headings.
Firstly, it is necessary to characterize the diverse types of agroforestry systems in terms of
species and their spatial and temporal arrangements, and the climatic and edaphic conditions
under which the experiments were conducted. The second major section deals with the
efficiency with which agroforestry systems are able to use natural resources, including water
and nutrients, compared with systems which include only crops. The third major section deals
with the productivity of the diverse agroforestry systems studied within the CRP.
1. CHARACTERIZATION OF AGROFORESTRY SYSTEMS
Trees are a natural feature of rural landscapes and provide a range of benefits to
farming communities. Trees on farms may be a relic of the native vegetation or may be
exotic, introduced species. Trees can provide fruits and nuts, fodder for animals, timber and
fuel wood, industrial products (oils, gums, resins, tannins, latex) and also traditional
medicinal and cosmetic products. Thus a single tree may provide several benefits.
Agroforestry is the practice of integrating trees on farms in order to increase the overall
productive capacity of the land. It is a well established management practice for tropical crops
that require shade trees, e.g. coffee, cocoa, tea. Trees are also needed for shelter in animal
production systems that are located in regions with hot, dry summers and cold, wet winters.
1.1. Agroforestry systems studied in the project
There are innumerable possibilities for the combination of trees and crops in terms of
species, geometrical patterns and sequences. The majority of the tree species used in the
project were legumes, but non-legumes were also included (Table 1). The most commonly
used crop was maize, but other cereal, grain legume and pasture species were included
(Table 1). Coffee was included as the crop in one study. The most common agroforestry
design was alley cropping (tree hedgerows with crops planted between the hedgerows). The
alley hedgerows were a permanent feature, with the crop being grown during the rainy
season(s). Other systems involved the rotation of trees and crops (so-called tree fallows or
improved fallows), or rotation of alley-sown pasture with wheat (Table 1). A range of nuclear
techniques were applied to study nutrient and water dynamics in agroforestry systems
(Table 1), and these applications will be discussed in greater detail in Section 2.
1.2. Environmental and edaphic variables
Field experiments were carried out under a range of climatic conditions, covering
semi-arid, temperate and tropical regimes (Table 2) in both the northern and southern
hemispheres (Table 2). Two sites were at relatively high elevation (>1000 m, Table 2) and
several sites were located in high rainfall areas (>1500 mm annual average) with either a
unimodal or bimodal rainfall pattern. A bimodal pattern (two rainy seasons per year)
permitted two crops per year (e.g. Kenya and Sri Lanka). However, experiments were carried
out at some sites over several years, and high year-to year variability was noted at several
sites, e.g. at Msekera in Zambia annual rainfall for 1992–2003 varied between 550 and
1400 mm with 50% of the years receiving less than the long-term average of 1000 mm.
Another important issue in agroforestry systems is the depth of groundwater. Trees can access
groundwater at greater depth compared with crops, which can significantly lessen the
competition between crops and trees for surface water.

2
The field experiments were also carried out on a range of soil types, covering five
orders of the soil taxonomy classification (Table 3). They ranged in texture from coarse (e.g.
sandy loam) through medium (e.g. loam) to fine (e.g. clay), which had a marked influence on
the soils’ abilities to hold water. All soils were weakly to moderately acid, with generally low
organic C contents (exception Costa Rica) and with low to moderate abilities to hold cations
(cation exchange capacity) as seen in Table 3. Overall, the soils would be regarded as having
low fertility.
TABLE 1. AGROFORESTRY SYSTEMS STUDIED
Agroforestry parameters Member State
Authors
Tree Crop System
Nuclear techniques
Costa
Rica
Cervantes Erythrina poeppigiana,
Gliricidia sepium
Coffea arabica
(Coffee)
Shade tree 15
N enriched
fertilizer, 15
N tree injection
Chile Ovalle et al. Acacia caven,
Chamaecytisus proliferus (Tagasaste)
Annual pasture
(native spp, Medicago
polymorpha)
Silvo-
pastoral alleys/wheat
rotation
15N tree injection,
15N enriched
fertilizer
Sri
Lanka
Nissanka
and Sangakkara
Gliricidia sepium Zea mays
(Maize)
Alley (G.
sepium hedgerow),
maize monocrop
15N enriched
fertilizer, 15
N tree injection, δ
13C (soil,
plants)
China Zhang et al. Choerospondias axillaris Arachis hypogaea
(Peanut)
Alley (C. axillaris
hedgerow), peanut
monocrop
15N enriched
fertilizer, soil
moisture neutron probe
Malaysia Zaharah et
al.
Paraserianthes
falcataria, Gliricidia
sepium
Zea mays
(Maize)
Alley (P.
falcataria, G.
sepium hedgerows),
maize monocrop
15N enriched
fertilizer, δ 18
O
(water sources)
Zambia Chintu et al. Gliricidia sepium, Leucaena leucocephala,
Senna siamea, Calliandra calothyrsus,
Flemingia microphylla, Acacia angustissma
Zea mays (Maize)
Tree/maize rotation,
maize monocrop
Soil moisture neutron probe
Kenya Ndufa et al. Sesbania sesban, Crotalaria grahamiana,
Cajanus cajan,
Tephrosia vogelii, Senna spectabilis, C.
calothyrsus
Zea mays (Maize)
Tree/maize rotation
15N tree injection
Niger Smith Azadirachta indica
(Neem)
Pennisetum
glaucum (pearl millet)
Windbreak δ 18
O (water sources)
Australia Cullen et al. Callitris glaucophylla, Acacia spp, Eucalyptus
spp
None Natural ecosystem
(native trees)
δ 18
O (water, plant tissue), δ
13C (plant
tissue), δ 2H (water
sources)

3
TABLE 2. ENVIRONMENTAL VARIABLES
Member
state
Authors Site Latitude/lo
ngitude
Altitude
(m asl)
Rainfall
(mm)a
RH
range
(%)a
Temp
range
(oC)
a
Costa
Rica
Cervantes Heredia
(humid),
San Isidro
(humid)
10o08'N
84o06'W
9° 22'N
83° 42'W
1250
(2278)
(2354)
(76)
(83)
(19.9)
(24.0)
Chile Ovalle et al. Cauquenes
Mediterranean
35o58’S,
72o17’W
140 (650) 60–85 4.5–29
Sri Lanka Nissanka and
Sangakkara
Dodangolla 07o07'N,
81o13'E
367 1500–2000
(bi-modal)
28–32
(max.)
China Zhang et al. Yingtan
(sub-tropical)
28o15'N
116o55'E
55 (1729) (76) (18.2)
Malaysia Zaharah et al. Puchong humid
tropical
02o59’N,
101o39’E
(2000) 80–90 19–36
Zambia Chintu et al. Msekera
(sub-humid),
Kagoro
13o39’S
32o34’E
14o15’S
32o00’E
(1000)
(800)
Kenya Ndufa et al. 00o06’N,
34o34’E
1330 1800
(bi-modal)
Australia Cullen et al. Hamersley
(semi-arid)
(300) 12–40
aData in parentheses are long-term annual averages.
TABLE 3. SOIL PROPERTIES
Member
tate
Author Site Soil order Depth
(cm)
Texturea pH C (%)
b CEC
c
Costa
Rica
Cervantes Heredia,
San Isidro
Andisol
Ultisol
0–12 l 6.7
5.8
7.2 15.0
Chile Ovalle et al. Cauquenes Entisol 0–12 sacl 5.7 1.27
Sri
Lanka
Nissanka and
Sangakkara
Dodangolla Ultisol 0–21
21–48
sal
sacl
6.3
6.5
0.32
0.12
14.2
17.8
China Zhang et al. Yingtan Ultisol 0–7
45–95
sicl
sicl
4.3
4.5
0.42
0.12
6.2
9.2
Malaysia Zaharah et al. Puchong Ultisol 0–20 sacl 4.8 0.84 7.0
Zambia Chintu et al. Msekera,
Kagoro
Alfisol
Alfisol
0–20
0–20
sacl
c
4.7
5.2
1.00
<1.0
Kenya Ndufa et al. Oxisol 0–15 c 5.6 1.40 7.9
asacl, sandy clay loam; sicl, silty clay loam; sal, sandy loam; l, loam; c, clay. bOrganic C. cCEC, cation exchange capacity (cmol(+) kg–1).
1.3. Availability, quality and location of tree prunings
The transfer of tree prunings (leaves, stems) to the cropping area accomplishes transfer
of nutrients from trees to crops. The prunings remain on the soil as surface mulch and
nutrients are released during decomposition. Several authors commented on the competition
between agricultural sectors for tree prunings. In some areas, the need for animal fodder is
perceived to be more acute than the need for nutrient replenishment. Insect pests may
constitute a serious hazard to both trees and crops in some areas, which will dictate the
selection of species. Another factor that can be significant is the ability of the tree to coppice
S

4
after pruning. Several studies were concerned with the quality of tree prunings as a source of
nutrients as determined by chemical analysis for certain plant constituents (e.g. proximate
analysis). Another aspect studied under controlled laboratory conditions was the placement of
the prunings, being either incorporated or left on the soil surface.
2. RESOURCE USE EFFICIENCY
2.1. Water
An important aim of agroforestry is to enhance biomass production on farms by
increasing the productive use of rainfall. In arid and semi-arid regions, crops commonly
utilize less than half of the annual rainfall productively, with the remainder lost as runoff,
evaporation or drainage. In order to protect the food security of farm households, water use by
agroforestry trees should not be at the expense of crop growth because of competition.
Successful use of agroforestry therefore requires that trees utilize water that would otherwise
be lost from cropped fields by evaporation, runoff and drainage. Use of groundwater by trees
that is inaccessible to shallow-rooted crops can be verified by comparing the relative
concentrations (δ values) of the stable isotopes 2H or
18O in sap and water from possible
sources, as differences commonly exist in the natural isotopic composition of groundwater
and soil water. Use of this technique to compare the sources of water exploited by trees and
crops in agroforestry can indicate whether their water use is competitive or complementary.
The efficacy of the method was tested in both humid (Malaysia) and water-limited
environments in Niger and Australia (Tables 1 and 2).
2.1.1. Sources of water in a humid environment
In a Gliricidia-maize alley cropping system (4 m between hedgerows) under humid
tropical conditions in Malaysia, δ 18
O values of rainwater differed significantly from the
values in the sap of Gliricidia hedgerows, with δ 18
O values of soil water and maize sap being
intermediate. δ 18
O values of all sources varied both within and between years, but among
sources, groundwater showed less temporal variation. Gliricidia and maize took up water
mainly from the 30–60 cm soil depth, and seemed to compete for water at this depth during
the establishment phase of Gliricidia. However as Gliricidia aged, the trees appeared to be
taking up water from lower soil depths.
2.1.2. Sources of water in water-limited environments
Competition for water between trees and crops may be unavoidable in water-limited
environments unless the deep roots of trees can exploit water that has drained through the
crop rooting zone to the water table. In a windbreak system of neem trees and millet at two
locations in the Sahelian zone of Niger where groundwater occurred at depths of 35 m
(Sadore) and 6 m (Majjia Valley), differences in the δ18
O signatures of groundwater, soil
water at 0–3 m depth and the sap of neem and millet revealed that the trees and crop used
water from the topsoil after rain at both sites, but during dry periods the tree was able to
access shallow groundwater in the Majjia Valley, but not deep groundwater at Sadore. Thus,
trees and crops compete for water in the topsoil, but during periods of drought the tree can use
shallow groundwater to mitigate the water stress. The relationship between these findings and
millet yields is discussed in Section 3.
In a natural ecosystem in semi-arid northwest Australia with a mean annual rainfall of
300 mm, the mean δ2H of soil water at 2 m depth was –24.4‰ while the mean δ
2H of

5
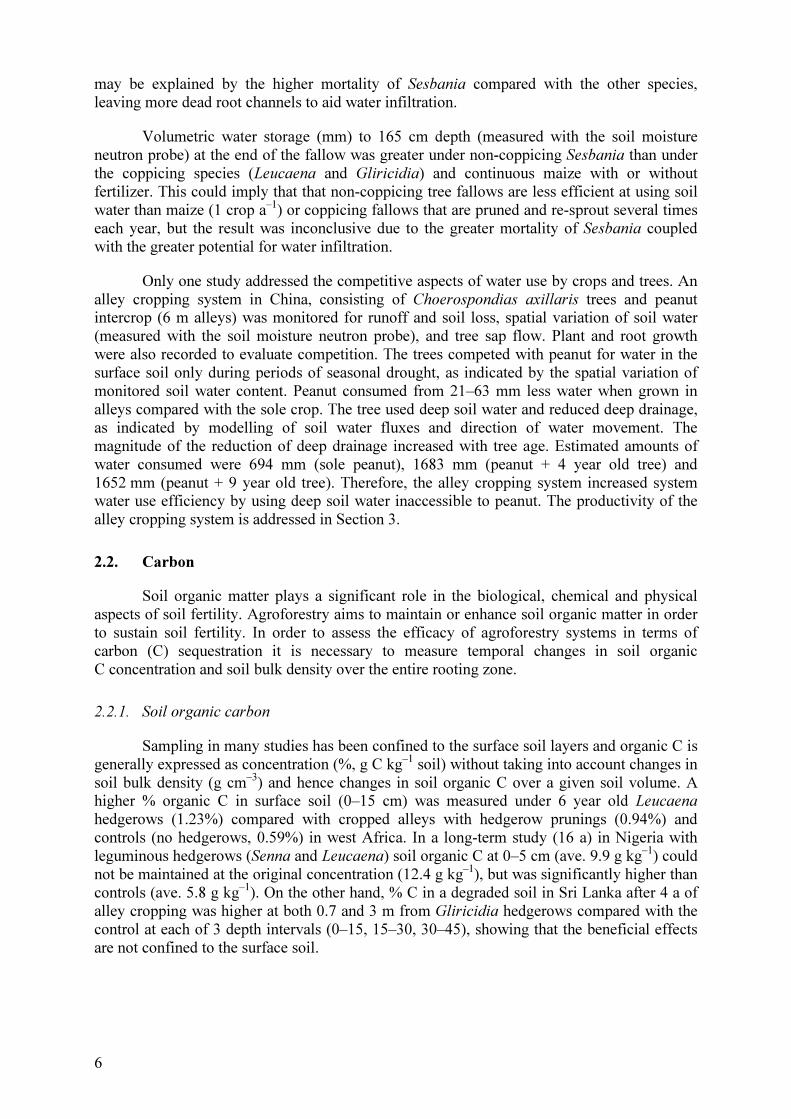
groundwater was –49‰. The δ2H signatures of rainwater ranged from +11‰ (November) to –
24‰ (August). Thus, there were very large differences in the δ2H signatures between and
within different water sources. Considerable differences in δ2H between tree species and
landscape positions were also evident. Based on these observations it was concluded that
species adapted to growing in and along creek lines have access to groundwater and are less
dependent on stored soil water, while conversely, species growing on floodplains are highly
dependent on rainwater.
Several implications can be drawn from the above observations with respect to
agroforestry systems. Tree species from arid environments may be adaptable for use in
agroforestry systems in areas with strong seasonality in rainfall. The presence of roots deep in
the soil profile is not a reliable indicator of the zones of water uptake, both spatially and
temporally. Development of areas with little access to groundwater for agroforestry may not
be sustainable without periodic recharge of soil water by rainfall. Design and management of
agroforestry systems requires detailed knowledge of climate, the depth of groundwater and
soil water volume. Unfortunately, the idea that differences in the spatial distribution of roots
between tree and crop species will be the key to complementarity in agroforestry systems is
not supported by observations. Rooting patterns for trees and crops are usually similar, and
although trees have deeper roots than crops there is little spatial separation. Complementarity
in agroforestry must depend on the distribution of the water resource, not on the distribution
of roots.
2.1.3. Using stable isotopes to assess sources of water
Knowledge of the spatial and temporal variations in the relative abundance of the
naturally-occurring stable isotopes of H2 and O2 (δ2H and δ
18O) in groundwater, soil water,
rain water and plant sap provides a powerful tool for identifying sources of water used by tree
and crop components of agroforestry systems. However, caution is required in both the
sampling and data interpretation aspects of the methodologies. For example, significant δ18
O
isotopic discrimination can occur in the ascending sap of herbaceous species due to radial
evaporation from the stem. Artificial ‘suberization’ by wrapping the stem of maize in plastic
film was found to be effective in minimising fractionation. While both 2H and
18O have been
used to identify sources of water used by plants, 2H may be better for this purpose, while
18O
may be more useful for examining relationships with climate.
Ideally, the isotope technique should be used in conjunction with other measurements
of system water status, including the spatial and temporal distribution of volumetric soil water
content, so that estimates of the soil water balance can be obtained. If the soil water balance is
known, total uptake from individual soil layers can be estimated. If leaf water potentials,
transpiration by the tree and crop and root distributions are measured, partitioning of uptake
from individual soil layers by trees and crops can be modelled, and the information generated
can be used to quantitatively assess the extent of competition and complementarity in
agroforestry under various management regimes.
2.1.4. Movement, storage and competition for water
A comparison of 3 year tree fallows, natural fallow and continuous maize at Msekera
in Zambia showed marked differences in infiltration of water at the end of the fallow period.
Cumulative water intake increased significantly in the order Sesbania (non-coppicing) >
natural fallow > maize + fertilizer = Gliricidia (coppicing) > maize – fertilizer. This result
6
may be explained by the higher mortality of Sesbania compared with the other species,
leaving more dead root channels to aid water infiltration.
Volumetric water storage (mm) to 165 cm depth (measured with the soil moisture
neutron probe) at the end of the fallow was greater under non-coppicing Sesbania than under
the coppicing species (Leucaena and Gliricidia) and continuous maize with or without
fertilizer. This could imply that that non-coppicing tree fallows are less efficient at using soil
water than maize (1 crop a–1
) or coppicing fallows that are pruned and re-sprout several times
each year, but the result was inconclusive due to the greater mortality of Sesbania coupled
with the greater potential for water infiltration.
Only one study addressed the competitive aspects of water use by crops and trees. An
alley cropping system in China, consisting of Choerospondias axillaris trees and peanut
intercrop (6 m alleys) was monitored for runoff and soil loss, spatial variation of soil water
(measured with the soil moisture neutron probe), and tree sap flow. Plant and root growth
were also recorded to evaluate competition. The trees competed with peanut for water in the
surface soil only during periods of seasonal drought, as indicated by the spatial variation of
monitored soil water content. Peanut consumed from 21–63 mm less water when grown in
alleys compared with the sole crop. The tree used deep soil water and reduced deep drainage,
as indicated by modelling of soil water fluxes and direction of water movement. The
magnitude of the reduction of deep drainage increased with tree age. Estimated amounts of
water consumed were 694 mm (sole peanut), 1683 mm (peanut + 4 year old tree) and
1652 mm (peanut + 9 year old tree). Therefore, the alley cropping system increased system
water use efficiency by using deep soil water inaccessible to peanut. The productivity of the
alley cropping system is addressed in Section 3.
2.2. Carbon
Soil organic matter plays a significant role in the biological, chemical and physical
aspects of soil fertility. Agroforestry aims to maintain or enhance soil organic matter in order
to sustain soil fertility. In order to assess the efficacy of agroforestry systems in terms of
carbon (C) sequestration it is necessary to measure temporal changes in soil organic
C concentration and soil bulk density over the entire rooting zone.
2.2.1. Soil organic carbon
Sampling in many studies has been confined to the surface soil layers and organic C is
generally expressed as concentration (%, g C kg–1
soil) without taking into account changes in
soil bulk density (g cm–3
) and hence changes in soil organic C over a given soil volume. A
higher % organic C in surface soil (0–15 cm) was measured under 6 year old Leucaena
hedgerows (1.23%) compared with cropped alleys with hedgerow prunings (0.94%) and
controls (no hedgerows, 0.59%) in west Africa. In a long-term study (16 a) in Nigeria with
leguminous hedgerows (Senna and Leucaena) soil organic C at 0–5 cm (ave. 9.9 g kg–1
) could
not be maintained at the original concentration (12.4 g kg–1
), but was significantly higher than
controls (ave. 5.8 g kg–1
). On the other hand, % C in a degraded soil in Sri Lanka after 4 a of
alley cropping was higher at both 0.7 and 3 m from Gliricidia hedgerows compared with the
control at each of 3 depth intervals (0–15, 15–30, 30–45), showing that the beneficial effects
are not confined to the surface soil.

7
2.2.2. Residue quality
Studies on the relationships between residue quality parameters and decomposition
under controlled conditions (France) showed that during the initial phase of decomposition,
the principal factor determining decomposition kinetics was the nature of the added C, which
strongly affected the nature and activity of the decomposing microbial biomass. Initial C
mineralization (after 3 d of incubation) was significantly related to the percentage of soluble
compounds in the residue, while after 142 d, an inverse linear relationship was observed
between cumulative C mineralization and the percentage of the lignin-like fraction (r2 = 0.73,
P < 0.05).
C mineralized from roots was 20 to 30% less than for leaves and stems, and this was
assumed to be related to the high lignin-suberin content in roots. The lower decomposition of
root-C translated into higher stabilisation of root-derived C into the soil, suggesting a higher
contribution of root systems than above ground parts to the soil organic C pool. This suggests
that inputs of C from roots contribute proportionally more than other plant parts to the long-
term build up of soil organic matter.
2.2.3. Soil organic C derived from residues
If the δ13
C signature of plant residues differs from that of soil organic C, it is possible
to estimate the percentage of soil C derived from the residues after a period of decomposition.
In Sri Lanka, Gliricidia residues (leaves, stems and roots) having a δ13
C value of –25.93‰
were added to soil having a δ13
C value of –23.22‰. The percentage of soil C derived from the
residues was 36% 4 weeks after addition and 31% at maize harvest. These data show the
substantial contribution of residues to the soil C pool, but this percentage declines with time
due to decomposition, and therefore continued residue addition is required to maintain soil C
levels.
The addition of 13
C-enriched residues to soil also permits the residue-derived C to be
differentiated from the background soil organic C. In France, the placement of 13
C-enriched
residues of oilseed rape either as surface mulch or incorporated had a marked effect on
decomposition during 3 wet/dry cycles over a 9 week incubation period under controlled
environmental conditions. Decomposition (as shown by 13
CO2 evolution) was more rapid for
incorporated residues. After 9 weeks, 73.5% of the residue-C remained in the mulch while
7.8% entered the soil fraction down to 10 cm (18.7% was evolved as CO2). When
incorporated, 20.7% remained as residue while 24.6% entered the soil fraction, of which
10.8% was leached down to 17.5 cm (54.7% was evolved as CO2). The migration of residue-
C into the soil fraction was rapid, occurring mainly in the first 3 weeks.
2.2.4. Soil physical properties
Studies in eastern Zambia have shown that trees and tree biomass can improve soil
physical properties, particularly on Alfisols. Alley cropping with hedgerow species can
reduce soil bulk density, increase porosity and increase water infiltration (Section 2.1.4). Soil
hardness or compaction as indicated by penetrometer resistance at 0–5 cm was least for
Gliricidia fallow (0.6 Mpa) and highest for unfertilized maize (1.7 Mpa). Compared with
traditional grass fallow, the percentage of water stable aggregates (>2mm diameter) under
Sesbania fallow was less, but was much greater under Sesbania than under continuous maize.
These differences were inversely related to time-to-runoff measurements. The role of roots in
the development of structure was also emphasised by the study in Kenya, where the 15
N

8
recovery from labelled roots and foliage in water stable aggregates (>20µm) was 39 and 31%,
respectively.
Runoff and soil loss were measured over a 3 year period in China in a tree-peanut
alley cropping system on a gentle 5o slope. Runoff in the first year was greatest in 4 year and
7 year old monoculture tree plots (280–300 mm) and was least for the alley cropping systems
(120–140 mm). In contrast, soil loss was highest in the peanut monocrop (6800 kg ha–1
) and
lowest in the tree monocrops in the first year (1500 kg ha–1
). The greater runoff in the
monoculture tree systems may be due to surface seals that decrease infiltration. Tillage for
peanut cropping can increase infiltration, but it also predisposes the soil to erosion. The lower
soil losses in the tree monocrops (years 1, 2 and 3) were due to the absence of tillage, and the
lower losses in intercrops (years 2 and 3) were due to the protection of the tilled soil by
surface mulch.
In West Africa, alley cropping using Leucaena was able to reduce runoff from 67% in
the tilled control to 3% in a 2-m tall Leucaena alley crop treatment. Soil loss was similarly
reduced from 6.2 t ha–1
to 0.2 t ha–1
in the same treatments.
2.3. Nitrogen
2.3.1. Soil organic N
Changes in soil organic N would normally follow the same trend as changes in soil
organic C. For example, in the long-term study (16 a) in Nigeria with leguminous hedgerows
(Senna and Leucaena) soil organic N at 0–5 cm (ave. 0.81 g kg–1
) could not be maintained at
the original concentration (1.45 g kg–1
), but was significantly higher than controls (ave. 0.43 g
kg–1
). On the other hand, % N in a degraded soil in Sri Lanka after 4 a of alley cropping was
higher at both 0.7 and 3 m from Gliricidia hedgerows compared with the control at each of
3 depth intervals (0–15, 15–30, 30–45), showing that the beneficial effects are not confined to
the surface soil. For the 0–15 cm interval, % N at both 3 and 7 m from the hedgerow was
0.09% compared with the initial concentration of 0.05%.
2.3.2. Residue quality
Studies on the relationships between residue quality parameters and decomposition
under controlled conditions (France) showed that the amount of N mineralized was strongly
related to the initial N content of the residues (r2roots = 0.93, P < 0.05; r
2leaves = 0.93, P < 0.01;
r2stems = 0.91, P < 0.01) . No specific interaction with the origin of the residues (agro-, pasture
or forest ecosystem) was observed, indicating that concepts for describing crop residue
decomposition may be generalized for the decomposition of grass roots and tree leaves, and
therefore for mixed residues in agroforestry systems.
2.3.3. Residues as a source of N for crops
The recovery of tree biomass N by crops was measured in Costa Rica, Chile, Kenya
and Sri Lanka by labelling the tree biomass with 15
N by a stem injection technique. In Kenya,
six tree legume species were enriched with 15
N and treatments were imposed to separate the
contribution of foliage + roots, foliage alone and roots alone to the N nutrition of 4 crops of
maize grown over 2 a (2 crops a–1
). Total above ground N (leaves, wood, litterfall) ranged
from 7.6 g tree–1
(Crotalaria) to 23.1 g tree–1
(Calliandra), with shoot to root ratios varying
from 1.2 (Senna) to 3.2 (Crotalaria). Maize recovered only a relatively small percentage of
the labelled legume residues, with recoveries consistently in the order: foliage + roots >

9
foliage alone > roots alone. Recoveries ranged from 4.0% (Calliandra) to 21.5% (Sesbania)
for foliage + roots, from 2.4% (Senna) to 7.0% (Tephrosia) for foliage alone, and from 1.1%
(Cajanus) to 4.5% (Tephrosia) for roots alone. In a similar 15
N tree injection study in Sri
Lanka with Gliricidia, maize recovered 12.9% from pruned foliage + roots and 2.5% from
roots alone. In Costa Rica, coffee plants recovered 3.1 and 4.2% of N from Erythrina and
Gliricidia prunings, respectively, after decomposition for 60d.
In Chile, the contribution of the tree legume, Tagasaste, and a sown pasture legume
(Medicago polymorpha) to the N nutrition of wheat grown in rotation with the pasture phase
after 1, 2, 3 or 4 years of pasture was assessed using a combination of 15
N tree labelling by
injection and 15
N soil labelling in the pasture. Sheep were allowed to graze the pasture and the
Tagasaste and all faeces and urine were collected, weighed, analysed and returned to the
pasture. The treatments consisted of natural pasture, sown pasture, natural pasture in
Tagasaste alleys and sown pasture in Tagasaste alleys. The legumes contributed from 4.3 to
11.0 kg N ha–1
to wheat after 1 a of pasture, 13.4 to 28.7 kg N ha–1
after 2 a of pasture, 20.6 to
45.6 kg N ha–1
after 3 a of pasture, with no additional contribution after 3 a. Tagasaste
contributed less N than the improved pasture, and the combination of Tagasaste + improved
pasture was superior to improved pasture alone only after 1 a of pasture. The percentages of
wheat N derived from the legumes ranged from 6–16% after 1 a pasture, from 16–31% after 2
year pasture and from 22–45% after 3 a pasture, with no additional benefit conferred after 3 a.
Thus, the pasture legume was able to supply about one-half of the N requirement of wheat
after 3 a. The contribution of N from Tagasaste (6–23% of wheat N) was suboptimal due to
root fungus attack.
In Malaysia, N transferred from the prunings of hedgerow legumes to maize was
estimated by an indirect 15
N labelling technique involving labelling plots with enriched
fertilizer and then measuring the isotope dilution of the treatment relative to a control. The
contribution of N from leaf mulch obtained from Paraserianthes falcataria hedgerows
contributed 15% to the N nutrition of one maize alley crop. The contribution of N from leaf
mulch obtained from Gliricidia sepium hedgerows to the N nutrition of four maize alley crops
showed marked seasonal variability (5 to 32% of maize N).
In China, the recovery of fertilizer N by a hedgerow tree (C. axillaris) and a peanut
crop was estimated in each of 2 years by placing 15
N-enriched fertilizer at 3 depth intervals
(10–15, 30–35 and 50–55 cm) in peanut alone plots and alley plots bordered by 4- and 9 year
old trees. The results indicated that peanut mainly uses N in the surface soil (10–15 cm), but
the trees can use N in deeper soil (>40 cm). The tree competed with peanut for N in the
surface soil as indicated by the lower 15
N recovery by peanut and the higher 15
N recovery of
the tree in the alley cropping system. The older trees were more efficient at recovering
labelled N than the younger trees at each placement depth. The alley cropping system
increased system N use efficiency compared with the peanut monocropping system. For
example, for fertilizer placed at 10–15 cm depth in 2001, 15
N recoveries in above ground
biomass were 25% for sole peanut, 45% for peanut alley cropped with 4 year old tress and
65% for peanut alley cropped with 9 year old trees.
2.3.4. Soil inorganic N
In Zambia, concentrations of soil inorganic N (NH4+ + NO3
-) in topsoil (0–20 cm)
during Oct.–Nov. (the so-called pre-season), spanning the several weeks preceding maize
planting, were positively correlated with maize yields (r2 = 0.71, P < 0.05). Inorganic-N
concentrations (0–20 cm) under improved leguminous fallows were invariably higher than
continuous maize without N fertilizer or natural fallow, but were similar to maize with N

10
fertilizer. The improved available N status in topsoil associated with the leguminous tree
fallows may be attributed to N inputs from BNF and litterfall. In contrast, nitrate in subsoil
(150–200 cm) was higher under maize with or without fertilizer (2 mg N kg–1
soil) compared
with coppicing Gliricidia and Leucaena tree fallows (0–1 mg N kg–1
soil), indicating that the
trees utilized nitrate, which had leached beyond the maize roots. However, subsoil nitrate
under non-coppicing Sesbania was higher than the other treatments (6 mg N kg–1
soil). Thus,
N resource use efficiency was improved by coppicing tree fallows but not under non-
coppicing Sesbania fallow. Mixing coppicing and non-coppicing species was effective in
reducing subsoil nitrate.
Studies conducted under humid tropical conditions showed the high potential for
leaching of fertilizer N (Costa Rica) and N derived from the decomposition of leguminous
hedgerow biomass (Malaysia). In the former study, less than 2% of urea fertilizer was
recovered in the 0–90 cm soil depth at two sites two weeks after N application. In the latter
study, the mineralization of 15
N-labelled P. falcataria biomass was very rapid with 20% of
leaf N released in 1 d. Thus, it may be difficult for crops to capture fertilizer N or N released
rapidly from high quality residues under warm and moist conditions with a high leaching
potential.
2.4. Soil pH, Ca, Mg, K and P
Biomass transfer can increase surface soil pH due to the transfer of ash alkalinity. The
magnitude of the pH shift will depend on the soil pH buffering capacity and the amount of
alkalinity transferred. In Malaysia, the pH of surface soil (0–10 cm) increased following the
transfer of P. falcataria biomass, but the effect was transient, and biomass transfer had no
effect on subsoil pH.
Improvement in the organic matter content of the soil through biomass transfer can
also increase effective cation exchange capacity (CEC) and the concentrations of
exchangeable cations. For example, in the long-term study (16 a) in Nigeria with leguminous
hedgerows (Senna and Leucaena) exchangeable Ca++
under Senna mulch at 0–5 cm was
3.4 cmol(+)
kg–1
compared with the original grass fallow of 2.8 cmol(+)
kg–1
, Leucaena mulch
(2.2 cmol(+)
kg–1
) and the control (ave. 1.4 cmol(+)
kg–1
). Values for exchangeable Mg++
and
K+ in mulch treatments were higher than the control soil, but were less than the original grass
fallow. Effective CEC was improved or maintained under mulch (3.5–4.7 cmol(+)
kg–1
)
compared with the original soil (4.1 cmol(+)
kg–1
) but was significantly less in the control (ave.
2.4 cmol(+)
kg–1
). In the same study, there was no improvement in soil available P status
(Bray-1) due to biomass transfer.
3. PRODUCTIVITY OF AGROFORESTRY SYSTEMS
3.1. Tree fallows
In East Africa, maize grown after leguminous tree fallows in Kenya and Zambia
showed highly significant yield responses when compared with the control treatment
(continuous maize). In Kenya, maize yield (second crop) increased from 118 to 242 g plant–1
for the control and Senna fallow, respectively, and from 130 to 160 g plant–1
for the third
maize crop in the same treatments, but maize yields for the 4th
crop were much reduced (52–
71 g plant–1
) with no significant difference between the control and the fallow treatments.

11
In Zambia, planted tree fallows significantly increased maize yields over the no-tree
unfertilized control. However, planted Sesbania (non-coppicing) fallows significantly
improved maize yields only in the first three post-fallow years (4.5–3.5 t ha–1
). After 3 a,
Sesbania post fallow maize yields were 1–2 t ha–1
, equivalent to no-tree (no fallow)
unfertilised control. Maize yields after 9 post-fallow cropping years following Gliricidia and
Leucaena (coppicing) were similar to those in the no-tree fertilized control (3.5–5 t ha–1
).
Mixing a coppicing fallow species with a non-coppicing species significantly increased maize
yields compared with single-species fallows. However, mixtures of non-coppicing species did
not increase maize yields compared with sole species.
3.2. Alley cropping
3.2.1. Crop yields
In a 10 year study of alley cropping maize with Leucaena and Dactyladenia in West
Africa fertilized maize yields were consistently higher in the alleys (2.5–5.6 t ha–1
) compared
with the control with (1.7–2.5 t ha–1
) or without (1 t ha–1
) fertilizer. In a 3-season study in Sri
Lanka, yield of cowpea in Gliricidia alleys was consistently higher when Gliricidia prunings
were applied and when cowpea residues were retained compared with the control (no addition
of prunings or retention of crop residues) or Gliricidia prunings alone.
Studies conducted in Malaysia with P. falcataria and Gliricidia hedgerows and maize
as the alley crop or sole crop gave variable results. There were no significant treatment effects
on the yield of 2 crops of maize with or without (i) P. falcataria hedgerows (ii) leaf mulch
and (iii) 50 kg N ha–1
fertilizer addition. For the Gliricidia hedgerow with the same
treatments, the control treatment gave the highest maize yield for the first crop, with the
hedgerow treatments giving the lowest yields. For the next maize crop, the treatments with
hedgerow plus mulch gave the highest total dry matter production.
In China, the yield of peanuts over 4 years was consistently less in C. axillaries alleys
compared with sole crops, but the differences were very variable between years (range of 8–
60%). Yield of peanuts and above ground dry matter increased with distance from the
hedgerow to the alley centre, indicative of competition for resources. The same result was
observed in Sri Lanka, where cowpea grain yield was higher in the middle rows (9–11 g
plant–1
) compared with 4–5 g plant–1
near the hedgerows.
3.2.2. Physiological response of the crop
Studies in Sri Lanka showed that the hedgerow has a marked effect on the
physiological response of maize (C4 plant) and cowpea (C3 plant). Hedgerows may influence
1–3 adjacent crop rows negatively, possibly due to competition for light or water resources.
For example, the leaf chlorophyll content (SPAD readings) of 2 maize rows adjacent to
Gliricidia hedgerows was 35 compared with a reading of 42 for the 3 rows in the centre of the
alley. The leaf photosynthesis rate of cowpea at 10.00 h was significantly lower near the
hedgerows (10 µmol m–2
s–1
) compared with the centre of the alley (45 µmol m–2
s–1
).
3.3. Agro-silvo-pastoral
In the study conducted in Chile in a Mediterranean environment, a traditional system
of natural pasture was compared with sown legume-based pasture, and with traditional and
improved pasture between hedgerows of Tagasaste (tree lucerne). Sheep were allowed to
graze the pasture and trees, and all faeces and urine were collected and returned to the plots.
12
The pasture phase of 1, 2, 3 or 4 a was followed by a crop of wheat. Grain yield of wheat was
lower in the traditional system after 2 or more years of pasture (1560–1847 kg ha–1
) compared
with the other treatments (2240–3380 kg ha–1
), but there was no additional advantage when
Tagasaste was included with improved pasture. There was also no advantage in increasing the
length of the pasture phase beyond 2 a. However, the inclusion of legume trees confers
additional benefits not quantified in the study. The presence of trees in this environment is
crucial in terms of providing shelter during the hot, dry summer, and the rainy and windy cold
winters when sheep are lambing.
3.4. Shade trees
The use of leguminous shade trees (Erythrina) for coffee in Costa Rica is a traditional
agronomic practice. Both coffee and shade trees are pruned. By increasing the shade tree
density from 238 to 500 trees ha–1
and introducing a staggered tree pruning schedule so that
one-third of the shade trees were pruned at any one time, it was possible to increase tree
biomass from 2400 to 4500 kg ha–1
and biomass N content from 110 to 190 kg ha–1
. Yields of
coffee beans in the fertilized control, low tree density and high tree density were 20 300, 19
400 and 23 500 l a–1
, respectively. Thus it was convincingly demonstrated that improved
management of leguminous shade trees could replace the large amounts of N fertilizer
currently applied to coffee in Costa Rica, which constitutes a serious environmental hazard
due to the high leaching potential and low uptake efficiency on the young, permeable volcanic
soils under humid tropical conditions.
3.5. Windbreaks
Soil degradation and damage to crops occurs in the Sahelian zone of West Africa, due
to erosion of the predominantly sandy soils by strong winds preceding rainstorms.
Windbreaks are recommended to ameliorate wind erosion where the natural savannah trees
have been lost through drought or cutting. Studies conducted in Niger in a water-limited
environment demonstrated that millet yields in fields sheltered by windbreaks increased when
the trees had access to groundwater (6–10 m deep), but were adversely affected when
groundwater was inaccessible, and both species were forced to compete for the same limited
water supply in the top 2 m of the soil profile.
4. CONCLUSIONS
The present CRP has added to the existing body of knowledge by applying nuclear
techniques to gain insight into resource use efficiency in agroforestry systems. A sealed
radioactive source (soil moisture neutron probe) and stable isotopes at both enriched (15
N, 13
C) and natural abundance levels (13
C, 18
O, 2H) were employed to obtain data on water and
nutrient dynamics that could not be easily or accurately obtained by using traditional non-
nuclear techniques.
Knowledge of the spatial and temporal variations in the relative abundance of the
naturally-occurring stable isotopes of H2 and O2 (δ2H and δ
18O) in groundwater, soil water,
rain water and plant sap provided a powerful tool for identifying sources of water used by tree
and crop components of agroforestry systems. However, caution is required in both the
sampling and data interpretation aspects of the methodologies. For example, significant δ18
O
isotopic discrimination can occur in the ascending sap of herbaceous species due to radial
evaporation from the stem. Artificial ‘suberization’ by wrapping the stem of maize in plastic
film was found to be effective in minimising fractionation.

13
Ideally, the isotope technique should be used in conjunction with other measurements
of system water status, including the spatial and temporal distribution of volumetric soil water
content, so that estimates of the soil water balance can be obtained. Volumetric soil water
content is most accurately measured with the soil moisture neutron probe. If the soil water
balance is known, total uptake from individual soil layers can be estimated. If leaf water
potentials, transpiration by the tree and crop and root distributions are measured, partitioning
of uptake from individual soil layers by trees and crops can be modelled, and the information
generated can be used to quantitatively assess the extent of competition and complementarity
in agroforestry under various management regimes.
Extensive use was made of the stable isotope 15
N to quantify the contribution of tree
roots and prunings to the N nutrition of crops, and to track movement of N in the soil profile.
The stable isotope 13
C was also used to quantify the contribution of tree roots and prunings to
soil carbon stocks, and to track the movement of carbon into different soil physical or
chemical fractions that are important in terms of soil structure and chemical fertility. Without
the use of residues with 15
N or 13
C isotopic signatures different from that of the soil organic N
and C pools, it is impossible to accurately follow the pathways and estimate the recovery of
residue N and C in soils and crops, since the background concentrations of soil organic N and
C are large relative to the amounts of residues added.
A fundamental requirement of agroforestry is that the trees and crops should
complement each other in terms of resource use and not be competitive for resources. Thus
climate plays an important role in the efficacy of agroforestry systems. Under humid tropical
conditions where rainfall is high, water is usually not a limitation to either trees or crops.
However, under limited rainfall conditions, trees may compete for water to the detriment of
the crop, since tree and crop roots are abundant in surface soil. Improved water use efficiency
in agroforestry systems requires that the tree can access groundwater that is not accessible to
the companion crop. Improved nutrient use efficiency in agroforestry also requires that the
tree can access nutrients at depth, which are then recycled to the crop through tree prunings.
Leguminous trees can improve the N nutrition of crops through the cycling of prunings with a
high N content. The study in China clearly demonstrated that an alley cropping system
increased water and N use efficiencies almost 2.5-fold compared with the sole crop, but this
was achieved at a cost in reduced peanut yields.
The adoption of agroforestry systems by farmers will depend on a variety of socio-
economic factors. Agroforestry systems are labour intensive and require careful management.
They will be more attractive to farmers as a soil fertility management tool where
manufactured fertilizers are unavailable or too costly, or where the soils have become
degraded through continuous monocropping. However for optimum production in
agroforestry systems it will be necessary to provide small amounts of fertilizer to overcome
severe nutrient deficiencies, such as phosphorus deficiency. The goal of agroforestry to
increase resource use efficiency was convincingly demonstrated in the CRP. There are clear
environmental benefits to increased water use and recovery of subsoil nitrate by trees, but this
should not be at the expense of reduced crop yields.


15
RELATIVE CONTRIBUTION OF HEDGEROW LEGUMINOUS TREES,
LEAF MULCH AND SUPPLEMENTARY UREA TO THE YIELD
AND N NUTRITION OF ALLEY MAIZE CROPS
A.R. ZAHARAH, R. CHINTU, Z.Z. ZIANA, A.R. BAH, W.A.K WAN RASHIDAH
Department Land Management,
Universiti Putra Malaysia, Malaysia
Abstract
Maize was grown between hedgerows of leguminous trees (Paraserianthes falcataria and Gliricidia
sepium) in an alley cropping system from 1999–2004, and the tree prunings were used as a source of nutrients
for the maize crops. The relative contribution of the nitrogen released by the tree prunings and the amounts taken
up by the associated maize crop were measured using the 15N dilution method in six maize crops (two crops with
P. falcataria, and 4 crops with G. sepium as hedgerow trees). Rain, groundwater and water at 30, 60, 150 cm soil
depth were collected at the flowering stage of the maize crop, and the 18O signatures determined to elucidate if
there was competition for water by the maize and hedgerow trees. Leaf prunings from these two tree species
were easily decomposed and nutrients were released at a rapid rate. The leaf prunings contributed up to 15% of
the N taken up by the maize. Hedgerow trees were found to contribute N to the maize, possibly through root
decomposition. The 18O tracer study showed that these hedgerow trees compete for soil water with the
companion maize crop during the early establishment period. However, as the trees grew older, this competition
was minimized.
1. INTRODUCTION
Alley cropping systems, where food crops are grown between hedgerows of
leguminous trees or shrubs and their prunings used as a source of nutrients to the cereals have
been reported to sustain grain yields and improve soil fertility [1, 2]. Tree pruning are known
to improve soil physico-chemical and biological properties by directly providing plant
available nutrients through mineralization [1, 3], and can ameliorate heavy metal toxicities in
acid soils through complexation reactions by the organic acids and other byproducts released
in the process [4, 5]. The Ca and Mg released are widely believed to reduce Al saturation on
the exchange complex [6].
A direct relationship is known to exist between decomposition rate and initial N or
lignin and soluble polyphenols in leguminous litter. High initial N, low C : N, low (lignin +
polyphenol) : N or low polyphenol : N ratios generally favour high rates of decomposition of
fresh leguminous leaves [7, 8, 9, 10, 11]. These biochemical characteristics have been
observed to vary with the age of the plants [12], growth conditions [13], and the plant part
[14]. Thus, both plant residues and the nature of the decomposers influence the process to
considerable extents [15, 16]. As such, nutrient release by organic inputs is expected to differ
in extent and pattern.
Consequently, the objective of this study was to estimate the contributions of labelled
fertilizer N, hedgerows of the leguminous trees Paraserianthes falcataria and Gliricidia
sepium, leaf prunings of P. falcataria and G. sepium applied as a surface mulch, and
supplementary urea N fertilizer in 8 treatment combinations to the N nutrition of 6 crops of
maize intercropped within the legume alleys. 18
O signatures of the water in the plants and
from the possible sources (rain, groundwater and soil water at 30, 60, 150 cm soil depth) were
also measured in order to establish the level of competition for water or nutrients between the
trees and the crops.

16
2. MATERIALS AND METHODS
2.1. Experimental
A field experiment was carried out at the Puchong experimental site of the Universiti
Putra Malaysia, under humid tropical conditions, with a mean annual rainfall of about 2000
mm, a temperatures range between 19 and 36°C, and with relative humidity ranging between
80 and 90%. The area is dominated by soils of the Bungor series (Typic Paleudult). Specific
soil physical and chemical characteristics of the experimental site are shown in Table 1. The
plot size was 4m wide and 5 m long and a total of 32 plots were prepared with legume tree
seedlings planted as hedgerows in one half of the plots with four replications completely
randomized. The 8 treatments were:
- No hedgerow (control)
- Hedgerow
- No hedgerow + leaf mulch
- Hedgerow + leaf mulch
- No hedgerow + 50 kg N ha–1
harvest–1
- Hedgerow + 50 kg N ha–1
harvest–1
- No hedgerow + leaf mulch + 50 kg ha–1
harvest–1
- Hedgerow + leaf mulch + 50 kg N ha–1
harvest–1
TABLE 1. CHARACTERISTICS OF THE 0–20 CM SOIL DEPTH IN THE STUDY AREA
Soil characteristics Value
Organic Carbon (Walkley and Black)
Total N (Kjedahl) Cation Exchange Capacity (NH4Ac pH7.0)
pH (Water) pH (KCl) Clay
Silt Sand
Bray–1 P (0.01N HCl + 0.03N NH4F))
1.44%
0.15% 7.0 cmol(+)
kg–1
4.8 3.9 26.4%
4.3% 69.2%
5.1 mg kg–1
For each crop, 15
N labeled ammonium sulfate fertilizer (10.27 atom % 15
N excess) was
applied to a 1 × 3 m micro-plot (covering 13 maize plants at the center row of each of the
32 plots) at the rate of 40 kg N ha–1
one month after sowing. At the same time, 100 kg P ha–1
(first crop), and 50 kg P ha–1
(in subsequent crops) as Triple Super Phosphate (TSP) and
120 kg K ha–1
as Muriate of Potash (MOP) were applied to all plots for all crops to alleviate
the likely nutrient deficiencies. Nitrogen was applied as urea at the rate of 50 kg N ha–1
to all
the respective land-use systems in two split applications; the first application was at one
month after planting and the second application at two months after sowing. The trees were
trimmed to a height of 1m (hereafter called hedgerows or H) and their foliage was used for
application to the plots. Fresh legume leaves were applied to the leaf mulch (LM) plots at the
equivalent N rate of 120 kg N ha–1
that was split equally into two applications, one at one
month, and the other at two months after sowing. This rate will be used in calculations of N
use efficiency by maize in this study. During the second crop, the survival and growth of P.
falcataria trees was low due to fungal and other pest infestations, and therefore most of the
leaf material applied was collected from sources outside the experiment (biomass transfer).

17
After two maize crops, the hedge row trees were replaced with G. sepium, and four crops of
maize were grown using their leaf prunings as the N source. At maturity, the centre nine
maize plants from the 15
N labelled area were harvested, separated into stover and cobs, and
the stover was chopped into 3-cm pieces, mixed thoroughly and quartered. Two quarters were
again mixed and two quarters were taken as a subsample for each plot. The subsamples were
oven dried at 70°C until constant weight, ground to pass a 1 mm sieve and sent for 15
N
analysis to the IAEA Seibersdorf laboratory. Water samples were also collected at the grain-
filling stage for each of crops 3, 4 and 5 and sent for 18
O analysis. Groundwater was collected
from a tube-well located outside the experimental field, while water samples from 30, 45 and
60 cm depths were collected from tensiometers placed inside each plot. Sap was extracted
from each plant by attaching the cut end of the plant into a flask attched to a hand operated
suction pump. Suction was applied manually for 3–5 minutes, and then the top 5 cm of the
plant was removed or cut. More suction was applied and another 5 cm of the plant removed or
cut. This was continued until a few mL of sap was extracted from the plant. All the water and
sap samples collected for the day were placed and transported in an ice box and transferred
into the freezer in the laboratory until analysed.
2.2. Calculations and data analysis
Percent N derived from treatment (%NdfrT) was calculated using the following formula: [17]
%NdrfT = (1-[atom% 15
N excess of maize in residue treatment ÷ atom% 15
N excess of maize
in control treatment]) × 100
NdrfT (kg ha–1
) = %NdrfT x Total N uptake by maize in each land-use system
Differences between treatment means were tested for significance using Duncan’s New
Multiple Range Test (DNMRT) at the 5% level of probability [18, 19]
3. RESULTS
The chemical and physical characteristics of the soil and the plant prunings are shown
in Tables 1 and 2, respectively.
TABLE 2. RESIDUE QUALITY OF P. FALCATARIA AND G. SEPIUM
Characteristics P. falcataria G. sepium
Moisture content (%)
Organic Carbon (%) Total N (%) Lignin (%)
Polyphenol (%) (Lignin + Polyphenol):N
Lignin : N Polyphenol : N Carbon : N
57.3
41.9 3.47 25.6
1.73 7.9
7.4 0.50 11.2
73.0
26.8 4.87 15.1
1.68 3.5
3.1 0.34 5.5

18
3.1. P. falcataria hedgerow
No significant yield differences were obtained between treatments for the different
yield components in both crops 1 and 2 (Table 3).
The N concentrations (%) present in the different yield component for the two crops
showed significant differences between treatments in the stover for crops 1 and 2, and grain
for crop 1, while the husk did not show any significant differences between treatments in both
crops (Table 4).
There were no differences in the total N yield of the grain and husk for both maize
crops (Table 5). The N yield in the stover showed significant responses due to the different
treatments. Mulching with leaves alone showed the lowest N yield in all the maize
components in crop 1, while in crop 2, there were no significant responses in the total N
accumulated by the maize crop for all treatments.
TABLE 3. DRY MATTER YIELD (mg ha–1
) OF GRAIN, HUSKS AND STOVER OF MAIZE
CROPS 1 AND 2
CROP 1 CROP 2
Treatments Grain Husk Stover Grain Husk Stover
No hedgerow (Control) 5.06 1.82 4.13 4.40 1.15 4.00
Hedgerow 4.52 1.84 4.51 3.92 1.00 3.11
Leaf mulch 4.59 1.62 4.32 4.64 1.17 4.35
Hedgerow + leaf mulch 3.89 1.59 4.28 4.35 1.05 3.99
Control + 50 kg N ha–1 3.72 1.50 4.16 3.92 1.20 3.25
Hedgerow + 50 kg N ha–1 5.03 1.02 4.97 4.94 1.12 3.55
Leaf mulch + 50 kg N ha–1 4.58 1.73 4.88 4.16 1.40 4.11
Hedgerow + leaf mulch + 50 kg N ha–1 4.93 1.87 5.37 4.39 1.10 3.75
LSD P = 0.05 ns ns ns ns ns ns
TABLE 4. N CONCENTRATION (%) IN THE STOVER, GRAIN AND HUSKS OF MAIZE- CROPS 1 AND 2
CROP 1 CROP 2 Treatments
Stover Grain Husk Stover Grain Husk
No hedgerow (Control) 1.24 ab 1.52 b 0.52 a 1.21 bc 1.71 a 1.74 a
Hedgerow 1.34 ab 1.70 ab 0.49 a 1.21 bc 1.73 a 1.97 a
Leaf mulch 1.10 b 1.74 ab 0.49 a 1.35 ab 1.69 a 1.82 a
Hedgerow + leaf mulch 1.32 ab 1.71 ab 0.49 a 1.33 abc 2.28 a 2.64 a
Control + 50 kg N ha–1 1.48 a 1.74 ab 0.61 a 1.47 a 1.73 a 1.82 a
Hedgerow + 50 kg N ha–1 1.41 ab 1.83 a 0.44 a 1.27 bc 2.15 a 2.99 a
Leaf mulch + 50 kg N ha–1 1.42 ab 1.81 a 0.49 a 1.19 c 1.43 a 1.65 a
Hedgerow + leaf mulch + 50 kg N ha–1 1.51 a 1.72 ab 0.49 a 1.32 abc 1.50 a 1.54 a
TABLE 5. N YIELD (kg ha–1
) IN STOVER, GRAIN AND HUSKS OF MAIZE CROPS 1 AND 2
CROP 1 CROP 2 Treatments
Stover Grain Husk Total Stover Grain Husk Total
No hedgerow (control) 30.8 cd 76.2 a 9.1 a 116.2 b 31.3 b 73.8 a 6.9 a 112.0 a
Hedgerow 35.9 cd 76.2 a 7.4 a 121.1 b 38.4 b 66.0 a 5.4 a 109.7 a
Leaf mulch 24.9 d 80.1 a 7.9 a 112.9 b 59.9 a 77.5 a 7.8 a 142.2 a
Hedgerow + leaf mulch 35.7 cd 77.2 a 7.5 a 121.2 b 52.0a 66.0 a 5.9 a 123.9 a
Control + 50 kg N ha–1 33.3 cd 80.5 a 8.6 a 126.3 b 46.9ab 67.3 a 7.5 a 121.7 a
Hedgerow + 50 kg N ha–1 48.3 ab 105.1 a 6.7 a 171.0 a 44.6 ab 79.7 a 8.2 a 132.3 a
Leaf mulch + 50 kg N ha–1 41.8 bc 87.3 a 7.6 a 143.0 ab 49.8 ab 73.1 a 8.5 a 131.4 a
Hedgerow + leaf mulch + 50
kg N ha–1
56.4 a 89.8 a 11.1 a 155.9 ab 49.9 ab 81.0 a 7.1 a 138.0 a

19
The 15
N enrichments in the stover showed the highest values with the grain showing
the lowest values (Table 6). For all the maize components, the 15
N enrichment obtained from
the treatments with leaf mulching and the control showed the highest values in crop 1, thus
showing that there was no N contribution from the leaves of P. falcataria mulch. All values
lower than the control treatment in each column showed N being contributed by the added
amendments.
The highest percentage of maize N derived from the treatments in crops 1 and 2 did
not exceed 20%, and was highest for both crops in the Hedgerow + leaf mulch + 50 kg N ha–1
treatment (Fig. 1).
TABLE 6. 15N ENRICHMENT (ATOM % EXCESS) IN THE STOVER, GRAIN AND HUSKS OF
MAIZE CROPS 1 AND 2
CROP 1 CROP 2 Treatments
Stover Grain Husk Stover Grain Husk
No hedgerow (Control) 2.508a 1.786a 2.061a 2.054b 1.888a 1.814ab
Hedgerow 2.243a 1.516a 1.752a 2.746a 1.521b 1.970a
Leaf mulch 2.688a 1.853a 2.125a 1.675bc 1.696ab 1.583ab Hedgerow + leaf mulch 2.092a 1.586a 1.888a 1.905bc 1.706ab 1.860ab
Control + 50 kg N ha–1 2.330a 1.794a 1.940a 1.911bc 1.649ab 1.707ab
Hedgerow + 50 kg N ha–1 2.034a 1.544a 1.802a 1.818bc 1.533b 1.648ab
Leaf mulch + 50 kg N ha–1 2.048a 1.657a 1.858a 1.895bc 1.515b 1.558ab
Hedgerow + leaf mulch + 50 kg N ha–1 2.018a 1.478a 1.666a 1.561c 1.495b 1.535b
0
5
10
15
20
25
H
LM
H +
LM
Fer
t
H +
Fer
t
LM
+ F
ert
H +
LM
+ F
ert
Nd
frT
(%
)
Crop 1
Crop 2
FIG. 1. Percentage of N in maize crops 1 and 2 derived from the treatments (%NdfrT): P. falcataria
hedgerow (H), leaf mulch (LM) and urea fertilizer (Fert) and combinations of H + LM, H + Fert and
H + LM + Fert.
Nitrogen contributed by the amendments accumulated in the grain, followed by the
stover and husk (Table 7). When 50 kg urea N was added, only 4.9 kg ha–1 unlabelled N was
utilized by the maize (Table 7), but when urea N was added in the presence of P. falcataria as
hedgerows, the utilization of unlabelled N increased to 35.0 kg ha–1 in crop 1. In crop 2,
hedgerow + leaf mulch + fertilizer showed the highest total N derived from the treatments
(32.2 kg N ha–1). The presence of hedgerow with and without leaf mulch improved the amount
of unlabelled N taken up by the maize crop.

20
TA
BL
E 7
. N
(kg h
a–1)
DE
RIV
ED
FR
OM
P.
FA
LC
AT
AR
IA H
ED
GE
RO
W,
LE
AF
MU
LC
H A
ND
N F
ER
TIL
IZE
R I
N G
RA
IN,
ST
OV
ER
AN
D H
US
KS
OF
MA
IZE
CR
OP
S 1
AN
D 2
CR
OP
1
CR
OP
2
Tre
atm
ents
S
tover
G
rain
H
usk
T
ota
l S
tover
G
rain
H
usk
T
ota
l
No
hed
ger
ow
(C
ontr
ol)
0
.0c
0.0
c 0
.0a
0.0
c 0
.0c
0.0
c 0
.0a
0.0
d
Hed
ger
ow
3
.6b
1
0.7
b
0.3
a 1
4.6
b
0.0
c 1
6.9
a 0
.0a
16
.9b
c
Lea
f m
ulc
h
0.0
c 0
.0c
0.0
a 0
.0c
13
.7ab
8
.4ab
1
.2a
23
.3ab
Hed
ger
ow
+ l
eaf
mu
lch
6
.6b
c 0
.6c
0.8
a 8
.1b
4
.1ab
c 5
.9ab
0
.02
a 1
0.0
cd
Co
ntr
ol
+ 5
0 k
g N
ha–
1
0.4
c 4
.1b
c 0
.5a
4.9
b
3.1
bc
8.8
ab
0.5
a 1
2.4
c
Hed
ger
ow
+ 5
0 k
g N
ha–
1
11
.1a
22
.6a
1.3
a 3
5.0
a 4
.9ab
c 1
4.6
a 0
.7a
20
.1b
c L
eaf
mu
lch
+ 5
0 k
g N
ha–
1
7.4
ab
3.8
bc
0.7
a 1
1.9
b
3.0
bc
15
.0a
1.2
a 1
8.1
bc
Hed
ger
ow
+ l
eaf
mu
lch
+ 5
0 k
g N
ha–
1
11
.3a
9.7
b
2.1
a 2
3.1
ab
14
.6a
16
.5a
1.1
a 3
2.2
a

21
3.2. G. sepium hedgerow
The highest total dry matter yield (DMY) in crop 3 was obtained from the control
treatment (no hedgerows and without 50 kg N ha–1), and the treatment with leaf mulch + 50 kg
N ha–1 (Table 8), while the hedgerow treatments showed the lowest grain yield. This is
probably due to the hedgerow competition for nutrients, water and even light. A previous
study at the same location using 32
P showed the competition for nutrients between Gliricidia
hedgerows and the associated maize crops [20]. For crop 4, the treatments with hedgerows
with the addition of leaf mulch showed the highest total dry matter production.
The highest total N yield for crops 3 and 4 were from plots with leaf mulch and
additional N fertilizer treatments, with the hedgerow treatments showing the lowest N yields.
In general all the treatments with additional N fertilizer showed between 30–39% more N in
the stover and grain, respectively (Tables 9). The same observation was seen in crops 5 and 6
for yield and total N uptake (Tables 10 and 11).
TABLE 8. DRY MATTER YIELD (kg ha–1
) OF GRAIN AND STOVER IN MAIZE CROPS 3 AND 4
CROP 3 Total CROP 4 Total Treatments
Grain Stover DMY Grain Stover DMY
No hedgerow (Control) 2184 a 1783 b 4520 a 1225 b 1960 a 3185 ab
Hedgerow 1209 c 927 c 2470 c 1377 ab 1128 c 2505 bc
Leaf mulch 1858 ab 1997 b 4369 ab 917 c 1522 ab 2493c
Hedgerow + leaf mulch 1603 bc 1134 bc 3118bc 1814 a 1282 bc 3096 ab
Control + 50 kg N ha–1 1880 ab 1567 bc 4022 b 1042 b 1615 b 2657 bc
Hedgerow + 50 kg N ha–1 1985 ab 1624 bc 4054 b 1209 b 1508 ab 2717 b
Leaf mulch + 50 kg N ha–1 2243 a 2025 a 4853 a 1335 ab 1837 ab 3172 ab
Hedgerow + leaf mulch + 50 kg N ha–1 1776 bc 1496 bc 3633 bc 1839 a 1848 ab 3687 a
TABLE 9. N YIELD (kg ha–1) OF GRAIN AND STOVER IN MAIZE CROPS 3 AND 4
CROP 3 CROP 4 Treatments
Grain Stover Total Grain Stover Total
No hedgerow (Control) 34.4 ab 26.7 ab 61.2 ab 14.8 bc 25.1 a 39.9 bc
Hedgerow 17.3 c 13.2 c 30.5 c 16.7 bc 16.1 c 32.4 c
Leaf mulch 28.7 b 23.0 b 51.7 b 11.4 c 22.6 b 34.0 c
Hedgerow + leaf mulch 26.4 b 15.7 c 42.1 bc 24.1 a 15.7 c 39.9 bc
Control + 50 kg N ha–1 34.6 ab 20.9 bc 55.6 b 12.1 c 17.8 c 30.2 c
Hedgerow + 50 kg N ha–1
36.5 ab 23.1 b 59.6 ab 18.0 b 18.3 bc 36.3 bc
Leaf mulch + 50 kg N ha–1 39.4 a 30.5 a 70.0 a 19.3 b 23.5 ab 44.5 b
Hedgerow + leaf mulch + 50 kg N ha–1 30.4 ab 25.1 ab 55.5 b 24.1 a 24.1 a 50.1 a

22
TA
BL
E 1
0.
DR
Y M
AT
TE
R Y
IEL
D (
kg h
a–1)
OF
GR
AIN
, S
TO
VE
R A
ND
HU
SK
S I
N M
AIZ
E C
RO
PS
5 A
ND
6
CR
OP
5
CR
OP
5
Tre
atm
ents
G
rain
S
tover
H
usk
T
ota
l D
MY
G
rain
S
tover
H
usk
T
ota
l D
MY
No h
edger
ow
(C
ontr
ol)
2994 a
1786 a
bc
481 b
5262 a
b
22
95
ab
9
43
ab
cd
24
18
ab
3
36
2 a
b
Hed
ger
ow
1850 c
1675 b
c 483 a
b
4006 c
1
64
5 c
7
67
d
18
76
b
26
44
b
Lea
f m
ulc
h
2433 a
bc
2127 a
574 a
b
5133 a
b
22
29
ab
c 8
65
cd
2
44
5 a
b
33
12
ab
Hed
ger
ow
+ l
eaf
mu
lch
2499 a
bc
1348 c
525 a
b
4372 b
c 2
05
6 b
c 8
93
bcd
2
29
4 a
b
31
88
ab
Contr
ol
+ 5
0 k
g N
ha–
1
2778 a
b
2350 a
651 a
5780 a
2
26
2 a
b
92
7 a
bcd
2
51
8 a
b
34
46
ab
Hed
ger
ow
+ 5
0 k
g N
ha–
1
2295 b
c 1684 a
bc
469 b
4448 b
c 2
20
9 a
bc
97
0 a
bc
27
10
a
36
80
a
Lea
f m
ulc
h +
50
kg N
ha–
1
3019 a
1992 a
b
587 a
b
5597 a
2
78
5 a
1
06
5 a
b
29
92
a
40
58
a
Hed
ger
ow
+ l
eaf
mu
lch
+ 5
0 k
g N
ha–
1
3028 a
2315 a
651 a
5994 a
2
61
3 a
b
10
95
a
26
95
a
37
92
a
TA
BL
E 1
1.
N Y
IEL
D (
kg h
a–1)
OF
GR
AIN
, S
TO
VE
R A
ND
HU
SK
S O
F M
AIZ
E C
RO
PS
5 A
ND
6
Tre
atm
ents
C
RO
P 5
C
RO
P 6
G
rain
S
tover
H
usk
T
ota
l N
yie
ld
Gra
in
Hu
sk
Sto
ver
T
ota
l N
yie
ld
No h
edger
ow
(C
ontr
ol)
23.8
bc
27.7
ab
3.3
cd
54.8
bcd
3
0.2
ab
7
.3 a
bc
21
.9 b
c 5
9.3
ab
c
Hed
ger
ow
23.8
bc
15.3
c
3.5
bcd
43.0
d
19
.5 c
6
.5 b
c 1
7.0
c
43
.0 d
Lea
f m
ulc
h
29.7
ab
22.8
bc
4.0
abcd
63.8
ab
27
.6 a
bc
5.6
c
23
.8 a
bc
56
.9 b
cd
Hed
ger
ow
+ l
eaf
mu
lch
19.6
c
24.6
bc
3.0
d
47.2
cd
25
.7 b
c 5
.7 c
2
3.3
ab
c 5
4.8
cd
Contr
ol
+ 5
0 k
g N
ha–
1
34.6
a
24.5
bc
4.8
a
63.8
ab
30
.3 a
b
7.2
ab
c 2
3.8
ab
c 6
1.3
ab
c
Hed
ger
ow
+ 5
0 k
g N
ha–
1
24.7
bc
25.5
ab
4.7
a
54.9
bcd
3
1.1
ab
7
.0 a
bc
27
.1 a
b
66
.7 a
bc
Lea
f m
ulc
h +
50
kg N
ha–
1
29.8
ab
35.0
a
4.6
ab
68.9
a
36
.4 a
8
.0 a
b
29
.8 a
7
4.2
a
Hed
ger
ow
+ l
eaf
mu
lch
+ 5
0 k
g N
ha–
1
33.5
a
30.9
ab
4.2
abc
68.6
a
35
.9 a
8
.7 a
2
6.7
ab
7
1.7
ab

23
The highest % of maize N derived from the treatments (%NdfT) was obtained with the addition of urea fertilizer. For the treatments without the addition of N fertilizer, only the leaf treatments showed some contribution to the N nutrition of the maize crops. The hedgerow and hedgerow + leaf mulch did not contribute any N to the maize crops (Fig. 2). However, as the hedgerow trees grew older, hedgerow treatments started to contribute some N to the maize crops (Fig. 3). This may be due to the larger root biomass that may have undergone decomposition and thus, the released N was taken up by the companion maize crop planted between the trees.
0
5
10
15
20
25
30
H LM
H+LM
FERT
H+FERT
LM
+FERT
H+LM
+FERT
%NdfT
Crop 3
Crop 4
FIG. 2. Percentage of N in maize crops 3 and 4 derived from the treatments (%NdfT): G. sepium
hedgerow (H), leaf mulch (LM) and urea fertilizer (FERT) and combinations of H + LM, H + FERT
and H + LM + FERT.
05
101520253035
H LM
H+LM
FERT
H+FERT
LM
+FERT
H+LM
+FERT
%NdfT Crop 5
Crop 6
FIG. 3. Percentage of N in maize crops 5 and 6 derived from the treatments (%NdfT): G.
sepium hedgerow (H), leaf mulch (LM) and urea fertilizer (FERT) and combinations of H +
LM, H + FERT and H + LM + FERT).

24
3.3. 18
O analysis of soil water and plant sap
Samples from the rain water, soil water and plant sap taken in 2003 and 2004 were analyzed for 18O for maize crops 4 and 5 (Fig. 4 and Fig. 5, respectively). Both Gliricidia trees and maize plants took up water mainly from the 30–60 cm depth, and seemed to compete for water at this depth (Fig. 4). However, as the Gliricidia aged, the trees appeared to be taking up water from lower soil depths, while the maize accessed water from the upper layers of the soil (Fig. 5).
-8
-6
-4
-2
0
1 5 9 13 17 21 25 29
Time
O-1
8 (
o/o
o)
Soil Water 30 cm
Soil Water 60 cm
Soil Water 150 cm
Rain Water
Maize Water
Gliricidia Water
FIG. 4. Variations in δ 18
O in soil water, rain water and plant sap for crop 4.
-10
-8
-6
-4
-2
0
1 3 5 7 9 11 13 15 17 19
SAMPLE
O-1
8 v
alu
es
(o
/oo
) Rain
Soil 30cm
Soil 60cm
Soil 150cm
Underground
Gliricidia
Maize
FIG. 5. Variations in δ 18
O in rain water, soil water and plant sap for crop 5.
4. DISCUSSION
Leaf mulch did not contribute N to corn production in the first season (Fig. 1), but contributed some to the subsequent crops (Fig. 2 and Fig. 3), and the integration of legume prunings with either fertilizer or the hedgerow (or both), resulted in an improvement in the N nutrition of corn (Figs 1, 2 and 3). The phenomenon of low N contributions to corn in treatments with surface applied leaves was reported in the literature by various authors [21, 22, 23, 24, 25]. The low N uptake by corn from surface applied leaves is often attributed to high N losses through ammonia volatilization [24] or lack of synchrony between N demand by maize and N release from the legume leaves [26]. As it has been hypothesized that leaf prunings of high quality, such as P. falcataria and G. sepium leaves, will mineralize N too quickly to meet crop demand [24], especially in the hot and humid conditions such as those prevalent in this experiment, it is likely that most of the mineralized N would be lost via

25
nitrate leaching and ammonia volatilization. Where leaves were applied in treatments with Hedgerow and urea, there was a tendency for improved N nutrition of maize derived from the treatments imposed.
The other reason for the inconsistent results obtained between treatments for the different cropping cycles may also be due to the short time difference between the time of applying 15N labelled fertilizers and the unlabelled residues which may have resulted in errors associated with pool substitution [27]. Pool substitution has been described as the process by which added labelled inorganic N (fertilizer N) stands proxy for unlabelled inorganic soil N that would otherwise have been abstracted from the pool by one or more consumption processes [28].
There is also a possibility that considerable amounts of soluble condensed tannins and hydrolysable tannins (reactive polyphenolics) are released during legume leaf decomposition in the field and these compounds may react with N compounds from the other components such as roots, thereby immobilizing part of the N. Reactive polyphenols are known for their N binding capacities [29] and hence form stable polymers once they come into contact with proteins and other N compounds during plant tissue decomposition. Soluble compounds are capable of travelling down the moist soil profiles from surface applied leaves (leaf mulches) and would consequently react with N compounds of below ground biomass such as the hedgerow in this study, as well as the N in the applied urea occurring in solution [24, 30].
It is important to state that the N contribution of root biomass was low, probably because of the limited quantity as far as soil N build up and its eventual recovery by the crop. The reduction in the percent N recovery from 13% (crop 1) to 4.8% (crop 2) in the H treatment (Fig. 1) would offer some confirmation to this. Such a decline has been attributed to effects of competition for the same nutrient resources between the trees in the hedgerow and maize in the alley, especially where the trees are allowed to re-sprout during corn growth [20].
It is also worth noting that the N contribution of roots in the field study may be underestimated because of the lack of quantitative data on root biomass and turn over, especially where H was used with other unlabelled N sources. It was not possible to calculate specific %N recovery rates associated with H treatments using NdfrT data of the H treatment, because biomass input of roots was not known. Therefore, we emphasise the need for simple and non-destructive methods for estimating below ground biomass and N.
The use of legume residue with inorganic N rather than the use of either individually, seems a potentially more viable nutrient management strategy for improving N availability and N use efficiency (Figs 1, 2 and 3).
The 18O results showed that, with time the competition for water between maize plants and the trees decreased significantly (Figs 4 and 5). The water source for maize remained in the upper (top 30 cm) layer of the soil profile while that of the trees shifted from the upper to the deeper (below 30 cm) layers with time (or age). Chirwa et al. [31] observed that the deeper tree rooting is an important attribute for complementarity in tree-crop systems, as the tree and crop can access water and nutrients from difference soil volumes, thereby minimising competition for such resources. Deep rooting may also entail mitigation of nutrient leaching, as tree roots can act as safety-nets in the wet season and exploit the residual soil water during the post-rainy period. The tree coppice biomass can be pruned 2 to 3 times and the prunings can be incorporated in the soil as an N source to the alley crop during the cropping season. Incorporating coppice biomass into soil every cropping season further recycles the subsoil nutrients to the soil surface for the benefit of crops. Chintu et al [32] also found that

26
inorganic-N in the topsoil under coppiced tree legumes was significantly higher than in unfertilized maize mono-cropped plots. Subsoil N accumulation was evident under fertilized maize mono-cropping [32]. Subsoil nitrate-N beneath planted trees was less than that beneath mono-cropped maize plots indicating that trees probably retrieved subsoil N [32]. Continuous N fertilization of shallow rooting crops may lead to N leaching and accumulation in the subsoil, which is not only a loss for crops but may also pose serious environmental problems [31]. Coppicing tree legumes with deep roots can not only potentially intercept nutrients leaching down the soil profile, they can also access the nutrients accumulated in the sub-soils below the rooting zone of annual crops [32]. Subsoil nutrients captured by planted trees in farming systems become inputs when transferred to the soil surface in the form of leaf litter and other tree residues [31]. Though considerable knowledge is available on the contribution of trees to N supply through aboveground biomass in agroforestry systems, little is known about the role of tree roots in N cycling. If water or nutrient stress occurs in the topsoil, the uptake of subsoil nutrients and water by deep-rooted trees is enhanced, particularly if the subsoil has accumulated nutrients and water. Chintu et al. [32] found that planted tree legumes rooted much deeper than annual crops at Msekera in Eastern Zambia. Adequate knowledge about the rooting depth of coppicing tree legumes is critical in designing agroforestry systems. Integration of trees and annual crops with similar rooting depths in time and space might result in competition for water and nutrients, resulting in lower crop yields [32].
5. CONCLUSIONS
The overall challenge lies in developing ways and means of managing the decomposition rates of organic matter to enhance N uptake by crops. Integrated use of inorganic N and plant residues seems a more viable and attractive strategy for improving N use efficiency. The economic advantage to resource poor farmers is that the rates of fertilizer N application may be as little as or less than one half, since some N supplementation would come from the plant residues as demonstrated in this study. Integration of legume leaves with either or both a fertilizer or/and the legume tree hedgerow as source of N, resulted in an improvement in the N recovery by the associated maize. Older tree legumes used in the alley cropping system are unlikely to compete for water and nutrients with the maize or any annual crop, as root system of older trees tend to be deeper than that of the annual crops. However, adequate knowledge about the rooting depth of coppicing tree legumes is critical in designing agroforestry systems. Tree legumes are known to improve soil fertility by increasing inorganic-N availability mainly through biological nitrogen fixation (BNF), deep capture of N from subsoil profiles and addition of leaf litter [31]. Thus, growing N fixing trees as an in-situ source of N for food crop production in resource poor countries is a viable option. More studies need to be undertaken to quantitatively establish the potential of a range of agroforestry planted trees to intercept, retrieve and recycle subsoil N.
ACKNOWLEDGEMENTS
We gratefully acknowledge the technical and financial support of the International Atomic Energy Agency through the research contract number MAL10560/R1-R5.

27
REFERENCES
[1] KANG, B.T., et al., Alley cropping maize (Zea mays L.) and Leucaena (Leucaena
leucocephala Lam. de Witt) in Southern Nigeria, Plant Soil 63 (1981) 165–179. [2] TIAN, G., Mulching effects of plant residues with chemically contrasting composition
on maize growth and nutrients accumulation, Plant Soil 153 (1993) 179–187 [3] WEBSTER, C.C., WILSON, P.N., Agriculture in the Tropics, 2nd edn, Longman,
London (1980). [4] HARGROVE, W.L., THOMAS, G.W., “Effect of organic matter on exchangeable
aluminum and plant growth in acid soils”, Chemistry in the Soil Environment (STELLY, M., Ed.), ASA, Madison, Wisconsin (1981).
[5] HUE, N.V., et al., Effects of organic acids on aluminum toxicities in subsoils, Soil Sci. Soc. Am. J. 50 (1986) 28–34.
[6] WADE, M.K., SANCHEZ, P.A., Mulching and green manure applications for continuous crop production in the Amazon basin, Agron. J. 75 (1983) 39–45.
[7] CONSTANTINIDES, M., FOWNES, J.H., Nitrogen mineralization from leaves and litter of tropical plants: Relationship to nitrogen, lignin and soluble polyphenol concentrations, Soil Biol. Biochem. 26 (1994) 49–55.
[8] FOX, R.H., et al., The nitrogen mineralization rate of legume residues in soil as influenced by their polyphenol, lignin and nitrogen contents, Plant Soil 129 (1990) 251–259.
[9] OGLESBY, K.A., FOWNES, J.H., Effects of chemical composition on nitrogen mineralization from green manures of seven tropical leguminous trees, Plant Soil 143 (1992) 127–132.
[10] PALM, C.A., SANCHEZ, P.A., Nitrogen release from the leaves of some tropical legumes as affected by their lignin and polyphenolic contents, Soil Biol. Biochem. 23 (1991) 83–88.
[11] VALLIS, I., JONES, R.J., Net mineralization of nitrogen in leaves and leaf litter of Desmodium intortum and Phaseolus atropurpureus mixed with soil, Soil Biol. Biochem. 5 (1973) 391–398.
[12] KACHAKA, S., et al., “Decomposition and nitrogen mineralization of prunings of different quality”, Soil Organic Matter Dynamics and Sustainability of Tropical Agriculture, (MULONGOY, K., MERCKX, R, Eds), John Wiley, Chichester, UK (1993) 199–208.
[13] COTRUFO, M.F., et al., Decomposition of tree leaf litters grown under elevated CO2: Effect of litter quality, Plant Soil 163 (1994) 121–130.
[14] XU, Z., Nitrogen cycling in Leucaena (Leucaena leucocephala) alley cropping in semi-arid tropics. II. Response of maize growth to addition of nitrogen fertilizer and plant residues, Plant Soil 148 (1993) 73–82.
[15] TIAN, G., Effects of chemical composition on N, Ca, and Mg release during incubation of leaves from selected agroforestry and fallow species, Biogeochem. 15 (1992) 1–17.
[16] TIAN, G., Biological effects of plant residues with contrasting chemical compositions under humid tropical conditions–Decomposition and nutrient release, Soil Biol. Biochem. 24 (1992) 1051–1060.
[17] ZAPATA, F. “Isotope techniques in soil fertility and plant nutrition studies”, Use of Nuclear Techniques in Studies of Soil-Plant Relationships, (HARDARSON, G., Ed.), IAEA-TCS-2, IAEA, Vienna (1990) 61–127.
[18] SAS INSTITUTE INC., SAS/STAT User’s Guide, Release 6.03 edn, SAS Institute,Cary, N.C. (1988).

28
[19] GOMEZ, A.K., GOMEZ, A.A., Statistical Procedures for Agricultural Research, 2nd edn, John Wiley & Sons, Chichester (1984).
[20] ZAHARAH, A.R., BAH, A.R., Patterns of decomposition and nutrient release by fresh Gliricidia (Gliricidia sepium) leaves in an Ultisol, Nutr. Cycl. Agroecosys. 55 (1999) 269–277.
[21] MULONGOY, K., SANGINGA, M.K., Nitrogen contribution by Leucaena in alley cropping system, IITA Research 1 (1990) 14–17.
[22] PALM, C.A., Contribution of agroforestry trees to nutrient requirements of intercropped plants, Agroforest. Syst. 30 (1995) 105–124.
[23] GILLER, K.E, CADISCH, G., Future benefits from biological nitrogen fixation. An ecological approach to agriculture, Plant Soil 174 (1995) 255–277.
[24] MAFONGOYA, P.L, et al., Multipurpose tree prunings as a source of nitrogen to maize under semiarid conditions in Zimbabwe. 2. Nitrogen recovery and crop growth as influenced by mixture and prunings, Agroforest. Syst. 35 (1997) 47–56.
[25] MAFONGOYA, P.L, “Effect of multipurpose trees, age of cutting and drying methods on pruning quality”, Driven by Nature: Plant Litter Quality and Decomposition, (CADISCH, G., GILLER, K.E., Eds), CAB International, Wallingford (1997) 167–174.
[26] MYERS, R.J.K., et al., “The synchronization of nutrient mineralisation and plant nutrient demand”, The Biological Management of Tropical Soil Fertility, (WOOMER, P.L., SWIFT, M.J., Eds), John Willey & Sons, Chichester (1994).
[27] HOOD, R.C., et al., A comparison of direct and indirect 15N isotope dilution for estimating N uptake from organic residue decomposition, Plant Soil 208 (1999) 259–270.
[28] HOOD, R.C., BAUTISTA, E., HEILING, M., Gross mineralization and plant N uptake from animal manures under non-N limiting conditions, measured using 15N isotope dilution techniques, Phytochemistry Rev. 2 (2003) 113–119.
[29] MARTIN, J.P., HAIDER, K. 1980. “Microbial degradation and stabilization of 14C-labelled lignin, phenolics, and phenolic polymers in relation to soil humus formation”, Lignin Biodegradation: Microbiology, Chemistry and Potential Application, Vol. 2
(KIRK, T.K., et al., Eds), CRC Press, West Palm Beach (1980) 78–100. [30] BRIONES, M.J.I., INESON, P., Decomposition of eucalyptus leaves in litter mixtures,
Soil Biol. Biochem. 28 (1996) 1381–1388. [31] CHIRWA, T.S., MAFONGOYA, P.L., CHINTU, R., Mixed planted-fallows using
coppicing and non-coppicing tree species for degraded Acrisols in eastern Zambia, Agroforest. Syst. 59 (2003) 243–251.
[32] CHINTU, R., et al., Subsoil nitrogen dynamics as affected by planted coppicing tree legume fallows, Exp. Agr. 40 (2004) 327–340.

29
DETERMINATION OF PLANT WATER SOURCES USING STABLE
ISOTOPES: A STRATEGIC TOOL FOR PLANNING WATER RESOURCE
MANAGEMENT FOR AGROFORESTRY
D.M. SMITH1 Centre for Ecology & Hydrology, Crowmarsh Gifford, Wallingford, Oxfordshire, United Kingdom
Abstract
An important aim of agroforestry in water-limited environments is to enhance biomass production on
farms by increasing the productive use of rainfall. To protect the food security of farm households, water use by
trees should not be at the expense of crop growth because of competition. Successful use of agroforestry
therefore requires that trees utilise water that would otherwise be lost from cropped fields by evaporation, runoff
or drainage. Competition may be unavoidable in water-limited environments, however, unless the deep roots of
trees can exploit water that has drained through the crop rooting zone to the water table. Use of groundwater by
trees can be verified by comparing the concentrations of the naturally-abundant stable isotopes 2H or 18O in sap
and water from possible sources, as differences commonly exist in the isotopic composition of groundwater and
soil water. Use of this technique to compare the sources of water exploited by trees and crops in agroforestry can
indicate whether their water use is competitive or complementary. The technique was tested for windbreak
systems at sites in Niger with markedly different water table levels. Where the water table was 6–10 m deep, the
trees extracted groundwater or deep reserves of soil water during dry periods; where the water table was 35 m
deep, both the trees and crop relied on water from the top 2 m of the soil profile. Competition for water is
therefore less severe where trees can access groundwater, but may reduce crop productivity where they cannot.
Management strategies should be designed to sustainably maximise the economic returns on water use where
groundwater is accessible, but to limit water use by trees where it is not. Use of isotopes to determine sources of
plant water promises to become a key tool in the planning and management of agroforestry.
1. INTRODUCTION
There are a wide variety of agroforestry systems in use around the world [1], [2], but each shares the goal of (a) protecting resources from degradation, while (b) sustainably increasing biomass production. The former arises from, for example, the use of trees to control soil erosion and to prevent nutrient depletion [3], [4]; Cannell et al. [5] argued that the latter is possible if the water, nutrients or light utilised by trees for growth would otherwise be left unused by crops. Thus, in the case of water limited environments, if rainfall is poorly utilised, integrating trees into the farming system can increase farm productivity.
In arid and semi-arid regions, crops commonly utilise less than half of the annual rainfall productively, with the remainder lost as runoff, soil evaporation or drainage. For example, transpiration from traditionally-farmed maize amounted to just 15% of seasonal rainfall in a semi-arid area of Zimbabwe [6]; on the Deccan plateau of India, 59% of rainfall was lost as runoff or drainage from a traditional cropping system [7]; and 30–45% of rainfall was lost from millet crops in semi-arid Niger by direct evaporation from the soil [8]. Furthermore, significant quantities of rainfall may be wasted if rain falls outside of the cropping season, as for example in Hyderabad, India, where 20% or 152 mm of rain occurs outside the normal growing season [7]. Thus, rainfall is typically utilised very ineffectively by rainfed agriculture in arid and semi-arid zones and there is great scope for enhancing biomass production in these regions by increasing the utilisation of water by vegetation. A fundamental hypothesis of agroforestry in drylands is that this can be achieved by combining trees and crops [5].
1 Current Address: IUCN-The World Conservation Union, Rue Mauverney 28, 1196 Gland, Switzerland.

30
Introducing trees into cropped fields result in changes in the soil water balance. Trees which retain foliage in the dry season can make use of residual water stored in the soil profile and any rainfall received after the crop is harvested. On an annual basis, therefore, trees can increase the productive use of water. Trees can also increase water utilisation during the growing season. If they are more deeply rooted than crops, and seasonal rainfall is sufficient to cause infiltration beyond the crop rooting zone, trees are able to utilise water that would otherwise have been lost as drainage [9]. Shading by the tree canopy reduces evaporation from soil [10] and may thereby enhance the availability of water to crops during the growing season. Similarly, when planted along contours, woody hedges promote infiltration of water into the soil and thus reduce runoff from sloping fields [11], making more water available for crop growth. Further benefits of agroforestry can result from modifications to microclimate by trees which increase the water use efficiency of crops [12]. Some or all of these advantages of growing crops with trees can, however, be negated by evaporation of intercepted rainfall from the tree canopy [12, 13].
A danger from combining trees and crops is that the hypothesis of Cannell et al. [5] may fail, with the result that tree production is realised only at the expense of crop growth. If trees deprive the crop of shared resources in limited supply, crop production in agroforestry will be impaired [14] and the food security of the farmer threatened. It is therefore critical for the success of agroforestry that competition for resources between trees and crops is avoided, or at least minimised. Hence, a major challenge for management of agroforestry is to control competition and encourage ‘complementarity’ between trees and crops in resource use. Complementarity occurs when components of mixed vegetation utilise spatially or temporally distinct sources of resources and consequently avoid competition [14].
A key to the successful design and implementation of agroforestry in arid and semi-arid regions is understanding the sources of water used by the tree and crop components of the system. This enables evaluation of the extent of competition and complementarity in water use, which dictates the management strategies most appropriate for particular sites. The nuclear sciences have provided environmental scientists with a vital means of assessing the sources of water used by vegetation: the natural abundance of 2H and 18O in water commonly varies in the environment and the sources of water exploited by plants can, consequently, often be identified by analysis of isotopic ratios in plant water. This technique has been widely used in ecology, but it should become a key tool for agroforestry, because when used in conjunction with other methods of investigating plant water use and soil water, it will enable development of improved systems for managing water resources.
2. USING STABLE ISOTOPES TO ASSESS PLANT WATER SOURCES: THEORY
The stable isotopes 2H and 18O comprise only about 0.015% and 0.2%, respectively, of hydrogen and oxygen in water [15]. However, their concentrations vary between portions of the hydrological cycle because of the effects of isotopic fractionation during evaporation and condensation. Consequently, isotopic ratios of 2H and 18O are commonly different in rainwater, soil water and groundwater [16, 17, 18, 19].
Strong enrichment of heavy isotopes occurs at sites of evaporation from plants, such as leaves and herbaceous or immature woody stems [20, 21, 22]. However, without evaporation, the isotopic composition of water in plant xylem is conserved; thus, isotopic ratios for 2H and 18O are unchanged during movement of water from soil into plant roots [23, 24, 25] and through mature, suberised stems [21, 26]. As a result, where there is sufficient contrast in the isotopic composition of water from different sources, the source of water taken

31
up by plant roots can be readily identified by comparing isotopic ratios for water from stems and each possible source.
To determine the source of water used by plants, samples of stem tissue, soil and groundwater must be taken; rainwater may also be collected. For trees and shrubs, suberised twigs should be sampled, but for crops, the sampling strategy used must prevent fractionation by evaporation from stem walls. Groundwater is most easily sampled from springs, wells or boreholes and soil samples should be collected from a series of depths to enable determination of the variation in the isotopic composition of water with depth. All samples must be immediately sealed after collection to prevent evaporation and thus isotopic fractionation.
Sources of water may be identified be examining isotopic ratios for either 2H or 18O; in some studies, both isotopes have been used (for example, Brunel et al., [27]). Isotopic ratios are measured using an isotope ratio mass spectrometer. Conventionally, all water must be recovered by azeotropic distillation from soil or tissue samples prior to analysis [26]. For analysis of 18O ratios, however, an equilibration method can now be used which greatly simplifies the analytical procedure, as it eliminates the need for distillation [28].
Isotopic ratios are normally expressed relative to a standard, using delta (δ) notation. For 2H and 18O, the common reference is standard mean ocean water, or SMOW. Values of δ
2H or δ 18O are given by where RS and RSMOW are the
2H/
1H or
18O/
16O ratios for the sample and
SMOW, respectively. Units for δ values are per mil (‰).
10001O H
SMOW
S182
⎟⎟⎠
⎞⎜⎜⎝
⎛−=
R
Rδδ
3. KEY RESULTS FROM ECOLOGICAL STUDIES
One of the first studies to use the natural abundance of stable isotopes in water to identify sources of uptake by vegetation was undertaken by White et al. [29], for forest trees in the eastern United States. Their analysis showed that trees with access to groundwater used rainwater in the days following rainfall, but used increasing proportions of groundwater as the rainwater in the soil was depleted. They quantified the fractional contribution of groundwater and rainwater to plant sap by calculating the relative weighting of the isotopic ratios for the two sources in tree sap using a two-ended linear mixing model [30, 31].
Dawson and Ehleringer [24] used stable isotopes in water to demonstrate that mature riparian trees utilised deep groundwater rather than stream water, and Ehleringer et al. [32] and Flanagan et al. [33] used the technique to compare utilisation of summer rainfall and groundwater or stored soil water among species with contrasting growth habits in plant communities in desert regions of the south-western United States. In Australia, the technique was combined with measurements of sap flow in trees to quantify discharge from saline groundwater by tree transpiration [34]. Brunel et al. [27, 35] and Walker and Richardson [25] compared isotopic ratios of plant sap and water in the soil profile and identified soil layers from which plants were taking up water. A similar analysis was made by Bishop and Dambrine [36] for a forest in northern Sweden, but in addition to 18O at natural abundance, they used enriched 3H as a tracer to improve the resolution among soil layers.
Isotopic ratios for 2H were used by Dawson [37] in an elegant confirmation of ‘hydraulic lift’, where groundwater is transferred within root systems to dry topsoil. Values of

32
δ2H for soil water at 30 cm depth beneath an Acer saccharum tree were similar to values for
groundwater, but differed substantially from values for rainwater; furthermore, isotopic ratios for the sap of shallow-rooted understorey plants showed that between 3 and 60% of their water was supplied from groundwater by the trees via hydraulic lift.
Le Roux et al. [38] used isotopic ratios for water to test the hypothesis that shrubs and grasses in tropical savannahs use water from different layers of the soil. Their analysis showed that this was not the case for humid savannah in Côte d’Ivoire, as both the shrubs and grasses used water from the upper soil layers. Competition for water thus has a considerable impact on the growth and distribution of the two components of the savannah in this region.
4. ROOT DISTRIBUTIONS AND COMPLEMENTARITY IN AGROFORESTRY
The conventional wisdom held among agroforesters is that complementarity in use of below ground resources is achieved by utilising tree species with deep root systems that have few superficial lateral roots. It is presumed that these trees have a low capacity for exploiting resources in the crop rooting zone and instead act as a ‘safety net’ and obtain water and nutrients that have drained or leached beyond the reach of crop roots. Such ideal trees would show spatial complementarity with crops in use of below ground resources, thus avoiding competition and fulfilling the hypothesis of Cannell et al. [5].
Unfortunately, there are few indications that such root distributions are found for trees, at least when grown with annual crops. Rooting patterns for Grevillea robusta trees and understorey maize are shown in Fig. 1 for a site in the semi-arid uplands of Kenya with a shallow soil and no water table. Maximum root distributions for both species coincided at the top of the profile and root populations were dominated by G. robusta at all times, all depths and all distances from the trees [39]. Although the trees had deeper roots than the crop, there was no spatial separation of their rooting zones. As the only source of water available was rainwater stored near the soil surface, competition between the tree and crop was unavoidable. Complementary use of water would only be possible if an alternative source of water such as groundwater was available to the trees.
A wide variety of tree species that are popularly used in agroforestry in semi-arid regions similarly have root distributions that do not conform to the ideal for agroforestry [40, 41, 42]; like crops, trees normally have their maximum root length densities at the top of the profile [43]. The spatial differentiation of the root systems of trees and annual crops with soil depth is, consequently, most likely unobtainable. If tree species share the same basic pattern of root distribution, spatial complementarity for water in agroforestry cannot be obtained by selecting one tree species over another. The extent of complementarity must, therefore, be dependent on the distribution of water resources, not the distribution of roots. The key to successfully fulfilling the hypothesis of Cannell et al. for water is thus knowledge of below ground hydrology and identifying sites where trees can access groundwater, rather than detailed information on root distributions. The use of stable isotopes to identify sources of water used by plants provides a simple and expedient method of assessing complementarity in water use in agroforestry and the contribution of groundwater to water uptake by the trees.

33
Ld (cm cm
-3)
0 1 2
De
pth
(m
)
2.0
1.6
1.2
0.8
0.4
0.0
FIG. 1. An example of tree and crop root distributions in agroforestry. Shown are vertical distributions of root lengths for Grevillea robusta trees (solid lines) and maize (dashed lines) at a site
in Kenya [39]. Error bars show +1 s.e.
5. COMPARING TREE AND CROP WATER SOURCES IN AGROFORESTRY
5.1. Sampling herbaceous stems for isotopic analysis of sap
To be applied to agroforestry, the isotopic method for determining water sources of plants must be applicable to both woody and herbaceous vegetation, to ensure that the crop component of agroforestry systems can be included in the analysis. To prevent any change in the isotopic composition of sap in herbaceous stem samples because of evaporation from stem walls, ‘artificial suberisation’ can be employed. Stems are wrapped in plastic film from the soil surface to a height of about 10 cm for at least two hours prior to sampling, to prevent radial evaporation from the stem; these pieces of stem are then cut and retained for isotopic analysis. The efficacy of this procedure was tested using pot-grown maize (Zea mays) plants. The plants were well watered and evaporation from the soil surface was prevented using polythene sheets. On a hot, sunny day after tasselling, the lowermost internodes of four plants were wrapped with several layers of plastic film and four other plants were left unwrapped. The plants were allowed to transpire for two hours to ensure that sap in the lengths of stem sealed in plastic was replaced by water from the roots. Pieces of stem were then sampled from the base of each plant, at mid-height and from just below the tassel; samples of soil were also taken. Values of δ18O for all samples were determined by direct equilibration [28].
Isotopic fractionation occurred as sap ascended the maize stems (Fig. 2); the concentration of 18O in sap increased significantly (P < 0.05), because the lighter 16O evaporated more quickly, causing δ18O values to become less negative. When stems were wrapped in plastic film and sampled from the base of the plant, however, the δ18O value for sap was unchanged from the value for soil (Fig. 2). Thus, the artificial suberisation procedure successfully prevented evaporative fractionation of sap in herbaceous stems, enabling the sources of water utilised by crops to be identified using stable isotopes.

34
δ18
O (‰)
-9 -7 -5
Sample
soil
stem base
mid-height
top
no artificial suberisation
-9 -7 -5
with artificial suberisation
FIG. 2. Values of δ 18
O for water in soil and pieces of maize stem sampled at the base of the plant, at mid-height and from just below the tassel, with and without ‘artificial suberisation’ (see text) prior to sample collection. Error bars show ±1 s.e.
5.2. Effects of windbreaks on crop production in the Sahel
In the Sahelian zone of West Africa, erosion of the predominantly sandy soils by strong winds preceding rain storms is a severe problem, causing soil degradation and damage to crops. Where drought and cutting have reduced the protective cover provided by savannah trees, windbreaks are recommended as a means of controlling erosion and providing fuelwood and other tree products [44]. In addition, amelioration of the microclimate of crops sheltered by windbreaks has been shown to result in increases in crop yields [45]. Such positive effects of windbreaks on crop growth can, however, be negated by competition for water with the trees [46]. To understand the extent of competition for water in windbreak systems, sources of water used by windbreak trees and crops were investigated at two sites in Niger; at both sites, pearl millet (Pennisetum glaucum) was sheltered by neem (Azadirachta indica) windbreaks, but the depth of groundwater at the two locations was markedly different.
In the Majjia Valley, in central Niger, the water table occurs at a depth of 6–10 m and studies have shown that the production of millet has increased by 20–25% in fields sheltered by the network of windbreaks established there since the 1970s [47]. At Sadoré, where groundwater is found at 35 m, however, the establishment of windbreaks has not resulted in enhanced crop production [48]. Van den Beldt [44] suggested that such differences in the impact of windbreaks on crop productivity may have arisen because competition for water is less severe at locations where groundwater is accessible to tree roots.
To test this hypothesis, the sources of water used by the neem trees and millet at the two locations were determined by comparing δ18O values for groundwater, water in the soil profile between the surface and 3 m, sap from neem twigs and sap from the stems of millet plants. Samples of groundwater were taken from wells and boreholes within a few hundred metres of each site. Soil samples were collected by augering below the windbreak canopy and beneath the crop, 30 m from the trees. Only mature twig samples were collected, from a 100 m length of windbreak. Samples of millet stem were taken 30 m from the trees, after employing the artificial suberisation procedure. Values of δ18O for the samples were determined using direct equilibration [28] and water contents of soil samples were measured gravimetrically. Full details of the sampling regime used are provided by Smith et al. [49].

35
5.3. Sources of water used by windbreak trees and crops in the Sahel
Results of the isotopic analyses for samples collected on two occasions during the cropping season are summarised in Figs 3 and 4. When the soil surface was wet after recent rain, both the windbreak trees and millet utilised water from the top of the soil profile, at both Sadoré and the Majjia Valley. For example, on the day after 44 mm of rain in the Majjia Valley, the top of the soil profile was wet (Fig. 3(a), inset) and values of δ18O for millet and tree sap were not significantly different (P < 0.05) (Fig. 3(a)). They were, however, significantly higher (P < 0.05) than the value for groundwater and both coincided with δ18O values for shallow soil water, indicating that both the trees and crop were obtaining their water from the top 1 m of the soil profile. Similarly, on the day after 45 mm of rain at Sadoré, the surface layers of the soil were wet (Fig. 3(b), inset) and values of δ18O for tree and millet sap coincided with values for soil water from the top 1 m of the soil profile (Fig. 3(b)). Although Fig. 3(b) suggests that the groundwater at Sadoré may have contributed to uptake by the trees, this is improbable, as there was no indication that the trees at Sadoré had access to groundwater, 35 m below the surface, even during the driest period of the year [49]. The neem windbreaks were able to utilise water in the surface layers of the soil when it was abundant, regardless of the proximity of the water table.
Differences in the exploitation of water resources between the two sites arose during dry spells in the cropping season, when the soil surface was drier than underlying layers (Figs 4(a) and 4(b), inset). In the Majjia Valley, only the δ18O value for millet sap coincided with values for soil water near the surface (Fig. 4(a)); the δ18O value for tree sap coincided with values for soil water from below 2 m and was not significantly different (P < 0.05) from the value for groundwater. Thus, when water was not abundant near the soil surface, windbreak trees in the Majjia Valley were able to extract water from below 2 m, probably including some groundwater, while the millet crop relied on water from near the top of the soil profile. By contrast, at Sadoré during a similar dry spell, the δ18O values for millet and tree sap were not significantly different (P < 0.05) and both coincided with values from the top 2 m of the profile (Fig. 4(b)), where the soil was wettest (Fig. 4(b), inset). During dry periods, therefore, the windbreaks and millet in the Majjia Valley used spatially distinct sources of water, while at Sadoré, they probably competed for water in the rooting zone of the crop; spatial complementarity is consequently enhanced when the trees have access to groundwater.
Proximity of the water table to the surface thus has important implications for the severity of competition for water between trees and crops when windbreaks are established in semi-arid regions such as the Sahel. Where trees have access to groundwater, as in the Majjia Valley, they are only likely to obtain large amounts of their water from the surface layers of the soil during periods when water there is plentiful, for example after rain, so that competition for water is unlikely to have a large impact on the crop. Where access to groundwater by trees is not possible, the evidence from Sadoré indicates that competition for water could be severe during dry periods, potentially causing a reduction in the productivity of adjacent crops. The observation of improved complementarity between windbreaks and crops where groundwater is accessible to tree roots may help to explain why Long [47] found increases in millet production in fields in the Majjia Valley sheltered by windbreaks, while Brenner et al. [48] found that windbreaks did not enhance millet production at Sadoré. Hence, it appears that the hypothesis of Cannell et al. [5] was fulfilled in the Majjia Valley because the trees utilised water resources that would not otherwise have been used by the crop; at Sadoré, their hypothesis appeared to fail because both the trees and crop were forced to compete for water from the same source.

36
-6.0 -4.0 -2.0 0.0 2.0 4.0 6.0 8.0
Dep
th (
m)
6.40
3.00
2.00
1.00
0.00
Plantθg (kg kg-1)
0.00 0.05 0.10 0.15
Dep
th (
m)
4.0
3.0
2.0
1.0
0.0
Millet Trees
GW (a) Majjia Valley
δ18
O (‰)
-10.0 -8.0 -6.0 -4.0 -2.0 0.0 2.0 4.0
Dep
th (
m)
34.70
3.00
2.00
1.00
0.00
Plantθg (kg kg-1)
0.00 0.05 0.10 0.15
Dep
th (
m)
4.0
3.0
2.0
1.0
0.0
Millet Trees
GW (b) Sadoré
FIG. 3. Values of δ
18O for the sap of Azadirachta indica trees in windbreaks ( ) and adjacent millet
( ), and for groundwater (GW) ( ) and soil water beneath the trees ( ) and millet ( ) on days
after rainfall at (a) the Majjia Valley and (b) Sadoré. Inset: the gravimetric moisture content (θg) of
soil beneath the windbreaks ( ) and crop ( ). Error bars show ±1 s.e.

37
-6.0 -4.0 -2.0 0.0 2.0 4.0 6.0 8.0 10.0 12.0
Dep
th (
m)
8.00
3.00
2.00
1.00
0.00
Plantθg (kg kg-1)
0.00 0.05 0.10 0.15
Dep
th (
m)
4.0
3.0
2.0
1.0
0.0
Trees
GW (a) Majjia Valley
Millet
δ18
O (‰)
-6.0 -4.0 -2.0 0.0 2.0 4.0 6.0 8.0 10.0 12.0
Dep
th (
m)
35.50
3.00
2.00
1.00
0.00
Plantθg (kg kg-1)
0.00 0.05 0.10 0.15
Dep
th (
m)
4.0
3.0
2.0
1.0
0.0
Trees
GW (b) Sadoré
Millet
FIG. 4. Values of δ
18O for the sap of Azadirachta indica trees in windbreaks ( ) and adjacent millet
( ), and for groundwater (GW) ( ) and soil water beneath the trees ( ) and millet ( ) during a
dry spell in the rainy season at (a) the Majjia Valley and (b) Sadoré. Inset: the gravimetric moisture
content (θg) of soil beneath the windbreaks ( ) and crop ( ). Error bars show ±1 s.e.

38
5.4. A strategy for windbreak deployment in the Sahel
Productive use of rainfall is enhanced in rainfed agricultural systems where trees can
utilise groundwater, because water extracted from the water table was lost previously by drainage from the rooting zone of the crop. Competition with crops for water is avoided and, provided that extraction by tree roots does not exceed annual recharge, the consequent increases in biomass productivity on farms are sustainable (although the availability of water to downstream users may be affected and should be evaluated). Access by tree roots to groundwater is therefore a crucial consideration when designing strategies for establishing and managing windbreaks — and other agroforestry systems — in water-limited environments such as the Sahel.
If accessibility of groundwater is used as a key criterion in planning windbreaks, a strategy for windbreak deployment can be outlined that aims to minimise the impact of competition for water between trees and crops, but maximise the opportunity for increasing biomass production provided by complementary use of water [50]:
• Where groundwater or other deep reserves of soil water are not accessible to windbreak trees, the main benefits of establishing windbreaks are likely to be control of wind erosion and provision of tree products. However, to ensure that the food security of farmers is not threatened, it is vital that management strategies are employed to reduce water use by the trees. Tree species known to have low water use should be chosen and they should have root systems that do not spread laterally for long distances in the crop rooting zone; if warranted by the returns on labour invested, trenching can be used to prune lateral roots [43, 51]. Once established, demand for water by windbreak trees should be reduced by pruning of the canopy. The timing and severity of pruning and the desired shape of the canopy should be optimised by on-farm testing, but the goal of pruning windbreaks should be to minimise demand for water by the trees while maximising control of wind erosion.
• Where windbreaks have access to groundwater or other deep reserves of soil water, strategies for limiting transpiration by the trees are not necessary (unless conservation of groundwater is a concern). Benefits of windbreaks at these locations will be control of wind erosion, provision of tree products and increased crop production in sheltered zones where microclimate is ameliorated. At these locations, an array of tree species should be used to provide people with a broad range of tree products and to maximise the economic value of the windbreaks. The tree species selected must have rooting habits that enable them to reach the groundwater and hydrological analyses should be used to ensure that extraction of groundwater by the trees is sustainable.
Alternatively, where groundwater is not accessible to tree roots, competition between trees and crops might be reduced by using an agroforestry system that requires a lower density of trees. For example, it may be that parkland trees dispersed over a wide area are as effective in controlling wind erosion as windbreaks, but require lower amounts of resources and therefore have less impact on crop production.
6. ANALYSIS OF SOIL WATER PARTITIONING BETWEEN TREES AND CROPS
Isotopic analysis of plant water sources is an ideal tool for diagnosing competition or complementarity for water in agroforestry systems. However, the isotopic method is unsuited to circumstances where there is little distinction in the isotopic ratios of different sources of water and may sometimes give ambiguous results. The technique is also incapable of

39
quantifying the partitioning of water in any particular soil layer between tree and crop components of agroforestry. Consequently, to aid interpretation of results and to enable partitioning of soil water to be quantified, isotopic analyses should not be undertaken without collecting other supporting data, ideally including measurement of soil water and plant water relations.
The minimum data required to support interpretation of isotopic analyses are soil water contents, as they show where most water is present in the soil profile. It is preferable, however, if profiles of soil water potentials are known, because they indicate water availability in the soil [35]. These data can be used to clarify ambiguities in the analysis of uptake where, for example, soil layers have similar isotopic ratios for water but one is very dry and the other wet [27, 49]. If the soil water balance is known, total uptake from individual soil layers can be estimated [52]; if leaf water potentials [53], transpiration by the tree and crop [54] and root distributions [39] are measured, partitioning of uptake from individual soil layers by trees and crops can be modelled [55]. Such models can be used to assess quantitatively the extent of competition and complementarity in agroforestry under various management regimes. If these models can be adequately parameterised, they thus provide another tool for assessing the exploitation of water resources that can be used alongside isotopic methods.
7. CONCLUSIONS
In rainfed agricultural systems in semi-arid regions, water is often used ineffectively, with only a small proportion of rainfall used productively by crops. An aim of integrating trees into cropping systems is to increase the utilisation of rainfall by vegetation, to enhance biomass production on farms. However, water use by trees should not be at the expense of crop growth because of competition for water, as this would threaten the food security of farmers and their families. Thus, as Cannell et al. [5] hypothesised, successful use of agroforestry to increase biomass production in water-limited environments requires that the trees utilise water that would not otherwise be used by the crop; trees should therefore use water that would be lost from cropped fields by evaporation, runoff or drainage. As maximum root lengths for trees and crops can be expected to coincide in the topsoil, competition for water is unavoidable in water-limited environments, unless the deeper roots of trees can exploit an alternative source of water below the crop rooting zone. If trees exploit groundwater, they avoid competing with the crop for water and increase the effectiveness of rainfall utilisation, because water taken up from the water table was previously lost by drainage from the crop rooting zone.
Where differences exist in the isotopic composition of groundwater and soil water, stable isotopes should be used to compare the sources of water used by trees and crops in agroforestry, to enable assessment of the extent of competition or complementarity in water use. The results of isotopic analyses of water utilisation should then be used in conjunction with information on the soil water balance and tree and crop water relations to plan appropriate strategies for the management of water resources at particular sites. Where groundwater cannot be used by trees, steps must be taken to limit the impact on the crop of water use by the trees. Where trees are able to exploit groundwater, provided that uptake is less than annual recharge, economic returns from the trees should be maximised.
To fully understand the impacts of below ground interactions between trees and crops on agroforestry, it will be necessary in future to integrate analysis of water resource use with studies of nutrient acquisition by plants. Movement of water to roots is required to facilitate nutrient uptake and thus strategies designed to make effective use of water resources have

40
implications for nutrient acquisition. For example, if trees utilise groundwater and the fertile topsoil is extremely dry, how do they obtain nutrients? Does hydraulic lift facilitate nutrient acquisition from dry soils, and if so, does the release of water from tree roots into the topsoil enhance the availability of water to shallow-rooted crops? A powerful means of exploring such interactions is provided by isotopic tracers for water and nutrients, both at natural abundance and using enriched sources, particularly if they are used in conjunction with other experimental techniques. Results from analyses of the interactions between water use and the acquisition of nutrients by trees and crops will enable integrated systems of nutrient and water management to be developed for agroforestry; such systems should enhance rates of success in using agroforestry to sustainably increase biomass production while protecting resources from degradation.
REFERENCES
[1] NAIR, P.K.R. (Ed.), Agroforestry Systems in the Tropics, Kluwer, Dordrecht (1989) 664 pp.
[2] GORDON, A.M., NEWMAN, S.M. (Eds), Temperate Agroforestry Systems, CAB International, Wallingford (1997) 269 pp.
[3] YOUNG, A., Agroforestry for Soil Conservation, CAB International, Wallingford (1989) 276 pp.
[4] SANCHEZ, P.A., Science in agroforestry, Agrofor. Syst. 30 (1995) 5–55. [5] CANNELL, M.G.R., et al., The central agroforestry hypothesis: the trees must acquire
resources that the crop would not otherwise acquire, Agrofor. Syst. 34 (1996) 27–31. [6] BUTTERWORTH, J.A., The Hydrology of a Dryland Catchment in Southern
Zimbabwe and the Effects of Climatic and Land Use Change on Shallow Groundwater Resources, PhD Thesis, University of Reading, Reading (1997).
[7] ONG, C.K., et al., “Water use of agroforestry systems in semi-arid India”, Growth and Water Use of Plantations (Proc. Symp. Bangalore, 1991) (CALDER, I.R., et al., Eds), Wiley, Chichester (1992) 347–358.
[8] WALLACE, J.S., “The measurement and modelling of evaporation from semiarid land”, Soil Water Balance in the Sudano-Sahelian Zone (Proc. Symp. Niamey, 1991) (SIVAKUMAR, M.V.K., et al., Eds), IAHS Press, Wallingford (1991) 131–148.
[9] VAN NOORDWIJK, M., et al., “Root distribution of trees and crops: competition and/or complementarity”, Tree-Crop Interactions: A Physiological Approach (ONG, C.K., HUXLEY, P., Eds), CAB International, Wallingford (1996) 319–364.
[10] JACKSON, N.A., WALLACE, J.S., Soil evaporation measurements in an agroforestry system in Kenya, Agric. For. Meteorol. 94 (1999) 203–215.
[11] KIEPE, P., No Runoff, No Soil Loss: Soil and Water Conservation in Hedgerow Barrier Systems, PhD Thesis, Wageningen Agricultural University, Wageningen (1995).
[12] WALLACE, J.S., “Water balance of mixed tree-crop systems”, Tree-Crop Interactions: A Physiological Approach (ONG, C.K., HUXLEY, P., Eds), CAB International, Wallingford (1996) 189–233.
[13] JACKSON, N.A., et al., Water Balance of Agroforestry Systems on Hillslopes, Inst. of Hydrology/Department for International Development Rep. 98/3. Inst. of Hydrology, Wallingford (1998).
[14] ANDERSON, L.S., SINCLAIR, F.L., Ecological interactions in agroforestry systems, Agrofor. Abstr. 6 (1993) 57–91.
[15] GRIFFITHS, H., Applications of stable isotope technology in physiological ecology, Func. Ecol. 5 (1991) 254–269.
[16] DANSGAARD, W., Stable isotopes in precipitation, Tellus 16 (1964) 436–468.

41
[17] BARNES, C.J., ALLISON, G.B., The distribution of deuterium and 18O in dry soils. 1. Theory, J. Hydrol. 60 (1983) 141–156.
[18] LAWLER, H.A., Sampling for isotopic responses in surface waters, Earth Surface Proc. Landforms 12 (1987) 551–559.
[19] JOSEPH, A., et al., Isotope characteristics of meteoric water and groundwater in the Sahelo-Sudanese zone, J. Geophys. Res. 97 (1992) 7543–7551.
[20] WHITE, J.W.C., “Stable hydrogen isotope ratios in plants: a review of current theory and some potential applications”, Stable Isotopes in Ecological Research (RUNDEL, P.W. et al., Eds), Springer, New York (1989) 142–162.
[21] DAWSON, T.E., EHLERINGER, J.R., Isotopic enrichment of water in the “woody” tissues of plants: implications for plant water source, water uptake and other studies which use the stable isotopic composition of cellulose, Geochim. Cosmochim. Acta 57 (1993) 3487–3492,
[22] YAKIR, D., “Oxygen-18 of leaf water: a crossroad for plant-associated isotopic signals”, Stable Isotopes: Integration of Biological, Ecological and Geochemical Processes (GRIFFITHS, H., Ed.), Bios, Oxford (1998) 147–168.
[23] ZIEGLER, H., “Hydrogen isotope fractionation in plant tissues”, Stable Isotopes in Ecological Research (RUNDEL, P.W. et al., Eds), Springer, New York (1989) 105–123.
[24] DAWSON, T.E., EHLERINGER, J.R., Streamside trees that do not use stream water, Nature 350 (1991) 335–337.
[25] WALKER, C.D., RICHARDSON, S.B., The use of stable isotopes of water in characterising the source of water in vegetation, Chem. Geol. (Isotope Geosci. Sect.) 94 (1991) 145–158.
[26] THORBURN, P.J., et al., Extraction of water from Eucalyptus trees for analysis of deuterium and oxygen-18: laboratory and field techniques, Plant Cell Environ. 16 (1993) 269–277.
[27] BRUNEL, J.-P., et al., “Using stable isotopes of water to trace plant water uptake”, Stable Isotopes in Plant Nutrition, Soil Fertility and Environmental Studies (Proc. Symp. Vienna, 1990), IAEA, Vienna (1991) 543–551.
[28] SCRIMGEOUR, C.M., Measurement of plant and soil water isotope composition by direct equilibration methods, J. Hydrol. 172 (1995) 261–274.
[29] WHITE, J.W.C., et al., The D/H ratios of sap in trees: implications for water sources and tree ring D/H ratios, Geochim. Cosmochim. Acta 49 (1985) 237–246.
[30] CHRISTOPHERSEN, N., HOOPER, R.P., Multivariate analysis of stream chemical data: the use of principal components analysis for the end-member mixing problem, Water Resources Res. 18 (1992) 99–107.
[31] DAWSON, T.E., “Water sources of plants as determined from xylem-water isotopic composition: perspectives on plant competition, distribution, and water relations”, Stable Isotopes and Plant Carbon-Water Relations (EHLERINGER, J.R., et al., Eds), Academic Press, San Diego (1993) 465–496.
[32] EHLERINGER, J.R., et al., Differential utilization of summer rains by desert plants, Oecologia 88 (1991) 430–434.
[33] FLANAGAN, L.B., et al., Differential uptake of summer precipitation among co-occurring trees and shrubs in a pinyon-juniper woodland, Plant Cell Environ. 15 (1992) 831–836.
[34] THORBURN, P.J., et al., Combining measurements of transpiration and stable isotopes of water to determine groundwater discharge from forests, J. Hydrol. 150 (1993) 563–587.
[35] BRUNEL, J.-P., et al., Field validation of isotopic procedures for determining sources of water used by plants in a semi-arid environment, J. Hydrol. 167 (1995) 351–368.

42
[36] BISHOP, K., DAMBRINE, E., Localization of tree water uptake in Scots pine and Norway spruce with hydrological tracers, Can. J. For. Res. 25 (1995) 286–297.
[37] DAWSON, T.E., Hydraulic lift and water use by plants: implications for water balance, performance and plant-plant interactions, Oecologia 95 (1993) 565–574.
[38] LE ROUX, X., et al., Spatial partitioning of the soil water resource between grass and shrub components in a West African humid savanna, Oecologia 104 (1995) 147–155.
[39] SMITH, D.M., et al., Root distributions in a Grevillea robusta-maize agroforestry system in semi-arid Kenya, Plant Soil 211 (1999) 191–205.
[40] JONSSON, K., et al., The vertical distribution of fine roots of five tree species and maize in Morogoro, Tanzania, Agrofor. Syst. 26 (1988) 23–45.
[41] DHYANI, S.K., et al., Studies on root distribution of five multipurpose tree species in Doon Valley, India, Agrofor. Syst. 12 (1990) 149–161.
[42] TOKY, O.P., BISHT, R.P., Observations on the rooting patterns of some agroforestry trees in an arid region of north-western India, Agrofor. Syst. 18 (1992) 245–263.
[43] SCHROTH, G., Tree root characteristics as criteria for species selection and systems design in agroforestry, Agrofor. Syst. 30 (1995) 125–143.
[44] VAN DEN BELDT, R.J., “Agroforestry in the semiarid tropics”, Agroforestry: Classification and Management (MACDICKEN, K.G., VERGARA, N.T., Eds), Wiley, New York (1990) 150–194.
[45] UJAH, J.E., ADEOYE, K.B., Effects of shelterbelts in the sudan savanna zone of Nigeria on microclimate and yield of millet, Agric. For. Meteorol. 33 (1984) 99–107.
[46] KESSLER, J.J., BREMAN, H., The potential of agroforestry to increase primary production in the Sahelian and Sudanian zones of West Africa, Agrofor. Syst. 13 (1991) 41–62.
[47] LONG, S.P., Influence of Neem Windbreaks on Yield, Microclimate, and Water Use of Millet and Sorghum in Niger, West Africa, MSc Thesis, Texas A&M University, College Station (1989).
[48] BRENNER, A.J., et al., “Tree-crop interface competition in a semi-arid Sahelian windbreak”, 4th International Symposium on Windbreaks and Agroforestry, July 26–30 1993, Viborg, Denmark (1993).
[49] SMITH, D.M., et al., Sources of water used by trees and millet in Sahelian windbreak systems, J. Hydrol. 198 (1997) 140–153.
[50] SMITH, D.M., et al., Management of windbreaks in the Sahel: the strategic implications of tree water use, Agrofor. Syst. 40 (1998) 83–96.
[51] ONYEWOTU, L.O.Z., et al., A study of competitive effects between a Eucalyptus
camaldulensis shelterbelt and an adjacent millet (Pennisetum typhoides) crop, Agric., Ecosys. Environ. 51 (1994) 281–286.
[52] EASTHAM, J., et al., Tree/pasture interactions at a range of tree densities in an agroforestry experiment. II Water uptake in relation to rooting patterns, Aust. J. Agric. Res. 41 (1990) 697–707.
[53] BOYER, J.S., Measuring the Water Status of Plants and Soils, Academic Press, San Diego (1995) 178 pp.
[54] SMITH, D.M., ALLEN, S.J., Measurement of sap flow in plant stems, J. Exp. Bot. 47 (1996) 1833–1844.
[55] SMITH, D.M., et al., Root Quantity, Activity and Below-Ground Competition in Grevillea robusta Agroforestry Systems, Inst. of Hydrology/Department for International Development Rep. 98/7. Inst. of Hydrology, Wallingford (1998).

43
USING STABLE ISOTOPES TO UNDERSTAND TREE RESPONSES
TO ENVIRONMENTAL VARIATION AND STRESS
L.E. CULLEN, P. LANDMAN, P. GRIERSON Ecosystems Research Group, School of Plant Biology, University of Western Australia, Australia
M. ADAMS∗ Centre of Excellence in Natural Resource Management, c/- Faculty of Natural and Agricultural Sciences, University of Western Australia, Australia Abstract
Stable isotopes are a powerful tool for examining relationships between plants and their environments.
Knowledge gained from studies using isotopes of H, C, N, O and S can inform decisions about management of
agroforestry systems – in particular management of water and nutrients. Isotopes of carbon, oxygen and
deuterium are now widely used to determine patterns of water use and environmental adaptations. Dual analysis
of carbon and oxygen isotopes continues to provide new opportunities to gain a more detailed understanding of
variation in ecophysiological processes of plants. For example, coupling a dual isotope approach with other
disciplines, particularly dendrochronology, has expanded our ability to examine and compare short- and long-
term temporal relationships between plants and their environment. Correlations between carbon and oxygen
isotopes of tree rings of Callitris glaucophylla, growing in semi-arid, north-west Australia, reveal an apparent
shift in the balance between photosynthesis and stomatal conductance. Between 1920 and 1960, the two isotopes
are negatively correlated, while after 1960 they switch rapidly to a positive association. The shift to a positive
correlation strongly suggests an increase in stomatal control to regulate water use, possibly a reflection of
changes in rainfall patterns in north-west Australia. Detailed modelling of climate-isotope relationships also
reveals a number of unusual relationships. Contrary to most studies, we found a significant correlation between
δ18O values and climate of the preceding year. This suggests reduced oxygen re-exchange during cellulose
synthesis than reported for other species. Variation in oxygen isotopes largely reflects relative humidity and
rainfall early in the growing season, and temperature late in the preceding and current growing season. Again in
contrast to other studies, carbon isotopes of tree rings of C. glaucophylla appear less useful than oxygen as a
climate proxy, but reveal fundamental information about differences in physiology between conifers and
broadleaf species. While carbon and oxygen are commonly used to examine relationships between trees and
climate, deuterium isotopes are more commonly used to examine water sourcing by plants. In arid regions,
dependence on rainfall or groundwater is largely a reflection of landscape position. For example, species adapted
to growing in and along creek lines have access to groundwater and are less dependent on stored soil water.
Conversely, species growing on floodplains are highly dependent on rainwater. A difference in access to water
translates into differences in physiology and water use: rates of transpiration of creek line species varies little
between seasons. These findings have implications for management of mixed systems and their adaptability to
long-term changes in rainfall and groundwater supply.
1. INTRODUCTION
Agricultural systems that combine woody perennials (trees and shrubs) with herbaceous annuals (crops and pasture) are increasingly being adopted in Australia and elsewhere [1]. Such systems are implemented as part of efforts to optimize resource utilization, while also addressing issues of land degradation due to water logging, erosion and salinization. Fundamental to developing sustainable agroforestry systems is knowledge of how trees and shrubs function both in agricultural and natural systems. Key questions that are being addressed to help develop this knowledge are: how do trees and shrubs adapt to
∗ New address: Laboratory for Ecology and Ecosystem, University of New South Wales, Australia.

44
variation in environmental conditions? How important are differences between species in their ecophysiology and resource utilization? How do long-lived species respond to disturbance? Stable isotopes are a powerful tool which can assist in answering these questions [2, 3]. In particular, stable isotopes of carbon (δ13C), oxygen (δ18O) and deuterium (δ2H) allow comparison of patterns of water use within and between species, between contrasting environmental conditions and through time with changes in water availability.
Increasing use of stable isotopes to understand natural and managed ecosystems over the last decade is a direct result of improvements in analytical capabilities, and, more importantly, a better physiological understanding of isotope fractionation. Discrimination against 13C is directly related to the ratio of internal to ambient CO2 concentration of leaves (ci/ca) [4]. Stomatal closure during periods of drought reduces ci, reducing discrimination against 13C which is evident as less negative δ13C values. Therefore, the factors that influence stomatal conductance, relative humidity and rainfall, are often strongly correlated with δ13C of plant materials [5]. Similarly, δ18O ratios are negatively related to stomatal conductance, which is largely dependent on the ratio of water inside and outside the leaf (expressed as a difference in vapor pressure) and the δ18O of source water [2]. As humidity, which is the dominant control on evaporation through its influence on stomatal conductance and vapor pressure deficit, declines, δ18O values increase [6]. Enrichment of δ2H of leaf water is controlled by the same factors that control enrichment of δ18O. The final δ18O and δ2H signature of plant carbohydrates is a balance between further fractionation processes during photosynthesis and post-photosynthetic metabolism [7].
Because of the relationships between isotopes and measures of water stress, many studies now use stable isotopes of carbon and oxygen to infer drought tolerance and plant responses to changes in water availability. In Australia, a detailed understanding of the drought tolerance of native woody species is largely limited to a few angiosperms, such as Eucalyptus and Acacia. Angiosperms typically have higher rates of hydraulic supply, stomatal conductance and transpiration than conifers [8, 9] and are likely to respond differently to changes in water stress than conifers. Callitris species (Cupressaceae) are the only widely distributed conifers in low rainfall environments in Australia [10] and provide the potential to significantly expand our understanding of plant adaptations to drought in Australia both in terms of short-term (seasonal) and long-term (decadel and longer) responses to water stress. Expansion of studies to a broader range of environments and species, particularly those that more closely match the interests of agroforestry, are needed to fully characterize how isotopes can be used to infer plant-environment relationships.
Increasingly, δ13C and δ18O ratios are being used to examine relationships between tree growth and climatic variation over decades to centuries with the aim of improving our capacity to reconstruct past climates [11, 12]. These isotope pairs help quantify tree responses and adaptations to environmental variation and allow predictions of plant responses to future climate change. Tree ring studies have so far largely focused on identifying appropriate sampling methods, e.g. [13, 14]. An increasing number of studies are, however, using isotope signatures in tree rings to examine or reconstruct variables such as drought indices [11], water-use efficiency [15] and temperature and rainfall [12]. The most successful of these studies recognize that ratios of trees from dry sites will be more sensitive to variations in climate than those of moist sites, further emphasizing the need to expand the range of environments sampled in isotope studies. No studies in mainland Australia have attempted to reconstruct long term growth trends using stable isotopes, although Callitris appears to have good potential for stable isotope dendroclimatology. Ring formation in Callitris is mostly annual and largely driven by rainfall and water availability [16]. Furthermore, Callitris is

45
widespread in semi-arid and arid Australia, providing the opportunity to develop a network of sites and therefore proxy climate data. Measurement of stable isotope signals in tree rings may provide the key to improving our ability to extract proxy climate data from Australian trees, including Callitris. Stable isotope ratios of tree rings appear to be a more accurate record of environmental or climatic effects on annual growth than tree ring width, with little retention of non-climatic information that is common in tree-ring width chronologies [17]. Stable isotopes have proved extremely useful in developing tree-ring chronologies from tropical trees, many of which exhibit little or no formation of annual rings [18].
Coupled with tree ring and foliage isotope data, understanding where and when trees access water is critical to selecting appropriate species for agroforestry, as well as developing management strategies. Stable isotopes of water (δ18O and δ2H) have proven remarkably robust tools in identifying and quantifying plant use of ground and soil water. The key assumption of these isotope techniques is that the isotopic composition of xylem sap is an integration of the isotopic signatures of water from varying soil zones and depths (including surface waters, water in different soil horizons, groundwater sources [19]. Such techniques have also already provided us with an understanding of the range of the active rooting zone and biogeochemical processes, e.g. [19]. Furthermore, it is evident that some plants switch rapidly between different sources of water, a clear advantage when water is in short supply and of some help in explaining the co-dominance of grasses and trees in semi-arid and savanna systems, e.g. [20]. While a number of assumptions are needed when applying stable isotopes to determine sources of water for trees, using the signal in xylem sap of branches or twigs to infer rooting depths and water sourcing has many advantages:
• The water can be collected easily and quickly in the field; • It is a quantitative and objective measure; • It can be applied to species where digging is not possible, or is expensive or
dangerous; • Large shrubs and trees can be measured repeatedly building knowledge of temporal
and spatial variation in water sourcing by trees.
Here we present recent work undertaken in the Pilbara, north-west Australia examining carbon, oxygen and deuterium signatures of plant material to determine relationships between tree growth and climate, and variation in access to water sources.
2. METHODS
2.1. Environmental controls on stable isotope signatures of tree rings and foliage
of Callitris glaucophylla
2.1.1. Field site description
In the central Pilbara, C. glaucophylla is primarily confined to south-facing gullies and gorges, where it is protected from the frequent fires of the floodplains. The climate of the Pilbara region is semi-arid and sub-tropical [21]. Day time temperatures at in summer (late November to March) range from 26°C to 40°C, while in winter, temperatures are between 12°C and 26°C. Average yearly rainfall in the area is around 300 mm; over 60% of this falls between December and March, often associated with cyclones or rain-bearing low pressure systems [22]. Soils are skeletal, and gully sites extremely rocky with low water holding capacity.
46
2.1.2. Foliage sampling
To examine seasonal integration of the effects of water availability on growth of C.
glaucophylla, we collected foliage samples for carbon and oxygen isotope analysis on four occasions spanning the dry and wet seasons of 2003 and 2004. At the same time as the foliage collection, we measured rates of gas exchange (net rates of carbon fixation, A; of transpiration, E), leaf water potentials (as a measure of soil water availability) and variables necessary to calculate leaf-to-air vapor pressure deficits (LAVPD). Gas exchange parameters were calculated according to [23] and are expressed on a dry mass basis, a common approach when measuring gas exchange of non-needle conifers, e.g. [24, 25]. Foliage samples were analyzed for the abundances of isotopes of C and O as described below.
2.1.3. Developing isotope chronologies
2.1.3.1. Field sampling
To develop isotope chronologies from C. glaucophylla, we extracted cores from c. 70 trees within the gully site. Once the cores were dried and sanded to reveal the annual rings, cross-dating was undertaken to assign a calendar date to each ring [26]; both particularly narrow and wide rings were useful in matching ring width patterns between cores. Of the 70 trees, 12 could be cross-dated back to 1919; cores which could not be cross-dated were excluded largely because of a very high frequency of false growth bands, missing rings and unclear ring boundaries. Wood from each year was separated using a razor and combined.
2.1.3.2. Test for necessity of extracting cellulose
We determined the necessity of extracting cellulose for developing isotope chronologies from C. glaucophylla by comparing the relationships among whole wood, cellulose and climate for the period 1979–1999. We used the cellulose extraction methods described in [14]. Isotope analysis is described below (2.1.4.).
2.1.3.3. The final isotope chronologies
The results of our preliminary study above indicated that cellulose chronologies of C.
glaucophylla had more stable relationships with climate through time. Therefore, we extracted cellulose from the remaining tree rings [14], which was analyzed for the abundances of isotopes of C and O as described below to produce both carbon and oxygen isotope chronologies extending back to 1919.
The raw δ13C chronology exhibited a decline (more negative) in δ13C beginning around 1955, reflecting the lowering of δ13C of air by 1 to 2‰ since 1850 due to anthropogenic-related increases in CO2 [5]. We used the data provided in [27] and [5] to remove the atmospheric δ13C trend from the carbon chronology.
2.1.4. Isotope analysis
Finely ground, oven dried sub-samples of 2–2.5 mg were weighed into tin capsules for δ
13C analysis and 0.2–0.25 mg were weighed into silver capsules for δ18O analysis. All isotope analyses were undertaken at the Western Australian Biogeochemistry Centre, UWA. δ
13C values were measured using a Roboprep-Tracermass or ANCA S/L-20/20 mass spectrometer system (PDZ Europa, UK). The precision of both systems, calculated as the mean standard deviation of at least five replicates of an internal laboratory reference (radish/collegate; δ13C = –28.61‰), was always <0.2‰. δ18O values were measured using a

47
TC/EA coupled to a Finnigan DELTA+XL mass spectrometer (Thermo Electron Corporation, Bremen, Germany). Internal laboratory standards for δ18O analysis were lab-sucrose (δ18O = 35.35‰, precision <0.78‰) and lab-benzoic acid (δ18O = 20.05‰, precision <1.15‰). For each batch of analyses, c. 10–15% of the samples were analyzed twice to check homogeneity of sample preparation: mean standard deviation of sample replicates was 0.18‰ for δ13C and 0.11‰ for δ18O. δ13C values are reported as the 13C/12C ratio relative to PDB and δ18O are reported as the 18O/16O ratio relative to Vienna MSOW.
2.1.5. Data analysis
We used linear and non-linear regressions and correlations to examine relationships between gas exchange variables, and among gas exchange variables, isotope ratios of foliage and leaf-to-air VPD and water potential.
Climate data were obtained from Newman, the nearest long-term climate station (1965-ongoing). Relationships between isotope chronologies and monthly climate variables were modeled using bootstrapped correlation analysis [28]. Climate variables included in the correlation analysis were: average monthly temperature; average minimum monthly temperature; average maximum monthly temperature; total monthly rainfall; and average monthly relative humidity. Twenty monthly predictors from February of the preceding growth year to September of the current growth year were included in the correlation functions. We defined the growth year as being October to September.
2.2. Understanding water use by native trees in semi-arid Pilbara
At the landscape scale within the central Pilbara, water availability is the most important factor affecting the distribution of species and communities. In turn, water availability is partly a function of topography and consequently depth to water tables, but also variability in soil types. Therefore, within the central Pilbara there is the opportunity to undertake spatial and temporal comparisons of water use by differing trees and shrubs across landscapes. For example, the genus Acacia is largely dominant on the floodplains. Acacia
xiphophylla grows adjacent to the major creek lines, but where soils are shallow Acacia
aneura grows in groves. Large trees such as Eucalyptus camaldulensis and E. victrix are mostly restricted to riparian zones, although Eucalyptus leucophloia is widespread on basalt hills and surrounding ranges.
2.2.1. Field site description
Hamersley Station in the central Pilbara lies within a large basin that forms part of the plateau of the Hamersley Ranges. The Station encompasses basalt hills (depth to groundwater = 75 m), floodplains (38 m) and riparian zones (21 m) in close proximity, such that differences in depth to groundwater and soil types are likely to be the main drivers of species distributions and water use. We measured deuterium signatures of the following species:
Species Landscape position
Eucalyptus leucophloia Hill
Acacia aneura Floodplain
Hill Acacia xiphophylla Floodplain Hill
Eucalyptus victrix Riparian Eucalyptus camaldulensis Riparian Acacia citrinoviridis Riparian

48
2.2.2. Sample collection
In order to identify temporal and spatial variation in sources of plant water, samples were collected before the summer rains (November) and following summer and winter rainfall (August) at different points in the landscape. Xylem water of branches and roots was extracted under vacuum at the time of collection. The potential for evaporation was minimized by preventing bubbling during collection and sealing all containers as soon as possible. It was assumed that there was no fractionation during extraction [29]. All branches were selected in full sun and all leaves were removed as soon as the branch was cut from the tree to minimize water loss. Collected water was transferred to 1.8 mL cryotubes and stored in a freezer until analysis. Soil water was cryogenically extracted from samples collected at a depth of 2 m; this depth corresponds to the maximum depth of lateral roots of all species sampled. Groundwater samples were collected from nearby bores and rain water was sampled opportunistically. Collected rain water was also transferred to cryotubes and stored in a freezer until analysis.
2.2.3. Deuterium analysis
All extracted water samples were analyzed using the zinc reduction method [30]. Briefly, 10 μl of the water sample was reacted with 0.5 mg of zinc at 490°C for 1 h in sealed pyrex tubes. The mass to charge ratios of 2H to 1H of H2 gas trapped in the head space of the tubes were calculated using a SIRA 9 VG Isogas Dual-Inlet Mass Spectrometer. The molar ratio of 2H/1H was expressed in delta notation (δ2H).
3. RESULTS
3.1. Seasonal variation in isotopes of Callitris foliage
δ13C decreased by ~ 0.5‰ between the late dry and late wet sample periods (LSD P <
0.05; Fig. 1) indicating an increase in discrimination against 13CO2 and reduced water use efficiency. Trends in δ18O did not match those of δ13C: we observed a significant increase in δ
18O values between the early dry-2003 and late dry, where δ18O peaked at 39.20‰, before values decreased again to 36.43‰ by the early dry-2004 (LSD P < 0.05; Fig. 1). δ13C and δ
18O were weakly and positively correlated (r2 = 0.11, P = 0.011) for the early dry-2003 period, but the two isotopes were not correlated for any other periods. When the four sampling periods were combined, δ13C and δ18O were poorly but significantly correlated (r2 = 0.03, P = 0.015).
Carbon isotope ratios were significantly and negatively correlated with stomatal conductance (r2 = –0.38, P <0.001; Fig. 2), while variation in stomatal conductance across seasons was driven by soil water stress as measured by pre-dawn leaf water potentials (data not shown). However, δ13C was not well correlated with pre-dawn water potentials (r2 = –0.09, P = 0.065), which is largely a reflection of the highly skewed distribution in ψpd values (data not shown). In general, discrimination against 13CO2 increases with greater stomatal conductance, a consequence of higher internal CO2 concentration and therefore, a decrease in water stress. Surprisingly, there was little evidence of a relationship between δ13C values and instantaneous water use efficiency (iWUE = ratio of net carbon fixation to rate of water loss, A/E; r2 = –0.092, P = 0.057) and there was certainly no relationship between δ13C and ci/ca ratios (P = 0.456). δ18O values were not related to g (P = 0.587), LAVPD (P = 0.872), iWUE (P = 0.197), E (P = 0.605), or total or average rainfall for the three months prior to sampling (both P = 0.842) or average relative humidity for the month prior to sampling (P = 0.387).

49
FIG. 1. Seasonal variation in (a) δ 13
C (‰) and (b) δ 18
O (‰). Data are means ± se; the same letters
indicate values are not significantly different (ANOVA, LSD, P = 0.05).
Stomatal conductance (mmol kg-1 s-1)
0 100 200 300 400 500 600 700 800
δ13C
-29.0
-28.5
-28.0
-27.5
-27.0
-26.5
-26.0
-25.5
-25.0
FIG. 2. The relationship between stomatal conductance, g, (mmol kg–1 s
–1) and δ
13C (‰). Linear
regression: δ 13
C = – 0.003g – 26.566.
3.2. Long-term variation in isotopes of tree rings of Callitris glaucophylla
3.2.1. Cellulose versus whole wood
Overall, the isotopes series for whole wood and for cellulose isotope exhibited similar patterns. Carbon isotopes of whole wood and cellulose were significantly correlated (r2 = 0.64, P < 0.001), as were those of δ18O (r2 = 0.68, P < 0.001; Fig. 3). Whole wood δ13C values were, on average, 1.17 ± 0.4‰ more negative than those of cellulose, while δ18O of cellulose was 7.59 ± 1.1‰ more enriched than whole wood.
Early dry 2003 Late dry Late wet Early dry 2004
δ13C
(‰
)
-27.6
-27.4
-27.2
-27.0
-26.8
-26.6
a a
bb
Sample period
Early dry 2003 Late dry Late wet Early dry 2004
δ18Ο
(‰
)
36
37
38
39
40
a
b
ab
c

50
1978 1980 1982 1984 1986 1988 1990 1992 1994 1996 1998 2000
δ13C
(‰
)
-25.0
-24.5
-24.0
-23.5
-23.0
-22.5
-22.0
-21.5
-21.0
Year
1978 1980 1982 1984 1986 1988 1990 1992 1994 1996 1998 2000
δ18O
(‰
)
20
22
24
26
28
30
32
34
36
38
(a)
(b)
FIG. 3. δ 13
C and δ 18
O cellulose (closed circles) and whole wood (open circles) chronologies of Callitris glaucophylla.
Regardless of wood or isotope type, there was considerable temporal instability in
correlations between isotopes of tree rings of C. glaucophylla and climate (Figs 4 and 5). Nevertheless, δ13C of whole wood generally exhibited weaker and more variable correlations with climate through time than cellulose (Fig. 4). For δ18O, there was less discrepancy between whole wood and cellulose in their relationships with climate (Fig. 5). On occasions, whole wood δ18O ratios are more strongly correlated with climate than those of cellulose (e.g. 1990–1993, Fig. 6(a); 1997–1998, Fig. 6(b)). However, as for δ13C, δ18O of cellulose generally had a stronger relationship with climate than whole wood. The moving correlation functions suggest whole wood records climate in a different way, and more weakly, than cellulose. We postulate that the instability of whole wood-climate relationships reflects the inclusion of a climate signal from lignin that is more variable between tree rings than cellulose. Hence, extraction of cellulose is necessary when developing stable isotope chronologies from C. glaucophylla to ensure an accurate and, more importantly, stable proxy of past climate.
1987 1988 1989 1990 1991 1992 1993 1994 1995 1996 1997 1998 1999 2000
0.0
0.1
0.2
0.3
0.4
0.5
0.6
0.7
Year
1987 1988 1989 1990 1991 1992 1993 1994 1995 1996 1997 1998 1999 2000
Co
rre
latio
n c
oe
ffic
ien
t
for
10
-ye
ar
mo
vin
g in
terv
al
-1.0
-0.8
-0.6
-0.4
-0.2
0.0
(a)
(b)
FIG. 4. Moving 10 year correlation between δ
13C of cellulose (closed circles) and whole wood (open
circles) and (a) average December temperature and (b) January rainfall. Correlation coefficients are plotted for the last year of each 10 year period.

51
1987 1988 1989 1990 1991 1992 1993 1994 1995 1996 1997 1998 1999 2000
0.0
0.1
0.2
0.3
0.4
0.5
0.6
0.7
Year
1987 1988 1989 1990 1991 1992 1993 1994 1995 1996 1997 1998 1999 2000
Corr
ela
tion c
oeffic
ient
for
10-y
ear
movin
g inte
rval
-1.0
-0.8
-0.6
-0.4
-0.2
0.0
(a)
(b)
FIG. 5. Moving 10 year correlation between δ 18
O of cellulose (closed circles) and whole wood (open circles) and (a) maximum February temperature and (b) January rainfall. Correlation coefficients are
plotted for the last year of each 10 year period.
1915 1920 1925 1930 1935 1940 1945 1950 1955 1960 1965 1970 1975 1980 1985 1990 1995 2000
δ13C
(‰
)
-26
-25
-24
-23
-22
-21
-20
-19
-18
Year
1915 1920 1925 1930 1935 1940 1945 1950 1955 1960 1965 1970 1975 1980 1985 1990 1995 2000
δ18O
(‰
)
28
30
32
34
36
38
40
(a)
(b)
FIG. 6. Stable carbon (a) and oxygen (b) isotope chronologies from C. glaucophylla from 1919 to 1999. The heavy line is the 11 year running mean.
3.2.2. Carbon and oxygen isotope chronologies
Carbon isotope values ranged between –18.8 (in 1957) to –25.0‰ (in 1942), while δ
18O ranged from 29.5 (1999) to 39.3‰ (1964; Fig. 6). High frequency variation appears to be greater in the δ18O chronology, which had a higher standard deviation than δ13C (Table 1). The δ18O chronology also retains more long-term variation than the δ13C chronology. First-order autocorrelations were significant for both isotopes, but greater for the δ18O chronology, which also had significant 11- and 14-order autocorrelation coefficients (Table 1).

52
TABLE 1. SUMMARY DATA FOR δ13
C AND δ18
O TREE-RING CHRONOLOGIES
δ13C δ
18O
Mean (‰) –20.97 34.91 Standard deviation (‰) 0.95 1.98 1st-order autocorrelation 0.230 0.401
δ18O values are mostly well above average from the 1920s to mid 1950s, when they
switch to being mostly below average (Fig. 6). In contrast, below average (more negative) δ
13C values are evident from 1935 to 1950 and from 1979 to the present, while in between these two periods δ13C values are above average (more positive) (Fig. 6).
Curiously, examining the correlation between the two series in more detail reveals that between 1955 and 1965, δ13C and δ18O switch from being negatively to positively correlated (Fig. 7). Prior to 1955 the average correlation between δ13C and δ18O is –0.302, while after 1965 it is +0.359.
The change in the relationship between δ13C and δ18O coincides with a well-recognized increase in rainfall around 1960 in the region (Fig. 8) [31]. The similarity of recent rainfall trends at Newman and longer running stations such as Derby (1896–1987, c. 900 km from Newman, r = 0.481) and Broome (1890-ongoing, c. 750 km from Newman, r = 0.354) strongly suggest rainfall in the local area exhibits similar long-term trends to the rest of north-west Australia. Further support for a change in rainfall influencing the correlation between δ
13C and δ18O is provided when the running correlation between the two isotopes is plotted against the 21 year running mean of rainfall at Broome (r2 = 0.58) and Derby (r2 = 0.38) (Fig. 9). Positive correlations between the two isotopes are clearly associated with higher rainfall, while negative correlations correspond to periods with lower rainfall.
First year of correlation period
1910 1920 1930 1940 1950 1960 1970 1980 1990
Co
rre
latio
n c
oe
ffic
ien
t
-0.6
-0.4
-0.2
0.0
0.2
0.4
0.6
FIG. 7. 20 year running correlation between δ 13
C and δ 18
O plotted at the start of each period. Vertical lines delineate the transition period between the negative and positive correlation between
δ 13C and δ
18O.
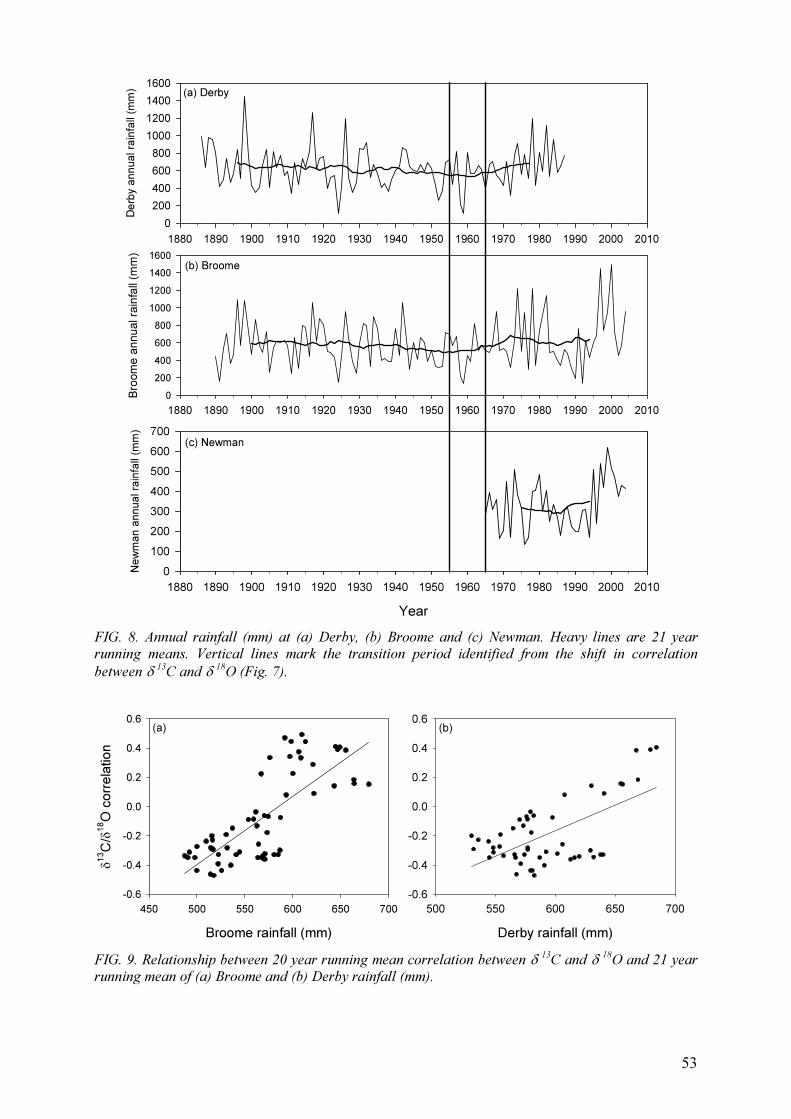
53
1880 1890 1900 1910 1920 1930 1940 1950 1960 1970 1980 1990 2000 2010
Derb
y a
nnual ra
infa
ll (m
m)
0
200
400
600
800
1000
1200
1400
1600
1880 1890 1900 1910 1920 1930 1940 1950 1960 1970 1980 1990 2000 2010
Bro
om
e a
nnual ra
infa
ll (m
m)
0
200
400
600
800
1000
1200
1400
1600
Year
1880 1890 1900 1910 1920 1930 1940 1950 1960 1970 1980 1990 2000 2010
New
man a
nnual ra
infa
ll (m
m)
0
100
200
300
400
500
600
700
(a) Derby
(b) Broome
(c) Newman
FIG. 8. Annual rainfall (mm) at (a) Derby, (b) Broome and (c) Newman. Heavy lines are 21 year running means. Vertical lines mark the transition period identified from the shift in correlation
between δ 13C and δ
18O (Fig. 7).
Broome rainfall (mm)
450 500 550 600 650 700
δ13C
/δ18O
corr
ela
tion
-0.6
-0.4
-0.2
0.0
0.2
0.4
0.6
Derby rainfall (mm)
500 550 600 650 700
-0.6
-0.4
-0.2
0.0
0.2
0.4
0.6(a) (b)
FIG. 9. Relationship between 20 year running mean correlation between δ 13
C and δ 18
O and 21 year running mean of (a) Broome and (b) Derby rainfall (mm).

54
3.2.3. Climate relationships of isotope chronologies
3.2.3.1. Oxygen
The δ18O chronology exhibited a number of significant correlations with monthly climate variables of the current and preceding growth year (Fig. 10). The key relationships between δ18O and climate were:
• Negative correlation with rainfall and relative humidity from November to February; • Positive correlation with temperatures of current growth year from January to August; • Positive correlation with temperatures of June and July of the preceding growth year; • Positive correlation with temperature and negative correlation with rainfall and
relative humidity of previous growing year summer.
In summary, these correlations suggest higher evaporative enrichment of δ18O is associated with warmer and drier summers, but also that a climate signal following the summer wet period (i.e. April to August) is incorporated into isotope abundances of tree rings.
The relatively strong relationship between δ18O and climate of the preceding year is consistent with the first-order autocorrelation exhibited by the δ18O chronology. For temperature in particular, the correlation with climate of the preceding growth year is stronger than that with current growing season conditions.
FEBMARAPRMAYJUNJULAUGSEP O
ctNovDec Ja
nFebMar A
prMay Ju
nJulAugSep
Corr
ela
tion c
oeffic
ient
-0.2
0.0
0.2
0.4
0.6
0.8
(a) mean temperature
FEBMARAPRMAYJUNJULAUGSEP O
ctNovDec Ja
nFebMar A
prMay Ju
nJulAugSep
0.0
0.2
0.4
0.6
(c) min temperature
Month
FEBMARAPRMAYJUNJULAUGSEPOctNovDec Ja
nFebMarAprMay Ju
nJulAugSep
Corr
ela
tion c
oeffic
ient
-0.6
-0.4
-0.2
0.0
0.2
0.4
0.6
(d) ppt
Month
FEBMARAPRMAYJUNJULAUGSEPOctNovDec Ja
nFebMarAprMay Ju
nJulAugSep
-0.4
-0.3
-0.2
-0.1
0.0
0.1
0.2
0.3
(e) RH
FIG. 10. Correlations between δ 18
O and monthly climate parameters. Black bars indicate a significant correlation (P < 0.05) from bootstrapped correlation function analysis; grey bars are not
significant (P ≥ 0.05). Months in capitals are from the previous growth year, while the remainder are from the current growth year.
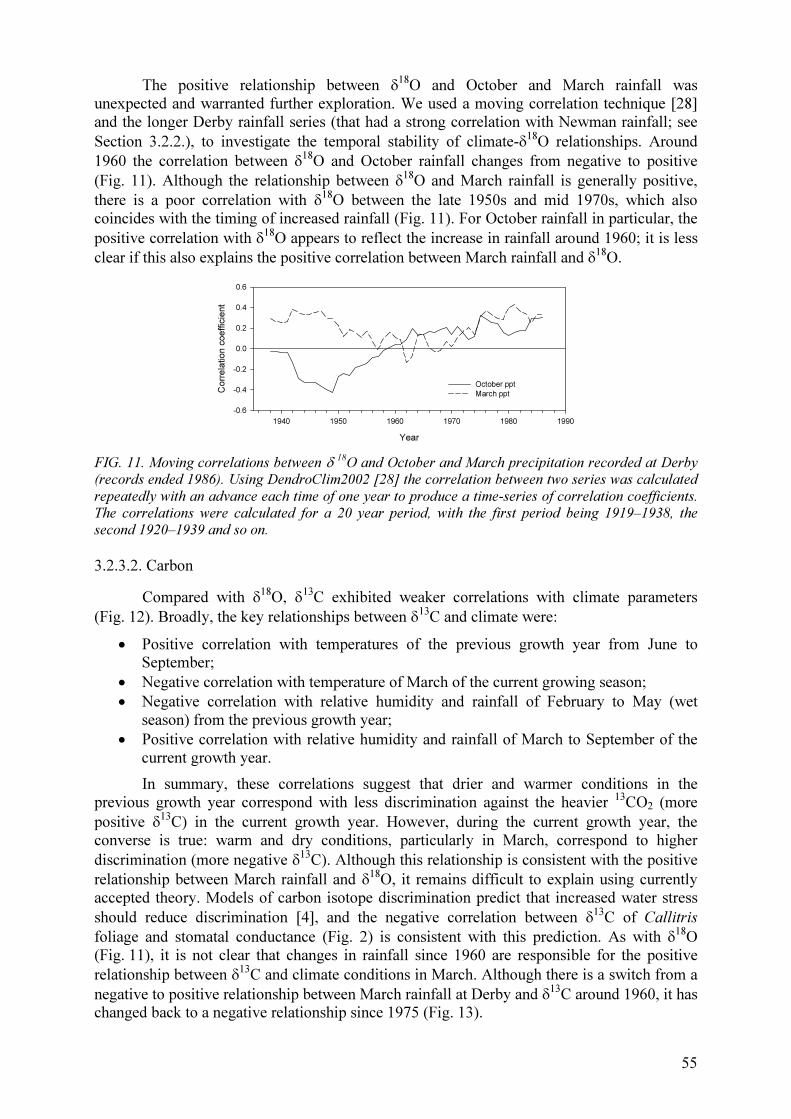
55
The positive relationship between δ18O and October and March rainfall was
unexpected and warranted further exploration. We used a moving correlation technique [28] and the longer Derby rainfall series (that had a strong correlation with Newman rainfall; see Section 3.2.2.), to investigate the temporal stability of climate-δ18O relationships. Around 1960 the correlation between δ18O and October rainfall changes from negative to positive (Fig. 11). Although the relationship between δ18O and March rainfall is generally positive, there is a poor correlation with δ18O between the late 1950s and mid 1970s, which also coincides with the timing of increased rainfall (Fig. 11). For October rainfall in particular, the positive correlation with δ18O appears to reflect the increase in rainfall around 1960; it is less clear if this also explains the positive correlation between March rainfall and δ18O.
Year
1940 1950 1960 1970 1980 1990
Corr
ela
tion c
oeffic
ient
-0.6
-0.4
-0.2
0.0
0.2
0.4
0.6
October ppt
March ppt
FIG. 11. Moving correlations between δ 18
O and October and March precipitation recorded at Derby (records ended 1986). Using DendroClim2002 [28] the correlation between two series was calculated
repeatedly with an advance each time of one year to produce a time-series of correlation coefficients. The correlations were calculated for a 20 year period, with the first period being 1919–1938, the second 1920–1939 and so on.
3.2.3.2. Carbon
Compared with δ18O, δ13C exhibited weaker correlations with climate parameters (Fig. 12). Broadly, the key relationships between δ13C and climate were:
• Positive correlation with temperatures of the previous growth year from June to September;
• Negative correlation with temperature of March of the current growing season; • Negative correlation with relative humidity and rainfall of February to May (wet
season) from the previous growth year; • Positive correlation with relative humidity and rainfall of March to September of the
current growth year.
In summary, these correlations suggest that drier and warmer conditions in the previous growth year correspond with less discrimination against the heavier 13CO2 (more positive δ13C) in the current growth year. However, during the current growth year, the converse is true: warm and dry conditions, particularly in March, correspond to higher discrimination (more negative δ13C). Although this relationship is consistent with the positive relationship between March rainfall and δ18O, it remains difficult to explain using currently accepted theory. Models of carbon isotope discrimination predict that increased water stress should reduce discrimination [4], and the negative correlation between δ13C of Callitris
foliage and stomatal conductance (Fig. 2) is consistent with this prediction. As with δ18O (Fig. 11), it is not clear that changes in rainfall since 1960 are responsible for the positive relationship between δ13C and climate conditions in March. Although there is a switch from a negative to positive relationship between March rainfall at Derby and δ13C around 1960, it has changed back to a negative relationship since 1975 (Fig. 13).

56
FEBMARAPRMAYJUNJULAUGSEPOctNovDec Ja
nFebMar Ap
rMay Ju
nJulAugSep
Co
rre
latio
n c
oe
ffic
ien
t
-0.4
-0.3
-0.2
-0.1
0.0
0.1
0.2
0.3
0.4
FEBMARAPRMAYJUNJULAUGSEPOctNovDec Ja
nFebMar Ap
rMay Ju
nJulAugSep
-0.4
-0.3
-0.2
-0.1
0.0
0.1
0.2
0.3
0.4
Month
FEBMARAPRMAYJUNJULAUGSEPOctNovDec Ja
nFebMar Ap
rMay Ju
nJulAugSep
Co
rre
latio
n c
oe
ffic
ien
t
-0.3
-0.2
-0.1
0.0
0.1
0.2
0.3
0.4
Month
FEBMARAPRMAYJUNJULAUGSEPOctNovDec Ja
nFebMar Ap
rMay Ju
nJulAugSep
-0.4
-0.3
-0.2
-0.1
0.0
0.1
0.2
0.3
0.4
(a) mean temperature (b) min temperature
(c) ppt (d) RH
FIG. 12. Correlations between δ 13
C and monthly climate parameters. Black bars indicate a significant
correlation (P < 0.05) from bootstrapped correlation function analysis; grey bars are not significant (P ≥ 0.05). Months in capitals are from the previous growth year, while the remainder are from the
current growth year.
Year
1935 1940 1945 1950 1955 1960 1965 1970 1975 1980 1985 1990
Corr
ela
tio
n c
oe
ffic
ien
t
-0.8
-0.6
-0.4
-0.2
0.0
0.2
0.4
FIG. 13. Moving correlations between δ 13
C and March precipitation recorded at Derby (records ended 1986). Using DendroClim2002 [28] the correlation between two series was calculated
repeatedly with an advance each time of one year to produce a time-series of correlation coefficients. The correlations were calculated for a 20 year period, with the first period being 1919–1938, the second 1920–1939 and so on.
3.3. Water use of native trees
The mean δ2H of soil water at around 2 m depth was –24.4‰, while the mean δ2H of groundwater was around –49‰; these values were used as the soil and groundwater signals in subsequent comparisons. The δ2H signature of rainwater ranged from +11‰ (November) to –24‰ (August).

57
3.3.1. Landscape variation in water sources
Considerable variation in δ2H signatures between species and landscape positions is evident in the Pilbara (Fig. 14). The most negative δ2H values were found for water of shoots of Eucalyptus victrix and Acacia citrinoviridis in riparian zones; these values were consistently similar to those of groundwater. In contrast, δ2H signatures of water in shoots of E. leucophloia, A. xiphophylla and A. aneura were considerably less negative than those of underlying groundwater, reflecting the poor availability of water to these species (based on leaf water potentials; data not shown). Species on the floodplain (A. aneura and A.
xiphophylla) also appear to have poor access to groundwater, with δ2H signatures dissimilar to groundwater. Generally, the δ2H of water in shoots of A. xiphophylla was similar on the floodplain as the hill slopes (Fig. 14).
FIG. 14. δ 2H (‰) of water in shoots of Acacia and Eucalyptus species at a riparian, floodplain and
hill site in November.
3.3.2. Temporal variation in water sources
Irrespective of landscape position, in August (after winter rains) δ2H of water in the shoots of all species was substantially enriched relative to November (before summer rains) (Fig. 15). August δ2H values of all species were similar to those of soil water (–24‰). In contrast, November δ2H values of the riparian species tended to be similar to δ2H of groundwater (–49‰), while those of the two floodplain Acacia’s were between the δ2H values of shallow soil and groundwater.
E. leucophloia –35.2‰ A. aneura –21.8‰ A. xiphophylla –36.5‰
A. aneura –10.2‰ A. xiphophylla –38.2‰
12.8 km
Riparian Floodplain
Hill
E. victrix –46.4‰ A. citrinoviridis –51.7‰
Groundwater =
–46.3 to –51.5‰
Groundwater =
–42.3 to –49.1‰
150 m

58
S p e c ie s
Aca
cia x
iphophyl
la
Aca
cia a
neura
Aca
cia c
itrin
ovirid
is
Euca
lyptu
s vi
ctrix
Euca
lyptu
s ca
mald
ulensi
s
δ2H
of
wa
ter
in s
ho
ots
(‰
)
-6 0
-5 0
-4 0
-3 0
-2 0
-1 0
0
N o v
A u g
δ2H o f
s o il w a te r
δ2H o f
g ro u n d w te r
F lo o d p la in C re e k
FIG. 15. δ 2H of xylem water in shoots of floodplain (A. xiphophylla, A. aneura) and riparian (A.
citrinoviridis, E. victrix, E. camaldulensis) species in November (dry, before summer rains) and
August (wet, after winter rains). Error bars are ± standard error.
All species had dimorphic root systems with numerous lateral roots and a tap-root or sinker root. The tap-roots of Eucalyptus victrix, E. camaldulensis and Acacia xiphophylla were well developed and at least three quarters the diameter of the stem, while the tap-roots of A. aneura were much smaller and approximately one tenth stem diameter.
Despite similarities in the development of tap or sinker roots, during the dry period floodplain and riparian species differed in their δ2H signatures of water collected from tap-roots. The δ2H signatures of tap-roots of the floodplain species, A. aneura and in particular, A.
xiphophylla, were considerably enriched relative to groundwater in November (Fig. 16). In comparison, δ2H signatures of water in tap-roots of the riparian species E. victrix and A.
citrinoviridis were strongly depleted in 2H in November, with signatures very similar to groundwater. By August, differences between floodplain and riparian species were less marked, with δ2H signatures of tap-roots much more similar to that of soil water (Acacia
citrinoviridis, A. xiphophylla) or between that of shallow soil (< 2 m) and groundwater (A.
aneura, E. victrix). Regardless of season or landscape position, δ2H values of water in lateral roots tended to be most similar to that of soil water (Fig. 16).
In November, shoot and tap-root δ2H signatures were strongly correlated (r = 0.947), while in August, shoot and lateral root δ2H signatures were strongly correlated (r = 0.988), confirming that shoot δ2H signatures reflects access to different water sources by roots.

59
Species
Acacia
xiphophyll
a
Acacia
aneura
Acacia
citri
noviridis
Eucalyptu
s vict
rix
δ2H
of w
ate
r in
late
ral a
nd
tap
roo
ts (‰
)
-60
-50
-40
-30
-20
-10
0
November - lateral
November - tap root
August - lateral
August - tap root
Floodplain Creek
δ2H of
soil water
δ2H of
groundwter
FIG. 16. δ
2H of xylem water in lateral and tap roots of floodplain (A. xiphophylla, A. aneura) and
creek bed (A. citrinoviridis, E. victrix) species in November (dry, before summer rains) and August (wet, after winter rains).
4. DISCUSSION
4.1. Mechanisms of drought tolerance in Callitris glaucophylla: evidence from isotope
analysis of foliage
δ13C isotope ratios of foliage provide strong evidence that the response of Callitris
glaucophylla to water stress is largely mediated by stomatal behaviour. Less negative δ13C values during drought, as we observed in this study, are strongly indicative of stomatal closure [32]. Drought tolerance by reducing water loss has been reported for other species of Callitris [33]. However, when water availability increases, Callitris glaucophylla switches to a less conservative water-use strategy (δ13C becomes more negative). This response appears widespread in species growing in arid environments with strong seasonality in rainfall, [34, 35]. Brodribb and Hill [36] suggest that water use efficiency under optimal conditions is not a reliable indicator of drought tolerance, which is supported by our findings. Rather it is the ability of genera such as Callitris to control their water use and improve their water use efficiency during drought which is the key strategy to tolerating seasonal drought in arid environments.
In our study, isotope and gas exchange measures of drought (iWUE, ci/ca) were poorly correlated. Kloeppel et al. [37] attributed the poor correlation between iWUE and carbon isotope discrimination for species of Larix, Pseudostuga, Picea and Pinus to high diurnal and seasonal variation in iWUE. A poor correlation may also be due to the difficulty in accurately measuring rates of gas exchange of non-needle conifers and small-leaved plants with unusual

60
stomatal distributions, such as Callitris. For C. glaucophylla at least, δ13C values, rather point-in-time estimates of drought tolerance, appear to be more indicative of plant adaptations to drought in terms of water use.
The assumption that humidity is the main driver of stomatal conductance has led to an expectation that δ13C and δ18O will be strongly correlated [38]. Yet, we found little evidence of a strong relationship between δ18O of foliage of Callitris glaucophylla and measures of gas exchange, atmospheric and soil water stress or δ13C. Scheidegger et al. [38] suggested a positive correlation between δ13C and δ18O is more likely where water is not limiting and that the expected relationship between the two isotopes may not be applicable to all environments. Our study supports this suggestion and it appears that the commonly supposed model of humidity driving δ13C and δ18O in the same way may not be true for trees growing in relatively dry areas with summer-dominant rainfall. In addition, δ18O abundances in C.
glaucophylla growing in the Pilbara may retain a stronger source water signal than elsewhere owing to a combination of factors, including: little access to groundwater; poor soil structure so that water is quickly lost from the soil profile; and consequently, a high dependence on rainfall events for growth.
Implications for agroforestry
• Species adapted to arid environments can tolerate drought through minimizing water use and maximizing water use efficiency when water availability is low, but rapidly increase gas exchange and (presumably) growth with increased water availability — therefore, species from arid environments may be adaptable for use in agroforestry systems in areas with strong seasonality in rainfall.
• One-off measurements of isotope abundances may lead to incorrect conclusions as to mechanisms of drought tolerance; measurements over several seasons (and preferably) years are needed to fully characterize species’ response and adaptability to changes in water stress.
• Need to question assumptions about what variation in δ18O reveals about water use and drought tolerance.
4.2. Inferring relationships between climate and tree growth using isotope signatures
of tree rings
Dual analysis of isotope abundances of tree rings revealed long-term shifts in ecophysiological processes in response to changes in climate. The shift to a positive correlation between δ13C and δ18O abundances of tree rings after 1960 strongly suggests an increase in stomatal control of water use [38]. We suggest that this increase in range over which stomata operate directly reflects the increase in rainfall around the same time. Conversely, prior to 1960, when rainfall was lower, the negative correlation between the two isotopes indicates stomata were operating within a more limited range. Prior to 1960 then, variation in δ13C is more related to drawdown by photosynthesis [38]. Our cautious interpretation of the δ13C-δ18O relationship assumes that variation in δ18O is mostly driven by changes in relative humidity, which appears to be true on an annual time scale (Fig. 10), if not for abundances of 18O within foliage (see 4.1).
Variation in δ18O of tree rings corresponds to changes in temperature and humidity, mostly during the summer. These relationships are generally consistent with isotope theory and have been reported previously, e.g. [39]. The δ18O isotope time series implies that

61
between 1919 and 1955, summers were relatively dry and warm, but since then summers have become cooler, more humid and wetter (Fig. 6). Although not as strong, the relationship between δ13C and climate confirms the importance of humidity and temperature in driving isotopic variation in tree rings and, therefore, tree growth. The unexpected positive relationships among both isotopes and rainfall or relative humidity in some months may reflect long-term changes in rainfall, a change in the way climate parameters drive isotopic variation [12], a real ecophysiological response to climate, or the effect of autocorrelation on apparent climate-isotope relationships. Further analyses are required to establish whether these or other factors are involved.
For both isotopes, we found strong correlations with climate conditions from the previous growth year, in part a reflection of using the whole annual ring rather than just latewood. The formation of earlywood often utilizes carbohydrates produced the previous year (see also Macfarlane and Adams [40] for discussion of the role of wood type in isotope signatures). During the metabolic processes involved in transforming stored polysaccharides into new cellulose there is little alteration of δ13C abundances; so, lags in δ13C isotope series are common [41]. In contrast, oxygen isotopes of tree rings are expected to reflect only the water used that year because of the re-exchange of oxygen atoms of photosynthates with xylem water prior to cellulose formation [12]. Callitris glaucophylla trees in gully sites are likely to have shallow root systems due to site constraints, so that dampening of the soil water signal by access to homogenized groundwater does not explain the high autocorrelation in our oxygen chronology. Again, because of site constraints, there is very limited soil water storage. Rather, and in contrast to inferences made from δ18O of foliage (see 4.1), the lagged oxygen-climate relationship may be due to less re-exchange of oxygen atoms of photosynthates during the synthesis of cellulose in Callitris than previously reported for other species (up to 50% [42]).
Implications for agroforestry
• Isotope abundances in tree rings of semi-arid trees are a useful means of obtaining data on past climates in areas where long records of climate are lacking.
• Over the long-term (decades), trees exhibit shifts in their ecophysiology in response to climate variation.
4.3. Water sourcing by native trees
Seasonal variation in where trees source their water from is largely dependent on their location in the landscape and therefore, access to deeper water sources. The riparian species Eucalyptus victrix and Acacia citrinoviridis are similar to other riparian vegetation in that following rain they use moisture from surface layers of the soil profile, e.g. [35], switching to groundwater as soil water is depleted [43]. This switch in water source supports continued transpiration and water use throughout the dry season (based on sap flow and gas exchange, data not shown). Although the floodplain species, A. xiphophylla and A. aneura, also switch from deeper to shallower soil layers following rainfall, they are much more reliant on stored soil water with no access to groundwater. Consequently, these acacias are reliant on soil water recharge from rainfall and have to ‘chase’ water down the drying soil profile. The extraction of water from greater soil depths during dry periods most likely explains the poor relationship between δ2H signatures of xylem water of Acacia and those of groundwater and soil water at a 2 m depth in November. E. leucophloia and A. xiphophylla growing on the hill site did not have access to groundwater at any time. The growth of E. leucophloia and A. xiphophylla

62
trees, like other species with little access to ground or stored soil water, may be supported by water that collects in cracks within the basalt [44].
Woody species, once mature, typically extract water from deeper in the soil profile than grasses, creating a two-layered system [20] that can be exploited for agroforestry systems. Although tree species with an ability to use shallow soil water following rainfall may periodically compete with grass species for water, this competition is relatively short-lived and unlikely to affect the sustainability or productivity of agroforestry systems [45]. In the semi-arid Pilbara, for example, the co-occurrence of woody perennials and grass species in many areas appears to reflect mechanisms of water resource partitioning. Nevertheless, such mixed ecosystems can change over time. In particular, modelling over long-time scales suggest that increasing summer rainfall will favor grasses while winter rainfall will favor shrubs/trees [46]. Potential shifts in species survival and community composition with changes in climate represent a significant water management issue for agroforestry.
Implications for agroforestry
• The presence of roots deep in the soil profile is an unreliable indicator of actual zones of water uptake, both spatially and temporally.
• Where trees access water from is largely a function of landscape position; use of groundwater during seasonally dry periods is only possible where trees are able to access such water.
• Therefore, development of areas with little access to groundwater for agroforestry may present problems for sustainable tree growth without periodic recharge of soil water by rainfall.
• However, variation in depth to groundwater and soil water volume can be managed by adjusting tree composition of agroforestry systems.
REFERENCES
[1] BURGESS, S.S.O., et al., Characterisation of hydrogen isotope profiles in an agroforestry system: implications for tracing water sources of trees, Agr. Water Manage. 45 (2000) 229–241.
[2] ADAMS, M.A., GRIERSON, P.F., Stable isotopes at natural abundance in terrestrial plant ecology and ecophysiology: an update, Plant Biology 3 (2001) 299–310.
[3] DAWSON, T.E., et al., (2002) Stable isotopes in plant ecology, Annu. Rev. Ecol. Syst. 33 (2002) 507–559.
[4] FARQUHAR, G.D., EHLERINGER, J.R., HUBICK, K.T., Carbon isotope discrimination and photosynthesis, Annu. Rev. Plant Phys. 40 (1989) 503–537.
[5] MCCARROLL, D., LOADER, N.J., Stable isotopes in tree rings, Quaternary Sci. Rev. 23 (2004) 771–801.
[6] BARBOUR, M. M., FARQUHAR, G.D., Relative humidity- and ABA-induced variation in carbon and oxygen isotope ratios of cotton leaves, Plant Cell Environ. 23 (2000) 473–485.
[7] YAKIR, D., (1992) Variations in the natural abundance of oxygen-18 and deuterium in plant carbohydrates, Plant Cell Environ. 15 (1992) 1005–1020.
[8] BRODRIBB, T.J., FIELD, T.S., Stem hydraulic supply is linked to leaf photosynthetic capacity: evidence from New Caledonian and Tasmanian rainforests, Plant Cell Environ. 23 (2000) 1381–1388.

63
[9] LUSK, C.H., WRIGHT, I., REICH, P.B., Photosynthetic differences contribute to competitive advantage of evergreen angiosperm trees over evergreen conifers in productive habitats, New Phytol. 160 (2003) 329–336.
[10] BOWMAN, D.M.J.S., HARRIS, S., "Conifers of Australia's dry forests and open woodlands", Ecology of the Southern Conifers, (ENRIGHT, N.J., HILL, R.S., Eds), Univ. of Melbourne Press (1995) 252–270.
[11] LEAVITT, S.W., LONG, A., Drought indicated in carbon-13/carbon-12 ratios of south-western tree rings, Water Resour. Bull. 25 (1989) 341–347.
[12] ANDERSON, W.T., et al., Oxygen and carbon isotopic record of climatic variability in tree ring cellulose (Picea abies): an example from central Switzerland (1913–1995), J. Geophys. Res. 103 (1998) 31625–31636.
[13] LOADER, N.J., ROBERTSON, I., MCCARROLL, D., Comparison of stable carbon isotope ratios in the whole wood, cellulose and lignin of oak tree rings, Palaeogeogr. Palaeocl 196 (2003) 395–407.
[14] CULLEN, L.E., MACFARLANE, C., Comparison of cellulose extraction methods for analysis of stable-isotope ratios of carbon and oxygen in plant material, Tree Physiol. 25 (2005) 619–625.
[15] BERT, D., LEAVITT, S.W., DUPOUEY, J-L., Variations in wood 13C and water-use efficiency of Abies alba during the last century, Ecology 78 (1997) 1588–1596.
[16] PERLINSKI, J.E., The Dendrochronology of Callitris columellaris F. Muell. in Arid, Sub-tropical Continental Western Australia, MA Thesis, Univ. of Western Australia (1986).
[17] PANEK, J.A., WARING, R.H., Stable carbon isotopes as indicators of limitations to forest growth imposed by climate stress, Ecol. Appl. 7 (1997) 854–863.
[18] EVANS, M.N., SCHRAG. D.P., A stable isotope-based approach to tropical dendroclimatology, Geochim. Cosmochim. Ac. 68 (2004) 3295–3305.
[19] EHLERINGER, J.R., DAWSON, T.E., Water uptake by plants: perspectives from stable isotope composition, Plant Cell Environ. 15 (1992) 1073–1082.
[20] JACKSON, P.C., et al., Partitioning of soil water among tree species in a Brazilian Cerrado ecosystem, Tree Physiol. 19 (1999) 717–724.
[21] BOM, Climate of Western Australia, Bureau of Meteorology, Canberra (1995). [22] GENTILLI, J., Climate of Australia and New Zealand, Elsevier, Amsterdam (1971). [23] VON CAEMMERER, S., FARQUHAR, G.D., Some relatioships between the
biochemistry of photosynthesis and the gas exchange of leaves, Planta 153 (1981) 376–387.
[24] MOORE, D.J., NOWAK, R.S., TAUSCH, R.J., Gas exchange and carbon isotope discrimination of Juniperus osteosperma and Juniperus occidentalis across environmental gradients in the Great Basin of western North America, Tree Physiol. 19 (1999) 421–433.
[25] KLOEPPEL, B.D., et al., Leaf-level resource use for evergreen and deciduous conifers along a resource-availability gradient, Funct. Ecol. 14 (2000) 281–292.
[26] STOKES, M.A., SMILEY, T.L., An Introduction to Tree-ring Dating, Univ. of Chicago Press (1968).
[27] FRANCEY, R.J., et al., A 1000-year high precision record of 13C in atmospheric CO2, Tellus 51B (1999) 170–193.
[28] BIONDI, F., WAIKUL, K., DENDROCLIM2002: A C++ program for statistical calibration of climate signals in tree-ring chronologies, Comput. Geosci. 30 (2004) 303–311.
[29] DAWSON, T.E., "Water source of plants as determined by xylem-water isotopic composition: perspectives on plant competition, distribution, and water relations",

64
Stable Isotopes and Plant Carbon-Water Relations, (EHLERINGER, J.R., HALL, A.E., FARQUHAR, G.D., Eds), Academic Press, San Diego (1993) 465–196.
[30] COLEMAN, M.C., et al., Reduction of water with zinc for hydrogen isotope analysis, Anal. Chem. 54 (1982) 993–995.
[31] HENNESSY, K.J., SUPPIAH, R., PAGE, C.M., Australian rainfall changes, 1910–1999, Aust. Meteorol. Mag. 48 (1999) 1–13.
[32] FARQUHAR, G.D., O'LEARY, M.H., BERRY, J.A., On the relationship between carbon isotope discrimination and intercellular carbon dioxide concentration in leaves, Aust. J. Plant Physiol. 9 (1982) 121–137.
[33] CLAYTON-GREENE, K.A., The tissue water relationships of Callitris columellaris, Eucalyptus melliodora and Eucalyptus microcarpa investigated using the pressure-volume technique, Oecologia 57 (1983) 368–373.
[34] ATTIWILL, P.M., CLAYTON-GREENE, K.A., Studies of gas exchange and development in a sub-humid woodland, J. Ecol. 72 (1984) 285–294.
[35] EHLERINGER, J.R., et al., Differential utilization of summer rains by desert species, Oecologia 88 (1991) 430–434.
[36] BRODRIBB, T.J., HILL, R.S., The photosynthetic drought physiology of a diverse group of southern hemisphere conifer species is correlated with minimum seasonal rainfall, Funct. Ecol. 12 (1998) 465–471.
[37] KLOEPPEL, B.D., et al., Foliar carbon isotope discrimination in Larix species and sympatric evergreen conifers: a global comparison, Oecologia 114 (1998) 153–159.
[38] SCHEIDEGGER, Y., et al., Linking stable oxygen and carbon isotopes with stomatal conductance and photosynthetic capacity: a conceptual model, Oecologia 125 (2000) 350–357.
[39] ROBERTSON, I., et al., Oxygen isotope ratios of oak in east England: implications for reconstructing the isotopic composition of precipitation, Earth Planet. Sc. Lett. 191 (2001) 21–31.
[40] MACFARLANE, C., ADAMS, M.A., 13C of wood in growth-rings indicates cambial activity of drought-stressed trees of Eucalyptus globulus, Funct. Ecol. 12 (1998) 655–664.
[41] HILL, S.A., et al., Rapid recycling of triose phosphates in oak stem tissue, Plant Cell Environ. 18 (1995) 931–936.
[42] CERNUSAK, L.A., FARQUHAR, G.D., PATE, J.S., Environmental and physiological controls over oxygen and carbon isotope composition of Tasmanian blue gum, Eucalyptus globulus, Tree Physiol. 25 (2005) 129–146.
[43] THORBURN, P.J., WALKER, G.R., BRUNEL, J.P., Extraction of water from Eucalyptus trees for analysis of deuterium and oxygen-18: laboratory and field techniques, Plant Cell Environ. 16 (1993) 269–277.
[44] DELL, B., BARTLE, J.R., TRACEY. W.H., Root occupation and root channels of Jarrah forest subsoils, Aust. J. Bot. 31 (1983) 615–627.
[45] SMITH, D.M., JARVIS, P.G., ODONGO, J.C.W., Sources of water used by trees and millet in Sahelian windbreak systems, J. Hydrol. 198 (1997) 140–153.
[46] WELTZIN, J.F., MCPHERSON, G.R., Spatial and temporal soil moisture resource partitioning by trees and grasses in a temperate savanna, Arizona, USA, Oecologia 112 (1997) 156–164.

65
ASSESSMENT OF COMPETITION FOR WATER BETWEEN PEANUT
(ARACHIS HYPOGAEA) AND CHOEROSPONDIAS AXILLARIS IN
AN ALLEY CROPPING SYSTEM IN SUBTROPICAL CHINA
B. ZHANG, Y. ZHAO, M.Z.WANG Institute of Soil Science, Chinese Academy of Sciences, Nanjing, China
Abstract
Tree and crop components of an alley cropping system may compete for nutrients and water in the
surface soil while the deeper-rooting tree may have better access to resources in the subsoil. The objectives of
the present study in an alley cropping system were to monitor runoff and soil loss, spatial variation of soil water,
and tree sap flow to determine competitiveness for water between the tree and peanut. Plant and root growth
were also recorded to evaluate competition. The tree competed for water in the surface soil at some critical
period as indicated by the spatial variation of monitored soil water content. The tree used deep soil water and
reduced deep drainage as indicated by modelling of soil water fluxes and direction of water movement. Trees in
the alley cropping system used less soil water than peanut, and more water than trees alone, as indicated by water
balance modelling. The magnitude of the reduction of deep drainage increased with tree age. The alley cropping
system increased system water use efficiency by using deep soil water as indicated by water balance modelling.
The alley cropping system promoted Choerospondias axillaris growth by 50 to 100% and reduced peanut
biomass and yield by 20 to 50%. Field management should aim to prevent water competition between trees and
crops in the surface soil.
1. INTRODUCTION
Under the increasing pressures of population growth and encroachment of cultivated lands by industrialization and urbanization, China has launched programmes to extend arable land by reclamation of low hills. However, uneven rainfall distribution causes runoff and soil erosion in the rainy season and seasonal drought in the dry season in subtropical China [1, 2]. Alley cropping may be an alternative land use system to mono cropping as trees may prevent soil erosion and use deep soil water [3].
Alley cropping is one agroforestry system that has been intensively studied in Africa and Asia since the middle 1980s with respect to multipurpose tree screening, system management and component interactions [4, 5]. Field researches have shown that alley cropping systems may improve the system productivity and soil fertility [6], and prevent runoff and soil erosion [7, 8]. Recent research has shown that alley crops may benefit from the process of hydraulic lift, whereby water and nutrients from deep soil are captured by tree roots and are transferred and released to the surface soil [9, 10].
However, the alley cropping systems also showed negative impacts on crop production, through competition for light above ground and for water and nutrients below ground if the intercropped components were not complementary in time and space [11]. Field studies also showed that alley cropping systems might decrease crop yields even though the system productivity improved overall [8, 9, 12, 13]. The net benefits of alley cropping systems depended on the type of trees and management practices such as tree spacing and pruning to minimize competition [14]. The relationships among water, fertilizer and light are seemingly paradoxical because of differences in species, monitoring times and locations [15, 16, 17], which requires a thorough understanding of resource use, particularly water use between the plant species.

66
Many researches on water use in agroforestry were reported [4, 18, 19]. The magnitude of water competition between the components in an alley cropping system depended on root architecture, soil hydraulic properties and rainfall [18, 20]. Observations of root structure, estimates of field water balance, water simulation models and a recently developed method of sap flow measurement have been applied to identify the processes of water competition between trees and crops and to quantify the competitiveness of tree roots [21]. Livesley et al. [13] reported that soil water content beneath the alley system increased with increasing distance from the tree row. This was attributed to preferential water uptake beneath the canopy and reduced rainfall input through canopy interception, but was not confirmed either experimentally or by modeling. Simulation models based on soil-plant-environment interactions may be helpful in understanding the underlying processes and functioning of alley cropping systems. Water balance models are well known and have been summarized in a number of publications for forestry [22, 23] and agroforestry systems [24].
The objectives of the study were to monitor runoff and soil loss, seasonal and spatial variation of soil water, and tree sap flow in an alley cropping system to determine competitiveness between the tree and peanut for water.
2. MATERIALS AND METHODS
2.1. Experimental site and layout
The experimental site was located at the Red Soil Ecological Experimental Research Station, Chinese Academy of Sciences (28°15´N, 116°55´E, 55 m asl). The climate at the research station is representative of the subtropics in China (Table. 1). The monthly average temperature was 5.9°C in January and 30°C in July. Rainfall concentrates from late April to early July, accounting for about 50% of the annual average of 1795.0 mm. During the observation period rainfall was 2003.5 mm in 1999, 1928.4 mm in 2000, 1614.5 mm in 2001 and 1690.5 mm in 2002.
TABLE 1. BASIC METEOROLOGIC PARAMETERS FROM 1950 TO 1999.
Climatic variables Jan Feb Mar Apr May Jun Jul Aug Sep Oct Nov Dec Annual
Tmean (°C) 5.9 7.5 12.0 17.8 22.2 25.9 30.0 29.3 25.6 19.7 13.8 8.3 18.2
Tmax (°C) 10.4 11.7 16.5 22.5 26.5 30.3 35.0 34.6 30.5 24.8 18.8 13.0 22.9
Tmin (°C) 2.5 4.3 8.7 14.2 18.8 22.5 25.8 25.2 21.7 15.7 10.0 4.8 14.5
Wind speed (m s–1) 2.1 2.4 2.5 2.4 2.4 2.1 2.2 2.1 2.3 2.4 2.1 2.0 2.2
Relative Humidity (%) 77 79 80 80 80 80 71 72 74 72 74 76 76 Sunshine (h d–1
) 3.7 3.4 3.3 4.2 4.5 5.6 9.0 8.5 7.1 6.0 5.0 4.4 5.4
Rainfall (mm) 75 130 188 257 286 284 124 112 94 63 62 53 1729 ETo (mm) 43 45 65 90 112 126 183 174 135 109 69 50 1200
The experimental site was on a gentle slope of 5oC and the land use was grassland with sparse Mason pine (Pinus massoniana L.) before March 1999 when the experiment started. The soil is an Alumi-Orthic Acrisol according to FAO/UNESCO [25] or an Udic Kandiusltult according to the USDA soil taxonomy [26]. The soil is 450 cm deep and is well structured as indicated by the sub-angular aggregates in the soil profile. The soil is low in pH, and nutrient and water retention capacity. Available soil water between pF = 1.0 and pF = 4.2 ranged from 18% in the surface soil to 7% in the subsoil as shown by Zhang et al. [27].
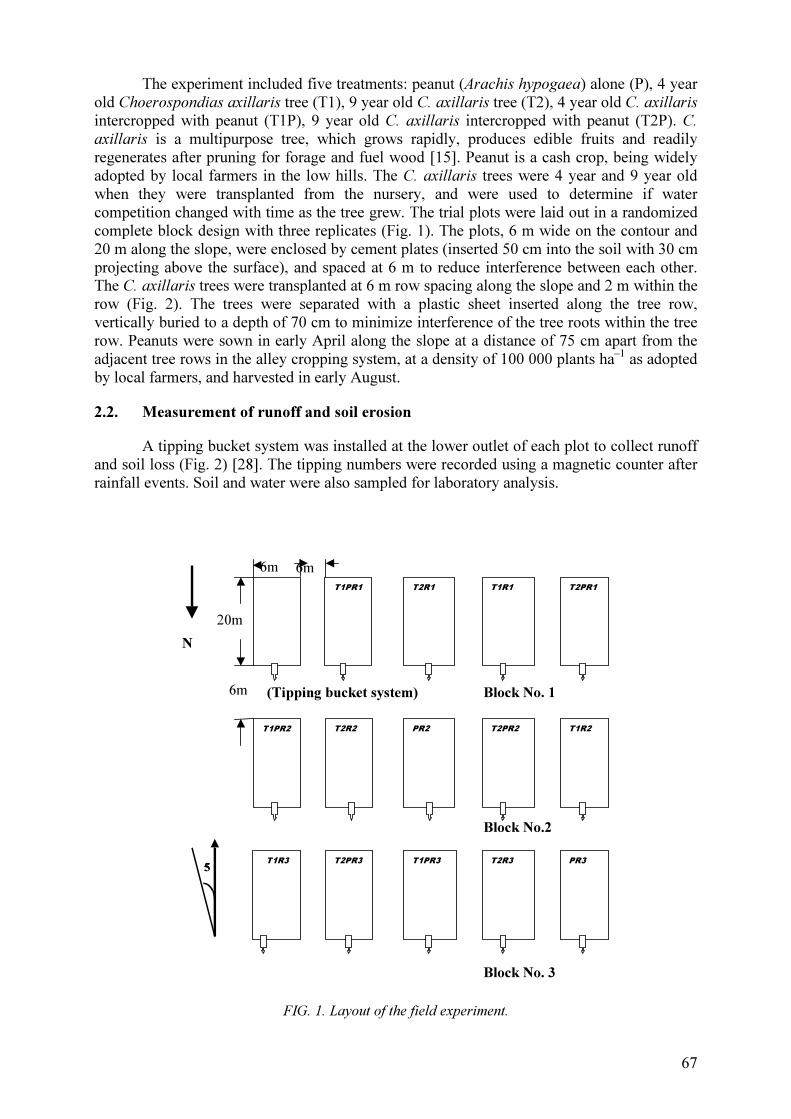
67
The experiment included five treatments: peanut (Arachis hypogaea) alone (P), 4 year old Choerospondias axillaris tree (T1), 9 year old C. axillaris tree (T2), 4 year old C. axillaris intercropped with peanut (T1P), 9 year old C. axillaris intercropped with peanut (T2P). C.
axillaris is a multipurpose tree, which grows rapidly, produces edible fruits and readily regenerates after pruning for forage and fuel wood [15]. Peanut is a cash crop, being widely adopted by local farmers in the low hills. The C. axillaris trees were 4 year and 9 year old when they were transplanted from the nursery, and were used to determine if water competition changed with time as the tree grew. The trial plots were laid out in a randomized complete block design with three replicates (Fig. 1). The plots, 6 m wide on the contour and 20 m along the slope, were enclosed by cement plates (inserted 50 cm into the soil with 30 cm projecting above the surface), and spaced at 6 m to reduce interference between each other. The C. axillaris trees were transplanted at 6 m row spacing along the slope and 2 m within the row (Fig. 2). The trees were separated with a plastic sheet inserted along the tree row, vertically buried to a depth of 70 cm to minimize interference of the tree roots within the tree row. Peanuts were sown in early April along the slope at a distance of 75 cm apart from the adjacent tree rows in the alley cropping system, at a density of 100 000 plants ha–1 as adopted by local farmers, and harvested in early August.
2.2. Measurement of runoff and soil erosion
A tipping bucket system was installed at the lower outlet of each plot to collect runoff and soil loss (Fig. 2) [28]. The tipping numbers were recorded using a magnetic counter after rainfall events. Soil and water were also sampled for laboratory analysis.
FIG. 1. Layout of the field experiment.
20m
N
(Tipping bucket system) Block No. 16m
Block No.2
5 5
Block No. 3
PR1
T1PR2 T1R2T2PR2PR2T2R2
T1PR1 T2R1 T1R1 T2PR1
T1R3 T2PR3 T1PR3 T2R3 PR3
6m 6m

68
FIG. 2. Instrumentation in the field for monitoring the soil moisture regime. P, peanut row; T, tree
line; ○, neutron access tube; ◎, tensiometer; TB, tipping bucket system.
2.3. Measurement of tree sap flow
Tree sap flow was measured using a thermal dissipation technique [29, 30, 31] to determine transpiration from April to October in 2001. Three trees in the block at the lowest slope position were selected according to trunk diameter. The probes were connected to a datalogger (Delt T2e, Delt T Inc., UK) and data were recorded every 30 min. The measured temperature between the probes was used to calculate sap flux density.
2.4. Measurement of soil water regime
Soil water content and soil water potential were measured using a neutron moisture gauge and stoppered tensiometers, respectively. Sets of tensiometers and neutron access tubes were installed on either side of the central tree row in each plot, being 50 cm away from the tree, at distances of 0, 1, 2 and 4 m from a tree row in the plots with 9 year old trees, and at distances of 0, 1 and 2 m in the plots with 4 year old trees. In the peanut alone treatment, the sets of access tubes and tensiometers were installed at the positions similar to those in the tree alone and alley cropping systems (Fig. 2).
The neutron access tubes were 200 cm deep. Volumetric soil water content was manually measured using the neutron moisture gauge every five days at an interval of 10 cm within 100 cm depth, and at an interval of 20 cm from 100 to 200 cm after calibration in the field. Additional measurement of soil water content in the top 20 cm was measured by gravimetry. The depths of the tensiometers were 10, 30, 100, 150 and 180 cm. The tensiometers were installed close to the access tubes and spaced 10 cm between each other. Soil water potential was manually recorded at 09:00 h every two days with a reading meter, which was equipped with a pressure transducer and was connected to the tensiometers by inserting the fine needle into the stopper.
P P
T
1m
2m T P P P P P P P P P P P 2m 1mP P 0.5m 0.5m P T
○ T ◎
T
P 1m P ○
◎P 1m P ○
◎P P P ○
◎P P P P P P T
T
T
P P
2m
TB

69
2.5. Calculation of water fluxes and determination of directions along the slope
Considering to the slope, the total water flux (qr) was composed of the water flux along the slope and the vertical direction according to the geometrical relationship [32, 33]. The composite water flux and direction angle were calculated by the following equations:
22 )cos()sin( ααvvdr
qqqq ++= (1)
)/cos(co 1
rvqqs αγ
−
=
(2)
where, qr is the water flux (cm h–1), α is the slope angle in degrees, qv, the water flow along the slope; qd, the vertical water flow; γ is the direction angle of qr (0–360 degrees). Water fluxes were calculated using the simple Darcy’s law (Eq. 3) [34].
zkq
∂
∂−=
ψθ )(
(3)
where, q is the water flux (cm h–1), k(θ) is the unsaturated hydraulic conductivity corresponding to the water content at the maximum depth reached by the roots, Ψ is the water potential and z is the distance between soil depths corresponding in a tensiometer set or the distance between the tensiometer sets. k(θ) was determined in situ by the instantaneous profile method and expressed as an exponential function (Eq. 4) [35, 36].
( ) b
s
ak )(θ
θθ =
(4)
where, θ, is the measured soil water content, θs, is the saturated water content, and a, b are empirical coefficients related to soil texture.
The γ values were classified into 7 classes anticlockwise to visualize the direction of soil water flow, namely, γ = 0 (0 degrees), 1 (0 to 90 degrees), 2 (90 degrees), 3 (90 to 180 degrees), 4 (180 degrees), 5 (180 to 270 degrees), 6 (270 degrees), 7 (270 to 360 degrees). Since 0 indicated the direction of slope, the values from 1 to 3 and from 5 to 7 indicated that soil water moved upward and downward in the soil profile, respectively. The values from 7 to 1 and from 3 to 5 indicated soil water moved toward and away from the hedgerow, respectively. Visualization of soil water flow direction was carried out using isolines of the γ values by ordinary Kriging.
2.6. Calculation of system evapotranspiration
The system evapotranspiration, ET was estimated using the soil water balance model which is expressed as follows [37]:
ET = P –R –CI – Rs – D –△S (5)
where, P (mm), precipitation measured at the weather station; R (mm), runoff measured using the tipping bucket system; △S (mm), change in soil water storage in the depth of 0–200 cm according to the neutron moisture gauge measurement; CI (mm), tree rainfall interception estimated by an analytical model and statistical data in this area from the station [38, 39]; and D (mm), net deep drainage (the difference of the drainage component and water supply) [36] was estimated using the following equation:
tz
kD Δ∂
∂−=
ψθ )(
(6)

70
where △t is the interval of time, the other symbols are given in Eq. 3; Rs (mm), inner horizontal flow, calculated according to Eq. 6, where z is the horizontal distance, and k(θ) in the horizontal direction is assumed to be the same as the vertical direction. Finally, the evapotranspiration was calculated with the Eq. 5 after estimating the values of the other components of the soil water balance equation. 2.7. Crop coefficients and resource competitiveness
Crop coefficients (Kc) for peanut and C. axillaris were calculated using the relation Kc
= ET/ET0, where ET0 is the FAO reference evapotranspiration (mm d–1) calculated by the following equation [40]:
( ) ( ))34.01(
)()273/(900408.0
2
2
0
u
eeuTGRnET
as
++Δ
−++−Δ=
γ
γ
(7)
where, Rn is the net radiation (MJ m−2 d−1), G the soil heat flux density (MJ m−2 d−1), T the daily air temperature (OC), u2 the wind speed at a height of 2 m (m s−1), es the saturation vapour pressure (kPa), ea the actual vapour pressure (kPa), ∆ the slope of the vapour pressure curve (kPa OC−1), and γ is the psychrometric constant (kPa OC−1). The weather variables needed for calculating ET0 were measured with a fully automatic weather station located next to the experimental site. The evapotranspiration rate (ET) was calculated using Eq. 5.
The net effect of trees on the availability of water resource A, TA to the crop was analyzed to determine the resource interaction between tree and crop in the agroforestry system. TA is defined by the following equation [19]:
S
SAF
A
AA
AT
−
=
TA > –1 (8)
where, AAF is the availability of water resource A to the crop in the agroforestry system, and AS is the availability of water resource A to the sole crop.
2.8. Measurement of plant growth performance
Tree height, trunk perimeter, canopy diameter and peanut growth performance and yield were measured using a coring method each year. Trenching was applied to measure root distributions of crop and tree in 2003. Root distribution is described as an average of 3 to 4 replicates in terms of total length, density and root weight varied with time and soil profile. The biomass of leaves, branches, trunks and roots of C. axillaris in micro-plots were sampled and calculated according to the relationship between tree performance and its biomass [41].
2.9. Statistics
Analysis of variance (GLM Univariate, SPSS) was performed for the effect of alley cropping treatment and space difference on water use. Differences between treatments were assessed by the least significant difference (LSD) test.
3. RESULTS
3.1. Runoff and soil erosion
Runoff and soil loss showed the same trends in the three years, higher in 2000 due to the higher rainfall (Fig. 3). Runoff was the greatest in the monoculture of trees (T1 and T2) followed by the alley cropping systems (T1P and T2P) and by the mono-cropping of peanut

71
(P). Soil loss was in contrast highest in the P treatment and lowest in the T1 and T2 treatments. Compared to the P treatment, the alley cropping systems decreased runoff by 50–60% and increased soil loss by 247–352%. Soil erosion occurred mainly during April to June. The risk periods of soil erosion were during the first flowering period in early June and post harvest of peanut after August. Those results were consistent with other report [1]. The greater runoff in the forestry systems may be attributed to the surface seals, which decrease infiltration. Tillage for peanut cropping can increase infiltration, but increased soil loss. The lower soil loss in the alley cropping system resulted from the litter coverage in the tree rows, which hindered soil loss from the crop alley.
2000 2001 2002
0
1000
2000
3000
4000
5000
6000
7000
8000
So
il lo
ss (
Kg
ha-1
)
year
P T1 T2 T1P T2P
0
40
80
120
160
200
240
280
320
Ove
rall
run
off
(m
m)
FIG. 3. Runoff and soil loss from 2000 to 2002.
3.2. Sap flow
The sap flow of C. axillaris had diurnal variation and was affected by the cropping system as shown in Fig. 4. The cumulative sap flow during the observation period amounted to 10.5 l d–1 in T1, 26.9 l d–1 in T1P, 29.0 l d–1 in T2 and 39.8 l d–1 in T2P. The sap flow in the tree alley cropping systems was greater than the tree alone systems even after peanut was harvested on August 7. The magnitude of the difference was greater in the systems with older trees. The sap flow was closely related soil water potential at 100 cm depth (R = 0.737**) [42]. The results indicated that the alley cropping system can improve the root system of the trees to use deeper soil water.
0
20
40
60
0
20
40
60
20 01 -6 -1 5 2 001 -6 -29 2001 -7 -13 2001 -7 -27 200 1 -8 -10 200 1 -8 -24 2001 -9 -7
0
20
40
60
R a in fa ll
Ra
infa
ll (m
m)
Sa
pflo
w (
l d
ay-1
)
T 2 T 2 P T 1 T 1 P
FIG. 4. Sap flow in different treatments during the period June 15 to September 7, 2001.

72
3.3. Soil water regime
Soil water content in the soil profiles for the P, T2 and T2P treatments is illustrated in Fig. 5. The volumetric soil water content at 30 cm depth was higher by 2% in the T2 treatment in the rainy season than in other treatments, and higher by 2 to 4% in the P treatment than in other treatments during the dry period (150–200 days). With increasing soil depth, the soil water content was higher in the P treatment all the time and the magnitude of the differences increased with increasing depth, and was larger in the dry period than in the wet period. These results indicate the systems with trees used deep soil water, and trees in the alley cropping system competed for water only during the very dry period.
The isoline graphs of soil water suction in the soil profiles in the middle row of the plots in replicate 2 (Block 2) are shown in Fig. 6. Soil water suction did not exceed 80 kPa during the peanut cropping period in 1999. After peanut harvesting soil water suction was over 80 kPa to the depth of 60 cm in the peanut monocropping system (P), while in the tree controls, soil water suction over 80 kPa appeared at the depth of 30 cm in the T1 treatment and at the depth of 120 cm in the T2 treatment. Compared with the tree controls, soil water suction over 80 kPa was at the depth of 50–60 cm in the T1P and T2P treatments. The T2P treatment had higher soil water suction of longer duration than the other treatments. The temporal and spatial variations of soil water suction in the T1 and T1P treatments are shown in Figs 7 and 8. The dimension of high soil water suction increased within the soil profile as the trees grew, and increased more in the T1P than in the T1 treatment. Spatially soil water suction over 80 kPa occurred to a depth of 60–90 cm at a distance of 1 m from the tree line in the treatment T1, and at 2 m in the treatment T1P. The temporal and spatial variations of soil water suction in the T2 and T2P treatments are shown in Figs 9 and 10. The trends of spatial variation of soil water suction were similar to those in the treatments with small trees, but high soil water suction extended to deeper depths. These results indicate that alley cropping increased the use of deep soil water in the dry season, but trees and peanut competed for water in the upper soil layer.
0
50
100
150
200
250
0 50 100 150 200 250 300 350
0.20
0.24
0.28
0.32
0.36
0.40 30cm
Volu
metr
ic w
ate
r conte
nt (c
m3 c
m-3)
0 50 100 150 200 250 300 350
0.20
0.24
0.28
0.32
0.36
0.40 60cm P
T2
T2P
0 50 100 150 200 250 300 350
0.20
0.24
0.28
0.32
0.36
0.40100cm
Time (days)
0 50 100 150 200 250 300 350
0.20
0.24
0.28
0.32
0.36
0.40180cm
Ra
infa
ll (m
m)
FIG. 5. Soil water content at 0 distance from the tree at different depths in P, T2 and T2P treatments
in 2000.

73
-180
-150
-120
-90
-60
-30
Depth
(cm
)
07-31- 99
08- 31-99
09- 30-99
11-01-99
12-28-99
01-24-00
03-27-00
04-28-00
06-01-00
07-03-00
08-02-00
09-01-00
10-03-00
11-06-00
12-06-00
01-08-01
03-13-01
04-12-01
05-12-01
06- 13-01
07-15-01
08-19-01
09-18-01
11-02-01
11-30-01
P- 0 m
-180
-150
-120
-90
-60
-30
Depth
(cm
)
07-31-99
08-31- 99
09- 30-99
11-01-99
12- 28-99
01-24-00
03-27-00
04-28-00
06-01-00
07-03-00
08-02-00
09-01-00
10-03-00
11- 06-00
12-06-00
01-08-01
03- 13-01
04-12-01
05-12-01
06- 13-01
07-15-01
08-19-01
09-18-01
11-02-01
11-30-01
T1- 0 m
-180
-150
-120
-90
-60
-30
Depth
(cm
)
07-31-99
08- 31-99
09-30-99
11-01-99
12-28-99
01-24-00
03-27-00
04-28- 00
06-01-00
07-03-00
08-02- 00
09-01-00
10-03-00
11-06-00
12-06-00
01-08-01
03-13-01
04-12-01
05-12- 01
06-13-01
07-15-01
08-19- 01
09-18-01
11- 02-01
11-30-01
T2- 0 m
-180
-150
-120
-90
-60
-30
Depth
(cm
)
07-31-99
08-31- 99
09- 30- 99
11-01-99
12-28-99
01-24-00
03-27-00
04-28-00
06-01-00
07-03-00
08-02-00
09-01-00
10-03-00
11- 06- 00
12-06-00
01- 08-01
03- 13- 01
04-12-01
05- 12-01
06-13- 01
07- 15-01
08- 19-01
09-18-01
11-02-01
11-30-01
T1P- 0 m
-180
-150
-120
-90
-60
-30
Depth
(cm
)
07-31-99
08-31- 99
09-30- 99
11-01-99
12- 28-99
01-24-00
03-27-00
04-28-00
06-01-00
07-03-00
08-02-00
09-01-00
10-03-00
11- 06-00
12-06-00
01-08-01
03- 13-01
04-12-01
05-12-01
06- 13- 01
07-15-01
08-19-01
09-18-01
11-02-01
11-30-01
T2P- 0 m
-20 10 30 45 60 80
s (kPa)
0
-180
-150
-120
-90
-60
-30
Depth
(cm
)
07-31- 99
08- 31-99
09- 30-99
11-01-99
12-28-99
01-24-00
03-27-00
04-28-00
06-01-00
07-03-00
08-02-00
09-01-00
10-03-00
11-06-00
12-06-00
01-08-01
03-13-01
04-12-01
05-12-01
06- 13-01
07-15-01
08-19-01
09-18-01
11-02-01
11-30-01
P- 0 m
-180
-150
-120
-90
-60
-30
Depth
(cm
)
07-31- 99
08- 31-99
09- 30-99
11-01-99
12-28-99
01
-180
-150
-120
-90
-60
-30
Depth
(cm
)
07-31- 99
08- 31-99
09- 30-99
11-01-99
12-28-99
01-24-00
03-27-00
04-28-00
06-01-00
07-03-00
08-02-00
09-01-00
10-03-00
11-06-00
12-06-00
01-08-01
03-13-01
04-12-01
05-12-01
06- 13-01
07-15-01
08-19-01
09-18-01
11-02-01
11-30-01
P- 0 m
-180
-150
-120
-90
-60
-30
Depth
(cm
)
07-31-99
08-31- 99
09- 30-99
11-01-99
12- 28-99
01-24-00
03-27-00
04-28-00
06-01-00
07-03-00
08-02-00
09-01-00
10-03-00
11- 06-00
12-06-00
01-08-01
03- 13-01
04-12-01
05-12-01
06- 13-01
07-15-01
08-19-01
09-18-01
11-02-01
11-30-01
T1- 0 m
-180
-150
-120
-90
-60
-30
Depth
(cm
)
07-31-99
08-31- 99
09- 30-99
11-01-99
12- 28-99
01-24-00
0
-180
-150
-120
-90
-60
-30
Depth
(cm
)
07-31-99
08-31- 99
09- 30-99
11-01-99
12- 28-99
01-24-00
03-27-00
04-28-00
06-01-00
07-03-00
08-02-00
09-01-00
10-03-00
11- 06-00
12-06-00
01-08-01
03- 13-01
04-12-01
05-12-01
06- 13-01
07-15-01
08-19-01
09-18-01
11-02-01
11-30-01
T1- 0 m
-180
-150
-120
-90
-60
-30
Depth
(cm
)
07-31-99
08- 31-99
09-30-99
11-01-99
12-28-99
01-24-00
03-27-00
04-28- 00
06-01-00
07-03-00
08-02- 00
09-01-00
10-03-00
11-06-00
12-06-00
01-08-01
03-13-01
04-12-01
05-12- 01
06-13-01
07-15-01
08-19- 01
09-18-01
11- 02-01
11-30-01
T2- 0 m
-180
-150
-120
-90
-60
-30
Depth
(cm
)
07-31-99
08- 31-99
09-30-99
11-01-99
12
-180
-150
-120
-90
-60
-30
Depth
(cm
)
07-31-99
08- 31-99
09-30-99
11-01-99
12-28-99
01-24-00
03-27-00
04-28- 00
06-01-00
07-03-00
08-02- 00
09-01-00
10-03-00
11-06-00
12-06-00
01-08-01
03-13-01
04-12-01
05-12- 01
06-13-01
07-15-01
08-19- 01
09-18-01
11- 02-01
11-30-01
T2- 0 m
-180
-150
-120
-90
-60
-30
Depth
(cm
)
07-31-99
08-31- 99
09- 30- 99
11-01-99
12-28-99
01-24-00
03-27-00
04-28-00
06-01-00
07-03-00
08-02-00
09-01-00
10-03-00
11- 06- 00
12-06-00
01- 08-01
03- 13- 01
04-12-01
05- 12-01
06-13- 01
07- 15-01
08- 19-01
09-18-01
11-02-01
11-30-01
T1P- 0 m
-180
-150
-120
-90
-60
-30
Depth
(cm
)
07-31-99
08-31- 99
09- 30- 99
11-01-99
12-28-99
01-24-00
03-27-00
-180
-150
-120
-90
-60
-30
Depth
(cm
)
07-31-99
08-31- 99
09- 30- 99
11-01-99
12-28-99
01-24-00
03-27-00
04-28-00
06-01-00
07-03-00
08-02-00
09-01-00
10-03-00
11- 06- 00
12-06-00
01- 08-01
03- 13- 01
04-12-01
05- 12-01
06-13- 01
07- 15-01
08- 19-01
09-18-01
11-02-01
11-30-01
T1P- 0 m
-180
-150
-120
-90
-60
-30
Depth
(cm
)
07-31-99
08-31- 99
09-30- 99
11-01-99
12- 28-99
01-24-00
03-27-00
04-28-00
06-01-00
07-03-00
08-02-00
09-01-00
10-03-00
11- 06-00
12-06-00
01-08-01
03- 13-01
04-12-01
05-12-01
06- 13- 01
07-15-01
08-19-01
09-18-01
11-02-01
11-30-01
T2P- 0 m
-180
-150
-120
-90
-60
-30
Depth
(cm
)
07-31-99
08-31- 99
09-30- 99
11-01-99
12- 28-99
01-24-00
03-27-00
04-28-00
-180
-150
-120
-90
-60
-30
Depth
(cm
)
07-31-99
08-31- 99
09-30- 99
11-01-99
12- 28-99
01-24-00
03-27-00
04-28-00
06-01-00
07-03-00
08-02-00
09-01-00
10-03-00
11- 06-00
12-06-00
01-08-01
03- 13-01
04-12-01
05-12-01
06- 13- 01
07-15-01
08-19-01
09-18-01
11-02-01
11-30-01
T2P- 0 m
-20 10 30 45 60 80
s (kPa)
0-20 10 30 45 60 80
s (kPa)
0
FIG. 6. Soil water suction under the middle tree row (Block 2) in different treatments from July 1999
to December 2001.

74
-180
-150
-120
-90
-60
-30
D e
p t h
( c m
)
0 m
-180
-150
-120
-90
-60
-30
D e
p t h
( c m
)
1 m
-180
-150
-120
-90
-60
-30
D e
p t h
( c m
)
07-3
1-9
9
08-3
1-9
9
09-3
0-9
9
11-0
1-9
9
12-2
8-9
9
01-2
4-0
0
03-2
7-0
0
04-2
8-0
0
06-0
1-0
0
07-0
3-0
0
08-0
2-0
0
09-0
1-0
0
10-0
3-0
0
11-0
6-0
0
12-0
6-0
0
01-0
8-0
1
03-1
3-0
1
04-1
2-0
1
05-1
2-0
1
06-1
3-0
1
07-1
5-0
1
08-1
9-0
1
09-1
8-0
1
11-0
2-0
1
11-3
0-0
1
2 m
-20 10 30 45 60 80
s (kPa)
0 FIG. 7. Soil water suction at different distances (0, 1, 2 m) from the tree line in the middle of the T1
treatment from July 1999 to December 2001.
-180
-150
-120
-90
-60
-30
D e
p t h
( c m
)
0 m
-180
-150
-120
-90
-60
-30
D e
p t h
( c m
)
1 m
-180
-150
-120
-90
-60
-30
D e
p t h
( c m
)
07-3
1-9
9
08-3
1-9
9
09-3
0-9
9
11-0
1-9
9
12-2
8-9
9
01-2
4-0
0
03-2
7-0
0
04-2
8-0
0
06-0
1-0
0
07-0
3-0
0
08-0
2-0
0
09-0
1-0
0
10-0
3-0
0
11-0
6-0
0
12-0
6-0
0
01-0
8-0
1
03-1
3-0
1
04-1
2-0
1
05-1
2-0
1
06-1
3-0
1
07-1
5-0
1
08-1
9-0
1
09-1
8-0
1
11-0
2-0
1
11-3
0-0
1
2 m
-20 10 30 45 60 80
s (kPa)
0 FIG. 8. Soil water suction at different distances (0, 1, 2 m) from the tree line in the middle of the T1P treatment from July 1999 to December 2001.

75
-180
-150
-120
-90
-60
-30
D e
p t h
( c m
)
0 m
-180
-150
-120
-90
-60
-30
D e
p t h
( c m
)
1 m
-180
-150
-120
-90
-60
-30
D e
p t h
( c m
)
2 m
-180
-150
-120
-90
-60
-30
D e
p t h
( c m
)
07-3
1-9
9
08-3
1-9
9
09-3
0-9
9
11-0
1-9
9
12-2
8-9
9
01-2
4-0
0
03-2
7-0
0
04-2
8-0
0
06-0
1-0
0
07-0
3-0
0
08-0
2-0
0
09-0
1-0
0
10-0
3-0
0
11-0
6-0
0
12-0
6-0
0
01-0
8-0
1
03-1
3-0
1
04-1
2-0
1
05-1
2-0
1
06-1
3-0
1
07-1
5-0
1
08-1
9-0
1
09-1
8-0
1
11-0
2-0
1
11-3
0-0
1
4 m
-20 10 30 45 60 80
s (kPa)
0 FIG. 9. Soil water suction at different distances (0, 1, 2, 4 m) from the tree line in the middle of the T2
treatment from July 1999 to December 2001.
-180
-150
-120
-90
-60
-30
D e
p t h
( c m
)
0 m
-180
-150
-120
-90
-60
-30
D e
p t h
( c m
)
1 m
-180
-150
-120
-90
-60
-30
D e
p t h
( c m
)
2 m
-180
-150
-120
-90
-60
-30
D e
p t h
( c m
)
07-3
1-9
9
08-3
1-9
9
09-3
0-9
9
11-0
1-9
9
12-2
8-9
9
01-2
4-0
0
03-2
7-0
0
04-2
8-0
0
06-0
1-0
0
07-0
3-0
0
08-0
2-0
0
09-0
1-0
0
10-0
3-0
0
11-0
6-0
0
12-0
6-0
0
01-0
8-0
1
03-1
3-0
1
04-1
2-0
1
05-1
2-0
1
06-1
3-0
1
07-1
5-0
1
08-1
9-0
1
09-1
8-0
1
11-0
2-0
1
11-3
0-0
1
4 m
-20 10 30 45 60 80
s (kPa)
0 FIG. 10. Soil water suction at different distances (0, 1, 2, 4 m) from the tree line in the middle of the T2P treatment from July 1999 to December 2001.

76
3.4. Soil water flux and flow direction
Water fluxes changed dramatically in the rainy season, but remained stable in the dry season. The horizontal water flux decreased with increasing canopy density, distance from the tree row or soil depth (Fig. 11). The vertical water flux slightly decreased with increase of canopy density and soil depth. The vertical water flux increased with increased distance from the tree row in the subsoil and changed dramatically in the dry season in the topsoil (Fig. 12).
The flow direction was expressed with the water flux angle (Fig. 13). In the P treatment, the flow direction was dominantly downwards in the rainy season in the whole profile, while in the dry season downwards in the top soil, with the angle from 180 to 360 degrees, and upwards in the subsoils, with the angle from 90 to 180 degrees. In the T1 and T2 treatments, the flow angles ranged from 180 to 270 degrees in the whole soil profile, indicating downwards water flow to the adjacent hedgerow along the slope. In the T1P and T2P treatments, the flow direction in the top soil (0–30 cm) was dominantly downwards in the rainy season, with the angle ranging from 270 to 360 degrees, and dominantly upwards in the dry season as the angle changed to the range from 90 to 180 degrees. In T2P treatment, the flow angle ranged from 0 to 90 degrees at 50 to 120 cm depth, and ranged from 90 to 180 degrees below 120 cm, indicating that water moved upward to the hedgerow.
3.5. System evapotranspiration (ET)
The water component ratios in different treatments and at different distances from the central tree row are demonstrated in Table 2. The rainfall distribution indicated that the 10%–15% of rainfall produced a surface water runoff, 5%–20% was interception, 65%–85% was infiltration, which 15%–20% was drainage, 5%–10% was water storage and others of them is transition of evapotranspiration. Upward water flow from the bottom of the soil profile by capillary rise accounts for 5%–10% of rainfall. This would indicate that decreases in soil water caused by evapotranspiration were partly compensated by capillary rise from the deeper soil layers.
The water infiltration under the tree canopy (0 m) was lower than other positions (1–4 m) owing to tree interception. In general, compared with the mono system, the alley systems (T1P and T2P) decreased the net drainage and increased the ET. Compared with the different distances, D decreased with increasing distance but increased at 4 m, and ET increased with increasing distance from the tree. In the alley system, the inner horizontal flow (Rs) moved to the tree row. With increasing distances from the tree, the water flow direction changed to negative, i.e. moved far away from the tree. The change in Rs showed that both the tree age and spacing influenced the direction and dimension of horizontal water flow. Compared with the T2 treatment, the T2P treatment lowered the changes in soil water storage (△S) under the tree row throughout the year, especially in the dry season. The results indicated that the trees in the alley system used more water than the mono system probably because of root development. In addition, the effect of alley cropping treatment and space difference on water use was evaluated through analysis of variance. Significant (P<0.05) differences in evapotranspiration for different treatments were found in 2000, 2001 and 2002, and significant (P<0.05) differences in evapotranspiration for different space distances in 2000, but not in 2001 and 2002.

77
FIG.11. Lateral water fluxes at different distances from the middle tree row at 30 cm depth in the T2 (a) and T2P (b) treatments, and at 100 cm depth in the T2 (c) and T2P (d) treatment in 2000.
FIG. 12. Vertical water fluxes at different depths at 1 m distance from the central tree row in the T2
(a) and T2P (b) treatments, and at 2 m distance in the T2 (c) and T2P (d) treatments in 2000.
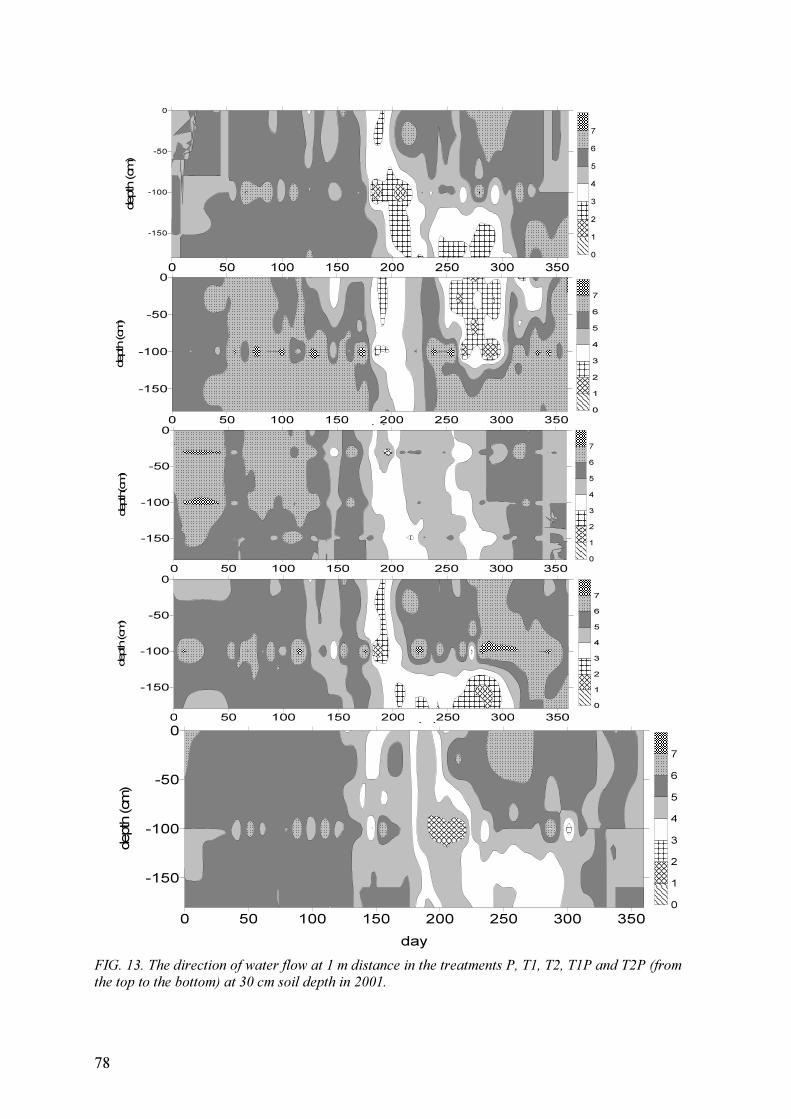
78
FIG. 13. The direction of water flow at 1 m distance in the treatments P, T1, T2, T1P and T2P (from the top to the bottom) at 30 cm soil depth in 2001.
0 50 100 150 200 250 300 350
day
-150
-100
-50
0
depth
(cm
)
0
1
2
3
4
5
6
7
0 50 100 150 200 250 300 350
-150
-100
-50
0
depth
(cm
)
0
1
2
3
4
5
6
7
0 50 100 150 200 250 300 350
day
-150
-100
-50
0
depth(cm)
0
1
2
3
4
5
6
7
( )
0 50 100 150 200 250 300 350
-150
-100
-50
0
depth
(cm)
0
1
2
3
4
5
6
7
( )
0 50 100 150 200 250 300 350
day
-150
-100
-50
0
depth
(cm
)
0
1
2
3
4
5
6
7
( )

79
TABLE 2. WATER BALANCE IN 2000. PRECIPITATION (PP), RUNOFF (R) AND STORAGE
CHANGE (△S) WERE MEASURED; INTERCEPTION (CI), INNER HORINZONTAL FLOW
(RS), EVAPOTRANSPIRATION (ET) AND NET DEEP DRAINAGE (D) WERE ESTIMATED.
Treatment Distance P (mm) CI R Rs ET D △S
0m 90.4 191.0 12.9 1387.6 199.3 73.1
1m 90.4 191.0 12.2 1437.5 155.5 66.5
P
2m 90.4 191.0 11.9 1491.3 105.5 62.5
0m 279.2 222.0 85.8 1198.9 210.1 104.0
1m 167.5 370.0 9.7 1117.1 186.6 96.9
T1
2m 41.9 481.0 –89.0 1032.0 175.4 109.1
0m 322.3 197.3 138.0 1264.4 123.6 158.8
1m 225.6 394.7 105.5 1131.8 139.3 142.6
2m 128.9 552.5 –97.8 941.4 99.7 108.0
T2
4m 16.1 592.0 –93.2 879.7 232.6 114.7
0m 279.2 151.8 87.0 1347.5 142.7 94.3
1m 230.0 121.4 11.9 1364.7 129.7 94.6
T1P
2m 146.2 197.3 –108.4 1268.9 94.1 113.5
0m 322.3 178.6 78.2 1260.3 99.3 146.1
1m 316.0 107.2 113.8 1341.5 138.0 139.5
2m 219.3 232.2 –111.6 1137.4 120.5 107.4
T2P
4m
1928.4
106.5 250.1 –98.6 1214.0 189.7 69.6
* Negative values in Rs indicate horizontal soil water movement far away from the hedgerow.
3.6. Crop growth and tree root distribution
Peanut grain yield and biomass showed the same tendency among the treatments with time (Fig. 14). Peanut yield ranged from 1250 to 2250 kg ha–1 in the mono-cropping system during the experimental period and the greatest yields were in 2001 and 2002. Peanut yields decreased by 8 to 60% in the alley cropping system compared with the mono-cropping system, with the greatest decreases in 2001 and 2002. The peanut biomass was greatest in 1999 and no difference was found among the treatments. The peanut biomass decreased by 25 to 60% in the following years and the difference was greater in the peanut treatment than the alley cropping systems. Peanut yield and biomass increased with the distance from the hedgerow to the alley center (data not shown).
Tree height, trunk diameter and canopy width increased in the alley cropping systems compared with the mono-cropping treatments (T1 and T2) (Fig. 15). The magnitudes of the differences in these parameters between the alley and the mono cropping treatments decreased with time from 1999 to 2002. Compared with the mono-cropping treatments, the tree biomass in the T1P and T2P treatments, respectively, increased by 50 to 100% in 2000 and by 17 to 18% in 2001.
The root distribution excavated in 2003 indicated that the roots of C. axillaris concentrated in soil above 40 cm depth in the treatments with younger trees (T1 and T1P) and

80
above 60 cm in the treatments with older trees (T2 and T2P) (Fig. 16). The root weight for the older trees was twice that for the younger trees. The tree root weight was two-fold higher in the alley cropping systems than the mono-cropping systems in the 0–30 cm depth. The tree root weight was higher in the deeper soil in the alley cropping systems than in the mono-cropping systems. The lateral roots of young trees accounted for 50% above the 30 cm depth, for 15% at 30–40 cm and for 5% below 60 cm in the T1P treatment. The tree taproot reached to 100 cm depth in the T2P treatment and the lateral roots were largely distributed in the upper 60 cm, with 30% of root length density below 60 cm and less than 5% below 80 cm.
1 9 9 9 2 0 0 0 2 0 0 1 2 0 0 2
0
5 0 0
1 0 0 0
1 5 0 0
2 0 0 0
2 5 0 0
Pean
ut str
aw
bio
mass (
kg h
a-1
)
Y e a r s
P T 1 P T 2 P
0
5 0 0
1 0 0 0
1 5 0 0
2 0 0 0
2 5 0 0
Peanu
t yie
ld (
kg
ha-1
)
FIG. 14. Peanut yield and biomass in the years from 1999 to 2002.
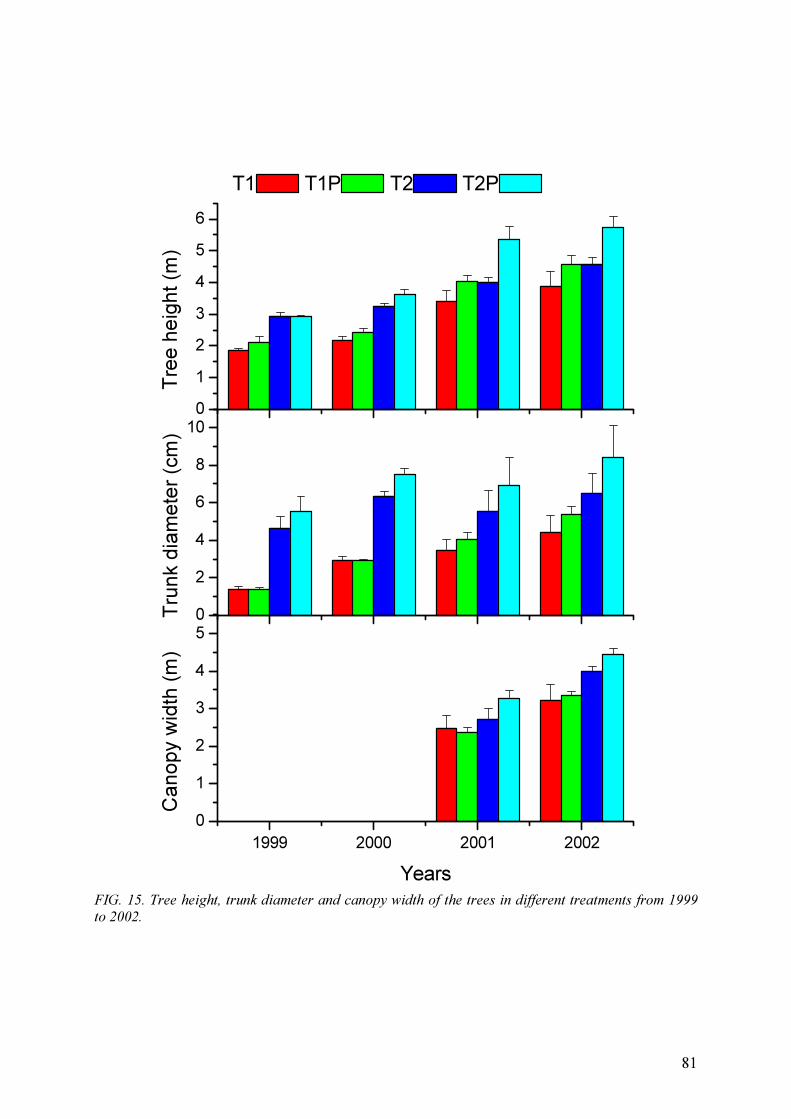
81
1999 2000 2001 2002
0
1
2
3
4
5
Canopy w
idth
(m
)
Years
T1 T1P T2 T2P
0
2
4
6
8
10
Tru
nk d
iam
ete
r (c
m)
0
1
2
3
4
5
6
Tre
e h
eig
ht (m
)
FIG. 15. Tree height, trunk diameter and canopy width of the trees in different treatments from 1999
to 2002.

82
100
80
60
40
20
0
0 1 2 3 4 5 6
100
80
60
40
20
0
0 2 4 6 8 10 12
T1S
oil
de
pth
(cm
)
T1P
T2
Root weight (kg per tree)
T2P
FIG. 16. Root weight distribution in different treatments for the excavation in 2002.

83
3.6. Crop coefficients
According to the water balance equation, water consumption by peanut was estimated as 694 mm, 673 mm and 631 mm in the P, T1P and T2P treatments, respectively. The water consumption of C. axillaris was 912 mm, 1012 mm, 1010 mm and 1021 mm in the T1, T2, T1P and T2P treatments, respectively. The crop coefficients (Kc) averaged 1.1 for peanut and 1.2 for C. axillaris. According to the water consumption by tree and crop, the relative net tree effect on availability of water to the crop (Tw) was 0.03 in the T1P treatment and 0.10 in the T2P treatment.
4. DISCUSSION AND CONCLUSIONS
The alley cropping system promoted C. axillaris growth by 50 to 100%, and reduced peanut biomass and yield by 20 to 50% as compared to the peanut mono-cropping system. The spatial and temporal variations of the soil water regime and soil water flux and flow direction revealed that tree and crop in the alley cropping systems competed for surface soil water, but the tree tended to use deep soil water.
The application of the water balance method in the alley cropping system was a practical way to allow for the quantification of evapotranspiration, drainage and the other components, and for the optimization of water use in the alley system. The results indicated that C. axillaris competed with peanut for water in the alley cropping systems, especially during the seasonal drought, when deep water is scarce, and soil water availability is restricted to the upper horizons and transpiration is higher. Alley cropping systems could use deeper soil water, which was also supported by the water movement in the soil profile. Soil water tends to move downward during rainfall events and to the tree rows in the soil layers above 30 cm during the dry period. In addition, soil water tended to move to tree rows in the layer from 100 to 200 cm in the alley cropping system, indicating that C. axillaris in the alley system used deeper soil water beyond the crop root zone. In the alley cropping system the water fluxes near the tree rows were higher than further out, indicating that the trees also used the soil water in the alley and competed for water with the peanut crop in the alley. Trees in the alley cropping system used less soil water than peanut and more water than trees alone as indicated by water balance modelling. The alley cropping systems used deep soil water and thereby reduced deep drainage.
The water flow and water consumption is consistent with the root distribution of the tree and crop, which are the sources of competition for water and nutrient in the soil [43]. The root analysis shows that both peanut and C. axillaris have a dense root distribution in the 0–40 cm depth, which is the origin of competition for water. However, the tree roots are also large and dense from 40 to 100 cm depth, which not only gave the tree a competitive advantage, but also buffered the resource competition with the crop. Van Noordwijk and Lusiana [18] indicated the ability of a tree’s root system to take up resources from depth depends on the distribution of the tree and crop roots, soil hydraulic properties and rainfall regime. The red soil has a high water storage capacity at depth, which can be accessed by the tree [44]. In comparing treatment T2 with treatment T2P, the soil water content within the tree rows shows little variation at the 30 cm depth, but a big variation occurred at the 60 cm depth, showing that the trees, rather than peanut crops, can use soil water in the deep layers (>30–60 cm).
The below ground competition for water, as shown in the present experiment, can only partly explain the decrease in peanut yield in the alley cropping systems, because analysis of the relative net tree effect on the availability of water to the crop illustrated that little

84
competition for water existed between the tree and crop. The alley system changes the relationship of water utilization, which indicated that competition for water is related to root architecture and the root absorption volume. Above ground competition is another important factor. Willey and Reddy [45] reported that the influence of shade was greater than competition for water on the yield of peanut intercropped with Pennisetum glaucum. Our research also showed that tree shading had a significant effect on the yield and biomass of peanut, and there was a good linear correlation between peanut yield and biomass and photo-synthetically active radiation (PAR) [46]. Tree pruning decreased evapo-transpiration (ET) [42], suggesting that management of trees in the alley cropping system can reduce the competition for natural resources. However, more detailed work in several areas, including root description, water use mechanisms by roots, interactions of water and light, and interaction of soil fertility with root distribution, should be done in order to ensure that the system could benefit from soil and water conservation through a lower tree ET to promote crop production.
ACKNOWLEDGEMENTS
The authors thank the International Foundation of Sciences (IFS) (Grant No. D2872-1), the International Atomic Energy Agency (IAEA) (Grant No. CPR-10407) and the Natural Science Foundation of China (Grant No. 49701008) for financial support. Dr. Wang Xingxiang, Dr. Jing Yuanshu, Mr. Zhao Huachun and Mr. Zhou Jin are acknowledged for their involvement in the research.
REFERENCES
[1] ZHANG, B., ZHANG, T.L., Cause of seasonal drought formation and strategy of the eastern hills in southern China, Acta Ecologica Sinica 15 (1995) 413–419.
[2] ZHANG, T.L., 1999. Mechanism and Control of Red Soil Degradation in China, China Agricultural Publishing House, Beijing (1999) 138 pp.
[3] XIE, J.X., Survey in agroforestry, Transaction of Beijing Forestry University 10 (1989) 104–108.
[4] KANG, B.T., REYNOLDS, L., ATTA-KRAH, A.N., Alley farming, Adv. Agron. 43 (1990) 315–359.
[5] PURI, S., NAIR, P.K.R., Agroforestry research for development in India: 25 years of experiences of a national program, Agroforest. Syst. 61 (2004) 437–452.
[6] KANG, B.T., SILSON, G.F., “The development of alley cropping as a promising agroforestry technology”, Agroforestry: A Decade of Development, (STEPPLER, H.A., NAIR, P.K.R., Eds), ICRAF, Nairobi, Kenya (1987) 227–243.
[7] GHOSH, S.P., et al., Productivity, soil fertility and soil erosion under cassava-based agroforestry systems. Agroforest. Syst. 8 (1989) 67–82.
[8] NARAIN, P., et al., Agroforestry for soil and water conservation in western Himalayan valley region of India. I. Runoff, soil and nutrient losses, Agroforest. Syst. 39 (1997) 175–189.
[9] SMITH M., JACKSON, N., ROBERTS, J., A new direction in hydraulic lift: can tree roots siphon water downwards? Agroforestry Forum 8 (1997) 23–25.
[10] CARBON, B.A., et al., The distribution of root length, and the limits to flow of soil water to roots in a dry Sclerophyll forest, For. Sci. 26 (1980) 656–664.
[11] SANCHEZ, P. A., Science in agroforestry, Agroforest. Syst. 30 (1995) 5–55. [12] FRANCIS, C.A., Multiple Cropping Systems, Macmillan, New York, USA (1986).

85
[13] LIVESLEY, S.J., GREGORY, P.J., BURESH, R.J., Competition in tree row agroforestry systems. 3. Soil water distribution and dynamics, Plant Soil 264 (2004) 129–139.
[14] ONG, C.K., et al., Tree–crop interactions: manipulation of water use and root function, Agr. Water Manage. 53 (2002) 171–186.
[15] LIU, J.Y., QIN, T.M., QIU, M.H., “Biomass and productivity of trees screened for low hilly regions”, Red Soil Ecosystem Research, Vol.3, China Agricultural Sci. & Tech. Publishing House, Beijing (1996) 138–143.
[16] JOSE, S., et al., Defining competition vectors in a temperate alley cropping, system in the midwestern USA. 2. Competition for water, Agroforest. Syst. 48 (2000) 41–59.
[17] YE, C., et al., Study on intercropping of Paulownia and Tea in low hilly red soil, Acta Agr. Jiangxi 13 (2001) 1–8.
[18] VAN NOORDWIJK, M., LUSIANA, B., WaNuLCAS, a model of water, nutrient and light capture in agroforestry systems, Agroforest. Syst. 43 (1999) 217–242.
[19] KHO, R. M., A general tree-environment-crop interaction equation for predictive understanding of agroforestry systems, Agr. Ecosyst. Environ. 80 (2000) 87–100.
[20] MC INTYRE, B.D., RIHA, S.J., ONG, C.K., Competition for water in a hedge-intercrop system, Field Crops Res. 52 (1997) 151–160.
[21] MARAUX, F., LAFOLIE, F., BRUCKLER, L., Comparison between mechanistic and functional models for estimating soil water balance: deterministic and stochastic approaches, Agr. Water Manage. 38 (1998) 1–20.
[22] LANDSBERG, J.J., WARING, R.H., A generalized model of forestry productivity using simplified concepts of radiation-use efficiency, carbon balance and partitioning, Forest Ecol. Manage. 95 (1997) 209–228.
[23] WHITEHEAD, D., Regulation of stomatal conductance and transpiration in forest canopies, Tree Physiol. 18 (1998) 633–644.
[24] SCHLEGEL, P., HUWE, B., TEIXEIRA, W.G., Modelling species and spacing effects on root zone water dynamics using Hydrus-2D in an Amazonian agroforestry system, Agroforest. Syst. 60 (2004) 277–289.
[25] FAO/UNESCO, Soil Map of the World, Revised Legend, World Soil Resources Report No. 60, FAO, Rome, Italy (1988).
[26] SOIL SURVEY STAFF, Key to Soil Taxonomy, 8th edn, USDA, Washington, DC, Pocahontas Press Inc. (1998).
[27] ZHANG, B., WANG, X.X, WANG, M.Z., Fertilizer nitrogen recovery from different soil depths in an alley system consisting of peanut (Arachis hypogaea) and Choerospondias axillaris in subtropical China, IAEA-TECDOC-xxx (this issue) (2007) xx–xx.
[28] KHAN, A.A.H., ONG, C.K., Design and calibration of tipping bucket system for field runoff and sediment quantification, J. Soil Water Conserv. 52 (1997) 437–443.
[29] GRANIER, A., Une nouvelle methode pour la mesure du flux de seve brute dans le tronc des arbres, Ann. Sci. For. 42 (1985) 193–200.
[30] GRANIER, A., Evaluation of transpiration in a Douglas-fir stand by means of sap flow measurements, Tree Physiol. 3 (1987) 309–320.
[31] LU, P., A direct method for estimating the average sap flux density using a modified Granier measuring system, Aust. J. Plant Physiol. 24 (1997) 701–705.
[32] HARR, R.D., Water flux in soil and subsoil on a steep forested slope, J. Hydrol. 33 (1977) 37–58.
[33] SUN, G., Study on water flux in soil on a forested hillslope, Chinese J. Ecol. 13 (1994) 36–39.
[34] LANDSBERG, J.J., Physiological Ecology of Forest Production, Academic Press, Sydney (1986) 198 pp.

86
[35] LEI, Z.D., YANG, S.X., XIE, S.C., Soil Water Dynamics, Publishing House of Tsinghua University, Beijing (1988).
[36] SOARES, J.V., ALMEIDA, A.C., Modeling the water balance and soil water fluxes in a fast growing Eucalyptus plantation in Brazil, J. Hydrol. 253 (2001) 130–147.
[37] PALOMO, M.J., et al., Determining water consumption in olive orchards using the water balance approach, Agr. Water Manage. 55 (2002) 15–35.
[38] GASH, J.H.C., LLOYD, C.R., LACHAUD, G., Estimating sparse forest rainfall interception with an analytical model, J. Hydrol. 170 (1995) 79–86.
[39] YI, C., LIU, K., ZHOU, T., Research on a formula of rainfall interception by vegetation, J. Soil Erosion Soil Water Conserv. 2 (1996) 47–49.
[40] ALLEN, R.G., et al., Crop Evapotranspiration — Guidelines for Computing Crop Water Requirements, FAO Irrigation and Drainage Paper No. 56, FAO, Rome, Italy (1998).
[41] FENG, Z.W., WANG, X.K., WU, G., Biomass and Productivity of Forest System in China, Science Press, Beijing (1993) 13–14.
[42] ZHAO, Y., et al., Transpiration of Choerospondias axillaris in an agroforestry system and its affecting factors, Chinese J. App1. Eco1. l6 (2005) 2035–2040.
[43] WU, G., LI, J., DENG, H.B., Primary research on interface ecology in agroforestry ecosystems, Chinese J. Appl. Ecol. 11 (2000) 459–460.
[44] ZHANG, B., ZHANG, T.L., Hydraulic ecological characteristics of alley cropping systems and its productivity in low hilly red soil region, Chinese J. Ecol. 16 (1997) 1–5.
[45] WILLEY, R.W., REDDY, M.S., A field technique for separating above and below ground interactions in intercropping: an experiment with pearl millet/groundnut, Exp. Agric. 17 (1981) 257–264.
[46] ZHAO, Y., ZHANG, B., WANG, M.Z., Assessment of competition for water, fertilizer and light between components in the alley cropping system, Acta Ecologica Sinica 26 (2006) 1792–1801.

87
EVALUATION OF LONG TERM AGROFORESTRY: SOIL FERTILITY
MANAGEMENT IN THE DERIVED SAVANNA IN WEST AFRICA
A. BATIONO, N. SANGINGA, B. VANLAUWE, B. WASWA, J. KIHARA Tropical Soil Biology and Fertility Institute of CIAT, Nairobi, Kenya Abstract
Achieving self sufficiency in food production continues to be a major challenge to agricultural research
in West Africa. The ever increasing population pressure on land, the consequent reduction in the fallow period
below a minimal period of time to allow for regeneration of soil fertility, and the low use of external inputs have
led to negative nutrient balances at the field as well as at the regional scale. A considerable number of long-term
experiments have been conducted in this region and have given valuable insights into soil processes and
management practices that control soil fertility. Practices such as alley cropping, living fences, fodder banks,
domestication of native trees and contour planting, improved fallows and combined use of organic and inorganic
nutrient sources continue to be demonstrated. These have shown mixed results in terms of their impact on soil
properties, food supply and adoption by farmers. This paper reviews the long term practice of agroforestry, with
a focus on the effects of different practices on soil fertility management in the derived savanna of West Africa.
1. INTRODUCTION
Increasing human population pressure has decreased the availability of arable land and it is no longer feasible to use extended fallow periods to restore soil fertility [1]. Despite the growth of cereal production in Asia and Latin America over the last 35 years, there has been a reduction in per capita cereal production from 150 to 130 kg in Africa [2] High population densities have necessitated the cultivation of marginal lands that results in environmental degradation through soil erosion and nutrient mining. As a result, the increase in yield has been due more to land expansion than to crop improvement potential [3] For example, the 7.6% yield increase of yam in West Africa was manly due to an area increase of 7.2% and only 0.4% due to improvement in crop productivity itself (Table 1).
TABLE 1. PERCENTAGE ANNUAL INCREASE IN CROP YIELD DUE TO LAND EXPANSION AND CROP IMPROVEMENT POTENTIAL IN WEST AFRICA
Crops Area (% a
–1) Productivity (% a
–1) Production (% a
–1)
Cassava 2.6 0.7 3.3
Maize 0.8 0.2 1.0
Yam 7.2 0.4 7.6
Cowpea 7.6 –1.1 6.5
Soybean –0.1 4.8 4.7
Plantain 1.9 0.0 2.0
Based on three year average for 1988–1990 and 1998–2000. Source: [3].
In West Africa as in the rest of the continent, removal of crop residues from the fields,
coupled with lower rates of macronutrient applications compared to losses, has contributed to negative nutrient balances [4]. For nitrogen as an example, whereas 4.4 million tons are lost per year, only 0.8 million tons are applied [5] (Fig. 1). Additionally, low and erratic rainfall, high ambient soil and air temperatures, inherent poor soil fertility, low water holding capacities and degraded soil structure lead to low crop productivity in this environment. Consequently, the present farming systems have not been sustainable [6]. Transforming

88
agriculture in West African agro-ecosystems and expanding its production capacity are prerequisites for alleviating rural poverty, household food deficits and environmental exploitation [5].
In the 1970’s, agricultural research focused on overcoming soil constraints to fit plant requirements through purchased inputs [7]. This approach gained widespread success in Asia/Latin America and in some African countries where subsidies on fertilizer and agricultural inputs were provided.
4.4
0.5
3.0
0.8
0.3 0.2
0.0
0.5
1.0
1.5
2.0
2.5
3.0
3.5
4.0
4.5
5.0
N P K
Nutrients
Mil
lion
ton
s p
er y
ear
Loss
Consumption
FIG. 1. Nutrient losses versus application rate in Africa
The mid-80s saw a paradigm change with the focus being directed to less use of
manufactured fertilizers. This was necessitated by the perceived negative impacts of increased fertilizer use in Asia and Latin America as well as the structural adjustment programme (SAP) that limited provision of subsidies on fertilizers and other farm inputs. Strategic research organizations such as TSBF and ICRAF started focusing on biological management of tropical soils and developed the concept of ‘low input sustainable agriculture’ (LISA). Alley cropping formed an important technology under this concept.
The 90s saw more focus being directed at overcoming soil constraints by relying on biological processes by adapting germplasm to adverse soil conditions, enhancing soil biological activity, and optimizing nutrient cycling to minimize external inputs and maximize their use efficiency [7]. Combined use of inorganic and organic nutrient sources aimed at building soil organic matter (SOM) and maintaining soil physico-chemical health, while the use of inorganic fertilizer was to ensure immediate nutrient supply. Under this paradigm issues of synchrony, fertilizer use efficiency and soil biological health were emphasised.
Refinement of research has now led to the concept of integrated soil fertility management (ISFM), a holistic approach to soil fertility research that embraces the full range of driving factors and consequences of soil degradation – biological, chemical, physical, social, economic, and political (Fig. 2). This approach also emphasises scaling up/out of results of best bet soil fertility technologies to more farmers and communities using a wide range of participatory dissemination tools. Other issues addressed include health, markets and policy implications of the soil fertility management strategies.

89
FIG. 2. Integrated Soil Fertility Management (ISFM) concept
2. SOIL FERTILITY STATUS IN WEST AFRICA
There is evidence of declining SOM and hence soil fertility as a result of continuous cultivation of soils in West Africa [8]. Woomer [9] observed that total system carbon in different land use types indicated that forests, woodland and parkland had the highest total and aboveground carbon contents (Fig. 3) compared to cultivated and degraded lands. For the sandy soils, average annual losses in SOC, may be as high as 4.7%, whereas for sandy loam soils, reported losses seem much lower at an average of 2% ([10]; Table 2). However, such declines are site-specific and depend heavily on management practices such as the choice of the cropping system, soil tillage and the application of mineral and organic soil amendments [11].
FIG. 3. Soil carbon variations in different landuse systems in West Africa [9]
0
20
40
60
80
100
120
To
tal S
ys
tem
C (
t h
a-1
)
Se
ne
ga
l R
ive
r V
all
ey
Sa
he
lia
nS
hru
bb
y G
ras
sla
nd
(Sy
lvo
-pa
sto
ral
Zo
ne
)
Sa
ha
lia
n-S
ud
an
es
e T
ran
sit
ion
Dri
er
Su
da
ne
se
Wo
od
lan
d
(Old
Gro
un
dn
ut
Ba
sin
)
We
tte
r S
ud
an
es
e W
oo
dla
nd
(Ne
w G
rou
nd
nu
t B
as
in)
Su
da
ne
se
-Gu
ine
an
Tra
ns
itio
n
(Ca
sa
ma
nc
e)
forest
cultivated
grazed
cultivated
degraded
grazed
parkland
cultivated
fallow
woodland
grazed
cultivated
forest
parkland
fallow
cultivated
Vegetation and Land Use
16.5o N 13.1o N16.1o N 15.2o N 14.8o N 14.1o N
Source: Woomer 2003

90
TABLE 2. ANNUAL LOSS RATES OF SOIL ORGANIC CARBON MEASURED AT SELECTED
RESEARCH STATIONS IN THE SUDANO-SAHELIAN ZONE OF WEST AFRICA (SSWA)
Annual loss rates of soil organic carbon (k)
Place and Source
Dominant cultural succession
Observations Clay + Silt (%) (0–0.2
m) Years of
measurement k (%)
Burkina Faso With tillage
Saria, INERA-IRAT
Sorghum monoculture Sorghum monoculture
Sorghum monoculture Sorghum monoculture
Without fertilizer Low fertilizer (lf)
High fertilizer (hf) lf + crop residues
12 12
12 12
10 10
10 10
1.5 1.9
2.6 2.2
CFJA, INERA-IRCT
Cotton-cereals Eroded watershed 19 15
6.3
Senegal With tillage Bambey, ISRA-IRAT
Millet groundnut Millet groundnut
Millet groundnut
Without fertilizer With fertilizer
Fertilizer + straw
3 3
3
5 5
5
7.0 4.3
6.0 Bambey, ISRA-IRAT
Millet monoculture with PK fertilizer + tillage
4 3
4.6
Nioro-du-Rip, IRAT-ISRA
Cereal-leguminous Cereal-leguminous Cereal-leguminous
Cereal-leguminous Cereal-leguminous
F0T0 F0T2 F2T0
F2T2 F1T1
11 11 11
11 11
17 17 17
17 17
3.8 5.2 3.2
3.9 4.7
Chad With tillage, high
fertility soil
Bebedjia, IRCT-IRA
Cotton monoculture Cotton — cereals
+ 2 years fallow + 4 years fallow
11 20 20
20 20
2.8 2.4
1.2 0.5
F0 = no fertilizer, F1 = 200 kg ha–1 of NPK fertilizer, F2 = 400 kg ha–1 of NPK fertilizer + Taiba phosphate rock,
T0 = manual tillage, T1 = light tillage, T2 = heavy tillage. Source: Pieri [10]
Trees form an important component of farming systems in West Africa. Most
subsistence farmers in semi-arid West Africa consider trees as an integral part of agriculture. For centuries, they have maintained a traditional land use system known as the "agroforestry parkland" system, in which trees occur scattered in cultivated or recently fallowed fields [12].
Through careful tree selection, farmers have deliberately shaped tree production on their farmland to fulfill their specific needs; traditional medicines as well as basic food commodities, including a variety of gums, oils, proteins, fruits and drinks, which are of nutritional importance for a large number of people, especially in rural areas. Agroforestry parklands are also a major source of wood and non-wood products, which provide significant household income and appear to be important for local economies.
Biophysical interactions between trees and crops have shaped the physical configuration of parkland agroforestry and are one of the primary determinants of the way farmers manage trees in their fields. Faidherbia albida, one of the most extensively studied parkland species, has a reverse cycle, shedding its leaves during the rainy season, and is generally responsible for a substantial increase of grain yields under its canopy [13]. In contrast, crop performance under species with a more typical cycle such as Vitellaria
paradoxa and Parkia biglobosa is significantly reduced. However, there is also some

91
evidence to the contrary, which has been hypothetically attributed to the positive effect of shade on microclimate, offsetting the decline of photosynthesis [12].
Differences in crop yields under crowns of varying sizes and shapes indicate an effect of light competition between crops and trees [14]. The possibility of increasing crop yields by increasing their exposure to sunlight is a strong argument for pruning. Experiments on Cordyla pinnata in Senegal [15] and Azadirachta indica in Burkina Faso [16] indicate that crop yields under pruned trees are generally higher than under unpruned trees and sometimes higher than in open controls. However, soils under mature parkland tree canopies are generally more fertile than those in the open [12].
3. COMBINING ORGANIC AND INORGANIC NUTRIENT SOURCES AND NUTRIENT BALANCES
Increasing human population has resulted in the reduction of fallow periods or the natural regeneration periods for soils in the parkland systems. Improved cropping systems with in-situ production of organic matter therefore require the input of additional inorganic N to maintain crop production in a sustainable way [17]. Sole application of relatively high quantities of inorganic fertilizers could result in nutrient imbalances. Management practices that combine application of organic and inorganic inputs have been advocated to counteract those negative nutrient balances [18]. Beside adding nutrients, organic inputs also maintain the physical and physicochemical components contributing to soil fertility such as cation exchange capacity (CEC) and soil structure. Aihou et al. [19] observed that application of inorganic fertilizer up to 150 kg NPK ha–1 and 50 kg urea ha–1 alone did not sustain maize grain yield on ‘terre de barre’ soils in Southern Benin Republic. However, application of small amounts of fertilizer in Leucaena leucocephala and Senna siamea alley cropping maintained maize grain yield above 2 t ha–1.
Various farm practices integrating the use of organic and inorganic inputs have been employed to build soil fertility in West Africa. Organic materials available for mulching or incorporation into the soil are scarce due to low overall production levels of biomass in the region as well as their competitive use as fodder, construction material and cooking fuel [20]. In a study to determine crop residue availability at the farm level Baidu-Forson [21] reported that at Diantandou in Niger with a long-term annual rainfall of 450 mm, an average of 1200 kg ha–1 of millet stover was produced, but at the end of the following year, barely 250 kg ha–1 remained for mulching. Powell [22] showed that at least 50% of these large on-farm disappearance rates of millet stover could be attributed to livestock grazing. Animal manure will require rangeland between 10 and 40 ha of dry season grazing and between 3 and 10 ha of wet season grazing to maintain yields on one hectare of cropland [23]. The potential of manure to maintain SOC levels and maintain crop production is thus limited by the number of animals and the size and quality of the rangeland. The potential livestock transfer of nutrients in West Africa is 2.5 kg N and 0.6 kg P ha–1 of cropland [24].
Scarcity of organic matter calls for alternative options to increase its availability for improvement of soil fertility. Firstly, the application of mineral fertilizer is a prerequisite for more crop residues at the farm level and the maintenance of soil organic carbon in West African agro-ecosystems, and therefore most research should focus on the improvement of nutrient use efficiency in order to offer to the smallholder farmers cost-effective mineral fertilizer recommendations. Secondly, a recent success story on increasing crop production and SOC at the farm level is the use of dual purpose grain legumes having the ability to derive a large proportion of their N from biological N fixation, a low N harvest index and substantial production of both grain and biomass [25]. Legume residues can be used for improvement of

92
soil organic carbon through litter fall, or for feeding livestock with the resultant manure being
returned to the crop fields.
Alley cropping, a cropping system where food crops are grown between hedges or
preferably N2 fixing trees [26], was one of the first promising technologies dealing with soil
fertility replenishment that was developed and tested at the International Institute of Tropical
Agriculture (IITA) during the eighties and early nineties. In this system, the leguminous
hedgerows are regularly cut back to minimize tree-crop competition for water, nutrients and
light. Preliminary result indicated higher maize yields in alley cropped systems as compared
to the no-tree control treatments. It was acknowledged that addition of chemical fertilizer
boosted maize yields even further [27].
Hedgerows differ in their effects on soils fertility improvement. Hauser and Kang [28]
showed that alley cropping with Leucaena maintained higher levels of soil organic carbon
than in the control (no hedgerow) treatment (Table 3). Six years of alley cropping with
Leucaena on an Oxic Paleustalf, showed that the organic C level in the surface soil in the
alleys was 0.94% C, but declined to a very low level in the control (no hedgerow) treatment
(0.59% C). Higher soil organic carbon was also maintained under the L. leucocephala
hedgerow (1.23% C).
TABLE 3. CHEMICAL CHARACTERISTICS OF SURFACE (10–15 CM) SOILS IN ALLEY CROPPED PLOTS WITH LEUCAENA LEUCOCEPHALA AND IN THE CONTROL TREATMENT
Alley Cropped Control Chemical parameter
Hedgerow In alleys No hedgerows
Organic C (%) 1.23 0.94 0.59
Exchangeable cations (cmol kg–1
) Ca 1.47 1.24 1.37 Mg 0.46 0.37 0.45
K 0.39 0.58 0.52 pH (H2O) 5.3 5.1 5.3
Vanlauwe et al. [29] reported on the long term effects of alley cropping on selected
soil fertility characteristics and maize and cowpea yields in a long-term alley cropping trial
established by IITA in 1986 (Table 4). Organic carbon and total N in all treatment decreased
between 1986 and 2002 but this decrease was less dramatic in the treatments with trees
(Leucaena and Senna) due to the sustained inputs of pruning material over 17 years. Cation
(Ca, Mg and K) concentrations showed very significant responses to the alley treatments
where larger stocks of these nutrients remained in the soil after 17 years.
As with declining organic C and N, maize yields generally decreased over the years
with extreme cases being observed in the control treatment without fertilizers which produced
a mere 44 kg ha–1
in 2002 [29]. Yields were sustained best in the Senna + fertilizer treatment
with a maize yield of 2.2 t ha–1
in 2002. Fertilizer alone could not sustain yields; the final
yield obtained after 16 years of continuous cropping was only 0.4 t ha–1
.
Alley cropping has also been demonstrated to be able to increase maize production
and reduce runoff and soil erosion. Kang et al. [30] in a 10 year study of alley cropping maize
with Leucaena and Dactyladenia observed higher maize yields in Dactyladenia + fertilizer
and Leucaena + fertilizer treatments compared to the control plus or minus fertilizer
treatments (Fig. 4). Similarly, sorghum grain yields were significantly increased with
application of organic inputs from different agroforestry trees and shrubs [31] in West Africa
(Table 5).

93
TABLE 4. SELECTED SOIL CHARACTERISTICS AT TRIAL ESTABLISHMENT (APRIL 1986)
AND BEFORE PLANTING MAIZE (APRIL 2002) FOR 0–5 AND 5–10 CM LAYERS
pH in Exchangeable cations (cmolc kg–1
) Org C
(g kg–1
)
Tot N
(g kg–1
)
Bray–1 P
(mg kg–1
) H2O KCl Ca Mg K Acidity ECEC
April 1986
0–5 cm 12.41 1.45 31.9 5.7 5.6 2.75 0.73 0.45 0.04 4.1
5–10 cm 7.51 0.80 28.3 5.2 NA 1.71 0.43 0.26 0.18 2.7
April 2002
0–5 cm
Control – F 5.66 0.37 19.54 5.4 5.0 1.24 0.36 0.18 0.10 2.2
Control + F 5.94 0.48 51.12 5.3 4.8 1.62 0.38 0.18 0.07 2.6
Leucaena – F 9.02 0.81 13.38 5.3 4.9 2.08 0.58 0.30 0.23 3.5
Leucaena + F 10.02 0.82 61.02 5.2 4.9 2.26 0.60 0.32 0.20 3.7
Senna – F 10.01 0.78 17.96 5.8 5.4 3.42 0.56 0.32 0.03 4.7
Senna + F 10.58 0.84 63.10 5.4 5.2 3.32 0.48 0.32 0.03 4.5
SED 1.11 0.10 5.95 0.1 0.1 0.27 0.05 0.04 0.13 0.3
ECEC, effective cation exchange capacity; F, fertilizer; SED, standard error of the differences; NA, not available.
TABLE 5. EFFECT OF TREE BIOMASS ON SORGHUM YIELDS (KG HA–1
) [31]
Treatment Leaf Biomass (kg ha
–1) Sorghum grain yield (kg ha
–1)
Indigofera astragalina 304 1301
Crotalaria ochroleuca 732 836
Crotalaria agatiflora 2215 1141
Crotalaria retusa 1768 680
Crotalaria goreensis 1870 1187
Crotalaria paulina 2571 732
Tephrosia vogelii 2420 848
Natural fallow nd 899
Continuous Sorghum nd 565
0
0.5
1
1.5
2
2.5
3
3.5
4
4.5
5
4 5 6 7 8 9 10
Cropping year
Ma
ize g
ra
in y
ield
(to
n h
a-1)
Control - Fertilizer
Control + Fertilizer
Dactyladenia + Ferilizer
Leucaena + Fertilizer
FIG. 4. Long-term effect of alley cropping on a degraded Alfisol [30]

94
In a study by Kang et al. [30], alley cropping using Gliricidia was able to reduce runoff from 66.6% in the tilled control without alley cropping to 2.6% in 2 m tall Leucaena alley cropped treatment (Table 6). Further lower soil losses were observed in the alley cropped treatments as compared to the tilled control treatment without alley cropping.
The results above point to the potential of agroforestry systems to contribute to improved soil fertility and hence increased food production in the West African region.
TABLE 6. RUNOFF AND SOIL LOSS UNDER MAIZE [30]
Treatment Runoff (% rainfall in mm) Soil loss (t ha–1
)
Without alley cropping Tilled control 66.6 6.18 Non tilled control 5.6 0.43
Alley cropped and tilled
2-m Gliricidia 4.8 0.57
4-m Gliricidia 23.1 1.44 2-m Leucaena 2.6 0.17 4-m Leucaena 10.7 0.82
4. CHALLENGES TO AGROFORESTRY PRACTICES
Adapting agroforestry to farming systems is a major challenge to food production considering the complex tree-crop interactions. For better use of trees in agroforestry systems, it is important to understand the biophysical adaptability of the commonly grown multipurpose woody trees and/or shrubs (MWS). Many of the soil-fertility and nutrient-cycling benefits of agroforestry systems are derived from the production and decomposition of tree biomass [32]. The ability of trees in early-successional agroforestry systems (e.g., alley cropping) to coppice vigorously after being cut or pruned is therefore of great importance. In addition to the quantity of the organic inputs, the quality is equally important. Palm et al. [33] have identified the different organic residue quality parameters which influence decomposition and hence nutrient supply. Such parameters should be considered when selecting the organic sources to apply or to integrate with inorganic fertilizer.
Competition for below ground resources between trees and food crops can mask or surpress many of the advantages that trees may provide for the long term sustainability of agroforestry systems [34]. Spatial and temporal root distributions of tree roots are known to vary with species, tree husbandry and edaphic site factors [35, 36]. There is a need to select trees with desirable structural root and shoot architecture that will be compatible with food crops under different agroforestry systems. According to van Noordwijk and Purnomoshidi [34], the desirable root architecture requirement differs for sequential and simultaneous agroforestry systems. The possession of a vigorous tap root and extensive root systems of MWS will enhance proper anchorage, nutrient capture and storage, and transfer of nutrients after root decomposition to subsequent crops in sequential systems.
5. CONCLUSIONS
Declining soil fertility remains a major challenge to food production in West Africa. Adoption of best agroforestry practices, especially with N2 fixing trees, and the integration of organic and inorganic nutrient sources have the potential to improve soil fertility and thus

95
food production. Proper selection of trees and understanding of the interactions and decomposition patterns of the different organic residues can help to maximize the benefits accrued from agroforestry systems to improve food production.
REFERENCES
[1] NANDWA, S.M., Soil organic carbon (SOC) management for sustainable productivity of cropping and agro-forestry systems in Eastern and Southern Africa, Nutr. Cycl. Agroecosys. 61 (2001) 143–158.
[2] FAO (Food and Agriculture Organization of the United Nations, Soil Fertility Management in Support of Food Security in Sub-Saharan Africa, FAO, Rome, Italy (2001) 66 pp.
[3] FAO (Food and Agriculture Organization of the United Nations), FAOSTAT Agriculture Data, http://apps.fao/cgi-binnph-db.pl?suset=agriculture, FAO, Rome, Italy (2003).
[4] STOORVOGEL, J., SMALING, E.M., Assessment of soil nutrient depletion in sub-Saharan Africa: 1983–2000. Vol. 1, Main Report. The Winand Staring Center, Wageningen, The Netherlands (1990).
[5] BATIONO, A., et al., “The African Network for Soil Biology and Fertility: New challenges and opportunities”, Managing Nutrient Cycles to Sustain Soil Fertility in Sub-Saharan Africa (BATIONO, A., Ed.), Academic Science Publishers, Nairobi, Kenya (2004).
[6] BATIONO, A., BUERKERT, A., Soil organic carbon management for sustainable land use in Sudano-Sahelian West Africa, Nutr. Cycl. Agroecosys. 61 (2001) 131–142.
[7] SANCHEZ, P.A., “Tropical soil fertility research: Towards the second paradigm”, Inaugural and State of the Art Conferences, Transactions 15th World Congress of Soil Science, Acapulco, Mexico (1994) 65–68.
[8] BATIONO, A., et al., “A critical review of crop residue use as soil amendment in the West African semi-arid tropics”, Livestock and Sustainable Nutrient Cycling in Mixed Farming Systems of Sub-Saharan Africa, (POWELL, J.M., FERNANDEZ RIVERA, S., WILLIAMS, T.O., RENARD, C., Eds), Proc. International Conference ILCA, Addis Ababa, Ethiopia (1995) 305–322.
[9] WOOMER, P.L., Field and laboratory guidelines for carbon characterization in African dry lands. Senegal and Sahel carbon planning, design and implementation workshop, Dakar, Senegal 11–15 March (2003).
[10] PIERI, C., Fertilite de terres de savane. Bilan de trente ans de recherche et de developpement agricoles au sud du Sahara. Ministere de la Cooperation, CIRAD, Paris, France (1989) 444 pp.
[11] ZOUGMORE, R., Integrated water and nutrient management for sorghum production in semiarid Burkina Faso. Ph.D Dissertation, Wageningen University, The Netherlands (2003).
[12] BOFFA, J.M., West “African agroforestry parklands: keys to conservation and sustainable management”, Trees Outside Forests, Unasylva No. 200, 51 2000 (1).
[13] CIRAD-Forêt, Les parcs à Faidherbia. Cahiers Scientifiques du CIRAD-Forêt, No. 12. Paris, CIRAD, ORSTOM and WECARD (1996).
[14] KATER, L.J.M., KANTE, S., BUDELMAN, A., Karité (Vitellaria paradoxa) and néré (Parkia biglobosa) associated with crops in South Mali, Agroforest. Syst. 18 (1992) 89–105.
[15] SAMBA, S.A.N., Influence de Cordyla pinnata sur la fertilité d'un sol ferrugineux tropical et sur le mil et l'arachide dans un système agroforestier traditionnel au Sénégal. Ph. D thesis, Laval University, Quebec, Canada (1997).

96
[16] ZOUNGRANA, I., YELEMOU, B., HIEN, F., Étude des relations neem-sol-sorgho dans les systèmes agroforestiers du Bulkiemdé (Burkina Faso), International Symposium on Agroforestry Parklands in the Semi-arid Lands of West Africa, Ouagadougou, Burkina Faso, 25–27 October (1993).
[17] VANLAUWE, B., et al., Maize yield as affected by organic inputs and urea in the West-African moist savanna, Agron. J. 93 (2001) 1191–1199.
[18] PALM, C.A., MYERS, R.J.K., NANDWA, S., “Combined use of organic and inorganic nutrient sources for soil fertility maintenance and replenishment”, Replenishing Soil Fertility in Africa (BURESH, R.J., SANCHEZ, P.A., CALHOUN, F., Eds), SSSA Special publication No. 51, Madison, Wisconsin (1997) 193–218.
[19] AIHOU, K., et al., Alley cropping in the moist savanna of West Africa: I. Restoration and maintenance of soil fertility on “terre de barre” soils in Benin Republic, Agroforest. Syst. 42 (1999) 213–227.
[20] LAMERS, J.P.A., FEIL, P., The many uses of millet residues, ILEA Newsletter 9 (1993) 15.
[21] BAIDU-FORSON, J., Determinants of the availability of adequate millet stover for mulching in the Sahel, J. Sustain. Agr. 5 (1995) 101–116.
[22] POWELL, J.M., Yields of sorghum and millet and stover consumption of livestock in Nigeria, Trop. Agr. 62 (1985) 77–81.
[23] FERNANDEZ RIVERA, S., et al., “Faecal excretion by ruminants and manure availability for crop production in semi arid West Africa”, Livestock and Sustainable Nutrient Cycling in Mixed Farming Systems of Sub-Saharan Africa (POWELL, J.M., et al., Eds), Proceedings of an International Conference, 22–26 November 1993, International Livestock Centre for Africa (ILCA), Addis Ababa, Ethiopia, Vol. 2, Technical Papers (1995) 393–409.
[24] BATIONO, A., et al., “Sustainable intensification of crop–livestock systems through manure management in eastern and western Africa: Lessons learned and emerging research opportunities”, Sustainable Crop-livestock Production for Improved Livelihoods and Natural Resource Management in West Africa (WILLIAMS, T.O., et al., Eds), Proceedings of an International Conference, International Institute of Tropical Agriculture (IITA) Ibadan, Nigeria, 19–22 November 2001. ILRI International Livestock Research Institute), Nairobi Kenya ns CTA (Technical Centre for Agricultural and Rural Cooperation, ACP-EC, Wageningen, The Netherlands (2004).
[25] SANGINGA, N., Role of biological nitrogen fixation in legume based cropping systems: A case study of West Africa farming systems, Plant Soil 252 (2003) 25–39.
[26] KANG, B.T., GRIMME, H., LAWSON, T.L., Alley cropping sequentially cropped maize and cowpea with Leucaena on a sandy soil in Southern Nigeria, Plant Soil 85 (1985) 267–277.
[27] KANG, B.T., REYNOLDS, L., ATTA-KRAH, A.N., Alley farming, Adv. Agron. 43 (1990) 315–359.
[28] HAUSER, S., KANG, B.T., “ Nutrient dynamics, maize yield and soil organic matter in alley cropping with Leucaena leucocephala”, Soil Organic Matter Dynamics and Sustainability of Tropical Agriculture (MULONGOY, K., MERCKX, R., Eds), John Wiley & Sons, Chichester, UK (1993) 215–222.
[29] VANLAUWE, B., et al., Long-term integrated soil fertility management in South-western Nigeria: Crop performance and impact on the soil fertility status, Plant Soil 273 (2005) 337–354.
[30] KANG, B.T., et al., “Alley farming research on high base status soils”, Alley Farming Research and Development. (KANG, B.T., OSINAME, A.O., LARBI, A., Eds),

97
Proceedings of an International Conference on Alley Farming, 14–18 September 1992, Ibadan, Nigeria (1995).
[31] KAYA, B., et al., Performance evaluation of various agroforestry species as short duration improved fallows for enhancement of soil fertility and sorghum crop yields in Mali. Proc. AfNet International Symposium on Improving Human Welfare and Environmental Conservation by Empowering Farmers to Combat Soil Fertility Degradation, Yaoundé, Cameroon, May 17–21, 2004 (2005).
[32] NAIR, P.K.R., et al., “Nutrient cycling in tropical agroforestry systems: myths and science”, Agroforestry in Sustainable Agricultural Systems (BUCK, L.E., LASSOIE, J.P., FERNANDES, E.C.M., Eds), CRC Press, Boca Raton, Florida, USA (1999).
[33] PALM, C.A., et al., Organic inputs for soil fertility management in tropical agroecosystems: application of an organic resource database, Agr. Ecosyst. Environ. 83 (2001) 27–42.
[34] VAN NOORDWIJK, M., PURNOMOSHIDI, P., Root architecture in relation to tree-soil-crop interactions and shoot pruning in agroforestry, Agroforest. Syst. 30 (1995) 161–173.
[35] AKINNIFESI, F.K., KANG, B.T., TIJANI-ENIOLA, H., Root size distribution of a Leucaena leucocephala hedgerow as affected by pruning and alley cropping, Nitrogen Fixing Trees Research Report 13 (1995) 65–69.
[36] HAUSER, S., Root distribution of Dactyladenia (Acioa) barteri, Senna (Cassia) siamea in alley cropping on an Ultisol. I. Implications for field experimentation, Agroforest. Syst. 24 (1993) 111–121.


99
CARBON AND NITROGEN DYNAMICS IN SOILS:
EFFECTS OF RESIDUE QUALITY AND LOCALIZATION.
S. RECOUS, F. COPPENS, S. ABIVEN, P. GARNIER
INRA, Unité d’Agronomie, Laon, France
R. MERCKX
K.U. Leuven, Department of Land Management, Heverlee, Belgium
Abstract
During the years 1999–2005 a series of incubation experiments were conducted under controlled
conditions to investigate the effect of plant litter quality and residue location (surface vs. incorporated) on
residue decomposition, C storage and N dynamics in soils. Comparisons between decomposition of roots and
other plant parts (leaves and stems) were emphasized in order to better evaluate the contribution of root systems
to nutrient release and soil C sequestration. The second aspect investigated was the decomposition of residues
from forest, grassland and annual crops. The aim was to assess the relative effects of soil past history and residue
quality on short term biodegradation. During the initial phase of decomposition, the principal factor determining
decomposition kinetics was the nature of the added carbon, which strongly affected the nature and activity of the
decomposing microbial biomass. Initial C mineralization (after 3 d of incubation) was significantly related to the
percentage of soluble compounds in the residue, while after 142 d, a linear relationship was observed between
cumulative C mineralization and the percentage of the lignin-like fraction. The amount of N mineralized was
strongly related to the initial N content of the residues. No specific interaction with the origin of the residues
(agro-, pasture or forest ecosystem) was observed, indicating that concepts for describing crop residue
decomposition may be generalized for the decomposition of grass roots and tree leaves, and therefore for mixed
residues in agroforestry systems. The C and N mineralization of leaf and stem residues from four tropical species
were related to their biochemical composition and could be predicted from their N content, thus indicating a
similar behaviour for a range of temperate crop residues. C mineralized from roots was 20 to 30% less than for
leaves and stems, and this was assumed to be related to the presence of a high lignin-suberin content. The lower
decomposition of root-C translated into higher stabilisation of root-derived C into the soil, suggesting a higher
contribution of root systems than above ground parts to the soil organic C pool. This suggests that inputs of C
from roots contribute proportionally more than other plant parts to the long-term build up of soil organic matter.
When residues were placed on the soil surface or were incorporated into the soil when N availability was not a
factor limiting decomposition, and where there was no gradient in soil and air humidity and temperature, there
was no significant effect of placement on C dynamics and little difference in N dynamics, whatever the
biochemical quality of the residues. When residues were placed either at the soil surface as a mulch or
incorporated, in an experimental system that mimics actual conditions, i.e. allowing water and solute transport
into the soil after rain and evaporation, the main effect of residue location was a change in evaporation rate, and
therefore in soil moisture content and distribution, acting in turn on microbial activity and N mineralization.
1. INTRODUCTION
Within the context of global change, the importance of the carbon (C) and nitrogen (N) cycles in the prediction of future climatic scenarios and the potential storage capacity of carbon in the terrestrial biosphere have received considerable attention [1]. One option that contributes to a reduced impact of the gases, in particular CO2, is decreasing emissions from agricultural soils and increasing C sequestration, which largely depend on land use and soil management factors. Amongst others factors agricultural land use determines the amount and nature of plant litter that returns to the soil and decomposes, while soil management for arable crops includes a range of tillage practices. Tillage systems affect crop residue management and location (mulch vs. incorporated) and physical conditions in soil (aggregation, hydrodynamic properties) that in turn modify short- and long-term C- and N-dynamics. i.e. nutrient release from soil organic matter (OM), nutrient availability for crops, the possible losses to the atmosphere and hydrosphere, and the storage of organic matter in soil.

100
While several studies have addressed the relationships between the biochemical composition of residues and decomposition rates, there is less information on the relative decomposition rates of different plant organs, especially roots. Placement of residues is also an important factor influencing decomposition. While it is generally accepted that crop litter at the soil surface decomposes slower than incorporated residues, the processes involved are not well understood. For example, residue placement interacts with soil water dynamics that influences in turn the bio-transformations of C and N.
The objective of the present study was to determine the effects of soil and residue characteristics and proximity on C and N mineralization in tropical and temperate soils under controlled incubation conditions in the absence of N limitation to decomposition. Residues varied in terms of species and plant parts and were either unlabelled or doubly labelled with 13C and 15N.
2. RESIDUE SOURCE AND QUALITY
2.1. C and N mineralization in three temperate soils with and without the foliage of
two crop species, the roots of two pasture species and the leaves of one tree
species
2.1.1. Materials and methods
2.1.1.1. Characteristics of the soils
Three contrasting soils with different land use histories were selected to represent arable (Mons-en-Chaussée, Northern France), pasture (Theix, Central France) and forest (Hesse, Eastern France) soils. The soils were sampled from the 0–10 cm layer, sieved (<2 mm) and stored at 4°C prior to use. Soil properties are shown in Fig. 1. The soils differed widely in texture, C and N concentrations, C : N ratio and pH. Treatments with agricultural, pasture and forest soil are further referred to as AGRI, PAST and FOR, respectively.
FIG. 1. Soil texture, pH and C and N concentrations of soils having histories with arable crops
(AGRI), pasture (PAST) and forest (FOR).
pH
0
2
4
6
8
10
AGRI PAST FOR
pH H20
Soil texture
0% 20% 40% 60% 80%
100%
AGRI PAST FOR
>2000µm
200–2000µm
50–200µm
2–50µm
<2µm
Carbon and Nitrogen
0
5
10
15
20
25
30
AGRI PAST FOR
g / kg
Org C
Total N
C/N

101
2.1.1.2. Characteristics of the plant residues
Five different plant residues were used for incubation: mature oilseed rape (Brassica
napus L.), young rye (Secale cereale), orchard grass roots (Dactylis glomerata), rye-grass roots (Lolium perenne) and beech leaves (Fagus sylvatica). Oilseed rape and rye crops were grown under hydroponic conditions in a plant growth chamber as described previously [2]. Beech leaves were collected from 10 year old trees. Roots of orchard grass and rye-grass were recovered from soil by wet sieving and hand picking. Characteristics of the different plant residues are given in Fig. 2. Large variations existed in the concentration of N in the residues, between 0.7 and 2.7% for beech leaves and young rye, respectively, resulting in C: N ratios between 16 and 70. Residues also differed in biochemical composition, determined by proximate analysis [3]. Maximum and minimum amounts of soluble compounds were found in young rye and grass roots, respectively. For the lignin-like fraction, amounts were maximal in beech leaves and almost nil in young rye.
FIG. 2. Biochemical composition of the various plant residues, determined by the proximate analysis
[3].
2.1.1.3. Incubation conditions
The three soils were pre-incubated in the dark at 20°C. A solution of KNO3 was added to bring the soil nitrate concentration to 60 mg NO3-N kg–1 soil to allow decomposition under non-limiting conditions of N availability. After 2 weeks of pre-incubation, each soil was divided into 30-g sub-samples. Residues, cut with scissors to an average size of 1 to 3 mm, were mixed into the soil at a rate of 2 g dry matter (DM) kg–1 soil. Each of the residues was incorporated in their ‘original’ soil, i.e. oilseed rape and rye in AGRI, orchard grass and rye-grass roots in PAST and beech leaves in FOR. Other soil-residue combinations were prepared to have all residues incorporated in AGRI and the rye residue in all soils. Sub-samples without residue addition were used as control treatments. The sub-samples were compacted to 1.2 g cm-³ and incubated in sealed jars at 20°C for 142 d at constant water content, corresponding to a matric potential of –50 kPa. A small vial containing water was added to each jar to limit water loss from the soil during incubation. The jars were opened periodically to prevent oxygen limitation and to allow adjustments for water loss. Three replicates were used for each treatment.
2.1.1.4. Measurement of C and N mineralization
The CO2 produced was trapped in 0.25 M NaOH and back titrated with HCl. The traps were changed periodically in order to renew the atmosphere in the jars and prevent saturation of NaOH. The C mineralization from the residue was calculated by difference with a control
0% 10% 20% 30% 40% 50% 60% 70% 80% 90%
100%
Rape Rye Beechleaves
Dactylis Lolium
%LIGNIN
%CELLULOSE
%HEMICEL
%SOLUBLE

102
treatment, assuming that mineralization from soil C was not modified by the addition of residue (no priming effect), or that the priming effect was of the same order of magnitude for the various residues compared. C mineralization was expressed per unit of added C. Mineral-N was extracted with 1 M KCl (30 min of agitation at 20°C, 1 : 8 soil : solution ratio). The extract was then analysed for NH4
+ and NO3- by continuous flow colorimetry (Skalar). Net N
mineralization was calculated by subtracting the initial soil mineral N content and the soil mineral N content of the control.
2.1.2. Results
2.1.2.1. Mineralization of C and N in three soils with no residues
A large difference in carbon mineralization of native organic matter was observed for the agricultural (AGRI), pasture (PAST) and forest (FOR) soils (Fig. 3). The C mineralization rate in the FOR treatment was respectively 4 to 7 times larger than for AGRI and PAST. A strong relationship was found between the cumulative C mineralization after 142 d of incubation (a) and the amount of initial biomass-C (x): a = 2.0 x + 43.4; R² = 1. Also the patterns of N mineralization were very different for the three soils. In AGRI, no NH4
+-N was measured and during the first 4 weeks of incubation, and net N immobilization was observed. In PAST, the amount of NO3
--N increased from the beginning of the incubation, while in FOR nitrification was initially inhibited by the low soil-pH. In the latter, the increase in Mineral-N during the first 5 weeks of incubation resulted from an accumulation in NH4
+-N. Net N mineralization of native organic matter after 142 d was 4 to 5 times larger in FOR (+ 99.3 mg Nmin kg–1) compared to AGRI (+ 19.5 mg Nmin kg–1) or PAST (+ 27.5 mg Nmin kg–1).
Cumulative C mineralization
0
200
400
600
800
1000
1200
1400
0 20 40 60 80 100 120 140 160
days
mg
C /
kg
Control HESSE
Control THEIX
Control MONS
FIG. 3. C mineralization of AGRI (Mons), PAST (Theix) and FOR (Hesse) soils during 142 d at 20°C.
2.1.2.2. Net C and N mineralization in an arable soil with five residues
The effect of plant residue quality on decomposition and N dynamics was examined by incubating oilseed rape, rye, beech leaves and roots of orchard grass and rye-grass in the AGRI soil (Figs 4(a) and 4(b)). Using one reference soil eliminated interactions with soil type effects such as pH, native soil organic matter, texture or soil microbial biomass. The C mineralization rate was much larger for rye and oilseed rape residues than for roots of the two grasses and beech leaves. This resulted in a significantly larger cumulative carbon mineralization after 142 d of incubation, expressed as the % of added C, for rye (67.4%) and oilseed rape (57.5%) compared to the other three residues (32.3%–38.7%). Net N mineralization was largest with incorporation of rye (+41 mg min-N kg–1), while incorporation of all other residues resulted in N immobilization compared with the control soil after 142 d of incubation.

103
(a)
(b)
% o
f a
dd
ed
C
0
10
20
30
40
50
60
70
RyeOilseed rapeLolium rootsDactylis rootsBeech leaves
Time / days
0 20 40 60 80 100 120 140 160
mg
Nmin k
g-1
30
60
90
120
RyeOilseed rapeLolium rootsDactylis rootsBeech leavesControl soil
FIG. 4. (a) Cumulative net C mineralization (expressed as % of added residue C) and (b) net N
mineralization during the incubation of the 5 residues into the AGRI soil during 142 d at 20°C. The
values are the means of 3 replicates.
Carbon dynamics were mainly explained by the biochemical composition of the plant residues. Initial C mineralization (after 3 d of incubation) was significantly related to the percentage of soluble compounds in the residue (R² = 0.84). After 142 d, a linear relationship was observed between cumulative C mineralization and the percentage of the lignin-like fraction (R² = 0.73) (Fig. 5). The smaller long-term C mineralization of grass roots and beech leaves compared to oilseed rape and rye was explained by their larger fraction of lignin-like compounds. Concerning N dynamics, the amount of N mineralized during the incubation was strongly related to the initial N content of the residues (R² = 0.97).
FIG. 5. Relationship between plant residue lignin content and cumulative C mineralization after 142 d
incubation at 20°C.
% C mineralized after 142 d
a = –1.2725x + 62.185
R2 = 0.73
0 20 40 60 80
0 5 10 15 20 25 30
LIGNIN (% DM)

104
2.1.2.3. Soil type
To characterize the effect of soil type on residue decomposition and nitrogen mineralization, one residue (rye) was incubated in the three soils, and further (results not shown), beech leaves and rye-grass roots were incubated in their ‘original’ soil and a reference soil, i.e. AGRI. Carbon mineralization of rye, beech leaves and rye-grass roots was little affected by the soil type in which the residues were incorporated (rye, Fig. 6). This was particularly the case during the first weeks of incubation, where mineralization kinetics was almost identical for all three residues. Over time, mineralization kinetics slightly diverged for the three soils (max. 10%), with in general, a larger C mineralization for the residues incubated in AGRI. For all residue treatments, AGRI resulted in a larger cumulative C mineralization after 142 d of incubation compared to the other soils (results not shown). Net N accumulation in the soil was mainly determined by the mineralization of native organic N.
FIG. 6. Rye residue mineralization in AGRI (Mons), PAST (Theix) and FOR (Hesse) soils.
2.1.3. Discussion
The results demonstrate that the potential relative contribution to C storage in soil of grass roots and beech leaves is larger than that of the above ground plant parts of oilseed rape and rye, irrespective of the soil type in which they decompose. However, the largest fluxes of C and N were observed in the forest soil, when mineralization of native organic matter was taken into account.
During the initial phase of decomposition, the principal factor determining decomposition kinetics was the nature of the added carbon, which strongly affects the nature and activity of the decomposing microbial biomass. Previously established relationships between C mineralization and the biochemical plant residue quality (e.g. [4]) were confirmed. No specific interaction with the origin of the used residues (agro-, pasture or forest ecosystem) was observed, indicating that concepts for describing crop residue decomposition may be generalized for the decomposition of grass roots and tree leaves, and therefore for mixed residues in agroforestry systems.
The comparison of mineralization kinetics of one residue in three soils with different physico-chemical characteristics and land use history demonstrated the minor influence of soil type on the initial decomposition of fresh organic matter, which is in agreement with the results of Scott et al. [5]. Only during the later stages of decomposition, soil type, and in particular its texture, may have played a role in the degree of stabilization of newly formed microbial biomass and its metabolites. The soil surface area increases as clay content
Cumulative C mineralization
0 10 20 30 40 50 60 70
0 20 40 60 80 100 120 140 160
days
% of added C
Rye FOR
Rye PAST
Rye AGRI

105
increases, thereby enhancing the potential contact between the soil mineral fraction and incorporated residues, resulting in increased organic matter stabilization. The larger C mineralization in AGRI, which had the lowest clay content compared to the other soils, confirmed this hypothesis. We suggest that soil type affected the mineralization kinetics only when re-mineralization of C and N of the microbial biomass became important. As a consequence, decomposition of plant residues is not necessarily favoured in soil that receives regularly the same type of residues. This result is very important in regard to the role and adaptation of indigenous microflora of the soil in the decomposition of organic matter [6]. The large variation in the initial amount of microbial biomass-C, which was responsible for the differences in the mineralization of native organic matter in the three soils (i.e. autochthonous biomass), did not influence the decomposition rate of fresh organic matter. These results also suggest that modelling tools for the dynamics of OM in soils, mainly developed for agricultural systems, will be easily adapted to agro-forestry situations that combine a tree component and a crop component.
2.2. C and N mineraslization in a tropical soil amended with roots, stems and leaves
of four crop and one pasture species
2.2.1. Materials and methods
2.2.1.1. Characteristics of the plant residues
Four plant species were sampled on the experimental site at Goiânia (Goiàs state, Brazil): rice (Oryza sativa), soybean (Soja hispida), sorghum (Sorghum spp.) and Brachiaria (Brachiaria ruziziensis). Wheat (Triticum aestivum) grown in hydroponics was also included in the study to allow comparison with previous studies. The roots, stems and leaves of each individual plant for each species were separated and kept apart, forming a total of 15 different plant residues (5 species × 3 organs). The residues were dried at 40°C and cut by scissors to form 2–3 mm particle sizes. The total C and N concentrations, the soluble C and the proximate analysis [3] and the soluble polyphenols [7] were measured.
2.2.1.2. Characteristics of the soil and incubation conditions
The soil was sampled from the surface 0–30 cm of a field site near Goiânia, Brazil, and kept moist and in cold conditions until use. The Ferralitic soil (48% clay, pH5.6) had a bulk density of 1.3 g cm–3 and an initial mineral N content of 34 mg N kg–1 soil. The moist soil was sieved over a 4 mm screen, and pre-incubated at 15°C for 7 d before the beginning of the experiment. Soil moisture was monitored and maintained at–60 kPa. Mineral-N content in the soil was adjusted to 80 mg N kg–1 dry soil by adding KNO3 to allow decomposition under non-limiting conditions of N availability. Residues were added to the soil at the rate of 2 g DM kg–1 soil. The residues were incorporated homogeneously into 30 g of fresh soil (residue amended treatment) or without residues (control treatment) in small glass vials that were placed into 2-L glass jars, and incubated at 25°C for 100 d.
2.2.1.3. C and N mineralization
The measurement is described in Section 2.1.1.4.
2.2.2. Results
2.2.2.1. Residue quality
The biochemical fractions of the 15 crop residues (Table 1) show that the NDS-fraction (soluble-like fraction) ranged from 9 (wheat stem) to 46% (soybean leaf) of the residue DM. The lignin-like fraction varied from 3 (rice stem and wheat leaf) to 26%

106
(soybean root) of the residue DM. Soluble C extracted at 20 °C ranged from 5.7 to 28.9%
DM. The concentrations of polyphenols varied from 0.32% (wheat root) to 1.51% DM (rice leaf). The N concentration of the residues varied from 0.4% N for the wheat stem to 4.4% for the soybean leaf, leading to C : N ratios between 10.7 to 127.5.
Therefore the 15 residues provided a wide range of chemical characteristics that covered the range of values reported in the literature [4, 8]. Similarities can be observed between organs: 4 root residues out of the five were characterised by high values (>15%) of lignin-like fractions and by low soluble C and N contents. Leaves were particularly rich in polyphenols (4 out of 5 had polyphenols >1.1% DM). Stems had no particular characteristics. Different levels of polyphenols and N, as a function of the plant organ considered, were observed earlier [9]. On the contrary, the presence and effect of high contents of lignin-like fractions in roots were not emphasized earlier, probably because published work for roots, linking decomposition and biochemical quality, are rare.
TABLE 1. BIOCHEMICAL COMPOSITION (% DM) OF THE RESIDUES
Van Soest [3] compartments Species Organ
NDS ADS ADL Lignin-like
Soluble C
C N C : N Polyphenols
Brachiaria Root 20 26 38 17 5.8 40.1 1.1 36.2 0.36
Sorghum 31 23 27 19 13.6 39.3 0.6 66.5 0.62
Rice 17 35 32 16 6.7 42.3 1.4 30.5 0.49
Soybean 12 21 41 26 6.9 46.2 1.5 31.6 0.29
Wheat 17 42 33 8 10.3 41.7 0.6 69.7 0.32
Brachiaria Stem 22 32 39 7 18.5 44.3 2.3 19.6 0.73
Sorghum 19 30 42 9 22.3 45.6 0.9 48.5 0.70
Rice 27 37 34 3 28.9 44.8 1.0 46.6 0.49
Soybean 33 14 41 12 24.2 44.4 2.0 22.5 0.42
Wheat 9 27 52 6 12.5 44.7 0.4 127.5 0.55
Brachiaria Leaf 22 43 30 5 15.4 37.8 1.4 26.3 1.44
Sorghum 20 46 28 6 13.9 42.4 2.6 16.1 1.51
Rice 22 34 39 5 15.9 46.9 2.6 18.2 1.18
Soybean 49 28 17 6 22.6 47.2 4.4 10.7 1.50
Wheat 21 29 44 3 14.3 42.4 0.7 59.3 0.69
Lignin alone cannot explain high values for the lignin-like fraction in roots because unlike stems, roots do not need a high content of supportive tissues [10]. The presence of suberin in the roots and its ability to form complex barriers when associated with lignin [11] could explain such high contents. This impermeable suberin-lignin structure is supposed to protect the plant from harmful substances diffusing from the soil. On the other hand, the presence of a suberin-lignin complex in roots sampled from the field could explain the relative low lignin-like fraction of the roots of wheat cultivated in hydroponics.

107
2.2.2.2. C and N mineralization
The cumulative C mineralization for the 5 plants and their respective stem, leaf and root at day 100 ranged from 40.2 ± 1.0 (soybean root) to 73.8 ± 3.1% (rice stem) of added C (Fig. 7). The C mineralization of three of the five roots did not reach 50% of C added during the incubation period while the rate of decomposition already slowed down. The lower cumulative mineralization resulted from lower rates of the decomposition right from the beginning that was not compensated for later on. It suggests that roots may behave in a specific way due to their chemical characteristics, but it was not possible to establish a significant relationship between any of the measured biochemical characteristics and the C mineralization kinetics of the roots (data not shown). No significant differences were observed between C kinetics of the stems and leaves.
Net N mineralization (Fig. 8) showed a large range of patterns, both in absolute terms and in terms of kinetics. Net N immobilisation was observed for all the residues over the period investigated (where most of the decomposition occurred), except soybean, Brachiaria and sorghum leaves and soybean root that showed rapid net N mineralization. The net N mineralization varied between–31.8 mg N kg–1 dry soil (wheat leaf at day 17) and +65.1 mg N kg–1 (soybean leaf at day 100). Linear relationships were obtained between the amount of N mineralized after 60 d and the initial organic N content of the residue. Correlation was less significant for the roots (r2 = 0.70) than for the leaves (r2 = 0.93) and for the stems (r2 = 0.91) (data not shown).
FIG. 7. Cumulative C mineralization of leaf, stem and root for Brachiaria, sorghum, rice, soybean,
and wheat plants.
-40
-20
0
20
40
60
80
0 20 40 60 80
roots stems leaves
C-CO2 (% added C)
Mineral N (mg. kg-1 d.s.)
Soybean leaf
Wheat stem
Soybean root
-40
-20
0
20
40
60
80
0 20 40 60 80
roots stems leaves
C-CO2 (% added C)
Mineral N (mg. kg-1 d.s.)
Soybean leaf
Wheat stem
Soybean root
C-CO2 (% added C)
Mineral N (mg. kg-1 d.s.)
Soybean leaf
Wheat stem
Soybean root
FIG. 8. Net production of mineral-N in soil after incorporation of leaf (green lines), stem (blue lines)
and root (red lines) of Brachiaria, sorghum, rice, soybean, and wheat plants. Mineral-N is plotted
against % C mineralized and calculated by difference with the control at each time and by difference
with day 0 for each treatment.
0
20
40
60
80
0 20 40 60 80 100
roots stems leaves
Brachiaria root Soybean root Rice root

108
2.2.3 Discussion
The C and N mineralization of leaf and stem residues from soybean, sorghum, Brachiaria and rice obtained from tropical conditions were related to their biochemical composition and could be fairly well predicted from their N content, thus indicating a similar behaviour of a range of crop residues from temperate agrosystems. However roots generally behaved differently from leaf and stem, with 20 to 30% less C mineralized, and this was assumed to be related to the presence of a high lignin-suberin content in the roots. The lower decomposition of root-C translated into higher stabilisation of root-derived C into the soil, suggesting a higher contribution of root systems than above ground parts to the soil organic C pool. Previous results (e.g. [2]) also showed low rates of decomposition for roots. This suggests that inputs of C from roots contribute proportionally more than other plant parts to the long-term build up of soil organic matter. This could be particularly important in terms of C sequestration. Future investigations should explore the specific composition and tissue organisation of roots, and characterize the nature of the undecomposed root C. It is likely that failure in predicting the long-term status of C in soils resulted not only from an underestimation of the inputs of root-C in soils, but also from an overestimation of root decomposition, as usually this decomposition was assumed to be similar to above ground plant parts.
3. CROP RESIDUE LOCATION
The effect of crop residue location on C and N mineralization and soil water status was investigated in two incubation experiments. The objective of the first experiment was to evaluate the effects of soil-residue contact by surface placement or incorporation of residues on C and N mineralization in a tropical soil. The second experiment aimed at evaluating how residue placement affects soil physical processes, and particularly how residue mulch affects soil water dynamics and in turn microbial activity and C and N fluxes.
3.1. C and N mineralization in a tropical soil with the stems of four crop and one
pasture species incorporated or unincorporated
3.1.1. Materials and methods
3.1.1.1. Characteristics of the soil and residues
A Ferralitic soil with 48% clay, 1.74% organic C and pH5.6 and was sampled from the surface 0–30 cm of an experimental field site in Goiânia (Brazil). The moist soil was sieved over a 4 mm screen, and pre-incubated at 15°C for 7 d. The mineral N content in the soil was adjusted to 80 mg N kg–1 dry soil to allow decomposition without N limitation. Dry stems from rice (Oryza sativa), soybean (Soja hispida), sorghum (Sorghum spp.), Brachiaria (Brachiaria ruziziensis) and wheat (Triticum aestivum) were added to the soil at the rate of 3.2 g DM kg–1 soil. Residues were previously described (Table 1).
3.1.1.2. Incubation conditions and analyses
The residue particles were incorporated homogeneously into the soil or placed as a single layer on the soil surface. Fresh soil (30 g), with or without residues, were placed in glass vials that were then placed into 2-L glass jars, and incubated at constant temperature (25°C) and moisture (–60 kPa) for 120 d. The CO2 produced was trapped in 0.25 M NaOH and back-titrated with 0.25 M HCl. Mineral N was extracted on 7 occasions during the incubation with 1 M KCl after destructive sampling of the soil, and analysed for NH4
+ and NO3
- by continuous flow colorimetry.

109
3.1.2. Results
Overall, no significant differences (Bracharia and soybean) or small differences at some dates (rice, sorghum, wheat) were observed in the C mineralization kinetics between incorporated and surface-applied residues (Fig. 9(a)). Indeed, incorporated residues decomposed a little faster at the beginning but this was compensated for later on (no significant differences after 22 d). This may be due to a delay in colonization of residues by decomposers and/or a delay in moistening of residues that was compensated for rapidly. The residues with smaller N contents (i.e. wheat) were not affected by location, indicating that limited N availability for surface-placed residue did not occur. There was therefore no effect of residue placement on decomposition, whatever the biochemical composition of the residues, suggesting that the residue location at the surface does not affect decomposition per
se, and that the experimental design allowed similar conditions for decomposition at the surface and within the soil (temperature and moisture, N availability). The Brachiaria and soybean residues had a large N content (i.e. smaller C : N ratio) and induced less net N immobilisation in soil compared to the other three residues (Fig. 9(b)), which is an expected result [4]. For these two residues, the net N mineralization was slightly greater with surface applied residues compared with incorporated residues. For sorghum, rice and wheat, net N immobilisation was larger and similar whatever the residue location. These results indicate an interaction between residue N content and placement that affected the N dynamics in soil. Since mineral N was added to the soil to prevent N limitation during decomposition, the lack of an effect of residue placement on C mineralization suggests that placing a single layer of residue at the soil surface does not affect availability of soil mineral-N to decomposer micro-organisms.
(a)
0
20
40
60
80
0 20 40 60 80 100 120
C-CO2 (% added C)
Time (day)
Brachiaria stems
Rice stems
Buried
Surface
0
20
40
60
80
0 20 40 60 80 100 120
C-CO2 (% added C)
Time (day)
0
20
40
60
80
0 20 40 60 80 100 120
C-CO2 (% added C)
Time (day)
Brachiaria stems
Rice stems
Buried
Surface
(b)
-35
-25
-15
-5
5
0 15 30 45 60
C-CO2
(% added C)
Mineral N (mg. kg-1 d.s.)
Buried
Surface
-35
-25
-15
-5
5
0 15 30 45 60
C-CO2
(% added C)
Mineral N (mg. kg-1 d.s.)
Buried
Surface
FIG. 9. (a) Cumulative CO2 mineralized (expressed as % C added) and (b) Net changes in
mineral N in soils expressed against C mineralized (% added C) for Brachiaria and rice
stems during 120 d of incubation at 25°C. Continuous lines correspond to incorporation of
residues; dotted lines correspond to surface placement of residues. Values are means of 3
replicates.

110
The micro-aggregated structure of the Ferralitic soil was probably a positive characteristic that increased soil contact with the residue. Also, the ability of fungi to colonize surface residues, even when not directly in contact with the soil, and the translocation of N by their hyphae may explain why no limitations were observed [12]. This might not be true if larger amounts of residue were left as a mulch at the soil surface, with a large fraction of the residue mass having no direct contact with the soil. The smaller net N immobilisation observed for Brachiaria and soybean residues decomposing at the surface of the soil is probably due to a more efficient use of residue-N by decomposers when left at the surface, which would provide a significant “advantage” for N-rich residues.
3.2. Water, C and N dynamics in a temperate soil amended with a mixture of leaves,
stalks, branches and pods of oilseed rape labelled with 13
C and 15
N
3.2.1. Materials and methods
3.2.1.1. Characteristics of the soil and plant residue
The soil was a silt loam, obtained from the experimental site of INRA, Mons-en-Chaussée, France. The surface 0–25 cm soil was sampled, sieved (<2 mm) at field moisture content and stored at 4°C prior to use. The soil pH (H2O) was 8.2 and it contained 0.67% organic C and 0.092% N, resulting in a C : N ratio of 7.3. The selected fresh organic matter was mature rape (Brassica napus L.), doubly labelled with 13C and 15N. Oilseed rape was grown under hydroponic conditions in a plant growth chamber with an atmosphere enriched in 13C-CO2, and in a nutrient solution with 15N-KNO3 [2]. The atom excess was 2.88% for 13C and 9.73% for 15N. The applied residues, chopped to 1 cm size, consisted of a mixture of leaves (25%; C : N: 13), stalks (41%; C : N: 49), branches (8%; C : N: 50) and pods (26%; C : N: 30). The C : N ratio of the mixture was 29 (42.2% C, 1.45% N). Its biochemical composition determined by proximate analysis [3] consisted of 44.5% soluble fraction, 33.9% cellulose, 14.7% hemi-cellulose and 6.9% lignin-like fractions.
3.2.1.2. Soil column preparation
Plastic cylinders (PVC, 15.4 cm i.d. and 30 cm high) with perforated bases were filled with soil and compacted to a bulk density of 1.3 g cm–3. Rape residues were applied either at the surface (referred to as ‘mulch’) or homogeneously mixed in the upper 10 cm (referred to as ‘incorporated’) before compaction, at a rate of 14.83 g column–1, equivalent to a return of 8 t ha–1. The same amount of soil was used for the control and the mulch treatment; but when residues were incorporated an equivalent volume of soil was replaced by the volume of the added residues. For each treatment, 3 × 3 columns were provided for destructive sampling during the incubation period. In addition, 2 columns per treatment were equipped with TDR probes and tensiometers at –6 and –14 cm below the soil surface; and soil solution samplers were installed at –2 cm, –10 cm and –18 cm. These columns were also used to measure the CO2-flux.
3.2.1.3. Incubation conditions
At the start of a 9 week incubation period, artificial rain was applied on all of the soil columns during 2.5 h at a rate of 12 mm h–1, increasing the volumetric water content of the columns to 33.7%. Subsequently the soil columns were transferred to a controlled-environment chamber and left uncovered at 20°C and 70% relative humidity to allow evaporation. After 3 and 6 weeks of incubation and at the end of the incubation (9 weeks), 3

111
soil columns of the control, mulch and incorporation treatments were destructively sampled, while the remaining columns were adjusted to the initial water content by submitting them again to a new rain event.
3.2.1.4. Analyses
Soil respiration and residue decomposition were determined by measuring the CO2-flux and the concentration of 13C-CO2 from the soil surface. For this purpose, a temporary head space was created by fixing an enclosure on top of the columns, and the accumulation of CO2 during 3 min was measured by infrared gas analysis. The 13C-CO2 was determined using an air-circulating system, in which the air was returned to the headspace after stripping the CO2 in NaOH solution. After every rain event, one series of columns was sacrificed to measure the soil microbial activity, the aggregate size distribution and the distribution of 13C and 15N in every aggregate size fraction. At different depths, soil was analysed for total C and N (with their isotopic excess), soluble C and mineral N. For the ‘mulch’ and ‘incorporated’ treatments, the soil and the residues were separated over a 2 mm sieve to obtain the ‘soil fraction’ (<2 mm) and ‘residue fraction’ (>2 mm).
3.2.2. Results
3.2.2.1. Water fluxes
Mulch reduced the soil water evaporation rate by about 50% compared to the ‘control’ or the ‘incorporated’ treatment (Fig. 10A). It also reduced the temporal variability of the evaporation rate during the 9 week incubation period. This translated into a higher soil water content under the mulch (Fig. 10B). The ‘control’ and ‘incorporated’ treatments developed a clear humidity gradient and were subjected to more pronounced dry-wet cycles (not shown). These observed differences in soil and residue water content between the two treatments are key factors determining the decomposition rate of the residues.
FIG. 10. (A) Mean evaporation rate for the ‘control’, the ‘mulch’ and the ‘incorporated’ treatments during 3 dry-wet cycles and (B) Temporal changes in the volumetric water content of the whole
columns for the ‘control’ (•), the ‘mulch’ (ο) and the ‘incorporated’ (�) treatments during the 9 week
incubation period. Arrows (↓) indicate the imposed rain events. Error bars give the standard deviation of 3 replicates.
B: Volumetric Water Content
Days
0 10 20 30 40 50 60 70
Vo
l. w
ate
r co
nte
nt (%
)
22
24
26
28
30
32
34
36
38
Control
Mulch
Incorporated
A: Evaporation rate
Treatment
Control Mulch Incorporated
mm
/ d
ay
0,0
0,5
1,0
1,5
2,0
Cycle 1
Cycle 2
Cycle 3

112
3.2.2.2. C dynamics
In general, a larger CO2-flux was measured when residues were incorporated, except for the first days after a rain event (Fig. 11). The influence of changing soil water content on microbial activity could be inferred from the CO2-flux of the control soil. During the first 14 d of each 3 week evaporation period, the CO2-flux gradually increased, due to the combined effect of a facilitated release of CO2 from the soil solution and a stimulation of the soil microbial activity due to the rain pulse. At day 14 of each dry-wet cycle, the soil water content was estimated at 26%vol or 20%grav. From this point, a further decrease in soil water content led to a decreased CO2-flux due to reduced substrate availability.
FIG. 11. The CO2 flux for the ‘control’ (•), the ‘mulch’ (ο) and the ‘incorporation’ (�) treatments
during the 9 week incubation period. Arrows (↓) indicate the imposed rain events. Error bars give the
standard deviation of 2 replicates for the ‘control’ and ‘mulch’ treatments, and 3 replicates for the ‘incorporation’ treatment.
At the end of each dry-wet cycle, the residual residue-C in 3 columns of each treatment was calculated from the soil total C and its 13C isotopic excess (Table 2): 18.7% of the residue-C was mineralized when applied as mulch, and 54.7% when incorporated into the soil. After 9 weeks of incubation, 73.5% of the residue-C remained in the mulch, whereas 7.8% was transferred into the soil fraction (<2 mm) (Table 2), and could be found down to 10 cm. When incorporated, 20.7% of the residue-C was recovered from the residue fraction (>2 mm), while 24.6% had entered the soil fraction, of which 10.8% was leached down to 17.5 cm. The migration of residue-C into the soil fraction mainly took place in the first 3 weeks of the incubation: 86% for the mulch and 95% for the incorporation treatment.
The larger percentage of residue-C recovered in the soil fraction when residues were incorporated, can be explained by the contribution of fresh particulate organic matter. The residue-C in the soil under mulch probably resulted from dissolved organic carbon or small residue particles transported by the applied rain. The direct impact of the rain on the mulch caused an immediate release of the soluble carbon from the residues. After 3 weeks of incubation, 65% more dissolved organic C was found in the soil under mulch compared with the ‘incorporated’ treatment. The total microbial activity was stimulated in these soil layers enriched by residue-C (results not shown). The difference in origin of fresh organic matter in the soil will influence the formation and stability of aggregates and the distribution of 13C in the different aggregate size classes. In the longer term, effects on C stability by physical protection could be anticipated.
CO2 Flux
Days
0 10 20 30 40 50 60 70
mg
C /
kg
/ d
ay
0
5
10
15
20
25
Control
Mulch
Incorporation

113
TABLE 2. DISTRIBUTION OF RESIDUE-C AT THE END OF EACH DRY-WET CYCLE FOR
THE ‘MULCH’ AND ‘INCORPORATED’ TREATMENTS
Mulch Incorporated Carbon (%)
Cycle 1 Cycle 2 Cycle 3 Cycle 1 Cycle 2 Cycle 3
In residue fraction (>2 mm) 84.2 79.2 73.5 45.7 25.0 20.7
In soil fraction (<2 mm) 6.7 7.7 7.8 23.3 27.7 24.6
Mineralized 9.1 13.1 18.7 31.0 47.3 54.7
3.2.2.3. N dynamics
The initial LOCALISATION of the applied residues determined the distribution of residue-N in the soil during the decomposition (Table 3). After 9 weeks of incubation, 77.7% of the initial residue-N was recovered in the soil fraction (<2 mm) while only 17.9% was left in the residue fraction (>2 mm) when the residues were incorporated. With the mulch, 48.6% of the initial residue-N was found in the soil fraction and 45% remained in the residues at the surface. In both treatments, the 15N balance suggests that on average 5% of the initial residue-N was lost by gaseous emissions.
Residue incorporation resulted in net N immobilisation during the whole incubation period and mainly took place in the upper 5 cm of the soil profile. Only the decomposition of residues left as mulch led to net N mineralization (Fig. 12).
TABLE 3. DISTRIBUTION OF RESIDUE-N AT THE END OF EACH DRY-WET CYCLE FOR THE ‘MULCH’ AND ‘INCORPORATED’ TREATMENTS
Mulch Incorporated Nitrogen (%)
Cycle 1 Cycle 2 Cycle 3 Cycle 1 Cycle 2 Cycle 3
In residue fraction (>2 mm) 56.8 53.4 45.0 20.7 17.2 17.9
In soil fraction (< 2 mm) 39.0 43.4 48.6 67.0 77.6 77.7
N mineralisation
Days
0 10 20 30 40 50 60 70
mg N
O3-N
/ k
g
-6
-4
-2
0
2
4
6
Mulch
Incorporated
FIG. 12. NO3
--N in the soil for the ‘mulch’ (ο) and the ‘incorporation’ (�) treatments during the 9 week incubation period. Error bars give the standard deviation of 3 replicates. NO3
--N was calculated
by difference at each sampling date between control and residue treatments, and by difference with the initial NO3
--N content.

114
3.3. Discussion on crop residue location
When residues were placed on the soil surface or were incorporated into the soil when N availability was not a factor limiting decomposition, and where there was no gradient in soil and air humidity and temperature, there was no significant effect of placement on C dynamics and little difference in N dynamics, whatever the biochemical quality of the residues. It appears that the soil-residue contact per se does not influence residue decomposition, at least in the short term (<60 d at 25°C). This information is useful in understanding the various factors involved in the ‘soil-residue’ contact, but this situation almost never occurs in situ, where most of the time, the plant litter forms a thick mulch at the soil surface, and the soil is submitted to gradients of temperature, moisture, nutrient availability and microbial activities.
When residues were placed either at the soil surface as a mulch or incorporated, in an experimental system that mimics actual conditions, i.e. allowing water and solute transport into the soil after rain and evaporation, the first main effect of residue location was a change in evaporation rate, and therefore in soil moisture content and distribution, acting in turn on microbial activity and N mineralization. The decomposition of surface-placed residues was also under the control of water content, i.e. directly influenced by the rain pattern and air humidity. As expected the distribution of C and mineral N through the soil profile varied considerably between ‘mulch’ and ‘incorporated’ residue treatments. It was the result of the combined effects of soil water content on microbial activities and nitrate transport, and of C LOCALISATION on microbial growth and N immobilisation. These results suggest a strong interaction between physical characteristics (here particularly water dynamics) and OM dynamics in the soil, and the need for a better understanding of how mechanisms influence each other.
4. CONCLUSIONS
While this research was mainly conducted in the context of arable crops, the conclusions on the role of residue quality and of residue location on nutrient cycling in the short-term, and C storage in the medium-term, are relevant to agroforestry systems, where nutrient dynamics are driven either by a combination or succession of plant species that differ greatly in terms of (i) contribution of above- versus below ground litter, (ii) biochemical quality and N content and (iii) conditions for decomposition (at the soil surface or into the soil). In such systems, the tree leaves, whether senesced in situ or pruned for mulch or for export, not only greatly influence the recycling of nutrients in soil (particularly N) and the subsequent availability to the following crop, but also the drainage/evaporation sequences and the soil water content. Therefore, depending on the climatic characteristics, the decomposition of a mulch of plant litter may or may not be under the control of rain events, and may or may not significantly influence the soil microbial activity and nutrient fluxes underneath. It is important to consider that the biochemical quality of plant litter determines its potential degradation whatever the recent soil history, and simplifies the conceptualization and modelling of C and N cycling associated with the return of plant litter of various origins to the soil. For all types of plant cover (annual and perennial plants, trees), there is a need to better quantify above- and below ground inputs to soil organic matter, and to better characterize their biochemical composition and structure in order to be able to predict their contribution to C storage in soil and soil fertility. The selection of appropriate tree species that determine the subsequent availability of plant litter of various biochemical qualities, and the contribution of root systems in nutrient cycling, are key issues in agroforestry systems.

115
REFERENCES
[1] ROBERT, M., La Séquestration du Carbone dans le Sol pour une Meilleure Gestion des Terres, Rapport sur les Ressources en Sols du Monde No. 96, FAO, Rome (2002) 76 pp.
[2] TRINSOUTROT, I., et al., C and N fluxes of decomposing 13C and 15N Brassica
napus L.: effects of residue composition and N content, Soil Biol. Biochem. 32 (2000) 1717–1730.
[3] VAN SOEST, P.J., Use of detergent in the analysis of fibrous feeds. II. A rapid method for the determination of fiber and lignin, J. Assoc. Off. Agr. Chem. 46 (1963) 829–835.
[4] TRINSOUTROT, I., et al., Relationships between biochemical quality of crop residues and C and N mineralization kinetics under non-limiting N conditions, Soil Sci. Soc. Am. J. 64 (2000) 918–926.
[5] SCOTT, N.A., et al., Soil textural control on decomposition and soil organic matter dynamics, Soil Sci. Soc. Am. J. 60 (1996) 1102–1109.
[6] PANKHURST, C.E., et al., Biodiversity of soil microbial communities in agricultural systems, Biodivers. Conserv. 5 (1996) 197–209.
[7] KING, H.G., HEALTH, G.W., The chemical analyses of small samples of leaf material and the relationship between the disappearance and composition of leaves, Pedobiologia 7 (1967) 192–197.
[8] TIAN, G., BRUSSAARD, L., KANG, B.T., An index for assessing the quality of plant residues and evaluating their effects on soil and crop in the sub humid tropics, Appl. Soil Ecol. 2 (1995) 25–32.
[9] PALM, C.A., SANCHEZ, P.A., Nitrogen release from the leaves of some tropical legumes as affected by their lignin and polyphenolic contents, Soil Biol. Biochem. 23 (1991) 83–88.
[10] MAUSETH, J.D., "Roots", Botany, An Introduction to Plant Ecology, Saunders College Publishing (1995) Ch. 7, 173–194.
[11] ZEIER, J., et al., Chemical analysis and immunolocalisation of lignin and suberin in endodermal and hypodermal/rhizodermal cell walls of developing maize (Zea mays L.) primary roots, Planta 209 (1999) 1–12.
[12] FREY, S.D., et al., Fungal translocation as a mechanism for soil nitrogen inputs to surface residue decomposition in a no-tillage agrosystem, Soil Biol. Biochem. 32 (2000) 689–698.


117
SOIL N ENRICHMENT USING BIOMASS OF GLIRICIDIA SEPIUM
INJECTED WITH LABELLED 15
N FERTILIZER AND SUBSEQUENT
RECOVERY BY ZEA MAYS IN AN ALLEY CROPPING SYSTEM
S.P. NISSANKA, U.R. SANGAKKARA Department of Crop Science, Faculty of Agriculture, University of Peradeniya, Sri Lanka
Abstract
Agroforestry has been identified as a sustainable land use system for degraded lands in the humid
tropics. The dynamics of N in a Gliricidia-maize alley-cropping system was studied through the injection of 15N-
labelled fertilizer into Gliricidia trees, and subsequently the 15N label was traced into the maize crop through
Gliricidia root decomposition and prunings incorporated in the surface soil. The experiment was conducted at
the University of Peradeniya, Sri Lanka. The roots of 3 year old Gliricidia trees were isolated by lined trenches
and the trunks were injected with 15N-enriched ammonium sulphate (98 atom %, 1.415 g tree–1) and harvested 4
weeks after labelling. Harvested above ground residues were applied to 3 equal compartmentalized sections
around isolated trees (2 m radius) to form three treatments. T1: 15N labelled above ground Gliricidia residue and
15N-labelled Gliricidia roots remained in the compartment (roots not removed); T2: similar amount of non-
labelled above ground Gliricidia residues and 15N-labelled roots remained; T3: non-labelled Gliricidia residues
and 15N-labelled Gliricidia roots removed. Four weeks after incorporation of Gliricidia residues to the respective
plots, a maize crop was planted. N cycling and corn productivity were measured. The 15N distribution among
different parts of Gliricidia 4 weeks after injection was 71, 15 and 1.7% in the stems, leaves and roots,
respectively, with the total recovery of 88%. 15N recoveries by the subsequent maize crops amounted to 13%
from Gliricidia foliage and roots. Approximately 10% of the N recovered by maize was from leaves and stems
of Gliricidia residues, while around 2% was recovered from Gliricidia root residues. Surface soil organic C and
N contents increased with the addition of Gliricidia residues up to 4–6 weeks and gradually declined with time.
Soil C derived from Gliricidia residues ranged from 21–36%. The injection of 15N into the tree component of an
agroforestry system promises to be an effective way to evaluate N cycling in mixed cropping systems.
1. INTRODUCTION
In situ soil organic matter replenishment is a very important requirement in tropical cropping systems for maintaining sustainability. Agroforestry systems are assumed to be superior to other cropping systems with respect to organic matter addition, protection from erosion and improving micro climatic conditions. In addition, these systems provide various other production benefits to farmers such as timber, fuelwood, food, fodder, etc.
Zijestra [1] emphasized the need for improved land use in all shifting cultivation areas in Sri Lanka. An inter-ministerial study group on soil conservation in 1986 recommended implementation of a phased withdrawal of cultivation from vulnerable areas, and to afforest steep slopes with suitable species to be kept under permanent forests. Agroforestry was proposed as a land use system to replace chena and tobacco shifting cultivation. However, farmer adoption of agroforestry is low due to the lack of understanding of its importance. The impact of such systems in terms of resource utilization, nutrient cycling and productivity improvement needs to be demonstrated.
Therefore, the objective of this research was to study the potential of an alley-cropping system to improve degraded land and crop productivity in the Mid-Country Intermediate Zone of Sri Lanka. The N dynamics of Gliricidia residues labelled with 15N through tree injection, and subsequent recovery by Zea mays in an alley cropping system was studiied. The specific objectives were to determine (i) Injected 15N dynamics within the plant parts of Gliricidia and percentage recovery of 15N, (ii) Soil chemical and physical properties as influenced by the

118
addition of Gliricidia residues, (iii)Productivity and 15N recovery by maize, (iv) Carbon dynamics and % carbon derived from Gliricidia residues.
2. METHODOLOGY
The 15N tree injection experiment was located in the same field where the experiment on surface application of labelled 15N was carried out at Dodangolla University Experimental Station [2]. The climatic conditions and characteristics of the soil at the experimental site were described previously [2].
2.1. Tree selection
Four Gliricidia sepium trees at the same maturity stage were selected for N injection. Selected trees were approximately 3 year old and had an average girth of 5 to 10 cm at 30 cm above the ground level. Trees were isolated 3 months before 15N injection by cutting 0.2 m wide and 1 m deep trenches around the base at a 2 m radius. Thick polythene sheets were buried in the trench down to 1m depth around each tree.
2.2. Preliminary tests on sap flow
Tests were conducted to determine sap flow rates of stems and roots using an artificial sap solution. Cut branches at different maturities and intact mature roots were dipped in the sap solution dissolved in a fuchsia dye. Stem and root injections were done with the sap solution.
The flow rate was less than 1 mL h–1 in all plant parts, and there were no visible differences among different plant parts. The injected sap flow was mainly concentrated near the bark in stems, and it was evenly distributed across roots. However, the dye had traveled up to 5 to 6 cm in the stem and 15 cm in roots after 24 h (Fig. 1).
FIG. 1. Cross section of a stem and root treated with fuchsia dye.
The tests were also carried out to check the lethal dose of injected 15N in Gliricidia
sepium. Trees injected with 2.8 g (NH4)2SO4 tree–1 showed scorching of leaves, and therefore the dose was reduced to 1.4025 g (NH4)2SO4 tree–1 in the injection experiment.
stem root

119
2.3. Preparation of solutions to be injected
A solution of 5.0 mM KCL and 0.4 mM malic acid adjusted to pH5.4 was used as an artificial sap solution [3]. The injecting solution for one plant was prepared by dissolving 1.4025g (NH4)2SO4 with 98 atom % 15N in 100 mL sap solution.
2.4. Tree injection
The trees were injected in March 2004 as described by Horwath et al. [3] with slight modifications. The injection apparatus was prepared using 50 mL pharmaceutical syringes with tubes attached. The connecting end to the tree was prepared using a 2mL syringe fixed with a rubber suba-seal. The solution-receiving syringe was fixed 1m above the point to be drilled. Using an electric drill, a 0.25 mm diameter hole was drilled 1/2 to 2/3 through the stem at 30 cm above the soil surface. The hole was immediately flushed with artificial sap to eliminate any air blockage of the xylem to ensure continuous flow of the sap. The drilled hole was immediately sealed with a rubber suba-seal and the needle from the sap solution syringe was inserted through the rubber seal. Flow of the sap started, after the air inside was removed with another needle. When steady flow was achieved, a gravity-fed reservoir containing the 15N sap solution was connected by inserting the needle through a septum to the hole. Appropriate precautions were taken to ensure that the plant was absorbing the artificial sap and there was no leakage before 15N was injected into the reservoir. Unlabelled sap solution was later used to flush labelled 15N from the reservoir until uptake ceased. The top was covered with para-film to avoid any foreign matter entering the system. Trees were injected early in the morning when soil moisture was at field capacity to improve tree transpiration and hence N uptake.
However, the time taken to complete injection varied and an average of 24 to 48 h (sometime 72 h) was taken to completely inject the 100 mL solution. For some trees two injection sets were used at a time. During the entire operation, the ground was covered with polythene sheets to prevent any solution spillage to the soil.
2.5. Tree harvesting
Six weeks after injection, each tree was injected with 25 mL of glyphosate to kill the entire plant in order to avoid any regeneration after harvesting. Plants were completely wilted 2 d after the injection of glyposate and plants were cut at ground level to collect the above ground biomass for incorporation. After the above ground plant parts were cut, they were separated into leaves and stems and weighed. Stems were chopped into small pieces (<1 cm), air dried and stored with leaves for residue incorporation.
2.6. Root excavation and isolation of compartments around the tree base
The isolated circular area (Fig. 2) was divided in to three compartments using the base of the tree as the center. Soil sampling was done in each compartment at three depths (0–15, 15–30, 30–45 cm) at 25 cm and 175 cm distance from the base of the tree.

120
FIG. 2. A schematic diagram of root excavation and quarter isolation.
After soil sampling, soil was removed down to 45 cm depth from one quarter (assigned randomly). Soil was removed layer by layer at 15 cm depth intervals (3 layers, 0–15, 15–30, 30–45 cm) and placed separately onto a polythene sheet laid on the ground. From each soil layer removed, all Gliricidia roots were collected separately by using a 2 mm sieve. The roots in each soil layer were dried (60°C), weighed and stored for future use. The soil was refilled back to the respective layers in the excavated quarter after laying a polythene sheet around the walls to separate that quarter from other quarters. The remaining quarters were also isolated by laying a polythene sheet in trenches cut along the margins. Within these walls, together with the polythene laid around the circle, 4 quarters separated from the surrounding soil were formed.
A set of control plots were established close to the injected plots. Control plots were 1.5 × 1.5 m in area. These plots were also isolated by cutting trenches down to 45 cm depth and burying polythene along the trenches.
2.7. Residue incorporation
The stored labelled Gliricidia residue was used for incorporation into quarters and the control plots. Similar sized Gliricidia trees from outside the trial were also harvested, chopped and dried to obtain non-labelled residue for incorporation for selected treatments.
Before incorporation, chopped stems and leaves of each tree were mixed uniformly. Injected residues were applied to two adjacent quarters (3 and 4) of each plot. The root excavated quarter (1) and the adjacent quarter (2) were amended with similar amounts of non-labelled residues. The amounts of labelled or non-labelled residues applied to each quarter are given in Table 1. In order to have the all injected 15N residues incorporated into the trial plots, residue application rates were adjusted on the basis of the above ground biomass of the injected Gliricidia trees. The residue was incorporated 10 cm into the soil using a hand fork.
15 cm
30 cm
45 cm
roots removed 1
23
4
roots removed
roots removed
4m

121
TABLE 1. AMOUNTS OF GLIRICIDIA RESIDUES APPLIED ON ISOLATED QUARTERS AND
SOLE PLOTS
Tree identification
number
Above ground
harvested DM (kg)
Application rate
(kg ha–1
)
Per quarter
(kg 3.14m–2
)
Per sole plot
(kg 2.25 m–2
)
1 11.022 12.921 4.06 2.91
2 12.495 14.648 4.60 3.30
3 8.986 10.534 3.31 2.37
4 10.479 12.285 3.86 2.76
2.8. Treatments
Treatments are identified based on the type of Gliricidia residues incorporated and the removal of roots in the quarter (Fig. 3).
Treatment 1 (T1): Roots intact and labelled residues applied (15N-enriched residue, roots and root exudates);
Treatment 2 (T2): Roots intact and non-labelled residues applied (15N enriched roots and root exudates);
Treatment 3 (T3): Roots removed and non-labelled residues applied (15N-enriched unrecovered smaller roots and root exudates).
These treatments were arranged in each tree injected, to get four replicates in a randomized complete block design.
FIG. 3. Treatment allocation to different quarters (Q1– Q4) of each injected tree.
2.9. Crop establishment and management
Maize variety Ruwan was planted in September 2004, in and around the circular compartments at 30 × 60 cm spacing. At this spacing, 24 plants were established in a single compartment. Fertilizer was applied according to local recommendations. Weeds were controlled by hand weeding during the entire period. Weeds removed were incorporated back into the same compartment to prevent any 15N loss from respective plots. Maize was harvested at physiological maturity. Entire maize plants were uprooted and separated into
16 m
8 m
Gliricidia tree 1 Gliricidia tree 2
Q2
Q1
Q3
Q4
Q3
Q4
Q2
Q1

122
stems, leaves, cobs and roots. Plant parts were dried at 60°C, weighed and prepared for isotope-ratio analyses.
2.10. Sampling
2.10.1. Soil sampling
Soil samples were taken just before residue incorporation, 6 weeks after residue incorporation (at planting of maize) and at physiological maturity of maize from 2 distances to the dead tree base (0.25 m and 1.75 m) and also from 3 depths of 0–15, 15–30 and 30–45 cm.
2.10.2. Plant sampling and physiological measurements
Representative Gliricidia leaves, stem and root samples were taken from each injected tree for analysis when they were harvested. Total dry matter of maize and weights of leaves, stems, roots and seeds were taken at physiological maturity. Leaf photosynthesis and leaf chlorophyll contents were measured during the silking period of maize. Isotope-ratio analyses of all plant and soil samples for 15N and 13C were done at the IAEA laboratory, Seibersdorf [4].
3. RESULTS
3.1. 15
N enrichment of Gliricidia
Three to 4 year old Gliricidia trees used for injection had a total biomass range from 11 to 15 kg tree–1 (Table 2). The N concentration was highest in the leaves and lowest in the roots. Because of the greater stem biomass, total N content in stems was 3.3 and 2 fold higher than leaves and roots, respectively. There was a wide variation in the 15N enrichment in different plant parts with roots being nearly 18 times lower when compared to leaves and stems, indicating some discrimination by different plant parts. From the amount of 15N injected (294.49 mg tree–1) the total 15N recovery was around 88% in Gliricidia plant parts. The unaccounted amount may be associated with exudates through fine roots during the period of 6 weeks and from roots that were not collected (deeper roots). The % C content was highest in stems and the mean δ13C across all plant parts was around –25.93‰.
TABLE 2. AVERAGE DRY MATTER, TOTAL N, 15
N EXCESS, TOTAL CARBON, AND δ13
C OF DIFFERENT PARTS OF 15N INJECTED GLIRICIDIA TREES
Nitrogen 15
N excess Gliricidia parts
Dry matter
(kg) (%) (g) (atom %) (mg)
% 15N recovery
C (%) δ13
C
(‰)
Leaves 1.675
(0.556)
2.6
(0.730)
43.6
(0.02)
0.102
(0.007)
44.5 15.1 38.99
(2.95)
–27.29
(0.52)
Stems 9.07
(1.406)
1.71 (0.148)
155.1 (14.24)
0.135 (0.055)
209 71.1 42.31 (0.41)
–25.41 (0.55)
Roots 4.83
(0.455)
1.62 (0.614)
78.2 (0.024)
0.0065 (0.002)
5.1 1.7 30.86 (1.82)
–25.10 (0.96)
Total 15.58 - 276.9 - 259 87.9 - -
Standard deviations of means are given in parentheses.

123
3.2. Soil N and C concentrations
At the time of tree harvesting the soil had relatively low concentrations of N and C,
but with the addition of organic matter and subsequent decomposition, N and C
concentrations increased at planting of maize and decreased again with time due to the decay
of added residues (Table 3). Soil N and C concentrations were reduced by 32 and 25%,
respectively, when soil depth increased (results not shown). Even with the added organic
residues, soil N and C concentrations were relatively low. Greater N and C concentrations
after 4–6 weeks of incubation with Gliricidia residues indicated rapid decomposition due to
the prevailing high soil temperature and moisture conditions. Soil organic C concentrations
measured at different depths at two distances from the tree base (0.25m and 1.75m) showed
no significant effects of distance (results not shown).
3.3. Maize yield
Maize dry matter production and yield components in all residue management
treatments were similar (Table 4). On average, grain yield production was 5.88 Mg ha–1
and
total dry matter production was 13.47 Mg ha–1
, resulting in a 44 % harvest index.
3.4. Physiological response of maize to residue treatments
Leaf photosynthesis, stomatal conductance and transpiration measurements taken
during the silking period were similar in all residue management treatments (Table 5).
3.5. N distribution and recovery of labelled N from Gliricidia residues by maize
The N concentrations in maize were highest in the leaves followed by grain (Table 6),
being about 5.3- and 4-fold greater in leaves and grain compared with stem and roots.
However, the 15
N enrichment among the maize plant parts did not differ. This may indicate
the absence of discrimination in moving labelled 15
N into leaves and grain.
Application of 15
N-labelled Gliricidia above ground residues to maize plots revealed
that 15
N enrichment in leaves, stems, roots and seeds increased by five fold compared with the
non-labelled Gliricidia residues added to the maize plots where Gliricidia roots were removed
or kept intact. When labelled Gliricidia residues (92.68 mg quarter–1
area) were added to the
maize plot with Gliricidia roots intact, the maize crop recovered about 13% from the enriched
residues. The amounts of 15
N excess in maize when unlabelled Gliricidia residues were added
to plots with 15
N labelled roots removed or kept intact were similar (average of 2.372 mg
quarter–1
area). This indicates that most of the labelled N in roots was released to the soil
through root exudation or decomposition of root hairs and small roots within a 4–6 weeks
period. When the amounts of 15
N excess in the non-labelled Gliricidia added treatments (with
or without roots intact) were compared (11.985–2.372 mg), it could be estimated that the
Gliricidia residue (stem and leaves) contributed 9.612 mg of 15
N excess to the maize dry
matter resulting in ~10% recovery of labelled N. Therefore, it can be suggested that the N
recovery made through root exudates and decomposition of small roots to be around 2.5%.

124
TABLE 3. TOTAL N AND ORGANIC C CONCENTRATIONS IN RESIDUE TREATMENTS
AVERAGED ACROSS SOIL DEPTHS AND DISTANCE FROM THE TREE
Treatment Soil property Sampling time
T1 T2 T3
Total N (%) Tree harvest 0.075 ± 0.003 0.079 ± 0.003 0.081 ± 0.002
Maize planting 0.080 ± 0.006 0.078 ± 0.005 0.078 ± 0.004
Maize harvest 0.069 ± 0.007 0.081 ± 0.004 0.077 ± 0.005
Organic C (%) Tree harvest 0.571 ± 0.027 0.676 ± 0.019 0.652 ± 0.017
Maize planting 0.621 ± 0.038 0.742 ± 0.031 0.664 ± 0.029
Maize harvest 0.517 ± 0.058 0.662 ± 0.039 0.630 ± 0.032
Standard deviations of means are given in parentheses.
TABLE 4. COMPONENTS OF MAIZE YIELD AT PHYSIOLOGICAL MATURITY IN RESIDUE TREATMENTS
Treatment Yield parameter
(g DM) T1 T2 T3
Cob number 1.06 ± 0.04 1.06 ± 0.06 1.00 ± 0.00
Cob DM 115 ± 10 117 ± 11 103 ± 1
Grain DM 100 ± 2 101 ± 10 93 ± 4
100 seed DM 5.08 ± 2.12 5.25 ± 0.22 4.91 ± 0.07
Stem DM 56.7 ± 3.1 53.0 ± 4.2 53.0 ± 2.5
Leaf DM 35.9 ± 1.2 34.0 ± 4.4 34.6 ± 2.0
Root DM 25.4 ± 1.3 20.7 ± 4.4 26.3 ± 0.9
Total DM 233 ± 6 224 ± 19 217 ± 11
Standard deviations of means are given in parentheses.
TABLE 5. LEAF PHOTOSYNTHESIS, STOMATAL CONDUCTANCE AND TRANSPIRATION
OF FULLY EXPANDED MAIZE LEAVES AT EARLY GRAIN FILLING STAGE AT NOON AT FULL SUNLIGHT
Treatment Physiological parameter
T1 T2 T3
Photosynthesis (μ mol m–2 s–1) 39.6 ± 0.4 41.4 ± 4.3 34.5 ± 0.5 Stomatal conductance (s cm–1) 0.19 ± 0.02 0.17 ± 0.02 0.13 ± 0.01
Transpiration (mmol m–2 s–1) 6.07 ± 0.28 5.20 ± 0.32 5.51 ± 0.48
Standard deviations of means are given in parentheses.
TABLE 6. N CONCENTRATION AND N UPTAKE OF MAIZE PER QUARTER (3.14 M2),
CONCENTRATION AND AMOUNT OF 15N EXCESS PER QUARTER, AND RECOVERY OF 15
N FROM LABELLED GLIRICIDIA RESIDUES
Nitrogen 15N excess Treatment Plant part
(%) (g quarter–1) (atom %) (mg quarter–1)
15N recovery
(%)
T1 Leaves 2.254 14.57 0.022 3.207 Stems 0.460 5.88 0.020 1.178
Roots 0.390 1.78 0.019 0.339
Grain 1.915 34.57 0.021 7.261
Total 56.8 11.985* 12.9
T2 Leaves 2.197 13.43 0.005 0.671
Stems 0.452 5.59 0.004 0.223
Roots 0.524 1.95 0.003 0.058
Grain 1.717 31.22 0.004 1.249
Total 52.19 2.202 2.5
T3 Leaves 2.480 15.42 0.004 0.617
Stems 0.407 4.57 0.005 0.228
Roots 0.374 1.77 0.004 0.071
Grain 1.617 27.12 0.006 1.627
Total 48.88 2.543 2.5
*92.68 mg 15N excess added in Gliricidia above ground residues

125
3.6. Soil carbon dynamics
Soil δ13C (‰) of the residue treatments at Gliricidia tree harvesting, maize planting and maize physiological maturity indicated that the values increased with addition of Gliricidia residues and decreased with time due to decomposition (Table 7). The % soil C derived from Gliricidia residues (taking δ13C ‰ values for Gliricidia leaves and stems as–26.35; for leaves, stems and roots as –25.93) during the period up to maize planting was in the range of 23–36 %. The δ13C ‰ decreased with time due to decomposition, and was highest in the root-removed treatment. Therefore the addition of Gliricidia residues contributed significantly to the soil C pool. However, continued residue addition is necessary to keep higher C contents in soils.
TABLE 7. δ13
C SIGNATURE IN SOIL BEFORE GLIRICIDIA RESIDUE INCORPORATION, 4
WEEKS LATER AND AT MAIZE MATURITY AND % OF SOIL C DERIVED FROM THE RESIDUES
Soil δ13C (‰) Soil C derived from residues (%) Treatment
Before residue
addition (1)
4 weeks after
addition (2)
At maize
maturity (3)
Between 1st &
2nd period
Between 1st & 3rd
period
T1 –23.22 –24.20 –24.05 36.1 30.6
T2 –23.34 –24.00 –23.94 25.5 23.0
T3 –23.64 –24.28 –23.65 23.6 3.7
4. DISCUSSION AND CONCLUSION
The direct tree injection technique used for Gliricidia resulted in a greater recovery of 15N compared with surface application to soil. Approximately 71 and 15% were recovered in stems and leaves. The % 15N excess in roots were 18-fold less than in the stems and leaves. From the amount of 15N injected (294.49 mg tree–1) the overall recovery was around 88% in Gliricidia plant parts. The unaccounted amount may be associated with exudates through roots and from the fine roots that were not collected.
McNeill et al. [5] found a recovery of 71–75% in the shoots and 3–13% in roots of subterranean clover and 53–61% in shoots and 13–26% in roots of serradella (Ornthopus
compressus) pasture legume at late vegetative growth. Russell and Fillery [6, 7] using a cotton wick stem injection techniques recovered 76% in the leaves and stems of lupin (Lupinus
angustifolius) and about 23% in the roots. In this study, Gliricidia proportionately allocated more 15N to the stem.
15N recovery by maize from the labelled tree residues applied was 13%. Approximately 10 % was recovered from the above ground residues of leaves and stems, while around 2% was recovered from roots. A field survey by Seiter and Horwath [8] using 15N stem injection techniques recovered 18% from both above- and below ground biomass of maize. However, the lower recovery in this study may be due the low decomposition of stem parts where a greater amount of 15N accumulated.
Soil organic C and N contents increased with the addition of Gliricidia residues especially in the top soil layer (0–15 cm) after 4–6 weeks and gradually declined with time. C derived from Gliricidia residues ranged from 21–36%.
The injection of tracer N provides a relatively easy ways to study the transfer of 15N into the tree and it promises to be an effective way to evaluate N cycling in mixed cropping systems.
126
REFERENCES
[1] ZIJESTRA, P.J., Erosion hazards and land suitability in the Nuwara Eliya District, IRDP, Nuwara Eliya, Sri Lanka (1989).
[2] NISSANKA, S.P., SANGAKKARA, U.R., Nutrient cycling, soil properties and physiological and yield responses in a Gliricidia-maize alley cropping system in the mid-country intermediate zone of Sri Lanka, IAEA-TECDOC- (This issue) (2008) 131–147.
[3] HORWARTH, W.R., PAUL, E.A. PREGITZER, K.S., Injection of 15N into trees to study nitrogen cycling in soil, Soil Sci. Soc. Am. J. 56 (1992) 316–319.
[4] INTERNATIONAL ATOMIC ENERGY AGENCY, Use of Isotope and Radiation Methods in Soil and Water Management and Crop Nutrition,Training Course Series No. 14, IAEA, Vienna (2001).
[5] MCNEILL, A.M., CHUNYA, Z., FILLERY, I.R.P., Use of in situ 15N labeling to estimate the total below-ground nitrogen of pasture legumes in intact soil-plant systems, Aust. J. Agric. Res. 48 (1997) 295–304.
[6] RUSSELL, C.A., FILLERY, I.R.P., In situ labeling of lupin belowground biomass, Aust. J. Agric. Res 47 (1996) 1035–1046.
[7] RUSSELL, C.A., FILLERY, I.R.P, Estimation of lupin belowground biomass nitrogen, dry matter and N turnover to wheat, Aust. J. Agric. Res. 47 (1996) 1047–1059.
[8] SEITER, S., HORWATH, W.R., The fate of tree roots and pruning nitrogen in a temperate climate alley cropping system determined by tree injected 15N, Biol. Fertil. Soils 30 (1999) 61–68.
127
NUTRIENT CYCLING, SOIL PROPERTIES AND PHYSIOLOGICAL
AND YIELD RESPONSES IN A GLIRICIDIA–MAIZE ALLEY CROPPING
SYSTEM IN THE MID-COUNTRY INTERMEDIATE ZONE OF SRI LANKA
S.P. NISSANKA, U.R. SANGAKKARA Department of Crop Science, Faculty of Agriculture, University of Peradeniya, Sri Lanka
Abstract
The objective of the research was to study the potential of alley-cropping agroforestry systems to
improve degraded lands in the Mid-Country Intermediate Zone of Sri Lanka. A field experiment was carried out
at the University of Peradeniya experimental station using Gliricidia as the hedgerow tree species. Gliricidia
hedgerows having within row spacing of 0.75 m (8 m long rows) and between row spacing of 7 m were
established. 15N-enriched ammonium sulphate (60 kg N ha–1, 10 atom % 15N excess) was applied to a subplot
(2.25 m wide × 3.5 m long) in the alley, which enclosed 3 Gliricidia trees. Labelled plant material was added to
microplots as crop residue only (ML), Gliricidia loppings only (GL), crop residue and Gliricidia loppings
(GLML), and no residues (NL) in the subsequent seasons. Soil properties, crop yields and nutrient dynamics
were recorded regularly for every growing season.Addition of Gliricidia loppings and crop residues over 5 a
improved soil chemical properties including soil organic matter, major (especially N) and minor nutrients and
physical properties. There was no significant impact of hedgerows on soil fertility compared with the sole crop
or at different distances from the hedgerow. Physiological parameters measured in this study illustrated that
hedgerows may influence one or two adjacent crop rows negatively, possibly due to competition for light or
water resources. Photosynthesis rates of both maize and cowpea crops were reduced near the hedgerow
compared to the sole crops, due to partial shading by the hedgerow. However, leaf photosynthesis and yields
were significantly greater in rows in the middle of the alleys compared with the sole-crop (control). This would
suggest the existence of complementary interactions from Gliricidia hedgerows through increasing the resource
availability and/or making the microenvironment more favorable for the crop species. Addition of Gliricidia and
crop residues (MLGL) enhanced growth and yield of crops more than the other treatments. Addition of similar
litter amounts to the sole crop also resulted in similar trends. 15N recovery by the maize crop was 25% in seeds
and 23% in leaves and stems (in total 48%).
1. INTRODUCTION
Land degradation is a serious problem in Sri Lanka. Inappropriate agricultural practices, clearing of forests for timber and shifting cultivation, improper land use patterns, non implementation of legislation or inadequate legislation towards land-use systems, land fragmentation, unfavorable tenancy conditions (insecurity of land tenure), and fire disturbance in agro/natural ecosystems are the major factors contributing to land degradation, especially in the hill country region [1, 2]. According to the FAO estimates of 1989, the total extent of degraded land in the country is about 700 000 ha, which is about 10.8% of the total arable land area [3], but actual values at present may be even higher than this.
Direct impacts of the land degradation are the loss of productivity, impoverishment of the vegetation, reduced nutrient and water holding capacity and pollution of water bodies due to sedimentation and eutrofication. When the soils become highly degraded and organic carbon in the soil becomes very low, the water holding capacity, infiltration, soil microbial diversity and activity, buffering capacity and temperature regulation of soil are drastically reduced [4].
As one of the major land use systems, shifting cultivation has been practiced on a large scale in the up- and mid-country intermediate zone, especially on sloping areas with no soil conservation measures. As a result of soil erosion, sedimentation of reservoirs has been a

128
major problem in this region. In addition, most of the lands in these regions are subjected to periodic burning and it causes extensive damage to the ecosystem. It arrests natural succession, depletes soil chemical, physical and biological properties, causes extensive losses to biological diversity and subsequently results in desertification [3].
In situ soil organic matter enrichment is a very important component in tropical cropping systems for maintaining productivity and sustainability. Agroforestry systems are assumed to be superior to other cropping systems with respect to organic matter addition, protection from erosion and improving micro climatic conditions. In addition, these systems provide additional benefits to farmers such as timber, fuel wood, food, fodder, etc.
Zijestra [5] emphasized the need for very urgent land use improvement in all shifting cultivation lands in Sri Lanka. An inter-ministerial study group on soil conservation in 1986 recommended stopping further expansion of shifting cultivation and tobacco cultivation in the hill country, implementation of a phased withdrawal of cultivation from vulnerable areas, to afforest with suitable species and to keep steep slopes under permanent forests. Agroforestry was also suggested as a priority activity in chena (shifting cultivation) and tobacco cultivation areas.
Some initiatives have been taken to conserve lands using different low cost conservation measures such as agroforestry systems. However, most of the farmers are reluctant to adopt agroforestry systems due to their unawareness of its importance. It is important to study the impacts of such systems, especially resource utilization, nutrient cycling in soil and productivity improvements.
Therefore, the objectives of this research were to study the potential of alley cropping agroforestry systems to improve degraded lands, while increasing crop productivity as a viable land use system in the Mid-Country Intermediate Zone of Sri Lanka. Nitrogen dynamics in the system were studied using labelled 15N indirectly (soil surface application). The specific objectives were to assess and quantify (i) Nutrient dynamics (mainly N) in tree and crop components, (ii) Nutrient use efficiency of added organic matter of tree and crop components, (iii) Growth and physiological response of crops as influenced by hedgerows, (iv) Improvement of soil properties due to long-term addition of organic matter from the alley species.
2. METHODOLOGY
2.1. Experimental site
The experiment was carried out at the University of Peradeniya Experimental Farm at Dodangolla. The site is located at 8° North and 81° East, with the altitude of about 367 m above sea level. The major soil type of the region is a Reddish Brown Latosol and according to the Soil Taxonomy [6] it is a Rhodudult. The rainfall pattern is bimodal and the rainy seasons range from April to September (Yala) and October to February (Maha). The mean annual rainfall varies from 1500–2000 mm and the mean annual maximum temperature ranges from 28–32°C. The experimental site was located in the Agro-Ecological Zone of Mid-Country Intermediate Zone (IM3), and was representative of degraded farm lands in the zone.
2.2. Treatments and experimental layout
The experiment was laid out with eight treatment combinations in a Randomized Complete Block Design with four replications. The treatments were as follows:

129
Gliricidia hedgerow alley cropping with surface application of 15N-fertilizer:
• T1 : Enriched Gliricidia lopping residue only; • T2 : Enriched crop residues only; • T3 : Enriched Gliricidia lopping and crop residues; • T4 : No Gliricidia lopping or crop residues.
Sole cropping with the application of different combinations of 15N-enriched Gliricidia and crop residues obtained from the alley cropping microplots:
• T5 : Gliricidia lopping only; • T6 : Crop residues only; • T7 : Gliricidia lopping and crop residues; • T8 : No Gliricidia lopping or crop residues.
Alley-cropping plots consisted of four vegetatively propagated Gliricidia hedgerows each 8 m in length (Fig. 1). Spacing between hedgerows was 7 m and spacing within the row was 0.75 m. The total area for the alley cropping plots and sole crop plots were 21 m × 8 m each. Gliricidia poles 2.5 cm in diameter and 1 m in length were planted to a depth of 0.3 m in the alley cropping treatments in June 1999.
FIG. 1. Layout of the 15
N-fertilizer subplot area (2.25 m × 7 m) and the arrangement of the enriched
Gliricidia and crop residues applied within the surfaced applied 15
N microplot areas in the alley
(a:T1, T2, T3, T4) and sole crop (b:T5, T6, T7, T8) areas in subsequent seasons.
2.3. Cropping pattern
1st season (Maha: November 1999–March 2000)
The experiment was established in November 1999. Maize was grown in the alleys and in the sole crop treatments using the standard recommendations given by the Department of Agriculture. The first season was cultivated to get the productivity of the site without organic matter additions from Gliricidia or crop residues.
2nd
season (Yala: May 2000–September 2000) Loppings of the hedgerows and crop residues were incorporated into the soil in the
respective treatments 3 weeks before the planting of maize for the Yala season (May 2000). The recommended level of fertilizer was applied as a basal application and as a top dressing.
***********************
< 8 m>
***********************
**********************
**********************
< 2.25 m>
T1 T2
T4 T3
3.5 m
3.5 m
7 m
1.5 m
1.5 m T5
T8
T6 T7
Layout of alley-crop area with microplots (a) Layout of sole-crop area with microplots (b)
Gliricidia hedgerows
130
Labelled 15N fertilizer was applied to a subplot of the alley system as a top dressing at a rate of 60 kg N ha–1 3 weeks after the planting of maize. The subplot area was 2.25 m × 7m as shown in Fig. 1.
3rd
season (Maha: 2000 October–March 2001) Gliricidia hedgerows were lopped and fresh weight was taken, and then incorporated
into the soil during land preparation. Gliricidia loppings and crop residues from the 15N fertilizer subplots were removed and the area was divided into 4 equal microplots. Then 15N labelled Gliricidia and crop residues in different combinations were added separately to each microplot to study the N and organic C dynamics added from different litter types. The respective litter treatments of Gliricidia loppings (T1:GL), crop residues (T2:ML), Gliricidia loppings and crop residues (T3:GLML) and no litter (T4:NL) were allocated randomly (Fig. 1). Four microplots (1.5 m × 1.5 m) were also marked in the sole cropping treatment as shown in Fig. 1 and treatments of Gliricidia loppings (T5:GL), crop residues (T6:ML), Gliricidia loppings and crop residues (T7:MLGL) and no residues (T8:NL[control]) were allocated randomly. Respective organic matter types obtained from the 15N subplots were added using rates similar to the dry matter production per unit area in the given season. A maize crop was planted 3 weeks after residue incorporation using 30 cm × 60 cm spacing, and all the other cultural and management practices were carried out according to the Department of Agriculture recommendations for each season.
4th
season (Yala: 2001 June–October 2001): The cropping pattern was the same as the 3rd season. Addition of litter materials and
nutrients, and other management techniques were similar to the previous season.
5th
season (Maha: 2001 November–March 2002): The cropping pattern was the same as the 4th season.
6th
season (Yala: 2002 May–September 2002): The cropping pattern was the same as the 5th season. There were several dry spells and
the crop was irrigated. Production was reduced significantly due to the drought conditions. This season was a failure and there was no harvest.
7th
season (Maha: 2002 October–March 2003): An intercropping experiment of maize and cowpea with Gliricidia was carried out.
8th
season (Yala: 2003 May–September 2003): Cowpea (Vigna unguiculata) was established as a single crop with Gliricidia.
9th
season (Yala: 2004April–August 2004): The cropping pattern was the same as the 8th season.
10th
season (Maha: 2004 September–February 2005): The cropping pattern was the same as the 9th season.
2.4. Analysis of soil samples
Soil samples were taken from three depths, 0–15, 15–30 and 30–45 cm in the microplots where 15N was applied, at 0.75 cm (A) and 3 m (B) away from the hedgerow, respectively, before planting maize in each season. Soil pH, organic matter, total N, available P and exchangeable Ca, Na and K were measured in each season. Subsamples were sent to IAEA for the isotope-ratio analyses of labelled material [7].

131
2.5. Physiological parameters
Leaf chlorophyll content of the top ear leaf of maize and Gliricidia leaves were measured at regular intervals using a chlorophyll meter (SPAD; Minolta). Measurements were taken from 6 maize plants (two readings per plant) and from ten Gliricidia leaves from each treatment. Stomatal resistance, leaf transpiration, leaf temperature, leaf photosynthesis and water potential were also measured every 2–3 h on selected dates during the silking and grain filling periods of maize from the middle of each row (there were 8 maize rows between two Gliricidia hedgerows) from the 3rd sunlit leaf from the top in some seasons. A portable steady state porometer (Li-Cor 1600), an infrared gas analyzer (Li-Cor 6400) and a pressure bomb were used to make the above measurements.
2.6. Plant dry matter and grain yield
Destructive samples were taken every 4 weeks from planting to determine dry matter partitioning to leaves, stems, roots and ears and the grain yield at physiological maturity. Sub samples of maize leaves, stems, roots and grain, weeds and stems and leaves of Gliricidia were also taken, ground and sent to the IAEA laboratory for labelled N and C analyses [7].
3. RESULTS
3.1. Weather conditions
The amount of rainfall and variations in temperature during the last 5 years of the experiment were similar to the normal pattern of the intermediate zone. The rainfall distribution pattern is bimodal having two peaks at Yala and Maha (Fig. 2). Greater rainfall is received during the Maha season compared with the Yala season. However, the rainfall distribution was slightly abnormal and several droughts were experienced in some seasons (2000 Maha, 2002 Yala, 2003 Maha). In order to protect the crop, irrigation was provided when it was necessary.
FIG.2. Distribution of rainfall for 2000/01/02 years at the experimental site.
3.2. Initial soil chemical and physical properties
The soil profile showed high sand and low clay contents (Table 1). The mean weight diameter (MWD) of the soil particles was used to analyze the dry aggregate stability, which was poor in each soil horizon, indicating greater vulnerability for erosion. The cation exchange capacity ranged from 14–19 cmol+ kg–1 soil. This relatively high CEC may be due
0 50
100 150 200 250 300 350 400
0 1 2 3 4 5 6 7 8 9 10 11 12Months of year
Monthly total RF (mm)
RF 2000 RF 2001 RF 2002

132
to the immature nature of the soil. Weathering parent material (C horizon) was present below 40–48 cm depth, with fine mica common in the A3 and BW horizons and abundant mica in the C horizon.
The soil was initially slightly acidic and had very low organic matter and total N concentrations across all depths (Table 2). Soil organic matter and total soil N were, however, significantly higher in the topsoil layer (0–10 cm) and decreased with depth. Low organic matter in the soil resulted in a relatively high soil bulk density (1.2–1.5 g cm–3) and relatively low dry and wet soil aggregate stability, which predisposed the soil to wind and water erosion.
Continuous additions of lopping materials from hedgerows and crop residues over 4 years, improved soil organic matter and total nitrogen contents (Tables 2, 3 and 4), CEC and other soil chemical and physical properties (data not shown). Soil organic matter contents near the hedgerows were slightly higher than 3 m away from the hedgerow, which may be due to a lower soil temperature resulting in a slower rate of decomposition compared with the middle of the alley. Organic matter content decreased with soil depth.
TABLE 1. TEXTURE, MEAN WEIGHT DIAMETER (MWD) AND CATION EXCHANGE CAPACITY (CEC) OF THE SOIL HORIZONS
Particle size distribution (%) Soil horizon
Sand Silt Clay
Texture MWD
(mm)
CEC
(cmol+ kg–1
)
A3 (0–21 cm) 80.7 10.2 9.1 Sandy loam 0.90 14.2
BW (21–48 cm) 83.7 5.1 11.2 Sandy clay loam 0.91 17.8
TABLE 2. INITIAL SOIL PROPERTIES OF THE EXPERIMENTAL SITE AT DIFFERENT SOIL DEPTHS (MEANS OF 4 REPS ± STANDARD DEVIATION)
Depth (cm) pH Organic matter (%) Total N
(mg N g–1)
Exchangeable K
(cmol+ kg
–1)
0–15 6.33 ± 0.02 0.56 ± 0.01 0.05 ± 0.017 5.2 ± 0.6
15–30 6.01 ± 0.13 0.27 ± 0.07 0.04 ± 0.010 3.6 ± 0.8 30–45 6.48 ± 0.14 0.15 ± 0.06 0.02 ± 0.06 7.5 ± 0.9
TABLE 3. PERCENTAGE SOIL N IN RESIDUE MANAGEMENT TREATMENTS AT TWO DISTANCES OF 0.5 M (A) AND 3 M (B) FROM THE GLIRICIDIA HEDGEROW AT THREE
DEPTHS (D1 = 0–15 CM; D2 = 15–30 CM; D3 = 30–45 CM) ACROSS YEARS AND SEASONS.
Residue treatments 2000 Maha 2001Yala 2002 Maha 2003 Yala
T1: GL AD1 0.09 (0.02) 0.10 (0.02) 0.08 (0.01) 0.10 (0.03)
GL AD2 0.07 (0.04) 0.08 (0.03) 0.07 (0.02) 0.05 (0.02)
GL AD3 0.06 (0.03) 0.08 (0.03) 0.03 (0.01) 0.03 (0.01)
GL BD1 0.09 (0.02) 0.10 (0.02) 0.09 (0.02) 0.10 (0.02)
GL BD2 0.08 (0.03) 0.08 (0.02) 0.05 (0.04) 0.06 (0.03)
GL BD3 0.06 (0.03) 0.06 (0.03) 0.04 (0.05) 0.04 (0.03)
T2: ML AD1 0.09 (0.03) 0.10 (0.01) 0.09 (0.01) 0.10 (0.01)
ML AD2 0.09 (0.04) 0.09 (0.02) 0.09 (0.02) 0.07 (0.02)
ML AD3 0.08 (0.03) 0.06 (0.02) 0.05 (0.02) 0.04 (0.02)
ML BD1 0.09 (0.02) 0.09 (0.02) 0.09 (0.02) 0.07 (0.01)

133
ML BD2 0.06 (0.04) 0.07 (0.03) 0.08 (0.00) 0.06 (0.01)
ML BD3 0.05 (0.04) 0.05 (0.04) 0.04 (0.00) 0.03 (0.02)
T3: GLML AD1 0.12 (0.03) 0.10 (0.02) 0.10 (0.01) 0.08 (0.02)
GLML AD2 0.09 (0.02) 0.08 (0.03) 0.08 (0.04) 0.05 (0.02)
GLML AD3 0.06 (0.03) 0.08 (0.02) 0.06 (0.02) 0.03 (0.01)
GLML BD1 0.11 (0.01) 0.10 (0.02) 0.09 (0.01) 0.09 (0.01)
GLML BD2 0.08 (0.04) 0.09 (0.02) 0.07 (0.01) 0.08 (0.00)
GLML BD3 0.05 (0.04) 0.07 (0.02) 0.06 (0.01) 0.05 (0.02)
T4: NL AD1 0.08 (0.02) 0.09 (0.02) 0.07 (0.02) 0.07 (0.01)
NL AD2 0.07 (0.03) 0.08 (0.03) 0.05 (0.02) 0.06 (0.02)
NL AD3 0.06 (0.03) 0.06 (0.02) 0.04 (0.03) 0.04 (0.02)
NL BD1 0.07 (0.03) 0.08 (0.03) 0.08 (0.03) 0.08 (0.02)
NL BD2 0.05 (0.03) 0.07 (0.03) 0.06 (0.04) 0.07 (0.03)
NL BD3 0.04 (0.03) 0.05 (0.03) 0.04 (0.02) 0.04 (0.02)
Standard deviation of the mean is given in parenthesis.
TABLE 4. PERCENTAGE C IN RESIDUE MANAGEMENT TREATMENTS AT TWO DISTANCES OF 0.5 M (A) AND 3 M (B) FROM THE GLIRICIDIA HEDGEROW AT THREE
DEPTHS (D1 = 0–15 CM; D2 = 15–30 CM; D3 = 30–45 CM) ACROSS TWO SEASONS IN CONSECUTIVE YEARS.
Residue treatments 2000 Maha 2001Yala
T1:GL AD1 0.77 (0.13) 0.77 (0.14)
GL AD2 0.78 (0.16) 0.64 (0.22)
GL AD3 0.49 (0.21) 0.62 (0.26)
GL BD1 0.81 (0.13) 0.80 (0.17)
GL BD2 0.65 (0.25) 0.68 (0.15)
GL BD3 0.55 (0.20) 0.59 (0.26)
T2: ML AD1 0.72 (0.23) 0.78 (0.10)
ML AD2 0.69 (0.29) 0.61 (0.24)
ML AD3 0.63 (0.23) 0.48 (0.18)
ML BD1 0.72 (0.14) 0.72 (0.18)
ML BD2 0.49 (0.29) 0.56 (0.28)
ML BD3 0.40 (0.32) 0.46 (0.31)
T3:GLML AD1 0.85 (0.10) 0.88 (0.20)
GLML AD2 0.80 (0.19) 0.67 (0.23)
GLML AD3 0.54 (0.21) 0.64 (0.17)
GLML BD1 0.86 (0.13) 0.79 (0.19)
GLML BD2 0.58 (0.32) 0.72 (0.18)
GLML BD3 0.46 (0.29) 0.52 (0.19)
T4: NL AD1 0.65 (0.15) 0.75 (0.18)
NL AD2 0.58 (0.24) 0.63 (0.24)
NL AD3 0.47 (0.21) 0.48 (0.13)
NL BD1 0.70 (0.21) 0.71 (0.24)
NL BD2 0.68 (0.27) 0.66 (0.24)
NL BD3 0.65 (0.23) 0.39 (0.21)
Standard deviation of the mean is given in parenthesis.

134
There were no significant differences in organic matter among the different litter types (GL, ML, and GLML) applied to the 15N subplots, although there is a tendency to have slightly higher C and N contents in the crop residue + Gliricidia lopping (GLML) treatment (Fig. 3). Similar responses were obtained in all seasons. Soil pH also slightly increased. Although the increment may not be biologically significant, when compared with the initial soil condition, N and C contents were increased by about 50–75%. Soil C and N concentrations decreased down the soil profile. However, these properties are not significantly different at 0.7 m from the hedgerow compared with the middle of the hedgerow (3 m), indicating there was no depletion of nutrients, especially N, near the Gliricidia hedgerows (Figs 4 and 5).
A B
0 0.2 0.4 0.6 0.8 1 1.2
45-30
30-15
15-0
So
il dep
th (c
m)
Organic matter %
0 0.2 0.4 0.6 0.8 1 1.2
45-30
30-15
15-0
So
il de
pth
(cm
)
Organic matter %
GL
GLML
ML
NL
C D
0 0.2 0.4 0.6 0.8 1 1.2
30-45
15-30
0-15S
oil d
epth
(cm
)
Organic matter %
0 0.2 0.4 0.6 0.8 1 1.2
30-45
15-30
0-15
Soil d
epth
(cm
)
Organic matter %
FIG. 3. Changes of soil organic matter at 0.7 m and 3 m away from Gliricidia hedgerows with soil depth for two representative growing seasons. A. Season two, 0.7 m away from hedgerow; B. Season two, 3 m away from hedgerow; C. Season one, 0.7 m away from hedgerow; D. Season one, 3 m away
from hedgerow; GL: Only Gliricidia residues applied, ML: only crop residues applied; GLML: Gliricidia and crop residues applied; NL: no residues applied.

135
0 0.02 0.04 0.06 0.08 0.1
Initial
2003B
2003A
%N
0-15
15-30
30-45
FIG. 4. Percent N down the soil profile of A = 0.7 m and B = 3 m from the hedgerow in 2003
compared with the initial N concentration.
0 0.2 0.4 0.6 0.8 1
Initial
2003B
2003A
%C
0-15
15-30
30-45
FIG. 5. Percentage C down the soil profile of A = 0.7 m and B = 3 m from the hedgerow in 2003
compared with the initial C concentration.
3.3. Physiological parameters
Leaf chlorophyll content, leaf temperature, and leaf transpiration rates were measured in maize (four seasons), and cowpea (three seasons) plants in the middle of each row. Results indicated that leaf chlorophyll contents, leaf temperature and transpiration of maize were greater at the middle region of the rows in the alley compared to the rows near the hedgerows (Fig. 6). Lower chlorophyll and lower transpiration near hedgerows may be due to the competition for N and water and shading by the hedgerows. Because of this competition plants near Gliricidia hedgerows slightly increased stomatal resistance (Fig. 7). This may be due to the water limitation caused by the hedgerow species on maize plants compared to the plants at the middle. Cowpea plants in the middle rows had lower chlorophyll contents compared with rows closer to the hedgerow. Cowpea being a C3 species, high light intensities may bleach chlorophyll indicating lower light saturation compared with maize (Fig. 8).

136
FIG. 6. Leaf chlorophyll content of the ear-leaf of maize in different rows between two hedgerows of
Gliricidia. (Gli- Gliricidia hedgerows, Msole-sole crop of maize, and M1…M8-maize rows) (Averages
over three years).
FIG. 7. Stomatal resistance and transpiration of the ear leaf of maize in the middle of different rows
between two hedgerows of Gliricidia.
35
40
45
50
55
GL1 R
1R2R3R4R5R6R7R8R9R10R11R12R13R14R15R16GL2
CON
Row Number
SP
AD
Rea
din
gs
FIG. 8. Leaf chlorophyll content of cowpea leaves in different rows (R1...R16), between two
hedgerows of Gliricidia (GL1 & GL2) and sole crop (Con) (averages over two years).
0 5
10 15 20 25 30 35 40 45 50
Gli M1 M2 M3 M4 M5 M6 M7 M8 M9 GliMsole
SP
AD
read
ing
3
3.5
4
4.5
5
0 2 4 6 8 10
Transpiration (µg m–2
s–1
) Stomatal resistance (s m–1
)

137
During the grain filling period the photosynthesis rates of maize were higher in the middle rows compared with the rows closer to the hedgerows (data not shown). However, there was no significant difference between the maize plants grown as a sole crop and within the Gliricidia hedgerows (Fig. 9). Leaf water potential was reduced during midday in all treatments, but the reduction was relatively less in maize in the alley cropping system (Fig. 10). Significantly lower water potential during midday in the sole crop maize may be a result of moisture limitation, incident solar radiation and higher plant temperature. Relatively lower leaf water potential of maize grown in alleys may be due to partial shading, lower temperature and other microclimate modifications by the hedgerows. Photosynthesis measurements for cowpea also showed a similar trend as observed for maize (Fig. 11). The leaf photosynthesis rate was significantly lower near the hedgerows and had a higher rate than the control plots.
Fig. 6. Rate of photosynthesis of sole cropping of maize (M.sole) and Intercropped t FIG. 9. Rates of photosynthesis of maize grown as a sole crop (M-.Sole) and grown in alleys with
Gliricidia (M.IC plots) during the da.
FIG. 10. Leaf water potential of maize grown as a sole crop (M.SC) and grown in alleyswith
Gliricidia (M.IC-Plots- 1 & 2) during the day.
0
5
10 15
20
25
30 35
40
45
9:00 AM 11:00 AM 1:00 PM 3:00 PM 5:00 PM Times
M-Sole M-IC-plot–1 M-IC-plot–2
Rate of photosynthesis
(µ mol m–2 s–1)
0
-5
-10
-15
-20
-25
-30
35
8:00 AM 10:00 AM 12:00 AM 2:00 PM 4:00 PM
Times of the day
M.SC M.IC-P-1 M.IC-P-2
Leaf water
potential
(Bar)

138
FIG. 11. Photosynthesis rates of different cowpea rows (R1..R8) between two Gliricidia hedgerows
(GL1 & GL2) and sole crop control (Con) during the day.
3.4. Biomass production
Dry matter production of maize varied significantly among different seasons (Fig. 12). This was mainly associated with the moisture availability of the season. Several seasons were very badly affected by prolonged drought causing significant yield losses (e.g. Yala 2001 and Maha 2001). Maize yield was greater in alley cropped plots compared with the sole crop. In general, application of litter increased the productivity of maize. No significant differences were observed among the different organic matter types added to the labelled N alley microplots and maize grown in the sole crop microplots compared with the control treatment where only maize residues were added.
Cowpea yields (G 5 plants–1) also showed significant seasonal variation and the yield was significantly higher in the Gliricidia and crop residues applied treatment compared with the other treatments. All three season recorded on average 60%, 13% and 25% more grain yield for 2003 Yala, 2004 Yala and Maha seasons (Table 5).
FIG. 12. Total biomass production of maize in three seasons of Gliricidia (GL), maize (ML),
Gliricidia and maize (GLML) and no organic matter (NL) treatments in alley crop (T1..T4) and sole
crop (T5..T8) treatments.
0
2
4
6
8
10
12
14
16
T1GL T2ML T3GLML T4NL T5GL T6ML T7GLML T8NL
Maha 2000/01 Yala 2001 Maha 2002
Mt ha–1
0
10
20
30
40
50
60
GL1 R1 R2 R3 R4 R5 R6 R7 R8 CON GL2
Row Number
10:00 AM
1:00 PM
3:00 PM
Photosyntheses rate (µ mol m-2 s-1)

139
TABLE 5. IMPACT OF DIFFERENT LITTER APPLICATIONS ON COWPEA SEED YIELD (G 5 PLANTS–1) FOR THREE YEARS GROWN IN THE ALLEY-CROPPING SYSTEM WITH GLIRICIDIA AND AS A SOLE CROP
Treatments 2002/03 Maha 2004 Yala 2004/05 Maha T1:GL 3974 (25.0) 3795 (18.6) 2935 (26.6) T2:ML 3735 (15.0) 3424 (32.3) 2696 (20.6) T3:MLGL 4269 (42.1) 4185 (56.6) 3142 (30.0) T4:NL 3215 (18.3) 3306 (68.6) 2031 (26.0) T5:GL 3587 (6.60) 4435 (60.3) 2845 (40.3) T6:ML 4306 (48.6) 3657 (70.9) 2870 (41.6) T7:MLGL 4692 (18.5) 4194 (85.9) 3240 (20.9) T8:NL 2673 (25.6) 3687 (34.0) 2494 (45.3) CV% 12.17 13.25 12.25 Pr>F 0.004 0.0312 0.026
Standard deviation of the mean is given in parenthesis.
Cowpea grain yield was higher in the middle rows compared with rows closer to the
hedges (Fig. 13). This would indicate that there is a resource limitation from hedgerows for the adjacent crop rows. However, the productivity was significantly greater in the middle rows compared with sole crop plants.
Biomass produced by the Gliricidia hedges increased significantly over the period of 3–4 a (Fig. 14) from about 40 kg (per four 8-m hedgerows) at the beginning (after 1st year) to about 240 kg after 4 a.
0
20
40
60
R1R2R3R4R5R6R7R8R9R10R11R12R13R14R15R16
Row Number
g / fiv
e p
lants
FIG. 13. Variation of seed yield of different cowpea rows between two hedgerows of Gliricidia.
0.00
2.00
4.00
6.00
8.00
10.00
12.00
0
1
2
3 4 5 6 7 8
Season
Mt/
ha
FIG. 14. Fresh weight of Gliricidia lopping materials obtained from hedgerows.
9

140
3.5. % 15
N recovery
Total N concentrations of maize leaves and seeds were nearly three times higher than stems and roots (Fig. 15). However, the 15 N concentrations in different plant parts were not significantly different and decreased over several seasons. The 15N concentrations in Gliricidia and weeds were about 30% of the total N concentration. The total N concentrations of Gliricidia and weeds were nearly 3–4 times higher than maize.
15N concentrations in maize and Gliricidia decreased in subsequent seasons due to the dilution effect (Figs 16 and 17). Maize grain and residues of stems and leaves had N derived from the fertilizer of 13.9 and 14.1 kg ha–1, respectively. The % 15N recovery by the maize crop was about 25% in grain and 23% in residues of leaves and stems (in total 48%).
4. DISCUSSION AND CONCLUSIONS
Soil analysis and profile descriptions at the beginning of the experiment clearly indicated that the site was degraded, having very low soil organic matter and N content compared with other agricultural fields. The soil was very shallow and prone to erosion and nutrient leaching. Introducing Gliricidia alleys improved soil properties. Soils physical (e.g. aggregate stability) and chemical (e.g. organic matter, N) properties slowly built up with time. Addition of biomass by lopping Gliricidia hedgerows significantly increased with the hedgerow maturity. Incorporation of both Gliricidia loppings and the maize residues of the previous crop contributed to the improvement of soil fertility over last five years, and there was no significant adverse impact of hedgerows on soil fertility compared with the sole maize crop or at different distances from the hedgerow.
Physiological parameters measured in this study illustrate that hedgerows may negatively influence one or two adjacent maize rows due to the competition for resources. Photosynthesis rates were reduced near the hedgerow of both maize and cowpea crops compared to the sole crops. Reduction of photosynthesis may be associated with the partial shading by the hedgerows which were pruned only once before the planting of the crop. Reduced rates of photosynthesis were reflected in the final crop yield in rows near the hedgerows. The negative impact on crop rows closer to hedgerows may have been reduced if several loppings were done during the cropping season. However, the physiological and yield responses were significantly greater in the rows in the middle of the alleys compared with the control. This would clearly illustrate the existence of some complementary interaction from Gliricidia hedgerows, perhaps through increasing the resource availability or making the microenvironment more favorable for the crop species.
Addition of Gliricidia and crop residues (MLGL) enhanced growth and yield of crops more than the other litter treatments and the control. Addition of similar amounts of litter to sole crops had the same result. Overall results of this experiment illustrated that a Gliricidia based alley cropping system increased productivity and improved sustainability. Therefore, it could be concluded that a Gliricidia based alley cropping system is a viable alternative farming system to shifting cultivation in the intermediate region of the country.

141
FIG. 15. N concentration (%) and
15N abundance (atom %) in maize leaves, stems, seeds and roots for
the Maha season 2000.
0
0.1
0.2
0.3
0.4
0.5
0.6
0.7
2001Yala 2001
Maha
2002Yala
GL
ML
MLGL
NL
0
0.02
0.04
0.06
0.08
0.1
0.12
0.14
0.16
0.18
0.2
2001Yala 2001Maha 2002Yala
FIG. 16. 15
N enrichment (atom % excess) of maize grown in 15
N labelled microplots in the alleys
in three seasons.
FIG. 17. 15N enrichment (atom % excess) of Gliricidia residues obtained from 15
N microplots in
the alley in three seasons.
0.0
0.5
1.0
1.5
2.0
N%- 15
N%- N%- 15
N%- N%- 15
N% N%- 15N%-
Leaves Stems Seeds Roots

142
REFERENCES
[1] DIMANTHA, S., Soil scientists should lead the scientific land use planning. Joachim memorial lecturer, Soil Science Society of Sri Lnaka (1992).
[2] FSMP (Overview of the Forestry Sector Master Plan), Forestry Planing Unit, Ministry of Agriculture, Lands and Forestry, Sri Lanka (1995).
[3] CRISHOLM, A., EKANAYAKE, A., JAYASURIYA, S., Economic policy reforms and the environment: Land degradation in Sri Lanka. Ministry of Public Administration, Home Affairs & Plantation Industries, Planning Division, 55/75, Colombo (1999).
[4] YOUNG, A., Agroforestry for Soil Conservation, CAB International, Wallingford, UK (1994).
[5] ZIJESTRA, P.J., Erosion hazards and land suitability in the Nuwara Eliya District, IRDP, Nuwara Eliya, Sri Lanka (1989).
[6] SOIL SURVEY STAFF, Key to Soil Taxonomy, 8 th edn, USDA, Washington, DC, Pocahontas Press Inc. (1998).
[7] INTERNATIONAL ATOMIC ENERGY AGENCY, Use of Isotope and Radiation Methods in Soil and Water Management and Crop Nutrition,Training Course Series No. 14, IAEA, Vienna (2001).

143
QUANTIFYING THE CONTRIBUTION OF ABOVE — AND BELOW
GROUND N IN LEGUMES TO SOIL N POOLS AND SUBSEQUENT
MAIZE IN AN IMPROVED FALLOW SYSTEM USING IN SITU 15
N LABELLING TECHNIQUES IN WESTERN KENYA
J.K. NDUFA Kenya Forestry Research Institute (KEFRI), Nairobi, Kenya
A. ALBRECHT Soil Science Laboratories, ICRAF/IRD, Nairobi, Kenya
G. KEERTHISINGHE Soil and Water Management & Crop Nutrition Section, International Atomic Energy Agency
G. CADISCH
Department of Agricultural Sciences, Imperial College at Wye, University of London, United Kingdom
Abstract
A field experiment was undertaken in western Kenya to (i) determine the amount of legume below
ground biomass N at a given time without physically disturbing the soil, (ii) study 15N recovery by maize from
decomposing labelled roots of legume fallows and assess interactions occurring when mixed with the above
ground fallow biomass and (iii) determine the distribution of excess 15N in water stable aggregates, free organic
matter and the clay + silt fraction. One year old Sesbania sesban, Calliandra calothyrsus, Senna spectabilis,
Cajanus cajan, Crotalaria grahamiana and Tephrosia vogelii were enriched in situ with labelled ammonium
sulphate [(15NH4)2SO4] through stem injection techniques. The total above ground dry matter (DM) of the
legumes varied between 589 g tree–1 for Senna and 1572 g tree–1 for Calliandra. The shoot to root ratio ranged
from 1.2 for Senna to 3.1 for Calliandra. Total above ground N ranged from 8.6 to 23.1 g tree–1 and was highest
for Calliandra and lowest for Senna. Cajanus, Calliandra, Crotalaria and Tephrosia exhibited similar
proportions of 15N enrichment in the leaves and wood, but Senna allocated more 15N to wood as compared to
leaves. Total above ground 15N recovery ranged from 49% for Crotalaria to 69% for Tephrosia indicating that
27 to 50% is potentially allocated to the roots. About 2.5 to 7.4% of 15N is potentially recovered from roots less
than 5 mm. A large proportion (39%) of below ground N became protected in water stable meso- and macro-
aggregates while around 20% was associated with the clay-silt sized fraction. This contrasts with the fate of 15N
labelled foliage litter from which only 31% was found in aggregates, but a larger proportion remained in the free
organic fraction, suggesting an important role of roots in aggregate formation. 15N recoveries of below ground N
in the catch crop were small suggesting that these inputs play a more important role in soil structure rather than
in nutrient supply.
1. INTRODUCTION
Deliberate planting of tree, shrub and herbaceous legumes in rotation with food crops has become a central and integral part of land management practices for replenishing soil fertility in nutrient-depleted small-scale farms of tropical sub-Saharan Africa [1]. Legumes cause significant positive yield effects on subsequent non-legumes when compared with rotations with non-legumes. Considerable knowledge exists on the contribution of above ground inputs to crop nutrition. However, less information exists on the contribution of roots to soil N pools and the nutrition of the subsequent crop after the fallow. Roots can provide a significant amount of N in the form of dead roots, nodules and rhizodeposition [2, 3]. Root systems can provide litter for soil organic matter (SOM) formation and labile C that can prime microbial processes on SOM mineralization. Roots can alter soil structure and act as a sink for

144
water and nutrients. However, it has generally been assumed that roots in improved fallow systems play only a small role in nutrient cycling as compared with above ground biomass inputs.
The lack of appropriate methodologies has hampered the estimation of the in situ contributions of roots to nutrient cycling in fallow systems. Soil excavation and root separation processes are destructive, difficult and time consuming, and often only coarse roots are recovered. Current methods for separating and quantifying root biomass require sizeable investments in labour and time, and sampling of entire root systems is extremely difficult. Methods for root studies include root excavation [4], root mapping on soil profile walls, monolith sampling [5], sequential root coring [6] and the use of minirhizotrons [7, 8]. The accuracy of estimation of fine root biomass by excavation and wet sieving is questionable. Fine and decomposed roots may pass through large sieves thereby underestimating root biomass [9, 10] and root rhizodeposts are not considered. Livesley et al. [10] found that 93 to 96% of root biomass was recovered on a 0.5 mm sieve, while a 2 mm sieve has been used in many studies.
Many studies have shown that N release and immobilization from any organic material depends on the C-to-N ratio [11], lignin content [12], the content of polyphenols [13, 14] and (lignin + polyphenol)-to-N ratio [15], and roots are no exception. Frankenberger and Abdelmagid [16] found that the N release pattern from roots of cowpea was 1.09-fold higher than the above ground biomass, despite the fact that the leaves contained more total N than the roots. When roots of Gliricidia and Leucaena from 4-month old plants, which had a high N content and low C : N ratio (13.1 and 14.3, respectively), were incubated for two months, dry matter yield and N uptake of a following crop of maize were higher than the control [17]. However, roots can also contribute to N immobilization by providing a readily available carbon source [2, 3, 11]. In a few studies [18, 19] roots obtained from pots were applied under field conditions, but the validity of such an approach to the actual decomposition process in
situ is questionable. The artificially applied excavated roots may not reflect the actual decomposition of roots under field conditions because of spatial differences. It is increasingly clear that undisturbed roots decompose at a faster rate because of the proximity of rhizodeposits to the microorganism [20]. The characteristic patterns of root distribution down the soil profile cannot be artificially duplicated.
To determine the contribution of the below ground biomass to soil available N, the root mineralization should be separated from that of above ground residues. Use of paired plots whereby fallow tress are labelled in situ with 15N, and the above ground biomass is either removed or retained, offers an alternative approach to understanding the contribution of below ground biomass to N pools. Recent studies have shown that the below ground contribution from forage legume roots may have been grossly underestimated [21, 22, 23]. The total N deposition may be 2 to 3 times higher than maximum root N. The use of stem labelling techniques to enrich shoot and root systems of woody perennial trees [24, 25] and leaf feeding techniques for herbaceous legumes [21, 22] represents a potential solution for quantifying the contribution of roots to soil N pools and the nutrition of subsequent crops.
In the present study an in situ 15N stem injection technique was used to determine the fate of above- and below ground N distribution in the soil-plant system and subsequent recovery of N by maize. The specific objectives of the study were: (i) to determine the amount of legume below ground biomass N at a given time without physically disturbing the soil, (ii) to measure 15N recovery by maize from decomposing labelled roots of fallow legumes and assess interactions occurring when mixed with the above ground fallow biomass and (iii) to determine the distribution of 15N in water stable aggregates, free organic matter and the clay + silt fraction.

145
2. MATERIALS AND METHODS
2.1. Site characterization and experimental design
The study was conducted on a farmer’s field in western Kenya (0°06’N latitude, 34°34’E longitude, 1330 m above sea level. Rainfall in the study area is binomially distributed allowing two growing season per year with an annual mean of 1800 mm. The long rainy cropping season extends from March to August and the short rainy cropping extends from September to January. Monthly rainfall recorded during the experimental phase is shown in Fig. 1. Soils are generally classified as very fine, kaolinitic, isohyperthermic Kandiudalfic Eutrudox [26]. Soil physical and chemical characteristics at a depth of 0–15 cm were: pH = 5.6 (in a 1 : 2.5 soil : water suspension); organic carbon = 14 g kg–1 by wet oxidation with heated acidified dichromate followed by colorimetric determination of Cr3++ [6]; nitrogen = 1.3 g kg–1 ; extractable P = 1.3 mg kg–1 and extractable K = 0.3 cmol
(+) kg–1 (by extraction with 0.5 M NaHCO3 + 0.01 M ethylene-diamine-tetra-acetic acid pH8.5; and exchangeable Ca 5.4 cmol
(+) kg–1, Mg = 1.7 cmol (+) kg–1, and exchangeable acidity = 0.5
cmol(+) kg–1 (by 1 M KCl extraction); sand = 33%, clay = 52%, silt = 15% and bulk density = 1.3 g cm–3. The species tested included: Sesbania sesban, Crotalaria grahamiana, Cajanus
cajan, Tephrosia vogelii, Senna spectabilis and Calliandra calothyrsus. The experiment was established in September 1998 on 4.5 × 4.5 m plots with a tree spacing of 0.75 × 0.75 m, and two trees plot–1 were injected with 15N in September 1999. The experimental design was a randomized complete block with 3 replications.
FIG. 1. Microplots layout and treatments in tree injection experiment at Oloo farm in 1999.
X
X
X
X
X
X
15N root
X
X
X
X
X
X
Root excavation
Region
X
X
X
X
X
X
4.5M
X
X
X
X
X
X
15N shoot
X
X
X
X
X
X
15N root + 15N shoot
X
X
X
X
X
X
4.5M
Key:
X Microplot (0.75 × 0.75 m) with an enclosed tree

146
2.2. Microplot installation
In July 1999, approximately two months before 15N injection, three bounded microplots were installed to confine the tree roots to reduce the dilution effect and increase the sensitivity of 15N recovery, since unconfined roots are likely to spread throughout the plot. Each microplot containing a tree was enclosed with an iron sheet of 0.75 × 0.75 m and 45 cm soil depth to restrict the tree rooting zone. The microplot was installed well before tree injection so that the severed roots could recover, and to minimize 15N loss through root exudates. After the 15N stem injection, trees were allowed to grow for 3 weeks to allow N assimilation and equilibrium in the translocation between above- and below ground parts. At the tree harvest, three treatments were superimposed in each plot as shown in Fig. 1: In microplot 1, above ground woody biomass was removed from the 15N injected tree but foliage and litterfall were retained in the microplot (referred to as 15N shoot + 15N root). In microplot 2, above ground woody biomass, foliage and litterfall were removed from the microplot to asses the contribution of roots (referred to as 15N root). In microplot 3, above ground 15N-labelled foliage and litterfall from microplot 2 were applied to this unlabelled microplot (referred to as 15N shoot) and microplot 4 was reserved for excavation of root biomass.
2.3. In situ 15N stem injection procedure
Two months after microplot installation two trees plot–1 were each labeled with 1.0 g (15NH4)2SO4 at 98 atom % (equivalent to approximately 10% of the total tree N). The (15NH4)2SO4 (207 mg 15N excess) was dissolved in 100 mL artificial sap solution. The artificial sap solution consisted of 5.0 mM KCl and 0.4 mM malic acid adjusted to pH5.4 [27]. Before the stem injection, we ensured that the soil was at field capacity to improve tree transpiration and hence N uptake. A 0.25 mm diameter hole was drilled ¾ through the stem using a rechargeable drill at 15 cm above the soil surface. The hole was immediately flushed with artificial sap to ensure continuous flow of the sap and to eliminate any air blockage of the xylem since the injection method relies on an active transpiration stream so that the tracer 15N can be carried with the transpiration stream to the leaves. The sterile Tecmoset solution set was used to deliver 15N solution to the stem from a reservoir containing the 15N-enriched artificial sap. Appropriate precautions were taken to ensure that the plant was taking the artificial sap and that there was no leakage before 15N was injected into the reservoir. A gravity-fed reservoir containing the 15N-sap solution was then connected by inserting the Tecmoset set delivery tube containing a syringe needle inserted through a septum to the hole (Fig. 2). The sap was forced into the cavity until a steady stream of liquid was seen to be flowing. Unlabelled sap solution was later used to flush labeled N from the severed vessels until uptake ceased. Care was exercised when switching from the 15N solution to the flush solution to avoid introducing air into the injection line.
2.4. 15N recovery by the subsequent maize crop
After harvest of the tree, the microplot soil was mixed with biomass according to the treatments described above, and fertilizer was applied at a rate of 100 kg P ha–1 and 100 kg K ha–1. Six maize seeds were sown inside the microplot at an spacing of 0.25 m × 0.75 m and later thinned to three maize plants microplot–1 to give a maize density equivalent of 53 333 plants ha–1. The plots were weeded twice and kept weed free by regularly uprooting any emerging weeds.

147
FIG. 2. Diagram of the technique used to inject 15
N into the tree (Adapted from Horwath et al.[24]).
2.5. Above ground tree biomass harvesting
Before tree injection, the tree base was covered with a mesh and abscised leaves collected in a net and recovered daily from the tree throughout the growing period after injection. After three weeks all the above ground biomass (leaves, litterfall, twigs, branches, stem) were harvested and quantified. Above ground biomass was dried at 40°C.
2.6. Below ground tree biomass harvesting
The amount of roots in 0–15, 15–30 and 30–50 cm was quantified by excavation of the entire 0.75 × 0.75 m microplot. The roots were sorted out into rootstock, roots >5 mm and roots between 2–5 mm in the microplot 4. Root <2 mm were quantified by washing a 5 kg subsample from each soil layer using the method described by [5]. Roots were dried at 40°C.
2.7. Maize planting and harvesting
Before biomass incorporation, fertilizer equivalent to 100 kg ha–1 of P and K as Triple superphosphate (TSP) and Muriate of potash (MOP), respectively, was broadcast in the plot. Maize seeds were sown per planting hole at a spacing of 25 cm within the row and 75 cm between rows. Maize was harvested before physiological maturity because of drought (approximately 60 DAP) in long-rains 2002 and at physiological maturity in the subsequent seasons. Maize was dried at 40°C.
2.8. Organic matter fractionation
To distinguish the impact of above ground inputs from that of below ground N inputs the following treatments were imposed at tree harvest: 1) Above ground woody biomass, foliage and litterfall biomass removed from the microplot to assess the contribution of roots and 2) Above ground 15N-labelled biomass from microplot 1) applied to an unlabelled microplot to assess foliage impact on soil structure. Maize was subsequently planted and at maize harvest soil samples (0–15 cm) were fractionated according to [28].

148
2.9. Data analysis
The amounts of 15N excess (mg) applied in maize microplots treatments were:
⎟⎟⎠
⎞⎜⎜⎝
⎛×−⎟⎟
⎠
⎞⎜⎜⎝
⎛×=+
100
%
100
%1515
1515wdexcessNatom
wdDMyfertexcessNatom
fertNrootNshootN (1)
⎟⎟⎠
⎞⎜⎜⎝
⎛×+⎟⎟
⎠
⎞⎜⎜⎝
⎛×=
100
%
100
%1515
15litfexcessNatom
litfDMyfolexcessNatom
folDMyshootN (2)
15N root = Eqn. 1 – Eqn. 2
Fert = fertilizer DMy = Dry Matter yield wd = wood fol = foliage litf = literfall
% 15N recovery = (mg 15N excess in harvested biomass x 100)/mg 15N excess added (3)
3. RESULTS
3.1. 15N uptake and biomass distribution by different plant species
Trees were injected with 15N solution early in the morning and after heavy rain the previous day, since the method relies on active transpiration, and the rate of N uptake increases with increased transpiration. All the species took up 100 mL of artificial sap containing 1 g (15NH4)2SO4 at 98 atom % 15N in less than 24 h after injection. There were no visible symptoms of leaf necrosis or excessive leave fall. At tree harvest, the above ground biomass DM ranged between 589 g tree–1 for Senna to 1572 g tree–1 for Calliandra (Table 1). Corresponding average for leaves and wood biomass followed the same pattern as total above ground biomass. Leaf biomass ranged from 72 to 436 g tree–1 whereas the woody biomass ranged from 501 to 1132 g tree–1. Total N content ranged from 7.6 g tree–1 for Crotalaria to 23.1 g tree–1 for Sesbania (Table 2).
The total below ground biomass DM to 50 cm depth (distributed in shoot stump and various root diameter classes) ranged from 203 g tree–1 for Crotalaria to 545 g tree–1 for Sesbania (Table 3). Most roots were found in the 0–15 cm soil layer. The shoot–to-root ratio was approximately 2-to-1 for Cajanus, Senna and Sesbania and 3-to-1 for Calliandra, Crotalaria and Tephrosia. Senna, the smallest plant, had the shoot-to-N ratio closer to 1.
TABLE 1. DISTRIBUTON OF ABOVE GROUND BIOMASS DM IN LEAVES, WOOD AND LITTERFALL BY DIFFERENT LEGUME SPECIES AT TREE HARVEST 21 DAYS AFTER ISOTOPE INJECTION
Above ground biomass DM (g tree–1) Species
Leaves Wood Litterfall Total
Cajanus
Calliandra
Crotalaria
Senna
Sesbania
Tephrosia
93 (19)
436 (40)
100 (25)
72 (8)
112 (25)
124 (7)
536 (73)
1132 (49)
533 (98)
501 (36)
950 (107)
678 (112)
4.7 (0.3)
4.1 (0.4)
6.2 (1.0)
15.8 (2.1)
4.7 (0.4)
9.8 (1.4)
634
1572
639
589
1067
812
Standard errors of means are given in parentheses.
149
TABLE 2. DISTRIBUTON OF NITROGEN CONTENT IN LEAVES, WOOD AND LITTERFALL BY DIFFERENT LEGUME SPECIES AT TREE HARVEST 21 DAYS AFTER ISOTOPE INJECTION
Nitrogen content (g tree–1) Species
Leaves Wood Litterfall Total
Cajanus
Calliandra
Crotalaria
Senna
Sesbania
Tephrosia
3.8 (0.8)
13.5 (1.1)
3.2 (0.9)
2.8 (0.3)
4.7 (1.1)
4.9 (0.7)
6.1 (1.1)
9.5 (1.3)
4.2 (0.5)
5.7 (0.8)
6.1 (1.3)
6.0 (1.0)
0.13 (0.007)
0.08 (0.006)
0.15 (0.025)
0.48 (0.008)
0.11 (0.008)
0.25 (0.040)
10.3
23.1
7.6
8.6
10.8
11.2
Standard errors of means are given in parentheses.
TABLE 3. DISTRIBUTION OF BELOW GROUND BIOMASS DM (G TREE–1) IN THE ROOTSTOCK AND DIFFERENT ROOT DIAMETER CLASSES AT 0–15, 15–30 AND 30–50 CM DEPTHS AT TREE HARVEST
Species Soil
depth
(cm)
Rootstock Roots >5
mm
Roots
2–5 mm
Roots
<2 mm
Total roots Total
shoots :
root*
Cajanus 0–15
15–30
30–50
131.7 (34)
15.2 (0.9)
3.8 (1.2)
44.0 (17)
1.3 (1.3)
0
8.7 (3.7)
2.6 (1.0)
0.5 (0.1)
23.1 (2.9)
34.6 (6.9)
28.8 (5.8)
207.5 (57)
53.8 (8.3)
33.1 (4.8)
2.2
Calliandra 0–15
15–30
30–50
172.3 (32)
76.2 (42)
11.3 (1.7)
80.7 (12)
15.1 (15)
0
16.6 (2.5)
9.4 (3.4)
5.5 (2.6)
79.9 (47)
35.8 (7.4)
31.1(10.7)
349.5 (76)
135.4 (65)
46.2 (10)
3.0
Crotalaria 0–15
15–30
30–50
50.3 (11)
28.8 (18)
8.2 (04)
7.6 (03)
6.1 (6.1)
0
5.5 (2.7)
1.0 (0.3)
2.3 (0.3)
36.9 (9.7)
26.8 (5.6)
30.0 (3.8)
100.3 (15)
63.6 (28)
40.5 (5.1)
3.2
Senna 0–15
15–30
30–50
134.5 (57)
51.4 (13)
9.9 (0.3)
44.5 (20)
13.3 (7.3)
0
13.6 (4.5)
13.4 (7.3)
2.4 (1.0)
23.4 (4.1)
33.2 (3.0)
22.3 (11)
216.1 (84)
111.3 (15)
34.7 (11)
1.2
Sesbania 0–15
15–30
30–50
202.2 (15)
65.4 (43)
36.8 (17)
41.5 (06)
9.5 (09)
5.2 (05)
37.7 (7.2)
7.2 (2.9)
5.3 (0.6)
74.3 (27)
21.0 (4.9)
23.4 (5.4)
373.2 (26)
103.0 (55)
70.7 (24)
1.9
Tephrosia 0–15
15–30
30–50
101.0 (29)
56.2 (21)
16.6 (04)
12.8 (08)
5.9 (5.9)
1.0 (1.0)
10.4 (2.3)
5.6 (1.2)
2.5 (1.0)
35.1(4.4)
33.8 (17)
19.5 (7.2)
159.0 (35)
101.6 (27)
37.8 (12)
3.1
Standard errors of means are given in parentheses, *0–50 cm.
3.2. 15N enrichment by different species
There was a wide variation in N concentration and 15N enrichment of leaves and wood
as shown in Table 4. Cajanus and Sesbania had the highest leaf N concentrations while Calliandra and Crotalaria had the lowest. Cajanus leaves were most enriched (1.67 atom % 15N excess) and Calliandra leaves were the lowest with 0.50 atom % 15N excess. Wood N concentrations ranged from 0.65% for Sesbania to 1.1% for Cajanus. Senna wood had 2.09 atom % 15N excess as compared to Calliandra with 0.40 atom % 15N excess. Generally, Cajanus, Calliandra, Crotalaria, Sesbania and Tephrosia exhibited similar proportional enrichment of leaves and wood, but Senna allocated more 15N to wood as compared with leaves. Litterfall N concentration varied from 2.04 to 3.11% while atom % 15N excess ranged from 0.04 to 0.39.

150
TABLE 4. NITROGEN CONCENTRATION AND 15N ENRICHMENT OF LEAVES, WOOD AND LITTERFALL TWO WEEKS AFTER 15N STEM INJECTION
Leaves Wood Litterfall Species
(% N) (atom % 15N
exc.)
(% N) (atom % 15N
exc.)
(% N) (atom % 15N
exc.)
Cajanus
Calliandra
Crotalaria
Senna
Sesbania
Tephrosia
4.0 (0.1)
3.2 (0.3)
3.2 (0.2)
3.8 (0.1)
4.1 (0.2)
3.9 (0.1)
1.67 (0.34)
0.50 (0.06)
1.46 (0.18)
1.03 (0.17)
1.12 (0.36)
1.48 (0.36)
1.11 (0.09)
0.84 (0.05)
0.90 (0.06)
1.14 (0.06)
0.65 (0.13)
0.90 (0.06)
1.89 (0.37)
0.40 (0.12)
1.30 (0.32)
2.09 (0.31)
1.15 (0.25)
1.44 (0.26)
2.73 (0.07)
2.04 (0.10)
2.48 (0.13)
3.11 (0.09)
2.23 (0.07)
2.82 (0.12)
0.04 (0.01)
0.17 (0.07)
0.25 (0.06)
0.39 (0.10)
0.05 (0.01)
0.14 (0.02)
Standard errors of means are given in parentheses.
3.3. 15N recovery in the above and below ground biomass
Since the atom 15N excess is confounded by differences in total N content of different parts, percentage 15N recovery was calculated as a proportion of the applied 15N in different shoot (Table 5) and root (Table 6) parts. The highest amount of 15N was recovered by Senna (67%) and the lowest by Crotalaria (49%). 15N which was not accounted for and was potentially translocated to the roots varied between 23 and 51%. However, only 2.5 to 7.4% was recovered in roots <5 mm (Table 6), and the remaining was assumed to be distributed in the roots >5 mm, root stump, nodules and root rhizodeposits.
TABLE 5. AMOUNT OF 15N EXCESS IN LEAVES, WOOD AND LITTERFALL AND PERCENTAGE 15N RECOVERY BY THE ABOVE GROUND BIOMASS
15N excess (mg) 15N recovery (%) Species
Leaves Wood Litter
fall
Above ground Total above
ground
Unaccounted*
Cajanus
Calliandra
Crotalaria
Senna
Sesbania
Tephrosia
52 (10)
66 (8.0)
39 (1.0)
28 (5.0)
50 (13)
61 (1.0)
74 (7.0)
46 (7.0)
63 (8.0)
109 (9.0)
62 (10.0)
75 (7.0)
0.06
0.14
0.38
1.85
0.05
0.04
125 (9.0)
112 (14.0)
103 (7.0)
138 (10.0)
112 (8.0)
137 (7.0)
61 (4.4)
54 (6.7)
49 (3.3)
67 (5.1)
54 (4.1)
66 (3.4)
39
46
51
23
46
34
Standard errors of means are given in parentheses;*15N potentially translocated to roots.
TABLE 6. ROOT BIOMASS DM, NITROGEN CONCENTRATION, NITROGEN CONTENT, 15N ENRICHMENT OF ROOTS <5 MM FROM 0–50 CM DEPTH AT TREE HARVEST
Nitrogen 15N enrichment 15N recovery (%) Species DM (g)
(%) (g) (atom % 15N exc.)
mg Roots Unacc-ounted*
Cajanus Calliandra Crotalaria Senna Sesbania Tephrosia
98.3 (2.4) 176.6 (29) 103.4 (10) 108.4 (15) 168.5 (19) 107.0 (10)
0.83 (0.07) 1.15 (0.07) 1.19 (0.17) 1.81 (0.09) 1.87 (0.22) 2.12 (0.17)
0.82 (0.06) 2.12 (0.46) 1.22 (0.21) 1.95 (0.29) 3.14 (0.56) 2.28 (0.30)
0.92 (0.12) 0.27 (0.06) 0.47 (0.13) 0.36 (0.15) 0.47 (0.06) 0.60 (0.09)
7.4 (1.0) 6.2 (2.0) 5.3 (1.0) 7.2 (3.0) 15.0 (3.0) 13.7 (2.0)
3.6 (0.5) 3.0 (1.2) 2.5 (0.5) 3.5 (1.5) 7.4 (1.7) 6.6 (1.2)
35 43 48 24 39 27
Standard errors of means are given in parentheses; *15N potentially in roots >5 mm, rhizodeposition, nodules and
senesced roots.

151
3.4. Maize biomas yield and N recovery by maize from 15N labelled shoots and roots
The maize total biomass (dry matter) for the 4 cropping seasons is given in Table 7. In long rains 2000, total maize shoot dry weight was highest where both roots and shoot biomass were recycled, followed by the microplot where the 15N enriched biomass was applied, and was least for the microplot where 15N root plots were left intact (Table 7). In short rains 2001, the microplots where legume shoots were applied gave significantly higher maize biomass than the control microplot. In the root microplot, Crotalaria and Cajanus roots gave similar maize biomass yield as compared to other legumes. In long and short rains of 2001, the maize biomass yield was relatively similar in all the plots.
TABLE 7. TOTAL MAIZE BIOMASS YIELD (G PLANT–1) OVER FOUR 4 MAIZE GROWING SEASONS
2000 2001
Long rains Short rains Long rains Short rains
Species
15N shoot
Cajanus 50.3 209.2 165.9 49.2 Calliandra 60.0 171.7 163.0 47.2 Crotalaria 50.3 213.7 177.4 70.0 Senna 66.3 189.3 162.3 62.8 Sesbania 51.0 190.7 145.9 66.4 Tephrosia 56.3 218.7 171.1 64.0 Control nd 118.4 130.0 59.3 SED nd 20.4** 22.3 23.0
15N root
Cajanus 30.0 138.4 160.6 45.7 Calliandra 34.3 168.3 122.7 43.9 Crotalaria 44.7 131.1 127.2 68.7 Senna 49.3 155.6 159.6 57.6 Sesbania 49.0 167.0 134.4 61.1 Tephrosia 57.7 172.0 155.6 49.9 Control nd 118.4 130.0 59.3 SED nd 16.6* 35.0 14.6
15N shoot + 15N root
Cajanus 64.7 179.8 176.3 71.3 Calliandra 45.0 173.4 165.9 61.8 Crotalaria 45.3 221.7 195.7 70.9 Senna 66.7 242.8 209.4 52.1 Sesbania 66.0 178.2 141.4 71.2 Tephrosia 74.0 226.3 176.2 69.4 Control nd 118.4 130.0 59.3 SED nd 18.6*** 14.6** 14.1
SED = Standard error of differences between treatment means; *** = significant at P< 0.001; ** = significant at P<
0.01; * = significant at P< 0.05; nd = not determined.
The 15N enrichment and total maize shoot 15N recovery were highest where both roots
and root biomass were recycled, followed by the microplot where the 15N enriched biomass was applied, and were least for the microplot where 15N root plots were left intact (Table 8). 15N recovery from labelled combined shoot and roots ranged from 4% for Calliandra to 21.5% for Sesbania. 15N recovery from shoot only was highest for Tephrosia and lowest for Senna, while 15N recovery from roots ranged from 1.1% for Cajanus roots to 4.5% for Tephrosia roots.

152
TABLE 8. 15N ENRICHMENT AND 15N RECOVERY OF MAIZE SHOOTS IN MICROPLOTS
Species Microplot treatment Atom % 15N excess 15N recovery (%)
Cajanus 15N shoot + 15N root 15N shoot 15N root
0.167 (0.05)
0.212 (0.01)
0.062 (0.01)
7.9 (3.9)
3.3 (1.7)
1.1 (0.2)
Calliandra 15N shoot + 15N root 15N shoot 15N root
0.314 (0.08)
0.202 (0.19)
0.080 (0.01)
4.0 (1.3)
2.9 (1.9)
2.5 (0.8)
Crotalaria 15N shoot + 15N root 15N shoot 15N root
0.227 (0.08)
0.218 (0.07)
0.100 (0.04)
9.7 (3.0)
3.8 (1.9)
2.3 (1.4)
Senna 15N shoot + 15N root 15N shoot 15N root
0.106 (0.16)
0.104 (0.04)
0.078 (0.02)
7.1 (1.4)
2.4 (1.8)
1.4 (0.4)
Sesbania 15N shoot + 15N root 15N shoot 15N root
0.281 (0.02)
0.214 (0.03)
0.160 (0.02)
21.5 (1.4)
4.5 (0.5)
3.7 (0.4)
Tephrosia 15N shoot + 15N root 15N shoot 15N root
0.318 (0.04)
0.225 (0.02)
0.140 (0.04)
9.9 (0.5)
7.0 (1.2)
4.5 (1.0)
Standard errors of means are given in parentheses.
3.5. Soil organic matter fractionation
A large proportion (31–39%) of below ground N became protected in water stable meso and macro-aggregates whilst around 20% was associated with the clay-silt sized fraction (Table 9). TABLE 9. ROLE OF ROOTS AND FOLIAGE IN FORMATION OF WATER STABLE AGGREGATES AT 6 MONTHS AFTER FALLOW HARVEST
15N recovery (%) N source
WSA > 20µm Free OM > 20 µm Clay + silt
Root 39 39 22
Foliage 31 49 20
WSA = water stable aggregates, OM = organic matter.
4. DISCUSSION
The 15N stem injection used in this study showed potential in monitoring N fluxes in the fallow-maize cropping system. Injection of 1 g (15NH4)2SO4 at 98 atom % 15N was sufficient to provide the desired 15N enrichment of the shoot and root system two weeks after stem injection. Three weeks were purposely used based on the previous study by Russell and Fillery [23] who showed that enrichment of the root biomass occurred within five days of 15N injection and was stable for about 2 weeks. They also observed increased 15N enrichment of dead roots between weeks 2 and 8, which indicated turnover of roots.

153
From 50 to 67% of injected 15N was recovered in the above ground biomass and 33 to 50% was potentially translocated to the root systems. Recoveries of 71 to 75% of foliar-applied 15N were found in the shoots and 9 to 13% in the roots of subterranean clover (Trifolium subterraneum), and 53 to 61% in shoots and 13 to 26% in roots of serradella (Ornthopus compressus) pasture legumes at late vegetative growth in pot experiments [21, 22, 23, 29]. Using the cotton wick stem injection technique, recoveries of 76% in the leaves and stem of lupin (Lupinus angustifolius) and about 23% in the roots were obtained [23, 29]. However, both studies were conducted in pot culture. In the present study, proportionally more 15N was allocated to the stem in Senna compared with Calliandra. In contrast, less 15N was allocated to leaves by Senna and more by Calliandra. In general, there was more preferential allocation of 15N to the above ground biomass as compared with roots in all the species except Crotalaria, which allocated 50% of injected 15N to the roots and the shoot.
15N recovery by maize ranged from 4–20% in the first crop after the fallow. 15N recovery in maize was generally highest where both above ground and below ground biomass remained in the plot, followed by the biomass transfer plot and was lowest for the root microplot. Less than 5% of the below ground N was recovered by maize. Under controlled conditions, a recovery of 40% by wheat from lupin below ground N in the first year and 15% in the second year was reported [23]. The recovery of legume below ground N was 25% for subterranean clover as compared with 18% for serradella [21]. High recoveries from the pasture legumes were attributed to a higher mineralization rate as compared with the legume trees used in this study [30]. In a field study using the 15N stem injection technique, 18% of above ground and below ground tree biomass was recovered by maize, with 12% being attributed to the root contribution [25]. By the end of second maize cropping season, maize had recovered 34 and 38% of the originally applied residue [25]. However, low recoveries found in the present study were associated with the low decomposition of the residues and roots because of drought, which was experienced during the maize growing period. At the end of the first cropping season, about 25 to 35% of root N was recovered in the 0–15 cm soil layer. Previous studies of root biomass at crop maturity have suggested that root mass is smaller than the shoot, has low N content and comprises only about 10–15% of the total plant N.
Interestingly, the below ground inputs contributed more to soil structure building with 39% of root derived 15N found in water stable aggregates six months after fallow harvest. This contrasts with the fate of 15N labelled foliage litter from which only 31% was found in aggregates, but a larger proportion (49%) was found in free organic matter fractions. This confirms the important role of foliage inputs for soil fertility (e.g. N mineralization), whereas roots play a larger role in soil structure formation.
5. CONCLUSIONS
For larger plants, such as agroforestry trees, the stem injection method was suitable to enrich roots and trace the fate of plant-derived N in structural components of the soil system. However, multiple 15N labelling events are recommended to better assess the contribution of below ground inputs over an entire growing period, particularly where root turnover occurs during the growing season. The compiled data suggested that below ground N inputs account for as little as 3% to over 61% in legumes. These below ground inputs also significantly improved N balances from N2 fixation of many legumes, previously judged to have negative soil N balances. Our results indicated that below ground N inputs are actively contributing to the formation of water stable meso- and macro-aggregates. Below ground N inputs may thus become protected from mineralization suggesting that these inputs play a more important role in the building of soil structure rather than in nutrient supply.

154
In order to better understand below ground N dynamics it is also necessary to evaluate carbon dynamics at the same time. The combined use of 13C and 15N will provide a better assessment of the below ground contribution to N and soil organic matter dynamics and ultimately to the contribution of these inputs to soil fertility and carbon sequestration. The N release from roots (rhizodeposition) under agroforestry systems is also poorly understood and yet may play an important role in influencing N dynamics after legume harvest.
REFERENCES
[1] BURESH, R.J., TIAN, G., Soil improvement by trees in sub-Saharan Africa, Agroforest. Syst. 38 (1997) 51–76.
[2] LEHMANN, J., et al., Decomposition and nutrient release from leaves, twigs and roots of three alley-cropped tree legumes in central Togo, Agroforest. Syst. 29 (1995) 21–36.
[3] LEHMANN, J., ZECH, W., Fine roots turnover of irrigated hedgerow intercropping in Northern Kenya, Plant Soil 198 (1998) 19–31.
[4] RAO, M. R., et al., Observations of some tree root systems in agroforestry intercrop situations and their graphical representation, Exp. Agr. 29 (1993) 183–194.
[5] MEKONNEN, K., et al., Root and inorganic nitrogen distributions in Sesbania fallow, natural fallow and maize fields, Plant Soil 188 (1997) 319–327.
[6] ANDERSON, J.M., INGRAM, J.S.I., (Eds) Tropical Soil Biology and Fertility: A Handbook of Methods, CAB International, Wallingford, UK (1993) 221 pp.
[7] GIJSMAN, A.J., et al., An inflatable minirhizotron system for root observations with improved soil tube contact, Plant Soil 134 (1991) 261–269.
[8] KLEPPER, P., KASPAR, T.C., Rhizotrons: their development and use in agricultural research, Agron. J. 86 (1994) 745–754.
[9] AMATO, M., PARDO, A., Root length and biomass losses during sample preparation with different screen mesh sizes, Plant Soil 161 (1994) 299–303.
[10] LIVESLEY, S.J., et al., Sieve size effects on root length and biomass measurements of maize (Zea mays) and Grevillea robusta, Plant Soil 207 (1998) 183–193.
[11] URQUIAGA, S., et al., Influence of decomposition of roots of tropical forage species on the availability of soil nitrogen, Soil Biol. Biochem. 30 (1998) 2099–2106.
[12] THOMAS, R. J., ASAKAWA, N. M., Decomposition of leaf litter from tropical forage grasses and legumes, Soil Biol. Biochem. 25 (1993) 1351–1361.
[13] PALM, C.A., SANCHEZ, P.A., Nitrogen release from the leaves of some tropical legumes as affected by their lignin and polyphenolic contents, Soil Biol. Biochem. 23 (1991) 83–88.
[14] VALLIS, I., JONES, R.J., Net mineralization of nitrogen in leaves and leaf litter of Desmodium intortum and Phaseolus atropurpureus mixed with soil, Soil Biol. Biochem. 5 (1973) 391–398.
[15] FOX, R.H., et al., The nitrogen mineralization rate of legume residues in soil as influenced by their polyphenol, lignin and nitrogen contents, Plant Soil 129 (1990) 251–259.
[16] FRANKENBERGER, W.T., ABDELMAGID, H.M., Kinetic parameters of nitrogen mineralization rates of leguminous crops incorporated into the soil, Plant Soil 87 (1985) 257–271.
[17] RISASI, E.L., et al., Assessment of N availability of roots of selected woody species and maize, Biol. Agric. Hortic. 16 (1998) 87–96.
[18] WARDLE, D.A., GREENFIELD, L.G., Release of mineral nitrogen from plant-root nodules, Soil Biol. Biochem. 23 (1991) 827–832.
[19] BERGERSEN, F.J., et al., Contributions of nitrogen in soybean crop residues to subsequent crops and to soils, Aust. J. Agric. Res. 43 (1992) 155–169.
155
[20] MARTIN, J.K., In situ decomposition of root-derived carbon, Soil Biol. Biochem. 21 (1989) 973–974.
[21] MCNEILL, A.M., et al., A new approach for quantifying the benefit from pasture legumes to succeeding wheat, Aust. J. Agric. Res. 49 (1998) 427–436.
[22] MCNEILL, A.M., et al., Use of in situ N-15-labeling to estimate the total below-ground nitrogen of pasture legumes in intact soil-plant systems, Aust. J. Agric. Res. 48 (1997) 295–304.
[23] RUSSELL, C.A., FILLERY, I.R.P., Estimates of lupin below-ground biomass nitrogen, dry matter, and nitrogen turnover to wheat, Aust. J. Agric. Res. 47 (1996) 1047–1059.
[24] HORWATH, W.R., et al., Injection of N-15 into trees to study nitrogen cycling in soil, Soil Sci. Soc. Am. J. 56 (1992) 316–319.
[25] SEITER, S., HORWATH, W.R., The fate of tree root and pruning nitrogen in a temperate climate alley cropping system determined by tree injected N-15, Biol. Fert. Soils 30 (1999) 61–68.
[26] Hartemink, A.E., et al., Soil nitrate and water dynamics in Sesbania fallow, weed fallows and maize, Soil Sci. Soc. Am. J. 60 (1996) 568–574.
[27] DICKSON, R.E., et al., Glutamine transfer from xylem to phloem and translocation to developing leaves of Populus deltoides, Plant Physiol. 77 (1985) 412–417.
[28] GREGORICH, E.G., et al., Carbon mineralization in soil size fractions after various amounts of aggregate disruption, J. Soil Sci. 40 (1989) 649–659.
[29] RUSSELL, C.A., FILLERY, I.R.P., In situ 15N-labelling of lupin below-ground biomass, Aust. J. Agric. Res. 47 (1996) 1035–1046.
[30] NDUFA, J.K., Nitrogen and Soil Organic Matter Benefits to Maize by Fast Growing Pure and Mixed Species Legume Fallows in Western Kenya, PhD Thesis, Univ. of London (2001) 323 pp.


157
THE EFFECT OF LEGUME TREES AND PASTURES ON THE
N CONTRIBUTION AND PRODUCTIVITY OF AN AGROFORESTRY
SYSTEM IN MEDITERRANEAN CENTRAL CHILE
C.M. OVALLE, J.R. AVENDAÑO Instituto de Investigaciones Agropecuarias, INIA-Quilamapu, Chillan, Chile A.L. DEL POZO, E.V. ZAGAL Universidad de Concepción, Facultad de Agronomía, Chillan, Chile J. ARONSON Centre d’Ecologie Fonctionnelle et Evolutive, Montpellier, France
S. URQUIAGA EMBRAPA Agrobiología, Río de Janeiro, Brazil
Abstract
This research is a part of a longstanding effort aimed at the ecological and economic rehabilitation of
the anthropogenic savannahs, locally known as ‘espinales’, which occupy over 2 000 000 ha, and support the
livelihoods of more than 350 000 people in the Mediterranean type climate region of central Chile. The field
experiment was carried out in the subhumid Mediterranean zone of Chile from 1999 to 2005. The treatments
included comparisons of the traditional agroforestry system in the region, consisting of a natural annual pasture
associated with a sparse population of Acacia caven; with an alternative agroforestry system composed of annual
legume-based pastures associated with Tagasaste (Chamaecytisus proliferus var palmensis). In the treatment that
included Tagasaste, an 15N tree injection technique was used to measure the contribution of tree N to the crop.
The agroforestry systems that include annual legumes in rotation with wheat, or Tagasaste with natural pasture in
rotation with wheat, have the potential to improve the yield and nitrogen uptake by the wheat crop.
1. INTRODUCTION
The ‘Espinales’ represent the most important and widespread agro-ecosystem of the dryland portions of the Mediterranean climate region of central Chile. It covers about two million ha (ca. 30°–36°S) and supports approximately 350 000 rural inhabitants [1, 2, 3]
The traditional land use system in the Espinal is based on a rotation of the natural pasture with annual crops (wheat). This crop-pasture sequence is mainly used on hillsides; after a crop phase, grassland re-establishes naturally. Depending on the size of the farm, soil quality, and cereal market conditions, the pasture phase varies from 3–5 years or more [3, 4, 5]. This ley cropping system, applied for more than four centuries on soils of excessive slope, has not only altered the vegetation, but the soils have been severely eroded, compacted and generally depleted in organic matter and fertility [6]. A programme of introduction of nitrogen fixing legumes (NFLs), whether native, naturalized or introduced, was undertaken during the past decade in order to improve the productivity of these systems [7, 8]. Additionally, their potential to fix atmospheric N2 has been estimated in field experiments. Contributions of 30 to 96 kg N ha-1 a–1 were assessed for annual legumes depending on the species and on soil type [9]. For woody legumes the contributions varied from 10 to 200 kg N ha–1 a–1, depending on the species, age of the trees and environmental conditions [4, 10].

158
Considering that legumes constitute a fundamental tool for the rehabilitation of degraded agroecosystems, it was hypothesized that re-establishment of a stronger presence of well-adapted NFLs could ameliorate poor structural, chemical and biological soil conditions and thereby increase overall productivity and stability. From both management and ecological viewpoints, there are advantages and disadvantages in using annual vs. perennial woody NFLs, with respect to specific effects on N-inputs and N-cycling. In simple terms, we asked, what are the relative merits of the two plant groups as ‘rehabilitators’ of soil?
In this paper we provide a synthesis of the results achieved on comparison of the traditional agroforestry system consisting of natural annual pasture associated with sparse populations of Acacia caven; with an alternative agroforestry system composed of an annual pasture legume (Medicago polymorpha) associated with Tagasaste (Chamaecytisus proliferus var palmensis), a promising new leguminous tree species with a high potential for nitrogen fixation and fodder production under Mediterranean Chilean conditions. In particular, the combined influence of Tagasaste trees and of an associated legume pasture on N availability for a cereal crop in a field rotation incorporated in an agroforestry system was evaluated. The specific objectives were a) to evaluate the influence of the fast-growing Tagasaste on N availability for an associated cereal crop, b) to evaluate the combined influence of Tagasaste and of an associated legume-rich pasture on N availability for a cereal crop in a field rotation incorporated into an agroforestry system, c) to determine the influence of Tagasaste and Acacia caven trees on the availability of water in the agroforestry system, d) to determine the sources and origin of the water used by each component of the agroforestry system (trees, pasture, crop).
2. METHODOLOGY
The field experiment was located in the subhumid Mediterranean zone of Chile at Cauquenes Experimental Center (35º58’ S; 72º17’ W, 140 m.a.s.l.) of the Agricultural Research Institute (INIA), VII Region. The alluvial soil (Entisol) derived from granite was rich in quartz, sandy clay loam in texture (0–12 cm) and with pH = 5.7. Mean annual rainfall in the area is 650 mm, with 6 months of summer drought (November to April).
The treatments consisted of the traditional agroforestry system in the region, a natural annual pasture associated with a sparse population of Acacia caven; and an alternative agroforestry system composed of an annual legume (Medicago polymorpha) based pasture associated with Tagasaste (Chamaecytisus proliferus var palmensis), a promising system for the Mediterranean Chilean conditions. In particular, the combined influence of Tagasaste trees and of an associated legume-rich pasture on N availability for a cereal crop in a field rotation incorporated in an agroforestry system was evaluated (Table 1).
Inside a 30 × 30 m fenced ‘macro-plot’, 25 m² plots were delineated, 1 row of 6 trees each, when the treatment includes Tagasaste (TST and IST) (Fig. 1). In treatments without trees (TS and IS) the plot dimensions were the same 25 m². Tree spacing was 0.68 m within the row and 6 m between rows.
In the treatment that included Tagasaste, the 15N tree injection technique was used to measure the N contribution to the crop. Tree labelling with 15N was carried out by injection of the plant with a 70 mM solution of (NH4)2SO4, calculated to add approximately 2% of the total N of 3 year old trees. i.e. 0.588 g of 15N in 288 mL of a 70 mM solution of (NH4)2SO4.

159
TABLE 1. DESCRIPTION OF THE TREATMENTS
Treatments Description of the crop rotation
1 Traditional system (TS) No trees; rotation scheme: 1, 2, 3 and 4 year’s natural pasture, followed by 1 year of wheat.
2 Traditional system + Tagasaste (TST) Agroforestry system associating the TS with Tagasaste plantation (same crop rotation scheme)
3 Improved system without trees (IS) Sown pasture of annual medic (Medicago polymorpha), for 1, 2, 3 and 4 years, followed by 1 year of wheat.
4 Improved system + Tagasaste (IST) Agroforestry system associating IS with Tagasaste planted in alleys. Same rotation scheme.
FIG. 1. Layout and dimensions of the experimental plots.
In the treatments that didn't include trees (TS and IS), the indirect method was used to estimate the N contributions of the legume pastures to the wheat in the crop rotation. Wheat labelling was carried out by fertilization of the plots with (NH4)2SO4 enriched with 10 atom % 15N excess. The fertilizer dose added was 40 kg N ha–1. The size of the labelled ‘micro-plot’ was 1 m2.
2.1. Determination of the edible biomass and N contribution of trees and pastures
In October of each year an evaluation of the consumable biomass of the trees and pastures was carried out. At the beginning of the experiment the trees were 3 year old. One individual tree was evaluated within each treatment and replication. All the leaves and consumable stems of diameter <2 mm were excised. In the pastures, samples of 1 m2 per plot and per replicate were cut. The samples were dried in a forced draft oven for 72 h. The nitrogen concentration of the components of the systems and of each species in particular was determined.

160
2.2. Grazing of pastures and legume trees
During October of each year, sheep of similar live weight (45 kg) were selected to graze the plots. Each animal had no food supply during the 72 h before entering the plots to avoid previous faeces and urine contamination. Each animal was equipped with a harness to collect faeces and urine during the grazing period, which varied from 48 to 72 h until all available material was consumed, and then for an additional 48 h until all faeces and urine were voided. The total quantity of faeces and urine for each animal was determined by weighing, and samples were taken for the determination of N and 15N concentrations. Finally, all the faeces and urine for each treatment and replicate were returned to the plots and incorporated by tillage.
2.3. Sowing and harvest of wheat
Wheat was sown 7 months after the grazing phase. The seed bed was prepared by plowing and tillage in April (autumn) of each year. Wheat (Triticum aestivum) cv. Ciko was sown each year in May at the rate of 180 kg seed ha–1, in the respective treatments. The wheat was managed in the conventional way, carrying out manual control of weeds. A basal fertilizer dressing of 40 kg N ha–1 (urea) and 24 kg P ha–1 (triple super phosphate) was applied each year.
The harvest was carried out in December of each year. An area of 1 m2 was harvested for grain production and total biomass. Additionally, root biomass was estimated by excavating the soil to 30 cm depth. The roots were manually separated from the soil by means of water and fine mesh. The plant samples (roots, stubble and grain) were dried in a forced-draft oven for 72 h and then weighed, and sub-samples were finely ground for analysis of N and 15N concentrations [11] at the FAO/IAEA Agriculture and Biotechnology Laboratory, Seibersdorf, Austria.
2.4. Tree growth rates
The growth rate of trees was evaluated by measurement of tree height, trunk diameter and crown width at the end of the active growth season (March).
2.5. Data analysis
Significant differences between treatment means were determined by analysis of variance and Duncan’s multiple comparison test using SAS statistical packages.
3. RESULTS
3.1. Consumable biomass production of the pasture and trees and contributions of N
to the systems
The introduction of N fixing legumes to the system, annuals only or annuals plus a woody species (Tagasaste), led to a significant increase in the production of consumable biomass (Table 2). Also biomass production of the annual legume pastures increased with increasing length of the pasture phase (treatments IS and IST), but this trend was not observed in the natural pasture (treatments TS and TST). The least productive treatment was the natural pasture. The N concentration in the biomass was much higher in the legume pastures and Tagasaste trees (Table 2).

161
TABLE 2. ANNUAL PRODUCTION OF CONSUMABLE DRY MATTER, N CONCENTRATION AND N CONTENT IN THE BIOMASS OF 1-, 2-, 3- OR 4 YEAR OLD PASTURES AND TAGASASTE TREES IN EACH AGROFORESTRY SYSTEM
Treatment LPF 1* LPF 2 LPF 3 LPF 4
Dry matter (kg ha–1
)
Traditional system (TS) Pasture 773 b 700 b 467 b 933 b
Improved system (IS) Pasture 1480 a 2,940 a 2380 a 3551 A
Traditional system + Tagasaste (TST) Pasture 747 b 700 b 967 b 667 b
Tree 510 A# 580 A 1,108 A 621 A
Improved system + Tagasaste (IST) Pasture 1500 a 2,260 a 2,593a 3288 A
Tree 561 A 474 A 1244 A 409 B
N concentration (%)
Traditional system (TS) Pasture 1.89 b 1.53 a 1.76 b 2.00 b
Improved system (IS) Pasture 3.57 a 1.96 a 2.81 ab 3.60 A
Traditional system + Tagasaste (TST) Pasture 1.72 b 1.70 a 2.55 ab 1.40 b
Tree 3.61 A 3.29 A 3.23 A 2.80 A
Improved system + Tagasaste (IST) Pasture 3.82 a 2.19 a 3.56 a 3.40 A
Tree 3.99 A 4.28 A 3.69 A 2.80 A
N content (kg N ha–1)
Traditional system (TS) Pasture 14.6 b 10.7 b 8.2 c 18.7 b
Improved system (IS) Pasture 52.8 a 57.6 a 66.9 b 127.8 a
Traditional system + Tagasaste (TST) Pasture 12.8 b 11.9 b 24.7 b 9.3 b
Tree 18.4 A 19.1 A 35.8 B 17.4 A
Improved system + Tagasaste (IST) Pasture 57.4 a 49.5 a 92.3 a 111.8 a
Tree 22.4 A 20.3 A 45.9 A 11.5 A
* LPF is the length of the pasture phase (1, 2, 3 or 4 a). # Values in a column followed by the same letter are not
significantly different (P < 0.05). Capital letters are for the comparison among trees.
The production of N was also greater in treatments which included annual and tree legumes (Table 2). This is the result of the greater biomass production achieved by the pasture and the tree legumes and also by the higher N concentration present in the biomass of those species, as compared to the natural pasture without legumes (Table 2).
The contribution of the annual legume pastures was clearly superior to the Tagasaste trees. The greatest productivity in terms of dry matter and N content was achieved in treatments with annual medic (IS and IST). The edible dry matter and N content of Tagasaste was similar when the tree was associated with the legume pasture (IST) or the natural pasture. In the natural pasture associated with Tagasaste (TST), the legume tree contributed approximately 40% of the total biomass and 60% of the N.
3.2. Nitrogen cycling by grazing animals
Consumption by sheep of the pasture and tree biomass produced in each treatment resulted in the input of animal faeces and urine to the system. In general, the greatest amount of dry matter of faeces and urines was in the improved system with Tagasaste (IST), and the lowest amount in the traditional system (TS) (Table 3). The estimated N input was lower in the traditional system, ranging between 14–17 kg N ha–1 a–1, but increased in the improved systems ranging between 21–33 and 31–39 kg N ha–1 a–1, in the legume pasture and legume pasture plus Tagasaste treatments, respectively (Table 3).

162
TABLE 3. DRY MATTER OF FAECES AND URINE, N CONCENTRATION AND ANNUAL CONTRIBUTION OF N BY FAECES AND URINE IN 1-, 2-, 3- OR 4 YEAR OLD PASTURES IN EACH AGROFORESTRY SYSTEM
Treatment
LPF 1*
(2001)
LPF 2
(2002)
LPF 3
(2003)
LPF 4
(1999)
Dry matter (kg ha–1
a–1
)
Traditional system (TS) 530 b 497 b 527 b 616 b
Improved system (IS) 584 b 1034 a 651 ab 1017 ab
Traditional system + Tagasaste (TST) 547 b 1074 a 531 b 846 b
Improved system + Tagasaste (IST) 1485 a 1349 a 905 a 1303 a
N concentration (%)
Traditional system (TS) 2.62 b 2.88 ab 3.27 a 2.83 ab
Improved system (IS) 3.79 a 3.23 a 3.29 a 3.12 a
Traditional system + Tagasaste (TST) 2.52 b 2.54 b 3.11 a 2.23 c
Improved system + Tagasaste (IST) 2.63 b 2.7 ab7 3.41 a 2.76 bc
N contribution (kg ha–1)
Traditional system (TS) 13.9 b 14.3 b 17.2 b 17.4 b
Improved system (IS) 22.1 b 33.4 a 21.4 b 31.7 a
Traditional system + Tagasaste (TST) 13.8 b 27.3 a 16.5 b 18.9 b
Improved system + Tagasaste (IST) 39.0 a 37.4 a 30.9 a 36.0 a
* LPF is the length of the pasture phase (1, 2, 3 or 4 a) with the actual year shown in parenthesis.
Values in a column followed by the same letter are not significantly different (P < 0.05).
3.3. Wheat production, nitrogen uptake and nitrogen derived from the legume (Ndfl)
Total dry matter and yield of wheat in relation to the length of the pasture phase in the pasture-wheat rotation for each agroforestry system is shown in Table 4. Total dry matter and grain yield were lower in the traditional system (TS) after 2 or more years of pasture compared with the other agroforestry systems. The presence of Tagasaste increased total dry matter and grain yield, as well as the introduction of annual legumes in the system (Table 4). However, no further improvement in wheat yield was observed when both Tagasaste and annual legumes were included in the agro-ecosystem.
The N uptake by the wheat crop was greater in the agroforestry systems that included annual legumes or Tagasaste than in the control system without legumes (Table 5). The highest values of N uptake (>100 kg N ha–1y–1) was attained after 3 a of annual legumes (treatments IS and IST), whereas the control system reached only 60 kg N ha–1y–1 (Table 5). After 4 a of annual legumes the uptake of N by the wheat crop seemed to decline, probably due to a decrease in the population of the medic in the pasture, which is replaced by annual grasses that do not contribute N to the system, but rather they extract it.
A significant increment in the N uptake by wheat derived from the legume (Ndfl) was observed in all agroforestry systems that included legumes (Table 5). Ndfl increased as the length of legume pasture phase increased reaching the maximum value in the third year (Table 5). The lowest values were reached in the agroforestry system with only Tagasaste (TST). Tagasaste and the annual legume together (IST) did not improve the Ndfl in wheat compared to annual legumes without Tagasaste (IS), except in the second year of the pasture rotation (Table 5).

163
TABLE 4. DRY MATTER AND GRAIN YIELD OF WHEAT GROWN AFTER 1-, 2-, 3- OR 4 YEAR OF PASTURE IN EACH AGROFORESTRY SYSTEM
Treatment
LPF 1* (2001)
LPF 2 (2002)
LPF 3 (2003)
LPF 4 (1999)
Dry matter (kg ha–1
)
Traditional system (TS) 11686 a 9580 b 9230 b 7551 b
Improved system (IS) 12382 a 11267 a 11567 a 10948 a
Traditional system + Tagasaste (TST) 13397 a 11830 a 9640 b 8007 b
Improved system + Tagasaste (IST) 12267 a 11397 a 9790 b 9643 ab
Grain yield (kg ha–1)
Traditional system (TS) 2748 a 1560 b 1847 b 1767 b
Improved system (IS) 2640 a 2407 a 3380 a 2852 a
Traditional system + Tagasaste (TST) 3060 a 2320 a 2367 b 2280 ab
Improved system + Tagasaste (IST) 2907 a 2390 a 2240 b 2675 a
* LPF is the length of the pasture phase (1, 2, 3 or 4 a) with the actual year shown in parenthesis.
Values in a column followed by the same letter are not significantly different (P < 0.05).
TABLE 5. N UPTAKE AND N DERIVED FROM THE LEGUME (NDFL) BY WHEAT GROWN AFTER 1-, 2-, 3- OR 4 YEAR OF PASTURE IN EACH AGROFORESTRY SYSTEM
Treatment
LPF 1* (2001)
LPF 2 (2002)
LPF 3 (2003)
LPF 4 (1999)
Total nitrogen (kg ha–1
)
Traditional system (TS) 59.8 a 66.8 c 60.3 b 56.7 c
Improved system (IS) 57.8 a 76.9 bc 101.3 a 97.3 a
Traditional system + Tagasaste (TST) 70.1 a 83.5 ab 93.6 a 76.0 bc
Improved system + Tagasaste (IST) 68.6 a 91.8 a 106.3 a 81.1 ab
Ndfl (kg ha–1)
Traditional system (TS) 0 a 0 c 0 c 0 c
Improved system (IS) 7.1 b 21.2 ab 45.6 a 36.0 a
Traditional system + Tagasaste (TST) 4.3 c 13.4 b 20.6 b 17.7 b
Improved system + Tagasaste (IST) 11.0 d 28.7 a 43.0 a 35.9 a
* LPF is the length of the pasture phase (1, 2, 3 or 4 a) with the actual year shown in parenthesis.
Values in a column followed by the same letter are not significantly different (P < 0.05).
The contribution of legumes to the N nutrition of wheat was between 5 and 20 kg N ha–1 in the agroforestry system with Tagasaste (TST), while in the systems with legume pasture (IS) and legume pasture plus Tagasaste (IST), the values varied between 7 and 12 kg N ha–1 after 1 a of pasture, and between 43 and 45 kg N ha–1 after 3 a of pasture. In the 3 agroforestry systems a decrease of the contributions of N was observed after 4 a of pasture.
4. DISCUSSION AND CONCLUSIONS
The traditional crop rotation system in degraded soils of the Mediterranean climate area of Chile, do not include legumes, and the most common rotation is a sequence in which a cereal is followed by a stubble fallow without legumes [3], which contributes to a strong decline in productivity and soil fertility.

164
The incorporation of an agroforestry system that include annual legumes in rotation with wheat, or a tree legume (Tagasaste) with natural or legume pasture, improves the edible forage production for the animals, and the yield of the cereal in the subsequent crop rotation. Nevertheless, the addition of Tagasaste trees and legume pasture together did not provide an additional increment in the yield of the cereal. These results are consistent with those obtained in other parts of the world, such as Southern and Western Australia, where the ley farming system, a crop rotation between legume pastures and cereals, exploits N fixation by the pastures to produce forage of high nutritive value, improves soil fertility and contributes N to the subsequent cereals in the crop rotation [12, 13, 14, 15, 16].
The inclusion of legume trees, besides the forage and the N fixation produced, contribute additional benefits not quantified in the present study. The trees provide shade for the animals, an important aspect in an environment like Central Chile, characterized by a strong summer aridity and high temperatures. On the other hand, in the winter period when the sheep are lambing, the animals require protection against wind and rain. This aspect is highly relevant in the study area, characterized by rigorous, humid and cold winters that cause high mortality of lambs. Shade in summer and protection in winter improve sheep reproduction and productivity. On the other hand, the total amount of forage production in Tagasaste was less than expected, due to root fungus attack caused by excessive soil moisture in winter. Production and utilization of forage at the optimum time is more important than the total amount produced. The leaves and tender shoots of Tagasaste constitute an extremely valuable fodder [4, 17] since they contribute protein during the period that the animals have high requirements (breeding) when there are no other available resources due to the aridity of the summer. Finally, aspects like landscape improvement, creation of niches for birds and wild animals, are other benefits that the trees confer, and should be considered in a complete evaluation of their role in the improvement of the agroforestry systems in Mediterranean Central Chile.
REFERENCES
[1] OVALLE, C., Etude du Système Ecologique Sylvo-Pastoral à Acacia caven (Mol.) Hook. et Arn.: Applications à la gestion des ressources renouvelables dans l'aire climatique méditerranéenne du Chili, Ph. D Dissertation, Université des Sciences et Techniques du Languedoc, Montpellier, France (1986).
[2] OVALLE, C., AVENDAÑO, J., Interactions de la strate ligneuse avec la strate herbacée dans les formations d'Acacia caven (Mol.) Hook et Arn. au Chili. II. Influence de l'arbre sur quelques éléments du milieu microclimat et sol, Acta Oecol.-Oec. Plant. 9 (1988) 113–134.
[3] OVALLE, C., et al., The espinal: An Agroforestry system of the mediterranean-type climate region of Chile. State of the art and prospect for improvement, Agroforest. Syst. 10 (1990) 213–239.
[4] OVALLE, C., et al., Producción de fitomasa aérea consumible de tagasaste (Chamaecytisus proliferus subsp.palmensis) en dos localidades de ambientes climáticamente contrastados en la zona mediterránea, Agricultura Técnica 56 (1996) 214–223.
[5] OVALLE, C., DEL POZO, A., (Eds), La Agricultura del Secano, Instituto de Investigaciones Agropecuarias, Editorial Los Andes (1994) 234 pp.
[6] OVALLE, C., et al., Restoration and rehabilitation of mixed espinales in central Chile: 10-year report and appraisal, Arid Soil Res. Rehab. 13 (1999) 369–381.
[7] DEL POZO, A., et al., Ecotypic differentiation in Medicago polymorpha along an environmental gradient in central Chile. I. Phenology, winter vigor and biomass production, Plant Ecol. 159 (2001) 119–130.

165
[8] DEL POZO, A., et al., Ecotypic differentiation in Medicago polymorpha along an environmental gradient in central Chile. II. Winter growth as related to phenology and temperature, Plant Ecol. 160 (2002) 53–59.
[9] OVALLE, C., et al., Consequences of landscape heterogeneity on grassland diversity and productivity in the Espinal agroecosystem of central Chile, Landscape Ecol. 21 (2005) 585–594.
[10] ARONSON, J., et al., Agroforestry tree selection in central Chile: biological nitrogen fixation and plant growth in six dryland species, Agroforest. Syst. 56 (2002)155–166.
[11] IAEA, Use of Isotope and Radiation Methods in Soil and Water Management and Crop Nutrition. Manual, Training Course Series No. 14, IAEA, Vienna, Austria (2001).
[12] UNKOVICH, M.J., PATE, J.S., SANFORD, P., Nitrogen fixation by annual legumes in Australian Mediterranean agriculture, Aust. J. Agric. Res. 48 (1997) 267–293.
[13] ANGUS, J.F., et al., The source of mineral nitrogen for cereals in south-eastern Australia, Aust. J. Agric. Res. 49 (1998) 511–522.
[14] PEOPLES, M.B., et al., The effect of pasture management on the contributions of fixed N to the N-economy of ley-farming systems, Aust. J. Agric. Res. 49 (1998) 459–474.
[15] PEOPLES, M.B., BALDOCK, J.A., Nitrogen dynamics of pastures: nitrogen fixation inputs, the impact of legumes on soil nitrogen fertility, and the contributions of fixed nitrogen to Australian farming systems, Aust. J. Exp. Agric. 41 (2001) 327–346.
[16] FILLERY, I.R., The fate of biologically fixed nitrogen in legume-based dryland farming systems: a review, Aust. J. Exp. Agric. 41 (2001) 361–381.
[17] OVALLE, M. C., et al., El tagasaste en Chile, Boletín técnico, Serie Quilamapu No. 113 (1998) 150 pp.


167
FERTILIZER NITROGEN RECOVERY FROM DIFFERENT SOIL DEPTHS
IN AN ALLEY CROPPING SYSTEM CONSISTING OF PEANUT
(ARACHIS HYPOGAEA) AND CHOEROSPONDIAS AXILLARIS
IN SUBTROPICAL CHINA
B. ZHANG, X.X. WANG, M.Z. WANG Institute of Soil Science, Chinese Academy of Sciences, Nanjing, China
Abstract
Tree and crop components of an alley cropping system may compete for N in the surface soil while the
tree may use leached N in the deep soil not accessed by the crop. The objective of the present study was to
evaluate the recovery of nitrogen by placing 15N fertilizer at different soil depths to assess the competitiveness
for N between tree and crop in an alley cropping system, consisting of peanut and Choerospondias axillaris. The
tree competed with peanut for N in the surface soil as indicated by the lower 15N recovery by peanut and the
higher 15N recovery in the tree in the alley cropping system, and by a higher N content in the tree mono
treatment. The tree can use leached N in the deep soil as indicated by the high 15N recovery when 15N was placed
at 60 cm depth. Usage of N in the deep soil was consistent with the deeper tree root distribution in the alley
cropping system as compared to that in the tree alone system. The magnitudes of these changes were larger for
the system with larger trees and increased with time. The alley cropping system increased system N use
efficiency compared with the peanut mono cropping system. The N use efficiency increased as the tree grew as
indicated by the increased 15N recovery. These results suggest that introduction of trees can reduce N loss in
cropping systems, but management should aim to prevent N competition with the crop in the surface soil.
1. INTRODUCTION
As Zhang et al. [1] have indicated, alley cropping may be an alternative land use system to subtropical mono cropping as trees may prevent soil erosion and use water in the deep soil. Alley cropping controlled water erosion of soil due to coverage of litter and pruned materials [2, 3], improved soil fertility due to maintenance of higher soil organic matter content and N fixation by leguminous trees [4]. Nitrogen leaching loss is one of the important losses in N-cycling. Recent research showed that alley cropping systems used soil nutrients by a ‘nutrient pumping’ effect, which was attributed to root uptake of nutrients from deep soil and their transfer and release to superficial soil. Nutrient pumping of leached nitrate in alley cropping systems was beneficial to intercrops, improving nitrogen use efficiency and reducing environmental impacts [5].
However, the alley cropping systems also showed negative impacts on crop production, through the competition for nutrients if the intercropped components were not complement in time and space [6]. Field research has shown that alley cropping systems may improve the system productivity and soil fertility, but may decrease the intercrop yields [7, 8, 9].
The objective of the present study was to evaluate the recovery of nitrogen by placing 15N fertilizers at different soil depths to assess the competitiveness for N between tree and crop in an alley cropping system consisting of Choerospondias axillaris and peanut.

168
2. MATERIALS AND METHODS
2.1. Experimental site and layout
The experimental site was located at the Red Soil Ecological Experimental Research Station, Chinese Academy of Sciences (28°15´N, 116°55´E, 55 m asl). The climate was representative of subtropics China as given by Zhang et al. [1]. The soil is an Alumi-Orthic Acrisol according to FAO/UNESCO [10] or a Udic Kandiusltult according to the USDA Soil Taxonomy [11]. The soil is 450 cm deep and is well structured as indicated by the sub-angular aggregates in the soil profile. It is well drained throughout the soil profile. Some physical and chemical properties are given in Table 1. The soil is low in pH and nutrient and water retention capacities. The total N concentration in the soil profile before the 15N experiment was very high, ranging from 4.7 to 6.1 g kg–1 (Table 2).
TABLE 1. SOIL PHYSICAL AND CHEMICAL PROPERTIES MEASURED BEFORE THE EXPERIMENT
Depth (cm) Sand
(%)
Silt
(%)
Clay
(%)
BD
g cm–3
pH
(H2O)
Al sat
(%)
BS
(%)
OC
(%)
CEC
θ (%v)
pF = 1.0
θ (%v)
pF = 4.2
0–7 19 43 38 - 4.3 52 31 0.42 6.2
7–22 17 43 39 1.35 4.4 55 26 0.24 6.2 41 23
22–45 14 40 47 - 4.5 54 18 0.15 7.6
45–95 12 36 52 1.20 4.5 54 15 0.12 9.2 44 26
95–150 11 36 53 1.27 4.5 60 12 0.11 9.9 44 29
150–220 10 36 54 1.46 4.5 49 9 0.25 15.8 44 34
220–270 7 39 54 1.36 4.4 72 10 0.09 13.4 49 41
300–350 8 39 53 - 4.3 63 8 0.05 17.6
370–450 10 43 47 - 4.4 58 7 0.04 22.2
BD, bulk density; BS, base saturation; OC, organic carbon; CEC, cation exchange capacity (cmol+ kg–1).
TABLE 2. N DISTRIBUTION WITH DEPTH MEASURED BEFORE THE EXPERIMENT
Soil depth (cm) Total N (g kg–1) NH4+-N (mg kg–1) NO3
--N (mg kg–1)
0–20cm 6.1 1.3 9.6
20–40cm 4.7 5.8 10.0
40–60cm 5.1 7.5 10.1
60–80cm 4.9 9.1 8.4
80–100cm 4.9 7.6 7.3
The experiment had five treatments, including peanut (Arachis hypogaea) alone system (P), 4 year old Choerospondias axillaris tree (T1), 9 year old C. axillaris tree (T2), 4 year old C. axillaris intercropping with peanut (T1P), 9 year old C. axillaris intercropping with peanut (T2P). The trial plots were laid out in a randomized complete block design with three replicates [1]. The plots, 6 m wide on the contour times 20 m long along the slope were enclosed with cement plates. The C. axillaris trees were transplanted at 6 m row spacing along the slope and 2 m within the row. Liming at a rate of 750 kg ha–1 was carried out only in 1999 before sowing peanut seeds. Weed control was done by hand. Fertilizers were applied only to peanut rows at doses of 172.5 kg N ha–1, 43 kg P ha–1 and 112 kg K ha–1 calculated in the peanut planting area [1].

169
2.2. 15
N placement experiments
The 15N was applied in 2000 and 2001 to depths of 10–15 cm, 30–35 cm and 50–55 cm in the peanut alone (P) and the alley cropping systems (T1P and T2P) with 3 replicates (Fig. 1). Agricultural plastic sheets were pre-buried to the soil depth of 70 cm between the C.
axillaris trees to minimize root interference. Metal frames 0.5 m wide by 0.5 m long by 0.2 m deep were positioned 10 cm aboveground in the sites where 15N was applied to the depth of 10–15 cm to prevent N loss by runoff. Metal frames were positioned on either side of a tree as marked using the letter M in Fig. 1. Three stands of peanuts were sown within the metal frames. 15N was injected in the same row to depths of 35 and 55 cm through 2 cm inner diameter PVC tubes, but no metal frames were used. The PVC tubes were installed to the depths after coring and positioned nearby one peanut stand and replicated 3 times. The sites with metal frames and PVC tubes were 1 m away from each other to prevent interaction of N use by peanut. The total areas of the micro-plots besides the tree row were taken as the possible source of N for the tree from the peanut cropping area, if any, rather than used as replicates due to spatial variation of N use by trees. The fertilizers were 20.33 g (NH4)2SO4 with 21.50 atom % 15N-excess to the depths of 10–15 cm within each metal frame at the same doses applied in the trial plots. 15.56 g KNO3 with 20.38 atom % 15N-excess, which was equal to 50% of the top dressing in the micro-plots, and 1.3 g KH2PO4 were diluted and applied through the PVC tubes to the depths of 30–35 cm and 50–55 cm. After application the PVC tubes were washed with water and covered. The source area for calculation of N use was set equal to that in the micro-plot experiment.
FIG. 1. Layout of injection tubes in the field. P, peanut row; T, tree line; D1, D2, PVC tubes for
injection of 15
N fertilizer; M, microplot for 15
N fertilizer competition.
P
1m
P D1 D2 M
T ree 1m 2m T ree T ree
P D1 D 2 M
P
P
P
P
P
P
P
P
P
P 2m 1m
P
P 0.5m 0.5m
P
T ree
T ree
Tree
P
P
P
P
P
P
P
P
P
P
P
P
P
T ree
Tree Tree
P
P

170
2.3. Soil and plant sampling
In the metal micro-plots, the soil at the depth of 0–20 cm was dug out and mixed for sub-sampling. The soil at the depths of 20–40 cm and 40–60 cm was randomly taken 5 times with an auger. The samples were thoroughly mixed before sub-sampling. Peanut grain and straw were harvested separately in the metal micro-plots as well as the peanut stands near the PVC tubes to determine the dry matter yield, total N content and 15N enrichment. Branches and leaves were sampled from all C. axillaris trees near the micro-plots for analysis of total N content and 15N enrichment. One 5 year old C. axillaris tree in the T1P treatment and one 10 year old C. axillaris tree in the T2P treatment were selected as representative samples, and the weight of leaves, branches, trunk and roots were recorded in 2000. Meanwhile, two of the 5 year old and 10 year old C. trees in the guard area were also cut down and sampled. The samples of each part were used to determine the biomass of the trees according to the relationship between tree performance and weight. The sub-samples from each part were used to determine the ratio of N concentration to 15N and its distribution in leaves, branches, trunk and roots. All plant samples were oven dried at 70°C for 24 h before being ground to a fine powder using a ball mill.
2.4. Determination and calculation of 15
N in soil and plant
The N content and 15N enrichment of soil and plant samples were analyzed in the FAO/IAEA Agricultural and Biotechnology Laboratory, Seibersdorf, Austria. Samples were prepared according to the instruction provided by IAEA [12]. Determination of 15N abundance was performed using an MR253 isotope-ratio mass spectrometer. The percentage of fertilizer N left in the soil (% Nis) was computed according to Equation 1. The percentage of plant N derived from inorganic 15N-labelled fertilizer (Ndff) was calculated according to Equation 2. The percentages of 15N-fertilizer recovered by peanut and C. axillaris were calculated using Equations 3 and 4.
Nis (%) = atom% 15N excess soil* N soil/(atom%15Nexcess N applied* N applied) *100……….…...(1) Ndff (%) = (atom % 15N-excess in plant)/(atom % 15N-excess in fertilizer)*100 ………….………….(2) Nyield = Dry matter yield* N concentration………………………………………………………..…..(3) 15N-fertilizer recovery (%) = (Nyield * Ndff/100)/Rate of N-fertilizer*100………….…..……………..(4)
2.5. Statistics
Analysis of variance (ANOVA) was performed for the effect of the alley cropping treatment on N use in the 15N injection experiment. The differences between treatment means were assessed by the least significant difference (LSD) test.
3. RESULTS
3.1. 15
N left in soil (Nis) and recovered by plants (Ndff) in the microplot experiment
The top dressing (10–15 cm deep) fertilization experiment in the micro-plots conducted in 2000 and 2001 showed that the treatments varied in N use efficiency (Fig. 2). The Nis
and Ndff by peanut and tree crops in 2000 were 66 and 24%, respectively, in both the P and T1P treatments, and 50 and 40% in the T2P treatments. The Nis
and Ndff in the P treatment were similar in 2001 to those in 2000. The Nis
in the T1P treatment decreased to 45 % and the Ndff increased to 42% in 2001, while the Nis
and Ndff were 24% and 64% in the T2P treatment. These results indicated that mono-cropping of peanut has the lowest N use efficiency (25%) than the agroforestry systems (25–64%) and the agroforestry system increased N use efficiency as the trees grew by direct use of 15N in the soil.

171
P T1P T2P -- P T1P T2P
0
10
20
30
40
50
60
70
80
0-100 cm0-60 cm
20012000
Nis
le
ft in
th
e s
oil
pro
file
(%
)
Nd
ff
re
co
ve
red
by p
lan
ts (
%)
FIG. 2. 15N left in the soil (Nis) (0 – 60 cm in 2000 and 0–100 cm in 2001) and
15N recovery (Ndff) by
crop and tree plants in different systems for the top dressing of N fertilizer at 10–15 cm depth in 2000 and 2001.
3.2. 15
N left in soil (Nis) and recovered by plants (Ndff) in the N placement experiment
The N concentration in peanut grain and straw in the N placement experiment in 2000 was about 4 and 1.5%, respectively, and was not significantly affected by fertilization depth in the different cropping systems (Fig. 3).
The total N in the trees in the alley cropping systems increased by over 50% as compared to mono- tree treatments (Fig. 4). The total N in the bigger trees was higher than in the smaller trees irrespective of the mono-tree system or alley cropping system. The total N of the trees in the alley cropping systems was not affected by N application depth. These results indicated that the bigger trees used N in the deeper soil if leached, and could use N distributed evenly at 60 cm depth in the soil.
10-15 35-40 55-600
1
2
3
4
5
P
N %
Peanut grain
peanut straw
10-15 35-40 55-600
1
2
3
4
5
T1P
10-15 35-40 55-60
0
1
2
3
4
5
T2P
N %
Depth 15
N fertilization (cm)
FIG. 3. N concentrations in peanut grain and straw as affected by 15N fertilization depth.

172
0
5
10
15
20
25
30
35
40
45
T1P/55-60T1P/35-40T1
Tota
l N
(g/tre
e)
Depth of 15
N fertilzation (cm)
T1P/10-15
0
10
20
30
40
50
60
70
80
90
T2P/55-60T2P/35-40
Tota
l N
(g/tre
e)
T2P/10-15T2
FIG. 4. Total N in the trees in mono-cropping system (T1 and T2) and in the alley cropping systems (T1P and T2P) as affected by 15N fertilization depth.
The Ndff by peanut crop in all treatments decreased as the N fertilization depth increased (Fig. 5). The Ndff from the 10–15 cm soil layer by peanut ranged from 9.9 to 24.3%, with the highest in the P treatment and the lowest in the T2P treatment. The Ndff recovered from this depth by peanut decreased by 37.8% in the T1P treatment and by 44.2% in the T2P treatment as compared to the P treatment. The Ndff from 35–40 cm soil depth recovered by peanut was about 10% in the P treatment and decreased to 3–5% in the alley cropping systems (T1P and T2P). The Ndff recovered from the 55–60 cm depth by peanut was less than 2 % in all the treatments with the peanut crop. The Ndff from different N fertilization depths was not different in the two years for all treatments. The Ndff by C. axillaris was greater in the system with bigger trees (T2P over T1P) in 2001 than in 2000 (Fig. 5). The Ndff by the tree decreased with N fertilization depth in the alley cropping systems and the Ndff was not significantly different between 10–15 cm and 35–40 cm in the T2P treatment. The Ndff from 10–15 cm and 35–40 cm depths in the T2P treatment was 30 and 50% in 2000 and 2001, respectively, and about 10% from the 55–60 cm depth in 2000 and 2001. The Ndff in the T1P treatment increased from 9% in 2000 to 30% in 2001 at 10–15 cm depth, from 3% in 2000 to 13% in 2001 at 35–40 cm depth and from < 2% in 2000 to 5% in 2001 at 55–60 cm depth. These results indicated that peanut mainly uses the N in the surface soil (10–15 cm) and the trees can use the N in deeper soil (>40 cm). The N use efficiency did not vary for the peanut crop in different years, but increased with the tree growth.
10-15
35-40
55-60
10-15
35-40
55-60
0
10
20
30
40
20012000
P
15
N application depth (cm)
0
10
20
30
40 T1P
15
N r
ecovery
(%
)
peanut tree
0
10
20
30
40
50
60 T2P
FIG. 5. 15N recovery (Ndff) by peanut and tree in different treatments as affected by 15
N fertilization depth in 2000 and 2001.
173
4. DISCUSSION AND CONCLUSIONS
The alley cropping system promoted C. axillaris growth by 50 to 100% and depressed peanut biomass and yield by 20 to 50% [1]. The 15N labelling experiments indicated that the beneficial impacts for tree growth may result from the use of N in deep soil, and the negative impact for peanut growth and peanut yield may be due to the competition for N in the surface soil. The depth of fertilization affects the yields of peanut and its straw and tree biomass. With the increment of fertilization depth, the yield and biomass of peanut decreased.
In the humid climate with a yearly average rainfall of 1729 mm in this region, N leaching is a major pathway of N loss. The 15N placement experiment indicated that the trees in the alley cropping systems used 15N placed at the depth from 40 to 60 cm. The uptake capacity increased as the trees grew. The N uptake was consistent with the tree root distribution [1]. The tree roots can penetrate as deep as 80–100 cm although the soil was very acid (pH = 4.5 in water). The proportion of roots in the deep soil accounted for over 20–30 %. The peanut root system was restricted to the upper 30 cm and couldn’t penetrate to the deep soil due to the high acidity, indicating that peanut roots hardly use N below 55 cm soil depth. The low N recovery from placements below 40 cm was also observed by Rowe et al. [13]. C.
axillaries was more tolerant to the acidity than the peanut crop and was encouraged to grow by using the N leached into the deep soil, and the bigger trees with larger roots can use more leached N.
The competition for N in the topsoil (0–20 cm) between peanut and the intercropped trees may exist as indicated by the decrease in 15N recovery by the peanut crop and the increase in 15N recovery by trees in the alley cropping systems. However, in the alley cropping system, total N in trees increased, but the N concentration in the peanut crop did not decrease. Zhu [14] analysed the spatial structure of roots of trees and wheat at the interface and in nearby soil between a forest belt and crops in agroforestry systems on the Loess Plateau. It was concluded that the niche breadth of trees is bigger than that of wheat, and so trees can use water and nutrients in deep soil that can alleviate competition for water and nutrient between trees and wheat. This result indicated that the reduction of peanut biomass may result not only from N competition, but also from other competitions such as for light and water [1]. N competition may be also mediated by biological N2 fixation of the peanut crop [13, 15].
Despite the possible N competition in the surface soil, the system N use efficiency increased 39% in the T2P treatment (64%) as compared to the P treatment (25%). Lehmann et al. [16] also observed higher N use efficiency in an alley cropping system. However, there was no significant difference between the P and T1P treatments in 2000 and 2001, indicating that the increases in N use efficiency may be due to the uptake of N leached by the bigger trees. The root systems from the small trees may not penetrate and use the N leached to the deeper soil. Rowe et al. [13] reported significant differences in N uptake at different soil depths between different species of trees due to different root distribution patterns. The penetration of the tree root system to the deep soil is significant in terms of mitigation of deep drainage, with the added benefit of utilizing leached soil and fertilizer N [1].
The research suggested that introduction of trees could reduce N loss due to leaching in arable soils, resulting in higher N use efficiency overall. However, N competition between crop and tree components might take place in the surface soil where competition might enhance tree growth at the expense of peanut growth.

174
ACKNOWLEDGEMENTS
The authors thank the International Atomic Energy Agency (IAEA) (Grant No. CPR-10407), the International Foundation of Sciences (IFS) (Grant No. D2872-1), and the Natural Science Foundation of China (Grant No. 49701008) for financial support. Dr. Zhao Ying is acknowledged for manuscript revision.
REFERENCES
[1] ZHANG, B., ZHAO, Y., WANG, M.Z, Assessment of competition of water use between peanut (Arachis hypogaea) and Choerospondias axillaris in alley cropping systems in subtropical China, IAEA-TECDOC- (This issue) (2008) 69–90.
[2] GHOSH, S.P., et al., Productivity, soil fertility and soil erosion under cassava-based agroforestry systems, Agroforest. Syst. 8 (1989) 67–82.
[3] NARAIN, P.R.K., et al., Agroforestry for soil and water conservation in western Himalayan valley region of India. I. Runoff, soil and nutrient loss, Agroforest. Syst. 39 (1998) 175–189.
[4] KANG, B.T., SILSON, G.F., “The development of alley cropping as a promising agroforestry technology”, Agroforestry: A Decade of Development (STEPPLER, H.A., NAIR, P.K.R., Eds), ICRAF, Nairobi, Kenya (1987) 227–243.
[5] CANNELL, M.G.R., VAN, NOORDWIJK, M., ONG, C.K., The central agroforestry hypothesis: the trees must acquire resources that the crop would not otherwise acquire, Agroforest. Syst. 34 (1996) 27–31.
[6] SANCHEZ, P. A., Science in agroforestry, Agroforest. Syst. 30 (1995) 5–55. [7] FRANCIS, C.A., Multiple Cropping Systems, Macmillan, New York, USA (1986). [8] SMITH, M., JACKSON, N., ROBERTS, J., A new direction in hydraulic lift: can tree
roots siphon water downwards? Agroforestry Forum 8 (1997) 23–25. [9] LIVESLEY, S.J., GREGORY, P.J., BURESH, R.J., Competition in tree row
agroforestry systems. 3. Soil water distribution and dynamics, Plant Soil 264 (2004) 129–139.
[10] FAO/UNESCO, Soil Map of the World, FAO, Rome, Italy (1974). [11] SOIL SURVEY STAFF, Key to Soil Taxonomy, 8th edn, USDA, Washington, DC,
Pocahontas Press Inc. (1998). [12] ZAPATA, F., “Isotope techniques in soil fertility and plant nutrition studies”, Use of
Nuclear Techniques in Studies of Soil-Plant Relationships (HARDARSON, G., Ed.), IAEA-TCS-2, IAEA, Vienna, Austria (1990) 61–127.
[13] ROWE, E. C., et al., Testing the safety-net role of hedgerow tree roots by 15N placement at different soil depths, Agroforest. Syst. 43 (1999) 81–93.
[14] ZHU, Q.K., ZHU, J.Z., Study on niche of agroforestry systems in the Loess Plateau, Sci. Soil Water Conserv. 1 (2003) 49–52.
[15] AKINNIFESI, F.K., et al., Nitrogen use efficiency and N-competition between Leucaena hedgerows and maize in an alley cropping system, Nutr. Cycl.Agroecosys. 47 (1997) 71–80.
[16] LEHMANN, J., et al., Nutrient cycling in an agroforestry system with runoff irrigation in Northern Kenya, Agroforest. Syst. 43 (1999) 49–70.

175
NITROGEN MANAGEMENT IN COFFEE–LEGUME
AGROFORESTRY SYSTEMS IN COSTA RICA
C.A. CERVANTES Escuela Ciencias Agrarias, Universidad Nacional, Costa Rica
Abstract
An agroforestry system that included coffee (Coffea arabica) plants associated with two species of
legume trees, Erythrina poeppigiana and Gliricidia sepium was established. The experiment included three
treatments, coffee without legume trees, coffee and Erythrina and coffee with Gliricidia in two different coffee
growing areas of Costa Rica. Shade trees were planted in May 1999 on a 2 year old coffee plantation. Several
studies were completed on the experimental areas including N fertilizer efficiency, N leaching through the soil
profile, and N cycling from legume prunings. Labelled 15N was injected into Gliricidia and Erythrina trees in
2003 in order to study the dynamics of N from the legume tree residues. Very low recoveries of N by coffee
were obtained from fertilizer sources (3.2 % for urea and <1% for nitrate), and different sinks of plant N were
identified depending on the N source. Nitrate fertilizer had the highest leaching potential especially on the
Heredia site, and cannot be recommended for coffee. The N2 fixation capacity of Erythrina was around 50%.
With the tree injection technique, the time required for N in the legume residues to be recovered by coffee was
30 d for the initial appearance with a peak around 60 d. The modified system with 500 legume trees ha–1
produced the highest coffee yield and foliar N values. The amount of biomass produced by Erythrina was around
4500 kg ha–1, containing 200 kg N ha–1. Part of that N comes from biological N2 fixation and part from soil N
being recycled by the tree. The Erythrina density of 500 trees ha–1 is recommended as the best system to
substitute for N fertilizer.
1. INTRODUCTION
Coffee cultivation has been a very important economic activity in Costa Rica since the beginning of the 19th century. Coffee occupies 4th place as a source of income. It has a strong influence on the political and social fabric of the country. Coffee plantations cover an area of 110 000 ha and the total annual production of coffee beans is around 855 600 metric tons. Around 92% of coffee producers have less than 10 ha farms. Eighty nine percent of the production is exported, mainly to the United States and Germany. During the last decade, low prices and market changes produced a crisis in the industry. The market is demanding reductions in the use of agrochemicals, and the low prices require management alternatives that would reduce the dependency on manufactured fertilizers, especially N. Non-traditional market niches such as ‘organically produced’ coffee that attract higher prices may offer a partial solution to the crisis.
N fertilizer has been a focal point of discussion due to its potential to contaminate underground and surface waters, and to contribute to N2O emissions. There is a critical relationship between coffee cultivation and groundwater contamination because of the characteristics of the soils and climate in the growing areas, composed mainly of young volcanic soils under heavy rainfall conditions, and located on the mountain hillsides, where groundwater recharge occurs. Under such conditions, agroforestry has the potential to partially or totally replace commercial N fertilizers, to increase the inputs of C to the system, to improve soil organic matter and hence soil chemical and physical properties and to increase economic benefits. In the present investigation, the traditional production system was studied using 15N isotope techniques, and compared with systems that included leguminous trees in two of the most important coffee production areas in Costa Rica.

176
2. MATERIALS AND METHODS
The traditional system consists of the perennial tree crop, Coffea arabica, with leguminous shade trees, which are pruned twice a year at the beginning of June and in August. Coffee management also includes pruning of the coffee plants. Prunings are either left on the ground to decompose or the wood is used for fuel or replanted in other areas. Row spacing in coffee is 1.5 to 2 m and plant distance is 1 m, with a plant population density around 6700 ha–1. Shade trees are planted in a rectangle of 6 m by 7 m for a tree population of 238 trees ha–1. The tree density varies in the different ecological areas where coffee grows. Coffee trees flower at the beginning of the rainy season, generally in May, and coffee beans are harvested during November-December, depending on the region. Coffee plantations are fertilized three times a year. The first fertilization is applied in May using an 18–5–15–6-2 formula at 300 kg ha–1. The second application is made in August using 15–15–15 at a rate of 300 kg ha–1. The last application consists of 300 kg N ha–1 of urea or ammonium nitrate.
Two experimental sites were established in two coffee-growing regions in Costa Rica, one located on the central plateau in Barva, province of Heredia, and the other in the south at San Isidro, province of San José. The legumes Erythrina poeppigiana and Gliricidia sepium
were planted in commercial coffee plantations in plots of 0.5 ha. Experimental data were collected when the trees were able to survive pruning, around 2 a after planting. The coffee trees were not pruned during the experimental period.
Three different cropping system were tested: (i) full light and high fertilizer input system (ii) the system used by traditional farmers that combine coffee with legumes trees at a density of 238 legume trees ha–1, and (iii) a modified system that increases the number of trees to approximately 500 ha–1. The planting distance of the Erythrina trees was 4.5 m between trees and 4.5 m between rows. Each legume tree was pruned twice a–1, with a sequential system where only 33% of the trees were pruned at any one time. The pruning schedule is depicted in Fig. 1.
I----------- 4.5 m -------I X O X X X X ▲ X X X X ♦ X X X X X X X X X X X X X X X X X X X X X X X X X X X X X X X X X X X ♦ X X X X O X X X X ▲ X X X = coffee plants O, ▲, ♦ = Legume trees O = 1st pruning ▲ = 2nd pruning ♦ = 3rd pruning
FIG. 1. Arrangement of coffee and legume trees and pruning sequence.
Several experiments were completed to obtain information about N movement, efficiency of different N fertilizer sources (commercial N fertilizers and legume prunings) and N2 fixation capacity of the legume trees. N from three fertilizer sources was applied to coffee. Ammonium nitrate (10.38 atom % excess 15NO3
-), urea (10 atom % 15N excess) and ammonium sulphate (10 atom % 15N excess) were applied to coffee plants at a rate of 85 kg N ha–1 in bands around the coffee plants using a 1.5 m2 microplot. The labelled fertilizer was applied at the beginning of the rainy season in May 2002. The experiment was a randomised

177
complete block design with 3 replicates. After 4 weeks the whole coffee plant was sampled and divided in roots, stem and leaves. The sol profile under the coffee plant was sampled at 0–10, 10–30, 30–60 and 60–90 cm depth intervals, and the soil and plant samples were analysed for total N and 14N/15N ratios at the International Atomic Energy Agency Laboratories at Seibersdorf, Austria [1].
The biological N2 fixation capacity of the legume trees was estimated using the 15N dilution method and a reference plant [2].
Legume trees were labelled by injecting a highly enriched 15N solution (98 atom % excess) into the tree vascular system according to the Agency methodology [3]. The legumes were pruned 3 weeks after labelling, and the surrounding coffee plants were sampled 2 weeks after the pruning and every 2 weeks after that, for a period of 8 weeks.
2.1 Climatic and soil characteristics at Heredia
The mean annual precipitation is 2277.7 mm (Fig. 2). October is the rainiest month with 413.3 mm and January is the driest with 10.3 mm. There is a dry season from December to March. Average relative humidity is 75.6%. According to Holdridge, the ecological classification of the zone is a Pre-mountain very humid forest. The mean annual temperature is 26.8°C (Fig. 3).
10,322,359,6
108,5
317,2341,5
196,2256,6
359,4413,3
151,4
41,20
100
200
300
400
500
Jan
Feb
Mar
Apr
May Ju
nJul
AugSept O
ctNov
Dec
Precipitation mm
FIG. 2. Mean (2001–2005) precipitation at the Heredia experimental site
18,6
19,820,4
2120,5
20,120 2019,619,519,819,6
17
18
19
20
21
22
Jan
Feb
Mar
Apr
May Ju
n Jul
Aug
Sept O
ctNov
Dec
Temperature oC
FIG. 3. Mean (2001–2005) temperature at the Heredia experimental site.

178
The area of Barva, Heredia, is formed over a lava stream from the Barva Volcano, and the rocks are of an Andesitic-Basaltic composition, the dominant minerals being feldspars and sodic-calcic pyroxenes. According to the USDA Soil Taxonomy System, the soils belong to the Andisol Order and were classified as Distric Haplustand and Lithic Haplustand. Some physical and chemical characteristics of the soil are given in Tables 1 and 2, respectively.
TABLE 1. PHYSICAL PROPERTIES OF THE SOIL HORIZONS AT THE HEREDIA SITE
Particle size distribution (%)a Horizon Depth (cm)
Clay Silt Sand
H20 at 15 bar (%)
Bulk density (g cm–3)
Ap 0–12 13.3 36.8 49.8 31 0.7 A12 12–40 18.9 30.0 51.0 34 0.7 A13 40–46 18.2 30.4 51.0 35 0.8 A14 46–106 16.0 32.8 51.2 32 0.8
aTexture is loam throughout the profile.
TABLE 2. CHEMICAL PROPERTIES OF THE SOIL HORIZONS AT THE HEREDIA SITE
Exchangeable cations (cmol(+) kg–1)
Horizon pH (H20)
Ca Mg K Ala
CEC (cmol(+) kg–1)
Organic matter (%)
Extractable P (mg kg–1)
Ap 6.7 12.5 1.6 0.8 0.1 (0.7) 15.0 12.5 25 A12 6.7 10.5 1.4 0.8 0.1 (0.8) 12.8 13.3 32 A13 6.4 8.5 1.2 0.2 0.1 (1.0) 10.0 7.6 19 A14 6.4 6.5 2.3 0.2 0.1 (1.0) 9.1 8.5 11
2.2. Climatic and soil characteristics at San Isidro
The San Isidro area is a valley located in southern Costa Rica. The soils are mainly older soils of the Ultisol and Entisol orders. The mean annual precipitation is 2353.7 mm (Fig. 4). October is the rainiest month with 481.3 mm and January is the driest month with 6.9 mm of rain. The climate is affected by the Pacific Ocean and has a dry season that goes from December to April. High relative humidity is a characteristic of the rainy season. The mean annual temperatures are shown in Fig. 5.
FIG. 4. Mean (2001–2005) precipitation at San Isidro experimental site.
6,9 8,6
14,9
124,4
358,3
246,9
185,8
254,9
379,8
481,3
196,2
41,5
0
100
200
300
400
500
600
Jan Feb Mar Apr May Jun Jul Aug Sept Oct Nov Dec
Mean
mo
nth
ly p
recip
itati
on
Precipitation mm
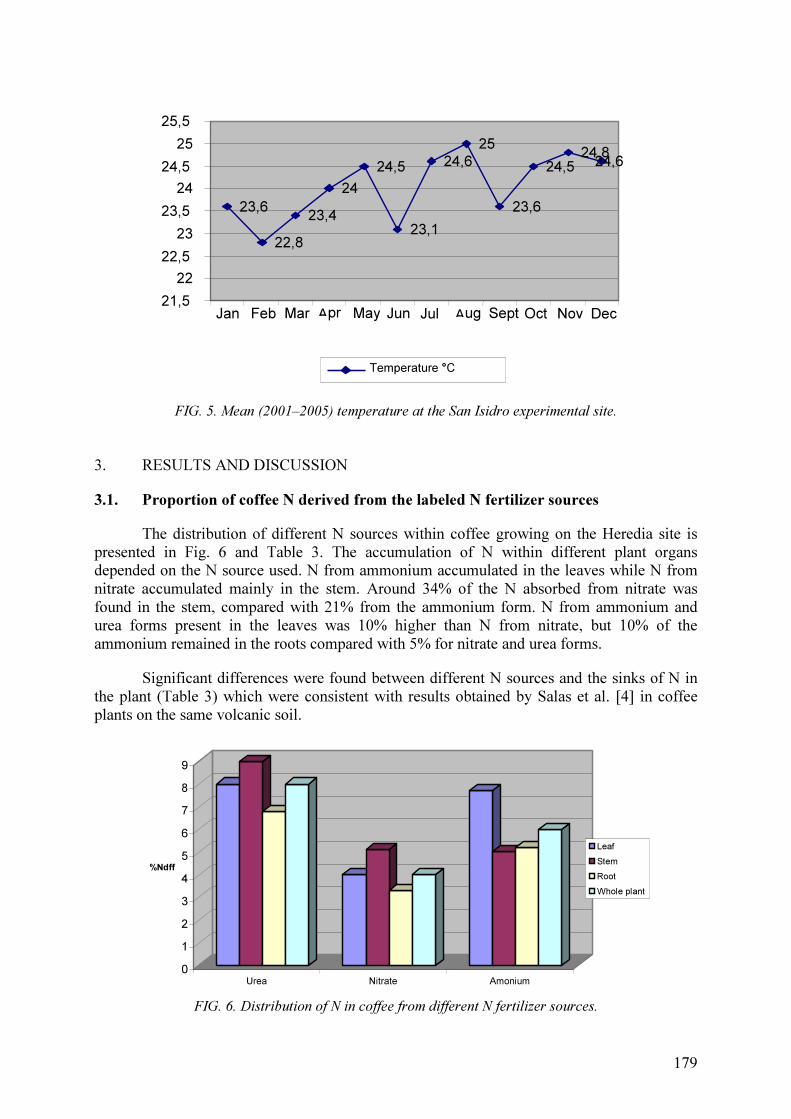
179
FIG. 5. Mean (2001–2005) temperature at the San Isidro experimental site.
3. RESULTS AND DISCUSSION
3.1. Proportion of coffee N derived from the labeled N fertilizer sources
The distribution of different N sources within coffee growing on the Heredia site is presented in Fig. 6 and Table 3. The accumulation of N within different plant organs depended on the N source used. N from ammonium accumulated in the leaves while N from nitrate accumulated mainly in the stem. Around 34% of the N absorbed from nitrate was found in the stem, compared with 21% from the ammonium form. N from ammonium and urea forms present in the leaves was 10% higher than N from nitrate, but 10% of the ammonium remained in the roots compared with 5% for nitrate and urea forms.
Significant differences were found between different N sources and the sinks of N in the plant (Table 3) which were consistent with results obtained by Salas et al. [4] in coffee plants on the same volcanic soil.
0
1
2
3
4
5
6
7
8
9
%Ndff
Urea Nitrate Amonium
Leaf
Stem
Root
Whole plant
FIG. 6. Distribution of N in coffee from different N fertilizer sources.
23,6
22,8
23,4
24 24,5
23,1
24,6
25
23,6
24,524,8
24,6
21,5
22 22,5
23
23,5
24 24,5
25
25,5
Jan
Feb Mar
Apr
May Jun Jul Aug Sept Oct Nov Dec
Temperature °C
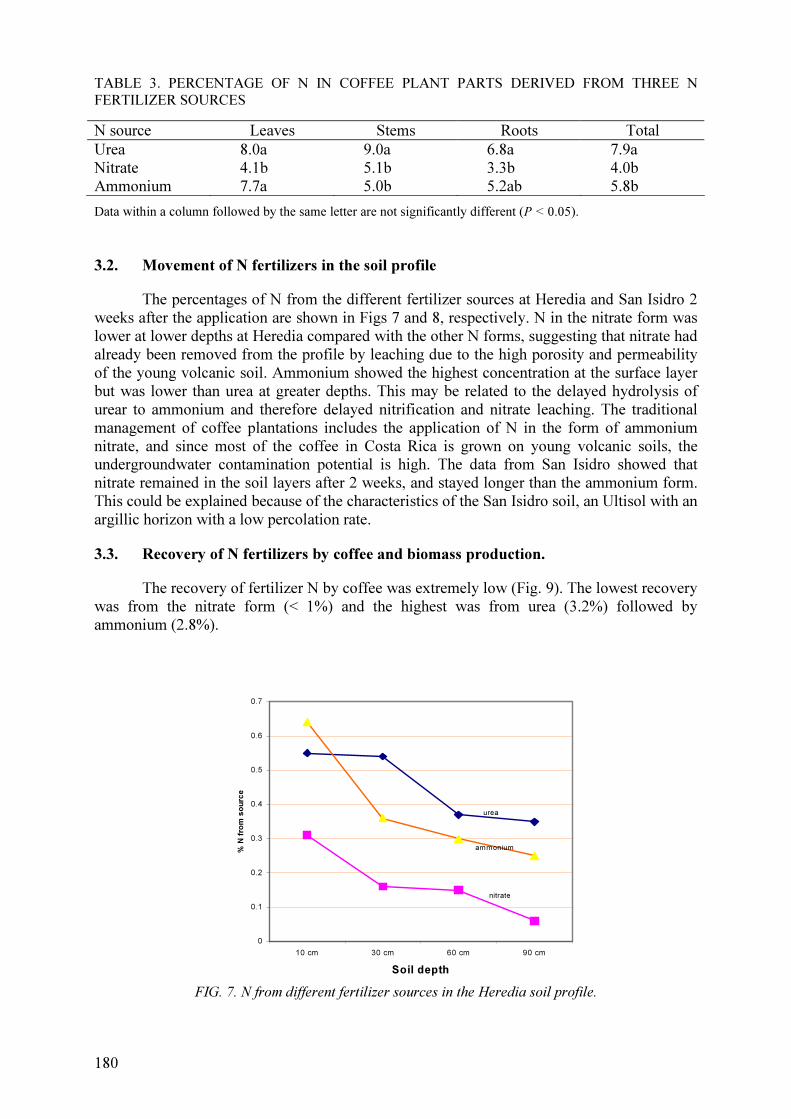
180
TABLE 3. PERCENTAGE OF N IN COFFEE PLANT PARTS DERIVED FROM THREE N FERTILIZER SOURCES
N source Leaves Stems Roots Total Urea 8.0a 9.0a 6.8a 7.9a Nitrate 4.1b 5.1b 3.3b 4.0b Ammonium 7.7a 5.0b 5.2ab 5.8b
Data within a column followed by the same letter are not significantly different (P < 0.05).
3.2. Movement of N fertilizers in the soil profile
The percentages of N from the different fertilizer sources at Heredia and San Isidro 2 weeks after the application are shown in Figs 7 and 8, respectively. N in the nitrate form was lower at lower depths at Heredia compared with the other N forms, suggesting that nitrate had already been removed from the profile by leaching due to the high porosity and permeability of the young volcanic soil. Ammonium showed the highest concentration at the surface layer but was lower than urea at greater depths. This may be related to the delayed hydrolysis of urear to ammonium and therefore delayed nitrification and nitrate leaching. The traditional management of coffee plantations includes the application of N in the form of ammonium nitrate, and since most of the coffee in Costa Rica is grown on young volcanic soils, the undergroundwater contamination potential is high. The data from San Isidro showed that nitrate remained in the soil layers after 2 weeks, and stayed longer than the ammonium form. This could be explained because of the characteristics of the San Isidro soil, an Ultisol with an argillic horizon with a low percolation rate.
3.3. Recovery of N fertilizers by coffee and biomass production.
The recovery of fertilizer N by coffee was extremely low (Fig. 9). The lowest recovery was from the nitrate form (< 1%) and the highest was from urea (3.2%) followed by ammonium (2.8%).
0
0.1
0.2
0.3
0.4
0.5
0.6
0.7
10 cm 30 cm 60 cm 90 cm
Soil depth
% N
fro
m s
ou
rce
urea
ammonium
nitrate
FIG. 7. N from different fertilizer sources in the Heredia soil profile.

181
0.000
0.100
0.200
0.300
0.400
0.500
0.600
0-30 cm 30-60 cm 60-90 cm
Soil depth
% N
fro
m s
ou
rce
Ur ea
Ni tr ate
Amoni um
FIG. 8. N from different fertilizer sources in the San Isidro soil profile.
3.2
0.93
2.76
0
0.5
1
1.5
2
2.5
3
3.5
%
Urea Nitrate Amonium
N Source
FIG. 9. N recovery (%) by coffee plants from different N sources at the Heredia site.
The ammonium form could be retained at the cation exchange sites on the clays and
organic matter before nitrification. While the young volcanic soils of Heredia are particularly high in organic matter (Table 3), non-crystalline clays such as allophane with relatively low CEC are abundant. Under the relatively high rainfall conditions at the Heredia site (Fig. 2) nitrate is easily leached below the 0–40 cm depth interval where most of the coffee roots occur. Production of biomass for each of the different coffee plant parts was greater in the ammonium fertilizer treatment, and least in the nitrate treatment, with urea intermediate (Fig. 10), again emphasising the inefficiency of nitrate fertilizer under the prevailing environmental and edaphic conditions.
3.4. N cycling from legume residues
The amount of fixed N produced by the legume trees will depend on the biomass produced ha–1, the biomass N concentration and the proportional dependence of the legume on N2 fixation. According to estimates made earlier, 50% of the tree legume N came from N2 fixation (results not presented). Biomass production of 2400 kg dry matter ha–1 was measured at the Heredia site with 238 trees ha–1(Table 4). With a total N concentration of 4.56% for Erytrhyna (Table 4), the system obtained 55 kg N ha–1 of fixed N2. With the new tree density of 500 trees ha–1, the dry biomass obtained at San Isidro was 4500 kg ha–1 (Table 4) at 4.2% N, giving almost 95 kg N ha–1 of fixed N2. Besides N, others nutrients contained in the legume residues (Table 4) are recycled by the legume tree from deep soil out of the reach of coffee roots, providing additional benefits of the association.

182
0
50
100
150
200
250
300
350
400
450
Amonium Nitrate Urea
N source
gra
m D
.M/p
lan
t
Leaves
Stems
Roots
FIG. 10. Biomass produced by coffee plant organs for three N fertilizer sources.
TABLE 4. YIELD AND NUTRIENT CONTENTS OF ERYTHRINA PRUNINGS RETURNED TO THE SOIL AT TWO SITES AND TWO TREE DENSITIES.
Plant parameter San Isidro (500 trees ha–1) Heredia (230 trees ha–1)
Erythrina biomass (kg ha–1) 4492 2400 N concentration (%) 4.2 4.56 N uptake (kg ha–1)a 187 110 K2O (kg ha–1) 116 nd Ca (kg ha–1) 35 nd Mg (kg ha–1) 10 nd P2O5 (kg ha–1) 9 nd C (kg ha–1) 1700 nd
a Estimated 50% from N2 fixation; nd, not determined.
Lower recoveries were obtained from the banded N fertilizer sources compared with
Erythrina tree residues (Figs 9 and 11). The highest recovery of fertilizer N was 3.2% for urea (Fig. 9), while the maximum N recovered by coffee from Erythrina and Gliricidia residues was 4.15 and 3.1%, respectively, 60 d after pruning (Fig. 11). The data illustrate the slow release pattern of tree legume prunings on the soil surface, requiring at least 60 d before the maximum N recovery was reached. These results suggest the possibility of a total substitution of the fertilizer N applied to the coffee plantations, by N from tree legume green manure, for the conditions of Heredia and San Isidro, Costa Rica.
0 0
2.37
2.81
4.15
0 0
2.21 2.26
3.1
0
0.5
1
1.5
2
2.5
3
3.5
4
4.5
0 15 30 45 60
Days after pruning
% N
fro
m l
eg
um
e t
ree
Gliricidia
Erythrina
FIG. 11. Percentage recovery of N in coffee plants from legume residues.

183
With 500 legume ha–1 an increment in the amount of N entering the system through biological N2 fixation was obtained by increasing the amount of legume biomass. An increase from 238 to 500 trees ha–1, with a biomass increment of 130%, was established at the San Isidro site, where conditions were favourable for very fast legume growth. Each legume tree was pruned twice a–1, with a sequential system where only 33% of the trees were pruned at any one time. The new system provided a better distribution of the biomass on the plantation, without affecting the competition between species. Under this system, the shade conditions of the plantation were little changed compared with the traditional management system, because trees are with full leaves at different times, while there is a constant biomass input to the system. Beer, cited by Thurston [5], found that there were no competitive effects for light when Erythrina trees increased from 140 to 280 trees ha–1. Under alternative pruning management the amount of trees produced enough biomass to supply N without affecting the production of coffee beans (Table 5). This higher amount of N made the system independent from external N inputs, reducing the N fertilizer requirement to zero. This is of great importance for the marketing of coffee, as higher prices for coffee grown under organic conditions are being realised. Green manure is a cheap way to provide N to coffee under conditions where competition for water is not a factor limiting coffee production.
TABLE 5. YIELD OF COFFEE BEANS AT SAN ISIDRO IN 2004
Treatment Yield (litres a–1) Fertilized 20270a 238 legume trees ha–1 19400a 500 legume trees ha–1 23540b
Data are means of 5 replicates (LSD = 2336 litres).
4. CONCLUSIONS
The traditional high fertilizer N input system used to grow coffee in Costa Rica has a low fertilizar use efficiency and a high potential for environmental degradation due to nitrate leaching through permeable soils under high rainfall, with the consequent contamination of ground and surface waters. Most of the coffee areas in Costa Rica are also areas of undergroundwater recharge. The traditional associations of legumes trees with coffee do not supply enough N for maximum coffee yields. Thus farmers are applying N fertilizers at high rates to achieve the desired yields on farms that are often only 10 ha in area. The present studies have shown that by increasing the density of legume trees and improving pruning management practices it is possible to replace N fertilizer through enhanced biological N2 fixation and efficient N cycling through slow release decomposition of legume prunings. The highest yield of coffee was obtained under the higher legume tree density of 500 ha–1, even though the number of coffee plants ha–1 was reduced to accommodate more legume trees. Additional benefits of tree legume prunings include improved recycling of other nutrients as well as improved soil physical and biological properties.
REFERENCES
[1] FIELDER, R., PROKSCH, G., The determination of nitrogen-15 by emission and mass spectrometry in biochemical analysis: a review, Anal. Chim. Acta 78 (1975) 1–62.

184
[2] BERGERSEN, F.J. (Ed.) Methods for Evaluating Biological Nitrogen Fixation, John Willey & Sons, Chichester (1980) 701 pp.
[3] INTERNATIONAL ATOMIC ENERGY AGENCY, “Labelling of residues using tree injection”, Use of Isotopes and Radiation Methods in Soil and Water Management and Crop Nutrition, IAEA-TCS-14, IAEA, Vienna, Austria (2001) 75–76.
[4] SALAS, R., et al., Absorcion del fertilizante nitrogenado por la planta de café y su influencia sobre la contaminacion de las aguas subterraneas, (JENNY REYNOLDS VARGAS, Ed.), Proc. Int. Symp. Manejo integrado de aguas subterraneas: un reto para el futuro, EUNED, San Jose, Costa Rica (2002) 89–104.
[5] THURSTON, H.D., et al., (Eds), Tapado. Los sistemas de siembra con cobertura, CATIE. CIIFAD, Cornell University, Ithaca, NY (1994).

185
INTEGRATING LEGUMINOUS TREES AND SHRUBS IN
CROPPING SYSTEMS OF SOUTHERN AFRICA
R. CHINTU, K. LINYUNGA World Agroforestry Centre – ICRAF, C/O Lutheran World Foundation (LWF), Tete, Mozambique P.M. MATAKALA World Agroforestry Centre (ICRAF) — Southern Africa Regional Office, Maputo, Mozambique M. MWALE
Ministry of Agriculture and Cooperatives (MACO), Mt. Makulu Central Research Station, Soil and Water Management Division, Chilanga, Zambia T.S. CHIRWA, P.L. MAFONGOYA, J.M. MATIBINI World Agroforestry Center (ICRAF) — Zambia Agroforestry Project, Chipata, Zambia Abstract
Soil and water management is an essential element in food security, agriculture sector growth and
sustainable land management of sub-Saharan Africa (SSA). The increased land degradation and declining
fertility of SSA soils contribute to food insecurity and poverty. Previously, agroforestry researchers tended to
focus mostly on soil nutrient replenishment as being solely responsible for post-fallow crop yield dynamics.
Missing from many studies on soil fertility issues is the recognition of the important role of soil physical
properties in agricultural productivity. However, many factors affect soil fertility and some agroforestry
measures taken to correct soil nutrient deficiencies can also produce desirable soil physical effects. We
hypothesized that planted tree fallows can potentially increase soil N status and improve soil physical properties,
thus increasing subsequent crop yields. Field studies were conducted on infertile sandy clay loams at Msekera
and Kagoro, Zambia, to determine the effect of contrasting fallows (natural fallow, planted non-coppicing and
coppicing tree fallows) and no-tree no-fallow [maize (Zea mays L.) with and without fertilizer] on soil fertility
and maize yields. This study attempted to address agricultural productivity by viewing soil fertility in terms of
both chemical and physical properties. Hence, this report discusses the implications of improving the nutrient
status of soils without correcting soil physical constraints. Data from both tree-(agroforestry) and non-tree-based
systems have been used to illustrate important physical and chemical changes that occur in soils as a
consequence of varying management regimes or cropping systems. Such data show that the concept of soil
productivity refers to more than replacement of the lost nutrients. Other aspects include soil structure, soil water
retention, water storage, infiltration and soil penetration resistance. The results imply that standard inputs such as
mineral or organic fertilizers can maintain only some elements of soil productivity. Therefore, a broader view
that incorporates the role of soil physical properties and water in influencing productivity is appropriate. This
research does not attempt to provide a comprehensive treatment of all aspects of soil fertility in agroforestry
systems. For example, it does not address the role of soil biota diversity in soil productivity.
1. INTRODUCTION
In southern Africa, the ever increasing human population, and subsequent shortening of the fallow period has rendered natural fallow systems incapable of sustaining the fertility of agricultural land if inorganic fertilizers are not used [1]. Improving food production and soil resources in the smallholder farm sector of southern Africa is an enormous challenge. Soil degradation and nutrient depletion have become serious threats to agricultural productivity in southern Africa. The decline of soil fertility due to continuous cultivation without using fertilizers is a major cause of low crop yields in the entire sub-Saharan African region [2]. Deficiencies of N and in some cases P, as well as water stress and subsoil compaction are

186
some of the major soil productivity constraints which contribute to low yields on small holder farms in southern Africa.
Overcoming soil fertility depletion is fundamental to arresting the ever declining crop yields. Poor soil fertility translates to low maize production, increased impoverishment of rural households, further weakening their ability to invest in improved soil management. The effects of poor soil management are creating larger problems through increased food insecurity, soil erosion and siltation of water systems, deforestation and desertification through agricultural expansion into marginal lands, and social stresses due to excessive urban immigration.
Zambia with a population of 10 million people is a typical case in southern Africa, where maize is the staple food crop grown by about 2 million farmers throughout the country. Most maize is grown continuously without fertilizer addition giving average maize yields of 0.5 to 1.0 t ha–1. An average household of 6 people needs about 1.1 t a–1of maize grain to meet its food intake. This low maize yield leads to food insecurity periods of 6–9 months a–1. Maize productivity can be raised above 4 t ha–1 through application of inorganic fertilizers. However these inputs are expensive and not easily accessible by small scale farmers. The timely delivery of these inputs is also a problem due to poor infrastructure in the rural areas. Presently only about 20% of the households access inorganic fertilizers and 30% access improved seed in the country. As acute food insecurity continues to ravage most parts of southern Africa, governments are encouraging farmers to grow more food. Agroforestry systems involving the use of fast-growing, short-duration leguminous tree fallows that effectively fix N2, retrieve subsoil nitrate and reverse subsoil compaction can help to sustain agricultural productivity and improve rural food security levels. Thus, improved soil structure and soil nutrients are complementary and may be interactive, giving an added synergistic effect. Soil productivity recognizes that soil resources have certain characteristics that need to be taken into account for their sustainable management. This has implications in the way soil degradation is characterized, and on the design of programmes to tackle the issue. Although soil productivity is an ecologically-complex phenomenon, most analyses have concentrated only on the effects of soil physical properties or nutrient depletion in isolation.
However, a scientifically sound predictive ability of the nature, magnitude and duration of fallow benefits to soil fertility is needed in identifying management options that can maximize crop production per unit area within a given location. This paper is a synthesis of soil chemical and physical properties and crop yield dynamics from a series of agroforestry experiments conducted in eastern Zambia over the last ten years. It explores some of the processes influencing soil productivity under improved fallows with a view to improving crop production per unit area.
2. MATERIALS AND METHODS
2.1. Site characteristics
The studies were conducted at Msekera Research Station (32°34’E 13o39’S) and on-farm at Kagoro (32°00'E14o15’S) in eastern Zambia. The climate is subhumid with a unimodal rainfall pattern. The wet season is from November to April followed by a dry season from May to October. Annual rainfall at Msekera during 1992 to 2003 ranged between 550–1400 mm, with 50% of the years receiving less than the long-term average of 1000 mm (Fig. 1). Such seasons had erratic rainfall distributions characterized by a number of prolonged dry spells. Rainfall at Kagoro is even more variable with annual averages usually lower than 800 mm.
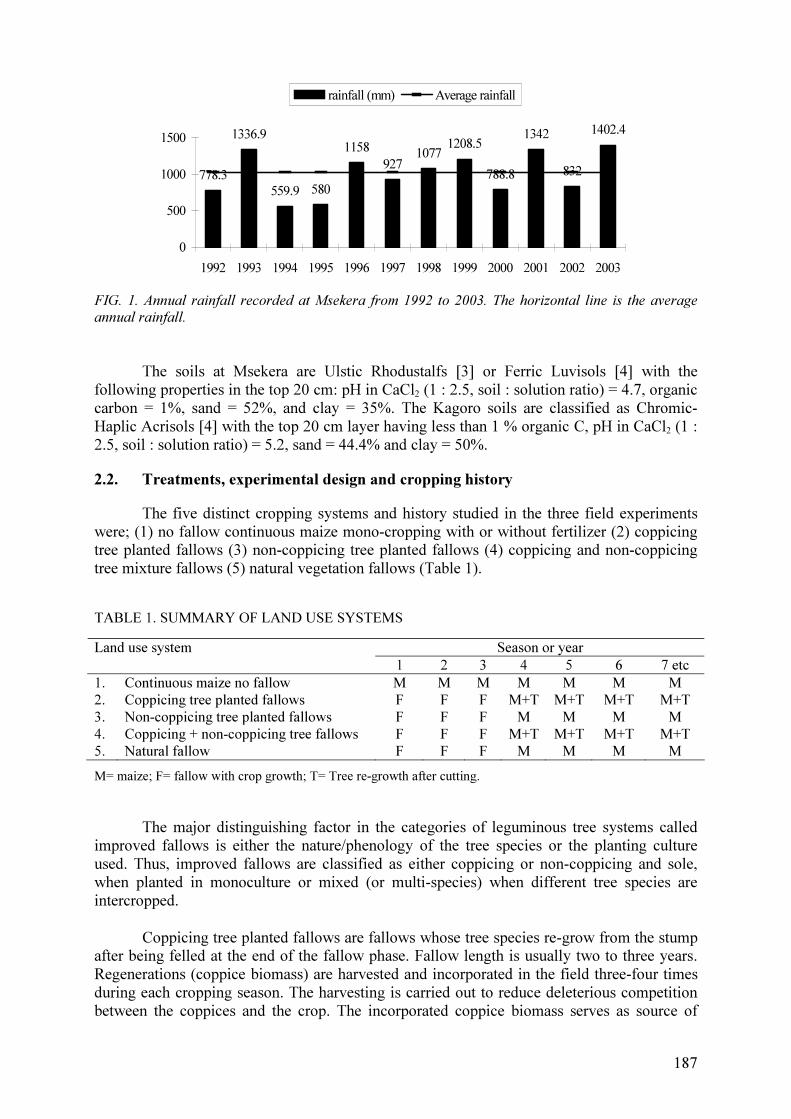
187
778.3
1336.9
559.9 580
1158
9271077
1208.5
788.8
1342
832
1402.4
0
500
1000
1500
1992 1993 1994 1995 1996 1997 1998 1999 2000 2001 2002 2003
rainfall (mm) Average rainfall
FIG. 1. Annual rainfall recorded at Msekera from 1992 to 2003. The horizontal line is the average annual rainfall.
The soils at Msekera are Ulstic Rhodustalfs [3] or Ferric Luvisols [4] with the following properties in the top 20 cm: pH in CaCl2 (1 : 2.5, soil : solution ratio) = 4.7, organic carbon = 1%, sand = 52%, and clay = 35%. The Kagoro soils are classified as Chromic-Haplic Acrisols [4] with the top 20 cm layer having less than 1 % organic C, pH in CaCl2 (1 : 2.5, soil : solution ratio) = 5.2, sand = 44.4% and clay = 50%.
2.2. Treatments, experimental design and cropping history
The five distinct cropping systems and history studied in the three field experiments were; (1) no fallow continuous maize mono-cropping with or without fertilizer (2) coppicing tree planted fallows (3) non-coppicing tree planted fallows (4) coppicing and non-coppicing tree mixture fallows (5) natural vegetation fallows (Table 1).
TABLE 1. SUMMARY OF LAND USE SYSTEMS
Season or year Land use system 1 2 3 4 5 6 7 etc
1. Continuous maize no fallow M M M M M M M 2. Coppicing tree planted fallows F F F M+T M+T M+T M+T 3. Non-coppicing tree planted fallows F F F M M M M 4. Coppicing + non-coppicing tree fallows F F F M+T M+T M+T M+T 5. Natural fallow F F F M M M M
M= maize; F= fallow with crop growth; T= Tree re-growth after cutting.
The major distinguishing factor in the categories of leguminous tree systems called improved fallows is either the nature/phenology of the tree species or the planting culture used. Thus, improved fallows are classified as either coppicing or non-coppicing and sole, when planted in monoculture or mixed (or multi-species) when different tree species are intercropped.
Coppicing tree planted fallows are fallows whose tree species re-grow from the stump after being felled at the end of the fallow phase. Fallow length is usually two to three years. Regenerations (coppice biomass) are harvested and incorporated in the field three-four times during each cropping season. The harvesting is carried out to reduce deleterious competition between the coppices and the crop. The incorporated coppice biomass serves as source of

188
nutrients (especially nitrogen) for the associated crop. Among the tree species used in the field experiments, Gliricidia sepium (Gliricidia), Leucaena leucocephala (Leucaena), Senna
siamea (Senna), Calliandra calothyrsus (Calliandra) and Flemingia microphylla (Flemingia), and Acacia angustissma (Acacia) were coppicing fallow species as they sprouted from the cut stump.
Non-coppicing tree planted fallows are fallows propagated with tree species that do not sprout after being cut at the end of the fallow phase. Fallow length is usually one to two years. The residual effects from the fallow phase may only support 2–3 post-fallow maize crops after which another fallow has to be established to rebuild soil fertility. An example of a non-coppicing tree fallow in this study is that of Sesbania sesban (Sesbania).
As the name states, coppicing + non-coppicing tree mixture fallows are a category of fallows in which two or more tree species are inter-planted in the same time and space. Coppicing and a non-coppicing tree species, respectively, were comboined as follows in Experiment 1; Gliricidia + Sesbania, Acacia + Sesbania, Leucaena + Sesbania.
Sole or mono-species fallows are simply single species fallows. This means that they consist of the same plant species planted in pure stands or monoculture. Thus, mono-species fallows may either be coppicing or non-coppicing in nature.
Tree and maize biomass, tree coppicing, tree deep N capture, soil compaction, N and water dynamics were measured in the 1999/2000 season in two on-going agroforestry field experiments at Msekera (experiment 1 established in November 1992 and experiment 2 established in 1997) and a third one at Kagoro (experiment 3 established in 1997). All three experiments were rain-fed and the unimodal rainfall of both sites supports only one maize crop per year. The size of each experimental unit (main plot) was 10 m × 10 m, while the sub-plot was an area of 7m × 7m in the centre of the main plot, from which measurements were taken. The spacing between trees was 1 m x 1 m in fallows with one or two tree species.
2.2.1. Experiment 1
Experiment 1 had 10 treatments arranged in a randomized complete block design (RCBD) with three replications. However, only Gliricidia and Leucaeana were selected for the soil N dynamics study. In addition, Sesbania, Senna Calliandra and Flemingia were included in tree and long-term maize productivity assessments. The planted fallow trees in experiment 1 were clear felled in 1995 after three years of growth, and the fallow treatments were under the 5th maize crop, while the continuous maize cropping controls had the 8th crop at the time the study was superimposed in 2000.
2.2.2. Experiment 2
Experiment 2 had 10 treatments which were also arranged in a RCBD with three replications, but only the following treatments were selected; Acacia, Gliricidia, Leucaena, Sesbania and natural fallow, to study soil N dynamics, post-fallow maize yields, and water intake and storage. The measurements in experiment 2 were done at the same time as in experiment 1; this was during the second year of fallow in experiment 2, which was the second crop for the no-tree (no fallow) continuous maize cropping controls.

189
2.2.3. Experiment 3
Experiment 3 had 12 treatments arranged in a RCBD with three replicates. Eight fallow systems namely Gliricidia + Sesbania, Acacia + Sesbania, Leucaena + Sesbania, Gliricidia sole, Sesbania sole, Leucaena sole, Acacia sole and the natural fallow (NF) were monitored. Additionally, the continuous maize with fertilizer (M+F) and without fertilizer (M-F), were used as controls mainly to compare maize yield, soil inorganic-N and physical properties with those under the planted and natural fallow treatments. This experiment tested fallows using coppicing tree species alone and in combination with Sesbania, a non-coppicing tree species. In addition, the experiment included Sesbania as a sole treatment. The measurements in experiment 3 were done at the same time as in experiments 1 and 2, but this was during the second year of fallow in experiment 3, which was the second crop for the no-tree (no fallow) continuous maize cropping controls in both experiments 2 and 3.
2.3. Plant management
The foliar biomass of trees and the vegetation in the tree and natural fallows, respectively, were incorporated into the soil by hand hoeing in experiment 1. The test crop, a hybrid maize variety (MM 604 of 135–140 days to physiological maturity and a yield potential of 7–9 t ha–1) was hand sown in continuous maize cropping (across experiments) and post-fallow (in experiment 1) plots at a spacing of 25 cm within the rows and 100 cm between the rows (44 444 plants ha–1). Fertilizer was applied only to the fertilized control plots at the rate of 20 kg N, 18 kg P, and 17 kg K ha–1 using Compound-D at sowing and 92 kg N ha–1 using urea, 4 weeks after sowing across experiments. All experiments were cultivated manually by hand-hoe at establishment. Post-fallow resprouts of coppicing tree species (experiment 1) were allowed to grow in the dry season. The resprouts in experiment 1 were cut and incorporated at maize sowing each season and once more at 5 weeks after maize sowing. Experiments 2 and 3 were in the fallow phase in 2000, thus no management was required except for control plots of continuous maize with and without fertilizer. However, similar management as in experiment 1 was applied in experiments 2 and 3 during the post-fallow phase.
2.4. Cumulative water intake
Cumulative water intake was monitored in experiment 2 at Msekera at fallow clearing towards the end of the dry season of 2000 using a double ring infiltrometer [5]. Measurements were made at three locations, diagonally across the sub-plot of each plot, and observations taken at 0, 5, 10, 15, 20, 30, 45, 60, 90, 120, 150 and 180 min. The average readings were used to calculate cumulative water intake per plot using the Kostiakov model [6].
2.5. Soil water content
A calibrated neutron probe was used to measure volumetric soil water content in experiment 2 at Msekera in 15 cm increments to a depth of 165 cm bi weekly from all plots at fallow clearing and during the cropping phase. One aluminium access tube was installed in the center of the sub-plot. Neutron probe calibration was based on simultaneous probe readings and gravimetric measurements. Soil water content on 15 July 2001 was calculated by summing readings in the top 1.65 m soil profile.

190
2.6. Soil penetration resistance
Resistance to penetration was measured on 17 April 2001 at Kagoro using a hand penetrometer (Bush soil penetrometer SP1000, version 1.0). The probe was pushed into the soil at five random positions in the sub-plot and the soil resistance at 0–5, 5–10, 10–15 and 15–20 cm depths was recorded at each of the five positions.
2.7. Tree and maize biomass estimation
The above ground biomass of trees was separated into foliage and wood at fallow clearing, and the fresh weight of each component was taken across experiments. These data were used to estimate the dry weights on the main plots, which were then extrapolated to ha–1 basis. The wood (>5 mm diameter) biomass was taken away for use as fuelwood, as wood in this area is scarce. Maize plants were harvested from each plot at physiological maturity (140 d after sowing). Maize grain yields were determined on an oven dry weight basis across experiments.
2.8. Soil N determination
Soil was sampled for inorganic-N dynamics across experiments in the wet and dry seasons using a metal sampler [(4.2 cm diameter Galvanised Iron (G.I) pipe)]. Samples were collected from 0–20, 20–40, 40–60, 60–100, 100–150 and 150–200 cm depths in each treatment. The soil sample from each depth was collected from the 8 × 8 m sub-plot at eight points in a systematic diagonal pattern. Soil from the eight points was then combined into a composite sample of 250 g for each depth. A subsample of 20 g from the 250 g freshly-collected composite sample of each treatment was extracted by shaking in a 100 mL 2 M KCl for 1 h. The contents were allowed to settle for 10 min before being filtered through a Whatman 42 filter paper, which was initially flushed with deionised water to remove any ammonium and nitrate contamination [7, 8]. Ammonium was determined by a colorimetric method [7]. Nitrate was determined by a cadmium reduction method [8]. The sum of ammonium-N and nitrate-N (NH4
+ + NO3-) constituted inorganic-N.
2.9. Data analyses
All data were subjected to analysis of variance (ANOVA) using the generalized linear model (PROC GLM) of the SAS system [9]. The standard error of the difference (s.e.d.) was used to separate treatment means in the case of a significant F-test at P < 0.05. Simple linear regressions and correlations were used to determine the relationships between inorganic N, biomass N and maize grain yield.
3. RESULTS
3.1. Single species fallows
3.1.1. Above ground tree biomass at three years of growth
Sesbania was significantly (P< 0.05) taller than the rest of the tree species at 3 years of growth. This was followed by Senna and Leucaena which had heights of 4.6 m and 4.5 m, respectively. Flemingia and Calliandra were the shortest at 2.8 m and 2.9 m, respectively (Table 2; P < 0.05). Senna and Leucaena had the significantly highest foliage biomass of 3.2 and 1.2 t ha–1, respectively, at 3 years of fallow. Fallen litter biomass was highest in Senna (11.7 t ha–1), Sesbania (9.3 t ha–1) and Gliricidia (8.2 t ha–1) at the end of the fallow phase.

191
TABLE 2. TREE GROWTH AND ABOVE-GROUND BIOMASS PRODUCTION IN THREE YEAR FALLOWS (NOVEMBER, 1994) AT MSEKERA, ZAMBIA
Biomass (t ha–1) Treatment Tree height (m)
Foliage Stem Total standing Fallen leaf litter
Senna 4.46 3.15 26.38 29.53 11.74
Sesbania 5.58 0.32 28.79 29.11 9.29 Leucaena 4.61 1.15 24.15 25.3 4.33 Gliricidia 3.88 0.42 19.06 19.48 8.16 Flemingia 2.84 0.18 12.08 12.26 5.55 Calliandra 2.95 0 6.41 6.41 3.71 Grass fallow nd nd nd nd 3.85
S.E.D. 0.33 0.32 2.92 3.11 1.5
CV% 11.6 51.9 21.2 21.6 31.8 Probability < 0.001 < 0.001 < 0.001 < 0.001 < 0.001
nd = not determined; SED = standard error of the difference.
3.1.2. Seasonal post-fallow coppice biomass production
Sesbania did not coppice after being felled at three years of age, and therefore is absent in Fig. 2. Senna, Leucaena, Gliricidia, Flemingia and Calliandra coppiced with Senna being significantly outstanding (0.2 to 7.0 t ha–1) compared with Flemingia (0.4 to 2.4 t ha–1) and Calliandra [(generally < 1 t ha–1; (Fig. 2; P < 0.05)] from 1996–2002.
3.2. Mixed fallows
3.2.1. Tree survival, dry matter biomass and N yield at the end of 3 years of fallow
Tree survival was significantly higher in sole Gliricidia than in all the other tree systems (P < 0.05). The lowest (P < 0.05) survival was in sole Sesbania (12%). Survival in Leucaena and all land use systems associated with Sesbania were relatively low with 31–44% survival (Table 3). Foliage and total biomass (foliage + wood) yield was highest (P < 0.05) in sole Gliricidia (1.8 t ha–1 leaf and 22 t ha–1 total) and where Gliricidia was mixed with Sesbania (0.7 t ha–1 leaf and 19.5 t ha–1 total). Natural fallow had the least total biomass (2.4 t ha–1). The fresh foliage of sole Gliricidia incorporated into the soil at the end of the fallow, subsequent to the first post-fallow maize crop, added 64 % more nitrogen (42 kg of N ha–1) than Gliricidia + Sesbania mixture (15 kg of N ha–1). Foliage N yield or input in Acacia sole, Sesbania sole, and fallow mixtures with Sesbania ranged from 4.6–15 kg ha–1 and were not significantly different (P < 0.05) from the natural fallow control, which was 15 kg ha–1. Sole Leucaena foliage N yield (2.5 kg ha–1) was the only treatment that was significantly lower than the control.
3.2.2. Post-fallow coppice biomass production in mixed fallow systems
Significant differences (P < 0.01) were recorded in coppice production at all cutting times during the first and second post-fallow cropping seasons (Fig. 3). The highest coppice production of 2.0 and 1.9 t ha–1 was recorded in Gliricidia mixed with Sesbania, at the first and second coppice harvests, respectively, in the first post-fallow season. Total first post-fallow seasonal coppice biomass and N yields were significantly (P < 0.01) affected by the different land use systems (Table 4). Coppice biomass (3.9 t ha–1) and N (125 kg ha–1) inputs were significantly greater in the Gliricidia + Sesbania mixture than in the sole Gliricidia fallow [2.3 t ha–1 biomass (Fig. 3) and 72 kg N ha–1 (Table 4) and all the other systems. Sole Leucaena had the lowest coppice biomass (0.8 t ha–1) and hence the lowest N input of 28 kg ha–1.

192
0
2
4
6
8
1996 1997 1998 1999 2000 2001 2002
Season
Co
pp
ice b
iom
ass
(t
ha-1)
Senna Leucaena Gliricidia Flemingia Calliandra
FIG. 2. Seasonal post-fallow biomass yield from coppicing tree species in experiment 1 at Msekera,
Zambia.
TABLE 3. TREE SURVIVAL, BIOMASS AND N CONCENTRATION OF FALLOW SYSTEMS AT THE END OF THREE YEARS IN NOVEMBER 2000 AT KAGORO, ZAMBIA
Biomass (t ha–1) Fallow system Survival (%) Foliage Wood Total
biomass
Foliage N content
(%)
Foliage N yield
(kg ha–1)
Sole Gliricidia 96 1.81 20.30 22.11 3.47 41.6 Gliricidia + Sesbania 44 0.71 18.76 19.47 3.27 15.2 Sole Acacia 58 0.29 6.13 6.42 3.00 7.6 Acacia + Sesbania 34 0.28 6.22 6.51 3.04 8.6 Leucaena+ Sesbania 35 0.31 6.82 7.13 3.27 10.2 Sole Leucaena 31 0.07 2.34 2.41 3.34 2.5 Sole Sesbania 12 0.15 2.72 2.87 3.07 4.6 Natural fallow nd nd nd 2.38 0.62 14.8 SED 10 0.22 2.79 2.74 0.22 5.6 Probability < 0.01 < 0.01 < 0.01 < 0.01 < 0.01 < 0.01
nd = not determined; SED = standard error of the difference.
TABLE 4. COPPICE N INPUT (KG HA–1) DURING FIRST AND SECOND POST-FALLOW CROPPING SEASONS (2000–2002) AT KAGORO, ZAMBIA
1st post-fallow year 2nd post-fallow year Land use system
1st coppice
2nd coppice
1st year total 3rd harvest 4th harvest 5th harvest
2nd year total
Gliricidia + Sesbania 64.2a 60.9a 125.1a 24.4a 15.3ab 11.6b 51.3ab
Sole Gliricidia 36.3b 35.8b 72.1b 23.7a 20.1a 16.6a 60.4a
Sole Acacia 30.6b 22.2bc 52.8bc 17.8a 9.9bc 10.3b 38.1b
Acacia + Sesbania 22.5bc 18.5bc 41.0c 3.7b 6.3cd 4.1cd 14.1c
Leucaena + Sesbania 20.2bc 17.7bc 37.9c 0.4b 3.1d 3.4d 6.9c
Sole Leucaena 14.0c 14.9c 28.9c 0.4b 6.4cd 7.6bc 14.3c
Mean 31.3 28.3 59.6 11.7 10.2 8.9 30.9
Probability < 0.01 < 0.01 < 0.01 < 0.01 < 0.01 < 0.01 < 0.01
Values in each column followed by same letter(s) are not significantly different at P < 0.05.

193
0.0
0.5
1.0
1.5
2.0
2.5
3.0
3.5
4.0
4.5
Year
1
Year
2
Year
1
Year
2
Year
1
Year
2
Year
1
Year
2
Year
1
Year
2
Year
1
Year
2
Gliricidia
+ Sesbania
Gliricidia Acacia Acacia +
Sesbania
Leucaena Leucaena
+ Sesbania
Seasons and tree species
Co
pp
ice
bio
mass
(t
ha-1
)
Coppice 3
Coppice 2
Coppice 1
FIG. 3. Post-fallow coppice biomass production in 2000 and 2001 at Kagoro, Zambia: Means for the
same year followed by the same letter (s) are not significantly different at P < 0.05. Italicised and non-italicised symbols are for years 1 and 2, respectively. Sesbania did not coppice.
3.2.3. Coppice biomass and nitrogen inputs during the second post-fallow cropping
Coppices were harvested thrice in the second post-fallow season as opposed to twice in the first post-fallow season. However, the general trend was that there was more coppice biomass in the first than in the second post-fallow season across the land use systems. Second post-fallow season coppice biomass was significantly highest and statistically similar in sole Gliricidia (1.9 t ha–1), Gliricidia + Sesbania (1.6 t ha–1), and sole Acacia (1.3 t ha–1). The lowest coppice biomass, 0.1–0.4 t ha–1 was in sole Leucaena, Leucaena + Sesbania and Acacia + Sesbania (Fig. 3). Second post-fallow season, coppice biomass N input in sole Gliricidia (60 kg N ha–1) and Gliricidia + Sesbania mixture (51 kg N ha–1) were not significantly different (Table 4).
3.3. Pre season topsoil (0–20 cm) inorganic N
Land use systems in experiment 1 differed significantly (P < 0.05) in terms of pre-season topsoil N concentrations, except in 2000 when all land use systems did not differ (Table 5). This was at the end of the fallow before trees were cut. First post-fallow (October 2001) pre-season N concentration was lowest in the natural fallow and in the continuously unfertilized maize plots (12 and 13 mg kg–1, respectively). Pre-season topsoil inorganic-N was highest in continuously fertilized maize plots (18 mg kg–1) and Leucaena land use systems (19 mg kg–1; Table 5; P < 0.05).
a
a
b
a bc
a bc
b
c
b
c
b

194
TABLE 5. PRE-SEASON TOPSOIL INORGANIC-N IN EXPERIMENT 1 FROM 1997–2001 AT MSEKERA, ZAMBIA
Inorganic-N (mg kg–1) at 0–20 cm Treatment Nov–1997 Oct–1998 Oct–1999 Oct–2000 Oct–2001
Calliandra 10.2 7.8 7.9 9.0 14.6
Senna 11.4 9.0 9.6 11.8 15.2
Flemingia 11.0 8.9 9.0 8.7 16.1
Natural fallow 12.5 7.9 7.4 9.3 12.0
Gliricidia 12.8 11.5 11.5 11.1 15.3
Leucaena 15.0 14.2 13.0 11.8 19.1
Maize + Fertilizer 14.3 14.4 11.5 12.6 18.0
Maize – Fertilizer 7.8 6.6 6.9 10.8 12.7
Sesbania 6.5 10.4 8.8 10.2 13.5
SED 1.4 2.1 1.6 1.6 2.4
Probability < 0.001 < 0.05 < 0.05 ns < 0.05
ns = not significant at P < 0.05.
3.4. Maize yields in experiment 1
Planted tree fallows significantly increased maize yields over the no-tree unfertilized control. However, planted Sesbania fallows significantly improved maize yields only in the first three post-fallow years over the no-tree, unfertilized control (Fig. 4; P < 0.05). After 3 years Sesbania post-fallow maize yields were 1–2 t ha–1 which was statistically equivalent to the no-tree (no fallow) unfertilized control. Maize yields after 9 post-fallow cropping years following Gliricidia and Leucaena were statistically similar to those in the no-tree fertilized control. Regression analysis (Fig. 5) shows that pre-season topsoil inorganic-N (NH4
+ + NO3-)
was highly correlated with associated maize yields (r2 = 0.71; n = 10;P < 0.05) in the 1997/98 season. This relationship was consistently reflected in all seasons across experiments.
0.0
1.0
2.0
3.0
4.0
5.0
6.0
7.0
8.0
1995 1996 1997 1998 1999 2000 2001 2002 2003
Season
Mai
ze g
rain
yie
ld (
t ha-1
)
Gliricidia Leucaena M+F M-F Sesbania Natural fallow
= SED
FIG. 4. Maize grain yield dynamics in experiment 1 from 1995–2003 at Msekera, Zambia. Bars are
s.e.d at P < 0.05.

195
y = 0.16x - 0.25
R2 = 0.71
0.5
1.0
1.5
2.0
2.5
3.0
3.5
0.0 5.0 10.0 15.0 20.0 25.0
Inorganic N (mg N kg-1
soil)
Mai
ze g
rain
(t
ha-1)
FIG. 5. Relationship between 1997/98 pre-season top soil (0–20 cm) inorganic-N (NH4
+ + NO3
-) and
the fourth maize crop grain yield in experiment 1 at Msekera, Zambia.
3.5. Subsoil N dynamics in experiment 1 and 2 at Msekera
No significant differences were observed in pre-season nitrate-N (0–20 cm soil layer) among the land use systems in samples taken before the initial foliage incorporation in October, 2000 (Fig. 6(a)). Continuously fertilized maize plots in experiment 2 had the highest (P < 0.05) nitrate at 150–200 cm soil depth followed by maize without fertilizer. On the other hand Gliricidia, Acacia, Senna and Leucaena had lower nitrate than the no-tree controls at the depth interval of 150–200 cm just before the end of the fallow phase (Fig. 6(a)).
Planted coppicing fallows had significantly (P < 0.05) higher post-fallow, pre-season topsoil nitrate levels (0–20 cm) than the unfertilized control but this was not significantly different to fertilized plots (Fig. 6(b)). However, subsoil nitrate at 200 cm depth was significantly lower under coppicing fallows than in the no-tree (no fallow) unfertilized and fertilized maize mono-cropping controls, and in post Sesbania fallow maize plots in experiment 1 (Fig. 6(b)). The highest post-fallow subsoil (at 200 cm) nitrate concentrations were recorded under Sesbania treatments. On the contrary, subsoil nitrate levels in Sesbania plots in the fallow phase did not significantly differ from those in planted tree systems (Fig. 6(b); P < 0.05).
3.6. Cumulative intake and storage of water in experiment 2 at Msekera, Zambia
3.6.1. Cumulative water intake in 2000 post-fallow season
Significant cumulative water intake differences (P < 0.05) were observed at fallow clearing in experiment 2. Sesbania had 701 mm of cumulative water intake compared with 119 mm under maize without fertilizer after 3 h of soil ponding (Fig. 7). The results show that the non-coppicing Sesbania fallow had the highest post-fallow water intake followed by the natural fallow. Significant differences in the first post-fallow season cumulative water intake did not arise between coppicing Gliricidia and unfertilized maize. Plots that were continuously cropped with maize without fertilizer application had the lowest cumulative

196
water intake in the first post-fallow harvest in experiment 2 at Msekera after 180 min of ponding.
3.6.2. Post first harvest soil water content in 2001
Water storage in the top 165 cm soil profile at post harvest in July 2001 was significantly affected by land use systems. Water storage was significantly highest in the non-coppicing Sesbania fallow (580 mm/165 cm) and lowest (520 mm/165 cm) in the coppicing Leucaena fallow (Fig. 8).
Although the post-fallow water storage capacity to 165 cm depth of the Sesbania land use system significantly surpassed that of coppicing tree systems and the continuously cropped plots of fertilized and unfertilized maize (no tree) systems, it did not significantly differ from that of the natural fallow. Natural fallow water storage (560 mm) differed significantly from that of Leucaena, but did not differ (P < 0.05) from that of Gliricidia (535 mm) and the continuously cropped plots of fertilized and unfertilized maize (no tree) systems (540 mm and 543 mm, respectively; Fig. 8). However, water storage of the coppicing tree systems, Leucaena and Gliricidia, was not statistically different.
0
50
100
150
200
0 1 2 3 4 5 6 7
Nitrate(a)
(mg N kg-1
)
So
il d
ep
th (
cm
)
Gliricidia
Leucaena
Maize + Fertilizer
Maize - Fertilizer
Sesbania
0
50
100
150
200
0 1 2 3 4 5 6 7
Nitrate(b)
(mg N kg-1
)
So
il d
ep
th (
cm
)
FIG. 6 (a). Pre-season topsoil nitrate-N in experiment 2 in October 2000 before foliage application
subsequent to the first post-fallow cropping at Msekera, Zambia. (b). Pre-season subsoil nitrate-N as affected by fallow species in experiment 1 in October 2000 after the 7th
post-fallow season at Msekera, Zambia.

197
0
100
200
300
400
500
600
700
800
0 20 40 60 80 100 120 140 160 180 200
Time (minutes)
Cum
ula
tive
wa
ter
inta
ke (
mm
)
Natural fallow Gliricidia Maize+fertilizer Maize-fertilizer Sesbania
FIG. 7. Effects of land-use system on cumulative water intake (mm) of the soil at fallow clearance in
2000 in experiment 2 at Msekera, Zambia.
FIG. 8. Water storage (0–165 cm) as affected by land use system in July 2001 at Msekera, Chipata-
Zambia.
3.7. Penetrometer resistance in mixed fallows at Kagoro, Zambia
Penetrometer resistance measured on 17 April 2001 at Kagoro showed significant differences (P < 0.05) among land use systems and soil depths, except in the subsoil layer of 15–20 cm (Table 6). Sole Gliricidia had lower penetration resistance (0.6 Mpa) compared with maize without fertilizer, which had the highest soil resistance to penetration (1.7 Mpa) in the 0–5 cm soil layer. The highest penetrometer resistance in the 5–10 cm soil layer was still in maize without fertilizer (2.2 Mpa) and lowest in Gliricidia + Sesbania and Acacia + Sesbania mixtures (0.8 Mpa each). On the other hand, in the 10–15 cm soil layer the highest penetrometer resistance (3.0 MPa) was recorded under natural fallow, and maize with and without fertilizer. The least resistance (1.7 Mpa) was recorded under Gliricidia + Sesbania mixture.
490500510520530540550560570580590
Natur
al F
allo
w
Glir
icid
a
Leu
caen
a
Mai
ze+Fer
tilize
r
Ses
bani
a
Mai
ze-fer
tilize
r
Land use system
Wat
er s
tora
ge
(mm
/16
5 c
m)
ab
bbc
c
b
a
Bars = Lsd

198
TABLE 6. CONE PENETROMETER RESISTANCE UNDER DIFFERENT LAND USE SYSTEMS MEASURED AT DIFFERENT SOIL DEPTHS ON 17 APRIL 2001 AFTER FIRST CROPPING AT KAGORO, ZAMBIA
Penetrometer resistance (Mpa) Fallow/crop system
0–5 cm 5–10 cm 10–15 cm 15–20 cm
Sole Sesbania 0.9 ab 1.1 bc 2.3 ab 3.1
Sole Gliricidia 0.6 b 0.9 c 2.0 ab 3.3
Sole Leucaena 0.8 ab 1.1 bc 2.5 ab 3.6
Sole Acacia 1.0 ab 1.6 abc 2.6 ab 3.4
Gliricidia + Sesbania 0.7 ab 0.8c 1.7 b 2.9
Acacia + Sesbania 0.7 ab 0.8 c 2.1 ab 3.6
Leucaena + Sesbania 1.0 ab 1.2 abc 2.2 ab 3.3
Natural fallow 0.9 ab 1.6 abc 3.0 a 3.8
Maize (+fertilizer) 1.2 ab 1.9 ab 3.0 a 3.7
Maize (–fertilizer) 1.7 a 2.2 a 3.0 a 3.8
SED 0.5 0.5 0.7 0.6
F-probability < 0.05 < 0.01 < 0.05 Ns
Treatment means within each column followed by the same letter(s) are not significantly different at P < 0.05, ns
= not significant at P < 0.05; SED = standard error of difference in treatment means.
4. DISCUSSION AND CONCLUSIONS
The five distinct cropping systems studied could be generally classified as follows: (1) no fallow continuous maize mono-cropping with or without fertilizer (2) coppicing tree planted fallows (3) non-coppicing tree planted fallows (4) mixed tree species planted fallows and (5) natural vegetation fallows (Table 1).
Most of the improved fallow work in southern Africa has concentrated on Sesbania [10]. However, this species has several drawbacks, including (i) defoliation by the Mesoplatys beetle, significantly reducing its fresh foliage biomass [11], (ii) high mortality at the end of three years [10] and (iii) it does not sprout or coppice when cut at the end of a fallow, which is normally 2–3 years of growth (Table 2 and Fig. 3). Hence, fallows of Sesbania, as well as those of Tephrosia and Cajanus species, are called non-coppicing fallows. Therefore, farmers practicing non-coppicing fallows must rely on a fresh supply of seedlings or seed reserves to regenerate their fields after 2–3 years of post-fallow cropping.
The residual effects of non-coppicing fallows on subsequent maize have been shown to be significantly higher than the natural fallows for only two to three seasons, but decline sharply in the third season (Fig. 4) to 1.0 t ha–1 of maize grain yield [12]. This may be related to nutrient depletion and deterioration of soil physical properties [13]. Planted improved fallows which coppice such as those of Gliricidia and Leucaena will have longer lasting residual effects than non-coppicing Sesbania planted fallows (Fig. 4). This is due to the continuous application of high quality organic matter to soil from the coppice growth [2] (Figs 2 and 3, Table 4). The term ‘high quality’ refers to organic residues with high N (>2.5%), low lignin (< 15%) and low soluble polyphenols (< 3%) [14, 15, 16]. The quality of Sesbania, Gliricidia and Leucaena residues at Msekera were found to be in this range [17].
The high mortality in mixtures and sole Sesbania could be mainly attributed to high natural dieback of Sesbania after 2 years of growth. High mortality and thus low biomass in

199
sole Acacia and sole Leucaena fallows, was chiefly due to cattle and goats browsing during and after the fallow phase. Hence, fallows associated with these species may not be suitable in free-ranging livestock areas. During the first post-fallow cropping season, the total foliage of Gliricidia + Sesbania mixture which was incorporated into the soil added 80% more nitrogen (125 kg N ha–1) than sole Gliricidia (72 kg N ha–1). This implies that the Gliricidia + Sesbania mixture had a greater advantage over the other land use systems studied in terms of coppice growth and nitrogen input. This phenomenon was contrary in the other coppicing species (Acacia and Leucaena) mixed with Sesbania, probably because of heavy browsing which reduced their biomass and hence nitrogen input. However, Gliricidia was not browsed by livestock. The significantly higher coppice biomass from Gliricidia mixed with Sesbania in the first post-fallow season could also be partly attributed to the increased Gliricidia coppicing ability and its potential to exploit soil water and nutrients caused by lower plant density in the post-fallow phase after the death of Sesbania (a non-coppicing species). Lower coppice biomass N input in the second post-fallow season in experiment 3 could be attributed to lower rainfall (701 mm) in 2001/2002 compared to higher rainfall (905 mm) received during the 2000/2001 season at Kagoro (rainfall data not shown). Topsoil inorganic-N accounted for over 80% of variations of post-fallow maize yields, which is good enough for topsoil inorganic-N to be used to predict subsequent post-fallow maize yields [1, 2, 13].
There was significantly higher water intake under non-coppicing Sesbania fallows than the coppicing and no-tree systems, which could be due to the high Sesbania mortality by the end of three years. The dead Sesbania roots in the course of decomposition might have left channels or macro-pores, which may have caused easy water infiltration into the soil. Increased water intake implies reduced water runoff and thus Sesbania fallows may be effective in reducing soil erosion, though this was not measured. However, this phenomenon seemed to have encouraged leaching and thus subsoil nitrate accumulation during post-fallow years in the absence of live Sesbania trees (Fig. 6(b)). Heavy post-fallow leaching (Fig. 6(b)) could be one of the reasons for the improved, but short-lived, post-fallow maize yields in the sole Sesbania land use system (Fig. 4). Similarly, Pereira et al. [18] and Lal et al. [19] also reported improved soil water infiltration following different legumes and grass cover crops. Torquebiau and Kwesiga [20] also reported increased water infiltration after 2 years of Sesbania fallow, but also a significant reduction in maize yield after two post-fallow cropping seasons on Ferric Luvisols at Msekera. The lower infiltration in the continuous maize with and without fertilizer could be due to soil compaction as a result of degradation of soil structure, as confirmed from high penetrometer resistance values (Table 6). Many researchers reported decreased soil organic matter and soil structure degradation due to continuous cultivation [21, 22]. Lal [23] further showed that the decline in equilibrium infiltration rate is mainly due to structural degradation associated with a decrease in soil organic matter content, which may also lead to reduction in earthworms and other soil fauna activities [24].
Water storage in the top 165 cm of the soil profile at post-harvest in July 2001 at Msekera was significantly affected by different land use systems. Water storage was highest under the Sesbania land use systems compared with Leucaena (Fig. 8). The low water storage under Gliricidia and Leucaena land use systems could be attributed to high water use by coppicing species because of their high coppice productivity during the dry (post maize harvest) period [13]. The dry season residual soil water and nutrients that may otherwise be lost to deeper soil beyond crop roots in non-coppicing and no-tree systems, is utilized to support coppice growth in coppicing tree systems. The nutrients so intercepted are recycled to surface soil for crop use via foliage biomass application. This implies that coppicing tree systems may be more efficient in soil resource capture and use because of reduced drainage, reduced soil surface evaporation and leaching, because of root interception and recycling of

200
water and nutrients [25, 26]. The significantly higher post-fallow subsoil nitrate accumulation in non-coppicing fallows compared with coppicing fallows supports the hypothesis that live tree roots provide a safety net against nutrient leaching (Figs 6(a) and 6(b)) [27]. This also implies that the consistently higher maize productivity under coppicing fallows is due to continuous biomass N additions from coppices. Chintu et al. [1] found that biomass N input in improved fallows accounted for over 70% of maize yield variations. The high post-maize residual water in the top 1.65 m of post-Sesbania fallow plots and the continuously maize mono-cropped plots would be partly responsible for the subsoil nitrate accumulation (Fig. 6(b)), as such water drains downward because of the lack of hydraulic lift in the absence of living trees. Hence non-coppicing tree systems are perceived to be leaky during the post-fallow years (Figs 6(a) and 6(b)) when trees have been cleared.
The least penetrometer resistance (1.7 Mpa) was recorded under Gliricidia + Sesbania mixture. The study showed that 3 year tree mixture and sole species planted fallows were able to reduce cone penetration resistance in the top 15 cm soil depth as compared to maize mono-cropping with or without fertilizer. This further proves the positive effect of planted fallows on soil fertility, because low soil resistance implies that roots of subsequent crops would be able to exploit a larger soil volume because of easy penetration. This study shows that soil fertility replenishment in SSA in its totality should go beyond N availability alone. Soil physical properties such as water storage, infiltration rate and compaction combined with crop nutrient requirements and other factors, may reduce or improve soil fertility and subsequent crop yields. In short, improvements in soil physical properties frequently have a more pronounced effect on yields when used in conjunction with nitrogen fixing trees or nutrient additions.
ACKNOWLEDGEMENTS
The authors greatly appreciate the technical assistance of P. Phiri, S. Chikale, J. Banda, S. Phiri, R. Phiri, M. Chitalu, Y. Ndlovu and the late E. Mkhalipi in field data collection, laboratory analysis and data entry. The authors further acknowledge CIDA, SIDA and IAEA for funding this research.
REFERENCES
[1] CHINTU, R., et al., Propagation and management of Gliricidia sepium planted fallows in subhumid eastern Zambia, Exp. Agr. 40 (2004) 341–352.
[2] CHINTU, R., et al., Subsoil nitrogen dynamics as affected by planted coppicing tree legume fallows, Exp. Agr. 40 (2004) 327–340.
[3] SOIL SURVEY DIVISION STAFF, Soil Survey Manual, Soil Conservation Service, US Department of Agriculture Handbook 18 (1993).
[4] FAO/UNESCO, Soil Map of the World-Revised Legend, World Soil Resources Report 60, FAO/UNESCO, Rome (1988).
[5] BOUWER, H., “Intake rate: cylinder infiltrometer”, Methods of Soil Analysis: Part 1, Physical and Mineralogical Methods (KLUTE, A., Ed.) Agronomy Monograph Number 9, American Society of Agronomy, Madison, Wisconsin, USA (1986) 825–844.
[6] KOSTIAKOV, A.N., On the dynamics of the coefficient of water-percolation in soils and on the necessity for studying it from a dynamic point of view for purposes of amelioration. Transactions of the Sixth International Society of Soil Science, Russian Part A (1932) 17–21.

201
[7] ANDERSON, J.M., INGRAM, J.S.I., Tropical Soil Biology and Fertility: A Handbook of Methods, 2nd edn, CAB International, Wallingford, UK (1993) 221pp.
[8] DORICH, R.A., NELSON, D.W., Evaluation of manual cadmium reduction methods for determination of nitrate in potassium chloride extracts of soil, Soil Sci. Soc. Am. J. 48 (1984) 72–75.
[9] SAS INSTITUTE, SAS/STAT, Release 6.12, SAS Institute Inc., Cary, NC (1996). [10] KWESIGA, F., COE, R., The effect of short rotation Sesbania sesban planted fallows
on maize yield, Forest Ecol. Manag. 64 (1994) 199–208. [11] SILESHI, G., MAFONGOYA, P.L., KWESIGA, F., Perfomance of Sesbania sesban
infested by defoliating beetle Mesoplatys ochroptera in Zambia, Agroforest. Syst. 56 (2002) 177–184.
[12] KWESIGA, F., et al., Sesbania sesban improved fallows: Their inception, development and farmer enthusiasm, Agroforest. Syst. 47 (1999) 49–66.
[13] CHIRWA, T.S., MAFONGOYA, P.L., CHINTU, R., Mixed planted-fallows using coppicing and non-coppicing tree species for degraded Acrisols in eastern Zambia, Agroforest. Syst. 59 (2003) 243–251.
[14] MAFONGOYA, P.L, NAIR, P.K.R., DZOWELA, B.H., Mineralization of nitrogen from decomposing leaves of multipurpose trees as affected by their chemical composition, Biol. Fert. Soils 27 (1998) 143–148.
[15] CHINTU, R., ZAHARAH, A.R., Nitrogen uptake of maize (Zea mays L.) from isotope-labeled biomass of Paraserianthes falcataria grown under controlled conditions, Agroforest. Syst. 57 (2003) 101–107.
[16] CHINTU, R., ZAHARAH, A.R., WAN RASIDAH, A.K., Decomposition and nitrogen release patterns of Paraserianthes falcataria tree residues, Agroforest. Syst. 63 (2004) 45–52.
[17] BARIOS, E., et al., Light fraction soil organic matter and available nitrogen following trees and maize, Soil Sci. Soc. Am. J. 61 (1997) 826–831.
[18] PEREIRA, H.C., et al., Water conservation by fallowing in semi-arid tropical East Africa, Imp. J. Exp. Agr. 26 (1958) 203–228.
[19] LAL, R., WILSON, G.F., OKIGBO, B.N., No-tillage farming after various grasses and leguminous cover crops in tropical Alfisols I. Crop performance, Field Crop. Res. 1 (1978) 71–84.
[20] TORQUEBIAU, E.F., KWESIGA, F., Root development in Sesbania sesban fallow-maize system in eastern Zambia, Agroforest. Syst. 34 (1996) 193–211.
[21] LAL, R., Mechanized tillage systems effects on physical properties of an Alfisol in watersheds cropped to maize, Soil Till. Res. 6 (1985) 149–161.
[22] WILKINSON, G.E., Effects of grass fallow rotations in Northern Nigeria, Trop. Agr. 52 (1975) 97–103.
[23] LAL, R., Agroforestry systems and soil surface management of a tropical Alfisol: IV. Effects on soil physical and mechanical properties, Agroforest. Syst. 8 (1989) 197–215.
[24] PALM, C.A., et al., Management of organic matter in the tropics: translating theory into practice, Nutr. Cycl. Agroecosys. 61 (2001) 63–75.
[25] MAROKO, J.B., et al., Soil nitrogen availability as affected by fallow–maize systems on two soils in Kenya, Biol. Fert. Soils 26 (1998) 229–234.
[26] GATHUMBI, S.M., Nitrogen Sourcing by Fast-growing Legumes in Pure and Mixed Species Fallows in Western Kenya, PhD Thesis, Wye College, Univ. of London (2000).
[27] IKERRA, S., et al., Soil nitrogen dynamics and relationships with maize yields in Gliricidia–maize intercrop in Malawi, Plant Soil 211 (1999) 155–164.


203
SUSTAINABLE MAIZE PRODUCTION THROUGH LEGUMINOUS TREE
AND SHRUB FALLOWS IN EASTERN ZAMBIA
P. L. MAFONGOYA, R. CHINTU, G. SILESHI, T. S. CHIRWA, J. MATIBINI, E. KUNTASHULA Zambia/ICRAF Agroforestry Project, Msekera Research Station, Chipata, Zambia
Abstract
Nitrogen is the major nutrient limiting maize production in Zambia and Southern Africa. Removal of
subsidies on manufactured fertilizers made them very expensive and most farmers cannot afford them. Short
duration planted fallows using a wide range of leguminous trees have been found to replenish soil fertility and
increase subsequent maize yields. Species such as Sesbania sesban, Tephrosia vogelii and Cajanus cajan have
been found to be well suited for planted fallow technology. These improved fallow crop rotations are being
adopted by small-scale farmers in Eastern Zambia. Since the seminal paper of Kwesiga and Coe [1], research has
been carried out to understand how the planted tree fallows replenish soil fertility and improve maize yields. A
wide range of species has been screened as alternatives to Sesbania fallows to overcome limitations of Sesbania
such as susceptibility to nematodes and insect pests. Species such as Gliricidia sepium and Leucaena
leucocephala have maintained maize yields of 3 t ha–1 over 10 years of cropping when Sesbania fallow yields
declined to 1.1 t ha–1 after 3 years of cropping. The selection criteria for good fallow species are high biomass
production and litterfall. Maize yields after fallows were highly correlated to biomass and litterfall yields. High
quality biomass, which is low in lignin and polyphenols and high in N, is needed for higher maize yields. Mixing
of Gliricidia and Sesbania fallows resulted in higher maize yields compared with single species fallows (3.0 vs.
1.8 t ha–1). Mechanisms contributing to the efficacy of mixed fallows will be discussed. Pre-season inorganic-N
(NO3
- + NH4
+) was highly correlated with maize yield (r2 = 0.62) and this could be used to select fallow species
and management practices. Nutrient budgets of N, P and K over 8 years showed that a positive balance of N and
P was maintained for coppicing fallows, while a negative balance of K started from the fourth year onwards on
fertilized maize, Gliricidia, Leucaena and Sesbania fallows, emphasising the need to use P and K fertilizers to
supplement the N supply from leguminous fallows. Improved fallows increased infiltration, reduced runoff,
increased water storage, and reduced soil loss. The biophysical limits of most fallow species and other emerging
issues such as pests and diseases, the need to inoculate with rhizobium, the amount of N fixed by different
species and provenances and soil acidification under improved fallows are the subjects of further research.
Biomass transfer technology using biomass from leguminous trees was evaluated on maize and vegetable
production in the dambos (wetlands). Maize and vegetable yields were significantly increased by application of
high quality biomass from Gliricidia and Leucaena. However, financial analysis showed that it is not viable to
apply biomass on a low value crop like maize, but biomass transfer was economically viable on high value crops
such a vegetables.
1. INTRODUCTION
Low soil fertility is increasingly recognized as a fundamental biophysical cause for declining food security among small-farm households in sub-Saharan Africa (SSA) [2]. Because maize is the staple food crop in most of southern Africa, it will be the focus of this paper. In 1993, SSA produced 26 million metric tons (Mmt) of maize on about 20 M ha; about 54 Mmt is expected to be needed by 2020. Meeting this maize production goal will depend on sustaining and improving soil fertility levels that have been declining in recent years.
Soil fertility is not the only significant constraint; lack of locally-adapted, high-quality germplasm, inadequate rural infrastructure and other socio-economic factors also limit maize production. However, protecting and enhancing soil fertility is the most basic requirement for achieving production goals. In most cases, nitrogen is the main nutrient that limits maize productivity, with phosphorus and potassium being occasional constraints. Although manufactured fertilizers are used throughout the region, the amounts applied are seldom

204
sufficient to meet crop demands due to their high costs and uncertain availability. Most countries in southern Africa have formulated fertilizer recommendations for all their major crops, sometimes with regionally-specific adaptations. However, the amount of fertilizer used in southern Africa is very small in comparison to other parts of the world. For most smallholders, fertilizer use averages as little as 5 kg ha–1 a–1 [3].
While the need for increasing the availability of soil nutrients in southern Africa is quite apparent, increasing their supply is very challenging. A high-external-input strategy cannot rely on standard fertilizer-seeds-credit packages without addressing other requirements for successful uptake of Green Revolution technologies, including reliable irrigation, credit systems, infrastructure, fertilizer manufacture and supply, and access to markets. Most African conditions differ markedly from those in the prime agricultural regions of Asia. Approaches that produced successes in Asia are not readily transferable to the African continent. Considering the acute poverty and the limited access to manufactured fertilizers in SSA, therefore, an ecologically robust approach of promoting leguminous tree fallows is discussed here. This contribution is a review of many years of agroforestry research and development by the International Centre for Research on Agroforestry (ICRAF), now called the World Agroforestry Centre, working with various partners in eastern and southern Africa.
2. LEGUMINOUS TREES AND SHRUBS AND THE TOPOLOGY OF FALLOWS
Improved fallows involve the deliberate planting of fast-growing species, usually woody tree legumes, for the rapid replenishment of soil fertility. Improved fallows were not a major area for research during the Green Revolution due to its focus on eliminating soil constraints by use of manufactured fertilizers. Biological approaches to soil fertility improvement began to receive attention in connection with the articulation of a second soil-fertility paradigm based on adaptability and sustainability considerations [4]. Research on leguminous tree fallows began to increase from the mid-1980s, and by the mid-1990s it had become a focus in agroforestry research. e.g. [1, 5, 6, 7]. Large-scale farmer adoption of fallows containing leguminous trees and shrubs is now taking place across southern and eastern Africa.
2.1. Use of non-coppicing leguminous trees and shrubs
Non-coppicing species do not resprout and regrow when cut at the end of the fallow period, typically after two years of growth. Non-coppicing species include Sesbania sesban, Tephrosia vogelii, Tephrosia candida, Cajanus cajan (pigeon pea), and Crotalaria spp. Since the work of Kwesiga and Coe [1] on Sesbania fallows, much has been learned about the performance of improved fallows using tree species that do not coppice. There has been extensive on-farm testing of various species and fallow lengths to determine their impact on maize productivity, and to assess the processes that influence fallow performance. The performance of Sesbania and Tephrosia under a wide range of biophysical conditions is shown in Table 1.
TABLE 1. EFFECT OF FALLOWS ON MAIZE GRAIN YIELD ACROSS 18 LOCATIONS IN ZAMBIA
Land use Maize grain yield (t ha–1)
Year 1 Year 2 Year 3
Sesbania sesban fallow 3.9 1.7 1.1 Tephrosia vogelii fallow 2.4 0.8 0.9 Traditional grass fallow 1.1 0.7 0.7 Unfertilized maize 1.0 0.7 0.6 LSD 0.8 0.6 0.6

205
Trials at Msekera Research Station, Zambia, have shown that natural regeneration of Sesbania fallows is possible through self-reseeding, but it is highly erratic. Improved fallows of two year duration using either Tephrosia or Sesbania significantly increased maize yields well above those of unfertilized maize, the most common farmer practice in the region. While it was true that fertilized maize usually performed better than improved fallows in most cases, this required a greater cash outlay, so improved fallows could be more profitable. The problem demonstrated in these trials was that the residual effects of these improved fallows on maize yield declined after the second year of cropping (Table 1). In a third year of cropping, maize yields following fallow were similar to those of unfertilized maize. The marked decline of maize yields two or three seasons after a non-coppicing fallow is probably related to depletion of soil nutrients and/or to deterioration in soil chemical and physical properties.
2.2. Use of coppicing leguminous trees and shrubs
Coppicing species include Gliricidia sepium, Leucaena leucocephala, Calliandra
calothyrsus, Senna siamea and Flemingia macrophylla. Fallowing with a coppicing species, in contrast to a non-coppicing species, shows increases in residual soil fertility beyond 2–3 years because of the additional organic inputs that are derived each year from coppice regrowth that is cut and applied to the soil. An experiment was established in the early 1990s at Msekera Research Station to examine these relationships. These plots have now been cropped for 9 years during which time both maize yields and coppice growth were monitored.
The species evaluated showed significant differences in their coppicing ability and biomass production, with Leucaena, Gliricidia and Senna a having the greatest coppicing ability and biomass production, while Calliandra and Flemingia performed poorly. The trends in maize yields were measured over 9 seasons (Fig. 1), Maize yields in the plots with Sesbania fallow were high for the first 3 seasons, but then declined to the same level as control plots. Flemingia and Calliandra showed low maize yields over all years. There were no significant differences in maize grain yields between Gliricidia and Leucaena fallows over the seasons.
0
2
4
6
8
1996 1997 1998 1999 2000 2001 2002 2003 2004
Years/seasons
Gra
in y
ield
(t ha-1
)
Gliricidia Leucaena Fertilized maize
Unfertilized maize Sesbania Natural fallow
FIG. 1. Grain yield of maize in fallow systems for nine years at Msekera, eastern Zambia.

206
The effects of different fallow species on maize yield can be explained partly by the different amounts of biomass added and the quality of the biomass and coppice regrowth. Species such as Leucaena and Gliricidia, which have good coppicing ability, produce large amounts of high-quality biomass with high nitrogen content and low contents of lignin and polyphenols, thereby contributing to higher maize yields [8, 9]. While Sesbania produces high quality biomass, its lack of coppice regrowth means that it cannot supply nutrients for an extended period of cropping. Species such as Flemingia, Calliandra and Senna, on the other hand, produce low-quality biomass, high in lignin and polyphenols and low in nitrogen. Their use as fallow species leads to N immobilization and reduced maize yields.
Both Gliricidia and Leucaena have shown good potential as coppicing fallows. Over 9 years of cropping, cumulative maize yield of these fallows was greater than unfertilized maize, maize grown after Sesbania and traditional grass fallow. Continuous nutrient replenishment is achieved by applying the coppice regrowth as mulch to the soil.
2.3. Mixed-species fallows
Improved fallow practices using shrub legume species like Sesbania have become popular agroforestry systems for soil fertility management in southern Africa and western Kenya. Large increases in maize yields have been reported following short-duration fallows of 9–24 months with single species. Sesbania has been the main focus for these improved fallows given its ability to provide large amounts of high-quality biomass and fuel wood. Dependence upon a few successful fallow species has revealed some drawbacks, however, as Sesbania is susceptible to root nematodes and the Mesoplatys beetle. Introduction of any new species can lead to the outbreak of new pests and diseases as was observed with Crotalaria
grahamiana in western Kenya [10]. Thus, there is an urgent need to diversify the fallow species and types offered to farmers. Mixing species with compatible and complementary rooting or shoot-growth patterns in fallow systems should lead to more diverse systems that maximize growth and resource utilization above- and below ground. Sowing herbaceous legumes under open-canopy tree species can increase the use of photosynthetic radiation by the whole canopy and thus enhance the system’s primary production.
Mixing shallow-rooted species with deep-rooted species can optimize the soil-water and nutrient-uptake zone within the soil profile. More importantly, it enhances the utilization of subsoil nutrients such as the nitrate that is otherwise lost through leaching. Mixing species in fallows may also reduce the risks with fallow establishment, e.g., if one species is susceptible to water stress, diseases or pests, another can survive and even prosper. Obtaining multiple products from mixed fallows as well as increasing the biodiversity of the system makes the whole system more robust. We have assessed a variety of mixed fallows of tree legumes or tree legumes with herbaceous legumes to test these hypotheses.
Mixing a coppicing fallow species such as Gliricidia with a non-coppicing species like Sesbania significantly increased maize yields compared to single-species fallows (Table 2).
However, mixtures of non-coppicing species did not increase maize yield compared to sole species (Table 3). Mixing coppicing and non-coppicing species reduces the level of subsoil nitrate, and we found that it reduces Mesoplatys beetles [11]. We have found also that mixing Gliricidia, Tephrosia or Sesbania with herbaceous legumes such as mucuna or dolichos reduces tree growth, and hence maize yield. Such mixtures also lead to a build-up of the Mesoplatys beetle, which can cause more damage [11].

207
TABLE 2. MAIZE GRAIN YIELD (T HA–1) FROM THREE YEAR COPPICING MIXED-FALLOW SPECIES AT MSEKERA, EASTERN ZAMBIA
Species 2003 2004
Fertilized maize 5.9 3.4
Acacia angustissma–34/88 3.7 1.3
Acacia angustissma + Sesbania sesban 4.6 2.2
Gliricidia sepium – Retalhuleu 4.1 2.9
Gliricidia sepium + Sesbania sesban 4.6 2.7
Gliricidia sepium + Tephrosia vogelii 3.3 2.1
Leucaena diversfolia 3.6 1.5
Leucaena diversfolia + Sesbania sesban 4.3 2.0
Sesbania sesban 3.9 1.9
Tephrosia vogelii 4.3 2.6
Tephrosia vogelii + Sesbania sesban 4.3 2.0
Traditional grass fallow 2.5 1.3
Unfertilized maize 1.7 1.4
SED 0.5*** 0.8 ns
ns not significant; *** significant at P < 0.001.
TABLE 3. MAIZE GRAIN YIELD (T HA–1) FROM TWO YEAR NON-COPPICING MIXED-FALLOW SPECIES AT MSEKERA, EASTERN ZAMBIA
Species 2002 2003
Maize with fertilizer 4.7 4.3
Tephrosia vogelii + Cajanus cajan 4.7 2.0
Sesbania sesban + Tephrosia vogelii 4.4 1.3
Sesbania sesban + Cajanus cajan 4.0 1.8
Tephrosia vogelii 3.9 1.6
Sesbania sesban 3.4 1.0
Cajanus cajan 2.7 0.9
Maize without fertilizer 1.3 0.4
SED 0.9*** 0.4***
*** significant at P < 0.001.
2.4. Leguminous-tree biomass transfer
Traditionally, resource-poor farmers in parts of Southern Africa have collected leaf litter from secondary forest, called miombo, as a source of nutrients for their crops. In the long term, this practice is not sustainable because it mines nutrients from the forest ecosystems in order to enhance soil fertility in croplands. Also, the miombo litter is of low quality and may immobilize N instead of supplying N immediately to the crop [8]. An alternative means of producing high-quality biomass is through the establishment of on-farm ‘biomass banks’ from which the biomass is cut and transferred to crop fields in different parts of the farm. In western Kenya, for example, the use of Tithonia diversifolia, Senna
spectabilis, Sesbania sesban and Calliandra calothyrsus planted as farm boundaries, woodlots and fodder banks has proven to be beneficial as a source of nutrients for improving maize production [12, 13]. A study by Gachengo [14] found that Tithonia green biomass grown outside a field and transferred into a field was quite effective in supplying N, P and K to
208
maize, equivalent to the amount of commercial NPK fertilizer recommended. In some cases, maize yields were higher with Tithonia biomass than with commercial fertilizer.
Biomass transfer using leguminous-tree species is a more sustainable means for maintaining nutrient balances in maize and vegetable-based production systems, as the tree leafy materials are able to supply N to the soil [15]. Synchrony between nutrient release from tree litter and crop uptake can be achieved with well-timed biomass transfer. The management factors that can be manipulated to achieve this are litter quality, rate of litter application, method and time of litter application [9, 16].
Biomass transfer technologies, however, require a lot of labor for managing and incorporating the leafy biomass. If used for the production of low-value crops like maize, the higher maize yield from biomass-transfer technologies may not be enough to compensate for the higher labor cost. Most economic analyses have concluded that it is unprofitable to invest in biomass transfer when labor is scarce and its cost is thus high. However, when prunings are applied to high-value crops like vegetables, the technology becomes profitable [17]. This practice has been found quite suitable for vegetable production in dambo areas of southern Africa [15].
Dambos are shallow, seasonally or permanently waterlogged depressions at or near the head of a natural drainage network, or alternatively they can occur independently of a drainage system. All together, dambos serve about 240 million ha in all of sub-Saharan Africa [18], of which 16 million ha are in southern Africa. Though dambos are extremely vulnerable to poor agricultural practices, rising population pressure has caused their agricultural use to become increasingly important [19]. Without applying fertilizers or cattle manure, smallholder farmers cannot produce vegetables successfully in dambos that are degraded due to their continuous cultivation for over 25 years [20]. Commercial fertilizer is not always available to smallholder farmers, and cattle manure is accessible only to those with animals. This calls for alternatives such as biomass transfers for fertilizing vegetables in dambos of southern Africa.
Farmer participatory experiments conducted in 2000–2004 by Kuntashula et al. [15] have shown that biomass transfer using Leuceana and Gliricidia is tenable for sustaining vegetable production in dambos. In addition to increasing yields of vegetables such as cabbage, rape, onion and tomato and maize grown after vegetable harvests, biomass transfer has shown potential to increase yields of other high-value crops such as garlic (Table 4). Our studies suggest that biomass transfer has greatest potential when (a) the biomass is of high quality and it rapidly releases nutrients, (b) when the opportunity costs of labor are low, (c) when the value of the crop is high, and (d) when the biomass does not have other, valued uses apart from being a source of nutrients.
3. MECHANISMS FOR IMPROVED SOIL FERTILITY AND HEALTH
3.1. Biomass quantity and quality
The success of maize crop rotations with leguminous tree fallows depends very much on strategies for pruning biomass and on their nutrient yields. Analysis of maize yields across several sites with different trees shows that maize yield is most closely correlated with the N content of prunings, with rainfall, and with the quantity of biomass applied. Low and insufficient biomass yields, combined with the low quality of prunings in most instances, have contributed to the frequently observed low performance of the technology. The low production of biomass for pruning may result from use of unsuitable species, poor tree growth due to low soil fertility, soil acidity, moisture stress, or poor management of the species.

209
TABLE 4. SELECTED VEGETABLE YIELDS (T HA–1) IN DAMBOS USING FERTILIZER OR ORGANIC INPUTS FROM MANURE OR TREE LEAF BIOMASS IN CHIPATA DISTRICT, ZAMBIA
Treatments Cabbage yield
(n = 31) (2000)
Green maize yield after
onion (t ha–1)
Onion yield
(n = 12) (2001)
Green maize yield after cabbage (t ha–1)
Garlic yield
(n = 6) (2004)
10 t Manure + ½ rec. fertilizer 66.8 11.6 96.0 11.7 9.1 Recommended fertilizer 57.6 8.4 57.1 10.4 7.2 12 t Gliricidia 53.6 12.4 79.8 17.3 - 8 t Gliricidia 43.1 10.9 68.3 14.9 10.3 12 t Leucaena 32.6 -- -- 13.0 -- Non-fertilized 17.0 6.4 28.1 7.8 4.2 SED 5.3*** 2.06*** 11.2* 3.04* 1.2***
-- treatment not evaluated, * significant at P < 0.05; *** significant at P < 0.001.
Decomposition and nutrient release from tree or shrub prunings are affected by the
concentrations of polyphenols (PP), lignin (L) and nitrogen (N) [9]. Recently we have found also that maize yields after fallows with various tree legumes were negatively correlated with the (L + PP): N ratio and positively correlated with recycled biomass (Fig. 2). Fallow species with high N, low lignin and low polyphenols such as Gliricidia and Sesbania gave higher maize yields compared with species such as Flemingia, Calliandra and Senna. This work has shown that it is not the quantity of polyphenols that is critically important, but rather their quality as measured by their protein-binding capacity [21]. Legume species for improved fallows can be screened for their suitability based on the above characteristics.
y = 0.3x + 0.7
R2 = 0.7
0.0
0.5
1.0
1.5
2.0
2.5
3.0
3.5
0.0 2.0 4.0 6.0 8.0
Recyled litter + leaf + resprout biom ass (t ha -1)
A. angustissim a-34/88; C. calothyrsus-em bu; G sepium; N . fallow; L.
collinsii-45/88; L . divers 35/88; L. divers 53/88; L . esc (M achakos); L .
Maiz
e g
rain
(t
ha-1
)
FIG. 2. Relationship between maize yield and recycled biomass at Katete, eastern Zambia

210
3.2. Biological nitrogen fixation and N cycles
The contribution of leguminous trees to crop yield through N2 fixation is well recognized, although not all legumes fix N2. Numerous non-leguminous species have N fixed in their roots and root zones through associations with diazotrophic bacteria. Nitrogen fixation in alley cropping systems in the humid and subhumid zones of Africa has been reviewed by Sanginga et al. [22]. However, there has been little work done quantifying N2 fixation by trees in southern Africa. Such analysis has been difficult due to constraints in the methodologies for measuring N2 fixed. A series of multi-location trials has been set up to measure the amount of N2 fixed by different tree genera and provenances using the 15N natural abundance method. The data on percent N derived from atmospheric N2 fixation (Ndfa) shows high variability among species and varieties of the same species. Greatervariation was recorded also for the same species across different locations.
Sanginga et al. [23] found that the Ndfa ranged from 37 to 74% for different varieties of Leucaena leucocephala. The initial data show a huge potential of trees to fix N2 and increase N inputs in N-deficient soils. In future analysis we will focus on factors responsible for the variability in N2-fixation across sites and on how to optimize N2 fixation under field conditions.
An estimated value of the level of inorganic-N in soil before a cropping season begins is an accepted test for assessing prospective soil productivity. Results of studies in Southern Africa show that pre-season inorganic-N can also be an effective indicator of the N that is plant-available after fallow with different species [24]. Studies conducted at 18 locations in eastern Zambia have indicated that in a tropical soil with a pronounced dry season, total pre-season inorganic N (i.e., NO3
- + NH4+) is more closely related to maize yield (R2 = 0.62; b =
0.27, se = 0.03) than to pre-season NO3- alone. While large amounts of NH4
+ can accumulate during a dry season, it may not be nitrified when the soil is sampled at the beginning of the rainy season. We have concluded that pre-season inorganic-N is a relatively rapid and simple index that is related to maize yield on N-deficient soils, and hence it can be used to screen fallow species and management practices.
3.3. Deep capture of soil nutrients
The retrieval and cycling of nutrients from soil below the zone exploited by crop roots is referred to as nutrient ‘pumping’ [25]. Soil nutrients not accessible to annual crops such as maize can be extracted by perennial trees through deep capture. The distribution and density of roots, the plant demand for nutrients, and the distribution and concentration of plant-extractable nutrients and water will influence deep capture of nutrients by trees [26]. Deep capture is favored when perennials have a deep rooting system and a high demand for nutrients, when water or nutrient stress occurs in the surface soils, and/or when considerable extractable nutrients or weatherable minerals occur in the subsoil [27]. These conditions were observed in eastern Zambia where nitrate accumulated in the subsoil during periods of maize growth, and trees grown in rotation with maize could then effectively retrieve the nitrate in the subsoil that had been ‘lost’ to maize.
Intercropping rather than rotating trees with crops appears to improve the long-term efficiency of nutrient use in deep soils (Fig. 3). When perennials such as G. sepium are intercropped with maize, they always remain in the agroecosystem compared with non-coppicing trees such as S. sesban. In a mixed fallow, Gliricidia functions as a safety-net to reduce nitrate leaching. In the Sesbania-maize rotation, there is no active perennial legume.

211
Therefore, nitrate leaches into deep soil below the effective rooting depth of maize. Intercropping with trees such as Gliricidia may thus be more effective for retrieval of soil nutrients than a Sesbania-maize rotation. In the base-rich deep soils of Msekera, eastern Zambia, there is potential for subsoil accumulation of cations such Ca, Mg and K due to the weathering of minerals and leaching of cations that accompany NO3 leaching in fully fertilized maize crops without any trees present. The introduction of Gliricidia with maize rotation has a great potential for deep capture of Ca and Mg compared to continuously fertilized monoculture maize.
0
50
100
150
200
0 2 4 6 8 10 12 14 16
Nitrate (mg N kg-1)
Soil
depth
(cm
)
Gliricidia Gliricidia + Sesbania Unfertilized maize Sesbania
FIG. 3(a). Nitrate concentration as affected by tree species and soil depth during the wet season at
Msekera, eastern Zambia.
0
20
40
60
80
100
120
140
160
180
200
0 5 10 15 20
Nitrate (mg N kg-1
)
Depth
(cm
)
C. cajan
Fertilized maize
S. sesban
S. sesban + C. cajan
S. sesban + T. vogelii
T. vogelii
FIG. 3(b). Nitrate concentration as affected by soil depth and years in 2 year mixed fallows (99/2)–
Feb 03.
3.4. Soil acidity and phosphorus
Acidic soils cover approximately 27% of the land in tropical Africa. Acidic soils are characterized by low pH, deficiencies of phosphorus, calcium and magnesium, and toxic levels of aluminum. Therefore, strategies that offset soil acidity and low P availability are needed. Agroforestry systems can address these two related constraints.
Lime application is the most widely used ameliorant for high acidity in countries such as Brazil and USA, but it is financially prohibitive for resource-poor farmers in southern Africa and cannot be considered a viable solution to the problem. Numerous laboratory

212
experiments have recorded increased soil pH, decreased Al saturation, and improved conditions for plant growth as a result of the addition of plant materials to acid soils such tree prunings, which also supply base cations such as Ca, Mg and K. The value of tree prunings as a ‘liming’ material for acid soils is related in their cation content [28] and ash alkalinity. There is evidence from field experiments [29] that the lateral transfer of alkalinity can be achieved by pruning pure stands of agroforestry trees and applying their pruned biomass to a maize crop (Fig. 4 and Table 5).
Several mechanisms contribute to the increase in soil pH through such measures [30]. These processes depend on the ash alkalinity of the organic inputs and on the organic anion content. Leguminous materials are particularly useful in this respect because they have high ash alkalinity and offer the benefit of N2 fixation, while providing cash-limited farmers with an inexpensive biological means of liming acid soils without having to buy costly lime.
0
20
40
60
80
100
120
140
160
180
200
4.0 4.5 5.0 5.5 6.0
Soil pH
Soil
dep
th (
cm)
1997
1998
1999
2001
2002
Initial
FIG. 4. Soil pH as affected by soil depth in 2 year fallow species (Nov 97–02).
TABLE 5. SOIL PH AND PHOSPHORUS IN 0–20 CM LAYER UNDER FALLOW SYSTEMS AT MSEKERA, EASTERN ZAMBIA
Species pH (CaCl2) Av. Phosphorus (mg kg–1)
1998 1999 2000 1998 1999 2000
Calliandra 4.6 4.8 4.7 10.5 15.2 11.8 Senna 5.3 5.4 5.3 9.2 10.2 9.6 Flemingia 4.6 4.8 4.6 9.2 11.4 9.7 Natural. fallow 4.8 4.9 4.8 8.5 8.5 9.6 Gliricidia 5.1 5.3 5.0 6.6 6.6 7.2 Leucaena 4.9 5.3 5.0 10.9 10.0 9.4 Maize with fertilizer 4.4 4.6 4.4 51.6 43.8 47.8 Maize without fertilizer 4.7 4.9 4.8 9.8 11.9 10.1 Sesbania 4.8 5.0 4.9 7.9 8.9 8.0 SED 0.1*** 0.2*** 0.1*** 4.8*** 3.3*** 6.2***
*** significant at P < 0.001.

213
3.5. Soil physical properties
The ability of trees and biomass from trees to maintain or improve soil physical properties has been well documented. Alley-cropping, for example, can definitely improve the soil physical conditions on Alfisols [31]. Plots alley-cropped with four hedgerow species showed lower soil bulk density, higher porosity, and greater water infiltration rates compared with a no-tree treatment [32]. Tree fallows can improve soil physical properties also due to the addition of large quantities of litter fall, root biomass, root activity, biological activities, and roots leaving macropores in the soil following their decomposition [6].
In our studies, we have seen that Sesbania fallow increases the percentage of water-stable aggregates with a diameter >2 mm compared with continuous maize cultivation without fertilizer. After six months of cropping, the decrease in water-stable aggregates was highly significant under Sesbania (18%) compared with a traditional grass fallow, which did not lose its aggregate stability. The decrease in aggregate stability was more pronounced under Sesbania followed by maize without fertilizer compared with Cajanus followed by maize with fertilizer [33]. Under a Sesbania fallow, the improvement in soil structure was evident, as reflected by the results from our time-to-runoff studies. Time-to-runoff after fallow clearing followed this order: traditional grass fallow > Sesbania > fertilized maize. After one season of cropping, time-to-runoff decreased in all treatments, except that the traditional grass fallow maintained longer time-to-runoff, reflecting its good maintenance of aggregate stability.
Through rainfall simulation studies, Nyamadzawo et al. [34] evaluated the effects of improved fallows on runoff, infiltration, and soil and nutrient losses under improved fallows. Tree fallows of Sesbania and Gliricidia mixed with Dolichos increased infiltration rates significantly compared with continuously fertilized maize plots [34]. Tree fallows also significantly reduced soil loss compared with no-tree plots.
That trees improve soil physical properties is seen from measured increases in infiltration rates, increased infiltration decay coefficients, and reduced runoff and soil losses. However, these benefits are short-lived and decline rapidly during the first year of cropping where non-coppicing species are used. This is consistent with an increase in soil loss in the second year and a decrease in infiltration rates as well. Mixing a coppicing species like Gliricidia with an herbaceous legume like Dolichos maintains high infiltration rates and reduced soil loss over two years of cropping [33]. In agroforestry, as in other agricultural systems, we see repeated advantages of mixed cropping over the use of single species.
4. EFFECTS ON SOIL BIOTA
Soil biological processes, mediated by roots, flora and fauna, are an integral part of the functioning of natural and managed fallows [35, 36]. Among the soil biota essential in soil processes in agroforestry, probably the most important ones are the so-called ecosystem engineers, e.g. termites, earthworms and some ants, and the litter transformers including millipedes, some beetles and many other soil-dwelling invertebrates. Sileshi and Mafongoya [37] compared the populations of various soil macro-invertebrates under maize grown in an agroforestry system with monoculture maize. In five separate experiments conducted at Msekera and Kalunga, the number of invertebrate orders per sample and the total macrofauna recorded were higher under maize grown in coppicing fallows than under fully fertilized monoculture maize.

214
Similarly the population density of total macrofauna (all individuals m–2) under maize grown in coppicing fallows was higher than those under fully-fertilized monoculture maize in all experiments at Msekera. Earthworm, millipede and centipede populations under maize grown in coppicing fallows were also higher than under monoculture maize. Millipedes were absent from monoculture maize at both Msekera and Kalunga sites during most of the sampling periods. At Msekera, the population density of beetles was also higher under legume fallows compared to monoculture maize. Clearly, the nature of the above ground biomass affects the flora and fauna below ground.
We also noted differences according to tree species used for fallows. Cumulative litter
fall, tree leaf biomass, and re-sprouted biomass under the respective legume species appeared to influence macrofauna populations. Macrofauna diversity (number of orders) was positively associated with total recycled biomass. The litter biomass under the tree species at fallow termination also influenced populations of beetles and earthworms. The tree-leaf biomass incorporated into the soil at fallow termination was positively correlated with populations of beetles, earthworms and millipedes in the wet season. Among the fallows species, litter transformer populations were higher under Gliricidia, which produced good quality organic inputs. On the other hand, a higher population of ecosystem engineers was found under trees that produced poor quality organic inputs [37].
5. SUSTAINABILITY OF TREE-BASED LAND USE SYSTEMS
Improved fallows with Sesbania or Tephrosia have been shown to give subsequent maize grain yields of 3 to 4 t ha–1 without any inorganic fertilizer addition. Palm [12] showed that organic inputs of various tree legumes applied at 4 t ha–1 can supply enough nitrogen for maize grain yields of 4 t ha–1. However, most of these organic inputs could not supply enough phosphorus and potassium to support such maize yields over time as shown in Fig. 5.
The question for sustainability is: “Can improved fallows potentially reduce soil stocks of P and K over time while maintaining a positive N balance?” To answer this question we have conducted nutrient balances on improved fallow trials at Msekera Research Station. These plots were maintained under fallow-crop rotations for 8 years.
The nutrient balances considered the nutrients added through leaves and litter fall, which were incorporated after fallows as inputs. The nutrients in maize grain harvested, in maize stover removed, and in fuelwood taken away at the end of the fallow period were then considered as nutrient exports. For all the land use systems, there was a positive N balance in the two years of cropping after the fallow. Fertilized maize had the highest N balance due to the annual application of 112 kg N ha–1 for the past 10 years. Unfertilized maize had lower balances due to low maize grain and stover yields over time. The tree-based fallows had a positive N balance due to BNF and deep capture of N from depth. These results are consistent with those of Palm [12] showing that organic inputs can supply enough N to support maize grain yields of 3 to 4 t ha–1.
However, we note that in the second year of cropping, the N balance became very small. This is consistent with our earlier results which showed a decline of maize yields in the second year of cropping after a two year fallow. The large amount of N supplied by fallow species could be lost through leaching beyond the rooting depth of maize. Our leaching studies have shown substantial inorganic N at some depths under maize after improved fallows. This implies that if cropping goes beyond three years after fallowing, there will be a negative N balance. Thus the recommendation of two years of fallow followed by two years of cropping is supported by both N balance analyses and maize grain yield trends.

215
Most of the land use systems showed a positive P balance. This can be attributed to low offtake of P in maize grain yield and stover. However, it should be noted that Msekera (Table 5) had a high phosphorus status already. The trees could have increased P availability through secretion of organic acids and increased mycorrhizal populations in the soil. These issues are under investigation at Msekera. In general, we have observed positive P balances over eight years. However, this result needs to be tested on-farm where the soils are inherently low in P.
Most land-use systems showed a negative balance for K. For tree-based systems, Sesbania showed a higher negative K balance compared to pigeon pea. This is attributed to the higher fuelwood yield of Sesbania with subsequent higher export of K compared with pigeon pea. The higher negative K balance for fully-fertilized maize is due to higher maize and stover yields which export a lot of potassium. This implies that the K stocks in the soil were very high and that K mining has not reached a point where it negatively affects maize productivity. However in sites with low stocks of K in the soil, maize productivity may become adversely affected.
Overall, the tree-based fallows maintained positive N and P balances. However, on low-P-status soils, a negative P balance would be expected. There was a negative K balance with most land-use systems. It can be hypothesized that as improved fallows are scaled up on depleted soils on farmers’ fields, the K and P balances would be or become negative. This has
FIG. 5. Interaction of inorganic fertilizer and sesbania fallows on maize grain yield
0
1
2
3
4
5
1996 1997 1998 1999 2000Season
Maiz
e y
ield
(t ha
–1
)
M-f M+f Ss Ss+1/4Fert Ss+1/2Fert
--

216
implications for fertilizer policy. In Zambia, ‘compound D’ which contains N, P and K is the currently imported basal fertilizer for maize. If farmers adopt improved fallows on a wider scale, these will meet their N requirement for maize. Where there is K and P deficit, farmers may not need to buy ‘compound D’ because N is adequately supplied by the fallows, and they need only K and P as nutrients to supplement N from the fallow. This may require a shift in government policy on the type of fertilizer imported. There is an urgent need to conduct nutrient budget analyses at a landscape level on farmers’ fields to test the validity of our findings.
6. COMBINATION OF INORGANIC FERTILIZER AND IMPROVED FALLOWS
Several papers have shown that fertilizer usage is very low in Africa. This low rate of fertilizer application stems from costs, scarcity, supply and distribution problems and associated government policies. Government subsidies on fertilizer often create a class of entrepreneurs linking the fertilizer companies with the farmer while exploiting most of the subsidy. In this process, adulteration of fertilizer cannot be excluded.
Many studies have looked at crop responses to applied fertilizers in southern Africa. Maize grain yield responses to fertilizer application have been significant, but prolonged use of N fertilizers is often claimed to lead to accelerated soil acidification and consequently reduce the soil base status. This is particularly true for ammonium sulphate. However other sources such as urea have a lower acidification potential. Soil acidification also depends on soil type and its buffer capacity.
Although the Green Revolution was very successful in Asia and Latin America, only minor achievements were made in sub-Saharan Africa for reasons already mentioned. Due to the environmental problems caused by the Green Revolution in the mid 1980s and 1990s there was a move to develop farming systems where inputs of fertilizers were minimized or even avoided, and to intensified research on the biological management of soil fertility. Systems such as alley cropping, live mulch legume systems and improved fallows with tree legumes were examples of such minimal or zero input technologies. The hypotheses forming the basis of such systems were related to observations that natural fallows recycle nutrients very efficiently.
Nutrients removed by crop harvests were supposed to be replenished by N2 fixation from the atmosphere or by recovery of P and cations from below the crop rooting zone. Trees would be considered as nutrient pumps. These species would recover nutrients like N, leached beyond the reach of crop roots. Application of organic inputs would increase the soil organic C content. However, soil available P values were inconsistent across treatments and years.
There is a substantial body of evidence demonstrating gains in crop productivity from nutrient additions through mixtures of organic and inorganic sources of nutrients compared with either alone [38]. Maintenance of organic inputs to the soil is thus an important management strategy for efficient use of external inputs.
7. CONCLUSIONS
This paper has described the progress that has been made during the past decade in research efforts to understand the mechanisms involved in the efficacy of leguminous tree fallows. Although a body of knowledge has been generated, some aspects of improved fallows have received little evaluation. These will be highlighted here.

217
Work on improved fallows has focused on just a few genera of trees such as Sesbania, Tephrosia, Crotalaria and Gliricidia. Further work is needed to identify more species for improved fallows. Given the large number of potential genera and species of legumes, the selection process could be accelerated by creating a database containing information on fallow performance in relation to environmental, edaphic and biotic factors such as rainfall, soil type and chemistry, and incidence of pests and diseases. Our recent trials across sites have shown a great potential for Tephrosia candida as an alternative species to Sesbania and T. vogelii, and equally for Leucaena collinsii and Acacia angustissima as alternative coppicing fallow species to Gliricidia.
The biophysical limits of improved fallows need to be assessed and extended to facilitate scaling up with minimum research efforts. Simulation modeling, both as a tool for research and for extrapolation, has potential for integrating research results, identifying key components or processes that merit greater research attention, and also ecozones where appropriate fallow species and management techniques have a good chance of success.
Agroforestry land-use systems have been reported to have large potentials to sequester soil carbon. However, there are few, if any, studies in southern Africa that have measured C sequestration in improved fallows. The relationship between increased soil aggregation and carbon storage also needs further research.
As noted earlier, the interaction of pests with soil fertility is gaining attention due to wider interest in scaling-up of improved fallows. So far, most research efforts have concentrated on insect pests and nematodes. Equally important for farmers, however, are plant diseases and weeds. Little effort has been invested in these issues. With scaling-up across many ecozones, the incidence of new pests and diseases is likely to increase. This means there will be a need to monitor pests and diseases with farmers to determine which economic pests need to be dealt with in a concerted research programme. Such work is now being started in southern Africa.
Many of the species currently used in improved fallows are prolific seed producers. If not managed well, these species can become invasive weeds and become a menace to natural ecosystems such as the miombo woodlands. To date there has been no concerted research effort to determine the invasiveness of introduced tree species. There is an urgent need to use current models to predict the potential of new species to become invasive, studying at the same time the reproductive biology, and design management practices that will mitigate potential invasions of natural ecosystems.
Research during the last decade has established the main mechanisms explaining how improved fallows function. Despite significant progress in biophysical research in improved fallows in southern Africa, the application of that scientific knowledge by small-scale farmers is still minimal. The main challenge now is to increase the generation of viable and acceptable fallow options that can make improved fallows more productive, so that they markedly increase the income and food security of small-scale farmers. Future research issues on biomass transfer will involve the residual effect of low- and high-quality biomass, combinations of organic and inorganic sources of nutrients, the effects of biomass banks on nutrient mining, agronomic research of potential biomass transfer with different leguminous species, and economic analysis of the systems.

218
ACKNOWLEDGEMENTS
The authors are grateful to the Swedish International Development Agency (SIDA), the Canadian International Development Agency (CIDA) and the International Atomic Energy Agency (IAEA) for their continued financial support for agroforestry research over the past 10 years.
REFERENCES
[1] KWESIGA, F., COE, R., Potential of short rotation Sesbania fallows in eastern Zambia, Forest Ecol. Manag. 64 (1994)161–170.
[2] SANCHEZ, P.A., et al., “Soil fertility replenishment in Africa: An investment in natural resource capital”, Replenishing Soil Fertility in Africa, (BURESH, R.J., SANCHEZ, P.A., CALHOUN, F., Eds), Soil Science Society of America Special Publication 51. SSSA/ASA, Madison, Wisconsin (1997) 1–46.
[3] GERNER, H., HARRIS, G., “The use and supply of fertilizers in sub-Saharan Africa”, The Role of Plant Nutrients for Sustainable Food Crop Production in sub-Saharan Africa, (REULER, H.V., PRINS, W., Eds), Vereniging van Kunstmest Producenten, Leidschendam, Netherlands (1993).
[4] SANCHEZ, P.A., Tropical soil fertility research, towards the second paradigm, Transactions, 15th World Congress of Soil Science, Acapulco, Mexico, 1 (1994) 65–88.
[5] DRECHSEL, P., STEINER, K.G., HAGEDORN, F., A review on the potential of improved fallows and green manure in Rwanda, Agroforest. Syst. 33 (1996) 109–136.
[6] RAO, M.R., NAIR, P.K.R., ONG, K., Biophysical interactions in tropical agroforestry systems, Agroforest. Syst. 38 (1998) 3–49.
[7] SNAPP, S.S., MAFONGOYA, P.L., WADDINGTON, S., Nutrient cycling in agroforestry systems in semi arid tropics of Africa, Ann. Arid Zone 38 (1999) 275–307.
[8] MAFONGOYA, P.L., NAIR, P.K.R., Multipurpose tree prunings as a source of nitrogen to maize under semiarid conditions in Zimbabwe: Nitrogen recovery rates in relation to pruning quality and method of application, Agroforest. Syst. 35 (1997) 47.
[9] MAFONGOYA, P.L., GILLER, K.E., PALM, C.A., Decomposition and nitrogen release patterns of tree prunings and litter, Agroforest. Syst. 38 (1998) 77–97.
[10] CADISCH, G., et al., “Resource acquisition of mixed species fallows: Competition or complementarity?”, Balanced Nutrient Management Systems for the Moist Savanna and Humid Forest Zones of Africa (VANLAUWE, B., SANGINGA, N., MERCKX, R., Eds), Kluwer Academic Publishers, Dordrecht, Netherlands (2002) 143–154.
[11] SILESHI, G., MAFONGOYA, P.L., Incidence of Mesoplatys ochroptera Stål (Coleoptera: Chrysomelidae) on Sesbania sesban in pure and mixed species fallows in eastern Zambia, Agroforest. Syst. 56 (2002) 225–231.
[12] PALM, C.A., Contribution of agroforestry trees to nutrient requirements of intercropped plants, Agroforest. Syst. 30 (1995) 105–124.
[13] PALM, C.A., et al., Organic inputs for soil fertility management: some rules and tools, Agr. Ecosyst. Environ. 83 (2001) 27–42.
[14] GACHENGO, C.N., Phosphorus Release and Availability on Addition of Organic Materials to Phosphorus Fixing Soils, M. Phil. Thesis, Moi Univ., Kenya (1996).
[15] KUNTASHULA, E., et al., Potential of biomass transfer technologies in sustaining vegetable production in the wetlands (dambos) of eastern Zambia, Exp. Agr. 40 (2004) 37–51.
[16] MAFONGOYA P.L., DZOWELA, B.H., Biomass production of tree fallows and their residual effect on maize in Zimbabwe, Agroforest. Syst. 47 (1999) 139–151.

219
[17] ICRAF, Annual Report 1996. International Centre for Research in Agroforestry, Nairobi, Kenya (1997).
[18] ANDRIESSE, W., “Area and distribution: the wetlands and rice in sub-Saharan Africa”, Proceedings of a Workshop, 4–8 November, 1985, International Institute of Tropical Agriculture, Ibadan, Nigeria (1986) 15–30.
[19] KUNDHLANDE, G., GOVEREH, J., MUCHENA, O., “Socioeconomic constraints to increased utilisation of dambos in selected communal areas”, Dambo Farming in Zimbabwe: Water Management, Cropping and Soil Potentials for Smallholder Farming in the Wetlands, (OWEN, R., et al., Eds), CIIFAD, Ithaca, NY, and Univ. of Zimbabwe, Harare (1995) 87–96.
[20] RAUSSEN, T., DAKA, A.E., BANGWE, L., “Dambos in Eastern Province: Their Agroecology and Use”, Department of Agriculture, Chipata, Zambia (1995).
[21] MAFONGOYA, P.L., BARAK, P., REED, J.D., Carbon, nitrogen and phosphorus mineralization from multipurpose tree leaves and manure from goats fed these leaves, Biol. Fert. Soils 30 (2000) 298–305.
[22] SANGINGA, N., VANLAUWE, B., DANSO, S.K.A., Management of biological N2-fixation in alley cropping systems: estimation and contribution to N balance, Plant Soil 174 (1995) 119–141.
[23] SANGINGA, N., et al., Effect of successive cuttings on uptake and partitioning of nitrogen-15 among plant parts of Leucaena leucocephala, Biol. Fert. Soils 9 (1990) 37–42.
[24] BARRIOS, E., et al., Light fraction soil organic matter and available nitrogen following trees and maize, Soil Sci. Soc. Am. J. 61 (1997) 826–831.
[25] VAN NOORDWIJK, M., et al., “Root distribution of trees and crops: Competition and/or complementarity”, Tree-Crop Interactions: A Physiological Approach, (ONG, C.K., HUXLEY, P., Eds), CAB International, Wallingford, UK (1996) 319–364.
[26] BURESH, R.J., et al., “Opportunities for capture of deep soil nutrients”, Below-ground Interactions in Tropical Agroecosystems, (VAN NOORDWIJK, M., CADISCH, G., ONG, C.K., Eds), CABI Publishing, Wallingford, UK (2004) 109–125.
[27] BURESH, R.J., TIAN, G., Soil improvement by trees in sub-Saharan Africa, Agroforest. Syst. 38 (1997) 51–76.
[28] WONG, M.T.F., et al., Measurement of the acid neutralizing capacity of agroforestry tree prunings added to tropical soils, J. Agr. Sci. 134 (2000) 269–276.
[29] WONG, M.T.F., et al., Initial responses of maize and beans to decreased concentrations of monomeric inorganic aluminium with application of manure or tree prunings to an Oxisol in Burundi, Plant Soil 171 (1995) 275–282.
[30] WONG, M.T.F., SWIFT, R.S., “Role of organic matter in alleviating soil acidity in farming systems”, Handbook of Soil Acidity, (RANGEL, Z., Ed.), Marcel Dekker, New York (2003) 337–358.
[31] HULLUGALLE, N.R., KANG, B.T., Effect of hedgerow species in alley cropping systems on surface soil physical properties of an Oxic paleustalf in southwestern Nigeria, J. Agr. Sci. 114 (1990) 301–307.
[32] MAPA, R.B., GUNASENA, H.P.M., Effect of alley cropping on soil aggregate stability of a tropical Alfisol, Agroforest. Syst. 32 (1995) 237–245.
[33] CHIRWA, T.S., et al., Changes in soil properties and their effects on maize productivity following Sesbania sesban and Cajanus cajan improved fallow systems in eastern Zambia, Biol. Fert. Soils 40 (2004) 28–35
[34] NYAMADZAWO, G., et al., “Soil and carbon losses under rainfall simulation from two contrasting soils under maize-improved fallows rotation in Eastern Zambia”, Soil Erosion and Carbon Dynamics, (ROOSE, E.J., et al., Eds), CRC Press, Adv. Soil Sci. 15 (2005) 197–206.

220
[35] SANGINGA, N., MULONGOY, K., SWIFT, M.J., Contribution of soil organisms to the sustainability and productivity of cropping systems in the tropics, Agr. Ecosyst. Environ. 41 (1992) 135–152.
[36] ADEJUYIGBE, C.O., TIAN, G., ADEOYE, G.O., Soil microarthropod populations under natural and planted fallows in southern Nigeria, Agroforest. Syst. 47 (1999) 263–272.
[37] SILESHI, G., MAFONGOYA, P.L., Variation in macrofauna communities and functional groups under contrasting land-use systems in eastern Zambia, Appl. Soil Ecol. 33 (2005) 49–60.
[38] SWIFT, M.J., et al., “Long term experiments in Africa: developing a database for sustainable land use under global change”, Long Term Experiments in Agricultural and Ecological Sciences, (LEIGH, R.A., JOHNSON, A.E., Eds), Wiley (1994) 229–251.

221
DECOMPOSITION AND NITROGEN MINERALIZATION
OF LEAVES OF PARASERIANTHES FALCATARIA IN
AN ULTISOL UNDER FIELD CONDITIONS
R. CHINTU World Agroforestry Centre – ICRAF, c/o Lutheran World Foundation (LWF), Tete, Mozambique P. M. MATAKALA World Agroforestry Centre – ICRAF, ICRAF-Southern Africa Regional Office, Maputo, Mozambique A.R. ZAHARAH Universiti Putra Malaysia, Serdang, Selangor, Malaysia
Abstract
The dynamics of N released from fresh leaves of Paraserianthes falcataria when applied as surface
mulch to an Ultisol, and their effects on soil acidity, were studied under tropical field conditions in Malaysia. 15N-labelled residues were applied to confined microplots to trace the pathways and fate of mineralized N, and
resin bags placed at 20 cm soil depth under the microplots collected leached inorganic N for quantification. A
control treatment consisted of no residue application. The microplots were kept free of vegetation.
Decomposition of the high quality residue was very fast with the likelihood that crop N demand would not be in
synchrony with the rate of N mineralization. Nitrate was readily leached to 20 cm depth suggesting a high
potential for N loss and poor N use efficiency in the system. The leaf mulch had a short term positive effect in
the 0–10 cm soil depth as an ameliorant of soil acidity.
1. INTRODUCTION
The ability to predict the quantity of plant available nitrogen which will be potentially mineralized from applied plant residues is of great importance in agriculture. With such information there can be better management of organic residues, with resulting benefits in terms of labour, the environment and crop yields.
Most of the mineralization studies concerning organic residues have been conducted under controlled conditions in laboratories [1, 2, 3, 4, 5]. However, a few studies involving Gliricidia sepium and other legume trees have been carried out under field conditions [6, 7, 8]. There has been no comprehensive report on the decomposition of the biomass of the tree legume P. falcataria. P. falcataria has high quality leaf residues, with the N concentration in fresh leaves of usually more than 3%. Thus, the potential of P. falcataria leaves as a green manure when the tree is integrated into cropping systems would be high. However, characterization of its mineralization under field conditions is needed, in order to design proper strategies for its integration in agroforestry cropping systems. Application of plant residues may not only provide N and other nutrients for crop production [3, 7], but may also reduce soil acidity and hence alleviate acid soil infertility problems [9, 10, 11, 12, 13, 14].
In this study, an assumption was made that the nutrients that leach into the top 20 cm of the soil profile, following surface amendment with an organic residue, would be potentially available for a crop, since the roots of most annual crops are concentrated in this zone. However, appreciable plant uptake will only occur if the nutrient demand by the crop is in synchrony with nutrients released by the decomposing residues. In the absence of crop demand for the released N, or when the rate of N release exceeds the demand by crop, then N

222
loss will occur. Various N loss pathways are known, such as ammonia volatilization, microbial N immobilization and nitrate leaching [15]. Assuming that leaching would be the major N loss pathway under humid field situations that are devoid of crops, a field study was conducted to assess the N mineralization rate from 15N labelled P. falcataria leaves. Leaching of N was taken to be equivalent to net N mineralization and was assessed as the amount of inorganic N above the background levels of the control.
2. MATERIALS AND METHODS
2.1. Site, soil and plant materials
The experiment was conducted at Puchong field experimental site of the Faculty of Agriculture, Universiti Putra Malaysia (UPM) from May 15–July 23, 2001. Puchong is 101° 38.85' E and 2°59.01' N and it has a humid tropical climate with a mean annual rainfall of about 2000 mm. Maximum and minimum temperature range between 34.7–35.8°C and 20.1–20.4°C, respectively. Detailed weather data are given by other authors [7]. The rainfall and temperature were recorded at the site during the study period.
Puchong is dominated by an Ultisol locally described as Bungor series (Typic Paleudult) with the following characterics: pH(water), 4.76; Organic C, 8.4 g kg-1; Total N, 0.6 g kg–1; P (Bray-1), 5.1 mg kg–1; CEC (1M NH4OAc pH 7.0), 7 cmol(+) kg–1; and a sandy loam texture with 69% sand, 27% clay and 4% silt. The P. falcataria leaves had the following characteristics [16]: N, 3.26%; Lignin, 25.3%; Polyphenol, 1.7%, Dry matter content, 34% and 15N enrichmernt, 0.192 atom% excess.
2.2. Field lysimeter preparation
Polyvinyl chloride (PVC) tubes measuring 8 cm in diameter, and 25 cm long were used to demarcate the soil volume in the field. Resin bags of 20 cm diameter were prepared from fine polyvinyl netting fabric of 150 µm mesh size to accommodate 12.5 g of amberlite IR – 120 SO3–form, bead diameter 0.5 mm cation resin, plus 12.5 g of amberlite IRA – 402, Cl-form, mean diameter of between 620–770 µm anion resin with total exchange capacity of more than 1.3 eq l–1. The 1:1 mixture of anion and cation resins in the mesh bag was placed beneath each PVC tube to act as a sink (trap) for nutrients leached beyond the 20 cm soil column.
The PVC tubes were first sunk 20 cm into the soil and then carefully retrieved with an intact core of the 0–20 cm soil profile. A resin bag was placed at the base (bottom end) of each hole, before the tube was carefully re-installed into its respective hole. This meant that 5 cm of the PVC tube was left protruding above the soil surface, for the purpose of providing a reservoir for holding the surface applied P. falcataria leaves in place. A total of 50 PVC tubes were installed for this study. Fresh 15N labelled leaves were then applied at a rate of 5 g tube–1 surface area (approximately 50 cm2) except in the case of the control PVC tube, where no residues were applied. Five grams represented approximately 10 t ha–1 of fresh leaves and about 110 kg N ha–1 (dry matter basis). The sampling intervals were at 1, 3, 5, 10, 20, 30, 40, 50, 60 and 70 days of field incubation. No crop was planted, and the area was always kept free of weeds to avoid loss of nutrients through plant uptake. Four replications of the treated soils were sampled together with one control at each sampling date. Sampling involved re-excavation of the PVC tube with its soil core intact, and careful separation of the soil into two layers: 0–10 cm and 10–20 cm (hereafter referred to as topsoil and subsoil, respectively). The resin bags of the corresponding PVC tubes were individually and separately cleared of any

223
adhering soil particles or organic matter with a brush and then thoroughly rinsed with distilled water before being air dried in a clean and an ammonia-free environment.
2.3. Soil and resin sampling and analyses
Field fresh soil samples were extracted with 2M KCl (1:4 w:v) followed by steam distillation for NH4
+-N and NO3--N using MgO and Devarda’s alloy, respectively [17]. The
distillate was trapped in dilute (0.0025 M) HCl and inorganic N was determined by titration with 0.01M NaOH. Inorganic N refers to the summation of NH4
+-N and NO3--N. The 15N
enrichment for NH4+-N and NO3
--N distillates was determined on N2 generated by hyprobromite oxidation using emission spectrometry after acidification following titration [18]. Soil pH was determined after drying the soil samples.
The ions adsorbed on the resins were eluted by shaking the sampled resin bag in 100 mL of 1M NaCl solution for one hour. The extract was analyzed for NH4
+-N and NO3--N by
steam distillation and titration [17]. The 15N enrichment of the eluents was determined by emission spectrometry after acidification of NH4
+-N and NO3--N titrated distillates. Soil K, Ca
and Mg were analyzed by atomic absorption spectrophotometery after a 1:10 dilution with 1000 mg l–1 SrCl2 solution.
2.4. Calculations of results
Percentage of inorganic soil N derived from P. falcataria residues (%Ndfr) was calculated by Equation 1 [18]:
%Ndfr = (atom% 15N excess of NH4+ or NO3
- in extract ÷ 0.192) × 100 .......... (1)
Multiplication of %Ndfr by the amount inorganic N accumulated in the particular soil profile at any one sampling date gave the amount of N in soil that was derived from the applied residue (Ndfr) in mg kg–1. The 15N enrichment of soil inorganic N is expressed as atom percent 15N in excess of the natural abundance level of 0.3663 atom%. Net mineralization of N or of any other element for each sampling time was calculated as the difference between the value of treated soil and that of the untreated soil. Negative values indicated net nutrient immobilization. For instance in the case of N the formula reads: Net N mineralization = [N of amended soil] – [N of control or unamended soil]. All data were statistically analysed and significances of the treatment means were computed as standard errors of the means (s.e.m) at the 5% level of probability using SAS version 9.1 for windows. Paired t-test and t-test for independent samples were used to analyse the data where appropriate.
3. RESULTS
3.1. Rainfall distribution
The experiment was conducted from May 15 to July 23, 2001. The average minimum temperature was 21°C while the maximum averaged 31.8°C. The rainfall distribution experienced during the duration of the experiment is given in Fig. 1. The rainfall in this period was low and erratic in distribution with the occurrence of a total number of 14 rain events that amounted to 199.08 mm during the duration of 70 days. The highest rainfall recorded during a single event was only about 24 mm and the lowest was 1.68 mm. No rainfall fell in the first 6 days after the start of the incubation, which covered the first three sampling dates. There were 3 rain events between the 7th and the 10th day that totalled 46.2 mm. This accounts for almost
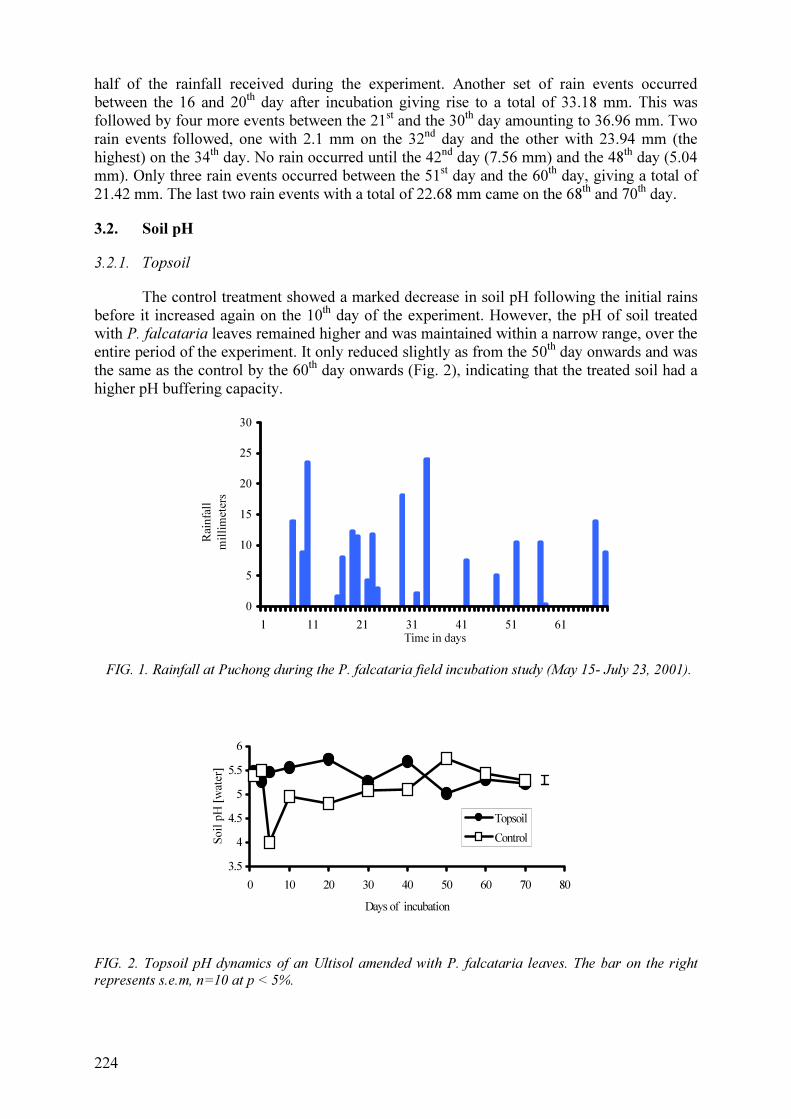
224
half of the rainfall received during the experiment. Another set of rain events occurred between the 16 and 20th day after incubation giving rise to a total of 33.18 mm. This was followed by four more events between the 21st and the 30th day amounting to 36.96 mm. Two rain events followed, one with 2.1 mm on the 32nd day and the other with 23.94 mm (the highest) on the 34th day. No rain occurred until the 42nd day (7.56 mm) and the 48th day (5.04 mm). Only three rain events occurred between the 51st day and the 60th day, giving a total of 21.42 mm. The last two rain events with a total of 22.68 mm came on the 68th and 70th day.
3.2. Soil pH
3.2.1. Topsoil
The control treatment showed a marked decrease in soil pH following the initial rains before it increased again on the 10th day of the experiment. However, the pH of soil treated with P. falcataria leaves remained higher and was maintained within a narrow range, over the entire period of the experiment. It only reduced slightly as from the 50th day onwards and was the same as the control by the 60th day onwards (Fig. 2), indicating that the treated soil had a higher pH buffering capacity.
0
5
10
15
20
25
30
1 11 21 31 41 51 61Time in days
Rain
fall
mil
lim
ete
rs
FIG. 1. Rainfall at Puchong during the P. falcataria field incubation study (May 15- July 23, 2001).
3.5
4
4.5
5
5.5
6
0 10 20 30 40 50 60 70 80
Days of incubation
So
il p
H [
wat
er]
Topsoil
Control
FIG. 2. Topsoil pH dynamics of an Ultisol amended with P. falcataria leaves. The bar on the right
represents s.e.m, n=10 at p < 5%.

225
3.2.2. Subsoil
There were no notable differences between soil pH of the control and that of the P.
falcataria treatment except that the soil pH of the control increased during the initial rains and suddenly decreased sharply after the rain on the 10th day (Fig. 3). This is the reverse of the situation that occurred in the topsoil pH within the stated time. The subsoil pH was always slightly lower than the topsoil pH (Fig. 4). Generally, the applied leaves did not seem to have as much effect on the subsoil pH as they had on the topsoil pH, except after the initial rains when treated soil showed a higher pH buffering effect as compared to the control (Fig. 3).
3.3. Inorganic N
3.3.1. Topsoil
Inorganic topsoil N dropped from around 40 mg N kg–1 on the first day to about 10 mg N kg–1 on the 3rd day before increasing to 40 mg N kg–1 again on the 5th day (Fig. 5). The drop in inorganic topsoil N on the 3rd day (Fig. 5) coincided with a sharp increase to a peak of 150 mg N kg–1 in the subsoil (Fig. 6). Inorganic N dropped significantly on the 5th day following the initial rain before rising again to 50 mg N kg–1, 30 days after leaf application (Fig. 5). More NO3
--N was present in the soil than was NH4+-N by the 20th day, implying a
predominance of the nitrification process. By the 30th day the concentration of soil inorganic N was very low indicating a likelihood of N immobilization. A high inorganic N concentration (85 mg N kg–1) occurred on the 60th day, and up to this time from the 30th day the NH4
+-N and NO3--N quantities or dynamics were similar to each other. However, nitrate
N predominated in the soil by the 70th day, with about 60 mg N kg–1 as compared to 15 mg NH4
+-N kg–1 (Fig. 5).
4.5
4.75
5
5.25
5.5
0 10 20 30 40 50 60 70 80
Days of incubation
So
il p
H [
wat
er]
Subsoil
Control
FIG. 3. Subsoil pH dynamics of an Ultisol amended with P. falcataria leaves. The bar represents s.e.m, n=10 at p < 5%.
3.5
4
4.5
5
5.5
6
0 10 20 30 40 50 60 70 80
Days of incubation
So
il p
H [
wat
er]
Topsoil
Subsoil
FIG. 4. Soil pH dynamics of an Ultisol amended with P. falcataria leaves. The bars represent s.e.m, n=10 at p < 5%.

226
-20
0
20
40
60
80
100
0 10 20 30 40 50 60 70 80
D ays after leaf application
Ino
rgan
ic-N
(m
g N
kg-1
so
il)
Inorganic-N N O 3 -N N H 4 -N
FIG. 5. Dynamics of leached inorganic N from the surface applied P. falcataria leaves in the Ultisol
topsoil. The bars represent s.e.m, n = 10 at p < 5%.
-50
0
50
100
150
200
0 10 20 30 40 50 60 70 80
Days after leaf application
Ino
rgan
ic-N
(m
g N
kg-1 s
oil
)
Inorganic-N
Nitrate-N
Ammonium-N
FIG. 6. Dynamics of leached inorganic N from the surface applied P. falcataria leaves in the 10–20
cm Ultisol subsoil column. The bars represent s.e.m, n = 20 at p < 5%.
3.3.2. Subsoil
Leached inorganic N accumulated rapidly in the subsoil reaching a peak of 150 mg N kg–1 in just 3 days following leaf application (Fig. 6). This implies that despite there being no rain there was ample water present in the profile to transport the released N downwards. The level of leached N decreased to around 50 mg N kg–1 on the 5th day before the initial rains and further on the 10th day following the initial rains. By the 20th day leached inorganic N had increased to about 50 mg N kg–1 and remained fluctuating between 30 and 50 mg N kg–1 until the 50th day when it decreased following a combined total rainfall of 12.60 mm. Leached inorganic N increased again to 50 mg N kg–1 on the 60th day before falling slightly following a total 22.68 mm of rain just before the last sampling at 70 days after soil amendment.

227
In summary N accumulation into the subsoil following surface application of P.
falcataria leaves showed two phases; the first one which was very quick, and a second slow and relatively stable phase. The larger part of inorganic N on the third day was NH4
+-N while the larger part of inorganic N from the 30th day to the 60th day was in the form of NO3
--N.
3.4. 15
N enrichment
15N enrichment was only detected in the 1st and 3rd day samples of the topsoil in the form of both NH4
+-N and NO3--N. None of the subsoil samples had detectable 15N
enrichment. Initial N mineralization from P. falcataria leaves was rapid; about 25% of the inorganic N occurring in the 1st and 3rd day topsoil samples was derived from the applied fresh P. falcataria leaves. The general concept where, 2.2 × 10⁶ kg is taken as the weight of a surface (0–15 cm) furrow slice of soil on 1 ha of land [19], and bearing in mind that topsoil in this study was sampled from 0–10 cm, the amount of the applied residue N that was mineralized at this point in time could be easily estimated. The 25% inorganic N which was 14.3 mg N kg–1 (Table 1) of inorganic topsoil N derived from the leaves (Ndfr) during the 1st day is calculated to be about 20% (about 21 kg N ha–1) of the total amount of N (110.8 kg N ha–1) applied in the form of leaf mulch.
TABLE 1..INORGANIC TOPSOIL N AND 15N ENRICHMENT AFTER APPLICATION OF LABELLED LEAVES
Ammonium -N Nitrate-N Inorganic-N
Day Ammonium
(mgN kg–1) 15N excess
(%)
Ndfr
(%)
Ndfr
(mgN kg–1)
(mgN
kg–1)
15N excess
(%)
Ndfr
(%)
Ndfr
(mgN kg–1)
Ndfr
(mgN kg–1)
1 20.8 0.046 24 5.0 37.1 0.048 25 9.3 14.3 3 5.2 0.049 26 1.4 52.4 0.049 26 13.6 15.0
15N excess is % of 15N above the natural abundance of 0.366%. Initial 15N excess of P. falcataria leaves was
0.192.
3.5. Resin-trapped inorganic N
The amount of ammonium N leached beyond the 20 cm soil profile was consistently low and insignificant through out the duration of the experiment. All of the N dynamics reflected in terms of inorganic N accumulation were due to nitrate N. Nitrate N was by far the larger amount of inorganic N that leached beyond the top 20 cm of soil. Leached inorganic N increased on the 10th day following the initial rains. The resins below the treated soils became severely depleted in inorganic N by the 20th day implying that N immobilization was possibly taking place with in the resin bags. However, resins sampled on the 30th day showed very high concentration of nitrate N, which remained relatively high until after the 60th day. Actually, this phase coincided exactly with the period when nitrate N availability predominated in the subsoil (Figs 6 and 7). The resin samples of the 70th day showed nitrate N immobilization, while ammonium N remained stable and low but not immobilized (Fig. 6).
3.6. Leached Ca++
, Mg++
and K+ in the resins
Initially, all three elements showed trends of being immobilized, though to varying extents, with K+ being immobilized for a longer time (Fig. 8). Ca++ had been leached appreciably as from the 50th day onwards (>2000 mg kg–1 of resin). Both the K+ and the Mg++
had been significantly leached by the 70th day, though the amount of Mg leached was relatively low. More K+ (6000 mg kg–1) than Ca++ (5000 mg kg–1) had accumulated in the resins by the 70th day.

228
-200
-100
0
100
200
300
400
0 10 20 30 40 50 60 70 80
Period after leaf application
N m
g g
-1 r
esin
Ammonium-N Nitrate-N Inorganic N
FIG. 7. Dynamics of soil inorganic N leached past the top 20 cm of soil following surface application
of P. falcataria leaves. The bars represent s.e.m, n=10 at p < 5%; s.e.m for ammonium = 5.77, but
bar not visible on graph.
-2000
0
2000
4000
6000
8000
0 10 20 30 40 50 60 70 80
Days after leaf application
Min
eral
s in
mg
kg-1
of
resi
n Mg++ K+ Ca++
FIG. 8. Ca++
, Mg++
and K+
derived from P. falcataria leaves leached through the top 20 cm of an
Ultisol. The bars represent s.e.m, n=10 at p < 5%.
4. DISCUSSION
The pH of soil treated with P. falcataria leaves was higher and did not fluctuate drastically with changes in weather as compared to the pH of untreated soil (Fig. 3). This implies that the buffering capacity of the acidic Ultisol had improved following amendment with leaves of P. falcataria. It has been noted that, the buffering capacity of soil is related to its cation exchange capacity (CEC) and is therefore related to the clay content and mineralogy and also to the amount of soil organic matter present [19]. The larger the amounts of either clay or organic matter, the greater the buffering capacity. The subsoil pH was found to be lower (Fig. 4) than that, of the topsoil because subsoils are generally lower in organic matter content. The liming phenomenon of green manures applied to acid soils has been discussed at length by other authors [9, 10, 11, 12, 13, 14]. However, the fact that a positive effect (Fig. 3) was observed under field conditions with mulching is important in that farmers who use fertilizers may also show interest in mulching for the purpose of ameliorating soil acidity. However, the applied residues did not show a marked impact on the subsoil pH (Fig. 4). This may be due to the lack of direct interaction between the mulch and the subsoil, as well as due

229
to the short duration in which the experiment was conducted. For subsoil pH to increase significantly due to plant residue amendment, the amounts of bases that are released during residue decomposition should be high and should move down the profile and be retained in the subsoil. This requires time, as the movement of bases such as K+, Ca++, and Mg++ is relatively slow (Fig. 8), in soils which are largely negatively charged.
The rate of nutrient accumulation in the subsoil will depend on the soil type, the prevailing weather conditions, and most importantly the amount and type (quality) of the residue applied. Under humid conditions, high quality residues may release the bulk of their nutrient into the soil within a short interval.
The results (Fig. 6 and 7) indicated that NO3--N was leached much more than NH4
+-N. Nitrate, being a negatively charged anion, is prone to leaching in soils with negatively charged colloids. Vegetation reduces nitrate leaching [19], with perennials such as trees and grasses being more effective than annual crops. Therefore, under wet conditions, leaching is likely to be greatest in systems devoid of plants. Though this study did not include plants, the results obtained are still important in relation to synchrony of N release from green manure with N uptake by plants. If application of leaf mulch is not well timed in relations to the needs of the growing crop, then most of the N input would be lost to the environment. Under the humid conditions that prevailed during this experiment, coupled with relatively low anion exchange capacity of the soil, loss of N through nitrate leaching would be more pronounced. In general, the amount and intensity of rainfall, evaporation rate, temperature, soil properties, the type of land-use, cropping and tillage practices, and the amount and form of available N, interact in complex ways to determine the amount of nitrate leached [19]. However, the specificity of such interactions was beyond the scope of this study.
15N enrichment in soil inorganic N was not detected beyond three days and beyond the topsoil. This could be due to excessive dilution by the N being mineralized from the soil itself, especially if there were a priming effect from the applied residues. Moreover, the leaf material used had low 15N enrichment (0.192 atom% excess). However, the results obtained were sufficient to indicate that the leaf N mineralization rate under field conditions was very rapid (Table 1). Fig. 6 also verifies that the leaching of N into the subsoil was highest 3 days after leaf application. 15N data show that 20% (20.92 kg ha–1) of the applied N in the residues was released within the 1st day. If such a rate could be sustained, the whole amount (110 kg ha–1) of the applied N would be mineralized within a week. In practical terms, such a scenario presents a big challenge in terms of synchronizing N availability to plant uptake of N. The opportunity of the crop to take up most of the released N in the short period it is available in the rooting zone is indeed narrow. Chintu and Zaharah [20] reported that the rates of N recovery by corn from surface applied P. falcataria leaves had been relatively low. However, on the contrary, an incubation study [5] showed a high rate of N release from P. falcataria leaves. If the aim in practical farming is to recover as much as possible of the plant derived N in the subsequent crops, then plant materials from which N release is relatively slow must be used, as most of the N from the fast N releasing residues is usually lost [21]. However, instead of discarding the use of high quality residues outright, the challenge is there to find ways of regulating their rates of nutrient release to reduce losses through experimentation. Mixing of residues of varying qualities is one such way, as demonstrated in the incubation study reported by Chintu et al. [5].
Movement of the bases down the soil profile is a positive trend as it can lead to decreased aluminium saturation and consequently to increased crop rooting depth [15] and water uptake. These effects associated with soil pH have practical importance and should be given careful attention in other areas that are also prone to high soil acidity.

230
5. CONCLUSIONS
The release of N from P. falcataria leaves under humid tropical conditions is relatively fast, and may not be in synchrony with crop demand for N. Thus, ways of regulating N release from P. falcataria leaf mulches have to be sought to optimize N use efficiency and crop growth, while at same time avoiding nitrate-N leaching to groundwater. The rapid release of N from applied residues could imply high risks of nitrate loading into groundwater under wet conditions if the application rates are high, combined with low plant N uptake and soil anion exchange capacity. Split application could possibly help to improve N uptake by crops, while still maintaining the pH moderating effect of the organic residues. However, long-term pH effects ought to be investigated in relation to the quality, amount and frequency of plant residue application in acid soils.
REFERENCES
[1] COLLINS, H.P., et al., Decomposition and interactions among residue components, Soil Sci. Soc. Am. J. 54 (1990) 780–785.
[2] CONSTANTINIDES, M., FOWNES, J.H., Nitrogen mineralization from leaves and litter of tropical plants, relationship to nitrogen, lignin, and soluble polyphenol concentrations, Soil Biol. Biochem. 26 (1994) 49–55.
[3] MAFONGOYA, P.L., Multipurpose Tree Prunings as a Source of Nitrogen to Maize (Zea mays L.) under Semiarid Conditions in Zimbabwe, PhD Thesis, Univ. of Florida (1995).
[4] BRIONES, M.J.I., INESON, P., Decomposition of eucalyptus leaves in litter mixtures, Soil Biol. Biochem. 28 (1996) 1381–1388.
[5] CHINTU, R., ZAHARAH, A.R., WAN RASHIDAH, A.K., Decomposition and nitrogen release patterns of Paraserianthes falcataria tree residues under controlled incubation, Agroforest. Syst. 63 (2005) 45–52.
[6] BARIOS, E., et al., Light fraction soil organic matter and available nitrogen following trees and maize, Soil Sci. Soc. Am. J. 61 (1997) 826–831.
[7] ZAHARAH, A.R, et al., Management of Gliricidia (Gliricidia sepium) residues for improved sweet corn yield in an Ultisol, Nutr. Cycl. Agroecosys. 54 (1999) 31–39.
[8] WAN RASIDAH, K., VAN CLEEMPUT, O., ZAHARAH, A.R., Microbial respiration and nitrogen release patterns of decomposing Acacia mangium leaf litter from Kemasul Reserve, Malaysia, J. Trop. Forest Sci. 13 (2001) 1–12.
[9] HOYT, P.B., TURNER, R.C., 1975. Effect of organic material added to very acid soils on pH, aluminium, exchangeable NH4 and crop yields, Soil Sci. 119 (1975) 227–237.
[10] LUNGU, O. I., et al., Effects of lime and farm yard manure on soil acidity and maize growth on an acid Alfisol from Zambia, Trop. Agr. 70 (1993) 309–314.
[11] BERECK, A.K, RADJAGUKGUK, B., MAAS, A., “The effect of different organic materials on the alleviation of Al toxicity in soyabean on a yellow podozolic soil”, Plant Interactions at Low pH: Principles and Management, (DALE, R.A., et al., Eds), Kluwer Academic Publishers, Dordrecht (1995) 579–584.
[12] NOBLE, A.D., ZENNECK, I., RANDALL, P.J., Leaf litter ash alkalinity and neutralization of soil acidity, Plant Soil 179 (1996) 293–302.
[13] IYAMUREMYE, F., DICK, R.P., BAHAM, J., Organic amendments and phosphorus sorption by soils, Adv. Agron. 56 (1996) 139–185.
[14] HAYNES, R.J., MOKOLOBATE, M.S., Amelioration of Al toxicity and P deficiency in acid soil by additions of organic residues; a critical review of the phenomenon and the mechanisms involved, Nutr. Cycl. Agroecosys. 59 (2001) 47–63.

231
[15] SANCHEZ, P.A., Properties and Management of Soils in the Tropics, John Wiley and Son, New York (1976).
[16] ANDERSON, J.M., INGRAM, J.S.I., Tropical Soil Biology and Fertility: A
Handbook of Methods, CAB International, Wallingford (1993). [17] KEENEY, D.R., NELSON, D.W., “Nitrogen-inorganic forms”. Methods of Soil
Analysis, Part 2, Chemical and Microbiological Properties, 2nd edn, (Page, A.L., Miller, R.H., Keeney, D.R., Eds), ASA-CSSA-SSSA, Madison (1982) 643–698.
[18] ZAPATA, F., “Isotope techniques in soil fertility and plant nutrition studies”. Training Course Series No.2. Use of Nuclear Techniques in Studies of Soil-Plant Relationships, (Hardarson, G., Ed), IAEA, Vienna (1990) 61–127.
[19] PRASAD, R., POWER, J.T., Soil Fertility Management for Sustainable Agriculture, CRC Press, New York, (1997).
[20] CHINTU, R., ZAHARAH, A.R., Nitrogen uptake of maize (Zea mays L.) from isotope-labelled biomass of Paraserianthes falcataria grown under controlled conditions, Agroforest. Syst. 57 (2003) 101–107.
[21] MULLER, M.M., SUNDMAN, V., The fate of nitrogen (15N) released from different plant materials during decomposition under field conditions, Plant Soil 105 (1988) 133–139.


233
RECENT IAEA PUBLICATIONS ON
SOIL AND WATER MANAGEMENT AND CROP NUTRITION
2001 Use of Isotope and Radiation Methods in Soil and Water Management and Crop
Nutrition –Manual (IAEA Training Course Series No. 14).
2002 Water Balance and Fertigation for Crop Improvement in West Asia (IAEA-TECDOC-1266).
2002 Assessment of Soil Phosphorus Status and Management of Phosphatic Fertilisers to Optimise Crop Production (IAEA-TECDOC-1272).
2002 Nuclear Techniques in Integrated Plant Nutrient, Water and Soil Management (Proc. Symp.Vienna, 2000) (IAEA C+S Paper Series 11/P).
2002 Irradiated Sewage Sludge for Application to Cropland (IAEA-TECDOC-1317).
2003 Neutron and Gamma Probes: Their Use in Agronomy (Second Edition) (IAEA Training Course Series No. 16).
2003 Les Sondes à Neutrons et à Rayons Gamma: Leur Applications en Agronomie (Deuxième Édition) (Collection Cours de Formation No.16).
2003 Las Sondas de Neutrones y Gamma: Sus Aplicaciones en Agronomía (Segunda Edición) (Colección Cursos de Capacitación No. 16).
2003 Management of Crop Residues for Sustainable Crop Production (IAEA-TECDOC-1354).
2003 Guidelines for the Use of Isotopes of Sulfur in Soil-Plant Studies (IAEA Training Course Series No. 20).
2003 Maximising the use of biological nitrogen fixation in agriculture (Developments in Plant and Soil Sciences No. 99. FAO, Rome, and Kluwer Academic Publishers, Dordrecht).
2004 Use of phosphate rocks for sustainable agriculture. (FAO Fertilizer and Plant Nutrition Bulletin 13. Joint FAO/IAEA Division of Nuclear Techniques in Food and Agriculture and the Land and Water Development Division-AGL, FAO, Rome).
2004 Use of Isotope and Radiation Methods in Soil and Water Management and Crop Nutrition (An interactive CD).
2005 Nutrient and water management practices for increasing crop production in rainfed arid/semi-arid areas (IAEA-TECDOC-1468).
2007 Management Practices for Improving Sustainable Crop Production in Tropical Acid Soils Results of a Coordinated Research Project organized by the Joint FAO/IAEA Programme of Nuclear Techniques in Food and Agriculture, Proceedings Series, STI/PUB/1285.
2008 Guidelines on Nitrogen Management in Agricultural Systems, Training Course Series No. 29: IAEA-TCS-29/CD - ISSN 1998-0973.
2008 Field Estimation of Soil Water Content, A Practical Guide to Methods, Instrumentation and Sensor Technology, Training Course Series No. 30. Also IAEA-TCS-30/CD - ISSN 1998–0973.


235
LIST OF PARTICIPANTS
Kouessi, A. Institut national des recherches agricoles du Bénin
Direction de la recherche agronomique 01 B.P. 884, Cotonou Benin Email: [email protected]
Ovalle-Molina, C. Estación Experimental Quilamapu Instituto de Investigaciones Agropecuarias (INIA) Avenida Vicente Mendez 515 Casilla 426, Chillán Chile Email: [email protected]
Zhang, B. Soil and Water Conservation Soil Physics Institute of Soil Science Chinese Academy of Sciences P.O. Box 821, Nanjing 210008 China Email: [email protected]
Cervantes Umana, C. Escuela de Ciencias Agrarias Universidad Nacional Apartado Postal 86, Heredia 3000 Costa Rica Email: [email protected], [email protected]
Ndufa, J.K. Kenya Forestry Research Institute (KEFRI) Kenya Agricultural Research Institute (KARI) International Centre for Research in Agroforestry, Busia Road P.O. Box 25199, Kisumu Kenya Email: [email protected]
Abdul Rahman, Z. Department of Soil Science University Putra Malaysia (UPM) 43400 Serdang, Selangor Malaysia Email: [email protected]; [email protected]
Nissanka, S.P. Department of Crop Science Faculty of Agriculture University of Peradeniya Peradeniya 20400 Sri Lanka Email: [email protected]
Ebanyat, E. Department of Soil Science Makerere University P.O. Box 7062 Kampala Uganda Email: [email protected]

236
Chintu, R. Msekera Agricultural Research Station Ministry of Agriculture, Food and Fisheries P.O. Box 510089, Chipata Zambia Email: [email protected]
Adams, M. Laboratory for Ecology and Ecosystem University of New South Wales Room 552C Sydney, NSW 2052 Australia Email: [email protected]
Smith, M. Centre for Ecology & Hydrology Crowmarsh Gifford Wallingford, Oxfordshire United Kingdom Current address: The World Conservation Union rue Mauverney 28 1196 Gland Switzerland Email: [email protected]
Recous, S. Unité d'agronomie Laon-Reims-Mons Institut national de la recherche agronomique (INRA) Rue F. Christ 02007 Laon CEDEX France Email: [email protected]
Verchot, L. Ecosystem Rehabilitation Programme International Centre for Research in Agroforestry United Nations Avenue Gigiri P.O. Box 30677, Nairobi Kenya Email: [email protected]
Sanginga, N.E. Bationo, A.
Tropical Soil Biology and Fertility Institute of CIAT United Nations Avenue P.O. Box 30677, Nairobi 00100 Kenya Email: [email protected]; [email protected]
Consultants Meeting Vienna, Austria: 8–10 September 1997
Research Coordination Meetings
Vienna, Austria: 19–23 April 1999 Kuala Lumpur, Malaysia: 7–11 May 2001
Colombo, Sri Lanka: 2–6 June 2003 Vienna, Austria: 18–22 April 2005


