Embed Size (px)
Citation preview

G. Trickey, Psychological Consultancy Ltd
Technical Manual

© Copyright Psychological Consultancy Limited, 2019 all rights reserved. Risk Type Compass® is a registered trademark in Europe: CTM No. 010726818.
1 I
Copyright © 2019 by Psychological Consultancy Ltd.All rights reserved. No part of this publication may be reproduced or transmitted in any form or by any means, electronic or mechanical, including photocopy, recording or any information storage or retrieval system, without permission in writing from the publishers.
Published in the United Kingdom in 2019 byPsychological Consultancy Limited, 8 Mount Ephraim, Tunbridge Wells, TN4 8AS.T 01892 559540F 01892 522096E [email protected]
Printed in the United Kingdom.

© Copyright Psychological Consultancy Limited, 2019 all rights reserved. Risk Type Compass® is a registered trademark in Europe: CTM No. 010726818.
II
Foreword To The Fourth Edition
The effort to reduce risk in business (and in life) has been described as “the world’s largest industry1”. The process of risk reduction is deeply complex and not easily defined or quantified.
The challenge of reducing risk can be approached from two different perspectives. The first and most common approach focuses on the actual risk: identifying, measuring, and reducing disruptive, dangerous, or costly incidents, and monitoring and predicting trends in financial risk. The second approach is less common. It focuses on people: their dispositions, vulnerabilities, behaviors, and decision making. This approach lies in the realm of personality psychology, something outside the mainstream of risk management practices.
Most risk management practices concern designing strategies and procedures to control workplace behavior, or developing statistical and actuarial practices to predict behavior, and regulations to control behavior. In this context, considering the people side of the equation may have seemed messy, challenging, dauntingly unfamiliar. The Risk Type Compass™ offers a new approach: it focuses on human factor issues by providing a coherent conceptual framework, reliable measurement, and an accessible working vocabulary to support a range of professional practices as described and illustrated in this manual.
The design of the Risk Type Compass™ is striking in terms of: (a) its psychological reasoning; and (b) its technical test development perspective. It offers an innovative conceptualization of personality as related to the perception of risk, the reaction to risk, and the propensity for risk taking. These are dispositions that likely have a persistent effect on decision making at all levels, whether by individuals or teams. This should be of interest because the success and survival of individuals and organizations depends on maintaining a balance between seizing opportunities and weighing the risks involved.
The range of potential applications of this measure is indicated by the research described in this manual. This innovative and purposeful personality tool represents a significant addition to the psychometric tool kit. It will be of interest to a wide sphere of psychologists and risk professionals and will make a potent contribution to unravelling the nuanced complexities of risk.
DR ROBERT HOGAN, 2017
Hogan Assessment Systems, Tulsa, USA
1 John Adams, in his book ‘RISK’ (Routledge, 1995)

© Copyright Psychological Consultancy Limited, 2019 all rights reserved. Risk Type Compass® is a registered trademark in Europe: CTM No. 010726818.
II III
Preface To The Fourth Edition
The development of the Risk Type Compass™ was originally triggered by the UK regulatory requirement that financial advice should be based on the risk appetite of the potential investor. At that point our knowledge about risk was at the same uninformed level as most other people but we knew a lot about psychometrics and personality assessment and were surprised by the casual construction of simplistic assessments being rushed out to meet the demands of the regulators.
Against this background, our immediate response to the Financial Services Authority requirement of risk appetite assessment of all investors was deeply sceptical. On the other hand, aware that many subthemes within the now consensual Five Factor Model touched on risk perception and reaction to risk, we saw an opportunity.
The relationship between risk taking and personality has been extensively debated within the research literature. Numerous studies over many years have referenced a relationship between risk taking and all the major personality factors. Similarly, risk research and the professional rhetoric of those that have to deal with risk also acknowledge a ‘human factor’; an aspect of risk that has become central to recent debate amongst practitioners, regulators and standards bodies, as well as academics.
Our starting point had been the Five Factor Model of personality but, as our understanding of the relationship between personality and risk developed, our views on both risk and personality have evolved in the light of both experience and research. For example, the two bi-polar scales of the Risk Type Compass™ align well with the observation of the Government Chief Scientific Officer, Sir Mark Walport, in his 2014 Annual Report Innovation: Managing Risk, Not Avoiding It: ‘Decision-making draws on both the analytical and emotional systems in the brain’. Persistent symmetry of the incidence of Risk Types as the sample size has increased, the marked reliability of the Risk Type Compass™, and its ability to differentiate also encourages the view that something substantive is being measured.
The following points represent our view at this point in 2016.
Firstly, we question the a priori assumption that risk related behaviour is external to personality.
Risk taking is an intrinsic and unavoidable part of life, not an occasional event. How a person perceives risk, reacts to risk and how much risk they are disposed to take are day-to-day issues shaped by personality. Personality characteristics are the foundation of our risk dispositions, not merely correlates.
Secondly, the complexity of the risk component of personality has been obscured by the assumption that risk taking is a simple linear variable.
In reality, risk behaviour takes many forms and may be a consequence of, for example, impulsivity, poor vigilance, over-reaction, fear, over-confidence, imperturbability

© Copyright Psychological Consultancy Limited, 2019 all rights reserved. Risk Type Compass® is a registered trademark in Europe: CTM No. 010726818.
IV
excitement seeking, unwarranted trust, carelessness, prudence, and many other personality characteristics. A simple linear variable with extreme risk aversion at one end and reckless impulsivity at the other is a relatively crude simplification of this reality.
Thirdly, risk variables in personality research are essentially arbitrary.
The basic confounding problem for research is that risk is an abstraction that cannot be defined outside of a specific context and cannot be objectively measured beyond an estimate of a probability. Variables cannot adequately reflect the ubiquitous, all pervasive nature of risk. Anything, potentially, can be a risk and anything can, potentially, be at risk. Risk is always situationally and subjectively defined.
All these factors influence our efforts to manage risk and to evaluate the relationship between personality and risk. It may be inevitable that the focus has been on ‘the risk out there’; the threats, the dangers and the hazards we are faced with rather than on the nature of the people involved and the risks that they may and may not take. Certainly, the world has been made vastly safer by risk management but there have been huge failings too; everything from the sinking of the Titanic to the 2004-2008 banking crisis. There is a growing suspicion that “...risk failures are mostly attributable to human factors” (Mazarr, 2016). Any reluctance of risk professionals to address this view will have partly been due to the perception that ‘people factors’ are just too messy and complicated to get to grips with. The onus is on psychology to get its act together and to deliver something useful; we view the Risk Type Compass™ as a step in this direction.
________________________________
This manual has been a work in progress over several years, with ongoing research and consultancy projects continuously adding to our understanding. I would like to record my appreciation for the contributions of all PCL staff who have assisted in development of techniques and the clients that, in seeking our assistance, created opportunities for developing strategies and deployment techniques. Many people were very directly involved with the research and the compilation of this manual. Sarah Rasmussen, Gillian Hyde, Matthew Stewart, Gemma Knocker, So Yi Yeung and Grace Walsh all played a crucial role at various points along the way. Lee Carnell handled the programming and the North American web service; Catherine Childs picked up the baton on client facing issues and project support; and Tony Zemaitis contributed with realisation of design, layout and formatting. Simon Toms has played a vital role over the past three years with data analysis that has brought out key features of the Risk Type Compass™, such as ‘risk strength’, and, in researching a short form, has highlighted the remarkably robust reliability of the instrument. His considerable efforts in refreshing and updating the content and fostering relationships with the international research effort have been very much appreciated.
Geoff Trickey, 2018

© Copyright Psychological Consultancy Limited, 2019 all rights reserved. Risk Type Compass® is a registered trademark in Europe: CTM No. 010726818.
IV V
Contents
Foreword To The Fourth Edition IPreface To The Fourth Edition II
Introduction 8 Everyday Risk 8The Risk Type Compass™ 8Uses of the Risk Type Compass™ 9Personal Implications 9Implications for Others 9Risk Management 10
Chapter 1 - Theoretical Background 11Personality and Risk Tolerance 11The Five Factor Model (FFM) of Personality and Risk Tolerance 11The Hexaco Model of Personality and Risk Taking 15Personality and Risk Tolerance Summary 16Genetic Influence on Risk Taking 18Risk Tolerance and Risk Attitude 19Risk Type, Risk Attitude and Risk Intelligence 20
Chapter 2 - Risk Themes Amongst the Factor Structure of Personality 23
The Beginning 23The Background 23Factor Analysis 24Risk Type 26Positioning the Compass 30Typology 32
Chapter 3 – What the Risk Type Compass™ Measures 34Personality Scales 34The Bi-polar Scales 34Risk Type Compass™ Types 37The Eight Risk Types 38The Risk Type Spectrum 41Risk Strength 41Risk Attitude 42Risk Tolerance 45The Validity Scale 46Summary 46
© Copyright Psychological Consultancy Limited, 2019 all rights reserved. Risk Type Compass® is a registered trademark in Europe: CTM No. 010726818.
VI
Chapter 4 – Descriptive Statistics 47Risk Personality Factors and Scales 47Risk Type Frequencies 51The Risk Type Compass™ 2019 Norm Group 53
Chapter 5 – Reliability and Validity Research 61Reliability 61Internal Reliability of the Personality Factors and Scales 61Internal Reliability of the Subthemes 62Risk Type Compass™ Short Form 72Validity 73Personality Scale Validity 73Correlations with Profile:Match2™ 73Correlations with the Hogan Personality Inventory 74Correlations with the Hogan Development Survey 76Correlations with the Motives, Values, Preferences Inventory 77Correlations with the Hogan Personality Inventory Safety Competencies 78Interpretative Summaries of Correlation Research 80The Pure Risk Types 80The Complex Risk Types 82Summary 84Risk Tolerance 85Risk Tolerance and MVPI Security 87
Chapter 6 - Occupational and Age Differences in Risk Type 90Public versus Private Sectors 90Job Level 90The Risk Profiles of Specific Occupations 92The Recruiter Risk Profile 97The Risk Profile of IT Professionals 99The Risk Profile of Police Officers 102The Risk Profile of Engineers 105The Risk Profile of Auditors 106The Risk Profile of Air Traffic Controllers 108Comparison of Employment Categories by Risk Types 111Risk Types by Seniority 112Risk Type & Age 114Risk Type 115What are the subthemes driving these variations? 116Do our findings align with the literature? 117Conclusions 118Summary 118

© Copyright Psychological Consultancy Limited, 2019 all rights reserved. Risk Type Compass® is a registered trademark in Europe: CTM No. 010726818.
VI VII
Chapter 7 - The Varied Uses Of The Risk Type Compass™ 119Individual Level 120Selection 120Strategic Re-Deployment 120Personal Development 120Team Level 121Auditing Teams 121Developing Teams 121Case Study – Why your creative employees are more likely to be risk-takers 122Organisational Level 124Risk Culture 124Risk Landscape 126Summary 127
Chapter 8 - Real World Consequences 128Concept Validation 128The 360-Degree Spectrum of Risk Dispositions 128Eight Risk Types 128Meaning & Significance 128Risk & Human Nature 129Risk Type & Individual Differences 130Risk & Creativity 131Risk & the Legal Industry 133Risk & Mental Health Professionals 134Risk & Change Management 134Risk & Resilience 136Risk & Wellbeing 138Risk Type Compass™ & the Hogan Development Survey (HDS) 140Risk & Agreeability 144Teams & Groups 146Value of Diversity 146Risk Dispositions & Team Dynamics 147Mining Company Board 147Commercial Team (Historic Trust) 148Insurance Company Risk Team 149Board Members of a Charity 150Russell Group University 150Traders 151Summary 151Industries & Sectors 152Attraction, Selection, Attrition (ASA) 152Chi-Square Goodness of Fit Analyses 152 General Management 153 Information Technology 155 Air Traffic Controllers 156
© Copyright Psychological Consultancy Limited, 2019 all rights reserved. Risk Type Compass® is a registered trademark in Europe: CTM No. 010726818.
VIII
Legal Professionals 158 Police Officers 159 Auditors 161 Mental Health Professionals 163 Recruiters 164Organisational Risk Culture 166Summary 167
Chapter 9 - A Brief Guide to Interpreting the Risk Type Compass™
168What Does The Risk Type Compass™ Tell You? 168Risk Type 168Two Fundamental Risk Dispositions 169Explaining the Risk Types 170The Pure Risk Types 170The Complex Risk Types 174Risk Type Strength 179Risk Attitude 179Risk Tolerance Index 181
Chapter 10 - Reports 183Report Types 183Personal Report 183Investor Report 183Financial Adviser Report 184Risk Type Report 184Team Report 184
Glossary 186
References 189

© Copyright Psychological Consultancy Limited, 2019 all rights reserved. Risk Type Compass® is a registered trademark in Europe: CTM No. 010726818.
8
Introduction
Everyday RiskThere is potential for risk in almost everything that we do and there are many different factors that influence a person’s readiness to take a risk at a particular moment in time. Some of these factors are unsystematic incidents that defy management. Happenstance of this nature is incapable of quantification and it has to be considered as ‘noise’ in the system; random elements that may obscure the consistencies that are rooted in our nature. Risk taking proves to be an inherent component of personality. The full extent of this was not generally recognised until recent studies identified the many ‘risk themes’ that permeate the major personality factors and reconfigured these as an assessment focused specifically on risk disposition; this publication recounts this process. Research has also identified a number of genes that are linked to risk-related behaviour. While we have to recognise that there will always be a degree of unpredictability about risk behaviour we also need to recognise that individual propensities for risk will be deeply rooted and have a consistent and pervasive influence. Balancing opportunity and risk is key to the success and survival of individuals, species and organisations.
The Risk Type Compass™The Risk Type Compass™ is an online psychometric assessment that aims to capture the distinguishing ways in which we behave in risk-orientated situations. It does this by assigning individuals to one of eight distinctive Risk Types based on personality. The aim of the Risk Type Compass™ is to accurately reflect the individual’s unique predisposition towards risk.
At its simplest, there are two reasons why people take risks. The first is concerned with levels of fearlessness and a lack of anxiety and the second concerns impulsivity, curiosity and thrill seeking. Combined with their opposite extremes, this creates the four poles of the Risk Type Compass™. The fact that we will all register somewhere on each of these dimensions - with the possibility of being high on either, both, or neither - creates the possibility of eight different Risk Types. These are labelled Wary, Prudent, Deliberate, Composed, Adventurous, Carefree, Excitable and Intense. In addition to these eight Risk Types, the central Axial group identifies those whose scores on both underlying scales are close to the central point; the means between both extremes. This group will have a neutral and balanced risk perspective encompassing moderate elements of all the Risk Types.
The Risk Type Compass™ recognises that an individual’s approach to risk is influenced by both their natural temperament and by their experiences, risk exposure and personal circumstances. This is reflected in the important distinction made by the Risk Type Compass™ between ‘Risk Type’ and ‘Risk Attitude’. Risk Type is concerned with personality based dispositions that remain relatively stable over a working life. Risk Attitudes, on the other hand, characterise the variations that arise from day-to-day events

© Copyright Psychological Consultancy Limited, 2019 all rights reserved. Risk Type Compass® is a registered trademark in Europe: CTM No. 010726818.
8 9
and experiences, such as economic instability, changes in personal circumstances, or personal accidents.
Part 1 of the Risk Type Compass™ questionnaire addresses Risk Type while Part 2 focuses on differences in Risk Attitude across five key risk domains: Health & Safety Risk, Recreational Risk, Financial Risk, Reputational Risk and Social Risk. These provide a snapshot of current variations in Risk Attitude. These two influences differ importantly in terms of their consistency over time and in the level of consciousness at which they operate. Risk Type is a direct derivative of personality and, as such, operates at a largely subconscious level. Its importance stems from the persistence and consistency of its influence. Risk Attitude reflects the sentient characteristics of our species; higher cognitive capabilities and freedom of thought. It is influenced by a kaleidoscopic combination of incidental, situational, and contextual influences encountered in day-to-day life and may therefore be very changeable.
Uses of the Risk Type Compass™
The Risk Type Compass™ can be used to facilitate planning, research and discussion about risk awareness, risk tolerance, risk management and decision making. It provides a taxonomy and a vocabulary that facilitates navigation of the complexities of human factor risk and identifies the potential benefits and challenges faced by different Risk Types in different roles and situations.
Personal ImplicationsThe psychology of individual differences recognises that perception and awareness of risk differs from person to person. At their extremes, Risk Type perceptions generate very different personal views about risk and opportunity. This implies wide differences in interests, behaviours and opinions; differences of perspective that may at times cause irritation or conflict with others and interfere with effective and constructive communications. For this reason, Risk Type has implications for self-awareness and personal effectiveness. This is especially important for decision makers who have to resolve such differences of opinion about the appropriate balance between risk and opportunity.
Implications for OthersIndividuals that are strong examples of different Risk Types may be quite incomprehensible to each other. This has an important bearing on working relationships, for teams, for managers and for organisations. The possibilities for misunderstanding

© Copyright Psychological Consultancy Limited, 2019 all rights reserved. Risk Type Compass® is a registered trademark in Europe: CTM No. 010726818.
10
and misinterpretation increase when distinctive individual differences in Risk Type are not appreciated or understood. Conversely, groups may be dysfunctional by virtue of extreme homogeneity and the absence of a balance across Risk Types. A team’s effectiveness can therefore be enhanced by an appreciation of its Risk Type structure and recognition of the implications for group dynamics.
Risk ManagementIn the past, management of risk has focused heavily on procedures, regulation and legislation rather than on the risk taking nature of the individuals involved. The Risk Type Compass™ identifies critical individual differences that allow managers to maximise potential and to balance the contributions of both risk takers and more risk averse individuals, thereby minimising risk whilst maximising opportunity. To quote a frequently repeated truism attributed to the influential thinker, Peter Drucker: “If you can’t measure it, you can’t manage it”. The Risk Type Compass™ can be used across industries and from the C-Suite to the shop floor. It has a particular relevance to teams where group dynamics, risk polarisation and the ‘Risky Shift’ phenomenon can create distortions that are a threat to controlled decision making. In survey mode, the Risk Type Compass™ captures the wider risk landscape and the contribution made by Risk Types to organisational culture.
Psychological Consultancy Ltd (PCL) has used the Risk Type Compass™ in a wide array of applications beyond these three broad categories; from coaching of city traders, senior police staff and high performance car drivers to work with operatives in aluminium manufacturing and heavy engineering, to applications in financial consulting, Health and Safety, risk management, project management, auditing, flight traffic controllers, and board development with both non-profit and commercial companies. The range of research and application develops continuously.

© Copyright Psychological Consultancy Limited, 2019 all rights reserved. Risk Type Compass® is a registered trademark in Europe: CTM No. 010726818.
10 11
Chapter 1 - Theoretical Background
Personality and Risk ToleranceHistorically, parameters measured when assessing risk tolerance have fallen into three main categories: an individual’s personal circumstances, their experience, and their personality. This section focuses on the last of these points, providing an overview of the relevant literature that explores the complex link between personality and risk tolerance, as well as a discussion of the different approaches that have been used to measure it.
The Five Factor Model (FFM) of Personality and Risk Tolerance
Personality is one of the most thoroughly researched areas of psychology and has been successfully utilised in applied settings for many years. Theories of personality rest on the assumption that, within each of us, there are enduring structures that shape our personal uniqueness and account for the behavioural consistencies on which our reputation with others is based; who we are and how we are likely to come across to others. A comprehensive review of the literature by Barrick and Mount (2005) summarises the breadth of research within the domain of personality, referencing the key outcomes from work and other life situations. Overall, they found that personality has a strong influence, not only on job performance, but also on absenteeism, turnover and citizenship behaviours – in addition to more general factors such as life satisfaction, quality of life and even life span. As well as having proven predictive qualities, personality assessments are easy to administer using questionnaires and offer the benefit of not discriminating between racial or ethnic groups, as can be the case with ability measures or other forms of assessment.
After decades of research, psychologists have identified five key factors that can be viewed as the ‘primary colours’ that underpin all personality. Together they are termed the ‘Five Factor Model’ (e.g. Barrick & Mount, 1991; Wiggins, 1996). The Five Factor Model is well supported by research findings over the past 20 years, using meta-analytic techniques and data from tens of thousands of personality assessments. This model has been hugely influential in psychological science, providing a global framework for much of the subsequent research in the area. Risk tolerance research is no exception to this, with literature on risk tolerance and personality exploring the extent to which one or more of these five factors influences a person’s risk behaviour and perceptions of risk. The considerable body of research is briefly summarised below by an illustrative selection from the relevant findings (Table 1.1).

© Copyright Psychological Consultancy Limited, 2019 all rights reserved. Risk Type Compass® is a registered trademark in Europe: CTM No. 010726818.
12
Table 1.1. The Five Factor ModelOpenness to Experience The degree to which a person needs intellectual stimulation,
change and variety.Conscientiousness The degree to which a person is willing to comply with conventional
rules and is organised, planful and attentive to detail.Extraversion The degree to which a person is gregarious, assertive and seeks
excitement.Agreeableness The degree to which a person needs pleasant and harmonious
relations with others, and is sympathetic and concerned with what other people think of them.
Neuroticism The degree to which a person experiences unpleasant emotions such as anger, anxiety, depression and a feeling of vulnerability. (Also known as Emotional Stability, with lower scores on Neuroticism signifying higher Emotional Stability, characterising those that are less prone to feeling stressed and who are more calm and even tempered).
Extraversion and Risk ToleranceExtraversion is believed to play a key role in risk tolerance. Research by Nicholson, Soane, Fenton-O’Creevy, and Willman (2005), for example, invited 2,700 participants to complete a measure of personality (the Revised NEO Personality Inventory; an assessment based on the Five Factor Model) and a measure of risk propensity, assessed in terms of current and past risk behaviours in domains including financial, health and social behaviour. Correlational analysis revealed Extraversion to be associated with greater overall risk taking across all domains. Drawing upon neuropsychological work by Eysenck (1973), Nicholson et al. (2005) proposed that this may be due to the Extrovert’s desire for sensation-seeking. Indeed, Eysenck (1973) suggests that Extroverts possess a chronically under-aroused cortical system, resulting in a need for heightened external stimulation - such as risk taking - just to reach ‘normal’ levels of cortical functioning. In support of this, Harlow and Brown (1990) found that, out of the 183 students they sampled, those that were shown to have high levels of sensation seeking were more likely to show greater levels of risk tolerance.
Other research has indicated that sensation seeking - the Extravert’s desire for external simulation - is related to other risk taking behaviour; including dangerous sports (Zuckerman, 1983), smoking heavily (Zuckerman, Ball, & Black, 1990) and making decisions about driving speed (Goldenbeld & van Schagen, 2007). Participants with low Extraversion scores (i.e. introverts) were more likely to have lower risk tolerance levels.
On the other hand, Kowert and Hermann (1997), who measured risk using a choice dilemma questionnaire and a self-report assessment of risk taking in corporate settings, found Extraversion to be unrelated to risk taking. However, they did find that the excitement seeking subscale of Extraversion was associated with scores on both measures of risk taking. It seems that certain aspects of Extraversion, such as sociability

© Copyright Psychological Consultancy Limited, 2019 all rights reserved. Risk Type Compass® is a registered trademark in Europe: CTM No. 010726818.
12 13
and warmth, may not be as important in predicting of risk taking as other aspects, such as sensation seeking, as has been suggested by previous researchers.
Openness to Experience and Risk ToleranceWithin the same research study, Nicholson et al. (2005) found that individuals high in ‘Openness to Experience’ were more risk taking than those low in the trait. McCrae and Costa (1997) see Openness to Experience as a cognitive stimulus for risk seeking, explaining that Openness allows the individual to be more accepting of experimentation and tolerant of uncertainty and change. This is in agreement with Kowert and Hermann (1997) who found increased levels of Openness to Experience and two related subthemes to be associated with risk taking in both the choice dilemmas and self-report measure. Kowert and Hermann concluded that individuals with this characteristic are adventurous and imaginative and that they tend to search for new experiences, as well as actively seek out risks.
Conscientiousness and Risk ToleranceResearch has shown that individuals with higher levels of Conscientiousness show a lower propensity for risk, presumably due to the characteristic need for conformity and control that is also associated with this personality trait (Hogan & Ones, 1997). Hampson, Andrews, Barckley, Lichenstein, and Lee (2000) studied the influence of personality on health related risk and found that those higher in Conscientiousness were less likely to encourage cigarette smoking within the home due to the perceived health consequences. In another study that looked specifically at risk taking in pre-adolescents, Conscientiousness was once again found to be significantly associated with risk taking, with those high in the trait found to show more risk-averse choices in decision-making games (McGhee, Ehrler, Buckhalt, & Phillips, 2012). Taking a closer look at the themes within the trait, Kowert and Hermann (1997) reported that those that were more deliberate - a subscale of Conscientiousness - reported lower levels of risk taking, whereas individuals that were hasty, impulsive, careless and impatient were more likely to willingly take risks.
Overall, there is no shortage of research showing the same outcome; conscientious individuals are almost always found to be less risk taking than their low conscientious counterparts. In fact, out of all of the FFM traits studied, Kowert and Hermann (1997) found the strongest (negative) relationship with risk taking and Conscientiousness.
Agreeableness and Risk ToleranceEvidence regarding the influence of Agreeableness on risk taking has been inconsistent. In a study by Nicholson et al. (2005), Agreeableness was shown to be linked to risk taking, with higher levels of the trait associated with lower levels of risk taking. The authors hypothesise that this may be due to consideration - or lack of - for the consequences that risk taking may have on other people. Kowert and Hermann’s (1997) research supports these conclusions, with increased levels of self-reported risk taking showing a strong inverse relationship with Agreeableness. However, this effect was not found when risk was assessed using the choice dilemmas assessment measure. Kowert and Hermann

© Copyright Psychological Consultancy Limited, 2019 all rights reserved. Risk Type Compass® is a registered trademark in Europe: CTM No. 010726818.
14
similarly explain these findings by concluding that those high in Agreeableness are more likely to worry about the harm that could come to others through their own risk taking, and may therefore avoid engaging in risky activities for this reason.
Neuroticism and Risk ToleranceHigh levels of Neuroticism have been found to be associated with reduced propensity for risk taking (Nicholson et al., 2005), which is perhaps unsurprising if we recall that Neuroticism is associated with a tendency towards experiencing unpleasant emotions, including anxiety. Hogan & Hogan’s (2007) research findings report Neuroticism (Low Adjustment) as being associated with descriptions of being low in self-confidence, defensive, mistrustful, moody and temperamental. These findings supported previous research (Klein & Kunda, 1994) suggesting that risk taking requires resilience, a characteristic that is rarely associated with high levels of Neuroticism. Interestingly, however, Kowert and Hermann (1997) found Neuroticism to be unrelated to risk, although they did note that lower levels of the anxiety subscale were linked to increased levels of self-reported risk taking, while increased self-consciousness – again a subscale of Neuroticism - was associated with reduced risk taking, implying that risk relates only to certain aspects of Neuroticism.
More recently, Paulus, Rogalsky, Simmons, Feinstein, and Stein (2003) investigated the relationship between risky decision-making, insula activation within the brain and personality, as measured using the NEO Five Factor Inventory (Costa & McCrae, 1992). They found that participants with higher levels of Neuroticism displayed increased right anterior insula activation when punished for making a ‘risky’ decision over a ‘safe’ one, which in turn lead to greater propensity for choosing a ‘safe’ response in a following task. This implies that Neuroticism may lead to more risk-averse behaviour due to a heightened sensitivity to the possible negative consequences associated with risky decision-making. Interestingly this study again highlights the likely biological correlates associating personality with risk-taking.
Haleblian, Markoczy, and McNamara (2004) focused their research on the relationship between risk and trait anxiety, defined as ‘reactivity to stress and a tendency to worry’. They also assessed the relationship between risk and Competence; i.e. the tendency towards being sure of oneself and having belief in one’s ability to excel. The participants, 168 strategic management students, completed the NEO PI-R Anxiety subscale from the Neuroticism factor and the Competence subscale from the Conscientiousness factor. Risk was assessed using a decision-making scenario in which participants took on the role of the CEO in an engine manufacturing firm. They were given a choice of new products to produce, one being a low risk/low reward option and the other being high risk/high reward. Results found that higher levels of Competence are associated with greater risk taking. Additionally, lower levels of anxiety were also found to be associated with increased risk taking.
It is important to briefly note that, although the Competence characteristic appears in the Conscientious scale of the NEO PI-R, the concept of Competence could also

© Copyright Psychological Consultancy Limited, 2019 all rights reserved. Risk Type Compass® is a registered trademark in Europe: CTM No. 010726818.
14 15
be associated with other FFM factors. For example, the Hogan Personality Inventory includes a measure of ‘Self-Confidence’ in what is the equivalent to the FFM’s Extraversion factor, whilst Profile:Match2TM includes ‘Self-Esteem’ - a concept similar to Competence - in its equivalent to the FFM Emotional Stability factor.
Haleblian et al. (2004) cite some interesting research to explain the findings of their study, emphasising the literature on ‘Confidence’, rather than the NEO PI-R Competence scale, which they argue differs only in semantics. It seems that those high in confidence tend to place a greater emphasis on the positive outcomes of situations (such as those faced when weighing up the consequences of a risky situation), and therefore are more likely to take an optimistic view. Furthermore, Haleblian et al. (2004) note that individuals high in confidence are more likely to approach the threats faced in risky situations with the belief that they are able to exert some control over it (Klein & Kunda, 1994). However, a possible downside to this attitude is that such individuals are unlikely to pay adequate attention to the threats they encounter and be so confident about being successful that they take risks unknowingly.
Regarding trait anxiety, it is thought that those with higher levels of anxiety will focus more on the threats of a situation, as opposed to the potential positive outcomes (Eysenck, 1992), in contrast to those high in Confidence described above. Eysenck (1992) theorises that high anxiety individuals have an over-developed internal ‘danger detection process’ which causes them to become hyper-vigilant and grossly exaggerate the severity of dangerous events in the environment. Therefore, in terms of taking risks, these individuals are likely to worry more about the potential negative consequences rather than focusing on the potential opportunities. In addition to this, these individuals are likely to perceive ambiguous stimuli as more threatening (MacCleod & Cohen, 1993). Overall, those prone to anxiety will prefer to take actions that reinforce their sense of security (Raghunathan & Pham, 1999), rather than embarking on more risky ventures that would only reduce security. This suggests that their decisions will reflect a preference for low risk options over options with a higher potential for failure.
The Hexaco Model of Personality and Risk Taking
De Vries, De Vries, and Feij (2009) conducted a study examining the relationship between risk taking and personality using the HEXACO model of personality. The HEXACO model shares some similarities with the FFM, however the model encompasses six factors in total: Honesty-Humility (H), Emotionality (E), Extraversion (X), Agreeableness (A), Conscientiousness (C), and Openness to Experience (O). Whilst the Extraversion, Openness to Experience and Conscientiousness dimensions have a great deal of overlap with the FFM, the main differences between HEXACO and FFM are the Honesty-Humility and Emotionality components. The Honesty-Humility component is concerned with individual differences in fairness, sincerity, greed avoidance and modesty. The Emotionality component is similar to the FFM Neuroticism factor, including experience of anxiety, sentimentality, fearlessness, detachment and independence. In the De Vries et

© Copyright Psychological Consultancy Limited, 2019 all rights reserved. Risk Type Compass® is a registered trademark in Europe: CTM No. 010726818.
16
al. (2009) research study, participants were asked to complete the HEXACO Personality Inventory, the IPIP Risk-Taking Scale (Goldberg, 1999) and the Sensation Seeking Scale (van den Berg & Feij, 1988). The Sensation Seeking Scale is comprised of four subscales: Disinhibition, Experience Seeking, Boredom Susceptibility and Adventure Seeking. Results indicated that, other than Agreeableness, the HEXACO factor scales were significantly related to sensation seeking and risk taking. Specifically, it was found that high Openness to Experience, high Extraversion, low Emotionality, low Honesty-Humility and low Conscientiousness played an important role in risk tolerance. This reinforces a number of the FFM findings relating personality to risk taking.
Personality and Risk Tolerance Summary
A summary of the studies cited above, and some additional relevant studies, that together demonstrate significant relationships between the Five Factor Model’s personality scales and measures of willingness to engage in risk are presented in Table 1.2.
Table 1.2. A summary of research into the Five Factor Model and risk tolerance conceptsAuthors Factors Associated with Risk Tolerance
ConceptsPan and Statman (2010) Openness to Experience
Low ConscientiousnessExtraversion
Mayfield, Perdue, and Wooten (2008) Openness to ExperienceLow Neuroticism
Nicholson et al. (2005) Openness to ExperienceLow ConscientiousnessExtraversionAgreeablenessLow Neuroticism
Grable and Joo (2004) Low Neuroticism (self-esteem)
Haleblian et al. (2004) Low Neuroticism (low anxiety)High Conscientiousness (high competence)
Hunter and Kemp (2004) Openness to ExperienceLow Conscientiousness (impulsivity)Extraversion (sensation seeking)
Zuckerman and Kuhlman (2000) Extraversion (sensation seeking)

© Copyright Psychological Consultancy Limited, 2019 all rights reserved. Risk Type Compass® is a registered trademark in Europe: CTM No. 010726818.
16 17
Authors Factors Associated with Risk Tolerance Concepts
Kowert and Hermann (1997) Openness to ExperienceLow ConscientiousnessExtraversion (excitement seeking)AgreeablenessLow Neuroticism (low anxiety and self-consciousness)
Harlow and Brown (1990) Extraversion (sensation seeking and low Introversion)
Zuckerman, Kolin, Price, and Zoob (1964) Extraversion (sensation seeking)
De Vries et al. (2009) Openness to ExperienceExtraversionLow ConscientiousnessLow Emotionality (Neuroticism)
Paulus et al. (2003) Low Neuroticism
McGhee et al. (2012) Low ConscientiousnessHigh ExtraversionHigh Open to Experience
Hampson et al. (2000) Low Conscientiousness
In the discussion above, each of the studies includes a process that estimates the actual risk-taking behaviour of the individuals in their sample to compare with their personality assessment data. These risk-taking behaviour estimates can be made in different ways: self-report, observer ratings, behavioural observations or work performance ratings, none of which can be entirely objective. Firstly, it is important to appreciate that no common metric is available for the ‘degree of risk’ involved in any activity so, while the personality assessments all have a common element, the estimates of behavioural risk lack a similar consistency. Secondly, an important distinction has to be made between an individual’s subjective experience of any risk and the way in which that ‘degree of risk’ might be rated by others, or by the same person in the same situation at a different time. There is clearly a cognitive aspect to risk behaviour which impacts on the fears and anxieties associated with any risk taking. Experience of and exposure to a particular risk changes the subjective appraisal of that risk and the level of anxiety and resistance associated with it. Knowledge, experience and familiarity dispel uncertainty and may either increase or diminish apprehension.
Overall, the research on the Five Factor Model and risk taking suggests that there is an association between personality and risk tolerance. Taken together these findings paint a picture of the typical personality profile of the ‘risk tolerant’ individual. The most consistent finding is that such individuals are likely to be high in confidence and will be less likely to worry about any potentially negative consequences of any venture,
© Copyright Psychological Consultancy Limited, 2019 all rights reserved. Risk Type Compass® is a registered trademark in Europe: CTM No. 010726818.
18
preferring instead to focus on the positives of a situation. As such they are likely to enter a risky situation with minimal anxiety (low Neuroticism). They are also likely to have little desire for conformity and control, preferring spontaneity and flexibility (low Conscientiousness). The risk tolerant individual will tend to actively seek excitement and external sensation (high Extraversion), whether that is through recreational activities, in the social environment or through other means. Finally, a yearning for variety and adventurous activities (high Openness to Experience) also appears to be an important characteristic of the risk tolerant profile. The literature on the final factor within the FFM, Agreeableness, remains inconsistent. Although a few studies establish a significant relationship between the trait and risk tolerance, it has been suggested that this may relate more to the security of others than to personal exposure risk. It therefore remains to be seen whether this factor plays any direct role in risk behaviours.
Taken together, the links between personality and risk tolerance are clear. An individual’s personality is likely to influence their perception of risk, their emotional reaction to risk and their willingness to seek and enjoy risk and ambiguity. We argue that these characteristics establish patterns of perceptual and emotional bias that have a consistent influence on decision-making and risk behaviour.
Genetic Influence on Risk TakingAlthough not discounting the important role of the environment in the development of risk behaviour, there is little doubt that genes also play a defining role in its manifestation. Striking the required balance between risk and opportunity in critical decision-making situations is crucial to all species and would have proved essential to the survival of our early ancestors. No other influence will be as consistent or as persistent as DNA and this would also account for the reported heritability.
Twin studies have provided an effective research method in teasing out the interplay between genes and the environment. By comparing the behavioural characteristics of monozygotic (identical) twins, who have exactly the same set of genes, and dizygotic (non-identical) twins, who will share roughly 50% of their genes, we can estimate the proportion of variance in risk taking behaviour that can be attributed to genetic origins. Utilising this research method, Anokhin, Golosheykin, Grant, and Heath (2009) found individual differences in the propensity for risk taking to be significantly heritable. This finding is supported by Cesarini, Dawes, Johannesson, Lichtenstein, and Wallace (2009) who, in their twin study, estimated that genes accounted for as much as 20% of the behavioural variation in risk taking.
Other studies have aimed to pinpoint the exact gene, or combination of genes, that play a part in the development of risk tolerance. Kuhnen and Chiao (2009), for example, found that variants of two genes that regulate dopamine and serotonin neurotransmission (5-HTTLPR and DRD4) predict financial risk taking. Interestingly, these genes had

© Copyright Psychological Consultancy Limited, 2019 all rights reserved. Risk Type Compass® is a registered trademark in Europe: CTM No. 010726818.
18 19
previously been linked to emotional behaviour, anxiety and addiction. Zhong, Israel, Xue, Sham, Ebstein, and Chew (2009), on the other hand, have singled out the MAOA-L gene variant for its part in risk taking behaviour. This so-called ‘warrior gene’ is thought to make carriers eager to take risks while simultaneously enabling them to better assess their chances of success. However, in certain situations, it is thought that this gene may also be responsible for impulsive and aggressive behaviour.
Roe, Tilley, Gu, Beversdorf, Sadee, Haab, and Papp (2009) found that polymorphisms in the CHRNA4 gene were related to risk attitudes. CHRNA4 is a neural receptor that regulates the release of several neurotransmitters, such as dopamine and serotonin. Harm avoidance (which has been associated with extremely high introversion and neuroticism) is a risk attitude characterised by a tendency to worry and appear self-doubting, fearful and shy. It was found to be significantly related to two single nucleotide polymorphisms of this gene.
Whilst molecular genetics to this level of specificity is ground-breaking, the study of biological composites to personality is far from new. Some of our greatest early philosophers, Hippocrates and Galen, proposed a physiological basis to personality more than two millennia ago. Since then, various theories of personality have risen and fallen in popularity, but many reflect the fundamental belief that our biology must somehow be related to the individual differences in our personality.
On the whole, the theoretical stance of the Risk Type Compass™ is not dependent on pinpointing the exact biological correlates of risk behaviour. This is simply because, as a personality-based psychometric tool, it is not attempting to explain why a person’s behaviour may display a particular individuality, just that people do behave in certain characteristic ways and are therefore likely to continue to do so in the future. It is nevertheless important to recognise that the model reflects the interaction between nature and nurture and recognises that genes, nurture and the external environment will influence risk related behaviour, firstly in the shaping of personality, and secondly in terms of the situations, events, circumstances that ‘frame’ the act. The following section revisits this idea as it considers the important relationship between Risk Type, risk attitude and risk tolerance.
Risk Tolerance and Risk AttitudeA review of the literature suggests that issues about individual differences in risk tolerance have often been addressed through the concept of ‘risk attitudes’. Since attitudes can clearly change, this approach exposes the variability in risk behaviour. As an example, the changeability in risk attitudes is demonstrated by the effectiveness of publicity campaigns designed to influence safety behaviour - notably concerning smoking, seat belts, disability and drink driving. Furthermore, attitudes to financial risk were transformed almost overnight following the dramatic financial events of 2008,

© Copyright Psychological Consultancy Limited, 2019 all rights reserved. Risk Type Compass® is a registered trademark in Europe: CTM No. 010726818.
20
where perceptions of borrowing and lending money changed radically.
In line with this viewpoint, it is widely believed that different situations may evoke different risk-taking behaviours in the same individual. For example, the correlation between recreational risk and financial risk may, intuitively at least, be expected to be low - we wouldn’t necessarily assume that a mountaineer would also take extreme financial risks, for example. So, are individuals capable of different levels of risk tolerance in different risk domains?
This was certainly the prediction of Jackson, Hourany, and Vidmar (1972) who proposed four domains of risk tolerance: financial, physical, social and ethical. Each individual is expected to show a unique profile of risk tolerance within each of these domains, with some showing greater variability in their risk attitude across domains than others. Weber, Blais, and Betz (2002) and Blais and Weber (2006) similarly argue that risk taking is highly domain specific and not consistent across situations. These authors propose five main risk taking domains, swapping Jackson et al.’s (1972) physical risk domain for a recreational risk domain and adding a fifth for health & safety. Weber et al. (2002) argue that these five domains represent a comprehensive and complete picture of risk-taking situations. In a more recent study Nicholson et al. (2005) argued for a six domain model which he believed to be a more accurate representation of the types of risk encountered on a daily basis: recreation, health, career, finance, safety and social risk taking. This involved dropping the ethical domain, adding a career domain and the splitting of health & safety. A number of studies have researched the validity of this domain approach to risk taking. For example, Hanoch, Johnson, and Wilke (2006) reported that individuals with high risk tolerance scores in one domain area (e.g. recreational risk) would, at the same time, report being risk averse in other areas (e.g. financial risk).
This picture of behavioural variability is certainly accurate, but focusing a psychometric assessment entirely on Risk Attitudes rather than something more stable limits its utility. The shelf life of any assessment based in this approach must be limited. The Risk Type Compass™, therefore, addresses both the more stable elements of risk behaviour, Risk Type, as well as the more transient aspects of Risk Attitude. When interpreting the Risk Type Compass™ it is therefore important to recognise that risk attitude is influenced by events, situations and circumstances as well as by personality. Personality is, both by definition and evidenced by research, relatively stable. Attitudes, in so far as that the concept is clearly defined, may be less systematic or predictable.
Risk Type, Risk Attitude and Risk IntelligenceTo summarise, the Risk Type model establishes a clear position in the debate concerning the variability of risk behaviour across risk domains and the stability of personality. The Risk Type assessment reconciles these two observations by differentiating between Risk Type and Risk Attitude. Risk Type is stable and has a consistent and persistent

© Copyright Psychological Consultancy Limited, 2019 all rights reserved. Risk Type Compass® is a registered trademark in Europe: CTM No. 010726818.
20 21
influence on behaviour. It reflects personality characteristics that we believe to be underpinned by genetic endowment and to become firmly established during infancy and the dispositions associated with them. It will exert a continuous and pervasive influence on perceptions, emotions and inclinations. The Risk Attitude measure offers an all-embracing picture of the individual’s current disposition so far as both attitudes and temperament are concerned. It incorporates Risk Type, but is compounded by the consequence of experience, training, exposure and the impact of an infinite variety of serendipitous and unsystematic influences. Attitudes are transient and Risk Attitude assessments can only provide a snapshot of the current balance in risk sensitivity across key risk domains.
A third related concept, Risk Intelligence (Evans, 2012), makes a useful contribution to this discussion. The latest edition of Evan’s book (2012) is subtitled, “How To Live With Uncertainty”, providing an indication of his approach. Risk Intelligence reflects the cognitive evaluation of risk, the extent to which training and experience can moderate risk perception. Risk perceptions are notoriously subjective. We may consider travelling by car as safer than flying although, statistically, this is not the case. Whether or not the statistical fact that car journeys are nearly 400 times more dangerous than plane journeys induces more rational behaviour might be considered a matter of Risk Intelligence. Risk Intelligence is about ensuring that decisions are properly informed, or estimated reasonably and as objectively as possible; it has been proffered as an effective development strategy for decision makers. It is an attempt to stabilise some of the variables that would be included in the discussion above as contributing to Risk Attitudes. Risk Intelligence is not a part of the Risk Type model but it is fully compatible with it. Issues about the influence of training, experience and exposure are addressed by both approaches. Within Risk Type, these are seen as influences on the subjective evaluation of risk and, as such, they explain differences in behaviour without having any impact on Risk Type. The anxious person who becomes a happy flyer hasn’t become braver across the board; their appraisal of risk has simply become better informed, either through experience or through learning the facts.
The crucial distinction concerns the persistence and pervasiveness of Risk Type versus the variability of Risk Attitude and the ease with which it may be influenced. Both are important in understanding current behaviour.

© Copyright Psychological Consultancy Limited, 2019 all rights reserved. Risk Type Compass® is a registered trademark in Europe: CTM No. 010726818.
22
Figure 1.1. Pictorial representation of the relationship between Risk Attitude and Risk Type
Figure 1.1. illustrates the relationship between behaviour and personality. The boat may be observed in many different ‘attitudes’ influenced by transient events: the choppy waves, the winds and the rise and fall of the tides. But it is also limited and restrained by the anchor. Observing the boat from the shore, the position of the anchor will not immediately be clear, however, it will become apparent over time. Similarly, when it comes to taking risks, we are influenced by circumstances and events and experience allows us to recalibrate risk in the light of knowledge and exposure. But, we are by nature endowed with personality dispositions that determine how impulsive, curious, excitement seeking or fearful we naturally are. The evidence regarding these characteristics is that they remain pretty stable throughout adult life and this ‘anchors’ our disposition to risk.

© Copyright Psychological Consultancy Limited, 2019 all rights reserved. Risk Type Compass® is a registered trademark in Europe: CTM No. 010726818.
22 23
Chapter 2 - Risk Themes Amongst the Factor Structure of Personality
The BeginningWhen London based Columbus Wealth Management invited PCL in to discuss a problem with them, it wasn’t about the usual performance or selection issues. Being tightly regulated by the Financial Services Authority (now the Financial Conduct Authority), they were required to assess each client’s risk appetite as a basis for appropriate investment portfolio recommendations and the purchase of other financial products. Their difficulty was that, in spite of the many questionnaires rushed to market in response to this new regulatory requirement, Columbus couldn’t find a convincing and useful way to do it. The wider issue was how to prevent this becoming a box-ticking, regulation inspired chore rather than something that really worked for the company and for their clients. Coming from a Business Psychology background and having particular interest and experience in personality assessment, we were surprised to discover a parallel universe of questionnaire construction that had little connection with psychometrics or personality.
The BackgroundEveryday vocabulary is replete with words that allow us to recognise individual differences in people’s disposition towards risk: words like ‘reckless’, ‘fearless’, ‘cautious’, ‘timid’ and many more. There are many terms in the communal lexicon that would fall into this category. The implication is that people differ in some fundamental way in this regard. In personality research there are innumerable references that draw on this terminology when describing personality differences or defining traits. As practitioners, we were aware of many narrative themes from the personality assessment domain that are associated with risk perception, reaction to risk or risk-taking.
There was extensive and growing personality research literature that illustrated the relationship between risk and personality variables. For example, high scorers on a Neuroticism scale interpret ambiguous stimuli as more threatening (MacCleod & Cohen, 1993), the sensation seeking aspects of an Extraversion scale are associated with higher risk tolerance (Pan & Statman, 2010), and higher scorers on measures of Openness search for new experiences and actively seek out risk (Kowert & Hermann, 1997). High scores on Conscientiousness are significantly associated with intolerance of uncertainty, change and innovation (Nicholson, Soane, Fenton-O’Creevy, & Willman, 2005), and with a need for conformity and control (Hogan & Ones, 1997). These and numerous other observations link personality measures to risk. Added to the consensus building around the FFM, these findings convinced us that what was already known about risk and personality provided a solid starting point for our research.
Since the late 1980s, there had been a steadily growing consensus about the measurement of personality. Following the early work of Robert Hogan at Johns Hopkins University in the early 1970s and the subsequent meta-analyses (Barrick & Mount, 1991; Costa & McCrae, 1992; Salgadoa & Táuriza, 2014), the differences between personality

© Copyright Psychological Consultancy Limited, 2019 all rights reserved. Risk Type Compass® is a registered trademark in Europe: CTM No. 010726818.
24
assessments based on very different theories of personality were increasingly being superseded by the substantive nature of the Five Factor Model (FFM).
Our literature review identified a number of FFM studies of risk and personality with promising results (e.g. Bailard, Biehl, & Kaiser, 1986). We found many studies that illustrated the relationship between risk behaviour and four of the five FFM factors (Emotional Stability, Conscientiousness, Openness to Experience and Extraversion). Evidence for the fifth (Agreeability) was inconsistent. Clearly, the notion that propensity for risk could be meaningfully captured by a simple linear scale, with the reckless at one end and the risk-averse at the other, was not going to reflect this complexity. On the other hand, although there were many risk related themes in the FFM model, these assessments were panoramic and clearly tapped into aspects of personality far beyond our focus on risk. For these reasons we set out to extract the personality elements of FFM that were risk related, leaving behind what might, for these purposes, just be noise in the system.
The following themes drawn from the FFM were identified as potentially relevant in some way to risk or risk aversion and were selected for inclusion in the research.
• Audacious• Apprehensive• Equable• Careless• Conforming• Confident• Deliberate• Intuitive
• Explorative• Focused• Forgiving• Impulsive• Methodical• Optimistic• Eager• Perfectionistic
• Hasty• Resilient• Sensitive• Spontaneous• Astute
Factor Analysis
Positive and negative items were written for each of these themes and a research questionnaire was created. Data was collected from an initial sample of 328 adults in work across a wide spectrum of occupations. Factor analysis generated the following four-factor solution.

© Copyright Psychological Consultancy Limited, 2019 all rights reserved. Risk Type Compass® is a registered trademark in Europe: CTM No. 010726818.
24 25
Table 2.1. Factor Analysis (Varimax Rotation with Kaiser Normalisation) of the Risk Type Compass™ Subthemes (n=328)Subthemes Factor 1 -
CalmFactor 2 - Emotional
Factor 3 - Measured
Factor 4 –Daring
Resilient .76Equable .51Confident .58Forgiving .59Eager .56Apprehensive .63Sensitive .68Intuitive .68Optimism -.66Astute -.47Focused .54Methodical .67Perfectionistic .67Audacious .68Conforming -.54Explorative .63Hasty .74Spontaneous .62
Table 2.1 displays significant correlations between 18 subthemes and the four factors. Subthemes were clustered into four groups; the four factors they correlate the most with. Six of the original risk themes were lost during the process, but the analysis separated the remaining themes into four clear factors; one relating to being calm and composed, a second relating to emotional intensity, a third associated with having a cautious and measured approach and a fourth related to being daring. We assigned the factors with the convenience labels ‘Calm’, ‘Emotional’, ‘Measured’ and ‘Daring’ (see Table 2.2 below).
Table 2.2. The Mean, Standard Deviation, Skew, and Kurtosis findings for the 4 Risk Type Compass™ Factors (n=328)RTC Factor Mean SD Skew SE Skew Kurtosis SE KurtosisCalm 54.8 12.6 -.42 .14 .32 .27Emotional 43.5 13.6 .28 .14 -.34 .27Measured 36.7 7.8 -.22 .14 -.50 .27Daring 61.3 12.9 .01 .14 -.09 .27

© Copyright Psychological Consultancy Limited, 2019 all rights reserved. Risk Type Compass® is a registered trademark in Europe: CTM No. 010726818.
26
Risk Type
In the literature review that prefaced our research into propensity for risk we came across many examples of studies, some of which had already set a precedent in searching for a personality based Risk Type taxonomy.
Bailard, Biehl, and Kaiser (1986) identified five main risk personality types, using different combinations of the Neuroticism (‘Confident’ to ‘Anxious’) and Conscientious (‘Careful’ to ‘Impetuous’) FFM scales. They consider that these two scales reflect the individual’s confidence in their own ability and their preferred ‘method of acting’; how methodical they tend to be. The five resulting personality types suggest distinct profiles ranging from the strong-willed go-getter (Adventurer) to the cautious safe-guarder (Guardian).
Figure 2.1. Bailard et al.’s (1986) Five Way Model of Risk Personality
Barnewall (1987) had developed a personality based risk typology having identified two main types of risk taking in investors. ‘Passive investors’ are described as having a greater need for security and a lower risk tolerance, whereas ‘Active investors’ have a lesser need for security and thus greater risk tolerance. Whilst this model appears to tap primarily into values (i.e. a value for security), rather than personality per se, links could certainly be drawn between valuing security and our own research into the Neuroticism scale of the Five Factor Model.
On a similar note, Myers (1999) had identified six risk taking investor types: Cautious, Emotional, Technical, Busy, Casual and Informed. However, what differentiates Myers’ model from the others is his fundamental belief that individuals will treat different aspects of their life in the same way and therefore will approach risky situations in a similar way regardless of the situational context.

© Copyright Psychological Consultancy Limited, 2019 all rights reserved. Risk Type Compass® is a registered trademark in Europe: CTM No. 010726818.
26 27
Our four factor solution (Table 2.1) had triggered the idea of a compass model for the assessment. This approach appealed because of its potential in creating an assessment that would be readily accessible and easily understood beyond the usual HR focus of personality assessments. Neither Financial Advisors nor their clients would be familiar with psychometric assessment. For the same reason, we were open to the idea of something that could be presented in a ‘Risk Type’ format, the benefit being a simplified and coherent framework and a clear and differentiating vocabulary.
The first requirement in exploring ‘Risk Type’ possibilities was to translate four factors into two bi-polar scales. From the risk perspective, the content of the Calm and Emotional factors had a lot in common with the language used in the interpretation of the Emotional Stability (or Neuroticism) factor of FFM although, of course, all the item content in this case had exclusively risk related connotations. To explore whether these themes could effectively be re-combined and reanalysed as two bi-polar scales, the data from both the ‘Calm’ and ‘Emotional’ factors was pooled and subjected to traditional item analysis. The resulting scale (alpha coefficient 0.86) was interpreted as self-doubting, fearful, pessimistic and emotionally reactive at one pole, and confident, imperturbable, optimistic and calm at the other. A similar process was then applied to the ‘Measured’ and ‘Daring’ factors, resulting in a second bi-polar scale (alpha coefficient 0.83). This scale can be interpreted as excitement seeking, impulsive, challenging and careless at one pole and organised, compliant, focused and perfectionistic at the other. The results of this exercise provided the basis for a revised 72 item questionnaire.

© Copyright Psychological Consultancy Limited, 2019 all rights reserved. Risk Type Compass® is a registered trademark in Europe: CTM No. 010726818.
28
Figure 2.2. The distribution curves of the raw scores for the two bi-polar scales Emotional:Calm and Daring:Measured (n=328)
The distributions in Figure 2.2 can be described as normal. There is a greater concentration
No.
of P
artic
ipan
tsN
o. o
f Par
ticip
ants
Emotional:Calm Raw Score
Daring:Measured Raw Score

© Copyright Psychological Consultancy Limited, 2019 all rights reserved. Risk Type Compass® is a registered trademark in Europe: CTM No. 010726818.
28 29
of instances around the centre, with fewer at the tails, and distribution is symmetrical. According to the logic of the ‘type compass’ design blueprint, it would often be the case that an individual would score at one of the extremes on both scales. It therefore made sense that these two bi-polar scales should be presented as conceptually orthogonal. Given their origins in four independent factors, we didn’t anticipate any difficulty with this approach other than being clear that this orthogonal relationship was conceptual and logical rather than statistical. We were encouraged by the fact that our starting point had been four independent factors. By using a z score style scale with a mean of zero and viewing all the scores as positive, incremented standard scores could be computed for each of the four compass poles (see Figure 2.3). In each case, the axis of this configuration would mark a neutral point between the two poles.
Figure 2.3. The 4 points of the Emotional:Calm and Daring:Measured scales
The outcome for a candidate would be expressed incrementally as a score towards one extreme on either scale (either Prudent or Carefree, Intense or Composed).
In this model, every candidate would inevitably fall somewhere along both scales. To account for this inevitability, four intermediate ranges were introduced to describe those achieving high scores on both neighbouring compass points, creating the model displayed in Figure 2.4 below:

© Copyright Psychological Consultancy Limited, 2019 all rights reserved. Risk Type Compass® is a registered trademark in Europe: CTM No. 010726818.
30
Figure 2.4. The 8 points of the Risk Type Compass™
The original four compass points displayed in Figure 2.3 were described as ‘pure Risk Types’ and the additions displayed in Figure 2.4, which each involve interaction between two elevated or high scores, were described as ‘complex Risk Types’. In effect, this is a continuous 360° spectrum in which neighbouring Risk Types blend into each other and this is reflected by the positioning of the candidate’s ‘dot’ radially and in terms of distance from the axis.
Positioning the Compass
The final task was to engineer accurate placement of individuals within the designed space of the compass. Mapping scores against two axes would usually use a rectangular space. The task of transcribing similar data onto the circular space implied by the compass necessitated the design of specific algorithms. Criteria for Risk Type designation were established based on scores on the two underlying scales. Criteria were also established for placing the individual within each Risk Type segment of the compass. This placement is according to Risk Type strength; indicated diametrically by increasing distance from the axis, and differentiated radially according to the degree of differentiation from the neighbouring Risk Type. The compass space illustrated in Figure 2.5 below allowed for 25 different locations in each segment after having designated a central ‘axial’ group that achieved scores on both scales that were too close to the mean (axis) to warrant Risk Type designation. Nine locations within the axial space differentiated those with a slight influence from one of the Risk Types from those at the centre. The default assumption for this group was that they would be effectively neutral in respect of Risk Type.

© Copyright Psychological Consultancy Limited, 2019 all rights reserved. Risk Type Compass® is a registered trademark in Europe: CTM No. 010726818.
30 31
Figure 2.5. The final model of the Risk Type Compass™
Although this process involved a reduction in the detailed discrimination inherent in the underlying scales, this was considered to be within acceptable bounds and compared favourably with other established metrics such as stanines and stens that also represent reduced differentiation. In both these cases, this is justified by the inferential nature of psychometric assessment and concerns about over-interpretation of small score differences. In the case of the Risk Type Compass™, algorithmic conversion was necessary in order to portray each of the eight Risk Types topographically within the compass space. The priority then was for candidates to be placed systematically within each quadrant according to equivalent criteria. The data below, based on a large sample, indicates the effectiveness of the process.
There are two important points to bear in mind. Firstly, that although emphasising Risk Typology, the Risk Type Compass™ actually presents a continuous 360° spectrum of risk dispositions. The Risk Type designation is perhaps analogous to the numbers on a clock face in that they arbitrarily divide up the continuity of time for the purpose of reference and comparison. Secondly, there are no good or bad Risk Types. As with all personality characteristics, each has potential benefits and disadvantages in different circumstances and situations. Although there may be particular attractions in some occupations for some Risk Types (and the evidence strongly suggests that this is the case), every organisation and every profession will have some roles that buck any such general trend. The important thing is that individuals are aware of the particular behavioural biases that will emanate from their Risk Type. There will be potential pitfalls and challenges within any role that arise from a person’s risk disposition. Risk Type helps to identify the personal agenda that each individual has to deal with in order to take personal responsibility for their performance in this regard and to be successful within a particular context.

© Copyright Psychological Consultancy Limited, 2019 all rights reserved. Risk Type Compass® is a registered trademark in Europe: CTM No. 010726818.
32
Typology
Data for a sample of 13,613 individuals from a variety of industries and sectors demonstrated the following characteristics. The distribution curves for the two underlying scales are displayed in Figure 2.6 below.
Figure 2.6. The distribution curves of the raw scores for the two bi-polar scales (Emotional:Calm and Daring:Measured) (n=13,613)

© Copyright Psychological Consultancy Limited, 2019 all rights reserved. Risk Type Compass® is a registered trademark in Europe: CTM No. 010726818.
32 33
Perhaps the most notable point to make about the distributions displayed in Figure 2.6 above is the considerable stability of the curvilinear pattern resulting when compared to the early stages of the development of the Risk Type Compass™. Despite a considerably larger sample size of 13,613, the distribution of raw scores has remained highly consistent with the early analysis that encompassed a sample size of 328 participants. The resulting assignment of 8 Risk types and the Axial group on this sample is displayed in Table 2.3 below.
Table 2.3. The proportions of the sample categories as each of the 8 Risk Types and the Axial Group (n=13,613)Risk Type 2019 % DistributionWary 11.60%Prudent 10.31%Deliberate 15.63%Composed 11.34%Adventurous 12.07%Carefree 10.20%Excitable 10.44%Intense 8.62%Axial 9.79%Grand Total 100.0%
The equality of incidence of Risk Types in this data clearly reflected the symmetry of the distribution of the two underlying scales.
The processes described above were necessary in order to achieve the benefits of a Risk Typology within a compass format that could readily be understood and communicated. This model supports coherent interpretation and a vocabulary that affords the utility desired by our original sponsors and is beneficial to the wide range of applications and industries.
© Copyright Psychological Consultancy Limited, 2019 all rights reserved. Risk Type Compass® is a registered trademark in Europe: CTM No. 010726818.
34
Chapter 3 – What the Risk Type Compass™ Measures
Three measures are provided by the Risk Type Compass™. The first and most important is Risk Type, a personality based measure of an individual’s fundamental disposition towards risk. As a complement to this, and in recognition that risk behaviour varies and can be modified by experience, circumstances, situations and other influences, a second measure, Risk Attitude, provides an estimate of the respondent’s variability of Risk Attitude across different risk domains. The third measure, the Risk Tolerance Index (RTi), is an estimate of the individual’s overall Risk Tolerance.
Personality ScalesThe Risk Type Compass™ measures eighteen different risk-related personality subthemes. These feed into the two conceptually orthogonal bi-polar scales that underpin and provide the basic structure of the Risk Type Compass™ matrix and the eight Risk Types. These themes define the explicit content of the Risk Type Compass™ questionnaire but interpretation of results also relies on the wealth of personality research that allows further inferences to be drawn from a profile.
The Bi-polar Scales
1) The Emotional:Calm scale is concerned with the emotional elements associated with risk taking; plotting an individual’s tendency to be emotional, apprehensive and anxious at one end of the scale, or calm, confident and resilient at the other.
2) The Daring:Measured scale is concerned with caution, preparedness and need for certainty; the extent to which an individual needs the reassurance of familiarity, clarity and established guidelines. The other end of the scale identifies those who are impulsive, flexible and happy to work with ambiguity.
Emotional:Calm Scale Subthemes
The Emotional:Calm scale is made up of ten subthemes. These themes all have a strong relationship with the scale and may be very close to each other in terms of descriptive semantics.
Resilient: Optimistic, tenacious, not easily discouraged, takes feedback positively.
Sample item – ‘Nothing really throws me off balance.’
Equable: Steady, level-headed, consistent and predictable in their mood.
Sample item – ‘I experience very few emotional highs and lows.’

© Copyright Psychological Consultancy Limited, 2019 all rights reserved. Risk Type Compass® is a registered trademark in Europe: CTM No. 010726818.
34 35
Confident: Self-assured, poised and projects an image of competence and positivity.
Sample item – ‘I think highly of myself.’
Forgiving: Doesn’t harbour resentment, gets over incidnets and moves on quickly.
Sample item – ‘I don’t hold grudges.’
Eager: Irritated by delays or interruptions that impede progress.
Sample item – ‘I would rather take my time and get a good result.’
Apprehensive: Tends to worry about things and to dwell on past misfortunes.
Sample item – ‘I spend time thinking about past mistakes.’
Sensitive: Emotionally reactive and inluenced by the emotions of others
Sample item – ‘I am easily influenced by my emotions.’
Intuitive: Inclined to make decisions based on feelings and intuition.
Sample item – ‘I base my goals in life on inspiration, rather than logic.’
Optimistic: Displays an upbeat and positive mindset, turnig problems into opportunities.
Sample item – ‘Things usually work out alright in the end.’
Astute: Doubtful of others and wary about their motives and intentions
Sample item – ‘I believe that others have good intentions.’
Daring:Measured Scale DescriptionsThe Daring:Measured scale is comprised of eight subthemes. These themes all have a strong relationship with the scale and may be very close to each other in terms of descriptive semantics.

© Copyright Psychological Consultancy Limited, 2019 all rights reserved. Risk Type Compass® is a registered trademark in Europe: CTM No. 010726818.
36
Focused: Purposeful, goal-driven and not easily deterred from objectives.
Sample item – ‘I am not easily distracted from my objectives.’
Methodical: Plans ahead carefully adopting an organised and systematic approach.
Sample item – ‘I always prepare things carefully.’
Perfectionistic: Meticulous, detailed, has exceptionally high standards.
Sample item – ‘I like things to be ‘just right’.
Audacious: Welcomes change, actively seeks variety and new ventures.
Sample item – ‘I am attracted by novelty and the unconventional.’
Conforming: Abides by rules, respects superiors and the status quo.
Sample item – ‘I am always careful to stick to the rules.’
Explorative: Curious, seeks novelty and enjoys experience for its own sake.
Sample item – ‘I am willing to try anything once.’
Hasty: Pushes the limits, tries things on impulse, not always thinking them through.
Sample item – ‘I have sometimes taken extreme risks.’
Spontaneous: Quick-witted, instinctive and makes decisions ‘on he fly’.
Sample item – ‘I am quick thinking.’

© Copyright Psychological Consultancy Limited, 2019 all rights reserved. Risk Type Compass® is a registered trademark in Europe: CTM No. 010726818.
36 37
Risk Type Compass™ TypesEach end of the conceptually orthogonal bi-polar scales of the Risk Type Compass™ is associated with a different ‘Risk Type’. The four Pure Risk Types are: Intense, Prudent, Carefree and Composed. Between each of these falls a Complex Risk Type, which adopts aspects from each of its Pure Type neighbours. Together, therefore, there are eight Risk Types which form a continuous spectrum round the Risk Type Compass™ (see Figure 3.1 below). Every Risk Type has similarities with its neighbouring Risk Type and has characteristics that are opposite to their facing Risk Types.
Figure 3.1. Four Pure Risk Types are derived from the two conceptually orthogonal bi-polar personality scales, Emotional:Calm and Daring:Measured (left). The four complex Risk Types are created through their interaction when scores on adjacent Pure Risk Types are both high (right).
All the Risk Type descriptions draw firstly from the item content of the questionnaire. In other words, they reflect what the person completing the questionnaire has said about themselves. More interestingly, inferences are also drawn from the extensive literature and research into personality. The total of the item responses can be interpreted by the extent to which they match known and understood response patterns. Each personality construct or scale is associated with particular behaviours and a particular vocabulary that, to those familiar with such patterns, allows them to discern patterns that are likely to be relevant. Finally, understanding about the meaning of any personality scale becomes increasingly informed by studies that compare it with similar or related scales from other personality assessments.
All personality assessments are estimates rather than hard facts. They estimate the likelihood that a person may be accurately described in a certain way. The more recent instruments do this extremely well but their findings are still hypothetical rather than certain. They do certainly warrant careful consideration, even when the person assessed may not agree with them. We all tend to foster somewhat distorted self-images, whether that is because they are sanitised and self-deluding or because they are overly self-

© Copyright Psychological Consultancy Limited, 2019 all rights reserved. Risk Type Compass® is a registered trademark in Europe: CTM No. 010726818.
38
critical and unnecessarily disparaging.
Personalities seem to be built on genetic foundations and shaped, especially during early infancy, by the style and emotional quality of nurturing that the individual is exposed to. Later influences, unless truly traumatic, tend to make less impact. By early adulthood, when the brain reaches full maturity and the ongoing instinctive influences of development have run their course, personality becomes stable through to the influences of aging in the later years. Personality assessments have to be viewed in this light. The roots are always there and always influential. These deeply rooted characteristics define our temperament and might be referred to as ‘constitutional’. This, in our opinion, is particularly likely to be the case where risk-taking characteristics are concerned because of their fundamental importance to species survival - whether in their protective and risk avoidant aspects or their daring and adventurous aspects.
Risk Type descriptions are cameos that reflect the core inferences that might apply in each case. Since Risk Type strengths will vary considerably between people of the same Risk Type, they will apply more to some than to others. Also, because in reality there is a continuous spectrum of Risk Type characteristics, they necessarily blur at the edges.
The eight Risk Types are described below.
The Eight Risk Types
ExcitableAt the root of this Risk Type is impulsivity and an attraction to risk combined with distress and regret if things go wrong. This Type tend to be passionate and vary in their moods between excited enthusiasm and pessimistic negativity. Such people are both frightened and excited by their impulsiveness and are likely to respond emotionally to events and react strongly to disappointment or the unexpected. Depending on the mood of the moment, they may enjoy the spontaneity of making unplanned decisions. Not being planful or well organised, there is a danger that such people may not take the trouble to check things out in their enthusiasm to embrace a new undertaking. (Opposite Type: Deliberate)
IntenseAt the root of this Risk Type is anxiety and worry about risk; people who expect the worst. This Type is characterised by anxiety, strength of feeling and a tendency to become very involved at a personal level in things. Such people are highly-strung and alert to any risk or threat to their wellbeing. They invest a lot emotionally in their decisions and commitments and take it personally when things don’t work out. Such people can therefore be very passionate about things but their mood can vary dramatically and today’s enthusiastic endorsement can turn into tomorrow’s critical rejection. (Opposite Type: Composed)

© Copyright Psychological Consultancy Limited, 2019 all rights reserved. Risk Type Compass® is a registered trademark in Europe: CTM No. 010726818.
38 39
WaryCharacterised by a combination of self-discipline and concern about risk, these are cautious, organised people who put security at the top of their agenda. They are likely to be alert to the risk aspect of any investment opportunity before evaluating any potential benefits. Ideally, such people like to know precisely what they can expect. This quest for certainty may make it difficult to make decisions. At the extreme they will be strongly attracted to the idea of securing their future but anxious that, however well it has worked for others, something may go wrong in their case. (Opposite Type: Adventurous)
PrudentAt the root of this Risk Type is a high level of self-control and detailed planning. This type is organised, systematic, and conforming. Conservative and conventional in their approach, such people prefer continuity to variety and are most comfortable operating within established and familiar procedures. They like change to be gradual and evolutionary rather than radical. Generally very cautious and suspicious of any new ventures, they may find reassurance in sticking with what they know. (Opposite Type: Carefree)
DeliberateAt the root of this Risk Type are high levels of calm self-confidence combined with caution. This Type tends to be unusually calm. In situations that would worry most people, they experience little anxiety and may seem almost too accepting of risk and uncertainty. However, any concerns about them being unaware of risk should be balanced by a desire to do things in a planned and systematic way. Because they are highly organised, compliant and like to be fully informed about what is going on, they are unlikely to walk into anything unprepared. (Opposite Type: Excitable)
ComposedAt the root of this Risk Type is a high level of composure and self-confidence. This Type is cool headed, calm and unemotional, but at the extreme may seem almost oblivious to risk. Their outlook will always be optimistic and untroubled. These people take everything in their stride, seem quite imperturbable and appear to manage stress very well. They are not particularly impulsive, but neither are they very organised or systematic. (Opposite Type: Intense)
AdventurousAt the root of this Risk Type is a combination of impulsiveness and fearlessness. Extreme examples of this Type are people who combine a deeply constitutional calmness with impulsiveness and a disregard for custom, tradition or convention. They are imperturbable and seemingly oblivious to risk. Their decision making is likely to be influenced by both their lack of anxiety and their impulsiveness. (Opposite Type: Wary)

© Copyright Psychological Consultancy Limited, 2019 all rights reserved. Risk Type Compass® is a registered trademark in Europe: CTM No. 010726818.
40
CarefreeAt the root of this Risk Type are high levels of impulsiveness and unconventionality. These individuals dislike repetitive routine and don’t really like being told what to do. Such people may seem excitement seeking and, in extreme cases, reckless. Not being good at detail or careful preparation, they may seem rather vague about their intentions and objectives. Their impatience, impulsivity and distractibility might leave them exposed to imprudent and hasty decisions. (Opposite Type: Prudent)
Axial GroupIndividuals who show none of the extremes that characterise other Risk Types are classified as being in the Axial Group. Members of this group are not particularly impulsive, anxious or emotional nor are they especially calm, self-assured or organised. Any pronounced risk-taking behaviours will likely be due to attitudes developed from specific experiences. Therefore, however distinctive these individuals may be in other ways, so far as the Risk Type Compass™ and the deep-seated aspects of personality that have a bearing on risk-taking are concerned, they are on the whole relatively unexceptional.
Figure 3.2 displays each of the Risk Types within the Risk Type Compass™ graphic.
Figure 3.2. The Risk Type Compass™ graphic indicating the positioning of the eight Risk Types across the compass

© Copyright Psychological Consultancy Limited, 2019 all rights reserved. Risk Type Compass® is a registered trademark in Europe: CTM No. 010726818.
40 41
The Risk Type SpectrumAn individual’s Risk Type Compass™ score is indicated by a marker (•) on the Risk Type Compass™ graphic contained in the Risk Type Compass™ report (see Figure 3.2). The nearer the marker is to the outside edge of the compass, the more closely a person is likely to relate to that Type description. This is referred to as ‘Risk Strength’, which ranges from 0 (i.e. Axial) to 5. Since the Risk Type Compass™ is a continuous spectrum, scores can also vary in terms of their closeness to the Type boundaries, so that individuals with markers close to a neighbouring Type may also relate to some of the characteristics associated with it. Another important point to make is that there is less deviation between the adjacent Types the closer the score is to the centre of the compass, as the scores become less extreme and the individual’s characteristics become more in line with the central Axial group. This detailed, finely incremented model offers high levels of differentiation with the advantage of an easily communicated Type structure. This was designed to promote understanding of the influence that an individual’s personality may have on the way they deal with risk in everyday life.
Risk StrengthThe model’s ability to differentiate in terms of Risk Strength as well as Risk Type was displayed in an analysis conducted upon a sample group of 13,613 participants. The sample excluded ‘Axial’ individuals, who score a Risk Strength of ‘0’ by definition. An illustration of the Risk Strength distribution across each of the eight Risk Types is displayed in Figure 3.3 below.
Figure 3.3. The distribution of Type Strength for each of the eight Risk Types (n=13,613)

© Copyright Psychological Consultancy Limited, 2019 all rights reserved. Risk Type Compass® is a registered trademark in Europe: CTM No. 010726818.
42
Identifying an individual’s Risk Strength is a notable feature of the Risk Type Compass™, as higher scorers are more likely to strongly reflect the characteristics outlined in their Risk Type description.
Risk Attitude
Research suggests that individuals have different attitudes to risk across different domains (Blais & Weber, 2006; Jackson, Hourany, & Vidmar, 1972; Weber, Blais & Betz, 2002); an individual may be more comfortable with talking in front of a room full of strangers (social risk) than they are with betting money on the horse races (financial risk). Preference for taking risk in any particular domain may be influenced by a wide range of situational and experiential factors. Whatever the initial perceptions of the risk involved in learning to swim, ride a bike, or for a toddler in learning to walk, experience and familiarity will change those perceptions and attitudes. Differences in the amount of support and reassurance required, the size of incremental steps towards mastery that can be managed, the time it takes and the levels of expertise and enjoyment that will ultimately be achieved are all likely to reflect the constitutional influences of Risk Type.
We argue that, in effect, Risk Attitude reflects the recalibration or re-evaluation of risk. As uncertainty is replaced by knowledge and as experience identifies ways in which a risk can effectively be navigated, attitudes change. However, these changes are likely to be domain specific. A prudent and anxious person who has developed a successful career in the financial sector may seem more adventurous in their investments because of the knowledge and confidence they have built up over a number of years. Whether or not that confidence would be immediately transferable to horse riding or sky diving is another question. The inference from a body of personality research strongly suggests it would not, but this is an empirical question and capable of an empirical answer.
What matters is the degree of anxiety, concern and emotional distress that may potentially be involved in any risk taking challenge. Training may achieve a superficial change in attitude in a desired direction but, whilst one such person may shrug off a new challenge or set-back, another may despair, lose their nerve, become functionally impaired or even suicidal when confronted with an expectation that takes them a step too far, or when things go wrong. Such derailing behaviours are likely to reflect constitutional aspects of personality. Attitude is still important because it is reflected in current self-reporting and behaviour and because people feel sure that their attitude to different kinds of risk does vary. This expectation has to be dealt with if they are to appreciate the deeper significance of Risk Type.
To account for variability of this nature, the second part of the Risk Type Compass™ explores differences in current Risk Attitude across five key domains; Recreational risk, Financial risk, Reputational risk, Health & Safety risk and Social risk. Any variation of attitude across risk domains is attributed to experience, exposure, knowledge, recent events, circumstances and a wide range of other unsystematic influences. The purpose

© Copyright Psychological Consultancy Limited, 2019 all rights reserved. Risk Type Compass® is a registered trademark in Europe: CTM No. 010726818.
42 43
of this exercise is to quantify the variability of their risk attitudes.
A sample risk attitude item is presented in Figure 3.4. Each item includes three risk related statements, each referencing a different risk domain. For illustrative purposes, the domains have been displayed next to the described behaviours. Respondents are asked to indicate the activities they would be ‘most likely’ to engage in and which they would be ‘least likely’ to engage in, leaving the third option blank.
Domain Risk Behaviour Most Likely
Least Likely
Recreational Support mandatory protective clothing in all sportsSocial Openly disagree with the tastes of a friend
Financial Be alert to new money making opportunitiesFigure 3.4. Sample item from the Risk Attitudes section of the Risk Type Compass™ Questionnaire
The Risk Type Compass™ reports display Risk Attitude in a pie-chart graphic (see Figure 3.5). The larger the section of the ‘pie’, the greater appetite for risk the individual will have in this area.
Figure 3.5. The Risk Attitudes Graphic from the Risk Type Compass™ Report
Risk Attitude Domain DefinitionsThe assessment of risk attitude within the Risk Type Compass™ is a ‘within person’ assessment concerned with intra-individual differences, not differences between people; it is ipsative rather than normative. The segment size in the pie chart does not represent an absolute level of risk. Rather, they represent that particular individual’s relative preference for risk taking in each domain. The five Risk Attitude domains – Recreational, Financial, Health & Safety, Social and Reputational – are outlined in more detail below. The domains described briefly here could have included a very wide range

© Copyright Psychological Consultancy Limited, 2019 all rights reserved. Risk Type Compass® is a registered trademark in Europe: CTM No. 010726818.
44
of risk features. Recreational risk, for example, might range from the security of reading a book at home to the dangers of white water rafting. But, in this part of the assessment, we are only concerned with the variability of Risk Attitudes across different domains. Appetite for risk is addressed by Risk Type; the risk domains within which that appetite is most likely to be satisfied is determined by Risk Attitude.
RecreationalAttitudes to risk within the Recreational domain are concerned with the possibility of physical danger and its influence on decisions about which sports or recreational activities one engages in. Aversion to this type of risk suggests an anxiety about the potential for physical damage in any activity. A preference for this domain suggests that one may accept an element of physical danger as exciting and be more comfortable with the ‘rough and tumble’ of some physical activities.
FinancialAttitudes to risk within the Finance domain concern one’s willingness to take chances in one’s financial affairs. Aversion to this type of risk suggests financial prudence and a preference for security and predictability. Such people will be cautious and seek to secure their future and to protect their capital. A preference for this domain suggests lower anxiety about financial issues than about other types of risk.
Health and SafetyAttitudes to risk within the Health and Safety domain concern being alert to common dangers and matters that may impact one’s current or future health, whether at work, at home or in other everyday situations. Aversion to this type of risk suggests a concern about Health and Safety regulations and compliance in following recommended procedures. A preference for this domain suggests a lower awareness of everyday dangers or a relatively casual attitude to personal Health and Safety issues.
SocialAttitudes to risk within the Social domain concern the risk of embarrassing oneself or others and risking disapproval, unpopularity or loss of reputation. Aversion to this type of risk suggests a concern about how one comes across to others, being cautious about what one says and how one behaves. A preference for this domain suggests being relatively relaxed about the impression one makes in social situations, being likely to speak one’s mind and being less anxious about other people’s opinions.
ReputationalAttitudes to risk within the Reputational domain concern morality and a readiness to live life according to accepted principles and codes of behaviour. Aversion to this type of risk suggests a concern about what is right and wrong and not allowing oneself leeway on matters of principle. Such people will be anxious to do the right thing in any situation rather than seek personal advantage by bending the rules. A preference for this domain suggests being relatively expedient and viewing issues in terms of shades of grey rather than black and white. Decisions and behaviour may reflect one’s evaluation of a situation

© Copyright Psychological Consultancy Limited, 2019 all rights reserved. Risk Type Compass® is a registered trademark in Europe: CTM No. 010726818.
44 45
rather than one’s principles.
Risk Tolerance
The overall extent to which an individual is risk seeking or risk averse is estimated using an algorithm that incorporates all the personality and attitudinal elements assessed in the Risk Type Compass™ to form a unified ‘Risk Tolerance Index’ (RTi): a 0 to 100 scale that allows an individual to see clearly and quantifiably the extent to which their personality and attitudes contribute to their risk tolerance (see Figure 3.6). Scores at the higher end of the index indicate a strong risk tolerance and signify that the individual is likely to be very comfortable taking high levels of risks. Scores at the lower end of the index signify that an individual will be more risk averse and only comfortable with lower levels of risks. The graphic also indicates the average RTi for those that are a more distinctive example of each Risk Type, allowing an individual to see how their assessed level of risk tolerance compares to these reference points. The length of the red bar is determined by the amount of variability that exists across the various risk attitude domains, as described above.
Figure 3.6. The Risk Tolerance Index graphic from the Risk Type Compass™ report
Some practitioners and researchers have a requirement for a single metric that gives a specific indication of an individual’s risk tolerance relative to others. Rather than generate such a metric as a further derivative of the process required to convey risk disposition within the designed space of the Risk Type Compass™, by going back a step we calculate an additional risk tolerance index directly from scores on the two scales of the Risk Type Compass™. Using the conventional standard score calibration techniques, RTi scores are derived from the combined T scores achieved on each of the Risk Type Compass™ scales. Using the ‘active’ mid score range of the T score scale, the range within which 99% of scores are likely to fall, we construct the 1 to 100 scale in Figure 3.6 with the same measurement properties.
© Copyright Psychological Consultancy Limited, 2019 all rights reserved. Risk Type Compass® is a registered trademark in Europe: CTM No. 010726818.
46
The Validity Scale
There are ten items within the Risk Type Compass™ that assess the validity, or consistency, of a person’s responses. The scale is made up of items that the majority of people will answer in the same way, agreeing with the positive items and disagreeing with the negative items. If a respondent starts to drop points on this scale it is indicative that they are not adequately paying attention to the items. Example items within the validity scale include ‘most people have some positive qualities’ and ‘I like to do things well’.
The validity scale ranges from 0-50 and scores that are equal to, or greater than, 24 are deemed acceptable. Anybody who scores below 24 on the validity scale is flagged up as having an invalid profile. All of the Risk Type Compass™ reports include a validity statement that indicates whether the profile is valid and interpretable or invalid. If the profile is invalid this would suggest careless or inattentive responding. Depending on the situation, the respondent may be asked to complete the assessment again, or the reasoning behind the respondent’s carelessness may be explored as part of a feedback discussion.
SummaryThe Risk Type Compass™ report provides the participant with:
1. Their Risk Type2. The strength of their Risk Type3. Their position within the full 360° spectrum of Risk Types4. The potentially positive and negative implications of their Risk Type5. The questionnaire themes attracting emphatic responses6. The variability of their risk attitude across different domains7. Their overall risk tolerance
These different reference points are to be considered by the individual assessed in the light of their experience and their current self-perceptions. The assessment provides a number of systematic data points and inferences and an objective view positioning the person assessed in relation to others. This is likely to compliment current assumptions based on daily life and experience, but it may also challenge those more subjective perceptions.
The benefits of the assessment process come from harmonising these two potentially very different perspectives; the personal and the psychometric. Both emanate in their different ways from the candidate. The report offers the opportunity for them to subject their present view of themselves to a rigorous auditing process in the expectation that they may make some useful revisions. This may not be an immediate result, as it is very difficult to assimilate such information instantly, but it will raise useful questions, challenge assumptions and plant new ideas, even if it takes time to achieve a resolution.

© Copyright Psychological Consultancy Limited, 2019 all rights reserved. Risk Type Compass® is a registered trademark in Europe: CTM No. 010726818.
46 47
Chapter 4 – Descriptive Statistics
This chapter looks at the statistical properties of each of the four personality factors (Calm, Emotional, Daring and Measured), and the two underlying, and conceptually orthogonal, scales (Emotional:Calm and Daring:Measured) that make up the Risk Type Compass™. The final section gives a breakdown of the current Risk Type Compass™
norm group.
Risk Personality Factors and ScalesTable 4.1 shows the average score of each of the four personality factors (from 1 -100, except in the case of Measured which scores from 1 - 60), and the score distribution around the mean. These statistics are based on a sample of 13,613 working individuals from a broad range of working, ethnic and demographic backgrounds.
Table 4.1 also displays descriptive statistics for the underlying axis scales of the Risk Type Compass™. The Emotional:Calm scale is derived from the combination of the themes for the personality factor Calm with those from Emotional. It describes people who are, at one end of the scale, particularly fearless, optimistic and calm and at the other end of the scale nervous, apprehensive and pessimistic. The Daring:Measured scale was similarly derived by combining Measured with Daring. It places individuals along a continuum from carefree, impulsive and disorganised to prudent, planful and compliant. Due to the number of items in the two scales, the highest raw score for Emotional:Calm is 200, while for Daring:Measured it is 160.
Prominent personality psychology researchers (e.g. Cattell, 1978) point out that, as with many natural phenomena, personality traits will fall broadly along a normal distribution. For each personality trait, we would therefore expect fewer individuals to fall at either extreme and the majority to fall somewhere in between, with the highest proportion possessing - what is by its very definition - ‘average’ amounts of the trait. This has been the case for the personality factors that make up the FFM (e.g. Cobb-Clark & Schurer, 2012). The concept that personality characteristics are normally distributed is a pivotal part to the theory of norm-referenced psychometric assessments, i.e. those that compare individuals’ scores to a sample of a larger population, such as with the Risk Type Compass™. Consequently, we would expect the four personality factors, and two underlying scales, of the Risk Type Compass™ to be normally distributed.
To test the hypothesis that the Risk Type Compass™ personality factors and scales are normally distributed, scatterplots with skew statistics were produced. When dealing with large sample sizes, the established rule of thumb is that a skew or kurtosis above 2 would indicate that the data are not normally distributed. As we can see in Table 4.1, this is not the case. This is further confirmed visually by the scatterplots (see Figures 4.1 to 4.6) which can be seen to show an approximately symmetrical bell-shaped curve. These provide evidence that there is no significant skew or kurtosis in the Emotional:Calm and Daring:Measured scales nor in their composite personality factors (Calm, Emotional, Measured and Daring).

© Copyright Psychological Consultancy Limited, 2019 all rights reserved. Risk Type Compass® is a registered trademark in Europe: CTM No. 010726818.
48
Table 4.1. Mean, Standard Deviation, Skew and Kurtosis statistics for the Calm, Emotional, Measured and Daring personality factors and the Emotional:Calm and Daring:Measured scales (n=13,613)Personality FactorsCalm 55.18 11.19 -0.26 0.12Emotional 36.89 9.67 0.29 0.33Measured 38.13 7.91 -0.35 0.09Daring 60.03 11.97 -0.01 -0.02Personality ScalesEmotional:Calm 118.29 19.17 -0.33 0.22Daring:Measured 78.10 15.86 -0.16 0.11
Visual representations of these Factor and Scale distributions are presented in Figures 4.1 to 4.6 below.
Figure 4.1. Scatterplot showing the distribution of the Calm factor (n=13,613). Please note, the scales of Emotional and Daring are reversed when used in the ‘Emotional:Calm’ and ‘Daring:Measured’ scales respectively.

© Copyright Psychological Consultancy Limited, 2019 all rights reserved. Risk Type Compass® is a registered trademark in Europe: CTM No. 010726818.
48 49
Figure 4.2. Scatterplot showing the distribution of the Emotional factor (n=13,613)
Figure 4.3. Scatterplot showing the distribution of the Measured factor (n=13,613)
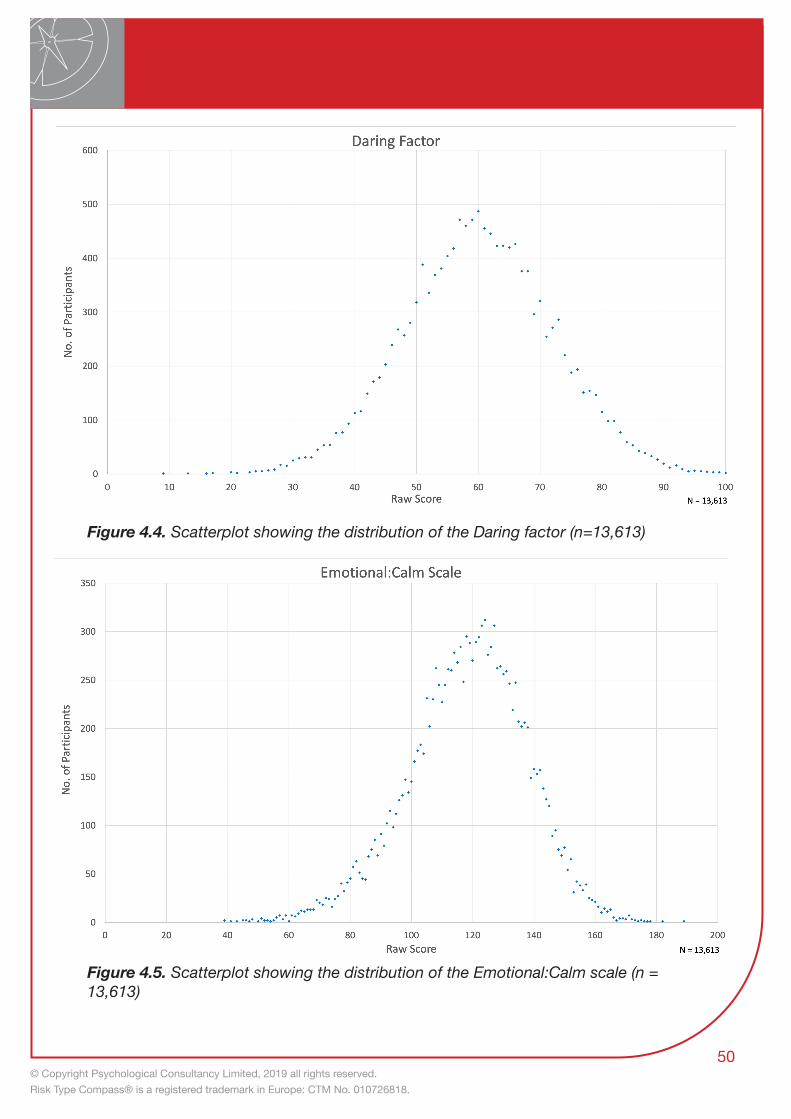
© Copyright Psychological Consultancy Limited, 2019 all rights reserved. Risk Type Compass® is a registered trademark in Europe: CTM No. 010726818.
50
Figure 4.4. Scatterplot showing the distribution of the Daring factor (n=13,613)
Figure 4.5. Scatterplot showing the distribution of the Emotional:Calm scale (n =13,613)

© Copyright Psychological Consultancy Limited, 2019 all rights reserved. Risk Type Compass® is a registered trademark in Europe: CTM No. 010726818.
50 51
Figure 4.6. Scatterplot highlighting the distribution of the Daring:Measured scale (n=13,613)
Risk Type Frequencies
After providing some basic information, a total of 13,613 participants took part in the Risk Type Compass™ assessment. Table 4.2 and Figure 4.7 below present the distribution of these 13,613 individuals across the eight Risk Types and the Axial group.
Table 4.2. Percentage of the total sample in each of the eight Risk Type groups. The Axial group consists of 9.79% (n=13,613)Risk Type % of SampleWary 11.60%Prudent 10.31%Deliberate 15.63%Composed 11.34%Adventurous 12.07%Carefree 10.20%Excitable 10.44%Intense 8.62%
Perhaps the most significant feature of the Risk Type frequencies in Table 4.2 concerns the striking similarity of frequencies for Risk Type distributions, with a range of just 7.01%

© Copyright Psychological Consultancy Limited, 2019 all rights reserved. Risk Type Compass® is a registered trademark in Europe: CTM No. 010726818.
52
between the most populace Risk Type, Deliberate (15.63%), and the least populace Risk Type, Intense (8.62%). The fact that the Risk Types occur in almost equal frequencies across the population gives credit to the suggestion that the Risk Type Compass™ is successfully capturing, measuring and categorising a very real phenomenon within individuals.
Figure 4.7. The percentage of participants in each of the eight Risk Types. The Axial group accounts for 9.79% (n=13,613)
A total of 13,014 participants from the overall sample provided information on their gender, allowing PCL researchers to divide these candidates into males and females and analyse the Risk Type distributions to see if any gender differences arose. Figure 4.8 presents the findings of this analysis.

© Copyright Psychological Consultancy Limited, 2019 all rights reserved. Risk Type Compass® is a registered trademark in Europe: CTM No. 010726818.
52 53
Figure 4.8. The percentage of males and females in each of the eight Risk Types. The Axial group accounted for 8.92% of the male population and 9.73% of the female population (n=13,014).
The Risk Type Compass™ 2019 Norm Group
The Risk Type Compass™ 2019 Norm Group is gathered using an opportunity sampling method comprising of people who have completed the Risk Type Compass™ assessment. This is a sample that is almost exclusively comprised of working adults, all of whom have passed the Risk Type Compass™’s in-built validity scale.
The 2019 Norm Group consists of 10,000 participants. This reflects an increase of nearly 3,000 from the previous norm group. The 2019 Norm Group includes 5,000 males and 5,000 females.
Of the 1,822 participants who reported their ethnicity, 76% were British, 2% were from another European countr, 4% weare Asian, 1% were African, and 17% described themselves as ‘Other’.
A total of 9,343 participants provided information about their age. The lowest and highest reported ages were 18 and 79 respectively, and the average was 40.08 (SD 21.75). A breakdown of the ages can be seen in Table 4.3. below.

© Copyright Psychological Consultancy Limited, 2019 all rights reserved. Risk Type Compass® is a registered trademark in Europe: CTM No. 010726818.
54
Table 4.3. Distribution of age ranges in the norm group (n=9,343)Age Range % of 2019 Sample18-30 26.14%31-40 26.20%41-50 26.61%51-60 16.42%Over 60 4.63%
The key point established by the information above is the even spread of ages across the adult working population that is present in the Risk Type Compass™ 2019 norm. An analysis of the impact age has on risk incorporates all 9,343 participants from the 2019 norm group and can be found in the next chapter.
The ability to draw from various age categories contrasts with norms that are heavily reliant upon student populations and supports the norm’s appropriateness for use in the working population.
This leads to the breakdown of job roles in the 2019 norm. A total of 6,652 participants volunteered information on their jobs, enabling us to identify the norm group’s distribution of job categories in Table 4.4 below.
Table 4.4. Distribution of job roles in the norm group (n=6,652)Job Category % of 2019 SampleAdministration 2.74%Finance 10.39%General Management 7.90%Human Resources 4.07%IT 6.82%Production 1.73%Professional Services 51.55%Research & Development 1.61%Sales & Marketing 3.74%
The opportunistic nature of sampling for the 2019 norm reflects the innate appropriateness of the norm by definition, as users would typically be completing the questionnaire for application in a professional capacity.
Unsurprisingly, the most frequently reported job category is ‘Professional Services’, as this is the most common group of workers who use the Risk Type Compass™. Some recurring job roles in the professional services category include consultancy, health and
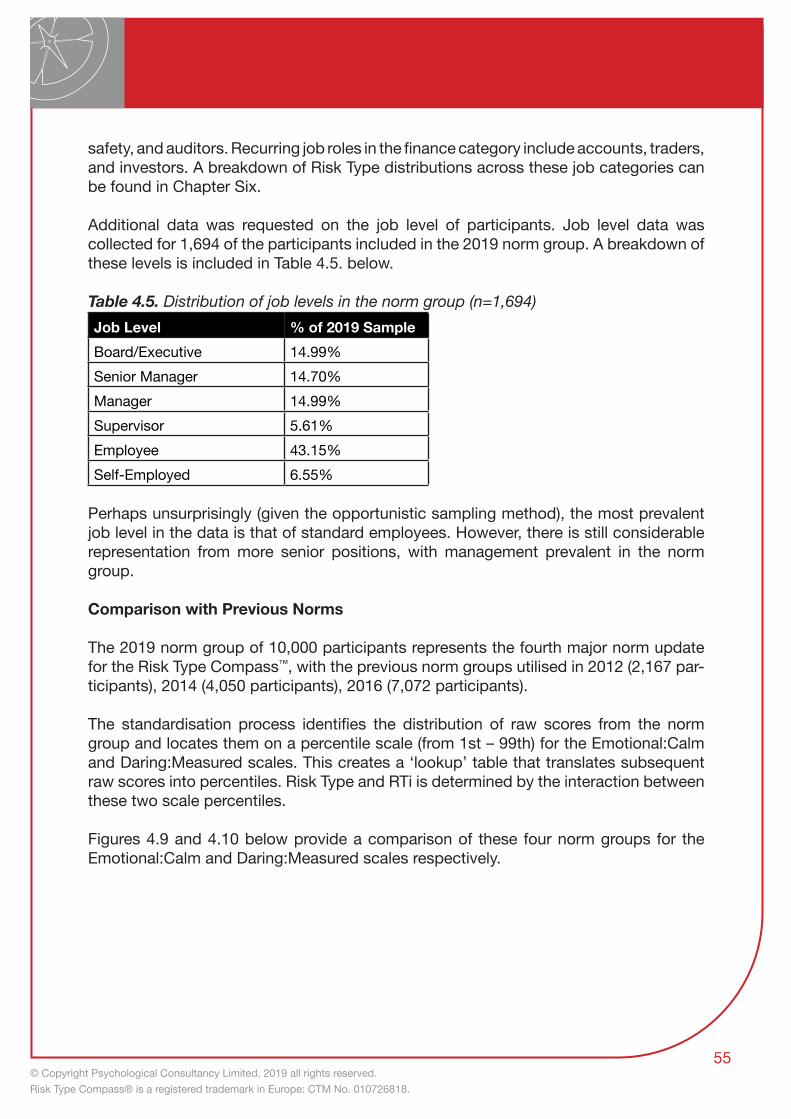
© Copyright Psychological Consultancy Limited, 2019 all rights reserved. Risk Type Compass® is a registered trademark in Europe: CTM No. 010726818.
54 55
safety, and auditors. Recurring job roles in the finance category include accounts, traders, and investors. A breakdown of Risk Type distributions across these job categories can be found in Chapter Six.
Additional data was requested on the job level of participants. Job level data was collected for 1,694 of the participants included in the 2019 norm group. A breakdown of these levels is included in Table 4.5. below.
Table 4.5. Distribution of job levels in the norm group (n=1,694)Job Level % of 2019 SampleBoard/Executive 14.99%Senior Manager 14.70%Manager 14.99%Supervisor 5.61%Employee 43.15%Self-Employed 6.55%
Perhaps unsurprisingly (given the opportunistic sampling method), the most prevalent job level in the data is that of standard employees. However, there is still considerable representation from more senior positions, with management prevalent in the norm group.
Comparison with Previous Norms
The 2019 norm group of 10,000 participants represents the fourth major norm update for the Risk Type Compass™, with the previous norm groups utilised in 2012 (2,167 par-ticipants), 2014 (4,050 participants), 2016 (7,072 participants).
The standardisation process identifies the distribution of raw scores from the norm group and locates them on a percentile scale (from 1st – 99th) for the Emotional:Calm and Daring:Measured scales. This creates a ‘lookup’ table that translates subsequent raw scores into percentiles. Risk Type and RTi is determined by the interaction between these two scale percentiles.
Figures 4.9 and 4.10 below provide a comparison of these four norm groups for the Emotional:Calm and Daring:Measured scales respectively.

© Copyright Psychological Consultancy Limited, 2019 all rights reserved. Risk Type Compass® is a registered trademark in Europe: CTM No. 010726818.
56
Figure 4.9. Comparison of norm groups for the Emotional:Calm scale (n=2,167 [2012], n=4,050 [2014], n=7,072 [2016], n=10,000 [2019]
Figure 4.10. Comparison of norm groups for the Daring:Measured scale (n=2,167 [2012], n=4,050 [2014], n=7,072 [2016], n=10,000 [2019])
Figures 4.9. and 4.10. demonstrate the inter-norm stability of the Risk Type Compass™ two underlying scales, as only minor variations in the percentile assignment have emerged over the four norm groups. After determining the stability between norms, our analyses moved on to establishing consistency of application between males and females.
The Influence of Biological Sex
Our analysis of males and females illustrated in Figure 4.8. above indicated a clear var-iance in the prevalence of Risk Types in these two groups. The most notable of these differences involve the Wary Risk Type (7.21% males to 18.89% females) and the Ad-venturous Risk Type (17.63% males to 8.72% females). Guidance on addressing the Risk Types of participants are expanded upon in the User Guide, and the implications

© Copyright Psychological Consultancy Limited, 2019 all rights reserved. Risk Type Compass® is a registered trademark in Europe: CTM No. 010726818.
56 57
of Risk Types are explored in the latter stages of this technical manual. However, we felt this variance demanded further analysis to understand the driving factors.
This began with an analysis on the Emotional:Calm and Daring:Measured scales for 13,014 participants (including all participants from the 2019 norm group) after dividing them by biological sex. The purpose of these analyses was to determine if and how males (n = 7,879) and females (n = 5,135) differed on their scale scores, and whether these differences were statistically significant. The findings of the analyses are present-ed in Table 4.6. below.
Table 4.6. Descriptive findings of scale raw scores by sex (n=13,014)Scale Sex N Mean Std. Deviation Std. Error MeanEmotional:Calm Male 7,879 121.82 17.977 0.203
Female 5,135 113.11 19.502 0.272Daring:Measured Male 7,879 76.24 15.523 0.175
Female 5,135 80.51 16.035 0.224
Findings indicate that females scored lower on the Emotional:Calm and higher on the Daring:Measured scales respectively. Standard deviation also indicated a slightly broader spread of scores for females in each scale. Additional analysis using Independent T Tests indicated these differences were statistically significant (p < 0.01). These findings are illustrated in Figures 4.11. and 4.12. below.
Figure 4.11. Emotional:Calm raw score distributions of males (n=7,879) and females (n=5,135)

© Copyright Psychological Consultancy Limited, 2019 all rights reserved. Risk Type Compass® is a registered trademark in Europe: CTM No. 010726818.
58
Figure 4.12. Daring:Measured raw score distributions of males (n=7,879) and females (n=5,135)
The variation between males and females on each scale would drive the variation in Risk Type propensity. Males were slightly more likely to report higher scores on the Emotional:Calm (i.e. calm) scale and lower scores on the Daring:Measured (i.e. daring) scale than females. This pattern of scoring would increase the likelihood locating ‘lower’ on the compass (e.g. Adventurous/Composed/Carefree) Risk Type designations, and the findings presented in Figure 4.8. above show this is true.
Despite reporting variation between males and females on each scale, the considerable level of overlap should also be noted. This leads us to conclude that focus should be given to the Risk Type designation of individuals, with subsequent feedback conducted accordingly (see Risk Type Compass™ Handbook for guidance on feedback).
Further analysis was also conducted to ensure that the structure of the Risk Type Compass™ was equally applicable to both sexes. This process is outlined in greater detail in Chapter Two and involved the use of factor analysis on subtheme scores. An analysis of the 2019 Risk Type Compass™ norm group compared males (n = 5,000) and females (n = 5,000), and the findings are presented in Table 4.7. below.

© Copyright Psychological Consultancy Limited, 2019 all rights reserved. Risk Type Compass® is a registered trademark in Europe: CTM No. 010726818.
58 59
Table 4.7. Factor Analysis (Varimax Rotation with Kaiser Normaliation) of the Risk Type Compass™ subthemes by biological sex - females in parentheses (n=10,000 [males n=5,000, females n=5,000])
SubthemeFactor
Emotional Calm Measured DaringApprehensive -0.533 (-0.678) -0.408 (-0.273)Sensitive -0.817 (-0.834) 0.018 (0.1340Intuitive -0.51 (-0.381) 0.298 (0.415)Astute 0.103 (0.07) -0.756 (0.771)Eager -0.184 (0.163) -0.239 (0.271)
Resilient 0.507 (0.641) 0.472 (0.367)Confident 0.481 (0.593) 0.294 (0.25)Forgiving 0.302 (0.466) 0.713 (0.613)Optimistic 0.15 (0.298) 0.594 (0.624)Equable 0.752 (0.769) 0.211 (0.111)
Audacious -0.116 (-0.178) 0.595 (0.625)Explorative -0.086 (-0.071) 0.704 (0.686)Hasty -0.148 (-0.167) 0.773 (0.774)Spontaneous 0.21 (0.237) 0.612 (0.602)
Focused 0.714 (0.701) 0.224 (0.228)Methodical 0.748 (0.724) -0.342 (-0.412)Perfectionistic 0.809 (0.81) -0.073 (-0.01)Conforming 0.503 (0.427) -0.516 (-0.578)
Findings from the factor analysis indicate that, whilst some minor variation exists between the factor loadings of subthemes, the structure of the Risk Type Compass™ can be considered consistent between males and females.
Having established the variance in scores between and males and females and the consistent applicability of the Risk Type Compass™ framework, the final step of our investigation was to compare our findings against peer reviewed academic literature.
As previously discussed in the earlier chapter of the technical manual, the Risk Type Compass™ views the Five Factor Model of personality through the lens of risk. This approach enables us to draw parallels with a vast body of research.

© Copyright Psychological Consultancy Limited, 2019 all rights reserved. Risk Type Compass® is a registered trademark in Europe: CTM No. 010726818.
60
We initially focussed on the Emotional:Calm scale, which reported the greater male-to-female variance of the two scales. By far the largest factor influence on the Emotional:Calm scale from the Five Factor Model is Neuroticism. Costa, Terracciano, and McCrae (2001) describe Neuroticism as a broad domain of negative affect, and numerous Risk Type Compass™ subthemes encompassed by the Emotional:Calm scale reflect the factor’s traits. After conducting analysis on over 23 thousand adult and college-age participants from 26 cultures using the NEO-PI-R, Costa et al. (2001) reported modestly higher levels of Neuroticism in the females of the sample. More specifically, Costa et al. (2001) reported male-to-female differences in the facets of Anxiety and Vulnerability to be the greatest of the six, and these could be regarded as the most relevant to risk. Similar results were also presented by a sample of 2,643 participants, with Weisberg, DeYoung, and Hirsh (2011) reporting higher scores for females on the Neuroticism aspects of Withdrawal and Volatility.
Our analysis of the Daring:Measured scale indicated relatively smaller, yet significant, differences between males and females. Comparisons with the literature are based upon the influence of Conscientiousness and Extraversion, with these factors resulting in higher and lower scores on the Daring:Measured scale respectively. In addition to their findings on Neuroticism, Costa et al. (2001) reported higher scores for males on the Extraversion facets of Explorative and Assertiveness, and lower scores on the Conscientiousness facets of Order and Dutifulness. Weisberg et al’s (2011) analysis indicated that males scored higher for the Extraversion aspect of Assertiveness and lower on the Conscientiousness aspect of Orderliness.
These patterns of results would align with the scale-level differences reported by our analyses comparing males and females. This supports the development process of the Risk Type Compass™ framework, and the subsequent results that are generated.
Ultimately, sex-based differences resulting from our analysis of Risk Type Compass™ data are significant yet small, meaning that any application of the Risk Type Compass™ should focus exclusively on the individual and/or group data of those who are receiving the feedback.

© Copyright Psychological Consultancy Limited, 2019 all rights reserved. Risk Type Compass® is a registered trademark in Europe: CTM No. 010726818.
60 61
Chapter 5 – Reliability and Validity Research
This chapter reports the reliability and validity research that has been carried out on the Risk Type Compass™ to date.
The first section details reliability research, which is concerned with assessing whether the constructs within the Risk Type Compass™ are consistent within themselves. The chapter then goes on to look at validity research, reporting on the relationships between the two Risk Type Compass™ scales, Emotional:Calm and Daring:Measured, and relevant themes or scales within other psychometric assessments; namely Profile:Match2™, the Hogan Personality Inventory (HPI), the Hogan Development Survey (HDS) and the Motives, Values, Preferences Inventory (MVPI). In a further test of construct validity, scores on the Risk Type Compass™ were also assessed against another measure of risk that taps specifically into risk attitudes (Blais & Weber, 2006).
Following the argument of Hogan and Hogan (1997), the presumption here is that the nuances of the Risk Type Compass™ scales should be discovered according to the pattern of correlates that emerge from these studies, rather than necessarily pre-empted or pre-determined. The discussion that follows considers how the research findings help us to better understand the risk taking behaviours of the Risk Types.
ReliabilityInternal Reliability of the Personality Factors and Scales
Internal reliability is concerned with the extent to which all the items within a personality scale are ‘pulling’ in the same direction. That is, does this analysis support the view that they are all measuring the same underlying construct? The internal reliability of a psychometric assessment indicates whether the construct being addressed is broad and complex or narrow and specific, and provides reassurance that that scale is internally consistent.
Internal reliability analysis was carried out on the items that make up each of the four personality factors identified by factor analysis (Table 5.1); Calm, Emotional, Measured and Daring, as well as the two Risk Type Compass™ scales; Emotional:Calm and Daring:Measured.
Focus should be on the scale level, as the interaction between the two scale scores determine Risk Type. We also conducted analyses comparing Males (N=7,879) and Females (N=5,135) to ensure that reliability was relatively consistent between these groups.

© Copyright Psychological Consultancy Limited, 2019 all rights reserved. Risk Type Compass® is a registered trademark in Europe: CTM No. 010726818.
62
Table 5.1. Internal Reliability Coefficients for the Risk Type Compass™ personality factors and scales (n=13,014)
Internal Reliability CoefficientAll (n=13,014) Male (n=7,879) Female (n=5,135)
Factor
Calm .813 .798 .822Emotional .77 .743 .788Daring .805 .806 .806Measured .839 .83 .847
ScaleEmotional:Calm .876 .861 .884Daring:Measured .847 .842 .851
The results demonstrate that both the personality factors and the Risk Type Compass™
scales have strong internal consistency, with all values significantly greater than the widely accepted benchmark of .70 (Nunnally & Bernstein, 1994). This reinforces the view that each of the four factors are indeed generating measurements consistently across the various contributing item themes, and that the two bi-polar scales constructed from these factors also provide highly reliable measurements. Our multiple analyses also identified no notable drop in internal reliability coefficients between the males and females, with all values remaining comfortably above the 0.7 threshold.
The benefit of collating internal reliability coefficients for the Emotional:Calm and Daring:Measured scales is that it can enable us to determine the standard error of measurement values for each scale. Table 5.2. presents the findings of the analysis for the Emotional:Calm scale (which is scored out of 200) and the Daring:Measured scale (which is scored out of 160).
Table. 5.2. Means, Standard Deviations, and Standard Error of Measurements for Risk Type Compass™ Scales (n=10,793)Scale Mean Stdeva Standard Error
of MeasurementConfidence Interval
Upper Limit
Lower Limit
Emotional:Calm 118.59 18.84 6.79 13.32 131.91 105.27Daring:Measured 77.74 15.97 6.18 12.12 89.86 65.62
The findings of the analysis indicate that there is a 95% chance that an individual’s ‘true’ score will fall between 105.27 and 131.91 for the Emotional:Calm scale, and between 65.62 and 89.86 for the Daring:Measured scale.
Internal Reliability of the Subthemes
The strong internal consistency reliabilities reported at the Risk Type Compass™ scale and personality factor levels reflect the assessment’s effective performance at item

© Copyright Psychological Consultancy Limited, 2019 all rights reserved. Risk Type Compass® is a registered trademark in Europe: CTM No. 010726818.
62 63
and subtheme level. Each of the Risk Type Compass™’ 18 subthemes has four items scored using a 0-5 response scale (to generate a total raw score between 0-20). Every subtheme is associated with the relevant personality factor so that responses contribute to an individual’s position on one of the two underlying scales (Emotional:Calm and Daring:Measured) of the Risk Type Compass™. Data from the 2019 sample of 13,613 Risk Type Compass™ participants was analysed to determine internal reliability coefficients, means, and standard deviations for each of the 18 Risk Type Compass™ subthemes. Table 5.2 presents the findings of this analysis, as well as showing how each subtheme is grouped into scale and personality factors.
Table 5.3. Risk Type Compass™ Subtheme Internal Reliabilities, Means, and Standard Deviations (n=13,613)Scale Factor Subtheme Subtheme
AlphaSubtheme Mean
SubthemeSD
Emotional:Calm
Emotional Apprehensive .68 10.18 3.67Sensitive .73 8.23 3.70Intuitive .72 6.99 3.11Astute .78 6.63 3.03Eager .54 11.49 2.73
Calm Resilient .52 10.95 3.17Confident .76 13.85 3.41Forgiving .80 12.45 3.80Optimistic .63 15.14 2.69Equable .65 9.43 3.69
Daring:Measured
Daring Audacious .70 14.02 3.12Explorative .62 13.02 3.50Hasty .68 9.95 3.99Spontaneous .71 14.13 3.06
Measured Focused .73 13.99 3.23Methodical .72 11.11 3.46Perfectionistic .57 13.03 3.26Compliant .68 11.09 3.41
Whilst several of the subtheme groupings reflect limited internal consistency reliabilities (of which Resilient (.50), Eager (.54), and Perfectionistic (.59) were the lowest), it should be noted that each subtheme only consists of four items.
To explore the consistency of the concepts and items encompassed by the Risk TypeCompass, a Test Retest process was conducted on a sample of 242 participants. As well as conducting analysis on all 242 participants, the nature of temporal analysis led
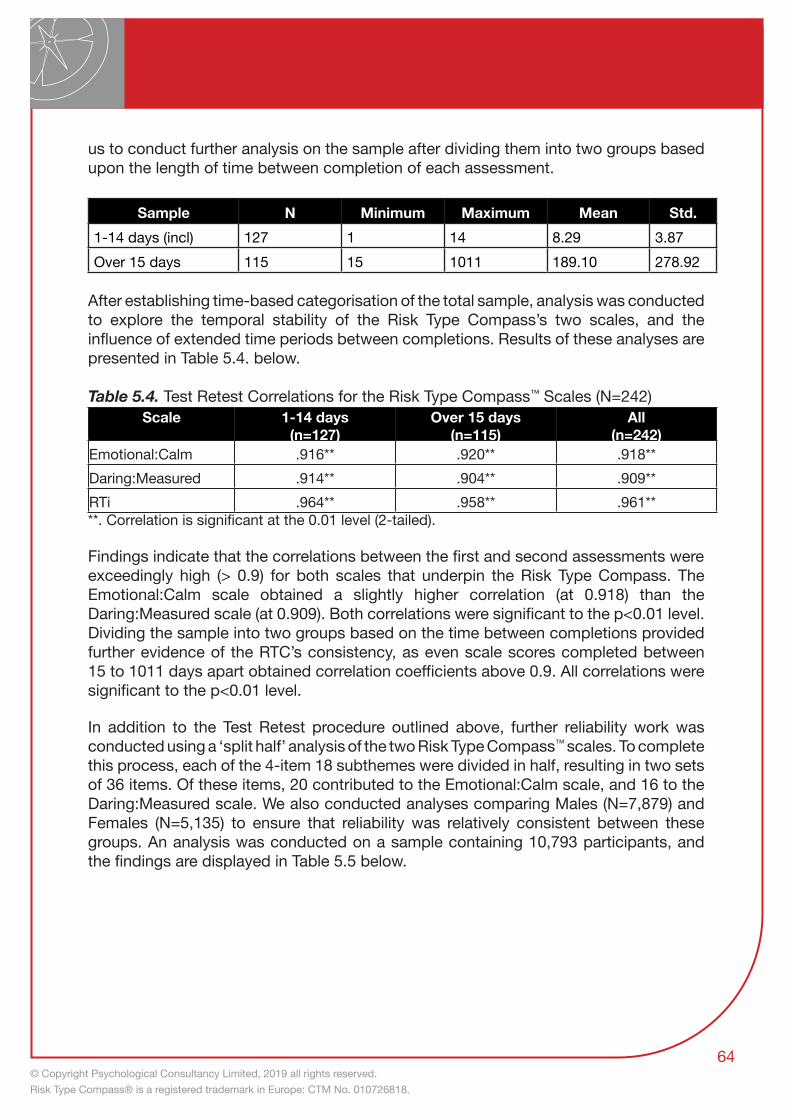
© Copyright Psychological Consultancy Limited, 2019 all rights reserved. Risk Type Compass® is a registered trademark in Europe: CTM No. 010726818.
64
us to conduct further analysis on the sample after dividing them into two groups based upon the length of time between completion of each assessment.
Sample N Minimum Maximum Mean Std.1-14 days (incl) 127 1 14 8.29 3.87Over 15 days 115 15 1011 189.10 278.92
After establishing time-based categorisation of the total sample, analysis was conducted to explore the temporal stability of the Risk Type Compass’s two scales, and the influence of extended time periods between completions. Results of these analyses are presented in Table 5.4. below.
Table 5.4. Test Retest Correlations for the Risk Type Compass™ Scales (N=242)Scale 1-14 days
(n=127)Over 15 days
(n=115)All
(n=242)Emotional:Calm .916** .920** .918**Daring:Measured .914** .904** .909**RTi .964** .958** .961****. Correlation is significant at the 0.01 level (2-tailed).
Findings indicate that the correlations between the first and second assessments wereexceedingly high (> 0.9) for both scales that underpin the Risk Type Compass. The Emotional:Calm scale obtained a slightly higher correlation (at 0.918) than the Daring:Measured scale (at 0.909). Both correlations were significant to the p<0.01 level. Dividing the sample into two groups based on the time between completions provided further evidence of the RTC’s consistency, as even scale scores completed between 15 to 1011 days apart obtained correlation coefficients above 0.9. All correlations were significant to the p<0.01 level.
In addition to the Test Retest procedure outlined above, further reliability work was conducted using a ‘split half’ analysis of the two Risk Type Compass™ scales. To complete this process, each of the 4-item 18 subthemes were divided in half, resulting in two sets of 36 items. Of these items, 20 contributed to the Emotional:Calm scale, and 16 to the Daring:Measured scale. We also conducted analyses comparing Males (N=7,879) and Females (N=5,135) to ensure that reliability was relatively consistent between these groups. An analysis was conducted on a sample containing 10,793 participants, and the findings are displayed in Table 5.5 below.

© Copyright Psychological Consultancy Limited, 2019 all rights reserved. Risk Type Compass® is a registered trademark in Europe: CTM No. 010726818.
64 65
Table 5.5. Split-Half Analysis of the Risk Type Compass™ Scales (N=13,014)Scale Part/Half No. of
ItemsCorrelation Between Parts Spearman-Brown Coefficient
Male (n=7,879)
Female (n=5,135)
All (n=13,014)
Male (n=7,879)
Female (n=5,135)
All (n=13,014)
Emotional:Calm
Part 1 20.794 .836 .82 .885 .911 .901
Part 2 20
Daring:Measured
Part 1 16.814 .823 .819 .898 .903 .901
Part 2 16
Split-half analysis of the Risk Type Compass™ indicated strong correlations between thetwo halves of the two scales, with strong Pearson correlation coefficients of .82 (2 d.p) for each scale. Each scale also reported a Spearman-Brown Coefficient of .90 (2 d.p). There were slightly higher variations between males and females for the Emotional:Calm scale, although differences were relatively minor.
In order to determine an individual’s Risk Type, the Risk Type Compass™ utilises 18 subthemes, each consisting of four items. Tables 5.6 – 5.22 present the inter-item correlations between each of the items included in the subtheme, in addition to each item’s correlation to the subtheme total.
Table 5.6.Inter-Item Correlations of Audacious Subtheme Items (n=13,613)AUD_1 x .755**
AUD_2 .459** x .714**AUD_3 .410** .251** x .704**AUD_4 .434** .371** .376** x .757**
AUD_1 AUD_2 AUD_3 AUD_4 AUD_TOTAL
Table 5.7. Inter-Item Correlations of Apprehensive Subtheme Items (n=13,613)APP_1 x .681**APP_2 .372** x .750**APP_3 .357** .426** x .754**APP_4 .258** .313** .325** x .660**
APP_1 APP_2 APP_3 APP_4 APP_TOTAL

© Copyright Psychological Consultancy Limited, 2019 all rights reserved. Risk Type Compass® is a registered trademark in Europe: CTM No. 010726818.
66
Table 5.8. Inter-Item Correlations of Equable Subtheme Items (n=13,613)EQU_1 x .675**EQU_2 .261** x .707**EQU_3 .385** .446** x .736**EQU_4 .303** .304** .252** x .691**
EQU_1 EQU_2 EQU_3 EQU_4 EQU_TOTAL
Table 5.9. Inter-Item Correlations of Confidence Subtheme Items (n=13,613)CFD_1 x .760**CFD_2 .421** x .690**CFD_3 .302** .369** x .694**CFD_4 .471** .283** .293** x .730**
CFD_1 CFD_2 CFD_3 CFD_4 CFD_TOTAL
Table 5.10. Inter-Item Correlations of Conforming Subtheme Items (n=13,613)CFM_1 x .760**
CFM_2 .421** x .690**CFM_3 .302** .369** x .694**CFM_4 .471** .283** .3293** x .730**
CFM_1 CFM_2 CFM_3 CFM_4 CFM_TOTAL
Table 5.11. Inter-Item Correlations of Intuitive Subtheme Items (n=13,613)INT_1 x .760**INT_2 .497** x .751**INT_3 .324** .282** x .687**INT_4 .511** .481** .345** x .778**
INT_1 INT_2 INT_3 INT_4 INT_TOTAL
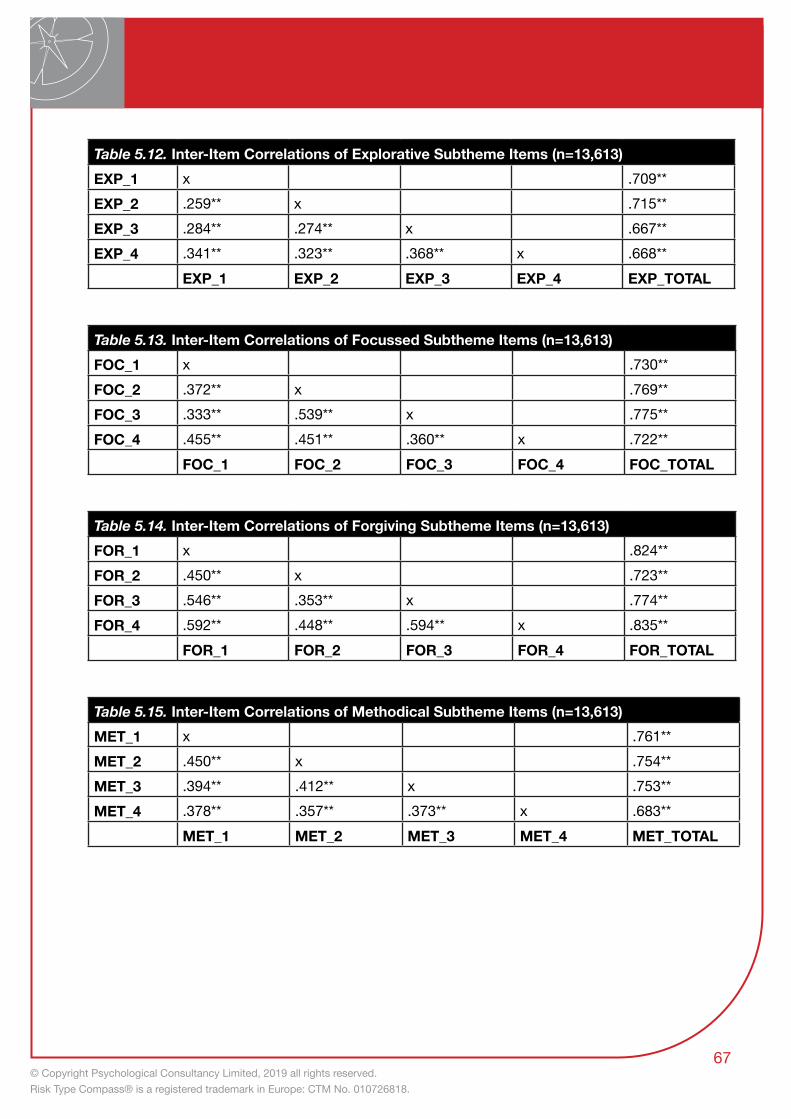
© Copyright Psychological Consultancy Limited, 2019 all rights reserved. Risk Type Compass® is a registered trademark in Europe: CTM No. 010726818.
66 67
Table 5.12. Inter-Item Correlations of Explorative Subtheme Items (n=13,613)EXP_1 x .709**EXP_2 .259** x .715**EXP_3 .284** .274** x .667**EXP_4 .341** .323** .368** x .668**
EXP_1 EXP_2 EXP_3 EXP_4 EXP_TOTAL
Table 5.13. Inter-Item Correlations of Focussed Subtheme Items (n=13,613)FOC_1 x .730**FOC_2 .372** x .769**FOC_3 .333** .539** x .775**FOC_4 .455** .451** .360** x .722**
FOC_1 FOC_2 FOC_3 FOC_4 FOC_TOTAL
Table 5.14. Inter-Item Correlations of Forgiving Subtheme Items (n=13,613)FOR_1 x .824**FOR_2 .450** x .723**FOR_3 .546** .353** x .774**FOR_4 .592** .448** .594** x .835**
FOR_1 FOR_2 FOR_3 FOR_4 FOR_TOTAL
Table 5.15. Inter-Item Correlations of Methodical Subtheme Items (n=13,613)MET_1 x .761**MET_2 .450** x .754**MET_3 .394** .412** x .753**MET_4 .378** .357** .373** x .683**
MET_1 MET_2 MET_3 MET_4 MET_TOTAL
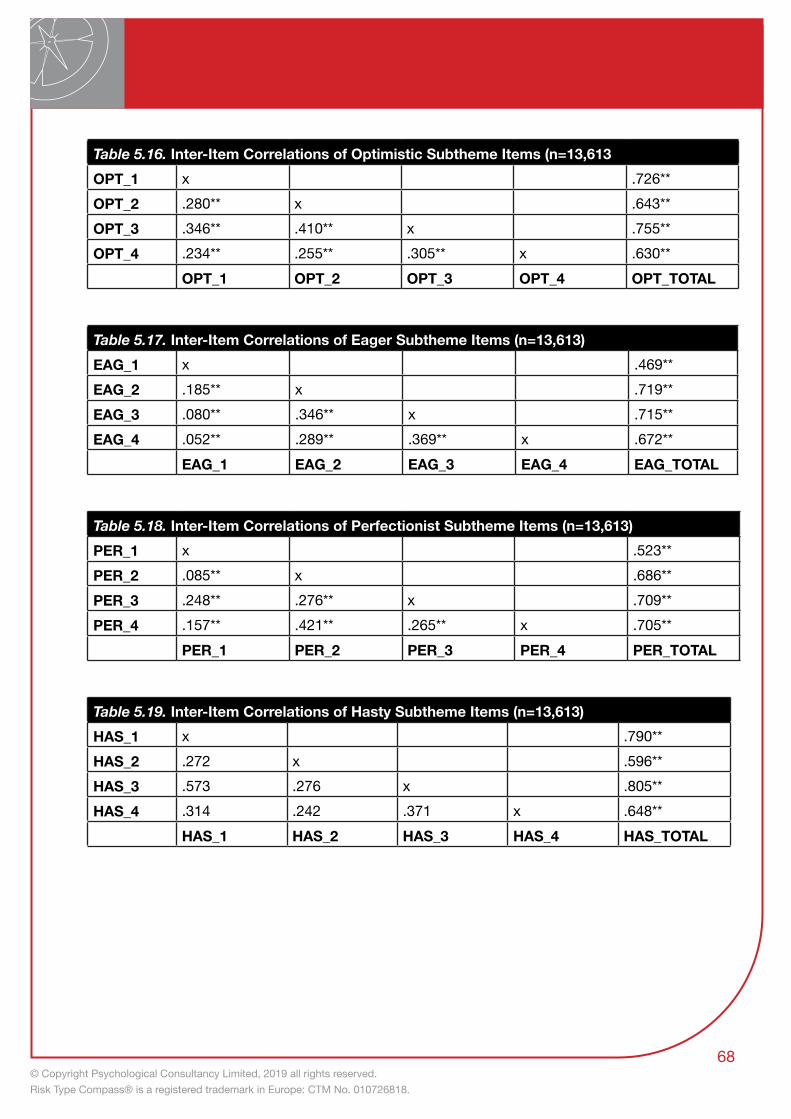
© Copyright Psychological Consultancy Limited, 2019 all rights reserved. Risk Type Compass® is a registered trademark in Europe: CTM No. 010726818.
68
Table 5.16. Inter-Item Correlations of Optimistic Subtheme Items (n=13,613OPT_1 x .726**OPT_2 .280** x .643**OPT_3 .346** .410** x .755**OPT_4 .234** .255** .305** x .630**
OPT_1 OPT_2 OPT_3 OPT_4 OPT_TOTAL
Table 5.17. Inter-Item Correlations of Eager Subtheme Items (n=13,613)EAG_1 x .469**EAG_2 .185** x .719**EAG_3 .080** .346** x .715**EAG_4 .052** .289** .369** x .672**
EAG_1 EAG_2 EAG_3 EAG_4 EAG_TOTAL
Table 5.18. Inter-Item Correlations of Perfectionist Subtheme Items (n=13,613)PER_1 x .523**PER_2 .085** x .686**PER_3 .248** .276** x .709**PER_4 .157** .421** .265** x .705**
PER_1 PER_2 PER_3 PER_4 PER_TOTAL
Table 5.19. Inter-Item Correlations of Hasty Subtheme Items (n=13,613)HAS_1 x .790**HAS_2 .272 x .596**HAS_3 .573 .276 x .805**HAS_4 .314 .242 .371 x .648**
HAS_1 HAS_2 HAS_3 HAS_4 HAS_TOTAL

© Copyright Psychological Consultancy Limited, 2019 all rights reserved. Risk Type Compass® is a registered trademark in Europe: CTM No. 010726818.
68 69
Table 5.20. Inter-Item Correlations of Reslience Subtheme Items (n=13,613)RES_1 x .667**RES_2 .080** x .506**RES_3 .291** .036** x .654**RES_4 .341** .266** .247** x .723**
RES_1 RES_2 RES_3 RES_4 RES_TOTAL
Table 5.21. Inter-Item Correlations of Sensitive Subtheme Items (n=13,613)SEN_1 x .786**SEN_2 .534** x .780**SEN_3 .428** .483** x .718**SEN_4 .363** .334** .288** x .690**
SEN_1 SEN_2 SEN_3 SEN_4 SEN_TOTAL
Table 5.22. Inter-Item Correlations of Spontaneous Subtheme Items (n=13,613)SPO_1 x .746**SPO_2 .377** x .754**SPO_3 .500** .321** x .707**SPO_4 .365** .450** .292** x .726**
SPO_1 SPO_2 SPO_3 SPO_4 SPO_TOTAL
Table 5.23. Inter-Item Correlations of Astute Subtheme Items (n=13,613)AST_1 x .756**AST_2 .425** x .787**AST_3 .463** .456** x .786**AST_4 .478** .600** .449** x .789**
AST_1 AST_2 AST_3 AST_4 AST_TOTAL
As discussed in previous chapters, the 18 subthemes that comprise the Risk Type Compass™ are broadly grouped under four main factors, which have been derived through factor analysis. Inter-subtheme correlations are presented in Tables 5.24 – 5.27.

© Copyright Psychological Consultancy Limited, 2019 all rights reserved. Risk Type Compass® is a registered trademark in Europe: CTM No. 010726818.
70
Table 5.24. Inter-Subtheme Correlations of Calm Factor Subthemes (n=13,613)EQU_TOTAL x .706**
CFD_TOTAL .337** x .644**FOR_TOTAL .346** .322** x .727**EAG_TOTAL .179** -.006 .176** x .439**RES_TOTAL .395** .422** .466** .278** x .768**
EQU_TOTAL
CFD_TOTAL
FOR_TOTAL
EAG_TOTAL
RES_TOTAL
Calm Factor
Table 5.25. Inter-Subtheme Emotional Factor Subthemes (n=13,613)APP_TOTAL x -.582**
INT_TOTAL .049** x -.463**OPT_TOTAL -.391** .085** x .708**SEN_TOTAL .404** .439** -.157** x .715**AST_TOTAL -.186** .101** .387** -.008 x .446**
APP_TOTAL
INT_TOTAL
OPT_TOTAL
SEN_TOTAL
AST_TOTAL
Emotional Factor
Table 5.26. Inter-Subtheme Measured Factor Subthemes (n=13,613)FOC_TOTAL x .749**MET_TOTAL .374** x .812**PER_TOTAL .431** .538** x .823**
FOC-TOTAL MET_TOTAL PER_TOTAL Measured Factor
Table 5.27. Inter-Subtheme Daring Factor Subthemes (n=13,613)AUD_TOTAL x .687**
CFM_TOTAL -.341** x -.618**EXP_TOTAL .376** -.242** x .748**HAS_TOTAL .396** -.391** .679** x .835**SPO_TOTAL .341** -.165** .243** .343** x .577**
AUD_TOTAL
CFM_TOTAL
EXP_TOTAL
HAS_TOTAL
SPO_TOTAL
Daring Factor
Whilst the four factors inform the conceptual structure of the Risk Type Compass, the determination of Risk Types is primarily determined through the use of the Emotional:Calm and Daring:Measured scales. The former scale encompasses ten of the 18 subthemes, whilst the Daring:Measured scale encompasses the remaining eight. Tables 5.28 and

© Copyright Psychological Consultancy Limited, 2019 all rights reserved. Risk Type Compass® is a registered trademark in Europe: CTM No. 010726818.
70 71
Table 5.29 present the inter-subtheme correlations of these two scales.Table 5.28. Inter-Subtheme Emotional:Calm Scale Subthemes (n=13,613)APP_TOTAL
x -.677**
EQU_TOTAL
-.433** x .706**
CFD_TOTAL
-.478** .337** x .668**
INT_TOTAL
.049** -.264** -.150** x -.344**
FOR_TOTAL
-.401** .346** .322** -.015 x .668**
OPT_TOTAL
-.391** .209** .435** .085** .359** x .518**
EAG_TOTAL
-.023** .179** -.006 -.098** .176** -.053** x .297**
RES_TOTAL
-.386** .395** .422** -.128** .466** .266** .278** x .688**
SEN_TOTAL
.404** -.586** -.470** .439** -.261** -.157** -.086** -.412** x -.693**
AST_TOTAL
-.186** .164** .101** .101** .404** .387** .067** .181** -.008 x .413**
APP_TOTAL
EQU_TOTAL
CFD_TOTAL
INT_TOTAL
FOR_TOTAL
OPT_TOTAL
EAG_TOTAL
RES_TOTAL
SEN_TOTAL
AST_TOTAL
E:CScale
Table 5.29. Inter-Subtheme Daring:Measured Scale Subthemes (n=13,613)AUD_TOTAL
x -.588**
CFM_TOTAL
-.341** x .669**
EXP_TOTAL
.376** -.242** x -.651**
FOC_TOTAL
.132** .176** .003 x .307**
MET_TOTAL
-.283** .454** -.275** .374 x .721**
PER_TOTAL
-.167** .332** -.130** .431** .538** x .584**
HAS_TOTAL
.396** -.391** .679** .061** -.334** -.195** x -.730**
SPO_TOTAL
.341** -.165** .243** .326** -.091** .047** .343** x -.379**
AUD_TOTAL
CFM_TOTAL
EXP_TOTAL
FOC_TOTAL
MET_TOTAL
PER_TOTAL
HAS_TOTAL
SPO_TOTAL
D:MScale

© Copyright Psychological Consultancy Limited, 2019 all rights reserved. Risk Type Compass® is a registered trademark in Europe: CTM No. 010726818.
72
Risk Type Compass™ Short Form
The standard Risk Type Compass™ questionnaire is a manageable size, involving 102 items (72 items to determine Risk Type, 20 items to determine Risk Attitude, and 10 items for validity). However, the value of the Risk Type Compass™ as a research tool has led to the creation of a ‘short form’ including just half of the items used to identify an individual’s Risk Type. Table 5.30 outlines the internal reliability coefficients, means, and standard deviations of the 36-item short form assessment.
Table 5.30. Short Form Risk Type Compass™ Subtheme Internal Reliability Coefficients, Means, and Standard Deviations (n=13,613)Scale Factor Subtheme (Short) Subtheme
Alpha (Short)Subtheme Mean (Short)
Subtheme SD (Short)
Emotional:Calm
Emotional Apprehensive .597 4.77 2.278Sensitive .695 4.89 2.178Intuitive .674 2.84 1.71Astute .748 7.1 1.619Eager .539 2.99 1.788
Calm Resilient .509 5.25 2.001Confident .749 6.94 1.982Forgiving .744 6.2 2.209Optimistic .558 7.92 1.505Equable .617 4.66 2.193
Daring:Measured
Measured Audacious .618 7.22 1.717Explorative .527 7.21 1.738Hasty .729 5.09 2.731Spontaneous .62 6.75 1.876
Daring Focused .682 7.15 1.956Methodical .62 5.02 2.049Perfectionistic .593 6.63 2.097Conforming .639 5.5 2.104
Despite consisting of only two items per subtheme, all internal reliability coefficients of the short form Risk Type Compass™ subthemes report alpha scores of .5 or above, with 12 of the subthemes having alpha scores of 0.6 or above. Further analysis identified the correlation values between the Emotional:Calm and Daring:Measured scale raw scores of the short form and standard Risk Type Compass™. We also conducted analyses comparing Males (N=7,879) and Females (N=5,135) to ensure that the inter-test

© Copyright Psychological Consultancy Limited, 2019 all rights reserved. Risk Type Compass® is a registered trademark in Europe: CTM No. 010726818.
72 73
correlations were relatively consistent between these groups. Findings are presented in Table 5.31.
Table 5.31. Short Form Risk Type Compass™ raw score correlations with standard Risk Type Compass™ scales (n=13,014)
Scale Raw Score CorrelationAll (n=13,014) Male (n=7,789) Female (n=5,135)
Emotional:Calm .956 .949 .959Daring:Measured .937 .935 .939
Findings indicate that, despite dropping to half of the items in the standard Risk Type Compass™ assessment, the raw scores for the Emotional:Calm and Daring:Measured scales still achieve very strong correlational values between 72-item standard and 36-item short form versions of the assessment. It is also important to note that relatively little variation was identified in the correlations between the long and short-form RTC when comparing males and females. The high correlation between the long and short form scales indicates that the assumption of parallelism have been met.
ValidityPersonality Scale Validity
A common method for analysing the construct validity of psychometric assessments is to correlate the test’s underlying scales against those within established assessments that claim to be measuring the same, similar, or related themes. The construct validity of the Risk Type Compass™ was examined through correlational analysis of the Emotional:Calm and Daring:Measured scales against relevant scales within the instruments cited later in this chapter.
Correlations with Profile:Match2™
One hundred and forty-one participants from a range of occupations completed both the Risk Type Compass™ and Profile:Match2™; a Five Factor model of personality developed and published by Psychological Consultancy Limited and designed to assess individuals against key competencies related to work performance. Two hypotheses were proposed. First, that the Emotional:Calm scale will be related to the two Profile:Match2™ (PM2) personality scales Composure and Self Esteem, which relate to the Five Factor Model’s Emotional Stability. Second, that the Daring:Measured scale will be negatively related to the two Profile:Match2™ scales that measure aspects of Conscientiousness; the Compliant and Perfectionistic scales. Results of this analysis are presented in Table 5.32.

© Copyright Psychological Consultancy Limited, 2019 all rights reserved. Risk Type Compass® is a registered trademark in Europe: CTM No. 010726818.
74
Table 5.32. Correlations between the Risk Type Compass™ scales and Profile:Match2™ personality scales (n=141)
Composure PM
Self-Esteem PM
Compliant PM Perfectionistic PM
Emotional:Calm .44** .44**Daring:Measured -.41** -.48**
**p <.01
Overall, both hypotheses were supported. Results of the analysis show strong correlations between the scales at the .01 significant level, ranging from .41 to .48. A second analysis looked at the extreme ends of the personality scales by splitting the data into quartiles and including only the top and bottom quarters in the analysis. The correlations were re-run with a reduced sample (n=74) and the results are presented in Table 5.33. The relationship between high and low scorers on the Risk Type Compass™ scales and their corresponding Profile:Match2™ scales were found to be highly significant, although the reduced sample size suggests caution about over-generalising from these results.
Table 5.33. Correlations between the Risk Type Compass™ scales (top and bottom quartile scorers only) and Profile:Match2™ personality scales (n =74)
Composure PM
Self-Esteem PM
Compliant PM Perfectionistic PM
Emotional:Calm .75*** .78***Daring:Measured -.61** -.57**
**p<.01, ***p<.001
Correlations with the Hogan Personality Inventory
The Hogan Personality Inventory (HPI) is a Five Factor Model instrument designed specifically for occupational assessment purposes. It is a measure of normal personality, designed to predict ‘reputation’; how an individual is likely to perform at work and how they come across to others. The assessment consists of seven scales which, when combined, create a detailed overview of an individual’s personality that can be used in selection, development, coaching and other occupational settings. First developed by Hogan Assessment Systems in the 1970s, the HPI is now backed by almost four decades of comprehensive research and is used globally.
243 participants from a range of occupational backgrounds completed both the HPI and the Risk Type Compass™. It was hypothesised that the Risk Type Compass™ Daring:Measured and Emotional:Calm scales would correlate with two theoretically similar scales within the HPI; Prudence, which is concerned with conscientiousness,

© Copyright Psychological Consultancy Limited, 2019 all rights reserved. Risk Type Compass® is a registered trademark in Europe: CTM No. 010726818.
74 75
self-discipline and dependability, and Adjustment, which is to do with confidence, self-esteem and emotional stability. The results are presented in Table 5.34.
Table 5.34. Correlations between the Risk Type Compass™ and HPI personality scales (n=297)
Adjustment HPI
Prudence HPI
Emotional:Calm .34**Daring:Measured -.26**
**p<0.01
As expected, both scales of the Risk Type Compass™ were significantly correlated with the selected HPI scales, with correlation coefficients of .34 for Emotional:Calm and -.26 for Daring:Measured. The participants were ranked by their scale scores, then the correlations with personality scales were re-run on the sample’s top and bottom quartiles. The results of this analysis are presented in Table 5.9. The correlation coefficients show significant relationships between high and low scorers on the Risk Type Compass™ scales and their corresponding HPI scales; individuals who scored high on Adjustment HPI were more likely to fall at the Calm end of the Emotional:Calm scale, while those that scored high on Prudence HPI were more likely to fall at the Measured end of the Daring:Measured scale.
The derivation of the Risk Type Compass™ through our original research, extracting risk related themes from the FFM themes and the subsequent identification of four risk related factors (Calm, Emotional, Measured and Daring), implies that there are significant structural differences between the Risk Type Compass™ and FFM models. The results (Table 5.35) confirm this, whilst acknowledging a significant relationship between the two. Overall, these findings suggest a shared variance of no more than 25%.
Table 5.35. Correlations between the Risk Type Compass™ (top and bottom scorers only) and HPI personality scales (n=110)
Adjustment HPI
Prudence HPI
Emotional:Calm .51*Daring:Measured -.33*
*p<0.01
As a further measure, the Risk Type Compass™ scales were analysed against the remaining HPI scales of Ambition, Sociability, Agreeability, Inquisitive and Learning Ability. No significant relationships were found here. Again, this is in line with expectations that, since only some FFM item themes are absorbed as contributors to the Risk Type Compass™ scales, other aspects of the FFM (and of the HPI) will be unrepresented in the Risk Type Compass™ model.

© Copyright Psychological Consultancy Limited, 2019 all rights reserved. Risk Type Compass® is a registered trademark in Europe: CTM No. 010726818.
76
Correlations with the Hogan Development Survey
The risks that leaders choose, or choose not, to take will undoubtedly play a key role in organisational success. Leaders must continuously weigh up the costs and benefits of situations and events and make a decision that will impact the working lives of others. As such, there has been a great deal of research into what contributes to good or poor leadership performance (e.g. Fiedler, 1995). However, consensus or coherence in the subject has proved elusive. The Hogan Development Survey (HDS) was developed to measure factors that contribute specifically to leadership failure. The HDS is comprised of eleven scales of personality that, while generally advantageous, can prove counter-productive, especially under stress or periods of intoxicating success.
Termed ‘dark side’ characteristics, these behaviours can be grouped into three main themes, each containing between 2 and 5 behaviour scales: Moving Away, Moving Against and Moving Towards. Each of these three themes is related to the way an individual will handle insecurity and were developed from the self-defeating interpersonal styles identified by Horney (1950). Moving Away is characterised by a tendency to manage one’s inadequacy by avoiding contact with others and maintaining a distance. Moving Against is characterised by using manipulation or control techniques to manage anxiety. Moving Towards, or ‘ingratiation’, is characterised by dealing with one’s doubts through building alliances with others. Hogan saw Horney’s classification as a useful way of organising dysfunctional behaviour (Hogan and Hogan, 1997). Furthermore, Hogan found the disorders to accurately reflect the common themes exhibited by individuals who, on the most part, appear to be getting by but perhaps are not realising their full potential or are gradually failing (Hogan & Hogan, 1997).
Seventy-three participants completed both the HDS and the Risk Type Compass™. It is worth noting at this point that due to the relatively small sample size, any conclusions drawn from the results must be tentative. It was hypothesised that individuals with different Risk Types would achieve significantly different scores on the HDS scale and that particular inferences for the interpretation of one or more of the Risk Type Compass™ scales based on the HDS may be justified by the relationships observed.
Correlational analysis between the Risk Type Compass™ scales and the three themes within the HDS revealed interesting findings (Table 5.36). First, it was found that participants who scored higher on the Moving Away HDS theme, characterised by a tendency to gain security by distancing oneself from others, were more likely to score low on the Emotional:Calm scale. This placed them at the emotional end of the spectrum which is characterised by a tendency to be pessimistic, easily irritated, apprehensive and emotional. The only exception here was the Reserved HDS scale, which did not show a significant association with either Risk Type Compass™ scale.
Second, participants who scored high on the Moving Against HDS theme, characterised

© Copyright Psychological Consultancy Limited, 2019 all rights reserved. Risk Type Compass® is a registered trademark in Europe: CTM No. 010726818.
76 77
by the type of individual who wins recognition with self-promotion or charm, tended to score higher on the Daring:Measured scale. The Bold HDS scale is an exception here. Individuals who fall at this end of the Daring:Measured scale are likely to be seen as flexible, carefree, disorganised and spontaneous in their risk taking. The strongest association within this cluster is with the Mischievous HDS scale, which is characterised by an enjoyment of risk taking, impulsivity and limit testing, a craving for excitement and a tendency to be manipulative or, at times, exploitative.
Third, participants who scored highly in the Moving Towards HDS theme, characterised by a tendency towards being loyal and indispensable in an attempt to obtain approval, generally scored lower on the Daring:Measured scale. Although both HDS scales within this theme were found to be negatively related to the Daring:Measured scale, Dutiful narrowly missed out on being significant which could perhaps be a consequence of the relatively small sample size used in the study.
Table 5.36. Results of two-way Pearson correlational analysis between the HDS scales, categorised here according to their themes, and the two Risk Type Compass™ scales (n=74)HDS Theme HDS Scale Emotional:Calm Daring:MeasuredMoving Away Excitable -.559** -.1
Sceptical -.366** -.088Cautious -.360** .131*Reserved -.220** -.053Leisurely -.177** .098
Moving Against Bold .125* -.193**Mischievous -.112 -.599**Colourful .004 -.385**Imaginative -.076 -.426**
Moving Towards Diligent .058 .349**Dutiful .058 .062
* p<.05, **p<.01
Correlations with the Motives, Values, Preferences Inventory
Research conducted as part of an MSc Occupational Psychology dissertation project by Gordon (2010) aimed to examine the role of security values in the workplace and how this might be related to the Risk Type Compass™ scales.
Security was measured using the Hogan Motives, Values, Preferences Inventory (MVPI), which assesses an individual’s identity, motives and personal preferences. The MVPI

© Copyright Psychological Consultancy Limited, 2019 all rights reserved. Risk Type Compass® is a registered trademark in Europe: CTM No. 010726818.
78
is derived from over 80 years of literature on motivation and consists of ten scales which can be used to assess a person’s ‘fit’ with a job, team or organisation. One of the scales in the MVPI is Security; high scores on the Security MVPI scale are associated with a need for structure, order and predictability. Individuals with this profile are likely to be averse to risk taking and will tend not to take unnecessary chances. They will be most satisfied working in an organisation that emphasises planning, has well defined processes and procedures and a history of stability.
130 participants, from a broad range of occupations within the UK working population, completed the Risk Type Compass™ and the MVPI. The results of a regression analysis between the Risk Type Compass™ scales, Daring:Measured and Emotional:Calm and MVPI Security values is displayed in Table 5.37.
Table 5.37. Standardised beta coefficients for the study variables in the regression analysis (n=130)MVPI Variable Daring:Measured Emotional:CalmSecurity -.59*** -0.1
***p<.001
Correlations with the Hogan Personality Inventory Safety Competencies
Safety in the workplace can have important implications at the individual and organisational level, as well as to the wider economy (Barling & Frone, 2004). The traditional approach to improving workplace safety is to look at environmental factors, but a lack of success with this strategy has prompted researchers to focus on individual differences instead (e.g. Clarke, 2006). In response, Hogan Assessment Systems developed the Safety Competencies as part of their Hogan Personality Inventory (HPI) to help organisations identify individuals that were likely to engage in safe behaviours at work. These are displayed in Table 5.38.
Table 5.38. The Hogan Safety Competencies with descriptionCompetency DescriptionCompliant A person’s tendency to follow rules. Poor performers ignore
authority and company rules. Exceptional performers willingly follow rules and guidelines.
Strong A person’s ability to handle stress with confidence. Poor performers tend to panic under pressure and make mistakes. Exceptional performers are steady under pressure.
Emotionally Stable A person’s ability to handle pressure without emotional outbursts. Poor performers easily lose their tempers and then make mistakes. Exceptional performers control their tempers.

© Copyright Psychological Consultancy Limited, 2019 all rights reserved. Risk Type Compass® is a registered trademark in Europe: CTM No. 010726818.
78 79
Competency DescriptionVigilant A person’s ability to stay focused when performing monotonous
tasks. Poor performers are easily distracted and then make mistakes. Exception performers stay focused on the task at hand.
Cautious A person’s tendency to avoid risk. Poor performers tend to take unnecessary risks. Exceptional performers evaluate their options before making risky decisions.
Trainable A person’s tendency to respond favourably to training. Poor performers overestimate their competence and are hard to train. Exceptional performers listen to advice and like to learn.
Safety and risk taking at work are linked concepts. It’s likely that certain Risk Types will have a more favourable disposition to safety behaviours and this will subsequently be reflected in their scores on the Safety Competencies. Research conducted by PCL set out to examine this relationship.
Participants consisted of 78 individuals who completed both the Risk Type Compass™ and the Hogan Personality Inventory. Although there was a fairly even spread of participants across each Risk Type, there were only a limited number of participants in each, with sample sizes ranging from 6 in the Prudent Type to 12 each in the Adventurous and Carefree Types. Therefore, conclusions must be tentative.
Results found the Daring:Measured scale to be significantly associated with the HPI Safety Competencies (HSC) Compliant and Cautious. This suggests that individuals who fall at the Measured end of this Risk Type Compass™ scale are likely to follow rules and evaluate all options before making a decision. No significant relationship was found with the Vigilant HSC.
Emotional:Calm was found to be significantly associated with the Strong and Emotionally Stable HSC, implying that individuals that are calm and composed in their risk-taking style are more likely to be capable of handling pressure and stress without emotional outbursts. A significant association was also found between the Trainable HSC and Emotional:Calm scale. The association with Daring:Measured and the Trainable HSC was marginally not significant (p=0.05).
Table 5.39. Correlation analysis of the two Risk Type Compass™ scales and the six HPI Safety Competencies (n=78)
Compliant HSC
Strong HSC
Emotionally Stable HSC
Vigilant HSC
Cautious HSC
Trainable HSC
Emotional:Calm .36** .19 -.19 -.18 -.46*** -.22Daring:Measured .26* .51*** -.53*** -.19 .00 .25*
*p<.05. **p<.01. ***p<.001

© Copyright Psychological Consultancy Limited, 2019 all rights reserved. Risk Type Compass® is a registered trademark in Europe: CTM No. 010726818.
80
Interpretative Summaries of Correlation ResearchThis section draws together each of the studies reported above to consider what we can draw from these findings in terms of the meaning and interpretation that can be applied to Risk Type Compass™ assessment results.
There are broadly three levels of interpretation for a personality questionnaire like the Risk Type Compass™. The first is the item content, i.e. the questions that the candidate has answered. Here we can make assumptions about the individual based on the way that they have answered the items and where they fall on the tool’s underlying scales.
The second level involves inferences that are supported by the extensive research into personality accumulated over recent decades and, in particular, by the various validation studies comparing the specific instrument in question with others addressing similar or related themes or constructs and different behavioural variables (like those described above). Here we can broaden our understanding of the meaning of the assessment, allowing fuller interpretation of the Risk Type Compass™ scales and, consequently, of the Risk Types.
Thirdly, as with the use of any personality questionnaire, the proficiency of the practitioner will reflect the depth and use of the information gleaned; in particular, experience in giving feedback to candidates and discussing their profiles. This develops a clearer appreciation of a subtler range of implications for particular profiles. Overall, the first level of interpretation can be seen as the most literal, the second is backed by empirical evidence and the third is the richest and most nuanced.
Drawing from the validation studies reported above, the following inferences may reasonably be made about the eight Risk Type Compass™ Risk Types.
The Pure Risk TypesThe Composed Risk Type (High Calm)The Composed Risk Type is even-tempered, emotionally even and remains calm and steady in the face of change or the unexpected. Such people should be capable of taking life’s ups and downs in their stride and will be comparatively calm in situations that may rattle others (Composure PM2). Consequently, the Composed Risk Type is likely to be capable of coping with fast-paced work environments and will cope with heavy workloads without over-reacting to stress (Adjustment HPI). On the whole, the Composed Risk Type is likely to appear self-confident, upbeat and optimistic; they will be at ease with themselves and have few self-doubts about the value of their own views and their ability to communicate their ideas (Self-esteem PM2).
Overall, themes of resilience, composure and optimism can be seen to consistently emerge as key constructs underscoring this Risk Type (Strong, Emotionally Stable

© Copyright Psychological Consultancy Limited, 2019 all rights reserved. Risk Type Compass® is a registered trademark in Europe: CTM No. 010726818.
80 81
and Trainable HSC). As a side point, the association made here to the HPI Safety Competencies points to the appropriate use of the Risk Type Compass™ for Health and Safety management within the workplace. Those who fall within the Composed Risk Type are likely to be considered ‘safer’ employees due to their tendency to be level-headed and emotionally stable and their willingness to embrace new training opportunities (Foster, 2010).
The Intense Risk Type (High Emotional)The Intense Risk Type may react passionately to events and display their emotions readily (Composure PM2). At times, their passion may be perceived as an inconsistency in mood in which they appear ‘up’ one moment and ‘down’ the next (Excitable HDS). While the Composed Risk Type will remain cool, calm and collected in the face of stress, the Intense Type is likely to become anxious and on edge. They are their own worst self-critic and are hard on themselves. This, coupled with being overly sensitive to criticism from others, means they tend to feel things deeply when things go wrong and dwell on past mistakes (low Adjustment HPI, Sceptical HDS). On the upside, when able to manage the negative aspects of strong fluctuating emotions, their passion and enthusiasm make them committed and loyal employees (Composure PM2, Excitable HDS). With the potential of this Risk Type to not trust people, they may choose to distance themselves from others, assuming others have bad intentions (Moving Away HDS). They are also likely to avoid taking chances where possible in an attempt to sidestep the inevitable anxiety.
The Intense Risk Type may be described as being self-conscious, unsure of their ability, and have a tendency to be self-doubting (Self-esteem PM2). On the upside, these characteristics can provide the fuel and determination required for the Intense Type to improve and succeed in what they do; due to their tendency to be self-critical they make note from past failings and learn from their mistakes. (Low Adjustment HPI).
The Prudent Risk Type (High Measured)Drawing from the validity research, the Prudent Risk Type is likely to appear conforming and obedient; they may be particularly anxious to comply with rules and procedures and, as a result, behave in a restrained and cautious manner (Compliant PM2, Prudent HPI, Compliant HSC). On occasions, this desire to stick to the ‘right way’ of doing things may be seen as a level of inflexibility and result in an inability to cope in fast-paced or more fluctuating environments (Prudent HPI and Diligent HDS). This potentially explains the risk-averse nature of the Prudent Type, for whom sticking with the established way of doing things will typically take preference over any form of innovation.
The Prudent Risk Type is likely to be thorough, organised and concerned about the quality of the detail in their work (Perfectionistic PM2). Individuals with this profile are likely to be the type of person who will prefer to gather all the information available and consider it in a systematic manner before making a decision (Prudent HPI, Cautious HSC). They are likely to value working within a climate of predictability and certainty, in which everything ‘has its place’ and there are clear and structured guidelines to

© Copyright Psychological Consultancy Limited, 2019 all rights reserved. Risk Type Compass® is a registered trademark in Europe: CTM No. 010726818.
82
work within (Security MVPI). In terms of risk taking, it is likely that the Prudent Type will attempt to minimise risk by having a detailed and structured plan that will allow them to overcome all eventualities.
The Carefree Risk Type (High Daring)Situated at the opposite end of the scale from the Prudent Type, the Carefree Risk Type may be described as individualistic and autonomous; this Type will have little concern for conforming with established ways of doing things, preferring instead to tread their own path (low Compliant PM2, low Diligent HDS). As such, they are likely to be viewed as flexible, and perhaps as innovative thinkers (low Prudence HPI, Imaginative HDS); characteristics that have shown to correlate with greater risk tolerance.
On the other hand, the Carefree Risk Type may seem careless and disorganised at times (low Perfectionistic PM2, Colourful HDS). They will be less concerned about adopting a carefully planned and structured approach and, as a result, their decision-making style may lack consistency (low Prudence HPI). The Carefree Type has a preference for variety and enjoys a changing work environment; they embrace uncertainty and revel in the excitement associated with being impulsive and spontaneous. They may at times purposely test the limits and push the boundaries, fuelled by a craving for excitement and a lack of inhibition (Mischievous HDS). The attention this type of behaviour attracts from others may only add to the excitement and appeal (Colourful HDS). Risk taking for the Carefree Type is likely to be a consequence of both a lack of concern for structure, order and predictability, coupled with a need for excitement and experience seeking.
The Complex Risk TypesPositioned between two ‘Pure’ Risk Types, the ‘Complex’ Risk Types display a combination of features from their adjoining neighbours. In addition to this simple summation, there will be an interaction between these two influences; a chemistry that contributes an additional set of features distinct to that Risk Type.
The Deliberate Risk Type (High Calm and High Measured)The Deliberate Type falls between the Composed and Prudent Type on the compass and will therefore contain elements of both. Feeding in from the Composed side, the Deliberate Type is likely to be resilient and calm in the face of stress (Composure PM2) and will appear self-confident, self-assured and optimistic (Adjustment HPI, Self-esteem PM2). Coupled with this is a desire to stick to the rule book and follow procedures; a tendency to conform to the established norms (Compliant PM2). These individuals are likely to be particularly capable of adopting a systematic and organised approach to their work, for example researching options thoroughly and putting in place detailed plans of action (Prudent HPI, Diligent HDS). Although this Risk Type has a preference for predictability and certainty, their resilience, optimism and confidence allow them to tolerate risk reasonably well. They will remain relatively calm and steady under pressure

© Copyright Psychological Consultancy Limited, 2019 all rights reserved. Risk Type Compass® is a registered trademark in Europe: CTM No. 010726818.
82 83
(Adjustment HPI) and approach decision-making in a business like, purposeful way and never go into anything unprepared.
The Adventurous Risk Type (High Calm and High Daring)Falling between the Composed and the Carefree Risk Types, the Adventurous Risk Type shares characteristics with each. This Risk Type will be relatively unmoved by disappointment and will remain calm under pressure (Composure PM2). They are able to maintain a positive and upbeat outlook, taking any setbacks confidently in their stride (Adjustment HPI). In addition, the Adventurous Risk Type has the potential to be impulsive, spontaneous and nonconforming with regard to expected rules and processes (low Prudence HPI, low Compliant PM2).
Taken together, their optimism and resilience, combined with being excitement seeking, impulsive and resilient, give the Adventurous Risk Type a level of risk tolerance that surpasses all others. A desire for stimulating challenges, combined with the self-belief and confidence to meet new experiences head on, means their decision-making will be fuelled by an impulsive fearlessness.
The Excitable Risk Type (High Daring and High Emotional)The Excitable Risk Type falls between the Intense and the Carefree Types, creating a unique combination of characteristics derived from the two. The Excitable Type is likely to demonstrate elements of passion and emotion; an enthusiastic rush when things are going well, coupled with ‘moodiness’ when the going gets tough (low Composure PM2). As a result, their mood is likely to be inconsistent and their commitment to ideas, projects or new ventures may be seen to vary (Excitable HDS). This temperamental nature may be further fuelled by the excitement-seeking impulsivity adopted from the Carefree Type (Colourful HDS, Mischievous HDS). This Risk Type also has the tendency to disregard rules, and a preference for a flexible and individualistic approach (low Prudence HPI, low Diligent HDS).
However, although experience seeking, the Excitable Risk Type is anxious by nature and will possess a fear of failure (low Adjustment HPI, low Self-esteem PM2). As a consequence, this kind of individual is likely to appear inconsistent in their risk taking style; moving from excitable impulsiveness to being cautious and regretful about decisions made in haste.
The Wary Risk Type (High Measured and High Emotional)The Wary Risk Type falls at the top of the compass, sandwiched by the Prudent and the Intense Risk Types. Consequently, they are likely to demonstrate elements of rule-abiding conformity, with a high level of anxiousness. They may be seen to be restrained, cautious and perhaps rather inflexible (Prudence HPI). As such, the Wary Type may not be as comfortable as others in fast-paced environments, preferring a level of prescribed structure and predictability (Security MVPI).
This Risk Type is likely to be particularly organised and concerned with the quality of
© Copyright Psychological Consultancy Limited, 2019 all rights reserved. Risk Type Compass® is a registered trademark in Europe: CTM No. 010726818.
84
their work. They will devote time and effort to everything they do in an effort to avoid failure (Perfectionistic PM2). Underlying characteristics of the Wary Risk Type suggest they are more emotional than most (low Composure PM2). They will be uncomfortable under pressure or when out of their comfort zone (low Adjustment HPI) and have the potential to be self-doubting in their abilities (Self-esteem PM2, Composure PM2). Yet, when things are going according to their rather exacting requirements, the Wary type will bring enthusiasm and passion to the table (Excitable HDS) as well as commitment and loyalty.
In terms of their risk taking, the Wary Type appears to have two reasons for being particularly risk averse: first in their preference for structure, order and predictability and, second, in a level of fearfulness that arises from their low confidence, pessimism and anxious nature. It is therefore perhaps unsurprising that the Wary Type is the most risk-averse of all the Risk Types.
SummaryThe broad ranging nature of the personality characteristics discussed above, and the fact that the research produced correlations that fall towards the medium to low range in strength, implies that their influence will be nuanced rather than emphatic. Each individual falling within a particular Risk Type will show a unique combination of characteristics from this broad spectrum described. The influence of these dispositions will not be confined to risk behaviour. The Risk Type Compass™ is a personality measure and, although focused on risk, the impact of Risk Type characteristics will be widely expressed in behaviour and in many contexts.
To summarise our findings, the Emotional:Calm scale is concerned with measuring dispositions ranging from fearful, e.g. hypersensitive, changeable in mood, and apprehensive, to fearless, e.g. stable, poised, flexible, self-confident, upbeat and optimistic. Considering risk preferences along the Emotional:Calm scale, we appear to be categorising risk taking in terms of the degree of fear and apprehension inherent in individuals faced with threat, change, the unexpected or the need to make decisions with unknown consequences. Those who fall at the Calm end of the scale (the Composed, Adventurous and Deliberate Risk Types) are likely to be more risk tolerant due to an inherent fearlessness; they are comfortable with taking leaps into the unknown because they are generally optimistic; they are ‘calm and collected’ in conditions that would fluster others and confident in their choices and their ability. Those falling towards the Emotional end of the scale (the Intense, Wary and Excitable Risk Types) will be risk averse for the opposite reasons.
The correlation results both confirm and add to what we already know about the Daring:Measured scale. In summary, the results show that the Daring:Measured scale is tapping into constructs of conformity, dependability, obedience and rule-abiding tendencies. Or, at the opposite end of the scale, an almost reckless disregard for

© Copyright Psychological Consultancy Limited, 2019 all rights reserved. Risk Type Compass® is a registered trademark in Europe: CTM No. 010726818.
84 85
established procedures. In addition, there is a key theme of characteristics pertaining to being organised, prepared and systematic, and wanting to gather and evaluate all the available information. This runs through several of the correlation research findings. An inherent tendency to be prudent, detailed, planned and compliant with procedures and rules will typically place individuals at the Measured end of the Daring:Measured scale (i.e. Prudent, Deliberate and Wary Risk Types). This is likely to lead to behaviours that are typically risk averse. Towards the Daring end, individuals are likely to be carefree, unpredictable, vague, disorganised and impulsive and therefore fairly risk tolerant (the Carefree, Adventurous and Excitable Risk Types). In this way, the two scales can be seen to take different stances on measuring risk tolerance. The Emotional:Calm scale looks at risk taking personality as a consequence of fear, while the Daring:Measured scale can be described as a measure of impulsivity.
Risk ToleranceThe focus of the above discussion is on the meaning of Risk Type Compass™ scores and the inferences that can appropriately be considered in interpreting each of the Risk Types. In addition to these Risk Type validity issues, responses to the Risk Type Compass™
questionnaire are also scored to derive a composite measure of risk tolerance; the RTi. The remaining issue is, ‘does the Risk Type Compass™ actually measure risk taking?’. We know that it is built from Five Factor Model (FFM) risk themes and that the FFM scales are backed by a significant body of research confirming their associations with various features of risk taking and risk aversion; impulsivity, over-confidence, prudence, vigilance, compliance and fearfulness, for example. There are also a number of studies that have explicitly addressed the question that we originally posed; ‘is personality a predictor of risk behaviour?’. These all provided some affirmative evidence within different contexts.
To address the issue more directly, PCL conducted a study comparing the overall risk tolerance measure derived from the Risk Type Compass™ (the RTi), with a questionnaire relating to five different risk domains (Blais & Weber, 2006) that was also capable of generating an overall measure of propensity for risk taking. The approaches of the two instruments are conceptually different: the focus of the Risk Type Compass™ is on the more deeply rooted core of personality, seeking to get behind the more variable influences of personal experience, situation, exposure and attitudes; the approach adopted by Blais and Weber is more holistic, incorporating both what the Risk Type Compass™ would term Risk Type and Risk Attitude. The questionnaire measures risk taking across five domains: reputational, financial, recreational, social and health and safety.
For the purposes of this study, a total risk taking variable was created from the Blais and Weber questionnaire by summing the scores on each of the five risk attitude domains (‘Total Risk’). It is important to note that whilst the questionnaire uses similar domains

© Copyright Psychological Consultancy Limited, 2019 all rights reserved. Risk Type Compass® is a registered trademark in Europe: CTM No. 010726818.
86
to the Risk Type Compass™ Risk Attitudes measure (part two of the assessment), the questionnaire itself differs both theoretically, as discussed above, and structurally. Importantly, Blais and Weber’s (2006) risk attitude measure is normative rather than ipsative, allowing objective comparisons to be made between participants. In practical terms, the similarities between the Risk Type Compass™ and the Blais and Weber questionnaire are that both are self-report and concerned with predicting risk behaviours. Both, in their different ways, take risk attitude into account but with different degrees of emphasis.
Seventy participants who had completed the Risk Type Compass™ were invited to complete the Blais and Weber (2006) risk attitude questionnaire. The questions are based on a Likert scale, requiring participants to rate the likelihood of engaging in particular risky behaviours on a scale from 1 (“Extremely Unlikely”) to 7 (“Extremely Likely”).
Table 5.40. Correlations for the personality and risk attitude variables measured in the study (n=70)
Reputational Financial Health & Safety
Recreational Social Total Risk
Emotional:Calm -.16 .31** -.10 -.39** -.47*** -.31**Daring:Measured .22 .44*** .33** .46*** .59*** .64***
**p<.01. ***p<.001
The Risk Type Compass™ Daring:Measured scale was found to show a strong positive relationship to the Blais and Weber’s Total Risk, implying that the further towards the Daring end of the spectrum an individual fell, the greater their risk tolerance. Similarly, Emotional:Calm was also found to show a significant positive relationship to the Blais and Weber measure, suggesting that the further towards the Calm end of the scale an individual fell, the greater their risk tolerance.
Inspection of risk tolerance at the domain level reveals how this relationship is patterned in different areas of risk taking. From Table 5.40 we can see that the Emotional:Calm and Daring:Measured scales are significantly positively related to risk tolerance within the financial, recreational and social domain. The exception is the Health & Safety domain, which, although significantly related to the Daring:Measured scale, showed no relationship to the Emotional:Calm scale.
Overall, these results provide strong evidence of the relationships between the personality scales Emotional:Calm and Daring:Measured and risk tolerance as assessed by Blais and Weber’s (2006) self-reported attitudinal measure. Both hypotheses were supported. First, high Emotional:Calm scores were found to be related to greater risk tolerance. That is, those that are likely to be described as resilient, confident, calm, optimistic, trusting, forgiving, patient and as the type of person who would not let their emotions affect their decision making, will show greater risk tolerance overall. This can be explained by the tendency of these individuals not to be overly anxious about failure and to have the

© Copyright Psychological Consultancy Limited, 2019 all rights reserved. Risk Type Compass® is a registered trademark in Europe: CTM No. 010726818.
86 87
confidence to take risks that others may find daunting. This behavioural pattern was found to be consistent across all domains, excluding health and safety.
Second, higher Daring:Measured scores were related to having a greater risk tolerance. Individuals with this score profile are likely to be spontaneous, adventurous and excitement seeking, but at times may also be reckless, non-conforming and lack a methodical and focused approach. These individuals will not be aware of the need to plan through the positives and negatives of risk actions and their desire for adventurous and sensation seeking means they are likely to actively seek out risks. This was found to be true across all risk domains.
Risk Tolerance and MVPI Security
In a second study looking at the validity of risk tolerance, Gordon (2010) considered the association between valuing Security (MVPI) and risk tolerance, hypothesising that those individuals that have a preference for security will have a lower risk tolerance (RTi).
High scores on the Security MVPI scale are associated with a need for structure, order and predictability. People with scores like this will be concerned with planning for the future and minimising financial risk, employment, uncertainty and criticism. They are likely to be averse to risk taking and will not take unnecessary chances. In the workplace they will foster a climate devoted to safety, proper procedures and minimising mistakes. High scorers should therefore have fairly low levels of risk tolerance. Gordon’s study used a sample of 132 people from a variety of different sectors.
Table 5.41. Standardised beta coefficients for the study variables in the regression(n=132)Predictor Variables Risk Tolerance IndexSecurity -.42***Gender .33***Age .08
***p<.001
Results showed Security to be significantly negatively associated with the Risk Tolerance Index (Beta= -.42, p<0.001), confirming the hypothesis that high scorers on the Security scale are associated with having a lower risk tolerance.
There was no relationship between age and risk tolerance. However, gender was significantly related (Beta = .33, p<0.001), with males (Mean=54.96, SD = 17.88, n=72) having higher risk tolerance levels than females (Mean=40.50, SD = 18.18, n=60).
Mean Security scores were also ascertained for each of the Risk Types. As each Risk Type is associated with a different level of risk tolerance (with those at the top of the compass less risk tolerant than those at the bottom), each should also be associated

© Copyright Psychological Consultancy Limited, 2019 all rights reserved. Risk Type Compass® is a registered trademark in Europe: CTM No. 010726818.
88
with varying levels of the Security variable.
Analysis of Variance (ANOVA) showed significant differences in Security scores across the Risk Types (F(8,123) = 6.23, p<0.001). Definitive conclusions cannot be drawn due to the small sample sizes in the majority of the groups. Nonetheless, it would be predicted that as Risk Tolerance increases from the top of the graphic at the least risk tolerant Wary type down to the most risk tolerant Adventurous type, Security scores would follow the same pattern. Results indicate that this is largely the case, with the mean Security value for the Wary Type (44.93) significantly higher than the mean Security value for Adventurous (34.62).
Table 5.42. Average score on MVPI Security for each Risk Type (n=132)Risk Type Security MVPIWary 44.93Intense 38.25Prudent 43.6Deliberate 43.36Excitable 33.89Axial 39.67Composed 37.59Carefree 32.75Adventurous 34.62Total 39.98
However, it is interesting that Security scores do not decrease entirely in accordance with increasing risk tolerance. This may be due to the two main personality scales that underpin the Risk Types. There is a tendency for the Types associated with taking a measured approach to risk (Wary, Prudent and Deliberate) rather than having a more daring disposition (Excitable, Carefree and Adventurous) to score higher on Security. The emotional side of risk personality seems not to have a great impact on valuing security, as indicated by minimal differences between the Type associated with low levels of emotional stability, Intense (Security mean=38.25), and the Type related to high levels of emotional stability at the opposite end of the spectrum, Composed (Security mean=37.59). The implications are that it is the daring and excitement seeking aspect of risk tolerance that is most linked to having a preference for security. This was examined further by entering the personality scales underpinning the types into a regression analysis alongside the Security variable; the results are presented in Table 5.43.

© Copyright Psychological Consultancy Limited, 2019 all rights reserved. Risk Type Compass® is a registered trademark in Europe: CTM No. 010726818.
88 89
Table 5.43. Standardised beta coefficients for the study variables in the regressionanalysis (n=132)Predictor Variables Daring:Measured Emotional:CalmSecurity -.59*** -.01
***p<.001
As would be predicted, only Daring:Measured was significantly associated with Security (Beta = -.59, p<0.001). This is in accordance with the previous Risk Tolerance validity study based on Blais and Weber’s (2006) psychometric assessment. In summary, this suggests that characteristics pertaining to Daring and Measured have a greater overall influence on risk tolerance than those associated with the more emotional side of risk taking.

© Copyright Psychological Consultancy Limited, 2019 all rights reserved. Risk Type Compass® is a registered trademark in Europe: CTM No. 010726818.
90
This chapter explores the Risk Type profiles of different occupations and across age ranges. The subject of occupational differences is approached from multiple angles, taking into consideration industry sector, job level, years of experience and a discussion of the risk profiles of a selection of individual job types. The aim here is to explore how Risk Type differs as a function of various job attributes.
Public versus Private SectorsIt has been argued that the work motivations and preferences of private sector workers differ from those who work in the public sector (e.g. Buelens & Van den Broeck, 2007). Some of these differences may stem from the nature of public sector jobs, many of which are to do with caring for others or contributing directly to the welfare of society. Alternatively, people may be attracted to public sector jobs due to a desire for greater job security; in the majority of cases, public sector jobs are less volatile than their private counterparts, tend to be more secure and have generous pension plans. This perhaps explains why research has consistently found public sector workers to be more risk averse than those in the private sector. Roszkowski, Davey, and Grable (2009), for example, looked at the financial risk tolerance of financial planners and found private sector workers to be significantly more risk tolerant than their public sector counterparts. Psychological Consultancy Ltd (PCL) set out to research this topic and recruited 433 participants (156 of whom worked in the public sector) to complete the Risk Type Compass™. In line with previous research, it was hypothesised that public sector workers would show a lower risk tolerance than private sector workers.
An independent sample T-Test revealed private sector workers as having a significantly greater risk tolerance (RTi) than their public sector counterparts (277 vs. 156, p<.05), supporting the hypothesis. This implies that - whether through a process of attraction, selection and/or attrition - those in the public sector are generally more risk averse than those in the private sector.
Job LevelIn a second study, PCL assessed risk tolerance against job level. Previous research suggests that CEOs are more risk taking than the average employee (McGowan, 2007), so it was hypothesised that we would see an increase in Risk Tolerance as job level increased. In a second part of this study, reported below, we looked at job level against scores on the two Risk Type Compass™ scales; Emotional:Calm and Daring:Measured. As far as we are aware, there has been no recent research specifically assessing individual differences in risk taking propensity across job levels, therefore the inclusion of the Risk Type Compass™ scales in the research was intended to be explorative; designed to see whether risk tolerance differences across job level stemmed from a level of fearfulness (Emotional:Calm scale), impulsivity (Daring:Measured scale), or both.
Chapter 6 - Occupational and Age Differences in Risk Type

© Copyright Psychological Consultancy Limited, 2019 all rights reserved. Risk Type Compass® is a registered trademark in Europe: CTM No. 010726818.
90 91
0
10
20
30
40
50
60
CEO/MD/Owner Managerial Roles Support Staff
RTi
Three job levels were explored: CEO/MD/Owner, Managers, and Support Staff. Here we defined Managers broadly to include Office Managers, Business Managers, Duty Managers and Managers from specific occupational areas (e.g. Sales Managers and Financial Managers). Support staff included roles such as Administrator, Office Clerk, Personal Assistant and Secretary.
Table 6.1. & Figure 6.1. Jobs Level ranked by average RTi (n=707)Job Level n Average RTi SDCEO/MD/Owner 369 55.1 15.2Managers 257 49.3 13.5Support Staff 81 44.2 13.5
In total, 707 participants were included in this study. The average Risk Tolerance Index scores per group are displayed in Table 6.1 and Figure 6.1. A one-way independent sample ANOVA and post-hoc Bonferroni test revealed these differences to be significant. That is, the Risk Tolerance of the CEO/MD/Owner group was found to be greater than that of the Managerial group, and the Risk Tolerance of the Managerial group was found to be greater than that of the Support Staff group (F (2,704) = 25.3, p<.01).
In the second part of the study, scores on the Risk Type Compass™ scales, Emotional:Calm and Daring:Measured, were analysed against job level. As shown in Table 6.2, it was found that as job level increased, scores on the Emotional:Calm scale increased while scores on the Daring:Measured scale decreased. An independent sample one-way ANOVA and post-hoc Bonferroni test revealed these effects to be significant (F (2,704) = 11.7, p<.01 and F (2,704) = 16.1, p<.01, respectively). The only interaction to not reach significance was the difference in the Daring:Measured scale scores for the Managerial and Support Staff groups. Overall these results suggest that as job level increases, individuals are more likely to fall at the Calm end of the Emotional:Calm scale;
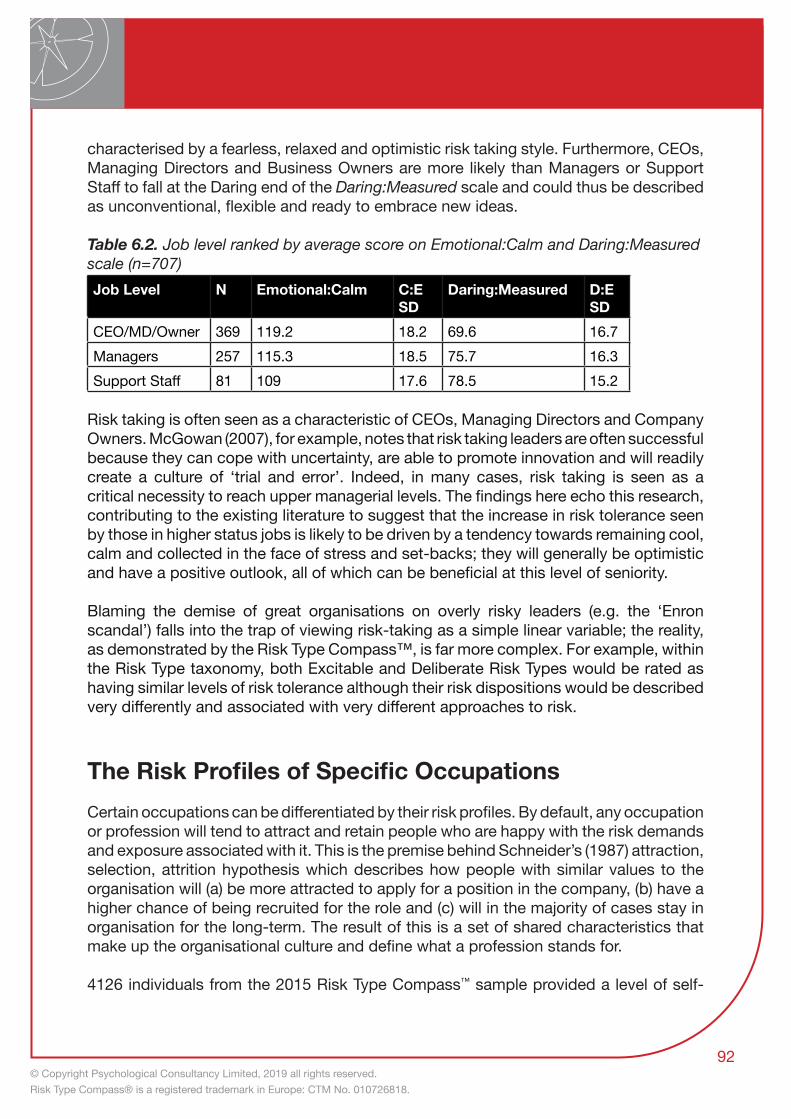
© Copyright Psychological Consultancy Limited, 2019 all rights reserved. Risk Type Compass® is a registered trademark in Europe: CTM No. 010726818.
92
characterised by a fearless, relaxed and optimistic risk taking style. Furthermore, CEOs, Managing Directors and Business Owners are more likely than Managers or Support Staff to fall at the Daring end of the Daring:Measured scale and could thus be described as unconventional, flexible and ready to embrace new ideas.
Table 6.2. Job level ranked by average score on Emotional:Calm and Daring:Measured scale (n=707)Job Level N Emotional:Calm C:E
SDDaring:Measured D:E
SDCEO/MD/Owner 369 119.2 18.2 69.6 16.7Managers 257 115.3 18.5 75.7 16.3Support Staff 81 109 17.6 78.5 15.2
Risk taking is often seen as a characteristic of CEOs, Managing Directors and Company Owners. McGowan (2007), for example, notes that risk taking leaders are often successful because they can cope with uncertainty, are able to promote innovation and will readily create a culture of ‘trial and error’. Indeed, in many cases, risk taking is seen as a critical necessity to reach upper managerial levels. The findings here echo this research, contributing to the existing literature to suggest that the increase in risk tolerance seen by those in higher status jobs is likely to be driven by a tendency towards remaining cool, calm and collected in the face of stress and set-backs; they will generally be optimistic and have a positive outlook, all of which can be beneficial at this level of seniority.
Blaming the demise of great organisations on overly risky leaders (e.g. the ‘Enron scandal’) falls into the trap of viewing risk-taking as a simple linear variable; the reality, as demonstrated by the Risk Type Compass™, is far more complex. For example, within the Risk Type taxonomy, both Excitable and Deliberate Risk Types would be rated as having similar levels of risk tolerance although their risk dispositions would be described very differently and associated with very different approaches to risk.
The Risk Profiles of Specific OccupationsCertain occupations can be differentiated by their risk profiles. By default, any occupation or profession will tend to attract and retain people who are happy with the risk demands and exposure associated with it. This is the premise behind Schneider’s (1987) attraction, selection, attrition hypothesis which describes how people with similar values to the organisation will (a) be more attracted to apply for a position in the company, (b) have a higher chance of being recruited for the role and (c) will in the majority of cases stay in organisation for the long-term. The result of this is a set of shared characteristics that make up the organisational culture and define what a profession stands for.
4126 individuals from the 2015 Risk Type Compass™ sample provided a level of self-

© Copyright Psychological Consultancy Limited, 2019 all rights reserved. Risk Type Compass® is a registered trademark in Europe: CTM No. 010726818.
92 93
reported qualitative data that was sufficient to place them within job categories. In many cases, the detail that was provided enabled an additional level of specificity (e.g. auditors, accountants, police officers, etc.), allowing researchers to draw multiple comparisons between job roles. Exploration of the data indicated that a sizeable range of job roles were represented in the sample group, allowing analyses to reflect the distribution of Risk Types that are prevalent in several industries. Within some industries the distribution of Risk Types is broadly similar to that in the total sample and the first two examples in the discussion below - Professional Services and Finance - show a fairly equal balance of Risk Types. This is probably because of the diversity of roles within both of these sectors. In each of the other examples, differentiation is more pronounced.
Professional ServicesA total of 3,743 candidates (54.45% male, 45.55% female) reported a role that fell into this broad category, with examples including ‘risk managers’, ‘consultants’, ‘auditors’, and ‘project managers’. Figure 6.2 illustrates the breakdown of Risk Types in this group.
Figure 6.2. Pie chart illustrating the percentage of the ‘Professional Services’ sample in each of the eight Risk Types (n=3,743). The Axial group consists of 9.7%.
The distribution of Risk Types in the ‘Professional Services’ group indicates a relatively even spread of Risk Types.
FinanceAnother broad employment category was labelled ‘Finance’, which contained 979 individuals (78.95% male, 21.05% female). Job roles in this sample included ‘trader’, ‘accountant’, and ‘finance director’. Figure 6.3 below presents a breakdown of Risk Types for this group.

© Copyright Psychological Consultancy Limited, 2019 all rights reserved. Risk Type Compass® is a registered trademark in Europe: CTM No. 010726818.
94
Figure 6.3. Pie chart illustrating the proportion of the ‘Finance’ sample in each of the eight Risk Types (n=979). The Axial group consists of 10.21%.
Comparison of the ‘Finance’ group against the Risk Type distributions in the overall sample shows that, with a couple of minor exceptions, both have a similar distribution of Risk Types. The most significant contrast is reflected in the ‘Axial’ group, with a greater proportion of individuals allocated to this category. The data also indicates a slight decrease in the proportion of ‘Deliberate’ Risk Types in the Finance sample. Overall, the distribution between Risk Types in these two samples is fairly even. This is perhaps reflective of the wide range of skills and roles available under these two categories meaning that no one Type dominance emerges.
Human ResourcesAn additional employment subset was categorised as ‘Human Resources’, which included a sample of 358 individuals (22.19% male, 77.81% female). Examples of the roles that were included in this group were ‘human resources advisor’, ‘recruiter’, and ‘junior HR Specialist’. Figure 6.4 below illustrates the distribution of the eight Risk Types within this group of individuals.
Figure 6.4. Pie chart illustrating the percentage of the ‘Human Resources’ sample in each of the eight Risk Types. The Axial group consists of 11.45% (n=358).

© Copyright Psychological Consultancy Limited, 2019 all rights reserved. Risk Type Compass® is a registered trademark in Europe: CTM No. 010726818.
94 95
As with other broad employment groups, the ‘Human Resources’ sample showed variations in the distribution of Risk Types when compared with the overall sample group. When compared against the total sample of 7,072 individuals, there are notable contrasts within this employment category; lower proportions of the ‘Deliberate’ and ‘Composed’ Risk Types, and greater proportions of the ‘Intense’ and ‘Carefree’ Risk Types. We have chosen to report on just a few occupations that have particularly visible cultures; namely, Recruiters, IT professionals, Police Officers and Auditors. The risk profile of each of these is discussed below.
AdministrationA subset of individuals were categorised as ‘Administration’ professionals. This sample of 240 individuals (29.71% male, 70.29% female) is represented in Figure 6.5 below.
Figure 6.5. Pie chart illustrating the percentage of the ‘Administration’ sample in each of the eight Risk Types. The Axial group consists of 8.33% (n=240).
General ManagementA subset of individuals were categorised as ‘General Management’ professionals. This sample of 1,250 individuals (67.73% male, 32.27% female) is represented in Figure 6.6 below.
Figure 6.6. Pie chart illustrating the percentage of the ‘General Management’ sample in each of the eight Risk Types. The Axial group consists of 8.88% (n=1,250).
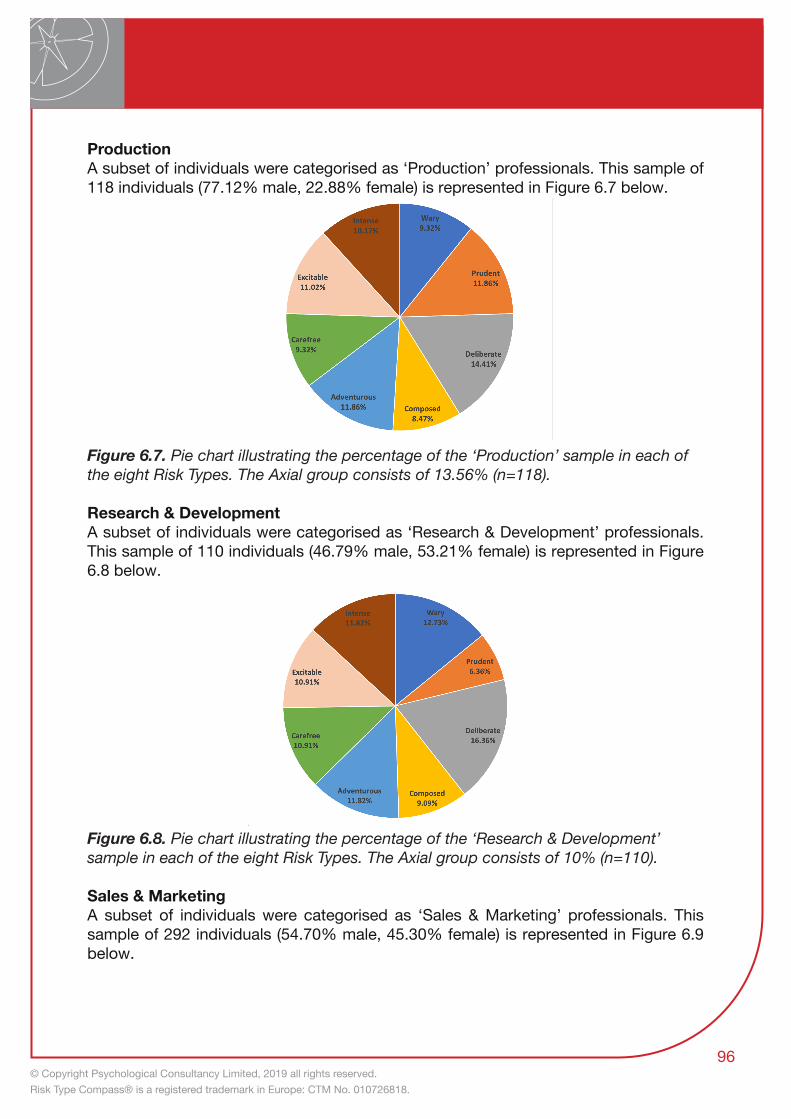
© Copyright Psychological Consultancy Limited, 2019 all rights reserved. Risk Type Compass® is a registered trademark in Europe: CTM No. 010726818.
96
ProductionA subset of individuals were categorised as ‘Production’ professionals. This sample of 118 individuals (77.12% male, 22.88% female) is represented in Figure 6.7 below.
Figure 6.7. Pie chart illustrating the percentage of the ‘Production’ sample in each of the eight Risk Types. The Axial group consists of 13.56% (n=118).
Research & DevelopmentA subset of individuals were categorised as ‘Research & Development’ professionals. This sample of 110 individuals (46.79% male, 53.21% female) is represented in Figure 6.8 below.
Figure 6.8. Pie chart illustrating the percentage of the ‘Research & Development’ sample in each of the eight Risk Types. The Axial group consists of 10% (n=110).
Sales & MarketingA subset of individuals were categorised as ‘Sales & Marketing’ professionals. This sample of 292 individuals (54.70% male, 45.30% female) is represented in Figure 6.9 below.

© Copyright Psychological Consultancy Limited, 2019 all rights reserved. Risk Type Compass® is a registered trademark in Europe: CTM No. 010726818.
96 97
Figure 6.9. Pie chart illustrating the percentage of the ‘Sales & Marketing’ sample in each of the eight Risk Types. The Axial group consists of 11.99% (n=292).
The Recruiter Risk Profile
The role of the recruiter has become increasingly complex. The recruitment consultant today very often works across a wide range of industry sectors and requires an extended level of expertise and knowledge of areas such as Telecoms, IT and Finance. Furthermore, there has been dramatic impact from Internet based innovation on recruitment practices. A role in recruitment requires the ability to be proactive and innovative as well as to be resilient to persevere in the face of frequent setbacks. While the core element of the recruitment industry is sales and profit, the industry deviates from traditional sales roles in terms of the amount of risk involved. Traditional sales roles involve finding a match between a customer and a product; the need for the recruitment consultant to establish a match that is acceptable to both parties effectively doubles the risk of failure.
PCL sought to explore risk personality of the recruiter profession, hypothesising that recruiters would have a higher risk tolerance than the general population. In total, 141 participants from the industry (mostly recruitment consultants) and 664 participants from other occupations (‘general population’) completed the Risk Type Compass™. The results of the analysis are presented below (Figure 6.10).
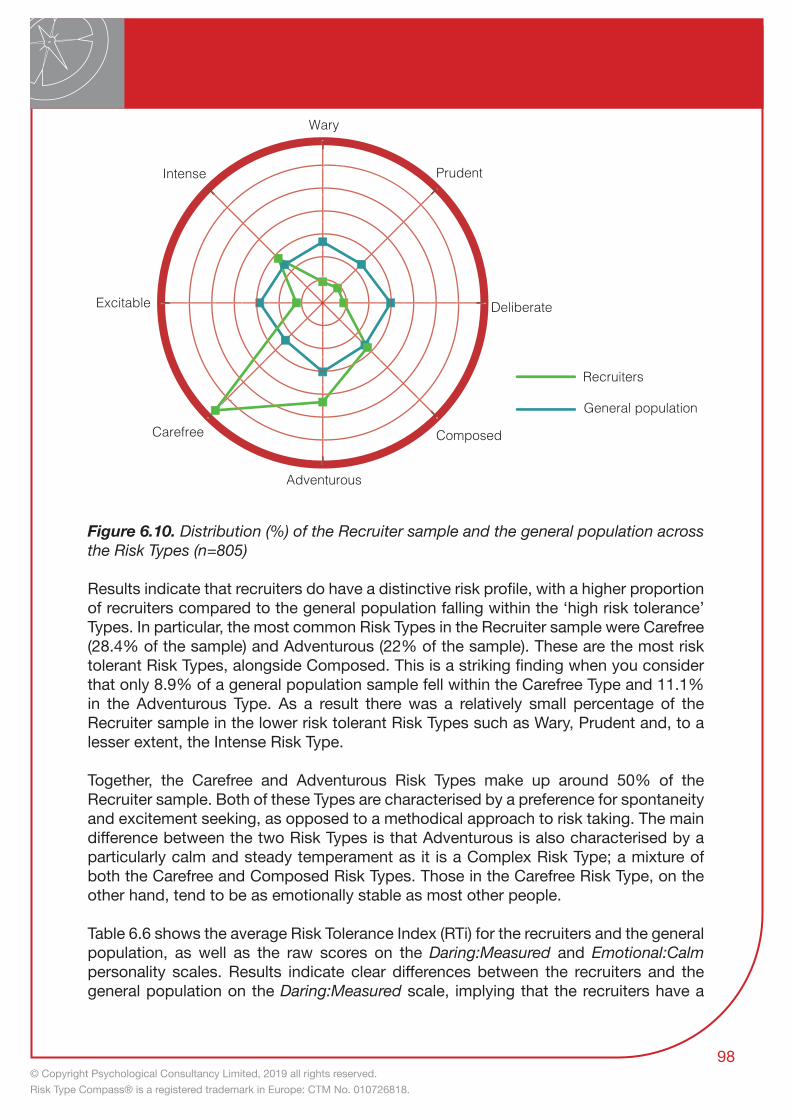
© Copyright Psychological Consultancy Limited, 2019 all rights reserved. Risk Type Compass® is a registered trademark in Europe: CTM No. 010726818.
98
Figure 6.10. Distribution (%) of the Recruiter sample and the general population across the Risk Types (n=805)
Results indicate that recruiters do have a distinctive risk profile, with a higher proportion of recruiters compared to the general population falling within the ‘high risk tolerance’ Types. In particular, the most common Risk Types in the Recruiter sample were Carefree (28.4% of the sample) and Adventurous (22% of the sample). These are the most risk tolerant Risk Types, alongside Composed. This is a striking finding when you consider that only 8.9% of a general population sample fell within the Carefree Type and 11.1% in the Adventurous Type. As a result there was a relatively small percentage of the Recruiter sample in the lower risk tolerant Risk Types such as Wary, Prudent and, to a lesser extent, the Intense Risk Type.
Together, the Carefree and Adventurous Risk Types make up around 50% of the Recruiter sample. Both of these Types are characterised by a preference for spontaneity and excitement seeking, as opposed to a methodical approach to risk taking. The main difference between the two Risk Types is that Adventurous is also characterised by a particularly calm and steady temperament as it is a Complex Risk Type; a mixture of both the Carefree and Composed Risk Types. Those in the Carefree Risk Type, on the other hand, tend to be as emotionally stable as most other people.
Table 6.6 shows the average Risk Tolerance Index (RTi) for the recruiters and the general population, as well as the raw scores on the Daring:Measured and Emotional:Calm personality scales. Results indicate clear differences between the recruiters and the general population on the Daring:Measured scale, implying that the recruiters have a

© Copyright Psychological Consultancy Limited, 2019 all rights reserved. Risk Type Compass® is a registered trademark in Europe: CTM No. 010726818.
98 99
greater preference for spontaneity and adventure compared to the general population. Group differences across the Emotional:Calm scale, on the other hand, were found to be negligible.
Table 6.3. Average Risk Tolerance Index, Daring:Measured and Emotional:Calm raw scores for Recruiters and the General Population (n=805)Group RTi Daring:Measured Emotional:Calm
Recruiters 61.5 94.6 113.8General Population 50.5 83.6 111.7
In summary, recruiters can be seen to have a specific risk profile that, in general, is more risk tolerant than the general population. This increased risk tolerance within recruiters appears to be predominantly driven by a preference for change, variety and excitement, rather than an inherent fearlessness. In terms of specific Risk Types, a substantial proportion of the recruiters sampled fell within just two Types: Adventurous and Carefree.
The Risk Profile of IT Professionals
A sample of individuals from the IT industry were invited by PCL to complete the Risk Type Compass™ via an article in Computer Weekly magazine. Data on a number of demographic variables such as industry experience and job title were also collected in order to explore whether these factors distinguished between Risk Types.
There has been little research conducted on the personality profile of IT professionals to date. However, of note is a study by Lounsbury, Fisher, Levy, and Welsh (2009) who found individuals within the IT profession tended to score higher on Emotional Resilience, Openness, Tough-Mindedness and Customer Service, when compared with the general population. Lounsbury et al. also found IT professionals to score lower on Conscientiousness; one of the Five Factor Model’s personality traits, concerned with being organised, conforming and planful. Overall, this paints a picture of heightened tolerance to risk within the IT profession. Theoretically, this appears to fit neatly with the requirement of IT roles; a sector that is characterised by innovation, continuous change, flexible work environments and unconventionality. Based on this research, it was hypothesised that IT employees would be more risk tolerant than that of the general population. Overall, 599 IT professionals completed the Risk Type Compass™. The results of this are displayed below (Figure 6.11).

© Copyright Psychological Consultancy Limited, 2019 all rights reserved. Risk Type Compass® is a registered trademark in Europe: CTM No. 010726818.
100
Figure 6.11. The distribution of Risk Types in the IT Industry sample. The Axial group consists of 9.02% of the sample (n=599).
As can be seen from Figure 6.11, a large proportion of the IT Industry sample fell within the Adventurous, Carefree and Excitable Risk Types (together making up 48.91% of the sample). These Risk Types are associated with a greater preference for risk taking. The Adventurous Risk Type concerns being both impulsive and emotionally stable, the Carefree Type is primarily associated with a tendency towards being excitement seeking and daring, and the Excitable Type is characterised by excitement seeking and emotionality. There were considerably fewer participants in the Prudent (8.35%) and Deliberate (6.84%) Risk Types, both of which are associated with an aversion to risk that stems from being overly pessimistic, apprehensive and emotional. Our results are in support of the hypothesis.
Finally, it was considered relevant to look at whether the Risk Type of individuals within the IT profession played a role in their work arrangements, assuming that working arrangements are, in the majority of cases, self-selected. It was predicted that freelance workers would show a greater disposition for risk compared to those working in full-time (‘permanent’) employment. This is due to the fact that freelance work tends to lack the security that permanent work brings and should therefore attract people who are comfortable taking chances. The distribution of Risk Types for each group is presented in Figure 6.12 below. Axial participants were removed from the IT professionals sample of 599.

© Copyright Psychological Consultancy Limited, 2019 all rights reserved. Risk Type Compass® is a registered trademark in Europe: CTM No. 010726818.
100 101
Figure 6.12. The percentage of each Risk Type in Freelance and Permanent workers (n=209)
Overall, we can see roughly equal frequencies of the Wary Risk Type in both groups and only a very small group difference within the Prudent Risk Type. However, a greater proportion of freelance workers fell within the Deliberate, Adventurous and (to a small extent) Composed Risk Types. These three Risk Types are associated with high scores (i.e. towards the Calm end) on the Emotional:Calm scale, implying that freelance workers are perhaps more fearless and therefore more comfortable taking risks than their permanent counterparts. Nevertheless, a greater proportion of permanent IT professionals fell within the Carefree Risk Type, associated with high risk tolerance and driven by a more flexible and unconventional approach. It therefore remains unclear whether it is the freelance or permanent group that are, on the whole, more risk tolerant. To test the assumption that freelance IT professionals are characterised by a fearless risk taking style overall, and to assess which group has the highest risk tolerance, it was considered worthwhile analysing scores on the Risk Type Compass™ scales and the RTi within both work arrangements.
Table 6.4. Sample size, Mean and Standard Deviation of Risk Type Compass™ raw scores across working arrangement groups in the IT Profession (n=235)Scale Working
ArrangementsN Mean SD
Emotional:Calm Freelance 49 120.80 18.38Permanent 186 114.55 17.07
Daring:Measured Freelance 49 88.65 18.01Permanent 186 87.97 15.89
0
5
10
15
20
25
30
Wary Prudent Deliberate Composed Adventurous Carefree Excitable Intense
Freelance Permanent

© Copyright Psychological Consultancy Limited, 2019 all rights reserved. Risk Type Compass® is a registered trademark in Europe: CTM No. 010726818.
102
Scale Working Arrangements
N Mean SD
RTi Freelance 49 60.38 22.54Permanent 186 56.32 20.20
Looking at Table 6.7, the average scores of freelance workers on the Emotional:Calm scale were found to be significantly higher than those working in permanent employment (t (233) = 2.24, p <.05), as expected. Risk Tolerance (RTi) scores were also found to be higher for this group, however this effect narrowly missed out on reaching significance. Scores on Daring:Measured between the two groups are almost identical. These results imply that freelance or contract workers tend to have a slightly increased tolerance to risk than their permanent counterparts and that this tolerance is likely driven by a greater sense of calm fearlessness and optimism.
In summary, a greater prevalence of the more risk tolerant Risk Types - such as Composed, Carefree and Adventurous - were found in the IT professional sample. This reflects the requirements associated with the profession of having sufficient resilience to cope with stressful job demands, and yet being flexible enough to cope with a continuously changing industry sector; the IT industry is continually improving with new innovated systems, processes and software applications. Further differences were found between freelance and permanent IT professionals. Freelance workers were found to have increased levels of fearlessness; i.e. they approach risk in a relaxed, flexible and optimistic way. The Adventurous Risk Type was found to be more prevalent than any other in this group. Nevertheless, there was no clear indication that freelance workers were substantially more risk tolerant overall than their permanent counterparts.
In addition to demonstrating the ability of the Risk Type Compass™ to differentiate across professions, the findings here also suggest that individuals with the more risk tolerant Risk Types - the Adventurous, Carefree and Composed Risk Types – are likely to make effective employees within the IT sector. These findings have implications for both selection and coaching practices. Further research should test these findings by including a measure of job performance.
The Risk Profile of Police Officers
The Authorised Professional Practice (APP) for the policing profession states that the willingness to make decisions in conditions of uncertainty (i.e. risk taking) is a core requirement for the police. Avoiding decision making in these conditions is not deemed as acceptable practice; police officers are expected to be able to readily respond to risks and act decisively. Nevertheless, decisions are expected to be logical and, above all, should be in the interest of the community they serve.
PCL assessed the risk taking personality of a sample of police officers using the Risk
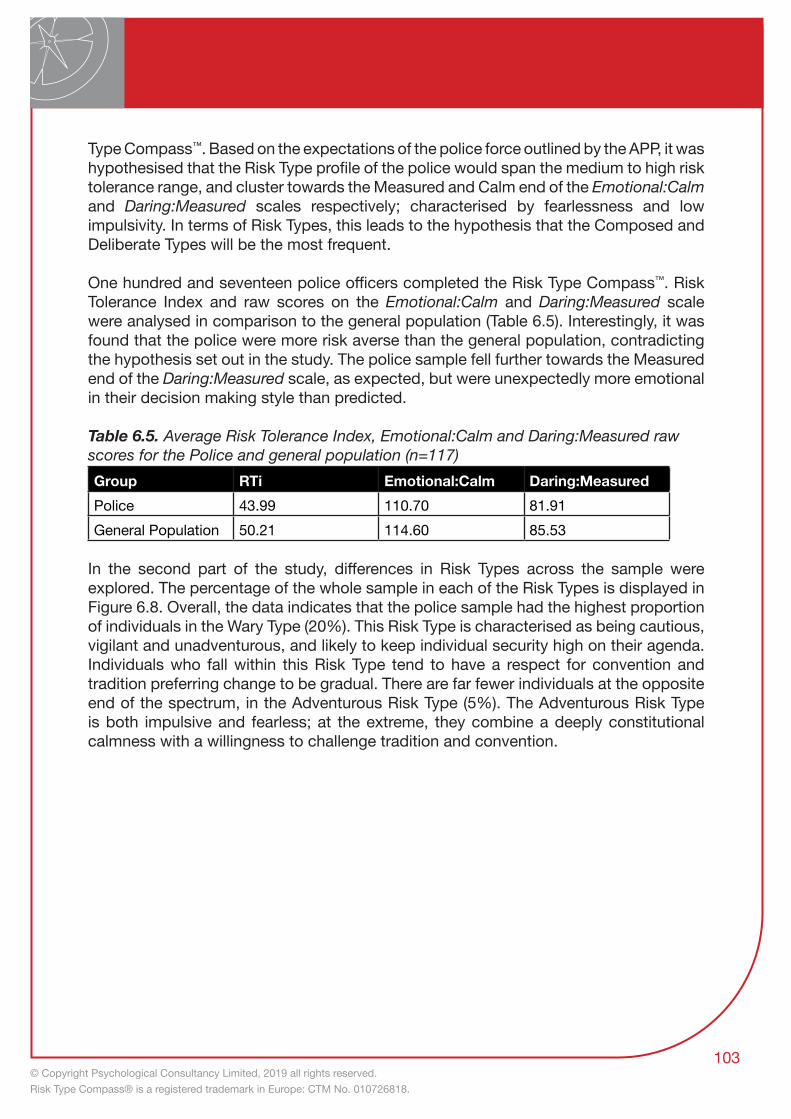
© Copyright Psychological Consultancy Limited, 2019 all rights reserved. Risk Type Compass® is a registered trademark in Europe: CTM No. 010726818.
102 103
Type Compass™. Based on the expectations of the police force outlined by the APP, it was hypothesised that the Risk Type profile of the police would span the medium to high risk tolerance range, and cluster towards the Measured and Calm end of the Emotional:Calm and Daring:Measured scales respectively; characterised by fearlessness and low impulsivity. In terms of Risk Types, this leads to the hypothesis that the Composed and Deliberate Types will be the most frequent.
One hundred and seventeen police officers completed the Risk Type Compass™. Risk Tolerance Index and raw scores on the Emotional:Calm and Daring:Measured scale were analysed in comparison to the general population (Table 6.5). Interestingly, it was found that the police were more risk averse than the general population, contradicting the hypothesis set out in the study. The police sample fell further towards the Measured end of the Daring:Measured scale, as expected, but were unexpectedly more emotional in their decision making style than predicted.
Table 6.5. Average Risk Tolerance Index, Emotional:Calm and Daring:Measured raw scores for the Police and general population (n=117)Group RTi Emotional:Calm Daring:MeasuredPolice 43.99 110.70 81.91General Population 50.21 114.60 85.53
In the second part of the study, differences in Risk Types across the sample were explored. The percentage of the whole sample in each of the Risk Types is displayed in Figure 6.8. Overall, the data indicates that the police sample had the highest proportion of individuals in the Wary Type (20%). This Risk Type is characterised as being cautious, vigilant and unadventurous, and likely to keep individual security high on their agenda. Individuals who fall within this Risk Type tend to have a respect for convention and tradition preferring change to be gradual. There are far fewer individuals at the opposite end of the spectrum, in the Adventurous Risk Type (5%). The Adventurous Risk Type is both impulsive and fearless; at the extreme, they combine a deeply constitutional calmness with a willingness to challenge tradition and convention.
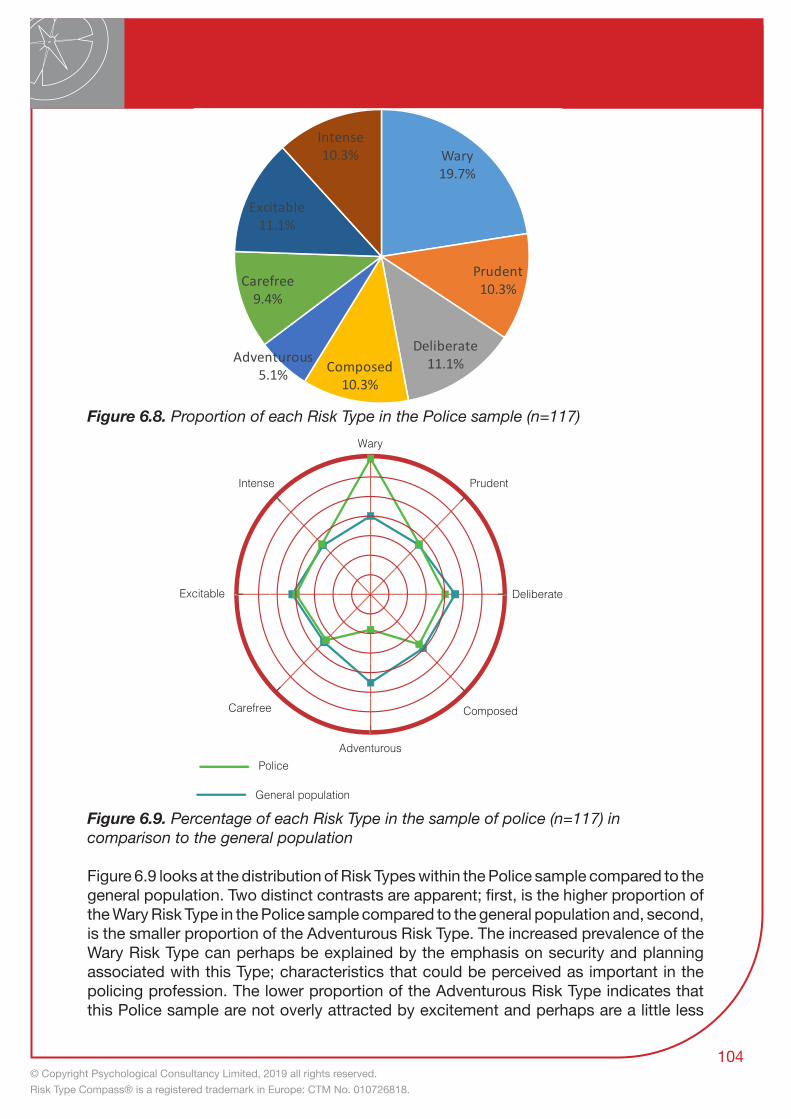
© Copyright Psychological Consultancy Limited, 2019 all rights reserved. Risk Type Compass® is a registered trademark in Europe: CTM No. 010726818.
104
Figure 6.8. Proportion of each Risk Type in the Police sample (n=117)
Figure 6.9. Percentage of each Risk Type in the sample of police (n=117) in comparison to the general population
Figure 6.9 looks at the distribution of Risk Types within the Police sample compared to the general population. Two distinct contrasts are apparent; first, is the higher proportion of the Wary Risk Type in the Police sample compared to the general population and, second, is the smaller proportion of the Adventurous Risk Type. The increased prevalence of the Wary Risk Type can perhaps be explained by the emphasis on security and planning associated with this Type; characteristics that could be perceived as important in the policing profession. The lower proportion of the Adventurous Risk Type indicates that this Police sample are not overly attracted by excitement and perhaps are a little less
5
10
15
202020
General population
Police
Intense
Excitable
Carefree
Adventurous
Composed
Deliberate
Prudent
Wary
Wary19.7%
Prudent10.3%
Deliberate11.1%Composed
10.3%
Adventurous5.1%
Carefree9.4%
Excitable11.1%
Intense10.3%
Police

© Copyright Psychological Consultancy Limited, 2019 all rights reserved. Risk Type Compass® is a registered trademark in Europe: CTM No. 010726818.
104 105
resilient than the general population.
In summary, based on the APP’s principles of policing, it was hypothesised that the Police Officer sample would be found to have a medium to high risk tolerance and would fall towards both the Measured and Calm polarised Risk Type scales. Unexpectedly, the Police sample in this study showed low risk tolerance and higher prevalence of the Wary Risk Type. Although this contradicts the study’s hypothesis, these findings can perhaps be explained by the emphasis on security and conformity in decision making procedures and the over-emphasis on individual Health and Safety compliance within the profession.
The Risk Profile of Engineers
The engineering profession recognises that risk is inherent in the activities undertaken by its members. Engineers are tasked with solving real world challenges, the solution to which must often satisfy contradictory requirements; safety procedures may add to complexity and conflict with the desire to work rapidly. The optimal engineering solution is the one that considers all such conflicting demands and which will largely depend on the Engineer’s analysis of the levels of risk involved.
The sheer scope and diversity of engineering makes generalisations about Risk Type difficult. It is a profession in which challenges range from the nuclear industry to ship building and from aerospace to road construction. Nevertheless, all of the engineering specialisms have to deal with risk and to make decisions about tolerances and safety margins. Failures do happen and, when engineers fail, the social and economic costs can be very high.
In a research study conducted by PCL, 120 engineers completed the Risk Type Compass™. Initial analysis grouped the data in to the Risk Types (Figure 6.10) and compared the dispersion to that of the general population (Figure 6.11).
Figure 6.10. Proportion of Engineers in each of the Risk Types (n=120)
Wary12.0%
Prudent10.9%
Deliberate16.3%
Composed20.7%
Adventurous10.9%
Carefree6.5%
Excitable6.5%
Intense8.7%
Engineers

© Copyright Psychological Consultancy Limited, 2019 all rights reserved. Risk Type Compass® is a registered trademark in Europe: CTM No. 010726818.
106
Figure 6.10 shows a clear preference towards the Composed, Deliberate and Adventurous Risk Types that are associated with a self-assured, resilient, optimistic and emotionally stable approach to risk. Together these three Risk Types account for 46% of the engineering sample. Out of these, the Composed Risk Type was the most prevalent (16.7%). Individuals who fall in this Risk Type tend to maintain a calm and positive outlook despite difficulties and setbacks. The least prevalent Risk Types amongst the engineering sample were Carefree and Excitable. These are individuals who tend to be unpredictable, unconventional and inclined to act on impulse. They may be considered either creative and innovative or, at times, challenging and unorganised.
Figure 6.11. Percentage of Engineers (n=120) in each of the Risk Types compared with the General Population
As shown in Figure 6.11, the Composed and Adventurous Risk Types were found to be more prevalent in the Engineer sample than in the general population. This suggests that the engineer profession does possess its own unique Risk Type profile and that this is characterised by a calm self-assurance. Overall, these results are generally in line with the assumption that engineers need the ‘can do’ temperament to confront and deal with the challenges that arise, whilst needing to be systematic in the search for optimal solutions. From the personality point of view, these findings emphasise the value of engineers being calm, methodical and resilient decision makers.
The Risk Profile of Auditors
Research exploring the Risk Type profile of auditors was carried out in conjunction with Exemplar Global, who aided the recruitment of auditor participants from Canada, USA and Australia. Exemplar Global is an internationally recognised personnel and
5
10
15
20
25
2525
Gen pop
Engineers
Intense
Excitable
Carefree
Adventurous
Composed
Deliberate
Prudent
Wary
10

© Copyright Psychological Consultancy Limited, 2019 all rights reserved. Risk Type Compass® is a registered trademark in Europe: CTM No. 010726818.
106 107
training certification body for auditors across a range of disciplines and industries, including Quality, Environment and Occupational Health and Safety. Using the Risk Type Compass™, PCL aimed to identify any systematic patterns in the risk disposition of the auditor profession. Although there are many specialisms across the auditing profession, we hypothesised that a common need for care and vigilance would generalise throughout the group.
Auditors are required to look for risks, assess the likelihood of occurrence and, in the event that the risk is realised, calculate its severity. The main concern for individuals in this sector is that an incorrect or incomplete audit has a direct impact on the audited organisation. It can result in organisational mismanagement and breaches in regulatory requirements, as well as potentially huge financial costs. The emphasis on prudence and attention to detail suggested that, for those working in audit roles, the more apprehensive, careful and cautious Risk Types would be most prevalent.
One hundred and ninety-eight auditors completed the Risk Type Compass™. The dispersion of Risk Type within the sample is shown in Figure 6.12. Here we can see a very distinctive distribution of Risk Types, with 69% of the participating Auditors grouped in a cluster of just three Risk Types. The highest proportion of individuals fell in to the Deliberate Type (37%), described as being rooted in a high level of calm self-confidence combined with detailed preparation and planning. The second most common Risk Type was the Composed Type (22%); individuals who fall within this group are described as having high levels of poise, self-belief, optimism and resilience and being imperturbable and even-tempered. There are far fewer individuals in the Intense and Excitable Risk Types, and just 1% within the Carefree Risk Type.
Figure 6.12. Proportion of Auditors in each Risk Type (n=198)
Wary7.6%
Prudent13.1%
Deliberate36.4%
Composed17.7%
Adventurous7.6%
Carefree2.0%
Excitable4.0%
Intense3.0%

© Copyright Psychological Consultancy Limited, 2019 all rights reserved. Risk Type Compass® is a registered trademark in Europe: CTM No. 010726818.
108
Figure 6.13. Distribution of auditor Risk Types (%) compared to the general population (n=198)
Figure 6.13 illustrates the strong ‘pull’ of the calm and organised side of the Risk Type Compass™ in the Auditor sample. The difference in prevalence between the Deliberate Risk Types in the sample in comparison to the general population (almost a factor of four) is quite remarkable, as is the greater proportion of the Composed Risk Types. Figure 6.13 clearly highlights that there is significant under-representation of other Risk Types, excluding the Prudent Risk Type. There is an almost complete absence of the Carefree Risk Type and the Intense and Excitable Risk Type representation is also very limited. These Risk Types are associated with approaches to risk that may be impulsive, unconventional and emotionally charged suggesting that, by and large, Auditors are likely to be less emotionally reactive and spontaneous than most other people.
Overall, the auditing profession possess a very unique Risk Type profile. In line with the hypothesis, this profile is characterised by exceptional care and vigilance and a lack of impulsivity or excess emotionality.
The Risk Profile of Air Traffic Controllers
When it comes to handling high-stake risks on a day-to-day basis, the role of an air traffic controller has few rivals. Traditional risk management approaches focus on training, procedures, the work environment and employee health, but the interaction between personality and risk remains comparatively unexplored.
5
10
15
20
25
30
35
40
4040
55
Gen Pop
Auditors
Intense
Excitable
Carefree
Adventurous
Composed
Deliberate
Prudent
Wary35
5
10
55

© Copyright Psychological Consultancy Limited, 2019 all rights reserved. Risk Type Compass® is a registered trademark in Europe: CTM No. 010726818.
108 109
So do Air Traffic Controllers have a Type?
To explore this specialist form of employment, we analysed the reports of 219 individuals from the latter stages of an ATC recruitment process. Initial results point to a resounding “yes”, but it is only when compared against a general population sample of 13,613 that the extent of these differences become fully apparent (see Fig. 6.14 below).
Figure 6.14. Comparison of Risk Type distributions between the Air Traffic Controller sample (n=219) and the general population (n=13,613)
As indicated, over 70% of the ATC sample were categorised as ‘Deliberate’ Risk Types, greatly exceeding the 15% represented in the general population. A complete absence of Carefree and Excitable Risk Types was also notable as, together, these reflect around

© Copyright Psychological Consultancy Limited, 2019 all rights reserved. Risk Type Compass® is a registered trademark in Europe: CTM No. 010726818.
110
a quarter of the general population. However, the distinctiveness of the sample did not end with the distribution of Risk Types.
Risk Type Strength refers to the distance of the individual from the Risk Type Compass™’ central axis, and reflects how closely the individual will relate to their Risk Type description. When compared with Deliberate Risk Types from the general population, the Air Traffic Control group were over three times more likely to fall into the strongest ‘Strength 5’ category (see Figure 6.15 below).
Figure 6.15. A comparison of Risk Strength distributions between the Air Traffic Controller sample (n=155) and the general population (n=2,088)
An individual’s Risk Type is a reflection of their perception, tolerance and propensity towards risk taking, and this insight can be applied in various ways. When used in combination with other metrics, the Risk Type Compass™ can facilitate discussion around a variety of risk-related topics, and these can benefit processes involved in the selection and personal development of individuals in the air traffic controller industry.
Each Risk Type encompasses various strengths and challenges that influence how individuals approach and complete tasks. The self-awareness generated by the Risk Type Compass™ can aid in identifying the most suitable and effective strategies for that individual to adopt in dealing with any challenges and to improve performance. An example for the Deliberate Risk Type could be the need to appreciate that whilst their calm and business-like manner will usually prove a valuable asset in coping with the stress of their role, that same calmness may also prove a barrier to communicating the potential urgency of a situation to pilots.
Understanding variation in these factors will aid in selection, development and team building programs to help ensure an organisation achieves its desired balance.

© Copyright Psychological Consultancy Limited, 2019 all rights reserved. Risk Type Compass® is a registered trademark in Europe: CTM No. 010726818.
110 111
Comparison of Employment Categories by Risk Types
An additional benefit of employment data is the ability to conduct comparisons of Risk Type distributions between multiple groups. One such comparison was made between a sample of auditors (n=148, male = 58.11%, female = 41.89%), and traders (n=294, male = 97.28%, female = 2.72%). Figure 6.16 below presents findings from the comparison of these two groups.
Figure 6.16. Bar graph illustrating a comparison of Risk Type distribution between Auditors (n=148, Axial = 6.76%) and Traders (n=294, Axial = 18.37%).
By presenting two samples side-by-side, outputs of Risk Type distributions can highlight potentially significant contrasts between job roles. Figure 6.16 above presents several of these contrasts, with Auditors considerably more likely to be Deliberate, Wary, or Prudent Risk Types, whilst Traders reflected a higher proportion of Carefree Risk Types.
Another comparison was made between those reporting their position as either accountants or sales. The accountant group contained a total of 56 individuals (male = 37.5%, female = 62.5%), whilst the sales group totalled 74 participants (male = 68.92%, female = 31.08%). Figure 6.17 presents findings from the comparison between these two groups.
0%
5%
10%
15%
20%
25%
30%
Adventurous Carefree Composed Deliberate Excitable Intense Prudent Wary
Auditors vs Traders
Auditors
Traders

© Copyright Psychological Consultancy Limited, 2019 all rights reserved. Risk Type Compass® is a registered trademark in Europe: CTM No. 010726818.
112
Figure 6.17. A comparison of Risk Type distribution between Accountants (n=56, Axial = 5.36%) and Sales (n=74, Axial = 12.16%).
The side by side comparison presented in Figure 6.17 highlights several variations in the Risk Type distributions for these two employment groups. The largest of these concerns the Wary Risk Type, with a considerably larger proportion of accountants represented. In contrast, the most prevalent Risk Type within the sales group was the Excitable Risk Type, with over a fifth of the sample assigned to this category.
Risk Types by Seniority
A total of 4880 individuals provided information on their level of seniority, which have been grouped into 7 categories. Table 6.9 provides the sample sizes for each of these groups.
Table 6.6. Sample sizes for the 7 levels of seniority represented in the sample (n=4880)Job Level NBoard 9Executive 913Senior Manager 448Manager 888Supervisor 80Employee 2532Self-Employed 10Total 4880
0%
5%
10%
15%
20%
25%
30%
Adventurous Carefree Composed Deliberate Excitable Intense Prudent Wary
Accountants vs Sales
Accountant
Sales

© Copyright Psychological Consultancy Limited, 2019 all rights reserved. Risk Type Compass® is a registered trademark in Europe: CTM No. 010726818.
112 113
Approximately 98% of responses fall within 4 of the 7 categories, with the largest represented by the Employee category, followed by Executive, Manager, and Senior Manager categories respectively. Figure 6.18 below illustrates the Risk Type distributions for these four most populated job level categories.
Figure 6.18. Distribution of Risk Type by Job Level (n=4257)
Perhaps the most noticeable characteristic of these findings is the greater prevalence of Adventurous and Carefree Risk Types in the most senior Executive category, with the lowest prevalence represented by the Prudent, Intense and Wary Risk Types respectively. In contrast, lower levels of seniority reflect a more even distribution of Risk Types.
0%
2%
4%
6%
8%
10%
12%
14%
16%
18%
20%
Adventurous Carefree Composed Deliberate Excitable Intense Prudent Wary
Executive Senior Manager Manager Employee

© Copyright Psychological Consultancy Limited, 2019 all rights reserved. Risk Type Compass® is a registered trademark in Europe: CTM No. 010726818.
114
Risk Type and AgePCL’s desire to understand the potential interaction between age and risk led us to analyse nearly ten thousand participants. This sizeable sample provides solid grounding for subsequent analysis, although caution should be exercised with the ‘under 20s’ group due to its comparatively small sample size of 106. Figure 6.19. below presents the average raw scores of each age group on the two underlying scales of Emotional:Calm and Daring:Measured. It also includes the sample sizes of each age group.
Figure 6.19. Raw score averages of the two Risk Type Compass™ scales by age group
A higher raw score on the Emotional:Calm scale signifies a closer proximity to the ‘Calm’ end of the spectrum, whilst a higher raw score on the ‘Daring:Measured’ scale would place the scorer closer to the ‘Measured’ end of the spectrum.
As illustrated by the line graph in Figure 6.19., the Emotional:Calm scale recorded the largest variation between age groups, with a positive correlation of ‘.077’ that was statistically significant at the p<0.01 level. This indicates that individuals may become calmer with age, although the small effect size and timescale suggests that the rate of such development would be gradual.
The Emotional:Calm scale finding is driven by weak, yet statistically significant, correlations between age and both the ‘Calm’ factor (.077) and ‘Emotional’ factor (-.064) upon which the scale is built. In contrast, the Daring:Measured scale appears to have a weaker relationship with age, although variation is evident at the factor level. Despite the ‘Measured’ factor recording a significant (at the p<0.05 level), albeit weaker, correlation with age of .028, the ‘Daring’ factor showed no correlation with age.

© Copyright Psychological Consultancy Limited, 2019 all rights reserved. Risk Type Compass® is a registered trademark in Europe: CTM No. 010726818.
114 115
Risk Type
In the context of PCL’s research into age, variance between age groups in the proportions of Risk Types was observed, the most striking of which occurred with the ‘Excitable’ and ‘Deliberate’ Risk Types. The former are individuals who reside at the ‘Emotional’ and ‘Daring’ ends of the Emotional:Calm and Daring:Measured scales respectively, whilst the latter are positioned towards the ‘Calm’ and ‘Measured’ ends of these scales. These differences place the two Risk Types at opposing sides of the compass. Figure 6.20. below displays the proportion of Excitable and Deliberate Risk Types within each age group.
Figure 6.20. Proportion of Deliberate and Excitable Risk Types across the age groups
The clear finding from the bar graph above is the decrease in Excitable and increase in Deliberate Risk Types as the ages of participants increase. These findings should be viewed in the context of the ‘General Population’ sample of 13.5 thousand, in which Excitable and Deliberate Risk Types comprise of 10.44% and 15.63% of the total respectively. Additional understanding of these trends is provided by considering the Risk Type descriptions included in Chapter Three.
Risk Type provides insightful narratives into the variations recorded by the underlying scales, making the Risk Type Compass™ a powerful assessment tool and a useful instrument for research into population trends in individual differences. However, the Risk Type and scale scores presented above are built upon 18 distinct subthemes, and the trends that have emerged in our analyses warrant further investigation at this more granular level.

© Copyright Psychological Consultancy Limited, 2019 all rights reserved. Risk Type Compass® is a registered trademark in Europe: CTM No. 010726818.
116
What are the Subthemes driving these variations?
The two scales that underpin the Risk Type Compass™ draw from 18 subthemes, each of which comprise of four items. Delving into these subthemes provides additional insight into the aspects of personality driving scale-level findings, although caution should be observed due to the limited number of items in each subtheme.
Quantitative analysis of age group variance found between-group differences to be statistically significant in 15 of the 18 subthemes, with the exceptions including the subthemes of ‘Sensitive’, ‘Optimistic’ and ‘Perfectionistic’. Of the remaining subthemes, ‘Apprehensive’, ‘Equable’ and ‘Explorative’ recorded the largest variance between the six age group categories. Figure 6.21. below illustrates the pattern and strength of these variances.
Figure 6.21. Apprehensive, Equable and Explorative subtheme raw score averages
As with Risk Types, considering the narrative descriptions of the subthemes in question provide valuable insight into the dispositional differences indicated by variance in observed age group trends. These subthemes are described in more detail below:
Apprehensive – Distinguishes those that will rarely worry about things unnecessarily from those that are apprehensive and need reassurance.
Equable – Distinguishes those that have a high level of self-esteem and belief in their own worth from those who may be self-critical and pessimistic.
Explorative – Distinguishes individuals that avoid extreme or risky activities from those that need stimulation and seek excitement.

© Copyright Psychological Consultancy Limited, 2019 all rights reserved. Risk Type Compass® is a registered trademark in Europe: CTM No. 010726818.
116 117
The Apprehensive and Equable subthemes would feed into the Emotional:Calm scale, reflecting the overarching trend for the scale illustrated in Figure 6.21. above, whilst Explorative would be addressed by the Daring:Measured scale. In line with the findings at the broader scale and factor levels, effect sizes of inter-age group subtheme differences were small, suggesting that whilst we cannot discard the influence that age may have upon the traits reflected by the subthemes, the strength of such influence appears to be limited.
Do our findings align with the literature?
Despite its innovative approach to exploring the various traits that affect individuals’ disposition to risk, the Risk Type Compass™ is deeply rooted in decades of academic research concerning the psychological study of personality. General consensus has emerged regarding the existence of five basic dimensions of personality deemed the ‘Big Five’ consisting of ‘Agreeableness’, ‘Extraversion’, ‘Openness to Experience’, ‘Conscientiousness’ and ‘Neuroticism’. The Risk Type Compass™ was developed using facets that were most relevant to risk from the latter four factors, enabling us to contextualise the findings of our analyses alongside thousands of peer-reviewed academic research studies.
In the case of the ‘Big Five’, Neuroticism is the factor most represented in the RTC, with the Emotional:Calm scale reflecting various facets of the trait in the subthemes it contains. The Daring:Measured scale’s relationship with the ‘Big Five’ is more complex, as the subthemes it contains reflect elements of Extraversion, Openness to Experience and Conscientiousness. This gives us a basis for comparisons with the research literature, which is best understood using ‘meta-analytic’ methods that combine and analyse large datasets collated from multiple studies. A meta-analysis of longitudinal research into personality traits conducted by Roberts, Walton, and Viechtbauer (2006) encompassed over twenty thousand participants spread across 92 samples. Figure 6.22. below provides a basic overview of two ‘Big Five’ factors addressed by Roberts et al’s (2006) research.
Figure 6.22. Cumulative d scores for the traits of Emotional Stability and Conscientiousness across the lifespan (Roberts et al., 2006)

© Copyright Psychological Consultancy Limited, 2019 all rights reserved. Risk Type Compass® is a registered trademark in Europe: CTM No. 010726818.
118
Conclusions
This section above reports some clear findings emerging from our analysis of Risk Type Compass™ data and age for nearly ten thousand participants. Our large sample size gives us a high degree of confidence in the differences we are reporting, as this has driven the very low ‘p values’ that have emerged during our tests of statistical significance. However, these must be viewed in conjunction with the small effect sizes that characterise the correlations and group differences we have reported. It must also be noted that our data is cross-sectional, meaning that individuals were not tracked over time. The youngest age group was also the smallest by far, suggesting that the variations emerging from their data should be treated with caution.
The findings that we report align with the expectations resulting from meta analyses of longitudinally-derived data. This validates the conceptual underpinnings of the Risk Type Compass™, as the ‘Big Five’ trends emerge from both datasets in a similar fashion. In terms of personality, whilst our data cannot contribute to the notion that our dispositions become ‘set in stone’ at some point in early adulthood, our findings do lend support to the ‘relative’ stability of personality over the adult lifespan. When viewed in conjunction with the very strong ‘test-retest’ findings of the assessment, our research into age provides added credence for the longevity of data obtained from a well-developed personality assessment like the Risk Type Compass™.
SummaryThe specific studies described in this chapter demonstrate that the Risk Type Compass™ is able to differentiate very clearly between the risk characteristics of individuals as well as between teams, professions, organisations and sectors and even generation. As well as each individual study being interesting in its own right, together they demonstrate how we can differentiate between groups of individuals based on their Risk Type, providing further validation for the Risk Type Compass™. These results highlight the benefits of using the tool in selection and recruitment as well as employee development.

© Copyright Psychological Consultancy Limited, 2019 all rights reserved. Risk Type Compass® is a registered trademark in Europe: CTM No. 010726818.
118 119
The Risk Type Compass™ can be applied across three broad levels: the individual, the team and the organisation as a whole. It has wide relevance across these areas and has been applied in a variety of industries. As Risk Type is a recent concept, there are also considerable opportunities to develop new and interesting applications for the assessment. The aim of this chapter is to provide an overview of how the Risk Type Compass™ is currently being used in practice and to ignite new ideas on its application. Towards the end of the chapter we look more specifically at some of the wide ranging occupational domains and industries that so far have embraced the Risk Type Compass™ and are experiencing the benefits of its application.
The potential application of the Risk Type Compass™ is extensive because there are few situations where risk is not a consideration. The immediate and most obvious opportunities reflect the interests and challenges of the risk management professions, which are almost entirely associated with efforts to control and minimise risk. Events in banking and the financial sector, which threatened the global economy, highlighted issues around risk taking. However, the focus still remains largely on the nature of the risk itself and on working practices - the systems, regulation and legislation. The catastrophic impact of particular individuals and the collapse, or near collapse, of huge institutions as a direct consequence of their actions suggests that a focus on the personal characteristics of employees in risk–related occupations could be fruitful and necessary.
Effective risk management is not just a matter of eliminating risk; risk aversion can be just as devastating and detrimental. Success in any organisation requires a balance between risk mitigation, innovation and embracing new opportunities. Balancing risk and opportunity is a tightrope that organisations have to tread; those who do it successfully are the ones that survive. The implication of this argument is that risk management has to embrace both sides of the risk/opportunity equation; addressing the challenges of risk culture that are out of balance in either direction, being either too risk taking or too risk averse. We refer to this concept as ‘Positive Risk Management’.
The Risk Type Compass™ is not simply a revised version of something that has previously existed. It has no direct precursors and, in addressing the causes of risk behaviours, it achieves something that has not been successfully accomplished in the past. It therefore has to be instrumental in discovering its own opportunities. Since the territory and practices of risk management have been shaped by a very different set of assumptions, the opportunities for Risk Type Compass™, with its focus on individual differences, will depend on identifying new approaches to risk management and other new professional practices. This puts us, as the developers, and you, as the practitioners, in a very exciting position: opening new doors to unexplored areas in human factor risk.
Chapter 7 - The Varied Uses Of The Risk Type Compass™

© Copyright Psychological Consultancy Limited, 2019 all rights reserved. Risk Type Compass® is a registered trademark in Europe: CTM No. 010726818.
120
Individual LevelWhen using the Risk Type Compass™ on a one-to-one basis we gain a better understanding of an individual’s risk threshold: their risk perception, reaction to risk, risk-taking propensity and how in turn these can influence decision-making. From a manager’s perspective, this broadened viewpoint plays a useful part in selection and re-deployment, providing an additional window to view the strengths and potential blind spots of applicants. The Risk Type Compass™ can also be used on a one-to-one basis for employee development. For example, it can be incorporated into coaching sessions or built into appraisals. In this way, employees can benefit from an increased self-awareness and understanding of their own personal biases in relation to risk and an appreciation of how to manage some of those impulses and dispositions. Self-awareness, discipline and personal responsibility are all big factors in the shaping of risk behaviour.
Selection
The Risk Type Compass™ adds a further dimension to existing selection procedures, better informing employee appointment decisions. The key here is the ‘fit’ between individual risk profiles and the role. It is not the case that there will necessarily be a one-to-one match between role and Risk Type. Although risk issues may differ dramatically from role to role, there may also be an argument for a balance of Risk Types within a particular group or workforce. Although compliance officers may face a very different risk agenda than traders, a mix of Risk Types may be complementary and broaden the perspective within either of those contexts.
Strategic Re-Deployment
Through greater awareness of Risk Type, valued employees can be strategically re-deployed into roles that may better suit their risk-taking dispositions. The Risk Type Compass™ provides an additional angle from which to evaluate the positioning of employees, in terms of their department, job focus and the team they work within. In many cases there are benefits to having diversity and a balance of Risk Types, combining the vigilance and caution of the more risk averse with the inquisitiveness, adventurousness and pursuit of opportunities of the more risk tolerant.
Personal Development
An individual’s awareness and knowledge of their own disposition towards risk provides a basis for personal development. Coaching helps an individual to better understand their own risk propensity and the implications this will have on risk behaviour, management style or team dynamics. A coach can work with the employee to understand, maximise or overcome these biases, as appropriate, to improve performance and achieve the desired outcome.

© Copyright Psychological Consultancy Limited, 2019 all rights reserved. Risk Type Compass® is a registered trademark in Europe: CTM No. 010726818.
120 121
In some instances, the coaching strategy can be further tailored to the situation. In the case of traders, for example, work has been undertaken to identify specific ‘trader pit-falls’ relative to each of the Risk Types. Here, a number of common trading errors are categorised according to the characteristics associated with each Risk Type. Wary Risk Types, for example, may be more prone to missing out on significant trades, holding back until the opportunity is lost, and may need to override this natural caution. Excitable Risk Types, on the other hand, may sometimes need to curb their impulsivity.
Team LevelResearch has consistently shown that people react differently to risk when in group situations compared to when making decisions individually. The ‘Risky Shift’ phenomenon refers to the ‘risk polarisation’ that occurs when high risk takers predominate in a group. This situation seems to establish a climate in which risk taking escalates and the individuals involved sanction greater levels of risk than any of them normally would if they were acting alone. Wallach, Kogan, and Bem (1964) suggest that this is due to diffusion of responsibility: social bonds decrease decision-making anxiety as responsibility for the outcome is perceived to be shared. Similarly, a group of risk-averse individuals within a team can behave in an overly cautious manner as each person encourages the next to make increasingly wary choices. This is sometimes known as “Cautious Shift”. In both scenarios, teams can unknowingly fall victim to these biases, resulting in decisions that are either too risk averse or too risk tolerant.
Auditing Teams
The Risk Type Compass™ can be used to audit groups and teams to increase understanding of a team’s strengths, limitations, dynamics and overall propensity for risk taking. It highlights the composition of teams and may reveal a need to develop a more suitable balance in the risk-taking tendencies of the team. The team audit may indicate the need for a team development event.
Developing Teams
The Risk Type Compass™ Team Report was designed specifically to support the group development process. Using a series of group data graphics, the team report views the group through a number of different perspectives. It considers Risk Type convergence or factions within the group, the degree of influence each Risk Type has within the wider group dynamics, and how this impacts the risk perception and risk-taking propensity of the group overall. The aim is to encourage discussion and debate about the implications, strategies and potential developmental goals. This approach allows the group to work through each of these perspectives, resulting in a framework against which they can re-evaluate team functioning and effectiveness, as well as the risk characteristics, group dynamics and decision-making processes of the team.

© Copyright Psychological Consultancy Limited, 2019 all rights reserved. Risk Type Compass® is a registered trademark in Europe: CTM No. 010726818.
122
Case Study – Why your creative employees are more likely to be risk-takers
“Five years from now, over one-third of skills (35%) that are considered important in today’s workforce will have changed [...] Creativity will become one of the top three skills workers will need.” – World Economic Forum (2016)
In the most popular TED talk of all time, Sir Ken Robinson delivers a powerful argument about the way educational institutions often hinder students’ creativity. His central message is clear – being wrong is not the same as being creative, but if you are not prepared to be wrong, you will never come up with anything original (Ted, 2007). He concludes that the fear and anxiety resulting from this stigmatisation can significantly hamper our creativity. This, in turn, affects our ability to innovate and adapt to the unpredictable demands of an increasingly uncertain future.
So how can we embrace creativity and prepare the workforce for what the World Economic Forum (2016) has termed ‘The Fourth Industrial Revolution’?
Tolerance of uncertaintyThinking ‘outside the box’ involves challenging the way things are done, but without yet having an alternative solution. For some, that is an uncomfortable, risk-taking scenario. They don’t like to stray, even mentally, from the comfort of what they know and have little desire for change.
The appetite for originality goes hand in hand with tolerance of uncertainty. Whether the urge to create overrides the fear of risk, or whether fear of risk stifles the urge to create is, to some extent, a matter of internal dynamics. Either way, an individual’s ability to tolerate uncertainty is importantly related to their capacity to be creative.
Risk aversion and creativityYet, creativity is not solely determined by what’s inside us; the climate or culture of an organisation provides the context within which natural inclinations may grow or be suppressed. Echoing Sir Ken Robinson, Gigerenzer (2014) argues in his book ‘Risk Savvy: How to make good decisions’ that concern about making errors is essentially a form of risk aversion. So if employees are incessantly discouraged from taking a chance, exercising their own judgement or challenging the status quo, their organisations are actively fostering a culture of risk aversion.
Discouragement can come in the form of stigmatic external pressures like overbearing managers, judgemental colleagues or stifling company bureaucracy. Creativity will struggle to flourish in any environment where risk aversion has been encouraged and fostered to the point of becoming excessive.
Personality, risk and creativityAgainst this background, research into how people differ in their perception of risk can

© Copyright Psychological Consultancy Limited, 2019 all rights reserved. Risk Type Compass® is a registered trademark in Europe: CTM No. 010726818.
122 123
provide useful insights to help us understand creativity. An academic study conducted by Cichomska (2010) with Psychological Consultancy Ltd using psychometric assessments addresses the issue of the relationship between personality, risk-taking and creativity.
The Risk Type Compass™ assesses the elements of personality that have the greatest influence on how individuals perceive and manage risk and how these propensities influence their decision-making. The PCL research used this assessment in conjunction with a widely used adjective checklist that measures creativity. Assessing individuals using both instruments shows a strong and statistically significant positive relationship between an individual’s risk tolerance and their level of creativity. Therefore, more creative individuals are likely to be higher risk-takers.
Risk, creativity and entrepreneurshipSimilar conclusions were also recently reported from a study in South Africa by psychology consultancy JvR Psychometrics. Whilst the Risk Type Compass™ was again used to evaluate risk tolerance, creativity was assessed using a measure of entrepreneurship that focuses on an individual’s ability to generate innovative business ideas.
Again, a significant positive association was found between risk tolerance and creativity. The focus on entrepreneurial creative potential is also interesting because entrepreneurs will often be drawn towards innovation and pride themselves on identifying opportunities where others see only danger.
Understanding the interaction between risk and personalityPersonality provides an important perspective on risk-taking and creativity. Both are related to an aspect of personality that disposes people to embrace novelty, question routine and to find fast-moving roles and changing environments stimulating. At the other end of this scale are individuals who are measured, organised and systematic. Their preferred approach to change - if indeed it needs to happen at all - is cautious and incremental.
In conjunction, the research mentioned above indicates the value of considering the interaction between personality and risk. Creativity has been identified as a precursor and propellant to innovation (Locke, 2009) and an individual’s perception of risk is a vital component in understanding their creative behavioural tendencies. A leap of faith is needed if radical new ideas are to take off, but there are important collaborating roles for others who spot the flaws and weaknesses that might otherwise have brought disaster.
Whatever the fruits of ‘blue sky thinking’, there will always be a place for those who can constructively question, those who can think through the pit-falls and those who can turn ideas into realities. No matter what the future holds, creative ideas alone will never be the full story. Success will always be the reward for the teams that strike this essential balance.

© Copyright Psychological Consultancy Limited, 2019 all rights reserved. Risk Type Compass® is a registered trademark in Europe: CTM No. 010726818.
124
Lessons for management:
1. Some workplace situations may require employees to comply to rules and follow rigid procedures. However, ‘blind obedience’ to these processes is not the same as employees taking personal responsibility for their actions. While the first stifles creativity, the second encourages it.
2. Personality dispositions feed the desire to innovate in some people and the wish to limit exposure to risk and uncertainty in others. Organisations need to harness their employees’ natural dispositions in ways that build understanding, mutual respect and cooperation between the two. This is effective team building.
3. You can have ‘too much of a good thing’; too much creativity can be as unproductive as excessive risk aversion. The former can lead to endless questioning, unsettling rapid change or so many ideas flying around that no decisions are ever made. The latter can result in inhibiting discretionary decision-making, infantilising the workforce or becoming too inflexible to address changing technical and economic challenges.
4. Most people try to act in accordance with what is expected of them at work and this can make them appear deceptively similar. In reality, one person’s welcomed opportunity may be an onerous demand for another. So, an individual’s personal development agenda depends on their own nature - the natural tendencies and dispositions that don’t just go away. Understanding those dispositions is the foundation for development and that is what personality profiling is all about.
Organisational Level
Risk Culture
At the micro level, risk culture is inevitably influenced by the individuals of whom that culture is composed. Schneider’s (1987) ‘the people make the place’ theory of culture is the clearest exposition of this. In this two-way, dynamic relationship, people make an important contribution to culture and culture influences the people. Surveying the propensity for risk at the level of the individual provides a reliable, objective and deliverable strategy for the elucidation of the wider risk culture.
The risk culture of an organisation reflects the values, style and behaviours prominent amongst current staff (particularly amongst senior staff) and the legacy of their predecessors. Considering this perspective, the Risk Type Compass™ assessment provides objective measures through which to identify shortcomings and set goals, shape, foster and monitor the risk culture and manage change across an organisation.
Any occupation or profession will tend to attract and retain people who are happy

© Copyright Psychological Consultancy Limited, 2019 all rights reserved. Risk Type Compass® is a registered trademark in Europe: CTM No. 010726818.
124 125
with the risk demands and exposure associated with it. This is the premise behind the attraction, selection, attrition hypothesis (Schneider, 1987). This hypothesis describes how: (a) people with similar values to the organisation will be more attracted to, and more likely to apply for, a position in a company that has similar values; (b) the recruitment process is likely to bias their application because incumbents tend to recruit in their own image; and (c) those who fit with the culture will stay, while those don’t will leave or be excluded.
The Risk Onion graphic (Figure 7.1 below) suggests the relationship between ‘Risk Type’, ‘risk attitude’, ‘risk behaviour’ and ‘risk culture’. Risk Type is seen as the core of risk culture, and risk attitude grows and develops from this through exposure and experience. Together these combine to produce an individual’s visible risk behaviour, which (along with others in the team/organisation) will contribute to the wider risk culture.
Figure 7.1. The ‘Risk Onion’
The ‘cascade’ project model is one example of an approach to risk culture change that has been successfully utilised by Psychological Consultancy Ltd. In essence, a cascade model approach will encompass a programmed series of group coaching and Risk Type team development events that start at the pinnacle (i.e. the boardroom), and work down through successive management levels of the organisation, all the way to the shop floor. This is a process that can extend across the workforce, providing a common frame of reference for the consideration of risk issues and a vocabulary that facilitates strategic planning and the communication of risk-related ideas and policies. It also clarifies personal responsibilities and provides a development agenda for individuals that reflects the compliance requirements of their particular role.

© Copyright Psychological Consultancy Limited, 2019 all rights reserved. Risk Type Compass® is a registered trademark in Europe: CTM No. 010726818.
126
Risk Landscape
The Risk Type Compass™ can be used to uncover the risk-taking tendencies within a department or larger group of teams. It can highlight where there are concentrations of a particular Risk Type, or where other Risk Types are lacking. This enables the organisation to reflect on the appropriate balance between the ‘risk tolerant’ and the ‘risk averse’ to improve the performance of that department. The Risk Type Compass™ not only illuminates such distinctions in risk-taking behaviour at an organisational level, but it also makes them manageable.
To aid this process, PCL have developed specialised software that allows users to physically map the risk landscape of an organisation so that it can be viewed in a tangible way (see Figure 7.2). Using this software, organisations can identify ‘hot’ and ‘cold’ risk spots. The risk landscape software can be used to inform strategic planning and risk policy development.
Figure 7.2. Screenshot of the Risk Type Compass™ Company Risk Landscape software
Group data on an organisational scale can be difficult to summarise without losing the extent of differentiation between individuals and groups to the vagueness of averages. The Risk Landscape software was designed to present Risk Type data in a way that allows it to be viewed on-screen graphically. Risk Type Compass™ data can be viewed at different levels of an organisation and interrogated down to team and individual levels. In the illustration, each ‘node’ represents a team. It is possible to click through to view Risk Type dispersal of any team, and the characteristics of

© Copyright Psychological Consultancy Limited, 2019 all rights reserved. Risk Type Compass® is a registered trademark in Europe: CTM No. 010726818.
126 127
any individual. The colour saturation, or ‘tint’, of each node conveys the mean Risk Tolerance Index (RTi) for the team: stronger colour reflecting stronger risk tendencies in either risk-taking or risk-averse direction; bleaching out to white for the most balanced teams.
Group data on an organisational scale can be difficult to summarise without losing the extent of differentiation between individuals and groups to the vagueness of averages. The Risk Landscape software was designed to present Risk Type data in a way that allows it to be viewed on-screen graphically. Risk Type Compass™ data can be viewed at different levels of an organisation and interrogated down to team and individual levels. In the illustration, each ‘node’ represents a team. It is possible to click through to view Risk Type dispersal of any team, and the characteristics of any individual. The colour saturation, or ‘tint’, of each node conveys the mean Risk Tolerance Index (RTi) for the team: stronger colour reflecting stronger risk tendencies in either risk-taking or risk-averse direction; bleaching out to white for the most balanced teams.
SummaryThe Risk Type Compass™ has been researched within more than 20 different sectors. It can be applied at the individual, team and organisational level for both selection and development purposes and has a key role to play in pro-actively managing risk culture. The above is an account of the early impact of Risk Type within the world of work and largely in English-speaking countries; it is by no means intended to be an exhaustive list of all the uses of the Risk Type Compass™. We anticipate that further application will become apparent as the tool demonstrates its utility to more practitioners and in more varied scenarios. The Risk Type Compass™ is now being distributed in north America, Canada, South Africa and Australia. The assessment is now available in four languages.

© Copyright Psychological Consultancy Limited, 2019 all rights reserved. Risk Type Compass® is a registered trademark in Europe: CTM No. 010726818.
128
The concept of Risk Type as expressed in this Technical Manual and allied publications is supported in a number of ways by past developments in the realms of personality theory and by research from other spheres. Our assertion that the Risk Type Compass™ identifies individual differences that are deeply rooted in our constitution ring fences ‘subjective risk’ as an area of coherence within the labyrinthine complexities of the total risk domain. It implies relevance to humanity in general.
Risk Type Compass™ validity is discussed here at several levels and in different terms. We refer to the reasoning behind the theory, the logic of the Compass model and the position of Risk Type as Concept Validation. More specifically, the Risk Type Compass™ has important implications for Individuals, for Teams, for Industries, and for Risk Culture. We discuss validity under each of these headings in terms of the meaning and plausibility of inferences for test interpretation.
Our aim is to provide reassurance at the most objective level possible. The discussion of Concept Validation is rhetorical; discussion of significance to Individuals is correlational; implications for Teams are illustrated by case study summaries; organisational differences in Risk Type composition are validated using non-parametric statistics; and Risk Culture is briefly discussed in terms of ongoing action research.
Concept ValidationDevelopment of the Risk Type Compass™ model was entirely research driven, by factor analysis and by psychometric development of the two orthogonal bi-polar scales that provide measures of the emotional and cognitive components of decision-making.
The 360-Degree Spectrum of Risk Dispositions
The 360-degree spectrum reflects the orthogonality of the two neurological functions - cognition and emotion - which are crucial components of decision making. Arranged orthogonally (as an ‘X’), they provide the axes for a continuously incremented 360-degree spectrum of risk dispositions. The radii of this circumplex model map all the possible permutations of those two orthogonal measures.
Eight Risk Types
Factor analysis defined the four ‘poles’ of the Risk Type Compass™ (Intense, Prudent, Composed, Carefree). Additional horizontal and vertical axes (as a ‘+’) are require to account for individuals with extreme scores on both the scales, adding four more Risk Types to the model (Wary, Deliberate, Adventurous, Excitable). See page 37 for details.
Meaning & Significance
Decades of personality research has provided a rich source of meaning for interpretive
Chapter 8 - Real World Consequences

© Copyright Psychological Consultancy Limited, 2019 all rights reserved. Risk Type Compass® is a registered trademark in Europe: CTM No. 010726818.
128 129
personality narrative. It also contributes to our understanding of the trajectory of personality characteristics over the life cycle (Harris et al., 2016), its relevance across different cultures (Allik & McCrae, 2002), and its heritability (Gottesman, 1963). Evolutionary psychology contributes to the debate about the signifance of personality to species survival (Social Defence Theory, Ein-Dor, 2013). Neuroscience provides insights into decision making, cognition and emotion (e.g. Damasio, 2006; Berthoz, 2006), and establishes consensus that two brain systems are involved in decision making (Simon, 1983; Walport, 2014). Common Currency Theory (Levy & Glimcher, 2012) highlights the correlation between propensity for risk taking across different domains and reward systems - all of which are relevant to the positioniong of the Risk Type Compass™.
In our view, Risk Type is stable from brain maturity through to the onset of degenerative processes of age. It is a feature of human nature that can be detected across cultures. It maps onto accepted neuroscience. It is consistent with an evolutionary psychology perspective that recognises the role of diversity in species survival.
Risk & Human Nature
The relationship between risk taking and personality is intrinsic. Our personalities (Risk Type) shape our world view, the decisions we make and our approach to the challenges involved in realising opportunities (subjective risk). The consequences of those endeavours, whether intended or not, generate the statistics of risk (objective risk). Whether we buy or sell influences value, financial markets, the econonomy, and, ultimately, what our money is worth. Whether we cross roads or wait, or drive cars carefully or intrepidly, influences accident statistics, as does road design, road maintenance, aircraft design, aircraft maintenance, or any other kind of design or maintenance. Risk statistics arise from what we do. Why we do it is about human nature.
Human factor risk is concerned with our perceptions, feelings and temperamental dispositions on the one hand (emotional factors), and with differences in the extent that individuals have a need for ‘locked down’ certainty, order and coherence in making sense of their world (cognitive factors) on the other. Together, these account for the individual differences in risk personality dispositions that have global consequences.
All this takes us a long way beyond the simplistic assumption that risk taking is a linear characteristic defined by a single scale from extreme caution to extreme recklessness. The reality that decision making involves emotion as well as rationality is rich with possibilities. For Homo Sapiens, dealing with risk successfully is clearly a team game. Whether those decision making teams exist in a military, corporate, commercial or public sector context, the ability to create teams or to audit teams on the basis of Risk Type diversity is something new. In order to play the game better and to raise our performance, it is necessary to understand this.

© Copyright Psychological Consultancy Limited, 2019 all rights reserved. Risk Type Compass® is a registered trademark in Europe: CTM No. 010726818.
130
Risk Type & Individual DifferencesThe study of individual differences has been a central theme within scientific psychology for decades and Risk Type was developed within this tradition. As with any other personality test, interpretive narrative of Risk Type draws from the extensive accumulation of personality research and insights of professional practice.
“No two persons are born exactly alike; but each differs from the other in natural endowments, one being suited fro one occupation and the other for another.”
- Plato
Scale names per se provide only an approximate indication of the meaning and interpretation of test scores and should never be regarded as more than barely adequate labels. Item content gives some understanding of personality scales but this is elaborated by other research into a construct and incrementally developed by comparison with other measures and confirmed through use: statistically through successful application to work samples; and qualitatively through candidate feedback and coaching sessions.
The inferences attributed to Risk Type Compass™ test scores have been enriched by numerous statistically significant relationships established with the constructs and themes of other measures in the course of research. Strong relationships imply a semantic overlap between measures.
Table 8.1. Correlations between Risk Type Compass™ and other measuresEmotional:Calm Scale Daring:Measured Scale Risk Tolerance Index (RTi)Emotional Reaction -.480** Emotional Reaction .330** Emotional Reaction -.615**Short Term Thinking -.507** Short Term Thinking .231** Short Term Thinking -.564**Resistance to Change -.399** Resistance to Change .439** Resistance to Change -.644**Wellbeing (JAWS) .324** Wellbeing (JAWS) -.266** Wellbeing (JAWS) .677**Routine Seeking -.258** Routine Seeking .458** Routine Seeking -.538**Uncertainty -.386** Uncertainty .287** Uncertainty -.507**Resilient .463** Resilient -.212* Resilient .546**HDS Bold .125* HDS Bold -.193**HDS Leisurely -.177** HDS Leisurely -.215**HDS Reserved -.220** HDS Reserved -.127*HDS Cautious -.360** HDS Cautious -.363**HDS Sceptical -.336** HDS Sceptical -.232**HDS Excitable -.559** HDS Excitable -.339**
HDS Mischievous -.559** HDS Mischievous .353**HDS Colourful -.385** HDS Colourful -.293**

© Copyright Psychological Consultancy Limited, 2019 all rights reserved. Risk Type Compass® is a registered trademark in Europe: CTM No. 010726818.
130 131
Emotional:Calm Scale Daring:Measured Scale Risk Tolerance Index (RTi)HDS Diligent .349** HDS Diligent -.223**
Performance .328** Performance .255**Proactivity .203* Proactivity .215*Adaptivity .381** Adaptivity .358**Task Proficiency .193* Task Proficiency .226*CD-RISC .598**Scientific Creativity (SR) .231* Scientific Creativity (SR) .225*Planned Change .182* Planned Change .182*
*p<.05. **p<.01
An account of each of the research studies from which these data were generated are presented below. The original PCL-published White Papers from which they are drawn are available in full from the Knowledge Bank on the PCL website.
The subject matter of the Risk Type Compass™ is well-suited for driving interesting research, from industry to individual levels. It has been administered over 14,000 times, allowing research samples to be compared against a ‘general population’ sample. The Risk Type Compass™ generates data points based on Risk Type designation; firstly, on the two scales that provide the underpinning axes for the Compass model - the Emotional:Calm and Daring:Measured scales; secondly, on the Risk Tolerance Index - the RTi; and finally, from the eighteen Risk Type Compass™ subthemes.
The Risk Type Compass™ is a British Psychological Society registered test with excellent reliability (Cronbach’s Alpha, Test Retest, and Split Half - see Chapter 5), and has been used in a range of psychological research. The content below refers only to recent research but a considerable amount of additional content can be found in previous sections of this Technical Manual.
Risk & Creativity
Creativity and risk go hand in hand. From crafting artwork to starting a new entrepreneurial venture, engaging in creative endeavours opens the creator up to potential risk and reward. Understanding this is vital to organisations hoping to attract and retain creative or entrepreneurial talent.
The current study sought to explore the interaction between risk and creativity by asking purposively sampled ‘creative’ individuals (n=85) to complete the Risk Type Compass™ assessment and two measures of creativity. The first measure focused on self-rated creativity (SRC) (Hughes, Farnham & Batey (2013)) and then second focussed on creative achievements (CAQ) (Carson, Peterson, & Higgins (2005)).

© Copyright Psychological Consultancy Limited, 2019 all rights reserved. Risk Type Compass® is a registered trademark in Europe: CTM No. 010726818.
132
Findings indicated that Excitable Risk Types were 3.5 times more likely to occur in the creative sample compared with the general population (n=11,900).
Figure 8.1. Risk Type breakdown of creativity and general population samples
Further breakdown indicated nuance between Risk Type Compass™ subthemes and SRC domains. The most notable Risk Type Compass™ subtheme was Intuitive, which generated contrasting correlations between ‘artistic’ and ‘scientific’ creativity domains.
Table 8.2. Correlations between Risk Type Compass™ subthemes and SRC scores
Risk Type Compass™ Subtheme
Self-Rated Creativity Domain (SRC)SRC Total
Scientific Social Visual Arts
Verbal Arts Sports
Apprehensive -0.2 -0.203 -0.014 0.039 -0.142 -.250*Sensitive -.334** -0.035 .308** 0.209 -0.193 -0.032Intuitive -.243* .216* .308** .399** -.224* 0.196Astute 0.03 0.184 -.219* -0.01 0.046 0.006Eager -0.165 0.047 0.148 0.108 -0.011 0.054Resilient -0.094 .351** -0.016 0.078 -0.008 0.13Confident 0.137 .381** -0.051 -0.052 .387** .245*Forgiving 0.11 0.187 -0.032 .238* 0.003 .232*Optimistic -0.017 0.096 0.138 0.101 -0.062 0.117Equable .236* 0.045 -.241* -0.195 0.149 0.005

© Copyright Psychological Consultancy Limited, 2019 all rights reserved. Risk Type Compass® is a registered trademark in Europe: CTM No. 010726818.
132 133
Risk Type Compass™ Subtheme
Self-Rated Creativity Domain (SRC)SRC Total
Scientific Social Visual Arts
Verbal Arts Sports
Audacious 0.031 .327** 0.089 0.189 0.099 .338**Explorative 0.185 0.019 -0.051 -0.052 .387** .245*Hasty 0.189 0.113 -0.078 0.009 .266* .242*Spontaneous 0.083 .454** -0.002 .215* 0.007 .342**Focused 0.138 0.21 0.1 -0.044 0.019 0.2Methodical -0.147 0.208 0.175 -0.06 -0.098 0.027Perfectionist -0.161 0.157 .271* -0.022 -0.176 0.024Conforming -0.06 -0.077 -0.052 -.220* 0.179 -0.102
*p<.05. **p<.01
In summary, findings indicate a clear trend of Risk Types, with Excitable considerably over-represented. This could in part be due to the greater proportion of ‘artistic’ creatives. This effect could also be located in the subtheme breakdown with the SRC (Table 8.2 above), where Intuitive appeared to influence differentiation between these forms of creativity.
Risk & the Legal Industry
Research into the legal industry was conducted using the Risk Type Compass™. A sample of 105 lawyers/legal representatives were analysed. Figure 8.2 below shows the distribution of Risk Types in comparison with the general population of 11,900 individuals.
Figure 8.2. Risk Type breakdown of lawyers and general population samples

© Copyright Psychological Consultancy Limited, 2019 all rights reserved. Risk Type Compass® is a registered trademark in Europe: CTM No. 010726818.
134
The findings indicate a clear ‘upward’ trend, with Wary Risk Types (29.52%) considerably over-represented in the sample of 105 legal representatives. Findings also indicate minimal representation of Daring Risk Types (i.e. Excitable (7.62%), Carefree (3.81%), Adventurous (1.9%)). This suggests that risk-taking individuals are neither drawn to, nor selected, nor remain in a legal profession designed to enforce rules.
Risk & Mental Health Professionals
Research into the Mental Health Professionals industry was conducted using the Risk Type Compass™. A sample of 234 Mental Health Professionals were analysed. Figure 8.3 below shows the distribution of Risk Types in comparison with the general population sample of 11,900.
Figure 8.3. Risk Type breakdown of Mental Health Professionals and general population samples
Findings indicate a clear left-sided trend, suggesting individuals employed in the Mental Health industry were more likely to reside on the Emotional side of the Emotional:Calm scale with Wary (25.43%), Intense (21.98%) and Excitable (12.5%) being the most prominent Risk Types respectively.
Risk & Change Management
Change is an unavoidable part of organisational growth and development and has become more important as economic and social volatility has grown. The current study encompasses a sample of 121 participants and focusses on the variable of ‘Resistance to Organisational Change’ (Oreg, 2003). This variable comprises of four factors, and was correlated against the subthemes, scales, and RTi of the Risk Type Compass™. See Table 8.3 below.

© Copyright Psychological Consultancy Limited, 2019 all rights reserved. Risk Type Compass® is a registered trademark in Europe: CTM No. 010726818.
134 135
Table 8.3. Correlations between Risk Type Compass™ subthemes and Resistance to Organisational Change
Resistance to Change FactorsResistance to Change
TotalRoutine Seeking
Emotional Reaction
Short Term
Thinking
Cognitive Rigidity
RTCSubthemes
Apprehensive .252** .553** .389** -0.61 .420**Sensitive .180* .365** .3** -.224* .254**Intuitive -0.025 o.004 0.125 -.233** .359**Astute o.o38 0.011 -0.142 -0.063 -0.054Eager -0.104 -0.12 -.233* 0.072 -0.137Resilient -0.128 -.419** -.404** 0.083 -.322**Confident -.354** -.463** -.472** .214* -.395*Forgiving -.292** -.376** -.357** -0.138 -.419**Optimistic -.344** -.224* -.207* -0.061 -.297**Equable -.205* -.416** -.384** 0.135 -.323**Audacious -.593** -.441** -.454** -0.07 -.556**Explorative -.432** -.256** -.285** -0.087 -.377**Hasty -.472** -.368** -.318** -0.123 -.457**Spontaneous -.259** -.237** -.250** 0.05 -.250**Focused -0.157 -.243** -.236** .374** -0.104Methodical .304** .321** 0.126 .253** .359**Perfectionist 0.109 0.156 -0.004 .196* 0.164Conforming .224* 0.172 0.059 0.118 .204*
RTCScales
E:C Percentile -.258** -.480** -.507** 0.162 -.399**D:M Percentile .456** .330** .231* .217* .439**RTi -.538** -.615** -.564** -0.066 -.644**
Analysis indicated numerous and (in some cases) large statistically significant relationships between each level of the Risk Type Compass™ and both the factor-level and total of the Resistance to Change variable. Factor-level influence varies but remains highly significant (with the exception of the Cognitive Rigidity factor), suggesting some interesting nuances alongside the overall finding regarding risk and resistance to change. These findings also have implications at Risk Type level, as shown in Table 8.4.

© Copyright Psychological Consultancy Limited, 2019 all rights reserved. Risk Type Compass® is a registered trademark in Europe: CTM No. 010726818.
136
Table 8.4. Average scores by Risk Type for the 4 factors and Total of Resistance to Change
Risk Type NResistance to Change Factor
Resistance to ChangeRoutine
SeekingEmotional Reaction
Short Term Thinking
Cognitive Rigidity
Wary 17 3.14 4.00 3.25 3.12 3.38Prudent 10 2.67 2.70 2.47 3.40 2.81Deliberate 7 2.38 2.43 1.62 3.19 2.40Composed 11 2.06 2.15 1.70 3.18 2.27Adventurous 8 1.75 2.13 1.79 3.25 2.23Carefree 13 2.10 2.67 2.21 3.05 2.51Excitable 18 1.98 2.94 2.52 2.50 2.49Intense 20 2.25 2.98 2.30 2.90 2.61Axial 17 2.14 2.73 2.18 3.24 2.57Total 121 2.29 2.86 2.33 3.04 2.63
Table 8.4 highlights the lowest (in green) and highest (in red) Risk Type average for each column, with Risk Types broadly sorted from lowest RTi (least risk tolerant) to highest RTi (most risk tolerant). This further illustrates the influence of risk tolerance on resistance to change, with the most resistant being Wary and the least resistant likely to be Adventurous (although factor variation does exist).
These findings strongly support the argument that practitioners involved in change management must take individual differences into account when establishing the impact that organisational change processes are likely to have upon pre-existing staff.
Risk & Resilience
Several separate studies have explored the interaction between the Risk Type Compass™ and resilience, which has become an emerging focus of organisations in recent years. Our research into change management (n=121) also included the ‘Brief Resilience Scale’ (Smith, Dalen, Wiggins, Tooley, Christopher & Bernard (2008)). This was analysed against the Risk Type Compass™ data and is presented in Table 8.5 below.
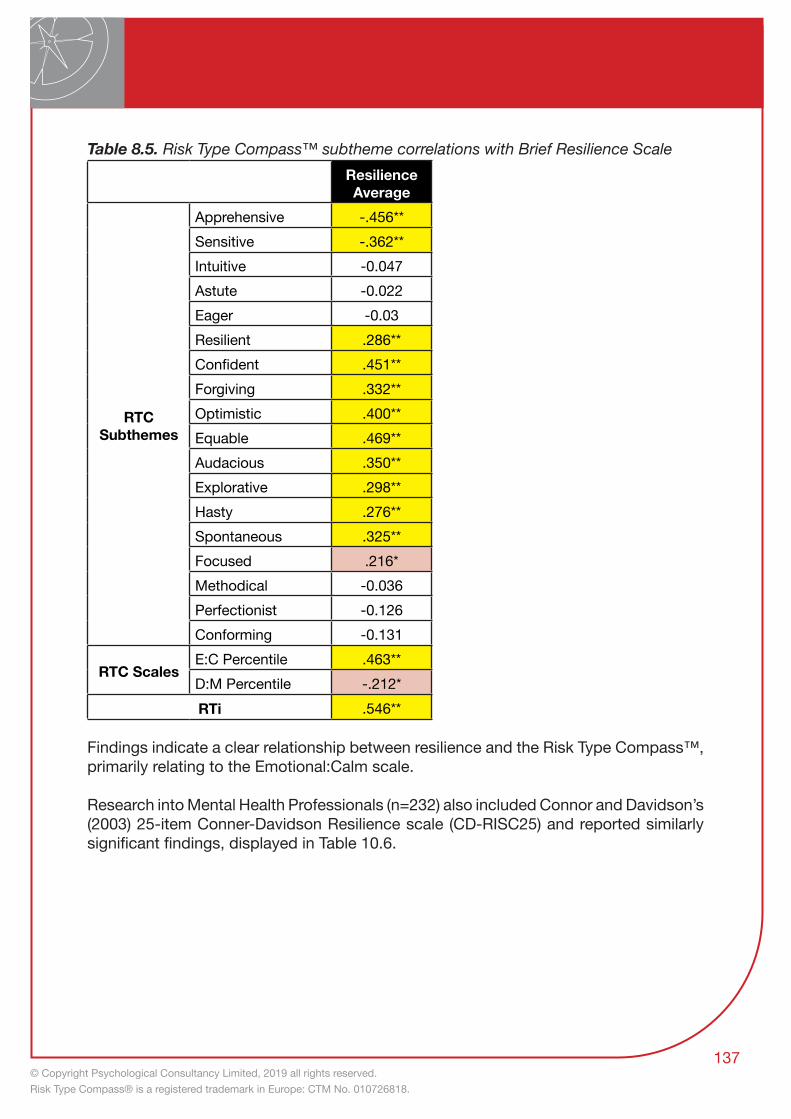
© Copyright Psychological Consultancy Limited, 2019 all rights reserved. Risk Type Compass® is a registered trademark in Europe: CTM No. 010726818.
136 137
Table 8.5. Risk Type Compass™ subtheme correlations with Brief Resilience ScaleResilience Average
RTC Subthemes
Apprehensive -.456**Sensitive -.362**Intuitive -0.047Astute -0.022Eager -0.03Resilient .286**Confident .451**Forgiving .332**Optimistic .400**Equable .469**Audacious .350**Explorative .298**Hasty .276**Spontaneous .325**Focused .216*Methodical -0.036Perfectionist -0.126Conforming -0.131
RTC ScalesE:C Percentile .463**D:M Percentile -.212*RTi .546**
Findings indicate a clear relationship between resilience and the Risk Type Compass™, primarily relating to the Emotional:Calm scale.
Research into Mental Health Professionals (n=232) also included Connor and Davidson’s (2003) 25-item Conner-Davidson Resilience scale (CD-RISC25) and reported similarly significant findings, displayed in Table 10.6.

© Copyright Psychological Consultancy Limited, 2019 all rights reserved. Risk Type Compass® is a registered trademark in Europe: CTM No. 010726818.
138
Table 8.6. Risk Type Compass™ subtheme correlations with CD-RISC25CD-RISC Total (25)
RTC Subthemes
Apprehensive -.478**Sensitive -.455**Intuitive -.161*Astute .192**Eager 0.013Resilient .356**Confident .577**Forgiving .313**Optimistic .577**Equable .390**Audacious .354**Explorative .253**Hasty .261**Spontaneous .366**Focused .526**Methodical 0.064Perfectionist .179**Conforming 0.114
RTC ScalesE:C Percentile .598**D:M Percentile -0.083RTi .513**
As with the Brief Resilience Scale, the CD-RISC25 scale presented numerous interactions with Risk Type Compass™ subthemes, with clear emphasis on the Emotional:Calm scale. These findings would suggest that levels of resilience are in part determined by deeply-rooted personality temperaments, some of which are assessed by the Risk Type Compass™.
Risk & Wellbeing
Several projects have also explored the role that personality plays in feelings of wellbeing using the Risk Type Compass™. As with resilience, greater focus has been placed on this variable in recent years, with increased pressure on companies to take the wellbeing of their staff into account. Research using the Job Affective Wellbeing Scale (JAWS) (Van Katwyk, Fox, Spector, & Kelloway (2000)) was conducted with a

© Copyright Psychological Consultancy Limited, 2019 all rights reserved. Risk Type Compass® is a registered trademark in Europe: CTM No. 010726818.
138 139
sample of 74 managers. The JAWS is job specific and can be broken into four factors, but acts primarily as a total score using all 20 items. Findings from the analysis are presented in Table 8.7. below.
Table 8.7. Correlations between Risk Type Compass™ subthemes and the Job Affective Wellbeing Scale (JAWS)
High Pleasurable-High Arousal
High Pleasurable- Low Arousal
Low Pleasurable- High Arousal
Low Pleasurable- Low Arousal
JAWS Total Score
Apprehensive -0.072 -.236* -0.175 -0.065 -0.17Sensitive 0.096 -0.068 -0.142 0.04 -0.019Intuitive -0.175 -0.205 -0.185 -0.134 -0.219Astute 0.117 .375** .379** .389** .395**Eager -0.015 0.023 0.109 0.072 0.057Resilient 0.022 0.179 .273* 0.1 0.176Confident 0.197 0.221 0.155 0.187 .240*Forgiving 0.228 0.186 0.206 0.16 .245*Optimistic .290* .372** 0.113 0.174 .301**Equable -0.11 0.162 0.225 0.145 0.129Audacious 0.059 0.212 0.126 -0.07 0.099Explorative .301** .239* -0.07 0.082 0.179Hasty 0.194 0.157 -0.033 0.029 0.112Spontaneous 0.105 0.197 0.051 0.129 0.153Focused .378** .320** 0.081 .352** .363**Methodical 0.11 0.082 -0.075 0.024 0.048Perfectionist 0.135 0.139 -0.037 0.177 0.135Conforming 0.17 0.11 -0.072 0.193 0.133E:C Percentile 0.159 .342** .327** 0.212 .324**D:M Percentile 0.023 -0.044 -0.019 0.117 0.027RTi 0.075 .251* .248* 0.07 0.198
In comparison to the resilience findings, analysis indicated the prominence of the Emotional:Calm scale in its significance to wellbeing.
The Change Management research (n=121) also encompassed Warr’s Wellbeing scale and reported the correlations below.

© Copyright Psychological Consultancy Limited, 2019 all rights reserved. Risk Type Compass® is a registered trademark in Europe: CTM No. 010726818.
140
Table 8.8. Correlations between the Risk Type Compass™ subthemes and Warr’s (1990) Wellbeing Scale
Wellbeing Average
RTC
Sub
them
es
Apprehensive -.545**Sensitive -.333**Intuitive -0.069Astute 0.145Eager .216*Resilient .409**Confident .580**Forgiving .486**Optimistic .483**Equable .443**Audacious .489**Explorative .314**Hasty .306**Spontaneous .397**Focused .343**Methodical -.189*Perfectionist -0.05Conforming -0.027
RTC Scales
E:C Percentile .599**
D:M Percentile -.266**
RTi .677**
These findings elicited stronger relationships with the Risk Type Compass™, potentially due to the broader focus of the scale (in comparison with the job-specific JAWS). The Emotional:Calm scale was again influential, suggesting deeply-rooted dispositions play a role in feelings of wellbeing reported by individuals.
Risk Type Compass™ & the Hogan Development Survey (HDS)
The Hogan Development Survey (HDS) is a psychometric measure of leadership derailers, referred to as ‘the Dark Side of personality’. Each of the eleven scales is concerned with sub-clinical manifestations of personality disorder characteristics within the range of the normal population. Very high scores (above the 90th percentile) indicate high risk

© Copyright Psychological Consultancy Limited, 2019 all rights reserved. Risk Type Compass® is a registered trademark in Europe: CTM No. 010726818.
140 141
of career derailment. Table 8.9. provides correlations of the Risk Type Compass™ RTi/scales/subthemes and the eleven HDS scales. The sample is of 297 individuals who had completed both the Risk Type Compass™ and the HDS assessments.
Table 8.9. HDS Scale Percentile Average by Risk Type
HDS Scale Average Percentiles
Risk Type N
Exci
tabl
e
Scep
tical
Cau
tious
Res
erve
d
Leis
urel
y
Bold
Mis
chie
vous
Col
ourf
ul
Imag
inat
ive
Dili
gent
Dut
iful
Wary 9 81.00 83.78 71.33 69.89 72.78 51.33 44.22 47.67 60.33 71.44 54.22
Prudent 22 72.23 70.18 57.05 64.73 64.77 57.50 42.55 46.59 61.68 79.86 47.73
Intense 13 87.31 77.00 62.92 63.69 50.54 39.23 60.77 67.38 63.85 37.69 47.23
Deliberate 90 47.29 52.46 43.21 51.98 51.77 52.86 39.71 46.19 49.03 67.73 48.48
Axial 25 72.60 68.12 59.00 56.52 56.28 56.76 72.44 54.80 73.76 54.48 45.88
Excitable 4 83.00 69.00 63.25 75.50 75.75 67.50 79.25 64.25 72.25 40.50 44.75
Composed 73 44.78 55.85 41.97 50.96 49.21 62.84 61.48 62.66 71.67 60.64 50.74
Carefree 20 69.80 70.40 44.55 56.55 43.00 57.35 81.85 63.70 79.90 50.40 44.15
Adventurous 41 51.29 59.17 34.73 56.66 47.98 68.20 76.49 69.78 77.68 45.12 44.76
Total 297 55.97 60.30 46.16 55.38 52.27 57.96 57.53 56.64 64.95 59.92 48.02

© Copyright Psychological Consultancy Limited, 2019 all rights reserved. Risk Type Compass® is a registered trademark in Europe: CTM No. 010726818.
142
Table 8.10. Correlations between the Risk Type Compass™ subthemes and HDS Scales
HDS Scale
Exci
tabl
e
Scep
tical
Cau
tious
Res
erve
d
Leis
urel
y
Bold
Mis
chie
vous
Col
ourf
ul
Imag
inat
ive
Dili
gent
Dut
iful
Emot
iona
l:Cal
m
Apprehensive .361** .229** .266** 0.1 .138* -.128* -.022 -.125* 0.009 0.041 .141*
Sensitive .318** 0.08 .257** -0.052 0.065 -.118* 0.093 .150** 0.085 -.213** 0.023
Intuitive -0.046 -.115* 0.054 -.122* -0.043 -0.072 .132* .160** 0.063 -.307** -0.008
Astute -.270** -.476** -0.056 -.312** -0.097 0.006 -.193** .144* -0.064 -0.1 -0.018
Eager -.193** -.171** -0.043 -0.095 -.154** -.230** -.221** -.235** -.145* 0.089 .135*
Resilient -.376** -.212** -.275** -.149* -.201** -0.021 0.013 -0.075 -0.021 -0.067 0.025
Confident -.368** -.207** -.433** -.175** -.115* .315** 0.084 .201** 0.098 0.067 -.136*
Forgiving -.441** -.478** -.252** -.293** -.238** 0.024 -0.043 .118* -0.085 -0.085 0.065
Optimistic -.258** -.214** -0.09 -.224** -0.113 .140* .163** .220** 0.044 -0.088 0.025
Equable -.404** -.132* -.132* -0.091 0.059 0.003 -.212** -.133* -.227** 0.045 0.039
Darin
g:M
easu
red
Audacious -0.021 -0.064 -.171** -0.005 -0.07 .294** .400** .266** .414** -0.091 -0.036
Explorative -0.019 0.087 -.191** 0.007 -.119* .215** .507** .315** .356** -0.026 0.058
Hasty 0.046 .144* -.212** 0.041 -0.108 .206** .550** .264** .395** 0.031 -0.03
Spontaneous -.141* -0.065 -.354** -.181** -.128* .302** .250** .329** .276** 0.015 -.114*
Focused -.188** -0.094 -.351** -.179** -0.067 .227** 0.015 0.056 0.08 .283** -0.075
Methodical -.173** -0.095 -0.052 -0.05 -0.043 -0.076 -.349** -.224** -.185** .506** 0.073
Perfectionist -0.015 .114* 0.012 -0.028 .136* 0.099 -.130* -.127* -0.109 .516** -0.087
Conforming -.226** -.150** 0.004 -.172** -0.054 -.133* -.324** -.178** -.223** .219** .253**
Scal
e Emotional:Calm -.559** -.366** -.360** -.220** -.177** .125* -0.112 0.004 -0.076 0.058 0.008
Daring:Measured -0.1 -0.088 .131* -0.053 0.098 -.193** -.599** -.385** -.426** .349** 0.062
RTi -.339** -.232** -.363** -.127* -.215** .238** .353** .293** .251** -.223** -0.058
These tables illustrate an interesting alignment between the themes and factors of Risk Type and the scales and factors of the HDS. The HDS has been factor analysed into three factors: ‘Moving Against’ (Bold, Mischievous, Colourful, Imaginative); ‘Moving Away’ (Excitable, Sceptical, Cautious, Reserved, Leisurely); and ‘Moving Towards’ (Diligent, Dutiful).
Findings indicate greater association between the Risk Type Compass™ Emotional:Calm themes with the HDS scales of the ‘Moving Away’ factor, and between the Risk Type Compass™ Daring:Measured themes and the HDS scales of the ‘Moving Against’ factor.
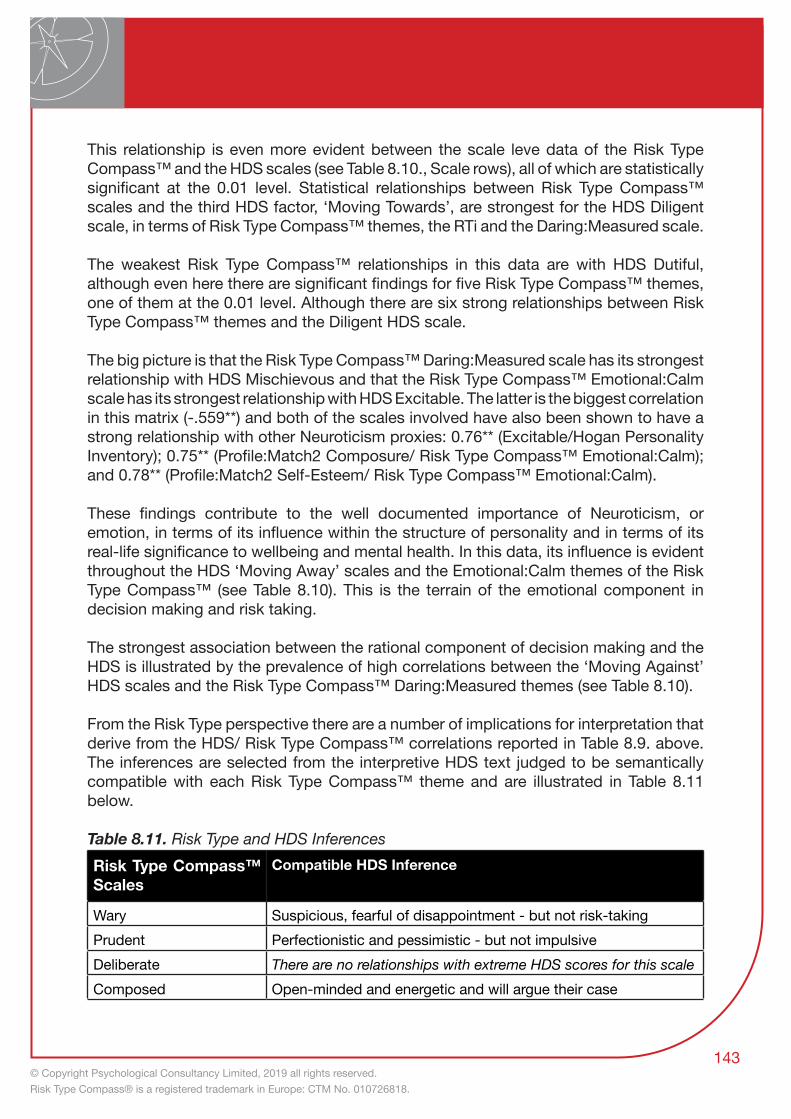
© Copyright Psychological Consultancy Limited, 2019 all rights reserved. Risk Type Compass® is a registered trademark in Europe: CTM No. 010726818.
142 143
This relationship is even more evident between the scale leve data of the Risk Type Compass™ and the HDS scales (see Table 8.10., Scale rows), all of which are statistically significant at the 0.01 level. Statistical relationships between Risk Type Compass™ scales and the third HDS factor, ‘Moving Towards’, are strongest for the HDS Diligent scale, in terms of Risk Type Compass™ themes, the RTi and the Daring:Measured scale.
The weakest Risk Type Compass™ relationships in this data are with HDS Dutiful, although even here there are significant findings for five Risk Type Compass™ themes, one of them at the 0.01 level. Although there are six strong relationships between Risk Type Compass™ themes and the Diligent HDS scale.
The big picture is that the Risk Type Compass™ Daring:Measured scale has its strongest relationship with HDS Mischievous and that the Risk Type Compass™ Emotional:Calm scale has its strongest relationship with HDS Excitable. The latter is the biggest correlation in this matrix (-.559**) and both of the scales involved have also been shown to have a strong relationship with other Neuroticism proxies: 0.76** (Excitable/Hogan Personality Inventory); 0.75** (Profile:Match2 Composure/ Risk Type Compass™ Emotional:Calm); and 0.78** (Profile:Match2 Self-Esteem/ Risk Type Compass™ Emotional:Calm).
These findings contribute to the well documented importance of Neuroticism, or emotion, in terms of its influence within the structure of personality and in terms of its real-life significance to wellbeing and mental health. In this data, its influence is evident throughout the HDS ‘Moving Away’ scales and the Emotional:Calm themes of the Risk Type Compass™ (see Table 8.10). This is the terrain of the emotional component in decision making and risk taking.
The strongest association between the rational component of decision making and the HDS is illustrated by the prevalence of high correlations between the ‘Moving Against’ HDS scales and the Risk Type Compass™ Daring:Measured themes (see Table 8.10).
From the Risk Type perspective there are a number of implications for interpretation that derive from the HDS/ Risk Type Compass™ correlations reported in Table 8.9. above. The inferences are selected from the interpretive HDS text judged to be semantically compatible with each Risk Type Compass™ theme and are illustrated in Table 8.11 below.
Table 8.11. Risk Type and HDS InferencesRisk Type Compass™ Scales
Compatible HDS Inference
Wary Suspicious, fearful of disappointment - but not risk-takingPrudent Perfectionistic and pessimistic - but not impulsiveDeliberate There are no relationships with extreme HDS scores for this scaleComposed Open-minded and energetic and will argue their case

© Copyright Psychological Consultancy Limited, 2019 all rights reserved. Risk Type Compass® is a registered trademark in Europe: CTM No. 010726818.
144
Risk Type Compass™ Scales
Compatible HDS Inference
Adventurous Innovative and energetic - but not vigilantCarefree Limit-testing and flexibile - but not easily irritatedExcitable Passionate and has no regrets - but not diligentIntense Takes things personally and alert to rejection - but not assertiveAxial Insightful, open-minded and energetic and will argue their case
Risk & Agreeability
In the original Risk Type Compass™ research, items were written addressing themes from four of the Five Factor Model (FFM) factors. The literature review at the outset showed equivocal and contradictory correlations between FFM Agreeability and various measures of risk-taking, so no items were written for that factor. In the processes of factor analysing the data collected for all original items and the processes of scale development, some themes and items were discarded. The most prominent factors of the FFM incorporated into the final version of the Risk Type Compass™ are Neuroticism (Emotional:Calm scale), and Extraversion and Conscientiousness (Daring:Measured scale). This study considers the relationship between the Risk Type Compass™ themes and a measure of Agreeability.
This research involved 105 legal professionals who completed a brief Agreeability scale derived from the International Personality Item Pool (IPIP), and the correlations of this scale are presented in Table 8.12. below.
Table 8.12. Correlations between the Risk Type Compass™ and AgreeabilityAgreeability
Emot
iona
l:Cal
m S
ubth
emes
Apprehensive 0.117Sensitive .425**Intuitive .379**Astute .373**Eager 0.122Resilient 0.098Confident -0.164Forgiving 0.129Optimistic .362**Equable -.197*

© Copyright Psychological Consultancy Limited, 2019 all rights reserved. Risk Type Compass® is a registered trademark in Europe: CTM No. 010726818.
144 145
Agreeability
Dar
ing:
Mea
sure
d Su
bthe
mes
Audacious 0.089Explorative 0.15Hasty -0.07Spontaneous -0.012Focused 0.079Methodical 0.167Perfectionist 0.155Conforming .299**
Scal
e Emotional:Calm -0.04Daring:Measured 0.126
RTi -0.118
These findings indicated that, despite the omission of Agreeability items in the Risk Type Compass™, some relationships do exist between the Risk Type Compass™’s subthemes and this measure of Agreeability, although these relationships are not in a consistent direction in the context of the Risk Type Compass™’s framework (e.g. the subthemes of Intuitive and Astute would contrast in the Emotional:Calm scale but are in the same direction when correlatedagainst agreeability). These findings evidence the distinctiveness of the Risk Type Compass™, but also point towards some conceptually-consistent inter-factor patterns.
There are some implications for the Risk Type Compass™ in terms of nuanced interpretation that concerns the Optimistic, Astute, Sensitive, Intuitive and Conforming subthemes. There is a semantic coherence in the positive relationships between these Risk Type Compass™ subthemes and language associated with the interpretation of FFM Agreeability scores. The Agreeability construct concerns charm, tact and interpersonal skills, none of which are in direct conflict with the Risk Type Compass™ themes under discussion. In terms of personal interaction, there are connotations within which Agreeability might be implied simply because of the Risk Type Compass™ subthemes Astute, Optimistic and Conforming would all be regarded as interpersonally positive and Sensitive and Intuitive are neutral rather than negative in this respect.
Table 8.13. Risk Type Compass™ Subthemes and Agreeability TerminologyRisk Type Compass™ Subtheme
Compatible Agreeability Terminology
Sensitive Dreamy, tender, touching, affectionate, sensitiveIntuitive Sensitive, feeling, naturalAstute Open, unsuspicious, innocent, confiding, acceptingOptimistic Cheerful, hopeful, upbeat, happy
© Copyright Psychological Consultancy Limited, 2019 all rights reserved. Risk Type Compass® is a registered trademark in Europe: CTM No. 010726818.
146
Risk Type Compass™ Subtheme
Compatible Agreeability Terminology
Equable Genial, tranquil, even-tempered, easy-goingConforming Harmonious, obliging, compatible
Even within a scientific psychology, language is a melting pot of overlapping semantics and nuance. For the psychology professionals, a coach or personality psychologist, their understanding of personality terminology and the meaning of personality scales will be a process of continuous refinement based on feedback discussions with clients, candidates or patients. Language is used tentatively, suggestively and exploratively seeking shared meaning and insights. All the correlations identified in this section allow consideration about whether a particular inference might be justified in a particular feedback conversation.
Teams & Groups
Value of Diversity
There is a tendency in all organisations not to challenge the way in which problems are framed and the ways in which decisions made and this can be a serious problem. Irving Janis (1918-1990), the Yale research psychologist famous for his theory of ‘group-think’, identified the tendency of groups to minimise conflict and reach consensus at the cost of critical scrutiny of ideas. Efforts to reduce ‘group-think’ can be complex and cumbersome, as well as efforts to reduce ‘risk polarisation’: the tendency for groups that are predominantly either cautious or disposed towards risk to amplify those dispositions in the decisions they make; also referred to as ‘risky shift’.
‘Red Team Strategies’, which is the process of adding a deliberately opposing voice to a team to introduce an adverserial discussion, have been used in both military and civilian organisations to improve decision making by challenging the consensus. Social Defence Theory (SDT) attributes group success to “the combination of personality patterns that contribute to effective reactions in times of danger” (Ein-Dor, 2013). Risk Type dispositions each have characteristic advantages that increase ‘inclusive fitness’. The diversity of risk dispositions in our species, and the communication capability afforded by the development of language, creates possibilities for group collaboration and survival unmatched by competing species. The risk dispositions originally used to support SDT were defined in terms of attachment theory (e.g. Harris, 1998; Field, 1996), but the adoption of highly reliable Risk Type Compass™ metrics strengthens the evolutionary argument and the logic regarding the advantage of diverse risk dispositions in the face of danger or uncertainty.

© Copyright Psychological Consultancy Limited, 2019 all rights reserved. Risk Type Compass® is a registered trademark in Europe: CTM No. 010726818.
146 147
Risk Dispositions & Team Dynamics
Risk dispositions have a very significant influence on team dynamics. Individuals of the same Risk Type will more easily find common ground and are more likely to see things in similar ways. Reaching agreement is uncomplicated by differing perceptions of the amount of risk involved. On the other hand, different Risk Types, especially if opposite and extreme, will find it very difficult to appreciate the other’s points of view. One advantage of approaching these issues from the Risk Type perspective is that these differences can easily be identified and articulated. It is perfectly feasible for team members to be aware of the team’s Risk Type composition. In some cases, members may agree to make this explicit so that everyone is open about these differences in emphasis and able to take them into account.
The fact that there are similar proportions of each of the Risk Types in the population, and the point that these are complementary to each other, fosters positive attitudes and mutual respect between Risk Types. Team events have proved to be a very constructive way of harnessing the benefits of Risk Type diversity.
The following case studies are included to illustrate the use of Risk Type Compass™ in team environments and the positive effects of team events on mutual understanding and decision making processes.
Mining Company Board
In this study, board members asked the question ‘Is our exposure to risk okay?’ - the board wished to dive into their attitudes to risk and its effects on their decision making processes. Sharing Risk Types in an open setting was a precursor to setting risk appetite thresholds for strategic objectives.
The Board and Executive Committee were predisposed to caution on regulatory issues: health and safety, environmental protection, diversity, inclusion, etc. They were overly cautious with respect to diversification into other commodoties and outside their home market. Risk Type Compass™ helped to generate a conversation and some modified strategic choices, as well as stronger risk reporting.
Figure 8.4. below shows the Risk Type distribution of the Mining Company Board members.

© Copyright Psychological Consultancy Limited, 2019 all rights reserved. Risk Type Compass® is a registered trademark in Europe: CTM No. 010726818.
148
Figure 8.4. Risk Type Distribution of Mining Company Board Members
The risk dispositions of board members reflect the nature of mining and the dangers involved. The emphasis on engineering detail and rigorous safety requirements are reflected in the clustering of Prudent and Deliberate Risk Types. At the opposite side of the spectrum, the Head of Sales & Marketing will be open-minded and innovative. The natural dispositions of the CEO, who is an Excitable Risk Type but close to the Intense boundary, will be cautious while also being excited by innovative alternatives to traditional approaches. The challenge for the CEO is in enthusing the board as a whole about embracing new opportunities and technical innovation.
Commercial Team (Historic Trust)
On the face of it, the Risk Type distribution of this team represented an ideal placement for a commercial team: it is a remarkably homogeneous, free-wheeling, creative group sharing excitement about new ideas, and there will be no shortage of ideas. The Risk Type distribution is shown in Figure 8.5. below.
Figure 8.5. Risk Type Distribution of Commercial Team Members

© Copyright Psychological Consultancy Limited, 2019 all rights reserved. Risk Type Compass® is a registered trademark in Europe: CTM No. 010726818.
148 149
The problem we uncovered with this team was the absence of any representation of the more detail-oriented and systematic Risk Types, which left them in an almost permanent cycle of discussion without reaching firm conclusions. They were able to recount a string of past interests, concerns and enthusiasm that never reached fruition.
Using the Risk Type Compass™ helped to highlight this homogenity and create a shared language moving forward. Knowing the attitudes and Risk Types that were missing from the team, they were able to acknowledge their flaws and take actions to improve.
Insurance Company Risk Team
This team were struggling with attempts to change a longstanding conservatism, inflexibility and resolute resistance to any view of risk management other than a dogged resistance to innovation - this view is exemplified by the long-standing Prudent and Deliberate Risk Type team members.
Figure 8.6. Risk Type Distribution of Insurance Company Risk Team Members
A new Chief Risk Officer with a radically different orientation, a Carefree Risk Type, had been appointed, and her newer appointments to the team were closer to her disposition. The challenge for the CEO was bringing this team together as a cooperating group and realising the potential strength in their diversity.
Working with the Risk Type Compass™ allowed the creation of a common language and fostered a culture of appreciation for members with differing views. Instead of pitting the new members against the old members, the team were able to appreciate the views of their opposing Risk Types, creating a more effective team environment.

© Copyright Psychological Consultancy Limited, 2019 all rights reserved. Risk Type Compass® is a registered trademark in Europe: CTM No. 010726818.
150
Board Members of a Charity
Figure 8.7. Risk Type Distribution of Charity Organisation Board Members
There are two immediately noticeable features to this grouping of Risk Types. Firstly, there is no representation from three segments of the Compass and only one within that entire 180-degree segment of the Compass. The effect of this will be that, as a whole, they are all optimistic and relatively relaxed; but a lack of urgency is likely to blunt any critical edge to debate. Secondly, the board divides in terms of the formality, organisation and detail of the Prudent and Deliberate Risk Types and the flexibility and open-mindedness of the Carefree and Adventurous Risk Types. These two distinctive features in particular provided the basis for a board development exercise.
Russell Group University
Figure 8.8. Risk Type Distribution of Russell Group University Academics

© Copyright Psychological Consultancy Limited, 2019 all rights reserved. Risk Type Compass® is a registered trademark in Europe: CTM No. 010726818.
150 151
This study involved a major transformational change project, working with senior academic staff to put students at the heart of the service offering. All change involves risk so there is a direct relationship between Risk Type and individual perceptions of the challenge - see Resistance to Change research earlier in this Chapter. The Risk Type Compass™ results were used as a basis for individual team coaching. Risk Type Compass™ enabled the process for change to be much richer and more inclusive.
Traders
Figure 8.9. Risk Type Distribution of Directional, Spread and Volatility Traders
This data was provided by coachee traders. Although they are widely spread throughout the Compass, taken as a whole they gravitate towards the lower right. Two thirds of the sample fall within the Carefree, Adventurous, Composed and Deliberate segments; more risk taking in terms of both emotion and cognition. However, there is an interesting grouping of traders according to the kind of trading they are involved with.
Summary
Decision making teams need to be able to operate in circumstances that may be stressful and when decisions may be critical for the organisation’s future competitiveness and survival. The creation of a high performance team may or may not have been the driving force in ‘team selection’. Even if it was, the knowledge, expertise and techniques available to assist in pursuance of that goal is limited. The effectiveness of teams and their mode of functioning is inevitably influenced by the risk dispositions of their members. Risk Type will play a very significant part in this, although it may not be recognised as such.
Each Risk Type views the world through their own particular lens, and that 360-degree perspective is a very powerful asset. Diametrically opposed viewpoints can raise tensions, but that is no reason to opt for the cosy alternative of a built-in like-minded

© Copyright Psychological Consultancy Limited, 2019 all rights reserved. Risk Type Compass® is a registered trademark in Europe: CTM No. 010726818.
152
consensus. That may in fact be the most dangerous option of all.
Industries & Sectors
Attraction, Selection, Attrition (ASA)
Culture differs considerably across industries and professions. The atmosphere in a tax office, for example, is very different to the atmosphere in a recruitment firm, marketing firm, or a branch of the military. These differences are palpable and widely understood. To a considerable extent this is because different professions attract different personalities, and retain those that fit.
The ‘people make the place’ model of culture, developed by psychologist Benjamin Schneider (1987), reflects these points. In his view, people are attracted to a job by the reputation of the organisation or the profession and their affinity with those qualities. Selection processes further refine the fit between individual and organisation, filtering out those that are less compatible. Attrition reflects the further depuration of the workforce as people leave, fail their probationary period, or are dismissed. The staff that stay become increasingly acculturated and established and emerge as the evolving embodiment of the organisation’s culture, its routines, practices and the shared awareness that makes life predictable and dependable.
The studies described in this section explore differences in the prevalence of Risk Types in a variety of professions. In instances of currently-employed participants, we can assume that they have: (1) been attracted to; (2) been selected by; and (3) remained in their job roles.The Attraction-Selection-Attrition (ASA) model would support the view that they have been, and continue to be, at least partially successful in their job. Our expectation that this will differ significantly and in line with the ASA hypothesis is discussed.
Chi-Square Goodness of Fit Analyses
The Chi-Square Goodness of Fit test is used to determine whether the distribution of cases (i.e. participants) in a single categorical variable follows a known or hypothesised distribution. In the instances below, Risk Type represents the categorical variable, and the Risk Type distribution in our general population sample of 13,614 individuals represents the hypothesised distribution. The Chi-Square Goodness of Fit test represents a framework of analysis that compares the Risk Type distribution of specific samples (e.g. job roles or industries) against the general population sample to determine if there are statistically significant differences between the two distributions.

© Copyright Psychological Consultancy Limited, 2019 all rights reserved. Risk Type Compass® is a registered trademark in Europe: CTM No. 010726818.
152 153
If Risk Type does play an influential role in the ASA context, there is an increased likelihood that there will be significant difference between the Risk Type distributions of the specific and general population samples.
If Risk Type does not play an influential role in the ASA context, there is an increased likelihood that there will be no significant difference between the Risk Type distributions of the specific and general population samples.
Each industry-specific analysis generates a table. The first data column outlines the number of Risk Types in the specific sample (Observed N). The second column uses the general population sample to hypothesis the number of Risk Types assuming no industry influence (Expected N). The third column gives the difference between these two values (Residual): the closer to 0 the Residual value is, the more closely the observed and expected frequencies align. This would represent a ‘better fit’ and provide support for the conclusion that Risk Type does not play an influential role in the ASA context. The following sections will present the findings of our analyses, before interpreting them using the Risk Type Compass™’s psychological insight.
General Management
This is a very broad category and it also draws from a wide range of sectors. Within this sample, the breadth of the role, the seniority of the role within an organisation, and the number and variations in the people they manage and have responsibility for will vary widely. The common elements are responsibility for the performance of individuals and of the systems involved. The findings of the Chi-Square Goodness of Fit analysis of General Management are presented in Table 8.14. below.
Table 8.14. General Management Chi-Square Goodness of Fit
Risk TypeGeneral Management (n=1,250)
Observed N Expected N ResidualWary 116 145 -20Prudent 116 128.9 -12.9Deliberate 179 195.4 -16.4Composed 164 141.8 22.2Adventurous 189 150.9 38.1Carefree 152 127.5 24.5Excitable 130 130.5 -0.5Intense 93 107.7 -14.7Axial 111 122.4 -11.4

© Copyright Psychological Consultancy Limited, 2019 all rights reserved. Risk Type Compass® is a registered trademark in Europe: CTM No. 010726818.
154
Figure 8.10. Risk Type Distribution (n=1,250) [Axial=8.88%]
A Chi-Square Goodness of Fit test was conducted to determine whether our General Managers sample had the same distribution of Risk Types compared against our general population sample of 13,614. The minimum expected frequency was 107.7 (Intense). The Chi-Square Goodness of Fit test indicated that the Risk Type distribution of General Managers was statistically significantly different from the proportions found in the general population (χ2(8) = 29.391, p=.000).
The most understanding feature of this distribution of Risk Types is a greater prevalence in all the Compass segments where the Calm factor from the Emotional:Calm scale has an influence (Deliberate, Composed, Carefree and Adventurous). Of these four, Carefree Risk Types ar ethe lowest percentage and also the most influenced by moderate to low Emotional:Calm scores. Also in this vein, the least represented Risk Type is the Intense Risk Type, which is defined by low Emotional:Calm scores.
In general, this pattern of Risk Types implies some emphasis on: flexibility and innovative problem solving (Carefree); leadership capability, capacity to accommodate to unexpected turns of events and the ability to be assertive and hold to ones own corner (Adventurous); calm even-temperedness (Composed); and vigilance regarding standards and compliance (Deliberate). These findings are broadly in line with popular conceptions of managerial roles, although the diversity of sectors within our sample would be expected to reduce the sharpness of focus and differentiation.
Information Technology
IT roles are an interesting combination of technical know-how, innovation and creativity.

© Copyright Psychological Consultancy Limited, 2019 all rights reserved. Risk Type Compass® is a registered trademark in Europe: CTM No. 010726818.
154 155
IT staff often have an enthusiasm for cutting-edge technical developments and, in this rapidly developing sphere, need the motivation to keep up with events and to continuously update their own skills and knowledge.
There is a hardware systems maintenance side of the profession, which calls for astute problem solving skills within an area where frontiers are constantly moving and where awareness of trends and innovations are essential. At the systems design and programming side of things, the professional will be challenged to deliver on complex projects that rely on creativity and a readiness to deal with the risks that inevitably accompany ground breaking innovation. On the other hand, the core of programming solutions is likely to be derived from tried, tested and established practices; checking ‘how everyone else does it’ provides a solid basis from which to build. The findings of the Chi-Square Goodness of Fit analysis of IT are presented in Table 8.15. below.
Table 8.15. IT Chi-Square Goodness of Fit
Risk TypeIT (n=599)
Observed N Expected N ResidualWary 54 69.5 -15.5Prudent 50 61.8 -11.8Deliberate 41 93.6 -52.6Composed 55 67.9 -12.9Adventurous 107 72.3 34.7Carefree 81 61.1 19.9Excitable 105 62.5 42.5Intense 52 51.6 0.4Axial 54 58.7 -4.7
Figure 8.11. Risk Type Distribution (n=599) [Axial=9.02%]

© Copyright Psychological Consultancy Limited, 2019 all rights reserved. Risk Type Compass® is a registered trademark in Europe: CTM No. 010726818.
156
A Chi-Square Goodness of Fit test was conducted to determine whether our IT sample had the same distribution of Risk Types compared against our general population sample of 13,614. The minimum expected frequency was 516 (Intense). The Chi-Square Goodness of Fit test indicated that the Risk Tye distribution of IT professionals was statistically significantly different from the proportions found in the general population (χ2(8) = 90.131, p=.000).
The balance of Risk Types within this IT sample is weighted towards flexibility, innovation, individuality and risk tolerance. Just three Risk Types make up more than 50% of the Compass: the Excitable, Carefree and Adventurous Risk Types, all of which are comfortable with uncertainty and ambiguity and in working within the undefined territory between established and familiar protocols and the aspirations expressed in customer requirements. The Composed and Deliberate Risk Type reflects the calmness, optimism and patience required to live with the long-term uncertainties of any ‘work in progress’. The common ground for the remaining 26% of the sample (Intense, Wary and Prudent Risk Types) represents discomfort with risk in terms of emotion (anxiety) and discomfort with uncertainty. This group is characterised by their cautious attention to detail and emphasis on security, accompanied by a conservative approach to design and structure.
Air Traffic Controllers
This is well-recognised as one of the most stressful jobs. Air Traffic Controllers (ATCs) are key to aviation safety. They maintain the flow of aircraft in and out of airports and in flight. Their work is highly prescribed by well-defined operating procedures designed to address all the possible eventualities that could arise in managing airline traffic. ATCs have to be fully conversant with this extensive range of potential air traffic scenarios and the safety procedures associated with each of those situations.
Effectiveness requires total concentration and vigilance and carries huge responsibilities. When smooth running operations are disrupted and a potential crisis is building, ATCs have to remain a calm and reassuring presence as they get things back on track. The findings of the Chi-Square Goodness of Fit analysis of Air Traffic Controllers are presented in Table 8.16. below.
Table 8.16. Air Traffic Controllers Chi-Square Goodness of Fit
Risk TypeAir Traffic Controllers (n=219)
Observed N Expected N ResidualWary 2 28.4 -26.4Prudent 21 25.2 -4.2Deliberate 155 38.2 116.8Composed 26 27.7 -1.7Adventurous 3 29.5 -26.5

© Copyright Psychological Consultancy Limited, 2019 all rights reserved. Risk Type Compass® is a registered trademark in Europe: CTM No. 010726818.
156 157
Risk TypeAir Traffic Controllers (n=219)
Observed N Expected N ResidualCarefree 1 24.9 -23.9Excitable 0 n/a n/aIntense 5 21.1 -16.1Axial 6 23.9 -17.9
Figure 8.12. Risk Type Distribution (n=219) [Axial=2.74%]
A Chi-Square Goodness of Fit test was conducted to determine whether our Air Traffic Controllers sample had the same distribution of Risk Types compared against our general population sample of 13,614. The minimum expected frequency was 21.1 (Intense). It should also be noted that the complete absence of Excitable Risk Types in the ATC sample led to its exclusion from the analysis. The Chi-Square Goodness of Fit test indicated that the Risk Type distribution of Air Traffic Controllers was statistically significantly different from the proportions found in the general population (χ2(7) = 454.562, p=.000).
The extreme demands of the ATC role are reflected in the dramatic Risk Type distribution of personnel. This is a role that requires very specific qualities. The demands, even at face value, are likely to discourage most career seekers; the filtering of appropriate staff is aided by the unattractiveness of this as an option for the vast majority of people. The predominance of Deliberate Risk Types and the neighbouring Risk Types (Prudent and Composed) tells a very clear story. The fact (not apparent in this graphic) is that many more than expected of this 94% cluster near the perimiter of the Compass, categorising them as amongst the strongest examples of their Risk Type. There are zero Excitable Risk Types in the sample and only one Carefree Risk Type, two Wary Risk Types and three Adventurous Risk Types. Less than a quarter of the expected number fall within the Axial group.

© Copyright Psychological Consultancy Limited, 2019 all rights reserved. Risk Type Compass® is a registered trademark in Europe: CTM No. 010726818.
158
The Deliberate Risk Type is described as:
“Combining calm self-confidence with detailed preparation and planning. They are even-tempered, cautious and coolheaded. Although not afraid of risk, they work to
eliminate uncertainty through careful planning, attention to detail and by considering the options with painstaking care. Neither anxious and emotional nor spontaneous and
impulsive, the Deliberate Risk Type is calculated and sure-footed.”
Clearly, these characteristics align extremely well with the requirements of the Air Traffic Controller role.
Legal Professionals
To be effective, legal professionals need to master a great deal of detailed and complex information and to have high level reasoning skills. The emphasis on tradition, principles, established processes and attention to detail takes priority over flexibility and creativity. Legal documents have to be constructed with care and precision and legal processes strictly define any course of action. Ingenuity and creative thinking clearly also play a part but any innovation has to be a logical development of the basic legal foundations.
The findings of the Chi-Square Goodness of Fit analysis of Legal Professionals are presented in Table 8.17. below.
Table 8.17. Legal Professionals Chi-Square Goodness of Fit
Risk TypeLegal Professionals (n=150)
Observed N Expected N ResidualWary 35 17.4 17.6Prudent 17 15.5 1.5Deliberate 16 23.4 -7.4Composed 9 17 -8Adventurous 10 18.1 -8.1Carefree 13 15.3 -2.3Excitable 10 15.7 -5.7Intense 19 12.9 6.1Axial 21 14.7 6.3

© Copyright Psychological Consultancy Limited, 2019 all rights reserved. Risk Type Compass® is a registered trademark in Europe: CTM No. 010726818.
158 159
Figure 8.13. Risk Type Distribution (n=150) [Axial=14%]
A Chi-Square Goodness of Fit test was conducted to determine whether our Legal Professionals sample had the same distribution of Risk Types compared against our general population sample of 13,614. The minimum expected frequency was 12.9 (Intense). The Chi-Square Goodness of Fit test indicated that the Risk Type distribution of Legal Professionals was statistically significantly different from the proportions found in the general population (χ2(8) = 35.681, p=.000).
This pie chart (Figure 8.13.) maintains the symmetry of the Risk Type Compass™ graphic. This is significant in that it represents a strong bias towards the risk averse end on both of the underlying Risk Type Compass™ scales. More than half of the sample are either Intense or Prudent Risk Types, or a combination of them both - the Wary Risk Type. From both an emotional and a rational point of view, the term ‘Wary’ is not an unreasonable description of the profession as a whole. It is exemplified in the care, cautiousness and attention to detail on which legal professional practices depend. It is what makes this a ‘traditional’ profession.
Police Officers
Policing is a very varied job, both in the sense that deployment can change from day to day and sometimes hour to hour, and also in the sense that there are many opportunities for further training and specialisation. There’s a seemingly never-ending list of characteristics that can contribute to success. Ethical and professional responsibility, communication skills, creativity and critical thinking are high on the agenda, but there are many other valuable qualities. In dealing with people from all walks of life, compassion and a sense of humour are important. The procedural side of the job requires attention to detail. Ability to work with others, to support colleagues emotionally as well as collaboratively, all require a capacity for teamwork.

© Copyright Psychological Consultancy Limited, 2019 all rights reserved. Risk Type Compass® is a registered trademark in Europe: CTM No. 010726818.
160
The findings of the Chi-Square Goodness of Fit analysis of Police Officers are presented in Table 8.18. below. Table 8.18. Police Officers Chi-Square Goodness of Fit
Risk TypePolice Officers (n=216)
Observed N Expected N ResidualWary 34 25.1 8.9Prudent 20 22.3 -2.3Deliberate 25 33.8 -8.8Composed 21 24.5 -3.5Adventurous 16 26.1 -10.1Carefree 23 22 1Excitable 26 22.5 3.5Intense 31 18.6 12.4Axial 20 21.2 -1.2
Figure 8.14. Risk Type Distribution (n=216) [Axial=9.26%]
A Chi-Square Goodness of Fit test was conducted to determine whether our Police Officers sample had the same distribution of Risk Types compared against our general population sample of 13,614. The minimum expected frequency was 18.6 (Intense). The Chi-Square Goodness of Fit test indicated that Risk Type distribution of Police Officers was statistically significantly different from the proportions found in the general population (χ2(8) = 18.971, p=.015).
Inevitably, the extreme variety of challenges that have to be addressed by the police force is reflected in these findings. The distribution of Risk Types is somewhat similar

© Copyright Psychological Consultancy Limited, 2019 all rights reserved. Risk Type Compass® is a registered trademark in Europe: CTM No. 010726818.
160 161
to that of the wider population. The most distinctive differences are at the top and bottom of the Compass: there are more of the Wary Risk Type (the most risk averse) and fewer of the Adventurous Risk Type (the most extreme in risk tolerance). This may reflect caution within the recruitment process and sensitivities about reliability of staff at the expense of the more adventurous. There may also be a vocational factor in that the policing role is likely to attract those with a preference for order and disciplined behaviour; characteristics strongly associated with the Wary Risk Type. With such a broad range of Risk Types available, the police force’s task of addressing a very wide range of demands is made more feasible.
Auditors
The highest profile auditors work in finance verifying a company’s financial reporting and the effectiveness of their internal controls. Financial auditors are trained in accounting, finance or a related field. However, many aspects of an organisation’s operations other than financial may be the subject of an audit. Audits may be made of quality control systems, security, anti-bribery, engineering, food safety, environmental systems, health and safety or other business processes.
The outstanding requiremetn of any auditor is that they are systematic, thorough and detailed. The findings of the Chi-Square Goodness of Fit analysis of Auditors are presented in Table 8.19. below.
Table 8.19. Auditors Chi-Square Goodness of Fit
Risk TypeAuditors (n=254)
Observed N Expected N ResidualWary 39 29.5 9.5Prudent 35 26.2 8.8Deliberate 61 39.7 21.3Composed 34 28.8 5.2Adventurous 16 30.7 -14.7Carefree 15 25.9 -10.9Excitable 16 26.5 -10.5Intense 13 21.9 -8.9Axial 25 24.9 0.1

© Copyright Psychological Consultancy Limited, 2019 all rights reserved. Risk Type Compass® is a registered trademark in Europe: CTM No. 010726818.
162
Figure 8.15. Risk Type Distribution (n=254) [Axial=9.84%]
A Chi-Square Goodness of Fit test was conducted to determine whether our Auditors sample had the same distribution of Risk Types compared against our general population sample of 13,614. The minimum expected frequency was 21.9 (Intense). The Chi-Square Goodness of Fit test indicated that the Risk Type distribution of Auditors was statistically significantly different from the proportions found in the general population (χ2(8) = 37.773, p=.000).
This is a very distinctive distribution, dominated by the Composed, Deliberate, Prudent and Wary Risk Types. The implication is that auditors have strong inclinations towards security, detail and order. The Deliberate Risk Type, accounting for 24% of the sample, combine the qualities of both the Composed and Prudent Risk Types; they are calm, purposeful, organised and check things carefully. This is traditional auditing. There is an interesting counter-balance between the Composed Risk Type (13%) and the Wary Risk Type (15%); these are opposite ends of the same underlying scale concerned with emotionality – or lack of it.
This speaks to the difference between optimism and flexibility (Composed) and pessimism and rigidity (Wary) and suggests a wide range of auditing styles. Three of the under-represented Risk Types (Adventurous, Carefree and Excitable) seem a poor match with the traditional finance domain. However, there are new auditing opportunities in emerging areas of technology, for example, where development of more flexible and innovative systems of auditing might be required.
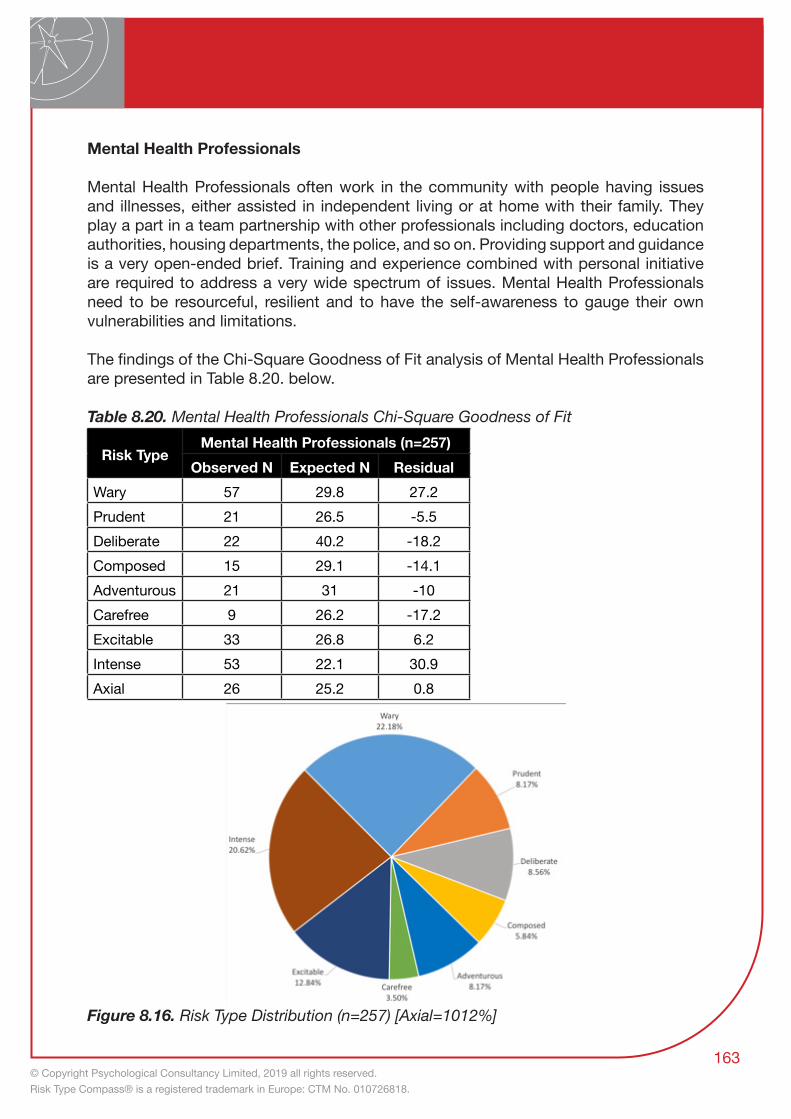
© Copyright Psychological Consultancy Limited, 2019 all rights reserved. Risk Type Compass® is a registered trademark in Europe: CTM No. 010726818.
162 163
Mental Health Professionals
Mental Health Professionals often work in the community with people having issues and illnesses, either assisted in independent living or at home with their family. They play a part in a team partnership with other professionals including doctors, education authorities, housing departments, the police, and so on. Providing support and guidance is a very open-ended brief. Training and experience combined with personal initiative are required to address a very wide spectrum of issues. Mental Health Professionals need to be resourceful, resilient and to have the self-awareness to gauge their own vulnerabilities and limitations.
The findings of the Chi-Square Goodness of Fit analysis of Mental Health Professionals are presented in Table 8.20. below.
Table 8.20. Mental Health Professionals Chi-Square Goodness of Fit
Risk TypeMental Health Professionals (n=257)
Observed N Expected N ResidualWary 57 29.8 27.2Prudent 21 26.5 -5.5Deliberate 22 40.2 -18.2Composed 15 29.1 -14.1Adventurous 21 31 -10Carefree 9 26.2 -17.2Excitable 33 26.8 6.2Intense 53 22.1 30.9Axial 26 25.2 0.8
Figure 8.16. Risk Type Distribution (n=257) [Axial=1012%]

© Copyright Psychological Consultancy Limited, 2019 all rights reserved. Risk Type Compass® is a registered trademark in Europe: CTM No. 010726818.
164
A Chi-Square Goodness of Fit test was conducted to determine whether our Mental Health Professionals sample had the same distribution of Risk Types compared against our general population sample of 13,614. The minimum expected frequency was 22.1 (Intense). The Chi-Square Goodness of Fit test indicated that the Risk Type distribution of Mental Health Professionals was statistically significantly different from the proportions found in the general population (χ2(8) = 100,004, p=.000).
This striking distribution of Risk Types shows the emotionality of those working in this field. This is understandable from the perspective of empathy and the insight required by Mental Health Professionals into the condition and needs of their clients. It is likely that such emotions will have played a part in attracting recruits to this role. At the other end of the scale, the Carefree Risk Type contribute the smallest segment (3.5%) to the distribution. This may be in recognition of the long-term commitment required in this sector which would run counter to the excitement seeking characteristics of this Risk Type.
The Excitable Risk Type (12.84%), which combines the emotional sensitivity of the Intense Risk Type with the flexibility of excitement seeking, may be attracted to the worthiness of the cause and the positive light that this casts on Mental Health Professionals. Although the Prudent (8.17%), Deliberate (8.56%) and Composed (5.84%) Risk Types are under-represented, it is likely that their contribution will be an important one. The rational, orderly, systematic approach of the Prudent Risk Type, the calm imperturbability of the Composed Risk Type and the combination of those qualities in the Deliberate Risk Type would be a strong stabilising influence and a counter balance to the strong emotions that permeate this role.
Recruiters
Recruitment involves building a client base of prospective employers and establishing a network of contacts and online resources through which to find a credible shortlist of applicants. It is a vital and fast paced profession dealing with continuously changing opportunities as well as the vicissitudes of the employment market. The energetic pursuit of leads, focus on performance and results and a very competitive environment give outgoing, articulate, astute, persuasive and mentally nimble people an advantage. Rewards are closely linked to results so drive and initiative are important assets.
The findings of the Chi-Square Goodness of Fit analysis of Recruiters are presented in Table 8.21. below.
Table 8.21. Recruiters Chi-Square Goodness of Fit
Risk TypeRecruiters (n=314)
Observed N Expected N ResidualWary 23 36.4 -13.4

© Copyright Psychological Consultancy Limited, 2019 all rights reserved. Risk Type Compass® is a registered trademark in Europe: CTM No. 010726818.
164 165
Risk TypeRecruiters (n=314)
Observed N Expected N ResidualPrudent 18 32.4 -14.4Deliberate 21 49.1 -28.1Composed 27 35.6 -8.6Adventurous 59 37.9 21.1Carefree 49 32 17Excitable 60 32.8 27.2Intense 32 27.1 4.9Axial 25 30.7 -5.7
Figure 8.17. Risk Type Distribution (n=314) [Axial=7.96%]
A Chi-Square Goodness Of Fit test was conducted to determine whether our Recruiters sample had the same distribution of Risk Types compared against our General Population sample of 13,614. The minimum expected frequency was 27.1 (Intense). The Chi-Square Goodness Of Fit test indicated that the Risk Type distribution of Recruiters was statistically significantly different from the proportions found in the general population (χ2(8) = 74.836, p = .000).
Recruitment professionals are dominated by the proactive, driven hustlers represented in this distribution by the Excitable (19.11%), Carefree (15.61%) and Adventurous (18.79%) Risk Types. In contrast, the Composed Risk Types (8.60%) will show less sense of urgency and the Prudent Risk Types (5.73% and the smallest segment overall) will be restrained by inflexibility and fear of getting too close to the boundaries of compliance and integrity. The Deliberate Risk Type (6.69%) are likely to be a stabilising influence, but probably best suited to specialist recruitment in the more traditional professions.

© Copyright Psychological Consultancy Limited, 2019 all rights reserved. Risk Type Compass® is a registered trademark in Europe: CTM No. 010726818.
166
The drive of the Intense Risk Types (10.19%) is often powered by self-doubt and fear of failure and, in this highly competitive environment, this could lead to early burnout or to the escape route of promotion to more executive responsibilities.
Organisational Risk Culture
Field research developed two useful tools for the development of organisational culture using the Risk Type Compass™ as a strategy. This work might be described as action research. Results were very favourable but not quantified. A brief description is included here in order to complete the scope of our work with Risk Type Compass™ and to illustrate its utility in relation to Risk Culture.
Organisational culture embodies the values, processes, procedures and customs that define what is considered proper, or “the way we do things around here”. It reflects observable attitudes, feelings, experiences, meanings, and behaviours. It is determined by the individuals of whom that culture is composed. All models of organisational culture reflect this, either explicitly or implicitly. Schneider’s theory of culture, that ‘the people make the place’ is the clearest example of this approach. He describes the mechanism that links individuals to culture in his ‘Attraction, Selection, Attrition hypothesis’ (ASA). The culture of the organisation attracts like-minded people (attraction); the selection processes further refines the intake (selection); and appointees that prove to be a poor fit leave or are dismissed (attrition). Culture maintains a momentum that accommodates gradually to absorb the influences of the outside world but resists sudden or radical change.
The risk sensitivity of an organisation will reflect the nature of the business and the kinds of risk involved: Air Traffic Control centres, hospitals, civil engineering firms or investment banks, for example. Risk Culture will also reflect an organisation’s appetite for risk and the personality and talent of the executives. Manager profiles in the banking sector, for example, have been found to be linked to bank business models and policy choices (Hagendorff, Saunders, Steffen, & Vallascas, 2015).
Data from many sectors and organisations (including the Chi-Square Goodness of Fit analyses earlier in this Chapter) clearly illustrate their distinctiveness.

© Copyright Psychological Consultancy Limited, 2019 all rights reserved. Risk Type Compass® is a registered trademark in Europe: CTM No. 010726818.
166 167
Figure 8.18. Risk Type Compass™ Organisational Fingerprints
Summary
The current chapter gives readers an introduction to the large and growing body of evidence on the insight provided by the Risk Type Compass™. There are consequences of this insight at every level, from individuals, teams, organisations and beyond.
Multiple distinct research projects evidence various relationships with constructs of considerable importance to individuals that include resilience, creativity and performance. Team reports can provide awareness of group composition, enabling the user to understand the implications of intra-team interaction in light of work demands. The Risk Landscape offers understanding at a top-down level and can help predict repercussions of company policy, with change resistance representing one major example.
Our understanding is constantly growing, and this growth is demonstrated by the increasing number of case studies, articles and white papers published in PCL’s knowledge bank – a freely available resource on our website. Covering all this content in the technical manual would be impossible, which is why in-depth breakdowns of this work is made publicly available by PCL online. For more information, visit www.psychological-consultancy.com/knowledge-bank.

© Copyright Psychological Consultancy Limited, 2019 all rights reserved. Risk Type Compass® is a registered trademark in Europe: CTM No. 010726818.
168
Chapter 9 - A Brief Guide to Interpreting the Risk Type Compass™
This chapter provides an introduction to the interpretation of the Risk Type Compass™ and practical advice about giving informative and effective feedback. It will also serve as a useful refresher to consolidate practitioners’ understanding of the tool based on the previous chapters. This chapter should be used alongside the Risk Type Compass™ handbook, available separately.
What Does The Risk Type Compass™ Tell You?The Risk Type Compass™ explores an individual’s predisposition to risk and their capacity to manage it. Two key factors determine an individual’s current risk-related behaviour. Firstly, their natural temperament will have a persistent and pervasive influence and establish a baseline for their response to any kind of risk or uncertainty; in effect, a behavioural bias. Secondly, experience, exposure, training and personal circumstances will influence their comfort level within particular areas of risk. By understanding our own risk biases and the effects of experience we can develop an increasingly objective view of ourselves. Furthermore, appreciation of the likely risk biases of our associates, colleagues or of others within our immediate team will increase our understanding of their viewpoints, priorities and decision-making processes and facilitate constructive dialogue and collaboration.
There are three components to the Risk Type Compass™ that, when combined, give a holistic view of the risk behaviour of an individual. These are Risk Type, Risk Attitude and Risk Tolerance.
Risk Type
The Risk Type Compass™ assessment places individuals in one of eight Risk Types, or into a central Axial Group. Location on the compass reflects an individual’s temperament and natural disposition with regard to risk; to what extent they are, for example, adventurous and optimistic as opposed to being cautious and anxious, or to what extent they act on impulse or plan things carefully. Temperament is deeply rooted and will exercise a continual influence on the amount of risk an individual is willing to take, how much uncertainty they can cope with and how they are likely to react when things go wrong. Factors from early life experiences, such as the complexities of care and upbringing and the impact of culture, will also contribute to early development of an individual’s temperament. Risk Type, as with all personality, is therefore the product of both ‘nature and nurture’. However, personality seems to stabilise in early adulthood and, for most people, will remain pretty constant throughout adult working life.
Risk Type assessment is ‘normative’, meaning that it provides a description of risk dispositions relative to those from a large sample of other people.

© Copyright Psychological Consultancy Limited, 2019 all rights reserved. Risk Type Compass® is a registered trademark in Europe: CTM No. 010726818.
168 169
Two Fundamental Risk Dispositions
Our Risk Type Compass™ research extracted risk-related themes from across the complete spectrum of personality. Analysis of the resulting pool of data identified two bi-polar factors that together determine an individual’s inherent propensity for risk taking: firstly, the degree to which they are fearful (measured by the Emotional:Calm scale); and secondly, the degree to which they will act on impulse (measured by the Daring:Measured scale).
1. FearfulThe Emotional:Calm scale is complex and rich in meaning but, broadly speaking, it is a measure of fearfulness. People at one extreme of the fearful continuum will be so anxious and apprehensive about everything that they may be severely limited in their capacity to live a normal life (fear of flying, fear of open spaces, fear of strangers, fear of small spaces, etc.; the list is extensive). People at the other extreme will be so insensitive to danger that they barely show signs of anxiety or fear even under the most threatening of conditions. This may be useful under fire on active service, or in times of crisis, but their insensitivity to cues and warning signs can also be a danger to themselves and to others.
Of course, the really extreme cases at either end of the scale are relatively rare – as is the case with all personality characteristics. At a more familiar, everyday level, people towards the fearful end of the spectrum might be described as anxious, nervous or apprehensive. They approach everything with caution, trust only what they know really well and are pessimistic about everything else. They feel vulnerable and are easily stressed. People at the other end of the scale are relaxed, flexible, calm, optimistic and resilient.
2. ImpulsiveThe Daring:Measured scale is also complex but, broadly speaking, can be considered a measure of impulsivity. On this scale, people range from being reckless, challenging and unrestrained at one extreme to being very controlled, highly organised, systematic and attentive to detail at the other. At the everyday level, those towards the impulsive end of the scale may be considered carefree, spontaneous and unpredictable. Untroubled by ambiguity, they may work to the vaguest of plans and be prepared to set aside convention and traditional approaches in favour of novelty and change.
At the other extreme, people work hard to organise uncertainty out of their lives, planning ahead and controlling everything they can. Prudent and compliant, they do things ‘by the book’ and don’t stray from their comfort zone. They are consistent and predictable, exact and unambiguous. Thorough and highly systematic in their planning, they have everything organised down to the last detail, and have a back-up plan.
Everyone falls somewhere on both of these scales.

© Copyright Psychological Consultancy Limited, 2019 all rights reserved. Risk Type Compass® is a registered trademark in Europe: CTM No. 010726818.
170
Explaining the Risk TypesBefore discussing the results of a Risk Type Compass™ assessment it can be helpful to feel your way with a fairly open discussion about that individual’s risk-related experiences, behaviours and attitudes. All of the themes described above can be picked up within that discussion, as illustrated by the examples.
Examples of Opening Questions to use in a Feedback Session
• What is the riskiest thing you have ever done? How did it make you feel?• What risky activities are you drawn to or why are you not drawn to them?• When has the speed of decision-making been advantageous and/or
disadvantageous?• Have you ever had to make a decision without having all of the information to make
an informed decision? How did this make you feel? What was the outcome?• What does stress mean to you?• Give me an example of the last time you felt under pressure. How did you cope?• Can you tell me about a failed endeavour? How did you approach it the next time?• To what extent does your job role require you to embrace new ways of doing things
and unfamiliar environments?• To what extent do you explore unfamiliar experiences in your life outside of work?
The Risk Type descriptions below are informed generalisations based on extensive personality research and professional experience in the use of personality assessment. While the essence of a Risk Type will be accurate for the majority of those falling into that group, individuals will vary in the degree to which Risk Type characteristics dominate their overall persona; firstly, as a result of strength of Risk Type, and secondly because of the balance of influences resulting from their proximity to neighbouring Risk Type boundaries. In all cases, someone’s behaviour will also be influenced by their life experiences, which will be reflected in their reaction and approach to situations. However, the influence of an individual’s underlying personality will remain persistent. When things change significantly or go seriously wrong, or when under pressure, those who have learned to cope effectively with initially challenging situations will tend to revert to their Type.
The Pure Risk Types
These four Types sit at either end of the two bi-polar scales: the Emotional:Calm scale, which tracks fearfulness; or the Daring:Measured scale, which measures impulsivity.
IntenseStrong examples of the Intense Risk Type tend to be highly-strung, pessimistic and nervous about any threat to their equilibrium. In extreme examples, personal relationships and decision-making can become an emotional minefield. Passionate and self-critical

© Copyright Psychological Consultancy Limited, 2019 all rights reserved. Risk Type Compass® is a registered trademark in Europe: CTM No. 010726818.
170 171
by nature, they react strongly to disappointment, taking it personally when things don’t work out.
This Risk Type is equally passionate in their enthusiasm, their apprehension and in their regrets. The most extreme examples of this type are highly-strung but genuine, candid and loyal. Edgy when stressed, their moods are unpredictable and their apprehensiveness can make them mistrustful. They feel things deeply and take it personally if they don’t work out. Self-doubt makes them their own most unforgiving critic but it often fuels their drive and determination to succeed.
At a more general level, the Intense Type wear their hearts on their sleeves, are enthusiastic, sincere and involved with people and projects at a personal and emotional level. Haunted by past disappointments, they can never quite shake off the belief that something may go wrong. Neither particularly cautious nor impulsive, this type will be less resilient than most but ready to be generous in their commitment and their passion.
Possible weaknesses and vulnerabilities:• This Risk Type can be unpredictable and edgy under pressure• Initial enthusiasm for a project may evaporate if they feel let down• Their emotionality may interfere with calm, rational decision-making• They may tend to deflect personal criticism by highlighting the failings of others • Anxious not to risk failure, they may be very restricted in their comfort zone• Worried about things going wrong, they may over-react to minor set-backs• Pessimism and past failures cast a shadow over plans for the future• Self-doubts cause them to see personal criticism where none was intended• Having difficulty masking their feelings, others will know when they have upset them
Possible strengths and benefits:• This Risk Type is impassioned, earnest and reflective• Such people make strong emotional commitments to people and projects• They are enthusiastic, committed and loyal• They are alert to the potential risk in any proposition• Candid and unpremeditated, they speak their mind• Usually very self-aware, they are realistic about their shortcomings• Fearful of failure, they prepare carefully for any challenge, rather than ‘winging it’• Sensitive about past failures, they work hard to avoid repeating mistakes• They are neither very impulsive nor overly constrained by convention
PrudentVery self-controlled and detailed in their planning, the Prudent Risk Type is organised, systematic, conservative and conforming. Conventional in their approach, they prefer continuity to variety and are most comfortable sticking to what they know.
At the root of this Risk Type is a desire to eliminate uncertainty through high levels of self-control, compliance and detailed planning. The most extreme examples are very
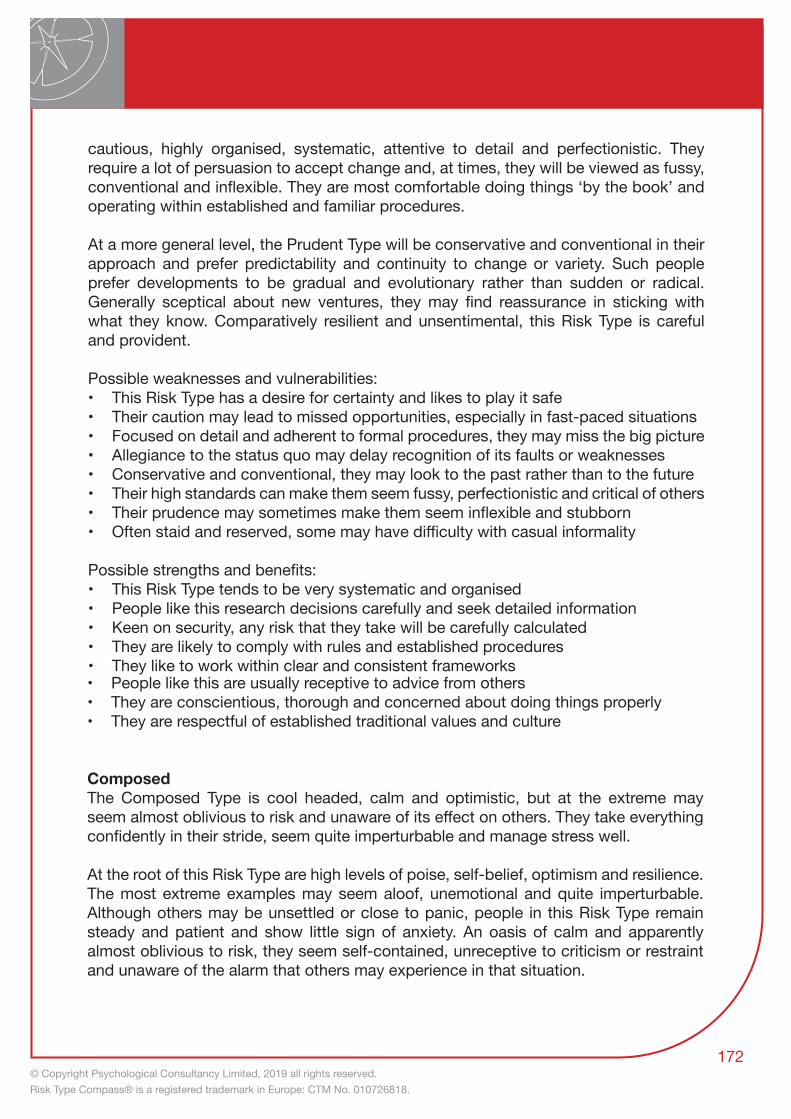
© Copyright Psychological Consultancy Limited, 2019 all rights reserved. Risk Type Compass® is a registered trademark in Europe: CTM No. 010726818.
172
cautious, highly organised, systematic, attentive to detail and perfectionistic. They require a lot of persuasion to accept change and, at times, they will be viewed as fussy, conventional and inflexible. They are most comfortable doing things ‘by the book’ and operating within established and familiar procedures.
At a more general level, the Prudent Type will be conservative and conventional in their approach and prefer predictability and continuity to change or variety. Such people prefer developments to be gradual and evolutionary rather than sudden or radical. Generally sceptical about new ventures, they may find reassurance in sticking with what they know. Comparatively resilient and unsentimental, this Risk Type is careful and provident.
Possible weaknesses and vulnerabilities:• This Risk Type has a desire for certainty and likes to play it safe• Their caution may lead to missed opportunities, especially in fast-paced situations• Focused on detail and adherent to formal procedures, they may miss the big picture• Allegiance to the status quo may delay recognition of its faults or weaknesses• Conservative and conventional, they may look to the past rather than to the future• Their high standards can make them seem fussy, perfectionistic and critical of others• Their prudence may sometimes make them seem inflexible and stubborn• Often staid and reserved, some may have difficulty with casual informality
Possible strengths and benefits:• This Risk Type tends to be very systematic and organised• People like this research decisions carefully and seek detailed information• Keen on security, any risk that they take will be carefully calculated• They are likely to comply with rules and established procedures• They like to work within clear and consistent frameworks• People like this are usually receptive to advice from others• They are conscientious, thorough and concerned about doing things properly• They are respectful of established traditional values and culture
ComposedThe Composed Type is cool headed, calm and optimistic, but at the extreme may seem almost oblivious to risk and unaware of its effect on others. They take everything confidently in their stride, seem quite imperturbable and manage stress well.
At the root of this Risk Type are high levels of poise, self-belief, optimism and resilience. The most extreme examples may seem aloof, unemotional and quite imperturbable. Although others may be unsettled or close to panic, people in this Risk Type remain steady and patient and show little sign of anxiety. An oasis of calm and apparently almost oblivious to risk, they seem self-contained, unreceptive to criticism or restraint and unaware of the alarm that others may experience in that situation.

© Copyright Psychological Consultancy Limited, 2019 all rights reserved. Risk Type Compass® is a registered trademark in Europe: CTM No. 010726818.
172 173
At a more general level, this Risk Type will always be relatively untroubled and more even-tempered than most. They seem to take whatever life throws at them and to maintain a positive outlook. Even when things go wrong, they don’t dwell on regrets, harbour grudges or bear resentments. The Composed Risk Type manages stress well, rides out any turbulence and stays on-task. Not reckless, but not averse to risk either, this Risk Type keep its nerve and sees things through. Possible weaknesses and vulnerabilities:• This Type can be so optimistic that they fail to evaluate or anticipate risk• Confidence in their decisions makes them slow to pick up early signs of difficulty• Being so sure of their opinions, they may miss vital new information• They can appear oblivious to the level of risk associated with a proposal• These people may ignore or dismiss negative feedback about their performance• They can be so self-assured that their behaviour seems self-important or arrogant• Not much concerned about risk themselves, expectations of others may be unrealistic
Possible strengths and benefits:• This Risk Type remains calm and level-headed in situations that unsettle others• They are able to ‘keep their head’ and be effective when things go wrong• Whatever happens, they are likely to remain composed and consistent• They don’t dwell on their mistakes or on past decisions that cannot be changed• Such people tend to have confidence in their own ability• They are likely to be up-beat and optimistic about the future• People like this tend to be patient, purposeful and unhurried• Consistent in their disposition, they are even-handed and reassuring
CarefreeSpontaneous and unconventional, the Carefree Risk Type is daring, excitement seeking and sometimes reckless. Not good at detail or careful preparation, they often seem unclear about their objectives. Their impatience and imprudence can lead to hasty and unwise decisions.
At the root of this Risk Type are high levels of spontaneity, a desire to challenge convention and a preference for novelty and excitement over routine. The most extreme examples may seem impetuous, careless and impatient. They are likely to opt for variety over consistency, excitement over caution, action over planning and individuality over conformity. They feel constrained by petty rules, traditions or being micro-managed. Although not naturally methodical or attentive to detail, this Risk Type will provide a challenge to dogma and relish opportunities to break new ground.
At a more general level, this Risk Type welcomes variety and values their independence and personal autonomy. Not highly methodical but easily diverted to new interests, they may not always seem very focused. They are at their best in fast moving situations or when on a personal mission that gives them a clear purpose and sense of direction.

© Copyright Psychological Consultancy Limited, 2019 all rights reserved. Risk Type Compass® is a registered trademark in Europe: CTM No. 010726818.
174
Possible weaknesses and vulnerabilities:• This Risk Type can be impulsive, unpredictable and may not think things through• They may not always be attentive or receptive to advice • They are likely to bend the rules and circumvent procedures• May be disorganised in their affairs and need help in planning events or projects• Not good with details, they may struggle to provide clear and accurate information• They can be impatient with bureaucracy, red tape or micro-management• Disliking routine, they find repetitive or detailed tasks wearisome and stressful
Possible strengths and benefits:• This Risk Type is likely to welcome any change from the usual routine• Being excitement seeking, they may enjoy the risk of jumping in at the deep end• They are likely to be open-minded and ready to embrace new ideas• Preference for action over planning can have a dynamic and energising influence• Their direct approach may challenge petty rules and unnecessary procedures• Their flexibility should equip them well for fast moving situations• Independently minded, they may add a different perspective to the debate• Uninhibited by the traditional view, they may cut through to the core issues
The Complex Risk Types
In addition to the four Pure Risk Types described above, the Risk Type Compass™ includes four Complex Risk Types. These arise at the points in the continuous 360° spectrum of the compass where two Pure Risk Types merge and interact. Each of the Complex Risk Types surfaces from the chemistry arising from these combined influences. This reflects the fact that the Risk Types were conceived as reference points that structure the compass. In this respect, they can be likened to the numbers on a clock face that mark out arbitrary units on the continuity of time. In reality, those who fall into neighbouring segments but are close to the same dividing line will be very similar in their Risk Type features. The variety described by the Risk Types is certainly there but, in reality, not so distinctly segregated. This is an important point to keep in mind when interpreting results or giving feedback.
WarySelf-disciplined and cautious of risk, the Wary Risk Type is organised but unadventurous and puts security at the top of the agenda. They will be drawn to the idea of securing their future but anxious that however well something worked for others, in their case it may go wrong.
This Risk Type combines anxiety about risk with a methodical approach and a shrewd and persistent scepticism. The most extreme examples of this type are fearful, apprehensive and ultra-sensitive about vulnerability and risk. Strongly attracted to the idea of securing the future but very difficult to reassure, they seem to seek an unattainable ideal. Anxious

© Copyright Psychological Consultancy Limited, 2019 all rights reserved. Risk Type Compass® is a registered trademark in Europe: CTM No. 010726818.
174 175
about failure, they protect themselves and what they have by being conservative, prudent and well organised. They are driven to control people and events to hold the threat of turbulence at bay.
At a more general level, the Wary Type is cautious, vigilant and pessimistic. Security is always high on their agenda. They will be alert to the risk element of any idea or innovation and dubious about the benefits. Such people have a need for certainty and like to know precisely what they can expect. They are naturally neither adventurous nor emotionally resilient but should have a respect for convention and tradition and prefer change to be gradual.
Possible weaknesses and vulnerabilities:• This Type’s caution and emphasis on security may make them indecisive• They may miss opportunities by taking too long to weigh up the options • Concerned everything is done by the rule book, they seek to control• They may seem conservative, inflexible and resistant to change• Variable in their moods, enthusiasm may easily turn to disaffection• Feeling things strongly, their reactions will be fervent and emotional• Their need for conformity makes them seem intolerant of others’ behaviour• Having high hopes and expectations, they fear repeating past disappointments• Unable to live with ambiguity
Possible strengths and benefits:• This Risk Type is vigilant and will not overlook violations of procedure• They will be alert to the potential risks in any idea or proposal• Conservative and conforming, they tend to comply with rules and procedures• They like to seek detailed information before making decisions• They consider any feedback or advice they may receive carefully• Enthusiastic and passionate, they invest a lot emotionally in their affairs• Sensitive about their past mistakes, they will be anxious to avoid repeating them• Systematic and conscientious, they will have a framework for everything• They will be enthusiastic ambassadors for their perceived ‘right way’
DeliberateSelf-confident, systematic and compliant, the Deliberate Risk Type tends to be unusually calm and optimistic. They experience little anxiety and tackle risk and uncertainty in a business-like and unemotional way. They never walk into anything unprepared.
At the root of this Risk Type is a high level of calm self-confidence combined with detailed preparation and planning. The most extreme examples are calm, cautious and cool-headed but may be over-confident. Although not afraid of risk, they work to eliminate uncertainty through careful planning, attention to detail and by considering the options with painstaking care. Neither anxious and emotional, nor spontaneous and impulsive, the Deliberate Risk Type is calculated and sure-footed.

© Copyright Psychological Consultancy Limited, 2019 all rights reserved. Risk Type Compass® is a registered trademark in Europe: CTM No. 010726818.
176
At a more general level, this Risk Type will be self-assured and even-tempered. However, because they are organised, compliant and well informed about what is going on, they are unlikely to walk into anything unprepared. Any aversion to risk will be practical rather than emotional, with a desire to do things in a balanced, sensible and systematic way. This Risk Type is not unnerved by radical or extreme proposals, but evaluates them precisely before giving their view or taking action.
Possible weaknesses and vulnerabilities:• This Risk Type may be so confident that they seem opinionated• They can be so thorough in their risk assessment that they miss opportunities• Their ardent adherence to rules can delay their decision-making• Being caught up in the detail, they may miss the more fundamental issues• Their caution may mean that they miss opportunities for wider experience• Their calm, rational and methodical approach may come across as unfeeling
Possible strengths and benefits:• This Risk Type is not easily unnerved, but still inclined to check things out carefully• They tend to seek out a lot of information about things that interest them• They like to research, ask questions and clarify their options• These people value a planned and systematic approach• They are likely to be level-headed and calm, even in times of uncertainty• They will make a rational and unemotional evaluation before acting• They are unlikely to dwell on regrets or past decisions that cannot be changed• These people tend to be confident about their own ability• Typically upbeat, even in difficult times they are optimistic about the future
AdventurousThe Adventurous Risk Type is both impulsive and fearless. At the extreme, they combine a deeply constitutional calmness with high impulsivity and a willingness to challenge tradition and convention. Intrepid and never discouraged, they quickly rebound from any setback.
At the root of this Risk Type is a combination of a gung-ho impulsivity and fearlessness. The most extreme examples are people who are neither anxious about risk nor much restrained by caution. They combine impulsivity with a deeply constitutional calmness and are not in awe of custom, tradition or convention. These are unflappable, intrepid excitement seekers who keep their nerve. Neither organised nor prudent, their choices and decisions are influenced both by their lack of anxiety and by their impulsiveness. When things go wrong, they just dust themselves down and start all over again.
At a more general level, this Risk Type is resilient and attracted by excitement. They will be open to new experiences and will cope well with disappointments and unexpected turns of event. Their positive, upbeat outlook means that they are drawn towards

© Copyright Psychological Consultancy Limited, 2019 all rights reserved. Risk Type Compass® is a registered trademark in Europe: CTM No. 010726818.
176 177
stimulating challenges and are able to pursue their adventures unperturbed.
Possible weaknesses and vulnerabilities:• This Risk Type can be impulsive and capable of rash decisions• Their confidence sometimes makes them unrealistically optimistic• At times they may seem almost oblivious to the level of risk they are taking• Being self-assured but impulsive, they may miss vital detail or new information• Impetuous and unpredictable, they may not evaluate the possible consequences• These people are not always attentive or receptive to advice from others• They may have a casual approach to rules and procedures• Probably somewhat disorganised in their affairs, they may struggle with the detail• They can be impatient with bureaucracy and repetitive or routine tasks
Possible strengths and benefits:• Excited by novelty, this Risk Type may welcome radical ideas and new experiences• Calm and level-headed, they remain composed, even in extreme situations• Taking everything in their stride, they are not perturbed by the unexpected• Straightforward to deal with, they don’t hold grudges or dwell on past mistakes• Being optimistic, it seems nothing is impossible; there is always a way• These people are adaptable and able to change course easily• Their impulsive, freewheeling nature allows them to make quick decisions • It may sometimes appear that they feel indestructible
ExcitableUninhibited and excitable, this Risk Type enjoys the spontaneity of unplanned decisions. They are attracted to risk like moths to a flame, but are distraught when things go wrong. Their passion and imprudence make them exciting but unpredictable.
This Risk Type reflects a tension between impulsive excitement seeking and strong emotions, anxiety and self-doubt. For the most extreme, impetuosity opens the door to a gamut of emotions, from passionate enthusiasm to regret and despair. High hopes and expectations combined with a tendency to act hastily risks a cycle of highs and lows in which disappointing outcomes lead to remorse and self-criticism. They are excited by their impulsivity but they are also fearful of it. Under pressure, they may not hold their nerve well.
At a more general level, the Excitable Risk Type is emotionally expressive and reacts strongly to events. The spontaneity of ‘on the fly’ decisions will always appeal to the excitable side of their nature, but they are also prone to anxiety and stress if things go wrong. Their feelings are likely to play a significant part in their decision-making.
Possible weaknesses and vulnerabilities:• This Risk Type make rash decisions and feel remorseful when things go wrong• They can be impulsive, changeable and easily distracted

© Copyright Psychological Consultancy Limited, 2019 all rights reserved. Risk Type Compass® is a registered trademark in Europe: CTM No. 010726818.
178
• They may take disagreements personally when no criticism was intended• Their changeable moods may make them seem hard to please• They may appear disorganised and inattentive to the details• Feeling things deeply and being impulsive, they struggle to make rational decisions• If things go wrong, they tend to suspect others before questioning themselves• Not particularly compliant, they may bend rules or challenge procedures• They may tend to dwell on past failures or disputes
Possible strengths and benefits:• This Risk Type is likely to be candid and unpremeditated• They are not in awe of convention or tradition or unduly inhibited by it• More excitement seeking than most, they should welcome a variety of experiences• Although sensitive and maybe resentful of criticism, they reflect on it seriously• They are likely to feel strongly about things and be passionate in their commitments• Once ‘on board’ with a project, they should be able to make quick decisions• Such people are likely to be open-minded about new ideas and opportunities• They are usually very realistic about their shortcomings• More impulsive than most, they commit to people and projects with enthusiasm
Axial GroupThe Axial group encompasses individuals whose score on the Risk Type Compass™ places them at the centre of the model. Some individuals of this group will have some extreme personality characteristics, but not within the scope of this assessment and its specific focus on risk tolerance. For others, although total scores are average, some subtheme scores will be more extreme. Examples of this may be included on page six of the Personal report.
Any more pronounced risk-taking behaviour by this group is likely to be due to attitudes developed towards particular types of risk resulting from specific experiences. Where risk tolerance has been enhanced in this way, it will usually be specific to those domains rather than generalised to all situations.
Because they score close to the centre on both axes of the Risk Type Compass™, the Axial group will not be exceptionally prudent or unusually reckless, neither will they be particularly emotional nor extremely calm. Their neutral position at the axis of the compass places them particularly well to appreciate the full variety of Risk Type behaviours. Those that are placed towards the edge of the compass, and who are therefore a strong example of their Risk Type, will have some difficulty in appreciating the gulf that lies between individuals possessing low risk strength in the same Risk Type. In contrast, the Axial group are positioned close enough to all Risk Types to give them some insight into all of them.
The Axial Group is well positioned to take a pivotal role within a team. They should be promising candidates for a conciliatory influence where misunderstandings between

© Copyright Psychological Consultancy Limited, 2019 all rights reserved. Risk Type Compass® is a registered trademark in Europe: CTM No. 010726818.
178 179
Risk Types occur or are being taken personally. Their ability to balance extreme views from all points of the Risk Type Compass™ suggest a role as chairperson or spokesperson for the group.
Possible strengths and benefits:• A neutral and balanced position in relation to risk• They can see the positives in different viewpoints• Flexible rather than rigidly committed to any one approach• Not reckless but not prone to stifling over-regulation either• Risk aware without being likely to panic in a crisis• A constructive ‘anchoring’ force for any team dynamic• Able to mediate opposing risk perspectives in group decision-making• More open than most to consideration of different risk strategies• Can identify the realistic practicalities of more extreme proposals
Possible weaknesses and vulnerabilities:• More a facilitator than a source of radical new approaches• Flexibility may come across as inconsistency or indecisiveness• Not the most resilient or calm under pressure• Reasonably alert to potential risk but not the most vigilant• Unlikely to be the most enthusiastic or passionate about new ventures• Although generally systematic, may overlook the finer details at times• May lack a clear sense of direction or preference
Risk Type Strength
Each individual is given a Risk Type strength score. Higher scores, indicated by marks that appear closer to the outer boundary of the Risk Type Compass™, will be strong versions of their Risk Type. These individuals are likely to exhibit the traits associated with their Type in a clear and obvious manner. Those who fall closer to the centre of the compass will exhibit the characteristics associated with their Risk Type to a lesser degree.
Risk Attitude
The Risk Type Compass™ also provides a measure of Risk Attitude but this is fundamentally different to Risk Type. While Risk Type differentiates one individual from another on the basis of their questionnaire responses, the Risk Attitude measure is concerned solely with variations within the person assessed. That is to say, it differentiates between a person’s inclination to take risks in one area compared with their inclination for risk in another. There is nothing here that should be taken as an indication of how much risk they might take, just that if they did take any risk it would be more likely to be in one area rather than another. Two people could have Risk Attitude charts that are exactly

© Copyright Psychological Consultancy Limited, 2019 all rights reserved. Risk Type Compass® is a registered trademark in Europe: CTM No. 010726818.
180
the same, but one might be very risk taking and the other quite risk averse. The only similarity between them is in the kinds of risk they would prefer to take if indeed they took any risk at all. It’s like two people who both like the same food, but one will eat very little while the other loads their plate!
The Risk Attitude measure looks at risk appetite across five important areas of risk taking: health and safety risk, recreational risk, social risk, financial risk and reputational risk. As a result of personal experience and circumstances, an individual’s Risk Attitude may come to vary somewhat from situation to situation. For example, being brought up in a sports-loving family, with intensive exposure to sports, may influence a willingness to take recreational risk. Since one would be exposed over time from early childhood, sport and all its paraphernalia would be familiar and therefore less threatening; an incremental, ‘one step at a time’ introduction to its attractions and its challenges would be less daunting than jumping in at the deep end later in life. Similar influences, either for or against, might influence appetite for risk in any one of the domains.
The purpose of this process is not an interest in Risk Attitude per se. Attitudes are, by definition, transient and changeable. Public service campaigns for the wearing of seat belts and for drink driving have had a dramatic effect on attitudes. Similarly, the 2008 financial meltdown reversed attitudes in the financial markets over night. Any assessment of Risk Attitude must be a snapshot and expected to change in response to exposure and experience. It is important that users of the Risk Type Compass™ appreciate this distinction between Risk Type, which is a relatively stable and persistent influence, and Risk Attitudes that clearly are not. This will often have to be explained during feedback or coaching events since people will often feel that they do take more risk in one area than they do in another. The practitioner has to be able to clarify this distinction. The roots of Risk Type are deep and persistent while environmental influences may change dramatically over time and both are required to explain today’s behaviour. However, if someone is advising about the long-term risk involved in an investment, they need to be clear that Risk Type is a better basis for prediction than Risk Attitude.
The Five Risk Attitudes
Reputational ‘Overstepping established social, cultural and/or moral rules’
Reputational risk describes the extent to which an individual will make decisions that cross the border of established social, cultural or moral rules. For example, borrowing milk from your flatmate to make a cup of tea or not telling the supermarket cashier that they undercharged you.
Recreational‘Pursuing physically challenging and/or dangerous activities’
Recreational risks are concerned with the extent to which an individual will pursue

© Copyright Psychological Consultancy Limited, 2019 all rights reserved. Risk Type Compass® is a registered trademark in Europe: CTM No. 010726818.
180 181
physically challenging activities, especially those that may put the individual in the path of danger. Often these activities are perceived to be undertaken for the ‘adrenaline thrill’. Examples include skydiving or skiing.
Financial‘Confidence in making uncertain investment choices’
Financial risks describe the degree to which an individual is comfortable in gambling with their investment choices and, therefore, risking their financial security to some extent. For example, investing in a potentially lucrative, but high-risk, business or betting on a sporting event.
Social‘Readily opening oneself up to scrutiny of others’
Social risk concerns the degree to which an individual is comfortable in taking risks in social situations. Sometimes this will involve stepping outside social conformities or norms, such as voicing controversial opinions or being particularly open and forthcoming. Some examples include being the first up to sing karaoke, or voicing thoughts even if they may offend.
Health & Safety‘Neglecting to attend to matters that may impact current or future health’
Health risk describes the extent to which an individual will neglect to attend to matters that may impact their current or future health. Such individuals may be perceived as having a blasé approach to their dietary or physical health as they will appear to simply brush off health precautions. For example, sunbathing without sunscreen or avoiding going to the see the doctor.
Risk Tolerance Index
The numeric scale in the graphic for the Risk Tolerance Index (RTi) estimates tolerance for risk based on both an individual’s Risk Type and their Risk Attitude. The bar on the chart represents the degree of uncertainty surrounding the RTi. This incorporates the margin of error of the assessment (the standard error of measurement) combined with the variability of the individual’s Risk Attitudes across different domains assessed - the extent to which their attitude varies for different types of risk situations. The mid-point of the solid bar marks the individual’s level of Risk Tolerance and relates to the 0 to 100 scale along the bottom.
The Risk Type markers arranged across the upper part of the scale are there solely for reference purposes. They mark the typical position along the scale of the more distinctive examples of each Risk Type.

© Copyright Psychological Consultancy Limited, 2019 all rights reserved. Risk Type Compass® is a registered trademark in Europe: CTM No. 010726818.
182
When giving feedback on Risk Tolerance Index, you can talk about how risk seeking or risk averse the individual is overall. This score is normative, and so interpretations can be made relative to the wider population.
© Copyright Psychological Consultancy Limited, 2019 all rights reserved. Risk Type Compass® is a registered trademark in Europe: CTM No. 010726818.
182 183
Chapter 10 - Reports
The range of Risk Type Compass™ reports have been designed for use in a multitude of assessment and development applications. A brief summary of each of the reports is provided below. If you require more detailed information, price lists, or sample reports, please visit our website (www.psychological-consultancy.com) or contact PCL directly. Please note that all report options may not be available in every country and it is worth checking with PCL or your local distributor.
Report TypesPersonal Report
The Personal Report is designed to give a comprehensive overview of an individual’s risk personality. It can be used in selection or development across any occupational domain, making it our most widely used Risk Type Compass™ report.
Key features of the Personal Report: • Applicable in selection or development• Comprehensive description of Risk Type, including:
• Risk Type graphic displaying exact Risk Type positioning • Upsides and downsides of belonging to this Risk Type • Opposite Type and (when appropriate) neighbouring Type• Individual’s unique prominent characteristics based on the Risk Type Compass™
subthemes• Risk Attitude graphic and discussion on risk attitude preferences and variation • Risk Tolerance graphic displaying the individual’s RTi
For an example of the Personal Report, please turn to the end of this chapter.
Investor Report
The Investor Report has been specifically designed to address the UK regulatory requirements of the financial investment industry. Financial advisors are required to arrange an assessment of each client’s capacity to cope with risk as a basis for portfolio decisions. The Investor Report allows the investor to gain a greater understanding of their own risk taking preferences, allowing them to make better decisions about which financial products that are most suitable for them. While the content of the report is not far removed from that of the Personal Report, small adjustments have been made to tailor the report appropriately to the financial context.
Key features of the Investor Report: • Applicable to those interested in making financial investments• Comprehensive description of Risk Type, including: • Risk Type graphic displaying exact Risk Type positioning

© Copyright Psychological Consultancy Limited, 2019 all rights reserved. Risk Type Compass® is a registered trademark in Europe: CTM No. 010726818.
184
• Upsides and downsides of belonging to this Risk Type • Opposite Type and (when appropriate) neighbouring Type• Individual’s unique prominent characteristics based on the Risk Type Compass™
subthemes• Risk Attitude graphic and discussion on risk attitude preferences and variation• Risk Tolerance graphic displaying the individual’s RTi
Financial Adviser Report
The one-page Financial Adviser report is a concise summary of a client’s risk personality that accompanies the Investor Report.
Key features of the Financial Adviser Report:• Applicable to Financial Advisers for use with clients• Concise one-page summary• Risk Type graphic displaying Client’s exact Risk Type positioning• Risk Attitude graphic displaying Client’s preferences for risk taking across 5 domains• Bullet point list summarising implications for client management• Risk Tolerance graphic displaying client’s RTi
Risk Type Report
The Risk Type report only looks at the Risk Type component of the assessment; the central focus within the model on risk behaviour and how it influences the way an individual perceives and handles risk. Risk Attitude, the ipsative section of the questionnaire, is not included in the Risk Type Report.
Key features of Risk Type Report:• Applicable to anyone interested only in the deeply rooted aspects of risk personality• Participants only complete Part One of the Risk Type Compass™ questionnaire• Comprehensive description of Risk Type, including: • Risk Type graphic displaying exact positioning • Upsides and downsides of belonging to this Risk Type • Opposite Type and (when appropriate) neighbouring Type• Individual’s unique prominent characteristics based on the Risk Type Compass™
subthemes• Risk Tolerance graphic displaying the individual’s RTi and variability
Team Report
The Team report has been designed for use of groups of up to 25 people and is designed for team audits and team development. Using a series of illustrative graphics

© Copyright Psychological Consultancy Limited, 2019 all rights reserved. Risk Type Compass® is a registered trademark in Europe: CTM No. 010726818.
184 185
and descriptive text, the report views the team through a number of different lenses; the extent to which Risk Types cluster or disperse around the compass, potential fault lines where Risk Type distribution signals tension or conflict, the relative impact of each Risk Type influence, the overall risk disposition of the team and the areas of the compass that are most likely to be amplified in terms of influence on team decision making.
Key features of Team Report:• Applicable to teams of up to 25 people• Overall Risk Type profile of the team• Data is fully anonymous• Graphical representation, description and explorative questions on: • Group scattergram – convergence, dispersion and factions of Risk Type across the team • Risk Type Influence – areas of the compass that are under - or over - represented • Centre of gravity – the overall direction of pull within the compass • The team’s overall Risk Tolerance (RTi)• Explorative questions throughout encourage group discussion and provide
development opportunities• A removable resources section at the back of the report includes: • Each team member’s Risk Type, Risk Attitude and RTi in a one-page summary • Socio-metric implications; the team members who are closest and most remote within the compass boundaries• An optional one-page Team Report Key matches the anonymous Team Report Data
with team member’s names.
In addition, the team report is accompanied by a set of team graphics based on composite team data (for team development workshop slides) and with an individual blank page workbook with each team graphic for participants in the team development event.
Samples of all current Risk Type Compass™ reports are available on the PCL website (www.psychological-consultancy.com).

© Copyright Psychological Consultancy Limited, 2019 all rights reserved. Risk Type Compass® is a registered trademark in Europe: CTM No. 010726818.
186
Glossary
Adventurous Risk TypeCharacterised by a combination of impulsiveness and fearlessness. This type are imperturbable and seemingly oblivious to risk. Their decision-making is likely to be influenced by both their lack of anxiety and their impulsiveness.
Axial GroupIndividuals who show none of the extremes that characterise other Risk Types are classified as being in the Axial group. Members of this group are not particularly impulsive, anxious or emotional nor are they especially calm, self-assured or organised. Any pronounced risk-taking behaviours will likely be due to attitudes developed from specific experiences.
Carefree Risk TypeCharacterised by high levels of impulsiveness and unconventionality. This Type dislike repetitive routine and don’t really like being told what to do. Such people may seem excitement seeking and, in extreme cases, reckless. Not being good at detail or careful preparation, they may seem rather vague about their intentions and objectives.
Complex Risk TypesThe four Risk Types that are combinations of any two neighbouring Pure Risk Types. These are; Wary, Deliberate, Adventurous and Excitable.
Composed Risk TypeCharacterised by a high level of composure and self-confidence. This Type is cool headed, calm and unemotional, but at the extreme may seem almost oblivious to risk. These people take everything in their stride, seem quite imperturbable and appear to manage stress very well.
Deliberate Risk TypeCharacterised by calm self-confidence combined with caution. In situations that would worry most people, this Type experience little anxiety and may seem almost too accepting of risk and uncertainty. However, any concerns about them being unaware of risk should be balanced by a desire to do things in a planned and systematic way.
Excitable Risk TypeCharacterised by impulsivity and an attraction to risk, but distressed if things go wrong. This Type tend to be passionate and to vary in their moods between excited enthusiasm and pessimistic negativity. Such people are likely to respond emotionally to events and react strongly to disappointment or the unexpected. Not being planful or well organised, such people may not take the trouble to seek comprehensive information before embracing a new opportunity.
Financial Risk AttitudeConcerned with one’s willingness to take chances in one’s financial affairs.
Health and Safety Risk AttitudeConcerned with being alert to common dangers and matters that may impact one’s current or future health; whether at work, at home or other everyday situations.
Intense Risk Type Characterised by anxiety and worry about risk - people who expect the worst. This Type have a tendency to become very involved at a personal level in things. Such people are highly-strung

© Copyright Psychological Consultancy Limited, 2019 all rights reserved. Risk Type Compass® is a registered trademark in Europe: CTM No. 010726818.
186 187
and alert to any risk or threat to their wellbeing. They invest a lot emotionally in their decisions and commitments and take it personally when things don’t work out.
Prudent Risk TypeCharacterised by a desire for a high level of self-control and detailed planning. This Type is organised, systematic, and conforming. Generally very cautious and suspicious of any new ventures, they may find reassurance in sticking with what they know.
Pure Risk TypesThe four Risk Types that fall at either end of the two Risk Personality Dimensions; Emotional:Calm and Daring:Measured are known as the Pure Risk Types. These are Prudent (Measured), Carefree (Daring), Intense (Emotional) and Composed (Calm).
Recreational Risk AttitudeConcerned with the possibility of physical danger and its influence on decisions about which sports or recreational activities one engages in.
Reputational Risk AttitudeConcerned with morality and a readiness to live life according to accepted principles and codes of behaviour.
Risk AttitudeThe aspects of risk behaviour that are more changeable in nature. These are characterised by the variations that arise from day to day events, experiences, training and exposure. Risk Attitudes are transient and easily influenced. There are 5 main domains of Risk Attitude; recreational, health & safety, financial, social and reputational.
Risk IntelligenceTerm coined by Evans (2012) that reflects the cognitive evaluation of risk; i.e. the extent to which training and experience can moderate risk perception. Not directly a part of the Risk Type Compass™, but a compatible notion.
Risk Personality DimensionsThe structure of the Risk Type Compass™ is based on two conceptually orthogonal Risk Personality Dimensions; the first is, broadly speaking, a measure of Fear (‘Emotional:Calm’ dimension) and the second is a measure of Impulsivity (‘Daring:Measured’ dimension).
Risk ToleranceIndicated by the Risk Tolerance Index (RTi); a 100-point scale that measures how comfortable an individual is likely to be with handling risk. Scores at the higher end of the index indicate a strong risk tolerance, whereas scores at the lower end of the index signify that an individual will be more risk averse.
Risk TypeReflects an individual’s risk-related personality characteristics and the dispositions associated with them. Risk Type is assumed to be relatively stable over a working life and will have a consistent and persistent influence on behaviour.

© Copyright Psychological Consultancy Limited, 2019 all rights reserved. Risk Type Compass® is a registered trademark in Europe: CTM No. 010726818.
188
Social Risk AttitudeConcerned with the risk of embarrassing oneself or others and risking disapproval, unpopularity or loss of reputation.
Wary Risk TypeCharacterised by a combination of self-discipline and concern about risk, these are cautious, organised people who put security at the top of their agenda. Ideally, such people like to know precisely what they can expect. At the extreme they will be strongly attracted to the idea of securing their future but anxious that, however well it has worked for others, something may go wrong in their case.

© Copyright Psychological Consultancy Limited, 2019 all rights reserved. Risk Type Compass® is a registered trademark in Europe: CTM No. 010726818.
188 189
References
Allik, J., & McCrae, R.R. (2002). A Five-Factor Theory perspective. In R. R. McCrae & J. Allik (Eds.), The Five-Factor Model of personality across cultures. New York: Kluwer Academic/Plenum Publishers.
Allport, G. W. (1937). Personality: A Psychological Interpretation. New York: Holt
Amabile, T. M. (1988). A model of creativity and innovation in organizations. In B. M. Staw, & L. L. Cummings (Ed.), Research in Organizational Behavior, 10 (pp.123-167). Greenwich, CT: JAI Press.
Anokhin, A. P., Golosheykin, S., Grant, J., & Heath, A. C. (2009). Heritability of risk-taking in adolescence: a longitudinal twin study. Twin research and human genetics, 12(4), 366-371.
Arnett, J. (1990). Contraceptive use, sensation seeking, and adolescent egocentrism. Journal of Youth and Adolescence, 19(2), 171-180. doi:10.1007/BFO1538720.
Arnett, J. (1990). Drunk driving, sensation seeking, and egocentrism among adolescents. Personality and individual differences, 11(6), 541-546. doi: 10.1016/0191-8869(90) 90035-P
Bailard, T.E., Biehl, D. L. & Kaiser, R.W. (1986). Personal money management (5th ed.). Chicago: Science Research Associates, Inc.
Bakshi, G., & Chen. Z. (1994). Baby boom, population ageing, and capital markets. Journal of Business, 67, 165-202.
Barling, J. E., & Frone, M. R. (2004). The psychology of workplace safety. American Psychological Association.
Barnewall, M. M. (1987). Psychological Characteristics of the Individual Investor. In W. Droms (Ed.), Asset Allocation for the individual investor. Charlottesville, VA.: The Institute of Chartered Financial Analysts.
Barrick, M. R., & Mount, M. K. (1991). The Big Five personality dimensions and job performance: A meta analysis. Personnel Psychology, 44, 1-26.
Barrick, M. R., & Mount, M. K. (2005). Yes, personality matters: Moving on to more important matters. Human Performance, 18, 359-372.
Berthoz, A. (2006). Emotion and Reason: The Cognitive Neuroscience of Decision Making. Oxford: Oxford University Press
Blais, A., & Weber. E.U. (2006). A domain-specific risk-taking scale for adult populations. Judgement and Decision Making, 1, 33-47.

© Copyright Psychological Consultancy Limited, 2019 all rights reserved. Risk Type Compass® is a registered trademark in Europe: CTM No. 010726818.
190
Brewer, M. B., & Caporael, L. R. (1990). Selfish Genes vs. Selfish People: Sociobology as origin myth. Motivation Emotion, 14, 237-243.
Buelens, M., & Van den Broeck, H. (2007). An analysis of differences in work motivation between public and private sector organizations. Public Administration Review, 67(1), 65-74.
Carson, S. H., Peterson, J. B., & Higgins, D. M., (2005). Reliability, Validity, and Factor Structure of the Creative Achievement Questionnaire. Creativity Research Journal 17(1), 37-50
Cattell, R.B. (1978) Scientific use of factor analysis in behavioral and life sciences. New York: Plenum Press.
Cesarini, D., Dawes, C.T., Johannesson, M., Lichtenstein, P., & Wallace, B. (2009). Genetic variation in preferences for giving and risk-taking. Quarterly Journal of Economics, 124, 809-842.
Cichomska, K. (2010) Risk, Affect and Creativity at Work. Unpublished dissertation, City University, London
Clarke, S. (2006). The relationship between safety climate and safety performance: a meta-analytic review. Journal of Occupational Health Psychology, 11(4), 315-327.
Cobb-Clark, D. A., & Schurer, S. (2012). The stability of big-five personality traits. Economics Letters, 115(1), 11-15.
Connor, K., Davidson, J. (2003). Development of a new resilience scale: The Connor-Davidson Resilience Scale (CD-RISC). Depress Anxiety, 18, 76–82.
Cosmides, L. (1989). The logic of social exchange: Has natural selection shaped how humans reason? Studies with the Wason selection task. Cognition, 31, 187-276.
Costa, P. T., & McCrae, R. R. (1992). Normal personality assessment in clinical practice: the NEO Personality Inventory. Psychological assessment, 4(1), 5-13.
Costa, P. T., Terracciano, A., & McCrae, R. R. (2001). Gender differences in personality traits across cultures: Robust and surprising findings. Journal of Personality and Social Psychology, 81(2), 322-331
De Vries, R. E., De Vries, A., & Feij, J. A. (2009). Sensation seeking, risk-taking, and the HEXACO model of personality. Personality and Individual Differences, 47(6), 536-540.
Domasio, R., (2006). Descartes’ Error: Emotion, Reason and the Human Brain. Random
© Copyright Psychological Consultancy Limited, 2019 all rights reserved. Risk Type Compass® is a registered trademark in Europe: CTM No. 010726818.
190 191
House.
Ein-Dor, T. (2013). Social Defence Theory: How a mixture of personality traits in group contexts may promote our survival. In M. Mikulincer & P. R. Shaver (Eds.), Nature and development of social connections: From brain to group (pp. 357-372). Washington, D.C.: American Psychological Association
El-Murad, J., & West, D. C. (2004). The definition and measurement of creativity: what do we know? Journal of Advertising Research, 44(2), 188-201.
Evans, D. (2012). Risk intelligence: how to live with uncertainty. New York: Simon and Schuster.
Eysenck, H. J. (1973). Eysenck on Extraversion. New York: Wiley.
Eysenck, H. J. (1992). Four ways five factors are not basic. Personality and Individual Differences, 13, 667-673.
Feist, G. J. (1998). A meta-analysis of personality in scientific and artistic creativity. Personality and Social Psychology Review, 2(4), 290-309.
Fiedler, F. E. (1995). Cognitive resources and leadership performance: a rejoinder, Applied Psychology, 44(1), 50-56.
Field, T. (1996). Attachment and Separation in Young Children, Annual Review of Psychology, 47, 541-562.
Foster, J. (2010). How Personality Influences Safety-Related Work Behavior, The Online Newsletter for Personality Science. Retrieved 15 August 2016, from http://www.personality-arp.org/html/newsletter05/article_safety.html
Gazzaniga, M. S. (2008). Human: The Science of What Makes Us Unique. New York: Harper Collins.
Gerber, A. S., Huber, G. A., Doherty, D., & Dowling, C. M. (2011a). The Big Five Personality Traits in the Political Arena. Annual Review of Political Science, 14(1), 265-287.
Gigerenzer, G. (2014). Risk savvy: How to make good decisions. London: Penguin
Goldberg, L. R. (1999). A broad-bandwidth, public domain, personality inventory measuring the lower-level facets of several five-factor models. Personality psychology in Europe, 7, 7-28.
Goldenbeld, C., & van Schagen, I. (2007). The credibility of speed limits on 80km/h rural roads: The effects of road and person(ality) characteristics. Accident Analysis &

© Copyright Psychological Consultancy Limited, 2019 all rights reserved. Risk Type Compass® is a registered trademark in Europe: CTM No. 010726818.
192
Prevention, 39(6), 1121-1130.
Gordon, H. (2010). Can Personal Values predict Risk-Type and Corporate Social Responsibility Orientation? Unpublished doctoral dissertation, University of Nottingham, Nottingham, United Kingdom.
Gottesman, I. I. (1963). Heritability of personality: A demonstration. Psychological Monographs: General and Applied, 77(9), 1-21.
Gough, H. G. (1979). A creative personality scale for the Adjective Check List. Journal of personality and social psychology, 37(8), 1398-1405.
Grable, J. E., Joo, S. H. (2004). Environmental and biopsychosocial factors associated with financial risk tolerance. Financial Counseling and Planning, 15, 73–82.
Hagendorff, J., Saunders, A., Steffen, S., & Vallascas, F. (2015). The Wolves of Wall Street? How bank executives affect bank risk taking, SSRN eLibrary (USA).
Haleblian, J., Markoczy. L., & McNamara, G. (2004). The effect of anxiety and confidence on risky decision making in competitive and non-competitive decision settings (Working paper October 2004). California: University of California.
Hampson, S. E., Andrews, J. A., Barckley, M., Lichtenstein, E., & Lee, M. E. (2000). Conscientiousness, perceived risk, and risk-reduction behaviors: A preliminary study. Health Psychology, 19(5), 496-500.
Hanoch, Y., Johnson, J.G., & Wilke, A. (2006). Domain specificity in experimental measures and participant recruitment: an application to risk-taking behavior. Psychological Science, 17, 300-304.
Harlow, W.V., & Brown, K. (1990). Understanding and assessing financial risk tolerance: A biological perspective. Financial Analysts Journal, 46, 50-62.
Harris, J. R. (1998). The Nurture Assumption: Why Children Turn Out The Way They Do. New York: Free Press.
Harris, M.A., Brett, C.E., Johnson, W., & Dreary, I.J. (2016) Personality Stability From Age 14 to Age 77 Years. Pssychol Aging, 31(8), 862–874.
Hogan, J., & Ones, D. S. (1997) Conscientiousness and integrity at work. In J. Johnson, R. Hogan and S. Briggs (Eds.), Handbook of Personality Psychology. London: Academic Press.
Hogan, R., & Hogan, J. (1997). Hogan Development Survey manual. Tulsa, OK: Hogan Assessment Systems.

© Copyright Psychological Consultancy Limited, 2019 all rights reserved. Risk Type Compass® is a registered trademark in Europe: CTM No. 010726818.
192 193
Hogan, R., & Hogan, J. (2007). Hogan Personality Inventory manual (3rd ed.). Tulsa, OK: Hogan Assessment Systems.
Horney, K. (1950). Neurosis and human growth: The struggle towards self-realization. New York: Norcross.
Hughes, D. H., Furnham, A., & Batey, M. D. (2013). The structure and personality predictors of self-rated creativity. Thinking Skills and Creativity, 9, 76-84.
Hunter, K., & Kemp, S. (2004), The personality of e-commerce investors, Journal of Economic Psychology, 25, 529–537.
Hyde, G., & Trickey, G. (1997). Hogan Personality Inventory: UK Edition Manual. Tunbridge Wells, UK: Psychological Consultancy Limited.
Institute of Risk Management (2012). Risk Culture: Under the Microscope for Boards. Retrieved August 15, 2016, from https://www.theirm.org/media/885907/Risk_Culture_A5_WEB15_Oct_2012.pdf
Jackson, D.N., Hourany, L., & Vidmar, N.J. (1972). A four dimensional interpretation of risk-taking. Journal of Personality, 40, 483-501.
James, K., Brodersen, M., & Eisenberg, J. (2004). Workplace affect and workplace creativity: A review and preliminary model. Human Performance, 17(2), 169-194.
Josef, A., Richter, D., Samanez-Larkin, G. R., Wagner, G. G., Hertwig, R., & Mata, R. (2016). Stability and Change in Risk-Taking Propensity Across the Adult Lifespan. Journal of Personality and Social Psychology, Retrieved 15 August 2016, from http://www.diw.de/documents/publikationen/73/diw_01.c.525809.de/diw_sp0816.pdf
Jung, C.G. ([1921] 1971). Psychological Types, Collected Works of C.G. Jung, Volume 6, Princeton, N.J.: Princeton University Press. ISBN 0-691-01813-8.
Klein, W. M., & Kunda, Z. (1994). Exaggerated self-assessments and the preference for controllable risks. Organizational Behavior and Human Decision Processes, 59, 410-17.
Kowert, P. A., & Hermann, M. G. (1997). Who takes risks? Daring and caution in foreign policy making. Journal of Conflict Resolution, 41, 611-37.
Kuhnen, C.M., & Chiao, C. Y. (2009). Genetic Determinants of Financial Risk Taking. Retrieved August 15, 2016, from http://journals.plos.org/plosone/article?id=10.1371/journal.pone.0004362
Levy, D. J., & Glimcher, P. W. (2011). Comparing apples and organges: using reward-

© Copyright Psychological Consultancy Limited, 2019 all rights reserved. Risk Type Compass® is a registered trademark in Europe: CTM No. 010726818.
194
specific and reward-general subjective value representation in the brain. Journal of Neuroscience, 31(41), 14693-14707. Doi. 10.1523/JNEUROSCI 18-11.2011
Levy, D. J., & Glimcher, P. W. (2012). The root of all value: a neural common currency for choice. Current opinion in neurobiology, 22(6), 1027-1038. doi: 10.1016/j.conb. 2012.06.001
Locke, E. A. (Ed.) (2009) Handbook of principles of organizational behavior (2nd Ed.). New York: Wiley
Lounsbury, J. W., Fisher, L. A., Levy, J. J., & Welsh, D. P. (2009). An investigation of character strengths in relation to the academic success of college students. Individual Differences Research, 7(1), 52-69.
MacLeod, C., & Cohen, I. L. (1993). Anxiety and the interpretation of ambiguity: A text comprehension study. Journal of Abnormal Psychology, 102, 238-247
Mayfield, C., Perdue, G., & Wooten, K. (2008). Investment management and personality type. Financial Services Review, 17, 219-236
Mazarr, M. J. (2016, June). Risk Management – The True Character of Risk. Risk Management Magazine. Retrieved 15 August 2016, from http://www.rmmagazine.com/2016/06/01/the-true-character-of-risk/
McCrae, R. R., & Costa, P. T. (1997). Personality trait structure as a human universal. American Psychologist, 52(5), 509-516.
McCrae, R. R., Costa, P. T., de Lima, M. P., Simões, A. Ostendorf, F., Angleitner, A., Marusic, I., Bratko, D., Caprara, G. V., Barbaranelli, C., Chae, J-H., and Piedmont, R. L. (1999). Age differences in personality across the adult life span: Parallels in five cultures. Developmental Psychology, 35(2), 466-477
McGhee, R. L., Ehrler, D. J., Buckhalt, J. A., & Phillips, C. (2012). The relation between five-factor personality traits and risk-taking behavior in preadolescents. Psychology, 3(8), 558-561.
McGowan, J.J. (2007). Swimming with sharks: Perspectives on professional risk taking. Journal of the Medical Library Association, 95, 104-113.
Mondak, J. J. (2010). Personality and the Foundations of Political Behaviour. Cambridge: Cambridge University Press.
Myers, J. (1999). Profits Without Panic: Investment Psychology for Personal Wealth. London: Nicholas Brealey Publishing Limited.

© Copyright Psychological Consultancy Limited, 2019 all rights reserved. Risk Type Compass® is a registered trademark in Europe: CTM No. 010726818.
194 195
Nicholson, N., Soane, E., Fenton-O’Creevy, M., & Willman, P. (2005). Personality and domain-specific risk taking. Journal of Risk Research, 8, 157-176.
Nunnally, J. C., & Bernstein, I. H. (1994). Psychometric theory (3rd Ed.). New York: McGraw-Hill.
Oreg, S. (2003). Resistance to Change: Developing an Individual Differences Measure. Journal of Applied Psychology, 88(4), 680-693
Pan, C.H. & Statman, M., (2010). Beyond risk tolerance: regret, overconfidence, personality and other investor characteristics. Retrieved 11 August 2016, from https://www.researchgate.net/profile/Carrie_Pan/publication/228479814_Beyond_risk_tolerance_regret_overconfidence_personality_and_other_investor_characteristics/links/547510130cf245eb4370c12e.pdf
Paulus, M. P., Rogalsky, C., Simmons, A., Feinstein, J. S., & Stein, M. B. (2003). Increased activation in the right insula during risk-taking decision making is related to harm avoidance and neuroticism. Neuroimage, 19(4), 1439-1448.
Peter, P.J. (1979). Reliability: A Review of Psychometric Basics and Recent Marketing Practices. Journal of Marketing Research, 16, 6-17.
Pfeffer, J. & Sutton, R.I. (2000). The knowing-doing gap: How smart companies turn knowledge into action. Cambridge, MA: Harvard Business School Press.
Raghunathan, R., & Pham, M.T. (1999). All negative moods are not equal: Motivational influences of anxiety and sadness on decision making. Organizational Behavior and Human Decision Processes, 79, 56-77.
Roberts, B. W., Walton, K. E., & Viechtbauer, W. (2006). Patterns of Mean-Level Change in Personality Traits Across the Life Course: A Meta-Analysis of Longitudinal Studies. Psychological Bulletin, 132(1), 1-25. doi: 10.1037/0033-2909.132.1.1
Roe, B. E., Tilley, M. R., Gu, H. H., Beversdorf, D. Q., Sadee, W., Haab, T. C., & Papp, A. C. (2009). Financial and psychological risk attitudes associated with two single nucleotide polymorphisms in the nicotine receptor (CHRNA4) gene. PLoS One, 4(8), e6704.
Roszkowski, M. J., Davey, G., & Grable, J. E. (2005). Insights on measuring risk tolerance from psychology and psychometrics. Journal of Financial Planning, 18, 66-76.
Roszkowski, M. J., & Grable, J. E. (2009). Evidence of lower risk tolerance among public sector employees in their personal financial matters. Journal of Occupational and Organizational Psychology, 82(2), 453-463.
Salgadoa, J. F., & Táuriza, G., (2014). The Five-Factor Model, forced-choice personality

© Copyright Psychological Consultancy Limited, 2019 all rights reserved. Risk Type Compass® is a registered trademark in Europe: CTM No. 010726818.
196
inventories and performance; A comprehensive meta-analysis of academic and occupational validity studies. European Journal of Work and Organizational Psychology, 23 (1), 3-30.
Schneider, B. (1987). The people make the place. Personnel Psychology, 40, 437-453
Sternberg, R. J., & Lubart, T. I. (1993). Creative giftedness: A multivariate investment approach. Gifted Child Quarterly, 37, 7-15.
Simon, H. (1983). Reasoning in Human Affairs. Stanford: Stanford University Press
Smith, B.W., Dalen, J., Wiggins, K., Tooley, E., Christopher, P., & Bernard, J. (2008). The brief resilience scale: Assessing the ability to bounce back, International Journal of Behavioral Medicine, 15(3), 194-200.
Ted Talk (Producer). (2007, January 6). Sir Ken Robinson: Do Schools Kill Creativity [Video file]. Retrieved from https://www.youtube.com/watch?v=iG9CE55wbtY
van den Berg, P. T., & Feij, J. A. (1988). De ontwikkeling van een selectieversie van de Spanningsbehoeftelijst (SBL-s). Nederlands Tijdschrift voor de Psychologie, 43, 328-334.
Van Katwyk, P. T., Fox, S., Spector, P. E., & Kelloway, E. K. (2000). Using the Job-Related Affective Well-Being Scale (JAWS) to investigate affective responses to work stressors. Journal of Occupational Health Psychology, 5(2), 219-230
Wallach, M. A., Kogan, N., & Bem, D. J. (1964). Diffusion of responsibility and level of risk taking in groups. Journal of Abnormal and Social Psychology, 68, 263-274
Walport, M. (2014). Innovation: Managing Risk, Not Avoiding It. Government Chief Scientific Adviser Annual Report, The Government Office for Science, London. https://assets.publishing.service.gov.uk/government/uploads/system/uploads/attachment_data/file/381905/14-1190a-innovation-managing-risk-report.pdf
Warr, P. (1990). The measurement of well-being and other aspects of mental health, Journal of Occupational Psychology, 63(3), 193–210.
Watson, D., Clark, L. A., & Tellegen, A. (1988). Development and validation of brief measures of positive and negative affect: the PANAS scales. Journal of Personality and Social Psychology, 54(6), 1063-1070.
Weber, E.U., Blais, A, R., & Betz, N.E. (2002). A domain-specific risk attitude scale: Measuring risk perceptions and risk behaviors. Journal of Behavioral Decision Making, 15, 263-290.

© Copyright Psychological Consultancy Limited, 2019 all rights reserved. Risk Type Compass® is a registered trademark in Europe: CTM No. 010726818.
196 197
Weisberg, Y. J., DeYoung, C. G., & Hirsh, J. B. (2011). Gender differences in personality across the ten aspects of the Big Five. Frontiers in Psychology, 178(2), 1-11.
Wiggins, J. S. (1996). The Five Factor Model of Personality, Theoretical Perspectives (Ed.). New York: The Guilford Press.
World Economic Forum (2016). The 10 skills you need to thrive in the Fourth Industrial Revolution. Retrieved 19 August 2016, from https://www.weforum.org/agenda/2016/01/the-10-skills-you-need-to-thrive-in-the-fourth-industrial-revolution/
Zhong S., Israel H., Xue P. C., Sham S., Ebstein R. P., & Chew S. H. (2009) A neurochemical approach to valuation sensitivity over gains and losses. Proc. R. Soc. B 276, 4181-4188.
Zuckerman, M. (1983). Sensation seeking and sports. Personality and individual differences, 4(3), 285-292.
Zuckerman, M., Ball, S., & Black, J. (1990). Influences of sensation seeking, gender, risk appraisal, and situational motivation on smoking. Addictive behaviors, 15(3), 209-220.
Zuckerman, M., & Kuhlman, D. M., (2000). Personality and risk-taking: Common biosocial factors. Journal of Personality, 68(6), 999-1029.
Zuckerman, M., Kolin, E. A.; Price, L., & Zoob, I. (1964). Development of a sensation-seeking scale. Journal of Consulting Psychology, 28(6), 477-482.

Published in the United Kingdom in 2019 byPsychological Consultancy Limited, 8 Mount Ephraim, Tunbridge Wells, TN4 8AS.T 01892 559540F 01892 522096E [email protected]


