Embed Size (px)
Citation preview

Anjali Maliwal
StressPsychological Perspectives
Stress: Psychological Perspectives


Stress: Psychological Perspectives
Anjali Maliwal
Stress: Psychological Perspectives Anjali Maliwal
ISBN: 978-93-5429-127-2
© 2021 Vidya Books
Published by Vidya Books,
305, Ajit Bhawan,
21 Ansari Road,
Daryaganj, Delhi 110002
This book contains information obtained from authentic and highly regarded sources. All chapters are published with
permission under the Creative Commons Attribution Share Alike License or equivalent. A wide variety of references are
listed. Permissions and sources are indicated; for detailed attributions, please refer to the permissions page. Reasonable
efforts have been made to publish reliable data and information, but the authors, editors and publisher cannot assume any
responsibility for the validity of all materials or the consequences of their use.
Trademark Notice: All trademarks used herein are the property of their respective owners. The use of any trademark in this
text does not vest in the author or publisher any trademark ownership rights in such trademarks, nor does the use of such
trademarks imply any affiliation with or endorsement of this book by such owners.
The publisher’s policy is to use permanent paper from mills that operate a sustainable forestry policy. Furthermore, the
publisher ensures that the text paper and cover boards used have met acceptable environmental accreditation standards.
Contents
Chapter 1 Effect of a brief cognitive behavioral program on
depressive symptoms among newly licensed registered nurses: An observational study ...................................................... 1
Chapter 2 A mix-method investigation on acculturative stress among
Pakistani students in China .............................................................................. 9
Chapter 3 Psychiatric symptoms and emotion regulation strategies
among the unemployed people in Korea: A latent
profile analysis ................................................................................................... 26
Chapter 4 Variation of stress levels, burnout, and resilience throughout
the academic year in first-year medical students ........................................ 42
Chapter 5 Students’ perspectives on interventions to reduce stress in medical school: A qualitative study ........................................................... 55
Chapter 6 Perceived stress and well-being of Polish migrants in the
UK after Brexit vote .......................................................................................... 70
Chapter 7 Exploring issues surrounding mental health and wellbeing
across two continents: A preliminary cross-sectional
collaborative study between the University of California, Davis, and University of Pretoria .................................................................... 85
Chapter 8 Emotion regulation strategies modulate the effect of
adverse childhood experiences on perceived chronic stress with implications for cognitive flexibility .......................................... 97
Chapter 9 Does laughing have a stress-buffering effect in daily life?
An intensive longitudinal study ................................................................... 115
Chapter 10 Practice assistants´ perceived mental workload:
A cross-sectional study with 550 German participants
addressing work content, stressors, resources, and organizational structure .......................................................................... 126
Chapter 11 Relationships between psychosocial stressors among
pregnant women in San Francisco: A path analysis .................................. 138
Chapter 12 Suicidality among Chinese college students: A cross-sectional
study across seven provinces........................................................................ 154
Table of Contents
Chapter 13 Elevated psychological distress in undergraduate and
graduate entry students entering first year medical school ...................... 167
Chapter 14 Trauma exposure and PTSD prevalence among Yazidi,
Christian and Muslim asylum seekers and refugees
displaced to Iraqi Kurdistan .......................................................................... 178
Effect of a brief cognitive behavioral programon depressive symptoms among newlylicensed registered nurses: An observationalstudy
Kosei Esaki1, Masashi IkedaID1*, TomoOkochi1, Satoru Taniguchi1, Kohei Ninomiya1,
Ayu Shimasaki1, Yasuyo Otsuka2, Yoshiko Oda2, Takaya Sakusabe3, Keiko Mano2,
Takeo Saito1, Nakao Iwata1
1 Department of Psychiatry, Fujita Health University School of Medicine, Toyoake, Aichi, Japan, 2 Division ofNursing, Fujita Health University Hospital, Toyoake, Aichi, Japan, 3 Medical Engineering, Fujita Health
University School of Medical Sciences, Toyoake, Aichi, Japan
Abstract
Depressive symptoms are a serious problem in workplaces. Hospital staff members, such
as newly licensed registered nurses (NLRNs), are at particularly increased risk of these
symptoms owing to their limited experience. Previous studies have shown that a brief pro-
gram-based cognitive behavioral therapy program (CBP) can offer effective treatment.
Here, we conducted a longitudinal observational study of 683 NLRNs (CBP group, n = 522;
no-CBP group, n = 181) over a period of 1 year (six times surveys were done during this
period). Outcomes were assessed on the basis of surveys that covered the Beck Depres-
sion Inventory-I (BDI). The independent variables were CBP attendance (CBP was con-
ducted 3 months after starting work), personality traits, personal stressful life events,
workplace adversity, and pre-CBP change in BDI in the 3 months before CBP (ΔBDIpre-CBP).All factors were included in Cox proportional hazards models with time-dependent covari-
ates for depressive symptoms (BDI�10), and we reported hazard ratios (HRs). Based on
this analysis, we detected that CBP was significantly associated with benefit for depressive
symptoms in all NLRNs (Puncorrected = 0.0137, HR = 0.902). To identify who benefitted most
from CBP, we conducted a subgroup analysis based on the change in BDI before CBP
(ΔBDIpre-CBP). The strongest association was when BDI scores were low after starting work
and increased before CBP (Puncorrected = 0.00627, HR = 0.616). These results are consistent
with previous findings, and indicate that CBPmay benefit the mental health of NLRNs. Fur-
thermore, selective prevention based on the pattern of BDI change over time may be impor-
tant in identifying who should be offered CBP first. Although CBP is generally effective for all
nurses, such a selective approach may be most appropriate where cost-effectiveness is a
prominent concern.
Editor: Vincenzo De Luca, University of Toronto,
CANADA
1
1
Introduction
A deterioration in subjective well-being, or more specifically the onset of depressive symp-
toms, is a worldwide challenge in many workplaces. Such conditions are not only very com-
mon [1] but also have significant economic, productivity, and quality of life implications,
especially if workers develop depression [2].
Depressive symptoms are relevant to all workers in all occupations, but they are a particular
problem among hospital staff [3–5]. Due to the expectations placed on nurses, who must
remain highly motivated in the face of significant responsibility, professional conflict, and the
strains of night shifts, among other factors, this group is at particularly increased risk [6].
Moreover, as newly licensed registered nurses (NLRNs) tend to be young and have less experi-
ence, they may lack the skills and confidence to cope with workplace stress. In turn, this may
place them at higher risk of depressive symptoms or worse well-being [7]. Improved training
in coping skills could help to maintain well-being in this group, protecting them against psy-
chologic distress, depression, and burnout.
Cognitive behavioral therapy (CBT) is a sophisticated psychological therapy with long-term
efficacy, and it has become one of the most common and useful treatment options for many
psychiatric disorders, including depression and anxiety. In the workplace, CBT has been modi-
fied to fit the needs of workers by using fewer sessions and focusing on the key facts for pre-
venting psychological distress or maintaining well-being, as exemplified by cognitive
behavioral programs (CBPs) [8]. To date, several internet-based and face-to-face intervention
studies have been conducted, together with a couple of meta-analyses, and these suggest that
CBT or CBP can prevent depressive symptoms and/or increase well-being and self-esteem [9–
12]. A couple of studies have also targeted nurses and concluded that CBT might be effective,
although the evidence was of low quality [13, 14].
In this study, we aimed to confirm whether CBT/CBP was an effective intervention for
nurses and to identify those nurses in whom CBP has the greatest effect. Therefore, we ana-
lyzed longitudinal data for NLRNs in Japan based on reported depressive symptoms. Although
this was an observational study, we considered that it was possible to speculate on the effect of
CBP by comparing the psychological distress scores on the Beck Depression Inventory-I
(BDI-I) between subjects who did or did not attend CBP sessions.
Materials andmethods
Subjects and data collection
Data were collected in six phases as part of the Depression Protection Program in Fujita [15]. We
enrolled 910 NLRNs employed by Fujita Health University Hospital and starting work between
2012 and 2017 who agreed to participate. A subset of these subjects had been used in a previous
analysis [15]. Inadequate questionnaire responses were provided by 227 subjects (i.e., did not
respond to the “baseline−1,” “baseline 0,” or “all” for the follow-up surveys), so they were excluded.
The ethics committee of Fujita Health University approved this study. After a complete descrip-
tion of the study was provided to the subjects, all gave their written informed consent.
In total, 683 subjects were eligible for inclusion, comprising 618 women and 65 men with a
mean age of 22.2 ± 1.8 years at enrollment. These were divided into six phases by the year they
started work: phase I, from April 2012 (n = 77); phase II, from April 2013 (n = 84); phase III,
from April 2014 (n = 139); phase IV, from April 2015 (n = 109); phase V, from April 2016
(n = 125); and phase VI, from April 2017 (n = 149).
Subjects were evaluated every 3 months after the baseline assessment in April (i.e., July,
October, January, and April the following year). As such, a person could be surveyed a
Funding: This work was supported by the Strategic
Research Program for Brain Sciences (SRPBS)
from the Japan Agency for Medical Research and
Development (AMED) under Grant Numbers
JP20dm0107097 (NI); GRIFIN of P3GM from
AMED under Grant Numbers JP20km0405201 (T
Saito and NI) and JP20km0405208 (MI); JSPS
Kakenhi Grant Numbers JP25293253 (NI),
JP16H05378 (NI), JP26293266 (MI), JP17H04251
(MI), and JP18K15497 (T Saito); the Private
University Research Branding Project fromMEXT
(NI); SENSHINMedical Research Foundation,
Japan (MI and NI). The funders had no role in
study design, data collection and analysis, decision
to publish, or preparation of the manuscript.
Competing interests: Dr. N Iwata has received
research support or speakers’ honoraria from, or
has served as a consultant to Jansen, Glaxo
SmithKline, Eli Lilly, Otsuka, Shionogi, Dainippon
Sumitomo, Tanabe Mitsubishi, Daiichi-Sankyo.
Stress: Psychological Perspectives
2
maximum of six times: “baseline−1” (April in their first year, just after starting work), “baseline
0” (July in their first year, just before CBP), “Survey 1” (September in their first year: first time
after CBP),”Survey 2” (October in their first year),”Survey 3” (January in their first year),”Sur-
vey 4” (April in their second year) (S1 Fig). Surveys were numbered with reference to when
CBT was performed. Nurses were enrolled at baseline−1, when they were not working in clini-
cal settings. The baseline 0 survey was conducted just before CBT for subjects in phases III to
VI, as described below.
Each subject was evaluated for the following: depressive symptoms, using the Beck Depres-
sion Inventory-I (BDI) [16]; stressful life events (SLEs) during the previous 6 months, based
on the List of Threatening Experiences (LTE) 12-item questionnaire [17]; and workplace-
based adversity, using our own questionnaire that covered exposure to intimidating doctors or
patients, receiving abusive language, violence or sexual harassment, and involvement in medi-
cal incidents or accidents. Personality traits were assessed at enrollment using the NEO Five-
Factor Inventory (NEO-FFI) [18].
Cognitive behavioral program
In the Depression Protection Program in Fujita [15], CBP was introduced from 2014 as a part
of the training and educational session provided by the Department of Nursing in Fujita
Health University Hospital. Therefore, all subjects in phases III–VI received CBP (N = 522),
whereas those in phases I and II did not receive CBP (N = 161). In S1 Table, the descriptive sta-
tistics of demographic characteristics for these subjects are shown.
The CBP was conducted in face-to-face group session (four times) by two trained psycholo-
gists. Sessions were limited to 1 hour each, once a week, with a maximum of ten subjects. The
following content was covered: (1) understanding motives for change and stress/stressor, (2)
understanding the ABCmodel and cognitive therapy, (3) training in cognitive restructuring to
change their relationship with negative automatic thoughts, and (4) training to improve cop-
ing skills and to identify areas for possible behavioral change. The CBP was first delivered 3
months after starting work in the first year (August/September; S1 Fig).
Statistical analysis
Demographic data were analyzed using t-test for continuous variables and chi-square test for
categorical data using SPSS version 27 (IBM, New York, NY, USA).
The main analysis that was used to assess the effect of CBP was based on the three Cox pro-
portional hazards models with time-dependent covariates, including person surveys as the
unit of the analysis (rms package in R version 3.5.3: www.r-project.org). This analysis is
expected to adjust numerous patterns of changes associated with the CBP group. Each model
was based on BDI as the outcome variable, assigning 0 to scores<10 and 1 to scores�10 (indi-
cating mild depressive symptoms [19]). The following were included as independent variables:
prior CBP attendance, personality (i.e., neuroticism and openness scores), SLE count, work-
place adversity count, sex, BDI score at baseline 0, and pre-CBP change in BDI (ΔBDIpre-CBP)from baseline–1 to baseline 0. This included their interactions: neuroticism × SLE count,
neuroticism × workplace adversity, and CBP × ΔBDIpre-CBP. Personality scores, sex, andΔBDIpre-CBP were treated as time-fixed covariates, and the other parameters as time-depen-
dent covariates.
Before implementing the models, we checked for correlations among the NEO-FFI person-
ality traits (i.e., neuroticism, extraversion, openness, agreeableness, and conscientiousness)
using SPSS version 27 (IBM) to minimize collinearity (S2 Table). We also checked the ΔBDI-pre-CBP to assess the effect of work on the BDI (i.e., baseline–1 to baseline 0; S2 Fig) because the
Stress: Psychological Perspectives
3
response to the stressor might reflect the ΔBDIpre-CBP and constitute a “personality” trait.
Thus, we classified ΔBDIpre-CBP groups as follows: (1) a low-to-high group whose BDI changed
from<10 at baseline−1 to�10 at baseline 0 (no CBP = 110; CBP = 383), (2) a high-to-high
group whose BDI remained�10 between baseline−1 and baseline 0 (no CBP = 45, CBP = 121),
(3) a low-to-low group whose BDI remained<10 between baseline−1 and baseline 0 (no
CBP = 6, CBP = 16), and (4) a high-to-low group whose BDI changed from�10 at baseline−1
to<10 at baseline 0 (no CBP = 0, CBP = 2; this group was therefore too small for analysis).
The detailed setting was as follows. As reported in previous studies [20, 21], neuroticism, a
strong predictor, was modeled using a restricted cubic spline with five knots to allow for a
potential nonlinear association, using the rcs function in the rms package in R program. We
then scored SLE and workplace adversity as follows: 0, no event; 1, one event; and 2, at least
two events. Finally, the ΔBDIpre-CBP classifications were scored as follows: 1, low-to-low group
and high-to-low group; 2, high-to-high group; and 3 low-to-high group. This order was used
because we assumed that it would reflect an increase in benefit by CBP. The low-to-low and
high-to-low groups were merged because of the small number in the latter and implied lack of
efficacy of the CBP.
The type I error rate was set at 0.05. In this paper, uncorrected P-values were presented;
although, we recognize that our results have multiple testing issues.
Results
In total, 1804 surveys were completed by 683 subjects and were available for the analysis; of
these, 161 had not received CBP and 522 had received CBP.
First, we checked the trends in the BDI scores for each survey, as shown in S3 Fig. Interest-
ingly, the shape of the histogram changed from baseline−1 (first survey after starting work) to
baseline 0 (pre-CBP) (Wilcoxon signed test: Z = −12.254, P = 1.60 × 10⁻³⁴). However, there
were no dramatic changes from baseline−0 to Survey 1 (Z = -0.127, P = 0.899), from Survey 1
to Survey 2 (Z = −2.306, P = 0.0211), from Survey 2 to Survey 3 (Z = −2.789, P = 0.00529), and
from Survey 3 to Survey 4 (Z = −1.458, P = 0.145).
Second, we confirmed the correlation of the NEO-FFI personality traits evaluated at enroll-
ment. This analysis showed that the only traits that had no significant correlation were neurot-
icism (reported to be a strong risk factor [20, 21]) and openness (S2 Table). These were
selected as independent variables for the subsequent analysis.
Cox proportional hazards analyzes were performed to assess the association between BDI
and the effect of CBP. Despite our observational study design, we used the subjects who did
not receive CBP in their first year after starting work as a comparison group in the model (i.e.,
those in phases I and II; n = 161). There was a significant association between BDI (�10 or
<10) and CBP attendance (P = 0.0137), the neuroticism score (P = 1.61 ×10⁻⁷), workplace
adversity count (P = 0.0246), BDI score at baseline 0 (P = 6.96 ×10⁻¹⁴), ΔBDIpre-CBP (P = 5.82
×10−6), and the interaction with ΔBDIpre-CBP (P = 0.00750) (Table 1). Finally, because we
detected significant differences for the ΔBDIpre-CBP and the interaction of CBP and ΔBDIpre-CBP, we performed further analysis to confirm which sub-group of the ΔBDIpre-CBP contributedmost to the significant association between depressive symptoms and CBP. There was only a
significant association with CBP in the low-to-high ΔBDIpre-CBP group, which was expected
given these were most sensitive to stressors (P = 0.00627; Table 2)
Discussion
This longitudinal observational survey with follow-up every 3 months confirmed that CBP
[13, 14], neuroticism [20, 21], and recent workplace adversity were associated with depressive
Stress: Psychological Perspectives
4
symptoms. Subgroup analysis further revealed that subjects who developed psychological dis-
tress after starting work gained the greatest benefit from CBP.
The Cox proportional hazards analysis of the effect of CBP indicated that there was a signif-
icant association between CBP and mild depressive symptoms for all NLRNs. Therefore, we
consider that CBP will be of use as a universal prevention or intervention course. Previous
research in a similar target population (NLRNs), but using a randomized control design, also
revealed that CBP was effective against depressive symptoms in their entire cohort [13]. Our
results support this finding and strengthen the evidence in favor of using CBP for NLRNs.
As a more selective intervention, we also showed that a low-to-high ΔBDIpre-CBP sub-groupwas most likely to benefit from CBP (i.e., those whose BDI score changed from below to above
the 10-point cutoff). This result was somewhat expected because such subjects were probably
more sensitive to workplace stressors due to lower levels of resilience. Therefore, this study
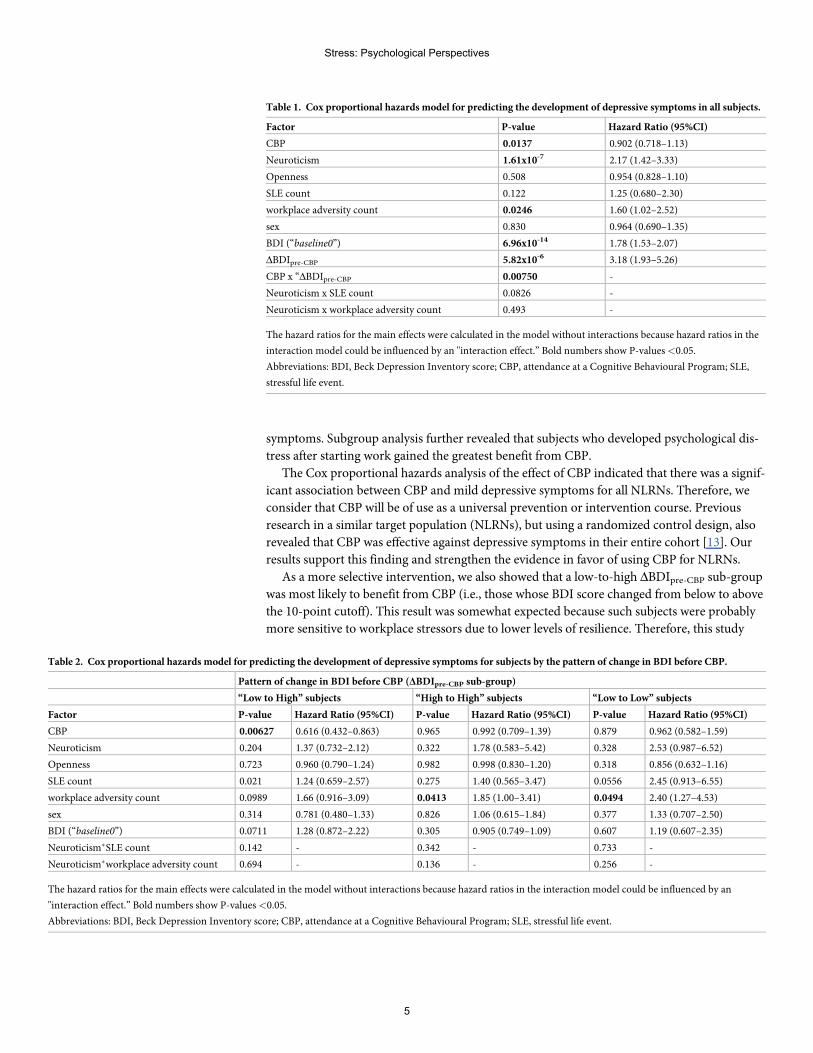
Table 1. Cox proportional hazards model for predicting the development of depressive symptoms in all subjects.
Factor P-value Hazard Ratio (95%CI)
CBP 0.0137 0.902 (0.718–1.13)
Neuroticism 1.61x10⁻⁷ 2.17 (1.42–3.33)
Openness 0.508 0.954 (0.828–1.10)
SLE count 0.122 1.25 (0.680–2.30)
workplace adversity count 0.0246 1.60 (1.02–2.52)
sex 0.830 0.964 (0.690–1.35)
BDI (“baseline0”) 6.96x10⁻¹⁴ 1.78 (1.53–2.07)
ΔBDIpre-CBP 5.82x10⁻⁶ 3.18 (1.93–5.26)
CBP x “ΔBDIpre-CBP 0.00750 -
Neuroticism x SLE count 0.0826 -
Neuroticism x workplace adversity count 0.493 -
The hazard ratios for the main effects were calculated in the model without interactions because hazard ratios in the
interaction model could be influenced by an "interaction effect.” Bold numbers show P-values<0.05.
Abbreviations: BDI, Beck Depression Inventory score; CBP, attendance at a Cognitive Behavioural Program; SLE,
stressful life event.
Table 2. Cox proportional hazards model for predicting the development of depressive symptoms for subjects by the pattern of change in BDI before CBP.
Pattern of change in BDI before CBP (ΔBDIpre-CBP sub-group)
“Low to High” subjects “High to High” subjects “Low to Low” subjects
Factor P-value Hazard Ratio (95%CI) P-value Hazard Ratio (95%CI) P-value Hazard Ratio (95%CI)
CBP 0.00627 0.616 (0.432–0.863) 0.965 0.992 (0.709–1.39) 0.879 0.962 (0.582–1.59)
Neuroticism 0.204 1.37 (0.732–2.12) 0.322 1.78 (0.583–5.42) 0.328 2.53 (0.987–6.52)
Openness 0.723 0.960 (0.790–1.24) 0.982 0.998 (0.830–1.20) 0.318 0.856 (0.632–1.16)
SLE count 0.021 1.24 (0.659–2.57) 0.275 1.40 (0.565–3.47) 0.0556 2.45 (0.913–6.55)
workplace adversity count 0.0989 1.66 (0.916–3.09) 0.0413 1.85 (1.00–3.41) 0.0494 2.40 (1.27–4.53)
sex 0.314 0.781 (0.480–1.33) 0.826 1.06 (0.615–1.84) 0.377 1.33 (0.707–2.50)
BDI (“baseline0”) 0.0711 1.28 (0.872–2.22) 0.305 0.905 (0.749–1.09) 0.607 1.19 (0.607–2.35)
Neuroticism�SLE count 0.142 - 0.342 - 0.733 -
Neuroticism�workplace adversity count 0.694 - 0.136 - 0.256 -
The hazard ratios for the main effects were calculated in the model without interactions because hazard ratios in the interaction model could be influenced by an
"interaction effect.” Bold numbers show P-values<0.05.
Abbreviations: BDI, Beck Depression Inventory score; CBP, attendance at a Cognitive Behavioural Program; SLE, stressful life event.
Stress: Psychological Perspectives
5
provides an indicator for selecting the most appropriate target population. Based on our
assumption, approximately 70% (383 out of 522 subjects in the CBP subjects) of the subjects
corresponded to this group, enabling us to reduce the cost by identifying appropriate targets
with high possibility of responding to CBP.
Besides the main findings of CBP effect, the trends in the BDI scores for each survey
revealed interest implications: We clarified the time course of depressive symptoms based on
the BDI score, with evidence showing that scores tended to deteriorate after starting the work
(baseline 0), remained somewhat higher for half a year and then stabilized. This implied that
interventions to prevent depressive symptoms, such as CBP, should be planned early after
starting work [13], consistent with our approach.
On the basis of these findings, CBP at an appropriate time can be a recommended program
for NLRNs and probably, for general workers who are new employees, to prevent depressive
symptoms. Also, CBP may influence subjects’ cognition temporarily and permanently; there-
fore, the subjects who attend CBP would acquire protective skill against depression for many
years, especially in subjects who are sensitive to stresses.
Our study contains important limitations that must be considered when interpreting the
results. First, as this was a longitudinal observational study, the no-CBP group was not
regarded as the best control group. This is because we did not conduct a randomized control
trial (RCT), and our CBP was carried out as a part of training and educational sessions.
Although we recognize that the “no-CBP group” in our study has several disadvantages, it is
important to mention that there were no obvious difference in the clinical background of CBP
and no-CBP subjects and this supports our decision that no-CBP group can be considered as
“historical controls” (S1 Table). Second, we did not correct the issue of multiple comparisons.
It is important to mentioned that there is no gold standard for correction in such correlated
variables, and therefore we present uncorrected P-values throughout the study. However, we
are confident of our results as they are in line with previous studies [13, 14], providing an addi-
tional proof of replication of the CBP effect. Third, not all subjects responded to the surveys,
which introduced loss to follow-up and potential bias. Fourth, the comparison sample (phases
I and II) with no CBP was small. There is a need for further study in a larger sample size.
In conclusion, our data support the results of previous research in indicating that CBP is
probably beneficial for NLRNs. We add to this knowledge base by showing that a change in
the BDI over a 3 month period after first starting work (i.e., ΔBDIpre-CBP) can be used to iden-
tify the most suitable target population. Specifically, our data indicate that those who change
from a low to a high BDI score (i.e., the low-to-high ΔBDIpre-CBP sub-group) were most likely
to benefit from CBP.
Supporting information
S1 Fig. Scheme of our study.
S2 Fig. Pre-CBP change in BDI (ΔBDIpre-CBP) from baseline–1 to baseline 0.
S3 Fig. Trends in the BDI scores for each survey.
S1 Table. The descriptive statistics of demographic characteristics in no-CBP and CBP
groups.
Stress: Psychological Perspectives
6
S2 Table. Correlation among subsets of NEOAC.
Acknowledgments
The authors thank the nurses who participated in this study. We also thank the members of
SRPBS team and the staff of the Center for Research Promotion and Support, in Fujita Health
University for their assistance in sample collection.
Author Contributions
Conceptualization:Masashi Ikeda, Nakao Iwata.
Data curation: Kosei Esaki, Masashi Ikeda, Tomo Okochi, Satoru Taniguchi, Kohei Nino-
miya, Ayu Shimasaki, Yasuyo Otsuka, Yoshiko Oda, Takaya Sakusabe, Takeo Saito.
Formal analysis: Kosei Esaki, Masashi Ikeda, Tomo Okochi, Satoru Taniguchi, Kohei Nino-
miya, Ayu Shimasaki, Yasuyo Otsuka, Yoshiko Oda, Takaya Sakusabe, Takeo Saito.
Funding acquisition:Masashi Ikeda, Takeo Saito, Nakao Iwata.
Supervision: Keiko Mano.
Visualization: Kosei Esaki, Masashi Ikeda.
Writing – original draft: Kosei Esaki, Masashi Ikeda.
Writing – review & editing: Kosei Esaki, Masashi Ikeda, Tomo Okochi, Satoru Taniguchi,
Kohei Ninomiya, Ayu Shimasaki, Yasuyo Otsuka, Yoshiko Oda, Takaya Sakusabe, Keiko
Mano, Takeo Saito, Nakao Iwata.
References1. Nishi D, Ishikawa H, Kawakami N. Prevalence of mental disorders and mental health service use in
Japan. Psychiatry Clin Neurosci. 2019; 73(8): 458–465. https://doi.org/10.1111/pcn.12894 PMID:31141260
2. Yamabe K, Liebert R, Flores N, Pashos CL. Health-related quality of life outcomes, economic burden,and associated costs among diagnosed and undiagnosed depression patients in Japan. ClinicoeconOutcomes Res. 2019; 11: 233–243. https://doi.org/10.2147/CEOR.S179901 PMID: 30881068
3. McNeely E. The consequences of job stress for nurses’ health: time for a check-up. Nurs Outlook.2005; 53: 291–299. https://doi.org/10.1016/j.outlook.2005.10.001 PMID: 16360700
4. de Boer J, Lok A, Van’t Verlaat E, Duivenvoorden HJ, Bakker AB, Smit BJ. Work-related critical inci-dents in hospital-based health care providers and the risk of post-traumatic stress symptoms, anxiety,and depression: a meta-analysis. Soc Sci Med. 2011; 73: 316–326. https://doi.org/10.1016/j.socscimed.2011.05.009 PMID: 21696873
5. Weinberg A, Creed F. Stress and psychiatric disorder in healthcare professionals and hospital staff.Lancet. 2000; 355: 533–537. https://doi.org/10.1016/S0140-6736(99)07366-3 PMID: 10683003
6. McVicar A. Workplace stress in nursing: a literature review. J Adv Nurs. 2003; 44: 633–642. https://doi.org/10.1046/j.0309-2402.2003.02853.x PMID: 14651686
7. Unruh L, Zhang NJ. The Hospital Work Environment And Job Satisfaction of Newly Licensed Regis-tered Nurses. Nurs Econ. 2014; 32: 296–305, 311. PMID: 26267960
8. Beck ATCognitive therapy and emotional disorders. N.Y.: International Universities Press; 1979.
9. Carolan S, Harris PR, Cavanagh K. Improving EmployeeWell-Being and Effectiveness: SystematicReview and Meta-Analysis of Web-Based Psychological Interventions Delivered in theWorkplace. JMed Internet Res. 2017; 19: e271. https://doi.org/10.2196/jmir.7583 PMID: 28747293
10. Joyce S, Modini M, Christensen H, Mykletun A, Bryant R, Mitchell PB, et al. Workplace interventions forcommonmental disorders: a systematic meta-review. Psychol Med. 2016; 46: 683–697. https://doi.org/10.1017/S0033291715002408 PMID: 26620157
Stress: Psychological Perspectives
7
11. Tan L, WangMJ, Modini M, Joyce S, Mykletun A, Christensen H, et al. Preventing the development ofdepression at work: a systematic review and meta-analysis of universal interventions in the workplace.BMCMed. 2014; 12: 74. https://doi.org/10.1186/1741-7015-12-74 PMID: 24886246
12. Kunikata H, Yoshinaga N, Nakajima K. Effect of cognitive behavioral group therapy for recovery of self-esteem on community-living individuals with mental illness: Non-randomized controlled trial. PsychiatryClin Neurosci. 2016; 70: 457–468. https://doi.org/10.1111/pcn.12418 PMID: 27377450
13. SampsonM, Melnyk B, Hoying J. TheMINDBODYSTRONG Intervention for New Nurse Residents: 6-Month Effects on Mental Health Outcomes, Healthy Lifestyle Behaviors, and Job Satisfaction. World-views Evid Based Nurs. 2019; https://doi.org/10.1111/wvn.12411 PMID: 31721425
14. Ruotsalainen JH, Verbeek JH, Marine A, Serra C. Preventing occupational stress in healthcare workers.Cochrane Database Syst Rev. 2015: CD002892. https://doi.org/10.1002/14651858.CD002892.pub5PMID: 25847433
15. Ikeda M, Shimasaki A, Takahashi A, Kondo K, Saito T, Kawase K, et al. Genome-wide environmentinteraction between depressive state and stressful life events. J Clin Psychiatry. 2016; 77: e29–30.https://doi.org/10.4088/JCP.15l10127 PMID: 26845276
16. Beck AT, Beamesderfer A. Assessment of depression: the depression inventory. Modern problems ofpharmacopsychiatry. 1974; 7: 151–169. https://doi.org/10.1159/000395074 PMID: 4412100
17. Brugha T, Bebbington P, Tennant C, Hurry J. The List of Threatening Experiences: a subset of 12 lifeevent categories with considerable long-term contextual threat. Psychological medicine. 1985; 15:189–194. https://doi.org/10.1017/s003329170002105x PMID: 3991833
18. Costa P, McCrae R. Professional manual: Revised NEO Personality Inventory (NEO-PI-R) and NEOFive-Factor- Inventory (NEO-FFI) Psychological Assessment Resources. Odessa, FL. 1992.
19. Beck AT, Steer RA, Carbin MG. Psychometric properties of the Beck Depression Inventory: Twenty-five years of evaluation. Clin Psychol Review. 1988; 8: 77–100.
20. Vittengl JR. Who pays the price for high neuroticism? Moderators of longitudinal risks for depressionand anxiety. Psychol Med. 2017; 47: 1794–1805. https://doi.org/10.1017/S0033291717000253 PMID:28193303
21. Navrady LB, Ritchie SJ, Chan SWY, Kerr DM, AdamsMJ, Hawkins EH, et al. Intelligence and neuroti-cism in relation to depression and psychological distress: Evidence from two large population cohorts.Eur Psychiatry. 2017; 43: 58–65. https://doi.org/10.1016/j.eurpsy.2016.12.012 PMID: 28365468
Stress: Psychological Perspectives
8
Amix-method investigation on acculturativestress among Pakistani students in China
Cao Shan1, Mudassir HussainID2*, Ghulam Raza Sargani3
1 School of Education, Minnan Normal University, Zhangzhou, China, 2 School of Education, HuazhongUniversity of Science and Technology, Wuhan, P.R. China, 3 School of Economics and Management,
Huazhong Agriculture University, Wuhan, P.R. China
Abstract
This article investigates acculturation stress among Pakistani students who are studying in
Chinese universities, located in five provinces where international students are concen-
trated, with a mix-method approach. 203 students among 260 questionnaire recipients
responded the online survey. When using the ASSIS (Acculturation Stress Scale for Interna-
tional Students) as instrument, the Principal Component Analysis Method and SPSS 20.0,
we found that Pakistani students are under acculturative stress, 68.53%, 10.97% and
9.15% of them perceived discrimination, home sickness and perceived hate, and 5.25%,
3.11% and 2.58% of them fear, culture shock and guilt respectively. The qualitative segment
of the study is consisted of 20 Pakistani students studying in 4 universities located in Wuhan
city of Hubei capital enquiring through semi-structured interviews. The findings illustrate that
Pakistani students in China are expressing their major concerns on culture shock, home-
sickness, food and language barriers while disconfirm ASSIS findings like perceived dis-
crimination, hate, fear and guilt as factors responsible for acculturative stress. The study
suggested that pre-departure orientation lectures about host country’s cultural values and
campus environment, and on-campus extra-curricular, cultural activities and maximum
social interaction with local students can effectively acculturate students in new cultural set-
ting, and can lower their acculturative stress.
Introduction
International students in Chinese universities belong to different countries with different edu-
cational backgrounds. These students compose a complex and culturally diversified society by
the provision of varied cultural values, mental outlooks and social norms. It has turned into a
globalized source of generating monetary and non-monetary revenues from abroad through
the enrollment of international students. According to the Project Atlas 2016–2017 China
holds the 3rd position among the countries hosting international students with a number of
442,773 international students, United Kingdom is at the 2nd position with 501,045 whereas
United States has the top position hosting 1,078,822 international students.
The major population of the international students in China higher education is composed
of Asian students. Besides, a considerable number of international students are enrolled from
Editor: Sakamuri V. Reddy, Charles P. Darby
Children’s Research Institute, UNITED STATES
Funding: The authors received no specific funding
for this work.
2
9
Middle East and Arab states, e.g. China hosts a number of international students from African
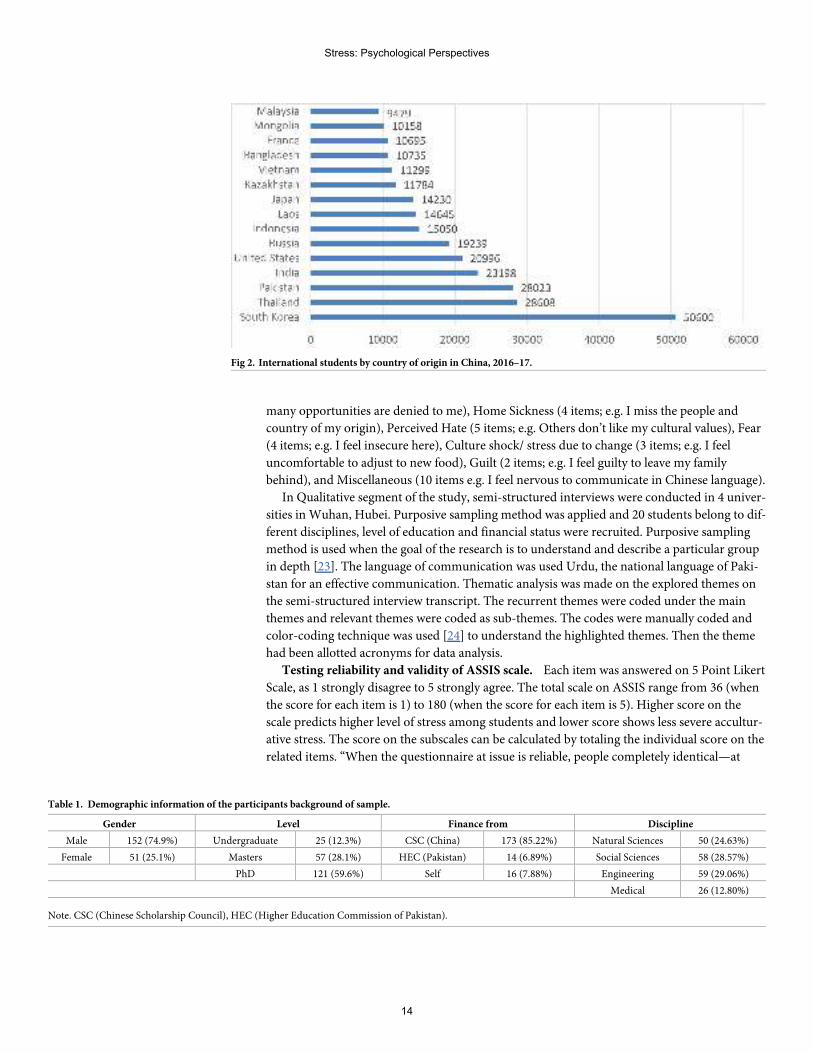
countries and Europe as well. According to the Ministry of Education, China statistics 2016–
2017, the top ten of major population of international students in China by country of origin is
as given as South Korea, USA, Thailand, Pakistan, India, Russia, Indonesia, Kazakhstan and
Japan, and African countries as a group inserting the top 2nd. Chinese Universities are
experiencing more complex and a diverse student population and China is playing a leading
role in Asia hosting international students. Cross-border and regional collaborations have
strengthened higher education in Asia [1] and these Higher Education Institutions (HEIs) are
focusing on different management and international students’ mobility [2].
According to the statistics released by Ministry of Education China dated 2018.03.01,
442,773 international students from 205 countries and regions study in 829 institutions of
higher education and of scientific research in 31 provinces in 2016–2017. This number of
international students are growing annually and 11.35% increase in 2016 compared to that in
2015. According to the MOE, a growing number of foreign students are choosing to study in
China for a master’s or Ph.D. degree across a widening range of disciplines, and scholarships
granted by the Chinese government are playing an increasingly important role in attracting
international students. In 2017, 58,600 foreign students from 180 countries were awarded Chi-
nese government scholarships, accounting for 11.97% of the total in 2017. 88.02% of the schol-
arship recipients were degree students (51,600); 69.57% (40,800) were master and doctoral
students, marking an increase of 20.06% compared to 2016. The self-funded students were
430,600 which accounts for 88.03% of all overseas students. 48.45% of these students were
enrolled for liberal arts degrees, while the number of students majoring in engineering, man-
agement, science, art and agriculture increased by 20% annually.
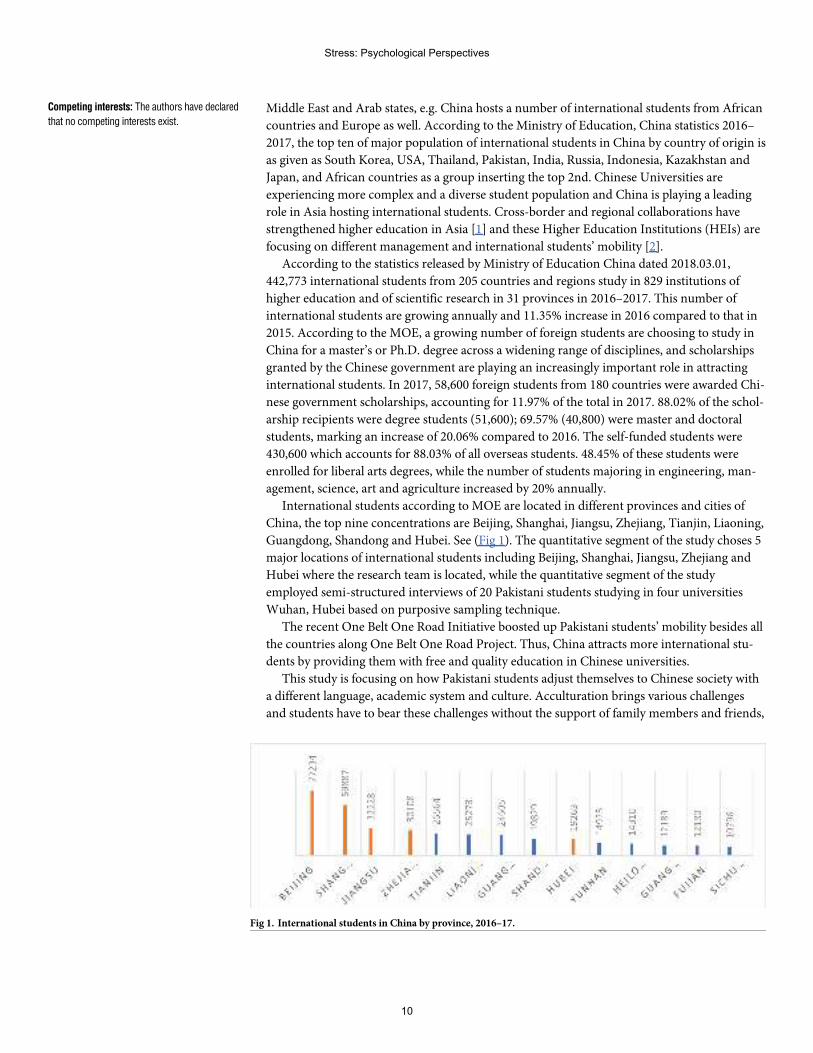
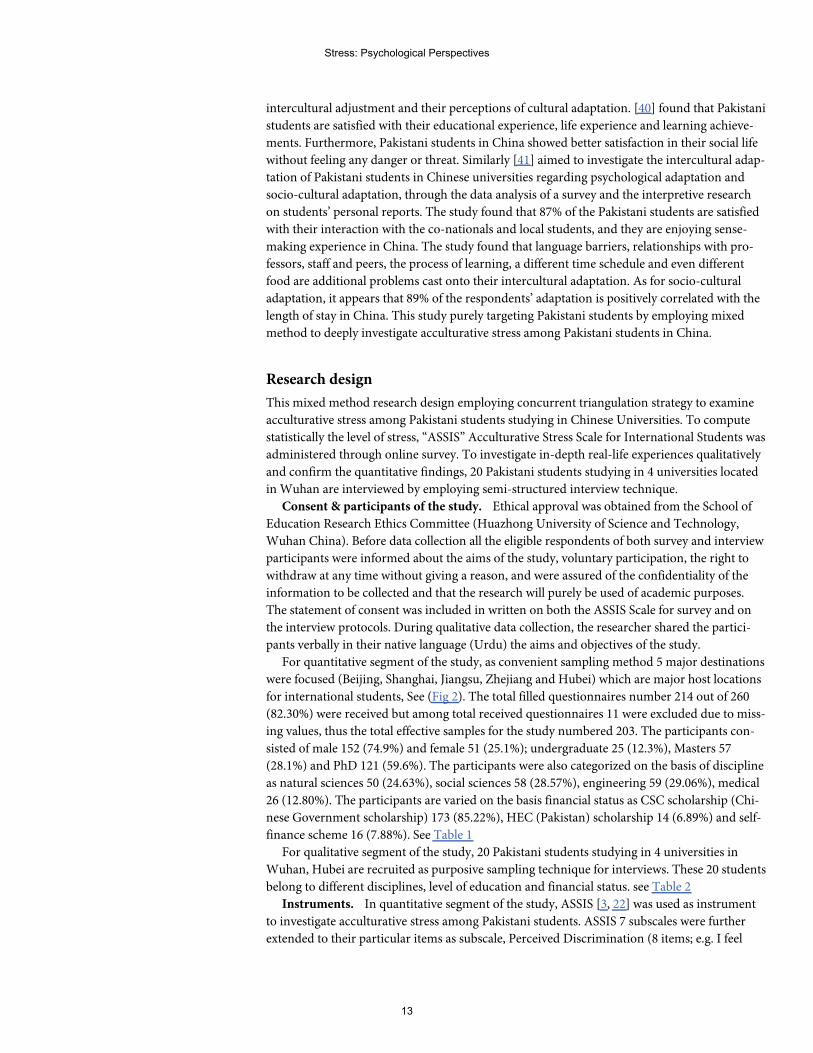
International students according to MOE are located in different provinces and cities of
China, the top nine concentrations are Beijing, Shanghai, Jiangsu, Zhejiang, Tianjin, Liaoning,
Guangdong, Shandong and Hubei. See (Fig 1). The quantitative segment of the study choses 5
major locations of international students including Beijing, Shanghai, Jiangsu, Zhejiang and
Hubei where the research team is located, while the quantitative segment of the study
employed semi-structured interviews of 20 Pakistani students studying in four universities
Wuhan, Hubei based on purposive sampling technique.
The recent One Belt One Road Initiative boosted up Pakistani students’ mobility besides all
the countries along One Belt One Road Project. Thus, China attracts more international stu-
dents by providing them with free and quality education in Chinese universities.
This study is focusing on how Pakistani students adjust themselves to Chinese society with
a different language, academic system and culture. Acculturation brings various challenges
and students have to bear these challenges without the support of family members and friends,
Fig 1. International students in China by province, 2016–17.
Competing interests: The authors have declared
that no competing interests exist.
Stress: Psychological Perspectives
10
and they suffer from home sickness. According ASSIS model designed by [3], migrating from
their home usually results a stress, missing friends and homes. This mix method study aimed
at examining acculturative stress among Pakistani students in Chinese universities using
ASSIS scale through online survey and further investigating the real-life experiences of adapta-
tion in China by conducting semi-structured interviews of 20 Pakistani students in 4 universi-
ties in Wuhan, Hubei.
Research questions
The study’s aim is to answer the given research questions:
• Are Pakistani students studying in China going through acculturative stress?
• What is the level of perceived acculturative stress of Pakistani students in China?
• What is the role of language in causing acculturative stress?
• How do these students express their experiences while adopting to Chinese society?
Literature review
Acculturation by term is referred to the extent to which a person from another culture has to
learn as language, custom and cultural values like the person of the host culture [4]. Interna-
tional students are expected to adapt the ways of life and basic customs of the people of the
host culture such as language, food, dress and cultural values. [5] defines “Acculturation” that
it is a process that includes psychological and cultural changes between cultural groups; Several
factors impact the process of acculturation, for instance, cultural identity, duration of stay in
host country, language competency, social interaction, and engagement with the people of the
host country. In acculturation process cultural changes and psychological both ensue within
the two distinct cultures but major changes are expected in the minor group and the dominant
group usually undergo less changes [6]. Sometimes this process obliges as a mutual adaptation
process where two different interacting groups adapt the cultural values of each other. Accul-
turation has long been focused in other subjects like anthropology and psychology but globali-
zation is a recent phenomenon which provided an opportunity of a close intercultural contact,
consequently it led to individual and cultural changes [6].
Research studies illustrate that greater acculturation leads to individual’s psychological
well-being and health, although the process of change concomitant with acculturation is often
perceived as stressful [6]. From a conceptual perspective, acculturation level defines accultura-
tion stress and culture shock, it is significant to make a clear difference between acculturation
level and acculturation stress [7]. The international students level of acculturation can be eval-
uated from how they are acculturated and what is the level of acculturation and how stressful
was this process of adjustment while they were passing through, the term is generally put into
use for both the phenomena, acculturation process and the considered stress due to accultura-
tion but very rarely the attention is paid to the relation of these two situations [8]. If a student
is experiencing difficulties in a new culture and has a low level of acculturation, the student is
expected to be probably experiencing more challenges and with a high acculturative stress
level. Several aspects of acculturation process of international students’ raise adjustment prob-
lems that are stressful physically, socially and psychologically [9]. Such a cluster of stress of
diverse nature occasionally becomes so intense, and ultimately hinders the adjustment and
acculturation process, for they leave the international students with anxiety and disorientation
[9]. These students likely to experience less acceptance, tolerance and knowledge of their
Stress: Psychological Perspectives
11
cultural practices by the people of the host culture, and sometimes, they may experience even
racial discrimination [10].
Low acceptance and tolerance lead an individual to a deviant personality with a negative
perceptions and cultural ethnocentrism. Students assume that their own cultural practices are
better than that of the host culture. The multiple demands international students experience
are the cognitive, emotional and physiological level, when they migrate to another culture [11]
are certainly vital for the adjustment of international students and often lead international stu-
dents to acculturative stress which consequently provokes initial intrapersonal and interper-
sonal issues. However, these insignificants are neither inevitable for all international students
nor are they necessarily the only results of this potentially positive transformation [12]. Inter-
national students sometimes show discrimination towards the host nationals and other inter-
national students of different race, language, color and religion. These factors can add to
international students’ feelings of loneliness, alienation, powerlessness and depression [9].
International students with a label of being “foreigners” put them into a stressful experience in
bending to the host culture and live a life of an exile and their success has a direct relation with
the level of their adjustment and acculturation process. These related issues of adjustment
seem to lead the literature [13], highlighted depression, loneliness, and homesickness as the
dominant concerns of international students. [14] hypothesized the major issues of interna-
tional students as anxiety, [15] emphasized major concern on stress, fear, pessimism and frus-
tration, but the findings of all these psychological studies on the acculturation process of
students are varied and aimless in nature. The newly arrived Pakistani students to China not
only need to compete with their Chinese classmates and other international students but they
have also to face the challenges of acculturation due to adjustment to the values and practices
of the host culture. This group of international students are under a pressure of foreign
demands, for instance, the pursuit of academic excellence, learning the cultural values and
especially the host community language etc. Somally suggested the term “language shock” to
be added to the conceptualization of culture shock for it leads to acculturative stress, and the
language holds a dominant position in prompting this phenomenon [16].
[17] identify academic pressure, relationship problems, stereotyping, prejudice, familial
concerns, and adjustment to the host country are some of the demands faced by international
students. Many researchers have come up with findings like loss of identity [18], and some-
times the acculturative stress develops so intense that it leads an individual to develop a sense
of inferiority [3]. [19], for example, while classifying the challenges that are particularly con-
cerned to the international students (language, diet, teaching methodology, finance etc.) and
to those of color (racism), the research recognizes issues that are common to all (registration,
major selection, and class size in particular). The level of acculturation stress may be varied
among international students having different demographic backgrounds and personality
types. It is illogical to assume that all the international students experience acculturative stress
in the same way and to the same degree [20]. Previously a study, cofounded byWayne State
University USA with the collaboration of Wuhan University China, titled, “Acculturative
Stress and Influential Factors Among International Students in China: A structural dynamic
perspective” [21], worked on a stratified sample numbered 567 based on the categories of
international students in Wuhan city, found that acculturative stress was more common
among international students in China than in developed countries and was also more com-
mon among international students who did not well prepared, married, and belonged to an
organized religion.
[40] conducted a study on “The Intercultural Adjustment of Pakistani Students at Chinese
Universities.” They recruited 15 Pakistani students studying in Huazhong University of Sci-
ence and Technology, P. R. China to evaluate the effective strategies that promote the
Stress: Psychological Perspectives
12
intercultural adjustment and their perceptions of cultural adaptation. [40] found that Pakistani
students are satisfied with their educational experience, life experience and learning achieve-
ments. Furthermore, Pakistani students in China showed better satisfaction in their social life
without feeling any danger or threat. Similarly [41] aimed to investigate the intercultural adap-
tation of Pakistani students in Chinese universities regarding psychological adaptation and
socio-cultural adaptation, through the data analysis of a survey and the interpretive research
on students’ personal reports. The study found that 87% of the Pakistani students are satisfied
with their interaction with the co-nationals and local students, and they are enjoying sense-
making experience in China. The study found that language barriers, relationships with pro-
fessors, staff and peers, the process of learning, a different time schedule and even different
food are additional problems cast onto their intercultural adaptation. As for socio-cultural
adaptation, it appears that 89% of the respondents’ adaptation is positively correlated with the
length of stay in China. This study purely targeting Pakistani students by employing mixed
method to deeply investigate acculturative stress among Pakistani students in China.
Research design
This mixed method research design employing concurrent triangulation strategy to examine
acculturative stress among Pakistani students studying in Chinese Universities. To compute
statistically the level of stress, “ASSIS” Acculturative Stress Scale for International Students was
administered through online survey. To investigate in-depth real-life experiences qualitatively
and confirm the quantitative findings, 20 Pakistani students studying in 4 universities located
inWuhan are interviewed by employing semi-structured interview technique.
Consent & participants of the study. Ethical approval was obtained from the School of
Education Research Ethics Committee (Huazhong University of Science and Technology,
Wuhan China). Before data collection all the eligible respondents of both survey and interview
participants were informed about the aims of the study, voluntary participation, the right to
withdraw at any time without giving a reason, and were assured of the confidentiality of the
information to be collected and that the research will purely be used of academic purposes.
The statement of consent was included in written on both the ASSIS Scale for survey and on
the interview protocols. During qualitative data collection, the researcher shared the partici-
pants verbally in their native language (Urdu) the aims and objectives of the study.
For quantitative segment of the study, as convenient sampling method 5 major destinations
were focused (Beijing, Shanghai, Jiangsu, Zhejiang and Hubei) which are major host locations
for international students, See (Fig 2). The total filled questionnaires number 214 out of 260
(82.30%) were received but among total received questionnaires 11 were excluded due to miss-
ing values, thus the total effective samples for the study numbered 203. The participants con-
sisted of male 152 (74.9%) and female 51 (25.1%); undergraduate 25 (12.3%), Masters 57
(28.1%) and PhD 121 (59.6%). The participants were also categorized on the basis of discipline
as natural sciences 50 (24.63%), social sciences 58 (28.57%), engineering 59 (29.06%), medical
26 (12.80%). The participants are varied on the basis financial status as CSC scholarship (Chi-
nese Government scholarship) 173 (85.22%), HEC (Pakistan) scholarship 14 (6.89%) and self-
finance scheme 16 (7.88%). See Table 1
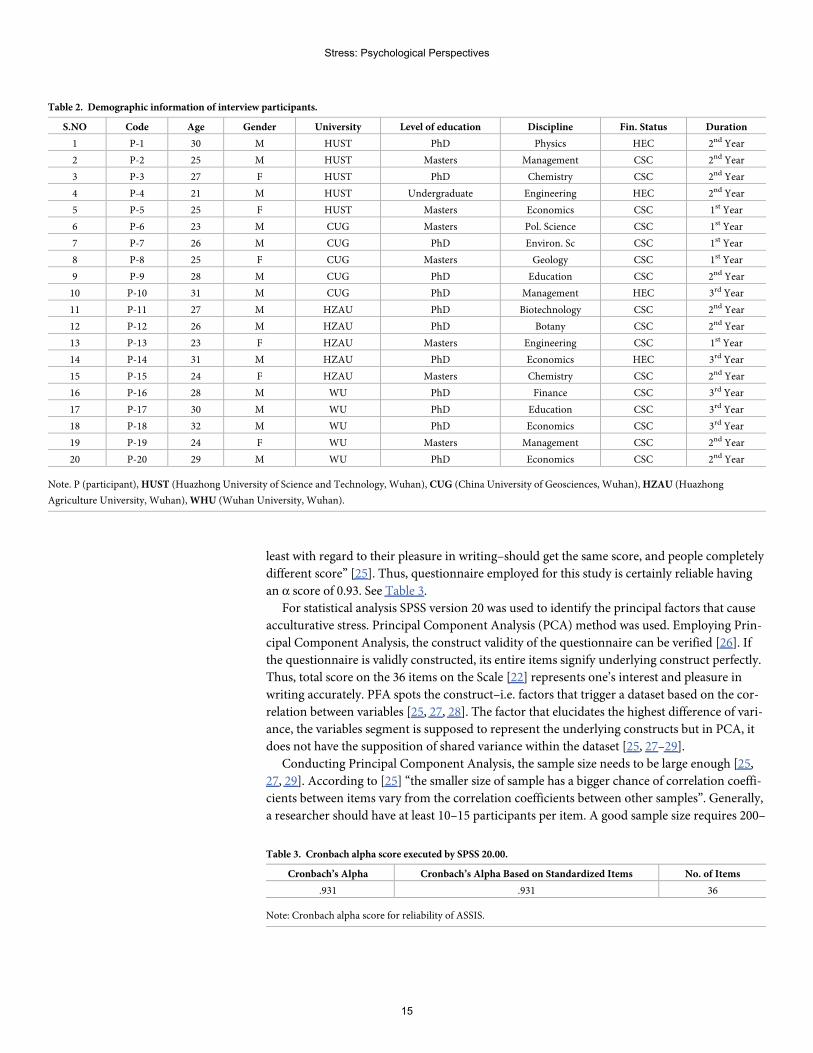
For qualitative segment of the study, 20 Pakistani students studying in 4 universities in
Wuhan, Hubei are recruited as purposive sampling technique for interviews. These 20 students
belong to different disciplines, level of education and financial status. see Table 2
Instruments. In quantitative segment of the study, ASSIS [3, 22] was used as instrument
to investigate acculturative stress among Pakistani students. ASSIS 7 subscales were further
extended to their particular items as subscale, Perceived Discrimination (8 items; e.g. I feel
Stress: Psychological Perspectives
13
many opportunities are denied to me), Home Sickness (4 items; e.g. I miss the people and
country of my origin), Perceived Hate (5 items; e.g. Others don’t like my cultural values), Fear
(4 items; e.g. I feel insecure here), Culture shock/ stress due to change (3 items; e.g. I feel
uncomfortable to adjust to new food), Guilt (2 items; e.g. I feel guilty to leave my family
behind), and Miscellaneous (10 items e.g. I feel nervous to communicate in Chinese language).
In Qualitative segment of the study, semi-structured interviews were conducted in 4 univer-
sities inWuhan, Hubei. Purposive sampling method was applied and 20 students belong to dif-
ferent disciplines, level of education and financial status were recruited. Purposive sampling
method is used when the goal of the research is to understand and describe a particular group
in depth [23]. The language of communication was used Urdu, the national language of Paki-
stan for an effective communication. Thematic analysis was made on the explored themes on
the semi-structured interview transcript. The recurrent themes were coded under the main
themes and relevant themes were coded as sub-themes. The codes were manually coded and
color-coding technique was used [24] to understand the highlighted themes. Then the theme
had been allotted acronyms for data analysis.
Testing reliability and validity of ASSIS scale. Each item was answered on 5 Point Likert
Scale, as 1 strongly disagree to 5 strongly agree. The total scale on ASSIS range from 36 (when
the score for each item is 1) to 180 (when the score for each item is 5). Higher score on the
scale predicts higher level of stress among students and lower score shows less severe accultur-
ative stress. The score on the subscales can be calculated by totaling the individual score on the
related items. “When the questionnaire at issue is reliable, people completely identical—at
Fig 2. International students by country of origin in China, 2016–17.
Table 1. Demographic information of the participants background of sample.
Gender Level Finance from Discipline
Male 152 (74.9%) Undergraduate 25 (12.3%) CSC (China) 173 (85.22%) Natural Sciences 50 (24.63%)
Female 51 (25.1%) Masters 57 (28.1%) HEC (Pakistan) 14 (6.89%) Social Sciences 58 (28.57%)
PhD 121 (59.6%) Self 16 (7.88%) Engineering 59 (29.06%)
Medical 26 (12.80%)
Note. CSC (Chinese Scholarship Council), HEC (Higher Education Commission of Pakistan).
Stress: Psychological Perspectives
14
least with regard to their pleasure in writing–should get the same score, and people completely
different score” [25]. Thus, questionnaire employed for this study is certainly reliable having
an α score of 0.93. See Table 3.
For statistical analysis SPSS version 20 was used to identify the principal factors that cause
acculturative stress. Principal Component Analysis (PCA) method was used. Employing Prin-
cipal Component Analysis, the construct validity of the questionnaire can be verified [26]. If
the questionnaire is validly constructed, its entire items signify underlying construct perfectly.
Thus, total score on the 36 items on the Scale [22] represents one’s interest and pleasure in
writing accurately. PFA spots the construct–i.e. factors that trigger a dataset based on the cor-
relation between variables [25, 27, 28]. The factor that elucidates the highest difference of vari-
ance, the variables segment is supposed to represent the underlying constructs but in PCA, it
does not have the supposition of shared variance within the dataset [25, 27–29].
Conducting Principal Component Analysis, the sample size needs to be large enough [25,
27, 29]. According to [25] “the smaller size of sample has a bigger chance of correlation coeffi-
cients between items vary from the correlation coefficients between other samples”. Generally,
a researcher should have at least 10–15 participants per item. A good sample size requires 200–
Table 2. Demographic information of interview participants.
S.NO Code Age Gender University Level of education Discipline Fin. Status Duration
1 P-1 30 M HUST PhD Physics HEC 2nd Year
2 P-2 25 M HUST Masters Management CSC 2nd Year
3 P-3 27 F HUST PhD Chemistry CSC 2nd Year
4 P-4 21 M HUST Undergraduate Engineering HEC 2nd Year
5 P-5 25 F HUST Masters Economics CSC 1st Year
6 P-6 23 M CUG Masters Pol. Science CSC 1st Year
7 P-7 26 M CUG PhD Environ. Sc CSC 1st Year
8 P-8 25 F CUG Masters Geology CSC 1st Year
9 P-9 28 M CUG PhD Education CSC 2nd Year
10 P-10 31 M CUG PhD Management HEC 3rd Year
11 P-11 27 M HZAU PhD Biotechnology CSC 2nd Year
12 P-12 26 M HZAU PhD Botany CSC 2nd Year
13 P-13 23 F HZAU Masters Engineering CSC 1st Year
14 P-14 31 M HZAU PhD Economics HEC 3rd Year
15 P-15 24 F HZAU Masters Chemistry CSC 2nd Year
16 P-16 28 M WU PhD Finance CSC 3rd Year
17 P-17 30 M WU PhD Education CSC 3rd Year
18 P-18 32 M WU PhD Economics CSC 3rd Year
19 P-19 24 F WU Masters Management CSC 2nd Year
20 P-20 29 M WU PhD Economics CSC 2nd Year
Note. P (participant),HUST (Huazhong University of Science and Technology, Wuhan), CUG (China University of Geosciences, Wuhan),HZAU (Huazhong
Agriculture University, Wuhan),WHU (Wuhan University, Wuhan).
Table 3. Cronbach alpha score executed by SPSS 20.00.
Cronbach’s Alpha Cronbach’s Alpha Based on Standardized Items No. of Items
.931 .931 36
Note: Cronbach alpha score for reliability of ASSIS.
Stress: Psychological Perspectives
15
300, since this study has 203 sample-size so is considered fit for factor analysis (PCA). Kaiser-
Meyer-Olkin measure of sampling adequacy (KMO) can perfectly indicate if the sample size is
big enough to reliably extract factors [25]. KMO “signifies the ratio of the squared correlation
between variables to the squared partial correlation between variables [25]. If the KMO is close
to 1, a factor or factors can perhaps be extracted, since the conflicting pattern is visible. There-
fore, KMO “values between 0.5 and 0.7 are mediocre, values between 0.7 to 0.8 are good, values
between 0.8 to 0.9 are great and values above 0.9 are superb.” [25]. For this study, the KMO
values of the sample size is good at 0.81. See Table 4.
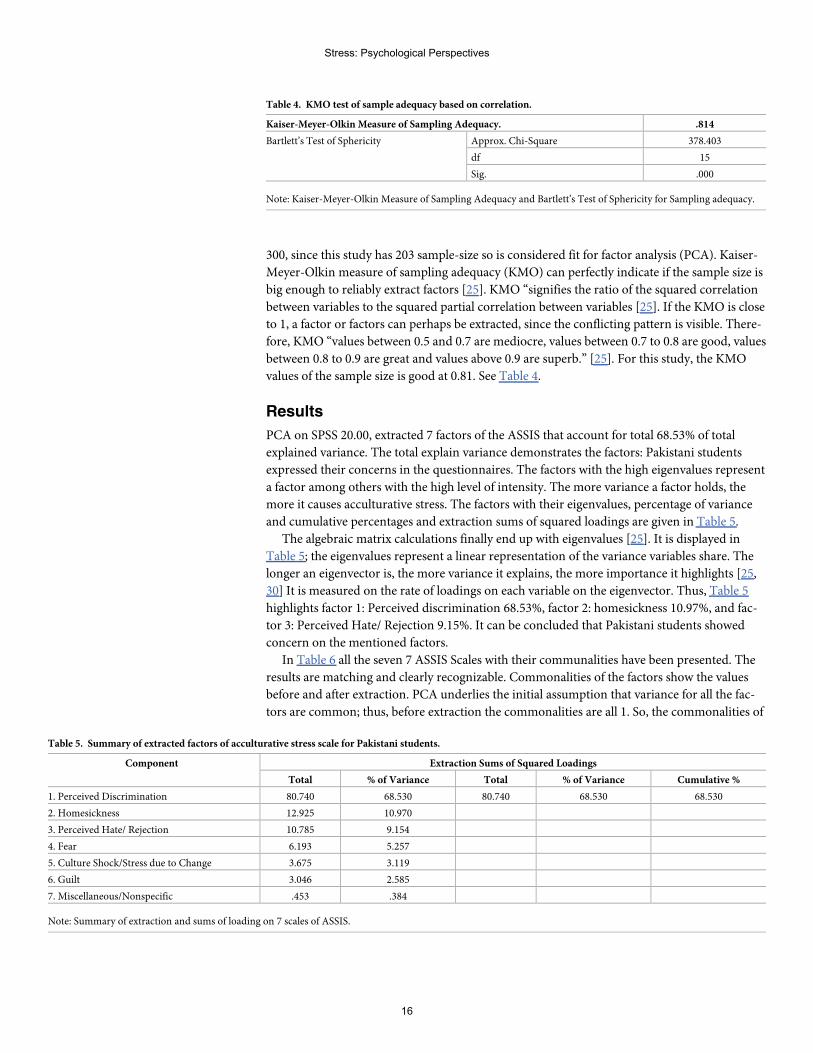
Results
PCA on SPSS 20.00, extracted 7 factors of the ASSIS that account for total 68.53% of total
explained variance. The total explain variance demonstrates the factors: Pakistani students
expressed their concerns in the questionnaires. The factors with the high eigenvalues represent
a factor among others with the high level of intensity. The more variance a factor holds, the
more it causes acculturative stress. The factors with their eigenvalues, percentage of variance
and cumulative percentages and extraction sums of squared loadings are given in Table 5.
The algebraic matrix calculations finally end up with eigenvalues [25]. It is displayed in
Table 5; the eigenvalues represent a linear representation of the variance variables share. The
longer an eigenvector is, the more variance it explains, the more importance it highlights [25,
30] It is measured on the rate of loadings on each variable on the eigenvector. Thus, Table 5
highlights factor 1: Perceived discrimination 68.53%, factor 2: homesickness 10.97%, and fac-
tor 3: Perceived Hate/ Rejection 9.15%. It can be concluded that Pakistani students showed
concern on the mentioned factors.
In Table 6 all the seven 7 ASSIS Scales with their communalities have been presented. The
results are matching and clearly recognizable. Commonalities of the factors show the values
before and after extraction. PCA underlies the initial assumption that variance for all the fac-
tors are common; thus, before extraction the commonalities are all 1. So, the commonalities of
Table 4. KMO test of sample adequacy based on correlation.
Kaiser-Meyer-Olkin Measure of Sampling Adequacy. .814
Bartlett’s Test of Sphericity Approx. Chi-Square 378.403
df 15
Sig. .000
Note: Kaiser-Meyer-Olkin Measure of Sampling Adequacy and Bartlett’s Test of Sphericity for Sampling adequacy.
Table 5. Summary of extracted factors of acculturative stress scale for Pakistani students.
Component Extraction Sums of Squared Loadings
Total % of Variance Total % of Variance Cumulative %
1. Perceived Discrimination 80.740 68.530 80.740 68.530 68.530
2. Homesickness 12.925 10.970
3. Perceived Hate/ Rejection 10.785 9.154
4. Fear 6.193 5.257
5. Culture Shock/Stress due to Change 3.675 3.119
6. Guilt 3.046 2.585
7. Miscellaneous/Nonspecific .453 .384
Note: Summary of extraction and sums of loading on 7 scales of ASSIS.
Stress: Psychological Perspectives
16
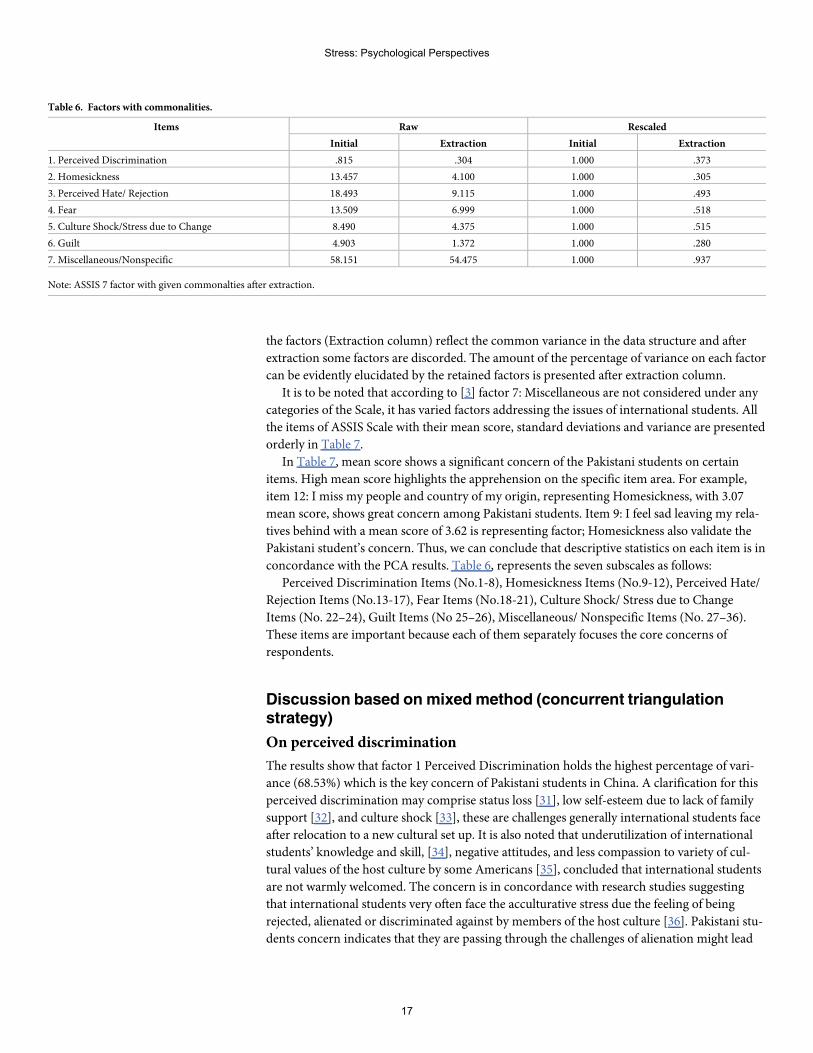
the factors (Extraction column) reflect the common variance in the data structure and after
extraction some factors are discorded. The amount of the percentage of variance on each factor
can be evidently elucidated by the retained factors is presented after extraction column.
It is to be noted that according to [3] factor 7: Miscellaneous are not considered under any
categories of the Scale, it has varied factors addressing the issues of international students. All
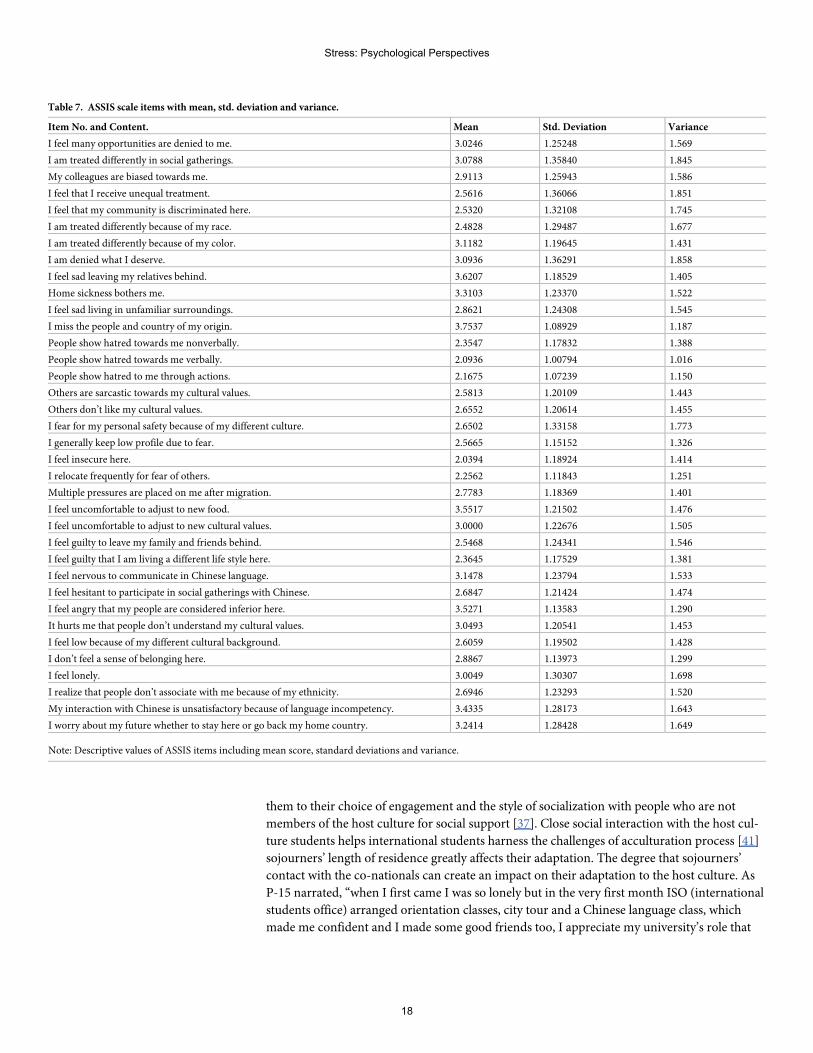
the items of ASSIS Scale with their mean score, standard deviations and variance are presented
orderly in Table 7.
In Table 7, mean score shows a significant concern of the Pakistani students on certain
items. High mean score highlights the apprehension on the specific item area. For example,
item 12: I miss my people and country of my origin, representing Homesickness, with 3.07
mean score, shows great concern among Pakistani students. Item 9: I feel sad leaving my rela-
tives behind with a mean score of 3.62 is representing factor; Homesickness also validate the
Pakistani student’s concern. Thus, we can conclude that descriptive statistics on each item is in
concordance with the PCA results. Table 6, represents the seven subscales as follows:
Perceived Discrimination Items (No.1-8), Homesickness Items (No.9-12), Perceived Hate/
Rejection Items (No.13-17), Fear Items (No.18-21), Culture Shock/ Stress due to Change
Items (No. 22–24), Guilt Items (No 25–26), Miscellaneous/ Nonspecific Items (No. 27–36).
These items are important because each of them separately focuses the core concerns of
respondents.
Discussion based onmixedmethod (concurrent triangulationstrategy)
On perceived discrimination
The results show that factor 1 Perceived Discrimination holds the highest percentage of vari-
ance (68.53%) which is the key concern of Pakistani students in China. A clarification for this
perceived discrimination may comprise status loss [31], low self-esteem due to lack of family
support [32], and culture shock [33], these are challenges generally international students face
after relocation to a new cultural set up. It is also noted that underutilization of international
students’ knowledge and skill, [34], negative attitudes, and less compassion to variety of cul-
tural values of the host culture by some Americans [35], concluded that international students
are not warmly welcomed. The concern is in concordance with research studies suggesting
that international students very often face the acculturative stress due the feeling of being
rejected, alienated or discriminated against by members of the host culture [36]. Pakistani stu-
dents concern indicates that they are passing through the challenges of alienation might lead
Table 6. Factors with commonalities.
Items Raw Rescaled
Initial Extraction Initial Extraction
1. Perceived Discrimination .815 .304 1.000 .373
2. Homesickness 13.457 4.100 1.000 .305
3. Perceived Hate/ Rejection 18.493 9.115 1.000 .493
4. Fear 13.509 6.999 1.000 .518
5. Culture Shock/Stress due to Change 8.490 4.375 1.000 .515
6. Guilt 4.903 1.372 1.000 .280
7. Miscellaneous/Nonspecific 58.151 54.475 1.000 .937
Note: ASSIS 7 factor with given commonalties after extraction.
Stress: Psychological Perspectives
17
them to their choice of engagement and the style of socialization with people who are not
members of the host culture for social support [37]. Close social interaction with the host cul-
ture students helps international students harness the challenges of acculturation process [41]
sojourners’ length of residence greatly affects their adaptation. The degree that sojourners’
contact with the co-nationals can create an impact on their adaptation to the host culture. As
P-15 narrated, “when I first came I was so lonely but in the very first month ISO (international
students office) arranged orientation classes, city tour and a Chinese language class, which
made me confident and I made some good friends too, I appreciate my university’s role that
Table 7. ASSIS scale items with mean, std. deviation and variance.
Item No. and Content. Mean Std. Deviation Variance
I feel many opportunities are denied to me. 3.0246 1.25248 1.569
I am treated differently in social gatherings. 3.0788 1.35840 1.845
My colleagues are biased towards me. 2.9113 1.25943 1.586
I feel that I receive unequal treatment. 2.5616 1.36066 1.851
I feel that my community is discriminated here. 2.5320 1.32108 1.745
I am treated differently because of my race. 2.4828 1.29487 1.677
I am treated differently because of my color. 3.1182 1.19645 1.431
I am denied what I deserve. 3.0936 1.36291 1.858
I feel sad leaving my relatives behind. 3.6207 1.18529 1.405
Home sickness bothers me. 3.3103 1.23370 1.522
I feel sad living in unfamiliar surroundings. 2.8621 1.24308 1.545
I miss the people and country of my origin. 3.7537 1.08929 1.187
People show hatred towards me nonverbally. 2.3547 1.17832 1.388
People show hatred towards me verbally. 2.0936 1.00794 1.016
People show hatred to me through actions. 2.1675 1.07239 1.150
Others are sarcastic towards my cultural values. 2.5813 1.20109 1.443
Others don’t like my cultural values. 2.6552 1.20614 1.455
I fear for my personal safety because of my different culture. 2.6502 1.33158 1.773
I generally keep low profile due to fear. 2.5665 1.15152 1.326
I feel insecure here. 2.0394 1.18924 1.414
I relocate frequently for fear of others. 2.2562 1.11843 1.251
Multiple pressures are placed on me after migration. 2.7783 1.18369 1.401
I feel uncomfortable to adjust to new food. 3.5517 1.21502 1.476
I feel uncomfortable to adjust to new cultural values. 3.0000 1.22676 1.505
I feel guilty to leave my family and friends behind. 2.5468 1.24341 1.546
I feel guilty that I am living a different life style here. 2.3645 1.17529 1.381
I feel nervous to communicate in Chinese language. 3.1478 1.23794 1.533
I feel hesitant to participate in social gatherings with Chinese. 2.6847 1.21424 1.474
I feel angry that my people are considered inferior here. 3.5271 1.13583 1.290
It hurts me that people don’t understand my cultural values. 3.0493 1.20541 1.453
I feel low because of my different cultural background. 2.6059 1.19502 1.428
I don’t feel a sense of belonging here. 2.8867 1.13973 1.299
I feel lonely. 3.0049 1.30307 1.698
I realize that people don’t associate with me because of my ethnicity. 2.6946 1.23293 1.520
My interaction with Chinese is unsatisfactory because of language incompetency. 3.4335 1.28173 1.643
I worry about my future whether to stay here or go back my home country. 3.2414 1.28428 1.649
Note: Descriptive values of ASSIS items including mean score, standard deviations and variance.
Stress: Psychological Perspectives
18
help new comers to be confident, familiar with host culture and local students.” This effective
support by Chinese universities play a crucial role in adopting to new cultural setting, aca-
demic environment and lowering acculturative stress among international students.
The factor “Perceived Discrimination” as the most concerned factors based on quantitative
results loaded with 68% variance and stood at first place among all the seven factors of the
ASSIS scale. The items of the scale under discrimination as its factor, are all close ended ques-
tions and the participants cannot fully express their perception. They can only answer as YES
or NO but cannot explain in depth the severity and nature of their feelings.
Qualitative data findings provided this factor with deep insight as the interviewee discussed
in detail on discrimination. Mix Method Research (MMR) provided the data with effective tri-
angulation to confirm and disconfirm the finding gotten from both the sources of data collec-
tion. Qualitative data disconfirmed surprisingly the most leaded factor “Perceived
Discrimination” which was stood at top most concern of Pakistani students in China. After
mixing qualitative and quantitative findings, it can be concluded that this discrimination is not
the discrimination as negative but it’s a natural perception of many international students
because of their unfamiliarity with the host country laws and cultural norms. The more the
students get familiar with the new environments either social or academic, the more students
feel secured and equally treated [41]. The quantitative feelings of discrimination were because
of students’ expectations based on the previous social and academic backgrounds.
On homesickness
Homesickness subscale falls at the second most concerned factor among the students. Home-
sickness subscale with a (10.97%) percentage of total variance indicates that most of Pakistani
students are suffering from homesickness. Several studies highlight that international students
express their feelings of loneliness due to leaving relatives, friends and family members in the
countries of their origin as they migrated to a foreign country to pursue their higher education
[38]; Less sociability and sense of acquaintance of local students with Pakistani students also
stimulating the feelings of homesickness. The Chinese with good English communication and
understanding feel confident and make friendship with international students and Pakistani
students with Chinese language skills often feel free to interact with their Chinese class mates.
[40] found that students in the initial stage of mobility, face difficulty in social interaction due
to unproficiency in Chinese language which further lead these students to isolation and stress-
ful life. Factor 7 of the also addresses different concerns of the international students (see
Table 6) such as Item 27; My interaction with Chinese is unsatisfactory because of my language
incompetency (mean score 3.43), demonstrate Pakistani students concerns over language bar-
riers causing stress. Qualitative findings record a significant concern of Pakistani students on
homesickness. The findings show homesickness severity in the students who are in the first
year of their studies. Interview participants who study in their 2nd and 3rd year are expressing
a very mild concern unlike 1st year students. As P-13 a 1st year student narrated, “This is my
first journey out of my home and sometimes I badly miss my family. I am far off my family
members and relatives but my objectives motivate me to face it patiently”. Foreign students’
feelings of obligation to keep attach to the roots of their own culture [39] stimulate homesick-
ness. The response of a 3rd year study participant P-18 was as, “I remember my initial days, I
was feeling lonely missing my family and people of my culture. Gradually, I began to interact
with locals, other international students and my country-mates so if you ask me today, I am
the part of this society, I feel happy and I am focusing on my studies”. [41] revealed that the
low level of willingness to interact with host people results in lack of knowledge about the host
country and lower sociocultural adaptation. Home sickness is a common phenomenon among
Stress: Psychological Perspectives
19
all the international students who migrate voluntarily abroad. Pakistani students like others
are motivated towards their mobility to China and abroad experiences so are expected to over-
come the feeling of home sickness by resilience and determination.
On perceived hate
Perceived Hate holds (9.15%) of variance as a concern of Pakistani students which was
recorded moderate and in uniform scores on each item of the factors such as (see Table 6)
Item 13 (mean 2.35) “People show hatred toward me non-verbally”, Item 14 (mean 2.09)
“People show hatred toward me verbally”, Item 15 (mean 2.16) “People show hatred toward
me through action”, Item 16 (mean 2.58) “Others are sarcastic towards my cultural values”,
and Item 17 (mean 2.65) “Others don’t like my cultural values”. These items record a mild
concern of Pakistani students because of their insufficient social interaction during initial
days of migration. Similar response was noted during interview of P13, “University facili-
tates students to accommodate their guests in universities’ exchange centers but this was all
booked, and when I went to book a room for my guest outside I was denied, saying we don’t
entertain foreigners, that was a bitter experience and I perceived that I am being hated as a
foreigner.” It is to be noted that Chinese government issue licensed to hotels and categorize
them on the basis of their facilities so that a clean and peaceful environment should be
ensured, the hotels with the facilities provided can host foreigners. These findings are in
concordance with the previous study conducted by [41] that the students very positively
evaluate their intercultural experiences, especially with regards to their relationships with
Chinese people. The perception of being hated in China was due to newly migrated stu-
dents’ unawareness of culture and local rules and regulations. The feelings became lower
with the duration of stay in China as mentioned by [40] in study on intercultural adaptation
of Pakistani students in China.
On fear
Fear was found among Pakistani students but this feeling of fear seems to be due to different
culture, different ways of life, different language and unfamiliar surroundings. Individual per-
sonality type and first-time abroad experience also intensify feeling of fear in Pakistani stu-
dents. The feelings of fear is not on the scale of severe intensity, it might be because Pakistan
and China have brotherly socio-political relations that encourages international students from
Pakistan and this feelings of trusted friendship lowers the sense of insecurity like many con-
firms in US for increasing number of crimes, racial discrimination and socio-political realities
of off and on hostile relations among some international students’ country of origins (Iran,
Iraq, etc.) and the United States [3]. As stated earlier, fear is a concern of international students
in some of the western societies where students are discriminated on the basis of religion,
color and political issues. Interview feedbacks show that these students are feeling secure in
China as when inquired whether has she ever sensed a threat or fear during your stay here, P-
15 responded, “Being a female from a conservative family background, I and my mother were
both feeling insecure to go abroad, but I feel equal, powerful and secure”. The qualitative data
concludes that Pakistani students in Chinese universities are recording no concern on fear or
insecurity. The results show that feelings in insecurity in a new socio-cultural and academic
environment lead to the feelings of fear among students. The results of this study support the
findings of [41] which stated that possessing Chinese language proficiency provided students
with confidence in different social and cultural [40] as well as in academic settings that ulti-
mately resulted in lowering the acculturative stress, anxiety and depression.
Stress: Psychological Perspectives
20
On culture shock/stress due to change
Culture shock subscale recorded concerns of Pakistani students. All the 3 items show that cul-
ture shock is generated due to the pressure placed on the newly arrived international students
where everything is unique, different for what they had experienced in their home countries.
The findings confirm that Pakistani students have a critical concern and are experiencing cul-
ture shock. This culture shock or stress due to change leads these students to acculturative
stress. Qualitative data demonstrate three major concerns on factors like physiological, inter-
personal and psychological that further contribute to mental strain and culture shock. The
symptoms commonly related with culture shock were buoyed to varying grades for each of the
participants by the data collected from the interviews. The participants, in spite of expressed or
implied feelings of confusion or astonishment from prior in their 1st year which is in concor-
dance with [40], were overall considerate about any cultural variances rather than contemptu-
ous, to the degree that by the 3rd year, they stated that any culture shock they had experienced,
if at all, was marginal and in the past. P-5, for example, stated: “I noticed very few differences,
but they are easy to be accepted and are not stressful.” P-13 declared that “I didn’t notice any
sign of culture shock which I could remember. I was readily accepting new ideas and were
struggling to adapt.” Finally, P-18, when asked if there is anything that shocked him in current
year, responded, “Maybe in my initial days in China, which I don’t remember.” Culture Shock
is the most researched topic in the literature on foreign students [31].
On guilt
The factor “Guilt” captured (2.28%) of total variance, shows a slight concern of guilt among
Pakistani students studying in China. (See Table 6) Item 25, (mean 2.54) “I feel guilty leaving
my friends and family behind”, Item 26 (mean 2.36) “I feel guilty that I am living a different
life style here”. Adjusting to the host culture is generally conceived infidelity and betrayal to
their own culture. This is a natural phenomenon that one loves one’s own culture, family and
homeland. This has been revealed by respondent upon asking whether he has felt guilt, P-10
stated, “I, during my first year, was many times totally overwhelmed by severe sense of guilt. . .
To leave my kids and family behind.” International students seemingly struggle to maintain
their identity in the host culture but the dominant host culture somehow influence them to
adapt. As P-18 asserted, “I like my own ways of life, China is totally different, to adapt certain
ways like eating habits and time at first made me stressful but I tried to forget my past and
finally adjusted”. The dominance of the host culture and the pressure of acculturation that is
crucial for their academic excellence, self-esteem and physical well-being tempt them to adapt
the host culture but morally it seems to them as insincere to their own culture and people.
Miscellaneous such as language inability and food adaptation
Some very important concerns of Pakistani students in China were highlighted by Item 27, “I
feel nervous to communicate in Chinese” (mean 3.14) indicates the intense concern of Paki-
stani students on the language incompetency. This highly loaded concern with a significant
mean score indicates the language is undoubtedly a barrier in acculturation process either
social or academic. It deters the process of adaptation and gradually leads to many disorders
like acculturation stress, depression and sometimes inferiority complex. Item 29, “I feel angry
that my people are considered inferior here (mean 3.52). The mean score for this item shows
that students develop feelings of loneliness because they feel themselves homesick and in
minority. Findings from interviews demonstrate four significant concerns of Pakistani stu-
dents. R-7 on being asked about its effects stated, “I don’t exactly know. . .but when I don’t get
enough sleep at night, I feel sleepiness during the day, general tiredness, irritability and
Stress: Psychological Perspectives
21
problems with concentration.” For language barriers the concerns of the 1st year students
were higher as compared to 2nd and 3rd year students. P-7 a 1st year PhD student narrated, “I
understand Chinese is very important. . . but it’s my first year and this language is very difficult
to learn.” Chinese language incompetency cause fear, anxiety and is a key factor hindering aca-
demic, psychological and socio-cultural adaptation. It negatively affects Pakistani students
because [41] language barriers cause difficulty in relationship with professor, staff and peers
and understating and adjusting to the process of learning in Chinese educational settings. Chi-
nese language has characters construction unlike alphabetic so that is something new and
seems hard to be acquired. When asked P-16 if he had experienced any food issue, responded,
“Last year I went to another province to attend a conference, the food was so different and too
spicy for me. I tried but couldn’t.” 1st year students’ responses on interview script show their
concern on loneliness. As P-5, a 1st year PhD student stated, “I was feeling lonely because I
had no any friend local or international but after 3 months, I found my country-mates, foreign
students and even get acquainted with my Chinese class mates there is no more loneliness.”
This statement clearly demonstrates that social interaction on the part of international stu-
dents is crucial to overcome acculturative stress.
Conclusion
In quantitative segment, the study administered ASSIS Scale to examine acculturative stress
among Pakistani Students studying in China. The quantitative findings of each subscale of the
ASSIS and total variance on some factors indicate that Pakistani students are going through a
mild acculturative stress and it can be generalized that the more the variance percentage grows
up, the more we perceive the level of acculturative stress. ASSIS includes 7 subscales or factors
that are assumed to be responsible for acculturative stress among international students.
Through these factors, we understand that Perceived Discrimination, Perceived Hate, Home-
sickness, Fear, Culture Shock/ Stress due to Change and Guilt are the significant factors caus-
ing acculturation stress among Pakistani students studying in China. Apart from
aforementioned factors, food, language, lacking sense of belonging and loneliness are impor-
tant factors to be considered responsible for causing acculturative stress.
The qualitative findings illustrate that Pakistani students in China are expressing their
major concerns on culture shock, homesickness, food and language barriers while disconfirm
ASSIS findings like perceived discrimination, hate, fear and guilt as factors responsible for
acculturative stress. The study findings indicate that many factors are affecting international
students because of language incompetency. Therefore, we suggest that the sending country
should provide an effective literature of host country’s culture and engage the aspirants to
learn Chinese before leaving their country. The study suggested that pre-migration orientation
lectures about host country’s cultural values and campus environment, and post-migration
extra-curricular, cultural activities and maximum social interaction with local students can
effectively acculturate students in new cultural setting, and can lower their acculturative stress.
Findings of the present study could be used for, and guide the support mechanism at uni-
versities for international students in Chinese higher education intuitions.
Firstly, in relation to the orientation and counseling, the materials provided to the students
at the pre-departure stage should comprise of basic literature that should be clear and up to the
date to allow aspirants understand the requirements for their future study. It is will be more
appropriate and productive if university should integrate and invite senior international stu-
dents for lectures to share their experience and guide the newly arrived international students.
A comprehensive orientation by elder students and university staff would be more effective to
cultivate readiness among new students to cope with the unfamiliar social and academic
Stress: Psychological Perspectives
22
setting. It is more practical way of orientation because the seniors can share their lived experi-
ences and advise them how to respond to these difficulties and stressors. Furthermore, orienta-
tion courses should include Chinese language exercises as well as there should be arranged
classes of English language to improve the academic writing skills of Pakistani students as
English is not their first language.
Secondly, academic adaptation and understanding laws of Chinese higher education are a
key apprehension of most of the participants of the study. It has also been shown in the present
study, in many of the occurred cases, the unawareness of rules and degree requirements nega-
tively impact the students’ adaptation both academically as well as socially. Most of them are
seeking information and guidance through peers including senior countrymates and other
international students, which means that they do not receive adequate and timely information
of their requirements. The university ought to provide more information regarding rules and
regulations of the university as well as rule amended by the ministry at any time of the aca-
demic year so that these students should be mentally prepare to respond to the requirements
positively. The ISO and the secretary of each school should work on the effectiveness of dis-
semination of information to every student. WeChat groups might be generated for the stu-
dents, because social media approach seems to have more positive effect on the students’
academic and social adaptation.
Thirdly, it is crucial for the university to produce more chances and form more co-curricu-
lar activities to interact and integrate Pakistani students, other international students and Chi-
nese students. Effective strategies should be applied to stimulate maximum international
student to participate efficiently in cultural activities.
Fourthly, the staff and faculty should recognize the key weakness and differences in the stu-
dents’ previous educational background as well as academic language abilities. Therefore, fac-
ulty should have a proper understanding student’s needs so as to offer effective supervision
and instruction. It would be more effective to plan the courses by opening with outline of the
particular discipline, which familiarizes each of the students with, educational norms and
important ideas of important application to the major of study and academic standards.
Finally, the supervisors should settle their availability in advance as schedule and should
encourage the students to seek guidance. Similarly, it is significantly advised for international
students to seek the assistance of supervisors and staff while needed and be positive while fac-
ing academic challenges. Generally, Pakistani students might straightforwardly acclimate to
Chinese academic and social norms and practices and may flourish in their instructions pro-
vided that university leadership, faculty, and students themselves meticulously comprehend
conceivable stressors as well as generate and withstand advantageous academic environments.
Limitation of the study
The findings are significant but covering only 5 provinces with the sample 203 can be further
studied covering more provinces and large sample based on different demographic character-
istics like marital status, country of origin, religion and personality type is recommended. To
generalize the findings to all international students’ needs care because home culture of Paki-
stan may not be similar to many other countries.
Supporting information
S1 File.
Stress: Psychological Perspectives
23
Author Contributions
Conceptualization:Mudassir Hussain.
Data curation:Mudassir Hussain.
Methodology:Mudassir Hussain.
Software: Ghulam Raza Sargani.
Writing – original draft:Mudassir Hussain.
Writing – review & editing: Cao Shan.
References1. Bank AD. Regional Cooperation and Cross-border Collaboration in Higher Education in Asia: Ensuring
that EveryoneWins: Asian Development Bank Mandaluyong City, Philippines; 2012.
2. Sakamoto R, D AV IDWC. Expanding Across Borders: e Growth of Cross-border Partnerships inHigher Education. Cross-border Partnerships in Higher Education: Routledge; 2010. p. 15–27.
3. Sandhu DS, Asrabadi BR. Development of an acculturative stress scale for international students: Pre-liminary findings. Psychological reports. 1994; 75(1):435–48.
4. Myers HF, Rodriguez N. Acculturation and physical health in racial and ethnic minorities. 2003.
5. Berry JW. Acculturation: Living successfully in two cultures. International journal of intercultural rela-tions. 2005; 29(6):697–712.
6. Berry JW. Conceptual approaches to acculturation: American Psychological Association; 2003.
7. Berry JW, Kim U, Minde T, Mok D. Comparative studies of acculturative stress. International migrationreview. 1987; 21(3):491–511.
8. HwangW-C, Ting JY. Disaggregating the effects of acculturation and acculturative stress on the mentalhealth of Asian Americans. Cultural Diversity and Ethnic Minority Psychology. 2008; 14(2):147. https://doi.org/10.1037/1099-9809.14.2.147 PMID: 18426287
9. Hamboyan H, Bryan AK. International students. Culture shock can affect the health of students fromabroad. Canadian Family Physician. 1995; 41:1713. PMID: 8829581
10. Randall M, Naka K, Yamamoto K, Nakamoto H, Arakaki H, Ogura C. Assessment of psychosocialstressors and maladjustment among foreign students of the University of the Ryukyus. Psychiatry andclinical neurosciences. 1998; 52(3):289–98. https://doi.org/10.1046/j.1440-1819.1998.00396.x PMID:9681580
11. Chapdelaine RF, Alexitch LR. Social skills difficulty: Model of culture shock for international graduatestudents. Journal of College Student Development. 2004; 45(2):167–84.
12. Adler PS. The transitional experience: An alternative view of culture shock. Journal of humanistic psy-chology. 1975.
13. Altbach PG, Kelly DH, Lulat Y-M. Research on foreign students and international study: An overviewand bibliography: Praeger Publishers; 1985.
14. Pederson E, editor The ecology of a semantic space. Annual Meeting of the Berkeley Linguistics Soci-ety; 1991.
15. Dillard JM, ChisolmGB. Counseling the International Student in a Multicultural Context. Journal of col-lege student personnel. 1983; 24(2):101–5.
16. Zapf MK. Cross-cultural transitions and wellness: Dealing with culture shock. International journal forthe advancement of counselling. 1991; 14(2):105–19.
17. Lin J-CG, Yi JK. Asian international students’ adjustment: Issues and program suggestions. Collegestudent journal. 1997.
18. Brinson JA, Kottler J. International students in counseling: Some alternative models. Journal of CollegeStudent Psychotherapy. 1995; 9(3):57–70.
19. Leong F, Chou E. Counseling international students. In. Pedersen PB, Drauguns JG, et al.(Eds.),Counseling across cultures (pp. 210–242). Newbury Park, CA: Sage; 1996.
20. Popadiuk N, Arthur N. Counseling international students in Canadian schools. International Journal forthe Advancement of Counselling. 2004; 26(2):125–45.
21. Yu B, Chen X, Li S, Liu Y, Jacques-Tiura AJ, Yan H. Acculturative stress and influential factors amonginternational students in China: A structural dynamic perspective. PloS one. 2014; 9(4).
Stress: Psychological Perspectives
24
22. Sandhu D, Asrabadi B. An acculturative stress scale for international students: A practical approach tostress management. Evaluating stress: A book of resources. 1998; 2:1–33.
23. Cohen D, Crabtree B. Qualitative research guidelines project. 2006.
24. Creswell JW. Mapping the field of mixed methods research. Sage Publications Sage CA: Los Angeles,CA; 2009.
25. Field A. Discovering statistics using IBM SPSS statistics: sage; 2013.
26. Bornstedt GW. Reliability and Validity Assessment. AttitudeMeasurement, Gosen F Summers (editor),Chicago: RandMcNally and Company. 1970.
27. Tabachnik B, Fidell L. Using multivariate analysis. 4th. Boston: Allyn and Bacon; 2001.
28. Rietveld T, Van Hout R. Statistical techniques for the study of language behaviour. Berlijn: Mouton deGruyter. 1993.
29. Costello AB, Osborne J. Best practices in exploratory factor analysis: Four recommendations for gettingthe most from your analysis. Practical assessment, research, and evaluation. 2005; 10(1):7.
30. Field A. Discovering Statistics using SPSS for Window. London: Sage; 2009.
31. Alexander A, Klein MH,Workneh F, Miller MH. Psychotherapy and the foreign student. Counselingacross cultures. 1981; 2:227–43.
32. Pedersen PB. Counseling international students. The counseling psychologist. 1991; 19(1):10–58.
33. Allen F, Cole J. Foreign student syndrome: Fact or fable? Journal of American College Health. 1987; 35(4):182–6. https://doi.org/10.1080/07448481.1987.9938986 PMID: 3819191
34. Mestenhauser H. Learning from sojourners. Handbook of intercultural learning. 2013; 2:153–85.
35. Lee MY. Needs of Foreign Students fromDeveloping Nations at US Colleges and Universities (EditedbyDunnett Stephen C) Washing-ton. DC: National Association for Foreign Student Affairs. 1981.
36. Anumonye A. African students in alien cultures: Black Academy Press; 1970.
37. Mumford D. The measurement of culture shock. Social psychiatry and psychiatric epidemiology. 1998;33(4):149–54. https://doi.org/10.1007/s001270050037 PMID: 9567664
38. Cox JL. The overseas student: Expatriate, sojourner or settler? Acta Psychiatrica Scandinavica. 1988;78(S344):179–84.
39. Siegel C. Counseling international students: A clinician’s comments. The Counseling Psychologist.1991; 19(1):72–5.
40. Noreen Sehrish, FanWei Wei Mehvish Zareen, and Malik Sameena. 2019. "The Intercultural Adjust-ment of Pakistani students at Chinese Universities." International Journal of Academic Research inBusiness and Social Sciences 9 (3) 1044–1059.
41. Su Xiaoqing. 2017. "The Intercultural Adaptation of the Pakistani Students at Chinese Universities."Universal Journal of Educational Research 5 (12): 2236–2240.
Stress: Psychological Perspectives
25
Psychiatric symptoms and emotion regulationstrategies among the unemployed people inKorea: A latent profile analysis
Min Sun KimID*
Department of Psychology and Psychotherapy, Dankook University, Dongnam-gu, Cheonan-si, Chungnam,South Korea
Abstract
This study aimed to explore the profiles of emotion regulation strategies among unemployed
people, and to examine the association of latent profiles with demographics and psychiatric
symptoms. The study included 136 men (42.8%) and 182 women (57.2%). The average
age of the participants was 35.84 years (SD = 26.83). Latent profile analysis was used to
determine emotion regulation strategy profiles. Associated factors of profile membership
were identified with multinomial logistic regression. The four-profile model (low adaptive
emotion regulation class, low negative emotion regulation/moderate positive regulation
class, high negative emotion regulation/support-seeking class, adaptive emotion regulation
class) was selected as the best solution. As a result of examining the probability of being
classified into each class according to emotional difficulties, the lower the level of anxiety
and somatization, the higher the probability of belonging to the class 2 adaptive emotion reg-
ulation class (n = 56, 18%). The higher the depression, the higher the probability of being
classified into class 4 (n = 65, 20%) using a lot of negative emotion regulation strategies.
The results of this study indicate that unemployed people can be classified into various sub-
groups according to their emotion regulation strategies. Also, the probability of being classi-
fied into each subgroup was different based on the types of emotional difficulties such as
depression, anxiety, and somatization. Through the results of this study, it is possible to
understand the relationship between the psychiatric symptoms of unemployed people and
emotion regulation strategies and to suggest methods for promoting effective emotion regu-
lation strategies among this population group.
Introduction
Korea has been in a spiral of unprecedented unemployment since it received bailouts from the
International Monetary Fund (IMF). In mid 1998, when restructuring, including layoffs were
underway, the official real number reached 1.6 million, raising the sense of social crisis. The
IMF’s bailout seemed to have solved the problem of unemployment, but in 2001, the number
of official unemployed workers exceeded 1 million again. In addition, the first restructuring by
Editor: Silvia Cimino, Sapienza - University of
Roma, Italy, ITALY
Funding: The author(s) received no specific
funding for this work.
3
26
layoffs was mainly focused on manufacturing workers, but after the 1980s, middleclass manag-
ers, experts, and office workers were the main targets, and the layoff rate of men and higher
education workers has been increasing gradually [1] According to the Organization for Eco-
nomic Cooperation and Development (OECD) Employment Outlook 2018, Korea had the
highest turnover rate among the OECD countries [2] at 31.8% and a relatively weak social
safety net for loss of income in the reemployment process. Also, the reemployment rate in
Korea within 1 year after the dismissal of a worker was 46.1%, which was slower compared
with other OECD countries such as the United States (57.8%), Japan (50.8%), and Australia
(73.6%).
In the absence of a social security system, unemployment not only poses a fundamental
threat to the right to live for individual workers, but also has a negative effect on the entire
family, which can threaten the structure of the family and the overall social structure. The
prevalence of family crises among Koreans is 50%, and the frequency of economic crisis (e.g.,
unemployment) was the highest among the family crises [3]. In periods of economic recession
and overall industrial change, problems related to unemployment can be a factor that makes
the social cost more burdensome. Therefore, it is necessary to expand mental health programs
that can facilitate the process from unemployment to reemployment, and to focus more on the
mental health problems of unemployed people at the national level.
From a psychological perspective, unemployment is linked to the following negative results:
First, it was found that the loss of economic independence and social role performances due to
the decrease of economic resources obtained from a fixed income were insolvent. Second, it
leads to involuntary interruption of the mutual relationship between individuals and the orga-
nization. Third, unemployment means loss of work, which, for many, is the basis of achieve-
ment, self-realization, and self-identity [4, 5, 6]. Also, the increase in anxiety and tension due
to unemployment has been demonstrated by many empirical studies [7, 8, 9]. McKee-Ryan,
Song, Wanberg, and Kinicki [10] examined 52 cross-sectional studies that compared the health
of unemployed and employed people and found that those who were unemployed had signifi-
cantly poorer mental health, life satisfaction, family satisfaction, and subjective physical health.
Unemployment has been linked to increases in the suicide rate among middle-aged people.
According to the distribution trend of suicide rates by age in Korea (the number of suicides
per 100,000 ages), the suicide rate of young people in their 20s was the highest in 1983, but the
suicide rate of young people in their 20s was lowered in 1993, while the suicide rate of older
people rose [11]. Comparing the distribution of suicide rates by age in 1993 and 2003, it can be
seen that the suicide rate is increasing as the age of the population increases, and the suicide
rate of adults aged over 50 years has been increasing very rapidly recently.
In stress situations, unemployed people are more likely to cope with stress by self-reading
or wishful thinking rather than actively coping and avoiding behavior. In a study by Ahn, Tak,
Yoo, Han, and Han [12], dysfunctional coping, reemployment restriction requirements,
employment commitment, and job search intensity had negative effects on mental health,
whereas self-esteem, life satisfaction, adaptive coping, and social support had positive effects.
However, most of the studies conducted in Korea have been based on specific mediating vari-
ables such as family resilience [13] and perceived social support [14, 15]. Therefore, there is a
relative lack of understanding of the various emotion regulation strategies and influences used
by unemployed people. Therefore, this study examined the types of spontaneous groups that
are derived according to the emotional-centered coping strategies for unemployed people, and
explored the probability of being classified into each group according to the psychiatric
symptoms.
Competing interests: The authors have declared
that no competing interests exist.
Stress: Psychological Perspectives
27
Emotion regulation strategies
Theories that explain emotion regulation explain the influence of various strategies to control
emotions. The most well-known theory, the process model, explains the process of emotion
regulation by dividing the emotion before and after the emotional expression based on the
flow of time [16]. The focus is mainly on the positive reinterpretation of the situation, such as
the cognitive reinterpretation of the situation before the emotional expression. Next, the strate-
gies that are implemented after emotional expression focus on emotion regulation strategies
during emotional manifestation, such as emotional suppression, problem-solving, acceptance,
and rumination. Although some of the emotion regulation strategies used in the process of
controlling emotions are effective at reducing unpleasant emotions, there are also strategies
that may cause the development of various psychiatric symptoms and psychopathology
through the accumulation and exacerbation of unpleasant emotions [15, 17, 18]. Some
researchers have focused on the specific strategies mobilized for emotion regulation and have
investigated the relationship between emotion regulation strategies and psychiatric symptoms
[19–21]. In Lee JY [18] ’s study, negative emotion regulation strategy was shown to increase
psychopathology, and only support seeking strategy among positive emotion regulation strat-
egy lowered psychopathology.
This study assumed that various subgroups would be derived according to subfactors of
emotion regulation strategies based on findings from previous studies, which are as follows: In
a study by Eftekhari, Zoellner, and Vigil [22], the emotional control group was divided into
the high emotional control group, high cognitive reinterpretation-low oppression group,
medium cognitive reinterpretation-low suppression group, and low emotional control group.
The high cognitive reinterpretation-low repression group showed lower levels of depression,
anxiety, and post-traumatic stress disorder scores than the other groups, and the low emo-
tional control group showed higher levels of depression, anxiety, and post-traumatic stress dis-
order. In the study of Lee, Kim, and Choi [23], four groups was derived based on emotional
recognition and expression: emotion recognition, shield behaviors to not recognize emotions,
negative emotional expression behavior, and regulation behavior. The results of the study
showed that emotional difficulties such as somatization, obsession, depression, and anxiety
were high in the negative emotional expression behavior group.
Some studies [22–24] have been conducted based on the assumption that there are various
subgroups according to the emotion regulation strategy, and the more positive emotion regu-
lation strategies were used, the lower Psychiatric Symptoms was. However, there are limita-
tions to this approach. First, the variable-centered approach does not take into account that
unemployed people can use multiple emotion regulation strategies in combination. For exam-
ple, the variable-centered approach focuses mainly on the linear relationship between variables
and ignores the fact that variables can be combined in new ways. The variable-centered
approach and person-centered approach are similar in that both only interpret emotion regu-
lation and the relationship between variables. In the variable-centered approach, the effect of
the variables is independently verified through individual differences, and in the person-cen-
tered approach, the relationship between the combination of variables and different strategies
is verified [25]. This study attempts to shed light on the complicated emotional processes of
unemployed people by examining various emotion regulation strategies together, unlike the
existing variable-centered approach that regards negative emotion regulation strategies and
positive emotion regulation strategies as mutually exclusive. Second, some study [26, 27] that
have examined subgroups according to emotion regulation strategies have focused on cogni-
tive efforts such as suppression, avoidance, and reinterpretation, and because they mainly used
emotion regulation strategies from stress-coping theory, they do not include comprehensive
Stress: Psychological Perspectives
28
strategies. Lastly, the studies [22, 23] on the subgroups according to the emotion regulation
strategies for the general public are classified by cluster analysis, so the group classification can
be somewhat arbitrary and it is limited to generalize to individuals in the stress situation of
unemployment.
Emotion regulation strategies and psychiatric symptoms
Previous studies [28–32] found that the use of specific emotion regulation strategies (e.g., sup-
pression of expression, thought suppression, rumination) and the low use of other strategies
(e.g., reinterpretation and self-disclosure) were related to the level of depression symptoms.
Studies that have examined emotion regulation strategies of people experiencing depression
focused mainly on cognitive emotion regulation, and only on examining the influence of spe-
cific emotion regulation strategies such as avoidance [33], rumination [20, 34], and reinterpre-
tation [32] among cognitive emotion regulation. In fact, cognitive emotion regulation
processes such as reinterpreting or changing the situation are linked to emotional expressions,
responses, and self-disclosure, and there are also people who use various strategies at the same
time rather than as a conscious emotion regulation strategies [23, 35].
People with high trait anxiety can be sensitive to stress situations and show excessive anxi-
ety. Caver, Scheier, andWeintraub [36] noted that high trait anxiety tends to avoid stimuli.
Therefore, those who feel anxiety due to their personality characteristics are highly concerned
about vague threats that have not occurred and try to control their anxious emotions. People
with panic disorder, for example, can explain that the “fear by fear” experience contributes to
the maintenance and triggering of seizure symptoms [37]. This leads to the use of emotion reg-
ulation strategies to avoid or suppress fears because fears are not accepted and negative emo-
tions are formed. Furthermore, anxiety disorder can lead to misinterpretation of general
emotional responses and thus dysfunctional emotion regulation attempts are generated. In
contrast to the control group with low anxiety levels, the emotional disorder group has low
emotional acceptance and awareness levels and the transitional disorder group has low emo-
tional acceptance and awareness levels [28, 38].
Next, this study examined whether the probability of being classified into each subgroup
was different according to the somatization level. The correlation between negative emotions
and physical symptoms is known to be .30~.50, and the more negative emotions, the more
likely a person is to complain about physical symptoms [39–44]. However, there have been
reports that somatization problems occur when suppressing emotions rather than with nega-
tive emotions [42, 45]. Some studies [46, 47] have noted that people with high somatization
may have a high belief in negative emotions, and that if they cannot control unpleasant emo-
tions at a cognitive level, they may show exaggerated physical and behavioral responses in
stress situations and become vulnerable to diseases.
However, recent studies have shown that there are some inconsistent results in explaining
the relationship between psychopathology, positive emotional regulation strategies, and nega-
tive emotional regulation strategies. For example, Schfer, Naumann, Holmes, Tuschen-Caffier,
and Samson [48], which meta-analyzed existing studies on the relationship between emotional
regulation strategies, depression, and anxiety, have shown that positive emotional regulation
strategies such as cognitive reinterpretation have more important effects on psychiatric symp-
toms such as depression and anxiety than negative emotional regulation strategies such as
rumination and avoidance. This means that enhancing positive emotional regulation strategies
can have a more positive effect on depression and anxiety of adolescents than reducing nega-
tive emotional regulation. On the other hand, Aldao and Nolen [49] ’s study showed that the
relationship between positive emotion regulation strategies and psychiatric symptoms were
Stress: Psychological Perspectives
29
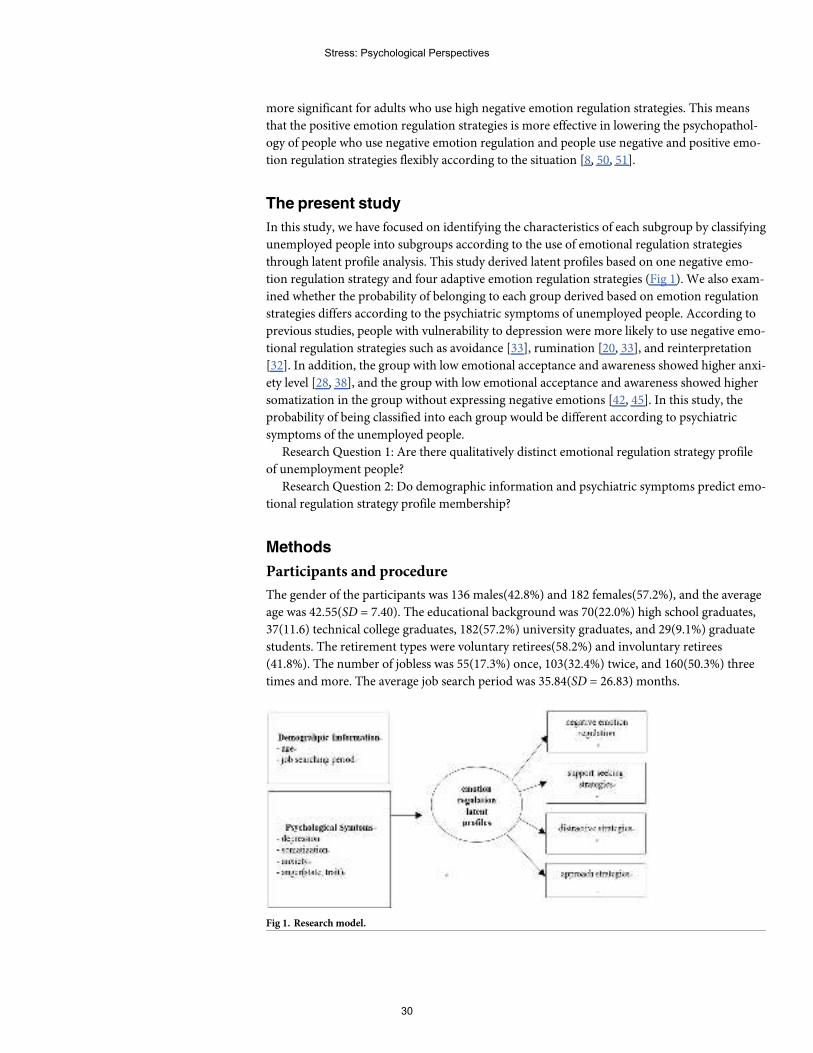
more significant for adults who use high negative emotion regulation strategies. This means
that the positive emotion regulation strategies is more effective in lowering the psychopathol-
ogy of people who use negative emotion regulation and people use negative and positive emo-
tion regulation strategies flexibly according to the situation [8, 50, 51].
The present study
In this study, we have focused on identifying the characteristics of each subgroup by classifying
unemployed people into subgroups according to the use of emotional regulation strategies
through latent profile analysis. This study derived latent profiles based on one negative emo-
tion regulation strategy and four adaptive emotion regulation strategies (Fig 1). We also exam-
ined whether the probability of belonging to each group derived based on emotion regulation
strategies differs according to the psychiatric symptoms of unemployed people. According to
previous studies, people with vulnerability to depression were more likely to use negative emo-
tional regulation strategies such as avoidance [33], rumination [20, 33], and reinterpretation
[32]. In addition, the group with low emotional acceptance and awareness showed higher anxi-
ety level [28, 38], and the group with low emotional acceptance and awareness showed higher
somatization in the group without expressing negative emotions [42, 45]. In this study, the
probability of being classified into each group would be different according to psychiatric
symptoms of the unemployed people.
Research Question 1: Are there qualitatively distinct emotional regulation strategy profile
of unemployment people?
Research Question 2: Do demographic information and psychiatric symptoms predict emo-
tional regulation strategy profile membership?
Methods
Participants and procedure
The gender of the participants was 136 males(42.8%) and 182 females(57.2%), and the average
age was 42.55(SD = 7.40). The educational background was 70(22.0%) high school graduates,
37(11.6) technical college graduates, 182(57.2%) university graduates, and 29(9.1%) graduate
students. The retirement types were voluntary retirees(58.2%) and involuntary retirees
(41.8%). The number of jobless was 55(17.3%) once, 103(32.4%) twice, and 160(50.3%) three
times and more. The average job search period was 35.84(SD = 26.83) months.
Fig 1. Research model.
Stress: Psychological Perspectives
30
In order to recruit participants, the purpose of the study was explained to the institutions
that help reemployment or job search such as the vocational education center under the Minis-
try of Labor and the Women’s Job Center. In this study, participants were selected from adults
over 20 years old who do not currently have a full-time job and want to find a job. The study
was conducted in accordance with the Declaration of Helsinki. The survey kits were distrib-
uted to the institutions that allowed the participation in the study, and the questionnaires were
distributed to the people who were willing to participate in the study. This study explained the
necessity and purpose of the study to the participants and received oral consent. The research-
ers explained that there is no disadvantage due to the absence of research and that they can
withdraw if there is no intention to participate in the survey.
Measures
Emotional regulation strategy. In this study, the emotion regulation strategy question-
naire(ERSQ) developed by Lee and Kwon [52] was used to measure the emotion regulation
strategy. ERSQ is divided into cognitive, experiential, and behavioral strategies according to
what aspect of emotion is approach ed and emotional changes are caused. A total of 16 strat-
egies including 5 cognitive strategies, 5 experiential strategies, and 6 behavioral strategies
are measured. A result of Lee and Kwon [52] ’s research, 16 emotion regulation strategies
were classified into maladaptive strategies, support-seeking strategies, attention distraction
strategies, and approach strategies. Maladaptive strategies showed significant positive corre-
lation with psychopathology such as depression, while other strategies showed negative cor-
relation [53, 54]. Previous research [52] classified the other three strategies as adaptive ones
except for maladaptive emotion regulation. Lee and Kwon referred to support-seeking strat-
egies, attraction differentiation strategies, and approach strategies as adaptive strategies.
This study classified latent profiles according to emotional regulation strategies of unem-
ployed people based on ERSQ scale, which measures various emotional regulation
strategies.
Depression. In this study, Beck Depression Inventory (BDI) [55] was used to measure
depression. BDI is a self-reported test developed to measure the severity of symptoms and the
presence of depression symptoms. This study used the scale adapted and validated by Lee and
Song [52] for Korean people and consists of 21 questions in total. Each item is scored from 0
to 3 and the total score is from 0 to 63. In the study of Lee and Song [56], the overall reliability
of BDI for the general people was .78 and .85 for the depressed patients. The reliability of the
existing Zung self-rating depression scale (SDS) [57] and MMPI-Depression scale (MMPI-D)
[58] was .70 and .50 in the depressed group, respectively.
Somatization. The somatization was used by extracting questions about the somatization
symptoms appeal among the nine sub-factors of the scale validated by Kim, Kim, Won [59] in
the Korean version of SCL-90(Brief Symptom Inventory &Matching Clinical Rating Scale)
developed by Derogatis [60]. The question is designed to measure the 12 symptoms of head-
ache, dizziness, heavy arms and leg et cetera on a 5-point Likert scale. Participants recall their
experiences over the past week and respond to how similar they are to each item. The range of
total score is continuous variable from 12 to 60, and the higher the score, the more severe the
somatization symptoms. The reliability of this scale is presented in each area, and the reliability
of the somatization factor at the time of development of the scale .79.
Trait anxiety. In this study, the State-Trait Anxiety Inventory(STAI) which was produced
by Spielberger [61] and adapted by Kim [11] was used to measure trait anxiety. The trait anxi-
ety is a trait that is not affected by psychological tension according to the situation as a rela-
tively unchanging individual difference. It consists of 20 items and each item is evaluated as
Stress: Psychological Perspectives
31
4-points on the Likert scale. The range of individual scores is from 20 to 80, and the higher the
score, the higher the trait anxiety.
Analysis
This study was conducted to classify latent profiles according to emotional regulation strate-
gies for unemployed people and to verify the influence of related variables. To do this, the
Latent Profile Analysis(LPA) was conducted using the Mplus 7.0 program. When classifying
groups in LPA, the subgroups estimated through the analysis of the responses are called latent
profiles. Unlike the existing variable-centered approach to understand the phenomenon
through the relationship of variables, latent profile analysis is based on the person-oriented
approach that approaches with interest in individual characteristics [40]. In addition, unlike
cluster analysis is that sorts groups somewhat subjectively, LCA sets a model and determines
the number of groups through statistical procedures, and it is easy to interpret using
probability.
In this study, the suitability of the model was evaluated based on the quality of classifica-
tion, information index, and model comparison verification for the final model selection.
To classify the quality of the model, the Entropy index was used. The Entropy index was
between 0–1 and the probability of belonging to one latent class was close to 1, and the
value increased as the rate of belonging to another latent class was close to 0. The value of
about 0.8 is decided as the good classification [62]. Next, the information index used AIC
(Akaike Informaton Criterion) [63], BIC(Bayesian Information Criterion) [64], SABIC
(Sample-size Adjusted BIC) indexes, and the lower the value, the better the fit. Finally, the
LMRLRT(Lo-Mendell-Rubin adjusted Likelihood Ratio Test) [65] and the BLRT(Paramet-
ric Bootstrap Likelihood Ratio Test: BLRT) [66] were used for the model comparison verifi-
cation. When evaluating the model with the number of latent profiles k, both of the results
are used to verify the difference between the k-1 latent profile and the k-1 latent profile
model. The p-value of the result is used to evaluate whether k-1 latent profile model are
rejected to support the k latent profile model. If the latent profile model of k is not signifi-
cant, the latent profile model of k-1 is selected. In this study, the influence of independent
variables was verified through the polytomous logistic regression presented in the final
model analysis results.
Results
Descriptive analysis
Correlations and means/standard deviations of all variables are shown in Table 1. The results
of correlation analysis showed that negative emotion regulations strategies had a significant
positive correlation with depression, somatization, and anxiety. Also, the three types of adap-
tive emotion regulation strategies were found to have a significant negative correlation with
depression and anxiety. On the other hand, attention distractive and approach strategies
showed significant negative correlation with somatization and state anxiety, while support
seeking strategies did not show significant correlation.
Identification and description of latent classes
Model fit indices for the five classes are reported in Table 2. As a result of the study, when AIC,
BIC, and SABIC compared to 2 class solution, the value became smaller as the number of pro-
files increased significantly, and the Entropy value was .80 in 4 class solution, which was suit-
able for classification criteria. Class 5 also meets the criteria for the quality of classification and
Stress: Psychological Perspectives
32
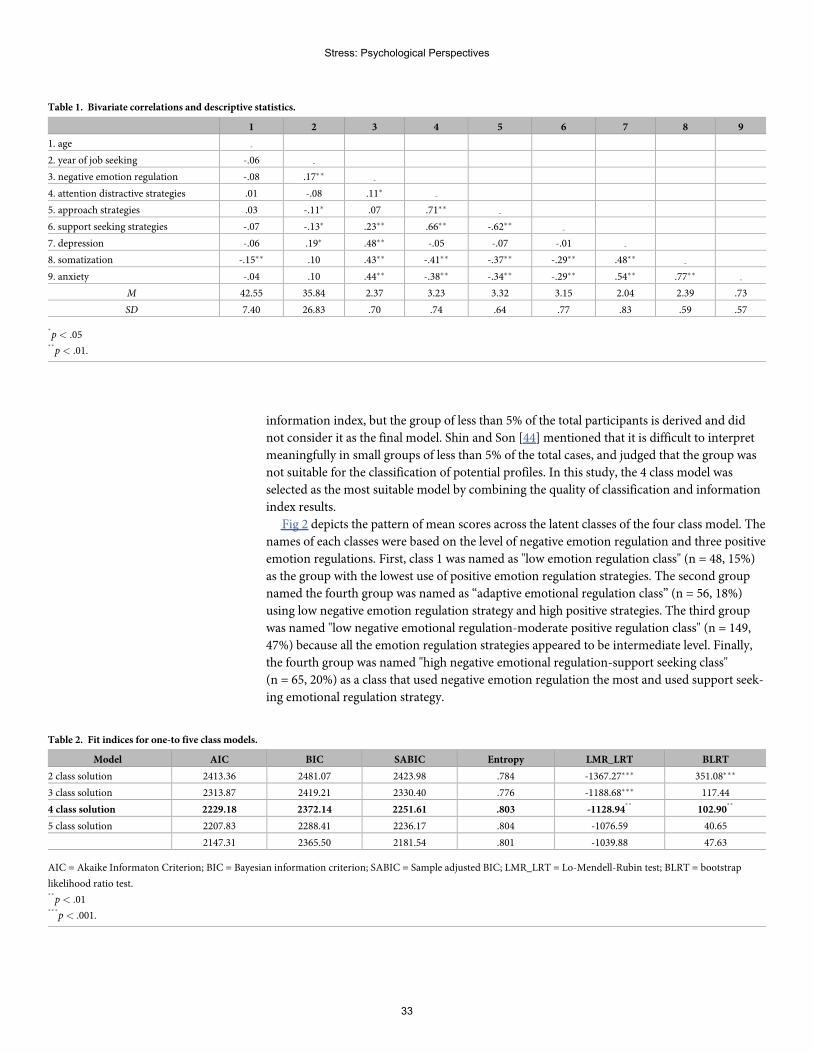
information index, but the group of less than 5% of the total participants is derived and did
not consider it as the final model. Shin and Son [44] mentioned that it is difficult to interpret
meaningfully in small groups of less than 5% of the total cases, and judged that the group was
not suitable for the classification of potential profiles. In this study, the 4 class model was
selected as the most suitable model by combining the quality of classification and information
index results.
Fig 2 depicts the pattern of mean scores across the latent classes of the four class model. The
names of each classes were based on the level of negative emotion regulation and three positive
emotion regulations. First, class 1 was named as "low emotion regulation class" (n = 48, 15%)
as the group with the lowest use of positive emotion regulation strategies. The second group
named the fourth group was named as “adaptive emotional regulation class” (n = 56, 18%)
using low negative emotion regulation strategy and high positive strategies. The third group
was named "low negative emotional regulation-moderate positive regulation class" (n = 149,
47%) because all the emotion regulation strategies appeared to be intermediate level. Finally,
the fourth group was named "high negative emotional regulation-support seeking class"
(n = 65, 20%) as a class that used negative emotion regulation the most and used support seek-
ing emotional regulation strategy.
Table 1. Bivariate correlations and descriptive statistics.
1 2 3 4 5 6 7 8 9
1. age -
2. year of job seeking -.06 -
3. negative emotion regulation -.08 .17�� -
4. attention distractive strategies .01 -.08 .11� -
5. approach strategies .03 -.11� .07 .71�� -
6. support seeking strategies -.07 -.13� .23�� .66�� -.62�� -
7. depression -.06 .19� .48�� -.05 -.07 -.01 -
8. somatization -.15�� .10 .43�� -.41�� -.37�� -.29�� .48�� -
9. anxiety -.04 .10 .44�� -.38�� -.34�� -.29�� .54�� .77�� -
M 42.55 35.84 2.37 3.23 3.32 3.15 2.04 2.39 .73
SD 7.40 26.83 .70 .74 .64 .77 .83 .59 .57
�
p< .05��
p< .01.
Table 2. Fit indices for one-to five class models.
Model AIC BIC SABIC Entropy LMR_LRT BLRT
2 class solution 2413.36 2481.07 2423.98 .784 -1367.27��� 351.08���
3 class solution 2313.87 2419.21 2330.40 .776 -1188.68��� 117.44
4 class solution 2229.18 2372.14 2251.61 .803 -1128.94��
102.90��
5 class solution 2207.83 2288.41 2236.17 .804 -1076.59 40.65
2147.31 2365.50 2181.54 .801 -1039.88 47.63
AIC = Akaike Informaton Criterion; BIC = Bayesian information criterion; SABIC = Sample adjusted BIC; LMR_LRT = Lo-Mendell-Rubin test; BLRT = bootstrap
likelihood ratio test.��
p< .01���
p< .001.
Stress: Psychological Perspectives
33
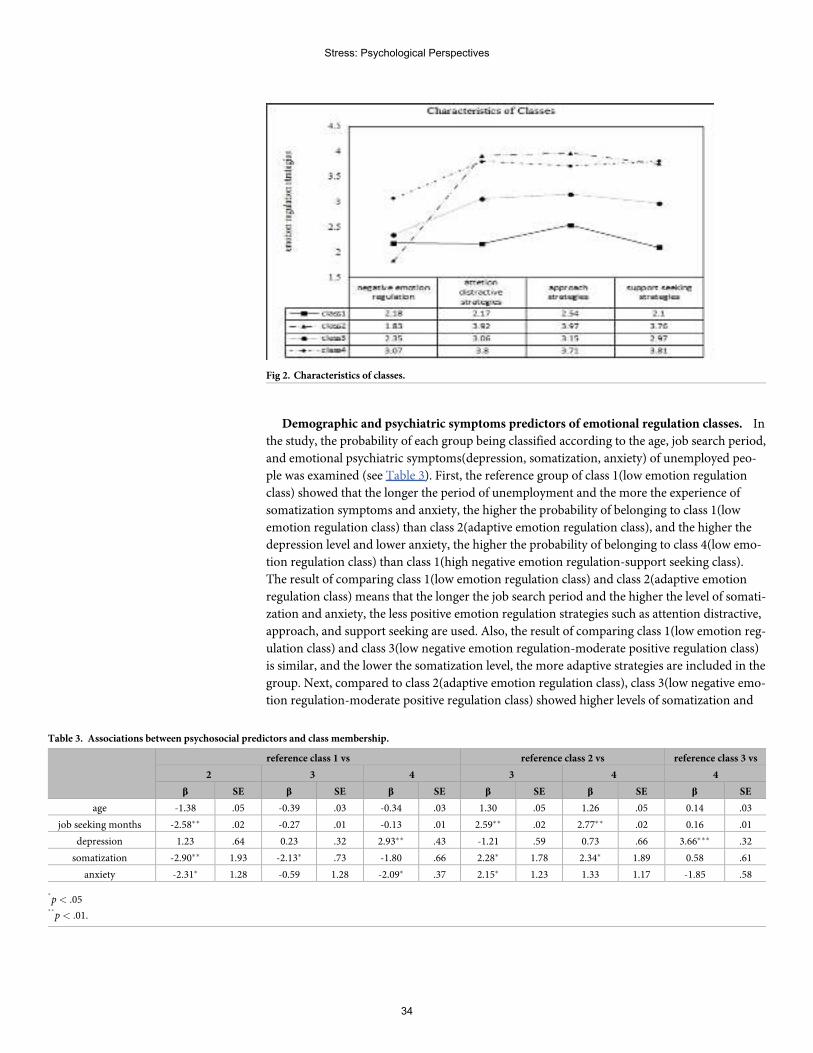
Demographic and psychiatric symptoms predictors of emotional regulation classes. In
the study, the probability of each group being classified according to the age, job search period,
and emotional psychiatric symptoms(depression, somatization, anxiety) of unemployed peo-
ple was examined (see Table 3). First, the reference group of class 1(low emotion regulation
class) showed that the longer the period of unemployment and the more the experience of
somatization symptoms and anxiety, the higher the probability of belonging to class 1(low
emotion regulation class) than class 2(adaptive emotion regulation class), and the higher the
depression level and lower anxiety, the higher the probability of belonging to class 4(low emo-
tion regulation class) than class 1(high negative emotion regulation-support seeking class).
The result of comparing class 1(low emotion regulation class) and class 2(adaptive emotion
regulation class) means that the longer the job search period and the higher the level of somati-
zation and anxiety, the less positive emotion regulation strategies such as attention distractive,
approach, and support seeking are used. Also, the result of comparing class 1(low emotion reg-
ulation class) and class 3(low negative emotion regulation-moderate positive regulation class)
is similar, and the lower the somatization level, the more adaptive strategies are included in the
group. Next, compared to class 2(adaptive emotion regulation class), class 3(low negative emo-
tion regulation-moderate positive regulation class) showed higher levels of somatization and
Fig 2. Characteristics of classes.
Table 3. Associations between psychosocial predictors and class membership.
reference class 1 vs reference class 2 vs reference class 3 vs
2 3 4 3 4 4
β SE β SE β SE β SE β SE β SE
age -1.38 .05 -0.39 .03 -0.34 .03 1.30 .05 1.26 .05 0.14 .03
job seeking months -2.58�� .02 -0.27 .01 -0.13 .01 2.59�� .02 2.77�� .02 0.16 .01
depression 1.23 .64 0.23 .32 2.93�� .43 -1.21 .59 0.73 .66 3.66��� .32
somatization -2.90�� 1.93 -2.13� .73 -1.80 .66 2.28� 1.78 2.34� 1.89 0.58 .61
anxiety -2.31� 1.28 -0.59 1.28 -2.09� .37 2.15� 1.23 1.33 1.17 -1.85 .58
�
p< .05��
p< .01.
Stress: Psychological Perspectives
34
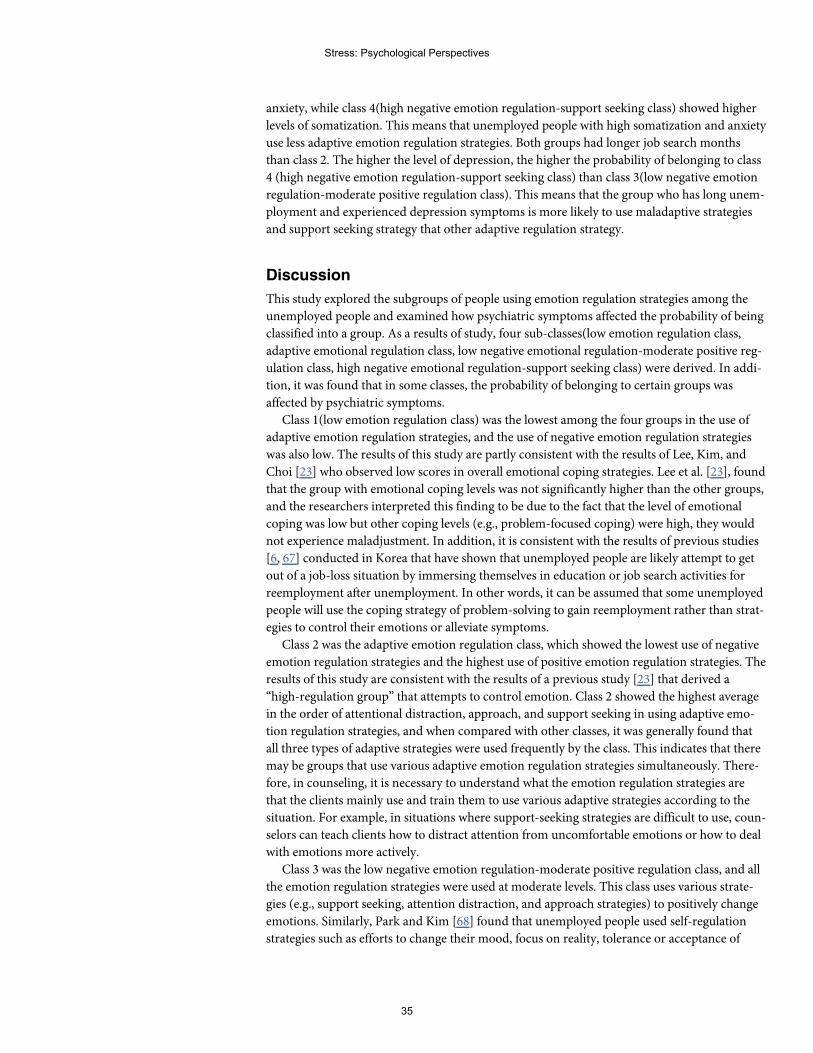
anxiety, while class 4(high negative emotion regulation-support seeking class) showed higher
levels of somatization. This means that unemployed people with high somatization and anxiety
use less adaptive emotion regulation strategies. Both groups had longer job search months
than class 2. The higher the level of depression, the higher the probability of belonging to class
4 (high negative emotion regulation-support seeking class) than class 3(low negative emotion
regulation-moderate positive regulation class). This means that the group who has long unem-
ployment and experienced depression symptoms is more likely to use maladaptive strategies
and support seeking strategy that other adaptive regulation strategy.
Discussion
This study explored the subgroups of people using emotion regulation strategies among the
unemployed people and examined how psychiatric symptoms affected the probability of being
classified into a group. As a results of study, four sub-classes(low emotion regulation class,
adaptive emotional regulation class, low negative emotional regulation-moderate positive reg-
ulation class, high negative emotional regulation-support seeking class) were derived. In addi-
tion, it was found that in some classes, the probability of belonging to certain groups was
affected by psychiatric symptoms.
Class 1(low emotion regulation class) was the lowest among the four groups in the use of
adaptive emotion regulation strategies, and the use of negative emotion regulation strategies
was also low. The results of this study are partly consistent with the results of Lee, Kim, and
Choi [23] who observed low scores in overall emotional coping strategies. Lee et al. [23], found
that the group with emotional coping levels was not significantly higher than the other groups,
and the researchers interpreted this finding to be due to the fact that the level of emotional
coping was low but other coping levels (e.g., problem-focused coping) were high, they would
not experience maladjustment. In addition, it is consistent with the results of previous studies
[6, 67] conducted in Korea that have shown that unemployed people are likely attempt to get
out of a job-loss situation by immersing themselves in education or job search activities for
reemployment after unemployment. In other words, it can be assumed that some unemployed
people will use the coping strategy of problem-solving to gain reemployment rather than strat-
egies to control their emotions or alleviate symptoms.
Class 2 was the adaptive emotion regulation class, which showed the lowest use of negative
emotion regulation strategies and the highest use of positive emotion regulation strategies. The
results of this study are consistent with the results of a previous study [23] that derived a
“high-regulation group” that attempts to control emotion. Class 2 showed the highest average
in the order of attentional distraction, approach, and support seeking in using adaptive emo-
tion regulation strategies, and when compared with other classes, it was generally found that
all three types of adaptive strategies were used frequently by the class. This indicates that there
may be groups that use various adaptive emotion regulation strategies simultaneously. There-
fore, in counseling, it is necessary to understand what the emotion regulation strategies are
that the clients mainly use and train them to use various adaptive strategies according to the
situation. For example, in situations where support-seeking strategies are difficult to use, coun-
selors can teach clients how to distract attention from uncomfortable emotions or how to deal
with emotions more actively.
Class 3 was the low negative emotion regulation-moderate positive regulation class, and all
the emotion regulation strategies were used at moderate levels. This class uses various strate-
gies (e.g., support seeking, attention distraction, and approach strategies) to positively change
emotions. Similarly, Park and Kim [68] found that unemployed people used self-regulation
strategies such as efforts to change their mood, focus on reality, tolerance or acceptance of
Stress: Psychological Perspectives
35
negative emotions, and efforts to stabilize emotions. The present study showed that, in this
class, adaptive emotion regulation strategies are used evenly and involve individual adaptive
efforts to control negative emotions. This class most reflects the cultural characteristics of
Korea. In the case of the Korean people, they recognize their efforts as very important factors
when coping with stress situations. Those who are unemployed try to overcome their difficul-
ties by overcoming the related psychological difficulties.
Class 4 was the negative emotion regulation-support seeking class, which was the highest in
the use of negative emotion regulation and the group that used support-seeking strategies
most frequently among the adaptive emotion regulation strategies. The results of this study are
partly consistent with the results of Lee et al. [23] who derived the "high divergence behavior
group" with high negative behavior. Class 3 group is a group that blames others to control neg-
ative emotions in the unemployed situation or emits emotions in a safe situation, and uses neg-
ative methods such as rumination and addictive behavior.
As a result of examining the probability of being classified into each group according to
demographic characteristics and psychological symptoms, the higher the somatization level,
the higher the probability of being classified into class 1 (low emotion regulation class) than
class 3(low negative emotion regulation-moderate positive regulation class). It means that the
level of somatization is high and it is difficult to use support seeking, attention dispersion, and
approach strategy. The results of this study are similar to those of a previous study [69] that
found that people with high somatization symptoms are too careful to notice, amplify, per-
ceive, or be caught up in symptoms and interpret the problem as physical causes. Lee, Lee,
Yoon, Yang, Mun, Jung, and Eun [70] reported that patients who experienced somatization
symptoms may have lower the use of the overall emotion regulation strategy because it attri-
butes everything to the problem of the body rather than the attempt to control the emotion.
Class 2(adaptive emotion regulation class) was a group with a high probability of belonging
to people with low psychological symptoms. Specifically, when compared with class 3(low neg-
ative emotion regulation class), the lower the level of anxiety, the higher the probability of
belonging to class 2. This suggests that the higher the level of anxiety, the less the probability of
using adaptive emotion regulation strategies and the less the attempt to recognize or control
emotions [36].
Class 3 (low negative emotion regulation-moderate positive regulation class) was lower in
depression level than class 4 (negative emotion regulation-support seeking class). In other
words, depressed people use maladaptive strategies more frequently and prefer help-seeking
strategies rather than emotional regulation strategies such as attentional dispersion or
approach. These results are consistent with the results of previous studies [17, 20] that showed
that depressed people use more negative emotional regulation strategies such as rumination
and use limited active strategies such as problem solving and cognitive reconstruction.
The theoretical implications of this study are as follows. First, this study divided emotion
regulation strategies into maladaptive strategy, attentional distraction strategy, approach strat-
egy, and support-seeking strategy and examined which subgroup was formed according to
emotion regulation strategies. This is meaningful in that it extended existing studies on emo-
tion regulation strategies through a person-centered approach, assuming that everyone can
use various emotion regulation strategies beyond the existing variable-centered approach that
examined the relationship between the subtypes of emotion regulation strategies and psychiat-
ric symptoms. In particular, it is meaningful that people mainly use some types of emotion reg-
ulation strategies and look at the characteristics of each type. Second, there have been claims
that psychiatric symptoms is connected to the problem of emotion regulation strategies, and
although emotion regulation related studies are actively conducted, there are limited studies
on the relationship between various mental disorders and emotion regulation strategies.
Stress: Psychological Perspectives
36
Through this study, we examined the possibility of people with psychiatric symptoms being
classified into types according to the use of emotion regulation strategies, and it is expected
that it will be possible to understand emotion regulation strategies of people with psychiatric
symptoms in counseling and treatment and to intervene in efficiently controlling emotions.
This study has the following practical implications: First, it was found that unemployed
people can experience various psychological difficulties such as depression, anxiety, and soma-
tization after job loss, and they may employ different emotion regulation strategies depending
on the types of psychiatric symptoms. Recently, emotion regulation studies [61, 71] have men-
tioned that various emotion regulation strategies need to be used in accordance with context
or situation, and negative strategies may have a positive effect in specific situations. Therefore,
it is necessary to help the unemployed to have complementary emotion regulation strategies
by exploring how they regulate their emotions according to psychological difficulties and how
these emotion regulation strategies can be linked to the difficulties or long-term unemploy-
ment that they experience after the unemployment. For example, unemployed people with
high depression often use negative emotion regulation strategies, whereas only support-seek-
ing strategies among positive emotion regulation strategies are likely to be classified as high
groups. Therefore, it is necessary for unemployed people with high depression to lower nega-
tive emotion regulation strategies and to increase various emotion regulation strategies, such
as attentional distraction and approach emotion regulation strategy.
Second, in this study, group with relatively high anxiety showed less use of emotion regula-
tion strategies than adaptive group. In other words, unemployed people with high anxiety are
more likely to engage in problem-solving behavior, such as constantly trying to find a job or
receiving necessary re-education rather than recognizing and solving their emotions. In
counseling, it is necessary to examine the health of the group from a long-term perspective,
and if necessary to lower the level of anxiety and to intervene in using adaptive emotion regu-
lation strategies.
Finally, in the case of the most adaptive group, group 2, negative emotion regulation strate-
gies were used the least, whiles approach strategy, attention distractive strategy, and support-
seeking strategy were used evenly. Moreover, this study showed that when the use of negative
emotion regulation strategies of unemployed people is similarly low, the lower the somatiza-
tion and anxiety, the more likely they are to be classified as a group that uses positive emotion
regulation strategies. This means that positive emotional regulation strategies can have a posi-
tive effect on somatization and anxiety regardless of the level of negative emotional regulation
strategies. The results of this study are somewhat different from the results of previous studies
[49] which showed significant relationship between positive emotional regulation and psycho-
logical problems only when negative emotional regulation strategies are high. Rather, This
means that positive emotional regulation strategies are likely to be linked to specific psychiatric
symptoms such as negative emotional regulation strategies. In counseling, it is necessary to
teach the client how to use the most efficient emotion regulation strategies according to the sit-
uation of the client rather than teaching only one of these emotion regulation strategies. Specif-
ically, it is necessary for unemployed people to recognize their emotions, use the most
appropriate emotion regulation strategy for the situation, and develop the emotion regulation
ability to objectively evaluate the reduction of negative emotions.
Despite these implications, this study has the following limitations. First, the unemployed
people who participated in this study may have had more desire to find a job compared with
others because they participated in training programs such as the Women’s Job Center and the
Vocational Education Center under the Ministry of Labor. In previous studies [46, 72], the
presence of psychological symptoms was significantly different according to job search status
and duration of unemployment. Second, since this study was a study conducted in Korea, it is
Stress: Psychological Perspectives
37
necessary to consider the cultural background when interpreting the results. In Korea, the fear
and helplessness experienced during the financial crisis of 1997 had lasting effects, and the psy-
chological difficulties experienced by heads of households who cannot provide for their fami-
lies economically can be severe because of the patriarchal nature of the culture. In addition,
because a long-term social security system for unemployed people is not yet established and
fragmentary support is being provided, the psychological burden on the unemployed in Korea
is higher than that of the unemployed in countries where the social security system is better
established. Next, because the definition and measurement tools of emotion regulation strate-
gies change with the researcher, it is necessary to considering the concepts and subtypes of
emotion regulation strategies used in this study when interpreting the results. In particular,
this study measured negative emotion regulation strategies as one factor based on Lee &
Kwon’s [73] findings, but it includes various types of negative emotion regulation strategies,
such as blaming others, emotional expression in a safe situation, and addictive behavior. These
strategies were classified as negative emotion regulation strategies through empirical research,
but for unemployed people, there may be strategies with positive effects in the short term.
Therefore, future studies should examine which groups are derived when more diverse classifi-
cation criteria are used, and negative emotion regulation is treated as more than one factor.
Finally, follow-up studies will need to use scales to measure more diverse mental health and
behavioral problems. For example, according to age group, behavior problems such as Internet
addiction may occur more frequently in young adults [74–76]. Therefore, it is necessary to
examine whether each group according to the emotional regulation strategies of unemployed
people has different behavioral results such as internet addiction and eating disorders.
Author Contributions
Conceptualization:Min Sun Kim.
Formal analysis:Min Sun Kim.
Methodology:Min Sun Kim.
Resources:Min Sun Kim.
Writing – original draft:Min Sun Kim.
Writing – review & editing:Min Sun Kim.
References1. Schmidt SR, Svorny SV. Recent trends in job security and stability. Journal of Labor Research. 1998;
19: 647–668.
2. OECD. OECD Employment Outlook 2018. OECD Publishing, Paris; 2018. Available from: http://dx.doi.org/10.1787/empl_outlook-2018-en.
3. Kim YK, Lee YB, Son SH, Cho SH, Park SA. Diagnosis of family crisis and response strategy accordingto the diversification of social environment. Health and Social Affairs Research Institute; 2016.
4. Fryer D, Payne R. Being unemployed: A review of the literature on the psychological experience ofunemployment. In: Cooper C, Robertson I, editors. International review of industrial and organizationalpsychology. Chichester: Wiley; 1986.
5. Kim YK, Lee YB, Son SH, Cho SH, Park SA. Diagnosis of family crisis and response strategy accordingto the diversification of social environment. Health and Social Affairs Research Institute; 2016.
6. Kim HW. The psychological experience of the unemployed: the effects of critical events and coping pro-cesses (Masters dissertation). Seoul National University, Seoul, Korea. 1999.
7. DeFrank RS, Ivancevich JM. Job loss: An individual level review and model. Journal of VocationalBehavior. 1986; 28(1): 1–20.
Stress: Psychological Perspectives
38
8. Kashdan TB, Rottenberg J. Psychological flexibility as a fundamental aspect of health. Clinical Psychol-ogy Review. 2010; 30: 865–878. https://doi.org/10.1016/j.cpr.2010.03.001 PMID: 21151705
9. Murphy GC, Athanasou JA. The effect of unemployment on mental health. Journal of Occupational andOrganizational Psychology. 1999; 72: 83–99.
10. McKee-Ryan F, Song Z, Wanberg CR, Kinicki AJ. Psychological and physical well-being during unem-ployment: A meta-analytic study. Journal of Applied Psychology. 2005; 90(1): 53–76. https://doi.org/10.1037/0021-9010.90.1.53 PMID: 15641890
11. Kim JT. Relationship between Trait anxiety and social performance: Focused on Spielberger’s STAI(Masters dissertation). Korea University, Seoul, Korea. 1978.
12. Ahn SS, Tak JK, Yoo TY, Han TY, Han YS. A study of the psychological health of unemployed womenin the middle aged group: From Longitudinal data. Korean Psychological Association Conference.2006; 2006(1): 208–209.
13. Cho HS. The effect of family stress on psychological distress in unemployed female head: The interac-tions with family solidarity and coping. Journal of Korean HomeManagement Association. 2000; 18(3):25–37.
14. Kim HJ, Ham KA, Lee DH. Effects of family resilience and active coping strategies on post-traumaticgrowth among the job losers. The Korean Journal of Counseling and Psychotherapy. 2014; 26(3): 787–806.
15. Shin JS, Lee YB. The effects of social supports on psychosocial well-being of the unemployed. KoreanJournal of Social Welfare. 1999; 37(4): 241–269.
16. Gross JJ. Emotion regulation affective, cognitive, and social consequences. Psychophysiology. 2002;39: 281–291. https://doi.org/10.1017/s0048577201393198 PMID: 12212647
17. Aldao A, Nolen-Hoeksema S, Schweizer S. Emotion-regulation strategies across psychopathology: Ameta-analytic review. Clinical Psychology Review. 2010; 30: 217–237. https://doi.org/10.1016/j.cpr.2009.11.004 PMID: 20015584
18. Lee JY. The effects of emotion regulation strategies on emotion dysregulation. The Korean Journal ofCounseling and Psychotherapy. 2010; 22(3):821–841.
19. Davey GCL, Levy S. Catastrophic worrying: Personal inadequacy and a perseverative iterative style asfeatures of the catastrophizing process. Journal of Abnormal Psychology. 1998; 107(4): 576–586.https://doi.org/10.1037//0021-843x.107.4.576 PMID: 9830245
20. Nolen-Hoeksema S. Responses to depression and their effects on the duration of depressive episodes.Journal of Abnormal Psychology. 1991; 100(4): 569. https://doi.org/10.1037//0021-843x.100.4.569PMID: 1757671
21. Silk JS, Steinberg L, Morris AS. Adolescents’ emotion regulation in daily life: Links to depressive symp-toms and problem behavior. Child Development. 2003; 74: 1869–1880. https://doi.org/10.1046/j.1467-8624.2003.00643.x PMID: 14669901
22. Eftekhari A, Zoellner LA, Vigil SA. Patterns of emotion regulation and psychopathology. Anxiety StressCoping. 2009; 22(5): 571–586. https://doi.org/10.1080/10615800802179860 PMID: 19381989
23. Lee DG, Kim HU, Choi HY. Subtypes based on coping through understanding and expression of emo-tion and psychological adjustment. The Journal of the Social and Personality Psychology. 2008; 22(1):63–77.
24. Shin EJ, SonWS. A latent profile analysis of primary students’ homework behavior: homework time andeffort. The Journal of Curriculum and Evaluation. 2019; 22(4):105–126.
25. Bergman LR, Magnusson D. A Person-oriented approach in research on developmental psychopathol-ogy. Development and Psychopathology. 1997; 9: 291–319. https://doi.org/10.1017/s095457949700206x PMID: 9201446
26. Julie D, Raphael T, Anaïs M, Dorine N, Gregory N. Coping profiles, perceived stress and health-relatedbehaviors: a cluster analysis approach. Health Promotion International. 2015; 30(1): 88–100. https://doi.org/10.1093/heapro/dau090 PMID: 25324530
27. Tam VC. Coping profiles among Chinese adolescents in Hong Kong: a person-centered approach.International Journal of Adolescent Medicine and Health. 2008; 20(1): 73-83. https://doi.org/10.1515/ijamh.2008.20.1.73 PMID: 18540286
28. Campbell-Sills DH, Barlow TA, Brown SG, Hofmann. Conscious appraisal and suppression of negativeaffect in individuals with anxiety and mood disorders. Manuscript submitted for publication; 2003.
29. Garnefski N, Kraaij V. Relationships between cognitive emotion regulation strategies and depressivesymptoms: A comparative study of five specific samples. Personality and Individual Differences. 2006;40(8): 1659–1669.
Stress: Psychological Perspectives
39
30. Garnefski N, Kraaij V. The Cognitive Emotion Regulation Questionnaire: Psychometric features andprospective relationships with depression and anxiety in adults. European Journal of PsychologicalAssessment. 2007; 23: 141–149.
31. Garnefski N, Kraaij V, Spinhoven PH. Negative life events, cognitive emotion regulation and depres-sion. Personality and Individual Differences. 2001; 30(8): 1311–1327.
32. Gross JJ, John OP. Individual differences in tow emotion regulation processes: implications for affect,relationships, and well-being. Journal of Personality and Social Psychology. 2003; 85(2): 348–362.https://doi.org/10.1037/0022-3514.85.2.348 PMID: 12916575
33. Gross JJ. The emerging field of emotion regulation: An intergrative review. Review of General Psychol-ogy. 1998; 2(3): 271–299.
34. Joormann J, Gotlib IH. Emotion regulation in depression: Relation to cognitive inhibition. Cogn Emot.2010; 24(2): 281–298. https://doi.org/10.1080/02699930903407948 PMID: 20300538
35. Ochsner KN, Bunge SA, Gross JJ, Gabrieli JD. Rethinking feelings: An fMRI study of the cognitive regu-lation of emotion. Journal of Cognitive Neuroscience. 2002; 14(8): 1215–1229. https://doi.org/10.1162/089892902760807212 PMID: 12495527
36. Carver CS, Scheier MF, Weintraub JK. Assessing coping strategies: a theoretically based approach.Journal of personality and social psychology. 1989; 56(2): 267–283. https://doi.org/10.1037//0022-3514.56.2.267 PMID: 2926629
37. Barlow DH. Unraveling the mysteries of anxiety and its disorders from the perspective of emotion the-ory. American Psychologist. 2000; 55(11): 1247. https://doi.org/10.1037//0003-066x.55.11.1247 PMID:11280938
38. Shin AY, Chae JH. Emotion regulation Strategies in patients with depressive and anxiety disorders.Cognitive Behavior Therapy. 2011; 11(1): 41–52.
39. Shin HK. The Interpretation, inference, and memory biases of bodily sensations in somatization group.Ph.D. thesis of Seoul National University; 1998.
40. Beiser M. Components and correlates of mental well-being. Journal of Health and Social Behavior.1974; 15(4): 320–327. PMID: 4455735
41. Harding SD. Psychological well-being in great Britain: An evaluation of the Bradburn Affect BalanceScale. Personality and Individual Differences. 1982; 3(2): 167–175.
42. Watson D, Pennebaker JW. Health complaints, stress, and distress: Exploring the central role of nega-tive affectivity. Psychological Review. 1989; 96(2): 234–254. https://doi.org/10.1037/0033-295x.96.2.234 PMID: 2710874
43. Kang HJ. The relationship among self-discrepancies, emotion, and physical symptoms. Korean Journalof Psychology: Health. 2000; 5(2): 193–208.
44. Shin HK. The effect of negative affect and the moderating effects of emotional expressiveness and self-concept on adolescent‘s experience of somatic symptoms. Korean Journal of Clinical Psychology.2006; 25(3): 727–746.
45. Pennebaker JW, Kiecolt-Glaser JK, Glaser R. Disclosure of traumas and immune function: Health impli-cations for psychotherapy. Journal of Consulting and Clinical Psychology. 1988; 56(2): 239–245.https://doi.org/10.1037//0022-006x.56.2.239 PMID: 3372832
46. Martin JB. The stress-alexithymia hypothesis: Theoretical and empirical considerations. Psychotherapyand Psychosomatics. 1985; 43(4): 169–176. https://doi.org/10.1159/000287876 PMID: 4034888
47. Waller E, Scheidt CE. Somatoform disorders as disorders of affect regulation: A development perspec-tive. International Review of Psychiatry. 2006; 18(1): 13–24. https://doi.org/10.1080/09540260500466774 PMID: 16451876
48. Schafer JO, Naumann E, Holmes EA, Tuschen-Caffier B, Samson AC. Emotion regulation strategies indepressive and anxiety symptoms in youth: A meta-analytic review. Journal of Youth and Adolescence.2017; 46(2): 261-276. https://doi.org/10.1007/s10964-016-0585-0 PMID: 27734198
49. Aldao A, Nolen-Hoeksema S. When are adaptive strategies most predictive of psychopathology? Jour-nal of Abnormal Psychology. 2012; 121(1): 276–281. https://doi.org/10.1037/a0023598 PMID:21553934
50. Rottweiler AL, Taxer JL, Nett UE. Context matters in the effectiveness of emotion regulation strategies.AERAOpen. 2018; 4(2): 1–13.
51. Westphal M, Seivert NH, Bonanno GA. Expressive flexibility. Emotion. 2010; 10(1): 92–100. https://doi.org/10.1037/a0018420 PMID: 20141306
52. Lee JY, Kwon SM. Development of the Emotion Regulation Strategy Questionnaire. Korean Journal ofClinical Psychology. 2007; 26(4): 963–976.
Stress: Psychological Perspectives
40
53. Lee JY, Kwon SM. The relationship between emotional disorders and emotion regulation strategies.Korean Journal of Clinical Psychology. 2009; 28(1): 245–261.
54. Lee JY, Kwon SM. The effect of experiential emotion regulation strategies. The Korean Journal ofCounseling and Psychotherapy. 2010; 22(1): 95–116.
55. Beck AT. Depression: Clinical, experimental and theoretical aspects. New York: Harper & Row; 1967.
56. Lee YH, Song JY. A study of the reliability and the validity of the BDI, SDS, and MMPI-D Scales. KoreanJournal of Clinical Psychology. 1991; 10(1): 98–113.
57. ZungWWK. A self-rating depression scale. Archives of General Psychiatry. 1965; 12: 63–70. https://doi.org/10.1001/archpsyc.1965.01720310065008 PMID: 14221692
58. Hathaway SR, McKinley JC. A multiphasic personality schedule (Minnesota). The measurement ofsymptomatic depression. Journal of Psychology. 1948; 4: 73–84.
59. Kim KI, Kim JH, Won HT. Symptom checklist-90-revision implementation summary. Seoul: SogangUniversity Social Problem Research Institute; 1984.
60. Derogatis LR. SCL-90-R Administration, scoring and procedures manual. Baltimore, MD Clinical Psy-chometric Research; 1977.
61. Spielberger CD. Manual for the State-Trait Anxiety Inventory. Palo alto, CA, Consulting PsychologistPress; 1970.
62. Clark SL. Mixture modeling with behavioral data Doctoral dissertation. University of California; LosAngeles: 2010.
63. Akaike H. A new look at the statistical model identification. IEEEE Transactions on Automatic Control.1974; 19: 716–723.
64. Schwarz G. Estimating the dimension of a model. Annals of Statistics. 1978; 6(2): 461–464.
65. Lo Y, Mendell NR, Rubin DB. Testing the number of components in a normal mixture. Biometrika. 2001;88: 767–778.
66. McLachlan G, Peel D. Finite mixture models. New York, NY: JohnWiley; 2000.
67. Na HS. Phenomenological Study for re-employment process for the Unemployed (Doctoral disserta-tion). Baekseok University, Cheonan, Korea; 2012.
68. Park YS, Kim UC. The experience of stressful life—events, coping strategies, and social supportamong salaried employees and the unemployed: An indigenous analysis. Korean Journal of Psychol-ogy: Social Issues. 2000; 6(1): 85–117.
69. Barsky AJ, Geringer E, Wool CA. A cognitive-educational treatment for hypochondriasis. General Hos-pital Psychiatry; 1988; 10(5): 322–327. https://doi.org/10.1016/0163-8343(88)90003-5 PMID: 3049228
70. Lee JY, LeeMS, Yoon JS, Yang JC, Mun JU, Jung HW, et al. The stress coping strategies and psycho-logical characteristics in patients with somatization disorder. J Korean Neuropsychiatr Assoc. 2006; 45(6): 534–540.
71. Lee JA. Men in crisis. . . The number of men in their 30s and 40s has increased, despite the decrease insuicide rates since 2009. Donga Science. 2019 February 7[Cited 2020 January 1]. Available from:http://dongascience.donga.com/news.php?idx=26693
72. Martin RC, Dahlen ER. Cognitive emotion regulation in the prediction of depression, anxiety, stress,and anger. Personality and Individual Differences. 2005; 39(7): 1249–1260.
73. Lee JY, Kwon SM. Relationship between emotion regulation and psychopathology: recent researchtrends and future research tasks. The Korean Journal of Counseling and Psychotherapy. 2006; 18(3):461–493.
74. Cimino S, Cerniglia L. A longitudinal study for the empirical validation of an etiopathogenetic model ofinternet addiction in adolescence based on early emotion regulation. BioMed research international.2018; 1–9.
75. Kim K, Lee H, Hong JP, et al. Poor sleep quality and suicide attempt among adults with internet addic-tion: A nationwide community sample of Korea. PLOSOne. 2017; 12(4):e0174619. https://doi.org/10.1371/journal.pone.0174619 PMID: 28384238
76. Lee JY. Differences in emotion regulation as a function of age from adolescence to adulthood. KoreanJournal of Psychology: General. 2012; 31(3): 783–808.
Stress: Psychological Perspectives
41
Variation of stress levels, burnout, andresilience throughout the academic year infirst-year medical students
Richard K. Jordan☯, Shivam S. Shah☯, Harsh Desai☯, Jennifer Tripi☯, Anthony Mitchell,
Randall G. WorthID*
Department of Medical Microbiology & Immunology, University of Toledo College of Medicine & Life Sciences,Toledo, OH, United States of America
☯ These authors contributed equally to this work.
Abstract
Medical student wellness is of great concern in the health care field. A growing number of
studies point to increases in suicide, depression, anxiety, mood disorders, and burnout
related to physician lifestyles. Mental health issues commencing in medical school have
been suggested to have a significant impact on future physician lifestyle and burnout. Track-
ing the mental health of medical students at the University of Toledo College of Medicine
and Life Sciences (UTCOMLS) with standardized indices will help elucidate triggers of poor
mental health. Anonymous surveys were developed and distributed to preclinical medical
students at five strategic time points throughout the 2018 2019 academic year. Surveys col-
lected basic demographic information as well as inventories measuring perceived stress,
burnout, resilience, and mindfulness. 172 M1s (83 males and 89 females) were included in
the study and average response rate for the first 4 (out of 5) surveys averaged 74.8%. M1
males and females had on average increased personal burnout over time with females con-
sistently scoring higher. Both males and females had an increase in stress from August to
each subsequent month (p<0.05). Females reported a higher level of perceived stress than
males in the beginning and middle of the academic year (p<0.05). Both males and females
report a gradual decrease in resiliency throughout the academic year. These surveys dem-
onstrated over half of males and females in medical school reported higher perceived stress
scores than their gender-matched peers in the general United States population. Our study
strengthens documented trends in resiliency, perceived stress, and burnout amongst medi-
cal students. More study in designing targeted approaches to ameliorate these findings in
the medical student population is warranted.
Introduction
Medical student mental health is a topic of increasing concern as burnout rates and depression
have been on the rise [1]. Moreover, poor mental wellness outcomes among physicians in the
workplace are becoming more prevalent. With increasing research in this area, it’s become
Editor: Kenji Hashimoto, Chiba Daigaku, JAPAN
Funding: RGWwas supported in part by a grant
from the NIH/NHLBI (HL122401).
Competing interests: The authors have declared
that no competing interests exist.
4
42
clear that mental health issues arise in medical school and may have a significant impact on
future mental wellness of physicians [2].
A recent systematic review of 195 articles illustrated an overall prevalence of 11.1% for sui-
cidal ideation in medical students, and among students who screened positive for depression,
only 15.7% sought treatment [3]. In another large study with a 35% participation rate from all
medical students nationwide, 44.6% of medical students scored high on the burnout index,
28.0% reported an intermediate burnout level, 58.2% screened positive for depression, and
9.4% of medical students had suicidal ideation within the past 12 months. Finally, 57.7% of
medical students reported high fatigue [4]. Poor mental health potentially has adverse conse-
quences on the ability to learn, subsequently impacting academic performance [5]. These data
present an alarming picture, especially given the high rates of subsequent depression, burnout,
and suicide amongst American physicians [6].
There are multiple proposed reasons why indicators of poor mental health are more preva-
lent amongst the general medical student population. The rigor of current medical education,
curricular format, the belief that students must be ‘strong’ enough to handle stress to succeed,
and the lack of attention given to mental health in comparison to physical health problems are
all contributing factors [4].
The current literature is controversial regarding sex discrepancies in mental health among
medical students. In a large national longitudinal study of a cohort of medical students sur-
veyed in 2010, Hadman et al. analyzed the risk of depressive symptoms and mental health bur-
den among women at the start of medical school, as compared to their male counterparts
[7,8]. They reported that female medical students experienced a higher mental health burden
compared to males. These findings were alarming given this was a group of first-year medical
students, and other studies suggest that their mental health will continue to decline [5]. Addi-
tional studies comparing depressive symptoms by sex are inconclusive, showing either no dif-
ference by sex or higher rates among females [9].
Finding positive relationships and effective interventions is important to improve the well-
ness of medical students. This will allow them to reach their full potential academically, clini-
cally, and personally. The goal of our study is to better understand the trends and variations of
stress, burnout, and resilience throughout the academic year in first-year medical students at
the University of Toledo College of Medicine and Life Sciences (UTCOMLS). Further, we
aimed to understand the relationship between sex and mental health burden in medical school.
Data collected from this study serves as a driving force to provide evidence-based interventions
supporting medical students in preventing or overcoming mental health challenges and miti-
gating the risk of depression and burnout. The survey instrument will continue to be adminis-
tered throughout medical students’ training at the UTCOMLS to allow a longitudinal
understanding of time points in the curriculum where the mental health of students may be at
highest risk.
Methods
A cross-sectional study of 700 students at the UTCOMLS were asked to complete a 53-ques-
tion survey. The survey was optional, and responses were kept anonymous. There was no
incentive attached to completing the survey. The only criteria that had to be met to participate
in this study was enrollment in the UTCOMLS MD program. This study was conducted after
approval from the UTCOMLS Institutional Review Board (IRB). Our data focused on the first-
year medical students’ (M1) responses to the survey.
Data collection was completed using an electronic survey emailed to all students at five set
time points during the year. The survey was sent to M1s in August, the beginning of the
Stress: Psychological Perspectives
43
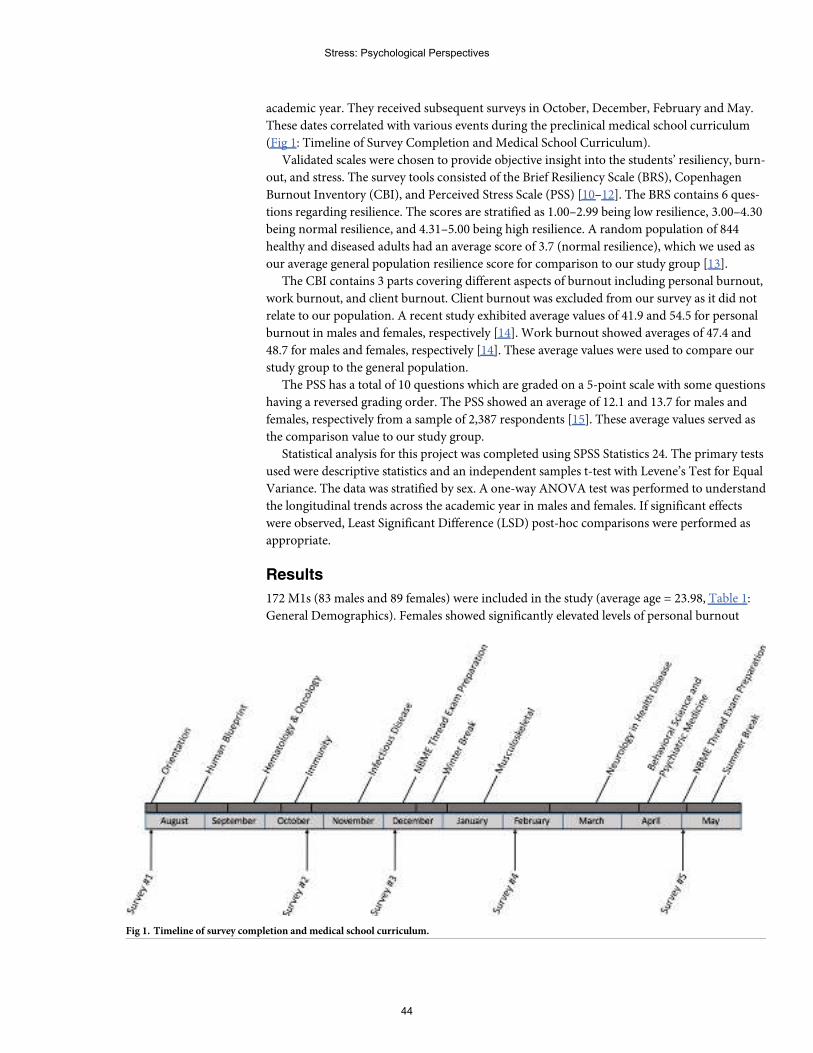
academic year. They received subsequent surveys in October, December, February and May.
These dates correlated with various events during the preclinical medical school curriculum
(Fig 1: Timeline of Survey Completion and Medical School Curriculum).
Validated scales were chosen to provide objective insight into the students’ resiliency, burn-
out, and stress. The survey tools consisted of the Brief Resiliency Scale (BRS), Copenhagen
Burnout Inventory (CBI), and Perceived Stress Scale (PSS) [10–12]. The BRS contains 6 ques-
tions regarding resilience. The scores are stratified as 1.00–2.99 being low resilience, 3.00–4.30
being normal resilience, and 4.31–5.00 being high resilience. A random population of 844
healthy and diseased adults had an average score of 3.7 (normal resilience), which we used as
our average general population resilience score for comparison to our study group [13].
The CBI contains 3 parts covering different aspects of burnout including personal burnout,
work burnout, and client burnout. Client burnout was excluded from our survey as it did not
relate to our population. A recent study exhibited average values of 41.9 and 54.5 for personal
burnout in males and females, respectively [14]. Work burnout showed averages of 47.4 and
48.7 for males and females, respectively [14]. These average values were used to compare our
study group to the general population.
The PSS has a total of 10 questions which are graded on a 5-point scale with some questions
having a reversed grading order. The PSS showed an average of 12.1 and 13.7 for males and
females, respectively from a sample of 2,387 respondents [15]. These average values served as
the comparison value to our study group.
Statistical analysis for this project was completed using SPSS Statistics 24. The primary tests
used were descriptive statistics and an independent samples t-test with Levene’s Test for Equal
Variance. The data was stratified by sex. A one-way ANOVA test was performed to understand
the longitudinal trends across the academic year in males and females. If significant effects
were observed, Least Significant Difference (LSD) post-hoc comparisons were performed as
appropriate.
Results
172 M1s (83 males and 89 females) were included in the study (average age = 23.98, Table 1:
General Demographics). Females showed significantly elevated levels of personal burnout
Fig 1. Timeline of survey completion andmedical school curriculum.
Stress: Psychological Perspectives
44
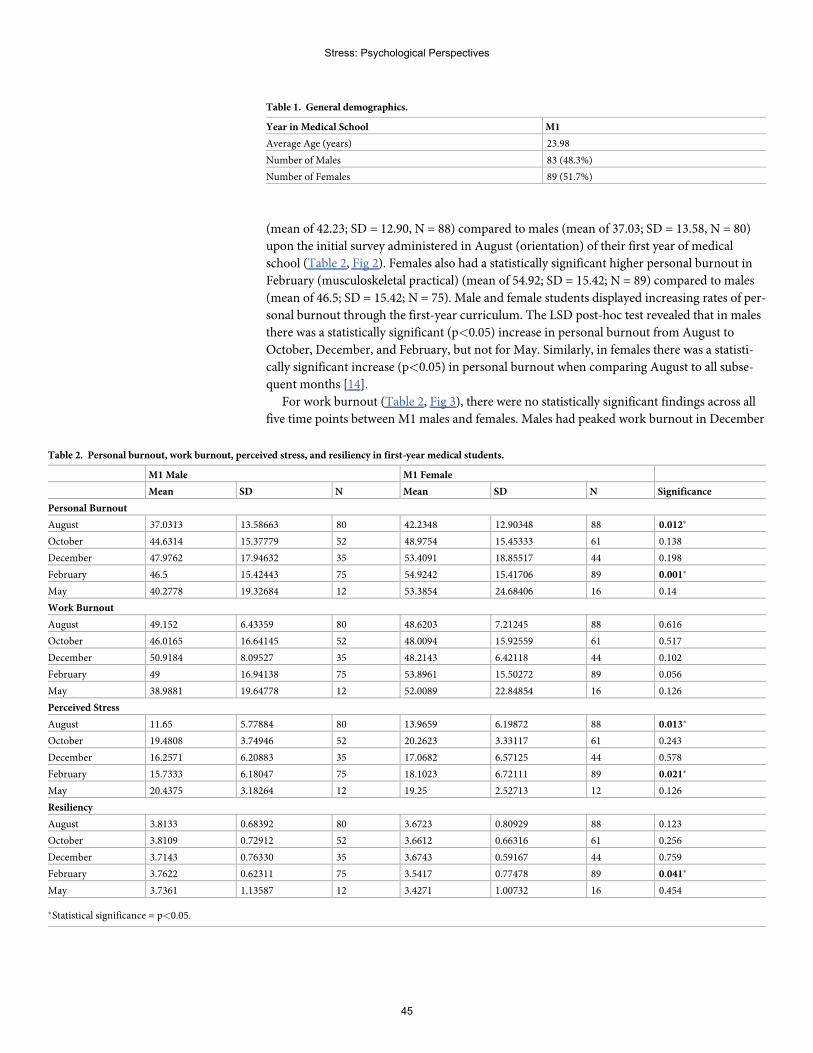
(mean of 42.23; SD = 12.90, N = 88) compared to males (mean of 37.03; SD = 13.58, N = 80)
upon the initial survey administered in August (orientation) of their first year of medical
school (Table 2, Fig 2). Females also had a statistically significant higher personal burnout in
February (musculoskeletal practical) (mean of 54.92; SD = 15.42; N = 89) compared to males
(mean of 46.5; SD = 15.42; N = 75). Male and female students displayed increasing rates of per-
sonal burnout through the first-year curriculum. The LSD post-hoc test revealed that in males
there was a statistically significant (p<0.05) increase in personal burnout from August to
October, December, and February, but not for May. Similarly, in females there was a statisti-
cally significant increase (p<0.05) in personal burnout when comparing August to all subse-
quent months [14].
For work burnout (Table 2, Fig 3), there were no statistically significant findings across all
five time points between M1 males and females. Males had peaked work burnout in December
Table 1. General demographics.
Year in Medical School M1
Average Age (years) 23.98
Number of Males 83 (48.3%)
Number of Females 89 (51.7%)
Table 2. Personal burnout, work burnout, perceived stress, and resiliency in first-year medical students.
M1 Male M1 Female
Mean SD N Mean SD N Significance
Personal Burnout
August 37.0313 13.58663 80 42.2348 12.90348 88 0.012�
October 44.6314 15.37779 52 48.9754 15.45333 61 0.138
December 47.9762 17.94632 35 53.4091 18.85517 44 0.198
February 46.5 15.42443 75 54.9242 15.41706 89 0.001�
May 40.2778 19.32684 12 53.3854 24.68406 16 0.14
Work Burnout
August 49.152 6.43359 80 48.6203 7.21245 88 0.616
October 46.0165 16.64145 52 48.0094 15.92559 61 0.517
December 50.9184 8.09527 35 48.2143 6.42118 44 0.102
February 49 16.94138 75 53.8961 15.50272 89 0.056
May 38.9881 19.64778 12 52.0089 22.84854 16 0.126
Perceived Stress
August 11.65 5.77884 80 13.9659 6.19872 88 0.013�
October 19.4808 3.74946 52 20.2623 3.33117 61 0.243
December 16.2571 6.20883 35 17.0682 6.57125 44 0.578
February 15.7333 6.18047 75 18.1023 6.72111 89 0.021�
May 20.4375 3.18264 12 19.25 2.52713 12 0.126
Resiliency
August 3.8133 0.68392 80 3.6723 0.80929 88 0.123
October 3.8109 0.72912 52 3.6612 0.66316 61 0.256
December 3.7143 0.76330 35 3.6743 0.59167 44 0.759
February 3.7622 0.62311 75 3.5417 0.77478 89 0.041�
May 3.7361 1.13587 12 3.4271 1.00732 16 0.454
�Statistical significance = p<0.05.
Stress: Psychological Perspectives
45
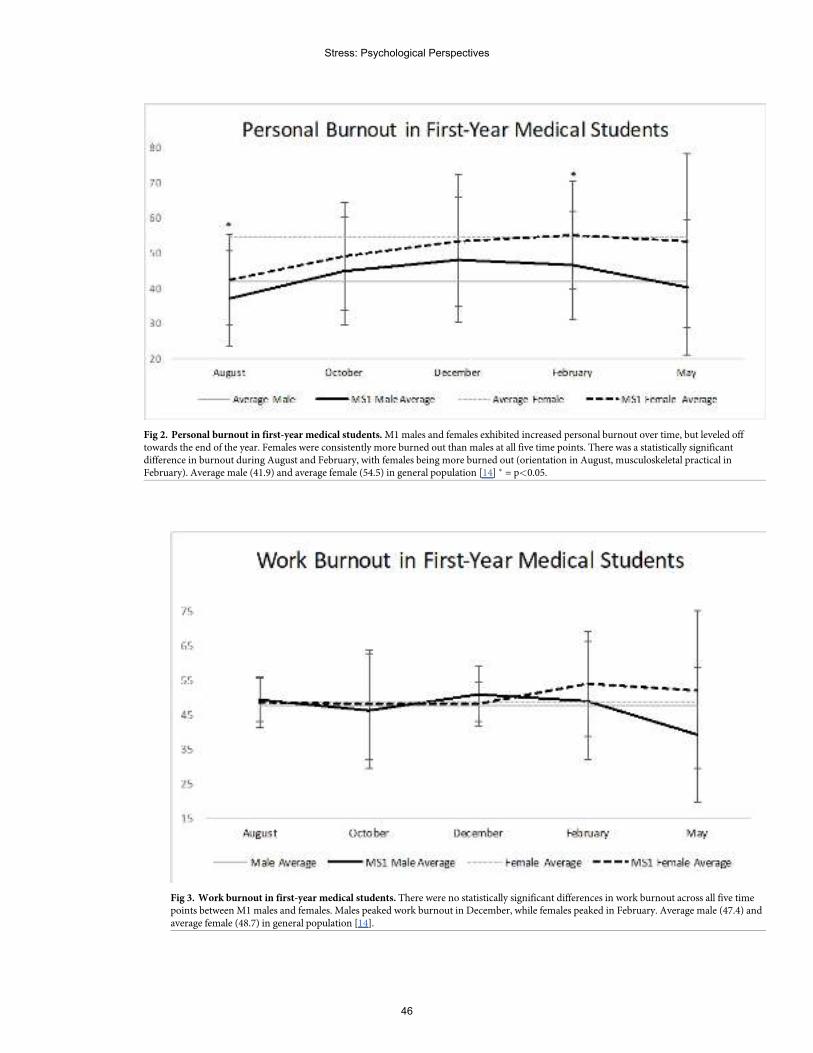
Fig 2. Personal burnout in first-year medical students.M1males and females exhibited increased personal burnout over time, but leveled offtowards the end of the year. Females were consistently more burned out than males at all five time points. There was a statistically significantdifference in burnout during August and February, with females being more burned out (orientation in August, musculoskeletal practical inFebruary). Average male (41.9) and average female (54.5) in general population [14] � = p<0.05.
Fig 3. Work burnout in first-year medical students. There were no statistically significant differences in work burnout across all five timepoints betweenM1males and females. Males peaked work burnout in December, while females peaked in February. Average male (47.4) andaverage female (48.7) in general population [14].
Stress: Psychological Perspectives
46
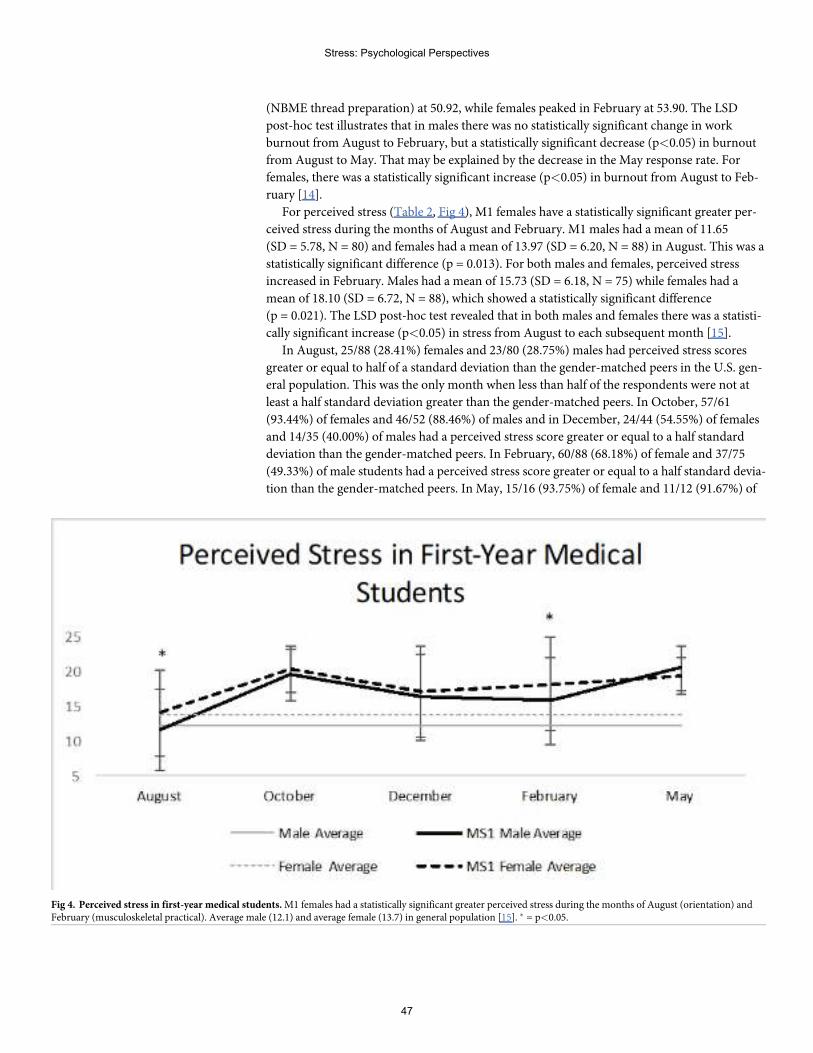
(NBME thread preparation) at 50.92, while females peaked in February at 53.90. The LSD
post-hoc test illustrates that in males there was no statistically significant change in work
burnout from August to February, but a statistically significant decrease (p<0.05) in burnout
from August to May. That may be explained by the decrease in the May response rate. For
females, there was a statistically significant increase (p<0.05) in burnout from August to Feb-
ruary [14].
For perceived stress (Table 2, Fig 4), M1 females have a statistically significant greater per-
ceived stress during the months of August and February. M1 males had a mean of 11.65
(SD = 5.78, N = 80) and females had a mean of 13.97 (SD = 6.20, N = 88) in August. This was a
statistically significant difference (p = 0.013). For both males and females, perceived stress
increased in February. Males had a mean of 15.73 (SD = 6.18, N = 75) while females had a
mean of 18.10 (SD = 6.72, N = 88), which showed a statistically significant difference
(p = 0.021). The LSD post-hoc test revealed that in both males and females there was a statisti-
cally significant increase (p<0.05) in stress from August to each subsequent month [15].
In August, 25/88 (28.41%) females and 23/80 (28.75%) males had perceived stress scores
greater or equal to half of a standard deviation than the gender-matched peers in the U.S. gen-
eral population. This was the only month when less than half of the respondents were not at
least a half standard deviation greater than the gender-matched peers. In October, 57/61
(93.44%) of females and 46/52 (88.46%) of males and in December, 24/44 (54.55%) of females
and 14/35 (40.00%) of males had a perceived stress score greater or equal to a half standard
deviation than the gender-matched peers. In February, 60/88 (68.18%) of female and 37/75
(49.33%) of male students had a perceived stress score greater or equal to a half standard devia-
tion than the gender-matched peers. In May, 15/16 (93.75%) of female and 11/12 (91.67%) of
Fig 4. Perceived stress in first-year medical students.M1 females had a statistically significant greater perceived stress during the months of August (orientation) andFebruary (musculoskeletal practical). Average male (12.1) and average female (13.7) in general population [15]. � = p<0.05.
Stress: Psychological Perspectives
47
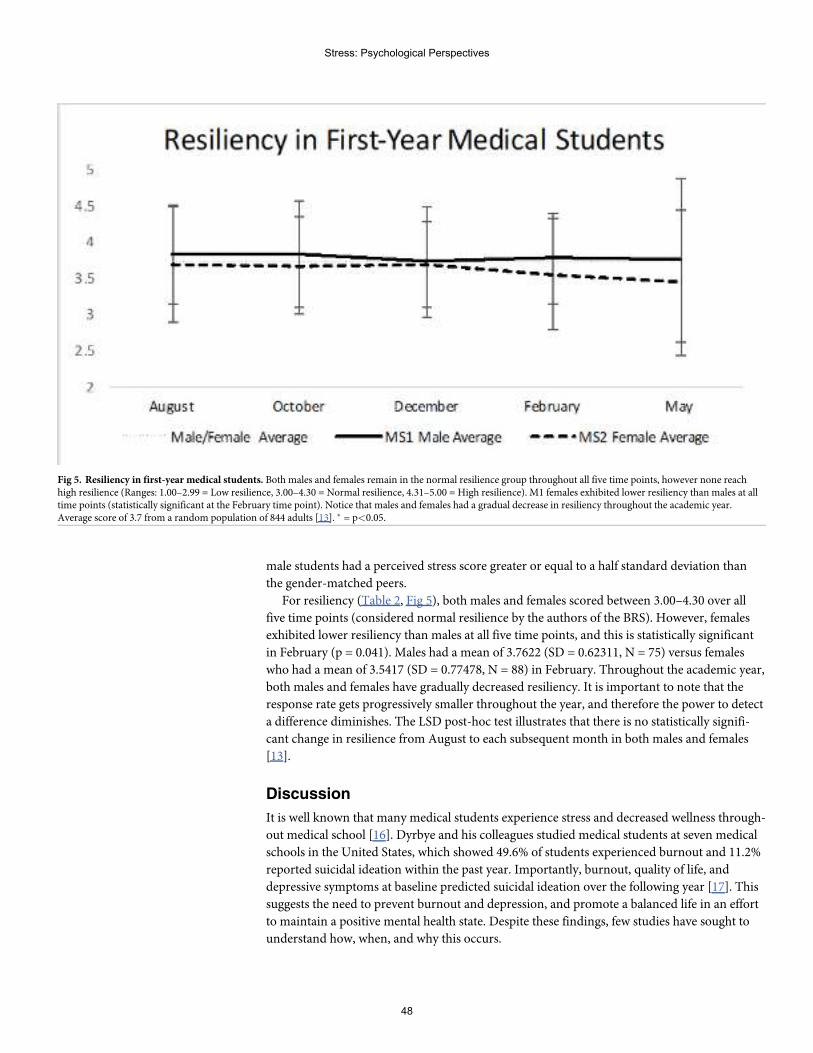
male students had a perceived stress score greater or equal to a half standard deviation than
the gender-matched peers.
For resiliency (Table 2, Fig 5), both males and females scored between 3.00–4.30 over all
five time points (considered normal resilience by the authors of the BRS). However, females
exhibited lower resiliency than males at all five time points, and this is statistically significant
in February (p = 0.041). Males had a mean of 3.7622 (SD = 0.62311, N = 75) versus females
who had a mean of 3.5417 (SD = 0.77478, N = 88) in February. Throughout the academic year,
both males and females have gradually decreased resiliency. It is important to note that the
response rate gets progressively smaller throughout the year, and therefore the power to detect
a difference diminishes. The LSD post-hoc test illustrates that there is no statistically signifi-
cant change in resilience from August to each subsequent month in both males and females
[13].
Discussion
It is well known that many medical students experience stress and decreased wellness through-
out medical school [16]. Dyrbye and his colleagues studied medical students at seven medical
schools in the United States, which showed 49.6% of students experienced burnout and 11.2%
reported suicidal ideation within the past year. Importantly, burnout, quality of life, and
depressive symptoms at baseline predicted suicidal ideation over the following year [17]. This
suggests the need to prevent burnout and depression, and promote a balanced life in an effort
to maintain a positive mental health state. Despite these findings, few studies have sought to
understand how, when, and why this occurs.
Fig 5. Resiliency in first-year medical students. Both males and females remain in the normal resilience group throughout all five time points, however none reachhigh resilience (Ranges: 1.00–2.99 = Low resilience, 3.00–4.30 = Normal resilience, 4.31–5.00 = High resilience). M1 females exhibited lower resiliency than males at alltime points (statistically significant at the February time point). Notice that males and females had a gradual decrease in resiliency throughout the academic year.Average score of 3.7 from a random population of 844 adults [13]. � = p<0.05.
Stress: Psychological Perspectives
48
Our study’s goal was to identify variation and patterns of stress levels, burnout, and resil-
ience in first-year medical students over the course of the academic year. Further, we
attempted to understand if there was a discrepancy in outcomes by sex. The surveys were
administered five times over the course of the year, in hopes to gain an understanding of when
medical students appear more at risk for burnout and psychiatric illness. Importantly, we asso-
ciated the M1 curriculum with the dates that our survey was completed by the students (Fig 1).
By knowing when students are more vulnerable to medical school stresses, more resources can
be targeted to prevent negative outcomes during those times.
Many studies have demonstrated high prevalence of burnout among medical students.
Mazurkiewicz and colleagues studied 86 entering third-year medical students at Mount Sinai
School of Medicine in New York which showed 71%met criteria for burnout. This suggests
that medical students are often burned out before reaching their clinical clerkships [18]. Addi-
tionally, a study of the trends in burnout among 1,098 medical students from three Minnesota
medical schools showed 45% experienced burnout, with an increasing trend among clinical stu-
dents versus preclinical students. Our study used the Copenhagen Burnout Inventory to mea-
sure personal and work burnout levels [11]. M1 males and females both exhibited an increasing
trend in personal burnout over time, which then stabilized towards the end of the academic
year. Females were consistently more burned out than males at all five time points (Table 2, Fig
2). There was a statistically significant difference in burnout during August (p = 0.012) and Feb-
ruary (p = 0.001), with females being more burned out. Perhaps females had a more difficult
time with adjusting to medical school and its demands. During February, the students were pre-
paring for their musculoskeletal practical, which perhaps led to greater personal burnout in
females as it requires many hours spent studying not only textbooks, but also in the cadaver lab.
For work burnout, both males and females had similar burnout scores throughout the year,
with no statistically significant difference at all five time points (Table 2, Fig 3).
Previous studies have shown that medical students have higher levels of perceived stress
and less resiliency than the general population. Perceived stress levels reported by these studies
indicated that� 50% of medical students scored at least half of a standard deviation greater
than the norm for age-matched peers in the U.S. general population [19,20]. Our study pro-
vides further support to these findings. The average M1 male and female perceived stress levels
were at least half of a standard deviation greater than the norm for gender-matched peers in
the U.S. general population in four of the five months (October, December, February, and
May) [10]. This means that in October, December, February, and May over half of the respon-
dents reported stress levels substantially higher than that of age matched peers in the U.S. pop-
ulation. In August and February, the M1 females had a statistically significant elevation in
perceived stress when compared to the M1 males (Table 2, Fig 4).
The finding that female medical students have higher levels of perceived stress has been
reported internationally, but this has not been consistent. Two Pakistani studies, a Swedish
study, a Canadian study, and a U.S. study reported higher levels of perceived stress in females
compared to males [21–24]. To the contrary, a Finnish study and a British study did not find a
gender difference in perceived stress [25,26]. Our study provides further support that females
experience more stress than males, at least during their first year of medical school. These find-
ings are important, as we know that student stress causes depersonalization and reduces empa-
thy [27,28]. Medicine is governed by the Hippocratic oath of doing no harm to patients, and
we postulate that this oath should also be applied to training physicians. Ideally, medical stu-
dents should graduate with the same sense of altruism, compassion, and empathy that they
had upon starting.
Resiliency is defined as the ability to remain positive despite experiencing adversity. Stu-
dents who have greater resiliency possess a mindset and skill set that allows them to work
Stress: Psychological Perspectives
49
through and overcome adversity [21]. A previous study of Canadian medical students demon-
strated lower resiliency than age and gender matched peers in the general population [22].
Commonly, male students have higher resiliency scores than females, however this finding is
not unanimous [21,29–31]. Our study provides further support to male medical students pos-
sessing higher levels of resiliency than females, at least during the first year of medical school.
In all five surveys, the M1 males had higher levels of resiliency than the M1 females, with a sta-
tistically significant difference seen in February. However, both M1 males and females experi-
enced a gradual decrease in resiliency throughout the academic year (Table 2, Fig 5).
Importantly, according to the authors of the BRS, a score of 3.00–4.30 is considered normal
resilience, and both males and females remained in this group at all five time points. However,
they never reach high resilience, which is a score of 4.31–5.00.
Fortunately, resiliency is modifiable, and has recently been designated as a priority for med-
ical education [31]. Building resiliency may be key to the reduction of stress and protection
against the effects of stressors that arise during medical school. While our study group exhib-
ited normal resilience throughout the academic year, it may be beneficial for them to gain
skills, so they have high resilience, therefore protecting them frommedical school stresses.
Our findings highlight that resilience of medical students continues to be an important area
for future study, and medical schools should focus on developing students’ resiliency.
Despite the overwhelming evidence of high stress and burnout in medical students,
research is lacking in finding strategies to promote resiliency, health, and wellness to prevent
such negative experiences. Unfortunately, an associated stigma has prevented medical students
from seeking mental health services when needed, which further complicates our ability to be
proactive in preventing these health issues [32].
A few studies have revealed strategies to be beneficial to medical students. A cross-sectional
study of medical students at the University of North Dakota School of Medicine and Health
Sciences found that greater use of approach-oriented coping strategies rather than avoidant-
oriented strategies was associated with significantly decreased risk of burnout (p = .02) and
was inversely correlated with depression [32]. This suggests that adequate coping strategies
promotes mental health resilience. Furthermore, another study found that self-reported
engagement in self-care activities had an inverse relationship with perceived stress and direct
relationship with quality of life in medical students, suggesting that students who maintain a
balanced life sustain greater resiliency [19].
Mentorship programs led by faculty of the medical school may be a good approach to
reducing burnout and alleviating stress in students. Jordan et al. studied the utility of a resi-
dent-student mentorship program for fourth-year medical students during their emergency
medicine subinternship [33]. The Maslach Burnout Inventory was completed by the interven-
tion and control group before and after the rotation. The intervention group had a statistically
significant higher personal accomplishment score after the rotation. Most students also felt the
program positively impacted their rotation, decreased stress, provided career guidance, and
positively impacted their personal and professional development. A mentorship program is a
relatively easy resource to incorporate into medical training and appears to have many positive
implications.
The practice of mindfulness may also be a promising intervention to help ameliorate anxi-
ety and stress, and enhance academic performance in medical students. Mindfulness-Based
Stress Reduction (MBSR) is a behavioral intervention designed to teach self-regulatory skills
for stress reduction and emotional management. There is an overall lack of data to support
the use of MBSR in medical students, and studies that have been conducted contain a small
sample size making it difficult to make any conclusions. However, mindfulness meditation has
been supported in many other healthcare professionals and students. A study of nursing
Stress: Psychological Perspectives
50
professionals and students who underwent mindfulness and loving kindness meditation over a
six-week period revealed a significant reduction (p<0.05) between pre-intervention and post-
intervention scores for perceived stress, burnout, depression, and anxiety [34]. However, there
was no significant difference between post-intervention and follow-up which suggests the
need to consistently practice mindfulness to maintain the benefits. Qualitative results showed
“improvement in the reactivity to inner experience, a more attentive perception of internal
and external experiences, and greater attention and awareness of actions and attitudes at every
moment”. A meta-analysis of medical, nursing, social work, psychology, and other health stu-
dents found that MBSR decreases stress, anxiety, depression, and improves mindfulness,
mood, self-efficacy, and empathy [35]. Finally, a study completed in Ireland examined first-
and second- year medical students’ perception and satisfaction ratings of a seven-week MBSR
program [36]. The M1 (n = 140) class had mandatory participation, whereas it was optional
for the M2 (n = 88) class. M1 students were less satisfied with the content and learning out-
comes than M2 students (p< .0005). The M1 class provided feedback that they hoped for less
discussion and more practice. The second-year medical students’ satisfaction with the program
suggests that an optional program for all medical students may be beneficial for medical
schools to integrate into their training programs.
Drolet et al implemented a program at Vanderbilt that takes a comprehensive view of well-
ness [37]. They implemented focusing on multiple dimensions of wellness (emotional, physi-
cal, and mental) and engages students through leadership, class building, and a longitudinal
curriculum with active workshops. St. Louis University, among others including U. Toledo,
have implemented curricular changes in hopes of alleviating burnout and providing a more
robust educational experience. Some facets included in St. Louis University’s updated curricu-
lum include Pass/Fail grading, reduced contact hours for the first two years, longitudinal elec-
tives, and implementing learning communities [38]. Importantly, improved results were
reported after just two years of implementation thus providing strong evidence for longitudi-
nal studies of medical education during curricular changes.
There were many limitations to our study. First, this was a questionnaire-based study, so
reporting bias cannot be ignored and certainly may contribute to variation. Additionally, the
surveys were completed by medical students at a single medical school in the United States, so
it is more difficult to generalize the results to all medical students. However, our students are
selected from a national pool of applicants and the curriculum is similar in nature to many
other programs so we believe our data will be generalizable. Moreover, measures of burnout,
interpersonal reactivity and tolerance for ambiguity used by AAMC graduate questionnaire
show that our school is the same as “All Medical Schools” further supporting that our data
may be generalizable. Future studies may incorporate multiple medical schools from across
the world, which would increase the sample size and therefore power of our study. Impor-
tantly, the surveys were completed anonymously, so we do not know which students com-
pleted the survey at each time point. It is possible that a different set of students responded to
each survey, and therefore our longitudinal data is invalidated. Future studies would ideally
assign each student a number that they record into each survey so we can be certain we are fol-
lowing the same students throughout the academic year. Additionally, our response rate
decreased as the year progressed, and therefore selection bias may be present. Finally, although
this study measured levels of burnout, stress, and resiliency, specific information about the
particular burnout triggers and stressors experienced was not collected. There are also
strengths of our study including frequency of surveys and response rate. Our survey is sent to
M1, M2, and M4 students five times during the academic year and to M3 students at the end
of each clinical clerkship. This allows us to detect points in the curriculum that have a negative
impact on student wellness and informs curricular changes or offer additional support to
Stress: Psychological Perspectives
51
students during these times. Moreover, we have an excellent response rate allowing us to inter-
pret the data as a good representative of our class and not just a small cohort. Although
response rate decreased near the end of the year, we’re working on ways to improve response
rates thus empowering the study.
It is clear that medical schools must be more proactive in preventing student burnout and
psychological disorders, while promoting resiliency. Our findings support the paradox that
medical education actually fosters unhealthy habits, psychological distress, and burnout in
first-year medical students. Additionally, our data suggests that females experience more burn-
out, perceived stress, and lower resilience than males. Though some stressors may be inevita-
ble, such as academic pressure, this does not preclude the utility of stress reduction programs.
Additionally, our data provides insight into time points during the academic year that students
perceive as more stressful. If medical schools gather similar data, this can guide them in alter-
ing the curriculum accordingly, or increasing stress reduction resources during those times.
The stigma that prevents many students from seeking mental health care when necessary has
created a barrier that we must overcome. Promoting resiliency strategies through a mentorship
program, mindfulness practice sessions, or classes on the importance of maintaining a bal-
anced life and utilizing healthy coping strategies appears to be the next best step forward but
will require an institutional cultural change in order to empower students’ participation.
Supporting information
S1 File. Data medical student 6-3-2019.
Author Contributions
Conceptualization: Richard K. Jordan, Shivam S. Shah, Jennifer Tripi, Randall G. Worth.
Formal analysis: Richard K. Jordan, Shivam S. Shah, Harsh Desai, Jennifer Tripi, Anthony
Mitchell, Randall G. Worth.
Investigation: Shivam S. Shah.
Methodology: Richard K. Jordan, Shivam S. Shah, Harsh Desai, Jennifer Tripi, Anthony
Mitchell, Randall G. Worth.
Project administration: Richard K. Jordan, Shivam S. Shah, Randall G. Worth.
Supervision: Randall G. Worth.
Writing – original draft: Richard K. Jordan, Shivam S. Shah, Harsh Desai, Jennifer Tripi,
Randall G. Worth.
Writing – review & editing: Richard K. Jordan, Shivam S. Shah, Harsh Desai, Jennifer Tripi,
Anthony Mitchell, Randall G. Worth.
References1. Dyrbye LN, Sciolla AF, Dekhtyar M, Rajasekaran S, Allgood JA, ReaM, et al. Medical School Strategies
to Address Student Well-Being: A National Survey. Academic medicine: journal of the Association ofAmericanMedical Colleges. 2019; 94(6):861–8. Epub 2019/01/27. https://doi.org/10.1097/acm.0000000000002611 PMID: 30681453.
2. Brazeau CM, Schroeder R, Rovi S, Boyd L. Relationships betweenmedical student burnout, empathy,and professionalism climate. Academic medicine: journal of the Association of AmericanMedical Col-leges. 2010; 85(10 Suppl):S33–6. Epub 2010/10/15. https://doi.org/10.1097/ACM.0b013e3181ed4c47PMID: 20881699.
Stress: Psychological Perspectives
52
3. Rotenstein LS, Ramos MA, Torre M, Segal JB, PelusoMJ, Guille C, et al. Prevalence of Depression,Depressive Symptoms, and Suicidal Ideation AmongMedical Students: A Systematic Review andMeta-Analysis. Jama. 2016; 316(21):2214–36. Epub 2016/12/07. https://doi.org/10.1001/jama.2016.17324 PMID: 27923088; PubMed Central PMCID: PMC5613659.
4. Dyrbye LN,West CP, Satele D, Boone S, Tan L, Sloan J, et al. Burnout among U.S. medical students,residents, and early career physicians relative to the general U.S. population. Academic medicine: jour-nal of the Association of American Medical Colleges. 2014; 89(3):443–51. Epub 2014/01/23. https://doi.org/10.1097/acm.0000000000000134 PMID: 24448053.
5. Dyrbye LN, ThomasMR, Shanafelt TD. Medical student distress: causes, consequences, and proposedsolutions. Mayo Clinic proceedings. 2005; 80(12):1613–22. Epub 2005/12/14. https://doi.org/10.4065/80.12.1613 PMID: 16342655.
6. Osborne JW. Testing Stereotype Threat: Does Anxiety Explain Race and Sex Differences in Achieve-ment? Contemporary educational psychology. 2001; 26(3):291–310. Epub 2001/06/21. https://doi.org/10.1006/ceps.2000.1052 PMID: 11414722.
7. Dyrbye LN, ThomasMR, HarperW, Massie FS Jr., Power DV, Eacker A, et al. The learning environ-ment and medical student burnout: a multicentre study. Medical education. 2009; 43(3):274–82. Epub2009/03/03. https://doi.org/10.1111/j.1365-2923.2008.03282.x PMID: 19250355.
8. Hardeman RR, Przedworski JM, Burke SE, Burgess DJ, Phelan SM, Dovidio JF, et al. Mental Well-Being in First Year Medical Students: A Comparison by Race and Gender: A Report from the MedicalStudent CHANGE Study. Journal of racial and ethnic health disparities. 2015; 2(3):403–13. Epub 2015/09/29. https://doi.org/10.1007/s40615-015-0087-x PMID: 26413458; PubMed Central PMCID:PMC4579540.
9. Dyrbye LN, ThomasMR, Power DV, Durning S, Moutier C, Massie FS Jr., et al. Burnout and seriousthoughts of dropping out of medical school: a multi-institutional study. Academic medicine: journal of theAssociation of AmericanMedical Colleges. 2010; 85(1):94–102. Epub 2010/01/01. https://doi.org/10.1097/ACM.0b013e3181c46aad PMID: 20042833.
10. Cohen S, Kamarck T, Mermelstein R. A global measure of perceived stress. Journal of health and socialbehavior. 1983; 24(4):385–96. Epub 1983/12/01. PMID: 6668417.
11. Kristensen T, Borritz M, Villadsen E, Christensen K. The Copenhagen Burnout Inventory: A new tool forthe assessment of burnout. Work and Stress—WORK STRESS. 2005; 19:192–207. https://doi.org/10.1080/02678370500297720
12. Smith BW, Dalen J, Wiggins K, Tooley E, Christopher P, Bernard J. The brief resilience scale: assess-ing the ability to bounce back. International journal of behavioral medicine. 2008; 15(3):194–200. Epub2008/08/13. https://doi.org/10.1080/10705500802222972 PMID: 18696313.
13. Smith B, Epstein E, Ortiz J, Christopher P, Tooley E. The Foundations of Resilience: What Are the Criti-cal Resources for Bouncing Back from Stress? Resilience in Children, Adolescents, and Adults. NewYork, NY: Springer; 2013.
14. Sestili C, Scalingi S, Cianfanelli S, Mannocci A, Del Cimmuto A, De Sio S, et al. Reliability and Use ofCopenhagen Burnout Inventory in Italian Sample of University Professors. International journal of envi-ronmental research and public health. 2018; 15(8). Epub 2018/08/12. https://doi.org/10.3390/ijerph15081708 PMID: 30096954; PubMed Central PMCID: PMC6121611.
15. Cohen S, Williamson G. Perceived Stress in a Probability Sample of the United States. Social Psychol-ogy of Health. 1988.
16. IshakW, Nikravesh R, Lederer S, Perry R, Ogunyemi D, Bernstein C. Burnout in medical students: asystematic review. The clinical teacher. 2013; 10(4):242–5. Epub 2013/07/10. https://doi.org/10.1111/tct.12014 PMID: 23834570.
17. Dyrbye LN, ThomasMR, Massie FS, Power DV, Eacker A, HarperW, et al. Burnout and suicidal idea-tion among U.S. medical students. Annals of internal medicine. 2008; 149(5):334–41. Epub 2008/09/04. https://doi.org/10.7326/0003-4819-149-5-200809020-00008 PMID: 18765703.
18. Mazurkiewicz R, Korenstein D, Fallar R, Ripp J. The prevalence and correlations of medical studentburnout in the pre-clinical years: a cross-sectional study. Psychology, health & medicine. 2012; 17(2):188–95. Epub 2011/07/26. https://doi.org/10.1080/13548506.2011.597770 PMID: 21781020.
19. Ayala EE, Winseman JS, Johnsen RD, Mason HRC. U.S. medical students who engage in self-carereport less stress and higher quality of life. BMCmedical education. 2018; 18(1):189. Epub 2018/08/08.https://doi.org/10.1186/s12909-018-1296-x PMID: 30081886; PubMed Central PMCID: PMC6080382.
20. Dyrbye LN, Schwartz A, Downing SM, Szydlo DW, Sloan JA, Shanafelt TD. Efficacy of a brief screeningtool to identify medical students in distress. Academic medicine: journal of the Association of AmericanMedical Colleges. 2011; 86(7):907–14. Epub 2011/06/07. https://doi.org/10.1097/ACM.0b013e31821da615 PMID: 21642810.
Stress: Psychological Perspectives
53
21. Houpy JC, LeeWW,Woodruff JN, Pincavage AT. Medical student resilience and stressful clinicalevents during clinical training. Medical education online. 2017; 22(1):1320187. Epub 2017/05/04.https://doi.org/10.1080/10872981.2017.1320187 PMID: 28460570; PubMed Central PMCID:PMC5419301.
22. Rahimi B, Baetz M, Bowen R, Balbuena L. Resilience, stress, and coping among Canadian medical stu-dents. Canadian medical education journal. 2014; 5(1):e5–e12. Epub 2014/01/01. PMID: 26451221;PubMed Central PMCID: PMC4563614.
23. ShahM, Hasan S, Malik S, Sreeramareddy CT. Perceived stress, sources and severity of stress amongmedical undergraduates in a Pakistani medical school. BMCmedical education. 2010; 10:2. Epub2010/01/19. https://doi.org/10.1186/1472-6920-10-2 PMID: 20078853; PubMed Central PMCID:PMC2820489.
24. Shaikh BT, Kahloon A, Kazmi M, Khalid H, Nawaz K, Khan N, et al. Students, stress and coping strate-gies: a case of Pakistani medical school. Education for health (Abingdon, England). 2004; 17(3):346–53. Epub 2005/04/26. https://doi.org/10.1080/13576280400002585 PMID: 15848822.
25. Niemi PM, Vainiomaki PT. Medical students’ distress—quality, continuity and gender differences duringa six-year medical programme. Medical teacher. 2006; 28(2):136–41. Epub 2006/05/19. https://doi.org/10.1080/01421590600607088 PMID: 16707294.
26. Firth J. Levels and sources of stress in medical students. British medical journal (Clinical research ed).1986; 292(6529):1177–80. Epub 1986/05/03. https://doi.org/10.1136/bmj.292.6529.1177 PMID:3085772; PubMed Central PMCID: PMC1340185.
27. West CP, Shanafelt TD, Kolars JC. Quality of life, burnout, educational debt, and medical knowledgeamong internal medicine residents. Jama. 2011; 306(9):952–60. Epub 2011/09/09. https://doi.org/10.1001/jama.2011.1247 PMID: 21900135.
28. Bonanno GA. Loss, trauma, and human resilience: have we underestimated the human capacity tothrive after extremely aversive events? The American psychologist. 2004; 59(1):20–8. Epub 2004/01/23. https://doi.org/10.1037/0003-066X.59.1.20 PMID: 14736317.
29. Dyrbye L, Shanafelt T. Nurturing resiliency in medical trainees. Medical education. 2012; 46(4):343.Epub 2012/03/21. https://doi.org/10.1111/j.1365-2923.2011.04206.x PMID: 22429167.
30. Peng L, Zhang J, Li M, Li P, Zhang Y, Zuo X, et al. Negative life events and mental health of Chinesemedical students: the effect of resilience, personality and social support. Psychiatry research. 2012;196(1):138–41. Epub 2012/03/13. https://doi.org/10.1016/j.psychres.2011.12.006 PMID: 22405636.
31. Bacchi S, Licinio J. Resilience and Psychological Distress in Psychology and Medical Students. Aca-demic psychiatry: the journal of the American Association of Directors of Psychiatric Residency Trainingand the Association for Academic Psychiatry. 2017; 41(2):185–8. Epub 2016/04/10. https://doi.org/10.1007/s40596-016-0488-0 PMID: 27060093.
32. Thompson G, McBride RB, Hosford CC, Halaas G. Resilience AmongMedical Students: The Role ofCoping Style and Social Support. Teaching and learning in medicine. 2016; 28(2):174–82. Epub 2016/04/12. https://doi.org/10.1080/10401334.2016.1146611 PMID: 27064719.
33. Jordan J, Watcha D, Cassella C, Kaji AH, Trivedi S. Impact of a Mentorship Program on Medical Stu-dent Burnout. AEM education and training. 2019; 3(3):218–25. Epub 2019/07/31. https://doi.org/10.1002/aet2.10354 PMID: 31360814; PubMed Central PMCID: PMC6637010.
34. van der Riet P, Levett-Jones T, Aquino-Russell C. The effectiveness of mindfulness meditation fornurses and nursing students: An integrated literature review. Nurse education today. 2018; 65:201–11.Epub 2018/03/31. https://doi.org/10.1016/j.nedt.2018.03.018 PMID: 29602138.
35. McConville J, McAleer R, Hahne A. Mindfulness Training for Health Profession Students-The Effect ofMindfulness Training on Psychological Well-Being, Learning and Clinical Performance of Health Profes-sional Students: A Systematic Review of Randomized and Non-randomized Controlled Trials. Explore(New York, NY). 2017; 13(1):26–45. Epub 2016/11/28. https://doi.org/10.1016/j.explore.2016.10.002PMID: 27889445.
36. Aherne D, Farrant K, Hickey L, Hickey E, McGrath L, McGrath D. Mindfulness based stress reductionfor medical students: optimising student satisfaction and engagement. BMCmedical education. 2016;16(1):209. Epub 2016/08/19. https://doi.org/10.1186/s12909-016-0728-8 PMID: 27535243; PubMedCentral PMCID: PMC4989331.
37. Drolet BC, Rodgers S. A comprehensive medical student wellness program—design and implementa-tion at Vanderbilt School of Medicine. Acad Med. 2010; 85(1):103–10. https://doi.org/10.1097/ACM.0b013e3181c46963 PMID: 20042835.
38. Slavin SJ, Schindler DL, Chibnall JT. Medical student mental health 3.0: improving student wellnessthrough curricular changes. AcadMed. 2014; 89(4):573–7. https://doi.org/10.1097/ACM.0000000000000166 PMID: 24556765; PubMed Central PMCID: PMC4885556.
Stress: Psychological Perspectives
54
Students’ perspectives on interventions toreduce stress inmedical school: A qualitativestudy
Melina DederichsID*, JeannetteWeberID, ThomasMuth, Peter Angerer, Adrian Loerbroks
Institute for Occupational, Social and Environmental Medicine, Centre for Health and Society, Faculty ofMedicine, Heinrich-Heine-University of Dusseldorf, Dusseldorf, North Rhine-Westphalia, Germany
Abstract
The mental health of medical students remains to be a matter of concern. Numerous set-
ting-based and individual-based interventions for student mental health have been pro-
posed in the literature. However, the student perspective on those interventions has been
largely neglected. This study aims to explore how medical students perceive different inter-
ventions and if they desire any additional changes with regard to their studies. Eight focus
groups with 71 participants were conducted at a large German medical school. Focus
groups were recorded, transcribed and content-analyzed using MAXQDA 18. We found that
medical students prefer setting-based interventions. Most proposed interventions were on a
setting-based level. For instance, students asked for more information on the university’s
psychosocial counseling services and for better information management regarding contact
persons. Interventions proposed in the literature received mixed reactions: Several partici-
pants did not favour a pass/fail grading system. Students considered a peer-to-peer mentor-
ing program for freshmen very helpful. Students had diverse attitudes towards Balint
groups. They approved of several self-management courses, most of them being related to
time or stress management. Interestingly, the most urgently wanted interventions appear to
be rather easy to implement (e.g. a mentoring program). This study explored the medical
student perspective on student mental health interventions. Additionally, our study illustrates
the benefit and feasibility of involving students early on in the conception of interventions.
Further research with a representative sample is needed to obtain broader information on
the acceptance of the suggested interventions.
Introduction
Medical students show a high prevalence of mental illnesses worldwide, such as high levels of
depression and depressive symptoms [1].To address medical students’ poor mental health, set-
ting-based and individual-based interventions have been proposed [2–5]. Setting-based inter-
ventions aim to improve health by modifying environmental factors, e.g. curricular changes in
medical schools [3, 6, 7]. Individual-based approaches, by contrast, seek a change in the indi-
vidual, e.g., by providing skills that help to cope with stress [8, 9]. Although some interventions
Editor: Andrew Soundy, University of Birmingham,
UNITED KINGDOM
Funding: TM received funding for this work by the
Heinrich-Heine-University Dusseldorf (study
number 4041). Furthermore, we acknowledge
5
55
have been found to be effective in improving medical students’ wellbeing, there are few consis-
tent findings and the overall quality of data is low [10].
In the following section, we provide an overview of the most important interventions that
have been implemented already by some medical schools.
Interventions described in literature
Pass/Fail grading systems. In pass/fail grading systems no mark is given and students do
not receive other feedback on their performance than whether they passed or failed (e.g. [11]).
A systematic review suggests that pass/fail grading improves medical students’ wellbeing [12]
in terms of reduced stress, anxiety or depression and enhanced self-control or satisfaction.
Furthermore, pass/fail grading systems seem to improve well-being without negatively affect-
ing academic outcomes [12, 13]. Based on this evidence many medical schools have imple-
mented pass/fail systems already.
Peer-to-peer mentoring program. A peer-to-peer mentoring program connects
advanced students with freshmen. The latter receive support and insights during their orienta-
tion period. Peer-mentoring-programs have been found to reduce stress and to facilitate tran-
sition into medical school [14]. However, the quality of data has been described as low.
Nevertheless, the notion of peer-to-peer mentoring in medical school has persisted for many
years and has been adopted by numerous universities [15, 16].
Balint groups. Balint groups are meetings for physicians with a trained facilitator that
allow for confidential discussion of challenging patient cases. Traditionally consisting of 6 to
12 physicians, the goal of the groups is to improve the physician-patient-relationship [17, 18].
At the same time Balint groups can help physicians cope with burdensome experiences [19].
Likewise, medical students can be confronted with difficult situations like the sudden death of
a patient [20]. Only few studies have investigated the usefulness of Balint groups for medical
students. There is inconsistent evidence related to the question whether medical students con-
sider Balint groups helpful or not [21–23].
Self-management courses. The term “self-management” includes a range of behavioral
interventions and healthful behaviors like emotional management [24]. A systematic review
examined 39 studies that evaluated the effectiveness of interventions designed to improve
medical students’ wellbeing [8]. Out of 39 studies, 31 focused on individual-based interven-
tions like mindfulness, stress management, psychoeducation, relaxation techniques or yoga.
The studies suggested some short-term reduction of anxiety, depression and stress. However,
the quality of evidence is low due to weak study designs. Long-term effects could not be deter-
mined because they were not assessed in most studies.
Aim of the present study
The first step in developing suitable interventions to improve medical students’ mental health
is to explore which measures medical students find helpful and acceptable themselves. Such
user involvement can increase the level of user acceptance [25]. The acceptance of a healthcare
intervention is an important prerequisite for its utilization and effectiveness [25, 26]. However,
the literature on how students perceive interventions (e.g. in terms of usefulness and accep-
tance) remains scarce. Most of the interventions that have been tested so far have been devised
based on insights into relevant stressors or proposed by experts (e.g. [27]).
Additionally, if students were involved in the process of designing interventions, they often
participated as program leaders or in small committees (e.g. the Student Wellness Committee
at Vanderbilt School of Medicine [28]). Within the concept of participatory development how-
ever, it is important to listen to the full range of opinions to be able to consider all wishes and
support by the Heinrich-Heine-University
Dusseldorf to publish open access. The funders
had no role in study design, data collection and
analysis, decision to publish, or preparation of the
manuscript.
Competing interests: The authors declare that they
attempted to present a well-balanced account of
the findings. However, being employed (MD, JW,
TM, PA, AL), a member of the teaching staff (MD,
TM, PA, AL) and working together with the dean’s
office of the medical faculty of the Heinrich-Heine-
University Dusseldorf may have induced some
bias, which we are unaware of though.
Stress: Psychological Perspectives
56
different perspectives. We therefore conducted a qualitative study with focus groups to gather
insights and specific explanations for why students deemed specific interventions useful or not.
Our study aims to answer the following questions:
1. What interventions do medical students themselves suggest and wish for?
2. How do medical students perceive interventions that have been described in the literature
(pass/fail grading, a peer-to-peer mentoring program, Balint groups, and self-management
courses)?
Methods
Participants
Participants were recruited through social media or advertisement on campus of Heinrich-
Heine-University of Dusseldorf in Germany. The only criteria for participation were to be cur-
rently enrolled as medical student and not having participated at our previous focus groups
[29]. Participants of one focus group were recruited through a stress-management seminar.
Participation was explicitly on a voluntary basis. All participants gave their informed consent.
Students were compensated for their participation with two cinema tickets and one cinema
discount card.
Focus groups were conducted until data saturation was reached. Students were grouped
into focus groups according to their period of study. This maximised the likelihood that partic-
ipants could relate to each other in terms of experience regarding classes and exams. Four
groups included students in the preclinical part of their studies (year 1 to 3) and four groups
included students both from the clinical part (year 4 to 5) as well as students in their clinical
internship year (after the second state examination).
Setting
The focus groups took place in June and July 2019 at the Medical Faculty of Heinrich-Heine-
University Dusseldorf. In 2013, the medical faculty introduced a new curriculum. Tradition-
ally, medical students take one final exam organised by the state (state-examination) for each
of the three periods of study: the first after the preclinical phase (after year 3), the second after
the clinical phase (after year 5) and the last one after one year of practical internship at a hospi-
tal. With the new curriculum, the first state examination takes place after the first two years.
Permission to conduct this study was given by the ethics committee of the medical faculty of
Heinrich-Heine-University of Dusseldorf.
Material and procedure
After provision of written informed consent, participants were asked to fill out a questionnaire
covering demographic data.
The focus groups were conducted by TM, a faculty member and psychologist by training,
while MD, a junior researcher and trained psychologist, took notes. The focus groups followed
a topic guide developed by MD and TM (S1 File). Both facilitators provide lectures for medical
students and are involved in research on medical students’ wellbeing. Participants were
informed about the facilitators’ research focus. First, participants were asked about their expe-
rience in medical school so far and in which situations they had encountered obstacles or expe-
rienced stress. Secondly, students were asked about potential changes and interventions that
could contribute to stress reduction in medical school. Previous research at our faculty already
pointed out high stress levels and specific stressors of our medical students [29, 30].
Stress: Psychological Perspectives
57
To answer the second research question (how the students perceived literature-based inter-
ventions), we discussed interventions proposed in the literature with medical students. The
topic guide contained a list of the interventions (see introduction section), which were
explained by the facilitator and then discussed by the students one after the other. If necessary,
the facilitator asked follow-up questions to further explore students’ views. Every single partici-
pant was encouraged to contribute to discussions at an early stage.
Data analysis
All focus groups were audio-recorded, transcribed and content analyzed byMD and JW accord-
ing toMayring [31] using MAXQDA 18. JW is experienced with occupational health and qualita-
tive research [29]. Research questions were transformed into deductive main categories (students’
suggestions, interventions from literature). During analysis these categories were further broken
down into sub-categories by inductive category formation. After MD completed the first coding
round of 25% of the data, AL, an experienced qualitative researcher [29, 30, 32, 33], reviewed the
coding scheme. The coding scheme was then adapted and a second coding round was performed
byMD. JW coded the data of four groups independently. Both versions were compared and dis-
crepancies resolved. After that, MD recoded the remaining four groups and transferred changes
made to the coding system in the previous discussion with JW. Finally, JW andMD discussed the
focus groups once more. There was no need for further recoding since there were only minor dif-
ferences between the analyses of MD and JW. Due to logistic constraints, corrections and feed-
back on transcripts and research findings were not obtained from study participants.
The completed checklist of consolidated criteria for reporting qualitative research
(COREQ; [34]) can be found in S2 File.
Results
Eight focus groups consisting of 5 to 16 medical students were conducted. Focus groups lasted
between 90 and 130 minutes. In total, 71 medical students (56 women) participated. With
N = 2816 medical students being enrolled at the medical faculty in the summer semester of
2020, we included 2.5% of the population in our focus groups. Participant age ranged between
19 and 39 years (mean = 23.71; SD = 3.50).
Generated ideas
All participants engaged in a comprehensive discussion about what they would like to change
in medical school to improve student wellbeing. In the following, we will present their pro-
posed starting points for interventions.
Regulations for absence of lecturers. Students reported that especially in the clinical
study phase, many lecturers did not show up for teaching. Students asked for a substitution or
at least a designated contact person.
“But sometimes I don’t know. Okay, if nobody shows up [for the lecture], whom do I ask? And
then I contact the ward nurse. And she calls the medical referee and he then calls someone
else. Somehow it would be nice if there were a list or something where you knew, okay, nobody
is showing up for the lecture, so I can call this number.”
Attendance. Attendance rules were perceived to be too strict. According to the study reg-
ulations, an attendance of at least 85% presence per subject is required. However, if one subject
consists of three appointments for example, all three seminars have to be attended. By attend-
ing only two of them, the presence would be 67%, thus below 85%. Students therefore
Stress: Psychological Perspectives
58
requested that if one misses class due to sickness or death of a family member, an exception
should be granted.
“I think the pressure that is put on us is relatively high. [Regarding] absence, it is obvious that
there is a need to keep it within a limit. But I think that if someone really wants to attend a
funeral or has a sick leave certificate, then not attending should be permissible. It is unaccept-
able that we have to attend our seminars sick because otherwise we would have to repeat the
semester [. . .]. A fellow student of mine tried to stand next to the dissection table with a
40-degrees fever, just trying to keep her eyes open. She didn’t pass the exam because she didn’t
have time to recover.”
According to the participating students, there should also be the option to complete a com-
pensatory task, for instance, holding a presentation on the subject that was missed. As another
solution for not missing a mandatory event, participants suggested switching groups with their
peers for the required event only. Due to the high number of mandatory classes during the pre-
clinical phase, students wished for less mandatory attendance during this phase.
Coordination of practical and theoretical phases. The Dusseldorf medical curriculum
combines phases of theoretical studying (lectures) and practical experience (clinical trainee-
ship). Students wished that the curriculum is adapted so that theoretical and practical lectures
as well as corresponding tutorials are better aligned and deal with the same subjects. This was
believed to increase their learning effect.
“I think it would carry our studies forward in terms of quality if practical phases matched the-
oretical lessons, so that you get the opportunity to deal with one topic over a period of eight
weeks, to repeat things. And then this would allow for things to consolidate and settle.”
Students noted that the workload between theoretical and practical phases fluctuates signifi-
cantly with high workload during theoretical phases and low workload during practical phases.
Therefore, they wished for shorter practical phases to distribute the workload more evenly.
Often, the lecture-free week takes place after the clinical traineeship. However, students
would rather have a week off for studying after completing the theoretical lectures when they
find to have more content to repeat and memorize.
Counseling. Participants pointed out that they would benefit from a broader psychologi-
cal support system. Regarding the on-campus counseling service, students wished for longer
opening hours as well as opening hours that are compatible with their schedules. Free of cost
confidential counseling services were perceived as useful for reaching out to students to
address mental health issues. Overall, students wished for more information regarding mental
health problems and interventions.
“[. . .] especially at the beginning of our studies there is a need for more lectures in our curricu-
lum that address this topic. Like how do I deal with stressful situations?Whom can I ask for
help? So that it becomes more normal and isn’t only [mentioned] at the funeral of a fellow stu-
dent who put an end to his life. [. . .] Things like that [informational event] should be part of
the curriculum. That is how they are established.”
Possible solutions students brought up were for instance a mandatory lecture about stress
related to medical school, coping strategies and support contacts. Additionally, students sug-
gested that a newsletter should be emailed close to the first state examination to present infor-
mation on emergency contacts and counseling services.
Stress: Psychological Perspectives
59
Registration processes for elective subjects. Students explained that when they want to
register for a subject, they have to log in to an online portal. There they would have to wait
until midnight until the registration process opens. They further explained that registrations
are allocated on a first come, first serve basis. Therefore, students stated that without access to
a fast and reliable internet connection at that time they would not be able to take the class they
prefer.
Students would like this procedure be replaced by a selection based on preference. In this
procedure, students could indicate their preference within a certain period. Then they would
be matched according to their choice. If there is no personnel to do this task, some students
suggested that at least the first come-first serve procedure was opened during daytime.
Information management. Students reported a lack of information management in med-
ical school. They requested a comprehensive online portal containing information on classes
and exams. Moreover, students expressed that they would benefit from an introductory lecture
for each new topic block that contains all relevant administrative information, e.g. on how to
register for an exam. A FAQ that addresses most urgent questions concerning the first state
examination was considered useful.
“The search for information is extremely tiring. If you are already stressed out and are search-
ing for specific information but just can’t find it, it’s incredibly frustrating. “[There should be]
a neatly organized guide [about the first state examination] or some information including
frequently asked questions and answers [. . .]”
Online lectures. Many students raised the topic of online lectures. They perceived online
lectures as an efficient measure to reduce stress and improve flexibility. Especially commuters
were thought to profit significantly from it. Online lectures were thought to be a great learning
tool and aid with the preparation of future seminars. One student requested a contact person
in case any questions arise during a session.
“I think it would be great to have this opportunity. I personally learn at night. In the morning,
I don’t pick up much, but at night I am really diligent. And it were a lot easier to combine fam-
ily, job and university. That would be a huge advantage.”
Refresher courses. Students stated that they would benefit from refresher courses before
the second state examination.
“I believe it would be pretty fair, for instance, to have courses that prepare you for the state
examination in practical terms during the semester. That would be, I think, not bad.”
Examinations. Students reported that their exams cover several subjects at once. Students
asked for a restricted number of subjects within the same exam. They reported that this could
be achieved if exams included more questions on the same subject per exam instead of the
same subject posing only a few questions per exam over several exams.
„Now for instance [in this exam] there were like 15 different subjects. Often with only a few
questions, but I lost track. I forgot to learn five of them because the list [of subjects] was so
long. I would prefer it to be limited. Ten subjects, that you can keep in mind and study.”
They also suggested grades acquired in seminars should be added to the exam score and act
as a buffer.
Stress: Psychological Perspectives
60

It was discussed whether more open-ended questions instead of multiple-choice questions
would be beneficial. Some students stated that they could explain their knowledge better in
open-ended questions. Moreover, it would motivate them to learn more details. Others pre-
ferred the existing multiple-choice format.
Teaching content. Participants made a range of suggestions to improve the quality of
teaching.
For instance, students wished for a contact person to report verbal harassment of students
like depreciative comments by teaching staff. Exact teaching guidelines containing learning
goals for every subject were considered potentially helpful.
“I think it is unacceptable that people are treated unfairly. That some receive a very good
exam preparation and others a very bad preparation, not learning anything in the course. I
think lecturers should be encouraged to get some sort of catalogue on what they should explain
and who needs to be taught what [. . .]”
They also wished for more covering of content relevant for the second state examination. A
perceived lack of interest and skill of teaching staff was thought to be solved through employ-
ing senior students or external referents. They asked for more interactive and clinically orien-
tated teaching.
Elective subjects. In total, 14 elective subjects have to be completed over the course of five
years at the Medical School in Dusseldorf. Some of the subjects are graded. Participants raised
the idea to reduce the total number of required courses to reduce stress and provide more time
for state exam preparation.
“It is good that we have elective subjects. But there are too many. And it is stressful, to have
eight elective subjects here and another six elective subjects there. It would be great if we had
less.”
Alternatively, additional credit for scientific projects, clinical lectures or extracurricular
activities was suggested.
Clinical traineeship. Students asked to move the clinical traineeships towards the end of
the medical curriculum, because students felt that they are often confronted with medical con-
ditions for which they are not prepared yet and often clinicians presuppose content they have
not dealt with yet.
“In the last general physician traineeship, I benefitted because I knew something. I knew the
medications and I felt like I could say something about every [patient]. And there I really
learned something and could pick [new] things up. But in the general physician traineeship
before that . . . It’s just too early, in my opinion it doesn’t yield a learning effect, it might as
well be dropped.”
They also suggested informing clinicians about what the students have learned so far in
order for them to have a more realistic estimate of what a student can be requested to do and
what exceeds their knowledge.
Students reported frequent difficulties in their clinical traineeships. For instance, clinicians
that are supposed to teach them are often not available and, if they are present, students felt
that they do not take time to teach them adequately. More available contact persons or a cen-
tral complaints office that assists them were mentioned as a possible solution to this issue.
Stress: Psychological Perspectives
61
Preparation for the second state examination. Students wished for lecture free and
exam free time for preparation before the second state examination. They requested to have at
least 100 days to dedicate completely to studying. This way they stated they could follow the
learning schedule they wanted to use (so called “100-day study plan” which is well-known and
widely used by medical students in Germany).
“It is a question of planning. Then, if you have these one hundred days, I think that would
help a lot. And it would be nice if it wasn’t exactly one hundred days but a couple of days
more because maybe you don’t study seven days a week.”
Participants had many ideas on how to provide more time to study. Participants proposed
shortening clinical trainings, or to move them towards the end of the medical curriculum to
avoid that students have to pass other exams right before the second state examination. Stu-
dents were willing to complete their clinical training during semester break or to begin the
semester early to provide more preparation time for the second state examination.
“I think everyone would be willing to sacrifice a little, like one week of recreational time during
this period to have a longer preparation time for the second state examination.”
“If all semester breaks were shortened by one week, I think that would still provide enough free
time. Then, at the end [of medical school], we would have another eight weeks [to study].”
Measures proposed in the literature
Pass-fail system. There was no consensus among the students in our focus groups related
to the usefulness of pass-fail systems. Some were in favour of eliminating grades because it
would reduce pressure and stop demotivation through bad grades. Others in favour of the
pass-fail system argued grades did not have any informative value regarding their ability as a
physician anyway and were thus of no importance. Students opposing the pass-fail system
reported to appreciate the incentive they received from good grades and to appreciate the feed-
back to better understand whether they had learned enough.
“To be honest, I use my performance for orientation. It helps me to see what I did wrong [. . .].
Or it gives me an incentive to do better. [. . .]”
Students depending on a scholarship or on receiving particularly good grades raised con-
cerns regarding their ability to compete and prove their performance. Scholarship holders
among the students reported that in order to keep their scholarship, they had to prove to
belong to the top students in their semester. Without grades, this might be difficult to prove
and students from other universities might have an advantage. In Dusseldorf, the final grade
for the first state examination is calculated as a cumulative sum score of grades from the first
to the third year and of the performance on the day of the state examination. Students argued
that this way they did not solely depend on one’s day performance and therefore the stress on
the day of the first state examination was reduced. Some preferred keeping grades to maintain
this system. However, students suggested alterations of the pass-fail system. They were in
favour of eliminating grades from some subjects to reduce stress but maintain the current sys-
tem of collecting grades for the first state examination.
Mentoring. Almost all participants were in favour of a mentoring program. They appreci-
ated it for its easy access and voluntary nature. The idea of having a permanent contact person
that provides not only informational and emotional support but also further networking
Stress: Psychological Perspectives
62
opportunities to higher semesters was welcomed. The personal experience and organizational
knowledge of a senior student was thought to reduce stress significantly.
“I would have liked having someone who told me ‘Everything is fine, this is normal. I experi-
enced it too.’ Especially at the beginning of medical school. . . I had just moved here. . . and
everything was new.Having someone who can answer questions related to studying or simply
help you.”
Many students in senior semesters expressed the desire to become a mentor themselves.
Those who did not want a mentoring program stated they already established such a contact to
a senior student by themselves. There were many suggestions regarding the design of a men-
toring program. A pool with volunteers, possibly on an online-based platform was proposed.
Students further proposed that mentors should receive some form of compensation, either
monetary or in a non-monetary form, like an honorary position. Students argued that their
willingness to participate in a mentoring program also depended on the mentor’s personality.
They feared that overly performance-driven students might be a bad role model in terms of
stress management.
“It truly depends on who is doing [the mentoring]. If it is some extreme medical student, who
learns at night and, I don’t know, whenever possible, on the loo, whenever, then I would
politely decline.”
Balint groups. The idea of participating in a Balint group received mixed feedback. Those
in favour of Balint groups requested that it should be on a voluntary basis and regularly start-
ing with the beginning of medical school. Especially for difficult patient cases, it was perceived
as potentially helpful.
“Having the possibility to talk to others can reduce fears [. . .]. And you learn how to handle
[your fears].””
Students who would not want to participate in a Balint group stated that they preferred
being mentored by their peers or supervising physicians. They reported to rely on their own
social networks for emotional support. Some students expressed fear of stigmatisation due to
participation in a Balint group. They worried about talking freely about unpleasant experiences
and being stigmatized by their peers. Therefore, they would not want to participate.
Self-management courses. Students were interested in learning self-management strate-
gies or competences to strengthen their resilience. In this context, they wished for subjects on
stress-management and relaxation techniques.
“It is nice that we know what to do with our patients when they feel bad. But it is bad that we
don’t have any guidelines ready at hand on what to do if we ourselves feel bad.”
Moreover, students wished for a time-management course and more capacities in an exist-
ing elective subject deals with mind-body-medicine. Participants stated they would benefit
from courses that covered efficient learning strategies and presentation skills. There was little
consensus among participants regarding the question when and how those classes should be
implemented in their curriculum. In general, students perceived lack of time as a barrier to
participate in a non-obligatory class. Some students suggested that it should be an ongoing
offer over a long period of time where students could decide for themselves every week
Stress: Psychological Perspectives
63
whether they wanted to participate or not. Students preferred to schedule such courses at the
beginning of medical school and shortly before the first state examination.
General dissatisfaction with already existing self-management courses on campus was
expressed. Students either perceived lack of information about those classes, lack of quality of
available classes or limited capacity to enroll all interested students.
Discussion
The aim of the present study was to explore which interventions students suggest to improve
their mental health and to discuss interventions suggested in the literature. In our eight focus
groups, students suggested specific solutions to their perceived obstacles in medical school.
Interventions that students proposed most frequently pertained to setting-based aspects such
as curricular changes, improved information management and new regulations concerning
absence of teaching staff and students.
Many of the suggested interventions, such as online lectures, appear rather easy to imple-
ment. Due to the current COVID-19 pandemic (time of publication; [35]), our faculty
addressed the wish for more online lectures by creating new digital learning opportunities and
structures. Eventually these structures will persist after the university switches to conventional
lectures once again. It is also striking that many of the suggested interventions might not only
reduce stress, but also improve several aspects of teaching (e.g. the coordination of practical
and theoretical phases). This suggests that improvement of well-being and improvement of
academic outcomes go into the same direction. In contrast to students’ wish for setting-based
interventions, most interventions being proposed in the literature focus on the individual [8].
However, such interventions are believed to not tackle the root of the problem [36]. It is
argued that instead of teaching students how to cope with stress, the causes for stress need to
be addressed [36]. Some individual-based interventions (e.g. stress-management courses)
might even have the opposite effect by being an addition to existing classes and workload. It is
further of interest that we observed that a significant number of our participants did not favor
the interventions suggested by the literature. For instance, several students did not prefer a
switch to a pass/fail grading system. These students perceived grades as helpful, were con-
cerned that the absence of grades would have a negative impact on their academic perfor-
mance, or would cause increased stress at the first state examination. However, this latter
concern is not supported by the data [12, 37].
It is possible that the idea of a pass/fail grading system elicits discomfort among our stu-
dents because it is rather uncommon in Germany. When the pass/fail system was first intro-
duced in the US similar concerns were raised [38]. A shift to a pass/fail system was perceived
as a disadvantage for students and students coming from a university with pass/fail grading
were thought to experience difficulties finding a residency placement. Therefore, the authors
did not recommend such a transition [38]. However, a recent study showed that a pass/fail
grading does not curtail career prospects [29]. Specifically, there were no differences in resi-
dency placement (receiving a placement at all and percentage of students that receive top spe-
cialty choices) and overall academic performance between pass/fail and tiered grading system
cohorts [29].
Besides pass/fail grading being uncommon in Germany, it would also require a change of
the persisting score calculation for the first state examination. Additionally, it would require a
cultural shift towards a non-competitive environment among all students in order to be suc-
cessful. Therefore, instead of fully switching to pass/fail grading only, a mixed approach might
be more feasible in which pass/fail grading could be adopted in some subjects while other
subject are still graded. In this approach, grades still contribute to the result of the state
Stress: Psychological Perspectives
64
examination. This would address medical students’ preference to accumulate marks and
thereby reduce stress during the first state examination without a prompt change that requires
time for adaptation.
Possible mentoring programs by senior students were well received by the participants in
our study. More advanced students were believed to provide invaluable informational and
emotional support. Since such a program has relatively low costs and was also favored by
potential mentors, we propose starting a peer-to-peer mentoring program at our university as
recommended by others [39].
Balint groups received mixed reactions. This is in line with previous research suggesting
indifferent to mildly positive student attitudes towards Balint groups [21, 22]. A qualitative
study from Finland reported a more positive evaluation of Balint groups [23]. Here, students
reported being satisfied with their participation and benefiting from the groups [23]. In our
present study, especially those students who had already encountered a difficult situation with
a patient stated that they would be grateful for this kind of opportunity and support. Therefore,
the implementation of a Balint group with voluntary participation on request as suggested by
students could be considered. It could build on already established peer-support-programs
such as the programs at Brigham andWomen’s Hospital in Boston, which has repeatedly
served as a model for peer-support-programs [40].
Students themselves requested a variety of self-management courses. Most were interested
in learning relaxation techniques and how to deal with stress. They stated that existing offers,
like a time management class, are less attractive because their study curriculum does not allow
for the implementation of taught strategies in this class. Overall, they expressed the wish that
classes to improve resilience should be accessible to everyone. Some stress management
courses (e.g. “stress management” or “mind-body-medicine”) are only offered as elective sub-
jects and are therefore only available for a fraction of the students. We suggest that all students
receive a basic stress-management training and psychoeducation, preferably at the beginning
of the curriculum. At some universities, such as the Monash University medical school in Aus-
tralia, mindfulness and stress management have been part of the curriculum for many years
[41]. Since some studies found reliable short-term effects [8, 42], students could benefit from it
in most stressful times without the concern of losing time to study. For the latter reason we
also suggest that more classes that address mental health are offered. In addition to face-to-
face training, e-mental-health-solutions could be made accessible for students for quick sup-
port. Students’ wish for e-learning opportunities suggests that they are open to digital formats
that grant them more independence in terms of time and location of use. Furthermore, infor-
mation on specific counseling opportunities should be made more accessible. It is possible that
raising awareness of medical students’ mental health will reduce fear of stigmatization by peers
which was mentioned as a concern in the context of Balint groups.
Overall, we find that students proposed more setting-based interventions than individual-
based interventions. This is in sharp contrast with the persistent emphasis on individual-based
interventions in medical schools [8–10, 43]. Importantly, while setting-based interventions
are sometimes considered expensive or difficult to implement [7], most ideas in the focus
groups (e.g. attendance rules, a new course selection procedure, teaching guidelines) seem eas-
ily feasible and resource-friendly and will not only improve wellbeing, but also academic
performance.
Strengths and limitations
A strength of this study is its rich data, which were collected among as much as 71 students
from a broad range of semesters in eight focus groups until data saturation was reached.
Stress: Psychological Perspectives
65
However, the generalizability of our findings may be limited since only students from the
medical school at the University of Dusseldorf were included in this study. Our findings might
be specific to issues and obstacles encountered at universities in Germany and therefore only
somewhat transferable to universities in other countries.
When we asked the participants about their opinions on a pass/fail grading system, we did
not clarify in detail whether they would still like feedback on their performance if a pass/fail
grading system was implemented. Thus, we do not know to what extent students perceive a
pass/fail grading system and feedback on their performances mutually exclusive.
Further, we cannot rule out selection bias. One might argue that only those students suffer-
ing from stress or those who are especially dissatisfied with medical school attended the focus
groups. On the other hand, one might assume that those students experiencing a high level of
stress choose not to participate because of the additional workload. The fact that focus group
facilitators were members of the teaching staff and that one focus group was held within a class
on stress management could also have affected the observations. MD’s and TM’s position as a
teaching staff member might have elicited a social desirability bias and reduced willingness to
share sensitive topics. However, also in this seminar, we felt that students spoke very openly
about their issues. The contents of this focus group did not differ thematically from the other
focus groups.
This study explored which type of interventions students consider acceptable and useful.
Based on our data we are however unable to evaluate the feasibility and effectiveness of pro-
posed interventions. However, we believe that only interventions that are favored by students
and address their specific needs will be successful.
Conclusions
In contrast to interventions to improve medical students’ mental health that are proposed in
the literature, we find that medical students mostly proposed interventions on a setting level
rather than on an individual level. Importantly, many interventions suggested by the students
are low-cost and easy to implement. We believe that considering the student perspective is a
key factor in designing mental health interventions. Further research with a representative
sample is needed to obtain more generalizable information on the acceptance of the proposed
interventions and to test them in terms of feasibility and effectiveness by using both qualitative
and quantitative approaches.
Supporting information
S1 File. Focus group guide.
S2 File. Completed checklist of the consolidated criteria for reporting qualitative research
(COREQ).
Acknowledgments
We would like to thank Johanna Schwerdt for her invaluable help understanding the medical
school curriculum and putting the students’ perspectives into the right context.
Author Contributions
Conceptualization: Thomas Muth, Peter Angerer.
Stress: Psychological Perspectives
66
Data curation:Melina Dederichs, Thomas Muth.
Formal analysis:Melina Dederichs, Jeannette Weber, Adrian Loerbroks.
Funding acquisition: Thomas Muth.
Methodology: Adrian Loerbroks.
Writing – original draft:Melina Dederichs.
Writing – review & editing: Jeannette Weber, Thomas Muth, Peter Angerer, Adrian
Loerbroks.
References1. Rotenstein LS, Ramos MA, Torre M, Segal JB, PelusoMJ, Guille C, et al. Prevalence of Depression,
Depressive Symptoms, and Suicidal Ideation AmongMedical Students: A Systematic Review andMeta-Analysis. JAMA. 2016; 316(21):2214–36. https://doi.org/10.1001/jama.2016.17324 PMID:27923088
2. Slavin SJ. Medical Student Mental Health: Culture, Environment, and the Need for Change. Jama.2016; 316(21):2195–6. https://doi.org/10.1001/jama.2016.16396 PMID: 27923076
3. Slavin SJ, Schindler DL, Chibnall JT. Medical student mental health 3.0: improving student wellnessthrough curricular changes. Academic medicine: journal of the Association of AmericanMedical Col-leges. 2014; 89(4):573–7.
4. Dyrbye LN, Sciolla AF, Dekhtyar M, Rajasekaran S, Allgood JA, ReaM, et al. Medical School Strategiesto Address Student Well-Being: A National Survey. Academic medicine: journal of the Association ofAmericanMedical Colleges. 2019; 94(6):861–8.
5. Seritan AL, Rai G, Servis M, Pomeroy C. The office of student wellness: innovating to improve studentmental health. Academic psychiatry: the journal of the American Association of Directors of PsychiatricResidency Training and the Association for Academic Psychiatry. 2015; 39(1):80–4.
6. Dooris M. Holistic and sustainable health improvement: the contribution of the settings-based approachto health promotion. Perspect Public Health. 2009; 129(1):29–36. https://doi.org/10.1177/1757913908098881 PMID: 19338133
7. Fernandez A, Howse E, Rubio-Valera M, Thorncraft K, Noone J, Luu X, et al. Setting-based interven-tions to promote mental health at the university: a systematic review. International journal of publichealth. 2016; 61(7):797–807. https://doi.org/10.1007/s00038-016-0846-4 PMID: 27364779
8. Witt K, Boland A, Lamblin M, McGorry PD, Veness B, Cipriani A, et al. Effectiveness of universal pro-grammes for the prevention of suicidal ideation, behaviour and mental ill health in medical students: asystematic review and meta-analysis. Evidence-based mental health. 2019; 22(2):84–90. https://doi.org/10.1136/ebmental-2019-300082 PMID: 30918000
9. Daya Z, Hearn JH. Mindfulness interventions in medical education: A systematic review of their impacton medical student stress, depression, fatigue and burnout. Medical teacher. 2018; 40(2):146–53.https://doi.org/10.1080/0142159X.2017.1394999 PMID: 29113526
10. Wasson LT, Cusmano A, Meli L, Louh I, Falzon L, Hampsey M, et al. Association Between LearningEnvironment Interventions and Medical Student Well-being: A Systematic Review. Jama. 2016; 316(21):2237–52. https://doi.org/10.1001/jama.2016.17573 PMID: 27923091
11. Rohe DE, Barrier PA, Clark MM, Cook DA, Vickers KS, Decker PA, editors. The benefits of pass-failgrading on stress, mood, and group cohesion in medical students. Mayo Clinic proceedings; 2006:Elsevier.
12. Spring L, Robillard D, Gehlbach L, Moore Simas TA. Impact of pass/fail grading on medical students’well-being and academic outcomes. Medical education. 2011; 45(9):867–77. https://doi.org/10.1111/j.1365-2923.2011.03989.x PMID: 21848714
13. Ange B, Wood EA, Thomas A, Wallach PM. Differences in Medical Students’ Academic Performancebetween a Pass/Fail and Tiered Grading System. Southern medical journal. 2018; 111(11):683–7.https://doi.org/10.14423/SMJ.0000000000000884 PMID: 30392003
14. Akinla O, Hagan P, AtiomoW. A systematic review of the literature describing the outcomes of near-peer mentoring programs for first year medical students. BMCmedical education. 2018; 18(1):98.https://doi.org/10.1186/s12909-018-1195-1 PMID: 29739376
15. Slockers MT, van de Ven P, Steentjes M, Moll H. Introducing first-year students to medical school:experiences at the Faculty of Medicine of Erasmus University, Rotterdam, The Netherlands. Medicaleducation. 1981; 15(5):294–7. https://doi.org/10.1111/j.1365-2923.1981.tb02491.x PMID: 7266393
Stress: Psychological Perspectives
67
16. Andre C, Deerin J, Leykum L. Students helping students: vertical peer mentoring to enhance the medi-cal school experience. BMC research notes. 2017; 10(1):176. https://doi.org/10.1186/s13104-017-2498-8 PMID: 28464902
17. Balint M. The doctor, his patient and the illness. 1957.
18. Van Roy K, Vanheule S, Inslegers R. Research on Balint groups: a literature review. Patient educationand counseling. 2015; 98(6):685–94. https://doi.org/10.1016/j.pec.2015.01.014 PMID: 25681874
19. Sekeres MA, Chernoff M, Lynch TJ Jr, Kasendorf EI, Lasser DH, Greenberg DB. The impact of a physi-cian awareness group and the first year of training on hematology-oncology fellows. Journal of clinicaloncology. 2003; 21(19):3676–82. https://doi.org/10.1200/JCO.2003.12.014 PMID: 14512400
20. Habib MA, RahmanMA, Manara A, AyubM, BegumN, Hossain S. Stressors perceived by the para-clin-ical undergraduate medical students. Bangladesh Journal of Medical Education. 2018; 9(2):3–10.
21. Parker S, Leggett A. Teaching the clinical encounter in psychiatry: a trial of Balint groups for medicalstudents. Australasian Psychiatry. 2012; 20(4):343–7. https://doi.org/10.1177/1039856212447965PMID: 22767937
22. Parker S, Leggett A. Reflecting on our practice: an evaluation of Balint groups for medical students inpsychiatry. Australasian Psychiatry. 2014; 22(2):190–4. https://doi.org/10.1177/1039856213517946PMID: 24449530
23. Torppa MA, Makkonen E, Martenson C, Pitkala KH. A qualitative analysis of student Balint groups inmedical education: contexts and triggers of case presentations and discussion themes. Patient educa-tion and counseling. 2008; 72(1):5–11. https://doi.org/10.1016/j.pec.2008.01.012 PMID: 18295432
24. Lorig KR, Holman HR. Self-management education: history, definition, outcomes, and mechanisms.Annals of behavioral medicine. 2003; 26(1):1–7. https://doi.org/10.1207/S15324796ABM2601_01PMID: 12867348
25. Kujala S. User involvement: a review of the benefits and challenges. Behaviour & information technol-ogy. 2003; 22(1):1–16.
26. Sekhon M, Cartwright M, Francis JJ. Acceptability of healthcare interventions: an overview of reviewsand development of a theoretical framework. BMC health services research. 2017; 17(1):88. https://doi.org/10.1186/s12913-017-2031-8 PMID: 28126032
27. Rathbun J. Helping medical students develop lifelong strategies to cope with stress. Academic Medi-cine. 1995; 70(11):955–6. https://doi.org/10.1097/00001888-199511000-00007 PMID: 7575945
28. Drolet BC, Rodgers S. A comprehensive medical student wellness program—design and implementa-tion at Vanderbilt School of Medicine. Academic medicine: journal of the Association of AmericanMedi-cal Colleges. 2010; 85(1):103–10.
29. Weber J, Skodda S, Muth T, Angerer P, Loerbroks A. Stressors and resources related to academicstudies and improvements suggested by medical students: a qualitative study. BMCmedical education.2019; 19(1):312. https://doi.org/10.1186/s12909-019-1747-z PMID: 31429744
30. Bergmann C, Muth T, Loerbroks A. Medical students’ perceptions of stress due to academic studiesand its interrelationships with other domains of life: a qualitative study. Medical education online. 2019;24(1):1603526. https://doi.org/10.1080/10872981.2019.1603526 PMID: 31007152
31. Mayring P. Qualitative content analysis: theoretical foundation, basic procedures and software solution.2014.
32. Heinrichs K, Vu-Eickmann P, Hummel S, Gholami J, Loerbroks A. What are the perceived influences onasthma self-management at the workplace? A qualitative study. BMJ open. 2018; 8(8):e022126. https://doi.org/10.1136/bmjopen-2018-022126 PMID: 30158229
33. Loerbroks A, Nguyen XQ, Vu-Eickmann P, KrichbaumM, Kulzer B, Icks A, et al. Psychosocial workingconditions and diabetes self-management at work: A qualitative study. Diabetes research and clinicalpractice. 2018; 140:129–38. https://doi.org/10.1016/j.diabres.2018.03.023 PMID: 29608978
34. Tong A, Sainsbury P, Craig J. Consolidated criteria for reporting qualitative research (COREQ): a 32-item checklist for interviews and focus groups. Int J Qual Health Care. 2007; 19(6):349–57. https://doi.org/10.1093/intqhc/mzm042 PMID: 17872937
35. Bundesregierung P-uId. Meeting between Federal Chancellor Merkel and the Minister-Presidents of theLander to discuss the coronavirus—Press release 2020 [Available from: https://www.bundesregierung.de/resource/blob/973812/1733914/fa51a075a455ada58bb478c0561b43f7/2020-03-23-beschluss-laender-statement-kanzlerin-eng-data.pdf?download=1.
36. Fernandes A, Shah R, Shah S. Medical student perspective on stress: tackling the problem at the root.Medical education online. 2019; 24(1):1633173. https://doi.org/10.1080/10872981.2019.1633173PMID: 31208299
37. McDuff SG, McDuff D, Farace JA, Kelly CJ, Savoia MC, Mandel J. Evaluating a grading change atUCSD school of medicine: pass/fail grading is associated with decreased performance on preclinical
Stress: Psychological Perspectives
68
exams but unchanged performance on USMLE step 1 scores. BMCmedical education. 2014; 14(1):127.
38. Dietrick JA, Weaver MT, Merrick HW. Pass Fail Grading—a Disadvantage for Students Applying forResidency. Am J Surg. 1991; 162(1):63–6. https://doi.org/10.1016/0002-9610(91)90204-q PMID:2063972
39. Kotter T, Pohontsch NJ, Voltmer E. Stressors and starting points for health-promoting interventions inmedical school from the students’ perspective: a qualitative study. Perspectives on medical education.2015; 4(3):128–35. https://doi.org/10.1007/s40037-015-0189-5 PMID: 26032519
40. Shapiro J, Galowitz P. Peer Support for Clinicians: A Programmatic Approach. Academic medicine:journal of the Association of American Medical Colleges. 2016; 91(9):1200–4.
41. Hassed C, Sierpina VS, Kreitzer MJ. The health enhancement program at Monash University medicalschool. Explore. 2008; 4(6):394–7. https://doi.org/10.1016/j.explore.2008.09.008 PMID: 18984555
42. Hassed C, de Lisle S, Sullivan G, Pier C. Enhancing the health of medical students: outcomes of an inte-grated mindfulness and lifestyle program. Advances in health sciences education: theory and practice.2009; 14(3):387–98.
43. Shiralkar MT, Harris TB, Eddins-Folensbee FF, Coverdale JH. A systematic review of stress-manage-ment programs for medical students. Academic psychiatry: the journal of the American Association ofDirectors of Psychiatric Residency Training and the Association for Academic Psychiatry. 2013; 37(3):158–64.
Stress: Psychological Perspectives
69
Perceived stress and well-being of Polishmigrants in the UK after Brexit vote
Klaudia Martynowska1☯, Tomasz Korulczyk2☯, Piotr Janusz MamcarzID3☯*
1Department of Special Education, The John Paul II Catholic University of Lublin, Lublin, Poland,2Department of Organizational and Management Psychology, The John Paul II Catholic University of Lublin,
Lublin, Poland, 3Department of Emotion and Motivation Psychology, The John Paul II Catholic University ofLublin, Lublin, Poland
☯ These authors contributed equally to this work.* [email protected]
Abstract
Objective
This study aimed to investigate factors affecting personal well-being of Polish immigrants liv-
ing in the UK in the face of a significant political change—the Brexit vote. We measured per-
ceived changes in attitude or behaviour of supervisors and co-workers, respondents’
perceived stress, and its outcomes such as psychological well-being and intention to leave
the UK after the Brexit vote.
Method
551 Polish migrants residing in various regions of the UK took part in the study in the form of
Qualtrics online survey. We used self-report measures: Perceived Stress Scale, The Satis-
faction with Life Scale, Scale of Psychological Well-being.
Results
The most of the respondents did not notice any change in the attitude or behaviour of the
supervisor (81%) or co-workers (84%), and only a small percentage of the participants
reported negative changes in attitude or behaviour of supervisors (9%) and co-workers
(14%). Also, negative change in attitude or behaviour of supervisors or co-workers are asso-
ciated with perceived stress, which inturn is linked with intention to leave the UK, psychologi-
cal well-being and life satisfaction.
Conclusion
Polish and British co-existence in a workplace setting has not changed much after the Brexit
vote.
Editor: Sergio A. Useche, Universitat de Valencia,
SPAIN
6
70
Introduction
Brexit has not only signified a political change but, more than anything, a major social change
in immigrants’ life. It is reflected in the statistics which show that there has been a rise in the
number of European citizens leaving the UK since the Brexit vote. In 2016, a 84.000 drop in
migration to the UK—the lowest level for nearly three years—was driven by a 40.000 rise in
emigration compared to 2015. According to The Guardian—a leading British newspaper—the
immigration drop was partly caused by a dropping number of 25.000 Poles and other Eastern
Europeans—citizens coming to work in Britain, probably affected negatively by the referen-
dum vote [1], and a 16.000 rise in the number of them leaving the UK. Generally speaking, the
Brexit vote, among others, has elucidated the right-wing anti-globalisation movement which
may result in negative social behaviours such as xenophobia reflected in the experience of
minorities [2]. The anti-immigrant rhetoric of some political leaders in the UK has led to a ris-
ing number of racially aggravated offences towards immigrants after Brexit vote [3, 4]. The evi-
dent examples included cards saying “Leave the EU/No more Polish vermin” left outside
primary schools in Huntingdon, Cambridgeshire [5], and the tragic example of the murder of
a middle-aged Polish factory worker—Arkadiusz Joźwik who after being heard speaking Polish
was punched to the ground [6]. Racism, racially motivated hostility, and xenophobia in the
UK are not new phenomena. Hate crimes and racially motivated hostility strongly correspond
to shifts in demographics, political, and economic trends [7] Brexit vote. However, the Brexit
results “legitimised” these and caused a significant increase in their occurrence [8] towards not
only Polish but also other minorities living in the UK [9, 10]. Despite a growing interest in the
after Brexit vote consequences with many papers exploring racist hate crimes as a posttrau-
matic stress disorder and victimisation [1], there is not much evidence presenting the psycho-
logical effects of this political decision experienced by migrant employees. Also, while there is
a regular survey to study the psychological well-being (PWB) of UK citizens, there is a consid-
erable lack of attention paid to the PWB of the immigrants, also in the scientific terms [4]. In
an organisational context, racially motivated hostility may take more latent or open form. The
first one may be expressed in the form of a change of attitude into more hostile and can be
observed through indirect unfriendly behaviours. The latter one is manifested through inci-
dents of discrimination, hateful behaviours and may even take a form of workplace harass-
ment. Therefore, the present study aims to examine a possible change in attitude or behaviour
of supervisors (NCS) or co-workers (NCC), perceived stress (PSS) and its consequences on
well-being of migrant employees.
Perception of Poles living in the UK over time
The EU Succession of Poland and seven other countries (A8) on 1st of May 2004 triggered a
mass economic migration within the EU. While the majority of existing EU members
restricted access to their labour markets for citizens of newly joined countries, the UK as one
out of three countries allowed legal work immediately after EU enlargement. This political
decision was made due to significant shortages in the labour market in low-paid and low-
skilled jobs [11]. Many people experiencing high unemployment, lack of career opportunities,
and low wages in Poland decided to leave for the UK to work and settle down [12]. Within less
than a decade, the Polish-born population enlarged almost ten times, reaching a number over
half of a million. The statistics show that 15 years after the EU succession, there are over a mil-
lion Polish-speaking people in the UK [13]. It constitutes about 2% of the whole UK popula-
tion, which makes Polish people the largest non-British nationality residing in the UK. At the
time of EU succession, Polish people were considered as hardworking, honest and acknowl-
edged by British people for their contribution in the recent history of England, in other words,
Funding: The author(s) received no specific
funding for this work.
Competing interests: The authors have declared
that no competing interests exist.
Stress: Psychological Perspectives
71
they were perceived as desirable employees on the UK labour market. Yet, the image of Polish
people has gradually changed after the UK’s market suffered from economic problems due to
the crisis in 2008. At the very same time, the Polish population enlarged from 50.000 to about
a million. Being an EUmember, UK was bound by freedom of movement law which at some
point was regarded as the main political reason causing problems on the UK’s market. To get a
vote of approval, leaders of some political parties claimed free migration as a challenging issue
while intensifying their anti-immigrant rhetoric. In 2016, the Leave campaign argued that leav-
ing the EU would allow Britain to “take back control of its borders”. The other politician—
Amber Rudd during the Conservative Party’s conference in October 2017 said that foreign
workers should not be “taking jobs that British people could do” echoing Gordon Brown’s
“British jobs for British workers” remark in 2007 [8]. Not only politicians contributed to the
change of perception of Polish people living in the UK, but it was media who played a leading
role in this process, mainly three of them: The Sun, the Express, and the Daily Mail [14]. As a
result, the European Commission against Racism and Intolerance in 2016 denounced the UK
newspapers for using offensive, discriminatory language.
Social consequences of Brexit vote
After the conservative party won the election in 2015, under the pressure of society and media,
the prime minister, David Cameron, announced the Brexit referendum. Surprisingly, most
electors, yet slightly over the half, with the majority of votes of the older population decided to
leave the EU. This situation sparked a large number of hateful incidents towards minority
groups living in the UK. The analysis of over a hundred of racist violence incidents after Brexit
vote supported the link between the rhetoric of politicians and behaviour of perpetrators [9].
By engaging in hostile behaviours, the offenders may feel like they are “executing” the results
of the vote. They perceive their behaviour as totally justified and believe their acts of aggression
are even patriotic. Comparing the situation of Polish people in the UK after Brexit vote and
the minorities in the US after 9/11, one can observe apparent similarities. Craig-Henderson
and Sloan expressed it as follows: “Since the September 11 terrorists attacks, the Civil Rights
Division of the Justice Department has noted a dramatic increase in the number of violent
hate crimes directed at people who are perceived to be Arab, Muslim, or simply Middle East-
ern. In general, Middle Easterners have been targeted because they are perceived to share
membership in the ethnic group to which the perpetrators of the terrorist attacks belong.
There is evidence that the Americans who have perpetrated anti-Middle Eastern hate crimes
in the wake of 09/11 and have been apprehended see themselves as strongly patriotic and
believe their aggression to be retaliatory and justified” [15], p. 482. Polish migrants have been
targeted due to their membership to an ethnic group considered a “threat” to the UK citizens.
However, this threat has not been physical but rather economic [16]. Within 15 years as a
result of strong political discourse, the image of Poles has changed from desirable members of
society to the members of the threatening group. It is reflected in both public and organisa-
tional environments which may be manifested in a negative change in attitude and hostile
behaviour in the workplace. The arising question here is whether the collaborative work of Pol-
ish and British people for more than a decade has not built a bond strong enough to overcome
the stereotypical perception of Poles as threatening minority group.
A negative change in attitude or behaviour of supervisors and co-workers
In an organisational setting, employees view their work relationships either with the organisa-
tion or its authorities as social exchanges [17, 18]. In the light of uncertainty coming from an
unstable political situation after Brexit vote, migrants may project their experiences of societal
Stress: Psychological Perspectives
72
change in attitude on their work relationships. The change of attitude may relate to the fairness
of judgments. Thau, Aquino, and Wittek [19] have extensively researched this concept with
antisocial and hostile behaviours, in the framework of uncertainty management theory (UMT)
which specifies the mechanisms of fairness judgments affecting work behaviours [20]. Follow-
ing UMT, employees focus on fairness information, especially when they face uncertainty. It
may relate to the trustworthiness of the authority in a decision-making situation [21]. The rela-
tional model of procedural justice, fair procedures have an impact on relational bonds among
people and group authorities, e.g., supervisors, managers [22]. Fair procedures reflect status to
members of an organisation by communicating to the employees that “if we treat you fairly,
we must care about you or respect you.” [23]. Finally, there are some possible boundary condi-
tions for the well-established empirical relationship between justice perceptions and antisocial
work behaviour [24–26]. On the other hand, uncertainty may be linked with instability, both
financial and emotional, as a result of the Brexit vote for the minority groups who mostly
migrated to the UK. On this basis, the following hypothesis is set (H1): Respondents observed
the negative change in attitude or behaviour of supervisors and co-workers after Brexit vote.
Organisational policy and perceived stress
Significant political changes have socioeconomic consequences which are experienced by
organisations and institutions and have a substantial impact on the company’s internal policy.
Landells and Albrecht [27] have undertaken an attempt to develop a richer understanding of
how employees perceive organisational politics in contemporary organisational contexts, in
positive and negative terms. The findings, among others, revealed that political behaviours
were described by five established bases of organisational power: connection power, informa-
tion power, coercive power, positional power, and personal power. It leads to the assumption
of behaviour displayed by employees on various organisational levels exert a sense of power.
Moreover, organisational politics have direct, moderated, and mediated effects on stress-
related outcomes experienced by employees [28, 29]. An organisational policy may be proac-
tive or reactive. Reactive behaviours such as avoidance of action, avoidance of responsibility,
strategy of passiveness appear more frequently in of the face of change. For instance, an
employee perceives a change of rule as a threat that may harm his or her interests and thus acts
to mitigate the losses in the future. Every abnormality in the work environment can be a trig-
ger to stress, fear, feeling of threat, and other negative cognitive-emotional states. According to
the Process Model of Organizational Politics and Stress [30] which underlines the role of per-
ception of organisational politics, political behaviour, and political skills in determining stress-
related outcomes, including psychological and physiological well-being as well as job burnout,
the following hypothesis is set (H2): A negative change in attitude or behaviour of supervisors
and co-workers increases the level of perceived stress.
The role of social support in stress reduction
In the face of demanding life situations imposing major changes, individual’s personal
resources are of prime importance as well-being and adjustment capabilities depend on them.
Hobfoll [31] indicated 74 different types of resources grouped into internal and external ones.
The first group of resources embrace values (e.g., development, life, family), psychological cap-
ital (e.g., coping with stress, emotional intelligence, the locus of control, optimism, hardiness,
self-esteem) and personality traits. External resources, also understood as environmental, may
vary with regard to living conditions of an individual. In a work context, positive environmen-
tal resources comprise autonomy, constructive feedback, rewards, social support and a positive
change in behaviour, and attitude of supervisors/co-workers. A rich vein of contemporary
Stress: Psychological Perspectives
73
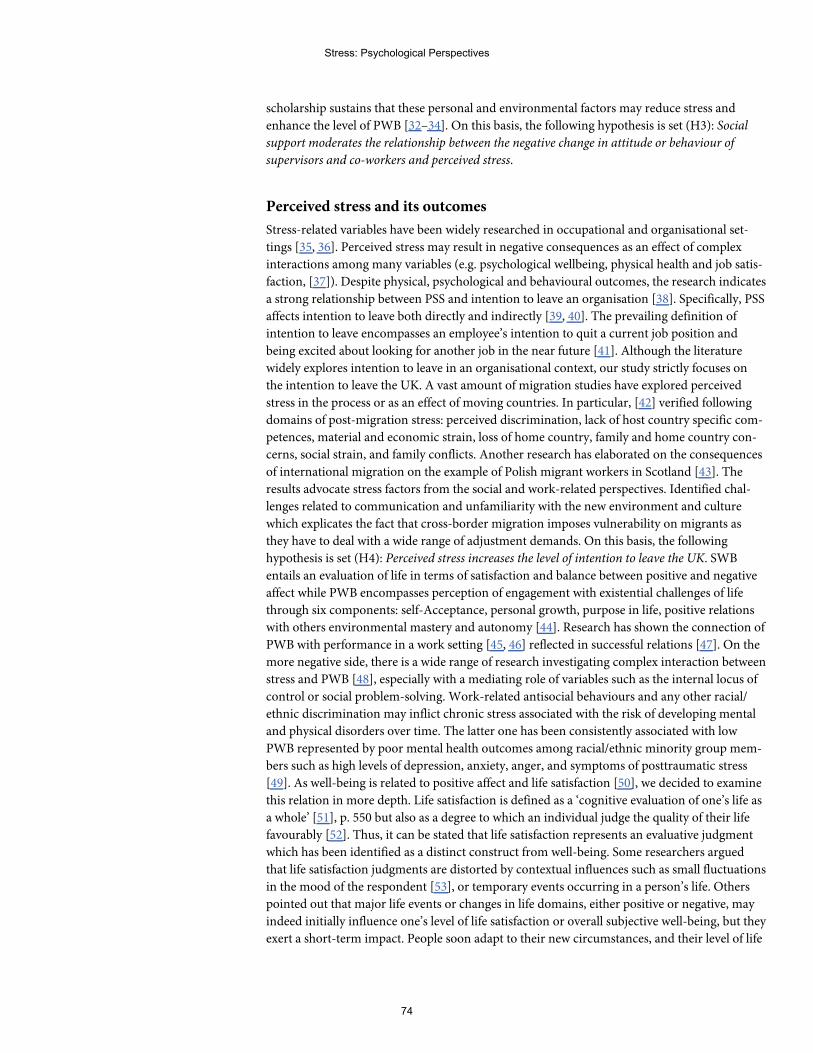
scholarship sustains that these personal and environmental factors may reduce stress and
enhance the level of PWB [32–34]. On this basis, the following hypothesis is set (H3): Social
support moderates the relationship between the negative change in attitude or behaviour of
supervisors and co-workers and perceived stress.
Perceived stress and its outcomes
Stress-related variables have been widely researched in occupational and organisational set-
tings [35, 36]. Perceived stress may result in negative consequences as an effect of complex
interactions among many variables (e.g. psychological wellbeing, physical health and job satis-
faction, [37]). Despite physical, psychological and behavioural outcomes, the research indicates
a strong relationship between PSS and intention to leave an organisation [38]. Specifically, PSS
affects intention to leave both directly and indirectly [39, 40]. The prevailing definition of
intention to leave encompasses an employee’s intention to quit a current job position and
being excited about looking for another job in the near future [41]. Although the literature
widely explores intention to leave in an organisational context, our study strictly focuses on
the intention to leave the UK. A vast amount of migration studies have explored perceived
stress in the process or as an effect of moving countries. In particular, [42] verified following
domains of post-migration stress: perceived discrimination, lack of host country specific com-
petences, material and economic strain, loss of home country, family and home country con-
cerns, social strain, and family conflicts. Another research has elaborated on the consequences
of international migration on the example of Polish migrant workers in Scotland [43]. The
results advocate stress factors from the social and work-related perspectives. Identified chal-
lenges related to communication and unfamiliarity with the new environment and culture
which explicates the fact that cross-border migration imposes vulnerability on migrants as
they have to deal with a wide range of adjustment demands. On this basis, the following
hypothesis is set (H4): Perceived stress increases the level of intention to leave the UK. SWB
entails an evaluation of life in terms of satisfaction and balance between positive and negative
affect while PWB encompasses perception of engagement with existential challenges of life
through six components: self-Acceptance, personal growth, purpose in life, positive relations
with others environmental mastery and autonomy [44]. Research has shown the connection of
PWB with performance in a work setting [45, 46] reflected in successful relations [47]. On the
more negative side, there is a wide range of research investigating complex interaction between
stress and PWB [48], especially with a mediating role of variables such as the internal locus of
control or social problem-solving. Work-related antisocial behaviours and any other racial/
ethnic discrimination may inflict chronic stress associated with the risk of developing mental
and physical disorders over time. The latter one has been consistently associated with low
PWB represented by poor mental health outcomes among racial/ethnic minority group mem-
bers such as high levels of depression, anxiety, anger, and symptoms of posttraumatic stress
[49]. As well-being is related to positive affect and life satisfaction [50], we decided to examine
this relation in more depth. Life satisfaction is defined as a ‘cognitive evaluation of one’s life as
a whole’ [51], p. 550 but also as a degree to which an individual judge the quality of their life
favourably [52]. Thus, it can be stated that life satisfaction represents an evaluative judgment
which has been identified as a distinct construct from well-being. Some researchers argued
that life satisfaction judgments are distorted by contextual influences such as small fluctuations
in the mood of the respondent [53], or temporary events occurring in a person’s life. Others
pointed out that major life events or changes in life domains, either positive or negative, may
indeed initially influence one’s level of life satisfaction or overall subjective well-being, but they
exert a short-term impact. People soon adapt to their new circumstances, and their level of life
Stress: Psychological Perspectives
74
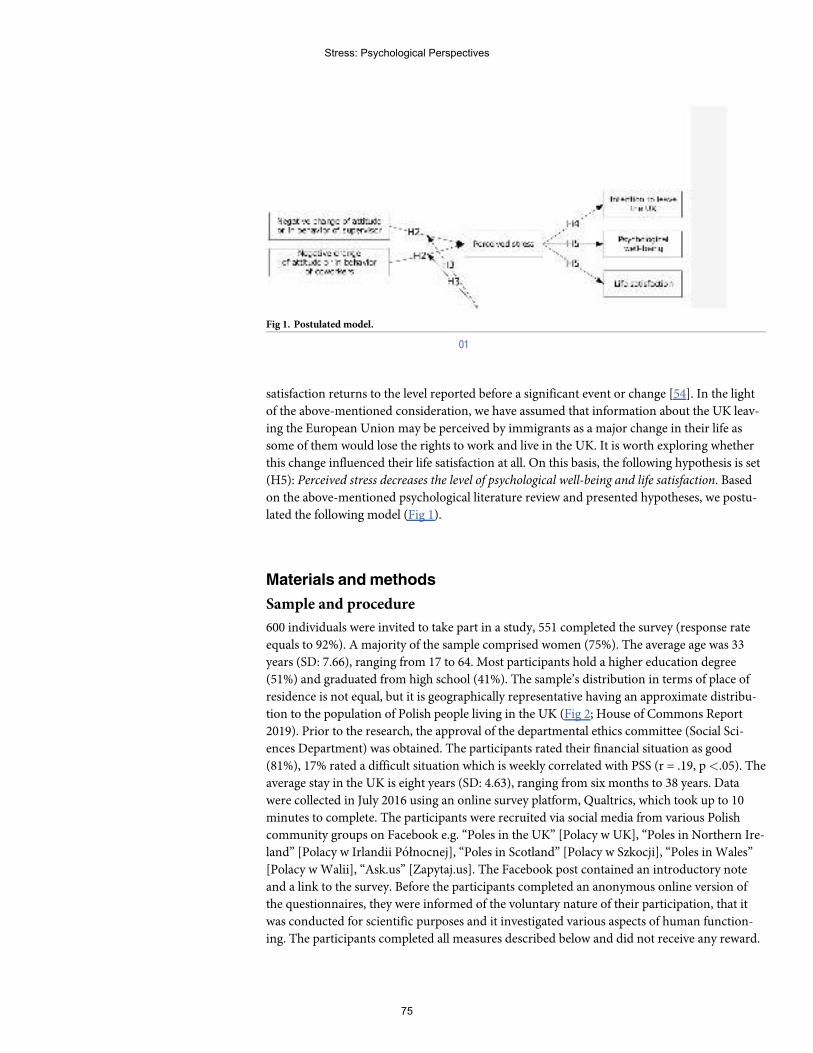
satisfaction returns to the level reported before a significant event or change [54]. In the light
of the above-mentioned consideration, we have assumed that information about the UK leav-
ing the European Union may be perceived by immigrants as a major change in their life as
some of them would lose the rights to work and live in the UK. It is worth exploring whether
this change influenced their life satisfaction at all. On this basis, the following hypothesis is set
(H5): Perceived stress decreases the level of psychological well-being and life satisfaction. Based
on the above-mentioned psychological literature review and presented hypotheses, we postu-
lated the following model (Fig 1).
Materials andmethods
Sample and procedure
600 individuals were invited to take part in a study, 551 completed the survey (response rate
equals to 92%). A majority of the sample comprised women (75%). The average age was 33
years (SD: 7.66), ranging from 17 to 64. Most participants hold a higher education degree
(51%) and graduated from high school (41%). The sample’s distribution in terms of place of
residence is not equal, but it is geographically representative having an approximate distribu-
tion to the population of Polish people living in the UK (Fig 2; House of Commons Report
2019). Prior to the research, the approval of the departmental ethics committee (Social Sci-
ences Department) was obtained. The participants rated their financial situation as good
(81%), 17% rated a difficult situation which is weekly correlated with PSS (r = .19, p<.05). The
average stay in the UK is eight years (SD: 4.63), ranging from six months to 38 years. Data
were collected in July 2016 using an online survey platform, Qualtrics, which took up to 10
minutes to complete. The participants were recruited via social media from various Polish
community groups on Facebook e.g. “Poles in the UK” [Polacy w UK], “Poles in Northern Ire-
land” [Polacy w Irlandii Połnocnej], “Poles in Scotland” [Polacy w Szkocji], “Poles in Wales”
[Polacy wWalii], “Ask.us” [Zapytaj.us]. The Facebook post contained an introductory note
and a link to the survey. Before the participants completed an anonymous online version of
the questionnaires, they were informed of the voluntary nature of their participation, that it
was conducted for scientific purposes and it investigated various aspects of human function-
ing. The participants completed all measures described below and did not receive any reward.
Fig 1. Postulated model.
01
Stress: Psychological Perspectives
75
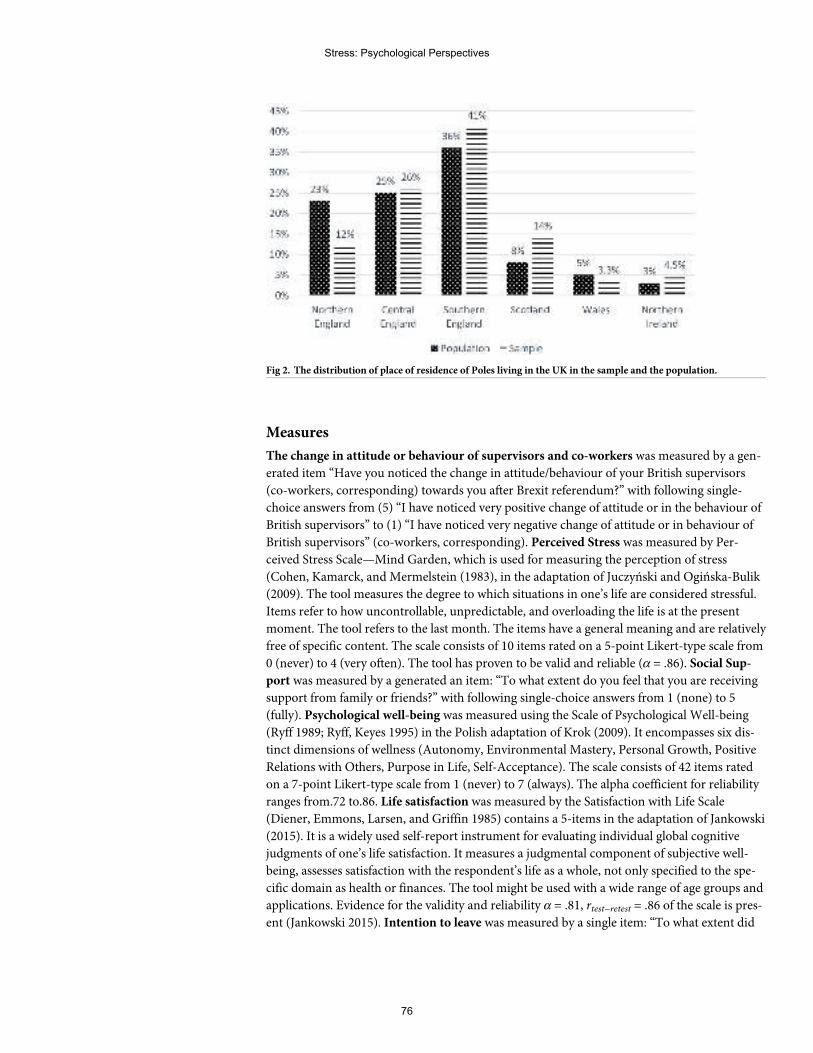
Measures
The change in attitude or behaviour of supervisors and co-workers was measured by a gen-
erated item “Have you noticed the change in attitude/behaviour of your British supervisors
(co-workers, corresponding) towards you after Brexit referendum?” with following single-
choice answers from (5) “I have noticed very positive change of attitude or in the behaviour of
British supervisors” to (1) “I have noticed very negative change of attitude or in behaviour of
British supervisors” (co-workers, corresponding). Perceived Stress was measured by Per-
ceived Stress Scale—Mind Garden, which is used for measuring the perception of stress
(Cohen, Kamarck, and Mermelstein (1983), in the adaptation of Juczyński and Ogińska-Bulik
(2009). The tool measures the degree to which situations in one’s life are considered stressful.
Items refer to how uncontrollable, unpredictable, and overloading the life is at the present
moment. The tool refers to the last month. The items have a general meaning and are relatively
free of specific content. The scale consists of 10 items rated on a 5-point Likert-type scale from
0 (never) to 4 (very often). The tool has proven to be valid and reliable (α = .86). Social Sup-
port was measured by a generated an item: “To what extent do you feel that you are receiving
support from family or friends?” with following single-choice answers from 1 (none) to 5
(fully). Psychological well-being was measured using the Scale of Psychological Well-being
(Ryff 1989; Ryff, Keyes 1995) in the Polish adaptation of Krok (2009). It encompasses six dis-
tinct dimensions of wellness (Autonomy, Environmental Mastery, Personal Growth, Positive
Relations with Others, Purpose in Life, Self-Acceptance). The scale consists of 42 items rated
on a 7-point Likert-type scale from 1 (never) to 7 (always). The alpha coefficient for reliability
ranges from.72 to.86. Life satisfaction was measured by the Satisfaction with Life Scale
(Diener, Emmons, Larsen, and Griffin 1985) contains a 5-items in the adaptation of Jankowski
(2015). It is a widely used self-report instrument for evaluating individual global cognitive
judgments of one’s life satisfaction. It measures a judgmental component of subjective well-
being, assesses satisfaction with the respondent’s life as a whole, not only specified to the spe-
cific domain as health or finances. The tool might be used with a wide range of age groups and
applications. Evidence for the validity and reliability α = .81, rtest−retest = .86 of the scale is pres-
ent (Jankowski 2015). Intention to leave was measured by a single item: “To what extent did
Fig 2. The distribution of place of residence of Poles living in the UK in the sample and the population.
Stress: Psychological Perspectives
76
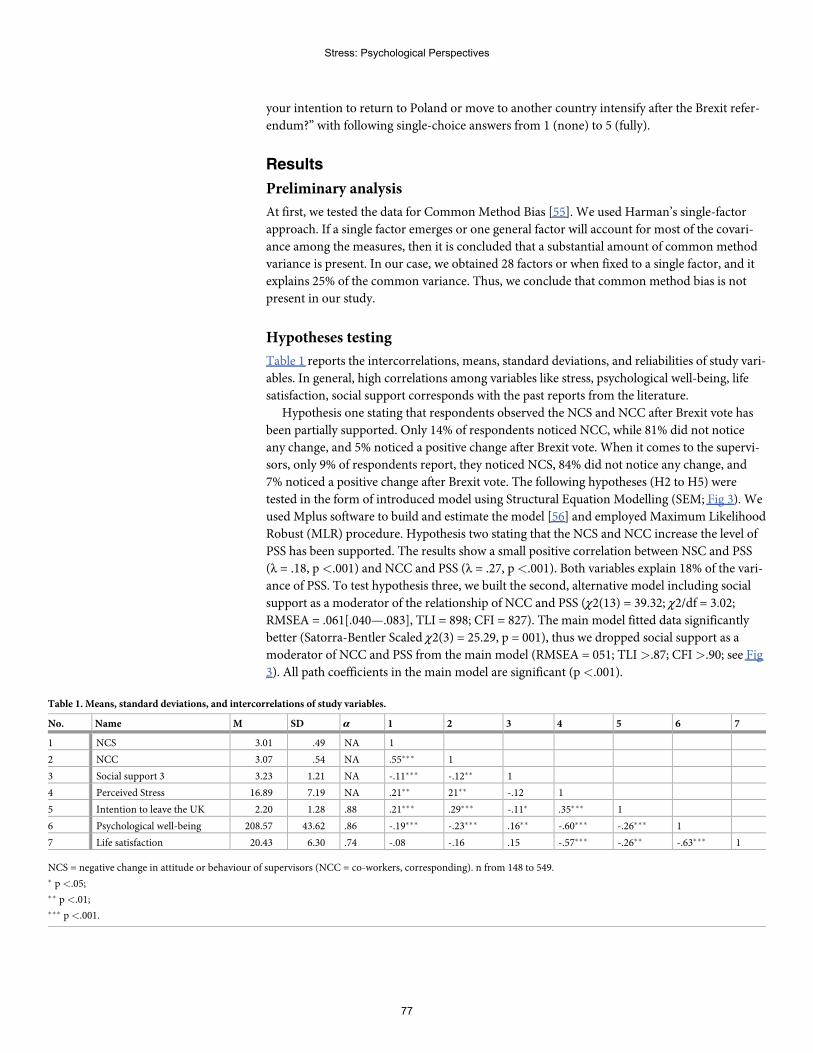
your intention to return to Poland or move to another country intensify after the Brexit refer-
endum?” with following single-choice answers from 1 (none) to 5 (fully).
Results
Preliminary analysis
At first, we tested the data for CommonMethod Bias [55]. We used Harman’s single-factor
approach. If a single factor emerges or one general factor will account for most of the covari-
ance among the measures, then it is concluded that a substantial amount of common method
variance is present. In our case, we obtained 28 factors or when fixed to a single factor, and it
explains 25% of the common variance. Thus, we conclude that common method bias is not
present in our study.
Hypotheses testing
Table 1 reports the intercorrelations, means, standard deviations, and reliabilities of study vari-
ables. In general, high correlations among variables like stress, psychological well-being, life
satisfaction, social support corresponds with the past reports from the literature.
Hypothesis one stating that respondents observed the NCS and NCC after Brexit vote has
been partially supported. Only 14% of respondents noticed NCC, while 81% did not notice
any change, and 5% noticed a positive change after Brexit vote. When it comes to the supervi-
sors, only 9% of respondents report, they noticed NCS, 84% did not notice any change, and
7% noticed a positive change after Brexit vote. The following hypotheses (H2 to H5) were
tested in the form of introduced model using Structural Equation Modelling (SEM; Fig 3). We
used Mplus software to build and estimate the model [56] and employed Maximum Likelihood
Robust (MLR) procedure. Hypothesis two stating that the NCS and NCC increase the level of
PSS has been supported. The results show a small positive correlation between NSC and PSS
(λ = .18, p<.001) and NCC and PSS (λ = .27, p<.001). Both variables explain 18% of the vari-
ance of PSS. To test hypothesis three, we built the second, alternative model including social
support as a moderator of the relationship of NCC and PSS (χ2(13) = 39.32; χ2/df = 3.02;
RMSEA = .061[.040—.083], TLI = 898; CFI = 827). The main model fitted data significantly
better (Satorra-Bentler Scaled χ2(3) = 25.29, p = 001), thus we dropped social support as a
moderator of NCC and PSS from the main model (RMSEA = 051; TLI>.87; CFI>.90; see Fig
3). All path coefficients in the main model are significant (p<.001).
Table 1. Means, standard deviations, and intercorrelations of study variables.
No. Name M SD α 1 2 3 4 5 6 7
1 NCS 3.01 .49 NA 1
2 NCC 3.07 .54 NA .55��� 1
3 Social support 3 3.23 1.21 NA -.11��� -.12�� 1
4 Perceived Stress 16.89 7.19 NA .21�� 21�� -.12 1
5 Intention to leave the UK 2.20 1.28 .88 .21��� .29��� -.11� .35��� 1
6 Psychological well-being 208.57 43.62 .86 -.19��� -.23��� .16�� -.60��� -.26��� 1
7 Life satisfaction 20.43 6.30 .74 -.08 -.16 .15 -.57��� -.26�� -.63��� 1
NCS = negative change in attitude or behaviour of supervisors (NCC = co-workers, corresponding). n from 148 to 549.� p<.05;�� p<.01;��� p<.001.
Stress: Psychological Perspectives
77
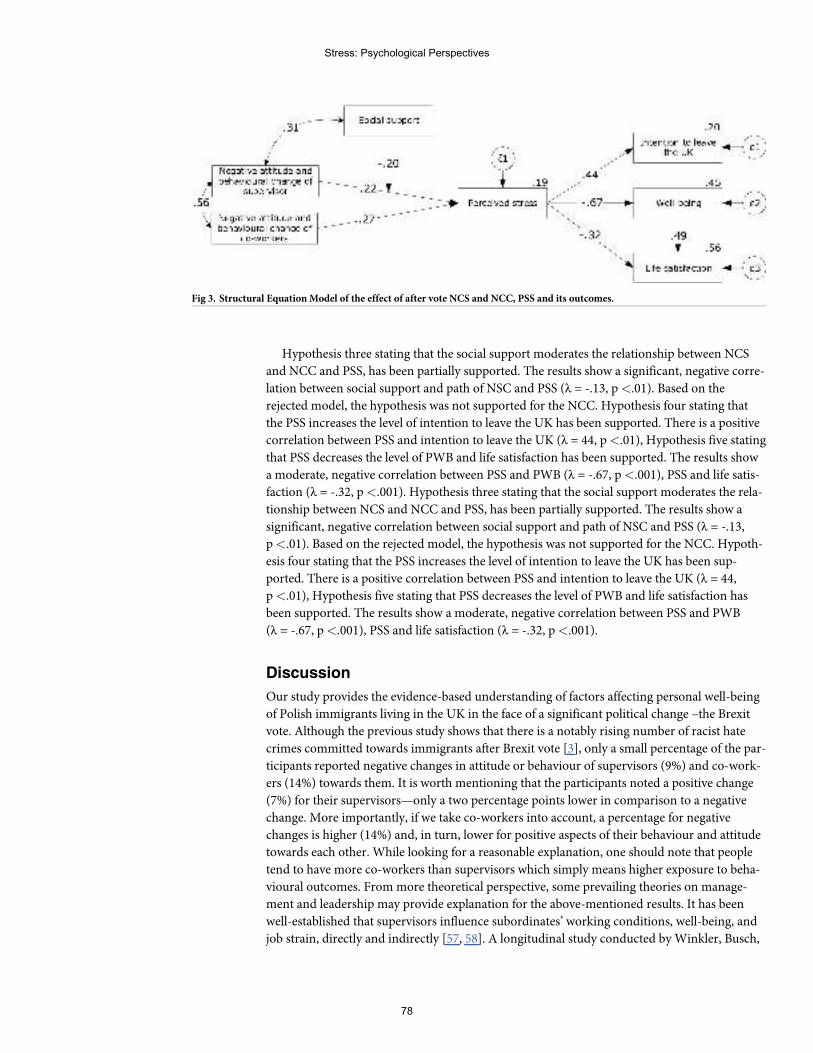
Hypothesis three stating that the social support moderates the relationship between NCS
and NCC and PSS, has been partially supported. The results show a significant, negative corre-
lation between social support and path of NSC and PSS (λ = -.13, p<.01). Based on the
rejected model, the hypothesis was not supported for the NCC. Hypothesis four stating that
the PSS increases the level of intention to leave the UK has been supported. There is a positive
correlation between PSS and intention to leave the UK (λ = 44, p<.01), Hypothesis five stating
that PSS decreases the level of PWB and life satisfaction has been supported. The results show
a moderate, negative correlation between PSS and PWB (λ = -.67, p<.001), PSS and life satis-
faction (λ = -.32, p<.001). Hypothesis three stating that the social support moderates the rela-
tionship between NCS and NCC and PSS, has been partially supported. The results show a
significant, negative correlation between social support and path of NSC and PSS (λ = -.13,
p<.01). Based on the rejected model, the hypothesis was not supported for the NCC. Hypoth-
esis four stating that the PSS increases the level of intention to leave the UK has been sup-
ported. There is a positive correlation between PSS and intention to leave the UK (λ = 44,
p<.01), Hypothesis five stating that PSS decreases the level of PWB and life satisfaction has
been supported. The results show a moderate, negative correlation between PSS and PWB
(λ = -.67, p<.001), PSS and life satisfaction (λ = -.32, p<.001).
Discussion
Our study provides the evidence-based understanding of factors affecting personal well-being
of Polish immigrants living in the UK in the face of a significant political change –the Brexit
vote. Although the previous study shows that there is a notably rising number of racist hate
crimes committed towards immigrants after Brexit vote [3], only a small percentage of the par-
ticipants reported negative changes in attitude or behaviour of supervisors (9%) and co-work-
ers (14%) towards them. It is worth mentioning that the participants noted a positive change
(7%) for their supervisors—only a two percentage points lower in comparison to a negative
change. More importantly, if we take co-workers into account, a percentage for negative
changes is higher (14%) and, in turn, lower for positive aspects of their behaviour and attitude
towards each other. While looking for a reasonable explanation, one should note that people
tend to have more co-workers than supervisors which simply means higher exposure to beha-
vioural outcomes. Frommore theoretical perspective, some prevailing theories on manage-
ment and leadership may provide explanation for the above-mentioned results. It has been
well-established that supervisors influence subordinates’ working conditions, well-being, and
job strain, directly and indirectly [57, 58]. A longitudinal study conducted byWinkler, Busch,
Fig 3. Structural EquationModel of the effect of after vote NCS and NCC, PSS and its outcomes.
Stress: Psychological Perspectives
78
Clasen and Vowinkel [59] confirms that changes in leadership behaviours predict changes in
job satisfaction and well-being in low-skilled workers. The researchers stated that subordi-
nates’ and supervisors’ individual power distance orientations will moderate the effect of sub-
ordinates’ perceptions of leadership behaviour and the subsequent effects on their well-being.
This is especially valid when it comes to a highly culturally diverse work setting. Building on
the leader-member exchange theory which sustains that high-quality exchanges create more
opportunities for interactions, work support, and the exchange of organizational and job-
related information, subordinates with high power distance orientation do not undermine
authority. In turn, those with low power distance orientation, expect more equality in hierar-
chical levels and maintain more personalized relationships with authority figures [60]. Our
research finding suggests that there is a positive relation between perceived stress of employees
and a negative change in their supervisors and co-workers’ attitude or behaviour. This result
may have a two-fold explanation. On the one hand, experiencing NCS and NCCmay trigger
stress reactions as, in the light of unfavourable Brexit news, an immigrant may perceive any
behavioural change as a potential threat which, in turn, induces stressful reactions. NCS and
NCCmay be displayed through changes in fair procedures and following the relational model
of procedural justice developed by Tyler and Lind [61], it may have an impact on relational
bonds among people and group authorities, e.g., supervisors, managers. On the other hand, on
the basis of uncertainty management theory [19], the mechanisms of fairness judgments affect-
ing work behaviours may be explained through the concept of uncertainty. Polish migrants
experiencing uncertainty due to a rapid political change may focus explicitly on fairness infor-
mation which may relate to the trustworthiness of the authority in a decision-making situa-
tion. On the other hand, our research shows that only 18% variance of PSS is explained by
NCC and NCS which may be interpreted that there were other factors influencing intensified
perceived stress—or possibly stressful reactions may have occurred as a prime factor. Brexit
itself may have induced the general feeling of being in an unfavourable position as immigrant
workers which stands in line with a study of Gumbrell-McCormick and Hyman [16] where
Polish workers were classified as “labour threat” to UK citizens. With this in mind, the Brexit
vote may have elevated their stress level connected with unstable working conditions. As a
result, their attitude, expectations, performance in workplace may have changed onto more
suspicious and prone to any comments made by supervisors and co-workers. Research shows
that the psychological culmination of identity and status changes for immigrants is likely to be
a constant source of insecurity: perceived uncertainty about the continuation or viability of
one’s circumstances—inside and outside work [62]. Generally speaking, job insecurity has
negative outcomes, such as increased withdrawal, declining job attitudes and performance,
and poor mental and physical health [63]. The issue of authority and its perception by employ-
ees may exemplify an interesting result that social support plays a stress-reducing role for NCS
but not for NCC. When a supervisor displays a negative change in his or her behaviour
towards an employee, this may trigger more stressful reaction than in the case of a change of
behaviour of a co-worker. Supervisors are representatives of authority of the organization.
Building on social exchange theory [64], Eisenberger and colleagues [65] proposed that
employees are attentive to cues about whether they are supported by their organizations.
When organizations provide favourable treatment, employees feel that the organization cares
about their contributions and values their well-being, which motivates them to reciprocate
with strengthened affective commitment, enhanced performance, increased citizenship, and
decreased withdrawal. The extensive research has corroborated these propositions by present-
ing that support from supervisors is a primary contributor to feeling supported by the organi-
zation [66]. Our study showed that PSS decreases the level of PWB and life satisfaction. These
findings stand in line with the previous research which shows that PSS is negatively associated
Stress: Psychological Perspectives
79
with PWB, resilience, life satisfaction, and mindfulness [67, 68]. High level of stress decrease
self-protection mechanisms against negative stimuli and situations. Persons who experience
constant stress have a lower level of resistance, which affects other psychological resources.
PSS is significantly correlated with subjects’ subjective cognitive patterns [69]. The results of
our study support the literature in this regard. Perceived stress of Polish migrants has been
found to intensify their intention to leave the UK. It casts a new light on the recent public sta-
tistics which show that there has been a rise in the number of European citizens leaving the
UK since Brexit vote. Those who experience a possible threat to their everyday existence, focus
on relocation to ensure the safety of their own and their families. Referring this finding to an
organisational context, [39] have found that perceived organisational support fully mediates
the existing relationship between stress and intention to leave. The study conducted by
Arnoux-Nicolas, Sovet, Lhotellier, Di Fabio, and Bernaud [70] shows that stressful working
conditions (including, e.g. work pressure, lack of resources, organisational changes) were posi-
tively and significantly associated with turnover intentions. On the other hand, it has to be
mentioned that our study explored whether the intention to leave UK has been intensified
after the Brexit vote which could simply mean that the intention to move countries existed
beforehand. Those who intend to leave UKmay experience more stress in general which corre-
sponds with the research stating that moving countries is a stressful life transition [71]. Job
insecurity and uncertainty about the future may be linked with settling down in a new place or
going back to a homeland. Summing up, Polish and British co-existence in a workplace setting
has not changed much after the Brexit vote. Polish migrant workers reported almost the same
percentage of negative and positive changes in attitude and behaviour of co-workers and
supervisors—both were low. In turn, it may be assumed that British supervisors and co-work-
ers did not display any form of discriminant or antisocial behaviour towards this minority
group. Possibly these two cultures of workers have established a bond which stands above any
politically induced divisions.
Future research directions
Our major limitations relate to the work tenure of participants which we did not take into
account and which may have affected participants’ perception on work relations. Future
research may explore possible negative changes in the work environment due to external polit-
ical conditions through the lenses of interactional justice and supervisory ratings of antisocial
work behaviours. Additionally, fairness judgments should be taken into consideration in the
light of the social comparison theory. It would also be interesting to conduct a more in-depth
study indicating specific antisocial behaviours experienced by immigrants. When it comes to
the PWB of immigrants, it would be worth to undertake a study investigating the role of psy-
chological resources of an individual applied, for instance, in the form of coping strategies.
Future research could also benefit from exploring a mediating role of social support more in
depth.
Author Contributions
Conceptualization: Klaudia Martynowska.
Data curation: Tomasz Korulczyk.
Formal analysis: Piotr Janusz Mamcarz.
Investigation: Klaudia Martynowska.
Methodology: Tomasz Korulczyk.
Stress: Psychological Perspectives
80
Supervision: Piotr Janusz Mamcarz.
Visualization: Tomasz Korulczyk.
Writing – original draft: Klaudia Martynowska.
Writing – review & editing: Piotr Janusz Mamcarz.
References1. Arnorsson A, Zoega G. On the causes of Brexit. European Journal of Political Economy. 2018. https://
doi.org/10.1016/j.ejpoleco.2018.02.001
2. Macgregor-Bowles I, C Bowles D. Trump, Brexit, Right-wing Anti-globalisation, and An Uncertain Futurefor Public Health. AIMS Public Health. 2017. https://doi.org/10.3934/publichealth.2017.2.139 PMID:29546210
3. Cuerden G, Rogers C. Exploring Race Hate Crime Reporting in Wales Following Brexit. Review ofEuropean Studies. 2017. https://doi.org/10.5539/res.v9n1p158
4. Tabor D. Personal well-being estimates -April 2017 to march 2018—Local Authority. 2018.
5. Anti-Polish cards in Huntingdon after EU referendum; 2016. Available from: https://www.bbc.com/news/uk-england-cambridgeshire-36633388.
6. Krupa J. The killing of a Polish man exposes the reality of post-referendum racism; 2016. Availablefrom: https://www.theguardian.com/commentisfree/2016/sep/05/death-arkadiusz-jozwik-post-referendum-racism-xenophobes-brexit-vote.
7. Berrill KT, Herek GM. Primary and Secondary Victimization in Anti-Gay Hate Crimes: Official Responseand Public Policy. Journal of Interpersonal Violence. 1990. https://doi.org/10.1177/088626090005003012
8. Rzepnikowska A. Racism and xenophobia experienced by Polish migrants in the UK before and afterBrexit vote. Journal of Ethnic and Migration Studies. 2019. https://doi.org/10.1080/1369183X.2018.1451308
9. Burnett J. Racial violence and the Brexit state. Race and Class. 2017. https://doi.org/10.1177/0306396816686283
10. Komaromi P, Singh K. Post-ReferendumRacism and Xenophobia: The Role of Social Media Activismin Challenging the Normalisation of Xeno-Racist Narratives.;. Available from: http://www.irr.org.uk/app/uploads/2016/07/PRRX-Report-Final.pdf.
11. McCollum D, Findlay A. “Flexible” workers for “flexible” jobs? The labour market function of A8 migrantlabour in the UK.Work, Employment and Society. 2015. https://doi.org/10.1177/0950017014568137
12. White A. Young people and migration from contemporary Poland. Journal of Youth Studies. 2010.https://doi.org/10.1080/13676261.2010.487520
13. ONS. Language in England andWales, 2011. Office for National Statistics. 2013.
14. Moore MM, Brown PM. The association of self-regulation, habit, and mindfulness with texting while driv-ing. Accident Analysis and Prevention. 2019. https://doi.org/10.1016/j.aap.2018.10.013 PMID:30448709
15. Craig-Henderson K, Sloan LR. After the Hate: Helping Psychologists Help Victims of Racist HateCrime. Clinical Psychology: Science and Practice. 2006.
16. Gumbrell-Mccormick R, Hyman R.What about the workers? the implications of Brexit for British andEuropean labour; 2017.
17. Masterson SS, Lewis K, Goldman BM, Taylor MS. Integrating Justice And Social Exchange: The Differ-ing Effects Of Fair Procedures And Treatment OnWork Relationships. Academy of Management Jour-nal. 2000.
18. Hu B, Han S. Distributive Justice: Investigating the Impact of Resource Focus and Resource Valence.Journal of Business and Psychology. 2020. https://doi.org/10.1007/s10869-019-09668-1
19. Thau S, Aquino K, Wittek R. An extension of uncertainty management theory to the self: The relation-ship between justice, social comparison orientation, and antisocial work behaviors. Journal of AppliedPsychology. 2007. https://doi.org/10.1037/0021-9010.92.1.250
20. Lind EA, van den Bos K. When fairness works: Toward a general theory of uncertainty management.Research in Organizational Behavior. 2002. https://doi.org/10.1016/S0191-3085(02)24006-X
21. van Dijke M, De Cremer D, Mayer DM. The Role of Authority Power in Explaining Procedural FairnessEffects. Journal of Applied Psychology. 2010. https://doi.org/10.1037/a0018921
Stress: Psychological Perspectives
81
22. Wellman N. Authority or community? A relational models theory of group-level leadership emergence.Academy of Management Review. 2017. https://doi.org/10.5465/amr.2015.0375
23. Thau S, Bennett RJ, Mitchell MS, Marrs MB. Howmanagement style moderates the relationshipbetween abusive supervision and workplace deviance: An uncertainty management theory perspective.Organizational Behavior and Human Decision Processes. 2009. https://doi.org/10.1016/j.obhdp.2008.06.003
24. AmbroseML, Seabright MA, Schminke M. Sabotage in the workplace: The role of organizational injus-tice. Organizational Behavior and Human Decision Processes. 2002. https://doi.org/10.1016/S0749-5978(02)00037-7
25. Aquino K, Lamertz K. A relational model of workplace victimization: Social roles and patterns of victimi-zation in dyadic relationships. Journal of Applied Psychology. 2004. https://doi.org/10.1037/0021-9010.89.6.1023 PMID: 15584839
26. Long EC, Christian MS. Mindfulness buffers retaliatory responses to injustice: A regulatory approach.Journal of Applied Psychology. 2015. https://doi.org/10.1037/apl0000019
27. Landells EM, Albrecht SL. The Positives and Negatives of Organizational Politics: A Qualitative Study.Journal of Business and Psychology. 2017. https://doi.org/10.1007/s10869-015-9434-5
28. Ferris GR, Treadway DC. Politics in organizations: Theory and research considerations; 2012. https://doi.org/10.4324/9780203197424
29. Vigoda-Gadot E, Talmud I. Organizational Politics and Job Outcomes: The Moderating Effect of Trustand Social Support. Journal of Applied Social Psychology. 2010. https://doi.org/10.1111/j.1559-1816.2010.00683.x
30. Perrewe PL, Rosen CC, Maslach C. Organizational politics and stress: The development of a processmodel. In: Politics in Organizations: Theory and Research Considerations; 2012.
31. Hobfoll S, Halbesleben J, Neveu JP,WestmanM. Conservation of Resources in the OrganizationalContext: The Reality of Resources and Their Consequences; 2018.
32. Luszczynska A, Cieslak R. Protective, promotive, and buffering effects of perceived social support inmanagerial stress: The moderating role of personality. Anxiety, Stress and Coping. 2005. https://doi.org/10.1080/10615800500125587
33. Halbesleben JRB. “Sources of social support and burnout: A meta-analytic test of the conservation ofresources model”: Correction. Journal of Applied Psychology. 2011. https://doi.org/10.1037/a0021982
34. Hakanen JJ, Perhoniemi R, Toppinen-Tanner S. Positive gain spirals at work: From job resources towork engagement, personal initiative and work-unit innovativeness. Journal of Vocational Behavior.2008. https://doi.org/10.1016/j.jvb.2008.01.003
35. Ferreira AI, Mach M, Martinez LF, Brewster C, Dagher G, Perez-Nebra A, et al. Working sick and out ofsorts: a cross-cultural approach on presenteeism climate, organizational justice and work-family con-flict. International Journal of Human Resource Management. 2019. https://doi.org/10.1080/09585192.2017.1332673
36. Bowling NA, Beehr TA. Workplace harassment from the Victim’s perspective: A theoretical model andmeta-analysis. Journal of Applied Psychology. 2006. https://doi.org/10.1037/0021-9010.91.5.998PMID: 16953764
37. Johnson S, Cooper C, Cartwright S, Donald I, Taylor P, Millet C. The experience of work-related stressacross occupations. Journal of Managerial Psychology. 2005. https://doi.org/10.1108/02683940510579803
38. Kim H, Stoner M. Burnout and turnover intention among social workers: Effects of role stress, job auton-omy and social support. Administration in Social Work. 2008. https://doi.org/10.1080/03643100801922357
39. Villanueva D, Djurkovic N. Occupational Stress and Intention to Leave Among Employees in Small andMedium Enterprises. International Journal of Stress Management. 2009. https://doi.org/10.1037/a0015710
40. Acikgoz Y, Sumer HC, Sumer N. Do Employees Leave Just Because They Can? Examining the Per-ceived Employability-Turnover Intentions Relationship. Journal of Psychology: Interdisciplinary andApplied. 2016. https://doi.org/10.1080/00223980.2016.1160023
41. Weisberg J. MeasuringWorkers’ Burnout and Intention to Leave. International Journal of Manpower.1994. https://doi.org/10.1108/01437729410053590
42. Malm A, Tinghog P, Narusyte J, Saboonchi F. The refugee post-migration stress scale (RPMS)—Devel-opment and validation among refugees from Syria recently resettled in Sweden. Conflict and Health.2020. https://doi.org/10.1186/s13031-019-0246-5 PMID: 31921332
Stress: Psychological Perspectives
82
43. Weishaar HB. Consequences of international migration: A qualitative study on stress among Polishmigrant workers in Scotland. Public Health. 2008. https://doi.org/10.1016/j.puhe.2008.03.016 PMID:18619633
44. Ryff CD. Psychological well-being revisited: Advances in the science and practice of eudaimonia. Psy-chotherapy and Psychosomatics. 2013. https://doi.org/10.1159/000353263 PMID: 24281296
45. Shimazu A, Schaufeli WB, Kamiyama K, Kawakami N. Workaholism vs. Work Engagement: the TwoDifferent Predictors of FutureWell-being and Performance. International Journal of Behavioral Medi-cine. 2015. https://doi.org/10.1007/s12529-014-9410-x PMID: 24696043
46. Gawke JC, Gorgievski MJ, Bakker AB. Personal costs and benefits of employee intrapreneurship: Dis-entangling the employee intrapreneurship, well-being, and job performance relationship. Journal ofOccupational Health Psychology. 2018. https://doi.org/10.1037/ocp0000105 PMID: 29283602
47. Diener E, Oishi S, Lucas RE. SubjectiveWell-Being: The Science of Happiness and Life Satisfaction.In: The Oxford Handbook of Positive Psychology, ( 2 Ed.); 2012.
48. Chang EC, D’Zurilla TJ, Sanna LJ. Social problem solving as a mediator of the link between stress andpsychological well-being in middle-adulthood. Cognitive Therapy and Research. 2009. https://doi.org/10.1007/s10608-007-9155-9
49. Schmitt MT, Postmes T, Branscombe NR, Garcia A. The consequences of perceived discrimination forpsychological well-being: A meta-analytic review. Psychological Bulletin. 2014. https://doi.org/10.1037/a0035754
50. Arthaud-day ML, Rode JC, Mooney CH, Near JP. The subjective well-being construct: A test of its con-vergent, discriminant, and factorial validity. Social Indicators Research. 2005. https://doi.org/10.1007/s11205-004-8209-6
51. Diener E. Subjective well-being. Psychological Bulletin. 1984. https://doi.org/10.1037/0033-2909.95.3.542 PMID: 6399758
52. Ball R, Chernova K. Absolute income, relative income, and happiness. Social Indicators Research.2008. https://doi.org/10.1007/s11205-007-9217-0
53. Yap SCY,Wortman J, Anusic I, Glenn Baker S, Scherer LD, Brent Donnellan M, et al. The effect ofmood on judgments of subjective well-being: Nine tests of the judgment model. Journal of Personalityand Social Psychology. 2017. https://doi.org/10.1037/pspp0000115 PMID: 27936835
54. Diener E, Lucas RE, Scollon CN. Beyond the hedonic treadmill: Revising the adaptation theory of well-being. American Psychologist. 2006. https://doi.org/10.1037/0003-066X.61.4.305 PMID: 16719675
55. Podsakoff PM, MacKenzie SB, Lee JY, Podsakoff NP. CommonMethod Biases in BehavioralResearch: A Critical Review of the Literature and Recommended Remedies; 2003.
56. Muthen L, Muthen B. Mplus user’s guide (version 7); 2007.
57. Kuoppala J, Lamminpaa A, Liira J, Vainio H. Leadership, job well-being, and health effects—A system-atic review and a meta-analysis. Journal of Occupational and Environmental Medicine. 2008. https://doi.org/10.1097/JOM.0b013e31817e918d
58. Kalasova A, Krchova Z. Road Users’ Risky Behavior: Analysis Focusing on Aggressiveness. Interna-tional Journal of Vehicular Technology. 2011; 2011:1–5. https://doi.org/10.1155/2011/810273
59. Winkler E, Busch C, Clasen J, Vowinkel J. Changes in Leadership Behaviors Predict Changes in JobSatisfaction andWell-Being in Low-SkilledWorkers: A Longitudinal Investigation. Journal of Leadershipand Organizational Studies. 2015. https://doi.org/10.1177/1548051814527771
60. Bochner S, Hesketh B. Power distance, individualism/collectivism, and job-related attitudes in a cultur-ally diverse work group. Journal of Cross-Cultural Psychology. 1994; 25(2):233–257. https://doi.org/10.1177/0022022194252005
61. Tyler TR, Lind EA. A relational model of authority in groups. Advances in Experimental Social Psychol-ogy. 1992; 25(C):115–191.
62. Nahar L, Hossain A, Rahman A, Bairagi A. The Relationship of Job Satisfaction, Job Stress, MentalHealth of Government and Non-Government Employees of Bangladesh. Psychology. 2013; 04(06):520–525. https://doi.org/10.4236/psych.2013.46074
63. Cheng ST, Fung H, Chan A. Maintaining self-rated health through social comparison in old age. Jour-nals of Gerontology—Series B Psychological Sciences and Social Sciences. 2007. https://doi.org/10.1093/geronb/62.5.P277
64. Emerson RM. Social Exchange Theory. Annual Review of Sociology. 1976. https://doi.org/10.1146/annurev.so.02.080176.002003
65. Eisenberger R, Fasolo P, Davis-LaMastro V. Perceived Organizational Support and Employee Dili-gence, Commitment, and Innovation. Journal of Applied Psychology. 1990. https://doi.org/10.1037/0021-9010.75.1.51
Stress: Psychological Perspectives
83
66. Eisenberger R, Stinglhamber F, Vandenberghe C, Sucharski IL, Rhoades L. Perceived supervisor sup-port: Contributions to perceived organizational support and employee retention. Journal of Applied Psy-chology. 2002. https://doi.org/10.1037/0021-9010.87.3.565
67. Atanes ACM, Andreoni S, HirayamaMS, Montero-Marin J, Barros VV, Ronzani TM, et al. Mindfulness,perceived stress, and subjective well-being: A correlational study in primary care health professionals.BMCComplementary and Alternative Medicine. 2015. https://doi.org/10.1186/s12906-015-0823-0PMID: 26329810
68. Torres-Montiel S, Pelaez-Hernandez V, Robles-Uribe B, Perez-CabañAs E, Figueroa-Herrera F, Orea-Tejeda A, et al. Gender differences in perceived stress, psychological well-being and therapeutic com-pliance; 2017.
69. Tugade MM, Fredrickson BL. Resilient Individuals Use Positive Emotions to Bounce Back FromNega-tive Emotional Experiences; 2004.
70. Arnoux-Nicolas C, Sovet L, Lhotellier L, Di Fabio A, Bernaud JL. Perceived work conditions and turn-over intentions: The mediating role of meaning of work. Frontiers in Psychology. 2016. https://doi.org/10.3389/fpsyg.2016.00704 PMID: 27242616
71. Praharso NF, Tear MJ, Cruwys T. Stressful life transitions and wellbeing: A comparison of the stressbuffering hypothesis and the social identity model of identity change. Psychiatry Research. 2017.https://doi.org/10.1016/j.psychres.2016.11.039 PMID: 27936438
Stress: Psychological Perspectives
84
Exploring issues surroundingmental healthand wellbeing across two continents: Apreliminary cross-sectional collaborativestudy between the University of California,Davis, and University of Pretoria
Munashe ChigerweID1*, Dietmar E. Holm2, El-Marie Mostert3, Kate May2, Karen
A. Boudreaux4
1 Department of Veterinary Medicine and Epidemiology, School of Veterinary Medicine, University ofCalifornia Davis, Davis, California, United States of America, 2 Department of Production Animal Studies,
Faculty of Veterinary Science, University of Pretoria, Onderstepoort, Pretoria, South Africa, 3 Department forEducation Innovation, Faculty of Veterinary Science, University of Pretoria, Onderstepoort, Pretoria, SouthAfrica, 4 Dean’s Office, School of Veterinary Medicine, University of California Davis, Davis, California,
United States of America
Abstract
Mental health and wellness research continue to be a topic of importance among veterinary
students in the United States of America (US). Limited peer reviewed literature focusing on
South African veterinary students is available. South African veterinary medical students
might benefit from approaches to improve mental health and wellness similar to those rec-
ommended in the US. However, these recommendations may not address the underlying
risk factors for mental health and wellness concerns or mismatch resources available to
South African veterinary medical students. The purpose of this collaborative study was to
compare the mental health and wellness among veterinary students enrolled at the Univer-
sity of California, Davis (UCD), and the University of Pretoria (UP), the only veterinary
school in South Africa. Our primary research question was; Are the measures of mental
health and wellness for students at similar stages in the veterinary curriculum different
between the two schools? We hypothesized that mental health and wellness as determined
by assessment of anxiety, burnout, depression, and quality of life between the two schools
is different. A cross-sectional study of 102 students from UCD and 74 students from UP, at
similar preclinical stages (Year 2 for UCD and Year 4 for UP) of the veterinary curriculum
was performed. Anxiety, burnout, depression, and quality of life were assessed using the
Generalized Anxiety Disorder (GAD-7), Maslach Burnout Inventory (MBI), Patient Health
Questionnaire (PHQ-9), and Short Form-8 (SF-8), respectively. Students from both schools
had moderate levels of anxiety, high levels of burnout, mild to moderate levels of depres-
sion, poor mental health, and good physical health. Our results suggest that similar mental
health and wellness concerns in South African veterinary students is comparable with con-
cerns in veterinary medical students in the US. Recommendations and resources to improve
Editor: Rachel A. Annunziato, Fordham University,
UNITED STATES
Data Availability Statement: The data presented n
our study potentially contain sensitive identifying
7
85
mental health and wellness in US veterinary medical students might be applicable to South
African veterinary medical students.
Introduction
Several universities educating veterinarians in the United States have recently undergone cur-
ricular revision. The University of California, Davis, School of Veterinary Medicine (UCD)
completed its curricular revision for its Doctor of Veterinary Medicine (DVM) in 2011, gradu-
ating its first class from the revised curriculum in 2015 [1]. The UCD’s revised integrated
block design curriculum was anticipated to reduce student and faculty stress and burnout by
focusing learning material to fundamental “Day One Skills” necessary for graduates [1]. The
revised curriculum was student-centered, inquiry-based, and included teaching and assessing
methods that promoted critical thinking, such as case analysis and veterinary practice applica-
tions [1]. The University of Pretoria’s Faculty of Veterinary Science (UP) completed a major
curricular revision in 2016 [2]. While the UP’s driving forces for change were programmatic
and educational, the UCD identified student and faculty stress and burnout as an additional
impetus for curricular change. While the UP did not specifically identify mental health and
wellness as a factor for change, the concerns for student mental health and wellness recently
became prominent in the South African higher education sector [2]. The concerns for mental
health and wellness were compounded by student protests prompted by persistence of power-
ful symbols of colonial history of tertiary institutions, lack of gender and racial diversity, and
financial pressures on students during the curricular revision process [2]. Therefore, student
mental health and wellness among veterinary students is associated with design, modification
or change of curriculum. The similarities between drivers for curricular changes between
UCD and UP programs included emphasis on core learning material for entry level veterinari-
ans (Day One Skills), and recognition of the influences of external forces such as licensing
accrediting bodies, and other stakeholders [1, 2].
There is a significant body of literature on mental health and wellness available for students
in US veterinary schools [3–5]. In one study across three consecutive semesters at a US school,
proportions as high as 49%, 65%, and 69%, respectively, of veterinary students reported
depression levels above the clinical cut-off [4]. Furthermore, a cross-sectional study of 1,245
students from 33 US veterinary colleges reported that 66% of students had symptoms of mild
to moderate depression, and these levels were higher compared to college students in other
programs (41%) or medical students (23%) [5]. Factors associated with increased scores of
anxiety and depression among US veterinary medical students include transitional stress (diffi-
culty fitting in), academic stress (heavy workload), and homesickness [3, 4]. Female veterinary
students have been reported to have higher scores for depression compared to males [4, 5].
In contrast, little peer reviewed information is available describing factors associated with
mental health and wellness among South African veterinary medical students. However, fac-
tors associated with anxiety and depression in non-veterinary students and the general South
African adult population include cultural differences [6, 7] and race [6, 8, 9]. Furthermore,
social, and economic factors such as higher number of household members, lower education
attainment, gender, lower social status, multiracial race, and less income stability also have
been associated with depression and anxiety in South African adults [10]. Thus, some factors
that are negatively associated with optimal mental well-being among veterinary students on
the two continents might be different. For instance, anecdotal perceived important stressors
negatively associated with optimal mental well-being in South African students include
personal information. We have provided contacts
to which data requests may be sent. The contacts
are the respective institutional representatives for
the ethics committees: University of California
Davis: Office of Research IRB Administration 1850
Research Park Drive Davis, CA 95618-6153 Phone:
(530) 754-7679 Fax: (530) 754-7894 Email:
[email protected] University
of Pretoria: Deputy Dean, Postgraduate and
Research Ethics Faculty of Humanities Email:
Funding: The study was funded by the University
Capacity Development Grant of the Department of
Higher Education and Training (DHET) of South
Africa, and the UC Davis Faculty Discretionary
Support funds. There was no additional external
funding received for this study.
Competing interests: The authors have declared
that no competing interests exist.
Stress: Psychological Perspectives
86
loneliness due to the geographical isolation of the veterinary school, and electrical power fail-
ures (thereby reducing study time). In contrast, perceived poor health and unclear curriculum
expectations are major stressors negatively associated with optimal mental well-being in US
veterinary students [3–5]. Furthermore, the resources available to support veterinary students’
mental health and wellness are different between US and South African schools of veterinary
medicine. Despite these potential differences in resource availability, South African veterinary
students may adopt approaches to improve mental health and wellness similar to those recom-
mended in the US. This is because some of the perceived stressors associated with poor mental
health in veterinary students such as increased academic workload, and lack of racial diversity
in class composition are common to South African and US veterinary schools. However, these
recommendations may not address the underlying risk factors for mental health and wellness
concerns or mismatch available resources in South Africa. Consequently, collaboration
between schools of veterinary medicine on two different continents will not only promote col-
laboration amongst educational researchers in veterinary medicine but enhance communica-
tion and provide research data that advances the knowledge of mental health and wellness
issues in veterinary students.
Current mental health and wellness support for veterinary students
The University of California Davis and UP provided the following onsite mental health and
wellness programs (excluding campus-wide, state, or national resources) at the time of study:
University of California Davis
The UCD wellness program had one full time and one part-time professional counselors on
staff to provide psychotherapy. The Wellness Center was equipped with individual quiet
rooms for sleeping, resting, and relaxation massage chairs. The Wellness Center was located
within a walking distance from lecture rooms and the teaching hospital. A wellness initiative
referred to as ‘Wake up for Wellness’ was held several times a semester to promote self-care
and wellness, boost morale, and built a sense of community. A veterinary student-run Health
andWellness Club provided opportunities for self-care and promoted mental, physical and
emotional health, and wellbeing through activities such as organizing presentations and webi-
nars related to mental health and wellness, and physical activities such as yoga (along with fac-
ulty), meditation, wine-tasting, cooking, and hiking.
University of Pretoria
The UP had a one full-time faculty advisor providing student support on issues such as life-bal-
ancing, time management, motivation, and stress management. A part-time professional
counselor was available to provide psychotherapy to veterinary students. A part-time physician
(general medicine) and a part-time nurse were also available through the Faculty Medical Ser-
vices. All professionals providing mental health and wellness support to the students could
refer cases to a comprehensive campus service (University of Pretoria Counselling Services).
The Onderstepoort Paraveterinary and Veterinary Student Committee, which was a profes-
sionally trained peer group provided opportunities and support for students through work-
shops and presentations on approaches to manage stress, anxiety, and depression.
Current study
This study provides an opportunity to examine mental health and wellness issues in programs
of veterinary medicine in two countries potentially providing more information about the
Stress: Psychological Perspectives
87
drivers and risk factors of mental health and wellness in schools of veterinary medicine. Specifi-
cally, this study focuses on the mental health and wellness aspects of students in terms of anxiety,
burnout, depression, and quality of life. This preliminary, collaborative, cross-sectional study
compared the mental health and wellness among students enrolled at UCD, United States of
America, and UP, South Africa. Our primary research question was; Are the measures of mental
health and wellness for students at similar stages in the veterinary curriculum different between
the two schools? We hypothesized that mental health and wellness as determined by assessments
of anxiety, burnout, depression, and quality of life would be different between the two schools.
Study designmethods
Sampling and data collection
Sampling consisted of a non-probability sampling method via the use of a voluntary and con-
venient sample of students enrolled at the end of their second and fourth year of the DVM pro-
grams at UCD, and UP, respectively. While the DVM program is a 4-year curriculum at UCD
requiring a bachelor’s degree for a student to be eligible, the Bachelor of Veterinary Science
(BVSc) program is a 6-year curriculum at UP where students complete their first year of basic
natural sciences education at the Hatfield campus in the Faculty of Natural and Agricultural
Sciences, then transfer into the veterinary portion of the curriculum to complete the second
through sixth years of education at the Onderstepoort campus in the Faculty of Veterinary Sci-
ence. The UCD begins its academic year in August, while UP commences in February. Data
were collected in May 2018 for UCD and in November 2018 for UP, prior to the onset of the
end of year examinations. Both data collection periods utilized the Qualtrics online survey tool
where students were informed that the data collected were confidential but not anonymous as
responses were tracked via individual emails to ensure each student responded only once to
the survey. This data collection tool also allowed for follow-up reminders. Consent by students
to participate in the study was requested via email. Consent by students was electronically writ-
ten. The study was approved by the UCD Institutional Review Board (Decision HRP 503) and
the UP-Research Ethics Committee (#GW20181001).
Instrumentation
The following instruments were used to assess anxiety, burnout, depression, and quality of life
of students at both schools.
Anxiety
The Generalized Anxiety Disorder (GAD-7) [11] was a self-administered patient questionnaire
used as a screening tool and severity measure for generalized anxiety disorder. The GAD-7 con-
sisted of seven questions where students indicated the frequency they experienced designated
problems. Scores were calculated by assigning a value of 0, 1, 2, or 3, to the response categories
of ’not at all’, ’several days’, ’more than half the days’, and ’nearly every day’, respectively, and
the sum was calculated for the seven questions for a total score ranging from 0 to 21. Scores of
5, 10, and 15 were considered the cut-off points for mild, moderate, and severe anxiety, respec-
tively. The GAD-7 had established internal and test-retest reliability and criterion, construct,
factorial and procedural validity with sensitivity and specificity scores of 89% and 82%, respec-
tively [11]. The GAD-7 was selected to assess anxiety over other instruments, including the
Mental Health Inventory [12], the Zung Self-Rating Anxiety Scale [13], the State-Trait Anxiety
Inventory [14], and the Trimodal Anxiety Questionnaire [15] because of its efficiency (short
length of 7 items), good reliability, criterion construct, factorial and procedural validity [11].
Stress: Psychological Perspectives
88
Burnout
The Maslach Burnout Inventory (MBI) [16] was an instrument that measures individual burn-
out levels through the subscales of emotional exhaustion, depersonalization, and personal
accomplishment which are identified as the key aspects to burnout, thereby providing a con-
text for why burnout has possibly occurred [16]. The emotional exhaustion subscale assessed
feelings of overextension and exhaustion from schoolwork with total scores of� 18, 19–26
and�27 indicating low, average, and high levels of burnout, respectively. The depersonaliza-
tion subscale measured an impersonal response to other students with total scores of� 5, 6–9
and�10 indicating low, average, and high levels of burnout, respectively. Total personal
accomplishment subscale measured students’ feelings of competence and success with scores
of�40, 39–34 and�33 indicating low, average, and high levels of burnout, respectively.
Depression
The Patient Health Questionnaire (PHQ-9) [17] included a depression module that is part of
the self-administered version of the PRIME-MD (Primary Care Evaluation of Mental Disor-
ders) diagnostic instrument for common mental disorders. The PHQ-9 scored nine depressive
symptom criteria present during the previous 2 weeks as 0 (not at all) to 3 (nearly every day)
resulting in a severity measure ranging from 0 to 27. Total scores of 0–4, 5–9, 10–14, 15–19,
and 20–27, indicated none, mild, moderate, moderately severe, and severe levels of depression,
respectively. The PHQ-9 had demonstrated construct validity for use in primary care yielding
a test-retest reliability of 0.84, sensitivity of 88% and specificity of 88% for major depression.
The PHQ-9 was used to monitor the severity of depression and response to treatment as it is
not a screening tool for depression. While several instruments are available to assess depres-
sion, including the Zung Depression Rating Scale [18], various versions of the Beck Depression
Inventory [19, 20], and the Center for Epidemiological Studies Depression Scale [21], the
PHQ-9 was selected for our study because of its ability to assess severity of depression, along
with its acceptable reliability and validity coefficients [17].
Quality of life
The Optum Short Form-8 Health Survey (SF-8) was an 8-item self-reported Likert scale instru-
ment that assessed health related quality of life with established reliability and validity for the
health domain scales of general health perception (GH), physical functioning (PF), role limita-
tions due to physical health problems (role physical, RP), bodily pain (BP), energy/fatigue
(vitality, VT), social functioning (SF), role limitation due to emotional problems (role emo-
tional, RE), and psychological distress and well-being (mental health, MH) [22]. Two summary
measures were determined, namely the physical component summary (PCS) and the mental
component summary (MCS). Alternate-form reliability for a 4-week recall for the subscales
ranged from 0.70 to 0.88. Responses were standardized into scores for the eight dimensions
using Optum Pro CoRE software (Optum Pro CoRE, Eden Prairie, MN). Scores below 50
points (mean score = 50, standard deviation = 10) correspond to deviations from normality
and indicated a poorer quality of life, whereas scores above 50 points represented a better qual-
ity of life than that of the average adult American population [22].
Data analysis
Descriptive statistics were reported for response rate, gender, marital status, and age. Normal-
ity check of the data was performed by the Shapiro-Wilk test. When data were normally dis-
tributed, mean ± standard deviation (SD) was reported, whereas median and 95% confidence
Stress: Psychological Perspectives
89
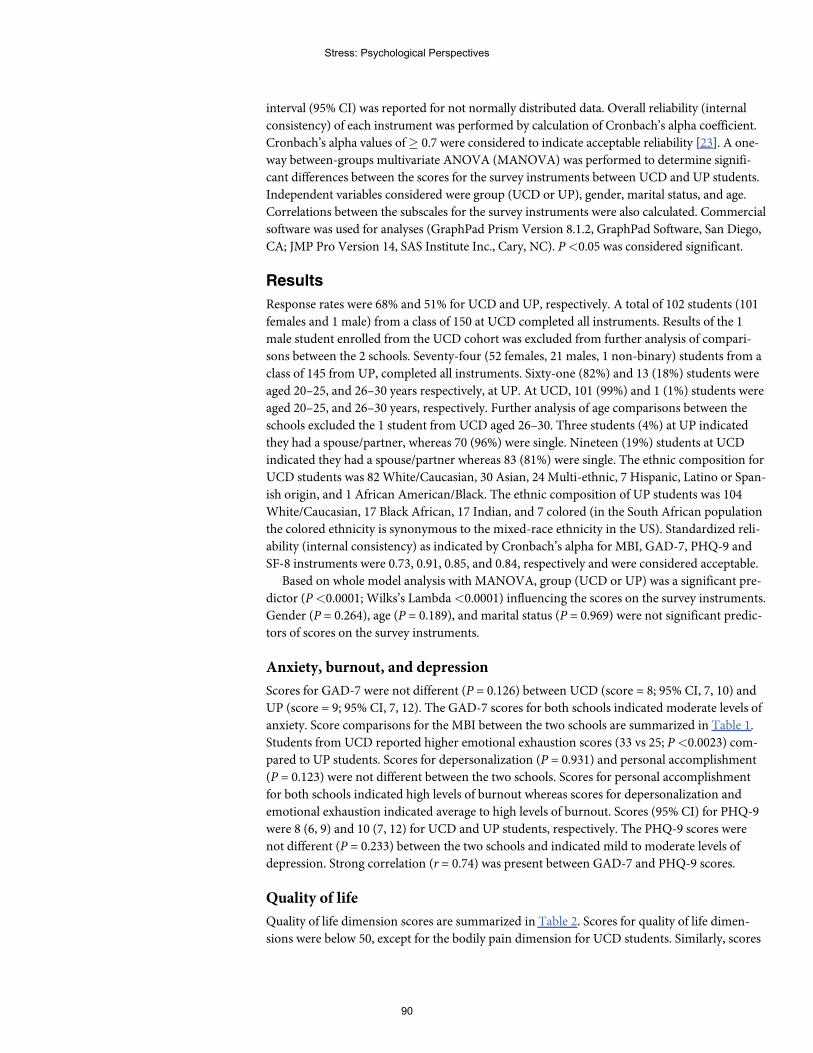
interval (95% CI) was reported for not normally distributed data. Overall reliability (internal
consistency) of each instrument was performed by calculation of Cronbach’s alpha coefficient.
Cronbach’s alpha values of� 0.7 were considered to indicate acceptable reliability [23]. A one-
way between-groups multivariate ANOVA (MANOVA) was performed to determine signifi-
cant differences between the scores for the survey instruments between UCD and UP students.
Independent variables considered were group (UCD or UP), gender, marital status, and age.
Correlations between the subscales for the survey instruments were also calculated. Commercial
software was used for analyses (GraphPad Prism Version 8.1.2, GraphPad Software, San Diego,
CA; JMP Pro Version 14, SAS Institute Inc., Cary, NC). P<0.05 was considered significant.
Results
Response rates were 68% and 51% for UCD and UP, respectively. A total of 102 students (101
females and 1 male) from a class of 150 at UCD completed all instruments. Results of the 1
male student enrolled from the UCD cohort was excluded from further analysis of compari-
sons between the 2 schools. Seventy-four (52 females, 21 males, 1 non-binary) students from a
class of 145 from UP, completed all instruments. Sixty-one (82%) and 13 (18%) students were
aged 20–25, and 26–30 years respectively, at UP. At UCD, 101 (99%) and 1 (1%) students were
aged 20–25, and 26–30 years, respectively. Further analysis of age comparisons between the
schools excluded the 1 student from UCD aged 26–30. Three students (4%) at UP indicated
they had a spouse/partner, whereas 70 (96%) were single. Nineteen (19%) students at UCD
indicated they had a spouse/partner whereas 83 (81%) were single. The ethnic composition for
UCD students was 82White/Caucasian, 30 Asian, 24 Multi-ethnic, 7 Hispanic, Latino or Span-
ish origin, and 1 African American/Black. The ethnic composition of UP students was 104
White/Caucasian, 17 Black African, 17 Indian, and 7 colored (in the South African population
the colored ethnicity is synonymous to the mixed-race ethnicity in the US). Standardized reli-
ability (internal consistency) as indicated by Cronbach’s alpha for MBI, GAD-7, PHQ-9 and
SF-8 instruments were 0.73, 0.91, 0.85, and 0.84, respectively and were considered acceptable.
Based on whole model analysis with MANOVA, group (UCD or UP) was a significant pre-
dictor (P<0.0001; Wilks’s Lambda<0.0001) influencing the scores on the survey instruments.
Gender (P = 0.264), age (P = 0.189), and marital status (P = 0.969) were not significant predic-
tors of scores on the survey instruments.
Anxiety, burnout, and depression
Scores for GAD-7 were not different (P = 0.126) between UCD (score = 8; 95% CI, 7, 10) and
UP (score = 9; 95% CI, 7, 12). The GAD-7 scores for both schools indicated moderate levels of
anxiety. Score comparisons for the MBI between the two schools are summarized in Table 1.
Students from UCD reported higher emotional exhaustion scores (33 vs 25; P<0.0023) com-
pared to UP students. Scores for depersonalization (P = 0.931) and personal accomplishment
(P = 0.123) were not different between the two schools. Scores for personal accomplishment
for both schools indicated high levels of burnout whereas scores for depersonalization and
emotional exhaustion indicated average to high levels of burnout. Scores (95% CI) for PHQ-9
were 8 (6, 9) and 10 (7, 12) for UCD and UP students, respectively. The PHQ-9 scores were
not different (P = 0.233) between the two schools and indicated mild to moderate levels of
depression. Strong correlation (r = 0.74) was present between GAD-7 and PHQ-9 scores.
Quality of life
Quality of life dimension scores are summarized in Table 2. Scores for quality of life dimen-
sions were below 50, except for the bodily pain dimension for UCD students. Similarly, scores
Stress: Psychological Perspectives
90
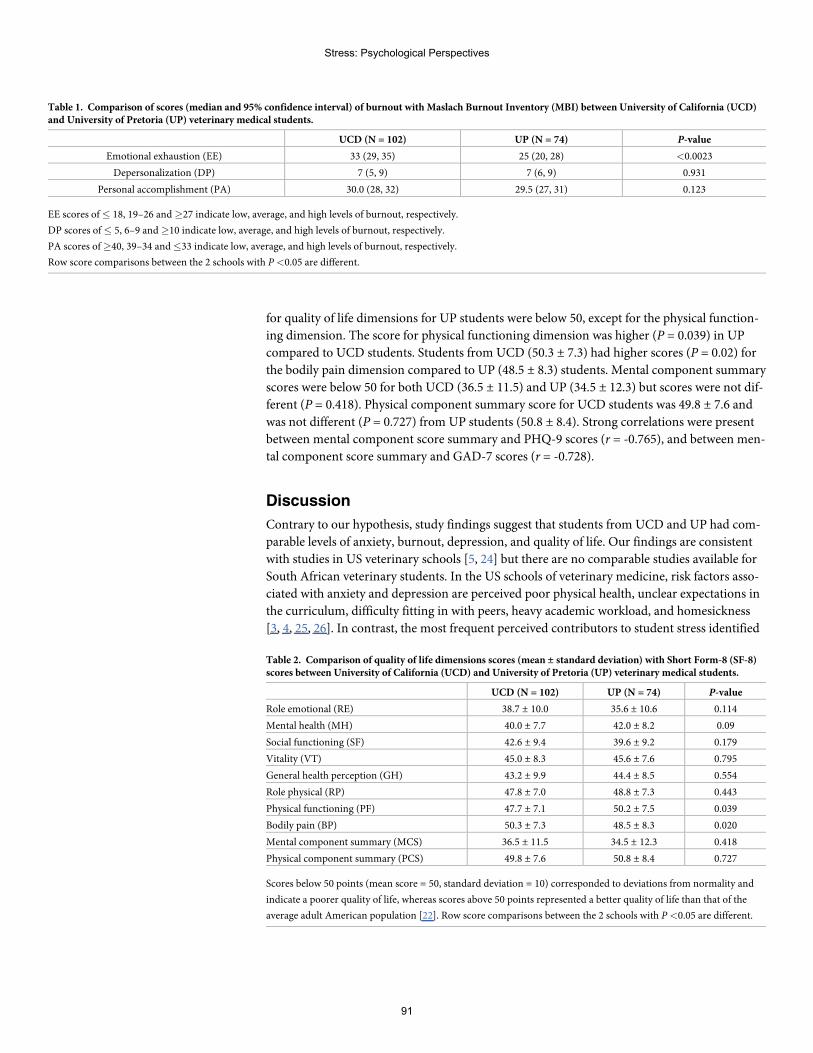
for quality of life dimensions for UP students were below 50, except for the physical function-
ing dimension. The score for physical functioning dimension was higher (P = 0.039) in UP
compared to UCD students. Students from UCD (50.3 ± 7.3) had higher scores (P = 0.02) for
the bodily pain dimension compared to UP (48.5 ± 8.3) students. Mental component summary
scores were below 50 for both UCD (36.5 ± 11.5) and UP (34.5 ± 12.3) but scores were not dif-
ferent (P = 0.418). Physical component summary score for UCD students was 49.8 ± 7.6 and
was not different (P = 0.727) from UP students (50.8 ± 8.4). Strong correlations were present
between mental component score summary and PHQ-9 scores (r = -0.765), and between men-
tal component score summary and GAD-7 scores (r = -0.728).
Discussion
Contrary to our hypothesis, study findings suggest that students from UCD and UP had com-
parable levels of anxiety, burnout, depression, and quality of life. Our findings are consistent
with studies in US veterinary schools [5, 24] but there are no comparable studies available for
South African veterinary students. In the US schools of veterinary medicine, risk factors asso-
ciated with anxiety and depression are perceived poor physical health, unclear expectations in
the curriculum, difficulty fitting in with peers, heavy academic workload, and homesickness
[3, 4, 25, 26]. In contrast, the most frequent perceived contributors to student stress identified
Table 1. Comparison of scores (median and 95% confidence interval) of burnout with Maslach Burnout Inventory (MBI) between University of California (UCD)and University of Pretoria (UP) veterinary medical students.
UCD (N = 102) UP (N = 74) P-value
Emotional exhaustion (EE) 33 (29, 35) 25 (20, 28) <0.0023
Depersonalization (DP) 7 (5, 9) 7 (6, 9) 0.931
Personal accomplishment (PA) 30.0 (28, 32) 29.5 (27, 31) 0.123
EE scores of � 18, 19–26 and�27 indicate low, average, and high levels of burnout, respectively.
DP scores of � 5, 6–9 and�10 indicate low, average, and high levels of burnout, respectively.
PA scores of�40, 39–34 and�33 indicate low, average, and high levels of burnout, respectively.
Row score comparisons between the 2 schools with P <0.05 are different.
Table 2. Comparison of quality of life dimensions scores (mean ± standard deviation) with Short Form-8 (SF-8)scores between University of California (UCD) and University of Pretoria (UP) veterinary medical students.
UCD (N = 102) UP (N = 74) P-value
Role emotional (RE) 38.7 ± 10.0 35.6 ± 10.6 0.114
Mental health (MH) 40.0 ± 7.7 42.0 ± 8.2 0.09
Social functioning (SF) 42.6 ± 9.4 39.6 ± 9.2 0.179
Vitality (VT) 45.0 ± 8.3 45.6 ± 7.6 0.795
General health perception (GH) 43.2 ± 9.9 44.4 ± 8.5 0.554
Role physical (RP) 47.8 ± 7.0 48.8 ± 7.3 0.443
Physical functioning (PF) 47.7 ± 7.1 50.2 ± 7.5 0.039
Bodily pain (BP) 50.3 ± 7.3 48.5 ± 8.3 0.020
Mental component summary (MCS) 36.5 ± 11.5 34.5 ± 12.3 0.418
Physical component summary (PCS) 49.8 ± 7.6 50.8 ± 8.4 0.727
Scores below 50 points (mean score = 50, standard deviation = 10) corresponded to deviations from normality and
indicate a poorer quality of life, whereas scores above 50 points represented a better quality of life than that of the
average adult American population [22]. Row score comparisons between the 2 schools with P <0.05 are different.
Stress: Psychological Perspectives
91
at UP during a recent study included academic pressure and heavy academic workload, electri-
cal power failures, and isolation due to the remote location of the veterinary campus (unpub-
lished data). Furthermore, UP has the only faculty of veterinary medicine in South Africa, a
country with a population of> 55 million people (United Nations, World Population Pros-
pects 2019, Office of the Director, DESA/Population division, New York, NY), thereby adding
more scrutiny on its role in public service. Consequently, UP must justify the current and
future resources to maintain and improve mental health and wellness for veterinary students.
The similarities in mental health and wellness concerns between the schools might be due
to common stressors in any veterinary curriculum, including heavy academic workload. The
results of our study indicate that recommendations and resources to improve mental health
and wellness in the US might be applicable to South African veterinary medicine students. Spe-
cific strategies for improving mental health and wellness include curricular changes [3, 4], pro-
viding on-site resources for students’ mental health [4], increasing awareness of mental health
among students and faculty [4], and inclusion of mindfulness-based stress reduction interven-
tion programs in the curriculum [27–31]. Although no comparable studies using the GAD-7
in veterinary students are available, the moderate levels of anxiety reported in our study is con-
sistent with previous studies [3]. It should be noted that our study did not evaluate other
potential risk factors for anxiety and depression including cultural [6, 7], social-economic [10],
and racial factors [6, 8, 9], which have been reported in non-veterinary students and adult
South Africans. Thus, further studies examining these risk factors for anxiety and depression
are warranted in the South African veterinary student population.
Our study yielded levels of burnout consistent with previous studies at UCD [32]. Female
students at UP (only one male student responded from UCD but was excluded) were likely to
have higher scores of emotional exhaustion, indicating higher levels of stress consistent with
previous studies in veterinary medical students at UCD [5]. It is important to note that the
scores for personal accomplishment indicated high levels of burnout for students enrolled at
both schools. The personal accomplishment subscale assesses feelings of competence and suc-
cessful achievement in a student’s schoolwork. Personal accomplishment and depersonaliza-
tion determine emotional exhaustion [33], in contrast to studies by Maslach [34], which
focused on emotional exhaustion. Thus, focusing on early signs of emotional exhaustion is not
recommended because when the signs of emotional exhaustion appear, the burnout process is
already underway [33]. To increase the sense of personal accomplishment and counteract
burnout, specific training programs were recommended for employees in various fields [35].
These training programs include role-playing to provide success experiences (enactive
mastery), models of performances (vicarious experiences), coaching and encouragement (ver-
bal persuasion) [35]. Of these recommendations, coaching and encouragement are two
approaches that can be incorporated into stress management classes in the veterinary
curriculum.
The mild to moderate levels of depression reported in our study is consistent with previous
studies in veterinary students. Gender was not a significant predictor of levels of depression,
which is in contrast to previous studies that indicated that that female students experienced
higher levels of depression compared to male students [4, 5]. A likely reason for this difference
is the fewer number of male students (1 at UCD who was excluded, and 21 at UP) in our
study. Thus, the results of this study only reflected the analysis of gender for the UP cohort.
Although not significant predictors of mental health in our study, we had hypothesized
that older or married students would report higher scores of depression due to additional
stressors from responsibilities in their personal life. However, older students or married stu-
dents might be more resilient in adapting to stressors from schoolwork as they rely on personal
experiences.
Stress: Psychological Perspectives
92
Assessment of quality of life allows identification of the most compromised dimensions of
well-being and therefore, the ability to intervene by providing resources for students. Quality
of life assessments allow comparison of the students in our study to a reference US adult popu-
lation, and therefore are interpreted as deviations from normality. Our study yielded lower
quality of mental health in veterinary students which may be related to the stressors associated
with being enrolled in veterinary school. In contrast, students from both schools exhibited
better physical health likely due to the young age of our study population (<30 years). The
physical component summary scores decrease with age [36]. The nature of the veterinary cur-
riculum which includes physical and outdoor activities and working with animals may also
have contributed to the better physical health. General factors found to decrease quality of life
in medical students which are applicable to veterinary students include peer competition,
unprepared teachers, excessive learning activities, harsh social realities, frustrations with the
medical program, and insecurity regarding professional future [37]. In contrast, good teachers,
classes with good didactic approaches, active learning methodologies, efficient time manage-
ment, and meaningful relationships with family members, friends, and teachers are associated
with improved quality of life [37]. While these factors can be addressed with curricular
changes, quality of life in veterinary medical students may also be improved by inclusion of
mindfulness-based stress reduction intervention programs [38].
Implications of this study for collaborative future studies
The broader implications of this study include the importance of collecting data on mental
health and wellness in veterinary programs during curricular implementation. Student mental
health and wellness assessment will increase awareness among students and instructors of the
impact of curricular revision, implementation, and evaluation. Furthermore, veterinary col-
leges should consider sharing resources and information on improving mental health and
wellness during curricular revision and implementation.
Although our study is a preliminary study, the results serve to facilitate collaborative
research between the two schools. Specific future large, longitudinal, research studies will
focus on assessing social, racial, cultural, and economic factors associated with anxiety and
depression. Furthermore, studies on impact of implementation and monitoring of mindful-
ness-based stress reduction intervention programs for veterinary students across all stages of
the curriculum are warranted.
Limitations of the study
The non-probability convenient sample size was relatively small consisting of a single class
from each school; therefore, the results of this study cannot be generalized to populations
other than those included in the sample because the sample is not representative of all veteri-
nary students in the United States or Africa. The non-probability voluntary sample may pro-
duce a voluntary response bias as students who were more interested in the topic self-selected
to participate in the study. Consequently, a nonresponse bias may also be produced where stu-
dents choosing not to participate may have differed from the sample in several ways. This may
result in an over or under representation of students from particular groups. External validity
of the results in our study may be limited as data were self-reported and are prone to response
bias, honesty and image management, introspective ability, understanding questions, rating
scales, ordinal measures, and control of sample [39, 40]. Response bias is when a student
responds in a particular way to an item regardless of what is assessed. Honesty and image man-
agement refers when a student may not respond honestly due to the nature of the question in
order to manage how he/she will be perceived. Introspective ability addresses a student’s lack
Stress: Psychological Perspectives
93
of ability to reflect accurately on one’s self. Students may also vary in their ability to understand
and interpret questions especially when dealing with abstract concepts, such as perceived level
of stress. The value of each interval of a rating scale may be interpreted differently among stu-
dents, as well as the distance between ordinal measures in a scale. Finally, students complete
the survey at their own convenience, and the environment cannot be controlled. While our
study did allow students to respond only once by soliciting surveys via individual emails, there
is no control over the attention given to the survey by the student or if the indicated student
completed the survey, thus we relied on the honesty of individual students.
Design, modification or change of the curriculum has an impact on student mental health
and wellness. The effect of the curricula changes on mental health and wellness were not evalu-
ated at both schools in our study to allow sufficient time for adjustments to the revised curric-
ula. Holistic curricula evaluation, including assessment of mental health and wellness are
planned for 2021 and 2022 academic years for UCD and UP, respectively.
Although the UP cohort had 13 students>26 years, age distribution in the 2 cohorts con-
sisted of a higher proportion of students aged 20–25. Thus, the results from our study might be
limited to this age group. Male participants were fewer for both schools with only 1 male
respondent from UCD. Thus, analysis of gender comparisons was only applicable to the UP
cohort. Further studies are required to evaluate the association between gender or age and
scores of instruments assessing mental health and wellness in veterinary students from the two
continents.
Conclusion
Instruments for assessing anxiety, burnout, depression, and quality of life had acceptable reli-
ability. Students from both schools in our study had moderate levels of anxiety, high levels of
burnout, mild to moderate levels of depression, poor mental health, and good physical health.
The results suggest that mental health and wellness concerns in South African veterinary stu-
dents is comparable with concerns in the US. Recommendations and resources to improve
mental health and wellness in the US might be applicable to a South African school of veteri-
nary medicine.
Acknowledgments
The authors thank the University of California, Davis School of Veterinary Medicine and Uni-
versity of Pretoria, Faculty of Veterinary Science students who took their time to complete the
instruments.
Author Contributions
Conceptualization:Munashe Chigerwe, Dietmar E. Holm, Karen A. Boudreaux.
Data curation:Munashe Chigerwe, El-Marie Mostert, Kate May, Karen A. Boudreaux.
Formal analysis:Munashe Chigerwe, Karen A. Boudreaux.
Funding acquisition: Dietmar E. Holm.
Investigation:Munashe Chigerwe, El-Marie Mostert, Kate May, Karen A. Boudreaux.
Methodology:Munashe Chigerwe, Karen A. Boudreaux.
Project administration: Karen A. Boudreaux.
Writing – original draft:Munashe Chigerwe.
Stress: Psychological Perspectives
94
Writing – review & editing:Munashe Chigerwe, Dietmar E. Holm, El-Marie Mostert, Karen
A. Boudreaux.
References1. Ilkiw J, Nelson R, Watson J, Conley AJ, Raybould HE, ChigerweM, et al. Curricular revision and reform:
The process, what was important and lessons learned. J Vet Med Educ. 2017; 44: 480–89. https://doi.org/10.3138/jvme.0316-068R PMID: 28876993
2. Irons P, Holm DE, Annandale C. Curricular renewal at the southern tip of Africa: The 2016 veterinarycurriculum at the University of Pretoria. J Vet Med Educ. 2017; 44: 440–49. https://doi.org/10.3138/jvme.0316-062R PMID: 28876992
3. Siqueira Drake AA, Hafen M Jr, Rush BR, Reisbig AM. Predictors of anxiety and depression in veteri-nary medicine students: a four-year cohort examination, J Vet Med Educ. 2012; 39: 322–30. https://doi.org/10.3138/jvme.0112-006R PMID: 23187025
4. Reisbig AMJ, Danielson JA, Wu TF, Hafen M Jr, Krienert A, Girard D, et al. A study of depression andanxiety, general health, and academic performance in three cohorts of veterinary medical studentsacross the first three semesters of veterinary school, J Vet Med Educ. 2012; 39: 341–58. https://doi.org/10.3138/jvme.0712-065R PMID: 23187027
5. Killinger SL, Flanagan S, Castine E, Howard KAS. Stress and depression among veterinary medicalstudents. J Vet Med Educ. 2017; 44:3–8. https://doi.org/10.3138/jvme.0116-018R1 PMID: 28206849
6. Mosotho NL, Louw DA, Calitz FJW, Esterhuyse KG. Depression among Sesotho speakers in Manga-ung, South Africa, Afr J Psychiatry. 2008; 11:35–43.
7. Hassim J, Wagner C. Considering the cultural context in psychopathology formulations. S Afr J Psych.2013; 19: 4–10.
8. Steele GI, Edwards DJA. Development and validation of the Xhosa translations of the Beck Inventories:2. Item analyses and internal consistency. Journal of Psychology in Africa. 2008; 18: 217–226.
9. Makhubela MS. Measurement invariance of the Beck Depression Inventory-Second Edition acrossrace with South African university students. S Afr J Psych. 2016; 46: 449–461.
10. Hamad R, Fernald LCH, Karlan DS, Zinman J. Social and economic correlates of depressive symptomsand perceived stress in South African adults. J Epidemiol Community Health. 2008; 62:538–544.https://doi.org/10.1136/jech.2007.066191 PMID: 18477753
11. Spitzer RL, Kroenke K, Williams JBW, Lowe B. A brief measure for assessing generalized anxiety disor-der—The GAD-7. Arch Intern Med. 2006; 166:1092–7. https://doi.org/10.1001/archinte.166.10.1092PMID: 16717171
12. Veit CT, Ware JE Jr. The structure of psychological distress and well-being in general populations. JConsult Clin Psychol. 1983; 51: 730–42. https://doi.org/10.1037//0022-006x.51.5.730 PMID: 6630688
13. ZungWWK. A rating instrument for anxiety disorders. Psychosomatics, 1971; 12: 371–9. https://doi.org/10.1016/S0033-3182(71)71479-0 PMID: 5172928
14. Spielberger CD, Gorsuch RL, Lushene R, Vagg PR, Jacobs GA. Manual for the State–Trait AnxietyInventory (Form Y). Palo Alto: Mind Garden; 2003.
15. Lehrer PM,Woolfolk RL. Self-report assessment of anxiety: somatic, cognitive, and behavioral modali-ties. Behav Assess. 1982; 4:167–77.
16. Maslach C, Jackson SE: Maslach Burnout Inventory-Human Services Survey (MBI-HSS). In: MaslachC, Jackson SE, Leiter P, editors. Maslach Burnout Inventory Manual. Mountain View: Consulting Psy-chologists Press; 1996. pp. 1–48.
17. Kroenke K, Spitzer RL, Williams JBW. The PHQ-9: Validity of a Brief Depression Severity Measure. JGen Intern Med. 2001; 16: 606–13. https://doi.org/10.1046/j.1525-1497.2001.016009606.x PMID:11556941
18. ZungWWK. A self-rating scale depression scale. Arch Gen Psychiatry. 1965; 12: 63–70. https://doi.org/10.1001/archpsyc.1965.01720310065008 PMID: 14221692
19. Beck AT, Ward CH, Mendelson M, Mock J, Erbaugh J. An inventory for measuring depression. ArchGen Psychiatry. 1961; 4:561–71. https://doi.org/10.1001/archpsyc.1961.01710120031004 PMID:13688369
20. Beck AT, Guth D, Steer RA, Ball R. Screening for major depression disorders in medical inpatients withthe Beck Depression Inventory for Primary Care. Behav Res Ther. 1997; 35: 785–91. https://doi.org/10.1016/s0005-7967(97)00025-9 PMID: 9256522
21. Radloff LS. The CES-D scale: a self-report depression scale for research in the general population.Appl Psychol Meas. 1: 385–401.
Stress: Psychological Perspectives
95
22. Turner-Bowker DM, Bayliss MS, Ware JE Jr., Kosinski M. Usefulness of the SF-8 Health Survey forcomparing the impact of migraine and other conditions, Qual Life Res. 2003; 12: 1003–12. https://doi.org/10.1023/a:1026179517081 PMID: 14651418
23. Bland J, Altman D. Statistics notes: Cronbach’s alpha. BMJ. 1997; 314:275.
24. Nahar VK, Davis RE, Dunn C, Layman B, Johnson EC, Dascanio JJ, et al. The prevalence and demo-graphic correlates of stress, anxiety, and depression among veterinary students in the SoutheasternUnited States. Res Vet Sci. 2019; 125:370–373. https://doi.org/10.1016/j.rvsc.2019.07.007 PMID:31377419
25. Hafen M Jr, Reisbig AMJ, White MB, Rush BR. The first-year veterinary student and mental health: therole of common stressors, J Vet Med Educ. 2008; 35:102–9. https://doi.org/10.3138/jvme.35.1.102PMID: 18339964
26. Hafen M Jr, Ratcliffe GC, Rush BR. Veterinary medical student well-being: depression, stress, and per-sonal relationships, J Vet Med Educ. 2013; 40: 296–302. https://doi.org/10.3138/jvme.1112-101RPMID: 23975073
27. Kabat-Zinn J. Full catastrophe living—using the wisdom of your body and mind to face stress, pain, andillness. 3rd ed. New York: BantamDell; 2005.
28. Grossman P, Niemann L, Schmidt S, Walach H. Mindfulness-based stress reduction and health bene-fits. J Psychosom Res. 2004; 57: 35–43. https://doi.org/10.1016/S0022-3999(03)00573-7 PMID:15256293
29. Hassed C, de Lisle S, Sullivan G, Pier C. Enhancing the health of medical students: outcomes of an inte-grated mindfulness and lifestyle program, Adv Health Sci Educ Theory Pract, 2009; 4: 387–98.
30. Shapiro SL, Schwartz GE, Bonner G. Effects of mindfulness-based stress reduction on medical andpremedical students, J BehavMed. 1998; 21: 581–99. https://doi.org/10.1023/a:1018700829825PMID: 9891256
31. Reibel DK, Greeson JM, Brainard GC, Rosenzweig S. Mindfulness-based stress reduction and health-related quality of life in a heterogeneous patient population, Gen Hosp Psychiatry. 2001; 23: 183–92.https://doi.org/10.1016/s0163-8343(01)00149-9 PMID: 11543844
32. ChigerweM, Boudreaux KA, Ilkiw JE. Assessment of burnout in veterinary medical students using theMaslach Burnout Inventory-Educational Survey: a survey during two semesters. BMCMed Educ. 2014;28: 14:255.
33. van Dierendonck D, Schaufeli WB, Buunk BP. Toward a process model burnout: results from a second-ary analysis. Eur J Work and Organ Psychol. 2001; 10: 41–52.
34. Maslach C: Burnout: A Multidimensional Perspective. Professional Burnout: Recent Developments inTheory and Research. Eds: Schaufeli WB, Maslach C, Marek T; New York: Hemisphere; 1993.pp. 19–32.
35. Bandura A: Self Efficacy: The Exercise of Control. New York: W.H Freeman; 1997.
36. Kaarlola A, Tallgren M, Pettila V. Long-term survival, quality of life, and quality-adjusted life-yearsamong critically ill elderly patients. Crit Care Med. 2006; 34: 2120–6. https://doi.org/10.1097/01.CCM.0000227656.31911.2E PMID: 16763517
37. Tempski P, Bellodi PL, Paro HB, Enns SC, Martins MA, Schraiber LB. What do medical students thinkabout their quality of life? A qualitative study, BMCMed Educ. 2012; 12: 106. https://doi.org/10.1186/1472-6920-12-106 PMID: 23126332
38. Correia HM, Smith AD, Murray S, Polak LS,Williams B, Cake MA. The impact of a brief embeddedmindfulness-based program for veterinary students. J Vet Med Educ. 2017; 44: 125–33. https://doi.org/10.3138/jvme.0116-026R PMID: 28206840
39. Phillips AW, Reddy S, Durning SJ. Improving response rates and evaluating nonresponse bias in sur-veys: AMEEGuide No. 102, Med Teacher. 2016; 38: 217–228.
40. Harvey P, Pinkham A, Penn D. 61.1 Introspective Accuracy as a Predictor of Real-World Outcomes.Schizophr Bull. 2017; 43(Suppl 1):S35–S36.
Stress: Psychological Perspectives
96
Emotion regulation strategies modulate theeffect of adverse childhood experiences onperceived chronic stress with implications forcognitive flexibility
Vrinda KaliaID*, Katherine Knauft
Department of Psychology, Miami University, Oxford, Ohio, United States of America
Abstract
Exposure to early life adversity is associated with chronic stress and a range of stress-
related health problems in adulthood. Since chronic stress debilitates activity in the prefron-
tal cortex (pFC), maladaptive regulatory strategies in response to stress have been pro-
posed as one explanation for the impact of early life adversity on health outcomes in
adulthood. We conducted a study to examine the impact of adverse childhood experiences
(ACEs) on cognitive flexibility, a key executive function implicated in activity in the pFC, in a
sample of adults (N = 486). Additionally, we investigated whether perceptions of chronic
stress in adulthood would mediate the influence of ACEs on cognitive flexibility. However,
stress is a subjective experience, and emotion regulation strategies can attenuate the stress
response. So, we also examined if individual differences in emotion regulation strategies
would modulate the relationship between ACEs and chronic stress. Our results demonstrate
that early life adversity, as characterized by ACEs, is associated with decreased cognitive
flexibility in adulthood. Additionally, number of ACEs was positively correlated with per-
ceived stress, which in turn was negatively correlated with cognitive flexibility. But, individual
differences in the habitual use of emotion regulation strategies moderated the influence of
ACEs on chronic stress. Specifically, habitual use of cognitive reappraisal attenuated the
stress levels whereas habitual use of expressive suppression exacerbated stress levels.
Overall, our study highlights the importance of examining emotion regulation in individuals
who have experienced early life adversity.
Introduction
Exposure to adverse experiences in early development is associated with increased risk of men-
tal illness and negative health outcomes in adulthood [1]. For instance, exposure to adversity
in childhood is correlated with increased risk for depression in adulthood [2]. Early life adver-
sity (ELA; i.e., exposure to environmental experiences that deviate from normative stimulation
that fosters brain development) has also been implicated in increased risk for heart disease and
Editor: Petri Bockerman, University of Jyvaskyla,
FINLAND
8
97
coronary distress [3, 4]. Considering that approximately two-thirds of Americans report expo-
sure to some form of ELA [5], this places a major burden on the public health system. Thus, it
is relevant to examine factors and variables that enhance or attenuate the impact of ELA on
health outcomes in adulthood.
Both positive and negative experiences in early development have a profound impact on
the brain’s development [6]. ELA, such as abuse, parental neglect, or deprivation, can alter the
normative development of neural circuitry [7]. Neurobiological evidence has shown that ELA
can have a debilitating impact on prefrontal cortex (pFC) structure and function [8, 9] in par-
ticular. Since cognitive control and strategic thinking are implicated in the pFC [10], this can
negatively influence goal-directed behavior in adulthood. Yet, the putative implications of
ELA on cognitive and emotional regulatory capacities, such as cognitive flexibility, that are
implicated in activity in the pFC are understudied [1].
In addition to having a negative impact on pFC development, ELA is associated with endur-
ing changes in the central nervous system [3]. ELA occurs at a time when the hypothalamic-
pituitary-axis (HPA axis) is still immature, and exposure to increased levels of stress hormones
can disrupt normative development of the structure (e.g., reduced volume of the hippocam-
pus) and function (e.g., persistent overactivation) of the HPA axis [11]. As a result, ELA can
unbalance the normally adaptive physiological stress response [12], which disrupts the body’s
ability to maintain stability in the face of changing environmental demands (or allostasis) and
results in structural and functional abnormalities in brain development [13]. Consequently,
the short-term stress response initiated adaptively to environmental cues may become an
enduring activation of the stress systems with detrimental consequences [13]. One proposed
explanation for the association between ELA and physical morbidity in adulthood is the habit-
ual deployment of maladaptive coping strategies (e.g., drug use) in response to stressful events
[5]. However, not all individuals exposed to ELA exhibit negative outcomes associated with
early life stress. Individual differences in emotion regulation could account for some of the
observed variance in outcomes [14, 15].
Emotion regulation strategies
People attempt to regulate their emotions in myriad ways. Gross’s process model of emotion
regulation suggests that emotion regulation begins after the identification of an emotion as
being helpful or harmful to a goal [16]. Emotion regulation strategies help to maintain,
increase, or decrease an individual’s response to emotion-evoking events [17]. Gross [18] has
identified two key strategies–expressive suppression and cognitive reappraisal.
Expressive suppression is a strategy in which an individual attempts to conceal or inhibit
emotional expressions [18]. It is important to note that this strategy fails to change the emo-
tional experience. Instead, experimental evidence indicates that it may enhance physiological
response associated with the emotion [18]. Longitudinal work has shown that habitual use of
expressive suppression is associated with more intrapersonal costs, such as increased fatigue
and lower self-esteem [19]. Additionally, a meta-analytic review of the literature on the rela-
tionship between emotion regulation strategies and psychopathology has demonstrated that
suppression is associated with increased levels of psychopathology [20]. There are some studies
that indicate that the cost of suppression is dependent on factors such as how burdensome
[21] or inauthentic [22] it feels to suppress one’s feeling. Regardless, suppression is viewed
overall as a costly emotion regulation strategy that is associated with negative health outcomes
[23, 24].
Reappraisal, on the other hand, requires that the individual alter or update the way they
think about or frame an event to enhance or reduce its emotional impact [25]. In order to
Stress: Psychological Perspectives
98
engage in reappraisal as an emotion regulation strategy, an individual has to intentionally shift
one’s appraisal of the situation or the goal that’s associated with the emotion. Gross and col-
leagues have shown that, in comparison to suppression, reappraisal is an adaptive method for
regulating one’s emotions [18]
Early life adversity, emotion regulation, and chronic stress
Reappraisal is particularly germane within the context of a stress response. Stress is a subjective
experience that engages both the brain and the body [8]. The physiological stress response
emerges from an interaction of individual characteristics and the environmental context [13].
The biopsychosocial model of challenge and threat [26] provides an account of individual dif-
ferences in the experience of stress by focusing on the person’s appraisal of available resources.
When demands exceed available resources, the situation is appraised as threatening. But, when
one perceives they have sufficient resources to meet contextual demands, the stressor is evalu-
ated as challenging, not threatening [26]. In effect, an individual’s stress response is dependent
on the way they appraise a stressor.
Early life stressors, however, which could take the form of maltreatment (physical or sexual
abuse) or neglect, often exceed the child’s ability to evaluate or cope [1]. These early stressors
are more likely to be perceived as uncontrollable and hence more debilitating [27]. As a result,
the individual might develop short-term or maladaptive coping strategies (e.g., drug use) that
help them cope with their stress [5]. These maladaptive behaviors, in turn, account for the link
between early life stress and negative health outcomes [3]. Indeed, converging evidence indi-
cates that neurobiological development in response to ELA may be the mechanism that results
in cognitive and emotional impairment thereby increasing risk of a variety of stress-related
health problems [5].
However, there is also some evidence to suggest that individuals exposed to ELA exhibit
enhanced cognitive skills in ecologically relevant tasks associated with threat and danger [28].
Additionally, individuals exposed to ELA appear to develop independent emotion regulation
strategies faster than those who have not been exposed to ELA [7]. This raises the possibility
that individual differences in emotion regulation could influence the association between ELA
and chronic stress experienced in adulthood. Thus, it is possible to speculate that individuals
with adaptive emotion regulation strategies might be able to attenuate the impact of ELA on
pFC-regulated cognitive abilities.
Current study
We conducted a study to investigate the effect of ELA on cognitive flexibility in adulthood. We
conceptualize ELA as the enduring soil that houses the seeds for cognitive and emotional out-
comes in adulthood. We assessed ELA using the Adverse Childhood Experiences Scale
(ACEs). Cognitive flexibility is a key component of executive functions [29] that is often the
last to emerge in development [30]. It is a multifaceted construct that exhibits both trait and
state characteristics [31]. Researchers have approached and measured cognitive flexibility in
several different ways [32]. Some researchers propose that set shifting and attention shifting
are key characteristics of cognitive flexibility [30]; whereas other researchers have highlighted
the flexible adaptation of behavior and cognitive processes to changing environmental
demands [31]. One outcome associated with cognitive flexibility is that it allows the individual
the ability to reframe and reconsider information in a challenging context to enable effective
coping [33].
Depending on their approach, tasks measuring cognitive flexibility assess different aspects
of cognitive flexibility [34]. For example, the Wisconsin Card Sort Test (WCST) [35], which is
Stress: Psychological Perspectives
99
behavioral measure of cognitive flexibility, isolates an individual’s ability to shift between rules
as a way to determine cognitive flexibility. Self-report measures of cognitive flexibility, which
offer a practical alternative to behavioral measures, can be used to provide insight about state
characteristics of cognitive flexibility [36]. In this study, we focused on the kind of cognitive
flexibility that is highlighted in cognitive behavioral therapeutic settings [34]. Specifically, our
goal was to assess the individual’s ability to reformulate and restructure maladaptive thoughts
in response to challenging circumstances and affective states [34]. In order to do so, we
assessed cognitive flexibility using the Cognitive Flexibility Inventory (CFI) [34].
We also sought to determine whether perceived chronic stress mediated the relationship
between ELA and cognitive flexibility. Based on prior research showing that chronic psychoso-
cial stress disrupts pFC functioning, which has a negative impact on attentional control in set-
shifting tasks [37], we assumed that chronic stress levels would influence cognitive flexibility
negatively. But, we also expected that chronic stress would mediate the relationship between
ELA and cognitive flexibility because of the known impact of ELA on allostasis [13]. One of
the physiological consequences of ELA is that it alters allostasis, which is the body’s ability to
maintain stability through changes wrought by managing environmental demands [13]. This
can result in an extreme or extended activation of the physiological stress response and is
known as toxic chronic stress [13]. As a result, we expected that individuals with higher num-
ber of ACEs would also report increased stress levels [38]. This chronic stress has been pro-
posed as the explanation for the association between ELA and negative health outcomes [39].
Since chronic stress reduces cognitive abilities implicated in the pFC [27], we speculated that
ELA, partially through chronic stress, would have a negative impact on cognitive flexibility.
Since stress is an individualized experience, we chose to focus on perceived chronic stress,
which was measured using the Perceived Stress Scale (PSS) [40].
In contrast to its debilitating effect on cognitive abilities [41], some researchers have pro-
posed that exposure to ELA might hasten emotion learning in development in some individu-
als [7]. Empirical evidence in support of this notion indicates that physically abused children
are more likely to over-recognize angry or negative facial expressions [28, 42]. Hence, abused
children may be more prone to interpreting neutral faces as angry or threatening. In effect,
ELA might reprioritize development in the emotional systems in ways that offer advantages
for survival [7].
Appraisal theories of emotion regulation raise the possibility that individual differences in
emotion regulation processes could emerge as a key moderator of the impact of ELA on adult
outcomes [43]. Specifically, appraisal theories highlight that it is the way an individual
appraises an event that causes a stressful emotional reaction, not the event itself [43]. Thus, it is
possible that in individuals with enhanced emotion regulation strategies we would observe an
attenuated effect of ELA on perceived stress, and through perceived stress, on cognitive flexi-
bility. Consequently, we also explored whether emotion regulation strategies would moderate
the observed associations between ELA and perceived stress. We measured habitual use of
emotion regulation strategies using the Emotion Regulation Questionnaire (ERQ) [17].
Based on prior research showing that exposure to ELA is associated with diminished cogni-
tive flexibility [41, 44], our primary prediction was adverse childhood experiences (ACEs)
would predict reduced cognitive flexibility (i.e., lower scores on the CFI). Because ELA dis-
rupts the body’s ability to maintain stability in the face of changing environmental demands
(or allostasis) [13], our second hypothesis was that individuals with higher number of ACEs
would also report higher levels of stress. In other words, number of ACEs would be positively
correlated with perceived stress levels. As chronic stress is associated with reduced cognitive
flexibility [37, 45], our third hypothesis was that individuals with high levels of stress would
also have lower scores on cognitive flexibility. Since previous research evidence indicates stress
Stress: Psychological Perspectives
100
reactivity mediates the relationship between ELA and goal-directed behavior [46], our fourth
hypothesis was that the relationship between ACEs and decreased cognitive flexibility would
be mediated by the perceived stress. Considering that greater perceived stress has been shown
to be associated with reduced habitual use of cognitive reappraisal [47], our fifth hypothesis
was that reappraisal would attenuate the effect of ELA on perceived chronic stress, with impli-
cations for cognitive flexibility. Past research has shown that habitual use of suppression
enhances the experience of perceived stress [48], so our final hypothesis was suppression
would enhance the effect of ELA on perceived chronic stress and therefore exacerbate the
impact of perceived chronic stress on cognitive flexibility.
Methods
All study procedures were approved by the Institutional Review Board at Miami University;
protocol # 01620. Written consent was obtained from all participants in the study. Following
informed consent, participants completed measures assessing their exposure to adverse child-
hood experiences, perceived stress, and cognitive flexibility, in addition to demographics.
Participants and procedure
Individuals living with the United States were recruited via Amazon’s Mechanical Turk
(MTurk; N = 486; participants who failed more than half of the attention checks were
removed; Male = 335; Female = 150; Missing = 1). Amazon’s Mechanical Turk (MTurk) is a
web interface that allows researchers to recruit participants and conduct studies online. To ini-
tiate a study using MTurk, researchers must create an account with adequate funds to cover
participant costs and any additional fees charged by Amazon. Participants responded to a brief
description of the study and were recruited until the maximum number approved by the insti-
tutional review board was reached. They were compensated one dollar for their participation.
The target sample size was determined using Monte Carlo simulations anticipating small to
medium effect sizes. Participant age ranged from 19 years to 86 years (MAge = 33.10, SD = 9.66;
n = 77 participants did not provide age information). Majority of the participants self-identi-
fied as White (57.2%), and the remaining participants categorized themselves as Asian (22%),
Hispanic (10.1%), African American (9.5%), and Native American (3.3%), Indian American
(2.5%), race or ethnicity not listed (0.60%), or preferred not to disclose (0.40%).
Measures
Adverse Childhood Experiences scale (ACEs) [49]. Consists of 10 questions assessing an
individual’s exposure ELA including trauma and abuse. To capture the experience of early
adversity, all questions regarding the ACEs pertain to the first 18 years of an individual’s life
[50]. Five items in the scale ask about exposure to different types of maltreatment (e.g., Did a
parent or other adult in the household often push, grab, slap or throw something at you?). The
other five items request information about parental or family incapacities (e.g.,Were your
parents ever separated or divorced?). Every response in the affirmative (‘yes’) to a question was
given 1 point. Although the exact definition of ELA continues to be debated [51], and different
types of ELA (e.g., physical abuse, neglect) have traditionally been studied separately, empirical
evidence indicates that they are interrelated and frequently co-occur [52, 53]. Additionally,
prior research with ACEs has demonstrated a graded effect such that exposure to different
types of ELA increases the risk for negative health outcomes [3, 54]. To account for the cumu-
lative effect of ELA, we summed each individual’s yes responses to calculate their ACE score.
Consequently, higher ACE scores indicate greater exposure to early adversity (α = 0.88).
Stress: Psychological Perspectives
101
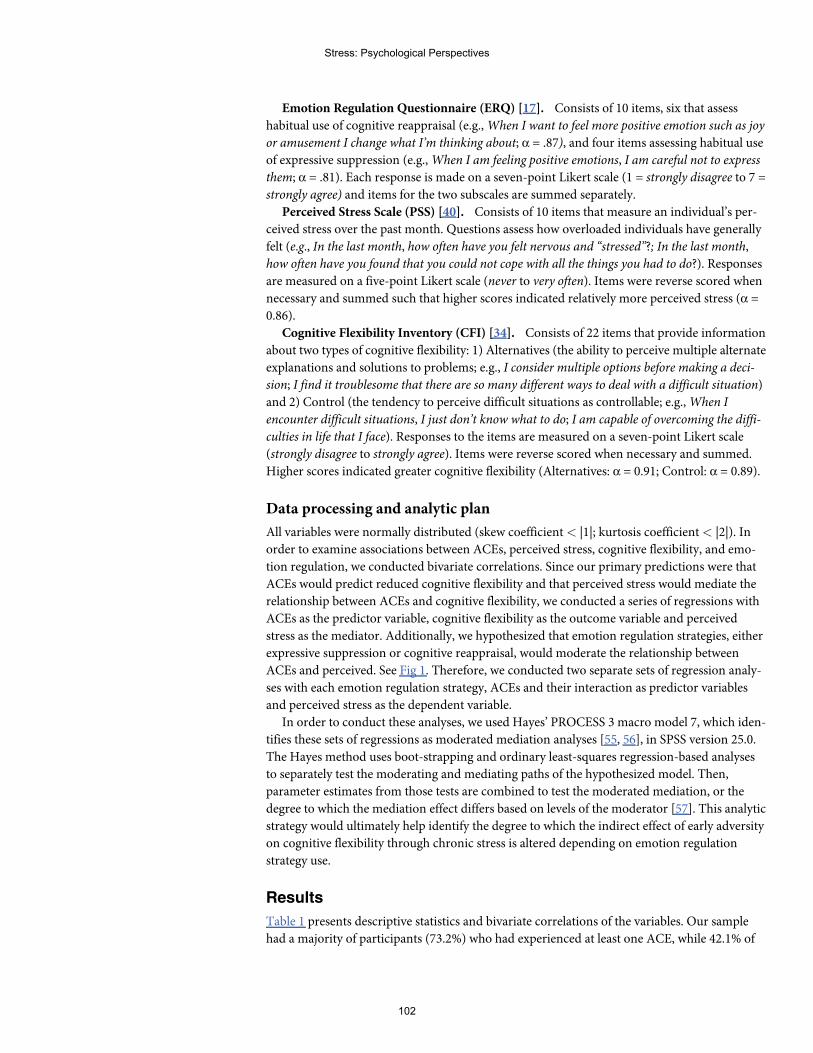
Emotion Regulation Questionnaire (ERQ) [17]. Consists of 10 items, six that assess
habitual use of cognitive reappraisal (e.g.,When I want to feel more positive emotion such as joy
or amusement I change what I’m thinking about; α = .87), and four items assessing habitual use
of expressive suppression (e.g.,When I am feeling positive emotions, I am careful not to express
them; α = .81). Each response is made on a seven-point Likert scale (1 = strongly disagree to 7 =
strongly agree) and items for the two subscales are summed separately.
Perceived Stress Scale (PSS) [40]. Consists of 10 items that measure an individual’s per-
ceived stress over the past month. Questions assess how overloaded individuals have generally
felt (e.g., In the last month, how often have you felt nervous and “stressed”?; In the last month,
how often have you found that you could not cope with all the things you had to do?). Responses
are measured on a five-point Likert scale (never to very often). Items were reverse scored when
necessary and summed such that higher scores indicated relatively more perceived stress (α =
0.86).
Cognitive Flexibility Inventory (CFI) [34]. Consists of 22 items that provide information
about two types of cognitive flexibility: 1) Alternatives (the ability to perceive multiple alternate
explanations and solutions to problems; e.g., I consider multiple options before making a deci-
sion; I find it troublesome that there are so many different ways to deal with a difficult situation)
and 2) Control (the tendency to perceive difficult situations as controllable; e.g.,When I
encounter difficult situations, I just don’t know what to do; I am capable of overcoming the diffi-
culties in life that I face). Responses to the items are measured on a seven-point Likert scale
(strongly disagree to strongly agree). Items were reverse scored when necessary and summed.
Higher scores indicated greater cognitive flexibility (Alternatives: α = 0.91; Control: α = 0.89).
Data processing and analytic plan
All variables were normally distributed (skew coefficient< |1|; kurtosis coefficient< |2|). In
order to examine associations between ACEs, perceived stress, cognitive flexibility, and emo-
tion regulation, we conducted bivariate correlations. Since our primary predictions were that
ACEs would predict reduced cognitive flexibility and that perceived stress would mediate the
relationship between ACEs and cognitive flexibility, we conducted a series of regressions with
ACEs as the predictor variable, cognitive flexibility as the outcome variable and perceived
stress as the mediator. Additionally, we hypothesized that emotion regulation strategies, either
expressive suppression or cognitive reappraisal, would moderate the relationship between
ACEs and perceived. See Fig 1. Therefore, we conducted two separate sets of regression analy-
ses with each emotion regulation strategy, ACEs and their interaction as predictor variables
and perceived stress as the dependent variable.
In order to conduct these analyses, we used Hayes’ PROCESS 3 macro model 7, which iden-
tifies these sets of regressions as moderated mediation analyses [55, 56], in SPSS version 25.0.
The Hayes method uses boot-strapping and ordinary least-squares regression-based analyses
to separately test the moderating and mediating paths of the hypothesized model. Then,
parameter estimates from those tests are combined to test the moderated mediation, or the
degree to which the mediation effect differs based on levels of the moderator [57]. This analytic
strategy would ultimately help identify the degree to which the indirect effect of early adversity
on cognitive flexibility through chronic stress is altered depending on emotion regulation
strategy use.
Results
Table 1 presents descriptive statistics and bivariate correlations of the variables. Our sample
had a majority of participants (73.2%) who had experienced at least one ACE, while 42.1% of
Stress: Psychological Perspectives
102
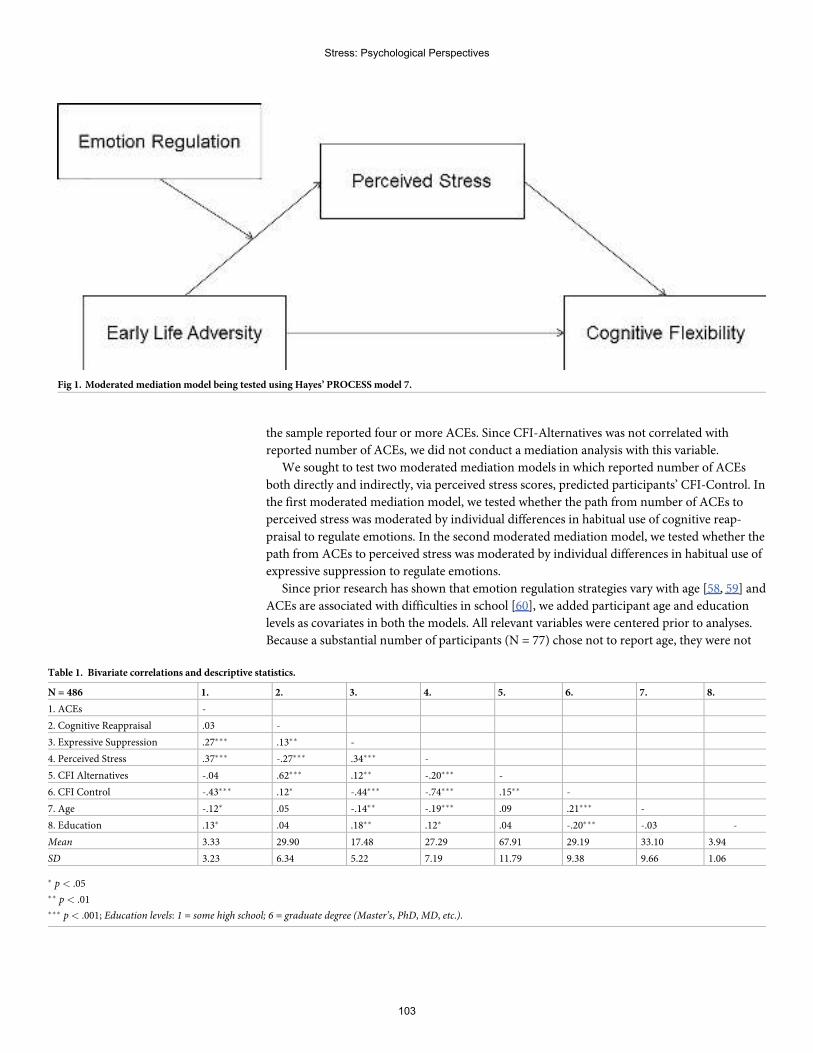
the sample reported four or more ACEs. Since CFI-Alternatives was not correlated with
reported number of ACEs, we did not conduct a mediation analysis with this variable.
We sought to test two moderated mediation models in which reported number of ACEs
both directly and indirectly, via perceived stress scores, predicted participants’ CFI-Control. In
the first moderated mediation model, we tested whether the path from number of ACEs to
perceived stress was moderated by individual differences in habitual use of cognitive reap-
praisal to regulate emotions. In the second moderated mediation model, we tested whether the
path from ACEs to perceived stress was moderated by individual differences in habitual use of
expressive suppression to regulate emotions.
Since prior research has shown that emotion regulation strategies vary with age [58, 59] and
ACEs are associated with difficulties in school [60], we added participant age and education
levels as covariates in both the models. All relevant variables were centered prior to analyses.
Because a substantial number of participants (N = 77) chose not to report age, they were not
Fig 1. Moderated mediation model being tested using Hayes’ PROCESSmodel 7.
Table 1. Bivariate correlations and descriptive statistics.
N = 486 1. 2. 3. 4. 5. 6. 7. 8.
1. ACEs -
2. Cognitive Reappraisal .03 -
3. Expressive Suppression .27��� .13�� -
4. Perceived Stress .37��� -.27��� .34��� -
5. CFI Alternatives -.04 .62��� .12�� -.20��� -
6. CFI Control -.43��� .12� -.44��� -.74��� .15�� -
7. Age -.12� .05 -.14�� -.19��� .09 .21��� -
8. Education .13� .04 .18�� .12� .04 -.20��� -.03 -
Mean 3.33 29.90 17.48 27.29 67.91 29.19 33.10 3.94
SD 3.23 6.34 5.22 7.19 11.79 9.38 9.66 1.06
� p < .05�� p < .01��� p< .001; Education levels: 1 = some high school; 6 = graduate degree (Master’s, PhD,MD, etc.).
Stress: Psychological Perspectives
103
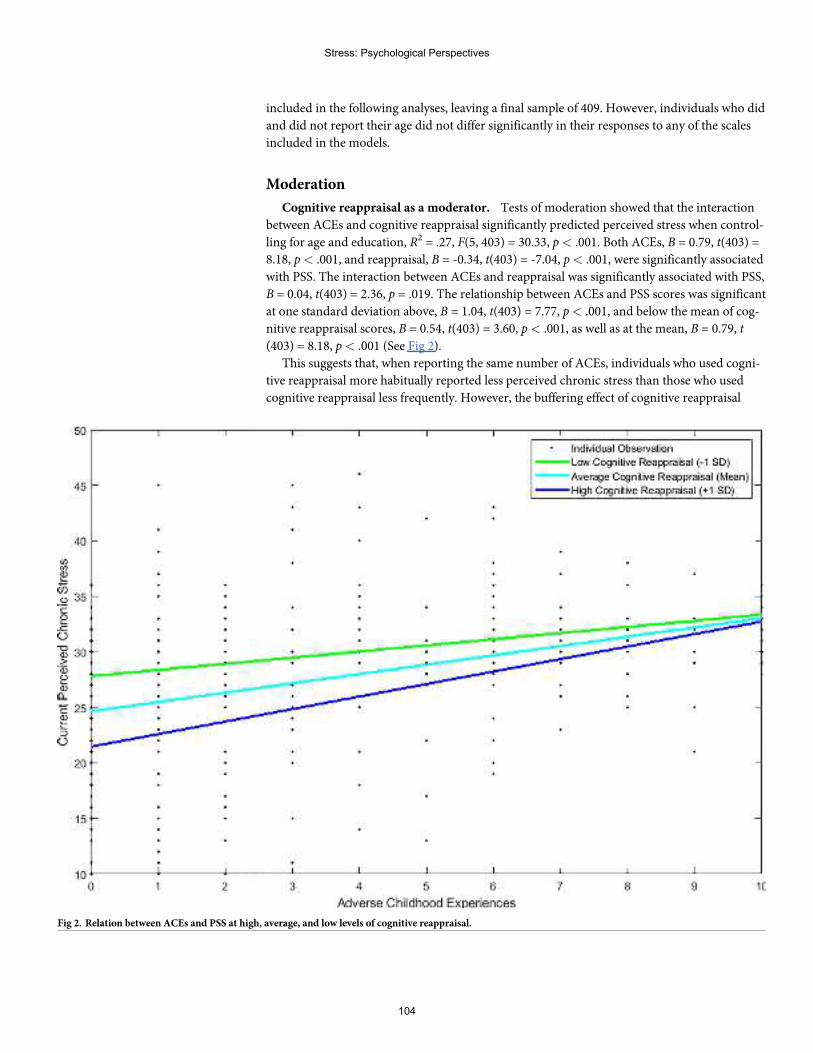
included in the following analyses, leaving a final sample of 409. However, individuals who did
and did not report their age did not differ significantly in their responses to any of the scales
included in the models.
Moderation
Cognitive reappraisal as a moderator. Tests of moderation showed that the interaction
between ACEs and cognitive reappraisal significantly predicted perceived stress when control-
ling for age and education, R2 = .27, F(5, 403) = 30.33, p< .001. Both ACEs, B = 0.79, t(403) =
8.18, p< .001, and reappraisal, B = -0.34, t(403) = -7.04, p< .001, were significantly associated
with PSS. The interaction between ACEs and reappraisal was significantly associated with PSS,
B = 0.04, t(403) = 2.36, p = .019. The relationship between ACEs and PSS scores was significant
at one standard deviation above, B = 1.04, t(403) = 7.77, p< .001, and below the mean of cog-
nitive reappraisal scores, B = 0.54, t(403) = 3.60, p< .001, as well as at the mean, B = 0.79, t
(403) = 8.18, p< .001 (See Fig 2).
This suggests that, when reporting the same number of ACEs, individuals who used cogni-
tive reappraisal more habitually reported less perceived chronic stress than those who used
cognitive reappraisal less frequently. However, the buffering effect of cognitive reappraisal
Fig 2. Relation between ACEs and PSS at high, average, and low levels of cognitive reappraisal.
Stress: Psychological Perspectives
104
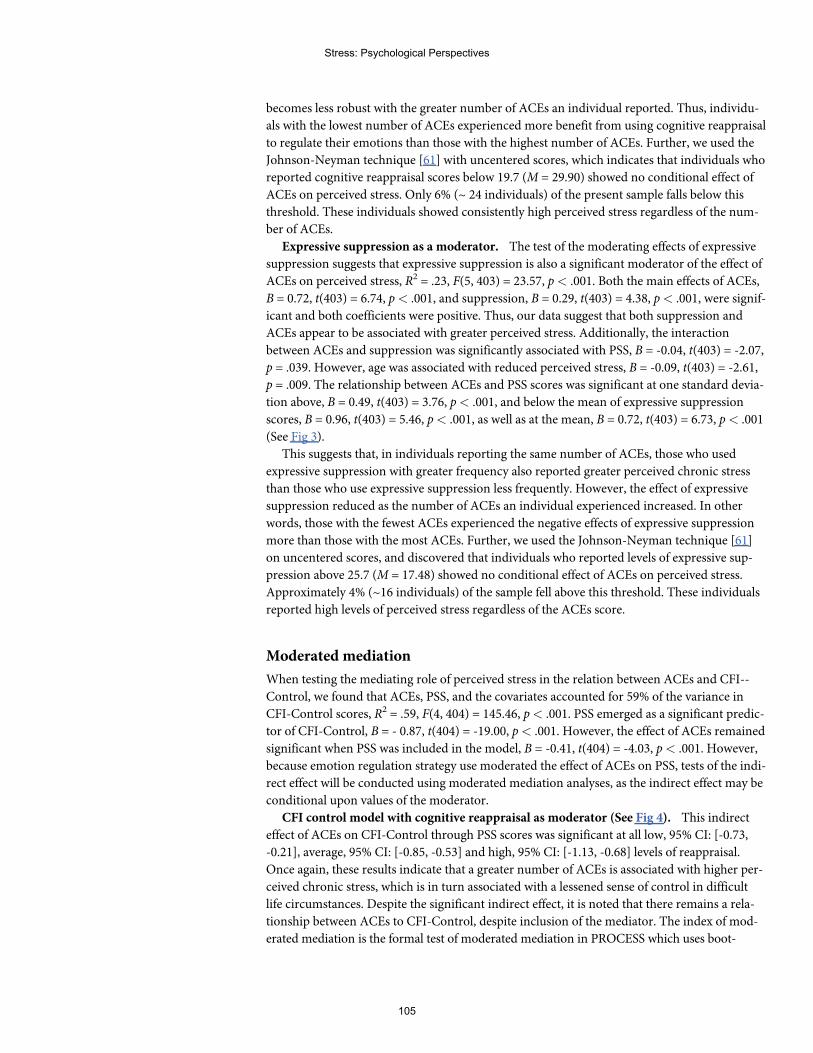
becomes less robust with the greater number of ACEs an individual reported. Thus, individu-
als with the lowest number of ACEs experienced more benefit from using cognitive reappraisal
to regulate their emotions than those with the highest number of ACEs. Further, we used the
Johnson-Neyman technique [61] with uncentered scores, which indicates that individuals who
reported cognitive reappraisal scores below 19.7 (M = 29.90) showed no conditional effect of
ACEs on perceived stress. Only 6% (~ 24 individuals) of the present sample falls below this
threshold. These individuals showed consistently high perceived stress regardless of the num-
ber of ACEs.
Expressive suppression as a moderator. The test of the moderating effects of expressive
suppression suggests that expressive suppression is also a significant moderator of the effect of
ACEs on perceived stress, R2 = .23, F(5, 403) = 23.57, p< .001. Both the main effects of ACEs,
B = 0.72, t(403) = 6.74, p< .001, and suppression, B = 0.29, t(403) = 4.38, p< .001, were signif-
icant and both coefficients were positive. Thus, our data suggest that both suppression and
ACEs appear to be associated with greater perceived stress. Additionally, the interaction
between ACEs and suppression was significantly associated with PSS, B = -0.04, t(403) = -2.07,
p = .039. However, age was associated with reduced perceived stress, B = -0.09, t(403) = -2.61,
p = .009. The relationship between ACEs and PSS scores was significant at one standard devia-
tion above, B = 0.49, t(403) = 3.76, p< .001, and below the mean of expressive suppression
scores, B = 0.96, t(403) = 5.46, p< .001, as well as at the mean, B = 0.72, t(403) = 6.73, p< .001
(See Fig 3).
This suggests that, in individuals reporting the same number of ACEs, those who used
expressive suppression with greater frequency also reported greater perceived chronic stress
than those who use expressive suppression less frequently. However, the effect of expressive
suppression reduced as the number of ACEs an individual experienced increased. In other
words, those with the fewest ACEs experienced the negative effects of expressive suppression
more than those with the most ACEs. Further, we used the Johnson-Neyman technique [61]
on uncentered scores, and discovered that individuals who reported levels of expressive sup-
pression above 25.7 (M = 17.48) showed no conditional effect of ACEs on perceived stress.
Approximately 4% (~16 individuals) of the sample fell above this threshold. These individuals
reported high levels of perceived stress regardless of the ACEs score.
Moderated mediation
When testing the mediating role of perceived stress in the relation between ACEs and CFI--
Control, we found that ACEs, PSS, and the covariates accounted for 59% of the variance in
CFI-Control scores, R2 = .59, F(4, 404) = 145.46, p< .001. PSS emerged as a significant predic-
tor of CFI-Control, B = - 0.87, t(404) = -19.00, p< .001. However, the effect of ACEs remained
significant when PSS was included in the model, B = -0.41, t(404) = -4.03, p< .001. However,
because emotion regulation strategy use moderated the effect of ACEs on PSS, tests of the indi-
rect effect will be conducted using moderated mediation analyses, as the indirect effect may be
conditional upon values of the moderator.
CFI control model with cognitive reappraisal as moderator (See Fig 4). This indirect
effect of ACEs on CFI-Control through PSS scores was significant at all low, 95% CI: [-0.73,
-0.21], average, 95% CI: [-0.85, -0.53] and high, 95% CI: [-1.13, -0.68] levels of reappraisal.
Once again, these results indicate that a greater number of ACEs is associated with higher per-
ceived chronic stress, which is in turn associated with a lessened sense of control in difficult
life circumstances. Despite the significant indirect effect, it is noted that there remains a rela-
tionship between ACEs to CFI-Control, despite inclusion of the mediator. The index of mod-
erated mediation is the formal test of moderated mediation in PROCESS which uses boot-
Stress: Psychological Perspectives
105
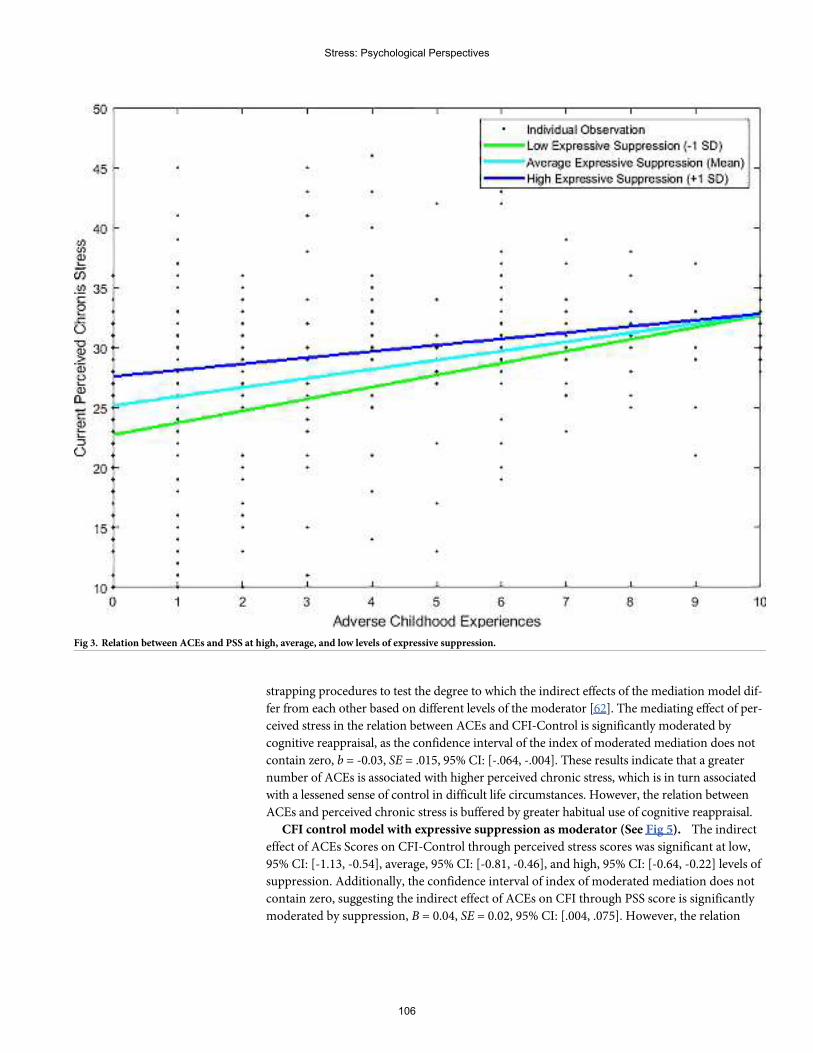
strapping procedures to test the degree to which the indirect effects of the mediation model dif-
fer from each other based on different levels of the moderator [62]. The mediating effect of per-
ceived stress in the relation between ACEs and CFI-Control is significantly moderated by
cognitive reappraisal, as the confidence interval of the index of moderated mediation does not
contain zero, b = -0.03, SE = .015, 95% CI: [-.064, -.004]. These results indicate that a greater
number of ACEs is associated with higher perceived chronic stress, which is in turn associated
with a lessened sense of control in difficult life circumstances. However, the relation between
ACEs and perceived chronic stress is buffered by greater habitual use of cognitive reappraisal.
CFI control model with expressive suppression as moderator (See Fig 5). The indirect
effect of ACEs Scores on CFI-Control through perceived stress scores was significant at low,
95% CI: [-1.13, -0.54], average, 95% CI: [-0.81, -0.46], and high, 95% CI: [-0.64, -0.22] levels of
suppression. Additionally, the confidence interval of index of moderated mediation does not
contain zero, suggesting the indirect effect of ACEs on CFI through PSS score is significantly
moderated by suppression, B = 0.04, SE = 0.02, 95% CI: [.004, .075]. However, the relation
Fig 3. Relation between ACEs and PSS at high, average, and low levels of expressive suppression.
Stress: Psychological Perspectives
106
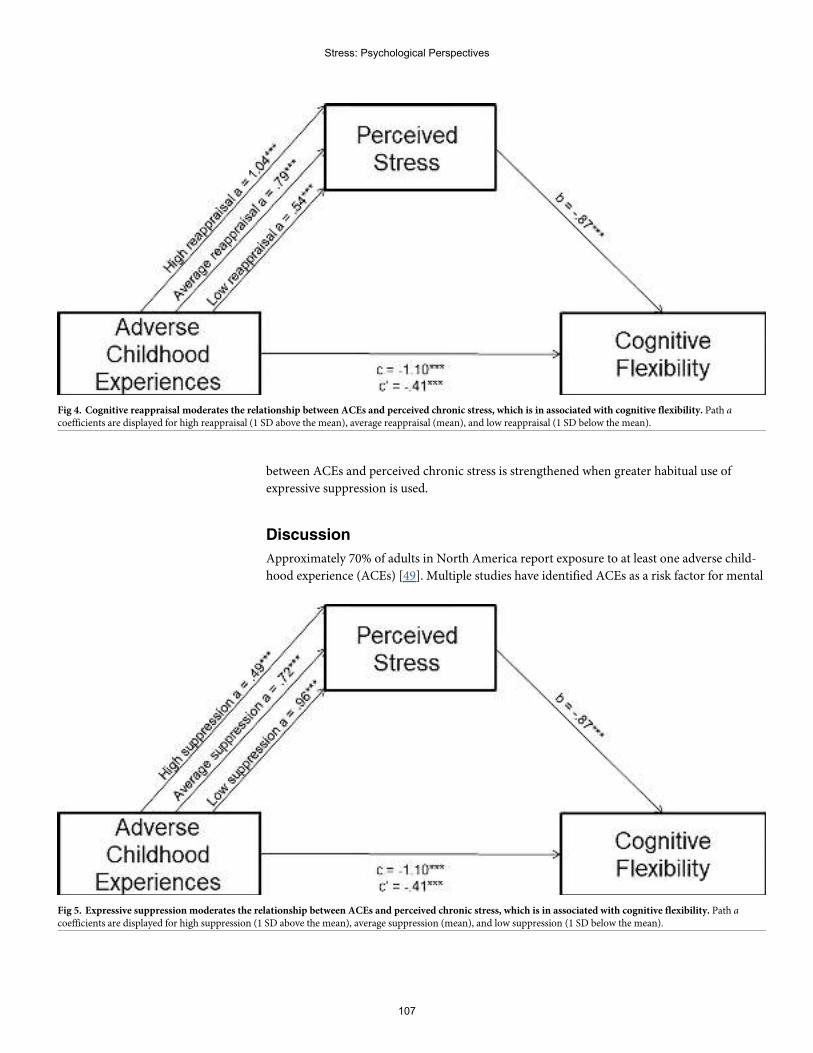
between ACEs and perceived chronic stress is strengthened when greater habitual use of
expressive suppression is used.
Discussion
Approximately 70% of adults in North America report exposure to at least one adverse child-
hood experience (ACEs) [49]. Multiple studies have identified ACEs as a risk factor for mental
Fig 4. Cognitive reappraisal moderates the relationship between ACEs and perceived chronic stress, which is in associated with cognitive flexibility. Path acoefficients are displayed for high reappraisal (1 SD above the mean), average reappraisal (mean), and low reappraisal (1 SD below the mean).
Fig 5. Expressive suppression moderates the relationship between ACEs and perceived chronic stress, which is in associated with cognitive flexibility. Path acoefficients are displayed for high suppression (1 SD above the mean), average suppression (mean), and low suppression (1 SD below the mean).
Stress: Psychological Perspectives
107
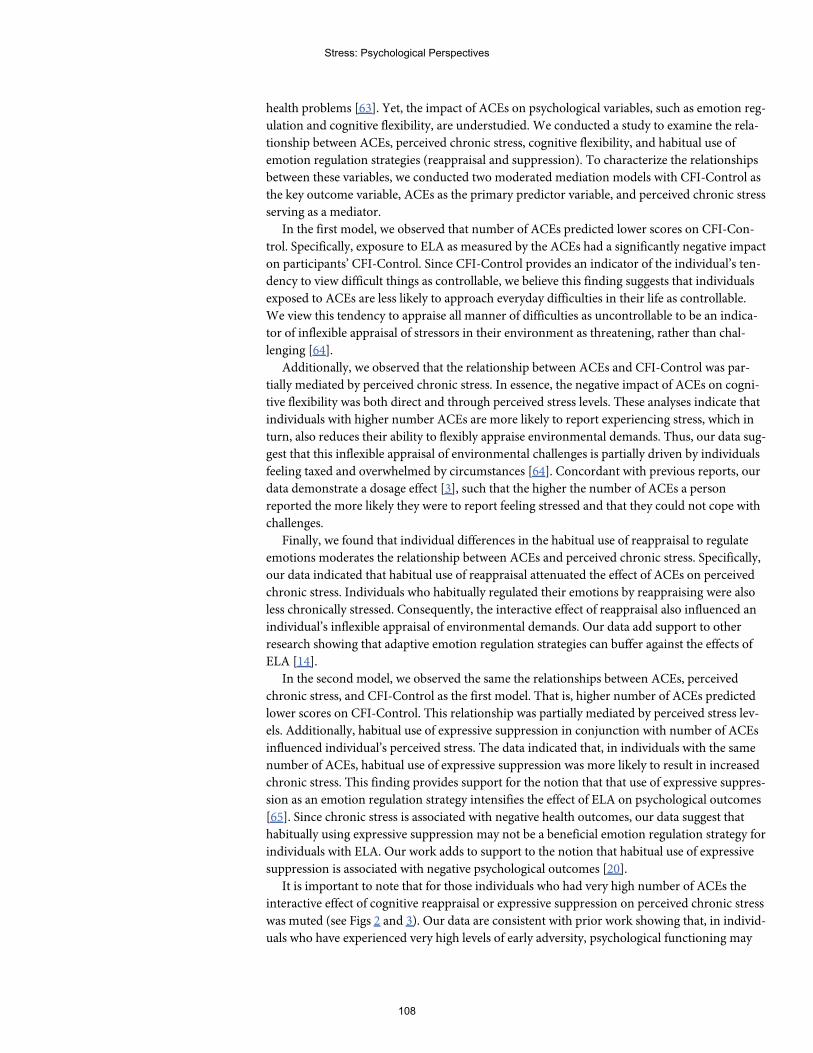
health problems [63]. Yet, the impact of ACEs on psychological variables, such as emotion reg-
ulation and cognitive flexibility, are understudied. We conducted a study to examine the rela-
tionship between ACEs, perceived chronic stress, cognitive flexibility, and habitual use of
emotion regulation strategies (reappraisal and suppression). To characterize the relationships
between these variables, we conducted two moderated mediation models with CFI-Control as
the key outcome variable, ACEs as the primary predictor variable, and perceived chronic stress
serving as a mediator.
In the first model, we observed that number of ACEs predicted lower scores on CFI-Con-
trol. Specifically, exposure to ELA as measured by the ACEs had a significantly negative impact
on participants’ CFI-Control. Since CFI-Control provides an indicator of the individual’s ten-
dency to view difficult things as controllable, we believe this finding suggests that individuals
exposed to ACEs are less likely to approach everyday difficulties in their life as controllable.
We view this tendency to appraise all manner of difficulties as uncontrollable to be an indica-
tor of inflexible appraisal of stressors in their environment as threatening, rather than chal-
lenging [64].
Additionally, we observed that the relationship between ACEs and CFI-Control was par-
tially mediated by perceived chronic stress. In essence, the negative impact of ACEs on cogni-
tive flexibility was both direct and through perceived stress levels. These analyses indicate that
individuals with higher number ACEs are more likely to report experiencing stress, which in
turn, also reduces their ability to flexibly appraise environmental demands. Thus, our data sug-
gest that this inflexible appraisal of environmental challenges is partially driven by individuals
feeling taxed and overwhelmed by circumstances [64]. Concordant with previous reports, our
data demonstrate a dosage effect [3], such that the higher the number of ACEs a person
reported the more likely they were to report feeling stressed and that they could not cope with
challenges.
Finally, we found that individual differences in the habitual use of reappraisal to regulate
emotions moderates the relationship between ACEs and perceived chronic stress. Specifically,
our data indicated that habitual use of reappraisal attenuated the effect of ACEs on perceived
chronic stress. Individuals who habitually regulated their emotions by reappraising were also
less chronically stressed. Consequently, the interactive effect of reappraisal also influenced an
individual’s inflexible appraisal of environmental demands. Our data add support to other
research showing that adaptive emotion regulation strategies can buffer against the effects of
ELA [14].
In the second model, we observed the same the relationships between ACEs, perceived
chronic stress, and CFI-Control as the first model. That is, higher number of ACEs predicted
lower scores on CFI-Control. This relationship was partially mediated by perceived stress lev-
els. Additionally, habitual use of expressive suppression in conjunction with number of ACEs
influenced individual’s perceived stress. The data indicated that, in individuals with the same
number of ACEs, habitual use of expressive suppression was more likely to result in increased
chronic stress. This finding provides support for the notion that that use of expressive suppres-
sion as an emotion regulation strategy intensifies the effect of ELA on psychological outcomes
[65]. Since chronic stress is associated with negative health outcomes, our data suggest that
habitually using expressive suppression may not be a beneficial emotion regulation strategy for
individuals with ELA. Our work adds to support to the notion that habitual use of expressive
suppression is associated with negative psychological outcomes [20].
It is important to note that for those individuals who had very high number of ACEs the
interactive effect of cognitive reappraisal or expressive suppression on perceived chronic stress
was muted (see Figs 2 and 3). Our data are consistent with prior work showing that, in individ-
uals who have experienced very high levels of early adversity, psychological functioning may
Stress: Psychological Perspectives
108
be determined by factors other than emotion regulation [66]. As indicated in Fig 2, individuals
with 10 ACEs who also report high habitual use of cognitive reappraisal exhibited chronic
stress levels that were higher than individuals with 0 ACEs and low frequency of reappraisal to
regulate emotions. In contrast, as shown in Fig 3, individuals with 10 ACEs reported similar
levels of chronic stress regardless of high or low frequency of expressive suppression to regu-
late emotions. This finding further highlights that the impact of ACEs accumulates with
increasing exposure to different types of adversities [3, 63]. Since ACEs are a factor that cannot
be modified, future research should consider that individuals with very high number of ACEs
might be potential targets for treatments aimed at improving emotion regulation skills. In
view of the fact that cumulative trauma in early development is associated with higher levels of
psychopathology in adulthood (e.g., substance abuse [3]), prevention programs that focus on
the improving emotion regulation skills in children and young adults may be able to counter
some of the negative effects of early adversity [66].
The difference in the moderating effect of expressive suppression and reappraisal could be
the result of two related reasons. First, expressive suppression is a response-focused strategy
that emerges once the emotional event is underway and requires constant monitoring
resources to maintain. This can make it cognitively costly [67, 68], thereby leaving fewer cogni-
tive resources for dealing with environmental demands. Thus, the observed reduction in cog-
nitive flexibility could be a by-product of reduced cognitive resources overall. Second,
expressive suppression can have a degrading effect on the individual’s relationships and social
functioning by negatively impacting contingent responsiveness in social interactions [69].
Given that ACEs are associated with greater interpersonal difficulty [63], it is possible that use
of expressive suppression as an emotion regulation strategy makes individuals feel unsup-
ported and alone when confronting difficulties. As a result, expressive suppression serves to
enhance inflexible appraisal of stressors as threats. Regardless, our data add further credence
to the notion that habitual use of expressive suppression may be maladaptive [20].
One possible explanation for perceived chronic stress emerging as a mediator between
ACEs and CFI-Control is that individuals with high number of ACEs do have more stressors
in their life. For instance, past research has shown that ACEs are linked with poor economic
outcomes and food insecurity [70]. It is relevant to note that we controlled for education levels
in our analyses. However, it is also possible that the inflexible appraisal of stressors we observe
in participants with high ACEs scores is due to enhanced development of vigilance to threats
in the environment [7]. This might foster attention to or monitoring of stressors [71], but
appears to come at the cost of flexibility. Overall, our data add some support to the notion that
exposure to early abuse alters threat appraisal in adulthood [7].
Interestingly, we did not observe an association between ACEs and CFI-Alternatives. This
provides further evidence that the two subscales of the CFI assess different aspects of cognitive
flexibility [34]. In the original report on the development of the instrument, it was CFI-Control
that had exhibited larger correlations with depression scores across two studies (r = -.50; p =
.001 and r = -.44; p = .001) compared to CFI-Alternatives (r = -.19; p = .01 and r = -.20; p =
.01). Thus, it is possible that CFI-Control is more likely to be associated with outcomes than
CFI-Alternatives. Considering that CFI-Alternatives is an indicator of an individual’s ability to
view a problem frommultiple perspectives, our data suggest that ACEs do not influence this
aspect of cognitive flexibility. This is a hopeful and encouraging finding, particularly for indi-
viduals with exposure to ELA. Although empirical evidence suggests that early life stress is
associated with reduced cognitive flexibility in children and adolescents [41, 44], our data indi-
cate that ELA might not influence all aspects of cognitive flexibility in adults.
The fact that our sample size had a wide age range (19–86 years) may have influenced our
results. For instance, participant age was positively associated with CFI-Control and negatively
Stress: Psychological Perspectives
109
associated with perceived stress and habitual use of suppression as a strategy to regulate emo-
tions. Although we controlled for age effects in our analyses, our data suggest that studies that
systematically examine the effect of ACEs on different aspects of cognitive flexibility across the
life span are warranted. Considering that this relationship remains significant after accounting
for variance explained by perceived stress levels, participant age, and education levels, our
study highlights the significance of ACEs in predicting inflexibility.
Several limitations must be noted when interpreting our findings. First, our work is based
on self-report measures. There is some evidence to suggest that behavioral and self-report
measures provide insight about different aspects of cognitive flexibility [36], so it is possible
that the observed associations would differ if a behavioral measure of cognitive flexibility (e.g.,
WCST) were used. Second, we did not collect data on participants’ current or past economic
status. This is a major confound that precludes us from differentiating between the effects of
economic hardship and physical and psychological trauma in development. Childhood pov-
erty is accompanied by psychological and material hardships that profoundly impact the tra-
jectory of development [12]. We made this decision prior to data collection based on previous
studies with ACEs showing that education, not income, was associated with outcomes [3].
However, we also acknowledge that the sample used in those studies consisted of majority
white, middle class, and educated individuals [72]. Therefore, it is entirely possible that indi-
viduals who are living in economic deprivation are also experiencing increased feelings of
helplessness which can be exhibited as reduced control over challenging circumstances. Since
empirical evidence has suggested that increased levels of adversity exist in lower income fami-
lies [72], future research should include socioeconomic status in their study design. Third, the
proposed mediation model may not extend to populations with mental health problems [73].
Despite empirical evidence from rodent models [74], the observed direction of the relation
between perceived stress and cognitive flexibility should ideally be resolved through longitudi-
nal studies. Our study design was correlational and needs to be replicated before any firm con-
clusions can be drawn. Finally, we did not randomize the order in which the questionnaires
were presented. Nevertheless, by studying cognitive flexibility as an outcome variable in adults,
we were able to extend the existing literature on ACEs. Additionally, by investigating the mod-
erating effect of emotion regulation strategies, our study provides further evidence that effec-
tive emotion regulation can be a key resilience factor in individuals who have experienced
early adversity.
Author Contributions
Conceptualization: Vrinda Kalia.
Data curation: Katherine Knauft.
Formal analysis: Katherine Knauft.
Project administration: Vrinda Kalia.
Resources: Vrinda Kalia.
Supervision: Vrinda Kalia.
Visualization: Katherine Knauft.
Writing – original draft: Vrinda Kalia.
Writing – review & editing: Katherine Knauft.
Stress: Psychological Perspectives
110
References1. Pechtel P., & Pizzagalli D. A. (2011). Effects of early life stress on cognitive and affective function: An
integrated review of human literature. Psychopharmacology, 214(1), 55–70. https://doi.org/10.1007/s00213-010-2009-2 PMID: 20865251
2. Chapman D. P., Whitfield C. L., Felitti V. J., Dube S. R., Edwards V. J., & Anda R. F. (2004). Adversechildhood experiences and the risk of depressive disorders in adulthood. Journal of Affective Disorders,82(2), 217–225. https://doi.org/10.1016/j.jad.2003.12.013 PMID: 15488250
3. Anda R. F., Brown D. W., Dube S. R., Bremner J. D., Felitti V. J., & GilesW. H. (2008). Adverse child-hood experiences and chronic obstructive pulmonary disease in adults. American Journal of PreventiveMedicine, 34(5), 396–403. https://doi.org/10.1016/j.amepre.2008.02.002 PMID: 18407006
4. Gilbert L. K., Breiding M. J., Merrick M. T., ThompsonW.W., Ford D. C., Dhingra S. S., et al. (2015).Childhood adversity and adult chronic disease: An update from ten states and the District of Columbia,2010. American Journal of Preventive Medicine, 48(3), 345–349. https://doi.org/10.1016/j.amepre.2014.09.006 PMID: 25300735
5. Dube S. R., Anda R. F., Felitti V. J., Chapman D. P., Williamson D. F., & GilesW. H. (2001). Childhoodabuse, household dysfunction, and the risk of attempted suicide throughout the life span: Findings fromthe Adverse Childhood Experiences Study. JAMA, 286(24), 3089–3096. https://doi.org/10.1001/jama.286.24.3089 PMID: 11754674
6. Ganguly P., & Brenhouse H. C. (2015). Broken or maladaptive? Altered trajectories in neuroinflamma-tion and behavior after early life adversity.Developmental Cognitive Neuroscience, 11, 18–30. https://doi.org/10.1016/j.dcn.2014.07.001 PMID: 25081071
7. Callaghan B. L., & TottenhamN. (2016). The stress acceleration hypothesis: Effects of early-life adver-sity on emotion circuits and behavior.Current Opinion in Behavioral Sciences, 7, 76–81. https://doi.org/10.1016/j.cobeha.2015.11.018 PMID: 29644262
8. McEwen B. S. (2012). Brain on stress: How the social environment gets under the skin. Proceedings ofthe National Academy of Sciences, 109(Supplement 2), 17180–17185. https://doi.org/10.1073/pnas.1121254109
9. UnderwoodM. D., Bakalian M. J., Escobar T., Kassir S., Mann J. J., & Arango V. (2019). Early-lifeadversity, but not suicide, is associated with less prefrontal cortex gray matter in adulthood. Interna-tional Journal of Neuropsychopharmacology, 22(5), 349–357. https://doi.org/10.1093/ijnp/pyz013PMID: 30911751
10. Asplund C. L., Todd J. J., Snyder A. P., & Marois R. (2010). A central role for the lateral prefrontal cortexin goal-directed and stimulus-driven attention.Nature Neuroscience, 13(4), 507–512. https://doi.org/10.1038/nn.2509 PMID: 20208526
11. Dahmen B., Puetz V. B., ScharkeW., von Polier G. G., Herpertz-Dahlmann B., & Konrad K. (2018).Effects of early-life adversity on hippocampal structures and associated HPA axis functions.Develop-mental Neuroscience, 40(1), 13–22. https://doi.org/10.1159/000484238 PMID: 29237154
12. Blair C., & Raver C. C. (2012). Child development in the context of adversity; Experiential canalizationof brain and behavior. American Psychologist, 67(4), 309–318. https://doi.org/10.1037/a0027493PMID: 22390355
13. Danese A., & McEwen B. S. (2012). Adverse childhood experiences, allostasis, allostatic load, andage-related disease. Physiology & Behavior, 106(1), 29–39. https://doi.org/10.1016/j.physbeh.2011.08.019
14. Cameron L. D., Carroll P., & HamiltonW. K. (2018). Evaluation of an intervention promoting emotionregulation skills for adults with persisting distress due to adverse childhood experiences.Child Abuse &Neglect, 79, 423–433. https://doi.org/10.1016/j.chiabu.2018.03.002
15. Troy A. S., & Mauss I. B. (2011). Resilience in the face of stress: Emotion regulation ability as a protec-tive factor. In Southwick S., Charney D., FriedmanM., & Litz B. (Eds.), Resilience to stress (pp. 30–44).Cambridge, England: Cambridge University Press
16. Gross J. J. (2015). Emotion regulation: Current status and future prospects. Psychological Inquiry, 26(1), 1–26. https://doi.org/10.1080/1047840X.2014.940781
17. Gross J. J., & John O. P. (2003). Individual differences in two emotion regulation processes: Implica-tions for affect, relationships, and well-being. Journal of Personality and Social Psychology, 85(2),348–362. https://doi.org/10.1037/0022-3514.85.2.348 PMID: 12916575
18. Gross J. J. (2001). Emotion regulation in adulthood: Timing is everything.Current Directions in Psycho-logical Science, 10(6), 214–219. https://doi.org/10.1111/1467-8721.00152
19. Cameron L. D., & Overall N. C. (2018). Suppression and expression as distinct emotion-regulation pro-cesses in daily interactions: Longitudinal and meta-analyses. Emotion, 18(4), 465–480. https://doi.org/10.1037/emo0000334 PMID: 28569538
Stress: Psychological Perspectives
111
20. Aldao A., Nolen-Hoeksema S., & Schweizer S. (2010). Emotion-regulation strategies across psychopa-thology: A meta-analytic review.Clinical Psychology Review, 30(2), 217–237. https://doi.org/10.1016/j.cpr.2009.11.004 PMID: 20015584
21. Franchow E. I., & Suchy Y. (2015). Naturally-occurring expressive suppression in daily life depletesexecutive functioning. Emotion, 15(1), 78–89. https://doi.org/10.1037/emo0000013 PMID: 25111882
22. English T., & John O. P. (2013). Understanding the social effects of emotion regulation: Themediatingrole of authenticity for individual differences in suppression. Emotion, 13(2), 314–329. https://doi.org/10.1037/a0029847 PMID: 23046456
23. Knauft K., Ortiz S., Velkoff E., Smith A., & Kalia V. (2019). Keep calm and carry on? Grit buffers againstdisordered eating unless expressive suppression is used to regulate emotions. Journal of Social andClinical Psychology, 38(4), 321–342. https://doi.org/10.1521/jscp.2019.38.4.321
24. Ortiz S., Knauft K., Smith A., & Kalia V. (2019). Expressive suppression mediates the relation betweendisordered eating and suicidal ideation. Journal of Clinical Psychology, 75(10), 1943–1958. https://doi.org/10.1002/jclp.22830 PMID: 31332800
25. Gross J. J. (1998). The emerging field of emotion regulation: An integrative review.Review of GeneralPsychology, 2(3), 271–299. https://doi.org/10.1037/1089-2680.2.3.271
26. Blascovich J. (2008). Challenge, threat, and health. In Shah J. Y. & GardnerW. L (Eds.), Handbook ofmotivation science (pp. 481–493). Guilford Press
27. Arnsten A. F. T. (2015). Stress weakens prefrontal networks: Molecular insults to higher cognition.Nature Neuroscience, 18(10), 1376–1385. https://doi.org/10.1038/nn.4087 PMID: 26404712
28. Frankenhuis W. E., & deWeerth C. (2013). Does early-life exposure to stress shape or impair cogni-tion?.Current Directions in Psychological Science, 22(5), 407–412. https://doi.org/10.1177/0963721413484324
29. Miyake A., & Friedman N. P. (2012). The nature and organization of individual differences in executivefunctions: Four general conclusions.Current directions in psychological science, 21(1), 8–14. https://doi.org/10.1177/0963721411429458 PMID: 22773897
30. Diamond A. (2013). Executive functions.Annual Review of Psychology, 64, 135–168. https://doi.org/10.1146/annurev-psych-113011-143750 PMID: 23020641
31. Ionescu T. (2012). Exploring the nature of cognitive flexibility.New Ideas in Psychology, 30(2), 190–200. https://doi.org/10.1016/j.newideapsych.2011.11.001
32. Dajani D. R., & Uddin L. Q. (2015). Demystifying cognitive flexibility: Implications for clinical and devel-opmental neuroscience. Trends in Neurosciences, 38(9), 571–578. https://doi.org/10.1016/j.tins.2015.07.003 PMID: 26343956
33. Bonanno G. A., & Burton C. L. (2013). Regulatory flexibility: An individual differences perspective oncoping and emotion regulation. Perspectives on Psychological Science, 8(6), 591–612. https://doi.org/10.1177/1745691613504116 PMID: 26173226
34. Dennis J. P., & Vander Wal J. S. (2010). The cognitive flexibility inventory: Instrument development andestimates of reliability and validity.Cognitive Therapy and Research, 34(3), 241–253. https://doi.org/10.1007/s10608-009-9276-4
35. Curtiss G., & Tuttle K. (1993). Wisconsin Card Sorting Test: Computer version-2. Lutz, FL: Psychologi-cal Assessment Resources.
36. Johnco C., Wuthrich V. M., & Rapee R. M. (2014). Reliability and validity of two self-report measures ofcognitive flexibility. Psychological Assessment, 26(4), 1381–1387. https://doi.org/10.1037/a0038009PMID: 25265414
37. Liston C., McEwen B. S., & Casey B. J. (2009). Psychosocial stress reversibly disrupts prefrontal pro-cessing and attentional control. PNAS, 106(3), 912–917. https://doi.org/10.1073/pnas.0807041106PMID: 19139412
38. Karatekin C. (2018). Adverse childhood experiences (ACEs), stress and mental health in college stu-dents. Stress and Health, 34(1), 36–45. https://doi.org/10.1002/smi.2761 PMID: 28509376
39. Johnson S. B., Riley A. W., Granger D. A., & Riis J. (2013). The science of early life toxic stress for pedi-atric practice and advocacy. Pediatrics, 131(2), 319–327. https://doi.org/10.1542/peds.2012-0469PMID: 23339224
40. Cohen S., Kamarck T., & Mermelstein R. (1983). A global measure of perceived stress. Journal ofHealth and Social Behavior, 24(4), 385–396. https://doi.org/10.1016/j.socscimed.2016.08.021 PMID:6668417
41. HarmsM. B., Shannon Bowen K. E., Hanson J. L., & Pollak S. D. (2018). Instrumental learning and cog-nitive flexibility processes are impaired in children exposed to early life stress.Developmental Science,21(4), e12596. https://doi.org/10.1111/desc.12596 PMID: 29052307
Stress: Psychological Perspectives
112
42. Pollak S. D. (2008). Mechanisms linking early experience and the emergence of emotions: Illustrationsfrom the study of maltreated children.Current Directions in Psychological Science, 17(6), 370–375.https://doi.org/10.1111/j.1467-8721.2008.00608.x PMID: 21701602
43. Troy A. S., Mauss I. B. (2011). Resilience in the face of stress: Emotion regulation ability as a protectivefactor. In Southwick S., Charney D., FriedmanM., Litz B., (Eds.), Resilience to stress (pp. 30–44).Cambridge, England: Cambridge University Press.
44. Hostinar C. E., Stellern S. A., Schaefer C., Carlson S. M., & Gunnar M. R. (2012). Associations betweenearly life adversity and executive function in children adopted internationally from orphanages. Proceed-ings of the National Academy of Sciences, 109 (Supplement 2), 17208–17212. https://doi.org/10.1073/pnas.1121246109
45. OremD. M., Petrac D. C., & Bedwell J. S. (2008). Chronic self-perceived stress and set-shifting perfor-mance in undergraduate students. Stress, 11(1), 73–78. https://doi.org/10.1080/10253890701535103PMID: 17853073
46. LovalloW. (1975). The cold pressor test and autonomic function: A review and integration.Psychophys-iology, 12(3), 268–282. https://doi.org/10.1111/j.1469-8986.1975.tb01289.x PMID: 1153632
47. Miklosi M., Martos T., Szabo M., Kocsis-Bogar K., & Forintos D. P. (2014). Cognitive emotion regulationand stress: A multiple mediation approach. Translational Neuroscience, 5(1), 64–71. https://doi.org/10.2478/s13380-014-0207-9
48. Roos L. G., Levens S. M., & Bennett J. M. (2018). Stressful life events, relationship stressors, and corti-sol reactivity: The moderating role of suppression. Psychoneuroendocrinology, 89, 69–77. https://doi.org/10.1016/j.psyneuen.2017.12.026 PMID: 29331801
49. Felitti V. J. (1998). The relationship of adult health status to childhood abuse and household dysfunc-tion. American Journal of Preventive Medicine, 14, 245–258. https://doi.org/10.1016/s0749-3797(98)00017-8 PMID: 9635069
50. Danese A., Moffitt T. E., Harrington H., Milne B. J., Polanczyk G., Pariante C. M., et al. (2009). Adversechildhood experiences and adult risk factors for age-related disease: Depression, inflammation, andclustering of metabolic risk markers. Archives of Pediatrics & Adolescent Medicine, 163(12), 1135–1143. https://doi.org/10.1001/archpediatrics.2009.214
51. McLaughlin K. A. (2016). Future directions in childhood adversity and youth psychopathology. Journalof Clinical Child & Adolescent Psychology, 45(3), 361–382. https://doi.org/10.1080/15374416.2015.1110823
52. Anda R. F., Croft J. B., Felitti V. J., Nordenberg D., GilesW. H., Williamson D. F., et al. (1999). Adversechildhood experiences and smoking during adolescence and adulthood. JAMA, 282(17), 1652–1658.https://doi.org/10.1001/jama.282.17.1652 PMID: 10553792
53. DongM., Anda R. F., Felitti V. J., Dube S. R., Williamson D. F., Thompson T. J., et al. (2004). The inter-relatedness of multiple forms of childhood abuse, neglect, and household dysfunction.Child Abuse &Neglect, 28(7), 771–784. https://doi.org/10.1016/j.chiabu.2004.01.008
54. Anda R. F., DongM., Brown D.W., Felitti V. J., GilesW. H., Perry G. S., et al. (2009). The relationshipof adverse childhood experiences to a history of premature death of family members.BMCPublicHealth, 9, 106. https://doi.org/10.1186/1471-2458-9-106 PMID: 19371414
55. Hayes A. F. (2018). Introduction to mediation, moderation, and conditional process analysis. ( 2nd Ed.).The Guilford Press.
56. Preacher K. J., Rucker D. D., & Hayes A. F. (2007). Addressing moderated mediation hypotheses: The-ory, methods, and prescriptions.Multivariate Behavioral Research, 42(1), 185–227. https://doi.org/10.1080/00273170701341316 PMID: 26821081
57. Hayes A. F., Montoya A. K., & Rockwood N. J. (2017). The analysis of mechanisms and their contingen-cies: PROCESS versus structural equation modeling. Australasian Marketing Journal, 25(1), 76–81.https://doi.org/10.1016/j.ausmj.2017.02.001
58. John O. P., & Gross J. J. (2004). Healthy and unhealthy emotion regulation: Personality processes, indi-vidual differences, and life span development. Journal of Personality, 72(6), 1301–1334. https://doi.org/10.1111/j.1467-6494.2004.00298.x PMID: 15509284
59. Kalia V., Knauft K., & Smith A. R (under review). Differential associations between strategies of emotionregulation and facets of gritty personality in college students and adults. Journal of Social and ClinicalPsychology.
60. Blodgett C., & Lanigan J. D. (2018). The association between adverse childhood experience (ACE) andschool success in elementary school children. School Psychology Quarterly, 33(1), 137–146. https://doi.org/10.1037/spq0000256 PMID: 29629790
61. Johnson P. O., & Neyman J. (1936). Tests of certain linear hypotheses and their applications to someeducational problems. Statistical Research Memoirs, 1, 57–93.
Stress: Psychological Perspectives
113
62. Hayes A. F. (2015). An index and test of linear moderated mediation.Multivariate Behavioral Research,50(1), 1–22. https://doi.org/10.1080/00273171.2014.962683 PMID: 26609740
63. Poole J. C., Dobson K. S., & Pusch D. (2018). Do adverse childhood experiences predict adult interper-sonal difficulties? The role of emotion dysregulation.Child Abuse & Neglect, 80, 123–133. https://doi.org/10.1016/j.chiabu.2018.03.006
64. Lazarus R. S., & Folkman S. (1984). Stress, appraisal, and coping. Springer Publishing.
65. Boyes M. E., Hasking P. A., & Martin G. (2016). Adverse life experience and psychological distress inadolescence: Moderating and mediating effects of emotion regulation and rumination. Stress andHealth, 32(4), 402–410. https://doi.org/10.1002/smi.2635 PMID: 25764473
66. Rudenstine S., Espinosa A., McGee A. B., & Routhier E. (2019). Adverse childhood events, adult dis-tress, and the role of emotion regulation. Traumatology, 25(2), 124. http://dx.doi.org/10.1037/trm0000176
67. Moore S. A., & Zoellner L. A. (2012). The effects of expressive and experiential suppression on memoryaccuracy and memory distortion in women with and without PTSD. Journal of Experimental Psychopa-thology, 3(3), 368–392. https://doi.org/10.5127/jep.024411 PMID: 23308337
68. Richards J. M., & Gross J. J. (2000). Emotion regulation and memory: The cognitive costs of keepingone’s cool. Journal of Personality and Social Psychology, 79(3), 410–424. https://doi.org/10.1037//0022-3514.79.3.410 PMID: 10981843
69. Butler E. A., Egloff B., Wlhelm F. H., Smith N. C., Erickson E. A., & Gross J. J. (2003). The social conse-quences of expressive suppression. Emotion, 3(1), 48–67. https://doi.org/10.1037/1528-3542.3.1.48PMID: 12899316
70. Sun J., Knowles M., Patel F., Frank D. A., Heeren T. C., & Chilton M. (2016). Childhood adversity andadult reports of food insecurity among households with children. American Journal of Preventive Medi-cine, 50(5), 561–572. https://doi.org/10.1016/j.amepre.2015.09.024 PMID: 26596189
71. Pollak S. D. (2005). Early adversity and mechanisms of plasticity: Integrating affective neurosciencewith developmental approaches to psychopathology.Development and Psychopathology, 17(3), 735–752. https://doi.org/10.1017/S0954579405050352 PMID: 16262990
72. Cronholm P. F., Forke C. M., Wade R., Bair-Merritt M. H., Davis M., Harkins-Schwarz M., et al. (2015).Adverse childhood experiences: Expanding the concept of adversity. American Journal of PreventiveMedicine, 49(3), 354–361. https://doi.org/10.1016/j.amepre.2015.02.001 PMID: 26296440
73. Laloyaux J., Dessart G., Van der Linden M., Lemaire M., & Larøi F. (2016). Maladaptive emotion regula-tion strategies and stress sensitivity mediate the relation between adverse life events and attenuatedpositive psychotic symptoms.Cognitive Neuropsychiatry, 21(2), 116–129. https://doi.org/10.1080/13546805.2015.1137213 PMID: 26829655
74. Liston C., Miller M. M., Goldwater D. S., Radley J. J., Rocher A. B., Hof P. R., et al. (2006). Stress-induced alterations in prefrontal cortical dendritic morphology predict selective impairments in percep-tual attentional set-shifting. Journal of Neuroscience, 26(30), 7870–7874. https://doi.org/10.1523/JNEUROSCI.1184-06.2006 PMID: 16870732
Stress: Psychological Perspectives
114
Does laughing have a stress-buffering effectin daily life? An intensive longitudinal study
Thea Zander-Schellenberg☯, Isabella Mutschler CollinsID☯, Marcel Miche,
Camille Guttmann, Roselind Lieb, KarinaWahlID*
Division of Clinical Psychology and Epidemiology, Department of Psychology, University of Basel, Basel,
Switzerland
☯ These authors contributed equally to this work.
Abstract
Positive affect is associated with alleviating mental and physiological stress responses. As
laughter is a common physiological operationalization of positive affect, we investigated
whether the effects of experiencing a stressful event on stress symptoms is lessened by fre-
quency and intensity of daily laughter. Using an intensive longitudinal design, we ambulatory
assessed the self-reported experience of stressful events, stress symptoms and the fre-
quency as well as the intensity of laughter in university students’ daily lives. Our hierarchical
ecological momentary assessment data were analyzed with multilevel models. The results
support the stress-buffering model of positive affect: We found that the frequency of laughter
attenuated the association between stressful events and subsequent stress symptoms. The
level of intensity of laughter, however, was found to have no significant effect. Future studies
should use additional psychophysiological indicators of stress and straighten out the differ-
ential contributions of frequency and intensity of daily laughter.
Introduction
Positive affect is understood as a state of experiencing pleasure. For example, people feel
happy, joyful, calm, enthusiastic, excited, and/or satisfied when being in a positive affect state
[1, 2]. Using various forms of operationalization, several studies report associations of positive
affect with a wealth of positive outcomes. For example, positive affect is positively associated
with meaning in life [3], future life satisfaction [4], positive health behaviors [5], restful sleep
[6], and longevity [7]; for reviews, see [8, 9]; and [10]; see [5] as well as [11] for more nuanced
approaches.
Moreover, studies observed that positive affect is not only associated with positive outcomes
but also plays a crucial role in alleviating stress. Stress can negatively impact physical and men-
tal health. It has been linked to various medical conditions such as fatigue, back pain, and car-
diac and immunosuppressive conditions [12, 13] and increases the risk of developing anxiety
and depression (e.g., [14]). Stress-buffering models of positive affect suggest that positive affect
has the potential to reduce these negative health-harming consequences of psychological stress
on mind and body. In particular, it has been proposed that positive affect attenuates negative
Editor: H. Jonathon Rendina, Hunter College,
UNITED STATES
Funding: The author(s) received no specific
funding for this work.
Competing interests: The authors have declared
that no competing interests exist.
9
115
consequences of stress by reducing the physiological stress reactivity or by altering coping
strategies of the stressed individual [8].
There is a substantial amount of empirical evidence providing support for the assumptions
of the stress-buffering model of positive affect. Bolstering the moderating effect of positive
affect, study results suggest an “undoing effect of positive emotions” on the “cardiovascular
aftereffects [sic] of negative emotions” [15]. Fredrickson [1], for example, showed healthy par-
ticipants fear-evoking movie sequences and measured their cardiac responses. Afterwards,
participants either watched a sad, neutral, or amusing movie. The cardiac responses of those
participants who watched the amusing movie recovered faster to baseline level than the cardiac
responses of the other two groups, supporting the assumptions of the stress-buffering model of
positive affect (for further examples, see also Kraft and Pressman [16]). A recent prospective
study showed that the stress-buffering function of positive affect is more pronounced in indi-
viduals who experience high levels of stress [17]. Along these lines, a recent review of investiga-
tions into humor and pain reported a humor-triggered increased pain tolerance for
experimental pain and a keen sense of humor as a coping mechanism for chronic pain condi-
tions [18].
Laughter can be seen as the physiological expression of positive affect and, thus, positive
affect has often been operationalized as frequency or intensity of laughter (or smiling). It is
assumed that people laugh depending on the level of pleasure experienced. If the level of plea-
sure experienced is high, a laugh follows; where it is lower, people rarely exhibit a smile [19].
Martin and Kuiper [20] estimate that individuals typically laugh 18 times per day, mostly in
interaction with others. They also report daytime and gender differences in the frequency of
daily laughter. A meta-analysis revealed that, on average, women smile more than men [21].
More recent studies also report differences in the frequency of smiling between cultures [22].
The link between laughter and a reduced stress response has mostly been investigated in
the laboratory (e.g., [15, 16]) or in prospective studies using typically two measurement points
(e.g., [17]). Whether the relationship between stress and positive affect also applies to daily life
experiences when stress and positive affect might happen in close temporal approximation has
not been investigated so far. Thus, the current study investigated the stress-buffering model of
positive affectivity using an intensive prospective longitudinal study design in a real-life setting
with high ecological validity. In particular, the aim of the study was to examine in a student
sample whether the effect of experiencing a stressful event on stress symptoms is attenuated by
frequency and intensity of laughter. Based on the empirical evidence summarized above, we
derived the following hypotheses: Frequency of laughter attenuates the association between
prior experience of stressful events and subsequent experience of stress symptoms in daily life
(hypothesis 1); intensity of laughter attenuates the association between prior experience of
stressful events and subsequent experience of stress symptoms in daily life (hypothesis 2).
Methods
Design
Our study, which was conducted over a period of three months fromMarch to May 2018, is
based on an intensive prospective longitudinal study design using the Experience Sampling
Method (ESM; [23]). Data were collected from university students in their real-life settings
during 14 consecutive days with the help of smartphones.
The study was approved by the Institutional Review Board of the Department of Psychology
of the University of Basel (IRB No. 016-17-2). All participants gave written informed consent
prior to participation.
Stress: Psychological Perspectives
116
Participants
45 psychology students from the University of Basel participated in this study. Due to technical
problems with the smartphones, datasets from four participants were excluded, resulting in a
final sample size of N = 41 participants (33 female). The mean age was 21.6 (SD = 3.9,
range = 19–44 years). The number of semesters studied varied between 2 and 8 (mean = 3.2,
SD = 1.5). In our final sample, 48.7% of the students reported being in a relationship, while
51.2% stated that they were single. Furthermore, 12.2% reported living alone, 60.9% with their
families and 26.8% in shared accommodation. Participants were recruited via advertisements
at our Faculty and were awarded course credits as compensation for their participation. Addi-
tionally, they were invited to take part in a lottery for 10 vouchers worth 20 Swiss Francs each.
Procedure
ESM. In order to ambulatory assess the frequency/intensity of daily laughter by ESM as
well as the experience of stressful events and stress symptoms (measures see below), we devel-
oped an app with a questionnaire for Android and installed it on the following devices: Sam-
sung Galaxy S5 mini and Samsung Galaxy A3. The app was designed so that during a period of
two weeks, the participants received prompts in form of an acoustic signal. The prompts
occurred at randomized time intervals eight times per day, and in the ESM-sessions following
each prompt the participants were asked to answer questions regarding the frequency/intensity
of laughter as well as the stressful events and stress symptoms experienced since the last
prompt. The prompts were delivered daily between 8.00 a.m. and 9.30 p.m. The minimum
time interval between two prompts was set at 30 minutes. Participants were given the choice to
activate a delay option twice per day to postpone filling out the survey in case they were unable
to do so at the specific moment of receiving a prompt. If they did not answer the questions
within 15 minutes after receiving a prompt, the survey for this particular prompt was automat-
ically closed.
ESM-session. Each session began with two introductory questions (“Where are you?” and
“Are you alone?”). These items only served as starter questions for the participants and were
not analyzed. Subsequently, the participants were asked about the frequency/intensity of their
laughter as well as the experience of stressful events and stress symptoms. These questions
were arranged in three blocks presented in randomized order.
The study procedure was the following. Participants first took part in a group session to
familiarize themselves with the study procedure. They were each provided with a smartphone
with the newly developed app installed on it and shown how the app worked. They also filled
out a demographic questionnaire. During the subsequent two weeks, they filled out indepen-
dently the relevant questionnaires provided by the app after each acoustic prompt. At the end
of the study period, they returned the devices to us. Finally, the participants were thanked,
awarded the course credits earned, and informed about the purpose of the study.
Measures
Laughter was assessed with a slightly revised version of the Daily Laughter Record [20], which
we translated into German. We measured the frequency (“How often did you laugh since the
last prompt?” with 0 = “not at all” to 5 = “very often”) as well as the intensity of laughter (“In
the situations in which you laughed, how strong was your laugh?” with 1 = “weak” to 3 =
“strong”) and the reason for laughing (“What was the reason that made you laugh?”; here, mul-
tiple answers were possible, e.g., “interaction with others”).
Stress: Psychological Perspectives
117
The experience of stressful events was assessed with the subscale “acute pressure of stress”
of the Stress and Coping Inventory (SCI; [24]). Participants were asked whether they had expe-
rienced a stressful event since the last prompt (response options were “yes” or “no”).
The experience of stress symptoms was measured with a revised version of the subscale
“physical and mental stress symptoms” of the SCI [24] consisting of, ultimately, eight self-rat-
ing items that required to be answered on a 6-point Likert-scale (“I suffered from stomach
pressure or a stomach ache”, “I had a lump in my throat”, “I had a headache”, “I had twitch-
ings/convulsions in my face that I could not control”, “I ruminated”, “I felt desperate”, “I was
nervous”, “I felt restless”). We omitted four items that were not considered to be representative
of daily fluctuations (e.g., sleep problems) and only included items which could plausibly be
seen as being subject to variation within a short period of time. Satow [24] reported a Cron-
bach’s alpha of .86 for this scale, which can be regarded as very good. Using the nine SCI
items, we constructed two outcomes of self-reported stress symptoms. First, we computed the
average of items one through eight (specifying physical, cognitive, or emotional stress symp-
toms). However, one of the eight items (stress-related mimic twitches) was excluded from this
averaged outcome on account of it being disconfirmed in most instances (item scale 0 through
5, median = 0). Second, we used the item “Since the last prompt, how much stress have you
experienced” as a standalone outcome.
Statistical analyses
We used linear mixed modeling (LMM; e.g., [25]) to answer our research questions. This type
of modeling is suitable for analyzing hierarchical EMA data in which multiple observations are
nested within subjects, with the number and timing of observations varying between subjects,
and in which some observations are usually missing [26]. In both hypotheses, the outcome was
the experience of stress symptoms, and the predictor was the experience of stressful events. In
hypothesis 1, the respective moderator was reported frequency of laughter, while in hypothesis
2, the moderator was reported intensity of laughter.
All multilevel models included fixed and random effects. Fixed effects of the models were
theoretically derived, while random effects were derived empirically, using best model-fit as
the criterion. All models included in both parts of the mixed model the predictor, the out-
come, the respective moderator variable, and, as potential confounding variables, time (EMA
assessments) and sex, with the latter only featuring in the fixed effects part of the model. The
random effects part of the model was kept at its empirically justifiable maximum, as recom-
mended by [27]. Sex was included as a potential confounding variable since prior studies
observed differences between men and women with regard to the frequency of daily laughter
(e.g., [20, 21]).
In our analyses, the predictor and moderator were person-mean-centered, i.e., the zero
value of a specific scale represents the individual’s mean score on that particular scale [25].
Prior to analysis, the outcome was log-transformed due to its right skewness, to better meet
the LMM test assumptions. Finally, both the predictor and the moderator were lagged, so that
we estimated the prospective association between the stressful event experienced at time T and
the stress symptoms experienced at time T+1, moderated by either frequency or intensity of
laughter at time T. Thus, a negative regression coefficient for the moderation term (as hypoth-
esized by us) would mean that subjects who reported laughing more often (at T; frequency or
intensity) also reported a subsequent lower level of stress symptoms (at T+1), compared to
those reporting laughing less, always relative to the individual zero value of laughter. To exam-
ine the moderator effect of frequency and intensity of laughter respectively, we tested the
cross-variable product between predictor and each of these two moderators.
Stress: Psychological Perspectives
118
As results we report fixed effects and present both unstandardized (usCOEF) and standard-
ized model coefficients (sCOEF), each including their 95% confidence intervals (CI). Stan-
dardization was obtained by multiplying the regression coefficient by its standard deviation,
divided by the standard deviation of the outcome [28].
All analyses were conducted in R (version 3.5.1) using the following packages: esmprep [29]
to prepare the raw EMA data to be analyzed, nlme [30] for model estimation, effects [31] to
compute the slopes for two levels of the moderator, and both cowplot [32] and ggplot2 [33] to
visualize the moderation, and psych [34] to standardize model coefficients.
Results
Descriptive results pertaining to the EMA data
Overall, of 5008 prompted questionnaires, 94.6% were answered (median 96.7%), with a mini-
mum of 75.6% and a maximum of 100%. The number of days during which EMA question-
naires were answered ranged from between 15 (seven participants) and 17 (one participant).
The mean (as well as median) time that elapsed between successive prompts within the course
of individual days was 102 minutes, mainly ranging from between 30 and 180 minutes (96.6%
of all prompts). Less than 30 minutes or more than 180 minutes passed in 1.4% and 2%,
respectively. There were direct cross-sectional effects of self-reported stressful events on stress
symptoms. Using the combined measure of experienced stress symptoms as outcome, the
LMM yielded an unstandardized association coefficient of 0.404, with a 95% confidence inter-
val (95% CI) 0.350–0.457 (standardized: 0.374, 95% CI 0.324–0.432). Using the global (single
item) measure of experienced stress symptoms as outcome, the unstandardized results were
0.669, with a 95% confidence interval (95% CI) 0.595–0.742 (standardized: 0.418, 95% CI
0.372–0.464). In both analyses we adjusted for sex.
Hypothesis 1: Frequency of laughter attenuates the association betweenprior experience of stressful events and subsequent experience of stresssymptoms in daily life
Using the combined measure of experienced stress symptoms, frequency of laughter moder-
ated the association between experience of stressful events and subsequent experience of stress
symptoms (see Table 1). Thus, the association between a previously experienced stress event
and the subsequent experience of stress symptoms decreases by 0.048 (95% CI: -0.077 to
-0.020; standardizied coefficient: -0.052; 95% CI = -0.082 to -0.021) when frequency of laughter
increases by one standard deviation. Fig 1 illustrates the interaction effect for different levels of
frequency of laughter. Using the global measure of experienced stress symptoms, the interac-
tion effect remained stable (unstandardized coefficient: -0.083; 95% CI: -0.128 to -0.039; stan-
dardized coefficient: - 0.060: 95% CI: -0.092 to -0.028; see Table 2 and Fig 1).
Hypothesis 2: Intensity of laughter attenuates the association between priorexperience of stressful events and subsequent experience of stresssymptoms in daily life
Evaluating intensity of laughter as moderator, the interaction effects for both outcome mea-
sures contained the zero value in the 95% CI (see Tables 3 and 4). Therefore, hypothesis 2 was
not confirmed.
Stress: Psychological Perspectives
119
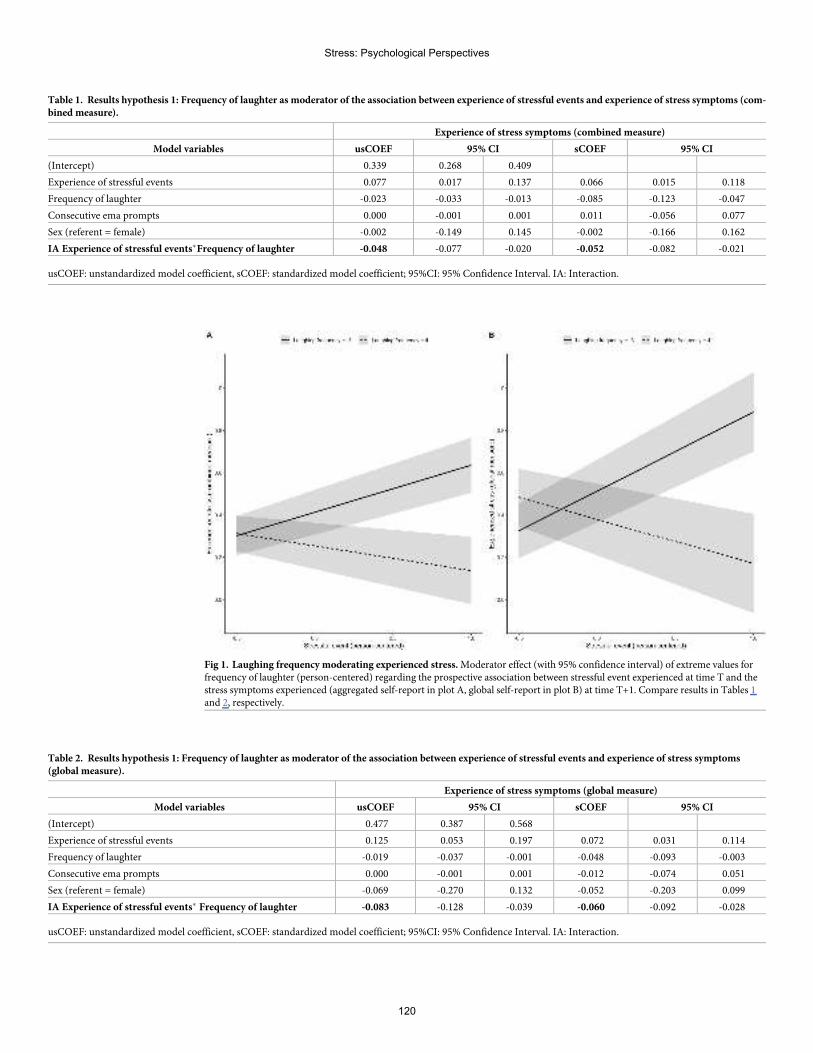
Table 1. Results hypothesis 1: Frequency of laughter as moderator of the association between experience of stressful events and experience of stress symptoms (com-bined measure).
Experience of stress symptoms (combined measure)
Model variables usCOEF 95% CI sCOEF 95% CI
(Intercept) 0.339 0.268 0.409
Experience of stressful events 0.077 0.017 0.137 0.066 0.015 0.118
Frequency of laughter -0.023 -0.033 -0.013 -0.085 -0.123 -0.047
Consecutive ema prompts 0.000 -0.001 0.001 0.011 -0.056 0.077
Sex (referent = female) -0.002 -0.149 0.145 -0.002 -0.166 0.162
IA Experience of stressful events�Frequency of laughter -0.048 -0.077 -0.020 -0.052 -0.082 -0.021
usCOEF: unstandardized model coefficient, sCOEF: standardized model coefficient; 95%CI: 95% Confidence Interval. IA: Interaction.
Fig 1. Laughing frequency moderating experienced stress.Moderator effect (with 95% confidence interval) of extreme values forfrequency of laughter (person-centered) regarding the prospective association between stressful event experienced at time T and thestress symptoms experienced (aggregated self-report in plot A, global self-report in plot B) at time T+1. Compare results in Tables 1and 2, respectively.
Table 2. Results hypothesis 1: Frequency of laughter as moderator of the association between experience of stressful events and experience of stress symptoms(global measure).
Experience of stress symptoms (global measure)
Model variables usCOEF 95% CI sCOEF 95% CI
(Intercept) 0.477 0.387 0.568
Experience of stressful events 0.125 0.053 0.197 0.072 0.031 0.114
Frequency of laughter -0.019 -0.037 -0.001 -0.048 -0.093 -0.003
Consecutive ema prompts 0.000 -0.001 0.001 -0.012 -0.074 0.051
Sex (referent = female) -0.069 -0.270 0.132 -0.052 -0.203 0.099
IA Experience of stressful events� Frequency of laughter -0.083 -0.128 -0.039 -0.060 -0.092 -0.028
usCOEF: unstandardized model coefficient, sCOEF: standardized model coefficient; 95%CI: 95% Confidence Interval. IA: Interaction.
Stress: Psychological Perspectives
120
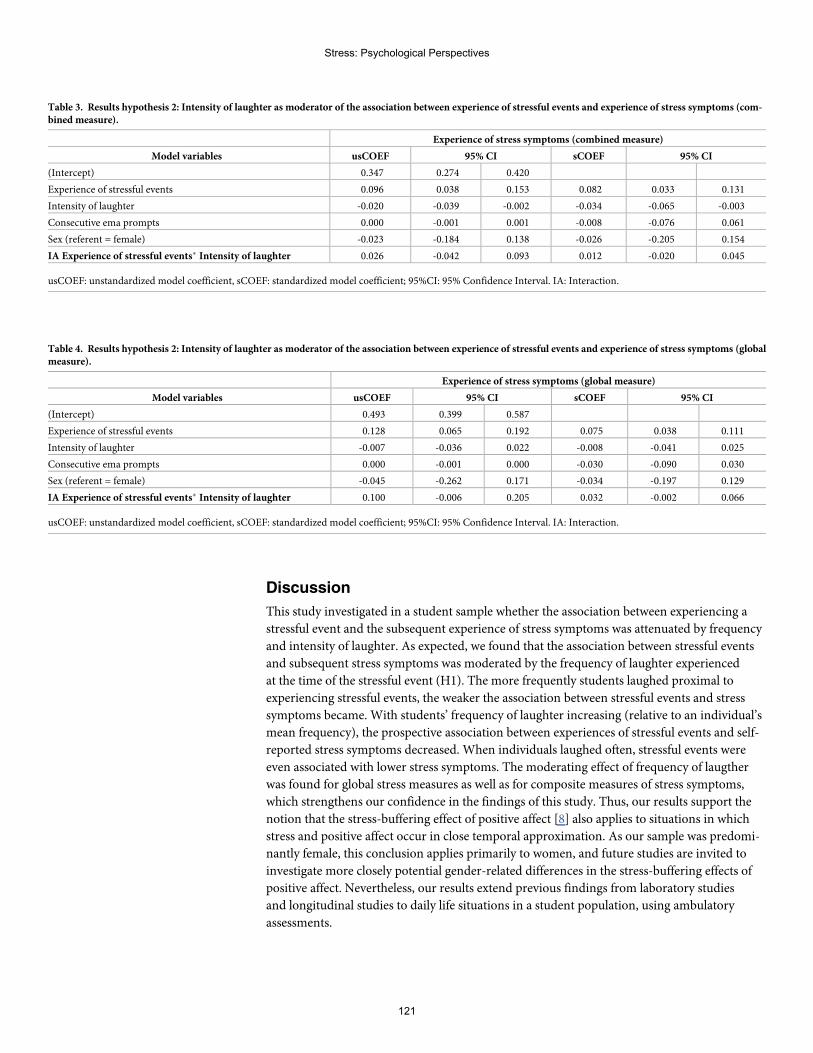
Discussion
This study investigated in a student sample whether the association between experiencing a
stressful event and the subsequent experience of stress symptoms was attenuated by frequency
and intensity of laughter. As expected, we found that the association between stressful events
and subsequent stress symptoms was moderated by the frequency of laughter experienced
at the time of the stressful event (H1). The more frequently students laughed proximal to
experiencing stressful events, the weaker the association between stressful events and stress
symptoms became. With students’ frequency of laughter increasing (relative to an individual’s
mean frequency), the prospective association between experiences of stressful events and self-
reported stress symptoms decreased. When individuals laughed often, stressful events were
even associated with lower stress symptoms. The moderating effect of frequency of laugther
was found for global stress measures as well as for composite measures of stress symptoms,
which strengthens our confidence in the findings of this study. Thus, our results support the
notion that the stress-buffering effect of positive affect [8] also applies to situations in which
stress and positive affect occur in close temporal approximation. As our sample was predomi-
nantly female, this conclusion applies primarily to women, and future studies are invited to
investigate more closely potential gender-related differences in the stress-buffering effects of
positive affect. Nevertheless, our results extend previous findings from laboratory studies
and longitudinal studies to daily life situations in a student population, using ambulatory
assessments.
Table 3. Results hypothesis 2: Intensity of laughter as moderator of the association between experience of stressful events and experience of stress symptoms (com-bined measure).
Experience of stress symptoms (combined measure)
Model variables usCOEF 95% CI sCOEF 95% CI
(Intercept) 0.347 0.274 0.420
Experience of stressful events 0.096 0.038 0.153 0.082 0.033 0.131
Intensity of laughter -0.020 -0.039 -0.002 -0.034 -0.065 -0.003
Consecutive ema prompts 0.000 -0.001 0.001 -0.008 -0.076 0.061
Sex (referent = female) -0.023 -0.184 0.138 -0.026 -0.205 0.154
IA Experience of stressful events� Intensity of laughter 0.026 -0.042 0.093 0.012 -0.020 0.045
usCOEF: unstandardized model coefficient, sCOEF: standardized model coefficient; 95%CI: 95% Confidence Interval. IA: Interaction.
Table 4. Results hypothesis 2: Intensity of laughter as moderator of the association between experience of stressful events and experience of stress symptoms (globalmeasure).
Experience of stress symptoms (global measure)
Model variables usCOEF 95% CI sCOEF 95% CI
(Intercept) 0.493 0.399 0.587
Experience of stressful events 0.128 0.065 0.192 0.075 0.038 0.111
Intensity of laughter -0.007 -0.036 0.022 -0.008 -0.041 0.025
Consecutive ema prompts 0.000 -0.001 0.000 -0.030 -0.090 0.030
Sex (referent = female) -0.045 -0.262 0.171 -0.034 -0.197 0.129
IA Experience of stressful events� Intensity of laughter 0.100 -0.006 0.205 0.032 -0.002 0.066
usCOEF: unstandardized model coefficient, sCOEF: standardized model coefficient; 95%CI: 95% Confidence Interval. IA: Interaction.
Stress: Psychological Perspectives
121
Surprisingly, however, intensity of laughter was found to have no moderating effect on the
association between experiencing a stressful event and subsequent stress symptoms, and our
hypothesis 2 was therefore not confirmed. Several factors may explain the discrepancy in find-
ings between frequency and intensity of laughter. For example, it is possible that the self-report
of intensity of laughter is less reliable than the self-report of frequency of laughter. In particu-
lar, people may have difficulties in specifically recalling differing degrees of intensity of laugh-
ter, whereas frequency of laughter may be easier to quantify (see also limitations below).
Alternatively, intensity of laughter might simply be a less reliable indicator of positive affect
than frequency of laughter. Future studies should therefore disentangle the potentially distinct
relationships between stress alleviation and frequency and intensity of laughter, respectively.
The strengths of our study lie in the following. First, we chose an intensive longitudinal
study design with up to 123 measurements per participant (i.e., 8 questionnaires per day over a
period of 14 consecutive days). Second, on average 94.6% of all questionnaire prompts were
answered by our 41 participants, yielding a relatively small rate only of missing observations.
Third, we report prospective associations (by establishing a temporal order of prior exposure
and subsequent outcome), an essential criterion when discussing potential causality [35, 36].
Fourth, we investigated the stress-buffering effect of positive affect outside the laboratory,
thereby enhancing ecological validity and being able to infer real-life dynamics.
Despite these strengths, this study faces the following potential limitations and opens up
various avenues of future investigation: First, our study is an observational study, not an exper-
imental one. This design does not allow for direct causal implications to be inferred. Second,
our assessment does not allow the temporal disentanglement of stress from laughter. As a start-
ing point, future studies are invited to consider different time intervals when modeling possi-
ble stress-buffering effects of positive affect on subsequent outcomes. Given that certain stress
symptoms might take some time to develop, it would be interesting to test other forms of
lagged models. Third, no physiological stress measures were applied. Participants in our study
completed only self-evaluation measures. Individuals, however, may differ in their abilities to
self-report the intensity and frequency of laughter, and individuals’ self-reports may be prone
to biases (e.g., including mood effects). Future studies might consider the use of devices such
as the Electronically Activated Recorder (EAR) to detect the intensity and frequency of laugh-
ter more objectively. Previous studies were already successful in applying the EAR as a method
to investigate daily social behavior [37, 38]. Future studies are also invited to include physio-
logical stress measures, such as cortisol levels or puls rates. Fourth, our sample consisted of a
fairly homogenous group of young, predominantly female students from the University of
Basel, which is why our results are not generalizable to the general population. A last limitation
lies in the fact that only few stressful events (ca. 12%) were reported by the students, and we
thus cannot ascertain with any certainty whether the observed moderation effect pertains to
populations experiencing more stressful events. For instance, the stress-buffering function of
laughing in the context of experiencing one single, only mildly stressful event might be differ-
ent from that of laughing in the context of multiple, highly stressful events. However, results of
a recent study investigating the prospective association between positive affect and longevity
suggest that the link between positive affect and positive health outcomes is more pronounced
in people who experience high stress levels [17]. Thus, it would be interesting to explore
whether this holds also true in daily life, where the experience of different affect and stress lev-
els are subject to frequent rapid change. Extending this, another future research perspective
may be to investigate whether certain kinds of traits may have an influence on the stress-buff-
ering effect of positive affect. For instance, it might be interesting to explore whether the
stress-buffering effect of positive affect is stronger in individuals with high trait mindfulness
Stress: Psychological Perspectives
122
and/or high emotion regulation skills as both are per se associated with greater levels of posi-
tive affect and well-being [39, 40, 41].
To conclude, our study adds important empirical evidence to the stress-buffering model of
positive affect [8]. Future studies need to replicate our findings in order to test the model’s
robustness. A future EMA design might include wearables with reliable sensor technique to
assess physiological symptoms of stress at the moment of occurrence such as pulse rate or skin
conductance level, possibly in populations experiencing high levels of stress in their daily lives.
Acknowledgments
We thank Claudio Gloggner for his help with the data collection.
Author Contributions
Conceptualization: Thea Zander-Schellenberg, Isabella Mutschler Collins, Roselind Lieb, Kar-
ina Wahl.
Formal analysis:Marcel Miche.
Investigation: Camille Guttmann.
Methodology:Marcel Miche.
Supervision: Roselind Lieb, Karina Wahl.
Writing – original draft: Thea Zander-Schellenberg, Isabella Mutschler Collins, Marcel
Miche, Roselind Lieb, Karina Wahl.
Writing – review & editing: Thea Zander-Schellenberg, Isabella Mutschler Collins, Marcel
Miche, Camille Guttmann, Roselind Lieb, Karina Wahl.
References1. Fredrickson BL. What good are positive emotions? Review of general psychology. 1998; 2(3):300–19.
https://doi.org/10.1037/1089-2680.2.3.300 PMID: 21850154
2. Pressman SD, Cohen S. Does positive affect influence health? Psychological bulletin. 2005; 131(6):925. https://doi.org/10.1037/0033-2909.131.6.925 PMID: 16351329
3. King LA, Hicks JA, Krull JL, Del Gaiso AK. Positive affect and the experience of meaning in life. Journalof personality and social psychology. 2006; 90(1):179. https://doi.org/10.1037/0022-3514.90.1.179PMID: 16448317
4. Seder JP, Oishi S. Intensity of smiling in Facebook photos predicts future life satisfaction. Social Psy-chological and Personality Science. 2012; 3(4):407–13.
5. Pressman SD, Cross MP. Moving beyond a one-size-fits-all view of positive affect in health research.Current Directions in Psychological Science. 2018; 27(5):339–44.
6. Pressman SD, Jenkins BN, Kraft-Feil TL, Rasmussen H, Scheier MF. The whole is not the sum of itsparts: Specific types of positive affect influence sleep differentially. Emotion. 2017; 17(5):778. https://doi.org/10.1037/emo0000256 PMID: 28191993
7. Abel EL, Kruger ML. Smile intensity in photographs predicts longevity. Psychological Science. 2010;21(4):542–4. https://doi.org/10.1177/0956797610363775 PMID: 20424098
8. Pressman SD, Jenkins BN, Moskowitz JT. Positive affect and health: What do we know and where nextshould we go? Annual Review of Psychology. 2019; 70:627–50. https://doi.org/10.1146/annurev-psych-010418-102955 PMID: 30260746
9. Chida Y, Steptoe A. Positive psychological well-being and mortality: a quantitative review of prospectiveobservational studies. PsychosomMed. 2008; 70(7):741–56. https://doi.org/10.1097/PSY.0b013e31818105ba PMID: 18725425
10. Zhang Y, Han B. Positive affect and mortality risk in older adults: A meta-analysis. PsyCh journal. 2016;5(2):125–38. https://doi.org/10.1002/pchj.129 PMID: 27113246
Stress: Psychological Perspectives
123
11. Dufner M, Brummer M, Chung JM, Drewke PM, Blaison C, Schmukle SC. Does Smile Intensity in Pho-tographs Really Predict Longevity? A Replication and Extension of Abel and Kruger (2010). PsycholSci. 2018; 29(1):147–53. https://doi.org/10.1177/0956797617734315 PMID: 29131719
12. Schonfeld P, Brailovskaia J, Bieda A, Zhang XC, Margraf J. The effects of daily stress on positive andnegative mental health: Mediation through self-efficacy. International Journal of Clinical and Health Psy-chology. 2016; 16(1):1–10. https://doi.org/10.1016/j.ijchp.2015.08.005 PMID: 30487845
13. Schneiderman N, Ironson G, Siegel SD. Stress and health: psychological, behavioral, and biologicaldeterminants. Annu Rev Clin Psychol. 2005; 1:607–28. https://doi.org/10.1146/annurev.clinpsy.1.102803.144141 PMID: 17716101
14. Faresjo Å, Theodorsson E, Chatziarzenis M, Sapouna V, Claesson H-P, Koppner J, et al. Higher per-ceived stress but lower cortisol levels found among young Greek adults living in a stressful social envi-ronment in comparison with Swedish young adults. PloS one. 2013; 8(9):e73828. https://doi.org/10.1371/journal.pone.0073828 PMID: 24066077
15. Fredrickson BL, Mancuso RA, Branigan C, Tugade MM. The undoing effect of positive emotions. Moti-vation and emotion. 2000; 24(4):237–58. https://doi.org/10.1023/a:1010796329158 PMID: 21731120
16. Kraft TL, Pressman SD. Grin and bear it: The influence of manipulated facial expression on the stressresponse. Psychological science. 2012; 23(11):1372–8. https://doi.org/10.1177/0956797612445312PMID: 23012270
17. Okely JA, Weiss A, Gale CR. The interaction between stress and positive affect in predicting mortality.Journal of psychosomatic research. 2017; 100:53–60. https://doi.org/10.1016/j.jpsychores.2017.07.005PMID: 28789793
18. Perez-Aranda A, Hofmann J, Feliu-Soler A, Ramırez-Maestre C, Andres-Rodrıguez L, RuchW, et al.Laughing away the pain: A narrative review of humour, sense of humour and pain. European Journal ofPain. 2019; 23(2):220–33. https://doi.org/10.1002/ejp.1309 PMID: 30176100
19. RuchW, Ekman P. The expressive pattern of laughter. Emotions, qualia, and consciousness: WorldScientific; 2001. p. 426–43.
20. Martin RA, Kuiper NA. Daily occurrence of laughter: Relationships with age, gender, and Type A per-sonality. Humor. 1999; 12(4):355–84.
21. LaFranceM, Hecht MA, Paluck EL. The contingent smile: a meta-analysis of sex differences in smiling.Psychological bulletin. 2003; 129(2):305. https://doi.org/10.1037/0033-2909.129.2.305 PMID:12696842
22. Talhelm T, Oishi S, Zhang X. Who smiles while alone? Rates of smiling lower in China than US. Emo-tion. 2019; 19(4):741. https://doi.org/10.1037/emo0000459 PMID: 29963886
23. Bolger N, Laurenceau J-P. Intensive longitudinal methods: An introduction to diary and experience sam-pling research: Guilford Press; 2013.
24. Satow L. Stress-und Coping-Inventar (SCI): Test-und Skalendokumentation. URL: www drsatow de[Zugriff: 266 2016]. 2012.
25. Enders CK, Tofighi D. Centering predictor variables in cross-sectional multilevel models: a new look atan old issue. Psychological methods. 2007; 12(2):121. https://doi.org/10.1037/1082-989X.12.2.121PMID: 17563168
26. Kim J, Marcusson-Clavertz D, Togo F, Park H. A Practical Guide to Analyzing Time-Varying Associa-tions between Physical Activity and Affect Using Multilevel Modeling. Computational and mathematicalmethods in medicine. 2018; 2018.
27. Barr DJ, Levy R, Scheepers C, Tily HJ. Random effects structure for confirmatory hypothesis testing:Keep it maximal. Journal of Memory and Language. 2013; 68(3):255–278.
28. Lorah J. Effect size measures for multilevel models: Definition, interpretation, and TIMSS example.Large-Scale Assessments in Education. 2018; 6(1):8.
29. Miche M. esmprep: Data Preparation During and After the Use of the Experience Sampling Methodol-ogy (ESM). Version 0.2.0 ed2019.
30. Pinheiro J BD, DebRoy S, Sarkar D, R Core Team. nlme: Linear and Nonlinear Mixed Effects Models.Version 3.1–139 ed2019.
31. Fox J. Effect Displays in R for Generalised Linear Models. Journal of Statistical Software. 2003; 8(15):1–27.
32. Wilke CO. cowplot: Streamlined Plot Theme and Plot Annotations for ’ggplot2’. Version 1.0.0 ed2019.
33. WickhamH. ggplot2: elegant graphics for data analysis: Springer; 2016.
34. Revelle W. psych: Procedures for Personality and Psychological Research. 1.8.10. ed. NorthwesternUniversity, Evanston, Illinois, USA2018.
Stress: Psychological Perspectives
124
35. Kraemer HC, Kazdin AE, Offord DR, Kessler RC, Jensen PS, Kupfer DJ. Coming to terms with theterms of risk. Archives of general psychiatry. 1997; 54(4):337–43. https://doi.org/10.1001/archpsyc.1997.01830160065009 PMID: 9107150
36. Hill AB. The environment and disease: association or causation?: Sage Publications; 1965.
37. Mehl MR, Pennebaker JW, Dabbs J, Price JH. The electronically activated recorder (EAR): A device forsampling naturalistic dayily activities and conversations. Behavior research methods, instruments, &computers. 2001; 33(4):517–523.
38. Mehl MR. The electronically activated recorder (EAR): A method fort he naturalistic oberservation ofdaily social behavior. Current directions in psychological science. 2017; 26(2):184–190. https://doi.org/10.1177/0963721416680611 PMID: 28529411
39. Tomlinson ER, Yousaf O, Vitterso AD, Jones L. Dispositional mindfulness and psychological health: asystematic review. Mindfulness. 2018; 9:23–43. https://doi.org/10.1007/s12671-017-0762-6 PMID:29387263
40. Gross JJ, John OP. Individual differences in two emotion regulation processes: Implications for affect,relationships, and well-being. Journal of Personality and Social Psychology. 2003; 85(2):348–362.https://doi.org/10.1037/0022-3514.85.2.348 PMID: 12916575
41. Hu T, Zhang D,Wang J, Mistry R, Ran G,Wang X. Relation between emotion regulation and mentalhealth: A meta-analysis review. Psychological Reports. 2014; 2:341–362.
Stress: Psychological Perspectives
125
Practice assistants´ perceivedmentalworkload: A cross-sectional study with550 German participants addressing workcontent, stressors, resources, andorganizational structure
Jan HoffmannID1¤a*, Christine Kersting2¤b, Birgitta Weltermann1
1 Institute of General Practice and Family Medicine, University Hospital of Bonn, Bonn, Germany, 2 Institutefor General Medicine, University Hospital Essen, University of Duisburg-Essen, Essen, Germany
¤a Current address: Institute of Medical Sociology, Health Services Research and Rehabilitation Science,University of Cologne, Cologne, Germany
¤b Current address: Institute of General Practice and Interprofessional Care, Faculty of Health/School ofMedicine, Witten/Herdecke University, Witten, Germany* [email protected]
Abstract
Introduction
Practice assistants represent a highly relevant occupational group in Germany and one of
the most popular training professions in Germany. Despite this, most research in the health
care sector has focused on secondary care settings, but has not addressed practice assis-
tants in primary care. Knowledge about practice assistants’ workplace-related stressors and
resources is particularly scarce. This cross-sectional study addresses the mental workload
of practice assistants working in primary care practices.
Methods
Practice assistants from a network of 185 German primary care practices were invited to
participate in this cross-sectional study. The standardized ‘Short Questionnaire for Work-
place Analysis’ (German: Kurzfragebogen zur Arbeitsanalyse) was used to assess practice
assistants´ mental workload. It addresses eleven workplace factors in 26 items: versatility,
completeness of task, scope of action, social support, cooperation, qualitative work
demands, quantitative work demands, work disruptions, workplace environment, informa-
tion and participation, and benefits. Sociodemographic and work characteristics were also
obtained. A descriptive analysis was performed for sociodemographic data and “Short
Questionnaire for Workplace Analysis” factors. The one-sided t-test and Cohen´s d were
calculated for a comparison with data from 23 professional groups (n = 8,121).
Results
A total of 550 practice assistants from 130 practices participated. The majority of practice
assistants was female (99.3%) and worked full-time (66.5%) in group practices (50.6%).
Editor: Sergio A. Useche, Universitat de Valencia,
SPAIN
10
126
Compared to the other professional groups, practice assistants reported higher values for
the factor social support (4.0 versus 3.7 [d 0.44; p<0.001]), information and participation
(3.6 versus 3.3 [d 0.38; p<0.001] as well as work disruptions (2.7 vs. 2.4 [d 0.42; p<0.001]),while practice assistants showed lower values regarding scope of action (3.4 versus 3.8 [d
0.43; p<0.001]).
Conclusions
Our study identified social support and participation within primary care practices as protec-
tive factors for mental workload, while work disruptions and scope of action were perceived
as stressors.
Introduction
Practice assistants (PrAs) represent the largest group of employees in the German outpatient
health care sector [1] and the second most popular training profession among German women
[2]. However, little is known about how PrAs perceive their work conditions. More specifi-
cally, data on the relationship between work and psychological stress in PrAs are lacking.
While psychosocial assessment studies of health personnel in secondary care have been per-
formed [3–6], only few have addressed this issue in PrAs in German primary care [1, 7, 8].
Therefore, it is important to further investigate PrAs’ perceived level of psychological stress, as
psychological strain may not only threaten PrAs’ health with potentially tremendous economic
costs, but may also impair high-quality patient care [9].
In recent years, increasing attention has been devoted to employees’ mental health. A sys-
tematic review by Theorell et al. highlighted that job strain has an impact on the development
of depressive symptoms [10]. Also, the socio-economic implications are increasingly evident:
preceded only by musculoskeletal diseases, mental health conditions rank second with 16.7%
of all sick leaves among German employees [11] and caused a damage of 21.7 billion Euros
gross added value in 2017 [11].
The stress-strain model developed by Rohmert and Rutenfranz in 1975 differentiates
between the terms ‘psychological stress’ and ‘psychological strain’. ‘Psychological stress’
describes all external factors that influence one’s psychological well-being. When referring to
psychological stress in a work environment, the term ‘mental workload´ refers to employees´
exposure to individual work demands and the environment at work [12]. However, the term
does not necessarily have a negative connotation [13]. ‘Psychological strain’ can be understood
as an individual´s response to psychological stress. Thus, the same level of psychological stress
may elicit a different level of psychological strain depending on an employee´s coping strategy
and constitution [14]. A well-balanced amount of psychological strain can lead to a healthy
and productive workflow [12], while an extreme level of psychological strain may threaten
employees’ health. Studies have shown a negative association between high levels of psycholog-
ical strain and mental illness [15, 16].
Since 2014, the German Safety and Health at Work Act (ArbSchG) obliges employers to
perform a general risk assessment of their employees’ work conditions [17]. Assessing the
mental workload (a so-called ‘psychosocial risk assessment´) is part of this risk assessment.
Based on the results, employers must take countermeasures as necessary to enhance their
employees’ health [18]. Due to differences in work demands, work hazards, and work environ-
ments across professions there is no gold standard that defines what instrument should be
Funding: Funding for this study was provided by
the Ministry of Culture and Science, North-Rhine
Westphalia, Germany, formerly the Ministry of
Innovation, Science and Research, North-Rhine
Westphalia, Germany. https://www.mkw.nrw/. The
funders had no role in study design, data collection
and analysis, decision to publish, or preparation of
the manuscript.
Competing interests: The authors have declared
that no competing interests exist.
Stress: Psychological Perspectives
127
used for the psychosocial risk assessment. While different instruments exist [19], the so-called
Kurzfragebogen zur Arbeitsanalyse (KFZA; English: Short Questionnaire for Workplace Anal-
ysis), a questionnaire addressing perceived workload, is widely used across professions [20].
Data from more than 8,000 participants from 23 professions are available [8].
The aims of this cross-sectional study are threefold: i) to assess the mental workload of PrAs
working in German primary care practices, ii) to identify resources and stressors, and iii) to
compare results with aggregated data from 23 different professions.
Material andmethods
Study design and recruitment of participants
The psychosocial assessment of PrAs reported in this paper was obtained as part of a larger
cross-sectional study investigating multiple aspects of stress in primary care practices. Details
of the study are reported elsewhere [21, 22]. Briefly, general practitioners (GPs) and PrAs of
the 185 general medicine practices of the practice network of the Institute for General Medi-
cine, University Hospital Essen, Essen, Germany, were asked to participate in the study. The
practices were located in urban and rural regions of North Rhine-Westphalia (Western Ger-
many) with an average distance of 30 km (range: 2±180 km) to the Institute. In a prior study it
was shown that the practices affiliated with the network are representative for German primary
care practices [23]. Practices had been invited by mail and contacted by phone for further
recruitment. Those refusing to participate were asked to answer a short questionnaire on prac-
tice characteristics and to provide reasons for non-participation. Data were collected between
April and September 2014 during on-site visits. Within each practice, all GPs (practice owners
and employed physicians) and PrAs including medical secretaries and PrA trainees were eligi-
ble for participation and received the study documents. The study documents comprised a
study information sheet, an informed consent form to be completed by all participants, and a
set of questionnaires which included sociodemographic questions and the KFZA analyzed in
this paper. To ensure data protection, participants were asked to seal the completed question-
naire in an envelope. As an incentive, practice teams received a department store chain
voucher of 5 euros per person, irrespective of the participation of individual team members. In
addition, the dataset contained information about the practices´ location from the practice
network´s database and matched with public regional data for the population size in 2012
(www.it.nrw.de). This paper follows the STROBE recommendations for reporting cross-sec-
tional studies [24].
Ethical approval had been obtained from the Ethics Committee of the Medical Faculty of
the University of Duisburg-Essen (reference number: 13-5536-BO, date of approval: 24/11/
2014). All participants received written information and signed informed consent forms.
Study instrument to assess mental workload
The KFZA was developed by Prumper et al. in 1995 and is as a widely accepted screening tool
for psychological stress at the workplace [25]. The questionnaire is a standardized instrument
with closed questions. It is completed by the employees themselves and thus provides a subjec-
tive view of each individual’s perception of the work environment. According to DIN EN ISO
10075 “Ergonomic principles related to mental workload“, the instrument is categorized as a
“precision level 2 process for overview purposes” [26]. The instrument is listed in the
toolbox for “Instruments for recording mental loads” of the Federal Institute for Occupational
Safety and Health and covers multiple aspects of the work environment [27]. It includes four
dimensions: work content, resources, stressors, and organizational culture. Dimensions consist
of 11 factors which are derived from 26 single items with answer options on a Likert scale
Stress: Psychological Perspectives
128
ranging from 1 (does not apply at all) to 5 (is completely true).Work content contains two fac-
tors (versatility, completeness of task) and five single items (learning new skills, use of knowl-
edge, skills and ability, variety of tasks, visibility of task accomplishment, completeness of
product). Resources contains three factors (scope of action, social support, cooperation) and
nine single items (influence on sequence of activities, influence on work content, influence on
workload and procedures, social support by co-workers, social support by supervisors, social
cohesion within the department, necessity of cooperation, opportunity for social exchange
with co-workers, feedback from supervisors and co-workers). Stressors contains four factors
(qualitative work demands, quantitative work demands, work disruptions, workplace environ-
ment) and eight single items (excessive complexity of tasks, excessive demands on concentra-
tion, frequent work under time pressure, too much work to do, lack of information, work
materials or equipment, interruptions of workflow, unfavorable physicochemical conditions,
insufficient workspace and equipment). Organizational culture contains two factors (informa-
tion and participation, benefits) and four single items (information about organizational devel-
opments, consideration of employee input, continuous education, opportunities for
advancement). The dimensions job content, resources, and organizational culture represent
positive aspects, and high scores are considered positive. High scores in the stressors dimen-
sion are considered negative work aspects.
Given the time constraints in primary care practices, the KFZA was deemed suitable as it
takes only 10 minutes to complete. Also, data from more than 8,000 participants from 23 other
professional groups are available for comparison [25]. The questionnaire can be applied
throughout all professions and workspaces and is readily available for academic use [28].
Comparative data from 23 professional groups
In 2000, the Employers’ Liability Insurance Association for Medical Services andWelfare
Work (BGW) in cooperation with the German Employees’ Health Insurance (DAK) con-
ducted a cross-sectional study to measure stress at work [8]. A purposive sample of 27,584
employees from 23 professional groups was selected from the BGW and DAK register: physi-
cians, assistant pharmacists, pharmacists, office workers, teacher, hairdressers, pest controllers,
alternative practitioners, unskilled laborers, kindergarten teachers, chefs, nurses, masseurs,
medical laboratory technicians, porters, facility cleaners, social workers, PrAs, veterinarians,
care workers for persons at risk, employees of dialysis centers, and employees of workshops
for the disabled. A total of 8,121 employees participated in the study in the context of a project
called ‘Prevention of work-related health hazards’. The KFZA was used within the scope of the
study. We performed two comparative analyses using published data of the survey: first, we
compared KFZA results from the study of the 23 professional groups with results from our
population. Second, we compared the results for the subpopulation of PrAs from the study
with results from our population. The latter comparison is particularly interesting, as it pro-
vides a longitudinal approach (data from 2000 and 2014) in a situation where the vocational
training was meanwhile been revised and PrAs in Germany are professionalizing.
Data analysis
The analysis was performed using IBM SPSS Statistics for Windows, Version 25 (Armonk,
NY: IBM Corp.). Data of all PrAs were analyzed. Non-plausible values were recoded as missing
values. Missing data were managed by reporting valid percentages only.
Sociodemographic and work-related characteristics were analyzed descriptively. The mean,
standard deviation (SD), median, and range are reported for metric sociodemographic and
work variables. The practices’ population size was categorized into rural, small, medium-sized,
Stress: Psychological Perspectives
129
and big cities following categorization schemes of the Federal Institute for Research on Build-
ing, Urban Affairs and Spatial Development (rural� 4,999 inhabitants, small city 5000–
19,999, medium-sized city 20,000–99,9999, big city� 100,000).
Following Prumper et al., the results of the KFZA were evaluated by computing mean val-
ues on a factor level [25, 29]: As a first overview, positive items<3 and negative items>3 are
interpreted as high levels of psychological stress and indicate a need for more detailed analyses.
In addition, the comparison with data from other professional groups or from the same profes-
sional group provides information on how to set a benchmark against other results [29]. Dif-
ferences between the means of our population and the comparative population were analyzed
using a one-sided t-test (95% significance level; 0.05 = alpha). Additionally, Cohen´s d was cal-
culated to estimate the effect size. 95% confidence intervals (CI) were calculated for factors of
the 2014 PrA population. Power calculations were performed using the software G-Power 3.1
to determine the appropriateness of sample sizes used in the group comparisons.
Results
Study characteristics
550 PrAs participated in the study (response rate 70.3%; n = 130 practices). The sociodemo-
graphic characteristics of the participants are presented in Table 1. PrAs had a mean age of
37.97 years (SD: 12.63), with 99.27% of PrAs being female. The majority of PrAs was married
(50.64%), worked full-time (66.48%) on a permanent contract (89.25%) with a median work
experience of 18 years (range: 0–49 years). Most (62.59%) PrAs worked 20–39 hours a week,
while 25.37% of PrAs worked more than 39 hours. Most PrAs (93.87%) had completed a
three-year vocational training as “Medizinische Fachangestellte” or “Arzthelferin” which com-
bines practical training (3 days per week) and vocational training (2 days per week). Six per-
cent had other backgrounds (i.e.: secretary, practice aid, other practice employee or a
vocational training stated in the further comments section labeled as “other”). Almost all PrAs
had completed some sort of additional training: 19.23% of PrAs had completed additional
training as VERAHs (106 hours of theoretical and 94 hours of practical training) or EVAs (170
to 220 hours of theoretical training and 20 to 50 hours of practical training depending on prior
work experience) that allows PrAs to perform additional tasks (e.g.: home visits). On average,
PrAs worked in practices with 2.96 (SD 2.15) physicians and 7.73 (SD 7.64) PrAs. Half of the
practices (50.64%) were group practices. The smallest proportion of PrAs worked in practices
with a low patient load per quarter (5.59%, 501–1000 patients per quarter), while the largest
proportion of PrAs worked in practices with a high patient load per quarter (27.93%,>3001
patients per quarter). PrAs’ work setting characteristics are presented in Table 2.
Comparison of practice assistants with other professional groups(comparative data)
The power calculation revealed that the sample sizes compared (n = 550 versus n = 8.121)
were sufficient to achieve 80% power to detect small effect sizes of d = 0.12. In the case of
greater differences, the power achieved was even higher.
Table 3 shows the results of the KFZA analysis for PrAs and for the comparative population.
For a first overview of only results from our study population, the calculation of mean values
for the factor-level analysis yielded a critical score for the factor benefits (2.86 [SD 1.05]). In
contrast, social support showed the highest positive factor (4.05 [SD 0.79]).
As illustrated in Fig 1, the comparison of our results with data from Nolting et al. [8]
revealed statistically significant differences (p< 0.05) for the following factors: versatility (3.6
Stress: Psychological Perspectives
130
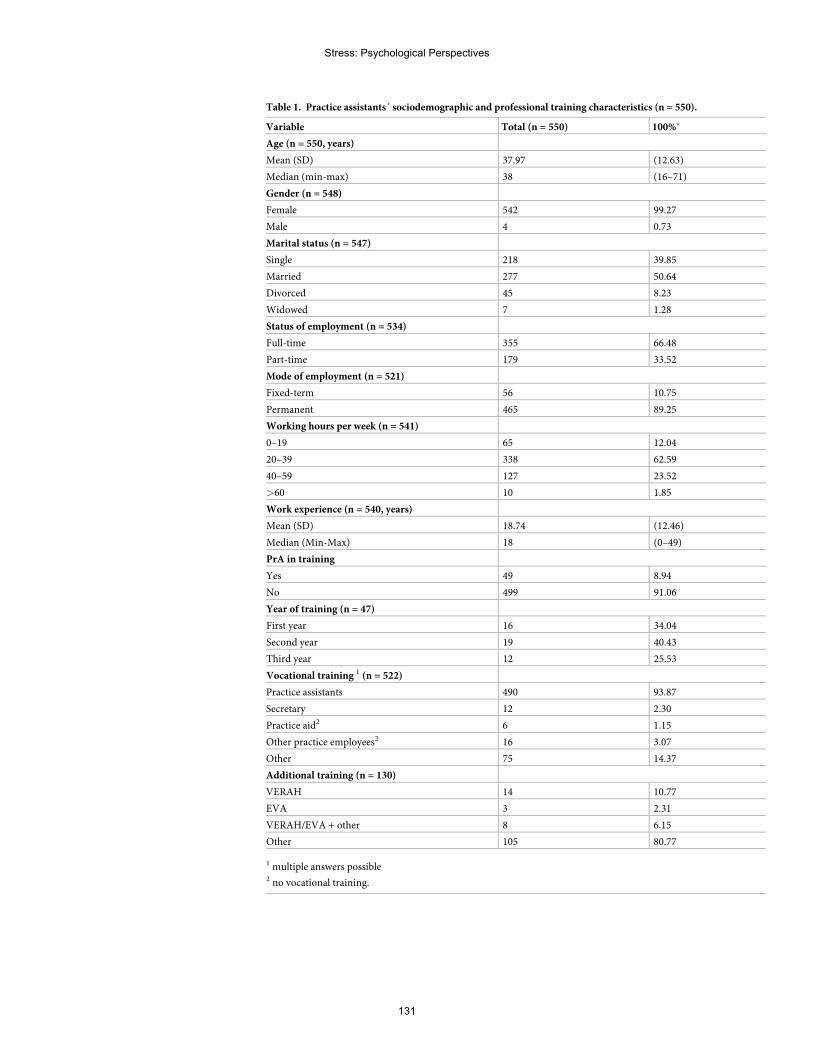
Table 1. Practice assistants´ sociodemographic and professional training characteristics (n = 550).
Variable Total (n = 550) 100%�
Age (n = 550, years)
Mean (SD) 37.97 (12.63)
Median (min-max) 38 (16–71)
Gender (n = 548)
Female 542 99.27
Male 4 0.73
Marital status (n = 547)
Single 218 39.85
Married 277 50.64
Divorced 45 8.23
Widowed 7 1.28
Status of employment (n = 534)
Full-time 355 66.48
Part-time 179 33.52
Mode of employment (n = 521)
Fixed-term 56 10.75
Permanent 465 89.25
Working hours per week (n = 541)
0–19 65 12.04
20–39 338 62.59
40–59 127 23.52
>60 10 1.85
Work experience (n = 540, years)
Mean (SD) 18.74 (12.46)
Median (Min-Max) 18 (0–49)
PrA in training
Yes 49 8.94
No 499 91.06
Year of training (n = 47)
First year 16 34.04
Second year 19 40.43
Third year 12 25.53
Vocational training 1 (n = 522)
Practice assistants 490 93.87
Secretary 12 2.30
Practice aid2 6 1.15
Other practice employees2 16 3.07
Other 75 14.37
Additional training (n = 130)
VERAH 14 10.77
EVA 3 2.31
VERAH/EVA + other 8 6.15
Other 105 80.77
1 multiple answers possible2 no vocational training.
Stress: Psychological Perspectives
131
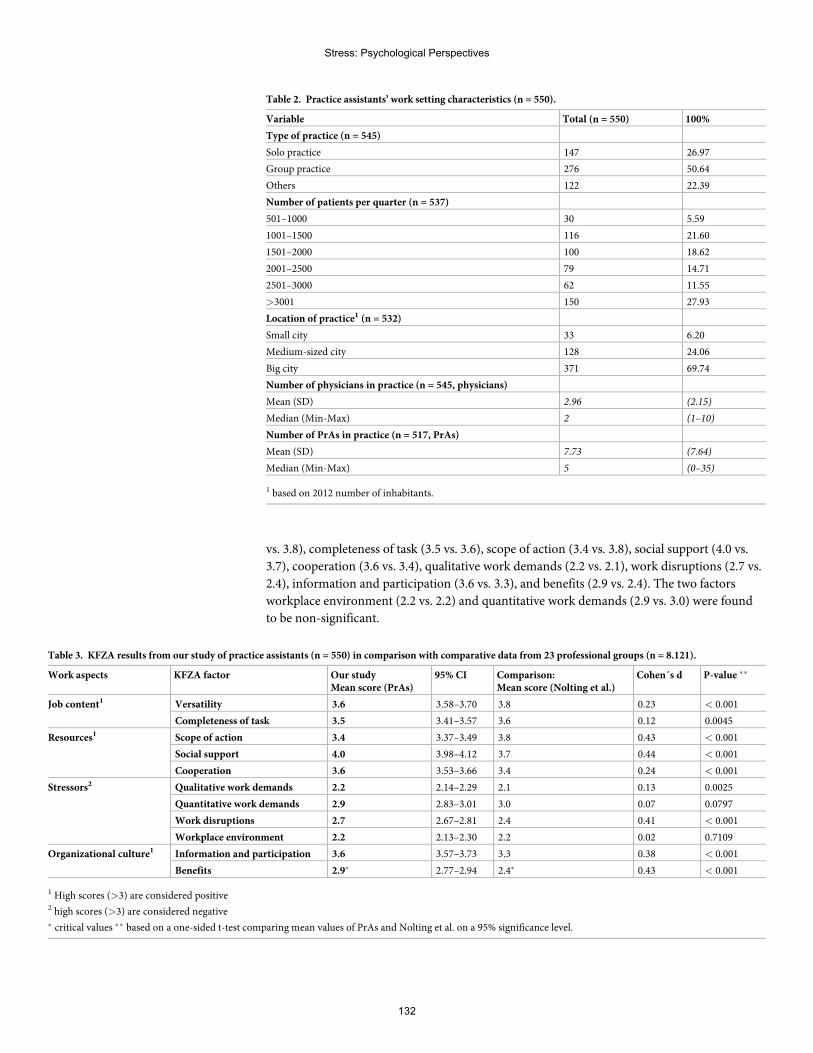
vs. 3.8), completeness of task (3.5 vs. 3.6), scope of action (3.4 vs. 3.8), social support (4.0 vs.
3.7), cooperation (3.6 vs. 3.4), qualitative work demands (2.2 vs. 2.1), work disruptions (2.7 vs.
2.4), information and participation (3.6 vs. 3.3), and benefits (2.9 vs. 2.4). The two factors
workplace environment (2.2 vs. 2.2) and quantitative work demands (2.9 vs. 3.0) were found
to be non-significant.
Table 2. Practice assistants’ work setting characteristics (n = 550).
Variable Total (n = 550) 100%
Type of practice (n = 545)
Solo practice 147 26.97
Group practice 276 50.64
Others 122 22.39
Number of patients per quarter (n = 537)
501–1000 30 5.59
1001–1500 116 21.60
1501–2000 100 18.62
2001–2500 79 14.71
2501–3000 62 11.55
>3001 150 27.93
Location of practice1 (n = 532)
Small city 33 6.20
Medium-sized city 128 24.06
Big city 371 69.74
Number of physicians in practice (n = 545, physicians)
Mean (SD) 2.96 (2.15)
Median (Min-Max) 2 (1–10)
Number of PrAs in practice (n = 517, PrAs)
Mean (SD) 7.73 (7.64)
Median (Min-Max) 5 (0–35)
1 based on 2012 number of inhabitants.
Table 3. KFZA results from our study of practice assistants (n = 550) in comparison with comparative data from 23 professional groups (n = 8.121).
Work aspects KFZA factor Our studyMean score (PrAs)
95% CI Comparison:Mean score (Nolting et al.)
Cohen´s d P-value ��
Job content1 Versatility 3.6 3.58–3.70 3.8 0.23 < 0.001
Completeness of task 3.5 3.41–3.57 3.6 0.12 0.0045
Resources1 Scope of action 3.4 3.37–3.49 3.8 0.43 < 0.001
Social support 4.0 3.98–4.12 3.7 0.44 < 0.001
Cooperation 3.6 3.53–3.66 3.4 0.24 < 0.001
Stressors2 Qualitative work demands 2.2 2.14–2.29 2.1 0.13 0.0025
Quantitative work demands 2.9 2.83–3.01 3.0 0.07 0.0797
Work disruptions 2.7 2.67–2.81 2.4 0.41 < 0.001
Workplace environment 2.2 2.13–2.30 2.2 0.02 0.7109
Organizational culture1 Information and participation 3.6 3.57–3.73 3.3 0.38 < 0.001
Benefits 2.9� 2.77–2.94 2.4� 0.43 < 0.001
1 High scores (>3) are considered positive2 high scores (>3) are considered negative� critical values �� based on a one-sided t-test comparing mean values of PrAs and Nolting et al. on a 95% significance level.
Stress: Psychological Perspectives
132
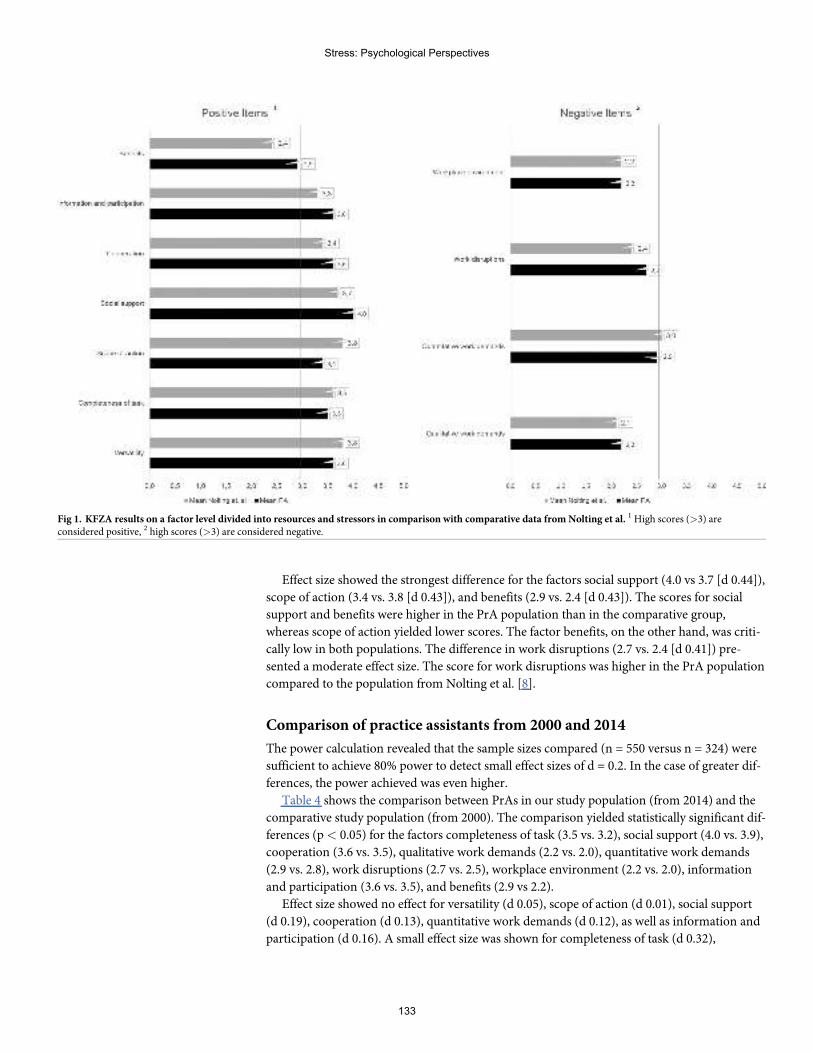
Effect size showed the strongest difference for the factors social support (4.0 vs 3.7 [d 0.44]),
scope of action (3.4 vs. 3.8 [d 0.43]), and benefits (2.9 vs. 2.4 [d 0.43]). The scores for social
support and benefits were higher in the PrA population than in the comparative group,
whereas scope of action yielded lower scores. The factor benefits, on the other hand, was criti-
cally low in both populations. The difference in work disruptions (2.7 vs. 2.4 [d 0.41]) pre-
sented a moderate effect size. The score for work disruptions was higher in the PrA population
compared to the population from Nolting et al. [8].
Comparison of practice assistants from 2000 and 2014
The power calculation revealed that the sample sizes compared (n = 550 versus n = 324) were
sufficient to achieve 80% power to detect small effect sizes of d = 0.2. In the case of greater dif-
ferences, the power achieved was even higher.
Table 4 shows the comparison between PrAs in our study population (from 2014) and the
comparative study population (from 2000). The comparison yielded statistically significant dif-
ferences (p< 0.05) for the factors completeness of task (3.5 vs. 3.2), social support (4.0 vs. 3.9),
cooperation (3.6 vs. 3.5), qualitative work demands (2.2 vs. 2.0), quantitative work demands
(2.9 vs. 2.8), work disruptions (2.7 vs. 2.5), workplace environment (2.2 vs. 2.0), information
and participation (3.6 vs. 3.5), and benefits (2.9 vs 2.2).
Effect size showed no effect for versatility (d 0.05), scope of action (d 0.01), social support
(d 0.19), cooperation (d 0.13), quantitative work demands (d 0.12), as well as information and
participation (d 0.16). A small effect size was shown for completeness of task (d 0.32),
Fig 1. KFZA results on a factor level divided into resources and stressors in comparison with comparative data from Nolting et al. 1High scores (>3) areconsidered positive, 2 high scores (>3) are considered negative.
Stress: Psychological Perspectives
133
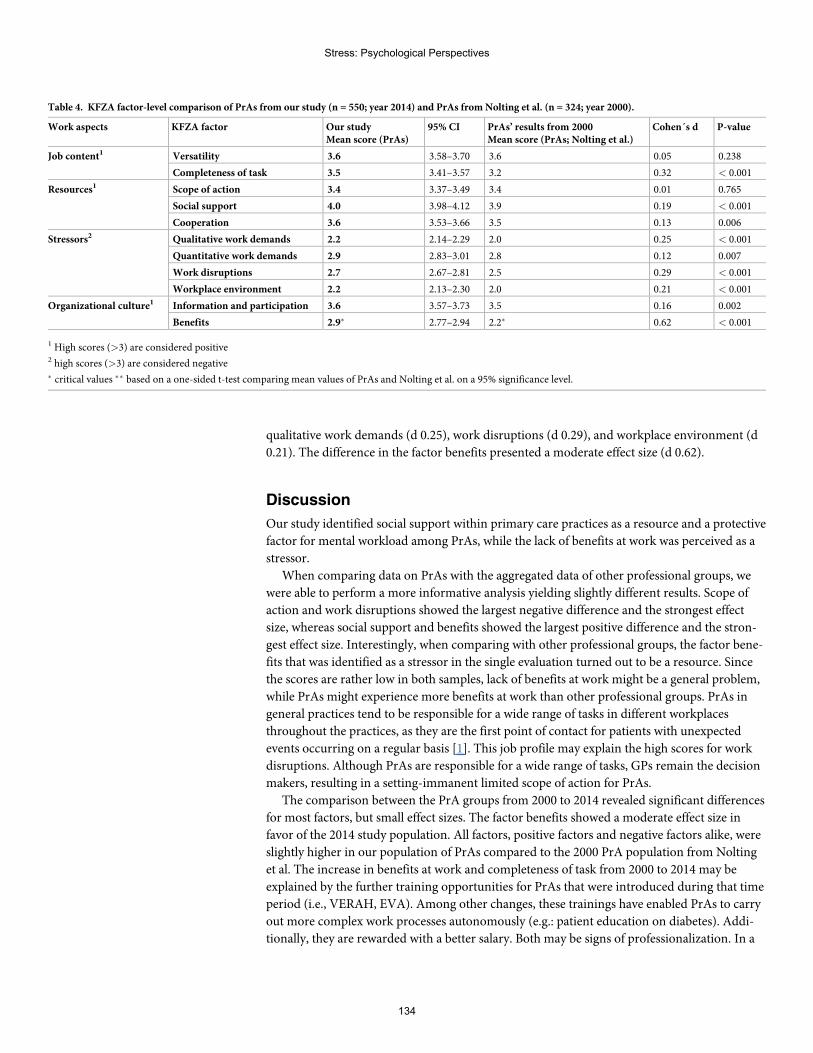
qualitative work demands (d 0.25), work disruptions (d 0.29), and workplace environment (d
0.21). The difference in the factor benefits presented a moderate effect size (d 0.62).
Discussion
Our study identified social support within primary care practices as a resource and a protective
factor for mental workload among PrAs, while the lack of benefits at work was perceived as a
stressor.
When comparing data on PrAs with the aggregated data of other professional groups, we
were able to perform a more informative analysis yielding slightly different results. Scope of
action and work disruptions showed the largest negative difference and the strongest effect
size, whereas social support and benefits showed the largest positive difference and the stron-
gest effect size. Interestingly, when comparing with other professional groups, the factor bene-
fits that was identified as a stressor in the single evaluation turned out to be a resource. Since
the scores are rather low in both samples, lack of benefits at work might be a general problem,
while PrAs might experience more benefits at work than other professional groups. PrAs in
general practices tend to be responsible for a wide range of tasks in different workplaces
throughout the practices, as they are the first point of contact for patients with unexpected
events occurring on a regular basis [1]. This job profile may explain the high scores for work
disruptions. Although PrAs are responsible for a wide range of tasks, GPs remain the decision
makers, resulting in a setting-immanent limited scope of action for PrAs.
The comparison between the PrA groups from 2000 to 2014 revealed significant differences
for most factors, but small effect sizes. The factor benefits showed a moderate effect size in
favor of the 2014 study population. All factors, positive factors and negative factors alike, were
slightly higher in our population of PrAs compared to the 2000 PrA population from Nolting
et al. The increase in benefits at work and completeness of task from 2000 to 2014 may be
explained by the further training opportunities for PrAs that were introduced during that time
period (i.e., VERAH, EVA). Among other changes, these trainings have enabled PrAs to carry
out more complex work processes autonomously (e.g.: patient education on diabetes). Addi-
tionally, they are rewarded with a better salary. Both may be signs of professionalization. In a
Table 4. KFZA factor-level comparison of PrAs from our study (n = 550; year 2014) and PrAs from Nolting et al. (n = 324; year 2000).
Work aspects KFZA factor Our studyMean score (PrAs)
95% CI PrAs’ results from 2000Mean score (PrAs; Nolting et al.)
Cohen´s d P-value
Job content1 Versatility 3.6 3.58–3.70 3.6 0.05 0.238
Completeness of task 3.5 3.41–3.57 3.2 0.32 < 0.001
Resources1 Scope of action 3.4 3.37–3.49 3.4 0.01 0.765
Social support 4.0 3.98–4.12 3.9 0.19 < 0.001
Cooperation 3.6 3.53–3.66 3.5 0.13 0.006
Stressors2 Qualitative work demands 2.2 2.14–2.29 2.0 0.25 < 0.001
Quantitative work demands 2.9 2.83–3.01 2.8 0.12 0.007
Work disruptions 2.7 2.67–2.81 2.5 0.29 < 0.001
Workplace environment 2.2 2.13–2.30 2.0 0.21 < 0.001
Organizational culture1 Information and participation 3.6 3.57–3.73 3.5 0.16 0.002
Benefits 2.9� 2.77–2.94 2.2� 0.62 < 0.001
1 High scores (>3) are considered positive2 high scores (>3) are considered negative� critical values �� based on a one-sided t-test comparing mean values of PrAs and Nolting et al. on a 95% significance level.
Stress: Psychological Perspectives
134
recent study by Vu-Eickmann et al., PrAs reported a high patient volume, which in addition to
handling many tasks at once may explain the high score for work disruptions [1].
Social support is an important resource and can positively influence job satisfaction, as
shown in a recent study with Portuguese nursing staff [30]. Job satisfaction was again shown to
positively correlate with patient satisfaction [31]. A systematic review yielded a similar result
linking social support with staff well-being in emergency departments [32]. In contrast, studies
have shown that negative work aspect (i.e.: lack of benefits, limited scope of action) cause psy-
chological strain and can lead to a higher turnover rate and depressive symptoms [10, 33].
In agreement with three other studies on this topic, we showed that PrAs in primary care
practices receive high social support and have a rather limited scope of action and still insuffi-
cient benefits at work [1, 7, 8].
Strengths and limitations
It is a strength of our study that it was based on a data set with a large number of participants
(550 PrAs). Also, prior analyses had shown that the practice network from which this sample
was taken is representative for German primary care practices [23]. Each participant received
an incentive in the form of a 5-Euro voucher to avoid a selection bias by selecting only highly
motivated PrAs. As the network is located in a rather densely populated area, our results may
overrepresent PrAs working in urban areas. The KFZA proved to be a cost-effective screening
tool to gain first insights into employees’ psychological stressors and resources. To our knowl-
edge this is the first study comparing PrAs’ data from a psychological risk assessment in pri-
mary care with a large sample from other professions.
In our study we were only able to assess the current situation and not the state desired by
PrAs, which could have provided even more insights. The comparison with data from 23 pro-
fessional groups was limited as only aggregated mean results were available without standard
deviations. Due to this, we were unable to calculate confidence intervals for both populations.
A strength of our study is the comparison of the results of the 2000 with the 2014 study from
the same professional group. However, the PrA populations were not identical, and caution is
advised when interpreting the results.
Conclusions
Mental well-being has a tremendous impact on preserving a healthy and productive workforce.
Therefore, our goal must be to first identify risk factors for mental well-being at work and put
them into perspective with other occupations, which we aimed to do in this study. Second, we
need to develop measures to tackle risk factors for psychological strain at work and enhance
protective factors such as social support, scope of action, benefits at work, and cooperation.
Last, measures need to be evaluated and implemented in the everyday working life of PrAs.
Acknowledgments
We thank the Institute for General Medicine, University Hospital Essen, for supporting the
conceptualization of the questionnaire, the data collection, and the provision of the data for
this analysis.
Author Contributions
Conceptualization: Christine Kersting, Birgitta Weltermann.
Data curation: Jan Hoffmann, Christine Kersting.
Formal analysis: Jan Hoffmann.
Stress: Psychological Perspectives
135
Funding acquisition: Birgitta Weltermann.
Investigation: Christine Kersting, Birgitta Weltermann.
Methodology: Jan Hoffmann, Birgitta Weltermann.
Project administration: Birgitta Weltermann.
Validation: Jan Hoffmann.
Visualization: Jan Hoffmann.
Writing – original draft: Jan Hoffmann.
Writing – review & editing: Christine Kersting, Birgitta Weltermann.
References1. Vu-Eickmann P, Loerbroks A. Psychosoziale ArbeitsbedingungenMedizinischer Fachangestellter:
Ergebnisse einer qualitativen Studie zu den berufsspezifischen Belastungen, Ressourcen, Praventions-moglichkeiten und Interventionsbedurfnissen. The Journal of Evidence and Quality in Health Care.2017; 126: 43–51. https://doi.org/10.1016/j.zefq.2017.06.005 PMID: 28716704
2. Statistisches Bundesamt. Auszubildene. Nach Ausbildungsberufen 2017 (TOP 20), Frauen. Available:https://www.destatis.de/DE/ZahlenFakten/GesellschaftStaat/BildungForschungKultur/BeruflicheBildung/Tabellen/AzubiRangliste.html. Accessed 12 March 2019.
3. Freimann T, Merisalu E. Work-related psychosocial risk factors and mental health problems amongstnurses at a university hospital in Estonia: a cross-sectional study. Scandinavian Journal of PublicHealth. 2015; 43: 447–452. https://doi.org/10.1177/1403494815579477 PMID: 25851017
4. Kern M, Buia A, Tonus C, Weigel TF, Dittmar R, Hanisch E, et al. Psychological stressors, resourcesand well-being of surgeons in Germany: A cross-sectional study. Chirurg. 2019. https://doi.org/10.1007/s00104-018-0780-5 PMID: 30610261
5. Ulusoy N, Wirth T, Lincke H-J, Nienhaus A, Schablon A. Psychosocial burden and strains in geriatricnursing: comparison of nursing personnel with and without migration background. Zeitschrift fur Geron-tologie und Geriatrie. 2018. https://doi.org/10.1007/s00391-018-1414-8 PMID: 29943078
6. Wagner A, Rieger MA, Manser T, Sturm H, Hardt J, Martus P, et al. Healthcare professionals’ perspec-tives on working conditions, leadership, and safety climate: a cross-sectional study. BMCHealth Ser-vices Research. 2019; 19: 53. https://doi.org/10.1186/s12913-018-3862-7 PMID: 30665401
7. Goetz K, Berger S, Gavartina A, Zaroti S, Szecsenyi J. How psychosocial factors affect well-being ofpractice assistants at work in general medical care?—a questionnaire survey. BMC Family Practice.2015; 16: 166. https://doi.org/10.1186/s12875-015-0366-y PMID: 26560752
8. Nolting H-D, Berger J, Niemann D, Genz HO, Kordt M. BGW-DAK Stress-Monitoring 2001. Uberblickuber die Ergebnisse einer BGW-DAK-Studie zum Zusammenhang von Arbeitsbedingungen undStressbelastung in ausgewahlten Berufen; 2001. Available: http://people.f3.htw-berlin.de/Professoren/Pruemper/instrumente/KFZA-BGW-DAK-StressMonitoring_UEBERBLICK.pdf. Accessed 20 March2019.
9. Paquet M, Courcy F, Lavoie-Tremblay M, Gagnon S, Maillet S. Psychosocial work environment andprediction of quality of care indicators in one Canadian health center. Worldviews on Evidence-BasedNursing. 2013; 10: 82–94. https://doi.org/10.1111/j.1741-6787.2012.00250.x PMID: 22548730
10. Theorell T, Hammarstrom A, Aronsson G, Traskman Bendz L, Grape T, Hogstedt C, et al. A systematicreview including meta-analysis of work environment and depressive symptoms. BMC Public Health.2015. https://doi.org/10.1186/s12889-015-1954-4 PMID: 26232123
11. Bundesanstalt fur Arbeitsschutz und Arbeitsmedizin. Volkswirtschaftliche Kosten durch Arbeitsunfahig-keit 2017; 2019. Available: https://www.baua.de/DE/Themen/Arbeitswelt-und-Arbeitsschutz-im-Wandel/Arbeitsweltberichterstattung/Kosten-der-AU/pdf/Kosten-2017.pdf?__blob=publicationFile&v=4. Accessed 20 March 2019.
12. Bundesanstalt fur Arbeitsschutz und Arbeitsmedizin. Psychological strain. Available: https://www.baua.de/DE/Themen/Arbeitsgestaltung-im-Betrieb/Psychische-Belastung/_functions/BereichsPublikationssuche_Formular.html?nn=8580646. Accessed 11 March 2019.
13. Lemyre L, Tessier R. Measuring psychological stress. Concept, model, and measurement instrument inprimary care research. Canadian Family Physician. 2003; 49: 1159–60, 1166–8. PMID: 14526870
Stress: Psychological Perspectives
136
14. Rohmert W, Rutenfranz J. Arbeitswissenschaftliche Beurteilung der Belastung und Beanspruchung anunterschiedlichen industriellen Arbeitsplatzen: Der Bundesminister fur Arbeit und Sozialordnung; 1975.
15. Rau R, Henkel D. Zusammenhang von Arbeitsbelastungen und psychischen Erkrankungen. Der Nerve-narzt. 2013; 84: 791–798. https://doi.org/10.1007/s00115-013-3743-6 PMID: 23793408
16. Rau R, Buyken D. Der aktuelle Kenntnisstand uber Erkrankungsrisiken durch psychische Arbeitsbelas-tungen. Zeitschrift fur Arbeits- und Organisationspsychologie. 2015; 59: 113–129. https://doi.org/10.1026/0932-4089/a000186
17. Gesetz uber die Durchfuhrung von Maßnahmen des Arbeitsschutzes zur Verbesserung der Sicherheitund des Gesundheitsschutzes der Beschaftigten bei der Arbeit (Arbeitsschutzgesetz—ArbSchG);2015.
18. Weigl M, Herbig B, Bahemann A, Bockelmann I, Darius S, Jurkschat R, et al. Recommendations ondeveloping and carrying out psychosocial risk evaluations at the workplace. Arbeitsmedizin Sozialmedi-zin Umweltmedizin. 2015: 660–665.
19. Hahnzog S. Gesund und glucklich arbeiten–Gefahrdungsbeurteilung psychischer Arbeitsbelastung. In:Pfannstiel MA, Mehlich H, editors. BGM–Ein Erfolgsfaktor fur Unternehmen: Losungen, Beispiele, Han-dlungsanleitungen. Wiesbaden: Springer FachmedienWiesbaden; 2018. pp. 681–698.
20. Richter G. Toolbox Version 1.2.—Instrumente zur Erfassung psychischer Belastungen.; 2010. Avail-able: https://www.baua.de/DE/Angebote/Publikationen/Berichte/F1965.html. Accessed 2 April 2019.
21. Viehmann A, Kersting C, Thielmann A, Weltermann B. Prevalence of chronic stress in general practi-tioners and practice assistants: Personal, practice and regional characteristics. PLoS ONE. 2017; 12:e0176658. https://doi.org/10.1371/journal.pone.0176658 PMID: 28489939
22. Dreher A, TheuneM, Kersting C, Geiser F, Weltermann B. Prevalence of burnout among German gen-eral practitioners: Comparison of physicians working in solo and group practices. PLoS ONE. 2019; 14:e0211223. https://doi.org/10.1371/journal.pone.0211223 PMID: 30726284
23. Viehmann A, Thielmann A, Gesenhues S, Weltermann B. Do Academic Family Practices Reflect Rou-tine Primary Care. Reprasentieren akademische Hausarztpraxen die hausarztliche Regelversorgung.Eine methodische Annaherung. Die Zeitschrift fur Allgemeinmedizin. 2014: 354–360.
24. von Elm E, Altman DG, Egger M, Pocock SJ, Gotzsche PC, Vandenbroucke JP. The Strengthening theReporting of Observational Studies in Epidemiology (STROBE) statement: guidelines for reportingobservational studies. Journal of Clinical Epidemiology. 2008; 61: 344–349. https://doi.org/10.1016/j.jclinepi.2007.11.008 PMID: 18313558
25. Prumper J, Hartmannsgruber K, Frese M. KFZA. Kurz-Fragebogen zur Arbeitsanalyse. European Eco-nomic Review. 1995; 39.
26. Prumper J. Von der KFZA-Grobanalyse zur IPLV-Feinanalyse Eine Methode zurMaßnahmenentwicklung in der Evaluierung psychischer Belastung. Personal Manager. 2015; 2.
27. Richter G. Toolbox Version 1.2. Instrumente zur Erfassung psychischer Belastungen; Forschung Pro-jekt F 1965. 2nd edition. Dortmund: Bundesanstalt fur Arbeitsschutz und Arbeitsmedizin; 2011.
28. Allgemeine Unfallversicherungsanstalt (AUVA). Kurzfragebogen zur Arbeitsanalyse. Available: https://fragebogen-arbeitsanalyse.at/login. Accessed 2 April 2019.
29. Leittretter S, editor. Arbeit in Krankenhausern human gestalten. Arbeitshilfe fur die Praxis von Betriebs-raten, betrieblichen Arbeitsschutzexperten und Beschaftigten in Krankenhausern. Dusseldorf: Hans-Bockler-Stiftung; 2008.
30. Orgambidez-Ramos A, Almeida H de. Work engagement, social support, and job satisfaction in Portu-guese nursing staff: A winning combination. Applied Nursing Research. 2017; 36: 37–41. https://doi.org/10.1016/j.apnr.2017.05.012 PMID: 28720237
31. Szecsenyi J, Goetz K, Campbell S, Broge B, Reuschenbach B, Wensing M. Is the job satisfaction of pri-mary care teammembers associated with patient satisfaction. BMJ Quality and Safety. 2011; 20: 508.https://doi.org/10.1136/bmjqs.2009.038166 PMID: 21262790
32. Schneider A, Weigl M. Associations between psychosocial work factors and provider mental well-beingin emergency departments: A systematic review. PLoS ONE. 2018. https://doi.org/10.1371/journal.pone.0197375 PMID: 29864128
33. Halter M, Boiko O, Pelone F, Beighton C, Harris R, Gale J, et al. The determinants and consequencesof adult nursing staff turnover: a systematic review of systematic reviews. BMC Health ServicesResearch. 2017. https://doi.org/10.1186/s12913-017-2707-0 PMID: 29246221
Stress: Psychological Perspectives
137
Relationships between psychosocial stressorsamong pregnant women in San Francisco: Apath analysis
Stephanie M. EickID1*, Dana E. Goin1, Monika A. Izano1, Lara CushingID
2, Erin DeMicco1,
AmyM. Padula1, Tracey J. Woodruff1, Rachel Morello-FroschID1,3*
1 Department of Obstetrics, Gynecology and Reproductive Sciences, Program on Reproductive Health andthe Environment, University of California, San Francisco, San Francisco, California, United States of America,
2 Department of Health Education, San Francisco State University, San Francisco, California, United Statesof America, 3 Department of Environmental Science, Policy and Management and School of Public Health,
University of California, Berkeley, Berkeley, California, United States of America
* [email protected] (SME); [email protected] (RM)
Abstract
Pregnant women who experience psychosocial stressors, such as stressful life events, poor
neighborhood quality, and financial hardship, are at an increased risk for adverse pregnancy
outcomes. Yet, few studies have examined associations between multiple stressors from
different sources, which may be helpful to better inform causal pathways leading to adverse
birth outcomes. Using path analysis, we examined associations between multiple self-
reported stressor exposures during and before pregnancy in the Chemicals in Our Bodies-2
study (N = 510), a demographically diverse cohort of pregnant women in San Francisco. We
examined associations between eight self-reported exposures to stressors and three
responses to stress which were assessed via interview questionnaire at the 2nd trimester.
Stressors included: neighborhood quality, stressful life events, caregiving, discrimination,
financial strain, job strain, food insecurity, and unplanned pregnancy. Perceived stress,
depression, and perceived community status were included as indicators of self-reported
stress response. Our model indicated that women who experienced discrimination and food
insecurity had a 3.76 (95% confidence interval [CI] = 1.60, 5.85) and 2.67 (95% CI = 1.31,
4.04) increase in depression scale scores compared to women who did not experience dis-
crimination and food insecurity, respectively. We additionally identified job strain and care-
giving for an ill family member as strong predictors of increased depressive symptoms (β =
1.63, 95% CI = 0.29, 3.07; β = 1.48, 95% CI = 0.19, 2.70, respectively). Discrimination, food
insecurity, and job strain also influenced depression indirectly through the mediating path-
way of increasing perceived stress, although indirect effects were less precise. In our study
population, women who experienced discrimination, food insecurity, job strain and caregiv-
ing for an ill family member had an increased number of depressive symptoms compared to
women who did not experience these stressors. Results from our study highlight the com-
plex relationships between stressors and stress responses and may help to identify possible
mediating pathways leading to adverse pregnancy outcomes.
Editor: Kenji Hashimoto, Chiba Daigaku, JAPAN
11
138
Introduction
Studies have shown that exposure to stressors prior to or during pregnancy may increase the
likelihood of adverse birth outcomes, including preterm birth and fetal growth restriction [1–4].
There are a number of stressful experiences during pregnancy that have been shown to adversely
affect maternal and fetal health, including financial hardship, the death of a family member, or
experiences with racial discrimination, and women are often exposed to a multitude of these
stressors during pregnancy [5–8]. Certain indicators of psychosocial stress are prevalent during
pregnancy, with 39% of women experiencing a stressful life event in the year prior to pregnancy
[9] and estimates of depressive symptoms during pregnancy at approximately 25% [10]. Studies
have examined diverse psychosocial stressors individually in relation to birth outcomes [11, 12].
However, this may not produce an accurate picture as psychosocial stressors often co-occur and
may be linked with one another. For example, individuals who experience stressful life events,
such as a family death or trauma, have an increased risk of perceived stress and depression [6,
13, 14]. Similarly, individuals in disadvantaged neighborhoods may be more likely to experience
violent crime [15], which may be considered a stressful life event and has been linked to adverse
pregnancy outcomes [16]. Women in disadvantaged neighborhoods are also more likely to
experience symptoms of depression [17] and have higher risk of preterm birth [18].
Few studies have examined other sources of psychosocial stress, such as caregiving for an ill
family member, financial hardship, and job strain, which may also be associated with elevated
levels of other stressors and ultimately adverse pregnancy outcomes [19, 20]. For example, it is
possible that caregivers experience financial strain, and subsequent depression [21], as a result
of missed work. Similarly, unplanned pregnancy has been associated with elevated levels of
perceived stress and depression [22, 23].
Psychosocial stress and responses to stress during pregnancy may contribute to the persis-
tence of disparities in adverse birth outcomes across socioeconomic and racial and ethnic
groups. For example, research from a multi-center pregnancy cohort indicated that roughly
50% of women with less than a college degree reported experiencing at least one stressful life
event during pregnancy, compared to only 33% of women who had completed college [9].
However, stressful life events were not associated with preterm birth in that cohort [24]. Psy-
chosocial stress levels may be higher among lower socioeconomic status (SES) populations due
to experiences of greater financial strain, food insecurity, and job strain as compared to higher
SES groups [25]. Perceived stress and depression may also be higher among non-white women
as a result of racial discrimination [26].
More research is needed to better understand the relationships between multiple stressors
to one another and to responses to stress, such as depression, which have been associated with
adverse pregnancy outcomes [1]. Additionally, identifying sources of stress may help identify
women at a high-risk for adverse outcomes and elucidate better interventions among vulnera-
ble populations. Therefore, the purpose of this study was to evaluate the relationships between
psychosocial stressor exposures that include measures such as neighborhood quality, stressful
life events, caregiving for an ill family member, discrimination, job strain, food insecurity,
financial strain, and unplanned pregnancy, and responses to psychosocial stress, including
perceived stress, depression, and perceived community status, in a diverse cohort of pregnant
women in San Francisco, CA.
Material andmethods
Study population
Our study utilized the Chemicals In Our Bodies-2 (CioB) cohort, which recruited pregnant
women in their second trimester from the University of California, San Francisco’s Moffit
Funding: This work was supported by grants
RD83543301 (TW) from the United States
Environmental Protection Agency, and
P01ES022841 (TW) from the National Institute of
Environmental Health Sciences, and
UG3OD023272 (TW) and UH3OD023272 (TW)
from the National Institutes of Health
Environmental influences on Child Health
Outcomes (ECHO) program. The funders had no
role in study design, data collection and analysis,
decision to publish, or preparation of the
manuscript.
Competing interests: The authors have declared
that no competing interests exist.
Stress: Psychological Perspectives
139
Long, Mission Bay, and Zuckerberg San Francisco General Hospitals during 2014–2018. The
Zuckerberg San Francisco General Hospital primarily serves low-income women Medi-Cal
(California’s Medicaid program), whereas the Moffit Long and Mission Bay Hospitals serve an
economically diverse group of women, the majority of whom have private health insurance.
The total sample size for the CiOB cohort was 510 participants, of which 189 women were
recruited from Zuckerberg San Francisco General Hospital and 321 women were recruited
from either the Moffit Long or Mission Bay Hospitals. The prenatal and delivery hospital at
Moffit Long moved to Mission Bay during the study period, however patient populations
remain similar demographically. Women were eligible for enrollment if they were>18 years
of age, with singleton pregnancies in the second trimester, and spoke English or Spanish as
their primary language. In addition to consenting access to their medical records, mothers par-
ticipated in an interview questionnaire in which they were asked to report their exposures to
multiple stressors during and prior to pregnancy. The interview questionnaire is provided in
the S1 File. The Institutional Review Boards at the University of California, San Francisco (10–
00861) and Berkeley (2010-05-04) approved CiOB and all women provided written, informed
consent prior to participating.
Psychosocial stressors and responses to stress were assessed via questionnaire administered
by study personnel during a 2nd trimester prenatal care visit. Questionnaires used to assess psy-
chosocial stress and responses to stress have previously validated in other studies. These ques-
tionnaires were designed to assess a variety of stress domains that are not routinely examined
during pregnancy, including psychosocial stress, work-related stress, and the physical
environment.
Psychosocial stressors and responses to stress were derived from the theory of allostasis
[27], which has been previously adapted in an effort to better understand and evaluate the
effects of pregnancy-related stress, coping, and physiologic changes that may lead to adverse
perinatal health outcomes [28]. The theory of allostasis allows us to understand how individu-
als regulate body systems when they experience expected or unexpected events that are stress-
ful or may be perceived as stressful. We differentiated between stressors and response to stress
in our study. Here, stressors were considered to be things that characterize experiences result-
ing from environmental demands. Responses to stress include those things that may result in
adverse maternal and child health outcomes. A detailed description of these measures is sum-
marized in S2 File Table A.
Psychosocial stressors
Neighborhood quality, stressful life events, caregiving for an ill family member, discrimina-
tion, job strain, food insecurity, financial strain, and unplanned pregnancy were included as
indicators of self-reported psychosocial stressors in our analysis.
Neighborhood quality. Neighborhood quality was assessed using 15 questions related to
collective efficacy, neighborhood safety, neighborhood dissatisfaction, and neighborhood
physical disorder [29, 30]. Questions that were positively stated were reverse coded and
responses to individual questions were summed to create a continuous measure of neighbor-
hood quality. The range of scores on the neighborhood quality scale was between 15 and 69
and higher scores indicate higher stressor levels.
Stressful life events. Participants were asked about the occurrences of certain stressful life
events within the last 12 months. Stressful life events included close family member hospitali-
zation, separation or divorce from participant’s partner, participant or participant’s partner
lost their job, moved to a new address, a close family member experienced immigration prob-
lems, participant argued with their partner more than usual, participant’s partner did not want
Stress: Psychological Perspectives
140
participant to be pregnant, participant was in a physical fight, participant had bills she could
not pay, participant’s partner had legal trouble, someone close to participant was drinking or
using drugs, someone close to participant passed away. The number of events occurring were
summed to create a continuous measure (range 0–11) where higher scores indicate higher
stress levels.
Caregiving. Participants were asked how often they were responsible for the care and
well-being of a parent or older relative or of a child requiring additional medical or educational
attention. Responses were ranked on a 5-point scale ranging from “never” to “very often”. If
participants answered “often” or “very often” to either questions, they were classified as having
experienced caregiving.
Discrimination. Discrimination was assessed by asking participants how frequently they
felt discriminated against due to their race, ethnicity, religion or color. Responses ranged from
“never” to “very often” and were ranked on a 5-point scale. Participants were considered to
have experienced discrimination if they answered “often” or “very often”.
Job strain. Job strain was assessed using 5 questions which asked participants about how
likely they were at their current job to make a lot of decisions, develop their own special abili-
ties, receive a fair salary, do an excessive amount of work, and feel tired and stressed after
work. Responses to all questions were ranked on a 5-point scale ranging from “very unlikely”
to “very likely”. If participants answered “unlikely” or “very unlikely” to questions regarding
decision-making at work, having the opportunity to develop special abilities, and receiving a
fair salary, they were considered to have a high strain job. Participants were also considered to
have a high strain job if they answered “likely” or “very likely” to questions regarding feeling
tired and stressed after work and excessive work load.
Food insecurity. Participants were asked if any of the following occurred within the last
12 months as a result of not having enough food: participant or other adults in the household
skipped meals, ate less than they felt they should, or were hungry but did not eat. Participants
were additionally asked to rate how true it was that they could not afford to eat balanced meals
and that the food they had just did not last. Responses to these questions ranged from “never
true” to “often true” and were ranked on a 3-point scale. Participants were classified as being
food insecure if they reported skipping meals, eating less than they should, or that they were
hungry, but did not eat or if they responded “sometimes true” or “often true” to questions
about eating balanced meals and not having enough food.
Financial strain. Financial strain was assessed by using combined family income and by
asking participants how hard it is to pay for basic essentials. Responses ranged from “not diffi-
cult” to “very difficult” and were ranked on a 4-point scale. Participants were considered to be
under financial strain if their household income was below the San Francisco county poverty
line for 2017 or if they reported that it was “somewhat difficult” or “very difficult” to pay for
basic necessities such as food, housing, medical care or utilities.
Unplanned pregnancy. Participants were asked how they felt about becoming pregnant.
Responses ranged from “I didn’t want to be pregnant then” to “I wanted to be pregnant sooner”
and were ranked on a 4-point scale. If participants reported wanting to be pregnant later or not
wanting to be pregnant at that time, she was considered to have an unplanned pregnancy.
Responses to psychosocial stress
Perceived stress, depression, and perceived community status were included as possible
responses to psychosocial stress in our analyses.
Perceived stress. We used the 4-item Perceived Stress Scale (PSS) [31] to measure per-
ceived stress. The PSS is designed to measure the degree to which a participant perceived her
Stress: Psychological Perspectives
141
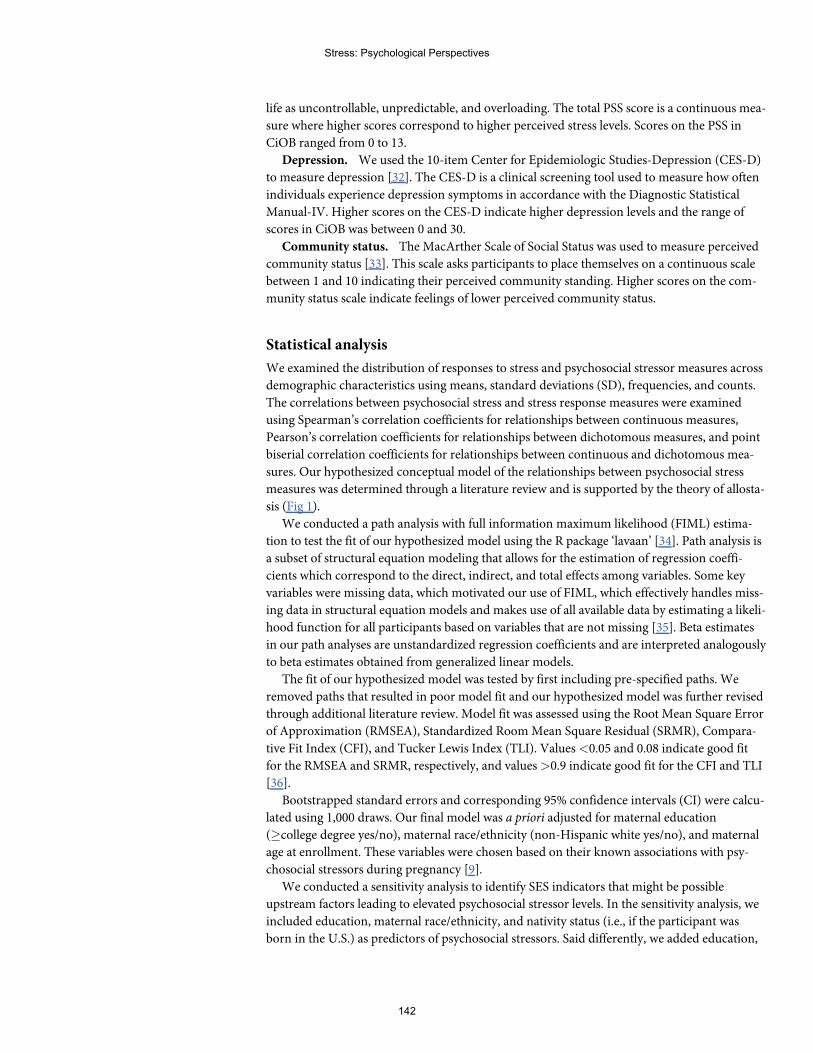
life as uncontrollable, unpredictable, and overloading. The total PSS score is a continuous mea-
sure where higher scores correspond to higher perceived stress levels. Scores on the PSS in
CiOB ranged from 0 to 13.
Depression. We used the 10-item Center for Epidemiologic Studies-Depression (CES-D)
to measure depression [32]. The CES-D is a clinical screening tool used to measure how often
individuals experience depression symptoms in accordance with the Diagnostic Statistical
Manual-IV. Higher scores on the CES-D indicate higher depression levels and the range of
scores in CiOB was between 0 and 30.
Community status. The MacArther Scale of Social Status was used to measure perceived
community status [33]. This scale asks participants to place themselves on a continuous scale
between 1 and 10 indicating their perceived community standing. Higher scores on the com-
munity status scale indicate feelings of lower perceived community status.
Statistical analysis
We examined the distribution of responses to stress and psychosocial stressor measures across
demographic characteristics using means, standard deviations (SD), frequencies, and counts.
The correlations between psychosocial stress and stress response measures were examined
using Spearman’s correlation coefficients for relationships between continuous measures,
Pearson’s correlation coefficients for relationships between dichotomous measures, and point
biserial correlation coefficients for relationships between continuous and dichotomous mea-
sures. Our hypothesized conceptual model of the relationships between psychosocial stress
measures was determined through a literature review and is supported by the theory of allosta-
sis (Fig 1).
We conducted a path analysis with full information maximum likelihood (FIML) estima-
tion to test the fit of our hypothesized model using the R package ‘lavaan’ [34]. Path analysis is
a subset of structural equation modeling that allows for the estimation of regression coeffi-
cients which correspond to the direct, indirect, and total effects among variables. Some key
variables were missing data, which motivated our use of FIML, which effectively handles miss-
ing data in structural equation models and makes use of all available data by estimating a likeli-
hood function for all participants based on variables that are not missing [35]. Beta estimates
in our path analyses are unstandardized regression coefficients and are interpreted analogously
to beta estimates obtained from generalized linear models.
The fit of our hypothesized model was tested by first including pre-specified paths. We
removed paths that resulted in poor model fit and our hypothesized model was further revised
through additional literature review. Model fit was assessed using the Root Mean Square Error
of Approximation (RMSEA), Standardized RoomMean Square Residual (SRMR), Compara-
tive Fit Index (CFI), and Tucker Lewis Index (TLI). Values<0.05 and 0.08 indicate good fit
for the RMSEA and SRMR, respectively, and values>0.9 indicate good fit for the CFI and TLI
[36].
Bootstrapped standard errors and corresponding 95% confidence intervals (CI) were calcu-
lated using 1,000 draws. Our final model was a priori adjusted for maternal education
(�college degree yes/no), maternal race/ethnicity (non-Hispanic white yes/no), and maternal
age at enrollment. These variables were chosen based on their known associations with psy-
chosocial stressors during pregnancy [9].
We conducted a sensitivity analysis to identify SES indicators that might be possible
upstream factors leading to elevated psychosocial stressor levels. In the sensitivity analysis, we
included education, maternal race/ethnicity, and nativity status (i.e., if the participant was
born in the U.S.) as predictors of psychosocial stressors. Said differently, we added education,
Stress: Psychological Perspectives
142
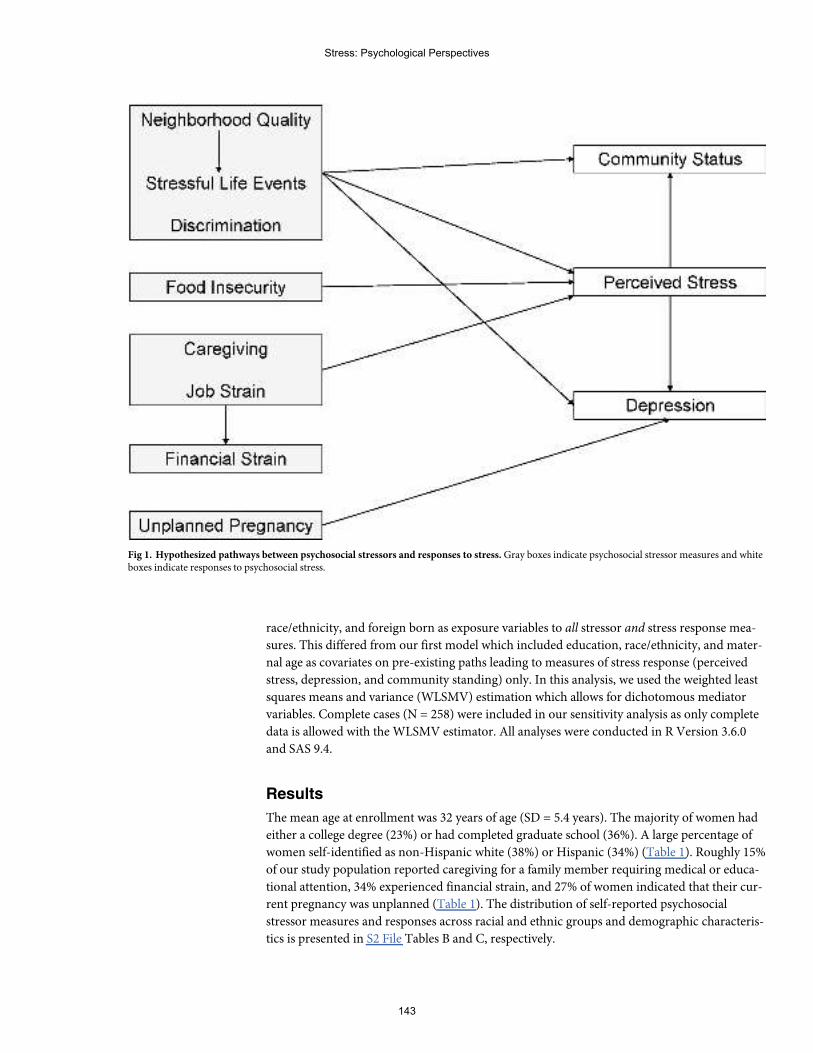
race/ethnicity, and foreign born as exposure variables to all stressor and stress response mea-
sures. This differed from our first model which included education, race/ethnicity, and mater-
nal age as covariates on pre-existing paths leading to measures of stress response (perceived
stress, depression, and community standing) only. In this analysis, we used the weighted least
squares means and variance (WLSMV) estimation which allows for dichotomous mediator
variables. Complete cases (N = 258) were included in our sensitivity analysis as only complete
data is allowed with the WLSMV estimator. All analyses were conducted in R Version 3.6.0
and SAS 9.4.
Results
The mean age at enrollment was 32 years of age (SD = 5.4 years). The majority of women had
either a college degree (23%) or had completed graduate school (36%). A large percentage of
women self-identified as non-Hispanic white (38%) or Hispanic (34%) (Table 1). Roughly 15%
of our study population reported caregiving for a family member requiring medical or educa-
tional attention, 34% experienced financial strain, and 27% of women indicated that their cur-
rent pregnancy was unplanned (Table 1). The distribution of self-reported psychosocial
stressor measures and responses across racial and ethnic groups and demographic characteris-
tics is presented in S2 File Tables B and C, respectively.
Fig 1. Hypothesized pathways between psychosocial stressors and responses to stress.Gray boxes indicate psychosocial stressor measures and whiteboxes indicate responses to psychosocial stress.
Stress: Psychological Perspectives
143
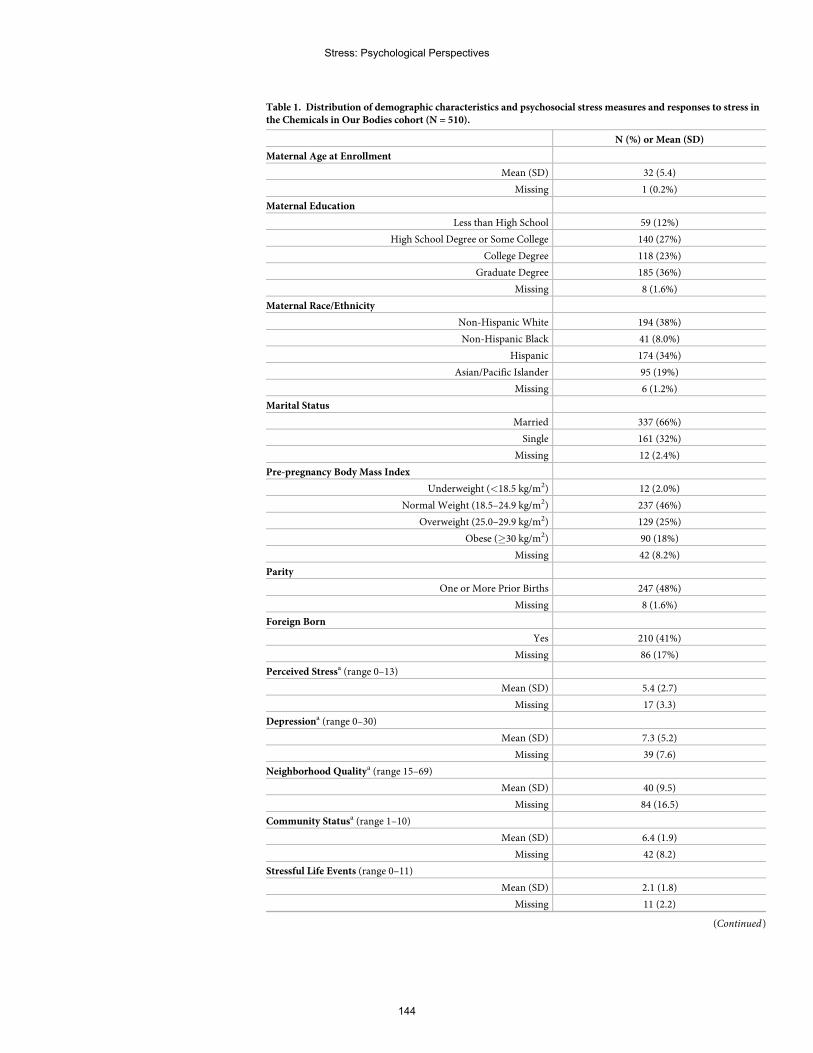
Table 1. Distribution of demographic characteristics and psychosocial stress measures and responses to stress inthe Chemicals in Our Bodies cohort (N = 510).
N (%) or Mean (SD)
Maternal Age at Enrollment
Mean (SD) 32 (5.4)
Missing 1 (0.2%)
Maternal Education
Less than High School 59 (12%)
High School Degree or Some College 140 (27%)
College Degree 118 (23%)
Graduate Degree 185 (36%)
Missing 8 (1.6%)
Maternal Race/Ethnicity
Non-Hispanic White 194 (38%)
Non-Hispanic Black 41 (8.0%)
Hispanic 174 (34%)
Asian/Pacific Islander 95 (19%)
Missing 6 (1.2%)
Marital Status
Married 337 (66%)
Single 161 (32%)
Missing 12 (2.4%)
Pre-pregnancy Body Mass Index
Underweight (<18.5 kg/m2) 12 (2.0%)
Normal Weight (18.5–24.9 kg/m2) 237 (46%)
Overweight (25.0–29.9 kg/m2) 129 (25%)
Obese (�30 kg/m2) 90 (18%)
Missing 42 (8.2%)
Parity
One or More Prior Births 247 (48%)
Missing 8 (1.6%)
Foreign Born
Yes 210 (41%)
Missing 86 (17%)
Perceived Stressa (range 0–13)
Mean (SD) 5.4 (2.7)
Missing 17 (3.3)
Depressiona (range 0–30)
Mean (SD) 7.3 (5.2)
Missing 39 (7.6)
Neighborhood Qualitya (range 15–69)
Mean (SD) 40 (9.5)
Missing 84 (16.5)
Community Statusa (range 1–10)
Mean (SD) 6.4 (1.9)
Missing 42 (8.2)
Stressful Life Events (range 0–11)
Mean (SD) 2.1 (1.8)
Missing 11 (2.2)
(Continued)
Stress: Psychological Perspectives
144
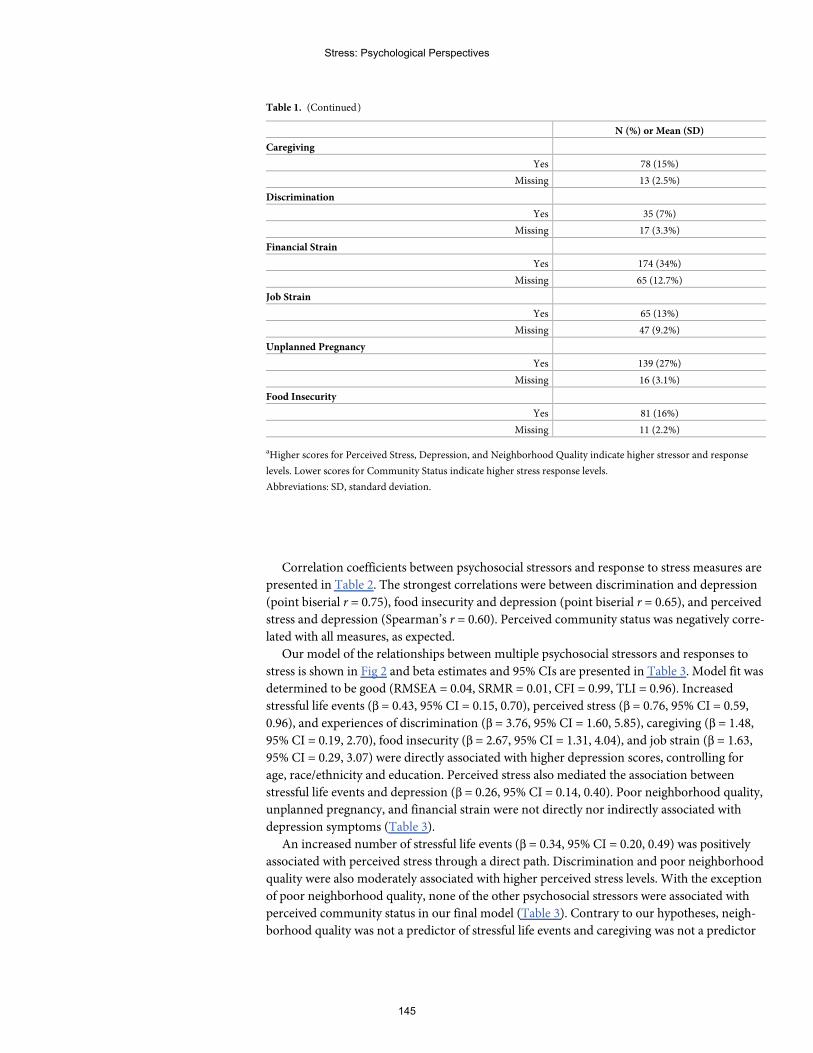
Correlation coefficients between psychosocial stressors and response to stress measures are
presented in Table 2. The strongest correlations were between discrimination and depression
(point biserial r = 0.75), food insecurity and depression (point biserial r = 0.65), and perceived
stress and depression (Spearman’s r = 0.60). Perceived community status was negatively corre-
lated with all measures, as expected.
Our model of the relationships between multiple psychosocial stressors and responses to
stress is shown in Fig 2 and beta estimates and 95% CIs are presented in Table 3. Model fit was
determined to be good (RMSEA = 0.04, SRMR = 0.01, CFI = 0.99, TLI = 0.96). Increased
stressful life events (β = 0.43, 95% CI = 0.15, 0.70), perceived stress (β = 0.76, 95% CI = 0.59,
0.96), and experiences of discrimination (β = 3.76, 95% CI = 1.60, 5.85), caregiving (β = 1.48,
95% CI = 0.19, 2.70), food insecurity (β = 2.67, 95% CI = 1.31, 4.04), and job strain (β = 1.63,
95% CI = 0.29, 3.07) were directly associated with higher depression scores, controlling for
age, race/ethnicity and education. Perceived stress also mediated the association between
stressful life events and depression (β = 0.26, 95% CI = 0.14, 0.40). Poor neighborhood quality,
unplanned pregnancy, and financial strain were not directly nor indirectly associated with
depression symptoms (Table 3).
An increased number of stressful life events (β = 0.34, 95% CI = 0.20, 0.49) was positively
associated with perceived stress through a direct path. Discrimination and poor neighborhood
quality were also moderately associated with higher perceived stress levels. With the exception
of poor neighborhood quality, none of the other psychosocial stressors were associated with
perceived community status in our final model (Table 3). Contrary to our hypotheses, neigh-
borhood quality was not a predictor of stressful life events and caregiving was not a predictor
Table 1. (Continued)
N (%) or Mean (SD)
Caregiving
Yes 78 (15%)
Missing 13 (2.5%)
Discrimination
Yes 35 (7%)
Missing 17 (3.3%)
Financial Strain
Yes 174 (34%)
Missing 65 (12.7%)
Job Strain
Yes 65 (13%)
Missing 47 (9.2%)
Unplanned Pregnancy
Yes 139 (27%)
Missing 16 (3.1%)
Food Insecurity
Yes 81 (16%)
Missing 11 (2.2%)
aHigher scores for Perceived Stress, Depression, and Neighborhood Quality indicate higher stressor and response
levels. Lower scores for Community Status indicate higher stress response levels.
Abbreviations: SD, standard deviation.
Stress: Psychological Perspectives
145
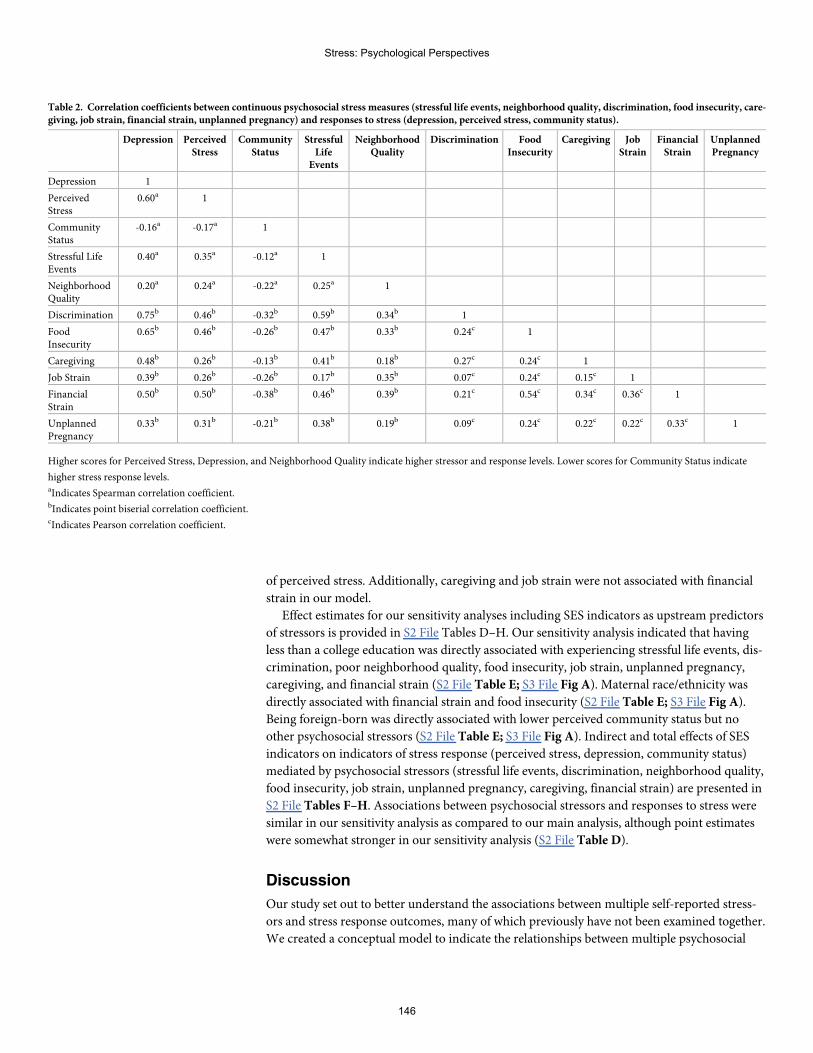
of perceived stress. Additionally, caregiving and job strain were not associated with financial
strain in our model.
Effect estimates for our sensitivity analyses including SES indicators as upstream predictors
of stressors is provided in S2 File Tables D–H. Our sensitivity analysis indicated that having
less than a college education was directly associated with experiencing stressful life events, dis-
crimination, poor neighborhood quality, food insecurity, job strain, unplanned pregnancy,
caregiving, and financial strain (S2 File Table E; S3 File Fig A). Maternal race/ethnicity was
directly associated with financial strain and food insecurity (S2 File Table E; S3 File Fig A).
Being foreign-born was directly associated with lower perceived community status but no
other psychosocial stressors (S2 File Table E; S3 File Fig A). Indirect and total effects of SES
indicators on indicators of stress response (perceived stress, depression, community status)
mediated by psychosocial stressors (stressful life events, discrimination, neighborhood quality,
food insecurity, job strain, unplanned pregnancy, caregiving, financial strain) are presented in
S2 File Tables F–H. Associations between psychosocial stressors and responses to stress were
similar in our sensitivity analysis as compared to our main analysis, although point estimates
were somewhat stronger in our sensitivity analysis (S2 File Table D).
Discussion
Our study set out to better understand the associations between multiple self-reported stress-
ors and stress response outcomes, many of which previously have not been examined together.
We created a conceptual model to indicate the relationships between multiple psychosocial
Table 2. Correlation coefficients between continuous psychosocial stress measures (stressful life events, neighborhood quality, discrimination, food insecurity, care-giving, job strain, financial strain, unplanned pregnancy) and responses to stress (depression, perceived stress, community status).
Depression PerceivedStress
CommunityStatus
StressfulLife
Events
NeighborhoodQuality
Discrimination FoodInsecurity
Caregiving JobStrain
FinancialStrain
UnplannedPregnancy
Depression 1
PerceivedStress
0.60a 1
CommunityStatus
-0.16a -0.17a 1
Stressful LifeEvents
0.40a 0.35a -0.12a 1
NeighborhoodQuality
0.20a 0.24a -0.22a 0.25a 1
Discrimination 0.75b 0.46b -0.32b 0.59b 0.34b 1
FoodInsecurity
0.65b 0.46b -0.26b 0.47b 0.33b 0.24c 1
Caregiving 0.48b 0.26b -0.13b 0.41b 0.18b 0.27c 0.24c 1
Job Strain 0.39b 0.26b -0.26b 0.17b 0.35b 0.07c 0.24c 0.15c 1
FinancialStrain
0.50b 0.50b -0.38b 0.46b 0.39b 0.21c 0.54c 0.34c 0.36c 1
UnplannedPregnancy
0.33b 0.31b -0.21b 0.38b 0.19b 0.09c 0.24c 0.22c 0.22c 0.33c 1
Higher scores for Perceived Stress, Depression, and Neighborhood Quality indicate higher stressor and response levels. Lower scores for Community Status indicate
higher stress response levels.aIndicates Spearman correlation coefficient.bIndicates point biserial correlation coefficient.cIndicates Pearson correlation coefficient.
Stress: Psychological Perspectives
146
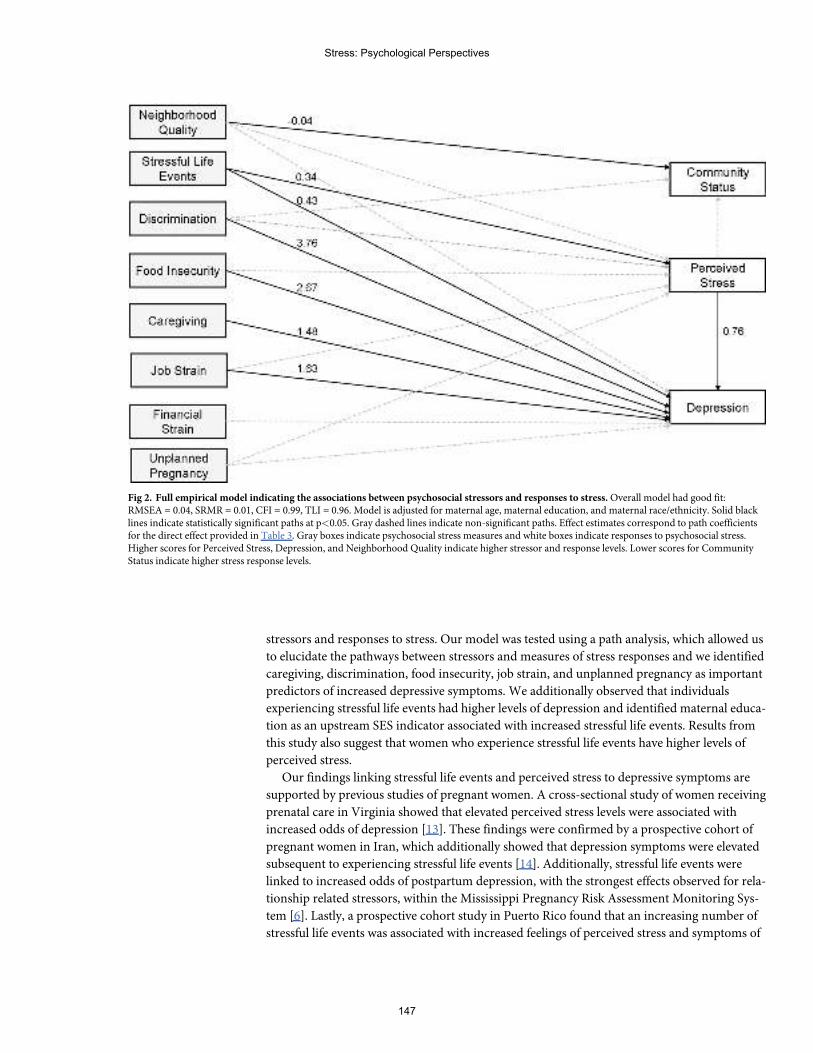
stressors and responses to stress. Our model was tested using a path analysis, which allowed us
to elucidate the pathways between stressors and measures of stress responses and we identified
caregiving, discrimination, food insecurity, job strain, and unplanned pregnancy as important
predictors of increased depressive symptoms. We additionally observed that individuals
experiencing stressful life events had higher levels of depression and identified maternal educa-
tion as an upstream SES indicator associated with increased stressful life events. Results from
this study also suggest that women who experience stressful life events have higher levels of
perceived stress.
Our findings linking stressful life events and perceived stress to depressive symptoms are
supported by previous studies of pregnant women. A cross-sectional study of women receiving
prenatal care in Virginia showed that elevated perceived stress levels were associated with
increased odds of depression [13]. These findings were confirmed by a prospective cohort of
pregnant women in Iran, which additionally showed that depression symptoms were elevated
subsequent to experiencing stressful life events [14]. Additionally, stressful life events were
linked to increased odds of postpartum depression, with the strongest effects observed for rela-
tionship related stressors, within the Mississippi Pregnancy Risk Assessment Monitoring Sys-
tem [6]. Lastly, a prospective cohort study in Puerto Rico found that an increasing number of
stressful life events was associated with increased feelings of perceived stress and symptoms of
Fig 2. Full empirical model indicating the associations between psychosocial stressors and responses to stress.Overall model had good fit:RMSEA = 0.04, SRMR = 0.01, CFI = 0.99, TLI = 0.96. Model is adjusted for maternal age, maternal education, and maternal race/ethnicity. Solid blacklines indicate statistically significant paths at p<0.05. Gray dashed lines indicate non-significant paths. Effect estimates correspond to path coefficientsfor the direct effect provided in Table 3. Gray boxes indicate psychosocial stress measures and white boxes indicate responses to psychosocial stress.Higher scores for Perceived Stress, Depression, and Neighborhood Quality indicate higher stressor and response levels. Lower scores for CommunityStatus indicate higher stress response levels.
Stress: Psychological Perspectives
147
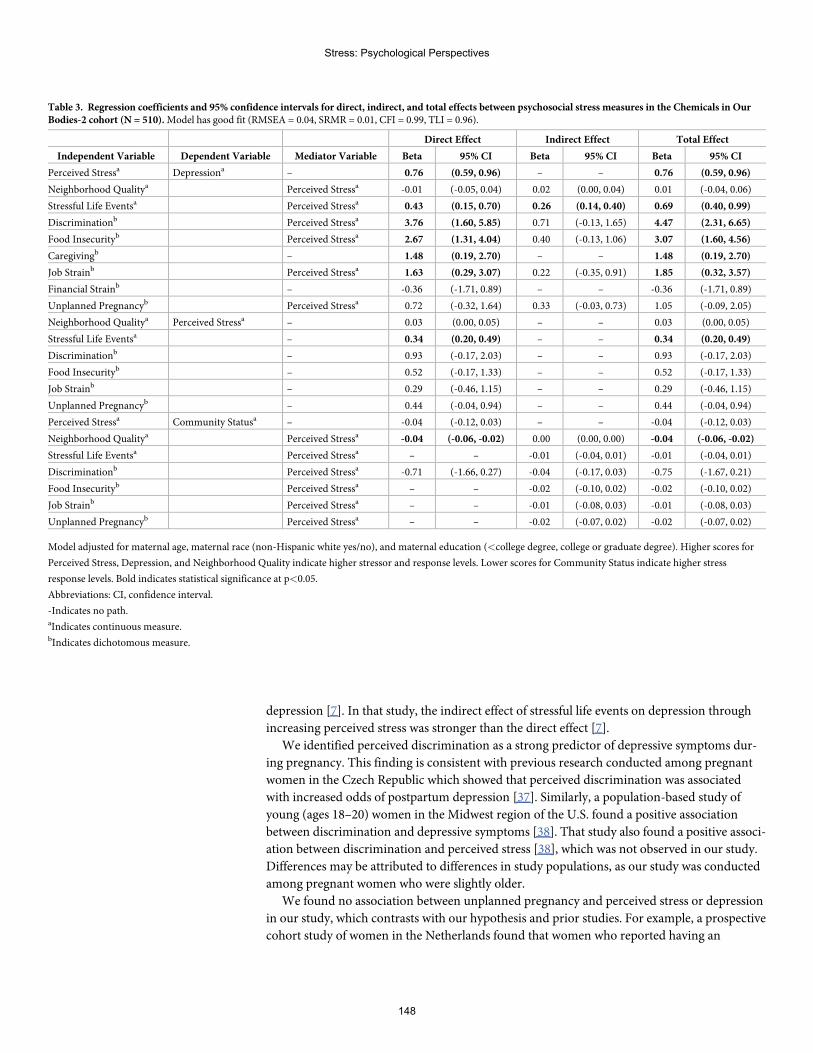
depression [7]. In that study, the indirect effect of stressful life events on depression through
increasing perceived stress was stronger than the direct effect [7].
We identified perceived discrimination as a strong predictor of depressive symptoms dur-
ing pregnancy. This finding is consistent with previous research conducted among pregnant
women in the Czech Republic which showed that perceived discrimination was associated
with increased odds of postpartum depression [37]. Similarly, a population-based study of
young (ages 18–20) women in the Midwest region of the U.S. found a positive association
between discrimination and depressive symptoms [38]. That study also found a positive associ-
ation between discrimination and perceived stress [38], which was not observed in our study.
Differences may be attributed to differences in study populations, as our study was conducted
among pregnant women who were slightly older.
We found no association between unplanned pregnancy and perceived stress or depression
in our study, which contrasts with our hypothesis and prior studies. For example, a prospective
cohort study of women in the Netherlands found that women who reported having an
Table 3. Regression coefficients and 95% confidence intervals for direct, indirect, and total effects between psychosocial stress measures in the Chemicals in OurBodies-2 cohort (N = 510).Model has good fit (RMSEA = 0.04, SRMR = 0.01, CFI = 0.99, TLI = 0.96).
Direct Effect Indirect Effect Total Effect
Independent Variable Dependent Variable Mediator Variable Beta 95% CI Beta 95% CI Beta 95% CI
Perceived Stressa Depressiona – 0.76 (0.59, 0.96) – – 0.76 (0.59, 0.96)
Neighborhood Qualitya Perceived Stressa -0.01 (-0.05, 0.04) 0.02 (0.00, 0.04) 0.01 (-0.04, 0.06)
Stressful Life Eventsa Perceived Stressa 0.43 (0.15, 0.70) 0.26 (0.14, 0.40) 0.69 (0.40, 0.99)
Discriminationb Perceived Stressa 3.76 (1.60, 5.85) 0.71 (-0.13, 1.65) 4.47 (2.31, 6.65)
Food Insecurityb Perceived Stressa 2.67 (1.31, 4.04) 0.40 (-0.13, 1.06) 3.07 (1.60, 4.56)
Caregivingb – 1.48 (0.19, 2.70) – – 1.48 (0.19, 2.70)
Job Strainb Perceived Stressa 1.63 (0.29, 3.07) 0.22 (-0.35, 0.91) 1.85 (0.32, 3.57)
Financial Strainb – -0.36 (-1.71, 0.89) – – -0.36 (-1.71, 0.89)
Unplanned Pregnancyb Perceived Stressa 0.72 (-0.32, 1.64) 0.33 (-0.03, 0.73) 1.05 (-0.09, 2.05)
Neighborhood Qualitya Perceived Stressa – 0.03 (0.00, 0.05) – – 0.03 (0.00, 0.05)
Stressful Life Eventsa – 0.34 (0.20, 0.49) – – 0.34 (0.20, 0.49)
Discriminationb – 0.93 (-0.17, 2.03) – – 0.93 (-0.17, 2.03)
Food Insecurityb – 0.52 (-0.17, 1.33) – – 0.52 (-0.17, 1.33)
Job Strainb – 0.29 (-0.46, 1.15) – – 0.29 (-0.46, 1.15)
Unplanned Pregnancyb – 0.44 (-0.04, 0.94) – – 0.44 (-0.04, 0.94)
Perceived Stressa Community Statusa – -0.04 (-0.12, 0.03) – – -0.04 (-0.12, 0.03)
Neighborhood Qualitya Perceived Stressa -0.04 (-0.06, -0.02) 0.00 (0.00, 0.00) -0.04 (-0.06, -0.02)
Stressful Life Eventsa Perceived Stressa – – -0.01 (-0.04, 0.01) -0.01 (-0.04, 0.01)
Discriminationb Perceived Stressa -0.71 (-1.66, 0.27) -0.04 (-0.17, 0.03) -0.75 (-1.67, 0.21)
Food Insecurityb Perceived Stressa – – -0.02 (-0.10, 0.02) -0.02 (-0.10, 0.02)
Job Strainb Perceived Stressa – – -0.01 (-0.08, 0.03) -0.01 (-0.08, 0.03)
Unplanned Pregnancyb Perceived Stressa – – -0.02 (-0.07, 0.02) -0.02 (-0.07, 0.02)
Model adjusted for maternal age, maternal race (non-Hispanic white yes/no), and maternal education (<college degree, college or graduate degree). Higher scores for
Perceived Stress, Depression, and Neighborhood Quality indicate higher stressor and response levels. Lower scores for Community Status indicate higher stress
response levels. Bold indicates statistical significance at p<0.05.
Abbreviations: CI, confidence interval.
-Indicates no path.aIndicates continuous measure.bIndicates dichotomous measure.
Stress: Psychological Perspectives
148
unplanned pregnancy had higher scores on the depression subscale of the Hospital Anxiety
and Depression Scale (HADS) during early pregnancy [39]. However, associations between
unplanned pregnancy and depression were attenuated to non-significance when the HADS
was administered in late pregnancy, which is consistent with our findings.
Our study identified food insecurity as an upstream predictor of depression. However, we
observed no associations between food insecurity and perceived stress. Elevated postpartum
perceived stress scores were observed among women in North Carolina who reported being
food insecure during pregnancy [40]. It is possible that we did not observe an association
between food insecurity and perceived stress as a result of when perceived stress was measured,
which was during pregnancy, not postpartum. Furthermore, there may be other SES factors,
such as poverty and a lack of affordable housing in the Bay Area, which could be influencing
food insecurity in our study population and may explain these differences. Nonetheless, our
finding that food insecurity was associated with higher scores on the depression scale is sup-
ported by a cross-sectional study conducted among pregnant women in South Africa [41].
Poor neighborhood quality was not associated with perceived stress or depressive symp-
toms in our cohort, which is in contrast to previous work. For example, a study among African
American pregnant women in Detroit found that lower neighborhood quality, as measured by
indicators of social and physical disorder, safety, walking environment, and overall neighbor-
hood quality, was associated with elevated depression symptoms and that the association was
partially mediated by perceived stress [42]. A second study found that lower perceived neigh-
borhood safety and walkability was associated with increased depression symptoms during
pregnancy among African American women [43]. Discrepancies in our results may be a result
of how neighborhood quality was measured. Neighborhood quality was a composite measure
of collective efficacy, neighborhood safety, neighborhood dissatisfaction, and neighborhood
physical disorder, which is somewhat different than other studies. Differences may also be due
to differences in study populations, as less than 10% of our study population identified as
being non-Hispanic black. Lastly, San Francisco experienced a severe shortage of affordable
housing crisis and rapid gentrification during our study period, which presents unique chal-
lenges and may have resulted in differences in how one’s neighborhood is perceived that may
be specific to the San Francisco Bay Area.
Previous studies have also linked financial strain to depression, which was not observed in
our study [23, 44]. Among a pregnancy cohort in Boston, postpartum experiences of financial
hardship were associated with increased odds of postpartum depressive symptoms [23]. Finan-
cial strain and depression were assessed during pregnancy, not postpartum, in our study,
which could explain these differences. An additional study among women of child bearing age
in the United Kingdom found that women experiencing financial hardship had increased haz-
ards of depression, these associations were attenuated to non-significance after adjusting for
covariates, which is consistent with our findings [44].
Our study has a several strengths. First, we included multiple indicators of psychosocial
stress, which allowed us to determine which stressors may be strongly linked to responses to
stress, including depression, a clinical outcome with implications for maternal and infant
health. This is a vital expansion on prior research which often only included a small number of
stress measures. The CiOB cohort also includes women from a variety of racial and ethnic
groups and many SES levels, an important advancement over previous work that have been
conducted among racially homogenous populations and high SES populations [42, 45]. Addi-
tionally, information regarding psychosocial stress was collected prior to delivery, which
reduces the likelihood that women would have reported higher levels of stress as a result of an
adverse pregnancy outcome. Lastly, the theory of allostasis was used to inform how we
grouped psychosocial stressors and responses to psychosocial stress in this analysis. Our
Stress: Psychological Perspectives
149
findings are also supported by the social ecological model, which acknowledges that multiple
levels, such as psychosocial states, communities, and the built environment, influence and
impact the health and behavior of individuals.
We also acknowledge several limitations of this study. Our cohort was not a random sam-
ple, and therefore our results may not be generalizable to populations beyond the study sam-
ple. Additionally, this was an exploratory analysis conducted within an existing study that was
designed to address additional research questions. Measures of psychosocial stress were
obtained at the same study visit and in that sense our study may be considered cross-sectional.
It is possible that women may have been more likely to report experiencing financial strain or
job strain as a result of pre-existing depression, rather than financial or job strain leading to
depression, and we are unable to differentiate between those pathways here. Lastly, we may
have been limited by a small sample size as some of our psychosocial stress measures, such as
job strain and discrimination, occurred in a relatively small number of participants.
Conclusions
Among a diverse cohort of pregnant women in San Francisco, we identified caregiving, dis-
crimination, food insecurity, job strain, and unplanned pregnancy as important upstream
stressors associated with depression. It is imperative to understand the mechanisms by which
stressors influence one another to better identify specific causal pathways leading to adverse
maternal and child health outcomes. Findings from this study may help clinicians in identify-
ing women who may be at an increased risk for adverse birth outcomes. Importantly, many of
the stressors examined in this analysis have been associated with adverse birth outcomes,
including preterm birth, in other studies [1, 2, 11]. Our findings also identify vulnerable popu-
lations and can inform interventions aimed at alleviating food insecurity, job strain, and dis-
crimination, and reducing the burden of depression during pregnancy. Future studies that
map relationships between multiple self-reported stressor exposures and responses could be
strengthened by also integrating biological measures of stress response, which may be elevated
in response to some of the self-reported exposures examined here, and could better character-
izing the indirect pathways we identified.
Supporting information
S1 File. Interview questionnaire used to assess psychosocial stressors and responses to psy-
chosocial stressors in CiOB.
S2 File. Supporting tables for relationships between psychosocial stressors among preg-
nant women in San Francisco: A path analysis.
S3 File. Supporting figure for relationships between psychosocial stressors among preg-
nant women in San Francisco: A path analysis.
Author Contributions
Conceptualization: Stephanie M. Eick, Dana E. Goin, Monika A. Izano, Lara Cushing, Amy
M. Padula, Rachel Morello-Frosch.
Data curation: Erin DeMicco, Tracey J. Woodruff, Rachel Morello-Frosch.
Stress: Psychological Perspectives
150
Formal analysis: Stephanie M. Eick.
Funding acquisition: AmyM. Padula, Tracey J. Woodruff, Rachel Morello-Frosch.
Investigation: Stephanie M. Eick, Tracey J. Woodruff, Rachel Morello-Frosch.
Project administration: Erin DeMicco, AmyM. Padula, Tracey J. Woodruff, Rachel Morello-
Frosch.
Resources: Tracey J. Woodruff.
Supervision: AmyM. Padula, Tracey J. Woodruff, Rachel Morello-Frosch.
Writing – original draft: Stephanie M. Eick.
Writing – review & editing: Stephanie M. Eick, Dana E. Goin, Monika A. Izano, Lara Cush-
ing, Erin DeMicco, AmyM. Padula, Tracey J. Woodruff, Rachel Morello-Frosch.
References1. Liu C, Cnattingius S, BergstromM, Ostberg V, Hjern A. Prenatal parental depression and preterm birth:
a national cohort study. Bjog. 2016; 123(12):1973–82. Epub 2016/10/19. https://doi.org/10.1111/1471-0528.13891 PMID: 26786413
2. Shapiro GD, FraserWD, Frasch MG, Seguin JR. Psychosocial stress in pregnancy and preterm birth:associations and mechanisms. J Perinat Med. 2013; 41(6):631–45. Epub 2013/11/13. https://doi.org/10.1515/jpm-2012-0295 PMID: 24216160
3. Lilliecreutz C, Laren J, Sydsjo G, Josefsson A. Effect of maternal stress during pregnancy on the risk forpreterm birth. BMC Pregnancy and Childbirth. 2016; 16(1):5. https://doi.org/10.1186/s12884-015-0775-x PMID: 26772181
4. Sabri Y, Nabel H. The impact of anxiety and depression during pregnancy on fetal growth and the birthoutcome. Egyptian Journal of Psychiatry. 2015; 36(2):95–100. https://doi.org/10.4103/1110-1105.158117
5. Lima SAM, El Dib RP, Rodrigues MRK, Ferraz GAR, Molina AC, Neto CAP, et al. Is the risk of low birthweight or preterm labor greater when maternal stress is experienced during pregnancy? A systematicreview and meta-analysis of cohort studies. PLoS One. 2018; 13(7):e0200594. Epub 2018/07/27.https://doi.org/10.1371/journal.pone.0200594 PMID: 30048456
6. Qobadi M, Collier C, Zhang L. The Effect of Stressful Life Events on Postpartum Depression: Findingsfrom the 2009–2011Mississippi Pregnancy Risk Assessment Monitoring System. Matern Child HealthJ. 2016; 20(Suppl 1):164–72. Epub 2016/06/25. https://doi.org/10.1007/s10995-016-2028-7 PMID:27339648
7. Eick SM, Meeker JD, Swartzendruber A, Rios-McConnell R, Brown P, Velez-Vega C, et al. Relation-ships between psychosocial factors during pregnancy and preterm birth in Puerto Rico. PloS one. 2020;15(1):e0227976–e. https://doi.org/10.1371/journal.pone.0227976 PMID: 31995596.
8. Alhusen JL, Bower KM, Epstein E, Sharps P. Racial Discrimination and Adverse Birth Outcomes: AnIntegrative Review. J MidwiferyWomens Health. 2016; 61(6):707–20. Epub 2016/10/14. https://doi.org/10.1111/jmwh.12490 PMID: 27737504
9. Eick SM, Barrett ES, van ’t Erve TJ, Nguyen RHN, Bush NR, Milne G, et al. Association between prena-tal psychological stress and oxidative stress during pregnancy. Paediatr Perinat Epidemiol. 2018; 32(4):318–26. Epub 2018/04/01. https://doi.org/10.1111/ppe.12465 PMID: 29603338
10. Da Costa D, Larouche J, Dritsa M, BrenderW. Psychosocial correlates of prepartum and postpartumdepressed mood. J Affect Disord. 2000; 59(1):31–40. Epub 2000/05/18. https://doi.org/10.1016/s0165-0327(99)00128-7 PMID: 10814768.
11. Dole N, Savitz DA, Hertz-Picciotto I, Siega-Riz AM, McMahonMJ, Buekens P. Maternal Stress and Pre-term Birth. American Journal of Epidemiology. 2003; 157(1):14–24. https://doi.org/10.1093/aje/kwf176PMID: 12505886
12. Zhang S, Ding Z, Liu H, Chen Z, Wu J, Zhang Y, et al. Association betweenmental stress and gesta-tional hypertension/preeclampsia: a meta-analysis. Obstet Gynecol Surv. 2013; 68(12):825–34. Epub2014/08/08. https://doi.org/10.1097/OGX.0000000000000001 PMID: 25102019.
13. Kinser PA, Thacker LR, Lapato D, Wagner S, Roberson-Nay R, Jobe-Shields L, et al. DepressiveSymptom Prevalence and Predictors in the First Half of Pregnancy. J Womens Health (Larchmt). 2018;27(3):369–76. Epub 2017/12/15. https://doi.org/10.1089/jwh.2017.6426 PMID: 29240527
Stress: Psychological Perspectives
151
14. Dolatian M, Mahmoodi Z, Alavi-Majd H, Moafi F, Ghorbani M, Mirabzadeh A. Psychosocial factors inpregnancy and birthweight: Path analysis. J Obstet Gynaecol Res. 2016; 42(7):822–30. Epub 2016/04/22. https://doi.org/10.1111/jog.12991 PMID: 27098096.
15. Krivo LJ, Peterson RD. Extremely Disadvantaged Neighborhoods and Urban Crime*. Social Forces.1996; 75(2):619–48. https://doi.org/10.1093/sf/75.2.619
16. Goin DE, A MG, Farkas K, Zimmerman SC, Matthay EC, Ahern J. Exposure to Community HomicideDuring Pregnancy and Adverse Birth Outcomes: AWithin-Community Matched Design. Epidemiology.2019; 30(5):713–22. Epub 2019/06/11. https://doi.org/10.1097/EDE.0000000000001044 PMID:31180933
17. Barcelona de Mendoza V, Harville EW, Savage J, Giarratano G. Experiences of Intimate Partner andNeighborhood Violence and Their AssociationWith Mental Health in Pregnant Women. J Interpers Vio-lence. 2018; 33(6):938–59. Epub 2015/11/19. https://doi.org/10.1177/0886260515613346 PMID:26576616
18. Ncube CN, Enquobahrie DA, Albert SM, Herrick AL, Burke JG. Association of neighborhood contextwith offspring risk of preterm birth and low birthweight: A systematic review and meta-analysis of popu-lation-based studies. Soc Sci Med. 2016; 153:156–64. Epub 2016/02/24. https://doi.org/10.1016/j.socscimed.2016.02.014 PMID: 26900890.
19. Mitchell AM, Christian LM. Financial strain and birth weight: the mediating role of psychological distress.ArchWomensMent Health. 2017; 20(1):201–8. Epub 2016/12/14. https://doi.org/10.1007/s00737-016-0696-3 PMID: 27957597
20. Croteau A, Marcoux S, Brisson C. Work Activity in Pregnancy, Preventive Measures, and the Risk ofPreterm Delivery. American Journal of Epidemiology. 2007; 166(8):951–65. https://doi.org/10.1093/aje/kwm171 PMID: 17652310
21. Kim D. Relationships between Caregiving Stress, Depression, and Self-Esteem in Family Caregivers ofAdults with a Disability. Occup Ther Int. 2017; 2017:1686143. Epub 2017/11/09. https://doi.org/10.1155/2017/1686143 PMID: 29114184
22. Nelson DB, Lepore SJ. The role of stress, depression, and violence on unintended pregnancy amongyoung urban women. J Womens Health (Larchmt). 2013; 22(8):673–80. Epub 2013/06/25. https://doi.org/10.1089/jwh.2012.4133 PMID: 23789582
23. Rich-Edwards JW, Kleinman K, Abrams A, Harlow BL, McLaughlin TJ, Joffe H, et al. Sociodemographicpredictors of antenatal and postpartum depressive symptoms among women in a medical group prac-tice. J Epidemiol Community Health. 2006; 60(3):221–7. Epub 2006/02/16. https://doi.org/10.1136/jech.2005.039370 PMID: 16476752
24. Ferguson KK, Rosen EM, Barrett ES, Nguyen RHN, Bush N, McElrath TF, et al. Joint impact of phthal-ate exposure and stressful life events in pregnancy on preterm birth. Environment International. 2019;133:105254. https://doi.org/10.1016/j.envint.2019.105254. PMID: 31675562
25. Okechukwu CA, El Ayadi AM, Tamers SL, Sabbath EL, Berkman L. Household food insufficiency, finan-cial strain, work-family spillover, and depressive symptoms in the working class: theWork, Family, andHealth Network study. Am J Public Health. 2012; 102(1):126–33. Epub 2011/11/19. https://doi.org/10.2105/AJPH.2011.300323 PMID: 22095360
26. Becares L, Atatoa-Carr P. The association betweenmaternal and partner experienced racial discrimina-tion and prenatal perceived stress, prenatal and postnatal depression: findings from the growing up inNew Zealand cohort study. International Journal for Equity in Health. 2016; 15(1):155. https://doi.org/10.1186/s12939-016-0443-4 PMID: 27658457
27. McEwen BS. Protective and Damaging Effects of Stress Mediators. New England Journal of Medicine.1998; 338(3):171–9. https://doi.org/10.1056/NEJM199801153380307 PMID: 9428819.
28. ShannonM, King TL, Kennedy HP. Allostasis: a theoretical framework for understanding and evaluatingperinatal health outcomes. J Obstet Gynecol Neonatal Nurs. 2007; 36(2):125–34. Epub 2007/03/21.https://doi.org/10.1111/j.1552-6909.2007.00126.x PMID: 17371513.
29. Sampson RJ, Raudenbush SW, Earls F. Neighborhoods and Violent Crime: A Multilevel Study of Col-lective Efficacy. Science. 1997; 277(5328):918. https://doi.org/10.1126/science.277.5328.918 PMID:9252316
30. Schulz AJ, Kannan S, Dvonch JT, Israel BA, Allen A 3rd, James SA, et al. Social and physical environ-ments and disparities in risk for cardiovascular disease: the healthy environments partnership concep-tual model. Environ Health Perspect. 2005; 113(12):1817–25. Epub 2005/12/07. https://doi.org/10.1289/ehp.7913 PMID: 16330371
31. Cohen S, Kamarck T, Mermelstein R. A global measure of perceived stress. J Health Soc Behav. 1983;24(4):385–96. Epub 1983/12/01. PMID: 6668417.
32. Radloff LS. The CES-D Scale: A Self-Report Depression Scale for Research in the General Population.Applied Psychological Measurement. 1977; 1(3):385–401.
Stress: Psychological Perspectives
152
33. Singh-Manoux A, Adler NE, Marmot MG. Subjective social status: its determinants and its associationwith measures of ill-health in theWhitehall II study. Soc Sci Med. 2003; 56(6):1321–33. Epub 2003/02/26. https://doi.org/10.1016/s0277-9536(02)00131-4 PMID: 12600368.
34. Rosseel Y. lavaan: An R Package for Structural Equation Modeling. 2012. 2012; 48(2):36. Epub 2012-05-24. https://doi.org/10.18637/jss.v048.i02
35. Enders CK. The impact of nonnormality on full information maximum-likelihood estimation for structuralequation models with missing data. Psychol Methods. 2001; 6(4):352–70. Epub 2002/01/10. PMID:11778677.
36. Lt Hu, Bentler PM. Cutoff criteria for fit indexes in covariance structure analysis: Conventional criteriaversus new alternatives. Structural Equation Modeling: A Multidisciplinary Journal. 1999; 6(1):1–55.https://doi.org/10.1080/10705519909540118
37. Stepanikova I, Kukla L. Is Perceived Discrimination in Pregnancy Prospectively Linked to PostpartumDepression? Exploring the Role of Education. Matern Child Health J. 2017; 21(8):1669–77. Epub 2017/01/25. https://doi.org/10.1007/s10995-016-2259-7 PMID: 28116534
38. Hall KS, Kusunoki Y, Gatny H, Barber J. Social discrimination, stress, and risk of unintended pregnancyamong young women. J Adolesc Health. 2015; 56(3):330–7. Epub 2015/01/15. https://doi.org/10.1016/j.jadohealth.2014.11.008 PMID: 25586228
39. van de Loo KFE, Vlenterie R, Nikkels SJ, Merkus P, Roukema J, Verhaak CM, et al. Depression andanxiety during pregnancy: The influence of maternal characteristics. Birth. 2018; 45(4):478–89. Epub2018/03/09. https://doi.org/10.1111/birt.12343 PMID: 29517137.
40. Laraia B, Vinikoor-Imler LC, Siega-Riz AM. Food insecurity during pregnancy leads to stress, disor-dered eating, and greater postpartum weight among overweight women. Obesity (Silver Spring). 2015;23(6):1303–11. Epub 2015/05/12. https://doi.org/10.1002/oby.21075 PMID: 25959858
41. Abrahams Z, Lund C, Field S, Honikman S. Factors associated with household food insecurity anddepression in pregnant South African women from a low socio-economic setting: a cross-sectionalstudy. Soc Psychiatry Psychiatr Epidemiol. 2018; 53(4):363–72. Epub 2018/02/16. https://doi.org/10.1007/s00127-018-1497-y PMID: 29445850
42. Giurgescu C, Misra DP, Sealy-Jefferson S, Caldwell CH, Templin TN, Slaughter-Acey JC, et al. Theimpact of neighborhood quality, perceived stress, and social support on depressive symptoms duringpregnancy in African American women. Soc Sci Med. 2015; 130:172–80. Epub 2015/02/24. https://doi.org/10.1016/j.socscimed.2015.02.006 PMID: 25703670
43. Sealy-Jefferson S, Giurgescu C, Slaughter-Acey J, Caldwell C, Misra D. Neighborhood Context andPreterm Delivery among African AmericanWomen: the Mediating Role of Psychosocial Factors. JUrban Health. 2016; 93(6):984–96. Epub 2016/10/06. https://doi.org/10.1007/s11524-016-0083-4PMID: 27704384
44. Dunn N, Inskip H, Kendrick T, Oestmann A, Barnett J, Godfrey K, et al. Does perceived financial strainpredict depression among young women? Longitudinal findings from the SouthamptonWomen’s Sur-vey. Ment Health FamMed. 2008; 5(1):15–21. Epub 2008/03/01. PMID: 22477842
45. Goossens J, Van Den Branden Y, Van der Sluys L, Delbaere I, Van Hecke A, Verhaeghe S, et al. Theprevalence of unplanned pregnancy ending in birth, associated factors, and health outcomes. HumReprod. 2016; 31(12):2821–33. Epub 2016/11/01. https://doi.org/10.1093/humrep/dew266 PMID:27798048.
Stress: Psychological Perspectives
153
Suicidality among Chinese college students: Across-sectional study across seven provinces
Bob Lew1☯, Kairi Kõlves2,3,4☯, Augustine Osman5☯, Mansor Abu Talib6☯,
Norhayati Ibrahim7☯, Ching Sin SiauID8☯*, Caryn Mei Hsien Chan7☯
1 Department of Social Psychology, Faculty of Human Ecology, Putra University of Malaysia, Serdang,
Selangor, Malaysia, 2 Australian Institute for Suicide Research and Prevention, Griffith University, Brisbane,Queensland, Australia, 3 WHOCollaborating Centre for Research and Training in Suicide Prevention, GriffithUniversity, Brisbane, Queensland, Australia, 4 School of Applied Psychology, Griffith University, Brisbane,
Queensland, Australia, 5 Department of Psychology, University of Texas at San Antonio, San Antonio, TexasUnited States of America, 6 Department of Human Development and Family Studies, Putra University ofMalaysia, Serdang, Selangor, Malaysia, 7 Faculty of Health Sciences, Universiti Kebangsaan Malaysia,
Kuala Lumpur, Malaysia, 8 Faculty of Social Sciences and Liberal Arts, UCSI University, Kuala Lumpur,Malaysia
☯ These authors contributed equally to this work.* [email protected]
Abstract
Background
Although the suicide rate in China has decreased over the past 20 years, there have been
reports that the younger age group has been experiencing an increased incidence of com-
pleted suicide. Given that undergraduate groups are at higher risks of suicidality, it is impor-
tant to monitor and screen for risk factors for suicidal ideation and behaviors to ensure their
well-being.
Objective
To examine the risk and protective factors contributing to suicidality among undergraduate
college students in seven provinces in China.
Methods
We conducted a cross-sectional study involving 13,387 college students from seven univer-
sities in Ningxia, Shandong, Shanghai, Jilin, Qinghai, Shaanxi, and Xinjiang. Data were col-
lected using self-report questionnaires.
Results
Higher scores in the psychological strain, depression, anxiety, stress, and psychache (psy-
chological risk factors for suicidality) and lower scores in self-esteem and purpose in life
(psychological protective factors against suicidality) were associated with increased suicid-
ality among undergraduate students in China. Demographic factors which were associated
with higher risks of suicidality were female gender, younger age, bad academic results,
Editor: Vincenzo De Luca, University of Toronto,
CANADA
12
154
were an only child, non-participation in school associations, and had an urban household
registration. Perceived good health was protective against suicidality.
Conclusions
Knowing the common risk and protective factors for suicidality among Chinese undergradu-
ate students is useful in developing interventions targeted at this population and to guide
public health policies on suicide in China.
Introduction
TheWorld Health Organization estimated about 793,000 suicide deaths worldwide in 2016,
and a global age-standardized suicide rate of 10.5 per 100,000 population [1]. There are
approximately 25 suicide attempts for every suicide death, and one suicide death is estimated
to affect 135 people [2], resulting in 108 million people world-wide being negatively impacted
by suicide.
Although China is the second largest economy in the world (with a Gross Domestic Prod-
uct (GDP) of $13.6 trillion in 2018, compared to the United States at $20.5 trillion) [3], its sui-
cide rate has decreased in the past 20 years from above 20/100,000 population to the current
rate of 8/100,000 population [4]. The current rate translates to an estimated 112,000 deaths, 2.8
million attempted suicides, and 15.1 million people impacted by suicide in China [1]. This rate
is lower than in the US which is estimated to be 13.7/100,000, and ranks between the suicide
rates of the world’s ten largest economies which range from 5.5/100,000 (Italy) to 16.5/100,000
(India) [1]. Zhang has outlined that this drop may possibly be due to the following six factors:
(1) fast economic development; (2) migration to urbanised areas; (3) modernised social values;
(4) one-child per family policy; (5) college surveillance-based counselling; and (6) governmen-
tal media control [4].
Suicide is widely recognised as the second leading cause of death in young people in the 15-
to 29-years age bracket worldwide [1]. There have been reports that this younger age group
has been experiencing an increased incidence of completed suicide in China [5,6]. Thus, it is
important to focus on individuals within this age bracket as they still have a long life-cycle. The
emotional as well as the economic costs incurred by the suicide deaths of this age group are
high [7]. Most undergraduate students fall within the 18 to 29 age range. Given that under-
graduate groups are the emerging generation which determine China’s future, it is important
to monitor and screen for risk factors for suicidal ideation and behaviors to ensure their well-
being.
There is a collective body of evidence on the identification of risk and protective factors for
suicide, which includes factors such as life stress and coping style [8], personality factors of
impulsivity and aggression [9], and depression [9–12]. In addition, adverse developmental
influences or events such as childhood adversity, divorce of parents, loss of a parent, and sexual
abuse are also risk factors for increased suicidality [9–12]. Among Chinese college students,
factors that have been found to influence suicidality are academic performance, academic
stress, occupational future, recent conflicts with classmates, satisfaction with major, and the
rupture of romantic relationships [12,13]. Finally, family influences such as parents’ educa-
tional level, family income, a history of suicide in the family, and originating from a rural back-
ground are also factors that are associated with suicidality among college students [14–19].
Funding: CCMH acknowledges support from the
Universiti KebangsaanMalaysia grant DIP-2018-
035. The funders had no role in study design, data
collection and analysis, decision to publish, or
preparation of the manuscript.
Competing interests: The authors have declared
that no competing interests exist.
Stress: Psychological Perspectives
155
Nevertheless, there still remains a lack of comprehensive studies on various common sui-
cidality risk and protective factors on this population segment in China using sufficiently large
samples. Although it may not be possible to study all colleges and provinces in a large country
like China simultaneously, this research attempts to address this gap, using established and rel-
evant psychological measurements. To the authors’ best knowledge, this is the largest study
undertaken on risk and protective factors for suicide among undergraduate students in China,
spanning seven provinces with more than 13,000 samples. A further understanding of risk and
protective factors for suicide is needed to guide public health policies on suicide in China.
Materials andmethods
Study design
We conducted a large cross-sectional cluster sample study of undergraduate college students
in seven provinces in China comprising Ningxia, Shandong, Shanghai, Jilin, Qinghai, Shaanxi,
and Xinjiang.
Data collection
Data was collected in survey format from students enrolled in various undergraduate degree
programs from universities in seven provinces. One university was selected in each province.
Students from each department were clustered according to the year of study. An equal num-
ber of classes from each year of study were then selected to obtain a reasonable representation
of each grade. All students in the selected classes were briefed about the purpose of the
research. Participants completed the questionnaires anonymously in approximately a half an
hour, and no identifiers were collected. This study received ethics approval from the institu-
tional review board of the Ethics Committee at the School of Public Health, Shandong Univer-
sity (No. 20161103). The participant signed an informed consent form before answering the
questionnaire. Hotlines on counseling services were provided in the information sheet tailored
to each province. Exclusion criteria were determined a priori as follows: 1) if gender and age
were not provided; and 2) if all items on the Suicidal Behaviors Questionnaire-Revised were
not completed.
Measurements
Demographics. The following information was collected: age (using year of birth), gender
(male = 1; female = 2), physical health (poor = 1 to good = 3), economic status (poor = 1 to
good = 3), academic results (poor = 1 to good = 3), only child status (yes = 1; no = 2), participa-
tion in school associations (yes = 1; no = 2), and household registration (urban = 1; rural = 2).
Suicidal Behaviors Questionnaire-Revised (SBQ-R). The SBQ-R was developed as a
brief measure of a range of suicide-related behaviors for use in both clinical and nonclinical
settings. It is a 4-item self-report questionnaire [20]. The total score ranges from 3 to 18, with
higher scores indicating greater risk of suicidal behaviors. A cut-off score of� 7 is used to indi-
cate suicide risk for undergraduate students [20]. Lifetime suicidal ideation and lifetime sui-
cide attempt were determined by the question, “Have you ever seriously thought about
suicide?”. Participants who responded “It was just a brief passing thought” indicated lifetime
suicidal ideation. Participants who responded “I have attempted to kill myself, but did not
want to die” or “I have attempted to kill myself, and really hoped to die” indicated lifetime sui-
cide attempt. The Chinese translated version yielded an internal consistency estimate of Cron-
bach’s α = 0.67 [21]. In this study, the Cronbach’s α of the scale score is 0.75.
Stress: Psychological Perspectives
156
Risk factors
DASS-21. DASS-21 is a well-established instrument comprising three dimensions of psy-
chological distress, including depression, anxiety and stress [22]. Each dimension is measured
by seven items. The score on each item ranges from 0 = “did not apply to me at all” to 3 =
“applied to me very much”, or “most of the time”). The total score ranges from 0 to 63. DASS-
21 has been widely used in China for various psychosocial studies, such as Cheng et al. which
reported an internal consistency estimate of Cronbach’s α = 0.77 [23]. In this study, the Cron-
bach’s α of the scale score is 0.95.
Psychache scale. The Psychache Scale [24] consists of 13 items reflecting psychache (i.e.,
mental pain) scored from 1 = “never or strongly disagree” to 5 = “always or strongly agree”.
The Psychache Scale scores have adequate psychometric properties, with alpha reliability coef-
ficients over 0.90 when completed by university students. In a sample of Chinese students, the
Cronbach’s α was 0.94 [21]. In this study, the Cronbach’s α of the scale score is 0.96.
Psychological strain. The Psychological Strain Scales (PSS), which showed good validity
and reliability estimates both in Chinese and American college samples, were first developed
in a Chinese sample to measure the level of strain [25]. The PSS consists of the four dimensions
of psychological strains, namely, value strain, aspiration strain, deprivation strain, and coping
strain; each of these dimensions contains 10 items. For example, “I am often confused about
what life means to me” corresponds to value strain; “I wish I had a better job now, but I cannot
realize it according to some reasons” corresponds to aspiration strain; “Compared to others in
my neighborhood (village), I am a poor person” corresponds to deprivation strain; and “Face
is so important to me that I will do everything to protect my public image, even suicide” corre-
sponds to coping strain. Response options for each item were as follows: 1 = never/not me at
all; 2 = rarely/not me; 3 = maybe/not sure; 4 = often/like me; 5 = yes, strongly agree/exactly
like me. The total score for each of the four strains was obtained by summing the total score of
each dimension (10 items). The higher the total score of the PSS was, the greater the level of
psychological strains. In this study, the Cronbach’s α of the scale score is 0.96.
Protective factors
Self-esteem scale. The self-esteem scale (SES), developed by Rosenberg [26], was origi-
nally used to assess adolescents’ overall feelings of self-worth and self-acceptance, is currently
the most widely used self-esteem measure of this construct, and has solid reliability estimate
(Cronbach’s α = 0.84). Although commonly used among adolescents, the scale has also been
used in a Chinese college student sample.27 The SES consists of 10 items, with every item rang-
ing from 1 = “strongly disagree” to 4 = “strongly agree”. The total score ranges from 10 to 40.
Higher scores indicate greater self-esteem. The Chinese SES was tested in China and had
acceptable reliability estimate (Cronbach’s α = 0.71) [27]. In this study, the Cronbach’s α of
the scale score is 0.66.
Purpose in life. The four-item purpose in life test–short form (PLT-SF) was used to mea-
sure the extent to which participants felt their lives had meaning and purpose [28]. The PLT-SF
includes a 7-point Likert-type scale response format. Responses to the items are summed to
obtain a total score ranging from 4 to 28. Higher scores indicate greater perceived meaning/
purpose in life. A Chinese version of the PLT-SF has been shown to have acceptable reliability
estimate (Cronbach’s α = 0.89) [29]. In this study, the Cronbach’s α of the scale score is 0.92.
Statistical analysis
Univariate and multivariate statistical analyses were conducted using the IBM SPSS v.21 (SPSS
Inc.; Armonk, NY). The participant demographics were computed using descriptive statistics.
Stress: Psychological Perspectives
157
Independent samples t-tests and one-way analyses of variance were conducted to test for sig-
nificant mean differences between age groups, gender, economic status, academic results, only
child status, participation in school associations, household registration, year of study, race,
other province, and political party membership. A multiple regression analysis was used to
determine the significant predictors of suicide risk based on SBQ-R total scores which were
log natural transformed. A binary logistic regression was conducted to test the model for the
odd ratios for being at risk of suicide (SBQ-R total score� 7). For all comparisons, differences
were determined using two-tailed tests while p-values less than 0.05 were considered statisti-
cally significant. Missing data were deleted list-wise during the statistical analysis.
Results
Participants
The total number of participants from seven provinces was 13,387. After deleting missing and
out of range data for demographics and the SBQ-R, 11,473 participants were included in the
final analysis (mean age = 20.69±1.35).
Demographic factors
Age. The highest suicidality score was reported by the 19-year-old (y.o.) age group at 1.44
±0.42 and the 24 y.o. age group reported the lowest suicidality at 1.33±0.37 which is signifi-
cantly lower than all the other age groups, F (6, 11,472) = 4.53, p<0.001.
Gender. Female students reported higher suicidality with a mean SBQ-R total score of
1.44 ±0.43 vs. male students with 1.40±0.41, t (9957.61) = -4.61, p<0.001.
Physical health. Students who self-reported “poor” physical health scored the highest in
suicidality at 1.55±0.49 compared to those who reported “normal” and “good” physical health,
F (2, 11,468) = 135.19, p<0.001.
Economic status. Students who self-reported that they have “poor” economic status
scored the highest at 1.46±0.45 followed by “good” and “normal”, F (2, 11,461) = 14.09, p<0.001.
Academic results. Those who reported “poor” academic results had the highest level of
suicidality mean score at 1.57±0.48, followed by “normal” and “good”, F (2, 11,454) = 62.11,
p<0.001. The “good” category scored the lowest among the three categories (p<0.001). There
appears to be a trend effect of the three categories of academic results (i.e. “poor”>“normal”
> “good”) on suicidal behaviors.
Only child. Students who reported that they come from an only child family reported a
higher suicidality mean score at 1.44±0.43 than students who reported that they have siblings
at 1.41±0.42, t (7561.70) = 3.79, p<0.001.
School associations. Students who reported that they participated in school associations
reported a lower suicidality mean score at 1.42±0.42 than those who do not participate in
school activities 1.44±0.43, t (5371.37) = -2.06, p = 0.039.
Household registration. Students with an urban household registration reported a higher
suicidality mean score at 1.46±0.44 compared to students who reported a rural household reg-
istration of 1.39±0.40, t (11,048.17) = 7.95, p<0.001 (Table 1).
Risk and protective factors for suicidality
The results of the multiple linear regression indicated that psychache (β = 0.162, p< 0.001)
and DASS-21 (β = 0.155, p< 0.001) demonstrated the strongest associations with increased
suicidality. Together, the independent variables accounted for 22.4% of the variance, R2 =
0.221, adjusted R2 = 0.219, F (22, 10,455) = 134.32, p<0.001 (Table 2).
Stress: Psychological Perspectives
158
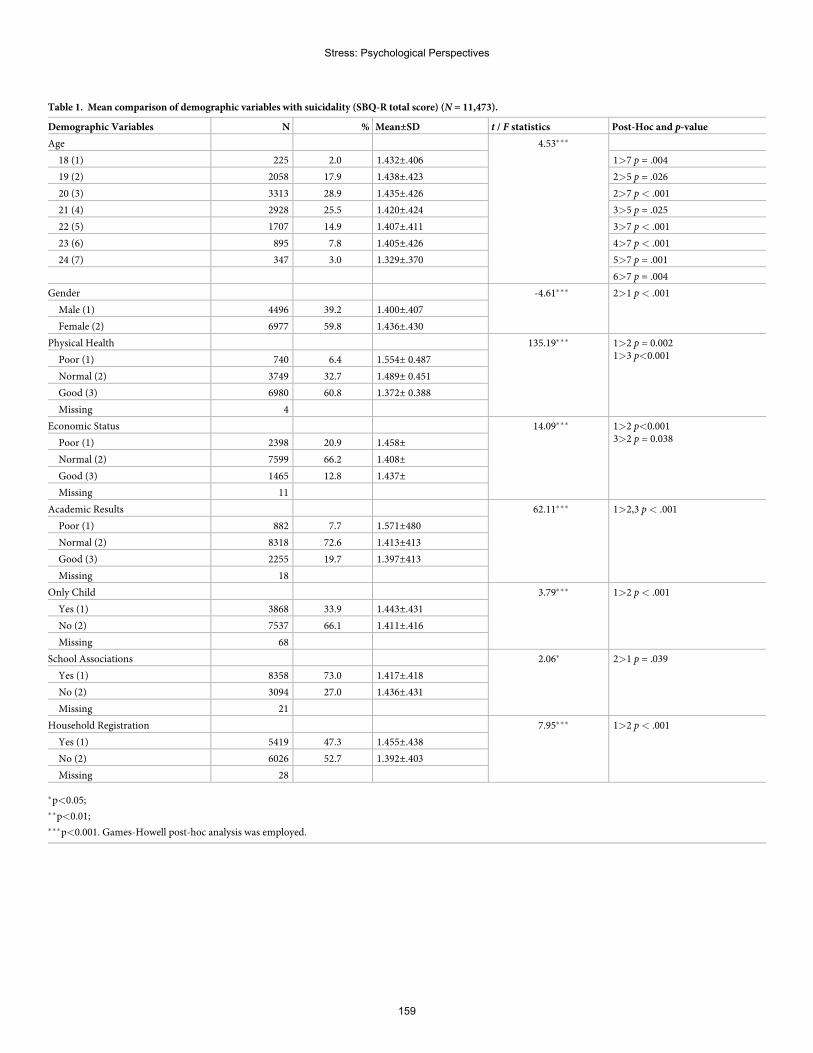
Table 1. Mean comparison of demographic variables with suicidality (SBQ-R total score) (N = 11,473).
Demographic Variables N % Mean±SD t / F statistics Post-Hoc and p-value
Age 4.53���
18 (1) 225 2.0 1.432±.406 1>7 p = .004
19 (2) 2058 17.9 1.438±.423 2>5 p = .026
20 (3) 3313 28.9 1.435±.426 2>7 p< .001
21 (4) 2928 25.5 1.420±.424 3>5 p = .025
22 (5) 1707 14.9 1.407±.411 3>7 p< .001
23 (6) 895 7.8 1.405±.426 4>7 p< .001
24 (7) 347 3.0 1.329±.370 5>7 p = .001
6>7 p = .004
Gender -4.61��� 2>1 p< .001
Male (1) 4496 39.2 1.400±.407
Female (2) 6977 59.8 1.436±.430
Physical Health 135.19��� 1>2 p = 0.0021>3 p<0.001Poor (1) 740 6.4 1.554± 0.487
Normal (2) 3749 32.7 1.489± 0.451
Good (3) 6980 60.8 1.372± 0.388
Missing 4
Economic Status 14.09��� 1>2 p<0.0013>2 p = 0.038Poor (1) 2398 20.9 1.458±
Normal (2) 7599 66.2 1.408±
Good (3) 1465 12.8 1.437±
Missing 11
Academic Results 62.11��� 1>2,3 p< .001
Poor (1) 882 7.7 1.571±480
Normal (2) 8318 72.6 1.413±413
Good (3) 2255 19.7 1.397±413
Missing 18
Only Child 3.79��� 1>2 p< .001
Yes (1) 3868 33.9 1.443±.431
No (2) 7537 66.1 1.411±.416
Missing 68
School Associations 2.06� 2>1 p = .039
Yes (1) 8358 73.0 1.417±.418
No (2) 3094 27.0 1.436±.431
Missing 21
Household Registration 7.95��� 1>2 p< .001
Yes (1) 5419 47.3 1.455±.438
No (2) 6026 52.7 1.392±.403
Missing 28
�p<0.05;��p<0.01;���p<0.001. Games-Howell post-hoc analysis was employed.
Stress: Psychological Perspectives
159
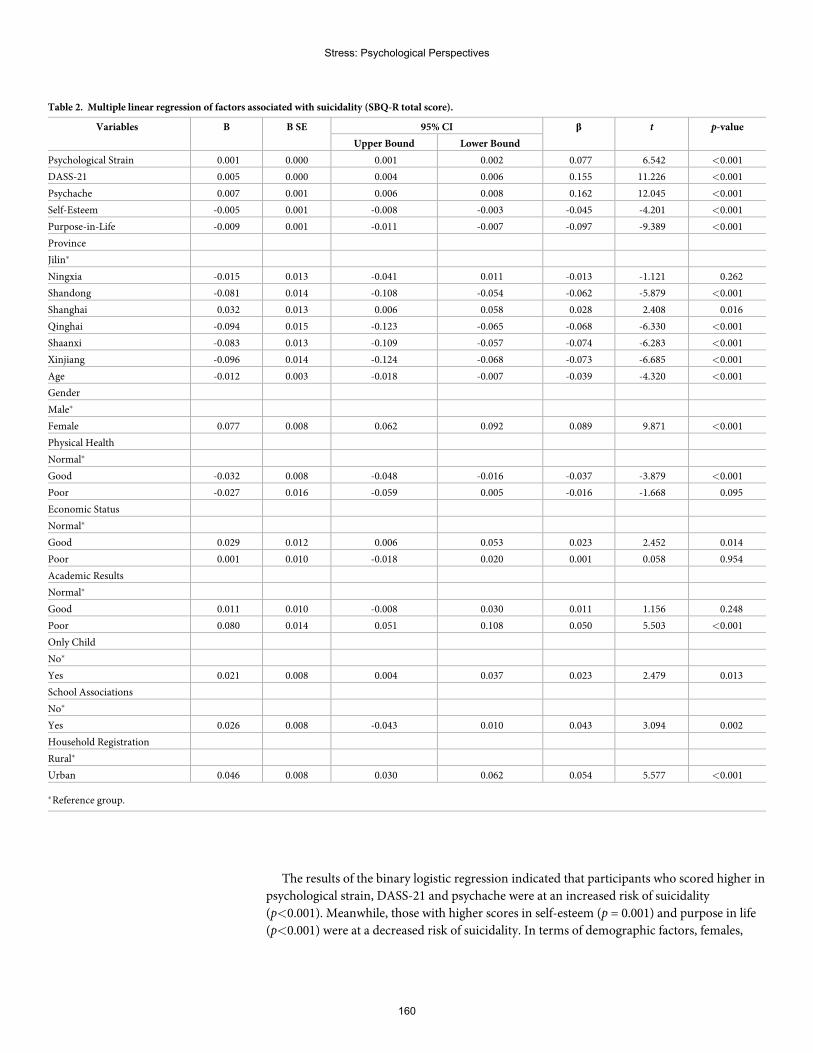
The results of the binary logistic regression indicated that participants who scored higher in
psychological strain, DASS-21 and psychache were at an increased risk of suicidality
(p<0.001). Meanwhile, those with higher scores in self-esteem (p = 0.001) and purpose in life
(p<0.001) were at a decreased risk of suicidality. In terms of demographic factors, females,
Table 2. Multiple linear regression of factors associated with suicidality (SBQ-R total score).
Variables B B SE 95% CI β t p-value
Upper Bound Lower Bound
Psychological Strain 0.001 0.000 0.001 0.002 0.077 6.542 <0.001
DASS-21 0.005 0.000 0.004 0.006 0.155 11.226 <0.001
Psychache 0.007 0.001 0.006 0.008 0.162 12.045 <0.001
Self-Esteem -0.005 0.001 -0.008 -0.003 -0.045 -4.201 <0.001
Purpose-in-Life -0.009 0.001 -0.011 -0.007 -0.097 -9.389 <0.001
Province
Jilin�
Ningxia -0.015 0.013 -0.041 0.011 -0.013 -1.121 0.262
Shandong -0.081 0.014 -0.108 -0.054 -0.062 -5.879 <0.001
Shanghai 0.032 0.013 0.006 0.058 0.028 2.408 0.016
Qinghai -0.094 0.015 -0.123 -0.065 -0.068 -6.330 <0.001
Shaanxi -0.083 0.013 -0.109 -0.057 -0.074 -6.283 <0.001
Xinjiang -0.096 0.014 -0.124 -0.068 -0.073 -6.685 <0.001
Age -0.012 0.003 -0.018 -0.007 -0.039 -4.320 <0.001
Gender
Male�
Female 0.077 0.008 0.062 0.092 0.089 9.871 <0.001
Physical Health
Normal�
Good -0.032 0.008 -0.048 -0.016 -0.037 -3.879 <0.001
Poor -0.027 0.016 -0.059 0.005 -0.016 -1.668 0.095
Economic Status
Normal�
Good 0.029 0.012 0.006 0.053 0.023 2.452 0.014
Poor 0.001 0.010 -0.018 0.020 0.001 0.058 0.954
Academic Results
Normal�
Good 0.011 0.010 -0.008 0.030 0.011 1.156 0.248
Poor 0.080 0.014 0.051 0.108 0.050 5.503 <0.001
Only Child
No�
Yes 0.021 0.008 0.004 0.037 0.023 2.479 0.013
School Associations
No�
Yes 0.026 0.008 -0.043 0.010 0.043 3.094 0.002
Household Registration
Rural�
Urban 0.046 0.008 0.030 0.062 0.054 5.577 <0.001
�Reference group.
Stress: Psychological Perspectives
160
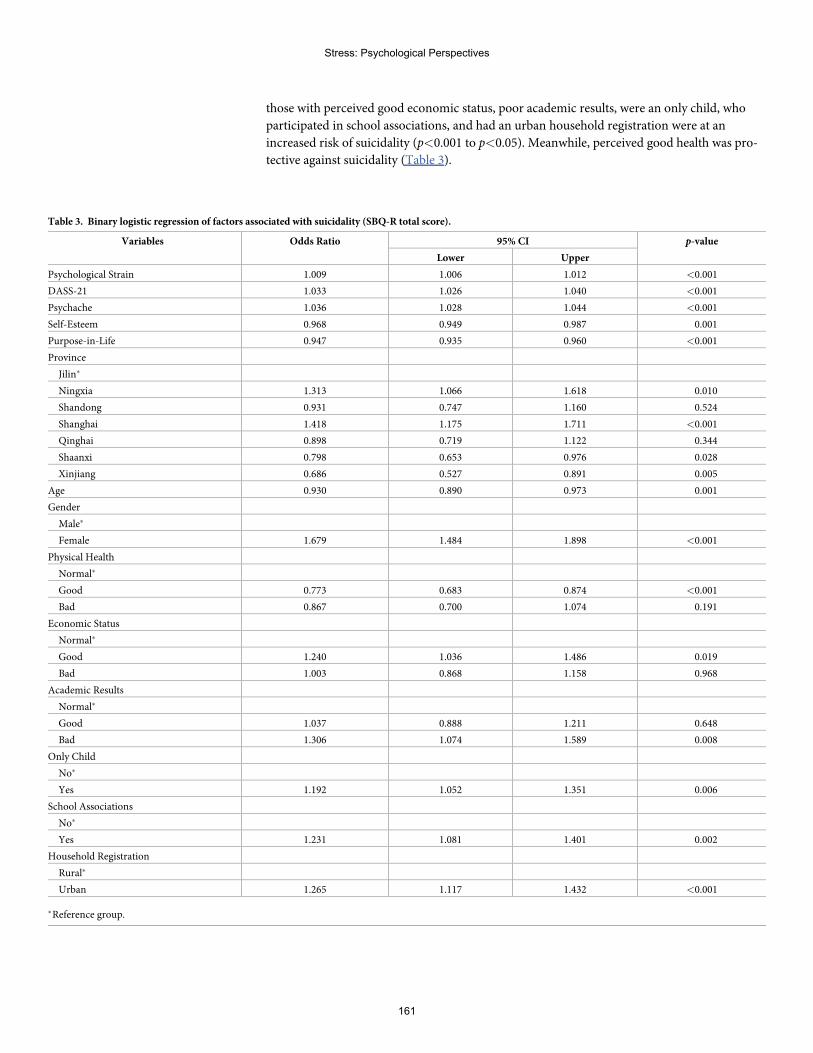
those with perceived good economic status, poor academic results, were an only child, who
participated in school associations, and had an urban household registration were at an
increased risk of suicidality (p<0.001 to p<0.05). Meanwhile, perceived good health was pro-
tective against suicidality (Table 3).
Table 3. Binary logistic regression of factors associated with suicidality (SBQ-R total score).
Variables Odds Ratio 95% CI p-value
Lower Upper
Psychological Strain 1.009 1.006 1.012 <0.001
DASS-21 1.033 1.026 1.040 <0.001
Psychache 1.036 1.028 1.044 <0.001
Self-Esteem 0.968 0.949 0.987 0.001
Purpose-in-Life 0.947 0.935 0.960 <0.001
Province
Jilin�
Ningxia 1.313 1.066 1.618 0.010
Shandong 0.931 0.747 1.160 0.524
Shanghai 1.418 1.175 1.711 <0.001
Qinghai 0.898 0.719 1.122 0.344
Shaanxi 0.798 0.653 0.976 0.028
Xinjiang 0.686 0.527 0.891 0.005
Age 0.930 0.890 0.973 0.001
Gender
Male�
Female 1.679 1.484 1.898 <0.001
Physical Health
Normal�
Good 0.773 0.683 0.874 <0.001
Bad 0.867 0.700 1.074 0.191
Economic Status
Normal�
Good 1.240 1.036 1.486 0.019
Bad 1.003 0.868 1.158 0.968
Academic Results
Normal�
Good 1.037 0.888 1.211 0.648
Bad 1.306 1.074 1.589 0.008
Only Child
No�
Yes 1.192 1.052 1.351 0.006
School Associations
No�
Yes 1.231 1.081 1.401 0.002
Household Registration
Rural�
Urban 1.265 1.117 1.432 <0.001
�Reference group.
Stress: Psychological Perspectives
161
Discussion
Our findings indicated that higher scores in the psychological risk factors (psychological strain,
depression, anxiety, stress, and psychache) and lower scores in the protective factors for suicid-
ality (self-esteem and purpose in life) were associated with increased suicidality among under-
graduate students in China. This is similar to the results of a number of studies carried out in
the West [30–33]. However, the “negative life events” experienced by Chinese undergraduate
students may differ, given that China has a different socio-political environment, educational
approach, and even campus administration style [4].
In terms of demographic factors, females were at an increased suicide risk, a finding which
is replicated in a number of Western and Chinese studies on college students [15 34–36]. This
may be due a number of factors, including a brooding ruminative style among females [35] or
wider sociocultural issues affecting females such as gender inequality, especially among female
individuals who adhere to Confucian ethics [37–39]. Younger college students may be more
susceptible to developing suicidality as they may still be transitioning to college life [40]. Per-
ceived good physical health was protective of suicide. The late adolescence and young adult-
hood are considered the healthiest periods of an individual’s life [41]. Therefore, perceived
poor health could be very distressing for this age group.
Undergraduates with an urban household registration reported higher suicidality compared
to those with a rural household registration. This is in contrast with an earlier study which
indicated no difference in the suicidality levels between rural and urban Chinese college stu-
dents [42], or higher levels of suicidality among rural Chinese college students [10]. The find-
ings may reflect the narrowing of rural:urban ratios in suicide rate, which has traditionally
been higher among the rural Chinese [43].
Another interesting finding is that participants who reported a good economic status were
at an increased risk of suicidality, as were those who participated in school activities. These
results are inconsistent with past findings, as past studies have indicated that students from a
lower socioeconomic background reported higher suicidality levels [44]. Participation in
school activities was seen as being protective of suicidality because exposure to a wider social
circle may increase social support [45]. Further investigations need to be conducted to test the
possible mediating variables in the relationship between socioeconomic background and
school activities with suicidality.
In the past 20 years, a decrease of suicide rates by 43% in China from 14.1 in 2000 to 8.1 per
100,000 population in 2016 has been recorded [46]. Compared to the US, college students in
China have reported lower suicide-related behaviors risk [47]. The public health implementa-
tion of targeted suicide prevention activities may have worked synergistically to lower the sui-
cide rates, apart from the possible effects of socioeconomic development. Examples include
regulatory changes in the use of pesticides, or the implementation of the lock-box method for
safe pesticide storage [48], the success of which was facilitated by urbanisation and migration
from rural areas to the cities, where there is less access to pesticides. The success of such means
restriction policies has also been successfully implemented in other Lower- and Middle-
Income Countries such as India [49], and may inform firearm regulation policies in the US
[50].
Conclusion
Understanding the common risk and protective factors for suicide among Chinese undergrad-
uate college students is crucial in building a resilient and appropriate suicide prevention pro-
gramme for this segment of society. The identified protective factors such as self-esteem and
Stress: Psychological Perspectives
162
purpose in life could be reinforced through various suicide prevention and character-building
curricula. Early intervention on this population could have long-term positive consequences.
Limitations
This is a cross-sectional study across seven provinces, thus causality could not be inferred. Pro-
vincial comparisons were not conducted as only one urban university was selected for each
province. The results are therefore not representative of Chinese college students. There may
be other important risk and protective factors for suicide which are not included in this study
due to questionnaire length constraints. For example, what students do during their free time
was not taken into consideration. The additional stress from working or caring for another
individual may affect their emotional health compared to those who do not have such activi-
ties. In addition, the time of administering survey should be considered as specific times dur-
ing the semester (e.g. before exams) may be associated with more stress and negative
emotions. Therefore, future studies should include other risk factors facing college students
such as parental and other relationships and personal time activities. The identification of
stressful timepoints would enable school authorities to assist with timing for implementing
more suicide intervention activities. A representative sampling of Chinese universities should
be undertaken in the future to ensure the wider generalizability of the results.
Acknowledgments
The authors would like to thank the seven collaborators and associates in China for their coor-
dination in data collection for each province: Prof. Cai Honglan (The People Hospital of Qing-
hai Province, Qinghai Minzu College, Qinghai Province), Prof. Jia Cunxian (Department of
Epidemiology, School of Public Health, Shandong University; Shandong University Center for
Suicide Prevention Research, Shandong Province), Prof. Kou Changgui (Department of Epide-
miology & Biostatistics, School of Public Health, Jilin University, Jilin Province), Prof. Liu
Changlin (Shanghai University), Prof. Liu Jiamin (Xinjiang Medical University, Xinjiang
Autonomous Region), Prof. Liu Qiling (Department of Epidemiology and Health Statistics,
School of Public Health, Shaanxi University of Chinese Medicine, Shaanxi Province), and
Prof. Wang Zhizhong (Department of Epidemiology and Health Statistics, School of Public
Health, Ningxia Medical University, Ningxia Autonomous Region). The authors also wish to
thank the lecturers, post-graduate students, and the participants involved in this study. We
wish to thank Prof. Wang Zhizhong who participated in the research design and the data coor-
dination work in China.
Author Contributions
Conceptualization: Bob Lew, Augustine Osman.
Data curation: Bob Lew.
Formal analysis: Bob Lew, Augustine Osman, Ching Sin Siau, Caryn Mei Hsien Chan.
Investigation: Bob Lew.
Methodology: Bob Lew, Augustine Osman, Ching Sin Siau, Caryn Mei Hsien Chan.
Stress: Psychological Perspectives
163
Project administration: Bob Lew.
Resources: Bob Lew.
Supervision:Mansor Abu Talib.
Writing – original draft: Bob Lew, Augustine Osman, Mansor Abu Talib, Ching Sin Siau,
Caryn Mei Hsien Chan.
Writing – review & editing: Bob Lew, Kairi Kõlves, Augustine Osman, Mansor Abu Talib,
Norhayati Ibrahim, Ching Sin Siau, Caryn Mei Hsien Chan.
References1. World Health Organization. Suicide Rates. Geneva: World Health Organization. https://www.who.int/
gho/mental_health/suicide_rates/en/. Accessed December 24, 2019.
2. Cerel J, BrownMM, Maple M, Singleton M, van de Venne J, Moore M, et al. Howmany people areexposed to suicide? Not six. Suicide Life Threat Behav. 2019; 49(2):529–34. https://doi.org/10.1111/sltb.12450 PMID: 29512876
3. World Bank (2019). Gross Domestic Products. https://databank.worldbank.org/data/download/GDP.pdf. Accessed December 24, 2019.
4. Zhang J. Suicide Reduction in China. Am J Public Health. 2019; 109(11):1533. https://doi.org/10.2105/AJPH.2019.305367 PMID: 31577505
5. Fei F, Liu H, Leuba SI, Li Y, Hu R, Yu M, et al. Suicide rates in Zhejiang Province, China, from 2006 to2016: a population-based study. J Epidemiol Community Health. 2019:jech-2018.
6. Zhao S, Zhang J. Suicide risks among adolescents and young adults in rural China. Int J Environ ResPublic Health. 2015; 12(1):131–45.
7. Kinchin I, Doran C. The cost of youth suicide in Australia. Int J Environ Res Public Health. 2018; 15(4):672.
8. Zhang X,Wang H, Xia Y, Liu X, Jung E. Stress, coping and suicide ideation in Chinese college students.J Adolesc. 2012; 35(3):683–90. https://doi.org/10.1016/j.adolescence.2011.10.003 PMID: 22032975
9. Wang L, He CZ, Yu YM, Qiu XH, Yang XX, Qiao ZX, et al. Associations between impulsivity, aggres-sion, and suicide in Chinese college students. BMC Public Health. 2014; 14(1):551.
10. Meng H, Li J, Loerbroks A, Wu J, Chen H. Rural/urban background, depression and suicidal ideation inChinese college students: a cross-sectional study. PLoS One. 2013; 8(8):e71313. https://doi.org/10.1371/journal.pone.0071313 PMID: 23977015
11. Sobowale K, Zhou AN, Fan J, Liu N, Sherer R. Depression and suicidal ideation in medical students inChina: a call for wellness curricula. Int J Med Educ. 2014; 5:31. https://doi.org/10.5116/ijme.52e3.a465PMID: 25341209
12. Xu Y, Chi X, Chen S, Qi J, Zhang P, Yang Y. Prevalence and correlates of depression among collegenursing students in China. Nurs Educ Today. 2014; 34(6):e7–12.
13. You Z, ChenM, Yang S, Zhou Z, Qin P. Childhood adversity, recent life stressors and suicidal behaviorin Chinese college students. PLoS One. 2014; 9(3):e86672. https://doi.org/10.1371/journal.pone.0086672 PMID: 24681891
14. Chen L, Wang L, Qiu XH, Yang XX, Qiao ZX, Yang YJ, et al. Depression among Chinese university stu-dents: prevalence and socio-demographic correlates. PLoS One. 2013; 8(3):e58379. https://doi.org/10.1371/journal.pone.0058379 PMID: 23516468
15. Zhai H, Bai B, Chen L, Han D,Wang L, Qiao Z, et al. Correlation between family environment and sui-cidal ideation in university students in China. Int J Environ Res Public Health. 2015; 12(2):1412–24.https://doi.org/10.3390/ijerph120201412 PMID: 25633031
16. Sun L, Zhou C, Xu L, Li S, Kong F, Chu J. Suicidal ideation, plans and attempts amongmedical collegestudents in china: the effect of their parental characteristics. Psychiatry Res. 2017; 247:139–43. https://doi.org/10.1016/j.psychres.2016.11.024 PMID: 27889604
17. Tang F, Qin P. Influence of personal social network and coping skills on risk for suicidal ideation in Chi-nese university students. PLoS One. 2015; 10(3):e0121023. https://doi.org/10.1371/journal.pone.0121023 PMID: 25803665
18. Zhao J, Xiao R, Yang X, Zhang X. Suicide exposure and its modulatory effects on relations between lifeevents and suicide risk in Chinese college students. Nan fang yi ke da xue xue bao = Journal of South-ern Medical University. 2013; 33(8):1111–6.
Stress: Psychological Perspectives
164
19. Wang YG, Chen S, Xu ZM, Shen ZH,Wang YQ, He XY, et al. Family history of suicide and high motorimpulsivity distinguish suicide attempters from suicide ideators among college students. J PsychiatrRes. 2017; 90:21–5. https://doi.org/10.1016/j.jpsychires.2017.02.006 PMID: 28214643
20. Osman A, Bagge CL, Gutierrez PM, Konick LC, Kopper BA, Barrios FX. The Suicidal Behaviors Ques-tionnaire-Revised (SBQ-R): Validation with clinical and nonclinical samples. Assessment. 2001; 8(4):443–54. https://doi.org/10.1177/107319110100800409 PMID: 11785588
21. Lew B, Huen J, Yu P, Yuan L, Wang DF, Ping F, et al. Associations between depression, anxiety,stress, hopelessness, subjective well-being, coping styles and suicide in Chinese university students.PloS One. 2019; 14(7).
22. Lovibond PF, Lovibond SH. The structure of negative emotional states: Comparison of the DepressionAnxiety Stress Scales (DASS) with the Beck Depression and Anxiety Inventories. Behav Res Ther.1995; 33(3):335–43. https://doi.org/10.1016/0005-7967(94)00075-u PMID: 7726811
23. Cheng Q, Kwok C, Zhu T, Guan L, Yip P. Suicide communication on social media and its psychologicalmechanisms: an examination of Chinese microblog users. Int J Environ Res Public Health. 2015; 12(9):11506–27. https://doi.org/10.3390/ijerph120911506 PMID: 26378566
24. Holden RR, Mehta K, Cunningham EJ, McLeod LD. Development and preliminary validation of a scaleof psychache. Can J Behav Sci. 2001; 33(4):224.
25. Zhang J, Lester D. Psychological tensions found in suicide notes: A test for the strain theory of suicide.Arch Suicide Res. 2008; 12(1):67–73. https://doi.org/10.1080/13811110701800962 PMID: 18240036
26. Rosenberg M. Society and the adolescent self-image. Princeton, NJ: Princeton University Press;1965.
27. Zhang J, Norvilitis JM. Measuring Chinese psychological well-being with Western developed instru-ments. J Pers Assess. 2002; 79(3):492–511. https://doi.org/10.1207/S15327752JPA7903_06 PMID:12511017
28. Schulenberg SE, Schnetzer LW, Buchanan EM. The Purpose in Life Test-Short Form: developmentand psychometric support. J Happiness Stud. 2011; 12(5):861–76.
29. Law BM. Psychometric properties of the existence subscale of the Purpose in Life questionnaire for Chi-nese adolescents in Hong Kong. Scientific World Journal. 2012;2012.
30. Zhang J, Liu Y, Sun L. Psychological strain and suicidal ideation: A comparison between Chinese andUS college students. Psychiatry Res. 2017; 255:256–62. https://doi.org/10.1016/j.psychres.2017.05.046 PMID: 28595148
31. Verrocchio MC, Carrozzino D, Marchetti D, Andreasson K, Fulcheri M, Bech P. Mental pain and suicide:A systematic review of the literature. Front Psychiatry. 2016; 7:108. https://doi.org/10.3389/fpsyt.2016.00108 PMID: 27378956
32. Wilburn VR, Smith DE. Stress, self-esteem, and suicidal ideation in late adolescents. Adolescence.2005; 40(157).
33. Straus E, Norman SB, Tripp JC, Pitts M, Pietrzak RH. Purpose in Life and Conscientiousness ProtectAgainst the Development of Suicidal Ideation in USMilitary VeteransWith PTSD and MDD: ResultsFrom the National Health and Resilience in Veterans Study. Chronic Stress. 2019;3:2470547019872172.
34. Mortier P, Cuijpers P, Kiekens G, Auerbach RP, Demyttenaere K, Green JG, et al. The prevalence ofsuicidal thoughts and behaviours among college students: a meta-analysis. Psychol Med. 2018; 48(4):554–65. https://doi.org/10.1017/S0033291717002215 PMID: 28805169
35. Polanco-Roman L, Gomez J, Miranda R, Jeglic E. Stress-related symptoms and suicidal ideation:The roles of rumination and depressive symptoms vary by gender. Cogn Therapy Res. 2016; 40(5):606–16.
36. Mortier P, Auerbach RP, Alonso J, Bantjes J, Benjet C, Cuijpers P, et al. Suicidal thoughts and behav-iors among first-year college students: Results from theWMH-ICS project. J Am Acad Child AdolescPsychiatry. 2018; 57(4):263–73. https://doi.org/10.1016/j.jaac.2018.01.018 PMID: 29588052
37. Chang Q, Yip PS, Chen YY. Gender inequality and suicide gender ratios in the world. J Affect Disord.2019; 243:297–304. https://doi.org/10.1016/j.jad.2018.09.032 PMID: 30261445
38. Jia CX, Zhang J. Confucian values, negative life events, and rural young suicide with major depressionin China. OMEGA. 2017; 76(1):3–14. https://doi.org/10.1177/0030222815575014 PMID: 28969515
39. Zhao J, Chi Y, Ju Y, Liu X, Wang J, Liu X, et al. Shame and suicidal ideation among undergraduates inChina: the mediating effect of thwarted belongingness and perceived burdensomeness. Int J EnvironRes Public Health. 2020; 17(7):2360.
40. Wyatt TJ, Oswalt SB, Ochoa Y. Mental Health and Academic Performance of First-Year College Stu-dents. Int J Higher Educ. 2017; 6(3):178–87.
Stress: Psychological Perspectives
165
41. Bauldry S, ShanahanMJ, Boardman JD, Miech RA, Macmillan R. A life course model of self-ratedhealth through adolescence and young adulthood. Soc Sci Med. 2012; 75(7):1311–1320. https://doi.org/10.1016/j.socscimed.2012.05.017 PMID: 22726620
42. Zhang J, Qi Q, Delprino RP. Psychological health among Chinese college students: a rural/urban com-parison. J Child Adolesc Ment Health. 2017; 29(2):179–86. https://doi.org/10.2989/17280583.2017.1345745 PMID: 28974168
43. Sha F, Chang Q, Law YW, Hong Q, Yip PS. Suicide rates in China, 2004–2014: comparing data fromtwo sample-based mortality surveillance systems. BMC Public Health. 2018; 18(1):239. https://doi.org/10.1186/s12889-018-5161-y
44. Liu S, Page A, Yin P, Astell-Burt T, Feng X, Liu Y, et al. Spatiotemporal variation and social determi-nants of suicide in China, 2006–2012: findings from a nationally representative mortality surveillancesystem. Psychol Med. 2015; 45(15):3259–68. https://doi.org/10.1017/S0033291715001269
45. Bauer BW, Capron DW,Ward-Ciesielski E, Gustafsson HC, Doyle C. Extracurricular activities are asso-ciated with lower suicidality through decreased thwarted belongingness in young adults. Arch SuicideRes. 2018; 22(4):665–78.
46. World Health Organization. Suicide Rates by Country 2016. http://www.who.int/gho/mental_health/suicide_rates/en/ (accessedMay 19, 2020)
47. Lew B, Osman A, Huen JM, Siau CS, Talib MA, Cunxian J, et al. A comparison between American andChinese college students on suicide-related behavior parameters. Int J Clin Health Psychol. 2020.https://doi.org/10.1016/j.ijchp.2020.03.005 PMID: 32550850
48. Page A, Liu S, Gunnell D, Astell-Burt T, Feng X, Wang L, et al. Suicide by pesticide poisoning remains apriority for suicide prevention in China: Analysis of national mortality trends 2006–2013. J Affect Disord.2017; 208:418–23. https://doi.org/10.1016/j.jad.2016.10.047
49. Bonvoisin T, Utyasheva L, Knipe D, Gunnell D, Eddleston M. Suicide by pesticide poisoning in India: areview of pesticide regulations and their impact on suicide trends. BMC public health. 2020 Dec; 20(1):1–6.
50. Kposowa A, Hamilton D, Wang K. Impact of firearm availability and gun regulation on state suiciderates. Suicide Life Threat Behav. 2016; 46(6):678–96. https://doi.org/10.1111/sltb.12243 PMID:26999372
Stress: Psychological Perspectives
166
Elevated psychological distress inundergraduate and graduate entry studentsentering first year medical school
Sean R. AtkinsonID*
School of Rural Health, Monash University, Churchill, Australia
Abstract
Background
Psychological distress in medical students is a global issue and poses a risk to their health,
academic performance, and ability to care for patients as clinicians. There has been limited
research on psychological distress levels in students prior to starting medicine and no direct
comparison between undergraduate and graduate-entry students.
Methods
Psychological distress was assessed using the 21-item Depression Anxiety and Stress
Scale in 168 undergraduate-entry and 84 graduate-entry medical students at two separated
campuses of the same university in the orientation week prior to starting classes. Mean
scores and severity proportions were compared between the two cohorts of students.
Demographic data was also collected and compared to distress scores using subgroup
analysis.
Results
The response rate for the study was 60.9%. The majority of undergraduate and graduate-
entry medical students were within the normal limits for depression (67.2% versus 70.2%, p
= 0.63), anxiety (56.5% versus 44.0%, p = 0.06), and stress scores (74.4% versus 64.2%, p
= 0.10). There was no significant difference between severity groups except for severe
stress (2.3% versus 9.5%, p = 0.01). The mean scores of the clinically distressed groups
indicated moderate levels of depression, moderate anxiety, and moderate stress scores.
There were no significant differences between undergraduate or graduate-entry students
for depressive (�x = 17.02 versus 15.76, p = 0.43), anxiety (�x = 14.22 versus 13.28, p = 0.39),
and stress scores (�x = 20.83 versus 22.46, p = 0.24). Female gender and self-believed
financial concerns were found be associated with higher levels stress in graduate entry
students.
Conclusions
The majority of medical students enter medical school with normal levels of psychological
distress. However, a large number of undergraduate and graduate-entry medical students
Editor:Markos Tesfaye, St. Paul’s Hospital
MilleniumMedical College, ETHIOPIA
Funding: The author received no specific funding
for this research.
13
167
have significant levels of depressive, anxiety, and stress levels, without a significant differ-
ence between undergraduate or graduate-entry students. There are several limitation of this
study but the results suggest that education and intervention may be required to support stu-
dents from the earliest weeks of medical school.
Introduction
Medical students have higher rates of stress and mental health problems than their matched
peers and it appears to be a global phenomenon [1–3]. Research suggests that at least one third
and possibly up to one half of medical students show some form of psychological distress dur-
ing medical school [3]. Risk factors put forth as contributing to distress, include perfectionist
and neurotic traits, academic workload, sleep issues, exposure illness and death of patients,
culture, and parenting styles [3–5].
Identifying students in psychological distress is vital as it has been associated with poor aca-
demic performance, decreased empathy, medical errors, depression, anxiety, and suicidality
[6–9]. Research has focussed on students already at medical school but there is less research on
students prior to commencement and scarce data comparing undergraduate to graduate-entry
students [10]. This information would establish whether students start the course in psycho-
logical distress or whether it becomes the result of undertaking the course.
In Australia there are two entry points into medical school. Undergraduate students enter
the course from high school and graduate-entry students who enter the course after obtaining
an undergraduate degree [11]. The coping styles differ between these cohorts and so it is
important to consider both groups when performing research [12].
Aim
The aim of this research was to determine the baseline level of psychological distress in gradu-
ate and undergraduate students prior to commencing their first year of medical school.
Method
Participants
Participants were invited to join in the study from two cohorts of first year medical students
from one Australian university in January 2019. Each cohort attended a different campus with
undergraduate-entry students from the urban campus and graduate-entry students from the
rural campus. The undergraduate cohort is larger than the graduate-entry group based upon
student intake each year.
Sample size
A sample size calculation was performed it was determined that the study needed 200 com-
pleted surveys to achieve a 95% confidence level with a presumed population proportion of
50%.
Inclusion and exclusion criteria
To be included participants had to be a first year medical student attending the university at
either campus. Students were excluded if they had previously been a first year medical student
at another university or were repeating the year.
Competing interests: The authors have declared
that no competing interests exist.
Stress: Psychological Perspectives
168
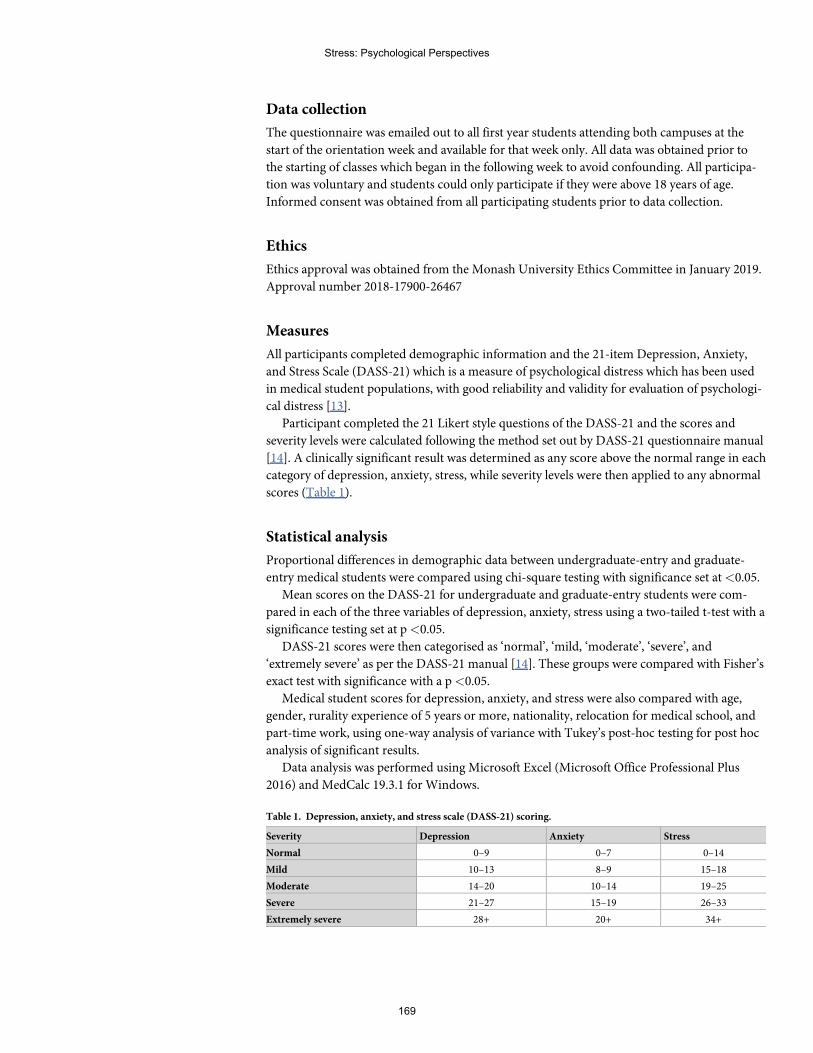
Data collection
The questionnaire was emailed out to all first year students attending both campuses at the
start of the orientation week and available for that week only. All data was obtained prior to
the starting of classes which began in the following week to avoid confounding. All participa-
tion was voluntary and students could only participate if they were above 18 years of age.
Informed consent was obtained from all participating students prior to data collection.
Ethics
Ethics approval was obtained from the Monash University Ethics Committee in January 2019.
Approval number 2018-17900-26467
Measures
All participants completed demographic information and the 21-item Depression, Anxiety,
and Stress Scale (DASS-21) which is a measure of psychological distress which has been used
in medical student populations, with good reliability and validity for evaluation of psychologi-
cal distress [13].
Participant completed the 21 Likert style questions of the DASS-21 and the scores and
severity levels were calculated following the method set out by DASS-21 questionnaire manual
[14]. A clinically significant result was determined as any score above the normal range in each
category of depression, anxiety, stress, while severity levels were then applied to any abnormal
scores (Table 1).
Statistical analysis
Proportional differences in demographic data between undergraduate-entry and graduate-
entry medical students were compared using chi-square testing with significance set at<0.05.
Mean scores on the DASS-21 for undergraduate and graduate-entry students were com-
pared in each of the three variables of depression, anxiety, stress using a two-tailed t-test with a
significance testing set at p<0.05.
DASS-21 scores were then categorised as ‘normal’, ‘mild, ‘moderate’, ‘severe’, and
‘extremely severe’ as per the DASS-21 manual [14]. These groups were compared with Fisher’s
exact test with significance with a p<0.05.
Medical student scores for depression, anxiety, and stress were also compared with age,
gender, rurality experience of 5 years or more, nationality, relocation for medical school, and
part-time work, using one-way analysis of variance with Tukey’s post-hoc testing for post hoc
analysis of significant results.
Data analysis was performed using Microsoft Excel (Microsoft Office Professional Plus
2016) and MedCalc 19.3.1 for Windows.
Table 1. Depression, anxiety, and stress scale (DASS-21) scoring.
Severity Depression Anxiety Stress
Normal 0–9 0–7 0–14
Mild 10–13 8–9 15–18
Moderate 14–20 10–14 19–25
Severe 21–27 15–19 26–33
Extremely severe 28+ 20+ 34+
Stress: Psychological Perspectives
169
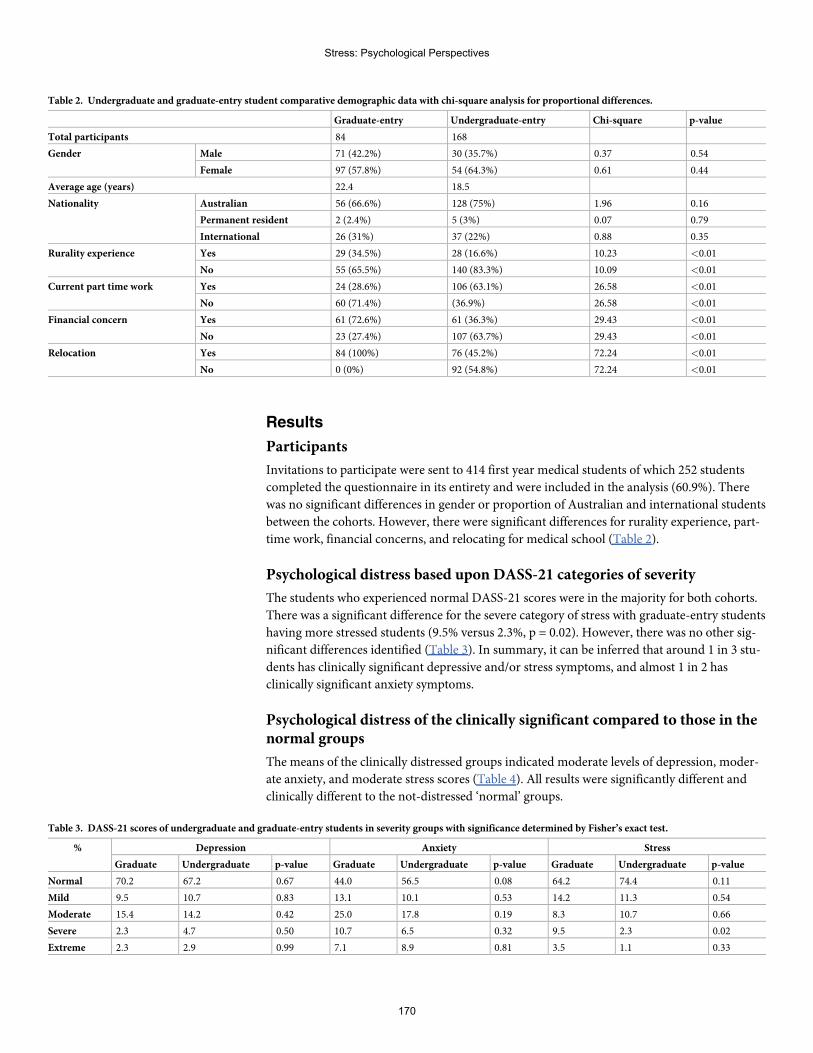
Results
Participants
Invitations to participate were sent to 414 first year medical students of which 252 students
completed the questionnaire in its entirety and were included in the analysis (60.9%). There
was no significant differences in gender or proportion of Australian and international students
between the cohorts. However, there were significant differences for rurality experience, part-
time work, financial concerns, and relocating for medical school (Table 2).
Psychological distress based upon DASS-21 categories of severity
The students who experienced normal DASS-21 scores were in the majority for both cohorts.
There was a significant difference for the severe category of stress with graduate-entry students
having more stressed students (9.5% versus 2.3%, p = 0.02). However, there was no other sig-
nificant differences identified (Table 3). In summary, it can be inferred that around 1 in 3 stu-
dents has clinically significant depressive and/or stress symptoms, and almost 1 in 2 has
clinically significant anxiety symptoms.
Psychological distress of the clinically significant compared to those in thenormal groups
The means of the clinically distressed groups indicated moderate levels of depression, moder-
ate anxiety, and moderate stress scores (Table 4). All results were significantly different and
clinically different to the not-distressed ‘normal’ groups.
Table 2. Undergraduate and graduate-entry student comparative demographic data with chi-square analysis for proportional differences.
Graduate-entry Undergraduate-entry Chi-square p-value
Total participants 84 168
Gender Male 71 (42.2%) 30 (35.7%) 0.37 0.54
Female 97 (57.8%) 54 (64.3%) 0.61 0.44
Average age (years) 22.4 18.5
Nationality Australian 56 (66.6%) 128 (75%) 1.96 0.16
Permanent resident 2 (2.4%) 5 (3%) 0.07 0.79
International 26 (31%) 37 (22%) 0.88 0.35
Rurality experience Yes 29 (34.5%) 28 (16.6%) 10.23 <0.01
No 55 (65.5%) 140 (83.3%) 10.09 <0.01
Current part time work Yes 24 (28.6%) 106 (63.1%) 26.58 <0.01
No 60 (71.4%) (36.9%) 26.58 <0.01
Financial concern Yes 61 (72.6%) 61 (36.3%) 29.43 <0.01
No 23 (27.4%) 107 (63.7%) 29.43 <0.01
Relocation Yes 84 (100%) 76 (45.2%) 72.24 <0.01
No 0 (0%) 92 (54.8%) 72.24 <0.01
Table 3. DASS-21 scores of undergraduate and graduate-entry students in severity groups with significance determined by Fisher’s exact test.
% Depression Anxiety Stress
Graduate Undergraduate p-value Graduate Undergraduate p-value Graduate Undergraduate p-value
Normal 70.2 67.2 0.67 44.0 56.5 0.08 64.2 74.4 0.11
Mild 9.5 10.7 0.83 13.1 10.1 0.53 14.2 11.3 0.54
Moderate 15.4 14.2 0.42 25.0 17.8 0.19 8.3 10.7 0.66
Severe 2.3 4.7 0.50 10.7 6.5 0.32 9.5 2.3 0.02
Extreme 2.3 2.9 0.99 7.1 8.9 0.81 3.5 1.1 0.33
Stress: Psychological Perspectives
170
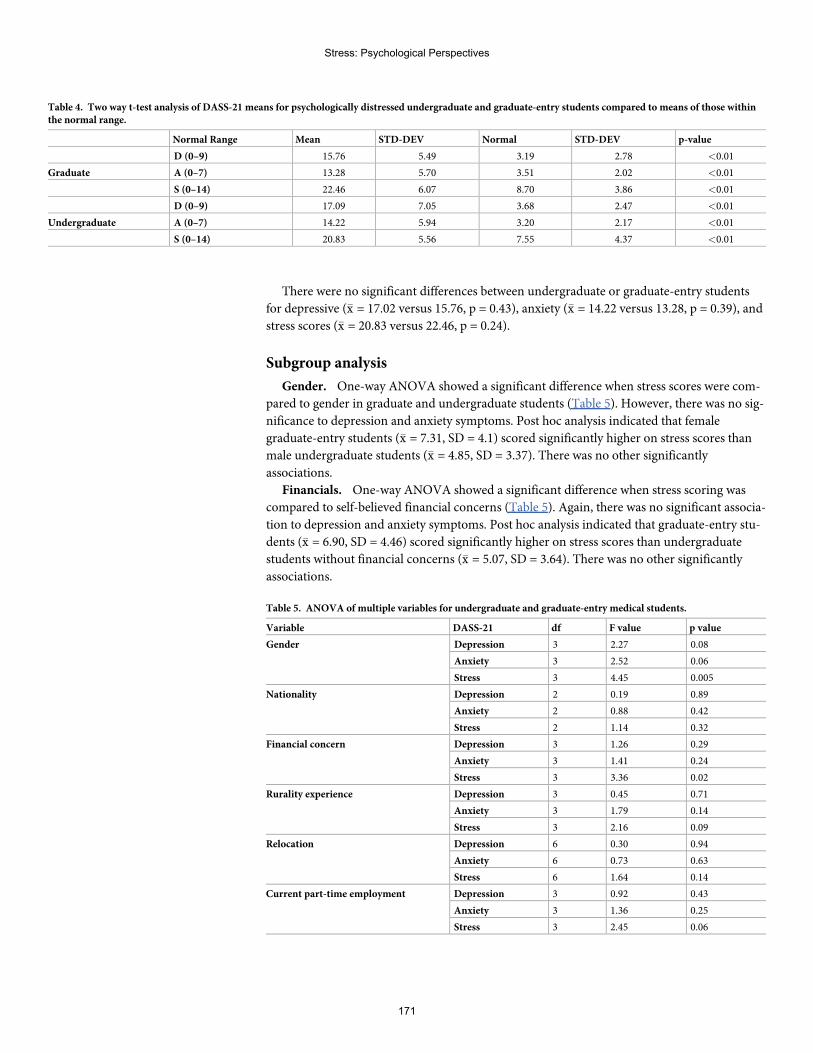
There were no significant differences between undergraduate or graduate-entry students
for depressive (�x = 17.02 versus 15.76, p = 0.43), anxiety (�x = 14.22 versus 13.28, p = 0.39), and
stress scores (�x = 20.83 versus 22.46, p = 0.24).
Subgroup analysis
Gender. One-way ANOVA showed a significant difference when stress scores were com-
pared to gender in graduate and undergraduate students (Table 5). However, there was no sig-
nificance to depression and anxiety symptoms. Post hoc analysis indicated that female
graduate-entry students (�x = 7.31, SD = 4.1) scored significantly higher on stress scores than
male undergraduate students (�x = 4.85, SD = 3.37). There was no other significantly
associations.
Financials. One-way ANOVA showed a significant difference when stress scoring was
compared to self-believed financial concerns (Table 5). Again, there was no significant associa-
tion to depression and anxiety symptoms. Post hoc analysis indicated that graduate-entry stu-
dents (�x = 6.90, SD = 4.46) scored significantly higher on stress scores than undergraduate
students without financial concerns (�x = 5.07, SD = 3.64). There was no other significantly
associations.
Table 4. Two way t-test analysis of DASS-21 means for psychologically distressed undergraduate and graduate-entry students compared to means of those withinthe normal range.
Normal Range Mean STD-DEV Normal STD-DEV p-value
D (0–9) 15.76 5.49 3.19 2.78 <0.01
Graduate A (0–7) 13.28 5.70 3.51 2.02 <0.01
S (0–14) 22.46 6.07 8.70 3.86 <0.01
D (0–9) 17.09 7.05 3.68 2.47 <0.01
Undergraduate A (0–7) 14.22 5.94 3.20 2.17 <0.01
S (0–14) 20.83 5.56 7.55 4.37 <0.01
Table 5. ANOVA of multiple variables for undergraduate and graduate-entry medical students.
Variable DASS-21 df F value p value
Gender Depression 3 2.27 0.08
Anxiety 3 2.52 0.06
Stress 3 4.45 0.005
Nationality Depression 2 0.19 0.89
Anxiety 2 0.88 0.42
Stress 2 1.14 0.32
Financial concern Depression 3 1.26 0.29
Anxiety 3 1.41 0.24
Stress 3 3.36 0.02
Rurality experience Depression 3 0.45 0.71
Anxiety 3 1.79 0.14
Stress 3 2.16 0.09
Relocation Depression 6 0.30 0.94
Anxiety 6 0.73 0.63
Stress 6 1.64 0.14
Current part-time employment Depression 3 0.92 0.43
Anxiety 3 1.36 0.25
Stress 3 2.45 0.06
Stress: Psychological Perspectives
171
Other demographics. There was no significant differences between the groups in any of
the variables for relocation, nationality, previous employment, or rurality experience of at least
5 years (Table 5).
Discussion
The majority of the students scored within the normal range for depressive, anxious, and stress
symptoms. One third of students showed significant stress and depressive symptoms while a
half of students were anxious, with little differences between the two cohorts. The proportions
are similar with other results found in Australia. However, obtaining a prevalence is difficult
to elucidate due to the use of a variety of psychological measurements of distress, mixed years
of study, and type of entry [1, 15–19]. Similarly, two global meta-analyses of mixed year levels
for anxiety and depression found similar proportions to this study [3, 8]. While comparisons
are limited and caution used in making bold inferences due to study differences, the result do
suggest a possible commonality of experience that seems to transcend culture and borders.
This study reveals that graduate-entry students, who have previous experience with a uni-
versity course, do not have a reduced burden of psychological distress as compared with their
younger, school-leaving colleagues. This has also been found by others in Australia and inter-
nationally in mixed year levels and here has yet to be a clear answer as to the absence of differ-
ences between these two cohorts [1, 12]. Clarity of this issue has also eluded this author.
However, it could be hypothesised that psychological distress is dependent on new or unaccus-
tomed activities and so age in itself is not relevant. Further, graduate and undergraduate
cohorts are not often significantly dissimilar in age as opposed to generational differences in
maturity. Finally, perhaps medical schools inadvertently select specific personality traits which
may predispose to psychological distress. Further research should be conducted to help fully
clarify this unexpected outcome.
Importantly, this study shows that students are entering medical school in distress rather
than it developing as a consequence of exposure to medical school and that entry-type is not
associated with a difference in the presence of any marker of distress or its severity. This is an
important shift from what others have found earlier, for both presence of psychological distress
and its severity [10, 20].
Further supporting this theory is a study of pre-medical undergraduate students that
showed psychological distress and burnout at higher rates than other undergraduates [21].
There is scant evidence for psychological distress in high school leavers entering medicine.
However, a recent study showed that high school students interested in studying medicine
experienced stress levels equal to early-years medical students [22]. Taken together, it may be
suggested that times have changed and graduate and undergraduate-entry students could now
share commonality in early experiences that predispose them to higher rates of psychological
distress. However, this is yet to be fully elucidated.
Psychologically distressed medical students often show maladaptive perfectionism, cogni-
tive distortions, imposter syndrome, and negative feelings such as shame and embarrassment
[23]. These traits are learned behaviours and would likely have been deeply rooted prior to
medical school [24]. At least for depressive symptoms that personal factors such as personality
traits and relationships may contribute more to the maintenance of symptoms than other fac-
tors such as medical school [25]. Overall, it may be more appropriate to consider medicine as a
new stressor and not the main driver for student distress.
There was limited differences between the students in subgroup analysis. Of note, interna-
tional students were not more psychologically distressed on any of the scales compared to Aus-
tralian or permanent residents. This was an interesting finding given the challenges faced by
Stress: Psychological Perspectives
172
international students studying in a foreign country [26]. Similarly, rural background students
were also not more psychologically distressed than their urban counterparts. This is interesting
as rural origin has been linked as a possible risk factor for burn out in later years and higher
rates of self-reported stress [27, 28]. It is possible that these groups may be more adaptable to
change than previously considered and there is some evidence for this [29].
Financial issues can be a significant issue to medical students [30]. Graduate-entry students
with self-believed financial concerns showed significant higher levels of stress. This seems logi-
cal as they are beginning their second degree and will therefore be facing a more significant
financial debt. Furthermore, all graduate students in this study were required to relocate and
many were unemployed which may increase their financial concern. This would make sense as
there was no differences in stress whether students simply relocated or not.
In this study there was a significant difference between graduate-entry female students and
their male undergraduate counterparts in stress scores. There was no other associations. Previ-
ous research has been inconsistent when gender is compared to depression, anxiety, and stress
which suggests that gender likely has no significant role as a risk factor for psychological dis-
tress [1, 3, 8, 31, 32].
If students are entering the course with distress it is important to consider whether initial
screening of candidates for psychological distress is appropriate [33]. It has been suggested
that the addition of psychological screening may allow for selection of more resilient medical
students [34–36]. Psychological screening is used in other high stress jobs such as police, mili-
tary, and airline pilots [37, 38]. However, there is also the risk of prejudice against those with
stable, or previous mental health conditions by suggesting they are incapable of undertaking a
medical career, of which there is limited evidence [33]. Finally, while not researched, there is
the possibility for cheating if using standardised psychological tests to obtain a desired result
during the screening process due to the competitive nature of entering medicine.
It would seem appropriate that early interventions are needed if students are entering medi-
cal school with psychological distress. To date many of the interventions involving pre-clinical
medical students have yielded mixed results [39–41]. Furthermore, a recent review suggested
short term but not long term effectiveness of many interventions for medical students [42].
A general consensus statement from Australia and New Zealand suggested a broad and
integrated approach was needed to help psychologically distressed students [33]. Their report
suggested among other things that medical schools can assist to encourage self-awareness
through educational sessions, de-stigmatise distress, and encourage help-seeking to appropri-
ate healthcare providers. This study suggests from the results that engagement needs to occur
in the earliest weeks. This approach may allow staff to perform their academic role without
becoming surrogates for healthcare professionals. Simultaneously, this may increase student
mental health literacy and health seeking behaviour [43]. Furthermore, this strategy may also
reduce the stress on staff, who themselves are at risk of mental health problems and burn out
[44, 45]. However, there are some barriers to consider such as student’s perceived risk to pro-
gression, cost, distance and leave for appointments, and academics comfort with pastoral care
that also need to be addressed [46–48]. Finally, it is important that medical schools discourage
an environment where psychological distress can fester through an evolution in curriculum
design that promotes collaboration not competition, improvement not perfection, collegiality
not hierarchy, and construction not criticism [35].
Limitations
This research looked specifically at students about to start medical school and does not provide
any information on how student psychological distress changes over time. It is possible that
Stress: Psychological Perspectives
173
starting a new course may have increased their stress levels and it could decline with time. The
graduate cohort was much smaller than the undergraduate cohort and this may have under- or
overestimated an effect size. Importantly, while a reasonable amount of students participated
in this study it would have been more powerful with a higher participation rate. Furthermore,
with almost forty percent of students not participating in the study there is a risk of selection
bias which could affect the generalisability of the data into real-world effects. However, while
the prevalence of how many students could be psychologically distressed may change with
increased participation in the study it is important to note that the results of this study appear
to align with what has been previously found.
There is a risk that unidentified factors may be able to explain the psychological distress
observed in the students and lack of differences between the cohorts. The study attempted to
control for confounders in the design by analysing the two cohorts independently, examining
the data of the normal and abnormal results separately to avoid dilution of the severity of
scores, and looked at several possible demographic risk factors. It is likely that there are other
factors present that may have contributed to the results observed. Possible factors may have
included a student’s past or current mental health diagnoses, whether medical students with
psychological distress participate more or less in research, and honesty in reporting based
upon their feelings of stigma, may have contributed to the results [49]. However, this was not
examined in this study and may be beneficial in future research efforts.
Further research
Further research needs to be aimed primarily at the underlying psychological causes of dis-
tress. It is important that appropriate evidence based strategies are implemented to help iden-
tify students in need and at risk of psychological distress. Once students are identifiable then it
is important for medical schools to find effective methods to connect them with an appropriate
healthcare professional and to understand the barriers and solutions to access to care. It is also
important to study, identify, and evolve curricula to meet the psychological needs of students.
Finally, it is medical school staff who are the vanguard of this issue and so it is important to see
how student distress affects their mental health.
Conclusion
This study of undergraduate and graduate-entry first year medical students showed that at
least one third of students showed some form of psychological distress prior to commence-
ment. There was no significant differences in depression, anxiety or stress mean scores or
severity between the cohorts despite age and attending different campuses. Within the limita-
tions of this study, this study suggests that all students may need appropriate education, identi-
fication, and intervention from the earliest weeks.
Supporting information
S1 Data.
Acknowledgments
My thanks go to Dr. David Reser for his invaluable advice on improving my academic writing
for this paper
Stress: Psychological Perspectives
174
Author Contributions
Conceptualization: Sean R. Atkinson.
Formal analysis: Sean R. Atkinson.
Writing – original draft: Sean R. Atkinson.
Writing – review & editing: Sean R. Atkinson.
References1. Casey D, Thomas S, Hocking DR, Kemp-Casey A. (2016). Graduate-entry medical students: older and
wiser but not less distressed. Australasian Psychiatry. Feb; 24(1):88–92. https://doi.org/10.1177/1039856215612991 Epub 2015 Oct 23. PMID: 26498151
2. Heinen I., Bullinger M. & Kocalevent R. Perceived stress in first year medical students—associationswith personal resources and emotional distress. BMCMed Educ 17, 4 (2017). https://doi.org/10.1186/s12909-016-0841-8
3. Quek TT, TamWW, Tran BX, et al. The Global Prevalence of Anxiety AmongMedical Students: AMeta-Analysis. Int J Environ Res Public Health. 2019; 16(15):2735. Published 2019 Jul 31. https://doi.org/10.3390/ijerph16152735 PMID: 31370266
4. Khalid A, Zhang Q,WangW, Ghaffari AS, Pan F. The relationship between procrastination, perceivedstress, saliva alpha-amylase level and parenting styles in Chinese first year medical students. PsycholRes Behav Manag. 2019; 12:489–498. Published 2019 Jul 3. https://doi.org/10.2147/PRBM.S207430PMID: 31308770
5. Dyrbye LN, ThomasMR, Shanafelt TD. Medical student distress: causes, consequences, and proposedsolutions.Mayo Clin Proc. 2005; 80(12):1613–1622. https://doi.org/10.4065/80.12.1613 PMID:16342655
6. Kotter T, Wagner J, Bruheim L, Voltmer E. Perceived Medical School stress of undergraduate medicalstudents predicts academic performance: an observational study. BMCMed Educ. 2017; 17(1):256.Published 2017 Dec 16. https://doi.org/10.1186/s12909-017-1091-0 PMID: 29246231
7. IshakW, Nikravesh R, Lederer S, Perry R, Ogunyemi D, Bernstein C. Burnout in medical students: asystematic review.Clin Teach. 2013; 10(4):242–245. https://doi.org/10.1111/tct.12014 PMID:23834570
8. Rotenstein LS, Ramos MA, Torre M, et al. Prevalence of Depression, Depressive Symptoms, and Sui-cidal Ideation AmongMedical Students: A Systematic Review and Meta-Analysis. JAMA. 2016; 316(21):2214–2236. https://doi.org/10.1001/jama.2016.17324 PMID: 27923088
9. Levey RE. Sources of stress for residents and recommendations for programs to assist them. AcadMed. 2001; 76(2):142–150. https://doi.org/10.1097/00001888-200102000-00010 PMID: 11158832
10. Yusoff MS, Abdul Rahim AF, Baba AA, Ismail SB, Mat Pa MN, Esa AR. The impact of medical educa-tion on psychological health of students: a cohort study. Psychol Health Med. 2013; 18(4):420–430.https://doi.org/10.1080/13548506.2012.740162 PMID: 23140393
11. LynaghMarita, et al. "Student selection for medicine: Still a ’Thorny’ issue." Archives of Medicine andHealth Sciences, vol. 6, no. 1, 2018, p. 147.Gale OneFile: Health and Medicine, Accessed 7 Feb.2020.
12. Zvauya R, Oyebode F, Day EJ, Thomas CP, Jones LA. A comparison of stress levels, coping stylesand psychological morbidity between graduate-entry and traditional undergraduate medical studentsduring the first 2 years at a UKmedical school. BMCRes Notes. 2017; 10(1):93. Published 2017 Feb13. https://doi.org/10.1186/s13104-017-2395-1 PMID: 28193287
13. Jafari P, Nozari F, Ahrari F, Bagheri Z. Measurement invariance of the Depression Anxiety StressScales-21 across medical student genders. Int J Med Educ. 2017; 8:116–122. Published 2017 Mar 30.https://doi.org/10.5116/ijme.58ba.7d8b PMID: 28362630
14. Lovibond S. H., & Lovibond P. F. (1995). Manual for the Depression Anxiety Stress Scales ( 2nd ed.).Sydney: Psychology Foundation of Australia.
15. Dendle C, Baulch J, Pellicano R, et al. Medical student psychological distress and academic perfor-mance.Med Teach. 2018; 40(12):1257-1263. https://doi.org/10.1080/0142159X.2018.1427222 PMID:29355074
16. Bacchi S, Licinio J. Resilience and Psychological Distress in Psychology and Medical Students. AcadPsychiatry. 2017; 41(2):185-188. https://doi.org/10.1007/s40596-016-0488-0 PMID: 27060093
Stress: Psychological Perspectives
175
17. Bore M, Kelly B, Nair B. Potential predictors of psychological distress and well-being in medical stu-dents: a cross-sectional pilot study. Adv Med Educ Pract. 2016; 7:125-135. Published 2016 Mar 2.https://doi.org/10.2147/AMEP.S96802 PMID: 27042156
18. Slonim J, Kienhuis M, Di Benedetto M, Reece J. The relationships among self-care, dispositional mind-fulness, and psychological distress in medical students.Med Educ Online. 2015; 20:27924. Published2015 Jun 24. https://doi.org/10.3402/meo.v20.27924 PMID: 26112354
19. Beyond Blue. National Mental Health Survey of Doctors and Medical Students [Internet]. 2013. Avail-able from: https://www.beyondblue.org.au/docs/default-source/research-projectfiles/bl1132-report—nmhdmss-full-report_web
20. Smith CK, Peterson DF, Degenhardt BF, Johnson JC. Depression, anxiety, and perceived hasslesamong entering medical students. Psychol Health Med. 2007; 12(1):31–39. https://doi.org/10.1080/13548500500429387 PMID: 17129931
21. Fang DZ, Young CB, Golshan S, Moutier C, Zisook S. Burnout in premedical undergraduate students[published correction appears in Acad Psychiatry. 2012 Mar 1;36(2):103. Young, Christina [corrected toYoung, Christina B]; Fang, Daniel [corrected to Fang, Daniel Z]] [published correction appears in AcadPsychiatry. 2012Mar;36(2):103]. Acad Psychiatry. 2012; 36(1):11–16. https://doi.org/10.1176/appi.ap.10080125 PMID: 22362430
22. Erschens R, Herrmann-Werner A, Keifenheim KE, et al. Differential determination of perceived stress inmedical students and high-school graduates due to private and training-related stressors. PLoSOne.2018; 13(1):e0191831. Published 2018 Jan 31. https://doi.org/10.1371/journal.pone.0191831 PMID:29385180
23. Hu KS, Chibnall JT, Slavin SJ. Maladaptive Perfectionism, Impostorism, and Cognitive Distortions:Threats to the Mental Health of Pre-clinical Medical Students. Acad Psychiatry. 2019; 43(4):381–385.https://doi.org/10.1007/s40596-019-01031-z PMID: 30725427
24. Curran T, Hill AP. Perfectionism is increasing over time: A meta-analysis of birth cohort differences from1989 to 2016. Psychol Bull. 2019; 145(4):410–429. https://doi.org/10.1037/bul0000138 PMID:29283599
25. Silva V, Costa P, Pereira I, et al. Depression in medical students: insights from a longitudinal study.BMCMed Educ. 2017; 17(1):184. Published 2017 Oct 10. https://doi.org/10.1186/s12909-017-1006-0PMID: 29017594
26. Malau-Aduli BS. Exploring the experiences and coping strategies of international medical students.BMCMed Educ. 2011; 11:40. Published 2011 Jun 25. https://doi.org/10.1186/1472-6920-11-40 PMID:21702988
27. Isaac V, McLachlan CS,Walters L, Greenhill J. Screening for burn-out in Australian medical studentsundertaking a rural clinical placement. BMJOpen. 2019; 9(7):e029029. Published 2019 Jul 9. https://doi.org/10.1136/bmjopen-2019-029029 PMID: 31289089
28. Durkin SR, Bascomb A, Turnbull D, Marley J. Rural origin medical students: how do they cope with themedical school environment?. Aust J Rural Health. 2003; 11(2):89–95. https://doi.org/10.1046/j.1440-1584.2003.00512.x PMID: 12780499
29. Eley DS, Leung J, Hong BA, Cloninger KM, Cloninger CR. Identifying the Dominant Personality Profilesin Medical Students: Implications for Their Well-Being and Resilience. PLoSOne. 2016; 11(8):e0160028. Published 2016 Aug 5. https://doi.org/10.1371/journal.pone.0160028 PMID: 27494401
30. Hill MR, Goicochea S, Merlo LJ. In their own words: stressors facing medical students in the millennialgeneration.Med Educ Online. 2018; 23(1):1530558. https://doi.org/10.1080/10872981.2018.1530558PMID: 30286698
31. Jafari P, Nozari F, Ahrari F, Bagheri Z. Measurement invariance of the Depression Anxiety StressScales-21 across medical student genders. Int J Med Educ. 2017; 8:116–122. Published 2017 Mar 30.https://doi.org/10.5116/ijme.58ba.7d8b PMID: 28362630
32. Miller GD, Kemmelmeier M, Dupey P. Gender differences in worry during medical school.Med Educ.2013; 47(9):932–941. https://doi.org/10.1111/medu.12236 PMID: 23931542
33. Kemp S, HuW, Bishop J, et al. Medical student wellbeing—a consensus statement from Australia andNew Zealand. BMCMed Educ. 2019; 19(1):69. Published 2019Mar 4. https://doi.org/10.1186/s12909-019-1505-2 PMID: 30832630
34. Powis D. Selecting medical students: An unresolved challenge.Med Teach. 2015; 37(3):252–260.https://doi.org/10.3109/0142159X.2014.993600 PMID: 25532428
35. Moir F, Yielder J, Sanson J, Chen Y. Depression in medical students: current insights. Adv Med EducPract. 2018; 9:323–333. Published 2018 May 7. https://doi.org/10.2147/AMEP.S137384 PMID:29765261
Stress: Psychological Perspectives
176
36. Bußenius L, Harendza S. The relationship between perfectionism and symptoms of depression in medi-cal school applicants. BMCMed Educ. 2019; 19(1):370. Published 2019 Oct 15. https://doi.org/10.1186/s12909-019-1823-4 PMID: 31615496
37. SellbomM, Corey DM, Ben-Porath YS. Examining the Validity of the Multidimensional PersonalityQuestionnaire in the Assessment of Police Candidates [published online ahead of print, 2019 Nov 13].Assessment. 2019;1073191119887443. https://doi.org/10.1177/1073191119887443 PMID: 31718241
38. Dhaliwal S, Carter RE. Aerospace, Assessment Of Fitness For Duty. In: StatPearls. Treasure Island(FL): StatPearls Publishing; 2020.
39. Dyrbye LN, Shanafelt TD, Werner L, Sood A, Satele D, Wolanskyj AP. The Impact of a Required Longi-tudinal Stress Management and Resilience Training Course for First-Year Medical Students. J GenIntern Med. 2017; 32(12):1309–1314. https://doi.org/10.1007/s11606-017-4171-2 PMID: 28861707
40. de Vibe M, Solhaug I, Rosenvinge JH, Tyssen R, Hanley A, Garland E. Six-year positive effects of amindfulness-based intervention on mindfulness, coping and well-being in medical and psychology stu-dents; Results from a randomized controlled trial. PLoSOne. 2018; 13(4):e0196053. Published 2018Apr 24. https://doi.org/10.1371/journal.pone.0196053 PMID: 29689081
41. Cameron D, Dromerick LJ, Ahn J, Dromerick AW. Executive/life coaching for first year medical stu-dents: a prospective study. BMCMed Educ. 2019; 19(1):163. Published 2019 May 22. https://doi.org/10.1186/s12909-019-1564-4 PMID: 31118014
42. Frajerman A. Which interventions improve the well-being of medical students? A review of the literature.Encephale. 2020; 46(1):55–64. https://doi.org/10.1016/j.encep.2019.09.004 PMID: 31767254
43. Gorczynski P., Sims-schoutenW., Hill D. andWilson J. Examining mental health literacy, help seekingbehaviours, and mental health outcomes in UK university students. 2017. The Journal of Mental HealthTraining, Education and Practice, Vol. 12 No. 2, pp. 111–120. https://doi.org/10.1108/JMHTEP-05-2016-0027
44. Kinman G., & Johnson S. Special section on well-being in academic employees. 2019. InternationalJournal of Stress Management, 26(2), 159–161. http://dx.doi.org/10.1037/str0000131
45. Hughes GJ, ByromNC. Managing student mental health: The challenges faced by academics on pro-fessional healthcare courses. J Adv Nurs. 2019; 75(7):1539–1548. https://doi.org/10.1111/jan.13989PMID: 30835889
46. Simpson V, Halpin L, Chalmers K, Joynes V. Exploring well-being: medical students and staff.ClinTeach. 2019; 16(4):356–361. https://doi.org/10.1111/tct.13080 PMID: 31364247
47. Gold JA, Johnson B, Leydon G, Rohrbaugh RM,Wilkins KM. Mental health self-care in medical stu-dents: a comprehensive look at help-seeking. Acad Psychiatry. 2015; 39(1):37–46. https://doi.org/10.1007/s40596-014-0202-z PMID: 25082721
48. Laws TA, Fiedler BA. Universities’ expectations of pastoral care: trends, stressors, resource gaps andsupport needs for teaching staff.Nurse Educ Today. 2012; 32(7):796–802. https://doi.org/10.1016/j.nedt.2012.04.024 PMID: 22633315
49. Moir F, Yielder J, Sanson J, Chen Y. Depression in medical students: current insights. Adv Med EducPract. 2018; 9:323–333 https://doi.org/10.2147/AMEP.S137384 PMID: 29765261
Stress: Psychological Perspectives
177
Trauma exposure and PTSD prevalenceamong Yazidi, Christian andMuslim asylumseekers and refugees displaced to IraqiKurdistan
Sami RichaID1*, Marie Herdane1, Azzam Dwaf1, Rami Bou Khalil1, Fadi Haddad1, Rhea El
Khoury1, Myriam Zarzour1, Anthony Kassab1, Ramez Dagher1, Alain Brunet2, Wissam El-
Hage3
1 Faculty of Medicine, Hotel-Dieu de France, Saint Joseph University, Beirut, Lebanon, 2 McGill University/Douglas Mental Health University Institute, Montreal (Qc), Canada, 3 UMR 1253, iBrain, Universite de Tours,
Inserm, CHRU de Tours, Clinique Psychiatrique Universitaire, Tours, France
* [email protected], [email protected]
Abstract
Background
There is unreliable, and negligible information on the mental health and trauma-exposure of
asylum-seekers and displaced refugees in the Iraqi Kurdistan region.
Objectives
To evaluate how responsible the ethno-religious origins are, for the prevalence of trauma
exposure and post-traumatic stress disorder (PTSD) in displaced Iraqi asylum-seekers and
refugees residing in the Iraqi Kurdistan region.
Methods
Structured interviews with a cross-sectional sample of 150 individuals, comprised of three
self-identified ethno-religious groups (50 participants in each): Christians, Muslims, and
Yazidis.
Results
100% prevalence of trauma exposure and 48.7% of current PTSD among refugees, 70%
PTSD rate of Yazidi participants, which is significantly higher (p < 0.01) compared to 44% of
Muslim participants and 32% of Christian participants. These findings were corroborated
using the self-rated PTSD, DSM-5 Checklist, with more severe PTSD symptom scores (p <0.001) obtained among Yazidis (43.1; 19.7), compared to Muslims (31.3; 20.1) and Chris-
tians (29.3; 17.8). Self-rated depressive symptoms (Patient Health Questionnaire-9) were
also higher (p < 0.007) among Yazidis (12.3; 8.2) and Muslims (11.7; 5.9), compared to
Christians (8.1; 7).
Editor: James Curtis West, Uniformed Services
University of the Health Sciences, UNITED STATES
Funding: The author(s) received no specific
funding for this work.
Competing interests: The authors have declared
that no competing interests exist.
14
178
I. Introduction
In 2016, the United Nations High Commissioner for Refugees disclosed the highest number of
refugees since 1996, with the population of concern also including asylum seekers and inter-
nally displaced persons, standing at 65.6 million up from 46.3 million at the midyear of 2014
[1]. Middle-Eastern populations have been increasingly exposed to war, and victims of perse-
cution and human rights violations in the midst of long-lasting political conflicts. Since 2003,
these events have caused several waves of migration, particularly from Syria and Iraq [2,3].
Iraq has consistently scored 5 on the Political Terror Scale, making it one of the seven worst
offenders of human security. According to the 2013 U.S State Department report, societal
abuses and discrimination are based on religious affiliation, belief, or practice. In fact, ISIS reb-
els, motivated by a confluence of religious, political, and cultural factors, are threatening,
oppressing and murdering those who do not conform to their religious ideals, including Yazi-
dis, Christians, and Muslims who do not adhere to their ideology.
The Yazidi religion is considered a pre-Islamic sect that draws from Christianity, Judaism
and the ancient monotheistic religion of Zoroastrianism. At the core of the Yazidis’ marginali-
zation is their worship of a fallen angel, who is often misunderstood to be Satan by other reli-
gious groups. They have consequently faced multiple genocides in their history, during
Saddam Hussein’s regime. In August of 2014, the terrorist organization ISIS attacked the larg-
est Yazidi community, of approximately 400,000 people, who were living in the Mount Sinjar
area, forcing them out of their homeland and fleeing to safer places.
In the last five years (since 2014), the Christian population in Iraq has declined by nearly
300,000 [4]. Indeed, after the fall of Mosul, more than 100,000 Christians fled Nineveh and
streamed into the relatively safe Kurdish region. They found refuge in Irbil and Dohuk, in
camps managed by humanitarian organizations and churches. The Nineveh Reconstruction
Committee, an ecumenical partnership between the Chaldean Catholic Church, Syriac Catho-
lic Church and Syriac Orthodox Church, restored thousands of houses in two towns, allowing
more than 11,000 displaced Christians to return home.
Despite the risk ISIS poses to Yazidis, Christians and other minorities in the country, the
risk to Iraq’s majority Muslims is far more widespread; most of the 4.2 million displaced Iraqis
are Sunnis, adherents to the branch of Islam that ISIS claims to represent. In fact, as the battles
intensified to capture Mosul, Iraq’s biggest Sunni city, and Raqqa, the group’s self-proclaimed
capital in Syria, many Sunni towns were being destroyed and depopulated; Sunnis were left
with no possessions and profoundly marked by ISIS militant’s atrocities. They chose to seek
shelter in Kurdish-controlled provinces, thus overcoming cultural and linguistic differences as
well as political conflicts between the Iraqi and the Kurdish governments. Mainly Muslims
were made responsible for the ethnic imbalance in those provinces, making it harder for their
socio-cultural integration.
Asylum seekers and refugees are often exposed to traumatic events and psychosocial stress-
ors (e.g., extreme violence, separation from family or detention in a concentration camp), not
only before and during displacement, but during the post-displacement period as well, after
they are resettled in suboptimal conditions in the host country [5–8]. Prevalence of Post-trau-
matic stress disorder (PTSD) diagnostic in refugees varies considerably, due to life circum-
stances of the sampled individuals, as well as the instruments and methods used [9,10]. A
positive association is frequently found between pre-migration/migration potentially trau-
matic events and PTSD or depression [11–16]. Given their exposure to torture, trauma and
mass displacement, Iraqi refugees living in Turkey report a high prevalence of PTSD of 55%
[17,18]. During the last 5 years, a considerable amount of changes has occurred in the Iraqi
population [4,19–22]. This data does not however take into consideration the difference in
Stress: Psychological Perspectives
179
symptomatology between the different religious groups, and more data is required regarding
the impact many factors have on the mental health of refugees and more precisely, the cultural,
religious and overall background of the refugees, in order to better asses any potential role
these factor will have on the psychiatric symptoms. The multicultural and religiously complex
aspect of the refugee crisis In Iraq makes it possible to take into account all of those factors.
The objective of our study was thus to evaluate the levels of PTSD and depressive symptoms
in the Iraqi refugee population by assessing and comparing the prevalence of symptoms
among different confessional groups of refugees, residing in Iraqi Kurdistan.
II. Material andmethods
II.1 Ethical considerations
The study’s protocol, has been approved by the ethics committee of Hotel-Dieu de France uni-
versity hospital in Beirut (reference number: 882).
II.2 Participants
This study was conducted starting 11/2016 and ending 01/2017 at the Erbil refugee camps,
that accommodate Iraqi refugees from different religious beliefs and socioeconomic character-
istics, although most of the refugees who seek help in the camps belong to a low socio-demo-
graphic status. All specific groups are welcomed within the camps and are subject to equal
rights and obligations irrespectively of their confession and cultural background. Sample
groups visited by a team of social workers were consecutively selected. All Iraqi refugees in the
camp are systematically and frequently visited by social workers regardless of their distress
level or any need. As a matter of fact, recruitment was made by a group of social workers that
agreed to participate as investigators in this study. In their routine assessment and for three
months, they selected all eligible Iraqi refugees that could participate in the study. Inclusion
and exclusion criteria were, refugees between the ages of 18 and 65, adherents to Christian,
Muslim and Yazidi communities, fluent in Arabic language, with no psychiatric disorders
(including PTSD), currently not being treated for any psychiatric disorder, and participating
in no other studies. A total of 360 refugee were approached in this period of time, of which 180
were considered being eligible to be included in the protocol. The sample was approximately
homogenous in terms of confession. Then, this sample was divided in three groups, according
to the three different confessions (Christianity, Yazidi, and Islam). The first 50 participants of
the same confession having provided written, fully anonymous informed consent were
included in the same group. Thus, a total of 150 participant was selected, divided in three
groups of 50 according to the three different confessions. To be noted that the number of each
religious group was representative of the overall makeup of the camp.
II.3 Assessment instruments
With the cooperation and permission of the Erbil Jesuit Refugee Service (JRS) head, a duo of a
psychotherapist and a specifically trained general practitioner, visited the camps on a regular
basis, conducting interviews under appropriate mental examination conditions with the 3
selected groups of participants as described earlier. A psychiatrist confirmed the cases that
were screened via the questionnaires.
Data was collected using a socio-demographic history form in Arabic language (used in the
camps), including age, sex, education level, marital status, number of children, religion, occu-
pation, monthly income, household crowding, duration of displacement, as well as psychiatric
and other chronic organic diseases.
Stress: Psychological Perspectives
180
The Life Events Checklist (LEC) is a 17-question self-report measure, that captures trauma
types as compared to the frequency of traumas. It was used to assess potentially traumatic
events exposure, on a 5-point nominal scale and administrated alongside with the PTSD
Checklist for DSM-5 (PCL-5) [19].
PCL-5 is a 20-item self-assessment questionnaire, that measures PTSD symptoms, (during
the past 30 days) as listed in the DSM-5 according to a 0 to 4 rating scale; for each item, a score
of 2 or above is regarded as clinically relevant. A PCL-5 cut-point of 33 is recommended to
consider PTSD. The 20-item self-rated PCL-5 was used to assess PTSD symptom severity in
the last month. We used the interviewer-rated MINI (Mini International Neuropsychiatric
Interview) to confirm the PTSD diagnosis [23]. Depression’s high prevalence in this clinical
setting and its high comorbidity with PTSD, we screened for it, by using the 9-item self-report
Patient Health Questionnaire (PHQ-9) depression subscale. With 9 items, this instrument is
half the length of many other depression scales, with a comparable sensitivity and specificity
making it a reliable measure for depression severity. It scores each of the 9 DSM-5 criteria as 0
(not at all) to 3 (nearly every day) [24]. All questionnaires that were used were validated in
Arabic.
Crowding index is an established and defined tool used for the evaluation of socioeconomic
status in a study population, with a negative association with socioeconomic characteristics. It
is defined as the total number of co-residents per household, with the exclusion of the newborn
infant, divided by the total number of rooms, excluding the kitchen and bathrooms [25]. All
instruments were culturally and linguistically adapted to suit the populations of interest. While
screening instruments were used for this study, it is important to point that no PTSD diagno-
ses were made without a psychiatrist’s clinical assessment.
II.4 Statistical analysis
Chi-square tests were performed to compare rates among the study groups, with the Fisher’s
exact test being employed when one or more of the cells had an expected frequency< 5. Inde-
pendent samples t-test were performed when comparing two group means of a normally dis-
tributed, homoscedastic interval dependent variable. Statistical significance was set at p< 0.05
in a two-sided test, for all tests. No measure was taken to control for alpha inflation due to mul-
tiple testing in this exploratory study. The statistical analysis was performed using SPSS (IBM
Corp, New York) version 20.0.
III. Results
III.1 Characteristics of participants
Fifty participants were recruited from each of the three religious groups (Yazidis, Muslims and
Christians). The socio-demographic data for each group is presented in Table 1. It can also be
assumed that the refugees are from a low socio-economic status due to their presence in
camps. No between-group differences were found in terms of mean age, gender or the pres-
ence of organic or severe psychiatric illness. A significant difference was observed between the
Yazidis and the Christians, with the latter having more single participants than the former (p =
0.001). Moreover, a higher educational level was reported among Christians and Muslims in
comparison with Yazidis (p< 0.001). Similarly, Yazidis had a lower monthly income (< 400$
vs.> 400$) compared to Muslims and Christians (p = 0.002 and 0.009, respectively). The
Yazidi population obtained a significantly higher crowding index than the other two popula-
tions (p = 0.02 and< 0.001, respectively).
Stress: Psychological Perspectives
181
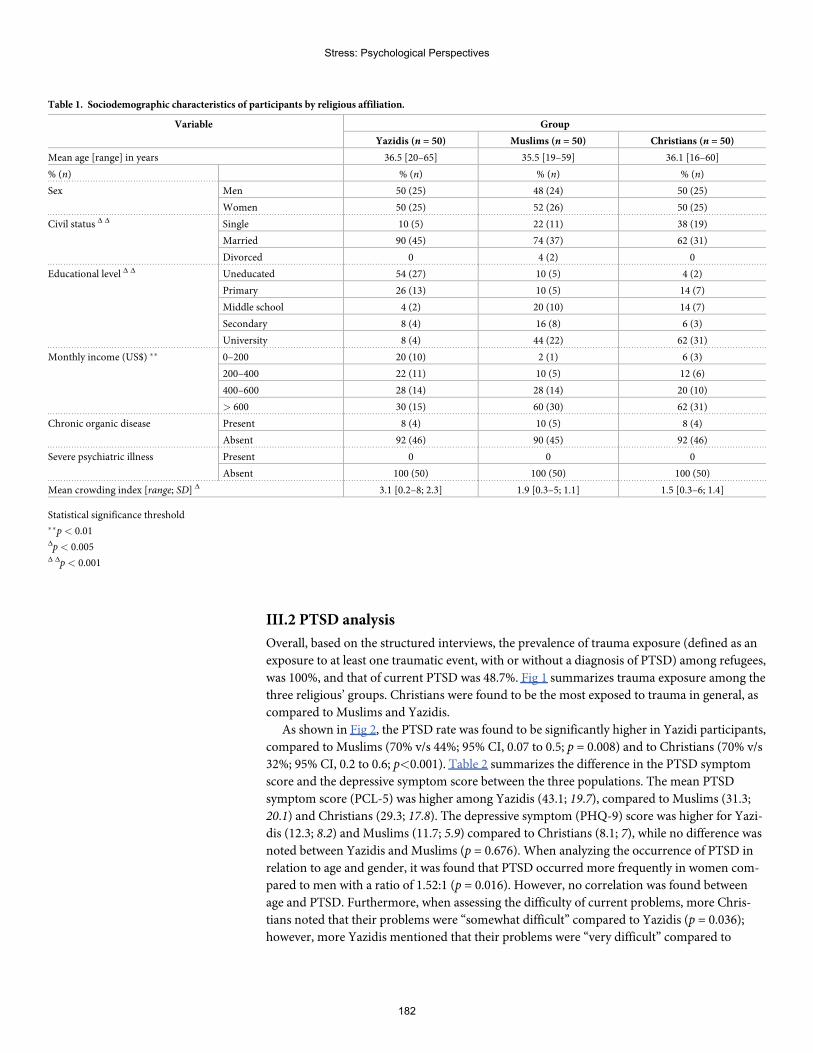
III.2 PTSD analysis
Overall, based on the structured interviews, the prevalence of trauma exposure (defined as an
exposure to at least one traumatic event, with or without a diagnosis of PTSD) among refugees,
was 100%, and that of current PTSD was 48.7%. Fig 1 summarizes trauma exposure among the
three religious’ groups. Christians were found to be the most exposed to trauma in general, as
compared to Muslims and Yazidis.
As shown in Fig 2, the PTSD rate was found to be significantly higher in Yazidi participants,
compared to Muslims (70% v/s 44%; 95% CI, 0.07 to 0.5; p = 0.008) and to Christians (70% v/s
32%; 95% CI, 0.2 to 0.6; p<0.001). Table 2 summarizes the difference in the PTSD symptom
score and the depressive symptom score between the three populations. The mean PTSD
symptom score (PCL-5) was higher among Yazidis (43.1; 19.7), compared to Muslims (31.3;
20.1) and Christians (29.3; 17.8). The depressive symptom (PHQ-9) score was higher for Yazi-
dis (12.3; 8.2) and Muslims (11.7; 5.9) compared to Christians (8.1; 7), while no difference was
noted between Yazidis and Muslims (p = 0.676). When analyzing the occurrence of PTSD in
relation to age and gender, it was found that PTSD occurred more frequently in women com-
pared to men with a ratio of 1.52:1 (p = 0.016). However, no correlation was found between
age and PTSD. Furthermore, when assessing the difficulty of current problems, more Chris-
tians noted that their problems were “somewhat difficult” compared to Yazidis (p = 0.036);
however, more Yazidis mentioned that their problems were “very difficult” compared to
Table 1. Sociodemographic characteristics of participants by religious affiliation.
Variable Group
Yazidis (n = 50) Muslims (n = 50) Christians (n = 50)
Mean age [range] in years 36.5 [20–65] 35.5 [19–59] 36.1 [16–60]
% (n) % (n) % (n) % (n)
Sex Men 50 (25) 48 (24) 50 (25)
Women 50 (25) 52 (26) 50 (25)
Civil status Δ Δ Single 10 (5) 22 (11) 38 (19)
Married 90 (45) 74 (37) 62 (31)
Divorced 0 4 (2) 0
Educational level Δ Δ Uneducated 54 (27) 10 (5) 4 (2)
Primary 26 (13) 10 (5) 14 (7)
Middle school 4 (2) 20 (10) 14 (7)
Secondary 8 (4) 16 (8) 6 (3)
University 8 (4) 44 (22) 62 (31)
Monthly income (US$) �� 0–200 20 (10) 2 (1) 6 (3)
200–400 22 (11) 10 (5) 12 (6)
400–600 28 (14) 28 (14) 20 (10)
> 600 30 (15) 60 (30) 62 (31)
Chronic organic disease Present 8 (4) 10 (5) 8 (4)
Absent 92 (46) 90 (45) 92 (46)
Severe psychiatric illness Present 0 0 0
Absent 100 (50) 100 (50) 100 (50)
Mean crowding index [range; SD] Δ 3.1 [0.2–8; 2.3] 1.9 [0.3–5; 1.1] 1.5 [0.3–6; 1.4]
Statistical significance threshold��p< 0.01Δp< 0.005Δ Δp< 0.001
Stress: Psychological Perspectives
182
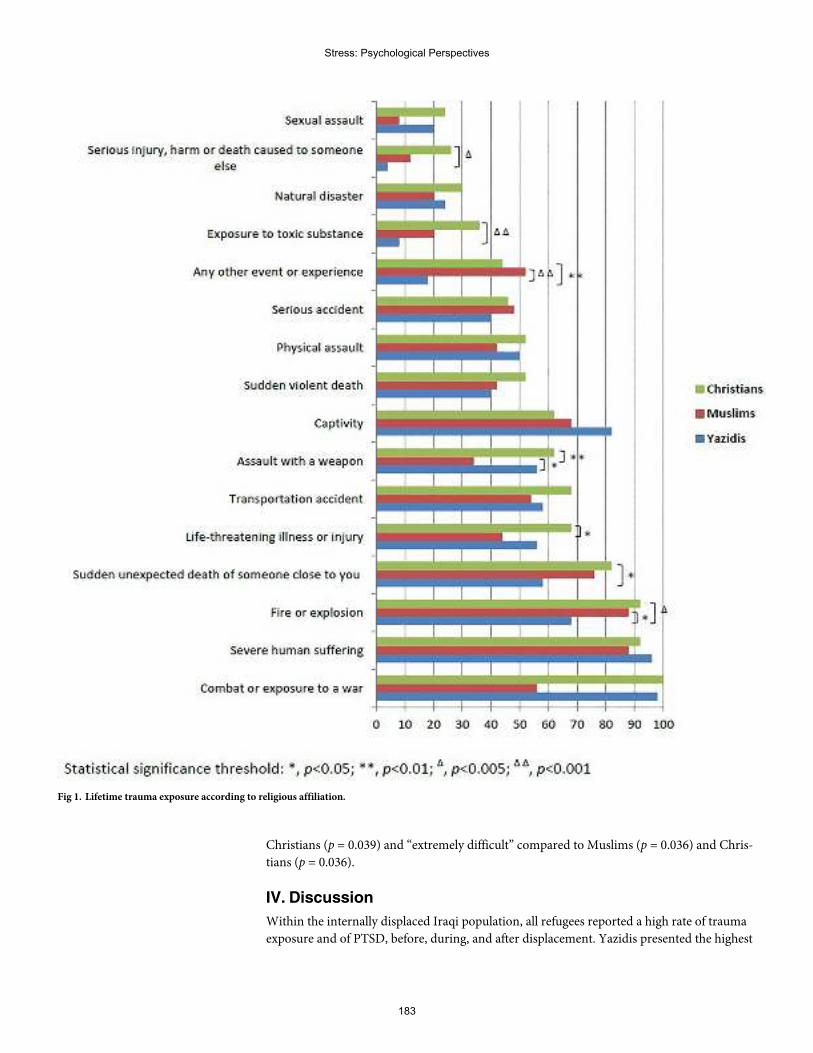
Christians (p = 0.039) and “extremely difficult” compared to Muslims (p = 0.036) and Chris-
tians (p = 0.036).
IV. Discussion
Within the internally displaced Iraqi population, all refugees reported a high rate of trauma
exposure and of PTSD, before, during, and after displacement. Yazidis presented the highest
Fig 1. Lifetime trauma exposure according to religious affiliation.
Stress: Psychological Perspectives
183
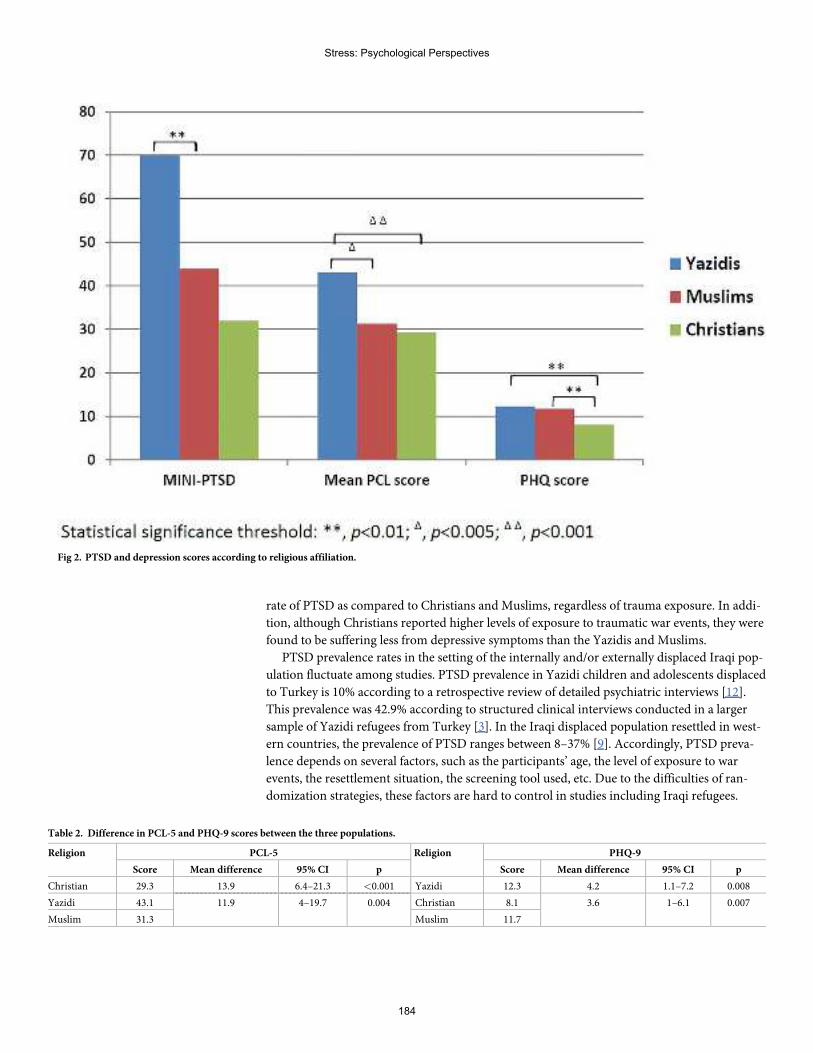
rate of PTSD as compared to Christians and Muslims, regardless of trauma exposure. In addi-
tion, although Christians reported higher levels of exposure to traumatic war events, they were
found to be suffering less from depressive symptoms than the Yazidis and Muslims.
PTSD prevalence rates in the setting of the internally and/or externally displaced Iraqi pop-
ulation fluctuate among studies. PTSD prevalence in Yazidi children and adolescents displaced
to Turkey is 10% according to a retrospective review of detailed psychiatric interviews [12].
This prevalence was 42.9% according to structured clinical interviews conducted in a larger
sample of Yazidi refugees from Turkey [3]. In the Iraqi displaced population resettled in west-
ern countries, the prevalence of PTSD ranges between 8–37% [9]. Accordingly, PTSD preva-
lence depends on several factors, such as the participants’ age, the level of exposure to war
events, the resettlement situation, the screening tool used, etc. Due to the difficulties of ran-
domization strategies, these factors are hard to control in studies including Iraqi refugees.
Fig 2. PTSD and depression scores according to religious affiliation.
Table 2. Difference in PCL-5 and PHQ-9 scores between the three populations.
Religion PCL-5 Religion PHQ-9
Score Mean difference 95% CI p Score Mean difference 95% CI p
Christian 29.3 13.9 6.4–21.3 <0.001 Yazidi 12.3 4.2 1.1–7.2 0.008
Yazidi 43.1 Christian 8.111.9 4–19.7 0.004 3.6 1–6.1 0.007
Muslim 31.3 Muslim 11.7
Stress: Psychological Perspectives
184
However, with 70% of the Yazidi population scoring positively, it appeared to be the most vul-
nerable to PTSD, while having a mean PTSD symptom score of 43.1 on the PCL-5 [19].
In the current study, the LEC presented a broader spectrum of adverse events that are not
specific to the war traumatic events, classically used by other studies on refugees. According to
our study sample, Christians reported in their answers, having witnessed more “serious injury,
harm or death caused to someone else”, more “exposure to toxic substances”, more “assaults
with a weapon”, more “life threatening illness or injury”, more “sudden unexpected death of
someone close” and more exposure to “fire or an explosion”. Although ISIS’s atrocities com-
mitted against the Yazidi community have been well documented and reported by the media,
Christians still reported to have been exposed more frequently, to adverse life events, than the
Yazidis. It can be speculated that several factors, such as education level and socio-economic
status, related to the assessed populations, may have contributed to these findings.
Despite a lower exposure to traumatic experiences, Yazidis reported the highest PTSD risk
rate, highly probable, due to post-resettlement circumstances and lower education level and
socio-economic status. The Yazidis in our sample, had a lower monthly income and a higher
crowding index, than those of Christians and Muslims. In addition, Yazidis mentioned that
their problems were “very difficult” much more than those of Christians and “extremely diffi-
cult” more so than those of Muslims and Christians. The above sheds light on the importance
of post-resettlement life circumstances, to be a significant predictor of PTSD development or
its persistence. Post-migration stress, is an important factor in predicting the occurrence of
mental disorders in refugees. Acculturation, which is the process of social, psychological, and
cultural changes, stemming from the blending of cultures, appears to be one of the major con-
tributing factors, to post-migration stress [26]. In the context of Yazidi refugees in Iraqi Kurdi-
stan, acculturation can be explained due to the fact that most conservative Yazidis speak
neither Arabic nor Kurdish, they do not mix with people of other religions, they can hardly
find jobs, due to their low education level and the discrimination they might be subject to, in
host communities.
Prevalence of depression in Iraqi refugees varies between 28.3 and 75% [9]. In our study,
56% of Yazidi refugees and 68% of Muslim refugees reported above the threshold of vulnera-
bility to depression, as screened by the PHQ-9. Depression is often comorbid with PTSD in
refugees. It is also related to known and significant pre-migration and post-migration stress.
One of the most prevalent post-migration stressors in the resettled Muslim community in
Iraqi Kurdistan, is related to the fact that Arab Muslim refugees have difficulty landing jobs,
due to longstanding historical conflicts between Arabs and Kurds, and the discrimination it
might generate. Another post-migration stressor, specific to the Muslim population that has
fled the ISIS strikes, is related to the lack of enough psychosocial support, from international
organizations, which were more focused on helping the supposedly more vulnerable religious
minorities. As for the Yazidis, one of the major post-migration stressors that might be more
specifically related to the development of depression, rather than any other mental disorder,
are guilt feeling and shame, in more general terms, a “loss of pride” feeling [16]. In the Yazidi
community, as in many other cultural and religious minorities throughout the world, a monu-
mental collective identity component, is related to a strong attachment to the community’s
geographical location and religious rituals. In Iraqi Kurdistan, the majority of displaced Yazi-
dis, express the “loss of pride” feeling, because they have lost their religious identity, their his-
torical roots, their cultural habits, through genocide and violence. In fact the genocide
perpetrated by ISIS has resurrected in the Yazidis memories 74 of their ancestors’ massacres
across 800 years. As a result, the “loss of pride” feeling, emanates from the sentiment of having
once again failed, at protecting their community’s weakest, their women, children and elderly
[27].
Stress: Psychological Perspectives
185
Despite its own set of limitations, this study is considered to be the first to provide such
data, on the rates of trauma exposure, PTSD, and depression among individuals displaced to
Iraqi Kurdistan’s refugee camps. Its main limitation pertains to sampling, which involved the
recruitment of individuals consecutively visited by the social worker teams. Although the
recruitment rate was high, not all the camp’s refugees had an equal probability of being inter-
viewed by our teams. This bias could have influenced the various rates reported here. How-
ever, it is very important to note that, purposely, we did not include participants who were
already followed for mental health problems, so as not to inflate such rates. Furthermore, the
study did not sample refugees living outside the camps, as it is known, this specific population
has had more socio-economic challenges than those residing inside the camps, due to a lack of
systematized coverage from international and non-governmental organizations [28]. There-
fore, we remain confident, that this study’s reported rates, do not overestimate the span of the
problems observed.
Author Contributions
Conceptualization: Sami Richa, Wissam El-Hage.
Formal analysis: Rami Bou Khalil, Fadi Haddad.
Investigation:Marie Herdane, Azzam Dwaf.
Resources:Myriam Zarzour, Anthony Kassab, Alain Brunet.
Visualization: Ramez Dagher.
Writing – original draft: Rhea El Khoury, Alain Brunet.
Writing – review & editing: Ramez Dagher, Wissam El-Hage.
References1. Tam SY, Houlihan S, Melendez-Torres GJ. A Systematic Review of Longitudinal Risk and Protective
Factors and Correlates for Posttraumatic Stress and Its Natural History in Forcibly Displaced Children.Trauma Violence Abuse. 2017 Oct 1; 18(4):377–95. https://doi.org/10.1177/1524838015622437 PMID:26721887
2. Nasıroğlu S, Ceri V. Posttraumatic stress and depression in Yazidi refugees. Neuropsychiatr Dis Treat.2016 Nov;Volume 12:2941–8. https://doi.org/10.2147/NDT.S119506 PMID: 27881919
3. Tekin A, KaradağH, Suleymanoğlu M, Tekin M, Kayran Y, Alpak G, et al. Prevalence and gender differ-ences in symptomatology of posttraumatic stress disorder and depression among Iraqi Yazidis dis-placed into Turkey. Eur J Psychotraumatology [Internet]. 2016 [cited 2017 Nov 25]; 7. Available from:https://www.ncbi.nlm.nih.gov/pmc/articles/PMC4756623/
4. Cetorelli V, Sasson I, Shabila N, BurnhamG. Mortality and kidnapping estimates for the Yazidi popula-tion in the area of Mount Sinjar, Iraq, in August 2014: A retrospective household survey. Tsai AC, editor.PLOSMed. 2017 May 9; 14(5):e1002297. https://doi.org/10.1371/journal.pmed.1002297 PMID:28486492
5. Johnson H, Thompson A. The development andmaintenance of post-traumatic stress disorder (PTSD)in civilian adult survivors of war trauma and torture: A review. Clin Psychol Rev. 2008 Jan 1; 28(1):36–47. https://doi.org/10.1016/j.cpr.2007.01.017 PMID: 17383783
6. MURTHY RS, LAKSHMINARAYANAR. Mental health consequences of war: a brief review of researchfindings. World Psychiatry. 2006 Feb; 5(1):25–30. PMID: 16757987
7. NosèM, Turrini G, Imoli M, Ballette F, Ostuzzi G, Cucchi F, et al. Prevalence and Correlates of Psycho-logical Distress and Psychiatric Disorders in Asylum Seekers and Refugees Resettled in an ItalianCatchment Area. J Immigr Minor Health. 2018 Apr; 20(2):263–70. https://doi.org/10.1007/s10903-017-0629-x PMID: 28730398
8. Turrini G, Purgato M, Ballette F, NosèM, Ostuzzi G, Barbui C. Commonmental disorders in asylumseekers and refugees: umbrella review of prevalence and intervention studies. Int J Ment Health Syst[Internet]. 2017 Dec [cited 2019 May 25]; 11(1). Available from: http://ijmhs.biomedcentral.com/articles/10.1186/s13033-017-0156-0
Stress: Psychological Perspectives
186
9. Slewa-Younan S, Uribe GuajardoMG, Heriseanu A, Hasan T. A Systematic Review of Post-traumaticStress Disorder and Depression Amongst Iraqi Refugees Located in Western Countries. J ImmigrMinor Health. 2015 Aug; 17(4):1231–9. https://doi.org/10.1007/s10903-014-0046-3 PMID: 24899586
10. Yehuda R, Hoge CW, McFarlane AC, Vermetten E, Lanius RA, Nievergelt CM, et al. Post-traumaticstress disorder. Nat Rev Dis Primer [Internet]. 2015 Dec [cited 2019May 25]; 1(1). Available from:http://www.nature.com/articles/nrdp201557
11. Arnetz J, Rofa Y, Arnetz B, Ventimiglia M, Jamil H. Resilience as a Protective Factor Against the Devel-opment of Psychopathology Among Refugees: J Nerv Ment Dis. 2013Mar; 201(3):167–72. https://doi.org/10.1097/NMD.0b013e3182848afe PMID: 23407208
12. Ceri V, Ozlu-Erkilic Z, Ozer U, Yalcin M, Popow C, Akkaya-Kalayci T. Psychiatric symptoms and disor-ders among Yazidi children and adolescents immediately after forcedmigration following ISIS attacks.neuropsychiatrie. 2016 Sep; 30(3):145–50. https://doi.org/10.1007/s40211-016-0195-9 PMID:27628299
13. Knipscheer JW, Sleijpen M, Mooren T, ter Heide FJJ, van der Aa N. Trauma exposure and refugee sta-tus as predictors of mental health outcomes in treatment-seeking refugees. BJPsych Bull. 2015 Aug; 39(4):178–82. https://doi.org/10.1192/pb.bp.114.047951 PMID: 26755950
14. Levy BS, Sidel VW. Adverse health consequences of the IraqWar. The Lancet. 2013Mar; 381(9870):949–58.
15. Piwowarczyk L. Asylum Seekers Seeking Mental Health Services in the United States: Clinical andLegal Implications. J Nerv Ment Dis. 2007 Sep; 195(9):715–22. https://doi.org/10.1097/NMD.0b013e318142ca0b PMID: 17984770
16. The “Loss of Pride” Syndrome in Yazidi Refugees | American Journal of Psychiatry [Internet]. [cited2019 May 25]. Available from: https://ajp.psychiatryonline.org/doi/10.1176/appi.ajp.2017.17070754
17. Five Facts You Need To Know about Iraq, its Religious Minorities, & ISIS—KENCHITWOOD [Internet].[cited 2019 May 25]. Available from: http://www.kenchitwood.com/blog/2014/8/11/five-things-you-need-to-know-about-iraq-isis-religious-persecution
18. Tufan AE, Alkin M, Bosgelmez S. Post-traumatic stress disorder among asylum seekers and refugeesin Istanbul may be predicted by torture and loss due to violence. Nord J Psychiatry. 2013 Jun 1; 67(3):219–24. https://doi.org/10.3109/08039488.2012.732113 PMID: 23249303
19. Blevins CA, Weathers FW, Davis MT,Witte TK, Domino JL. The Posttraumatic Stress Disorder Check-list forDSM-5 (PCL-5): Development and Initial Psychometric Evaluation: Posttraumatic Stress Disor-der Checklist forDSM-5. J Trauma Stress. 2015 Dec; 28(6):489–98. https://doi.org/10.1002/jts.22059PMID: 26606250
20. CNNMB.Was ISIS final blow to Christianity in Iraq? [Internet]. CNN. [cited 2019 May 25]. Availablefrom: https://www.cnn.com/2016/11/20/middleeast/iraq-christianity-peril/index.html
21. Iraqi Kurds worry about ethnic balance from waves of refugees [Internet]. Rudaw. [cited 2019May 25].Available from: http://www.rudaw.net/english/kurdistan/11082015
22. The Islamic State has been a catastrophe for Sunnis [Internet]. Washington Post. [cited 2019 May 25].Available from: http://www.washingtonpost.com/sf/world/2016/11/23/isis-a-catastrophe-for-sunnis/
23. Sheehan DV, Lecrubier Y, Sheehan KH, Amorim P, Janavs J, Weiller E, et al. The Mini-InternationalNeuropsychiatric Interview (M.I.N.I.): the development and validation of a structured diagnostic psychi-atric interview for DSM-IV and ICD-10. J Clin Psychiatry. 1998; 59 Suppl 20:22–33;quiz 34–57.
24. Kroenke K, Spitzer RL, Williams JBW. The PHQ-9. J Gen Intern Med. 2001 Sep; 16(9):606–13. https://doi.org/10.1046/j.1525-1497.2001.016009606.x PMID: 11556941
25. Household crowding index: a correlate of socioeconomic status and inter-pregnancy spacing in anurban setting | Journal of Epidemiology & Community Health [Internet]. [cited 2020 Feb 2]. Availablefrom: https://jech.bmj.com/content/58/6/476
26. LeMaster JW, Broadbridge CL, Lumley MA, Arnetz JE, Arfken C, Fetters MD, et al. Acculturation andpost-migration psychological symptoms among Iraqi refugees: A path analysis. Am J Orthopsychiatry.2018; 88(1):38–47. https://doi.org/10.1037/ort0000240 PMID: 28253013
27. Bou Khalil R, El Choueifaty D, Richa S. Displaced Iraqi Families in Kurdistan: Strangers in a StrangeLand. Am J Psychiatry. 2016 Jan; 173(1):16–7. https://doi.org/10.1176/appi.ajp.2015.15070990 PMID:26725342
28. Kizilhan JI, Noll-Hussong M. Individual, collective, and transgenerational traumatization in the Yazidi.BMCMed [Internet]. 2017 Dec [cited 2019 May 25]; 15(1). Available from: http://bmcmedicine.biomedcentral.com/articles/10.1186/s12916-017-0965-7
Stress: Psychological Perspectives
187


