Embed Size (px)
Citation preview
TEKSTİL ve KONFEKSİYON
ISSN 1300-3356 TEKSTİL VE KONFEKSİYON E-ISSN 2602-3075TEXTILE & APPAREL
JULY – SEPTEMBER, 2021 VOLUME 31 ISSUE 3 C O N T E N T S
PUBLISHER
On Behalf of Textile and Apparel Research Application Center
Faruk BOZDOĞAN
EDITOR IN CHIEF
Arif Taner ÖZGÜNEY
ASSOCIATE EDITORS
Mehmet KÜÇÜK
Pelin SEÇİM KARAKAYA
EDITORIAL BOARD
Ahmet ÇAY
Esen ÖZDOĞAN
Gözde ERTEKİN
Hale KARAKAŞ
Hüseyin Aksel EREN
Nilgün ÖZDİL
ENGLISH EDITING SERVICE
Mengü Noyan ÇENGEL
SCIENTIFIC ADVISORY BOARD
Andrej DEMŠAR
Arzu MARMARALI Bojana VONČINA Bülent ÖZİPEK E. Perrin AKÇAKOCA KUMBASAR Ender BULGUN Hüseyin KADOĞLU Mirela BLAGA Oktay PAMUK Ozan AVİNÇ Peter J. HAUSER Recep EREN Rıza ATAV Savvas G. VASSILIADIS Turan ATILGAN
CONTACT Ege Üniversitesi Tekstil ve Konfeksiyon Araştırma-Uygulama Merkezi
35100 Bornova – İzmir, TÜRKİYE Tel: +90 232 311 38 89-83
www.dergipark.gov.tr/tekstilvekonfeksiyon E-mail: [email protected]
ABSTRACTING / INDEXING
Science Citation Index Expanded (SCIE)
Scopus
WOS
EBSCO
TR Dizin
Ulakbim
Annual subscription rate for textile TYPESETTING AND PRINTING
META Basım Matbaacılık Hizmetleri +90 232 343 64 54 / E-mail: [email protected] Printed Date: 30 September, 2021 Annual subscription rate: 40 TL (VAT included)
Production and Characterization of N-Halamine Based Polyvinyl
Chloride (PVC) Nanowebs
Batuhan ÇOBANOĞLU, Fatma Nur PARIN, Kenan YILDIRIM.................... 147
Production and Characterization of Nanoencapsulated Phase
Change Materials (PCMs) and Bicomponent PCM Nanofibers
Simge ÖZKAYALAR, Sennur ALAY AKSOY............................................... 156
The Effect of Recycled Polyester (rPET) Filament Fiber
Properties on Various Woven Fabric Performance Properties
Gül KIRIŞ, Demet YILMAZ ............................................................................ 171
An Investigation on Some Mechanical Properties of the Tuft Carpets Produced by Homopolymer, Copolymer and Thermoplastic Polyolefin Mixed Polypropylene Bulked Continuous Filament Yarns Cemile Emel YAZ, Cem GÜNEŞOĞLU, Mehmet TOPALBEKİROĞLU...... 183
Investigation of the Effect of the Use of Bamboo and Silver Yarn on Antibacterial Activity in Towel Fabric
Navruz PAKSOY, Seval KONUKOĞLU, Levent Güven AYAR, Cansu Batcik, Hüseyin AYDIN ........................................................................ 195
Comparison of Poisson’s Ratio Measurement Methods: The Extensometer and the Universal Tensile Testing Devices Mehmet TIRITOĞLU, Serkan TEZEL, Yasemin KAVUŞTURAN................. 203
Precision of Measurement of Water Vapor Resistance of Fabrics With Different Surface Roughness by a Skin Model Lubos HES, Vinay Kumar MIDHA.................................................................. 214
Optimization of Draft and Twist Values for Improvement of Breaking Strength and Elongation Properties of Dual-Core Yarns Sümeyye ÜSTÜNTAĞ ..................................................................................... 220
Design of an Impact Absorbing Composite Panel from Denim Wastes and Acrylated Epoxidized Soybean Oil based Epoxy Resins Janset OZTEMUR, Hande SEZGIN, Ipek YALÇIN-ENIS .............................. 229

2 TEKSTİL ve KONFEKSİYON 1/2005
TEKSTİL ve KONFEKSİYON 31(3), 2021 147
TEKSTİL VE KONFEKSİYON
Vol: 31, No: 3
DOI: 10.32710/tekstilvekonfeksiyon.717601
Production and Characterization of N-Halamine Based
Polyvinyl Chloride (PVC) Nanowebs
Batuhan ÇOBANOĞLU1,2 0000-0002-5508-1739
Fatma Nur PARIN1* 0000-0003-2048-2951
Kenan YILDIRIM1* 0000-0002-1591-1988
*
1Bursa Technical University / Department of Polymer Materials Engineering / Yildirim, Bursa, Turkey 2RB Karesi Textile, Yildirim, Bursa, Turkey
Corresponding Author: Fatma Nur Parın, [email protected]
ABSTRACT
Antibacterial agent N-halamine, 7,7,9,9-tetramethyl-1,3,8-triazaspiro [4.5]-decane-2,4-dione (TTDD),
was synthesized, and it was added into the polyvinyl chloride (PVC) nanoweb. A versatile, and
relatively simple method, electrospinning, was used to fabricate continuous and uniform nanowebs.
7,7,9,9-tetramethyl-1,3,8-triazaspiro [4.5]-decane-2,4-dione (TTDD) is a cyclic N-halamine that can
be chlorinated easily due to three functional groups (imide, amide, and amine). Therefore, TTDD was
preferred for PVC regarding having high stability, non-toxic, non-irritant for skin, and renewable. The
rechargeable chlorination process was applied to webs using dilute hypochlorite solution. The
antibacterial activity of the webs were evaluated using the ASTM 2149 procedure. FTIR, TGA, and
SEM were used to investigate the morphology, thermal characteristics, and chemical structures of
PVC webs. Scanning electron microscopy (SEM) displayed that the average diameter of the fibers
increased with TTDD concentration. The thermal properties of the PVC webs did not changed
significantly. All chlorinated webs indicated highly effective antibacterial activities against both
Staphylococcus aureus and Escherichia coli with increased inactivation. Furthermore, the
antibacterial efficacy of nanowebs is reformed again by the rechargeable process. The rechargeable
chlorination capacity of obtained PVC non-wovens is over > 60% (within 6 hours, in pH 5), for four
rechargeable chlorine cycles. The new antibacterial PVC nanowebs have the potential for especially
useful in medical applications.
ARTICLE HISTORY
Received: 12.02.2020
Accepted: 03.06.2021
KEYWORDS
Antibacterial efficiency, N-halamine, nanoweb, polyvinylchloride (PVC), electrospinning
1. INTRODUCTION
Microbes are the smallest microorganisms that are a part of
daily life and can be found all over the environment and in
our bodies [1]. The spread of microorganisms such as
bacteria, fungus, algae, and viruses is becoming an
increasingly serious problem for healthcare organizations
[1, 2]. They are infectious and can cause nosocomial
infections in the community if humidity and temperature
are optimum [1, 3-5]. Nosocomial infections are usually
dangerous to people, and they can be present in everyday
products, particularly hospital equipment [6]. Furthermore,
washing and disinfection may not be enough to prevent
infections, as resistant strains have emerged in recent
decades. Antimicrobial agents are being employed in
various medical equipment and hospital workers to
overcome pathogen-caused hygiene deficiencies [7-10].
In compared to other agents, N-halamines have showed
excellent antibacterial activity against Gram-positive and
Gram-negative bacteria, fungi, protozoa, and viruses [10-
12]. N-halamines can be utilized as biocides due to their
long-lasting and rechargeable antibacterial characteristics.
To cite this article: Çobanoğlu B, Parın FN, Yıldırım K. 2021. Production and characterization of n-halamine based polyvinyl chloride (PVC) nanowebs. Tekstil ve Konfeksiyon, 31(3), 147-155.
148 TEKSTİL ve KONFEKSİYON 31(3), 2021
N-halamine structures have one or more nitrogen-halogen
covalent bonds and possess unique properties such as high
stability over a wide temperature and humidity range, long-
term usage, and the ability to be repeatedly regenerated in a
chlorine solution [10, 13-19]. As a result, N-halamines
could be used in water purification systems, food
packaging, coatings, medical devices, the textile industry,
hospitals, hygienic products, dental office equipment, and
household sanitation.
Electrospinning is regarding a versatile method for
fabricating fibrous structures with diameters from
micrometers to nanometers [20-24]. Because of the unique
properties of electrospun webs like a high specific surface
area, high porosity, and low diameter, they need potential
use in sterilization applications with fast response behavior
[25].
To fabricate protective medical garments, textiles in the
form of fibrous structures- non-wovens with antibacterial
agents have been widely used for over 20 years [26]. There
are several strategies to antibacterial agents such as
essential oils, boric acid, chitosan, triclosan, quaternary
ammonium salts, and N-halamines addition to non-wovens
[21, 27-30]. In this regard, Parın et al. synthesized gelatin
nanofibers containing essential orange oil (EOO) and
reported antibacterial efficacy against S. aureus bacteria
due to the D-limonene component found in orange oil [28].
Chen et al. synthesized and functionalized poly-
hexamethylene guanidine (PHMG) using chitosan
nanofibers. The resulting nanofibers exhibit a better
antibacterial impact against S. aureus and P. aeruginosa
bacteria [31]. In another study, Ullah et al. produced fibrous
structures by adding silver sulfadiazine (AgSD) to
polyacrylonitrile (PAN) [32]. The structures indicated good
antibacterial activity against both Escherichia coli and
Bacillus. Moreover, Zhang et al. prepared polyurethane/
triclosan coated polylactic acid nonwovens, which were
reported to have high antibacterial activity against
Staphylococcus aureus and Escherichia coli in a zone test
[30]. Zhang et al. reported electrospun PVA fibers modified
with quaternary ammonium salt and zwitterionic
sulfopropylbetaine showed 99.9% antibacterial efficiency
against both gram-positive and gram-negative bacteria [33].
Lv et al. developed antibacterial mats based on AgNPs-
loaded starch/PEO nanofibers for medical care. The
obtained NFs indicated limited antibacterial activity [34].
So far, studies have revealed that antibacterial agents other
than N-halamine compounds have a considerable decrease
in bactericidal activity, which is one of the technology's
major drawbacks [35].
N-halamine modified electrospun poly(vinyl alcohol)
(PVA) membranes for food packaging applications were
investigated by Liu et al. The antibacterial activity of the
resulting surfaces has been found to be 99.99 percent [36].
In a similar study reported by Tian et al. that PS/PU
modified with 5, 5-dimethyl hydantoin which is a N-
halamine compound and their study showed high
antibacterial efficiency (99.77%) against both E. coli and S.
aureus [37]. Ma et al. also developed rechargeable N-
halamine based nanofibrous sulfonated-polyethyleneimine
(PEI-S) surfaces that exhibited almost 100 % biocidal
activity and high disinfection efficiency with 99.9% [38].
7,7,9,9-tetramethyl-1,3,8-triazaspiro [4.5]-decane-2,4-dione
(TTDD) is a cyclic N-halamine. Song mentioned in his PhD
thesis that cyclic N-halamines are very efficient, which can
last relatively long. Besides, N-halamines with imide
functionality exhibit higher biocidal activity than those with
amines (imide > amide > amine) [39]. TTDD structure
includes these three functional groups. Due to TTDD
properties of rechargeable bactericidal action, rapid
inactivation rate, and environmental safety, and high
durability, TTDD which is synthesized by the halogenation
of nitrogen–hydrogen (N–H) bonds-containing precursors,
has a lot of potential in the medical field as an antibacterial
material [40].
PVC is one of the leading polymers which are
commercially important thermoplastic [41]. PVC-based
materials have competed with metals, ceramics, glass, and
other polymeric materials due to high mechanical strength,
excellent physical and chemical durability, low-cost
properties [42]. Various studies have been performed on
PVC including various antibacterial agents such as zinc
oxide (ZnO) [43,44], silver [45], silver zeolite (SZ) [46],
and modified silver nanoparticles [46], titanium dioxide
(TiO2) [47]. These agents were introduced to the polymer
by various methods of production. Lala et al. fabricated
electrospun PVC/AgNO3 fibers [49]. Zampino et al.
investigated PVC-silver zeolite composite to produce
antibacterial biomedical products [46]. In this study, PVC
was incorporated with silver zeolite in various ratios
between 2 and 20 wt %. Antibacterial tests were performed
at 6 h, 24 h, and 7, 14, and 30 days. The test results
indicated that PVC with 20 wt % of silver zeolite had a
maximum antibacterial effect. According to the zone
inhibition test, the fibers showed antibacterial protection
against E.coli bacteria. Moreover, there has just one study
about N-halamine containing PVC material via an extrusion
and injection molding process in literature. Chylinska et al.
produced PVC composites with N-chlorinated poly(3-(4'-
vinyl benzyl)-7,8-benzo-1,3-diazaspiro[4.5] decane-2,4-
dione) (MPS TET-Cl) [50]. The antibacterial test results
showed strong antibacterial activity against S. aureus and
E. coli.
Previous studies have mostly focused on PVC fibers with
various antibacterial agents. However, the antibacterial
agents-loaded PVC fibers have demonstrated limited
antibacterial effectiveness since these antibacterial agents
have no rechargable effect. In addition, TTDD has been
chosen as an antibacterial agent owing to functional groups
in cyclic TTDD. TTDD includes imide, amide, and amine
TEKSTİL ve KONFEKSİYON 31(3), 2021 149
functionalities. When all of the above compounds were
chlorinated, N-halamine compounds were formed, which
worked as good biocides. [51]. To the best our knowledge,
there is no study on PVC non-woven surfaces with
rechargeable antibacterial properties by using
electrospinning method. In the current study, we tried for
the first time to introduce of TTDD into PVC nanowebs as
an antibacterial compound and investigate antibacterial
effect of this compound. By varying TTDD concentration,
the properties of PVC nanowebs were investigated in terms
of microstructure, thermal, and chemical properties.
Furthermore, rechargeable chlorination capability was
observed and antibacterial efficiencies were evaluated
against S. aureus and E. coli bacteria.
2. MATERIAL AND METHOD
2.1 Material
The polyvinyl chloride powder (PVC, Mw=43,000 g/mol),
N, N-Dimethylformamide (DMF) and potassium iodide
(KI), Hydrochloric acid (HCl) with 36.5-38% purity,
tetrahydrofuran (THF), sodiumthiosulfate pentahydrate
(Na2S2O3.5 H2O), ethanol (99.5% purity), Triton X-100
(laboratory grade) were used. All chemicals were purchased
from Sigma-Aldrich Chemical Company. ACE® brand
NaOCl (P&G, Belgium) household bleach was used for
chlorination. All the reagents were used without
purification. Antibacterial testing was performed by Muller-
Hinton II agar culture media.
2.2 Synthesis of TTDD
The TTDD was prepared according to a general procedure
carried out previously [21]. TTDD was synthesized by
reacting 2,2,4,4-tetramethyl-4-piperidone, potassium
cyanide, and ammonium carbonate in a mole ratio of 1 : 2 :
6 in 100 mL of water/ethanol (1: 1 v/v) solution for 48
hours at room temperature. Then the reaction mixture was
filtered and TTDD was produced. Afterwards, TTDD was
washed with hot water, and dried TTDD was vacuumed for
24 hours in ambient conditions. TTDD synthesis is shown
in Figure 1.
NHO
ONH
NHCH3
CH3
CH3
CH3
KCN
(NH4)CO3
Diluted ethanolNHCH3
CH3
CH3
CH3
O
Figure 1. Synthesis of 7,7,9,9-tetramethyl-1,3,8-triazaspiro [4.5]-
decane-2,4-dione (TTDD) [21].
2.3. Preparation of Antibacterial Nanowebs
The polymer solutions were electrospun using a laboratory
machine called an electrospinning device (INOVENSO
Nanospinner 24, Turkey). PVC was dissolved in DMF and
THF binary-solvent systems (67.5:17.5, v/v) solution to
obtain a 15% (w/v) PVC solution for the electrospinning
process. The PVC solutions were put in a magnetic stirrer at
room temperature till a homogeneous solution was
obtained. Subsequently, different concentrations (1, 3 and 5
wt%) of TTDD were added to the PVC solutions
concerning the total polymer solutions. After TTDD had
dissolved in PVC solution, the mixture was transferred into
a plastic syringe (20 mL) and attached to a stainless steel
nozzle.
The electrical power supply to the nozzle of the syringe was
25 kV with a 1 mL/h flow rate (Figure 2). The distance
between a collector and a needle was 15 cm. During
electrospinning, the PVC nanowebs were collected on a
rotating drum at 100 rpm. In the course of electrospinning,
the solvent was evaporated and only nanowebs attached to
the aluminum foil forming nanoweb membranes remained.
Pure PVC nanowebs were prepared as a control.
Figure 2. Schematic illustration of the electrospinning process.
150 TEKSTİL ve KONFEKSİYON 31(3), 2021
2.4 Chlorination and Analytic Titration of the Nanowebs
Many prior studies on the effects of titration and
chlorination have been reported [8,10,21,49]. The PVC
nanowebs containing 1, 3, 5 % TTDD were chlorinated in
pH 7 and pH 5 for 1, 6, and 12 h by soaking, the samples in
10, 20, and 40 % commercial aqueous sodium hypochlorite
solution (NaOCl) at room temperature without stirring.
Afterward, 0.15 g of the non-ionic surfactant Triton-X was
added to each solution. The chlorinated nanowebs were
robustly washed with distilled water, then dried in an oven
at 50°C for an hour. The amount of chlorine loaded in the
structure was calculated by the iodometric/thiosulfate
method [52,53] according to the following formula.
(1)
In this equation, N is the normality of thiosulfate solution,
V is the volume of the consumed thiosulfate solution, and
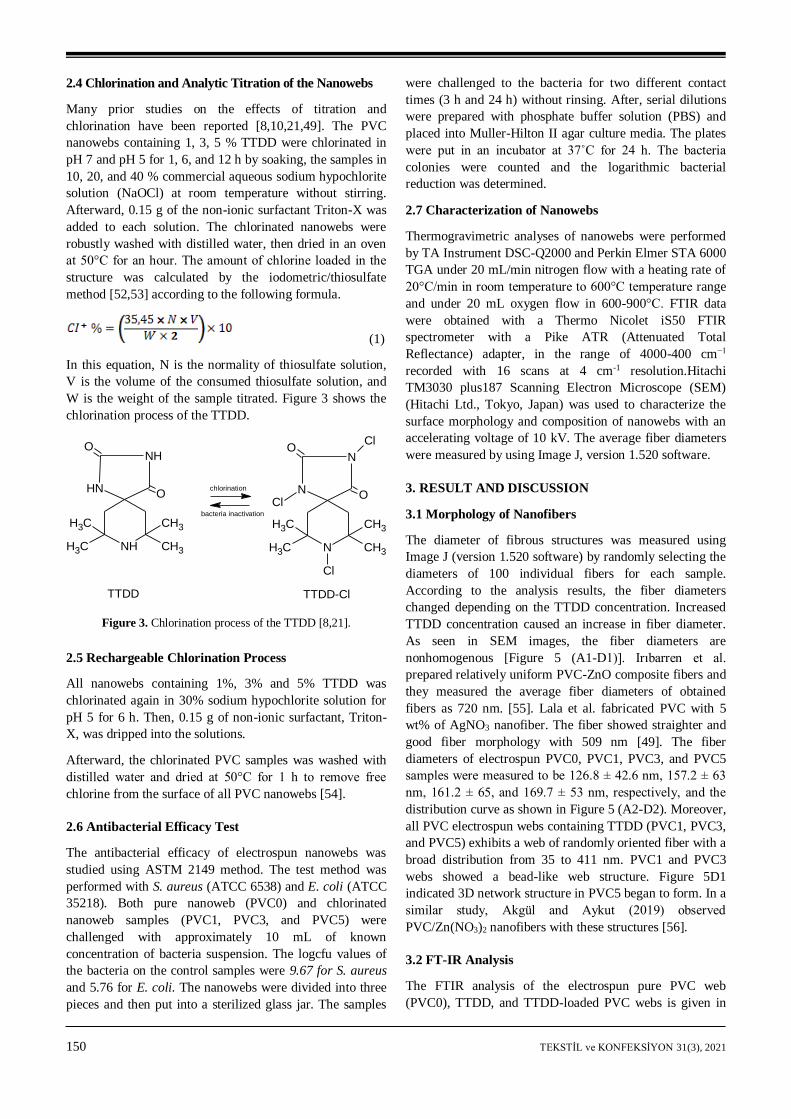
W is the weight of the sample titrated. Figure 3 shows the
chlorination process of the TTDD.
NHO
ONH
NHCH3
CH3
CH3
CH3
chlorination
bacteria inactivation
NO
ON
NCH3
CH3
CH3
CH3
Cl
Cl
Cl
TTDD TTDD-Cl
Figure 3. Chlorination process of the TTDD [8,21].
2.5 Rechargeable Chlorination Process
All nanowebs containing 1%, 3% and 5% TTDD was
chlorinated again in 30% sodium hypochlorite solution for
pH 5 for 6 h. Then, 0.15 g of non-ionic surfactant, Triton-
X, was dripped into the solutions.
Afterward, the chlorinated PVC samples was washed with
distilled water and dried at 50°C for 1 h to remove free
chlorine from the surface of all PVC nanowebs [54].
2.6 Antibacterial Efficacy Test
The antibacterial efficacy of electrospun nanowebs was
studied using ASTM 2149 method. The test method was
performed with S. aureus (ATCC 6538) and E. coli (ATCC
35218). Both pure nanoweb (PVC0) and chlorinated
nanoweb samples (PVC1, PVC3, and PVC5) were
challenged with approximately 10 mL of known
concentration of bacteria suspension. The logcfu values of
the bacteria on the control samples were 9.67 for S. aureus
and 5.76 for E. coli. The nanowebs were divided into three
pieces and then put into a sterilized glass jar. The samples
were challenged to the bacteria for two different contact
times (3 h and 24 h) without rinsing. After, serial dilutions
were prepared with phosphate buffer solution (PBS) and
placed into Muller-Hilton II agar culture media. The plates
were put in an incubator at 37˚C for 24 h. The bacteria
colonies were counted and the logarithmic bacterial
reduction was determined.
2.7 Characterization of Nanowebs
Thermogravimetric analyses of nanowebs were performed
by TA Instrument DSC-Q2000 and Perkin Elmer STA 6000
TGA under 20 mL/min nitrogen flow with a heating rate of
20°C/min in room temperature to 600°C temperature range
and under 20 mL oxygen flow in 600-900°C. FTIR data
were obtained with a Thermo Nicolet iS50 FTIR
spectrometer with a Pike ATR (Attenuated Total
Reflectance) adapter, in the range of 4000-400 cm−1
recorded with 16 scans at 4 cm-1 resolution.Hitachi
TM3030 plus187 Scanning Electron Microscope (SEM)
(Hitachi Ltd., Tokyo, Japan) was used to characterize the
surface morphology and composition of nanowebs with an
accelerating voltage of 10 kV. The average fiber diameters
were measured by using Image J, version 1.520 software.
3. RESULT AND DISCUSSION
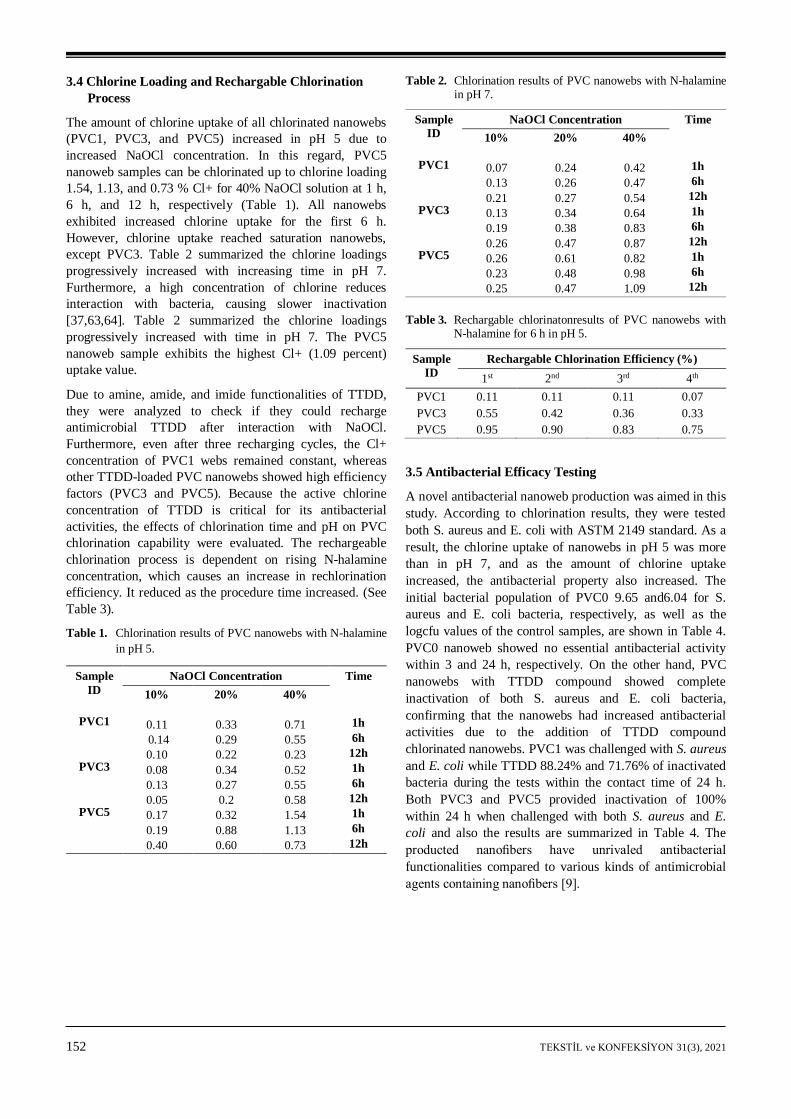
3.1 Morphology of Nanofibers
The diameter of fibrous structures was measured using
Image J (version 1.520 software) by randomly selecting the
diameters of 100 individual fibers for each sample.
According to the analysis results, the fiber diameters
changed depending on the TTDD concentration. Increased
TTDD concentration caused an increase in fiber diameter.
As seen in SEM images, the fiber diameters are
nonhomogenous [Figure 5 (A1-D1)]. Irıbarren et al.
prepared relatively uniform PVC-ZnO composite fibers and
they measured the average fiber diameters of obtained
fibers as 720 nm. [55]. Lala et al. fabricated PVC with 5
wt% of AgNO3 nanofiber. The fiber showed straighter and
good fiber morphology with 509 nm [49]. The fiber
diameters of electrospun PVC0, PVC1, PVC3, and PVC5
samples were measured to be 126.8 ± 42.6 nm, 157.2 ± 63
nm, 161.2 ± 65, and 169.7 ± 53 nm, respectively, and the
distribution curve as shown in Figure 5 (A2-D2). Moreover,
all PVC electrospun webs containing TTDD (PVC1, PVC3,
and PVC5) exhibits a web of randomly oriented fiber with a
broad distribution from 35 to 411 nm. PVC1 and PVC3
webs showed a bead-like web structure. Figure 5D1
indicated 3D network structure in PVC5 began to form. In a
similar study, Akgül and Aykut (2019) observed
PVC/Zn(NO3)2 nanofibers with these structures [56].
3.2 FT-IR Analysis
The FTIR analysis of the electrospun pure PVC web
(PVC0), TTDD, and TTDD-loaded PVC webs is given in
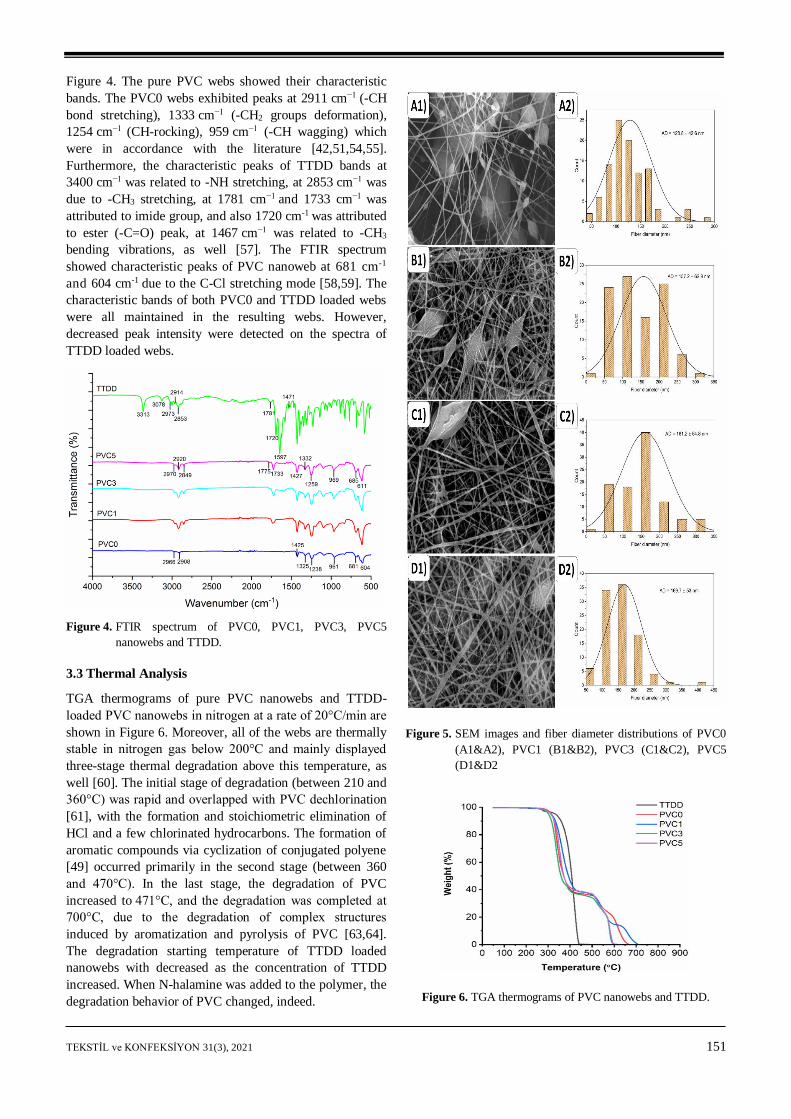
TEKSTİL ve KONFEKSİYON 31(3), 2021 151
Figure 4. The pure PVC webs showed their characteristic
bands. The PVC0 webs exhibited peaks at 2911 cm−1 (-CH
bond stretching), 1333 cm−1 (-CH2 groups deformation),
1254 cm−1 (CH-rocking), 959 cm−1 (-CH wagging) which
were in accordance with the literature [42,51,54,55].
Furthermore, the characteristic peaks of TTDD bands at
3400 cm−1 was related to -NH stretching, at 2853 cm−1 was
due to -CH3 stretching, at 1781 cm−1 and 1733 cm−1 was
attributed to imide group, and also 1720 cm-1 was attributed
to ester (-C=O) peak, at 1467 cm−1 was related to -CH3
bending vibrations, as well [57]. The FTIR spectrum
showed characteristic peaks of PVC nanoweb at 681 cm-1
and 604 cm-1 due to the C-Cl stretching mode [58,59]. The
characteristic bands of both PVC0 and TTDD loaded webs
were all maintained in the resulting webs. However,
decreased peak intensity were detected on the spectra of
TTDD loaded webs.
Figure 4. FTIR spectrum of PVC0, PVC1, PVC3, PVC5
nanowebs and TTDD.
3.3 Thermal Analysis
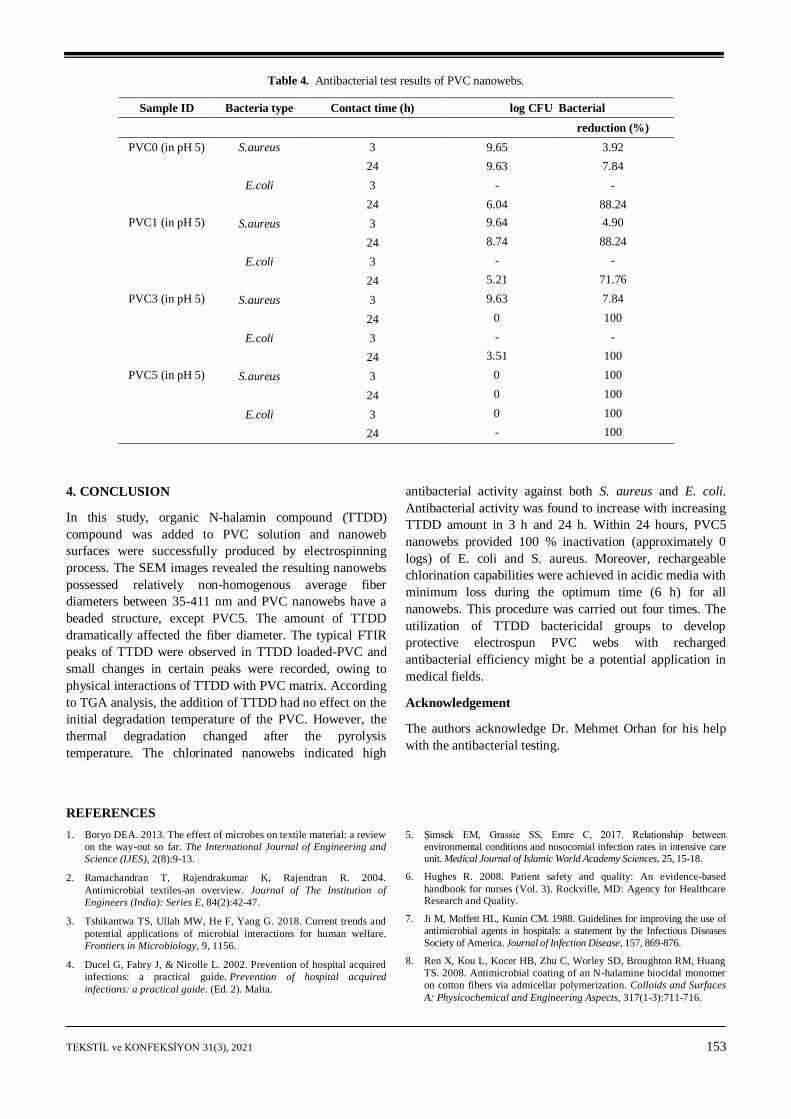
TGA thermograms of pure PVC nanowebs and TTDD-
loaded PVC nanowebs in nitrogen at a rate of 20°C/min are
shown in Figure 6. Moreover, all of the webs are thermally
stable in nitrogen gas below 200°C and mainly displayed
three-stage thermal degradation above this temperature, as
well [60]. The initial stage of degradation (between 210 and
360°C) was rapid and overlapped with PVC dechlorination
[61], with the formation and stoichiometric elimination of
HCl and a few chlorinated hydrocarbons. The formation of
aromatic compounds via cyclization of conjugated polyene
[49] occurred primarily in the second stage (between 360
and 470°C). In the last stage, the degradation of PVC
increased to 471°C, and the degradation was completed at
700°C, due to the degradation of complex structures
induced by aromatization and pyrolysis of PVC [63,64].
The degradation starting temperature of TTDD loaded
nanowebs with decreased as the concentration of TTDD
increased. When N-halamine was added to the polymer, the
degradation behavior of PVC changed, indeed.
Figure 5. SEM images and fiber diameter distributions of PVC0
(A1&A2), PVC1 (B1&B2), PVC3 (C1&C2), PVC5
(D1&D2
Figure 6. TGA thermograms of PVC nanowebs and TTDD.
152 TEKSTİL ve KONFEKSİYON 31(3), 2021
3.4 Chlorine Loading and Rechargable Chlorination
Process
The amount of chlorine uptake of all chlorinated nanowebs
(PVC1, PVC3, and PVC5) increased in pH 5 due to
increased NaOCl concentration. In this regard, PVC5
nanoweb samples can be chlorinated up to chlorine loading
1.54, 1.13, and 0.73 % Cl+ for 40% NaOCl solution at 1 h,
6 h, and 12 h, respectively (Table 1). All nanowebs
exhibited increased chlorine uptake for the first 6 h.
However, chlorine uptake reached saturation nanowebs,
except PVC3. Table 2 summarized the chlorine loadings
progressively increased with increasing time in pH 7.
Furthermore, a high concentration of chlorine reduces
interaction with bacteria, causing slower inactivation
[37,63,64]. Table 2 summarized the chlorine loadings
progressively increased with time in pH 7. The PVC5
nanoweb sample exhibits the highest Cl+ (1.09 percent)
uptake value.
Due to amine, amide, and imide functionalities of TTDD,
they were analyzed to check if they could recharge
antimicrobial TTDD after interaction with NaOCl.
Furthermore, even after three recharging cycles, the Cl+
concentration of PVC1 webs remained constant, whereas
other TTDD-loaded PVC nanowebs showed high efficiency
factors (PVC3 and PVC5). Because the active chlorine
concentration of TTDD is critical for its antibacterial
activities, the effects of chlorination time and pH on PVC
chlorination capability were evaluated. The rechargeable
chlorination process is dependent on rising N-halamine
concentration, which causes an increase in rechlorination
efficiency. It reduced as the procedure time increased. (See
Table 3).
Table 1. Chlorination results of PVC nanowebs with N-halamine
in pH 5.
Sample
ID
PVC1
PVC3
PVC5
NaOCl Concentration Time
1h
6h
12h
1h
6h
12h
1h
6h
12h
10%
0.11
0.14
0.10
0.08
0.13
0.05
0.17
0.19
0.40
20%
0.33
0.29
0.22
0.34
0.27
0.2
0.32
0.88
0.60
40%
0.71
0.55
0.23
0.52
0.55
0.58
1.54
1.13
0.73
Table 2. Chlorination results of PVC nanowebs with N-halamine in pH 7.
Sample
ID
PVC1
PVC3
PVC5
NaOCl Concentration Time
1h
6h
12h
1h
6h
12h
1h
6h
12h
10%
0.07
0.13
0.21
0.13
0.19
0.26
0.26
0.23
0.25
20%
0.24
0.26
0.27
0.34
0.38
0.47
0.61
0.48
0.47
40%
0.42
0.47
0.54
0.64
0.83
0.87
0.82
0.98
1.09
Table 3. Rechargable chlorinatonresults of PVC nanowebs with N-halamine for 6 h in pH 5.
Sample
ID
Rechargable Chlorination Efficiency (%)
1st 2nd 3rd 4th
PVC1 0.11 0.11 0.11 0.07
PVC3 0.55 0.42 0.36 0.33
PVC5 0.95 0.90 0.83 0.75
3.5 Antibacterial Efficacy Testing
A novel antibacterial nanoweb production was aimed in this
study. According to chlorination results, they were tested
both S. aureus and E. coli with ASTM 2149 standard. As a
result, the chlorine uptake of nanowebs in pH 5 was more
than in pH 7, and as the amount of chlorine uptake
increased, the antibacterial property also increased. The
initial bacterial population of PVC0 9.65 and6.04 for S.
aureus and E. coli bacteria, respectively, as well as the
logcfu values of the control samples, are shown in Table 4.
PVC0 nanoweb showed no essential antibacterial activity
within 3 and 24 h, respectively. On the other hand, PVC
nanowebs with TTDD compound showed complete
inactivation of both S. aureus and E. coli bacteria,
confirming that the nanowebs had increased antibacterial
activities due to the addition of TTDD compound
chlorinated nanowebs. PVC1 was challenged with S. aureus
and E. coli while TTDD 88.24% and 71.76% of inactivated
bacteria during the tests within the contact time of 24 h.
Both PVC3 and PVC5 provided inactivation of 100%
within 24 h when challenged with both S. aureus and E.
coli and also the results are summarized in Table 4. The
producted nanofibers have unrivaled antibacterial
functionalities compared to various kinds of antimicrobial
agents containing nanofibers [9].
TEKSTİL ve KONFEKSİYON 31(3), 2021 153
Table 4. Antibacterial test results of PVC nanowebs.
Sample ID Bacteria type Contact time (h) log CFU Bacterial
reduction (%)
PVC0 (in pH 5) S.aureus 3 9.65 3.92
24 9.63 7.84
E.coli 3 - -
24 6.04 88.24
PVC1 (in pH 5) S.aureus 3 9.64 4.90
24 8.74 88.24
E.coli 3 - -
24 5.21 71.76
PVC3 (in pH 5) S.aureus 3 9.63 7.84
24 0 100
E.coli 3 - -
24 3.51 100
PVC5 (in pH 5) S.aureus 3 0 100
24 0 100
E.coli 3 0 100
24 - 100
4. CONCLUSION
In this study, organic N-halamin compound (TTDD)
compound was added to PVC solution and nanoweb
surfaces were successfully produced by electrospinning
process. The SEM images revealed the resulting nanowebs
possessed relatively non-homogenous average fiber
diameters between 35-411 nm and PVC nanowebs have a
beaded structure, except PVC5. The amount of TTDD
dramatically affected the fiber diameter. The typical FTIR
peaks of TTDD were observed in TTDD loaded-PVC and
small changes in certain peaks were recorded, owing to
physical interactions of TTDD with PVC matrix. According
to TGA analysis, the addition of TTDD had no effect on the
initial degradation temperature of the PVC. However, the
thermal degradation changed after the pyrolysis
temperature. The chlorinated nanowebs indicated high
antibacterial activity against both S. aureus and E. coli.
Antibacterial activity was found to increase with increasing
TTDD amount in 3 h and 24 h. Within 24 hours, PVC5
nanowebs provided 100 % inactivation (approximately 0
logs) of E. coli and S. aureus. Moreover, rechargeable
chlorination capabilities were achieved in acidic media with
minimum loss during the optimum time (6 h) for all
nanowebs. This procedure was carried out four times. The
utilization of TTDD bactericidal groups to develop
protective electrospun PVC webs with recharged
antibacterial efficiency might be a potential application in
medical fields.
Acknowledgement
The authors acknowledge Dr. Mehmet Orhan for his help
with the antibacterial testing.
REFERENCES
1. Boryo DEA. 2013. The effect of microbes on textile material: a review
on the way-out so far. The International Journal of Engineering and
Science (IJES), 2(8):9-13.
2. Ramachandran T, Rajendrakumar K, Rajendran R. 2004.
Antimicrobial textiles-an overview. Journal of The Institution of
Engineers (India): Series E, 84(2):42-47.
3. Tshikantwa TS, Ullah MW, He F, Yang G. 2018. Current trends and
potential applications of microbial interactions for human welfare.
Frontiers in Microbiology, 9, 1156.
4. Ducel G, Fabry J, & Nicolle L. 2002. Prevention of hospital acquired
infections: a practical guide. Prevention of hospital acquired
infections: a practical guide. (Ed. 2). Malta.
5. Şimsek EM, Grassie SS, Emre C, 2017. Relationship between
environmental conditions and nosocomial infection rates in intensive care unit. Medical Journal of Islamic World Academy Sciences, 25, 15-18.
6. Hughes R. 2008. Patient safety and quality: An evidence-based
handbook for nurses (Vol. 3). Rockville, MD: Agency for Healthcare Research and Quality.
7. Ji M, Moffett HL, Kunin CM. 1988. Guidelines for improving the use of
antimicrobial agents in hospitals: a statement by the Infectious Diseases
Society of America. Journal of Infection Disease, 157, 869-876.
8. Ren X, Kou L, Kocer HB, Zhu C, Worley SD, Broughton RM, Huang
TS. 2008. Antimicrobial coating of an N-halamine biocidal monomer
on cotton fibers via admicellar polymerization. Colloids and Surfaces
A: Physicochemical and Engineering Aspects, 317(1-3):711-716.
154 TEKSTİL ve KONFEKSİYON 31(3), 2021
9. Aksoy OE, Ates B, Cerkez I. 2017. Antibacterial polyacrylonitrile
nanofibers produced by alkaline hydrolysis and chlorination. Journal
of Materials Science, 52(17):10013-10022.
10. Kocer HB, Akdag A, Ren X, Broughton RM, Worley SD, Huang TS.
2008. Effect of alkyl derivatization on several properties of N-
halamine antimicrobial siloxane coatings. Industrial&Engineering
Chemistry Research, 47(20):7558-7563.
11. Kocer HB. 2012. Residual disinfection with N-halamine based
antimicrobial paints. Progress in Organic Coatings, 74(1):100-105.
12. Worley SD, Williams DE, Crawford R. 1988. Halamine water
disinfectants. Critical Reviews in Environmental Science and
Technology, 18(2):133-175.
13. Kocer HB, Worley SD, Broughton RM, Huang TS. 2011. A novel N-
halamine acrylamide monomer and its copolymers for antimicrobial
coatings. Reactive and Functional Polymers, 71(5):561-568.
14. Ma Y, Li J, Si Y, Huang K, Nitin N, Sun G. 2019. Rechargeable
antibacterial N-halamine films with antifouling function for food
packaging applications. ACS Applied Materials&İnterfaces, 11(19):
17814-17822.
15. Demir B, Broughton RM, Qiao M, Huang TS, Worley SD. 2017. N-
halamine biocidal materials with superior antimicrobial efficacies for
wound dressings. Molecules, 22(10):1582.
16. Cerkez I, Kocer HB, Worley SD, Broughton RM, Huang TS. 2011. N-
halamine biocidal coatings via a layer-by-layer assembly technique.
Langmuir, 27(7):4091-4097.
17. Demirci F, Kocer HB. 2019. Preparation of antibacterial
polyvinylidene fluoride (PVDF) ultrafiltration membranes with direct
addition of N-halamine polymers. Separation Science and
Technology, 54(5):803-814.
18. Kocer HB, Cerkez I, Worley SD, Broughton RM, Huang TS. 2011. N-
halamine copolymers for use in antimicrobial paints. ACS Applied
Materials &İnterfaces, 3(8):3189-3194.
19. Ren X, Jiang Z, Liu Y, Li L, Fan X. 2016. N-halamines as
antimicrobial textile Finishes. G.S. Antimicrobial Textiles. USA:
Elsevier: Woodhead Publishing.
20. Bhardwaj N, Kundu SC. 2010. Electrospinning: a fascinating fiber
fabrication technique. Biotechnology Advances, 28(3):325-347.
21. Parin FN, Terzioğlu P, Sicak Y, Yildirim K, Öztürk M. 2020. Pine
honey–loaded electrospun poly (vinyl alcohol)/gelatin nanofibers with
antioxidant properties. The Journal of The Textile Institute,
112(4):628-635.
22. Parın FN, Aydemir Ç, Taner G, Yıldırım K. 2021. Co-electrospun-
electrosprayed PVA/folic acid nanofibers for transdermal drug
delivery: Preparation, characterization, and in vitro cytocompatibility.
Journal of Industrial Textiles, Doi:1528083721997185.
23. Parın FN, Yıldırım K. 2021. Preparation and characterisation of
vitamin-loaded electrospun nanofibres as promising transdermal
patches. Fibres & Textiles in Eastern Europe, 1(145):17-25.
24. Ren X, Kocer HB, Worley SD, Broughton RM, Huang T. 2013.
Biocidal nanofibers via electrospinning. Journal of Applied Polymer
Science, 127(4):3192-3197.
25. Fang J, Niu H, Lin T, Wang X. 2008. Applications of electrospun
nanofibers. Chinese Science Bulletin, 53(15):2265.
26. Goldade V, Vinidiktova N. 2017. Antimicrobial Fibers For Textile
Clothing And Medicine: Current State, ISJ Theoretical & Applied
Science, 3(47):178-194.
27. Parın FN, Yıldırım K, Kavçak Ö, Kalemtaş A, Aydın G. 2020, Eylül.
Fabrication of Antibacterial Orange Essential Oil−Loaded Gelatin
Fibers. In Y.U. 7. ULPAS Bildiri Kitapçığı (34-38). Bursa, Türkiye.
28. Ahmadi S, Hivechi A, Bahrami SH, Milan PB, Ashraf SS. 2021.
Cinnamon extract loaded electrospun chitosan/gelatin membrane with
antibacterial activity. International Journal of Biological
Macromolecules, 173, 580-590.
29. Yina M, Wang Y, Zhang Y, Ren X, Qiu Y, Huang T. 2020. Novel
quaternarized N-halamine chitosan and polyvinyl alcohol nanofibrous
membranes as hemostatic materials with excellent antibacterial
properties. Carbohydrate Polymers, 232, 115823.
30. Zhang Y, Li T, Shiu B, Sun F, Ren H, Zhang X, Lou C, Lin J. 2021.
Eco-friendly versatile protective polyurethane/triclosan coated
polylactic acid nonwovens for medical covers application. Journal of Cleaner Production, 282, 124455.
31. Chen S, Li C, Hou T, Cai Y, Liang L, Chen L, Li M. 2019.
Polyhexamethylene guanidine functionalized chitosan nanofiber
membrane with superior adsorption and antibacterial performances. Reactive and Functional Polymer, 145, 104379.
32. Ullah S, Hashmi M, Kharaghani D, Khan MQ, Saito Y, Yamamoto T,
Lee J, Kim IS. 2019. Antibacterial properties of in situ and surface
functionalized impregnation of silver sulfadiazine in polyacrylonitrile nanofiber mats. International Journal of Nanomedicine, 14, 2693-2703.
33. Zhanga T, Gua J, Liua X, Dengshuai W, Huiling Z, Haihua X,
Zhuocheng Z, Huali Y, Shiguo C. 2020. Bactericidal and antifouling
electrospun PVA nanofibers modified with a quaternary ammonium
salt and zwitterionic sulfopropylbetaine. Materials Science &
Engineering C, 111, 110855.
34. Lv H, Cui S, Yang Q, Song X, Wang D, Hua J, Zhou Y, Liu Y. 2021.
AgNPs-incorporated nanofiber mats: Relationship between AgNPs
size/ content, silver release, cytotoxicity, and antibacterial activity.
Materials Science & Engineering C, 118, 111331.
35. Dong A, Wang Y, Gao Y, Gao T, Gao G. 2017. Chemical Insights into Antibacterial N-Halamines. Chemical Reviews, 117, 4806-4862.
36. Liu M, Wang F, Liang M, Si Y, Yu J, Ding B. 2020. In situ green
synthesis of rechargeable antibacterial N-halamine grafted poly(vinyl
alcohol) nanofibrous membranes for food packaging applications. Composites Communications, 17, 147-153.
37. Tian C, Wu F, Jiao W, Liu X, Yin X, Si Y, Yu J, Ding B. 2021.
Antibacterial and antiviral N-halamine nanofibrous membranes with
nanonet structure for bioprotective applications. Composites
Communications, 24, 100668.
38. Ma Y, Yi J, Pan B, Nitin N, Sun G. 2020.Chlorine Rechargeable
Biocidal N-Halamine Nanofibrous Membranes Incorporated with
Bifunctional Zwitterionic Polymers for Efficient Water Disinfection
Applications. ACS Applied Materials Interfaces, 12(45):51057-51068.
39. Liang M, Wang F, Liu M, Yu J, Si Y, Ding B. 2019. N-Halamine
Functionalized Electrospun Poly(Vinyl Alcohol-co-Ethylene)
Nanofbrous Membranes with Rechargeable Antibacterial Activity
for Bioprotective Applications. Advanced Fiber Materials, 1, 126-136.
40. Nicholas P. 1997. Handbook of Engineering Polymeric Materials. USA: Marcel Dekker Inc.
41. Doble M, Kumar A. 2005. Biotreatment of Industrial Effluents. USA: Butterworth-Heinemann, Elsevier.
42. Li X, Xing Y, Jiang Y, Ding Y, Li W. 2009. Antimicrobial activities of
ZnO powder-coated PVC film to inactivate food pathogens. International Journal of Food Science&Technology, 44(11):2161-2168.
43. Machovsky M, Kuritka I, Bazant P, Vesela D, Saha P. 2014.
Antibacterial performance of ZnO-based fillers with mesoscale
structured morphology in model medical PVC composites. Materials Science and Engineering: C, 41, 70-77.
44. Behboudi A, Jafarzadeh Y, Yegani R. 2018. Incorporation of silica
grafted silver nanoparticles into polyvinylchloride/polycarbonate
hollow fiber membranes for pharmaceutical wastewater treatment. Chemical Engineering Research and Design, 135, 153-165.
45. Zampino D, Ferreri T, Puglisi C, Mancuso M, Zaccone R, Scaffaro R,
Bennardo D. 2011. PVC silver zeolite composites with antimicrobial
properties. Journal of Materials Science, 46(20):6734-6743.
46. Cushen M, Kerry J, Morris M, Cruz-Romero M, Cummins E. 2013.
Migration and exposure assessment of silver from a PVC nanocomposite. Food Chemistry, 139(1-4):389-397.
47. Lin H, Xu Z, Wang X, Long J, Su W, Fu X, Lin Q. 2008. Photocatalytic
and antibacterial properties of medical‐grade PVC material coated with
TiO2 film. Journal of Biomedical Materials Research Part B:Applied
Biomaterials, 87(2):425-431.
48. Lala NL, Ramaseshan R, Bojun L, Sundarrajan S, Barhate RS, Ying-
jun L, Ramakrishna S. 2007. Fabrication of Nanofibers With
Antimicrobial Functionality Used as Filters: Protection Against
TEKSTİL ve KONFEKSİYON 31(3), 2021 155
Bacterial Contaminants. Biotechnology and Bioengineering, 97(6):
1357-1365.
49. Chylińska M, Kaczmarek H, Burkowska-But A, Walczak M. 2015.
Novel biocidal N-halamine plastic based on poly (vinyl chloride):
preparation and characteristics. Journal of Industrial and Engineering
Chemistry, 28, 124-130.
50. Akdag A, Okur S, McKee ML, Worley SD. 2006. The stabilities of N−
Cl bonds in biocidal materials. Journal of Chemical Theory and
Computation, 2(3):879-884.
51. Ren X, Akdag A, Kocer HB, Worley SD, Broughton RM, Huang TS.
2009. N-Halamine-coated cotton for antimicrobial and detoxification
applications. Carbohydrate Polymers, 78(2):220-226.
52. Liang J, Chen Y, Barnes K, Wu R, Worley SD, Huang TS. 2006. N-
halamine/quat siloxane copolymers for use in biocidal coatings.
Biomaterials, 27, 2495-2501.
53. Liang J, Wu R, Wang JW, Barnes K, Worley SD, Cho U, Lee J,
Broughton RM, Huang TS. 2007. N-halamine biocidal coatings.
Journal of Industrial Microbiology and Biotechnology, 34, 157-163.
54. Çobanoğlu B, Parın FN, Yıldırım K. 2019, Mayıs. Antibacterial
Polyvinyl Chloride (PVC) Nanofibers Containing N-Halamines. In
Y.U., 5. ULPAS Bildiri Kitapçığı (79-81). İstanbul, Türkiye.
55. Iribarren A, Rivero PJ, Berlanga C, Larumbe S, Miguel A, Palacio JF,
Rodriguez R, 2019. Multifunctional Protective PVC-ZnO
Nanocomposite Coatings Deposited on Aluminum Alloys by
Electrospinning. Coatings, 9(216):2-13.
56. Akgül YI, Aykut Y. 2019. Partially Transformation of Zinc Nitrate to
Zinc Compounds on PVC Nanofibers at Low-Temperature Heat
Treatment and Investigation of the Products Optical Properties. Tekstil
ve Mühendis, 26(114):118-124.
57. Zhong Z, Cao Q, Jing B, Wang X, Li X, Deng H. 2012. Electrospun
PVDF-PVC nanofibrous polymer electrolytes for polymer lithium-ion
batteries. Materials Science and Engineering: B, 177(1):86-91.
58. Zhong Z, Cao Q, Jing B, Li S, Wang X. 2012. Novel electrospun
PAN–PVC composite fibrous membranes as polymer electrolytes for
polymer lithium-ion batteries. Ionics, 18(9):853-859.
59. Guo JW, Lin ZY, Huang BR, Lu CH, Chen JK. 2018. Antigen
detection with thermosensitive hydrophilicity of poly (N-isopropyl
acrylamide)-grafted poly (vinyl chloride) fibrous mats. Journal of
Materials Chemistry B, 6(21):3486-3496.
60. Cerkez I, Kocer HB, Worley SD, Broughton RM, Huang TS. 2012.
Epoxide tethering of polymeric N-halamine moieties. Cellulose,
19(3):959-966.
61. Sherif EM, Es-saheb M, El-Zatahry A, Kenawyand E, Alkaraki AS.
2012. Coating electrospun polyvinyl alcohol and polyvinyl chloride
fibers as corrosion passivation applications. International Journal of
Electrochemical Science, 7, 6154-6167.
62. Hussein MA, Kumar M, Drew R, Al-Aqeeli N. 2018. Electrochemical
corrosion and in vitro bioactivity of nano-grained biomedical Ti-
20Nb-13Zr alloy in a simulated body fluid. Materials, 11(1):26.
63. Shnawa HA, Khalaf MN, Jahani Y. 2018. The effects of natural
polyphenols and calcium-based thermal stabilizer on the rheological
and thermal resistance behaviors of PVC. International Journal of
Plastics Technology, 22(2):65-385.
64. Nair MR, Thomas GV, Nair MG. 2007. Thermogravimetric analysis of
PVC/ELNR blends. Polymer Degradation and Stability, 92(2):189-
196.
156 TEKSTİL ve KONFEKSİYON 31(3), 2021
TEKSTİL VE KONFEKSİYON
Vol: 31, No: 3
DOI: 10.32710/tekstilvekonfeksiyon.761461
Production and Characterization of Nanoencapsulated Phase
Change Materials (PCMs) and Bicomponent PCM Nanofibers
Simge ÖZKAYALAR, 0000-0002-5390-8317
Sennur ALAY AKSOY* 0000-0002-5878-6726
*
Süleyman Demirel University, Engineering Faculty, Textile Engineering Department, Isparta, Turkey
Corresponding Author: Sennur Alay Aksoy, [email protected]
ABSTRACT
The aim of this study was to fabricate the nanocapsules and nanofibers with latent heat energy storage
properties. Therefore, phase change materials based on fatty alcohols were used as latent heat energy
storage materials. N-Dodecanol and 1-tetradecanol fatty alcohols were nanoencapsulated by
poly(methyl methacrylate-co-methacrylic acid) (p(MM-co-MA)) wall using emulsion polymerization
method. Prepared nanocapsules were incorporated in polyacrylonitrile nanofibers using the co-axial
electrospinning method. In this study, a two-stage (TS) emulsion polymerization process was defined
and compared to the known emulsion polymerization method defined as one-stage (OS).
Nanocapsules were characterized by Fourier-transform infrared (FT-IR) spectroscopy, transmission
electron microscopy (TEM), differential scanning calorimeter (DSC), and thermogravimetric analyzer
(TGA). According to the results, typical core-shell structured, spherical-shaped, uniform nano-sized
particles having high thermal stability and energy storage capacity were fabricated successfully.
Enthalpy values of the nanocapsules prepared by the TS process were higher and reached up to 171
J/g. It was concluded that the thermal degradation stability of the nanocapsules could be improved
using the TS emulsion polymerization method. Moreover, the nanocapsules were incorporated in
polyacrylonitrile nanofibers using the co-axial electrospinning method, and composite nanofibers
having 19 J/g energy storage capacities were produced. Although the surfaces of the prepared core-
sheath structured nanofibers were rough and coarse, their diameter distribution was unimodal.
ARTICLE HISTORY
Received: 01.07.2020
Accepted: 03.08.2021
KEYWORDS
Thermal energy storage, PCMs, nanocapsules, PCM nanofibers, PAN
1. INTRODUCTION
Phase change materials (PCMs) have attracted a great deal
of attention because of their capability of storing and
releasing large amounts of latent heat during their phase
change from one physical state to another. They have been
used as an energy storage material in many fields such as
solar energy storage, energy-efficient buildings,
thermoregulation clothing, and industrial textiles due to
their high energy storage capacity. A large number of
organic and inorganic solid-liquid PCMs are available.
Organic-based PCMs such as paraffin waxes or n-alkanes,
polyethylene glycol, fatty acids generally have been
preferred as thermal energy storage materials in many end-
use fields [1]. Their phase change temperatures and energy
storage capacities have taken into account in this selection.
One type of organic-based PCMs is fatty alcohols such as
n-dodecanol and 1-tetradecanol. In recent years, the use of
fatty alcohols as thermal energy storage material has been
attracted great deal of interest because of their low cost than
paraffin waxes and having high heat density and a wide
range of melting temperatures. However, fatty alcohols
have some disadvantages such as leakage, subcooling, low
thermal conductivity, reactivity toward the outside
environment, and flammability [2]. To overcome these
disadvantages, encapsulation technology has been utilized.
Encapsulation is to packet an oil drop or a solid particle as a
To cite this article: Özkayalar S, Alay Aksoy S. 2021. Production and characterization of nanoencapsulated phase change materials (pcms) and bicomponent pcm nanofibers. Tekstil ve Konfeksiyon, 31(3), 156-170.
TEKSTİL ve KONFEKSİYON 31(3), 2021 157
core material in a wall in order to develop micro or nano-
sized capsules [3]. Encapsulated PCM is composed of a
PCM as the core, and a polymer or an inorganic shell to
maintain the spherical capsule shape and prevent leakage of
PCM during its melting [4, 5]. The wall structure plays very
important role in order to meet the requirements of the
usage area of the encapsulated PCMs. According to the
literature survey on usage of fatty alcohols as PCM, n-
dodecanol have been encapsulated by various wall
materials such as SiO2 [2], melamine-formaldehyde resin
[6-8], methanol–melamine-formaldehyde [9, 10], styrene-
butyl acrylate copolymer [11], polymethyl methacrylate
(PMMA) [12], acrylic-based copolymer prepared using
acrylic monomers such as polyurethane acrylate and 1,4-
butylene glycol diacrylate [13], graphene oxide-modified
poly(melamine-formaldehyde) [14], poly(methyl
methacrylate) copolymer with different type co-monomers
such as acrylamide, butyl acrylate and acrylic acid [15],
poly(allyl methacrylate) [16], melamine–urea-
formaldehyde resins [17].
In the textile industry, phase change materials are used to
improve thermal clothing comfort and produce smart
thermo-regulating textiles. They have been incorporated
into the fibers directly or encapsulated form, during the
fiber spinning. Additionally, coating the fabrics with
encapsulated PCM doped polymer has been realized.
Recently, the electrospinning technique has been utilized to
produce nano-sized form-stable phase change fibers
containing PCMs in a supporting polymer matrix [18, 19].
Electrospinning technique has been used to fabricate the
phase change-composite fibers with unique advantages
such as ultrafine size, huge surface-to-volume ratio,
excellent thermal performance, lightweight, and direct
useage in various composites [18, 20, 21]. Electrospinning
is a simple and versatile method that involves the usage of
electrostatic force to draw a polymer solution into fibers
whose diameters vary from a few nanometers to a
submicron scale [18, 22, 23]. Phase change-composite
nanofiber webs prepared by single and double nozzle
(coaxial) electrospinning techniques can be applied in
garments, electronic components, etc. in order to enhance
the efficiency of thermal regulation [20]. Recently, the
preparation of temperature-regulating composite nanofibers
by coaxial electrospinning technique has attracted more and
more attention. In coaxial electrospinning, concentrically
aligned spinnerets have been used to fabricate core-sheath
or hollow nanofibers [22, 24]. Coaxial electrospinning is a
promising method to encapsulate PCM in the core of the
fibers and to maintain it inside the polymer sheath layer of
the fibers [25]. Coaxial electrospinning offers encapsulation
of both hydrophilic and oleophilic PCMs in a variety of
polymers and enhances the mechanical properties of the
phase-change-composite nanofibers [21]. Oleophilic or
hydrophilic solid-liquid PCMs such as long-chain
hydrocarbons and polyethylene glycol have been
encapsulated in core-sheath structured nanofibers by
coaxial electrospinning method [21, 24-32].
The aim of this study is to produce the nanocapsules and
nanofibers having latent heat storage and release properties
with improved thermal properties. In literature, poly(methyl
methacrylate) (PMMA) and its copolymers have been used in
the encapsulation of the various solid-liquid PCMs such as n-
alkanes and fatty acids [33-39]. In this study, n-dodecanol
and 1-tetradecanol fatty alcohols were used as solid-liquid
phase-change materials and nanoencapsulated in the wall of
poly(methyl methacrylate-co-methacrylic acid) (p(MMA-co-
MA)). A two-stage emulsion polymerization process was
performed to investigate its performance in improving the
thermal stability of the capsule shell structure. In the TS
emulsion polymerization process, the methacrylic acid
monomer was added to the emulsion medium during the
second stage of the process. Thereby, firstly PMMA shell
was synthesized to produce nanocapsules having a
poly(methyl methacrylate) inner shell. In the second step of
the process, MMA and MA monomers were copolymerized
to produce a poly(methyl methacrylate-co-methacrylic
amide) outer shell structure. Additionally, it was aimed to
form the nanocapsule shell containing more numerous
functional carboxylic acid groups by increasing the MA
monomer in the outer surface of the nanocapsules. Thereby,
the homogeneous distribution of the nanocapsules in the PEG
solution, which was the core spinning solution of the
bicomponent nanofibers, was aimed by increasing molecular
interaction between the OH groups of PEG and carboxylic
acid groups of the MA. In the study, synthesis of the single
P(MMA-co-MA) shell was carried out using the
conventional emulsion polymerization method which was
defined as one-stage emulsion polymerization. Their
properties were compared to the TS nanocapsules. The
prepared TS nanocapsules were loaded in nanofibers as the
core material via co-axial electrospinning technique and the
placement of the nanocapsules in the fiber structure was
investigated.
2. MATERIAL AND METHOD
2.1 Material
Methyl methacrylate (MMA, Merck) and methacrylic acid
(MA, from Sigma Aldrich) were used as monomers to
synthesize the shell of the nanocapsules. Ethylene glycol
dimethacrylate (EGDM, from Merck Company) was used
as a cross-linker. n-Dodecanol and (from Sigma Aldrich) 1-
tetradecanol (from Merck) as PCMs, and Triton X-100
(from Sigma Aldrich) as an emulsifier were used. Ferrous
sulfate heptahydrate and ammonium persulfate used as
initiators were obtained from a Sigma Aldrich company.
Sodium thiosulfate (from Merck) was used as a reactive
material. Tert-butyl hydroperoxide (70 % in water) was
obtained as an initiator from Acros Organics Company and
used as received.
To produce nanofibers, polyacrylonitrile (PAN, Mw 150000
g/mole from Sigma Aldrich) and polyethylene glycol (PEG,
Mw 1000 g/mol from Alfa Aesar) were used as polymers.
N,N-Dimethylformamide (DMF, with a purity of > % 98.8
from Carlo Erba Reagent) was used as the solvent.
158 TEKSTİL ve KONFEKSİYON 31(3), 2021
2.2 Method
2.2.1. Preparation of the nanocapsules
In this study, encapsulation of n-dodecanol and 1-
tetradecanol was carried out by emulsion polymerization
method. Different from the studies in literature, the
emulsion polymerization process (two-stage) was carried
out in two steps to manufacture nanocapsules having
poly(methyl methacrylate) inner and poly(methyl
methacrylate-co-methacrylic acid) outer walls.
In a two-stage (TS) polymerization procedure, a 12.5 g
quantity of core material (n-dodecanol or 1-tetradecanol)
was emulsified in 80 mL of distilled water at speed of 2000
rpm at 50 °C. Triton 100 (1 g) was added as an emulsifier.
Then, 6.25 g MMA, 0.5 mL of ferrous sulfate heptahydrate
solution (FSHS), 0.125 g of ammonium persulfate (APS),
1.25 g of ethylene glycol dimethacrylate (EGDM) were
added to the emulsion. The stirring speed of the emulsion
was decreased to 1000 rpm. Sodium thiosulfate (STS,
0.125 g) and 0.5 g of tert-Butyl hydroperoxide (TBHP)
were added and the reaction medium was heated to 85 ºC.
After 2 hours of stirring at 1000 rpm, the first step of the
process was completed. To start the second step of the
process, 0.5 g of Triton X100, 6.25 g of MMA, 2.5 g of
MA, 0.25 mL of ferrous sulfate heptahydrate solution,
0.0625 g of ammonium persulfate, and 0.625 g of ethylene
glycol dimethacrylate were added to the reaction medium.
After adding 0.0625 g of sodium thiosulfate and 0.25 g of
tert-Butyl hydroperoxide, the reaction was continued at 85
ºC for more than 2 hours. Afterward, the nanocapsules were
filtered, rinsed with water at 50 °C, and dried at room
temperature for analysis. Besides, the production process
defined in our previous study was used to produce one
walled nanocapsule and named as a one-stage process (OS)
[40, 41]. The amount of the materials used in the one-stage
production process was given in Table 1. In this process,
the polymerization reaction was conducted at 85 ºC for 4
hours by stirring at 1000 rpm. The abbreviated names and
contents of the nanocapsules were given in Table 1.
2.2.2. Production of core-sheath structured nanofibers
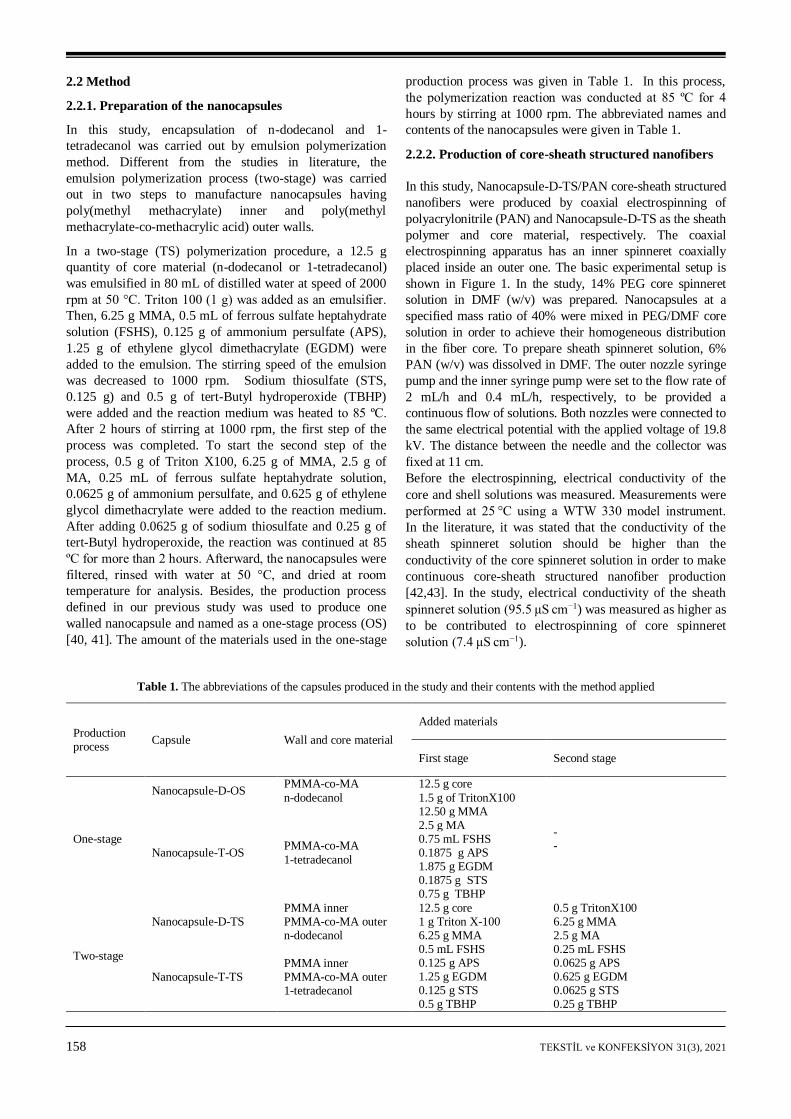
In this study, Nanocapsule-D-TS/PAN core-sheath structured
nanofibers were produced by coaxial electrospinning of
polyacrylonitrile (PAN) and Nanocapsule-D-TS as the sheath
polymer and core material, respectively. The coaxial
electrospinning apparatus has an inner spinneret coaxially
placed inside an outer one. The basic experimental setup is
shown in Figure 1. In the study, 14% PEG core spinneret
solution in DMF (w/v) was prepared. Nanocapsules at a
specified mass ratio of 40% were mixed in PEG/DMF core
solution in order to achieve their homogeneous distribution
in the fiber core. To prepare sheath spinneret solution, 6%
PAN (w/v) was dissolved in DMF. The outer nozzle syringe
pump and the inner syringe pump were set to the flow rate of
2 mL/h and 0.4 mL/h, respectively, to be provided a
continuous flow of solutions. Both nozzles were connected to
the same electrical potential with the applied voltage of 19.8
kV. The distance between the needle and the collector was
fixed at 11 cm.
Before the electrospinning, electrical conductivity of the
core and shell solutions was measured. Measurements were
performed at 25 °C using a WTW 330 model instrument.
In the literature, it was stated that the conductivity of the
sheath spinneret solution should be higher than the
conductivity of the core spinneret solution in order to make
continuous core-sheath structured nanofiber production
[42,43]. In the study, electrical conductivity of the sheath
spinneret solution (95.5 μS cm−1) was measured as higher as
to be contributed to electrospinning of core spinneret
solution (7.4 μS cm−1).
Table 1. The abbreviations of the capsules produced in the study and their contents with the method applied
Production process
Capsule Wall and core material
Added materials
First stage Second stage
One-stage
Nanocapsule-D-OS PMMA-co-MA
n-dodecanol
12.5 g core
1.5 g of TritonX100 12.50 g MMA 2.5 g MA 0.75 mL FSHS 0.1875 g APS 1.875 g EGDM 0.1875 g STS 0.75 g TBHP
- -
Nanocapsule-T-OS PMMA-co-MA
1-tetradecanol
Two-stage
Nanocapsule-D-TS PMMA inner PMMA-co-MA outer n-dodecanol
12.5 g core 1 g Triton X-100 6.25 g MMA 0.5 mL FSHS 0.125 g APS 1.25 g EGDM 0.125 g STS 0.5 g TBHP
0.5 g TritonX100 6.25 g MMA 2.5 g MA 0.25 mL FSHS 0.0625 g APS 0.625 g EGDM 0.0625 g STS 0.25 g TBHP
Nanocapsule-T-TS PMMA inner PMMA-co-MA outer 1-tetradecanol
TEKSTİL ve KONFEKSİYON 31(3), 2021 159
Figure 1. Co-axial electrospinning setup [40].
2.2.3. Characterization of the nanocapsules and
nanofibers
The morphology and core-shell structure of the
nanocapsules were analyzed using transmission electron
microscopy (TEM, JEOL JEM2100). In this procedure, one
drop of nanocapsule dispersion in the water was dropped
onto a copper grid and allowed to dry and examined by
TEM. In the study, the thickness of the nanocapsule shell
on TEM images was measured using the images of about
50 nanocapsules per each nanocapsule type using an image
analysis program. The Fourier transforms infrared (FTIR)
transmission spectra of the nanocapsules and nanofibers
were recorded between 4000 and 400 cm−1 at a resolution of
4 cm−1 and a number of scans of 16 using a Perkin Elmer
Spektrum BX spectrometer. The spectroscopic analyses of
the nanocapsules and nanofibers were performed on KBr
disks. The particle size of nanocapsules was measured
using a particle size instrument (Malvern MS2000E).
Before the measurements, dried capsules were
homogenized in the water by an ultrasonic homogenizer
(Bandaline Sonuplus UV 2200) for 2 hours. Thermal
properties of the nanocapsules and nanofibers such as latent
heat storage–releasing capacities and temperatures were
measured by differential scanning calorimetry (DSC,
Perkin-Elmer Fronter) at a heating–cooling rate of 5 °C/min
between -5 °C and + 80 °C under a constant stream of
nitrogen at a flow rate of 60 mL/min. In this study, the core
material permeability of the nanocapsule shell in an organic
solution was investigated. In the test, nanocapsules were
immersed in a 10% hexane solution for 24 hours and then
washed with hot water, filtered, and dried at room
temperature. Their thermal properties were also measured
by a DSC instrument. Thermogravimetric analysis (TGA)
of the nanoencapsulated fatty alcohols was carried out
using a thermal analyzer (Perkin-Elmer TGA7) at a heating
rate of 10 °C/min from 25 to 500 °C in nitrogen
atmosphere. Differential Thermogravimetry (DTG) was
also obtained to determine the maximum rate of weight
loss. The morphologies of the nanofibers were investigated
using a scanning electron microscope (SEM, LEO 440
Computer Controlled Digital). The surfaces of the
nanofibers were coated with gold prior to the imaging.
3. RESULTS AND DISCUSSION
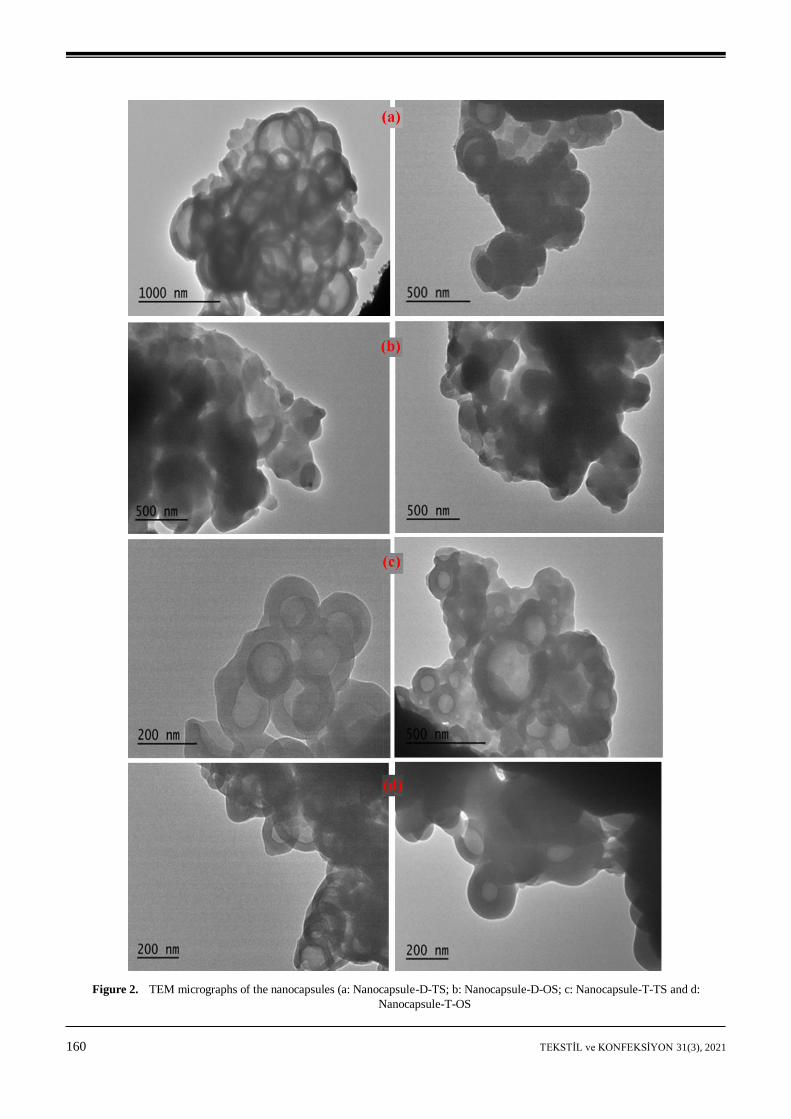
3.1. TEM analysis of the nanocapsules
The core-shell structures of the nanocapsules were
examined by TEM analysis. As seen from TEM images
given in Figure 2, typical core-shell structured nanocapsules
were obtained and the fatty alcohols were encapsulated by a
polymeric shell using the one-stage and two-stage emulsion
polymerization methods. Spherical-shaped and uniform
nano-sized particles were produced successfully. The
particle sizes of the nanocapsules on TEM images changed
between 200 and 500 nm. Nanocapsule-D-TS and
Nanocapsule-D-OS had almost 63 nm and 59 nm shell
thicknesses, while Nanocapsule-T-TS and Nanocapsule-T-
OS had almost 49 nm and 39 nm shell thickness,
respectively (Table 2). It was concluded the shell of the
nanocapsules prepared by the two-stage process were
thicker although the same amount of shell materials was
used in the processes. This might be due to the presence of
methacrylic acid comonomer used in wall structure
synthesis. Methacrylic acid is a monomer that dissolves in
water and swells in the polymerization environment.
Addition of water-soluble monomers such acrylic and
methacrylic acid into the oil-in-water emulsion medium in
microencapsulation processes make the polymerization
difficult and decrease the encapsulation efficiency,
especially when used in high amounts (10% or more).
However, in order to increase the functionality of the
microcapsule wall structure, it should be used as much as
possible [33]. Here, it was concluded that the addition of
the MA co-monomer in the reaction medium at the second
step reduced its negative effect on the polymerization
process and promoted the formation of a thicker wall
structure.
160 TEKSTİL ve KONFEKSİYON 31(3), 2021
Figure 2. TEM micrographs of the nanocapsules (a: Nanocapsule-D-TS; b: Nanocapsule-D-OS; c: Nanocapsule-T-TS and d:
Nanocapsule-T-OS
TEKSTİL ve KONFEKSİYON 31(3), 2021 161
Table 2. Shell thickness meaurement results of the nanocapsules
Nanocapsules
Shell thickness values
Mean Max. Min. CV%
Nanocapsule-D-OS 59 81 32 24.84
15.58
16.04
15.61
Nanocapsule-T-OS 39 44 30
Nanocapsule-D-TS 63 92 52
Nanocapsule-T-TS 49 59 37
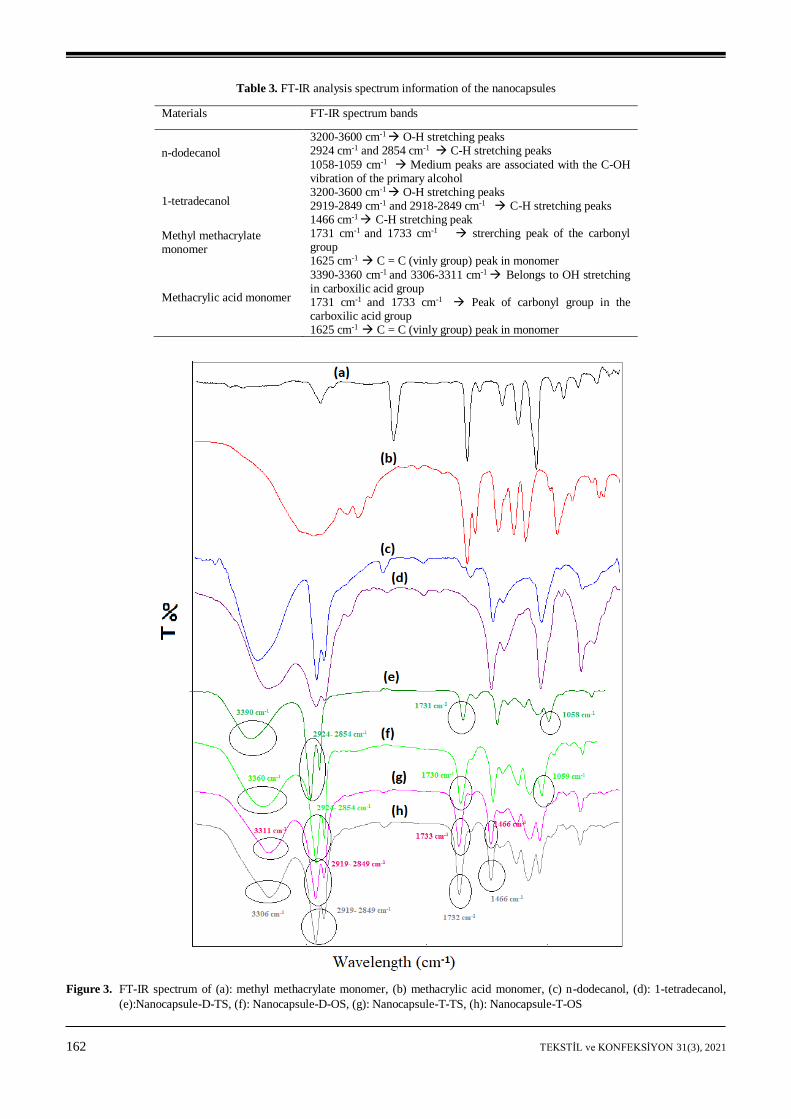
3.1.2. FT-IR analysis of the nanocapsules
To study the chemical structures of the nanocapsules, FT-
IR spectroscopy analyses were performed. The FTIR
spectra of the materials and the information obtained from
the FTIR spectra were given in Figure 3 and Table 3. C-H
stretching peaks of the n-dodecanol were seen at 2924 cm-1
and 2854 cm-1 wavelengths in the FT-IR spectra of the
Nanocapsule-D-TS and Nanocapsule-D-OS (Figure 3,
Table 3). Besides, the medium-strong peaks at 1058-1059
cm-1 were belonging to the C-OH vibration of primary
alcohol (n-dodecanol) [6,12]. The peaks at 1731 cm-1 in the
spectra of the nanocapsules were carbonyl peaks formed by
overlapping of the carbonyl peaks of the MMA and MA
monomers. The peaks at 3390-3360 cm-1 in the spectra of
nanocapsules were overlapped O-H stretching peaks both of
alcohol groups of the n-dodecanol, and carboxylic acid
groups of MA monomer. The peaks seen at wavelengths of
1625 cm-1 and 1639 cm-1, respectively, in spectra of MMA
and MA monomers were the vinyl group (C = C) stretch
peaks and were disappeared in the spectra of the
nanocapsules [41]. This finding was proof of the
polymerization reaction carried out between the MMA and
MA monomers. According to the FT-IR spectra of the
nanocapsules containing 1-tetradecanol given in Figure 3,
the peaks at 2919-2849 cm-1 and 2918-2849 cm-1 in the FT-
IR spectra of the Nanocapsule-T-TS and Nanocapsule-T-
OS were C-H stretching peaks of the 1-tetradecanol, which
were proofs of the encapsulated 1-tetradecanol. Besides,
arising of C-H stretching peaks of 1-tetradecanol at 1466
cm-1 in the FT-IR spectra of the nanocapsules were other
proofs of its presence in nanocapsule structure [44]. The
sharp peaks at a wavelength of 1733 cm-1 in the spectra of
the nanocapsules were carbonyl (C = O) peaks, which were
formed by overlapping of carbonyl peaks in the MA and
MMA monomers [41]. The peaks at 3306-3311 cm-1
wavelengths in the nanocapsule spectra were O-H
stretching peaks of the alcohol group of 1-tetradecanol and
the carboxylic acid group of methacrylic acid co-monomer.
The peaks at the wavelengths of 1625 cm-1 and 1639 cm-1
in FT-IR spectra of the MMA and MA monomers,
respectively, were the vinyl group (C = C) stretching peaks
of the methacrylic acid and methyl methacrylate monomers
[41]. These peaks were disappeared in the nanocapsules
FT-IR spectra, which proved that the polymerization
between methyl methacrylate and methacrylic acid
monomers took place.
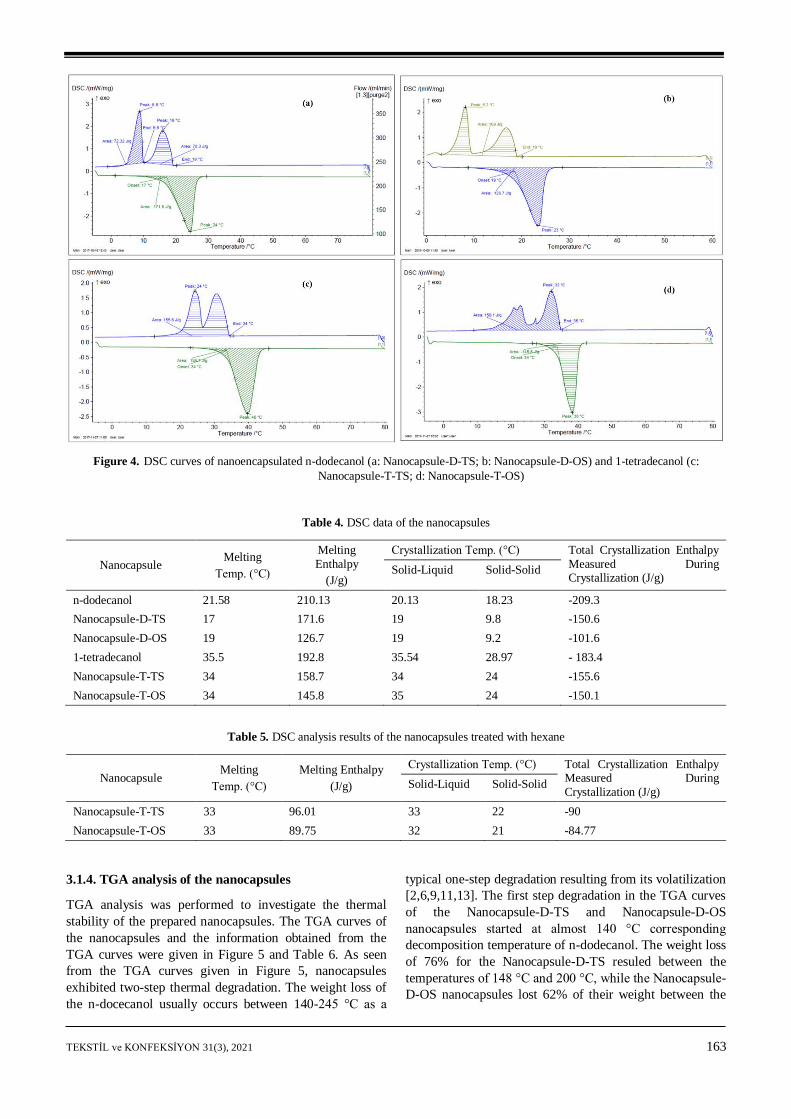
3.1.3. DSC analysis of the nanocapsules
To determine the thermal properties of the nanocapsules
such as latent heat energy-storing/releasing capacities and
temperatures, DSC analysis was performed. The DSC
curves of the nanocapsules and the information obtained
from the DSC curves were given in Figure 4 and Table 4.
As seen from the DSC curves, two peaks were observed in
the DSC spectrum during the cooling. This case resulted
from liquid-solid and solid-solid phase-change processes of
1-alcohols having low temperature and high temperature
crystalline forms. However, solid-solid and solid-liquid
transitions during heating were overlapped [45,46]. It was
seen from Table 4 that the liquid-solid and solid-solid
crystallization temperatures were respectively 19 °C and
9.8 °C for Nanocapsule-D-TS, and 19 °C and 9.2 °C for
Nanocapsule-D-OS. It was concluded from DSC analysis
that the latent heat storage/releasing capacities of the
prepared nanocapsules were very high compared to the
findings in the literature [2,6,9-17]. Besides, the enthalpy
values of the nanocapsules produced by the two-stage
process were measured as higher. As explained before, the
presence of a water-soluble MA comonomer in the
emulsion medium negatively affects the microencapsulation
process and decreases the microencapsulation efficiency. In
the two-stage process, only the methyl methacrylate
monomer dissolved in the oil phase was used in the first
stage of encapsulation. However, in the one-stage process,
an MMA monomer, as well as a water-soluble MA
monomer, was added to the emulsion during the
encapsulation period. Considering this matter, it was
concluded that lower enthalpy of the OS-nanocapsules
resulted from the adverse effect of the swelling of
methacrylic acid monomer in water during the
encapsulation process on the encapsulation of the fatty
alcohol.
In this study, DSC analysis of nanocapsules was repeated
after they were treated with hexane solution to determine
the permeability of their shell structure in an organic
solution. According to the DSC data given in Table 5, a
significant change in their thermal energy storage capacity
was observed after treatment with n-hexane for 24 h. They
almost lost their latent heat storage capacities in the ratio of
38-40 %. This result meant that the shell structure leaks the
core material in the presence of organic solvent n-hexane.
162 TEKSTİL ve KONFEKSİYON 31(3), 2021
Table 3. FT-IR analysis spectrum information of the nanocapsules
Materials FT-IR spectrum bands
n-dodecanol
3200-3600 cm-1 O-H stretching peaks
2924 cm-1 and 2854 cm-1 C-H stretching peaks
1058-1059 cm-1 Medium peaks are associated with the C-OH vibration of the primary alcohol
1-tetradecanol 3200-3600 cm-1
O-H stretching peaks
2919-2849 cm-1 and 2918-2849 cm-1 C-H stretching peaks 1466 cm-1
C-H stretching peak
Methyl methacrylate monomer
1731 cm-1 and 1733 cm-1 strerching peak of the carbonyl group 1625 cm-1
C = C (vinly group) peak in monomer
Methacrylic acid monomer
3390-3360 cm-1 and 3306-3311 cm-1 Belongs to OH stretching
in carboxilic acid group 1731 cm-1 and 1733 cm-1
Peak of carbonyl group in the carboxilic acid group 1625 cm-1
C = C (vinly group) peak in monomer
Figure 3. FT-IR spectrum of (a): methyl methacrylate monomer, (b) methacrylic acid monomer, (c) n-dodecanol, (d): 1-tetradecanol,
(e):Nanocapsule-D-TS, (f): Nanocapsule-D-OS, (g): Nanocapsule-T-TS, (h): Nanocapsule-T-OS
TEKSTİL ve KONFEKSİYON 31(3), 2021 163
Figure 4. DSC curves of nanoencapsulated n-dodecanol (a: Nanocapsule-D-TS; b: Nanocapsule-D-OS) and 1-tetradecanol (c:
Nanocapsule-T-TS; d: Nanocapsule-T-OS)
Table 4. DSC data of the nanocapsules
Nanocapsule Melting
Temp. (°C)
Melting
Enthalpy
(J/g)
Crystallization Temp. (°C) Total Crystallization Enthalpy
Measured During Crystallization (J/g)
Solid-Liquid Solid-Solid
n-dodecanol 21.58 210.13 20.13 18.23 -209.3
Nanocapsule-D-TS 17 171.6 19 9.8 -150.6
Nanocapsule-D-OS 19 126.7 19 9.2 -101.6
1-tetradecanol 35.5 192.8 35.54 28.97 - 183.4
Nanocapsule-T-TS 34 158.7 34 24 -155.6
Nanocapsule-T-OS 34 145.8 35 24 -150.1
Table 5. DSC analysis results of the nanocapsules treated with hexane
Nanocapsule Melting
Temp. (°C)
Melting Enthalpy
(J/g)
Crystallization Temp. (°C) Total Crystallization Enthalpy Measured During
Crystallization (J/g) Solid-Liquid Solid-Solid
Nanocapsule-T-TS 33 96.01 33 22 -90
Nanocapsule-T-OS 33 89.75 32 21 -84.77
3.1.4. TGA analysis of the nanocapsules
TGA analysis was performed to investigate the thermal
stability of the prepared nanocapsules. The TGA curves of
the nanocapsules and the information obtained from the
TGA curves were given in Figure 5 and Table 6. As seen
from the TGA curves given in Figure 5, nanocapsules
exhibited two-step thermal degradation. The weight loss of
the n-docecanol usually occurs between 140-245 °C as a
typical one-step degradation resulting from its volatilization
[2,6,9,11,13]. The first step degradation in the TGA curves
of the Nanocapsule-D-TS and Nanocapsule-D-OS
nanocapsules started at almost 140 °C corresponding
decomposition temperature of n-dodecanol. The weight loss
of 76% for the Nanocapsule-D-TS resuled between the
temperatures of 148 °C and 200 °C, while the Nanocapsule-
D-OS nanocapsules lost 62% of their weight between the
164 TEKSTİL ve KONFEKSİYON 31(3), 2021
125 °C and 200 °C. The second step thermal degradation,
which resulted from the degradation of the shell of the
capsules, started at 300 °C for Nanocapsule-D-TS and 290
°C for Nanocapsule-D-OS. The second step weight loss was
21% for the Nanocapsule-D-TS and 25% for the
Nanocapsule-D-OS. According to the TGA analysis of the
nanocapsules containing 1-tetradecanol, the first-step
degradation of the Nanocapsule-T-TS carried out between
148 °C and 290 °C and they lost 75% of their weight.
Nanocapsule-T-OS capsules exposed to first step
degradation between the 135 °C and 250 °C, and they lost
62% of their weight. The second-step degradation occurred
between 290 ° C and 480 °C for the Nanocapsule-T-TS and
between 270 ° C and 450 ° C for the Nanocapsule-T-OS.
Their weight loss values were 26% and 34%, respectively
(Table 6). It was concluded from the TGA analysis results
the thermal decomposition temperature of the nanocapsules
produced by the two-stage process increased compared to
that of the nanocapsules produced by the one-step process.
It was concluded that improving the thermal stability of
nanocapsules was due to increased wall thickness.
Figure 5. TGA curves of nanoencapsulated n-dodecanol (a: Nanocapsule-D-TS; b: Nanocapsule-D-OS) and nanoencapsulated 1-
tetradecanol (c: Nanocapsule-T-TS; d: Nanocapsule-T-OS)
Table 6. TGA data of the nanocapsules
Nanocapsule Degredation temperature interval (°C) Weight loss %
Nanocapsule-D-TS 148-200 (Stage 1) 76
300-425 (Stage 2) 21
Nanocapsule-D-OS 125-200 (Stage 1) 62
235-440 (Stage 2) 25
Nanocapsule-T-TS 148-290 (Stage 1) 75
290-480 (Stage 2) 26
Nanocapsule-T-OS 135-250 (Stage 1) 62
270-450 (Stage 2) 34
TEKSTİL ve KONFEKSİYON 31(3), 2021 165
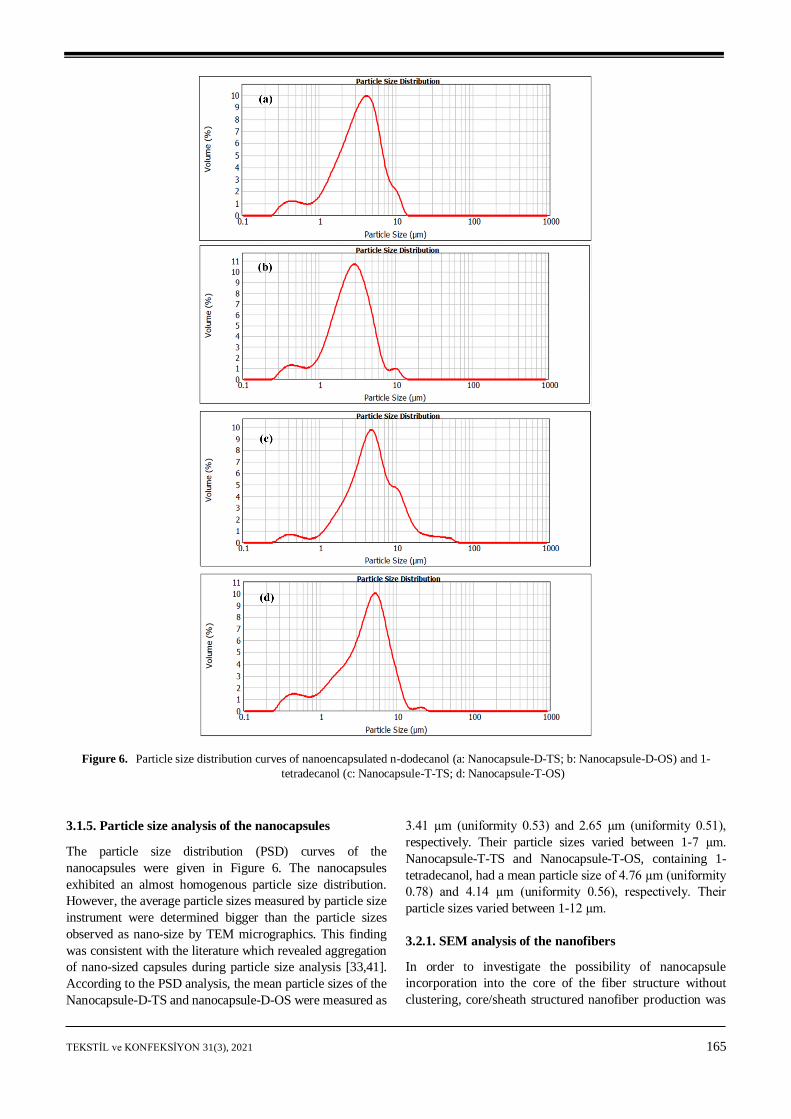
Figure 6. Particle size distribution curves of nanoencapsulated n-dodecanol (a: Nanocapsule-D-TS; b: Nanocapsule-D-OS) and 1-
tetradecanol (c: Nanocapsule-T-TS; d: Nanocapsule-T-OS)
3.1.5. Particle size analysis of the nanocapsules
The particle size distribution (PSD) curves of the
nanocapsules were given in Figure 6. The nanocapsules
exhibited an almost homogenous particle size distribution.
However, the average particle sizes measured by particle size
instrument were determined bigger than the particle sizes
observed as nano-size by TEM micrographics. This finding
was consistent with the literature which revealed aggregation
of nano-sized capsules during particle size analysis [33,41].
According to the PSD analysis, the mean particle sizes of the
Nanocapsule-D-TS and nanocapsule-D-OS were measured as
3.41 µm (uniformity 0.53) and 2.65 µm (uniformity 0.51),
respectively. Their particle sizes varied between 1-7 µm.
Nanocapsule-T-TS and Nanocapsule-T-OS, containing 1-
tetradecanol, had a mean particle size of 4.76 µm (uniformity
0.78) and 4.14 µm (uniformity 0.56), respectively. Their
particle sizes varied between 1-12 µm.
3.2.1. SEM analysis of the nanofibers
In order to investigate the possibility of nanocapsule
incorporation into the core of the fiber structure without
clustering, core/sheath structured nanofiber production was
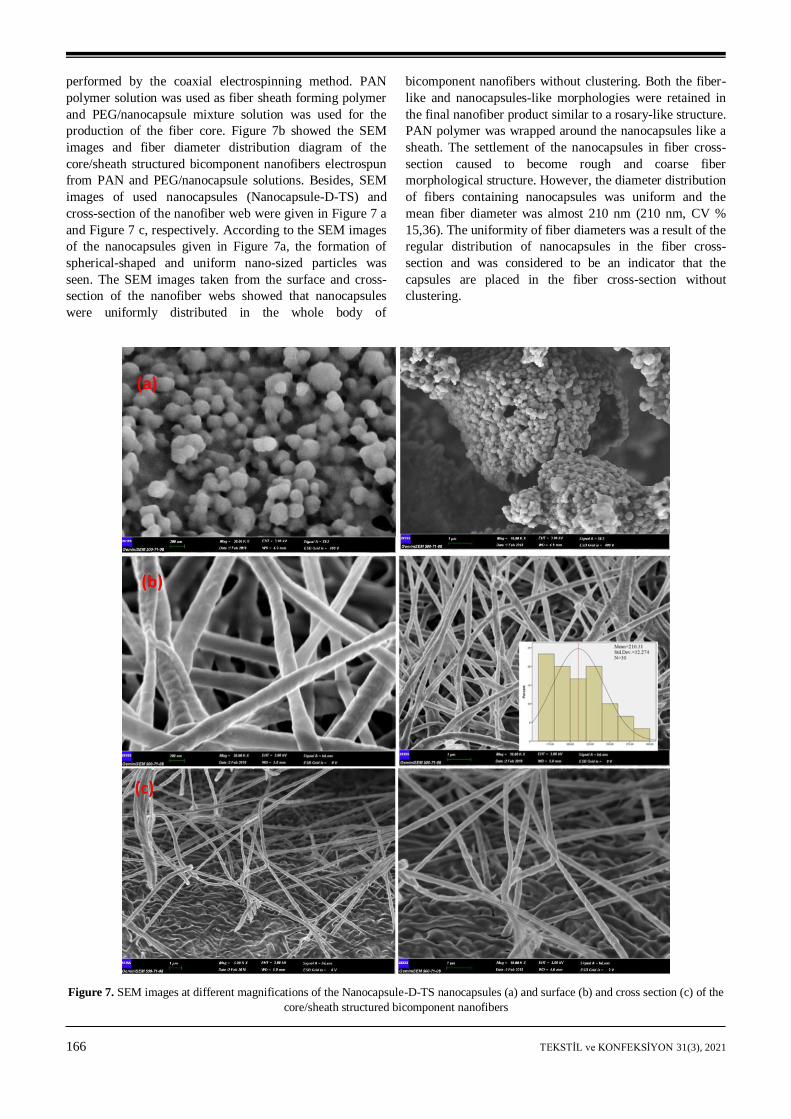
166 TEKSTİL ve KONFEKSİYON 31(3), 2021
performed by the coaxial electrospinning method. PAN
polymer solution was used as fiber sheath forming polymer
and PEG/nanocapsule mixture solution was used for the
production of the fiber core. Figure 7b showed the SEM
images and fiber diameter distribution diagram of the
core/sheath structured bicomponent nanofibers electrospun
from PAN and PEG/nanocapsule solutions. Besides, SEM
images of used nanocapsules (Nanocapsule-D-TS) and
cross-section of the nanofiber web were given in Figure 7 a
and Figure 7 c, respectively. According to the SEM images
of the nanocapsules given in Figure 7a, the formation of
spherical-shaped and uniform nano-sized particles was
seen. The SEM images taken from the surface and cross-
section of the nanofiber webs showed that nanocapsules
were uniformly distributed in the whole body of
bicomponent nanofibers without clustering. Both the fiber-
like and nanocapsules-like morphologies were retained in
the final nanofiber product similar to a rosary-like structure.
PAN polymer was wrapped around the nanocapsules like a
sheath. The settlement of the nanocapsules in fiber cross-
section caused to become rough and coarse fiber
morphological structure. However, the diameter distribution
of fibers containing nanocapsules was uniform and the
mean fiber diameter was almost 210 nm (210 nm, CV %
15,36). The uniformity of fiber diameters was a result of the
regular distribution of nanocapsules in the fiber cross-
section and was considered to be an indicator that the
capsules are placed in the fiber cross-section without
clustering.
Figure 7. SEM images at different magnifications of the Nanocapsule-D-TS nanocapsules (a) and surface (b) and cross section (c) of the
core/sheath structured bicomponent nanofibers
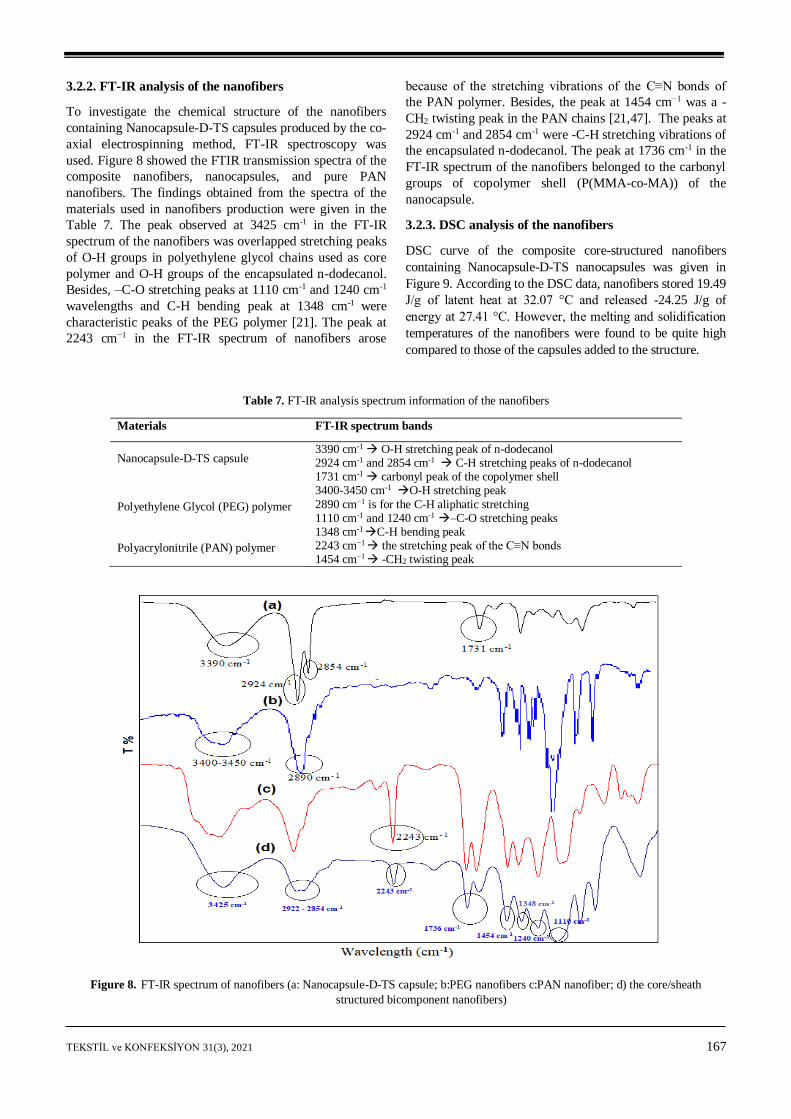
TEKSTİL ve KONFEKSİYON 31(3), 2021 167
3.2.2. FT-IR analysis of the nanofibers
To investigate the chemical structure of the nanofibers
containing Nanocapsule-D-TS capsules produced by the co-
axial electrospinning method, FT-IR spectroscopy was
used. Figure 8 showed the FTIR transmission spectra of the
composite nanofibers, nanocapsules, and pure PAN
nanofibers. The findings obtained from the spectra of the
materials used in nanofibers production were given in the
Table 7. The peak observed at 3425 cm-1 in the FT-IR
spectrum of the nanofibers was overlapped stretching peaks
of O-H groups in polyethylene glycol chains used as core
polymer and O-H groups of the encapsulated n-dodecanol.
Besides, –C-O stretching peaks at 1110 cm-1 and 1240 cm-1
wavelengths and C-H bending peak at 1348 cm-1 were
characteristic peaks of the PEG polymer [21]. The peak at
2243 cm−1 in the FT-IR spectrum of nanofibers arose
because of the stretching vibrations of the C≡N bonds of
the PAN polymer. Besides, the peak at 1454 cm−1 was a -
CH2 twisting peak in the PAN chains [21,47]. The peaks at
2924 cm-1 and 2854 cm-1 were -C-H stretching vibrations of
the encapsulated n-dodecanol. The peak at 1736 cm-1 in the
FT-IR spectrum of the nanofibers belonged to the carbonyl
groups of copolymer shell (P(MMA-co-MA)) of the
nanocapsule.
3.2.3. DSC analysis of the nanofibers
DSC curve of the composite core-structured nanofibers
containing Nanocapsule-D-TS nanocapsules was given in
Figure 9. According to the DSC data, nanofibers stored 19.49
J/g of latent heat at 32.07 °C and released -24.25 J/g of
energy at 27.41 °C. However, the melting and solidification
temperatures of the nanofibers were found to be quite high
compared to those of the capsules added to the structure.
Table 7. FT-IR analysis spectrum information of the nanofibers
Materials FT-IR spectrum bands
Nanocapsule-D-TS capsule 3390 cm-1 O-H stretching peak of n-dodecanol 2924 cm-1 and 2854 cm-1
C-H stretching peaks of n-dodecanol 1731 cm-1 carbonyl peak of the copolymer shell
Polyethylene Glycol (PEG) polymer
3400-3450 cm-1 O-H stretching peak
2890 cm−1 is for the C-H aliphatic stretching 1110 cm-1 and 1240 cm-1
–C-O stretching peaks 1348 cm-1
C-H bending peak
Polyacrylonitrile (PAN) polymer 2243 cm−1 the stretching peak of the C≡N bonds
1454 cm−1 -CH2 twisting peak
Figure 8. FT-IR spectrum of nanofibers (a: Nanocapsule-D-TS capsule; b:PEG nanofibers c:PAN nanofiber; d) the core/sheath
structured bicomponent nanofibers)
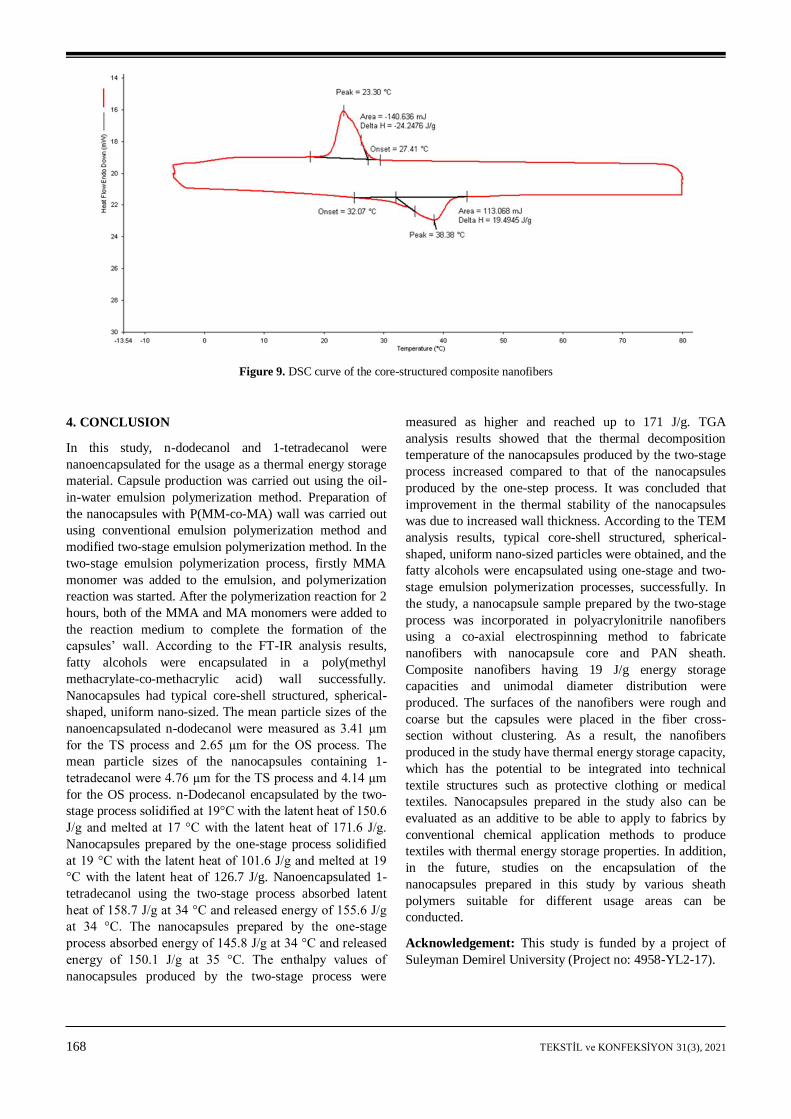
168 TEKSTİL ve KONFEKSİYON 31(3), 2021
Figure 9. DSC curve of the core-structured composite nanofibers
4. CONCLUSION
In this study, n-dodecanol and 1-tetradecanol were
nanoencapsulated for the usage as a thermal energy storage
material. Capsule production was carried out using the oil-
in-water emulsion polymerization method. Preparation of
the nanocapsules with P(MM-co-MA) wall was carried out
using conventional emulsion polymerization method and
modified two-stage emulsion polymerization method. In the
two-stage emulsion polymerization process, firstly MMA
monomer was added to the emulsion, and polymerization
reaction was started. After the polymerization reaction for 2
hours, both of the MMA and MA monomers were added to
the reaction medium to complete the formation of the
capsules’ wall. According to the FT-IR analysis results,
fatty alcohols were encapsulated in a poly(methyl
methacrylate-co-methacrylic acid) wall successfully.
Nanocapsules had typical core-shell structured, spherical-
shaped, uniform nano-sized. The mean particle sizes of the
nanoencapsulated n-dodecanol were measured as 3.41 µm
for the TS process and 2.65 µm for the OS process. The
mean particle sizes of the nanocapsules containing 1-
tetradecanol were 4.76 µm for the TS process and 4.14 µm
for the OS process. n-Dodecanol encapsulated by the two-
stage process solidified at 19°C with the latent heat of 150.6
J/g and melted at 17 °C with the latent heat of 171.6 J/g.
Nanocapsules prepared by the one-stage process solidified
at 19 °C with the latent heat of 101.6 J/g and melted at 19
°C with the latent heat of 126.7 J/g. Nanoencapsulated 1-
tetradecanol using the two-stage process absorbed latent
heat of 158.7 J/g at 34 °C and released energy of 155.6 J/g
at 34 °C. The nanocapsules prepared by the one-stage
process absorbed energy of 145.8 J/g at 34 °C and released
energy of 150.1 J/g at 35 °C. The enthalpy values of
nanocapsules produced by the two-stage process were
measured as higher and reached up to 171 J/g. TGA
analysis results showed that the thermal decomposition
temperature of the nanocapsules produced by the two-stage
process increased compared to that of the nanocapsules
produced by the one-step process. It was concluded that
improvement in the thermal stability of the nanocapsules
was due to increased wall thickness. According to the TEM
analysis results, typical core-shell structured, spherical-
shaped, uniform nano-sized particles were obtained, and the
fatty alcohols were encapsulated using one-stage and two-
stage emulsion polymerization processes, successfully. In
the study, a nanocapsule sample prepared by the two-stage
process was incorporated in polyacrylonitrile nanofibers
using a co-axial electrospinning method to fabricate
nanofibers with nanocapsule core and PAN sheath.
Composite nanofibers having 19 J/g energy storage
capacities and unimodal diameter distribution were
produced. The surfaces of the nanofibers were rough and
coarse but the capsules were placed in the fiber cross-
section without clustering. As a result, the nanofibers
produced in the study have thermal energy storage capacity,
which has the potential to be integrated into technical
textile structures such as protective clothing or medical
textiles. Nanocapsules prepared in the study also can be
evaluated as an additive to be able to apply to fabrics by
conventional chemical application methods to produce
textiles with thermal energy storage properties. In addition,
in the future, studies on the encapsulation of the
nanocapsules prepared in this study by various sheath
polymers suitable for different usage areas can be
conducted.
Acknowledgement: This study is funded by a project of
Suleyman Demirel University (Project no: 4958-YL2-17).
TEKSTİL ve KONFEKSİYON 31(3), 2021 169
REFERENCES
1. Sarier N, Onder E. 2012. Organic phase change materials and their textile applications: an overview. Thermochimica Acta, 540, 7-60.
2. Geng L, Wang S, Wang R, Luo R. 2016. Facile synthesis and thermal properties of nanoencapsulated n-dodecanol with
SiO2 shell as shape-formed thermal energy storage material. Energy & Fuels, 30(7), 6153-6160.
3. Ghosh SK. 2006. Functional coatings by polymer microencapsulation. Germany: Wiley-VCH Verlag GmbH&Co.KGaA.
4. Alkan C, Sarı A, Karaipekli A, Uzun O. 2009. Preparation, characterization, and thermal properties of microencapsulated phase change material for thermal energy storage. Solar Energy Materials and Solar Cells, 93(1), 143-147.
5. Sarı A, Alkan C, Karaipekli A, Uzun O. 2009. Microencapsulated n-octacosane as phase change material for thermal energy storage. Solar Energy, 83(10), 1757-1763.
6. Yu F, Chen ZH, Zeng XR. 2009. Preparation,
characterization, and thermal properties of microPCMs containing n-dodecanol by using different types of styrene-maleic anhydride as emulsifier. Colloid Polymer Science, 287(5), 549–560.
7. Yu F, Chen ZH, Zeng XR. 2009. Preparation and characterization of thermal energy storage microcapsulated n-dodecanol by phase change. Polymer Materials Science & Engineering, 25(6), 135-138.
8. Huang R, Li W, Wang J, Zhang X. 2017. Effects of oil-soluble etherified melamine-formaldehyde prepolymers on in situ microencapsulation and macroencapsulation of n-dodecanol. New Journal of Chemistry, 41(17), 9424-9437.
9. Su JF, Wang SB, Zhou JW, Huang Z, Zhao YH, Yuan XY,
Zhang YY, Kou JB. 2011. Fabrication and interfacial morphologies of methanol–melamine–formaldehyde (MMF) shell microPCMs/epoxy composites. Colloid Polymer Science, 289(2), 169-177.
10. Zhang H, Li W, Huang R, Wang J, Zhang X. 2017. Effects of polyvinyl alcohol modification on microstructure, thermal properties and impermeability of microencapsulated n dodecanol as phase change material. Chemistry Select, 2(29), 9369-9376.
11. Chen C, Chen Z. Zeng X, Fang X, Zhang Z. 2012. Fabrication and characterization of nanocapsules containing
n-dodecanol by miniemulsion polymerization using interfacial redox initiation. Colloid Polymer Science, 290(4), 307-314.
12. Chen ZH, Yu F, Zeng XR, Zhang ZG. 2012. Preparation, characterization and thermal properties of nanocapsules containing phase change material n-dodecanol by miniemulsion polymerization with polymerizable emulsifier. Applied Energy, 91(1), 7-12.
13. Ma Y, Zong J, Li W, Chen L, Tang X, Han N, Wang J, Zhang X. 2015. Synthesis and characterization of thermal energy storage microencapsulated n-dodecanol with acrylic polymer shell. Energy, 87, 86-94.
14. Chen Z, Wang J, Yu F, Zhang Z, Gao X. 2015. Preparation and properties of graphene oxide-modified poly(melamine-formaldehyde) microcapsules containing phase change
material n-dodecanol for thermal energy storage. Journal of Materials Chemistry A, 3(21), 11624-11630.
15. Yu F, Chen ZH, Zeng XR, Gao XN, Zhang ZG. 2015. Poly(methyl methacrylate) copolymer nanocapsules containing phase change material (n-dodecanol) prepared via
miniemulsion polymerization. Journal of Applied Polymer Science, 132(31), 1-7.
16. Li W, Zong J, Huang R, Wang J, Wang N, Han N, Zhang X. 2016. Design, controlled fabrication and characterization of narrow-disperse macrocapsules containing Micro/ NanoPCMs. Materials & Design, 99, 225-234.
17. Wu N, Xu L, Zhang C. 2018. The influence of emulsifiers on preparation and properties of microencapsules of melamine–
urea–formaldehyde resins with n-dodecanol as phase change material. Advances in Polymer Technology, 37(8), 3492-3498.
18. Cai Y, Ke H, Lin L, Fei X, Wei Q, Song L, Fong H. 2012. Preparation, morphology and thermal properties of electrospun fatty acid eutectics/polyethylene terephthalate form-stable phase change ultrafine composite fibers for thermal energy storage. Energy Conversion and Management, 64, 245- 255.
19. Cai Y, Zong X, Zhang J, Du J, Dong Z, Wei Q, Zhao Y, Chen Q, Fong H. 2014. The improvement of thermal stability and conductivity via incorporation of carbon nanofibers into electrospun ultrafine composite fibers of lauric acid/polyamide 6 phase change materials for thermal energy sorage. International Journal of Green Energy, 11(8), 861-875.
20. Sun SX, Xie R, Wang XX, Wen GQ, Liu Z, Wang W, Ju XJ,
Chu LY. 2015. Fabrication of nanofibers with phase-change core and hydrophobic shell, via coaxial electrospinning using nontoxic solvent. Journal of Materials Science, 50(17), 5729- 5738.
21. Noyan ECB, Onder E, Sarier N, Arat R. 2018. Development of heat storing poly(acrylonitrile) nanofibers by coaxial electrospinning. Thermochimica Acta, 662, 135-148.
22. Hu W, Yu X. 2014. Thermal and mechanical properties of
bio-based PCMs encapsulated with nanofibrous structure. Renewable Energy, 62, 454- 458.
23. Zdraveva E, Fang J, Mijovic B, Lin T. 2015. Electrospun poly(vinyl alcohol)/phase change material fibers: morphology, heat properties, and stability. Industrial & Engineering Chemistry Research, 54(35), 8706-8712.
24. Lu Y, Xiao X, Zhan Y, Huan C, Qi S, Cheng H, Xu G. 2018. Core-sheath paraffin-wax-loaded nanofibers by electrospinning for heat storage. ACS Applied Materials &
Interfaces, 10(15), 12759-12767.
25. Lu Y, Xiao X, Fu J, Huan C, Qi S, Zhan Y, Xu G. 2019. Novel smart textile with phase change materials encapsulated core-sheath structure fabricated by coaxial electrospinning. Chemical Engineering Journal, 355, 532-539.
26. McCann JT, Marquez M, Xia Y. 2006. Melt coaxial electrospinning: A versatile method for the encapsulation of solid materials and fabrication of phase change nanofibers.
Nano Letters, 6(12), 2868- 2872.
27. Chen C, Zhao Y, Liu W. 2013. Electrospun polyethylene glycol/cellulose acetate phase change fibers with core-sheat
170 TEKSTİL ve KONFEKSİYON 31(3), 2021
sctructure for thermal energy storage. Renewable Energy, 60, 222.-225.
28. Van Do C, Nguyen TTT, Park JS. 2013. Phase-change
core/shell structured nanofibers based on eicosane/poly (vinylidene fluoride) for thermal storage applications. Korean Journal of Chemical Engineering, 30(7), 1403-1409.
29. Dang, TT, Nguyen TTT, Chung OH, Park JS. 2015. Fabrication of form-stable poly(ethylene glycol)-loaded poly(vinylidene fluoride) nanofibers via single and coaxial electrospinning. Macromolecular Research, 23(9), 819-829.
30. Sun SX, Xie R, Wang XX, Wen GQ, Liu Z, Wang W, Ju XJ,
Chu LY. 2015. Fabrication of nanofibers with phase change core and hydrophobic shell, via coaxial electrospinning using nontoxic solvent. Journal of Materials Science, 50(17), 5729–5738.
31. Sarier N, Arat R, Menceloğlu Y, Önder E, Boz EC, Oğuz O. 2016. Production of PEG grafted PAN copolymers and their electrospun nanowebs as novel thermal energy storage materials. Thermochimica Acta, 643, 83- 93.
32. Babapoor A, Karimi G, Golestaneh SI, Mezjin MA. 2017. Coaxial electro-spun PEG/PA6 composite fibers: Fabrication and characterization. Applied Thermal Engineering, 118, 398- 407.
33 Alkan C, Alay Aksoy S, Altun Anayurt R. 2015. Synthesis of poly(methyl methacrylate-co-acrylic acid)/n-eicosane microcapsules for thermal comfort in textiles, Textile Research Journal, 85(19), 2051–2058.
34. Chang CC, Tsai YL, Chiu JJ, Chen H. 2009. Preparation of phase change materials microcapsules by using PMMA network‐silica hybrid shell via sol‐gel process. Journal of Applied Polymer Science, 112(3), 1850- 1857.
35. Sarı A, Alkan C, Karaipekli A. 2010. Preparation, characterization and thermal properties of PMMA/ n-heptadecane microcapsules as novel solid-liquid microPCM for thermal energy storage. Applied Energy, 87(5), 1529- 1534.
36. Qiu X, Li W, Song G, Chu X, Tang G 2012. Microencapsulated n-octadecane with different methylmethacrylate-based copolymer shell as phase change materials for thermal energy stgorage. Energy, 46(1), 188-199.
37. Wang Y, Shi H, Xia TD, Zhang T, Feng HX. 2012. Fabrication and performances of microencapsulated paraffin
composites with polymethylmethacrylate, Materials Chemistry and Physics, 135(1), 181-187.
38. Sarı A, Alkan C, Biçer A, Altuntas A. Bilgin C. 2014.
Micro/nanoencapsulated n-nonadecane with poly(methyl methacrylate) shell for thermal energy storage. Energy Conversion and Management, 86, 614–621.
39. Al-Shannaq R, Farid M, Al-Muhtaseb S, Kurdi J. 2015. Emulsion stability and cross-linking of PMMA microcapsules containing phase change materials. Solar Energy Materials and Solar Cells, 132, 311-318.
40. Özkayalar S. 2019. Production and textile application of
double-walled nano and microcapsules with phase change material core (Master’s thesis). Available from http://tez.sdu.edu.tr/Tezler/TF04267.pdf.
41. Alay Aksoy S, Alkan C, Tözüm MS, Demirbağ S, Altun Anayurt R, Ulcay Y. 2017. Preparation and textile application of poly(methyl methacrylate-co-methacrylic acid)/n-octadecane and n-eicosane microcapsules. The Journal of the Textile Institute, 108(1), 30-41.
42. Moghe AK, Gupta BS. 2008. Co‐axial electrospinning for nanofiber structures: preparation and applications. Polymer Reviews, 48(2), 353-377.
43. Onder E, Sarier N, Arat R. 2017. The manufacture of organic carbonate-poly (methyl ethylacrylate) nanowebs with thermal buffering effect. Thermochimica Acta, 657, 170-184.
44. Wang H, Gui P, Zhu Y, Hu S. 2020. Preparation and characterization of poly(melamine-urea-formaldehyde)
tetradecanol microcapsules coated with silver particles. Journal of Wuhan University of Technology-Material Science Edition, 35(2), 327-334.
45. Panák O, Držková M, Svoboda R, Gunde MK. 2017. Combined colorimetric and thermal analyses of reversible thermochromic composites using crystal violet lactone as a colour former. Journal of Thermal Analysis and Calorimetry, 127(1), 633-640.
46. Tozum MS, Alay-Aksoy S, Alkan C. 2018.
Microencapsulation of three-component thermochromic system for reversible color change and thermal energy storage. Fiber Polymers, 19(3), 660- 669.
47. Ribeiro RF, Pardini LC, Alves NP, Brito CAR. 2015. Thermal stabilization study of polyacrylonitrile fiber obtained by extrusion. Polimeros, 25(6), 523–530.
TEKSTİL ve KONFEKSİYON 31(3), 2021 171
TEKSTİL VE KONFEKSİYON
Vol: 31, No: 3
DOI: 10.32710/tekstilvekonfeksiyon.767428
The Effect Of Recycled Polyester (rPET) Filament Fiber
Properties On Various Woven Fabric Performance Properties
Gül KIRIŞ1 0000-0001-5209-2435
Demet YILMAZ2 0000-0003-4450-5935
*
1 KFS Sentetik San. ve Tic. A.Ş., Sakarya, Turkey 2 Suleyman Demirel Üniversity, Engineering Faculty, Textile Engineering Dept., West Campus, Isparta, Turkey
Corresponding Author: Demet Yılmaz, [email protected]
ABSTRACT
In order to reduce the requirement of waste eliminating and environmental pollution, recycling seems
to be a suitable solution. In this study, polyester fibers with three different number of filament and
two fiber cross section form (round and plus) were spun from recycled polyethylene terephthalate
(rPET) polymer and texturised on an industrial scale. rPET yarns were used as a weft yarn in woven
fabric production. Fabric performance properties such as breaking, tearing and seam slippage
resistance, weight, breaking elongation, abrasion resistance and air permeability were analysed and
compared with that of virgin PET fabrics. As a result of this study, it was determined that virgin and
rPET polymers provided almost similar fabric properties. Higher number of filaments gave lower
fabric breaking elongation, seam strength, abrasion resistance and air permeability values while led to
higher tearing strength. Except fabric weight and tensile properties, filament cross section had a
significant affect on other studied fabric properties.
ARTICLE HISTORY
Received: 11.07.2020
Accepted: 25.08.2021
KEYWORDS
Sustainability, textile waste, plastic wastes, recycle polyester, textured filament
yarns, woven fabric properties
1. INTRODUCTION
Today, the production and consumption of packaged
products (plastics, metal, glass, paper, cardboard etc.)
increase with living standards and population growth.
Packaging industry constitutes the biggest part of the world
polyethylene terephthalate (PET) consumption with 29%
share. PET products are disposed after usage, resulting in
waste. PET packaging materials make up a large amount,
such as 73% of environmental waste. As well as metal,
glass, paper and cardboard, PET wastes are classified as
solid waste. In our country, paper/cardboard and then PET
wastes constitute the biggest share of solid wastes [1].
While most of these wastes are stored in regular storage
facilities, the remaining part is disposed by methods such as
burning, burying in the ground, and pouring into the stream.
PET wastes, which are tried to be disposed by burying in
the soil or storing, can remain for a very long time (up to
3000 years) without degrading. As a result of accumulation,
incineration or burial of waste, many ecological problems
arise. Reduction of suitable areas for the waste disposal,
increased environmental pollution and high disposal costs
have led to find new methods for optimum use of resources
and waste reduction or utilization. Recycling or recovery
seems to be the most likely solution for waste disposal. For
this reason, recycling is carried out in order to transform the
wastes into secondary raw materials and thus to be included
in the production process again. PET can now be recycled
by mechanical and chemical methods and in modern
facilities. Polyester fibers can be obtained by recycling PET
wastes and the resulting fibers are called recycled
polyethylene terephthalate or rPET. Therefore, in present
days, PET and rPET polymers have been used for polyester
spun fiber production.
In this study, polyester fibers with different number of
filament (filament fineness) and fiber cross section were
produced from rPET polymer in order to investigate the
To cite this article: Kırış G., Yılmaz D. 2021. The effect of recycled polyester (rpet) filament fiber properties on various woven fabric performance properties. Tekstil ve Konfeksiyon, 31(3), 171-182.
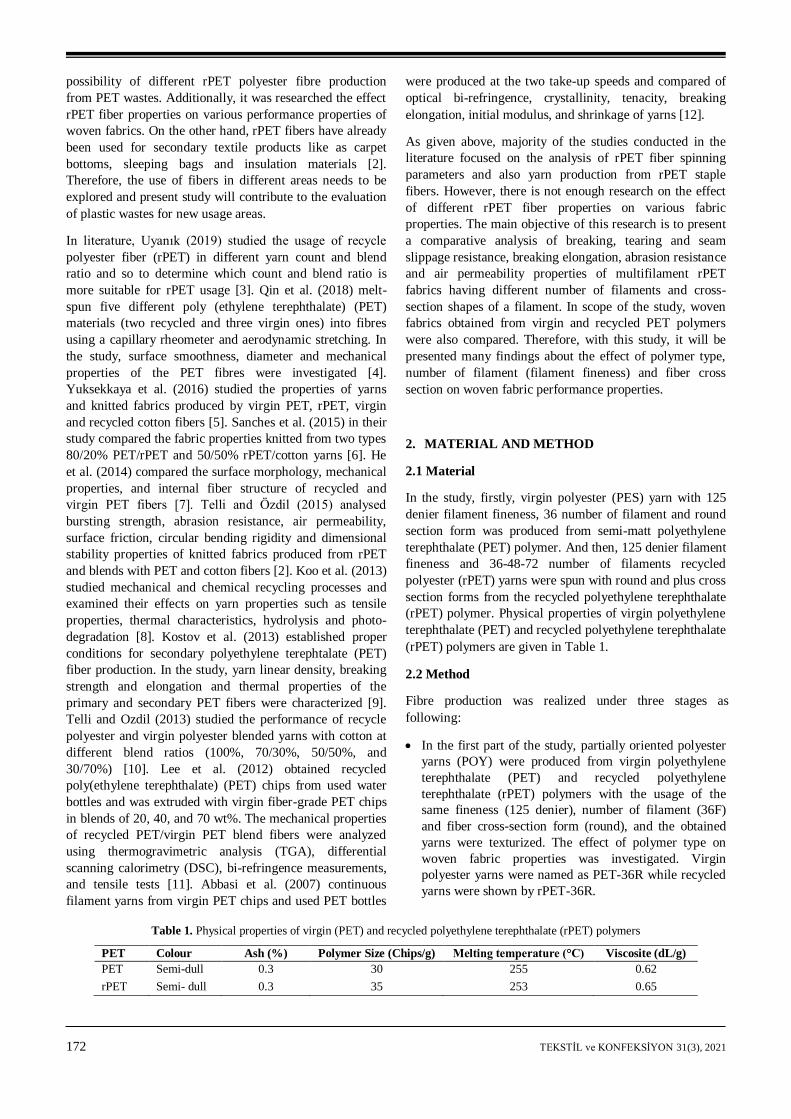
172 TEKSTİL ve KONFEKSİYON 31(3), 2021
possibility of different rPET polyester fibre production
from PET wastes. Additionally, it was researched the effect
rPET fiber properties on various performance properties of
woven fabrics. On the other hand, rPET fibers have already
been used for secondary textile products like as carpet
bottoms, sleeping bags and insulation materials [2].
Therefore, the use of fibers in different areas needs to be
explored and present study will contribute to the evaluation
of plastic wastes for new usage areas.
In literature, Uyanık (2019) studied the usage of recycle
polyester fiber (rPET) in different yarn count and blend
ratio and so to determine which count and blend ratio is
more suitable for rPET usage [3]. Qin et al. (2018) melt-
spun five different poly (ethylene terephthalate) (PET)
materials (two recycled and three virgin ones) into fibres
using a capillary rheometer and aerodynamic stretching. In
the study, surface smoothness, diameter and mechanical
properties of the PET fibres were investigated [4].
Yuksekkaya et al. (2016) studied the properties of yarns
and knitted fabrics produced by virgin PET, rPET, virgin
and recycled cotton fibers [5]. Sanches et al. (2015) in their
study compared the fabric properties knitted from two types
80/20% PET/rPET and 50/50% rPET/cotton yarns [6]. He
et al. (2014) compared the surface morphology, mechanical
properties, and internal fiber structure of recycled and
virgin PET fibers [7]. Telli and Özdil (2015) analysed
bursting strength, abrasion resistance, air permeability,
surface friction, circular bending rigidity and dimensional
stability properties of knitted fabrics produced from rPET
and blends with PET and cotton fibers [2]. Koo et al. (2013)
studied mechanical and chemical recycling processes and
examined their effects on yarn properties such as tensile
properties, thermal characteristics, hydrolysis and photo-
degradation [8]. Kostov et al. (2013) established proper
conditions for secondary polyethylene terephtalate (PET)
fiber production. In the study, yarn linear density, breaking
strength and elongation and thermal properties of the
primary and secondary PET fibers were characterized [9].
Telli and Ozdil (2013) studied the performance of recycle
polyester and virgin polyester blended yarns with cotton at
different blend ratios (100%, 70/30%, 50/50%, and
30/70%) [10]. Lee et al. (2012) obtained recycled
poly(ethylene terephthalate) (PET) chips from used water
bottles and was extruded with virgin fiber-grade PET chips
in blends of 20, 40, and 70 wt%. The mechanical properties
of recycled PET/virgin PET blend fibers were analyzed
using thermogravimetric analysis (TGA), differential
scanning calorimetry (DSC), bi-refringence measurements,
and tensile tests [11]. Abbasi et al. (2007) continuous
filament yarns from virgin PET chips and used PET bottles
were produced at the two take-up speeds and compared of
optical bi-refringence, crystallinity, tenacity, breaking
elongation, initial modulus, and shrinkage of yarns [12].
As given above, majority of the studies conducted in the
literature focused on the analysis of rPET fiber spinning
parameters and also yarn production from rPET staple
fibers. However, there is not enough research on the effect
of different rPET fiber properties on various fabric
properties. The main objective of this research is to present
a comparative analysis of breaking, tearing and seam
slippage resistance, breaking elongation, abrasion resistance
and air permeability properties of multifilament rPET
fabrics having different number of filaments and cross-
section shapes of a filament. In scope of the study, woven
fabrics obtained from virgin and recycled PET polymers
were also compared. Therefore, with this study, it will be
presented many findings about the effect of polymer type,
number of filament (filament fineness) and fiber cross
section on woven fabric performance properties.
2. MATERIAL AND METHOD
2.1 Material
In the study, firstly, virgin polyester (PES) yarn with 125
denier filament fineness, 36 number of filament and round
section form was produced from semi-matt polyethylene
terephthalate (PET) polymer. And then, 125 denier filament
fineness and 36-48-72 number of filaments recycled
polyester (rPET) yarns were spun with round and plus cross
section forms from the recycled polyethylene terephthalate
(rPET) polymer. Physical properties of virgin polyethylene
terephthalate (PET) and recycled polyethylene terephthalate
(rPET) polymers are given in Table 1.
2.2 Method
Fibre production was realized under three stages as
following:
In the first part of the study, partially oriented polyester
yarns (POY) were produced from virgin polyethylene
terephthalate (PET) and recycled polyethylene
terephthalate (rPET) polymers with the usage of the
same fineness (125 denier), number of filament (36F)
and fiber cross-section form (round), and the obtained
yarns were texturized. The effect of polymer type on
woven fabric properties was investigated. Virgin
polyester yarns were named as PET-36R while recycled
yarns were shown by rPET-36R.
Table 1. Physical properties of virgin (PET) and recycled polyethylene terephthalate (rPET) polymers
PET Colour Ash (%) Polymer Size (Chips/g) Melting temperature (°C) Viscosite (dL/g)
PET Semi-dull 0.3 30 255 0.62
rPET Semi- dull 0.3 35 253 0.65
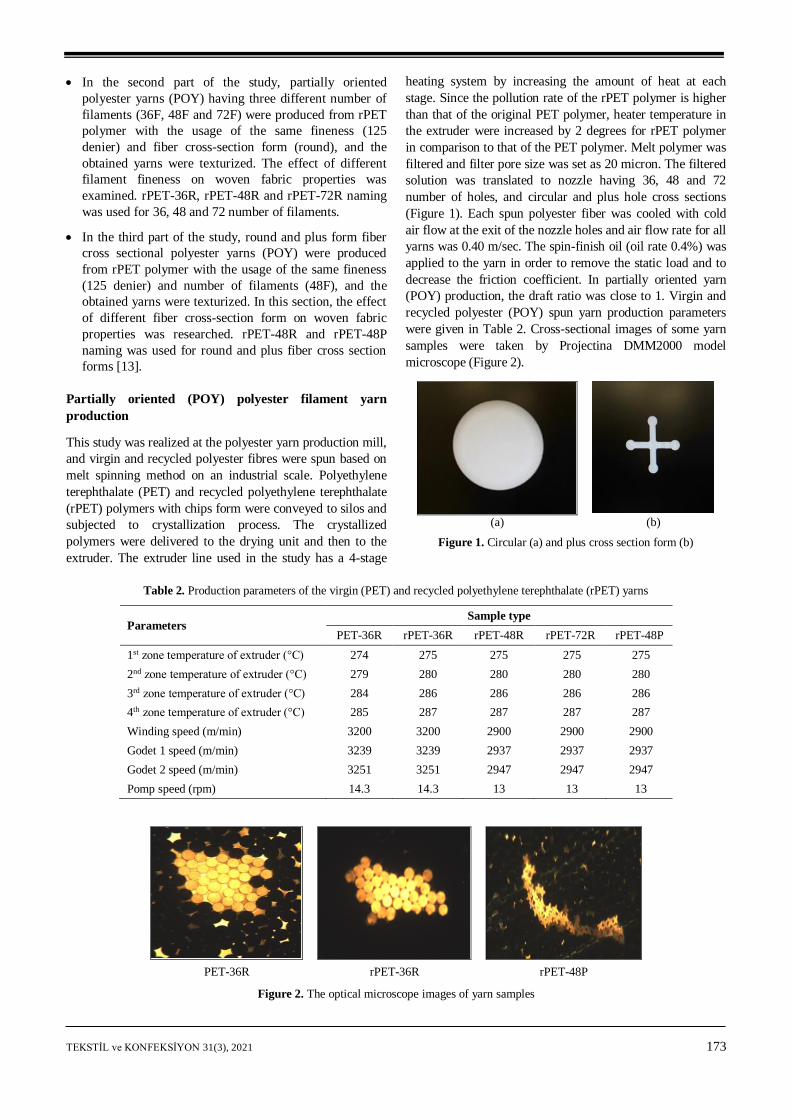
TEKSTİL ve KONFEKSİYON 31(3), 2021 173
In the second part of the study, partially oriented
polyester yarns (POY) having three different number of
filaments (36F, 48F and 72F) were produced from rPET
polymer with the usage of the same fineness (125
denier) and fiber cross-section form (round), and the
obtained yarns were texturized. The effect of different
filament fineness on woven fabric properties was
examined. rPET-36R, rPET-48R and rPET-72R naming
was used for 36, 48 and 72 number of filaments.
In the third part of the study, round and plus form fiber
cross sectional polyester yarns (POY) were produced
from rPET polymer with the usage of the same fineness
(125 denier) and number of filaments (48F), and the
obtained yarns were texturized. In this section, the effect
of different fiber cross-section form on woven fabric
properties was researched. rPET-48R and rPET-48P
naming was used for round and plus fiber cross section
forms [13].
Partially oriented (POY) polyester filament yarn
production
This study was realized at the polyester yarn production mill,
and virgin and recycled polyester fibres were spun based on
melt spinning method on an industrial scale. Polyethylene
terephthalate (PET) and recycled polyethylene terephthalate
(rPET) polymers with chips form were conveyed to silos and
subjected to crystallization process. The crystallized
polymers were delivered to the drying unit and then to the
extruder. The extruder line used in the study has a 4-stage
heating system by increasing the amount of heat at each
stage. Since the pollution rate of the rPET polymer is higher
than that of the original PET polymer, heater temperature in
the extruder were increased by 2 degrees for rPET polymer
in comparison to that of the PET polymer. Melt polymer was
filtered and filter pore size was set as 20 micron. The filtered
solution was translated to nozzle having 36, 48 and 72
number of holes, and circular and plus hole cross sections
(Figure 1). Each spun polyester fiber was cooled with cold
air flow at the exit of the nozzle holes and air flow rate for all
yarns was 0.40 m/sec. The spin-finish oil (oil rate 0.4%) was
applied to the yarn in order to remove the static load and to
decrease the friction coefficient. In partially oriented yarn
(POY) production, the draft ratio was close to 1. Virgin and
recycled polyester (POY) spun yarn production parameters
were given in Table 2. Cross-sectional images of some yarn
samples were taken by Projectina DMM2000 model
microscope (Figure 2).
(a) (b)
Figure 1. Circular (a) and plus cross section form (b)
Table 2. Production parameters of the virgin (PET) and recycled polyethylene terephthalate (rPET) yarns
Parameters Sample type
PET-36R rPET-36R rPET-48R rPET-72R rPET-48P
1st zone temperature of extruder (°C) 274 275 275 275 275
2nd zone temperature of extruder (°C) 279 280 280 280 280
3rd zone temperature of extruder (°C) 284 286 286 286 286
4th zone temperature of extruder (°C) 285 287 287 287 287
Winding speed (m/min) 3200 3200 2900 2900 2900
Godet 1 speed (m/min) 3239 3239 2937 2937 2937
Godet 2 speed (m/min) 3251 3251 2947 2947 2947
Pomp speed (rpm) 14.3 14.3 13 13 13
PET-36R rPET-36R rPET-48P
Figure 2. The optical microscope images of yarn samples
174 TEKSTİL ve KONFEKSİYON 31(3), 2021
Texturing
Partially oriented (POY) yarns were textured by friction-
disc texturing method and friction-disc texturing machine
(Barmag). Before texturing, filament yarns were heated,
cooled and then drafted between the Godet cylinders and
heater. In the texturing process, polyurethane (PU) discs
were used and the disc layout consisted of 1-5-1 combination. After the texturing, fixing was realized by
second heating process and then cone oil was applied to the
yarn. Textured yarn samples were produced on the same
line and production parameters are given in Table 3.
Woven fabric production
Fabric samples were woven from all spun and texturized
polyester yarn samples. Yarn samples were used as a weft
yarn. Jacquard loom woven machine (Itema firm) and
sateen weave type was used. During the weaving process,
fully drawn polyester yarn (FDY) was used as a warp yarn
for all woven samples. Warp yarns were kept constant to
analyse the fabric properties. The parameters of woven
fabric production are given in Table 4.
2.3. Test and analysis
Fabric weight of all woven fabrics was tested according to
TS 251. Tensile and tearing strength, breaking elongation
as well as the seam slippage are one of the properties
determining the usage area of textile fabrics. Tensile
strength and breaking elongation properties of woven fabrics obtained from all texturized polyester yarns were
tested according to the strip method by Titan-Universal
Strength Tester based on the EN ISO 13934-1 test standard.
Tearing strength of woven fabrics was analysed on the
Titan-Universal Strength Tester test device using the single-
tonque method according to EN ISO 13937-2 test standard.
Three samples were tested for each fabric type in the weft
and warp direction for tensile properties of the fabrics.
Seam slippage resistance is common test for the textile mill
and therefore seam slippage resistance properties of woven
fabrics were determined by Titan-Universal Strength Tester
according to EN ISO 13936-2 (60 N) standard. In order to
determine the abrasion resistance of woven fabrics, fabric
samples were tested by Martindale abrasion tester according to EN ISO 12947-2 standard and number of
abrasion cycles was determined when the first three yarn
breaks occurred. Air permeability properties of the fabric
samples were tested to evaluate the comfort-related
properties of the fabrics according to TS 391 EN ISO 9237
standard by FX 3300 model air permeability.
All the tests were carried out on the same testers and test
results were analysed statistically by SPSS 16.0 statistical
software to determine any significant differences. ANOVA
tests were used for two-way analysis of variance for the
analysis of the production parameters, multiple-range test
LSD method for the comparison of filament fineness and t-
test for the comparison of polymer type and fiber cross
section form and ANOVA analyses were performed for
α=0.05 significance level [13].
3. RESULTS AND DISCUSSION
Within the scope of the study, woven fabrics produced from
virgin and recycle polyester filament yarns and their
performance properties were examined. Sample codes are
summarized in Table 5 and the results for warp and weft
directions of woven fabrics were shown by WRP and WFT,
respectively.
Table 3. Production parameters for texturing process
Parameters Sample
PET-36R rPET-36R rPET-48R rPET-72R rPET-48P
Production speed (m/min) 650 600 600 600 600 Draft ratio 1.73 1.71 1.67 1.71 1.67 Disk speed (m/min) 1170 1100 1070 1100 1070 First heater temperature (°C) 180 140 175 140 175 Second heater temperature (°C) 160 130 150 130 150
Table 4. Woven fabric production parameters
Parameters Value
Machine speed (rpm) 278 Weft density (yarn/cm) 50 Warp density (yarn/cm) 60 Weave type Sateen (5:1) Weft yarn PET-36R, rPET-36R, rPET-48R, rPET-72R, rPET-48P Warp yarn 30 denier, 12F, FDY circular fiber cross section, 1000 tpm (Z)
Table 5. Explanation for sample codes
Sample code Polymer Filamant fineness Number of filament Fiber cross-section
PET-36R PET
125 denye
36 Round (R)
rPET-36R rPET 36 Round (R) rPET-48R rPET 48 Round (R) rPET-72R rPET 72 Round (R) rPET-72P rPET 48 Plus (P)
TEKSTİL ve KONFEKSİYON 31(3), 2021 175
3.1 Fabric weight
Fabric weight results of woven fabrics were given in Figure
3. When the results were examined, it was observed that
different polymer (PET-36R and rPET-36R) and filament
cross section types (rPET-48R and rPET-48P) had no
significant effect on fabric weight. As to the effect of
filament fineness (number of filament), all the fabrics
(rPET-36R, rPET-48R and rPET-72R) had almost similar
fabric weight values. However, fabric weight slightly
decreased with the increase in the number of filaments and
the lowest weight value was obtained in the highest
filament number. In any case, as seen in Figure 3, all the
fabrics had almost similar fabric weight values and there
were not considerably differences in the fabric weight
values. On the other hand, this study was realized in a mill
and the firm planned to use the yarns for sport textiles.
Finer warp yarns were used during the woven fabric
production and produced yarn samples were used as a weft
yarn. Due to finer warp yarns, the weight of fabric samples
varied about 67-69 g/m2.
Figure 3. Fabric weight results
3.2. Breaking strength
In order to determine the effect of different polymer type,
number of filament and fiber cross section on the
mechanical properties of the fabrics, the breaking strength
of woven fabrics was tested in the warp and weft directions.
Particularly, in the weft direction, it was determined that all
the fabrics have tensile strength values above 600 N and
they exhibit similar behaviour. As to warp direction, it was
observed different trends depending on fiber properties.
The results are given in Figure 4 while ANOVA statistical
analysis results were shown in Table 6-7.
When the effect of different polymer type on breaking
strength of fabrics was examined, similar tensile strength
values were determined for the fabrics (PET-36R and
rPET-36R) obtained from virgin and recycled PET
polymers. Additionally, the polymer type did not have
statistically significant effect on the fabric tensile strength
values (Table 6). Similar case was also observed for the
effect of the number of filaments and filament cross section
shape. There were not statistically significant differences in
the rPET-36R, rPET-48R and rPET-72R fabrics (Table 7).
Also, the differences between circular (rPET-48R) and plus
(rPET-48P) fiber cross sections were found statistically
insignificant at 5% level (Table 6).
Figure 4. Breaking strength results of woven fabrics for warp
direction
Actually, this result is not surprising and it was determined
that texturized yarns produced from different polymer type
(PET-36R and rPET-36R) and fiber cross section (rPET-
48R and rPET-48P) had statistically similar yarn strength
values [13]. Therefore, there was not statistically significant
difference in breaking strength values of the fabrics woven
from PET-36R and rPET-36R, or rPET-48R and rPET-48P
yarns.
In literature, Koo et al. (2013) determined that tensile
strains of mechanical and chemical recycled PET yarns are
lower than that of virgin PET yarn [8]. However, He et al.
(2014) indicated that recycled polyester fibers have a better
tensile strength and breaking elongation than virgin ones
and this result was explained by a bigger intermolecular
force and thus, higher degree of crystallinity [7]. Therefore,
the findings of virgin and recycled polyester fibers on yarn
strength and breaking elongation do not show a single
trend. Regarding the effect of filament cross section,
Babaarslan and Haciogullari (2013) determined high
tenacity and breaking elongation values in round cross
sectional shaped POY yarns and reported that tensile
properties of the yarns with multi-channelled cross-
sectional shapes such as hexsa were low. This case was
interpreted that multi-channelled structure makes the yarn
less resistant to breaking due to the change in individual
fiber tenacity [14]. In this study, it was also determined that
the fabric obtained from circular cross section form had
insignificantly higher fabric breaking strength values
compared to plus cross-sectional shape. On the other hand,
Behera and Singh (2014) determined that cross sectional
shapes have minor influence on tensile behaviour of
polyester fabric [15].
On the other hand, Özkan and Babaarslan (2010)
determined that yarn strength values increase up to a certain
number of filaments and then tend to decrease with the
increase in the number of filaments [16]. This result was
similar to the breaking strength of woven fabrics. In fact,
176 TEKSTİL ve KONFEKSİYON 31(3), 2021
they expected an increase in yarn strength and breaking
elongation values as the number of filaments in the yarn
section increased. However, an unexpected trend was
observed and a reduction was determined in yarn strength
and elongation values beyond certain number of filaments.
The explanation for unexpected case was reported that the
yarns with higher number of filaments are exposed to more
friction effects during the false-twisted texturing process,
and thus some weakening occurs in their structure. As a
result, texturing process based on friction method realized
in this study might be more effective on breaking strength
of the fabrics rather than the effect of number of filaments
and filament cross section form. As seen in Table 8, virgin
PET polymer gave higher yarn strength values than
recycled PET polymer. Additionally, 48F regarding number
of filaments and round cross-section regarding filament
cross-section form led to produce stronger yarns after
texturing process [13]. As to woven fabric, the highest
breaking strength values were obtained the woven fabrics
having 48F and round cross section, and the lowest values
were determined at 72F and plus cross-section.
Table 6. t-test results of fabric tensile strength values for warp
direction
Parameter Sig.
Polymer type 0.105
Cross section form 0.237
Table 7. ANOVA LSD test results of fabric tensile strength
values for warp direction
Fabric type Sig.
rPET-36R rPET-48R 0.176 rPET-72R 0.631
rPET-48R rPET-72R 0.088
Table 8. Yarn strength results after texturing process
Yarn type Strength (g/denier)
PET-36R 4.63
rPET-36R 4.48 rPET-48R 4.11 rPET-72R 4.00 rPET-48P 3.84
3.3. Breaking elongation
Breaking elongation results of woven fabrics are shown in Figure
5 and ANOVA statistical analysis results are given in Table 9-10.
Figure 5. Breaking elongation results of woven fabrics for warp and weft directions
When the effect of the polymer type was examined, it was
determined that the woven fabrics obtained from the virgin
and recycled PET polymers had statistically similar
breaking elongation values in the warp and weft directions
(PET-36R and rPET-36R) (Table 9).
Regarding the effect of number of filaments (rPET-36R,
rPET-48R and rPET-72R), it was observed different trends
in the warp and weft directions. As the number of filament
increased, breaking elongation of woven fabrics decreased
in warp direction while the values of weft direction changed
depending on number of filaments. In weft direction,
breaking elongation increased up to a certain number of
filaments (from 36 filaments to 48) and then decreased with
the higher number of filaments (from 48 filaments to 72).
When the results are evaluated statistically, it was
determined that there were not statistically significant
differences in breaking elongation values of warp direction
(Table 10). Therefore, all filaments gave similar fabric
breaking elongation values in warp direction. However, the
differences in the weft direction was determined to be
significant (Table 10) and number of filaments led to
significantly different fabric breaking elongation values. As
in yarn breaking elongation results after texturing process
(Table 11), the highest elongation values were obtained in
48 filaments and the lowest in 36 filaments. In literature,
Özkan and Babaarslan (2010) determined similar trend and
reported that breaking elongation of texturized polyester
yarns slightly increased when the number of filaments
increased from 24 to 34. Then the elongation value
decreased with the increase in the number of filaments [16].
This case was explained by the fact that POY yarns with
high number of filaments exposed to more friction during
texturing and the resulting lower breaking elongation due to
less resistant structure. The effect of texturing process
based on friction-disc method might be the reason for
breaking elongation results of woven fabrics.
As to the effect of the filament cross sectional form, fabrics
with round (rPET-48R) and plus cross-sections (rPET-48P)
forms in the warp direction had statistically similar values
(Table 9). In the weft direction, it has been determined that
the round form (rPET-48R) gave insignificantly higher
breaking elongation values compared to the plus cross
section form (rPET-48P). In literature, Babaarslan and
Haciogullari (2013) detected high tenacity and breaking
elongation values in round cross sectional shaped yarns and
tensile properties of multi-channelled cross-sectional shapes
were low [14]. Varshney et al. (2011) and Babaarslan and
Haciogullari (2013) explained the polyester yarn tenacity
having different cross section shapes with the change in
individual fiber tenacity [14, 17]. This case might be reason
for lower breaking elongation values of woven fabrics
obtained from plus cross section form. On the other hand,
breaking elongation of the fabrics woven from plus cross
sectional shape might be decreased as a result of subjecting
more friction during texturing process due to higher surface
area of the rPET-48P filament (Figure 2).
TEKSTİL ve KONFEKSİYON 31(3), 2021 177
3.4. Tearing strength
Tearing strength results of woven fabrics are indicated in
Figure 6 and ANOVA statistical analysis results for mean
values are given in Table 12-13.
When the effect of polymer type on the tearing strength of
fabrics (PET-36R and rPET-36R) was examined, different
trends were observed in the weft and warp directions.
Higher strength values were determined in the fabrics
obtained from rPET (rPET-36R) polymer in the warp
direction while PET polymer (PET-36R) gave better values
in the weft direction. However, the differences in tearing
strength values of warp direction were found statistically
insignificant (Table 12). However, in weft direction, the
differences in tearing strength of PET-36R and rPET-36R
fabrics were statistically significant.
On the other hand, tearing strength values decreased
slightly in warp direction while increased in weft direction
with higher number of filaments (rPET-36R, rPET-48R and
rPET-72R). In particular, the differences in tearing strength
values of the warp direction were found statistically
insignificant level for three different number of filament
values. As to weft direction, all fabrics had almost
statistically similar tearing strength values. However,
difference in the fabrics between rPET-36R and rPET-48R
was found statistically significant level (Table 13). rPET-
48R and rPET-72R fabrics having higher number of
filaments had similar fabric tearing strength values. In
literature, tearing strength is defined as a function of the
strength of the yarns in a fabric and the force required to
make them slip over the crossing threads [18]. When the
friction between the yarns in a fabric structure is increased,
freedom of movement of the yarns decreases. Thus, the
yarns do not slide over each other and this case lead to a
reduction in tearing strength values. Hu and Chan (1998)
reported that slack and exposed structures allow the yarns
to transfer and group together, and thus the result in a great
tearing strength in comparison to tight structures [19].
Thanikai Vimal et al. (2020) reported that fabrics with
longer floats have higher tearing strength in comparison of
the fabric having no floats like plain weave [20]. From
these findings, it was thought that the increased surface area
with higher number of filaments in the yarn cross section
prevent the filament slippage during tearing and thus the
fabrics having higher number of filaments give lower
tearing strength values.
As the filament cross section form was circularized, it was
determined that fabrics with round (rPET-48R) and plus
cross section (rPET-48P) form in warp direction had
statistically similar values. In the weft direction, as in
breaking strength results, it was found that the round form
gave higher tearing strength values and the difference was
found statistically significant level (Table 12). In literature,
Behera and Singh (2014) worked on the characterization of
the effect of fibre cross-sectional shape on various
structure–property relationship of fabric. In the study, mean
frictional coefficient calculated twelve different cross-
sectional shape filament yarns such as circular, octagonal,
plus, square, dumble, trilobal etc. mean frictional
coefficient was 0.127 for circular cross-section while it was
0.138 for plus one [21]. Therefore, as seen in Figure 2,
higher surface area and friction characteristic of plus cross-
section might be a reason for lower tearing strength of the
fabrics produced with this cross-section.
Table 9. t-test results for fabric breakage elongation values
Parameter Sig.
Warp direction Weft direction
Polymer type 0.159 0.288 Cross section form 0.989 0.288
Table 10. ANOVA LSD test results for fabric breaking elongation values for warp and weft directions
Fabric type Sig. Fabric type Sig.
rPET-36R-WRP rPET-48R-WRP 10.000
rPET-36R-WFT rPET-48R-WFT 0.000*
rPET-72R-WRP 0.283 rPET-72R-WFT 0.017* rPET-48R-WRP rPET-72R-WRP 0.283 rPET-48R-WFT rPET-72R-WFT 0.000*
*: The mean difference is significant at the 0.05 level.
Table 11. Yarn breaking elongation results after texturing process
Yarn type Breaking elongation (%)
PET-36R 26.04 rPET-36R 23.93 rPET-48R 25.52
rPET-72R 25.00 rPET-48P 18.68
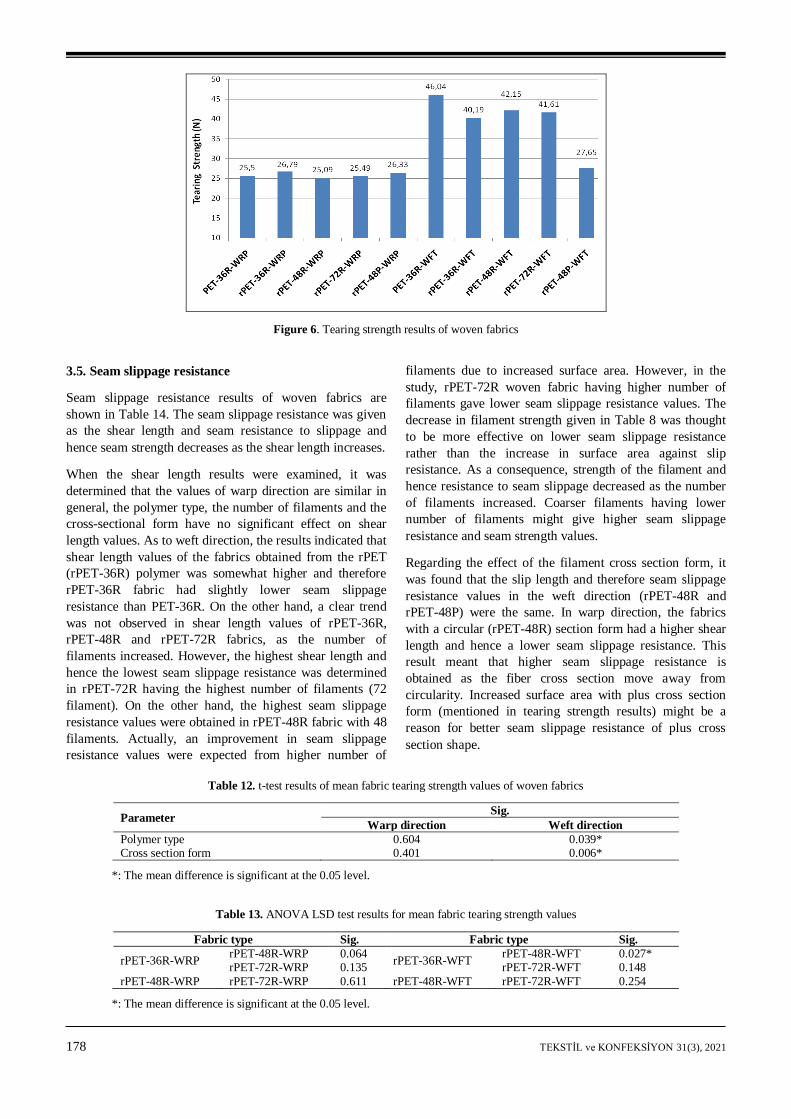
178 TEKSTİL ve KONFEKSİYON 31(3), 2021
Figure 6. Tearing strength results of woven fabrics
3.5. Seam slippage resistance
Seam slippage resistance results of woven fabrics are
shown in Table 14. The seam slippage resistance was given
as the shear length and seam resistance to slippage and
hence seam strength decreases as the shear length increases.
When the shear length results were examined, it was
determined that the values of warp direction are similar in
general, the polymer type, the number of filaments and the
cross-sectional form have no significant effect on shear
length values. As to weft direction, the results indicated that
shear length values of the fabrics obtained from the rPET
(rPET-36R) polymer was somewhat higher and therefore
rPET-36R fabric had slightly lower seam slippage
resistance than PET-36R. On the other hand, a clear trend
was not observed in shear length values of rPET-36R,
rPET-48R and rPET-72R fabrics, as the number of
filaments increased. However, the highest shear length and
hence the lowest seam slippage resistance was determined
in rPET-72R having the highest number of filaments (72
filament). On the other hand, the highest seam slippage
resistance values were obtained in rPET-48R fabric with 48
filaments. Actually, an improvement in seam slippage
resistance values were expected from higher number of
filaments due to increased surface area. However, in the
study, rPET-72R woven fabric having higher number of
filaments gave lower seam slippage resistance values. The
decrease in filament strength given in Table 8 was thought
to be more effective on lower seam slippage resistance
rather than the increase in surface area against slip
resistance. As a consequence, strength of the filament and
hence resistance to seam slippage decreased as the number
of filaments increased. Coarser filaments having lower
number of filaments might give higher seam slippage
resistance and seam strength values.
Regarding the effect of the filament cross section form, it
was found that the slip length and therefore seam slippage
resistance values in the weft direction (rPET-48R and
rPET-48P) were the same. In warp direction, the fabrics
with a circular (rPET-48R) section form had a higher shear
length and hence a lower seam slippage resistance. This
result meant that higher seam slippage resistance is
obtained as the fiber cross section move away from
circularity. Increased surface area with plus cross section
form (mentioned in tearing strength results) might be a
reason for better seam slippage resistance of plus cross
section shape.
Table 12. t-test results of mean fabric tearing strength values of woven fabrics
Parameter Sig.
Warp direction Weft direction
Polymer type 0.604 0.039* Cross section form 0.401 0.006*
*: The mean difference is significant at the 0.05 level.
Table 13. ANOVA LSD test results for mean fabric tearing strength values
Fabric type Sig. Fabric type Sig.
rPET-36R-WRP rPET-48R-WRP 0.064
rPET-36R-WFT rPET-48R-WFT 0.027*
rPET-72R-WRP 0.135 rPET-72R-WFT 0.148
rPET-48R-WRP rPET-72R-WRP 0.611 rPET-48R-WFT rPET-72R-WFT 0.254
*: The mean difference is significant at the 0.05 level.
TEKSTİL ve KONFEKSİYON 31(3), 2021 179
Table 14. Seam length results of woven fabrics
Shear length (mm) PET-36R rPET-36R rPET-48R rPET-72R rPET-48P
Warp direction 2 2 3 2 2 Weft direction 4.5 5 4 6 4
3.6. Abrasion resistance
Abrasion resistances of the textile materials are important
features to determine using life of the fabrics. In addition,
abrasion resistance is one of the most important mechanical
properties that affect fabric appearance during and after use.
In order to evaluate the abrasion resistance properties of
woven fabrics, two samples of each fabric type were
abraded between 8.000-50.000 rubbing cycles. Abrasion
resistance of the fabrics were assessed according to the
rubbing cycles which led to first three yarn breakages. As is
known, the abrasion resistance of the woven fabrics
increases with the increase in abrasion cycles where the
yarn break is observed. According to the results given in
Table 15, 1, 2 and 3 symbolizes the first, second and third
yarn breakages, respectively. As seen, yarn breakages were
observed at 40.000 and above rubbing cycles for the rPET-
36R coded fabrics obtained from rPET polymer, while yarn
breakages occurred between 25.000-32.000 rubbing cycles
in PET-36R fabric obtained from PET polymer. Therefore,
the fabrics woven from recycled polyester yarns
represented a bit slight more resistance to abrasion than the
fabrics with virgin polyester weft yarns.
Regarding the effect of number of filaments, yarn
breakages were determined at lower rubbing cycles as the
number of filaments increased. This case indicated that
resistance to abrasion decreases with finer filaments. Yarn
breakages were observed at 40.000 rubbing cycles for
rPET-36R having the lowest number of filaments (36F)
while it was 12.000-15.000 for rPET-72R having the
highest number of filaments (72F). As similar to this result,
Akgun (2014) reported that high number of filaments in
yarn structure led to higher structural abrasion of the
textured polyester woven fabric surfaces [22]. This case
was explained that yarns with high number of filaments
were more affected by abrasion and number of the pulled
filaments from yarn surfaces increased as abrasion cycles
increased. Lower abrasion resistance of the polyester yarns
having higher number of filaments might be resulted from
lower individual fiber tenacity of these yarns. As seen in
Table 8, yarn tenacity decreased with higher number of
filaments and this case led to lower resistance to abrasion
for rPET-72R than that of the rPET-36R and rPET-48R.
On the other hand, effect of cross section form on abrasion
resistance, the first three yarn breakages were observed in
22.000-28.000 rubbing cycles in rPET-48R fabric with
round section form and in 8.000-10.000 cycles in rPET-48P
fabric with plus cross section form. Abrasion resistance
results indicated that rPET polyester filament yarns having
lower number of filaments and round cross section form
enhance the resistance to abrasion. Shape of filament cross
section directly effects abrasion resistance. In literature, it
was stated that woven fabrics with high surface roughness
were affected more by abrasion. Plus filament cross section
had higher surface areas than round cross section and
therefore this case led to more abrasion. As stated in
breaking strength results of woven fabrics, another reason
might be higher fiber tenacity of round cross section form.
In literature, it was stated that tenacity values of the two
fibers with the same length and linear density values in the
circular and trilobal cross-sectional shapes were different
[14, 23]. On the other hand, Behera and Singh (2014)
determined that yarn tenacity values of multifilament yarns
are 2.52 g/denier for circular and 2.41 g/denier plus cross-
sections [21]. In present study, it was also determined that
yarn tenacity is 4.48 g/denier for round and 3.84 g/denier
for plus cross-section (Table 8). As similar to this case, the
higher fiber tenacity resulted from round cross section
shape caused more resistance to yarn breakages.
3.7. Air permeability
Air permeability results of woven fabrics are shown in Figure 7
and ANOVA statistical analysis results are given in Table 16-17.
Figure 7. Air permeability results
When the effect of polymer properties on the air
permeability of the fabrics was examined, it was
determined that the PET-36R fabrics obtained from the
PET polymer had significantly more air permeability values
than the rPET-36R fabrics woven from rPET yarns (Table
16).
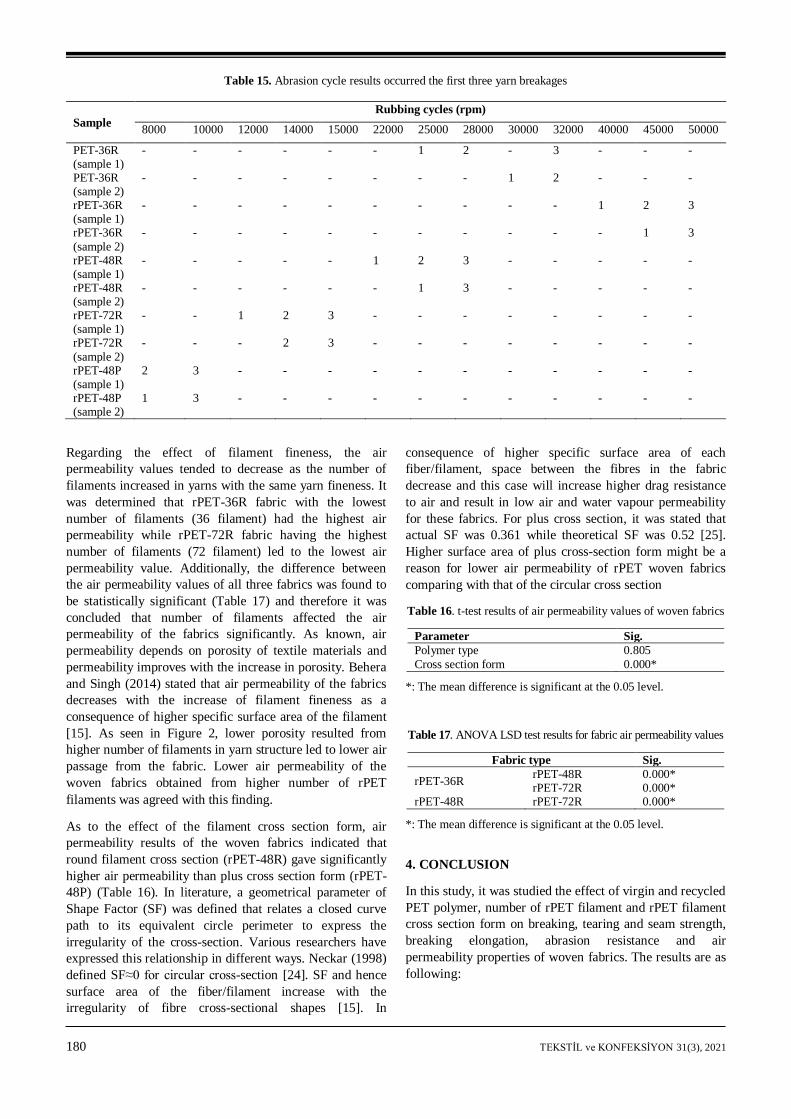
180 TEKSTİL ve KONFEKSİYON 31(3), 2021
Table 15. Abrasion cycle results occurred the first three yarn breakages
Sample Rubbing cycles (rpm)
8000 10000 12000 14000 15000 22000 25000 28000 30000 32000 40000 45000 50000
PET-36R (sample 1)
- - - - - - 1 2 - 3 - - -
PET-36R (sample 2)
- - - - - - - - 1 2 - - -
rPET-36R (sample 1)
- - - - - - - - - - 1 2 3
rPET-36R
(sample 2)
- - - - - - - - - - - 1 3
rPET-48R (sample 1)
- - - - - 1 2 3 - - - - -
rPET-48R (sample 2)
- - - - - - 1 3 - - - - -
rPET-72R (sample 1)
- - 1 2 3 - - - - - - - -
rPET-72R
(sample 2)
- - - 2 3 - - - - - - - -
rPET-48P (sample 1)
2 3 - - - - - - - - - - -
rPET-48P (sample 2)
1 3 - - - - - - - - - - -
Regarding the effect of filament fineness, the air
permeability values tended to decrease as the number of
filaments increased in yarns with the same yarn fineness. It
was determined that rPET-36R fabric with the lowest
number of filaments (36 filament) had the highest air
permeability while rPET-72R fabric having the highest
number of filaments (72 filament) led to the lowest air
permeability value. Additionally, the difference between
the air permeability values of all three fabrics was found to
be statistically significant (Table 17) and therefore it was
concluded that number of filaments affected the air
permeability of the fabrics significantly. As known, air
permeability depends on porosity of textile materials and
permeability improves with the increase in porosity. Behera
and Singh (2014) stated that air permeability of the fabrics
decreases with the increase of filament fineness as a
consequence of higher specific surface area of the filament
[15]. As seen in Figure 2, lower porosity resulted from
higher number of filaments in yarn structure led to lower air
passage from the fabric. Lower air permeability of the
woven fabrics obtained from higher number of rPET
filaments was agreed with this finding.
As to the effect of the filament cross section form, air
permeability results of the woven fabrics indicated that
round filament cross section (rPET-48R) gave significantly
higher air permeability than plus cross section form (rPET-
48P) (Table 16). In literature, a geometrical parameter of
Shape Factor (SF) was defined that relates a closed curve
path to its equivalent circle perimeter to express the
irregularity of the cross-section. Various researchers have
expressed this relationship in different ways. Neckar (1998)
defined SF≈0 for circular cross-section [24]. SF and hence
surface area of the fiber/filament increase with the
irregularity of fibre cross-sectional shapes [15]. In
consequence of higher specific surface area of each
fiber/filament, space between the fibres in the fabric
decrease and this case will increase higher drag resistance
to air and result in low air and water vapour permeability
for these fabrics. For plus cross section, it was stated that
actual SF was 0.361 while theoretical SF was 0.52 [25].
Higher surface area of plus cross-section form might be a
reason for lower air permeability of rPET woven fabrics
comparing with that of the circular cross section
Table 16. t-test results of air permeability values of woven fabrics
Parameter Sig.
Polymer type 0.805
Cross section form 0.000*
*: The mean difference is significant at the 0.05 level.
Table 17. ANOVA LSD test results for fabric air permeability values
Fabric type Sig.
rPET-36R rPET-48R 0.000* rPET-72R 0.000*
rPET-48R rPET-72R 0.000*
*: The mean difference is significant at the 0.05 level.
4. CONCLUSION
In this study, it was studied the effect of virgin and recycled
PET polymer, number of rPET filament and rPET filament
cross section form on breaking, tearing and seam strength,
breaking elongation, abrasion resistance and air
permeability properties of woven fabrics. The results are as
following:
TEKSTİL ve KONFEKSİYON 31(3), 2021 181
Regarding the effect of polymer type, it was not
determined any significant differences in fabric weight,
breaking strength and breaking elongation results.
However, the fabrics obtained from virgin PET polymer
gave better tearing strength, seam slippage resistance
and air permeability while fabrics woven from recycled
polyester yarns represented a bit slight more resistance
to abrasion than the fabrics with virgin polyester yarns.
Except fabric tearing strength results of weft direction,
the differences in all analysed performance properties of
the woven fabrics obtained from virgin and recycled
PET polymer were not statistically significant and
therefore both polymer types gave similar fabric
properties.
The results of warp direction were found statistically
insignificant level due to the usage of FDY polyester
yarn (30 denier and 12F) in warp direction of all woven
fabrics.
As to the effect of number of filaments, it was
determined that woven fabrics having 36, 48 and 72
filaments had statistically similar fabric weight and
breaking strength values. On the other hand, the results
indicated that higher number of filaments gave lower
fabric breaking elongation, seam slippage resistance,
abrasion resistance and air permeability values while
led to higher tearing strength.
The effect of increased surface are with higher number
of filaments might be the main reason for fabric
breaking elongation, tearing strength and air
permeability results. On the other hand, increased fiber
fineness and hence lower fiber tenacity resulted from
higher number of filaments in the same yarn cross
section was thought to have affected on seam slippage
resistance and abrasion resistance results.
Except fabric weight and tensile properties, filament
cross section shapes had a significant affect on other
studied fabric properties. It was determined that circular
cross section form gave higher fabric breaking strength
and elongation, tearing strength, abrasion resistance and
air permeability values while higher seam slippage
resistance values were obtained with plus cross section
form.
Higher individual fiber tenacity of circular cross section
form might be a reason for better tensile strength,
breaking elongation, tearing strength and abrasion
resistance values while increased surface area of plus
cross section shape might be effective higher seam
slippage resistance and lower air permeability results.
In recent years, recycled fibre usage has been attracting
attention due to concerns about environment protection and
increased raw material costs. This research makes several
noteworthy contributions to production possibility of
polyester yarns from polyethylene terephthalate (PET)
wastes exhibiting comparable woven fabric properties with
that of the virgin polyester yarns such as fabric strength and
comfort. Additionally, this study showed that polyester
yarns with different filament fineness and cross-sectional
shapes can be produced from recycled PET polymer.
Recycled polyester yarn could be used as an alternative to
the virgin polyester yarns and this case enhances to benefit
the low price and enviromentally friendly of the recycled
material.
As reported, this study was realized at the polyester yarn
production mill, and virgin and recycled polyester fibres
were spun based on melt spinning method on an industrial
scale. Due to limited yarn length, the current study has only
examined the recycled polyester yarns as a weft yarn. The
scope of this study was limited in terms of the analysis of
usage of the recycled polyester yarns as a warp yarn and
also fabric production parameters such as different weave
types, warp/weft yarn densities (fabric weight), etc. and
limited fabric properties. A future study investigating
various woven fabric properties produced with different
fabric production parameters would be very interesting.
Considerably detailed work will need to be done to
determine the tensile properties of the fabrics produced
from recycled yarns and to compare with that of the virgin
one. It is recommended that further research would be
undertaken about knitted fabric properties.
ACKNOWLEDGEMENTS
The authors also wish to express their gratitude to KFS
Sentetik San. ve Tic. A.Ş. (Sakarya/Turkey).
REFERENCES
1. TUİK. 2011, April 18. Atık Bertaraf ve Geri Kazanım Tesisleri
İstatistikleri (2011). Retrieved from https://data.tuik.gov.tr/
Bulten/Index?p=Atik-Bertaraf-ve-Geri-Kazanim-Tesisleri-
Istatistikleri
2. Telli A, Özdil N. 2015. Effect of recycled PET fibers on the
performance properties of knitted fabrics. Journal of Engineered
Fibers and Fabrics, 10(2), 47-60.
3. Uyanık S. 2019. A study on the suitability of which yarn number to
use for recycle polyester fiber. The Journal of the Textile
Institute, 110(7), 1012-1031.
4. Qin Y, Qu M, Kaschta J, Schubert DW. 2018. Comparing recycled
and virgin poly (ethylene terephthalate) melt-spun fibres. Polymer
Testing, 72, 364-371.
5. Yuksekkaya ME, Celep G, Dogan G, Tercan M, Urhan B. 2016. A
comparative study of physical properties of yarns and fabrics
produced from virgin and recycled fibers. Journal of Engineered
Fibers & Fabrics, 11(2), 68–76.
6. Sanches RA, Takamune KM, Guimaraes BM, Alonso RS, Jr DK,
Marcicano JPP, Duarte AYS, Dedini FG. 2015. Comparative study of
characteristics of knitted fabrics produced from recycled fibres
182 TEKSTİL ve KONFEKSİYON 31(3), 2021
employing the Chauvenet criterion, factorial design and statistical
analysis. Fibres & Textiles in Eastern Europe, 23(4), 19–24.
7. He SS, Wei MY, Liu MH, Xue WL. 2014. Characterization of virgin
and recycled poly(ethylene terephthalate) (PET) fibers. The Journal
of The Textile Institute, 106(8), 800– 806.
8. Koo HJ, Chang GS, Kim SH, Hahm WG, Park SY. 2013. Effects of
recycling processes on physical, mechanical and degradation
properties of PET yarns. Fibers and Polymers, 14(12), 2083-2087.
9. Kostov G, Atanassov A, Kiryakova D. 2013. Preparation and
characterization of fibers of waste and fresh polyethylene terephtalate
and mixtures of them. Fibers and Polymers, 14(2), 216-222.
10. Telli A, Özdil N. 2013. Properties of the yarns produced from r-pet
and their blends. Tekstil ve Konfeksiyon, 23(1), 3-10.
11. Lee JH, Lim KS, Hahm WG, Kim SH. 2013. Properties of recycled
and virgin poly (ethylene terephthalate) blend fibers. Journal of
Applied Polymer Science, 128(2), 1250-1256.
12. Abbasi M, Mojtahedi MRM, Khosroshahi A. 2007. Effect of spinning
speed on the structure and physical properties of filament yarns
produced from used PET bottles. Journal of Applied Polymer
Science, 103(6), 3972-3975.
13. Kırış G. 2020. Farklı filament inceliği ve filament kesit formu
kullanılarak geri dönüşüm pet polimerinden (rPET) POY ve tekstüre
(DTY) polyester ipliklerin eldesi ve örme ve dokuma kumaşların
çeşitli performans özelliklerinin incelenmesi (Master dissertation).
Available from Ulusal Tez Merkezi (Accesion
https://tez.yok.gov.tr/UlusalTezMerkezi/tezSorguSonucYeni).
14. Babaarslan O, Hacioğullari S. 2013. Effect of fibre cross-sectional
shape on the properties of POY continuous filaments yarns. Fibers
and Polymers, 14(1), 146-151.
15. Behera BK, Singh MK. 2014. Role of filament cross-section in
properties of PET multifilament yarn and fabric. Part I: Effect of fibre
cross-sectional shape on transmission behaviour of fabrics. The
Journal of the Textile Institute, 105(9), 895-904.
16. Özkan S, Babaarslan O. 2010. İplik kesitindeki filament sayısının
filament ve tekstüre ipliklerin özellikleri üzerindeki etkisi. Journal of
Textile & Apparel/Tekstil ve Konfeksiyon, 20(1), 17-22.
17. Varshney RK, Kothari VK, Dhamija S. 2011. Influence of polyester
fibre fineness and cross-sectional shape on low-stress characteristics
of fabrics. The Journal of the Textile Institute, 102(1), 31-40.
18. Taylor HM. 1999. Tensile and tearing strength of cotton cloths.
Journal of the Textile Institute, 50, 161–188.
19. Hu J, Chan YF. 1998. Effect of fabric mechanical properties on
drape. Textile Research Journal, 68(1), 57–64.
20. Thanikai Vimal J, Prakash C, Jebastin Rajwin A. 2020. Effect of
weave parameters on the tear strength of woven fabrics. Journal of
Natural Fibers, 17(9), 1239-1248.
21. Behera BK, Singh MK. 2014. Role of filament cross-section in
properties of PET multifilament yarn and fabric. Part II: effect of
fibre crosssectional shapes on fabric hand. The Journal of The Textile
Institute, 105(4), 365-376.
22. Akgun M. 2014. Surface roughness properties of polyester woven
fabrics after abrasion. The Journal of the Textile Institute, 105(4),
383-391.
23. Dhamija S, Kothari VK, Varshney RK. 2011. Effect of polyester fibre
fineness and cross-sectional shape on physical characteristics of
yarns. The Journal of the Textile Institute, 102(4), 293-307.
24. Neckar B. 1998. Morphology and structural mechanics of fibrious
assemblies. Liberec, Czech Republic: TU Liberec.
TEKSTİL ve KONFEKSİYON 31(3), 2021 183
TEKSTİL VE KONFEKSİYON
VOL: 31, NO. 3
DOI: 10.32710/tekstilvekonfeksiyon.807631
An Investigation on Some Mechanical Properties of the
Tuft Carpets Produced by Homopolymer, Copolymer
and Thermoplastic Polyolefin Mixed Polypropylene
Bulked Continuous Filament Yarns
Cemile Emel YAZ1 0000-0003-4463-7815
Cem GÜNEŞOĞLU2 0000-0002-8796-9679
Mehmet TOPALBEKİROĞLU2 0000-0003-4345-8815
1Gaziantep University / Naci Topçuoğlu Vocational School / Gaziantep, Turkey 2Gaziantep University / Department of Textile Engineering / Gaziantep, Turkey
Corresponding Author: Cemile Emel YAZ, [email protected]
ABSTRACT
There are several parameters that affect the mechanical properties of carpets such as yarn characteristic
and carpet construction. Yarn material is one of the most important factors which determine the usage
performance of carpets by consumers. This study investigated the mechanical behaviours of carpets
produced from polypropylene (PP) bulked continuous filament (BCF) yarns with not only
polypropylene homopolymer but also mixing with copolymer (coPP) or thermoplastic polyolefins
(TPO). In this respect, nine carpet samples produced by different types of BCF yarns used as pile were
examined. Experimental results indicated that mixing polypropylene homopolymer with copolymer or
thermoplastic polyolefin resulted with improvement in thickness loss and resilience properties. In
addition, thermoplastic polyolefin mixed samples exhibited higher performance compared to those of
copolymer, in both dynamic and static loading. PP BCF yarn composition had considerable influences
on compressibility behaviours of carpets, whereas there was no significant effect on tuft withdrawal
force.
ARTICLE HISTORY
Received: 08.10.2020
Accepted: 10.08.2021
KEYWORDS
Carpet, BCF yarn, polymer mixing, polypropylene homopolymer, copolymer, thermoplastic polyolefin
1. INTRODUCTION
The carpet industry utilises both filament and spun yarns as
pile materials. In tufted sector, filament yarns are more
popular. All of the filament yarns are bulked continuous
filament (BCF) and there is a widespread use of BCF
polypropylene (PP) in face-to-face carpets [1]. PP has a
handle like wool and also has low specific gravity that
provides better cover in the carpet than other pile fibres, thus
it is one of the most important pile fibres used in tufted
carpets. It also does not absorb water so it resists to water-
borne stain, although oily stains may be a problem. In
addition, the resilience (elastic recovery) of PP is not as good
as that of some other textile fibres, but this can be
compensated by increasing the pile density of carpet. The
low cost of its monomer is one of the main advantages of PP
[1, 2]. PP yarn used in the machine carpet industry is in
generally homopolymer structure which is more rigid than
PP copolymer and has better thermal resistance, but impact
resistance is low at low temperatures. In addition, ethylene-
propylene copolymer structure gives higher elongation and
impact resistance in injection molding applications with PP
material although it is more expensive than homopolymer [3,
To cite this article: Yaz CE, Güneşoğlu C, Topalbekiroğlu M. 2021. An investigation on some mechanical properties of the tuft carpets produced by homopolymer, copolymer and thermoplastic polyolefin mixed polypropylene bulked continuous filament yarns. Tekstil ve Konfeksiyon, 31(3), 183-194.
184 TEKSTİL ve KONFEKSİYON 31(3), 2021
4]. In addition, thermoplastic polyolefins (TPO) are physical
blends of rubbers and crystalline thermoplastics. The rubber
component is usually an ethylene-propylene rubber (either
EPM or EPDM) and the thermoplastics material is
polypropylene. The material is characterized by high-impact
strength, low density and good chemical resistance [5, 6].
In literature, there are several studies focused on mechanical
performances of carpets produced from different types of
pile yarns. By many researchers the effects of various
parameters, such as pile material, yarn and carpet structure,
on the carpet performances were investigated. Most of the
studies indicated that due to their characteristic features,
different raw materials such as polypropylene, acrylic, nylon
or wool have varied effects on carpet deformation
behaviours. In addition to this, since the constructional
properties, such as pile density and pile height, directly affect
the energy of pile yarns, these are defined as decisive
parameters on resilience properties of carpets [7-17]. It was
also emphasized that, increase pile density and decrease in
pile height are the main factors that decrease the deformation
[14]. Besides these constructional parameters, the effects of
production parameters of BCF yarn on yarn properties and
carpet behaviours were focused on by some researchers. It
was noted that yarn characteristics are not only based on
structural properties such as cross-section and yarn linear
density, but also depend on production parameters like heat-
setting temperature, twisting, drawing ratio, etc. [18-21].
As seen from the literature survey, most of the studies
investigated the influences of specific raw material
characteristics and yarn production parameters on yarn and
carpet behaviours. There is an only study which researched
polymer mixing in PP BCF. Tavanai et all searched the
properties of BCF yarns produced by mixing at different
ratios with polyamide 6 to improve the low stretchability
properties of PP [22]. However, the effects of BCF yarns on
carpet performances were not investigated. Additionally, in
literature, there are some studies that had examined the
toughening effect of coPP or TPO in blends on samples
prepared by injection-molded [23-25]. To the best of our
knowledge, there is no research on coPP and TPO usage in
BCF yarn production as pile yarns at carpets. With the aim
of determine the effects of polymer mixing on pile yarn
deformation behaviours, BCF yarns were produced by at
different mixing ratios of PP homopolymer with coPP or
TPO and carpets were manufactured keeping the all other
pile and carpet parameters constant. In order to determine
experimental results, carpet samples were applied dynamic
and short-term static loadings, compression and recovery,
hexapod appearance retention and tuft withdrawal force
tests.
2. MATERIAL AND METHOD
2.1 Material
In this study, nine different types of PP BCF yarns, four types
of TPO mixed, four types of coPP mixed and a pure PP as a
reference, were used as pile with linear density 2100/144
dtex. The compositions of BCF yarns consisted of
commercially available polypropylene homopolymer
(NATPET H25FBA), polypropylene impact copolymer
(coPP) (LyondellBasell Moplen EP548Q) and thermoplastic
polyolefin (TPO) (LyondellBasell Adflex Z101H).
Mechanical properties of polymers are given in Table 1. BCF
yarns were produced by laboratory scale BCF machine in
Kartal Halı Tekstil San. Tic. A.Ş.. The production
parameters and the composition percentages of BCF yarns
are shown in Table 2 and Table 3, respectively. The heat-
setting process parameters of BCF yarn samples were
applied as 135 °C setting temperature, 450 rpm winding
speed, 17.5 m/min band speed, 0.75 bar tunnel pressure and
1 minute tunnel waiting time. Carpet samples were produced
by Booria Robotuft tufting machine in Royal Halı İplik
Tekstil Mobilya San. Tic. A.Ş.. Production parameters were
kept constant for all samples, with 210 (pile/cm) pile density
and 12 mm pile height. Tufted samples were dried after
applying SBS latex and bonding the second ground fabric
(%100 PET plain weave).
Table 1. Mechanical properties of polymers
Property
Melt Flow
Rate
(g/10min)
Flexural
Modulus
(MPa)
Impact
Strength
(kJ/m²)
PP
Homopolymer 25 1700 2.2
PP Copolymer 19 1450 9
TPO 27 80 No break
Table 2. Production parameters of BCF yarns
Extruder Unit
Cabin Temperature (°C) Pressure (bar)
1 241
105
2 243
3 245
4 247
5 245
6 247
Cooling Unit
Cooling temperature is 25 °C, lubrication tank pressure 255 bar
Drawing Unit
Godet Temperature (°C) Cycle Speed
(rpm)
1 25 1020
2 90 1050
3 138 2470
4 37 2490
5 145 2490
Cabin - 1100
Barrel 145 800
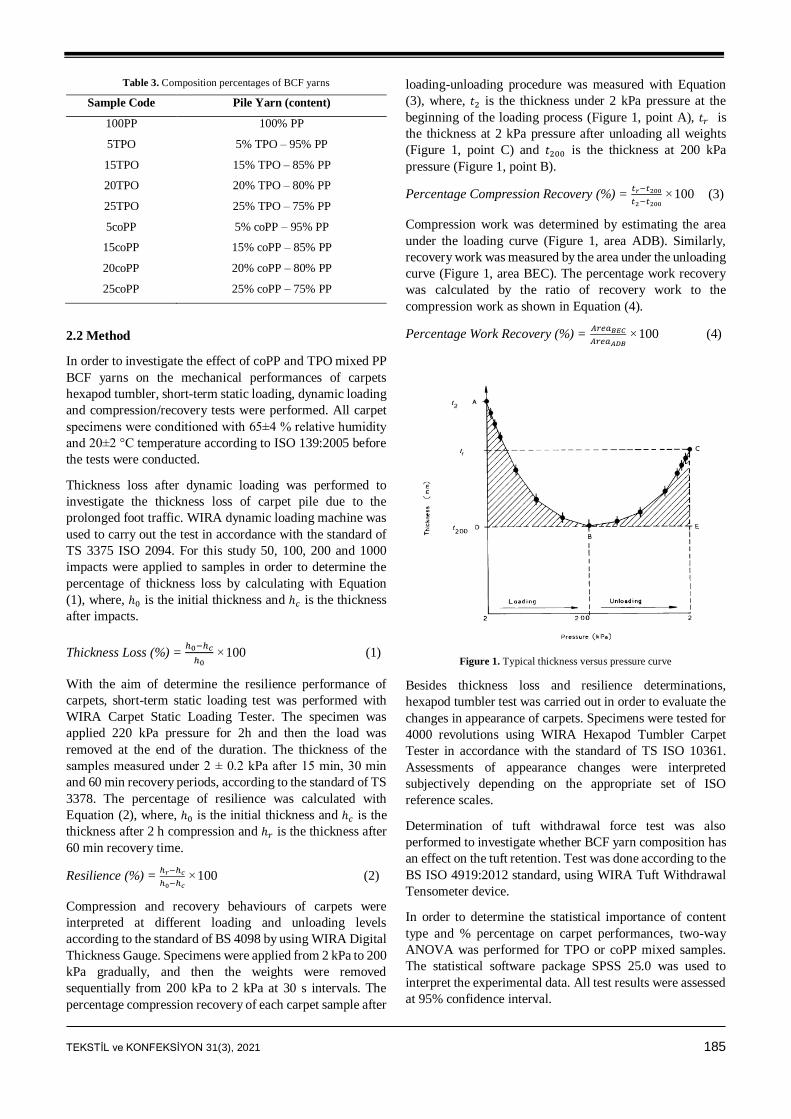
TEKSTİL ve KONFEKSİYON 31(3), 2021 185
Table 3. Composition percentages of BCF yarns
Sample Code Pile Yarn (content)
100PP 100% PP
5TPO 5% TPO – 95% PP
15TPO 15% TPO – 85% PP
20TPO 20% TPO – 80% PP
25TPO 25% TPO – 75% PP
5coPP 5% coPP – 95% PP
15coPP 15% coPP – 85% PP
20coPP 20% coPP – 80% PP
25coPP 25% coPP – 75% PP
2.2 Method
In order to investigate the effect of coPP and TPO mixed PP
BCF yarns on the mechanical performances of carpets
hexapod tumbler, short-term static loading, dynamic loading
and compression/recovery tests were performed. All carpet
specimens were conditioned with 65±4 % relative humidity
and 20±2 °C temperature according to ISO 139:2005 before
the tests were conducted.
Thickness loss after dynamic loading was performed to
investigate the thickness loss of carpet pile due to the
prolonged foot traffic. WIRA dynamic loading machine was
used to carry out the test in accordance with the standard of
TS 3375 ISO 2094. For this study 50, 100, 200 and 1000
impacts were applied to samples in order to determine the
percentage of thickness loss by calculating with Equation
(1), where, ℎ0 is the initial thickness and ℎ𝑐 is the thickness
after impacts.
Thickness Loss (%) = ℎ0−ℎ𝑐
ℎ0 ×100 (1)
With the aim of determine the resilience performance of
carpets, short-term static loading test was performed with
WIRA Carpet Static Loading Tester. The specimen was
applied 220 kPa pressure for 2h and then the load was
removed at the end of the duration. The thickness of the
samples measured under 2 ± 0.2 kPa after 15 min, 30 min
and 60 min recovery periods, according to the standard of TS
3378. The percentage of resilience was calculated with
Equation (2), where, ℎ0 is the initial thickness and ℎ𝑐 is the
thickness after 2 h compression and ℎ𝑟 is the thickness after
60 min recovery time.
Resilience (%) = ℎ𝑟−ℎ𝑐
ℎ0−ℎ𝑐 ×100 (2)
Compression and recovery behaviours of carpets were
interpreted at different loading and unloading levels
according to the standard of BS 4098 by using WIRA Digital
Thickness Gauge. Specimens were applied from 2 kPa to 200
kPa gradually, and then the weights were removed
sequentially from 200 kPa to 2 kPa at 30 s intervals. The
percentage compression recovery of each carpet sample after
loading-unloading procedure was measured with Equation
(3), where, 𝑡2 is the thickness under 2 kPa pressure at the
beginning of the loading process (Figure 1, point A), 𝑡𝑟 is
the thickness at 2 kPa pressure after unloading all weights
(Figure 1, point C) and 𝑡200 is the thickness at 200 kPa
pressure (Figure 1, point B).
Percentage Compression Recovery (%) = 𝑡𝑟−𝑡200
𝑡2−𝑡200 ×100 (3)
Compression work was determined by estimating the area
under the loading curve (Figure 1, area ADB). Similarly,
recovery work was measured by the area under the unloading
curve (Figure 1, area BEC). The percentage work recovery
was calculated by the ratio of recovery work to the
compression work as shown in Equation (4).
Percentage Work Recovery (%) = 𝐴𝑟𝑒𝑎𝐵𝐸𝐶
𝐴𝑟𝑒𝑎𝐴𝐷𝐵 ×100 (4)
Figure 1. Typical thickness versus pressure curve
Besides thickness loss and resilience determinations,
hexapod tumbler test was carried out in order to evaluate the
changes in appearance of carpets. Specimens were tested for
4000 revolutions using WIRA Hexapod Tumbler Carpet
Tester in accordance with the standard of TS ISO 10361.
Assessments of appearance changes were interpreted
subjectively depending on the appropriate set of ISO
reference scales.
Determination of tuft withdrawal force test was also
performed to investigate whether BCF yarn composition has
an effect on the tuft retention. Test was done according to the
BS ISO 4919:2012 standard, using WIRA Tuft Withdrawal
Tensometer device.
In order to determine the statistical importance of content
type and % percentage on carpet performances, two-way
ANOVA was performed for TPO or coPP mixed samples.
The statistical software package SPSS 25.0 was used to
interpret the experimental data. All test results were assessed
at 95% confidence interval.
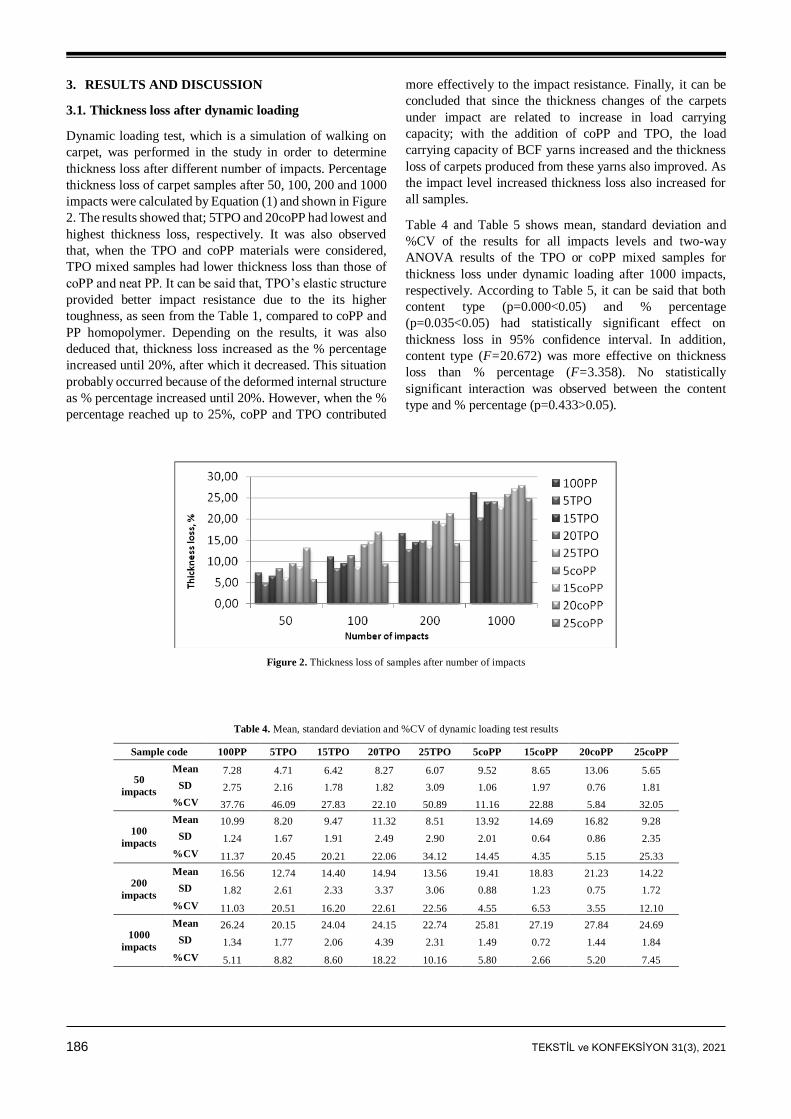
186 TEKSTİL ve KONFEKSİYON 31(3), 2021
3. RESULTS AND DISCUSSION
3.1. Thickness loss after dynamic loading
Dynamic loading test, which is a simulation of walking on
carpet, was performed in the study in order to determine
thickness loss after different number of impacts. Percentage
thickness loss of carpet samples after 50, 100, 200 and 1000
impacts were calculated by Equation (1) and shown in Figure
2. The results showed that; 5TPO and 20coPP had lowest and
highest thickness loss, respectively. It was also observed
that, when the TPO and coPP materials were considered,
TPO mixed samples had lower thickness loss than those of
coPP and neat PP. It can be said that, TPO’s elastic structure
provided better impact resistance due to the its higher
toughness, as seen from the Table 1, compared to coPP and
PP homopolymer. Depending on the results, it was also
deduced that, thickness loss increased as the % percentage
increased until 20%, after which it decreased. This situation
probably occurred because of the deformed internal structure
as % percentage increased until 20%. However, when the %
percentage reached up to 25%, coPP and TPO contributed
more effectively to the impact resistance. Finally, it can be
concluded that since the thickness changes of the carpets
under impact are related to increase in load carrying
capacity; with the addition of coPP and TPO, the load
carrying capacity of BCF yarns increased and the thickness
loss of carpets produced from these yarns also improved. As
the impact level increased thickness loss also increased for
all samples.
Table 4 and Table 5 shows mean, standard deviation and
%CV of the results for all impacts levels and two-way
ANOVA results of the TPO or coPP mixed samples for
thickness loss under dynamic loading after 1000 impacts,
respectively. According to Table 5, it can be said that both
content type (p=0.000<0.05) and % percentage
(p=0.035<0.05) had statistically significant effect on
thickness loss in 95% confidence interval. In addition,
content type (F=20.672) was more effective on thickness
loss than % percentage (F=3.358). No statistically
significant interaction was observed between the content
type and % percentage (p=0.433>0.05).
Figure 2. Thickness loss of samples after number of impacts
Table 4. Mean, standard deviation and %CV of dynamic loading test results
Sample code 100PP 5TPO 15TPO 20TPO 25TPO 5coPP 15coPP 20coPP 25coPP
50
impacts
Mean 7.28 4.71 6.42 8.27 6.07 9.52 8.65 13.06 5.65
SD 2.75 2.16 1.78 1.82 3.09 1.06 1.97 0.76 1.81
%CV 37.76 46.09 27.83 22.10 50.89 11.16 22.88 5.84 32.05
100
impacts
Mean 10.99 8.20 9.47 11.32 8.51 13.92 14.69 16.82 9.28
SD 1.24 1.67 1.91 2.49 2.90 2.01 0.64 0.86 2.35
%CV 11.37 20.45 20.21 22.06 34.12 14.45 4.35 5.15 25.33
200
impacts
Mean 16.56 12.74 14.40 14.94 13.56 19.41 18.83 21.23 14.22
SD 1.82 2.61 2.33 3.37 3.06 0.88 1.23 0.75 1.72
%CV 11.03 20.51 16.20 22.61 22.56 4.55 6.53 3.55 12.10
1000
impacts
Mean 26.24 20.15 24.04 24.15 22.74 25.81 27.19 27.84 24.69
SD 1.34 1.77 2.06 4.39 2.31 1.49 0.72 1.44 1.84
%CV 5.11 8.82 8.60 18.22 10.16 5.80 2.66 5.20 7.45
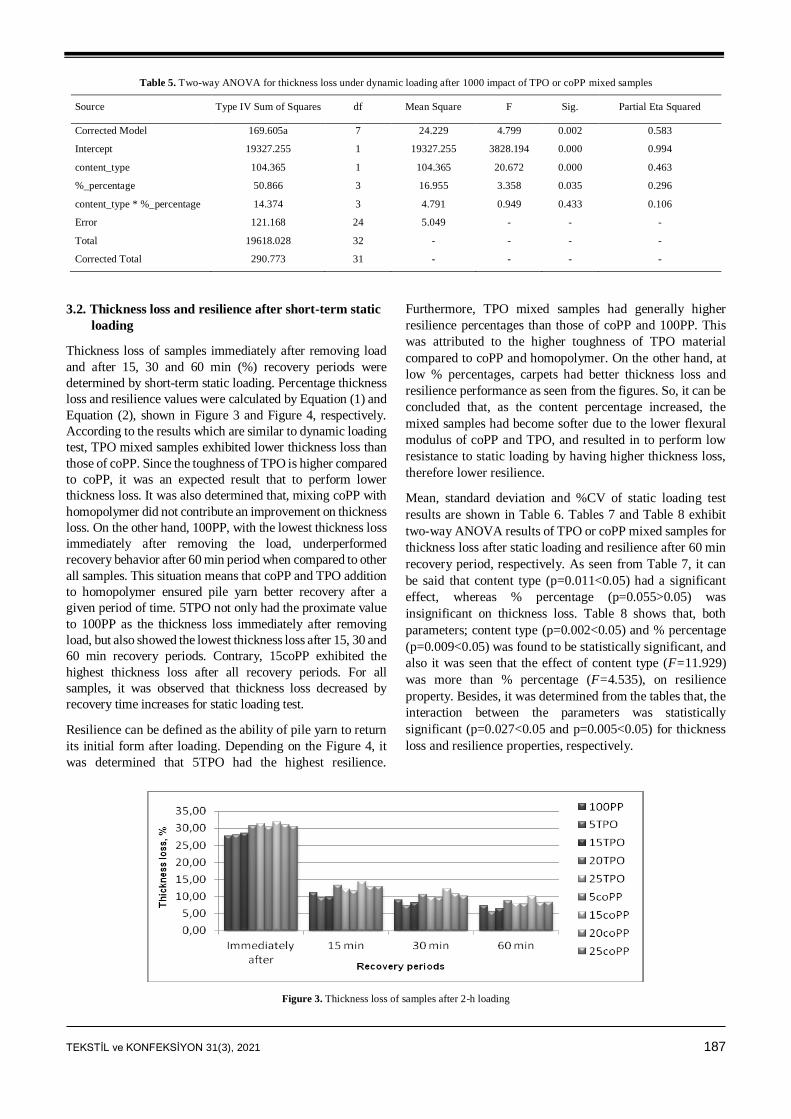
TEKSTİL ve KONFEKSİYON 31(3), 2021 187
Table 5. Two-way ANOVA for thickness loss under dynamic loading after 1000 impact of TPO or coPP mixed samples
Source Type IV Sum of Squares df Mean Square F Sig. Partial Eta Squared
Corrected Model 169.605a 7 24.229 4.799 0.002 0.583
Intercept 19327.255 1 19327.255 3828.194 0.000 0.994
content_type 104.365 1 104.365 20.672 0.000 0.463
%_percentage 50.866 3 16.955 3.358 0.035 0.296
content_type * %_percentage 14.374 3 4.791 0.949 0.433 0.106
Error 121.168 24 5.049 - - -
Total 19618.028 32 - - - -
Corrected Total 290.773 31 - - - -
3.2. Thickness loss and resilience after short-term static
loading
Thickness loss of samples immediately after removing load
and after 15, 30 and 60 min (%) recovery periods were
determined by short-term static loading. Percentage thickness
loss and resilience values were calculated by Equation (1) and
Equation (2), shown in Figure 3 and Figure 4, respectively.
According to the results which are similar to dynamic loading
test, TPO mixed samples exhibited lower thickness loss than
those of coPP. Since the toughness of TPO is higher compared
to coPP, it was an expected result that to perform lower
thickness loss. It was also determined that, mixing coPP with
homopolymer did not contribute an improvement on thickness
loss. On the other hand, 100PP, with the lowest thickness loss
immediately after removing the load, underperformed
recovery behavior after 60 min period when compared to other
all samples. This situation means that coPP and TPO addition
to homopolymer ensured pile yarn better recovery after a
given period of time. 5TPO not only had the proximate value
to 100PP as the thickness loss immediately after removing
load, but also showed the lowest thickness loss after 15, 30 and
60 min recovery periods. Contrary, 15coPP exhibited the
highest thickness loss after all recovery periods. For all
samples, it was observed that thickness loss decreased by
recovery time increases for static loading test.
Resilience can be defined as the ability of pile yarn to return
its initial form after loading. Depending on the Figure 4, it
was determined that 5TPO had the highest resilience.
Furthermore, TPO mixed samples had generally higher
resilience percentages than those of coPP and 100PP. This
was attributed to the higher toughness of TPO material
compared to coPP and homopolymer. On the other hand, at
low % percentages, carpets had better thickness loss and
resilience performance as seen from the figures. So, it can be
concluded that, as the content percentage increased, the
mixed samples had become softer due to the lower flexural
modulus of coPP and TPO, and resulted in to perform low
resistance to static loading by having higher thickness loss,
therefore lower resilience.
Mean, standard deviation and %CV of static loading test
results are shown in Table 6. Tables 7 and Table 8 exhibit
two-way ANOVA results of TPO or coPP mixed samples for
thickness loss after static loading and resilience after 60 min
recovery period, respectively. As seen from Table 7, it can
be said that content type (p=0.011<0.05) had a significant
effect, whereas % percentage (p=0.055>0.05) was
insignificant on thickness loss. Table 8 shows that, both
parameters; content type (p=0.002<0.05) and % percentage
(p=0.009<0.05) was found to be statistically significant, and
also it was seen that the effect of content type (F=11.929)
was more than % percentage (F=4.535), on resilience
property. Besides, it was determined from the tables that, the
interaction between the parameters was statistically
significant (p=0.027<0.05 and p=0.005<0.05) for thickness
loss and resilience properties, respectively.
Figure 3. Thickness loss of samples after 2-h loading
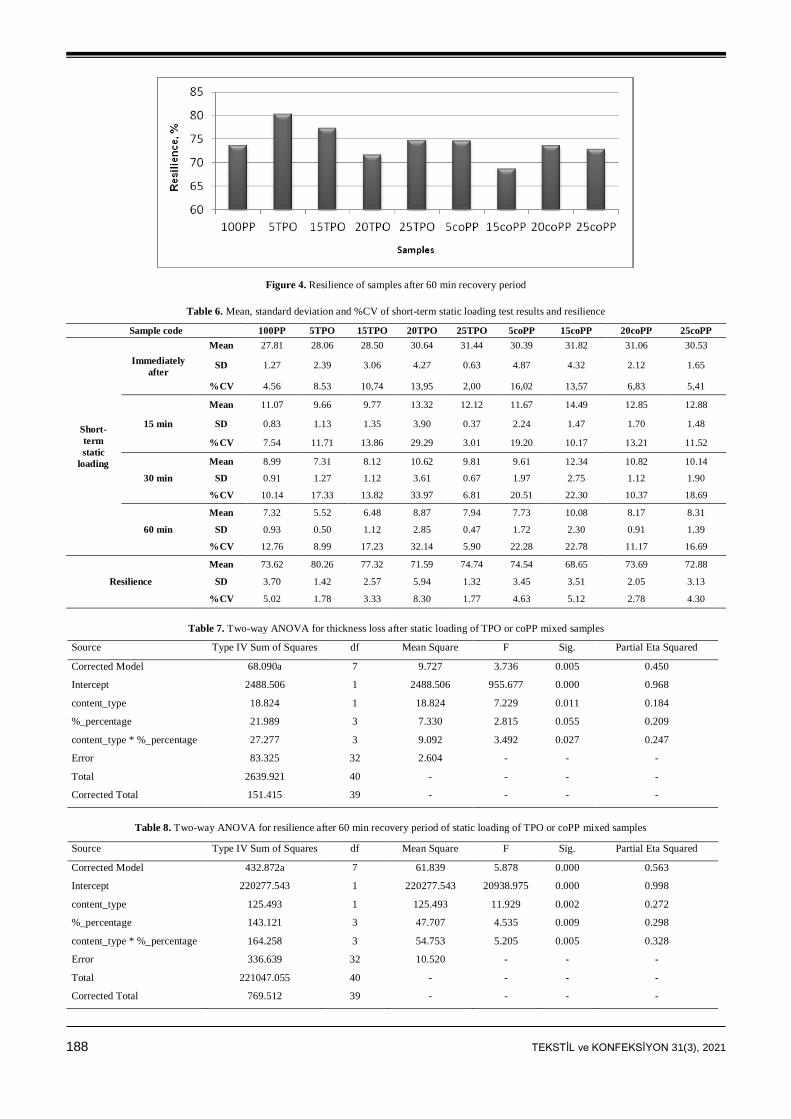
188 TEKSTİL ve KONFEKSİYON 31(3), 2021
Figure 4. Resilience of samples after 60 min recovery period
Table 6. Mean, standard deviation and %CV of short-term static loading test results and resilience
Sample code 100PP 5TPO 15TPO 20TPO 25TPO 5coPP 15coPP 20coPP 25coPP
Short-
term
static
loading
Immediately
after
Mean 27.81 28.06 28.50 30.64 31.44 30.39 31.82 31.06 30.53
SD 1.27 2.39 3.06 4.27 0.63 4.87 4.32 2.12 1.65
%CV 4.56 8.53 10,74 13,95 2,00 16,02 13,57 6,83 5,41
15 min
Mean 11.07 9.66 9.77 13.32 12.12 11.67 14.49 12.85 12.88
SD 0.83 1.13 1.35 3.90 0.37 2.24 1.47 1.70 1.48
%CV 7.54 11.71 13.86 29.29 3.01 19.20 10.17 13.21 11.52
30 min
Mean 8.99 7.31 8.12 10.62 9.81 9.61 12.34 10.82 10.14
SD 0.91 1.27 1.12 3.61 0.67 1.97 2.75 1.12 1.90
%CV 10.14 17.33 13.82 33.97 6.81 20.51 22.30 10.37 18.69
60 min
Mean 7.32 5.52 6.48 8.87 7.94 7.73 10.08 8.17 8.31
SD 0.93 0.50 1.12 2.85 0.47 1.72 2.30 0.91 1.39
%CV 12.76 8.99 17.23 32.14 5.90 22.28 22.78 11.17 16.69
Resilience
Mean 73.62 80.26 77.32 71.59 74.74 74.54 68.65 73.69 72.88
SD 3.70 1.42 2.57 5.94 1.32 3.45 3.51 2.05 3.13
%CV 5.02 1.78 3.33 8.30 1.77 4.63 5.12 2.78 4.30
Table 7. Two-way ANOVA for thickness loss after static loading of TPO or coPP mixed samples
Source Type IV Sum of Squares df Mean Square F Sig. Partial Eta Squared
Corrected Model 68.090a 7 9.727 3.736 0.005 0.450
Intercept 2488.506 1 2488.506 955.677 0.000 0.968
content_type 18.824 1 18.824 7.229 0.011 0.184
%_percentage 21.989 3 7.330 2.815 0.055 0.209
content_type * %_percentage 27.277 3 9.092 3.492 0.027 0.247
Error 83.325 32 2.604 - - -
Total 2639.921 40 - - - -
Corrected Total 151.415 39 - - - -
Table 8. Two-way ANOVA for resilience after 60 min recovery period of static loading of TPO or coPP mixed samples
Source Type IV Sum of Squares df Mean Square F Sig. Partial Eta Squared
Corrected Model 432.872a 7 61.839 5.878 0.000 0.563
Intercept 220277.543 1 220277.543 20938.975 0.000 0.998
content_type 125.493 1 125.493 11.929 0.002 0.272
%_percentage 143.121 3 47.707 4.535 0.009 0.298
content_type * %_percentage 164.258 3 54.753 5.205 0.005 0.328
Error 336.639 32 10.520 - - -
Total 221047.055 40 - - - -
Corrected Total 769.512 39 - - - -
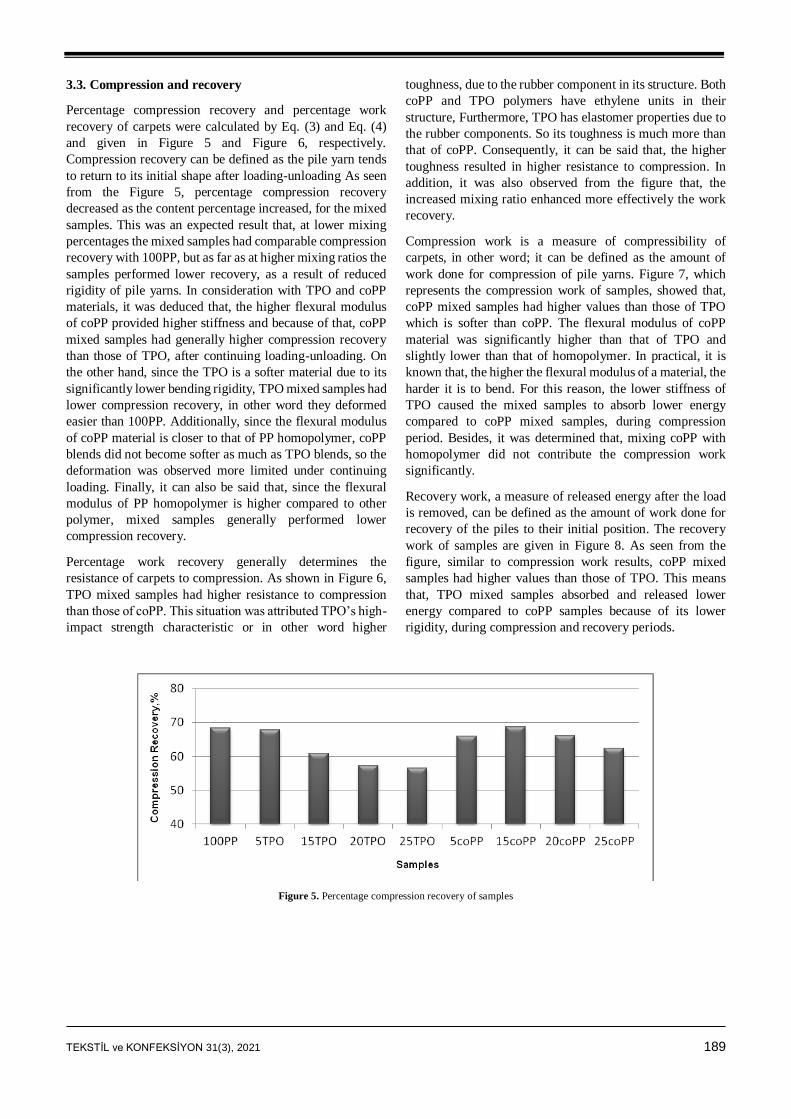
TEKSTİL ve KONFEKSİYON 31(3), 2021 189
3.3. Compression and recovery
Percentage compression recovery and percentage work
recovery of carpets were calculated by Eq. (3) and Eq. (4)
and given in Figure 5 and Figure 6, respectively.
Compression recovery can be defined as the pile yarn tends
to return to its initial shape after loading-unloading As seen
from the Figure 5, percentage compression recovery
decreased as the content percentage increased, for the mixed
samples. This was an expected result that, at lower mixing
percentages the mixed samples had comparable compression
recovery with 100PP, but as far as at higher mixing ratios the
samples performed lower recovery, as a result of reduced
rigidity of pile yarns. In consideration with TPO and coPP
materials, it was deduced that, the higher flexural modulus
of coPP provided higher stiffness and because of that, coPP
mixed samples had generally higher compression recovery
than those of TPO, after continuing loading-unloading. On
the other hand, since the TPO is a softer material due to its
significantly lower bending rigidity, TPO mixed samples had
lower compression recovery, in other word they deformed
easier than 100PP. Additionally, since the flexural modulus
of coPP material is closer to that of PP homopolymer, coPP
blends did not become softer as much as TPO blends, so the
deformation was observed more limited under continuing
loading. Finally, it can also be said that, since the flexural
modulus of PP homopolymer is higher compared to other
polymer, mixed samples generally performed lower
compression recovery.
Percentage work recovery generally determines the
resistance of carpets to compression. As shown in Figure 6,
TPO mixed samples had higher resistance to compression
than those of coPP. This situation was attributed TPO’s high-
impact strength characteristic or in other word higher
toughness, due to the rubber component in its structure. Both
coPP and TPO polymers have ethylene units in their
structure, Furthermore, TPO has elastomer properties due to
the rubber components. So its toughness is much more than
that of coPP. Consequently, it can be said that, the higher
toughness resulted in higher resistance to compression. In
addition, it was also observed from the figure that, the
increased mixing ratio enhanced more effectively the work
recovery.
Compression work is a measure of compressibility of
carpets, in other word; it can be defined as the amount of
work done for compression of pile yarns. Figure 7, which
represents the compression work of samples, showed that,
coPP mixed samples had higher values than those of TPO
which is softer than coPP. The flexural modulus of coPP
material was significantly higher than that of TPO and
slightly lower than that of homopolymer. In practical, it is
known that, the higher the flexural modulus of a material, the
harder it is to bend. For this reason, the lower stiffness of
TPO caused the mixed samples to absorb lower energy
compared to coPP mixed samples, during compression
period. Besides, it was determined that, mixing coPP with
homopolymer did not contribute the compression work
significantly.
Recovery work, a measure of released energy after the load
is removed, can be defined as the amount of work done for
recovery of the piles to their initial position. The recovery
work of samples are given in Figure 8. As seen from the
figure, similar to compression work results, coPP mixed
samples had higher values than those of TPO. This means
that, TPO mixed samples absorbed and released lower
energy compared to coPP samples because of its lower
rigidity, during compression and recovery periods.
Figure 5. Percentage compression recovery of samples
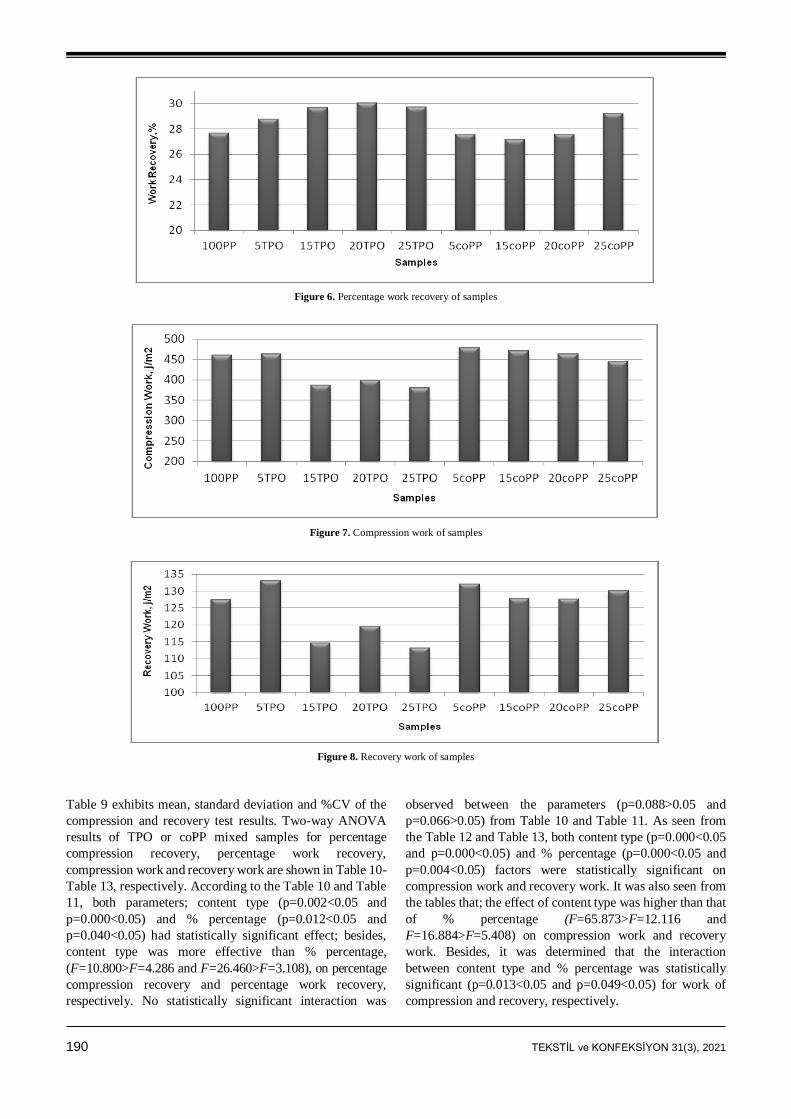
190 TEKSTİL ve KONFEKSİYON 31(3), 2021
Figure 6. Percentage work recovery of samples
Figure 7. Compression work of samples
Figure 8. Recovery work of samples
Table 9 exhibits mean, standard deviation and %CV of the
compression and recovery test results. Two-way ANOVA
results of TPO or coPP mixed samples for percentage
compression recovery, percentage work recovery,
compression work and recovery work are shown in Table 10-
Table 13, respectively. According to the Table 10 and Table
11, both parameters; content type (p=0.002<0.05 and
p=0.000<0.05) and % percentage (p=0.012<0.05 and
p=0.040<0.05) had statistically significant effect; besides,
content type was more effective than % percentage,
(F=10.800>F=4.286 and F=26.460>F=3.108), on percentage
compression recovery and percentage work recovery,
respectively. No statistically significant interaction was
observed between the parameters (p=0.088>0.05 and
p=0.066>0.05) from Table 10 and Table 11. As seen from
the Table 12 and Table 13, both content type (p=0.000<0.05
and p=0.000<0.05) and % percentage (p=0.000<0.05 and
p=0.004<0.05) factors were statistically significant on
compression work and recovery work. It was also seen from
the tables that; the effect of content type was higher than that
of % percentage (F=65.873>F=12.116 and
F=16.884>F=5.408) on compression work and recovery
work. Besides, it was determined that the interaction
between content type and % percentage was statistically
significant (p=0.013<0.05 and p=0.049<0.05) for work of
compression and recovery, respectively.
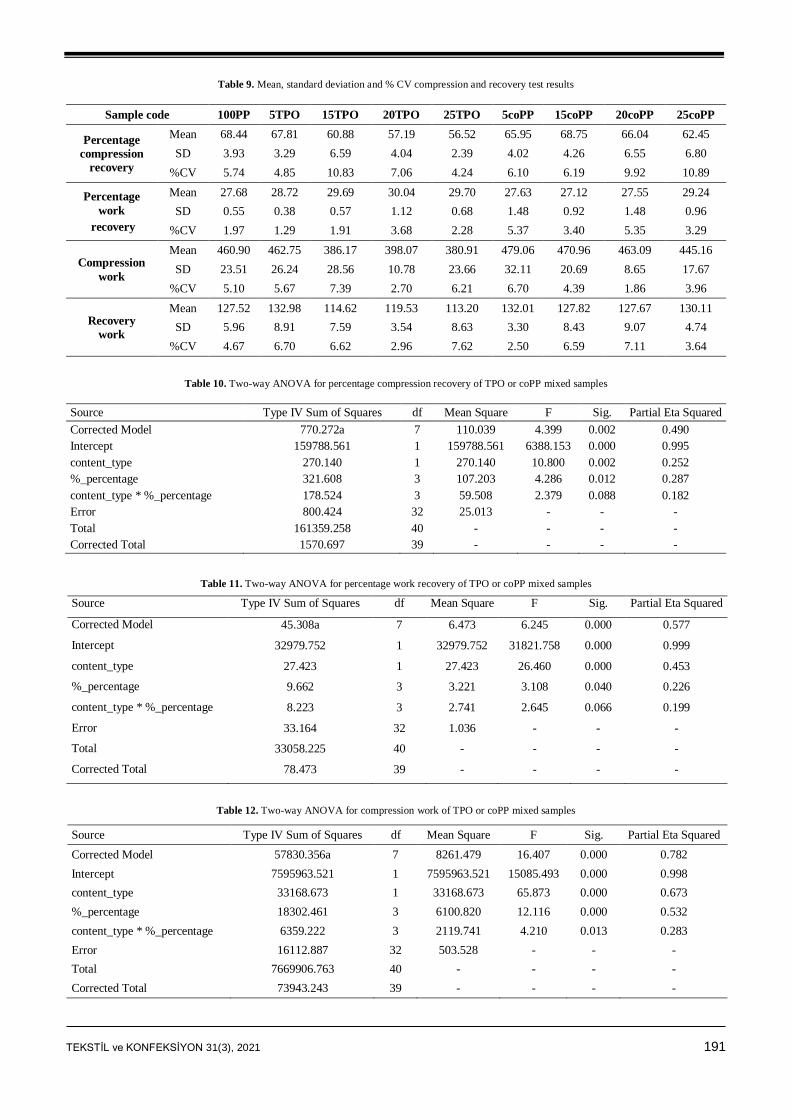
TEKSTİL ve KONFEKSİYON 31(3), 2021 191
Table 9. Mean, standard deviation and % CV compression and recovery test results
Sample code 100PP 5TPO 15TPO 20TPO 25TPO 5coPP 15coPP 20coPP 25coPP
Percentage
compression
recovery
Mean 68.44 67.81 60.88 57.19 56.52 65.95 68.75 66.04 62.45
SD 3.93 3.29 6.59 4.04 2.39 4.02 4.26 6.55 6.80
%CV 5.74 4.85 10.83 7.06 4.24 6.10 6.19 9.92 10.89
Percentage
work
recovery
Mean 27.68 28.72 29.69 30.04 29.70 27.63 27.12 27.55 29.24
SD 0.55 0.38 0.57 1.12 0.68 1.48 0.92 1.48 0.96
%CV 1.97 1.29 1.91 3.68 2.28 5.37 3.40 5.35 3.29
Compression
work
Mean 460.90 462.75 386.17 398.07 380.91 479.06 470.96 463.09 445.16
SD 23.51 26.24 28.56 10.78 23.66 32.11 20.69 8.65 17.67
%CV 5.10 5.67 7.39 2.70 6.21 6.70 4.39 1.86 3.96
Recovery
work
Mean 127.52 132.98 114.62 119.53 113.20 132.01 127.82 127.67 130.11
SD 5.96 8.91 7.59 3.54 8.63 3.30 8.43 9.07 4.74
%CV 4.67 6.70 6.62 2.96 7.62 2.50 6.59 7.11 3.64
Table 10. Two-way ANOVA for percentage compression recovery of TPO or coPP mixed samples
Source Type IV Sum of Squares df Mean Square F Sig. Partial Eta Squared
Corrected Model 770.272a 7 110.039 4.399 0.002 0.490
Intercept 159788.561 1 159788.561 6388.153 0.000 0.995
content_type 270.140 1 270.140 10.800 0.002 0.252
%_percentage 321.608 3 107.203 4.286 0.012 0.287
content_type * %_percentage 178.524 3 59.508 2.379 0.088 0.182
Error 800.424 32 25.013 - - -
Total 161359.258 40 - - - -
Corrected Total 1570.697 39 - - - -
Table 11. Two-way ANOVA for percentage work recovery of TPO or coPP mixed samples
Source Type IV Sum of Squares df Mean Square F Sig. Partial Eta Squared
Corrected Model 45.308a 7 6.473 6.245 0.000 0.577
Intercept 32979.752 1 32979.752 31821.758 0.000 0.999
content_type 27.423 1 27.423 26.460 0.000 0.453
%_percentage 9.662 3 3.221 3.108 0.040 0.226
content_type * %_percentage 8.223 3 2.741 2.645 0.066 0.199
Error 33.164 32 1.036 - - -
Total 33058.225 40 - - - -
Corrected Total 78.473 39 - - - -
Table 12. Two-way ANOVA for compression work of TPO or coPP mixed samples
Source Type IV Sum of Squares df Mean Square F Sig. Partial Eta Squared
Corrected Model 57830.356a 7 8261.479 16.407 0.000 0.782
Intercept 7595963.521 1 7595963.521 15085.493 0.000 0.998
content_type 33168.673 1 33168.673 65.873 0.000 0.673
%_percentage 18302.461 3 6100.820 12.116 0.000 0.532
content_type * %_percentage 6359.222 3 2119.741 4.210 0.013 0.283
Error 16112.887 32 503.528 - - -
Total 7669906.763 40 - - - -
Corrected Total 73943.243 39 - - - -
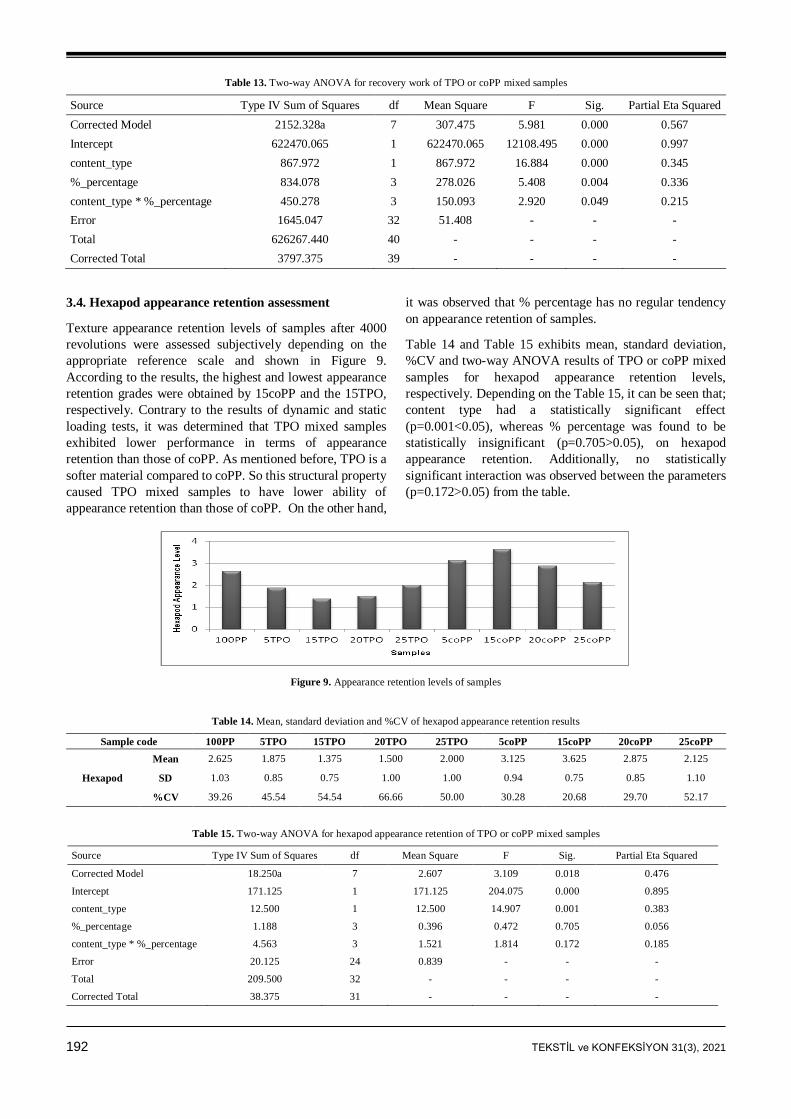
192 TEKSTİL ve KONFEKSİYON 31(3), 2021
Table 13. Two-way ANOVA for recovery work of TPO or coPP mixed samples
Source Type IV Sum of Squares df Mean Square F Sig. Partial Eta Squared
Corrected Model 2152.328a 7 307.475 5.981 0.000 0.567
Intercept 622470.065 1 622470.065 12108.495 0.000 0.997
content_type 867.972 1 867.972 16.884 0.000 0.345
%_percentage 834.078 3 278.026 5.408 0.004 0.336
content_type * %_percentage 450.278 3 150.093 2.920 0.049 0.215
Error 1645.047 32 51.408 - - -
Total 626267.440 40 - - - -
Corrected Total 3797.375 39 - - - -
3.4. Hexapod appearance retention assessment
Texture appearance retention levels of samples after 4000
revolutions were assessed subjectively depending on the
appropriate reference scale and shown in Figure 9.
According to the results, the highest and lowest appearance
retention grades were obtained by 15coPP and the 15TPO,
respectively. Contrary to the results of dynamic and static
loading tests, it was determined that TPO mixed samples
exhibited lower performance in terms of appearance
retention than those of coPP. As mentioned before, TPO is a
softer material compared to coPP. So this structural property
caused TPO mixed samples to have lower ability of
appearance retention than those of coPP. On the other hand,
it was observed that % percentage has no regular tendency
on appearance retention of samples.
Table 14 and Table 15 exhibits mean, standard deviation,
%CV and two-way ANOVA results of TPO or coPP mixed
samples for hexapod appearance retention levels,
respectively. Depending on the Table 15, it can be seen that;
content type had a statistically significant effect
(p=0.001<0.05), whereas % percentage was found to be
statistically insignificant (p=0.705>0.05), on hexapod
appearance retention. Additionally, no statistically
significant interaction was observed between the parameters
(p=0.172>0.05) from the table.
Figure 9. Appearance retention levels of samples
Table 14. Mean, standard deviation and %CV of hexapod appearance retention results
Sample code 100PP 5TPO 15TPO 20TPO 25TPO 5coPP 15coPP 20coPP 25coPP
Hexapod
Mean 2.625 1.875 1.375 1.500 2.000 3.125 3.625 2.875 2.125
SD 1.03 0.85 0.75 1.00 1.00 0.94 0.75 0.85 1.10
%CV 39.26 45.54 54.54 66.66 50.00 30.28 20.68 29.70 52.17
Table 15. Two-way ANOVA for hexapod appearance retention of TPO or coPP mixed samples
Source Type IV Sum of Squares df Mean Square F Sig. Partial Eta Squared
Corrected Model 18.250a 7 2.607 3.109 0.018 0.476
Intercept 171.125 1 171.125 204.075 0.000 0.895
content_type 12.500 1 12.500 14.907 0.001 0.383
%_percentage 1.188 3 0.396 0.472 0.705 0.056
content_type * %_percentage 4.563 3 1.521 1.814 0.172 0.185
Error 20.125 24 0.839 - - -
Total 209.500 32 - - - -
Corrected Total 38.375 31 - - - -
TEKSTİL ve KONFEKSİYON 31(3), 2021 193
3.5. Tuft withdrawal force
Results of tuft withdrawal force of carpet samples is given
Figure 10. It was determined that the tuft withdrawal forces
of the samples did not show a significant difference with
respect to the mixing of materials with different types and
quantities. Depending on the results, it was evaluated that,
measurements had high variation due to the unevenness of
latex applied to carpet samples. In addition, no linear
relationship was observed between content type and
percentage of mixes.
Mean, standard deviation, % CV of and two-way ANOVA
results of TPO or coPP mixed samples for tuft withdrawal
force are shown in Table 16 and Table 17, respectively. As
it is seen from the table, both content type (p=0.339>0.05)
and % percentage (p=0.230>0.05) were detected statistically
insignificant on tuft withdrawal force.
4. CONCLUSION
Depending on the dynamic and static loading test results, it
was concluded that TPO mixed samples had generally lower
thickness loss than those of coPP and neat PP. Furthermore,
for both loading tests it was revealed that, mixing 5% TPO
to homopolymer performed the best result in terms of
thickness loss and resilience. As the % percentage increased
for both mix type, thickness loss also increased, whereas
resilience decreased. This is a desirable situation with regard
to cost of production, because coPP and TPO are more
expensive than PP homopolymer.
According to the compression and recovery test results, TPO
mixed samples had lower values than those of coPP, for work
of compression and recovery. This was attributed TPO’s
softer structure due to the its lower flexural modulus
(bending rigidity) compared to coPP affected the work done,
therefore TPO absorbed lower energy when it was
compressed, and so released lower energy after the load was
removed. Additionally, coPP mixed samples had generally
higher compression recovery than those of TPO, since the
higher flexural modulus of coPP ensured higher stiffness. In
addition, TPO mixed samples had higher resistance to
compression than those of coPP. This situation was
attributed TPO’s high-impact strength characteristic or
Figure 10. Tuft withdrawal forces of samples
Table 16. Mean, standard deviation and %CV of tuft withdrawal force test results
Sample code 100PP 5TPO 15TPO 20TPO 25TPO 5coPP 15coPP 20coPP 25coPP
Tuft
withdrawal
force
Mean 644 556 696 610 470 665 657 579 610
SD 186.22 211.81 335.07 293.54 243.69 346.46 347.45 238.28 309.32
%CV 28.91 38.09 48.14 48.12 51.85 52.09 52.88 41.15 50.70
Table 17. Two-way ANOVA for tuft withdrawal force of TPO or coPP mixed samples.
Source Type IV Sum of Squares df Mean Square F Sig. Partial Eta Squared
Corrected Model 718717.500a 7 102673.929 1.180 0.317 0.052
Intercept 58636622.500 1 58636622.500 674.052 0.000 0.816
content_type 80102.500 1 80102.500 0.921 0.339 0.006
%_percentage 379087.500 3 126362.500 1.453 0.230 0.028
content_type * %_percentage 259527.500 3 86509.167 0.994 0.397 0.019
Error 13222660.000 152 86991.184 - - -
Total 72578000.000 160 - - - -
Corrected Total 13941377.500 159 - - - -
194 TEKSTİL ve KONFEKSİYON 31(3), 2021
in other word higher toughness. It was also determined that,
as the % percentage increased, percentage compression
recovery, work of compression and recovery decreased,
while percentage work recovery increased. This result
confirmed that, coPP and TPO enhanced the toughness
property of mixed samples, as stated in some studies in the
literature [23-25]. In addition, the amount of coPP or TPO in
PP homopolymer changed internal structure, therefore pile
yarns showed different load carrying performances.
Hexapod test assessments exhibited that coPP mixed
samples had better texture retention than those of TPO. This
can be interpreted as coPP had better appearance retention
than TPO. On the other hand, no linear relationship was
observed between % percentages of mixes.
Tuft withdrawal force results of samples showed that,
content type and % percentage had no significant effect.
High variation was observed on withdrawal forces, and this
was a probable result of unevenness of applied latex on the
back of carpets.
Acknowledgement
This study was supported by the Scientific and
Technological Research Council of Turkey (TÜBİTAK,
under Grant No: 217M176), for which the authors would like
to thank. They also wish acknowlodge Kartal Halı Tekstil
San. Tic. A.Ş. and Royal Halı İplik Tekstil Mobilya San. Tic.
A.Ş. for their technical support for production of yarn and
carpet samples.
REFERENCES
1. Crawshaw GH. 2002. Carpet Manufacture. New Zealand: Wronz
Developments.
2. Gong RH. 2011. Specialist Yarn and Fabric Structures Developments
and Applications. United Kingdom: Woodhead Publishing Limited.
3. Hannay F. 2002. Rigid Plastics Packaging - Materials, Processes and
Applications. United Kingdom: Rapra Technology Limited.
4. Tripathi D. 2002. Practical Guide to Polypropylene. United Kingdom:
Rapra Technology Limited.
5. Brydson JA. 1995. Thermoplastic Elastomers – Properties and
Applications. United Kingdom: Rapra Technology Limited.
6. Massey LK. 2004. Film Properties of Plastics and Elastomers, A
Guide to Nonwovens in Packaging Applications, Second Edition.
United Kingdom: William Andrew Applied Science Publishers.
7. Grover G, Zhu S, Twilley IC. 1993. Dynamic Mechanical Properties
of Carpet Yarns and Carpet Performance. Textile Research Journal,
63(5), 257-266.
8. Vangheluwe L, Kiekens P. 1997. Resilience Properties of
Polypropylene Carpets. Textile Research Journal, 67(9), 671-676.
9. Laughlin KC, Cusick GE. 1968. Carpet Performance Evaluation.
Textile Research Journal, 38(1), 78-80.
10. Önder E, Berkalp ÖB. 2001. Effects of Different Structural Parameters
on Carpet Physical Properties. Textile Research Journal, 71(6), 549-
555.
11. Koç E, Çelik N, Tekin M. 2005. An Experimental Study on Thickness
Loss of Wilton-Type Carpets Produced with Different Pile Material
after Prolonged Heavy Static Loading. Part-I: Characteristics
Parameters and Carpet Behaviour. FIBRES & TEXTILES in Eastern
Europe, 13(4), 56-62.
12. Koç E, Çelik N. 2007. An Experimental Study on Thickness Loss of
Wilton-Type Carpets Produced with Different Pile Material after
Prolonged Heavy Static Loading. Part-II: Characteristics Parameters
and Carpet Behaviour. FIBRES & TEXTILES in Eastern Europe,
15(4), 87-92.
13. Çelik N, Koç E. 2010. Study on the Thickness Loss of Wilton-Type
Carpets under Dynamic Loading. FIBRES & TEXTILES in Eastern
Europe, 18(1), 54-58.
14. Korkmaz Y, Koçer SD. 2010. Polipropilen Makine Halısı Üretim
Parametrelerinin Halı Performansına Olan Etkileri. Tekstil
Teknolojileri Elektronik Dergisi, 4(1), 48-58.
15. Özdil N, Bozdoğan F, Özçelik Kayseri G, Süpüren Mengüç G. 2012.
Compressibility and Thickness Recovery Characteristic of Carpet.
Tekstil ve Konfeksiyon, 3, 203-211.
16. Dayiary M, Shaikhzadeh Najar S, Shamsi M. 2009. A New Theoretical
Approach tu Cut-Pile Carpet Compression Based on Elastic-Stored
Bending Energy. The Journal of the Textile Institute, 100(8), 688-694.
17. Dayiary, M, Shaikhzadeh Najar, S, Shamsi, M. 2010. An Experimental
Verification of Cut-Pile Carpet Compression Behavior. The Journal of
the Textile Institute, 101(6), 488-494.
18. Sarkeshick S, Tavanai H, Zarrebini M, Morshed M. 2009. An
Investigation on the Effects of Heat-Setting Process on the Properties
of Polypropylene Bulked Continuous Filament Yarns. The Journal of
the Textile Institute, 100(2), 128-134.
19. Dadgar M, Merati AA, Varkiyani MH. 2015. Evaluation of Heat
Setting Parameters in Carpet Comfort. Fibers and Polymers, 16(5),
1169-1176.
20. Kebabcı M, Babaarslan O, Özkan Hacıoğulları S, Telli A. 2015. The
Effect of Drawing Ratio and Cross-Sectional Shapes on the Properties
of Polypropylene CF and BCF Yarns. Tekstil ve Mühendis Dergisi,
22(100), 46-53.
21. Erdoğan ÜH. 2012. Effect of Pile Fiber Cross Section Shape on
Compression Properties of Polypropylene Carpets. The Journal of the
Textile Institute, 103(12), 1369-1375.
22. Tavanai H, Morshed M, Hosseini SM. 2003. Effect of On-Line Melt
Blending of Polypropylene with Polyamide 6 on the Bulk and Strength
of the Resulting BCF Yarn. Iranian Polymer Journal, 12(5), 421-430.
23. Lotti C, Correa CA, Canevarolo SV. 1999. Mechanical and
Morphological Characterization of Polypropylene Toughened with
Olefinic Elastomer. Materials Research, 3(2), 37-44.
24. Fasihi M, Mansouri H. 2016. Effect of Rubber Interparticle Distance
Distribution on Toughening Behavior of Thermoplastic Polyolefin
Elastomer Toughened Polypropylene. Journal of Applied Polymer
Science, 133, 44068.
25. Rungswang W, Saendee P, Thitisuk B, Pathaweeisariyakul T,
Cheevasrirungruang W. 2013. Role of Crystalline Ethylene-Propylene
Copolymer on Mechanical Properties of Impact Polypropylene
Copolymer. Journal of Applied Polymer Science, 128, 3131-3140.
TEKSTİL ve KONFEKSİYON 31(3), 2021 195
TEKSTİL VE KONFEKSİYON
VOL: 31, NO. 3
DOI: 10.32710/tekstilvekonfeksiyon.820858
Investigation of the Effect of the Use of Bamboo and
Silver Yarn on Antibacterial Activity in Towel Fabric
Navruz PAKSOY1 0000-0002-0741-1174
Seval KONUKOĞLU2 0000-0001-6171-1883
Levent Güven AYAR2 0000-0001-8917-6157
Cansu BATCIK2 0000-0002-1400-5852
Hüseyin AYDIN1 0000-0003-3593-8712
*
1Sanko Textile Enterprises Industry and Trade Corporation (Towel) R&D Center, Gaziantep/Türkiye 2Sanko Textile Enterprises Industry and Trade Corporation (Yarn) R&D Center, Gaziantep/Türkiye
Corresponding Author: Navruz Paksoy, [email protected]
ABSTRACT
Towel fabrics provide a suitable environment for bacterial growth due to the moisture on them. For
this reason, studies are carried out on the antibacterial properties of the towel. In this study, it is aimed
to conduct research activities within the scope of developing antibacterial terry fabric. For this
purpose, different terry fabric productions were made using silver yarn, bamboo and antibacterial
chemicals, and their antibacterial properties were examined. In this context, the antibacterial chemical
finishing process, known as the classical method, was applied to the towels, which were first woven
from 100% cotton yarn. In addition, towel fabrics were produced by using 70% bamboo-30% cotton
yarn and 92% cotton-8% silver yarn. Antibacterial activities of the obtained fabric samples against S.
aureus and K. pneumonie bacteria according to AATCC 100 standard were examined.
ARTICLE HISTORY
Received: 15.12.2020 Accepted: 01.09.2021
KEYWORDS
Antibacterial property, bamboo, silver thread, antibacterial finish, towel
1. INTRODUCTION
Microorganisms are too small to be seen with the naked
eye. This structure includes bacteria, fungi, algae and
viruses. Textile materials carry microorganisms as bacteria
and fungi due to the adhesion of these organisms to their
surfaces. These microorganisms are found almost
everywhere in the environment and multiply rapidly when
they encounter moisture and temperature. The proliferation
of microorganisms on the textile during use and storage
both negatively affects the textile product and causes health
problems for the user [1-4].
Natural fibers such as cotton are more susceptible to
microorganism related problems than synthetic fibers due to
their porous and hydrophilic structure. Cellulosic fibers,
which are widely used in the textile industry due to these
properties, provide a suitable environment for
microorganisms. Textiles tend to harbor micro-organisms
responsible for proliferation of diseases, unpleasant odors,
discoloration and deterioration of fabrics. The most
common active ingredients used in antimicrobial
applications are triclosan, quaternary ammonium salts and
metals (silver, copper, zinc, etc.). Human and
environmental health, process-related concerns have
especially increased interest in silver-doped antimicrobial
materials. Although many metals are known to have
antimicrobial effects, silver is more preferred than other
metals. The main reasons for this are that it is the most
resistant metal against bacteria, it has been known for a
long time that it does not have harmful effects on the body
in its controlled use, it is cheaper to make it into a final
product compared to most materials, and the easy
production process [2, 5-9, 10, 11].
Silver compounds with a pronounced antibacterial effect
against most pathogenic microorganisms are widely used
To cite this article: Paksoy N, Konukoğlu S, Ayar LG, Batcik C, Aydın H. 2021. Investigation of the effect of the use of bamboo and silver yarn on antibacterial activity in towel fabric. Tekstil ve Konfeksiyon, 31(3), 195-202.
196 TEKSTİL ve KONFEKSİYON 31(3), 2021
[12]. Silver, on the other hand, is a relatively non-toxic
disinfectant that can significantly reduce many types of
bacteria and fungi. At the same time, the powerful
antimicrobial activity of silver is known to be effective
against nearly 650 types of bacteria. Silver is generally
applied to textiles in colloidal form and nano metallic form
or in insoluble silver salt dispersion. In the case of synthetic
fibers, silver can be incorporated into a spinning solution in
the form of a zeolite complex or nanoparticles. Silver
nanoparticles show good antibacterial properties due to
their large surface area [9, 11]. Silver is used safely in many
areas of textile [13].
Towel fabric is one of the main consumer products used by
people around the world. Bathroom, sports, swimming
pool, kitchen, beach, etc. towels with different water
absorption properties are used in various places [14]. Terry
fabrics consist of ground warp, pile warp and weft yarns
[14, 15]. Cotton fiber has been used in towel production for
many years. Today, however; It is observed that bamboo
fiber, which is claimed to have soft, anti-bacterial, high
level of absorbency and high level of washing fastness, is
preferred as much as cotton fiber in towel production [16].
Because bamboo contains bamboo extract, a substance
called Bamboo Kun, it is difficult for disease-causing
organisms or insects to affect this plant. This is why
bamboo is grown naturally without pesticides. Bamboo
fiber is an environmentally friendly fiber. Bamboo fiber is a
type of regenerated cellulose fiber produced from the raw
materials of bamboo pulp. The fineness and whiteness of
bamboo fiber is similar to classic viscose [17-20]. Tusief et
al. [21] reported that the use of bamboo fiber has a
significant effect on its antibacterial activity feature.
Many studies have shown that textile materials made of
antimicrobial fibers show longer durability against
microorganisms. However, the applications made with the
finishing chemical on the finished product also have
various advantages such as ease of application [5, 22].
Perelshtein et al. conducted an antibacterial activity study
by coating silver nanoparticles on different fabric types in
their study. The Ag-fabric composite has been shown to
show excellent antibacterial activity against Escherichia
coli (gram-negative) and Staphylococcus aureus (gram-
positive) cultures [23].
Antibacterial towel feature is provided with finishing
chemicals as a classical method. Antibacterial feature can
also be achieved with fiber. The natural structure of
bamboo fiber shows antibacterial properties. Silver fiber is
also known as the fiber that provides another antibacterial
property. While bamboo fiber from these fibers is used in
the production of terry cloth, silver fiber was not used in the
production of terry cloth in the literature screenings. Within
the scope of the study, it was aimed to investigate the
antibacterial properties of terry fabric by using bamboo and
silver fiber, which are antibacterial fibers, in addition to the
antibacterial chemical finishing process. In this direction, as
an alternative to the classical method, chemical antibacterial
finishing process, towels with bamboo and silver yarn were
obtained. The antibacterial properties of the yarns obtained
with bamboo fiber are provided by the substance called
Bamboo Kun in the structure of the fiber. An alternative has
been created by using yarns obtained with bamboo fiber to
provide antibacterial properties from the raw material. In
the study conducted by Yüksek, it was observed that 60%
bamboo-40% cotton experiments did not show antibacterial
activity, and they obtained antibacterial activity in the
experiments with 70% bamboo-30% cotton. Based on this
result, experiments were made from 70% bamboo-30%
cotton yarns in this study [24]. Another alternative work is
towels woven with yarn obtained using silver fiber. The
main purpose of the study within the scope of antibacterial
towel studies is to obtain antibacterial towels with
antibacterial finishing chemicals, bamboo and silver thread.
The antibacterial properties of the obtained towels were
investigated.
2. MATERIAL AND METHOD
2.1 Material
Yarns made of 100% cotton, 70% bamboo - 30% cotton
and 92% cotton - 8% silver fiber were used as materials in
the study. Organofunctional silane-based antibacterial
finish with a solid substance ratio of 4.12% was used to
obtain antibacterial properties by chemical finishing method. In the study, the experiments were evaluated on the
optical process without painting. Wetting agent, combined
bleaching chemical, caustic (48 Beo), hydrogen peroxide
(50%), optical brightener, acetic acid (80%), antiperoxide
enzyme and softening chemicals were used for the optical
treatment of the towels obtained. The companies from
which the chemicals used are supplied are given in Table 1.
Table 1. Chemical supply companies
Suppliers
Wetting Agent Denge Chemistry Combined Bleaching Chemical Rudolf
Caustic Alde Hydrogen Peroxide Alde Optical Brightener NF Chemistry
Acetic Acid Alde
Antiper Enzyme Dystar Softener Rudolf
2.2 Method
2.2.1 Yarn Production
The properties of pile warp, ground warp and weft yarns
used in the study are given in Table 2. The part that touches
the human skin in the towel fabric is mainly the pile yarn.
Therefore, the raw material to be used in the pile yarn
should provide the performance expected from the towel
and be suitable in terms of production. For this reason,
cotton and bamboo raw materials are used in pile yarn.
Yarns containing cotton, bamboo and silver fibers were
used in the weft and ground warp threads. In the study, the
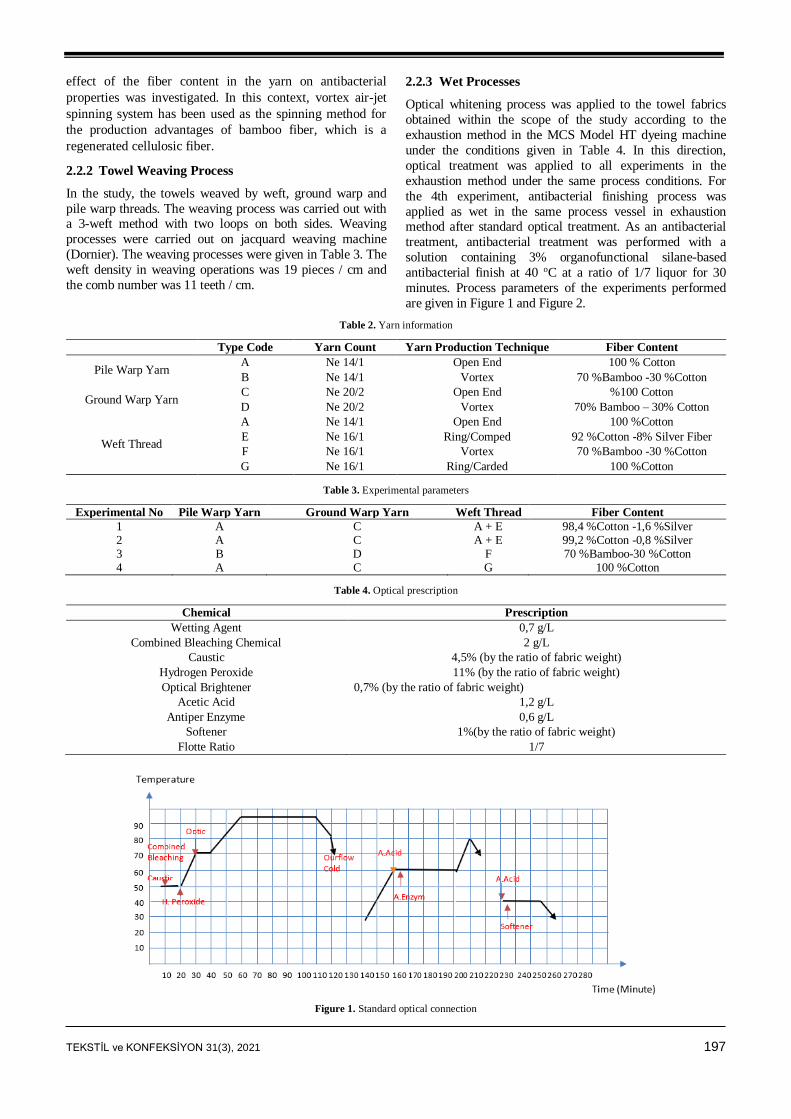
TEKSTİL ve KONFEKSİYON 31(3), 2021 197
effect of the fiber content in the yarn on antibacterial
properties was investigated. In this context, vortex air-jet
spinning system has been used as the spinning method for
the production advantages of bamboo fiber, which is a
regenerated cellulosic fiber.
2.2.2 Towel Weaving Process
In the study, the towels weaved by weft, ground warp and
pile warp threads. The weaving process was carried out with a 3-weft method with two loops on both sides. Weaving
processes were carried out on jacquard weaving machine
(Dornier). The weaving processes were given in Table 3. The
weft density in weaving operations was 19 pieces / cm and
the comb number was 11 teeth / cm.
2.2.3 Wet Processes
Optical whitening process was applied to the towel fabrics
obtained within the scope of the study according to the
exhaustion method in the MCS Model HT dyeing machine
under the conditions given in Table 4. In this direction,
optical treatment was applied to all experiments in the
exhaustion method under the same process conditions. For
the 4th experiment, antibacterial finishing process was
applied as wet in the same process vessel in exhaustion method after standard optical treatment. As an antibacterial
treatment, antibacterial treatment was performed with a
solution containing 3% organofunctional silane-based
antibacterial finish at 40 oC at a ratio of 1/7 liquor for 30
minutes. Process parameters of the experiments performed
are given in Figure 1 and Figure 2.
Table 2. Yarn information
Type Code Yarn Count Yarn Production Technique Fiber Content
Pile Warp Yarn A Ne 14/1 Open End 100 % Cotton
B Ne 14/1 Vortex 70 %Bamboo -30 %Cotton
Ground Warp Yarn C Ne 20/2 Open End %100 Cotton
D Ne 20/2 Vortex 70% Bamboo – 30% Cotton
Weft Thread
A Ne 14/1 Open End 100 %Cotton
E Ne 16/1 Ring/Comped 92 %Cotton -8% Silver Fiber
F Ne 16/1 Vortex 70 %Bamboo -30 %Cotton
G Ne 16/1 Ring/Carded 100 %Cotton
Table 3. Experimental parameters
Experimental No Pile Warp Yarn Ground Warp Yarn Weft Thread Fiber Content
1 A C A + E 98,4 %Cotton -1,6 %Silver 2 A C A + E 99,2 %Cotton -0,8 %Silver 3 B D F 70 %Bamboo-30 %Cotton 4 A C G 100 %Cotton
Table 4. Optical prescription
Chemical Prescription
Wetting Agent 0,7 g/L
Combined Bleaching Chemical 2 g/L
Caustic 4,5% (by the ratio of fabric weight)
Hydrogen Peroxide 11% (by the ratio of fabric weight)
Optical Brightener 0,7% (by the ratio of fabric weight)
Acetic Acid 1,2 g/L
Antiper Enzyme 0,6 g/L
Softener 1%(by the ratio of fabric weight)
Flotte Ratio 1/7
Figure 1. Standard optical connection
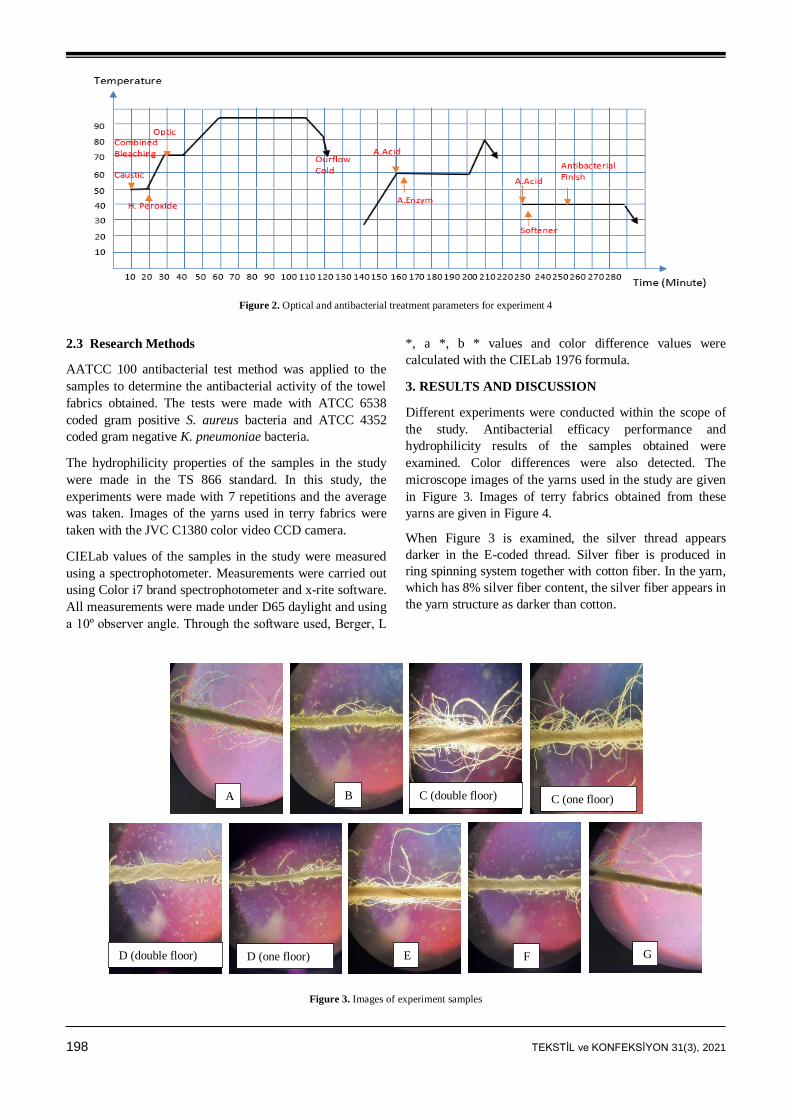
198 TEKSTİL ve KONFEKSİYON 31(3), 2021
Figure 2. Optical and antibacterial treatment parameters for experiment 4
2.3 Research Methods
AATCC 100 antibacterial test method was applied to the
samples to determine the antibacterial activity of the towel
fabrics obtained. The tests were made with ATCC 6538
coded gram positive S. aureus bacteria and ATCC 4352
coded gram negative K. pneumoniae bacteria.
The hydrophilicity properties of the samples in the study
were made in the TS 866 standard. In this study, the
experiments were made with 7 repetitions and the average
was taken. Images of the yarns used in terry fabrics were
taken with the JVC C1380 color video CCD camera.
CIELab values of the samples in the study were measured
using a spectrophotometer. Measurements were carried out
using Color i7 brand spectrophotometer and x-rite software.
All measurements were made under D65 daylight and using
a 10º observer angle. Through the software used, Berger, L
*, a *, b * values and color difference values were
calculated with the CIELab 1976 formula.
3. RESULTS AND DISCUSSION
Different experiments were conducted within the scope of
the study. Antibacterial efficacy performance and
hydrophilicity results of the samples obtained were
examined. Color differences were also detected. The
microscope images of the yarns used in the study are given
in Figure 3. Images of terry fabrics obtained from these
yarns are given in Figure 4.
When Figure 3 is examined, the silver thread appears
darker in the E-coded thread. Silver fiber is produced in
ring spinning system together with cotton fiber. In the yarn,
which has 8% silver fiber content, the silver fiber appears in
the yarn structure as darker than cotton.
Figure 3. Images of experiment samples
A B C (double floor) C (one floor)
D (double floor) D (one floor) E F G
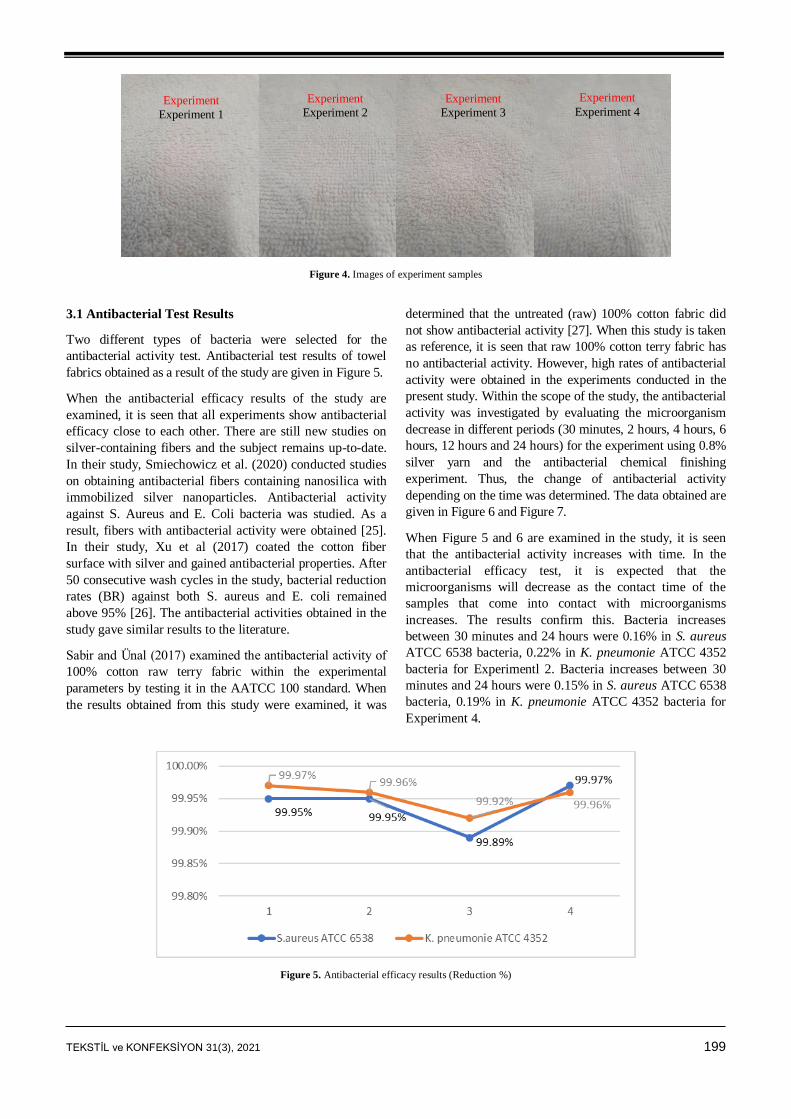
TEKSTİL ve KONFEKSİYON 31(3), 2021 199
Figure 4. Images of experiment samples
3.1 Antibacterial Test Results
Two different types of bacteria were selected for the
antibacterial activity test. Antibacterial test results of towel
fabrics obtained as a result of the study are given in Figure 5.
When the antibacterial efficacy results of the study are
examined, it is seen that all experiments show antibacterial
efficacy close to each other. There are still new studies on
silver-containing fibers and the subject remains up-to-date.
In their study, Smiechowicz et al. (2020) conducted studies
on obtaining antibacterial fibers containing nanosilica with
immobilized silver nanoparticles. Antibacterial activity
against S. Aureus and E. Coli bacteria was studied. As a
result, fibers with antibacterial activity were obtained [25].
In their study, Xu et al (2017) coated the cotton fiber
surface with silver and gained antibacterial properties. After
50 consecutive wash cycles in the study, bacterial reduction
rates (BR) against both S. aureus and E. coli remained
above 95% [26]. The antibacterial activities obtained in the
study gave similar results to the literature.
Sabir and Ünal (2017) examined the antibacterial activity of
100% cotton raw terry fabric within the experimental
parameters by testing it in the AATCC 100 standard. When
the results obtained from this study were examined, it was
determined that the untreated (raw) 100% cotton fabric did
not show antibacterial activity [27]. When this study is taken
as reference, it is seen that raw 100% cotton terry fabric has
no antibacterial activity. However, high rates of antibacterial
activity were obtained in the experiments conducted in the
present study. Within the scope of the study, the antibacterial
activity was investigated by evaluating the microorganism
decrease in different periods (30 minutes, 2 hours, 4 hours, 6
hours, 12 hours and 24 hours) for the experiment using 0.8%
silver yarn and the antibacterial chemical finishing
experiment. Thus, the change of antibacterial activity
depending on the time was determined. The data obtained are
given in Figure 6 and Figure 7.
When Figure 5 and 6 are examined in the study, it is seen
that the antibacterial activity increases with time. In the
antibacterial efficacy test, it is expected that the
microorganisms will decrease as the contact time of the
samples that come into contact with microorganisms
increases. The results confirm this. Bacteria increases
between 30 minutes and 24 hours were 0.16% in S. aureus
ATCC 6538 bacteria, 0.22% in K. pneumonie ATCC 4352
bacteria for Experimentl 2. Bacteria increases between 30
minutes and 24 hours were 0.15% in S. aureus ATCC 6538
bacteria, 0.19% in K. pneumonie ATCC 4352 bacteria for
Experiment 4.
Figure 5. Antibacterial efficacy results (Reduction %)
Experiment
Experiment 1
Experiment
Experiment 2
Experiment
Experiment 3
Experiment
Experiment 4
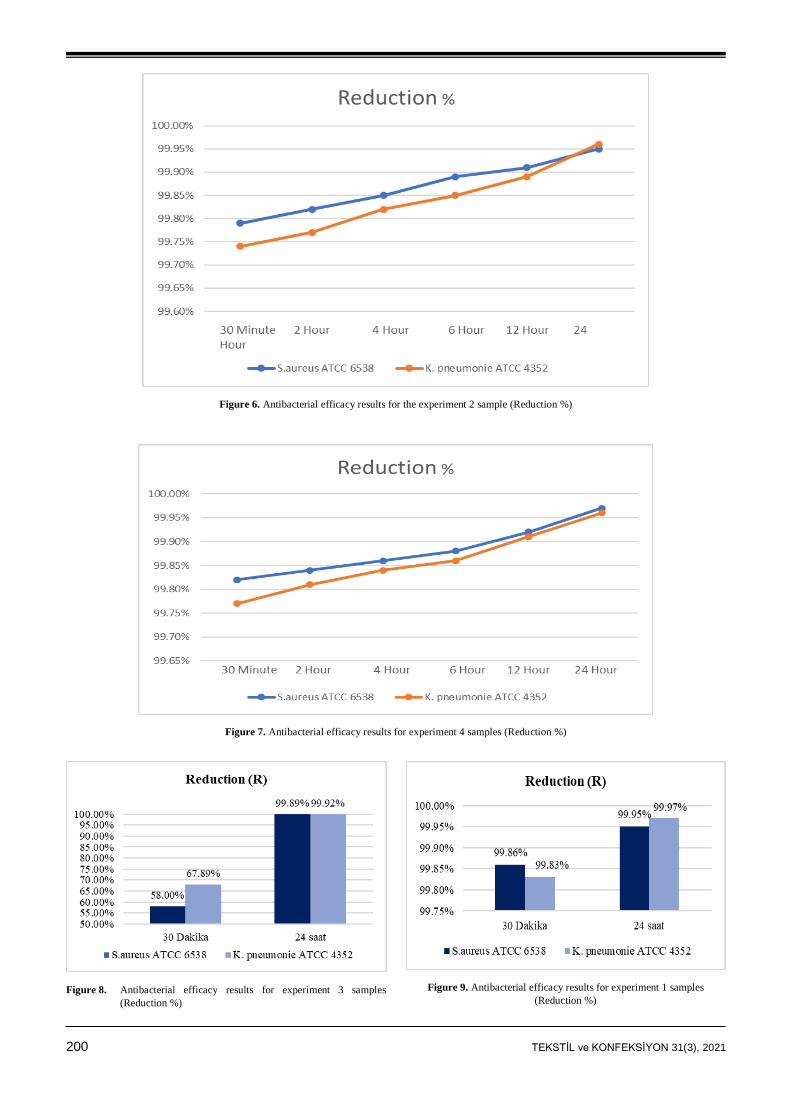
200 TEKSTİL ve KONFEKSİYON 31(3), 2021
Figure 6. Antibacterial efficacy results for the experiment 2 sample (Reduction %)
Figure 7. Antibacterial efficacy results for experiment 4 samples (Reduction %)
Figure 8. Antibacterial efficacy results for experiment 3 samples
(Reduction %)
Figure 9. Antibacterial efficacy results for experiment 1 samples
(Reduction %)
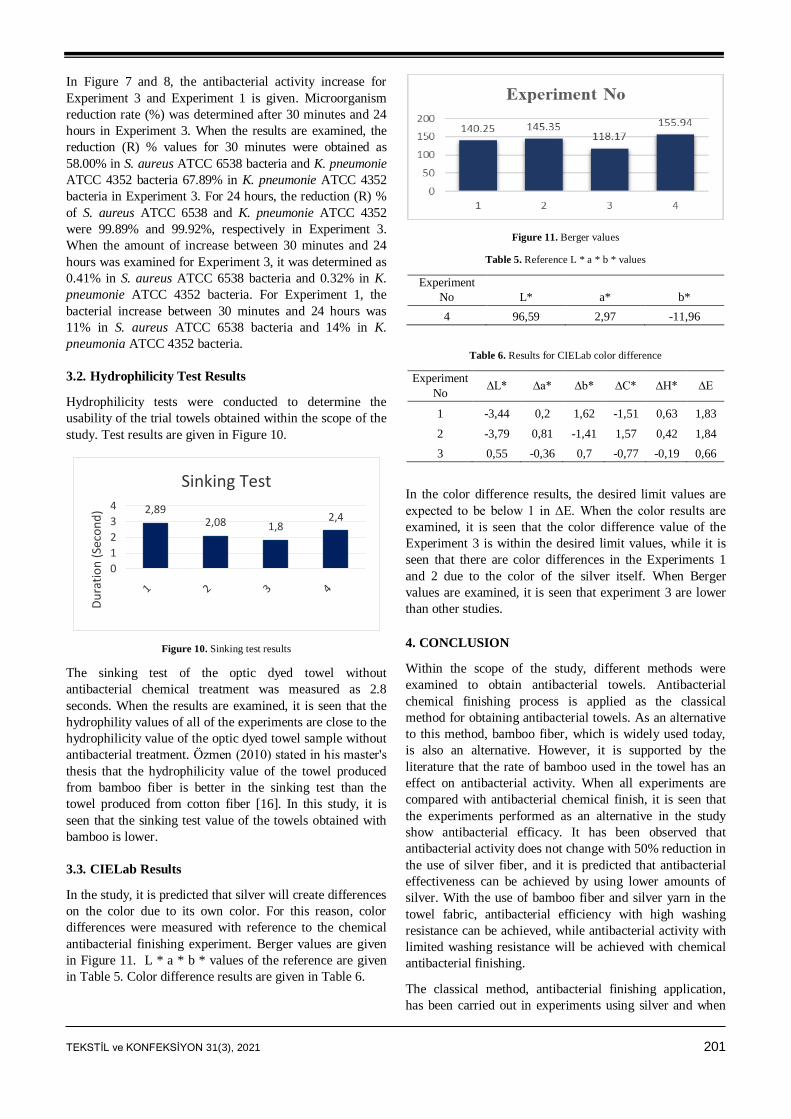
TEKSTİL ve KONFEKSİYON 31(3), 2021 201
In Figure 7 and 8, the antibacterial activity increase for
Experiment 3 and Experiment 1 is given. Microorganism
reduction rate (%) was determined after 30 minutes and 24
hours in Experiment 3. When the results are examined, the
reduction (R) % values for 30 minutes were obtained as
58.00% in S. aureus ATCC 6538 bacteria and K. pneumonie
ATCC 4352 bacteria 67.89% in K. pneumonie ATCC 4352
bacteria in Experiment 3. For 24 hours, the reduction (R) %
of S. aureus ATCC 6538 and K. pneumonie ATCC 4352
were 99.89% and 99.92%, respectively in Experiment 3.
When the amount of increase between 30 minutes and 24
hours was examined for Experiment 3, it was determined as
0.41% in S. aureus ATCC 6538 bacteria and 0.32% in K.
pneumonie ATCC 4352 bacteria. For Experiment 1, the
bacterial increase between 30 minutes and 24 hours was
11% in S. aureus ATCC 6538 bacteria and 14% in K.
pneumonia ATCC 4352 bacteria.
3.2. Hydrophilicity Test Results
Hydrophilicity tests were conducted to determine the
usability of the trial towels obtained within the scope of the
study. Test results are given in Figure 10.
Sinking Test
2,892,08 1,8
2,4
0
1
2
3
4
1 2 3 4
Du
rati
on
(Se
con
d)
Figure 10. Sinking test results
The sinking test of the optic dyed towel without
antibacterial chemical treatment was measured as 2.8
seconds. When the results are examined, it is seen that the
hydrophility values of all of the experiments are close to the
hydrophilicity value of the optic dyed towel sample without
antibacterial treatment. Özmen (2010) stated in his master's
thesis that the hydrophilicity value of the towel produced
from bamboo fiber is better in the sinking test than the
towel produced from cotton fiber [16]. In this study, it is
seen that the sinking test value of the towels obtained with
bamboo is lower.
3.3. CIELab Results
In the study, it is predicted that silver will create differences
on the color due to its own color. For this reason, color
differences were measured with reference to the chemical
antibacterial finishing experiment. Berger values are given
in Figure 11. L * a * b * values of the reference are given
in Table 5. Color difference results are given in Table 6.
Figure 11. Berger values
Table 5. Reference L * a * b * values
Experiment
No L* a* b*
4 96,59 2,97 -11,96
Table 6. Results for CIELab color difference
Experiment
No ∆L* ∆a* ∆b* ∆C* ∆H* ∆E
1 -3,44 0,2 1,62 -1,51 0,63 1,83
2 -3,79 0,81 -1,41 1,57 0,42 1,84
3 0,55 -0,36 0,7 -0,77 -0,19 0,66
In the color difference results, the desired limit values are
expected to be below 1 in ∆E. When the color results are
examined, it is seen that the color difference value of the
Experiment 3 is within the desired limit values, while it is
seen that there are color differences in the Experiments 1
and 2 due to the color of the silver itself. When Berger
values are examined, it is seen that experiment 3 are lower
than other studies.
4. CONCLUSION
Within the scope of the study, different methods were
examined to obtain antibacterial towels. Antibacterial
chemical finishing process is applied as the classical
method for obtaining antibacterial towels. As an alternative
to this method, bamboo fiber, which is widely used today,
is also an alternative. However, it is supported by the
literature that the rate of bamboo used in the towel has an
effect on antibacterial activity. When all experiments are
compared with antibacterial chemical finish, it is seen that
the experiments performed as an alternative in the study
show antibacterial efficacy. It has been observed that
antibacterial activity does not change with 50% reduction in
the use of silver fiber, and it is predicted that antibacterial
effectiveness can be achieved by using lower amounts of
silver. With the use of bamboo fiber and silver yarn in the
towel fabric, antibacterial efficiency with high washing
resistance can be achieved, while antibacterial activity with
limited washing resistance will be achieved with chemical
antibacterial finishing.
The classical method, antibacterial finishing application,
has been carried out in experiments using silver and when
202 TEKSTİL ve KONFEKSİYON 31(3), 2021
the results are examined, it is seen that there is an increase
in bacterial decreases depending on the time. In the
experiments made from bamboo yarn, it is seen that the rate
of bacterial reduction in 30 minutes is lower than other
experiments.
It is predicted that alternative methods can be used in these
trials to the antibacterial finishing application, which is
used as the classical method.
REFERENCES
1. Çukul D. 2013. Examples for the recent developments in technical
yarns. Journal of Textiles and Engineer 20(91), 50-63.
2. Beşen BS. 2019. Production of disposable antibacterial textiles via
application of tea tree oil encapsulated into different wall materials.
Fibers and Polymers 20(12), 2587-2593.
3. Abedi D, Mortazavi SM, Mehrizi MK, Feiz M. 2008. Antimicrobial
properties of acrylic fabrics dyed with direct dye and a copper salt.
Textile Research Journal 78, 311.
4. Gao Y, Cranston R. 2008. Recent advances in antimicrobial
treatments of textiles. Textile Research Journal 78(1), 60–72.
5. Üreyen ME, Çavdar A, Koparalı AS, Doğan A. 2015. Antibacterial
efficacy and laundering durability of textile fabrics treated by newly
developed silver doped nano scaled bio-antimicrobial finishing agent.
Journal of Textiles and Engineer 69, 26-31.
6. Ibrahim NA, Gouda M, Husseiny M, El-Gamal AR, Mahrous F.
2008. UV-protecting and antibacterial finishing of cotton knits.
Journal of Applied Polymer Science 112, 3589–3596.
7. Rimbu C, Cerempei A, Muresan R, Guguianu E, Ursache M, Borhan
O, Muresan A. 2015. Eco-friendly antibacterial finish for natural
knitted fabrics. Tekstil ve Konfeksiyon 25(4), 359-364.
8. Joshi M, Ali SW, Purwar R, Rajendran S. 2009. Ecofriendly
antimicrobial finishing of textiles using bioactive agents based on
natural products. Indian Journal of Fibre&Textile Research 34, 295.
9. Filipowska B, Rybicki E, Walawska A, Matyjas-Zgondek E. 2011.
New method for the antibacterial and antifungal modification of
silver finished textiles. Fibres & Textiles in Eastern Europe 19, 4
(87), 124-128.
10. Varesano A, Vineis C, Aluigi A, Rombaldoni F, Tonetti C,
Mazzuchetti G. 2013. Antibacterial efficacy of polypyrrole in textile
applications. Fibers and Polymers 14(1), 36-42.
11. Saengkiettiyut K, Rattanawaleedirojn P, Sangsuk S. 2008. A study on
antimicrobial efficacy of nano silver containing textile. Special Issue
on Nanotechnology 7(1), 33-36.
12. Dzhimak SS, Malyshko VV, Goryachko AI, Sokolov ME, Moiseev
AV, Basov AA. 2019. Adsorption of silver nanoparticles on mono-
and polyfilament fibers. Nanotechnologies in Russia 14 Nos. 1–2,
48–54.
13. Gülgönül M. 2018. Including silver complex production of
nanofibers and use in textile, (Master’s Thesis). Namık Kemal
University Institute of Science.
14. Cruz J, Leitão A, Silveira D, Pichandi S, Pinto M, Fangueiro R. 2017.
Study of moisture absorption characteristics of cotton terry towel
fabrics. Procedia Engineering, 200, 389–398
15. Kakde MV, More H, Magarwadia B, Kejkar V. 2017. Effect of pile
density on physical properties of terry towel fabric. International
Journal on Textile Engineering and Processes 3(1).
16. Özmen B. 2010. Comparison of terryclothes which are made up with
bamboo and cotton fiber in point of usag, (Master’s Thesis). Gazi
University Institute of Education Sciences.
17. Sekerden F. 2012. Effect of pıle yarn type on absorbency, stiffness,
and abrasion resistance of bamboo/cotton and cotton terry towels.
Wood and Fiber Science 44(2), 189-195.
18. Erdumlu N, Ozipek B. 2008. Investigation of regenerated bamboo
fibre and yarn characteristics. FIBRES & TEXTILES in Eastern
Europe 16, 4 (69), 43-47.
19. Mahish SS, Patra AK, Thakur R. 2012. Functional properties of
bamboo/polyester blended knitted apparel fabrics. Indian Journal of
Fibre & Textile Research 37, 231-237.
20. Yasin S, Liu L, Yao J. 2013. Biosynthesis of silver nanoparticles by
bamboo leaves extract and their antimicrobial activity. Journal of
Fiber Bioengineering and Informatics 6(1), 77-84.
21. Tusief MQ, Amin N, Mahmood N, Ahmad I, Abbas M. 2015.
Antimicrobial studies of knitted fabrics from bamboo, soybean and
flax fibers at various blends. Journal of Textile Science &
Engineering 5(3).
22. Unango FJ, Ramasamy KM. 2019. A review on the investigation of
biologically active natural compounds on cotton fabrics as an
antibacterial textile finishing. International Research Journal of
Science and Technology 1(1), 49-55.
23. Perelshtein I, Applerot G, Perkas N, Guibert G, Mikhailov S,
Gedanken A. 2008. Sonochemical coating of silver nanoparticles on
textile fabrics (nylon, polyester and cotton) and their antibacterial
activity. Nanotechnology 19, 245705.
24. Yüksek İÖ. 2008. An investigation into the factors affecting the
properties of bamboo yarns, (Master’s Thesis). Uludağ University
Institute of Education Sciences.
25. Smiechowicz E, Niekraszewicz B, Strzelinska M, Zielecka M. 2020.
Antibacterial fıbers containing nanosilica with immobilized silver
nanoparticles. AUTEX Research Journal 20(4), 441-448.
26. Xu Q, Xie L, Diao H, Li F, Zhang Y, Fu F, Liu X. 2017.
Antibacterial cotton fabric with enhanced durability prepared using
silver nanoparticles and carboxymethyl chitosan. Carbohydrate
Polymers 177, 187–193.
27. Sabır EC, Ünal BZ. 2017. The using of nettle fiber in towel
production and investigation of the performance properties. Journal
of Natural Fibers, 14(6), 781–787.
TEKSTİL ve KONFEKSİYON 31(3), 2021 203
TEKSTİL VE KONFEKSİYON
VOL: 31, NO. 3
DOI: 10.32710/tekstilvekonfeksiyon.895876
Comparison of Poisson’s Ratio Measurement Methods: The
Extensometer and the Universal Tensile Testing Devices
Mehmet TIRITOĞLU1 0000-0002-2316-0782
Serkan TEZEL2 0000-0003-4078-8210
Yasemin KAVUŞTURAN2 0000-0002-9919-564X *
1Bursa Uludag University/ Graduate School of Natural and Applied Sciences/ Department of Textile Engineering, Bursa, Turkey 2Bursa Uludag University/ Faculty of Engineering/ Department of Textile Engineering, Bursa, Turkey
Corresponding Author: Mehmet Tiritoğlu, [email protected]
ABSTRACT
Auxetic materials with a negative Poison’s ratio (PR) have the potential to meet the demand for
different materials, especially technical textiles. Universal Tensile Test (UTT) devices and various
experimental setups developed by researchers have been used in PR measurements. This study aims
to investigate the PR of knitted fabrics with UTT and extensometer devices comparatively by using
the same measurement parameters according to ASTM E132. Knitted fabrics with zigzag and foldable
patterns were produced in the study because of their auxetic behaviour. It has been determined that
the extensometer device can be used as an alternative to the UTT device for PR measurements. While
the PR of foldable fabrics cannot be measured with the UTT device because of the fabrics' folding on
themselves, it has been observed that it can be easily measured with the extensometer device thanks
to the horizontal axis principle.
ARTICLE HISTORY
Received: 12.03.2021
Accepted: 30.06.2021
KEYWORDS
Poisson's ratio, auxetic, knitted
auxetic fabric, fryma, extensometer
1. INTRODUCTION
Poisson's ratio (PR) is a mechanical property representing
the lateral behavior of materials under an axial load [1]. The
Poisson's ratio (ν) is defined as;
(1)
Where ɛLoad is the strain in the loading direction while ɛTrans
is the perpendicular strain or transverse to the loading
direction. Typical natural materials possess a positive
Poisson’s ratio, which means they contract when they are
stretched in one direction (Figure 1). Unlike standard
natural materials, auxetic materials are defined as solids
with negative PR [1, 2]. PR is an important parameter for
numerical simulation of garment pressure distribution, and
garment dressing system [3].
To cite this article: Tiritoğlu M, Tezel S, Kavuşturan Y. 2021. Comparison of poisson’s ratio measurement methods: the extensometer and the universal tensile testing devices. Tekstil ve Konfeksiyon, 31(3), 203-213.
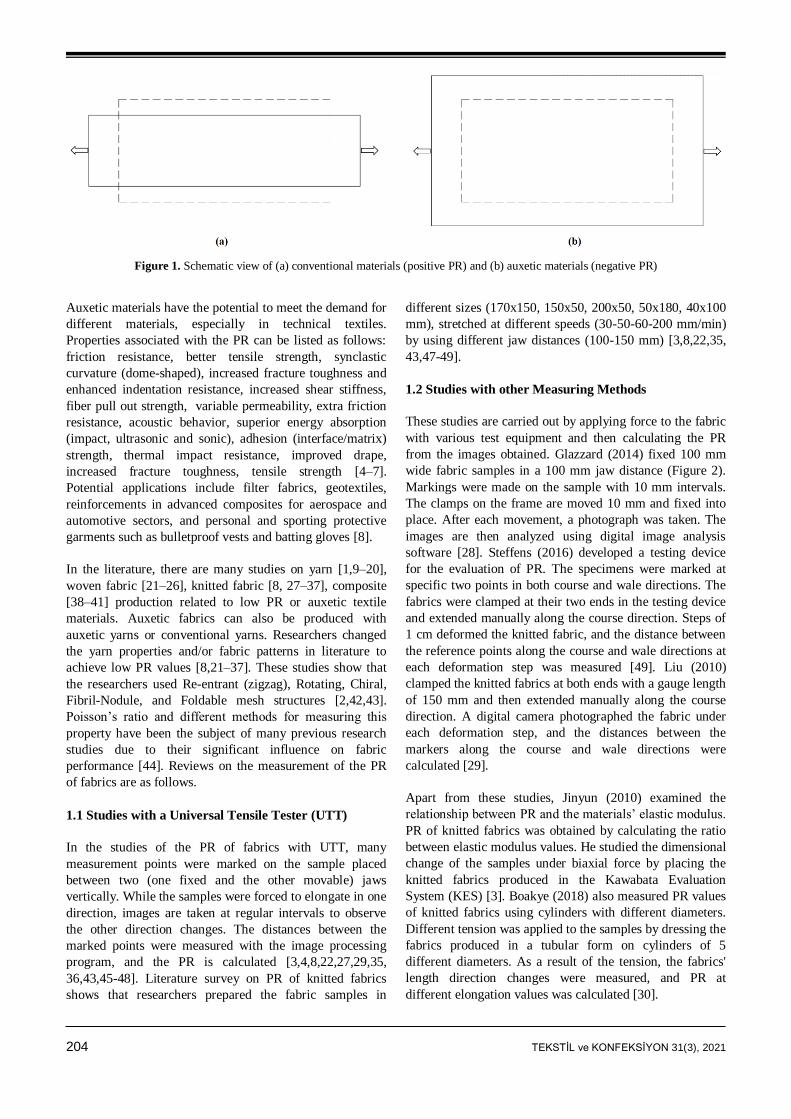
204 TEKSTİL ve KONFEKSİYON 31(3), 2021
Figure 1. Schematic view of (a) conventional materials (positive PR) and (b) auxetic materials (negative PR)
Auxetic materials have the potential to meet the demand for
different materials, especially in technical textiles.
Properties associated with the PR can be listed as follows:
friction resistance, better tensile strength, synclastic
curvature (dome-shaped), increased fracture toughness and
enhanced indentation resistance, increased shear stiffness,
fiber pull out strength, variable permeability, extra friction
resistance, acoustic behavior, superior energy absorption
(impact, ultrasonic and sonic), adhesion (interface/matrix)
strength, thermal impact resistance, improved drape,
increased fracture toughness, tensile strength [4–7].
Potential applications include filter fabrics, geotextiles,
reinforcements in advanced composites for aerospace and
automotive sectors, and personal and sporting protective
garments such as bulletproof vests and batting gloves [8].
In the literature, there are many studies on yarn [1,9–20],
woven fabric [21–26], knitted fabric [8, 27–37], composite
[38–41] production related to low PR or auxetic textile
materials. Auxetic fabrics can also be produced with
auxetic yarns or conventional yarns. Researchers changed
the yarn properties and/or fabric patterns in literature to
achieve low PR values [8,21–37]. These studies show that
the researchers used Re-entrant (zigzag), Rotating, Chiral,
Fibril-Nodule, and Foldable mesh structures [2,42,43].
Poisson’s ratio and different methods for measuring this
property have been the subject of many previous research
studies due to their significant influence on fabric
performance [44]. Reviews on the measurement of the PR
of fabrics are as follows.
1.1 Studies with a Universal Tensile Tester (UTT)
In the studies of the PR of fabrics with UTT, many
measurement points were marked on the sample placed
between two (one fixed and the other movable) jaws
vertically. While the samples were forced to elongate in one
direction, images are taken at regular intervals to observe
the other direction changes. The distances between the
marked points were measured with the image processing
program, and the PR is calculated [3,4,8,22,27,29,35,
36,43,45-48]. Literature survey on PR of knitted fabrics
shows that researchers prepared the fabric samples in
different sizes (170x150, 150x50, 200x50, 50x180, 40x100
mm), stretched at different speeds (30-50-60-200 mm/min)
by using different jaw distances (100-150 mm) [3,8,22,35,
43,47-49].
1.2 Studies with other Measuring Methods
These studies are carried out by applying force to the fabric
with various test equipment and then calculating the PR
from the images obtained. Glazzard (2014) fixed 100 mm
wide fabric samples in a 100 mm jaw distance (Figure 2).
Markings were made on the sample with 10 mm intervals.
The clamps on the frame are moved 10 mm and fixed into
place. After each movement, a photograph was taken. The
images are then analyzed using digital image analysis
software [28]. Steffens (2016) developed a testing device
for the evaluation of PR. The specimens were marked at
specific two points in both course and wale directions. The
fabrics were clamped at their two ends in the testing device
and extended manually along the course direction. Steps of
1 cm deformed the knitted fabric, and the distance between
the reference points along the course and wale directions at
each deformation step was measured [49]. Liu (2010)
clamped the knitted fabrics at both ends with a gauge length
of 150 mm and then extended manually along the course
direction. A digital camera photographed the fabric under
each deformation step, and the distances between the
markers along the course and wale directions were
calculated [29].
Apart from these studies, Jinyun (2010) examined the
relationship between PR and the materials’ elastic modulus.
PR of knitted fabrics was obtained by calculating the ratio
between elastic modulus values. He studied the dimensional
change of the samples under biaxial force by placing the
knitted fabrics produced in the Kawabata Evaluation
System (KES) [3]. Boakye (2018) also measured PR values
of knitted fabrics using cylinders with different diameters.
Different tension was applied to the samples by dressing the
fabrics produced in a tubular form on cylinders of 5
different diameters. As a result of the tension, the fabrics'
length direction changes were measured, and PR at
different elongation values was calculated [30].
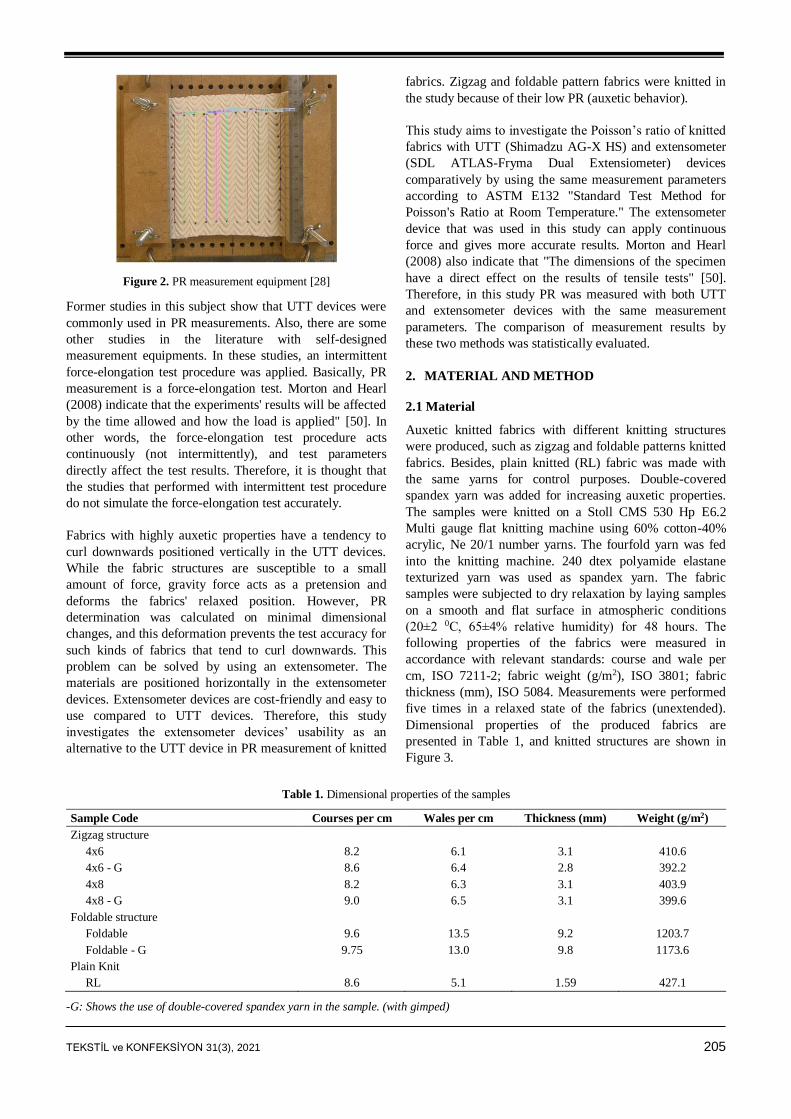
TEKSTİL ve KONFEKSİYON 31(3), 2021 205
Figure 2. PR measurement equipment [28]
Former studies in this subject show that UTT devices were
commonly used in PR measurements. Also, there are some
other studies in the literature with self-designed
measurement equipments. In these studies, an intermittent
force-elongation test procedure was applied. Basically, PR
measurement is a force-elongation test. Morton and Hearl
(2008) indicate that the experiments' results will be affected
by the time allowed and how the load is applied" [50]. In
other words, the force-elongation test procedure acts
continuously (not intermittently), and test parameters
directly affect the test results. Therefore, it is thought that
the studies that performed with intermittent test procedure
do not simulate the force-elongation test accurately.
Fabrics with highly auxetic properties have a tendency to
curl downwards positioned vertically in the UTT devices.
While the fabric structures are susceptible to a small
amount of force, gravity force acts as a pretension and
deforms the fabrics' relaxed position. However, PR
determination was calculated on minimal dimensional
changes, and this deformation prevents the test accuracy for
such kinds of fabrics that tend to curl downwards. This
problem can be solved by using an extensometer. The
materials are positioned horizontally in the extensometer
devices. Extensometer devices are cost-friendly and easy to
use compared to UTT devices. Therefore, this study
investigates the extensometer devices’ usability as an
alternative to the UTT device in PR measurement of knitted
fabrics. Zigzag and foldable pattern fabrics were knitted in
the study because of their low PR (auxetic behavior).
This study aims to investigate the Poisson’s ratio of knitted
fabrics with UTT (Shimadzu AG-X HS) and extensometer
(SDL ATLAS-Fryma Dual Extensiometer) devices
comparatively by using the same measurement parameters
according to ASTM E132 "Standard Test Method for
Poisson's Ratio at Room Temperature." The extensometer
device that was used in this study can apply continuous
force and gives more accurate results. Morton and Hearl
(2008) also indicate that "The dimensions of the specimen
have a direct effect on the results of tensile tests" [50].
Therefore, in this study PR was measured with both UTT
and extensometer devices with the same measurement
parameters. The comparison of measurement results by
these two methods was statistically evaluated.
2. MATERIAL AND METHOD
2.1 Material
Auxetic knitted fabrics with different knitting structures
were produced, such as zigzag and foldable patterns knitted
fabrics. Besides, plain knitted (RL) fabric was made with
the same yarns for control purposes. Double-covered
spandex yarn was added for increasing auxetic properties.
The samples were knitted on a Stoll CMS 530 Hp E6.2
Multi gauge flat knitting machine using 60% cotton-40%
acrylic, Ne 20/1 number yarns. The fourfold yarn was fed
into the knitting machine. 240 dtex polyamide elastane
texturized yarn was used as spandex yarn. The fabric
samples were subjected to dry relaxation by laying samples
on a smooth and flat surface in atmospheric conditions
(20±2 0C, 65±4% relative humidity) for 48 hours. The
following properties of the fabrics were measured in
accordance with relevant standards: course and wale per
cm, ISO 7211-2; fabric weight (g/m2), ISO 3801; fabric
thickness (mm), ISO 5084. Measurements were performed
five times in a relaxed state of the fabrics (unextended).
Dimensional properties of the produced fabrics are
presented in Table 1, and knitted structures are shown in
Figure 3.
Table 1. Dimensional properties of the samples
Sample Code Courses per cm Wales per cm Thickness (mm) Weight (g/m2)
Zigzag structure
4x6 8.2 6.1 3.1 410.6
4x6 - G 8.6 6.4 2.8 392.2
4x8 8.2 6.3 3.1 403.9
4x8 - G 9.0 6.5 3.1 399.6
Foldable structure
Foldable 9.6 13.5 9.2 1203.7
Foldable - G 9.75 13.0 9.8 1173.6
Plain Knit
RL 8.6 5.1 1.59 427.1
-G: Shows the use of double-covered spandex yarn in the sample. (with gimped)
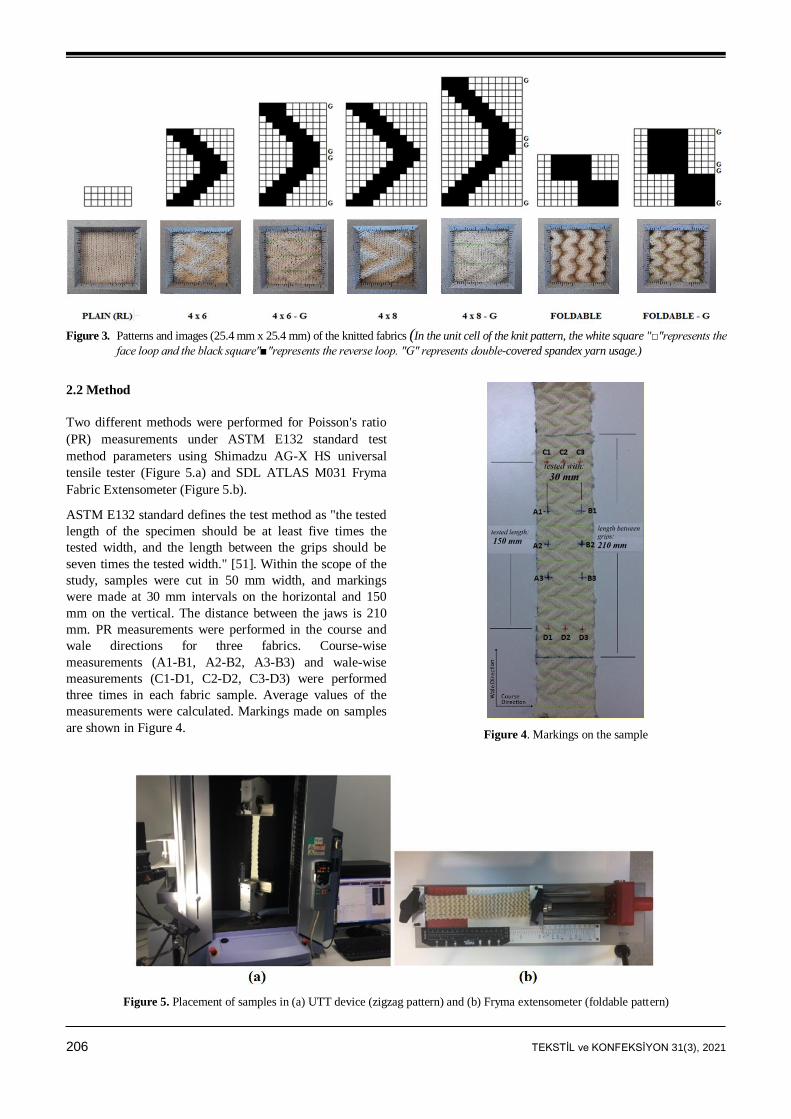
206 TEKSTİL ve KONFEKSİYON 31(3), 2021
Figure 3. Patterns and images (25.4 mm x 25.4 mm) of the knitted fabrics (In the unit cell of the knit pattern, the white square "□"represents the
face loop and the black square"■"represents the reverse loop. "G" represents double-covered spandex yarn usage.)
2.2 Method
Two different methods were performed for Poisson's ratio
(PR) measurements under ASTM E132 standard test
method parameters using Shimadzu AG-X HS universal
tensile tester (Figure 5.a) and SDL ATLAS M031 Fryma
Fabric Extensometer (Figure 5.b).
ASTM E132 standard defines the test method as "the tested
length of the specimen should be at least five times the
tested width, and the length between the grips should be
seven times the tested width." [51]. Within the scope of the
study, samples were cut in 50 mm width, and markings
were made at 30 mm intervals on the horizontal and 150
mm on the vertical. The distance between the jaws is 210
mm. PR measurements were performed in the course and
wale directions for three fabrics. Course-wise
measurements (A1-B1, A2-B2, A3-B3) and wale-wise
measurements (C1-D1, C2-D2, C3-D3) were performed
three times in each fabric sample. Average values of the
measurements were calculated. Markings made on samples
are shown in Figure 4.
Figure 4. Markings on the sample
Figure 5. Placement of samples in (a) UTT device (zigzag pattern) and (b) Fryma extensometer (foldable pattern)
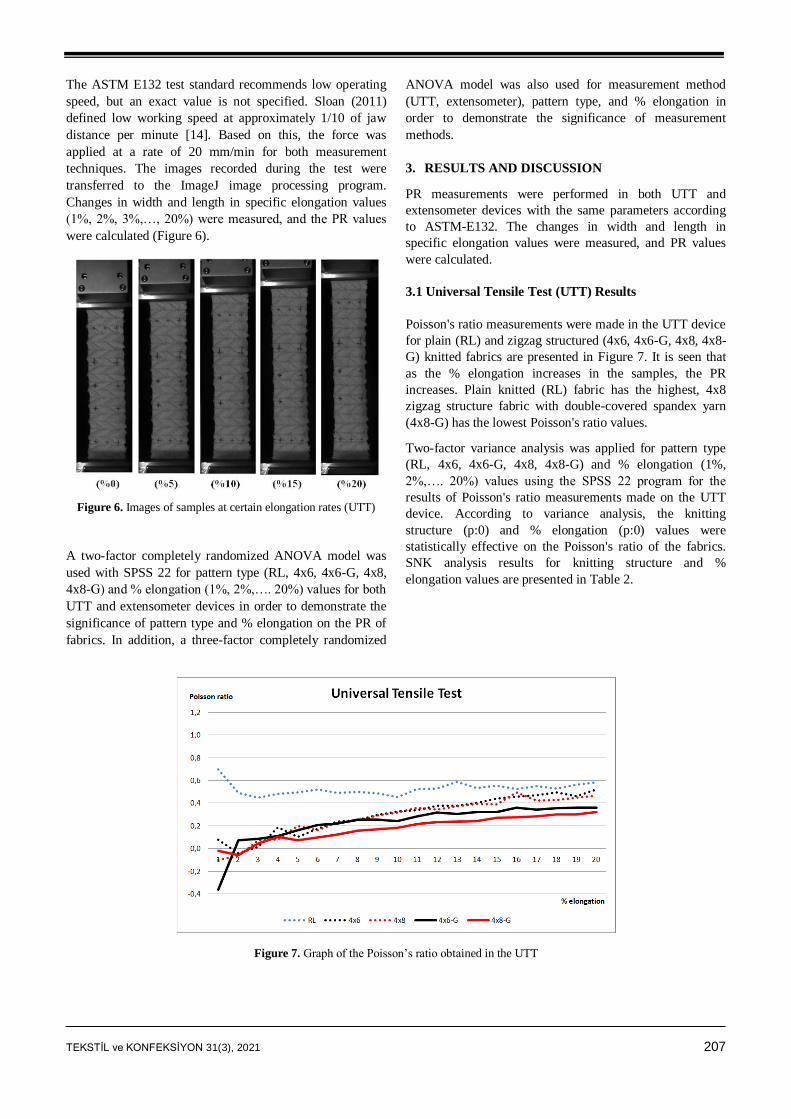
TEKSTİL ve KONFEKSİYON 31(3), 2021 207
The ASTM E132 test standard recommends low operating
speed, but an exact value is not specified. Sloan (2011)
defined low working speed at approximately 1/10 of jaw
distance per minute [14]. Based on this, the force was
applied at a rate of 20 mm/min for both measurement
techniques. The images recorded during the test were
transferred to the ImageJ image processing program.
Changes in width and length in specific elongation values
(1%, 2%, 3%,…, 20%) were measured, and the PR values
were calculated (Figure 6).
Figure 6. Images of samples at certain elongation rates (UTT)
A two-factor completely randomized ANOVA model was
used with SPSS 22 for pattern type (RL, 4x6, 4x6-G, 4x8,
4x8-G) and % elongation (1%, 2%,…. 20%) values for both
UTT and extensometer devices in order to demonstrate the
significance of pattern type and % elongation on the PR of
fabrics. In addition, a three-factor completely randomized
ANOVA model was also used for measurement method
(UTT, extensometer), pattern type, and % elongation in
order to demonstrate the significance of measurement
methods.
3. RESULTS AND DISCUSSION
PR measurements were performed in both UTT and
extensometer devices with the same parameters according
to ASTM-E132. The changes in width and length in
specific elongation values were measured, and PR values
were calculated.
3.1 Universal Tensile Test (UTT) Results
Poisson's ratio measurements were made in the UTT device
for plain (RL) and zigzag structured (4x6, 4x6-G, 4x8, 4x8-
G) knitted fabrics are presented in Figure 7. It is seen that
as the % elongation increases in the samples, the PR
increases. Plain knitted (RL) fabric has the highest, 4x8
zigzag structure fabric with double-covered spandex yarn
(4x8-G) has the lowest Poisson's ratio values.
Two-factor variance analysis was applied for pattern type
(RL, 4x6, 4x6-G, 4x8, 4x8-G) and % elongation (1%,
2%,…. 20%) values using the SPSS 22 program for the
results of Poisson's ratio measurements made on the UTT
device. According to variance analysis, the knitting
structure (p:0) and % elongation (p:0) values were
statistically effective on the Poisson's ratio of the fabrics.
SNK analysis results for knitting structure and %
elongation values are presented in Table 2.
Figure 7. Graph of the Poisson’s ratio obtained in the UTT
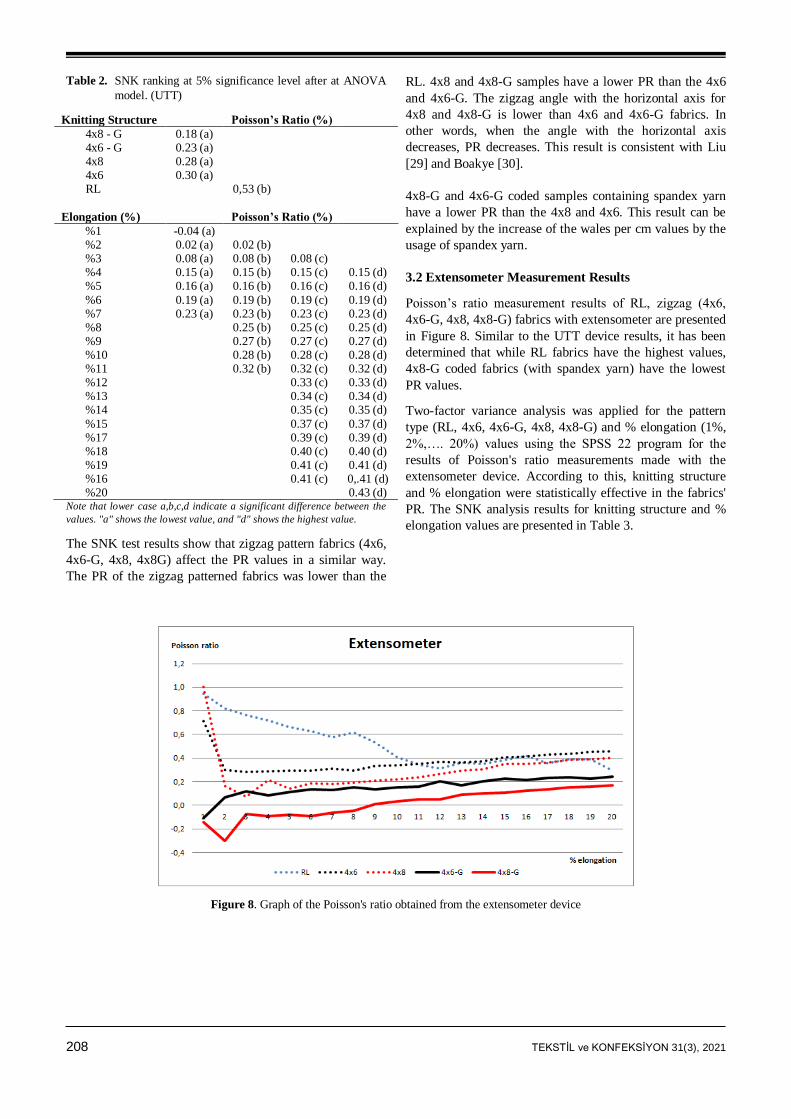
208 TEKSTİL ve KONFEKSİYON 31(3), 2021
Table 2. SNK ranking at 5% significance level after at ANOVA
model. (UTT)
Knitting Structure Poisson’s Ratio (%)
4x8 - G 0.18 (a) 4x6 - G 0.23 (a) 4x8 0.28 (a) 4x6 0.30 (a) RL 0,53 (b)
Elongation (%) Poisson’s Ratio (%)
%1 -0.04 (a) %2 0.02 (a) 0.02 (b) %3 0.08 (a) 0.08 (b) 0.08 (c) %4 0.15 (a) 0.15 (b) 0.15 (c) 0.15 (d) %5 0.16 (a) 0.16 (b) 0.16 (c) 0.16 (d)
%6 0.19 (a) 0.19 (b) 0.19 (c) 0.19 (d) %7 0.23 (a) 0.23 (b) 0.23 (c) 0.23 (d) %8 0.25 (b) 0.25 (c) 0.25 (d) %9 0.27 (b) 0.27 (c) 0.27 (d) %10 0.28 (b) 0.28 (c) 0.28 (d) %11 0.32 (b) 0.32 (c) 0.32 (d) %12 0.33 (c) 0.33 (d) %13 0.34 (c) 0.34 (d) %14 0.35 (c) 0.35 (d)
%15 0.37 (c) 0.37 (d) %17 0.39 (c) 0.39 (d) %18 0.40 (c) 0.40 (d) %19 0.41 (c) 0.41 (d) %16 0.41 (c) 0,.41 (d) %20 0.43 (d) Note that lower case a,b,c,d indicate a significant difference between the
values. "a" shows the lowest value, and "d" shows the highest value.
The SNK test results show that zigzag pattern fabrics (4x6,
4x6-G, 4x8, 4x8G) affect the PR values in a similar way.
The PR of the zigzag patterned fabrics was lower than the
RL. 4x8 and 4x8-G samples have a lower PR than the 4x6
and 4x6-G. The zigzag angle with the horizontal axis for
4x8 and 4x8-G is lower than 4x6 and 4x6-G fabrics. In
other words, when the angle with the horizontal axis
decreases, PR decreases. This result is consistent with Liu
[29] and Boakye [30].
4x8-G and 4x6-G coded samples containing spandex yarn
have a lower PR than the 4x8 and 4x6. This result can be
explained by the increase of the wales per cm values by the
usage of spandex yarn.
3.2 Extensometer Measurement Results
Poisson’s ratio measurement results of RL, zigzag (4x6,
4x6-G, 4x8, 4x8-G) fabrics with extensometer are presented
in Figure 8. Similar to the UTT device results, it has been
determined that while RL fabrics have the highest values,
4x8-G coded fabrics (with spandex yarn) have the lowest
PR values.
Two-factor variance analysis was applied for the pattern
type (RL, 4x6, 4x6-G, 4x8, 4x8-G) and % elongation (1%,
2%,…. 20%) values using the SPSS 22 program for the
results of Poisson's ratio measurements made with the
extensometer device. According to this, knitting structure
and % elongation were statistically effective in the fabrics'
PR. The SNK analysis results for knitting structure and %
elongation values are presented in Table 3.
Figure 8. Graph of the Poisson's ratio obtained from the extensometer device
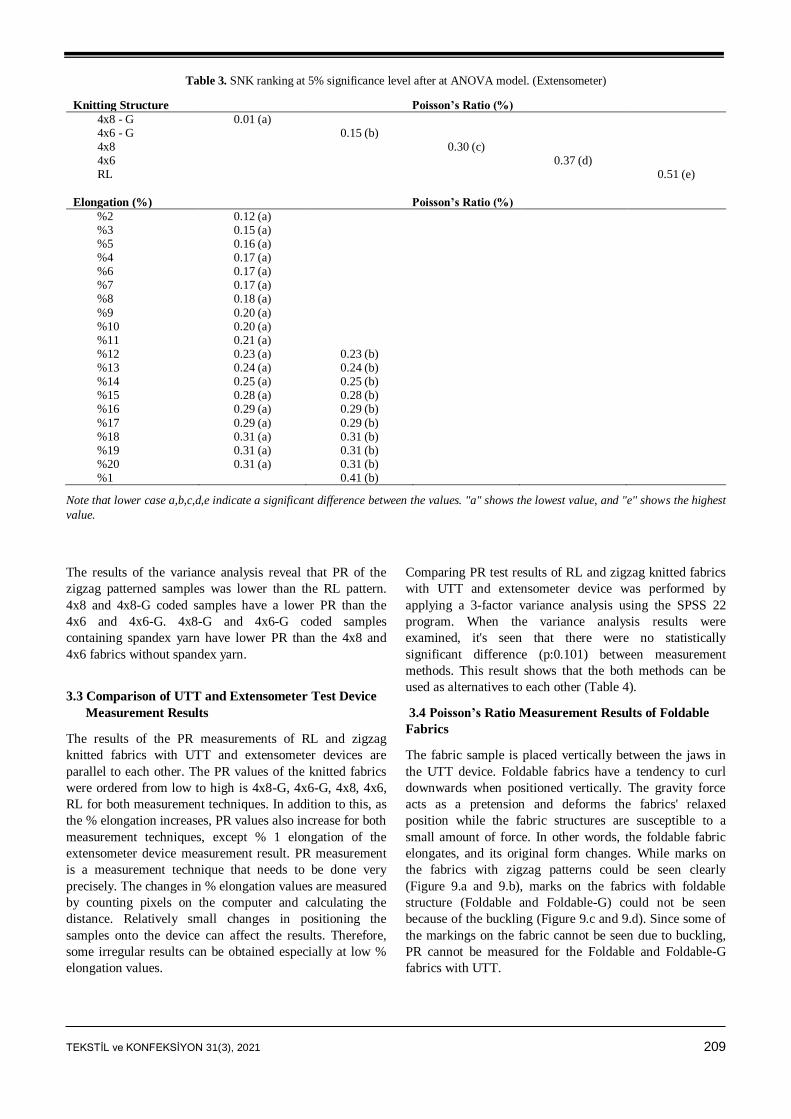
TEKSTİL ve KONFEKSİYON 31(3), 2021 209
Table 3. SNK ranking at 5% significance level after at ANOVA model. (Extensometer)
Knitting Structure Poisson’s Ratio (%)
4x8 - G 0.01 (a) 4x6 - G 0.15 (b) 4x8 0.30 (c) 4x6 0.37 (d) RL 0.51 (e)
Elongation (%) Poisson’s Ratio (%)
%2 0.12 (a) %3 0.15 (a) %5 0.16 (a) %4 0.17 (a) %6 0.17 (a) %7 0.17 (a) %8 0.18 (a)
%9 0.20 (a) %10 0.20 (a) %11 0.21 (a) %12 0.23 (a) 0.23 (b) %13 0.24 (a) 0.24 (b) %14 0.25 (a) 0.25 (b) %15 0.28 (a) 0.28 (b) %16 0.29 (a) 0.29 (b)
%17 0.29 (a) 0.29 (b) %18 0.31 (a) 0.31 (b) %19 0.31 (a) 0.31 (b) %20 0.31 (a) 0.31 (b) %1 0.41 (b)
Note that lower case a,b,c,d,e indicate a significant difference between the values. "a" shows the lowest value, and "e" shows the highest
value.
The results of the variance analysis reveal that PR of the
zigzag patterned samples was lower than the RL pattern.
4x8 and 4x8-G coded samples have a lower PR than the
4x6 and 4x6-G. 4x8-G and 4x6-G coded samples
containing spandex yarn have lower PR than the 4x8 and
4x6 fabrics without spandex yarn.
3.3 Comparison of UTT and Extensometer Test Device
Measurement Results
The results of the PR measurements of RL and zigzag
knitted fabrics with UTT and extensometer devices are
parallel to each other. The PR values of the knitted fabrics
were ordered from low to high is 4x8-G, 4x6-G, 4x8, 4x6,
RL for both measurement techniques. In addition to this, as
the % elongation increases, PR values also increase for both
measurement techniques, except % 1 elongation of the
extensometer device measurement result. PR measurement
is a measurement technique that needs to be done very
precisely. The changes in % elongation values are measured
by counting pixels on the computer and calculating the
distance. Relatively small changes in positioning the
samples onto the device can affect the results. Therefore,
some irregular results can be obtained especially at low %
elongation values.
Comparing PR test results of RL and zigzag knitted fabrics
with UTT and extensometer device was performed by
applying a 3-factor variance analysis using the SPSS 22
program. When the variance analysis results were
examined, it's seen that there were no statistically
significant difference (p:0.101) between measurement
methods. This result shows that the both methods can be
used as alternatives to each other (Table 4).
3.4 Poisson’s Ratio Measurement Results of Foldable
Fabrics
The fabric sample is placed vertically between the jaws in
the UTT device. Foldable fabrics have a tendency to curl
downwards when positioned vertically. The gravity force
acts as a pretension and deforms the fabrics' relaxed
position while the fabric structures are susceptible to a
small amount of force. In other words, the foldable fabric
elongates, and its original form changes. While marks on
the fabrics with zigzag patterns could be seen clearly
(Figure 9.a and 9.b), marks on the fabrics with foldable
structure (Foldable and Foldable-G) could not be seen
because of the buckling (Figure 9.c and 9.d). Since some of
the markings on the fabric cannot be seen due to buckling,
PR cannot be measured for the Foldable and Foldable-G
fabrics with UTT.
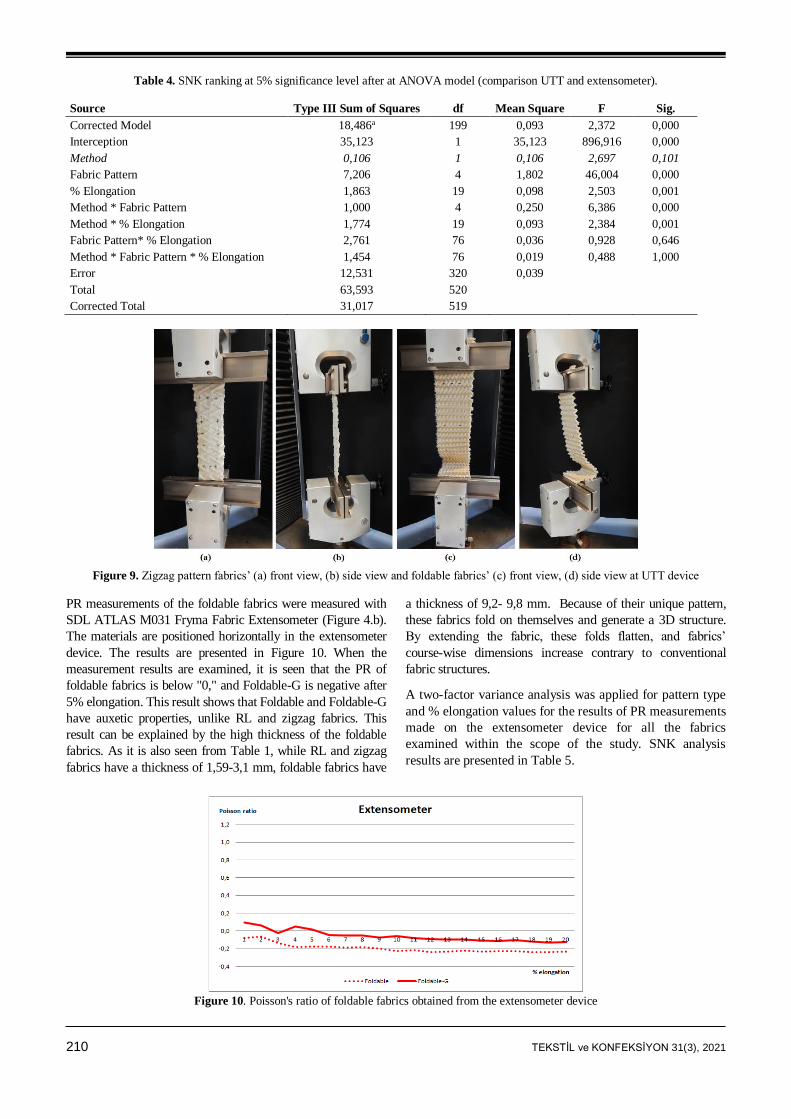
210 TEKSTİL ve KONFEKSİYON 31(3), 2021
Table 4. SNK ranking at 5% significance level after at ANOVA model (comparison UTT and extensometer).
Source Type III Sum of Squares df Mean Square F Sig.
Corrected Model 18,486a 199 0,093 2,372 0,000
Interception 35,123 1 35,123 896,916 0,000
Method 0,106 1 0,106 2,697 0,101
Fabric Pattern 7,206 4 1,802 46,004 0,000
% Elongation 1,863 19 0,098 2,503 0,001
Method * Fabric Pattern 1,000 4 0,250 6,386 0,000
Method * % Elongation 1,774 19 0,093 2,384 0,001
Fabric Pattern* % Elongation 2,761 76 0,036 0,928 0,646
Method * Fabric Pattern * % Elongation 1,454 76 0,019 0,488 1,000
Error 12,531 320 0,039
Total 63,593 520
Corrected Total 31,017 519
Figure 9. Zigzag pattern fabrics’ (a) front view, (b) side view and foldable fabrics’ (c) front view, (d) side view at UTT device
PR measurements of the foldable fabrics were measured with
SDL ATLAS M031 Fryma Fabric Extensometer (Figure 4.b).
The materials are positioned horizontally in the extensometer
device. The results are presented in Figure 10. When the
measurement results are examined, it is seen that the PR of
foldable fabrics is below "0," and Foldable-G is negative after
5% elongation. This result shows that Foldable and Foldable-G
have auxetic properties, unlike RL and zigzag fabrics. This
result can be explained by the high thickness of the foldable
fabrics. As it is also seen from Table 1, while RL and zigzag
fabrics have a thickness of 1,59-3,1 mm, foldable fabrics have
a thickness of 9,2- 9,8 mm. Because of their unique pattern,
these fabrics fold on themselves and generate a 3D structure.
By extending the fabric, these folds flatten, and fabrics’
course-wise dimensions increase contrary to conventional
fabric structures.
A two-factor variance analysis was applied for pattern type
and % elongation values for the results of PR measurements
made on the extensometer device for all the fabrics
examined within the scope of the study. SNK analysis
results are presented in Table 5.
Figure 10. Poisson's ratio of foldable fabrics obtained from the extensometer device
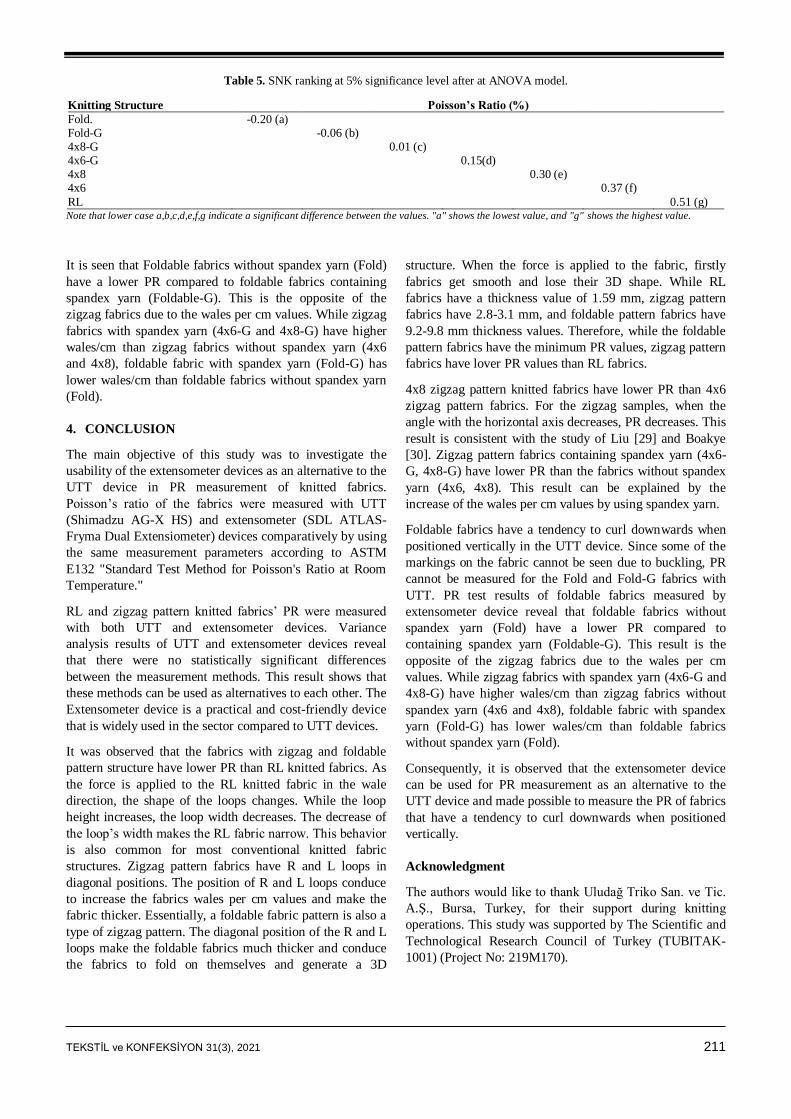
TEKSTİL ve KONFEKSİYON 31(3), 2021 211
Table 5. SNK ranking at 5% significance level after at ANOVA model.
Knitting Structure Poisson’s Ratio (%)
Fold. -0.20 (a) Fold-G -0.06 (b) 4x8-G 0.01 (c) 4x6-G 0.15(d) 4x8 0.30 (e) 4x6 0.37 (f)
RL 0.51 (g) Note that lower case a,b,c,d,e,f,g indicate a significant difference between the values. "a" shows the lowest value, and "g" shows the highest value.
It is seen that Foldable fabrics without spandex yarn (Fold)
have a lower PR compared to foldable fabrics containing
spandex yarn (Foldable-G). This is the opposite of the
zigzag fabrics due to the wales per cm values. While zigzag
fabrics with spandex yarn (4x6-G and 4x8-G) have higher
wales/cm than zigzag fabrics without spandex yarn (4x6
and 4x8), foldable fabric with spandex yarn (Fold-G) has
lower wales/cm than foldable fabrics without spandex yarn
(Fold).
4. CONCLUSION
The main objective of this study was to investigate the
usability of the extensometer devices as an alternative to the
UTT device in PR measurement of knitted fabrics.
Poisson’s ratio of the fabrics were measured with UTT
(Shimadzu AG-X HS) and extensometer (SDL ATLAS-
Fryma Dual Extensiometer) devices comparatively by using
the same measurement parameters according to ASTM
E132 "Standard Test Method for Poisson's Ratio at Room
Temperature."
RL and zigzag pattern knitted fabrics’ PR were measured
with both UTT and extensometer devices. Variance
analysis results of UTT and extensometer devices reveal
that there were no statistically significant differences
between the measurement methods. This result shows that
these methods can be used as alternatives to each other. The
Extensometer device is a practical and cost-friendly device
that is widely used in the sector compared to UTT devices.
It was observed that the fabrics with zigzag and foldable
pattern structure have lower PR than RL knitted fabrics. As
the force is applied to the RL knitted fabric in the wale
direction, the shape of the loops changes. While the loop
height increases, the loop width decreases. The decrease of
the loop’s width makes the RL fabric narrow. This behavior
is also common for most conventional knitted fabric
structures. Zigzag pattern fabrics have R and L loops in
diagonal positions. The position of R and L loops conduce
to increase the fabrics wales per cm values and make the
fabric thicker. Essentially, a foldable fabric pattern is also a
type of zigzag pattern. The diagonal position of the R and L
loops make the foldable fabrics much thicker and conduce
the fabrics to fold on themselves and generate a 3D
structure. When the force is applied to the fabric, firstly
fabrics get smooth and lose their 3D shape. While RL
fabrics have a thickness value of 1.59 mm, zigzag pattern
fabrics have 2.8-3.1 mm, and foldable pattern fabrics have
9.2-9.8 mm thickness values. Therefore, while the foldable
pattern fabrics have the minimum PR values, zigzag pattern
fabrics have lover PR values than RL fabrics.
4x8 zigzag pattern knitted fabrics have lower PR than 4x6
zigzag pattern fabrics. For the zigzag samples, when the
angle with the horizontal axis decreases, PR decreases. This
result is consistent with the study of Liu [29] and Boakye
[30]. Zigzag pattern fabrics containing spandex yarn (4x6-
G, 4x8-G) have lower PR than the fabrics without spandex
yarn (4x6, 4x8). This result can be explained by the
increase of the wales per cm values by using spandex yarn.
Foldable fabrics have a tendency to curl downwards when
positioned vertically in the UTT device. Since some of the
markings on the fabric cannot be seen due to buckling, PR
cannot be measured for the Fold and Fold-G fabrics with
UTT. PR test results of foldable fabrics measured by
extensometer device reveal that foldable fabrics without
spandex yarn (Fold) have a lower PR compared to
containing spandex yarn (Foldable-G). This result is the
opposite of the zigzag fabrics due to the wales per cm
values. While zigzag fabrics with spandex yarn (4x6-G and
4x8-G) have higher wales/cm than zigzag fabrics without
spandex yarn (4x6 and 4x8), foldable fabric with spandex
yarn (Fold-G) has lower wales/cm than foldable fabrics
without spandex yarn (Fold).
Consequently, it is observed that the extensometer device
can be used for PR measurement as an alternative to the
UTT device and made possible to measure the PR of fabrics
that have a tendency to curl downwards when positioned
vertically.
Acknowledgment
The authors would like to thank Uludağ Triko San. ve Tic.
A.Ş., Bursa, Turkey, for their support during knitting
operations. This study was supported by The Scientific and
Technological Research Council of Turkey (TUBITAK-
1001) (Project No: 219M170).
212 TEKSTİL ve KONFEKSİYON 31(3), 2021
REFERENCES
1. Lim TC. 2015. Auxetic materials and structures. New York:
Springer.
2. Chen S, Chawla KK, Chawla N. 2019. Handbook of mechanics of
materials. Springer. New York: Springer.
3. Jinyun Z, Yi L, Lam J, et al. 2010. The poisson ratio and modulus of
elastic knitted fabrics. Textile Research Journal 80(18), 1965–1969.
4. Miller W, Hook PB, Smith CW, et al. 2009. The manufacture and
characterization of a novel, low modulus, negative poisson’s ratio
composite. Composite Science and Technology 69, 651–655.
5. Alderson A, Evans KE. 1995. Microstructural modelling of auxetic
microporous polymers. Journal of Materials Science 30, 3319–3332.
6. Scarpa F, Patorino P, Garelli A, et al. 2005. Auxetic compliant,
flexible PU foams: static and dynamic properties. Basic Solid State
Physics 242(3), 681–694.
7. Uzun M. 2010. Negatif poi̇sson oranina sahi̇p (Auxetic) malzemeler
ve uygulama alanlari. Tekstil ve Mühendis 17(177), 13–18.
8. Alderson K, Alderson A, Anand S, et al. 2012. Auxetic warp knit
textile structures. Basic Solid State Physics 249(7), 1322–1329.
9. Hook P. 2011. Patent No: US 8.002.879 B2 Uses of auxetic fibres.
United States: Patent Application Publication.
10. Ng WS, Hu H. 2017. Tensile and deformation behavior of auxetic
plied yarns. Basic Solid State Physics 254(12), 1–11.
11. Shen Y, Adanur S. 2019. Mechanical analysis of the auxetic behavior
of novel braided tubular structures by the finite element method.
Textile Research Journal 89(23-24), 5187–5197.
12. Jiang N, Hu H. 2019. Auxetic yarn made with circular braiding
technology. Basic Solid State Physics 256, 1–12.
13. Sibal A, Rawal A. 2015. Design strategy for auxetic dual helix yarn
systems. Materials Letters 161(2015), 740–742.
14. Sloan MR, Wright JR, Evans KE. 2011. The helical auxetic yarn - A
novel structure for composites and textiles; Geometry, manufacture
and mechanical properties. Mechanics of Materials 43(2011), 476–
486.
15. McAfee J, Faisal NH. 2017. Parametric sensitivity analysis to
maximise auxetic effect of polymeric fibre based helical yarn.
Composite Structures 162(2017), 1–12.
16. Zeng J, Cao H, Hu H. 2018. Finite element simulation of an auxetic
plied yarn structure. Textile Research Journal 89(16), 3394–3400.
17. Chen J, Du Z. 2020. Structural design and performance
characterization of stable helical auxetic yarns based on the hollow-
spindle covering system. Textile Research Journal 90(3-4), 271–281.
18. Lee W, Lee S, et al. 2011. Patent No: US 2011/0039088 Moisture
sensitive auxetic material. United States: Patent Application
Publication.
19. Zhang GH, Ghita O, Evans KE. 2015. The fabrication and
mechanical properties of a novel 3-component auxetic structure for
composites. Composites Science and Technology 117, 257–267.
20. Ge Z, Hu H, Liu S. 2016. A novel plied yarn structure with negative
poisson’s ratio. The Journal of Textile Institute 107(2015), 578–588.
21. Ali M, Zeeshan M, Ahmed S, et al. 2018. Development and comfort
characterization of 2D-woven auxetic fabric for wearable and
medical textile applications. Clothing and Textile Research Journal
36(3), 199–214.
22. Cao H, Zulifqar A, Hua T, et al. 2018. Bi-stretch auxetic woven
fabrics based on foldable geometry. Textile Research Journal 89(13),
2694-2712.
23. Zulifqar A, Hu H. 2019. Geometrical analysis of bi-stretch auxetic
woven fabric based on re-entrant hexagonal geometry. Textile
Research Journal 89(21-22), 4476–4490.
24. Zulifqar A, Hua T, Hu H. 2019. Single and double-layered bistretch
auxetic woven fabrics made of nonauxetic yarns based on foldable
geometries. Basic Solid State Physics 257(10), 1–13.
25. Kamrul H, Dong W, Zulifqar A, et al. 2020. Deformation behavior of
auxetic woven fabric made of foldable geometry in different tensile
directions. Textile Research Journal 90(3-4), 410-421.
26. Chen Y, Zulifqar A, Hu H. 2020. Auxeticity from the folded
geometry: A numerical study. Basic Solid State Physics 257, 1–9.
27. Hu H, Wang Z, Liu S. 2011. Development of auxetic fabrics using
flat knitting technology. Textile Research Journal 81(14), 1493–
1502.
28. Glazzard M, Breedon P. 2014. Weft-knitted auxetic textile design.
Basic Solid State Physics 251(2), 267–272.
29. Liu Y, Hu H, Lam JKC, et al. 2010. Negative poisson’s ratio weft-
knitted fabrics. Textile Research Journal 80(9), 856–863.
30. Boakye A, Chang Y, Rafiu KR, et al. 2018. Design and manufacture
of knitted tubular fabric with auxetic effect. The Journal of Textile
Institute 109(5), 596–602.
31. Luan K, West A, DenHartog E, et al. 2020. Auxetic deformation of
the weft-knitted miura-ori fold. Textile Research Journal 90(5-6),
617–630.
32. Ugbolue SC, et al. 2011. Patent No: US 2011/0046715 A12011
Auxetic fabric structures and related fabrication methods. United
States: Patent Application Publication.
33. Xu W, Sun Y, Lin H, et al. 2020. Preparation of soft composite
reinforced with auxetic warp-knitted spacer fabric for stab resistance.
Textile Research Journal 90(3-4), 323–332.
34. Zhao S, Hu H, Kamrul H, et al. 2020. Development of auxetic warp
knitted fabrics based on reentrant geometry. Textile Research Journal
90(3-4), 344–356.
35. Wang Z, Hu H. 2013. 3D auxetic warp-knitted spacer fabrics. Basic
Solid State Physics 251(2), 281–288.
36. Wang Z, Hu H. 2017. Tensile and forming properties of auxetic
warp-knitted spacer fabrics. Textile Research Journal 87(16), 1925–
1937.
37. Blaga M, Ciobanu AR, Cuden AP, Rant D. 2013. Production of
foldable weft knitted structures with auxetic potential on electronic
flat knitting machines. Melliand International 19(4), 220-223
38. Herakovich CT. 1984. Composite laminates with negative through
the thickness poisson’s ratios. J Compos Mater 18, 447–455.
39. Evans KE, Donoghue JP, Alderson KL. 2004. The design, matching
and manufacture of auxetic carbon fibre laminates. Journal of
Composite Materials 38(2), 95–106.
40. Skertchly D. 2011. Patent No: US 2011/0214560 A1 Composite
auxetic armour. Place: United States Patent Application Publication.
41. Alderson KL, Simkins VR, Coenen VL, et al. 2005. How to make
auxetic fibre reinforced composites. Basic Solid State Physics 242(3),
509–518.
42. Grimmelsmann N, Meissner H, Ehrmann A. 2016, May. 3D printed
auxetic forms on knitted fabrics for adjustable permeability and
mechanical properties. IOP Conference Series: Materials Science
and Engineering. Hangzhou, China.
43. Chang Y, Ma P. 2018. Fabrication and property of auxetic warp-
knitted spacer structures with mesh. Textile Research Journal 88(19),
2206–2213.
TEKSTİL ve KONFEKSİYON 31(3), 2021 213
44. Ezazshahabi N. 2020. A Review on the poisson’s ratio of fabrics.
Journal of Textiles and Polymers 8(1), 53–63.
45. Lolaki A, Shanbeh M. 2019. Variation of poisson’s ratio of fabrics
woven with helical composite auxetic weft yarns in relation to fabric
structural parameters. Journal of Industrial Textiles 50(2),1-21.
46. Nazir MU, Shaker K, Hussain R, et al. 2019. Performance of novel
auxetic woven fabrics produced using helical auxetic yarn. Materials
Research Express 6(2019), 1-12.
47. Chang Y, Ma P, Jiang G. 2017. Energy absorption property of warp-
knitted spacer fabrics with negative possion’s ratio under low
velocity impact. Composite Structures 182(2017), 471–477.
48. Xu W, Sun Y, Raji KR, et al. 2019. Design and fabrication of novel
auxetic weft-knitted fabrics with Kevlar yarns. The Journal of Textile
Institute 110(9), 1257–1262.
49. Steffens F, Rana S, Fangueiro R. 2016. Development of novel auxetic
textile structures using high performance fibres. Materials and
Design 106(2016), 81–89.
50. Morton WE, Hearle JWS. 2008. Physical properties of textile fibres.
England: Woodhead Publishing.
51. ASTM-E132. 2010. Standard testmethod for poisson’s ratio at room
temperature.
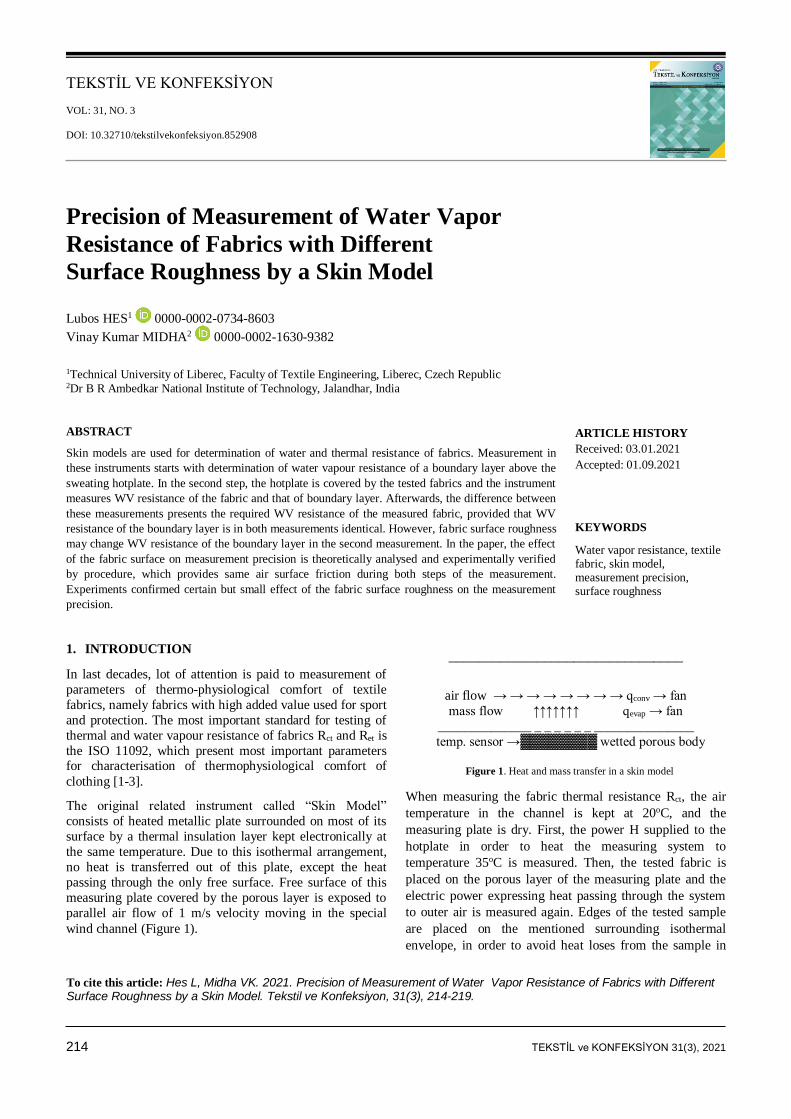
214 TEKSTİL ve KONFEKSİYON 31(3), 2021
TEKSTİL VE KONFEKSİYON
VOL: 31, NO. 3
DOI: 10.32710/tekstilvekonfeksiyon.852908
Precision of Measurement of Water Vapor
Resistance of Fabrics with Different
Surface Roughness by a Skin Model
Lubos HES1 0000-0002-0734-8603
Vinay Kumar MIDHA2 0000-0002-1630-9382
1Technical University of Liberec, Faculty of Textile Engineering, Liberec, Czech Republic 2Dr B R Ambedkar National Institute of Technology, Jalandhar, India
ABSTRACT
Skin models are used for determination of water and thermal resistance of fabrics. Measurement in
these instruments starts with determination of water vapour resistance of a boundary layer above the
sweating hotplate. In the second step, the hotplate is covered by the tested fabrics and the instrument
measures WV resistance of the fabric and that of boundary layer. Afterwards, the difference between
these measurements presents the required WV resistance of the measured fabric, provided that WV
resistance of the boundary layer is in both measurements identical. However, fabric surface roughness
may change WV resistance of the boundary layer in the second measurement. In the paper, the effect
of the fabric surface on measurement precision is theoretically analysed and experimentally verified
by procedure, which provides same air surface friction during both steps of the measurement.
Experiments confirmed certain but small effect of the fabric surface roughness on the measurement
precision.
ARTICLE HISTORY
Received: 03.01.2021
Accepted: 01.09.2021
KEYWORDS
Water vapor resistance, textile fabric, skin model, measurement precision, surface roughness
1. INTRODUCTION
In last decades, lot of attention is paid to measurement of
parameters of thermo-physiological comfort of textile
fabrics, namely fabrics with high added value used for sport
and protection. The most important standard for testing of
thermal and water vapour resistance of fabrics Rct and Ret is
the ISO 11092, which present most important parameters for characterisation of thermophysiological comfort of
clothing [1-3].
The original related instrument called “Skin Model”
consists of heated metallic plate surrounded on most of its
surface by a thermal insulation layer kept electronically at
the same temperature. Due to this isothermal arrangement,
no heat is transferred out of this plate, except the heat
passing through the only free surface. Free surface of this
measuring plate covered by the porous layer is exposed to
parallel air flow of 1 m/s velocity moving in the special
wind channel (Figure 1).
________________________________
air flow → → → → → → → → qconv → fan
mass flow ↑↑↑↑↑↑↑ qevap → fan
______________ _ _ _ _ _ _ _______________
temp. sensor →▓▓▓▓▓▓▓▓ wetted porous body
Figure 1. Heat and mass transfer in a skin model
When measuring the fabric thermal resistance Rct, the air
temperature in the channel is kept at 20oC, and the
measuring plate is dry. First, the power H supplied to the
hotplate in order to heat the measuring system to
temperature 35oC is measured. Then, the tested fabric is
placed on the porous layer of the measuring plate and the
electric power expressing heat passing through the system
to outer air is measured again. Edges of the tested sample
are placed on the mentioned surrounding isothermal
envelope, in order to avoid heat loses from the sample in
To cite this article: Hes L, Midha VK. 2021. Precision of Measurement of Water Vapor Resistance of Fabrics with Different Surface Roughness by a Skin Model. Tekstil ve Konfeksiyon, 31(3), 214-219.
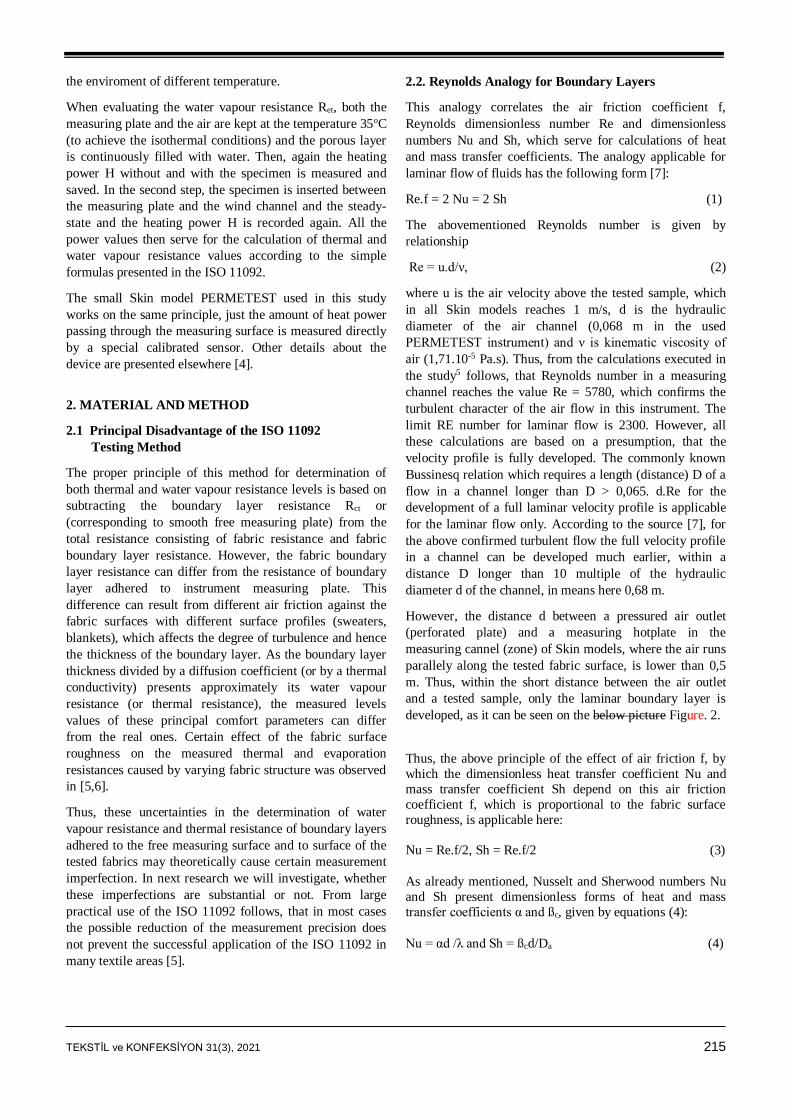
TEKSTİL ve KONFEKSİYON 31(3), 2021 215
the enviroment of different temperature.
When evaluating the water vapour resistance Ret, both the
measuring plate and the air are kept at the temperature 35oC
(to achieve the isothermal conditions) and the porous layer
is continuously filled with water. Then, again the heating
power H without and with the specimen is measured and
saved. In the second step, the specimen is inserted between
the measuring plate and the wind channel and the steady-
state and the heating power H is recorded again. All the
power values then serve for the calculation of thermal and
water vapour resistance values according to the simple
formulas presented in the ISO 11092.
The small Skin model PERMETEST used in this study
works on the same principle, just the amount of heat power
passing through the measuring surface is measured directly
by a special calibrated sensor. Other details about the
device are presented elsewhere [4].
2. MATERIAL AND METHOD
2.1 Principal Disadvantage of the ISO 11092
Testing Method
The proper principle of this method for determination of
both thermal and water vapour resistance levels is based on
subtracting the boundary layer resistance Rct or
(corresponding to smooth free measuring plate) from the
total resistance consisting of fabric resistance and fabric
boundary layer resistance. However, the fabric boundary
layer resistance can differ from the resistance of boundary
layer adhered to instrument measuring plate. This
difference can result from different air friction against the
fabric surfaces with different surface profiles (sweaters,
blankets), which affects the degree of turbulence and hence
the thickness of the boundary layer. As the boundary layer
thickness divided by a diffusion coefficient (or by a thermal
conductivity) presents approximately its water vapour
resistance (or thermal resistance), the measured levels
values of these principal comfort parameters can differ
from the real ones. Certain effect of the fabric surface
roughness on the measured thermal and evaporation
resistances caused by varying fabric structure was observed
in [5,6].
Thus, these uncertainties in the determination of water
vapour resistance and thermal resistance of boundary layers
adhered to the free measuring surface and to surface of the
tested fabrics may theoretically cause certain measurement
imperfection. In next research we will investigate, whether
these imperfections are substantial or not. From large
practical use of the ISO 11092 follows, that in most cases
the possible reduction of the measurement precision does
not prevent the successful application of the ISO 11092 in
many textile areas [5].
2.2. Reynolds Analogy for Boundary Layers
This analogy correlates the air friction coefficient f,
Reynolds dimensionless number Re and dimensionless
numbers Nu and Sh, which serve for calculations of heat
and mass transfer coefficients. The analogy applicable for
laminar flow of fluids has the following form [7]:
Re.f = 2 Nu = 2 Sh (1)
The abovementioned Reynolds number is given by
relationship
Re = u.d/ν, (2)
where u is the air velocity above the tested sample, which
in all Skin models reaches 1 m/s, d is the hydraulic
diameter of the air channel (0,068 m in the used
PERMETEST instrument) and ν is kinematic viscosity of
air (1,71.10-5 Pa.s). Thus, from the calculations executed in
the study5 follows, that Reynolds number in a measuring
channel reaches the value Re = 5780, which confirms the
turbulent character of the air flow in this instrument. The
limit RE number for laminar flow is 2300. However, all
these calculations are based on a presumption, that the
velocity profile is fully developed. The commonly known
Bussinesq relation which requires a length (distance) D of a
flow in a channel longer than D > 0,065. d.Re for the
development of a full laminar velocity profile is applicable
for the laminar flow only. According to the source [7], for
the above confirmed turbulent flow the full velocity profile
in a channel can be developed much earlier, within a
distance D longer than 10 multiple of the hydraulic
diameter d of the channel, in means here 0,68 m.
However, the distance d between a pressured air outlet
(perforated plate) and a measuring hotplate in the
measuring cannel (zone) of Skin models, where the air runs
parallely along the tested fabric surface, is lower than 0,5
m. Thus, within the short distance between the air outlet
and a tested sample, only the laminar boundary layer is
developed, as it can be seen on the below picture Figure. 2.
Thus, the above principle of the effect of air friction f, by
which the dimensionless heat transfer coefficient Nu and
mass transfer coefficient Sh depend on this air friction
coefficient f, which is proportional to the fabric surface
roughness, is applicable here:
Nu = Re.f/2, Sh = Re.f/2 (3)
As already mentioned, Nusselt and Sherwood numbers Nu
and Sh present dimensionless forms of heat and mass
transfer coefficients α and ßc, given by equations (4):
Nu = αd /λ and Sh = ßcd/Da (4)
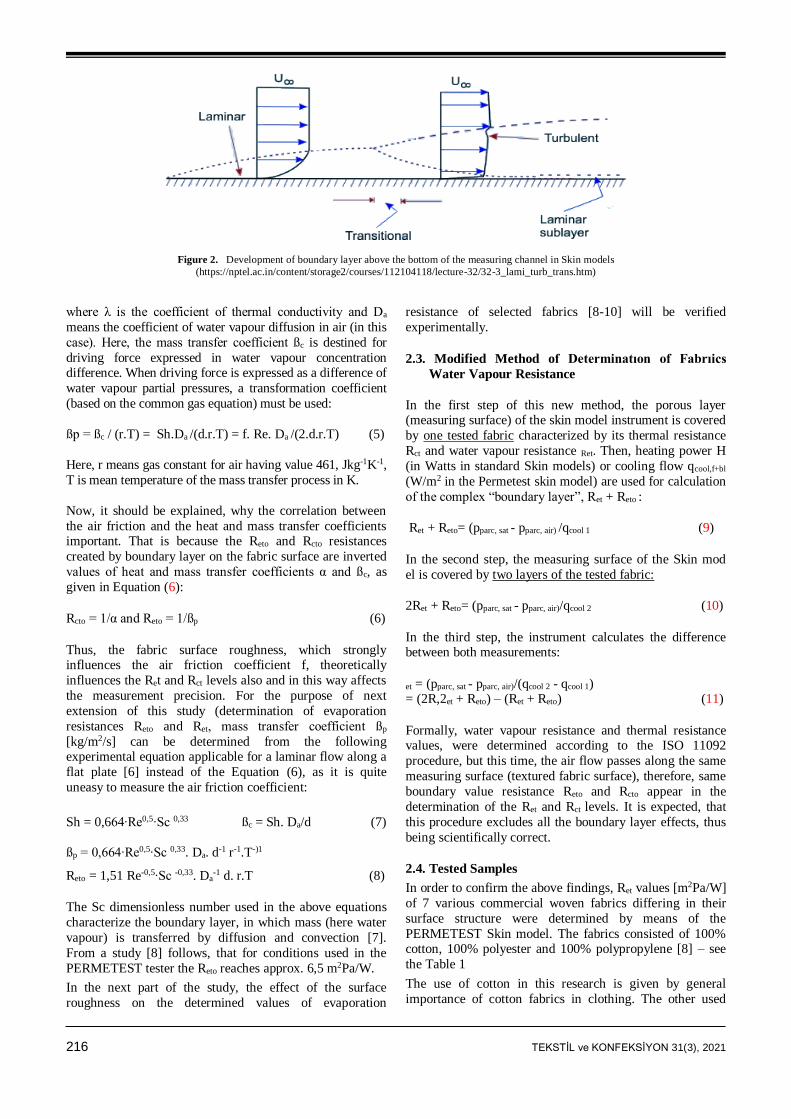
216 TEKSTİL ve KONFEKSİYON 31(3), 2021
Figure 2. Development of boundary layer above the bottom of the measuring channel in Skin models
(https://nptel.ac.in/content/storage2/courses/112104118/lecture-32/32-3_lami_turb_trans.htm)
where λ is the coefficient of thermal conductivity and Da
means the coefficient of water vapour diffusion in air (in this
case). Here, the mass transfer coefficient ßc is destined for
driving force expressed in water vapour concentration difference. When driving force is expressed as a difference of
water vapour partial pressures, a transformation coefficient
(based on the common gas equation) must be used:
ßp = ßc / (r.T) = Sh.Da /(d.r.T) = f. Re. Da /(2.d.r.T) (5)
Here, r means gas constant for air having value 461, Jkg-1K-1,
T is mean temperature of the mass transfer process in K.
Now, it should be explained, why the correlation between
the air friction and the heat and mass transfer coefficients important. That is because the Reto and Rcto resistances
created by boundary layer on the fabric surface are inverted
values of heat and mass transfer coefficients α and ßc, as
given in Equation (6):
Rcto = 1/α and Reto = 1/ßp (6)
Thus, the fabric surface roughness, which strongly influences the air friction coefficient f, theoretically
influences the Ret and Rct levels also and in this way affects
the measurement precision. For the purpose of next
extension of this study (determination of evaporation
resistances Reto and Ret, mass transfer coefficient ßp
[kg/m2/s] can be determined from the following experimental equation applicable for a laminar flow along a
flat plate [6] instead of the Equation (6), as it is quite
uneasy to measure the air friction coefficient:
Sh = 0,664∙Re0,5∙Sc 0,33 ßc = Sh. Da/d (7)
ßp = 0,664∙Re0,5∙Sc 0,33. Da. d-1 r-1.T-)1
Reto = 1,51 Re-0,5∙Sc -0,33. Da-1 d. r.T (8)
The Sc dimensionless number used in the above equations
characterize the boundary layer, in which mass (here water
vapour) is transferred by diffusion and convection [7].
From a study [8] follows, that for conditions used in the
PERMETEST tester the Reto reaches approx. 6,5 m2Pa/W.
In the next part of the study, the effect of the surface
roughness on the determined values of evaporation
resistance of selected fabrics [8-10] will be verified
experimentally.
2.3. Modified Method of Determinatıon of Fabrıics
Water Vapour Resistance
In the first step of this new method, the porous layer (measuring surface) of the skin model instrument is covered
by one tested fabric characterized by its thermal resistance
Rct and water vapour resistance Ret. Then, heating power H
(in Watts in standard Skin models) or cooling flow qcool,f+bl
(W/m2 in the Permetest skin model) are used for calculation
of the complex “boundary layer”, Ret + Reto :
Ret + Reto= (pparc, sat - pparc, air) /qcool 1 (9)
In the second step, the measuring surface of the Skin mod
el is covered by two layers of the tested fabric:
2Ret + Reto= (pparc, sat - pparc, air)/qcool 2 (10)
In the third step, the instrument calculates the difference between both measurements:
et = (pparc, sat - pparc, air)/(qcool 2 - qcool 1) = (2R,2et + Reto) – (Ret + Reto) (11)
Formally, water vapour resistance and thermal resistance values, were determined according to the ISO 11092
procedure, but this time, the air flow passes along the same
measuring surface (textured fabric surface), therefore, same
boundary value resistance Reto and Rcto appear in the
determination of the Ret and Rct levels. It is expected, that
this procedure excludes all the boundary layer effects, thus
being scientifically correct.
2.4. Tested Samples
In order to confirm the above findings, Ret values [m2Pa/W]
of 7 various commercial woven fabrics differing in their
surface structure were determined by means of the
PERMETEST Skin model. The fabrics consisted of 100% cotton, 100% polyester and 100% polypropylene [8] – see
the Table 1
The use of cotton in this research is given by general
importance of cotton fabrics in clothing. The other used
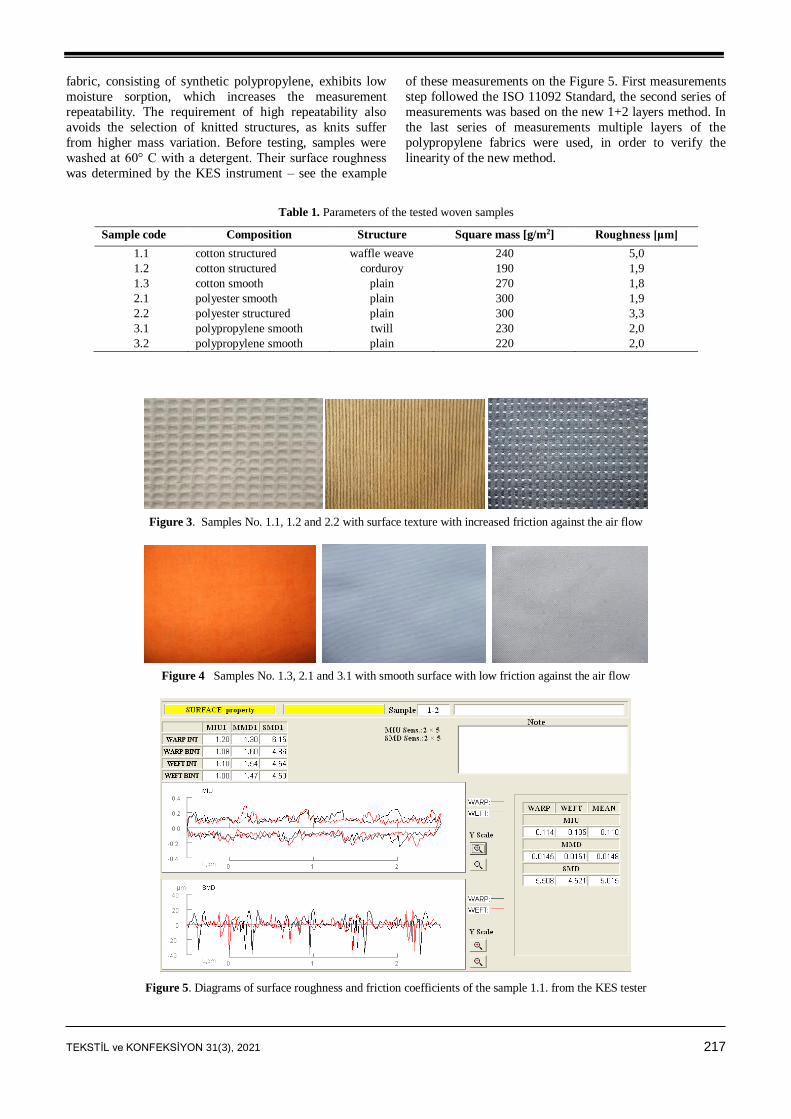
TEKSTİL ve KONFEKSİYON 31(3), 2021 217
fabric, consisting of synthetic polypropylene, exhibits low
moisture sorption, which increases the measurement
repeatability. The requirement of high repeatability also
avoids the selection of knitted structures, as knits suffer
from higher mass variation. Before testing, samples were
washed at 60° C with a detergent. Their surface roughness
was determined by the KES instrument – see the example
of these measurements on the Figure 5. First measurements
step followed the ISO 11092 Standard, the second series of
measurements was based on the new 1+2 layers method. In
the last series of measurements multiple layers of the
polypropylene fabrics were used, in order to verify the
linearity of the new method.
Table 1. Parameters of the tested woven samples
Sample code Composition Structure Square mass [g/m2] Roughness [μm]
1.1 cotton structured waffle weave 240 5,0
1.2 cotton structured corduroy 190 1,9
1.3 cotton smooth plain 270 1,8
2.1 polyester smooth plain 300 1,9
2.2 polyester structured plain 300 3,3
3.1 polypropylene smooth twill 230 2,0
3.2 polypropylene smooth plain 220 2,0
Figure 3. Samples No. 1.1, 1.2 and 2.2 with surface texture with increased friction against the air flow
Figure 4 Samples No. 1.3, 2.1 and 3.1 with smooth surface with low friction against the air flow
Figure 5. Diagrams of surface roughness and friction coefficients of the sample 1.1. from the KES tester
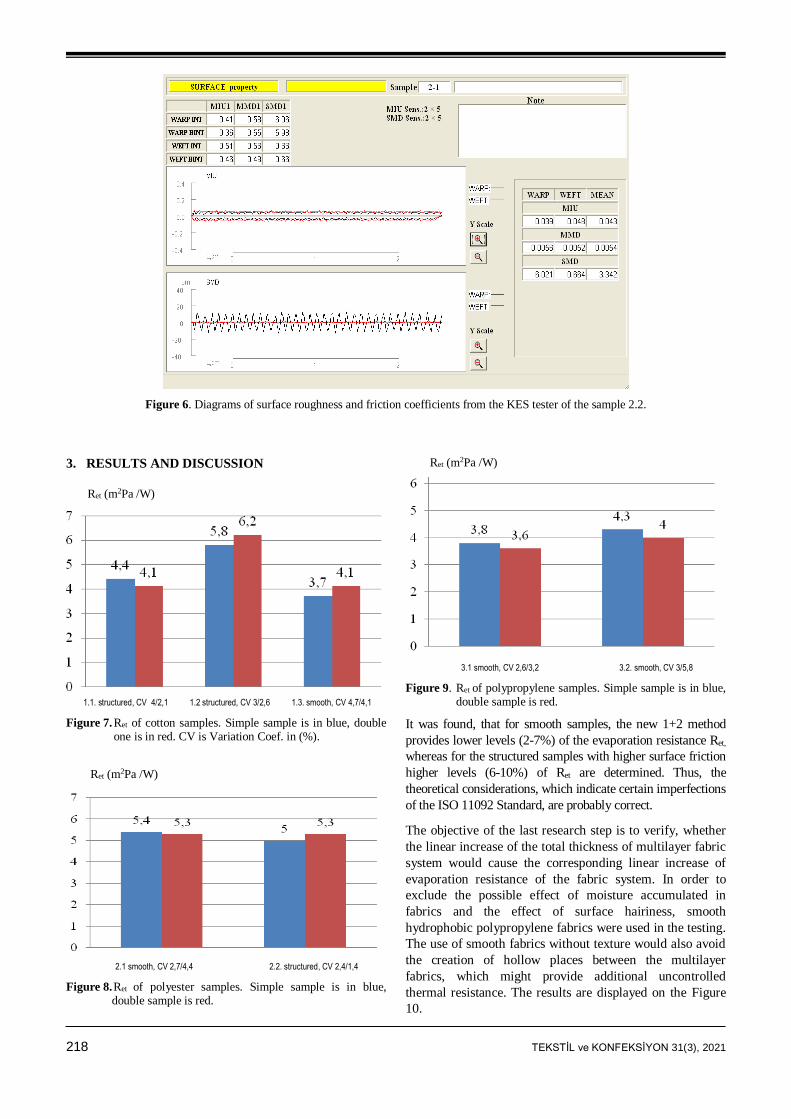
218 TEKSTİL ve KONFEKSİYON 31(3), 2021
Figure 6. Diagrams of surface roughness and friction coefficients from the KES tester of the sample 2.2.
3. RESULTS AND DISCUSSION
Ret (m2Pa /W)
1.1. structured, CV 4/2,1 1.2 structured, CV 3/2,6 1.3. smooth, CV 4,7/4,1
Figure 7. Ret of cotton samples. Simple sample is in blue, double one is in red. CV is Variation Coef. in (%).
Ret (m2Pa /W)
2.1 smooth, CV 2,7/4,4 2.2. structured, CV 2,4/1,4
Figure 8. Ret of polyester samples. Simple sample is in blue, double sample is red.
Ret (m2Pa /W)
3.1 smooth, CV 2,6/3,2 3.2. smooth, CV 3/5,8
Figure 9. Ret of polypropylene samples. Simple sample is in blue, double sample is red.
It was found, that for smooth samples, the new 1+2 method
provides lower levels (2-7%) of the evaporation resistance Ret,
whereas for the structured samples with higher surface friction
higher levels (6-10%) of Ret are determined. Thus, the
theoretical considerations, which indicate certain imperfections
of the ISO 11092 Standard, are probably correct.
The objective of the last research step is to verify, whether
the linear increase of the total thickness of multilayer fabric
system would cause the corresponding linear increase of
evaporation resistance of the fabric system. In order to
exclude the possible effect of moisture accumulated in
fabrics and the effect of surface hairiness, smooth
hydrophobic polypropylene fabrics were used in the testing.
The use of smooth fabrics without texture would also avoid
the creation of hollow places between the multilayer
fabrics, which might provide additional uncontrolled
thermal resistance. The results are displayed on the Figure
10.
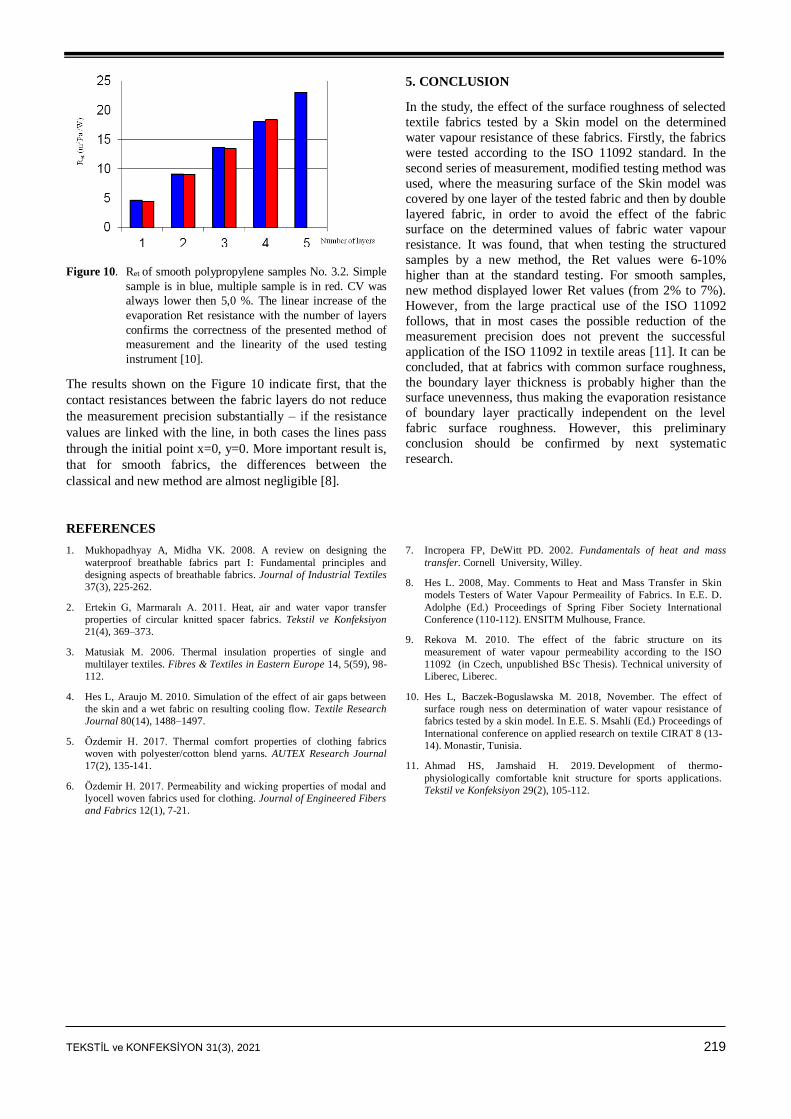
TEKSTİL ve KONFEKSİYON 31(3), 2021 219
Figure 10. Ret of smooth polypropylene samples No. 3.2. Simple
sample is in blue, multiple sample is in red. CV was
always lower then 5,0 %. The linear increase of the
evaporation Ret resistance with the number of layers
confirms the correctness of the presented method of
measurement and the linearity of the used testing
instrument [10].
The results shown on the Figure 10 indicate first, that the
contact resistances between the fabric layers do not reduce
the measurement precision substantially – if the resistance
values are linked with the line, in both cases the lines pass
through the initial point x=0, y=0. More important result is,
that for smooth fabrics, the differences between the
classical and new method are almost negligible [8].
5. CONCLUSION
In the study, the effect of the surface roughness of selected
textile fabrics tested by a Skin model on the determined
water vapour resistance of these fabrics. Firstly, the fabrics
were tested according to the ISO 11092 standard. In the
second series of measurement, modified testing method was
used, where the measuring surface of the Skin model was
covered by one layer of the tested fabric and then by double
layered fabric, in order to avoid the effect of the fabric surface on the determined values of fabric water vapour
resistance. It was found, that when testing the structured
samples by a new method, the Ret values were 6-10%
higher than at the standard testing. For smooth samples,
new method displayed lower Ret values (from 2% to 7%).
However, from the large practical use of the ISO 11092
follows, that in most cases the possible reduction of the
measurement precision does not prevent the successful
application of the ISO 11092 in textile areas [11]. It can be
concluded, that at fabrics with common surface roughness,
the boundary layer thickness is probably higher than the surface unevenness, thus making the evaporation resistance
of boundary layer practically independent on the level
fabric surface roughness. However, this preliminary
conclusion should be confirmed by next systematic
research.
REFERENCES
1. Mukhopadhyay A, Midha VK. 2008. A review on designing the
waterproof breathable fabrics part I: Fundamental principles and
designing aspects of breathable fabrics. Journal of Industrial Textiles
37(3), 225-262.
2. Ertekin G, Marmaralı A. 2011. Heat, air and water vapor transfer
properties of circular knitted spacer fabrics. Tekstil ve Konfeksiyon
21(4), 369–373.
3. Matusiak M. 2006. Thermal insulation properties of single and
multilayer textiles. Fibres & Textiles in Eastern Europe 14, 5(59), 98-
112.
4. Hes L, Araujo M. 2010. Simulation of the effect of air gaps between
the skin and a wet fabric on resulting cooling flow. Textile Research
Journal 80(14), 1488–1497.
5. Özdemir H. 2017. Thermal comfort properties of clothing fabrics
woven with polyester/cotton blend yarns. AUTEX Research Journal
17(2), 135-141.
6. Özdemir H. 2017. Permeability and wicking properties of modal and
lyocell woven fabrics used for clothing. Journal of Engineered Fibers
and Fabrics 12(1), 7-21.
7. Incropera FP, DeWitt PD. 2002. Fundamentals of heat and mass
transfer. Cornell University, Willey.
8. Hes L. 2008, May. Comments to Heat and Mass Transfer in Skin
models Testers of Water Vapour Permeaility of Fabrics. In E.E. D.
Adolphe (Ed.) Proceedings of Spring Fiber Society International
Conference (110-112). ENSITM Mulhouse, France.
9. Rekova M. 2010. The effect of the fabric structure on its
measurement of water vapour permeability according to the ISO
11092 (in Czech, unpublished BSc Thesis). Technical university of
Liberec, Liberec.
10. Hes L, Baczek-Boguslawska M. 2018, November. The effect of
surface rough ness on determination of water vapour resistance of
fabrics tested by a skin model. In E.E. S. Msahli (Ed.) Proceedings of
International conference on applied research on textile CIRAT 8 (13-
14). Monastir, Tunisia.
11. Ahmad HS, Jamshaid H. 2019. Development of thermo-
physiologically comfortable knit structure for sports applications.
Tekstil ve Konfeksiyon 29(2), 105-112.
220 TEKSTİL ve KONFEKSİYON 31(3), 2021
TEKSTİL VE KONFEKSİYON
VOL: 31, NO. 3
DOI: 10.32710/tekstilvekonfeksiyon.903690
Optimization of Draft and Twist Values for
Improvement of Breaking Strength and
Elongation Properties of Dual-Core Yarns
Sümeyye ÜSTÜNTAĞ 0000-0002-2625-4063*
Faculty of Engineering, Department of Textile Engineering, Erciyes University, 38039, Kayseri, Turkey
Corresponding Author: Sümeyye Üstüntağ, [email protected]
ABSTRACT
Dual-core yarns, which are developed to have high elasticity and strength properties at the same time
in the yarn structure, have been the focus of interest in yarn sector. Considering the purpose of
developing dual-core yarns, it is obvious that the breaking strength and elongation performances
expected from these yarns are very important. In this paper, the twist coefficient and PET
(Polyethylene terephthalate)/Elastane draft ratios of dual-core yarns were optimized by Taguchi
Method for improved of breaking strength and elongation performance. The signal to noise ratio
(SNR) was calculated for each output and optimum levels were determined over these ratios. As a
result of the study, it was determined that PET draft was the most effective parameter for both
outputs. Considering the individual optimum levels determined for each output, common factor-level
combinations covering both outputs were determined. Consequently, optimal common combination
for the multi-performances was found as 4.2 twist coefficient, 1.15 PET draft ratio and 3.8 elastane
ratio.
ARTICLE HISTORY
Received: 26.03.2021
Accepted: 17.08.2021
KEYWORDS
Dual-core yarn, Elastane draft ratio, PET draft ratio, Twist coefficient, Breaking
elongation, Breaking strength
1. INTRODUCTION
Elastic materials that impart stretch and recovery capability
to fabrics or garments are widely used for fashionable and
functional apparel products such as denim fabrics, medical
textiles and sportswear [1]. Core-spun yarn spinning
technology is a widely preferred method for placing elastic
materials in fabric structure, especially in the denim
industry. The elastic core-spun yarn which is a
multicomponent textile structure, consists of elastane core
(lycra®, creora® etc.) covered by natural or man-made
fibers with a certain twist. The elastic core part ensures the
yarn to have better stretch and recovery properties; besides,
the sheath fibers improve physical and comfort properties
of fabrics. In addition to the use of elastic core-spun yarn,
core-spun yarns containing PET, PA, PBT and T400®
filament are often preferred in order to enhance some
characteristics of fabric i.e. mechanical and functional
properties. Lately, dual-core yarns have been developed in
order to produce fabrics having better recovering, durability
and lower shrinkage as compared to the traditional single-
core yarns containing only elastane in the core and cotton in
the sheath. The dual core-spun yarns are composed of two
core components; filament (PET, PA etc.) and elastane or
semi-elastic core [2, 3]. Dual-core yarns can be
manufactured on modified conventional ring spinning
machine in two different methods. In the first method,
previously combined two core yarns are fed
simultaneously, whereas in the second method, two core
yarns are fed separately into the center of sheath fiber
bundle. Dual-core yarns produced with the first method are
called as pre-treated dual-core yarns (PDC) while the yarns
To cite this article: Üstüntağ, S. 2021. Optimization of draft and twist values for ımprovement of breaking strength and elongation properties of dual-core yarns. Tekstil ve Konfeksiyon, 31(3), 220-227.
TEKSTİL ve KONFEKSİYON 31(3), 2021 221
obtained with the second method are named as dual-core
(DC) yarns.
In recent years, dual-core yarns are highly preferred for
high quality fabrics and therefore, works on dual-core yarns
are increasing, day by day. Aydoğdu and Yılmaz studied
the effects of dual-core yarn production parameters
(different sheath fiber types, yarn counts, and core filament
linear densities) on some yarn and fabric properties. They
found that dual-core yarns with cotton sheath fibres had
significantly higher yarn unevenness, hairiness, thick
places, neps, and lower tenacity and breaking elongation
values, when compared to cotton/Tencel fibre and viscose
sheath fibers [4]. Erbil et al. investigated the structure and
properties of plain, elastane containing, and elastane +
filament containing hybrid yarns, produced by using cotton
as sheath fibers. They found that the elastic behaviour of
dual-core yarns was higher when compared to elastane core
and 100% carded cotton yarns [5]. Ute worked on influence
of the weft density and weft yarn type on mechanical and
dimensional properties of denim fabrics for dual-core and
core-spun. At the end of the study, it was determined that
growth values of the fabrics with elastic core-spun weft
yarns were generally higher than the growth values the
fabrics with elastic dual-core weft yarns [6]. Ertaş at al.
evaluated some properties of denim fabrics produced with
different weft densities by using elastane containing dual-
core yarns. They found that as weft density increased,
permanent elongation decreased [7]. Babaarslan at al.
investigated the air permeability of denim fabrics made
from dual-core spun weft yarns with different filament
fineness and elastane draft, by comparing them with PET
filament core-spun yarns and 100% cotton yarns. They
revealed that the elastane draft ratio had a significant effect
on the denim fabric air permeability whereas filament
fineness had no effect on air permeability [8]. Jabbar at al.
studied the effects of PET and elastane linear density on the
physical and mechanical properties of dual-core cotton
yarns. They revealed that yarn tenacity, elongation,
uniformity, and hairiness was significantly affected by the
linear densities of both the PET and elastane filaments in
the core [2]. Türksoy and Yıldırım investigated the
influence of some production parameters such as twist
level, wool draft and elastane draft on the properties of
dual-core yarns containing wool/elastane. The results
indicated that the twist level was significantly effective
parameter for the unevenness, hairiness, tenacity and
elongation values of dual-core yarns. In addition, it was
also observed that variation of elastane draft level affected
tenacity and elongation values of dual-core yarns [9].
Breaking strength and elongation are among the most
important and widely measured property of core-spun
yarns. Yarn strength and elongation, like other yarn
properties, is mainly influenced by fibre properties, yarn
twist, and yarn count. Since these properties are strongly
correlated with loom efficiency and usage performance, it
would be very useful to estimate the optimum yarn strength
and elongation, accurately. When we look at the literature
in general, the effects of the production parameters of dual-
core yarns on the yarn strength and elongation were
examined separately. While examining the factors affecting
the strength and elongation of multicomponent yarns,
considering all outputs together will provide more accurate
results. In this study, firstly, the optimum draft and twist
values of dual-core yarns were determined separately for
maximum breaking strength and elongation value. Then,
common optimum factor levels were determined for both
outputs. Taguchi method was used for the analysis of input
factors selected and the optimization of this factors.
1.1 Taguchi Method
The full factorial design considers all possible combinations
of a certain set of factors. As most of the industrial
experiments normally include a considerable number of
factors, a full factorial design results in a great number of
experiments. Contrary to the full factorial design, Taguchi
method provides the utility in terms of cost and time by
reducing the number of experiments [10]. The Taguchi
method is a statistical off-line quality control method that
purposes to minimize product or process variation at the
design phase. In Taguchi method, there are three design
stages, which are system, parameter and tolerance designs.
In system design, scientific and engineering knowledge is
utilized to detect the basic arrangement of the process. With
the parameter design, the settings that minimize the
variation change in performance characteristics and adjust
its mean to an ideal value are determined. Parameter design
is a methodology used to determine the best tolerances for
parameters, between system design and tolerance design
[11].
The orthogonal array (OA) and the signal to noise ratio
(SNR) are two important tools utilized in the Taguchi
method [12]. Orthogonal arrays are utilized to organize the
factors that influence the process and the levels where they
should vary [13]. OA is a matrix of numbers arranged in
rows and columns. Each row represents the level of factors
in each run and each column represents a specific level for
a factor that can be changed for each run [12].
The general purpose of the Taguchi design is to detect
factor levels that maximize the SNR is a measure of the
performance variability of processes in the presence of
noise factors. In that, S stands for mean and that is called
signal and also N stands for standard deviation and that is
called noise [11]. The higher the S/N ratio, the better the
quality; in general, the S/N ratio is classified into three
modes where smaller is better, nominal is better or larger is
better [10].
Nominal-the-better:
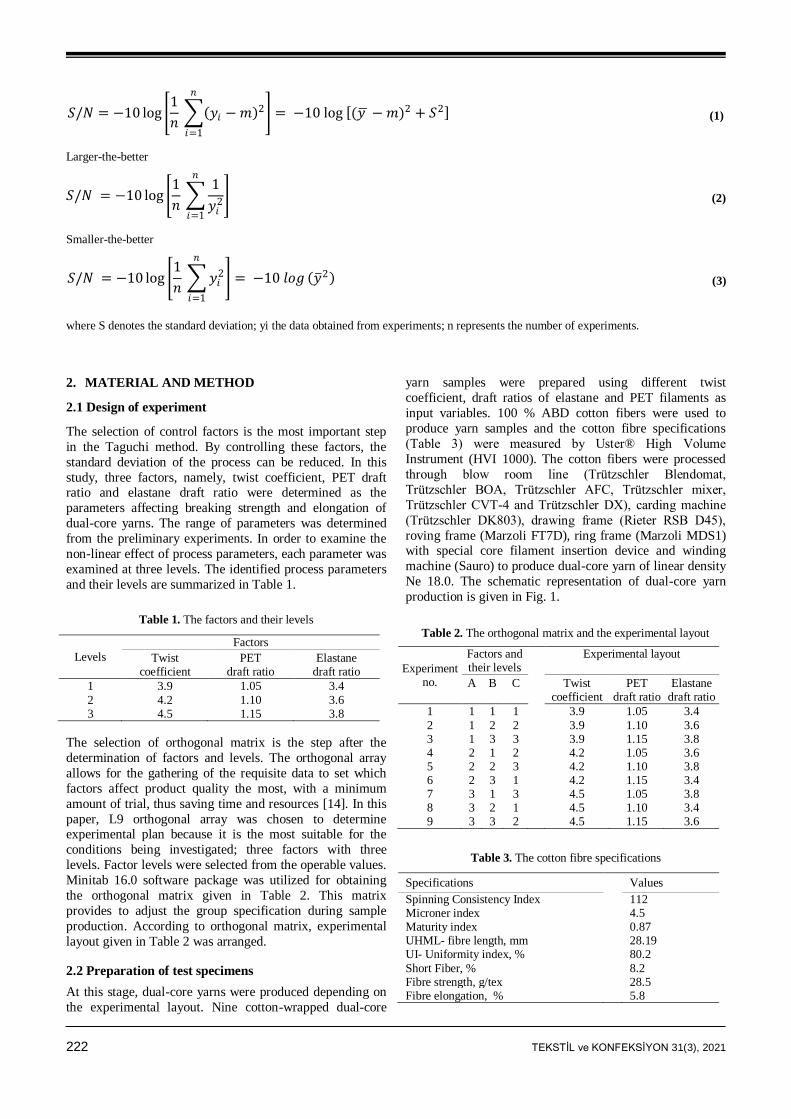
222 TEKSTİL ve KONFEKSİYON 31(3), 2021
(1)
Larger-the-better
(2)
Smaller-the-better
(3)
where S denotes the standard deviation; yi the data obtained from experiments; n represents the number of experiments.
2. MATERIAL AND METHOD
2.1 Design of experiment
The selection of control factors is the most important step
in the Taguchi method. By controlling these factors, the
standard deviation of the process can be reduced. In this
study, three factors, namely, twist coefficient, PET draft ratio and elastane draft ratio were determined as the
parameters affecting breaking strength and elongation of
dual-core yarns. The range of parameters was determined
from the preliminary experiments. In order to examine the
non-linear effect of process parameters, each parameter was
examined at three levels. The identified process parameters
and their levels are summarized in Table 1.
Table 1. The factors and their levels
Levels
Factors
Twist coefficient
PET draft ratio
Elastane draft ratio
1 3.9 1.05 3.4
2 4.2 1.10 3.6 3 4.5 1.15 3.8
The selection of orthogonal matrix is the step after the
determination of factors and levels. The orthogonal array
allows for the gathering of the requisite data to set which
factors affect product quality the most, with a minimum
amount of trial, thus saving time and resources [14]. In this
paper, L9 orthogonal array was chosen to determine experimental plan because it is the most suitable for the
conditions being investigated; three factors with three
levels. Factor levels were selected from the operable values.
Minitab 16.0 software package was utilized for obtaining
the orthogonal matrix given in Table 2. This matrix
provides to adjust the group specification during sample
production. According to orthogonal matrix, experimental
layout given in Table 2 was arranged.
2.2 Preparation of test specimens
At this stage, dual-core yarns were produced depending on
the experimental layout. Nine cotton-wrapped dual-core
yarn samples were prepared using different twist
coefficient, draft ratios of elastane and PET filaments as
input variables. 100 % ABD cotton fibers were used to
produce yarn samples and the cotton fibre specifications
(Table 3) were measured by Uster® High Volume
Instrument (HVI 1000). The cotton fibers were processed
through blow room line (Trützschler Blendomat,
Trützschler BOA, Trützschler AFC, Trützschler mixer,
Trützschler CVT-4 and Trützschler DX), carding machine
(Trützschler DK803), drawing frame (Rieter RSB D45),
roving frame (Marzoli FT7D), ring frame (Marzoli MDS1) with special core filament insertion device and winding
machine (Sauro) to produce dual-core yarn of linear density
Ne 18.0. The schematic representation of dual-core yarn
production is given in Fig. 1.
Table 2. The orthogonal matrix and the experimental layout
Experiment no.
Factors and their levels
Experimental layout
A B C Twist coefficient
PET draft ratio
Elastane draft ratio
1 1 1 1 3.9 1.05 3.4
2 1 2 2 3.9 1.10 3.6 3 1 3 3 3.9 1.15 3.8 4 2 1 2 4.2 1.05 3.6 5 2 2 3 4.2 1.10 3.8 6 2 3 1 4.2 1.15 3.4 7 3 1 3 4.5 1.05 3.8 8 3 2 1 4.5 1.10 3.4 9 3 3 2 4.5 1.15 3.6
Table 3. The cotton fibre specifications
Specifications Values
Spinning Consistency Index 112 Microner index 4.5 Maturity index 0.87 UHML- fibre length, mm 28.19 UI- Uniformity index, % 80.2
Short Fiber, % 8.2 Fibre strength, g/tex 28.5 Fibre elongation, % 5.8
𝑆/𝑁 = −10 log 1
𝑛 𝑦𝑖 − 𝑚 2
𝑛
𝑖=1
= −10 log (𝑦 − 𝑚)2 + 𝑆2
𝑆/𝑁 = −10 log 1
𝑛
1
𝑦𝑖2
𝑛
𝑖=1
𝑆/𝑁 = −10 log 1
𝑛 𝑦𝑖
2
𝑛
𝑖=1
= −10 𝑙𝑜𝑔 𝑦 2
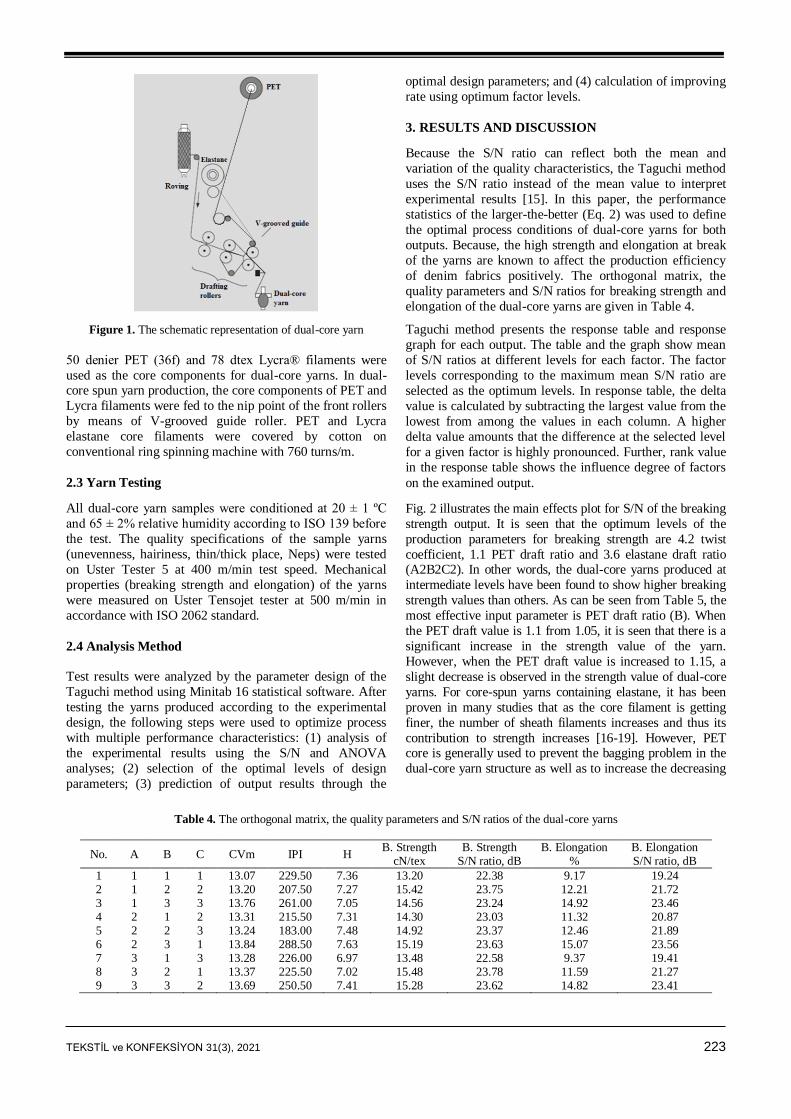
TEKSTİL ve KONFEKSİYON 31(3), 2021 223
Figure 1. The schematic representation of dual-core yarn
50 denier PET (36f) and 78 dtex Lycra® filaments were
used as the core components for dual-core yarns. In dual-core spun yarn production, the core components of PET and
Lycra filaments were fed to the nip point of the front rollers
by means of V-grooved guide roller. PET and Lycra
elastane core filaments were covered by cotton on
conventional ring spinning machine with 760 turns/m.
2.3 Yarn Testing
All dual-core yarn samples were conditioned at 20 ± 1 ºC
and 65 ± 2% relative humidity according to ISO 139 before
the test. The quality specifications of the sample yarns
(unevenness, hairiness, thin/thick place, Neps) were tested
on Uster Tester 5 at 400 m/min test speed. Mechanical
properties (breaking strength and elongation) of the yarns
were measured on Uster Tensojet tester at 500 m/min in
accordance with ISO 2062 standard.
2.4 Analysis Method
Test results were analyzed by the parameter design of the
Taguchi method using Minitab 16 statistical software. After
testing the yarns produced according to the experimental
design, the following steps were used to optimize process
with multiple performance characteristics: (1) analysis of
the experimental results using the S/N and ANOVA
analyses; (2) selection of the optimal levels of design
parameters; (3) prediction of output results through the
optimal design parameters; and (4) calculation of improving
rate using optimum factor levels.
3. RESULTS AND DISCUSSION
Because the S/N ratio can reflect both the mean and
variation of the quality characteristics, the Taguchi method
uses the S/N ratio instead of the mean value to interpret
experimental results [15]. In this paper, the performance
statistics of the larger-the-better (Eq. 2) was used to define
the optimal process conditions of dual-core yarns for both
outputs. Because, the high strength and elongation at break
of the yarns are known to affect the production efficiency
of denim fabrics positively. The orthogonal matrix, the
quality parameters and S/N ratios for breaking strength and
elongation of the dual-core yarns are given in Table 4.
Taguchi method presents the response table and response
graph for each output. The table and the graph show mean
of S/N ratios at different levels for each factor. The factor
levels corresponding to the maximum mean S/N ratio are
selected as the optimum levels. In response table, the delta
value is calculated by subtracting the largest value from the
lowest from among the values in each column. A higher
delta value amounts that the difference at the selected level
for a given factor is highly pronounced. Further, rank value
in the response table shows the influence degree of factors
on the examined output.
Fig. 2 illustrates the main effects plot for S/N of the breaking
strength output. It is seen that the optimum levels of the
production parameters for breaking strength are 4.2 twist
coefficient, 1.1 PET draft ratio and 3.6 elastane draft ratio (A2B2C2). In other words, the dual-core yarns produced at
intermediate levels have been found to show higher breaking
strength values than others. As can be seen from Table 5, the
most effective input parameter is PET draft ratio (B). When
the PET draft value is 1.1 from 1.05, it is seen that there is a
significant increase in the strength value of the yarn.
However, when the PET draft value is increased to 1.15, a
slight decrease is observed in the strength value of dual-core
yarns. For core-spun yarns containing elastane, it has been
proven in many studies that as the core filament is getting
finer, the number of sheath filaments increases and thus its
contribution to strength increases [16-19]. However, PET core is generally used to prevent the bagging problem in the
dual-core yarn structure as well as to increase the decreasing
Table 4. The orthogonal matrix, the quality parameters and S/N ratios of the dual-core yarns
No. A B C CVm IPI H B. Strength
cN/tex B. Strength
S/N ratio, dB B. Elongation
% B. Elongation S/N ratio, dB
1 1 1 1 13.07 229.50 7.36 13.20 22.38 9.17 19.24 2 1 2 2 13.20 207.50 7.27 15.42 23.75 12.21 21.72 3 1 3 3 13.76 261.00 7.05 14.56 23.24 14.92 23.46 4 2 1 2 13.31 215.50 7.31 14.30 23.03 11.32 20.87 5 2 2 3 13.24 183.00 7.48 14.92 23.37 12.46 21.89 6 2 3 1 13.84 288.50 7.63 15.19 23.63 15.07 23.56 7 3 1 3 13.28 226.00 6.97 13.48 22.58 9.37 19.41 8 3 2 1 13.37 225.50 7.02 15.48 23.78 11.59 21.27 9 3 3 2 13.69 250.50 7.41 15.28 23.62 14.82 23.41
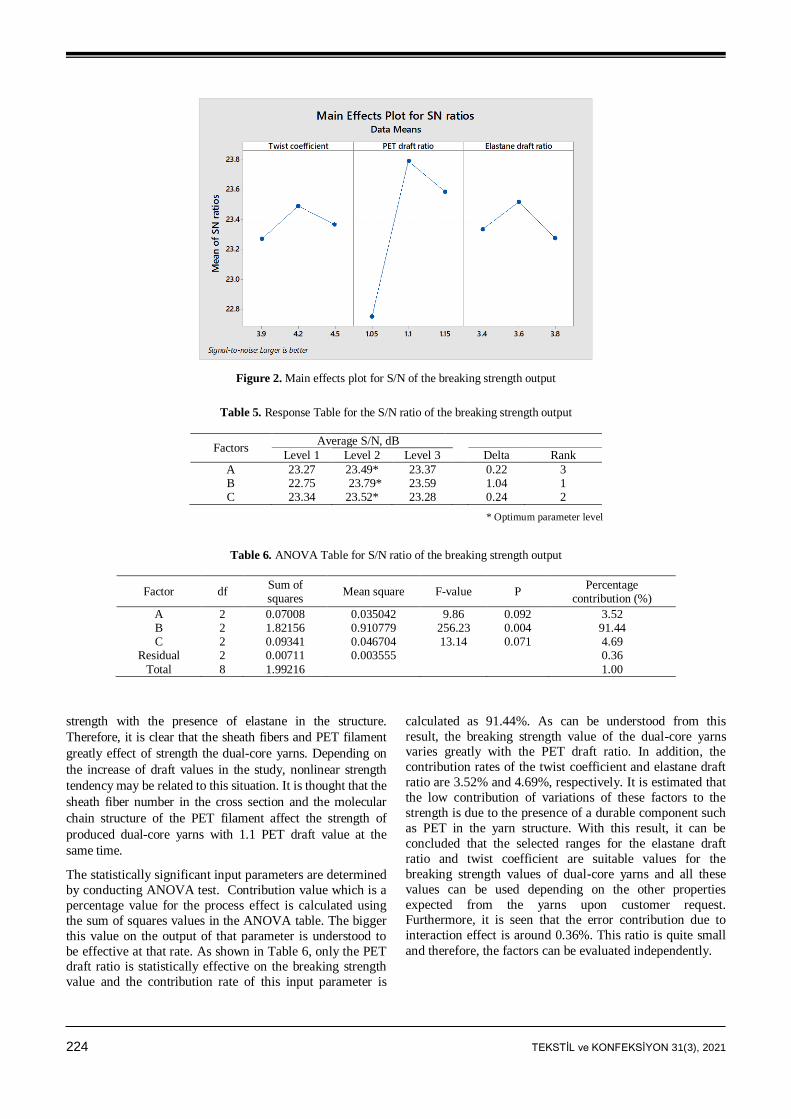
224 TEKSTİL ve KONFEKSİYON 31(3), 2021
Figure 2. Main effects plot for S/N of the breaking strength output
Table 5. Response Table for the S/N ratio of the breaking strength output
Factors Average S/N, dB
Level 1 Level 2 Level 3 Delta Rank
A 23.27 23.49* 23.37 0.22 3 B 22.75 23.79* 23.59 1.04 1 C 23.34 23.52* 23.28 0.24 2
* Optimum parameter level
Table 6. ANOVA Table for S/N ratio of the breaking strength output
Factor df Sum of squares
Mean square F-value P Percentage
contribution (%)
A 2 0.07008 0.035042 9.86 0.092 3.52 B 2 1.82156 0.910779 256.23 0.004 91.44 C 2 0.09341 0.046704 13.14 0.071 4.69
Residual 2 0.00711 0.003555 0.36
Total 8 1.99216 1.00
strength with the presence of elastane in the structure.
Therefore, it is clear that the sheath fibers and PET filament
greatly effect of strength the dual-core yarns. Depending on
the increase of draft values in the study, nonlinear strength
tendency may be related to this situation. It is thought that the
sheath fiber number in the cross section and the molecular
chain structure of the PET filament affect the strength of
produced dual-core yarns with 1.1 PET draft value at the
same time.
The statistically significant input parameters are determined
by conducting ANOVA test. Contribution value which is a
percentage value for the process effect is calculated using
the sum of squares values in the ANOVA table. The bigger
this value on the output of that parameter is understood to
be effective at that rate. As shown in Table 6, only the PET draft ratio is statistically effective on the breaking strength
value and the contribution rate of this input parameter is
calculated as 91.44%. As can be understood from this
result, the breaking strength value of the dual-core yarns varies greatly with the PET draft ratio. In addition, the
contribution rates of the twist coefficient and elastane draft
ratio are 3.52% and 4.69%, respectively. It is estimated that
the low contribution of variations of these factors to the
strength is due to the presence of a durable component such
as PET in the yarn structure. With this result, it can be
concluded that the selected ranges for the elastane draft
ratio and twist coefficient are suitable values for the
breaking strength values of dual-core yarns and all these
values can be used depending on the other properties
expected from the yarns upon customer request. Furthermore, it is seen that the error contribution due to
interaction effect is around 0.36%. This ratio is quite small
and therefore, the factors can be evaluated independently.
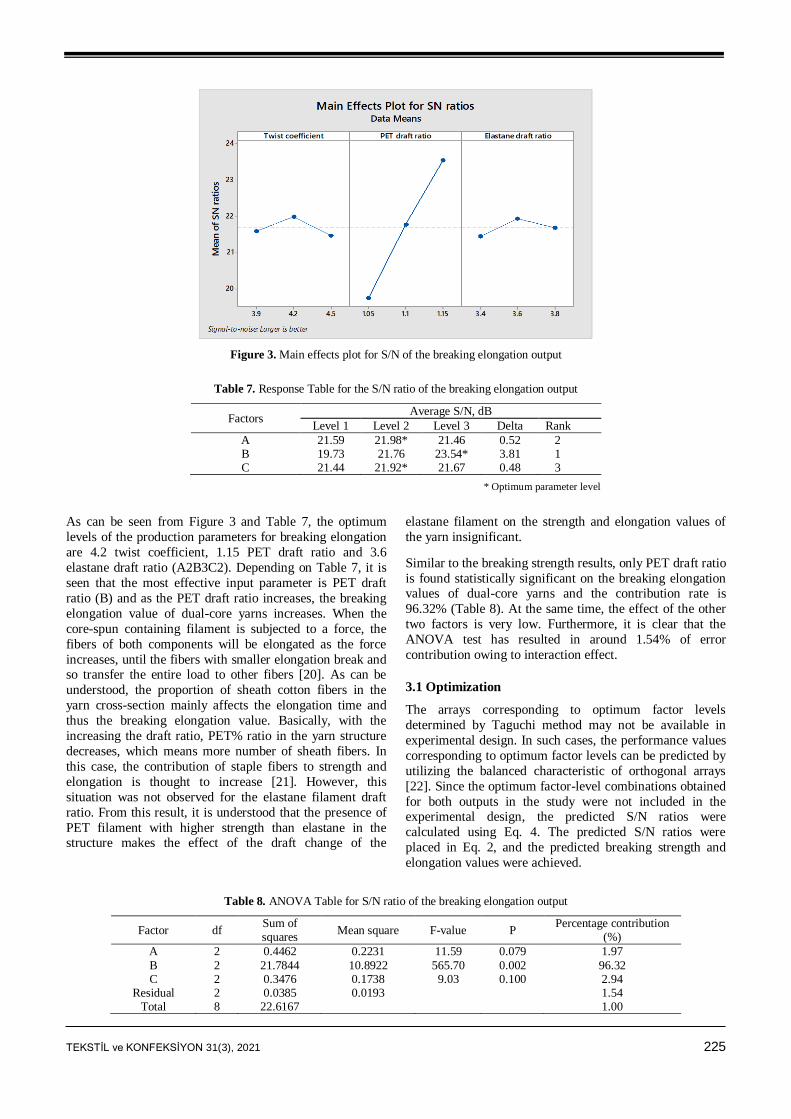
TEKSTİL ve KONFEKSİYON 31(3), 2021 225
Figure 3. Main effects plot for S/N of the breaking elongation output
Table 7. Response Table for the S/N ratio of the breaking elongation output
Factors Average S/N, dB
Level 1 Level 2 Level 3 Delta Rank
A 21.59 21.98* 21.46 0.52 2 B 19.73 21.76 23.54* 3.81 1 C 21.44 21.92* 21.67 0.48 3
* Optimum parameter level
As can be seen from Figure 3 and Table 7, the optimum
levels of the production parameters for breaking elongation
are 4.2 twist coefficient, 1.15 PET draft ratio and 3.6
elastane draft ratio (A2B3C2). Depending on Table 7, it is
seen that the most effective input parameter is PET draft
ratio (B) and as the PET draft ratio increases, the breaking
elongation value of dual-core yarns increases. When the
core-spun containing filament is subjected to a force, the
fibers of both components will be elongated as the force
increases, until the fibers with smaller elongation break and so transfer the entire load to other fibers [20]. As can be
understood, the proportion of sheath cotton fibers in the
yarn cross-section mainly affects the elongation time and
thus the breaking elongation value. Basically, with the
increasing the draft ratio, PET% ratio in the yarn structure
decreases, which means more number of sheath fibers. In
this case, the contribution of staple fibers to strength and
elongation is thought to increase [21]. However, this
situation was not observed for the elastane filament draft
ratio. From this result, it is understood that the presence of
PET filament with higher strength than elastane in the structure makes the effect of the draft change of the
elastane filament on the strength and elongation values of
the yarn insignificant.
Similar to the breaking strength results, only PET draft ratio
is found statistically significant on the breaking elongation values of dual-core yarns and the contribution rate is
96.32% (Table 8). At the same time, the effect of the other
two factors is very low. Furthermore, it is clear that the
ANOVA test has resulted in around 1.54% of error
contribution owing to interaction effect.
3.1 Optimization
The arrays corresponding to optimum factor levels
determined by Taguchi method may not be available in
experimental design. In such cases, the performance values
corresponding to optimum factor levels can be predicted by
utilizing the balanced characteristic of orthogonal arrays
[22]. Since the optimum factor-level combinations obtained
for both outputs in the study were not included in the experimental design, the predicted S/N ratios were
calculated using Eq. 4. The predicted S/N ratios were
placed in Eq. 2, and the predicted breaking strength and
elongation values were achieved.
Table 8. ANOVA Table for S/N ratio of the breaking elongation output
Factor df Sum of squares
Mean square F-value P Percentage contribution
(%)
A 2 0.4462 0.2231 11.59 0.079 1.97
B 2 21.7844 10.8922 565.70 0.002 96.32 C 2 0.3476 0.1738 9.03 0.100 2.94
Residual 2 0.0385 0.0193 1.54 Total 8 22.6167 1.00
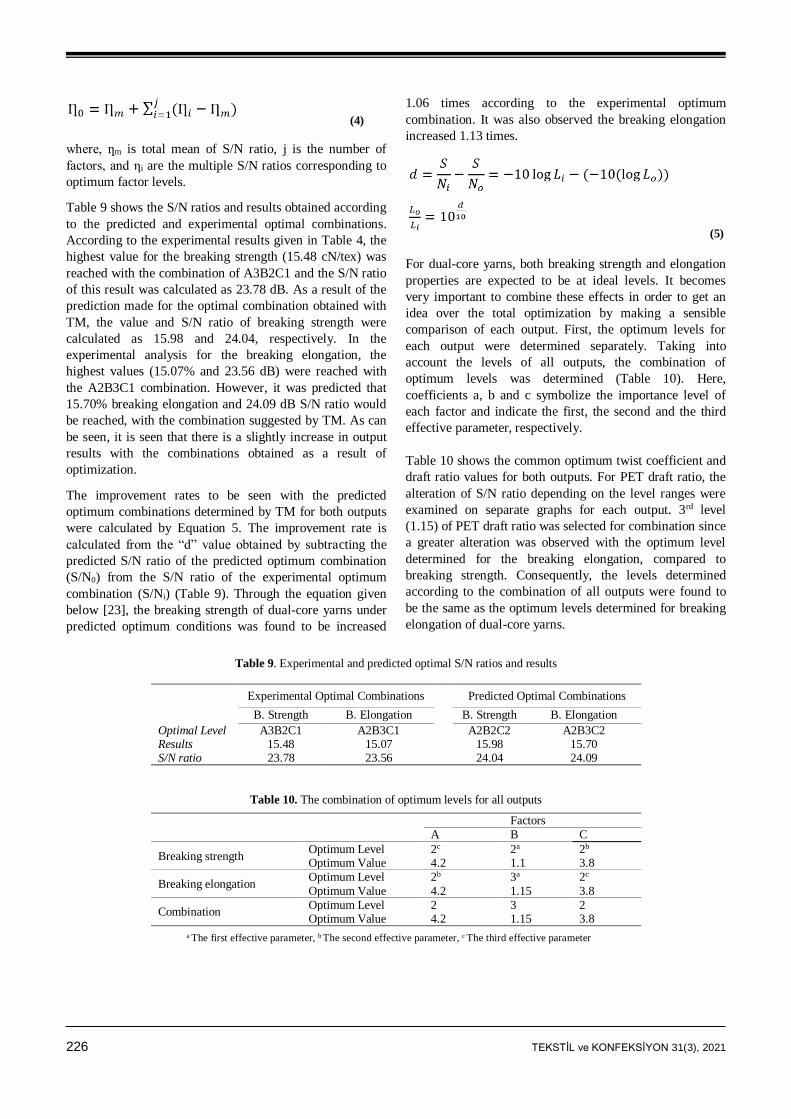
226 TEKSTİL ve KONFEKSİYON 31(3), 2021
(4)
where, ƞm is total mean of S/N ratio, j is the number of
factors, and ηi are the multiple S/N ratios corresponding to
optimum factor levels.
Table 9 shows the S/N ratios and results obtained according
to the predicted and experimental optimal combinations.
According to the experimental results given in Table 4, the
highest value for the breaking strength (15.48 cN/tex) was
reached with the combination of A3B2C1 and the S/N ratio
of this result was calculated as 23.78 dB. As a result of the
prediction made for the optimal combination obtained with
TM, the value and S/N ratio of breaking strength were
calculated as 15.98 and 24.04, respectively. In the
experimental analysis for the breaking elongation, the
highest values (15.07% and 23.56 dB) were reached with
the A2B3C1 combination. However, it was predicted that
15.70% breaking elongation and 24.09 dB S/N ratio would
be reached, with the combination suggested by TM. As can
be seen, it is seen that there is a slightly increase in output
results with the combinations obtained as a result of
optimization.
The improvement rates to be seen with the predicted
optimum combinations determined by TM for both outputs
were calculated by Equation 5. The improvement rate is
calculated from the “d” value obtained by subtracting the
predicted S/N ratio of the predicted optimum combination
(S/N0) from the S/N ratio of the experimental optimum
combination (S/Ni) (Table 9). Through the equation given
below [23], the breaking strength of dual-core yarns under
predicted optimum conditions was found to be increased
1.06 times according to the experimental optimum
combination. It was also observed the breaking elongation
increased 1.13 times.
(5)
For dual-core yarns, both breaking strength and elongation
properties are expected to be at ideal levels. It becomes
very important to combine these effects in order to get an
idea over the total optimization by making a sensible
comparison of each output. First, the optimum levels for
each output were determined separately. Taking into
account the levels of all outputs, the combination of
optimum levels was determined (Table 10). Here,
coefficients a, b and c symbolize the importance level of
each factor and indicate the first, the second and the third
effective parameter, respectively.
Table 10 shows the common optimum twist coefficient and
draft ratio values for both outputs. For PET draft ratio, the
alteration of S/N ratio depending on the level ranges were
examined on separate graphs for each output. 3rd level
(1.15) of PET draft ratio was selected for combination since
a greater alteration was observed with the optimum level
determined for the breaking elongation, compared to
breaking strength. Consequently, the levels determined
according to the combination of all outputs were found to
be the same as the optimum levels determined for breaking
elongation of dual-core yarns.
Table 9. Experimental and predicted optimal S/N ratios and results
Experimental Optimal Combinations
Predicted Optimal Combinations
B. Strength B. Elongation B. Strength B. Elongation
Optimal Level A3B2C1 A2B3C1 A2B2C2 A2B3C2 Results 15.48 15.07 15.98 15.70 S/N ratio 23.78 23.56 24.04 24.09
Table 10. The combination of optimum levels for all outputs
Factors
A B C
Breaking strength Optimum Level 2c 2a 2b
Optimum Value 4.2 1.1 3.8
Breaking elongation Optimum Level 2b 3a 2c
Optimum Value 4.2 1.15 3.8
Combination Optimum Level 2 3 2 Optimum Value 4.2 1.15 3.8
a The first effective parameter, b The second effective parameter, c The third effective parameter
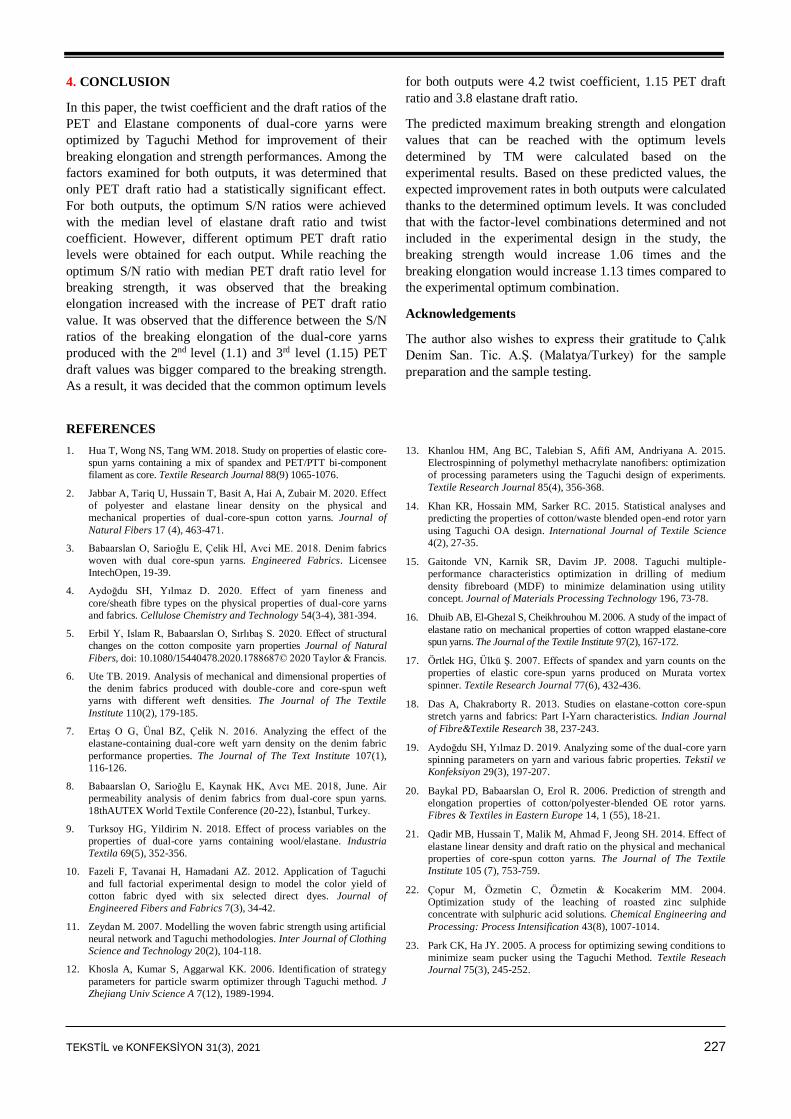
TEKSTİL ve KONFEKSİYON 31(3), 2021 227
4. CONCLUSION
In this paper, the twist coefficient and the draft ratios of the
PET and Elastane components of dual-core yarns were
optimized by Taguchi Method for improvement of their
breaking elongation and strength performances. Among the
factors examined for both outputs, it was determined that
only PET draft ratio had a statistically significant effect.
For both outputs, the optimum S/N ratios were achieved
with the median level of elastane draft ratio and twist
coefficient. However, different optimum PET draft ratio
levels were obtained for each output. While reaching the
optimum S/N ratio with median PET draft ratio level for
breaking strength, it was observed that the breaking
elongation increased with the increase of PET draft ratio
value. It was observed that the difference between the S/N
ratios of the breaking elongation of the dual-core yarns
produced with the 2nd level (1.1) and 3rd level (1.15) PET
draft values was bigger compared to the breaking strength.
As a result, it was decided that the common optimum levels
for both outputs were 4.2 twist coefficient, 1.15 PET draft
ratio and 3.8 elastane draft ratio.
The predicted maximum breaking strength and elongation
values that can be reached with the optimum levels
determined by TM were calculated based on the
experimental results. Based on these predicted values, the
expected improvement rates in both outputs were calculated
thanks to the determined optimum levels. It was concluded
that with the factor-level combinations determined and not
included in the experimental design in the study, the
breaking strength would increase 1.06 times and the
breaking elongation would increase 1.13 times compared to
the experimental optimum combination.
Acknowledgements
The author also wishes to express their gratitude to Çalık
Denim San. Tic. A.Ş. (Malatya/Turkey) for the sample
preparation and the sample testing.
REFERENCES
1. Hua T, Wong NS, Tang WM. 2018. Study on properties of elastic core-
spun yarns containing a mix of spandex and PET/PTT bi-component
filament as core. Textile Research Journal 88(9) 1065-1076.
2. Jabbar A, Tariq U, Hussain T, Basit A, Hai A, Zubair M. 2020. Effect
of polyester and elastane linear density on the physical and
mechanical properties of dual-core-spun cotton yarns. Journal of
Natural Fibers 17 (4), 463-471.
3. Babaarslan O, Sarioğlu E, Çelik Hİ, Avci ME. 2018. Denim fabrics
woven with dual core-spun yarns. Engineered Fabrics. Licensee
IntechOpen, 19-39.
4. Aydoğdu SH, Yılmaz D. 2020. Effect of yarn fineness and
core/sheath fibre types on the physical properties of dual-core yarns
and fabrics. Cellulose Chemistry and Technology 54(3-4), 381-394.
5. Erbil Y, Islam R, Babaarslan O, Sırlıbaş S. 2020. Effect of structural
changes on the cotton composite yarn properties Journal of Natural
Fibers, doi: 10.1080/15440478.2020.1788687© 2020 Taylor & Francis.
6. Ute TB. 2019. Analysis of mechanical and dimensional properties of
the denim fabrics produced with double-core and core-spun weft
yarns with different weft densities. The Journal of The Textile
Institute 110(2), 179-185.
7. Ertaş O G, Ünal BZ, Çelik N. 2016. Analyzing the effect of the
elastane-containing dual-core weft yarn density on the denim fabric
performance properties. The Journal of The Text Institute 107(1),
116-126.
8. Babaarslan O, Sarioğlu E, Kaynak HK, Avcı ME. 2018, June. Air
permeability analysis of denim fabrics from dual-core spun yarns.
18thAUTEX World Textile Conference (20-22), İstanbul, Turkey.
9. Turksoy HG, Yildirim N. 2018. Effect of process variables on the
properties of dual-core yarns containing wool/elastane. Industria
Textila 69(5), 352-356.
10. Fazeli F, Tavanai H, Hamadani AZ. 2012. Application of Taguchi
and full factorial experimental design to model the color yield of
cotton fabric dyed with six selected direct dyes. Journal of
Engineered Fibers and Fabrics 7(3), 34-42.
11. Zeydan M. 2007. Modelling the woven fabric strength using artificial
neural network and Taguchi methodologies. Inter Journal of Clothing
Science and Technology 20(2), 104-118.
12. Khosla A, Kumar S, Aggarwal KK. 2006. Identification of strategy
parameters for particle swarm optimizer through Taguchi method. J
Zhejiang Univ Science A 7(12), 1989-1994.
13. Khanlou HM, Ang BC, Talebian S, Afifi AM, Andriyana A. 2015.
Electrospinning of polymethyl methacrylate nanofibers: optimization
of processing parameters using the Taguchi design of experiments.
Textile Research Journal 85(4), 356-368.
14. Khan KR, Hossain MM, Sarker RC. 2015. Statistical analyses and
predicting the properties of cotton/waste blended open-end rotor yarn
using Taguchi OA design. International Journal of Textile Science
4(2), 27-35.
15. Gaitonde VN, Karnik SR, Davim JP. 2008. Taguchi multiple-
performance characteristics optimization in drilling of medium
density fibreboard (MDF) to minimize delamination using utility
concept. Journal of Materials Processing Technology 196, 73-78.
16. Dhuib AB, El-Ghezal S, Cheikhrouhou M. 2006. A study of the impact of
elastane ratio on mechanical properties of cotton wrapped elastane-core
spun yarns. The Journal of the Textile Institute 97(2), 167-172.
17. Örtlek HG, Ülkü Ş. 2007. Effects of spandex and yarn counts on the
properties of elastic core-spun yarns produced on Murata vortex
spinner. Textile Research Journal 77(6), 432-436.
18. Das A, Chakraborty R. 2013. Studies on elastane-cotton core-spun
stretch yarns and fabrics: Part I-Yarn characteristics. Indian Journal
of Fibre&Textile Research 38, 237-243.
19. Aydoğdu SH, Yılmaz D. 2019. Analyzing some of the dual-core yarn
spinning parameters on yarn and various fabric properties. Tekstil ve
Konfeksiyon 29(3), 197-207.
20. Baykal PD, Babaarslan O, Erol R. 2006. Prediction of strength and
elongation properties of cotton/polyester-blended OE rotor yarns. Fibres & Textiles in Eastern Europe 14, 1 (55), 18-21.
21. Qadir MB, Hussain T, Malik M, Ahmad F, Jeong SH. 2014. Effect of
elastane linear density and draft ratio on the physical and mechanical
properties of core-spun cotton yarns. The Journal of The Textile
Institute 105 (7), 753-759.
22. Çopur M, Özmetin C, Özmetin & Kocakerim MM. 2004.
Optimization study of the leaching of roasted zinc sulphide
concentrate with sulphuric acid solutions. Chemical Engineering and
Processing: Process Intensification 43(8), 1007-1014.
23. Park CK, Ha JY. 2005. A process for optimizing sewing conditions to
minimize seam pucker using the Taguchi Method. Textile Reseach
Journal 75(3), 245-252.
228 TEKSTİL ve KONFEKSİYON 31(3), 2021
TEKSTİL VE KONFEKSİYON
VOL: 31, NO. 3
DOI: 10.32710/tekstilvekonfeksiyon.910676
Design of an Impact Absorbing Composite Panel
from Denim Wastes and Acrylated Epoxidized
Soybean Oil based Epoxy Resins
Janset OZTEMUR 0000-0002-7727-9172
Hande SEZGIN 0000-0002-2671-2175
Ipek YALÇIN-ENIS 0000-0002-7215-3546*
Istanbul Technical University / Textile Technologies and Design Faculty/Textile Engineering Department/Istanbul, Turkey
Corresponding Author: Janset Oztemur, [email protected]
ABSTRACT
The focus of this work is to make a significant contribution to solid waste management by designing
impact-absorbing bio-composite panels using bio-resin and denim wastes. In this context, composite
panels are produced by vacuum infusion technique using both epoxy and acrylated epoxidized
soybean oil (AESO) based hybrid resins while denim wastes are utilized as reinforcement materials in
fiber and fabric forms. Both physical (fiber density and fiber weight ratio) and mechanical analyses
(drop-weight impact resistance and dynamic mechanical analysis (DMA)) of the composites are
performed. The outcomes of the study prove that the increase in the AESO ratio of the resin system
improves the ductility of the composite and consequently the impact resistance. On the other hand,
dynamic mechanical analysis results indicate that the AESO plug-in reduces the storage module and
increases the damping factor.
ARTICLE HISTORY
Received: 06.04.2021
Accepted: 12.07.2021
KEYWORDS
Bio-composite, Epoxy, AESO, Denim waste, Recycling
1. INTRODUCTION
The textile industry is a significant threat to the
environment, especially due to the processing of raw
materials, fabric preparation and finishing processes, as
well as post-consumer waste, and it accounts for 5% of the
world's pollutants [1]. It is estimated that the waste volume,
which was only 92 million tons of global fashion waste in
2015, will increase to 148 million tons in 2030. In addition,
a much larger amount is encountered when upholstery,
bedding, mattresses, packaging, rugs and carpets and
automotive interiors are added to this volume [2]. However,
it is a fact that only 15% of the textile wastes is recycled
and the rest is buried in landfills [3-4]. This situation
encourages the search for alternative products that can turn
this risky waste group into an advantage as a raw material,
and bio-composites have an important share at this point.
Bio-composites generally consist of petroleum-based
matrix and natural reinforcement materials [5]. Bio-
composites containing natural fibers have become
increasingly important considering the difficulties in plastic
disposal and the overuse of petroleum resources [6]. The
use of recycled natural fiber reinforcement takes this issue
one step further. For instance, denim fabrics are particularly
harmful to the environment in both pre-consumer and post-
consumer stages, and unfortunately, most of the denim
waste cannot be recycled. For this reason, non-recyclable
denims, which have strong and stiff structure, can be used
in composite constructions to minimize environmental
impact [7-8]. There are many other bio-composite studies
of petroleum-based matrix reinforced with different
recycled natural fibers in the literature [9-11].
On the other hand, when petroleum-based polymers are
used with natural reinforcement in a composite structure,
To cite this article: Öztemur J, Sezgin H, Yalçın-Enis İ. 2021. Design of an ımpact absorbing composite panel from denim wastes and acrylated epoxidized soybean oil based epoxy resins. Tekstil ve Konfeksiyon, 31(3), 228-234.
TEKSTİL ve KONFEKSİYON 31(3), 2021 229
this composite cannot be said to be completely “bio” since
the resins have serious environmental impacts besides their
benefits such as availability and low cost [12-13]. Thus,
considering the sustainability and environmental concerns,
matrix materials as well as reinforcement materials used
during composite production becomes crucial. This leads to
the emergence of the term “green composites”. Green
composites can be defined as composite structures in which
both the reinforcement and matrix materials are obtained
from renewable resources [14].
Although petroleum-based epoxy resin is widely preferred
in composite materials due to its low cost, ease of use and
high mechanical properties, uncertainties about petroleum
resources, prices and environmental effects necessitate
reducing the use of epoxy and replacing it with biomaterials
[15]. The most common bio-resins used in green
composites are vegetable oils such as soybean oil, castor
oil, palm oil, linseed oil, and sunflower oil [16]. Among
them, acrylated epoxized soybean oil (AESO) which is
produced by the epoxidation and acrylization of soybean
oil, is commercially available choice and it has benefits
such as non-volatile and non-toxic structure. However due
to its high viscosity at room temperature and low
crosslinking capacity, it is mostly used in hybrid resin
systems [17-18].
In the literature, many studies are conducted with
composite production including AESO resin and natural
fiber reinforcements. In a study conducted by Temmink et
al. (2018), it was seen that composites reinforced with four-
plied denim fabric, containing bio-epoxy and AESO have
very acceptable tensile strength (approximately 50 MPa for
bio-epoxy and 20 MPa for AESO) and impact resistance
(approximately 25 kJ/m2 for bio-epoxy and 30 kJ/m2 for
AESO) values in comparison to polyester resin systems that
serve alternatives for application areas such as automotive
interior parts, furniture, interior construction, and leisure
equipment [19]. In a similar way, a research on hybrid bio-
based composites developed by vacuum infusion technique
with reinforcement of woven jute fabric and AESO/epoxy
blended matrix was implemented by Ozkur et al (2020).
Results indicated that the ascending AESO ratio increased
the impact resistance of the material, but when the AESO
ratio was more than 30 wt. %, the tensile strength of the
material decreased, thus 30-50 wt. % AESO was stated as
optimum hybridization ratio with epoxy [5]. The enhanced
plasticity with the addition of AESO to the epoxy resin
reinforced with natural fiber composites are also studied by
Bakar et al [15] and Kocaman and Ahmetli [20].
On the other hand, it is not possible to see studies on
recycled natural based textile wastes with AESO in the
literature. In this context, in this study, bio-composite
structures with improved impact resistance are produced by
reinforcing epoxy resin and AESO with waste denim
structures in both fabric and fiber web form. Eight different
designs are produced via vacuum infusion method by
changing the resin type and/or reinforcement form
(fiber/fabric). The drop-weight impact resistance and
thermo-mechanical properties of the composite samples are
evaluated.
2. MATERIAL AND METHOD
2.1 Materials
Waste denim fabrics utilized in this study are supplied from
Calik Denim (Table 1) and used as reinforcement materials
in either fabric or fiber web form. Epoxy (F-1564,
FIBERMAK) and AESO (Sigma Aldrich) are used as
matrix materials while a hardener (F-3486, FIBERMAK) is
added to the resin system to initiate the curing process. The
properties of the matrix components are listed in Table 2.
2.2 Method
Preparation of reinforcement materials
The waste denim fabrics are shredded two times by rag
pulling machine (Balkan Makina, Turkey) for the
preparation of fiber webs, and then transferred to the
carding machine to obtain smooth surfaces at homogeneous
web density. These fiber webs are used either alone or in
combination with fabric forms to form sandwich structures.
The preparation steps of the reinforcement materials are
seen in Figure 1.
Table 1. Physical properties of denim fabric
Warp yarn type / yarn count ring spun / Ne 9
Weft yarn type / yarn count core spun / Ne 10
Fiber type 98% cotton 2% elastane
Weave type 3/1 Twill (Z)
Areal density (g/m2) 289.5 6.36
Count of cloth (ends/cm*picks/cm) 32*20
Table 2. The properties of matrix components
Epoxy AESO Hardener
Viscosity (25°C) (cps) 1200-1400 18000-32000 10-20
Density (25°C) (g/cm³) 1.15 1.40 1.00
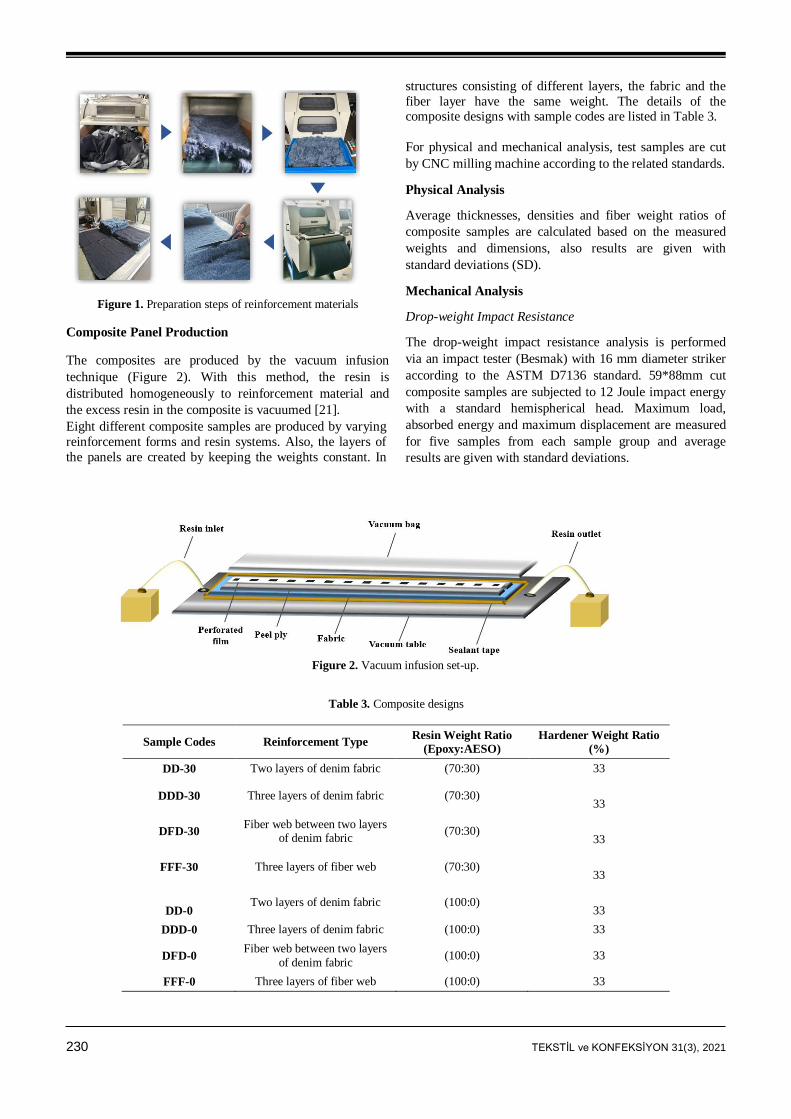
230 TEKSTİL ve KONFEKSİYON 31(3), 2021
Figure 1. Preparation steps of reinforcement materials
Composite Panel Production
The composites are produced by the vacuum infusion
technique (Figure 2). With this method, the resin is
distributed homogeneously to reinforcement material and
the excess resin in the composite is vacuumed [21].
Eight different composite samples are produced by varying
reinforcement forms and resin systems. Also, the layers of
the panels are created by keeping the weights constant. In
structures consisting of different layers, the fabric and the
fiber layer have the same weight. The details of the composite designs with sample codes are listed in Table 3.
For physical and mechanical analysis, test samples are cut
by CNC milling machine according to the related standards.
Physical Analysis
Average thicknesses, densities and fiber weight ratios of
composite samples are calculated based on the measured
weights and dimensions, also results are given with
standard deviations (SD).
Mechanical Analysis
Drop-weight Impact Resistance
The drop-weight impact resistance analysis is performed
via an impact tester (Besmak) with 16 mm diameter striker
according to the ASTM D7136 standard. 59*88mm cut
composite samples are subjected to 12 Joule impact energy
with a standard hemispherical head. Maximum load,
absorbed energy and maximum displacement are measured
for five samples from each sample group and average
results are given with standard deviations.
Figure 2. Vacuum infusion set-up.
Table 3. Composite designs
Sample Codes Reinforcement Type Resin Weight Ratio
(Epoxy:AESO)
Hardener Weight Ratio
(%)
DD-30 Two layers of denim fabric (70:30) 33
DDD-30 Three layers of denim fabric (70:30)
33
DFD-30 Fiber web between two layers
of denim fabric (70:30)
33
FFF-30 Three layers of fiber web (70:30)
33
DD-0 Two layers of denim fabric (100:0)
33
DDD-0 Three layers of denim fabric (100:0) 33
DFD-0 Fiber web between two layers
of denim fabric (100:0) 33
FFF-0 Three layers of fiber web (100:0) 33
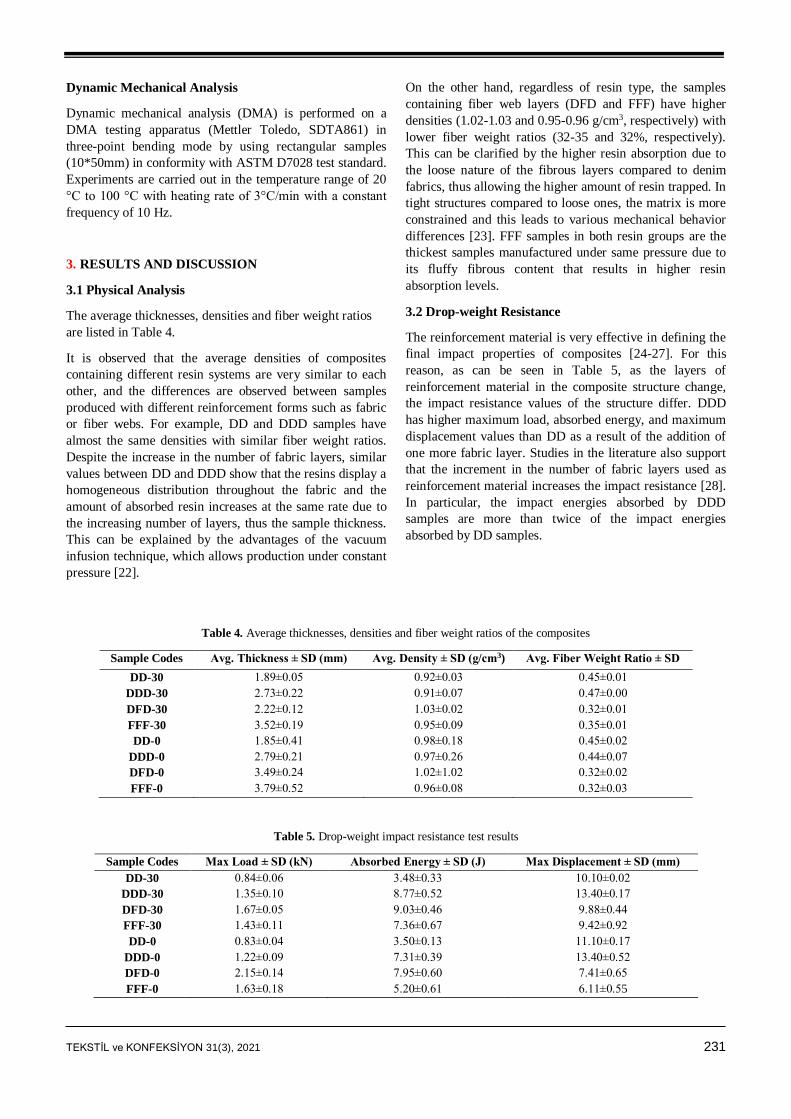
TEKSTİL ve KONFEKSİYON 31(3), 2021 231
Dynamic Mechanical Analysis
Dynamic mechanical analysis (DMA) is performed on a
DMA testing apparatus (Mettler Toledo, SDTA861) in
three-point bending mode by using rectangular samples
(10*50mm) in conformity with ASTM D7028 test standard.
Experiments are carried out in the temperature range of 20
°C to 100 °C with heating rate of 3°C/min with a constant
frequency of 10 Hz.
3. RESULTS AND DISCUSSION
3.1 Physical Analysis
The average thicknesses, densities and fiber weight ratios
are listed in Table 4.
It is observed that the average densities of composites
containing different resin systems are very similar to each
other, and the differences are observed between samples
produced with different reinforcement forms such as fabric
or fiber webs. For example, DD and DDD samples have
almost the same densities with similar fiber weight ratios.
Despite the increase in the number of fabric layers, similar
values between DD and DDD show that the resins display a
homogeneous distribution throughout the fabric and the
amount of absorbed resin increases at the same rate due to
the increasing number of layers, thus the sample thickness.
This can be explained by the advantages of the vacuum
infusion technique, which allows production under constant
pressure [22].
On the other hand, regardless of resin type, the samples
containing fiber web layers (DFD and FFF) have higher
densities (1.02-1.03 and 0.95-0.96 g/cm3, respectively) with
lower fiber weight ratios (32-35 and 32%, respectively).
This can be clarified by the higher resin absorption due to
the loose nature of the fibrous layers compared to denim
fabrics, thus allowing the higher amount of resin trapped. In
tight structures compared to loose ones, the matrix is more
constrained and this leads to various mechanical behavior
differences [23]. FFF samples in both resin groups are the
thickest samples manufactured under same pressure due to
its fluffy fibrous content that results in higher resin
absorption levels.
3.2 Drop-weight Resistance
The reinforcement material is very effective in defining the
final impact properties of composites [24-27]. For this
reason, as can be seen in Table 5, as the layers of
reinforcement material in the composite structure change,
the impact resistance values of the structure differ. DDD
has higher maximum load, absorbed energy, and maximum
displacement values than DD as a result of the addition of
one more fabric layer. Studies in the literature also support
that the increment in the number of fabric layers used as
reinforcement material increases the impact resistance [28].
In particular, the impact energies absorbed by DDD
samples are more than twice of the impact energies
absorbed by DD samples.
Table 4. Average thicknesses, densities and fiber weight ratios of the composites
Sample Codes Avg. Thickness ± SD (mm) Avg. Density ± SD (g/cm3) Avg. Fiber Weight Ratio ± SD
DD-30 1.89±0.05 0.92±0.03 0.45±0.01
DDD-30 2.73±0.22 0.91±0.07 0.47±0.00
DFD-30 2.22±0.12 1.03±0.02 0.32±0.01
FFF-30 3.52±0.19 0.95±0.09 0.35±0.01
DD-0 1.85±0.41 0.98±0.18 0.45±0.02
DDD-0 2.79±0.21 0.97±0.26 0.44±0.07
DFD-0 3.49±0.24 1.02±1.02 0.32±0.02
FFF-0 3.79±0.52 0.96±0.08 0.32±0.03
Table 5. Drop-weight impact resistance test results
Sample Codes Max Load ± SD (kN) Absorbed Energy ± SD (J) Max Displacement ± SD (mm)
DD-30 0.84±0.06 3.48±0.33 10.10±0.02
DDD-30 1.35±0.10 8.77±0.52 13.40±0.17
DFD-30 1.67±0.05 9.03±0.46 9.88±0.44
FFF-30 1.43±0.11 7.36±0.67 9.42±0.92
DD-0 0.83±0.04 3.50±0.13 11.10±0.17
DDD-0 1.22±0.09 7.31±0.39 13.40±0.52
DFD-0 2.15±0.14 7.95±0.60 7.41±0.65
FFF-0 1.63±0.18 5.20±0.61 6.11±0.55
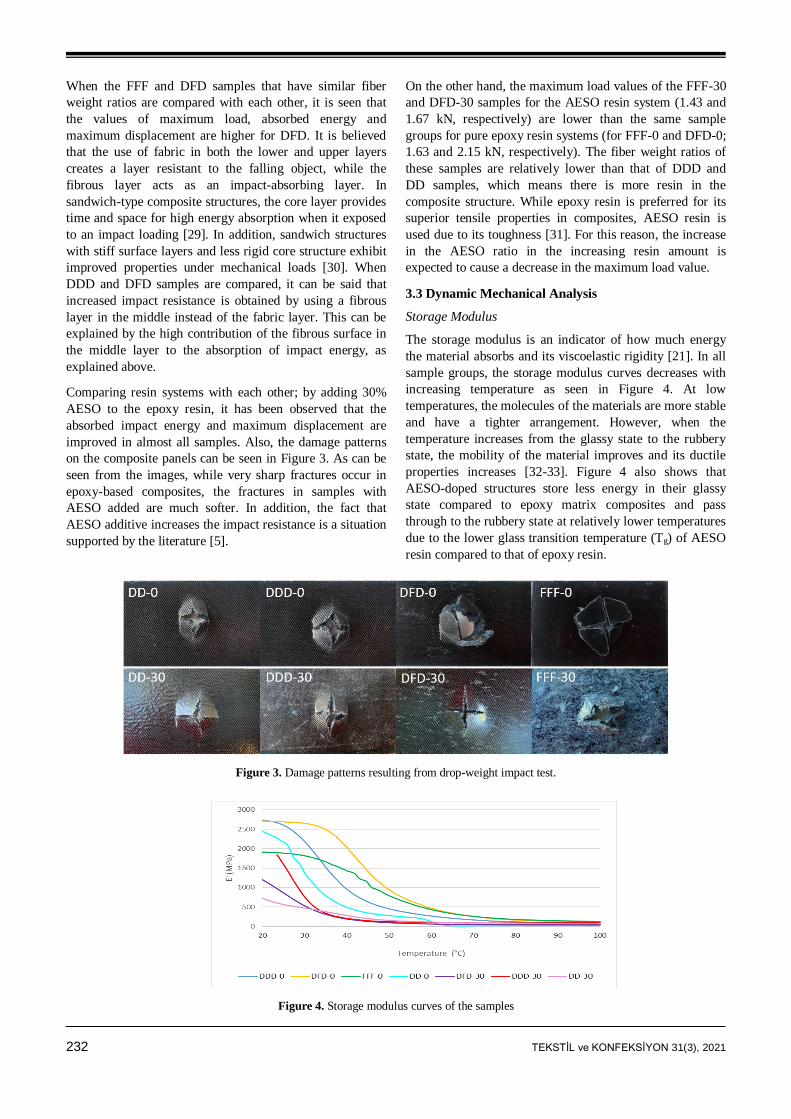
232 TEKSTİL ve KONFEKSİYON 31(3), 2021
When the FFF and DFD samples that have similar fiber
weight ratios are compared with each other, it is seen that
the values of maximum load, absorbed energy and
maximum displacement are higher for DFD. It is believed
that the use of fabric in both the lower and upper layers
creates a layer resistant to the falling object, while the
fibrous layer acts as an impact-absorbing layer. In
sandwich-type composite structures, the core layer provides
time and space for high energy absorption when it exposed
to an impact loading [29]. In addition, sandwich structures
with stiff surface layers and less rigid core structure exhibit
improved properties under mechanical loads [30]. When
DDD and DFD samples are compared, it can be said that
increased impact resistance is obtained by using a fibrous
layer in the middle instead of the fabric layer. This can be
explained by the high contribution of the fibrous surface in
the middle layer to the absorption of impact energy, as
explained above.
Comparing resin systems with each other; by adding 30%
AESO to the epoxy resin, it has been observed that the
absorbed impact energy and maximum displacement are
improved in almost all samples. Also, the damage patterns
on the composite panels can be seen in Figure 3. As can be
seen from the images, while very sharp fractures occur in
epoxy-based composites, the fractures in samples with
AESO added are much softer. In addition, the fact that
AESO additive increases the impact resistance is a situation
supported by the literature [5].
On the other hand, the maximum load values of the FFF-30
and DFD-30 samples for the AESO resin system (1.43 and
1.67 kN, respectively) are lower than the same sample
groups for pure epoxy resin systems (for FFF-0 and DFD-0;
1.63 and 2.15 kN, respectively). The fiber weight ratios of
these samples are relatively lower than that of DDD and
DD samples, which means there is more resin in the
composite structure. While epoxy resin is preferred for its
superior tensile properties in composites, AESO resin is
used due to its toughness [31]. For this reason, the increase
in the AESO ratio in the increasing resin amount is
expected to cause a decrease in the maximum load value.
3.3 Dynamic Mechanical Analysis
Storage Modulus
The storage modulus is an indicator of how much energy
the material absorbs and its viscoelastic rigidity [21]. In all
sample groups, the storage modulus curves decreases with
increasing temperature as seen in Figure 4. At low
temperatures, the molecules of the materials are more stable
and have a tighter arrangement. However, when the
temperature increases from the glassy state to the rubbery
state, the mobility of the material improves and its ductile
properties increases [32-33]. Figure 4 also shows that
AESO-doped structures store less energy in their glassy
state compared to epoxy matrix composites and pass
through to the rubbery state at relatively lower temperatures
due to the lower glass transition temperature (Tg) of AESO
resin compared to that of epoxy resin.
Figure 3. Damage patterns resulting from drop-weight impact test.
Figure 4. Storage modulus curves of the samples
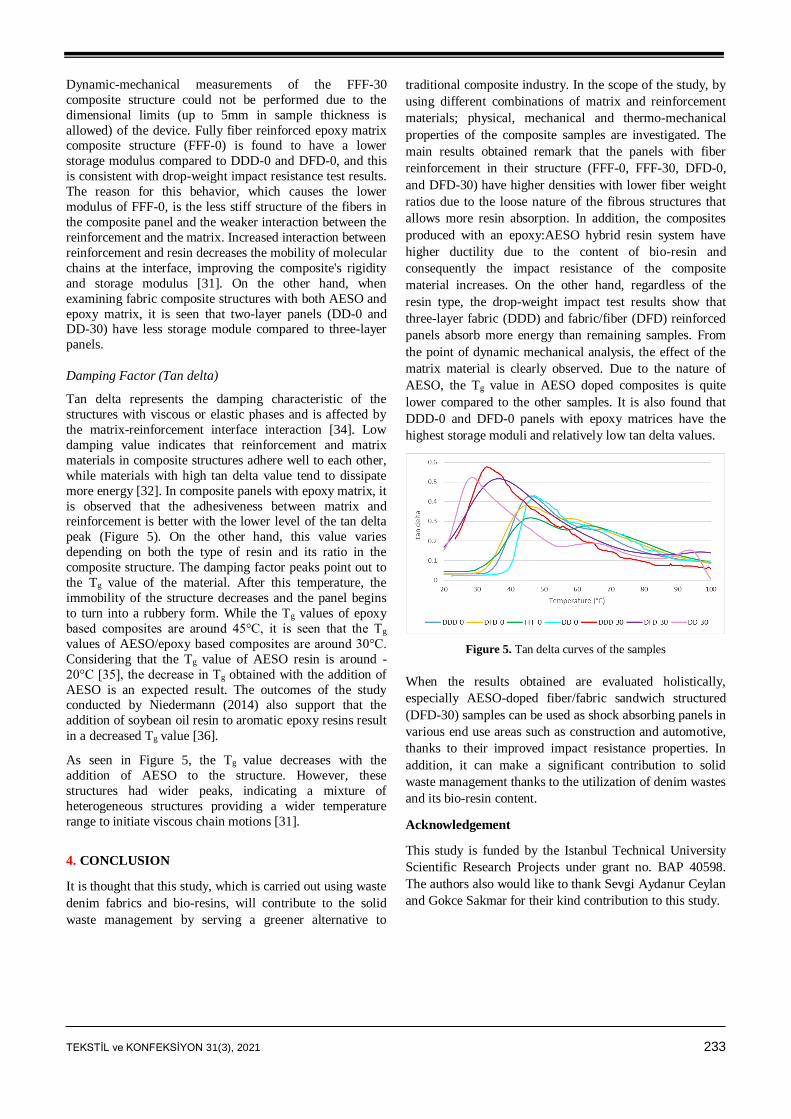
TEKSTİL ve KONFEKSİYON 31(3), 2021 233
Dynamic-mechanical measurements of the FFF-30
composite structure could not be performed due to the
dimensional limits (up to 5mm in sample thickness is
allowed) of the device. Fully fiber reinforced epoxy matrix composite structure (FFF-0) is found to have a lower
storage modulus compared to DDD-0 and DFD-0, and this
is consistent with drop-weight impact resistance test results.
The reason for this behavior, which causes the lower
modulus of FFF-0, is the less stiff structure of the fibers in
the composite panel and the weaker interaction between the
reinforcement and the matrix. Increased interaction between
reinforcement and resin decreases the mobility of molecular
chains at the interface, improving the composite's rigidity
and storage modulus [31]. On the other hand, when
examining fabric composite structures with both AESO and
epoxy matrix, it is seen that two-layer panels (DD-0 and DD-30) have less storage module compared to three-layer
panels.
Damping Factor (Tan delta)
Tan delta represents the damping characteristic of the
structures with viscous or elastic phases and is affected by
the matrix-reinforcement interface interaction [34]. Low
damping value indicates that reinforcement and matrix
materials in composite structures adhere well to each other,
while materials with high tan delta value tend to dissipate
more energy [32]. In composite panels with epoxy matrix, it
is observed that the adhesiveness between matrix and reinforcement is better with the lower level of the tan delta
peak (Figure 5). On the other hand, this value varies
depending on both the type of resin and its ratio in the
composite structure. The damping factor peaks point out to
the Tg value of the material. After this temperature, the
immobility of the structure decreases and the panel begins
to turn into a rubbery form. While the Tg values of epoxy
based composites are around 45°C, it is seen that the Tg
values of AESO/epoxy based composites are around 30°C.
Considering that the Tg value of AESO resin is around -
20°C [35], the decrease in Tg obtained with the addition of
AESO is an expected result. The outcomes of the study conducted by Niedermann (2014) also support that the
addition of soybean oil resin to aromatic epoxy resins result
in a decreased Tg value [36].
As seen in Figure 5, the Tg value decreases with the
addition of AESO to the structure. However, these
structures had wider peaks, indicating a mixture of
heterogeneous structures providing a wider temperature
range to initiate viscous chain motions [31].
4. CONCLUSION
It is thought that this study, which is carried out using waste
denim fabrics and bio-resins, will contribute to the solid
waste management by serving a greener alternative to
traditional composite industry. In the scope of the study, by
using different combinations of matrix and reinforcement
materials; physical, mechanical and thermo-mechanical
properties of the composite samples are investigated. The
main results obtained remark that the panels with fiber
reinforcement in their structure (FFF-0, FFF-30, DFD-0,
and DFD-30) have higher densities with lower fiber weight
ratios due to the loose nature of the fibrous structures that
allows more resin absorption. In addition, the composites
produced with an epoxy:AESO hybrid resin system have
higher ductility due to the content of bio-resin and
consequently the impact resistance of the composite
material increases. On the other hand, regardless of the
resin type, the drop-weight impact test results show that
three-layer fabric (DDD) and fabric/fiber (DFD) reinforced
panels absorb more energy than remaining samples. From
the point of dynamic mechanical analysis, the effect of the
matrix material is clearly observed. Due to the nature of
AESO, the Tg value in AESO doped composites is quite
lower compared to the other samples. It is also found that
DDD-0 and DFD-0 panels with epoxy matrices have the
highest storage moduli and relatively low tan delta values.
Figure 5. Tan delta curves of the samples
When the results obtained are evaluated holistically,
especially AESO-doped fiber/fabric sandwich structured
(DFD-30) samples can be used as shock absorbing panels in
various end use areas such as construction and automotive,
thanks to their improved impact resistance properties. In
addition, it can make a significant contribution to solid
waste management thanks to the utilization of denim wastes
and its bio-resin content.
Acknowledgement
This study is funded by the Istanbul Technical University
Scientific Research Projects under grant no. BAP 40598.
The authors also would like to thank Sevgi Aydanur Ceylan
and Gokce Sakmar for their kind contribution to this study.
234 TEKSTİL ve KONFEKSİYON 31(3), 2021
REFERENCES
1. Stanescu MD. 2021. State of the art of post-consumer textile waste
upcycling to reach the zero waste milestone. Environmental Science
and Pollution Research 28, 14253–14270.
2. Echeverria CA, Handoko W, Pahlevani F, Sahajwalla V. 2019.
Cascading use of textile waste for the advancement of fibre reinforced
composites for building applications. Journal of Cleaner Production
208, 1524–1536.
3. Shirvanimoghaddam K, Motamed B, Ramakrishna S, Naebe M. 2020.
Death by waste: Fashion and textile circular economy case. Science of
the Total Environment 718, 137317.
4. Wang Y. 2010. Fiber and textile waste utilization. Waste and Biomass
Valorization 1(1), 135–143.
5. Ozkur S, Sezgin H, Akay E, Yalcin-Enis I. 2020. Hybrid bio-based
composites from blends of epoxy and soybean oil resins reinforced
with jute woven fabrics. Materials Research Express 7(1), 15335.
6. Gnaba I, Omrani F, Wang P, Soulat D, Ferreira M, Vroman P,
Jaouachi B. 2019. Mechanical behavior of flax/polypropylene
commingled nonwoven at dry scale: Influence of process parameters.
Textile Research Journal 89(5), 791–800.
7. Haque MS, Sharif A. 2017. Processing and characterization of waste
denim fiber reinforced polymer composites. International Journal of
Innovative Science and Modern Engineering, 2(4), 24–28.
8. Uncu Akı S, Candan C, Uygun Nergis B, Onder N. 2020.
Understanding denim recycling : a quantitative study with
methodology. In Korlu A (Ed.) Waste in Textile and Leather Sectors.
United Kingdom: Intechopen, 1-26.
9. Baccouch W, Ghith A, Yalcin-Enis I, Sezgin H, Miled W, Legrand X,
Faten F. 2020. Investigation of the mechanical, thermal, and
acoustical behaviors of cotton, polyester, and cotton/polyester
nonwoven wastes reinforced epoxy composites. Journal of Industrial
Textiles. Advance online publication. [https://doi.org/10.1177/
1528083720901864]
10. Islam M, Sharif A, Hussain M, Hassan I. 2019. Synergic effect of
recycled cotton fabric and wood saw dust reinforced biodegradable
polypropylene composites. Bangladesh Journal of Scientific and
Industrial Research 54(1), 21–30.
11. Wei B, Xu F, Azhar SW, Li W, Lou L, Liu W, Qiu Y. 2015.
Fabrication and property of discarded denim fabric/polypropylene
composites. Journal of Industrial Textiles, 44(5), 798–812.
12. Narewska J, Lassila L, Fardim P. 2014. Preparation and
characterization of new mouldable cellulose-AESO biocomposites.
Cellulose 21(3), 1769–1780.
13. Åkesson D, Skrifvars M, Walkenström P. 2009. Preparation of
thermoset composites from natural fibres and acrylate modified soybean
oil resins. Journal of Applied Polymer Science 114(4), 2502–2508.
14. Pecas P, Carvalho H, Salman H, Leite M. 2018. Natural fibre
composites and their applications: a review. Journal of Composites
Science 2(4), 66.
15. Abu Bakar MB, Masri MN, Amini MMH, Thirmizir MMZ, Salim
MS. 2018, November. Mechanical, thermal and morphological
properties of epoxy resin toughened with epoxidized soybean oil. In
Abdullah MMA, Bin Abd. Rahim SZ, Bin Mat Saad MN, Bin Ghazli
MF, Ahmad R, Bin Mohd Tahir MF and Binti Jamaludin L. (Eds.),
AIP Conference Proceedings, (020277). Ho Chi Minh, Vietnam.
16. Grishchuk S. Karger-Kocsis J. 2011. Hybrid thermosets from vinyl
ester resin and acrylated epoxidized soybean oil (AESO). Express
Polymer Letters 5(1), 2-11.
17. Wu Y, Li K. 2017. Replacement of styrene with acrylated epoxidized
soybean oil in an unsaturated polyester resin from propylene glycol
and maleic anhydride. Journal of Applied Polymer Science 134(28),
450456.
18. Liu W, Fei M, Qiu R. 2017, August. Biocomposites from hemp fibers
and acrylated epoxidized soybean oil-based resins. 21st International
Conference on Composite Materials, Xi’an, China.
19. Temmink R, Baghaei B, Skrifvars M. 2018. Development of
biocomposites from denim waste and thermoset bio-resins for
structural applications. Composites Part A: Applied Science and Manufacturing 106, 59–69.
20. Kocaman S, Ahmetli G. 2016. Eco-friendly natural filler based epoxy
composites. World Academy of Science, Engineering and Technology
International Journal of Chemical, Molecular, Nuclear, Materials and Metallurgical Engineering 10(4), 471-474.
21. Sezgin H, Mishra R, Militky J, Berkalp OB. 2020. Mechanical,
thermo-mechanical and thermal characteristics of multi-walled carbon
nanotubes-added textile-reinforced composites. Journal of Industrial Textiles 50(5), 692–715.
22. Baccouch W, Ghith A, Yalcin-Enis I, Sezgin H, Miled W, Legrand X,
Faten F. 2020. Enhancement of fiber-matrix interface of recycled
cotton fibers reinforced epoxy composite for improved mechanical properties. Materials Research Express 7(1), 15340.
23. Liang Y, Wang H, Gu X. 2013. In-plane shear response of
unidirectional fiber reinforced and fabric reinforced carbon/epoxy
composites. Polymer Testing 32(3), 594–601.
24. Arpitha GR, Sanjay MR, Senthamaraikannan P, Barile C, Yogesha B.
2017. Hybridization effect of sisal/glass/epoxy/filler based woven fabric reinforced composites. Experimental Techniques 41(6), 577–584.
25. Awais H, Nawab Y, Anjang A, Md Akil H, Zainol Abidin MS. 2020.
Effect of fabric architecture on the shear and impact properties of
natural fibre reinforced composites. Composites Part B: Engineering 195, 108069.
26. Ramesh M, Palanikumar K, Reddy KH. 2013. Mechanical property
evaluation of sisal-jute-glass fiber reinforced polyester composites. Composites Part B: Engineering 48, 1–9.
27. Selver E, Dalfi H, Yousaf Z. 2020. Investigation of the impact and
post-impact behaviour of glass and glass/natural fibre hybrid
composites made with various stacking sequences: Experimental and
theoretical analysis. Journal of Industrial Textiles. Advance online publication. [https://doi.org/10.1177/1528083719900670]
28. Shyr TW, Pan YH. 2003. Impact resistance and damage characteristic
of composite laminates. Composite Structures 62(2), 193-203.
29. Lampeas G. 2020. Cellular and Sandwich Materials. In Pantelakis S
and Tserpes K. (Eds) Revolutionizing Aircraft Materials and Processes. Cham: Springer, 137-162.
30. Skrifvars M, Dhakal H, Zhang Z, Gentilcore J, Åkesson D. 2019.
Study on the mechanical properties of unsaturated polyester sandwich
biocomposites composed of uniaxial warp-knitted and non-woven
viscose fabrics. Composites Part A: Applied Science and
Manufacturing 121, 196–206.
31. Sahoo SK, Mohanty S, Nayak SK. 2017. Mechanical, thermal, and
interfacial characterization of randomly oriented short sisal fibers
reinforced epoxy composite modified with epoxidized soybean oil.
Journal of Natural Fibers 14(3), 357–367.
32. Jabbar A, Militký J, Wiener J, Karahan M. 2016. Static and dynamic
mechanical properties of novel treated jute/green epoxy composites. Textile Research Journal 86(9), 960–974.
33. Liu W, Chen T, Fei M, Qiu R, Yu D, Fu T, Qiu J. 2019. Properties of
natural fiber-reinforced biobased thermoset biocomposites: Effects of fiber type and resin composition. Composites Part B: Engineering 171, 87–95.
34. Shao B, Fang Y, Chen B, Shen J, Xu S, Ou R, Wang Q. 2020.
Statistical distribution of mechanical properties and energy absorption
of laminated cotton fabric reinforced epoxy composites. Polymer Composites 41(7), 2829–2840.
35. Fu L, Yang L, Dai C, Zhao C, Ma L. 2010. Thermal and mechanical
properties of acrylated epoxidized-soybean oil-based thermosets.
Journal of Applied Polymer Science 117(4), 2220-2225.
36. Niedermann P, Szebenyi G, Toldy A. 2014. Effect of epoxidized
soybean oil on curing, rheological, mechanical and thermal properties
of aromatic and aliphatic epoxy resins. Journal of Polymers and the
Environment 22(4), 525-536.