Embed Size (px)
Citation preview

Hindawi Publishing CorporationResearch Letters in Materials ScienceVolume 2008, Article ID 737546, 5 pagesdoi:10.1155/2008/737546
Research LetterTEM Nanostructural Study of Al-6Si-3Cu-xMgMelt-Spun Ribbons
Ismeli Alfonso Lopez,1 Cuauhtemoc Maldonado Zepeda,2 Gonzalo Gonzalez Reyes,1
Ariosto Medina Flores,2 and Juan Serrato Rodrıguez2
1 Instituto de Investigaciones en Materiales, Universidad Nacional Autonoma de Mexico (UNAM) Circuito Exterior s/n,Cd. Universitaria, Del. Coyoacan CP 04510 Mexico, DF, Mexico
2 Instituto de Investigaciones Metalurgicas, Universidad Michoacana de San Nicolas de Hidalgo, Morelia, CP 58000,Michoacan, Mexico
Correspondence should be addressed to Ismeli Alfonso Lopez, [email protected]
Received 29 February 2008; Accepted 10 April 2008
Recommended by Martin Crimp
Three quaternary Al-6Si-3Cu-xMg (x = 0.59, 3.80, and 6.78 wt.%) alloys were produced by melt-spun and characterized usingX-ray diffractometry (XRD), transmission electron microscopy (TEM), and microhardness techniques. Obtained second phaseswere Al2Cu(θ) for the alloy with 0.59% Mg and Al5Cu2Mg8Si6 (Q) for the alloys with 3.80 and 6.78% Mg. These phases are presentas 30–50 nm or as 5–10 nm nanoparticles. Alloying elements content in solid solution increased, mainly for Si and Mg. The highalloying elements content in solid solution and the small α-Al cell size for melt-spun alloys leads to microhardness values about 2times higher than those of ingot counterparts. The microhardness increase for melt-spun alloys with 3.80 and 6.78% Mg dependson Mg content in solid solution.
Copyright © 2008 Ismeli Alfonso Lopez et al. This is an open access article distributed under the Creative Commons AttributionLicense, which permits unrestricted use, distribution, and reproduction in any medium, provided the original work is properlycited.
1. INTRODUCTION
Among the aluminum alloys, the 319 is one of the mostwidely used Al-Si-Cu-Mg alloys in the automotive industry.This alloy presents Si contents from 5.5 to 6.5 and Cu inthe range from 3.0 to 4.0 wt% [1]. The cast structure for Al-Si-Cu-Mg alloys includes α-Al, Si eutectic particles, Mg2Si,Al2Cu, Al5Cu2Mg8Si6, and other complex intermetallics [1,2]. Applying a rapid solidification process (RSP) as melt-spinning, it is possible to avoid or minimize second phaseformation and obtain a supersaturated solid solution. Melt-spun produces metastable crystalline, nanocrystalline, andamorphous phases, with improved mechanical properties[3].
There was a previous work about the characterizationof Al-Si-Cu alloys [4] obtained by melt spun, remarkingthe solid solubility extension of Si in α-Al. However, theeffects of RSP on structure and properties when Mg isadded have not been reported in the literature. Mechanicalproperties improvement for these alloys has been relatedto nanocrystalline and amorphous phase formation. In
this work, nanostructure and mechanical properties forthe experimental 319 alloy are dealt with by examiningmelt-spun ribbons with three different Mg concentrations,analyzing the effect of Mg on nanostructure and on thequantity of alloying elements in solid solution, and theirrelationship with the mechanical properties.
2. EXPERIMENTAL
The master alloy was an A 356 alloy ingot with Al-8.5Si-0.3Mg (wt%), adding pure Cu and Mg. Castings were carriedout in graphite crucibles using an induction furnace undera controlled Ar atmosphere. Ingots were then remolten in aquartz tube and ejected through a 0.5-mm diameter apertureon to the surface of a 200-mm in diameter polished copperwheel rotating at 30 meters per second−1. The ribbons were20–60 μm in thickness. Table 1 shows the alloys chemicalcomposition.
Experimental alloys were characterized using XRD,TEM/STEM, and microhardness techniques. XRD measure-ments were carried out in a Siemens 400 X-ray diffractometer

2 Research Letters in Materials Science
5045403530
2θ (deg)
Inte
nsi
ty(a
.u.)
6.78 %Mg
3.8 %Mg
0.59 %Mg
Q(2
11)
Q(3
10)
Q(3
01)
Q(3
11)
Q(4
01)
Q(2
11)
Q(3
10)
Q(3
01)
Q(3
11)
Q(4
01)
Al(
111)
Al(
200)
θ(2
11)
θ(1
12)
θ(3
10)
(a)
(d)
(c)
Q particles
200 nm
Q particles200 nm
θ particles
200 nm
(b)
Figure 1: XRD profiles of the ribbons for the alloys with different Mg contents (a) and bright field transmission electron micrographs ofthe as-melt-spun ribbons for the alloys with: (b) 0.59% Mg, (c) 3.80% Mg, and (d) 6.78% Mg. Diffraction peaks belonging to θ and Q arecorrelated to the presence of arrowed nanoparticles.
1086420
Energy (keV)
0
2000
4000
6000
Cou
nts Cu
Al
Cu
(a)
1086420
Energy (keV)
0
1000
2000
3000
4000
5000
Cou
nts
Cu
Al
Cu
Mg
Si
(b)
Figure 2: EDS analysis obtained from the second phases: (a) for ribbons with 0.59% Mg and (b) for ribbons with 3.80% Mg.
using CuKα radiation at 30 kV and 25 mA. TEM/STEM andHRTEM investigations were conducted using a FEG-PhilipsTecnai F20 scanning/transmission electron microscope oper-ated at 200 kV, equipped with an energy dispersive spectrom-etry (EDS) with internal software for qualitative, semiquan-titative and quantitative chemical analysis. In order to obtainrepetitive and accurate results for each specimen 10 spectrawere collected and averaged. Each spectrum was collectedin only 10 seconds to avoid the electron beam to drift overthe sample resulting in reduced statistics. Specimens forTEM were prepared by dimpling using a Gatan 656 DimpleGrinder followed by Argon ions milling using a Gatan 691
Precision Ion Polishing System (PIPS). HRTEM micrographswere processed using Digital Micrograph(TM) 3.7.0 (Gatan).Microhardness measurements were made with a Vickersdiamond indenter in a Leitz Wetzlar microhardness testeremploying a load of 25 g for 15 seconds. Statistical treatmentcriteria were used to get repetitive and accurate results.
3. RESULTS AND DISCUSSION
In ternary Al systems, previous works report ample solidsolubility of alloying elements in α-Al matrix and minimumsecond phase formation as result of rapid solidification [3, 4].
Ismeli Alfonso Lopez et al. 3
Table 1: Average chemical composition (in wt%) of the experimental alloys.
Alloy code Si Cu Mg Fe Mn Zn Ti Al
AM01 6.40 3.02 0.59 0.34 0.09 0.04 0.14 Balance
AM03 6.31 3.03 3.80 0.32 0.08 0.03 0.13 Balance
AM06 5.84 2.95 6.78 0.31 0.07 0.03 0.12 Balance
20 nm
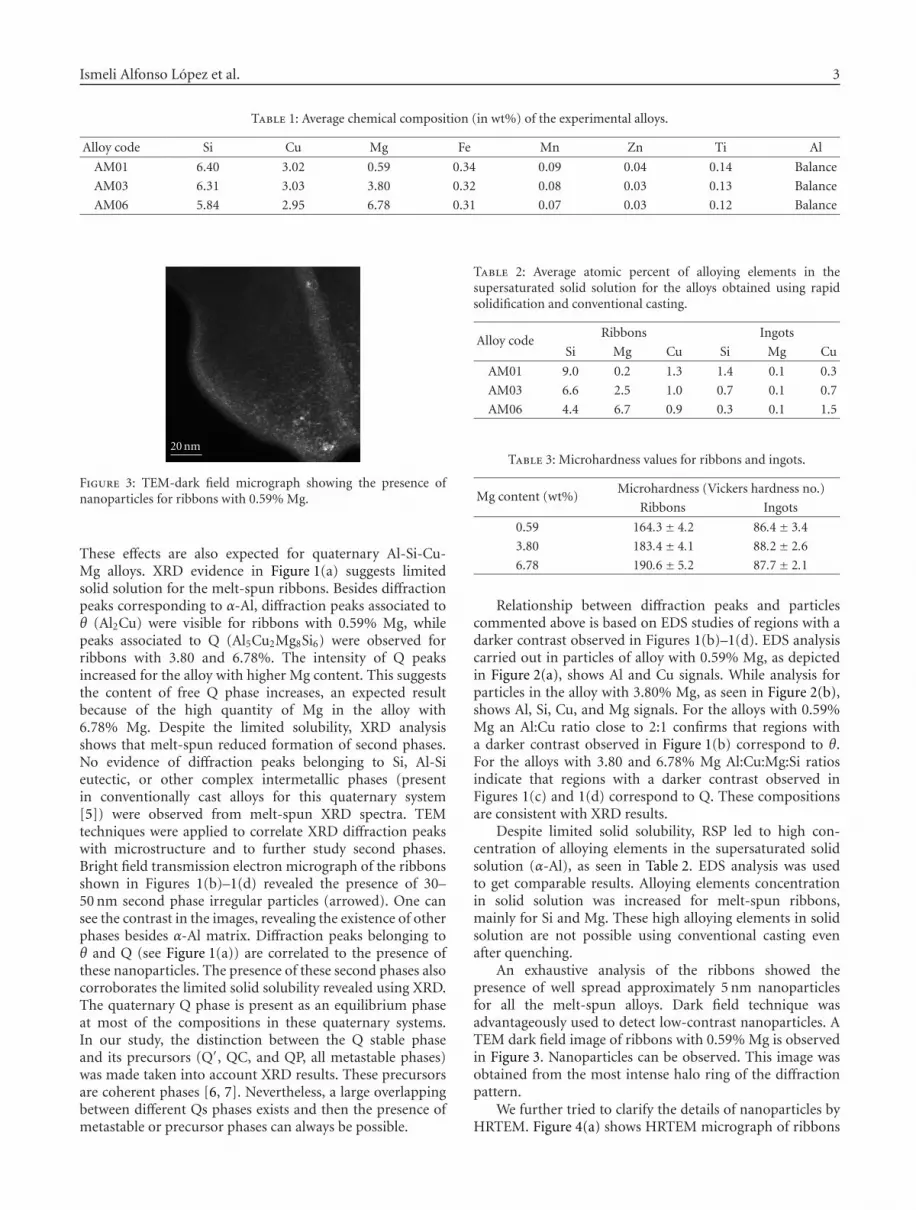
Figure 3: TEM-dark field micrograph showing the presence ofnanoparticles for ribbons with 0.59% Mg.
These effects are also expected for quaternary Al-Si-Cu-Mg alloys. XRD evidence in Figure 1(a) suggests limitedsolid solution for the melt-spun ribbons. Besides diffractionpeaks corresponding to α-Al, diffraction peaks associated toθ (Al2Cu) were visible for ribbons with 0.59% Mg, whilepeaks associated to Q (Al5Cu2Mg8Si6) were observed forribbons with 3.80 and 6.78%. The intensity of Q peaksincreased for the alloy with higher Mg content. This suggeststhe content of free Q phase increases, an expected resultbecause of the high quantity of Mg in the alloy with6.78% Mg. Despite the limited solubility, XRD analysisshows that melt-spun reduced formation of second phases.No evidence of diffraction peaks belonging to Si, Al-Sieutectic, or other complex intermetallic phases (presentin conventionally cast alloys for this quaternary system[5]) were observed from melt-spun XRD spectra. TEMtechniques were applied to correlate XRD diffraction peakswith microstructure and to further study second phases.Bright field transmission electron micrograph of the ribbonsshown in Figures 1(b)–1(d) revealed the presence of 30–50 nm second phase irregular particles (arrowed). One cansee the contrast in the images, revealing the existence of otherphases besides α-Al matrix. Diffraction peaks belonging toθ and Q (see Figure 1(a)) are correlated to the presence ofthese nanoparticles. The presence of these second phases alsocorroborates the limited solid solubility revealed using XRD.The quaternary Q phase is present as an equilibrium phaseat most of the compositions in these quaternary systems.In our study, the distinction between the Q stable phaseand its precursors (Q′, QC, and QP, all metastable phases)was made taken into account XRD results. These precursorsare coherent phases [6, 7]. Nevertheless, a large overlappingbetween different Qs phases exists and then the presence ofmetastable or precursor phases can always be possible.
Table 2: Average atomic percent of alloying elements in thesupersaturated solid solution for the alloys obtained using rapidsolidification and conventional casting.
Alloy codeRibbons Ingots
Si Mg Cu Si Mg Cu
AM01 9.0 0.2 1.3 1.4 0.1 0.3
AM03 6.6 2.5 1.0 0.7 0.1 0.7
AM06 4.4 6.7 0.9 0.3 0.1 1.5
Table 3: Microhardness values for ribbons and ingots.
Mg content (wt%)Microhardness (Vickers hardness no.)
Ribbons Ingots
0.59 164.3± 4.2 86.4± 3.4
3.80 183.4± 4.1 88.2± 2.6
6.78 190.6± 5.2 87.7± 2.1
Relationship between diffraction peaks and particlescommented above is based on EDS studies of regions with adarker contrast observed in Figures 1(b)–1(d). EDS analysiscarried out in particles of alloy with 0.59% Mg, as depictedin Figure 2(a), shows Al and Cu signals. While analysis forparticles in the alloy with 3.80% Mg, as seen in Figure 2(b),shows Al, Si, Cu, and Mg signals. For the alloys with 0.59%Mg an Al:Cu ratio close to 2:1 confirms that regions witha darker contrast observed in Figure 1(b) correspond to θ.For the alloys with 3.80 and 6.78% Mg Al:Cu:Mg:Si ratiosindicate that regions with a darker contrast observed inFigures 1(c) and 1(d) correspond to Q. These compositionsare consistent with XRD results.
Despite limited solid solubility, RSP led to high con-centration of alloying elements in the supersaturated solidsolution (α-Al), as seen in Table 2. EDS analysis was usedto get comparable results. Alloying elements concentrationin solid solution was increased for melt-spun ribbons,mainly for Si and Mg. These high alloying elements in solidsolution are not possible using conventional casting evenafter quenching.
An exhaustive analysis of the ribbons showed thepresence of well spread approximately 5 nm nanoparticlesfor all the melt-spun alloys. Dark field technique wasadvantageously used to detect low-contrast nanoparticles. ATEM dark field image of ribbons with 0.59% Mg is observedin Figure 3. Nanoparticles can be observed. This image wasobtained from the most intense halo ring of the diffractionpattern.
We further tried to clarify the details of nanoparticles byHRTEM. Figure 4(a) shows HRTEM micrograph of ribbons

4 Research Letters in Materials Science
5 nm
(a)
Al (111)
θ (200)
(b) (c) (d)
Figure 4: (a) HRTEM micrograph of the alloy with 0.59% Mg showing θ nanocrystallites; (b) FFT of the image; (c) frequenciescorresponding to θ to produce the IFFT image and (d) IFFT image isolating the θ nanoparticles.
5 nm
(a)
Al (200)
Q (100)
(b) (c) (d)
Figure 5: (a) HRTEM image of the melt-spun ribbons with 3.80% Mg showing Q nanocrystallites; (b) FFT of the image; (c) frequenciescorresponding to Q to produce the IFFT image and (d) IFFT image isolating the Q nanoparticles.
with 0.59% Mg. As noted, nanocrystallites are present in theα-Al matrix. The fast Fourier transform (FFT) depicted inFigure 4(b) shows the frequencies attributed to crystallitesof θ and the α-Al phase. The composition of the nanosizedparticles was determined using nanobeam EDS (3 nm indiameter spot size), indicating that it is close to Al2Cu (θ).To study the morphology of the nanosized particles inverse-FFT (IFFT) using θ frequencies were obtained (see Figures4(c), 4(d)). As observed, nanoparticles have irregular shapes.The filtered image for the (200) plane showed the interplanardistance matching to Al2Cu (3.04 A).
The increase in Mg content (alloy with 3.80% Mg)also leads to formation of nanoparticles distributed in asimilar fashion as those of 0.59% Mg alloy. The nanobeamEDS analysis of these nanoparticles revealed the presenceof elements with ratios near to the stechiometric ratios forQ phase (Al5Cu2Mg8Si6). Q phase was originated by theincrease in Mg content and is also observed for the alloywith 6.78% Mg. Figure 5(a) shows an HRTEM micrographfor ribbons with 3.80% Mg. Q phase nanocrystallites canbe observed. The FFT depicted in Figures 5(b), 5(c) showsthe frequencies attributed to crystallites of Q phase. IFFTimage obtained for Q frequencies revealed the irregular shapeof nanoparticles (see Figure 5(d)). The interplanar distance(3.16 A) corresponding to Q(200) plane corroborates EDSresults.
Table 3 shows microhardness values for ribbons andingots. Ribbons hardness values are about 2 times higherthan those of ingots with the same composition. Hardeningmechanisms of Al alloys can be described by several con-tributing factors: Hall-Petch hardening from the α-Al cellsize, solid solution hardening of α-Al matrix, and particlesize (according to Orowan hardening). Wang et al. [8] foundthat for melt-spun alloys, microhardness is mainly governedby a combination of Hall-Petch hardening from the small α-Al cell size and solid solution hardening of the α-Al matrix,whereas the Orowan hardening from the nanoparticles isnegligible. The increase in microhardness for the ribbonswith 3.80 and 6.78% Mg could be related to the presence ofa higher Mg content in solid solution, besides the increase ofthe volume fraction of Q phase.
4. CONCLUSIONS
From XRD and TEM analysis, it can be concluded that usingmelt-spun second phase formation was minimized and alloy-ing elements concentration in solid solution was increased.Second phases composition depends on Mg content: Al2Cufor the alloy with 0.59% Mg and Al5Cu2Mg8Si6 for thealloys with 3.80 and 6.78% Mg. These phases are presentas 30–50 nm nanoparticles. HRTEM studies also concludedthe presence of these phases as 5–10 nm nanoparticles.

Ismeli Alfonso Lopez et al. 5
Microhardness values of melt-spun ribbons are between160 and 190 VHN, about 2 times higher than those ofconventionally cast alloys with the same composition. Hard-ness improvement is originated from the high alloyingelements concentration in the supersaturated solid solutionand from nanostructure originated for the small α-Al cellsize, besides the presence of nanoparticles.
ACKNOWLEDGMENTS
The authors are thankful to F. Solorio and R. D. Cervantesfrom IIM-UMSNH and G. Lara from IIM-UNAM, Mexico,for technical support.
REFERENCES
[1] P. Ouellet and S. H. Samuel, “Effect of Mg on the agingbehaviour of Al-Si-Cu 319 type aluminium casting alloys,”Journal of Materials Science, vol. 34, no. 19, pp. 4671–4697,1999.
[2] Z. Li, A. M. Samuel, F. H. Samuel, C. Ravindran, and S.Valtierra, “Effect of alloying elements on the segregation anddissolution of CuAl2 phase in Al-Si-Cu 319 alloys,” Journal ofMaterials Science, vol. 38, no. 6, pp. 1203–1218, 2003.
[3] H. H. Liebermann, “Rapidly solidified alloys made by chillblock melt-spinning processes,” Journal of Crystal Growth, vol.70, no. 1-2, pp. 497–506, 1984.
[4] M. L. Ovecoglu, N. Unlu, N. Eruslu, and A. Genc, “Character-ization investigations of a melt-spun ternary Al-8Si-5.1Cu (inwt.%) alloy,” Materials Letters, vol. 57, no. 21, pp. 3296–3301,2003.
[5] I. Alfonso, C. Maldonado, G. Gonzalez, and A. Bedolla, “Effectof Mg content and solution treatment on the microstructure ofAl-Si-Cu-Mg alloys,” Journal of Materials Science, vol. 41, no. 7,pp. 1945–1952, 2006.
[6] C. Cayron and P. A. Buffat, “Transmission electron microscopystudy of the β′ phase (Al-Mg-Si alloys) and QC phase (Al-Cu-Mg-Si alloys): ordering mechanism and crystallographicstructure,” Acta Materialia, vol. 48, no. 10, pp. 2639–2653, 2000.
[7] D. J. Chakrabarti and D. E. Laughlin, “Phase relations andprecipitation in Al-Mg-Si alloys with Cu additions,” Progress inMaterials Science, vol. 49, no. 3-4, pp. 389–410, 2004.
[8] Y. Wang, Z. Zhang, W. Wang, and X. Bian, “Microstructuralevolution and microhardness of a melt-spun Al-5Ti-1B alloyduring annealing,” Materials Science and Engineering A, vol.366, no. 1, pp. 17–24, 2004.

Submit your manuscripts athttp://www.hindawi.com
ScientificaHindawi Publishing Corporationhttp://www.hindawi.com Volume 2014
CorrosionInternational Journal of
Hindawi Publishing Corporationhttp://www.hindawi.com Volume 2014
Polymer ScienceInternational Journal of
Hindawi Publishing Corporationhttp://www.hindawi.com Volume 2014
Hindawi Publishing Corporationhttp://www.hindawi.com Volume 2014
CeramicsJournal of
Hindawi Publishing Corporationhttp://www.hindawi.com Volume 2014
CompositesJournal of
NanoparticlesJournal of
Hindawi Publishing Corporationhttp://www.hindawi.com Volume 2014
Hindawi Publishing Corporationhttp://www.hindawi.com Volume 2014
International Journal of
Biomaterials
Hindawi Publishing Corporationhttp://www.hindawi.com Volume 2014
NanoscienceJournal of
TextilesHindawi Publishing Corporation http://www.hindawi.com Volume 2014
Journal of
NanotechnologyHindawi Publishing Corporationhttp://www.hindawi.com Volume 2014
Journal of
CrystallographyJournal of
Hindawi Publishing Corporationhttp://www.hindawi.com Volume 2014
The Scientific World JournalHindawi Publishing Corporation http://www.hindawi.com Volume 2014
Hindawi Publishing Corporationhttp://www.hindawi.com Volume 2014
CoatingsJournal of
Advances in
Materials Science and EngineeringHindawi Publishing Corporationhttp://www.hindawi.com Volume 2014
Smart Materials Research
Hindawi Publishing Corporationhttp://www.hindawi.com Volume 2014
Hindawi Publishing Corporationhttp://www.hindawi.com Volume 2014
MetallurgyJournal of
Hindawi Publishing Corporationhttp://www.hindawi.com Volume 2014
BioMed Research International
MaterialsJournal of
Hindawi Publishing Corporationhttp://www.hindawi.com Volume 2014
Nano
materials
Hindawi Publishing Corporationhttp://www.hindawi.com Volume 2014
Journal ofNanomaterials


