Embed Size (px)
Citation preview

Temmuz / July 20202


YAYIN İLKELERİ VE YAZAR REHBERİ
Mehmet Akif Ersoy Üniversitesi İktisadi ve İdari Bilimler Fakültesi Dergisi (MAKU IIBFD), Mart,
Temmuz ve Kassım aylarında olmak üzere yılda 3 kez Mehmet Akif Ersoy Üniversitesi İktisadi ve İdari
Bilimler Fakültesi tarafından yayımlanan hakemli bir bilimsel dergidir.
Dergide iktisat, işletme, tarih, sosyoloji, maliye, finans, uluslararası ilişkiler, kamu yönetimi, siyaset
bilimi ve diğer ilgili alanlarda Türkçe ve İngilizce dillerinde makaleler yayımlanmaktadır.
Yayınlanmak üzere gönderilen eserlerin başka bir yerde yayınlanmamış veya yayınlanmak üzere
gönderilmemiş olması gerekmektedir. Derginin yayın dili Türkçe ve İngilizcedir. Dergide yayınlanacak
eserlerin her türlü sorumluluğu yazar veya yazarlara aittir.
MAKU IIBFD, makale sunumlarını memnuniyetle karşılamakta ve hiçbir aşamada (başvuru,
hakemlik ve yayınlama) herhangi bir yayın ücreti talep etmemektedir.
Dergimize DergiPark sistemi üzerinden (http://dergipark.org.tr/makuiibf) başvurulması
gerekmektedir.
Yüklenen her bir makale öncelikli olarak iThenticate intihal tarama programı aracılığı ile
taranmaktadır. Tarama sonucu %20'nin üzerinde olan makaleler RED edilmektedir.
Makaleler en az iki hakem tarafından kör hakemlik uygulamasıyla değerlendirilmektedir.
Dergimizin yazım kuralları ile ilgili detaylı bilgiye http://dergipark.org.tr/makuiibf adresinden ulaşılabilir.
EDITORIAL PRINCIPLES AND GUIDE FOR AUTHORS
Journal of Mehmet Akif Ersoy University Economics and Administrative Sciences Faculty (MAKU
IIBFD) is an open-access, biannual (March, July, November) and peer reviewed scientific journal, which is
publishing by Mehmet Akif Ersoy University Economics and Administrative Sciences Faculty.
MAKU IIBFD publishes scientific articles on economics, bussiness, management, international
relations, public administration, political science, sociology, history, finance, and related fields, in English
or Turkish.
Manuscripts submitted to the journal are only accepted if they have not been or will not be published
and should not be under review elsewhere. Manuscript’s language is Turkish and English. All responsibility
of the studies belongs to the author(s).
MAKU IIBFD, welcomes article submissions and does not charge any fee for any (article submission,
peer review or publication) processes.
Submissions must be done via Dergipark (http://dergipark.org.tr/makuiibf) system.
Each uploaded article is scanned primarily through the iThenticate software. The articles that
exceeded 20% of the results of the scan are rejected.
Double blind peer review is used for review process.
Detailed information on the writing rules of our journal can be found at: http://dergipark.org.tr/makuiibf

THE US AND IRAQI KURDS’ RELATIONS BETWEEN 1945 AND 2011: AN INTEREST-BASED POLICY 1945 VE 2011 YILLARI ARASINDA ABD VE IRAKLI KÜRTLERİN İLİŞKİLERİ: ÇIKAR EKSENLI BIR POLİTİKA
Pages-Sayfalar: 252-275
Sefa MERTEK
THE RELATIONSHIP BETWEEN EXTERNAL DEBT, INTERNAL DEBT AND ECONOMIC GROWTH:
AN EMPIRICAL ANALYSIS ON BRICS-TM COUNTRIES DIŞ BORÇ, İÇ BORÇ VE EKONOMİK BÜYÜME ARASINDAKİ İLİŞKİ: BRICS-TM ÜLKELERİ ÜZERİNE AMPİRİK BİR ANALİZ
Pages-Sayfalar: 276-301
Mehmet Vahit EREN
INVESTIGATION OF CONSUMERS 'ORGANIC FOOD PURCHASES IN THE CONTEXT OF THE
RELATIONSHIP OF PERSONAL VALUES AND INDIVIDUAL FACTORS TÜKETİCİLERİN ORGANİK GIDA SATIN ALMA NİYETLERİNİN KİŞİSEL DEĞERLER İLE BİREYSEL FAKTÖRLER İLİŞKİSİ
BAĞLAMINDA ARAŞTIRILMASI
Pages-Sayfalar: 302-330
Aysel ERCİŞ, Tuğba YILDIZ, F. Görgün DEVECİ
EXAMINATIONS OF IMPACTS OF EMPOWERING LEADERSHIP ON INNOVATION ACTIVITIES IN
SERVICE SECTOR AND EMPLOYEES GÜÇLENDİRİCİ LİDERLİĞİN, HİZMET SEKTÖRÜNDEKİ YENİLİK FAALİYETLERİNE VE ÇALIŞANLARA ETKİLERİNİN
İNCELENMESİ
Pages-Sayfalar: 331-358
Zafer ADIGÜZEL, Yeliz CAYAN
THE DYNAMIC INTERACTIONS BETWEEN US AND EUROPEAN ECONOMIC POLICY
UNCERTAINTIES AND SELECTED MACROECONOMIC VARIABLES IN TURKEY ABD VE AVRUPA’NIN EKONOMİK POLİTİKA BELİRSİZLİKLERİ İLE TÜRKİYE'DE SEÇİLMİŞ MAKROEKONOMİK DEĞİŞKENLER
ARASINDAKİ DİNAMİK ETKİLEŞİMLERİN ANALİZİ
Pages-Sayfalar: 359-377
Merve KOCAMAN, Mustafa ÖZER
BAĞIMSIZLIK SONRASI BELARUS DIŞ POLİTİKASINI BELİRLEYEN YAPISAL FAKTÖRLER STRUCTURAL FACTORS DETERMINING THE BELARUS FOREIGN POLICY AFTER ITS INDEPENDENCE
Pages-Sayfalar: 378-395
Kaan DİYARBAKIRLIOĞLU
ARŞİVLENEN BELLEK OLARAK POSTA PULLARI VE SOSYO-KÜLTÜREL İŞLEVLERİ: KUZEY
KIBRIS ÖRNEĞİ POSTAGE STAMPS AS AN ARCIVED MEMORY AND ITS SOCIO-CULTURAL FUNCTION: NORTH CYPRUS EXAMPLE
Pages-Sayfalar: 396-417
Dilan ÇİFTÇİ, Orhan ÇİFTÇİ
TRANSFORMATION OF PASSIVE REPRESENTATION INTO SYMBOLIC REPRESENTATION IN THE
FRAMEWORK OF REPRESENTATIVE BUREAUCRACY APPROACH: A FIELD RESEARCH ON THE
GENDARMARIE AND THE POLICE TEMSİLİ BÜROKRASİ YAKLAŞIMI ÇERÇEVESİNDE PASİF TEMSİLİN SEMBOLİK TEMSİLE DÖNÜŞÜMÜ: JANDARMA VE POLİS
TEŞKİLATI ÜZERİNE BİR ARAŞTIRMA Pages-Sayfalar: 418-444
Mustafa ARSLAN, Mustafa LAMBA, Sezai ÖZTOP
SAĞLIK ÇALIŞANLARINDA ETİK LİDERLİK VE ÖRGÜT KÜLTÜRÜNÜN İNCELENMESİ: ÖZEL BİR
HASTANEDE UYGULAMA INVESTIGATION OF ETHICAL LEADERSHIP AND ORGANIZATIONAL CULTURE IN HEALTHCARE PROFESSIONALS:
APPLICATION IN A PRIVATE HOSPITAL
Pages-Sayfalar: 445-461
Sümeyye ÖZMEN, Özlem ÖZER, Okan ÖZKAN

HOCALI SOYKIRIMI İLE İLGİLİ TÜRK KAMUOYUNUN GÖRÜŞLERİ ÜZERİNE BİR ARAŞTIRMA A RESEARCH ON THE VIEWS OF THE TURKISH PUBLIC ABOUT THE HOCALI GENOCIDE
Pages-Sayfalar: 462-477
Esme ÖZDAŞLI
CLASSIFICATION OF LOGISTICS-BASED TRANSPORTATION ACTIVITIES IN OECD COUNTRIES
AND SELECTED NON-MEMBER COUNTRIES THROUGH CLUSTER ANALYSIS KÜMELEME ANALİZİ İLE OECD ÜLKELERİ VE SEÇİLMİŞ ÜYE OLMAYAN ÜLKELERİN LOJİSTİK FAALİYETLERİNE DAYALI
TAŞIMACILIK SINIFLANDIRILMASI Pages-Sayfalar: 478-501
Gülsen Serap ÇEKEROL
YAPAY SİNİR AĞLARI İLE BORSA ENDEKSİ TAHMİNİ FORECASTING STOCK MARKET INDEX WITH ARTIFICIAL NEURAL NETWORKS
Pages-Sayfalar: 502-514
Aygülen KAYAHAN KARAKUL

252
MEHMET AKİF ERSOY ÜNİVERSİTESİ
İKTİSADİ VE İDARİ BİLİMLER FAKÜLTESİ DERGİSİ
Mehmet Akif Ersoy University
Journal of Economics and Administrative Sciences Faculty
ISSN: 2149-1658 Cilt: 7 Sayı: 2 s.252-275
Volume: 7 Issue: 2 p.252-275
Temmuz 2020 July
THE US AND IRAQI KURDSi
RELATIONS BETWEEN 1945 AND 2011: AN INTEREST-BASED POLICY
1945 VE 2011 YILLARI ARASINDA ABD VE IRAKLI KÜRTLERİN İLİŞKİLERİ: ÇIKAR
EKSENLİ BİR POLİTİKA
Sefa MERTEK1
1. Arş. Gör., Ondokuz Mayıs Üniversitesi, İktisadi ve
İdari Bilimler Fakültesi, Siyaset Bilimi ve Kamu
Yönetimi, [email protected], https://orcid.org/0000-0002-4046-2248
Makale Türü Article Type
Araştırma Makalesi Research Article
Başvuru Tarihi Application Date
09.02.2019 02.09.2019
Yayına Kabul Tarihi Admission Date
07.07.2020 07.07.2020
DOI
https://doi.org/10.30798/makuiibf.524881
Abstract
Although the US and Iraq relations have vital importance for the Middle East, little is
known about relations between the US and Iraqi Kurds. Iraqi Kurds live in the Northern area of Iraq and throughout history, they have had an impact on both Iraq and the region.
This article focuses on the US and Iraqi Kurds’ relations from the beginning to Arab
Spring with the perspective of realism. Relations between the US and Iraqi Kurds were examined within three time periods, characterized by touchstone events in history,
namely the Second World War, the Gulf War and the Iraq War. The relations between
the US and Iraqi Kurds contribute considerably to our understanding of the balance of politics at the micro level in Iraq and the macro level in the region. This study
investigates whether Iraqi Kurds can be gainful or the US. As a result, because of the
US’ interest-based realism, the US is always gainful.
Keywords: The US, Iraqi Kurds, Northern Iraq, Realism, Interest-Based
Policy,
Öz
ABD ve Irak arasındaki ilişkiler, Ortadoğu için hayati bir öneme sahip olmasına rağmen,
ABD ve Iraklı Kürtler arasındaki ilişkilerin çok azı bilinmektedir. Iraklı Kürtler, Irak'ın
kuzey bölgesinde yaşamaktadır ve tarih boyunca, hem Irak hem de bölge üzerinde bir
etkiye sahip olmuşlardır. Bu makale, başlangıcından Arap Baharı’na kadar realizm perspektifinden ABD ve Irak Kürtlerinin ilişkilerine odaklanmaktadır. ABD ve Iraklı
Kürtler arasındaki ilişkiler, İkinci Dünya Savaşı, Körfez Savaşı ve Irak Savaşı gibi tarihi
olaylarla karakterize edilen üç zaman aralığında incelenmiştir. ABD ve Iraklı Kürtler arasındaki ilişkiler, mikro düzeyde Irak’taki ve makro düzeyde bölgedeki siyasi dengeyi
anlamamıza büyük katkı sağlamaktadır. Bu çalışma, Iraklı Kürtlerin, mi yoksa ABD'nin
mi kazançlı çıktığını incelemektedir. Sonuç olarak, ABD'nin çıkar eksenli realizmi nedeniyle ABD, her zaman kazançlı çıkmaktadır.
Anahtar Kelimeler: ABD, Iraklı Kürtler, Kuzey Irak, Realizm, Çıkar
Eksenli Politika,
i The term ‘Iraqi Kurds’ will be used to define Iraqi people whose ethnicity is Kurd and who lives in the northern area of Iraq.

The Us And Iraqi Kurds’ Relations Between 1945 And 2011: An Interest-Based Policy – 1945 Ve 2011 Yılları Arasında ABD Ve Iraklı Kürtlerin
İlişkileri: Çıkar Eksenli Bir Politika
Sefa MERTEK
253
GENİŞLETİLMİŞ ÖZET
Çalışmanın Amacı
Bu çalışma, ABD ve Iraklı Kürtlerin ilişkilerini ne tür bir zeminde inşa ettiklerini
araştırmaktadır.
Araştırma Soruları
ABD ve Iraklı Kürtlerin ilişkileri dostane bir ilişki midir? ABD’nin Iraklı Kürtler ile ilişkisi Irak
Merkezi Yönetimi arasındaki ilişkilerden etkilenmekte midir? ABD ve Iraklı Kürtlerin ilişkiler bölgesel
düzeyde ne gibi etkilere neden olmaktadır? İsrail, ABD ve Iraklı Kürtlerin arasındaki ilişkide nasıl bir
etkiye sahiptir? ABD, Iraklı Kürtlerin bağımsız bir devlet olmalarını istemekte midir? Iraklı Kürtler,
ABD ile niçin devamlı ortak hareket etmek istemektedir? Uzun süren ilişkilere rağmen kim kazançlıdır?
Literatür Araştırması
Gerek ulusal gerekse de uluslararası literatüre bakıldığında genellikle devletler arasındaki
ilişkileri inceleyen çalışmalar mevcuttur. Devletlerin herhangi bir etnik grupla olan ilişkisini inceleyen
çalışmalar yok denecek kadar azdır. Devletlerin etnik gruplarla olan ilişkilerini inceleyen çalışmalar,
çoğunlukla düşünce kuruluşları tarafından hazırlanan raporlardan oluşmaktadır. ABD ile Iraklı Kürtlerin
ilişkisinde de benzer bir durum söz konusudur. Dolayısıyla ABD’nin tüm Orta Doğu ülkeleriyle
ilişkilerini inceleyen çok sayıda çalışma olmasına rağmen Iraklı Kürtlerle ilişkilerini inceleyen
çalışmalar her zaman ihmal edilmiştir. Oysa bölgeyi anlayabilmek için bu ilişkiyi bilmek oldukça
elzemdir.
Yöntem
Uluslararası ilişkiler teorileri, genellikle devletler üzerine olan çalışmalarda başvurulmaktadır.
Örneğin, ABD ile Irak’ın ilişkilerini inceleyen teorik çalışmalar mevcuttur ve bir devletin diğer bir
devletle olan ilişkisini incelemek için tercih edilir. Ancak bu çalışmada bir devletin, yani ABD’nin, bir
etnik grupla, yani Iraklı Kürtler ile, ilişkileri realizme dayanılarak incelenmektedir. Buradaki tehlike
doğal olarak devlet olduğu için ABD’nin Iraklı Kürtlerle ilişkisinde daima hegemon konumda olarak
hareket etmesidir. Zaten ABD’nin hegemon bir konumda hareket etmesi, kendi çıkarlarından taviz
vermemesine ve tam bir çıkar eksenli politikalar gütmesine neden olmuştur. Dolayısıyla çalışmanın
teorik zemini realizme dayandırılmıştır. Teorik zeminin ardından ise çalışma ABD ve Iraklı Kürtlerin
1945-2011 yılları arasındaki ilişkilerini üç döneme ayırarak ele almaktadır. İlk dönem, Soğuk Savaş
dönemini, ikinci dönem, Körfez Savaşı ile Irak Savaşı arasındaki dönemi, üçüncü dönem ise Irak Savaşı
ile Arap baharı arasındaki dönemi ele almaktadır. Arap Baharı’ndan sonraki süreç, çalışmanın boyutunu
aşacağından dolayı kasıtlı olarak dışarıda tutulmuştur. Zira Arap Baharı’ndan sonraki süreç ayrı bir
çalışmanın konusu olarak incelenmelidir.

Mehmet Akif Ersoy İktisadi ve İdari Bilimler Fakültesi Dergisi - Mehmet Akif Ersoy University Journal of Economics and Administrative Sciences Faculty
Cilt:7 Sayı:2 s.252-275 Volume:7 Issue:2 p.252-275
Temmuz 2020 July
254
Sonuç ve Değerlendirme
Bulgu, hissedar aktivizmi ile KSS katılımı arasında pozitif bir ilişki olduğunu göstermektedir.
Bir başka hipotez, oy haklarının gücü ve hissedarlar ve şirketler arasındaki kurumsal diyalog, şirketlerin
KSS gündeminde yer almasında etkili yöntemler olarak görülmektedir.
The Us And Iraqi Kurds’ Relations Between 1945 And 2011: An Interest-Based Policy – 1945 Ve 2011 Yılları Arasında ABD Ve Iraklı Kürtlerin
İlişkileri: Çıkar Eksenli Bir Politika
Sefa MERTEK
255
1. INTRODUCTION
Realism is one of the most frequently used theories to explain international relations. It is also
pointless to talk about other theories without realism. Realism is a theory that goes back to Thucydides
and Sun Tzu as philosophical thought. Realism, which is carried to modern times by Niccolo
Machiavelli and Thomas Hobbes, is based on the idea that human nature is selfish, self-interested and
evil in its essence (Hobbes, 1987: 24). As a result of human nature being selfish, beneficent and evil,
the state of nature characterizes a situation in which people are at war with each other (Hobbes, 2016:
101). In realism, with the moving from human nature, it is believed that states have also this nature.
When talking about realism, three meanings, in general, are described. First one is realism as a
broad tradition; the second one is the realism which is divided into schools such as classical realism and
neorealism; the third one is the realism which is specific theories such as the balance of power, the
security dilemma (Wohlforth, 2008: 131.). So to speak, there is no single realism. In this study, the US
and Iraqi Kurds relations will be examined with the perspective of general realist thought and specific
realist theories like the balance of power and hegemonic stability theory.
Realism is “a combination of an often loosely related set of beliefs, a way of thinking and
responding, a sometimes desperate desire to preach to the uncomprehending heathen, and a pantheon of
canonical exemplars or saints whose very diverse intellectual and practical lives are seen to embody the
virtues of the religion” (Coady, 2005: 122). There is also other definition of realism. But it has to be
mentioned that four basic points which all realism schools or definitions of realism have in common.
First one is groupism. Because “politics takes place within and between groups” (Wohlforth, 2008: 133).
People have established states only because they can survive in the group. Although realism is generally
a theory that is sought among states, this study will also be used to explain the relationship between a
state and an ethnic group. Second one is egoism. As mentioned earlier, human nature is moving in the
direction of interest and is selfish in this sense. Because the groups are also people-managed, human
nature also manifests itself in the group and in the state (Wohlforth, 2008: 133). Third one is anarchy.
The absence of any authority in international relations causes anarchy. (Wohlforth, 2008: 133). Because
all states and groups use their power to maximize their own interests. Fourth one is power politics. “The
intersection of groupism and egoism in an environment of anarchy makes international relations,
regrettably, largely a politics of power and security” (Wohlforth, 2008: 133). States or groups use their
power either make social influence or control resources (Wohlforth, 2008: 133). Some of the realist
schools bring anarchy to the fore, while others bring power to the fore. Some are highlighting the group
while others are highlighting the interest. In other words, points pointed out from the four mentioned
subjects vary according to the realistic schools. This study suggests that four points must be taken into
account in order to explain the relations of the US and Iraqi Kurds. However if we have to include it in
a realistic school, this will be classical realism. Because the relations of the US and Iraqi Kurds are
predominantly in the direction of power and interest. In particular, this relations is shaped by balance of

Mehmet Akif Ersoy İktisadi ve İdari Bilimler Fakültesi Dergisi - Mehmet Akif Ersoy University Journal of Economics and Administrative Sciences Faculty
Cilt:7 Sayı:2 s.252-275 Volume:7 Issue:2 p.252-275
Temmuz 2020 July
256
power theory and hegemonic stability theory. The US sees the Iraqi Kurds as an element of balance that
they can use whenever they want by using their power. In addition, the US wants to dominate the
resources in the region by using the hegemonic dominance in the international system.
Realism has risen to the position of a theory often used to explain relations between states after
the Second World War. While issues of national security in realism are called high politics, other issues
such as commercial are called low politics (Keohane & Nye, 2012: 19). Today, states apply to realism
as a low political tool in the direction of their national interests. For this reason, low policies based on
the interests are particularly adapted to penetrate commercial areas.
Relations between the US and Iraqi Kurds can be examined within three periods. The first period
is between the 1950s and 1990 when the Gulf War started. The second period is between 1990 and 2003
when the US - Iraq War broke out. The third period is from 2003 to Arab Spring. Although the time
spanning the Arab Spring and ISIS actions can be considered a fourth period during which to examine
the US-Iraqi Kurd relations, this article focuses mainly on general developments between the US and
Iraqi Kurds, rather than on current issues following the Arab Spring.
Since the beginning of the Cold War, Middle East has been one of the most important issue of
US foreign policy due to economic, military, geostrategic and political considerations (Dodge, 2012:
198-205). While the USA is an independent state, the decision-making mechanisms have been
influenced by various actors in the historical process. The United States has been highly influenced by
lobbying and regional countries in determining its policy towards the Middle East in general and its
policy towards the Iraqi Kurds in particular. In this context, it is necessary to mention Israel which is
engaged in the most effective lobbying on the Middle East. Israel, as a result of its powerful lobbying
activities, is very effective in determining the US policy towards the Middle East and thus Iraqi Kurds.
1 In fact, Israel's relations with Iraqi Kurds have historical ties. Jews and Iraqi Kurds lived
together in the northern Iraq region, but after the establishment of Israel, the majority of Jews went to
Israel. (Minasian, 2007: 16-19). In addition, when determining policy towards the Middle East and Iraqi
Kurds, the US has to take into account Turkey, Iran and Iraq Central Government (ICG).
The aim of this study is to examine the relationship between the US and Iraqi Kurds between
the Second World War to the Arab Spring from the perspective of realism. The research question of this
work is that “how have the relations between the Iraqi Kurds and the U.S. evolved from the Cold War
up until Arab Spring?” While searching for the answer to this question, the ups and downs in their
relations and landmark events between these two actors are mentioned.
1 John J. Mearsheimer and Stephen M. Walt's famous book The Israel Lobby and US Foreign Policy clearly illustrates this situation.
However, Israel's role in the US decision-making mechanism is discussed in a superficial manner, as it may be the subject of a separate article. For more information see: Mearsheimer J. J. and Walt S. M. (2007), The Israel Lobby and US Foreign Policy,
New York: Farrar, Straus and Giroux.
The Us And Iraqi Kurds’ Relations Between 1945 And 2011: An Interest-Based Policy – 1945 Ve 2011 Yılları Arasında ABD Ve Iraklı Kürtlerin
İlişkileri: Çıkar Eksenli Bir Politika
Sefa MERTEK
257
2. THE US – IRAQI KURDS RELATIONS DURING COLD WAR
Relations between the US and Iraqi Kurds date back to the end of the Second World War. After
the First World War, the US returned to an isolation policy. By adopting this policy, the US chose not
to involve themselves in any conflict outside of the homeland, especially in Europe and the Middle East.
However, things changed after Second World War when the US abandoned this isolation policy and
became actively involved in world affairs, a move which made it clear that the US would indeed be an
active player in world affairs, especially in the Middle East. Before this point, the US was not a major
actor in Europe and the Middle East. After the Second World War, however, the US began to fill the
vacuum of power created by the departure of England from the Middle East. So, the period after the
Second World War marked the beginning of relations between the US and Iraq, along with Iraqi Kurds.
The Middle East policy of the US during this period was formed by the effect of the Cold War.
After the Second World War, the US adopted new foreign policies that significantly affected
the Middle East. These policies were adopted for a number of reasons. First, the rich oil reserves of
Middle Eastern countries, especially Iraq caught the attention of the US (Jones, 2012: 208). Second,
given its pivotal role in the Second World War, the Middle East had proven to be of considerable
geostrategic importance (Persson, 1998: 71). The third and most important reason for the US’ active
involvement in international affairs involved the need to limit USSR expansionism (Salep, 2012: 337-
338; also see, Erkan, 2010: 183-194). For these reasons, the US approached world affairs on a general
level in the Middle East, and on a specific level in Iraq and with Iraqi Kurds. General explanations of
the US policies and its approaches to the events were mentioned above. During this period, two
significant developments influenced the US policy in the Middle East. The first development was a
vacuum of power caused by the departure of England from Iraq. The US started to fill this vacuum of
power. The second development was Iraq’s liberation from the British mandate. So, the US began to
establish relations with the Iraqi Central Government (ICG) during the Cold War.
With the beginning of the Cold War, the US had no direct involvement with the Kurdish
movement until after the 1958 coup in Iraq’ – or something to that effect (Erkmen, 2008: 74). There
were three main reasons for this. Firstly, the US did not want to risk losing its allies, such as Turkey and
Iran. If the US had had relations with Iraqi Kurds, it would most probably have lost its allies at the
beginning of the Cold War. Secondly, at the beginning of the Cold War, the US did not want to lose Iraq
and its administration, for Iraq was very important to the US in the region. It was too risky for the US
to advocate any threat to the integrity of Iraq (see, Hahn, 2012). Thirdly, the US regarded Kurdish
movements as pro-USSR because of the Mahabad Kurdish Republic in Iran and Mullah Mustafa
Barzani’s actions in Northern Iraq (Kutschera, 2001: 232; also see, Westermann, 1946: 675-686). The
US confirmed the accuracy of its assessment about Kurds when Mullah Mustafa Barzani escaped to the
USSR after the collapse of the Mahabad Kurdish Republic (Eller, 1999: 166). In light of these
developments, the US considered the Kurdish movement to be a pro-USSR one. However, Kurds were

Mehmet Akif Ersoy İktisadi ve İdari Bilimler Fakültesi Dergisi - Mehmet Akif Ersoy University Journal of Economics and Administrative Sciences Faculty
Cilt:7 Sayı:2 s.252-275 Volume:7 Issue:2 p.252-275
Temmuz 2020 July
258
willing to work with the US and other Western countries because of the USSR’s indifference to Kurds
following the collapse of the Mahabad Kurdish Republic. Nevertheless, since the US did not want to
lose its allies or its position in Iraq, and considering the conclusion that the Kurds represented a pro-
USSR movement, the US did not establish any relations with Iraqi Kurds until the 1958 coup in Iraq.
So, we can say that the 1958 coup is the first turning point in relations between the US and Iraqi Kurds.
In 1958, the monarchy in Iraq collapsed as a result of the coup. While few changes were made
in domestic politics, much was changed in foreign politics. With the establishment of a republic in Iraq
and the accompanying new government, Iraq left the Baghdad Pact, started to establish close relations
with the USSR, nationalized petrol companies, etc. In general, the US–Iraq relations started to
deteriorate. To prevent further deterioration, the US made a number of operational initiatives (Becker,
2003: 20-21). Until 1975, when Iraq and Iran made an agreement about Shatt al-Arab, the US and Iran’s
relations with Iraq were not good and Iraqi Kurds were just a pawn for the US and Iran.
Although relations between the US and Iraq worsened following the 1958 coup, the US did not
want to support Iraqi Kurds (Erkmen, 2008: 80) because of the three previously mentioned reasons.
Also, reports about Iraq and Iraqi Kurds made by the US officials advised against supporting Iraqi Kurds
since it was believed that supporting Iraqi Kurds would lead to the collapse of Iraq’s integrity, along
with that of other the US allies, such as Turkey and Iran. Another crucial reason for the American
reluctance to support Iraqi Kurds was that Iraq would most likely have established closer relations with
the USSR (Office of the Historian, 1963), a move which would work directly against the US attempts
to limit Soviet expansion. Also, reports suggested that the problems between Iraq and Iraqi Kurds were
domestic ones, in which the US should not intervene (Office of the Historian, 1966). In light of these
reports, the US did not intervene in relations between Iraq and Iraqi Kurds until the late 1960s.
In 1969, however, the US indirectly intervened in relations between Iraq and Iraqi Kurds, a
decision that was hugely influenced by Israel and Iran. Israel directly supported Iraqi Kurds’ attempts
to weaken Iraq, its main rival in the region. Iran also supported Iraqi Kurds because, after the 1958 coup,
relations between Iraq and Iran had deteriorated because of the Shatt al-Arab issue. Specifically, Iraq
had suspended the Shatt al-Arab agreement, while Iran’s main aim was to regain the privileges related
to Shatt al-Arab. So, Iran acted like Israel and supported the Iraqi Kurds’ attempt to weaken Iraq in order
to compel Iraq into a new agreement on Shatt al-Arab. Iran had the strongest influence on the US’
decision to support Iraqi Kurds. Moreover, there were a number of coups in the 1960s in Iraq and the
balance of relations changed. Still, though, the US kept its decisive policy of non-intervention, since the
US assessments of the situation lead to the conclusion that any intervention would result in closer
relations between Iraq and the USSR.
Contrary to the US’ hesitance to establish relations, the Iraqi Kurds were eager to enter into
close relations with the US. Moreover, Iraqi Kurds wanted to be a strategic ally to the US. The leader of
the Iraqi Kurds, Mullah Mustafa Barzani, attempted a number of initiatives aimed at establishing direct
or indirect relations with the US. It was clear that the Iraqi Kurds were willing to do whatever the US

The Us And Iraqi Kurds’ Relations Between 1945 And 2011: An Interest-Based Policy – 1945 Ve 2011 Yılları Arasında ABD Ve Iraklı Kürtlerin
İlişkileri: Çıkar Eksenli Bir Politika
Sefa MERTEK
259
wanted, including providing intelligence, returning to the Baghdad Pact, and promising the US’ using
of Iraq’s oil reserves (Kıran, 2006: 44). In spite of all of the Iraqi Kurds’ efforts, the US did not abandon
its policies of non-intervention until the late 1960s.
The changing conditions in Basra Bay in 1969 necessitated direct cooperation between the US
and Iraqi Kurds along with the involvement of Iran in that area. This was the first instance in which the
US provided direct aid to Iraqi Kurds, which involved just sending advisers to the Iraqi Kurds (Yavuz,
1993: 95). In 1972, Iraq and the USSR signed the Friendship and Cooperation Agreement. This
agreement was the second turning point for the US because, after this agreement, the US started to give
arms and money to Iraqi Kurds. There were two main reasons why the US changed its policies towards
Iraqi Kurds. Firstly, the US concluded that Iraq was moving in the direction of establishing a USSR
base/satellite (Pelletiere, 1984: 167). Secondly, after the 1958 coup, Iraq nationalized oil companies and
adopted parallel policies with the USSR on energy (Pelletiere, 1984: 166). Additionally, Iran’s
encouragement of the US dealings with the Iraqi Kurds and Barzani’s willingness to have good relations
with the US affected these policy changes. It is important to note, however, that all of these negotiations,
and all cooperation and aid involving these parties, were secretly conducted (see Kissinger, 1999: 576-
596).
Between 1972 and 1975, the US adopted parallel policies with Iran. In this period, the US and
Iraqi Kurds had close relations. Barzani stated that Iraqi Kurds were willing to become the 51st State of
the US and provide the US with access to Iraq’s oil reserves (Meho & Nehme, 2004: 22). Iraqi Kurds
had blind confidence in the US’ promises that they would not be abandoned by the US or by Iran (Meho
& Nehme, 2004: 22). Henry Kissinger, who was Secretary of State between 1973 and 1977, “worked
closely with Israel and Iran to arrange for the Kurds a large shipment of weapons, including antiaircraft
and antitank missiles” (Gibson, 2015: 177). In 1975, Iran and Iraq signed the 1975 Algiers Agreement
which ended many disputes and conflicts between the two states, including the Shatt al-Arab issue. After
signing this agreement, Iran and stopped supporting Iraqi Kurds against the Iraqi government. According
to CIA reports, with the withdrawal of support from Iran and also Israel, Iraqi Kurds would have little
chance against the ICG (CIA Report, 1975: 2). The US had prepared itself for this situation because
nearly all intelligence reports forecasted this outcome. So, the US also changed its policy about Iraqi
Kurds to parallel that of Iran. Both the US and Iran utilized Iraqi Kurds as a pawn against the ICG. In
fact, the main aim of the US in supporting Iraqi Kurds was to distance the Iraqi government from the
USSR and solve the region's problems (Erkmen, 2008: 89). In light of these developments, the ICG
started to gain the upper hand in the war against the Iraqi Kurds. The Iraqi Kurds sent messages to the
US for help and demanded the US fulfill their pledges. But the US neither replied to these messages nor
sent their support to the Iraqi Kurds. Later, when asked about this policy, Henry Kissinger, just replied
“covert action should not be confused with missionary work” (Gibson, 2011). So, we can conclude that
the US applied a realist theory which is balance of power theory between the years of 1969 and 1975

Mehmet Akif Ersoy İktisadi ve İdari Bilimler Fakültesi Dergisi - Mehmet Akif Ersoy University Journal of Economics and Administrative Sciences Faculty
Cilt:7 Sayı:2 s.252-275 Volume:7 Issue:2 p.252-275
Temmuz 2020 July
260
against Iraqi Kurds. In this period, the US had good relations with Iraqi Kurds in order to weaken the
ICG. The US wanted to balance the ICG with Iraqi Kurds.
After the 1975 Algiers Agreement, the new situation was the US’s close relations with the ICG
and poor relations with Iraqi Kurds. The US and the ICG started to cooperate after signing this
agreement. But this new situation did not last long. There were three important developments that
changed the balance of power in the Middle East. Two of them, i.e., the Iranian Revolution and the
USSR invasion of Afghanistan, occurred in 1979, and the third, namely the Iraqi-Iranian War, started in
1980. These three important developments changed the US policy towards the ICG and Iraqi Kurds.
With the Iranian Revolution, the US lost one of its loyal allies, Iran, and this situation brought the US
closer to the ICG. During the invasion of Afghanistan, the US supported the Afghan mujahedin against
the USSR (Şahin, 2008: 45). In retaliation for this US policy, the USSR supported the Iraqi Kurds against
the Iraqi government and the US. Additionally, with the Iraqi-Iranian War, Iran started to support Iraqi
Kurds just like they had done before the 1975 Algiers Agreement (Pelletiere, 1984: 182-185). In this
period, the US did not support Iraqi Kurds because the US did not want to lose the ICG. The main
development affecting the US policy towards northern Iraq was the start of the Iraq-Iran War. This is
because after their revolution, Iran declared, the US to be Great Satan, a force that threatens regimes in
the Middle East, and became a much greater threat than Iraq, which was ruled by the Baath party. So,
the US swiftly mended relations with the ICG which had started to fight against the Iranian threat. Thus,
Washington-Baghdad relations improved in the face of a common enemy, Iran, and, in a sense, an
alliance was formed.
The US’ support of the ICG took various forms, including cooperation, selling food, and later,
providing arms and intelligence. Furthermore, the US was indifferent to the ICG’s use of chemical
weapons and voted against a proposal that says the ICG used chemical weapons against Iraqi Kurds, at
the United Nations Security Council (King, 2003). Later, however, the US changed its policy towards
the region. The new US policies emphasized protecting oil reserves, becoming more powerful and active
in the region and providing stability in the region (Erkmen, 2008: 92). This policy changes can be
explained by hegemonic stability theory and basic classical realism thought such as interest. The US
uses her hegemonic power to dominate in the Middle East. The result of this US’ action is to get benefit
and control resources in Iraq.
In the mid-1970s, there were two Kurdish parties. One of them was the Kurdistan Democratic
Party (KDP) and the other one was the Patriotic Union of Kurdistan (PUK). During the Iraqi-Iranian
War, the KDP supported Iran and the PUK supported the ICG. But later, when Iran seized the lead in
the war, the KDP and PUK joined forces and supported Iran. The US did not approve of the Iraqi Kurds’
approaches to warfare. Since the US and Iran were no longer allies after the Iranian Revolution, the US
became indifferent to any actions made by the ICG against Iraqi Kurds. Towards the end of the Iraq-
Iran war, Saddam Hussein started the Anfal Operation, which involved systematic attacks that mainly
targeted Iraqi Kurds in Northern Iraq. During the Anfal Operation, many villages in Northern Iraq were

The Us And Iraqi Kurds’ Relations Between 1945 And 2011: An Interest-Based Policy – 1945 Ve 2011 Yılları Arasında ABD Ve Iraklı Kürtlerin
İlişkileri: Çıkar Eksenli Bir Politika
Sefa MERTEK
261
destroyed. The Halabja Massacre, which was a part of the Anfal Operation, took place on 16 March
1988 and caused many deaths (Ciment, 1996: 161). This conflict continued until the outbreak of the
Gulf War in 1990. Relations between the US and Iraqi Kurds remained acrimonious until that time. The
US followed dominantly the ICG and even stayed silent on the genocide of Iraqi Kurds, considering
them only as a backup plan for achieving their goals in the region.
It is necessary to open a separate paragraph to Israel. Israel has tried to establish effective
cooperation with non-Arab groups in the Middle East region with the “peripheral strategy” adopted
since the late 1950s (Minasian, 2003: 309). In this context, Israel tried to disrupt the Arab unity by
making Iraq and the Arab countries in the region engage with the Kurds. Until the 1975 Algiers
Agreement, Israel has consistently provided assistance to Iraqi Kurds, particularly in the military and
intelligence fields. However, with this treaty, Israel's aid to Iraqi Kurds via Iran was hampered as it had
no direct border with Iraq. With the revolution that took place in Iran, Israel started to use the Iraqi
Kurds against Iran in addition to the internal conflicts in Iraq.
3. THE US – IRAQI KURDS RELATIONS FROM THE GULF WAR TO
THE IRAQ WAR
After the Iraq-Iran War, relations between the US and Iraqi Kurds were not close. In these years,
another turning point came to the fore. That turning point was the Gulf War which started with the Iraqi
attacks on Kuwait on 2 August 1990. After this war began, the United Nations (UN) started to take
actions against Iraq, and the US was the leading actor in these kinds of decisions.
At the beginning of the war, the US wanted the Iraqi Kurds to act against the Iraqi army in
Northern Iraq. However, the Iraqi Kurds did not act or rise up against the ICG because they were afraid
of the ICG’s use of chemical weapons, as in the Anfal Operation against Iraqi Kurds (Entessar, 1992:
50). But, when Iraq was defeated in 1991, Iraqi Kurds rose up against the ICG at the instigation of CIA
by a radio channel in Saudi Arabia (Kılıç, 2010: 230). During the uprising, many Jewish organizations
engaged in propaganda and lobbying to prevent Iraqi Kurds from being harmed (Minasian, 2007: 25).
With the invasion of Kuwait, the good relations between the US and the ICG, which were created during
the Iraq-Iran War, deteriorated. The US changed its policy towards the ICG for a number of reasons.
Firstly, the Cold War had ended and there was no longer any strong power supporting these states like
the USSR did in the Cold War. Secondly, it was no longer possible for the US to use Iraq against Iran
after the Iraq-Iran War. Thirdly, the US was troubled by Iraq's invasion of Kuwait, a move which
threatened oil-rich countries in the Gulf which were in close cooperation with the US. So, unlike in the
1980s, Washington saw Saddam’s Government as a new threat in the Middle East and started to
cooperate with some of the actors in the region against this government. During this process, Northern
Iraq, and more specifically, the Iraqi Kurds, was rediscovered by the US. This US action can be
explained by hegemonic stability theory. The US used her international power to protect her situation
in the region. So the US acted against ICG.
Mehmet Akif Ersoy İktisadi ve İdari Bilimler Fakültesi Dergisi - Mehmet Akif Ersoy University Journal of Economics and Administrative Sciences Faculty
Cilt:7 Sayı:2 s.252-275 Volume:7 Issue:2 p.252-275
Temmuz 2020 July
262
In a short time during the Gulf War, the Iraqi Kurds seized control of some cities in Northern
Iraq. With this accomplishment, Massoud Barzani and Jalal Talabani made speeches proclaiming that
they had won the war (Gunter, 1993: 50). But, these speeches were premature because, at the end of the
war, Saddam Hussein sent Iraqi troops to Northern Iraq to punish the Iraqi Kurds for their uprising. The
US, which encouraged the Iraqi Kurds’ uprising, did not take any action against Saddam for this move.
The Iraqi Kurds were defeated by Iraqi forces and were once again used by the US as a pawn.
There were at least four factors that contributed to the US’ decision not to defend the Iraqi
Kurds. Firstly, the US administration feared that any kind of intervention could lead to harmful
consequences in domestic politics (Gunter, 2001: 97). Secondly, the US administration thought that if
not Saddam won the war, it could lose Iraq entirely (Gunter, 2011: 97). Thirdly, the US concluded that
the success of Iraqi Kurds could threaten regional allies of the US such as Turkey and Syria. Since there
is also a high Kurdish population in these countries, the US was concerned that this population would
rise up against its allies (Gunter, 2011: 97). Fourthly, the US did not want to damage Iraq’s integrity
because the US believed that if Iraq collapsed, Iran would benefit from this outcome. For these reasons,
the US left the Iraqi Kurds to fend for themselves against Saddam. Again the US policy can be explained
by the balance of power theory. The US used Iraqi Kurds as a balancing tool in Iraq and region and
wanted to protect the balance of power in the region.
Based on the initiatives of the President of Turkey, Turgut Özal, and the Prime Minister of
England, John Major, safe heavens were created (Gunter, 1993: 56). The United Nations Security
Council (UNSC) intervened in the crisis and approved Resolution 687 which passed on 3 April 1991
and contained an armistice. On 5 April 1991, the UNSC also approved Resolution 688, which contained
humanitarian aid especially to the people on the borders of Turkey and Syria. Resolution 688 was very
important for Iraqi Kurds because once it was adopted, it became possible for Iraqi Kurds to survive in
war conditions and to go back home unharmed. Additionally, with Resolution 688, no-fly zones were
established in Northern Iraq to protect Iraqi Kurds and also in Southern Iraq to protect the Shiite people.
These Resolutions were enacted with Operation Provide Comfort I and II (Ministry of Defense, 2009).
The no-fly zones are shown below (Beauchamp, Fisher & Matthews, 2014):

The Us And Iraqi Kurds’ Relations Between 1945 And 2011: An Interest-Based Policy – 1945 Ve 2011 Yılları Arasında ABD Ve Iraklı Kürtlerin
İlişkileri: Çıkar Eksenli Bir Politika
Sefa MERTEK
263
Figure 1. No-Fly Zone of Iraq
Source: Beauchamp, Z.; Fisher, M. & Matthews, D. (2014). 27 maps that explain the crisis in
Iraq. http,//www.vox.com/a/maps-explain-crisis-iraq. (16.08.2016).
The US undertook guardianship of the Iraqi Kurds by means of Operation Provide Comfort
placed Turkey to protect safe haven. Thus, the effect of the US in northern Iraq began increasing. This
was the first time in history that the Iraqi Kurds had protection against Saddam’s government. As a
result, relations between the US and Iraqi Kurds started to institutionalize and Iraqi Kurds became the
closest ally of the US among all ethnic groups in Iraq. These situations also led Iraqi Kurds, especially
the KDP and PUK, to institutionalize their own controlled area in northern Iraq (Uzgel, 2006: 263).
After the war, Saddam removed all official institutions from Northern Iraq and left the Iraqi
Kurds to fend for themselves (Stansfield, 2003: 181). Saddam’s aim was to punish the Iraqi Kurds for
what they had done during wartime. But this goal was frustrated by the fact that western powers
supported the Iraqi Kurds in the establishment of their own system of government. So Saddam’s aim to
punish Iraqi Kurds by removing official institution led to Iraqi Kurds’ building their own system of
government and this result was just a coincidence (Anderson & Stansfield, 2004: 172).
After the war, the US adopted a Dual Containment Policy aimed at isolating Iraq and Iran from
the world (Demir, 2007: 198). The policy was foregrounded by Martin Indyk on 18 May 1993, who
emphasized that the US policy was to eliminate the Iraqi regime, in other words, Saddam’s government
(Özdağ, 1999: 110). In actuality, though, the US did not want to damage Iraq’s integrity. Their aim was
to design a less powerful and less dangerous Iraq. The Iraqi Kurds, however, had the specific aim of
separating from Iraq. Although the aims of the US and Iraqi Kurds were different, de facto situation in

Mehmet Akif Ersoy İktisadi ve İdari Bilimler Fakültesi Dergisi - Mehmet Akif Ersoy University Journal of Economics and Administrative Sciences Faculty
Cilt:7 Sayı:2 s.252-275 Volume:7 Issue:2 p.252-275
Temmuz 2020 July
264
Iraq was acceptable for both sides at the time. With the adoption of the Dual Containment policy, the
importance of Iraqi Kurds increased in the eyes of the US, who used every minority and actor in Iraq
and Iran to weaken the central government of these two states. In Iraq, the Iraqi Kurds were the most
powerful of these actors. Many states, with encouragement from the US, began implementing an
embargo against Iraq. However, Turkey and Syria worked against this embargo because of the numerous
trade agreements that existed between these countries and Iraq. So, Turkey, Syria, and Iran wanted to
reintegrate Iraq into the international community because of their economic loss and de facto situation
in northern Iraq (Sever, 2000: 350). Upon pressure from the international community, the US eased
embargo conditions in 1996 and later, the international community wanted the embargo to be lifted
entirely (Sever, 2000: 350). These points highlight some of the key obstacles to this embargo. Firstly,
states which had trade relations with Iraq wanted the embargo to be lifted because of the economic loss
they faced. Secondly, neighboring states, especially those that were not satisfied with Saddam losing
power over Iraqi Kurds and the subsequent strengthening of Iraqi Kurds, wanted to reintegrate Iraq into
the international community. Thirdly, the cooperation of Baghdad and the KDP in 1996 showed the
impossibility of the Dual Containment policy (Sever, 2000: 354). So, in 1996, this policy was steadily
moving closer to abandonment.
Some disputes and clashes arose between the KDP and PUK which greatly concerned the US,
which wanted to use the Iraqi Kurds against Saddam’s government within the framework of the Dual
Containment policy. To reconcile the KDP and PUK, the US tried to mediate between both sides on 27
July 1995 in Lisbon, but an agreement could not be reached. Following this attempt, the US again
brought the KDP and PUK together, this time in Dublin in August 1995. One of the neighboring states,
Turkey, participated as an observer in the Dublin process. Despite the US efforts to reconcile the KDP
and PUK, terms acceptable to both parties could not be established (Uzgel, 2006: 264). There were
similar kinds of meetings in the following months, each unsuccessful. However, on 11 October 1995,
the KDP and PUK announced that they had reached an agreement on some points (Özdağ, 1996: 100).
While these negotiations were going on, clashes erupted from time to time and Iran began strengthening
its position in northern Iraq.
In August 1996, with support from Iran, the PUK took control of Erbil. In September 1996, the
KDP and Saddam acted together in retaliation. The KDP gave many supporters of the PUK to Saddam’s
forces in Erbil (Kutschera, 1996: 8). The US, who at that time was bombing the southern area of Iraq,
did not intervene in this development (Arı, 2007: 474) because they wanted to prevent Iran from
strengthening in northern Iraq. With the help of Saddam’s forces, the KDP took control of Erbil, and
soon after, they took control of Sulaymaniyah which was a known PUK stronghold. Many PUK
supporters fled to Iran. In the meantime, 6700 Iraqi Kurds were sent to Guam, a Pacific island belonging
to the US (Uzgel, 2006: 265). These Iraqi Kurds had been working for the US, i.e., the CIA in northern
Iraq.

The Us And Iraqi Kurds’ Relations Between 1945 And 2011: An Interest-Based Policy – 1945 Ve 2011 Yılları Arasında ABD Ve Iraklı Kürtlerin
İlişkileri: Çıkar Eksenli Bir Politika
Sefa MERTEK
265
After ongoing negotiations and with the Iranian threat weakened, the US wanted to ensure
continued unity between the KDP and PUK and to use this unity against Saddam. So, the Ankara process
began in October 1996, when Turkey, the US, England, the KDP, the PUK and the Turkmens came
together in Ankara. Four meetings were held in there between October 1996 and May 1997.
Unfortunately, though, these parties could not establish any agreements. The US was not satisfied with
this outcome, so, they kept these initiatives going. In September 1998, the KDP and PUK met in
Washington and agreed on some issues (Shenon, 1998) and signed the Washington Agreement on 17
October 1998. The Washington Agreement aimed to stop clashes, start a normalization period, establish
elections etc. (Özkan, 2004: 310-311). The main goal of the US was to reunite the Iraqi Kurds against
Saddam Hussein, but the US could not achieve this goal at all because after signing the Washington
Agreement, the KDP started to establish their own government in Erbil and PUK started to establish
their own government in Sulaymaniyah. The US and Non-Governmental Organizations (NGO) helped
this institutionalization process. The NGOs were very helpful in introducing Iraqi Kurds to the
international arena (Natali, 2004: 111). This situation continued until the 2003 Iraq War which changed
the situation in the region. It has to be mentioned that the US used Iraqi Kurds as a balancing tool again.
The US wanted to protect the balance of power and her hegemonic power in Iraq and the region. The
map below shows the areas controlled by the KDP and PUK (University of Texas Libraries, 2003):
Figure 2. Kurdish Areas of Northern Iraq
Source: The University of Texas Libraries. Map of Iraqi Kurdish Areas.
http,//www.lib.utexas.edu/maps/middle_east_and_asia/iraq_kurdish_areas_2003.jpg.
(17.08.2016).

Mehmet Akif Ersoy İktisadi ve İdari Bilimler Fakültesi Dergisi - Mehmet Akif Ersoy University Journal of Economics and Administrative Sciences Faculty
Cilt:7 Sayı:2 s.252-275 Volume:7 Issue:2 p.252-275
Temmuz 2020 July
266
The reasons for these disagreements and fragmentations between the KDP and PUK should be
noted. The first reason involved the sociological and ideological distinctions between the KDP and PUK,
which were influenced by Northern Iraq’s two regions. One of these regions is called the Bahtinan
region, where people speak the Kırmanci dialect of Kurdish and support Barzani; the other is called
Soran, where people speak the Sorani dialect of Kurdish and support Talabani (Özmen, 1996: 50). These
two regions also differ in that they support a different kind of sheik and Tariq, so, we can say that even
their way of Islamic life is different. The second reason for the conflicts between the KDP and PUK was
the rivalry between their respective leaders, Barzani and Talabani. Massoud Barzani was the son of
Mullah Mustafa Barzani, leader of the most powerful tribe in the region and leader of the KDP
(Anderson & Stansfield, 2004: 173). Jalal Talabani was a well-known person in the Kurdish movement
for many years, a very talented politician and a favorite of the urban people (Anderson & Stansfield,
2004: 173). While people live in mainly urban areas support Talabani, others live in mainly rural areas
support Barzani. The third reason for the problem between the KDP and PUK was the disproportionate
allocation of resources among the Kurds in Northern Iraq, especially where oil income was concerned.
Since the KDP controlled oil-rich areas, they received the lion’s share of the income from this resource
(Kılıç, 2010: 231). These three main reasons can be seen as the root of the problem between the KDP
and PUK.
When George W. Bush was elected President of the US, Barzani, and Talabani wrote him a
letter that made clear Iraqi Kurds’ willingness to cooperate with the US. In this letter, Barzani and
Talabani first mentioned their appreciation of the aid to Iraqi Kurds which the US had been providing
since the First Gulf War (Şahin, 2006: 284). Secondly, they expressed their willingness to be part of any
intervention against Saddam (Attar, 2004, 292, cited in Şahin, 2006: 285). Thirdly, they requested U.S.
protection especially in safe havens (Attar, 2004, 292-293, cited in Şahin, 2006: 285). Fourthly, they
wanted some amount of oil income to be sent to the Kurdistan Regional Government (KRG) (Attar,
2004: 292-293, cited in Şahin, 2006: 285). Lastly, they reaffirmed their commitment to the Washington
Agreement (Attar, 2004: 292-293, cited in Şahin, 2006: 285). The aims of the Iraqi Kurds were to protect
the gains that they had made following the First Gulf War and to take advantage of the opportunity to
become a natural and mutual ally of the most powerful actor in the world, the US.
In this period, the Iraqi Kurds made two important gains. The first was the establishment of their
own institutions, and the second one was to meet governing experience of these institutions through the
first gain. Iraqi Kurds achieved from these two gains by means of international support, especially from
the US. As previously mentioned, by using the Iraqi Kurds against Saddam’s government, labeled by
the US as a rogue state, the aim of the US was to render Saddam’s government dysfunctional, powerless
and harmless. There was a win-win situation in this case. Both sides, Iraqi Kurds, and the US needed
each other even though they had different aims. Both of them acted in the direction of their interest.

The Us And Iraqi Kurds’ Relations Between 1945 And 2011: An Interest-Based Policy – 1945 Ve 2011 Yılları Arasında ABD Ve Iraklı Kürtlerin
İlişkileri: Çıkar Eksenli Bir Politika
Sefa MERTEK
267
4. THE US – IRAQI KURDS RELATIONS AFTER THE IRAQ WAR
After the 9/11 attack, which took place on 11 September 2001, the US changed its Middle East
policy and adopted a Preventive War policy. So, we can say that 9/11 was the fourth turning point in
relations between the US and Iraqi Kurds. In Iraq, the US wanted to remove Saddam Hussein, so they
started making allies on both the international and regional levels (Şahin, 2006: 284). With this policy,
the Iraqi Kurds started to become a natural ally of the US, who needed to gain the support of dissidents
of Saddam’s government, especially the Iraqi Kurds. The strategic necessity of dissenters’ coming
together was undeniable, as this would serve to protect them from possible attacks by Saddam and ensure
their survival.
Additionally, the Iraqi Kurds wanted some guarantees as they had twice been betrayed after
becoming allies with the US, first after signing the 1975 Algiers Agreement and then again during the
Gulf War in 1991. During these periods, Iraqi Kurds were used as a pawn by the US and they wanted to
avoid this in the upcoming war. So, the Iraqi Kurds wanted some guarantees from the US. Barzani said
in a newspaper interview, “First of all, we have to know who the alternative is if there is one. Of course,
so far there is no alternative . . . and we don't see one,” (Schneider, 2002) and, during an appearance on
a TV show Talabani said, “We do not know what will happen . . . we will not enter adventures whose
end is unclear” (Schneider, 2002). These statements made by two powerful leaders in northern Iraq show
that the Iraqi Kurds were very wary of being deceived for the third time. However, the US and Iraqi
Kurds needed each other, since the US wanted to overthrow Saddam and the Iraqi Kurds aimed to protect
its de facto situation in northern Iraq. So, talks between the US and Iraqi Kurds continued for some time.
During this process, the US sent aid to many of Saddam’s dissidents, not just the Iraqi Kurds. When the
Iraqi Kurds were convinced of the US commitment to their agreement, they started to trust the US again
and actively participated in the US actions in the region. The US had achieved their goal of restoring
unity among the Iraqi Kurds, who then established their parliament.
With the establishment of their parliament, the Iraqi Kurds officially reunited on 4 October 2002
and declared unity among Iraqi Kurds, promised not to act against each other, not to aim an independent
state etc. (Hürriyet, 2002). The US expected to benefit in a number of ways from bringing Iraqi Kurds
together. Firstly, in Iraq, the peshmerga forces of the Iraqi Kurds were well organized and could be used
by the US in pursuit of their own interests. Secondly, the US wanted to use the peshmerga and other
Kurds as a means of obtaining intelligence in the region. Thirdly, because of Saddam’s actions against
Iraqi Kurds, the US could use the Iraqi Kurds to legitimize any possible interventions on their part in
the region. At the same time, Iraqi Kurds made some demands in return. Firstly, the main aim of the
Iraqi Kurds had been, for many years, to establish an independent state. In the past, and now, there have
been many obstacles to the achievement of this aim. Conditions in the region are very fickle and many
states have had a number of different allies over the years. Still, though, many states wanted to protect
the integrity of Iraq including the US, Turkey, Iran, and Syria. Secondly, the Iraqi Kurds wanted to get
Mehmet Akif Ersoy İktisadi ve İdari Bilimler Fakültesi Dergisi - Mehmet Akif Ersoy University Journal of Economics and Administrative Sciences Faculty
Cilt:7 Sayı:2 s.252-275 Volume:7 Issue:2 p.252-275
Temmuz 2020 July
268
rid of Saddam’s government. To achieve this aim, it was necessary to be allied with the US. Thirdly,
Iraqi Kurds wanted to get revenue from oil resources in the region. This income was necessary to meet
the needs of the Kurdistan Regional Government (KRG). Meanwhile, a key decision taken by Turkey
impacted the US and Iraqi Kurds’ need for each other. Specifically, on 1 March 2003, Turkey did not
send their troops to fight in the Iraq War, making the Iraqi Kurds the only ally of the US in the northern
area of Iraq.
On 20 March 2003, the US-led coalition declared war on Iraq and began to invade Iraq. The US
named this war Operation Iraqi Freedom (OIF) (Katzman, 2009: 7), also known as the Iraq War and the
Second Gulf War. In the Iraq War, the US and Iraqi Kurds acted together in the northern area of Iraq.
With the support of the Iraqi Kurds, the US opened the northern front in Iraq (Şahin, 2006: 297). The
US sent troops to Northern Iraq with the help of air forces. These troops acted with the Peshmerga and
captured Kirkuk in a short time. The Iraqi Kurds plundered Kirkuk and took many actions against the
people of the city, especially Turkmens and Arabs, which were fiercely condemned by the regional and
international communities. Turkey, a neighboring state of Iraq, was especially vocal in their disapproval
of the Iraqi Kurds’ actions in the region and started initiatives to end the violence. With these initiatives,
Turkey managed to expel the Iraqi Kurds from Kirkuk. The main reason why Kirkuk is important is that
it is very rich in oil. According to the 1957 census, the population distribution of Kirkuk consists of
39.8% Turkmens, 35.1% Kurds and 23.8% Arabs (Gunter, 2008: 46). However, especially after the Iraq
War, the Kurds pursued an ethnic cleansing policy, especially against the Turkmens and secondly
against the Arabs (Gunter, 2008: 45-49). In the 1960s and 1970s, the ICG predicted that Kirkuk's occupy
of the Kurds meant that the United States, Israel, and pro-western Iran had taken over the city (Gunter,
2008: 46). The ICG was just wrong at one point in this prediction: Iran's exiting from the Western orbit
with the revolution. But it was right about the US and Israel. Also in 2004, Israeli media reported that
there was a meeting between Israeli Prime Minister Ariel Sharon and Masud Barzani and Jalal Talabani,
and that the relations were good (Minasian, 2007: 26).
After Saddam’s collapse, the US started to establish a new governmental system in Iraq. During
this transition process, Iraqi Kurds received many privileges because of their alliance with the US. Iraqi
Kurds’ goal of overthrowing Saddam and his government was achieved. These developments were
especially significant for Iraqi Kurds because of Saddam’s actions against them in the past. The Iraqi
Kurds became one of the most powerful actors in Iraq. They strengthened their position in Northern Iraq
and started to be part of the central government. Being an ally of the US during Iraq War had brought
much to the Iraqi Kurds.
During the transition process, the US tasked Jay Gayner, a retired the US General, to reconstruct
Iraq. But, at the same time, the US wanted to give authority to the Iraqi people and establish elections
as soon as possible. To this end, the Transnational Administration Law (TAL) was adopted on 8 March
2004. The aims of the TAL were to hold elections on 31 January 2005 for a 275 seat transitional National
Assembly, to draft a permanent constitution on 15 August 2005 and to hold national elections for a
The Us And Iraqi Kurds’ Relations Between 1945 And 2011: An Interest-Based Policy – 1945 Ve 2011 Yılları Arasında ABD Ve Iraklı Kürtlerin
İlişkileri: Çıkar Eksenli Bir Politika
Sefa MERTEK
269
permanent government on 15 December 2005 (Katzman, 2009: 10). With the TAL, the Iraqi Kurds had
finally gained their autonomy. However, it should be noted that although the Iraqi Kurds’ main aim was
to be an independent state, the US did not support any destabilizing action in Iraq (Katzman & Humud,
2016: 19). During the transitional election, Iraqi Kurds won 75 of the 275 seats in January 2005 and
won 53 seats in December 2005, i.e., during the full term election. The terms of the TAL were
implemented in 2005, including a constitutional referendum and full-term election. The next full term
election was held in 2009. In the following years, relations between the US and Iraqi Kurds continued
along the same lines.
On 7 April 2009, Barrack Obama, president of the US, stated that “It is time for us to transition
to the Iraqis. They need to take responsibility for their country and for their sovereignty” (The White
House, 2009). While establishing new governmental system was taking place in Iraq, the intention of
the US was not to leave Iraq to its people. The US wanted to control oil rich areas of Iraq.
The Maliki government acted against the Sunni community, which led to Sunni unrest in Iraq.
In the meantime, The Islamic State of Iraq and The Levant (ISIL) also known as ISIS or Daesh rose up
against the ICG. ISIS is the so-called Islamic group whose goal is the establishment of a caliphate in
Iraq and Syria. In late 2013, ISIS started to capture some of the Iraqi cities. The US did not want to leave
Iraq to ISIS and supported the ICG and Iraqi Kurds in their campaigns to stop ISIS from capturing
cities.2
To do so, the US gave support to the Iraqi Kurds by advising and training the Peshmerga,
conducting air strikes against ISIS and giving weapons to the Peshmerga to fight ISIS (Katzman &
Humud, 2016: 31). However, it should be noted that the weapons owned by ISIS were produced by
Western countries, mainly the US, UK, Russia, China, Germany and France (Amnesty International UK,
2018). When ISIS was in control of the region, it came into its possession. However, at a later date, the
necessary weapons were provided to ISIS, especially by the US and Saudi Arabia, and even the EU
stated that it should be paid attention to the sale of weapons (O’Connor, 2018).
After the Iraq War, the US and Iraqi Kurds became key partners in Iraq and this partnership was
crucial to the success of campaigns against ISIS. In dealing with ISIS, the US gave huge support to the
Iraqi Kurds, making them more powerful than ever before. Fight of Turkey, which is one of the major
power in the region, against ISIS also needs to be mentioned. According to the UN, Turkey has hosted
3.6 million Syrian refugees and 142 thousand Iraqi refugees (UNHCR, 2019). In order to end terrorism
and return these people to their homes, Zeytindali and Peace Spring Operation is organized in Syria
(TRT Haber, 2019). Turkey's main purpose here is to create a safe zone in Syria (TRT Haber, 2019).
It should be mentioned once again that all official announcements made by the US reinforced
their commitment to protecting Iraq’s integrity. So, the independent state which the Iraqi Kurds have
been striving for does not seem to be possible at the time being. Also, states in the region, especially
2 For more information on ISIS and the US Policy, Christopher M. Blanchard and Carla E. Humud, The Islamic State and the US
Policy, CRS Report for Congress, 27.07.2016

Mehmet Akif Ersoy İktisadi ve İdari Bilimler Fakültesi Dergisi - Mehmet Akif Ersoy University Journal of Economics and Administrative Sciences Faculty
Cilt:7 Sayı:2 s.252-275 Volume:7 Issue:2 p.252-275
Temmuz 2020 July
270
Turkey, oppose the Kurdish independent state and want to protect Iraq’s integrity (Hürriyet, 2015). In
this period, the US and Iraqi Kurds acted in direction of their interest again. For them, there is a win-
win situation again. But when there is no win-win situation, the winner was always the US.
5. CONCLUSION
Although relations between the US and Iraqi Kurds date back to the end of the Second World
War, this relationship has largely been ignored in attempts to understand the region’s issues. It is
essential to consider all the factors that have an impact on the issues of the region. In order to understand
the regional dynamics of today, the Iraqi Kurds’ past and current relations with other states, especially
with the US, need to receive more careful attention.
Throughout history, the US and Iraqi Kurds have had fluctuating relations, which were
influenced by four turning points, mentioned in the above. These were the 1958 Coup in Iraq, the Iraqi
government’s approach with the USSR in the 1960s, the First Gulf War, and the 9/11 attack. These
developments initiated changes in the US policies towards Iraq and Iraqi Kurds. Based on their own
interests, at times, the US established alliances with Iraq, and at other times with Iraqi Kurds.
Additionally, relations between the US and Iraqi Kurds were also were influenced by the perspective of
other states in the region, such as Turkey, Iran, Syria and the ICG. The US tried to balance its relations
with the Iraqi Kurds with its relation with Ankara and Baghdad. Between the years of 1945 and 2011,
the US’ policy can be explained by arguments of classical realism. The US used her power to protect
her interest. Specifically, it should be applied two theories which are a balance of power and hegemonic
stability. Firstly, the US always wanted to protect the balance of the region. If relations with Iraqi Kurds
threatened this balance, the US abandoned Iraqi Kurds. Because the balance of the region makes the US
gainful. Secondly, the US wanted to protect her hegemonic power in the region. With this aim, the US,
sometimes, used international power and acted with another state to intervene in Iraq. By doing so, the
US always protected her interest and became gainful.
Furthermore, it should be noted that the Arab Spring changed the balance of politics in the whole
region. So, then, it may be possible to add a fifth turning point in the relationship between the US and
Iraqi Kurds, namely ISIS affect. Following ISIS’s attacks on cities in Iraq, the US intervened in Iraq and
needed the Iraqi Kurds to assist in the fight against ISIS. Their mutual cooperation is now observable
even in the modern world and is likely to continue along these lines in the future. The historical relations
between the US and Iraqi Kurds shed light on the understanding of the alliances that occurred in today’s
world. The relations after the spring of Arab were not taken into account because of exceeding the size
of the study.
The main aim/dream of the Iraqi Kurds has been to establish an independent state. Today, with
the help of the US, they are gaining territory in both Iraq and Syria. They want to create a Kurdish
corridor to the Mediterranean through the northern border of Iraq and Syria. This territory, which is
south of Turkey, is of great interest to Turkey who opposes Kurdish independence. Relations in the

The Us And Iraqi Kurds’ Relations Between 1945 And 2011: An Interest-Based Policy – 1945 Ve 2011 Yılları Arasında ABD Ve Iraklı Kürtlerin
İlişkileri: Çıkar Eksenli Bir Politika
Sefa MERTEK
271
region are very complicated at the moment and, as always, they are very fragile and fickle. To understand
what was, and is currently, going on in the region, it is essential to examine the relations among all
groups involved in the region. Relations between Iraqi Kurds and the US are a big part of this and should
not be overlooked.
To sum up, the answer to the research question is the relations between the two actors have been
quite fluctuating. While the US pursues a policy of interest, the Iraqi Kurds have chosen to consent to
the US. The Iraqi Kurds have succumbed to the hegemony of the United States. In addition, Israel is
quite effective in the relationship between the US and Iraqi Kurds, both with lobbying activities in the
US decision-making process and direct military, intelligence, technical etc. support to Iraqi Kurds. Iraqi
Kurds see the US as their only chance to survive in the region. However, the US’ main aim is to protect
its own interest in the region.
REFERENCES
Amnesty International UK, “How Islamic States got its weapons?”,
https://www.amnesty.org.uk/how-isis-islamic-state-isil-got-its-weapons-iraq-syria,
(22.12.2019).
ANDERSON, L. & STANSFIELD, G. (2004). The Future of Iraq, Democracy or Division. New
York: Palgrave Macmillian.
ARI, T. (2007). Irak, İran, ABD ve Petrol. İstanbul: Alfa Yayınları.
BEAUCHAMP, Z.; FISHER, M. & MATTHEWS, D. (2014). 27 maps that explain the crisis in
Iraq. http,//www.vox.com/a/maps-explain-crisis-iraq. (16.08.2016).
BECKER, R. (2003). 1958-1963, Iraq Revolution and the US Response. Press for Conversion,
51, 20-21, http,//coat.ncf.ca/our_magazine/links/issue51/articles/51_20-21.pdf,
(10.08.2016).
BERZENCI, S. (1996). Irak Kürdistan’ında Mevcut Durum Hakkında Görüş. Avrasya Dosyası,
3(1), 193-206.
CIA Report. (1975). The Implications of the Iran-Iraq Agreement.
https,//www.cia.gov/library/readingroom/docs/DOC_0001115997.pdf. (18.08.2016).
CIMENT, J. (1996). The Kurds State and Minority in Turkey, Iraq, and Iran. The USA.: Facts
on File Inc.
COADY, C. A. J. (2005). The moral reality in realism. Journal of Applied Philosophy, 22, 121–
136.

Mehmet Akif Ersoy İktisadi ve İdari Bilimler Fakültesi Dergisi - Mehmet Akif Ersoy University Journal of Economics and Administrative Sciences Faculty
Cilt:7 Sayı:2 s.252-275 Volume:7 Issue:2 p.252-275
Temmuz 2020 July
272
Council on Foreign Relations. (1990). President George H. W. Bush’s Address on Iraq’s
Invasion of Kuwait, 1990. http,//www.cfr.org/iraq/president-george-hw-bushs-address-
iraqs-invasion-kuwait-1990/p24117. (16.08.2016).
DEMIR, İ. (2007). Northern Iraq, 1990-2000. ZKÜ Sosyal Bilimler Dergisi, 3(5), 193-207.
DODGE, T. (2012). “US foreign policy in the Middle East”. in US Foreign Policy, Cox, M. and
Doug S. (eds). 2th edn, Oxford: Oxford University Press, 198-218.
ELLER, J. D. (1999). From Culture to Ethnicity to Conflict. Ann Arbor: The University of
Michigan Press.
ENTESSAR, N. (1992). Kurdish Ethnonationalism. London: Lynne Rienner Publishers.
ERKAN, A. Ü. (2010). Amerika Birleşik Devletleri ve Sovyetler Birliği Arasındaki Soğuk
Savaş Yıllarında Amerikan Dış Politikası. Celal Bayar Üniversitesi S.B.E. 8(1), 183-
194.
ERKMEN, S. (2008). 1945-1989 Yılları Arasında ABD’nin Kuzey Irak Politikası. Akademik
Orta Doğu, 3(1), 67-96.
GHAREEB, E. (1981). The Kurdish Question in Iraq. New York: Syracuse University Press.
GIBSON, B. R. (2011). Are all leaks good? The Pike Committee Report, and the Distortion of
Events. http,//blogs.lse.ac.uk/mec/2011/11/07/are-all-leaks-good-the-pike-committee-
report-kissinger-and-the-distortion-of-events/. 07.07.2011.
GIBSON, B. R. (2015). Sold Out?: US Foreign Policy, Iraq, the Kurds, and the Cold War. New
York: Palgrave Macmillan.
GUNTER, M. (1993). The Kurds of Iraq, Tragedy and Hope, New York: St. Martin’s Press.
GUNTER, M. (2008). The Kurds Ascending, New York: Palgrave Macmillan.
GUNTER, M. (2011). The Five Stages of American Foreign Policy towards the Kurds. Insight
Turkey, 13(2), 93-106.
HAHN, P. (2012). A Century for the US Relations with Iraq.
http,//origins.osu.edu/article/century-us-relations-iraq. (10.08.2016).
HOBBES, T. (1987). De Cive. Howard Warrender (Ed.). Oxford: Clarendon Press.
HOBBES, T. (2016). Leviathan (14th ed). Semih Lim (Trans.). İstanbul: Yapı Kredi Yayınları.
Hürriyet (4 October 2002). Kürt Liderler Bağımsız Devlet Peşinde Değiliz.
http,//www.hurriyet.com.tr/kurt-liderler-bagimsiz-devlet-pesinde-degiliz-38419085, (
31.08.2016).

The Us And Iraqi Kurds’ Relations Between 1945 And 2011: An Interest-Based Policy – 1945 Ve 2011 Yılları Arasında ABD Ve Iraklı Kürtlerin
İlişkileri: Çıkar Eksenli Bir Politika
Sefa MERTEK
273
JONES, T. C. (2012). America, Oil, and War in the Middle East, Oxford: Oxford University
Press.
KATZMAN, K. (2009). Iraq, Post-Saddam Governance, and Security. CRS Report for
Congress.
KATZMAN, K. & HUMUD, C. E. (2016). Iraq, Politics, and Governance. CRS Report for
Congress.
KEOHANE, R. O. & NYE, J. S. (2012). Power and Interdependence (4th ed.). New York:
Longman.
KILIÇ, K. (2010). Kuzey Irak, Etnik bir Sorunun Arkeolojisi. In İnat, K., Duran, B. & Ataman,
M. (Eds.). Dünya Çatışmaları. (pp. 223-253). Ankara: Nobel Yayın Dağıtım.
KING, J. (2003). Arming Iraq, A Chronology of the US Involvement.
http,//www.iranchamber.com/history/articles/arming_iraq.php. (12.08.2016).
KIRAN, A. (2006). Kürt-Amerikan İlişkileri I. Serbesti, 24, 42-54.
KISSENGER, H. (1999). Years of Renewal. New York: Simon and Shuster.
KUTSCHERA, C. (1996). Invoicing the Future. The Middle East,
https,//www.highbeam.com/doc/1G1-18988312.html. (16.08.2016).
KUTSCHERA, C. (2001). Kürt Ulusal Hareketi. Fikret Başkaya (Trans.). İstanbul: Avesta
Yayınları.
MEHO, L. I. & NEHME M. G. (2004) “The Legacy of U.S. Support to Kurds, Two Major
Episodes”. In Meho, Lokman I. (Ed.). The Kurdish Question in U.S. Foreign Policy, A
Documentary Sourcebook. (pp. 13-26). Connecticut and London: Praeger.
MESUT, A. (1992). İngiliz Belgelerinde Kürdistan 1918-1958. İstanbul: Doz Yayınları.
MINASIAN, S. (2003). “The Turkish-Israeli Military and Political Co-Operation and Regional
Security Issues”. Iran and the Caucasus, 7 (1), 309-326.
MINASIAN, S. (2007). “The Israeli and Kurdish Relations”. 21st Century, 1, 15-32.
Ministry of Defense (2009). Iraq, No Fly Zones
http,//www.iraqinquiry.org.uk/media/223045/2009-11-06-briefing-mod-iraq-no-fly-
zones.pdf#search=no%20fly%20zones. (18.08.2016).
NATALI, D. (2004). Transnational Networks, New Opportunities, and Constraints for Kurdish
Statehood. Middle East Policy, 11(1), 111-114.
O’CONNOR, T. (2018). “How Did Isis Get Its Weapons? Europe Wants To Limit U.S. And
Saudi Arabia Arms Sales Because Guns Went To Militant Group”,

Mehmet Akif Ersoy İktisadi ve İdari Bilimler Fakültesi Dergisi - Mehmet Akif Ersoy University Journal of Economics and Administrative Sciences Faculty
Cilt:7 Sayı:2 s.252-275 Volume:7 Issue:2 p.252-275
Temmuz 2020 July
274
https://www.newsweek.com/europe-limit-us-saudi-weapons-sales-went-isis-1215758,
(22.12.2019).
Office of The Historian (1963). Circular Airgram From the Department of State to Certain Posts.
https,//history.state.gov/historicaldocuments/frus1961-63v18/d174. (18.08.2016).
Office of the Historian (1966). Memorandum from Harold Saunders of the National security
Council Staff to the President’s Special Assistant (Rostow).
https,//history.state.gov/historicaldocuments/frus1964-68v33/d383. (18.08.2016).
ÖZDAĞ, Ü. (1996). Kuzey Irak ve PKK. Avrasya Dosyası, 3(1), 81-105.
ÖZDAĞ, Ü. (1999). Türkiye, Kuzey Irak ve PKK. Ankara: Avrasya Stratejik Araştırmalar
Merkezi Yayınları.
ÖZKAN, T. (2004). CIA Kürtleri, Kürt Devletinin Gizli Tarihi. İstanbul: Alfa Yayınları.
ÖZMEN, H. (1996). Irak’taki Kürt Partiler Arasındaki İhtilafın Nedenleri. Avrasya Dosyası,
3(1), 55-61.
PELLETIERE, S.C. (1984). The Kurds, Unstable Element in the Gulf. London: Westview Press.
PERSSON, M. (1998). Great Britain, the United States and the Security of Middle East, The
Formation of Baghdad Pact. Malmö: Lund University Press.
PRADOS, A. (1991). Kurdish Separatism in Iraq, Developments and Implications for the US.
CRS Report for Congress.
PRINCE, J. M. (1993). “A Kurdish State in Iraq”, Current History, 92(570), 17-22.
SALEP, M. (2012). II. Dünya Savaşı Yıllarında Sovyet Dış Politikası ve Sovyet Emperyalizmi.
International Journal of History, 4(4), 317-345.
SCHNEIDER, H. (28 February 2002). The Last Thing We Want is a Confrontation. New York
Times.
SEVER, A. (2000), ABD’nin ‘İkili Çevreleme’ Politikası ve Türkiye. In Gencer Özcan & Şule
Kut (Eds.), En Uzun On Yıl, Türkiye’nin Ulusal Güvenlik ve Dış Politika Gündeminde
Doksanlı Yıllar. (pp. 345-369). İstanbul: Büke Yayınları.
SHENON, P. (1998). Two Kurd Groups Unite Against Baghdad in Pact Brokered by the US.
The New York Times. http,//www.nytimes.com/1998/09/18/world/two-Kurd-groups-
unite-against-Baghdad-in-pact-brokered-by-us.html, (17.08.2016).
STANSFIELD, G. (2003). Iraqi Kurdistan, Political Development, and Emergent Democracy.
London: Routledge Curzon.
The Us And Iraqi Kurds’ Relations Between 1945 And 2011: An Interest-Based Policy – 1945 Ve 2011 Yılları Arasında ABD Ve Iraklı Kürtlerin
İlişkileri: Çıkar Eksenli Bir Politika
Sefa MERTEK
275
ŞAHIN, M. (2006). 2003 Irak Savaşı ve Iraklı Kürtler. In Mehmet Şahin & Mesut Taştekin
(Eds.). II. Körfez Savaşı. (pp. 283-304). Ankara: Platin Yayınları.
ŞAHIN, M. (2008). ABD’nin Müslüman Savaşçıları. Akademik Ortadoğu Dergisi, 3(1), 43-52.
The White House (2009). Promise Kept. https,//www.whitehouse.gov/iraq. (02.09.2016).
The University of Texas Libraries. Map of Iraqi Kurdish Areas.
http,//www.lib.utexas.edu/maps/middle_east_and_asia/iraq_kurdish_areas_2003.jpg.
(17.08.2016).
TRT (9 December 2015), Irak ’ın Toprak Bütünlüğü ve Egemenliği Türkiye için Önemli.
http//www.trthaber.com/haber/dunya/irakin-toprak-butunlugu-ve-egemenligi-turkiye-
icin-onemli-221198.html, (02.09.2016).
TRT Haber, “MSB: Barış Pınarı Harekatı'nda sadece teröristler hedef alınmaktadır”,
https://www.trthaber.com/haber/gundem/msb-baris-pinari-harekatinda-sadece-
teroristler-hedef-alinmaktadir-434883.html, (23.12.2019).
TRT Haber, “Türkiye'nin Güvenli Bölge Planı”,
https://www.trthaber.com/haber/gundem/turkiyenin-guvenli-bolge-plani-434404.html,
(23.12.2019).
United Nations High Commissioner for Refugees, “UNHCR Türkiye İstatistikleri”,
https://www.unhcr.org/tr/unhcr-turkiye-istatistikleri, (22.12.2019).
UZGEL, İ. (2006). ABD ve NATO’yla İlişkiler. In Baskın Oran (Ed.), Türk Dış Politikası,
Kurtuluş Savaşından Bugüne Olgular, Belgeler, Yorumlar. (pp. 243-325). İstanbul:
İletişim Yayınları.
WESTERMANN, W. L. (1946). Kurdish Independence and Russian Expansion. Foreign
Affairs, 24(4), 675-686.
WOHLFORTH, W.C. (2008). Realism. In Christian Reus-Smit & Duncan Snidal (Eds.). The
Oxford Handbook of International Relations. (pp. 131-149). New York: Oxford
University Press.
YAVUZ, T. (1993). ABD’nin Kürt Kartı. İstanbul: Milliyet Yayınları.

276
MEHMET AKİF ERSOY ÜNİVERSİTESİ
İKTİSADİ VE İDARİ BİLİMLER FAKÜLTESİ DERGİSİ
Mehmet Akif Ersoy University
Journal of Economics and Administrative Sciences Faculty
ISSN: 2149-1658 Cilt: 7 Sayı: 2 s.276-296
Volume: 7 Issue: 2 p.276-296
Temmuz 2020 July
THE RELATIONSHIP BETWEEN EXTERNAL DEBT, INTERNAL DEBT AND
ECONOMIC GROWTH: AN EMPIRICAL ANALYSIS ON BRICS-TM COUNTRIES
DIŞ BORÇ, İÇ BORÇ VE EKONOMİK BÜYÜME ARASINDAKİ İLİŞKİ: BRICS-TM
ÜLKELERİ ÜZERİNE AMPİRİK BİR ANALİZ
Mehmet Vahit EREN1
1. Dr. Öğr. Üyesi, Kilis 7 Aralık Üniversitesi,
İktisadi ve İdari Bilimler Fakültesi, İktisat
Bölümü, [email protected], https://orcid.org/0000-0003-0348-0137
Makale Türü Article Type
Araştırma Makalesi Research Article
Başvuru Tarihi Application Date
14.05.2019 05.14.2019
Yayına Kabul Tarihi Admission Date
27.03.2020 03.27.2020
DOI
https://doi.org/10.30798/makuiibf.565077
Abstract
Private sector deficit, budget deficit and current account deficit can be counted among
the main reasons for external and internal borrowing. In reducing the developmental differences of countries, governments can intervene in the market by borrowing.
Therefore, it is important to investigate the existence of external and internal borrowing
in the BRICS-TM countries, which have high growth rates. The aim of this study is to investigate the relationship between external and internal debts and economic growth in
the BRICS-TM countries by data from the period 2000-2016. For the empirical analysis
of the research, panel data analysis method is used. According to the findings obtained from the analysis, no co-integration and causality relationship are found between
external and internal debts and economic growth. These results indicate that the high
growth rates do not supported by the external and internal debts in the BRICS-TM countries.
Keywords: External and Internal Debt, Economic Growth, Development,
BRICS-TM Countries,
Öz
Özel kesim açığı, bütçe açığı ve cari açık, iç ve dış borçlanmanın temel nedenleri
arasında yer almaktadır. Ülkelerin gelişmişlik farklarının azaltılmasında devlet piyasaya
müdahale ederek, borçlanma yoluna gidebilmektedir. Bu nedenle, BRICS-TM ülkelerinin yüksek büyüme hızlarına sahip olmasında dış ve iç borçlanmanın varlığının
araştırılması önem arz etmektedir. Bu çalışmanın amacı, BRICS-TM ülkelerinde 2000-
2016 dönemine ait verilerle dış ve iç borç ile ekonomik büyüme arasındaki ilişkinin araştırılmasıdır. Araştırmanın ampirik analizi için panel veri analizi yöntemi
kullanılmıştır. Analizden elde edilen bulgulara göre, dış ve iç borç ile ekonomik büyüme
arasında eşbütünleşme ve nedensellik ilişkisi bulunamamıştır. Bu sonuçlar, BRICS-TM ülkelerinin yüksek büyüme oranlarına sahip olmasının iç ve dış borçlanma ile
desteklenmediğini göstermektedir.
Anahtar Kelimeler: Dış ve İç Borç, Ekonomik Büyüme, Kalkınma, BRICS-
TM Ülkeleri,

The Relationship Between External Debt, Internal Debt And Economic Growth: An Empirical Analysis On BRICS-TM Countries – Dış Borç, İç Borç
Ve Ekonomik Büyüme Arasındaki İlişki: BRICS-TM Ülkeleri Üzerine Ampirik Bir Analiz
Mehmet Vahit EREN
277
GENİŞLETİLMİŞ ÖZET
Çalışmanın Amacı
Brezilya, Rusya, Hindistan, Çin, Güney Afrika, Türkiye ve Meksika ülkelerinin son dönemde
yüksek büyüme hızları ve sahip olduğu genç nüfus yapısıyla uzun vadede dünya ekonomisinde önemli
bir yeri olacağı düşünülmektedir. Yüksek büyüme hızlarına sahip olan BRICS-TM ülkelerinin
gelişmelerinde, kamunun iç ve dış borçlarının etkisi, araştırmanın konusunu oluşturmaktadır. Bu
çalışmada, BRICS-TM ülkelerinde 2000-2016 yıllarına ait yıllık frekansta veriler kullanılarak iç ve dış
borç ile ekonomik büyüme arasındaki ilişki ekonometrik yöntemlerle analiz edilmektedir.
Araştırma Soruları
Ekonomik büyümenin finansmanında borçlanmanın önemi nedir? BRICS-TM ülkelerinin
ekonomik büyüme performansı üzerinde iç ve dış borçlanmanın etkisi var mıdır? Literatürdeki
çalışmalardan elde edilen bulgular borçlanma ile ekonomik büyüme arasında bir ilişkinin var olduğunu
göstermekte midir?
Bulgular
Yatay kesit bağımlılığı testi sonucuna göre ülkeler arasında yatay kesit bağımlılığı
bulunmaktadır. Ülkelerden birine gelen bir birimlik şok diğer ülkeleri de etkilemektedir. Yatay kesit
bağımlılığı tespit edildiği için ikinci nesil birim kök testlerinden MADF testi kullanılmıştır. EXT
değişkeni düzey değerinde, lnGDP ve EXT değişkenleri ise birinci farkı alındığında durağandır.
Değişkenlerin eğim katsayılarının birimler arasında değişip değişmediğini tespit etmek amacıyla
heterojenlik testi uygulanmış, test sonucunda uzun dönemde birimler arasında eğim katsayılarının
değişmediği tespit edilmiştir. Durbin-Hausman eşbütünleşme testinden elde edilen bulgulara göre
değişkenler arasında uzun dönemli bir ilişkinin olmadığı görülmektedir. Dumitrescu-Hurlin nedensellik
testi sonuçları ise değişkenler arasında herhangi bir nedensellik ilişkisinin olmadığını belirtmektedir.
Elde edilen bu sonuçlar, Ademola vd. (2018) ve Daud (2016)’un çalışmalarıyla benzerlik gösterirken,
Onakoya ve Ogunade (2017); Burhanudin vd. (2017); Nantwi ve Erickson (2016); Lau ve Kon (2014);
Brini vd. (2016); Favour vd. (2017); Stauskas (2017)’ın eserleriyle çelişmektedir. Söz konusu
çelişkilerin oluşmasında kullanılan değişkenlerin yapısı, uygulanan yöntemin, ülke ya da ülke grubunun
ve veri setinin farklı olmasının etkili olduğu belirtilebilir.
Yöntem
Çalışmanın analizinde panel veri analizi yöntemi kullanılmıştır. Son yıllarda panel veri
analizlerinde birimler arasındaki bağımlılığın test edilmesi, sonuçların daha tutarlı olması için önem arz
etmektedir. Çalışmanın, hem panel veri analizi yöntemiyle daha çok ülkenin verilerinin kullanılması
hem de yatay kesit bağımlılığı dikkate alınarak hazırlanması nedeniyle literatürdeki diğer çalışmalardan
farklı olduğu düşünülmektedir. Bu kapsamda, analizde ilk önce, değişkenlerin yatay kesitleri arasında
bağımlılığın varlığı Pesaran vd. (2008)’nin LMadj testi ile araştırılmış, serilerin durağanlığı ise Taylor
ve Sarno (1998)’nun MADF birim kök testi ile analiz edilmiştir. Eğim katsayılarının birimler arasında

Mehmet Akif Ersoy İktisadi ve İdari Bilimler Fakültesi Dergisi - Mehmet Akif Ersoy University Journal of Economics and Administrative Sciences Faculty
Cilt:7 Sayı:2 s.276-296 Volume:7 Issue:2 p.276-296
Temmuz 2020 July
278
değişip değişmediğini tespit edebilmek amacıyla Pesaran ve Yagamata (2008) Delta testi uygulanmıştır.
Değişkenler arasında uzun dönemli ilişkinin tespiti için ise Durbin-Hausman (2008) eşbütünleşme testi
kullanılmış, nedensellik testi için ise Dumitrescu-Hurlin (2012) panel nedensellik testi yapılmıştır.
Sonuç ve Değerlendirme
BRICS-TM ülkelerinde ele alınan dönemde dış ve iç borçların boyutu ekonomik büyümeyi
olumlu ya da olumsuz etkileyecek boyutta değildir. Başka bir ifadeyle, BRICS-TM ülkelerinin borçlarla
büyüyen ülkeler olmadığı görülmektedir. Bu sebeple değişkenler arasında herhangi bir eşbütünleşme ve
nedensellik ilişkilerinin tespit edilemediği belirtilebilir. Bu çalışmanın, BRICS-TM ülkelerinin elde
ettiği ekonomik büyüme performansının gerçekleştirilmesinde farklı değişkenlerin ele alındığı, farklı
yöntemlerin uygulandığı başka çalışmalara örnek olabileceği düşünülmektedir.

The Relationship Between External Debt, Internal Debt And Economic Growth: An Empirical Analysis On BRICS-TM Countries – Dış Borç, İç Borç
Ve Ekonomik Büyüme Arasındaki İlişki: BRICS-TM Ülkeleri Üzerine Ampirik Bir Analiz
Mehmet Vahit EREN
279
1. INTRODUCTION
Today, when the global competition is increasing continuously, accelerating economic activities
cause emerging developmental differences among countries. Governments have a significant role in
eliminating these developmental differences. States endeavour to activate the economic activities by
intervening in the economy via the public finance policies. Lack of savings and fiscal deficit out of the
current deficit are the most significant reasons for borrowing. Public expenditures cannot be met by the
public revenues through expansionary policies. Thus, borrowing becomes an important fiscal policy tool
in public deficit financing. Borrowing which is an ordinary intervention tool of governments to the
economy via Keynesian policies affects the economy negatively or positively as an internal or external
debt. The money borrowed should be used in proper areas to enable a positive impact on the economy.
Otherwise, the principal and interest payments put the national economy in a difficult situation as well
as the removal of debt sustainability. Therefore, the success of debt management becomes more of an
issue.
It is thought that Brazil, Russia, India, China, South Africa, Turkey and Mexico will have a
remarkable place in the world economy in the long run due to their high rates of growth and young
population. ‘BRICS-TM’ expression in the literature is composed of the English initials of the countries
mentioned. The effect of internal and external debts of the public in the development process of these
countries is the subject of current study. This study analyzed the relationship between internal debt,
external debt and economic growth by econometrical methods through using the data in annual
frequency regarding the period of 2000-2016 in BRICS-TM countries. Panel data analysis was utilized
in the analysis of the data. Testing the dependency between the units in panel data analyses is significant
to provide more consistent results.
The relationship between internal debt, external debt and economic growth in BRICS-TM has
not been researched so far, which brings originality to this study. Moreover, the analysis in this study
was conducted via new generation tests by testing the cross-sectional dependence. Our survey differs
from other studies due to these reasons. It is seen in previous studies that the hypothesis of “there is a
relationship between the internal debt, external debt and the economic growth” is valid. In the study, we
first present a theoretical and conceptual framework relating to the issue; later, a literature review is
provided. Findings obtained from the analyses are discussed in the last section.
2. INTERNAL AND EXTERNAL BORROWING IN FINANCING OF
ECONOMIC GROWTH
Internal debt is defined as “obtained finance from domestic sources by the government through
issuing domestic government bonds”. In other words, a part of the national income is transferred from
individuals and public enterprises to the governments. Governments prefer internal borrowing because
of reasons such as paying the maturing liability, removing the imbalances in the economy, public

Mehmet Akif Ersoy İktisadi ve İdari Bilimler Fakültesi Dergisi - Mehmet Akif Ersoy University Journal of Economics and Administrative Sciences Faculty
Cilt:7 Sayı:2 s.276-296 Volume:7 Issue:2 p.276-296
Temmuz 2020 July
280
deficits, economic and social difficulties arising from new taxes and increasing tax rates (Bayraktar,
2011:2). Keynesian view mentions that internal debt will stimulate investments, and productivity will
increase when governments reserve the sources that have come from internal borrowing for the
investments that support private sector investments. The positive effect of internal debt on the private
sector investments via public expenditures is known as the “crowding-in effect” in the literature (Çevik
and Cural, 2013:117). Using the sources obtained through internal borrowing so as to contribute to the
economic growth is important in paying the debts.
There is not an addition to the available sources of a country via the internal borrowing;
however, a transfer is actualized in the economy. Especially the internal borrowing which aims to enable
bringing nonexpendable funds in the economy contributes to economic growth. Internal borrowing may
cause negative outputs in economy in an environment in which productivity and general economic
structure are not considered (Çiçek et al., 2010:143). The size of an internal debt stock is effective on
inflation and income distribution. Since an increasing internal debt brings along high interests which
will be paid for the savings, it creates a destructive effect on price stability. High inflation will affect the
purchasing power of the society, notably the fixed-income employees negatively. Moreover, since the
high-interest rates will decrease the private sector investments, the “crowding out effect” will emerge.
It is also known that this high internal borrowing rate will increase interest rates and rollover risk by
shaking the confidence in the economy (Çoban et al., 2008:249; Berkay and Ağcakaya, 2017:3). The
level of internal borrowing is significant in the financing of economic growth. While internal borrowing
contributes to economic growth up to a certain point, it may damage economic growth after exceeding
that certain point.
External debt is defined as “the debts that are borrowed by a country from external resources
under the condition of repaying them with the capital and interests at the end of a given period” (Egeli,
2003:124). External borrowing is preferred due to reasons such as closing the current deficit, lack of
domestic savings, budget deficits, global interest rates, lack of financial sources for development thrusts,
paying off the external debts by the external debts, lack of enough foreign currency reserve (Peker and
Bölükbaş, 2013:289-290). Since external borrowing provides an input entrance into the borrowing
country, the investments will be stimulated, and this will contribute to economic growth. Marginal
proceeds of the investments which are realized by the external debts need to be higher than the cost of
the external debts. An increase in national income can be observed after increasing the production
capacity if this condition is guaranteed (Çiçek et al., 2010:143).
The credibility score of the countries in external borrowing is highly important. Problems such
as borrowing at a higher interest and unavailability of new sources may occur when confidence to that
country is lost. External debts are discharged by the foreign currency, which differentiates external debt
from internal debt. Any changes that occur on the exchange rate will cause more effect on external debt
in comparison to internal debt. In addition to this, while a country can pay off its internal debts by

The Relationship Between External Debt, Internal Debt And Economic Growth: An Empirical Analysis On BRICS-TM Countries – Dış Borç, İç Borç
Ve Ekonomik Büyüme Arasındaki İlişki: BRICS-TM Ülkeleri Üzerine Ampirik Bir Analiz
Mehmet Vahit EREN
281
seigniorage revenues, there should be practical policies to increase the amount of foreign currency
because there is no possibility of making foreign money in a similar way (Esener, 2013:14).
The most important advantage of external borrowing is that there is a lower “crowding out
effect” risk in comparison with internal borrowing. Moreover, governments decrease their real debt
burden by external borrowing without having inflation problem stemming from internal borrowing. In
the inflationary environment, external borrowing enables long term debt due to its lower interest rates
in comparison with the higher interest rates of internal borrowing. The disadvantage of external debt is
that it creates a “crowding out effect” on private investments by the nominal exchange rate effect.
Meanwhile, external borrowing increases the sensitivity to the developments in other countries (Berkay
and Ağcakaya, 2017: 4).
Expansionary policies that are applied in underdeveloped and developing countries to increase
the rate of capacity utilization provide a positive contribution to the economic output in the short term.
However, economic growth will occur in the long term via the policies that can increase production
capacity. The factors that affect economic growth are as follows; technology, human and real capital,
and political and economic stability. An increase in the level of these factors cannot affect the long-term
economic growth at the level desired. This is because borrowing may appeal to countries to stimulate
investments and economic growth.
3. THE SOCIO-ECONOMIC STATUS OF BRICS-TM COUNTRIES
Definition of BRIC was first used by an economist, Jim O’Neill, in 2001. These countries are
accepted as the fastest-growing “emerging markets” in the world economy. BRIC countries have
common characteristics such as large square measure, overpopulation, high economic growth, a large
number of consumers, and the possibility of collaborating in several areas (O’Neill, 2001; Ağır and
Yıldırım, 2015:41).
South Africa, which started its efforts to participate in BRIC group in 2010, became a member
of the group on 24 December 2010. The group was called as BRICS. With reference to the World Bank
Statistics, BRICS countries have more than 40% of the world population and also occupy the one-fourth
of the world area. In conclusion, Brazil, Russia, India, China, and South Africa are important economic
forces (Nistor, 2015:982). Long term estimations show that South Africa will grow with an average of
3.5% in the next 50 years. As the population growth rate decreases, there will be a faster increase in per
capita income. It is estimated in the light of these projections that South African economy will be smaller
than the economy of BRIC (US $1.2 billion for Russia in comparison with the US $5.9); however, the
per capita income will be higher (Wilson and Purushothaman, 2003:11).
Turkey and Mexico have become the locomotive of the world economy due to their high
economic growth rates and young population structures. Therefore, Turkey and Mexico have been added
to BRICS countries and they are now called “BRICS-TM” countries. While Turkey got involved in this
group by means of 9.2% and 8.8% developmental performance obtained in the years of 2010 and 2011

Mehmet Akif Ersoy İktisadi ve İdari Bilimler Fakültesi Dergisi - Mehmet Akif Ersoy University Journal of Economics and Administrative Sciences Faculty
Cilt:7 Sayı:2 s.276-296 Volume:7 Issue:2 p.276-296
Temmuz 2020 July
282
respectively, Mexico was attached to this group by 5% of growth rate obtained in the same years (Dam
and Yıldız, 2016:224). Positive demographic structure of Mexico refers that it can be officially accepted
as a BRIC country until 2050 in terms of the economic size (O’Neill et al., 2005:4). Table 1 and 2 show
the data about per income capita, population and debt structures of BRICS-TM countries.
Table 1. The Socio-Economic Structure of BRICS-TM Countries
Country Variable 1990-1999 2000-2009 2010-2017
Brazil Per Capita Real Income ($) 8320.208 9539.999 10150.35
Population Growth Rate (%) 1.635639 1.205671 0.791628
China Per Capita Real Income ($) 1172.141 2771.699 5268.692
Population Growth Rate (%) 1.132066 0.607967 0.4509
India Per Capita Real Income ($) 616.5344 964.2851 1446.38
Population Growth Rate (%) 1.93808 1.601871 1.087938
Mexico Per Capita Real Income ($) 8005.34 9013.989 8455.85
Population Growth Rate (%) 1.809577 1.411443 1.241795
Russia Per Capita Real Income ($) 6833.749 8713.775 10117.5
Population Growth Rate (%) -0.03435 -0.30548 0.132253
South Africa Per Capita Real Income ($) 5628.043 6544.358 6657.954
Population Growth Rate (%) 2.040776 1.232855 1.186927
Turkey Per Capita Real Income ($) 7396.995 9236.978 11504.08
Population Growth Rate (%) 1.616089 1.356878 1.376117
Source: World Bank
As seen in the data of per capita income, the highest values based on the averages of the years
of 2010-2017 belong to Turkey, and Brazil is on the second rank. The country that has the lowest income
is India with 1446 dollars, and China is on the second rank with 5268 dollars. According to 1990-2017
data, China has the highest increase by 8.3% as the income level, and India has the second highest
increase by 4.7% as the income level. Regressing the population growth in China and India is one of the
most important reasons for the high growth rate in spite of their low-income level. The population
growth takes positive value in all the countries except for Russia. In other words, the population has
decreased in Russia though it continues to increase in other countries.
Table 2. The Ratio of Internal and External Debt to Gross Domestic Product in BRICS-TM Countries
(%)
Country Variable 2000-2009 2010-2016
Brazil Internal Debt/GDP 68.38 65.72
External Debt/GDP 28.71 21.71
China Internal Debt/GDP 26.75 37.71
External Debt/GDP 11.50 13.73
India Internal Debt/GDP 78.19 68.72
External Debt/GDP 18.88 20.81
Mexico Internal Debt/GDP 40.48 47.42

The Relationship Between External Debt, Internal Debt And Economic Growth: An Empirical Analysis On BRICS-TM Countries – Dış Borç, İç Borç
Ve Ekonomik Büyüme Arasındaki İlişki: BRICS-TM Ülkeleri Üzerine Ampirik Bir Analiz
Mehmet Vahit EREN
283
External Debt/GDP 20.17 31.18
Russia Internal Debt/GDP 23.64 13.26
External Debt/GDP 37.67 30.21
South Africa Internal Debt/GDP 33.82 43.70
External Debt/GDP 22.25 37.83
Turkey Internal Debt/GDP 53.88 32.20
External Debt/GDP 43.17 41.67
Source: World Bank and IMF.
The debt structures of BRICS-TM countries reveal that the share of the internal and external
debt from the gross domestic product has increased in China, Mexico and South Africa while the same
share has decreased in Brazil, Russia and Turkey. Even though India has reduced its internal debt, it is
still in the position with the highest debt. The country which has the lowest debt is Russia. While the
country which has the highest ratio in terms of the external debt is Turkey, the country that has the
lowest ratio about the same issue is China. The internal debt is more than the external debt in all the
countries except for Russia and Turkey. The reason of high external debt in comparison with the internal
debt in Russia and Turkey is that the cost of the external borrowing is lower than the cost of the internal
borrowing in these countries.
4. LITERATURE REVIEW
The relationship between economic growth and public debt, which is the sum of internal and
external debts, is the leading issue that has been researched for many years. Debt crises that emerged in
Latin American countries in the 1980s affected the economic performances of those countries. It is
pointed out that meeting the financing demands of countries by internal and external borrowing will
negatively affect economic growth. The relationship between internal and external debt was analyzed
in the literature by considering underdeveloped and developing countries or country groups. Besides,
the literature includes studies that survey the relationship of public debt with respect to internal and
external debt.
Schclarek and Ballester (2005), Erataş and Nur (2013), Zouhaier and Fatma (2014), Shkolnyk
and Koilo (2018) and Kharusi and Ada (2018) researched the relationship between external debt and
economic growth by analysing a specific group of countries. While these researchers found a negative
relationship between the variables, Mensah et al., (2018) found a positive relationship between them.
Lau and Kon (2014) pointed out that there was a unidirectional causality relationship from the external
debt to the national income. Malik et al., (2010), Ezeabasili et al. (2011), Çöğürcü and Çoban (2011),
Nwannebuike (2016) and Ademola et al. (2018) surveyed only one country and found a negative
relationship between external debt and economic growth. Ijirshar et al. (2016), Uchenna et al. (2017)
and Öztürk and Çınar (2018) identified a positive relationship between the same variables. Saad (2012)
Mehmet Akif Ersoy İktisadi ve İdari Bilimler Fakültesi Dergisi - Mehmet Akif Ersoy University Journal of Economics and Administrative Sciences Faculty
Cilt:7 Sayı:2 s.276-296 Volume:7 Issue:2 p.276-296
Temmuz 2020 July
284
conducted a study and expressed that there was a bidirectional causality between external debt and
economic growth.
Simic and Mustra (2012) tried to explain the relationship between internal debt, external debt
and economic growth by a group of countries. With reference to their research findings, it can be argued
that external and internal debt negatively affect the economic growth. Atique and Malik (2012), Anning
(2016) and Favour et al. (2017) researched the relationship between these variables by analysing only a
single country, and they found out that there was a negative relationship between internal debt, external
debt and economic growth. According to Çevik and Cural (2013), there is not a causality relation
between internal debt and national income when there is a unidirectional causality from external debt to
national income. Aminu et al. (2013) argue that there is not a causality between internal debt and
economic growth when there is a bidirectional causality between external debt and economic growth.
In addition, while external debt negatively affects growth, internal debt affects the growth in a positive
direction. Ntshakala (2015) mentioned that while there was not a relationship between external debt and
national income, internal debt positively affected national income. Onakoya and Ogunade (2017) found
a unidirectional relationship from the external debt to national income and a bidirectional causality
relation between internal debt and national income. Sheikh et al. (2010) pointed out that internal debt
positively affected national income. According to Pegkas (2018), the effect of internal debt on national
income is negative.
Afonso and Alves (2015), Mıynat and Bostan (2015) and Stauskas (2017) tried to explain the
relationship between public debt and economic growth and found a negative relationship between the
variables. Juarez and Almada (2016), Spilioti (2015) and Jakobo and Jalile (2017) researched the same
relationship and found a positive relationship between the variables mentioned. Mohanty et al. (2016)
expressed that there was a bidirectional causality relation between public debt and economic growth.
Burhanudin et al. (2017), Belguith and Omrane (2017), Nantwi and Erickson (2016), Brini et al. (2016)
and Daud (2016) surveyed the relationship between these variables for only a single country and
determined that public debt positively affected economic growth. According to Balassone et al. (2011),
the effect of public debt on economic growth is negative.
The other studies which found a causality relation between external debt, internal debt or public
debt and economic growth include Onakoya and Ogunade (2017), Burhanudin et al. (2017), Nantwi and
Erickson (2016), Lau and Kon (2014), Brini et al. (2016), Favour et al. (2017) and Stauskas (2017). On
the other hand, there are also studies that could not determine a causality relationship between these
variables (Ezeabasili et al., 2011; Ademola et al., 2018; Daud, 2016).
Much as there are different results about the direction of the relationship between internal debt,
external debt and economic growth; it is pointed out that internal and external debt negatively affect
economic growth. We see that the general run of the studies was employed time series methods, OLS,
and the first-generation tests by considering the data of a single country. Only one of the studies (Erataş

The Relationship Between External Debt, Internal Debt And Economic Growth: An Empirical Analysis On BRICS-TM Countries – Dış Borç, İç Borç
Ve Ekonomik Büyüme Arasındaki İlişki: BRICS-TM Ülkeleri Üzerine Ampirik Bir Analiz
Mehmet Vahit EREN
285
and Nur, 2013) was performed by panel data analysis methods which considers the cross-sectional
dependence.
It can be thought that our research study differs from the other studies in literature due to using
data from more countries and considering the cross-sectional dependence.
5. EMPIRICAL ANALYSIS
5.1. Data Set and Model
This research study included the data of 2000-2016 period by reaching the equal number of
observations regarding the BRICS-TM countries. The ratio of per capita real income (GDP) and the
ratio of external debt to gross domestic product (EXT) were obtained from the World Bank database.
The ratio of internal debt to the gross domestic product (INT) was obtained from the International
Monetary Fund (IMF). Since the GDP data prevent the changes in variance and do not allow extreme
values to affect the estimators, the GDP data were attached to the analysis in a logarithmic form. Other
variables are the ratios because they were used in the analysis by their level values. The model below
which shows the relationship between internal debt, external debt and economic growth was established
based on the studies of Onakoya and Ogunade (2017), Çevik and Cural (2013), Simic and Mustra (2012)
and Schclarek and Ballaster (2005):
𝑙𝑛𝐺𝐷𝑃𝑡 = 𝛽0 + 𝛽1𝐼𝑁𝑇𝑖𝑡 + 𝛽2𝐸𝑋𝑇𝑖𝑡 + 𝜀𝑖𝑡 (1)
i=1, 2, 3,….N shows the cross-section data in the equation, t=1, 2, 3, …..T refers to the time
dimension, and ɛ shows the error term.
5.2. Method
The panel data analysis was used to investigate the relationships between the internal-external
debts and the economic growth in BRICS-TM countries. The existence of the dependence between the
cross sections of the variables was scrutinized by the LMadj test of Pesaran et al. (2008). The stationarity
of the series was analyzed by the MADF unit root test of Taylor and Sarno (1998). The Delta test of
Pesaran and Yagamata (2008) was utilized to determine whether the slope coefficient changes between
the units. The Durbin-Hausman (2008) cointegration test specified the long-term relationship between
the variables. The Dumitrescu-Hurlin (2012) panel causality test was used to find the causality between
the variables.
5.2.1. The Cross-Sectional Dependence
In the cross-sectional dependence (CD), it is determined whether the panel units are affected by
the shock at the same degree when a specific shock comes to the variables in the panel data analysis.
The cross-sectional dependence should be tested in studies because it is a determinant in the reliability
of estimations or selection of estimation methods (Ün, 2018: 88). Researching the cross-sectional
dependence in the panel data analysis contributes to the results of studies to be more consistent. It is
assumed that the units are not affected by each other in the tests which do not consider the cross-sectional

Mehmet Akif Ersoy İktisadi ve İdari Bilimler Fakültesi Dergisi - Mehmet Akif Ersoy University Journal of Economics and Administrative Sciences Faculty
Cilt:7 Sayı:2 s.276-296 Volume:7 Issue:2 p.276-296
Temmuz 2020 July
286
dependence. Countries/regions are integrated with each other and they are also involved in an interaction
because of the globalization process. Therefore, researching the cross-sectional dependence enables
analyses to give more reliable results.
The presence of the cross-sectional dependence between the series is controlled by the Breusch-
Pagan (1980) CDlm1 test if the time dimension is bigger than the cross-section dimension (T>N). The
presence of the cross-sectional dependence between the series is controlled by the Pesaran (2004) CDlm2
test when the time dimension is equal to the cross-section dimension (T=N). The presence of the cross-
sectional dependence between the series is controlled by the Pesaran (2004) CD test when the time
dimension is smaller than the cross-section dimension (T<N). The Breusch-Pagan (1980) LM test
becomes biased when the group average is zero, but the individual average is different from zero.
Pesaran et al. (2008) corrected this deviance by adding variance and mean to the test statistics. Therefore,
the name of the test was corrected, and it is now called the LM test (LMadj) today (Yıldırım et al., 2013:
86-87).
While the main hypothesis shows that there is no cross-sectional dependence, the alternative
hypothesis proves the presence of the cross-sectional dependence. If the test statistics computed are
smaller than 0.1 at 10% significance level; 0.05 at 5% significance level; and 0.01 at 1% significance
level, the main hypothesis is rejected. Accordingly, the alternative hypothesis that accepts the presence
of the cross-sectional dependence is accepted.
5.2.2. The MADF Unit Root Test
Spurious regression problems may occur when the analyses are applied in nonstationary panel
data models. Therefore, it is important to test the stationarity of variables before the estimation and
analyzing the presence of the relationships between the variables when the time dimension increases in
the panel data (Tatoğlu, 2017: 4). Since there may be a correlation (dependence) between the units in
panel series, different unit root tests have been developed based on the presence of the correlation
between the units. The unit root tests applied are called as the first-generation tests if there is no
correlation between the units; the unit root tests applied are called as the second-generation tests if there
is a correlation between the units (Şak, 2018: 262).
One of the second-generation unit root tests used in case of CD is the broadened ADF (MADF)
unit root test, developed by Taylor and Sarno (1998). It estimates the system by an approach that recalls
the ADF equations and establishes test statistics for the whole panel. It can also be used when the time
dimension is bigger than the cross-section.
While the main hypothesis shows that the variable has a unit root, which means it is
nonstationary, the alternative hypothesis assumes that the variable does not have a unit root, which
means it is stationary. If the t statistics are bigger than the critical value at 5% significance level, the
main hypothesis is rejected, and the alternative hypothesis is accepted assuming that the variable is
stationary. If the t statistics are smaller than the critical value, the main hypothesis cannot be rejected
because the variable is not stationary.

The Relationship Between External Debt, Internal Debt And Economic Growth: An Empirical Analysis On BRICS-TM Countries – Dış Borç, İç Borç
Ve Ekonomik Büyüme Arasındaki İlişki: BRICS-TM Ülkeleri Üzerine Ampirik Bir Analiz
Mehmet Vahit EREN
287
5.2.3. The Homogeneity Test
Before researching the long-term relationship between the variables, it should be determined
whether the slope coefficients are homogeneous or heterogeneous to provide consistent results. While
the homogeneity shows that the slope coefficients are the same for all units, heterogeneity proves that
slope coefficients of at least one of the units are different. To this end, the homogeneity test which was
developed by Pesaran and Yamagata (2008) was applied. Two results were obtained from this test.
Delta_tilde statistics are offered for big samples, and Delta_tilde_adj statistics are offered for small
samples (Küçükaksoy and Akalın, 2017: 27).
While the main hypothesis shows that the slope coefficients are homogeneous, the alternative
hypothesis assumes that the slope coefficients are heterogeneous. The main hypothesis is rejected if t
statistics computed are smaller than 0.1 at 10% significance level; 0.05 at 5% significance level; 0.01 at
1% significance level. Accordingly, the alternative hypothesis is accepted, which means that the slope
coefficients are heterogeneous.
5.2.4. The Durbin-Hausman Cointegration Test
The Durbin-Hausman cointegration test, which was developed by Westerlund (2008), was
utilized to carry out the analysis of cointegration relation between the variables. This method enables
the cointegration analysis to be realized in cases when the explanatory variables are stationary at the
level value or the first degree on condition that the dependent variable is stationary at the first degree
[I(1)]. Moreover, this test is a second-generation test, and it considers the cross-sectional dependence.
Two test statistics are obtained from the Durbin-Hausman cointegration test. The Durbin-H Group
Statistics show that the autoregressive variables are different (heterogeneous) between the groups, and
the Durbin-H Panel Statistics show that the autoregressive variables are not different (homogeneous)
(Topal, 2017: 195-196).
While the main hypothesis indicates that there is no cointegration relation between the variables,
the alternative hypothesis accepts the presence of the cointegration relation between the variables. The
main hypothesis is rejected if t statistics computed are smaller than 0.1 at 10% significance level; 0.05
at 5% significance level; 0.01 at 1% significance level. So, the alternative hypothesis is accepted, which
means that there is a cointegration relation between the variables.
5.2.5. The Dumitrescu-Hurlin Causality Test
The Dumitrescu-Hurlin causality test is one of the causality tests that gives effective results if
there is a cross-sectional dependence or cross-sectional independence. Moreover, it can also be used in
circumstances in which there is a cointegration relation or in which there is not such a relation. The main
hypothesis shows that there is not a causality relationship from the first variable to the second variable
in this causality test in which the Z-bar and Z-bar tilde statistics are calculated (Dumitrescu and Hurlin,
2012). The Z-bar tilde statistics are more powerful when the Z-bar and Z-bar tilde statistics give different
results. Therefore, it is important to interpret the results by considering the Z-bar tilde statistics. In this

Mehmet Akif Ersoy İktisadi ve İdari Bilimler Fakültesi Dergisi - Mehmet Akif Ersoy University Journal of Economics and Administrative Sciences Faculty
Cilt:7 Sayı:2 s.276-296 Volume:7 Issue:2 p.276-296
Temmuz 2020 July
288
method, the stationarity of variables is essential. If they are not stationary, they must be turned into
stationary variables. The stationary variables should be used when researching the causality relationship.
While the main hypothesis shows that there is no causality relation between the variables, the
alternative hypothesis accepts the causality relationship between them. The main hypothesis is rejected
if t statistics computed are smaller than 0.1 at 10% significance level; 0.05 at 5% significance level; 0.01
at 1% significance level. So, the alternative hypothesis is accepted, which means that there is a causality
relationship between the variables.
5.3. Findings
This research study decided which unit root tests would be used in stationarity tests based on
whether there were dependencies between the sections. The table below shows the cross-sectional
dependence test results.
Table 3. The Cross-Sectional Dependence Test Results
Variables
CD
Tests
lnGDP INT EXT
T
Statistics
Prob.
Value
T
Statistics
Prob.
Value
T
Statistics
Prob.
Value
CDlm1 (BP,
1980) 290.0162 0.0000 106.7627 0.0000 76.17094 0.0000
CDlm2
(Pesaran,
2004)
41.51009 0.0000 13.23347 0.0000 8.513060 0.0000
CD
(Pesaran,
2004)
16.93386 0.0000 2.216475 0.0267 6.235343 0.0000
LMadj
(Pesaran et
al., 2008)
41.29134 0.0000 13.01472 0.0000 8.294310 0.0000
As given in Table 3, the probability values of CD tests are smaller than 0.01. Since T is bigger
than N in the research, the CDlm1 and LMadj results can be read. Since the CDlm1 test gives biased results,
the LMadj test results are considered. Accordingly, the hypothesis of “there is no dependency between
the sections” is denied. There is a cross-sectional dependence between the countries in the panel data,
and a one-unit shock affects other countries as well. The interaction between the countries is quite high
by the effect of the globalization. Accordingly, the policymakers have to consider the economy policies
of other countries at the same time.

The Relationship Between External Debt, Internal Debt And Economic Growth: An Empirical Analysis On BRICS-TM Countries – Dış Borç, İç Borç
Ve Ekonomik Büyüme Arasındaki İlişki: BRICS-TM Ülkeleri Üzerine Ampirik Bir Analiz
Mehmet Vahit EREN
289
Table 4. The MADF Unit Root Test Results
Variables
MADF
Level
lnGDP INT EXT
MADF t
Statistics 43.434(1) 153.878(1)* 63.916(4)
Critical Value
(%5) 55.310 55.310 86.328
First Difference
MADF t
Statistics 144.793(1)* - 119.248(2)*
Critical Value
(%5) 62.766 - 72.726
Note: The numbers are in brackets in the test statistical values show the lag length based on the
smallest AIC information criteria. Since the data of the research were the annual data, the maximum lag
length was accepted as 4.
Table 4 shows the MADF unit root test results that reveals whether the overall panel has a unit
root or not. It is seen based on the test results that the MADF test statistics are smaller than the critical
value at 5% significance level, and the lnGDP and EXT variables have unit roots at the level values.
They become stationary when the first difference is computed. Since the test statistics value is bigger
than the critical value, the INT series are stationary at the level value.
Table 5. Homogeneity Test Results
Test Statistics T Statistics Probability Value
Delta_tilde -1.176 0.880
Delta_tilde_adj -1.334 0.909
The Delta homogeneity test is applied to determine whether the slope coefficients change
between the units (Table 5). With reference to these test results, since the probability values of both test
statistics are bigger than 0.1, the slope coefficients do not change between the units in the long term; in
other words, they are homogeneous. Therefore, the panel statistics should be used instead of the group
statistics to examine the relations between the variables.
Table 6. The Durbin-Hausman Cointegration Test Results
Test Statistics T Statistics
Probability
Value
Durbin-H Group
Statistics 2.597 0.005
Durbin-H Panel
Statistics -0.313 0.623
Table 6 shows the test results that reveal whether there is a cointegration relation under the
assumption of both homogeneity and heterogeneity. When the results of the homogeneity test are
analyzed, it is determined that using panel statistics is more suitable. To this end, the Durbin-H Panel
statistics are considered. Therefore, since the probability value of the Durbin-H Panel statistics is bigger
than 0.1, there is not a long-term relationship between the variables.

Mehmet Akif Ersoy İktisadi ve İdari Bilimler Fakültesi Dergisi - Mehmet Akif Ersoy University Journal of Economics and Administrative Sciences Faculty
Cilt:7 Sayı:2 s.276-296 Volume:7 Issue:2 p.276-296
Temmuz 2020 July
290
Table 7. The Dumitrescu-Hurlin Causality Test Results
The Direction of
Causality
Test
Statistics T Statistics
Probability
Value (%5)
lnGDP≠>INT Z-bar 4.3294 0.1229
Z-bar tilde 0.9654 0.1965
INT ≠> lnGDP Z-bar 7.9390 0.0697
Z-bar tilde 2.2517 0.0697
lnGDP≠>EXT Z-bar -0.5044 0.6857
Z-bar tilde -0.6243 0.5234
EXT ≠> lnGDP Z-bar 3.9460 0.1318
Z-bar tilde 0.8288 0.2649
Note: The ≠> icon indicates the direction of causality. The test
statistics were obtained with 789 iterations.
Table 7 investigates the causality relations between internal debt, external debt, and economic
growth. Since the probability values of test statistics are bigger than 0.05, there is not a causality relation
between the variables. This result shows that the BRICS-TM countries discussed in the study do not
have an economic growth based on their debts.
6. CONCLUSION
The welfare levels of societies can be increased by borrowing when there are no sufficient
opportunities for realizing economic growth and developmental goals. This borrowing can be actualized
in two ways which are internal and external borrowings. One of the most important reasons for appealing
to external borrowing is the lack of resources. Another important reason is the lack of foreign currency
as an instrument of payment to buy the goods and services that public needs. Countries can also appeal
to internal borrowing if the public revenues cannot meet the expenses and if the domestic sources are
sufficient. Internal and external borrowings positively affect the economic activities of countries. That’s
why some countries may prefer borrowing from time to time. The money borrowed will create an
increasing effect for the national income when it is used in productive areas by increasing the capital
accumulation. Interest payments except for the capital need to be made in repayment process. The size
of the interest payments may create a reducing effect on the gross domestic product in the long-term.
The relationship between internal debt and external debt in BRICS-TM countries was analyzed
by the panel data analysis in this study. The data belong to 2000-2016 period based on the availability
of the data. First, the cross-sectional dependence test was applied for more consistent estimations.
According to the cross-sectional dependence test results, there is a cross-sectional dependence between
the countries. A one-unit shock that comes to one of the countries affects the other countries as well.
The MADF test was utilized because the cross-sectional dependence was determined. The INT variable
is steady at the level value, and the lnGDP and EXT values are stationary when their first differences
are computed. The Heterogeneity test was applied to determine whether the slope coefficients change

The Relationship Between External Debt, Internal Debt And Economic Growth: An Empirical Analysis On BRICS-TM Countries – Dış Borç, İç Borç
Ve Ekonomik Büyüme Arasındaki İlişki: BRICS-TM Ülkeleri Üzerine Ampirik Bir Analiz
Mehmet Vahit EREN
291
between the units. It was found at the end of the test that the slope coefficients did not change between
the units in the long-term. The Durbin-Hausman cointegration test results show that there is no long-
term relationship between the variables. According to the Dumitrescu-Hurlin causality test results, there
is no causality relation between the variables. While these results share similarities with the results of
studies such as Ademola et al. (2018) and Daud (2016), the same results conflict with a number of
studies including Onakoya and Ogunade (2017), Burhanudin et al. (2017), Nantwi and Erickson (2016),
Lau and Kon (2014), Brini et al. (2016), Favour et al. (2017) and Stauskas (2017). The structures of the
variables, which include being a different country, country groups and having a different data set, are
effective on the conflicts.
To sum up, the results of the current study put forth that the size of internal and external debts
does not have a dimension that can negatively or positively affect the economic growth in BRICS-TM
countries. In other words, the BRICS-TM countries are not growing through debts. That’s why, the
cointegration and causality relationships between the variables could not be found.
While there are positive developments in the economic performances of the BRICS-TM
countries, the share of the internal and external debts in the gross domestic product increases in China,
Mexico and South Africa. These countries need to avoid from the negative effects of internal and
external debts to ensure a sustainable economic growth. They should extend their debts to long-term
loans and utilise the debts in areas with high added value that positively contribute to the national
economy.
It is thought that our study can be a model for future studies in which different variables in
actualizing the economic performances achieved by the BRICS-TM countries may be considered and
different methods may be applied.
REFERENCES
ADEMOLA, S. S., TAJUDEEN, A. O., & ADEWUMI, Z. A. (2018). External Debt and
Economic Growth of Nigeria: An Empirical Investigation. South Asian Journal of
Social Studies and Economics, 1(2),1-11.
AFONSO, A. & ALVES, J. (2015). The Role Government Debt in Economic Growth. Review
of Public Economics, 215-(4/2015), 9-26.
AĞIR, H. & YILDIRIM, S. (2015). Türkiye ile BRICS Ekonomilerinin Makroekonomik
Performans Karşılaştırması: Betimsel Bir Analiz. KSÜ Sosyal Bilimler Dergisi 12(2),
39-66.
AMINU, U., AMINU, H. A. & SALIHU, M. (2013). External Debt and Domestic Debt Impact
on the Growth of the Nigerian Economy. MPRA Paper No:75122.

Mehmet Akif Ersoy İktisadi ve İdari Bilimler Fakültesi Dergisi - Mehmet Akif Ersoy University Journal of Economics and Administrative Sciences Faculty
Cilt:7 Sayı:2 s.276-296 Volume:7 Issue:2 p.276-296
Temmuz 2020 July
292
ANNING, L., OFORI, C. F. & AFFUM, E. K. (2016). The Impact of Government Debt on the
Economic Growth of Ghana: A Time Series Analysis from 1990-2015. International
Journal of Innovation and Economic Development, 2(5), 31-39.
ATIQUE, R. & MALIK, K. (2012). Impact of Domestic and External Debt on the Economic
Growth of Pakistan. World Applied Sciences Journal, 20(1), 120-129.
BALASSONE, F., FRANCESE, M. & Pace, A. (2011). Public Debt and Economic Growth in
Italy. Quaderni di Storia Economica (Economic History Working Papers), 1-34.
BAYRAKTAR, C. (2011). Türkiye’de İç Borçlanmanın Yapısı: 1980-2010 Dönemi. Hitit
Üniversitesi Sosyal Bilimler Enstitüsü Dergisi, 4(1), 1-14.
BELGUITH, S. O. & OMRANE, H. 2017. Macroeconomic Determinants of Public Debt
Growth: A Case Study for Tunisia. Theoretical and Applied Economics, Volume XXIV
(2017), No. 4(613), 161-168.
BERKAY, F. & AĞCAKAYA, S. (2017). Türkiye’de Kamusal Açıkların Finansmanında İç ve
Dış Borç Tercihi: 1990-2015 Dönemi. AKÜ İİBF Dergisi, XIX (1), 1-20.
BREUSH, T. S. & PAGAN, A. R. (1980). The Lagrange Multiplier Test and its Applications to
Model Specification in Econometrics, The Review of Economic Studies, 47(1), 239-
253.
BRINI, R., JEMMALI, H. & FERROUKH, A. (2016). Public Debt and Economic Growth in
Tunisia: A Re-examination. Advances in Economics and Business, 4(11), 584-590.
BURHANUDIN, M. D. A., MUDA, R., NATHAN, S. B. S. & ARSHAD, R. (2017). Real
Effects of Government Debt on Sustainable Economic Growth in Malaysia. Journal of
International Studies, 10(3), 161-172.
ÇEVIK, N. K. & CURAL, M. (2013). İç Borçlanma, Dış Borçlanma ve Ekonomik Büyüme
Arasında Nedensellik İlişkisi: 1989-2012 Dönemi Türkiye Örneği. Maliye Dergisi,
(165), 115-139.
ÇIÇEK, H., GÖZEGIR, S. & ÇEVIK, E. (2010). Bir Maliye Politikası Aracı Olarak Borçlanma
ve Ekonomik Büyüme İlişkisi: Türkiye Örneği (1990-2009). C.Ü. İktisadi ve İdari
Bilimler Dergisi, 11(1), 141-156.
ÇOBAN, O., DOĞANLAP, N. & UYSAL, D. (2008). Türkiye’de Kamu İç Borçlanmasının
Makroekonomik Etkileri. Selçuk Üniversitesi Sosyal Bilimler Enstitüsü Dergisi, (20),
229-244.
ÇÖĞÜRCÜ, İ. & ÇOBAN, O. (2011). Dış Borç Ekonomik Büyüme İlişkisi: Türkiye Örneği
(1980-2009). KMÜ Sosyal ve Ekonomik Araştırmalar Dergisi, 13(21), 133-149.

The Relationship Between External Debt, Internal Debt And Economic Growth: An Empirical Analysis On BRICS-TM Countries – Dış Borç, İç Borç
Ve Ekonomik Büyüme Arasındaki İlişki: BRICS-TM Ülkeleri Üzerine Ampirik Bir Analiz
Mehmet Vahit EREN
293
DAM, M. M. & YILDIZ, B. (2016). BRICS-TM Ülkelerinde Ar-Ge ve İnovasyonun Ekonomik
Büyüme Üzerine Etkisi: Ekonometrik Bir Analiz. Akdeniz Üniversitesi İ.İ.B.F. Dergisi,
(33), 220-236.
DAUD, S. N. M. (2016). The Real Effect of Government Debt: Evidence forum the Malaysian
Economy. Journal of Economic Cooperation and Development, 37(3), 57-86.
DUMITRESCU, E.-I. & HURLIN, C. (2012). Testing for Granger Non-Causality in
Heterogeneous Panels. Economic Modelling 29, 1450-1460.
EGELI, H. A. (2003). Türkiye'nin Dış Borç Yapısının Analizi (1980-1990). Ankara Üniversitesi
Siyasal Bilgiler Fakültesi Dergisi, 3(47), 123-138.
ERATAŞ, F. & NUR, H. B. (2013). Dış Borç ve Ekonomik Büyüme İlişkisi: “Yükselen Piyasa
Ekonomileri” Örneği. Marmara Üniversitesi İ.İ.B. Dergisi, XXXV(II), 207-230.
ESENER, S. Ç. (2013). Gelişmekte Olan Ülkelerde ve Türkiye’de Dış Borçlanmanın
Belirleyicilerinin İncelenmesi: 1980–2010. Ankara: Maliye Bakanlığı Strateji
Geliştirme Başkanlığı.
EZEABASILI, V. N., ISU, H. O. & MOJEKWU, J. N. (2011). Nigeria’s External Debt and
Economic Growth: An Error Correction Approach. International Journal of Business
and Management, 6(5), 156-170.
FAVOUR, E.-O. O., IDENYI, O. S., OGE, E. O. & CHARITY, I. A. (2017). Public Debt and
Economic Growth in Nigeria. Asian Research Journal of Arts & Social Sciences, 4(3),
1-16.
IJIRSHAR, V. U., JOSEPH, F. & GODOO, M. (2016). The Relationship between External Debt
and Economic Growth in Nigeria. International Journal of Economics & Management
Sciences, 6(1), 1-5.
IMF, World Economic Outlook Database
JACOBO, A. D. & JALILE, I. R. (2017). The Impact of Government Debt on Economic
Growth: An Overview for Latin America. Working papers of the Department of
Economics University of Perugia (IT), Working paper No. 28.
JUAREZ, I. S. & GARCIA-ALMADA, R. (2016). Public Debt, Public Investment and
Economic Growth in Mexico. International Journal Financial Study, 4(6), 1-14.
KHARUSI, S. & ADA, M. S. (2018). External Debt and Economic Growth: The Case of
Emerging Economy. Journal of Economic Integration, 33(1), 1141-1157.
Mehmet Akif Ersoy İktisadi ve İdari Bilimler Fakültesi Dergisi - Mehmet Akif Ersoy University Journal of Economics and Administrative Sciences Faculty
Cilt:7 Sayı:2 s.276-296 Volume:7 Issue:2 p.276-296
Temmuz 2020 July
294
KÜÇÜKAKSOY, İ. & AKALIN, G. (2017). Fisher Hipotezi’nin Panel Veri Analizi ile Test
Edilmesi: OECD Ülkeleri Uygulaması. Hacettepe Üniversitesi İktisadi ve İdari Bilimler
Fakültesi Dergisi, 35(1), 19-40.
LAU, E. & KON, T.-L. (2014). External Debt, Export and Growth in Asian Countries: 1988-
2006. Journal of Applied Sciences 14(18), 2170-2176.
MALIK, S., HAYAT, M. K. & HAYAT, M. U. (2010). External Debt and Economic Growth:
Empirical Evidence from Pakistan. International Research Journal of Finance and
Economics, (44), 88-97.
MENSAH, L., BOKPIN, G. & BOACHIE-YIADOM, E. (2018). External Debts, Institutions
and Growth in SSA. Journal of African Business, 19(4), 475–490.
MIYNAT, M. & BOSTAN, M. K. (2015). Mali Kural Uygulamalarının Makroekonomik
Değişkenler Üzerine Etkileri. Yönetim ve Ekonomi Dergisi, 22(2), 535-549.
MOHANTY, A., PATRA, S. K., KUMAR, S. & MOHANTY, A. (2016). An Empirical
Analysis of Effect of Public Debt on Economic Growth in India in The Post-Reform
Era. Asian Economic and Financial Review, 6(11), 692-705.
NANTWI, V. O. & ERICKSON, C. (2016). Public Debt and Economic Growth in Ghana.
African Development Review, 28(1), 116–126.
NISTOR, P. (2015). FDI Implications on BRICS Economy Growth. Procedia Economics and
Finance 32, 981–985.
NTSHAKALA, P. L. (2015). Effects of Public Debt on Economic Growth in Swaziland.
International Journal of Business and Commerce, 5(1), 1-24.
NWANNEBUIKE, U. S., IKE, U. J. & ONUKA, O. I. (2016). External Debt and Economic
Growth: The Nigeria Experience. European Journal of Accounting Auditing and
Finance Research, 4(2), 33-48.
O’NEILL, J. (2001). Building Better Global Economic BRICs. Global Economics Paper No:
66, Goldman Sachs, https://www.goldmansachs.com/insights/archive/archive-
pdfs/build-better-brics.pdf (13.10.2018).
O’NEILL, J., WILSON, D., PURUSHOTHAMAN, R. & STUPNYTSKA, A. (2005). How
Solid are the BRICs? Global Economics Paper No: 134, Goldman Sachs,
https://www.goldmansachs.com/insights/archive/archive-pdfs/how-solid.pdf
(13.10.2018).

The Relationship Between External Debt, Internal Debt And Economic Growth: An Empirical Analysis On BRICS-TM Countries – Dış Borç, İç Borç
Ve Ekonomik Büyüme Arasındaki İlişki: BRICS-TM Ülkeleri Üzerine Ampirik Bir Analiz
Mehmet Vahit EREN
295
ONAKOYA, A. B. & OGUNADE, A. O. (2017). External Debt and Nigerian Economic Growth
Connection: Evidence from Autoregressive Distributed Lag Approach. Journal of
Economics and Development Studies, 5(1), 66-78.
ÖZTÜRK, S. & ÇINAR, U. (2018). Kamu Dış Borçlanması ve Ekonomik Büyüme İlişkisi:
Türkiye Üzerine Ampirik Bir Uygulama (1975-2016). Sosyal Bilimler Metinleri, 1, 66-
79.
PEGKAS, P. (2018). The Effect of Government Debt and Other Determinants on Economic
Growth: The Greek Experience. Economies 2018, 6(1), 10, 1-19.
PEKER, O. & BÖLÜKBAŞ, M. (2013). Türkiye’de Dış Borçlanmanın Belirleyicileri:
Ekonometrik Bir Analiz. Atatürk Üniversitesi İktisadi ve İdari Bilimler Dergisi, 27(2),
289-302.
PESARAN, M. H. & YAMAGATA, T. (2008). Testing Slope Homogeneity in Large Panels.
Journal of Econometrics 142, 50-93.
PESARAN, M. H. (2004). General Diagnostic Tests for Cross Section Dependence in Panels.
CWPE 0435.
PESARAN, M. H., Ullah, A. & Yamagata, T. (2008). A Bias-Adjusted LM Test of Error Cross-
Section Independence. Econometrics Journal 11, 105-127.
SAAD, W. (2012). Causality between Economic Growth, Export, and External Debt Servicing:
The Case of Lebanon. International Journal of Economics and Finance, 4(11), 134-143.
ŞAK, N. (2018). Panel Birim Kök Testleri. In S. Güriş (Ed.) Panel Veri Ekonometrisi (pp.261-
314). İstanbul: Der Yayınları.
SCHCLAREK, A. & BALLESTER, F. R. (2005). External Debt and Economic Growth in Latin
America. www.cbaeconomia.com/Debt-latin.pdf (29.09.2018).
SHEIKH, M. R., FARIDI, M. Z. & TARIQ, K. (2010). Domestic Debt and Economic Growth
in Pakistan: An Empirical Analysis. Pakistan Journal of Social Sciences (PJSS), 30(29),
373-387.
SHKOLNYK, I. & KOILO, V. (2018). The Relationship between External Debt and Economic
Growth: Empirical Evidence from Ukraine and other Emerging Economies. Investment
Management and Financial Innovations, 15(1), 387-400.
SIMIC, V. & MUSTRA, V. (2012). Debts (Public and External) and Growth-Link or no Link?
Croatian Operational Research Review (CRORR), (3), 91-102.

Mehmet Akif Ersoy İktisadi ve İdari Bilimler Fakültesi Dergisi - Mehmet Akif Ersoy University Journal of Economics and Administrative Sciences Faculty
Cilt:7 Sayı:2 s.276-296 Volume:7 Issue:2 p.276-296
Temmuz 2020 July
296
SPILIOTI, S. (2015). The Relationship between the Government Debt and GDP Growth:
Evidence of the Euro Area Countries. Investment Management and Financial
Innovations, 12(1-1), 174-178.
STAUSKAS, O. (2017). The Long-Run Relationship Between Public Debt and Economic
Growth in Advanced Economies. Master’s Programme in Economics, Lund University.
TATOĞLU, F. Y. (2017). Panel Zaman Serileri Analizi. İstanbul: Beta Yayınları.
TAYLOR, M. P. & Sarno, L. (1998). The Behaviour of Real Exchange Rates During the Post-
Bretton Woods Period. Journal of International Economics 46, 281-312.
TOPAL, M. H. (2017). Vergi Yapısının Ekonomik Büyüme Üzerindeki Etkisi: OECD
Ülkelerinden Ampirik Bir Kanıt. Siyaset, Ekonomi ve Yönetim Araştırmaları Dergisi,
5(3), 183-206.
UCHENNA, O. L., J., NWANNEKA M., ADEDAYO, E. O. & O., EVBUOMWAN G. (2017).
Effect of External Debt on Economic Growth: Evidence from Nigeria. Sustainable
Economic Growth, Education Excellence, and Innovation Management through Vision
2020, 4046-4058.
ÜN, T. (2018). Panel Veri Modellerinin Varsayımlarının Testi. In S. Güriş (Ed.) Panel Veri
Ekonometrisi (pp. 75-101). İstanbul: Der Yayınları.
WESTERLUND, J. (2008). Panel Cointegration Tests of the Fisher Effect. Journal of Applied
Econometrics 23(2), 193-223.
WILSON, D. & PURUSHOTHAMAN, R. (2003). Dreaming with BRICs: The Path to 2050.
Global Economics Paper No: 99, Goldman Sachs,
https://www.goldmansachs.com/insights/archive/archive-pdfs/brics-dream.pdf
(13.10.2018).
WORLD BANK, World Development Indicators.
YILDIRIM, K., MERCAN, M. & KOSTAKOĞLU, S. F. (2013). Satın Alma Gücü Paritesinin
Geçerliliğinin Test Edilmesi: Zaman Serisi ve Panel Veri Analizi. Eskişehir Osmangazi
Üniversitesi İktisadi ve İdari Bilimler Fakültesi Dergisi, 8(3), 75-95.
ZOUHAIER, H. & FATMA, M. (2014). Debt and Economic Growth. International Journal of
Economics and Financial Issues, 4(2), 440-448.

297
MEHMET AKİF ERSOY ÜNİVERSİTESİ
İKTİSADİ VE İDARİ BİLİMLER FAKÜLTESİ DERGİSİ
Mehmet Akif Ersoy University
Journal of Economics and Administrative Sciences Faculty
ISSN: 2149-1658 Cilt: 7 Sayı: 2 s.297-325
Volume: 7 Issue: 2 p.297-325
Temmuz 2020 July
INVESTIGATION OF CONSUMERS 'ORGANIC FOOD PURCHASES IN THE CONTEXT
OF THE RELATIONSHIP OF PERSONAL VALUES AND INDIVIDUAL FACTORS*
TÜKETİCİLERİN ORGANİK GIDA SATIN ALMA NİYETLERİNİN KİŞİSEL DEĞERLER
İLE BİREYSEL FAKTÖRLER İLİŞKİSİ BAĞLAMINDA ARAŞTIRILMASI**
Aysel ERCİŞ1, Tuğba YILDIZ2, F. Görgün DEVECİ3
1. Professor, Atatürk University, Faculty of Business
Administration and Economics, Department of
Business, Production Management and Marketing,
Erzurum, Turkey, [email protected] https://orcid.org/0000-0002-9835-8574
2. Lecturer, Bayburt University, Demirözü Vocation
School, Department of Transportation Services,
Civil Aviation Management Programme, Bayburt,
Turkey, [email protected], https://orcid.org/0000-0003-0260-0555
3. Research Assistant, PhD., Atatürk University,
Faculty of Business Administration and
Economics, Department of Business, Production
Management and Marketing, Erzurum, Turkey,
[email protected], https://orcid.org/0000-0001-8987-2478
Makale Türü Article Type
Araştırma Makalesi Research Article
Başvuru Tarihi Application Date
01.06.2019 06.01.2019
Yayına Kabul Tarihi Admission Date
24.07.2020 07.24.2020
DOI
https://doi.org/10.30798/makuiibf.573331
* This research derived from “Relation of Consumers’
Attitudes Towards Organic Products with Personal
Values and the Mediation Effect of the Individual
Factors” and presented summary text at the “Global
Business Research Congress (GBRC), 24-25 May
2018, İstanbul.
** This research was supported by Atatürk University
BAP Coordination Unit (Scientific Research Project
Coordination Unit of Atatürk University), Project ID:
SHD-2018-6663, Project Name: Tüketicilerin Kişisel
Değerlerinin Bireysel Faktörlere ve Organik Ürünlere
Yönelik Tutumları Üzerindeki Etkisi (Relation of
Consumers’ Attitudes towards Organic Products with
Personal Values and the Mediation Effect of the
Individual Factors) and derived from this project.
Abstract
In this study, it was aimed to determine the factors affecting consumers organic food
purchase intention. In this direction; individual factors of personal values, attitude towards purchasing organic food of individual factors, and the effect of this variable on
the organic food purchase intention was investigated. The role of moderator in the
relationship between subjective norms' organic food purchasing attitude and organic food purchase intention is discussed. According to the results of the research, while
personal values affect individual factors; while health and environmental consciousness
have an impact on the attitude towards purchasing organic food, price consciousness has no effect. In addition, the findings show that the attitude towards purchasing organic
food has an impact on the purchase intention. Finally, the subjective norm has a
moderator effect between the organic food purchase intention and the attitude towards purchasing organic food.
Keywords: Organic Product, Personal Values, Individual Factors,
Subjective Norm, Attitude towards Purchasing Organic Product, Organic
Product Purchase Intention,
Öz
Bu çalışmada tüketicilerin organik gıda satın alma niyeti üzerinde etkili olan faktörlerin belirlenmesi amaçlanmıştır. Bu doğrultuda kişisel değerlerin bireysel faktörler, bireysel
faktörlerin organik gıda satın almaya yönelik tutum ve bu değişkenin ise organik gıda
satın alma niyeti üzerindeki etkisi araştırılmıştır. Öznel normların organik gıda satın almaya yönelik tutum ve niyet arasındaki ilişkide moderatör rolü de tartışılmıştır.
Araştırma sonuçlarına göre kişisel değerler bireysel faktörler üzerinde etkili iken;
organik gıda satın almaya yönelik tutum üzerinde bireysel faktörlerden sağlık ve çevre bilincinin etkisi varken fiyat bilincinin ise etkisi bulunmamaktadır. Ek olarak bulgular
organik gıda satın almaya yönelik tutumun satın alma niyeti üzerinde etkisi olduğunu
göstermiştir. Son olarak organik gıda satın alma niyeti ve organik gıda satın almaya yönelik tutum arasında öznel normun moderatör etkisi bulunmaktadır
Anahtar Kelimeler: Organik Gıda, Kişisel Değerler, Bireysel Faktörler,
Öznel Norm, Organik Gıda Satın Almaya Yönelik Tutum, Organik Gıda
Satın Alma Niyeti,
Mehmet Akif Ersoy İktisadi ve İdari Bilimler Fakültesi Dergisi - Mehmet Akif Ersoy University Journal of Economics and Administrative Sciences Faculty
Cilt:7 Sayı:2 s.297-325 Volume:7 Issue:2 p.297-325
Temmuz 2020 July
298
GENİŞLETİLMİŞ ÖZET
Çalışmanın Amacı
Bu çalışmada bireylerin sahip olduğu değerlerin, bireysel faktörler olan çevre, fiyat ve sağlık
bilinci, söz konusu değişkenin ise organik gıda satın almaya yönelik tutum üzerindeki etkisine bakılarak,
bu değişkenlerin çıktı değişken olan organik gıda satın alma niyeti üzerindeki etkisi ortaya konulmaya
çalışılmıştır. Ayrıca çalışmada organik gıda satın almaya yönelik tutumun organik gıda satın alma niyeti
üzerindeki etkisi ve öznel normun moderatör etkisi de ele alınmıştır.
Araştırma Soruları
Çalışmanın amacı doğrultusunda ele alınan sorular şu şekildedir: Kişisel değerler bireysel
faktörler üzerinde etkili mi? Bireysel faktörler organik gıda satın almaya yönelik tutum üzerinde etkili
mi? Organik gıda satın almaya yönelik tutum organik gıda satın alma niyeti üzerinde etkili mi? Öznel
normların organik gıda satın almaya yönelik tutum ve organik gıda satın alma niyeti arasında moderatör
etkisi var mı?.
Literatür Araştırması
İlgili literatür incelendiğinde, özellikle organik ürün pazarını tanımlayarak ve belirginleştirerek
doğru stratejilerin geliştirilmesini amaçlayan kişisel değerleri ve çevreye, sağlığına ve fiyata olan
duyarlılığı araştıran çalışmalara rastlamak mümkündür (Worsley ve Lea, 2008; Hedlund, 2011; Lee,
2011; Magnusson vd., 2011). Ayrıca organik ürünlere yönelik tutum üzerinde fiyat algısı, sağlık ve
çevre endişesi (Michaelidou ve Hassan, 2008; Smith ve Paladino 2010; Lee ve Yun, 2015) organik ürün
satın alma niyeti üzerinde ise tutumun (Tarkiainen ve Sundqvist, 2005) etkisini inceleyen çalışmalarda
mevcuttur. Öte yandan organik pazarda öznel normların tutum ve niyet arasındaki moderator etkisini
tespit etmeye yönelik çalışmalar bulunmaktadır (Fu vd., 2010; Al-Swidi vd., 2014;). Ancak bireylerin
sağlık, fiyat ve çevre bilincini bireysel faktör olarak ele alan ve bu değişkenler üzerinde kişisel değerlerin
etkisini inceleyen sınırlı sayıda çalışma bulunmaktadır. Araştırma ile kişisel değerlerin, bireysel
faktörler üzerindeki etkisi irdelenecek ve bireyin sahip olduğu kişisel değerler doğrultusunda hangi
bireysel faktörü daha çok önemsediği belirlenebilecektir. Bireysel özellikler üzerinde etkili olduğu
düşünülen, değerlerin belirlenmesiyle birlikte organik gıda tüketicileri daha iyi anlaşılabilecek ve bu
doğrultuda literatüre katkı sağlanabilecektir. Araştırma modeli doğrultusunda bireysel faktörlerin
organik gıda satın almaya yönelik tutum ve organik gıda satın alma niyeti üzerindeki etkinin tartışılacak
olması ve bu yönde organik gıda pazarı literatürüne katkı sağlanabilecek olması çalışmanın çıktıları
açısından önemli bir noktadır.
Yöntem
Örnekleme yöntemi olarak tesadüfi olmayan örnekleme yöntemlerinden kolayda örnekleme
kullanılmıştır. Anket sürecinde yaşanabilecek aksaklıklar, anketin eksik doldurulması gibi sorunlar göz
önünde bulundurularak toplamda 500 anket dağıtılmıştır. Hatalı ve eksik doldurulan anketler elendikten
sonra 420 adet anket değerlendirmeye alınmıştır. 420 anket için verilerin standardizasyonu yapıldıktan

Investigation Of Consumers 'Organic Food Purchases In The Context Of The Relationship Of Personal Values And Individual Factors - Tüketicilerin Organik
Gıda Satın Alma Niyetlerinin Kişisel Değerler İle Bireysel Faktörler İlişkisi Bağlamında Araştırılması
Aysel ERCİŞ, Tuğba YILDIZ, F.Görgün DEVECİ
299
sonra 352 anket değerlendirilmeye tabi tutulmuştur. Çalışmanın uygulama kısmında yüz yüze anket
uygulaması yöntemi kullanılmıştır. Anket çalışması Erzurum’ da 18 yaş ve üstü organik gıda satın alan
tüketicilere uygulanmıştır. Çalışma örneklemini organik gıda tüketicileri oluşturmaktadır. Bununla
birlikte çalışma sadece Erzurum ilini kapsamaktadır. Dolayısıyla araştırma organik ürün tercihinde
bulunmayan tüketiciler, tüm ürün grupları ve Türkiye için genellenemez.
Çalışma kapsamında kullanılan ölçekler; kişisel değerlere yönelik ifadeler Yıldırım (2013),
bireysel faktörlerin içinde yer alan çevre bilincine ilişkin ifadeler Huang vd., (2014), sağlık bilincine
ilişkin ifadeler Cheung vd., (2015), fiyat bilincine ilişkin ifadeler Lichtenstein vd., (1988), organik gıda
satın almaya yönelik tutum, organik gıda satın alma niyeti ve öznel norma ilişkin ifadeler Al-Swidi
(2014)’den uyarlanarak Türkçeye çevrilmiş, daha sonra ters çeviri-backtranslation yöntemiyle ifadeler
kontrol edilmiştir. Verilerin analizinde SPSS 20.0 ve AMOS 20 paket istatistik programlarından
faydalanılmıştır. Verilere tanımlayıcı istatistikler, güvenilirlik analizi, doğrulayıcı faktör analizi,
kanonik koreasyon ve regresyon analizleri uygulanmıştır.
Sonuç ve Değerlendirme
Araştırma sonuçlarına göre kişisel değerler bireysel faktörler üzerinde etkilidir. Bireysel
faktörler arasında yer alan sağlık ve çevre bilinci ise organik gıda satın almaya yönelik tutum üzerinde
etkilidir. Bununla birlikte, fiyat bilinci boyutunun organik gıda satın almaya yönelik tutumu
etkilemediği görülmektedir. Ayrıca, bulgular organik gıda satın alma konusundaki tutumun organik gıda
satın alma niyetini etkilediğini ortaya koymaktadır. Son olarak, öznel norm, organik gıda satın alma
niyeti ile organik gıda satın almaya yönelik tutumu arasında moderatör bir etkiye sahiptir. Çalışma
sonucunda organik gıda pazarı için önemli olan sağlık, çevre ve fiyat bilincinin oluşmasında bireyin
hayatında yol gösteren ilkeler olarak da ifade edilebilen kişisel değerlerin önem kazandığı görülmüştür.
Organik gıda satın alma niyetine giden süreçte anahtar rol oynayan tutuma etki edebilmek için hem
bireylerin sağlığını hem de doğaya ilişkin bireysel faktörlerini göz önünde bulundurmak gerekmektedir.
Bu etkinin gücünü ve yönünü etkileyebilecek değişkenlerin belirlenmesi sektörün harekete geçirilmesi
için önemli imkanlar sunacaktır. Organik gıda için ise bu etki toplumun düşünceleri yani öznel normun
moderatör etkisinin araştırılmasından geçmektedir.

Mehmet Akif Ersoy İktisadi ve İdari Bilimler Fakültesi Dergisi - Mehmet Akif Ersoy University Journal of Economics and Administrative Sciences Faculty
Cilt:7 Sayı:2 s.297-325 Volume:7 Issue:2 p.297-325
Temmuz 2020 July
300
1. INTRODUCTION
Organic food market is significantly developing throughout the world. This results from the
positive perceptions of consumers towards organic foods. Consumers consider organic products as
environmentally and animal friendly products that are not produced with antibiotics or hormones
(Hutchins and Greenhalgh, 1997; González et al., 2019; Popa et al., 2019). In the studies carried out on
organic products, organic products of consumers are generally; see it as healthy, sensory appeal, food
safety, taste, quality, proenvironment (Hill and Lynchehaun, 2012; Chekima et al., 2017; Golob et al.,
2018; Curl, 2019; Pham et al., 2019). According to consumers, organic products are healthy in many
aspects (Manzi and Duraz-zo, 2017; Hsu et al., 2016). In addition, the tendency of consuming organic
products is widely adopted in many industrialized countries. Therefore, both producers and marketers
attempt to learn the motivations affecting the consumption of these products (Janssen, 2018; Rock et al.,
2017; Massey et al., 2018).
Today, consumers behave more consciously about nature. Therefore, they gravitate towards
environmentally-friendly products and prefer the companies that are sensitive to the environment (Nasir
and Karakaya, 2014: 295). It is observed that the production and consumption of organic foods
significantly increase in the above-mentioned process. When organic products are approached from a
marketing perspective, understanding the knowledge of consumers towards these products is crucial in
terms of developing appropriate marketing strategies (Nasir and Karakaya, 2014). Organic agriculture,
which attracts attention in the world substantially, is accepted as one of the sectors having a promising
future (Eti, 2017). Organic production can be defined as an ecological production management system.
The minimum use of non-agricultural inputs as well as ensuring, protecting and developing the
ecological balance depend on the relevant managerial processes (Winter and Davis, 2006:117). Another
factor directing the behaviors of consumers and playing a significant role in the decision-making process
regarding organic foods is personal values (Winter, 2010:26). Also individuals who are worried that
they will lose their health turn to organic foods because of this anxiety. Thus, knowing organic foods in
a healthy way reduces the cognitive discrepancy experienced in individuals (Bilgen, 2017: 678-679).
According to Wang et al., (2020) environmental consciousness enhances consumers’ intention to
purchase organic food. Also, attitude, subjective norm and environmental concern significant positive
effect on organic food purchase intention (Saleki et al., 2019). With the consciousness of the society in
recent years, the demand for organic products (Keskin et al., 2017) as well as awareness about the the
harmful effects of chemicals in foods has been increasing. In this context, the tendency to purchase
organic food also increases. The gradual development of attitudes towards the origin of consumed food
and food purchasing behavior have not been adequately addressed in the marketing literature. At this
point, the study to determine the motivations of consumers to purchase organic food becomes important.
When the related literature is examined, personal values aiming to develop correct strategies by defining
and defining the organic product market in particular; There are a limited number of studies dealing with

Investigation Of Consumers 'Organic Food Purchases In The Context Of The Relationship Of Personal Values And Individual Factors - Tüketicilerin Organik
Gıda Satın Alma Niyetlerinin Kişisel Değerler İle Bireysel Faktörler İlişkisi Bağlamında Araştırılması
Aysel ERCİŞ, Tuğba YILDIZ, F.Görgün DEVECİ
301
the impact on individual factors. With the research, the effect of personal values, which reveal what is
important for the individual, on individual factors will be examined and which individual factor will be
determined more in line with the personal values of the individual. The increasing environmental
problems and the health problems of individuals have brought organic food to the fore. In this context,
it is important to raise the consciousness of the consumer for the development of the organic food
market. However, one of the issues that needs to be emphasized is what can be done in order to raise
consciousness effectively. Organic food consumers will be more clearly understood with the
determination of values, which can affect the individual characteristics of people. There are a limited
number of studies on this variable group in the literature. Finally, it is important that the attitudes of
potential buyers towards organic food become organic food purchase intentions in order to make the
organic food market more vivid. Today, consumers no longer care about themselves, besides what you
did for me, other individuals, society, environment, etc. What are they doing for? to the enterprises. In
light of the explanations above and the findings obtained after the study, it is aimed to fill in the gaps in
the related literature and contribute to the literature.
2. LITERATURE REVIEW
2.1. Personal Values
Schwartz (1994) defines values as the objectives with varying degrees of importance that act as
guiding principles in the life of a human or an individual in a society. Values are the criteria used for
choosing and legitimating actions as well as evaluating humans, events and personality (Grunert and
Juhl,1995). Personal values are the principles that guide how an individual should behave (Parks and
Guay, 2009). Personal values affect the preferences of consumers in addition to guiding their behaviors
(Candan and Yıldırım, 2013). Schwartz's system of personal values was developed by considering the
physical, psychological and social needs of individuals. Therefore, it is frequently used for analyzing
consumer behaviors since it offers a comprehensive evaluation (Ünal et.al., 2008). Schwartz discusses
this system under two dimensions. The first dimension includes the approach of Openness to
change/Conservation while the second dimension consists of Self-transcendence/Self-enhancement. In
the dimension of Openness to Change, there is the self-direction and stimulation value types while
security, conformity and tradition value types are included in the dimension of Conservation. The
dimension of hedonism includes the elements of both Openness to Change and Self-Enhancement value
groups among the ten value types in the system (Harcar, 2005:180). It is critical to understand the values
lying behind the food purchase preferences in order to obtain more perceptible information regarding
the individuals purchasing organic foods (Finch, 2006). The research examining the relationship
between values and environmentalist behavior has rimarily focused on two of the value categories of
Schwarz. These value categories are self-transcendence and self-enhancement (Schultz et.al., 2005:
459). The values of power, achievement and hedonism are included in the dimension of self-
enhancement while universalism and benevolence are included in the dimension of self-transcendence

Mehmet Akif Ersoy İktisadi ve İdari Bilimler Fakültesi Dergisi - Mehmet Akif Ersoy University Journal of Economics and Administrative Sciences Faculty
Cilt:7 Sayı:2 s.297-325 Volume:7 Issue:2 p.297-325
Temmuz 2020 July
302
(Schwartz, 1992). Moreover, the latter values were identified as the determinants of the general concern
about the environment. The dimension of self-transcendence had a positive impact on the concern about
the environment while the dimension of self-enhancement affected it negatively (Schultz et.al., 2005).
In their study conducted on sustainability, Şener and Hazer (2007) focused on five value types
(Universalism, Benevolence, Power, Achievement, Hedonism) that are included in Schwarz's self-
transcendence and self-enhancement dimensions. In this female-focused study, the value of universalism
had the highest mean score while hedonism had the lowest mean score. The value of power represents
to be able to gain social status and prestige, control or dominate humans and resources. The value of
achievement represents the success of the individuals demonstrating competence with respect to social
standards. Hedonism, which is another value, refers to sensory fulfillment and personal pleasure
received from life. Universalism reflects an appreciation of value, being tolerant and protecting the
nature and welfare of all people. Benevolence is to focus on the welfare of others in daily interaction
(Schwartz, 1992). Hence, the five dimensions of personal values, which are power, achievement,
universalism, hedonism and benevolence, were discussed in this research.
2.2. Individual Factors (Environmental Consciousness, Price Consciousness,
Health Consciousness)
In the study carried out on organic products, Lee (2016) examined three consciousness elements
to measure individual factors. These elements are environmental, health and price consciousness. Lea
and Worsley (2005) stated that organic products were more delicious and healthier compared to
conventional foods. Gök (2008) also specified that the prices of organic products were higher compared
to conventional products. Furthermore, the concern about the environment and health of consumers has
increased in parallel with the attention paid on the consumption of organic foods. In this context,
especially the marketing sector has been directed to analyzing the motivations behind the purchase of
organic products by consumers (Smith and Paladino, 2010).
Environmental consciousness is to exhibit strong emotions for environmental responsibility. In
other words, environmental consciousness is the protection of the environment as well as raising
awareness about this issue (Alsmadi, 2007). In the organic food sector, consumers demand higher
security and quality as well as the sustainability of the activities by showing sensitivity to the
environment. This means that the logical use of natural resources and the concern about the environment
are critical for this sector (Achilleas and Anastasios, 2008; Kusumaningsih et al., 2019). According to
Ueasangkomsate and Santiteerakul (2016) environment and health are also correlated to buying
intention organic foods. Health consciousness is regarding to what extent an individual adapts the
concern about his own health to his daily activities (Jayanti and Burns, 1988). Consumers, which have
health consciousness, increasingly prefer organic products rather than conventional foods. In other
words, the increase in diseases like heart problems and depression is very effective on the preference of
organic foods by consumers. In this context, the retail, distribution and marketing departments of
enterprises will be effective at the point of meeting the needs of consumers preferring organic foods

Investigation Of Consumers 'Organic Food Purchases In The Context Of The Relationship Of Personal Values And Individual Factors - Tüketicilerin Organik
Gıda Satın Alma Niyetlerinin Kişisel Değerler İle Bireysel Faktörler İlişkisi Bağlamında Araştırılması
Aysel ERCİŞ, Tuğba YILDIZ, F.Görgün DEVECİ
303
with an aim to increase their standards of living (Rana and Paul, 2017). Prakas et al., (2018) stated that
health and environmental consciousness significantly influence the consumer's intention to purchase
organic food. If a consumer has sensitivity in terms of price such as low price sensitivity, etc., it is
possible to specify that this consumer has price awareness for a specific product group (Lichtenstein
et.al., 1988:244). In their study, Kranjac et al. (2017) stated that high price was an important obstacle to
the purchase of organic products. Türk and Erciş (2017) emphasized that low reachability and high price
issues should be discussed for the development of the organic market. Raising awareness in society is
of significance for providing sustainability and increasing environmental consciousness. In addition, if
the environmental consciousness gains importance in the value system of a society, certain positive steps
can be taken regarding environmental consciousness (Kaya and Gündoğdu, 2007). Lee (2011) examined
environmental knowledge, concern and behavior as environmental consciousness. In this study, a
relationship between the value (value for fashion) and environmental consciousness was detected. In
their study, Karalar and Kiracı (2010) concluded that there was a positive relationship between the
frequency of exhibiting sustainable consumption behavior of the universalism and benevolence value
types. Furthermore, they found a positive effect on the frequency of exhibiting sustainable consumption
behavior of individuals with respect to the value of "universalism". In his study, Hedlund (2011) found
that universalism had a positive effect on environmental concern. Worsley and Lea (2008) expressed
that personal values were strong predictors for estimating the concerns of individuals about foods and
health. Worsley et al. (2013) argued that there was a positive relationship between the concern about the
security of foods and the values of conformity and universalism included in the value system of
Schwartz. In their study, Potocan et al. (2016) concluded that there was a significant effect on managers'
personal values on their attitudes towards the concern about the environment. Accordingly, the
following hypotheses were developed;
H1: Personal values have statistically significant effect on individual factors,
H11: Personal values have statistically significant effect on health consciousness
H12: Personal values have statistically significant effect on price consciousness
H13:Personal values have statistically significant effect on environmental consciousness.
2.3. Attitude and Intention
In line with the concerns about the potential effects of intensive agricultural practices on human
health and environment, the interest in organic products increases throughout the world (Yin et.al.,
2010). The theory of planned behavior suggests that the intention of individuals to exhibit a certain
behavior is affected by the attitude, perceived behavior control and subjective norm (Al-Swidi et.al.,
2014:1563). In addition, the theory of value is one of the theories used for better understanding the
organic food preferences of consumers like the theory of planned behavior (Aertsens et.al., 2009).
Attitude towards behavior can be defined as the positive or negative evaluation of a certain behavior by
an individual or the degree of evaluation. According to Michaelidou and Hassan (2008), health

Mehmet Akif Ersoy İktisadi ve İdari Bilimler Fakültesi Dergisi - Mehmet Akif Ersoy University Journal of Economics and Administrative Sciences Faculty
Cilt:7 Sayı:2 s.297-325 Volume:7 Issue:2 p.297-325
Temmuz 2020 July
304
consciousness can positively affect the attitude towards organic products. Besides Yadav ve Pathak
(2016) health consciousness positively influences the consumer's intention to purchase organic food.
In the study conducted on organic products, Lee (2016) found out that health and environmental
consciousness of individuals positively increased in line with the increase in their attitudes towards
purchasing organic products. According to the opinion of Magnusson et al. (2011), high prices are
important obstacles to the purchase of organic products. Because of many reasons, certified organic
foods are generally more expensive than traditional products. Therefore, price gains importance in the
marketing of organic food (Singh and Verma, 2017). According to the study conducted by Smith and
Paladino (2010), the attitude towards organic foods is affected by knowledge, environmental concern
and subjective norm while health consciousness, quality, subjective norm and familiarity affect organic
food purchase intention. In addition, Tarkiainen and Sundqvist (2005) suggested in their study
conducted on organic products that the positive attitude of consumers towards purchase positively
affected their organic food purchase intentions. In line with the information given above, the following
hypotheses were developed;
H2: Individual factors have statistically significant effect on the attitude towards purchasing
organic food.
H21: Health consciousness has statistically significant effect on the attitude towards purchasing
organic food.
H22: Price consciousness has statistically significant effect on the attitude towards purchasing
organic food.
H23: Environmental consciousness has statistically significant effect on the attitude towards
purchasing organic food.
H3: The attitude towards purchasing organic food has statistically significant effect on the
organic food purchase intention.
2.4. Subjective Norm
The theory of reasoned action suggests that the attitude towards behavior and subjective norm
reveals the intention towards behavior. Attitude reflects the subjective evaluation of an individual's
behavior. Subjective norm is related to the social pressure perception created by the people that an
individual attaches importance to (Wan et.al., 2017). Ajzen (1991) defines subjective norm as an
individual's perception of social pressures to perform or not to perform the behavior. Kim et al. (2009)
explain subjective norm as the effect of other individuals on the behaviors of an individual. In other
words, subjective norms, which are premises of the behavioral intention, represent the individual
motivations directing a person to behave according to the opinions of other people in the environment.
If consumers believe that the attitudes and opinions of other people towards organic products are
positive, their purchase intentions to purchase such products will increase in line with this positive effect
(Teng and Wang, 2015:1069).
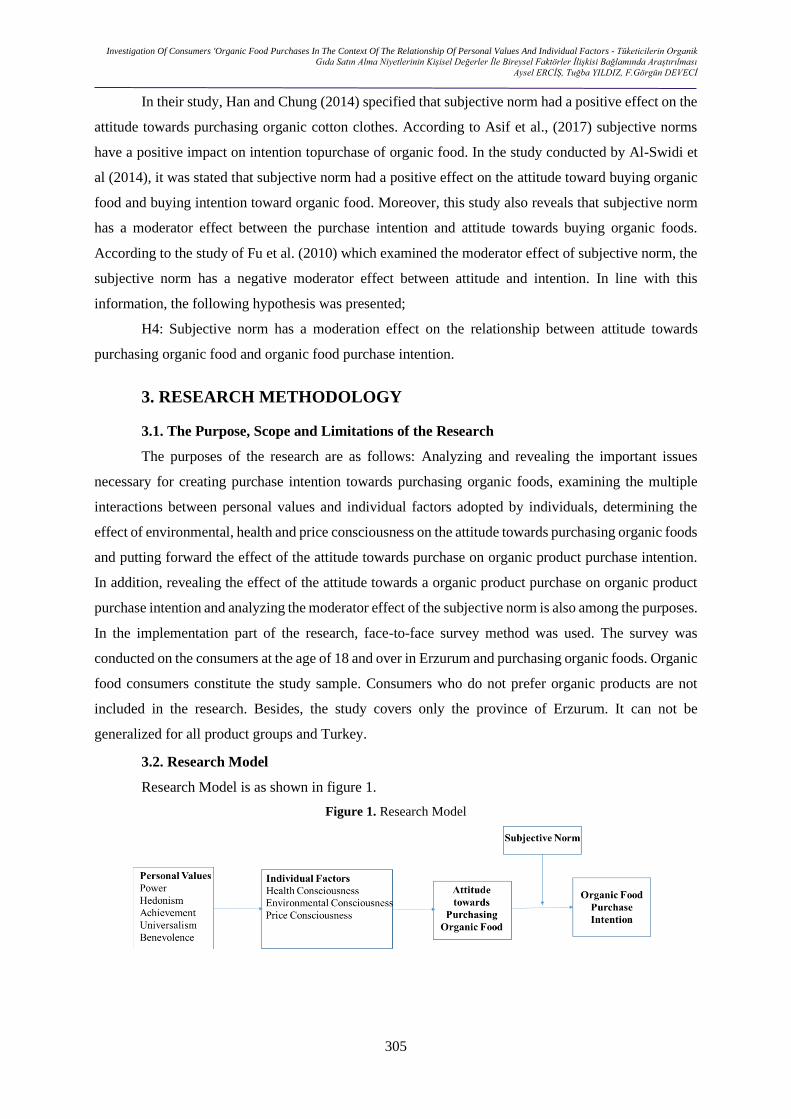
Investigation Of Consumers 'Organic Food Purchases In The Context Of The Relationship Of Personal Values And Individual Factors - Tüketicilerin Organik
Gıda Satın Alma Niyetlerinin Kişisel Değerler İle Bireysel Faktörler İlişkisi Bağlamında Araştırılması
Aysel ERCİŞ, Tuğba YILDIZ, F.Görgün DEVECİ
305
In their study, Han and Chung (2014) specified that subjective norm had a positive effect on the
attitude towards purchasing organic cotton clothes. According to Asif et al., (2017) subjective norms
have a positive impact on intention topurchase of organic food. In the study conducted by Al-Swidi et
al (2014), it was stated that subjective norm had a positive effect on the attitude toward buying organic
food and buying intention toward organic food. Moreover, this study also reveals that subjective norm
has a moderator effect between the purchase intention and attitude towards buying organic foods.
According to the study of Fu et al. (2010) which examined the moderator effect of subjective norm, the
subjective norm has a negative moderator effect between attitude and intention. In line with this
information, the following hypothesis was presented;
H4: Subjective norm has a moderation effect on the relationship between attitude towards
purchasing organic food and organic food purchase intention.
3. RESEARCH METHODOLOGY
3.1. The Purpose, Scope and Limitations of the Research
The purposes of the research are as follows: Analyzing and revealing the important issues
necessary for creating purchase intention towards purchasing organic foods, examining the multiple
interactions between personal values and individual factors adopted by individuals, determining the
effect of environmental, health and price consciousness on the attitude towards purchasing organic foods
and putting forward the effect of the attitude towards purchase on organic product purchase intention.
In addition, revealing the effect of the attitude towards a organic product purchase on organic product
purchase intention and analyzing the moderator effect of the subjective norm is also among the purposes.
In the implementation part of the research, face-to-face survey method was used. The survey was
conducted on the consumers at the age of 18 and over in Erzurum and purchasing organic foods. Organic
food consumers constitute the study sample. Consumers who do not prefer organic products are not
included in the research. Besides, the study covers only the province of Erzurum. It can not be
generalized for all product groups and Turkey.
3.2. Research Model
Research Model is as shown in figure 1.
Figure 1. Research Model

Mehmet Akif Ersoy İktisadi ve İdari Bilimler Fakültesi Dergisi - Mehmet Akif Ersoy University Journal of Economics and Administrative Sciences Faculty
Cilt:7 Sayı:2 s.297-325 Volume:7 Issue:2 p.297-325
Temmuz 2020 July
306
3.3. Sampling Process
As the sampling method, the convenience sampling method, which is one of the non-probability
sampling methods, was used. In total, 500 surveys were conducted by considering the potential
inconveniences that could occur during the survey process. 420 survey forms were obtained after the
incorrect or missing answers of the conducted survey were eliminated. After performing the
standardization of the data for 420 surveys, 352 surveys were subjected to evaluation. Data
Standardization is to make the test or scale safe to be applied safely for "a certain period" and "in certain
main masses or samples" So it is associated with reliability and validity. Standardization was applied in
order to increase the reliability and validity of the study (Şencan, 2005).
3.4. Data Collection Method and Tool
Information on the research scales is presented below
Table1. Information of Research Scale
Scales Quoted Articles Variables Items
Personal Vales Yıldırım (2013) 27 items
Individual Factors
-Environmental Consciousness
-Health Consciousness
-Price Consciousness
Huang et al., (2014)
Cheung et al., (2015)
Lichtenstein et al., (1988)
8 items
5 items
3 items
Attitude towards Organic Purchasing
Food
Al-Swidi (2014) 8 items
Subjective Norm Al-Swidi (2014) 4 items
Organic Food Purchase Intention Al-Swidi (2014) 4 items
So, sixty-seven questions about demographic, preliminary questions and research variables were
asked to the participants. The scales were first translation into Turkish and then the expressions were
checked with the back-translation method again. Individual factors (health, environment and price
consciousness), attitude towards purchasing, purchase intent and subjective norm questions were
measured with the 5-point Likert scale (5 = Totally Agree, 1 = Strongly Disagree). To measure personal
values, a scale scored between the ranges of -1 and 7 (1: inverse to my values, 0: unimportant; 3:
important, 6: very important and 7: absolute important) was used. As a preliminary question to the
participants,” Do you buy organic foods?” was asked. Thus, consumers who are knowledgeable about
organic food are included in the study. The data were obtained by using the convenience sample method,
which includes closed-ended questions as a first-hand data collection tool, and the questions were
prepared in advance, and by making face-to-face interviews with individuals who purchase organic food
living in Erzurum.
Analysis of the data, SPSS 20.0 and AMOS 20 package statistics programs were used.
Descriptive statistics, reliability analysis, confirmatory factor analysis, canonical correlation and
regression analysis were applied to the data.

Investigation Of Consumers 'Organic Food Purchases In The Context Of The Relationship Of Personal Values And Individual Factors - Tüketicilerin Organik
Gıda Satın Alma Niyetlerinin Kişisel Değerler İle Bireysel Faktörler İlişkisi Bağlamında Araştırılması
Aysel ERCİŞ, Tuğba YILDIZ, F.Görgün DEVECİ
307
4. ANALYSIS OF DATA
4. 1. Demographics and Descriptive Statistics
Firstly, the respondents were asked whether you are buying organic food, and the participants
who answered no to this question were asked to end the questionnaire. The majority of the participants
are male (%47,7), between 29 and 39 (%50,3), married (% 56,3), bachelor degree (% 36,9), public
servants (%36,4) and private sector employees (% 26,4) and 3000-4000 (%23,6) Turkish Liras. Besides
this mean and standard deviation about the research scale are in Appendix.
4.2. Reliability and Model Fit Values
The confirmatory factor analysis was performed with an aim to test whether the scales used in
the research show adaptation to the sampling. In addition, the reliability results were shown in Table 2.
Table 2. Acceptable Index Values in Model Compatibility
Fıt Indices Acceptable Compliance
X2 / sd X2 / sd ≤ 5
NFI 0,90 ≤ NFI
CFI 0,95 ≤ CFI
RMSEA RMSEA ≤ 0,08
GFI 0,85 ≤ GFI
AGFI 0,85 ≤ AGFI
RMR 0 < RMR≤ 0,008
Reference: Karagöz (2016), SPSS ve AMOS 23 Uygulamalı İstatiksel Analizler
Table 3. Reliability Results, Model Adaptive Values, CR and AVE values of the scales*
Cronbach
Alpha (α)
X2/sd NFI CFI RMSEA GFI AGFI RMR CR AVE
Personal Values 0.87 2.378 0.840 0.899 0.063 0.872 0.835 0.060 0,988 0,983
Individual
Factors
0.82 2.806 0.875 0.915 0.072 0.911 0.877 0.052 0,992 0,989
Attitude towards
Purchasing
Organic Product
0.81 1.782 0.960 0.982 0.047 0.976 0.955 0.024 0,978 0,976
Subjective
Norm
0.74 2.005 0.993 0.997 0.054 0.997 0.972 0.011 0,990 0,987
Organic Product
Purchase
Intention
0.77 0.489 0,997 1,000 0,000 0,999 0,993 0,006 0,994 0,994
*CR and AVE Scores formulation in Hair et al., 1998: 624
4.3. Canonical Anaysis
In line with the purpose of the research, whether there was a significant relationship between
personal values and individual factors was analyzed. For this purpose, the Canonical Correlation
Analysis was performed. The canonical correlation analysis is a type of analysis aiming at determining
the correlation between two variable sets. In order to see the mutual and multiple relationships between
variable sets, the canonical correlation analysis is performed (Karagöz, 2016:919). As a result of the
canonical correlation analysis, three functions were obtained since the lowest variable number in the
personal values and individual factors variables set. The research model is a cause-effect relationship
model. Canonical correlation analysis is seen as a complement to “multiple regression analysis” (Shiker,
2012). In the analysis, it is thought that the change in dependent variables, which are assumed by

Mehmet Akif Ersoy İktisadi ve İdari Bilimler Fakültesi Dergisi - Mehmet Akif Ersoy University Journal of Economics and Administrative Sciences Faculty
Cilt:7 Sayı:2 s.297-325 Volume:7 Issue:2 p.297-325
Temmuz 2020 July
308
independent variables, is the square of the multiple regression coefficient (Alpert and Peterson, 1972).
So it is very similar to multiple regression, which is an impact analysis. The point where the two analyzes
differ from each other is that canonical correlation is performed between sets (Marcoulides and
Hershberger, 2014). In this sense, canonical correlation analysis was preferred in order to analyze the
effect of personal values on individual factors in order to adapt to the research objectives.
Table 4. The Functions Obtained with the Canonical Correlation Analysis between the Personal Values and the
Individual Factors
Canonical
Functional
Canonical
Correlation
Coefficient
(Rc)
Canonical
Roots
Wilk’s
Lambda
Chi-
Square
df. Sig.
1 0,522 0,272 0,561 200,389 15,000 0,000
2 0,456 0,208 0,771 90,028 8,000 0,000
3 0,162 0,026 0,974 9,181 3,000 0,027
It is seen when Table 4 is examined that there are three functions where the correlation
coefficient is significant for the personal values and the individual factors. The significance
level was found as “p=0,00; p<0,05” for the 1st, 2nd and 3rd functions; thus, it can be put
forward that the canonical correlation coefficients between the data sets in these functions are
significant. The canonical correlation coefficient was determined as 0.522 for the variable pair
“personal values and individual factors in the first function, and the canonical correlation
coefficient was obtained as 0.456 for the variable pair “personal values and individual factors”
in the second function. The canonical correlation coefficient is 0.162 for the variable pair
“personal values and individual factors” in the third function. When the explained variance
ratios of the variables set are examined it is observed that the first functions explain a greater
part of the relationships set.
Table 5. The Correlation Matrix between the Dependent and Independent Variables
Health Consciousness Environmental
Consciousness
PriceConsciousness
Power 0,3584 0,2222 0,4037
Universalism -0,0117 0,3815 0,0661
Hedonism 0,1826 0,1907 0,3136
Achievement 0,1300 0,4033 0,1000
Benevolence 0,3623 0,3017 0,3565
In Table 5, the correlation values between the personal values data sets (independent variable)
and the individual factors data sets (dependent) are shown. Accordingly, the strongest relationships can
be mentioned as present between the data sets of “power-price consciousness (0.40)”, “achievement
value and environmental consciousness (0.40)” and “universalism value and environmental
consciousness (0.38)”.

Investigation Of Consumers 'Organic Food Purchases In The Context Of The Relationship Of Personal Values And Individual Factors - Tüketicilerin Organik
Gıda Satın Alma Niyetlerinin Kişisel Değerler İle Bireysel Faktörler İlişkisi Bağlamında Araştırılması
Aysel ERCİŞ, Tuğba YILDIZ, F.Görgün DEVECİ
309
Table 6. Canonical and Cross Loads belonging to Personal Value
Personal Values Canonical Loads Cross Loads
1.
Function
2.
Function
3.
Function
1.
Function
2.
Function
3.
Function
Power 0,917 -0,064 0,184 0,479 -0,029 0,030
Universalism 0,196 0,873 0,204 0,102 0,398 0,033
Hedonism 0,619 0,096 0,613 0,323 0,044 0,099
Achievement 0,390 0,754 -0,341 0,204 0,344 -0,055
Benevolence 0,894 0,140 -0,122 0,467 0,064 -0,020
As seen in Table 6, “power” (0.917) became the first, “benevolence” (0.894) the second,
“hedonism” (0.619) the third, “achievement” (0.390) the fourth and “universalism” (0.196) the fifth in
the canonical loads of the first function obtained. The value with the highest coefficient is “power”
(0.479) when the cross-relationships between the variable sets are viewed. “Benevolence” (0.467) is the
value with the second highest coefficient; “hedonism” (0.323) has the third highest coefficient and
“achievement” (0.204) comes the fourth. Thus, the variable, which has the highest importance for the
first function among the independent variables, is power. The value of power, which built the highest
amount of relationships with its own set, also established the strongest relationship with the dependent
variable. In the canonical loads of the second function, “universalism” (0.873) came the first,
“achievement” (0.754) the second, “benevolence” (0.140), the third, “hedonism” (0.096) the fourth and
“power” (0.064) the fifth. The value with the highest coefficient is “universalism” (0.398) when the
cross-relationships between the variable sets are viewed. “Achievement” (0.344) is the value with the
second highest coefficient; “benevolence” (0.064) has the third highest coefficient, “achievement”
(0.044) comes the fourth and “power” (-0.029) follows it as the fifth. Therefore, the variable, which has
the highest importance for the second function among the independent variables, is the universalism.
The value of universalism, which built the highest amount of relationships with its own set, also
established the strongest relation with the dependent variable. In the canonical loads of the third
function, “hedonism” (0.613) came the first, “achievement” (-0.341) the second, “universalism” (0.204)
the third, “power” (0.184) the fourth and “benevolence” (-0.122) the fifth. The value with the highest
coefficient is “hedonism” (0.099) when the cross-relationships between the variable sets are viewed.
“Achievement” (-0.055) is the value with the second highest coefficient; “universalism” (0.033) has the
third highest coefficient, “power” (0.030) comes the fourth and “benevolence” (-0.020) follows it as the
fifth. For this reason, the variable, which has the highest importance for the third function among the
independent variables, is hedonism. The value of hedonism, which built the highest amount of
relationships with its own set, also established the strongest relation with the dependent variable.

Mehmet Akif Ersoy İktisadi ve İdari Bilimler Fakültesi Dergisi - Mehmet Akif Ersoy University Journal of Economics and Administrative Sciences Faculty
Cilt:7 Sayı:2 s.297-325 Volume:7 Issue:2 p.297-325
Temmuz 2020 July
310
Table 7. Canonical and Cross Loads belonging to Individual Factors
Individual Factors Canonical Loads Cross Loads
1.
Function
2.
Function
3.
Function
1.
Function
2.
Function
3.
Function
Health Consciousness 0,775 -0,179 0,606 0,405 -0,082 -0,098
Environmental Consciousness 0,525 0,836 -0,159 0,274 0,381 -0,026
Price Consciousness 0,801 -0,089 0,592 0,418 -0,041 -0,096
In Table 7, canonical and cross loads belonging to individual factors are shown. The value,
which has the highest canonical load among the individual factors, is “price consciousness” (0.801).
Respectively, “health consciousness” (0.775) and “environmental consciousness” (0.525) follow the
price consciousness. It is seen that the highest value is “price consciousness” (0.418) in terms of the
cross loads. Health consciousness (0.405) was observed to have the second highest cross value. The
value, which has the highest canonical load among the individual factors, is “price consciousness”
(0.801). Respectively, “health consciousness” (0.775) and “environmental consciousness” (0.525)
follow the price consciousness. It is seen that the highest value is “price consciousness” (0.418) in terms
of the cross loads. Health consciousness (0.405) was observed to have the second highest cross value.
Table 8. The Relationship between the First Dependent Canonical Variable Set and the First Independent
Canonical Set
First Dependent Canonical Variable First Independent Canonical Variable
Power 0,917 Health Consciousness 0,775
Universalism 0,196 Environmental Consciousness 0,525
Hedonism 0,619 Price Consciousness 0,801
Achievement 0,390
Benevolence 0,894
It is possible to state in relation with the cross loads between the personal values and the
individual factors in Table 8 that the participants with high price consciousness in the first function are
the individuals who have a high perception of power (0.917) and benevolence (0.894) values and whose
hedonism dimension (0.619) comes into prominence. In other words, there is a positive relationship
between the dimensions of power, benevolence, hedonism and price consciousness. Hence, it was
observed that the participants who had the desire of being a rich, socially strong and respected person
with a position in the society had the price consciousness. Similarly, it was concluded that the individuals
who returned the favors, worked for the benevolence of the others, acted to have real friendships, had
the sense of responsibility, were sensitive to public issues, were moderate and honest acted with the
price consciousness. Lastly, price consciousness also outweighs in the individuals who think that life
has enjoyable aspects, want to enjoy their lives, try to have an entertaining life and are fond of their own
desires.

Investigation Of Consumers 'Organic Food Purchases In The Context Of The Relationship Of Personal Values And Individual Factors - Tüketicilerin Organik
Gıda Satın Alma Niyetlerinin Kişisel Değerler İle Bireysel Faktörler İlişkisi Bağlamında Araştırılması
Aysel ERCİŞ, Tuğba YILDIZ, F.Görgün DEVECİ
311
Table 9. The Relationship between the Second Dependent Canonical Variable Set and the Second Independent
Canonical Set
Second Dependent Canonical
Variable
Second Independent Canonical
Set
Power -0,064 Health Consciousness -0,179
Universalism 0,873 Environmental Consciousness 0,836
Hedonism 0,096 Price Consciousness -0,089
Achievement 0,754
Benevolence 0,140
As seen in Table 9, it is possible to express considering the second function that universalism
(0.873) and achievement (0.754) dimensions have a positive relationship with the environmental
consciousness in terms of the participants with high environmental consciousness, and it is very
prominent. This can be interpreted as follows; the individuals who are inclined to protect the
environment, live in peace with nature, desire a peaceful and serene world, aim at justice for everyone,
want to live without damaging the environment and are open to new ideas have the environmental
consciousness. In addition to the aforementioned universalism dimension, another dimension coming to
the forefront in terms of the environmental consciousness is the achievement. At this point, it is possible
to mention that the individuals who want to be the best in everything they do, aim at becoming an
important person in their work life, want to be successful and are ambitious, have developed
environmental consciousness as well.
Tablo 10. The Relationship between the Third Dependent Canonical Variable Set and the Third Independent
Canonical Set
Third Dependent Canonical
Variable
Third Independent Canonical
Variable
Power 0,184 Health Consciousness 0,606
Universalism 0,204 Environmental Consciousness -0,159
Hedonism 0,613 Price Consciousness 0,592
Achievement -0,341
Benevolence -0,122
Lastly, hedonism (0.613) and achievement (-0.341) dimensions can be said to be prominent in
the participants with high health consciousness. However, there is a negative relationship with the
achievement value whereas a positive relationship is visible between the health consciousness and the
hedonism value. Lastly, the individuals who think that life has enjoyable aspects, want to enjoy their
lives, try to have a colorful life and are fond of their own desires, also have the health consciousness. In
this case, the negative relationship of the achievement value can be interpreted as follows: the health
consciousness stays in the background in the individuals who consider the achievement primary.
According to the results of the canonical correlation analysis, the hypotheses H1, H11, H12 and
H13 were accepted.
4.4. The Effect of the Individual Factors on the Attitude towards Purchasing Organic
Product

Mehmet Akif Ersoy İktisadi ve İdari Bilimler Fakültesi Dergisi - Mehmet Akif Ersoy University Journal of Economics and Administrative Sciences Faculty
Cilt:7 Sayı:2 s.297-325 Volume:7 Issue:2 p.297-325
Temmuz 2020 July
312
Table 11. The Effect of the Individual Factors on the Attitude towards Purchasing Organic Product
R R2 Adjusted R2 Std.Error of the
Estimate
0,565 0,319 0,313 0,43966
ANOVA Values Sum of Squares Sd Mean Squares F Sig.
Regression 31,520 3 10,507 54,355 0, 000
Residual 67,268 348 0,193
Total 98,788 351
As stated in Table 11, the dimensions expressing the individual factors explain 31.9% of the
variable of the attitude towards purchasing organic product. The model is significant according to the
ANOVA values.
Table 12. The Beta Values Related to the Effect of the Individual Factors on the Attitude towards Purchasing
Organic Product
Pursuant to the result of the regression analysis, the dimensions of health consciousness and
environmental consciousness are effective on the attitude whereas the dimension of price consciousness
is not. Therefore, the hypothesis H2 was accepted partially. The effect of the health consciousness on
the attitude towards purchase H21 and the effect of the environmental consciousness on the attitude
towards purchase H23 were accepted. However, the hypothesis related to the effect of the price
consciousness on the attitude towards the purchase (H22) was not accepted.
4.5. The Effect of the Attitude towards Purchasing Organic Product on the Organic
Product Purchase Intention
Table 13. The Effect of the Attitude towards Purchasing Organic Product on the Organic Product Purchase
Intention
R R2 Adjusted R2 Std. Error of the
Estimated
0,616 0,379 0,377 0,48794
ANOVA Values Sum of Squares Sd Mean Squares F Sig.
Regression 50,889 1 50,889 213,744 0, 000
Residual 83,329 350 0,238
Total 134,217 351
As stated in Table 13, attitude towards purchasing organic product explains 37.9% of the
variable of the organic product purchase intention. The model is significant according to the ANOVA
values.
Unstandardized Coefficients Standardized
Coefficients t Sig.
B Std. Error B
Health
Consciousness
0,112 0,037 0,147 3,045 0,003
Environmental
Consciousness
0,464 0,045 0,500 10,416 0,000
Price
Consciousness
-0,009 0,030 -0,015 -0,315 0,753

Investigation Of Consumers 'Organic Food Purchases In The Context Of The Relationship Of Personal Values And Individual Factors - Tüketicilerin Organik
Gıda Satın Alma Niyetlerinin Kişisel Değerler İle Bireysel Faktörler İlişkisi Bağlamında Araştırılması
Aysel ERCİŞ, Tuğba YILDIZ, F.Görgün DEVECİ
313
Table 14. The Beta Values Related to the Effect of the Attitude towards Purchasing Organic Product on the
Organic Product Purchase Intention
According to the result of the regression analysis, attitude towards purchasing organic product
is effective on the organic product purchase intention. Therefore, the hypothesis H3 was accepted.
4.6. The Moderator Effect of the Subjective Norm between the Attitude towards
Purchasing Organic Product and the Organic Product Purchase Intention
Table 15. The Moderator Effect of the Subjective Norm between theAttitude towards Purchasing Organic
Product and Organic Product Purchase Intention
Model
B Std.
Error β t Sig
1
Attitude towards Purchase
0,517 0,044 0,527 11,877 0,000
Subjective Norm
0,263 0,041 0,282 6,363 0,000
R²=0,52 Adjusted. R²=0,52 F=190.701 p=0,000
2
Attitude towards Purchase 0,488 0,045 0,497 10,767 0,000
Subjective Norm 0,261 0,041 0,279 6,328 0,000
Attitude towards
Purchase*Subjective Norm -0,101 0,046 -0,087 -2,199 0,029
R²=0,53 Adjusted. R²=0,53 F=130,143 p=0,000
According to the research, the subjective norm (moderator variable) is thought to be the variable
which affects the direction and the power of the relationship between the organic product purchase
intention (dependent variable) and the attitude towards purchasing organic product (independent
variable). It is necessary to check the effect of the engaged effects of the attitude and the subjective norm
on the organic product purchase intention in order to research whether the subject norm has an effect on
the relationship between the attitude towards the organic product purchase and the organic product
purchase intention. Moreover, no interaction must exist between the attitude towards the purchase and
the subjective norm while discovering the moderator effect. The reason is that this leads to the problem
of multicollinearity. In other words, if the moderator term that signifies the engaged effect of the attitude
towards the purchase and the subjective norm (the attitude towards purchase*the subjective norm) has
a significant effect on the organic product purchase intention, it shows that the relationship between the
dependent and independent variables is set by the moderator (Baron and Kenny, 1986; Erciş and Türk,
2016). Although the effect is not that big, it caused a 1% increase in the R² value of the first model.
Furthermore, it is seen that the model is generally significant. Therefore, the hypothesis H4 was
accepted.
Unstandardized Coefficients Standardized
Coefficients t Sig.
B Std. Error B
Attitude
towards
Purchase
0,718 0,049 0,616 14,620 0,000

Mehmet Akif Ersoy İktisadi ve İdari Bilimler Fakültesi Dergisi - Mehmet Akif Ersoy University Journal of Economics and Administrative Sciences Faculty
Cilt:7 Sayı:2 s.297-325 Volume:7 Issue:2 p.297-325
Temmuz 2020 July
314
5.DISCUSSION AND SUGGESTIONS
It was discovered that the personal values had statistically significant effect on the individual
factors. While the effect of the environmental and health consciousness on the attitude towards
purchasing organic food was found, price appeared with no effect regarding the individual factors.
In terms of canonical correlation between personal values and individual factor participants with
a high price consciousness in terms of first function were found to have price consciousness who were
rich, socially powered, positioned and desire to be respected in the society. Similarly, it was seen that
the individuals who returned the favors, worked for the benevolence of the others, acted to have real
friendships, had the sense of responsibility, were sensitive to public issues, were moderate and honest
acted with the price consciousness. Lastly, price consciousness also outweighs in the individuals who
think that life has enjoyable aspects, want to enjoy their lives, try to have a colorful life and are fond of
their own desires. A market-related approach can be imposed on the consumers who have the desire to
be considered as a rich, socially strong and respected person with an important position in the society
via the perception supporting that the organic products are a sign of social status and carry a symbolic
value in addition to the price perception in purchasing these products. In terms of organic products, the
perception of these products as expensive must be eliminated and the perception must be formed
regarding that healthier organic consumptions and the resulting consumptions of different brands will
differentiate them. At the same time, thinking that the consumers with high perception of power will
affect their environment, different strategies must be developed to support that they will introduce new
things to their environment, create a trend and might become leaders through their consumption of
organic products. Besides, it was observed that the price consciousness came into prominence in terms
of the consumers who were named as the benevolence. Positive from-mouth-to-mouth communication
gains significance for the organic products. Thus, the elimination or at least the diminishment of the
price perception or sensitivity can be ensured thanks to the benevolents who share their positive
experiences with people in their environment. Awareness must be raised so that the consumers can focus
on the beneficent aspects of the organic products that may directly affect their health rather than their
price. Business can consider the expert recommendations to address the emotions of the consumers, gift
them additional products to let them feel that they are more beneficent or concentrate on sample product
distribution for them to test the product. Another dimension that appears for the price consciousness is
the hedonism. It is believed that the hedonist individuals’ perception of hedonic consumption is higher.
Fairs and various familiarization days can be organized in relation with the organic products in order to
eliminate the price sensitivity. And the localness of these products can be made attractive to increase the
attention. Festivals can be arranged for the organic products which grow in a specific locality.
When the second function is considered that the dimensions of universalism and achievement
come to prominence in terms of the participants with high environmental consciousness. Jaini et al.,
(2019) stated that altruistic and hedonic values have a positive effect on green cosmetics consumers’

Investigation Of Consumers 'Organic Food Purchases In The Context Of The Relationship Of Personal Values And Individual Factors - Tüketicilerin Organik
Gıda Satın Alma Niyetlerinin Kişisel Değerler İle Bireysel Faktörler İlişkisi Bağlamında Araştırılması
Aysel ERCİŞ, Tuğba YILDIZ, F.Görgün DEVECİ
315
proenvironmental beliefs. In addition, as stated in the literature section, Potocan et al. (2016) personal
values significantly influence attitudes toward the concern for natural environment. This can be
interpreted as follows; it can be said that the individuals who are inclined to protect the environment,
live in peace with the nature, desire a peaceful and serene world, aim at justice for everyone, want to
live without damaging the environment and are open to new ideas have the environmental
consciousness. This consumer group can be interpreted as the potential buyer for the organic product
market. Thus, it will be logical for the businesses to organize promotion activities which will reinforce
the maximum benefit and the values owned in the messages that will be given by the businesses when
it is thought that the convincing process of the aforementioned group will be easier. Hence, potential
buyers can be transformed into continuous customers. In this sense, the value of lifelong customer can
be formed in the long run via the relational marketing. Businesses can give importance to acting together
in recycling activities to influence the consumers who have the value of universalism and become the
sponsors of the programs explaining the significance of participating in environmental activities
(planting trees, reducing the usage of plastic products and nylon bags). In addition to the aforementioned
universalism dimension, another dimension that appears for the environmental consciousness is the
achievement. At this point, it is possible to mention that the individuals who want to be the best in
everything they do, aim at becoming an important person in their work life, want to be successful and
are ambitious, have developed environmental consciousness as well. Businesses can help the individuals
whose desires of achievement are prominent to be opinion leaders, send the prototypes of their products
to these people and learn their opinions by introducing the new products that will be put on the market
firstly to them. Meanwhile, these people can be encouraged to share videos reflecting their satisfaction
regarding the products via the social media applications. With these applications, these people, who
have the achievement tendency, can be supported and helped to share more. This will create an area that
will expand the organic product market. Another result of the research conducted for environmental
consciousness is the effect on the attitude towards purchase. To enliven the sector, the consumers need
to be more interested in purchasing or approach the organic products with positive thoughts. Therefore,
the positive effects of the organic production on the environment can be explained by the experts and
the businesses can support their nature-friendly production sustainably.
Lastly, it can be said that the dimensions of hedonism and achievement are prominent in the
participants with high health consciousness. According to Chang (2019) conservation values and self-
transcendence values are positively associated with health consciousness. In addition, as stated in the
literature section, Worsley and Lea (2008) expressed that personal values were strong predictors for
estimating the health concern. According to the results, health consciousness increases as the hedonism
level rises. For this reason, an individual’s level of hedonism will increase when the businesses act in a
way specially to lay emphasis on health while marketing the organic products and it is specified that the
active substances, they contain are not unhealthy. In addition, it is possible to say that the health
consciousness is not effective on the individuals who want to be the best in everything they do, aim at
Mehmet Akif Ersoy İktisadi ve İdari Bilimler Fakültesi Dergisi - Mehmet Akif Ersoy University Journal of Economics and Administrative Sciences Faculty
Cilt:7 Sayı:2 s.297-325 Volume:7 Issue:2 p.297-325
Temmuz 2020 July
316
becoming an important person in their work life, want to be successful and are ambitious. Instead of
healthy living, different variable groups can be used to influence this group. The attitude towards
purchase can be increased through product placement in health-related TV programs and commercials
or various social media tools via the vloggers, who are the experts of the topic. Meanwhile, product
placements can be supported with the expert recommendations or other consumers who use the product.
Considering the literature in the light of these results as stated in the literature section Lee
(2016) found out that health and environmental consciousness of individuals positively increased in line
with the increase in their attitudes towards purchasing organic products. Testa et al., (2018) stated that
health belief has a positive effect on attitude towards buying organic food. According to Mesnage et al.,
2019 consumers believe are healthier as they are less contaminated with pesticides. Nguyen et al., (2019)
Consumers’ environmental concern has a positive impact on their attitudes towards buying organic food.
This aspect of the study has similar results with Lee (2016), Testa et al., (2018), Mesnage et al., (2019),
Nguyen et al., (2019) research.
The effect of the attitude towards organic purchasing food on the organic food purchase
intention is another result and the subjective norms were found to have a negative moderating effect in
this relationship. Alswidi (2014) attitude has a positive effect on organic food buying intention.
Similarly, Fu et al. (2010) which examined the moderator effect of subjective norm, the subjective norm
has a negative moderator effect between attitude and intention. In order to influence the attitude that
plays a key role in the process leading to purchasing intention, it is necessary to consider both the health
of individuals and the individual factors related to nature. Determining the variables that may affect the
power and direction of this impact will provide important opportunities for mobilizing the sector.
Turning positive attitudes towards purchasing into intent will contribute to the growth of the market and
thus to economic prosperity. Personal values of an individual may influence the individual factors;
however, it becomes more important at this point to what extent the individual factors affect the attitude
and whether this effect results in the purchase decision. The reason is that an individual may be affected
by the value variables of power, universalism, hedonism, achievement and benevolence and reflect it on
health, environmental and price consciousness, but these factors may not be given much importance
while turning into the attitude, and therefore, the purchase decision may be postponed. For this reason,
sustainability must be supported by developing active strategies during this process. This situation has
great importance for not only today but also next generations. Consumption of the organic food must be
adopted as a way of life, not temporarily. Its adoption is directly affected by the approach of the business
to the organic food. It is believed that the businesses which support the organic production and
agriculture with this viewpoint will be the winners of the future.

Investigation Of Consumers 'Organic Food Purchases In The Context Of The Relationship Of Personal Values And Individual Factors - Tüketicilerin Organik
Gıda Satın Alma Niyetlerinin Kişisel Değerler İle Bireysel Faktörler İlişkisi Bağlamında Araştırılması
Aysel ERCİŞ, Tuğba YILDIZ, F.Görgün DEVECİ
317
APPENDIX
Table 16. Mean and Standard Deviation Values for Personal Values Scale
Mean Std.
Deviation
Being respected in the society 5,6905 1,60084
Being rich (possessing tangible assets and money) 4,9000 2,09318
Having image in the society 5,2857 1,92069
To be able to have social power (The power to manage others, the power to influence
others) 5,0786 2,16084
Having a position 5,2571 2,00609
Protect the environment 6,0286 1,35356
Living in integrity with nature 5,9095 1,35259
Living in a peaceful world 6,3310 1,00476
Living in a tranquility world 6,4286 ,91247
Providing justice for everyone in the community 6,4452 ,94192
Living without harming the environment 6,2571 1,10567
Being open-minded (tolerant of diverse and beliefs) 5,8714 1,59134
Having fun things in life (Eating, drinking, having fun, music, etc.) 5,5905 1,68495
Enjoying life 5,5500 1,65810
Having a fun life 5,4262 1,81660
Being fond of their enthusiasm (doing things that give them pleasure) 5,0714 2,10911
To be the best in everything I do (at work, in sports, at school, etc.) 5,6190 1,68883
Have influence in business life 5,5952 1,57788
Being successful 5,9429 1,37540
Being ambitious (To be hardworking and eager) 5,6119 1,73806
Responding to goodness (avoiding being owed to someone else) 6,1881 1,16240
Being helpful (working for the good of others) 6,1190 1,16640
Being able to make true friendships 6,1810 1,22255
Living as a responsible 6,2310 1,14216
Being sensitive to social problems 6,2214 1,12299
Being Moderate 6,0929 1,26960
Being Honest 6,5333 ,86366
Table 17. Mean and Standard Deviation Values for Individual Factors
Mean Std.
Deviation
I consider myself very health-conscious. 3,9571 ,87559
I think that I take health into account a lot in my life. 3,6429 ,99693
My health is so valuable to me that I am prepared to sacrifice many things for it. 3,9238 ,90288
I think that I pay more attention to health than other people. 3,6071 1,05931
I often think about whether everything I do is healthy. 3,7690 ,97535
I hate firms that conduct business by polluting the environment. 4,3238 ,79371
When two products are similar, I tend to select the one that harms the environment less,
even though it is more expensive. 4,0262 ,94061
If the products sold by the firms seriously damage the environment, I will refuse to
purchase them. 4,0643 ,93878
When purchasing products, I always select the ones with environmental certification,
even though they are more expensive. 3,8952 ,94401
I follow the key points of recycling and classify recycled waste at home. 3,6476 1,17841
Although the product harms the environment, I purchase it. 2,9476 1,32792
I am concerned about my actions to improve the environment. 4,2000 ,83366
I am concerned about environmental programs information. 4,0214 ,96824
I usually buy products when they are on sale. 3,9476 1,04875
When choosing products, I rely heavily on price. 4,0095 1,01770
I buy the products with the lowest price that suits my need . 3,9024 1,13209

Mehmet Akif Ersoy İktisadi ve İdari Bilimler Fakültesi Dergisi - Mehmet Akif Ersoy University Journal of Economics and Administrative Sciences Faculty
Cilt:7 Sayı:2 s.297-325 Volume:7 Issue:2 p.297-325
Temmuz 2020 July
318
Table 18. Mean and Standard Deviation Values Regarding Subjective Norms
Mean Std.
Deviation
The trend of buying organic food among people around me is increasing. 4,0024 ,92563
People around me generally believe that it is better for health to use organic food. 4,1333 ,85811
My close friends and family members would appreciate if I buy organic food. 3,8024 1,00903
I would get all the required support (money, time, information related) from friends
and family to. 4,0238 ,91365
Table 19. Mean and Standard Deviation Values for Attitudes towards Purchasing Organic Food
Mean Std.
Deviation
I prefer organic food because it is processed without any chemicals. 4,1333 ,87464
I prefer organic food because it tastes better than non-organic food. 4,0738 ,98280
I prefer organic food because it is more nutritious than conventional non-organic
food. 4,1929 ,91053
I prefer organic food as it causes less diseases than conventional food. 4,2095 ,88418
I prefer organic food because it is environment friendly. 4,1071 ,98942
I prefer organic food as no preservatives are used to enhance its shelf life. 4,0833 ,95992
I believe that price of organic food is quite justified. 3,4524 1,35037
It is exciting for me to buy organic food. 3,7048 ,96649
Table 20. Mean and Standard Deviation Values Regarding the Organic Food Purchase Intention
Mean Std.
Deviation
I would look for specialty shops to buy organic food. 3,6333 1,12419
I am willing to buy organic food in future. 4,0571 ,98513
I am willing to buy organic food on regular basis. 4,0476 ,93850
I would also recommend others to buy organic food. 3,9857 1,02930
REFERENCES
ACHILLEAS, K., & ANASTASIOS, S. (2008), Marketing Aspects of Quality Assurance
Systems: The Organic Food Sector Case, British Food Journal, 110(8), 829-839.
AERTSENS, J., VERBEKE, W., MONDELAERS, K., & VAN HUYLENBROECK, G. (2009),
Personal Determinants of Organic Food Consumption: A Review. British Food Journal,
111(10), 1140-1167.
ALPERT, M. I., & PETERSON, R. A. (1972). On The Interpretation of Canonical Analysis.
Journal of Marketing Research, 9(2), 187-192.
ALSMADI, S. (2007), Green Marketing and the Concern Over the Environment: Measuring
Environmental Conscious ness of Jordanian Consumers, Journal of Promotion
Management, 13(3-4), 339-361.
AL-SWIDI, A., MOHAMMED RAFIUL HUQUE, S., HAROON HAFEEZ, M., & NOOR
MOHD SHARIFF, M. (2014), The Role of Subjective Norms in Theory of Planned
Behavior in The Context of Organic Food Consumption. British Food Journal, 116(10),
1561-1580.
Investigation Of Consumers 'Organic Food Purchases In The Context Of The Relationship Of Personal Values And Individual Factors - Tüketicilerin Organik
Gıda Satın Alma Niyetlerinin Kişisel Değerler İle Bireysel Faktörler İlişkisi Bağlamında Araştırılması
Aysel ERCİŞ, Tuğba YILDIZ, F.Görgün DEVECİ
319
AJZEN, I. (1991), The Theory of Planned Behavior, Organizational Behavior and Human
Decision Processes, 50(2), 179-211.
ASIF, M., XUHUI, W., NASIRI, A., & AYYUB, S. (2018). Determinant Factors Influencing
Organic Food Purchase Intention and The Moderating Role of Awareness: A
Comparative Analysis. Food Quality and Preference, 63, 144-150.
BARON, R. M., & KENNY, D. A. (1986), The Moderator–Mediator Variable Distinction in
Social Psychological Research: Conceptual, Strategic, and Statistical Considerations.
Journal of Personality and Social Psychology, 51(6), 1173-1182.
BİLGEN, İ. (2017). Organik Tarim Ürünlerinde Algilanan Kalite: İstanbul İlindeki Tüketiciler
Üzerine Bir Araştırma. The Turkish Online Journal of Design, Art and Communication
- TOJDAC, 7(4), 678-685.
BRYŁA, P. (2016), Organic Food Consumption in Poland: Motives and Barriers, Appetite, 105,
737-746.
CANDAN, B., & YILDIRIM, S. (2013), Investigating the Relationship Between Consumption
Values and Personal Values of Green Product Buyers, International Journal of
Economics and Management Sciences, 2(12), 29-40.
CHANG, C. (2019). Self-Control-Centered Empowerment Model: Health Consciousness and
Health Knowledge as Drivers of Empowerment-Seeking through Health
Communication. Health communication, 1-12.
CHEKIMA, B., IGAU, A., WAFA, S. A. W. S. K., & CHEKIMA, K. (2017). Narrowing the
Gap: Factors Driving Organic Food Consumption. Journal of Cleaner Production, 166,
1438-1447.
CHEUNG, R., LAU, M. M., & LAM, A. Y. (2015). Factors Affecting Consumer Attitude
towards Organic Food: An Empirical Study in Hong Kong. Journal of Global Scholars
of Marketing Science, 25(3), 216-231.
CURL, C. (2019). Organic Food Health Benefits Have Been Hard To Assess, But That Could
Change. The Conversation. 1-6.
ERCİŞ, A., & TÜRK, B. (2016), Etik Çerçevesinde Tüketim, Tüketici ve Çevre: Ekolojik
Okuryazarlığın Moderatör Rolü, Çukurova Üniversitesi İİBF Dergisi, 20(2), 1-24.
ETİ, H.S (2017), Organik Gıda Tüketicilerinin Belirlenmesi: Teşvik Unsurları, Güven
Yönelimleri ve Satınalma Davranışı, Balkan ve Yakın Doğu Sosyal Bilimler Dergisi,
88-94.

Mehmet Akif Ersoy İktisadi ve İdari Bilimler Fakültesi Dergisi - Mehmet Akif Ersoy University Journal of Economics and Administrative Sciences Faculty
Cilt:7 Sayı:2 s.297-325 Volume:7 Issue:2 p.297-325
Temmuz 2020 July
320
FINCH, J. E. (2006), The Impact of Personal Consumption Values and Beliefs on Organic Food
Purchase Behaviour”, Journal of Food Products Marketing, 11(4), 63-76.
FU, F. Q., RICHARDS, K. A., HUGHES, D. E., & JONES, E. (2010), Motivating Salespeople
to Sell New Products: The Relative Influence of Attitudes, Subjective Norms, and Self-
Efficacy, Journal of Marketing, 74(6), 61-76.
GONZÁLEZ, N., MARQUÈS, M., NADAL, M., & DOMINGO, J. L. (2019). Occurrence of
Environmental Pollutants in Foodstuffs: A Review of Organic Vs. Conventional Food.
Food and Chemical Toxicology, 370-375.
GOLOB, U., KOKLIC, M. K., PODNAR, K., & ZABKAR, V. (2018). The Role Of
Environmentally Conscious Purchase Behaviour And Green Scepticism In Organic
Food Consumption. British Food Journal, 2411-2324.
GÖK, S.A. (2008), Genişleyen Avrupa Birliği Pazarında Türkiye’nin Organik Tarım Ürünleri
Ticareti Açısından Değerlendirilmesi (AB Uzmanlık Tezi). Tarım ve Köy İşleri
Bakanlığı Dış İlişkiler ve Avrupa Birliği Koordinasyon Dairesi Başkanlığı, Ankara.
GRUNERT, S.C., & JUHL, H. J. (1995), Values, Environmental Attitudes, and Buying of
Organic Foods, Journal of Economic Psychology, 16(1), 39-62.
HEDLUND, T. (2011), The Impact of Values, Environmental Concern, and Willingness to
Accept Economic Sacrifices to Protect the Environment on Tourists’ Intentions to
Buy Ecologically Sustainable Tourism Alternatives, Tourism and Hospitality Research,
11(4), 278-288.
HAIR, J.F. JR., ANDRESON, R.E. TAHTAM, R.L. & BLACK, W.C. (1998). Multivariate Data
Analysis, Fifth Edition Prentice-Hall International Inc, New Jersey.
HAN, T.I., & CHUNG, J.E. (2014), Korean Consumers’ Motivations and Perceived Risks
Toward the Purchase of Organic Cotton Apparel, Clothing and Textiles Research
Journal, 32(4), 235-250.
HARCAR, T. (2005). 2000’li Yıllarda Amerikan ve Türk Yöneticilerinin Bireysel Yöneticilik
Değerlerine İlişkin İki Kültür Arası Karşılaştırmaya Yönelik Bir Araştırma
(Yayımlanmış Doktora Tezi). İstanbul Universitesi. İstanbul
HSU, S. Y., CHANG, C. C., & LIN, T. T. (2016). An Analysis of Purchase Intentions Toward
Organic Food On Health Consciousness And Food Safety With/Under Structural
Equation Modeling. British Food Journal, 200-216.

Investigation Of Consumers 'Organic Food Purchases In The Context Of The Relationship Of Personal Values And Individual Factors - Tüketicilerin Organik
Gıda Satın Alma Niyetlerinin Kişisel Değerler İle Bireysel Faktörler İlişkisi Bağlamında Araştırılması
Aysel ERCİŞ, Tuğba YILDIZ, F.Görgün DEVECİ
321
HUANG, H. C., LIN, T. H., LAI, M. C., & LIN, T. L. (2014). Environmental Consciousness
and Green Customer Behavior: An Examination of Motivation Crowding Effect.
International Journal of Hospitality Management, 40, 139-149.
HUTCHINS, R. K., & GREENHALGH, L. A. (1997). Organic Confusion: Sustaining
Competitive Advantage. British Food Journal, 99(9), 336-338.
JAINI, A., QUOQUAB, F., MOHAMMAD, J., & HUSSIN, N. (2019). I Buy Green Products,
Do You…?. International Journal of Pharmaceutical and Healthcare Marketing.
1750- 6123 DOI 10.1108/IJPHM-02-2019-0017
KARAGÖZ, Y. (2016), SPSS ve AMOS Uygulamalı İstatistiksel Analizler, Ankara: Nobel
Yayıncılık.
KARALAR, R., & KİRACI, H. (2010), Bireysel Değerlerin Sürdürülebilir Tüketim Davranışı
Üzerindeki Etkisini Belirlemeye Yönelik Öğretmenler Üzerinde Bir Araştırma, İşletme
Araştırmaları Dergisi, 2(2), 79-106.
KAYA, İ., & GÜNDOĞDU, Y. (2007), Coğrafya Öğretmenlerinin Çevre Bilincini Oluşturma
ve Geliştirmedeki Rolü: Diyarbakır Örneği”, Doğu Coğrafya Dergisi, 12(18),187-204.
KESKIN, M., GÜL, S., BIÇER, O., & GÜNDÜZ, Z. (2017). Suitibility of Hair Goat Breeding
with regards to Organic Production. Turkish Journal of Agriculture-Food Science and
Technology, 5(13), 1700-1704.
KIM, H. B., KIM, T. T., & SHIN, S. W. (2009), Modeling Roles of Subjective Norms and E
trust in Customers' Acceptance of Airline B2C Ecommerce Websites, Tourism
management, 30(2), 266-277.
KRANJAC, M., VAPA-TANKOSIC, J., & KNEŽEVIĆ, M. (2017), Profile of Organic Food
Consumers. Economics of agriculture, 64(2), 497-514.
KUSUMANINGSIH, D., IRIANTO, H., & ANTRIYANDARTI, E. (2019). Effects of Health
Consciousness and Environmental Attitude on Intention Towards Organic Food
Purchase. In Iop Conference Series: Materials Science And Engineering, 1-6.
LEA, E., & WORSLEY, T. (2005), Australians' Organic Food Beliefs, Demographics and
Values, British Food Journal, 107(11), 855-869.
LEE, S. (2011), Consumers’ Value, Environmental Consciousness, and Willingness to Pay
More Toward Green-Apparel Products, Journal of Global Fashion Marketing, 2(3), 161-
169.

Mehmet Akif Ersoy İktisadi ve İdari Bilimler Fakültesi Dergisi - Mehmet Akif Ersoy University Journal of Economics and Administrative Sciences Faculty
Cilt:7 Sayı:2 s.297-325 Volume:7 Issue:2 p.297-325
Temmuz 2020 July
322
LEE, H.J. (2016), Individual and Situational Determinants of US Consumers’ Buying Behavior
of Organic Foods, Journal of International Food & Agribusiness Marketing, 28(2), 117-
131.
LEE, H.J., & YUN, Z.S. (2015), Consumers’ Perceptions of Organic Food Attributes and
Cognitive and Affective Attitudes as Determinants of Their Purchase Intentions toward
Organic Food, Food Quality and Preference, 39, 259-267.
LICHTENSTEIN, D. R., BLOCH, P.H., & BLACK, W. C. (1988), Correlates of Price
Acceptability, Journal of Consumer Research, 15(2), 243-252.
MAGNUSSON, M.K., ARVOLA, A., KOIVISTO HURSTI, U.K., ÅBERG, L., & SJÖDÉN,
P.O (2001), Attitudes towards Organic Foods Among Swedish Consumers, British food
journal, 103(3), 209-227.
MANZI, P., & DURAZZO, A. (2017), Organic vs. Conventional Milk: Some Considerations
on Fat-Soluble Vita mins and Lodine Content, Beverages, 3(3), 39, 1-9.
MARCOULIDES, G. A., & HERSHBERGER, S. L. (2014). Multivariate Statistical Methods:
A First Course. Psychology Press.
MASSEY, M., O'CASS, A., & OTAHAL, P. (2018). A Meta-Analytic Study of The Factors
Driving the Purchase of Organic Food. Appetite, 125, 418-427.
MESNAGE, R., TSAKIRIS, I. N., ANTONIOU, M. N., & TSATSAKIS, A. (2019). Limitations
in The Evidential Basis Supporting Health Benefits from A Decreased Exposure to
Pesticides Through Organic Food Consumption. Current Opinion in Toxicology.
MICHAELIDOU, N., & HASSAN, L. M. (2008), The Role of Health Consciousness, Food
Safety Concern and Ethical Identity on Attitudes and Intentions towards Organic Food,
International Journal of Consumer Studies, 32(2), 163-170.
NASİR, V. A., & KARAKAYA, F. (2014), Underlying Motivations of Organic Food Purchase
Intentions. Agribusiness, 30(3), 290-308.
NGUYEN, H. V., NGUYEN, N., NGUYEN, B. K., LOBO, A., & VU, P. A. (2019). Organic
Food Purchases in An Emerging Market: The Influence of Consumers’ Personal Factors
and Green Marketing Practices of Food Stores. International Journal of Environmental
Research and Public Health, 16(6), 1037.
JANSSEN, M. (2018), Determinants of Organic Food Purchases: Evidence from Household
Panel Data, Food Quality and Preference, 68, 19-28.

Investigation Of Consumers 'Organic Food Purchases In The Context Of The Relationship Of Personal Values And Individual Factors - Tüketicilerin Organik
Gıda Satın Alma Niyetlerinin Kişisel Değerler İle Bireysel Faktörler İlişkisi Bağlamında Araştırılması
Aysel ERCİŞ, Tuğba YILDIZ, F.Görgün DEVECİ
323
JAYANTI, R.K., & BURNS, A. C. (1998). The Antecedents of Preventive Health Care
Behavior: An Empirical Study. Journal of the Academy of Marketing Science, 26(1), 6-
15.
PARKS, L., & GUAY, R.P. (2009), Personality, Values, and Motivation, Personality and
Individual Differences, 47(7), 675-684.
PRAKASH, G., SINGH, P. K., & YADAV, R. (2018). Application of Consumer Style Inventory
(CSI) to Predict Young Indian Consumer’s Intention to Purchase Organic Food
Products. Food Quality and Preference, 68, 90-97.
PHAM, T. H., NGUYEN, T. N., PHAN, T. T. H., & NGUYEN, N. T. (2019). Evaluating the
Purchase Behaviour of Organic Food by Young Consumers in An Emerging Market
Economy. Journal of Strategic Marketing, 27(6), 540-556.
POPA, M. E., MITELUT, A. C., POPA, E. E., STAN, A., & POPA, V. I. (2019). Organic Foods
Contribution to Nutritional Quality and Value. Trends in Food Science & Technology,
84, 15-18.
POTOCAN, V., NEDELKO, Z., PELECKIENĖ, V., & PELECKIS, K. (2016), Values,
Environmental Concern and Economic Concern as Predictors of Enterprise
Environmental Responsiveness, Journal of Business Economics and Management,
17(5), 685-700.
RANA, J., & Paul, J. (2017), Consumer Behavior and Purchase Intention for Organic Food: A
Review and Research Agenda, Journal of Retailing and Consumer Services, 38, 157-
165.
ROCK, B., SURIYAN, J., VIJAY, B., THALHA, N., ELANGO, S., & RAJAJEYAKUMAR,
M. (2017). Organic Food and Health: A Systematic Review. Community Med. Health
Educ, 7, 2161-2711.
SALEKI, R., QUOQUAB, F., & MOHAMMAD, J. (2019). What Drives Malaysian
Consumers’ Organic Food Purchase Intention? The Role of Moral Norm, Self-Identity,
Environmental Concern and Price Consciousness. Journal of Agribusiness in
Developing and Emerging Economies, 584-603.
SCHULTZ, P. W., GOUVEIA, V. V., CAMERON, L. D., TANKHA, G., SCHMUCK, P., &
FRANĚK, M. (2005). Values and Their Relationship to Environmental Concern and
Conservation Behavior. Journal of cross-cultural psychology, 36(4), 457-475.
SCHWARTZ, S. H. (1992), Universals in the Content and Structure of Values: Theoretical
Advances and Empirical Tests in 20 Countries, In Advances in Experimental Social
Psychology, 25, 1-65.

Mehmet Akif Ersoy İktisadi ve İdari Bilimler Fakültesi Dergisi - Mehmet Akif Ersoy University Journal of Economics and Administrative Sciences Faculty
Cilt:7 Sayı:2 s.297-325 Volume:7 Issue:2 p.297-325
Temmuz 2020 July
324
SCHWARTZ, S. H. (1994), Are There Universal Aspects in the Structure and Contents of
Human Values?, Journal of Social Issues, 50(4), 19-45.
SHIKER, M. A. K. (2012). Multivariate statistical analysis. British Journal of Science, 6(1), 55-
66.
SINGH, A., & VERMA, P. (2017), Factors Influencing Indian Consumers' Actual Buying
Behaviour Towards Organic Food Products, Journal of Cleaner Production ,167, 473-
483.
SMİTH, S., & PALADİNO, A. (2010), Eating Clean and Green? Investigating Consumer
Motivations towards the Purchase of Organic Food, Australasian Marketing
Journal (AMJ), 18(2), 93-104.
ŞENER, A., & HAZER, O. (2007), Degerlerin Kadinlarin Surdurulebilir Tuketim Davranisi
Uzerindeki Etkilerine Iliskin Bir Araştirma, Hacettepe Universitesi Sosyolojik
Araştirmalar E-dergisi, 1-16. (DateAccessed:03.01.2018),
http://www.sdergi.hacettepe.edu.tr/makaleler/Arzu_Sener_Oya_Hazer-20-6-2007.pdf.
Şencan, H. (2005). Sosyal ve Davranışsal Ölçümlerde Güvenilirlik ve Geçerlilik. Seçkin
Yayıncılık, Ankara.
TARKIAINEN, A., & SUNDQVIST, S. (2005), Subjective Norms, Attitudes and Intentions of
Finnish Consumers in Buying Organic Food, British Food Journal, 107(11), 808-822.
TENG, C.C., & WANG, Y.M. (2015), Decisional Factors Driving Organic Food Consumption:
Generation of Consumer Purchase Intentions”, British Food Journal, 117(3), 1066-
1081.
TESTA, F., SARTI, S., & FREY, M. (2019). Are Green Consumers Really Green? Exploring
the Factors Behind the Actual Consumption of Organic Food Products. Business
Strategy and the Environment, 28(2), 327-338.
TÜRK, B., & ERCİŞ, A. (2017), 4A Marketing Mix Impacts on Organic Food Purchase
Intention, Serbian Journal of Management, 12(2), 189-199.
UEASANGKOMSATE, P., & SANTITEERAKUL, S. (2016). A Study of Consumers’
Attitudes and Intention to Buy Organic Foods for Sustainability. Procedia
Environmental Sciences, 34, 423-430.
ÜNAL, S., DENIZ, A., & CAN, P. (2008), Marka Bağlılığı ve Kişisel Değerler Açısından Pazar
Bölümleme, Atatürk Üniversitesi İktisadi ve İdari Bilimler Dergisi, 22(1), 211-237.

Investigation Of Consumers 'Organic Food Purchases In The Context Of The Relationship Of Personal Values And Individual Factors - Tüketicilerin Organik
Gıda Satın Alma Niyetlerinin Kişisel Değerler İle Bireysel Faktörler İlişkisi Bağlamında Araştırılması
Aysel ERCİŞ, Tuğba YILDIZ, F.Görgün DEVECİ
325
WAN, C., SHEN, G. Q., & CHOI, S. (2017), Experiential and Instrumental Attitudes:
Interaction Effect of Attitude And Subjective Norm on Recycling Intention, Journal of
Environmental Psychology, 50, 69-79.
WANG, J., PHAM, T. L., & DANG, V. T. (2020). Environmental Consciousness and Organic
Food Purchase Intention: A Moderated Mediation Model of Perceived Food Quality and
Price Sensitivity. International Journal of Environmental Research and Public Health,
17(3), 850, 1-18.
WINTER, C. K., & DAVIS, S. F. (2006), Organic Foods, Journal of Food Science, 71(9), 117-
124.
WINTER, A.B. (2010). Understandıng The Values and Belıefs of Canadıan Organıc Food
Consumers (In Partial Fulfill ment of Requirements for the Degree of Master of
Science). The Faculty of Graduate Studies of The Univer sity of Guelph.
WORSLEY, A., & LEA, E. (2008), Consumer Concerns About Food and Health: Examination
of General and Specific Relationships With Personal Values and Demographics, British
Food Journal, 110(11), 1106-1118.
WORSLEY, A., WANG, W.C., & HUNTER, W. (2013), Gender Differences in the Influence
of Food Safety and Health Concerns on Dietary and Physical Activity Habits”, Food
policy, 41, 184-192.
YADAV, R., & PATHAK, G. S. (2016), Intention to Purchase Organic Food Among Young
Consumers: Evidences from A Developing Nation. Appetite, 96, 122-128.
YILDIRIM, S. (2013), Tüketicilerin Kişisel Değerleri ile Tüketim Değerleri Arasındaki
Ilişkinin Incelenmesi: Çevre Dostu Ürün Kullanan Tüketiciler Üzerinde Bir
Araştırma (Published Doctoral Thesisi). Kocaeli Universitesi.Kocaeli
YIN, S., WU, L., DU, L., & CHEN, M. (2010), Consumers' Purchase Intention of Organic Food
in China, Journal of the Science of Food and Agriculture, 90(8), 1361-1367

326
MEHMET AKİF ERSOY ÜNİVERSİTESİ
İKTİSADİ VE İDARİ BİLİMLER FAKÜLTESİ DERGİSİ
Mehmet Akif Ersoy University
Journal of Economics and Administrative Sciences Faculty
ISSN: 2149-1658 Cilt: 7 Sayı: 2 s.326-353
Volume: 7 Issue: 2 p.353-353
Temmuz 2020 July
EXAMINATIONS OF IMPACTS OF EMPOWERING LEADERSHIP ON INNOVATION
ACTIVITIES IN SERVICE SECTOR AND EMPLOYEES
GÜÇLENDİRİCİ LİDERLİĞİN, HİZMET SEKTÖRÜNDEKİ YENİLİK FAALİYETLERİNE
VE ÇALIŞANLARA ETKİLERİNİN İNCELENMESİ
Zafer ADIGÜZEL1, Yeliz CAYAN2
1. Asst. Prof. Dr., Istanbul Medipol University,
[email protected], https://orcid.org/0000-0001-8743-356X
2. Bahcesehir University,
[email protected], https://orcid.org/0000-0002-7393-2808
Makale Türü Article Type
Araştırma Makalesi Research Article
Başvuru Tarihi Application Date
18.07.2019 07.18.2019
Yayına Kabul Tarihi Admission Date
02.05.2020 05.02.2020
DOI
https://doi.org/10.30798/makuiibf.593901
Abstract
The organizations in service sector in intense competition environment fall behind as a
result of not showing performance in desired level and have to leave from the sector. In
terms of leadership styles, it is necessary to manage the satisfaction and team management with the right understanding in the superior-subordinate relationship
hierarchy of the organizations. By managing and guiding employees correctly,
organizations can achieve their goals that they set. The research model examines how institutions in the service sector affect employees and innovation through the
empowering influence of leadership. When the findings are analyzed, it was found that
empowering leadership and proactive personality variables had positive effects on career satisfaction, innovation and creativity activities. Within the scope of the study,
survey were conducted with 483 white-collar employees (administrative personnel) who
work in the service sector (banking sector). SPSS 25 Program was used to make analysis. Since there were 5-point Likert-scale questions in the study, factor analysis
was conducted. After factor analysis, reliability analysis, correlation analysis, regression
analysis, and sobel test and hayes process were made for the analysis of mediation variable effect.
Keywords: Proactive Personality, Service Innovation, Career Satisfaction,
Empowering Leadership, Team Creativity,
Öz
Yoğun rekabet ortamında hizmet sektöründe bulunan kurumlar istenilen seviyede
performans sergileyememeleri sonucunda yarışta geriye düşmekte ve sektörden çıkmak zorunda kalmaktadırlar. Özellikle liderlik açısından örgütlerin ast-üst hiyerarşisinde
memnuniyet ve ekip yönetiminin doğru bir anlayışla yönetilmesi gerekmektedir.
Çalışanların doğru yönetilmesi ve yönlendirilmesiyle, örgütler belirledikleri hedeflere ulaşmaları mümkün olabilmektedir. Hizmet sektöründe bulunan kurumların, liderliğin
güçlendirici etkisiyle çalışanları ve yeniliği nasıl etkilediği araştırma modeli
kapsamında incelenmektedir. Elde edilen bulgular analiz edildiğinde, Güçlendirici liderlik ve proaktif kişilik değişkenlerinin, kariyer memnuniyetine, takım yaratıcılığına
ve yenilik faaliyetlerine olumlu yönde etkisinin olduğu tespit edilmiştir. Araştırmanın
amacı kapsamında hizmet sektöründe (bankacılık sektöründe) bulunan 483 beyaz yakalı (idari personel)’dan veriler toplanmıştır. SPSS 25 Programı kullanılarak Analizler
yapılmıştır. Anket çalışmasında 5’li Likert ölçekli sorular olduğu için faktör analizi
yapılmış, faktör analizinden sonra güvenirlilik analizi, korelasyon analizi, regresyon
analizi, ve aracı değişken etkisi için sobel testi ve hayes process yapılmıştır.
Anahtar Kelimeler: Proaktif Kişilik, Hizmet Yeniliği, Kariyer Memnuniyeti,
Güçlendirici Liderlik, Takım Yaratıcılığı,

Examining Of The Effect Of Empowering Leadership And Proactive Personality On Service Innovation, Career Satisfaction And Team Creativity – Güçlendirici
Liderliğin, Hizmet Sektöründeki Yenilik Faaliyetlerine Ve Çalışanlara Etkilerinin İncelenmesi
Zafer ADIGÜZEL, Yeliz CAYAN
327
GENİŞLETİLMİŞ ÖZET
Çalışmanın Amacı
Liderliğin karar vermede yüksek özerkliğe ve yetki gücüne odaklanmasına yol açmasından
dolayı görev belirsizliğini artırabileceği ve dolayısıyla performansın düşmesine neden olabileceği öne
sürülmektedir (Martin et al., 2013). Bununla birlikte örgütlerde başarı unsuru olarak liderlik tarzlarının
haricinde, aynı zamanda çalışanların sahip olduğu proaktif kişilik yapısında, yaşanılan sorunlar
karşısında yaptıkları işin kalitesini ve yaptıkları işte ne ölçüde destek gördüklerine ilişkin kendi
algılarının ve kendi inançlarının bulunduğuna dikkat çekilmektedir (Liang & Gong, 2013). Çalışmada,
güçlendirici liderlik ve proaktif kişilik özelliklerinin hizmet sektöründe bulunan firmaların sundukları
yeniliğe etkilerinin incelenmesiyle birlikte, bu yeniliğin gerçekleşmesinde önemli rol olan takım
yaratıcılığı ve çalışanların kariyer memnuniyeti değişkenleri üzerindeki etkileri incelenmektedir.
Araştırma Soruları
Bu araştırmada, bankacılık sektöründe faaliyet gösteren firmalarda çalışan beyaz yakalılar
üzerinde; güçlendirici liderlik ve proaktif kişilik değişkenlerinin; hizmet yeniliği, takım yaratıcılığı ve
kariyer değişkenleri üzerindeki etkilerini analiz etmek amacıyla önerilen hipotezler test edilmiştir.
Bulgular
Güçlendirici liderlik bağımsız değişkeninin ve proaktif kişilik aracı değişkeninin, bağımlı
değişkenler; takım yaratıcılığı, hizmet yeniliği ve kariyer memnuniyeti arasında pozitif yönde anlamlı
ilişki olduğu görülmektedir. Değişkenler arasında olumlu yöndeki bu ilişki aralarındaki ilişkinin
önemini ortaya koymaktadır. Bağımsız değişkenin, bağımlı değişkenler üzerindeki etkisinin ölçüldüğü
regresyon analizler sonucunda, hipotezler desteklenmiştir. Regresyon analizi sonucunda değişkenler
arasındaki ilişkiler istatistiksel olarak anlamlıdır. Proaktif kişilik aracı değişken etkisinin ölçüldüğü
araştırma modelimizde, proaktif kişilik aracı değişken etkisi olarak güçlendirici liderlik ile hizmet
yeniliği, kariyer memnuniyeti ve takım yaratıcılığı arasındaki ilişkide etkisinin olduğu analizler
sonucunda ortaya çıkmıştır.
Yöntem
Araştırmanın amacı kapsamında bankacılık sektöründe bulunan 483 beyaz yakalı çalışan (idari
personel) ile anket çalışması yürütülmüştür. Toplanan verilerin analizinde; SPSS 25 Programı
kullanılmıştır. Faktör analizi ve güvenirlilik analizlerinden sonra, korelasyon analizi, regresyon analizi
ve aracı değişken analizi için sobel testi ve hayes process yapılmıştır. Anket soruları beş değişkeni temsil
eden sorulardan oluşmaktadır. Güçlendirici Liderlik Ölçeğinde; Ahearne ve arkadaşları (2005)
(Güvernirlilik değeri 0.87’dir) ve Arnold ve arkadaşlarının (2000) (Güvernirlilik değeri 0.88’dir) yapmış
olduğu çalışmadaki sorulardan faydalanılmıştır. Bateman ve Crant'ın (1993) ve Seibert ve arkadaşlarının
(1999) (Güvenirlilik değeri 0.87’dir) yapmış olduğu çalışmalardaki proaktif kişilik ölçeğinden
faydalanılmıştır. Tierney ve Farmer’ın 2002 yılında yapmış olduğu araştırmadaki Takım Yaratıcılığı
ölçeğinden faydalanılmıştır. Swink’in 2003 yılında yapmış olduğu araştırmadaki hizmet yeniliği

Mehmet Akif Ersoy İktisadi ve İdari Bilimler Fakültesi Dergisi - Mehmet Akif Ersoy University Journal of Economics and Administrative Sciences Faculty
Cilt:7 Sayı:2 s.326-353 Volume:7 Issue:1 p.326-353
Temmuz 2020 July
328
ölçeğindeki sorular kullanılmıştır. Greenhaus ve arkadaşları’nın 1990 yılında (Güvenirlilik değeri
0.84’dür) yapmış oldukları çalışmadaki kariyer memnuniyeti ölçeğindeki sorulardan faydalanılmıştır.
Sonuç ve Değerlendirme
Yapılan araştırmalarda çalışan performansını olumlu yönde etkilemede güçlendirici liderliğin
belirgin bir rolünün olduğu kabul edilmektedir. Yapılan bazı araştırmalarda, çalışan çıktılarıyla
liderliğin güçlendirici etkisi arasında karmaşık sonuçların olduğu vurgulanmaktayken (Ahearne et al.,
2005; Fineman, 2006), Zhan ve Bartol’un 2010 yılında yapmış olduğu çalışmada, Çalışanların
yaratıcılığı ve liderliğin güçlendirici etkisi arasında olumlu yönde bir ilişki olduğu savunulmaktadır.
Güçlendirici liderliğin, proaktif kişilik yapısına sahip çalışanlarda ve özellikle yaratıcılığa yatkınlığı
olmayan çalışanlarda yaratıcı faaliyetleri arttırmada etkili olabileceği önerilmektedir. Yoğun çalışma
ortamlarında, liderlik tarzının, çalışanların tutumlarını, motivasyonlarını ve davranışlarını olumlu yönde
etkiliyebilmesi için pozitif bir liderlik tarzının olması gerekmektedir. Bu nedenle güçlendirici liderlik
tarzı, yoğun çalışma ortamında, örgüt içinde olumlu bir iklim yaratacak özelliğe sahiptir. Bu özellik,
örgütlerin bulundukları sektörlerde rekabetçi pozisyonları elde etmede ve sürdürmede avantajlar
sağlayabilir. Güçlendirici liderliğin olduğu örgütlerde, çalışanlar, biçimsel çalışma rollerinin ötesinde
davranışlar sergilerler, anlamlı ve bağımsız olarak çalışma eğilimindedirler (Martin et al., 2013).
Araştırma modeli kapsamında elde edilen analiz bulgularıda bu yöndedir. Aynı zamanda, bazı
çalışmalar, bazı astların çalışma çıktıları üzerinde güçlendirici liderliğin olumlu etkilerini
göstermektedir (Seibert et al., 2011).Araştırma modelinde, değişkenler arasındaki ilişkilere
bakıldığında, örgütlerin sahip olduğu en önemli özelliklerin lider-çalışanlar arasındaki uyumun
olmasında yattığı görülmektedir. Lider-çalışanlar arasındaki ilişkiler pozitif yönde olduğu müddetçe,
örgütsel performansında olumlu yönde ilerlediği savunabilmektedir. Örnek kitlemizde bulunan
çalışanların, bulundukları kurumlarda pozitif yönde ilişkinin olduğu görülmektedir. Hizmet sektöründe
yapılan araştırma sonucunda, takım yaratıcılığına ve hizmet yeniliğine, güçlendirici liderlik ve proaktif
kişilik yapısının olumlu yönde etkilediğini görebilmekteyiz. Bununla birlikte kariyer memnuniyeti
açısından çalışanların sahip oldukları proaktif kişilik yapısıyla birlikte örgütde daha çok başarılı
oldukları ve güçlendirici liderlik tarzınında kariyer memnuniyeti açısından çalışanların kendilerini
geliştirebilmeleri ve başarılı olmalarında önemli bir liderlik tarzı olduğu sonucuna varabilmekteyiz.

Examining Of The Effect Of Empowering Leadership And Proactive Personality On Service Innovation, Career Satisfaction And Team Creativity – Güçlendirici
Liderliğin, Hizmet Sektöründeki Yenilik Faaliyetlerine Ve Çalışanlara Etkilerinin İncelenmesi
Zafer ADIGÜZEL, Yeliz CAYAN
329
1. INTRODUCTION
Empowering leaders adopt a high-participation management approach by granting authority and
responsibility to their employees (Leach et al., 2003). Conceptually, empowerment leadership has a
broad definition, because it involves more than making employees participate in the decision-making
process. This leadership style consists of the ability to give its subordinates a strong feeling of self-
determination, trust, goal setting and self-confidence (Konczak et al., 2000). Empowering leadership
creates intrinsic motivation in employee behavior and thus, positive results such as job satisfaction,
participation, creativity, job performance and extra role behaviors can be obtained (Humborstad et al.,
2014). However, some studies do not have positive results about empowering leadership. It is suggested
that leadership can increase the ambiguity of the task due to its focus on high autonomy and power of
authority in decision-making, and thus decrease performance (Martin et al., 2013). However, apart from
their leadership style as an element of success in organizations, it is also pointed out that the Proactive
personality structure of employees also has their own perceptions and beliefs as response to how well
they do the job and how much support they receive in the job they do (Liang and Gong, 2013).
Employees must be able to use their talents to engage in creative activities. In this, employees need to
be supported by the management in their organizations. Employees with proactive personality traits can
fulfill their responsibilities when they receive positive support, as they have the ability to solve problems
and use resources most effectively (Fuller et al., 2006). Employees with a proactive personality structure
can positively effect the individual creativity of their colleagues as an important member of the team for
jobs in team spirit. Therefore, the individual creativity of the employees is the building block for team
creativity (Drazin et al., 1999). Gong et al. (2013) state that Empowering leadership has an important
feature that promotes and supports creativity in the team and encourage a creative culture. According to
Schumpeter (1934), innovation is a radical activity that creates a new object. It is also a source of
competitive advantage and survival for companies (Merrilees et al., 2011). Salunke et al. (2013)
discussed service innovation from interactive and supportive perspectives and it is explained that an
interactive innovation among employees within the organization is the place where value creation is
started in service concept and design. Supportive innovation is defined as supporting the new value
proposition developed within the organization. These conceptualizations show that service innovation
turns around process and service. In this respect, Gadrey et al. (1995) classified service innovation as
innovations in processes. In this study, the effects of empowering leadership and proactive personality
traits on the innovation offered by the firms in the service sector are examined, and the effects on team
creativity and career satisfaction variables that play an important role in realizing this innovation are
examined.

Mehmet Akif Ersoy İktisadi ve İdari Bilimler Fakültesi Dergisi - Mehmet Akif Ersoy University Journal of Economics and Administrative Sciences Faculty
Cilt:7 Sayı:2 s.326-353 Volume:7 Issue:1 p.326-353
Temmuz 2020 July
330
2. LITERATURE REVIEEW
2.1. Empowering Leadership
Empowering leadership is defined as leadership behavior that includes giving employees
authority, self-management and decision-making of them, coaching and sharing information with them
(Sharma and Kirkman, 2015). For many organizations, the creation of conditions enabling the
psychological empowerment of employees is considered important for success. The meaning of the
empowering effect of leaders on employees; Reducing procedures by trusting employees' abilities means
taking positive responsibilities and providing feedback to employees (Zhang and Bartol, 2010). In the
literature, when the researches about employee creativity are examined, an approach that assumes that
the creativity activity emerges as a result of the interactions of the characteristics of employees is
adopted (Woodman et al., 1993). An important factor that enables this creativity to emerge in existing
organizations is empowering leadership (Fineman, 2006). This emphasis has led to an effort to
understand how empowering leadership improves the creativity of employees. In the world where the
uncertainty and complexity for the future increases with the increasing competition in the service sector,
empowering leadership is effective in organizations that have the potential to increase creativity. There
are both opportunities and challenges for employees to demonstrate their creativity in being beneficial
to organizations (Zhang and Bartol, 2014). However, in order for empowering leadership to be effective
on employees, employees must also rely on their own abilities (Ahearne et al., 2005).
To effectively promote the creativity of employees, leaders need to be aware of the individual
differences between employees. At the same time, there is a need for both sectoral and cultural evidence
about how they influence and empower employees (Forrester, 2000). The interactive perspective of
creativity shows that employees avoid uncertainty about trust in leaders and empowering leadership is
critical to encourage creativity (Fineman, 2006). Leadership has an important effect on employees'
engagement in creative activities (Tierney, 2008). Employees must rely on the leaders decisions and
support in order to manage the risks and uncertainties they face (Rousseau et al., 1998). When employees
have confidence based on the influence of their leaders, they are more likely to feel truly empowered by
their leaders. With the trust of employees in their leaders, creativity activities begin to increase and
uncertainty environment begins to decrease. If there is no trust in organizations, that is, when leaders
cannot create trust, creativity may begin to decrease in case of high uncertainty avoidance. When
considered together, our aim in this research is to investigate how proactive staffing variables in
empowering leadership and mediating role are affected by service innovation, team creativity, and career
satisfaction.
2.2. Proactive Personality
Proactive personality is the pioneer of encouraging constructive change (Gong et al., 2012) and
individual creativity (Fuller and Marler, 2009). Although there are studies in the literature about the
positive effects of proactive personality structure, it is emphasized that more studies should be done on

Examining Of The Effect Of Empowering Leadership And Proactive Personality On Service Innovation, Career Satisfaction And Team Creativity – Güçlendirici
Liderliğin, Hizmet Sektöründeki Yenilik Faaliyetlerine Ve Çalışanlara Etkilerinin İncelenmesi
Zafer ADIGÜZEL, Yeliz CAYAN
331
the effects of both creativity and changes (Bateman and Crant, 1993). Barrick and Mount (2005)
suggested that “the basic tools that affect behaviors in the working environment are expected to be
realized in a positive way with motivation”. Although some studies in the literature examined the
mediation variable effect of proactive personality in order to evaluate the importance of trust and
knowledge variables (Fuller and Marler, 2009), they have ignored the process of motivation of proactive
personality into creativity. Individuals tend to exhibit proactive behaviors after a conscious decision-
making process (Bindl et al., 2012). In other words, proactive behaviors should be supported and
strengthened by leaders in order to have positive developments in employees' individual behaviors.
When its importance is considered, there are few studies with proactive personality structure that
examine employee outcomes in explaining the relationship between proactive personality and proactive
behaviors (Crant, 2000; Li et al., 2010).
Proactive employees are change-oriented, predicting the consequences that may occur and take
action to make constructive changes (Gong et al., 2012). Therefore, the responsibility of change
emerges, which is defined as the belief that the individual makes it mandatory (Choi, 2007). However,
it should be noted that having a proactive personality structure can be risky. Employees need to consider
possible outcomes and consider the next step before engaging in proactive behavior (Grant and Ashford,
2008). It is stated that proactive behaviors and perceptions of employees are encouraged in case of
leadership style which has positive effects in organizations (Raub and Liao, 2012). Therefore, it can be
explained that developmental feedback positively affects the proactive personality relationship and
makes employees feel the responsibility of the change. This study analyzes the effects of both
independent and mediation variable effect of proactive personality on team creativity, service innovation
and career satisfaction.
2.3. Team Creativity
As a result of the ability of employees or teams to produce new and useful ideas, successful
implementation by organizations is called creativity (Gumusluoglu and Ilsev, 2009). The creativity
feature may not be available to all individuals because creativity occurs when individuals use their skills
(Shalley et al., 2004). Therefore, when the concept of team creativity cannot be used in organizations,
it emerges as a problem. In order for organizations to give importance to the concept of team creativity,
individuals should be able to use their talents and creativity together (Shalley and Gilson, 2004).
Because, if organizations cannot bring together the employees and create an atmosphere of team
creativity, it may not be possible to come up with new and useful ideas. Moreover, this situation may
prevent the development of new products and / or services (Klijn and Tomic, 2010). The discovery of a
product / service does not have to be new to the world, however, it is stated that it should add potential
value to an organization and its applicability (Zhou and Ren, 2012). An important step in team creativity
activities is the value given to the organization.
As a result of environmental impacts, organizational structures are open to continuous
development and change, employees to be active in creativity (Shalley et al., 2004). Employees who

Mehmet Akif Ersoy İktisadi ve İdari Bilimler Fakültesi Dergisi - Mehmet Akif Ersoy University Journal of Economics and Administrative Sciences Faculty
Cilt:7 Sayı:2 s.326-353 Volume:7 Issue:1 p.326-353
Temmuz 2020 July
332
will provide the organization with a competitive advantage and ultimately contribute to their survival
will fully support these creative activities. Therefore, it has become a driving force in organizations in
terms of the importance of creativity and its effects on team creativity (Anderson et al., 2004). A study
by Scott and Bruce in 1994 argues that leadership styles influence creativity; in other words, when
leaders lead their employees to develop their creativity skills, they play an important role in team
creativity in terms of their knowledge and skills. This type of behavior of leaders increases productivity
and innovative behaviors (Owens and Hekman, 2012). If leaders ensure that creativity activities are
shared by all employees within the organization, alternative perspectives are developed and employees
are included in the decision-making process positive feedback can be obtained in team creativity
activities (Amabile et al., 2004). For this purpose, the effects of empowering leadership and proactive
personality on team creativity are examined within the framework of the model of research.
2.4. Service Innovation
In the service sector, where intense competition is experienced, the innovation approach of the
institutions is effective both in competition and in terms of economic growth (Chesbrough, 2010). In
the study of Chesbrough (2003), the need for institutions to innovation; not being behind the
technological developments, argues that it comes from the idea of evaluating both environmental
changes and internal factors. Service innovation according to a different perspective; is to gain benefits
by developing new business models and making improvements in process management (Enz, 2012). In
this regard, meeting the demands and needs of stakeholders with the innovation of service, gaining new
customers constantly, and gaining competitive advantage with innovations are considered as important
factors (West and Bogers, 2014). In the study by Chesbrough et al. (2006), they talked about the
importance of innovation in the service sector and why they should use the information capital used in
the field of innovation (Kelleher et al., 2012). The transfer of information gained through innovation
and changes to innovation can bring a competitive advantage to institutions. Service innovation is
important to provide benefits to organizations that implement and develop them, to keep the organization
in a dynamic structure and to gain an important advantage in the competitive environment (Toivonen
and Tuominen, 2009).
Similarly, In order to be successful in the competitive environment by offering value to
stakeholders, organizations need to consider service innovation both in process management and in the
successful implementation of business models (Ostrom et al., 2010). Service innovation is described as
a complex process consisting of four stages proposed by Edvardsson and Olsson (1996); These are the
idea generation phase, the project creation phase of planning to turn thought into reality, the design
phase and implementation phase of the new service. These four stages are consistent with Sundbo's
(2008) study, which provides a three-stage model for service innovation; The first stage is involvement
of actors in service innovation is the stage of developing the idea of service innovation and the third
stage is the service is the stage of the market. De Jong et al. (2003) state that successful innovation
practice in service organizations should be initiated as idea generation, evaluation, development, testing

Examining Of The Effect Of Empowering Leadership And Proactive Personality On Service Innovation, Career Satisfaction And Team Creativity – Güçlendirici
Liderliğin, Hizmet Sektöründeki Yenilik Faaliyetlerine Ve Çalışanlara Etkilerinin İncelenmesi
Zafer ADIGÜZEL, Yeliz CAYAN
333
and basic activities. To some extent, researchers recommend that service innovation development phases
overlap, while others are discussing a more sequential model (Gebauer et al., 2008). In this direction,
service innovation is accepted as an organizational mechanism capable of bringing together and
mobilizing new and existing resources (Yen et al., 2012). Within the framework of the research model,
the effects of empowering leadership and proactive personality structure of the employees on service
innovation are analyzed with the findings.
2.5. Career
Career opportunities (preferment, promotion) affect job satisfaction intensively. As a result of
the research, it is revealed that the job satisfaction is low and promotion absenteeism of employees who
believe that they deserve to be promoted (Savery, 1996; Orpen, 1994). Therefore, organizations need to
introduce policies and practices to improve individual career effectiveness of employees. In addition to
increasing the material income obtained from the job done, promotion raises the social status of the
employees and positively changes their place in the society. If the employees of each level has the
opportunity to promote when they are successful, their satisfaction will increase. If all promotion levels
in the organization are full, even if the employees succeed, job satisfaction will start to decrease when
they cannot find an opportunity to promote (Erdoğan, 1996). Promotion is the assignment of the
employee to a higher position, and thus to a more difficult duty. As the employees climb the career
ladder, their duties and responsibilities will increase. In other words, employees will begin to gain
experience in every new task and responsibility they take. In this way, employees will want to work
with new authority and responsibility whenever they gain experience. Employees whose progression
and promotion paths are blocked will decrease their efforts and pleasure. In short, promotion decisions
are reward decisions with financial and psychological awards. These decisions are vital decisions for
the future of the employee, and promotion above all indicates the success of the personnel.
The availability of promotion opportunities affects employee behavior, and as the higher the
self-improvement, the more self-confidence of the personnel (Boies and Rothstein, 2002). Promotion is
a psychological reward because it provides both strong prestige and opportunity to those who want to
have more voice in matters concerning them. The promotion which means more important work, more
responsibility and higher social respectability, increases the job satisfaction level of personnel.
Especially because there is an increase in wages in promotions at the manager level, job satisfaction is
higher in managers than in employees (Luthans, 1973). The social status achieved as a result of the
promotion, higher responsibility and higher salary increase is a situation that managers want to achieve.
As promotion is a rare occurrence, it increases job satisfaction further. Employees' career options,
decisions to move from one job to another, ability to see their future and make specific career choices
affect their reactions to their work. Meeting career expectations contributes to low labor turnover, high
satisfaction and commitment. Therefore, the needs of individuals within the organization need to be well
understood (Igbaria et al., 1999). Within this framework, it is aimed to make analyzes based on the

Mehmet Akif Ersoy İktisadi ve İdari Bilimler Fakültesi Dergisi - Mehmet Akif Ersoy University Journal of Economics and Administrative Sciences Faculty
Cilt:7 Sayı:2 s.326-353 Volume:7 Issue:1 p.326-353
Temmuz 2020 July
334
findings obtained in terms of the effects of proactive personality structure and career style on career
satisfaction.
2.6. Relations Between Variables
The empowering leadership and service innovation relationship is vital for organizations in the
service industry, where competition is intense and highly volatile. Because the organization has to create
the psychological infrastructure necessary for the employees to be innovative. In other words, in order
for the employees to exhibit innovative behaviors, they need to provide them with a movement area
(Amabile et al., 2004).
Employees with proactive personality; They work more actively by taking authority and
responsibility, by adopting the work they do, by making sense of the work, by trusting themselves, by
feeling competent in the work they do. With the contribution of leadership in the positive direction,
proactive employees who are psychologically stronger contribute more to the organization in terms of
innovation (Slåtten et al., 2011).
Empowering leaders encourage employees to contribute to improving their business processes
by ensuring that they take responsibility for their work. Leaders who can meet these conditions
contribute to the emergence of team creativity features in environments where employees are together
(Zhang & Bartol, 2010). Empowering leaders have a positive effect on providing career satisfaction for
employees by supporting training and development programs for continuous improvement in the
organization (Greco et al., 2006).
The ability of leaders to meet the expectations of the employees is of great importance in
increasing the performance of the employees and establishing positive relationships with the employees
(Chang & Chiang, 2007).
In Kanter's (1988) study, the characteristics of proactive individuals; He states as “anticipating
future opportunities and threats, making constructive and profitable decisions in this direction,
defending the ideas that are true or believed, and benefiting from the ideas and suggestions of his
friends”. Therefore, proactivity; It can be explained that it has a positive effect on innovative behavior,
creativity and performance.
Parker and Collins (2010) state that proactive individuals participate positively and statistically
in improvement efforts within the company. Based on these, it can be explained that proactive
personality causes innovative behavior (Seibert et al., 2001).
In evaluating the contribution of proactivity to performance; It is explained that the best
performers in the realization of the goals of the business and the organization are the employees with a
proactive personality structure (Thomas et al., 2010).

Examining Of The Effect Of Empowering Leadership And Proactive Personality On Service Innovation, Career Satisfaction And Team Creativity – Güçlendirici
Liderliğin, Hizmet Sektöründeki Yenilik Faaliyetlerine Ve Çalışanlara Etkilerinin İncelenmesi
Zafer ADIGÜZEL, Yeliz CAYAN
335
3. METHODOLOGY
Within the scope of the study, survey were conducted with 483 white-collar employees
(administrative personnel) who work in the banking sector. SPSS 25 Program was used to analyze the
data. In addition, sobel test and hayes process were performed in mediation variable analysis.
The sample of the research was determined by "easy sampling" and therefore public and private
bank employees operating in the marmara region were sampled. A questionnaire was sent online to all
administrative staff determined for the purpose of the research and 497 returns were provided. The data
of 14 participants who were not filled in as desired in the answers given were not included in the analysis
and 483 questionnaires were processed. Since this 483 unit sample has a sufficient sample size for
analysis, the data has been analyzed. It was tested whether there was a difference between the answers
given by the public and private sector participants and the data could be combined since there was no
significant difference between the answers given at the level of 0.05 significance. In fact, if there was a
difference between the answers given by the public and private sector employees, the model could be
analyzed in two stages with these conditions. The absence of discrepancy was made to make the data
stronger by combining it.
The survey questions consists of questions represent five variables. The questions developed by
Aheame et al. (2005) and Arnold et.al (2000) (Cronbach's alpha value is 0.87 in the current study)
(Cronbach's alpha value is 0.88 in the current study) were used in empowering leadership scale. In the
proactive personality scale, the questions developed by Bateman and Crant (1993) and Seibert et al.
(1999) (Cronbach's alpha value is 0.87 in the current study) were used. In team creativity scale, the
questions in study of Tierney and Farmer in 2002 were used. In service innovation scale, questions
developed by Swink (2003) were used. In the career satisfaction scale, questions developed by
Greenhaus et al. (1990) (Cronbach alpha value is 0.84 in the present study) were used.
3.1. Research Aim
In this research, we aim to determine the effects of empowering leadership and proactive
personality variables on service innovation, team creativity and career variables on white collar
employees working in service sector. The selection of the service sector is the more specific proactive
personality and service innovation activities. The reason why the sample group is selected from white-
collar employees is that they have a role in proactivity, creativity and innovation. Therefore, our research
objective is to evaluate and analyze service companies both for leadership and employees. To test the
propositions, a field survey was conducted using the survey.
3.2. Findings
The survey was conducted with total of 483 employees from Public (232) and Private Sector
(251) in the Marmara Region. 223 female and 260 male white-collars answered to our survey. 8.7% (42
Participants) of the participants had Vocational School/Associate Degree, 67.5% (326 Participants) of
them had Bachelor, 23.8% of them had (115 Participants) Graduate Degrees. Areas of activity of the

Mehmet Akif Ersoy İktisadi ve İdari Bilimler Fakültesi Dergisi - Mehmet Akif Ersoy University Journal of Economics and Administrative Sciences Faculty
Cilt:7 Sayı:2 s.326-353 Volume:7 Issue:1 p.326-353
Temmuz 2020 July
336
institutions where the participants work are, 122 participants work in the “National”, 223 participants
work in the “Regional” and, 138 participants work in the “International” activities. In terms of the level
of achieving the goals they set in their professional careers; it is stated that 52 Employees “Very Low”;
55 Employees “Low”; 168 Employees “Moderate”; 146 Employees “High”; 62 employees “Very High”.
3.3. Research Framework
In the research model determined as a result of literature research, independent variable is
empowering leadership, mediation variable is proactive personality, dependent variables are service
innovation, team creativity and career was applied. In the research, since the quantitative approach is
adopted as a statistical method, the data obtained are analyzed. The analyzes were made according to
the relationships between the variables in the research model (Thomas et al., 2015).
Figure 1. Research Model
Hypotheses;
H1: Empowering leadership in organizations has an impact on proactive personality.
H2: Empowering leadership in organizations has an impact on service innovation.
H3: Empowering leadership in organizations has an impact on career satisfaction.
H4: Empowering leadership in organizations has an impact on team creativity.
H5: Proactive personality in organizations has effect on service innovation.
H6: Proactive personality in organizations has effect on career satisfaction.
H7: Proactive personality in organizations has effect on team creativity.
H8: In organizations, the relationship between empowerment leadership and service innovation has a
medaiton variable effect of proactive personality.
Ser
vice
Innovation
H
Emp
owering
Leadership
Ca
reer
Satisfaction
Pr
oactive
Personality
Te
am
Creativity

Examining Of The Effect Of Empowering Leadership And Proactive Personality On Service Innovation, Career Satisfaction And Team Creativity – Güçlendirici
Liderliğin, Hizmet Sektöründeki Yenilik Faaliyetlerine Ve Çalışanlara Etkilerinin İncelenmesi
Zafer ADIGÜZEL, Yeliz CAYAN
337
H9: In organizations, the relationship between empowering leadership and career satisfaction has a
mediation variable effect of proactive personality.
H10: In organizations, the relationship between empowering leadership and team creativity has a
mediation variable effect of proactive personality.
4. ANALYSES
Factor Analysis is used to provide clues about the structure of the relationship between many
variables which are thought to be related (İslamoğlu, 2011). Three methods are used to determine
whether the data set is suitable for factor analysis. These are the formation of correlation matrix, Bartlett
test and Kaiser-Meyer-Olkin (KMO) tests (Ural and Kılıç, 2013). If KMO test sample size is 0.7-0.8
good, 0.5-0.7 medium and should be at least 0.5, if less than 0.5, more data should be collected. Since
KMO value; 0.921, exceeds 0.50 and Bartlett's test Sig. value is significant 0.000, the data set was found
suitable for factor analysis.
In our study, the variables prepared according to the 5-point Likert scale were measured with a
32-question survey. Variables, were subjected to factor analysis of proactive personality, service
innovation, career satisfaction, empowering leadership, team creativity. As a result of factor analysis 8
questions do not show factor distribution, the remaining 24 questions are distributed to 5 factors:
Table 1. Rotated Component Matrixa
Rotated Component Matrixa
Component
1 2 3 4 5
PP16. I am very good at turning problems into opportunities. 0.834
PP15. I like to challenge the status quo. 0.810
PP14. If I believe in an idea, it can not prevent me. 0.774
PP13. I love being a champion for my ideas even for others'
opposition.
0.762
PP12. I tend to allow others to take the initiative to start new
projects.
0.741
PP11. I try to create a difference in my community and perhaps
in the world.
0.711
SI1. At the Institution where I work, we develop our current
services.
0.756
SI2. At the Institution where I work, we develop our new
services.
0.728
SI3. At the Institution where I work, we take the services of other
companies as examples to improve our new services.
0.646
SI4. At the institution where I work, our new services are
developed according to customer requirements.
0.597
CS4. I am pleased with my progress towards achieving my
development goals.
0.679
CS5. I am pleased with my progress in achieving my goals for
the development of new skills.
0.652
CS3. I am pleased with my progress towards achieving my
income goals.
0.580
CS1. I am pleased with the success of my career. 0.555
CS2. I am pleased with my progress towards achieving my
overall career goals.
0.507

Mehmet Akif Ersoy İktisadi ve İdari Bilimler Fakültesi Dergisi - Mehmet Akif Ersoy University Journal of Economics and Administrative Sciences Faculty
Cilt:7 Sayı:2 s.326-353 Volume:7 Issue:1 p.326-353
Temmuz 2020 July
338
EL3. My manager believes that I can undertake challenging
tasks.
0.783
EL1. My manager helps me understand how my goals relate to
the Company's.
0.781
EL2. My manager makes many decisions with me. 0.774
.
EL4. My agent makes me do my own way. 0.743
EL5. They listen my working group’s ideas and suggestions. 0.651
TC2. At the institution where I work, I think that I am good at
producing new ideas.
0.766
TC3. I think that I am a master at developing the ideas of others
at the institution where I work.
0.750
TC4. At the institution where I work, I am good at finding
creative ways to solve problems.
0.706
TC1. At the institution where I work, I am confident about my
ability to solve problems in a creative way.
0.659
Extraction Method: Principal Component Analysis.
Rotation Method: Varimax with Kaiser Normalization.
a. Rotation converged in 6 iterations.
PP: Proactive Personality, SI: Service Innovation, CS: Career Satisfaction, EL: Empowering Leadership, TC:
Team Creativity
Reliability analyses for reliability and validity of scale developed in order to determine whether
survey questions ensure integrity to explain or to query to a homogeneous structure and Cronbach alpha
value, reliability coefficient, must be greater than α=0,70 for social sciences (Hair et al., 2014; Nunnally
and Bernstein, 1994).
Table 2. Reliability Analysis
Variables Number of Questions Cronbach Alfa (α) Values
Empowering Leadership 5 .893
Proactive Personality 6 .915
Team Creativity 4 .832
Career Satisfaction 5 .857
Service Innovation 4 .838
When the reliability table was examined, it was found that the values of Cronbach's Alpha
Coefficient were highly reliable for all factors. Since the reliability coefficients are very high, there is
no need to cancel any survey questions.
Before regression analysis, corelation analysis is carried out to test the direction and strength of
the relationships among the variables in the research model (Kalaycı, 2006). It is carried out to explain
and interpret the relationships between variables statistically. The feature of the correlation analysis is
that there are values between -1 and +1 among the variables and analysis is made according to these
values.

Examining Of The Effect Of Empowering Leadership And Proactive Personality On Service Innovation, Career Satisfaction And Team Creativity – Güçlendirici
Liderliğin, Hizmet Sektöründeki Yenilik Faaliyetlerine Ve Çalışanlara Etkilerinin İncelenmesi
Zafer ADIGÜZEL, Yeliz CAYAN
339
Table 3. Correlations
Correlations
Proaktif
Personality
Empowering
Leadership
Service
Innovation
Career
Satisfaction
Team
Creativity
Proaktif
Personality
Pearson Correlation 1 ,587** ,498** ,514** ,464**
Sig. (2-tailed) 0,000 0,000 0,000 0,000
Sum of Squares and
Cross-products
301,830 174,132 136,820 139,187 120,342
Covariance 0,909 0,524 0,412 0,419 0,362
N 483 483 483 483 483
Empowering
Leadership
Pearson Correlation ,587** 1 ,570** ,488** ,486**
Sig. (2-tailed) 0,000 0,000 0,000 0,000
Sum of Squares and
Cross-products
174,132 291,996 154,052 130,084 123,875
Covariance 0,524 0,880 0,464 0,392 0,373
N 483 483 483 483 483
Service
Innovation
Pearson Correlation ,498** ,570** 1 ,702** ,597**
Sig. (2-tailed) 0,000 0,000 0,000 0,000
Sum of Squares and
Cross-products
136,820 154,052 250,291 173,065 140,802
Covariance 0,412 0,464 0,754 0,521 0,424
N 483 483 483 483 483
Career
Satisfaction
Pearson Correlation ,514** ,488** ,702** 1 ,696**
Sig. (2-tailed) 0,000 0,000 0,000 0,000
Sum of Squares and
Cross-products
139,187 130,084 173,065 242,873 161,777
Covariance 0,419 0,392 0,521 0,732 0,487
N 483 483 483 483 483
Team
Creativity
Pearson Correlation ,464** ,486** ,597** ,696** 1
Sig. (2-tailed) 0,000 0,000 0,000 0,000
Sum of Squares and
Cross-products
120,342 123,875 140,802 161,777 222,436
Covariance 0,362 0,373 0,424 0,487 0,670
N 483 483 483 483 483
**. Correlation is significant at the 0.01 level (2-tailed).
As a result of the correlation analysis, it can be explained that the relationships between the
variables are positive and they affect each other positively. After the correlation analysis, regression
analysis was performed to test and analyze the hypotheses. The regression analysis results showing the
effect of the independent variable on the dependent variable except for the mediation variable effect are
shown in table 4.

Mehmet Akif Ersoy İktisadi ve İdari Bilimler Fakültesi Dergisi - Mehmet Akif Ersoy University Journal of Economics and Administrative Sciences Faculty
Cilt:7 Sayı:2 s.326-353 Volume:7 Issue:1 p.326-353
Temmuz 2020 July
340
Table 4. Results of Regression Analysis of the Effect of Independent Variables (IV) on Dependent
Variables (DV)
IV DV Standart β Sig. Adjusted R2 F
Value
Empowering
Leadership
Proactive
Personality .587*** 000 .342 173.609
Empowering
Leadership Service Innovation .570*** 000 .323 159.169
Empowering
Leadership Career Satisfaction .488*** 000 .236 103.732
Empowering
Leadership Team Creativity .486*** 000 .234 102.393
Proactive
Personality Service Innovation .498*** 000 .246 109.039
Proactive
Personality Career Satisfaction .514*** 000 .262 118.897
Proactive
Personality Team Creativity .464*** 000 .213 91.037
*: p<0.05 **: p<0.01 ***:p<0.001
As a result of regression analysis, it is seen that effects of empowering leadership and proactive
personality variables are positive and significant by sig. values.
As can be seen in Table 4, as a result of the regression analysis, it can be explained that the
independent variables have a positive effect on the dependent variables. Table 5 describes whether
hypotheses are supported according to regression analysis results.
Table 5. Hypotheses Results
Hypotheses Supported /
Unsupported
Significance
Level (Sig.)
H1: Empowering leadership in organizations has an impact on
proactive personality.
Supported P<0.001
H2: Empowering leadership in organizations has an impact on
service innovation.
Supported P<0.001
H3: Empowering leadership in organizations has an impact on career
satisfaction.
Supported P<0.001
H4: Empowering leadership in organizations has an impact on team
creativity.
Supported P<0.001
H5: Proactive personality in organizations has effect on service
innovation.
Supported P<0.001
H6: Proactive personality in organizations has effect on career
satisfaction.
Supported P<0.001
H7: Proactive personality in organizations has effect on team
creativity.
Supported P<0.001
As a result of the hypothesis tests performed among the variables mentioned in research model,
apart from the effect of mediation variable, hypotheses were supported by regression analysis. The
relationships between the variables were statistically significant after regression analysis.
Mediation Variable Effect in Research Model: In research model, in order to determine the
effect of the mediation variable (MV), especially proactive personality has an mediation variable effect
on relationship between empowering leadership independent variable (IV) and team creativity, service

Examining Of The Effect Of Empowering Leadership And Proactive Personality On Service Innovation, Career Satisfaction And Team Creativity – Güçlendirici
Liderliğin, Hizmet Sektöründeki Yenilik Faaliyetlerine Ve Çalışanlara Etkilerinin İncelenmesi
Zafer ADIGÜZEL, Yeliz CAYAN
341
innovation, career satisfaction dependent variables (DV); whether it has effect on the hypothesis
established as a result of the analyzes.
Table 6. Results of Regression Analysis of Mediation Variable (MV) Effect
Regression IV DV Standart β Sig. Adjusted R2 F
Value
IV Empowering
Leadership Service
Innovation
.424*** .000 .323 159.169
MV Proactive
Personality .249*** .000 .362 95.046
IV Empowering
Leadership Career
Satisfaction
.285*** .000 .236 103.732
MV Proactive
Personality .347*** .000 .313 76.778
IV Empowering
Leadership Team
Creativity
.326*** .000 .234 102.393
MV Proactive
Personality .273*** .000 .281 65.863
*: p<0.05 **:p<0.01 ***:p<0.001
In order to explain the effect of the mediation variable, the variable between the independent
variable and the dependent variable must be a measured variable. One of the tests measuring the effect
of this mediation variable is the sobel (1982) test. Analyzing the effect of the mediation variable with
Sobel test is calculated using the uncorrected regression coefficients and standard error values of the
related variables. In 1995, MacKinnon, Warsi, and Dwyer spread statistical methods to evaluate the
effect of mediation variables. There are two main versions of the sobel test as Aroian (1944/1947) and
Goodman (1960).
Table 7. Mediation Variable (MV) Effect Analysis with Sobel Test
Independent
Variable
Empowering
Leadership Input: Test statistic: Std. Error: p-value:
a 0.458 Sobel test: 4.37286702 0.03093897 0.00001226
Mediation
Variable
Proactive
Personality b 0.333 Aroian test: 4.36180356 0.03101744 0.0000129
Dependent
Variable
Service
Innovation Sa 0.109 Goodman test: 4.3840151 0.0308603 0.00001165
Sb 0.029
Mediation variable; If the p value is less than <0.05,
we can explain that there is an effect between the variables
Independent
Variable
Empowering
Leadership Input: Test statistic: Std. Error: p-value:
a 0.458 Sobel test: 4.02083258 0.03127611 0.00005799
Mediation
Variable
Proactive
Personality b 0.381 Aroian test: 4.01046819 0.03135694 0.0000606
Dependent
Variable
Career
Satisfaction Sa 0.109 Goodman test: 4.03127774 0.03119507 0.00005547
Sb 0.034
Mediation variable; If the p value is less than <0.05,
we can explain that there is an effect between the variables.
Independent
Variable
Empowering
Leadership Input: Test statistic: Std. Error: p-value:
a 0.547 Sobel test: 4.50938201 0.03105969 0.0000065
Mediation
Variable
Proactive
Personality b 0.338 Aroian test: 4.49806134 0.03113786 0.00000686
Dependent
Variable
Team
Creativity Sa 0.039 Goodman test: 4.52078859 0.03098132 0.00000616
Sb 0.035
Mediation variable; If the p value is less than <0.05,
we can explain that there is an effect between the variables.
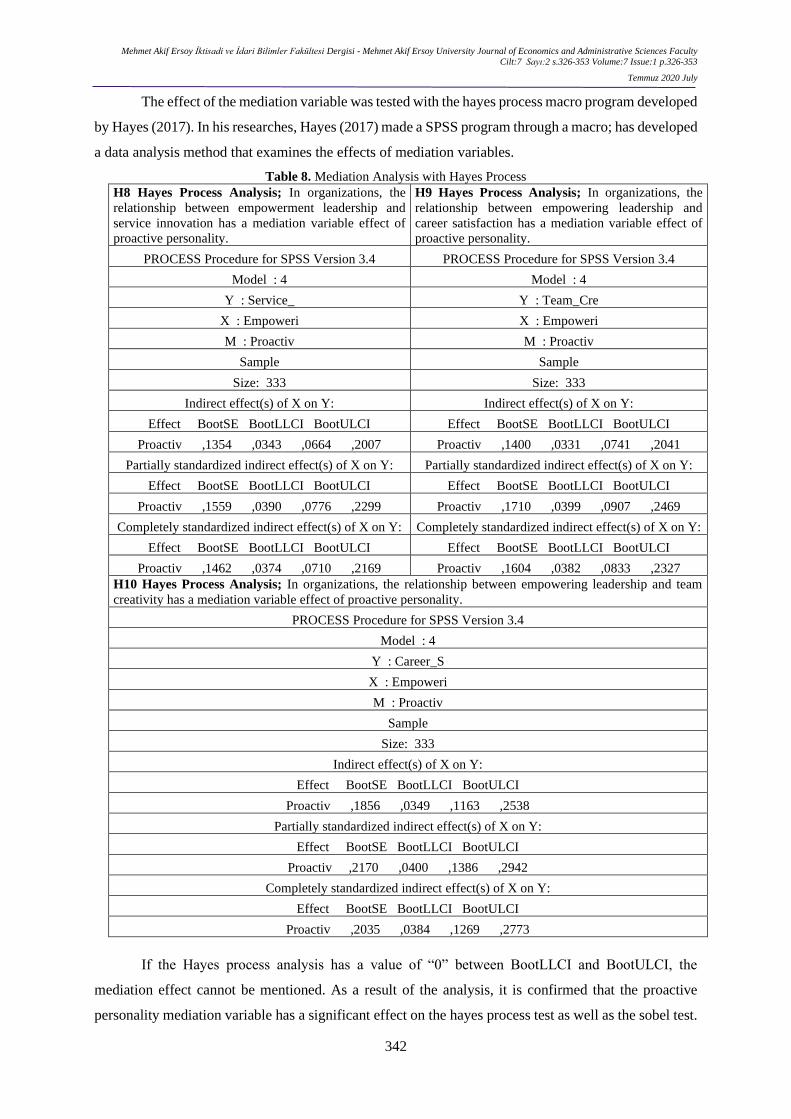
Mehmet Akif Ersoy İktisadi ve İdari Bilimler Fakültesi Dergisi - Mehmet Akif Ersoy University Journal of Economics and Administrative Sciences Faculty
Cilt:7 Sayı:2 s.326-353 Volume:7 Issue:1 p.326-353
Temmuz 2020 July
342
The effect of the mediation variable was tested with the hayes process macro program developed
by Hayes (2017). In his researches, Hayes (2017) made a SPSS program through a macro; has developed
a data analysis method that examines the effects of mediation variables.
Table 8. Mediation Analysis with Hayes Process
H8 Hayes Process Analysis; In organizations, the
relationship between empowerment leadership and
service innovation has a mediation variable effect of
proactive personality.
H9 Hayes Process Analysis; In organizations, the
relationship between empowering leadership and
career satisfaction has a mediation variable effect of
proactive personality.
PROCESS Procedure for SPSS Version 3.4 PROCESS Procedure for SPSS Version 3.4
Model : 4 Model : 4
Y : Service_ Y : Team_Cre
X : Empoweri X : Empoweri
M : Proactiv M : Proactiv
Sample Sample
Size: 333 Size: 333
Indirect effect(s) of X on Y: Indirect effect(s) of X on Y:
Effect BootSE BootLLCI BootULCI Effect BootSE BootLLCI BootULCI
Proactiv ,1354 ,0343 ,0664 ,2007 Proactiv ,1400 ,0331 ,0741 ,2041
Partially standardized indirect effect(s) of X on Y: Partially standardized indirect effect(s) of X on Y:
Effect BootSE BootLLCI BootULCI Effect BootSE BootLLCI BootULCI
Proactiv ,1559 ,0390 ,0776 ,2299 Proactiv ,1710 ,0399 ,0907 ,2469
Completely standardized indirect effect(s) of X on Y: Completely standardized indirect effect(s) of X on Y:
Effect BootSE BootLLCI BootULCI Effect BootSE BootLLCI BootULCI
Proactiv ,1462 ,0374 ,0710 ,2169 Proactiv ,1604 ,0382 ,0833 ,2327
H10 Hayes Process Analysis; In organizations, the relationship between empowering leadership and team
creativity has a mediation variable effect of proactive personality.
PROCESS Procedure for SPSS Version 3.4
Model : 4
Y : Career_S
X : Empoweri
M : Proactiv
Sample
Size: 333
Indirect effect(s) of X on Y:
Effect BootSE BootLLCI BootULCI
Proactiv ,1856 ,0349 ,1163 ,2538
Partially standardized indirect effect(s) of X on Y:
Effect BootSE BootLLCI BootULCI
Proactiv ,2170 ,0400 ,1386 ,2942
Completely standardized indirect effect(s) of X on Y:
Effect BootSE BootLLCI BootULCI
Proactiv ,2035 ,0384 ,1269 ,2773
If the Hayes process analysis has a value of “0” between BootLLCI and BootULCI, the
mediation effect cannot be mentioned. As a result of the analysis, it is confirmed that the proactive
personality mediation variable has a significant effect on the hayes process test as well as the sobel test.
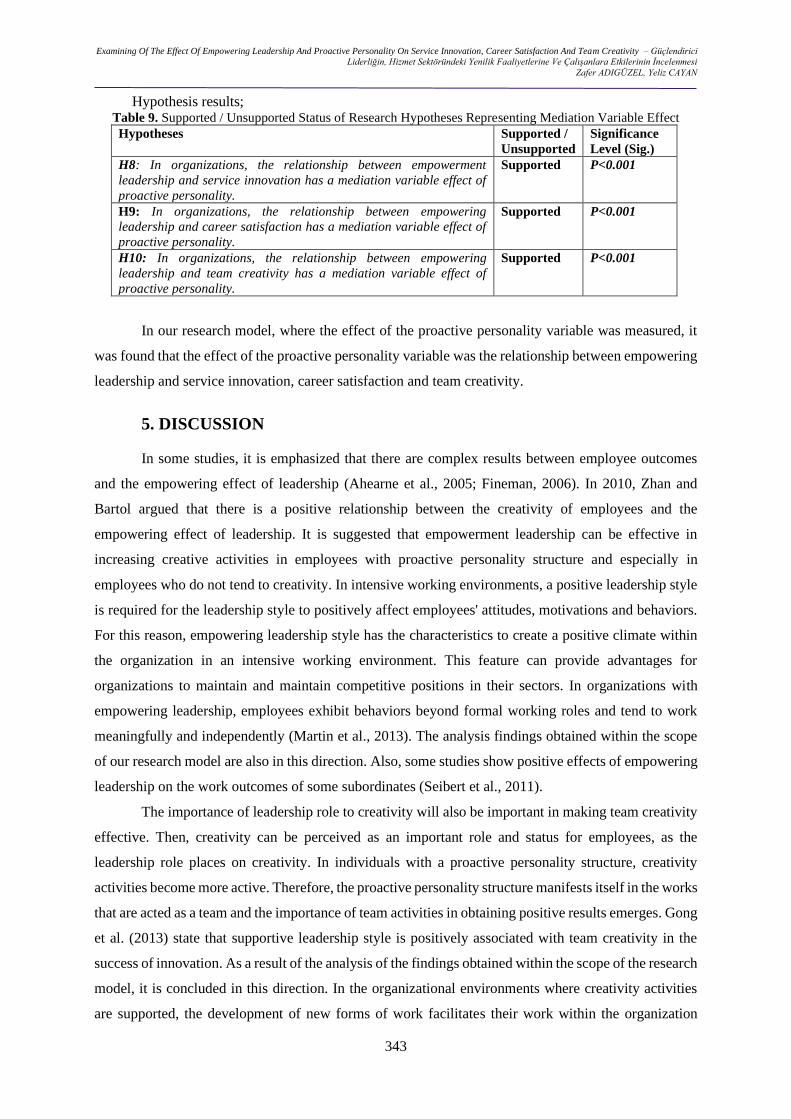
Examining Of The Effect Of Empowering Leadership And Proactive Personality On Service Innovation, Career Satisfaction And Team Creativity – Güçlendirici
Liderliğin, Hizmet Sektöründeki Yenilik Faaliyetlerine Ve Çalışanlara Etkilerinin İncelenmesi
Zafer ADIGÜZEL, Yeliz CAYAN
343
Hypothesis results; Table 9. Supported / Unsupported Status of Research Hypotheses Representing Mediation Variable Effect
Hypotheses Supported /
Unsupported
Significance
Level (Sig.)
H8: In organizations, the relationship between empowerment
leadership and service innovation has a mediation variable effect of
proactive personality.
Supported P<0.001
H9: In organizations, the relationship between empowering
leadership and career satisfaction has a mediation variable effect of
proactive personality.
Supported P<0.001
H10: In organizations, the relationship between empowering
leadership and team creativity has a mediation variable effect of
proactive personality.
Supported P<0.001
In our research model, where the effect of the proactive personality variable was measured, it
was found that the effect of the proactive personality variable was the relationship between empowering
leadership and service innovation, career satisfaction and team creativity.
5. DISCUSSION
In some studies, it is emphasized that there are complex results between employee outcomes
and the empowering effect of leadership (Ahearne et al., 2005; Fineman, 2006). In 2010, Zhan and
Bartol argued that there is a positive relationship between the creativity of employees and the
empowering effect of leadership. It is suggested that empowerment leadership can be effective in
increasing creative activities in employees with proactive personality structure and especially in
employees who do not tend to creativity. In intensive working environments, a positive leadership style
is required for the leadership style to positively affect employees' attitudes, motivations and behaviors.
For this reason, empowering leadership style has the characteristics to create a positive climate within
the organization in an intensive working environment. This feature can provide advantages for
organizations to maintain and maintain competitive positions in their sectors. In organizations with
empowering leadership, employees exhibit behaviors beyond formal working roles and tend to work
meaningfully and independently (Martin et al., 2013). The analysis findings obtained within the scope
of our research model are also in this direction. Also, some studies show positive effects of empowering
leadership on the work outcomes of some subordinates (Seibert et al., 2011).
The importance of leadership role to creativity will also be important in making team creativity
effective. Then, creativity can be perceived as an important role and status for employees, as the
leadership role places on creativity. In individuals with a proactive personality structure, creativity
activities become more active. Therefore, the proactive personality structure manifests itself in the works
that are acted as a team and the importance of team activities in obtaining positive results emerges. Gong
et al. (2013) state that supportive leadership style is positively associated with team creativity in the
success of innovation. As a result of the analysis of the findings obtained within the scope of the research
model, it is concluded in this direction. In the organizational environments where creativity activities
are supported, the development of new forms of work facilitates their work within the organization

Mehmet Akif Ersoy İktisadi ve İdari Bilimler Fakültesi Dergisi - Mehmet Akif Ersoy University Journal of Economics and Administrative Sciences Faculty
Cilt:7 Sayı:2 s.326-353 Volume:7 Issue:1 p.326-353
Temmuz 2020 July
344
(West and Farr, 1990). Chen et al. (2011) argue that service innovation is not only related to the creation
of new service processes, but also that there is intense competition due to the widespread use of
innovation in research. For this reason, leadership style and participation of employees in innovation are
important in organizational structure.
In the research model, when the relations between the variables are examined, it is seen that the
most important characteristics of organizations lie in the harmony between the leader and the employees.
As long as the relations between the leader and the employees are positive, they can argue that their
organizational performance is progressing positively. It is seen that the employees in our sample group
have a positive relationship in their institutions. In the intense competition environment, there is the fact
that the procedures that organizations set out in order to ensure the continuity of the organization are
defined correctly. This situation can make an advantageous position in the competitive environment in
terms of the sustainability principle of institutions. Because ordering in an institution where the
procedures are always welcomed by employees is important for the institutions.
6. CONCLUSION AND RECOMMENDATIONS
In the study conducted in the service sector within the scope of the research model, previous
studies are supported to explain the relationship between the outputs of the employees and the
strengthening effect of leadership. As the research on the effects of the empowering effect of leadership
on employees and the organization is at an early stage, it is aimed to guide future studies. A leader who
is interested in individual characteristics and differences needs to learn the creativity skills of the
employees and coordinate them by combining different abilities to contribute to team creativity
(Basadur, 2004). When the results of the analysis are considered, it can be accepted that empowering
leadership style is an important leadership in bringing together different talents.
Both the proactive personality structure and the creative behaviors of the employees are
important for the innovation activities of the service sector institutions (Reynoso et al., 2015). Because
the organizational structures that do not attach importance to the performance and development of the
employees within the organization, they fall back without adapting to the conditions in the competitive
environment and have to leave the sector. Organizational structures that attach importance to the
development of employees and provide opportunities to discover their talents can be more active in
adapting to the competitive conditions in the sector. Particularly, providing career opportunities that
employees attach importance to their own future within the framework of transparent and fair rules
connects employees more to the organization and can engage in activities that positively reflect the
organization's performance.
As a result of the research conducted in the service sector, we can see that strengthening
leadership and proactive personality structure positively affect team creativity and service innovation.
In addition, we can conclude that employees are more successful in the organization with their proactive
personality structure in terms of career satisfaction and empowering leadership is important in terms of

Examining Of The Effect Of Empowering Leadership And Proactive Personality On Service Innovation, Career Satisfaction And Team Creativity – Güçlendirici
Liderliğin, Hizmet Sektöründeki Yenilik Faaliyetlerine Ve Çalışanlara Etkilerinin İncelenmesi
Zafer ADIGÜZEL, Yeliz CAYAN
345
career satisfaction in self-development of employees and to be successful and in terms of career
satisfaction. In order for future studies to be better and to create qualitative studies and to create new
theoretical concepts, it is necessary to focus more on the different effects of leadership styles on
employees. In particular, it will be possible to obtain new concepts that may arise due to cultural
differences between regions, especially in the field of management and organization, but also in the field
of social sciences. The problems that arise in working life help to create new leadership and
management styles as well as academically new concepts. By examining the problems experienced in
working life more academically and with priority, it will be possible to gain new concepts in terms of
theoretical and analysis that may contribute to the world literature in future studies.
7. SUGGESTIONS FOR FUTURE STUDIES
With the technological developments in the world are experiencing huge and rapid changes.
Globalization is one of the most important consequences of this change. Global change has affected the
world as well as business life and has increased in competition among companies. Companies have
started to show interest in new management approaches in order to survive in this competitive
environment. Personnel empowerment, one of these new management approaches, emerged in the 80s
and was quickly accepted. Thanks to empowering, it is possible to increase productivity, reduce costs,
shorten the decision-making process and adapt more easily to rapidly changing environmental
conditions. In the work environment where personnel empowerment management is applied, there are
practices that will make employees feel more valuable. Thanks to these practices, both employee and
organization achieve significant gains.
When the sectoral weight in the world economy is analyzed, it is seen that the share of the
service sector is increasing. In this study, the importance of proactive personality structure, team
creativity and service innovation is emphasized. However, it is useful to examine the effects of proactive
personality structure and team creativity on different working groups in different sectors together with
empowering leadership style. At the same time, meta analysis should be given importance. Because
cultural and sectoral differences can be identified more easily by analyzing similar studies in different
countries. With the success of service innovation with changing market conditions, it will be possible to
gain competitive advantage and provide a higher quality service. Therefore, there is a need for studies
in various institutions in the field of service innovation.
As a result, the good performance of employees in the success of an organization in the service
sector stands out. In order to perform well in their employees, they should see themselves as the owners
of the workplace. The way to achieve this is to provide a working environment in which employees feel
competent and initiative and can influence output. It is also possible for leaders to achieve such an
environment by applying empowering leadership behaviors.

Mehmet Akif Ersoy İktisadi ve İdari Bilimler Fakültesi Dergisi - Mehmet Akif Ersoy University Journal of Economics and Administrative Sciences Faculty
Cilt:7 Sayı:2 s.326-353 Volume:7 Issue:1 p.326-353
Temmuz 2020 July
346
8. MANAGERIAL IMPLICATIONS
It is an indisputable fact that there is a need for individuals who have high intrinsic motivations,
who are emotionally committed to their organization, are satisfied with their work, share their
knowledge with their colleagues, and work with creative and high performance. Therefore, in order to
achieve the desired employee behavior and high employee performance, business managers should be
more examples of their employees, coaching them, sharing their knowledge with them, interacting with
them, paying attention to them and making them participate in decisions. In other words, managers
should make efforts to increase empowering leader behaviors.
Employees with a proactive personality structure and the leaders responsible for this
implementation process have important roles in strengthening team creativity. The help and support of
the leaders in this regard is very important. Leaders will be able to focus on top-level issues that are vital
rather than dealing with detail-demanding work, as they do not perceive empowerment of employees as
a threat to themselves, as opposed to giving them the power to make decisions. It is necessary to establish
an organizational culture in which employees can always feel strong, participate in the decision-making
process, obtain high-level information about the goals and vision of the business and receive
unconditional support from their superiors at all times.
Achieving the expected positive results by successfully applying the reinforcing leadership style
is possible by adapting subordinates, managers and organizational structure accordingly. Establishing
an appropriate organizational climate for the implementation of empowering leader behaviors in
organizations, providing continuous training to employees, the establishment of an information system
that allows information sharing and open communication channels in all directions, providing the
necessary resources to the employees for their work, creating an atmosphere of trust in the organization,
performance evaluation, feedback and development of reward systems and failure to be seen as an
opportunity to learn should be paid attention.
REFERENCES
AHEARNE, M., MATHIEU, J., & RAPP, A. (2005). To empower or not to empower your sales
force? An empirical examination of the influence of leadership empowerment behavior
on customer satisfaction and performance. Journal of Applied psychology, 90(5), 945.
AMABİLE, T. M., CONTİ, R., COON, H., LAZENBY, J., & HERRON, M. (1996). Assessing
the work environment for creativity. Academy of management journal, 39(5), 1154-
1184.
AMABILE, T.M., SCHATZEL, E.A., MONETA, G.B., & KRAMER, S.J. (2004). Leader
behaviors and the work environment for creativity: Perceived leader support. The
Leadership Quarterly, 15(1), 5-32.

Examining Of The Effect Of Empowering Leadership And Proactive Personality On Service Innovation, Career Satisfaction And Team Creativity – Güçlendirici
Liderliğin, Hizmet Sektöründeki Yenilik Faaliyetlerine Ve Çalışanlara Etkilerinin İncelenmesi
Zafer ADIGÜZEL, Yeliz CAYAN
347
ANDERSON, N., DE DREU, C.K., & NIJSTAD, B.A. (2004). The routinization of innovation
research: A constructively critical review of the state‐of‐the‐science. Journal of
organizational Behavior, 25(2), 147-173.
ARNOLD, J.A., ARAD, S., RHOADES, J.A., & DRASGOW, F. (2000). The empowering
leadership questionnaire: The construction and validation of a new scale for measuring
leader behaviors. Journal of Organizational Behavior, 21(3), 249-269.
AROİAN, L.A. (1944/1947). The probability function of the product of two normally
distributed variables. The Annals of Mathematical Statistics, 18, 265-271.
BARRICK, M.R. (2005). Yes, personality matters: Moving on to more important matters.
Human performance, 18(4), 359-372.
BASADUR, M. (2004). Leading others to think innovatively together: Creative leadership. The
Leadership Quarterly, 15(1), 103-121.
BATEMAN, T.S., & CRANT, J.M. (1993). The proactive component of organizational
behavior: A measure and correlates. Journal of organizational behavior, 14(2), 103-118.
BINDL, U.K., PARKER, S.K., TOTTERDELL, P., & HAGGER-JOHNSON, G. (2012). Fuel
of the self-starter: How mood relates to proactive goal regulation. Journal of Applied
Psychology, 97(1), 134.
BOIES, K., & ROTHSTEIN, M.G. (2002). Managers’ interest in international assignments: The
role of work and career satisfaction. International Journal of Intercultural Relations,
26(3), 233-253.
CHANG, W. C., & CHIANG, Z. H. (2007). A Study on how to elevating organizational
creativity of design organization. International Association of Societies of Design
Research, The Hong Kong Polytechnic University.
CHEN, J.S., TSOU, H.T., & CHING, R.K. (2011). Co-production and its effects on service
innovation. Industrial Marketing Management, 40(8), 1331-1346.
CHESBROUGH, H. (2003). The logic of open innovation: managing intellectual property.
California management review, 45(3), 33-58.
CHESBROUGH, H. (2010). Open services innovation: Rethinking your business to grow and
compete in a new era. John Wiley & Sons.
CHESBROUGH, H., VANHAVERBEKE, W., & WEST, J. (EDS.). (2006). Open innovation:
Researching a new paradigm. Oxford University Press on Demand.
CHOI, J.N. (2007). Change‐oriented organizational citizenship behavior: effects of work
environment characteristics and intervening psychological processes. Journal of

Mehmet Akif Ersoy İktisadi ve İdari Bilimler Fakültesi Dergisi - Mehmet Akif Ersoy University Journal of Economics and Administrative Sciences Faculty
Cilt:7 Sayı:2 s.326-353 Volume:7 Issue:1 p.326-353
Temmuz 2020 July
348
Organizational Behavior: The International Journal of Industrial, Occupational and
Organizational Psychology and Behavior, 28(4), 467-484.
CRANT, J.M. (2000). Proactive behavior in organizations. Journal of management, 26(3), 435-
462.
DE JONG, J.P., BRUINS, A., DOLFSMA, W., & MEIJAARD, J. (2003). Innovation in service
firms explored: what, how and why. Literature review. Zoetermeer: EIM Business and
Policy Research.
DRAZIN, R., GLYNN, M.A., & KAZANJIAN, R.K. (1999). Multilevel theorizing about
creativity in organizations: A sensemaking perspective. Academy of management
review, 24(2), 286-307.
EDVARDSSON, B., & OLSSON, J. (1996). Key concepts for new service development.
Service Industries Journal, 16(2), 140-164.
ENZ, C.A. (2012). Strategies for the implementation of service innovations. Cornell Hospitality
Quarterly, 53(3), 187-195.
ERDOĞAN, İ. (1996). İşletme yönetiminde örgütsel davranış. İstanbul Üniversitesi İşletme
Fakültesi.
FINEMAN, S. (2006). On being positive: Concerns and counterpoints. Academy of
management review, 31(2), 270-291.
FORRESTER, R. (2000). Empowerment: Rejuvenating a potent idea. Academy of Management
Perspectives, 14(3), 67-80.
FULLER JR, B., & MARLER, L.E. (2009). Change driven by nature: A meta-analytic review
of the proactive personality literature. Journal of Vocational Behavior, 75(3), 329-345.
FULLER, J.B., MARLER, L.E., & HESTER, K. (2006). Promoting felt responsibility for
constructive change and proactive behavior: Exploring aspects of an elaborated model
of work design. Journal of Organizational Behavior: The International Journal of
Industrial, Occupational and Organizational Psychology and Behavior, 27(8), 1089-
1120.
GADREY, J., GALLOUJ, F., & WEINSTEIN, O. (1995). New modes of innovation: how
services benefit industry. International journal of service industry management, 6(3), 4-
16.
GEBAUER, H., KREMPL, R., FLEISCH, E., & FRIEDLI, T. (2008). Innovation of product-
related services. Managing Service Quality: An International Journal, 18(4), 387-404.

Examining Of The Effect Of Empowering Leadership And Proactive Personality On Service Innovation, Career Satisfaction And Team Creativity – Güçlendirici
Liderliğin, Hizmet Sektöründeki Yenilik Faaliyetlerine Ve Çalışanlara Etkilerinin İncelenmesi
Zafer ADIGÜZEL, Yeliz CAYAN
349
GONG, Y., CHEUNG, S.Y., WANG, M., & HUANG, J.C. (2012). Unfolding the proactive
process for creativity: Integration of the employee proactivity, information exchange,
and psychological safety perspectives. Journal of management, 38(5), 1611-1633.
GONG, Y., KIM, T.Y., LEE, D.R., & ZHU, J. (2013). A multilevel model of team goal
orientation, information exchange, and creativity. Academy of Management Journal,
56(3), 827-851.
GOODMAN, L.A. (1960). On the exact variance of products. Journal of the American statistical
association, 55(292), 708-713.
GRANT, A.M., & ASHFORD, S.J. (2008). The dynamics of proactivity at work. Research in
organizational behavior, 28, 3-34.
GRECO, P., LASCHINGER, H. K. S., & WONG, C. (2006). Leader empowering behaviours,
staff nurse empowerment and work engagement/burnout. Nursing Leadership, 19(4),
41-56.
GREENHAUS, J.H., PARASURAMAN, S., & WORMLEY, W.M. (1990). Effects of race on
organizational experiences, job performance evaluations, and career outcomes.
Academy of management Journal, 33(1), 64-86.
GUMUSLUOGLU, L., & ILSEV, A. (2009). Transformational leadership, creativity, and
organizational innovation. Journal of business research, 62(4), 461-473.
HAIR, J.F., BLACK, W.C., BABIN, B.J., & ANDERSON, R.E. (2014). Multivariate data
analysis: Pearson new international edition. Essex: Pearson Education Limited.
HAYES, A. F. (2017). Introduction to mediation, moderation, and conditional process analysis:
A regression-based approach. Guilford publications.
HUMBORSTAD, S.I.W., NERSTAD, C.G., & DYSVİK, A. (2014). Empowering leadership,
employee goal orientations and work performance: A competing hypothesis approach.
Personnel Review, 43, 246-271.
IGBARIA, M., KASSICIEH, S.K., & SILVER, M. (1999). Career orientations and career
success among research, and development and engineering professionals. Journal of
Engineering and technology management, 16(1), 29-54.
İSLAMOĞLU, A. (2011). Hamdi: Sosyal Bilimlerde Araştırma Yöntemleri, 2. Bs., İstanbul,
Beta Basım AŞ.
KANTER, R. M. (1988). Three tiers for innovation research. Communication Research, 15(5),
509-523.

Mehmet Akif Ersoy İktisadi ve İdari Bilimler Fakültesi Dergisi - Mehmet Akif Ersoy University Journal of Economics and Administrative Sciences Faculty
Cilt:7 Sayı:2 s.326-353 Volume:7 Issue:1 p.326-353
Temmuz 2020 July
350
KALAYCI, Ş. (2006). SPSS uygulamalı çok değişkenli istatistik teknikleri [SPSS applied
multivariate statistical techniques]. Ankara, Turkey: Asil Yayın Dağıtım.
KELLEHER, C., CÉILLEACHAIR, A.Ó., & PEPPARD, J. (2012). Open service innovation
and co-creating the value propositions in online community based idea contests.
KLIJN, M., & TOMIC, W. (2010). A review of creativity within organizations from a
psychological perspective. Journal of Management Development, 29(4), 322-343.
KONCZAK, L.J., STELLY, D.J., & TRUSTY, M.L. (2000). Defining and measuring
empowering leader behaviors: Development of an upward feedback instrument.
Educational and Psychological measurement, 60(2), 301-313.
LEACH, D.J., WALL, T.D., & JACKSON, P.R. (2003). The effect of empowerment on job
knowledge: An empirical test involving operators of complex technology. Journal of
Occupational and Organizational Psychology, 76(1), 27-52.
LI, N., LIANG, J., & CRANT, J.M. (2010). The role of proactive personality in job satisfaction
and organizational citizenship behavior: A relational perspective. Journal of applied
psychology, 95(2), 395.
LIANG, J., & GONG, Y. (2013). Capitalizing on proactivity for informal mentoring received
during early career: The moderating role of core self‐evaluations. Journal of
Organizational Behavior, 34(8), 1182-1201.
LUTHANS, F. (1973), Organizational Behavior, Sixth Edition, New York: McGraw-Hill.
MACKINNON, D. P., WARSI, G., & DWYER, J. H. (1995). A simulation study of mediated
effect measures. Multivariate behavioral research, 30(1), 41-62.
MARTIN, S.L., LIAO, H., & CAMPBELL, E.M. (2013). Directive versus empowering
leadership: A field experiment comparing impacts on task proficiency and proactivity.
Academy of Management Journal, 56(5), 1372-1395.
MERRILEES, B., RUNDLE-THIELE, S., & LYE, A. (2011). Marketing capabilities:
Antecedents and implications for B2B SME performance. Industrial Marketing
Management, 40(3), 368-375.
NUNNALLY, J., & BERNSTEIN, I. (1994). Psychometric Theory 3rd edition (MacGraw-Hill,
New York).
ORPEN, C. (1994). The effects of organizational and individual career management on career
success. International journal of manpower, 15(1), 27-37.
OSTROM, A.L., BITNER, M.J., BROWN, S.W., BURKHARD, K.A., GOUL, M., SMITH-
DANIELS, V., ... & RABINOVICH, E. (2010). Moving forward and making a
Examining Of The Effect Of Empowering Leadership And Proactive Personality On Service Innovation, Career Satisfaction And Team Creativity – Güçlendirici
Liderliğin, Hizmet Sektöründeki Yenilik Faaliyetlerine Ve Çalışanlara Etkilerinin İncelenmesi
Zafer ADIGÜZEL, Yeliz CAYAN
351
difference: research priorities for the science of service. Journal of service research,
13(1), 4-36.
OWENS, B.P., & HEKMAN, D.R. (2012). Modeling how to grow: An inductive examination
of humble leader behaviors, contingencies, and outcomes. Academy of Management
Journal, 55(4), 787-818.
PARKER, S. K., & COLLINS, C. G. (2010). Taking stock: Integrating and differentiating
multiple proactive behaviors. Journal of management, 36(3), 633-662.
RAUB, S., & LIAO, H. (2012). Doing the right thing without being told: Joint effects of
initiative climate and general self-efficacy on employee proactive customer service
performance. Journal of applied psychology, 97(3), 651.
REYNOSO, J., KANDAMPULLY, J., FAN, X., & PAULOSE, H. (2015). Learning from
socially driven service innovation in emerging economies. Journal of Service
Management, 26(1), 156-176.
ROUSSEAU, D.M., SITKIN, S.B., BURT, R.S., & CAMERER, C. (1998). Not so different
after all: A cross-discipline view of trust. Academy of management review, 23(3), 393-
404.
SALUNKE, S., WEERAWARDENA, J., & MCCOLL-KENNEDY, J.R. (2013). Competing
through service innovation: The role of bricolage and entrepreneurship in project-
oriented firms. Journal of Business Research, 66(8), 1085-1097.
SAVERY, L.K. (1996). The congruence between the importance of job satisfaction and the
perceived level of achievement. Journal of Management Development, 15(6), 18-27.
SCHUMPETER, J.A. (1934). The theory of economic development: An inquiry into profits,
capital, credit, interest, and the business cycle (Vol. 55). New York: Transaction
Publishers.
SCOTT, S.G., & BRUCE, R.A. (1994). Determinants of innovative behavior: A path model of
individual innovation in the workplace. Academy of management journal, 37(3), 580-
607.
SEIBERT, S. E., KRAIMER, M. L., & CRANT, J. M. (2001). What do proactive people do? A
longitudinal model linking proactive personality and career success. Personnel
psychology, 54(4), 845-874.
SEIBERT, S.E., CRANT, J.M., & KRAIMER, M.L. (1999). Proactive personality and career
success. Journal of applied psychology, 84(3), 416.

Mehmet Akif Ersoy İktisadi ve İdari Bilimler Fakültesi Dergisi - Mehmet Akif Ersoy University Journal of Economics and Administrative Sciences Faculty
Cilt:7 Sayı:2 s.326-353 Volume:7 Issue:1 p.326-353
Temmuz 2020 July
352
SEIBERT, S.E., WANG, G., & COURTRIGHT, S.H. (2011). Antecedents and consequences
of psychological and team empowerment in organizations: A meta-analytic review.
Journal of applied psychology, 96(5), 981.
SHALLEY, C.E., & GILSON, L.L. (2004). What leaders need to know: A review of social and
contextual factors that can foster or hinder creativity. The leadership quarterly, 15(1),
33-53.
SHALLEY, C.E., ZHOU, J., & OLDHAM, G.R. (2004). The effects of personal and contextual
characteristics on creativity: Where should we go from here?. Journal of management,
30(6), 933-958.
SHARMA, P.N., & KIRKMAN, B.L. (2015). Leveraging leaders: A literature review and future
lines of inquiry for empowering leadership research. Group & Organization
Management, 40(2), 193-237.
SLÅTTEN, T., SVENSSON, G., & SVÆRİ, S. (2011). Empowering leadership and the
influence of a humorous work climate on service employees' creativity and innovative
behaviour in frontline service jobs. International Journal of Quality and Service
Sciences.
SOBEL, M.E. (1982). Asymptotic confidence intervals for indirect effects in structural equation
models. Sociological methodology, 13, 290-312.
SUNDBO, J. (2008). Innovation and involvement in services. In L. Fuglsang (Ed.), Innovation
and the creative process: Towards innovation with care (pp. 25–47). Cheltenham:
Edward Elgar.
SWINK, M. (2003). Completing projects on-time: how project acceleration affects new product
development. Journal of Engineering and Technology Management, 20(4), 319-344.
THOMAS, J. P., WHITMAN, D. S., & VISWESVARAN, C. (2010). Employee proactivity in
organizations: A comparative meta‐analysis of emergent proactive constructs. Journal
of occupational and organizational psychology, 83(2), 275-300.
THOMAS, J.R., NELSON, J.K., & SILVERMAN, S.J. (2015). Research methods in physical
activity. Human kinetics.
TIERNEY, P. (2008). Leadership and employee creativity. Handbook of organizational
creativity, 95123.
TIERNEY, P., & FARMER, S.M. (2002). Creative self-efficacy: Its potential antecedents and
relationship to creative performance. Academy of Management journal, 45(6), 1137-
1148.

Examining Of The Effect Of Empowering Leadership And Proactive Personality On Service Innovation, Career Satisfaction And Team Creativity – Güçlendirici
Liderliğin, Hizmet Sektöründeki Yenilik Faaliyetlerine Ve Çalışanlara Etkilerinin İncelenmesi
Zafer ADIGÜZEL, Yeliz CAYAN
353
TOIVONEN, M., & TUOMINEN, T. (2009). Emergence of innovations in services. The Service
Industries Journal, 29(7), 887-902.
URAL, A., & KILIÇ, İ. (2013). Bilimsel araştırma süreci ve spss ile veri analizi, Detay
Yayıncılık, 4. Baskı, Ankara, 31.
WEST, J., & BOGERS, M. (2014). Leveraging external sources of innovation: a review of
research on open innovation. Journal of Product Innovation Management, 31(4), 814-
831.
WEST, M.A., & FARR, J.L. (1990). Innovation and creativity at work: Psychological and
organizational strategies (265–267). NY: John Wiley & Sons.
WOODMAN, R.W., SAWYER, J.E., & GRIFFIN, R.W. (1993). Toward a theory of
organizational creativity. Academy of management review, 18(2), 293-321.
YEN, H.R., WANG, W., WEI, C.P., HSU, S.H.Y., & CHIU, H.C. (2012). Service innovation
readiness: Dimensions and performance outcome. Decision Support Systems, 53(4),
813-824.
ZHANG, X., & BARTOL, K.M. (2010). Linking empowering leadership and employee
creativity: The influence of psychological empowerment, intrinsic motivation, and
creative process engagement. Academy of management journal, 53(1), 107-128.
ZHANG, X., & ZHOU, J. (2014). Empowering leadership, uncertainty avoidance, trust, and
employee creativity: Interaction effects and a mediating mechanism. Organizational
Behavior and Human Decision Processes, 124(2), 150-164.
ZHOU, J., & REN, R. (2012). Striving for creativity: Building positive contexts in the
workplace. The Oxford handbook of positive organizational scholarship, 97-109.

354
MEHMET AKİF ERSOY ÜNİVERSİTESİ
İKTİSADİ VE İDARİ BİLİMLER FAKÜLTESİ DERGİSİ
Mehmet Akif Ersoy University
Journal of Economics and Administrative Sciences Faculty
ISSN: 2149-1658 Cilt: 7 Sayı: 2 s.354-372
Volume: 7 Issue: 2 p. 354-372
Temmuz 2020 June
THE DYNAMIC INTERACTIONS BETWEEN US AND EUROPEAN ECONOMIC POLICY
UNCERTAINTIES AND SELECTED MACROECONOMIC VARIABLES IN TURKEY
ABD VE AVRUPA’NIN EKONOMİK POLİTİKA BELİRSİZLİKLERİ İLE TÜRKİYE'DE
SEÇİLMİŞ MAKROEKONOMİK DEĞİŞKENLER ARASINDAKİ DİNAMİK
ETKİLEŞİMLERİN ANALİZİ
Mustafa ÖZER1, Merve KOCAMAN2
1. Professor Dr., Departmant of Economics, Faculty
of Economics and Administrative Sciences,
Anadolu University, Eskişehir, Turkey,
https://orcid.org/0000-0001-9852-8441
2. Research Assistant, Departmant of Economics,
Faculty of Economics and Administrative
Sciences, Anadolu University, Eskişehir, Turkey,
https://orcid.org/0000-0002-5708-6242
Makale Türü Article Type
Araştırma Makalesi Research Article
Başvuru Tarihi Application Date
26.06.2019 06.26.2019
Yayına Kabul Tarihi Admission Date
07.07.2020 07.07.2020
DOI
https://doi.org/10.30798/makuiibf.597309
Abstract
The purpose of this study is to examine the effects of economic policy uncertainties of EU (EPUEU) and US (EPUUS) on selected macroeconomic variables of Turkey, such
as interest rate, stock prices, consumer price index, industrial production index,
exchange rate by using ARDL bounds testing approach and monthly data over the period of 2002 January to 2015 December. According to results of the study, an increase in
EPUUS causes a statistically significant decrease in industrial production in the long-run and an increase in consumer prices. On the other hand, an increase in EPUEU leads
to increase in industrial production. Furthermore, the results show that no matter what
the source of the policy uncertainties are, financial indicators of the Turkish economy are not significantly affected by changes in economic policy uncertainties of both EU
and US. The results of the Granger causality tests indicate presence of both short-run
and long-run causal relations between variables, particularly short-run causalities from EPUEU and EPUUS to industrial production reinforcing the results of ARDL estimates.
Thus, Turkish policymakers should take into account of rising EU and US policy
uncertainties when forming economic policies.
Keywords: Economic Policy Uncertainty, Macroeconomic Performance,
Time Series Analysis,
Öz
Bu çalışmanın amacı, Avrupa Birliği (EPUEU) ve ABD (EPUUS) iktisadi politika belirsizliklerinin, Türkiye'nin, faiz oranı, hisse senedi fiyatı , tüketici fiyat endeksi, sınai
üretim endeksi, döviz kuru gibi seçilmiş makroekonomik değişkenleri üzerindeki
etkilerini; 2002 Ocak-2015 Aralık dönemine ait aylık veriler ve ARDL sınır testi yaklaşımını kullanarak incelemektir. Çalışmadan elde edilen ampirik sonuçlara göre,
EPUUS, uzun dönemde, Türkiye'de ekonomik faaliyetin ölçülmesinde bir gösterge olan
sınai üretimini azaltırken, tüketici fiyatlarında artışa neden olmaktadır. Öte yandan, EPUEU’daki artış, sanayi üretiminde artışa neden olmaktadır. Ayrıca, sonuçlar, Türkiye
ekonomisinin finansal göstergelerinin, politika belirsizliğinin kaynağı ne olursa olsun,
politika belirsizliklerinden önemli ölçüde etkilenmediğini göstermektedir. Granger nedensellik test sonuçları ise hem kısa hem de uzun dönemde, değişkenler arasında
nedensellik ilişkilerinin varlığına işaret etmektedir. Özellikle EPUEU ve EPUUS'tan
endüstriyel üretime kısa dönemde nedenselliklerin olması ARDL modelinin tahmin sonuçlarını da desteklemektedir. Bu nedenle, Türkiye’de politika yapıcılarının politika
oluştururken, AB ve ABD politika belirsizliklerini dikkate almaları uygulanacak
politikaların başarısı açısından önemlidir.
Anahtar Kelimeler: Ekonomi Politika Belirsizliği, Makroekonomik
Performans, Zaman Serisi Analizi,

The Dynamic Interactions Between US and European Economic Policy Uncertainties and Selected Macroeconomic Variables In Turkey – ABD ve Avrupa’nin
Ekonomik Politika Belirsizlikleri ile Türkiye'de Seçilmiş Makroekonomik Değişkenler Arasındaki Dinamik Etkileşimlerin Analizi
Merve KOCAMAN, Mustafa ÖZER
355
EXTENDED SUMMARY
Purpose
The purpose of this study is to examine the effects of economic policy uncertainties of EU
(EPUEU) and US (EPUUS) on selected macroeconomic variables of Turkey, such as interest rate, stock
exchange, consumer price index, industrial production index, exchange rate.
Method
Firstly, to test the stationarity of variables, we carry out Augmented Dickey Fuller (ADF),
Philips Perron (PP) and breakpoint unit root tests. After seeing that except for the economic policy
uncertainty variables, all the variables are stationary at their first differences, we used Pesaran’s (2001)
ARDL approach to investigate the existence of long run relationships among variables and whether the
variables are integrated or not. Then we used Engle Granger (1987)’s ECM based Granger causality test
to detect the existence of short and long run causality.
Findings and Conclusions
ARDL long run coefficients indicate that an increase in EPUUS causes a statistically significant
decrease in industrial production, which is a proxy to measure of economic activity, in Turkey. Also, it
causes an increase in consumer prices. On the other hand, an increase in EPUEU brings about to increase
in industrial production. Furthermore, the results show that no matter what the source of the policy
uncertainties are, financial indicators of the Turkish economy are not significantly affected by changes
in economic policy uncertainties of both EU and US. The results of the Granger causality tests in both
short-run and long-run indicate presence of causal relations between variables, particularly short-run
causalities from EPUEU and EPUUS to industrial production reinforcing the results of ARDL estimates.
Thus, both ARDL and Granger causality test results show that rising uncertainties in EU and USA
creating effects on economic activities in Turkey, which is Turkish policymakers should be aware of.

Mehmet Akif Ersoy İktisadi ve İdari Bilimler Fakültesi Dergisi - Mehmet Akif Ersoy University Journal of Economics and Administrative Sciences Faculty
Cilt:7 Sayı:2 s.355-372 Volume:7 Issue:2 p.354-372
Temmuz 2020 July
356
1. INTRODUCTION
To increase the investment and accelerate the growth, macroeconomic policies at the “right”
levels are not enough. Uncertainty about the future policies should also be minimized (Aizenman and
Marion, 1993: 1). As indicated in Sum (2012), since EPU affects the perception and behavior of market
participants in the goods and capital markets, examining the effects of policy uncertainties on real
economic indicators has a great deal of crucial implications. Especially, if we examine the issue from
the perspective of the emerging market economies such as Turkey, it can be more interesting because
of the fact that they are affected not only by their own policy uncertainties but also by economic policy
uncertainties of other countries, especially of USA and European Union.
Starting from the early 1980s and accelerated with the liberalization of foreign capital accounts
in 1989, Turkey’s economy has been almost fully integrated into global markets, especially financial
markets. This increased integration of Turkey’s economy has made the Turkey’s economy vulnerable
to different type of external shocks including foreign economic policy uncertainty (hereafter, EPU).
Turkey’s interaction with major developed economies in terms of exchanging the goods and services
and involving heavy financial transactions and heavy reliance of Turkey’s industrial sector to imports
has created a perception among the academics, policy maker and market professional that ‘when USA
and Europe sneeze Turkey catches a cold’. Thus, the potential negative effect of external EPU shocks
on domestic economic activity is an important issue for countries like Turkey.
The latest global crises has proven that this impact especially becomes the main concern of
policy makers, market professionals and academics during turmoil times renewing interest in the
economic impact of policy uncertainty and leading to a number of empirical investigations to examine
the effect of policy uncertainty shocks on a large set of economic variables such growth, employment
and inflation (Arouri et al., 2016: 136).
It is true that because of the nature of policy decision-making and implementation processes,
economic policies typically can create a significant amount of uncertainty which has high power of
imposing profound impacts on the financial markets and real economy. As is indicated in Gilchrist et
al. (2014) and Caldara et al. (2016), the economic uncertainty can also affect financial conditions and
hence the real economy. Moreover, as it is found it in Gilchrist et al. (2010) and Pastor and Veronesi
(2012), the policy uncertainty can cause an increase in the cost of finance, lowering investment and
intensifying economic contraction.
Adverse effects of uncertainty on economic growth first brought up by Bernanke (1983).
Bernanke (1983) indicated that in case of facing with uncertainity, firms prefer to reduce investments
and wait for further information since investment costs are irreversible. The construction of EPU index
by Baker et al. (2012) has accelerated the studies investigating the effects of EPU such as Sum and Fanta
(2012), Antonakakis et al. (2013), Balcilar et al. (2013), Kang and Ratti (2013), Lam and Zhang (2014),
Johnson and Lee (2014), Karnizova and Li (2014), Amengual and Xiu (2014), Klößner and Sekkel

The Dynamic Interactions Between US and European Economic Policy Uncertainties and Selected Macroeconomic Variables In Turkey – ABD ve Avrupa’nin
Ekonomik Politika Belirsizlikleri ile Türkiye'de Seçilmiş Makroekonomik Değişkenler Arasındaki Dinamik Etkileşimlerin Analizi
Merve KOCAMAN, Mustafa ÖZER
357
(2014), Bloom (2014), Wang et al. (2015) and Brogaard and Detzel (2015). Lastly, Baker et al. (2015)
argued, recent global financial crisis has proven that the uncertainties about US and European fiscal,
regulatory and monetary policies contributed to steep economic decline, especially causing significant
decline in the growth rates of emerging markets.
With this study, we aim to contribute this growing literature by researching the impacts
of EPUs of US and EU on Turkish economy, particularly selected macroeconomic variables,
by using ARDL Bounds testing approach. Since the Turkish economy is an open economy,
external shocks including EPU originating from US and EU may affect the country’s economy.
Furthermore, any increase in EPUEU may affect imports from Turkey, since it is affecting
member countries’ consumption and investment decisions and EU is the most important market
for Turkish exporters (44.5% of the Turkey’s exports are consist of exports to EU). Thus, we
expect that Turkey’s production, employment and other macroeconomic variables would be
affected by changes in EPUEU and EPUUS.
This paper is organized as follows. Section 2 explains how foreign EPU shocks
transmitted into domestic economy. Section 3 presents the brief literature review. Section 4
explains the methodology used in the study. Section 5 presents empirical data of the study.
Section 6 presents discussions based on the empirical results. Finally, section 7 summarizes and
concludes the paper.
2. THE CHANNELS OF TRANSMISSION OF ECONOMIC POLICY
UNCERTAINTY SHOCKS INTO DOMESTIC ECONOMY
To understand the channels of transmission of external EPU shocks of US and EU on Turkish
economy, we have to first explain how heightened uncertainty in US and EU will transmitted to domestic
economies through their effects on key macroeconomic variables such as employment, consumption,
investment and growth. According to Ndou et al. (2017), rise in economic policy uncertainties should
be considered one of the key factors responsible for the decline in global trade and economic growth.
Even IMF sources suggest that EPU spillovers occur through trade channel and can have potential
adverse effects on economic activity and import demand. When macroeconomic uncertainty disappears,
we should expect recovery in investment and consumption of durable goods. On the other hand,
heightened uncertainty can cause a significant rise in unemployment and a decrease in inflation which
implies that uncertainty shocks affects the economy via the aggregate demand channel. Thus, decline in
the demand for imports resulted from adverse foreign aggregate demand shocks can deteriorate
economic activity of the exporting countries. Besides these effects of EPU shocks, it can cause
depreciation of the exchange rate of the Turkish Lira to the US dollar and Euro which causes an extra
cost for import-based producers that leads cost inflation in the country.

Mehmet Akif Ersoy İktisadi ve İdari Bilimler Fakültesi Dergisi - Mehmet Akif Ersoy University Journal of Economics and Administrative Sciences Faculty
Cilt:7 Sayı:2 s.355-372 Volume:7 Issue:2 p.354-372
Temmuz 2020 July
358
EPU also has a potential to increase global risk aversion and can be the major source of sudden
booms and deeps in financial markets, on the strength of sudden and significant increase in capital
outflows from emerging market economies such as Turkey and Brazil. As a result, we can expect
temporary reduction in investment spending which negatively affects output. EPU shocks can also
tighten the credit and financial conditions. Moreover, the composition of capital flows is affected by
EPU. We know that the important one for the credit and financial condition is the composition of capital
flows. External EPU shocks are inversely related to equity inflows. That is, heightened EPU deters
equity flows into the domestic economy. Moreover, other countries’ economic policy uncertainties can
have negative effects on capital inflows (Ndou et al, 2017: 42). Thus, heightened EPU can cause a
significant fall in the capital flows into Turkish financial markets creating adverse effect on economic
growth. Obviously, this also negatively affects domestic price and financial stability.
3. LITERATURE REVIEW
According to the neoclassical growth theory, the policy uncertainty should not have any impact
on the long run growth rate of per capita output implying that the policy shocks only create short term
temporary effects on the economy. However, the endogenous growth theory concludes that the policies
and policy disturbances can create permanent effect on the growth (Aizenman and Marion, 1993:2).
Empirical studies of the policy uncertainty’s effects on the economy is dating back to the
eighties with Bernanke (1983). With the onset of the global financial crisis on 2008, the interest of such
effect has remerged (Dakhlaoui and Aloui, 2016: 143).
Aizenman and Marion (1993) and Hassett and Metcalf (1999) searched the effect of fiscal policy
uncertainty on investment decision. To represent the fiscal policy uncertainty, they used tax policy
uncertainty and they concluded that increasing uncertainty retards firm-level investment and leads to
lower levels of investments and growth. By using simulated method of moments and firm level data,
Bloom (2009) also concluded that higher uncertainty brings about firms to temporarily pause their
investment and hiring.
Byrne and Davis (2004) estimated the impacts of monetary policy uncertainties on non-
residential fixed investment by decomposing the uncertainty as permanent and temporary inflation
uncertainty. They concluded that temporary component of inflation uncertainty has larger negative
effect on investment than the permanent one has.
By using 25 less developed countries’ data, Lopez (1989) found that investment and real income
growth are negatively affected by real exchange rate instability (Rodrik, 1991: 19). Also, by using
monthly data between January 1973 and September 2008 and 926 firm, Gilchrist et al (2009) found that
an anticipated increase in uncertainty generates a cyclical downturn by raising the price of credit risk
that also lowers aggregate investment spending.
With using two state regime switching model, Ozoguz (2009) found a negative relationship
between EPU and stock returns. Also, Dzielinski (2012) constructed a special uncertainity index and

The Dynamic Interactions Between US and European Economic Policy Uncertainties and Selected Macroeconomic Variables In Turkey – ABD ve Avrupa’nin
Ekonomik Politika Belirsizlikleri ile Türkiye'de Seçilmiş Makroekonomik Değişkenler Arasındaki Dinamik Etkileşimlerin Analizi
Merve KOCAMAN, Mustafa ÖZER
359
found that high degree of uncertainity results with decline in stock returns in US. Pastor and Veronesi
(2012) found that government policy uncertainty has negative effect on stock prices. Kang and Ratti
(2013) found that an increase in EPU reduces real stock returns in Canada and in Europe. With
constructing a dynamic conditional correlation (DCC) model, Antonakakis et al. (2013) found that
increased EPU causes lower stock returns and increases stock market volatility in US. Brogaard and
Detzel (2015) found that EPU is an crucial risk factor for the US equities.
Also, the effect of one specific countries’ EPUs’ (especially EPUUS) on other countries
macroeconomic indicators is one of the widely searched topics. Colombo (2013) concludes that EPUUS
influences European aggregates more than Euro-area policy uncertainty does. Klößner and Sekkel
(2014) demonstrates that EPUUS spills over to influence other developed countries.
Sum’s (2012a) study investigates whether there is an effect of EPUUS on the returns on stock
markets in the BRIC countries. With using Granger causality test, he concluded that the EPUUS
statistically significantly and negatively affect stock market returns in Brazil, India and Russia.
However, although stock returns in China are negatively affected by the EPUUS, this effect is not
statistically significant.
For Turkey, one of the first studies that examines the effects of policy uncertainties is done by
Conway (1988) for the period of 1962-1986. His findings indicate that uncertainty causes a negative
effect on transport, manufacturing, and housing sectors. The stronger effect is observed in
manufacturing investment (Rodrik, 1991: 20).
One of the recent studies for Turkey is done by Sum (2012b). He researched the effect of
EPUEU on selected developed and developing countries’ stock market performance including Turkey.
He concluded that EPUEU negatively affects all stock market returns in the EU, Croatia, Norway,
Russia, Switzerland, Ukraine and Turkey.
4. METHODOLOGY
To see the cointegration relationship between the variables, many approaches has been
developed like Engle and Granger’s (1987) methodology which depends on the residuals, Phillips and
Hansen’s (1990) methodology that based on modified ordinary least square procedures and Johansen’s
(1996) multivariate cointegration analysis and Johansen and Juselius’s (1990) maximum likelihood
methods. These techniques require that all series have same ordered integrations. On the other hand,
recently developed Pesaran et al.’s (2001) autoregressive-distributed lag (ARDL) approach allows that
regressors may be stationary in levels (I(0)) or the first differenced (I(1)). Besides, ARDL Bounds testing
approach provides super consistent results even in a small sample case and not suffering from
endogeneity problem. Therefore, in this study, to obtain the long run relationship among the series,
Pesaran’s (2001) ARDL Bounds testing approach is used.
Firstly, both traditional unit root tests of ADF and PP as well as Breakpoint unit root test are
used to see that variables have a mix of degree of integration and none of them are integrated of order

Mehmet Akif Ersoy İktisadi ve İdari Bilimler Fakültesi Dergisi - Mehmet Akif Ersoy University Journal of Economics and Administrative Sciences Faculty
Cilt:7 Sayı:2 s.355-372 Volume:7 Issue:2 p.354-372
Temmuz 2020 July
360
greater than one. Knowing the fact that variables have different degree of integration of one and zero,
adopting the ARDL Bounds testing approach is decided to examine the dynamic relations among the
variables. After carrying out this cointegration test, Granger causality test taking into account of short
and long run relations among the variables is performed.
To implement ARDL Bounds testing approach, first the unrestricted error correction models are
formed (UECM) as follow:
∆𝐿𝐼𝑃𝐼_𝑆𝐴𝑡=𝛽11+∑ 𝛼1𝑖𝑛1𝑖=1 ∆𝐿𝐼𝑃𝐼_𝑆𝐴𝑡−𝑖 +
∑ 𝛼2𝑖𝑛2𝑖=0 ∆𝐿𝐶𝑃𝐼𝑡−𝑖+∑ 𝛼3𝑖
𝑛3𝑖=0 ∆𝐼𝑁𝑇𝑡−𝑖+∑ 𝛼4𝑖∆𝐿𝐵𝐼𝑆𝑇𝑡−𝑖
𝑛4𝑖=0 +∑ 𝛼5𝑖
𝑛5𝑖=0 ∆𝐿𝐸𝑋𝐶𝑡−𝑖 +
∑ 𝛼6𝑖𝑛6𝑖=0 ∆𝐿𝑈𝑆𝑡−𝑖+∑ 𝛼7𝑖
𝑛7𝑖=0 ∆𝐿𝐸𝑈𝑡−𝑖+𝜃11𝐼𝑃𝐼_𝑆𝐴𝑡−1+𝜃21𝐼𝑁𝑇𝑡−1+
𝜃31𝐿𝐵𝐼𝑆𝑇𝑡−1+𝜃41𝐿𝐸𝑋𝐶𝑡−1+𝜃51𝐿𝐼𝑃𝐼_𝑆𝐴𝑡−1 + 𝜃61𝐿𝑈𝑆𝑡−1+𝜃71𝐿𝐸𝑈𝑡−1+𝑢1𝑡
(1)
∆𝐿𝐶𝑃𝐼𝑡=𝛽12+∑ 𝜕1𝑖𝑚1𝑖=1 ∆𝐿𝐶𝑃𝐼𝑡−𝑖+∑ 𝜕2𝑖
𝑚2𝑖=0 ∆𝐼𝑁𝑇𝑡−𝑖+∑ 𝜕3𝑖∆𝐿𝐵𝐼𝑆𝑇𝑡−𝑖
𝑚3𝑖=0 +∑ 𝜕4𝑖
𝑚4𝑖=0 ∆𝐿𝐸𝑋𝐶𝑡−𝑖+
∑ 𝜕5𝑖𝑚5𝑖=0 ∆𝐿𝐼𝑃𝐼_𝑆𝐴𝑡−𝑖 +
∑ 𝜕6𝑖𝑚6𝑖=0 ∆𝐿𝑈𝑆𝑡−𝑖+∑ 𝜕7𝑖
𝑚7𝑖=0 ∆𝐿𝐸𝑈𝑡−𝑖+𝜃12𝐿𝐶𝑃𝐼𝑡−1+𝜃22𝐿𝐼𝑃𝐼_𝑆𝐴𝑡−1+𝜃32𝐼𝑁𝑇𝑡−1 +
𝜃42𝐿𝐵𝐼𝑆𝑇𝑡−1+𝜃52𝐿𝐸𝑋𝐶𝑡−1+𝜃62𝐿𝑈𝑆𝑡−1+𝜃72𝐿𝐸𝑈𝑡−1+𝑢2𝑡
(2)
∆𝐼𝑁𝑇𝑡=𝛽13+∑ 𝜔1𝑖𝑦1𝑖=1 ∆𝐼𝑁𝑇𝑡−𝑖+∑ 𝜔2𝑖
𝑦2𝑖=0 ∆𝐿𝐼𝑃𝐼_𝑆𝐴𝑡−𝑖 +
∑ 𝜔3𝑖𝑦3𝑖=0 ∆𝐶𝑃𝐼𝑡−𝑖+∑ 𝜔4𝑖∆𝐿𝐵𝐼𝑆𝑇𝑡−𝑖
𝑦4𝑖=0 +∑ 𝜔5𝑖
𝑦5𝑖=0 ∆𝐿𝐸𝑋𝐶𝑡−𝑖+∑ 𝜔6𝑖
𝑦6𝑖=0 ∆𝐿𝑈𝑆𝑡−𝑖+∑ 𝜔7𝑖
𝑦7𝑖=0 ∆𝐿𝐸𝑈𝑡−𝑖+
𝜃13𝐼𝑁𝑇𝑡−1+𝜃23𝐿𝐼𝑃𝐼_𝑆𝐴𝑡−1 + 𝜃33𝐿𝐶𝑃𝐼𝑡−1+𝜃43𝐿𝐵𝐼𝑆𝑇𝑡−1+𝜃53𝐿𝐸𝑋𝐶𝑡−1+𝜃63𝐿𝑈𝑆𝑡−1+𝜃73𝐿𝐸𝑈𝑡−1+𝑢3𝑡
(3)
∆𝐿𝐵𝐼𝑆𝑇𝑡=𝛽14+∑ 𝜑1𝑖𝑟1𝑖=1 ∆𝐿𝐵𝐼𝑆𝑇𝑡−𝑖 +
∑ 𝜑2𝑖𝑟2𝑖=0 ∆𝐿𝐼𝑃𝐼_𝑆𝐴𝑡−𝑖+∑ 𝜑3𝑖
𝑟3𝑖=0 ∆𝐶𝑃𝐼𝑡−𝑖+∑ 𝜑4𝑖∆𝐼𝑁𝑇𝑡−𝑖
𝑟4𝑖=0 +∑ 𝜑5𝑖
𝑟5𝑖=0 ∆𝐿𝐸𝑋𝐶𝑡−𝑖+∑ 𝜑6𝑖
𝑟6𝑖=0 ∆𝐿𝑈𝑆𝑡−𝑖+
∑ 𝜑7𝑖𝑟7𝑖=0 ∆𝐿𝐸𝑈𝑡−𝑖+𝜃14𝐿𝐵𝐼𝑆𝑇𝑡−1+𝜃24𝐿𝐼𝑃𝐼_𝑆𝐴𝑡−1 + 𝜃34𝐿𝐶𝑃𝐼𝑡−1+
𝜃44𝐼𝑁𝑇𝑡−1+𝜃54𝐿𝐸𝑋𝐶𝑡−1+𝜃64𝐿𝑈𝑆𝑡−1+𝜃74𝐿𝐸𝑈𝑡−1+𝑢4𝑡
(4)
∆𝐿𝐸𝑋𝐶𝑡=𝛽15+∑ 𝜇1𝑖𝑠1𝑖=1 ∆𝐿𝐸𝑋𝐶𝑡−𝑖+∑ 𝜇2𝑖
𝑠2𝑖=0 ∆𝐿𝐼𝑃𝐼_𝑆𝐴𝑡−𝑖 ∑ 𝜇3𝑖
𝑠3𝑖=0 ∆𝐶𝑃𝐼𝑡−𝑖+∑ 𝜇4𝑖∆𝐼𝑁𝑇𝑡−𝑖
𝑠4𝑖=0 +
∑ 𝜇5𝑖𝑠5𝑖=0 ∆𝐿𝐵𝐼𝑆𝑇𝑡−𝑖+∑ 𝜇6𝑖
𝑠6𝑖=0 ∆𝐿𝑈𝑆𝑡−𝑖+∑ 𝜇7𝑖
𝑠7𝑖=0 ∆𝐿𝐸𝑈𝑡−𝑖+𝜃15𝐿𝐸𝑋𝐶𝑡−1+𝜃25𝐿𝐼𝑃𝐼_𝑆𝐴𝑡−1 +
𝜃35𝐿𝐶𝑃𝐼𝑡−1+𝜃45𝐼𝑁𝑇𝑡−1+𝜃55𝐵𝐼𝑆𝑇𝑡−1+𝜃65𝐿𝑈𝑆𝑡−1+𝜃75𝐿𝐸𝑈𝑡−1+𝑢5𝑡
(5)
where 𝛽11, 𝛽12, 𝛽13,𝛽14 and 𝛽15 are the drift components and 𝑢𝑡s are white noise error term. Moreover,
the term with summation sign corresponds to the error correction dynamics and the second part of the
equation with 𝜃𝑠 show long run relationship.
Before carrying out cointegration test, the following ARDL models are determined, based on
optimal lag lengths which are determined by Shwarz criterion.

The Dynamic Interactions Between US and European Economic Policy Uncertainties and Selected Macroeconomic Variables In Turkey – ABD ve Avrupa’nin
Ekonomik Politika Belirsizlikleri ile Türkiye'de Seçilmiş Makroekonomik Değişkenler Arasındaki Dinamik Etkileşimlerin Analizi
Merve KOCAMAN, Mustafa ÖZER
361
∆𝐿𝐼𝑃𝐼_𝑆𝐴𝑡=𝛽11+∑ 𝛼1𝑖𝑛1𝑖=1 ∆𝐿𝐼𝑃𝐼_𝑆𝐴𝑡−𝑖 +
∑ 𝛼2𝑖𝑛2𝑖=0 ∆𝐿𝐶𝑃𝐼𝑡−𝑖+∑ 𝛼3𝑖
𝑛3𝑖=0 ∆𝐼𝑁𝑇𝑡−𝑖+∑ 𝛼4𝑖∆𝐿𝐵𝐼𝑆𝑇𝑡−𝑖
𝑛4𝑖=0 +∑ 𝛼5𝑖
𝑛5𝑖=0 ∆𝐿𝐸𝑋𝐶𝑡−𝑖 +
∑ 𝛼6𝑖𝑛6𝑖=0 ∆𝐿𝑈𝑆𝑡−𝑖+∑ 𝛼7𝑖
𝑛7𝑖=0 ∆𝐿𝐸𝑈𝑡−𝑖+𝜀1𝑡
(6)
∆𝐿𝐶𝑃𝐼𝑡=𝛽12+∑ 𝜕1𝑖𝑚1𝑖=1 ∆𝐿𝐶𝑃𝐼𝑡−𝑖+∑ 𝜕2𝑖
𝑚2𝑖=0 ∆𝐼𝑁𝑇𝑡−𝑖+∑ 𝜕3𝑖∆𝐿𝐵𝐼𝑆𝑇𝑡−𝑖
𝑚3𝑖=0 +∑ 𝜕4𝑖
𝑚4𝑖=0 ∆𝐿𝐸𝑋𝐶𝑡−𝑖+
∑ 𝜕5𝑖𝑚5𝑖=0 ∆𝐿𝐼𝑃𝐼_𝑆𝐴𝑡−𝑖 + ∑ 𝜕6𝑖
𝑚6𝑖=0 ∆𝐿𝑈𝑆𝑡−𝑖+∑ 𝜕7𝑖
𝑚7𝑖=0 ∆𝐿𝐸𝑈𝑡−𝑖+𝜀2𝑡
(7)
∆𝐼𝑁𝑇𝑡=𝛽13+∑ 𝜔1𝑖𝑦1𝑖=1 ∆𝐼𝑁𝑇𝑡−𝑖+∑ 𝜔2𝑖
𝑦2𝑖=0 ∆𝐿𝐼𝑃𝐼_𝑆𝐴𝑡−𝑖 +
∑ 𝜔3𝑖𝑦3𝑖=0 ∆𝐶𝑃𝐼𝑡−𝑖+∑ 𝜔4𝑖∆𝐿𝐵𝐼𝑆𝑇𝑡−𝑖
𝑦4𝑖=0 +∑ 𝜔5𝑖
𝑦5𝑖=0 ∆𝐿𝐸𝑋𝐶𝑡−𝑖+∑ 𝜔6𝑖
𝑦6𝑖=0 ∆𝐿𝑈𝑆𝑡−𝑖+∑ 𝜔7𝑖
𝑦7𝑖=0 ∆𝐿𝐸𝑈𝑡−𝑖+
𝜀3𝑡
(8)
∆𝐿𝐵𝐼𝑆𝑇𝑡=𝛽14+∑ 𝜑1𝑖𝑟1𝑖=1 ∆𝐿𝐵𝐼𝑆𝑇𝑡−𝑖 +
∑ 𝜑2𝑖𝑟2𝑖=0 ∆𝐿𝐼𝑃𝐼𝑆𝐴𝑡−𝑖
+∑ 𝜑3𝑖𝑟3𝑖=0 ∆𝐶𝑃𝐼𝑡−𝑖+∑ 𝜑4𝑖∆𝐼𝑁𝑇𝑡−𝑖
𝑟4𝑖=0 +∑ 𝜑5𝑖
𝑟5𝑖=0 ∆𝐿𝐸𝑋𝐶𝑡−𝑖+∑ 𝜑6𝑖
𝑟6𝑖=0 ∆𝐿𝑈𝑆𝑡−𝑖+
∑ 𝜑7𝑖𝑟7𝑖=0 ∆𝐿𝐸𝑈𝑡−𝑖+𝜀4𝑡
(9)
∆𝐿𝐸𝑋𝐶𝑡=𝛽15+∑ 𝜇1𝑖𝑠1𝑖=1 ∆𝐿𝐸𝑋𝐶𝑡−𝑖+∑ 𝜇2𝑖
𝑠2𝑖=0 ∆𝐿𝐼𝑃𝐼_𝑆𝐴𝑡−𝑖 ∑ 𝜇3𝑖
𝑠3𝑖=0 ∆𝐶𝑃𝐼𝑡−𝑖+∑ 𝜇4𝑖∆𝐼𝑁𝑇𝑡−𝑖
𝑠4𝑖=0 +
∑ 𝜇5𝑖𝑠5𝑖=0 ∆𝐿𝐵𝐼𝑆𝑇𝑡−𝑖+∑ 𝜇6𝑖
𝑠6𝑖=0 ∆𝐿𝑈𝑆𝑡−𝑖+∑ 𝜇7𝑖
𝑠7𝑖=0 ∆𝐿𝐸𝑈𝑡−𝑖+𝜀5𝑡
(10)
where, ∆𝐿𝐼𝑃𝐼_𝑆𝐴𝑡, ∆𝐿𝐶𝑃𝐼𝑡, ∆𝐼𝑁𝑇𝑡, ∆𝐿𝐵𝐼𝑆𝑇𝑡 and ∆𝐿𝐸𝑋𝐶𝑡 are the dependent variables, 𝛼1𝑖,..,
𝛼7𝑖; 𝜇1𝑖,…, 𝜇7𝑖 are the short run coefficients, and n1, …n7; m1, …,m7, … s1, …, s7 are the optimal length
of lags of the ARDL models.
In order to test for the existence of a long-run relationship between the variables, all the
equations (1), …, (5) are estimated by ordinary least squares (OLS) and then an F-test is conducted for
the joint significance of the coefficients of the lagged levels of the variable. Calculated F-statistics
should be compered with the upper bound and lower bound critical values that is generated by Pesaran
et al (2001). If the calculated F statistic is bigger than the upper bound critical value I(1), null hypothesis
will be rejected that means there is a cointegration relation between the variables. On the other side, if
the F statistic is lower than the lower bound critical value I(0), null hypothesis cannot be rejected which
means that variables are not cointegrated. If F-statistic is remain in between critical bounds, result
changes whether series are stationary at their level or first difference. Thus, the null hypothesis of no
co-integration among the variables in the equation 1 is:
𝐻0: 𝜃11 = 𝜃21 = 𝜃31 = 𝜃41 = 𝜃51 = 𝜃61 = 𝜃71 = 0 against the alternative hypothesis of
cointegration 𝐻1: 𝑎𝑡 𝑙𝑒𝑎𝑠𝑡 𝑜𝑛𝑒 𝑜𝑓 𝑡ℎ𝑒𝑚 𝑖𝑠 𝑑𝑖𝑓𝑓𝑒𝑟𝑒𝑛𝑡 𝑡ℎ𝑎𝑛 𝑧𝑒𝑟𝑜
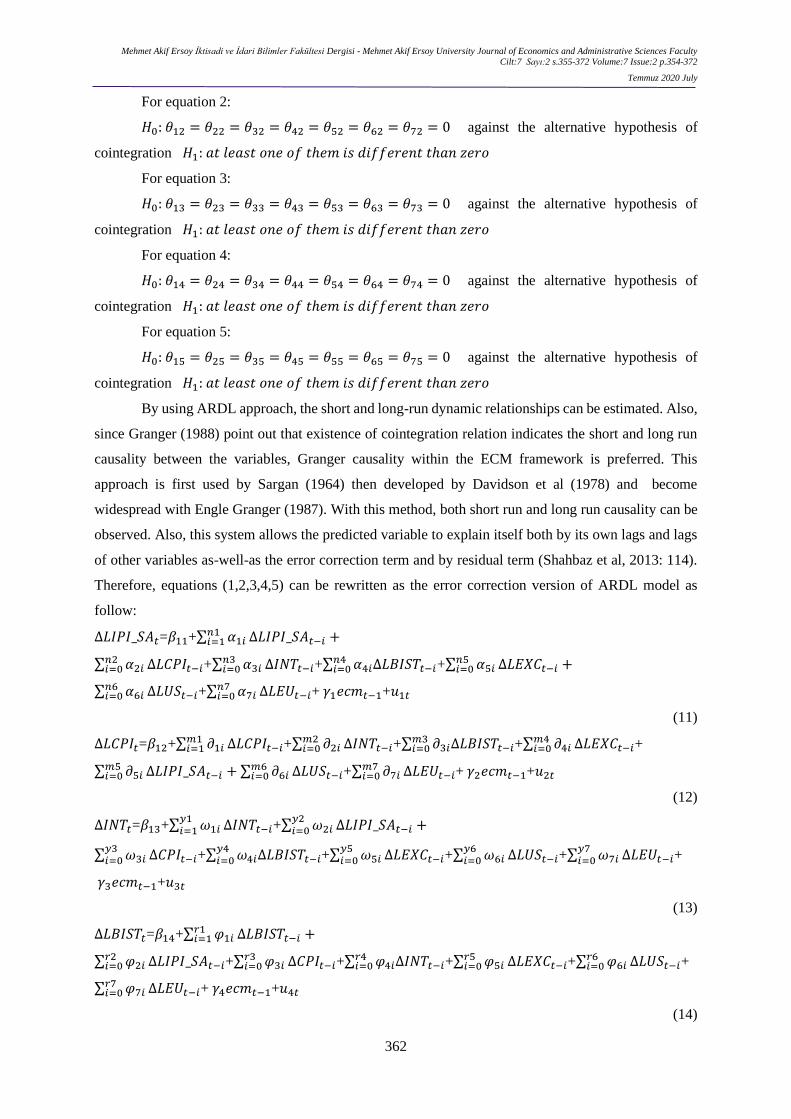
Mehmet Akif Ersoy İktisadi ve İdari Bilimler Fakültesi Dergisi - Mehmet Akif Ersoy University Journal of Economics and Administrative Sciences Faculty
Cilt:7 Sayı:2 s.355-372 Volume:7 Issue:2 p.354-372
Temmuz 2020 July
362
For equation 2:
𝐻0: 𝜃12 = 𝜃22 = 𝜃32 = 𝜃42 = 𝜃52 = 𝜃62 = 𝜃72 = 0 against the alternative hypothesis of
cointegration 𝐻1: 𝑎𝑡 𝑙𝑒𝑎𝑠𝑡 𝑜𝑛𝑒 𝑜𝑓 𝑡ℎ𝑒𝑚 𝑖𝑠 𝑑𝑖𝑓𝑓𝑒𝑟𝑒𝑛𝑡 𝑡ℎ𝑎𝑛 𝑧𝑒𝑟𝑜
For equation 3:
𝐻0: 𝜃13 = 𝜃23 = 𝜃33 = 𝜃43 = 𝜃53 = 𝜃63 = 𝜃73 = 0 against the alternative hypothesis of
cointegration 𝐻1: 𝑎𝑡 𝑙𝑒𝑎𝑠𝑡 𝑜𝑛𝑒 𝑜𝑓 𝑡ℎ𝑒𝑚 𝑖𝑠 𝑑𝑖𝑓𝑓𝑒𝑟𝑒𝑛𝑡 𝑡ℎ𝑎𝑛 𝑧𝑒𝑟𝑜
For equation 4:
𝐻0: 𝜃14 = 𝜃24 = 𝜃34 = 𝜃44 = 𝜃54 = 𝜃64 = 𝜃74 = 0 against the alternative hypothesis of
cointegration 𝐻1: 𝑎𝑡 𝑙𝑒𝑎𝑠𝑡 𝑜𝑛𝑒 𝑜𝑓 𝑡ℎ𝑒𝑚 𝑖𝑠 𝑑𝑖𝑓𝑓𝑒𝑟𝑒𝑛𝑡 𝑡ℎ𝑎𝑛 𝑧𝑒𝑟𝑜
For equation 5:
𝐻0: 𝜃15 = 𝜃25 = 𝜃35 = 𝜃45 = 𝜃55 = 𝜃65 = 𝜃75 = 0 against the alternative hypothesis of
cointegration 𝐻1: 𝑎𝑡 𝑙𝑒𝑎𝑠𝑡 𝑜𝑛𝑒 𝑜𝑓 𝑡ℎ𝑒𝑚 𝑖𝑠 𝑑𝑖𝑓𝑓𝑒𝑟𝑒𝑛𝑡 𝑡ℎ𝑎𝑛 𝑧𝑒𝑟𝑜
By using ARDL approach, the short and long-run dynamic relationships can be estimated. Also,
since Granger (1988) point out that existence of cointegration relation indicates the short and long run
causality between the variables, Granger causality within the ECM framework is preferred. This
approach is first used by Sargan (1964) then developed by Davidson et al (1978) and become
widespread with Engle Granger (1987). With this method, both short run and long run causality can be
observed. Also, this system allows the predicted variable to explain itself both by its own lags and lags
of other variables as-well-as the error correction term and by residual term (Shahbaz et al, 2013: 114).
Therefore, equations (1,2,3,4,5) can be rewritten as the error correction version of ARDL model as
follow:
∆𝐿𝐼𝑃𝐼_𝑆𝐴𝑡=𝛽11+∑ 𝛼1𝑖𝑛1𝑖=1 ∆𝐿𝐼𝑃𝐼_𝑆𝐴𝑡−𝑖 +
∑ 𝛼2𝑖𝑛2𝑖=0 ∆𝐿𝐶𝑃𝐼𝑡−𝑖+∑ 𝛼3𝑖
𝑛3𝑖=0 ∆𝐼𝑁𝑇𝑡−𝑖+∑ 𝛼4𝑖∆𝐿𝐵𝐼𝑆𝑇𝑡−𝑖
𝑛4𝑖=0 +∑ 𝛼5𝑖
𝑛5𝑖=0 ∆𝐿𝐸𝑋𝐶𝑡−𝑖 +
∑ 𝛼6𝑖𝑛6𝑖=0 ∆𝐿𝑈𝑆𝑡−𝑖+∑ 𝛼7𝑖
𝑛7𝑖=0 ∆𝐿𝐸𝑈𝑡−𝑖+ 𝛾1𝑒𝑐𝑚𝑡−1+𝑢1𝑡
(11)
∆𝐿𝐶𝑃𝐼𝑡=𝛽12+∑ 𝜕1𝑖𝑚1𝑖=1 ∆𝐿𝐶𝑃𝐼𝑡−𝑖+∑ 𝜕2𝑖
𝑚2𝑖=0 ∆𝐼𝑁𝑇𝑡−𝑖+∑ 𝜕3𝑖∆𝐿𝐵𝐼𝑆𝑇𝑡−𝑖
𝑚3𝑖=0 +∑ 𝜕4𝑖
𝑚4𝑖=0 ∆𝐿𝐸𝑋𝐶𝑡−𝑖+
∑ 𝜕5𝑖𝑚5𝑖=0 ∆𝐿𝐼𝑃𝐼_𝑆𝐴𝑡−𝑖 + ∑ 𝜕6𝑖
𝑚6𝑖=0 ∆𝐿𝑈𝑆𝑡−𝑖+∑ 𝜕7𝑖
𝑚7𝑖=0 ∆𝐿𝐸𝑈𝑡−𝑖+ 𝛾2𝑒𝑐𝑚𝑡−1+𝑢2𝑡
(12)
∆𝐼𝑁𝑇𝑡=𝛽13+∑ 𝜔1𝑖𝑦1𝑖=1 ∆𝐼𝑁𝑇𝑡−𝑖+∑ 𝜔2𝑖
𝑦2𝑖=0 ∆𝐿𝐼𝑃𝐼_𝑆𝐴𝑡−𝑖 +
∑ 𝜔3𝑖𝑦3𝑖=0 ∆𝐶𝑃𝐼𝑡−𝑖+∑ 𝜔4𝑖∆𝐿𝐵𝐼𝑆𝑇𝑡−𝑖
𝑦4𝑖=0 +∑ 𝜔5𝑖
𝑦5𝑖=0 ∆𝐿𝐸𝑋𝐶𝑡−𝑖+∑ 𝜔6𝑖
𝑦6𝑖=0 ∆𝐿𝑈𝑆𝑡−𝑖+∑ 𝜔7𝑖
𝑦7𝑖=0 ∆𝐿𝐸𝑈𝑡−𝑖+
𝛾3𝑒𝑐𝑚𝑡−1+𝑢3𝑡
(13)
∆𝐿𝐵𝐼𝑆𝑇𝑡=𝛽14+∑ 𝜑1𝑖𝑟1𝑖=1 ∆𝐿𝐵𝐼𝑆𝑇𝑡−𝑖 +
∑ 𝜑2𝑖𝑟2𝑖=0 ∆𝐿𝐼𝑃𝐼_𝑆𝐴𝑡−𝑖+∑ 𝜑3𝑖
𝑟3𝑖=0 ∆𝐶𝑃𝐼𝑡−𝑖+∑ 𝜑4𝑖∆𝐼𝑁𝑇𝑡−𝑖
𝑟4𝑖=0 +∑ 𝜑5𝑖
𝑟5𝑖=0 ∆𝐿𝐸𝑋𝐶𝑡−𝑖+∑ 𝜑6𝑖
𝑟6𝑖=0 ∆𝐿𝑈𝑆𝑡−𝑖+
∑ 𝜑7𝑖𝑟7𝑖=0 ∆𝐿𝐸𝑈𝑡−𝑖+ 𝛾4𝑒𝑐𝑚𝑡−1+𝑢4𝑡
(14)

The Dynamic Interactions Between US and European Economic Policy Uncertainties and Selected Macroeconomic Variables In Turkey – ABD ve Avrupa’nin
Ekonomik Politika Belirsizlikleri ile Türkiye'de Seçilmiş Makroekonomik Değişkenler Arasındaki Dinamik Etkileşimlerin Analizi
Merve KOCAMAN, Mustafa ÖZER
363
∆𝐿𝐸𝑋𝐶𝑡=𝛽15+∑ 𝜇1𝑖𝑠1𝑖=1 ∆𝐿𝐸𝑋𝐶𝑡−𝑖+∑ 𝜇2𝑖
𝑠2𝑖=0 ∆𝐿𝐼𝑃𝐼_𝑆𝐴𝑡−𝑖 ∑ 𝜇3𝑖
𝑠3𝑖=0 ∆𝐶𝑃𝐼𝑡−𝑖+∑ 𝜇4𝑖∆𝐼𝑁𝑇𝑡−𝑖
𝑠4𝑖=0 +
∑ 𝜇5𝑖𝑠5𝑖=0 ∆𝐿𝐵𝐼𝑆𝑇𝑡−𝑖+∑ 𝜇6𝑖
𝑠6𝑖=0 ∆𝐿𝑈𝑆𝑡−𝑖+∑ 𝜇7𝑖
𝑠7𝑖=0 ∆𝐿𝐸𝑈𝑡−𝑖+ 𝛾5𝑒𝑐𝑚𝑡−1+𝑢5𝑡
(15)
Where 𝑢1𝑡, 𝑢2𝑡, 𝑢3𝑡 , 𝑢4𝑡, 𝑢5𝑡 are residuals assumed to be normally distributed and white noise. 𝑒𝑐𝑚𝑡−1
is the error correction term that has to be negative and statistically significant. It shows the speed of
adjustment to long run equilibrium following a short run shock. Moreover, for the short run Granger
causality, following hypothesis are tested:
𝐻01: 𝛼2𝑖 = 0 implying that ∆LCPI does not Granger cause ∆LIPI_SA
𝐻02: 𝛼6𝑖 = 0 implying that ∆LUS does not Granger cause ∆LIPI_SA
𝐻03: 𝛼7𝑖 = 0 implying that ∆LEU does not Granger cause ∆LIPI_SA
𝐻04: 𝜕6𝑖 = 0 implying that ∆LUS does not Granger cause ∆LCPI
𝐻05: 𝜕7𝑖 = 0 implying that ∆LEU does not Granger cause ∆LCPI
𝐻06: 𝜔6𝑖 = 0 implying that ∆LUS does not Granger cause ∆INT
𝐻07: 𝜔7𝑖 = 0 implying that ∆LEU does not Granger cause ∆INT
𝐻08: 𝜇6𝑖 = 0 implying that ∆LUS does not Granger cause ∆LEXC
𝐻09: 𝜇7𝑖 = 0 implying that ∆LEU does not Granger cause ∆LEXC
and so on for other variables.
5. DATA AND EMPIRICAL ANALYSIS
Empirical estimation is based on monthly observations from 2002 January to 2015 December.
Variables used in the study are interest rate (effective maximum interest rates for TL deposits of banks-
up to 3 months), stock exchange, consumer price index (CPI), industrial production index (proxy for
economic activity level), exchange rate (USA Dollar/Turkish lira effective exchange rate), economic
policy uncertainty index of US, and economic policy uncertainty index of EU. Inside of them; interest
rate, CPI, stock exchange, PPI and exchange rate data are obtained from Turkish Central Bank database.
EPU index of EU and US is obtained from Baker, Bloom and Davis’s (2015) EPU index developed by
themselves (available at www.policyuncertanity.com).
In the analysis, we used the logarithmic values of variables except interest rate and Figure 1
shows time series plots of variables.

Mehmet Akif Ersoy İktisadi ve İdari Bilimler Fakültesi Dergisi - Mehmet Akif Ersoy University Journal of Economics and Administrative Sciences Faculty
Cilt:7 Sayı:2 s.355-372 Volume:7 Issue:2 p.354-372
Temmuz 2020 July
364
Figure 1. Time Series Plots of Variables
.0
.1
.2
.3
.4
.5
.6
.7
02 03 04 05 06 07 08 09 10 11 12 13 14 15
INT
9.0
9.5
10.0
10.5
11.0
11.5
02 03 04 05 06 07 08 09 10 11 12 13 14 15
LBIST
12.4
12.8
13.2
13.6
14.0
02 03 04 05 06 07 08 09 10 11 12 13 14 15
LCPI
3.5
4.0
4.5
5.0
5.5
6.0
02 03 04 05 06 07 08 09 10 11 12 13 14 15
LEU
0.0
0.2
0.4
0.6
0.8
1.0
1.2
02 03 04 05 06 07 08 09 10 11 12 13 14 15
LEXC
4.0
4.4
4.8
5.2
5.6
02 03 04 05 06 07 08 09 10 11 12 13 14 15
LUS
4.8
5.0
5.2
5.4
5.6
5.8
6.0
6.2
02 03 04 05 06 07 08 09 10 11 12 13 14 15
LIPI
5.0
5.2
5.4
5.6
5.8
6.0
02 03 04 05 06 07 08 09 10 11 12 13 14 15
LIPI_SA
Source: Authors’ calculation
As can be seen easily from the Figure 1, since industrial production index exhibits strong
seasonality, we use TRAMO/SEATS method to remove the seasonality in series. Because of the
structural breaks in the variables, we also carry out structural break unit root tests.
To test the stationarity of variables, we carry out Augmented Dickey Fuller (ADF), Philips
Perron (PP) and breakpoint unit root tests. Table 1 presents the results of unit root tests.
Table 1. Results of The Unit Root Tests
Variables ADF PP Breakpoint Unit Root
Intercept Trend and
Intercept
Intercept Trend and
Intercept
Intercept Trend and
Intercept
LIPI_SA -1.760844
(0.3989)
-2.435253
(0.3601)
-1.795761
(0.3817)
-2.390796
(0.3830)
-2.9510
(0.7124)
-4.4311
(0.2424)
ΔLIPI_SA -14.03137
(0.0000)
-14.06635
(0.0000)
-14.01796
(0.0000)
-14.07399
(0.0000)
-16.3120
(<0.01)
-14.585
(<0.01)
LEXC 0.462678
(0.9850)
-1.006586
(0.9393)
0.337555
(0.9796)
-1.171611
(0.9123)
-1.69721
(>0.99)
-4.49852
(0.2157)
ΔLEXC -9.349238
(0.0000)
-9.512676
(0.0000)
-8.894753
(0.0000)
-8.907285
(0.0000)
-10.2606
(<0.01)
-9.7022
(<0.01)
INT -4.539809
(0.0000)
-3.234234
(0.0814)
-5.233849
(0.0000)
-3.292774
(0.0710)
-5.0217
(<0.01)
-3.0447
(0.8484)
ΔINT -8.002451
(0.0000)
-8.776992
(0.0000)
-8.002451
(0.0000)
-8.745191
(0.0000)
-9.983189
(< 0.01)
-9.120682
(< 0.01)
LCPI -4.756487
(0.0001)
-6.337714
(0.0000)
-3.381947
(0.0130)
-5.796281
(0.0000)
-5.903167
(< 0.01)
-3.720215
(0.5982)*
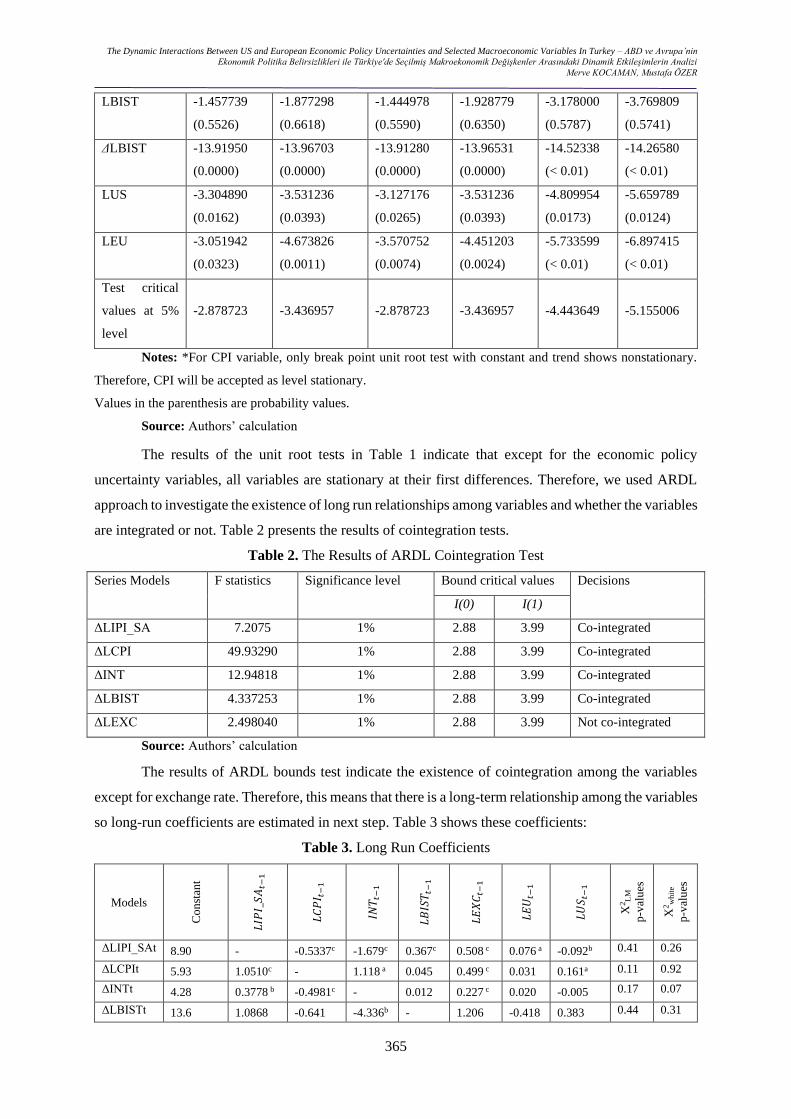
The Dynamic Interactions Between US and European Economic Policy Uncertainties and Selected Macroeconomic Variables In Turkey – ABD ve Avrupa’nin
Ekonomik Politika Belirsizlikleri ile Türkiye'de Seçilmiş Makroekonomik Değişkenler Arasındaki Dinamik Etkileşimlerin Analizi
Merve KOCAMAN, Mustafa ÖZER
365
LBIST -1.457739
(0.5526)
-1.877298
(0.6618)
-1.444978
(0.5590)
-1.928779
(0.6350)
-3.178000
(0.5787)
-3.769809
(0.5741)
ΔLBIST -13.91950
(0.0000)
-13.96703
(0.0000)
-13.91280
(0.0000)
-13.96531
(0.0000)
-14.52338
(< 0.01)
-14.26580
(< 0.01)
LUS -3.304890
(0.0162)
-3.531236
(0.0393)
-3.127176
(0.0265)
-3.531236
(0.0393)
-4.809954
(0.0173)
-5.659789
(0.0124)
LEU -3.051942
(0.0323)
-4.673826
(0.0011)
-3.570752
(0.0074)
-4.451203
(0.0024)
-5.733599
(< 0.01)
-6.897415
(< 0.01)
Test critical
values at 5%
level
-2.878723 -3.436957 -2.878723 -3.436957 -4.443649 -5.155006
Notes: *For CPI variable, only break point unit root test with constant and trend shows nonstationary.
Therefore, CPI will be accepted as level stationary.
Values in the parenthesis are probability values.
Source: Authors’ calculation
The results of the unit root tests in Table 1 indicate that except for the economic policy
uncertainty variables, all variables are stationary at their first differences. Therefore, we used ARDL
approach to investigate the existence of long run relationships among variables and whether the variables
are integrated or not. Table 2 presents the results of cointegration tests.
Table 2. The Results of ARDL Cointegration Test
Series Models F statistics Significance level Bound critical values Decisions
I(0) I(1)
ΔLIPI_SA 7.2075 1% 2.88 3.99 Co-integrated
ΔLCPI 49.93290 1% 2.88 3.99 Co-integrated
ΔINT 12.94818 1% 2.88 3.99 Co-integrated
ΔLBIST 4.337253 1% 2.88 3.99 Co-integrated
ΔLEXC 2.498040 1% 2.88 3.99 Not co-integrated
Source: Authors’ calculation
The results of ARDL bounds test indicate the existence of cointegration among the variables
except for exchange rate. Therefore, this means that there is a long-term relationship among the variables
so long-run coefficients are estimated in next step. Table 3 shows these coefficients:
Table 3. Long Run Coefficients
Models
Co
nst
ant
𝐿𝐼𝑃
𝐼_𝑆
𝐴𝑡−
1
𝐿𝐶
𝑃𝐼 𝑡
−1
𝐼𝑁𝑇 𝑡
−1
𝐿𝐵
𝐼𝑆𝑇 𝑡
−1
𝐿𝐸
𝑋𝐶
𝑡−1
𝐿𝐸
𝑈𝑡−
1
𝐿𝑈
𝑆 𝑡−
1
X2L
M
p-v
alu
es
X2w
hit
e
p-v
alu
es
ΔLIPI_SAt 8.90 - -0.5337c -1.679c 0.367c 0.508 c 0.076 a -0.092b 0.41 0.26
ΔLCPIt 5.93 1.0510c - 1.118 a 0.045 0.499 c 0.031 0.161a 0.11 0.92
ΔINTt 4.28 0.3778 b -0.4981c - 0.012 0.227 c 0.020 -0.005 0.17 0.07
ΔLBISTt 13.6 1.0868 -0.641 -4.336b - 1.206 -0.418 0.383 0.44 0.31

Mehmet Akif Ersoy İktisadi ve İdari Bilimler Fakültesi Dergisi - Mehmet Akif Ersoy University Journal of Economics and Administrative Sciences Faculty
Cilt:7 Sayı:2 s.355-372 Volume:7 Issue:2 p.354-372
Temmuz 2020 July
366
a Denotes statistically significant at 10% b Denotes statistically significant at 5% c Denotes statistically significant at 1%
Source: Authors’ calculation
Notes: X2LM indicates Breusch-Godfrey LM test and X2
white indicates white test.
According to the coefficient estimates, when there is one percent increase in EPUUS, industrial
production decreases about 0.09%. Moreover, if there is one percent increase in EPUEU, industrial
production increases 0.07%. This result is surprising but the reasons of this may be stem from the export
substitution effect. Since Turkey is an important trade partner for the EU, while an increase in EPUEU
decreases European production, import from other countries may increase. Namely, demand for Turkish
products can increase. This causes to increase industrial production in Turkey. Moreover, this dual
model says that if there is 1% increase in EPUUS, CPI increases 0.16%. In terms of diagnostic tests,
Breusch-Godfrey LM test shows that models do not suffer from serial correlation problem. White test
also shows that models don’t have heteroscedasticity problem.
As Granger (1988) indicated that the presence of cointegration implies at least one way of
Granger causality between the variables, we used Granger causality test within the ECM framework.
Table 8 shows the both short and long run Granger causality test results.
Table 8. The Results of Granger Causality Tests
Dependent
Variable
F-statistics [p-values] 𝑒𝑐𝑚𝑡−1
[p-values]
ΔLIPI_SAt ΔLCPIt ΔINTt ΔLBISTt ΔLEXCt ΔLEUt ΔLUSt
ΔLIPI_SAt - 3.1092 c
[0.0011]
3.6667 c
[0.0004]
5.6758 c
[0.0000]
5.6985 c
[0.0000]
2.0734 b
[0.0277]
4.1964 c
[0.0002]
-0.4078 c
[0.0000]
ΔLCPIt 0.4112
[0.5223]
- 4.2259 b
[0.0415]
0.3701
[0.5438]
0.8792
[0.3498]
0.0024
[0.9609]
0.1437
[0.7051]
- 0.0206 c
[0.0000]
ΔINTt 0.8570
[0.3928]
6.5147 c
[0.0004]
- 3.5469 b
[0.0312]
3.3666 c
[0.0010]
0.4850
[0.6283]
-0.5192
[0.6043]
-0.0673 c
[0.0000]
ΔLBISTt 0.3116
[0.7557]
-0.7601
[0.4483]
-2.2838 b
[0.0237]
- -0.4214
[0.6740]
-2.1438 b
[0.0336]
0.3520
[0.7253]
-0.13027 c
[0.0000]
ΔLEXCt 0.2113
[0.8329]
1.0089
[0.3146]
1.2185
[0.2249]
9.5288 c
[0.0001]
- 0.9951
[0.3212]
1.7124 a
[0.0888]
-
a Denotes statistically significant at 10%
b Denotes statistically significant at 5%
c Denotes statistically significant at 1%
Source: Authors’ calculation
Since the coefficients of error correction terms in each equation are statistically
significantly less than one, they indicate existence of long-run causality between left hand side
variable in each equation and right hand side variables. These results also support the findings
of the bounds test that showed the existence of co-movement of the variables in the long run.
The Dynamic Interactions Between US and European Economic Policy Uncertainties and Selected Macroeconomic Variables In Turkey – ABD ve Avrupa’nin
Ekonomik Politika Belirsizlikleri ile Türkiye'de Seçilmiş Makroekonomik Değişkenler Arasındaki Dinamik Etkileşimlerin Analizi
Merve KOCAMAN, Mustafa ÖZER
367
On the other hand, the results of short-run Granger causality tests indicate few
causalities running from EPUEU and EPUUS to macroeconomic variables. They are industrial
production and consumer price index. For example, whereas EPUUS only Granger causes
industrial production, EPUEU Granger causes both industrial production and stock prices at
5% significance level. In addition to these, interest rate, stock exchange, consumer prices and
exchange rate have one-way causality to industrial production. Also, CPI, stock exchange and
exchange rate variables have bi directional causality with interest rate.
Based on the empirical results of the study, we can easily conclude that whatever the
source of the policy uncertainties, financial indicators of the Turkish economy are not affected
by changes in economic policy uncertainties of both EU and US. However, because of the
Turkish economy’s integration into the EU through trade flows industrial production is
significantly affected by policy uncertainties of EU.
6. RESULTS AND DISCUSSION
One of the most important aspects belonging to the crisis is uncertainty. During the crises, both
consumers and investors lose their confidence and struggle to predict the future developments in the
economy. Thus, they behave timidly in their consumption and investment decisions. Because of rising
uncertainty, not only investors, but also consumers can delay their economic decisions. They behave so
carefully in their spending decisions, particularly on consumer durables, like cars and major appliances.
Thus, as Baker et al, (2012) indicated, because of high uncertainty, people spend less and accumulate
liquid assets against any damaging shocks. Also, Rodrik (1991) stated that even though most of the
developing countries have undertaken some comprehensive economic measures, the private investment
response to these reforms has been disappointing owing to the high degree of uncertainty regarding
future economic policy. Therefore, examining the responses of consumers and investors against
economic policy uncertainties will avail to policymakers about identifying the problem and what can be
done in this process.
It is one of the well accepted arguments that Turkey is a relatively open economy and its key
macroeconomic variables can be also affected by the economic policy uncertainties of US and EU. The
main findings of the study indicate that the economic policy uncertainties of US and EU have significant
effects on the price level and the industrial production of Turkey. These results show that both the
changes in price level and level of industrial production are very sensitive to foreign shocks. First of all,
both the price level and industrial production are significantly affected by exchange rate movements
(exchange rate pass through), partially reflected in increase in the economic policy uncertainties of US
and EU, because of the economy’s heavy reliance on imports of intermediate goods and inputs.
Therefore, policymakers of Turkey should always take economic policy uncertainties of US and

Mehmet Akif Ersoy İktisadi ve İdari Bilimler Fakültesi Dergisi - Mehmet Akif Ersoy University Journal of Economics and Administrative Sciences Faculty
Cilt:7 Sayı:2 s.355-372 Volume:7 Issue:2 p.354-372
Temmuz 2020 July
368
European Union into account to form any policies designed to affect the levels of price and industrial
productions.
Secondly, even though the results of the study do not indicate any direct dynamic interactions
between policy uncertainties and other key economic variables; but due to the significant relationships
between price level, industrial production and other macroeconomic variables, the policy makers will
have to be aware of these indirect effects of policy uncertainties on the variables.
7. CONCLUSION
Since economic policy uncertainties have an important impact on consumers and investors
decisions, searching the volume of this impact on specific variables is crucial for policymakers for
decision making process. Therefore, the effects of economic policy uncertainty on the countries’ some
real and financial indicators have been widely searched topics. In the literature, both a countries’ own
EPUs effect and other countries’ EPUs effect on its macroeconomic indicators are investigated.
Especially, the effects of developed countries’ EPU on developing countries macroeconomic indicators
have made a sensation. Since there are only a few studies that search Turkey’s macroeconomic variables
responses to EPUs of developed countries, this study aimed to contribute to the literature with examining
five macroeconomic variables responses to EPU of EU and US.
In this study, the dynamic interactions between economic policy uncertainties of US and EU
and selected macroeconomic variables in Turkey over the period of 2002 January to 2015 December is
examined by using autoregressive distributed lag approach (ARDL) and ECM based Granger causality.
Selected macroeconomic variables are interest rate, stock exchange, consumer price index, industrial
production index and exchange rate. The results of ARDL bounds tests show the existence of long run
relationship among variables. Also, the results of ARDL long-run coefficients and Granger causality
test results indicate significant dynamic interactions between economic policy uncertainties and selected
macroeconomic variables of Turkey both in the short-and long-run implying that important
macroeconomic variables of Turkish economy are vulnerable to foreign economic policy uncertainty
shocks. Therefore, it will be better for Turkish policymakers taking into consideration not only effects
of internal economic policy uncertainties but also external economic policy uncertainties.
REFERENCES
AIZENMAN, J. and MARION, N.P., (1993), “Policy Uncertainty, Persistence and Growth”,
Review of International Economics, Vol.1 No.2, pp.145–163. Available at:
http://dx.doi.org/10.1111/j.1467-9396.1993.tb00012.x.
AMENGUAL, D., and D. XIU., (2014), “Resolution of policy uncertainty and sudden declines
in volatility”, Working Paper, University of Chicago.

The Dynamic Interactions Between US and European Economic Policy Uncertainties and Selected Macroeconomic Variables In Turkey – ABD ve Avrupa’nin
Ekonomik Politika Belirsizlikleri ile Türkiye'de Seçilmiş Makroekonomik Değişkenler Arasındaki Dinamik Etkileşimlerin Analizi
Merve KOCAMAN, Mustafa ÖZER
369
ANTONAKAKIS, N., CHATZIANTONIOU, I., FILIS, G. (2013), “Dynamic co-movements of
stock market returns, implied volatility and policy uncertainty”, Economics Letters,
Vol. 120 No.1, pp. 87-92, doi: http://dx.doi.org/10.1016/j.econlet.2013.04.004.
AROURI, M., ESTAY, C., RAULT, C., and ROUBAUD, D. (2016). Economic policy
uncertainty and stock markets: Long-run evidence from the US. Finance Research
Letters, 18, 136-141, doi: https://doi.org/10.1016/j.frl.2016.04.011
BAKER, S. R., BLOOM, N., DAVIS, S. J. (2015), “Measuring economic policy uncertainty”,
Working paper, No. w21633. National Bureau of Economic Research, doi:
http://dx.doi.org/10.3386/w21633.
BAKER, S. R., BLOOM, N., DAVIS, S. J. (2012), “Has Economic Policy Uncertainty
Hampered the Recovery?”, Becker Friedman Institute for Research in Economics
Working Paper No. 2012-003, doi: http://dx.doi.org/10.2139/ssrn.2000734.
BALCILAR, M., CHANG, T., GUPTA, R., LI, X., (2013), “The Causal Relationship Between
Economic Policy Uncertainty And Stock Returns In China And India: Evidence From
A Bootstrap Rolling-Window Approach”, University of Pretoria Working paper.
BERNANKE, B. S. (1983) “Irreversibility, uncertainty, and cyclical investment”, The Quarterly
Journal of Economics, Vol. 98, No. 1, pp. 85-106, doi: http://dx.doi.org/10.3386/w0502.
BLOOM, N. (2009), “The impact of uncertainty shocks”, Econometrica, Vol. 77, No. 3, pp.
623-685, doi: http://dx.doi.org/10.3982/ECTA6248.
BLOOM, N. (2014), “Fluctuations in Uncertainty”, Journal of Economic Perspectives, Vol. 28,
No. 2, pp. 153–176. doi:10.1257/jep.28.2.153
BROGAARD, J., DETZEL, A. (2015), “The asset-pricing implications of government
economic policy uncertainty”, Management Science, Vol. 61, No. 1, pp. 3-18, doi:
http://dx.doi.org/10.1287/mnsc.2014.2044.
BYRNE, J. P., DAVIS, E. P. (2004), “Permanent and temporary inflation uncertainty and
investment in the United States”, Economics Letters, Vol. 85, No. 2, pp. 271-277, doi:
http://dx.doi.org/10.1016/j.econlet.2004.04.015.
CALDARA, D., FUENTES-ALBERO, C., GILCHRIST, S., and ZAKRAJŠEK, E. (2016),
“The macroeconomic impact of financial and uncertainty shocks”, European Economic
Review, Vol. 88, pp. 185-207.
COLOMBO, V. (2013), “Economic policy uncertainty in the US: Does it matter for the Euro
area?”, Economics Letters, Vol. 121, No. 1, pp. 39-42, doi:
http://dx.doi.org/10.1016/j.econlet.2013.06.024.

Mehmet Akif Ersoy İktisadi ve İdari Bilimler Fakültesi Dergisi - Mehmet Akif Ersoy University Journal of Economics and Administrative Sciences Faculty
Cilt:7 Sayı:2 s.355-372 Volume:7 Issue:2 p.354-372
Temmuz 2020 July
370
CONWAY, P. (1988), “The impact of uncertainty on private investment in Turkey”,
Department of Economics, University of North Carolina, December.
DAKHLAOUI, I., and ALOUI, C. (2016). The interactive relationship between the US
economic policy uncertainty and BRIC stock markets. International Economics, 146,
141-157.
DAVIDSON, J. E., HENDRY, D. F., SRBA, F., and YEO, S. (1978). Econometric modelling
of the aggregate time-series relationship between consumers' expenditure and income
in the United Kingdom. The Economic Journal, 661-692.
DZIELINSKI, M. (2012), “Measuring economic uncertainty and its impact on the stock
market”, Finance Research Letters, Vol. 9, No. 3, pp. 167-175, doi:
http://dx.doi.org/10.1016/j.frl.2011.10.003.
ENGLE, R. F., & GRANGER, C. W. J. (1987). Co-Integration and Error Correction:
Representation, Estimation, and Testing. Econometrica, 55(2), 251.
doi:10.2307/1913236
FRIEDMAN, M. (1968), “The Role of Monetary Policy,” American Economic Review, Vol.
58, No. 1 (March), pp. 1-17.
GILCHRIST, S., SIM, J., ZAKRAJSEK, E. (2009), “Uncertainty, credit spreads and investment
dynamics”, Federal Reserve Working Paper, doi: http://dx.doi.org/10.3386/w20038.
GILCHRIST, S., SIM, J., & ZAKRAJSEK, E. (2010), “Uncertainty, financial frictions, and
investment dynamics”. In 2010 Meeting Papers, Vol. 1285.
GILCHRIST, S., SIM, J. W., ZAKRAJŠEK, E. (2014), “Uncertainty, financial frictions, and
investment dynamics”, National Bureau of Economic Research Working Paper, No.
w20038., doi: http://dx.doi.org/10.3386/w20038.
GRANGER, C. W. (1988), “Some recent development in a concept of causality”, Journal of
econometrics, Vol. 39, No:1-2, pp. 199-211, doi: http://dx.doi.org/10.1016/0304-
4076(88)90045-0.
HASSETT, K. A., METCALF, G. E. (1999), “Investment with uncertain tax policy: Does
random tax policy discourage investment”, The Economic Journal, Vol. 109, No. 457,
pp. 372-393, doi: http://dx.doi.org/10.3386/w4780.
JOHANSEN S. (1996), Likelihood-based inference in cointegrated vector auto- regressive
models. 2nd ed.. Oxford: Oxford University Press.

The Dynamic Interactions Between US and European Economic Policy Uncertainties and Selected Macroeconomic Variables In Turkey – ABD ve Avrupa’nin
Ekonomik Politika Belirsizlikleri ile Türkiye'de Seçilmiş Makroekonomik Değişkenler Arasındaki Dinamik Etkileşimlerin Analizi
Merve KOCAMAN, Mustafa ÖZER
371
JOHANSEN S, JUSELIUS K. (1990), Maximum likelihood estimation and inference on
cointegration with application to the demand for money. Oxford Bull Econ Stat Vol.52,
pp.169–210
JOHNSON, T.C., LEE, J., (2014), “On the systematic volatility of unpriced earnings”, J. Financ.
Econ. Vol. 114, pp. 84–104
KANG, W., RATTI, R. A. (2013), “Oil shocks, policy uncertainty and stock market return”,
Journal of International Financial Markets, Institutions and Money, Vol. 26, pp. 305-
318, doi: http://dx.doi.org/10.1016/j.intfin.2013.07.001.
KARNIZOVA, L., and LI, J. C. (2014), “Economic policy uncertainty, financial markets and
probability of US recessions”, Economics Letters, Vol. 125 No. 2, pp. 261-265.
KLÖßNER, S., SEKKEL, R. (2014), “International spillovers of policy uncertainty”,
Economics Letters, Vol. 124, No. 3, pp. 508-512, doi:
http://dx.doi.org/10.1016/j.econlet.2014.07.015.
LAM, S.S., ZHANG, W., (2014), “Does Policy Uncertainty Matter for International Equity
Markets?” Available at SSRN 2297133.
NDOU, E., GUMATA, N., and NCUBE, M. (2017), Global Economic Uncertainties and
Exchange Rate Shocks. doi:10.1007/978-3-319-62280-4.
OZOGUZ, A. (2009), “Good times or bad times? Investors' uncertainty and stock returns”,
Review of Financial Studies, Vol. 22, No.11, pp. 4377-4422, doi:
http://dx.doi.org/hhn097.
PASTOR, L., VERONESI, P. (2012) “Uncertainty about government policy and stock prices”,
The Journal of Finance, Vol. 67, No. 4, pp. 1219-1264, doi: 10.1111/j.1540-
6261.2012.01746.x
PESARAN, M. H., SHIN, Y., and SMITH, R. J. (2001). Bounds testing approaches to the
analysis of level relationships. Journal of Applied Econometrics, 16(3), 289–326.
doi:10.1002/jae.616
PHILLIPS, P. C. B., & HANSEN, B. E. (1990). Statistical Inference in Instrumental Variables
Regression with I(1) Processes. The Review of Economic Studies, 57(1), 99.
doi:10.2307/2297545
RODRIK, D. (1991), “Policy uncertainty and private investment in developing countries”,
Journal of Development Economics, Vol. 36, No.2, pp. 229-242, doi:
http://dx.doi.org/10.3386/w2999.

Mehmet Akif Ersoy İktisadi ve İdari Bilimler Fakültesi Dergisi - Mehmet Akif Ersoy University Journal of Economics and Administrative Sciences Faculty
Cilt:7 Sayı:2 s.355-372 Volume:7 Issue:2 p.354-372
Temmuz 2020 July
372
SARGAN, J. D. (1964). Wages and prices in the United Kingdom: a study in econometric
methodology. Econometric analysis for national economic planning, 16, 25-54.
SHAHBAZ, M., HYE, Q. M. A., TIWARI, A. K., & LEITÃO, N. C. (2013). Economic growth,
energy consumption, financial development, international trade and CO2 emissions in
Indonesia. Renewable and Sustainable Energy Reviews, 25, 109-121.
SUM, V. (2012a), “Economic policy uncertainty and stock market performance: evidence from
the European Union, Croatia, Norway, Russia, Switzerland, Turkey and Ukraine”,
Journal of Money, Investment and Banking, Vol. 25, pp. 99-104, doi:
http://dx.doi.org/10.2139/ssrn.2094175.
SUM, V. (2012b), “The Reaction of Stock Markets in the BRIC Countries to Economic Policy
Uncertainty in the United States”, doi: http://dx.doi.org/10.2139/ssrn.2094697.
WANG, Y., ZHANG, B., DIAO, X., and WU, C. (2015), “Commodity price changes and the
predictability of economic policy uncertainty”, Economics Letters, Vol. 127, pp. 39-42,
doi:10.1016/j.econlet.2014.12.030

378
MEHMET AKİF ERSOY ÜNİVERSİTESİ
İKTİSADİ VE İDARİ BİLİMLER FAKÜLTESİ DERGİSİ
Mehmet Akif Ersoy University
Journal of Economics and Administrative Sciences Faculty
ISSN: 2149-1658 Cilt: 7 Sayı: 2 s.373-390
Volume: 7 Issue: 2 p. 373-390
Temmuz 2020 July
BAĞIMSIZLIK SONRASI BELARUS DIŞ POLİTİKASINI BELİRLEYEN YAPISAL
FAKTÖRLER
STRUCTURAL FACTORS DETERMINING THE BELARUS FOREIGN POLICY AFTER
ITS INDEPENDENCE
Kaan DİYARBAKIRLIOĞLU1
1. Dr. Öğr Üyesi, Yalova Üniversitesi, İktisadi ve
İdari Bilimler Fakültesi, Uluslararası İlişkiler,
[email protected], https://orcid.org/0000-0003-4511-5330
Makale Türü Article Type
Araştırma Makalesi Research Article
Başvuru Tarihi Application Date
19.02.2020 02.19.2020
Yayına Kabul Tarihi Admission Date
07.07.2020 07.07.2020
DOI
https://doi.org/10.30798/makuiibf.691424
Öz
Belarus Rusya yanlısı takip ettiği politika ve Batı ile normal ilişkiler kuramamasından
kaynaklanan nedenlerle eleştirilerin hedefi olmaktadır. Bu eleştirileri bertaraf etmek için Belarus yönetimi muhtelif zamanlarda çok yönlü (vektörlü) ve pro-aktif dış politika
uygulama girişimlerinde bulunmuştur. Ancak istenilen seviyede bir başarı
sağlanamamıştır. Bu makalede, vaka çalışması analiz yöntemi kullanılarak Belarus dış politikasını bağımsızlığından günümüze belirleyen yapısal faktörlerin incelenmesi
amaçlanmıştır. Bu bağlamda, Belarus'un bazı Asya, Afrika, Latin Amerika ve Arap
ülkeleriyle ilişkilerini etkileyen değişkenler, belirleyicilerin dış politika üzerinde nasıl bir etki yarattığını göstermek için analiz edilmiştir. Sonuç olarak, Belarus dış
politikasının gelişiminde bağımsızlık sonrası yapılan anayasal ve yasal düzenlemelerin
etkili olduğu, bu değişimlerde de ülkeyi kesintisiz 25 yıldır yöneten Aleksandr Lukaşenko’nun tek başına aldığı kararların önemli rol oynadığı anlaşılmaktadır.
Anahtar Kelimeler: Çok Yönlü Dış Politika, Belarus Dış Politikası, Belarus
Siyasi Tarihi, Siyasal Hayat, Siyasal Kurumlar, Bölgesel Çalışmalar,
Abstract
Belarus has been subject to criticisms for its policy in favor of Russia and its inability
to establish normal relations with the West. In order to eliminate these criticisms, the
Belarusian government has attempted to implement a multifaceted (vector) and proactive foreign policy at various times. However, the desired level of success has not
been achieved. In this article, by utilizing the case study analysis method, it is aimed to
examine the structural factors that determine the Belarusian foreign policy from its independence to present. In this context, the variables that affect the relations of Belarus
with some Asian, African, Latin American and Arab countries were analyzed to show
how the determinants have had influence on the foreign policy. As a result, it is understood that the constitutional and legal amendments made after independence were
effective in the development of Belarusian foreign policy, and the decisions taken by
Aleksandr Lukashenko, who ruled the country for 25 years without interruption, played an important role in these changes.
Keywords: Multifaceted Foreign Policy, Belarusian Foreign Policy,
Belarusian Political History, Political Life, Political Institutes, Regional
Studies,

Bağımsızlık Sonrası Belarus Dış Politikasını Belirleyen Yapısal Faktörler - Structural Factors Determining The Belarus Foreign Policy After Its
Independence
Kaan DİYARBAKIRLIOĞLU
379
EXTENDED SUMMARY
Research Problem
The aim of the study; In this article, the structural factors determining Belarusian foreign policy
after its independence have been examined comparatively with the case analysis method from its
independence to present. In this context, the variables that affect the relations of Belarus with some
Asian, African, Latin American and Arab countries were analyzed to show how the determinants have
had influence on the foreign policy.
Research Questions
How has Belarusian foreign policy emerged after its independence? What are the structural
factors determining Belarusian foreign policy from its independence to present? How have the variables
(structural factors) affected the relations of Belarus with some Asian, African, Latin American and Arab
countries?
Literature Review
The literature review was conducted in three stages. In the first stage, the articles and books on
the electronic databases such as EBSCO, JSTOR, Springer, Taylor and Francis were searched and
related sources were picked and read; in the second stage Belarusian Presidential decrees and official
documents on the websites of the Belarusian parliament and ministry were examined; In the third stage,
dissertation thesis on the Belarussian Politics and other countries were examined.It is understood that
there are two groups of studies regarding this research subject. In first group, the studies (reports, books,
articles, journals ect.) are published by Belarusian government agencies and employees. Therefore, it
can be suggested that official opinions are mostly reflected directly or indirectly in those studies. In the
second group, there are books and articles written by academicians from Belarus and other countries.
Those authors in this group are approaching the developments in Belarusian politics more critically than
the first group.In this study, beside the opinions of the both groups, the Belarussian official documents
and articles and news from the newspapers either from the Belarus and from the other countries are used
as sources to get answers to the research questions.
Methodology
This research mainly focused on three questions. First of all, in order to understand the research
subject (the structural factors determining Belarusian foreign policy after its independence), variables
were found after clustering the sources (literature review). The variables are as below: Independent
variables: First, Constitutional and other legal regulations from independence to present. Second,
Political leader (Aleksandr Lukaşenko) who has been the President since 25 years.Hypothesis:
Constitutional and other legal regulations, and political leader (Aleksandr Lukaşenko) who has been the
President since 25 years are most effective structural factors determining Belarusian foreign policy after
its independence.In this article, the structural factors determining Belarusian foreign policy have been
examined comparatively with the case analysis method from its independence to present. In this context,

Mehmet Akif Ersoy İktisadi ve İdari Bilimler Fakültesi Dergisi - Mehmet Akif Ersoy University Journal of Economics and Administrative Sciences Faculty
Cilt:7 Sayı:2 s.373-390 Volume:7 Issue:2 p.373-390
Temmuz 2020 July
380
the variables that affect the relations of Belarus with some Asian, African, Latin American and Arab
countries were analyzed to show how the determinants have had influence on the foreign policy.
Results and Conclusions
As the post-independence process continues until today, the Republic of Belarus has
experienced a difficult and challenging development process as a new independent state, like other
former Soviet countries. Although Belarusians' close relations with Russia have caused her national
identity to be weak, the political class consolidated around President Lukashenko during the
development process, along with the difficulties and failures, has revealed that they can manage the
country relatively independently. The constitutional and legal arrangements that built the political
system that will shape the post-independence state administration have formed the main framework for
the country, and in this context, the institutional foundations of Belarusian foreign policy have been laid.
It also develops over time. As the first country to voluntarily abandon nuclear weapons, Belarus has
made a significant contribution to the international and European security and disarmament process. At
the same time, good neighborly relations have been established with the neighboring countries.
However, it continues to develop integration ties with other countries that have gained post-Soviet
independence. Along with the successes, especially from the second half of the 1990s, deficiencies of
Belarusian foreign policy have also emerged. For 25 years since Lukashenko's winning the presidential
election in 1994, the USA and the European Union have pursued a policy to isolate Belarus
diplomatically in order to promote democratization and human rights in Belarus. This effort resulted in
the imposition of economic and travel sanctions against the Belarusian regime in 2006. The advantages
of Belarus's geopolitical and geo-economic position have not yet been used at the desired level.
Opportunities for good neighborly and wide-ranging cooperation have been particularly limited by
Russia, Belarus's financial-economic and military-political dependence on Russia has not decreased in
recent years but has increased. The deterioration of relations with western and influential European and
transatlantic organizations (European Union, Council of Europe, NATO) has weakened Belarus's
international positions and foreign policy potential. Lukaşenko did not strive for a strong national
identity awareness for years. Because Belarus saw patriotism as a devastating project sponsored by
political enemies. For this reason, shortly after he took office, he held a referendum that approved the
economic integration with Russia and gave Russian the same status with Belarusian. However, after
Moscow annexed Crimea and sent troops to Eastern Ukraine on the pretext of defending the "Russky
Mir" or Russian-speaking Russian population, Lukaşenko's above-mentioned thoughts began to change
in 2014 (Higgins: 2019). This grift cultural area mentioned by Russia also includes most of Belarus,
parts of Kazakhstan and large populations in three Baltic States. This, of course, inevitably revealed the
necessity of pursuing a multi-vector foreign policy in Belarusian foreign policy.It is seen that the
president himself was much more effective in Belarus's efforts to improve relations with some Asian,
African, Latin American and Arab countries since 1996. With the influence of the above-mentioned
developments, Lukashenko, who has ruled the country for 25 years, has increased the tendency to follow

Bağımsızlık Sonrası Belarus Dış Politikasını Belirleyen Yapısal Faktörler - Structural Factors Determining The Belarus Foreign Policy After Its
Independence
Kaan DİYARBAKIRLIOĞLU
381
multi-vector foreign policy. In this respect, firstly, adaptation in domestic and foreign policy should be
provided in order to strengthen Belarus's national and international identity and to establish a better
relationship with the West in order to make it a self-sufficient European state.
Mehmet Akif Ersoy İktisadi ve İdari Bilimler Fakültesi Dergisi - Mehmet Akif Ersoy University Journal of Economics and Administrative Sciences Faculty
Cilt:7 Sayı:2 s.373-390 Volume:7 Issue:2 p.373-390
Temmuz 2020 July
382
1. GİRİŞ
Genel olarak, Belarus Cumhuriyeti'nin gelişim tarihi ülkeyi yöneten siyasi rejimin türüne bağlı
olarak iki aşamaya ayrılabilir. İlk aşama, Belarus Cumhuriyeti’nin bağımsızlığını kazanmasının yasa ile
ilan edildiği 25 Ağustos 1991 tarihinden Aleksandr Lukaşenko’nun ilk cumhurbaşkanlığı seçimleri
sonucu devlet başkanlığına seçildiği 20 Temmuz 1994’e kadar olan kısa bir dönemi kapsamaktadır. Bu
dönem, 12. Yüksek Konseyin ülkenin başında olduğu dönemde, Mayıs 1990’da çalışmalarına başlayan
parlamento cumhuriyetinin var olduğu zamandır. Parlamenter cumhuriyet dönemi, bağımsızlık sonrası
meclis ve devlet başkanı olan ve yetkilerini 9 Eylül 1991’den 26 Ocak 1994’e kadar kullanan Stanislav
Shushkevich’in dönemidir (Sanford, 1996, s. 141). Belarus Cumhuriyeti tarihinin ikinci aşaması ise, 20
Temmuz 1994’te Aleksandr Lukashenko’nun Devlet Başkanı görevine gelmesinden itibaren başlayan
ve günümüze kadar devam eden 25 yıllık bir cumhurbaşkanlığı cumhuriyeti veya başkanlık hükümeti
dönemidir.
Belarus Cumhuriyeti tarihinin yukarıda bahsedilen dönemlerine göre dış politikasının tarihi de
parlamento cumhuriyetinin dış politikası ve cumhurbaşkanlığı cumhuriyetinin dış politikası olmak üzere
iki aşamaya ayrılabilir. Parlamento dönemini organik bütünlüğünü ve kısa vadeli olmasını hesaba
katınca daha alt dönemlere ayırmaya imkân yoktur. Ancak, Belarus devletinin dış politika tarihindeki
25 yıllık cumhurbaşkanlığı dönemini ayrıca iki aşamaya ayırmak mümkündür. İlk dönem 1994-1999
yıllarını kapsamaktadır. Bu dönem, Rusya ile beş yıllık "aktif bütünleşme politikası" dönemidir. Söz
konusu dönem, seçim programının temel unsurlarından biri olarak Rusya ile entegrasyonu ilan eden
Cumhurbaşkanı Aleksandr Lukashenko’nun iktidara gelmesiyle başlamakta ve iki büyük vakıa ile sona
ermektedir. Bunlar, 8 Aralık 1999’da Birlik Devletinin Kurulmasına İlişkin Belarus-Rusya
Antlaşması’nın imzalanması ve Rusya Federasyonu Başkanı Boris Yeltsin tarafından takip edilmiş olan
bir önceki entegrasyon politikasının sonu anlamına gelen çok daha önemli bir olayın 31 Aralık 1999’da
meydana gelmiş olmasıdır.
Cumhurbaşkanı Aleksandr Lukaşenko’nun dış politika faaliyetinin ikinci aşaması 2000 yılında
başlamış ve günümüze kadar devam etmiştir. Bu aşama, Belarus literatüründe, "çok yönlü dış politika"
olarak adlandırılmaktadır (Korosteleva, 2011, s. 576). “Belarus Cumhuriyeti'nin çok yönlü dış
politikası” olarak da ifade edilebilecek bu politikanın, cumhurbaşkanının bütünleşme politikası sırasında
Doğu-Batı’ya yönelik takip edilen politikalarla ilgili önyargıların düzeltilmesi olarak anlaşılması
gerekmektedir.
Dengeli ve tüm coğrafi vektörlerinin yeknesak bir şekilde geliştirilmesine çaba gösteren bir
devletin çok yönlü bir dış politikaya ihtiyaç duyacağı açıktır. Bu nedenle, devletler bu minvalde bir dış
politika ilkesini ya zorunlu kılmayı ya da hiç uygulamamayı tercih ederler. 1990'ların ikinci yarısında
doğuda Rusya yönünde bir önyargıdan ve 1996'dan beri de Batı ile normal ilişkilerin olmamasından
dolayı Belarus Cumhuriyeti için çok yönlü bir dış politika uygulanması arzulanan ama gerçek olmayan
bir durum olarak kalmaktadır. Aslında, Kasım 1996’dan sonra, devletin dış politikası batı ve kuzeyde,

Bağımsızlık Sonrası Belarus Dış Politikasını Belirleyen Yapısal Faktörler - Structural Factors Determining The Belarus Foreign Policy After Its
Independence
Kaan DİYARBAKIRLIOĞLU
383
özellikle siyasi alanda daha çok dış ekonomik alanla sınırlı ciddi bir dengesizlik yaşıyor iken, doğu ve
güney ile aktif ve normal olarak iki yönde gelişmektedir.
Belarus Cumhuriyeti dış politika tarihinde Batı ile ilişkilerin gelişimini iki döneme ayırmak
mümkündür. Birincisi 1991-1996 yılları arasında Batı devletleriyle ilişkilerin gelişmekte olduğu ve
sürdüğü aşama; ikincisi ise, 24 Kasım 1996'da yapılan ancak Batı devletleri ve uluslararası örgütler
(AGİT, Avrupa Konseyi, Avrupa Birliği) tarafından tanınmayan anayasa referandumundan sonra
başlayan dönemdir. Bu dönem, Batı toplumuyla normal ve istikrarlı ilişkilerin olmadığı bir dönemdir.
Bu makalede, Belarus dış politikasının bağımsızlık sonrası nasıl geliştiği ve oluşumunda hangi
faktörlerin etkili olduğu incelenmektedir. Belarus dış politikasının gelişimde bağımsızlık sonrası siyasal
alanda meydana gelen gelişimler sonucu ortaya konan anayasal ve yasal düzenlemeler etkili olmuş,
ancak zamanla 25 yıldan beri süre gelen aynı siyasal liderin tek başına aldığı kararlar dış politikanın
yönünü belirlemiştir.
2. BELARUS DIŞ POLİTİKASININ ANAYASAL, YASAL VE
KAVRAMSAL ARKA PLANI
Bağımsız bir Belarus dış politikasının temelleri, Belarus Halk Cephesi’nin (BHC) çabalarıyla
perestroyka döneminde şekillenmeye başlamıştır (Leshchenko, 2004, s. 341). BHC milletvekillerinin
girişimi üzerine, 27 Temmuz 1990 tarihinde Belarus Sovyet Sosyalist Cumhuriyeti (BSSC) Yüksek
Konseyi, Belarus’un bağımsızlığına ilişkin yasal dayanağı belirleyen Belarus Sovyet Sosyalist
Cumhuriyeti Devlet Egemenliği Bildirgesi'ni kabul etmiştir (Lashkevıch, 2011). Başarısız darbe
girişiminin ardından, 25 Ağustos 1991’de BSSC Yüksek Konseyi’nin olağanüstü 5. oturumu, Belarus
Sovyet Sosyalist Cumhuriyeti’nin Devlet Egemenliği Beyanına anayasal hukuk statüsünü vermiş ve
“Belarus Sovyet Sosyalist Cumhuriyeti'nin ekonomik ve siyasi bağımsızlığı" kararını almıştır (Foreign
Policy of the Republic of Belarus, 2018). Bu kararlar daha sonra Belarus’un bağımsızlık beyanı olarak
yorumlanmıştır.
15 Mart 1994 tarihinde kabul edilen Belarus Cumhuriyeti Anayasası, Belarus devletinin dış
politikasının temellerini, hedeflerini, amaçlarını ve ilkelerini belirleyen bir dizi hüküm içermektedir.
Anayasanın 8. maddesine göre, Belarus Cumhuriyeti, uluslararası hukukun genel kabul görmüş
ilkelerinin önceliğini kabul etmekte ve mevzuata uyumlarını sağlamaktadır. Aynı madde, uluslararası
hukukun normlarına uygun olarak, devletlerarası oluşumlara girme ve çıkma konusunda Belarus
Cumhuriyetinin haklarını da korumaktadır. Belarus Cumhuriyeti’nin devletlerarası oluşumlara girme ve
çıkma hakkı, Anayasa’ya 24 Kasım 1996 anayasa referandumunda kabul edilen değişikliklerle
eklenmiştir. Anayasa’nın 18. maddesi dış politikaya adanmıştır. Belarus Cumhuriyeti'nin dış
politikasında, devletlerin eşit olduğu, güç kullanımı veya güç tehdidinde bulunmama, sınırların
dokunulmazlığı, anlaşmazlıkların barışçıl yollarla çözülmesi, içişlerine müdahale etmeme ve

Mehmet Akif Ersoy İktisadi ve İdari Bilimler Fakültesi Dergisi - Mehmet Akif Ersoy University Journal of Economics and Administrative Sciences Faculty
Cilt:7 Sayı:2 s.373-390 Volume:7 Issue:2 p.373-390
Temmuz 2020 July
384
uluslararası hukukun genel kabul görmüş diğer ilke ve normlarına saygı gösterme gibi ilkeler
sıralanmıştır1.
Belarus devletinin dış politikasının temellerinin oluşumunun bir sonraki aşaması,
cumhurbaşkanlığı yönetimi dönemidir. 20 Temmuz 1994’ten sonra kabul edilen bu alandaki ana
belgelerin başında sırasıyla 1995, 2001 ve 2010 yıllarında belirlenen Belarus Cumhuriyeti’nin ulusal
güvenlik konsepti gelmektedir (National Security Concept Adopted in Belarus, 2010). Aynı zamanda
bu güvenlik konsepti temel olarak 2002 ve 2016 yıllarından ortaya konan Belarus Cumhuriyeti Askeri
Doktrinlerinin de temelini oluşturmaktadır (Sivitsk, 2016, s. 2). Bununla birlikte 2005 yılında Belarus
Cumhuriyeti İç ve Dış Politikasının Ana Yönergelerini Onaylayan Kanun gibi belgeleri de içermektedir
(Tikhomirov, 2017, s. 443).
3 Ocak 2002 tarihinde Belarus Cumhuriyeti Cumhurbaşkanı kararnamesi ile onaylanan Belarus
Cumhuriyeti askeri doktrini tamamen savunma niteliğindedir. Bu doktrinde ilk kez, Belarus’un diğer
devletlerden herhangi bir toprak talebinde bulunmadığı ve diğer devletlerin bu tür iddialarını tanımadığı
ifadesi vurgulanmaktadır. Sovyetler Birliğinin dağılmasından sonra bağımsızlığını kazanan diğer
devletlerin askeri doktrinlerinde bu tür toprak iddialarının doğrudan veya dolaylı yer aldığını görmek
çok nadiren rastlanan bir durumdur. Belarus askeri doktrini (2002), Belarus’un birlikte tek bir savunma
alanı oluşturduğu Rusya'nın rolünü vurgulamaktadır. Bununla birlikte, Rusya-Ukrayna arasında yaşanan
hibrit çatışma ve yeni bir “Soğuk savaş” ihtimalinin ortaya çıkması 2002 tarihli askeri doktrinin 2016'da
geliştirilmesine/güncellenmesine büyük katkıda bulunmuştur. 2016’da yapılan bu güncelleme ile sadece
Batı’dan değil, Rusya’dan gelecek olası zorlukları ve tehditleri de göz önünde bulunduran bir doktrin
ortaya konulmuştur (Sivitsk, 2016, p. 6).
Diğer taraftan, Belarus Cumhuriyeti dış politikasının ilkeleri, hedefleri ve amaçları, Belarus
Cumhuriyeti Cumhurbaşkanlığı kararnamesi ile onaylanan ve “Belarus Cumhuriyeti İç ve Dış
Politikasının Ana Yönergelerinin Onaylanmasına Dair Kanun” ile yasal olarak 14 Kasım 2005 tarihinde
düzenlenmiştir2. Bu belge, bir dizi özelliğe ile dikkat çekmektedir. Bunlardan ilki, belgede komşu ve
diğer yabancı ülkelerin yasama uygulamalarında genellikle kaçındığı iç ve dış politikanın ana yönlerinin
belirlenmiş olması ve bir kanunda birleştirilmesidir. Bu yönüyle, belge Anayasa'nın hükümlerini büyük
ölçüde tekrarlar niteliktedir. Bu nedenle, içeriği gereğinden fazla genel ifadelerle doludur. Bir diğer
özelliği ise, “Belarus Cumhuriyeti Dış Politikasının Ana Yönleri” bölümünde, Anayasa’da yer alan
“Belarus’un nükleersiz ve tarafsız bir devlet olma” prensibine atıfta bulunulmamasıdır. Bunun yerine,
“uluslararası ilişkilerin tutarlı bir şekilde silahsızlandırılması politikasına bağlılık; uluslararası
güvenliğin güçlendirilmesine, kitle imha silahlarının yayılmasının önlenmesine ve silahların kontrolüne
yardımcı olmak…” şeklinde ifadeler yer almaktadır. Son olarak, yasa metninde, öncelikler olağan dışı
1 Belarus Anayasa metni için bkz. “Konstitutsiya Respubliki Belarus”, http://pravo.by/pravovaya-informatsiya/normativnye-
dokumenty/konstitutsiya-respubliki-belarus. 2 Kanunun tam metni için bkz. “ZAKON RESPUBLIKI BELARUS 14 noyabrya 2005 g. № 60-Z Ob utverzhdenii Osnovnykh napravleniy vnutrenney i vneshney politiki Respubliki Belarus”, http://pravo.by/document/?guid=3871&p0=H10500060, 17
Temmuz 2019.

Bağımsızlık Sonrası Belarus Dış Politikasını Belirleyen Yapısal Faktörler - Structural Factors Determining The Belarus Foreign Policy After Its
Independence
Kaan DİYARBAKIRLIOĞLU
385
olarak dış politika uygulama alanlarına yerleştirilmiştir. Örneğin, dış ekonomik faaliyet ve uluslararası
ekonomik iş birliği ilk sırada yer almakta ve ardından ülkenin uzay etkinlikleri alanında uluslararası iş
birliği hedefi izlemektedir. Diğer taraftan, Uluslararası güvenlikten ve uluslararası askeri iş birliğinden
de bahsedilmektedir. Ancak, yabancı ülkelerle ve uluslararası örgütlerle ilişkiler gibi dış politika
uygulama alanlarından doğrudan söz edilmemektedir. Genel olarak belli alanlarda uluslararası iş birliği
kavramı kullanılmaktadır. Sonuç olarak, yasanın ikinci bölümünün metni, Belarus dış politikasını aşırı
pragmatik bir istikamete yönlendiren ve büyük oranda teknokrat bir bakışı yansıtmaktadır (Shadurski,
2018, s. 13).
9 Kasım 2010'da bir cumhurbaşkanlığı kararnamesiyle, Belarus Cumhuriyeti Ulusal Güvenlik
Konseptinin yeni bir versiyonu, ülkenin “kurulmuş, bağımsız, dünya güç merkezlerinden herhangi
birine ait olmayan egemen bir Avrupa devleti, barışçıl bir dış politika yürüten ve tarafsız bir statü3 elde
etmek için şartlar oluşturmayı isteyen bir devlet olduğu şekilde teyit edilmiştir”4. Bu formülasyonun,
Askeri Doktrinde veya İç ve Dış Politika Yönergesinde bulanmayan bir soruya cevap verdiği
görülmektedir. Konseptteki bu hüküm Anayasa'da belirtildiği gibi daha az kategorik ve kısa görünmekle
birlikte tarafsız bir statü elde etmek için uzun bir koşul oluşturma süreci içermektedir. Aynı zamanda,
Anayasa'nın 1994 yılında kabul edilmesinden sonra, ilk kez resmi bir belgede ortaya çıkması ve tarafsız
bir devlet olma arzusuna yapılan atıf, tarafsızlık kavramının baskın olduğu parlamento cumhuriyetinin
kavramsal kurallarına kesin bir dönüş olarak kabul edilebilir (Rotman & Veremeeva, 2011, s. 82).
Benzer bir kavramsal yapıya sahip önceki belgelerin aksine, mevcut Ulusal Güvenlik Konsepti (2010)
oldukça gerçekçi ve sade olarak bir ülkenin şu andaki ulusal güvenliğinin durumunu ve maruz kaldığı
temel tehditleri, zorlukları ve riskleri açıklamaktadır. Konseptte, örneğin, hammadde ve enerji
kaynakları arzının garanti edilmesinin imkânsızlığı, dış pazarların kaybı, yetersiz ve düşük yabancı
yatırım, Belarus Cumhuriyeti'nin katıldığı bütünleşme yapılarının ve uluslararası örgütlerin zayıflaması
gibi konular ön plana çıkmaktadır. Bu iç ve dış tehditlerin neler olduğu güncel ulusal güvenlik
konseptinin dördüncü ve beşinci bölümlerinde açıkça sıralanmaktadır (Rotman & Veremeeva, 2011, s.
84).
Sonuç olarak, görüldüğü gibi bağımsızlık yılları boyunca, özellikle cumhurbaşkanlığı
cumhuriyetinde, dış politikanın anayasal ve yasal çerçevesi oluşturulmuş ve sistematik olarak ihtiyaç
duyulan güncellemeler yapılmıştır. Ancak, Askeri Doktrin ve Ulusal Güvenlik Konseptinin sistematik
olarak güncellenmesinin yanı sıra, yabancı devletlerin yasal deneyimleri göz önünde bulundurularak
Belarus dış politikası daha da geliştirilebilir.
4 Kararnamenin tam metni için bkz. “Decree of the President of the Republic of Belarus of November 9, 2010 No. 575”,
http://www.pravo.by/document/?guid=3961&p0=P31000575, 17 Temmuz 2019.

Mehmet Akif Ersoy İktisadi ve İdari Bilimler Fakültesi Dergisi - Mehmet Akif Ersoy University Journal of Economics and Administrative Sciences Faculty
Cilt:7 Sayı:2 s.373-390 Volume:7 Issue:2 p.373-390
Temmuz 2020 July
386
3. BELARUS DIŞ POLİTİKA ÖNCELİKLERİ VE DİNAMİKLERİ
Belarus Cumhuriyeti Dışişleri Bakanı Pavlo Kravchenko, BM Genel Kurulunun 46. oturumunda
26 Eylül 1991 tarihinde yaptığı konuşmasında ilk kez Belarus Cumhuriyeti dış politikasının
önceliklerinden bahsetmiştir. Kravchenko'ya göre bu öncelikler arasında Belarus tarafından gerçek
bağımsızlık ve egemenliğin sağlanması, SSCB'nin diğer cumhuriyetleri ile etkileşim ve tek bir
ekonomik alan ve yeni bir egemen devletler birliği oluşturulması, Çernobil sorununun çözümünde
uluslararası desteğin seferber edilmesi, Belarus’un nükleerden arındırılmış ve tarafsız bir ülkeye
dönüştürülmesi, Belarus Cumhuriyeti’nin Pan-Avrupa sürecine dahil edilmesi, ülkede piyasa
ekonomisinin oluşumu için koşullar yaratılması, çevre güvenliğinin sağlanması, kültürlerin serbest
etkileşiminin sağlanması gibi konular bulunmaktadır (Metezh, 2016, s. 8). Ayrıca, Pavlo Kravchenko
BM Kürsüsünden, Belarus halkının hayati çıkarlarının devletin dış politikasının temeli olduğu
belirtmiştir. Pavlo Kravchenko'nun konuşması, bağımsızlık aşamasında Belarus Cumhuriyeti dış
politikasının amaçlarının, hedeflerinin ve öncelikli yönlerinin ilk kavramsal ifadesi olarak kabul
edilebilir. Diğer taraftan, Yüksek Konsey Başkanı Stanislav Shushkevich, Rusya ve diğer Bağımsız
Devletler Topluluğu (BDT) ülkeleriyle kapsamlı iş birliği için stratejik duruşu reddetmeden, Belarus
için Avrupa siyasi haritası üzerinde Doğu ile Batı arasında bir köprü olarak yeni bir yer arıyordu.
Dışişleri Bakanı Pavlo Kravchenko, gelecekte bir Doğu Avrupa ekonomik topluluğu oluşturmak
amacıyla Belarus’un BDT'deki entegrasyon süreçlerinin merkezine dönüştürülmesini istemekteydi.
Ancak, Yüksek Konsey Başkanı da dahil olmak üzere etkili siyasi güçlerden destek alamamıştır.
Stanislav Shushkevich ve Pavlo Kravchenko, bir dizi dış politika konusundaki pozisyon farklılığına
rağmen, Rusya'ya olan ekonomik, politik ve askeri bağımlılığı zayıflatma ve aynı zamanda Orta ve Batı
Avrupa ülkeleri ve ABD ile olan siyasi ve ticari ilişkileri güçlendirme arzusuyla birleşmiştir. Stanislav
Shushkevich’in dış politika faaliyetinin doruk noktası, Belarus Cumhuriyeti’nin nükleer olmayan bir
devlet olarak nükleer silahların yayılmasının önlenmesine ilişkin olarak katılımını sağlayan Stratejik
Silahların Azaltılması Antlaşması’nın (START-1) ve 1992 Lizbon Protokolünün 1993 yılı şubat ayında
meclis tarafından onaylanmasıdır. Bu, Belarus’un de jure olarak, 1996’da Rusya’daki stratejik nükleer
silahların ülkeden çekilmesinin ardından da de facto olarak nükleer bir devlet olmadığı anlamına
geliyordu (Tikhomirov, 2012, s. 4). Temmuz 1993’de Yüksek Konsey Başkanı Stanislav Shushkevich
başkanlığındaki bir Belarus resmi heyeti ABD’yi ziyaret etmiş ve Ocak 1994’te de ABD Başkanı Bill
Clinton Minsk’e resmi bir ziyarette bulunmuştur (Sivitsk, 2016, s. 7). Görüldüğü gibi, Batının diğer
ülkeleri ve Güney dünyası ile ilişkiler bu dönemde geliştirilmeye çalışılmıştır. Ancak diğer taraftan,
Stanislav Shushkevich’in şiddetle karşı çıkmasına rağmen, BDT’ye üye devletlerin Kolektif Güvenlik
Anlaşması’na katılmasını Nisan 1993’te kabul eden Yüksek Konsey kararı büyük bir dış politika
başarısızlığı olarak tarihteki yerini almıştır. Çünkü bu gelişmeyi Stanislav Shushkevich tarafsızlığa
doğru giden yoldan bir çıkış olarak görmüştür (Sivitsk, 2016, s. 9).

Bağımsızlık Sonrası Belarus Dış Politikasını Belirleyen Yapısal Faktörler - Structural Factors Determining The Belarus Foreign Policy After Its
Independence
Kaan DİYARBAKIRLIOĞLU
387
20 Temmuz 1994’de yapılan ilk başkanlık seçimini Alexander Lukashenko kazanmıştır.
Yönetiminin ilk iki yılında Cumhurbaşkanı Alexander Lukashenko dış politikanın yürütülmesi için
dengeli ve pragmatik bir yaklaşımdan yana tavır almıştır. Alexander Lukashenko, Belarus dış
politikasının özünün ekonomik çıkarlar olacağını ve Doğu’dan mı yoksa Batı’dan mı geldiğine
bakılmaksızın bu çıkarları karşılayan her şeyin korunacağını ve dikkate alınacağını savunmuştur.
Ayrıca, batı, orta ve doğu Avrupa bölgelerinin ülkeleriyle ilişkileri geliştirerek Belarus devletinin doğu
ve batı çıkarları arasında bir denge kurma niyetini açıklamıştır (Atasoy, Galai, & Mazbayev, 2014, s.
29).
Başkan, göreve gelmesinin ilk aylarında, Vyaçaslau Kebich hükümetinin Rusya ile enerji elde
etmek için kurduğu tercihli fiyatlara dayanan ilişkiler ağından uzaklaşmaya çalışmıştır. Ancak daha
sonra Moskova ile ilişkilerinde askeri-siyasi alanda biraz daha zamana oynayarak sakin kalmaya
çalışmıştır.
Diğer taraftan, Cumhurbaşkanı ile parlamento arasında bir çatışma yaşanmış ve politik bir krizle
sonuçlanmıştır. Bu çatışmanın en önemli sebebi, Alexander Lukashenko’nun diğer hükümet
organlarının aleyhine başkana çok geniş yetkiler veren bir Anayasa’yı Kasım 1996’da referanduma
götürmek istemesidir. Referandum, bağımsız Belarus tarihinde ve iki karşıt, ancak aynı zamanda
birbiriyle ilişkili ve birbirine bağımlı vektörler ile karakterize edilen dış politikasının tarihinde yeni bir
aşama açmıştır. Bir bakıma uluslararası alanda Belarus’u tecrit etmeye, kıyaslanamayan bir şekilde daha
güçlü bir doğu komşusu Rusya’ya olan bağımlılığının artmasına ve entegrasyona girmesine yol açmıştır.
1990'ların sonunda, Rusya yönelimi önyargısını düzeltmek amacıyla, Belarus cumhurbaşkanı
“çok yönlü” bir dış politika ilan etmiştir. Bu durum, Asya, Afrika ve Latin Amerika ülkeleriyle bağların
yoğunlaşmasında ve ülkenin 1998'de Bağlantısızlar Hareketi'ne katılımında ortaya çıkmıştır (Dwan &
Pavliuk, 2015, s. 81). Aynı zamanda, öncelikle NATO ve AB'ye yönelmiş batı komşularıyla (Polonya
ve Baltık ülkeleri) ilişkilerin geliştirilmesini amaçlayan Belarus çevresinde bir “komşuluk kuşağı”
oluşturma kavramı ortaya konulmuştur. Ancak, Batı devletleriyle olan ilişkilerin iyileştirilmesinde
önemli derecede başarı sağlanamamıştır.
Rusya Devlet Başkanı Vladimir Putin iktidara geldikten sonra, Rusya ile Belarus ilişkilerinin
geliştirilmesinde ekonomiyi etkili olarak kullanan pragmatist bir politika izlemiştir (Trenin, 2009, s. 17).
İlk olarak, iki ülkenin birbirleriyle bütünleşmesine (Anayasa Yasası'nın imzalanması ve tek bir para
biriminin getirilmesi gibi konularda) çalışılmış, ancak karşılıklı çıkarlarının uyuşmaması nedeniyle bu
çabalar belirsiz bir zamana ertelenmiştir. Belarus, Putin'in Belarus’un Rusya Federasyonu'na bir bütün
olarak ya da altı bölge olarak entegre edilmesi konusundaki önerilerini reddetmiştir. Diğer taraftan,
Belarus-Rusya ilişkilerinin gelişmesi, enerji ve ticaret alanlarında yaşanan sorunlar nedeniyle gölgede
kalmıştır. Rusya, geleneksel olarak Belarus’un ana ticaret ortağı ve Belarus malları için en büyük ihracat
pazarı olmuştur. 2018 rakamlarına göre Belarus ihracatının % 38,4'ü ve ithalatın % 58,9 Rusya ile
yapılmaktadır (Foreign trade of Belarus in 2018, 2019).

Mehmet Akif Ersoy İktisadi ve İdari Bilimler Fakültesi Dergisi - Mehmet Akif Ersoy University Journal of Economics and Administrative Sciences Faculty
Cilt:7 Sayı:2 s.373-390 Volume:7 Issue:2 p.373-390
Temmuz 2020 July
388
1990'ların ikinci yarısında, Belarus’un Asya ve Arap ülkeleriyle olan ilişkileri yoğunlaşmıştır.
Aleksandr Lukaşenko'nun Çin, Hindistan, Vietnam, Suriye, Mısır ve Asya-Pasifik bölgesinin diğer
ülkelerine resmi ziyaretler yapmış, bu ziyaretlerde, ikili siyasi, ekonomik, ticaret ve askeri bağların
güçlendirilmesi konusu ele alınmıştır. Cumhurbaşkanı Alexander Lukashenko’nun 1995, 1997, 2001,
2005, 2010, 2019 yıllarında Çin’e resmi ziyaretlerde bulunmuştur (Lukashenko begins working visit to
China, 2019). Buna karşılık Çin Halk Cumhuriyeti Başkanı Jiang Zemin (2001), Başkan Yardımcısı Hu
Jintao (2000) ve Xi Jinping (2010), Başbakan Wen Jiabao (2007), Li Peng (1995) Daimî Komite Başkanı
olarak) Belarus'a ziyarette bulunmuşlardır. Aralık 2005’te, iki ülkenin liderleri, Belarus-Çin ilişkilerinin
stratejik işbirliği seviyesine ulaştığının not edildiğine dair Ortak Deklarasyonu imzalamışlardır (Belarus
President’s official visit to China begins, 2013). Belarus Cumhuriyeti, uluslararası örgütlerde Çin
girişimlerini desteklemiş ve tek Çin politikasına olan desteğini vurgulamıştır. Belarus-Çin arasındaki
ekonomik ve ticari ilişkiler artarak gelişmiştir.
Belarus Cumhuriyeti, Orta Doğu’daki devletlerle de diplomatik ilişkiler kurmuştur. İran, Suriye,
İsrail, Filistin, Irak ve Birleşik Arap Emirlikleri (BAE) gibi ülkelerin büyükelçilikleri Minsk'te faaliyet
göstermektedir. Belarus diplomasisi, Belarus ürünlerinin yurtdışına erişimini ve satışını sağlamaya, yeni
pazarlar geliştirmeye, enerji kaynaklarını çeşitlendirmeye olanak sağlayacak “bölgesinde kendisini
destekleyecek ülkeleri içine alan bir yay oluşturmayı ve “ekonomik diplomasiyi” güçlendirmeyi
amaçlamıştır. Bu görevlerin yerine getirilmesi, Belarus ‘un Yakın ve Orta Doğu bölgesindeki diplomatik
misyonlarının çalışmalarının ana odağı haline gelmiştir. Bu maksatla, Mısır, Suriye, Birleşik Arap
Emirlikleri, İsrail ve İran'da Büyükelçilikler açılmıştır (Our relations with countries of Africa and
Middle East., 2017).
Belarus ve bölge ülkeleri düzenli olarak karşılıklı üst düzey ziyaretler gerçekleştirmişlerdir.
Belarus Cumhurbaşkanı iki kez 1998 ve 2006’da resmi olarak İran’ı ziyaret etmiştir. İran
Cumhurbaşkanları Hatemi 2004’te, Ahmedinejad ise 2007’de Belarus’u ziyaret etmiştir. Bununla
birlikte, Alexander Lukashenko ve İran İslam Cumhuriyeti Cumhurbaşkanı Hasan Ruhani, Haziran
2018’de Çin’deki Şangay İş birliği Teşkilatı (ŞİT) zirvesinde bir araya gelmiş, Eylül 2018’de, İran
Danışma Meclisi Başkanı Ali Laricani liderliğindeki bir heyet Belarus'u ziyaret etmiştir. Tahran'la
ilişkiler, ticaret, ekonomi, yatırım, eğitim, kültür vb. alanlarını kapsamaktadır. Ocak 2018'de Belarus-
İran Ekonomik İşbirliği Komisyonu Tahran'da bir toplantı düzenlemiştir (Sivitsk, 2016, s. 11). Diğer
taraftan, Pakistan ile çeşitli seviyelerde düzenli bir etkileşim söz konusudur. 2015 ve 2016'da Belarus
Cumhuriyeti Cumhurbaşkanı Aleksandr Lukaşenko Pakistan'ı ziyaret etmiş, böylece parlamentolar ve
diğer kurumlar arasında ilişkilerin gelişmesine kapı aralamıştır. Diğer taraftan, Belarus Cumhurbaşkanı,
1998’de Mısır’a, 2003’te Suriye’ye, 2000’de İsrail’e ve Filistin'e, 2000, 2007 ve 2013’te Birleşik Arap
Emirlikleri’ne, 2002'de Bahreyn Krallığı ve Kuveyt'e, 2007'de Umman'a, 2011'de ise Katar'a resmi
ziyaretlerde bulunmuştur. 2004-2005 yılları arasında Belarus ve Lübnan cumhurbaşkanları arasında
karşılıklı ziyaretler yapılmıştır. 2010 yılında Suriye Cumhurbaşkanı Beşar Esad, 2019 yılında ise Mısır

Bağımsızlık Sonrası Belarus Dış Politikasını Belirleyen Yapısal Faktörler - Structural Factors Determining The Belarus Foreign Policy After Its
Independence
Kaan DİYARBAKIRLIOĞLU
389
Cumhurbaşkanı Abdel Fattah el-Sisi Belarus Cumhuriyeti'ni ziyaret etmiştir (Lukashenko, Abdel Fattah
el-Sisi sum up Egypt leader’s official visit to Belarus, 2019).
Yukarıda ifade edilen ikili ilişkilerden de anlaşılabileceği gibi, Belarus dış politika
uygulayıcılarının önceliği ekonomik alanda ilişkilerin geliştirilmesine verdiği görülmektedir. Bununla
birlikte genel olarak, siyasi diyalog kanallarının açılması ve muhafaza edilmesi, parlamentolar arası
temaslar, akademik, bilimsel ve teknik iş birliği, bölge ülkeleriyle kültürel alışveriş gibi konularda
gelişmeler sağlandığı öne sürülebilir.
Asya ve Arap ülkelerinden başka, Belarus Cumhuriyeti'nin dış politika faaliyetleri 2000 yılından
itibaren Latin Amerika ülkelerine de uzanmaya başlamıştır. İlk olarak Küba bu ülkelerin başında
gelmektedir. Öncelikle, Belarus Cumhurbaşkanı Alexander Lukashenko'nun 2000 yılında Küba'ya
resmi ziyareti iki devlet arasındaki iş birliğini artırmıştır. Bu ziyarette Dostluk ilişkileri ve iş birliği
konulu bir anlaşma imzalanması ziyaretin önemli sonuçları arasındandır. Bu ziyarette, genel olarak,
ticaret ve ekonomi, sağlık, kültür, sertifikasyon ve konsolosluk ilişkilerinde iş birliği konusunda
hükümetler arası ve kurumlar arası 17 anlaşma imzalanmıştır.
Başkan Alexander Lukashenko 2000’de ve daha sonra da 2012’de Küba’yı ziyaret etmiştir. Bu
ziyaretlerde çeşitli alanlarda işbirliği anlaşmaları imzalanmıştır (On the Official Visit of Belarus’ Prime
Minister to Cuba, 2006; Alexander Lukaşenko makes official visit to Cuba, 2012). Belarus-Latin
Amerika ilişkilerinin gelişimindeki diğer önemli bir vakıa ise, iki cumhurbaşkanının yıllık toplantı
düzenlemesinin başlangıcını oluşturan Venezüella Cumhurbaşkanı Hugo Chavez’in 2006 yılında Minsk'
yaptığı resmi ziyaretidir (Rowcroft, 2009, s. 108). Bu ziyaretten sonra Chavez 2007, 2008, 2009, 2010
yıllarında Belarus’a çalışma ziyaretlerinde bulunmuştur. Ardından, Lukashenko ve Chavez, stratejik
ortaklık, karşılıklı destek, karşılıklı yarar getiren iş birliğinin genişletilmesi konularında bir yönelimi
ilan eden Ortak Deklarasyonu imzalanmışlardır. Venezuela Belarus ‘un petrol tedarikinde Rusya ile
karşılaştığı güçlükleri karşılama yoluna gitmiş, bu nedenle Venezuela ve Belarus arasında ticari ve
ekonomik iş birliği yoğun bir şekilde gelişmiştir. Her iki ülkenin ekonomik kuruluşları arasındaki
sözleşmelerin uygulanması sonucu ticaret hacmi 2009 yılında 1 milyar dolar, 2011'de ise 1,3 milyar
dolara ulaşmıştır. 2012 yılında Belarus hükümeti, Venezüella'dan gelen petrol arzının kârlı olmadığını
kabul etmiş ve daha önce Rusya'dan aldığı önceki plana geri dönmüştür (Sivitsk, 2016, s. 12). 2013’te
Hugo Chavez’in ölümünden sonra, iki ülke arasındaki ticarette keskin bir düşüş yaşanmıştır.
Belarus, Asya, Arap ve Latin Amerika ülkelerinin yanı sıra Afrika ülkeleri ile de ilişkiler
kurmaya çalışmıştır. İlk olarak, 1996-1998 yılları arasında Belarus hükümet delegasyonları Mısır,
Tunus, Libya ve Güney Afrika'ya bir dizi ziyaretler gerçekleştirmiştir. Belarus Cumhurbaşkanı 1998'de
Mısır'ı ve 2000'de Libya'yı ziyaret etmiştir. Libya lideri Muhammed Kaddafi, Uganda ve Sudan
başkanları ile Belarus'u ziyaret etmiştir. Afrika'da, Belarus, Mısır, Libya, Nijerya ve Güney Afrika'da
elçilikler bulunmaktadır. Bazı Afrika ülkelerinde, Belarus elçileri eşzamanlı olarak akredite edilirken,
sırayla, pek çok Afrika ülkesinin elçileri de aynı anda Belarus’ta akredite edilmiştir. Yakın zamana kadar
Belarus, Cezayir, Mısır, Libya, Fas, Uganda ve Güney Afrika ile siyasi ve ekonomik ilişkilerin

Mehmet Akif Ersoy İktisadi ve İdari Bilimler Fakültesi Dergisi - Mehmet Akif Ersoy University Journal of Economics and Administrative Sciences Faculty
Cilt:7 Sayı:2 s.373-390 Volume:7 Issue:2 p.373-390
Temmuz 2020 July
390
geliştirilmesinde en üst seviyeye ulaşmıştır. Bununla birlikte, 2011 “Arap Baharı” olaylarından sonra,
Mısır ve Libya bu ülkelerde meydana gelen iktidar değişiminden sonra bu listeden çıkmıştır. Ancak,
Aleksandr Lukaşenko, 2017'de Mısırı ziyaret etmiş ve bu ziyarette karşılıklı ticaret konusunda bir eylem
planı hazırlanmıştır. Diğer taraftan Mısır Cumhurbaşkanı Sisi de 18 Haziran 2019'da Belarus'u ziyaret
etmiştir (Negotiations with Egypt President Abdel Fattah el-Sisi, 2019).
Belarus Cumhuriyeti Dışişleri Bakanlığı'nın resmi web sitesine göre, ülkenin şu andaki dış
politikasının ana öncelikli alanları, komşu ülkeler, başta “Birlik Devleti” olarak adlandırılan Birlikte
stratejik işbirliği yapılan Rusya Federasyonu olmak üzere, BDT’ye üye ülkeler, Avrasya Ekonomik
Birliği, Kolektif Güvenlik Antlaşması Örgütü, Avrupa Birliği olarak sıralanmaktadır (Priorities of the
foreign policy of the Republic of Belarus, 2019).
Belarus’un dünya güç, kültür ve medeniyet merkezlerinin sınırında önemli jeopolitik bir
konuma sahip olması, ülkenin sayısız Avrupa savaşları ve çatışmalarının yıkıcı sonuçlarından muztarip
olan rahatsız edici bir tarihinin olması Belarus dış politikasının çok yönlü olması için rasyonel bir
gerekçe sunmaktadır. Çoklu yönlü dış politika, “dünyanın çeşitli bölgelerindeki devletlerle dengeli
yapıcı ilişkilerin geliştirilmesini öneren temel bir ilke olarak kabul edilmektedir. Söz konusu devletlerle
bir diyalog kurarken ve onlarla karşılıklı kazanca dayanan bir iş birliği yaparken, Belarus'a, pragmatizm
ve tutarlılık, karşılıklı saygı, eşitlik, içişlere müdahale etmeme, baskı ve güç kullanmama ilkeleri
rehberlik etmektedir.
Görüldüğü gibi Belarus’un “stratejik seçimi” onun önemli jeopolitik bir konumu sahip olması
ve bu nedenle de tarihsel süreçte yaşadığı sorunlardan kaynaklanmaktadır. Örnek olarak,
Cumhurbaşkanı Aleksandr Lukaşenko 22 Temmuz 2004 tarihli “Belarus Cumhuriyeti'nin Yeni
Dünyadaki Dış Politikası” başlıklı raporunda, ülkenin iki dev arasındaki konumunu (AB ve Rusya)
belirtmekte ve bunun için hangi seçimin yapılacağına ilişkin soruyu bir konuşmasında şöyle yanıt
vermekte: “Avrupa Birliği veya Rusya, genellikle bize kader olarak dayatmaya çalıştıkları seçim, Doğu
veya Batı hiçbir şekilde bir seçim değildir. Bu yanlış bir ikilemdir.” demektedir. Başka bir konuşmasında
da çok yönlü bir dış politika takip edeceklerini şu sözleriyle teyit etmektedir: “Dış politikamız temelde
çoklu yönlüdür. Bu yaklaşım etkinliğini kanıtlamıştır ve bu politikayı terk etmeyi düşünmüyoruz”
(Report of the President of Belarus A.G.Lukashenko in the Third All Belarusian National Assembly,
2006).
Belarus’un “stratejik seçimi” kavramı, Belarus Cumhuriyeti Devlet Başkanı’nın 6 Aralık
2010’da 4. Belarus Cumhuriyeti Meclisi’nde sunduğu raporunda şöyle yazılmıştır: “Belarus’un Batı ile
Doğu arasında bir kavşak ve geçiş yollarının birleştiği bir anayol statüsü ona jeopolitik olarak bahşedilen
bir statüdür. Fakat bir bariyer, tampon ya da bir kordon gibi değil, hiçbir şekilde bir avlu da yoktur”.
Raporda, Belarus’un yaptığı stratejik seçimin Doğu ve Batı'ya eşit yakınlık kavramı ile geliştirildiği
ifade edilmektedir. Cumhurbaşkanı Lukashenko bu raporda: “Avrupa Birliği ile Rusya arasında bir
seçim yapma niyetinde değiliz. Aptalca ve yanlış olurdu. Biz ne Doğu'ya ne de Batı'ya gitmeyiz.
Avrupa’da, Rabbimizin halkımıza verdiği, jeopolitik kimliğimizin ve ulusal çıkarlarımızın en önemlisi

Bağımsızlık Sonrası Belarus Dış Politikasını Belirleyen Yapısal Faktörler - Structural Factors Determining The Belarus Foreign Policy After Its
Independence
Kaan DİYARBAKIRLIOĞLU
391
olan herkesle dengeli bir etkileşimde bulunmalı, tüm çevremiz boyunca iyi bir komşuluk kuşağı
oluşturmalıyız” demektedir (Report of the President of Belarus A.G.Lukashenko in the Third All
Belarusian National Assembly, 2010).
Ancak, her ne kadar AB ile ilişkilere önem verilse de Janeliūnas’a göre Alexander Lukashenko,
her zaman büyük komşusu Rusya tarafından desteklendiği için AB tarafından izole edilme konusunda
oldukça sakin kalabilmiştir. Moskova Lukaşenko rejimini tanıdığı ve Belarus ekonomisine büyük destek
sağladığı için Belarus ve Rusya ilişkileri uzun zamandır oldukça başarılı olmuştur. Rusya desteğinin en
önemli yönü, Rusya iç pazarında uygulananlarla neredeyse aynı koşullarda Belarus'a enerji tedariki
olmuş, ucuz petrol ve doğal gaz Lukashenko rejiminin devlet kontrolündeki bir ekonomiyi
sürdürmesine, serbest piyasa ekonomisinin gelişimini duraklatmasına ve aynı zamanda ekonomik
büyümeyi sağlamasına imkan sağlamıştır (Janeliunas, 2006, s. 132).
2011 yılına gelindiğinde ise “Eşit Yakınlık” kavramı geliştirilmiştir. Belarus Parlamentosuna
21 Nisan 2011'de yaptığı konuşmada Lukashenko, Belarus’un Avrupa'da “iki güç kutupları arasında
dengeli bir etkileşim” gerektiren özel bir yere sahip olduğunu yinelemiştir. Bu konuşmanın akabinde,
coğrafi konumdan ve ülkenin transit ve sınai potansiyelinden faydalanmasını sağlayan “Doğu ve Batı'ya
eşit yakınlık stratejisi” ortaya konmuştur. Bu stratejisi kısaca, Rusya ile ilgili olarak, bağımsızlık ve
bütünleşme arasında denge kurmak, Avrupa Birliği ile ilgili olarak, politik olarak kendini diğer
ülkelerden izole etme ile ekonomik işbirliği için beklentilerle birlikte normalleşme arasında denge
kurmak, yani eş zamanlı olarak Avrupa Birliği için Belarus’un bağımsızlığını Rusya’dan korumaya
çalışırken; Rusya için ise ortak değerlerini ve çıkarlarını Batı’dan korumayı hedefleyerek ikisi arasında
denge kurmaya ihtimam göstermek şeklindedir (Pazdnyak, 2011, s. 176).
Belarus’un Doğu ve Batı’ya “eşit yakınlık” kavramı bir strateji olarak ortaya konsa da Batı ile
ilişkilerin iyi düzeyde olmadığı da bir gerçektir. Bu ilişkiler, cumhurbaşkanlığı seçimlerinin sonuçlarına
ilişkin Merkez Seçim Komisyonu tarafından mevcut cumhurbaşkanının kazandığını ilan eden
açıklamaya karşı 19-20 Aralık 2010 tarihlerinde Minsk'te düzenlenen kitlesel protesto gösterilerinin
yetkililerce dağıtılması sonrası en kötü zamanlarına dönmüştür. Diğer taraftan, Belarus’un
bağımsızlığını kazandığı 1994 yılından günümüze kesintisiz olarak Aleksandr Lukashenko'nun tüm
cumhurbaşkanlığı seçimlerini kazanması ve geniş yetkilere sahip olması, Batı değerleri açısından
düşünüldüğünde, şüphe ile karşılanmakta, bu husus Batı ile ilişkilerin iyileştirilmesinin önünde en
önemli engel olarak durmaktadır.
2014 yılında Ukrayna'da süregelen güç değişimi ve silahlı çatışma sonucu patlak veren Rus-
Amerikan ve Rus-Avrupa ilişkilerinde yaşanan derin kriz, Belarus'un dış politikası üzerinde önemli bir
etkiye sahip olmuştur. Çünkü, “Russky Mir” ya da Rus dünyasına ait Rusça konuşanları savunmak
bahanesiyle Doğu Ukrayna'ya asker göndermesi Belarus’ta endişeye neden olmuştur. Rusya’nın
bahsettiği bu girift kültürel alan aynı zamanda Belarus’un çoğunu, Kazakistan'ın bölümlerini ve üç
Baltık Devletindeki büyük nüfusları da içermektedir.

Mehmet Akif Ersoy İktisadi ve İdari Bilimler Fakültesi Dergisi - Mehmet Akif Ersoy University Journal of Economics and Administrative Sciences Faculty
Cilt:7 Sayı:2 s.373-390 Volume:7 Issue:2 p.373-390
Temmuz 2020 July
392
2016 yılı sonunda ve daha sonra 2018’de zaman zaman, Rusya'nın Belarus süt ürünleri ithalatına
getirdiği kısıtlamalar veya bu yöndeki tehditler Rusya ile ikili ilişkileri gün geçtikçe kötüleştirmektedir.
Ukrayna’da yaşanılan en son vaka aslında bir bakıma Batı ile ilişkileri düzeltme adına Belarus için bir
fırsat olabilirdi. Ancak 2020’ye kadar kayda değer bir iyileşme mümkün olmamıştır.
4. SONUÇ
Bağımsızlık sonrası yaklaşık 25 yıl süren bağımsız varoluş deneyimi, Belarus Cumhuriyeti'nin
diğer Sovyet sonrası ülkeler gibi, yeni bir bağımsız Avrupa devleti olarak zor ve tartışmalı oluşum
sürecini sürdürdüğünü göstermektedir. Bağımsızlık fikri geniş kitleler arasında hâlâ hâkim olmamasına
ve Belarusluların ulusal kimliğinin zayıf kalmaya devam etmesine rağmen, bütün nesnel ve öznel
zorluklar, başarısızlıklar ve yanlış hesaplamalarla birlikte, Belarus’un Cumhurbaşkanı Aleksandr
Lukashenko'nun etrafında konsolide olmuş politik sınıfı ülkeyi nispeten bağımsızca yönetebileceklerini
ortaya koymuştur.
Belarus dış politikasının oluşumu süreci devam etmektedir. Belarus, nükleer silahlardan gönüllü
olarak vazgeçen ilk ülke olarak, uluslararası ve Avrupa güvenliği ile silahsızlanma sürecine manidar bir
katkı sağlamıştır. Aynı zamanda, çevre ülkelerle iyi komşuluk ilişkileri kurulmuştur. Bununla birlikte,
Sovyetler sonrası bağımsızlığını kazanmış diğer ülkelerle bütünleşme bağlarını geliştirmeye devam
etmektedir.
Başarılarla birlikte, özellikle 1990'ların ikinci yarısından itibaren, Belarus dış politikasının
eksiklikleri de ortaya çıkmıştır. 1994 yılında, Lukashenko'nun 39 yaşında ülkenin ilk cumhurbaşkanlığı
seçimini kazanmasından günümüze kadar geçen 25 yıl boyunca, ABD ve Avrupa Birliği,
demokratikleşme ve insan haklarını desteklemek amacıyla, Belarus'u diplomatik olarak izole etme
politikası izlemiştir. Bu çaba 2006 yılında Belarus rejimine karşı ekonomik ve seyahat yaptırımlarının
dayatılmasıyla sonuçlanmıştır.
Belarus’un jeopolitik ve Joe-ekonomik konumunun avantajları henüz istenilen seviyede
kullanılamamıştır. İyi komşuluk ve geniş kapsamlı iş birliğine yönelik fırsatlar özellikle Rusya
tarafından sınırlandırılmış, Belarus’un Rusya'ya olan finansal, ekonomik ve askeri-politik bağımlılığı
son yıllarda azalmamış aksine artmıştır. Batı ve etkili Avrupa ve transatlantik örgütlerle (Avrupa Birliği,
Avrupa Konseyi ve NATO) ilişkilerin kötüye gitmesi, Belarus’un uluslararası pozisyonlarının ve dış
politika potansiyelinin zayıflamasına neden olmuştur.
Lukashenko, yıllarca güçlü bir ulusal kimlik bilincinin oluşması için çaba sarf etmemiştir.
Çünkü Belarus vatanseverliğini siyasi düşmanlarının sponsor olduğu yıkıcı bir proje olarak görmüştür.
Bu nedenle göreve geldikten kısa bir süre sonra Rusya ile ekonomik bütünleşmeyi onaylayan ve Rusçaya
Belarusça ile eşit statüde veren bir referandum düzenlemiştir. Ancak, Rusya’nın Kırım'ı ilhak ettikten
sonra Lukashenko’nun yukarıda bahsedilen düşünceleri 2014'te değişmeye başlamıştır (Higgins, 2019).
Öncelikli konu, Belarus’un ulusal ve uluslararası kimliğinin güçlendirilmesi, kendi kendine
yeten bir Avrupa devleti haline getirilmesinin yanı sıra, Belarus'u Rusya gibi daha güçlü komşularına

Bağımsızlık Sonrası Belarus Dış Politikasını Belirleyen Yapısal Faktörler - Structural Factors Determining The Belarus Foreign Policy After Its
Independence
Kaan DİYARBAKIRLIOĞLU
393
bağımlı bir ülke olmaya mahkûm eden zararlı tarihsel ve politik geleneklerin zayıflatılması ve uzun
vadede aşılması olmalıdır. Bu zorunlulukların gerçekleştirilmesinin ana koşulu, Belarus’ta demokrasi
ve evrensel hukuk ilkelerinin güçlendirilmesinin elzem olmasıdır. Komşu Orta ve Doğu Avrupa
devletlerinin gelişme aşamaları göstermektedir ki, Belarus Cumhuriyeti, kendi uygarlık ve jeopolitik
yerini bulmadaki sapma ve zorluklara rağmen, zaman içinde ait olduğu bölgenin komşu ülkeleriyle daha
fazla benzerlik kazanarak normal bir Avrupa devleti olma şansını yakalayabilir.
KAYNAKÇA
Alexander Lukaşenko makes official visit to Cuba. (2012). 25 Haziran, 2012,
http://president.gov.by/en/news_en/view/alexander-lukashenko-makes-official-visit-
to-cuba-593/ adresinden alındı.
ATASOY, E., GALAI, E., & MAZBAYEV, O. (2014). The Republic of Belarus from the
Perspective of Adminsration and Regional Geography. Marmara Üniversitesi, 20–44.
Belarus President’s official visit to China begins. (2013). 15 Temmuz 2013,
https://www.belarus.by/en/press-center/news/belarus-presidents-official-visit-to-china-
begins_i_6782.html adresinden alındı.
DWAN, R., & PAVLIUK, O. (2015). Building Security in the New States of Eurasia:
Subregional Cooperation in the Former Soviet Space. (R. Dwan & O. Pavliuk, Eds.)
(1st Editio). Routledge.
Foreign Policy of the Republic of Belarus. (2018). 28 Temmuz, 2018,
http://mfa.gov.by/en/foreign_policy adresinden alındı.
Foreign trade of Belarus in 2018. (2019). 11 Şubat, 2018, http://mfa.gov.by/export/ adresinden
alındı.
HIGGINS, A. (2019). As Putin Pushes a Merger, Belarus Resists With Language, Culture and
History. 29 Haziran, 2019, https://www.nytimes.com/2019/06/29/world/europe/russia-
belarus-putin Lukaşenko.html adresinden alındı.
JANELIUNAS, T. (2006). Between Russia and the EU: Transformational Opportunuties For
Belarus. Between Russia and the EU: Transformational Opportunities for Belarus,
19(2), 131–156.
KOROSTELEVA, E. (2011). Belarusian Foreign Policy in a Time of Crisis. Journal of
Communist Studies and Transition Politics, 27(3–4), 566–586.
LASHKEVICH. (2011). Deklaratsii o suverenitete Belarusi - 21 god Chitat’ polnost’yu. 27
Temmuz 2011, https://news.tut.by/politics/243576.html adresinden alındı.

Mehmet Akif Ersoy İktisadi ve İdari Bilimler Fakültesi Dergisi - Mehmet Akif Ersoy University Journal of Economics and Administrative Sciences Faculty
Cilt:7 Sayı:2 s.373-390 Volume:7 Issue:2 p.373-390
Temmuz 2020 July
394
LESHCHENKO, N. (2004). A fine instrument: Two nation-building strategies in post-Soviet
Belarus. Nations and Nationalism, 30(3), 333–352.
Lukaşenko, Abdel Fattah el-Sisi sum up Egypt leader’s official visit to Belarus. (2019). 19
Haziran, 2019, https://eng.belta.by/president/view/Lukaşenko-abdel-fattah-el-sisi-sum-
up-egypt-leaders-official-visit-to-belarus-121961-2019 adresinden alındı.
Lukaşenko begins working visit to China. (2019). 25 Nisan, 2019, from
https://eng.belta.by/president/view/Lukaşenko-begins-working-visit-to-china-120611-
2019 adresinden alındı.
METEZH, O. A. (2016). Formirovaniye Normativno-Pravovoy I Institutsionnoy Baz
Kul’turnogo Sotrudnichestva Mezhdu Respublikoy Belarus.
National Security Concept Adopted in Belarus. (2010). 11 Kasım, 2010,
http://dokshitsy.vitebsk-region.gov.by/en/republic-en/view/national-security-concept-
adopted-in-belarus-6211/ adresinden alındı.
Negotiations with Egypt President Abdel Fattah el-Sisi. (2019). Retrieved 18 Haziran, 2019,
http://president.gov.by/en/news_en/view/negotiations-with-egypt-president-abdel-
fattah-el-sisi-21309/ adresinden alındı.
On the Official Visit of Belarus’ Prime Minister to Cuba. (2006). 25 Nisan 2006, from
http://mfa.gov.by/en/press/news_mfa/a1c42d8e3e98f90c.html adresinden alındı.
Our relations with countries of Africa and Middle East. (2017). 11 Ağustos, 2017, from
http://mfa.gov.by/en/courtiers/asia_africa adresinden alındı.
PAZDNYAK, V. (2011). The Rise and Fall of Belarus’ Geopolitical Strategy. Lithuanian
Annual Strategic Review, 9(1), 173–190.
Priorities of the foreign policy of the Republic of Belarus. (2019). 26 Haziran, 2019,
http://mfa.gov.by/en/foreign_policy/priorities/ adresinden alındı.
Report of the President of Belarus A.G.Lukaşenko in the Third All Belarusian National
Assembly. (2006). 2 Mart, 2006, http://president.gov.by/ru/news_ru/view/doklad-
prezidenta-respubliki-belarus-agLukaşenko-na-tretjem-vsebelorusskom-narodnom-
sobranii-5863 adresinden alındı.
Report of the President of Belarus A.G.Lukaşenko in the Third All Belarusian National
Assembly. (2010). 6 Kasım, 2010, http://president.gov.by/ru/news_ru/view/doklad-
prezidenta-respubliki-belarus aleksandra-Lukaşenko-na-chetvertom-vsebelorusskom-
narodnom-sobranii-5895/ adresinden alındı.

Bağımsızlık Sonrası Belarus Dış Politikasını Belirleyen Yapısal Faktörler - Structural Factors Determining The Belarus Foreign Policy After Its
Independence
Kaan DİYARBAKIRLIOĞLU
395
ROTMAN, D., & VEREMEEVA, N. (2011). Belarus in the Context of the Neighbourhood
Policy: Between the EU and Russia. Journal of Communist Studies and Transition
Politics, 27(1), 73–98.
ROWCROFT, C. (2009). Belarus Country Study Guide Volume 1 Strategic Information and
Developments (1st Editio). U.S.A.: International Business Publications.
SANFORD, G. (1996). Belarus on the Road to Nationhood. Survival, 38(1), 131–153.
SHADURSKI, V. (2018). The Significance of Eurasian and European Integrations in the
Foreign Policy. History of International Relations and Foreign Policy, 4(1), 11–29.
SIVITSK, A. (2016). Belarus`s New Military Doctrine: What`s The Message? Top Chubashov
Center, 14, 12. Retrieved from
Tikhomirov, A.V. (2017). Foreign Policy of the Republic of Belarus (1991-2015). Minsk: BSU.
Ministry of Foreign Affairs of the Republic of Belarus, 18(2), 434–448.
TIKHOMIROV, A. V. (2012). Razvitiye politicheskogo dialoga mezhdu Respublikoy Belarus’
i SSHA v kontse 1991—nachale 1994 g.
TRENIN, D. (2009). Russia ’s Spheres of Interest, not Influence. The Washington Quarterly,
32(4), 3–22.

391
MEHMET AKİF ERSOY ÜNİVERSİTESİ
İKTİSADİ VE İDARİ BİLİMLER FAKÜLTESİ DERGİSİ
Mehmet Akif Ersoy University
Journal of Economics and Administrative Sciences Faculty
ISSN: 2149-1658 Cilt: 7 Sayı: 2 s.391-412
Volume: 7 Issue: 2 p. 391-412
Temmuz 2020 July
ARŞİVLENEN BELLEK OLARAK POSTA PULLARI VE SOSYO-KÜLTÜREL İŞLEVLERİ:
KUZEY KIBRIS ÖRNEĞİ
POSTAGE STAMPS AS AN ARCIVED MEMORY AND ITS SOCIO-CULTURAL
FUNCTION: NORTH CYPRUS EXAMPLE
Dilan ÇİFTÇİ1, Orhan ÇİFTÇİ1
1. Yrd. Doç. Dr., Yakındoğu Üniversitesi, İletişim
Fakültesi, [email protected], https://orcid.org/0000-0003-3806-3915
2. Prof. Dr., Kıbrıs İlim Üniversitesi, Rehberlik Ve
Psikolojik Danışmanlık Anabilim Dalı,
https://orcid.org/0000-0002-2217-2781
Makale Türü Article Type
Araştırma Makalesi Research Article
Başvuru Tarihi Application Date
19.02.2020 02.19.2020
Yayına Kabul Tarihi Admission Date
25.07.2020 25.07.2020
DOI
https://doi.org/10.30798/makuiibf.691464
Öz
19. yüzyılın ilk yarısında posta pullarının kullanımı, posta ücretinin ödendiğini gösteren
belge olarak kabul edilmiş olsa da zamanla posta pulları tarihin simülasyonları olarak basit resimler ve çizimler içeren etiketler şeklinde yaygınlık kazanmıştır. Kıbrıs
özelinde pullar ve onların temsiliyeti üzerine yapılan çalışmaların bulunmaması
sebebiyle bu çalışmada 1970-1998 yılları arasında hazırlanan pulların incelenmesi Raento ve Brunn’un (2005) Sixteen Thematic Categories of Stamps kodlama cetveli
kullanılarak yapılmıştır. Bu amaçla, çalışma kapsamında amaçlı örneklem metodu ile
belirlenen 418 pul incelenmiştir. Elde edilen bulgular çerçevesinde, 1970-1998 yıllarında Kıbrıs toplumu ve cumhuriyetin tanıtımı amacıyla doğa ve sanat temalı posta
pullarının basımının öne çıktığı görülmüştür. Bunun yanında söz konusu tarih aralığında
posta pullarında KKTC ve TC arasındaki resmi ziyaretlerin anısına basılan pullar da dikkat çekmektedir. Bu bağlamda dünya futbol organizasyonları ve olimpiyatları için
hazırlanan posta pullarının oldukça yaygın kullanıldığı görülmüştür. Aynı zamanda
posta pullarının ülkelerin doğasını ve sağlık gibi temalarını tanıtım amacıyla basıldıklarını da söylenebilir. Bütün bunlara ilaveten tarihi mekanların, çiçek türlerinin
ve hayvanların, resmi kuruluşların anısına da posta pullarının yayınlandığını
görülmektedir. Bu çalışmada posta pullarında ideoloji ve propaganda yerine Kıbrıs Türk
toplumunun oluşumu ve dünyaya entegre olması üzerinde yoğunlaşıldığı görülmüştür.
Anahtar Kelimeler: Tarih Anlatısı, Simülasyon, Posta Pulları, Kültürel
Bellek, Arşivlenen Bellek,
Abstract
Although the use of postage stamps in the first half of the 19th century was accepted as
a document indicating that the postage was paid, postage stamps became widespread in
the form of simulations of history, including simple paintings and drawings. The lack of studies on the postage stamps and their representation in Cyprus, this study prepared
between 1970-1998 postage stamps were analyzed by using the code of the Sixteen
Thematic Categories of Stamps of Raento and Brunn (2005). For this purpose, 418 postage stamps determined by the purposive sampling method. It was revealed that
stamps of nature-themed and art-themed postage stamps were used extensively between
1970 and 1998 for the purpose of introducing and promoting the Cypriot society and the republic. With the presentations on postage stamps, it is important to emphasize the state
visits between the TRNC and the TC and to be integrated with the world. In this study,
the formation of Turkish Cypriot community come to the fore in the rate of political messages and ideologies containing propaganda in postage stamps.
Keywords: History Narrative, Simulation, Postage Stamps, Cultural
Memory, Archived Memory,

Mehmet Akif Ersoy İktisadi ve İdari Bilimler Fakültesi Dergisi - Mehmet Akif Ersoy University Journal of Economics and Administrative Sciences Faculty
Cilt:7 Sayı:2 s.391-412 Volume:7 Issue:2 p.391-412
Temmuz 2020 July
392
EXTENDED SUMMARY
Research Problem
In this study, which was examined in terms of cultural memory and presentation codes on
postage stamps, it clearly revealed socio-cultural changes in Northern Cyprus between 1970 and 1998
and the issues and situations that Turkish Cypriots put forward in order to adapt to the world. In this
context, contrary to the stamps that are expected to emerge as political representations, it will not be
wrong to say that the intensity of stamps on themes such as nature and health in the period in question
was intended to promote rather than political propaganda. In the postage stamps examined within the
scope of the study, historical stamps, flowers, animals and stamps made in memory of the establishment
of official institutions and organizations attract attention. In this respect, it would be appropriate to say
that the stamps between 1970-1998 are important reference sources for the establishment and subsequent
promotion of the Turkish Republic of Northern Cyprus.
Research Questions
In presentation codes postage stamp relations with the Republic of Turkey metaphorically
prepared with stamps for official visit to the state in 1974 to depict sports in terms of the desire to
integrate with the world theme under the World Cup and the scales prepared for the Olympics stands
out. In addition, the United Nations and the British Royal family stamps on the island's influence and
continuity of external actors on the island is presented. In addition to this, the founding of the Turkish
Republic of Northern Cyprus and the people selected for representation in the stamps containing
important people are the prominent people for the Turkish Cypriot people. The aim of this study is to
question and determine the possible postage stamps of Cyprus based on the memory of history. The
production of the point stamps emphasized here is not only appealing to the period in which they were
produced, but also to the past. What is important here is about the dominance and style of expression of
deep histories.
Literature Review
Stamps do not consist of small pieces of paper affixed to envelopes and packages. On the
contrary, as Pierce (1996: 62) states that “stamps represent sovereignty pul, stamps differ only from the
state currencies used by the state themselves. Since stamps have this 'internal-external' role, they can be
regarded as windows of the state. According to Brunn (2000), it is often possible to read the history of
states with long stamps. If this history involves major conflicts or the transition from colonial status to
political independence, stamps can show copyright, colonial events, military conflicts, monuments,
personalities and events contributing to independence, and recent cultural achievements. Since the first
stamps are important elements in state iconography, great care is taken to plan designs, colors, images,
symbols and messages. Since symbolism and imagination are very important in state iconography, the
authorities responsible for the promotion of cultural history can plan their first flag, a famous monument,
a national coat of arms, and first stamps to show an important event in its history. The stamps are also

Arşivlenen Bellek Olarak Posta Pulları ve Sosyo-Kültürel İşlevleri: Kuzey Kıbrıs Örneği - Postage Stamps As An Archived Memory And Its Socio-
Cultural Function: North Cyprus Example
Dilan ÇİFTÇİ, Orhan ÇİFTÇİ
393
related to international events such as Olympic games, major regional or global conferences, and
important events in world history. States can be announced through the stamps of Olympic medals and
international award winners (scientists, writers and diplomats). Some countries issue stamps to
commemorate the events of other countries, such as America's biennial, the birth of Shakespeare and
commemoration of world treaties. European countries issue EUROPA stamps each year with a common
theme.
Methodology
In this study, stamps were discussed as the simulation of history through the memorial practices
that he mostly applied while explaining the restructuring and shaping of social memory. However, in
terms of historical time, representation and social memory, stamps are important in terms of both
pointing to the historical process and representing the historical process it points to in terms of their
rhetoric. In this context, a total of 418 stamps were examined in this study together with the 1970-1998
(28 year) stamp archive. The coding table created for the examination of the stamps in terms of the said
historical time and representation of the stamps was prepared by adapting to the study based on the
conceptualization of Raento and Brunn (2005) Sixteen Thematic Categories of Stamps. Permission was
obtained from the authors to translate the mentioned categories and scale into Turkish. The declaration
of permission is given in the attachment.
Results and Conclusions
In this study, which was examined in terms of cultural memory and presentation codes on
postage stamps, it clearly revealed socio-cultural changes in Northern Cyprus between 1970 and 1998
and the issues and situations that Turkish Cypriots put forward in order to adapt to the world. In this
context, contrary to the stamps that are expected to emerge as political representations, it will not be
wrong to say that the intensity of stamps on themes such as nature and health in the period in question
was intended to promote rather than political propaganda. In the postage stamps examined within the
scope of the study, historical stamps, flowers, animals and stamps made in memory of the establishment
of official institutions and organizations attract attention. In this respect, it would be appropriate to say
that the stamps between 1970-1998 are important reference sources for the establishment and subsequent
promotion of the Turkish Republic of Northern Cyprus.

Mehmet Akif Ersoy İktisadi ve İdari Bilimler Fakültesi Dergisi - Mehmet Akif Ersoy University Journal of Economics and Administrative Sciences Faculty
Cilt:7 Sayı:2 s.391-412 Volume:7 Issue:2 p.391-412
Temmuz 2020 July
394
1. GİRİŞ
Bu çalışmanın amacı, Kıbrıs’ın kuzeyinde yayınlanan posta pullarının, tarihin belleğe katılımını
sorgulamak ve anlamaktır. Bu çalışmada üzerinde durulan nokta pulların yalnızca üretildikleri döneme
hitap eden değil, aynı zamanda geçmişi bugüne taşımasıdır. Burada önemli olan derin tarihlerin
baskınlığı ve anlatım biçimi seçimidir. Bu çalışmada, tarihin anlatıları, bellek ve kolektif hatırlama,
bilginin ve maddi kültür öğesi olarak pulların hatırlatma gücüne ilişkin olarak anma törenleri ve
anmalarla ilgili pullar bağlamında tartışılacaktır.
Geleneksel medya aracı olarak kabul edilen kitle iletişim araçlarının yoğun etkinliği
gerçekliğinden yola çıkarak 19. Yüzyıl iletişim sürecine dönüldüğünde pullar posta ücretinin ödendiğini
göstermek amacıyla üretilmiş ve kullanılmıştır. Genellikle küçük resimlerden oluşan bu pulların
devletlerarası diplomaside çoğunlukla propaganda malzemesi olarak da kullanılmıştır. Bu bağlamda,
farklı dönemlerde ve farklı ülkeler bağlamında posta pullarının sanatsal değeri ve ideolojik önemi
üzerinde duran önemli çalışmalar bulunmasına rağmen (Reid, 1984; Davis,1985; Lauritzen, 1988;
Nuessel ve Cicagno, 1992; Lutz ve Collins, 1993; Rose, 1996, 2001; Brunn, 2000; Banks, 2001; Goin,
2001; van Leeumanen ve Jewitt, 2001; Sturken ve Cartwright, 2001; Child, 2005; Dobson, 2002; Deans
ve Dobson, 2005; Raento ve Brunn, 2005; Raento, 2006; Raento, 2016; Brunn, 2017; Klamar, Slivkova
ve Brunn, 2018) Kıbrıs genelinde ve Kuzey Kıbrıs özelinde üretilen ve dolaşıma giren posta pullarının
toplumsal bellek ve kültürel bellek ekseninde incelenmesi ile ilgili çalışmaların olmadığı ortaya
çıkmıştır.
2. KAVRAMSAL ÇERÇEVE
2.1. Pulları Görsel Temsil Olarak Okumak
Pullar, zarflara ve paketlere yapıştırılmış küçük kağıt parçalarından ibaret değildir. Aksine,
Pierce'in (1996: 62) “pulların egemenliği ifade etmesini” belirtiği üzere gibi pullar, yalnızca devletin
kendileri tarafından kullanılan devlet para birimlerinden farklıdır. Pulların bu 'iç-dış' rolü olduğu için
devletin pencereleri olarak kabul edilmektedir.
Brunn (2000)’e göre uzun geçmişi olan devletler tarihlerini pullarıyla okumak çoğu zaman
mümkündür. Bu tarih büyük çatışmalar veya sömürge statüsünden politik bağımsızlığa geçişi içeriyorsa,
pullar telif hakkını, sömürgeci olayları, askeri çatışmaları, anıtları, bağımsızlığa katkıda bulunan
kişilikleri ve olayları ve son kültürel başarıları gösterebilir. İlk pullar devlet ikonografisinde önemli
unsurlar olduğu için tasarımları, renkleri, görüntüleri, sembolleri ve mesajları planlamaya büyük özen
gösterilmektedir. Devlet ikonografisinde sembolizm ve imgelem çok önemli olduğu için kültürel tarihin
tanıtımından sorumlu yetkililer, yeni bayraklarını, ünlü bir anıtı, ulusal armayı, tarihinin önemli bir
etkinliğini göstermek için ilk pullarını planlayabilirler.
Pullar ayrıca olimpiyat oyunları, büyük bölgesel veya küresel konferanslar ve dünya tarihindeki
önemli olaylar gibi uluslararası etkinliklerle de ilgilidir. Devletler Olimpiyat madalyalarının

Arşivlenen Bellek Olarak Posta Pulları ve Sosyo-Kültürel İşlevleri: Kuzey Kıbrıs Örneği - Postage Stamps As An Archived Memory And Its Socio-
Cultural Function: North Cyprus Example
Dilan ÇİFTÇİ, Orhan ÇİFTÇİ
395
kazanılmasını ve uluslararası ödül kazananlar (bilim adamları, yazarlar ve diplomatlar) pullar
aracılığıyla ilan edilebilir. Bazı ülkeler, diğer ülkelerin olaylarını anmak için pullar yayınlar:
Amerika’nın iki yılda bir, Shakespeare’in doğumu ve dünya anlaşmalarını anma pulları yayınlaması
gibi. Avrupa ülkeleri her yıl ortak bir temayla EUROPA pulları çıkarmaktadır.
2.2. Bellek Mekân Olarak Pullar
Toplumsal belleğin kökeni ile ilgili güçlü bir açıklama, Maurice Halbwachs'ın klasik eseri ‘On
Collective Memory’ (1992) adlı eserinde önerilmiştir. Halbwachs (1992), hatıraların doğası ve oluşumu
üzerine yaptığı ilk çalışmalarında yazılı metinlerin bir araya gelerek toplumların koleksiyonunda
birleşmesini toplumsal bellek olarak açıklar. Maurice Halbwachs (1992) toplumsal bellek üzerine
yaptığı çalışmasında, aileler, toplumsal sınıflar ve dinler arasındaki bireysel anılar ve toplumsal olan
arasındaki çelişkileri vurgular. Bu çalışmada çerçeveler içindeki bellek, posta pulları aracılığıyla aracılı
gerçeklik olarak kabul edilmektedir. Bu nedenle, posta pulları, yeniden yapılanma sürecinde, aracılı
yeniden yapılanmada kilit rol oynamaktadır (Halbwachs, 1992: 43).
3. YÖNTEM
Bu çalışmada pullar toplumsal belleğin yeniden yapılandırma ve şekillendirmeyi açıklarken
çoğunlukla başvurduğu anma pratikleri üzerinden ve görsel temsil biçimleri olarak tarihin simülasyonu
olarak ele alınmıştır. Bununla birlikte, tarihsel zaman, temsil ve toplumsal bellek açısından pullar hem
tarihsel sürece işaret etmesi hem de işaret ettiği tarihsel süreci kendi retorikleri açısından temsil etmesi
anlamında önemlidir. Bu bağlamda bu çalışmada 1970-1998 (28 yıllık) pul arşiviyle birlikte toplam 418
pul incelenmiştir. Pulların söz konusu tarihsel zaman ve temsiliyeti anlamında pulların incelenmesi için
oluşturulan kodlama cetveli ile çalışmada nitel yöntem ile içerik analizi yapılmış, analiz sonuçlarının
betimsel ortaya koyulması amacıyla kullanım sıklıklarına yönelik niceliksel açıklamalara da ayrıca yer
verilmiştir. Bu yolla, çalışmada Raento ve Brunn’un (2005) Sixteen Thematic Categories of Stamps
kavramsallaştırmasından yola çıkılarak çalışmaya uyarlanarak hazırlanmıştır. Söz konusu kategorilerin
ve ölçeğin Türkçeye çevrilip kullanılması için yazarlardan izin alınmıştır. İzin beyanı ekte sunulmuştur.
Bu bağlamda çalışmada kullanılacak olan pulların konulara göre değerlendirilmesini özetleyen
kategoriler Tablo 1’de özetlenmektedir.
Tablo 1. Pulların Değerlendirilmesinde Kullanılan Temalar Cetveli
Pulların Teması İçeriği
1.Turizm, Boş Zaman ve Rekreasyon Bu kategorideki pullar turizm ve tanıtım amacıyla hazırlanmış.
2.Devlet Bu kategorideki pullar KKTC’nin kuruluşu ve ilgilidir.
3.Doğa Bu kategorideki pullar Kıbrıs adasının doğal güzellikleri ve
tarımı ile ilgilidir.
4.Uluslararası Referanslar Bu kategorideki pullar dünya genelinde kutlanan önemli
olaylar ve kişilerin anısına hazırlanmıştır.
5.Sağlık, Refah ve İyi Olma Bu kategorideki pullar herhangi bir sağlık sorununa işaret
etmektedir. AIDS vb. gibi.
6.Ekonomi Bu kategorideki pullar Kuzey Kıbrıs’ın gelir kaynakları ile
ilgilidir.

Mehmet Akif Ersoy İktisadi ve İdari Bilimler Fakültesi Dergisi - Mehmet Akif Ersoy University Journal of Economics and Administrative Sciences Faculty
Cilt:7 Sayı:2 s.391-412 Volume:7 Issue:2 p.391-412
Temmuz 2020 July
396
7.Tanımlanabilir Bireyler Bu kategorideki siyasi figürleri içermektedir.
8.Kadınlar, Çocuklar ve Engelliler Bu kategorideki pullar kadın hakları, çocuk hakları ve
dezavantajlı gruplarla ilgilidir.
9.Sanat ve Kültür Bu kategorideki pullar sanat eserleri ile ilgilidir.
10.Ulaştırma ve Haberleşme Bu kategorideki pullar Posta Dairesi ve telekomünikasyon
biriminin kuruluşu ile ilgilidir.
11.Folklor, Ritüeller Bu kategorideki pullar Kıbrıs kültürünü ve ritüellerini temsil
etmektedir.
12.Savaş Güvenlik ve Silah Bu kategorideki pullar savaş ve zaferlerin anısına
hazırlanmıştır.
13.Spor Bu kategorideki pullar olimpiyatlar ve dünya genelindeki spor
faaliyetlerini içermektedir.
14.Eğitim, Bilim ve Araştırma Bu kategorideki pullar buluşlar ve bilim insanlarını
içermektedir.
15.Din Bu kategorideki pullar dini konuları içermektedir.
Çalışmada kullanılan posta pulları Kuzey Kıbrıs Türk Cumhuriyeti Posta Bölümü (1999)
tarafından yayınlanan A Description of the Commemorative Issues of Postage Stamps 1970-1988
başlıklı kitaptan edinilmiştir. Tablo 1’de belirtilen temalar çalışmanın örneklemini oluştururken anahtar
kelimeler olarak da kullanılmıştır. Bu bağlamda söz konusu kitaptan anahtar sözcükler ışığında
yayınlanan pulların fotoğrafları çekilerek 15 farklı kategoride arşivlenmiştir. Bu bilgiler ışığında
çalışmanın evrenini kitaptaki paylaşılan tüm pullar oluştururken, amaçlı örneklem tekniği kullanılarak
çalışmanın örneklemi 418 (n=418) posta pulu olarak belirlenmiştir. Şekil 1 15 farklı kategorideki 418
pulun 15 farklı kategoriye göre dağılımını ve yüzdeliklerini özetlemektedir.
Şekil 1. 15 Farklı Kategoride Listelenen Pulların Dağılımı
4. BULGULAR
Şekil 2’de en fazla pul basılan yıllar sırasıyla 1988 (n=27), 1990 (n=26), 1992 (n=24), 1991
(n=23)’dir. 1988 yılının ön plana çıkmasının nedeni ise KKTC’nin kuruluşunun 5. Yılı olmasıdır. 1990
yılında devlet büyüklerinin ziyareti sıklıkla pullarda yer almaktadır. Kenan Evren ve Yıldırım
Akbulut’un ziyaretleri gibi 1991 ve 1992 yıllarında Kuzey Kıbrıs’ta yetişen kır çiçekleri ve doğa
110%
29%
319%
42%
54%
63%
77%
82%
912%
109%
117%
124%
138%
143%
151%
1 2 3 4 5 6 7 8 9 10 11 12 13 14 15

Arşivlenen Bellek Olarak Posta Pulları ve Sosyo-Kültürel İşlevleri: Kuzey Kıbrıs Örneği - Postage Stamps As An Archived Memory And Its Socio-
Cultural Function: North Cyprus Example
Dilan ÇİFTÇİ, Orhan ÇİFTÇİ
397
güzelliği özellikle pulların temasını oluşturmaktadır. Şekil 2 pulların yıllara göre dağılımını
özetlemektedir.
Şekil 2. Pulların Yıllara Göre Dağılımı
4.1. Birinci Grup Pullar: Turizm, Boş Zaman ve Rekreasyon Temalı Pullar
Turizm, boş zaman ve rekreasyon temasını içeren 1970-1998 yılları arasında 43 (n=43) tane pul
bulunmaktadır. Bu pulların arasında turizm, boş zaman ve rekreasyon temasının öne çıktığı yıl 1975
(n=10)’dir. Bununla birlikte sırasıyla, 1982, 1991, 1992 ve 1995 te turizm temalı konular pullarda
işlenmiştir. Birinci grup temayı içeren pullar arsında öne çıkanların bazıları şu şekilde sıralanabilir:
Atatürk Heykeli, Lal Mustafa Paşa Camii, St. Hilarion Kalesi, Namık Kemal Anıtı, Girne Limanı,
Mağusa Plajı, Othello Kulesi, Girne Kalesi (1975 yılında çıkarılan pullar); Lambusa Krallığı ve Fosiller
(1991 yılında çıkarılan pullar); Casino, Atış Poligamı, Buğday Camii, Salamis Bay Oteli (1992 yılında
çıkarılan pullar); St. Barnabas Müzesi (1993 yılında çıkarılan pul) ve Girne Plajı, Salamis Harabeleri,
Plaj Sörfü ve St. George Katedrali (1995 yılında çıkarılan pullar). Tablo 2 turizm, boş zaman ve
rekreasyon kategorisindeki pulları özetlemektedir. Aynı zamanda Görsel 1 bu kategorideki bazı pulları
göstermektedir.
Tablo 2. Turizm, Boş Vakit ve Rekreasyon Temasını İçeren Pullar
Pulun Yılı Pulun Teması Sayısı (n=43)
1975 Türk Federe Devleti Turistik Yerler 10
1976 Turistik Seriler 3
1982 Turizm 4
1986 Sosyal Konutların Redifi 1
1988 Turizm 3
1989 Turizm (Venüs Kıbrıs Adasının Sembolü) 1
1990 Avrupa Turizm Yılı 1
1991 Tarihi Yapılar 4
1
7
16
14
9
12
7
18
15
13
11
1516
18
15
27
13
26
21
24
1718
24
21
19
21
0
5
10
15
20
25
30

Mehmet Akif Ersoy İktisadi ve İdari Bilimler Fakültesi Dergisi - Mehmet Akif Ersoy University Journal of Economics and Administrative Sciences Faculty
Cilt:7 Sayı:2 s.391-412 Volume:7 Issue:2 p.391-412
Temmuz 2020 July
398
1991 Turistik Manzaralar 3
1992 Turistik Konular 4
1993 Turistik Konular 2
1993 Arabahmet Bölgesi Koruma Projesi 2
1995 Turistik Konular 4
1996 Bellapais Manastırı 1
Görsel 1. Turizm, Boş Vakit Ve Rekreasyon Temalı Pulların Bazıları (Soldan Sağa Pulların
Yayınlanma Yılları 1989, 1982, 1991)
4.2. İkinci Grup Pullar: Devlet Temalı Pullar
Devlet temasını içeren 1970-1998 yılları arasında 40 (n=40) tane pul bulunmaktadır. Bu pullar
genellikle Cumhuriyetin ilanı ve resmi devlet ziyaretlerini anmak üzere hazırlanan pullardan
oluşmaktadır. Tablo 3 ikinci grup pulların isimlerini özetlemektedir. Bu gruptaki pullarda daha çok
ulusal semboller, bayraklar ve devletin zümresini oluşturan kişilerin temsili öne çıkarken, Türkiye
Cumhuriyeti’nin kuruluşu ile ilgili yıldönümü pullarına da yer verilmiştir. Aynı zamanda Görsel 2 bu
kategorideki bazı pulları göstermektedir.
Tablo 3. Devlet Temasını İçeren Pullar
Pulun Yılı Pulun Teması Sayısı (n=40)
1973 Türkiye Cumhuriyeti’nin 50. Yıldönümü 7
1975 Kıbrıs’ta Barış 3
1976 Özgürlük Anma Pulu 2
1980 Kıbrıs Türk Federe Devleti 1
1980 Kıbrıs Cumhuriyeti Yıldönümü 3
1984 KKTC’nin İlanının 1. Yıldönümü 2
1987 Turgut Özal’ın Resmi Ziyareti 1
1988 Cenevre Barış Zirvesi 1
1988 KKTC’nin Kuruluşunun 5. Yıldönümü 1
1988 Turgut Özal’ın Resmi Ziyareti 1
1988 Bülent Ecevit’in Resmi Ziyareti 1
1988 Bülent Ulusu’nun Resmi Ziyareti 1
1988 Resmi Ziyaret 1
1988 KKTC’nin 5. Yılı 1
1989 Erdal İnönü’nün Resmi Ziyaret 1
1990 Kenan Evren’in Resmi Ziyaret 1
1990 Yıldırım Akbulut’un Resmi Ziyaret 1
1993 KKTC’nin 10. Yılı 4
1994 TBMM’nin 75. Yılı 1
1995 Süleyman Demirel’in Resmi Ziyaret 1
1997 Necmettin Erbakan’ın Resmi Ziyaret 1
1997 KKTC Bayrağı 1
1998 Barış Suyu Projesi Süleyman Demirel’in Resmi Ziyareti 1

Arşivlenen Bellek Olarak Posta Pulları ve Sosyo-Kültürel İşlevleri: Kuzey Kıbrıs Örneği - Postage Stamps As An Archived Memory And Its Socio-
Cultural Function: North Cyprus Example
Dilan ÇİFTÇİ, Orhan ÇİFTÇİ
399
1998 Bülent Ecevit’in Ziyareti 1
1998 Mesut Yılmaz’ın Resmi Ziyareti 1
Görsel 2. Devlet temalı pulların bazıları (Soldan sağa pulların yayınlanma yılları 1973, 1973, 1998,
1998)
4.3. Üçüncü Grup Pullar: Doğa Temalı Pullar
Doğa temasını içeren 1970-1998 yılları arasında 79 (n=79) tane pul bulunmaktadır. Bu pullar
genellikle yerel hayvan türlerinden, balıklardan, ağaçlardan, kelebeklerden, Kıbrıs’a özgü kır
çiçeklerinden oluşmaktadır. Tablo 4 yıllara göre bu temada bulunan pulları özetlemektedir. Bu
kategoride en fazla pul 1990 yılında nadir bitkiler (Onosma Caespttosum, Rosularia Cypria, Silene
Fraudratrix, Arabis Cypria, Sedum Lampusae, Scutellaria Sibthorph) olarak hazırlanmıştır. Bununla
birlikte Dünya Çevre Günü ile ilgili olarak da 1996 yılında ormanları resmeden 2 tane pul hazırlanmıştır.
Ayrıca 16 farklı kategorinin içerisinde en fazla pul bulunan kategori olarak doğa temalı pullar 1970-
1998 yılları arasındaki Kıbrıs pulları içerisinde önemli yer teşkil etmektedir. Aynı zamanda Görsel 3 bu
kategorideki bazı pulları yıllara göre göstermektedir.
Tablo 4. Doğa Temasını İçeren Pullar
Pulun Yılı Pulun Teması Sayısı (n=79)
1981 Kır Çiçekleri 4
1982 Kır Çiçekleri 4
1983 Kuşlar 4
1984 Ormanlar 1
1985 Yerel Hayvan Türleri 4
1989 Kuşlar 4
1989 Göl 1
1989 Orman 1
1990 Kuşlar 4
1990 Nadir Bitkiler 6
1991 Orkideler 2
1991 Orkideler 4
1992 Dünya Çevre Yılı 1
1992 KKTC Veteriner Servisleri 1
1992 Kedi 1
1993 Anıt Ağaçlar 4
1994 Deniz Kabukları 3
1995 Avrupa Doğayı Koruma Yılı 3
1995 Kelebekler 4
1996 Dünya Çevre Günü 2
1996 Temiz ve Sağlıklı Bir Çevrede Yaşamak Çocuklarımızın Hakkıdır 1
1996 Balıklar 4
1996 Nar Ağacı 1
1996 Palmiye Ağacı 1

Mehmet Akif Ersoy İktisadi ve İdari Bilimler Fakültesi Dergisi - Mehmet Akif Ersoy University Journal of Economics and Administrative Sciences Faculty
Cilt:7 Sayı:2 s.391-412 Volume:7 Issue:2 p.391-412
Temmuz 2020 July
400
1997 Mantarlar 4
1997 Kuşlar 4
1998 Yararlı Böcekler 4
1998 Uluslararası Okyanus Yılı 2
Görsel 3. Doğa Temalı Pulların Bazıları (Soldan Sağa Pulların Yayınlanma Yılları 1990, 1996, 1992,
1981,1983)
4.4. Dördüncü Grup Pullar: Uluslararası Referans Temalı Pullar
Uluslararası referans temasını içeren 1970-1998 yılları arasında 10 (n=10) tane pul
bulunmaktadır. Bu pullarda öne çıkan konulardan bazıları şu şekilde sıralanabilir: Filistin Halkı ile
Dayanışma pulları iki yıl süreyle (1980-1981) hazırlanmıştır. Ayrıca Kıbrıs için önemli bir uluslararası
referans kabul edilen Birleşmiş Milletlerin kuruluşunun 50. Yıldönümü anısına 1995 yılında hazırlanan
pul ile 1988 yılında da İnsan Hakları Evrensel Beyannamesi’nin 50. Yılı anısına hazırlanan pullar öne
çıkmaktadır. Tablo 5 uluslararası referans temasını içeren pulları yıllara göre özetlemektedir. Aynı
zamanda Görsel 4 bu kategorideki bazı pulları göstermektedir.
Tablo 5. Uluslararası Referans Temasını İçeren Pullar
Pulun Yılı Pulun Teması Sayısı (n=10)
1980 Filistin Halkı ile Dayanışma 2
1981 Filistin Halkı ile Dayanışma 1
1985 BM’nin Kuruluşunun 40. Yıldönümü 1
1985 Kızılhaç’ın 125. Hizmet Yılı 1
1986 FAO 1
1987 Uluslararası Eczacılar Federasyonu Üyeliği 1
1988 İnsan Hakları Evrensel Beyannamesi 50. Yılı 1
1995 BM’nin Kuruluşunun 50. Yıldönümü 1
1996 Bosna-Hersek Konulu Pul 1
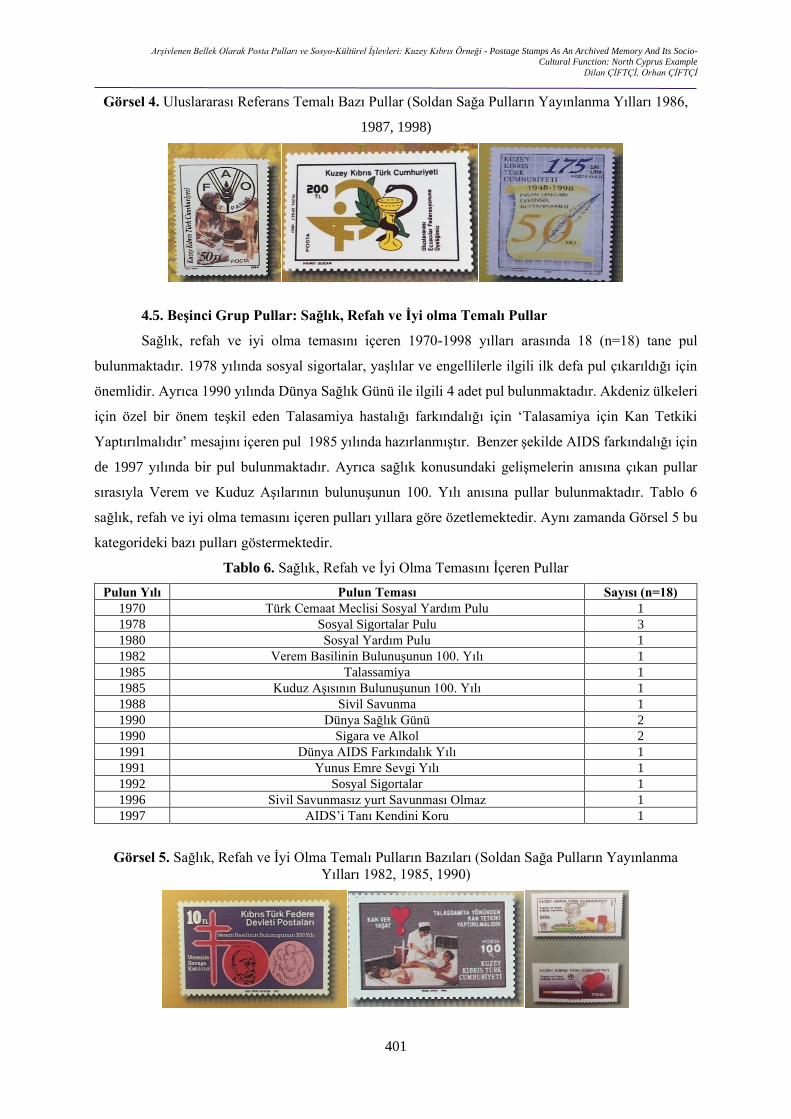
Arşivlenen Bellek Olarak Posta Pulları ve Sosyo-Kültürel İşlevleri: Kuzey Kıbrıs Örneği - Postage Stamps As An Archived Memory And Its Socio-
Cultural Function: North Cyprus Example
Dilan ÇİFTÇİ, Orhan ÇİFTÇİ
401
Görsel 4. Uluslararası Referans Temalı Bazı Pullar (Soldan Sağa Pulların Yayınlanma Yılları 1986,
1987, 1998)
4.5. Beşinci Grup Pullar: Sağlık, Refah ve İyi olma Temalı Pullar
Sağlık, refah ve iyi olma temasını içeren 1970-1998 yılları arasında 18 (n=18) tane pul
bulunmaktadır. 1978 yılında sosyal sigortalar, yaşlılar ve engellilerle ilgili ilk defa pul çıkarıldığı için
önemlidir. Ayrıca 1990 yılında Dünya Sağlık Günü ile ilgili 4 adet pul bulunmaktadır. Akdeniz ülkeleri
için özel bir önem teşkil eden Talasamiya hastalığı farkındalığı için ‘Talasamiya için Kan Tetkiki
Yaptırılmalıdır’ mesajını içeren pul 1985 yılında hazırlanmıştır. Benzer şekilde AIDS farkındalığı için
de 1997 yılında bir pul bulunmaktadır. Ayrıca sağlık konusundaki gelişmelerin anısına çıkan pullar
sırasıyla Verem ve Kuduz Aşılarının bulunuşunun 100. Yılı anısına pullar bulunmaktadır. Tablo 6
sağlık, refah ve iyi olma temasını içeren pulları yıllara göre özetlemektedir. Aynı zamanda Görsel 5 bu
kategorideki bazı pulları göstermektedir.
Tablo 6. Sağlık, Refah ve İyi Olma Temasını İçeren Pullar
Pulun Yılı Pulun Teması Sayısı (n=18)
1970 Türk Cemaat Meclisi Sosyal Yardım Pulu 1
1978 Sosyal Sigortalar Pulu 3
1980 Sosyal Yardım Pulu 1
1982 Verem Basilinin Bulunuşunun 100. Yılı 1
1985 Talassamiya 1
1985 Kuduz Aşısının Bulunuşunun 100. Yılı 1
1988 Sivil Savunma 1
1990 Dünya Sağlık Günü 2
1990 Sigara ve Alkol 2
1991 Dünya AIDS Farkındalık Yılı 1
1991 Yunus Emre Sevgi Yılı 1
1992 Sosyal Sigortalar 1
1996 Sivil Savunmasız yurt Savunması Olmaz 1
1997 AIDS’i Tanı Kendini Koru 1
Görsel 5. Sağlık, Refah ve İyi Olma Temalı Pulların Bazıları (Soldan Sağa Pulların Yayınlanma
Yılları 1982, 1985, 1990)

Mehmet Akif Ersoy İktisadi ve İdari Bilimler Fakültesi Dergisi - Mehmet Akif Ersoy University Journal of Economics and Administrative Sciences Faculty
Cilt:7 Sayı:2 s.391-412 Volume:7 Issue:2 p.391-412
Temmuz 2020 July
402
4.6. Altıncı Grup Pullar: Ekonomi Temalı Pullar
Ekonomi temasını içeren 1970-1998 yılları arasında 13 (n=13) tane pul bulunmaktadır. Bu
pullar arasında özellikle 2 yıl öne çıkmaktadır. Bunlar 1976’da ihraç ürünleri olan portakal, mandalina,
harnup, limon ve çilektir. Diğeri ise 1989 yılında tarımda kullanılan karasaban, döven ve yağ
değirmenini içeren 3 tane puldur. Tablo 7 ekonomi temasını içeren pulların yıllara göre dağılımını
özetlemektedir. Aynı zamanda Görsel 6 bu kategorideki bazı pulları göstermektedir.
Tablo 7. Ekonomi Temasını İçeren Pullar
Pulun Yılı Pulun Teması Sayısı (n=13)
1976 İhraç Ürünleri (portokal, mandalina, harnup vb.) 5
1987 Yeni Girne Limanı 1
1989 Free Port-Gazi Mağusa 1
1989 Tarım 1
1989 İçme Suyu 1
1989 Tarım 3
1992 Yeni Termik Elektrik Santrali-Girne 1
Görsel 6. Ekonomi Temalı Pulların Bazıları (Soldan Sağa Pulların Yayınlanma Yılları 1989, 1992,
1976)
4.7. Yedinci Grup Pullar: Önemli Kişiler Temalı Pullar
Önemli kişiler temasını içeren 1970-1998 yılları arasında 30 (n=30) tane pul bulunmaktadır. Bu
pullar arasında Atatürk’ü anma pulları öne çıkarken, diğer önemli politik figürler, araştırmacılar ve
sanatçıların ölümlerinin anısına da pullar hazırlanmıştır. Tablo 8 önemli kişiler temalı pulların yıllara
göre dağılımını özetlemektedir. Aynı zamanda Görsel 7 bu kategorideki bazı pulları göstermektedir.
Tablo 8. Önemli Kişiler Temasını İçeren Pullar
Pulun Yılı Pulun Teması Sayısı (n=30)
1978 Atatürk’ü Anma Pulu 3
1977 Namık Kemal’i Anma 2
1981 Atatürk’ün Doğumunun 100. Yıldönümü 1
1981 Atatürk Tanıtma Serisi 1
1981 Prens Charles ve Leydi Diana’nın Düğünü 1
1985 İsmet İnönü 1
1985 Dr. Fazıl Küçük ’ün Ölümünün 1. Yıldönümü 2
1986 Kraliyet Ailesi Pulları 2
1987 Osmanlı Paşaları 3
1988 Atatürk’ün Ölümünün 50. Yıldönümü 4
1988 Sedat Simavi 1
1990 Van Gogh’un 100. Ölüm Yıldönümü 2
1991 Başbakan Mustafa Çağatay 1

Arşivlenen Bellek Olarak Posta Pulları ve Sosyo-Kültürel İşlevleri: Kuzey Kıbrıs Örneği - Postage Stamps As An Archived Memory And Its Socio-
Cultural Function: North Cyprus Example
Dilan ÇİFTÇİ, Orhan ÇİFTÇİ
403
1993 Atatürk 1
1994 Dr. Fazıl Küçük’ün Ölüm Yıldönümü 1
1995 Pasteur’ün Ölümünün 100. Yılı 1
1996 Nasreddin Hoca Yılı 1
1998 Ahmet Şevki Bey 2
Görsel 7. Önemli Kişiler Temasını İçeren Pulların Bazıları (Soldan Sağa Pulların Yayınlanma Yılları
1981, 1985, 1988, 1994)
4.8. Sekizinci Grup Pullar: Kadın, Çocuk ve Dezavantajlı Gruplar Temalı Pullar
Kadın, çocuk ve dezavantajlı gruplar temasını içeren 1970-1998 yılları arasında 8 (n=8) tane
pul bulunmaktadır. Sırasıyla bu pullar, 1979 yılı Dünya Çocuk Yılına özel 3 adet, 1981 yılında
Uluslararası Engelliler Yılına özel 3 adet pul bulunmaktadır, bunların arasında ırk ayrımını kınama pulu
öne çıkarken, son olarak Uluslararası Gençlik Yılı anısına 2 adet pul basılmıştır. Tablo 9 kadın, çocuk
ve dezavantajlı gruplar temasını içeren pulların yıllara göre dağılımını özetlemektedir. Aynı zamanda
Görsel 8 bu kategorideki bazı pulları göstermektedir.
Tablo 9. Kadın, Çocuk ve Dezavantajlı Gruplar Temasını İçeren Pullar
Pulun Yılı Pulun Teması Sayısı (n=8)
1979 Dünya Çocuk Yılı 3
1981 Uluslararası Engelliler Yılı 3
1985 Uluslararası Gençlik Yılı 2
Görsel 8. Kadın, Çocuk ve Dezavantajlı Gruplar Temasını İçeren Bazı Pullar (Soldan Sağa Pulların
Yayınlanma Yılları 1979, 1979, 1985)
4.9. Dokuzuncu Grup Pullar: Sanat ve Kültür Temalı Pullar
Sanat ve kültür temasını içeren 1970-1998 yılları arasında 50 (n=50) tane pul bulunmaktadır.
Bunların arasından 1980 yılında Hz. Ömer Türbesi, Kalesi Mağusa, Bellapais ve Selimiye Camii gibi
pullar bulunurken, 1977 yılında Kıbrıs Türk Eserleri adı altında Arabahmet Camii, Bekir Paşa Su
Kanalları ve Baf Kalesi, 1986 yılında Bronz Çağ’a ait arkeolojik kalıntılar öne çıkmaktadır. Bunun
yanında, Kıbrıs’ta Barışı Anma Sergisi ve Özgürlük Anma Sergisi pulları 1975 ve 1976 yıllarında

Mehmet Akif Ersoy İktisadi ve İdari Bilimler Fakültesi Dergisi - Mehmet Akif Ersoy University Journal of Economics and Administrative Sciences Faculty
Cilt:7 Sayı:2 s.391-412 Volume:7 Issue:2 p.391-412
Temmuz 2020 July
404
önemli bir yer bulmaktadır. Diğer pullar ise genellikle 1988 ve 1989 yıllarında çeşitli tablo ve
resimlerden oluşmaktadır. Son olarak, Devlet Tiyatrolarının Kuruluşu ve Sinemanın 100. Yılı anısına
da pullar düzenlenmiştir. Tablo 10 sanat ve kültür temalı pulların yıllara göre dağılımını özetlemektedir.
Aynı zamanda Görsel 9 bu kategorideki bazı pulları göstermektedir.
Tablo 10. Sanat ve Kültür Temasını İçeren Pullar
Pulun Yılı Pulun Teması Sayısı (n=50)
1975 Kıbrıs’ta Barışı Anma Sergisi 3
1976 Özgürlük Anma Sergisi 2
1977 Kıbrıs’ta Türk Eserleri 4
1978 Ulusal Anıt 3
1980 Tarihi Eserler 5
1984 Atatürk Kültür Merkezi 1
1984 Resimler 2
1985 Tablolar 2
1986 Resimler 2
1986 Karagöz-Hacivat 1
1986 Tarihi Kalıntılar 4
1987 Resimler 2
1988 Resimler 3
1989 Resimler 3
1989 SADED 1
1991 Mozart 1
1991 Aşık Mene Resimleri 2
1992 Resimler 2
1993 KKTC Devlet Tiyatroları 1
1993 Çaykovski’nin 100. Ölüm Yılı 1
1994 Sanat Eserleri 2
1995 Sinemanın 100. Yılı 1
1997 Resimler 2
Görsel 9. Sanat ve Kültür Temasını İçeren Bazı Pullar (Soldan Sağa Pulların Yayınlanma Yılları
1975, 1989, 1991)
4.10. Onuncu Grup Pullar: Ulaştırma ve Haberleşme Temalı Pullar
Ulaştırma ve haberleşme temasını içeren 1970-1998 yılları arasında 38 (n=38) tane pul
bulunmaktadır. Bu kategoride en fazla pul 1994 yılında düzenlenen Köy Pullarının Kullanışının 100.
Yıldönümü pullarıdır. Bununla birlikte 1978 yılında kara, deniz ve hava ulaşımına ilişkin pullar da
hazırlanmıştır. Ayrıca 1979 yılında Uluslararası Telekomünikasyon Birliği anısına 3 adet pul
düzenlenmiştir. Trafik işaret ve kurallarını kapsayan 3 adet pul ise 1990 yılında Hayat Sigortası mesajı
ile hazırlanmıştır. Buna ilaveten deniz fenerini konu alan 3 adet pul 1991 yılında KKTC Deniz Fenerleri
olarak kayıtlara geçmiştir. 1983 yılında ise Dünya Haberleşme Yılı anısına 2 adet pul hazırlanırken,

Arşivlenen Bellek Olarak Posta Pulları ve Sosyo-Kültürel İşlevleri: Kuzey Kıbrıs Örneği - Postage Stamps As An Archived Memory And Its Socio-
Cultural Function: North Cyprus Example
Dilan ÇİFTÇİ, Orhan ÇİFTÇİ
405
bugün yok olan Kıbrıs Tren Yolları ile ilgili 1986 yılında 2 adet pul düzenlenmiştir. Kıbrıs kurum ve
kuruluşları anısına yapılan pullar ise kronolojik olarak sırasıyla şu şekildedir: Kuzey Kıbrıs Türk Hava
Kurumu, Kıbrıs Türk Hava Yolları, BRT’nin 35. Yılı Anısı, Kıbrıs Türk Postalarının 25. Yılı Anısı
puludur. Son olarak radyonun 100. Yılı anısına bir pul da bu kategoride 1995 yılında öne çıkmaktadır.
Tablo 11 ulaştırma ve haberleşme temalı pulların yıllara göre dağılımını özetlemektedir. Aynı zamanda
Görsel 10 bu kategorideki bazı pulları göstermektedir.
Tablo 11. Ulaştırma ve Haberleşme Temasını İçeren Pullar
Pulun Yılı Pulun Teması Sayısı (n=38)
1980 Kıbrıs’ta Basılan İlk Pulların Anısına Basılan Pullar 2
1978 Ulaşım 3
1979 Dünya Telekomünikasyon Birliği Anı Pulları 3
1980 Kıbrıs Türk Federe Devleti Postaları 1
1983 Dünya Haberleşme Yılı 2
1985 Kuzey Kıbrıs Türk Hava Kurumu 1
1986 Kıbrıs Türk Hava Yolları 2
1986 Tren Yolları 2
1988 Bayrak Radyo Televizyon Kurumu’nun Kuruluşunun 35. Yılı 1
1989 Kıbrıs Türk Postalarının 25. Yılı 1
1989 Tren Yolu 1
1990 Trafik 3
1991 Deniz Fenerleri 3
1992 Sivil Havacılık Hizmetleri 1
1992 Meteoroloji 1
1992 Haritacılık 1
1993 Basın ve Yayın 1
1994 Köy Pullarının Kullanılışının 100. Yıldönümü 5
1995 Radyonun 100. Yılı 1
1995 Devlet Basımevinin 20. Yılı 1
1995 TC Cumhurbaşkanı Süleyman Demirel’in Orhun Anıtlarını Ziyareti 2
Görsel 10. Ulaştırma ve Haberleşme Temalı Pulların Bazıları (Soldan Sağa Pulların Yayınlanma
Yılları 1980, 1979, 1983, 1985)
4.11. On Birinci Grup Pullar: Folklor, Ritüeller ve Gelenekler Temalı Pullar
Folklor, ritüeller ve gelenekler temasını içeren 1970-1998 yılları arasında 32 (n=32) tane pul
bulunmaktadır. Bu kategorideki pullar geleneksel kıyafetler (1987), halk dansları (1996), geleneksel
yemekler (1992 ve 1995) ve kullanılan paralar (1997) şeklinde sıralanabilir. Ayrıca, kaybolan el
sanatları ile ilgili pullar ise 1998 yılında kalaycılık, oymacılık, sepetçilik ve bileyiciler olarak öne
çıkmaktadır. Son olarak Kıbrıs el sanatlarının resmedildiği pullar 1977 yılında düzenlenmiştir. Tablo 12

Mehmet Akif Ersoy İktisadi ve İdari Bilimler Fakültesi Dergisi - Mehmet Akif Ersoy University Journal of Economics and Administrative Sciences Faculty
Cilt:7 Sayı:2 s.391-412 Volume:7 Issue:2 p.391-412
Temmuz 2020 July
406
folklor, ritüeller ve gelenekler temasını içeren pulların yıllara göre dağılımını özetlemektedir. Aynı
zamanda Görsel 11 bu kategorideki bazı pulları göstermektedir.
Tablo 12. Folklor, Ritüeller ve Gelenekler Temasını İçeren Pullar
Pulun Yılı Pulun Teması Sayısı (n=32)
1977 Kıbrıs El Sanatları 3
1982 Kıbrıs Düğünü ve Harnup Toplayıcıları 2
1983 Leymosun Otobüsü ve Nasırlı Eller 2
1987 Folklor 4
1988 Kardeşlik 1
1992 Kıbrıs Mutfağı 4
1995 Kıbrıs Mutfağı 3
1996 Folklor 1
1997 Kullanılan Paralar 4
1998 Eski Kapılar 2
1998 Çocuk Halk Dansları Festivali Etkinliği 2
1998 Kaybolan El Sanatları (Kalaycı, Oymacı, Sepetçi, Bileyici) 4
Görsel 11. Folklor, Ritüeller ve Gelenekler Temasını İçeren Bazı Pullar (Soldan Sağa Pulların
Yayınlanma Yılları 1988, 1998, 1998)
4.12. On İkinci Grup Pullar: Savaş, Askerlik ve Güvenlik Temalı Pullar
Savaş, askerlik ve güvenlik temasını içeren 1970-1998 yılları arasında 15 (n=15) tane pul
bulunmaktadır. Bu kategorideki pullar arasında öne çıkan pullar Kıbrıs Barış Harekatı’nın 5. 10. Ve 20.
Yılı anısına çıkan pullar, Güvenlik Kuvvetleri Komutanlığı’nın kuruluşunun 20. Yılı ve Türk
Mukavemet Teşkilatı’nın (TMT) 25. Yılı anısına çıkan pullardır. Tablo 13 savaş, askerlik ve güvenlik
temalı pulların yıllara göre dağılımını özetlemektedir. Aynı zamanda Görsel 12 bu kategorideki bazı
pulları göstermektedir.
Tablo 13. Savaş, Askerlik ve Güvenlik Temasını İçeren Pullar
Pulun Yılı Pulun Teması Sayısı (n=15)
1979 Kıbrıs Barış Harekatı’nın 5. Yıldönümü 1
1983 TMT’nin 25. Yıldönümü 3
1984 Kıbrıs Barış Harekatı’nın 10. Yıldönümü 2
1986 Güvenlik Kuvvetleri Komutanlığı 1
1987 Piyade Alayı’na Sancağın İlk Teslimi Töreni 1
1989 Erenköy Direnişi’nin 25. Yılı 1
1993 TMT 1
1994 Kıbrıs Barış Harekatı’nın 20. Yıldönümü 4
1996 Güvenlik Kuvvetleri Komutanlığı’nın Kuruluşu’nun 20. Yılı 1

Arşivlenen Bellek Olarak Posta Pulları ve Sosyo-Kültürel İşlevleri: Kuzey Kıbrıs Örneği - Postage Stamps As An Archived Memory And Its Socio-
Cultural Function: North Cyprus Example
Dilan ÇİFTÇİ, Orhan ÇİFTÇİ
407
Görsel 12. Savaş, Askerlik ve Güvenlik Temalı Pulların Bazıları (Soldan Sağa Pulların Yayınlanma
Yılları 1979, 1983, 1984,1986,1993)
4.13. On Üçüncü Grup Pullar: Spor Temalı Pullar
Spor temasını içeren 1970-1998 yılları arasında 32 (n=32) tane pul bulunmaktadır. Genellikle
Dünya Futbol Kupası ve Dünya Olimpiyatlarını içeren anı pulları bu kategoride öne çıkmaktadır. Tablo
14 spor temalı pulların yıllara göre dağılımını özetlemektedir. Aynı zamanda Görsel 13 bu kategorideki
bazı pulları göstermektedir.
Tablo 14. Spor Temasını İçeren Pullar
Pulun Yılı Pulun Teması Sayısı (n=32)
1976 Kıbrıs Türk Federe Devleti Monteal Olimpiyat Oyunları 2
1982 Dünya Futbol Kupası 1
1982 İzciliğin Kuruluşunun 75. Yıldönümü 1
1984 Los Angeles Olimpiyatları 2
1984 Uluslararası Tekvando Şampiyonası 5
1986 Mexico 86 Olimpiyatları 1
1988 Seul Olimpiyatları 3
1990 İtalya Dünya Kupası 2
1992 Barselona Olimpiyatları 4
1994 Dünya Kupası 2
1996 Atlanta Olimpiyat Oyunları 4
1996 Dünya Futbol Şampiyonası 2
1997 İzciliğin 90. Yılı 1
1998 Fransa Dünya Kupası 2
Görsel 13. Spor Temalı Pulların Bazıları (Soldan Sağa Pulların Yayınlanma Yılları 1982, 1982,
1984,1986)

Mehmet Akif Ersoy İktisadi ve İdari Bilimler Fakültesi Dergisi - Mehmet Akif Ersoy University Journal of Economics and Administrative Sciences Faculty
Cilt:7 Sayı:2 s.391-412 Volume:7 Issue:2 p.391-412
Temmuz 2020 July
408
4.14. On Dördüncü Grup Pullar: Eğitim, Bilim ve Araştırma Temalı Pullar
Eğitim, bilim ve araştırma temasını içeren 1970-1998 yılları arasında 13 (n=13) tane pul
bulunmaktadır. Bu pulların arasında öne çıkan konular şu şekildedir: 1990 Dünya Okuma ve Yazma
Yılı, 1995 Lefkoşa Türk Lisesi’nin 100. Yılı, 1987 Doğu Akdeniz Üniversitesi’nin Kuruluşu, 1988
Uluslararası Girne Konferansıdır. Tablo 15 eğitim, bilim ve araştırma temalı pulların yıllara göre
dağılımını özetlemektedir. Aynı zamanda Görsel 14 bu kategorideki bazı pulları göstermektedir.
Tablo 15. Eğitim, Bilim ve Araştırma Temasını İçeren Pullar
Pulun Yılı Pulun Teması Sayısı (n=13)
1986 Halley Yıldızı 1
1987 Beşinci İslam Zirve Konferansı 1
1987 Doğu Akdeniz Üniversitesi’nin Kuruluşu 1
1988 Uluslararası Kuzey Kıbrıs Fuarı 1
1988 Uluslararası Girne Konferansı 1
1990 Dünya Okuma ve Yazma Yılı-Baş Öğretmen Atatürk 2
1991 Doğu Akdeniz Üniversitesi 1
1992 KKTC’de Harita Çalışmaları 1
1992 Meteoroloji Hizmetleri 1
1995 Lefkoş Türk Lisesi 100. Yılı 1
1997 Dizel Motorun İcadı 1
1997 AIDS Eğitimi 1
Görsel 14. Eğitim, Bilim ve Araştırma Temalı Pulların Bazıları (Soldan Sağa Pulların Yayınlanma
Yılları 1987, 1988, 1991, 1995)
4.15. On Beşinci Grup Pullar: Din Temalı Pullar
Din temasını içeren 1970-1998 yılları arasında 5 (n=5) tane pul bulunmaktadır. Sırasıyla bu
pullar, 1980 İslam Anma Serisi pulları olarak Hicretin 15. Yüzyılı anısı pulu, Dünya İslam Konferansı
8. Genel Kurulu, Kıbrıs Türk Federe Devleti ilk İslam Konferansı anı pulu ve 1981 yılında İslam
Ülkeleri Dayanışma Günü anısına hazırlanan Türkçe ve İngilizce pullardır. Aynı zamanda Görsel 15 bu
kategorideki bazı pulları göstermektedir.
Tablo 16. Din Temasını İçeren Pullar
Pulun Yılı Pulun Teması Sayısı (n=5)
1980 İslam Anma Serisi 3
1981 İslam Ülkeleri Dayanışma Günü 2

Arşivlenen Bellek Olarak Posta Pulları ve Sosyo-Kültürel İşlevleri: Kuzey Kıbrıs Örneği - Postage Stamps As An Archived Memory And Its Socio-
Cultural Function: North Cyprus Example
Dilan ÇİFTÇİ, Orhan ÇİFTÇİ
409
Görsel 15. Din Temalı Pulların Bazıları (Soldan Sağa Pulların Yayınlanma Yılları 1980, 1981)
5. SONUÇ VE DEĞERLENDİRME
Posta pullarındaki sunum kodları ve temsiliyet konusu kültürel bellek açısından incelenen bu
çalışmada 1970 ve 1998 yılları arasında Kuzey Kıbrıs özelinde sosyo-kültürel değişimleri ve Kıbrıs
Türklerinin dünyaya uyum sağlama adına öne çıkardıkları konu ve durumları açıkça ortaya koymuştur.
Bu bağlamda siyasi temsiller olarak öne çıkması öngörülen pulların aksine söz konusu dönemde doğa,
sağlık gibi temalardaki pulların yoğunluğu siyasi propaganda amacından ziyade tanıtım amacı taşıdığını
söylemek yanlış olmayacaktır. Çalışma kapsamında incelenen posta pullarında, tarihi mekanlar,
çiçekler, hayvanlar ve resmi kurum ve kuruluşların kuruluşu anısına yapılan pullar dikkat çekmektedir.
Bu açıdan, 1970-1998 yılları arasındaki pullar için Kuzey Kıbrıs Türk Cumhuriyeti’nin kuruluşu ve
akabinde tanıtımı açısından önemli referans kaynaklar olduğunu söylemek yerinde olacaktır.
Posta pullarındaki sunum kodları içerisinde Türkiye Cumhuriyeti ile ilişkiler resmi devlet
ziyaretleri için hazırlanan pullar ile metaforik olarak 1974’ü resmederken, dünya ile entegre olma isteği
açısından spor teması altındaki Dünya Kupası ve Olimpiyatlar için hazırlanan pullar öne çıkmaktadır.
Bunun yanı sıra Birleşmiş Milletler ve İngiliz Kraliyet ailesi ile ilgili çıkan pullarda ise adanın
üzerindeki dış aktörlerin etkisi ve devamlılığı sunulmaktadır. Bunların yanında Kuzey Kıbrıs Türk
Cumhuriyeti’nin kuruluşu ve önemli kişilerin yer aldığı pullarda ise temsil edilmek üzere seçilen kişiler
Kuzey Kıbrıs Türk halkı için öne çıkan kişilerdir.
Kuzey Kıbrıs Türk Cumhuriyeti pullarını daha Cumhuriyet dönemi kurulmadan önceki
dönemden başlayarak politik olarak 16 kategoriden oluşan ölçekle incelediğimiz bu çalışmada pulların
ikonografik değerinin araştırma materyali olarak devletin, ulusun ve toplumun kültürel belleği
bağlamında görsel temsilleri ortaya koyulmuştur. Her durumda söz konusu döneme ait pullar topluma
ait kültürün sadece varlığını değil yokluğunu da gösteren birer anlatı olarak karşımıza çıkmaktadır. Öyle
ki posta pullarındaki görsel temsiller bir topluma ve onun baskın değer yapılarına sembol oluştururken
ulusal kimliğin inşasını da kronolojik olarak tarihin temsilleri şeklinde gözler önüne sermektedir.
Diğer batı toplumlarına nazaran bu çalışmadaki posta pullarında propagandacı ideolojilerden ve
siyasal mesajların oranından çok toplumun oluşumundaki süreçler ön plana çıkmıştır. Bu nedenle,
gelecek için siyasi mesajlar içeren propagandist tasarımlar yerine geçmişin yeniden üretimini öne
çıkaran ve yıldönümleri, anmalarla birlikte unutulmamasını amaç edinen pullar daha fazladır. Bu
çalışma belli bir dönemi ele alması açısından ve Kıbrıs özelinde yapılan pullarla ilgili ilk çalışma olması

Mehmet Akif Ersoy İktisadi ve İdari Bilimler Fakültesi Dergisi - Mehmet Akif Ersoy University Journal of Economics and Administrative Sciences Faculty
Cilt:7 Sayı:2 s.391-412 Volume:7 Issue:2 p.391-412
Temmuz 2020 July
410
bakımından önemlidir. Fakat nitel bir araştırma olması ve ilk olması sebebiyle pullarla ilgili belgelerin
haritası niteliğinde olan bu çalışma belirli bir dönemi işaret ettiği için sınırlıdır. İşaret ettiği dönemden
sonraki dönemlerde haberleşme aracı olarak postanın önemini kaybetmesi düşünüldüğünde çalışma
önemli veriler ortaya koymaktadır. Bu veriler ışığında gelecek çalışmalarda söz konusu dönemde pulları
aktif olarak kullanan vatandaşlara yönelik pulların öğretim malzemesi olarak kullanılması üzerinden
yeni çalışmalar yapılabileceği gibi söz konusu pulların görsel betimlemelerini de yapmak anlamlı
olacaktır. Pullar bir ülkenin tarihini anlamamıza yardımcı olan görselleştirmelerdir ve bu açıdan
karşılaştırmalı kapsamlı çalışmalar da ortaya değerli veriler koyacaktır.
KAYNAKÇA
Assmann, A. (2006). Memory, individual and collective. The Oxford handbook of contextual
political analysis, 9, 210-226.
Banks, M. (2001). Visual Methods in Social Research. Sage, London.
Brunn S.D. and Yanarella E., (1987). Towards a humanistic political geography. Studies in
Comparative International Development 22:(2) 3 49.
Brunn S.D. and Jones J.A., (1994). Geopolitical information and communication in shrinking
and expanding worlds. In: Demko G.J. and Wood W.B. (eds), Reordering the World:
Geopolitical Perspectives on the 21st Century. pp. 301–322. Westview Press, Boulder.
Brunn S.D., Baker J. and Cottle C., (1996). Small states’ worldviews and ‘windows’ on the
world: UN 50th anniversary speeches and ‘official’ WWW home pages. Paper
presented at Eighth International Conference on the Advancement of Socio-Economics,
University of Geneva, July.
Brunn, S.D. (2000).‘Stamps as iconography: Celebrating the independence of new European
and Central Asian states’, GeoJournal, 52: 315–323.
Child, J. (2005). The politics and semiotics of the smallest icons of popular culture: Latin
American postage stamps. Latin American Research Review, 108-137.
Conway, M. A., & Pleydell-Pearce, C. W. (2000). The construction of autobiographical
memories in the self-memory system. Psychological review, 107(2), 261.
Davis, B. (1985). "Maps on Postage Stamps as Propaganda". The Cartographic Journal, 22(2),
s.125-130.
Deans, P., and Dobson H. (2005). "Introduction: East Asian Postage Stampsas Socio-Political
Artefacts". East Asia, 22(2), 3-7.
Dobson, H. (2002). Japanese Postage Stamps: Propaganda and Decision Making. In Japan
Forum (Vol. 14, No. 1, pp. 21-39). Taylor & Francis.

Arşivlenen Bellek Olarak Posta Pulları ve Sosyo-Kültürel İşlevleri: Kuzey Kıbrıs Örneği - Postage Stamps As An Archived Memory And Its Socio-
Cultural Function: North Cyprus Example
Dilan ÇİFTÇİ, Orhan ÇİFTÇİ
411
Goin, P. (2001). ‘Visual literacy’, in DELYSER, D. and STARRS, P.F. (eds): Doing Fieldwork,
Geographical Review, 91 (Special Issue): 363–369.
Halbwachs, M. (1992). On collective memory. University of Chicago Press.
Hoelscher, S., & Alderman, D. H. (2004). Memory and place: geographies of a critical
relationship. Social & Cultural Geography, 5(3), 347-355.
Klamár, R., Slivková, S., Javor, M., & Brunn, S. D. (2018). Stamps of Czechoslovakia (1983–
1992) and Slovak and Czech Republics (1993–2002): juxtaposing fragmentation and
integration theory. Geografiska Annaler: Series B, Human Geography, 100(4), 377-
395.
Lauritzen, F. (1988). ‘Propaganda art in the postage stamps of the Third Reich’, Journal of
Decorative and Propaganda Arts, 10: 62–79.
Lutz, C. and Collins, J.L. (1993). Reading National Geographic. University of Chicago Press,
Chicago.
Matsuda, M. K., & Matsuda, M. K. (1996). The memory of the modern. Oxford University Press
on Demand.
Nuessel, F. and Cicogna, C. (1992). ‘Postage stamps as pedagogical instruments in the Italian
curriculum’, Italica, 69: 210–227.
Olick, J. K., & Robbins, J. (1998). Social memory studies: From “collective memory” to the
historical sociology of mnemonic practices. Annual Review of sociology, 24(1), 105-
140.
Pierce, P. R., & Zilka, A. M. (1996). U.S. Patent No. 5,584,017. Washington, DC: U.S. Patent
and Trademark Office.
Raento, P. (2004). ‘Where East meets West: International references on Finnish postage stamps,
1917–2001’. Paper presented at the international workshop ‘Apolitical? East Asian
Postage Stamps as Socio-Political Artefacts,’ University of Sheffield, UK, 13–14
August.
Raento, P., & Brunn, S. D. (2005). Visualizing Finland: Postage stamps as political
messengers. Geografiska Annaler: Series B, Human Geography, 87(2), 145-164.
Raento, P. (2006). Communicating geopolitics through postage stamps: the case of
Finland. Geopolitics, 11(4), 601-629.
Raento, P. (2016). A Geopolitics of the Horse in Finland. Geopolitics, 21(4), 945-968.

Mehmet Akif Ersoy İktisadi ve İdari Bilimler Fakültesi Dergisi - Mehmet Akif Ersoy University Journal of Economics and Administrative Sciences Faculty
Cilt:7 Sayı:2 s.391-412 Volume:7 Issue:2 p.391-412
Temmuz 2020 July
412
Reid, D.M. (1984). ‘The symbolism of postage stamps: A source of historians’, Journal of
Contemporary History, 19: 223–249.
Reid, D. M. (1993). "The Postage Stamp: A Windowon Saddam Hussein's Iraq". Middle East
Journal, 47(1), s.77-89.
Rose, G. (1996). ‘Teaching visualized geographies: Towards a methodology for the
interpretation of visual materials’, Journal of Geography in Higher Education, 20: 281–
294.
Rose, G. (2001). Visual Methodologies. An Introduction to the Interpretation of Visual
Materials. Sage, London.
Scott, D. (1995). European Stamp Design: A Semiotic Approach to Designing Messages.
Academy Editions, London.
Scott, D. (2002). ‘The semiotics of the lieu de mémoire: The postage stamp as a site of cultural
memory’, Semiotica, 142: 107–124.
Scott, D. (2004). ‘The politics and semiotics of postage stamp design. Paper presented at the
international workshop ‘Apolitical? East Asian Postage Stamps as Socio-Political
Artefacts,’ University of Sheffield, UK, 13–14 August.
Steiner, L., & Zelizer, B. (1995). Competing memories: Reading the past against the grain: The
shape of memory studies.
Sturken, M. and Cartwright, L. (2001). Practices of Looking. Oxford University Press, Oxford.
Van Leeuwen, T., & Jewitt, C. (Eds.). (2001). The handbook of visual analysis. Sage.
Wang, Z. (2008). National humiliation, history education, and the politics of historical memory:
Patriotic education campaign in China. International Studies Quarterly, 52(4), 783-806.
Yates, A. J. (1966). Psychological deficit. Annual review of psychology, 17(1), 111-144.
Zonabend, F. (1984). The enduring memory: Time and history in a French village. Manchester
University Press.

413
MEHMET AKİF ERSOY ÜNİVERSİTESİ
İKTİSADİ VE İDARİ BİLİMLER FAKÜLTESİ DERGİSİ
Mehmet Akif Ersoy University
Journal of Economics and Administrative Sciences Faculty
ISSN: 2149-1658 Cilt: 7 Sayı: 2 s.413-439
Volume: 7 Issue: 2 p.413-439
Temmuz 2020 July
TRANSFORMATION OF PASSIVE REPRESENTATION INTO SYMBOLIC
REPRESENTATION IN THE FRAMEWORK OF REPRESENTATIVE BUREAUCRACY
APPROACH: A FIELD RESEARCH ON THE GENDARMARIE AND THE POLICE
TEMSİLİ BÜROKRASİ YAKLAŞIMI ÇERÇEVESİNDE PASİF TEMSİLİN SEMBOLİK
TEMSİLE DÖNÜŞÜMÜ: JANDARMA VE POLİS TEŞKİLATI ÜZERİNE BİR ARAŞTIRMA
Mustafa ARSLAN1, Mustafa LAMBA2, Sezai ÖZTOP3
1. Dr. Öğr. Üyesi, Nevşehir Hacı Bektaş Veli
Üniversitesi, [email protected], https://orcid.org/0000-0003-3259-1012
2. Doç. Dr., Burdur Mehmet Akif Ersoy Üniversitesi,
[email protected] https://orcid.org/0000-0002-7406-6112
3. Dr. Öğr. Üyesi., Burdur Mehmet Akif Ersoy
Üniversitesi, [email protected], https://orcid.org/0000-0003-2656-2776
Makale Türü Article Type
Araştırma Makalesi Research Article
Başvuru Tarihi Application Date
20.02.2020 02.20.2020
Yayına Kabul Tarihi Admission Date
21.06.2020 06.21.2020
DOI
https://doi.org/10.30798/makuiibf.692039
Abstract
In this study, it is aimed to reveal the transformation of passive representation
into symbolic representation and the relationship between symbolic
representation and the attitudes of trust, participation and legitimacy of
individuals towards public bureaucracy. The perceptions and attitudes towards
law enforcement bureaucracy have been tried to determine through individuals
living in Nevşehir. The data of research have been collected by means of a
questionnaire form from 550 individuals who were selected by cluster
sampling method. In the research, it has been determined that the passive
representation transformed into symbolic representation. In addition, it has
been observed that there were statistically significant and positive, strong
relationships between symbolic representation and the attitudes of trust,
participation and legitimacy toward public bureaucracy. Therefore, it is
possible to assert that the representative bureaucracy approach can be used to
increase legitimacy and trust toward public authorities and to gain social
support as it is in the sample of law enforcement.
Keywords: Gendarmerie, Police, Representative Bureaucracy, Passive
Representation, Symbolic Representation,
Öz
Bu çalışmada, pasif temsilin sembolik temsile dönüşümü ve sembolik temsil
ile bireylerin kamu bürokrasisine karşı geliştirdikleri güven, katılım ve
meşruiyet tutumları arasındaki ilişkinin ortaya konulması amaçlanmıştır.
Kolluk bürokrasisi hakkındaki algı ve tutumlar, Nevşehir ilinde yaşayan
vatandaşlar üzerinden belirlenmeye çalışılmıştır. Araştırmanın verileri küme
örneklem metoduyla belirlenen 550 kişiden oluşan örneklem kitlesinden anket
formuyla derlenmiştir. Araştırmada pasif temsilin sembolik temsile dönüştüğü
bulgusuna ulaşılmıştır. Buna ilaveten, sembolik temsil ile kamu bürokrasisine
güven, katılım ve meşru görme tutumları arasında istatistiki olarak anlamlı,
pozitif yönlü ve güçlü ilişkiler olduğu tespit edilmiştir. Dolayısıyla kolluk
kuvvetleri özelinde, kamu kurumlarının meşruiyetinin ve kurumlara olan
güvenin arttırılmasında ve toplumsal desteğin sağlanmasında temsili bürokrasi
yaklaşımından yararlanılabileceği söylenebilir.
Anahtar Kelimeler: Jandarma, Polis, Temsili Bürokrasi, Pasif Temsil,
Sembolik Temsil,

Mehmet Akif Ersoy İktisadi ve İdari Bilimler Fakültesi Dergisi - Mehmet Akif Ersoy University Journal of Economics and Administrative Sciences Faculty
Cilt:7 Sayı:2 s.413-439 Volume:7 Issue:2 p.413-439
Temmuz 2020 July
414
GENİŞLETİLMİŞ ÖZET
Çalışmanın Amacı
Bu çalışmada, pasif temsilin sembolik temsile dönüşümü ve sembolik temsil ile bireylerin kamu
bürokrasisine karşı geliştirdikleri güven, katılım ve meşruiyet tutumları arasındaki ilişkinin ortaya
konulması amaçlanmıştır.
Araştırma Soruları
Araştırma kapsamında, örneklem üzerinde cevap aranan sorular şunlardır: (1) Passive temsil
sembolik temsile dönüşmekte midir? (2) Sembolik temsil ile kolluk faaliyetlerini meşru görme arasında
ilişki var mıdır? (3) Sembolik temsil algısıyla kamusal faaliyetlere katılım arasında ilişki var mıdır? (4)
Sembolik temsil algısıyla bürokrasiye güven arasında ilişki var mıdır?
Literatür Araştırması
Temsili bürokrasi kavramı, ilk olarak “kamu bürokrasisinin iktidardaki toplumsal sınıfın
özelliklerini yansıtması gerektiği” savıyla J. Donald Kingsley (1944) tarafından “Representative
Bureaucracy” isimli çalışmada kullanılmıştır (Frederickson ve Smith, 2002: 62). Dolayısıyla Kingsley
temsili bürokrasi teorisini ilk ortaya koyan araştırmacı olarak literatüre geçmiştir. Teorinin çağdaş
savunucuları gibi, Kingsley de temsili bürokrasiyi, idari sorumluluğu geliştirmenin bir aracı olarak ele
almıştır (Kernaghan, 1978: 490). Kingsley, bürokratların toplumla aynı demografik değerlere sahip
olmaları durumunda sorumluluk duygularının güçleneceğini ileri sürmüştür (Dauda, 1990: 467). Temsili
bürokrasi kavramı İkinci Dünya Savaşı ertesinde Kingsley (1942) tarafından aynı ismi taşıyan eseriyle
literatüre kazandırılmıştır. Bürokratların da siyasiler gibi toplumun farklı kesimlerini temsil etmeleri
gerektiği düşüncesine dayanan temsili bürokrasi yaklaşımı Avrupa’nın dışına taşarak, ABD’de David
Levitan (1946) tarafından bürokrasinin idari takdir yetkisini kontrol etmenin bir aracı olarak
görülmüştür. Long (1952) ise bürokrasinin aslında Kongre’den daha temsili olabileceği savını
geliştirmiştir. Mosher (1968) ise aktif temsil ve pasif temsil temsil kavramlarıyla konuya açıklık
getirmiştir. Bu süreçte, pasif temsilin sonuç yaratabilmesi için mutlaka aktif temsile dönüşmesinin
gerekli olmadığı savından hareketle sembolik temsil yaklaşımı geliştirilmiştir (Meier ve Stewart, 1991;
Hindera, 1993a, 1993b; Selden, 1997a; Gade ve Wilkins, 2013).Sembolik temsil yaklaşımına göre
temsil olgusunun sonuçları değiştirebilmesi için temsilci bürokratın herhangi bir eyleme geçmesi
gerekmez, temsilcinin kamu bürokrasisinde bulunması sonucun değişmesi için yeterlidir (Pitkin, 1967;
Gade ve Wilkins, 2013). Sembolik temsil yaklaşımı araştırmacılar tarafından polisler (Theobald ve
Haider-Markel, 2009; Meier ve Nicholson-Crotty , 2006; Andrews ve Miller, 2013; Andrews vd,2014;
Riccucci vd., 2014; Hong, 2017), harp malulleri (Gade ve Wilkins, 2013), öğretmenler (Grissom ve
Keiser, 2011), engelliler (Allen ve Cohen, 1980) ırk, etnik köken ve cinsiyet bazlı olarak yapılan
araştırmalarla ampirik teste tabi tutulmuştur. Kavram uluslararası literatürde geniş ilgi görmesine
rağmen Türkçe literatürde yeterli ilgiyi görmemiştir. Temsili bürokrasi konusunda yapılan çalışmalar
Aşkar (2019) tarafından kavramın teorik yönünü açıklayıcı bir makale, Lamba ve Tatlısu (2019)

Transformation of Passive Representation Into Symbolic Representation In The Framework Of Representative Bureaucracy Approach: A Field Research On The
Gendarmarie And The Police - Temsili Bürokrasi Yaklaşımı Çerçevesinde Pasif Temsilin Sembolik Temsile Dönüşümü: Jandarma Ve Polis Teşkilatı Üzerine Bir
Araştırma
Mustafa ARSLAN, Mustafa LAMBA, Sezai ÖZTOP
415
tarafından Türk yüksek öğretim kurumlarında cinsiyet temsilini inceleyen makale ile Arslan (2019)
tarafından temsili bürokrasi yaklaşımını teorik ve ampirik yönüyle genel olarak ele alan kitap
çalışmasından ibarettir.
Yöntem
Araştırmada nicel analiz yöntemi kullanılmıştır. Anket tekniğinden yararlanılmıştır.
Araştırmanın evrenini Nevşehir ilinde ikamet eden vatandaşlar oluşturmaktadır. Araştırmanın verileri
küme örneklem metoduyla belirlenen 550 kişiden oluşan örneklem kitlesinden elde edilmiştir.
Araştırmanın evrenini Nevşehir'de ikamet eden vatandaşlar oluşturmaktadır.
Sonuç ve Değerlendirme
Sembolik temsilin vatandaşların kamusal faaliyetlere katılımı üzerinde pozitif yönlü etki
yarattığına yönelik literatürde bulgulara rastlanmaktadır. Bu çalışmada da, Nevşehir'deki örneklem
ölçeğinde, jandarma ve polisin kendilerini temsil ettiğini düşünen katılımcıların kolluk faaliyetlerine
katılım ve destek sağlama eğilimlerinin yüksek olduğu bulgusuna ulaşılmıştır. Bulgulardan hareketle,
toplum destekli kolluk faaliyetlerinden beklenen etkinliğin sağlanabilmesi için toplum kesimlerinin
katılımının teşvik edilmesi gerektiği değerlendirilmektedir. Bunu gerçekleştirmenin aracı kolluk
kurumlarında temsil mekanizmasına işlerlik kazandırmaktır. Türkiye’de temsili bürokrasiye ilişkin
ampirik nitelikteki ilk çalışma olma vasfı taşıyan bu çalışmada pasif temsilin sembolik temsile
dönüştüğü, vatandaşların kolluk faaliyetlerini meşru görmelerine katkı sağladığı, vatandaş katılımını
sağladığı ve vatandaşların kolluk birimlerine güvenini pekiştirdiği sonucuna ulaşılmıştır. Bulgulardan
hareketle Türk kamu bürokrasisinin meşruiyetini artırmak, güvenilirliğini pekiştirmek; kamu
hizmetlerine vatandaş katılımını sağlamak için bürokrasiye temsil vasfı kazandırmak bir kamu politikası
olarak belirlenebilir.

Mehmet Akif Ersoy İktisadi ve İdari Bilimler Fakültesi Dergisi - Mehmet Akif Ersoy University Journal of Economics and Administrative Sciences Faculty
Cilt:7 Sayı:2 s.413-439 Volume:7 Issue:2 p.413-439
Temmuz 2020 July
416
1. INTRODUCTION
Kingsley (1942) has created representative bureaucracy term by means of a work with the same
name after the World War II. The representative bureaucracy approach, based on the opinion that
bureaucrats should represent various parts of society like politicians, went beyond Europe, and it was
assumed as a means to control the administrative discretion of bureaucracy by David Levitan (1946) in
the USA. However, Long (1952) asserted that the bureaucracy would be more representative than the
Congress actually. On the other hand, Mosher (1968) tried to explain the issue with the terms of active
representation and passive representation. In this process, symbolic representation approach has been
developed based on the allegation that it is not compulsory that passive representation transforms into
active representation in order for passive representation to create a result (Meier and Stewart, 1991;
Hindera, 1993a, 1993b; Selden, 1997a; Gade and Wilkins, 2013).
According to symbolic representative approach, it is not necessary for a representative
bureaucrat to start any action to change the results of representation fact; however, it is enough for a
change that the representative individual exists in public bureaucracy (Pitkin, 1967; Gade and Wilkins,
2013). Symbolic representation approach has been tested empirically based on race, ethnicity and gender
in some research such as in police (Theobald and Haider-Markel, 2009; Meier and Nicholson-Crotty,
2006; Andrews and Miller, 2013; Andrews, 2014; Riccucci et al., 2014; Hong, 2017), for veterans of
war (Gade and Wilkins, 2013), for teachers (Grissom and Keiser, 2011) and for disabled people (Allen
and Cohen, 1980).
It seems that the term has not been studied adequately in Turkey although there has been some
studies in international literature. The studies in representative bureaucracy include only an article by
Aşkar to clarify the theoretical perspective of the term (2019), and an article by Lamba and Tatlısu
(2019) to determine the gender representation in universities in Turkey, and a book by Arslan (2019) to
examine the representative bureaucracy approach theoretically and empirically.
Considering the literature mentioned above, it is aimed in this study to examine the
transformation of passive representation into symbolic representation, and to put forward the
relationship between the symbolic representation and the attitudes of trust, participation and legitimacy
toward public bureaucracy. Research data have been collected by means of e-questionnaire form from
550 participants who were selected with cluster sampling method from people living in Nevşehir.
2. THEORETICAL FRAMEWORK
The term of representative bureaucracy was used firstly in a book named as “Representative
Bureaucracy” by J. Donald Kingsley (1944) with the allegation that public bureaucracy should reflect
the features of ruling social class (Frederickson and Smith, 2002, p.62). Therefore, Kingsley has been
considered as the first researcher to put forward the theory of representative bureaucracy. As his
contemporary supporters did, Kingsley considered the representative bureaucracy as a means to develop

Transformation of Passive Representation Into Symbolic Representation In The Framework Of Representative Bureaucracy Approach: A Field Research On The
Gendarmarie And The Police - Temsili Bürokrasi Yaklaşımı Çerçevesinde Pasif Temsilin Sembolik Temsile Dönüşümü: Jandarma Ve Polis Teşkilatı Üzerine Bir
Araştırma
Mustafa ARSLAN, Mustafa LAMBA, Sezai ÖZTOP
417
administrative responsibility as well (Kernaghan, 1978, p.490). He asserted that the responsibility
feelings would become stronger if bureaucrats have the same demographical values with society (Dauda,
1990, p. 467). Kingsley discuss that when social groups get an opportunity to represent themselves in
public bureaucracy, the accountability feelings in bureaucracy will develop and the public interest will
be improved accordingly. Kingsley examined representation attitude based on group rather than
individual and has developed the approach in line with his observations in public bureaucracy of
England during the World War II. As a result of his observations, he has concluded that English public
bureaucracy was effective to implement the policies of ruling political party since both of them shared
an economic inclination of middle-class. Kingsley asserted that this shared demographical history
created common values and norms between the elected and the bureaucrats, and this feature enabled the
discretion of political authority to be adopted by bureaucrats accordingly and easily.
The observation of Kingsley happened at the same time that a transformation from aristocracy
into middle-class hegemony were occurring in English social structure. The researcher asserted that the
transformation in the society had to reflect in the public bureaucracy. It is vital for bureaucracy to
achieve a representative structure in order for executive power to meet its responsibility. The most
important concern of Kingsley was the social class integration of bureaucracy. He preferred the upper
and middle class English society to be represented rather than the representation of society as a whole.
He attributed his allegation that this type of limited representation would provide a mosaic including a
variety of political elites of nation, and be much better than the representation with biased small groups
(Kim, 1994, p.389). According to Kingsley, a democratic administration would be possible after the end
of war even though the future was unclear yet. Because the world would have democratic features after
the war. Representative bureaucracy as one of the steps to institutionalize this situation put forward some
ideas toward that the social groups should have representatives not only in political sense but also in
administrative level (Kelly, 1998).
When Kingsley first introduced the theory of representative bureaucracy in 1944, it meant to
draw attention the mechanisms, which public organizations accounted for social demands, and
especially the motivations on which the decisions taken by officials were based. Kingsley, who objected
the approach of “mechanic” Weberian, rational public authorities which asserted that the public officers
were impartial practitioners of political decisions, observed that the public officials behaved with respect
to people’s demands since they have the same opinions as individuals they represent rather than because
of their obligation to behave impartial. Public officers were stuck in the ideologies of their class and
behaved accordingly. This approach put forward by Kingsley are different and narrower than the term
perceived as representative bureaucracy nowadays. Kingsley focused on social class as a demographical
variable in his study.
In the studies carried out after Kingsley, the representative bureaucracy approach drifted apart
from its first meaning. David Levitan (1946) and Norton Long (1952) in USA have examined the
representative bureaucracy as a means to control administrative discretion. Levitan (1946) alleged that

Mehmet Akif Ersoy İktisadi ve İdari Bilimler Fakültesi Dergisi - Mehmet Akif Ersoy University Journal of Economics and Administrative Sciences Faculty
Cilt:7 Sayı:2 s.413-439 Volume:7 Issue:2 p.413-439
Temmuz 2020 July
418
external controls on bureaucrats were not enough, and the control means for the purpose of
bureaucratic/administrative accountability became insufficient. He asserted that it would be necessary
to make bureaucrats responsive to the society they represent in order to provide that they use their
administrative discretion fairly and appropriately. Thus, people will adopt the actions of public
institutions since bureaucracy will reflect the demands and expectations of people. Levitan suggested
the representative bureaucracy term as an alternative to the bureaucratic system in USA by emphasizing
the requirement to focus on the internal control of public officials’ behaviors and to motivate bureaucrats
on democratic values. In his work in which he tried to embed democracy into bureaucracy, he objected
the politics-administration dichotomy, and criticized the impartiality notion of bureaucracy and focused
on wider social, economic and political issues. What he was trying to emphasize was to refer that public
officials should continue their services to people with loyalty indiscriminately under whoever is in power
instead that they become members of political parties or play parts in active politics. Bureaucrats should
be in a position to reflect any demand and expectation of each group in society to public bureaucracy
just like politicians.
Norton Long (1952) has extended Levitan’s argument a short time later by emphasizing that
bureaucracy would be more representative than the congress actually and as a result, it would support
more capacity to support democratic values accordingly. It is valid not only according to country’s class
structure but also for groups, capabilities, economic interests, races, nations and religions. Precedence
of a legislative body elected is indisputable but it is necessary also for legislative and bureaucracy to
complete each other to meet social requirements. According to the researcher, the most appropriate place
is public bureaucracy to represent the rich variety of USA. He underlines that the expertise and variety
of values of bureaucrats are more than the members of parliament in terms of contribution to
management. Long asserted that rich and male people have opportunity to be represented in the
congress. People who cannot have opportunity to be represented sufficiently in the congress might have
more effective field to be represented through bureaucratic channel instead of political channel.
Considered that the bureaucracy is the formative of many political alternatives for political channel of
legislative and executive, representation ought to be taken into consideration as a primary criterion for
employment in bureaucracy. Bureaucracy provides an important constitutional element of pluralism in
government because of the extensity of interests represented in its composition. Bureaucracy provides
an environment to develop national combination under favor of the structure, permanence and processes
of it (Long, 1952, p. 814).
Another researcher to contribute in this theory after Long (1952) is Paul Van Riper. In the study
of Van Riper (1958), symbolic importance of representative bureaucracy was emphasized to legalize
citizenship policy. According to Van Riper (1958), the transformation to bring a representative feature
in bureaucracy is accomplished only by enabling bureaucracy, which is a reflection of society, to
represent general believes and attitudes of society. The researcher emphasizes that the implementation
of policies determined is affected with the experiences and personal attitudes of bureaucrats. According

Transformation of Passive Representation Into Symbolic Representation In The Framework Of Representative Bureaucracy Approach: A Field Research On The
Gendarmarie And The Police - Temsili Bürokrasi Yaklaşımı Çerçevesinde Pasif Temsilin Sembolik Temsile Dönüşümü: Jandarma Ve Polis Teşkilatı Üzerine Bir
Araştırma
Mustafa ARSLAN, Mustafa LAMBA, Sezai ÖZTOP
419
to Van Riper, if a bureaucracy has a representative feature passively, the decisions taken by this
bureaucracy reflect the common experiences and attitudes of that society. A representative bureaucracy
is a structure in which there is a separation between bureaucrats as a group and their attitudes and
practices on one hand, and society, social membership and their administrative behaviors, and the
practices and expectations of government on the other hand. In other words, representative bureaucracy
suggests a structure that represents the society widely in which it belongs, and to reflect the nation
substantially in its societal ideals and activities. According to Van Riper, a representative bureaucracy
should include the reasonable profile of society in terms of profession, class, geography and similarities,
and conform to social ethics and attitudes. When these are fulfilled, the decisions taken in a
representative bureaucracy would conform to both public opinion and the decisions of related
departments in government, and would not cause any problem. Briefly, a representative bureaucracy is
a statement of similarity and conformity between general behaviors of society and social expectations
from government and its administrative actions on the one hand and the bureaucrats as a group and their
administrative behaviors and practices on the other hand (Van Riper, 1958, p.552).
One of the researchers interested in representative bureaucracy in USA is Samuel Krislov.
Krislov did not only collect the facts related to insufficient representation of a part of society in
management but also developed a wider social justice argument for equal opportunity in his work in
1967 named as “The Negro in Federal Employment: The Quest for Equal Opportunity”. This perspective
required abandoning of the idea of impersonal and anonym bureaucrat and of that there was a solid
discrimination between politics and administration. Traditional models, which placed the legislative
power over democratic hierarchy and transferred political implementations to bureaucracy, started to be
rejected because of insufficient democratic contents (Groeneveld and Van de Walle, 2010, p.12).
According to Krislov (1967, p.64), the representation of social groups in public bureaucracy is an
indication of power distribution in a wide foundation. Thus, bureaucrats represent the facts regarding
the society which they manage, and the values which they possessed. Krislov determined that there were
four inseparable meanings of representative bureaucracy following his literature review. They are (i)
right of all social groups to participate and affect the management, (ii) availability of bureaucracy to
carry out its functions to the extent that it has a feature of representation, (iii) representative feature of
bureaucracy for both politically and analytically since bureaucracies symbolize values and ruling facts,
and (iv) the fact that the social texture and behaviors toward future in a society might be encouraged
only by means of bureaucracy. Foundation of representative bureaucracy has changed in line with
Krislov (1974, p.20) in time and it started to represent whole society rather than the prevailing social
class only. The Researcher has considered the representation term on the bases of race, ethnicity and
gender. Therefore, representative bureaucracy means a workforce reflecting a composition of all citizens
in a country. Various parts of society should be represented in bureaucratic positions just like political
ones.

Mehmet Akif Ersoy İktisadi ve İdari Bilimler Fakültesi Dergisi - Mehmet Akif Ersoy University Journal of Economics and Administrative Sciences Faculty
Cilt:7 Sayı:2 s.413-439 Volume:7 Issue:2 p.413-439
Temmuz 2020 July
420
Subramaniam (1967) asserts that there is more opportunity for the representation of middle-
class people in bureaucracy since bureaucracies are generally composed of middle-class groups.
According to the researcher, a representative bureaucracy is not a new term. The term is based on the
rejection of the tradition of European aristocracy in employment of public officials during the presidency
of Andrew Jackson. Subramaniam states that the development process of representative bureaucracy
has been emerged in different ways in Europe and USA. Expectations about the evolution of
representative bureaucracy have changed the course considering the development of performance
measurements of political representative institutions and public bureaucracy simultaneously in Europe.
However, representative political institutions and representative public services have developed
simultaneously but separately, and the performance tests have less emphasized in USA (Subramaniam,
1967, p.1011). Subramaniam accepts that there is a wide agreement in representative bureaucracy term,
but states that there is no agreement in the representative level desired and the categories which will be
represented. Two main problems have survived about the term. First of them is considered by European
leftwing-critics as the improper evolution of representative democratic political institutions for 150
years and the dissatisfaction from public bureaucracy. Second is resulted from the idea of satisfaction
of all groups’ requirements and general social interests, as asserted by dogmatic supporters of
representative bureaucracy. It is considered that representative bureaucracy is single and the most
effective answer to the problem of bureaucratic power. However, selection of public officials on merit-
principle, that is one of the basic principles of classical bureaucracy, contradicts with this consideration.
Which one would be preferred if the principle of representation and the merit-principle contradict in
bureaucracy? Will expertise, information and professionalism be sacrificed to enable public service to
be more representative? Furthermore, if there are many contradictions in the opinions of various groups
to be represented and the representatives of these groups try to prefer to protect the group interests to
which they belong, is it possible that the bureaucracy resulted from this situation might be divided and
ineffective? (Subramaniam, 1967).
Pitkin (1967), who is contemporary of Subramaniam, studied the inclinations of representative
individuals who behave for the sake of their groups (active representation), in addition to the idea to
represent all social groups in public bureaucracy. According to his passive representation theory in 1967,
the representation fact will be alive to the extent that the representatives of groups in bureaucracy behave
with respect to the interests of their groups. Basic theme of representative bureaucracy is assumption
that the passive representation results in active representation. Therefore, it is assumed that the
bureaucrats will behave completely on behalf of the groups they represent. The researcher asserts that
the passive representation is not absolute in bureaucracy in order for a bureaucracy, which is materially
representative, to make decisions.
Primary motivation source of the interest in passive representation is the expectation of that the
representatives of disadvantaged groups in bureaucracy will feel much responsibility to those
disadvantaged groups on the basis of common values and understanding (Pitkin, 1967). Pitkin describes

Transformation of Passive Representation Into Symbolic Representation In The Framework Of Representative Bureaucracy Approach: A Field Research On The
Gendarmarie And The Police - Temsili Bürokrasi Yaklaşımı Çerçevesinde Pasif Temsilin Sembolik Temsile Dönüşümü: Jandarma Ve Polis Teşkilatı Üzerine Bir
Araştırma
Mustafa ARSLAN, Mustafa LAMBA, Sezai ÖZTOP
421
three main components of representation as sensitivity, interests and actors. Sensitivity indicates
symbolic representation. If a representative of group participates in an organization, the group believes
in that organization more. Sensitivity indicates an action carried out on behalf of an individual or group
as described in contemporary active representation theories. The interests represented might be extended
in a wide area from individual or group interests to general public interests. In addition, there is an
interest representation which is a mixture of group and public interests, and which is undetermined and
more complex. Actor might be a bureaucrat or an organization itself.
It is asserted by Mosher (1968) first time that an individual, who is not a part of government’s
political wing, might represent the interest of others. Mosher (1968) states that these concerns compose
the core of discussions in public administration by mentioning that the power of bureaucracy to form
policy is resulted from the concerns about the representative role of bureaucracy. According to Mosher,
the concerns resulted from bureaucracy will diminish and public organization will be more sensitive to
citizens if it reflects the demographical features of people it serves. Because, bureaucracy will not be
considered as a threat against democracy if it represents the interest groups in society (Mosher, 1968).
He asserts that bureaucracies exist to present, and bureaucratic decisions is affected by the values of
bureaucrats. Values of a bureaucrat is formed by his social background, education and other factors
related. Mosher tried to diminish the complexity of representation by dividing it in two parts as passive
and active representation. According to him, sociologic meaning (or passive) of representation is related
to origins of individuals and the extent that they reflect the society as a whole. For example, origin,
nature (urban, rural, suburb, etc.), previous occupation, education, family income, social class, race and
religion could be considered in that category. Considering normative traces of Kingsley’s thesis, Mosher
determines that the bureaucracies behave with respect to the requirements and interests of the groups
they feel close to themselves, and calls that as active representation. According to Mosher, active
representation complies with the expectation that public officials pay regards to the interests and
demands of the groups they represent. Unlike Kingsley (1944), he defends that a bureaucracy should
represent all groups in society rather than dominant groups only.
2.1. Passive Representative Bureaucracy
Passive representation is adapted to literature by Pitkin (1967) as descriptive representation.
Descriptive term is included into literature by Griffiths and Wollheim (1960, p.188). Descriptive
representation approach asserts that the representation term and especially representative bureaucracy
can be seen when the representatives reflect the features of voters represented. Descriptive
representation approach is related to representation term and especially representative bureaucracy
theory (Kingsley, 1944; Long, 1952).
Mosher (1968), who inspired from Pitkin (1967), discriminate two meanings of bureaucratic
representation as passive representation and active representation. Passive representation is related to
the source of individuals’ origins and to the extent, it reflects the society. Roots (rural, urban, suburb,
etc.), previous profession, father’s occupation, education, family income, social class of family, race,

Mehmet Akif Ersoy İktisadi ve İdari Bilimler Fakültesi Dergisi - Mehmet Akif Ersoy University Journal of Economics and Administrative Sciences Faculty
Cilt:7 Sayı:2 s.413-439 Volume:7 Issue:2 p.413-439
Temmuz 2020 July
422
religion are such factors in this meaning. Passive representation describes an individual who has the
same roots with the population he serves. Passive representation indicates the conformity degree of
public bureaucracy with the society it serves. Passive representation in bureaucracy focuses how much
the different sections of society are represented and whether bureaucracy reflects the society or not. It
tries to serve general society. Opportunity and power equity is an indication of access, and supports
legitimacy of public bureaucracies (Mosher, 1968). This kind of representation is defined as conformity
by political science researchers (Mansbridge, 1999), and as passive representation by representative
bureaucracy researchers (Mosher, 1968). Therefore, passive representation means, “to be something
rather than doing something” (Pitkin, 1967, p.60). Mosher’s theoretical discrimination and definitions
are repeated or adapted by later researchers and tested empirically.
It is possible to see Mosher’s ideal effects in later definitions with respect to the term. For
example, Meier and Bohte (2001) define the passive representation as the statement of similarities of
demographic features in bureaucrats and citizen groups such as the situation race, gender, age, social
class and religion. Rosenbloom and Dolan (2006) emphasize that the texture of public officials reflects
the general population as a whole. Dovi (2007) asserts that citizens should have representatives who
have common experiences and are similar to them by reminding that the passive representation has been
the base of democratic theory. Naff (2011) and Roch et al. (2010) emphasize that personal structure of
public institutions should reflect the population or the variety of population. Stokes-Brown and Dolan
(2010) describe passive representation as a composition of social roots in bureaucracy, and state that
passive representation symbolizes the democratic representation and legitimacy of state. Passive
representation is related to how bureaucracy reflects the composition of population it serves such as
race, ethnicity, gender and social class (Keiser, 2010). Representatives are typical members of a bigger
class they represent. Black council members represent black voters; women council members represent
women voters. Few researcher has realized that the statement to change “passive” term might be resulted
not only from visible features such as skin color or gender but also from shared experiences. Thus, a
representative with a background in farming business will represent the group of farmers (Mansbridge,
1999, p.630). Passive representation or the extent of bureaucracy to reflect society in demographically
increase the legitimacy of state and provides symbolic interests by creating equal opportunity for all
groups (Krislov, 1974; Mosher, 1968; Selden, 1997a). A bureaucracy with complete and correct
representation of citizens plays a strong symbolic role for governance regime (Meier and Hawes, 2009,
p.282).
Studies on the subject of passive representation do not concentrate on the effects of
representation on political outcomes. Representation is considered as an endpoint in itself according to
that approach (Meier and Nicholson-Crotty, 2006, p.851). The thought that is stated implicitly in passive
representation studies is that the passive representation will direct and constitute other representative
forms (Thompson, 1976; Saltzstein, 1979). Those approaches has increased concerns about passive
representation and caused an idea that passive representation is a supplementary (Esman, 1999) or

Transformation of Passive Representation Into Symbolic Representation In The Framework Of Representative Bureaucracy Approach: A Field Research On The
Gendarmarie And The Police - Temsili Bürokrasi Yaklaşımı Çerçevesinde Pasif Temsilin Sembolik Temsile Dönüşümü: Jandarma Ve Polis Teşkilatı Üzerine Bir
Araştırma
Mustafa ARSLAN, Mustafa LAMBA, Sezai ÖZTOP
423
intermediary (Selden, 1997a) means in the course to the transformation into active representation.
Because, Mosher, who adopts and defends passive representation, rejected active representation since
he perceives it as a treat to social integrity and objectivity. Passive representation can be seen as an
attractive means to make bureaucracy more democratic or to decrease social tensions on one hand, but
it might be considered as a violation of employment based on merit-principle and individual right of
citizenship on the other hand (Meier and Hawes, 2009).
2.2. Active Representative Bureaucracy
Active representation approach has been brought by Mosher (1968) into literature with the term
of passive representation to provide clarity to the representative bureaucracy approach against critiques.
The approach is formed based on the values related to demographic origins and emphasizes the
programs, policies or decisions that provide interest to individuals with similar origins (Meier, 1993).
Mosher (1968), by defending the opinion that individuals from minority groups will try to their best to
increase interest for these minority groups from public services when they are employed in public
bureaucracy, qualifies that situation as active representation. He searched an answer to if there is active
representation actually. Mosher, as a founder of the term, has defined the active representation as a
pressure of an individual or administrator in bureaucracy for the interests of people who he/he represent.
According to Meier and Stewart (1992), active representation happens when bureaucrats use their
administrative discretion power for interest of a specific group with the values he shared. Hindera
(1993a) defines active representation as the use of administrative discretion to defend the interests of
his voters and to eliminate the discrimination among voters on the interest of different groups. Active
representation means specifically the transformation of the values resulted from common demographic
origins into the programs, policies and decisions by bureaucrats, which provide interests to citizens with
similar demographic origins (Meier and Nicholson-Crotty, 2006, p.851).
The researches related to the term after Mosher, have indicated that the passive representation
has not only symbolic effects and proved that the active representation exists. It has become more
important to provide representation opportunity for all groups and to solve normative problem of active
representation (Lim, 2006). The researchers assume that there is a connection among the experiences
and attitudes of managers and their political decisions in order for active representation to actualize. It
is assumed that decisions, attitudes and values of bureaucrats are formed by means of different life
experiences. The effective element to affect his administrative discretion is these values and attitudes.
Bureaucrats are not different from other people. When they have to choose, they reflect their own
personal values in the decisions they take (Dolan, 2000, p.516). It might be asserted that the decisions
taken according to this assertion will serve the interests of social groups having the same values with
the bureaucrats who represent them.
Empirical researches suggest that there are two explanations of active representation based on
individual interests and group communication (Hindera, 1990, 1993a). First theory based on individual
interests predicts that the representation of a group will unite with the interests of that group positively

Mehmet Akif Ersoy İktisadi ve İdari Bilimler Fakültesi Dergisi - Mehmet Akif Ersoy University Journal of Economics and Administrative Sciences Faculty
Cilt:7 Sayı:2 s.413-439 Volume:7 Issue:2 p.413-439
Temmuz 2020 July
424
(Niskanen, 1971). Second is the communication theory that predicts that the passive representation of a
group will be connected to the interests of that group positively and to the interests of other groups
negatively. It seems that the interviews conducted with people having the same ethnicity with the
researcher are more effective than the interviews carried out with the people with different ethnicity
from the researcher (Hindera, 1993b, p.427). Does an active representative bureaucracy contribute in
democracy by correcting some of its weak elements or does it damage democracy by dividing society
into small parts? What level should it be supported up to, and in what condition should it be avoided?
There is no complete consensus among the researchers on representative bureaucracy toward the
answers of these questions (Lim, 2006). That is resulted from that the passive representation has some
symbolic values considered important in terms of a democratic society although there is no guarantee
for democratic decision-making (Gravier, 2013).
Active representation is based on a common identity that bureaucrats might be connected with
citizens. Additionally, the passive representation is possible to transform into active representation if
“represented” identity variable is open to both citizens and bureaucrats. However, the mobility of
identities makes that representation hard (Dovi, 2002). Gade and Wilkings (2013, p.268) who question
the idea that the identities are formed with objective criteria, defend that the identity is composed of the
features both created with the personal choices and obtained from the institution included in addition to
some unchangeable features. Organizational socialization enables public official to have the mobility of
identity and thus, may put public official in a different identity. Therefore, public institution becomes
representative only in terms of symbolic perspective in the situations that the identities change
persistently (Naff and Capers, 2014, p.525). In other words, the society group related to the bureaucrat
feels as if represented even though the bureaucrat does not behave on behalf of the group.
2.3. Symbolic Representative Bureaucracy
Phenomenon of representation is approached with the perspectives from bureaucrats and public
institutions in both passive and active representation terms. However, symbolic representation considers
it from the perspective of citizens. Symbolic representation term transformed from the literature of
political representation into the literature of bureaucratic representation focuses on the perspective of
citizens, and is concentrated on a citizen group that perceives to be represented (Theobald and Haider-
Markel 2009, p.410; Gade and Wilkins, 2013). In other words, symbolic representation is interested in
the behaviors of citizen who feels to have been represented. For that purpose, it examines the behaviors
of citizen but the behaviors of bureaucrats. Therefore, it contradicts the typology of bureaucratic
representation terms (Gravier, 2013, p.821-822).
It has been examined if the bureaucrats are required to protect the interests of social group they
represent, in order for passive representation to affect public service or society after the discrimination
of passive representation and active representation in the representative bureaucracy approach. It has
been concluded in the studies that they create a change in society by existing in bureaucracy even if they
do not behave for the interest of groups they represent (Kranz, 1975). In line with the findings, symbolic
Transformation of Passive Representation Into Symbolic Representation In The Framework Of Representative Bureaucracy Approach: A Field Research On The
Gendarmarie And The Police - Temsili Bürokrasi Yaklaşımı Çerçevesinde Pasif Temsilin Sembolik Temsile Dönüşümü: Jandarma Ve Polis Teşkilatı Üzerine Bir
Araştırma
Mustafa ARSLAN, Mustafa LAMBA, Sezai ÖZTOP
425
representation term has been included in the literature as a new representation typology. There are some
studies to associate passive representation with political outputs directly (symbolic representation)
(Meier et al., 1989; Meier and Stewart, 1991; Hindera, 1993a, 1993b; Selden, 1997a). It is asserted in
symbolic representation that the attitudes and behaviors of citizens and political outputs might change
by means of a reflection of commitment of citizens and with the participation of individuals into public
bureaucracy as passive representatives rather than actual activities of individuals in bureaucracy. Feeling
of commitment is defined through social identities such as gender, race and profession. It is asserted in
symbolic representation that the participation of individuals from minorities in bureaucracy can change
the perceptions of attitudes of the minority groups and their perception on the legitimacy of state.
Symbolic representation does not require an individual in bureaucracy to act for a goal. It is sufficient
to participate in bureaucracy with a power to change the political outputs (Pitkin, 1967; Gade and
Wilkins, 2013).
In symbolic representation, there is no demographical features and actual activities of
bureaucrats, and the political outputs resulted from representative individual in bureaucracy. The
political output of symbolic representation consists of a perception of individuals in minority groups
that they are represented in public bureaucracy. Symbolic representation, that is indefinite from passive
representation, is based on emotions and attitudes. A semantic is imposed on a symbol far beyond its
actual meaning. The semantic or meaning is emerged only from individual’s belief rather than any reality
or any similarity of actuality. Results do not affect symbols as much as they do in the minds and belief
systems of people. Symbolic representation is based on a system of common values emerged from an
understanding between bureaucrat and people, and it has bilateral function (Duerst-Lahti and Verstegen,
1995, p.217). Individuals assume that a bureaucrat with similar features with themselves will perceive
any issue like themselves and tries to solve their problems effectively (Hale and Kelly, 1989; Selden,
1997b).
The gains from symbolic representation provides interest not only individuals from minority
groups but also all individuals in society, and it can be asserted that it might be a means to provide social
integrity. Because of the Weberian structure of public bureaucracy, individuals from minority groups
may not be able to behave actively for the interest of their groups but the minority groups of
representatives perceive that they are being represented in public bureaucracy. This perception provides
a symbolic positive effect on minority groups and enables the minority groups to feel that they are
represented in bureaucracy. Therefore, the minority groups can support public policies accordingly. In
a political perspective, bureaucratic representation may play a symbolic role by providing equal
opportunity and representation (Groeneveld and Van de Walle, 2010; Gravier, 2013; Peters et al., 2013).
Even though the passive representation does not turn into active representation, its existence in public
bureaucracy indicates that any individual has equal opportunity to be employed in public bureaucracy
regardless of what minority groups he belongs. Therefore, it is asserted that passive representation

Mehmet Akif Ersoy İktisadi ve İdari Bilimler Fakültesi Dergisi - Mehmet Akif Ersoy University Journal of Economics and Administrative Sciences Faculty
Cilt:7 Sayı:2 s.413-439 Volume:7 Issue:2 p.413-439
Temmuz 2020 July
426
provides a positive effect on society at the very least even though it is not effective always in practice
(Mosher, 1968, p.17).
3. RESEARCH METHODOLOGY
3.1. Purpose, Sample, Data Collection Method and Measurement Means of the Research
In this study, the perception of symbolic representation of the people who are serviced by the
Gendarmerie and the Police which are two important general law enforcement agencies in the public
administration structure in Turkey; and as a result of that perception, the attitudes of people are examined
in terms of the legitimacy of these agencies, the participation in the activities and the trust toward these
agencies.
The population of research is composed of 282.300 citizen living in Nevşehir. The sample
includes 550 individual determined with cluster sampling. The confidence interval is 95%. The possible
faults number because of the size of sample has been determined as 4,17% (less than 5%). Research
data have been collected with a questionnaire form from the sample, which was prepared by author after
reviewing literature by taking care of the social, bureaucratic and cultural structure of Turkey. The data
have been obtained by means of the questionnaire form with 26 questions through implementation of
electronic survey method. Questions were prepared with five-choices according to Likert method. The
highest point (5) that might be added from each question is “strongly agree” and the lowest point (1) is
“strongly disagree”. Some forms (34) of 584 questionnaires have been rejected and not used in the
evaluation because of invalidity.
3.2. Research Model and Hypotheses
Conceptual model of the research has been developed as following by reviewing the theoretical
and empirical findings in the literature related to the representative bureaucracy.
Figure 1. Research Model
Symbolic dimension in the representative bureaucracy theory is a primary part of passive
representation as mentioned by Mosher (1968) and Meier and Nicholson-Crotty (2006). Passive

Transformation of Passive Representation Into Symbolic Representation In The Framework Of Representative Bureaucracy Approach: A Field Research On The
Gendarmarie And The Police - Temsili Bürokrasi Yaklaşımı Çerçevesinde Pasif Temsilin Sembolik Temsile Dönüşümü: Jandarma Ve Polis Teşkilatı Üzerine Bir
Araştırma
Mustafa ARSLAN, Mustafa LAMBA, Sezai ÖZTOP
427
representation is related to symbolic representation and serves to symbolic role (Pitkin, 1967; Gravier,
2013, p.821). Symbolic representation may change the behaviors of citizens and the outputs on the
benefit of citizens accordingly (Bradbury and Kellough, 2011). Bureaucrats from minority groups can
change the attitudes of citizens from minority groups by providing attraction for these citizens (Meier
and Nicholson-Crotty, 2006; Theobald and Haider-Markel, 2009; Thielemann and Stewart, 1996).
Increasing research results indicate that only the existence of representatives from minority groups may
change the attitudes and perceptions of citizens regarding legitimacy of government (Meier and
Nicholson-Crotty 2006; Theobald and Haider Markel 2009). Bureaucrats in representative position
create an effect by forming a change in citizens’ behaviors in the relationship between passive
representation and political outputs rather than by representing the interests of any group actively.
Attitudes of citizens toward public services is possible to change when the bureaucrats are similar to
them or the citizens perceive that the bureaucrats are like them (Lim, 2006). Reviewing previous
findings, H1 hypothesis of the research is as following. H1: Passive representation turns into symbolic
representation.
Symbolic representation contributes in the development of administration. When citizens think
that they are represented in bureaucracy, they do not question the legitimacy of administration
(Thielemann and Stewart, 1996). The level of reflection of personnel composition in public bureaucracy
on the demographical composition of society shapes the legitimacies of society (Gade and Wilkins,
2013; Meier and Capers, 2013; Riccucci et al., 2014). The researches carried out indicate that an
improving effect is observed on the perception of trust, satisfaction and legitimacy when there are some
sociological similarities between bureaucrats and citizens (Meier and Nicholson Crotty, 2006; Gade and
Wilkins, 2013). When citizens realize that they are represented in an organization, they may have better
perception toward the legitimacy of the decisions and aims of bureaucracy. For example, Theobald and
Haider-Markel (2009) carried out some research on symbolic representation in the police based on race
and ethnicity. They determined that the symbolic representation has a function on individuals of the
society who think that they are represented. According to the results of that research, passive
representation results in black people to change their attitudes. It is determined that a black individual
feels comfort and accepts the legitimacy of action when he is stopped by a black police officer while
driving, and that a caucasian individual feels comfort when he is stopped by a caucasian police officer.
Accordingly Riccucci et al. (2014) has also determined that organizational gender composition affects
the attitudes of people to evaluate law enforcement units. Hong (2017) has concluded that an increase
in the number of official from minority groups provided a decrease in the accusations and complaints
(11%) and total complaints (20%) in following year. The researcher determined that the increase in the
percentage of individuals from minority groups in British and Welsh law enforcement forces provided
a decrease in the general complaints against police force as well as the complaint number per officer.
H2 hypothesis has been determined as following by reviewing the findings in literature. H2: There is a

Mehmet Akif Ersoy İktisadi ve İdari Bilimler Fakültesi Dergisi - Mehmet Akif Ersoy University Journal of Economics and Administrative Sciences Faculty
Cilt:7 Sayı:2 s.413-439 Volume:7 Issue:2 p.413-439
Temmuz 2020 July
428
positive directional relationship between symbolic representative and the perception of legitimacy
toward law enforcement practices.
Symbolic representation might be an element to improve political outputs especially in some
fields as public security (Riccucci et al., 2015). It encourages society to participate in administration and
contributes in governance (Conner, 2016). Existence of public officials who reflect values of citizens
provides more legitimacy and effective political outputs by strengthening participation of the social
groups on law representation level (Conner, 2016, p.298). It enables political outputs to be implemented,
which they are less supported by required for the interest of society (Pitts et al., 2010; Peters et al.,
2013). Social support might be achieved toward public policies; resistance toward difficult policies are
diminished; and policy implementation costs are decreased (Riccucci and Ryzen, 2017, p.28). For
example, employment of female officers in law enforcement units enables reports of domestic violence
complaints from women. When citizens think that they are represented in public bureaucracy, they
support more public service in which they are represented (Theobald and Haider-Markel, 2009; Gade
and Wilkins, 2013; Riccucci et al., 2014). In a representative bureaucracy research which Meier and
Nicholson-Crooty (2006) conducted on the officers of 60 top police districts in USA, it was determined
that the possibility of reporting complaints from crimes against women in the districts having female
officers was higher and the percentage of arresting suspects was high as well. The findings obtained by
these researchers indicate that to have more female officers in districts provides symbolic representation
more for women and enable women to report crimes against themselves at ease. The possibility of
women to report a crime against themselves increases if the district has a female officer to listen their
reports. The same findings have also obtained by Andrews and Miller (2013) and Andrews et al. (2014).
There is a significant relationship between the representation level of women in female officers and the
reporting rates of domestic violence against themselves. The women trust female officers will
understand them better in these crimes (Chanes and Saltzstein, 1998, p.761). Riccucci at al., (2014) has
found in a research in the police units that the representative level of gender results in the attitudes of
citizens’ trust toward public organizations. According to the researchers, citizens become more eager to
participate in public service delivery when they perceive more legitimacy in public bureaucracy.
Therefore, H3 hypothesis of the research is as following. H3: There is a positive directional relationship
between the perception of symbolic representation and the participation in public activities.
It has been determined in a research on teachers and school administrators that the job
satisfaction of teachers are high and the turnover rate is low when they work with a school manager
from the same race with them. In line with the representation theory, job satisfaction level is high and
turnover rate is low in the teachers who work with the manager with same race (Grissom and Keiser,
2011).
Gade and Wilkins (2013) who defends that the passive representation may turn into the symbolic
representation in the attitudes and behaviors of citizens without a requirement of active interaction have
focused on how citizens consider and evaluate the services of a public organization when they know

Transformation of Passive Representation Into Symbolic Representation In The Framework Of Representative Bureaucracy Approach: A Field Research On The
Gendarmarie And The Police - Temsili Bürokrasi Yaklaşımı Çerçevesinde Pasif Temsilin Sembolik Temsile Dönüşümü: Jandarma Ve Polis Teşkilatı Üzerine Bir
Araştırma
Mustafa ARSLAN, Mustafa LAMBA, Sezai ÖZTOP
429
that the manager of the organization has the same features with them. The researchers examined this
their theses on war veterans who took professional rehabilitation service, and they determined that the
veterans who took service from the advisors who were also veterans, evaluated the services with higher
satisfaction level. Allen and Cohen (1980) asserted that the disabled patients considered disabled
advisors as more emphatic and trustworthy. Priester et al. (2007) determined that the individuals with
alcohol addiction problem were inclined to prefer being rehabilitated by advisors who used to be
addicted to alcohol. Riccucci at al. (2015) implemented an experimental design and proved their
symbolic representation theses. The researchers determined that women were more eager to cooperate
and produced more important political outputs when the public bureaucrats or managers working with
them were female. In line with the researches mentioned above, H4 hypothesis has been determined as
following. H4: There is a positive directional relationship between the perception of symbolic
representation and the trust toward bureaucracy.
4. DATA ANALYSES AND FINDINGS
At start of the analyses, validity and reliability tests have been implemented and the Cronbach
Alfa Value has been determined as 0,89. In order to determine how the data pattern is, Kolmogorov
Smirnov Test has been used and the significance value has been determined as <0,05. Therefore, it has
been determined that the research data are non-parametric. In the analysis to determine the differences
between two groups, Mann Whitney U Test has been used and the correlation test has been used to
determine the relationship.
4.1. Demographical Variables
The findings obtained based on the result of definitive statistics are indicated on Table 1.
Features as gender, location of residence, age, education, and military service field are included in the
table. The facts about whether they have a relative in the law enforcement agencies are indicated in the
table as well.
Table 1. Demographical Variables

Mehmet Akif Ersoy İktisadi ve İdari Bilimler Fakültesi Dergisi - Mehmet Akif Ersoy University Journal of Economics and Administrative Sciences Faculty
Cilt:7 Sayı:2 s.413-439 Volume:7 Issue:2 p.413-439
Temmuz 2020 July
430
Reviewing the demographical data, it seems that the participants are male at the rate of 67,8%
and reside mostly in city center (60,7%). 58,4% are over thirty years old; more than half have completed
compulsory military service (56,6%). 55,1% have a relative in gendarmerie and 65,6% have a relative
in the police.
Table 2. Frequency Chart

Transformation of Passive Representation Into Symbolic Representation In The Framework Of Representative Bureaucracy Approach: A Field Research On The
Gendarmarie And The Police - Temsili Bürokrasi Yaklaşımı Çerçevesinde Pasif Temsilin Sembolik Temsile Dönüşümü: Jandarma Ve Polis Teşkilatı Üzerine Bir
Araştırma
Mustafa ARSLAN, Mustafa LAMBA, Sezai ÖZTOP
431
Frequency distribution of the answers to questionnaire form is indicated on Table 2. Frequency
values are composed of sum of positive answers as “agree” and “strongly agree”. According to the
findings, the rate of individual who think that the gendarmerie represents himself (71,7%) is higher than
the police (59,8%). Similarly, it is observed that the results of gendarmerie are higher than those of the
police. On the other hand, the rate of getting help from a relative or friend is higher in the police (16,5%)
than the gendarmerie (12,9%).
4.2. Tests of Hypotheses
In order to test H1 hypothesis as “passive representation turns into symbolic representation”,
the answers to the questions related to representation values have been compared in terms of people with
a relative/friend (officer, non-commissioned officer, specialized gendarmerie, specialized sergeant,
contractual gendarmerie) in gendarmerie and people with a relative/friend in police (senior officer,
officer, warden). The findings gathered with Mann Whitney U Test have been indicated on Table 3 and
Table 4.
Table 3. Mann Whitney U Test Between Participants with or without a Relative in the Gendamerie
According to the analyses on Table 3, the participants with a relative/friend and the participants
without a relative/friend in gendarmerie, it is observed that there is a significant difference in two groups
in terms of answers to questions about whether the gendarmerie represents them or not. However, there
is no significant difference between two groups in terms of the police. Mean rank value indicates that
the people with a relative/friend in gendarmerie are more positive on the idea that the gendarmerie
represents them. Therefore, it seems that the passive representation turns into the active representation
in terms of gendarmerie.
Table 4. Mann Whitney U Test Between Participants with or without a Relative in the Police
According to the findings on Table 4, there is a difference but not significant in the answers to
the questions about whether participants are represented, in terms of participants with a relative/friend
in the police and the participants without a relative/friend. The answers of same participants to the
questions about whether the gendarmerie represents themselves indicate almost the same results.

Mehmet Akif Ersoy İktisadi ve İdari Bilimler Fakültesi Dergisi - Mehmet Akif Ersoy University Journal of Economics and Administrative Sciences Faculty
Cilt:7 Sayı:2 s.413-439 Volume:7 Issue:2 p.413-439
Temmuz 2020 July
432
Therefore, it seems that passive representation does not turn into symbolic representation in terms of the
police.
In line with the findings, it has been determined that the passive representation turns into the
symbolic representation in the gendarmerie. Therefore, H1 has been accepted in terms of gendarmerie.
However, it has been rejected in terms of the police.
On the other hand, it has been concluded that there is no important difference in the perceptions
toward the gendarmerie (4,177) and the police (3,973) in terms of representation rates. The perceptions
of participants toward representation are quite high for both law enforcement agencies.
In order to test H2 hypothesis that there is a positive directional relationship between the
symbolic representation and the legitimacy perception, a correlation analysis has been implemented
between the answers to questions related to the representation factor and the legitimacy factor, and the
results are indicated on Table 5.
Table 5. Correlation Chart between Represebtation and Other Dimensions
The findings on Table 5 indicate that there are positive directional and significant strong
relationships between the representation dimension and legitimacy dimension of gendarmerie, and the
legitimacy dimension of police. Reviewing the correlation values, it is observed that the legitimacy
perception toward gendarmerie (,753**) is higher than the police (,623**). Similarly, it is observed that
there is a positive directional and significant strong relationship between the representation dimension
and the legitimacy dimension of the police and the legitimacy dimension of gendarmerie. Reviewing the
correlation values, it seems that the police representation and the legitimacy toward police (,698**) is
higher than the legitimacy toward gendarmerie (,627**), but the difference is very law. On the other
hand, the participants perceive more legitimacy toward activities of the agencies in which they think
that they are represented. Therefore, H2 hypothesis has been accepted according to the findings
obtained.

Transformation of Passive Representation Into Symbolic Representation In The Framework Of Representative Bureaucracy Approach: A Field Research On The
Gendarmarie And The Police - Temsili Bürokrasi Yaklaşımı Çerçevesinde Pasif Temsilin Sembolik Temsile Dönüşümü: Jandarma Ve Polis Teşkilatı Üzerine Bir
Araştırma
Mustafa ARSLAN, Mustafa LAMBA, Sezai ÖZTOP
433
Table 5 indicates the results of correlation analysis to test H3 hypothesis about that there is a
positive directional relationship between the symbolic representation and the participation in public
activities. In line with the findings on Table 5, it has been determined that there is a positive directional
and significant strong relationship between the mean value of representation dimension of gendarmerie
and the participation dimension of gendarmerie (,714**) and the participation dimension of police
(,617**) and between the mean value of representation dimension and the participation dimension of
gendarmerie (,586**) and the participation dimension of police (,679**). Therefore, H3 hypothesis has
been accepted.
Results of correlation analysis to test H4 hypothesis about that there is a positive directional
relationship between the perception of symbolic representation and the trust toward bureaucracy are
indicated on Table 5. It has been observed that there is a positive directional and significant strong
relationship between the representation dimension of gendarmerie and the trust dimension of
gendarmerie (,835**) and the trust dimension of police (,674**); and between the representation
dimension of police and the trust dimension of gendarmerie (,779**) and the trust dimension of police
(,850**). In line with the findings, H4 hypothesis has been accepted.
First of two important findings is the existence that there is a positive directional significant
strong relationship between the representation dimension of gendarmerie and the representation
dimension of police (,779**). It means that the participants who feel to be represented in one of these
agencies have same representation perception in other agency. Secondly, the relationship among the
dimensions of legitimacy (,753**), participation (,714**) and trust (,835**) in terms of participants who
think that the gendarmerie represents themselves is stronger than the relationship among the dimensions
of legitimacy (,623**), participation (,617**) and trust (,674**) toward police; and the relationship
among the dimensions of legitimacy (,698**), participation (,679**) and trust (,850**) in terms of
participants who think that the police represents themselves is stronger than the relationship among the
dimensions of legitimacy (,627**), participation (,586**) and trust (,675**). It means that the
participants feel more trust, participate more and perceive more legitimacy on the agency in which they
feel to be represented
5. CONCLUSION
It is possible to state that the passive representation turns into symbolic representation based on
gendarmerie in line with the difference in the answers toward representation variable between
participants with a relative/friend in gendarmerie and participants without a relative/friend in
gendarmerie with respect to the findings of this research. However, the situation is not the same in terms
of the representation variable toward the police. Therefore, it has been determined that there is no
difference in the perception of representation between the participants with a relative/friend and the
participants without a relative/friend in the police. However, the participants have perception of that the

Mehmet Akif Ersoy İktisadi ve İdari Bilimler Fakültesi Dergisi - Mehmet Akif Ersoy University Journal of Economics and Administrative Sciences Faculty
Cilt:7 Sayı:2 s.413-439 Volume:7 Issue:2 p.413-439
Temmuz 2020 July
434
both the gendarmerie and the police represent themselves. This outcome might be resulted from the
conservative structure of the province where this research was conducted.
In the scale of this research population, it is possible to state that the participants who think that
both gendarmerie and police represent themselves evaluate more legitimacy in the actions of both
gendarmerie and police. The participants consider more legitimacy for the activities of the law
enforcement agency (gendarmerie or police) which they think that they are represented. For this purpose,
one of the methods to provide legitimacy for the activities of public bureaucracy on people is to create
employment for various society groups in public bureaucracy. Society will reject less and support the
public activities which society considers more legitimacy.
It is observed that there have been findings in literature about the symbolic representation creates
positive effect on the participation level of citizens in public activities. It is concluded in this study also
that the citizens who think that the police and gendarmerie represent themselves are eager to participate
and support the activities of law enforcement agencies in the scale of this limited research. It is required
to encourage the social groups to participate in society-supported activities of the law enforcement
agencies in order to gain efficient support from society. One of the means to gain this support is to run
representation mechanism better in law enforcement agencies.
One of the benefits resulted from symbolic representative is to increase trust on public
bureaucracy. Citizens who think that the gendarmerie and police represent themselves trust in both law
enforcement agencies. The trust of individual toward the agency, which he/she believes represented,
seems higher than the other. In this perspective, representative bureaucracy might be a key element to
satisfy the trust issue between the government and the governed. Bureaucracy might be enabled more
representative in order for citizens to participate in government and bureaucracy.
In this study that might be qualified as first empirical research in relation to representative
bureaucracy in Turkey, it has been concluded in line with the findings of this limited research that the
passive representation turns into symbolic representation, and it contributes in citizens to perceive the
law enforcement agencies more legitimate, and it enables citizens to participate in law enforcement
activities, and it increases the trust of citizens toward law enforcement agencies. In line with the findings
of this research, it will be an important public policy to make bureaucracy more representative in order
to increase the legitimacy, develop the trust and enable citizen participation in public services.
It might be suggested for next studies to investigate various public institutions other than law
enforcement agencies.
REFERENCES
Allen, H. A., and Cohen, M.S. (1980). Client Preference for a Disabled Counselor.
Rehabilitation Counseling Bulletin, 23,165–168.

Transformation of Passive Representation Into Symbolic Representation In The Framework Of Representative Bureaucracy Approach: A Field Research On The
Gendarmarie And The Police - Temsili Bürokrasi Yaklaşımı Çerçevesinde Pasif Temsilin Sembolik Temsile Dönüşümü: Jandarma Ve Polis Teşkilatı Üzerine Bir
Araştırma
Mustafa ARSLAN, Mustafa LAMBA, Sezai ÖZTOP
435
Andrews, R., and Miller, J. K. (2013). Representative Bureaucracy, Gender, and Policing: The
Case of Domestic Violence Arrests in England. Public Administration, 91(4), 998-1014.
Andrews, R., Ashworth, R., and Meier, K. J. (2014). Representative Bureaucracy and Fire
Service Performance. International Public Management Journal, 17(1), 1-24.
Arslan, M. (2019). Temsili Bürokrasi, Ankara: Gazi Kitabevi.
Aşkar, G. (2019). Bürokraside Temsil Sorunu: Temsili Bürokrasi Yaklaşımı, Dumlupınar
Üniversitesi Sosyal Bilimler Dergisi, 59, 95-104.
Bradbury, M., and Kellough, J. E. (2011). Representative Bureaucracy: Assessing the Evidence
on Active Representation. American Review of Public Administration, 41(2), 157-167.
Chaney, C. K., and Saltzstein, G.H. (1998). Democratic Control and Bureaucratic
Responsiveness: The Police and Domestic Violence. American Journal of Political
Science, 42(3), 745-768.
Conner, T. W. (2016). Representation and Collaboration: Exploring the Role of Shared Identity
in the Collaborative Process. Public Administration Review, 76(2), 288-301.
Dauda, B. (1990). Fallacies and Dilemmas: The Theory of Representative Bureaucracy with a
Particular Reference to the Nigerian Public service. International Review of
Administrative Sciences, 56, 467-495.
Dovi, S. (2002). Preferable Descriptive Representation: Will Just Any Woman, Black or Latino
Do? American Political Science Review, 96(4), 729-743.
Dovi, S. (2007). The Good Representative. Malden, MA; Blackwell Publishing.
Duerst-Lahti, G., and Verstegen, D. (1995). Making Something of Absence: The 'Year of the
Woman' and Women's Representation." In G. Duerst-Lahti and R. M. Kelly (Eds.),
Gender Power, Leadership and Governance (p. 213-238), Ann Arbor, MI: The
University of Michigan Press.
Esman, M. J. (1999). Public Administration and Conflict Management in Plural Societies: The
Case for Representative Bureaucracy. Public Administration and Development, 19(4),
353-366.
Frederickson, H. G., and Smith, K. B. (2002). The Public Administration Theory Primer.
Colorado: Westview Press.
Gade, D. M., and Wilkins, V. M. (2013). Where did You Serve? Veteran Identity,
Representative Bureaucracy and Vocational Rehabilitation. Journal of Public
Administration Research and Theory, 23(2), 267-288.

Mehmet Akif Ersoy İktisadi ve İdari Bilimler Fakültesi Dergisi - Mehmet Akif Ersoy University Journal of Economics and Administrative Sciences Faculty
Cilt:7 Sayı:2 s.413-439 Volume:7 Issue:2 p.413-439
Temmuz 2020 July
436
Gravier, M. (2013). Challenging the Enhancing of the EU’s Legitimacy? The Evolution of
Representative Bureaucracy in the Commission’s Staff Policies. Journal of Public
Administration Research and Theory, 23(4), 817-838.
Griffiths, A. P., and Wollheim, R. (1960). How Can One Person Represent Another?.
Aristotelian Society Supplementary Volume 34 (1), 187-224
Grissom, J. A., and Keiser, L. (2011). A Supervisor like Me: Race, Representation, and the
Satisfaction and Turnover Decisions of Public Sector Employees. Journal of Policy
Analysis and Management, 30(3), 557-580.
Groeneveld, S., and Van de Walle, S. (2010). A Contingency Approach to Representative
Bureaucracy: Power, Equal Opportunity and Diversity. International Review of
Administrative Sciences, 76(2), 1-32.
Hale, M. M., and Kelly, R. M. (1989). Gender, Democracy and Representative Bureaucracies.
In M. M. Hale and R. M. Kelly (Eds.), Gender, Bureaucracy and Democracy (pp.18-
40), Westport, CT: Greenwood Press.
Hindera, J. J. (1990). Representative Bureaucracy: Are Active and Passive Representation
Linked?. Ph.D. dissertation, University of Houston
Hindera, J. J. (1993a). Representative Bureaucracy: Imprimis Evidence of Active
Representation in EEOC District Offices. Social Science Quarterly, 74, 95-108.
Hindera, J. J. (1993b). Representative Bureaucracy: Further Evidence of Active Representation
in EEOC District Offices. Journal of Public Administration Research and Theory, 3,
415-429.
Hong, S. (2017). Does Increasing Ethnic Representativeness Reduce Police Misconduct?.
Public Administration Review, 77(2), 195-205.
Keiser, L. R. (2010). Representative Bureaucracy. R. F. Durant in, Oxford Handbook of
American Bureaucracy (714–37). UK: Oxford University Press.
Kelly, R. M. (1998). An Inclusive Democratic Polity, Representative Bureaucracies, and the
New Public Management. Public Administration Review, 58(3), 201-208.
Kernaghan, K. (1978). Representative Bureaucracy: The Canadian Perspective. Canadian
Public Administration, 21, 489-512.
Kim, P. S. (1994). A Theoretical Overview of Representative Bureaucracy: Synthesis.
International Review of Administrative Sciences, 60(3), 385-397.
Kingsley, J. D. (1944). Representative Bureaucracy: An Interpretation of the British Civil
Service. Ohio: The Antioch Press.

Transformation of Passive Representation Into Symbolic Representation In The Framework Of Representative Bureaucracy Approach: A Field Research On The
Gendarmarie And The Police - Temsili Bürokrasi Yaklaşımı Çerçevesinde Pasif Temsilin Sembolik Temsile Dönüşümü: Jandarma Ve Polis Teşkilatı Üzerine Bir
Araştırma
Mustafa ARSLAN, Mustafa LAMBA, Sezai ÖZTOP
437
Kranz, H. (1975). Thoughts on Group Representativeness: A Reply from Mr. Kranz. Public
Administration Review, 35, 123-125.
Krislov, S. J. (1967). The Negro in Federal Employment: The Quest for Equal Opportunity,
Minneapolis: University of Minnesota Press.
Krislov, S. J. (1974). Representative Bureaucracy. Englewood Cliffs, NJ: Prentice Hall.
Lamba, M., and Tatlısu, İ. M. (2019). Kadın Temsili Boyutuyla Temsili Bürokrasi Yaklaşımı:
Türkiye’deki Üniversitelerin Üst Yönetim Organları Üzerine Bir İnceleme, Türk İdare
Dergisi, 91(488), 375-394.
Levitan, D. M. (1946). The Responsibility of Administrative Officials in a Democratic Society.
Political Science Quarterly, 61(4), 562-598.
Lim, H. (2006). Representative Bureaucracy: Rethinking Substantive Effects and Active
Representation. Public Administration Review, 66(2), 193-204.
Long, N. E. (1952). Bureaucracy and Constitutionalism. American Political Science Review,
46(3), 808-818.
Mansbridge, J. (1999). Should Blacks Represent Blacks and Women Represent Women? A
Contingent ‘Yes’. Journal of Politics, 61(3), 628-657.
Meier, K. J. (1993). Latinos and Representative Bureaucracy: Testing the Thompson and
Henderson Hypotheses. Journal of Public Administration Research and Theory, 3, 393-
415.
Meier, K. J., and Bohte, J. (2001). Structure and Discretion: Missing Links in Representative
Bureaucracy. Journal of Public Administration Research and Theory, 11(4), 455-470.
Meier, K. J., and Capers, K. J. (2013). Representative Bureaucracy: Four Questions. In B. G.
Peters and J. Pierre (Eds.), The Sage Handbook of Public Administration (pp.420-31).
London: SAGE.
Meier, K. J., and Hawes, D. P. (2009). Ethnic Conflict in France: A Case for Representative
Bureaucracy?. The American Review of Public Administration, 39(3), 269.
Meier, K. J., and Nicholson-Crotty, J. (2006). Gender, Representative Bureaucracy, and Law
Enforcement: The Case of Sexual Assault. Public Administration Review, 66, 850-860.
Meier, K. J., and Stewart, J. (1992). The Impact of Representative Bureaucracies: Educational
Systems and Public Policies. American Review of Public Administration, 22, 157-171.
Meier, K. J., Stewart, J., and England, R.E. (1989). Race, Class, and Education: The Politics of
Second Generation Discrimination. Madison: University of Wisconsin Press.

Mehmet Akif Ersoy İktisadi ve İdari Bilimler Fakültesi Dergisi - Mehmet Akif Ersoy University Journal of Economics and Administrative Sciences Faculty
Cilt:7 Sayı:2 s.413-439 Volume:7 Issue:2 p.413-439
Temmuz 2020 July
438
Meier, K. J., and Nigro, L. (1976). Representative Bureaucracy and Policy Preferences: A Study
in the Attitudes of Federal Executives. Public Administration Review, 36(4), 458-469.
Meier, K. J., and Stewart, J. (1991). The Politics of Hispanic Education. Albany: SUNY Press.
Mosher, F. (1968). Democracy and the Public Service. New York: Oxford University Press
Naff, K. C. (2011). Toward a Representative Bureaucracy: Can Gender Make a Difference? In
L. D. Whitaker (Ed.), Women in politics: Outsiders or insiders? Fifth edition (pp. 228–
237). Boston, MA: Longman.
Naff, K. C., and Capers, K. J. (2014). The Complexity of Descriptive Representation and
Bureaucracy: The Case of South Africa. International Public Management Journal,
17(4), 515-539.
Niskanen, W.A. (1971). Bureaucracy and Representative Government. Chicago: Aldine.
Peters, B., Schröter, E., and von Maravić, P. (2013). Representative Bureaucracy: Concept,
Driving Forces, Strategy. Representative Bureaucracy in Action. Cheltenham: Edward
Elgar Publishing, 1-18.
Pitkin, H. (1967). The Concept of Representation. Berkeley: University of California Press
Pitts, D. W., Hicklin, A. K., Dawes, D. P., and Melton, E. (2010). What Drives the
Implementation of Diversity Management Programs? Evidence from Public
Organizations. Journal of Public Administration Research and Theory, 20, 867-886.
Priester, P. E., Azen, R., Speight S., and Vera, E. M. (2007). The Impact of Counselor Recovery
Status Similarity on Perceptions of Attractiveness with Members of Alcoholics
Anonymous: An Exception to the Repulsion Hypothesis. Rehabilitation Counseling
Bulletin 51:14
Riccucci, N. M., and Van Ryzin, G. G. (2017). Representative Bureaucracy: A Lever to Enhance
Social Equity, Coproduction, and Democracy. Public Administration Review, 77(1),
21-30.
Riccucci, N. M., Van Ryzin, G. G., and Huafang L. (2015). Representative Bureaucracy and the
Willingness to Coproduce: An Experimental Study. Public Administration Review,
76(1), 121-130.
Riccucci, N. M., Van Ryzin, G. G., and Lavena, C. F. (2014). Representative Bureaucracy in
Policing: Does It Increase Perceived Legitimacy?. Journal of Public Administration
Research and Theory, 24(3), 1-15.

Transformation of Passive Representation Into Symbolic Representation In The Framework Of Representative Bureaucracy Approach: A Field Research On The
Gendarmarie And The Police - Temsili Bürokrasi Yaklaşımı Çerçevesinde Pasif Temsilin Sembolik Temsile Dönüşümü: Jandarma Ve Polis Teşkilatı Üzerine Bir
Araştırma
Mustafa ARSLAN, Mustafa LAMBA, Sezai ÖZTOP
439
Roch, C. H., Pitts, D. W., and Navarro, I. (2010). Representative Bureaucracy and Policy Tools:
Ethnicity, Student Discipline, and Representation in Public Schools. Administration and
Society, 42(1), 38-65.
Rosenbloom, D. H., and Dolan, J. (2006). La Bureaucratie Représentative. Revue Française
D’administration Publique, 118, 251-264.
Rosenbloom, D. H., and Featherstonhaugh, J. C. (1977). Passive and Active Representation in
the Federal Service: A Comparison of Blacks and Whites. Social Science Quarterly, 57,
873-882.
Saltzstein, G. H. (1979). Representative Bureaucracy and Bureaucratic Responsibility.
Administration and Society, 10, 465-475.
Selden, S. C. (1997a). The Promise of Representative Bureaucracy: Diversity and
Responsiveness in a Government Agency. Armonk, NY: M. E. Sharpe.
Selden, S. C. (1997b). Representative Bureaucracy: Examining the Linkage between Passive
and Active Representation in the Farmers Home Administration. American Review of
Public Administration, 27, 22-42.
Stokes-Brown, A.K., and Dolan, K. (2010). Race, Gender, and Symbolic Representation:
African American Female Candidates as Mobilizing. Journal of Elections, Public
Opinion and Parties, 20(4), 473-494.
Subramaniam, V. (1967). Representative Bureaucracy: A Reassessment. American Political
Science Review, 61, 1010-1019.
Theobald, N., and Haider-Markel, D. (2009). Race, Bureaucracy, and Symbolic Representation:
Interactions between Citizens and Police. Journal of Public Administration Research
and Theory, 19(2), 409-426.
Thielemann, G. S., and Stewart, J. (1996). A Demand Side Perspective on the Importance of
Representative Bureaucracy: AIDS, Ethnicity, Gender, and Sexual Orientation. Public
Administration Review, 56(2), 168-173.
Thompson, F. J. (1976). Minority Groups in Public Bureaucracies, are Passive and Active
Representation Linked?. Administration and Society, 8, 201-226.
Van Riper, P. (1958). History of the United States Civil Service. New York: Harper and Row.

440
MEHMET AKİF ERSOY ÜNİVERSİTESİ
İKTİSADİ VE İDARİ BİLİMLER FAKÜLTESİ DERGİSİ
Mehmet Akif Ersoy University
Journal of Economics and Administrative Sciences Faculty
ISSN: 2149-1658 Cilt: 7 Sayı: 2 s.440-456
Volume: 7 Issue: 2 p.440-456
Temmuz 2020 July
SAĞLIK ÇALIŞANLARINDA ETİK LİDERLİK VE ÖRGÜT KÜLTÜRÜNÜN
İNCELENMESİ: ÖZEL BİR HASTANEDE UYGULAMA
INVESTIGATION OF ETHICAL LEADERSHIP AND ORGANIZATIONAL CULTURE IN
HEALTHCARE PROFESSIONALS: APPLICATION IN A PRIVATE HOSPITAL
Sümeyye ÖZMEN1, Özlem ÖZER2, Okan ÖZKAN3
1. Dr. Öğr. Üyesi, Burdur Mehmet Akif Ersoy
Üniversitesi, İktisadi ve İdari Bilimler Fakültesi,
Sağlık Yönetimi Bölümü
[email protected], https://orcid.org/0000-0002-3056-0872
2. Doç. Dr., Sağlık Bilimleri Üniversitesi,
[email protected], https://orcid.org/0000-0002-7238-5371
3. Dr. Öğr. Üyesi, Sağlık Bilimleri Üniversitesi,
[email protected], https://orcid.org/0000-0001-9491-8696
Makale Türü Article Type
Araştırma Makalesi Research Article
Başvuru Tarihi Application Date
20.02.2020 02.20.2020
Yayına Kabul Tarihi Admission Date
05.07.2020 07.05.2020
DOI
https://doi.org/10.30798/makuiibf.692062
Öz
Bu çalışmada sağlık çalışanlarının etik liderlik algılarının örgüt kültürü
üzerindeki etkilerini araştırmak amaçlanmıştır. Çalışmanın evrenini
Ankara’da yer alan özel bir hastanede görev yapmakta olan sağlık çalışanları
oluşturmaktadır (N=450). Çalışmada örneklem seçilmemiş, 266 kişiden
kullanılabilir anket elde edilmiştir. Veriler, 6 Ocak-30 Ocak 2020 tarihleri
arasında toplanmıştır. Verilerin analizinde tanımlayıcı analizler, güvenirlik
analizi, faktör analizi, korelasyon analizi ve regresyon analizi kullanılmıştır.
Çalışmadan elde edilen sonuçlara göre katılımcıların etik liderlik ve örgüt
kültürü algılarının orta seviyede olduğu belirlenmiştir. Örgüt kültürü alt
boyutlarından klan kültürü ve adhokrasi kültürünün etik liderlik ile olan
korelasyonları pozitif yönde ve orta düzeyde; hiyerarşi kültürü boyutu ile olan
korelasyonları pozitif yönde ve zayıf düzeyde tespit edilmiştir.
Gerçekleştirilen regresyon analizi sonuçlarına göre ise etik liderlik, hiyerarşi
kültürü algısındaki toplam varyansın %14,8’ini; klan kültürü algısındaki
toplam varyansın %27,7’sini ve adhokrasi kültürü algısındaki toplam
varyansın %30,8’ini açıkladığı bulunmuştur.
Anahtar Kelimeler: Etik Liderlik, Örgüt Kültürü, Sağlık Çalışanları,
Abstract
In this study, it was aimed to investigate the effects of ethical leadership
perceptions of healthcare professionals on organizational culture. The universe
of the study consists of healthcare professionals working in a private hospital
in Ankara (N=450). The sample was not selected in the study, and a
questionable questionnaire was obtained from 266 people. The data were
collected between 6 January and 30 January 2020. Descriptive analysis,
reliability analysis, factor analysis, correlation analysis and regression analysis
were used in the analysis of the data. According to the results obtained from
the study, it was determined that the participants’ perceptions of ethical
leadership and organizational culture were at a medium level. The correlations
of clan culture and adhocracy culture, which are among the organizational
culture sub-dimensions, with ethical leadership were determined positively
and moderately; correlations with the dimension of hierarchy culture
positively and weakly. According to the results of the regression analysis, it
was determined that ethical leadership explained 14.8% of the total variance
in the hierarchy culture perception, 27.7% of the total variance in the clan
culture perception, and 30.8% of the total variance in the adhocracy culture
perception.
Keywords: Ethical Leadership, Organizational Culture, Healthcare
Professionals,

Sağlık Çalışanlarında Etik Liderlik ve Örgüt Kültürünün İncelenmesi: Özel Bir Hastanede Uygulama-Investigation of Ethical Leadership and Organizational
Culture in Healthcare Professionals: Application in a Private Hospital
Sümeyye ÖZMEN, Özlem ÖZER, Okan ÖZKAN
441
EXTENDED SUMMARY
Research Problem
The problem with this research to investigate the effects of ethical leadership perceptions of
healthcare professionals on organizational culture.
Research Questions
What are the healthcare professionals’ perceptions of ethical leadership and organizational
culture? What is the relationship between the organizational culture and ethical leadership dimensions
of healthcare professionals? What are the effects of ethical leadership perceptions of healthcare
professionals on organizational culture?
Literature Review
When national and international literature is analyzed, it is seen that there are many domestic
and foreign studies related to ethical leadership and organizational culture. Nowadays, unethical
behaviors that occur in organizations have led to a higher need for ethical leadership. Staff working in
the health sector often encounter events that require them to demonstrate ethical leadership
characteristics within the teams they are involved in. Hospitals, where physicians and nurses work
intensely, are very dynamic, complex, unpredictable and variable in nature because of the human
element in their center. Therefore, these institutions face ethical problems. Recently, the increasing
importance of the technological infrastructure and human interaction in health increases the
responsibilities and expands their impact on the services provided by hospitals. Therefore, as a result of
leadership behavior, the effectiveness and efficiency of the team are directly affected. The concept of
ethical leadership, which has come to the fore recently, is intensely discussed. The person who adheres
to ethical principles in daily work and is an example to others becomes an ethical leader. An ethical
leader is a leader who values and respects the rights and dignity of others. Ethical leadership; it is
expressed as the fact that leaders have the right values, robust and good characters. Organizational
culture; It is the formation that enables employees with different beliefs, values, attitudes, and cultures
to gather and work in harmony for the same purposes. The cultural formation in organizations is
explained by four different cultural structures: clan culture, bureaucratic culture, market culture, and
adhocracy culture.
Methodology
This study is a descriptive cross-sectional study prepared on the basis of questionnaire. The
universe of the study consists of healthcare professionals working in a private hospital in Ankara. The
sample was not selected in the study, and a questionable questionnaire was obtained from 266 people.
The data were collected between 6 and 30 January 2020. Descriptive analysis, reliability analysis, factor
analysis, correlation analysis and regression analysis were used in the analysis of the data.

Mehmet Akif Ersoy İktisadi ve İdari Bilimler Fakültesi Dergisi - Mehmet Akif Ersoy University Journal of Economics and Administrative Sciences Faculty
Cilt:7 Sayı2. s.440-456 Volume:7 Issue:2 p.440-456
Temmuz 2020 July
442
Results and Conclusions
According to the results obtained from the study, it was determined that the participants’
perceptions of ethical leadership and organizational culture were at a medium level. The correlations of
clan culture and adhocracy culture, which are among the organizational culture sub-dimensions, with
ethical leadership were determined positively and moderately; correlations with the dimension of
hierarchy culture positively and weakly. According to the results of the regression analysis, it was
determined that ethical leadership explained 14.8% of the total variance in the hierarchy culture
perception, 27.7% of the total variance in the clan culture perception, and 30.8% of the total variance in
the adhocracy culture perception.

Sağlık Çalışanlarında Etik Liderlik ve Örgüt Kültürünün İncelenmesi: Özel Bir Hastanede Uygulama-Investigation of Ethical Leadership and Organizational
Culture in Healthcare Professionals: Application in a Private Hospital
Sümeyye ÖZMEN, Özlem ÖZER, Okan ÖZKAN
443
1. GİRİŞ
Sağlık sektöründe çalışan personel, hizmet sunumu sırasında yer aldıkları ekipler içerisinde
liderlik özellikleri göstermelerini gerektiren olaylarla sıklıkla karşılaşmaktadır. Örneğin hekimler,
sağlık hizmeti veren ekibin olmazsa olmaz ve öne çıkan bir lideridir. Hemşireler ise bakım, tedavi,
eğitim ve danışma süreçlerinde hastaları ve diğer personeli yönlendirici ve oldukça önemli görevlere
sahiptir (Kaya Erten vd., 2017). Hekim ve hemşirelerin yoğun bir şekilde görev yaptığı hastaneler,
merkezinde insan unsurunun bulunmasından dolayı oldukça dinamik, karmaşık, öngörülemeyen ve
değişken bir yapıdadır. Bu nedenle bünyesindeki birimlerde etkili bir liderliğe ihtiyaç duyan, ayaktan
ve yatarak sağlık hizmeti sunan kuruluşlardır (Tengilimoğlu ve Yiğit, 2005).
Hastaneler, uzun vadede rekabet güçlerini ellerinde bulundurma, çalışanlarının yenilikleri
keşfetme ve uygulama potansiyelini ortaya çıkarma gibi konularda da etkili liderlik davranışlarının
gösterilmesi gereken yerlerdir (Tengilimoğlu ve Yiğit, 2005). Son dönemde sağlıkta teknolojik
altyapının ve insan etkileşiminin giderek önem kazanması, hastanelerin sundukları hizmetlerde
sorumluluklarını artırmakta, etki alanlarını genişletmekte bu nedenle de liderlik davranışları sonucunda
ekibin etkinlik ve verimliliği doğrudan etkilenmektedir (Velioğlu ve Vatan, 2002).
Bu çalışmada öncelikli olarak kavramsal çerçeve kapsamında etik liderlik ve örgüt kültürü
hakkında bilgiler verilmiş, araştırmanın metodolojisine dayalı olarak gerekli analizler gerçekleştirilmiş
ve bulgulara göre yorumlamalar yapılmıştır.
2. KAVRAMSAL ÇERÇEVE
2.1. Etik Liderlik
Liderler; insanları etkileyen, koordine eden ve örgütün amaçları doğrultusunda yönlendirebilen
kişilerdir (Mc Gregor, 1960). Bogardus (1934)’a göre liderler, çalışanlarını sadece bireysel özellikleri
ile değil, zihinsel özellikleri ile de etkilemektedir. Liderlik; hedefleri belirleme ve başarma yönünde
grubun faaliyetlerinin etkilenme süreci olarak tanımlanmaktadır (Can vd., 1998). Eren (2017)’e göre
liderlik, bir grup insanı önceden belirlenmiş amaçlar çevresinde toplama, harekete geçirme ve bu
amaçlara ulaşabilme konusunda bilgi ve beceriye sahip olma durumudur. Liderlik, yöneticilerin başarı
elde edebilmesi için çalışanların dürüst ve saygılı bir şekilde motive olmuş bir çalışma sistemi içerisinde
yer almalarıdır (Cohen, 2010). Robbins ve Judge (2012)’a göre ise liderlik, amaçların ya da vizyonun
gerçekleşebilmesi yönünde ekibi etkileme becerisi olarak tanımlanmaktadır.
Etik kavramı ise insanın var olduğu her alanda kendini gösterdiğinden dolayı liderlik sürecinde
de önemli bir yere sahiptir. Liderlerin güçlü karakterleri, kendilerinin ve diğerlerinin işyerindeki etik
performansını da etkilemektedir. Etik yaklaşım, bir lidere güven duyulmasını artıran ve lider olarak
kabul edilebilmesini mümkün kılan bir araç olmaktadır (Aslan, 2013). Etik, etimolojik olarak
Yunanca’da karakter anlamına gelmektedir. Ahlaki değerleri, ilkeleri ve standartları belirleyen, kişilere
neyin iyi, neyin kötü olduğunu seçmede belirleyici olan bir kavramdır (Bakan ve Doğan, 2013). Etik

Mehmet Akif Ersoy İktisadi ve İdari Bilimler Fakültesi Dergisi - Mehmet Akif Ersoy University Journal of Economics and Administrative Sciences Faculty
Cilt:7 Sayı2. s.440-456 Volume:7 Issue:2 p.440-456
Temmuz 2020 July
444
konusu her ne kadar felsefenin ortaya çıkması ile başlasa da, örgütsel anlamda etik, 1960’lı yıllardaki
sosyal sorumluluk hareketi ile gündeme gelmiştir. Sosyal sorumluluk hareketi sayesinde örgütlerde
görev yapan yöneticilerin ve liderlerin aldığı kararların; ekonomik kaynak kullanımının gerek çalışanlar
gerekse de toplum açısından refah düzeyini ve sosyal ahlak seviyesini etkilediği ortaya koyulmuştur
(Uzkesici, 2003). Sosyal sorumluluk hareketi ile birlikte yöneticilerin çevreye, canlılara ve topluma
karşı olan duyarlılığı, çalışanları arasında oluşturdukları etik anlayış farkındalığı ve örgütteki etik dışı
davranışları azaltma çabaları gündeme gelmiştir. Örgütsel etik ya da diğer ifadesiyle iş etiği, ahlaki
standartları akılcı bir şekilde değerlendirerek, çalışma ortamlarına nakletme ve uygulamaya geçirmedir
(Velasquez, 1998). Örgütsel etik, örgütü oluşturan bireylerin sahip olduğu değerler sistemi sayesinde
iletişim kurmalarını, karar vermelerini ve etik ikilemleri çözmelerini kolaylaştırarak işleyişi sağlayan
yazılı ve yazılı olmayan kurallar bütünüdür (Gül, 2006).
Son dönemde öne çıkan etik liderlik kavramı, tartışmaların üzerinde yoğunlaştığı bir liderlik
türüdür. Günlük meşguliyetlerinde etik ilkelere bağlılık gösteren ve diğerlerine örnek olan kişi, etik lider
olmaktadır (Gallagher ve Tschudin, 2010). Etik lider; kendisi dışındaki kişilerin de haklarını ve
onurlarını değerli bulan, saygı gösteren bir liderdir (Şantaş vd., 2018a). Etik liderlik, liderlerin doğru
değerlere, sağlam ve iyi karakterlere sahip olması durumu olarak ifade edilmektedir (Freeman ve
Stewart, 2006). Brown ve arkadaşları (2005) etik liderliği; dönüşümcü, otantik ve ruhsal liderlikten
ayırarak ilk kez ortaya koyan kişilerdir. Brown ve arkadaşları (2005) bu kavramı, kişisel faaliyetleri ve
kişilerarası ilişkileri aracılığıyla normatif olarak uygun davranışlar göstererek çift yönlü iletişim,
pekiştirme ve karar verme yoluyla takipçilerine örnek olma ve onları yönetme olarak ifade etmektedir.
Etik liderlik, durumsallık yaklaşımı ile örtüşen bir konudur. Durumlara bağlı gelişen
davranışlar, uygun bir örgütsel ortam içerisinde ortaya çıkabilmektedir (Minaz, 2019). Diğer yandan
etik liderlik, sosyal öğrenme kuramına da dayandırılmaktadır (Brown ve Treviño, 2006). Etik liderlerin
etik davranışları, takipçilerini olumlu yönde etkilerken etik dışı davranışları ise olumsuz anlamda
etkilemekte, onlara kötü bir model olmaktadır (Brown ve Treviño, 2006). Dolayısıyla liderler ve
çalışanlar arasındaki etkileşim, etik davranışlara yönlendirmektedir (Mayer vd., 2009).
Treviño ve arkadaşları (2000)’na göre etik liderlik, ahlaklı bir kişi açısından dürüstlük,
güvenilirlik, adalet, başkalarının sorunları ile ilgilenme, etik davranma gibi özellikleri içermektedir.
Ahlaklı bir yönetici için ise daha dönüşümcü çabalara odaklanan, takipçilerinin etik davranışlarını
etkileyen, astlarına etik davranışın önemini ileten, ödül ve ceza kullanan, onlara rol model olması
özelliklerini ifade etmektedir. Etik liderler, bekledikleri etik davranışları teşvik etmek amacıyla
ödüllendirme ve cezalandırma mekanizmalarını işletmektedir ve davranış değişimine sebep olarak
model olmaktadır (Mayer vd., 2009).
Treviño ve arkadaşları (2003) tarafından yapılan çalışmaya göre etik liderlerin belirgin kişilik
özellikleri; dürüst, güvenilir, insanları ve toplumu önemseyen, kişisel ve mesleki yaşamlarında etik
davranan, adil, yeniliklere açık, anlayışlı, etik bilince ve kaygıya sahip ilkeli karar vericiler şeklindedir.
Etik liderler, ahlaklı, insana ve topluma yarar getiren işler yapan, insanlar arasında itibarı ve ilkeleri olan

Sağlık Çalışanlarında Etik Liderlik ve Örgüt Kültürünün İncelenmesi: Özel Bir Hastanede Uygulama-Investigation of Ethical Leadership and Organizational
Culture in Healthcare Professionals: Application in a Private Hospital
Sümeyye ÖZMEN, Özlem ÖZER, Okan ÖZKAN
445
karar vericiler olarak tanınmaktadır. Mesleki yaşamlarında etik davranışlar sergileyen ahlaklı
yöneticilerdir (Treviño vd., 2000). Başarılı bir etik liderde kendini tanıma, kendisine güvenme ve
olumlu benlik saygısı öncelikli şartlardır. Toplumsal anlamda yaşayışın güçlü ve zayıf taraflarını, ayrıca
kültürel değerleri analiz etme becerisine sahip olması gerekmektedir (Kaya Erten vd., 2017).
Örgüt açısından etik liderlerin göstermeleri gereken davranışlar aşağıda belirtilmektedir
(Freeman ve Stewart, 2006):
✓ Örgütün amaçlarını ve değerlerini açıklamakla birlikte, etik bir bilinç oluşturmak için bu
amaç ve değerleri gerçekleştirir,
✓ Bireysel egoları bir kenara bırakarak, örgütsel başarılara odaklanır,
✓ Çalışabileceği en başarılı ve örnek kişileri bulur, onları geliştirir. Etik altyapısı sağlam
insanlarla çalışır,
✓ Etik, değerler ve paydaşlar için değer oluşturma konuları ile ilgili güncel bir tartışma ortamı
oluşturur. Etik kararlar alır,
✓ Karşıt fikirlerin dile getirilebileceği mekanizmaları oluşturur,
✓ Çalışanlara ve bulunduğu örgüte hizmet ederken; aynı zamanda çalışanlarının kişisel
amaçlarını dikkate alır ve değerlerini öncelikli tutar. Başkalarının değerlerine saygı duyar,
✓ Hayal gücünü çalıştırırken yapılması zor olan görev çağrılarında bulunur,
✓ Yapılacak eylemleri etik açıdan bir çerçevede değerlendirir. Değerlerin sınırlarını ve etik
prensipleri bilir,
✓ Paydaşların desteği ve sosyal meşruiyet içerisinde temel değerlere dair önermeler ile
bağlantı kurar,
✓ Örgütsel misyonun gerçekleştirilebilmesi için risk almaktan çekinmez,
✓ Çalışanlarıyla bilgi paylaşımını en kısa sürede ve tam olarak yapar,
✓ Acil durumlarda ve kritik konularda çalışanlarının cesaretle karar alabilmesini kolaylaştırır.
Etik bir lider olabilmek için ise aşağıdaki sorulara cevap aramak gerekmektedir (Freeman ve
Stewart, 2006):
✓ Benim en önemli değerlerim ve prensiplerim nelerdir?
✓ Bu değerleri yansıtmak için zamanımı ve dikkatimi nasıl harcıyorum?
✓ Astlarım ve meslektaşlarım değerlerimin neler olduğunu söyleyebilir?
✓ Otoriteme karşı koyabilecek birlikte çalıştığım kişilere dair tasarladığım mekanizmalar ve
süreçler hangileridir?
✓ Bu örgüt benden hangi durumlarda etik ilkelerden uzaklaşmamı isteyebilir?
✓ Benim liderliğimle ilgili neyi başarmayı isteyebilirim?
✓ Ben gittiğimde liderliğimle ilgili arkamdan ne söylensin isterim?
✓ Günün sonunda eve gidip, çocuklarıma veya sevdiğim birine liderliğimden bahsedebilir
miyim? Onlara günlük çalışmalarımdan yola çıkarak etik lider olmayı öğretebilir miyim?

Mehmet Akif Ersoy İktisadi ve İdari Bilimler Fakültesi Dergisi - Mehmet Akif Ersoy University Journal of Economics and Administrative Sciences Faculty
Cilt:7 Sayı2. s.440-456 Volume:7 Issue:2 p.440-456
Temmuz 2020 July
446
Günümüzde örgütlerde oluşan etik dışı davranışlar, etik liderliğe daha fazla ihtiyaç duyulmasına
sebep olmuştur. Skandallar gündeme geldikçe pek çok liderin kötü davranışlar gösterdikleri ortaya
çıkmıştır (Brown, 2007). Örgütler için etik dışı davranışlar, insanlar arasındaki ilişkilerin bozulmasına
neden olan ve sosyal açıdan kabul edilen kurallara aykırı olarak gösterilen davranışlardır. Örgütlerde
yaşanan en önemli etik dışı davranışlara, çalışanlar arasında çıkan çatışmalarda adil olmamak, rüşvet
almak (Weiss, 1998) örnek olarak verilebilmektedir. Ayrıca ülkemizde yapılan bir çalışmada da en
önemli etik dışı davranışlar çevre kirliliği, bilgi sızdırma ve rüşvet olarak ifade edilmektedir (Uzkesici,
2003). Bunlar dışında etik dışı davranışlar ayrımcılık, kayırma, yolsuzluk, yönetime yaranma, bağnazlık,
meslektaşlarını engelleme, yıldırma, bencillik, işkence, taciz, şiddet ve dogmatik davranma olarak
belirtilebilmektedir (Gül, 2006).
2.2. Örgüt Kültürü
Kültür, grup halindeki kişilerin diğerlerinden ayırıcı bazı zihinsel özelliklerini ifade etmektedir.
Bir diğer ifadeyle kültür; bu özellikler ile kişilerin yaşadıkları çevreden ve tecrübelerden kaynaklı olarak
zihinleri üzerinde gerçekleşen programlamadır (Erdem vd., 2010). Örgüt kültürü ise örgütler içerisinde
birbirinden farklı inanç, değer, tutum ve kültüre sahip çalışanların aynı amaçlar etrafında toplanarak
uyumlu bir şekilde çalışmasını sağlayan oluşumdur (Eren, 2017). Cameron ve Quinn (1999)’e göre
örgütlerdeki kültürel oluşum klan kültürü, bürokrasi kültürü, piyasa kültürü ve adhokrasi kültürü olmak
üzere dört farklı kültürel yapı ile açıklanmaktadır.
Klan kültürü; insanların gönüllü olarak kendilerinden kattıkları, geniş bir aile gibi sıcak ve
samimi bir ortamı, birleştirici ve katılımcı bir bakış açısını ifade etmektedir (Erdem, 2010). Kişiler arası
bağlılık, güven, uyum, insani ilişkiler ve gelişme üzerinde durmaktadır. Bu tür kültürlerde liderler, birer
rehber ve ebeveyn gibi görülmektedir. Örgüt, sadakat ve gelenek sayesinde bir arada tutulmaktadır
(Cameron ve Quinn, 1999). Bürokrasi kültürü; akılcı ve mantıklı kurallara dayanan bir hiyerarşi
kültürüdür (Erdem, 2010). Çok resmi kurallar, politikalar, prosedürler ve düzen üzerinde durmaktadır.
Bu tür örgütlerde liderler verimlilik odaklı iyi birer koordinatör ve organizatör olmakla gurur
duymaktadırlar. Piyasa (Pazar) kültürü; rekabet gücüne ve pazar üstünlüğüne dayanmaktadır. İşin
yapılmasına yani sonuca odaklanan bir örgüt yapısını ifade etmektedir. Bu tür örgütlerde liderler, sıkı
birer rakip, sert birer yarışmacı iken; örgütü ayakta tutan mekanizma kazanma arzusudur (Cameron ve
Quinn, 1999). Son olarak adhokrasi kültürü; dinamik, değişken, yenilikçi, girişimci bir bakış açısını ve
dış çevreye uyumu ifade etmektedir. Geleceğin inşa edilmesi üzerinde duran bu tür örgütlerde liderler
risk alarak ve sezgi yoluyla karar vermektedir. Örgüt, deneyime ve yenilikçiliğe önem verirken; bireysel
inisiyatifi ve özgürlüğü de teşvik etmektedir (Cameron ve Quinn, 1999). Kalıplaşmış modellerden ve
aşırı uzmanlaşmadan uzaklaşarak; resmi olmayan, kendini yenileyen ve esnek bir yapı oluşturmayı
amaçlamaktadır (Mintzberg, 2015).
Örgüt kültürü, örgütlerde etik ilkelerin oluşturularak kurumsallaşmanın sağlanması ve farklı
kültüre sahip kişilerin aynı davranışı gösterebilmesinin yoludur. Örgüt içerisindeki etik çerçeve, örgüt
üyeleri tarafından paylaşılan ahlaki düşünce ve değer dünyasını kapsamaktadır (Eren, 2017). Etik

Sağlık Çalışanlarında Etik Liderlik ve Örgüt Kültürünün İncelenmesi: Özel Bir Hastanede Uygulama-Investigation of Ethical Leadership and Organizational
Culture in Healthcare Professionals: Application in a Private Hospital
Sümeyye ÖZMEN, Özlem ÖZER, Okan ÖZKAN
447
liderliğin sağlam temellerinin olması, örgüt kültürünün bu değerler çevresinde yoğunlaşmasını
doğurmaktadır. Ayrıca örgütlerin paydaşlar arasında bir denge oluşturabilmesi, çalışanların ve
müşterilerin beklentilerine cevap verebilmesi bu sayede gerçekleşebilmektedir. Örgütlerde etik yönetim,
sistematik, bilinçli ve devamlı bir uğraş gösterme ile sağlanabilmektedir (Uzkesici, 2003).
Örgütler için yöneticilerin liderlik davranışı göstermeleri örgütün başarılı olması, çalışanların
ve yöneticilerin iş doyumunun sağlanması gibi pek çok açılardan büyük önem taşımaktadır
(Tengilimoğlu ve Yiğit, 2005). Yöneticilerin liderlik davranışı türlerinden biri de etik liderliktir. Etik
liderliğin ana amaçlarından biri olan etik dışı davranışların önlenmesi ile birlikte örgüt kültürünün de
olumlu etkilenebileceği düşünülmektedir.
Yöneticilerin ve liderlerin etik konusuna duyarlı olabilmesi, örgüt kültürünün sağlanması için
de önemli bir gerekliliktir. Bu sayede örgüt üyeleri arasında etik ilke ve standartlara bağlılığın artması
sağlanabilmektedir. Etik örgüt kültürü, uzun vadeli bir bakış açısı sayesinde paydaşların ve hissedarların
arasındaki dengeyi oluşturabilmektedir. Yöneticilere riske girmeleri ve yenilikçi kararlar almaları
konusunda cesaret vermektedir. Yüksek etik değerlerle örülü örgüt kültürü güçlü olduğunda, çalışanların
davranışları da olumlu yönde etkilenmektedir. Bunu elde edebilmek için yöneticilerin bir rol model
olması, etik kodları oluşturmaları ve çalışanlar arasında yaygınlaşmasını sağlamaları, etik konularda
eğitim vermeleri, etik kurullar oluşturmaları, etik davranış sergileyenleri görülebilir düzeyde
ödüllendirme ve davranmayanları ise cezalandırma sistemini uygulamaları, koruyucu mekanizmaları
oluşturmaları gerekmektedir (Robbins ve Judge, 2012). Etik bir iklim oluşturabilmek için en üstteki
yöneticilere büyük görevler düşmektedir. Üst yönetim, etik değerlere sıkı sıkıya bağlı olduğunda diğer
yöneticiler de etik liderlik davranışını o derece göstermektedirler (Gruys vd., 2008).
Liderler, grup tarafından seçileceği ve kabul edileceği için, etik lider ve örgüt kültürü arasında
yakın bir ilişki vardır. Ayrıca örgüt etiği, tüm çalışanların ortaklaşa değerlerin oluşuma katılmasıyla ve
liderin bu etik iklimi teşvik etmesiyle beraber işlerlik kazanmaktadır. Bu nedenle de etik liderlik ve örgüt
kültürü bağlantılı kavramlardır (Ray, 2006). Etik liderlik misyonunu gösteren yöneticinin örgütte
bulunan herkese dair ortak etik ilkeleri merkeze alarak karar vermesi ve uygulaması gerekmektedir
(Minaz, 2019). Etik liderler, örgütün amaçlarını, misyonu, vizyonu ve değerlerini somut hale getirerek,
gerçekleşmesini sağlamak için çalışanlar ile arasına bir köprü oluşturmaktadır (Şantaş vd., 2018a).
Dolayısıyla çalışanlar arasında oluşan etik bir örgüt kültürünün mimarı etik lider sayılabilmektedir.
3. YÖNTEM
3.1. Amaç ve Hipotezler
Bu çalışmanın amacı sağlık çalışanlarının etik liderlik algılarının örgüt kültürü üzerindeki
etkilerini incelemektir. Bu amaç doğrultusunda ise aşağıda yer alan hipotezler geliştirilmiştir:
•Hipotez 1. Sağlık çalışanlarının etik liderlik algıları örgüt kültürünün alt boyutlarından
hiyerarşi kültürü üzerinde istatistiksel olarak anlamlı bir etkiye sahiptir.

Mehmet Akif Ersoy İktisadi ve İdari Bilimler Fakültesi Dergisi - Mehmet Akif Ersoy University Journal of Economics and Administrative Sciences Faculty
Cilt:7 Sayı2. s.440-456 Volume:7 Issue:2 p.440-456
Temmuz 2020 July
448
•Hipotez 2. Sağlık çalışanlarının etik liderlik algıları örgüt kültürünün alt boyutlarından klan
kültürü üzerinde istatistiksel olarak anlamlı bir etkiye sahiptir.
•Hipotez 3. Sağlık çalışanlarının etik liderlik algıları örgüt kültürünün alt boyutlarından
adhokrasi kültürü üzerinde istatistiksel olarak anlamlı bir etkiye sahiptir.
3.2. Evren ve Örneklem
Çalışmanın evrenini, Ankara ilinde yer alan özel bir hastanede görev yapmakta olan sağlık
çalışanları (N=450) oluşturmaktadır. Hastanede 82 hekim, 170 hemşire, 103 diğer sağlık personeli ve
95 idari personel görev yapmaktadır. Araştırmada örneklem seçilmemiş ve veri toplama aracı
araştırmaya katılmayı kabul eden çalışanların tümüne dağıtılmıştır. Veri toplamanın devam ettiği süre 6
Ocak-30 Ocak 2020 tarihleri arasındadır ve çalışmada 266 kişiden veri toplanmıştır.
3.3. Etik İzin
Çalışmanın etik izni Burdur Mehmet Akif Ersoy Üniversitesi Girişimsel Olmayan Klinik
Araştırmalar Etik Kurulu’ndan alınmıştır (Toplantı Tarihi:04.13.2019).
3.4.Veri Toplama Aracı
Çalışmada katılımcıların etik liderlik algılarını ölçmek için Brown vd. (2005)’nin geliştirdiği,
Tuna vd. (2012)’nin Türkçe’ye çevirdiği ve geçerlilik ve güvenirliğini yaptığı ölçek kullanılmıştır.
Yeşiltaş (2012) tarafından tekrar geçerlilik ve güvenirliği yapılan bu ölçek, 10 maddeden ve tek boyuttan
oluşmaktadır. Ölçeğe ilişkin ifadeler “1=Kesinlikle Katılmıyorum”dan, “5=Kesinlikle Katılıyorum”a
kadar uzanan 5’li Likert tipinde ağırlıklandırılmaktadır. Çalışmada etik liderlik ölçeğinin geçerlilik ve
güvenilirliğini test etmek için faktör analizi ve Cronbach Alpha katsayısından yararlanılmıştır. Yapılan
analizler sonucunda ölçeğin güvenilirlik değeri 0,963 olarak bulunmuştur. Bu çalışmada yapılan faktör
analizi sonucunda ölçeğin Tuna vd. (2012)’nin ve Yeşiltaş (2012)’ın çalışması ile benzerlik gösterdiği
ve tek boyutlu bir yapıda olduğu tespit edilmiştir. Yapılan analiz sonucunda tek faktörlü bu yapının
toplam varyansın %75,045’ini açıkladığı belirlenmiş ve ölçek analizlere tek faktörlü olarak
uygulanmıştır (KMO= 0,948, χ2= 2785,996, df= 45, p<0,001).
Çalışmada örgüt kültürü algılarını ölçmek amacıyla Cameron ve Quinn’in (1999) geliştirmiş
olduğu ve Kasar (2019)’ın Türkçe formunu oluşturduğu Örgüt Kültürü Ölçeği kullanılmıştır. Ölçek 18
maddeden ve 3 alt boyuttan (adhokrasi, klan ve hiyerarşi kültürü) oluşmaktadır. Katılımcıların ifadeleri
“Kesinlikle Katılıyorum”dan “Kesinlikle Katılmıyorum”a kadar uzanan 5’li Likert tipi cevap skalasında
değerlendirilmektedir. Örgüt kültürü ölçeğine uygulanan güvenilirlik analizi sonucunda ölçeğin toplam
Cronbach Alpha güvenilirlik katsayısı 0,952 olarak bulunmuştur. Alt boyutlar bazında ise Cronbach
Alpha katsayıları hiyerarşi kültürü için 0,839; klan kültürü için 0,919; adhokrasi kültürü için 0,929
olarak hesaplanmıştır. Örgüt kültürü ölçeğine uygulanan faktör analizi sonuçlarına göre ise, ölçeğin bu
çalışmada Kasar (2019)’ın araştırması ile paralel olarak üç faktörlü bir yapı sergilediği tespit edilmiştir.
Elde edilen bu üç faktörlü yapının toplam varyansın %71,7’sini açıkladığı belirlenmiştir (KMO= 0,943,
χ2= 3864,834, df= 153, p<0,001). Buna göre adhokrasi kültürü 10 maddeden oluşmakta ve açıklanan

Sağlık Çalışanlarında Etik Liderlik ve Örgüt Kültürünün İncelenmesi: Özel Bir Hastanede Uygulama-Investigation of Ethical Leadership and Organizational
Culture in Healthcare Professionals: Application in a Private Hospital
Sümeyye ÖZMEN, Özlem ÖZER, Okan ÖZKAN
449
varyans %56,523; klan kültürü 6 maddeden oluşmakta ve açıklanan varyans %8,852; hiyerarşi kültürü
2 maddeden oluşmakta ve açıklanan varyans %6,326 olarak tespit edilmiştir.
3.5. Veri Analizi
Çalışmada istatistiksel analizler, SPSS 22 programı ile gerçekleştirilmiştir. Verilerin analizinde
tanımlayıcı analizler, güvenirlik analizi, faktör analizi, korelasyon analizi ve regresyon analizi
kullanılmıştır. Verilerin analizi %99 güven aralığında yapılmış ve p<0,01 anlamlılık düzeyine göre
değerlendirilmiştir. Korelasyon analizinde ise pearson korelasyon katsayısı kullanılmıştır.
4.BULGULAR
Tablo 1’de araştırmaya katılanlara ilişkin tanımlayıcı bilgiler verilmektedir. Buna göre;
katılımcıların %65’i kadındır ve %38’i lisans eğitim düzeyine sahiptir. Katılımcıların %9’u hekim,
%31,6’sı hemşire, %28,6’sı diğer sağlık personeli ve %30,8’i idari personelden oluşmaktadır.
Katılımcılara ait olan yaşların ortalaması hesaplandığında 32.99 olduğu görülmekte iken, sağlık
sektöründe toplam çalışma süresi ortalaması 9.31 ve mevcut birimde toplam çalışma süresi ortalaması
4.12 yıldır.
Tablo 1. Araştırmaya Katılanların Tanımlayıcı Özellikleri
Özellik Sayı Yüzde
Cinsiyet
Kadın
Erkek
173
93
65,0
35,0
Eğitim
Lise
Önlisans / İki yıllık Yüksekokul
Lisans
Lisansüstü
47
81
101
37
17,7
30,5
38,0
13,8
Hastanedeki Görev
Hekim
Hemşire
Diğer Sağlık Personeli
İdari Personel
24
84
76
82
9,0
31,6
28,6
30,8
Yaş
Ortalama: 32.99 – Maksimum: 67- Minimum: 19- Ranj: 48
Sağlık Sektöründe Çalışma Süresi (Yıl)
Ortalama: 9.31 – Maksimum: 37- Minimum: 1- Ranj: 36
Mevcut Birimde Çalışma Süresi (Yıl)
Ortalama: 4.12 – Maksimum: 25- Minimum: 1- Ranj: 24
Tablo 2’de araştırma değişkenlerine ilişkin temel istatistikler yer almaktadır. Buna göre; örgüt
kültürü alt boyutları arasında en yüksek ortalamayı klan kültürü alt boyutunun (3,48±0,88) ve en düşük
ortalamayı ise adhokrasi kültürü alt boyutunun (3,37±0,88) aldığı görülmektedir. Çalışmaya katılan
çalışanların etik liderlik değişkenine ilişkin algılamalarının ise orta seviyede olduğu (3,24±1,05) ifade
edilebilir. Örgüt kültürü alt boyutlarından klan kültürü ve adhokrasi kültürünün etik liderlik ile olan
korelasyonları pozitif yönde ve orta düzeyde iken hiyerarşi kültürü boyutu ile olan korelasyonları pozitif

Mehmet Akif Ersoy İktisadi ve İdari Bilimler Fakültesi Dergisi - Mehmet Akif Ersoy University Journal of Economics and Administrative Sciences Faculty
Cilt:7 Sayı2. s.440-456 Volume:7 Issue:2 p.440-456
Temmuz 2020 July
450
yönde ve zayıf düzeydedir (0,385≤ r ≤0,555). Örgüt kültürü alt boyutları arasındaki korelasyonlar ise
olumlu yönde, orta ve yüksek düzeydedir (0,558≤ r ≤0,771).
Tablo 2. Araştırma Değişkenlerine Ait Ortalama, Standart Sapma ve Korelasyon Değerleri
Değişkenler Ort. Std. Sapma 1 2 3 4
1.Etik Liderlik 3,24 1,05 (1)
2.Hiyerarşi Kültürü 3,43 0,94 0,385** (1)
3.Klan Kültürü 3,48 0,88 0,527** 0,714** (1)
4.Adhokrasi Kültürü 3,37 0,88 0,555** 0,558** 0,771** (1)
** Korelasyon 0.01 düzeyinde anlamlıdır (2-tailed)
Tablo 3’de araştırmanın hipotezlerini test etmek için gerçekleştirilen regresyon analizi sonuçları
gösterilmektedir. Etik liderliğe ilişkin algının hiyerarşi kültürü üzerindeki etkisini ortaya koymak üzere
oluşturulan regresyon modeline ilişkin istatistiksel tahminler modelin anlamlı olduğunu göstermektedir
(F=46,025; p<0,001). Etik liderlik, hiyerarşi kültürü algısındaki toplam varyansın %14,8’ini
açıklamaktadır. Regresyon modelinde regresyon katsayısının anlamlılığına ilişkin t-testi sonuçları
incelendiğinde, katılımcıların etik liderliğe ilişkin algılarının yükselmesi hiyerarşi kültürünü de
istatistiksel olarak artırmaktadır (t=6,784; p<0,001). Standardize edilmiş regresyon katsayısı
β=0,385’dir. Bu sonuçlar çalışmanın birinci hipotezinin (H1) doğrulandığını göstermektedir.
Tablo 3. Etik Liderlik ve Örgüt Kültürü Alt Boyutları Arasındaki İlişkileri İnceleyen Regresyon Analizi
Bağ
ımlı
Değ
işk
en
Bağımsız
Değişken B
Std.
Error β t p R R2 F p
Durbin-
Watson
Hiy
erar
şi
Kü
ltü
rü
Sabit 2,317 0,172 13,468 p<0,001
0,385
0,148
46,025
p<0,001
1,986 Etik Liderlik 0,343 0,051 0,385 6,784 p<0,001
Kla
n
Kü
ltü
rü
Sabit 2,050 0,149 13,718 p<0,001 0,527 0,277 101,251 p<0,001 1,768
Etik Liderlik 0,442 0,044 0,527 10,062 p<0,001
Ad
ho
kra
si
Kü
ltü
rü Sabit 1,858 0,146 12,697 p<0,001
0,555 0,308 117,452 p<0,001 1,687 Etik Liderlik 0,466 0,043 0,555 10,838 p<0,001
Etik liderlik algısının klan kültürü üzerine etkisine ilişkin yürütülen regresyon analizi sonucuna
göre etik liderliğin klan kültürü algısındaki toplam varyansın %27,7’sini açıkladığı belirlenmiştir.
Analiz sonuçlarına göre katılımcıların etik liderliğe ilişkin algılarının yükselmesi klan kültürü algılarını
istatistiksel olarak artırmaktadır (t=10,062; p<0.001). Standardize edilmiş regresyon katsayısı
β=0,527’dir. Bu sonuçlar çalışmanın ikinci hipotezinin (H2) doğrulandığını göstermektedir.
Etik liderlik algısının adhokrasi kültürü üzerine etkisine ilişkin yürütülen regresyon analizi
sonucuna göre ise etik liderliğin adhokrasi kültürü algısındaki toplam varyansın %30,8’ini açıkladığı
görülmektedir. Analiz sonuçlarına göre katılımcıların etik liderliğe ilişkin algılarının yükselmesi
adhokrasi kültürü algılarını istatistiksel olarak artırmaktadır (t=10,838; p<0.001). Standardize edilmiş

Sağlık Çalışanlarında Etik Liderlik ve Örgüt Kültürünün İncelenmesi: Özel Bir Hastanede Uygulama-Investigation of Ethical Leadership and Organizational
Culture in Healthcare Professionals: Application in a Private Hospital
Sümeyye ÖZMEN, Özlem ÖZER, Okan ÖZKAN
451
regresyon katsayısı β=0,555’dir. Bu sonuçlar bu çalışmanın üçüncü hipotezinin (H3) de doğrulandığını
göstermektedir.
5.TARTIŞMA VE SONUÇ
Sağlık kurumları; hekim otonomisinin yoğun bir şekilde yaşandığı, başta hemşireler ve diğer
sağlık personelinin yönetsel ve mesleki işlerde üstlerine karşı emir-komuta ile bağlı olduğu ve çoğu
zaman da kendisine verilen görevleri yerine getirmek durumunda kaldığı örgütlerdir. Bu açıdan
hemşirelerin, yönlendirmelerde bulunan sorumlu hekimi, başhemşiresi ve diğer yöneticilerden; ayrıca
diğer sağlık personelinin yönetsel ve mesleki işlerinde üstlerinin veya yöneticilerinin ahlaki standartlara
uymayan kararlarından daha fazla etkilenen kişiler olması beklenmektedir. Bu nedenle de yönetici
merkezli bir kavram olan “etik liderlik”, sağlık kurumlarında ön plana çıkan bir kavramdır (Sonğur vd.,
2017). Etik liderlik, özellikle mikro düzeydeki sağlık hizmeti sunucusu-hasta ilişkilerinde
profesyonellerin uygulamalarına ve davranışlarına odaklanmaktadır. Buna ek olarak bu liderlik türü,
ataerkil bakımdan hasta merkezli bakıma dönüşümün temel taşı gibi görünmektedir. Ayrıca etik liderlik,
tüm faaliyetlerinde kaliteyi ve güvenliği teşvik etmeyi ve uygulamayı savunmaktadır (Şantaş vd.,
2018a). Sağlık kurumları; verilen hizmetin karmaşık yapısı ve özellikleri açısından yöneticilik ve örgüt
kültürü bakımından işletme düzeyinde giderek önem kazanan kurumlardır. Sağlık kurumlarında temel
girdi insan olduğundan dolayı, yönetsel kademedeki kişilerin ve çalışanların liderlik niteliklerine sahip
olmaları ve kültürün temel bir yönetsel araç haline gelmesi beklenmektedir (Karahan, 2008).
Literatürde etik liderliğin; çalışanın devamsızlığını ve görevi kötüye kullanma davranışını
azalttığı, iş doyumunu ve performansını artırdığı ifade edilmektedir (Şantaş vd., 2018a). Esmaelzadeh
ve arkadaşları (2017) tarafından hemşireler üzerinde yapılan araştırmada ise, etik liderliğin örgütsel
iklimi olumlu anlamda etkilediği; örgütsel kimlik, güven ve dayanışma gibi unsurların oluşumunu
sağladığı tespit edilmiştir. Bu çalışmada ise sağlık çalışanlarının etik liderlik algılarının örgüt kültürü
üzerindeki etkilerini incelemek amaçlanmıştır. Literatürde sağlık sektöründe etik liderlik ile örgüt
kültürünü bir arada inceleyen çalışmaların çok sınırlı olması bu çalışmanın yapılmasının önemli bir
nedenini oluşturmaktadır.
Çalışmada yapılan analizler sonucunda katılımcıların etik liderlik puanlarının orta seviyede
olduğu tespit edilmiştir. Sonğur vd. (2017)’nin sağlık personeli üzerinde gerçekleştirdikleri
çalışmalarında da katılımcıların etik liderlik algılarının orta düzeyde olduğu belirlenmiştir. Yine
Büyükyılmaz ve Alper Ay (2017)’ın iki farklı devlet hastanesinde çalışan personelle yaptıkları
araştırmalarında katılımcıların etik liderlik algılarının orta düzeyde olduğu belirlenmiştir. Çıraklı vd.
(2014)’nin sağlık çalışanları üzerinde gerçekleştirdikleri çalışmalarında ise katılımcıların etik liderlik
algılarının düşük seviyede olduğu tespit edilmiştir. Çalışmada örgüt kültürü alt boyutları arasında en
yüksek ortalamayı klan kültürü alt boyutunun ve en düşük ortalamayı ise adhokrasi kültürü alt
boyutunun aldığı belirlenmiştir. Katılımcıların genel olarak örgüt kültürü algıları ise orta düzeydedir.
Şantaş vd. (2018b)’in bir üniversite hastanesinde çalışan personel üzerinde gerçekleştirdikleri
Mehmet Akif Ersoy İktisadi ve İdari Bilimler Fakültesi Dergisi - Mehmet Akif Ersoy University Journal of Economics and Administrative Sciences Faculty
Cilt:7 Sayı2. s.440-456 Volume:7 Issue:2 p.440-456
Temmuz 2020 July
452
çalışmalarında da katılımcıların örgüt kültürü algılarının orta düzeyde olduğu belirlenmiştir. Çıraklı vd.
(2017)’nin hastane personeli üzerinde gerçekleştirdikleri çalışmalarında kamu hastanesinde hiyerarşik
örgüt tipinin daha baskın olduğu belirlenmiştir. Yine Erdem (2007)’nin altı hastanede çalışan personel
üzerinde gerçekleştirdiği çalışmasında da genel olarak tüm hastaneler dikkate alındığında örgüt kültürü
tiplerinden hiyerarşi kültürünün ön plana çıktığı tespit edilmiştir.
Çalışmada yapılan analizler sonucunda örgüt kültürü alt boyutlarından klan kültürü ve adhokrasi
kültürünün etik liderlik ile olan korelasyonları pozitif yönde ve orta düzeyde iken hiyerarşi kültürü
boyutu ile olan korelasyonları pozitif yönde ve zayıf düzeydedir. Toytok ve Kapusuzoğlu (2016)’nun
öğretmenler üzerinde gerçekleştirdiği çalışmasında etik liderlik ve örgüt kültürü arasında yüksek
düzeyde pozitif yönde ve anlamlı bir ilişki olduğu belirlenmiştir. Rizwan vd. (2017)’nin çalışmasında
da etik liderlik ile örgüt kültürü arasında anlamlı ve pozitif yönde ilişkiler tespit edilmiştir.
Çalışmada gerçekleştirilen regresyon analizi sonuçlarına göre; etik liderliğin hiyerarşi kültürü
algısındaki toplam varyansın %14,8’ini; klan kültürü algısındaki toplam varyansın %27,7’sini ve
adhokrasi kültürü algısındaki toplam varyansın %30,8’ini açıkladığı belirlenmiştir. Katılımcıların etik
liderliğe ilişkin algılarının yükselmesi hiyerarşi, klan ve adhokrasi kültürünü istatistiksel olarak
artırmaktadır. Toytok ve Kapusuzoğlu (2016)’nun çalışmasında da etik liderliğin örgüt kültürünün güçlü
bir açıklayıcısı olduğu belirlenmiştir. Şentürk (2017)’nin çalışmasında ise klan kültürünün etik liderlik
davranışlarını açıklama düzeyi istatistiksel olarak anlamlı bulunmuş ve etik liderlik davranışları
üzerinde %5 gibi bir etkiye sahip olduğu bulunmuştur.
Sağlık çalışanlarının hizmetin sunumu aşamasında hasta haklarını ön planda tutmaları ve
hastalara karşı etik değerler çerçevesinde davranmaları gerektiğinden dolayı bu alanda etik liderliğe
büyük bir ihtiyaç vardır. Sağlık hizmeti veren örgütlerde etik anlayış, hizmet kalitesini ve hasta
memnuniyetini doğrudan etkileyen önemli bir unsur olarak göze çarpmaktadır. Yapılan etik dışı
uygulamalar kısa sürede kamuoyuna mal olabilmektedir. Bu noktada çalışanların üzerine düşen görevler
olduğu gibi, yöneticilerin de etik liderlik özelliklerine sahip olması gerekmektedir (Gül, 2006).
Çalışanların karşısındaki kişinin duygularını anlamaya çalışması ve o kişiye değer vermesi etik
ilkelere göre hareket etmenin öncelikli koşuludur. Etik lider durumundaki kişiler, birlikte çalıştıkları
ekibin üyelerinin tepkilerini dikkate almalı ve onları dinleyerek çözüm bulmaya çalışmalıdır (Kaya
Erten vd., 2017). Lider, çalışanların etik dışı davranışları hakkında ne kadar fikir sahibi olursa, sorunlara
çözüm bulması da o derece kolaylaşmaktadır (Gül, 2006). Etik lider, çalışanların örgüte bağlılıklarını
artırabilmek için evrensel değerler çerçevesinde doğru kararları alabilmeli ve proaktif davranabilmelidir
(Bakan ve Doğan, 2013).
Bu çalışmanın özel bir hastanede çalışan personel üzerinde gerçekleştirilmesi nedeniyle elde
edilen sonuçların tüm sağlık personeline genellenmesi konusu, araştırmanın sınırlılığını
oluşturmaktadır. Bu konuda yapılacak olan çalışmaların daha geniş kapsamlı bir şekilde ve farklı
sektörlerde gerçekleştirilmesinin etkili sonuçlar elde edilmesine yardımcı olacağı söylenebilir.

Sağlık Çalışanlarında Etik Liderlik ve Örgüt Kültürünün İncelenmesi: Özel Bir Hastanede Uygulama-Investigation of Ethical Leadership and Organizational
Culture in Healthcare Professionals: Application in a Private Hospital
Sümeyye ÖZMEN, Özlem ÖZER, Okan ÖZKAN
453
KAYNAKÇA
Aslan, Ş. (2013). Geçmişten Günümüze Liderlik Kuramları. Konya: Eğitim Yayınevi.
Bakan, İ. ve Doğan, İ. F. (2013). Liderlik: Güncel Konular ve Yaklaşımlar. Ankara: Gazi
Kitabevi.
Bogardus, E.S. (1934). Leaders and Leadership. New York: Appleton-Century.
Brown M. (2007). Misconceptions of Ethical Leadership, How To Avoid Potential Pitfalls,
Journal of Organizational Dynamics, 36(2), 140–155.
Brown, M.E. Treviño, L.K. ve Harrison, D.A. (2005). Ethical Leadership: A Social Learning
Perspective for Construct Development and Testing, Organizational Behavior and
Human Decision Processes, 97(2), 117-134.
Brown, M. E. ve Treviño. L.K. (2006). Ethical Leadership: A Review and Future Directions,
The Leadership Quarterly, 17, 595-616.
Büyükyılmaz, O. ve Alper Ay, F. (2017). Etik Liderliğin Örgütsel Vatandaşlık Davranışına
Etkisinde Örgütsel Adaletin Rolü, Hitit Üniversitesi Sosyal Bilimler Enstitüsü Dergisi,
10(1), 209-234.
Cameron, K.S. ve Quinn, R.E. (1999). Diagnosing and Changing Organizational Culture. Base
on the Competing Values Framework, Reading, Mass: Addison-Wesley.
Can, H., Akgün, A. ve Kavuncubaşı, Ş. (1998). Kamu ve Özel Kesimde Personel Yönetimi.
Ankara: Siyasal Kitabevi.
Cohen, W.A. (2010). Drucker ve Liderlik, Modern Yöneticiliği Ustasından Yeni Dersler. (Z.
Dicleli, Çev.). İstanbul: Optimist Yayınları.
Çıraklı, Ü., Gözlü, M. ve Dalkılıç, S. (2017). Hastane Personellerinin Örgüt Kültürü Tipi
Algısının İncelenmesi: Yozgat’ta Yer Alan İki Hastanede Bir Uygulama, Çankırı
Karatekin Üniversitesi İktisadi ve İdari Bilimler Fakültesi Dergisi, 7(1), 33-59.
Çıraklı, Ü., Uğurluoğlu, Ö., Şantaş, F. ve Çelik, Y. (2014). Etik Liderlik Davranışlarının
Örgütsel Adalet Üzerindeki Etkisi: Hastanede Bir Uygulama, İşletme Bilimi Dergisi,
2(2), 53-69.
Erdem, R. (2007). Örgüt Kültürü Tipleri ile Örgütsel Bağlılık Arasındaki İlişki: Elazığ İl
Merkezindeki Hastaneler Üzerinde Bir Çalışma, Eskişehir Osmangazi Üniversitesi İİBF
Dergisi, 2(2), 63-79.
Erdem, R. (2010). Akademik Personelin Kurumlarına İlişkin Algıladıkları ve Tercih Ettikleri
Örgüt Kültürü Tipler, Erciyes Üniversitesi İİBF Dergisi, 36, 73-78.

Mehmet Akif Ersoy İktisadi ve İdari Bilimler Fakültesi Dergisi - Mehmet Akif Ersoy University Journal of Economics and Administrative Sciences Faculty
Cilt:7 Sayı2. s.440-456 Volume:7 Issue:2 p.440-456
Temmuz 2020 July
454
Eren E. (2017). Örgütsel Davranış ve Yönetim Psikolojisi (16.Baskı). İstanbul: Beta Yayınları.
Esmaelzadeh, F., Abbaszadeh, A., Borhani, F. ve Peyrovi, H. (2017). Ethical Leadership and
Organizational Climate: The Experience of Iranian Nurses, Iran Red Crescent Medical
Journal, 19(4), e43554.
Freeman, R. ve Stewart, L. (2006). Developing Ethical Leadership. Erişim Tarihi: 01 Şubat
2020, file:///C:/Users/ASUS/Downloads/Developing%20Ethical%20Leadership.pdf
Gallagher, A. ve Tschudin, V. (2010). Educating for Ethical Leadership, Nurse Education
Today, 30(3), 224-227.
Gruys, M.L., Stewart, S.M., Goodstein, J., Bing, M.N. ve Wicks, A.C. (2008). Values
Enactment in Organizations: A MultiLevel Examination, Journal of Management 34(4),
806-843.
Gül, H. (2006). Etik Dışı Davranışlar ve Ussallaştırılması: Devlet Hastanelerinde Bir Uygulama,
Selçuk Üniversitesi Karaman İİBF Dergisi, 10(9), 65-79.
Karahan, A. (2008). Çalışanların Örgüt Kültürünü Algılamalarına Yönelik Ampirik Bir
Çalışma. Selçuk Üniversitesi Sosyal Bilimler Enstitüsü Dergisi, 20, 457-478.
Kasar, M. (2019). Örgüt Kültürünün Sanal Kaytarmaya Etkisi: Bilişim Teknolojileri Çalışanları
Üzerine Bir Araştırma. Yüksek Lisans Tezi, Bahçeşehir Üniversitesi, İstanbul.
Kaya Erten, Z., Bayraktar, E. ve Açmaz, G. (2017). Etik ve Etik Liderlik, Erciyes Üniversitesi
Sağlık Bilimleri Fakültesi, 4(2), 62-68.
Mayer D., Kuenzi M., Greenbaum R., Bardes M. ve Salvador R. (2009). How Low does Ethical
Leadership Flow? Test of a Trickle-Down Model, Organizational Behavior and Human
Decision Processes, 108, 1-13.
Mc Gregor, D. (1960). The Human Side of Enterprise. New York: McGraw Hill.
Minaz, M.B. (2019). Liderlik. M.A. Akın, (Ed.), Etik Liderlik. Ankara: Pegem Akademi.
Mintzberg, H. (2015). Örgütler ve Yapıları. (A. Aypay, Çev.). İstanbul: Nobel Akademik
Yayıncılık.
Ray, S. L. (2006). Whistleblowing and Organizational Ethics, Nursing Ethics, 13(4), 438-445.
Rizwan, M., Zeeshan, C. ve Mahmood, S. (2017). The Impact of Perceived Ethical Leadership
and Organizational Culture on Job Satisfaction with The Mediating Role of
Organizational Commitment in Private Educational Sector of Islamabad, Pakistan.
Journal of Intercultural Management, 9(1), 75-100.
Sağlık Çalışanlarında Etik Liderlik ve Örgüt Kültürünün İncelenmesi: Özel Bir Hastanede Uygulama-Investigation of Ethical Leadership and Organizational
Culture in Healthcare Professionals: Application in a Private Hospital
Sümeyye ÖZMEN, Özlem ÖZER, Okan ÖZKAN
455
Robbins, S. ve Judge A. T. (2012). Örgütsel Davranış. (İ. Erdem, Çev. Ed.). Ankara: Nobel
Akademik Yayıncılık.
Sonğur, C., Özer, Ö. ve Say Şahin, D. (2017). Etik Liderliğin Örgütsel Adalet Üzerine Etkisi:
Bir Kamu Hastanesinde Uygulama, Hacettepe Sağlık İdaresi Dergisi, 20(4), 445-456.
Şantaş, F., Şantaş, G. ve Özer, Ö. (2018a). Sağlık Kurumlarında Liderlik Araştırmaları. Ankara:
Siyasal Kitabevi.
Şantaş, G., Özer, Ö. ve Şantaş, F. (2018b). Bir Üniversite Hastanesi Çalışanlarının Örgüt
Kültürüne İlişkin Algılarının İncelenmesi. 6. Uluslararası Çin’den Adriyatik’e Sosyal
Bilimler Kongresi, 29-31 Mart, Ankara.
Şentürk, F.K. (2017). Etik Liderliğin Belirleyicileri Olarak Kişilik, Örgüt Kültürü ve Dini
Yönelim: Antalya’daki Dört ve Beş Yıldızlı Otellerde Bir Uygulama. Seyahat ve Otel
İşletmeciliği Dergisi, 14(3), 186-206.
Tengilimoğlu, D. ve Yiğit, A. (2005). Hastanelerde Liderlik Davranışlarının Personel İş
Doyumuna Etkisini Belirlemeye Yönelik Bir Alan Çalışması, Hacettepe Sağlık İdaresi
Dergisi, 8(3), 374-400.
Toytok, E.H. ve Kapusuzoğlu, S. (2016). Influence of School Managers’ Ethical Leadership
Behaviors on Organizational Culture: Teachers’ Perceptions, Eurasian Journal of
Educational Research, 66, 373-388.
Treviño, L.K., Hartman, L.P. ve Brown, M. (2000). Moral Person and Moral Manager: How
Executives Develop a Reputation for Ethical Leadership, California Management
Review, 42, 128-142.
Treviño, L.K., Brown, M. ve Hartman, L P. (2003). A Qualitative Investigation of Perceived
Executive Ethical Leadership: Perceptions from Inside And Outside the Executive
Suite. Human Relations, 55, 5−37.
Tuna, M. Bircan, H. ve Yeşiltaş, M. (2012) Etik Liderlik Ölçeği’nin Geçerlilik ve Güvenilirlik
Çalışması: Antalya Örneği, Atatürk Üniversitesi İİBF Dergisi, 26(2), 143-156.
Uzkesici, N. (2003). İşletmelerde Etik Yönetimi-İşletmelerde Etik Kalitesinin Yönetimine
Geçiş. İş, Güç Endüstri İlişkileri ve İnsan Kaynakları Dergisi, 5(2), 162.
Velasquez, M.G. (1998). Business Ethics, Concepts and Cases (Fourth Edition). Upper Saddle
River, N.J.: Prentice-Hall.
Velioğlu S. ve Vatan F. (2002). Yönetici Hemşirelerin Liderlik Davranış Boyutlarının
İncelenmesi. 5. Ulusal Sağlık kuruluşları ve Hastane Yönetimi Sempozyumu, Eşkişehir.

Mehmet Akif Ersoy İktisadi ve İdari Bilimler Fakültesi Dergisi - Mehmet Akif Ersoy University Journal of Economics and Administrative Sciences Faculty
Cilt:7 Sayı2. s.440-456 Volume:7 Issue:2 p.440-456
Temmuz 2020 July
456
Weiss, J.W. (1998). Business Ethics, A Stakeholder and Issues Management Approach (2. Ed.),
Forth Worth, TX: The Dryden Press.
Yeşiltaş, T. (2012). Örgütsel Özdeşleşmenin Oluşmasında Belirleyiciler Olarak Etik Liderlik ve
Etik İklim: Otel İşletmelerine Yönelik Bir Uygulama. Doktora Tezi, Gazi Üniversitesi
Eğitim Bilimleri Enstitüsü, Ankara.

457
MEHMET AKİF ERSOY ÜNİVERSİTESİ
İKTİSADİ VE İDARİ BİLİMLER FAKÜLTESİ DERGİSİ
Mehmet Akif Ersoy University
Journal of Economics and Administrative Sciences Faculty
ISSN: 2149-1658 Cilt: 7 Sayı: 2 s.457-472
Volume: 7 Issue: 2 p.457-472 Temmuz 2020 July
HOCALI SOYKIRIMI İLE İLGİLİ TÜRK KAMUOYUNUN GÖRÜŞLERİ ÜZERİNE BİR
ARAŞTIRMA
A RESEARCH ON THE VIEWS OF THE TURKISH PUBLIC ABOUT THE HOCALI
GENOCIDE
Esma ÖZDAŞLI1
1. Dr. Öğr. Üyesi, Burdur Mehmet Akif Ersoy
Üniversitesi, İktisadi ve İdari Bilimler Fakültesi,
Uluslararası İlişkiler Bölümü,
[email protected], https://orcid.org/0000-0003-2336-9719
Makale Türü Article Type
Araştırma Makalesi Research Article
Başvuru Tarihi Application Date
21.02.2020 02.21.2020
Yayına Kabul Tarihi Admission Date
24.07.2020 07.24.2020
DOI
https://doi.org/10.30798/makuiibf.692569
Öz
25-26 Şubat 1992 tarihinde, Ermeni silahlı kuvvetleri ve Rus 366. motorize gücünün,
10 bin nüfuslu Hocalı kasabasına gerçekleştirdiği saldırıda; 83 çocuk, 106 kadın ve 70’den fazla yaşlı dahil olmak üzere toplam 613 kişi öldürülmüş, 487 kişi ise ağır
yaralanmıştır. İnsanlık dışı işkence yöntemleriyle öldürülen bu insanların dışında çok
sayıda kişi rehin alınmış ve bazı Hocalı sakinleri ise kaybolmuştur. İnsan Hakları İzleme Örgütü’nün “Dağlık Karabağ Savaşı’ndan bu yana gerçekleştirilen en kapsamlı “sivil”
katliam olarak nitelendirdiği bu facianın faillerinin, hala hiçbir ceza almamaları
uluslararası hukuka olan inancı zedeleyen önemli bir husustur. Uluslararası hukuk açısından en büyük insanlık suçu olarak kabul edilen “soykırım”ı tanımlayan 1948
tarihli Birleşmiş Milletler Soykırımın Önlenmesi ve Cezalandırılması Sözleşmesi’nin
her maddesine göre Hocalı’da yaşananlar bir “soykırım”dır. Ancak Batılı ülkeler başta olmak üzere dünyanın görmezden geldiği bu olay, Türk Dünyası’nda hatta Türkiye’de
dahi tam olarak bilinmemektedir. Bu çalışma, Hocalı Soykırımı ile ilgili olarak araştırma
örneklemi nispetinde Türk kamuoyunun algısının ne yönde olduğunun tespit edilebilmesi için yapılmıştır. Bu çerçevede, NVivo 12 Paket Programı yardımıyla
yapılandırılmış görüşmeler neticesinde elde edilen metinler üzerinde İçerik Analizi
(Temasal Analiz) yapılmış ve elde edilen frekans dağılımları ve kavram haritaları
sayesinde yorumlara gidilmiştir.
Anahtar Kelimeler: Hocalı Soykırımı, Türkiye, Azerbaycan, Kamuoyu,
İçerik Analizi,
Abstract
On 25-26 February 1992, Armenian armed forces and the Russian 366th motorized force
attacked Khojali which had a population of 10 thousand. 613 people were killed,
including 83 children, 106 women and more than 70 elderly people, and 487 people were seriously injured. Moreover, many people were taken hostage and some of the
Khojaly residents were lost. The perpetrators of this disaster, which Human Rights
Watch described as the most comprehensive "civilian" massacre since the Nagorno-Karabakh War, are still an important issue that undermines the belief in international
law. Khojaly massacre is a “genocide” according to every article of the 1948 United
Nations Convention on Prevention and Punishment of Genocide which defines the genocide as the biggest crime against humanity in terms of international law. However,
this event, which is ignored by international community, is also not commonly known
in Turkic World and Turkey. This study is carried out to determine the direction of Turkish public opinion regarding the Khojaly Genocide. In this context, Content
Analysis is conducted on the texts obtained as a result of the structured interviews with
the help of NVivo 12 Package Program and comments are made thanks to the frequency distributions and concept maps obtained.
Keywords: Khojaly Genocide, Turkey, Azerbaijan, Public Opinion, Content
Analysis,

Mehmet Akif Ersoy İktisadi ve İdari Bilimler Fakültesi Dergisi - Mehmet Akif Ersoy University Journal of Economics and Administrative Sciences Faculty
Cilt7 Sayı:2 s.457-472 Volume:7 Issue:2 p.457-472
Temmuz 2020 July
458
EXTENDED SUMMARY
Research Problem
This study is carried out to determine the perception of the Turkish public opinion regarding the
Khojaly Genocide. In this framework, it aims to reveal the attitudes and thoughts of different community
groups towards the Khojaly Genocide. To provide information to the Azerbaijan State for the process
of forming public opinion regarding the Khojaly Genocide is also the objective of this study.
Research Questions
Within the scope of the research, the answers of the following questions were sought: 1. How
would you define the events in Khojaly? 2. When was the first time you heard about the Khojaly
Genocide? 3. Which events and experiences originated your awaress regarding the Khojaly genocide?
4. Do you believe that an international awereness has been raised adequately about the Khojaly
Genocide? 5. Do you think that are there adequate lobbying by Turkey and Azerbaijan about Khojaly
Genocide? 6. What should be done at the social and institutional level to raise awareness about the
Khojaly Genocide? 7. Did you work to announce this incident internationally individually or as a group
after you have been informed about the Khojaly Genocide?.
Methodology
The research population is made up of social media users who follow the researcher at their
social media accounts. With the Convenience Sampling method, a Structured Questionnaire was sent to
the followers of different social sections of the researcher's own social media accounts. There were 198
people who accepted and answered the questionnaire. Structured Interview is used as data collection
method in the research. As it is well known, the interview method is used in both quantitative and
qualitative research. In the structured interview method, the previously prepared questions are asked to
the participants and their answers are recorded. In accordance with the subject of the research, 7
questions that were prepared beforehand are directed to the people who accept the interview. The data
obtained as a result of these interviews are primary data because people are directly asked about their
views on the Khojaly Genocide.In this study, Content Analysis is used on the texts that are obtained as
a result of the structured interviews with the help of NVivo 12 Package Program. Comments are made
as a result of the frequency distributions and concept maps obtained.
Results and Conclusions
The main findings of the study are as follows: More than half of the participants (51%) consider
the event as genocide. As the average age of the interviewees is young, it is also among the findings that
they learned the event especially after 2000. An overwhelming majority (approximately 89%) of the
interviewees think that not enough awareness is raised internationaly concerning the Khojaly Genocide.
There is a strong impression that efforts of Turkey and Azerbaijan are not enough for international
lobbying. In the framework of the study, it is found out that more needs to be done to raise awareness
about the Genocide both in public opinion of Azerbaijan and Turkey as well as international public

Hocalı Soykırımı İle İlgili Türk Kamuoyunun Görüşleri Üzerine Bir Araştırma - A Research On The Views Of The Turkish Public About The Hocalı
Genocide
Esma ÖZDAŞLI
459
opinion. Particularly, it is emphasized by the participants that foreign media channels should be used
more effectively and more broadcasts should be made in foreign languages. In this study, which was
carried out in order to determine the perception of the Turkish public of the Khojaly Genocide, a
determination has been made that a more effective policy should be followed to introduce the issue to
the international community. Participants has made remarks that Turkey and Azerbaijan should follow
a common policy to raise the awareness about the issue. They have also emphasized the importance of
broadcasts in foreign languages and using social media channels more effectively.

Mehmet Akif Ersoy İktisadi ve İdari Bilimler Fakültesi Dergisi - Mehmet Akif Ersoy University Journal of Economics and Administrative Sciences Faculty
Cilt7 Sayı:2 s.457-472 Volume:7 Issue:2 p.457-472
Temmuz 2020 July
460
1. GİRİŞ
Kamuoyu kavramını genel anlamda, belirli bir dönem itibariyle, belirli sorunlarla ilgili toplum
kesimlerinin sahip oldukları kanaat olarak tanımlamak mümkündür. Bu kanaatin ne kadar etkin olarak
duyurulduğu da önemli bir diğer konudur (Kapani, 1983: 235). Kamuoyu oluşturma sürecinin, karar
vericilerin karar yönünün tespit edilmesinde büyük önem arz ettiği, günümüzde kamuoyunun
kendiliğinden oluşmadığını da belirtmek gerekmektedir. Kamuoyunun oluşturulmasında birinci önem
arz eden nokta, bir konu veya sorun ile ilgili olarak o konu ya da sorun hakkında toplumun
bilgilendirilmesi ya da haberdar edilmesi hususudur (Atabek, 2002: 235).
Bir olgu ya da olay ile ilgili olarak olay ya da olgudan etkilenen toplum kesimlerinin öncelikle
bu olay ya da olguları sorun olarak değerlendirmesi ve bu konuda bir ortak görüşün oluşması söz
konusudur. Oluşan bu görüş neticesinde ilgili toplum kesiminin belirgin bir tutuma sahip olması ve bu
tutum doğrultusunda davranışlar geliştirmesi gerekmektedir. Bu olay ya da olgu ile ilgili kamuoyunun
oluşmasında olumlu ya da olumsuz tepkiler gösterme eğilimi olarak tanımlanabilecek tutumlar büyük
önem arz etmektedir. Olay ve olgu ile ilgili olarak toplum kesiminin elde ettiği bilgiler; sevgi, öfke,
nefret vb. duyguları ve davranışsal tepkileri tutumlarının temel unsurlarıdır. Sahip olunan tutumlar
toplum kesimindeki bireyler tarafından sözlü olarak ifade edilmeye başladığında o toplum kesiminin
kanaatleri ortaya çıkmış olmaktadır (Yüksel, 2007: 574).
Sadece Azerbaycan tarihinin değil, insanlık tarihinin en kanlı hadiseleriniden biri olan Hocalı
Soykırımı münferit bir olay değil, aksine Ermenilerin yaklaşık olarak 200 yıldır devam eden “denizden
denize Büyük Ermenistan” hayallerinin en kanlı parçasıdır (Özdaşlı, 2015: 13). 25-26 Şubat 1992
tarihinde, Ermeni silahlı kuvvetleri ve Rus 366. motorize gücünün, 10 bin nüfuslu Hocalı kasabasına
gerçekleştirdiği saldırıda; 83 çocuk, 106 kadın ve 70’den fazla yaşlı dahil olmak üzere toplam 613 kişi
öldürülmüş, 487 kişi ise ağır yaralanmıştır. İnsanlık dışı işkence yöntemleriyle öldürülen bu insanların
dışında 1275 kişi rehin alınmış, akibeti hala bilinmeyen 150’ye yakın kişi de kaybolmuştur. (Bagırov,
2017). Katliam sırasında 7 ailenin bütün fertleri öldürülmüş, 27 ailenin ise sadece bir ferdi ayakta
kalabilmiş, 230 ailede anne veya baba öldürülmüştür. Katliamdan kaçmaya çalışan 200 kişi Gargar
çayını geçmiş, soğuğun etkisi ile ayakları donmuştur. Yapılan tüm müdahalelere rağmen bu kişilerin
ayakları kesilmiştir (Asker, 2017). Bunlar resmi rakamlardır. Tanıkların, gazetecilerin ve hatta bazı
Ermenilerin verdikleri bilgilere göre katliam günü 1300’den fazla insan hayatını kaybetmiştir (Asker,
2017).
Uluslararası hukuk açısından en büyük insanlık suçu olarak kabul edilen “soykırım”ı tanımlayan
1948 tarihli Birleşmiş Milletler Soykırımın Önlenmesi ve Cezalandırılması Sözleşmesi’nin her
maddesine göre Hocalı’da yaşananlar bir “soykırım”dır. Ancak Batılı ülkeler başta olmak üzere
dünyanın görmezden geldiği bu olay, Türk Dünyası’nda hatta Türkiye’de dahi tam olarak
bilinmemektedir. Bu çalışma, Hocalı Soykırımı ile ilgili olarak araştırma örneklemi nispetinde Türk
kamuoyunun algısının ne yönde olduğunun tespit edilebilmesi için yapılmıştır.

Hocalı Soykırımı İle İlgili Türk Kamuoyunun Görüşleri Üzerine Bir Araştırma - A Research On The Views Of The Turkish Public About The Hocalı
Genocide
Esma ÖZDAŞLI
461
2. HOCALI SOYKIRIMI: TARİHSEL ARKAPLAN VE TEMEL
NEDENLER
Hocalı’nın işgali, daha önce de ifade edildiği üzere münferit bir olay değil, Ermenilerin 19.
yüzyılın ortalarından itibaren Rusya’nın desteğiyle Azerbaycan topraklarına yönelik sürdürdüğü
mütecaviz stratejilerinin bir devamıdır. Bu bakımdan, Hocalı’yı anlayabilmek için öncelikle Hocalı’nın
da bir parçası olduğu Dağlık (Yukarı) Karabağ neresidir? Ruslar açısından önemi nedir? Ne şekilde işgal
edilmiştir? ve Azerbaycan’ın bölünmüşlüğü sorunu nasıl ortaya çıkmıştır? gibi konuların bilinmesi
gerekmektedir.
Karabağ, Azerbaycan’ın Kür ve Aras ırmakları ile günümüzde Ermenistan topraklarında
bulunan Gökçe (Sevan) Gölü arasındaki dağlık bölge ile bu bölgeye bağlı ovalardan oluşmaktadır.
Dağlık Karabağ yüzölçümü 18000 km2 olan Karabağ’ın 4392 km2’lik kısmını oluşturmaktadır (Aslanlı,
2001: 393- 384). Azerbaycan’ın bölünmüşlüğü ve dolayısıyla Karabağ sorununun temelini, Rusya ile
İran (Kaçar) arasında 18. yüzyılın başlarından itibaren yaşanmaya başlanan Kafkasya hakimiyet
mücadelesi oluşturmaktadır. 1803-1813 arasında yapılan Rus-İran savaşları neticesinde Karabağ’a bağlı
Gülistan köyünde imzalanan Gülistan Antlaşması ile Karabağ, Gence, Şeki, Bakü, Derbend, Kuba ve
Taliş hanlıkları Rusya, Güney Azerbaycan hanlıkları ise İran hâkimiyetine bırakılmıştır (Buniyatov,
1991: 320). Bu anlaşma, Türk Kafkası’nın büyük bir kısmının Rusya tarafından işgalinin resmi
belgesidir ( Mehmetov, 2009: 484). 1826’da başlayan ve İran’ın yenilgisiyle sonuçlanan ikinci Rus-
Kaçar savaşından sonra 18 Şubat 1828’de imzalanan Türkmençay Anlaşması ile Azerbaycan’ın
günümüze kadar gelen bölünmüşlüğü sorunu ortaya çıkmış, Gülistan Anlaşması’na ek olarak Erivan
(İrivan) ve Nahçivan Hanlıkları da Rusya’ya verilmiştir (Mehmetov, 2009: 487). Söz konusu
anlaşmalara göre Rusya tarafından kalan Kuzey Azerbaycan topraklarının bir kısmı Ermenilere verilmiş,
(Dilican, Gökçe Gölü, Zengezur-Katar mıntıkası) 114 bin km2 ülke toprağı Sovyet yönetimince ise 86
bin km2’ye düşürülmüştür. Bunun yanı sıra Ermenilerin zorlaması ile Azerbaycan’ın doğal sınırları
içinde yer alan Nahçivan’a muhtar cumhuriyet, Dağlık Karabağ’a ise muhtar vilayet statüsü verilerek
adım adım bu bölgelerin Azerbaycan ile bağı koparılmaya çalışılmıştır. SSCB’nin yıkılma sürecine
girmesi ile birlikte Ermeniler Dağlık Karabağ’ın muhtar statüsünden yararlanarak bölgeyi kademeli
olarak ele geçirmiştir (Alkan,2006: 138). Ermenilerin, Rusları Kafkasya hakimiyetine götürecek ne
denli isabetli bir araç oldukları 1827’de Revan Ruslar tarafından ele geçirildiğinde Rus General
Paskeviç’in Çar’a gönderdiği raporda net olarak görülmektedir: “…Bu sırada İrevan vilayetinde 10 bini
Müslüman-Türk, 3 bini Ermeni olmak üzere 13 bin insan yaşıyordu. Bunlardan Ermeniler kalenin kuzey
kapısını gizlice açtılar ve 1 Ekim’de Rusların şehre girmesine yardım ettiler.” (Attar, 2013: 52)
Rusya’nın Kafkasya’ya yönelmesi ile tüm bölge halkları için uzun yıllar sürecek zorlu bir nüfus
hareketliliği başlamıştır. 1828 yılında Türkmençay Anlaşması’nın 15. maddesine göre; Kaçar yönetimi
altında yaşayan (büyük ölçüde günümüzdeki İran toprakları) 50.000, 1829 Osmanlı-Rus Edirne
Anlaşması uyarınca ise Osmanlı topraklarında yaşayan 84.000 Ermeni’nin Karabağ başta olmak üzere
Azerbaycan topraklarına göç ettirilmesine karar verilmiştir. Gerek zorunlu gerekse gönüllü olarak 20.

Mehmet Akif Ersoy İktisadi ve İdari Bilimler Fakültesi Dergisi - Mehmet Akif Ersoy University Journal of Economics and Administrative Sciences Faculty
Cilt7 Sayı:2 s.457-472 Volume:7 Issue:2 p.457-472
Temmuz 2020 July
462
yy.’nin başlarına kadar devam bu nüfus hareketleri neticesinde yaklaşık olarak 1 milyon 300 bin Ermeni
Anadolu’dan ve İran’dan Kafkasya’ya göç etmiştir (Yeşilot, 2008: 192). Dolayısıyla, günümüzde
tarihsel toprak iddialarında bulunarak Dağlık Karabağ’ın kendilerine ait olduğunu iddia eden
Ermenilerin büyük bir kısmının bölgeye gelişi 19. yüzyılın ortalarına tekabül etmektedir. Sonuç olarak,
Hocalı gibi bir “soykırımın” da yaşandığı Karabağ sorunun temeli, Rusların teşvikiyle Ermenilerin
Azerbaycan topraklarını işgali ile başlamıştır.
Azerbaycan topraklarını ele geçiren Rusya, uzun yıllar sürdürdüğü Ermeni göç ve iskan
politikası ile Türk Kafkasyası ile Anadolu ve İran’ın kesiştiği bölgede tampon bir Ermeni eyaleti
oluşturularak, bölge denetimini elinde tutmayı hedeflenmiştir (Mehmetov, 2009: 487). Çarlık Rusya’nın
ve SSCB’nin Kafkasya ve devamında Türkistan’a nüfuz etme politikasının temelini, Anadolu Türkleri
ile Türkistan arasındaki bağlantıyı koparma planı oluşturmaktadır. Dolayısıyla Karabağ’ın işgali,
Anadolu ile Türkistan arasındaki bu organik bağı ortadan kaldırarak, Aleksandr Dugin’in ifadesi ile
Türkiye’yi kıta içi mekanlardan yani Türk dünyasından koparan bir işleve sahip olacaktır (Dugin, 2005:
78). Karabağ’ın Ermenilerce işgal edilmesi ile Nahçivan ile Azerbaycan arasına Ermeniler sokulmuş,
böylece Azerbaycan’ın önemli bir bölgesi ile bağlantısı kesilmiş, dolayısıyla Ermenistan Türkiye ile
Türk Dünyası arasına adeta bir hançer gibi saplanmıştır (Özdaşlı ve Kodaman, 2016: 77). Ermenistan,
sadece Türkiye ve Azerbaycan’dan değil Gürcistan’ın Cehavati bölgesinden de asılsız toprak
taleplerinde bulunarak tüm bölge için bir huzursuzluk kaynağı haline gelmiştir. Birçok yazarın üzerinde
hem fikir olduğu üzere, dünyada büyük güçler Rusya ve ABD’nin aynı anda desteklediği tek ülke
olması, bu nedenle de Dağlık Karabağ işgalini BM dahil bir çok uluslararası örgütün aldığı kararlara
rağmen sürdürmesini kolaylaştırmaktadır.
2.1. Ermeniler Hocalı’yı Neden Hedef Aldı?
Hocalı’nın Ermenilerce işgal edilmesinin nedenleri arasında, Dağlık Karabağ’ın tek hava
limanına sahip olmasının yanı sıra bulunduğu konum itibariyle önemli demiryolu ve karayolu
bağlantılarının üzerinde olması ve Dağlık Karabağ’ın merkezi Hankendi’ye (Ermeniler işgalden sonra
buraya Stapanakert adını vermişlerdir) 11 km mesafede olması sayılabilir. Dağlık Karabağ’ın merkezi
olan Handikendi’nin elektrik hattı, Bakü-Handikendi demiryolu hattı ve Bakü-Şuşa karayolu da
Hocalı’dan geçmektedir (Asker, 2017). Bununla birlikte Ermeniler, Hocalı’da bir soykırım
gerçekleştirerek, ileride yapacakları saldırılarılara yönelik Azerbaycan Türkleri üzerinde psikolojik bir
baskı oluşturmayı amaçlamış ve bölgenin asıl sahiplerinin yani Türklerin bu korku ile bölgeyi terk
etmelerini sağlamaya çalışmışlardır. Bu yüzden de Hocalı’da hamile kadınların karınlarının deşilmesi,
çocukların derilerinin yüzülmesi gibi en insanlık dışı uygulamalara imza atmışlardır. Bu açıdan, 1991-
94 yılları arasında Karabağ’da Ermeni silahlı kuvvetlerine komuta eden Ermenistan’ın eski
Cumhurbaşkanı Serj Sarkisyan’ın “Hocalı’ya kadar Azerbaycanlılar bizim sivilleri öldürmeyeceğimizi

Hocalı Soykırımı İle İlgili Türk Kamuoyunun Görüşleri Üzerine Bir Araştırma - A Research On The Views Of The Turkish Public About The Hocalı
Genocide
Esma ÖZDAŞLI
463
düşündü. Fakat Hocalı’da biz bunu yıktık” ifadeleri Ermenilerin bu stratejilerinin anlaşılması açısından
önemlidir.1
Aslında, Ermeniler Hocalı’ya gerçekleştirecekleri saldırının hazırlıklarını uzun süre yapmış,
katliam bir anlamda geliyorum demiştir. Öncelikle, Asker’in de ifade ettiği gibi, Azerbaycan yetkilileri
Hocalı’yı savunan görevlilerin tüm ikazlarına rağmen bu denli önemli bir mıntıkanın savunulmasına
gereken hassasiyeti gösterememişlerdir. Ermeniler, kasabayı yavaş yavaş ve aslında pek de gizli
olmayan bir yöntemle kontrol altına almışlardır. Son bir yıldır abluka altında tutulduğu için tek ulaşımın
havadan yapıldığı Hocalı’ya son helikopter de 13 Şubat 1992’de Hocalı’ya yemek, ilaç ve yakıt
getirmiştir. Ermenilerin elektriklerini de kestiği bölgenin dünya ile irtibatı kesilmiş ve Hocalı bir
anlamda Ermenilerce katliama hazırlanmıştır. Hocalı’nın askeri anlamda savunma durumuna
baktığımızda; sadece 200-250 otamatik silah, 1 adet top, 2 “Alazan” roketatar ve 1 zırhlı araçla
donatılmış 160 kişilik bir savunma birliği olduğu görülmektedir (Asker, 2017). Buna karşın Moskova
tarafından bizzat silahlandırılan Ermeni güçlerine bölgede konuşlu 366. Motorize Rus tugayının da
katılması ile Ermeniler askeri anlamda üstünlüğü ele geçirmişlerdir.
3. ARAŞTIRMANIN METODOLOJİSİ
3.1. Dipnotlar ve Son Notlar
Çalışmanın bu kısmında yukarıda genel hatlarıyla anlatılan Hocalı Soykırımı ile ilgili olarak
farklı toplum kesimlerin temel tutumları ve görüşlerini analiz eden araştırmanın amacı, evren ve
örneklemi, yöntemi ve bulguları sunulmaktadır. Araştırma 15 Şubat 2018 tarihinde başlayıp 15 Mart
2018 tarihinde sonlandırılmıştır.
3.2. Araştırmanın Amacı
Hocalı Soykırımına yönelik farklı toplum kesimlerinin tutumlarını ve düşüncelerini ortaya
koymaktır. Bu amaç doğrultusunda özellikle Azerbaycan Devleti’ne Hocalı Soykırımı ile ilgili kamuoyu
oluşturma sürecine yönelik bilgiler sunulacaktır.
3.3. Araştırmanın Evreni ve Örneklemi
Evren araştırmacının sosyal medya hesaplarında araştırmacıyı takip eden takipçilerden
oluşmuştur. Kolayda Örnekleme yöntemiyle araştırmacının kendi sosyal medya hesaplarında yer alan
farklı toplum kesimlerinden takipçilerine Yapılandırılmış Soru Formu gönderilmiştir. Soru Formunu
cevaplamayı kabul eden ve dönüş yapan 198 kişi olmuştur.
1Sarkisyan’ın uluslararası hukuku, insani değerleri yok sayan söylemleri bununla da sınırlı değildir.
Sarkisyan 17 Mayıs 2001’de yaptığı başka bir açıklamada, “İşgal ettiğimiz topraklar var. Bunda
utanılacak bir şey yok. Güvenliğimiz gereği yaptık. Biz bunu 1992’de de söylüyorduk, şimdi de
söylüyoruz” şeklinde ifadeler kullanırken, cumhurbaşkanı sıfatıyla 2011’de üniversite öğrencilerine
yaptığı bir başka konuşmada “Karabağ’ı bizim neslimiz aldı, Ağrı’yı da size bırakıyoruz” sözlerini
kullanabilmiştir. Bu durum Ermenistan’ın mütecaviz eylem ve söylemlerinin adeta bir devlet politikası
haline geldiğinin de kanıtıdır. Bu haliyle Ermenistan, üyesi olduğu Birleşmiş Milletler ve AGİT’in en
temel normları sayılan “sınırların değişmezliği” ve “ülkelerin toprak bütünlüklerine saygı” ilkelerini de
açıkça ihlal emektedir.

Mehmet Akif Ersoy İktisadi ve İdari Bilimler Fakültesi Dergisi - Mehmet Akif Ersoy University Journal of Economics and Administrative Sciences Faculty
Cilt7 Sayı:2 s.457-472 Volume:7 Issue:2 p.457-472
Temmuz 2020 July
464
3.4. Araştırmanın Yöntemi
Araştırmada veri toplama yöntemi olarak Yapılandırılmış Mülakat kullanılmıştır. Bilindiği
üzere mülakat yöntemi hem nicel hem de nitel araştırmalarda kullanılmaktadır. Yapılandırılmış mülakat
yönteminde önceden hazırlanmış sorular görüşmecilere iletilmekte ve verdikleri cevaplar kayıt altına
alınmaktadır (Arslan ve Özen, 2018: 129). Araştırmanın konusu doğrultusunda önceden hazırlanmış
olan 7 adet soru görüşmeyi kabul eden kişilere yöneltilmiştir. Bu görüşmeler neticesinde elde edilen
veriler birincil verilerdir çünkü doğrudan kişilere Hocalı Soykırımı ile ilgili görüşleri sorulmuştur.
Yapılandırılmış görüşmeler neticesinde elde edilen metinler üzerinde İçerik Analizi
gerçekleştirilmiştir. İçerik analizinde bir dizi usul kullanılarak görüşmeler neticesinde elde edilen
metinlerden sonuçlar çıkarılmıştır (Weber, 1990: 9). Metinler içerisinde bazı temalara (konulara) yani
birtakım kelimelere veya kelime anlamlarına odaklanarak kodlama yapılıp, bu kodlamalar neticesinde;
Temasal Analiz, Semantik Analiz veya Ağ Analizi olmak üzere üç çeşit içerik analizinden biri
kullanılabilir (Leblebici ve Kılıç, t.y: 7). Bu araştırmanın verilerinin analiz etmede kullanılan Temasal
Analiz, el yordamıyla yapılabildiği gibi, metinler Paket Programlara (örneğin NVivo) yüklenerek
kelimeleri keşfetmek, frekans dağılımlarını görmek ve kavram haritalarını çıkarmak şeklinde de
yapılabilmektedir. Sorularda yer alan ve ima edilen kavramlar ve kategoriler gözlemlenir ve
gözlemlenen ilişkiler sayesinde yorumlara gidilebilmektedir (Bazeley ve Jackson, 2013:249). Bu
çalışmada NVivo 12 Paket Programı yardımıyla İçerik Analizi (Temasal Analiz) yapılmıştır. Elde edilen
frekans dağılımları ve kavram haritaları sayesinde yorumlara gidilmiştir.
3.5. Araştırmanın Bulguları
Araştırmaya katılmayı kabul edenlerin 94 (%47,5)’ü kadın, 104 (%55,5)’ü erkektir.
Katılanlardan; 47 (%23,7)’si üniversite öğrencisi, 32 (%16,1) akademisyen, 37 (%18,6)’si devlet
memuru, 28 (%14,10)’i işçi, 54 (%27,20)’ü serbest meslek erbabı durumundadır. 78 (%39,30)’i
Ortaöğretim mezunu, 65 (%32,80)’si Lisans mezunu ve 55 (%27,7)’i Lisansüstü eğitim düzeyine sahip
olduğunu beyan etmiştir.
Araştırmaya katılanların yapılandırılmış mülakatta kendilerine iletilen 7 soru ile ilgili olarak
verdikleri cevaplardan oluşan metinlere paket program vasıtasıyla Temasal Analiz gerçekleştirilmiştir.
Öncelikle oluşan metinlerde aynı anlama gelen birbirine benzeyen ve bir grup altında toplanabilecek
olan kelimeler aynı kelime veya kelime grubu içerisinde toplanmıştır. Bu kelime ya da kelime
gruplarının frekans dağılımları ve kavram haritaları her bir soru için aşağıdaki gibi ortaya çıkmıştır:
Soru 1.: Size göre Hocalı’da yaşanan olaylar nasıl tanımlanmalıdır?
Araştırmaya katılanların bu soruya verdikleri cevaplardan oluşan metinler de yaşanan olayı
tanımlamayla ilgili kelime ve kelime grupları 82 kez tekrarlanmıştır. Bu kelime ve kelime gruplarının
frekans ve yüzdeleri şöyledir: Soykırım 42 (%51,21), Katliam 24 (%29,26), Vahşet 9 (%10,97), İnsanlık
Suçu 6 (%7,31), Etnik Temizlik 3 (%3,65). Katılımcıların 198 kişi olmasına rağmen metinler içerisinde
Hocalı Soykırımı ile ilgili sadece 82 kez tam bir kavramsallaştırma olması ilginç bir sonuçtur.

Hocalı Soykırımı İle İlgili Türk Kamuoyunun Görüşleri Üzerine Bir Araştırma - A Research On The Views Of The Turkish Public About The Hocalı
Genocide
Esma ÖZDAŞLI
465
Şekil 1. Hocalı’da Yaşananların Tanımlanmasıyla İlgili Kavram Haritası
Soru 2.: Hocalı Soykırımı’ndan ilk kez ne zaman haberdar oldunuz?
Verilen cevaplar itibariyle belirli bir zaman süreci ifade edebilecek kelime ve kelime grupları
açısından toplam 195 frekans oluşmuştur yani, bu kelime ya da kelime grupları 195 kez tekrarlanmıştır.
Bu kelime ve kelime grupları ve tekrarlanma sayıları ve yüzdeleri şöyledir:
2000 yılı sonrası 77 (% 39,48), 1992-2000 arası 42 (%22,05), Ortaöğretim 24 (%12,30),
Çocukluk ve ailede 23 (%11,79), Üniversite 14 (7,17), İlkokul 9 (%4,61) ve yeni duyanlar 5 (%2,56).
Şekil 1.’deki kavram haritasına bakıldığında soykırım yılı olan 1992’nin ağırlık kazandığı görülmekle
birlikte esasen 2000’li yıllardan sonra haberdar olanların sayısı fazladır. Bunun temel nedenlerinden
birinin katılımcılar içerisinde gençlerin sayıca fazla olması olduğu gibi 2000’li yıllardan sonra
Azerbaycan Devleti’nin Hocalı Soykırımı ile ilgili kamuoyu oluşturma çalışmalarına daha fazla
yoğunlaşması olabilir.
Şekil 2. Hocalı Soykırımından Ne Zaman Haberdar Olunduğu İle İlgili Kavram Haritası

Mehmet Akif Ersoy İktisadi ve İdari Bilimler Fakültesi Dergisi - Mehmet Akif Ersoy University Journal of Economics and Administrative Sciences Faculty
Cilt7 Sayı:2 s.457-472 Volume:7 Issue:2 p.457-472
Temmuz 2020 July
466
Soru 3.: Hocalı soykırımına ilişkin farkındalığınız hangi olaylar ve deneyimler sayesinde
oluştu?
Araştırmaya katılanların bu soruya verdikleri cevaplardan oluşan metinler de Hocalı
soykırımıyla ilgili farkındalığı olanların bu farkındalıklarının oluşumunda etkili olabilecek unsurlarla
ilgili kelime ve kelime grupları 152 kez tekrarlanmıştır. Bu kelime ve kelime grupları ve tekrarlanma
sayıları ve yüzdeleri şöyledir:
Konferans 23 (%15,13), TV 21 (13,81), Öğretmenler 16 (%10,52), Üniversite 16 (%10,52),
Sosyal Medya 14 (%9,21), Ülkü Ocakları 11 (%7,23), Kitap 10 (%6,57), Bireysel Araştırma 9 (%5,92),
İnternet 8 (%5,26), Tanıkları İzleme 8 (%5,26), Arkadaştan Duyma 5 (%3,28), Gazete 4 (%2,63) ve
Dergi 3 (%1,97).
Şekil 3. Hocalı Soykırımıyla İlgili Farkındalığın Nasıl Oluştuğu İle İlgili Kavram Haritası
Soru 4.: Hocalı Soykırımı’nın uluslararası alanda yeterince tanıtıldığına inanıyor
musunuz?
Görüşme formunu dolduran katılımcıların dördüncü soru ile ilgili cevaplarından oluşan
metinlerde Hocalı Soykırımının uluslararası alanda yeterince tanıtıldığına dair düşüncelerini ortaya
koyabilecekleri kelime veya kelime grupları 221 kez tekrarlanmıştır. İlgili kelime ve kelime grupları ve
tekrarlanma sayıları ve yüzdeleri şöyledir:
Hayır 163 (%73,7), İnanmıyorum 34 (%15,38), Yeterli Değil 7 (%3,16), Maalesef 6 (%2,26),
Yeterli (%2,26), Düşünmüyorum 5 (%2,26). Metinlerde tekrar okunduğunda katılımcıların neredeyse
tamamının etkili bir uluslararası tanıtımın yapılamadığı konusunda hem fikir olduğu görülmektedir.
Diğer taraftan yeterince tanıtılmaktadır diyen katılımcılar da tanıtımın etkili olmamasını ya dünyanın
diğer millet ve devletlerinin önemsememesine ya da Ermeni Diasporasının etkinliğine bağladığı
görülmektedir.

Hocalı Soykırımı İle İlgili Türk Kamuoyunun Görüşleri Üzerine Bir Araştırma - A Research On The Views Of The Turkish Public About The Hocalı
Genocide
Esma ÖZDAŞLI
467
Şekil 4. Hocalı Soykırımı’nın Uluslararası Alanda Yeterince Tanıtılma Durumuna İnanma Kavram
Haritası
Soru 5.: Sizce Türkiye ve Azerbaycan Hocalı Soykırımı’nı tanıtmak için yeterince lobi
faaliyeti yapıyorlar mı?
Hocalı Soykırımı ile ilgili Türkiye ve Azerbaycan’ın Lobi faaliyetlerinin yeterli olup olmadığı
ile ilgili kelime veya kelime grupları 221 kez tekrarlanmıştır. İlgili kelime ve kelime grupları ve
tekrarlanma sayıları ve yüzdeleri şöyledir:
Hayır 110 (%67,48), Kısmen 35 (%17,24), Evet 13 (%6,40), Yeterli 13 (%6,40) ve Bilgim Yok
4 (%1,97). Katılımcıların çoğunluğu lobi faaliyetlerinin yeterli olduğunu düşünmüyor. Yeterli olduğunu
düşünen katılımcılarda genellikle diğer ülkelerin görmezden geldiğini veya Ermeni Diasporasının güçlü
ve daha etkili olduğunu dolayısıyla Türkiye ve Azerbaycan’ın lobi faaliyetlerinin etkisizleştiğini
düşünüyorlar.
Şekil 5. Azerbaycan ve Türkiye’nin Hocalı Soykırımı İle İlgili Lobi Faaliyetleri Yapma Durumuyla
İlgili Kavram Haritası
Soru 6.: Hocalı Soykırımı’ndan haberdar olduktan sonra bu olayı uluslararası alanda
duyurmak için bireysel veya grup olarak herhangi bir çalışma yaptınız mı?
Hocalı Soykırımı ile ilgili katılımcıların bireysel veya grup olarak yapmış oldukları faaliyetler
ile ilgili kelime veya kelime grupları 221 kez tekrarlanmıştır. İlgili kelime ve kelime grupları ve
tekrarlanma sayıları ve yüzdeleri şöyledir:

Mehmet Akif Ersoy İktisadi ve İdari Bilimler Fakültesi Dergisi - Mehmet Akif Ersoy University Journal of Economics and Administrative Sciences Faculty
Cilt7 Sayı:2 s.457-472 Volume:7 Issue:2 p.457-472
Temmuz 2020 July
468
Hayır 97 (%48,01), Evet 43 (%21,28), Sosyal Medya 33 (%16,33), Bireysel 8 (%3,96),
Üniversite 8 (%3,96), Konferans 7 (%3,46) ve Uluslararası 6 (%2,97). Ortaya çıkan frekans ve yüzde
dağılımları katılımcıların yarıya yakınının Hocalı Soykırımı ile ilgili bir faaliyette bulunmadığını
göstermektedir. Gerçekleştirilen faaliyetlerle ilgili olarak da en çok yapılanın sosyal medya paylaşımları
olduğu dikkati çekmektedir. Bu faaliyetlerde ise uluslararası düzey sayısı çok az görünmektedir.
Şekil 6. Hocalı Soykırımı İçin Bireysel ve Grup Olarak Yapılan Faaliyetlerle İlgili Kavram Haritası
Soru 7.: Hocalı Soykırımına farkındalığı arttırmak için toplumsal ve kurumsal düzeyde
ne yapılmalıdır?
Hocalı Soykırımı ile ilgili olarak esasen millet ve devlet olarak neler yapılmasının farkındalığı
artırabileceği ile ilgili sorulan bu soruya verilen cevaplarla oluşan metinler üzerinde gerçekleştirilen
analiz neticesinde ilgili kelime veya kelime grupları 199 kez tekarlanmıştır. İlgili kelime ve kelime
grupları ve tekrarlanma sayıları ve yüzdeleri şöyledir:
Uluslararası Faaliyetler 38 (%19,08), Sosyal Medya 26 (%13,06), Konferanslar 26 (%13,06),
Medya 19 (%9,54), Üniversiteler 14 (%7,03), Lobicilik 12 (%6,03), Belgesel 11 (%5,52), Anma
Programları 9 (%4,52), Gündem 9 (%4,52), Okullar 8 (%4,02), Bilimsel Çalışma 6 (%3,01), Kamuoyu
6 (%3,01), Filmler 5 (%2,51), Kitap 5 (%2,51) ve Seminerler 5 (%2,51). Görüldüğü üzere kamuoyu
oluşturmanın yolları söylenmekle birlikte bu faaliyetlerin uluslararası düzeyde gerçekleştirilmesi
gerekliliği daha fazla vurgulanmış durumdadır.

Hocalı Soykırımı İle İlgili Türk Kamuoyunun Görüşleri Üzerine Bir Araştırma - A Research On The Views Of The Turkish Public About The Hocalı
Genocide
Esma ÖZDAŞLI
469
Şekil 7. Hocalı Soykırımı İle İlgili Farkındalığın Nasıl Artırılabileceği Düşünceleri İle İlgili Kavram
Haritası
4. SONUÇ VE DEĞERLENDİRMELER
İçerik Analizi sonucunda, örneklem dâhilinde kamuoyunda Hocalı Soykırımı ile ilgili olarak
bazı algılar ve tutumlar tespit edilmiştir. Bu çerçevede öncelikle katılımcıların önemli bir kısmının
Hocalı Soykırımı konusunda oldukça hassas oldukları söylenebilir. Bununla birlikte, genel bilgiler
dışında Hocalı’da yaşananların temel nedenleri hakkında bilgi düzeyinin oldukça sınırlı olduğunu
söylemek de mümkündür. Hocalı faciasının uluslararası topluma duyurulması noktasında toplumsal
bilincin oldukça düşük seviyelerde olduğu, konunun genel olarak olaya vakıf mecralarda dile getirildiği,
uluslararası kamuoyuna bu soykırımın duyurulması noktasında çok fazla girişimde bulunulmadığı da
çalışma kapsamında tespit edilmiştir. Ancak sayıca oldukça az olmakla birlikte, bazı katılımcıların
sosyal medya aracılığıyla konuyu uluslararası alanda tanıtmak için uğraştıklarını söylemek de
mümkündür. Katılımcıların yarısından fazlasının (%51) Hocalı’da yaşananları soykırım olarak
değerlendirmesi, örneklem bazında da olsa olaya yönelik bir “soykırım” algısının toplumda yerleşmeye
başladığını göstermektedir.
Sosyal medya kanallarının gelişmesi ve kullanıcı sayılarının artmasının ile Hocalı soykırımı
daha fazla kişi tarafından bilinir hale gelmiştir. Olayın duyulmasında özellikle yapılan etkinliklerin ve
medyanın oldukça etkili olduğu da ortaya çıkan sonuçlar arasındadır. Hocalı ile ilgili farkındalığın
özellikle lise ve üniversite yıllarında arttığı, bu noktada eğitim sürecinde düzenlenen toplantıların
oldukça etkili olduğu, öğrenci kulüplerinin ve bazı sivil toplum kuruluşlarının (Ülkü Ocakları vb.) da
Hocalı’da yaşananların kamuoyu tarafından duyulmasında önemli bir işlev gördüğü saptanmıştır. Konu
hakkında özellikle eğitim kurumlarında öğrencilerin bilinçlendirilmesi gerektiği, hatta yaş aralığına
uygun olarak çok daha erken dönemlerde; okuma parçaları, okul panoları, şarkılar gibi araçlarla
çocuklara olayın anlatılması gerektiği yönünde de görüşler mevcuttur. Mülakat yapılan katılımcılar
arasında sinema, dizi, belgesel ve tiyatro gibi etkinlikler aracılığıyla konunun dile getirilmesi gerektiğini

Mehmet Akif Ersoy İktisadi ve İdari Bilimler Fakültesi Dergisi - Mehmet Akif Ersoy University Journal of Economics and Administrative Sciences Faculty
Cilt7 Sayı:2 s.457-472 Volume:7 Issue:2 p.457-472
Temmuz 2020 July
470
vurgulayanların oranı da hayli yüksektir. Bununla birlikte, farklı dillerde yayınlar yapılarak dünya
kamuoyunun Hocalı’da yaşananlar hakkında bilgilendirilmesinin gerektiği de birçok katılımcı
tarafından dile getirilmiştir.
Herhangi bir konuda “kamuoyu” oluşturulmasında süreklilik, istikrar ve tekrarın ne denli önemli
olduğundan hareketle, konu ile ilgili faaliyetlerin tüm yılı kapsaması gerektiği, uluslararası toplumun
dikkatini çekmenin ancak bu şekilde mümkün olabileceği, sadece Şubat ayı yaklaşırken konunun
gündeme gelmesinin yeterli olmadığı da önemli sayıda katılımcı tarafından belirtilmiştir. Konunun
uluslararası hukuk çerçevesinde ele alınması gerektiği, bu çerçevede özellikle olayın faillerinin
günümüze kadar herhangi bir müeyyide ile karşılaşmamasının Türkiye ve Azerbaycan tarafından daha
yüksek sesle dile getirilmesi gerektiği de katılımcıların vurguladığı konular arasındadır. Kanımızda bu
vurgu, Hocalı’da yaşananların sadece Türk dünyasını değil tüm insanlığı ilgilendirdiği, böylesi bir sivil
katliamın göz ardı edilmesinin dünyanın farklı bölgelerinde bu tür gayriinsani girişimlerde bulunmak
isteyenleri teşvik edeceği gerçeği de dikkate alınarak yapılırsa, dünya kamuoyunun dikkatini çekmek
kolaylaşabilir. Çünkü uluslararası hukuk açısından en büyük insanlık suçu olarak kabul edilen soykırımı
gerçekleştirenlerin cezasız kalması etnik, dini ve kültürel birçok çatışmanın yaşandığı günümüzde bu
tür yeni faciaların yaşanma olasılığını artırabilir.
Bununla birlikte olayın faillerinin cezalandırmak bir yana, neredeyse ödüllendirilmeleri de
Hocalı Soykırımı’nı daha da hassas bir noktaya getirmektedir. İnsan Hakları İzleme Örgütü’nün, Dağlık
Karabağ Savaşı’ndan bu yana gerçekleştirilen en kapsamlı “sivil” katliam olarak nitelendirdiği bu
facianın yaşandığı dönemde Dağlık Karabağ’da Ermeni güçlerine komutanlık eden Serj Sarkisyan 2008-
2019 yılları arasında Ermenistan Cumhurbaşkanlığı yapmış ve tüm dünyada “kırmızı bültenle” aranması
gerekirken tabiri caizse “kırmızı halılarla” karşılanmıştır. Bu durumun özellikle dünyada çatışmaların
yoğun olarak yaşandığı bölgelerdeki taraflara verdiği mesaj oldukça tehlikelidir: Herhangi bir ülkenin
toprağını işgal edebilirsiniz, BM Güvenlik Konseyi’nin aldığı kararlara rağmen bu mütecaviz
tutumunuzu devam ettirebilirsiniz, hatta işgal ettiğiniz yerlerdeki insanları “soykırıma” tabi
tutabilirsiniz, bu soykırımın baş failleri üst düzey devlet görevlisi olabilir ve tüm dünya liderleri ile
hiçbir sıkıntı yaşamadan ilişki kurabilir. Bu bakımdan Hocalı Soykırımı ve benzeri hadiseler, sadece
olayın yaşandığı bölge barışını değil, tüm dünya barışını da etkilediği için uluslararası toplumun bu tür
hadiselere daha duyarlı olması beklenmektedir.
Katılımcıların önemli bir kısmı Hocalı Soykırımı’nın uluslararası alanda yeterince
tanıtılamadığı ve Türkiye ve Azerbaycan’ın bu konuda gerektiği kadar lobi faaliyeti yapamadığı algısına
sahiplerdir. Olaya ait farkındalığın artırılması için etkinliklerin, konferansların, anma programlarının
daha fazla yapılması ve sosyal medyanın özellikle uluslararası düzeyde daha etkin kullanılması yönünde
bir kanının ortaya çıktığı da tespit edilmiştir. Dolayısıyla Azerbaycan ve Türkiye’nin Hocalı Soykırımı
ile ilgili lobi faaliyetinin yeterli olmadığını düşünenler sayıca ağırlıklıdır. Ortak lobi çalışmalarını yeterli
gören katılımcıların cevapları neticesinde oluşan metinler ayrıntılı olarak okunduğunda ise, Batı
dünyasının olayı görmezden gelmesi ve Ermenistan diasporasının ekonomik ve siyasi gücü nedeniyle

Hocalı Soykırımı İle İlgili Türk Kamuoyunun Görüşleri Üzerine Bir Araştırma - A Research On The Views Of The Turkish Public About The Hocalı
Genocide
Esma ÖZDAŞLI
471
yapılan çalışmaların gölgede kaldığı yönünde de bir algının oluştuğu görülmüştür. Hatta bazı
katılımcılar, lobicilik faaliyetleri için boşuna zaman harcanmaması gerektiğini, bu olayın -etnik ve dini
nedenlerden dolayı- Batı’nın dikkatini çekmediğini, bu durumun da bu soykırımın uluslararası düzeyde
tanıtılmasını oldukça zorlaştırdığına inanmaktadırlar. Hocalı Soykırımı’nın tanıtılmasında yalnızda
devletlerarası resmi düzeyde yapılan girişimlerin yeterli olmadığı, hatta bundan daha da önemli olanın
uluslararası düzeyde kamu diplomasisinin daha etkin kullanılması olduğu yönünde de bir saptama
yapılmıştır.
Katılımcıların büyük bir çoğunluğunun Hocalı soykırımını özellikle 2000’li yıllardan sonra
öğrendikleri görülmüştür. Bu durum katılımcılar içerisinde gençlerin sayıca fazla olması ile ilgili olduğu
kadar, son yıllarda sosyal medya ağlarının gelişmesiyle de alakalıdır. Azerbaycan Devleti’nin 2000’li
yıllardan sonra Hocalı Soykırımı ile ilgili uluslararası düzeyde kamuoyu oluşturma çalışmalarına daha
fazla yoğunlaşmasının, bu olayın daha fazla duyulmasına katkı sağladığı yorumu da yapılabilir. Son
yıllarda sahip olduğu enerji gücünü dış politikada daha etkin bir baskı aracı olarak kullanan Azerbaycan,
özellikle Dağlık Karabağ sorununun çözümünde uluslararası destek alabilmek için “enerji
diplomasi”sini ciddi anlamda kullanmaktadır. Haydar Aliyev’in; “Petrol yalnızca bir meta değil,
Azerbaycan için özgürlüktür” sözleri ile özetlenebilecek bu politika, Hocalı Soykırımı’nın uluslararası
alanda daha fazla duyurulmasına büyük katkı sağlamaktadır. İlham Aliyev’in hemen hemen katıldığı
her toplantıda konuyu gündeme getirmesi de bu politikanın bir yansımasıdır.
KAYNAKLAR
ALKAN, A. (2006), Karadeniz Güvenliği, Ankara: Nobel Yayınları.
ARSLAN, Ş., ÖZEN, M. (2018), Nicel Araştırmada Veri Toplama Yöntemleri ve Veri Türleri,
Arslan, Ş. İçinde, Sosyal Bilimlerde Araştırma Yöntemleri, Konya: Eğitim Yayınevi.
ASKER, A. (2017), “Hocalı Soykırımı”, 21. Yüzyıl Türkiye Enstitüsü,
http://www.21yyte.org/tr/arastirma/azerbaycan/2012/02/24/6106/hocalisoykirimi#_ftn
ref5, adresinden alındı. Erişim tarihi: 10.05.2017.
ASLANLI, A. (2001), Tarihten Günümüze Karabağ Sorunu, Avrasya Dosyası, Cilt 7, Sayı 1,
ss. 593-430.
ATABEK, N. (2002), Kamuoyu, Medya ve Demokrasi, Kurgu Dergisi, Sayı 19, ss. 223-238.
ATTAR, A. (2013), 1830-1930 Yılları Arasında Çeşitli Nedenlerden Türkiye’ye Göç Etmiş
Azerbaycan Türkleri, Attar, A. ve Şimşir, S. içinde, Tarihten Günümüze Türkiye’de
Yaşayan Azerbaycan Türkleri, Ankara: Berikan Yayınevi.
BAGIROV, F. (2017), Hocalı Soykırımı’nın 25. Yıl Dönümü,
http://ankara.mfa.gov.az/files/file/Hocali_Soykirminin_25._Yildonumu.pdf adresinden
alındı. Erişim tarihi: 01.05.2017.

Mehmet Akif Ersoy İktisadi ve İdari Bilimler Fakültesi Dergisi - Mehmet Akif Ersoy University Journal of Economics and Administrative Sciences Faculty
Cilt7 Sayı:2 s.457-472 Volume:7 Issue:2 p.457-472
Temmuz 2020 July
472
BAZELEY, P. JACKSON, C. (2013), Qualitative Data Analysis With NVIVO, Second Edition,
Los Angeles: SAGE Publications.
BUNİYATOV, Z. M. (1991), “Azerbaycan”, İslam Ansiklopedisi, Türkiye Diyanet Vakfı
Yayınları, Cilt 4, ss. 322-324.
DUGİN, A. (2005), Rus Jeopolitiği, Çev. Vügar İmanov, İstanbul: Küre Yayınları.
KAPANİ, M. (1983), Politika Bilimine Giriş, Üçüncü Baskı. Ankara: Ankara Üniversitesi
Yayınları.
LEBLEBİCİ D. N. KILIÇ, M. (2004) İçerik Analizi, Ankara: Hacettepe Üniversitesi İ.İ.B.F.
Yayınları.
MEHMETOV, İ. (2009), Türk Kafkası’nda Siyasi ve Etnik Yapı, İstanbul: Ötüken.
ÖZDAŞLI, E. (2015), Son Türk Soykırımı: Hocalı, Dergi Ayrıntı, Cilt 3, Sayı 24, ss. 12-17.
ÖZDAŞLI, E. KODAMAN, T. (2016), Stratejik Ortaklık Kavramı Bağlamında İsrail
Azerbaycan İlişkileri, Ankara: Orion.
WEBER, P. W. (1990), Basic Content Analysis, 2nd Edition, California: Sage Publications.
YEŞİLOT, O. (2008), Türkmençay Anlaşması ve Sonuçları, A.Ü. Türkiyat Araştırmaları
Enstitüsü Dergisi, Sayı 36.
YÜKSEL, E. (2007), Kamuoyu Oluşturma” ve “Gündem Belirleme” Kavramları Nerede
Kesişmekte, Nerede Ayrılmaktadır?, Anadolu Üniversitesi Sosyal Bilimler Dergisi, Cilt
7, Sayı 1, ss. 571-586.

473
MEHMET AKİF ERSOY ÜNİVERSİTESİ
İKTİSADİ VE İDARİ BİLİMLER FAKÜLTESİ DERGİSİ
Mehmet Akif Ersoy University
Journal of Economics and Administrative Sciences Faculty
ISSN: 2149-1658 Cilt: 7 Sayı: 2 s.473-496
Volume: 7 Issue: 2 p.473-496
Temmuz 2020 July
CLASSIFICATION OF LOGISTICS-BASED TRANSPORTATION ACTIVITIES IN OECD
COUNTRIES AND SELECTED NON-MEMBER COUNTRIES THROUGH CLUSTER
ANALYSIS
KÜMELEME ANALİZİ İLE OECD ÜLKELERİ VE SEÇİLMİŞ ÜYE OLMAYAN
ÜLKELERİN LOJİSTİK FAALİYETLERİNE DAYALI TAŞIMACILIK
SINIFLANDIRILMASI
Gülsen Serap ÇEKEROL1
1. Doç. Dr., Eskişehir Teknik Üniversitesi, Ulaştırma
Meslek Yüksekokulu, [email protected], https://orcid.org/0000-0003-0391-2489
Makale Türü Article Type
Araştırma Makalesi Research Article
Başvuru Tarihi Application Date
15.04.2020 04.15.2020
Yayına Kabul Tarihi Admission Date
29.06.2020 06.29.2020
DOI
https://doi.org/10.30798/makuiibf.720768
Öz
Lojistik, ürünün yalnızca taşınması değil, ürünün üretiminden başlayarak
tüketiciye hatasız bir şekilde ulaştırılmasını sağlayan tüm faaliyetleri
kapsamaktadır. Lojistik, süreç temelli olup taşıma faaliyeti, bu sürecin
temelini oluşturmaktadır. Bu çalışmada, ülkelerin ekonomik gelişmişliğinde
önemli rol oynayan taşımacılık faaliyeti göstergeleri temel alınarak “İktisadi
İşbirliği ve Gelişme Teşkilatı” olan OECD ülkeleri ve seçilmiş üye olmayan
ülkelerin yer aldığı OECD istatistiklerinden yararlanılarak 47 ülke hiyerarşik
ve bulanık kümeleme yardımıyla sınıflandırılmaktır. Çalışmada taşımacılık
göstergeleri açısından OECD istatistiklerinde yer alan ülkelerin benzeştiği ve
farklılaşma gösterdiği kümeler bulunmuş ve Türkiye’nin ait olduğu küme
ortaya konulmuştur.
Anahtar Kelimeler: Lojistik, Taşımacılık, Kümeleme Analizi, OECD
İstatistikleri
Abstract
Logistics involves not only transportation of products, but also all the
procedures that make it possible to deliver products to customers without any
problems starting from production phase. Transport is the basic component of
logistics, which is a process-based activity. This study aims to classify 47
countries according to the statistics about OECD (Organization for Economic
Cooperation and Development) countries and selected non-member countries
through hierarchical clustering and fuzzy clustering in terms of transportation
activity indicators, which play an important role in countries' economic
development. The study found that there are clusters in which the countries
available in OECD statistics are similar or different in terms of transport
indicators. The cluster which Turkey belongs to was also presented within the
scope of the study.
Keywords: Logistics, Transportation, Cluster Analysis, OECD Statistics

Mehmet Akif Ersoy İktisadi ve İdari Bilimler Fakültesi Dergisi - Mehmet Akif Ersoy University Journal of Economics and Administrative Sciences Faculty
Cilt:7 Sayı:2 s.473-496 Volume:7 Issue:2 p.473-496
Temmuz 2020 July
474
GENİŞLETİLMİŞ ÖZET
Çalışmanın Amacı
Bu çalışmada, “İktisadi İşbirliği ve Gelişme Teşkilatı (OECD)” ülkeleri ve seçilmiş üye
olmayan ülkelerin, lojistik boyutlu taşımacılık göstergeleri açısından benzerlik gösteren ve farklılaşan
ülkeler olarak kümeleme analizi yöntemlerini kullanarak sınıflandırıp, Türkiye’nin bu sınıflandırma
içerisindeki yerini belirlemeyi amaçlanmıştır.
Araştırma Soruları
OECD ülkeleri ve seçilmiş üye olmayan ülkeler lojistik boyutuyla gerçekleştirdikleri taşımacılık
faaliyetlerine göre nasıl kümelenirler? Hangi kümeleme yöntemleri uygulanır? Uygulanan yöntemler
arasında, en uygun kümelemeyi hangi yöntem vermiştir? Oluşan kümelerdeki ülkeler hangileridir?
Türkiye hangi kümede yer almaktadır?
Literatür Araştırması
Çalışmada, taşımacılık konusuna ilişkin literatür incelendiğinde akademik değeri yüksek veri
tabanlarında taranan 120 dergi incelenmiştir. Türkiye’de taşımacılık konusunda 1986-2019 arası
toplamda yapılmış olan 126 tez taranmıştır. Araştırmanın yöntemi ile ilgili birçok kaynak olmasına
karşın, Türkiye’de bu konuda yapılmış çalışma bulunmamaktadır. Ancak yurtdışı uygulamalarına ilişkin
literatürde konunun farklı boyutları ele alınmış ve benzer uygulamalar çalışmanın içerisinde
özetlenmiştir.
Yöntem
OECD ülkeleri ve seçilmiş üye olmayan ülkelere ilişkin sınıflandırma için kümeleme analizi
yöntemleri kullanılmıştır. Analizde, yatay kesit verilerden yararlanılmış ve kümeleme analizinde,
hiyerarşik kümeleme ward yöntemi ve hiyerarşik olmayan kümelemede bulanık c-ortalamalar
yöntemleri uygulanmıştır.
Sonuç ve Değerlendirme
Araştırma sonucunda, OECD ülkeleri ve seçilmiş üye olmayan ülkelerin taşımacılık göstergeleri
doğrultusunda hiyerarşik kümeleme ward yöntemi ve bulanık kümeleme c-ortalamalar yöntemi
sonucunda elde edilen bulgular birbirinden farklılık göstermektedir. Bulanık c-ortalamalar yönteminin,
hiyerarşik ortalama ward yöntemine göre daha kararlı sonuçlar ürettiği gözlenmiştir. Türkiye’nin
içerisinde yer aldığı kümeler her iki yöntemde de benzerlik göstermekte olup ait olduğu küme yapıları
göz önüne alınarak lojistik stratejileri belirlenebilir. Araştırmada 7 göstergeye bağlı analiz yapılmıştır,
farklı temel ve alt göstergeler kullanılarak diğer kümeleme algoritmaları ile analiz genişletilebilir.
Beklenmeyen durumlara yönelik olarak ülkelerin kümelenmesi incelenebilir. Elde edilen bulgular olası
kriz durumlarına ilişkin strateji belirlenmesine yardımcı olacaktır.

Classification of Logistics-Based Transportation Activities in OECD Countries and Selected Non-Member Countries Through Cluster Analysis - Kümeleme
Analizi ile OECD Ülkeleri ve Seçilmiş Üye Olmayan Ülkelerin Lojistik Faaliyetlerine Dayalı Taşımacılık Sınıflandırılması
Gülsen Serap ÇEKEROL
475
1. INTRODUCTION
Due to increasing competition in global markets, countries have to minimize production costs
to increase their competitive power. Even if they are in the form of raw materials, semi-finished products
or finished products, or domestic or imported products, all modes of freight are a component of logistics
process until they reach customers through a supply chain. Therefore, high cost of logistics activities is
a variable that causes deceleration in economic growth of countries.
Logistics costs include expenses tracked by accountants through fiscal records and coordination
of related costs. Types of logistics costs are determined according to functionality during value creation
(Siepermann, 2003) and classified as follows: transportation costs, storage costs, inventory costs, order
processing costs, costs due to technology use, customer service costs and handling costs; transportation
costs being the highest.
Reducing transportation costs increases competitive power of a country and allows it to provide
more quality logistics services (Korinek and Sourdin, 2011: 5). A steady competitive power is an
advantage to transport a product from one place to another with the lowest cost. Considered as a simple
mathematical problem, logistics is the iceberg of logistics activities. Thus, logistics costs change
according to various variables such as weight and size of product, whether it is a dangerous product or
not, transportation destination and type of transportation. In addition, competitive power of a country in
global market depends on the following variables: geographical features, transportation policies,
transportation infrastructure and types of transportation.
Following the introduction section, the first section of the paper discusses the importance of
transportation in logistics and logistics activities. In the second section, OECD countries and selected
non-member countries are examined in terms of their transportation activities. The third section explains
Hierarchical and Fuzzy Clustering methods and the fourth one is about OECD countries and selected
non-member countries. In this section, logistics-based transportation activities in Turkey, which is the
founding member of OECD, was also examined in detail and compared to other countries. The last
section presents conclusions and suggestions derived from the study.
2. LITERATURE REVIEW
Transportation has been examined with an academic perspective in many fields of science due
to its significant role in economy. The literature review revealed that there are 120 journals focusing on
transportation (https://mjl.clarivate.com), and approximately 130.000 articles were published in 2019
(www.sciencedirect.com). In Turkish context, 126 dissertations on transportation were written between
1986 and 2019. As for the distribution of these dissertations according to fields of science, it was found
that transportation was mainly examined under the key word “transportation” in the field of business
administration, under the key word “optimization” in industrial engineering field and in terms of
“infrastructure” in the field of civil engineering field. In social sciences, sea, air and land transportation

Mehmet Akif Ersoy İktisadi ve İdari Bilimler Fakültesi Dergisi - Mehmet Akif Ersoy University Journal of Economics and Administrative Sciences Faculty
Cilt:7 Sayı:2 s.473-496 Volume:7 Issue:2 p.473-496
Temmuz 2020 July
476
were examined with reference to logistics. In addition, there are dissertations focusing on transportation
in law, economy and other fields of engineering (https://tez.yok.gov.tr/UlusalTezMerkezi/giris.jsp).
Academic studies in other countries have similar distribution patterns according to fields of science;
especially the USA has a rich literature on transportation.
The study uses cluster analysis as methodology. Although there are many dissertations and
articles related to this type of analysis, the literature did not reveal any studies using cluster analysis in
logistics and transportation.
Ren, Yong-Chan et.al used fuzzy cluster analysis for logistic center settlement plan (Ren, et.al
2010: 504). Similarly, Fu and Yin, in their dissertation, tried to develop an evaluation model based on
fuzzy cluster algorithm of logistics companies. Seven companies were classified through fuzzy cluster
analysis according to 8 variables (Fu and Yin, 2012: 1583).
Meng, in his performance evaluation for supply chain, tried to optimize e-trade supply chain
based on fuzzy cluster analysis. The study introduced a sample analysis, and various supply chain
options were classified through fuzzy clustering. The aim of the study was to develop an evaluation
method combining qualitative and quantitative analysis (Meng, 2007).
Hirschinger et.al wrote an article focusing on fuzzy clustering scenarios. They suggested that
decision makers in transportation and logistics industry are likely to use fuzzy clustering analysis in
order to group scenarios related to the development of transportation and logistics in developing
countries until 2030 (Hirschinger et.al, 2015).
Lima et.al (2014), in their research article titled “Humanitarian Logistics: A Clustering
Methodology for Assisting Humanitarian Operations”, suggest a method to define and classify regions
according to the type and frequency of disasters. The results show that classification through cluster
analysis considerably contributes to decision-making process during Humanitarian Logistics
intervention phase (Lima et.al, 2014).
Trappey et.al (2010) applied a clustering approach to supply chain partners in automobile
industry, prioritizing the services offered by third-party logistics service 3PL) providers. By applying a
two-stage clustering approach combined with Ward's minimum-variance method and the K-means
algorithm, the logistics companies prioritize their services to satisfy groups of customers with specific
preferences more effectively (Trappey et.al, 2010:731).
Wang and Wei carried out a cluster analysis for dangerous goods transportation in logistics by
using k-mean algorithm. Accessing the data from Chinese logistics information platform, the authors
did a cluster analysis involving 9 types of dangerous goods and 571 Logistics company. In corrected
algorithm, distance similarity between clusters was used to calculate cluster coefficient (k). The analysis
revealed some key points in dangerous goods transportation, and it was recommended that these points
should be focused on so that potential disasters can be avoided (Wang, 2016).
This study aims to classify 47 countries involving OECD (Organization for Economic
Cooperation and Development) countries according to 7 variables through hierarchical ward method

Classification of Logistics-Based Transportation Activities in OECD Countries and Selected Non-Member Countries Through Cluster Analysis - Kümeleme
Analizi ile OECD Ülkeleri ve Seçilmiş Üye Olmayan Ülkelerin Lojistik Faaliyetlerine Dayalı Taşımacılık Sınıflandırılması
Gülsen Serap ÇEKEROL
477
and fuzzy cluster c-means) algorithm in terms of their transportation activity indicators. The clusters
formed after the analysis and the cluster that includes Turkey were interpreted accordingly.
The next section will examine OECD statistics and transportation parameters of the
organization.
3. CONCEPTUAL FRAMEWORK
3.1. Logistics and Transportation
The most basic function of logistics in business world is to make profit just like in other related
activities. For instance, humanitarian aid logistics aims to ensure sustainability of life with the lowest
cost; urban logistics deals with delivering tons of freight to users and costumers despite the presence of
serious problems such as undesired environmental conditions and heavy traffic; the function of military
logistics is to provide necessary ammunitions on time during a war when needed; and finally, health
logistics serves human beings by providing services regarding the transportation of medical equipment,
medicine and blood as well as organs to be transplanted for people and health institutions (Keskin, 2015).
Nature itself has such a perfect logistics organization that it even inspires human beings for possible
solutions to problems encountered in logistics activities (Çekerol, 2019).
The definition of logistics should take into consideration the dynamics of the field where it will
be applied. In this respect, a comprehensive general definition of logistic in business world has been
made by Council of Supply Chain Management Professionals-CSCMP, which is a leading non-
governmental organization in the world. According to the council, logistics refers to the process of
planning, implementing, and controlling procedures for the efficient and effective transportation and
storage of goods which includes various services and related information used in different phases
starting from production until consumption phase for the purpose of meeting customer demands and
needs. This definition includes inbound, outbound, internal, and external movements.
Transportation is the main component of logistics, and it has recently played more extensive
roles due the increasing importance given to customer satisfaction and integration of computer systems
into the field. Logistics is not a unit or an activity; it is a comprehensive process involving many
activities starting from order of product until its final delivery to customers such as transport, storage,
forecasting, customer services, packaging etc. However, certain variables including market conditions,
competition, sector, geography and culture also play significant roles in logistics activities and affect
the coordination and management of these activities.
The basic aim of logistics is to achieve targeted customer satisfaction with minimum cost
(Bowersox and Cooper, 2002). In this respect, focusing on activities with high cost enables companies
to minimize their expenses. Therefore, the main activity to focus on in logistics activities should be
transportation.

Mehmet Akif Ersoy İktisadi ve İdari Bilimler Fakültesi Dergisi - Mehmet Akif Ersoy University Journal of Economics and Administrative Sciences Faculty
Cilt:7 Sayı:2 s.473-496 Volume:7 Issue:2 p.473-496
Temmuz 2020 July
478
Transportation simply refers to the activity of dispatching people, goods etc. with a vehicle from
one place to another. As for business world, transportation is inevitably necessary when potential
markets and customers are geographically far away from each other.
In a broader sense, transportation is a comprehensive and complex process involving various
services ranging from preparation of necessary documents for transportation (freight, driver, customs
etc.) to the delivery of products to certain regions and centers to meet customers’ needs and demands
(Taşkın&Durmaz, 2012: 41-42). In addition, transportation is a combination of activities that require
collaboration of different disciplines such as engineering, management and law (Figure 1).
Figure 1. Integrated Structure of Transport
Inte
gra
ted
Str
uct
ure
of
Tra
nsp
ort
Transport Modes
Unimodal Transport Modes
Roadways Transportation
Railways Transportation
Waterways-Inland Waterways Transportation
Airways Transportation
Pipeline Transportation
Multimodal Transport Types
İntermodal Transport
Combined Transport
Transport Vehicles and Equipment
Trnsportation Vehicles by Modes
Transportation Equipments
Vehicle Routing
Geographical Information Systems
Information Technologies
Vehicle Tracking Systems
Transportation Legislation
Infrastructure Legislation
Transport Legislation by Modes

Classification of Logistics-Based Transportation Activities in OECD Countries and Selected Non-Member Countries Through Cluster Analysis - Kümeleme
Analizi ile OECD Ülkeleri ve Seçilmiş Üye Olmayan Ülkelerin Lojistik Faaliyetlerine Dayalı Taşımacılık Sınıflandırılması
Gülsen Serap ÇEKEROL
479
Transportation sector is one of the main components of economy. The roles it plays in the
production of goods and services determine its current position. It also helps economic systems to
improve and function effectively and provides added value to economy, which makes it a basic
component of economic activities (Çancı and Güngören, 2013: 199).
3.2. OECD Statistics and Transportation Variables
Established in September 30th, 1961, OECD is an organization in which 36 member countries
collaboratively try to solve their economic, social and administrative problems due to globalization and
benefit from the positive consequences of this problem solution process. Turkey is the founding member
of the organization and other member countries are as follows: the USA, Austria, Australia, Canada,
France, Holland, Luxemburg, Germany, Greece, Italia, England, Belgium, Denmark, Ireland, Finland,
Swiss, Sweden, Spain, Iceland, Norway, Portugal, Czechia, Estonia, Japan, Korea, Latvia, Lithuania,
Israel, Hungary, Mexico, Poland, Slovakia, Slovenia, Chili, and New Zealand (MFA, 2020).
The website that publishes data about OECD countries and selected non-member countries
(https://stats.oecd.org/ ) provides rich data for the purposes of the study. The non-member countries
selected for this study are as follows: Albania, Armenia, Bulgaria, China, Croatia, Georgia, India, Malta,
Moldova, Montenegro, Romania, and Serbia.
The first article of the organization’s bylaws stipulates that the aim of the organization is to
develop politics that;
will maintain economic stability, increase life standards and ensure economic growth
and high levels of employment in member countries
will contribute to the development of world economy, healthy economic development
in member or non-member countries and the growth of multi-party world trade in conformity
with international liabilities. (MFA, 2020)
OECD is recognized as a reference organization in terms of economic analyses and statistical
data by the leading institutions such as IMF and World Bank, which take these references as bases for
their own activities. The variables related to logistics-based transportation indices were determined by
collecting up-to-date data from the website that publish statistical figures (https://stats.oecd.org/) (Figure
2);

Mehmet Akif Ersoy İktisadi ve İdari Bilimler Fakültesi Dergisi - Mehmet Akif Ersoy University Journal of Economics and Administrative Sciences Faculty
Cilt:7 Sayı:2 s.473-496 Volume:7 Issue:2 p.473-496
Temmuz 2020 July
480
Figure 2. OECD Transportation Variables
OE
CD
Taş
ımac
ılık
Par
amet
rele
ri
Transport Infrastructure
Capital Value
Investing Spending
Maintance Spending
Transport Measurement
Freight Transport
Coastal Shipping
Containers Transport
Inland Freight Transport
Economic and Social
Charges and Taxes by Type
Vehicle Taxes (EUR/year)
Fuel Taxes (EUR/year)
Time Based Charges (EUR/year)
Net Charges Per Domestic Haul
Net Charges Per Domestic Haul by Type
Transport Safety
Road Casualties
Road Injury Accıdents
Performamce Indicators
Transport Infrastucture
Economic and Social
Energy aand Environment
Safetyk
Traffic
Transport Equipment
Transpoet Measurement
Toatl inland freight transport in tonne-km per one thousand units of current USD GDP
Rail freight transport in tonne-km per one thousand units of current USD GDP
Road freight transport in tonne-km per one thousand units of current USD GDP
Inland waterways freight transport in tonne-km per one thousand units of current USD
GDP
Pipeline transport in tonne-km per one thousand units of current USD GDP
Share of rail freight transport in total inland freight transport
Share of road freight transport in total inland freight transport
Share of rnland waterways freight transport in total inland freight transport
Share of pipeline transport in total inland freight transport
Air freight transport in tonne-km per one thousand units of current USD GDP
Short-term Indicators
IRTAD databaseı
Urban access framework
Mod ile Mutlak Erişebilirlik
Coğrafi Öçeğe Göre Yakınlık
Moda göre Taşıma Performansı

Classification of Logistics-Based Transportation Activities in OECD Countries and Selected Non-Member Countries Through Cluster Analysis - Kümeleme
Analizi ile OECD Ülkeleri ve Seçilmiş Üye Olmayan Ülkelerin Lojistik Faaliyetlerine Dayalı Taşımacılık Sınıflandırılması
Gülsen Serap ÇEKEROL
481
However, it is not possible to use all the variables displayed in Figure 2 above. The common
indicators of OECD member countries were taken as the basis for clustering. For instance, although it
is important for logistics activities, coastal transportation was not used since not all the countries have
coastal regions; however, container transportation was taken as a variable since it is a common indicator
for each country. The study-specific variables were determined as follows after they were analyzed
within the algorithms used (Table 1).
Table 1. The Selected Variables
Variables
X1: Investment Spending
X2: Maintenance Spending
X3: Containers Spending
X4: Inland Freight Transport
X5: Share of Value Added by the Transport Sector
X6: Total Inland Freight Transport in Tonne - km per One Thousand Units of Current USD GDP
X7: Road Freight Transport in Tonne - km per One Thousand Units of Current USD GDP
The International Transport Forum collects, on a quarterly basis, monthly data from all its
Member countries. When monthly information is not available, then quarterly data are provided. The
survey contains a dozen variables selected for their quarterly availability among reporting countries.
Data are collected from Transport Ministries, statistical offices and other institution designated as
official data source. The variables of this study include the followings (https://stats.oecd.org/):
𝑿𝟏: Investment Spending includes the following variables: Transport gross investment
spending, total inland transport infrastructure investment, rail infrastructure investment, road
infrastructure investment, road infrastructure investment: of which motorway, inland waterway
infrastructure investment, maritime port infrastructure investment, airport infrastructure investment,
transport maintenance expenditures, capital value at the end of the year, total road spending.
𝑿𝟐: Maintenance Spending includes the following variables: Transport gross investment
spending, total inland transport infrastructure investment, rail infrastructure investment, road
infrastructure investment, road infrastructure investment: of which motorway, inland waterway
infrastructure investment, maritime port infrastructure investment, airport infrastructure investment,
transport maintenance expenditures, capital value at the end of the year, total road spending.
𝑿𝟑: Containers Spending includes the following variables: Information rail containers transport
(TEU: Twenty-foot Equivalent Unit), information rail containers transport (weight), information
maritime containers transport (TEU), information maritime containers transport (weight).
𝑿𝟒: Inland Freight Transport includes the following variables: Information Total inland freight
transport, Information Rail freight transport, Information Road freight transport, Information Road
freight transport for hire and reward, Information Road freight transport on own account, Information
Inland waterways freight transport, Information Pipelines transport.
𝑿𝟓: Share of Value Added by the Transport Sector
𝑿𝟔: Total Inland Freight Transport in Tonne - km per One Thousand Units of Current USD GDP

Mehmet Akif Ersoy İktisadi ve İdari Bilimler Fakültesi Dergisi - Mehmet Akif Ersoy University Journal of Economics and Administrative Sciences Faculty
Cilt:7 Sayı:2 s.473-496 Volume:7 Issue:2 p.473-496
Temmuz 2020 July
482
𝑿𝟕: Road Freight Transport in Tonne - km per One Thousand Units of Current USD GDP
4. METHODOLOGY
4.1. Cluster Analysis
This study uses hierarchical clustering Ward method and fuzzy c-means algorithm in order to
compare OECD countries and selected non-member countries in terms of transportation indicators and
to determine Turkey’s position in this comparison. Cluster analysis has a wide range of usage in various
disciplines such as economy, sociology, medicine, engineering, archeology and agriculture (Alpar,
2011, p, 30).
Cluster analysis is a multi-variable analysis technique aiming to classify data according to
certain criteria. Also known as numerical classification or classification analysis, cluster analysis uses
distance matrix to determine intra-cluster homogeneity and inter-cluster heterogeneity (Hair, 1998: 473).
In other words, cluster analysis starts with data sets containing information about a sampling that
composes of units and rearranges these units as homogenous groups (Aldenderfer&Blashfield,1984).
The functions of cluster analysis (Özdamar, 2004; 279-280) are
to group “n” number of cases, objects, phenomena based on the criteria determined
according to p variable into intra-homogenous and inter-heterogeneous subgroups.
to group “p” number variables according to values identified in “n” number of cases
into sub-clusters that are assumed to account for common features and to determine common
factor structures.
to split both cases and variables into sub-clusters having common characteristics.
to make biological and typological classification of cases according to values
determined in terms of “p” variable
In a broad sense, cluster analysis involves four steps:
Determining data matrix,
Selecting Clustering Algorithm,
Validity of Results,
Interpreting Results
In cluster analysis, there are two types of clustering process: hierarchical clustering and
nonhierarchical clustering (Malhotra, 2007). In hierarchical cluster analysis, clustering is carried out
according to similarity criteria for cases and variables without determining a specific number of clusters
in advance (Koyuncugil, 2006, s. 57). In contrast, non-hierarchical clustering methods are preferred
when number of clusters is known beforehand; the number of clusters is also determined in advance in
this method (Alpar, 2011, p. 314, 333).
4.1.1. Hierarchical Clustering
Hierarchical clustering aims to combine objects by considering their similarities according to
cluster distance measurement (Özdamar,2004). Basically, it has two approaches: agglomerative and
divisive (Rafsanjani et.al, 2012). The methods used while calculating distance between two clusters are
as follows: single linkage, complete linkage, average linkage, centroid linkage, Ward method, neighbor
joining and adjusted complete linkage.

Classification of Logistics-Based Transportation Activities in OECD Countries and Selected Non-Member Countries Through Cluster Analysis - Kümeleme
Analizi ile OECD Ülkeleri ve Seçilmiş Üye Olmayan Ülkelerin Lojistik Faaliyetlerine Dayalı Taşımacılık Sınıflandırılması
Gülsen Serap ÇEKEROL
483
The current study uses Ward method, which employs an agglomerative approach. This method
aims to minimize centroid-cluster variance by taking average distance as reference. In other words, it is
based on calculating the sum of squared errors by using centroid cluster squares deviations
(Murtagh&Contreras, 2017).
The method starts with “n” number of clusters each of which has a single case. Since each
observation becomes a cluster in the first step, sum of squared errors is zero (Everitt, 1974). In each
following phase, two subclusters are combined to form the next level. In this case, it is assumed that
k(k-1) is a subcluster. The sum of Euclid distances of “ni” point in k cluster to means vector of k cluster
is the sum of squared errors (Wi) and it is calculated as follows:
Wk = ∑ ∑(xijk − x̅ik)2
nk
j=1
p
i=1
= ∑ ∑(xijk)2
nk
j=1
p
i=1
− nk ∑(x̅ik)2
p
i=1
Here, 𝑊𝑘value is calculated for 𝑘 = 1,2,3 … … … . , 𝑛 clusters and the sum of centroid cluster
squared errors is calculated as:
𝑊 = ∑ 𝑊𝑘
𝑛
𝑖=1
Later, p and q clusters, which cause the lowest increase in W, are combined to obtain t cluster.
This increase in W is calculated by using the following equation:
DWpq = Wt − Wp − Wq
By doing so, “n” number of cases is split into (n-1) cluster and W increase values are calculated
until the number of clusters reach k=1 so that cases are hierarchically joined together. When Ward
Method is used in analysis, cases are displayed in a diagram called “dendrogram”, where these cases are
combined successfully at different levels (Dibb, 1998).
4.1.2. Non-Hierarchical Clustering
Non-hierarchical clustering techniques have been developed to combine cases rather than
variables in “k” number of clusters. The number of clusters (k) can be given as a certain value or
determined as a part of clustering technique because it is not obligatory to determine distance (similarity)
and to store main data when computer functions. Non-hierarchical clustering techniques can be applied
to bigger data clusters when compared to hierarchical techniques (Johnson &Wichern,1988).
The most common non-hierarchical clustering methods are k-means clustering, medoids
clustering and fuzzy clustering (Özdamar, 2010, p. 311). This study uses fuzzy clustering method in the
analysis
4.1.2.1. Fuzzy Cluster Analysis
Fuzzy sets theory was developed in 1965 by L.A. Zadeh as a method to represent uncertainty.
It defines the terms and concepts expressing a sort of uncertainty within the framework of cluster theory
by assigning a certainty level for these uncertainties without applying random splitting (Aksoy, et.al.,
2014).

Mehmet Akif Ersoy İktisadi ve İdari Bilimler Fakültesi Dergisi - Mehmet Akif Ersoy University Journal of Economics and Administrative Sciences Faculty
Cilt:7 Sayı:2 s.473-496 Volume:7 Issue:2 p.473-496
Temmuz 2020 July
484
Fuzzy clustering approach is appropriate when clusters are not clearly classified, or some objects
are inconsistent in terms of cluster membership. Being a flexible method, fuzzy clustering method
provides information about uncertain cluster memberships, which helps to identify complex
relationships among objects and clusters (Mansoori, 2011). All the cases in the data may become a
member of more than one cluster at the same time depending on various membership values thanks to
fuzzy clustering analysis.
Fuzzy clustering is based on distance measurements, and the use of distance criteria depends on
the structure of clusters and the algorithm used. Some useful features of fuzzy clustering are as follows:
it provides useful membership values so that accurate interpretation can be made
it is flexible in terms of distance use
when some of membership values are known, they might be combined with numerical
optimization (Naes& Mevik, 1999).
This study uses fuzzy c-means clustering method since it examines the situations in which
OECD member countries belong to more than one cluster rather than only one cluster.
Fuzzy c-means algorithm is the most common and the most popular fuzzy clustering method. It
was introduced by Dunn in 1973 and developed by Bezdek in 1981. Hierarchical clustering method is
the fuzzy version of k-means clustering algorithm. It tries to minimize objective function and uses
distance criteria like other algorithms. Which distance criterion will be used depends on cluster structure
and algorithm. Fuzzy c-means algorithm uses Euclid distance. When c-means algorithm is completed,
points in p-dimensioned space form global shapes. Therefore, algorithm gives the optimum result for
globally distributed data. Margin of error for the algorithm, which can also be used for ellipsoidal data,
should not be preferred for scattered data (Höppner et.al., 1999).
Fuzzy c means is a method of clustering which allows one piece of data to belong to two or
more clusters. This method is frequently used in pattern recognition. It is based on minimization of the
following objective function:
𝐽(𝑢, 𝑣) = ∑ ∑(𝑢𝑖𝑗)𝑚‖𝑥𝑗 − 𝑣𝑖‖2
𝑛
𝑗=1
𝑐
𝑖=1
There is a restriction for this objective function. Due to the principles of fuzzy logic, each data
belongs to a cluster with a membership value ranging between 0 and 1. The sum of membership values
of data for each cluster should be “1” (Ruspini, 1973).
𝑢𝑖𝑗 ≥ 0, ∑ 𝑢𝑖𝑗 = 1
𝑐
𝑖=1
, 1 ≤ 𝑗 ≤ 𝑛
Here;
X: {x1, x2, … … xn} ⊂ Rn = the data,
n:, number of data
c: number of clusters in X; 2 ≤ c ≤ n
uij: Fuzzy Membership level for j unit of i cluster
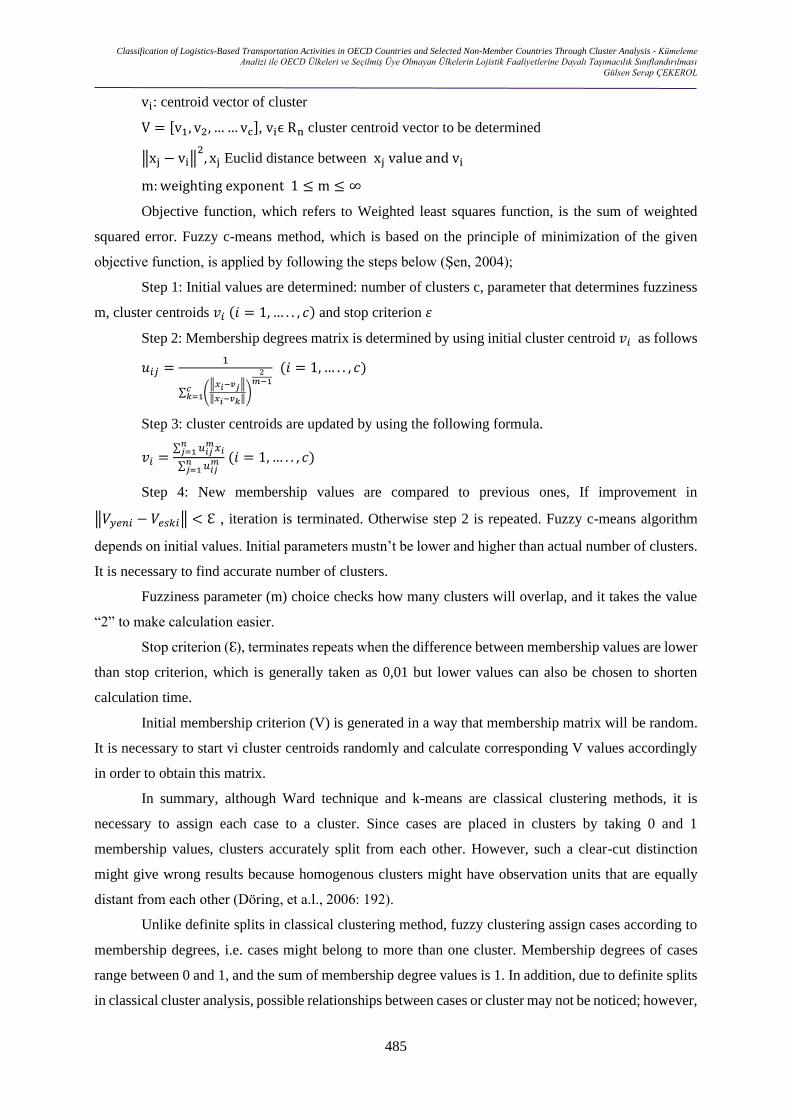
Classification of Logistics-Based Transportation Activities in OECD Countries and Selected Non-Member Countries Through Cluster Analysis - Kümeleme
Analizi ile OECD Ülkeleri ve Seçilmiş Üye Olmayan Ülkelerin Lojistik Faaliyetlerine Dayalı Taşımacılık Sınıflandırılması
Gülsen Serap ÇEKEROL
485
vi: centroid vector of cluster
V = [v1, v2, … … vc], viϵ Rn cluster centroid vector to be determined
‖xj − vi‖2
, xj Euclid distance between xj value and vi
m: weighting exponent 1 ≤ m ≤ ∞
Objective function, which refers to Weighted least squares function, is the sum of weighted
squared error. Fuzzy c-means method, which is based on the principle of minimization of the given
objective function, is applied by following the steps below (Şen, 2004);
Step 1: Initial values are determined: number of clusters c, parameter that determines fuzziness
m, cluster centroids 𝑣𝑖 (𝑖 = 1, … . . , 𝑐) and stop criterion 𝜀
Step 2: Membership degrees matrix is determined by using initial cluster centroid 𝑣𝑖 as follows
𝑢𝑖𝑗 =1
∑ (‖𝑥𝑖−𝑣𝑗‖
‖𝑥𝑖−𝑣𝑘‖)
2𝑚−1
𝑐𝑘=1
(𝑖 = 1, … . . , 𝑐)
Step 3: cluster centroids are updated by using the following formula.
𝑣𝑖 =∑ 𝑢𝑖𝑗
𝑚𝑥𝑖𝑛𝑗=1
∑ 𝑢𝑖𝑗𝑚𝑛
𝑗=1
(𝑖 = 1, … . . , 𝑐)
Step 4: New membership values are compared to previous ones, If improvement in
‖𝑉𝑦𝑒𝑛𝑖 − 𝑉𝑒𝑠𝑘𝑖‖ < ℇ , iteration is terminated. Otherwise step 2 is repeated. Fuzzy c-means algorithm
depends on initial values. Initial parameters mustn’t be lower and higher than actual number of clusters.
It is necessary to find accurate number of clusters.
Fuzziness parameter (m) choice checks how many clusters will overlap, and it takes the value
“2” to make calculation easier.
Stop criterion (ℇ), terminates repeats when the difference between membership values are lower
than stop criterion, which is generally taken as 0,01 but lower values can also be chosen to shorten
calculation time.
Initial membership criterion (V) is generated in a way that membership matrix will be random.
It is necessary to start vi cluster centroids randomly and calculate corresponding V values accordingly
in order to obtain this matrix.
In summary, although Ward technique and k-means are classical clustering methods, it is
necessary to assign each case to a cluster. Since cases are placed in clusters by taking 0 and 1
membership values, clusters accurately split from each other. However, such a clear-cut distinction
might give wrong results because homogenous clusters might have observation units that are equally
distant from each other (Döring, et a.l., 2006: 192).
Unlike definite splits in classical clustering method, fuzzy clustering assign cases according to
membership degrees, i.e. cases might belong to more than one cluster. Membership degrees of cases
range between 0 and 1, and the sum of membership degree values is 1. In addition, due to definite splits
in classical cluster analysis, possible relationships between cases or cluster may not be noticed; however,

Mehmet Akif Ersoy İktisadi ve İdari Bilimler Fakültesi Dergisi - Mehmet Akif Ersoy University Journal of Economics and Administrative Sciences Faculty
Cilt:7 Sayı:2 s.473-496 Volume:7 Issue:2 p.473-496
Temmuz 2020 July
486
fuzzy clustering method provides more detailed information by eliminating this problem to some extent
(Mansoori, 2011, p. 961).
Fuzzy sets can be examined in three groups: normal fuzzy sets, non-normal fuzzy sets and
convex fuzzy sets. If at least one of the cases in a set has a set membership equal to 1, it is called normal
fuzzy set. If the membership of all cases is lower than 1, it is non-normal fuzzy set. Finally, convex
fuzzy set occurs when membership values for increasing values in a set is monotonously increasing and
decreasing (Koyuncugil, 2006: 98).
5. FINDINGS
When means and variances of variables in a data matrix are largely different from each other,
those with high means and variances considerably affect the contribution of other variables to analysis.
Sometimes, extreme values of variables have negative effects on cluster analysis. In such cases, data
should be standardized or transformed (Özdamar, 2004: 291). Although there are many methods for data
standardization, this study used z point transformation and transformation to -1≤ x ≤1 range. This
technique is preferred when there are extreme values and / or heterogeneous values with positive and
negative signs.
Minitab 19 software was used for standardization. After the standardization, seven clusters were
obtained by using Ward method and NCSS 2019 software. These clusters are presented in Table 2.
Table 2. Results of Clustering through Ward Method
Cluster 1 Cluster 2 Cluster 3 Cluster 4 Cluster 5 Cluster 6 Cluster 7
Ireland
United Kingdom
Albania,
Armenia Australia
Austria
Belgium Bulgaria
China
Hungary Italy
Lithuania
Netherlands United States
Latvia
Luxembourg Malta
Mexico
Denmark
Greece Iceland
Japan
Korea Moldova
Czech Rep.
Georgia Romania
Sweden
Croatia
France Portugal
Russian Fed.
Turkey
Canada
Estonia Finland
Germany
India Montenegro
New Zealand
Norway Poland
Serbia
Slovak Rep. Slovenia
Spain
Switzerland
The results of clustering were displayed graphically through the dendrogram in Figure 3. This
dendrogram is scaled as 0-10 from left to right in equal distances between the units. Horizontal lines
show “distance” and vertical ones “intersecting clusters”.

Classification of Logistics-Based Transportation Activities in OECD Countries and Selected Non-Member Countries Through Cluster Analysis - Kümeleme
Analizi ile OECD Ülkeleri ve Seçilmiş Üye Olmayan Ülkelerin Lojistik Faaliyetlerine Dayalı Taşımacılık Sınıflandırılması
Gülsen Serap ÇEKEROL
487
Figure 3. Cluster Dendrogram for Countries through Ward Method
Testing the results of cluster analysis through statistical methods will provide more useful and
meaningful results (Kurtuluş, 2004:417).
When p values of variables in variance homogeneity test (Levene Test) are examined, it is seen
that variances for “Share of Value Added by The Transport Sector” variable are not homogenous (p <
0,05) while variances for other variables are homogenous (p > 0,05).
The researchers later examined the results of one-way ANOVA for variables confirming
homogeneity assumption and Welch test for those that did not confirm this assumption and found that
there were differences between the means of the clusters. Post-hoc tests were done to determine which
cluster(s) caused this difference. Bonferonni test was used for variables confirming homogeneity
assumption and DunnetT3 test for those that did not. According to the results, the variance for “share of
value added by the transport sector” variable is due to the second cluster. It might be concluded that the
countries in the second cluster is weaker than those in other clusters in terms of added value.
Finally, the countries were classified by using fuzzy c-means method. In this step, the results
displayed in Table 3 below were used to determine how many clusters the countries will be split into.
NCSS 2019 program was used for fuzzy c-means clustering algorithm. Table 3 below displays
mean silhouette statistics obtained for different cluster numbers k= 2, 3, 4, 5 in the classification of 46

Mehmet Akif Ersoy İktisadi ve İdari Bilimler Fakültesi Dergisi - Mehmet Akif Ersoy University Journal of Economics and Administrative Sciences Faculty
Cilt:7 Sayı:2 s.473-496 Volume:7 Issue:2 p.473-496
Temmuz 2020 July
488
countries and Turkey by fuzzy clustering method according to basic education indicators, and Dc(U)
values, which includes Dunn's partition coefficient, normalized Dunn coefficient.
Table 3. The Cluster Analysis Results according to Median Algorithm
Cluster 𝑺𝑪̅̅̅̅ 𝑭(𝑼) 𝑭𝒄(𝑼) 𝑫(𝑼) 𝑫𝒄(𝑼)
2 0,371462 0,7036 0,4072 0,1776 0,3551
3 0,423130 0,6820 0,5230 0,1909 0,2864
4 0,548646 0,6983 0,5977 0,1823 0,2431
5 0,514399 0,7267 0,6584 0,1700 0,2125
The table shows that the ideal number of clusters is k=5 according to the data used in the analysis
since more than one validity indicators are taken as reference in fuzzy c-means method: partition
coefficient 𝐹(𝑈), Dunn coefficient (standardized partition coefficient) 𝐹𝑐(𝑈), Kaufman coefficient
𝐷(𝑈), standardized Kaufman coefficient 𝐷𝑐(𝑈).
The ideal number of clusters is determined according to the highest value of 𝐹𝑐(𝑈) and the
lowest value of 𝐷𝑐(𝑈).When Dunn coefficient is normalized in a way to take a value between 0 and 1,
the value “0” displays fuzziness while “1” means lack of fuzziness and a strong clustering (Yılancı,
2010: 457). The value which is the closest to “1” is 𝐹𝑐(𝑈) = 0,6584 for 𝑘 = 5.
In contrast to Dunn coefficient, standardized Kaufmann coefficient shows strong clustering
when it gets closer to “0”. For k=5, Dc (U) = 0.2125 is the closest value to 0 and shows strong clustering.
In silhouette statistics, which shows stability structure of clusters, 𝑆𝐶̅̅̅̅ (Silhouette Coefficient)
takes a value between “-1” and “+1”, and a value closer to +1 implies accurate clustering. In fuzzy
cluster analysis, 𝑆𝐶̅̅̅̅ should be at least 0.50 when ideal number of clusters are determined. 𝑆𝐶̅̅̅̅ for k=5
is 0.514399.
The examination of cluster structure revealed that there are differences when compared to
cluster structures obtained by using Ward method. When probability values are examined, it can be
concluded that a normal fuzzy cluster was obtained, and the countries are quite likely to be assigned to
clusters (Table 4).
Table 4. Cluster Membership and Assignment Probabilities
Row Country Cluster Prob in 1 Prob in 2 Prob in 3 Prob in 4 Prob in 5
1 Albania 5 0,1844 0,1760 0,1665 0,1689 0,3041
2 Armenia 5 0,1058 0,1795 0,0988 0,1462 0,4697
3 Australia 5 0,1848 0,3022 0,1670 0,1694 0,1765 4 Austria 1 0,0074 0,0074 0,9666 0,0073 0,0113
5 Belgium 4 0,0037 0,0044 0,0044 0,9821 0,0054
6 Bulgaria 3 0,0005 0,0005 0,9977 0,0005 0,0008
7 Canada 2 0,0000 1,0000 0,0000 0,0000 0,0000
8 China 2 0,0053 0,9741 0,0068 0,0056 0,0083
9 Croatia 3 0,6879 0,0000 0,0000 0,3121 0,0000 10 Czech Republic 3 0,0005 0,0311 0,9673 0,0004 0,0007
11 Denmark 4 0,2708 0,1455 0,0034 0,5772 0,0031
12 Estonia 1 0,0114 0,0074 0,0074 0,0073 0,9665 13 Finland 4 0,0037 0,0035 0,0044 0,9831 0,0054
14 France 2 0,0138 0,9371 0,0161 0,0129 0,0201
15 Georgia 4 0,0000 0,0000 0,0000 1,0000 0,0000 16 Germany 3 0,0005 0,9978 0,0005 0,0005 0,0008
17 Greece 3 0,0005 0,0005 0,9978 0,0005 0,0008
18 Hungary 5 0,3022 0,1765 0,1670 0,1694 0,1849 19 Iceland 5 0,1040 0,1756 0,0972 0,1437 0,4794
20 India 5 0,1726 0,2751 0,1680 0,1775 0,2067
21 Ireland 3 0,0004 0,0285 0,8584 0,1122 0,0006
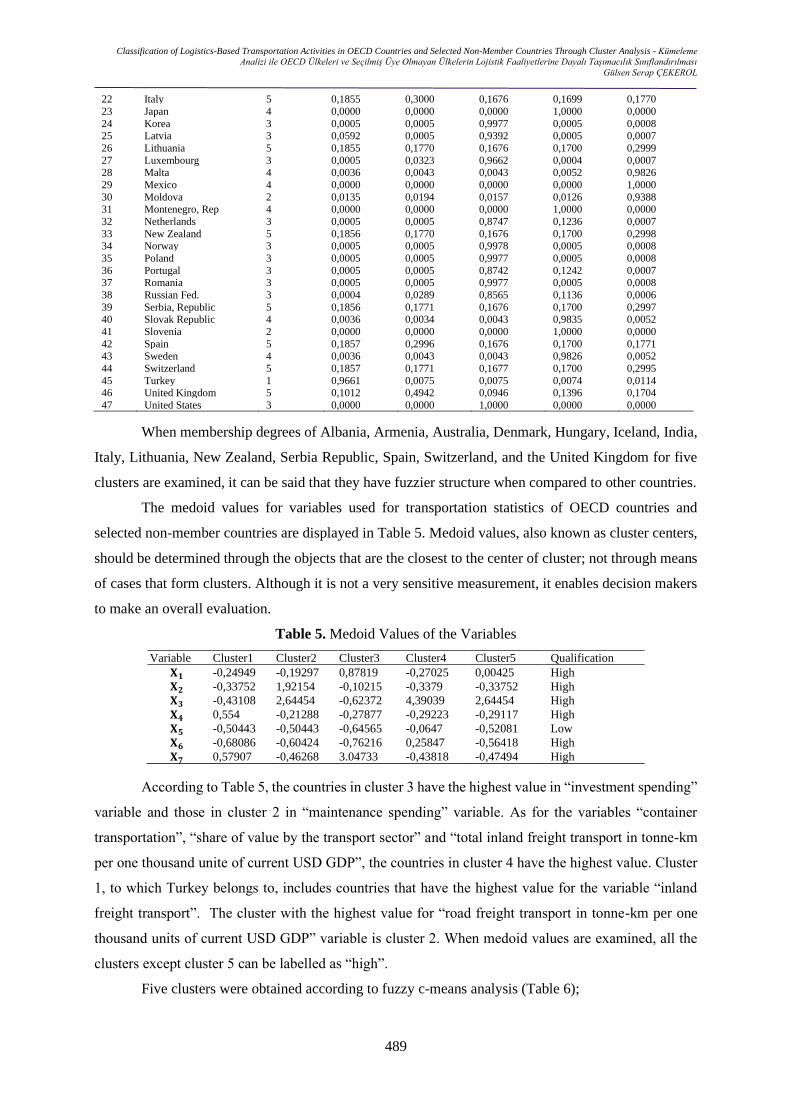
Classification of Logistics-Based Transportation Activities in OECD Countries and Selected Non-Member Countries Through Cluster Analysis - Kümeleme
Analizi ile OECD Ülkeleri ve Seçilmiş Üye Olmayan Ülkelerin Lojistik Faaliyetlerine Dayalı Taşımacılık Sınıflandırılması
Gülsen Serap ÇEKEROL
489
22 Italy 5 0,1855 0,3000 0,1676 0,1699 0,1770
23 Japan 4 0,0000 0,0000 0,0000 1,0000 0,0000
24 Korea 3 0,0005 0,0005 0,9977 0,0005 0,0008 25 Latvia 3 0,0592 0,0005 0,9392 0,0005 0,0007
26 Lithuania 5 0,1855 0,1770 0,1676 0,1700 0,2999
27 Luxembourg 3 0,0005 0,0323 0,9662 0,0004 0,0007 28 Malta 4 0,0036 0,0043 0,0043 0,0052 0,9826
29 Mexico 4 0,0000 0,0000 0,0000 0,0000 1,0000
30 Moldova 2 0,0135 0,0194 0,0157 0,0126 0,9388 31 Montenegro, Rep 4 0,0000 0,0000 0,0000 1,0000 0,0000
32 Netherlands 3 0,0005 0,0005 0,8747 0,1236 0,0007
33 New Zealand 5 0,1856 0,1770 0,1676 0,1700 0,2998 34 Norway 3 0,0005 0,0005 0,9978 0,0005 0,0008
35 Poland 3 0,0005 0,0005 0,9977 0,0005 0,0008
36 Portugal 3 0,0005 0,0005 0,8742 0,1242 0,0007 37 Romania 3 0,0005 0,0005 0,9977 0,0005 0,0008
38 Russian Fed. 3 0,0004 0,0289 0,8565 0,1136 0,0006
39 Serbia, Republic 5 0,1856 0,1771 0,1676 0,1700 0,2997 40 Slovak Republic 4 0,0036 0,0034 0,0043 0,9835 0,0052
41 Slovenia 2 0,0000 0,0000 0,0000 1,0000 0,0000
42 Spain 5 0,1857 0,2996 0,1676 0,1700 0,1771
43 Sweden 4 0,0036 0,0043 0,0043 0,9826 0,0052
44 Switzerland 5 0,1857 0,1771 0,1677 0,1700 0,2995
45 Turkey 1 0,9661 0,0075 0,0075 0,0074 0,0114 46 United Kingdom 5 0,1012 0,4942 0,0946 0,1396 0,1704
47 United States 3 0,0000 0,0000 1,0000 0,0000 0,0000
When membership degrees of Albania, Armenia, Australia, Denmark, Hungary, Iceland, India,
Italy, Lithuania, New Zealand, Serbia Republic, Spain, Switzerland, and the United Kingdom for five
clusters are examined, it can be said that they have fuzzier structure when compared to other countries.
The medoid values for variables used for transportation statistics of OECD countries and
selected non-member countries are displayed in Table 5. Medoid values, also known as cluster centers,
should be determined through the objects that are the closest to the center of cluster; not through means
of cases that form clusters. Although it is not a very sensitive measurement, it enables decision makers
to make an overall evaluation.
Table 5. Medoid Values of the Variables
Variable Cluster1 Cluster2 Cluster3 Cluster4 Cluster5 Qualification
𝐗𝟏 -0,24949 -0,19297 0,87819 -0,27025 0,00425 High
𝐗𝟐 -0,33752 1,92154 -0,10215 -0,3379 -0,33752 High
𝐗𝟑 -0,43108 2,64454 -0,62372 4,39039 2,64454 High
𝐗𝟒 0,554 -0,21288 -0,27877 -0,29223 -0,29117 High
𝐗𝟓 -0,50443 -0,50443 -0,64565 -0,0647 -0,52081 Low
𝐗𝟔 -0,68086 -0,60424 -0,76216 0,25847 -0,56418 High
𝐗𝟕 0,57907 -0,46268 3.04733 -0,43818 -0,47494 High
According to Table 5, the countries in cluster 3 have the highest value in “investment spending”
variable and those in cluster 2 in “maintenance spending” variable. As for the variables “container
transportation”, “share of value by the transport sector” and “total inland freight transport in tonne-km
per one thousand unite of current USD GDP”, the countries in cluster 4 have the highest value. Cluster
1, to which Turkey belongs to, includes countries that have the highest value for the variable “inland
freight transport”. The cluster with the highest value for “road freight transport in tonne-km per one
thousand units of current USD GDP” variable is cluster 2. When medoid values are examined, all the
clusters except cluster 5 can be labelled as “high”.
Five clusters were obtained according to fuzzy c-means analysis (Table 6);

Mehmet Akif Ersoy İktisadi ve İdari Bilimler Fakültesi Dergisi - Mehmet Akif Ersoy University Journal of Economics and Administrative Sciences Faculty
Cilt:7 Sayı:2 s.473-496 Volume:7 Issue:2 p.473-496
Temmuz 2020 July
490
Table 6. Clustering according to fuzzy c-means method for k=5
Cluster 1 Cluster 2 Cluster 3 Cluster 4 Cluster5
Croatia, Hungary
Portugal
Turkey
Australia Canada
China
France Germany
India
Italy Spain
United Kingdom
Austria Bulgaria
Czech Rep.
Greece Ireland
Korea
Latvia Luxembourg
Netherlands
Norway Poland
Romania
Russian Fed. United States
Belgium Denmark
Finland
Georgia Japan
Montenegro
Slovak Slovenia, Rep.
Sweden
Albania Armenia
Estonia
Iceland Latvia
Lithuania
Malta Mexico
Moldova
New Zealand Serbia
Switzerland
The findings obtained from hierarchical clustering Ward method and from fuzzy clustering c-
means method have considerable differences; fuzzy c-means method producing more stable results and
affected by extreme data and initial values less.
According to the findings;
Cluster 1 (Croatia, Hungary, Portugal, Turkey), which was obtained from fuzzy c-means method
and Cluster 6 (Croatia, France, Portugal, Russian Federation, Turkey), which was obtained from
hierarchical ward method, have similar structures. The countries in Cluster 1 - especially 3 countries -
have similar structures for the following variables: “inland freight transport”, “maintenance spending”
and “share of value added by the transport sector”. These countries were clustered according to their
similarities by hierarchical clustering Ward method as follows:
Cluster 2 (Hungary)
Cluster 6 (Croatia, Portugal, Turkey),
Cluster 2 (Australia, Canada, China, France, Germany, India, Italy, United Kingdom, United
States), which was obtained through c-means method, consists of leading countries in terms of trade
volume at global level. They have high expenses for investment and maintenance as indicated by the
results obtained for “investment spending” and “maintenance spending” variables. The clusters obtained
for these countries by using Hierarchical clustering Ward method are as follows:
Cluster 1 (United Kingdom)
Cluster 2 (Australia, China, Italy, United States),
Cluster 6 (France),
Cluster 7 (Canada, Germany, India)
It can be seen that the countries were split in different ways when this method was used.
Cluster 3, which was obtained through c-means method, involves the highest number of
countries (Bulgaria, Czech Republic, Greece, Ireland, Russian Federation, Korea, Luxembourg,
Netherlands, Norway, Poland, Romania). They show similarities for the following variables:
“maintenance spending”, “total inland freight transport in tonne-km per one thousand units of current
USD GDP”, “road freight transport in tonne-km per one thousand units of current USD GDP”
Classification of Logistics-Based Transportation Activities in OECD Countries and Selected Non-Member Countries Through Cluster Analysis - Kümeleme
Analizi ile OECD Ülkeleri ve Seçilmiş Üye Olmayan Ülkelerin Lojistik Faaliyetlerine Dayalı Taşımacılık Sınıflandırılması
Gülsen Serap ÇEKEROL
491
The clusters obtained for these countries by using Hierarchical clustering Ward method are as
follows:
Cluster 1 (Ireland)
Cluster 2 (Austria, Bulgaria, Netherlands)
Cluster 3 (Luxembourg)
Cluster 4 (Greece, Korea)
Cluster 5 (Czech Republic, Romania)
Cluster 6 (Russian Fed.)
Cluster 7 (Norway, Poland)
It can be seen that the countries were split in different ways when this method was used.
Cluster 4, which was obtained through c-means method, mostly consists of European countries
(Belgium, Denmark, Finland, Georgia, Japan, Montenegro, Slovak, Slovenia, Spain, Switzerland,
Sweden). These countries are similar in terms of the following variables: “share of value added by the
transport sector”, “total inland freight transport in tonne-km per one thousand units of Current USD
GDP”, “road freight transport in tonne-km per one thousand units of Current USD GDP”.
follows:
Cluster 2 (Belgium)
Cluster 4 (Denmark, Japan,)
Cluster 5 (Georgia, Sweden)
Cluster 7 (Finland, Montenegro, Slovak, Slovenia Spain, Switzerland)
It can be seen that the countries were split in different ways when this method was used.
Cluster 5 obtained through c-means method involves countries that have relatively fewer
logistics activities and related transportation activities (Albania, Armenia,Hungary, Iceland, Latvia,
Lithuania, New Zealand, Serbia).
The clusters obtained for these countries by using Hierarchical clustering Ward method are as
follows:
Cluster2 ( Albania, Armenia, Lithuania, United States)
Cluster3 ( Latvia, Malta, Mexico)
Cluster4 (Iceland, Moldova)
Cluster7 (Estonia, New Zealand, Serbia)
It can be seen that the countries were split in different ways when this method was used.
6. CONCLUSION
Logistics sector, which is the fundamental part of economy, and transportation, which is the
most important activity of this sector, are based on 7/24 service. In addition, increasing competition in
the globalized market requires efficient planning in transportation activities by taking into consideration
variables that affect performance of these activities. Transportation is a multi-disciplinary field, and

Mehmet Akif Ersoy İktisadi ve İdari Bilimler Fakültesi Dergisi - Mehmet Akif Ersoy University Journal of Economics and Administrative Sciences Faculty
Cilt:7 Sayı:2 s.473-496 Volume:7 Issue:2 p.473-496
Temmuz 2020 July
492
there are many variables affecting transportation performance such as transportation infrastructure of
the country, types of transportation, transportation fares and taxes, transportation safety, equipment and
regulations and effective use of information technologies.
This study examined clustering of OECD countries and selected non-member countries
according to their logistics-based transportation activities. The variables related to transportation
activities and 47 countries were examined through the data obtained from the available database.
For the purposes of the study, the author also collected time-based cross-sectional data related
to sub-variables such as transportation infrastructure, transportation measures, economic and social
indicators, safety, performance indicators and short-term indicators.
The basic aim of the study is to determine clusters for these countries according to basic
transportation variables. Therefore, it explained the idea behind clustering and clustering methods as
well.
Hierarchical clustering, also known as hierarchical cluster analysis, is an algorithm that groups
similar object into groups called clusters. The endpoint is a set of clusters, where each cluster is distinct
from each other cluster and the objects within each cluster are broadly similar to each other. A
dendrogram is a type of tree diagram showing hierarchical clustering relationships between similar sets
of data.
Other method is fuzzy clustering method, which is used when clusters are not clearly formed or
some objects are inconsistent in cluster membership. Fuzzy clustering methods provide information
about uncertainty cluster memberships. The current study used fuzzy clustering c-means algorithm.
Under the light of the data obtained from the database regarding OECD countries and selected
non-member countries, the following variables were determined after a series of attempts: Investment
Spending, Maintenance Spending, Containers Transport, Inland Freight Transport, Share of Value
Added by The Transport Sector, Total Inland Freight Transport in Tonne-Km Per One Thousand Units
of Current USD GDP, Road Freight Transport in Tonne-Km Per One Thousand Units of Current USD
GDP.
Cross-sectional data were used in the analysis; however, it was not possible to access data
providing complete information about all the countries. The gaps in the data were eliminated through
the use of means. Since the extreme values of the variables have different structures, they have negative
effects on cluster analysis. In this case, data should be standardized or transformed. Here, the data set
was standardized.
Because the number of clusters was not known in advance, the analysis started by using Ward
technique and seven clusters were obtained accordingly. Fuzzy c-means method was used to examine
clustering structures of 47 countries. The ideal number of clusters was determined as 5 with the help of
indices in fuzzy c-means method.
The findings showed that the clusters obtained through these two methods are different from
each other. When the clusters of countries obtained from two methods according to the variables were

Classification of Logistics-Based Transportation Activities in OECD Countries and Selected Non-Member Countries Through Cluster Analysis - Kümeleme
Analizi ile OECD Ülkeleri ve Seçilmiş Üye Olmayan Ülkelerin Lojistik Faaliyetlerine Dayalı Taşımacılık Sınıflandırılması
Gülsen Serap ÇEKEROL
493
examined, it was concluded that those obtained through fuzzy clustering c-means algorithm were more
appropriate.
When the clusters obtained from hierarchical clustering Ward method and fuzzy c-means
algorithm are examined, it can be said that there are fewer number of clusters obtained from fuzzy c-
means algorithm and the countries in these clusters have similar structures.
Cluster 1 and Cluster 6 are similar in terms of grouping according to both methods, and both
clusters involve Turkey. The countries in these clusters have similarities for the following variables:
inland freight transport, maintenance spending and Share of Value Added by The Transport Sector. In
addition, they are all developing economies and have extensive land transportation fleets since they
mainly prefer land transportation for domestic shipping activities.
Cluster 2 consists of developed countries in terms of trade volume which have high expenses
for “investment spending” and “maintenance spending”. The countries in one single cluster according
to fuzzy clustering were split in different clusters according to the results of the hierarchical clustering
method.
Clusters 3, which has the highest number of countries, involves countries having similar
structures in terms of the following variables: Maintenance Spending, Total Inland Freight Transport
in Tonne-Km Per One Thousand Units of Current USD GDP, Road Freight Transport in Tonne-Km Per
One Thousand Units of Current USD GDP.
Cluster 4 involves mostly European countries and the countries in the cluster have similar
structures for the following variables: Share of Value Added by The Transport Sector, Total Inland
Freight Transport in Tonne-Km Per One Thousand Units of Current USD GDP, Road Freight Transport
in Tonne-Km Per One Thousand Units of Current USD GDP.
Cluster 5 consists of developing countries with low population density, and their transportation
activities are limited due to limited economic activities.
“Investing Spending and Maintenance Spending” are two effective variables for transportation
indicators of OECD countries and selected non-member countries. Since economic volume determines
transportation indicators, here investment and transportation rates functioned as a determining factor in
clustering. The future studies might examine clustering according to different characteristics of countries
in terms of economy and through different algorithms in terms of statistical data.
REFERENCES
Aksoy, Y., Özkan, E.M., Karanfil, S. (2014). Bulanık Mantığa Giriş, 2.Baskı, Yıldız Teknik
Üniversitesi Basım Yayın Merkezi, İstanbul.
Aldenderfer, M.S. ve Blashfield R.K. (1984). Cluster Analysis, Sage Publications.
Alpar, R., (2011). Uygulamalı Çok Değişkenli İstatistiksel Yöntemler, Detay Yayıncılık,
Ankara.

Mehmet Akif Ersoy İktisadi ve İdari Bilimler Fakültesi Dergisi - Mehmet Akif Ersoy University Journal of Economics and Administrative Sciences Faculty
Cilt:7 Sayı:2 s.473-496 Volume:7 Issue:2 p.473-496
Temmuz 2020 July
494
Bezdek J.C. (1981). Pattern Recognition with Fuzzy Objective Function Algorithms, Plenum
Press, NewYork.
Bowersox, D.j., Closs, D.J, Cooper, M.B. (2002). Supply Chain Logistics Management, The
McGraw Hill/Irwim Series, Ninth Edition, New York.
Çancı, M. ve Güngören, M. (2013). “İktisadi Yaşamda Taşımacılık Sektörü”. Elektronik Sosyal
Bilimler Dergisi, 12 (45), pp.198-213.
Çekerol, G.S. (2019). Türkiye’de Lojistik Stratejileri ve Pratikler, Nisan Kitabevi, Eskişehir.
pp.10.
Dibb, S. (1998). Market Segmentation: Strategies for success, Marketing
Intelligence&Planning, 16/7, pp. 394–406.
Döring, C., Lesot, M.J., & Kruse, R. (2006). Data analysis with fuzzy clustering methods.
Computational Statistics & Data Analysis, pp. 192 – 214.
Everitt, B. (1974). Cluster Analysis, London: Heinemann Educational Books Ltd.
Fu, P.H., Yin, H.B., (2012). “Logistics Enterprise Evaluation Model Based On Fuzzy Clustering
Analysis”, Physics Procedia 24, pp.1583 – 1587.
Hair, J.F., Anderson, R.E., Tatham, R.L. ve Black, W.C. (1998). Multivariate data analysis.
(Fifth Edition). Prentice-Hall.
Hirschinger, M., Spickermann, A., Hartmann, E., Gracht, H.V.D., Darkow, I.L., (2015). “The
Future of Logistics in Emerging Markets—Fuzzy Clustering Scenarios Grounded in
Institutional and Factor‐Market Rivalry Theory”, Journal of Supply Chain Management
Volume 51, Issue 4.
Höppner, F., Klawonn, F., Rudolf, K., Runkler, T. (1999). Fuzzy Cluster Analysis: Methods for
Classification Data Analysis and Image Recognition. John Wiley & Sons, pp. 5-75.
Johnson, R. A. And D. W. Wichern (1988). Applied Multivariate Statistical Analysis:(2nd Ed.)
Prentice Hall, Englewood Cliffs, New Jersey.
Keskin, M.H. (2015). Lojistik El Kitabı, Küresel Aktörlerin Lojistik Pratikleri, 2. Basım, Nobel
Yayıncılık, Ankara, pp. 65.
Korinek, J. ve Sourdin, P. (2011). To what extent are high- quality logistics services trade
facilitating? OECD Trade Policy Papers, No. 108, Paris.
Koyuncugil, A. S. (2006). Bulanık veri madenciliği ve sermaye piyasalarına uygulanması,
Ankara Üniversitesi Fen Bilimleri Enstitüsü İstatistik Anabilim Dalı, Doktora Tezi,
Ankara.

Classification of Logistics-Based Transportation Activities in OECD Countries and Selected Non-Member Countries Through Cluster Analysis - Kümeleme
Analizi ile OECD Ülkeleri ve Seçilmiş Üye Olmayan Ülkelerin Lojistik Faaliyetlerine Dayalı Taşımacılık Sınıflandırılması
Gülsen Serap ÇEKEROL
495
Lima, F.S., Oliveira, D., Gonçalves, M.B., Samed, M.M.A. (2014). “Humanitarian Logistics:
A Clustering Methodology for Assisting Humanitarian Operations”, Journal of
Technology Management & Innovation vol.9 no.2 Santiago jul.
Malhotra, N. (2007). Marketing Research- An Applied Orientation Upper Saddle River. Prentice
Hall.
Mansoori, E.G. (2011). FRBC: A Fuzzy Rule-Based Clustering Algorithm. IEEE Transactıons
on Fuzzy Systems, 19 (5), 960-971.
Meng, W. (2007), “Optimize E-Commerce Supply Chain Based on the Fuzzy Clustering
Analysis”, 2007 IEEE International Conference on Automation and Logistics, I.E.E.E.
Murtagh, F., Contreras, P., 2017, “Algorithms for hierarchical clustering: an overview II”,
WIREs Data Mining and Knowledge Discovery, (7), Number:6, pp. 1-16.
Naes T., Mevik T.H., (1999). The Flexibility of Fuzzy Clustering Illustred By Examples, Journal
Of Chemo Metrics.
Özdamar, K. (2004). Paket programlar ile İstatistiksel Veri Analizi (Çok değişkenli analizler).
(5. Baskı). Eskişehir: Kaan Kitabevi.
Özdamar, K., (2010). Paket Programlar ile İstatistiksel Veri Analizi Çok Değişkenli Analizler –
2. (7. Baskı). Eskişehir: Kaan Kitabevi.
Rafsanjani, M.K., Varzaneh, Z.A., Chukanlo, N.E. (2012). “A survey of hierarchical clustering
algorithms”, The Journal of Mathematics and Computer Science, Cilt 5, Sayı 3, pp. 229-
240.
Ren,Y.C., Xing, T., Quan, Q., Zhao, G.Q. (2010). “Fuzzy Cluster Analysis of Regional City
Multi-level Logistics Distribution Center Location Plan”, Quantitative Logic and Soft
Computing 2010, pp. 499-508.
Ruspini, E.H. (1973). New experimental results in fuzzy clustering. Information Science, 6, pp.
273-284.
Siepermann, C. (2003). ‘Logistikkosten’, WiSu-Das Wirtschaftsstudium, Heft:7, 2003, s. 879.
Şen, Z., (2004). Mühendislikte Bulanık Mantık ile Modelleme Prensipleri, Su Vakfı Yayınları,
İstanbul.
Taşkın, E. ve Durmaz, Y. (2012). Lojistik Faaliyetler. Detay Yayıncılık, Ankara.
Trappey, C., Trappey, A.J.C., Chang, A.C., Huang, A.Y.L. (2010). “Clustering analysis
prioritization of automobile logistics services”, Industrial Management&Data Systems,
Vol. 110, No.5, pp.731-743.

Mehmet Akif Ersoy İktisadi ve İdari Bilimler Fakültesi Dergisi - Mehmet Akif Ersoy University Journal of Economics and Administrative Sciences Faculty
Cilt:7 Sayı:2 s.473-496 Volume:7 Issue:2 p.473-496
Temmuz 2020 July
496
Wang, L., Wei, L. (2016). “Clustering analysis of dangerous goods transportation of logistics
platform based on improved K-means algorithm”, 13th International Conference on
Service Systems and Service Management (ICSSSM), Kunming, China.
Council of Higher Education, Thesis Center. Retrieved from
https://tez.yok.gov.tr/UlusalTezMerkezi/tezSorguSonucYeni.jsp (Accessed
10.01.2020)
Council of Supply Chain management Proffesional, https://cscmp.org/ (Accessed 19.12.2019)
Repuclic of Turkey, Ministry of Foreign Affair, http://www.mfa.gov.tr/ (Accessed 11.12.2019)
Web of Science Group, https://mjl.clarivate.com (Accessed 07.01.2020)
Search for peer-review journals, articles, book chapter and open access content,
www.sciencedirect.com (Accessed 07.01.2020)
Organization for Economic Co-Operation and Development, https://stats.oecd.org/ (Accessed
12.12.2019)

497
MEHMET AKİF ERSOY ÜNİVERSİTESİ
İKTİSADİ VE İDARİ BİLİMLER FAKÜLTESİ DERGİSİ
Mehmet Akif Ersoy University
Journal of Economics and Administrative Sciences Faculty
ISSN: 2149-1658 Cilt: 7 Sayı: 2 s.497-509
Volume: 7 Issue: 2 p.497-509
Temmuz 2020 July
YAPAY SİNİR AĞLARI İLE BIST-100 ENDEKS DEĞERİNİN TAHMİN EDİLMESİ
FORECASTING BIST-100 INDEX VALUE WITH ARTIFICIAL NEURAL NETWORKS
Aygülen Kayahan KARAKUL1
1. Dr. Öğr. Üyesi, İzmir Katip Çelebi Üniversitesi,
İktisadi ve İdari Bilimler Fakültesi,
[email protected], https://orcid.org/0000-0002-8310-1709
Makale Türü Article Type
Araştırma Makalesi Research Article
Başvuru Tarihi Application Date
17.04.2020 04.17.2020
Yayına Kabul Tarihi Admission Date
05.07.2020 07.05.2020
DOI
https://doi.org/10.30798/makuiibf.721866
Öz
Bu çalışmanın amacı Yapay Sinir Ağları’nın finans alanındaki tahmin
problemlerine uygulanabilirliğinin gösterilmesi ve Borsa İstanbul (BIST)-100
Endeksini etkileyen değişkenler arasındaki ilişkilerin modellenmesidir.
Çalışmada BIST-100 Endeksi, Gecelik Faiz Oranları ve Dolar Kuru arasındaki
ilişkiler ileri beslemeli, geriye yayılımlı Çok Katmanlı Algılayıcı (Multi-
Layered Perceptron-MLP) kullanılarak Yapay Sinir Ağları ile modellenmiş ve
BIST-100 Endeks değeri tahmin edilmiştir. Çalışmada 4 Ocak 2010 ile 7 Ocak
2020 arasındaki 2511 iş gününe ait veriler Türkiye Cumhuriyet Merkez
Bankası Elektronik Veri Dağıtım Sisteminden alınmıştır. Veri setinin % 90’ı
eğitim, % 10’u test verileri olarak ayrılmış ve MATLAB 2020a ile veriler
analiz edilmiştir. Çeşitli eğitim, aktivasyon ve transfer fonksiyonları arasından
en uygun olanları veri seti üzerinde yapılan denemeler ile belirlenmiş,
sonrasında çeşitli mimarideki modeller kurulmuş; modellerin tahmin
başarıları, tahmin değerler ile gerçek veriler arasındaki regresyon ilişkisi ile
belirlenmiştir. Kurulan modeller ile eğitilen ağların test verileri üzerindeki
simülasyonu sonrasında modellerin performansları Ortalama Mutlak Yüzde
Hata (Mean Absolute Percentage Error-MAPE) değeri kullanılarak
yapılmıştır. Elde edilen sonuçlara göre değişkenler arasındaki ilişkileri
modelleyen ve en iyi performansı gösteren ağ, mimarisi 2-10-10-1 olan iki
gizli katmanlı, her gizli katmanında 10’ar nöronu olan ağdır. Böylece Yapay
Sinir Ağlarının finans alanındaki tahmin problemlerine uygulanabilir olduğu
görülmüştür.
Anahtar Kelimeler: Yapay Sinir Ağları, Tahmin Modeli, BIST-100 Endeksi,
Abstract
The aim of this research is to apply Artificial Neural Networks in finance
problems as well as to model the relationships between variables that effect
the Stock Market of Turkey:Borsa Istanbul. The relationship between BIST-
100 index, Overnight Interest Rates and Exchange Rate of Dollar modelled by
using feed-forward back propogation Multilayer Perceptron(MLP) of
Artificial Neural Networks and BIST-100 index value is estimated. The data
is taken from Turkish Republic Central Bank Electronic Data Distribution
system. 2511 data between 4 January 2010 and 7 January 2020 of working
days has been used. The % 90 of data set is used for training, % 10 is used for
testing. MATLAB 2020a is used for analysis. Many training, activation and
transfer functions under many architectures are used to establish the most
robust model. The performance is measured by the regression relationship
between the exact values and estimated values. The forecasting performance
of simulation of networks on test data is measured by Mean Absolute
Percentage Error-MAPE. According to the results the best performed neural
network that models the relationship between variables has 2 hidden layers,
with 10 neurons in each hidden layer and has the architecture 2-10-10-1.
Therefore Artificial Neural Networks can be used in the forecasting problems
of financial issues.
Keywords: Artificial Neural Networks, Forecasting Model, BIST-100
Index,

Mehmet Akif Ersoy İktisadi ve İdari Bilimler Fakültesi Dergisi - Mehmet Akif Ersoy University Journal of Economics and Administrative Sciences Faculty
Cilt:7 Sayı:2. s.497-509 Volume:7 Issue:2 p.497-509
Temmuz 2020 July
498
EXTENDED SUMMARY
Research Problem
This research has been conducted to forecast the Stock Market index of Turkey-Borsa Istanbul
(BIST) 100 index, by using an advanced technique: Artificial Neural Networks (ANNs).
Research Questions
The questions of research are listed as follows: Is it possible to use ANNs for forecasting the
BIST-100 Index of Turkey? Is it possible to model the relationships between variables BIST-100 Index,
Exchange Rate of Dollar and the overnight interest rates? If it is possible to model the patterns between
those variables is it possible to improve the model and find the best model by using the training and
learning capabilities of ANN.
Literature Review
Prediction is a part of science which enables to foresee the future. Forecasting and modelling
studies on Stock Markets enable to reduce the uncertainities about the future, so that the businesses can
make true investment decisions (Usul, Küçüksille ve Karaoğlan, 2017). The importance of the financial
studies requires to use advanced forecasting techniques. ANN which is a sub branch of Artificial
Intelligence, can learn from a sample of data, keep the learned knowledge and use this knowledge in a
sample of data that was not seen before, as well as it does not require any pre assumption. ANNs are
used in many fields mostly in signal processing, predicting and clustering as nonlinear, multi-layered
parallel regression techniques such as function approximation, pattern matching, data clustering,
classification and conceptualization, finding out parameters, accumulating knowledge through training,
application of a prior knowledge of the connection weights, adding knowledge in a neural network
structure for the purpose of Approximate Reasoning (Shanmuganathan, 2016:8-9). So this advanced
technique, ANN, is the best method to use in forecasting in the financial aspects, like predicting the
Stock Market index value.
Methodology
ANN enables to model the non linear relationships wthout any restriction as controversy to those
in the conventional statistical methods. ANN is a modelling method that simulates the biological neurons
in a nervous system of a human being with the help of the learning algorithms and activation functions
as in the cognitive functions of nervous system. The degree of accuracy of model can be calculated with
the Coefficient of Determination or Correlation Coefficient and the forecasting performance of network
is determined by the Mean Absolute Percentage Error (MAPE). The dataset in the research consisting
of 2511 days' data, is obtained from the official website of Turkish Republic Central Bank. Independent
variables are exchange rate of Dollar and overnight interest rates which are determined bu a literature
review on Stock Market index prediction. The dependent variable is the BIST-100 index value. The feed
forward and back propogation Multilayered Perceptron (MLP) is used to construct a model between
variables. Training, activation and learning algorithms are changed in each experiment to find the best
Yapay Sinir Ağları İle BIST-100 Endeks Değerinin Tahmin Edilmesi - Forecasting BIST-100 Index Value With Artificial Neural Networks
Aygülen Kayahan KARAKUL
499
fit, then the trained networks are simulated on the tesing data and the performance of networks are
compared with MAPE.
Results and Conclusions
The dataset is divided into two sets as training and testing sets as 90 % and 10 % respectively.
The best neural network model is searched on the training set and the trained networks are simulated on
the testing set. The best model between variables has been set up by using the learning capabilities of
ANNs. By changing the learning, training and activation functions in 16 experiments the best ones are
selected. 8 different models has been set up and 2 of them has been eliminated according to the
Regression results in MATLAB 2020a. The best model is selected between the rest ones by changing
the hidden layers and neurons in the hidden layers. The trained networks are simulated on the test data.
The performance of models has been compared with Mean Absolute Percentage Error- MAPE. As a
result the best model has an architecture of 2-10-10-1 with 2 hidden layers and 10 neurons in each hidden
layers. The MAPE is observed as 7, 91 % . It is obtained that ANN can be successfully used to forecast
the BIST-100 index value.

Mehmet Akif Ersoy İktisadi ve İdari Bilimler Fakültesi Dergisi - Mehmet Akif Ersoy University Journal of Economics and Administrative Sciences Faculty
Cilt:7 Sayı:2. s.497-509 Volume:7 Issue:2 p.497-509
Temmuz 2020 July
500
1. GİRİŞ
Yapay Zekâ, insan beyninin çalışma esasının matematiksel olarak modellenmesi fikrinden
doğmuştur. Bu fikir “sinir sisteminin merkezindeki beynin, biyolojik sinir ağları ile sürekli olarak bilgiyi
alıp, işlemesi ve sinir ağları içinden çıkan sonuçlara göre uygun kararları vermesi” (Haykın, 2009, 36)
durumunun benzetimidir. Yapay Sinir Ağları (YSA) biyolojik nöronların çeşitli bilgilerin depolandığı
birimlerden sinyallerle kurdukları ağ yapısı içinde yeni bilgiler karşısında onları sınıflama, gruplama,
ayırt etme ve yeniden üretme gibi tepkiler vermesi esasına dayanır. YSA sayesinde biyolojik sinir
ağlarının anlama, anlamlandırma ve öğrenme özellikleri matematiksel olarak modellenebilmekte,
böylece bir veri setinin değişkenleri arasındaki ilişkiler çeşitli fonksiyonlar ve algoritmalar yardımıyla
genel bir ağ yapısı olarak ifade edilebilmektedir.
İnsan zekâsının bir taklidi olarak kurgulanan Yapay Zekânın alt bileşeni olan yöntemler sadece
doğa bilimlerinde değil, aynı zamanda sosyal bilim alanlarında da sıklıkla kullanılabilmektedir. Bugün
gelinen noktada bu yöntemler tıbbi görüntüleme teknolojileri, hastalık nedenlerinin belirlenmesi,
genetik kan ve örnekleme haritalarının oluşturulması, (Kattan, Abdullah, & Geem, 2011: 5-6; Haykın,
1999), savunma sanayisinde uçuş yörüngelerinin belirlenmesi, robotik sistemlerin geliştirilmesi gibi
mühendislik projelerinde ve doğa bilimleri alanlarında olduğu kadar, aynı zamanda makroekonomik
tahminler, sigorta risk analizi, stok yatırım analizi, banka kredilerinin değerlendirilmesi, üretim
yönetimi, kalite analizi, otomasyon sistemlerinin geliştirilmesi, üretim birimlerinin optimizasyonu gibi
iktisadi konularda ve sosyal bilim alanlarında da kullanılmaktadır (Haykın, 1999).
Hisse senedi piyasası, ülke ekonomilerinin önemli göstergelerinden biri olup, bu piyasanın
bileşenleri arasındaki ilişkiler birçok çalışmada araştırılmıştır. Hisse senedi piyasasında yapılacak
tahmin ve modelleme çalışmaları, geleceğe dönük belirsizliklerin azaltılmasını sağlayacak ve böylece
işletmelerin yatırım konularında doğru kararlar almasına yardımcı olacaktır (Usul, Küçüksille ve
Karaoğlan, 2017). Bu araştırmanın amacı YSA’nın finans alanına uygulanabilirliğinin incelenmesi ve
bu yolla Borsa İstanbul (BIST) Endeks değerinin tahmininin yapılmasıdır. İyi finansal tahmin
modellerinin kurulması, finansal piyasalarda iyi kararlar verilmesini sağlayacaktır. Çalışmanın bundan
sonraki bölümleri şu şekilde oluşturulmuştur: Birinci bölümde daha önce yapılmış benzer çalışmalara
yer verilmiş, İkinci bölümde araştırmanın yöntemi olarak seçilen YSA ile modelleme verilmiş, üçüncü
bölümde araştırmanın bulguları, dördüncü bölümde de sonuçları verilmiştir.
2. LİTERATÜR
YSA, finans alanında borsa verileri üzerinde birçok tahmin probleminde kullanılmıştır. Bu
bölümde konu alanı olarak finans, yöntem olarak YSA kullanan araştırmalara yer verilmiştir.
Tektaş ve Karataş (2004) araştırmalarında gıda ve çimento alanlarında faaliyet gösteren ve hisse
senetleri İMKB’de işlem gören, 7 şirketin hisse senedi fiyatlarını tahmin etmeyi amaçlamışlar, YSA ve
çoklu regresyon tekniklerini haftalık ve günlük verilerden oluşan iki veri seti üzerinde kullanmışlardır.

Yapay Sinir Ağları İle BIST-100 Endeks Değerinin Tahmin Edilmesi - Forecasting BIST-100 Index Value With Artificial Neural Networks
Aygülen Kayahan KARAKUL
501
Haftalık verilerde bağımlı değişken olarak şirketlerin Cuma günkü hisse senedi kapanış fiyat bilgisini,
bağımsız değişkenler olarak aylık enflasyon endeksi, bir aylık mevduat faiz oranları, IMKB-100
Endeksi, IMKB Sınai Endeksi ve Dolar Kurunu kullanmışlardır. Günlük verilerde ise bağımlı değişken
olarak günlük hisse senedi kapanış fiyatı, bağımsız değişkenler olarak Dolar Kuru, IMKB-100 Endeksi
ve IMKB Sınai Endeksini kullanmışlardır. Tahmin performansı olarak gerçek ve tahmin veriler
arasındaki korelasyon katsayısını dikkate almışlardır. Elde ettikleri sonuçlar, günlük ve haftalık veriler
üzerinde uygulanan YSA’lar arasından günlük verilerin kullanıldığı ağ yapılarının daha başarılı
olduğunu; günlük veriler üzerindeki regresyon ve YSA arasından ise YSA yönteminin daha başarılı
olduğunu göstermektedir.
Kutlu ve Badur (2009) Borsada önceki günün kapanış fiyatını tahmin etmeyi amaçlamışlardır.
Araştırmacılar kurdukları üç modelde farklı bağımsız değişkenler kullanmışlardır. Birinci modeldeki
bağımsız değişkenler Dolar Kuru ve gecelik faiz değerleri, ikinci modeldekiler birinci modeldekilere ek
olarak haftanın günleri, üçüncü modeldekiler de ikinci modeldekilere ek olarak farklı 7 ülkedeki borsa
endeksi değerleridir. Model performanslarını belirlemek için R2 değerini kullanmışlardır. Elde ettikleri
sonuçlara göre en yüksek performansa sahip model en az sayıda bağımsız değişkeni içeren birinci
modeldir. Böylece daha çok sayıda bağımsız değişkenin her zaman daha iyi bir tahmin performansı
sergileyeceği düşüncesinin yanıltıcılığı ortaya çıkmıştır.
Merh, Saxena ve Pardasani (2011) araştırmalarında Bombay Borsası'na kayıtlı olan 30 şirketin
hisse senedi fiyat endeksi olan Sensex Endeks değerini tahmin etmeyi amaçlamışlardır. Çalışmalarında
her günün açılış değeri, en yüksek değeri, en düşük değeri ve kapanış değerini bağımsız değişken olarak
ele alıp bir sonraki günün değerini YSA ve ARIMA yöntemleri ile tahmin etmişlerdir. Tahmin
performanslarını AAE (Average Absolute Error- Ortalama Mutlak Hata), RMSE (Root Mean Square
Error-Hataların Ortalama Karekökü), MAPE (Mean Absolute Percentage Error-Ortalama Mutlak Yüzde
Hata) ve MSPE (Mean Square Percentage Error-Ortalama Karesel Yüzde Hata) ile karşılaştırdıklarında
ARIMA ile kurulan model performansının daha iyi olduğunu belirtmişlerdir.
Akcan ve Kartal (2011) İMKB-Sigorta Endeksini oluşturan 7 şirketin hisse senedi fiyatlarını
Yapay Sinir Ağları ile tahmin etmeyi amaçlamışlardır. Araştırmacılar çalışmalarında 4 makro ekonomik
değişken ve 8 mikro ekonomik değişkeni bağımsız değişkenler olarak kullanmışlardır. 2009 ve 2011
yılları arasındaki 508 işgünü verisini % 70 ve % 30 oranlarında eğitim ve test verileri olarak ayırmışlar,
kurdukları modellerin performanslarını MAE (Mean Absolute Error-Ortalama Mutlak Hata) ve MAPE
ile karşılaştırmışlar, YSA'nın tahmin performansının daha iyi olduğunu bulmuşlardır.
Güresen, Kayakutlu ve Daim (2011) Amerika’daki NASDAQ Borsası endeks değerini tahmin
etmeyi amaçladıkları çalışmalarında farklı YSA modellerini kullanmışlardır. Çok Katmanlı Algılayıcı,
Ghiassi & Saidane (2005) tarafından geliştirilen Dinamik YSA ve Roh (2007) tarafından geliştirilen
hibrit YSA modellerinin tahmin performanslarını karşılaştırmışlardır.
Yakut, Elmas ve Yavuz (2014) çalışmalarında BIST Endeks Değerini tahmin etmeye
çalışmışlar, çalışmalarında Kutlu ve Badur’un (2009) çalışmalarında ele aldıkları değişkenlere ek olarak

Mehmet Akif Ersoy İktisadi ve İdari Bilimler Fakültesi Dergisi - Mehmet Akif Ersoy University Journal of Economics and Administrative Sciences Faculty
Cilt:7 Sayı:2. s.497-509 Volume:7 Issue:2 p.497-509
Temmuz 2020 July
502
iki ve üç gün önceki BIST Endeksi değerlerini ekleyerek 9 farklı model kurmuşlardır. Modelleri
üzerinde YSA ve vektör destek makineleri yöntemlerini uygulamışlardır. Performans ölçütü olarak ele
aldıkları R2 değeri çalışmalarında 0,91 ile 0,97 arasında değişmektedir. YSA yöntemi kullandıklarında
tahmin performansı açısından en başarılı modeller bir önceki günün endeks değerini tahmin eden Dolar
Kuru, faiz oranı modeli ile yine bir önceki günün endeks değerini tahmin eden Dolar Kuru, faiz oranı
ve haftanın günleri değişkenlerinden oluşan modellerdir.
Çalışkan ve Deniz (2015) BIST-30 endeksinde yer alan verilerini elde edebildikleri 27 şirketin
hisse senedi fiyatlarını ve fiyat yönünü tahmin etmeyi amaçlamışlardır. Girdi değişkenleri olarak
şirketlerin günlük en yüksek, en düşük, kapanış fiyatlarını, günlük getiri oranlarını ve 5 günlük ortalama
fiyat değerlerini almış, ayrıca her hisse senedi için aynı olan BIST 100 değeri, Dolar Kuru, altın fiyatları
gibi değişkenleri kullanmışlardır. Bir gizli katmanlı, gizli katmanında 50 nöron içeren bir ağla yaptıkları
tahminde 27 şirket için MAPE değerlerini 7 şirket dışında % 2'nin altında bulmuşlardır.
Moghaddam A.H, Moghaddam, M.H ve Esfandyari (2016) YSA kullanarak Amerika’daki
NASDAQ Borsası'nın endeks değerini iki farklı türdeki girdi kümesi ile tahmin etmeye çalışmışlardır.
70 günlük veriyi eğitim seti olarak, 29 günlük veriyi test seti olarak ayırmışlardır. İlk olarak dört gün
önceki değerleri ve haftanın günlerini kullanmışlar, ikinci olarak dokuz gün önceki değerleri ve haftanın
günlerini kullanmışlardır. Farklı eğitim ve transfer fonksiyonları ile farklı gizli katman ve gizli katman
içindeki farklı nöron sayıları ile oluşturdukları modellerin performanslarını R2 ve MSE (Mean Square
Error- Ortalama Karesel Hata) değerlerini kullanarak karşılaştırmışlardır.
3. ARAŞTIRMA YÖNTEMİ VE MODELİ
Yapay Sinir Ağları tıpkı insanlar gibi deneyimler yaşadıkça öğrenir ve bunu, belirli öğrenme
algoritmaları kullanarak gerçekleştirir. Ağın öğrendiği bilgiler, daha önce ağ tarafından kullanılmamış
olan veri setleri üzerinde uygulanır. YSA’lar işaret işleme, örüntü eşleme, veri kümeleme, fonksiyon
yakınsaması sureti ile sınıflandırma ve tahmin problemlerinde kullanılır. Ayrıca ağın eğitilmesi
sonucunda oluşan bağlantı ağırlıklarının öncel bilgisi, bulanık mantık işlemcilerinin genel bir türü olarak
ifade edilen Yaklaşık Düşünme (Approximate Reasoning) amacıyla da kullanılabilir (Shanmuganathan,
2016:8-9).
YSA’lar öğrenme biçimlerine göre danışmanlı (supervised), danışmansız (unsupervised),
takviyeli (reinforcement) öğrenme biçimlerine sahip olanlar olarak gruplanabilir. Danışmanlı
öğrenmede, ağa girdi ve çıktı değerleri verilir ve ağın bu parametreler arasındaki bağlantı ağırlıklarını
öğrenmesi beklenir. Danışmansız öğrenmede girdi değerleri verilerek ağın çıktı değerlerini bulması
beklenir. Takviyeli öğrenmede ise girdiler verilerek iyi çıktılar sağlandığında bağlantı ağırlıkları
ödüllendirilir, kötü çıktılar sağlanırsa ağırlıklar cezalandırılır (Shanmuganathan, 2016:8).
Mimarisine göre YSA’lar belirli (deterministic) ve belirsiz (stochastic) YSA'lar olarak
gruplanır. Sinir ağlarının işaretinin akış yönüne göre, ileri beslemeli (feedforward) ve geri beslemeli
(feedback) olarak gruplanır. Giriş katmanından çıkış katmanına doğru, işaretlerin yalnız bir yönde

Yapay Sinir Ağları İle BIST-100 Endeks Değerinin Tahmin Edilmesi - Forecasting BIST-100 Index Value With Artificial Neural Networks
Aygülen Kayahan KARAKUL
503
ilerlediği ağa ileri beslemeli ağ, bir sinirin çıkışından girişine işaretin ulaştığı ağa geri beslemeli ağ denir
(Nabiyev, 2016:587).
Şekil 1. Bir Biyolojik Nöron ve Bir Yapay Sinir Ağı
Kaynak: Kattan, Abdullah, & Geem (2011)
YSA, nöron adı verilen pek çok işlemci elemandan oluşmaktadır. Nöronlar birbirine belirli
ağırlıklar atanmış olan birleştirme mekanizmaları ile birbirine bağlanmaktadır. Değişkenler arasında
doğrusal ilişkiler olmadığında Çok Katmanlı Algılayıcı (Multi Layered Perception-MLP) kullanılır
(Nabiyev, 2016:602). Bu ağ yapısında girdi, çıktı ve gizli katman olmak üzere üç katman vardır.
Nöronlar girdi parametrelerini alıp toplayıp onlara bir sabit (bias) ekleyerek sonrasında transfer
fonksiyonu uygulayarak çıktı parametrelerini oluşturur. Matematiksel ifade ile bir P nöronunun;
𝑥1, … , 𝑥𝑛 girdi parametreleri ve bağlantı ağırlıkları 𝑤𝑝1, … , 𝑤𝑝𝑛 olmak üzere, girdileri ağırlıklar ile
çarpıp toplaması Eşitlik (1)’deki gibi gösterilebilir.
𝑢𝑃 = ∑ 𝑤𝑃𝑖𝑥𝑖𝑛𝑖=1 (1)
Sonrasında oluşan 𝑢𝑃 girdi bileşenlerine, birer katsayı (Bias-𝑏𝑃 ) ekleyerek Eşitlik (2) de 𝜑 ile
gösterilmiş olan aktivasyon fonksiyonu ile nöronun çıktısı olan 𝑦𝑃’ ler elde edilir.
𝑦𝑃 = 𝜑(𝑢𝑃 + 𝑏𝑃) (2)
YSA'da Nümerik Analizdeki iterasyon tekniklerine ve optimizasyona dayanan birçok öğrenme
algoritması vardır. Bunlardan birisi doğrusal olmayan gerçel değerli fonksiyonların karesi olarak ifade
edilebilen çok değişkenli fonksiyonların minimumunu bulmayı sağlayan bir iterasyon tekniği olan LM
(Levenberg-Marquardt) algoritmasıdır. (Laurakis, 2005). Bir diğeri Hessian matrisine yakınsayan bir
matris dizisini genellemeyi içeren OSS (One Step Secant) algoritmasıdır (Mukkamala, Sung ve
Abraham, 2003, s242). Bir diğeri de öğrenme oranını dinamik olarak kendisi ayarlayan GDA (Gradient
Descent with Adaptive Learning Rate)’algoritmasıdır.
Aktivasyon fonksiyonları da Threshold (Eşik Değeri Fonksiyonu), Sigmoid (Sürekli Eşikleme
Fonksiyonu), Doğrusal Fonksiyon, Katı Sınırlamalı Eşiklendirme Fonksiyonu (signum), Azalan
Gradyan (Gradient Descent-GM) ve Momentum ile Azalan Gradyan (Gradient Descent with
Momentum-GDM)’ dur. Aktivasyon fonksiyonları nöronun aktivasyon düzeyini çıktı sinyaline
dönüştürür (Sıbı, Jones & Sıddarth, 2013).
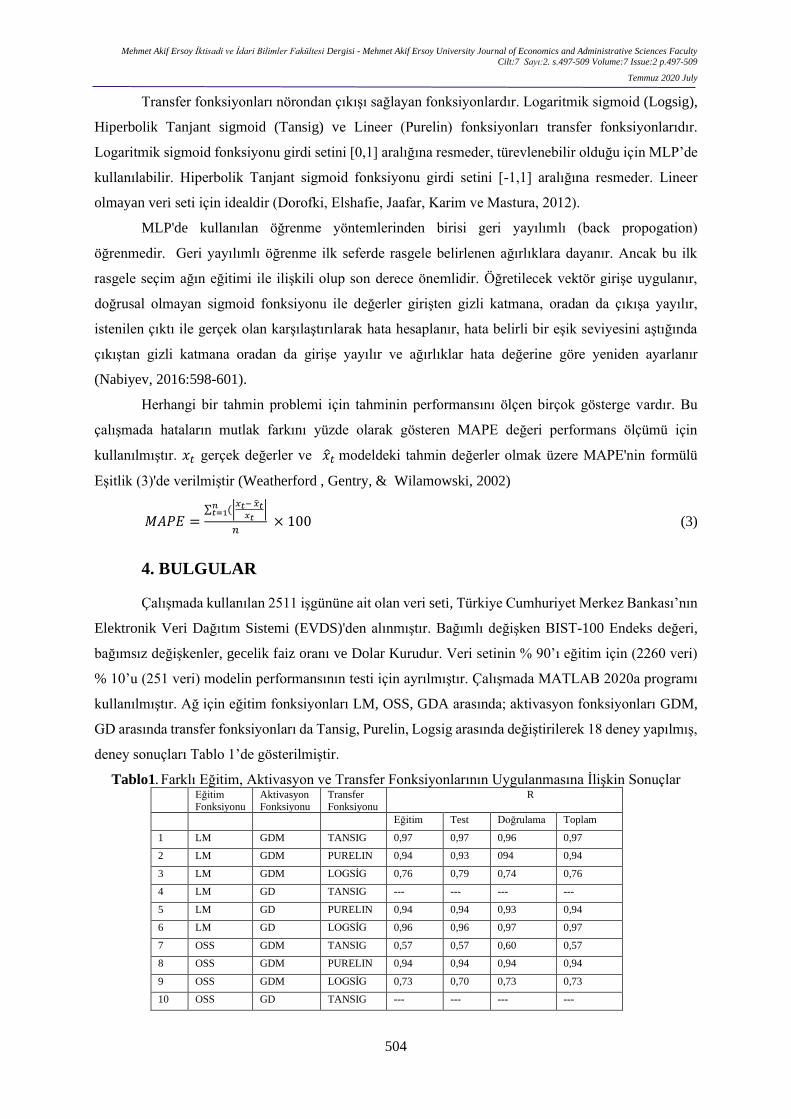
Mehmet Akif Ersoy İktisadi ve İdari Bilimler Fakültesi Dergisi - Mehmet Akif Ersoy University Journal of Economics and Administrative Sciences Faculty
Cilt:7 Sayı:2. s.497-509 Volume:7 Issue:2 p.497-509
Temmuz 2020 July
504
Transfer fonksiyonları nörondan çıkışı sağlayan fonksiyonlardır. Logaritmik sigmoid (Logsig),
Hiperbolik Tanjant sigmoid (Tansig) ve Lineer (Purelin) fonksiyonları transfer fonksiyonlarıdır.
Logaritmik sigmoid fonksiyonu girdi setini [0,1] aralığına resmeder, türevlenebilir olduğu için MLP’de
kullanılabilir. Hiperbolik Tanjant sigmoid fonksiyonu girdi setini [-1,1] aralığına resmeder. Lineer
olmayan veri seti için idealdir (Dorofki, Elshafie, Jaafar, Karim ve Mastura, 2012).
MLP'de kullanılan öğrenme yöntemlerinden birisi geri yayılımlı (back propogation)
öğrenmedir. Geri yayılımlı öğrenme ilk seferde rasgele belirlenen ağırlıklara dayanır. Ancak bu ilk
rasgele seçim ağın eğitimi ile ilişkili olup son derece önemlidir. Öğretilecek vektör girişe uygulanır,
doğrusal olmayan sigmoid fonksiyonu ile değerler girişten gizli katmana, oradan da çıkışa yayılır,
istenilen çıktı ile gerçek olan karşılaştırılarak hata hesaplanır, hata belirli bir eşik seviyesini aştığında
çıkıştan gizli katmana oradan da girişe yayılır ve ağırlıklar hata değerine göre yeniden ayarlanır
(Nabiyev, 2016:598-601).
Herhangi bir tahmin problemi için tahminin performansını ölçen birçok gösterge vardır. Bu
çalışmada hataların mutlak farkını yüzde olarak gösteren MAPE değeri performans ölçümü için
kullanılmıştır. 𝑥𝑡 gerçek değerler ve 𝑥𝑡 modeldeki tahmin değerler olmak üzere MAPE'nin formülü
Eşitlik (3)'de verilmiştir (Weatherford , Gentry, & Wilamowski, 2002)
𝑀𝐴𝑃𝐸 =∑ (|
𝑥𝑡− �̂�𝑡𝑥𝑡
|𝑛𝑡=1
𝑛 × 100 (3)
4. BULGULAR
Çalışmada kullanılan 2511 işgününe ait olan veri seti, Türkiye Cumhuriyet Merkez Bankası’nın
Elektronik Veri Dağıtım Sistemi (EVDS)'den alınmıştır. Bağımlı değişken BIST-100 Endeks değeri,
bağımsız değişkenler, gecelik faiz oranı ve Dolar Kurudur. Veri setinin % 90’ı eğitim için (2260 veri)
% 10’u (251 veri) modelin performansının testi için ayrılmıştır. Çalışmada MATLAB 2020a programı
kullanılmıştır. Ağ için eğitim fonksiyonları LM, OSS, GDA arasında; aktivasyon fonksiyonları GDM,
GD arasında transfer fonksiyonları da Tansig, Purelin, Logsig arasında değiştirilerek 18 deney yapılmış,
deney sonuçları Tablo 1’de gösterilmiştir.
Tablo1. Farklı Eğitim, Aktivasyon ve Transfer Fonksiyonlarının Uygulanmasına İlişkin Sonuçlar
Eğitim Fonksiyonu
Aktivasyon Fonksiyonu
Transfer Fonksiyonu
R
Eğitim Test Doğrulama Toplam
1 LM GDM TANSIG 0,97 0,97 0,96 0,97
2 LM GDM PURELIN 0,94 0,93 094 0,94
3 LM GDM LOGSİG 0,76 0,79 0,74 0,76
4 LM GD TANSIG --- --- --- ---
5 LM GD PURELIN 0,94 0,94 0,93 0,94
6 LM GD LOGSİG 0,96 0,96 0,97 0,97
7 OSS GDM TANSIG 0,57 0,57 0,60 0,57
8 OSS GDM PURELIN 0,94 0,94 0,94 0,94
9 OSS GDM LOGSİG 0,73 0,70 0,73 0,73
10 OSS GD TANSIG --- --- --- ---

Yapay Sinir Ağları İle BIST-100 Endeks Değerinin Tahmin Edilmesi - Forecasting BIST-100 Index Value With Artificial Neural Networks
Aygülen Kayahan KARAKUL
505
11 OSS GD PURELIN 0,94 0,94 0,93 0,94
12 OSS GD LOGSİG 0,95 0,95 0,95 0,95
13 GDA GDM TANSIG 0,71 0,73 0,75 0,72
14 GDA GDM PURELIN --- --- --- ---
15 GDA GDM LOGSİG 0,91 0,91 0,93 0,92
16 GDA GD TANSIG --- --- --- ---
17 GDA GD PURELIN 0,93 0,94 0,94 0,94
18 GDA GD LOGSİG … --- --- ---
Tablo 1’de verilen R değerleri anlamsız çıktığında sonuçlar gösterilmemiştir. Tablodaki
değerlere göre veri seti için eğitim fonksiyonu, öğrenme fonksiyonu ve transfer fonksiyonu olarak en
iyi sonuçları veren LM (Levenberg-Marquardt), GDM ve Tansig fonksiyonu belirlenmiştir. Bundan
sonraki aşamada YSA'nın farklı tipteki mimari yapıları bu fonksiyonlarla denenerek en iyi modelin
kurulması amaçlanmıştır. Bu amaçla kurulan farklı modellerin mimarileri ve bu modellerin Yapay Sinir
Ağları ile eğitilmeleri ile elde edilen sonuçlar Tablo 2'de verilmiştir.
Tablo2. Farklı Mimarideki Ağlara İlişkin Sonuçlar Yapı R
Eğitim Test Doğrulama Toplam
Model 1 2-5-1 0,97 0,97 0,96 0,97
Model 2 2-10-1 0,97 0,97 0,96 0,96
Model 3 2-20-1 - - - -
Model 4 2-5-5-1 0,97 0,97 0,98 0,97
Model 5 2-5-10-1 - - - -
Model 6 2-10-10-1 0,98 0,98 0,97 0,97
Model 7 2-10-20-1 - - - -
Model 8 2-20-20-1 0,98 0,98 0,97 0,98
Tablo 2’de anlamsız çıkan sonuçlar gösterilmemiştir. MATLAB programında gerçek değerler
ile modelden elde edilen tahmin değerler arasındaki ilişkiyi regresyon ile belirleyen modeller
gösterilmektedir. Örnek olarak 6. Modele ilişkin eğitim, doğrulama, test ve toplamdaki R değerleri,
Şekil 1’de verilmiştir. Şekil 1 incelenirse tahmin değerlerinin 4 durum için de regresyon doğrusunun
çevresinde dizildiği, R değerlerinin de 0,97- 0,98 olduğu görülebilir. Bu durum kurulan modelin tahmin
performansının iyi bir düzeyde olduğunu göstermektedir.

Mehmet Akif Ersoy İktisadi ve İdari Bilimler Fakültesi Dergisi - Mehmet Akif Ersoy University Journal of Economics and Administrative Sciences Faculty
Cilt:7 Sayı:2. s.497-509 Volume:7 Issue:2 p.497-509
Temmuz 2020 July
506
Şekil 2. Model 6 için Gerçek Değerler ile Tahmin Değerler Arasındaki İlişkiler
Bundan sonraki aşamada uygun sonuçlar veren Model 1, 2, 4, 6 ve 8'in test verileri üzerinde
simülasyonu gerçekleştirilmiştir. En iyi performansı gösteren modelin bulunması için Eşitlik (3)'de
formülü verilen MAPE değerleri karşılaştırılmıştır. Sonuçlar Tablo 3’te verilmiştir.
Tablo 3. En İyi Ağların Performans Sonuçları Ağ Yapısı Model 1 Model 2 Model 4 Model 6 Model 8
MAPE % 9,64 % 11,38 % 9,51 % 7,91 % 17,84
Tablo 3’e göre tahmin performansı en yüksek olan model, Model 6' dır. Model 6, mimarisi 2-
10-10-1 olan iki gizli katmanlı, her gizli katmanında 10 nöron olan ağdır, bu ağın mimarisi Şekil 2’de
verilmiştir. Sonuç olarak söz konusu tarih aralığındaki BIST-100 Endeksi, gecelik faiz oranları ve Dolar
Kuru arasındaki ilişkileri modelleyen ağ, eğitim fonksiyonu LM, aktivasyon fonksiyonu GDM, transfer
fonksiyonu tansig olan 2-10-10-1 mimarisine sahip olan Yapay Sinir Ağı'dır.
Şekil 3. En Uygun Ağın Mimarisi

Yapay Sinir Ağları İle BIST-100 Endeks Değerinin Tahmin Edilmesi - Forecasting BIST-100 Index Value With Artificial Neural Networks
Aygülen Kayahan KARAKUL
507
5. SONUÇLAR
Borsa verileri genellikle doğrusal olmayan veri setleri olduğundan varsayım gerektiren tahmin
yöntemleri kullanılarak analiz edilmesi zordur. YSA analizi yapabilmek için bir önkoşulun sağlanması
ya da bir varsayım gerekmemektedir. Bu araştırmada BIST-100 Endeks değerini tahmin etmek için
Dolar Kuru ve gecelik faiz oranı bağımsız değişkenler olarak ele alınmış, değişkenler arasındaki ilişkiler
YSA ile modellenmiştir. Öncelikle 2511 işgünü için EVDS' den alınan veri seti için en uygun transfer,
aktivasyon ve öğrenme fonksiyonları 18 deney yapılarak belirlenmiştir. Bunun sonucunda eğitim
fonksiyonu LM, aktivasyon fonksiyonu GDM transfer fonksiyonu tansig olarak belirlenmiştir. İkinci
aşamada veri seti içindeki ilişkileri modelleyen en uygun ağın tespiti için çeşitli mimarilerdeki modeller
kurularak model performansları MAPE değerleri ile karşılaştırılmıştır. Bu modellerden performansı en
iyi olan ağ, mimarisi 2-10-10-1 olarak belirlenmiştir.
Araştırma, literatürdeki birçok çalışma ile benzer olarak YSA'nın finans alanındaki çalışmalarda
iyi bir tahmin modeli kurma yöntemi olduğunu göstermiştir. İki bağımsız değişken ile bağımlı değişkeni
iyi bir performansla tahmin eden en iyi model kurulmuştur. Çalışmada tahmin performansı göstergesi
olarak kullanılan MAPE değeri, Model 6 için % 7,91'dir. Yani araştırmada kurulan modelle tahmin
edilmiş olan veriler, gerçek verilerden % 7,91 oranında sapma göstermektedir. Lewis (1982) MAPE
değerinin % 10'un altında olan modellerin tahmin performansını "çok iyi" olarak değerlendirmektedir.
Araştırma sonuçlarının Borsa alanında çalışan araştırmacı ve uygulayıcılar açısından örnek
teşkil edebilir, iktisadi karar birimleri için ve hisse senedi piyasasındaki yatırımcılar için yol gösterici
olabilir.
KAYNAKÇA
Akcan, A. ve Kartal, C. (2011). İMKB Sigorta Endeksini Oluşturan Şirketlerin Hisse Senedi
Fiyatlarının Yapay Sinir Ağları ile Tahmini. Muhasebe ve Finansman Dergisi. Temmuz.
(27-40).
Çalışkan, M.M.T, Deniz, D. (2015). Yapay Sinir Ağlarıyla Hisse Senedi Fiyatları ve Yönlerinin
Tahmini. Eskişehir Osmangazi Üniversitesi İİBF Dergisi, Aralık,10 (3), (177-194).
Dorofki, M., Elshafie, A.H., Jaafar, O., Karim, O.A. Mastura, S. (2012). Comparison of
Artificial Neural Network Transfer Functions Abilities to Simulate Extreme Runoff
Data. International Conference on Environment, Energy and Biotechnology IPCBEE
vol.33 Press, Singapore.
EVDS (2019). Türkiye Cumhuriyet Merkez Bankası Elektronik Veri Dağıtım Sistemi.
https://evds2.tcmb.gov.tr/index.php?/evds/serieMarket/collapse_1/5854/DataGroup/tur
kish/bie_mkbrgn/ Adresinden 08.01.2020 tarihinde alınmıştır.

Mehmet Akif Ersoy İktisadi ve İdari Bilimler Fakültesi Dergisi - Mehmet Akif Ersoy University Journal of Economics and Administrative Sciences Faculty
Cilt:7 Sayı:2. s.497-509 Volume:7 Issue:2 p.497-509
Temmuz 2020 July
508
Ghiassi, M., & Saindane, H. (2005). A Dynamic Architecture for Artificial Neural Networks.
Neurocomputing, 63, (397–413).
Güresen, E., Kayakutlu, G. ve Daim, T.U. (2011). Using Artificial Neural Network Models in
Stock Market Index Prediction. Expert Systems with Applications. 38. (10389-10397).
Haykın, S. (2009). Neural Networks and Learning Machines. Third Edition. Boston: Pearson
International Edition.
Kattan, A., Abdullah, R., & Geem, Z. W. (2011). Artificial Neural Network Training and
Software Implementation. Newyork: Nova Science.
Kutlu, B. ve Badur, B. (2009). Yapay Sinir Ağları ile Borsa Endeksi Tahmini. Yönetim. Yıl: 20,
Sayı: 63.(25-40).
Laurakis, M.I.A. (2005). A Brief Description of Levenberg - Marquard Algorithm implemented
by Levmar. Foundation of Research and Technology, (1-6).
Lewis, C. D. (1982). Industrial and Business Forecasting Methods. London: Butterworths.
Merh, N., Saxena, V.P. ve Pardasani, K.R. (2011). Next Day Stock Market Forecasting: An
Application of ANN and ARIMA. The IUP Journal of Applied Finance, Vol. 17, No. 1.
(70-84).
Moghaddam, A.H., Moghaddam, M.H., Esfandyari, M. (2016). Stock Market Index Prediction
Using Artificial Neural Network. Journal of Economics, Finance and Administrative
Sciences. 21. (89-93).
Mukkamala, S., Sung, A.H. ve Abraham, A. (2003). Intrusion Detection Using Ensemble of
Soft Computing Paradigms. (Ed: A. Abraham, K. Franke ve M. Köppen). Intelligent
System Design and Application İçinde. (239-250). New York: Springer.
Nabiyev, V. (2016). Yapay Zekâ. Stratejili Oyunlar, Örüntü Tanıma, Doğal Dil İşleme.
Genişletilmiş 5. Baskı. Ankara: Seçkin Yayıncılık.
Roh, T. H. (2007). Forecasting the Volatility of Stock Price Index. Expert Systems with
Applications, 33, (916–922).
Shanmuganathan, S. (2016). Artificial Neural Network Modelling: An introduction. (Ed:,
Shanmuganathan, S & Samarasinghe, S.) Artificial Neural Network Modelling İçinde.
(1-14), Switzerland: Springer.
Sıbı,P., Jones, S.A & Sıddarth, P. (2013). Analysis of Different Activation Functions Using
Back Propagation Neural Networks. Journal of Theoretical and Applied Information
Technology. Vol. 47 No.3.(1264-1268).

Yapay Sinir Ağları İle BIST-100 Endeks Değerinin Tahmin Edilmesi - Forecasting BIST-100 Index Value With Artificial Neural Networks
Aygülen Kayahan KARAKUL
509
Tektaş, A. ve Karataş, A. (2004). Yapay Sinir Ağları ve Finans Alanına Uygulanması: Hisse
Senedi Fiyat Tahminlemesi. İktisadi ve idari Bilimler Dergisi, Cilt: 18 Sayı: 3·4.(337-
349).
Usul, H., Küçüksille, E. ve Karaoğlan, S. (2017). Güven Endekslerindeki Değişimlerin Hisse
Senedi Piyasalarına Etkileri: Borsa İstanbul Örneği. Süleyman Demirel Üniversitesi
İktisadi ve İdari Bilimler Fakültesi Dergisi, C.22, S.3, (685-695).
Weatherford, L.R., Gentry, T.W. & Wilamowski, B. (2002). Neural Network Forecasting for
Airlines: A Comparative Analysis. Journal of Revenue Pricing Management, 1(4), (319-
331).
Yakut, E., Elmas, B. ve Yavuz, S. (2014). Yapay Sinir Ağları ve Destek Vektör Makineleri
Yöntemleriyle Borsa Endeksi Tahmini. Süleyman Demirel Üniversitesi İktisadi ve İdari
Bilimler Fakültesi Dergisi. C.19. S.1.(139-157).


