Embed Size (px)
Citation preview

Temperature reduction and local last glaciation maximum S. Imhof, C. Kull, J.-H. May, M. Grosjean, H. Veit 91
Samuel Imhof, Christoph Kull, Jan-Hendrik May, Martin Grosjean, Heinz Veit, Berne
1 Introduction
The Central Andes of South America (16°S-30°S) experienced major climatic changes during the late Quaternary, making this high altitude mountain region a key area for the study of processes and dynamics of tropical and extratropical climate variability. In the International Geosphere-Biosphere Program (IGBP), the Pole-Equator-Pole transect of the Americas (PEP I) has been analysed in detail by PAGES (Past Global Changes). The synthesis points to the climatic sensitiv-ity of this region (Markgraf et al. 2000). The challenge is to disentangle local and regional influences from hemispheric or global influences and processes of past climate variability (see Kull & Grosjean 1998).
Ice cores (Thompson et al. 1998; Thompson et al. 2003), lake sediments (Abbott et al. 2003; Grosjean et al. 2001), hydrological, glacier and climate modeling studies (Hostettler & Clark 2000; Klein et al. 1999; Kull et al. 2002; Seltzer 1992; Wyrwoll et al. 2000) provide quantifiable data for these environmental changes which occurred during the late Pleistocene and Holocene. The derived spatial and chronological pattern of climate variability in the western cordillera of northern Chile shows dynamical links to the extra-tropical westerly circulation south of 27°S and to the tropical influence in the northern part (Kull et al. 2002).
The eastern cordillera north of 27°S, situated close to the Amazon and Chaco basins, is mainly influenced by tropical circulation. There is still an ongoing debate about the chronology, the geographical extension and the related magnitude of late Pleistocene – Holocene environmental changes (Baker et al. 2001; Mour-guiard & Ledru 2003; Sylvestre et al. 1999).
Due to the aridity of this high elevation mountain range, morphological structures of former lake shore-lines and glacial moraines, for example, remain well preserved. An exact reconstruction of the past envi-ronment is possible. Actual annual precipitation in the center of the Arid Diagonal (Fig. 1) is about 100 mm, with a trend to higher values towards the north, east and south. This indicates that changes in the hydrologi-cal cycle are as important as changes in the temperature
regime. Recent and past glaciological conditions con-firm this fact, with missing glaciations in the extremely dry Arid Diagonal and above the continuous perma-frost belt (above 5500 m asl) being explained by lack of precipitation. Glacier dynamics, therefore, is mainly controlled by changes in the hydrological cycle (Kull et al. 2002). In the wetter areas north, south and to the east of the most arid zone, where annual precipitation reaches values of about 1000 mm as, for example on the eastern slope around Cochabamba, temperature (besides precipitation) plays an important role trig-gering glaciations. In this area, actual perennial snow cover and glaciers are limited to peaks above 5000 m asl. The different spatial sensitivity to moisture and/or temperature changes of glacier dynamics also influ-ences the chronology of local maximum glacier extent in the region, making it obvious that glaciers in the Central Andean area did not reach their maximum extent at the same time in all the areas (Kull et al. 2002). Large moraine systems in the region are the residual morphological features of former glaciations. The maximum extent was reached with a lowering of the equilibrium line altidudes (ELA) by as much as 1400 m (Mark et al. 2005).
During the past years, several studies focused on the detailed reconstruction of past glaciations in the central Andean region (Ammann et al. 2001; Kull & Grosjean 2000; Kull et al. 2003). Exposure age dating has been applied and is still in progress in order to establish a chronology of glacier advances in many parts of the Central Andes (Zech et al. 2006b). Fur-thermore, detailed studies using the mapped glaciers and subsequently applied mass balance models were successfully carried out to quantify the related past climatic conditions (Kull et al. 2002). These activi-ties concentrated on the western Chilean cordillera and the region of north-western Argentina, thereby encompassing the southern Altiplano (Fig. 1). Evi-dence for massive changes in the effective moisture regime during late glacial times due to an enhance-ment of the tropical circulation was found especially in the arid western cordillera between 18°S and 25°S (Betancourt et al. 2000; Clayton & Clapperton 1997; Grosjean et al. 1995; Kull & Grosjean 2000; Placzek et al. 2006). In contrast, the westerly influenced area south of 26°S experienced a substantial temperature depression combined with a moderate increase in pre-cipitation producing maximum glaciation during full glacial times, before and after the LGM (last glacia-tion maximum, 25-15 kyr B.P.; Caviedes 1990; Espizua
Temperature reduction and local last glaciation maximum (LLGM)The example of the east-Andean Cordillera around Cochabamba, Bolivia (17°S)

92 Geographica Helvetica Jg. 61 2006/Heft 2
������ ��
Fig. 1: Upper panel: location of the research area in the Cordillera de Cochabamba ~17°15’S/66°15’W. Lower panel: the area has been divided into three parts to allow for the influence of mean moisture flux from the east to be taken into consideration. The black star in the detailed map shows the paleoglacier used for 3D-modeling. Oben: Lage des Untersuchungsgebietes in der Cordillera de Cochabamba ~17°15’S/66°15’W. Unten: Um der allge-meinen Feuchtequelle aus Nordosten gerecht zu werden, wurde das Untersuchungsgebiet in 3 Teile unterteilt. En haut: site de la région de recherche dans la Cordillère de Cochabamba (~17°15’S/66°15’W). En bas: pour tenir compte de l’orientation nord-est des flux d’humidité, la région de recherche a été divisée en trois parties. Source: NASA SRTM 90 m DEM
92 Geographica Helvetica Jg. 61 2006/Heft 2 Temperature reduction and local last glaciation maximum S. Imhof, C. Kull, J.-H. May, M. Grosjean, H. Veit 93
1999; Kull et al. 2002; Zech et al. 2006a). In the east-ern cordillera on the slope to the Amazon and Chaco basins, several glacial advances are mapped and dated to pre-LGM and late glacial times (Clapperton et al. 1997; Heine 2000; Schäbitz 2000; Seltzer 1994; Zip-prich et al. 2000). There is strong evidence that LGM temperature depressions were on the order of 5-9°C. This is shown also by Stute et al. (1995) (5°C) and Colinvaux et al. (1996) (5-6°C) for the Amazonian lowlands, and in summary by Heine (2000) (5-6°C). Model results of research on north-western Argentina also indicate that maximum glaciation was triggered by massive temperature reduction and moderate humid-ity increase (Kull et al. 2003)
In this study, we employ a glacier climate model to test areas around Cochabamba in order to get a detailed picture of past glacier-climate dynamics on the central eastern Andean slope.
2 Study area and present climate
2.1 Study areaThe research area (Fig. 1) is located in the Cordillera de Cochabamba on the eastern slope of the Cordillera Oriental at 17°15’S, 66°15’W. Today, the study area is free of ice, but both satellite imagery and field work evidence large moraines triggered by at least one mas-sive glacier advance. 17 paleoglaciers, covering an alti-tudinal range between 3700-5000 m asl, were mapped in detail to obtain glaciological key parameters such as paleo-equilibrium line altitudes (paleo-ELA), accu-mulation area ratios (AAR), hypsographic curves and
bed topography. Not only valley glaciers, but also ice caps characterized the landscape during the LLGM as the morphology of this mountain area confirms.
Exposure age dating was applied to some moraines in our study area and is described in Zech et al. (2006b). Some of the moraines were dated to 12 and 10 kyr B.P. These dates suggest a late deglaciation on the eastern flank of the Cordillera Oriental, reflecting results from earlier studies (Abbott et al. 2003).
Paleo-ELA’s of the last local glaciation maximum (LLGM), evidenced by the top onset of the lateral moraines, were situated between 4350-4550 m asl in the central and western part of the research area and at about 4250 m asl on the eastern slope (Fig. 1). This significant difference between the eastern and western sections of the study area points to the important role of moisture advection from the eastern lowlands and the spatial pattern of precipitation. The AARs of the former glaciers vary between 0.59-0.94. Whilst high AARs (small ablation area, i.e. short tongues) point to a wet climate with a high balance gradient in the ablation area, low AARs (around 0.6) are character-istic for cold climates and glaciers with long tongues. The observed difference in geometry and AAR may be an indication of different phases during past glacial advances. Research on this aspect is still ongoing.
2.2 Present climateThe present climate is dominated by dry winters and wet summers with convective precipitation originat-ing from the tropical lowlands toward the east (Fig. 1). Local climatic data was obtained from a temperature
�
�������������������
����������������������������������������������
��������������������������������������������
���������������������������������������������������������������������
�
�������������������
���������
����������
�����
����������
��������
����������������
���
����������������� �������� ����� ����� ���
���������������������� ����������������� ����� ��� ���
��������������������� ��������� ���� ��������� ���������
��������������������� ��� �������������� ��������� ���������
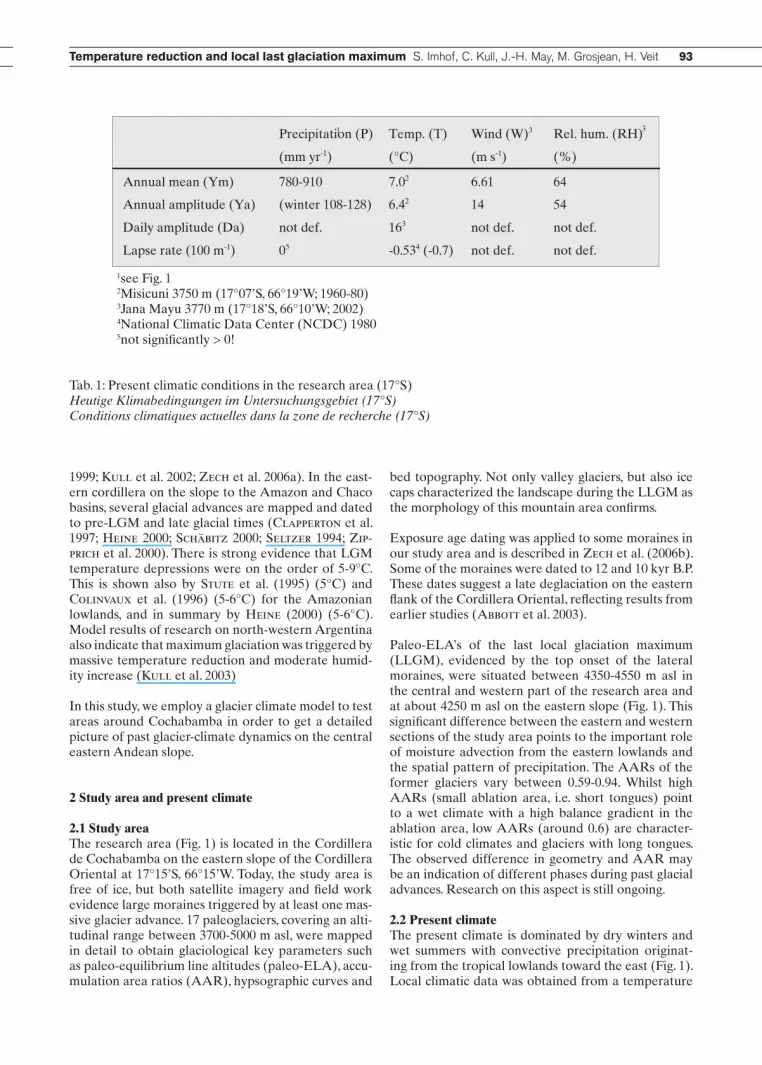
Tab. 1: Present climatic conditions in the research area (17°S)Heutige Klimabedingungen im Untersuchungsgebiet (17°S)Conditions climatiques actuelles dans la zone de recherche (17°S)
1see Fig. 12Misicuni 3750 m (17°07’S, 66°19’W; 1960-80)3Jana Mayu 3770 m (17°18’S, 66°10’W; 2002)4National Climatic Data Center (NCDC) 19805not significantly > 0!

94 Geographica Helvetica Jg. 61 2006/Heft 2
station and eight precipitation gauging stations that are scattered around the study area at different altitudes (Fig. 1). Daily climatic data, although incomplete, was available from the climate station Jana Mayu (2002, 3770 m asl, Fig.1, Table 1).
Extrapolation of the climatic data for the formerly glaciated areas suggests annual precipitation between 780-910 mm and 7.0°C mean annual temperature at 3500 m asl. A summary of present climatic key param-eters is given in Table 1.
Daily mean temperatures were calculated on the basis of daily minimum and maximum tempera-tures. These values differ by +0.65°C from the «real» values, calculated from continuous measurements (Jana Mayu). This discrepancy has been corrected in the mean annual temperatures mentioned above. Free atmosphere lapse rates are derived from radio-sonde measurements at La Paz between 4050-5800 m asl (National Climatic Data Center, NCDC 1980). Monthly mean values vary from -0.64°C/100 m in December to -0.42°C/100 m in June and show a sinu-soidal trend. Values are within the range mentioned in Kalnay et al. (1996). Regional ground-based lapse rates were calculated from temperature sta-tions between 2500-3700 m asl and show significantly higher values (-0.87 to –1.07°C/100 m). This is at least partially caused by local climates, lack of information about the exact location of stations (Kageyama et al. 2005) and the different altitudinal ranges considered. For this reason, two different scenarios were used for the modeling process.
Precipitation gradients were calculated from the eight precipitation stations in the study area. It should be noted that no significant positive precipitation lapse rate could be observed (multiple regression analysis). On the contrary, calculated values varied between -3 mm/100 m in the central and western parts of the study area and -1 mm/100 m in the eastern part. As a result, a value of 0 mm/100 m was selected for the pre-cipitation lapse rate in the model (Table 1).
3 Methodology
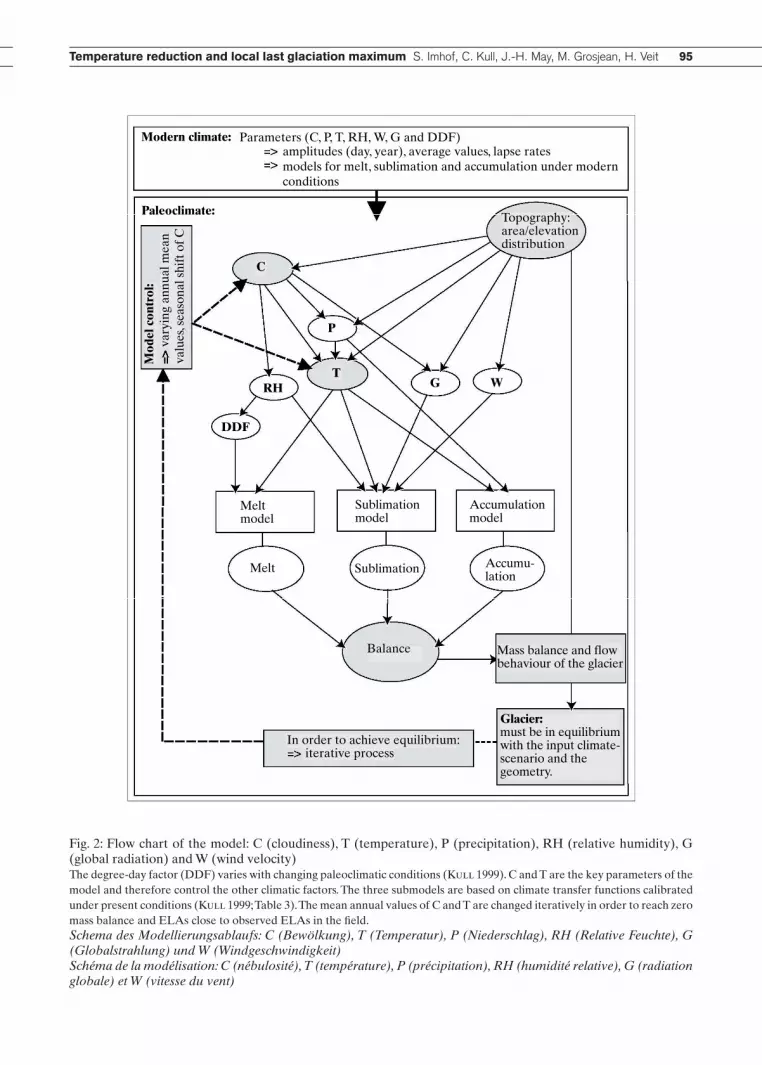
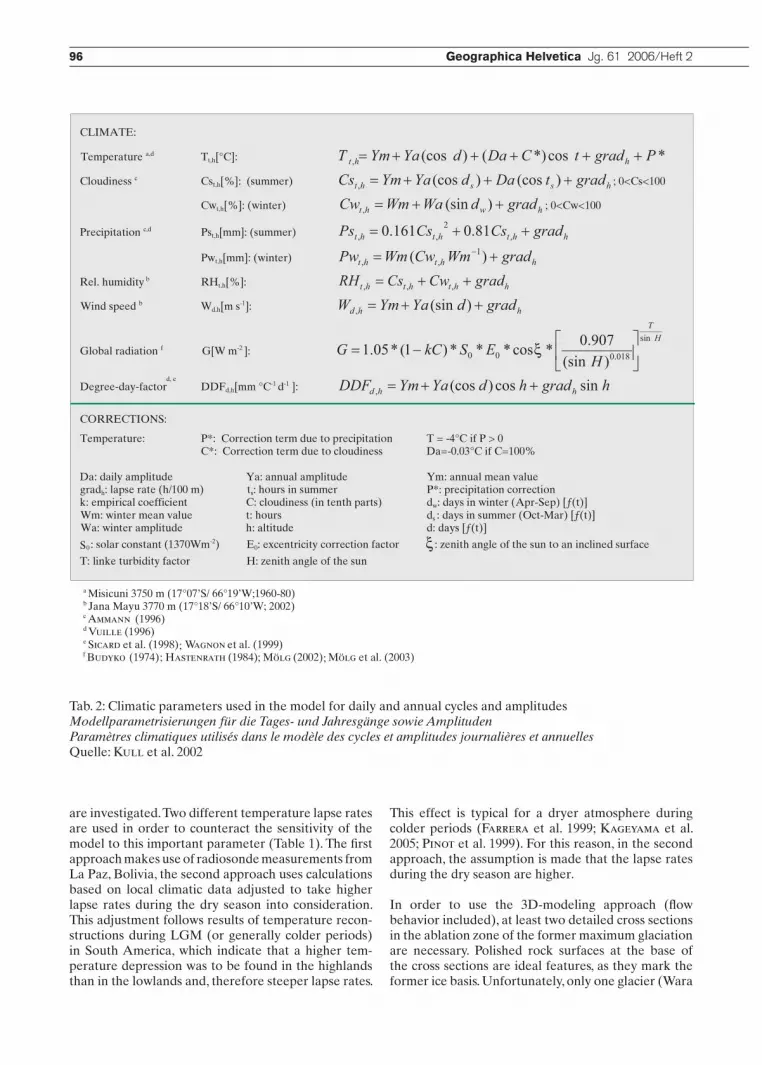
For the research purposes of this study, we used a gla-cier-climate model (Kull 1999; Kull & Grosjean 2000; Kull et al. 2002; Kull et al. 2003) to reconstruct climatic conditions during LLGM in the Cordillera de Cochabamba. A detailed description of the model is provided in Kull (1999). The model is based on the actualistic principle. Fig. 2 explains the modeling pro-cedure in a flow chart. The input parameters are: a) present climatic parameters such as diurnal and annual cycles, amplitudes and lapse rates (Table 2),
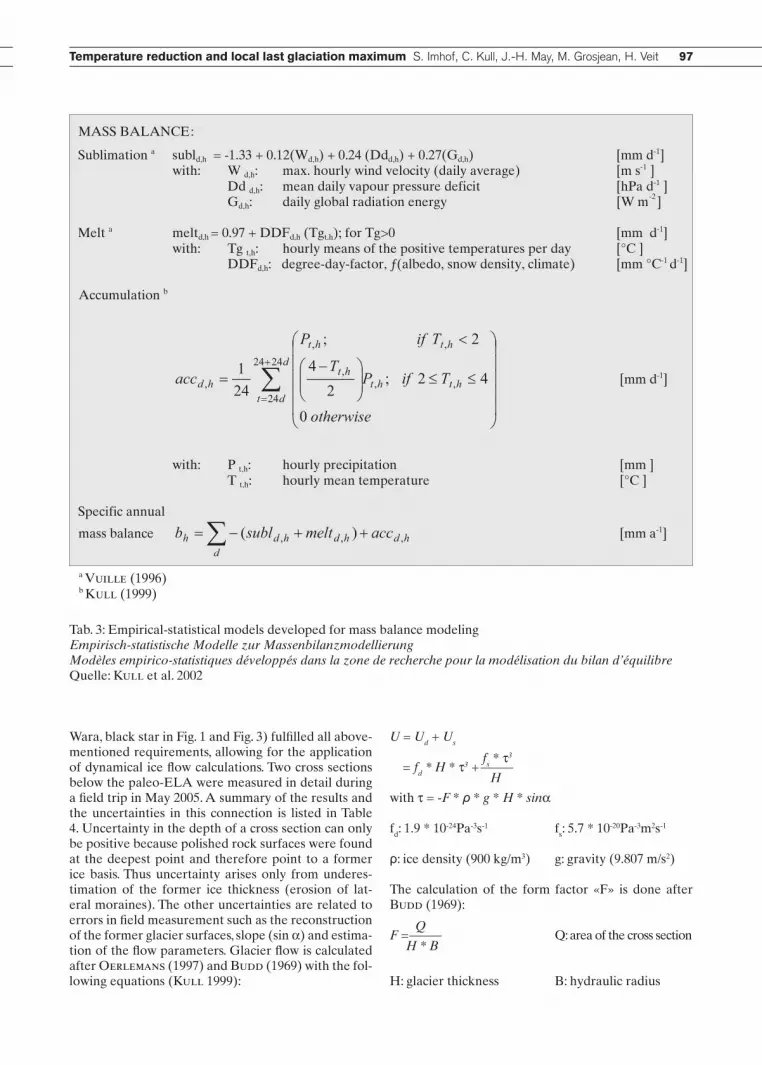
b) 3D-mapping of the former glacier geometry based on field measurements and remote sensing data (Fig. 1), c) empirical-statistical sublimation, melt and accumu- lation models (Table 3).
Furthermore, the model assumes that former glaciers fulfilled the following two conditions:I. The glaciers reached equilibrium (mass balance over the whole glacier = 0!). A 2D-modeling ap- proach that fulfils this condition results in several possible temperature-precipitation scenarios.II. Annual mass flux through a cross section in the ablation area is equal to annual mass balance below this cross section. With respective dynamical mass flux calculations derived for different cross sections, only one temperature-precipitation scenario fulfils both conditions.
The 2D-mapping is based on field work and a 30 m and 90 m digital terrain model (DTM), whereas 3D-geo-metrical reconstruction of the glacier bed is based on field measurements only. With the three sub-models (accumulation, sublimation, melt), the mass balance is calculated for each altitudinal belt (100 m equi-distance). By changing the climatic key parameters cloudiness (C) and temperature (T) and the depend-ent parameters precipitation (P), relative humidity (RH) and global radiation (G), the calculation of a climate scenario is done iteratively (Fig. 2). For all modeled scenarios, the amount of winter rain appears to be the same as today and varies between 100 mm and 150 mm, depending on annual precipitation. Con-sequently, for the scenario we assume that the main increase in annual precipitation is caused by stronger summer precipitation, a point that is also supported by field evidence (paleo-ELA distribution).
In a 2D-modeling approach (area-elevation distri-bution), only condition I (see above) has to be ful-filled. This leads to several temperature-precipitation scenarios. Results are especially sensitive to area-elevation distribution and vertical balance gradient (kg/(m2*m)). Reconstruction of the former glacier sur-face in the ablation zone is done manually as the ice surface is given by the height of the lateral moraines. In the accumulation zone, a model (Sailer et al. 1999) is used to approximately calculate the paleo-ice sur-face. Especially in complex valley structures where the actual ice thickness is often under or overesti-mated, modeled surfaces are modified manually. For the global radiation input, a model approach is used (Mölg 2002; Mölg et al. 2003). Incoming shortwave radiation is modeled every 30 minutes for each pixel (30 m x 30 m) of the reconstructed glacier surface as a function of latitude, exposition, shading, altitude and cloudiness. In the 2D-modeling scenario, all 17 glaciers
94 Geographica Helvetica Jg. 61 2006/Heft 2 Temperature reduction and local last glaciation maximum S. Imhof, C. Kull, J.-H. May, M. Grosjean, H. Veit 95
���������������� ��������������������������������������������������������������������������������������������������������������������������������������������������������������
�������������
���
����
����
���
�������������������
���������������������������
�������������������������������������
�������
�������������������������������������������������
���������������������������������������������
������������������������������������������������������������������������������
���������
����������������
�����������������
���� ����������� �������������
�
�
�
��
���
� �
Fig. 2: Flow chart of the model: C (cloudiness), T (temperature), P (precipitation), RH (relative humidity), G (global radiation) and W (wind velocity)The degree-day factor (DDF) varies with changing paleoclimatic conditions (Kull 1999). C and T are the key parameters of the model and therefore control the other climatic factors. The three submodels are based on climate transfer functions calibrated under present conditions (Kull 1999; Table 3). The mean annual values of C and T are changed iteratively in order to reach zero mass balance and ELAs close to observed ELAs in the field.Schema des Modellierungsablaufs: C (Bewölkung), T (Temperatur), P (Niederschlag), RH (Relative Feuchte), G (Globalstrahlung) und W (Windgeschwindigkeit)Schéma de la modélisation: C (nébulosité), T (température), P (précipitation), RH (humidité relative), G (radiation globale) et W (vitesse du vent)
96 Geographica Helvetica Jg. 61 2006/Heft 2
are investigated. Two different temperature lapse rates are used in order to counteract the sensitivity of the model to this important parameter (Table 1). The first approach makes use of radiosonde measurements from La Paz, Bolivia, the second approach uses calculations based on local climatic data adjusted to take higher lapse rates during the dry season into consideration. This adjustment follows results of temperature recon-structions during LGM (or generally colder periods) in South America, which indicate that a higher tem-perature depression was to be found in the highlands than in the lowlands and, therefore steeper lapse rates.
This effect is typical for a dryer atmosphere during colder periods (Farrera et al. 1999; Kageyama et al. 2005; Pinot et al. 1999). For this reason, in the second approach, the assumption is made that the lapse rates during the dry season are higher.
In order to use the 3D-modeling approach (flow behavior included), at least two detailed cross sections in the ablation zone of the former maximum glaciation are necessary. Polished rock surfaces at the base of the cross sections are ideal features, as they mark the former ice basis. Unfortunately, only one glacier (Wara
�
������������
����������������� � ���������� � � *cos*)()(cos, PgradtCDadYaYmT hht �
������������� � ��������������������� hssht gradtDadYaYmCs )(cos)(cos, �����������
� � ������������������������������������� hwht graddWaWmCw )(sin, �����������
������������������ � ��������������������� hhththt gradCsCsPs ,2
,, 81.0161.0 �
� � ��������������������� hhtht gradWmCwWmPw )( 1,, �
����������������� � ���������� � hhththt gradCwCsRH ,,, �
������������� � ������������� � hhd graddYaYmW )(sin, �
�������������������� ���������������������������� ����������������H
T
HESkCG
sin
018.000 )(sin907.0*cos***)1(*05.1
� �
����������������������
� � ����������������������� hgradhdYaYmDDF hhd sincos)(cos, �
��������������
�������������� � ������������������������������������������ � ����������������� �� �������������������������������������� � ���������������������
� � � ���������������������� � ��������������������� � ����������������������������������������������� ���� ������������������������������������� � ������������������������������������������������������ � ������������������������������� ���������������������������������������������������������� � ��������� � � � ���������������������������������������������������������� � ������������ � � ���������������
�� ���������������������������� ������������������������������������������ � �������������������������������������������������
�������������������������� ��������������������������� � ��
���������������������������������������������
� ��������������������������������������������
��������� �������� � � � � ����������������
� �������������������������� ��������������������
��������� ���������������������������
��������������� �� ������������������
��
Tab. 2: Climatic parameters used in the model for daily and annual cycles and amplitudesModellparametrisierungen für die Tages- und Jahresgänge sowie Amplituden Paramètres climatiques utilisés dans le modèle des cycles et amplitudes journalières et annuellesQuelle: Kull et al. 2002
96 Geographica Helvetica Jg. 61 2006/Heft 2 Temperature reduction and local last glaciation maximum S. Imhof, C. Kull, J.-H. May, M. Grosjean, H. Veit 97
Wara, black star in Fig. 1 and Fig. 3) fulfilled all above-mentioned requirements, allowing for the application of dynamical ice flow calculations. Two cross sections below the paleo-ELA were measured in detail during a field trip in May 2005. A summary of the results and the uncertainties in this connection is listed in Table 4. Uncertainty in the depth of a cross section can only be positive because polished rock surfaces were found at the deepest point and therefore point to a former ice basis. Thus uncertainty arises only from underes-timation of the former ice thickness (erosion of lat-eral moraines). The other uncertainties are related to errors in field measurement such as the reconstruction of the former glacier surfaces, slope (sin α) and estima-tion of the flow parameters. Glacier flow is calculated after Oerlemans (1997) and Budd (1969) with the fol-lowing equations (Kull 1999):
U = Ud + Us
= fd * H * τ3 + fs * τ3
_____
H
with τ = -F * ρ * g * H * sinα
fd: 1.9 * 10-24Pa-3s-1 fs: 5.7 * 10-20Pa-3m2s-1
ρ: ice density (900 kg/m3) g: gravity (9.807 m/s2)
The calculation of the form factor «F» is done after Budd (1969):
F = Q
_____ Q: area of the cross section
H * B
H: glacier thickness B: hydraulic radius
�
����������������
�������������� ����������������������������������������������������������� �� �� ����������� � ������ �������� ������������������������������������������ � ����������
� � ��������� ����������������������������������� � � �������������� � ������� ������������������������������� � ����������
�������� � ������������������������������������������� �������� � � �����������
� � ������� ��������� ��������������������������������������������������� �������� � ��������������������������������������������������������������� ���������������
����������������
� �
d
dththt
ht
htht
hd
otherwise
TifPT
TifP
acc2424
24,,
,
,,
,
0
42;2
4
2;
241
� �� �� �����������
� � ������� �������� ��������������������� � � �� ��������� � �������� ����������������������������������� � � ���������
�����������������
������������� d
hdhdhdh accmeltsublb ,,, )( � � � � �����������
����������������� � � � ����������������
���
Tab. 3: Empirical-statistical models developed for mass balance modeling Empirisch-statistische Modelle zur MassenbilanzmodellierungModèles empirico-statistiques développés dans la zone de recherche pour la modélisation du bilan d’équilibreQuelle: Kull et al. 2002

98 Geographica Helvetica Jg. 61 2006/Heft 2
The average ice flow velocity through a given cross section allows for the calculation of the mass flux by multiplying the velocity with the cross section. In the end, the calculated climate scenario has to estimate the same negative mass balance value below the cross sec-tion as mass flux through the respective cross section.
4 Results
4.1 Recent glacio-climatological conditionsToday, the study area is not glaciated and a recent ELA has not been observed in the field. However, both sat-ellite imagery and field work (for example, on huge moraine systems) provide evidence of large glaciations in the past. Snow fields on the south face of Cerro Tunari (about 5050 m asl), as seen on a field trip end of May 2005 indicate that a modern ELA would probably be not much higher than the highest peaks in the research area. Mark et al. (2005) calculates recent ELAs in the Cordillera Oriental in Bolivia at altitudes around 4980-5200 m asl (based on data from 1991-1995), the
geographically closest being at 5050 m asl (Quimsa Cruz, 17.06°S, 67.24°W) and 5100 m asl (Laguna Kollpa Kkota, 17.43°S, 67.88°W). This information served to test the models ability to estimate present glacio-cli-matological conditions in the research area. Based on local climatic data (Table 1, 1960-80) modeled modern ELAs varied between 5150 and 5250 m asl, depending on exposition, amount and annual distribution of pre-cipitation. The modeled results correspond with those observed in the field. The calculated present annual and seasonal balances are shown in Fig. 4. The ability of the model to calculate present values correctly made it possible to use the same model for assessing past gla-ciation events.
4.2 2D-ResultsIn the 2D-modeling approach, all 17 glaciers were investigated. Results derived with the higher lapse rate scenario (Table 1) are summarized in Fig. 5. All possible temperature-precipitation scenarios that ful-fill condition I of the model are shown. A clear differ-ence in reconstructed mean climatic conditions exists
������������
����������������
� � � �
����
����
����
����
����
����
����
Fig. 3: Paleoglacier Wara Wara (the case-study for 3D-modeling). Left: area-elevation distribution (solid line) and cumulative glacier area. Right: photo of the former glaciated valley. The large lateral moraines define the former ablation area in detail. Der ehemalige Gletscher Wara Wara (Fallstudie für die 3D-Modellierung): Links: Flächen-Höhen-Verteilung (durchgezogene Linie) und die kumulierte Gletscherfläche mit der Höhe. Rechts: Photo des ehemaligen verglet-scherten Tales. Le paléoglacier Wara Wara utilisé pour la modélisation 3D. A gauche: distribution étendue-altitude (ligne con-tinue) et étendue du glacier cumulée avec l’altitude. A droite: photo de la vallée anciennement glacée.Source: NASA landsat7_233_72_tif_panchromatic

98 Geographica Helvetica Jg. 61 2006/Heft 2 Temperature reduction and local last glaciation maximum S. Imhof, C. Kull, J.-H. May, M. Grosjean, H. Veit 99
between the glaciers in the east (ELAs at 4250 m), west (ELAs at 4550 m) and middle (ELAs at 4350 m) of the research area. Assuming synchronous glacier advances, these results can be interpreted as follows:- If precipitation is taken as a constant over the whole study area, the temperature depression is highest in the western part and lowest in the eastern part (dif- ferences of up to 2.5°C). In this small area, this type of temperature pattern seems very unlikely.- If a uniform temperature decrease over the study area is assumed, the eastern part would need a much higher increase in precipitation than the middle and western parts (plus 300-800 mm annual precipita- tion).
Modeling results with a lower lapse rate lead to simi-lar conclusions. Temperature-precipitation-«solution areas» (Fig. 5) generally move downward by about 0.5°C. It is thus clear that there is no linear relation-ship between T and P. The solution scenario lines become less inclined with the change from cold-dry conditions to warm-wet conditions. Therefore, at [dT= -9°C; dP= -200 mm], a further decrease in precipitation of 100 mm requires a decrease in tem-perature of about 3°C. In contrast, at [dT= -6°C; dP= +200 mm], an increase in temperature of about 3°C has to be compensated by an increase in precipitation of more than 700 mm! Glaciers in the lower left of Fig. 5 reacted very sensitively to changes in precipita-tion because it was cold enough. Glaciers in the upper right, on the other hand, reacted especially sensitively to changes in temperature because the climate was wet enough. This pattern can be explained by the fact that under cold climatic conditions, precipitation falls exclusively as snow: in a generally warm climate, small changes in temperature may have a huge effect on accumulation as precipitation falls either as snow or rain.
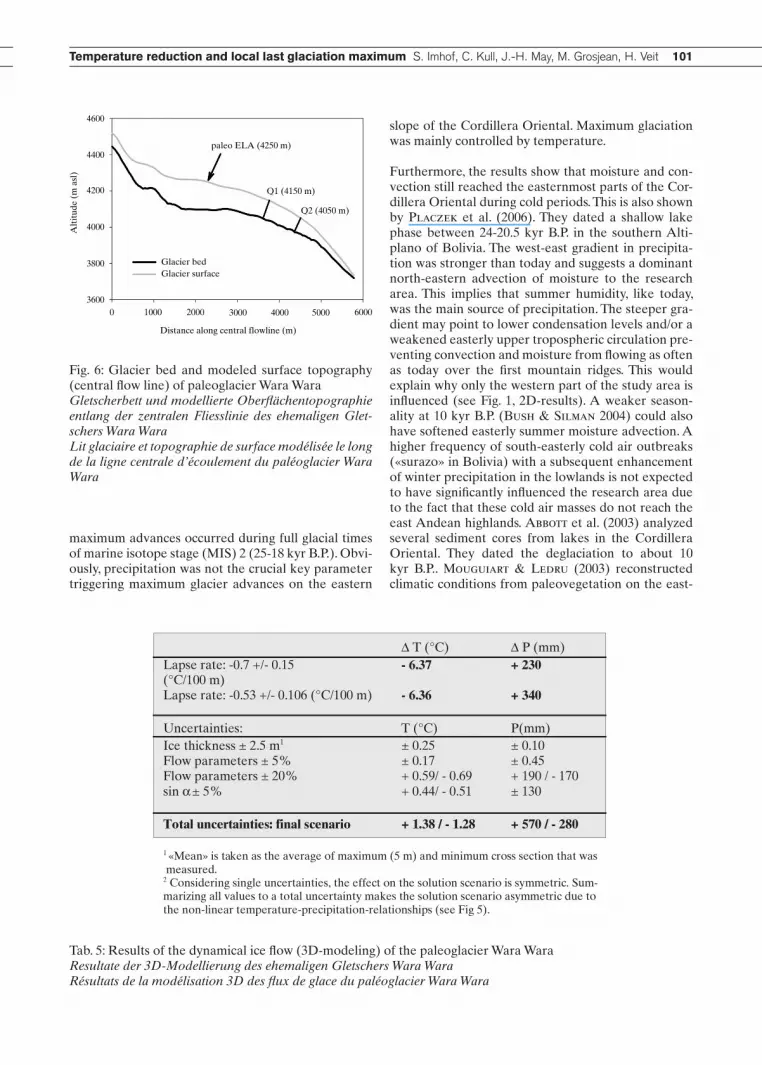
4.3 3D-ResultsAs mentioned above, only one paleoglacier fulfilled all requirements, enabling the exact computation of its flow behavior (Wara Wara, Fig.1). Fig. 6 shows the bed and modeled surface topography along its central flow-line. The 3D-modeling approach (Table 5) shows simi-lar results for both lapse rate scenarios. It is evident that a massive temperature decrease with annual precipita-tion reflecting present values led to the observed local last glaciation maximum at Wara Wara. The calculations respond very sensitively to small changes in slope and flow parameters. These uncertainties are listed in Table 5. Fig. 7 shows the annual mass balances of the paleo-glacier Wara Wara with regards to mean, maximum and minimum ice flow through the calculated cross sections (± 20% flow parameters, ± 2.5 m thickness, ± 5% slope) with the lower lapse rate of - 0.53 ± 0.106 °C/100 m. The maximum ice flow scenario is characteristic of a «cool-wet» climate (dT= -5°C; dP= +910 mm) whereas the minimum ice flow scenario reflects «cold-dry» cli-matic conditions (dT= -7.65°C; dP= +60 mm). There are clear seasonal differences in the computed mass balance (Fig. 8). During winter (April-September), net ablation is calculated over the whole glacier, even at elevations higher than 5000 m asl. Intensive solar radia-tion in combination with a dry windy climate leads to intensive sublimation. Respective values are higher than the accumulation of about 120 mm (most precipi-tation is deposited as snow). The low balance gradient in the ablation area reflects well the cold, dry climate. During summer (October-March), net accumulation dominates the glacier. In the annual mean the ELA is situated at 4250 m asl.
Basal shear stress was calculated for the upper (Q1, Table 4) and lower cross section, the values being between 0.773-0.855 bar, and 0.856-0.946 bar respec-tively. These values are not typical for either maritime
� ���������
������������������
���������
������������ ����������������
�������������������
��������������������������������������
������������������������������
�������
��� ����� ���� ���� ������ ����� ���� �������� ����� ���� ���� ������ ����� ����� ��������������������������������������������������������������������������������������������������������������������������������������������������������
Tab. 4: Geometry and mass flux in the cross sections (ablation zone) of the paleoglacier Wara Wara (Fig. 1)Kennzahlen der Querschnitte im Ablationsgebiet des ehemaligen Gletschers Wara Wara (Fig. 1)Géométrie et flux de glace dans les coupes transversales (zone d’ablation) du paléoglacier Wara Ware (Fig. 1)

100 Geographica Helvetica Jg. 61 2006/Heft 2
or continental type glaciers given the altitudinal range of the glacier (Maisch & Haeberli 1982) and are, therefore in line with the suggested climate scenario.
After application of these results to the whole test area (Fig.1), taking isochronous and iso-thermal conditions for LLGM into account, the conclusion can be made that in comparison to today, precipitation was similar in the west-ern part of the study area. In the middle part of the study area precipitation was greater by about 100 mm, and in the eastern part, the difference was close to 200 mm. This reflects a uniform temperature depression of about 6.5°C and con-firms a NE-SW precipitation gradient during the LLGM.
5 Paleoclimatic implications – discussion
Kull et al. (2003) show that glaciers in areas with annual precipitation values above about 800 mm are mainly con-trolled by temperature. In areas with less precipitation, humidity becomes the dominant parameter. Consequently, the varying chronology of glacier advances in the South American Andes can mostly be explained by their geo-graphical location with respect to the atmospheric circula-tion systems. For example, in the dry western cordillera of northern Chile and southern Peru, glacier advances were
caused by an increase of moisture supplied by the easterly tropical circulation during late glacial times (around 15-10 kyr B.P.). During the LGM (around 20 kyr B.P.), the cli-mate in the Atacama Desert was too dry to allow massive glacier advances (Grosjean et al. 2001; Kull & Grosjean 2000; Kull et al. 2002). In contrast, in the eastern Cordill-era Oriental, massive glacier advances occurred during the LGM. Therefore, even under cold LGM conditions, the moisture supply was high enough to enable glacier advances (Seltzer et al. 2002).
The conclusions made here are in agreement with recent exposure age dates of moraines in the same study area (Zech et al. 2006b), the results of Kull et al. (2003) for north-western Argentina, and those of Seltzer et al. (2002) for Bolivia. Following Zech et al. (2006b), glaciers substantially advanced at about 20 kyr, minor advances occurred around 12 and 10 kyr B.P.. Glacier advances at about 20 kyr B.P. (LGM) point to a tem-perature sensitivity of glaciers on the eastern slope of the Cordillera Oriental. Moisture supply from the east-ern lowlands seems to have been sufficient even during cold phases. The modeled climate scenario with a mas-sive cooling of about -5.0 to -7.65°C also suggests that
Fig. 4: Present annual and seasonal balance-elevation distribution in the highlands around Cochabamba The grey vertical line shows a mass balance of zero. The solid horizontal line represents the current ELA at ~5190 m asl, the dashed horizontal line the paleo-ELA at ~4250 m asl. Present climatic conditions at 3500 m asl are 7.0°C and 780-910 mm annual precipitation.Gegenwärtige jährliche und saisonale Bilanz-Höhen-Verteilung in der Cordillera nördlich von CochabambaRépartition annuelle et saisonnière actuelle de l’équili-bre-altitude dans la Cordillère au nord de Cochabamba
Fig. 5: Results of the 2D-modeling approach calculated with a lapse rate of - 0.7 +/- 0.15 °C/100 m The areas show possible temperature-precipitation combina-tions that lead to zero mass balance for the paleoglaciers. The different grey scales match with the three zones West(bright), Middle (dark), and East (medium) into which the research area has been divided (Fig. 1) and represent average results. It shows that the warmer the climate, the higher the precipi-tation has to be to keep the glacier at zero balance and to produce an ELA at the observed altitude.Resultate der 2D-Modellierung mit einem Höhengradi-enten der Temperatur von - 0.7 +/- 0.15 °C/100 mRésultats de la modélisation 2D avec un gradient d’altitude de la température de - 0.7°C +/- 0.15°C/100 m
��������������
������������������������������
��������������������������������
�����������������������������
������ ������ ����� ����� ����� ����� �
����������������
����
����
����
����
����
����
����
����
����
����
����������
����������������
�������
��������
��
��
��
��
���
������� ���� � ��� ��� ��� ��� ����
��������������
100 Geographica Helvetica Jg. 61 2006/Heft 2 Temperature reduction and local last glaciation maximum S. Imhof, C. Kull, J.-H. May, M. Grosjean, H. Veit 101
Fig. 6: Glacier bed and modeled surface topography (central flow line) of paleoglacier Wara WaraGletscherbett und modellierte Oberflächentopographie entlang der zentralen Fliesslinie des ehemaligen Glet-schers Wara WaraLit glaciaire et topographie de surface modélisée le long de la ligne centrale d’écoulement du paléoglacier Wara Wara
maximum advances occurred during full glacial times of marine isotope stage (MIS) 2 (25-18 kyr B.P.). Obvi-ously, precipitation was not the crucial key parameter triggering maximum glacier advances on the eastern
slope of the Cordillera Oriental. Maximum glaciation was mainly controlled by temperature.
Furthermore, the results show that moisture and con-vection still reached the easternmost parts of the Cor-dillera Oriental during cold periods. This is also shown by Placzek et al. (2006). They dated a shallow lake phase between 24-20.5 kyr B.P. in the southern Alti-plano of Bolivia. The west-east gradient in precipita-tion was stronger than today and suggests a dominant north-eastern advection of moisture to the research area. This implies that summer humidity, like today, was the main source of precipitation. The steeper gra-dient may point to lower condensation levels and/or a weakened easterly upper tropospheric circulation pre-venting convection and moisture from flowing as often as today over the first mountain ridges. This would explain why only the western part of the study area is influenced (see Fig. 1, 2D-results). A weaker season-ality at 10 kyr B.P. (Bush & Silman 2004) could also have softened easterly summer moisture advection. A higher frequency of south-easterly cold air outbreaks («surazo» in Bolivia) with a subsequent enhancement of winter precipitation in the lowlands is not expected to have significantly influenced the research area due to the fact that these cold air masses do not reach the east Andean highlands. Abbott et al. (2003) analyzed several sediment cores from lakes in the Cordillera Oriental. They dated the deglaciation to about 10 kyr B.P.. Mouguiart & Ledru (2003) reconstructed climatic conditions from paleovegetation on the east-
������������������
�����������
�����������
����
����
����
����
����
����
��������������������������
�����������������������������������
����������������
� ���� ���� ���� ���� ���� ����
��
�� � ������� � ���������������������������������������������
������ ������
��������������������������������������� ������� ������� ���������������� ������� ����������������������������� ������� ����������������������������� ������� ��������� ����������������������� ��������������� ������������������������� ��������������� ������ � �� � ������������������������������������� ���������������� ������������������������������������������������������������������������������������������������������������������������������������������������������������������������������������������������������������������������������������������������������������������������������������������������������������������������������������������������������������������������
Tab. 5: Results of the dynamical ice flow (3D-modeling) of the paleoglacier Wara WaraResultate der 3D-Modellierung des ehemaligen Gletschers Wara WaraRésultats de la modélisation 3D des flux de glace du paléoglacier Wara Wara

102 Geographica Helvetica Jg. 61 2006/Heft 2
Fig. 7: Modeled balance-elevation distributions for the paleoglacier Wara Wara The three graphs show modeled climate scenarios with mean (solid), maximum (dashed) and minimum (dotted) ice flow through the defined cross sections. All scenarios lead to the same ELA. The horizontal grey line is the paleo-ELA at 4250 m asl.Modellierte Bilanz-Höhen-Verteilung des ehemaligen Gletschers Wara Wara Modélisation de l’équilibre-altitude du paléoglacier Wara Wara
ern slope of the Cordillera Oriental in Bolivia. Their results indicate a relatively dry LGM, a wet late glacial period and drier climatic conditions at the onset of the Holocene. This climatic history may explain why dif-ferent glacier advances are associated with different glacier geometries. Mapping of former glacier extents (Fig.1) points to a broad range of observed AAR’s and various advances indicated by different moraine stages. This agrees with maximum advances under «cold-dry» (low AAR) conditions during the LGM, followed by late glacial «warm-wet» advances (high AAR) as also observed in north-western Argentina (Kull et al 2003). Chronology, geometry and moraine stratigraphy in the region therefore need further attention in order to be able to discern which glacier advances were driven by what climatic conditions and when.
6 Conclusions
A glacier-climate model was used to reconstruct paleoclimatic conditions that triggered the local last glaciation maximum on the eastern slope of the Cordillera Oriental near the city of Cochabamba (17°15’S/66°15’W), Bolivia. The results point primarily to a temperature sensitivity of the glaciers in the study
area. In order to reach the maximum extent, the most likely paleoclimate scenario suggests that annual mean temperatures were lower by 6.5 (+1.4, -1.3)°C while annual precipitation was about 300 mm higher than today. Humidity was delivered as today by north-east-erly advection of moist air in summer to the research area. The steeper west-east gradient in the past prob-ably suggests a lower condensation level in the atmos-phere, in agreement with the calculated massive tem-perature depression. Low shear stress values below 1 bar and an AAR of 0.59 confirm that the maximum glacial advance was not primarily driven by a precipi-tation increase under a «warm-wet» climate scenario. On the contrary, the results suggest a «cold-humid» cli-mate as most likely for the observed maximum glacier advances in the region.
The results presented here from theWara Wara paleogla-cier suggest that maximum glacier advances on the east-ern slope of the Cordillera around Cochabamba occurred during full glacial times of MIS 2 (25-18 kyr B.P.). Sub-sequent minor advances occurred likely during relatively warm and especially wet periods in late glacial times.
Fig. 8: Modeled seasonal balance-elevation distribu-tions for the paleoglacier Wara Wara The solid line is the calculated annual balance with mean ice flow (see Fig. 7). The differences between the winter and summer balances are substantial. This is an indication that during winter, the whole glaciated area is influenced by ablation. Further, the low winter balance gradients of ~1.5 kg*m- 2*m-1 indicate «cold-dry» (sublimation dominated) climatic conditions, whereas the summer season is character-ized by «wet-warm» (melt intensive) climatic conditions.Modellierte saisonale Bilanz-Höhen-Verteilungen für den ehemaligen Gletscher Wara WaraModélisation de l’équilibre-altitude saisonnier du paléoglacier Wara Wara
� �
� �
�������������������������������
����������������
����
����
����
����
����
����
����
��������� ����� ����� ����� ����� � ����
������������������
�����������������������������������������������������������������������
���������������������
�������������������
���������������������
������������������������������������������
����������������
����
����
����
����
����
����
����
����
������������������
���������������������������������
����� ����� ����� � ����

102 Geographica Helvetica Jg. 61 2006/Heft 2 Temperature reduction and local last glaciation maximum S. Imhof, C. Kull, J.-H. May, M. Grosjean, H. Veit 103
AcknowledgementsThis study is part of the Swiss NSF project «Pale-oecology of Eastern Bolivia» (NF 200020-105228/1). Meteorological data was provided by the «Centro de Levantamiento Aeroespaciales y Aplicaciones SIG» (Director Ing. Enrique Fernandez) and the «Grupo Técnico Recursos Naturales» (Ing. Holger Utermöh-len), Cochabamba, Bolivia.
LiteratureAbbott, M.B., Wolfe, B.B., Wolfe, A.P., Seltzer, G.O., Aravena, R., Mark, B.G., Polissar, P.J., Rodbell, D.T., Rowe, H.D. & M. Vuille (2003): Holocene paleohy-drology and glacial history of the Central Andes using multiproxy lake sediment studies. – In: Palaeogeogra-phy, palaeoclimatology, palaeoecology 194: 123-138.Ammann, C. (1996): Aktuelle Niederschlagsmuster. – In: Jenny, B., Kammer, K. & C. Ammann: Climate change in den trockenen Anden. – Geographica Bern-ensia G46: 81-127.Ammann, C., Jenny, B., Kammer, K. & B. Messerli (2001): Late Quaternary glacier response to humid-ity changes in the arid Andes of Chile (18-29°S). – In:Palaeogeography, palaeoclimatology, palaeoecology 172: 313-326.Baker, P.A., Seltzer, G.O., Fritz, S.C., Dunbar, R.B., Grove, M.J., Tapia, P.M., Cross, S.L., Rowe, H.D. & J.P. Broda (2001): The history of South American tropi-cal precipitation for the past 25,000 years. – In: Science 291, 5504: 640-643.Betancourt, J.L., Latorre, C., Rech, J.A., Quade, J. & K.A. Rylander (2000): A 22,000-year record of mon-soonal precipitation from northern Chile’s Atacama Desert. – In: Science 289, 5484: 1542-1546.Budd, W.F. (1969): The dynamics of ice masses. – = Australian National Antarctic Research Expeditions Scientific Report 108.Budyko, M.I. (1974): Climate and life. – New York: Academic Press.Bush, M.B. & M.R. Silman (2004): Observations on late Pleistocene cooling and precipitation in the low-land neotropics. – In: Journal of Quaternary science 19, 7: 677-684.Caviedes, C.N. (1990): Rainfall variation, snowline depression and vegetational shifts in Chile during the Pleistocene. – In: Climatic change 16: 9-114.Clapperton, C.M., Clayton, J.D., Benn, D.I., Marden, C.J. & J. Argollo (1997): Late Quaternary glacier advances and palaeolake highstands in the Bolivian Altiplano. – In: Quaternary international 38-39: 49-59.Clayton, J.D. & C.M. Clapperton (1997): Broad syn-chrony of a late-glacial glacier advance and the high-stand of palaeolake Tauca in the Bolivian Altiplano. – In: Journal of Quaternary science 12, 3: 169-182.Colinvaux, P.A., de Oliveira, P.E., Moreno, J.E., Miller, M.C. & M.B. Bush (1996): A long pollen
record from Lowland Amazonia: forest and cooling in glacial times. – In: Science 274, 5284: 85-88.Espizua, L.E. (1999): Chronology of late Pleistocene glacier advances in the Rio Mendoza Valley, Argentina. – In: Global and planetary change 22, 1-4: 193-200.Farrera, I., Harrison, S.P., Prentice, I.C., Ramstein, G., Guiot, J., Bartlein, P.J., Bonnefille, R., Bush, M., Cramer, W., von Grafenstein, U., Holmgren, K., Hooghiemstra, H., Hope, G., Jolly, D., Lauritzen, S.E., Ono, Y., Pinot, S., Stute, M. & G. Yu (1999): Trop-ical climates at the last glacial maximum: a new syn-thesis of terrestrial palaeoclimate data. I. Vegetation, lake-levels and geochemistry. – In: Climate dynamics 15, 11: 823-856.Grosjean, M., Geyh, M., Messerli, B. & U. Schot-terer (1995): Late-glacial and early Holocene lake sediments, groundwater formation and climate in the Atacama Altiplano. – In: Journal of paleolimnology 14: 252-341.Grosjean, M., van Leeuwen, J.F.N., van der Knaap, W.O., Geyh, M.A., Ammann, B., Tanner, W., Mes-serli, B., Nuñez, L.A., Valero-Garces, B.L. & H. Veit (2001): A 22,000 14C year BP sediment and pollen record of climate change from Laguna Miscanti (23°S), northern Chile. – In: Global and planetary change 28, 1-4: 35-51.Hastenrath, S. (1984): The glaciers of Equatorial East Africa. – Dordrecht: D. Reidel Publishing Company.Heine, K. (2000): Tropical South America during the last glacial maximum: evidence from glacial, perigla-cial and fluvial records. – In: Quaternary international 72: 7-21.Hostetler, S.W. & P.U. Clark (2000): Tropical climate at the last glacial maximum inferred from glacier mass-balance modeling. – In: Science 290, 5497: 1747-1750.Kageyama, M., Harrison, S.P. & A. Abe-Ouchi (2005): The depression of tropical snowlines at the last gla-cial maximum: What can we learn from climate model experiments? – In: Quaternary international 138-139: 202-219.Kalnay, E., Kanamitsu, M., Kistler, R., Collins, W., Deaven, D., Gandin, L., Iredell, M., Saha, S., White, G., Woollen, J., Zhu, Y., Chelliah, M., Ebisuzaki, W., Higgins, W., Janowiak, J., Mo, K.C., Ropelewski, C., Wang, J., Leetmaa, A., Reynolds, R., Jenne, R. & D. Joseph (1996): The NCEP/NCAR 40-year reanalysis project. – In: Bulletin of the American Meteorological Society 77: 437-471.Klein, A.G., Seltzer, G.O. & B.L. Isacks (1999): Modern and last local glacial maximum snowlines in the Central Andes of Peru, Bolivia, and northern Chile. – In: Quaternary science reviews 18, 1: 63-84.Kull, CH. (1999): Modellierung paläoklimatischer Verhältnisse, basierend auf der jungpleistozänen Ver-gletscherung – ein Beispiel aus den nordchilenischen Anden. – In: Zeitschrift für Gletscherkunde und Glazialgeologie 35, 1: 35-64.

104 Geographica Helvetica Jg. 61 2006/Heft 2
Kull, C. & M. Grosjean (1998): Albedo changes, Milankovitch forcing, and late Quaternary climate changes in the Central Andes. – In: Climate dynamics 14: 871-881.Kull, C. & M. Grosjean (2000): Late Pleistocene cli-mate conditions in the north Chilean Andes drawn from a climate-glacier model. – In: Journal of glaciol-ogy 46: 622-632.Kull, C., Grosjean, M. & H. Veit (2002): Modeling modern and late Pleistocene glacio-climatological conditions in the north Chilean Andes. – In: Climatic change 52: 359-381.Kull, C., Hänni, F., Grosjean, M. & H. Veit (2003): Evidence of an LGM cooling in NW-Argentina (22°S) derived from a glacier climate model. – In: Quaternary international 108: 3-11.Maisch, M. & W. Haeberli (1982): Interpretation geometrischer Parameter von Spätglazialgletschern im Gebiet Mittelbünden, Schweizer Alpen. – In: Bei-träge zur Quartärforschung in der Schweiz, Physische Geographie 1, Zürich: 111-126.Mark, B.G., Harrison, S.P., Spessa, A., New, M., Evans, D.J.A. & K.F. Helmens (2005): Tropical snowline changes at the last glacial maximum: a global assess-ment. – In: Quaternary international 138-139: 168-201.Markgraf, V., Baumgartner, T.R., Bradbury, J.P., Diaz, H.F., Dunbar, B., Luckman, B.H., Seltzer, G.O., Swetnam, T.W. & R. Villalba (2000): Paleoclimate reconstruction along the Pole-Equator-Pole transect of the Americas (PEP 1). – In: Quaternary science reviews 19, 1-5: 125-140.Mölg, T. (2002): Modellierung der kurzwelligen Ein-strahlung mit GIS am Beispiel eines tropischen Hoch-gebirges. – In: Strobl, J., Blaschke T. & G. Grieseb-ner (Hrsg): Beiträge zum AGIT-Symposium Salzburg 2002. – Berlin, Heidelberg: Wichmann: 347-356.Mölg, T., Georges, C. & G. Kaser (2003): The con-tribution of increased incoming shortwave radiation to the retreat of the Rwenzori glaciers, East Africa, during the 20th century. – In: International journal of climatology 23: 291-303.Mourguiart, P. & M.-P. Ledru (2003): Last glacial maximum in an Andean cloud forest environment (Eastern Cordillera, Bolivia). – In: Geology 31, 3: 195-198.National Climatic Data Center (NCDC) (1980): Inte-grated global radiosonde archive. – http://www.ncdc.noaa.gov/oa/climate/igra/index.php?name=visualization NCDC 5.8.2005.Oerlemans, J. (1997): A flowline model for Nigards-breen, Norway: projection of future glacier length based on dynamic calibration with the historic record. – In: Annals of glaciology 24: 382-389.Pinot, S., Ramstein, G., Harrison, S.P., Prentice, I.C., Guiot, J., Stute, M. & S. Joussaume (1999): Tropi-cal paleoclimates at the last glacial maximum. Com-parison of Paleoclimate Modeling Intercomparison
Project (PMIP) simulations and paleodata. – In: Cli-mate dynamics 15: 857-874.Placzek, C., Quade, J. & P.J. Patchett (2006): Geo-chronology and stratigraphy of late Pleistocene lake cycles on the southern Bolivian Altiplano. Implications of causes of tropical climate change. – In: Geological Society of America (GSA) Bulletin 118, 5: 515-532.Sailer, R., Kerschner, H. & A. Heller (1999): Three-dimensional reconstruction of younger Dryas glaciers with a raster-based GIS. – Glacial geology and geo-morphology 1999/rp01, http://ggg.qub.ac.uk/papers/frame.htm.Schäbitz, F. (2000): Vegetation and climate history on the eastern flank of the Sierra de Santa Victoria, Jujuy Province, NW-Argentina (first results). – In: Zentral-blatt für Geologie und Paläontologie (Teil 1) 7, 8: 969-989.Seltzer, G.O. (1992): Late Quaternary glaciation of the Cordillera Real, Bolivia. – In: Journal of Quater-nary science 7, 2: 87-98.Seltzer, G.O. (1994): A lacustrine record of late Pleis-tocene climatic change in the subtropical Andes. – In: Boreas 23: 105-111.Seltzer, G.O., Rodbell, D.T., Baker, P.A., Fritz, S.C., Tapia, P.M., Rowe, H.D. & R.B. Dunbar (2002): Early warming of tropical South America at the last glacial-interglacial transition. – In: Science 296, 5573: 1685-1686.Sicard, J.E., Wagnon, P., Gallaire, R., Francou, B., Ribstein, P., Pouyaud, B. & H. Baldivieso (1998): Mesures météorologiques, hydrologiques et glaciolo-giques sur le glacier du Zongo, année hydrologique 1996-97. – In: Informe 57, Office de la recherche scien-tifique et technique outre-mer (ORSTOM), La Paz: 119.Stute, M., Forster, M., Frischkorn, H., Serejo, A., Clark, J.F., Schlosser, P., Broecker, W.S. & G. Bonani (1995): Cooling of lowland tropical Brazil (5°C) during the last glacial maximum. – In: Science 269: 379-383.Sylvestre, F., Servant, M., Servant-Vildary, S., Causse, C., Fournier, M. & J.P. Ybert (1999): Lake-level chro-nology on the southern Bolivian Altiplano (18°-23°S) during late-glacial time and the early Holocene. – In: Quaternary research 51, 1: 54-66.Thompson, L.G., Davis, M.E., Mosley-Thompson, E., Sowers, T.A., Henderson, K.A., Zagorodnov, V.S., Lin, P.-N., Mikhalenko, V.N., Campen, R.K., Bolzan, J.F., Cole-Dai, J. & B. Francou (1998): A 25’000-year tropical climate history from Bolivian ice cores. – In: Science 282: 1858-1864.Thompson, L.G., Mosley-Thompson, E., Davis, M.E., Lin, P.-N., Henderson, K. & T.A. Mashiotta (2003): Tropical glacier and ice core evidence of climate change on annual to millennial time scales. – In: Cli-matic change 59: 137-155.Vuille, M. (1996): Zur raumzeitlichen Dynamik von Schneefall und Ausaperung im Bereich des südlichen

104 Geographica Helvetica Jg. 61 2006/Heft 2 Temperature reduction and local last glaciation maximum S. Imhof, C. Kull, J.-H. May, M. Grosjean, H. Veit 105
Altiplano, Südamerika. – = Geographica Bernensia G45, Bern.Wagnon, P., Ribstein, P., Francou, B. & B. Pouyaud (1999): Annual cycle of energy balance of Zongo gla-cier, Cordillera Real, Bolivia. – In: Journal of geophysi-cal research 104: 3907-3923.Wyrwoll, K.H., Dong, B. & P. Valdes (2000): On the position of southern hemisphere westerlies at the last glacial maximum: an outline of AGCM simulation results and evaluation of their implications. – In: Qua-ternary science reviews 19, 9: 881-898.Zech, R., Kull, C. & H. Veit (2006a): Late Quaternary glacial history in the Encierro Valley, northern Chile (29°S), deduced from 10Be surface exposure dating. – In: Palaeogeography, palaeoclimatology, palaeoecol-ogy 234: 277-286.Zech, R., Kull, C. & H. Veit (2006b): Expositionsda-tierung in den Zentralen Anden: quartäre Gletscher- und Klimarekonstruktion mittels in situ 10Be. – In: Geographica Helvetica (this issue).Zipprich, M., Reizner, B., Zech, W., Stingel, H. & H. Veit (2000): Upper Quaternary landscape and climate evolution in the Sierra de Santa Victoria (north-west-ern Argentina) deduced from geomorphologic and pedogenic evidence. – In: Zentralblatt für Geologie und Paläontologie (Teil 1) 7, 8: 997-1011.
Abstract: Temperature reduction and local last glaciation maximum (LLGM). The example of the east-Andean Cordillera around Cochabamba, Bolivia (17°S)This study presents results from a glacier-climate model that reconstructed glacio-climatological conditions during the last local glaciation maxi-mum (LLGM) in the Cordillera to the north of Cochabamba (17°15’S, 66°15’W), Bolivia. Results emphasize the temperature-sensitivity of glaciers on the eastern slope of the Cordillera Oriental. Maxi-mum glacier advances appear to have been caused by a massive cooling of about 6.5°C, while annual precipitation was about 300 mm higher than today (850 mm/yr). Modeling results indicate maximum glacial advances during cold phases such as MIS 2 (25-18 kyr B.P.) and minor advances during late gla-cial cool events (12-10 kyr B.P.). This chronology is supported by exposure age dating results. Further evidence may be found in the low AAR-values (accu-mulation area ratio) which indicate low mass balance gradients and therefore cold climate conditions. Mod-eled basal shear stresses smaller than 1 bar exclude extremely «cold-dry» or «warm-wet» conditions. The spatial pattern of regional paleo-ELA’s (equilibrium line altitude), with higher ELA’s in the western part of the study area, reflects a strong east-west gradient in paleoprecipitation. Easterly summer precipitation is suggested to be the reason for this phenomenon.
These results are in agreement with other studies of the east-Andean slope, indicating temperature as the driving factor for maximum glacier advances in north-western Argentina.
Zusammenfassung: Temperaturreduktion und lokales letzteiszeitliches Gletschermaximum (LLGM). Ergebnisse aus der Cordillera de Cochabamba, Boli-vien (17°S)Ein Gletscher-Klima-Modell wurde angewendet, um die glazio-klimatologischen Bedingungen, die in der Cordillera Oriental nördlich der Stadt Cochabamba (17°15’S, 66°15’W), Bolivien, zur letzten grossen Vereisung führten, zu rekonstruieren. Die Resultate bestätigen die Temperatur-Sensitivität der Gletscher am Ostabhang der Cordillera Oriental. Die Glet-schervorstösse wurden durch einen starken Rückgang der Jahrestemperatur von 6.5°C verursacht, während der Jahresniederschlag im Vergleich zu heute nur um ~300 mm erhöht war. Auf Grund dieser modellierten Temperaturreduktion bestätigt sich die Annahme, dass die Vorstösse während Kältephasen wie MIS 2 (25-18 kyr B.P.) oder spätglazialen Kälteereignissen (12-10 kyr B.P.) stattfanden. Diese Befunde werden durch Expositionsalterdatierungen unterstützt. Die rekonstruierten glaziologischen Parameter stimmen ebenfalls gut mit den modellierten Klimabedingun-gen überein. So weisen die tiefen AAR-Werte (accu-mulation area ratio) auf tiefe Bilanzgradienten, kalte Klimabedingungen und damit relativ lange Gletscher-zungenbereiche hin. Die modellierten basalen Scher-spannungen zwischen 0.77 und 0.95 bar schliessen extrem «kalt-trockene» oder «warm-feuchte» Klima-bedingungen aus. Das räumliche Muster der einstigen Gleichgewichtslinien (GWL) mit tieferen GWL im Osten und höheren GWL im Westen bezeugen einen steilen Ost-West-Gradienten der ehemaligen Nieder-schläge. Deshalb kann davon ausgegangen werden, dass aus dem Tiefland im Nordosten stammende Som-merniederschläge auch damals den grössten Teil der Niederschläge ausmachten.
Die Resultate stimmen gut mit vorherigen Studien am Anden-Ostabhang (Nordwestargentinien) überein, in denen die Temperatur als der entscheidende Faktor für Gletschervorstösse erkannt wurde.
Résumé: Diminution de température et dernier maximum glaciaire local (LLGM). L’exemple de la Cordillère andine de Cochabamba en Bolivie (17°S)Cette étude présente les résultats d’un modèle appliqué à la reconstitution des conditions glaciaires et climato-logiques de la dernière glaciation dans l’est de la Cor-dillère des Andes, au nord de la ville de Cochabamba en Bolivie (17°15’S, 66°15’W). Les résultats confirment que les glaciers sont très sensibles aux changements de températures sur le versant oriental de la Cordillère.

106 Geographica Helvetica Jg. 61 2006/Heft 2
Les avancées glaciaires ont été causées par une baisse de la température annuelle d’environ 6,5°C, tandis que les précipitations annuelles étaient supérieures d’environ 300 mm aux niveaux actuels. Les résultats de la modélisation indiquent que l’avancée glaciaire maximum s’est faite durant les phases froides comme celle de MIS 2 (25-18 kyr B.P.), alors que les avancées mineures ont eu lieu durant les derniers âges glaciai-res (12-10 kyr B.P.). Cette chronologie est confirmée par des datations d’âge d’exposition. Les paramètres glaciaires reconstruits sont aussi en bonne conformité avec les conditions climatologiques modélisées. Les valeurs faibles de l’AAR (accumulation area ratio) indiquent des gradients d’équilibre bas, des conditions climatologiques froides et des langues glaciaires rela-tivement longues. Les tensions de cisaillement basales modélisées de 0,77 et 0,95 bar permettent d’exclure des conditions climatologiques extrêmement «froides-arides» ou «chaudes-humides». Le modèle spatial des anciennes lignes d’équilibre, caractérisé par des lignes plus basses à l’est et plus hautes à l’ouest, est le signe d’un gradient est-ouest des paléoprécipitations, peut-être lié à des précipitations précoces et estivales.
Les résultats concordent avec des études antérieures effectuées sur le versant oriental des Andes (au nord-ouest de l’Argentine) dans lesquelles la température constitue le facteur crucial des avancées glaciaires.
Dipl.-Geogr. Samuel Imhof, Dipl.-Geogr. Jan-Hen-drik May, Prof. Dr. Heinz Veit, Geographical Institute, University of Berne, Hallerstrasse 12, CH-3012 Berne, Switzerland.e-mail: [email protected]@[email protected]. Christoph Kull, PAGES IPO, Sulgeneckstrasse 38, CH-3007 Berne, Switzerland.e-mail: [email protected]. Dr. Martin Grosjean, NCCR Climate Manage-ment Centre, Erlachstrasse 9a, CH-3012 Berne, Swit-zerland.e-mail: [email protected]
Manuskripteingang/received/manuscrit entré le15.2.2006Annahme zum Druck/accepted for publication/accepté pour l’impression: 30.6.2006


