Embed Size (px)
Citation preview

1535
Letters to the Editor
Table 1
Enzyme Activities in Fibroblasts (in mU/mg protein) of Controls,Patients with Phosphomannomutase Deficiency, and Three Patientswith Phosphomannose Isomerase Deficiency
PMI Activities PMM Activities
Controls 6.8 52.4 (7) 3.8 5 .9 (8)
PMM deficient 8.0 5 4.4 (13) .5 5 .3 (13)
Patient A .2, .3 6.3
Patient B .2, .8 3.2
Patient C .2, .2 3.5
NOTE.—Phosphomannomutase and protein were measured as de-scribed elsewhere (Van Schaftingen and Jaeken 1995; Jaeken et al.1997a). Phosphomannose isomerase was assayed at 307C in a reactionmixture (1 ml) containing 50 mM Hepes, pH 7.1, 5 mM MgCl2, 25mM KCl, 1 mM dithiothreitol, 0.6 mM NAD1, 0.5 mM mannose 6-phosphate, 2.5 U/ml glucose 6-phosphate dehydrogenase from Leu-conostoc mesenteroides, and 10 mg/ml phosphoglucose isomerase with10 ml of an extract containing 5–20 mg protein/ml. Control and PMMdeficient measures are mean values 5 SD. Where two data are given,the values were obtained on two different subcultures.
Figure 1 Scheme of mannose metabolism. Phosphomannoseisomerase 5 PMI; phosphomannomutase 5 PMM; hexokinase 5 HK.The horizontal bar indicates the defect in phosphomannose isomerase.
Am. J. Hum. Genet. 62:1535–1539, 1998
Phosphomannose Isomerase Deficiency: ACarbohydrate-Deficient Glycoprotein Syndrome withHepatic-Intestinal Presentation
To the Editor:Carbohydrate-deficient glycoprotein (CDG) syndromesare genetic diseases that are due to defects in the gly-cosylation of glycoproteins (Jaeken et al. 1993, 1997b).With one exception (Billette de Villemeur et al. 1995),all reported patients presented moderate to severe braindisease (Jaeken and Casaer 1997). The diagnosis is usu-ally made by isoelectrofocusing of serum transferrinshowing different patterns of cathodal shift due to thedeficiency of the terminal sialic acid (Jaeken et al. 1984;Stibler and Jaeken 1990). The majority of patients showthe so-called type I pattern characterized by an increaseof di- and asialotransferrin. About 70% of patients withthe type I pattern have a deficiency of phosphomanno-mutase (PMM) (type IA) (Van Schaftingen and Jaeken1995; Jaeken et al. 1997a), the enzyme catalyzing thesecond step in the conversion of fructose 6-phosphateto GDP-mannose (fig. 1), and mutations in the PMM2gene have been found in all patients with a PMM de-ficiency (Matthijs et al. 1997a, 1998).
Among the patients from which we analyzed the fi-
broblasts (Van Schaftingen and Jaeken 1995; Jaeken etal. 1997a; Matthijs et al. 1997b), ∼30 did not showPMM deficiency. On the rationale that type I glycosy-lation pattern may be due to other enzymatic defects inthe pathway leading to GDP-mannose, the activity ofphosphomannose isomerase, which catalyzes its firststep, was systematically analyzed in the samples fromthe latter patients. As shown in table 1, three of themshowed a marked deficiency in this enzyme, whereasPMM activity was normal. Experiments in which ex-tracts were mixed indicated that the deficiency was notdue to the presence of an inhibitor. As reported elsewhere(Van Schaftingen and Jaeken 1995), PMI activity wasnormal in PMM-deficient patients. For patient C, thePMI deficiency was independently found at about thesame time by other investigators (Niehues et al.,1998).This patient, who had a similar liver disease as-sociated with protein-losing enteropathy (Freeze et al.1997; Niehues et al., 1998) as patient A (see below) wasnot further investigated in the present study. The parentsof patient B, but not of patient A, were available fortesting; surprisingly, normal activities of PMI were found

1536 Letters to the Editor
Figure 2 Sequence alignment showing the position of the mu-tations in patient A. The sequences of the enzymes from Candidaalbicans (canal), Saccharomyces cerevisiae (sacce), Emericella nidulans(emeni), Caenorhabditis elegans (caeel), and man (human) are shown.Numbering of the residues starts from the initiator methionine. Con-served residues are in bold. Three of the four residues liganding Zn21
in the C. albicans enzyme are indicated by an asterisk (*). The mutatedresidues are shown below the alignment.
in their leukocytes (mother 5.5 mU/mg protein; father6.7 mU/mg protein; controls for ).5.4 5 0.9 n 5 6
On the basis of the available sequence of the PMIcDNA (Proudfoot et al. 1994), primers were designedfor the amplification and analysis of PMI. Primers PMI-Biot (5′-Biotin-CGA GCA TGG CCG CTC CGC-3′) andPMI-R2 (5′-CCA GCT CTT CCA GGG TAT AC-3′)were used to amplify the PMI cDNA from total RNAisolated from fibroblasts according to established pro-cedures (Sambrook et al. 1989; Matthijs et al. 1997b).The amplified fragment was sequenced using three flu-orescently labeled primers: PMI-F1: 5′-FITC-CCA ATCAGG AAC TGA AAC TC-3′, PMI-F2: 5′-FITC-ACAGGG TTG GCA CTT CAA TG-3′, and PMI-F3: 5′-FITC-GAA TTT AGG GTG GCT GGC AG-3′. ThecDNA fragment generated using primer PMI-R2 andPMI-F1 (identical to PMI-Biot but lacking the biotin)was cloned in pCR.2 by use of the TA-cloning kit (In-vitrogen). The mutations were retrieved by sequencingwith PMI-F1. To confirm the phase of the mutations,two clones representing the two alleles of the patientswere entirely sequenced using the previously describedprimers and the M13-reverse and universal primers.
Patient A was found to be compound heterozygousfor a CrT mutation at position 304, causing a SerrLeusubstitution at codon 102, and a TrC mutation at po-sition 413, replacing Met at codon 138 by Thr (fig. 2).Both mutations concern positions that are conservedfrom Saccharomyces cerevisiae and Candida albicans tohuman PMI (Proudfoot et al. 1994). The correspondingamino acids are situated near the active site, as deter-mined by X-ray crystallography of the C. albicans en-zyme (Cleasby et al. 1996). The Glu residue adjacent toMet138 (Glu138 in C. albicans corresponding toGlu137 in human PMI) is one of the four residues in-volved in binding the catalytic Zn21 ion. The Lys residueat position 100 in C. albicans (corresponding to Lys99in human PMI) points inward into the active site, andthe mutation at Ser102 may well affect this orientation.Thus, the mutations in the PMI gene are likely to explainthe lack of activity of this enzyme in patient A.
Except for a polymorphism at codon 377 (GTA/GTG,both coding for Val), no sequence variation was detectedin PCR-amplified cDNA from patient B. The presenceof the polymorphism allowed us to select and fully se-quence two clones derived from different alleles. Sincethere is no mutation, the low activity in fibroblasts ofpatient B could be due to a decrease in the transcriptionof the gene because of mutations either in the promoteror in a transcription factor required for the expressionof the enzyme. The finding of a normal activity in leu-kocytes of the parents argues for this second possibility,if at least the same isozyme is expressed in fibroblastsand leukocytes. The fact that the supposed genetic defectin patient B is different from that in patient A probably
explains why the enzyme deficiency is not as pronouncedin the former.
The clinical description of patient A has been brieflyreported elsewhere (Billette de Villemeur et al. 1995).He was the third child of unrelated Lebanese parents.His siblings were healthy. He was admitted at the ageof 5.5 mo for chronic diarrhea since the age of 3 moand hypoglycemia with convulsions, coma, and apnea.There was no dysmorphy. Liver was 6 cm below thecostal margin and firm. Stool culture showed Pseudo-monas aeruginosa. Hypoglycemia tended to recur par-ticularly after 4 h following feeding. Liver biopsy re-vealed fibrosis of the portal spaces and microvesicularsteatosis. At the age of 10 mo, he was readmitted withgeneralized edema secondary to hypoalbuminemia.Weight was 6.7 kg ( ), length 65 cm (! P 5 7.8 ! P 53 3
), and head circumference 43 cm ( ). Gross69 ! P 5 44.23
motor development was moderately retarded. Liver wasunchanged. Liver function testing showed slightly in-creased bilirubin (50 mM) and glutamate-oxaloacetatetransaminase (82 U/liter). IgG (2.6 g/liter) and IgA (0.32g/liter) were decreased. Prothrombin time was 63%. Sev-eral clotting and anticlotting factors were decreased: fac-tor XI (20%), antithrombin III (45%), protein C (29%)and total protein S (51%). There was intermittent slightproteinuria and moderate hyperaminoaciduria (partic-ularly of glycine). Further extensive metabolic screeningdid not reveal the cause of the hypoglycemias. Serumtransferrin isoelectrofocusing, however, showed the typ-ical CDG syndrome type I pattern (decreased hexa-,penta- and tetrasialotransferrin, and increased di- andasialotransferrin) but phosphomannomutase activity infibroblasts was normal. Radiological examination of theintestine suggested malabsorption, with fragmentation

Letters to the Editor 1537
and flocculation of the contrast substance. Sweat testwas normal as well as intestinal disaccharidase activities.On endoscopy, fragility of the intestinal mucosa witheasy bleeding was noted. Histology of duodenal biopsiesshowed partial villus atrophy with hypercellularity andonly rare and discrete lymphangiectasias. Repeat liverbiopsy at the age of one year showed a more pronouncedpicture of congenital hepatic fibrosis with stellate fibrosisof the portal spaces and proliferation of numerous bil-iary canaliculi without any inflammation and withoutnotable alteration of the hepatocytes. Renal hyperech-ogenicity was found on ultrasound examination. Treat-ment consisted of Diazoxide, which normalized gly-cemia, regular intravenous administration ofimmunoglobulins and albumin, and nasogastric tubefeeding with only a hydrolyzed, MCT-supplementedmilk. He suffered from frequent bacterial as well as viralgastroenteritis. At the age of 26 months, weight was 9kg ( ) and length 77.5 cm ( ). He! P 5 10.8 ! P 5 823 3
had a large abdomen with pronounced collateral cir-culation, numerous disseminated angiomas, and un-changed hepatomegaly. Since oral feeding was still notsupported, the nasogastric tube feeding was changed totube feeding via a gastrostomy. Neurological examina-tion was normal. He was last seen at the age of 2
years with persisting protein-losing enteropathy.9/12However, psychomotor development was normal. Hedied at the age of 4 years from an unknown cause.
Patient B had a similar clinical picture consistingmainly of liver disease, which disappeared after the in-troduction of solid food at 3 mo. The case will be moreextensively presented elsewhere.
PMM deficiency results in a multisystem disease withsevere neurological involvement and dysmorphy, be-sides, usually mild, liver, intestinal, and other organ dis-ease (Jaeken et al. 1993, 1997a, 1997b). PMI deficiencycauses the same kind of sialotransferrin electrofocusingpattern as PMM deficiency, but its clinical presentationappears to be quite different in that the disease wasenterohepatic in patients A and C and hepatic with mildneurological signs in patient B. Different explanationscan be provided for the fact that the clinical manifes-tations of PMI deficiency are mainly hepatic and intes-tinal. A first one is the possible existence of differentisozymes of PMI, as is the case for PMM (Matthijs etal. 1997a, 1997b; Pirard et al. 1997). The cDNA thathas been identified and sequenced by Proudfoot et al.(1994) appears to be derived from a gene that is onlypoorly expressed in liver, as shown by northern blotanalysis. Still, the fact that mutations in this gene leadto liver involvement in patient A indicates that this formof PMI is expressed in liver. Furthermore, all humanexpressed sequence tags found in data banks seem to bederived from this gene, except maybe one that couldpossibly encode an isozyme. However, we have been
unable to PCR-amplify human liver and leukocytecDNA with primers designed on the basis of thissequence.
A second explanation stems from the different posi-tion of PMM and PMI in the pathway leading to theformation of GDP-mannose. Both enzyme deficienciesare expected to cause a decrease in the biosynthesis ofdolichol-pyrophosphate-oligosaccharide in the endo-plasmic reticulum (Powell et al. 1994; Krasnewich et al.1995), and both defects are indeed known to be lethalin yeast (Kepes and Schekman 1988). There is, however,a major difference between PMM and PMI in that thelatter, but not the former, can be by-passed by the low-Km hexokinases. These enzymes can indeed convert man-nose to mannose 6-phosphate, displaying for this sub-strate a rather high affinity with mM in the case ofK 5m
the brain enzyme hexokinase I (Sols and Crane 1954).In contrast, glucokinase—also known as “hexokinaseIV”—the major, if not the only, hexokinase present inhepatocytes (Reyes and Cardenas 1984) has a very lowaffinity for mannose with a Km equal to 33 mM ac-cording to Weinhouse (1976) and is therefore rather in-efficient to phosphorylate this substrate at the concen-trations prevailing in plasma (50 mM in controls;Etchison and Freeze 1997). Blood mannose, which de-rives from glycoprotein degradation and alimentarymannose in unknown proportion, is therefore mostlikely sufficient to support N-glycosylation in tissuesother than the liver. The exception appears also to applyto the intestinal mucosa, as evidenced by the markedenteropathy found in patients A and C (Niehues et al.1988; Freeze et al. 1997). Remarkably, the specific ac-tivity of PMM is more than four times higher in the ratmucosa than in other tissues, which indicates that itsGDP-mannose requirements are elevated (M. Pirard andE. Van Schaftingen, unpublished data). Furthermore, itis a tissue in which the glucose concentration is elevated,due to active absorption from the intestinal lumen and,during postabsorptive period, to equilibration withblood glucose through Glut2 (Thorens et al 1988). Glu-cose can therefore competitively inhibit the phosphor-ylation of mannose. Difference in tissue involvement ofPMI deficiency could also possibly arise from differencein expression of the specific, low Km mannose transporter(Panneerselvam and Freeze 1996), which appears to beinvolved in the preferential utilization of radiolabeledmannose over radiolabeled glucose in cultured fibro-blasts (Panneerselvam et al. 1997).
A logical consequence of the fact that hexokinasephosphorylates mannose to mannose 6-phosphate is thatPMI deficiency, unlike PMM deficiency (Jaeken and Ca-saer 1997; Marquardt et al. 1997; Mayatepek et al.1997), should be treatable by administration of mannosesupplements. This appears to be the case for patient C(Niehues et al. 1988; Freeze et al. 1997), in which we

1538 Letters to the Editor
have also found PMI deficiency. Unfortunately, patientA died before trials with mannose could be attempted.It would be interesting to know if the improvement ofthe symptomatology observed in patient B following in-troduction of solid food is due to the presence of man-nose in the latter.
Because of its very different clinical presentation, thisnew type of CDG syndrome was probably not recog-nized as a glycosylation defect until now. In 1985, thesame clinical picture as that of patient A and C wasreported as a new syndrome in four infants from thenortheastern part of Quebec. They died between the agesof 4 and 21 mo. They had also antithrombin III defi-ciency (Pelletier et al. 1985), a typical feature of CDGsyndromes. We strongly suspect that these patients hada PMI deficiency. In conclusion, PMI deficiency is anewly recognized, lethal but potentially treatable CDGsyndrome that should be searched for in unexplainedenteropathy and/or liver disease.
We thank Dr. J.-J. Cassiman for providing the fibroblastsand G. Berghenouse and E. Jansen for their competent tech-nical help. This work was supported by the Belgian NationalFunds for Scientific Research, the Actions de Recherche Con-certees, and the Belgian Federal Service for Scientific, Technical,and Cultural Affairs.
JAAK JAEKEN,1GERT MATTHIJS,2 JEAN-MARIE SAUDUBRAY,3
CARLO DIONISI-VICI,4 ENRICO BERTINI,5
PASCALE DE LONLAY,3 HUGUES HENRI,6
HUBERT CARCHON,1 ELS SCHOLLEN,2 AND
EMILE VAN SCHAFTINGEN7
1Department of Pediatrics, and 2Center for Human Genetics,University of Leuven, Leuven; 3Clinique de GenetiqueMedicale, Hopital des Enfants Malades, Paris; Departmentsof 4Metabolism and 5Neuropediatrics, “Bambino Gesu”Hospital, Rome; 6Laboratoire Central de Chimie Clinique,Centre Hospitalier Universitaire Vaudois, Lausanne; and7Laboratory of Physiological Chemistry, InternationalInstitute of Cellular and Molecular Pathology, University ofLouvain, Brussels
References
Billette de Villemeur T, Poggi-Travert F, Laurent J, Jaeken J,Saudubray JM (1995) Le syndrome d’hypoglycosylation desproteines: un nouveau groupe de maladies hereditairesd’expression multisystemique. In: Arthuis M, Beaufils F,Caille B, Dommergues JP, Fontaine JL, Griscelli C, Job JC,et al (eds) Journees Parisiennes de Pediatrie 1995. Paris.Medecine-Sciences Flammarion, 119–124
Cleasby A, Wonacott A, Skarzynski T, Hubbard RE, DaviesGJ, Proudfoot AE, Bernard AR, et al (1996) The X-ray crys-tal structure of phosphomannose isomerase from Candidaalbicans at 1.7 angstrom resolution. Nat Struct Biol 3:470–479
Etchison JR, Freeze HH (1997) Enzymatic assay of D-mannosein serum. Clin Chem 43:533–538
Freeze H, Niehues R, Hasilik M, Marquardt T, Etchison J,Panneerselvam K, Harms K (1997) Initial results of mannosetherapy in N-glycosylation disorders. Glycobiology 7:1020
Jaeken J, Artigas J, Barone R, Fiumara A, De Koning TJ, Poll-The BT, de Rijk-van Andel JF, et al (1997a) Phosphoman-nomutase deficiency is the main cause of carbohydrate-de-ficient glycoprotein syndrome with type I isoelectrofocusingpattern of serum sialotransferrins. J Inherit Metab Dis 20:447–449
Jaeken J, Carchon H, Stibler H (1993) The carbohydrate-de-ficient glycoprotein syndromes: pre-Golgi and Golgi disor-ders? Glycobiology 3:423–428
Jaeken J, Casaer P (1997) Carbohydrate-deficient glycocon-jugate (CDG) syndromes: a new chapter of neuropaediatrics.Eur J Paediatr Neurol 2/3:61–66
Jaeken J, Matthijs G, Barone R, Carchon H (1997b) Carbo-hydrate deficient glycoprotein (CDG) syndrome type I. JMed Genet 34:73–76
Jaeken J, van Eijk HG, van der Heul C, Corbeel L, Eeckels R,Eggermont E (1984) Sialic acid-deficient serum and cere-brospinal fluid transferrin in a newly recognized genetic syn-drome. Clin Chim Acta 144:245–247
Kepes F, Schekman R (1988) The yeast SEC53 gene encodesphosphomannomutase. J Biol Chem 263:9155–9161
Krasnewich DM, Holt GD, Brantly M, Skovby F, Redwine J,Gahl WA (1995) Abnormal synthesis of dolichol-linked oli-gosaccharides in carbohydrate-deficient glycoprotein syn-drome. Glycobiology 5:503–510
Marquardt T, Hasilik M, Niehues R, Herting M, Muntau A,Holzbach U, Hanefeld F, et al (1997) Mannose therapy incarbohydrate-deficient glycoprotein syndrome type 1 - firstresults of the German multicenter study. Amino Acids 12:389
Matthijs G, Schollen E, Pardon E, Veiga-da-Cunha M, JaekenJ, Cassiman J-J, Van Schaftingen E (1997a) Mutations inPMM2, a phosphomannomutase gene on chromosome16p13, in carbohydrate-deficient glycoprotein type I syn-drome (Jaeken syndrome). Nat Genet 16:88–92
Matthijs G, Schollen E, Pirard M, Budarf ML, Van SchaftingenE, Cassiman J-J (1997b) PMM (PMM1), the human ho-mologue of SEC53 or yeast phosphomannomutase, is lo-calized on chromosome 22q13. Genomics 40:41–47
Matthijs G, Schollen E, Van Schaftingen E, Cassiman J-J, Jae-ken J (1998) Lack of homozygotes for the most frequentdisease allele in carbohydrate-deficient-glycoprotein syn-drome type Ia. Am J Hum Genet 62:542–550
Mayatepek E, Schroder M, Kohlmuller D, Bieger WP, Nutz-enadel W (1997) Continuous mannose infusion in carbo-hydrate-deficient glycoprotein syndrome type I. Acta Pae-diatr 86:1138–1140
Niehues R, Hasilik M, Alton G, Korner C, Schiebe-SukumarM, Koch HG, Zimmer K-P, et al (1998) Carbohydrate-de-ficient glycoprotein syndrome type Ib: phosphomannoseisomerase deficiency and mannose therapy. J Clin Invest 101:1414–1420
Panneerselvam K, Etchison JR, Freeze HH (1997) Human fi-broblasts prefer mannose over glucose as a source of man-nose for N-glycosylation. Evidence for the functional im-portance of transported mannose. J Biol Chem 272:23123–23129

Letters to the Editor 1539
Panneerselvam K, Freeze HH (1996) Mannose enters mam-malian cells using a specific transporter that is insensitive toglucose. J Biol Chem 271:9417–9421
Pelletier VA, Galeano N, Brochu P, Morin CL, Weber AM,Roy CC (1986) Secretory diarrhea with protein-losing en-teropathy, enterocolitis cystica superficialis, intestinal lym-phangiectasia, and congenital hepatic fibrosis: a new syn-drome. J Pediatr 108:61–65
Pirard M, Collet JF, Matthijs G, Van Schaftingen E (1997)Comparison of PMM1 with the phosphomannomutases ex-pressed in rat liver and in human cells. FEBS Lett 411:251–254
Powell LD, Paneerselvam K, Vij R, Diaz S, Manzi A, Buist N,Freeze H, et al (1994) Carbohydrate-deficient glycoproteinsyndrome: not an N- linked oligosaccharide processing de-fect, but an abnormality in lipid-linked oligosaccharide bi-osynthesis? J Clin Invest 94:1901–1909
Proudfoot AE, Turcatti G, Wells TN, Payton MA, Smith DJ(1994) Purification, cDNA cloning and heterologous ex-pression of human phosphomannose isomerase. Eur JBiochem 219:415–423
Reyes A, Cardenas ML (1984) All hexokinase isoenzymes co-exist in hepatocytes. Biochem J 221:303–309
Sambrook J, Fritsch EF, Maniatis T (1989) Molecular cloning:a laboratory manual, 2d ed. Cold Spring Harbor LaboratoryPress, Cold Spring Harbor, NY
Sols A, Crane RK (1954) Substrate specificity of brain hexo-kinase. J Biol Chem 210:581–595
Stibler H, Jaeken J (1990) Carbohydrate deficient serum trans-ferrin in a new systemic hereditary syndrome. Arch Dis Child65:107–111
Thorens B, Sarkar HK, Kaback HR, Lodish HF (1988) Cloningand functional expression in bacteria of a novel glucosetransporter present in liver, intestine, kidney and b-pancre-atic islet cells. Cell 55:281–290
Van Schaftingen E, Jaeken J (1995) Phosphomannomutase de-ficiency is a cause of carbohydrate-deficient glycoproteinsyndrome type I. FEBS Letters 377:318–320
Weinhouse S (1976) Regulation of glucokinase in liver. CurrTop Cell Regul 11:1–50
Address for correspondence and reprints: Dr. J. Jaeken, University HospitalGasthuisberg, Herestraat 49, B-3000 Leuven, Belgium. E-mail:[email protected]
q 1998 by The American Society of Human Genetics. All rights reserved.0002-9297/00/6206-0033$02.00
Am. J. Hum. Genet. 62:1539–1543, 1998
Temperature-Sensitive Phenotypes of Peroxisome-Assembly Processes Represent the Milder Formsof Human Peroxisome-Biogenesis Disorders
To the Editor:Peroxisome-biogenesis disorders (PBDs) are lethal he-reditary diseases caused by abnormalities in the assembly
processes of peroxisomes (Moser et al. 1995). The per-oxisome is a ubiquitous organelle involved in vital met-abolic functions, such as oxidative processes involvingH2O2, b-oxidation of fatty acids, and biosynthesis ofplasmalogens (Van den Bosch et al. 1992 ). PBDs arecharacterized by multiple defects in these functions, aswell as by the lack of morphologically normal peroxi-somes. They are genetically classified into complemen-tation groups (CGs), the number of which is x11 (Shi-mozawa et al. 1993; Moser et al. 1995; Poulos et al.1995). Each CG contains significantly different clinicalphenotypes—for example, Zellweger syndrome (ZS), ne-onatal adrenoleukodystrophy (NALD), and infantileRefsum disease (IRD). ZS patients have severe neuro-logical abnormalities, dysmorphic features, hepatome-galy, and multiple renal cysts, and most die at age !6mo. NALD patients have similar symptoms, but theysurvive considerably longer, dying during early child-hood. In contrast, IRD patients do not exhibit significantabnormalities in the CNS, and they have the longestaverage life span among patients with PBDs (Lazarowand Moser 1995; Moser et al. 1995). Although thecausal genes (PEXs) for several CGs have been clonedand the mutations have been identified at the molecularlevel (Shimozawa et al. 1992 ; Dodt et al. 1995; Wiemeret al. 1995; Fukuda et al. 1996; Yahraus et al. 1996;Chang et al. 1997; Okumoto and Fujiki 1997; Port-steffen et al. 1997; Reuber et al. 1997), it is unknownwhy such diverse clinical phenotypes occur in the sameCGs although, in all CGs, the phenotypes are very sim-ilar. We report that milder forms of PBDs are charac-terized by temperature-sensitive (TS) phenotypes of per-oxisome-assembly processes in the fibroblasts ofpatients.
In spite of the variations in the clinical features, thefibroblasts from patients of all three PBD phenotypesgenerally lack peroxisomes. Although the occurrence ofa reduced number of peroxisomes occasionally has beennoted in several PBD cell lines (Arias et al. 1985; Wiemeret al. 1991; Slawecki et al. 1995), no correlation withclinical features has been apparent. We assumed thatlimited types of leaky mutations in the PEX genes couldbe the causes of the milder forms of PBDs. As a possibleparameter representing such leakiness, we examinedtemperature sensitivity. Fibroblasts from PBD patientswith different CGs were incubated at 307C and at 377Cand were subjected to immunofluorescence staining withanti-catalase antibody. After 72 h incubation at 307C,punctate staining of catalase typical of peroxisomes wasdetected in the fibroblasts of all six patients with IRDand in three of five of those with NALD, belonging tofour different CGs (fig. 1b and table 1), whereas noperoxisomes appeared in the same cells after incubationat 377C (fig. 1a). Catalase and the 70-kD peroxisomalmembrane protein (PMP70) were colocalized in these

1540 Letters to the Editor
Figure 1 Immunofluorescence staining of peroxisomes in pa-tients’ fibroblasts and in Z65 mutant Chinese-hamster-ovary cells.Cells were cultured for 72 h at either 377C (a, c, and e) or 307C (b,d, and f) and were stained with either anti–human catalase antibody(a–d) or anti–rat catalase rabbit antibody (e and f). a and b, Fibroblastsof an IRD patient (F-05). c and d, Fibroblasts of a ZS patient (F-01).e and f, Z65 transformant with Pex2E55K. (Scale bar 5 50 mm)
Table 1
Temperature Sensitivity of Peroxisome Biogenesis in Fibroblasts ofPBD Patients
CG AND
PATIENTa PHENOTYPE
PEROXISOME-POSITIVE CELLS
INCUBATED ATb
(%)AGE AT DEATH
OR LAST
FOLLOW-UPc377C 307C
A (8):A-06 ZS 0 10 4 moA-05 NALD 0 90A-08 NALD 0 80 3 years 1 moA-04d IRD 0 60
C (4):C-03e ZS 0 0 8 moC-08 ZS 0 0 4 mo
E (1):E-14 ZS 0 0 4 moE-01f NALD 5 5 2 years 9 moE-13 NALD 1 1 1 year 8 moE-05d IRD 0 90E-24 IRD 0 60 1 year 7 mog
E-25 IRD 0 60 10 years 7 mog
E-26 IRD 0 50 6 years 1 mog
F (10):F-01h ZS 0 0 8 moF-04i ZS 0 0 3 moF-05 IRD 0 70
)j (6):6-01 NALD 5 80 4 years 6 mo
a The letter designation is that provided by Gifu University (Japan),and the number designation (in parentheses) is that provided by theKennedy Krieger Institute.
b Data are averages of several view fields, at #200.c Data are for traceable cases only.d Purchased from Coriell Cell Repositories (Camden, NJ); the cell
line designations are 222GM08771 (A-04) and GM08770 (E-05).e Source: Fukuda et al. (1996).f Source: Maeda et al. (1990).g Parents were alive after the age at the last follow-up (i.e., age
shown).h Source: Shimozawa et al. (1992).i Source: Shimozawa et al. (1998).j No designation of CG was available from Gifu University.
cells after incubation for 72 h at 307C (data not shown),thereby confirming the identity of these catalase-positivegranules as peroxisomes. In the fibroblasts of ZS patientswith any CGs tested, no peroxisomes were found ateither 307C or 377C incubation (fig. 1c and d and table1). Fibroblasts of normal controls had punctate patternsof catalase at both 307C and 377C incubation (data notshown).
We confirmed the formation of functional peroxi-somes in the TS cells at 307C, on the basis of threebiochemical criteria: the peroxisomal b-oxidation activ-ity of very-long-chain fatty acids (Suzuki et al. 1991),the activity of peroxisomal dihydroxyacetonephosphateacyltransferase (Shimozawa et al. 1988) involved in theplasmalogen biosynthesis, and the proteolytic processingof peroxisomal acyl-CoA oxidase (Tsukamoto et al.1995), which occurs within the peroxisomes. These ac-tivities were deficient in the ZS cells (F-01), at both 307Cand 377C incubation, whereas in the TS cells (F-05),
these functions were markedly improved by incubationat 307C but not by incubation at 377C (data not shown).
To identify the mutation responsible for the TS phe-notype, the PEX2 gene (GenBank), the causal gene forCG-F (Shimozawa et al. 1992), was amplified by PCRfrom the genomic DNA of TS cells F-05. PCR reactionwas performed by use of PEX2 gene–specific antisense(complementary to the PEX2 cDNA sequence of posi-tions 967–991, 5′-ATA CTT AGG ATG ACT AAT ATTAAG-3′) and sense (an intron sequence of the PEX2gene, starting 48 bp upstream of the 5′ end of the codingexon, 5′-CAA GAT TGC AAC TCT TTG CTA ATG-3′)oligonucleotides. PCR conditions were as follows: initialheating for 1 min at 947C, followed by 40 cycles ofdenaturation for 1 min at 947C, annealing for 2 min at

Letters to the Editor 1541
557C, and extension for 3 min at 727C. Nucleotide-se-quence comparison with the normal PEX2 gene revealedthat this patient was heterozygous for two point mu-tations. One was a GrA substitution at nucleotide po-sition 163,, relative to the A residue of the initiationcodon, causing an amino acid alteration (E55K). Theother was a CrT substitution at nucleotide position 355,resulting in the change of the codon 119 to a stop codon,TGA (R119 Stop). These two mutations were also foundin the PEX2 cDNA obtained by reverse transcrip-tase–PCR of the mRNA from F-05. The latter nonsensemutation is identical to that reported by Shimozawa etal. in both ZS patient F-01 (Shimozawa et al. 1992) andanother CG-F patient (Shimozawa et al. 1993) (bothcases were homozygous for the mutation), and it pre-viously had been established that this mutation is non-functional. Accordingly, we investigated the relationshipbetween the E55K mutation and the TS phenotype, bygene transfection. The PEX2E55K gene sequence sub-cloned in the expression vector pUcD2SRaMCS (Tsu-kamoto et al. 1995 ) was transfected to a PEX2-deficientChinese-hamster-ovary cell mutant (Z65) (Tsukamoto etal. 1991, 1994), and stable transformants were pro-duced. The transformants revealed a punctate distribu-tion of catalase after 72 h incubation at 307C, whereasno catalase-positive granules were observed for incu-bation at 377C (fig. 1e and f); Z65 transfected with wild-type PEX2 had catalase-positive granules at both 307Cand 377C; and the cells transfected with the empty vectorexhibited no peroxisomal staining at either 307C or 377C(data not shown). Thus, the TS phenotype of peroxisomebiogenesis of the IRD fibroblasts (F-05) is caused by theE55K mutation of the PEX2 gene.
The present results indicate that the peroxisome-as-sembly process is TS in the fibroblasts of patients withthe mildest form of PBD (i.e., IRD), irrespective of CGs,and that this phenotype is directly linked to the specificgenotype of the responsible PEX gene, at least in F-05.Such a TS phenotype was not observed for the mostsevere form of PBD (i.e., ZS), whereas only a subset ofthe cell lines were TS for NALD, the intermediate formof PBD. In this regard, it is interesting to note that theNALD patients with the TS phenotype (patients A-08and 6-01) had longer life spans than did those with thenon-TS phenotype (patients E-01 and E-13), eventhough the latter two patients exhibited slight leakinessat both temperatures. Thus, the TS phenotypes of per-oxisome assembly in the cultured fibroblasts representthe mildness of the clinical symptoms of PBD. Patientswith the TS phenotypes may be mosaic for peroxisomeoccurrence from cell to cell in the body at normal bodytemperatures. A mosaicism of peroxisomes was indeedreported in the liver of a PBD patient who had a rela-tively long life span (Giros et al. 1996). It is also possiblethat TS patients have partially functional peroxisomes.
In any case, the TS patients probably have higher grossperoxisomal activities than do the patients with non-TSleaky phenotypes (patients E-01 and E-13).
Temperature- or cold-sensitive phenotypes have beennoted in a few genetic diseases. In epidermolysis bullosasimplex, the disturbance of the skin becomes worse athigher temperatures, whereas, in paramyotonia congen-ita, exposure to lower temperatures causes myotonia. Inthese instances, the symptoms are understood to be di-rect effects of the temperature- and cold-sensitive phe-notypes of the corresponding gene products, keratin(Morley et al. 1995) and Na1-channel protein (Mc-Clatchey et al. 1992), respectively. In maple syrup–urinedisease, symptoms sometimes worsenwhen there is ahigh fever (Chuang and Shih 1995); however, the re-sponsible mutation has not been identified. Thus, TSphenotypes directly linked to specific genotypes possiblyoccur in various genetic diseases. Among these, PBDcases are unique in that a complex cellular process, per-oxisome assembly, becomes TS because of a single genemutation, causing distinct clinical features.
Our present results would raise several clinical impli-cations. First, the severity of prognosis could be diag-nosed, by examination of the temperature sensitivity ofperoxisome assembly in the fibroblasts of newborn PBDpatients. Second, precaution against fever may be nec-essary in the treatment TS PBD patients. Third, hypo-thermal therapy might be applicable to TS PBD patients.Such therapy might increase the frequency of cells havingfunctional peroxisomes, thereby improving clinicalsymptoms.
Acknowledgments
We thank T. Hashimoto and N. Usuda for anti-human andanti-rat catalase antibodies, respectively, and we thank H. W.Moser, A. B. Moser, R. J. A. Wanders, G. T. N. Besley, B. C.Paton, and A. Poulos for patients’ fibroblasts. This work wassupported in part by Grants-in-Aid for Scientific Research andExploratory Research, from the Ministry of Education, Sci-ence, Sports and Culture of Japan, and by grants from theSumitomo Foundation and Uehara Memorial Foundation.
ATSUSHI IMAMURA,1 TOSHIRO TSUKAMOTO, 1
NOBUYUKI SHIMOZAWA,2 YASUYUKI SUZUKI,2
ZHONGHI ZHANG,2 TSUNEO IMANAKA,4 YUKIO FUJIKI,5
TADAO ORII,3 NAOMI KONDO,2 AND TAKASHI OSUMI1
1Department of Life Science, Himeji Institute of Technology,Kamigori, Hyogo, Japan; 2Department of Pediatrics, GifuUniversity School of Medicine, and 3Faculty of HumanWelfare, Chubu Gakuin University, Seki, Gifu, Japan;4Department of Microbiology and Molecular Pathology,Faculty of Pharmaceutical Sciences, Teikyo University,Sagamiko, Kanagawa, Japan; and 5Department of Biology,Faculty of Science, Kyushu University, Fukuoka, Japan

1542 Letters to the Editor
Electronic-Database Information
Accession numbers and URLs for data in this article are asfollows:
GenBank, http://www.ncbi.nih.gov/Web/Search/index/html(for human peroxisome-assembly factor-1 [hsPEX2; acces-sion number M86852])
References
Arias JA, Moser AB, Goldfischer SL (1985) Ultrastructural andcytochemical demonstration of peroxisomes in cultured fi-broblasts from patients with peroxisomal deficiency disor-ders. J Cell Biol 100:1789–1792
Chang CC, Lee WH, Moser H, Valle D, Gould SJ (1997)Isolation of the human PEX12 gene, mutated in group 3 ofthe peroxisome biogenesis disorders. Nat Genet 15:385–388
Chuang DT, Shih VE (1995) Disorders of branched chainamino acid and keto acid metabolism. In: Scriver CR, Beau-det AL, Sly WS, Valle D (eds) The metabolic and molecularbases of inherited disease. McGraw-Hill, New York, pp1239–1278
Dodt G, Braverman N, Wong C, Moser A, Moser HW, WatkinsP, Valle D, et al (1995) Mutations in the PTS1 receptor gene,PXR1, define complementation group 2 of the peroxisomebiogenesis disorders. Nat Genet 9:115–125
Fukuda S, Shimozawa N, Suzuki Y, Zhang Z, Tomatsu S, Tsu-kamoto T, Hashiguchi N, et al (1996) Human peroxisomeassembly factor-2 (PAF-2): a gene responsible for group Cperoxisome biogenesis disorder in humans. Am J Hum Ge-net 59:1210–1220
Giros M, Roels F, Prats J, Ruiz M, Ribes A, Espeel M, WandersRJ, et al (1996) Long survival in a case of peroxisomalbiogenesis disorder with peroxisome mosaicism in the liver.Ann N Y Acad Sci 804:747–749
Lazarow PB, Moser HW (1995) Disorders of peroxisome bi-ogenesis. In: Scriver CR, Beaudet AL, Sly WS, Valle D (eds)The metabolic and molecular bases of inherited disease. Mc-Graw-Hill, New York, pp 2287–2324
Maeda K, Terada A, Murakami Y, Terabe K, Oki S, HattoriM, Matsumoto N, et al (1990) Clinical and biochemicalanalysis of infant with neonatal adrenoleukodystrophy (inJapanese). Acta Paediatr Jpn 94:1869–1876
McClatchey AI, van den Bergh P, Pericak VM, Raskind W,Verellen C, McKenna YD, Rao K, et al (1992) Temperature-sensitive mutations in the III-IV cytoplasmic loop region ofthe skeletal muscle sodium channel gene in paramyotoniacongenita. Cell 68:769–774
Morley SM, Dundas SR, James JL, Gupta T, Brown RA, SextonCJ, Navsaria HA, et al (1995) Temperature sensitivity ofthe keratin cytoskeleton and delayed spreading of keratin-ocyte lines derived from EBS patients. J Cell Sci 108:3463–3471
Moser AB, Rasmussen M, Naidu S, Watkins PA, McGuinnessM, Hajra AK, Chen G, et al (1995) Phenotype of patientswith peroxisomal disorders subdivided into sixteen comple-mentation groups. J Pediatr 127:13–22
Okumoto K, Fujiki Y (1997) Pex12 encodes an integralmembrane protein of peroxisomes. Nat Genet 17:265–266
Portsteffen H, Beyer A, Becker E, Epplen C, Pawlak A, KunauWH, Dodt G (1997) Human PEX1 is mutated in comple-mentation group 1 of the peroxisome biogenesis disorders.Nat Genet 17: 449–452
Poulos A, Christodoulou J, Chow CW, Goldblatt J, Paton BC,Orii T, Suzuki Y, et al (1995) Peroxisomal assembly defects:clinical, pathologic, and biochemical findings in two patientsin a newly identified complementation group. J Pediatr 127:596–599
Reuber BE, Germain LE, Collins CS, Morrell JC, AmeritungaR, Moser HW, Valle D, et al (1997) Mutations in PEX1 arethe most common cause of peroxisome biogenesis disorders.Nat Genet 17:445–448
Shimozawa N, Suzuki Y, Orii T, Moser A, Moser HW, WandersRJ (1993) Standardization of complementation grouping ofperoxisome-deficient disorders and the second Zellweger pa-tient with peroxisomal assembly factor-1 (PAF-1) defect. AmJ Hum Genet 52:843–844
Shimozawa N, Suzuki Y, Orii T, Yokota S, Hashimoto T (1988)Biochemical and morphologic aspects of peroxisomes in thehuman rectal mucosa: diagnosis of Zellweger syndrome sim-plified by rectal biopsy. Pediatr Res 24:723–727
Shimozawa N, Suzuki Y, Tomatsu S, Nakamura H, Kono T,Takada H, Tsukamoto T, et al (1998) A novel mutation,R125X in peroxisome assembly factor-1 responsible forZellweger syndrome. Hum Mutat Suppl 1:S134–S136
Shimozawa N, Tsukamoto T, Suzuki Y, Orii T, Shirayoshi Y,Mori T, Fujiki Y (1992) A human gene responsible for Zell-weger syndrome that affects peroxisome assembly. Science255:1132–1134
Slawecki ML, Dodt G, Steinberg S, Moser AB, Moser HW,Gould SJ (1995) Identification of three distinct peroxisomalprotein import defects in patients with peroxisome biogen-esis disorders. J Cell Sci 108:1817–1829
Suzuki Y, Shimozawa N, Yajima S, Yamaguchi S, Orii T, Hash-imoto T (1991) Effects of sodium 2-[5-(4-chlorophe-nyl)pentyl]-oxirane-2-carboxylate (POCA) on fatty acid ox-idation in fibroblasts from patients with peroxisomal dis-eases. Biochem Pharmacol 41:453–456
Tsukamoto T, Miura S, Fujiki Y (1991) Restoration by a 35Kmembrane protein of peroxisome assembly in a peroxisome-deficient mammalian cell mutant. Nature 350:77–81
Tsukamoto T, Miura S, Nakai T, Yokota S, Shimozawa N,Suzuki Y, Orii T, et al (1995) Peroxisome assembly factor-2, a putative ATPase cloned by functional complementationon a peroxisome-deficient mammalian cell mutant. Nat Ge-net 11:395–401
Tsukamoto T, Shimozawa N, Fujiki Y (1994) Peroxisome as-sembly factor 1: nonsense mutation in a peroxisome-defi-cient Chinese hamster ovary cell mutant and deletion anal-ysis. Mol Cell Biol 14:5458–5465
Van den Bosch H, Schutgens RBH, Wanders RJA, Tager JM(1992) Biochemistry of peroxisomes. Annu Rev Biochem 61:157–197
Wiemer EA, Nuttley WM, Bertolaet BL, Li X, Francke U,Wheelock MJ, Anne UK, et al (1995) Human peroxisomaltargeting signal-1 receptor restores peroxisomal protein im-

Letters to the Editor 1543
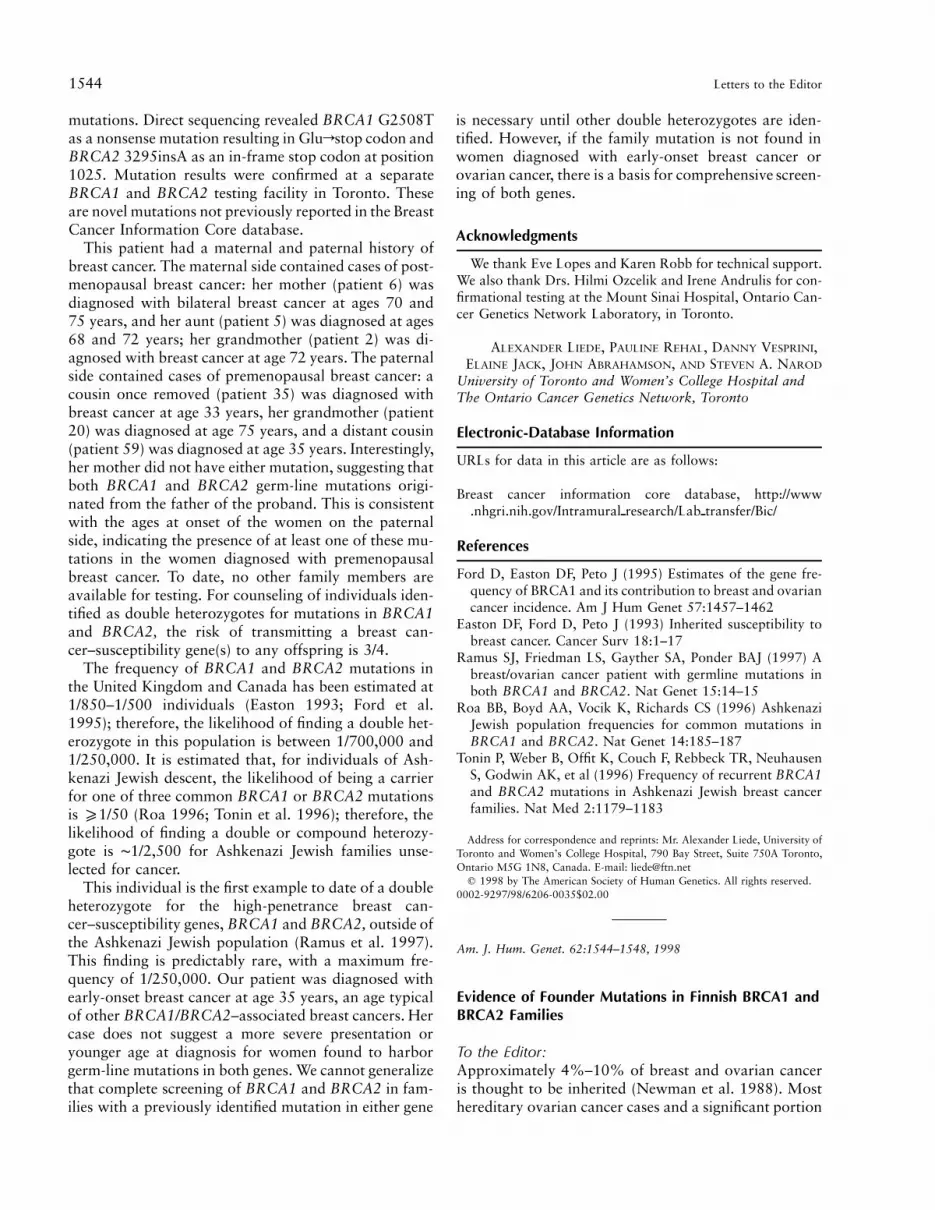
Figure 1 Pedigree of family 232. Blackened circles indicate affected women; blackened squares indicate affected men; and a diagonalslash indicates that the patient is deceased. Individual identification numbers appear directly below the symbols. Breast cancer is indicated withage at diagnosis (“dx”); bilateral breast cancer is indicated (“bil”) with ages at diagnoses; “PSU” indicates primary site not known; and “TAH-BSO” indicates a complete abdominal hysterectomy, including bilateral oophorectomy. The plus sign (1) indicates the presence of the BRCA1G2508T mutation and the BRCA2 3295insA mutation, in the proband tested. The minus sign (2) indicates the absence of these two mutationsin BRCA1 and BRCA2.
port in cells from patients with fatal peroxisomal disorders.J Cell Biol 130:51–65
Wiemer EA, Out M, Schelen A, Wanders RJ, Schutgens RB,van den Bosch H, Tager JM (1991) Phenotypic heterogeneityin cultured skin fibroblasts from patients with disorders ofperoxisome biogenesis belonging to the same complemen-tation group. Biochim Biophys Acta 1097:232–237
Yahraus T, Braverman N, Dodt G, Kalish JE, Morrell JC,Moser HW, Valle D, et al (1996) The peroxisome biogenesisdisorder group 4 gene, PXAAA1, encodes a cytoplasmicATPase required for stability of the PTS1 receptor. EMBOJ 15:2914–2923
Address for correspondence and reprints: Dr. Takashi Osumi, Department ofLife Science, Himeji Institute of Technology, Kamigori, Hyogo 678-1297, Japan.E-mail: [email protected]
q 1998 by The American Society of Human Genetics. All rights reserved.0002-9297/98/6206-0034$02.00
Am. J. Hum. Genet. 62:1543–1544, 1998
A Breast Cancer Patient of Scottish Descent withGerm-Line Mutations in BRCA1 and BRCA2
To the Editor:Ramus et al. (1997) previously described an AshkenaziJewish patient found to have germ-line mutations in bothbreast and ovarian cancer–susceptibility genes, BRCA1and BRCA2. We report the first such example for thenon-Jewish Caucasian population. The patient, who isindicated by an arrow in pedigree 232 (fig. 1), was ofScottish origin. She was diagnosed with breast cancer(grade 2 adenocarcinoma) at age 35 years. Simultaneousscreening by protein truncation test of both BRCA1(exon 11) and BRCA2 (exon 11) detected truncating
1544 Letters to the Editor
mutations. Direct sequencing revealed BRCA1 G2508Tas a nonsense mutation resulting in Glurstop codon andBRCA2 3295insA as an in-frame stop codon at position1025. Mutation results were confirmed at a separateBRCA1 and BRCA2 testing facility in Toronto. Theseare novel mutations not previously reported in the BreastCancer Information Core database.
This patient had a maternal and paternal history ofbreast cancer. The maternal side contained cases of post-menopausal breast cancer: her mother (patient 6) wasdiagnosed with bilateral breast cancer at ages 70 and75 years, and her aunt (patient 5) was diagnosed at ages68 and 72 years; her grandmother (patient 2) was di-agnosed with breast cancer at age 72 years. The paternalside contained cases of premenopausal breast cancer: acousin once removed (patient 35) was diagnosed withbreast cancer at age 33 years, her grandmother (patient20) was diagnosed at age 75 years, and a distant cousin(patient 59) was diagnosed at age 35 years. Interestingly,her mother did not have either mutation, suggesting thatboth BRCA1 and BRCA2 germ-line mutations origi-nated from the father of the proband. This is consistentwith the ages at onset of the women on the paternalside, indicating the presence of at least one of these mu-tations in the women diagnosed with premenopausalbreast cancer. To date, no other family members areavailable for testing. For counseling of individuals iden-tified as double heterozygotes for mutations in BRCA1and BRCA2, the risk of transmitting a breast can-cer–susceptibility gene(s) to any offspring is 3/4.
The frequency of BRCA1 and BRCA2 mutations inthe United Kingdom and Canada has been estimated at1/850–1/500 individuals (Easton 1993; Ford et al.1995); therefore, the likelihood of finding a double het-erozygote in this population is between 1/700,000 and1/250,000. It is estimated that, for individuals of Ash-kenazi Jewish descent, the likelihood of being a carrierfor one of three common BRCA1 or BRCA2 mutationsis x1/50 (Roa 1996; Tonin et al. 1996); therefore, thelikelihood of finding a double or compound heterozy-gote is ∼1/2,500 for Ashkenazi Jewish families unse-lected for cancer.
This individual is the first example to date of a doubleheterozygote for the high-penetrance breast can-cer–susceptibility genes, BRCA1 and BRCA2, outside ofthe Ashkenazi Jewish population (Ramus et al. 1997).This finding is predictably rare, with a maximum fre-quency of 1/250,000. Our patient was diagnosed withearly-onset breast cancer at age 35 years, an age typicalof other BRCA1/BRCA2–associated breast cancers. Hercase does not suggest a more severe presentation oryounger age at diagnosis for women found to harborgerm-line mutations in both genes. We cannot generalizethat complete screening of BRCA1 and BRCA2 in fam-ilies with a previously identified mutation in either gene
is necessary until other double heterozygotes are iden-tified. However, if the family mutation is not found inwomen diagnosed with early-onset breast cancer orovarian cancer, there is a basis for comprehensive screen-ing of both genes.
Acknowledgments
We thank Eve Lopes and Karen Robb for technical support.We also thank Drs. Hilmi Ozcelik and Irene Andrulis for con-firmational testing at the Mount Sinai Hospital, Ontario Can-cer Genetics Network Laboratory, in Toronto.
ALEXANDER LIEDE, PAULINE REHAL, DANNY VESPRINI,ELAINE JACK, JOHN ABRAHAMSON, AND STEVEN A. NAROD
University of Toronto and Women’s College Hospital andThe Ontario Cancer Genetics Network, Toronto
Electronic-Database Information
URLs for data in this article are as follows:
Breast cancer information core database, http://www.nhgri.nih.gov/Intramuralpresearch/Labptransfer/Bic/
References
Ford D, Easton DF, Peto J (1995) Estimates of the gene fre-quency of BRCA1 and its contribution to breast and ovariancancer incidence. Am J Hum Genet 57:1457–1462
Easton DF, Ford D, Peto J (1993) Inherited susceptibility tobreast cancer. Cancer Surv 18:1–17
Ramus SJ, Friedman LS, Gayther SA, Ponder BAJ (1997) Abreast/ovarian cancer patient with germline mutations inboth BRCA1 and BRCA2. Nat Genet 15:14–15
Roa BB, Boyd AA, Vocik K, Richards CS (1996) AshkenaziJewish population frequencies for common mutations inBRCA1 and BRCA2. Nat Genet 14:185–187
Tonin P, Weber B, Offit K, Couch F, Rebbeck TR, NeuhausenS, Godwin AK, et al (1996) Frequency of recurrent BRCA1and BRCA2 mutations in Ashkenazi Jewish breast cancerfamilies. Nat Med 2:1179–1183
Address for correspondence and reprints: Mr. Alexander Liede, University ofToronto and Women’s College Hospital, 790 Bay Street, Suite 750A Toronto,Ontario M5G 1N8, Canada. E-mail: [email protected]
q 1998 by The American Society of Human Genetics. All rights reserved.0002-9297/98/6206-0035$02.00
Am. J. Hum. Genet. 62:1544–1548, 1998
Evidence of Founder Mutations in Finnish BRCA1 andBRCA2 Families
To the Editor:Approximately 4%–10% of breast and ovarian canceris thought to be inherited (Newman et al. 1988). Mosthereditary ovarian cancer cases and a significant portion

Letters to the Editor 1545
Table 1
Classification of 88 Cancer Families According to Occurrence ofBreast and Ovarian Cancer in 1st-Degree Relatives
NO. OF CASES OF
BREAST CANCER
NO. OF FAMILIES IN WHICH NO. OF CASES
OF OVARIAN CANCER 5
0 1 2 3 4
0 1 2 1 11 13 9 22 27 5 13 14 14 85 1 1 1
of breast cancer cases are due to mutations in the BRCA1gene (Miki et al. 1994). In addition, BRCA2 mutationsaccount for a large fraction of hereditary breast cancerbut for only a small number of cases of hereditary ovar-ian cancer (Wooster et al. 1995). Other cancer pheno-types associated with mutations in these genes are pros-tate cancer and colon carcinoma, for BRCA1 (Ford etal. 1994), and prostate cancer and pancreatic carcinoma,for BRCA2 (Wooster et al. 1995 ). Most of the identifiedmutations appear to be highly penetrant, conferring aremarkably elevated lifetime cancer risk (Easton 1997).The proportion of breast/ovarian cancer families whosedisease is attributable to BRCA1 or BRCA2 mutationsvaries, depending on the population studied. Althoughthere seems to be a wide spectrum of different germ-linemutations in most countries, some geographically or eth-nically isolated populations, such as Icelanders and Ash-kenazi Jews, have shown clusterings of specific muta-tions (Szabo and King 1997; also see Breast CancerInformation Core).
Population history explains much of the enrichmentof certain disease-related gene defects in Finland. Theconcept of Finnish disease heritage currently includes130 diseases that are more prevalent in Finland than inother populations (de la Chapelle 1993). The majorityof these diseases are rare autosomal recessive disorders,but founder mutations can also be seen in the morecommon diseases, such as hereditary nonpolyposis coloncancer (HNPCC) (Nystrom-Lahti et al. 1995). There-fore, we were interested to see whether we could findany mutational clustering in the BRCA1 and BRCA2genes. Also, the phenotypic characteristics of the mu-tation carriers were determined.
Eighty-eight families from the Oulu University Hos-pital area (population 720,000), each with either at leasttwo cases of breast and/or ovarian cancer in first-degreerelatives or other characteristics of inherited suscepti-bility (e.g., bilateral/multiple primary tumors or age atdiagnosis !40 years) were analyzed. Expression of breastand ovarian cancer in these families is shown in table1. Pedigree data were obtained from the probands bymeans of a questionnaire and an interview. Permissionfor genetic testing was requested during genetic coun-seling. The study was approved by the Ethical Com-mittee of the Oulu University Medical Faculty.
The protein-encoding and splice site–junction regionsof BRCA1 and BRCA2 were examined mainly by con-formation-sensitive gel electrophoresis, the mutation-de-tection sensitivity of which is estimated to be in the rangeof 60%–95% (Korkko et al. 1998). Exon 11 of BRCA1and exons 10 and 11 of BRCA2 were screened by useof protein-truncation test (Hakansson et al. 1997). Forsequencing, we used Cyclist Exo2Pfu DNA SequencingKit (Stratagene). The primer sets and PCR conditionshave been described elsewhere (Castilla et al. 1994;
Friedman et al. 1994, 1997; Couch et al. 1996). Thefour microsatellite markers used to determine the dis-ease-linked BRCA1 haplotypes were D17S846,D17S855, D17S1322, and D17S1323 (Genome Data-base).
Altogether, five distinct mutations were ob-served—two in BRCA1 and three in BRCA2 (table 2).The proportion of disease-related BRCA1 and BRCA2mutations in the population studied was 12.5% (11/88).The mutation prevalence of true high-risk families was17% (6/36), and that for moderate-risk families was10% (5/52), suggesting that a strong family history isnot the only parameter that can predict mutations; earlydisease onset, tumor bilaterality, and multiple primarytumors should also be taken into account. Cancer phe-notypes are shown in table 2. BRCA1 mutations wereobserved in 7% (6/88) of the studied kindreds: the3745delT mutation leads to a premature protein-trans-lation termination at codon 1209, and the ArG sub-stitution at 4216-2nt generates an aberrant splice-ac-ceptor recognition site. Both of these mutations werepresent in three families. The proportion of BRCA2 mu-tations was 6% (5/88): the 999del5 mutation leadsto translation termination at codon 273, and the6503delTT mutation, which also is a frameshift muta-tion, generates a stop codon 18 bp farther downstream.Each of these two mutations was found in one family.The ArG 9346-2nt splice-acceptor site mutation is pre-dicted to result in the skipping of exon 24. Three familieswere found to carry this mutation. In addition to thedisease-related mutations, other DNA alterations in thecoding regions were seen (table 3). Furthermore, severalpolymorphisms were identified in the noncoding regionsof BRCA1 (in introns 6, 9, 17, 18, and 21) and BRCA2(in exon 2 and introns 8, 24, and 25).
Interestingly, four of the mutations identified in ourstudy were found to be the same as those in anotherFinnish study, by Vehmanen et al. (1997a, 1997b). Com-bined data show the presence of the BRCA1 exon 113745delT mutation in six families, the BRCA1 exon 124216-2ntArG mutation in five families, the BRCA2

1546 Letters to the Editor
Table 3
Polymorphisms and Unknown and Silent Variants Occurring inExonic Regions
Gene and Exon Alteration Effect Type (No. of Cases)a
BRCA1:9 C710T CysrCys S (2)11 C3832T ProrLeu UV (1)13 T4427C SerrSer P (41)15 G4654T SerrIle UV (1)16 A4956G SerrGly P (27)16 T5002C MetrThr UV (3)16 T5074C MetrThr UV (1)16 G5075A MetrIle P (3)
BRCA2:25 T9639G ThrrThr S (1)27 A10462G IlerVal UV (3)
a S 5 silent variant; UV 5 unknown variant; and P 5polymorphism.
Table 2
Mutations and Cancers in BRCA1 and BRCA2 Families
Family Gene Exon Mutation
Breast/Ovarian Cancer(s) in 1st- and 2d-Degree Relatives (Age [years] at
Diagnosis)a Other Cancers (No. of Cases)a
014 BRCA1 11 3745delT Ov (46, 47, 50, 70b) Kid (1)016 BRCA1 11 3745delT Br (47, u) Col (1), End (1), Lip (2), Liv (1)062 BRCA1 11 3745delT Ov (44, 50) )015 BRCA1 12 4216-2ntArG Br (28, 51, u), Ov (u) Bt (1), Liv (1)017 BRCA1 12 4216-2ntArG Br (29,c 36, 42, 52, u), Ov (u), Br1Ov (52) Bt (1), Leu (1), Liv (1), Sto (1), Tes (1), Ton (1)113 BRCA1 12 4216-2ntArG Br (62, u) Col (1), Cx (1), Lu (1), Sto (1)034 BRCA2 9 999delTCAAA Bil Br (68/68d) Bo (1), Col (1), End (1), Lu (1), Sar (1)028 BRCA2 11 6503delTT Br (77), Ov (64, u) End (2), Lu (1)002 BRCA2 24 9346-2ntArG Br (45, 47, 48, u), Bil Br (62/64) Csu (3), Liv (3), Pro (1), Sto (1), Thy (1)005 BRCA2 24 9346-2ntArG Br (37, 38, 46, 68) Csu (1), Leu (1)087 BRCA2 24 9346-2ntArG Br (39) Lu (1), Mel (1), Pan (1), Sto (2)
a Bas 5 basalioma; Bil Br 5 bilateral breast cancer; Bo 5 bone cancer; Br 5 breast cancer; Bt 5 brain cancer; Col 5 colon cancer; Csu 5cancer site unknown; Cx 5 cervical cancer; End 5 endometrial cancer; Kid 5 kidney cancer; Leu 5 leukemia; Lip 5 lip cancer; Liv 5 livercancer; Lu 5 lung cancer; Mel 5 melanoma; Ov 5 ovarian cancer; Pan 5 pancreatic cancer; Pro 5 prostate cancer; Sar 5 sarcoma; Sto 5stomach cancer; Tes 5 testicular cancer; Thy 5 thyroid cancer; Ton 5 cancer of the tongue; and u 5 age unknown. Mutation carrier statusis not defined for all individuals.
b Endometrial cancer also present.c Liver cancer also present.d Basalioma (at age 69 years) and colon cancer (at age 72 years) also present.
exon 9 999del5 mutation in eight families, and theBRCA2 exon 24 9346-2ntArG mutation in eight fam-ilies, providing evidence of at least four different foundermutations in Finland. At present, the BRCA1 exon 12and BRCA2 exon 24 splice-site mutations appear to beunique to the Finnish population, but the BRCA13745delT and BRCA2 999del5 mutations have also beenobserved in Sweden (Zelada-Hedman et al. 1997) andIceland (Johannesdottir et al. 1996), respectively. Theancestors of all three families with the BRCA1 3745delTmutation have been traced back to the late 19th centuryand the same rural area south of Oulu. Families 014and 016 share the same disease-linked haplotype for fourBRCA1 markers, indicating a common origin of the mu-tation (data not shown). Interestingly, both families haverelatives living in Stockholm, where the Swedish familywith the BRCA1 3745delT mutations resides. Althoughextensive migration from Finland to Sweden has oc-curred for many centuries, there is no indication thatthe Swedish family is related to the Finnish families inour study. It is quite peculiar that the BRCA2 999del5mutation, which occurs frequently in Iceland, appearsto be a founder mutation in Finland also but, as yet, hasnot been reported in other Nordic countries. BRCA26503delTT is the only mutation with no present recur-rence in the Finnish population. However, several otherfamilies with this mutation have been identified else-where (see Breast Cancer Information Core), and it ispossible that this site represents a mutational hot spot.The observed phenotype of one breast cancer and twoovarian cancers in family 028 corresponds well to whatwas expected, since the mutation is located within the
ovarian cancer cluster region. This family was negativefor a polymorphic stop codon, lys3326ter, which hasbeen detected in some individuals carrying the6503delTT mutation (Gayther et al. 1997). Haplotypeand genealogical studies to determine the age and pos-sible common ancestors of the mutations that are nowobserved—and to elucidate their relationship to the samemutations observed in other populations—have beeninitiated.
The population history of Finland differs, in manyrespects, from that of most countries. The coastal areaswere populated mainly during the 15th century, and itwas not until the 17th century that the vast inlandregions were gradually inhabited by a relatively small

Letters to the Editor 1547
number of individuals. The presence of several regionallyoccurring BRCA1 and BRCA2 founder mutations couldreflect this development, a situation similar to that forHNPCC. For instance, the four BRCA1 and BRCA2Finnish founder mutations are responsible for 91% ofthe mutations in the families studied in Oulu but foronly 45% of the mutations observed in the Helsinkistudy. None of the other 12 mutations identified in thestudy of individuals from southern Finland (Vehmanenet al. 1997a, 1997b) was seen in our material.
The clustering of mutations provides significant di-agnostic advantages. In HNPCC, for example, two mu-tations have been found to account for a majority (63%)of the Finnish cases. It has therefore become importantto design simple PCR-based tests for rapid mutation de-tection (Nystrom-Lahti et al. 1995). Since the BRCA1and BRCA2 founder mutations are currently seen in55% (27/49) of the Finnish mutation-positive kindreds,it makes meaningful the development of similar diag-nostic tests for breast and ovarian cancer.
Acknowledgments
This study was supported by the University of Oulu, OuluUniversity Hospital, the Finnish Cancer Society, the CancerFoundation of Northern Finland, and the Finnish Breast Can-cer Group. We also wish to thank Ake Borg, Arto Mannermaa,Jarmo Korkko, Helena Rahja, and Kari Mononen.
PIA HUUSKO,1 KATI PAAKKONEN,1 VIRPI LAUNONEN,1
MINNA POYHONEN,1 GUILLERMO BLANCO,2
ANTTI KAUPPILA,3 ULLA PUISTOLA,3 HEIKKI KIVINIEMI,4
MARIKA KUJALA,1 JAAKKO LEISTI,1 AND
ROBERT WINQVIST1, 2
Departments of 1Clinical Genetics, 2Oncology andRadiotherapy, 3Obstetrics and Gynecology, and 4Surgery,Oulu University Hospital, University of Oulu, Oulu,Finland
Electronic-Database Information
URLs for data in this article are as follows:
Breast Cancer Information Core, http://www.nhgri.nih.gov/Intramuralpresearch/Labptransfer/Bic/
Genome Database, http://gdbwww.gdb.org/
References
Castilla LH, Couch FJ, Erdos MR, Hoskins KF, Calzone K,Garber JE, Boyd J, et al (1994) Mutations in the BRCA1gene in families with early-onset breast and ovarian cancer.Nat Genet 8:387–391
Couch FJ, Farid LM, DeShano ML, Tavtigian SV, Calzone K,Campeau L, Peng Y, et al (1996) BRCA2 germline mutationsin male breast cancer cases and breast cancer families. NatGenet 13:123–125
de la Chapelle A (1993) Disease gene mapping in isolated
human populations: the example of Finland. J Med Genet30:857–865
Easton D (1997) Breast cancer genes—what are the real risks?Nat Genet 16:210–211
Ford D, Easton DF, Bishop DT, Narod SA, Goldgar DE, BreastLinkage Consortium (1994) Risks of cancer in BRCA1-mu-tation carriers. Lancet 343:692–695
Friedman LS, Gayther SA, Kurosaki T, Gordon D, Noble B,Casey G, Ponder BAJ, et al (1997) Mutation analysis ofBRCA1 and BRCA2 in a male breast cancer population. AmJ Hum Genet 60:313–319
Friedman LS, Ostermeyer EA, Szabo CI, Dowd P, Lynch ED,Rowell SE, King MC (1994) Confirmation of BRCA1 byanalysis of germline mutations linked to breast and ovariancancer in ten families. Nat Genet 8:399–404
Gayther SA, Mangion J, Russell P, Seal S, Barfoot R, PonderBAJ, Stratton MR, et al (1997) Variation of risks of breastand ovarian cancer associated with different germline mu-tations of the BRCA2 gene. Nat Genet 15:103–105
Hakansson S, Johannsson O, Johansson U, Sellberg G, LomanN, Gerdes A-M, Holmberg E, et al (1997) Moderate fre-quency of BRCA1 and BRCA2 germ-line mutations in Scan-dinavian familial breast cancer. Am J Hum Genet 60:1068–1078
Johannesdottir G, Gudmundsson J, Bergthorsson JT, ArasonA, Agnarsson BA, Eiriksdottir G, Johannsson OT, et al(1996) High prevalence of the 999del5 mutation in Icelandicbreast and ovarian cancer patients. Cancer Res 56:3663–3665
Korkko J, Annunen S, Pihlajamaa T, Prockop DJ, Ala-KokkoL (1998) Conformation sensitive gel electrophoresis for sim-ple and accurate detection of mutations: comparison withdenaturing gradient gel electrophoresis and nucleotide se-quencing. Proc Natl Acad Sci USA 95:1681–1685
Miki Y, Swensen J, Shattuck-Eidens D, Futreal PA, HarshmanK, Tavtigian S, Liu Q, et al (1994) A strong candidate forthe breast and ovarian cancer susceptibility gene BRCA1.Science 266:66–71
Newman B, Austin MA, Lee M, King MC (1988) Inheritanceof human breast cancer: evidence for autosomal dominanttransmission in high-risk families. Proc Natl Acad Sci USA85:3044–3048
Nystrom-Lahti M, Kristo P, Nicolaides NC, Chang SY, Aal-tonen LA, Moisio AL, Jarvinen HJ, et al (1995) Foundingmutations and Alu-mediated recombination in hereditarycolon cancer. Nat Med 1:1203–1206
Szabo CI, King M-C (1997) Population genetics of BRCA1and BRCA2. Am J Hum Genet 60:1013–1020
Vehmanen P, Friedman LS, Eerola H, McClure M, Ward B,Sarantaus L, Kainu T, et al (1997a) Low proportion ofBRCA1 and BRCA2 mutations in Finnish breast cancer fam-ilies: evidence for additional susceptibility genes. Hum MolGenet 6:2309–2315
Vehmanen P, Friedman LS, Eerola H, Sarantaus L, PyrhonenS, Ponder BAJ, Muhonen T, et al (1997b) A low proportionof BRCA2 mutations in Finnish breast cancer families. AmJ Hum Genet 60:1050–1058
Wooster R, Bignell G, Lancaster J, Swift S, Seal S, MangionJ, Collins N, et al (1995) Identification of the breast cancersusceptibility gene BRCA2. Nature 378:789–792

1548 Letters to the Editor
Zelada-Hedman M, Wasteson Arver B, Claro A, Chen J, Wer-elius B, Kok H, Sandelin K, et al (1997) A screening forBRCA1 mutations in breast and breast-ovarian cancer fam-ilies from the Stockholm region. Cancer Res 57:2474–2477
Address for correspondence and reprints: Dr. Robert Winqvist or Dr. PiaHuusko, Department of Clinical Genetics, Oulu University HospitalKajaanintie 50, FIN-90220 Oulu, Finland. E-mail: [email protected]
q 1998 by The American Society of Human Genetics. All rights reserved.0002-9297/98/6206-0036$02.00
Am. J. Hum. Genet. 62:1548–1551, 1998
A Triplet Repeat on 17q Accounts for MostExpansions Detected by the Repeat-Expansion–Detection Technique
To the Editor:Eight hereditary neurogenerative disorders have beenidentified that result from expansions of CAG trinucle-otide repeats (Gilles et al. 1997). Thus, there has beengreat incentive to develop techniques to efficiently screenfor repeat sequences in specific patient populations. Therepeat-expansion detection (RED) is a widely used tech-nique that screens for trinucleotide expansions withouta requirement of prior knowledge of the disease locus(Schalling et al. 1993; Zander et al. 1997). The methoduses genomic human DNA as a template, specific-repeatoligonucleotide primers, and a thermostable ligase togenerate oligomers of the primer. However, there arelimitations to the technique. Non–disease-related ex-pansions occur frequently in the population, which com-plicate the interpretation of disease-association studies.For a repeat to be detected by the RED, it must standout in size, and smaller expansions causing disease canbe missed. Also, once an expanded repeat is found, thereis no information about chromosomal localization.
Other techniques for identifying trinucleotide expan-sions have recently been developed (Sanpei et al. 1996;Koob et al. 1998). The direct identification of repeatexpansion and cloning technique (DIRECT) was de-signed to enable the localization and cloning of ex-panded-repeat regions (Sanpei et al. 1996). By means ofthe DIRECT technique, a novel, long, and unstableCAG/CTG trinucleotide repeat (Dir I) was identified andlocalized to chromosome 17q (Ikeuchi et al. 1998). Thisrepeat is highly polymorphic, ranging in size from 10 to92 repeat copies (30–276 bp) in normal individuals(Ikeuchi et al. 1998). Independently, a second groupidentified this expanded repeat by cloning the gene frag-ment from RED positive DNAs (Nakamoto et al. 1997).
DNA samples, obtained with informed consent frompsychiatric patients with childhood onset of disease,
were studied specifically to detect increased numbers oftriplet repeats by use of the RED technique (Burgess etal. 1998). Since children and adolescents with psychi-atric disorders appear to have functional brain abnor-malities (McKenna et al. 1994), these patients are a val-uable resource for such studies. Although expansions oftrinucleotide repeats have been associated with severaldisorders affecting the brain and nervous system, theirinvolvement in the etiology of psychiatric disorders hasnot been clearly demonstrated (Lindblad et al. 1995;Morris et al. 1995; O’Donovan et al. 1995). Since ex-panded repeats can be associated with genetic antici-pation, patients with an early onset of disease are es-pecially good candidates to evaluate.
The RED technique was used to identify trinucleotideexpansions in 227 individuals, including 36 patients di-agnosed with childhood-onset schizophrenia (COS); 21diagnosed with atypical psychosis, termed by us as “mul-tidimensionally impaired” (MDI) (Kumra et al. 1998);46 patients with attention-deficit hyperactivity disorder(ADHD); 51 screened controls; and 73 relatives of pro-bands. Patients were diagnosed according to standardDiagnostic and Statistical Manual of Mental Disordersdefinitions with standardized interviews as describedelsewhere (Gordon et al. 1994; Castellanos et al. 1996).Diagnostic criteria for the MDI group has been discussedelsewhere (Kumra et al. 1998). The RED analysis wasperformed with a CTG10 oligonucleotide in the REDreaction, producing a repeat-size representation at 30-nucleotide intervals (Lindblad et al. 1996; Zander et al.1997). The same samples were then analyzed for ex-pansions of the polymorphic CAG/CTG Dir I trinucle-otide repeat on chromosome 17q, by use of PCR con-ditions as described elsewhere (Ikeuchi et al. 1998; seefig. 1).
RED expansions of x180 nucleotides were detectedin a total of 99 (44%) of the 227 individuals screened,with the distribution of RED scores shown in table 1.When diagnoses were evaluated separately, RED scoresof x180 nucleotides were seen in 41% of COS patients( ), 43% of MDI patients ( ), 43% ofn 5 36 n 5 21ADHD patients ( ), and 29% of the controlsn 5 24( ) (fig. 2A).n 5 51
In analyzing the CAG/CTG repeat on chromosome17q, we scored the allele in each individual with thelargest repeat size. A total of 81 (36%) of the 227 in-dividuals screened had a chromosome 17q Dir I repeatexpansion of 1150 bp. Interestingly, 80 of the 81 indi-viduals with a repeat size of 1150 bp on chromosome17q had RED scores of x180 nucleotides. Thus, theRED technique appeared to detect this expansion reli-ably. There was also a strong correlation between thesize of the Dir I expansion and the size of the expansiondetected by RED (table 1).
Dir I repeats in excess of 50 copies (150 bp) were

Letters to the Editor 1549
Table 1
Correlation of Dir I Expansion Size with RED Score in Individualswith RED scores of x180 Nucleotides
DIR IREPEAT
SIZE
(BP)
RED SCORE
(NUCLEOTIDES)
Total180 210 240 270 300
X150 2 7 5 4 1 19151–180 20 1 1 0 0 22181–210 14 23 3 0 1 41211–240 0 6 10 0 0 161240 0 0 0 1 0 1
Total 36 37 19 5 2 99
Figure 1 RED score (nucleotides) vs. Dir I size (bp): A, normal controls, B, patients with COS, C, patients with ADHD, and D, patientswith MDI. Circled individuals were found to have expansions of CTG 18.1.
observed in 33% of 36 COS patients ( ), 35% ofn 5 1246 ADHD patients ( ), 33% of 21 MDI patientsn 5 16( ), and 27% of the 51 controls ( ). On then 5 7 n 5 14basis of these frequencies and P values (COS, ;P ! .568ADHD, ; MDI, ), it does not appearP ! .428 P ! .607that expansions at this locus are specifically associatedwith any of these disease phenotypes.
Thus, expansions of Dir I appear to account for themajority of elevated RED scores observed in our pop-ulation. However, in each diagnostic group and in thecontrols there were ∼20% of individuals with increasedtriplet repeats detected by the RED who did not haveDir I expansions (fig. 2A). These individuals werescreened for expansions of another known heritable ex-panding CTG repeat in SEF2-1, a gene encoding a tran-scriptional factor protein found on the human chro-mosome 18q21.1 (Breschel et al. 1997). A 1.6-kb clone(termed “CTG 18.1”), which consists of portions ofSEF2-1, contains an intronic (CTG)24 repeat, which ishighly polymorphic but not associated with an obviousabnormal phenotype.
In the majority of patients with elevated RED scores
without an expansion of Dir I, examination of theCTG18.1 locus revealed an expanded allele of x150bp. Patients with the expanded CTG18.1 allele generallyhad very high RED values (many were x240 nucleo-tides). Removing these samples greatly improved the cor-relation of RED score with Dir I expansion size (figs.2B and 2C), changing the adjusted R2 value from 0.500to 0.740.

1550 Letters to the Editor
Figure 2 A, Distribution of elevated RED scores by diagnosis. B, Linear fit of RED scores plotted against Dir I repeat size: observations5 227, adjusted , root mean square error 5 15.62, analysis of variance . C, Linear fit when 15 individuals with expansions2R 5 0.500 P X .001at CTG18.1 are removed: observations 5 212, adjusted , root mean square error 5 11.42, analysis of variance .2R 5 0.740 P X .001
This study demonstrates that up to 94% of trinucle-otide-repeat expansions detected by RED can be ac-counted for by PCR analysis of two specific loci, Dir Iand CTG18.1. The etiology of the remaining expansionsrequires further study. The combination of RED analysiswith PCR of the Dir I and CTG18.1 loci may improvethe ability to identify other disorders associated withrepeat expansions. Clearly, although the RED technique
reliably detects large trinucleotide repeats in the genome,many of the large repeats identified are not those relatedto illness.
Acknowledgments
We acknowledge the clinical assistance of Tom Fernandez,Paul Lee, Dr. Xavier Castellanos, Dr. Leslie Jacobson, and Dr.

Letters to the Editor 1551
Sanjiv Kumra. We also thank K. Kuhns and E. Alzona for helpwith manuscript preparation, Azita Kashani and Barbara Stub-blefield for technical assistance, and Mary LaMarca and VukKoprivica for assistance in preparing the figures. C.B. and M.S.were supported by EC Biomed 2, the Swedish Medical Re-search Council, the National Association for Research onSchizophrenia and Affective Disorder, and the Scottish RiteFoundation.
ELLEN SIDRANSKY,1 CATHERINE BURGESS,3,∗
TAKESHI IKEUCHI,4,∗ KERSTIN LINDBLAD,3
ROBERT T. LONG,1 ROBERT A. PHILIBERT,1
JUDITH RAPOPORT,2 MARTIN SCHALLING,3
SHOJI TSUJI,4 AND EDWARD I. GINNS1
1Clinical Neuroscience Branch and 2Child PsychiatryBranch, National Institute of Mental Health, NationalInstitutes of Health, Bethesda; 3Department of MolecularMedicine, Karolinska Hospital, Stockholm; and 4Departmentof Neurology, Brain Research Institute, Niigata University,Niigata, Japan
References
Breschel TS, McInnis MG, Margolis RL, Sirugo G, Corne-liussen B, Simpson SG, McMahon FJ, et al (1997) A novel,heritable, expanding CTG repeat in an intron of the SEF2-1 gene on chromosome 18q21.1. Hum Mol Genet 6:1855–1863
Burgess CE, Lindblad K, Sidransky E, Yuan Q-P, Breschel T,Ross CA, McInnis M et al (1998) Large CAG/CTG repeatexpansions are associated with childhood-onset schizophre-nia. Mol Psychiatry (in press)
Castellanos FX, Giedd JN, Marsh WL, Hamburger SD, Vai-tuzis AC, Dickstein DP, Sarfatti SE, et al (1996) Quantitativebrain magnetic resonance imaging in attention-deficit/hy-peractivity disorder. Arch Gen Psychiatry 53:607–616
Gilles D, Abbas N, Stevanin G, Durr A, Yvert G, Cancel G,Weber C, et al (1997) Cloning of the SCA7 gene reveals ahighly unstable CAG repeat expansion. Nat Genet 17:65–70
Gordon CT, Frazier JA, McKenna K, Giedd J, Zametkin A,Zahn T, Hommer D, et al (1994) Childhood onset schizo-phrenia: a NIMH study in progress. Schizophr Bull 20:697–712
Ikeuchi T, Sanpei K, Takano H, Sasaki H, Tashiro K, CancelG, Brice A, et al (1998) A novel long and unstable CAG/CTG trinucleotide repeat on chromosome 17q. Genomics(in press)
Koob MD, Benzow KA, Bird TD, Day JW, Moseley ML,Ranum LPW (1998) Rapid cloning of expanded trinucleo-tide repeat sequences from genomic DNA. Nat Genet 18:72-75
Kumra S, Jacobsen LK, Lenane M, Zahn TP, Wiggs E, Alagh-band-Rad J, Castellanos FX (1998) Multidimensionally im-paired disorder: is it a variant of very early-onset schizo-phrenia? J Am Acad Child Adolesc Psychiatry 37:91–99
Lindblad K, Nylander P-O, Debruyn A, Sovrey D, Fander C,Engstrom C, Holmgren G, et al (1995) Detection of ex-panded CAG repeats in bipolar affective disorder using therepeat expansion detection (RED) method. Neurobiol Dis2:55–62
Lindblad K, Savontaus M-L, Stevanin G, Holmberg M, DigreK, Zander C, Ehrsson H, et al (1996) CAG repeat expan-sions in spinocerebellar ataxia type 7. Genome Res 6:965–971
McKenna K, Gordon CT, Lenane M, Kaysen D, Fahley K,Rapoport JL (1994) Childhood-onset schizophrenia: timelyneurobiological research. J Am Acad Child Adolesc Psychi-atry 33:771–781
Morris AG, Gaitonde E, McKenna PJ, Mollon JD, Hunt DM(1995) Repeat expansions and schizophrenia: associationwith disease in females and with early age-at-onset. HumMol Genet 4:1957–1961
Nakamoto M, Takebayashi H, Kawaguchi Y, Narumiya S,Taniwaki M, Nakamura Y, Ishikawa Y, et al (1997) A CAG/CTG expansion in the normal population. Nat Genet 17:385–386
O’Donovan MC, Guy C, Craddock N, Murphy KC, CardnoAG, Jones LA, Owen MJ, et al (1995) Schizophrenia andbipolar disorder are associated with expanded CAG/CTGrepeats. Nat Genet 10:380–381
Sanpei K, Takano H, Igarashi S, Sato T, Oyake M, Sasaki H,Wakisaka A, et al (1996) Identification of the spinocerebellarataxia type 2 gene using a direct identification of repeatexpansion and cloning technique, DIRECT. Nat Genet 14:277–284
Schalling M, Hudson TJ, Buetow KH, Housman DE (1993)Direct detection of novel expanded trinucleotide repeat inthe human genome. Nat Genet 4:135–139
Zander C, Burgess CE, Johansen J, Lindblad K, Hudson T,Schalling M (1997) Repeat expansion detection. In: TaylorGR (ed) Laboratory methods for detection of mutations andpolymorphisms in DNA. CRC Press, New York, pp263–271
Address for correspondence and reprints: Dr. Ellen Sidransky, Clinical Neu-roscience Branch, IRP, National Institute of Mental Health, NIH, Building 49,Room B1EE16, 49 Convent Drive, MSC 4405, Bethesda, MD 20892-4405. E-mail: [email protected]
∗These authors contributed equally to this work.q 1998 by The American Society of Human Genetics. All rights reserved.
0002-9297/98/6206-0037$02.00
Am. J. Hum. Genet. 62:1551–1555, 1998
Paternal Isodisomy of Chromosome 7 Associated withComplete Situs Inversus and Immotile Cilia
To the Editor:Uniparental disomy (UPD) refers to the inheritance oftwo homologous chromosomes from one parent, in adiploid individual. Heterodisomy is the inheritance ofboth parental homologues, whereas isodisomy impliesthe inheritance of two copies of a single parental ho-mologue (Engel 1980). Uniparental inheritance of a hu-man autosome in a cytogenetically normal individualwas first recognized by Spence et al. (1988), on the basis

1552 Letters to the Editor
Figure 1 Complete situs inversus. A chest X-ray demonstratesthe laterality defect manifested as dextrocardia and visceral situs in-versus. The ultrastructural appearance of bronchial cilia is shown inthe insets. Note normal axonemal structure with typical doublet9 1 2microtubular configuration. Arrowheads indicate normal inner andouter dynein arms (transmission electron microscopy).
Table 1
DNA Markers and Results of Genotyping
CHROMOSOME
AND MARKERa LOCATION
ALLELES
HETEROZYGOSITYMother Patient
7:D7S531b 7pter-p15 2,3 1,1 .77D7S481 7pter-p15 1,2 2,2 .84D7S507b 7pter-p15 1,2 3,3 .89D7S488b 7p21-p15 1,2 3,3 .83D7S673b 7 1,2 3,3 .86D7S526b 7p21-p15 1,2 3,3 .71D7S485b 7p15 2,2 1,1 .78Elastin 7q11.23 1,2 1,1 .63D7S849 7p11-q21 1,2 2,2 .57D7S440 7q 1,1 1,1 .73D7S492 7q15-q22 1,2 1,1 .76D7S501 7q31 1,1 1,1 .81D7S471b 7 1,3 2,2 .83D7S650 7q 1,1 1,1 .85D7S640b 7q 2,3 1,1 .85D7S495 7q31-q35 1,2 1,1 .81D7S636 7 2,3 1,1 .90D7S483b 7q31-qter 1,2 3,3 .82D7S550b 7q31-qter 2,3 1,1 .83D7S489 7p15-q22 1,2 1,1 .38D7S467 7q35-q36 1,1 1,1 .93
Other:D1S249 1,2 2,3 .87D9S195 1,1 1,2 .74D9S67 2,2 1,2 .64D10S187 1,2 1,1 .83D10S211 1,2 2,3 .83D14S67 2,3 1,2 .87D14S68 2,2 1,2 .88D16S406 1,1 1,1 .83D17S806 1,3 1,2 .90D21S1255 1,2 1,2 .80
a Twenty one polymorphic loci were examined for evidence of UPDfor chromosome 7, and 10 markers from other chromosomes wereused to examine maternity.
b Demonstrated uniparental isodisomy.
of the failure to detect a paternal allele in the course ofgenotyping a patient with cystic fibrosis (CF; MIM219700).
Patient CC was born at 34 wk gestation to a 20-year-old Hispanic mother after an uncomplicated pregnancy.His birth weight was 2,540 g and the newborn physicalexam was reported as normal. The family history wasunremarkable, and there was no known consanguinity.He developed respiratory distress at 10 d of age, and achest X-ray and echocardiogram demonstrated dextro-cardia with a structurally normal heart (fig. 1). An ab-dominal ultrasound demonstrated visceral situs inversuswith a structurally normal spleen. At 6 mo of age, thechild was growth retarded with signs of significant res-piratory disease. A tracheal aspirate grew Pseudomonasaerugenosa and Staphylococcus aureus, and a sweatchloride test confirmed the clinical diagnosis of CF. Be-cause of the presence of situs inversus and severe lungdisease, a bronchial biopsy was performed to evaluateciliary function. The respiratory mucosal brushings wereobtained by the endoscopist, transported in isotonic sa-line, and immediately examined by the pathologist. Theendoscopist was instructed to avoid mucosal areas withacute and/or chronic inflammatory changes, such as ero-sions, ulcerations, or hyperemia, and to sample only
those areas that appear clinically normal. Microscopicexamination for ciliary motility was performed by useof dark-field microscopy with the cytologic material di-luted with saline (Rutland and Cole 1980, 1981). Anexhaustive search with numerous wet preparation slideswas performed. No normal ciliary motion was observed,despite the lack of an inflammatory infiltrate. Electronmicroscopy of the sample demonstrated structurally nor-mal cilia (fig. 1, inset).
A peripheral lymphocyte karyotype was normal. DNAtesting showed the patient to be homozygous for theDF508 CFTR (cystic fibrosis transmembrane-conduc-tance regulator) mutation, with his mother lacking anydetectable alteration. To further define the mode of in-heritance, DNA was extracted from lymphoblasts of thepatient and his mother; a sample from the father wasnot available for study. PCR amplification was carried

Letters to the Editor 1553
out under standard conditions for the di- and trinucle-otide repeat loci listed in table 1 (Gyapay et al. 1994),by use of a Perkin-Elmer 480 device and polyacrylamideelectrophoresis. A total of 21 loci along the length ofchromosome 7 were used to demonstrate paternal iso-disomy for the chromosome. The patient was homo-zygous at all 21 loci, with 10 of the markers being fullyinformative for paternal inheritance. To establish thatmaternity is correct, 10 highly polymorphic markers(6–16 alleles for each) for autosomal loci other thanchromosome 7 were tested. The patient shared at leastone allele at each locus with his mother, indicating ahigh likelihood (199%) of maternity.
To address the possibility of a second independentetiology for situs abnormalities, the patient’s DNA wasexamined for deletions within the critical region of theX-linked heterotaxy locus in Xq26.2 (MIM 306955;Casey et al. 1993), and the coding region of a recentlyidentified gene that when altered leads to heterotaxy(Gebbia et al. 1997) was sequenced. Males with X-linkedheterotaxy typically have complex heart anomalies inaddition to visceral situs ambiguous (Casey et al. 1993), a feature lacking in this patient. Sporadic cases ofheterotaxy have been described with submicroscopic de-letions within this critical region (Ferrero et al. 1997).A total of nine sequence-tagged-site markers distributedthroughout the critical region were used to search forsubmicroscopic deletions, and none were identified (datanot shown). Furthermore, the protein-encoding exonsfrom the gene now known to be responsible for X-linkedheterotaxy (ZIC3; Gebbia et al. 1997) was sequencedfrom the patient, and no mutation was identified. Inaddition, the differential display technique (Liang andPardee 1992) was used to compare transcripts presentin lymphoblasts from this patient, a patient with ma-ternal isodisomy of chromosome 7 (Spence et al. 1988),and from control cell lines. This analysis failed to iden-tify any differentially expressed transcripts among thesecell lines (except for immunoglobulin light-chain tran-scripts), possibly because of the cell type used as thesource of RNA.
Several possible mechanisms for UPD have been pro-posed, including gamete complementation, postzygoticmonosomy duplication, reduction to disomy of a tri-somic conception, and somatic crossing over (Spence etal. 1988). The two more likely explanations in this casewould be (1) monosomy duplication associated with anullisomic maternal gamete or (2) a paternal meoisis IInondisjunction resulting in a trisomic conceptus, withsubsequent reduction to disomy through loss of the ma-ternal chromosome 7 (trisomic rescue). UPD is increas-ingly recognized as a mechanism for the non-Mendeliantransmission of a recessive disorder (reviewed by Led-better and Engel 1995). In addition to CF, examplesinclude methylmalonic aciduria (MIM 251000; Abra-
mowicz et al. 1994), rod monochromacy (MIM 216900;Pentao et al. 1992), Bloom syndrome (MIM 210900;Woodage et al. 1994), lipoprotein lipase deficiency(MIM 238600; Benlian et al. 1996), Duchenne musculardystrophy in a female (MIM 310200; Quan et al. 1997),Herlitz junctional epidermolysis bullosa (MIM 226700;Pulkkinen et al. 1997), and congenital chloride diarrhea(CLD; MIM 214700; Hoglund et al. 1994). As withseveral cases of maternal disomy of chromosome 7, thepatient was initially identified because of CF. Maternalisodisomy for chromosome 7 or 7p is consistently as-sociated with short stature (Spence et al. 1988; Voss etal. 1989; Spotila et al. 1992; Eggarding et al. 1994;Langlois et al. 1995), and in one patient this has beenattributed to growth-hormone deficiency (Hubbard etal. 1980). Similarly, both hetero- and isodisomy of chro-mosome 7 has been reported in association with dwarf-ism, either unspecified dwarfism or with clinical featuresof Russell-Silver syndrome (MIM 180860; Kotzot et al.1995; Preece et al. 1997). The finding of maternal het-erodisomy implies that genomic imprinting may be theunderlying cause of the dwarfism. Since it is known thatthe region of conserved synteny in the mouse undergoesimprinting (Cattanach and Kirk 1985), it is reasonableto predict that there is one or more loci on chromosome7 involved in the growth-hormone axis that undergoesimprinting during development. Potential genes locatedon chromosome 7 include, among others, insulin-likegrowth-factor binding protein 1 (IGF-BP1), insulin-likegrowth-factor binding protein 3 (IGF-BP3), or thegrowth hormone–releasing hormone receptor(GHRHR). In contrast, paternal isodisomy for the entirechromosome has been reported in only a single patient,who came to medical attention because of CLD, a dis-order previously mapped to chromosome 7 (Hoglund etal. 1994). The patient was reported to have normal stat-ure and, apart from CLD, has no clinically detectableabnormalities except for mild high-frequency hearingloss.
A parsimonious interpretation of this case would sug-gest that the child inherited two recessive disorders fromhis father: CF, and immotile cilia associated with com-plete situs inversus. It is, of course, possible that the twodisorders are unrelated in this patient; for example, hemay coincidentally have autosomal dominant or reces-sive heterotaxy, especially in light of the unavailabilityof the father for a detailed clinical evaluation. X-linkedheterotaxy is less likely given the failure to identify anysequence alterations in the causative gene or any smalldeletions in the adjoining regions.
Immotile-cilia syndrome (MIM 242650) is likely a ge-netically heterogeneous disorder that typically comes tomedical attention because of sinopulmonary infections(rhinosinusitus, bronchitis, and bronchiectasis) and maleinfertility. In the face of situs inversus, it is referred

1554 Letters to the Editor
to eponymically as “Kartagener syndrome” (MIM244400), with an estimated prevalence of 1/20,000–1/60,000 individuals (Afzelius and Mossberg 1995). Al-though, by use of electron microscopy, abnormalities ofciliary structures are a frequent finding, there are a num-ber of cases of Kartagener syndrome with structurallynormal cilia that are dysmotile or immotile (Herzon andMurphy 1980; Pedersen 1983), and a recent report in-dicates that subtle structural deficiencies may be muchmore common than has been previously recognized (Tek-nos et al. 1997). In examining ciliary function, care mustbe taken to process the sample properly, and acute orchronic inflammation from a variety of sources may leadto false-positive results, especially in the case of a CFpatient. In light of the fact that only half of the patientswith immotile-cilia syndrome have situs inversus, elec-tron microscopic evaluation of ciliary structure in thoseCF patients with unusually severe respiratory diseasemay be warranted. Interestingly, one other well-estab-lished case of CF in association with situs inversus thatwas interpreted to be Kartagener syndrome has beenreported (Burnell and Robertson 1974 ). In contrast,Liechti-Gallati and Kraemer (1995) failed to detect anyCF mutations in a cohort of patients with immotile-ciliasyndrome.
It is noteworthy that laterality defects have been as-sociated with complex chromosome rearrangements in-volving chromosome 7. One patient has been described(Koiffman et al. 1993) with an insertion of chromosome8 material into 7q22 (46,XY,ins[7;8][q22;q12q24]),whereas the offspring of a mother with ectrodactyly andan apparently balanced reciprocal translocation, t(2;7)(q21.1;q22.1), was found to have situs ambiguus andcomplex heart disease (analysis of a karyotype from theinfant was not performed) (Genuardi et al. 1993). Al-though genes such as nodal and Vg1 have been impli-cated in the lateralization of vertebrate embryos (Col-lignon et al. 1996; Hyatt et al. 1996), a variety of othergenes may be involved in laterality and ciliary defects,including other extracellular signalling molecules, tran-scription factors, and cytoskeletal components. In thisregard, the gene for actin-binding protein 2 (FLN2), pre-viously localized to chromosome 7, may represent a can-didate gene. It is proposed that chromosome 7 shouldbe examined in a large collection of families with Kar-tagener syndrome.
Acknowledgments
The authors thank the family for their cooperation. Thiswork was supported in part by the Baylor College of MedicineMental Retardation Research Center (National Institute ofChild Health and Human Development [NICHD] 2P30-HD24064) and Child Health Research Center (NICHD 1P30-
HD27823) (to W.J.C.) and by a March of Dimes grant (toL.G.S.).
YANZHEN PAN,1 CHRISTOPHER D. MCCASKILL,1
KATHERINE H. THOMPSON,1 JOHN HICKS,2 BRETT CASEY,2
LISA G. SHAFFER,1 AND WILLIAM J. CRAIGEN1,3
Departments of 1Molecular and Human Genetics,2Pathology, and 3Pediatrics, Baylor College of Medicine,Houston
Electronic-Database Information
Accession numbers and URLs for data in this article are asfollows:
Online Mendelian inheritance in man (OMIM), http://www.ncbi.nlm.gov/htbin-post/Omim (for cystic fibrosis[MIM 219700], X-linked heterotaxy [MIM 306955], meth-ylmalonic aciduria [MIM 251000], rod monochromacy[MIM 216900], Bloom syndrome [MIM 210900], lipopro-tein lipase deficiency [MIM 238600], Duchenne musculardystrophy [MIM 310200], Herlitz junctional epidermolysisbullosa [MIM 226700], congenital chloride diarrhea [MIM2147000], Russell-Silver syndrome [MIM 180860], immo-tile-cilia syndrome [MIM 242650], and Kartagener syn-drome [MIM 244400])
References
Abramowicz MJ, Andrien M, Dupont E, Dorchy H, Parma J,Duprez L, Ledley FD, et al (1994) Isodisomy of chromosome6 in a newborn with methylmalonic acidemia and agenesisof pancreatic beta cells causing diabetes mellitus. J Clin In-vest 94:418–421
Afzelius B, Mossberg B (1995) Immotile-cilia syndrome (pri-mary ciliary dyskinesia), including Kartagener syndrome. In:Scriver C, Beaudet AL, Sly W, Valle D (eds) The metabolicand molecular bases of inherited disease, 7th ed. McGraw-Hill, New York, pp 3943–3954
Benlian P, Foubert L, Gagne E, Bernard L, De Gennes JL,Langlois S, Robinson W, et al (1996) Complete paternalisodisomy for chromosome 8 unmasked by lipoprotein li-pase deficiency. Am J Hum Genet 59:431–436
Burnell RH, Robertson EF (1974) Cystic fibrosis in a patientwith Kartagener syndrome. Am J Dis Child 127:746–747
Casey B, Devoto M, Jones K, Ballabio A (1993) Mapping agene for familial situs abnormalities to human chromosomeXq24-q27.1. Nat Genet 5:403–407
Cattanach B, Kirk M (1985) Differential activity of maternallyand paternally derived chromosome regions in mice. Nature315:496–498
Collignon J, Varlet I, Robertson EJ (1996) Relationship be-tween asymmetric nodal expression and the direction of em-bryonic turning. Nature 381:155–158
Eggerding FA, Schonberg SA, Chehab FF, Norton ME, CoxVA, Epstein CJ (1994) Uniparental isodisomy for paternal7p and maternal 7q in a child with growth retardation. AmJ Hum Genet 55:253–265
Engel E (1980) A new genetic concept: uniparental disomy andits potential effect, isodisomy. Am J Med Genet 6:137–143

Letters to the Editor 1555
Ferrero GB, Gebbia M, Pilia G, Witte D, Peier A, Hopkin RJ,Craigen WJ, et al (1997) A submicroscopic deletion in Xq26associated with familial situs ambiguus. Am J Hum Genet61:395–401
Gebbia M, Ferrero GB, Pilia G, Bassi MT, Aylsworth AS, BirdLM, Penman-Splitt M, et al (1997) X-linked situs abnor-malities result from mutations in ZIC3. Nat Genet 17:305–308
Genuardi M, Pomponi M, Sammito V, Bellussi A, Zollino M,Neri G (1993) Split hand/split foot anomaly in a familysegregating a balanced translocation with breakpoint on7q22.1. Am J Med Genet 47:823–831
Gyapay G, Morissette J, Vignal A, Dib C, Fizames C, Millas-seau P, Marc S, et al (1994) The 1993–94 Genethon humangenetic linkage map. Nat Genet 7:246–339
Herzon F, Murphy S (1980) Normal ciliary ultrastructure inchildren with Kartagener’s syndrome. Ann Otol Rhinol Lar-yngol 89:81–83
Hoglund P, Holmberg C, de la Chapelle A, Kere J (1994)Paternal isodisomy for chromosome 7 is compatible withnormal growth and development in a patient with congenitalchloride diarrhea. Am J Hum Genet 55:747–752
Hubbard V, Davis P, DiSant’Agnese PA, Gordon P, SchwartzR (1980) Associated growth hormone deficiency and cysticfibrosis: a report of two cases. Am J Dis Child 134:317–319
Hyatt BA, Lohr JL, Yost HJ (1996) Initiation of vertebrateleft-right axis formation by maternal vg1. Nature 384:62–65
Koiffmann CP, Wajntal A, de Souza DH, Gonzalez CH, CoatesMV (1993) Human situs determination and constitution46,XY,ins (7;8)(q22;q12q24). Am J Med Genet 47:568–569
Kotzot D, Schmitt S, Bernasconi F, Robinson W, Lurie I, IlyinaH, Mehes K, et al (1995) Uniparental disomy 7 in Silver-Russell syndrome and primordial growth retardation. HumMol Genet 4:583–587
Langlois S, Yong S, Wilson R, Kwong L, Kalousek D (1995)Prenatal and postnatal growth failure associated with ma-ternal heterodisomy for chromosome 7. J Med Genet 32:871–875
Ledbetter D, Engel E (1995) Uniparental disomy in humans:development of an imprinting map and its implications forprenatal diagnosis. Hum Mol Genet 4:1757–1764
Liang P, Pardee AB (1992) Differential display of eukaryoticmessenger RNA by means of the polymerase chain reaction.Science 257:967–971
Liechti-Gallati S, Kraemer R (1995) Cystic fibrosis mutationsand immotile cilia syndrome. Clin Genet 47:328–329
Pedersen M (1983) Specific types of abnormal ciliary motilityin Kartagener’s syndrome and analogous respiratory dis-orders. Eur J Respir Dis Suppl 64:78–90
Pentao L, Lewis RA, Ledbetter DH, Patel PI, Lupski JR (1992)Maternal uniparental isodisomy of chromosome 14: asso-ciation with autosomal recessive rod monochromacy. Am JHum Genet 50:690–699
Preece MA, Price SM, Davies V, Clough L, Stanier P, TrembathRC, Moore GE (1997) Maternal uniparental disomy 7 inSilver-Russell syndrome. J Med Genet 34:6–9
Pulkkinen L, Bullrich F, Czarnecki P, Weiss L, Uitto J (1997)Maternal uniparental disomy of chromosome 1 with reduc-tion to homozygosity of the LAMB3 locus in a patient with
Herlitz junctional epidermolysis bullosa. Am J Hum Genet61:611–619
Quan F, Janas J, Toth-Fejel S, Johnson DB, Wolford JK, Po-povich BW (1997) Uniparental disomy of the entire X chro-mosome in a female with Duchenne muscular dystrophy.Am J Hum Genet 60:160–165
Rutland J, Cole PJ (1980) Non-invasive sampling of nasal ciliafor measurement of beat frequency and study of ultrastruc-ture. Lancet 2:564–565
——— (1981) Nasal mucociliary clearance and beat fre-quency in cystic fibrosis compared with sinusitis and bron-chiectasis. Thorax 36:654–658
Spence JE, Perciaccante RG, Grieg GM, Willard HF, LedbetterDH, Hejtmancik JF, Pollack MS, et al (1988) Uniparentaldisomy as a mechanism for human genetic disease. Am JHum Genet 42:217–226
Spotila LD, Sereda L, Prockop DJ (1992) Partial isodisomyfor maternal chromosome 7 and short stature in an indi-vidual with a mutation at the COL1A2 locus. Am J HumGenet 51:1396–1405
Teknos TN, Metson R, Chasse T, Balercia G, Dickersin GR(1997) New developments in the diagnosis of Kartagener’ssyndrome. Otolaryngol Head Neck Surg 116:68–74
Voss R, Ben-Simon E, Avital A, Godfrey S, Zlotogora J, DaganJ, Tikochinski Y, et al (1989) Isodisomy of chromosome 7in a patient with cystic fibrosis: could uniparental disomybe common in humans? Am J Hum Genet 45:373–380
Woodage T, Prasad M, Dixon JW, Selby RE, Romain DR,Columbano-Green LM, Graham D, et al (1994) Bloom syn-drome and maternal uniparental disomy for chromosome15. Am J Hum Genet 55:74–80
Address for correspondence and reprints: Dr. William J. Craigen, S821, De-partment of Molecular and Human Genetics, Baylor College of Medicine, OneBaylor Plaza, Houston, TX 77030. E-mail: [email protected]
q 1998 by The American Society of Human Genetics. All rights reserved.0002-9297/98/6206-0038$02.00
Am. J. Hum. Genet. 62:1555–1557, 1998
Familial Skewed X Inactivation and X-LinkedMutations: Unbalanced X Inactivation is a PowerfulMeans to Ascertain X-Linked Genes That Affect CellProliferation
To the Editor:We read with great interest the article by Pegoraro et al.(1997) in which they report familial skewed X inacti-vation associated with a submicroscopic deletion atXq28. This deletion, which spans ∼800 kb near the F8Clocus, is transmitted in the expected X-linked fashionthrough females, but no males have the deletion. Al-though we agree that the skewed X-inactivation patternin this family is attributable to the region around orincluded in the deletion, we disagree with their inter-

1556 Letters to the Editor
pretation of these results and with some assertions thatmay lead to confusion about the underlying basis forskewed X inactivation in this family.
The authors suggest that the simplest interpretationof their data is that this disorder behaves like an X dom-inant with lethality in the male fetus. All the evidencesupports this hypothesis: The Xq28 deletion is lethalwhen present in hemizygous males and confers a pro-liferative disadvantage to cells of heterozygous femalesin whom the deleted chromosome is active, which ex-plains why these females are clinically normal.
However, Pegoraro et al. (1997) considered the hy-pothesis of an X-dominant disorder with male lethalityinconsistent with their data on the basis that the relevantlocus cannot be a genetic or cell lethal, because, if so,affected males would die soon after fertilization. In fact,the time at which a male embryo carrying the deletionwould become inviable, or at which the population ofmutant cells in the female would be eliminated, dependson the nature of the mutant gene product—when it isneeded, in which cells it is expressed, and how detri-mental (or advantageous) it is in the presence of wild-type cells in the mosaic population. Clearly, a male withthis small deletion might not be aborted before the preg-nancy is recognizable; some males with macroscopic de-letions of the X chromosome can survive until late ges-tation or term (Rosenberg et al. 1987; Cremers et al.1988).
This family resembles those in which selection hasbeen shown to underlie X inactivation. The familialskewing seen with mutations at the incontinentia pig-menti (IP) locus, in cytogenetically normal females, isalso associated with recurrent abortion (Migeon et al.1989; Parrish et al. 1996). However, IP heterozygotesdo not eliminate their mutant population of cells as com-pletely as do the heterozygotes in this family, and hencesome IP heterozygotes may be clinically abnormal. Largedifferences in the growth of normal and abnormal cellscan result in early loss of disfavored cells, whereas moresubtle differences account for progressive loss during thelifetime of the heterozygote (Migeon et al. 1981, 1988).The familial skewed X inactivation associated with ad-renoleukodystrophy was also mapped to Xq28, by tightlinkage with the G6PD locus (Migeon et al. 1981), andwas shown to be attributable to a proliferative advan-tage of the mutant gene.
Pegoraro et al. (1997) suggest two alternative novelhypotheses to explain their findings: (1) the deleted re-gion in Xq28 is directly involved in the primary mech-anisms of X inactivation; or (2) the region is directlyresponsible for skewing. In either case, the observedskewing is attributed to a gene in Xq28 that determinesthe choice of X chromosome to inactivate or the abilityof an X to inactivate. As Pegoraro et al. (1997) note,there is no evidence in either mouse or human to support
the existence of a such a gene within the deletion atXq28. In addition, there is uncited evidence (discussedbelow) that argues against the existence of such a hy-pothetical locus in Xq28.
There may be multiple trans-acting factors involvedin the initiation and maintenance of X inactivation. Ob-servations of triploid embryos suggest that these arelikely to reside on autosomes (discussed by Jacobs andMigeon 1989). There is no convincing evidence that fac-tors responsible for cis inactivation lie outside the Xchromosome–inactivation center (XIC) at Xq13.2. Stud-ies of chromosomal deletions and translocations leadingto deletions indicate that this segment is the site of theXIC (Therman et al. 1979; Mattei et al. 1981), and allX-linked genes shown to have an effect on choice (Xce)or on inactivation (XIST) lie within this region. Evidencethat other regions of the X are unlikely to be relevantin the choice of X to inactivate comes from recent studiesof the murine XIC region transfected into male embry-onic stem cells, which indicate that the XIC region con-tains all the genetic information needed for cis inacti-vation of an X chromosome, including choice of inactiveX (Lee et al. 1996; Lee and Jaenisch 1997).
None of the reported families with skewed patternsof X inactivation has been shown, convincingly, to in-volve the mechanisms of X inactivation. Most of themcan be explained by mutations or cytogenetic deletionsthat adversely affect the proliferation of one of the cellpopulations produced by random X inactivation (re-viewed in Belmont 1996). In light of this, it seems thatrelatively few cases of familial unbalanced X inactivationwill be due to mutations causing primary nonrandominactivation. Although mutations affecting the processof X inactivation are real possibilities, one expects thatthose severe enough to interfere with X inactivationwould be embryonic lethals, because of the functionalX disomy. Mutations in the inactivation machinery thatare associated with normal phenotypes and two intactX chromosomes are most likely to be the ones that in-fluence only the choice of X to inactivate and thereforewould be at the XIST or an Xce-like locus or in otherconstituents of the XIC. However, even linkage to theXIC or with specific XIST alleles (Plenge et al. 1997) isnot sufficient evidence that skewing is in fact attributableto these genes, because it could be due to a hitchhikereffect, resulting from mutations in a close neighbor withpotential for cell selection.
We believe that familial skewing, which maps to theX chromosome but is unlinked to the XIC, most likelyresults from mutations that do not interfere with theinactivation machinery but that affect the proliferationof the cell populations produced following normal ran-dom X inactivation. Females who manifest X-recessivediseases provide a powerful means to detect unbalancedX inactivation (Migeon 1993). The corollary is that

Letters to the Editor 1557
skewed patterns of X inactivation, familial or not, pro-vide a powerful means of ascertaining mutations thatinfluence cell proliferation.
BARBARA R. MIGEON AND CAMILLE HAISLEY-ROYSTER
Department of Pediatrics andCenter for Medical GeneticsThe Johns Hopkins University School of MedicineBaltimore
References
Belmont JW (1996) Genetic control of X inactivation and pro-cesses leading to X-inactivation skewing. Am J Hum Genet58:1101–1108
Cremers FPM, van de Pol TJR, Wieringa B, Hofker MH, Pear-son PL, Pfeiffer RA, Mikkelsen M, et al (1988) Molecularanalysis of male-viable deletions and duplications allows or-dering of 52 DNA probes on proximal Xq. Am J Hum Genet43:452–461
Jacobs PA, Migeon BR (1989) Studies of X-chromosome in-activation in trisomies. Cytogenet Cell Genet 50:75–77
Lee JT, Jaenisch R (1997) Long-range cis effects of ectopic X-inactivation centres on a mouse autosome. Nature 386:275–279
Lee JT, Strauss WM, Dausman JA, Jaenisch R (1996) A 450kb transgene displays properties of the mammalian X-in-activation center. Cell 86:83–94
Mattei MG, Mattei JF, Vidal I, Giraud F (1981) Structuralanomalies of the X chromosome and inactivation center.Hum Genet 56:401–408
Migeon BR (1993) The postulated X-inactivation center atXq27 is most reasonably explained by ascertainment bias:heterozygous expression of recessive mutations is a powerfulmeans of detecting unbalanced X inactivation. Am J HumGenet 52:431–432
Migeon BR, Axelman J, Jan de Beur S, Valle D, Mitchell GA,Rosenbaum KN (1989) Selection against lethal alleles infemales heterozygous for incontinentia pigmenti. Am J HumGenet 44:100–106
Migeon BR, Moser HW, Moser AB, Sprenkle JA, Sillence D,Norum RA (1981) Adrenoleukodystrophy: evidence forX-linkage, inactivation and selection favoring the mutantallele in heterozygous cells. Proc Natl Acad Sci USA 78:5066–5070
Parrish JE, Scheuerle AE, Lewis RA, Levy ML, Nelson DL(1996) Selection against mutant alleles in blood leukocytesis a consistent feature in incontinentia pigmenti type 2. HumMol Genet 5:1777–1783
Pegoraro E, Whitaker J, Mowery-Rushton P, Surti U, LanasaM, Hoffman EP (1997) Familial skewed X inactivation: amolecular trait associated with high spontaneous-abortionrate maps to Xq28. Am J Hum Genet 61:160–170
Plenge RM, Hendrich BD, Schwartz C, Arena F, Naumova A,Sapienza C, Winter R, et al (1997) A promoter mutation inthe XIST gene in two unrelated families with skewed X-chromosome inactivation. Nat Genet 17:353–356
Rosenberg T, Niebuhr E, Yang H-M, Parving A, Schwartz M(1987) Choroideremia, congenital deafness and mental re-
tardation in a family with an X chromosomal deletion. Oph-thalmic Paediatr Genet 8:139–143
Therman E, Sarto GE, Palmer CG, Kallio H, Denniston C(1979) Position of the human X inactivation center on Xq.Hum Genet 50:59–64
Address for correspondence and reprints: Dr. Barbara R. Migeon, CMSC 10-04, The Johns Hopkins Hospital, 600 North Wolfe Street, Baltimore, MD 21287-3914. E-mail: [email protected]
q 1998 by The American Society of Human Genetics. All rights reserved.0002-9297/98/6206-0039$02.00
Am. J. Hum. Genet. 62:1557–1558, 1998
Reply to Migeon and Haisley-Royster
To the Editor:We thank Drs. Migeon and Haisley-Royster (1998 [inthis issue]) for their interest in our research. We are,however, a bit puzzled by their letter to the editor, sincethey write that they disagree with the interpretation ofour results yet then restate what was already written inour previously published article (Pegoraro et al. 1997 ).
The 50-member pedigree that we reported showed anX-linked dominant disorder with male lethality. Thereis no question of this fact, because we found a deletionmutation of Xq28 associated with skewed X inactivationand recurrent pregnancy loss (LOD 5 6.92). The dele-tion included the factor VIII gene, yet there were nomales from 50 females with factor VIII deficiency, againclearly proving that this family had an X-linked domi-nant disorder with male lethality.
Drs. Migeon and Haisley-Royster appear to wish toaddress two issues: (1) interpretation of the likely mech-anisms that would cause X-inactivation skewing in thefemales in this family; and (2) transcriptional timing ofthe deleted gene or gene products in Xq28 and the ob-served effect on miscarriage detection. There is very littleto disagree with in Drs. Migeon and Haisley-Royster’sinterpretation of our results; they suggest that a growthdisadvantage is probably playing a role, which is pre-cisely what we stated in our discussion. We, too, feelthat growth disadvantage is the most likely mechanismcausing skewing of X-chromosome inactivation. How-ever, in the absence of characterization of the causativegenes in Xq28, it seems unreasonable to dismiss the pos-sibility that the gene(s) may actually be involved in theprocess of X inactivation. This is the least likely mech-anism, but it does not seem to warrant exclusion fromdiscussion.
The timing of transcription of the gene products inXq28 undoubtedly affects when the miscarriage occurs.In fact, the issue of timing is central to the inferred ge-

1558 Letters to the Editor
netic mechanism. A cell-lethal trait expressed very earlyin embryonic development would be undetectable orperhaps would cause a “biochemical pregnancy.” Acti-vation later in embryonic life would still cause malelethality but would be less likely to cause complete skew-ing of X inactivation in multiple tissues in the hetero-zygous female. In view of this delicate balance in timing,we feel that the genes in question are most likely to betranscribed early in fetal development and to impart agrowth disadvantage rather than being cell lethal. Thesize of the deletion mutation, however, is less importantto when the miscarriage occurs: size is simply being usedas a surrogate to the assumed importance of the deletionregion and gene(s) contained in that region. In the end,this is all an exercise in mental gymnastics, since thecharacterization of the causative gene(s) will enlightenus all as to the true mechanism.
ERIC HOFFMAN, ELENA PEGORARO, AND
MARK LANASA
Department of Molecular Genetics and BiochemistryUniversity of Pittsburgh School of MedicinePittsburgh
References
Migeon BR, Haisley-Royster C (1998) Familial skewed X in-activation and X-linked mutations: unbalanced X inacti-vation is a powerful means to ascertain X-linked genes thataffect cell proliferation. Am J Hum Genet 62:1555–1557(in this issue)
Pegoraro E, Whitaker J, Mowery-Rushton P, Surti U, LanasaM, Hoffman EP (1997) Familial skewed X inactivation: amolecular trait associated with high spontaneous-abortionrate maps to Xq28. Am J Hum Genet 61:160–170
Address for correspondence and reprints: Dr. Eric Hoffman, Department ofMolecular Genetics and Biochemistry, University of Pittsburgh School of Med-icine, E1240 Biomedical Science Tower, Pittsburgh, PA 15261. E-mail:[email protected]
q 1998 by The American Society of Human Genetics. All rights reserved.0002-9297/98/6206-0040$02.00
Am. J. Hum. Genet. 62:1558–1560, 1998
Difficulties in the Estimation of Ethnic Affiliation
To the Editor:Although I disagree with their results, I am indebted toShriver et al. (1997) for reawakening my attention tothe interesting but tricky subject of the inference of eth-nic origin by DNA typing.
They have taken the novel and daunting approach ofculling through a vast catalogue of candidate DNA loci
to find those which are particularly discriminating. Theylist a battery of 10 loci, obtained mostly through sucha search, which they claim will be effective in determin-ing whether an unknown stain is of African American(AA) or European American (EA) origin. Specifically,they predict that only “0.01% [of individuals will] showlog likelihoods !3.0” favoring one origin over the other(Shriver et al. 1997, p. 962). If a prior probability of50% is assumed for each alternative, this implies theposterior ability to make a correct guess at least 999times in 1,000. Categorizing Americans as black or whiteby interviewing them probably does not achieve such ahigh level of reproducibility, so it seems natural to reviewwith care the basis for such a claim.
I am concerned that the claim rests on serious flawsin statistical methodology. My reanalysis shows that theestimates of efficacy for race determination are signifi-cantly overstated because of bias in the algorithm forprediction of likelihood ratios. This is true even for thehandful of loci from the literature the authors say thatthey were able to verify as useful. As for the majorityof the recommended loci—those discovered by surveyingthe catalogue—there is an additional bias that is prob-ably even more serious. I shall discuss a computer sim-ulation that shows that the apparent good performanceof the culled loci may be completely illusionary, explain-able as mere sampling variation.
These concerns can be conveniently discussed and il-lustrated in the context of D7S657, the most highly ratedof the loci found by the statistical survey. Figure 2 ofthe Shriver et al. article reveals enough information toallow a check of the calculations for this locus, calcu-lations that assert a typical likelihood ratio of r 5 19(log10 ). I will argue that that number is inflatedr 5 1.276both by algorithmic errors and by sampling bias. A morerealistic likelihood ratio estimation algorithm will reducethe value from 19 to ∼8 (log10 ), and considera-r 5 0.9tion of sampling bias will show that a value of 2.5(log10 ) or even less is plausible and consistentr 5 0.4with the reported results.
Let a1, a2, . . . and b1, b2, . . . be the allele frequenciesat some locus in populations A and B, for alleles 1, 2,. . . , respectively. Then for an allele whose true originis A and for allele frequencies that are known,
log r 5 a log (a /b ) (1)O10 AB i 10 i i
is the expected value of the logarithm of the likelihoodratio that the origin is the reference population A ratherthan the target population B. The formulas in the articleby Shriver et al. are equivalent, except that their notationrefers to genotypes rather than to single alleles (whichexplains why their formula has factors of “ ,” whereas1
2
mine does not), and they formulate a statistic that is

Letters to the Editor 1559
symmetric with respect to A and B. Consequently, theydefine the “log-likelihood level,” which in my notationis log10r where . For r itself, the geometric ex-r 5 r rAB BA
pected value of the likelihood ratio, I use the phrase“typical” likelihood ratio.
In practice, it is necessary to deal with sample fre-quencies rather than with true frequencies. Therein liesthe rub.
An obvious problem with (1) is possible division byzero when some allele is not observed in the target sam-ple. The best strategy in this situation is probably theone that Shriver et al. (1997, p. 958) chose: “an allelenot found in a sample is assumed to be the next alleleto be observed”; that is, assume a minimum frequencyof , where n is the number of people inb 5 1/(2n 1 1)i
the target sample. Apart from this proviso, the authorsmake computation (1) with sample frequencies , , asˆa bi i
if they were population frequencies (the “hat” [^] crown-ing a variable indicates and emphasizes that it is a “sta-tistic” computed from a population sample, and thus amere estimate of the hatless “parameter”). If the onlypurpose is a rough comparison of loci, this approachcould be accepted uncritically. However, since the like-lihood ratio statistic is to be interpreted as what it is—aspredicting the likelihood ratio performance that can beexpected in practice—then it must be an unbiased esti-mate. For example, it must satisfy the validation crite-rion (Brenner 1997) that, if one compares two identicalpopulations, then the likelihood ratio statistic should notimply that people will be more likely to come from onethan from the other. Imagine collecting two n-personsamples S and T from the same population A. The sam-ple frequencies will, of course, by random chance, differsomewhat, so a likelihood ratio analysis of the samples,even a correct one, will sometimes suggest that A canbe distinguished from A. However, when an average istaken over all samples S and T, there should be no ex-pected distinction. The average log likelihood ratioshould be zero. As an experiment, I posited a populationwith allele frequencies approximately like the D7S657AA sample frequencies. Testing the Shriver et al. for-mulas on repeated computer samples S and T from thispopulation, I found that log10 averaged ∼0.11 (ˆ ˆr r 5
) for distinguishing the simulated AA population1.3from itself. In other words, there was a bias of ∼30%.
A procedure that does seem to survive the validationtest is the one used by Erikson and Svensmark (1994).They added one to the target sample count for everyallele—not just for the unseen ones as do Shriver et al.When this method is applied to the D7S657 data, thelikelihood ratio drops to (log10 ).ˆ ˆr 5 8 r 5 0.9
The reader may wonder why the discrepancy between19 and 8 is much larger than the 30% accounted for bythe above validation test. It turns out that most of thediscrepancy has a less subtle explanation. Those values
that can be checked in Shriver et al.’s (1997) table 1 areconsistent with misinterpreting n as the sample size inalleles rather than in people, suggesting a solecism intheir computer implementation (a bug). Correcting thearithmetic would give log10 (so ).ˆ ˆr 5 1.09 r 5 12
The most powerful locus in the Shriver et al. articleis FY-null (Duffy blank), for which they give log10 r 5
( ) for distinguishing AA and EA. The aboveˆ1.858 r 5 72bug is not an issue here since there were no zero-countalleles; nor is sampling bias an issue since FY-null isamong the loci from the literature rather than from thestatistical survey. Nonetheless, substituting the Eriksonand Svensmark procedure reduces to 39 (log10ˆ ˆr r 5
), and that is probably a fairer guess of the efficacy1.59of this locus based on the data given. It is still a verydiscriminating locus. In ∼96% of the cases in which anunknown stain donor is African American, this locusalone will answer the question of ethnic origin. But adifficult question about allelic association: In estimatinghow many of the remaining 4% of such cases will beresolved by other loci, is it correct to use the overall AAallele frequencies, which after all come mostly from peo-ple who have FY-null?
It may be of interest to compare the r values discussedabove with values for typical forensic loci, not inten-tionally selected for their ethnic-discrimination poten-tial. Data from the Office of the Chief Medical Examinerof New York City (personal communication) comparingAA and EA samples (n 5 118 and n 5 107) in thetetrameric loci F13A, TH01, FES/FPS, and VWA, givevalues , 1.56, 1.43, and 1.17 (log10 ).ˆ ˆr 5 2.56 r X 0.4With somewhat more care and difficulty, the same sortof evaluation can be made for RFLP loci. Six of them,in common use by United States law-enforcement andpaternity laboratories for identification, average r 1 2(log10 ) per locus (Brenner 1997). Incidentally,r 1 0.3whereas Shriver et al. (1997, p. 957) say in their paperthat “most [DNA markers] offer little power to distin-guish ethnicity,” a handful of independent markers with
provide quite useful power (Brenner 1997), cer-r 5 2tainly better than “the best racial estimates[, which] are achieved” by bone and skull measurements,giving 80%–90% correct categorization as cited inShriver et al.’s (1997 , p. 958) paper. Further, with acomputationally more sophisticated approach (Evett etal. 1992; Brenner 1997), the RFLP efficacy increases toabout (log10 ) per locus. Combining a hand-r 5 3 r 5 0.5ful of loci of such power is sufficient to decide mostcases with confidence, but the predicted distribution issuch that 5%–10% of cases remain elusively ambiguous.
So compared with the standard repertoire of forensicloci, the claims of Shriver et al., even trimmed back afew orders of magnitude by the arguments that I havemade above, would still be impressive. By my rough

1560 Letters to the Editor
estimates, the top 10 loci would still rigidly categorizeAmericans as black or white, to an implausible extent.
My remaining concern, the most vexing and possiblythe most telling, is sampling bias. Of the 20 high-per-forming loci in Shriver et al.’s table 1 for discriminationbetween AA and EA, 17 were obtained by canvassing11,000 loci. To be more precise, what they canvassed is11,000 pairs of samples and sometimes rather smallsamples (e.g., people). This suggests the possi-n 5 21bility that most of the “high performers” are really or-dinary performers with an atypically lucky sample.
How much can be explained by luck depends on thesampling distribution of the likelihood level statistic, ,rwhich I have investigated with a Monte Carlo computerexperiment. Each experiment begins with 1,000 simu-lated loci whose AA and EA allele frequencies are as-signed according to one or another of the New Yorkdata mentioned above, so 1.17 X r X 2.56 (0.08 X
log10 ) for each simulated locus. For each of theser X 0.4loci, a 21-person sample and a 22-person sample (mim-icking the D7S657 sample sizes) are randomly selectedaccording to the assumed frequencies, and the statistic
is computed from the two samples. To simplify thercomparison with Shriver et al.’s table 1, I used the same(albeit incorrect, as per above discussion) formulas aswere used for that table.
The 17 largest values from such a 1,000-locus ex-rperiment are similar to the values for the 17 canvassedloci (out of 20 total) in the AA/EA column of table 1.The largest value is sometimes a little larger, sometimesa little smaller, than (log10 ) of D7S657.ˆ ˆr 5 19 r 5 1.276The 17th largest simulated (log10 )—easilyˆ ˆr ≈ 5 r ≈ 0.7comparable to (log10 ) in table 1. Oneˆ ˆr 5 3 r 5 0.498might say that what the computer experiment screens isnot nature but sampling variation. It lists loci withmerely ordinary ethnic-discrimination power, but withextraordinary statistics. From among 1,000 loci, onecould similarly find a set of 10 loci that differentiate the9-year-old children from the 10-year-olds in the localplayground. In the phrase of one of the referees of thisletter, the process has the potential to create the ap-pearance of signal where there is only noise.
Is the sieving procedure of Shriver et al. any differentfrom the computer experiment? The bias problem wouldbe mitigated if their sample sizes were mostly larger, orif some loci were screened twice. This may have beendone to some extent; the description in the Shriver et al.paper is not explicit. Also, there is of course a tendencyfor the better loci to achieve a better score. But as I haveshown, there is a strong countervailing tendency that thelist of top scores will be dominated by scores that areparticularly biased. Therefore, I do not believe that theirconclusion—namely, that they have found “a set of ge-netic markers that would allow the confident determi-
nation of ethnicity” (Shriver et al. 1997, p. 962)—islikely to be correct.
CHARLES H. BRENNER
Electronic-Database Information
Brenner CH (1997) http://www.ccnet.com/˜cbrenner/race.htm
References
Brenner CH (1997) Probable race of a stain donor. In: Pro-ceedings from the Seventh International Symposium on Hu-man Identification 1996. Promega, Madison, pp 48–52
Erikson B, Svensmark O (1994) DNA polymorphism in Green-land. Int J Legal Med 106:254–257
Evett IW, Pinchin R, Buffery C (1992) An investigation of thefeasibility of inferring ethnic origin from DNA profiles. JForensic Sci Soc 32:301–306
Shriver MD, Smith MW, Jin L, Marcini A, Akey JM, Deka R,Ferrell RE (1997) Ethnic-affiliation estimation by use of pop-ulation-specific DNA markers. Am J Hum Genet 60:957–964
Address for correspondence and reprints: Dr. Charles H. Brenner, 2486HilgardAvenue, Berkeley, CA 94709. E-mail: [email protected]
q 1998 by The American Society of Human Genetics. All rights reserved.0002-9297/98/6206-0041$02.00
Am. J. Hum. Genet. 62:1560–1561, 1998
Reply to Brenner
To the Editor:In response to the letter by Dr. Brenner (1998 [in thisissue]), there are a number of issues open for discussionwith regard to both our previously published article(Shriver et al. 1997) and, more generally, methods forestimation of biological ancestry. Dr. Brenner has iden-tified some specific concerns with regard to our methodsand results, which we address below. However, we re-main confident of the main conclusions of our study: (1)the reliable estimation of ethnic affiliation by use of pop-ulation-specific alleles (PSAs) is possible; and (2) manyof the loci we identified will be useful markers for thiseffort.
We have examined the computer program that wasused to calculate average single-locus log-likelihood lev-els and have found that Dr. Brenner is correct in hisdetermination that alleles that were not observed wereassigned a frequency of , instead of1/(4n 1 1) 1/(2n 1
, where n is the number of individuals in the sample.1)The effect of this error was to inflate the average single-locus and multilocus log-likelihood estimates, to a smalldegree. Since the same program was used to screen allthe allele-frequency data sets, it is reasonable to conclude

Letters to the Editor 1561
that the 40 loci with the highest log-likelihood levels,which we presented in tables 1 and 2 of our article(Shriver et al. 1997), are still good candidates for highperformers among the loci tested.
Dr. Brenner is correct to recognize that our methodfor determining average single-locus log-likelihood ra-tios (LLRs) and multilocus ethnic-affiliation estimates isappropriate only when accurate allele-frequency data areavailable. We expect that, in the determination of bio-logical ancestry, care will be taken to determine withprecision the allele frequencies of potential contributingpopulations. If accurate allele frequencies are available(e.g., individuals), no adjustment of the formulan 1 200we presented will be needed. In cases for which fre-quency data are available only from small samples, theaddition of one to the total allele count for each alleleis a reasonable adjustment.
Dr. Brenner concludes that the differences in allelefrequency that we observed between loci were largelydue to bias resulting from small sample size. He basesthis conclusion on a computer simulation in which heevidently resampled 1,000# from frequency data onfour short tandem-repeat identity markers. He then com-pared his results with the data in table 1 of our article(Shriver et al. 1997). We have two concerns with thisapproach. First, the 17 microsatellite PSAs that we pre-sented in table 1 were culled from ∼350 loci (1,000 loci/population combinations were tested in the work thatwe reported). Second, the range of variation in the fre-quency differential used in Dr. Brenner’s model was verylimited and, with only four loci (LLR of .08–.4), couldnot have reflected naturally observed levels of variationin the allele-frequency differential. We are well aware ofthe bias resulting from small sample sizes, which is whywe presented a list of 20 loci in table 1 and not just thebest 10. In fact, we stated, “It should be noted that themarkers on this list need to be typed in larger samplesfrom different parts of the country, both to have moreaccurate allele-frequency estimates and to identify themost efficient set for EAE [ethnic-affiliation estimation]”(Shriver et al. 1997, p. 963). Recently, we typed ninedimorphic autosomal PSAs in large samples from 120ethnographically defined populations, including 12 Af-rican-American population samples, and indeed foundthese markers to be useful for the estimation of ethnicaffiliation and admixture (Parra et al. 1997; E. J. Parra,A. Marcini, L. Jin, J. Akey, M. Batzer, R. Cooper, T.Forrester, et al., unpublished data). Overall and in viewof Dr. Brenner’s concerns, we still feel that this is a viableapproach for the estimation of the biological ancestryof a person and that we have provided an important listof putative PSAs for this purpose.
Finally, in responding to Dr. Brenner’s comments, wewould like to suggest an alternative phrase that moreaccurately describes what is being estimated by means
of the markers and methods that we, Dr. Brenner, andothers have described. Ethnicity is a term that directlyrefers to the culture of a person or people and that en-compasses their language, traditions, and national iden-tity. Ethnicity is often related to biological ancestry butnot always. In the United States, awkward terms thatcombine both ethnicity and biological ancestry are some-times used—for example, “non-Hispanic whites,”“black Hispanics,” and “non-Hispanic blacks.” Modernpopulations are highly complex, and the classificationof genetic differences among individuals and populationsis a potentially sensitive issue. We therefore propose andintend to use the term “estimation of biological ances-try,” rather than “ethnic-affiliation estimation,” to de-scribe the methods that we have presented.
MARK D. SHRIVER,1 MICHAEL W. SMITH,2 AND LI JIN3
1Department of Human Genetics, AlleghenyUniversity of the Health Sciences, Pittsburgh;2National Cancer Institute, Frederick Cancer Researchand Development Center, Frederick, MD; and3Human Genetics Centers, University of Texas,Houston
References
Brenner CH (1998) Difficulties in the estimation of ethnic af-filiation. Am J Hum Genet 62:1558–1560 (in this issue)
Parra E, Marcini A, Akey J, Ferrell RE, Shriver MD (1997) Asystematic study of African-American admixture using pop-ulation-specific alleles. Am J Hum Genet Suppl 61:A17
Shriver MD, Smith MW, Jin L, Marcini A, Akey JM, Deka R,Ferrell RE (1997) Ethnic-affiliation estimation by use ofpopulation-specific DNA markers. Am J Hum Genet 60:957–964
Address for correspondence and reprints: Dr. Mark D. Shriver, Departmentof Human Genetics, Allegheny University of the Health Sciences, 3290 WilliamPitt Way, Building B4, Room 125, Pittsburgh, PA 15212-4772. E-mail:[email protected]
q 1998 by The American Society of Human Genetics. All rights reserved.0002-9297/98/6206-0042$02.00
Am. J. Hum. Genet. 62:1561–1562, 1998
Discriminating between True and False-PositivePeaks in a Genomewide Linkage Scan, by Useof the Peak Length
To the Editor:A standard method to map disease-susceptibility lociconsists of collecting n affected sib pairs and their par-ents, genotyping them for a dense set of genetic markers,and counting, at each marker locus t, the number, Xt,of parental alleles shared identical by descent (IBD). Ac-cording to current statistical practice (e.g., see Feingold

1562 Letters to the Editor
Table 1
Joint Probability Distribution of (X1,X2)
l m P(X 5 l,X 5 m)1 2
1 1 W 7 p1 0 (1 2 W) 7 p0 1 (1 2 W) 7 (1 2 p)0 0 W 7 (1 2 p)
et al. 1993; Lander and Kruglyak 1995), only the heightof the peak (i.e., maxtXt) is used to decide whether thereis sufficient evidence in favor of linkage. Recently, Ter-williger et al. (1997) published in the Journal a paperin which they challenged the claim that “there is no wayto distinguish between small peaks that represent weaktrue positives and peaks of the same height arising fromrandom fluctuations” (Lander and Kruglyak 1995, p.244). By relying on some deeper results of the theory ofstochastic processes, Terwilliger et al. (1997) showedthat true positive peaks are expected to be longer thanfalse-positive peaks. The purpose of this letter is to ex-plain and support their result by presenting an extremelysimplified situation in which elementary argumentationis sufficient to obtain the same conclusion.
Let M1 and M2 denote two different but linked markerloci separated by a genetic distance of vP(0, ). The data1
2
consist of a single affected sib pair and only one parent.Both markers are assumed to be completely polymor-phic. Thus, it is possible to decide whether, from thisparent, the sib pair has inherited the same allele (X 5i
) or has not inherited the same allele ( ), at marker1 X 5 0i
locus i ( ). Let denote the proba-i 5 1,2 p 5 P(X 5 1)1
bility that the sib pair share an allele IBD at M1. If M1
is unlinked to the disease, then ; if is a disease1p 5 M12
locus, then . In both cases, the conditional prob-1p 1 2
abilities for the IBD score at the second marker locus,given the IBD score at the first marker locus, dependonly on the genetic distance v between M1 and M2
—that is, P(X 5 1 d X 5 1) 5P(X 5 0 d X 5 0)52 1 2 1
and2 2v 1 (1 2 v) 5 :W P(X 5 1 d X 5 0)5 P(X 5 0 d2 1 2
. The joint probability distribution ofX 5 1)5 1 2 W1
(X1,X2) is given in table 1.Now the terms “peak” and “length of a peak” have
to be defined. A peak occurs at marker locus i (iP{1,2})if . Given that there is a peak at marker locus i,X 5 1i
the length of this peak is either 2 (if ) or 1 (ifX 5 132i
). The following three conclusions are evidentX 5 032i
from table 1:
1. Given a peak at M1, the length of this peak is 2,with probability W. Thus, this probability does not de-pend on p.
2. However, given a peak at M2, the length of thispeak is 2, with probability .Wp/{Wp 1 [(1 2 W)(1 2 p)]}Since , this is a strictly increasing function in p,W ! 1for pP[ ,1].1
2
3. Given a peak “somewhere in the genome” (i.e., atM1 and/or M2), the length of this peak is 2, with prob-ability . Since the value for this ex-Wp/{1 2 [W(1 2 p)]}pression is strictly increasing with p, this shows that truepeaks ( ) are expected to be longer than false-pos-1p 1 2
itive peaks ( ).1p 5 2
This example can be extended to a consideration ofstatistical testing. Let a denote an arbitrary but fixedvalue, with a X W/2. Since 1P (max X 5 1)p5 tP{1,2} t2
, a (randomized) level a test based on the5 1 2 (W/2)test statistic is obtained by rejection of themax XtP{1,2} t
null hypothesis of no linkage, with probability. The power of this test isg : 5 a/[1 2 (W/2)] a 7 {1 21
. Alternatively, a test based on the[W(1 2 p)]}/[1 2 (W/2)]length of a peak can be constructed in the followingway: for , the probability is W/2 that a peak of1p 5 2
length 2 occurs. Thus, a randomized level a test basedon the length of a peak is obtained by rejection of thenull hypothesis, with probability . The powerg : 5 2a/W2
of this test is . Sincea 7 2 7 p 2p 1 {1 2 [W(1 2 p)]}/for , the second test, which is based on1[1 2 (W/2)] p 1 2
the length of a peak, is more powerful than the test basedsolely on the height of a peak. For a more realistic andrelevant situation than the one considered in the presentletter, it has to be determined how both height and lengthof a peak can be combined in a test for linkage. However,the observation described by Terwilliger et al. (1997)may prove very useful to increase the power for detectionof disease-susceptibility loci by genomewide linkagescans.
MICHAEL KNAPP
Institute for Medical StatisticsUniversity of BonnBonn
References
Feingold E, Brown PO, Siegmund D (1993) Gaussian modelsfor genetic linkage analysis using complete high-resolutionmaps of identity by descent. Am J Hum Genet 53:234–251
Lander ES, Kruglyak L (1995) Genetic dissection of complextraits: guidelines for interpreting and reporting linkage re-sults. Nat Genet 11:241–247
Terwilliger JD, Shannon WD, Lathrop GM, Nolan JP, GoldinLR, Chase GA, Weeks DE (1997) True and false positivepeaks in genomewide scans: application of length-biasedsampling to linkage mapping. Am J Hum Genet 61:430–438
Address for correspondence and reprints: Dr. Michael Knapp, Institute forMedical Statistics, University of Bonn, Sigmund-Freud-Strasse 25, D-53105Bonn, Germany. E-mail: [email protected]
q 1998 by The American Society of Human Genetics. All rights reserved.0002-9297/98/6206-0043$02.00


