Embed Size (px)
Citation preview

Temporal Pattern of Ovarian Activity in a Major CarpCatla catla and its Possible Environmental Correlate inan Annual Cycle
Ruma Dey, Sharmistha Bhattacharya and Saumen Kumar Maitra
Department of Zoology, Visva-Bharati University, Santiniketan 731 235, India
Abstract
Histophysiological studies of the ovary in a hitherto unconsidered major carp Catlacatla, included in this investigative treatise, have allowed the present investigators todemonstrate the pattern of annual events in ovarian functions, as well as the inter-relationship between changes in the ovary and environmental conditions. Month-wisestudies of cytological features along with various biochemical features of ovarianfunctions in free-living Catla revealed the existence of precise annual cyclic changes. On the basis of the studies made on gonads, the annual breeding cycle ofthis fish has been divided into four different phases, namely (a) the preparatory phase (January–March), (b) the pre-spawning phase (April–June), (c) the spawningphase (July–August), and (d) the post-spawning phase (September–December). Adetailed analysis of the data employing various exploratory data-analytic techniqueswas aimed at drawing a possible relationship between the indices of different reproductive events (oogenesis and oocyte maturation, vitellogenesis, steroidogene-sis) in mature free-living female Catla and the different components of the environ-ment in an annual cycle. The results of the study indicate that annual variations inphotoperiod, alone or in association with water temperature, may be the major environmental component which plays a significant role in the regulation of seasonalmaturation of ovary in Catla. These observations provided a basis for further experimental studies on the specific role of photoperiods in the regulation of ovarianactivities in the currently considered most economically important species of Indianmajor carp.
Keywords: Annual ovarian cycle, Carp, Catla catla, environment, photoperiods.
Address correspondence to: Professor Saumen Kumar Maitra, Department of Zoology, Visva-Bharati Uni-versity, Santiniketan 731 235, India. Tel./Fax: 0091-3463-261268; E-mail: [email protected]
Biological Rhythm Research2004, Vol. 35 Nos 4/5. pp. 329–353
DOI: 10.1080/09291010400003792 © 2004 Taylor & Francis Ltd.
Introduction
Reproduction in most free-living vertebrates, including fish, is periodic. The annualcycle of waxing and waning of reproductive competence of a species is repeated with great regularity from one year to the next. It ensures an optimal timing of thebirth of the young and, as a consequence, maximizes the chances of survival of thespecies.
The environmental components fluctuate at different times of the year to accountfor the different seasons and on many occasions this information is used in timingthe reproductive function of a species. The environmental components which formthe battery of information used in timing the reproductive function of a fish speciesin a broad sense include day length or photoperiod, temperature, rainfall, nutrients,food supply and some other factors like water current, turbidity, flood, salinity ofwater, lunar rhythms or periodicity, and some chemical characteristics of the ambientwaters, such as pH, dissolved oxygen, total alkalinity, specific conductivity and others(Lam, 1983; Chaudhuri, 1997). Among the components of the environment, annualchanges in the duration of the solar day has been proved to be the primary and regularvariable that individually, or in combination with other environmental component(s),impel the ‘driving function’ in determining the sexual periodicity in most of the fishspecies that breed at mid- and high latitudes (Lam, 1983; Vivien-Roles & Pevet, 1983;Vivien-Roles, 1985; Koya & Kamiya, 2000; Bornestaf et al., 2001; Garcia-Allegueet al., 2001). However, it does not exclude the possible role of supplementary infor-mation in the temporal adjustment of breeding in fishes at low latitudes, where annualvariation of a solar day is not very pronounced as compared to that in high latitudes(Sundararaj & Vasal, 1976; Srivastava & Singh, 1991, 1992a, 1992b, 1993; Singh &Joy, 1998).
Accordingly, an attempt was made to carry out the present investigation in a sub-tropical part of India (Lat. 23°14¢N, Long. 87°51¢E), where annual fluctuations of climatological factors including daily photoperiod are not so prominent as in tem-perate countries. The purpose of this study was to perform a month-wise study of dif-ferent features of ovarian activity (oogenesis and oocyte maturation, vitellogenesisand steroidogenesis) and thereby demonstrate the pattern of an annual reproductivecycle in a hitherto unstudied free-living mature female Indian major carp Catla catla.The primary objective of this paper is to report annual histophysiological events inthe ovary in details parallel with the annual cyclic changes in daily photoperiod,ambient water temperature and rainfall and thus to evaluate the probable phase rela-tionship between the proximate environmental factors and sexual periodicity of thiscarp, Catla catla.
Materials and Methods
Collection and care of fish
Adult female fish, Catla catla weighing between 700g and 1000g were used for thepresent investigation. The fish were captured from the lakes located within the campus
330 R. Dey et al.

of the University (Lat. 23°14¢N, Long. 87°51¢E) and were quickly transported live to the laboratory where they were temporarily maintained in different cement tanksof equal size (measuring about 2m (L) ¥ 80cm (W) ¥ 70cm (D)) with commerciallyavailable balanced fish food ad libitum until they were sacrificed between 10.00hrsand 14.00hrs on the same day. At least five fish were procured twice a month (i.e., atleast 10 fish in each month) at a regular interval of two weeks for two consecutivecalendar years (1999–2000).
Procurement of tissues
On every occasion, after measuring individual body weights with the help of a panbalance sensitive to 0.1g, the fish were sacrificed by decapitation. Subsequently, theirblood samples were collected separately and the serum of each fish was stored at -40°C until used for concentration of vitellogenin, and the ovarian tissues were collected for both microscopic as well as biochemical studies. All the chemicals used were of analytical grade and were procured from Sigma Chemicals, USA.
Procurement and preparation of the ovaries
Immediately after decapitation, both the ovaries of each fish were quickly dissectedout from the abdominal cavity, made free from extraneous tissues, soaked in blottingpaper and weighed. The paired ovarian weight of each fish was measured with thehelp of an electronic balance sensitive to 0.1mg and the value was used for the cal-culation of Gono-Somatic Index (GSI) i.e., paired ovarian wt. in g/100g body weight.Ovarian tissues of each fish were used for both microscopic study of the gametogenicdevelopment as well as for quantitative estimation of the activity of steroidogenicenzymes.
Microscopic evaluation of gametogenic status of the ovary. A small part of the left lobe of the ovary was freshly collected from each fish and was fixed in Bouin’sfixative for 24 hours, dehydrated through graded alcohols, and embedded in paraffinwax. Routine microtomy was followed for obtaining 5 mm thick paraffin sections,which were subsequently stained following Masson’s trichrome technique (Lillie,1954).
Stained sections of the ovary were studied under the microscope and different typesof oocytes were classified on the basis of the identifying characteristics of the nuclearand cytoplasmic characteristics of the oocytes. Five distinct stages of the develop-ment of oocytes have been identified during oogenesis: oogonia, stage-I primaryoocytes, stage-II primary oocytes, stage-III primary oocytes and atretic follicles. Atleast 10 stained sections of ovary from each fish were studied under the microscopeto ascertain the stage of ovarian development in the concerned fish by counting therelative numbers of different types of oocytes as routinely practised in other studies(Sundararaj & Sehgal, 1970a, 1970b; Sundararaj & Vasal, 1973, 1976; Acharia et al.,2000).
Temporal Pattern of Annual Ovarian Activity in Catla catla 331

Quantitative estimation of the ovarian activity of steroidogenic enzymes. Theright lobe of the ovary of each fish was used for quantitative estimations of the activity of two steroidogenic enzymes, viz., D53b-hydroxysteriod dehydrogenase (3b-HSD) following the method of Wiebe (1976) and 17b-hydroxysteriod dehydro-genase (17b-HSD) as used by Sen and Bhattacharya (1982) with some modifications,and the protein content of the ovary (from the supernatant of ovarian tissuehomogenate) was measured following the method of Lowry et al. (1951) using bovineserum albumin as the standard.
Quantitative estimation of serum concentration of vitellogenin. The serum contentof vitellogenin was determined as alkali-labile phosphorous according to the methodsdescribed by Nath and Surdararaj (1981) and Vogel (1975), and the concentration was expressed as micrograms of phosphorous per millilitre of serum (mg-P/ml serum).
Collection of physical and hydrological data
The mean values of duration of photoperiods and of total rainfall for each calendarmonth for the period of investigation (1999–2000) were obtained from the Office ofthe District Seed Farm (Govt. of West Bengal) located at the site of fish collection(Lat. 23°14¢N, Long. 87°51¢E). The pH, dissolved O2 (Wetzel & Likens, 1979) andCO2 content (estimated following Wetzel & Likens, 1979) and mean values of dailymaximum and minimum temperature in the water tank (where the fish were rearedand collected from) were measured at a regular interval.
Statistical analysis
One-way analysis of variance (ANOVA) was employed for statistical analysis of thevalues related to each variable to ascertain any significant variation between them.The reproductive phases in an annual gonadal cycle were demarcated followingcluster analysis of the data on different variables considered in the present study forevaluation of reproductive status of the concerned fish. Cluster analysis identifieshomogeneous groups of subjects according to their characteristics. The techniqueused was the hierarchical classification, which produces the dendogram (Aitchison,1986; Gujrathi, 1995).
For evaluation of the inter-relationship between the studied features of the ovaryand the variables in the surroundings, simple linear regression and correlation analy-ses were adopted. Simple correlation, multiple regression analysis, and cannonicalcorrelation analysis (using computer program STATISTICA) were done in search forcorrelation, if any, between the variables in the environment and the different vari-ables considered in the present study for evaluation of ovarian functions in individ-ual fish in an annual cycle. A simple correlation coefficient (r) measures the degreeof linear relationship between two variables, but fails to rule out the possible exis-
332 R. Dey et al.

tence of a strong non-linear relationship between them. Likewise, a multiple corre-lation coefficient provides basic information on the relationship between a set of variables with another variable, but not between two sets of continuous variables.Therefore, to have an insight into the possible relationship between different variablesconsidered in the present study as the indices of ovarian functions in fish and differ-ent variables of environment, the canonical correlation coefficient was sought. Thisstatistical method is considered as most suitable for demonstration of a maximumpossible linear relationship between a linear combination of one set of continuousvariables and a linear combination of another set of continuous variables (Aitchison,1986; Maddala, 1992; Gujrathi, 1995). The understanding of canonical analysis isfacilitated by awareness of the basic relationships between the components of a givenset of variables, and such a relationship is expressed in terms of canonical weights.The values of canonical weights of two sets of variables are obtained from a com-puter analysis of the data. The canonical weights are analogous to the beta weightsof regression analysis and their sign and size denote the nature (direct or inverse) anddegree of relationship between two sets of continuous variables, respectively.
The values of both F and R were considered statistically significant at the level of5% or less (p £ 0.05).
Results
Seasonal changes in the climatological and limnological variables
The mean values of different climatological and limnological variables for differentcalendar months during the period of investigation are presented in Table 1.
Seasonal changes in the ovary
It was noted that the month-wise changes in the pattern of time bound wax and wanein different indices of ovarian activity in Catla during the period of two consecutivecalendar years were identical.
Gono-somatic index
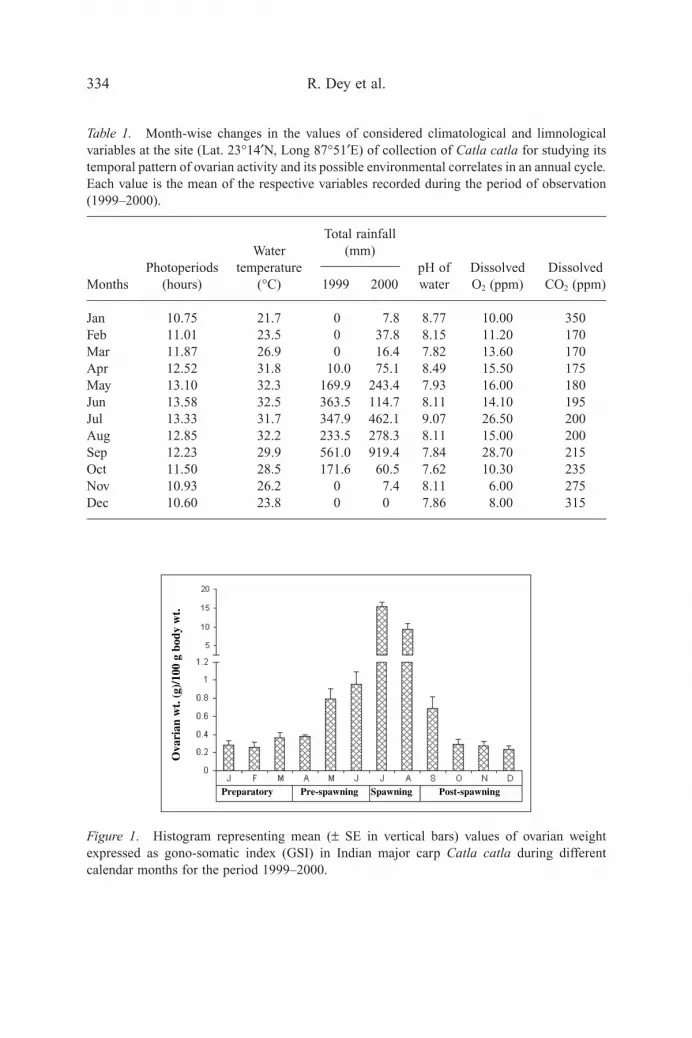
Study of the gono-somatic index (GSI) (paired ovarian weight in g/100g body weight)revealed precise annual cyclic changes in paired ovarian weight. The values of GSIin Catla catla did not show any significant changes over the months of Octoberthrough April. From May onward a progressive rise in the value of GSI was recordeduntil July, when it was maximum. Sudden fall in gonadal weight was noted thereafterto repeat the cycle (Fig. 1).
Morphology and histology of the ovary
In Catla, the ovary is a hollow paired organ. The ovary consists of oogonia, oocytes,and their surrounding follicular cells, supporting tissues or stroma, and vascular and
Temporal Pattern of Annual Ovarian Activity in Catla catla 333
334 R. Dey et al.
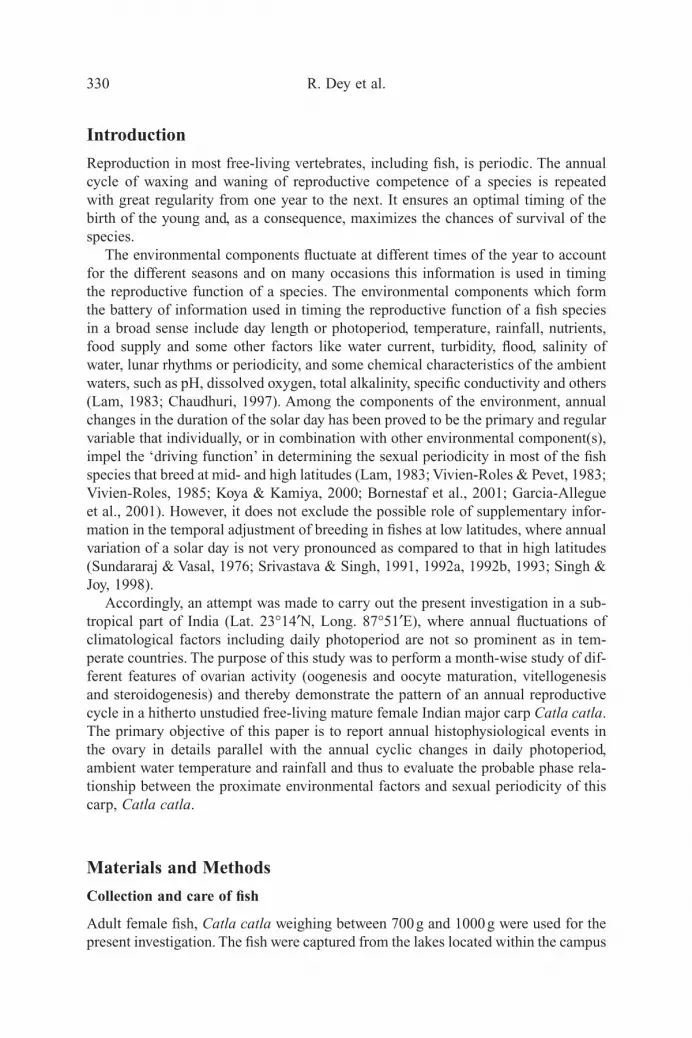
Table 1. Month-wise changes in the values of considered climatological and limnologicalvariables at the site (Lat. 23°14¢N, Long 87°51¢E) of collection of Catla catla for studying itstemporal pattern of ovarian activity and its possible environmental correlates in an annual cycle.Each value is the mean of the respective variables recorded during the period of observation(1999–2000).
WaterTotal rainfall
Photoperiods temperature(mm)
pH of Dissolved DissolvedMonths (hours) (°C) 1999 2000 water O2 (ppm) CO2 (ppm)
Jan 10.75 21.7 0 7.8 8.77 10.00 350Feb 11.01 23.5 0 37.8 8.15 11.20 170Mar 11.87 26.9 0 16.4 7.82 13.60 170Apr 12.52 31.8 10.0 75.1 8.49 15.50 175May 13.10 32.3 169.9 243.4 7.93 16.00 180Jun 13.58 32.5 363.5 114.7 8.11 14.10 195Jul 13.33 31.7 347.9 462.1 9.07 26.50 200Aug 12.85 32.2 233.5 278.3 8.11 15.00 200Sep 12.23 29.9 561.0 919.4 7.84 28.70 215Oct 11.50 28.5 171.6 60.5 7.62 10.30 235Nov 10.93 26.2 0 7.4 8.11 6.00 275Dec 10.60 23.8 0 0 7.86 8.00 315
Preparatory Pre-spawning Spawning Post-spawning
Ova
rian
wt.
(g)
/100
g b
ody
wt.
Figure 1. Histogram representing mean (± SE in vertical bars) values of ovarian weightexpressed as gono-somatic index (GSI) in Indian major carp Catla catla during different calendar months for the period 1999–2000.

nervous tissues. In this species of teleost, the ovarian cavity is continuous with theoviduct. At the microscopic level, the sections of ovary in Catla showed one or morestages of oogenesis depending upon the time of investigation in an annual cycle.Moreover, the relative number of different stages of oocytes was found to undergotime-bound changes during the period of ovarian growth and maturation. On the basisof the nuclear and cytoplasmic characteristics of the germ cells, the following stagesof the oogenesis were identified in the sections of ovary:
i. Oogonia. These are the most primitive type of ovarian germ cells, which are generally found along the ovigerous sac. Each oogonium is characterized by thepresence of a conspicuous large nucleus with nucleolus and scanty cytoplasm. Thediameter of each oogonium generally does not exceed the limit of 50 mm.
ii. Stage-I primary oocytes. The diameter of this type of oocyte ranges between50 and 150mm. They are mostly found along the ovigerous lamellae and are largerthan oogonia. They are characterized by a homogeneous basophilic cytoplasm with alarge nucleus containing 3–6 nucleoli.
iii. Stage-II primary oocytes. This stage of oocyte development is identified bythe presence of cortical alveoli or vacuoles, which are generally considered as theindex of vitellogenesis. Prominent follicular layers around the oocytes are notable.The cytoplasm appears to be granular and weakly basophilic. The diameter of thisstage of oocyte ranges between 190 and 350 mm.
iv. Stage-III primary oocytes. This stage of oocyte development is characterizedby the presence of yolk in the cytoplasm. Initially, yolk is deposited along the periph-ery in the form of minute granules, which are interspersed with the vacuoles. Thefully formed primary oocytes are invested with an outermost layer of thin and elon-gated theacal cells, which abuts against an inner layer of granulosa cells. The yolk is separated from the granulosa layer by a thin vitelline membrane or chorion. Thediameter of oocyte is found to vary from 600 to 850 mm.
v. Atretic follicles. The term corpora atrecia is an understandable usage for pre-ovulating follicles turning atretic or degenerated. In the case of immature oocytes,breakdown takes place by simple vacuolation and the disappearance of cytoplasmonly. In the case of yolky oocytes, degeneration takes place by breakdown of the ovumand hypertrophy of the granulosa cells, by fragmentation of the vitelline membraneand phagocytosis of yolk by granulosa cells, or by liquification of the yolk material.
Relative number of oocytes as the index of gametogenic activity of the ovary
The ovary varies greatly in appearance at different times in the cycle. The count ofrelative number of different types of oocytes in the Catla ovary also revealed time-bound changes in an annual cycle.
i. January–March. The ovaries appeared very small ribbon-like, colourless orslightly pinkish in colour, or translucent. The germ cells, which were arranged inmany distantly visible ovigerous sacs in the ovary during these months, were repre-sented by only oogonia and stage-I primary oocytes (see Table 2 and Fig. 2).
ii. April–June. During these months the size of the ovary increased and occupiedhalf or more than half of the body cavity. In external appearance, ovaries were opaque
Temporal Pattern of Annual Ovarian Activity in Catla catla 335

336R
. Dey et al.
Table 2. Month-wise changes in the mean values (± SE) of GSI, and the relative percentage of developing stages of ovarian folliclesin the ovary of Catla catla in an annual gonadal cycle.
Percentage of ovarian follicles with different stages of development
Gonosomatic Stage-I Stage-II Stage-III AtreticMonths index or GSI Oogonia Oocytes Oocytes Oocytes follicles
Jan (12) 0.281 ± 0.05 48.59 ± 1.61 40.79 ± 2.73 Nil Nil 10.62 ± 1.26c
Feb (10) 0.257 ± 0.06 45.57 ± 1.29 42.95 ± 2.24 Nil Nil 11.47 ± 2.43Mar (18) 0.367 ± 0.05 38.78 ± 1.41c 50.63 ± 1.33a 0.67 ± 0.15d Nil 9.84 ± 1.69Apr (14) 0.379 ± 0.02 42.11 ± 3.14 46.96 ± 1.53 2.94 ± 0.53d Nil 10.14 ± 1.72May (12) 0.795 ± 0.11c 23.16 ± 3.08 41.07 ± 2.01a 27.65 ± 4.29d Nil 8.12 ± 1.32Jun (14) 0.955 ± 0.14 22.31 ± 2.54 42.59 ± 3.66 20.47 ± 3.06 7.87 ± 2.12d 6.94 ± 1.25Jul (16) 16.400 ± 1.07d 7.17 ± 1.88d 20.22 ± 2.36d 7.19 ± 1.67d 44.58 ± 5.87d 5.70 ± 1.44Aug (16) 10.325 ± 1.46c 2.51 ± 0.74a 26.42 ± 3.11 5.11 ± 1.13 40.74 ± 5.03 9.08 ± 1.95Sep (10) 0.684 ± 0.13d 14.24 ± 2.24d 24.92 ± 2.41 2.39 ± 1.19 18.38 ± 5.35c 36.30 ± 4.05d
Oct (18) 0.295 ± 0.05b 33.14 ± 2.87d 38.27 ± 1.90d Nil Nil 29.13 ± 1.12Nov (17) 0.275 ± 0.05 40.51 ± 1.68 34.55 ± 1.90 Nil Nil 25.53 ± 2.61Dec (18) 0.235 ± 0.04 41.27 ± 1.98 41.63 ± 2.01a Nil Nil 18.12 ± 2.10a
Figures within parentheses denote the number of fish used in group concerned.Significant (differences by month) in Student’s t-test (after the F test) at the respective p-level, ap < 0.05, bp < 0.01, cp < 0.005, dp < 0.0001.F Values: GSI Æ F11,163 87.07, (p < 0.001)
Oogonia Æ F11,163 50.96, (p < 0.001)Stage-I Oocytes Æ F11,163 16.23, (p < 0.01)Stage-II Oocytes Æ F11,163 33.56, (p < 0.001)Stage-III Oocytes Æ F11,163 39.14, (p < 0.001)Atretic Follicles Æ F11,163 24.01, (p < 0.001)

orange/red in colour showing some relatively large ova, which looked like whitishgranules studded with many blood capilleries seen by the naked eye. The ovaries con-tained different types of follicles, like oogonia, stage-I, and stage-II follicles (seeTable 2, Fig. 3). The appearance of the cortical alveoli in the periphery of the folli-cle indicated the onset of vitellogenin synthesis in the liver.
iii. July–August. The ovaries collected during these months were enlarged andoccupied almost the entire body cavity and appeared highly vascularized. Ova were
Temporal Pattern of Annual Ovarian Activity in Catla catla 337
Figures 2–5. Photomicrographs of the sections of the Massion-trichrome stained 5 mm thickparaffin sections of ovary demonstrate the histological changes in an annual cycle of Indianmajor carp Catla catla. (2) Section of an ovary showing thin ovigerous sacs loaded with numer-ous oogonia and stage-I oocytes (S-I) during the preparatory phase (February) of an annualreproductive cycle (¥400). (3) In addition to many stage-I oocytes (S-I) and few oogonia,several stage-II oocytes (S-II) are found in the section of an ovary during the prespawningphase (May) of an annual reproductive cycle. Note the appearance of cortical alveoli (CA) inS-II oocytes (¥100). (4) Stage-III yolky oocytes (S-III) are abundant in the section of an ovaryduring the spawning phase (July) of an annual reproductive cycle (¥100). (5) Section of anovary showing oogonia, stage-I oocytes (S-I) and many atretic follicles (AF) during the post-spawning phase (October) of an annual reproductive cycle (¥100).

rather large, mostly separated from each other, and round shaped in external appear-ance. In sectional view, most of the follicles were detected as stage-III follicles or yolky oocytes (Fig. 4). Oogonial cells were rare, but few stage-I and stage-II follicles and some degenerated stage-I and stage-II follicles were found in the ovary(Table 2).
iv. September–December. At the end of the August or in early September, ovarieswere collapsed and contained necrotic or degenerative tissue. It could be detected inintact ovaries by the naked eye in the form of many grey to dark brown to red colouredtissues and spots, though total ovarian tissues were red in colour. Most of the advancedgerm cells showed the features of degeneration. The healthy germ cells were repre-sented by only oogonia and stage-I oocytes and atretic follicles (see Table 2, Fig. 5).
Steroidogenic enzyme activity in the ovary
(i) Activity of 3b-hydroxy steroid dehydrogenase (3b-HSD). A gradual rise in the3b-HSD enzyme activity was found from February onward which reached a peakduring the months of June–July, and then the activity of this enzyme graduallydecreased to the minimum level, and remained in a steady-state condition during themonths of August–December (Fig. 6). The variations in the value of enzyme activitywere found to be statistically significant (F11,163 48.51; p < 0.001).
(ii) Activity of 17b-hydroxy steroid dehydrogenase (17b-HSD). The mean valuesof the ovarian activity of 17b-HSD in different months of the year are presented inFigure 6. It was found that month-wise variations in an annual cycle were statisticallysignificant (F11,163 42.39; p < 0.002). The values were quite high over the period of May–July, though a maximum seasonal value was noted in the month of June (Fig. 6).
Seasonal changes in serum vitellogenin level
The values of month-wise variations in the amount of vitellogenin (alkali-labile phos-phorous) in serum over a period of two consecutive years are presented in Figure 6.It was found that the level of serum vitellogenin rises gradually from the month ofApril and reaches its peak during the month of June, then decreases sharply in Julywith a concomitant increase in ovarian weight. The level of serum vitellogenindropped to very low levels during the months of November to December. An analy-sis of the data over the period of investigation indicated that the month-wise varia-tions were statistically significant (F11,163 37.50; p < 0.005).
Statistical analysis of the values for determination of relationships amongdifferent variables
We name the variables in the following way for notational convenience. Major envi-ronmental variables are described as E (E: L ∫ Photoperiod, T ∫ Temperature, R ∫Rainfall), histological variables in the ovary are denoted as Y (Y*: Y 0*, Y*1, Y*2, Y*3 andY*4 ∫ percentage of the number of oogonia, stage-I, stage-II, stage-III and atretic
338 R. Dey et al.

follicles, respectively), and biochemical variables Z (Z1 and Z2 denote the ovarianactivity of 3b-HSD and 17b-HSD, respectively, and Z3 denotes the serum vitellogeninlevel).
Classification of the annual gonadal cycle
The plot of GSI against time (Fig. 1) reveals a steep rise around the spawning season(July–August) for two consecutive years. This is indicative of a seasonal effect duringthe spawning phase. As the data have been collected over 24 months, i.e., 24 timepoints with a periodicity of 12 months, a vigorous time series analysis is not possi-ble. However, an indication of the seasonality present in the data may be reflected ifthe observations are classified into four categories. It is presumed that the seasonal-ity pattern is present in all the variables i.e., Y, Z. As such, a dendogram has beenconstructed (Fig. 7) on the basis of the mean values for every month for each vari-able. This dendogram is based on Euclidean distance among the variables followinga single linkage clustering scheme or cluster analysis. From the dendogram it is clearthat the months are clustered in accordance with the previously mentioned four
Temporal Pattern of Annual Ovarian Activity in Catla catla 339
Enz
yme
acti
vity
/mg
prot
ein/
min
ute
Seru
m v
itel
loge
nin
leve
l ( m
g/m
l)
3b-HSD
17b-HSD
Vitellogenin
Figure 6. Diagrammatic presentation of month-wise changes in the mean (± SE in vertical bars) values of activity of 3b-hydroxysteroid dehydrogenase (3b-HSD) and of 17b-hydroxysteroid dehydrogenase (17b-HSD) in the ovary, and the concentration of vitellogeninin the serum in Catla catla.

phases. By critical appraisal of the dendogram and the periodic events in the ovaryof Catla catla, it is possible to group various months into several phases, as seen inTable 3.
Statistical relationship between the various indices of ovarian functions and theenvironmental variables in an annual cycle
In between seasonal profiles of oocytes and environmental variables. The relationship between the histological variables (Y) of the ovary and the environmen-tal variables (E) may be an interesting study. For this purpose, the already mentionednotations, Y 0*, Y 1*, Y*2, Y*3 and Y 4* have been used. It is to be noted that for
a particular experimental unit (fish), . Thus the data is essentially com- Yii
*=Â =
0
4
100
340 R. Dey et al.
Link
age
Dis
tanc
e
0
200
400
600
800
1000
M-1
9M
-8M
-20
M-7
M-1
8M
-17
M-6
M-1
6M
-5M
-9M
-21
M-1
5M
-14
M-4
M-3
M-2
4M
-23
M-1
2M
-11
M-1
3M
-2M
-22
M-1
0M
-1
Figure 7. Dendogram for classification of different reproductive phases of an annual gonadalcycle in female Catla catla.
Table 3. The results of statistical analysis showing that different months may be grouped ina different cluster and total annual cycle can be divided into four main phases.
Phases Case number* Months
Preparatory 2,14,15 Jan ’99, Feb ’99, Jan ’00, Feb ’00,
Pre-spawning 3,4,5,16,17 Mar ’99, Apr ’99, May ’99, Jun ’99,Mar ’00, Apr ’00, May ’00, Jun ’00
Spawning 6,7,8,18,19,20 Jul ’99, Aug ’99, Jul ’00, Aug ’00
Post-spawning 1,9,10,11,12,13,21, 22,23,24 Sep ’99, Oct ’99, Nov ’99, Dec ’99,Sep ’00, Oct ’00, Nov ’00, Dec ’00
*Denotes the sequence of number of months in a total period of 24 months (two consecutiveyears of study).

compositional in nature, i.e., the numerical value of a particular stage of ovariandevelopment represents a fraction (%) of the total population of ovarian germ cells.In connotation with the study by Aitchinson (1986), we propose excluding Y*4 fromthe observations to eliminate the close table effect, i.e., the statistical effect resultsfrom the contribution of each variable in a compositional data. Although Aitchinson(1986) proposed the division by the selected variable or by the geometric mean of allthe variables, in the present context this idea could not be implemented because ofthe abundance of zeros in the values of Y*2 and Y*3. Moreover, as Y*3 is the indicator ofmaturation of the ova, it cannot be excluded from current consideration. However, itis always possible to predict the value of Y4
* from the predicted values of the other
histological variables, viz. Y*0, Y*1, Y*2 and Y*3, by using the relation .
It is notable that the data corresponding to Y* variables have emerged from numerical counts and are expressed as percentages. Hence, the square root transfor-mation is implemented to ensure equal spread among the variables (Hoaglin et al.,1986). For further analysis, ÷Y*i (i = 0, 1, 2, 3, 4) is renamed as Yi. It has been observedthat Y*3 assumes non-zero values only in the neighbourhood of the spawning phase and it takes zero values otherwise. So, it really forms a two-part model with amass at Y*3 = 0 and has a continuous density when Y*2 ≥ 1. As such the distributionof Y*3 needs special attention and it should be studied separately in a more detailedfashion.
As a result of analysis of canonical correlation of the data on different stages ofovarian development and different variables of the environment, the value of the coef-ficient was found to be equal to 0.91659. The very high value of the correlation indi-cates the existence of a strong relationship between Y and E. The canonical weightscorresponding to different environmental variables and gonadal variables are shownin Table 4.
The scatter plot is also presented in Figure 8, which clearly indicates a strong linearrelationship between the combinations of the environmental variables with those ofthe ovarian variables.
Yii
*=Â =
0
4
100
Temporal Pattern of Annual Ovarian Activity in Catla catla 341
Table 4. The values of canonical weights (analogous to the beta weights of regression analy-sis) in consideration of different environmental variables (L: photoperiod, T: water tempera-ture, R: rainfall) and the gonadal variables (Y0: the number of oogonia, Y1: the number of stage-Ioocytes, Y2: the number of stage-II oocytes, Y3: the number of stage-III oocytes) in an annualcycle.
Environmental Canonical weights Ovarian variables Canonical weightsvariables
L 1.26754 Y0 -0.10456T -0.10824 Y1 -0.08366R -0.23892 Y2 0.66733
Y3 0.40292

Regression analysis of the data on the stages of ovarian development and on envi-ronmental variables. As it appears that a relationship exists between Y and E, onemay be interested in investigating the possible nature of dependence of one ovarianvariable on the environmental variables. In this respect, an attempt has been made tofind a regression equation, by means of which the number of oogonia present in anexperimental unit can be predicted by the environmental factors. After an exploratorymethod of data analysis (incorporating the data of photoperiods, temperature and rain-fall) and applying the standard regression technique, a significant relationship withthe multiple correlation coefficient R as 0.85601 was found between the ovarian vari-able and only the photoperiods, but not the temperature or rainfall. Therefore, theregression values of temperature and rainfall were ignored and the estimates of theparameters are:
(1)
where Li is the photoperiod (the beta coefficient is the regression value) correspond-ing to the (i, j)th observation. This high value of the multiple correlation coefficientindicates that the number of oogonia is highly dependent on the environmental vari-ables in general and on the photoperiods in particular. This observation is again sup-ported by Figure 9, obtained by plotting the observed values and the predicted valuesbased on the fitted regression equation (1).
Naturally, the next point of study should be to investigate the possible relationshipbetween the population of stage-I oocyte and the environmental variables. However,it is known that the stage-I oocyte is very closely related to oogonia. Hence, one mustfocus on the study of the relationship of the stage-I oocyte on the environmental vari-ables along with the oogonia present at that point of time and applying the standardregression technique; the regression equation explaining the dependence is:
Y Li0 21 21017 1 30454= -. . L L
342 R. Dey et al.
Environmental variables
Ova
rian
varia
bles
-1.4
-0.8
-0.2
0.0
1.2
1.6
2.2
-2.0 -1.5 -1.0 -0.5 2.01.51.00.0 0.5
Figure 8. Scatter plot of canonical correlation analysis of the ovarian variables and the envi-ronmental variables reveals a linear relationship between them. The scales of the two axes weredrawn on the basis of computational analysis of the linear combination of respective variables.

(2)
where the multiple correlation coefficient R is 0.92355. This high value of the mul-tiple correlation coefficient is indicative of the fact that the number of stage-I oocytesis highly dependent on that of oogonia and also on the photoperiod, which is againsupported by Figure 10, obtained by plotting the observed values and the predictedvalues based on the fitted regression equation (2).
Y Y L1 05 54354 0 23054 0 09862= + -. . . L L
Temporal Pattern of Annual Ovarian Activity in Catla catla 343
0
1
2
3
4
5
6
7
8
1 3 5 7 9 11 13 15 17 19 21 23Months
Squa
re r
oot
of
% o
f oo
goni
a
Obsd.Y0
Pred.Y0
Figure 9. Observed (Obsd.) and predicted (Pred.) values of the number of oogonia in theovary of Catla catla in consideration to environmental variables (photoperiod).
3
3.5
4
4.5
5
5.5
6
6.5
7
1 3 5 7 9 11 13 15 17 19 21 23
Months
Squa
re r
oot
of t
he %
of
stag
e-I
oocy
te
Pred. Y1Obsd. Y1
Figure 10. Schematic presentation of the observed (Obsd.) and predicted (Pred.) values ofthe number of stage-I oocytes in the ovary of Catla catla in consideration to the number ofoogonia and environmental variables (photoperiod).

Relationship between the activity of 3b-HSD and 17b-HSD with the environ-mental variables. Attempts have also been made to study whether there is any rela-tionship between the activities of steroidogenic enzymes in the ovary and the existingenvironmental variables. Since the steroidogenic activities of the ovary are seasonal,any changes in the concerned values may be attributed to changes in the environment.Moreover, the activities of 3b-HSD and 17b-HSD are likely to be related to eachother, and a possible relationship between different environmental factors like pho-toperiod, temperature and rainfall cannot be ruled out. Therefore, all the concerneddata were subjected to analysis for canonical correlation. Figure 11 shows the scatterplot corresponding to canonical variables, and the canonical weights are given in Table5. The calculated value of the canonical correlation coefficient was 0.543204. Ananalysis of the values of canonical weights reveals that all the considered environ-mental variables have a significant effect on the steroidogenic activity of the ovary,but the relationship of the steroidogenic variables of the ovary with the seasonal vari-ations in water temperature is stronger than with the photoperiod, while rainfall has
344 R. Dey et al.
Scatter plot
Environmental factors
Ste
roid
ogen
ic v
aria
bles
-3
-2
-1
0
1
2
-2.5 -2.0 -1.5 -1.0 -0.5 0.0 2.01.51.00.5
Figure 11. Scatter plot of the canonical analysis of the mean values of the activities ofsteroidogenic enzymes (3b-HSD and 17b-HSD) in the ovary of Catla catla in respect to theenvironmental factors. The scales of the two axes were drawn on the basis of computationalanalysis of the linear combination of respective variables.
Table 5. The values of canonical weights in consideration to different environmental vari-ables and studied steroidogenic variables in the ovary of Catla catla.
Environmentalvariables Canonical weights Steroidogenic variables Canonical weights
Photoperiod 1.20962 3b-HSD -0.17083Temperature -2.22637 17b-HSD -0.90487Rainfall 0.96304

the least significant effect on the steroidogenic activities of the ovary. It also appearspossible that the relationship of environmental variables with 17b-HSD activity (valueof canonical weight -0.90487) is stronger than with the ovarian activity of 3b-HSD(value of canonical weight -0.17083).
Relationship between the concentration of serum vitellogenin with the environ-mental variables. To explore whether there is any relationship between the envi-ronment and the yolk protein may be an interesting study. The dependence of the yolkprotein on photoperiod, temperature and rainfall may be explained through the regres-sion equation model.
Satisfying the assumptions of the standard regression theory and applying the leastsquares technique, the regression equation explaining the relationship between theyolk protein and the environmental factors is given by:
(3)
where the multiple correlation coefficient is 0.964378. Since the value of the multi-ple correlation coefficient is very high, it is clear that the amount of yolk protein canbe predicted through the environmental factors quite successfully. It also reveals thatamong the environmental variables, photoperiod is more important than others. Thesupposition earns support from Figure 12 which resulted from plotting the observedvalues and the predicted values of the yolk protein.
ln . . . .Z L T R3 2 45929 0 968828 0 13679 0 07401= - + - + L
Temporal Pattern of Annual Ovarian Activity in Catla catla 345
3
3.5
4
4.5
5
5.5
6
6.5
7
1 3 5 7 9 11 13 15 17 19 21 23Months
Log
arit
hm o
f se
rum
vit
ello
geni
nco
nc.
Obsd.Z3
Pred.Z3
Figure 12. Graphical presentation of the observed (Obsd.) and predicted (Pred.) values of theserum vitellogenin concentration in Catla catla in consideration to all the environmental vari-ables, but a strong relationship with photoperiods may be suggested on the basis of the obser-vation that the value of the beta coefficient of the photoperiod was more than that of temperatureand rainfall (cf. equation 3).

Relationship between the serum vitellogenin concentration and the steriodogenicenzyme activity of the ovary. It is known that the amount of yolk protein in theserum is a reflection of its presence in the gonad. So it appeared worthwhile to analysethe alleged relationship between the levels of yolk protein and the activity of 3b-HSD(Z1) and 17b-HSD (Z2) by employing a regression equation.
Hence, applying the standard regression package, the estimates of the parameterswere calculated with the multiple correlation coefficient as 0.90633. On the basis ofa very high value of the multiple correlation coefficient, the role of the concentrationof serum vitellogenin (Z3) may be explained quite satisfactorily by Z1 and Z2 throughthe regression equation:
(4)
The equation reveals that both the enzymes have major role in the regulation of serumvitellogenin concentration. A strong resemblance between the observed values of theyolk protein for different months with the predicted values of the same (Fig. 13) mayalso be suggested on the basis of the fitted regression equation (4).
Discussion
The results of the present investigation clearly indicate that the free-living adultfemale carp Catla catla attains sexual maturity only during restricted periods of theyear and the temporal pattern does not vary from one year to the next. Currentlyundertaken studies also clearly demonstrate the annual rhythmic pattern in the activ-ities of the ovary under natural environmental conditions. However, revelation of aprobable environmental synchronizer of the cyclic activity of the ovary, and appraisalof their functional relationship, if any, require detailed consideration.
Z Z Z3 1 230 99569 14 80893 33 50394= + +. . . L
346 R. Dey et al.
0
100
200
300
400
500
600
700
800
1 3 5 7 9 11 13 15 17 19 21 23Months
Con
c. o
f se
rum
vit
ello
geni
n le
vel
Obsd.Z3
Pred.Z3
Figure 13. Observed (Obsd.) and predicted (Pred.) values of the serum vitellogenin concen-tration on the basis of the activities of 3b-HSD and 17b-HSD in the ovary of Catla catla.

Major aspects of annual cyclicity in ovarian functions
Earlier studies (Wallace, 1985; Nath & Sundararaj, 1981) indicated that two consec-utive physiological events are involved in the completion of an ovarian cycle in fishin general. The first event is enlargement of the ovary with concomitant formation of the yolky oocytes, i.e., vitellogenesis, which is followed by the second event thatincludes maturation of oocytes, ovulation and spawning. The first event is called thevitellogenic phase and the second one is called the post-vitellogenic phase. The partof an ovarian cycle, when the ovary remains gametogenically inactive and the eventsof steroidogenic cascades and vitellogenesis are not triggered in the system, is calledthe previtellogenic phase. During vitellogenesis, a multicomponent yolk precursorprotein vitellogenin is synthesised in the liver by the stimulation of 17b estradiol andtransported via circulation to the ovary where it is taken up by the developing oocytes.17b estradiol is synthesised and secreted from the ovarian follicles and acts on fishliver during vitellogenesis (Bhattacharya, 1994).
Quantitative data on the studies of different components of the ovary revealed thatwithin a calendar year, growth and maturation of the ovary becomes maximum in themonth of July, when the number of mature stage-III yolky oocytes in the ovary is alsovery high. However, steroidogenic and vitellogenic activities show their peak in June.A sudden fall in each index of ovarian activity occurs in September. The gametogenicrecrudescence occurs during the month of April, though the mean values of pairedovarian weight are yet to show any significant changes over the preceding months.This observation supports the contention that actual activation of the gonad may occureven before it is reflected in its weight value (Lofts et al., 1973; Maitra & Ghosh,1981). Collectively, the features of the ovary studied during different months of theyear allow us to divide the annual ovarian cycle into four different phases, each ofwhich shows certain common characteristic features, as shown in Table 6. This clas-sification follows the pattern described for annual gonadal cycles in other Indianteleosts (Sundararaj & Sehgal, 1976; Garg & Jain, 1985; Mukherjee et al., 1989; Srivastava & Singh, 1991).
D5-3b HSD is a key enzyme catalysing the conversion of D5-3b hydroxysteroidsto D4-3 ketosteroids in the steroidogenic tissues. This is a very important enzyme, asit catalyses the formation of biologically potent steroid hormones from their lessactive precursors (Labrie et al., 1994; Civinini et al., 1997, 2001; Datta et al., 1999).Activity of 17b-HSD enzyme is an indicator of the synthesis of testosterone or 17bestradiol and is responsible for the conversion of the estradiol to estrone (Sen & Bhat-tacharya, 1982; Labrie et al., 1994; Civinini et al., 1997, 2001). In keeping with theview that an increase in the activity of steroidogenic enzymes like D5-3b HSD and17b HSD correlates with higher endocrine activity in the ovary (Suzuki et al., 1981;Mukherjee & Bhattacharya, 1983; Nagahama, 1994), it may be opined that endoge-nous titre of 17b estradiol in the present studied fish (Catla catla) remains at a highlevel during the month of June. Likewise, on the basis of the findings that vitellogeninsynthesis in the liver is stimulated by the estradiol hormone (Bhattacharya, 1994), thehigher concentration of vitellogenin in the serum during this month may be consid-ered as an index of the higher concentration of estradiol in the studied fish. The high
Temporal Pattern of Annual Ovarian Activity in Catla catla 347

348 R. Dey et al.
Table 6. Duration and characteristic features of different phases of an annual ovarian cyclein Indian major carp Catla catla.
Reproductive Duration inphases month Characteristic features of the ovary
Preparatory January–March Very small ribbon like, colourless or slightly pinkishtranslucent ovaries. Ova are minute and microscopic. The ovarian germ cells are represented mostly by oogonia and stage-I primary oocytes.
Pre-spawning April–June Compared to earlier months, weight and volume of theovary increased, occupying nearly half or more than half of the body cavity. In naked eyes, ovaries appear opaque orange in colour, with some whitish granules and many blood capillaries. At the microscopic level, ovaries are found to contain oogonia, stage-I, and stage-II oocytes.
Spawning July–August Enlarged ovaries occupy almost the entire body cavity andappear highly vascularised. Large and round shaped ovaare visible even by the naked eye. At the microscopiclevel, ovarian follicles are found to be represented bymostly stage-III yolky oocytes. A few stage-I and stage-II follicles are also present.
Post-spawning September– Regressed ovaries containing necrotic or degenerativeDecember tissues appear red in colour with some grey to dark
brown coloured spots. The follicular profiles of different ovaries are not identical; in some cases the population of atretic stage-III follicles is very high (probably resulting from the absence of egg spawning),while in others ovarian follicles are represented chiefly by oogonia, stage-I oocytes and many corpus lutea (most likely spawned ovary).
molecular protein vitellogenin is then incorporated into the developing enlargedoocytes in the ovary via circulation resulting into the formation of the yolky oocytes,and thereby accounts for a tremendous increase in the values of ovarian weight andgonosomatic index of the concerned fish during the peak breeding period(July–August) in an annual cycle (Nagahama, 1994).
Probable environmental synchroniser of the annual events in the ovary
Several field and laboratory studies indicated that a time-bound wax and wane inpiscine gonadal activity in a species is generally governed by the environmentalfactor(s), of which photoperiod, temperature and rainfall are the most important.Although the difference between the winter solstice and summer solstice in subtrop-ical countries is only about three hours, the possible influence of photoperiods and/or

other environmental factors on the gonadal events in an annual cycle has been indi-cated in several studies on mid- and low-latitude fishes (Lam, 1983; Vivien-Roles &Pevet, 1983; Chaudhuri, 1997; Martin et al., 1999; Bornestaf et al., 2001; Garcia-Allegue et al., 2001). Moreover, any conjecture on the environmental influence ongonadal development in Catla earns further support from the results of statisticalanalysis of data showing that gonadal maturation in this fish is significantly corre-lated (R = 0.91659) with the ambient photo-thermal conditions in general and pho-toperiod in particular. It is noteworthy that canonical weight for photoperiod (L) isvery high and positive and thereby indicates that ovarian maturation results from theincrease in photoperiods (Table 4). Thus it becomes apparent that the photoperiod isthe most important environmental factor which is responsible for timing the gonadalmaturation in Catla catla.
An analysis of data on the activity of steroidogenic enzymes in the ovary alsorevealed its functional relationship (R = 0.543204) with the environmental factors.However, following canonical analysis (Table 5) it appears that the activity of theseenzymes depends chiefly on the fluctuations of both photoperiods and temperature.Likewise, analysis of the values of serum vitellogenin level revealed a relationship(R = 0.964378) indicating that the level of vitellogenin in serum depends more onphotoperiods than on temperature and rainfall (Equation 3). Obviously, the results ofthe present study indicate that the variables of the environment in general, and pho-toperiods in particular, are related to the activity of steroidogenic enzymes of theovary, and the level of vitellogenin in serum as well. Within the limit of the currentphenological study it is difficult to comment on the cause and effect relationshipbetween the considered variables. However, on the basis of existing knowledge on thephysiology of reproduction in fish (Nagahama, 1994), it may not be unwise to surmisethat environmental factors influence the activity of steroidogenic enzymes in theovary, which in turn may be related to the circulating level of vitellogenin in an annualgonadal cycle. Nonetheless, the topic must remain speculative until further experi-mental study.
In free-living Catla catla, the ovarian regression occurs at a time (September) whenthe solar day-length begins to shorten, while the occurrence of ovarian recrudescence(April onwards) coincides with increasing day length. Therefore, it is not unlikely that the maximum ovarian weight is observed in July, when the day-length is alsomaximum in a seasonal cycle. Detailed statistical analysis of the observed data undernatural conditions reveals that there is a close relationship between the increasingday-length and increasing ovarian weight, thereby depicting a clear-cut effect of thisenvironmental factor on the reproduction of the carp. However, the study does notexclude a possible influence of water temperature on the reproduction of this fish.Although phenological study shows the occurrence of spawning during the season ofpeak rainfall or monsoon, a lack of significant correlation at a statistical level betweenthem does not promote the idea of a functional relationship between these two vari-ables. However, the role of rainfall as an ultimate environmental factor in the sexualact of fish or release of mature eggs cannot be ruled out (Chakrabarti, 1998).
In addition to major environmental factors, several other limnological factors likepH of water, amount of dissolved oxygen and dissolved carbon dioxide were consid-
Temporal Pattern of Annual Ovarian Activity in Catla catla 349

ered for drawing a statistical relationship between them and studied variables ofovarian functions in Catla catla. However, none of them appeared to be important forconsideration of their role in the process of seasonal growth and maturation of theovary, as no significant correlation has been noted between the indices of ovarianactivity and any of such limnological variables.
Collectively, it appears logical to surmise that the duration of photoperiods, in association with or without water temperature, constitute an important part of theenvironmental information used in the temporal organisation of seasonal ovarian maturation in the presently considered fish. Nonetheless, it deserves special mentionhere that the present investigation provides only basic information and further rigor-ous photoperiodic experiments are required to justify the hypothesis.
Acknowledgements
Financial assistance from the Indian Council of Agricultural Research, Governmentof India, New Delhi, through a research grant (F. No. 4-(40)/96-ASR-I) to SKM isthankfully acknowledged. The authors are grateful to Dr. Indranil Mukhopadhyay,Department of Statistics, University of Burdwan for his sincere help in statisticalanalysis of the data.
References
Acharia K, Lal B, Singh TP, Pati AK (2000): Circadian phase dependent thermal stimu-lation of ovarian recrudescence in Indian catfish, Clarias batrachus. Biol Rhythm Res31: 125–135.
Aitchison B (1986): The Statistical Analysis of Composition Data. London, ChapmanHall.
Bhattacharya S (1994): Recent advances in the hormonal regulation of gonadal matura-tion and spawning in fish. Current Science 76: 342–349.
Bornestaf C, Mayer I, Borg B (2001): Melatonin and maturation pace in female three-spined stickleback, Gasterosteus aculeatus. Gen Comp Endocrinol 112: 341–348.
Chakrabarti NM (1998): Catla catla In: Biology, Culture and Production of Indian majorcarp-A review. Narendra Publishing House, Delhi, India.
Chaudhuri H (1997): Environmental regulation of gonadal maturation and spawning infishes. In: Maitra SK, ed., Frontiers in Environmental and Metabolic Endocrinology.India, University of Burdwan Publication, pp. 91–100.
Civinini A, Padula D, Gallo VP (2001): Ultrastructural and histochemical study on theinterrenal cells of the male stickleback (Gasterosteus aculeatus, Teleostea), in rela-tion to the reproductive annual cycle. J Anat 199: 303–316.
Civinini A, Tallini M, Gallo VP (1997): The steroidogenic possibilities of ovarian andinterregnal tissues of the female stickleback (Gasterosteus aculeatus L.) during theannual cycle: Histochemical and ultrasructural observations. In: Maitra SK, ed., Fron-tiers in Environmental and Metabolic Endocrinology. India, University of BurdwanPublication, pp. 77–90.
350 R. Dey et al.

Datta M, Nagendra Prasad RJ, Bhattacharya S (1999): Thyroid hormone regulation ofperch ovarian 3b-hydroxysteroid dehydrogenase/D5-D4-isomerase activity: Involve-ment of a 52-kDa protein. Gen Comp Endocrinol 113: 212–220.
Garcia-Allegue R, Madrid JA, Sanchez-Vazquez FJ (2001): Melatonin rhythms in European sea bass plasma and eye: Influence of seasonal photoperiod and tempera-ture. J Pineal Res 31: 68–75.
Garg SK, Jain SK (1985): Effect of photoperiod and temperature on ovarian activity in the Indian murrel, Channa (Ophicephalus) punctatus (Bloch). Can J Zool 63:834–842.
Gujrathi DN (1995): Basic Econometrics, 3rd edn. New York, McGraw-Hill Publications.Hoaglin DC, Mosteller F, Tukey JW (1986): Understanding Robast and Exploratory Data
Analysis. New York, John Wiley & Sons, Inc.Koya Y, Kamiya E (2000): Environmental regulation of annual reproductive cycle in the
mosquitofish, Gambusia affinis. J Exp Zool 286: 204–211.Labrie F, Simard J, Luu-The V, Pelletier G, Belghmi K, Belanger A (1994): Structure, reg-
ulation and role of 3b-hydroxysteroid dehydrogenase, 17b-hydroxysteroid dehydro-genase and aromatase enzymes in formation of sex steroids in classical and peripheralIntracrine tissues. In: Sheppard MC, Stewart PM, eds., Hormones, Enzymes andReceptors. London, Bailliere Tindal Ltd., pp. 451–471.
Lam TJ (1983): Environmental influences on gonadal activity in fish. In: Hoar WS,Randall DJ, Donalson EM, eds., Fish Physiology Vol IX, Behaviour and FertilityControl. New York, London, Academic Press, pp. 65–116.
Lillie RD (1954): Histopathologic Technique and Practical Histochemistry. New York,McGraw-Hill Book Company.
Lofts B, Murton RK, Thearle RJP (1973): The effects of testosterone propionate andgonadotropins on the bill pigmentation and testis of the house sparrow, Passar domes-ticus. Gen Comp Endocrinol 21: 202–209.
Lowry OH, Rosebrough NJ, Farr AL, Randall RJ (1951): Protein measurment with Folin-phenol reagent. J Biol Chem 193: 265–275.
Maddala GS (1992) Introduction to Econometrics, 2nd edn. New York, MacMillan Publishing Company.
Maitra SK, Ghosh A (1981): Gonadal responses to testosterone propionate during breed-ing and post-breeding phases of the male blossomheaded parakeet, Psittaculacyanocephala (Aves: Psittaciformes). Aust J Zool 29: 853–859.
Martin P, Rebollar PG, San Juan LD, Illera JC, Alvarino JM (1999): Plasma estradiol-17blevels and gonosomatic index in tench (Tinca tinca) reared in natural and controlledconditions. J Physiol Biochem 55: 309–314.
Mukherjee D, Bhattacharya S (1983): Effects of gonadotropin hormone on fish ovarian 17b-hydroxysteroid dehydrogenase activity. Proc 1st Int Symp Life Sci 20:82–90.
Mukherjee J, Bhattacharya S, Nath P (1989): Annual changes in ovary and vitellogenincontent of liver, serum and ovary of murrel Channa punctatus (Bloch). Ind J ExpBiol 27: 764–769.
Nagahama Y (1994): Endocrine regulation of gametogenesis in fish. Int J Dev Biol 38:217–229.
Temporal Pattern of Annual Ovarian Activity in Catla catla 351

Nath P, Sundararaj BI (1981): Isolation and identification of female specific serumlipophosphoprotein (vitellogenin) in the catfish, Heteropnenstes fossilis (Bloch). GenComp Endocrinol 43: 184–190.
Sen S, Bhattacharya S (1982): Hormonal influence on perch ovarian 17b-Hydroxysteroiddehydrogenase activity in in vitro system. Ind J Exp Biol 20: 664–667.
Singh MS, Joy KP (1998): Precocious recrudescence of seminal vesicle and testis incatfish, Clarius batrachus (Linn.), subjected to a long photoperiod regime. Ind J ExpBiol 36: 1264–1268.
Srivastava SJ, Singh R (1991): Effects of constant photoperiod-temperature regimes onthe ovarian activity during the annual reproductive cycle in the murrel, Channa punc-tatus (Bloch). Aquaculture 96: 383–391.
Srivastava SJ, Singh R (1992a): Effects of constant photoperiod-temperature regimes onthe testicular activity of Channa punctatus (Bloch). Asian Fish Sci 5: 231–240.
Srivastava, SJ, Singh R (1992b): Effects of constant photoperiod-temperature regimes onthe ovary and pituitary gonadotropic cells of the murrel, Channa punctatus (Bloch)during the annual reproductive cycle. Biol Struct Morphogen 1: 28–31.
Srivastava SJ, Singh R (1993): Effects of constant photoperiod-temperature regimes ontestes and pituitary gonadotropic cells of the murrel, Channa punctatus (Bloch)during the annual reproductive cycle. Annal Endocrinol (Paris) 54: 203–206.
Sundararaj BI, Sehgal A (1970a): Effects of long or an increasing photoperiod on the initiation of ovarian recrudescence during the preparatory period in the catfish,Heteropneustes fossilis (Bloch). Biol Reprod 2: 413–423.
Sundararaj BI, Sehgal A (1970b): Response of the pituitary and ovary of the catfish, Het-eropneustes fossilis (Bloch) to accelerated light regimen of a decreasing followed byan increasing photoperiod during the post-spawning period. Biol Reprod 2: 435–443.
Sundararaj BI, Vasal S (1973): Photoperiod regulation of reproductive cycle in the catfish,Heteropneustes fossilis (Bloch). In: Progress in Endocrinology, Proceedings IVth
International Congress of Endocrinology, Washington, DC, 1972, International Congress series no. 273. Amsterdam, Excerpta Media.
Sundararaj BI, Vasal S (1976): Photoperiod and temperature control in the regulation ofreproduction in the female catfish Heteropneustes fossilis. J Fish Res Bio Can 33:959-973.
Suzuki K, Tamaoki Bun-Ichi, Hirose K (1981): In vitro metabolism of 4-pregnenes inovaries of a fresh water teleost, the Ayu (Plecoglossus altivelis): Production of 17a,20b-dihydroxy-4-pregnen-3-one and its 5b-reduced metabolites, and activation of 3b- and 20b-hydroxysteroid dehydrogenases by treatment with fish gonadotropin.Gen Comp Erdocrinol 45: 473–481.
Vivien-Roles B (1985): Interactions between photoperiod, temperature, pineal and sea-sonal reproduction in non-mammalian vertebrates In: Mess B, Ruzsas CS, Tima L,Pévet P, eds., The Pineal Gland, Current State of Pineal Research. Budapest,Hungary, Akademias Kiado, and Amsterdam, Elsevier Science, pp. 187–209.
Vivien-Roles B, Pevet P (1983): The pineal gland and synchronization of reproductivecycle with variations of the environmental climatic conditions, with special referenceto temperature. Pineal Res Rev 1: 91–143.
Vogel AI (1975): A Quantitative Inorganic Analysis, 3rd edn., London, ELBS, p. 810.
352 R. Dey et al.

Wallace RA (1985): Vitellogenesis and oocyte growth in nonmammalian vertebrates. In:Browder LW, ed., Developmental Biology, vol. I, New York, Plenum Publishing Corp.,pp. 127–177.
Wetzel RG, Likens GE (1979): Limnological Analyses. Philadelphia, PA, WB SaundersCompany.
Wiebe PJ (1976): Steroidogenesis in rat Leydig cell: changes in activity of 5-ane and 4-ene 3b-hydroxysteroid dehydrogenase during sexual maturation. Endocrinology 98: 505–513.
Temporal Pattern of Annual Ovarian Activity in Catla catla 353