Embed Size (px)
Citation preview
arX
iv:a
stro
-ph/
0007
177v
2 1
7 Ju
l 200
0
Submitted to Ap. J.
Testing the AGN-Starburst Connection in Seyfert Galaxies.
Valentin D. Ivanov, George H. Rieke, Christopher E. Groppi, Almudena Alonso-Herrero1, Marcia
J. Rieke, C. W. Engelbracht,
Steward Observatory, The University of Arizona, Tucson, AZ 85721,
vdivanov, grieke, cgroppi, aalonso, mrieke, & [email protected]
ABSTRACT
We use the CO band at 2.3µm to constrain the populations of young stars in the
central regions of Seyfert galaxies. We report new CO band spectroscopy of 46 Seyfert
galaxies. In most cases, the observed CO indices appear diluted by the presence of a
non-stellar component (most likely, warm dust surrounding the active nucleus). We
used JHKL aperture photometry to estimate the non-stellar contribution at 2.3µm.
We successfully corrected the CO band for the dilution for 16 galaxies which were not
dominated by the non-stellar component. Comparing with CO indices measured in
elliptical and purely starbursting galaxies, we find no evidence for strong starbursts in
the majority of these galaxies.
Subject headings: galaxies: Seyfert and starburst — infrared: galaxies
1. Introduction
There are many observational examples of starbursts occurring in active galaxies (e.g. Mauder
et al. 1994; Maiolino, Rieke & Keller 1995; Heckman et al., 1997; Gonzalez-Delgado et al., 1998;
Nelson & Whittle, 1998; Kunth & Contini, 1999). As a result, possible connections between active
galaxies and circumnuclear starbursts are the subject of extensive speculation.
Such associations might arise just because circumnuclear starbursts have a common cause
with AGNs. For example, mergers, interactions between galaxies, and bars (Shlosman, Frank &
Begelman, 1989; Shlosman, Begelman & Frank, 1990; Maiolino et al., 1997; Knapen, Shlosman &
Peletier, 1999) have all been invoked as a means to distort the gravitational potential of the host
galaxy, allowing the gas to lose angular momentum to the stars, so it can fall inward toward the
AGN. All of these phenomena appear also to be associated with nuclear starbursting.
1Current address: Department of Physical Sciences, University of Hertfordshire, College Lane, Hatfield AL10 9AB,
England; [email protected]

– 2 –
A more direct connection has been proposed by von Linden et al. (1993), who suggest that
starburst-induced turbulence in the ISM is responsible for the final stages of infall of gas into the
nuclear engine. Weedman (1983) pioneered an AGN model involving a large number of small
accretors - the remnants of the massive stars in a compact circumnuclear starburst, preceding the
AGN stage. Bailey (1980), David (1987a, 1987b), and Norman & Scoville (1988) refined this idea,
pointing out that a compact star cluster can form a super massive black hole. The theoretical
understanding of this process was advanced by the efforts of Perry & Dyson (1985), Perry (1992),
and more recently, of Williams, Baker & Perry (1999).
It has also been proposed that a starburst can mimic an AGN (Terlevich & Melnick, 1985).
Terlevich et al. (1992) showed that at least low luminosity Seyfert 2’s can be explained via active
circumnuclear star formation alone. However, this model has difficulties explaining the rapid X-ray
variability, and the broad iron emission lines of more luminous active galaxies. Cid Fernandes
(1997) summarized the current status of the model and suggested a dichotomy among AGNs, in
which some are powered by a black hole and others by a nuclear starburst.
Still another possibility is that circumnuclear starbursts strongly alter the observed properties
of AGNs. For example, Ohsuga & Umemura (1999) consider a model in which the wind from the
circumnuclear starburst forms an obscuring dust wall. The alternative process, in which an AGN
disturbs the galactic ISM and triggers a starburst was reported by van Breugel et al. (1985), van
Breugel & Dey (1993), and Dey et al. (1997). This behavior is usually related to the expansion of
a radio source into the ambient medium. Also, once formed, by whatever means, the black hole
can gravitationally disturb the interstellar gas, triggering a starburst.
A better understanding of the frequency of AGN and starburst coincidences is required
to probe the connection between the two phenomena. A conventional method to search for
young starbursts is to look for stellar absorption features in the ultraviolet spectra of galaxies
(e.g. Heckman et al., 1997; Gonzalez-Delgado et al., 1998). Current instrumentation allows this
approach to be applied in just a few cases; Heckman (1999) found only four Seyfert 2 nuclei
bright enough to obtain UV spectra with sufficiently high signal-to-noise to identify young stars.
It is possible that they show starburst signatures because of the selection bias toward galaxies
with high surface brightness, which could be a result of the active star formation. In addition,
application of this technique to AGNs is restricted by the extinction. Since the ISM lies around
the AGN in a complex three-dimensional distribution, a significant component of the observed
UV flux may come from the stellar population in front of the active nucleus and not be associated
closely with it.
In the optical, Kunth & Contini (1999) detected emission signatures of Wolf-Rayet stars in
the spectra of two Seyfert 2 galaxies out of five observed. CaII triplet absorption at 8555A is
strong in the spectra of massive stars and can also indicate the presence of starbursts (Terlevich,
Diaz & Terlevich, 1989; Terlevich, Diaz & Terlevich, 1990; Forbes, Boisson & Ward, 1992; Nelson
& Whittle, 1998). However, studies of this line in Seyfert galaxies were not conclusive because for

– 3 –
a fraction of these galaxies the CaII index values were inconsistent with a normal galaxy spectrum
diluted by a featureless power law continuum (see also Persson, 1988; Diaz, Terlevich & Terlevich,
1989).
The infrared range has an advantage in probing AGN environments because of the lower
extinction. Since the strengths of the CO bands at 1.6µm and 2.3µm are sensitive to the stellar
surface gravity, they can indicate the presence of young red supergiants. The CO band strength
is also a function of metallicity. However, in the bulges of large spirals, the typical haunt of a
Seyfert nucleus, the surface gravity dependence dominates. Empirically, quiescent spirals have a
very narrow range of 2.3µm band strengths (Frogel et al., 1978; Frogel, 1985) and most starburst
galaxies have bands substantially deeper than this value (Ridgway, Wynn-Williams & Becklin
1994; Goldader et al. 1995; Engelbracht 1997)
Although the 2.3µm strength has proven useful in identifying and studying starbursts, in
applying similar techniques to Seyfert galaxies one must contend with the possibility that the
band can be diluted by radiation from the warm dust surrounding the central engine in the AGN.
Oliva et al. (1995) therefore used the second overtone at 1.6µm to probe the environments of
AGNs. Unfortunately, this band is weak and its dependence on metallicity is strong comparable
to 2.3µm CO band. To avoid these issues, Oliva et al. (1999) derived the mass to luminosity of
the nuclear region and identified starburst/Seyfert combinations where this ratio was low, rather
than relying on the CO band strengths. Both of these approaches require high signal to noise
spectra of moderately high resolution. Thus, they can only be applied to AGNs that are bright in
the near infrared, which may result in a selection bias toward examples with strong circumnuclear
starbursts.
To address the Seyfert-starburst connection more thoroughly, we obtained K-band spectra of
46 Seyfert galaxies in the CfA sample at the 2.3µm CO bandhead. In addition, we obtained spectra
of 5 ellipticals, and used 19 starburst galaxy spectra from Engelbracht (1997) for comparison.
With this sample, we hope to alleviate the typical small number statistics of previous studies,
and to overcome the bias toward galaxies with high surface brightness. We apply a technique
based on JHKL aperture photometry and imaging to correct for the dilution of the CO band from
dust heated by the AGN. We then compare the corrected CO band strengths with those of the
ellipticals and starbursts.
2. Observations and Data reduction
2.1. Infrared Spectroscopy
The infrared spectra were taken over a period of four years at three different telescopes
with FSpec (Williams et al., 1993), a cryogenic long slit near infrared spectrometer utilizing a
NICMOS3 256x256 array. We used R ≈ 700, R ≈ 1200, and R ≈ 3000 resolution modes,

– 4 –
corresponding to gratings of 75, 300, and 600 lines/mm. The slit width was 1.2 arcsec at the
MMT, 2.4 and 3.6 arcsec at Steward Observatory 2.3m and 1.55m telescopes. The plate scales
were 0.4, 1.2 and 1.8 arcsec/pixel respectively. The observing log is presented in Table 1. The
galaxies are sorted in order of right ascension.
The spectra were reduced using IRAF tasks written specifically for FSpec (Engelbracht,
1999). An average of sky background images taken immediately before and after each object image
was subtracted to remove the sky emission lines, and simultaneously, the dark current and offset
level. Dark-subtracted dome flats were used to correct for pixel-to-pixel sensitivity variations.
Then the object images were shifted and combined to produce a single two-dimensional spectrum.
Known bad pixels were masked out. The large number of object images allowed us to exclude any
remaining bad pixels and cosmic rays. The one-dimensional spectrum was extracted by fitting a
3-5 order polynomial to the continuum in the two-dimensional image. The angular sizes of the
extraction apertures are given in Table 1.
The object spectra were divided by spectra of stars close to solar type, observed at the
same airmass, and then multiplied by a solar spectrum to remove the effects of the atmospheric
absorption (Maiolino, Rieke & Rieke, 1996). The true shape of the continuum was restored
by multiplying the spectra by the ratio of black bodies with standard star and Solar effective
temperatures. We used the OH airglow lines (Oliva & Origlia, 1992), complemented when
necessary with Ne-Kr comparison lamp spectra, for wavelength calibration.
Special attention was paid to determining the signal-to-noise of our data. The main sources
of uncertainty are the photon statistics for faint objects, the strong sky emission lines and sky
variation. First, we calculated the photon statistics, taking into account the object, the sky
emission and the contribution from the standard star used for atmospheric correction. This
is an optimistic estimate since it neglects the sky variations. Second, we calculated the noise
from a relatively featureless part of the spectrum, which gives a pessimistic estimate because
weak absorption lines were included as noise. Finally, for a few galaxies we calculated the
signal-to-noise in the process of combining one-dimensional spectra extracted from each individual
two-dimensional image. This is the most robust method and it accounts for all possible sources of
error. The last two determinations gave virtually the same answers. The second technique is easier
to implement but it has the disadvantage of estimating the noise level only on a clear continuum
part of the spectra. To obtain the noise level at the lines and bands of interest, we rescaled the
photon statistics noise spectrum to match the noise determined from the clear part of the spectra.
The corresponding averaged signal-to-noise ratio is shown in Table 1.
2.2. Infrared Line Measurements
The line measurements used Gaussian fitting. Broadband K images, kindly provided by
McLeod & Rieke (1995), were used to flux calibrate the spectra using the absolute calibration

– 5 –
of Campins, Rieke & Lebofsky (1985). In turn, most of the images were re-calibrated using
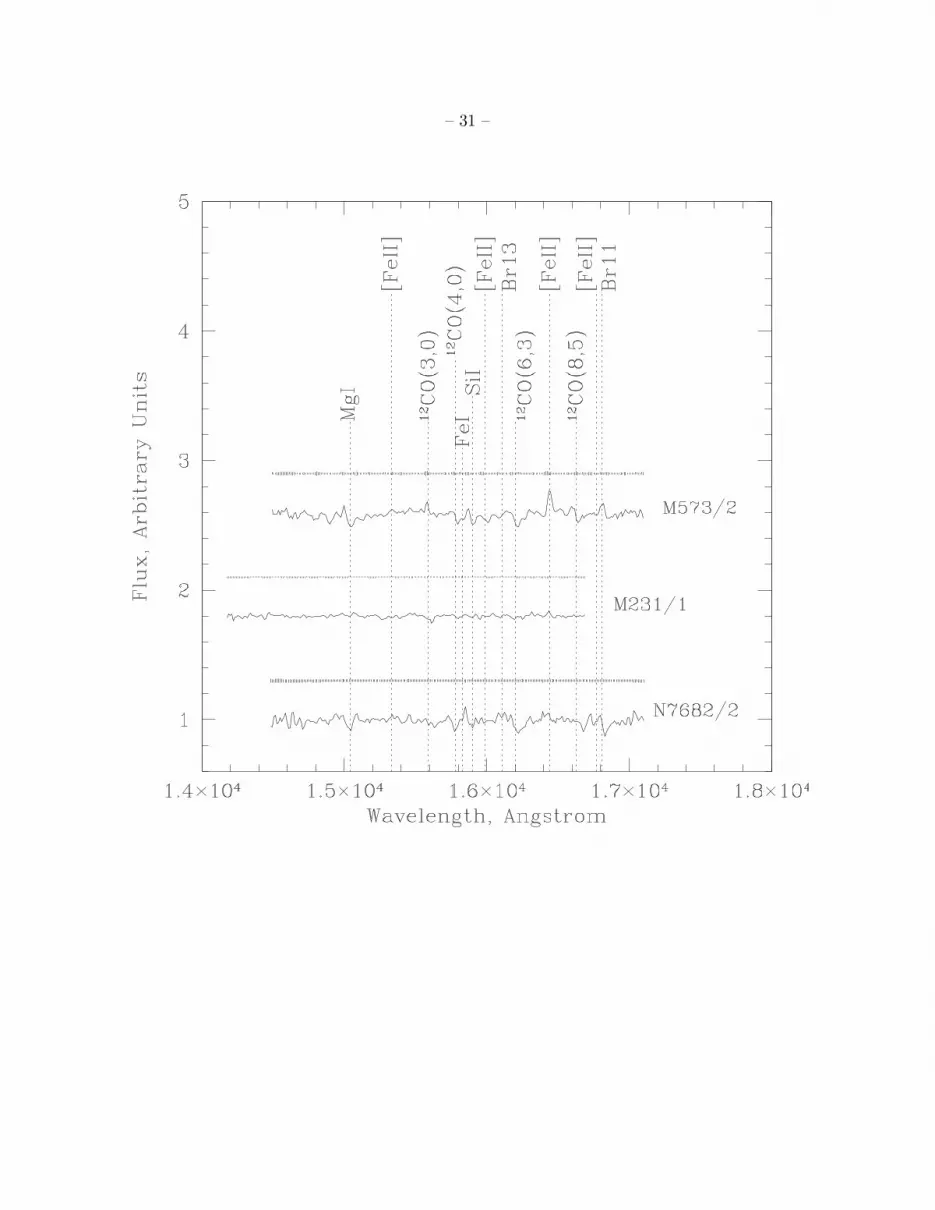
our aperture photometry (discussed below). The spectra in Figure 1 are divided by a low-order
polynomial fit to the continuum, and shifted vertically, for display purposes. The individual
absorption feature measurements are listed in Tables 2, and 3. Emission lines will be discussed in
a separate paper. 1σ errors for the flux measurements include uncertainties both in the spectra
(sky variation, continuum placement, shot noise) and in the flux calibration. 1σ errors for the
equivalent line widths include only the uncertainties in the spectra which are dominated by
the continuum placement error. The latter was estimated by taking measurements at different
continuum positions. Empty items in the tables denote a lack of spectral coverage, and zero
equivalent widths stand for a non-detection. In the latter case, the 1σ error has the meaning of a
1σ upper limit.
2.3. CO Band Measurements
Our high resolution spectra lack the wavelength coverage to measure the photometric CO
index of Frogel et al. (1978) or the spectroscopic CO index of Doyon, Joseph & Wright (1994).
We defined a narrower CO index to utilize the complete set of data. Our index has the advantage
of being insensitive to extinction. It follows the recipe of Doyon, Joseph & Wright (1994), but the
measured regions are narrower and closer:
CO = − 2.5 × log10(F22980A
/F22850A
) (1)
where F22980A
is flux averaged in the band within a 100A wide window centered at 22980A, and
F22850A
is flux averaged on nearby continuum within a 100A wide window centered at 22850A, in
the rest frame of the object.
A narrow index that does not encompass totally the spectral feature is sensitive to velocity
dispersion variations. To alleviate this problem, we left out NGC 5990 and NGC 6240 from the
comparison starburst sample, since they are known to have exceptionally large velocity dispersions.
NGC 6240 is also not a typical starburst galaxy, since its faint Brγ is indicative of a relatively old
burst of star formation.
An additional incentive to use narrower bandpasses is related to possible uncertainties in the
continuum shape of the infrared spectra. The CO feature is close to the edge of an atmospheric
window and we cannot measure the continuum level on both sides of the spectral feature. Although
during the data reduction the original continuum shape was restored after the spectra were
multiplied by the solar spectrum, we could not exclude some small deviations in the continuum
shape. The narrow CO index minimizes the effect of the continuum shape on our analysis. To
quantify this effect we used our JK aperture photometry to calculate the continuum slope at
2.3µm via simple linear interpolation. We imposed this slope on continuum divided spectrum and
measured the CO index again.

– 6 –
The statistical errors in the CO index (σCO = 0.01 mag for a spectrum with S/N=30 per
pixel) are negligible, compared to the systematic errors due to the uncertain continuum slope. To
determine the true uncertainties, we took advantage of the multiple spectra of some galaxies, taken
on different nights, and with different spectral resolution. We found the typical total uncertainty
in the CO index to be 0.02 mag.
Finally, we compared our CO index with that of Doyon, Joseph & Wright (1994) calculating
both indices for the set of stellar spectra by Kleinmann & Hall (1986). For 26 stars, the linear
conversion is:
CO(this work) = (0.97 ± 0.03) × CO(Doyon) + (0.002 ± 0.006) (2)
with standard deviation of residuals of 0.02. That is, within the errors the two indices are
equivalent. Our CO index is related to other systems of CO indices via transformations derived
by Doyon, Joseph & Wright (1994).
2.4. Aperture Photometry
The aperture photometry was carried out at the MMT using the facility single pixel InSb
aperture photometer. Aperture diameters, fluxes and observed colors with 1σ errors are shown in
Table 4. The calibration is based on the standard star network of Elias et al. (1982) with zero
points based on Campins, Rieke & Lebofsky (1985). With data already available in the literature,
a full set (JHKLN) of ground-based photometry is now available for the entire CfA sample.
2.5. K-band Imaging
K-band imaging was taken from the survey of McLeod & Rieke (1995). All the images were
calibrated using our aperture photometry. Many of the images had independent calibrations from
McLeod & Rieke (1995), and a comparison with the result from the photometry showed good
agreement. The calibration was transferred to the spectra by extracting fluxes with a rectangular
aperture that matched the slit size for the corresponding spectrum. To obtain an upper limit
to the uncertainties imposed by field rotation at the MMT, we placed this pseudo slit in 4
orientations rotated by 45 degrees on the nucleus of each galaxy. In most cases, the errors due to
slit rotation were the dominant source of uncertainty. These uncertainties and the statistical ones
were propagated through our CO band correction procedure to obtain a final error on the CO
correction.
3. Analysis

– 7 –
3.1. The CO Band Strength and Circumnuclear Starbursts
3.1.1. CO Band Strength and Starbursts
The goal of this study is to probe the presence of circumnuclear starbursts in the Seyfert
galaxies by measuring their 2.3µm first overtone CO bandhead strength. The strength of this
band depends on stellar temperature, metallicity, and surface gravity/luminosity. These multiple
dependencies suggest that interpretation of the band would be difficult. However, in the case of
nuclear starbursts in luminous galaxies, the behavior is dominated by the stellar luminosity.
The best evidence for this conclusion is empirical. From the work of Ridgway, Wynn-Williams
& Becklin (1994), we compute that 23 ”normal” galaxies recalibrated to the spectroscopic scale
have a CO index of 0.20. Because of the tight distribution, this value is very well determined. In
comparison, from this same work we find that the average CO band absorption index in 14 nuclear
starbursts is more widely distributed, but with an average value of 0.27 (as suggested by Ridgway
et al., we include only starbursts with H − K < 0.9). The study of luminous infrared galaxies by
Goldader et al. (1995) includes 31 examples dominated by star formation, for which the average
CO index corrected to the spectroscopic scale is also 0.27. The average photometric CO index of
the higher quality spectra of Engelbracht (1997) is 0.30 ± 0.07. The data of Oliva et al. (1995)
show a similar behavior.
For four low metallicity starbursting galaxies with well developed CO bands, the band
strengths fall close to the average for normal galaxies (Vanzi & Rieke, 1997). The metallicities of
these galaxies are typically 3 to 5 times lower than solar. Thus, metallicity does have the expected
effect on starburst CO band strengths, but it is only a modest one. Because of this modest
dependence, it is unlikely that the strong CO bands in starbursts could arise from high metallicity,
particularly since there is little evidence for higher than solar metallicities in starbursts.
The starburst CO band strengths measured by Ridgway, Winn-Williams & Becklin (1994)
and Goldader et al. (1995) do show a range that overlaps with the average value for normal
galaxies, so it would be hazardous to conclude that any given galaxy with a normal CO band
depth could not harbor a starburst. However, there are few if any normal galaxies with bands as
deep as the average for the starbursts, so deep bands are a relatively reliable indication of a recent
starburst. This conclusion becomes even stronger in comparing samples of galaxies, since a few
outliers in the distributions will have little effect on average values of the CO index.
In principle, the CO bands will be weak if the starburst is so young that hot stars make
a significant contribution to the K-band light. This situation may underly the few starbursts
with weak CO. However, this phase is short-lived; the red supergiants start to dominate the near
infrared after only a few million years, and continue to do so, until the burst is 50-100 Myr old.

– 8 –
3.1.2. Measuring CO Band Strengths in Seyfert Galaxies
AGNs often have spectral energy distributions peaking in the mid infrared due to emission
by hot dust, and this component could fill in the 2.3µm absorption and weaken it. To use our
spectra to estimate intrinsic CO band strengths requires that we correct for this emission. The
hot dust emission rises steeply between the K and L(3.5µm) bands (e.g., McAlary & Rieke 1988).
In most Sy1s, where the hot dust dominates the emission in L, the estimates of hot dust emission
at 2.3µm are too uncertain to allow an accurate correction to the CO band strength. In most
Sy2s, the excess emission above the stellar contribution at L is relatively weak, however, and we
can conclude that the dust emission at 2.3µm is small enough that even approximate corrections
can yield a useful determination of the intrinsic CO band strength.
The distribution of observed CO indices is shown on the top panel in Figure 2. We assume
that the observed fluxes at 2.3µm are the sums of similar stellar and non-stellar contributions. We
have developed a procedure to disentangle the two based on a priori knowledge of their typical
infrared colors.
(i) Our first step is to assume that the K-band emission is totally of stellar origin. As we shall
see, this assumption is usually not accurate but by repeating the procedure iteratively we can
correct for the remaining non-stellar contribution.
(ii) Next we estimate the stellar component in L-band using the typical K − L color for stars.
The infrared colors of normal galaxy nuclei are well known and are not a strong function of the
stellar population. We adopted the typical colors of ellipticals as determined by Aaronson (1977):
J − H = 0.73, H − K = 0.21, and by Impey, Wynn-Williams & Becklin (1986): K − L = 0.26.
(iii) Then we subtract the stellar contribution at L from the observed flux, and obtain the
non-stellar L-band flux. This step is facilitated by the equal diameter of K and L band apertures.
(iv) The next step is to use the typical K − L color for the non-stellar component to estimate
the non-stellar contribution in the K-band. Typical colors of the non-stellar component were
inferred from Seyferts which show no or very weak CO absorption, hence excluding galaxies with
a significant stellar contribution. We selected eight galaxies with observed CO index ≤ 0.05 and
obtained an average nuclear color (K − L)nuc = 2.79 ± 0.40 mag, as a difference between the K
flux measured within the slit aperture and the L-band flux within the circular aperture. Here we
assume that the non-stellar component is concentrated in a point-source, and is fully encompassed
by both the circular apertures and the slit.
(v) We then subtract a featureless spectrum, normalized to the non-stellar K-band flux, from
the flux-normalized K-band spectrum. The resulting spectrum is corrected for dilution.
The procedure has to be repeated to correct for the inaccurate initial assumption but it
converges after only one or two iterations. The correction can be applied in other ways, such as
starting at J, or H rather than K-band. The final results converge closely to the similar values.

– 9 –
An underlying assumption in this approach is that the nuclear sources in the sample galaxies
all have similar K − L colors. It appears that the near infrared nuclear emission is characterized
approximately by a blackbody at the typical destruction temperature of dust grains (Rieke &
Lebofsky, 1981; McAlary & Rieke, 1988; Alonso-Herrero et al., 1998). As a test, we combined
in various fractions a spectrum of an elliptical galaxy, representing the dominant old stellar
population, with a diluting black body spectrum, and measured the colors and the CO index
of the composite spectra. Most of our galaxies are consistent with TBlack Body = 1000 − 1200K
(Figure 3), supporting our assumption for the universal nature of the diluting spectra in Seyfert
galaxies. In addition, the near infrared continuum appears to be ”uncovered” abruptly at an
appropriate viewing angle rather than showing a succession of galaxy types with differing colors
in this continuum (Ruiz, Rieke, & Schmidt, 1994; Maiolino, Rieke & Keller, 1995; Quillen et al.,
2000b). Therefore, this underlying assumption is plausible, although differences in nuclear color
will limit our approach to galaxies where the corrections are modest.
We also assume that the non-stellar nuclear flux at L-band flux comes from a source smaller
than our slit width; that is, that there is no significant level of extended featureless emission.
Typical scale sizes for the hot dust source component are ≤ 10 pc, judged from variability time
scales (Rieke & Lebofsky, 1979; Glass, 1992; Glass, 1997; Glass, 1998; Quillen et al., 2000a). The
central engine is not expected to heat up the dust at 0.5-1 kpc from the center or further, which
is the typical linear size of the slit at the distance of most of our targets. The dust can also be
heated by an extended starburst in the disk. In that case, the L-band nuclear component will be
overestimated, leading to an overcorrection of the CO band, and deduction of a stronger starburst.
This effect would only strengthen our conclusions if we do not detect excess starburst activity.
We minimized the effect of reddening by starting our correction procedure from the K-band.
However, we can put limits on the reddening by comparing the observed J − H colors of the
Seyferts with those of a typical stellar population. This comparison is not exact because of both
the likely variations in the reddening within our photometric aperture and the emission associated
with the central engine. However, the derived J − H color excesses are small, so these potential
difficulties are relatively unimportant. We derive that K − L color excesses for the stars are only
a couple of percent, smaller than or comparable to the observational uncertainties. Hence, in our
analysis we neglected the effects of reddening in K − L. We will discuss in more detail the colors
of some of the galaxies in the next section.
The procedure described above cannot be applied to all of our targets. Many Type 1 Seyferts
have too strong a non-stellar component. We adopted the criterion for attempting a correction
that the L-to-K aperture flux ratio has to be smaller or equal to 1.0, equivalent to K − L ≤ 0.91
mag. The limit was chosen after an error propagation analyses showed that the CO absorption in
galaxies with larger L band excess cannot be reliably corrected for the non-stellar contribution.
Table 5 includes all Seyferts with corrected CO indices. We excluded from further analysis
2237+07 because of the insufficient signal-to-noise ratio at the long wavelength edge of the K-band.
We also discarded galaxies with corrections larger than 25 % in flux at K to keep the additional

– 10 –
uncertainty added to the corrected CO indices by the correction procedure itself to < 0.01 mag.
This constraints our maximum CO index correction to 0.05 mag.
For comparison purposes we carried out the same procedure on a sample of starburst galaxies
from Engelbracht (1997). The photometric data for these galaxies were collected mostly from
the literature (Table 6). Unlike the Seyferts, starburst galaxies display significant reddening. For
most of the targets Engelbracht (1997) inferred AV = 3 − 10 mag, from infrared spectroscopy.
We also used the infrared colors to supplement the reddening estimates. We carried out the CO
correction for the starbursts twice. First, we neglected the extinction. Second, we dereddened the
photometry before correcting the CO band. The reddening accounts for part of the K − L color
excess leading to smaller CO corrections. This would strengthen a conclusion for the absence of
strong starbursts in Seyferts.
3.1.3. Results
The results of the CO correction procedure starting at K, as described in the previous section,
are shown in Table 5 for Seyferts and Table 7 for starburst galaxies. The histograms of the CO
indices are plotted in Figure 2. The top panel shows the observed CO indices, the middle panel
shows the corrected CO indices neglecting the reddening (AV = 0) in starbursts, and the bottom
panel shows again the corrected CO indices but the colors of the starbursts were dereddened prior
to the CO correction. Ticks on the horizontal axis show the bin borders.
The CO absorption strength in luminous ellipticals is narrowly distributed within the
0.18-0.22 bin (we excluded Abell 770 as a double nucleus galaxy, and M 87 because of its mildly
active nucleus). See also Ridgway et al. (1994). As shown in Figure 2, our corrections to the CO
index in the type 2 Seyfert galaxies usually recovered the CO indices of an underlying old stellar
population, similar to that of the elliptical galaxies. We do not find evidence for a significant
contribution from young red stars, except in a few of the active galaxies.
To determine the significance of this result we ran a Monte-Carlo simulation. We fitted a
Gaussian to the distribution of the corrected CO indices of starburst galaxies, with reddening
taken into account. Next, we drew random realizations, and counted the cases that match or have
an excess of shallower CO indices compared with the corrected distribution of the CO indices of
Type 1.8-2 Seyfert galaxies. Based on 105 realizations, there is a probability of only 0.2% that the
two distributions are drawn from the same parent distribution.
3.2. Infrared Colors
Color-color diagrams (J − H vs. H − K and H − K vs. K − L) from our sample of Seyfert
galaxies are shown in Figure 4, with 1σ errors along both axes. Solid circles represent Seyfert types

– 11 –
1.8 and later, and open circles represent earlier Seyferts. Crosses and stars represent the typical
colors of elliptical (Frogel et al., 1978) and starburst (Engelbracht, 1997) galaxies, respectively.
The circle on the right hand side color-color diagram represents the typical colors of an elliptical
galaxy. Giants lie along the solid lines and supergiants along the dashed lines. Stellar colors are
from Johnson (1966) and Frogel et al. (1978). Although the photometric systems may not be
exactly the same, particularly the L-band, they are sufficiently close to our system for qualitative
comparison. The giants span the range between G5 and M8 on left panel and between G5 and
M5 on the right. The supergiants span the range between B0 and M5 on both panels. Reddening
vectors according to the Rieke & Lebofsky (1985) reddening law are also shown.
Most of our targets are redder then a typical old, red giant dominated stellar population
as represented by the elliptical galaxy locus. The spread of colors cannot be explained just
by reddening, as in pure starburst galaxies which are distributed along a line approximately
parallel to the reddening line. There is an additional component, showing the non-stellar nuclear
contribution. It is present more strongly in (K − L) (Glass & Moorwood, 1985; Spinoglio et al.,
1995; Alonso-Herrero, Ward & Kotilainen, 1996; Alonso-Herrero et al., 1998).
A number of galaxies show peculiar blue colors. In these cases, we have searched the literature
for additional measurements, shown in Table 8. Although comparisons are undermined to some
extend by possible variability, from them we can get a feeling for the external accuracy of our
measurements. In the case of NGC 1144, we believe the best measurement is K − L = 0.73 from
Carico et al. (1988). 1058+45 is a faint source and given the observational uncertainties, we
attributed the peculiar K − L color to a statistical error. Our literature search for Mkn 270 and
NGC 7682 yielded measurements consistent with ours. The blue colors (H − K and K − L) of
NGC 7682 can be partially explained if it has a relatively weak non-stellar component. This
explanation is consistent with the observed CO index of 0.18, which is close to the typical purely
stellar value. Still, the colors are bluer than expected from a giant dominated stellar population,
suggesting perhaps the presence of blue young stars of early spectral types. In contrast, Mkn 270
has peculiar J − H and K − L colors, while H − K is close to the typical values of other target
galaxies. It has a CO index of 0.11, suggesting some dilution. The observed colors can be produced
by a heavily reddened (AV ≈ 6 mag) blue population, even younger than in NGC 7682.
3.3. Comparison with Other Work
Oliva et al. (1999) have used the near infrared stellar absorption bands to determine velocity
dispersions and mass to luminosity ratios, M/LH, for active galaxies. Eleven ”obscured” Seyferts
(types 1.8-2) have a distribution of M/LH that is consistent with a combination of those for normal
spirals and starbursts. In this comparison, we exclude NGC 1052 and M87 because their nuclear
properties are rather different from the other objects in their sample. Five of these eleven have
sufficiently low M/LH to suggest recent circumnuclear starbursts. By comparison, in 14 type 1.8-2
Seyferts, we find two (Mkn 993 and Mkn 461) with deep CO indicative of starbursts. Because of

– 12 –
the broad distribution of CO band strength in starbursts, we cannot exclude other members of the
sample from this group. However, from the distributions in Figure 3, we can conclude that such
events are present in only a minority of the galaxies we have observed.
The Oliva et al. (1999) sample favors galaxies with bright nuclei; our study is less biased in
this direction. Nonetheless, the results are consistent in indicating that the near infrared stellar
luminosities in the majority of type 1.8-2 Seyfert galaxies are NOT dominated by red supergiants
from starbursts.
Oliva et al. show that the M/LH distribution for eight Seyfert 1 galaxies is indistinguishable
from that of normal spirals, Because of the relatively strong nuclear emission of type 1 Seyfert
galaxies, we have been able to measure CO band strengths for only two, but neither is strong. It
therefore appears that the near infrared luminosities of type 1 Seyfert nuclei are seldom dominated
by starburst-generated supergiants.
We quantified the role of starbursts in our sample by constructing a set of composite spectra.
We added increasing portions of starburst spectra to an average spectrum of an elliptical galaxy,
and ran the same Monte-Carlo simulation described above. We took an elliptical galaxy CO
strength distribution and added the distribution typical of starbursts until there was less than
a 5% probability that the CO strengths in the synthetic spectra were drawn from the same
distribution as the observed distribution of CO strengths in the Seyfert galaxies. We excluded
Mkn 993 from the fitting because its extremely strong CO index may partially result from the
relatively low signal-to-noise ratio of that spectrum. Increasing the starburst component in the
composite spectrum quickly lowers the probability to draw a matching CO index distribution.
The simulation suggests that typically less than 1/3 of the K-band flux originates from a starburst
in our sample of Type 1.8-2 Seyfert galaxies, at the 95% confidence level.
Let us assume that the starburst and the old population are represented by single bursts of
ages 107 and 109 years, respectively. Then, the upper limit on the K luminosity implies that the
starburst would contribute no more than 31% of the bolometric luminosity, 8% of the flux in the
V-band and 11% of the flux in the B-band. That is, the blue continuum of a typical type 1.8-2
Seyfert galaxy in our sample may have a weak contribution from young blue stars, but is unlikely
to be dominated by such stars. The starburst masses cannot typically exceed 107, or in the most
extreme cases, 108 M⊙. The corresponding limits on the starburst luminosities are similar to or
lower than those of the AGNs in these galaxies.
According to the predictions of the same model, the CO strength reaches the typical value
of an old stellar population about 50-100 Myr after the beginning of the starburst. Thus, our
technique is not sensitive to very old starbursts. However, after 100 Myr, the starburst absolute
K − band flux decreases by 3-4 mag, and its contribution to the total K − band flux from the
galaxy nucleus would become negligible.

– 13 –
4. Summary
We obtained K band spectroscopy of a set of Seyfert galaxies, to measure their stellar first
overtone CO band strengths at 2.3µm. We used JHKL aperture photometry to estimate the
non-stellar contribution at this wavelength. We successfully corrected the CO band for the dilution
for 16 galaxies which were not dominated by the non-stellar component. The comparison to
CO indices measured in elliptical and purely starbursting galaxies yielded no evidence for strong
starbursts in the majority of Seyfert 1.8-2 galaxies. This result suggests the nuclear activity in
many Seyfert 2 galaxies arises independently of any strong circumnuclear starbursts. We used an
evolutionary starburst model to place an upper limit of ∼ 11% on the contribution to the B band
light from hot, young stars in a typical type 1.8-2 Seyfert.
The research has made use of the NASA/IPAC Extragalactic Database (NED) which is
operated by the Jet Propulsion Laboratory, California Institute of Technology, under contract with
NASA. This work has been supported by NSF grant AST 95-29190. We thank the anonymous
referee for the useful suggestions which helped to improve the paper.

– 14 –
Table 1. Log of spectroscopic observations.
NGC Mkn R.A. Dec. Galaxy Sya Vradb Date Site Int. λc
c Grating S/Nd Slit Size
(other ID)a (1950) Typea Type km/s Time,s µm l/mm arcsece
Seyfert Galaxies
- 334 00:00:35 +21:40:54 Pec 1.8 6582±2 95/10/09 2.3 1440 2.25 75 80 2.4x4.8
(0048+29,U524) 00:48:53 +29:07:46 (R’)SB(s)b 1 10770 95/10/10 2.3 720 2.25 75 30 2.4x4.8
- 993 01:22:43 +31:52:36 SAB0/a 2 4658±6 97/10/12 MMT 960 2.33 300 15 1.2x1.6
- 573 01:41:23 +02:05:56 (R)SAB(rs)0+ 2 5174±23 95/10/09 2.3 720 1.60 75 30 2.4x4.8
95/10/09 2.3 720 2.25 75 50 2.4x4.8
97/10/12 MMT 2160 2.33 300 30 1.2x1.6
(0152+06,U1395) 0152:45 +06:22:02 SA(rs)b 1.9 5208 95/10/09 2.3 1440 2.25 75 25 2.4x4.8
863 590 02:12:00 -00:59:58 SA(s)a: 1.2 7910±12 95/10/09 2.3 720 2.25 75 90 2.4x4.8
1144 - 02:52:39 -00:23:08 RingB 2 8648±14 97/10/18 MMT 5520 2.33 300 45 1.2x1.6
- 3 06:09:48 +71:03:11 S0: 2 4050±5 95/03/13 MMT 4320 2.34 600 40 1.2x1.6
2273 620 06:45:38 +60:54:13 SB(r)a: 2 1849 95/03/14 MMT 5760 2.32 600 30 1.2x2.0
3081 - 09:57:10 -22:35:10 (R1)SAB(r)0/a 2 2358±7 95/03/14 MMT 1920 2.34 600 20 1.2x1.6
3080 1243 09:57:14 +13:17:03 Sa 1 10608 96/02/06 MMT 1920 2.25 75 35 1.2x2.0
3227 - 10:20:47 +20:07:06 SAB(s) pec 1.5 1157±3 96/02/07 MMT 480 2.20 75 70 1.2x2.4
94/03/23 2.3 960 2.31 600 25 2.4x6.0
95/03/13 MMT 1440 2.32 600 40 1.2x2.0
(1058+45,U6100) 10:58:43 +45:55:22 Sa? 2 8778 96/04/06 MMT 480 2.20 75 15 1.2x2.0
3516 - 11:03:23 +72:50:20 (R)SB(s)00: 1.5 2649±7 93/11/25 MMT 2880 2.34 600 50 1.2x1.6
3786 744 11:37:05 +32:11:11 SAB(rs)a pec 1.8 2678±6 96/02/05 MMT 960 2.25 75 80 1.2x2.0
3982 - 11:53:52 +55:24:18 SAB(r)b: 2 1109±6 96/02/10 MMT 1920 2.20 75 35 1.2x2.4
4051 - 12:00:36 +44:48:35 SAB(rs)bc 1.5 0725±5 96/02/10 MMT 1440 2.20 75 80 1.2x2.0
95/03/13 MMT 2880 2.32 600 40 1.2x1.6
4151 - 12:08:01 +39:41:02 (R’)SAB(rs)ab: 1.5 0995±3 96/02/10 MMT 1440 2.20 75 140 1.2x2.0
4235 - 12:14:37 +07:28:09 SA(s)a 1 2410±10 96/02/10 MMT 1440 2.20 75 60 1.2x2.0
95/03/14 MMT 12960 2.34 600 30 1.2x1.6
4253 766 12:15:56 +30:05:26 (R’)SB(s)a: 1.5 3876±16 96/02/10 MMT 960 2.20 75 70 1.2x2.0
4258 - 12:16:29 +47:34:53 SAB(s)bc 1.9 0448±3 95/03/13 MMT 1440 2.31 600 40 1.2x1.6
4388 - 12:23:15 +12:56:17 SA(s)b: sp 2 2524±1 96/02/06 MMT 480 2.25 75 30 1.2x2.4
- 231 12:54:05 +57:08:38 SA(rs)c? pec 1 12651±6 94/04/02 1.55 360 1.60 75 110 3.6x7.2
94/04/02 1.55 1080 2.21 75 90 3.6x7.2
5033 - 13:11:09 +36:51:31 SA(s)c 1.9 0875±1 96/02/06 MMT 240 2.25 75 60 1.2x2.4
95/03/13 MMT 2880 2.32 600 30 1.2x1.6
- 789 13:29:55 +11:21:44 - 1 9476±22 96/03/29 MMT 2400 2.20 75 30 1.2x2.0
(1335+39,U8621) 13:35:28 +39:24:31 S? 1.8 6023 96/03/29 MMT 2880 2.20 75 25 1.2x2.0
5252 - 13:35:44 +04:47:47 S0 1.9 6926 96/03/29 MMT 1440 2.20 75 45 1.2x2.0
5256 266 13:36:15 +48:31:48 Compact pec 2 8360±81 96/03/27 MMT 1800 2.20 75 35 1.2x1.6
96/03/28 MMT 1440 2.20 75 40 1.2x2.0
5283 270 13:39:41 +67:55:28 S0? 2 2700±77 96/03/29 MMT 960 2.20 75 70 1.2x2.0
95/03/13 MMT 5280 2.31 600 30 1.2x1.6
5273 - 13:39:55 +35:54:21 SA(s)00 1.9 1089 96/02/09 MMT 1440 2.20 75 50 1.2x2.4
- 461 13:45:04 +34:23:52 S 2 4856±32 96/03/29 MMT 2880 2.20 75 40 1.2x2.0
- 279 13:51:54 +69:33:13 S0 1.5 8814±90 96/02/09 MMT 480 2.20 75 75 1.2x2.0
5427 - 14:00:48 -05:47:19 SA(s)c pec 2 2730±4 95/03/14 MMT 960 2.33 600 5 1.2x1.6
5548 1509 14:15:44 +25:22:01 (R’)SA(s)0/a 1.5 5149±7 96/02/07 MMT 960 2.20 75 80 1.2x1.6
5674 - 14:31:22 +05:40:38 SABc 1.9 7442 96/03/28 MMT 3360 2.20 75 65 1.2x2.4
95/03/14 MMT 3840 2.37 600 20 1.2x1.6
5695 686 14:35:20 +36:47:02 SBb 2 4225±9 96/03/29 MMT 1440 2.20 75 40 1.2x2.0
95/03/14 MMT 1920 2.34 600 20 1.2x1.6
- 841 15:01:36 +10:37:56 E 1.5 10860±90 96/03/29 MMT 480 2.20 75 70 1.2x2.0
5929 - 15:24:19 +41:50:41 Sab: pec 2 2492±8 96/03/29 MMT 960 2.20 75 45 1.2x2.0
5940 1511 15:28:51 +07:37:38 SBab 1 10122 96/02/06 MMT 1440 2.20 75 25 1.2x2.4
6104 (1614+35) 16:14:40 +35:49:50 - 1.5 8382±50 95/10/10 2.3 2880 2.25 75 30 2.4x4.8
(IIZw136) 1513 21:30:01 +09:55:01 - 1 18630±90 95/10/10 2.3 4320 2.25 75 100 2.4x4.8
(2237+07,U12138) 22:37:46 +07:47:34 SBa 1.8 7375±90 95/10/07 2.3 1440 2.20 75 70 2.4x6.0
95/10/10 2.3 720 2.25 75 50 2.4x4.8
7469 1514 23:00:44 +08:36:16 (R’)SAB(rs)a 1.2 4892±2 94/11/19 MMT 720 2.35 600 40 1.2x1.6
7603 530 23:16:23 -00:01:47 SA(rs)b: pec 1.5 8851±22 95/10/07 2.3 720 2.20 75 60 2.4x6.0
95/10/10 2.3 720 2.25 75 90 2.4x4.8
7674 533 23:25:24 +08:30:13 SA(r)bc pec 2 8713±10 95/10/10 2.3 720 2.25 75 70 2.4x4.8
7682 - 23:26:31 +03:15:28 SB(r)ab 2 5107 95/10/09 2.3 1440 1.60 75 30 2.4x4.8
95/10/09 2.3 2160 2.25 75 30 2.4x4.8
Template Elliptical Galaxies
(Abell770A) 09:14:12 +60:38:00 E - - 94/04/04 1.55 1860 2.21 75 90 3.6x7.2
(Abell770B) 09:14:12 +60:38:00 E - - 94/04/04 1.55 1860 2.21 75 50 3.6x5.4
3379 (M105) 10:45:11 +12:50:48 E1 - 0920±10 94/04/02 1.55 5520 2.21 75 90 3.6x7.2
4472 (M49) 12:27:14 +08:16:36 E2/S0 - 0868±8 94/04/02 1.55 4860 2.21 75 70 3.6x7.2
4486 (M87) 12:28:18 +12:39:58 E+0-1 pec Sy 1282±9 94/04/04 1.55 3060 2.21 75 110 3.6x7.2
aUxxxx = UGCxxxx
bFrom N.E.D.
cCentral wavelength.
dSignal-to-nise ratio per pixel; averaged over the entire spectral range.
eAnguar size of the spectral aperture, i.e. the width of the slit x the width of the extracted one-dimensional spectrum.

– 15 –
Table 2. Equivalent widths for H-band spectral features Wλ(A).
Galaxy MgI FeI SiI CO
Name 1.504a 1.583 1.590 1.620
Mkn573 4.2 ± 0.3 2.1 ± 0.2 3.4 ± 0.2 6.2 ± 0.4
Mkn231 1.1 ± 0.1 0.0 ± 0.2 0.7 ± 0.1 0.9 ± 0.2
NGC7682 4.6 ± 0.3 0.5 ± 0.3 3.3 ± 0.3 9.0 ± 1.0
aCentral wavelengths in µm.
Note. — Equivalent line widths are given in A.
– 16 –
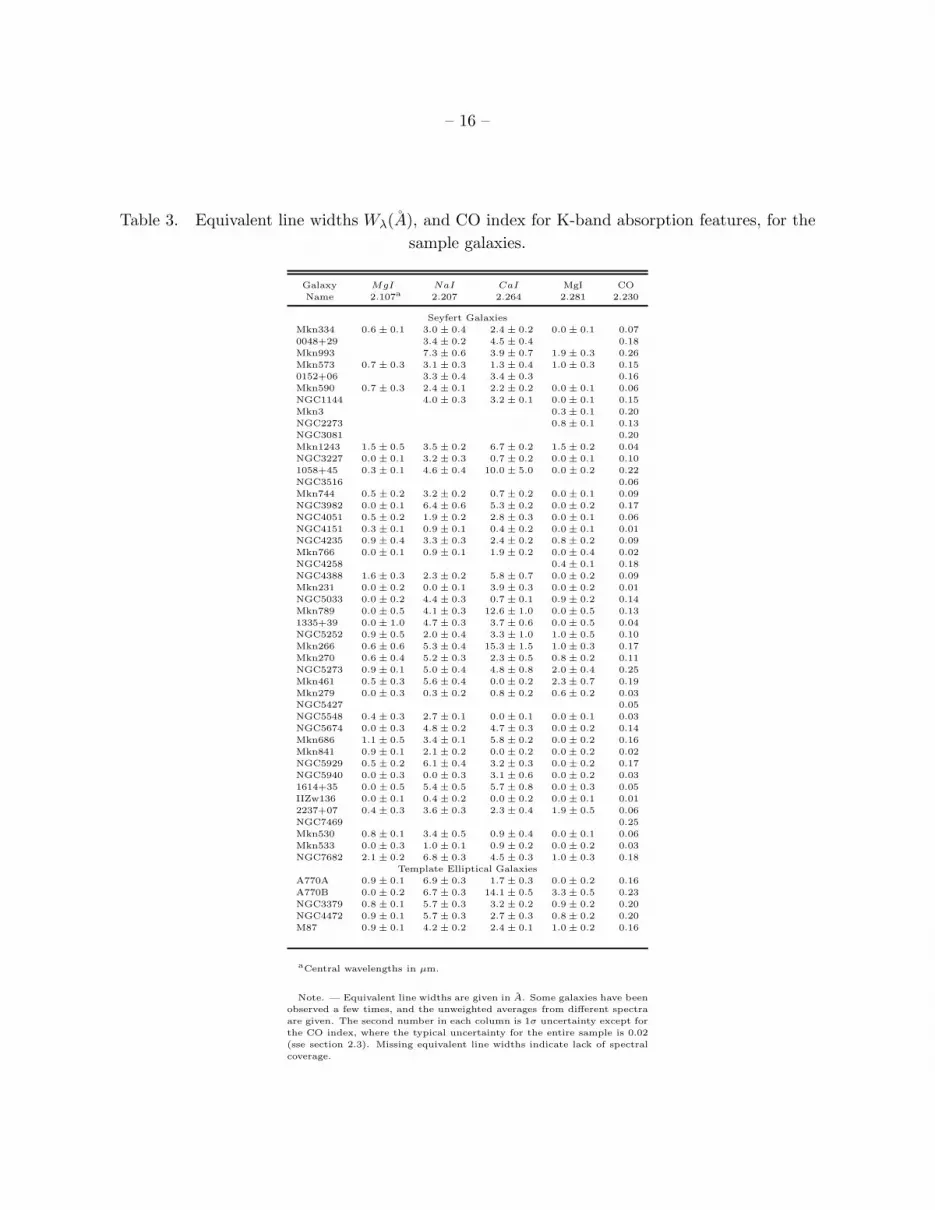
Table 3. Equivalent line widths Wλ(A), and CO index for K-band absorption features, for the
sample galaxies.
Galaxy MgI NaI CaI MgI CO
Name 2.107a 2.207 2.264 2.281 2.230
Seyfert Galaxies
Mkn334 0.6 ± 0.1 3.0 ± 0.4 2.4 ± 0.2 0.0 ± 0.1 0.07
0048+29 3.4 ± 0.2 4.5 ± 0.4 0.18
Mkn993 7.3 ± 0.6 3.9 ± 0.7 1.9 ± 0.3 0.26
Mkn573 0.7 ± 0.3 3.1 ± 0.3 1.3 ± 0.4 1.0 ± 0.3 0.15
0152+06 3.3 ± 0.4 3.4 ± 0.3 0.16
Mkn590 0.7 ± 0.3 2.4 ± 0.1 2.2 ± 0.2 0.0 ± 0.1 0.06
NGC1144 4.0 ± 0.3 3.2 ± 0.1 0.0 ± 0.1 0.15
Mkn3 0.3 ± 0.1 0.20
NGC2273 0.8 ± 0.1 0.13
NGC3081 0.20
Mkn1243 1.5 ± 0.5 3.5 ± 0.2 6.7 ± 0.2 1.5 ± 0.2 0.04
NGC3227 0.0 ± 0.1 3.2 ± 0.3 0.7 ± 0.2 0.0 ± 0.1 0.10
1058+45 0.3 ± 0.1 4.6 ± 0.4 10.0 ± 5.0 0.0 ± 0.2 0.22
NGC3516 0.06
Mkn744 0.5 ± 0.2 3.2 ± 0.2 0.7 ± 0.2 0.0 ± 0.1 0.09
NGC3982 0.0 ± 0.1 6.4 ± 0.6 5.3 ± 0.2 0.0 ± 0.2 0.17
NGC4051 0.5 ± 0.2 1.9 ± 0.2 2.8 ± 0.3 0.0 ± 0.1 0.06
NGC4151 0.3 ± 0.1 0.9 ± 0.1 0.4 ± 0.2 0.0 ± 0.1 0.01
NGC4235 0.9 ± 0.4 3.3 ± 0.3 2.4 ± 0.2 0.8 ± 0.2 0.09
Mkn766 0.0 ± 0.1 0.9 ± 0.1 1.9 ± 0.2 0.0 ± 0.4 0.02
NGC4258 0.4 ± 0.1 0.18
NGC4388 1.6 ± 0.3 2.3 ± 0.2 5.8 ± 0.7 0.0 ± 0.2 0.09
Mkn231 0.0 ± 0.2 0.0 ± 0.1 3.9 ± 0.3 0.0 ± 0.2 0.01
NGC5033 0.0 ± 0.2 4.4 ± 0.3 0.7 ± 0.1 0.9 ± 0.2 0.14
Mkn789 0.0 ± 0.5 4.1 ± 0.3 12.6 ± 1.0 0.0 ± 0.5 0.13
1335+39 0.0 ± 1.0 4.7 ± 0.3 3.7 ± 0.6 0.0 ± 0.5 0.04
NGC5252 0.9 ± 0.5 2.0 ± 0.4 3.3 ± 1.0 1.0 ± 0.5 0.10
Mkn266 0.6 ± 0.6 5.3 ± 0.4 15.3 ± 1.5 1.0 ± 0.3 0.17
Mkn270 0.6 ± 0.4 5.2 ± 0.3 2.3 ± 0.5 0.8 ± 0.2 0.11
NGC5273 0.9 ± 0.1 5.0 ± 0.4 4.8 ± 0.8 2.0 ± 0.4 0.25
Mkn461 0.5 ± 0.3 5.6 ± 0.4 0.0 ± 0.2 2.3 ± 0.7 0.19
Mkn279 0.0 ± 0.3 0.3 ± 0.2 0.8 ± 0.2 0.6 ± 0.2 0.03
NGC5427 0.05
NGC5548 0.4 ± 0.3 2.7 ± 0.1 0.0 ± 0.1 0.0 ± 0.1 0.03
NGC5674 0.0 ± 0.3 4.8 ± 0.2 4.7 ± 0.3 0.0 ± 0.2 0.14
Mkn686 1.1 ± 0.5 3.4 ± 0.1 5.8 ± 0.2 0.0 ± 0.2 0.16
Mkn841 0.9 ± 0.1 2.1 ± 0.2 0.0 ± 0.2 0.0 ± 0.2 0.02
NGC5929 0.5 ± 0.2 6.1 ± 0.4 3.2 ± 0.3 0.0 ± 0.2 0.17
NGC5940 0.0 ± 0.3 0.0 ± 0.3 3.1 ± 0.6 0.0 ± 0.2 0.03
1614+35 0.0 ± 0.5 5.4 ± 0.5 5.7 ± 0.8 0.0 ± 0.3 0.05
IIZw136 0.0 ± 0.1 0.4 ± 0.2 0.0 ± 0.2 0.0 ± 0.1 0.01
2237+07 0.4 ± 0.3 3.6 ± 0.3 2.3 ± 0.4 1.9 ± 0.5 0.06
NGC7469 0.25
Mkn530 0.8 ± 0.1 3.4 ± 0.5 0.9 ± 0.4 0.0 ± 0.1 0.06
Mkn533 0.0 ± 0.3 1.0 ± 0.1 0.9 ± 0.2 0.0 ± 0.2 0.03
NGC7682 2.1 ± 0.2 6.8 ± 0.3 4.5 ± 0.3 1.0 ± 0.3 0.18
Template Elliptical Galaxies
A770A 0.9 ± 0.1 6.9 ± 0.3 1.7 ± 0.3 0.0 ± 0.2 0.16
A770B 0.0 ± 0.2 6.7 ± 0.3 14.1 ± 0.5 3.3 ± 0.5 0.23
NGC3379 0.8 ± 0.1 5.7 ± 0.3 3.2 ± 0.2 0.9 ± 0.2 0.20
NGC4472 0.9 ± 0.1 5.7 ± 0.3 2.7 ± 0.3 0.8 ± 0.2 0.20
M87 0.9 ± 0.1 4.2 ± 0.2 2.4 ± 0.1 1.0 ± 0.2 0.16
aCentral wavelengths in µm.
Note. — Equivalent line widths are given in A. Some galaxies have been
observed a few times, and the unweighted averages from different spectra
are given. The second number in each column is 1σ uncertainty except for
the CO index, where the typical uncertainty for the entire sample is 0.02
(sse section 2.3). Missing equivalent line widths indicate lack of spectral
coverage.

– 17 –
Table 4. Infrared aperture photometry.
Galaxy Ap.a Fap
JF
ap
HF
ap
KF
ap
LF sl
K(J − H)ap (H − K)ap (K − L)ap Noteb
Name ′′ mJy mJy mJy mJy mJy mag mag mag
Mkn334 8.6 13.5 ± 0.7 21.1 ± 1.1 29.0 ± 1.5 41.0 ± 2.0 21.5 ± 1.5 0.92 ± 0.08 0.85 ± 0.08 1.30 ± 0.08
0048+29 5.4 10.4 ± 0.5 13.9 ± 0.7 13.1 ± 0.7 10.0 ± 1.0 7.9 ± 0.7 0.75 ± 0.08 0.44 ± 0.08 0.63 ± 0.12
Mkn993 8.6 13.8 ± 0.7 19.0 ± 0.9 16.0 ± 0.8 10.0 ± 1.0 2.3 ± 0.8 0.78 ± 0.08 0.32 ± 0.08 0.42 ± 0.12
Mkn573 8.6 22.0 ± 1.1 29.5 ± 1.5 26.3 ± 1.3 23.0 ± 1.1 14.1 ± 1.3 0.75 ± 0.08 0.38 ± 0.08 0.78 ± 0.08 2.4 × 4.8
4.9 ± 1.3 1.2 × 1.6
0152+06 5.4 5.2 ± 0.5 7.0 ± 0.7 8.0 ± 0.8 6.0 ± 0.6 5.4 ± 0.8 0.76 ± 0.15 0.65 ± 0.15 0.62 ± 0.15
Mkn590 5.4 20.0 ± 1.0 25.0 ± 1.2 40.0 ± 2.0 64.0 ± 3.2 29.9 ± 2.0 0.68 ± 0.08 1.01 ± 0.08 1.44 ± 0.08
NGC1144 5.4 12.0 ± 0.6 16.5 ± 0.8 14.6 ± 0.7 7.0 ± 0.7 1.8 ± 0.7 0.78 ± 0.08 0.37 ± 0.08 0.13 ± 0.12
Mkn1243 5.4 5.5 ± 0.6 7.9 ± 0.8 9.5 ± 0.9 14.5 ± 0.7 2.3 ± 1.0 0.83 ± 0.15 0.70 ± 0.15 1.39 ± 0.12
NGC3227 8.6 63.0 ± 3.2 78.0 ± 3.9 78.0 ± 3.9 71.0 ± 3.5 16.3 ± 3.9 0.67 ± 0.08 0.50 ± 0.08 0.83 ± 0.08 1.2 × 2.0
12.9 ± 3.9 1.2 × 1.6
45.9 ± 3.9 2.4 × 6.0
NGC3362 5.4 4.2 ± 0.4 5.4 ± 0.5 4.5 ± 0.5 4.0 ± 1.0 0.71 ± 0.15 0.32 ± 0.15 0.78 ± 0.16
1058+45 5.4 7.2 ± 0.7 9.7 ± 1.0 8.2 ± 0.8 3.3 ± 0.3 2.2 ± 0.8 0.76 ± 0.15 0.32 ± 0.15 −0.06 ± 0.15
Mkn744 8.6 19.8 ± 1.0 25.9 ± 1.3 27.8 ± 1.4 31.0 ± 1.5 8.4 ± 1.4 0.73 ± 0.08 0.58 ± 0.08 1.05 ± 0.08
NGC3982 5.4 11.2 ± 0.6 12.2 ± 0.6 10.2 ± 0.5 7.1 ± 0.9 0.53 ± 0.08 0.32 ± 0.08 0.52 ± 0.12
NGC4051 8.6 40.0 ± 2.0 49.0 ± 2.5 65.0 ± 3.2 77.0 ± 3.8 14.9 ± 3.3 0.65 ± 0.08 0.81 ± 0.08 1.11 ± 0.08 1.2 × 1.6
17.7 ± 3.3 1.2 × 2.0
NGC4151 8.6 105.0 ± 5.2 130.0 ± 6.5 194.0 ± 9.7 344 ± 17.2 35.3 ± 9.8 0.67 ± 0.08 0.94 ± 0.08 1.55 ± 0.08
NGC4235 5.4 23.0 ± 1.1 35.4 ± 1.8 29.9 ± 1.5 22.0 ± 1.1 4.8 ± 1.5 0.90 ± 0.08 0.32 ± 0.08 0.59 ± 0.08 1.2 × 1.6
5.7 ± 1.5 1.2 × 2.0
Mkn766 5.4 16.3 ± 0.8 26.7 ± 1.3 43.2 ± 2.2 86.0 ± 4.3 11.8 ± 2.2 0.97 ± 0.08 1.02 ± 0.08 1.68 ± 0.08
Mkn231 5.8 43.0 ± 2.2 77.0 ± 3.8 175.0 ± 8.8 360 ± 18 73.5 ± 8.8 1.07 ± 0.08 1.39 ± 0.08 1.71 ± 0.08
NGC5033 8.6 44.1 ± 2.2 61.6 ± 3.1 47.8 ± 2.4 43.0 ± 2.2 6.0 ± 2.4 0.80 ± 0.08 0.23 ± 0.08 0.81 ± 0.08 1.2 × 1.6
7.4 ± 2.4 1.2 × 2.0
8.1 ± 2.4 1.2 × 2.4
1335+39 5.4 4.5 ± 0.4 6.7 ± 0.7 7.2 ± 0.7 10.2 ± 0.5 2.0 ± 0.7 0.87 ± 0.15 0.58 ± 0.15 1.31 ± 0.12
NGC5252 5.4 10.6 ± 0.5 14.9 ± 0.7 14.9 ± 0.7 19.3 ± 1.0 4.2 ± 0.8 0.80 ± 0.08 0.50 ± 0.08 1.21 ± 0.08
Mkn266 8.6 6.0 ± 0.6 8.8 ± 0.9 8.7 ± 0.9 7.0 ± 0.7 2.6 ± 0.9 0.85 ± 0.15 0.49 ± 0.15 0.69 ± 0.15 1.2 × 1.6
3.3 ± 1.0 1.2 × 2.0
Mkn270 5.8 16.0 ± 0.8 18.0 ± 0.9 17.0 ± 0.9 7.0 ± 0.7 5.3 ± 0.9 0.56 ± 0.08 0.44 ± 0.08 −0.04 ± 0.12 1.2 × 2.0
4.6 ± 0.9 1.2 × 1.6
Mkn461 5.4 8.5 ± 0.9 10.8 ± 0.5 9.1 ± 0.9 8.5 ± 0.9 2.6 ± 0.9 0.69 ± 0.12 0.32 ± 0.12 0.85 ± 0.15
Mkn279 8.6 18.0 ± 0.9 24.0 ± 1.2 23.0 ± 1.1 32.0 ± 1.6 7.2 ± 1.2 0.75 ± 0.08 0.46 ± 0.08 1.29 ± 0.08
IC4397 5.4 4.7 ± 0.5 6.5 ± 0.7 5.4 ± 0.5 5.8 ± 1.4 0.79 ± 0.15 0.32 ± 0.15 0.99 ± 0.16
NGC5548 8.6 27.0 ± 1.4 36.0 ± 1.8 52.0 ± 2.6 91.0 ± 4.6 12.9 ± 2.6 0.75 ± 0.08 0.90 ± 0.08 1.54 ± 0.08
NGC5674 5.4 11.1 ± 0.6 15.2 ± 0.8 15.1 ± 0.8 15.5 ± 0.8 4.9 ± 0.8 0.78 ± 0.08 0.49 ± 0.08 0.96 ± 0.08 1.2 × 1.6
5.9 ± 0.8 1.2 × 2.4
Mkn686 5.4 13.3 ± 0.7 17.2 ± 0.9 13.9 ± 0.7 8.9 ± 0.9 3.0 ± 0.7 0.71 ± 0.08 0.27 ± 0.08 0.44 ± 0.12 1.2 × 1.6
3.5 ± 0.7 1.2 × 2.0
NGC5929 5.4 14.6 ± 0.7 20.2 ± 1.0 17.2 ± 0.9 13.7 ± 0.7 4.1 ± 0.9 0.79 ± 0.08 0.33 ± 0.08 0.68 ± 0.08
NGC5940 5.4 4.7 ± 0.5 7.0 ± 0.7 8.3 ± 0.8 10.7 ± 0.8 0.87 ± 0.15 0.70 ± 0.15 1.19 ± 0.16
1614+35 5.4 3.6 ± 0.4 5.6 ± 0.6 5.6 ± 0.6 6.4 ± 1.0 0.91 ± 0.15 0.52 ± 0.15 1.06 ± 0.16
2237+07 8.6 12.0 ± 0.6 17.8 ± 0.9 19.4 ± 1.0 16.0 ± 0.8 12.3 ± 1.0 0.86 ± 0.08 0.60 ± 0.08 0.72 ± 0.08 2.4 × 6.0
11.9 ± 1.0 2.4 × 4.8
NGC7469 8.6 57.0 ± 2.8 74.0 ± 3.7 123.0 ± 6.2 163 ± 8.1 18.5 ± 6.2 0.72 ± 0.08 1.05 ± 0.08 1.23 ± 0.08
Mkn530 8.6 17.0 ± 0.9 25.0 ± 1.2 25.0 ± 1.2 25.0 ± 1.2 16.1 ± 1.3 0.85 ± 0.08 0.50 ± 0.08 0.93 ± 0.08 2.4 × 6.0
15.4 ± 1.3 2.4 × 4.8
Mkn533 8.6 10.1 ± 0.5 15.6 ± 0.8 24.2 ± 1.2 46.0 ± 2.3 16.1 ± 1.2 0.91 ± 0.08 0.98 ± 0.08 1.63 ± 0.08
NGC7682 8.6 10.5 ± 0.5 14.9 ± 0.7 9.5 ± 0.9 4.6 ± 0.5 5.7 ± 1.0 0.81 ± 0.08 0.01 ± 0.12 0.14 ± 0.15
aAperture diameter, arcsec.
bSlit size in arcsec, if more then one spectra were taken
Note. — The table contains: JHKL fluxes within the given aperture diameter, centered at the nucleus, K flux within the slit, used to calibrate the
spectra, and the colors derived from the aperture fluxes, using the absolute calibration of Campins, Rieke & Lebofsky (1985). The second number in
each column is 1σ uncertainty.

– 18 –
Table 5. Corrected CO indices for Seyfert galaxies.
Name (L/K)ap COobs COHcor %H
n−st Iter. COKcor %Ks
n−st Iter. Note
1 2 3 4 5 6 7 8 9 10
0048+29 0.76 0.18 0.21 10 1 0.20 6 2
Mkn993 0.62 0.26 0.33 18 1 0.29 10 1
Mkn573 0.87 0.15 0.21 29 1 0.19 21 1
0152+06 0.75 0.16 0.18 11 1 0.18 5 2
NGC1144 0.48 0.15 0.15 2 1 0.15 0 0
NGC3227 0.91 0.10 0.15 40 1 0.13 28 1
1058+45 0.40 0.22 0.22 0 0 0.22 0 0 L − K < (L − K)Sy1
NGC4235 0.74 0.09 0.11 27 1 0.10 19 1
NGC5033 0.90 0.14 0.23 48 1 0.22 42 1
Mkn266 0.80 0.17 0.22 22 1 0.20 14 1
Mkn270 0.41 0.11 0.11 0 0 0.11 0 0 L − K < (L − K)Sy1
Mkn461 0.93 0.19 0.26 29 1 0.24 23 1
Mkn686 0.64 0.16 0.18 11 1 0.18 7 1
NGC5929 0.80 0.17 0.23 25 1 0.21 18 1
2237+07 0.82 0.06 0.08 14 1 0.08 8 2
NGC7682 0.48 0.18 0.18 0 0 0.18 0 0 L − K < (L − K)Sy1
Note. — Columns 4 and 7 contain the corrected CO indices with correction procedure started from H and K
respectively. Columns 5 and 8 show the non-stellar part of the K flux. The number of iterations are presented
in columns 6 and 9. Zero iterations indicates that the galaxy has K− L bluer then the adopted pure non-stellar
color (K − L)Sy1 = 2.79, and we assumed negligible non-stellar flux at K.

– 19 –
Table 6. Photometric data for the control sample of starburst galaxies.
Name Slit Size Effa. Phot. F apJ
F apH
F apK
F slK
F apL
AV Ref.′′ Ap.,′′ Ap.,′′ mJy mJy mJy mJy mJy Mag
NGC253 2.4 × 12.0 6.1 6.0 115.0 226.7 280.6 278.1 390.3 7.4 1,8b
NGC660 2.4 × 9.6 5.4 5.0 27.9 40.9 36.7 69.2 34.7 6.4 6
Maffei2 2.4 × 6.0 4.3 slit 16.6 45.6 55.5 55.5 - 8.5 1
IC342 2.4 × 6.0 4.3 3.8 49.0 74.0 71.0 87.1 44.0 5.1 9
NGC1614 2.4 × 6.0 4.3 6.0 32.3 52.4 51.5 27.6 55.9 3.5 11
NGC2146 2.4 × 6.0 4.3 17.0 132.1 253.2 270.5 94.3 285.7 6.4 2
NGC2782 2.4 × 6.0 4.3 17.0 55.1 73.7 62.5 22.1 65.6 2.9 2
M82 2.4 × 26.4 8.9 7.8 161.0 350.0 475.0 - 436.0 10.2 10
NGC3079 2.4 × 6.0 4.3 6.0 29.2 66.6 82.4 34.7 63.9 7.8 4
NGC3628 2.4 × 6.0 4.3 slit 06.2 14.8 19.4 19.4 - 9.7 1
NGC4102 2.4 × 6.0 4.3 3.8 80.5 118.0 117.0 87.1 89.0 5.7 5
NGC4194 2.4 × 6.0 4.3 13.0 73.3 78.6 67.3 24.9 69.0 3.5 3
NGC4339 2.4 × 6.0 4.3 slit 15.0 21.6 17.2 17.2 - 1.0 1
NGC5990 2.4 × 6.0 4.3 slit 16.6 23.7 27.6 27.6 - 7.7 1
NGC6000 2.4 × 6.0 4.3 slit 30.3 37.3 37.3 37.3 - 5.1 1
NGC6240 2.4 × 6.0 4.3 9.0 27.9 50.5 53.5 31.3 43.2 9.9 3
NGC6946 2.4 × 7.2 4.7 3.0 23.8 35.3 36.3 - - 4.3 1
NGC7714 2.4 × 6.0 4.3 5.0 20.4 25.6 21.5 18.5 22.4 4.3 4
Mkn331 2.4 × 6.0 4.3 5.0 26.0 36.4 34.9 23.8 29.1 4.8 7
aThe effective aperture is a circle with the same area as the slit aperture.
b1 for JHK, 8 for K − L
Note. — References are for the aperture photometry only. The flux within the slit is from
Engelbracht (1997), who gives Ks, instead of K, unlike the other sources. The difference between
the two filters is of order of 0.01 mag, insignificant compared to the typical uncertainties of 0.05-0.10
mag.
References. — (1) Engelbracht (1997); (2) Hunt & Giovanardi (1992); (3) Allen (1976); (4)
Lawrence et al. (1985); (5) Roche et al. (1991); (6) Brindle et al. (1991); (7) Carico et al. (1988);
(8) Rieke & Low (1975); (9) Becklin et al. (1980); (10) Rieke et al. (1980); (11) Glass & Moorwood
(1985)

– 20 –
Table 7. Observed and corrected CO indices for the control sample of starburst galaxies.
Name COobs AV = 0 AV 6= 0
COHcor COK
cor Iter. AV COHcor COK
cor Iter.
1 2 3 4 5 6 7 8 9
NGC253 0.24 0.31 0.29 1 7.4 0.27 0.26 1
NGC660 0.22 0.23 0.23 1 6.4 0.22 0.22 1
Maffei2 0.22 0.22 0.22 0 8.5 0.22 0.22 0
IC342 0.26 0.27 0.26 1 5.1 0.25 0.27 2
NGC1614 0.28 0.28 0.28 0 3.5 0.28 0.28 0
NGC2146 0.18 0.27 0.24 1 6.4 0.21 0.20 1
NGC2782 0.14 0.19 0.18 1 2.9 0.17 0.17 1
M82 0.27 0.27 0.27 0 10.2 0.27 0.27 0
NGC3079 0.17 0.22 0.19 1 7.8 0.17 0.17 1
NGC3628 0.24 0.24 0.24 0 9.7 0.24 0.24 0
NGC4102 0.19 0.21 0.22 1 5.7 0.19 0.20 2
NGC4194 0.15 0.21 0.20 1 3.5 0.18 0.18 1
NGC4339 0.25 0.25 0.25 0 1.0 0.25 0.25 0
NGC5990 0.12 0.12 0.12 0 7.7 0.12 0.12 1
NGC6000 0.25 0.25 0.25 0 5.1 0.25 0.25 0
NGC6240 0.18 0.22 0.21 2 9.9 0.17 0.18 1
NGC6946 0.26 0.26 0.26 0 4.3 0.26 0.26 0
NGC7714 0.26 0.30 0.29 1 4.3 0.27 0.28 1
Mkn331 0.22 0.25 0.26 2 4.8 0.23 0.23 2
Note. — Columns 1-9 are the same as in Table 5.

– 21 –
Table 8. Aperture photometry of Seyfert galaxies from the literature.
Name Ap,′′ J − H H − K K − L Ref.
NGC1144 4.0 0.89 0.38 0.55 1
5.0 0.72 0.44 0.73 2
5.4 1.01 0.47 3
8.5 1.43 0.58 4
12.0 0.75 0.41 5
30.0 0.75 0.21 6
Mkn270 5.9 0.50 0.46 -0.07 7
15.0 0.50 0.35 ≤0.84 8
NGC7682 8.5 0.80 0.02 4
References. — (1) Joy & Ghigo (1988); (2) Carico et
al. (1988); (3) Bushouse & Stanford (1985); (4) Edelson,
Malkan & Rieke (1987); (5) Cutri & McAlary (1985); (6)
Spinoglio et al. (1995); (7) Rieke (1978); (8) McAlary,
McLaren & Crabtree (1979)

– 22 –
REFERENCES
Aaronson, M, 1977, Ph.D. Thesis, Harvard University
Alonso-Herrero, A., Ward, M.J., & Kotilainen, J.K., 1996, MNRAS, 278, 902
Alonso-Herrero, A., Simpson, C., Ward, M.J., Wilson, A.S., 1998, ApJ, 495, 196
Allen, D.A., 1976, ApJ, 207, 367
Becklin, E.E., Gatley, I., Matthews, K., Neugebauer, G., Sellgren, K., Werner, M.W.,
Winn-Williams, C.G., 1980, ApJ, 236, 441
Bailey, M.E., 1980, MNRAS, 191, 195
Brindle, C., Hough, J.H., Bailey, J.A., Axon, D.J., Sparks, W.B., 1991, MNRAS, 252, 288
Bushouse, H.A., & Stanford, S.A., 1992, ApJS, 79, 213
Campins, H., Rieke, G.H., & Lebofsky, M.J., 1985, AJ, 90, 896
Carico, D.P., Sanders, D.B., Soifer, B.T., Elias, J.H., Matthews, K., & Neugebauer, G., 1988, AJ,
95, 365
Cid Fernandes, R., 1997, in Starburst Activity in Galaxies, eds. Franco J., Terlevich, R.J., Serrano,
A., Rev. Mex. A. A. Conf. Ser., 6, 201
Cutri, R.M., & McAlary, C.W., 1985, ApJ, 296, 90
David, L.P., Durstein, R.H., & Cohn, H.N., 1987a, ApJ, 313, 556
David, L.P., 1987b, ApJ, 316, 505
Dey, A., Breugel, W., Vacca, W.D., & Antonucci, R., 1997, ApJ, 490, 698
Diaz, A.I., Terlevich, E., & Terlevich, R., 1989, MNRAS, 239, 325
Doyon, R., Joseph, R.D., & Wright G.S., 1994, ApJ, 421, 101
Edelson, R.A., Malkan, M.A., & Rieke, G.H., 1987, ApJ, 321, 233
Elias, J.H., Frogel, J.A., Matthews, K., & Neugebauer, G., 1982, AJ, 87, 1029
Engelbracht, C.,W., 1997, Ph.D. Thesis, The University of Arizona
Engelbracht, C.,W., 1999, private communication
Forbes, D.A., Boisson, C., Ward, M.J., 1992, MNRAS, 259, 293
Frogel, J.A., Persson, S.E., Aaronson, M., & Matthews, K., 1978, ApJ, 220, 75

– 23 –
Frogel, J. A., 1985, ApJ, 298, 528
Goldader, J.D., Joseph, R.D., Doyon, R., Sanders, D.B., 1995, ApJ, 444, 97
Glass, I.S., & Moorwood, A.F.M., 1985, MNRAS, 214, 429
Glass, I.S., 1992, MNRAS, 256, 23
Glass, I.S., 1997, MNRAS, 292, L50
Glass, I.S., 1998, MNRAS, 297, 18
Gonzalez-Delgado, R.M., Heckman, T., Leitherer, C., Meurer, G., Krolik, J., Wilson, A.S., Kinney,
A., Koratkar, A., 1998, ApJ, 505, 174
Heckman, T.M., Gonzalez-Delgado, R., Leitherer, C., Meurer, G.R., Krolik, J., Wilson, A.S.,
Koratkar, A., & Kinney, A., 1997, ApJ, 482, 114
Heckman, T.M., 1999, preprint (astro-ph/9912029)
Hunt, L.K., & Giovanardi, C., 1992, AJ, 104, 1018
Impey, C.D., Winn-Williams, C.G., & Becklin, E.E., 1986, ApJ, 309, 572
Johnson, H.L., ARA&A, 4, 193
Joy, M., & Ghigo, F.D., 1988, ApJ, 332, 179
Kleinmann, S.G., & Hall, D.N.B., ApJS, 62, 501
Knapen, J.H., Shlosman, I., & Peletier, R.F., 1999, preprint
Kunth, D., & Contini, T., 1999, in Wolf-Rayet Phenomena in Massive Stars and Starburst
Galaxies, 193th Symp. of IAU, eds. van der Hucht, K., Koenigsberger, G., & Eenens,
P.R.J., p. 725
Lawrence, A., Ward, M., Elvis, M., Fabbiano, G., Willner, S.P., Carleton, N.P., Longmore, A.,
1985, ApJ, 291, 117
Maiolino, R., Rieke G.H., & Keller, L.D., 1995, ApJ, 446, 561
Maiolino, R., Rieke G.H., & Rieke, M.J., 1996, AJ, 111, 537
Maiolino, R., Ruiz, M., Rieke G.H., & Papadopoulos, P., 1997, ApJ, 485, 552
Mauder, W., Weigelt, G., Appenzeller, I., Wagner, S.J., 1994, A&A, 285, 44
McAlary, C.W., McLaren, R.A., & Crabtree, D.R., 1979, ApJ, 234, 471
McAlary, C.W., & Rieke, G.H., 1988, ApJ, 333, 1

– 24 –
McLeod, K.K., & Rieke G.H., 1995, ApJ, 441, 96
Nelson, C., & Whittle, M., 1998, in The AGN/Host Galaxy Connection as part of the Scientific
Assembly of COSPAR (astro-ph/9811035)
Norman, C., & Scoville., N., 1988, ApJ, 332, 124
Ohsuga, K., & Umemura, M., 1999, ApJ, 521, L13
Oliva, E., & Origlia, L. 1992, A&A, 254, 466
Oliva, E., Origlia, L., Kotilainen, J.K., & Moorwood, A.F.M., 1995, A&A, 301, 55
Oliva, E., Origlia, L., Maiolino, R., & Moorwood, A.F.M., 1999, A&A, 350, 9
Perry, J.J., & Dyson, J.E., 1985, MNRAS, 235, 665
Perry, J.J., 1992, in Relationships between Active Galactic Nuclei and Starburst Galaxies, ed.
Filippenko, A.V., ASP Conf. Ser., 31, 169
Persson, S.E., 1988, ApJ, 330, 751
Quillen, A.C., Shaked, S., Alonso-Herrero, A., McDonald, C., Lee, A., Rieke, M.J., Rieke, G.H.,
2000a, ApJ, 532, L17
Quillen, A.C. et al., 2000b, in preparation
Ridgway, S.E., Winn-Williams, C.G., & Becklin, E.E., 1994, ApJ, 428, 609
Rieke, G.H., & Low, F.J., 1975, ApJ, 197, 17
Rieke, G.H., 1978, ApJ, 226, 550
Rieke, G.H., & Lebofsky, M.J., 1979, ApJ, 229, L111
Rieke, G.H., Lebofsky, M.J., Thompson, R.I., Low, F.J., Tokunaga, A.T., 1980, ApJ, 238, 24
Rieke, G.H., & Lebofsky, M.J., 1981, ApJ, 250, 87
Rieke, G.H., & Lebofsky, M.J., 1985, ApJ, 288, 618
Roche, P.F., Aitken, D.K., Smith, C.H., Ward, M.J., 1991, MNRAS, 248, 606
Ruiz, M., Rieke, G.H., & Schmidt, G.D., 1994, ApJ, 423, 608
Shlosman, I., Frank, J., & Begelman, M.C., 1989, Nature, 338, 45
Shlosman, I., Begelman, M.C., & Frank, J., 1990, Nature, 345, 679
Spinoglio, L., Malkan, M.A., Rush, B., Carrasco, L., & Recillas-Cruz, 1995, ApJ, 453, 616

– 25 –
Terlevich, E., Diaz, A.I., & Terlevich, R., 1989, ApJS, 157, 15
Terlevich, E., Diaz, A.I., & Terlevich, R., 1990, MNRAS, 242, 284
Terlevich, R., & Melnick, J., 1985, MNRAS, 213, 841
Terlevich, R., Tenorio-Tagle, G., Franco, J., & Melnick, J., 1992, MNRAS, 255, 713
van Breugel, W., Filippenko, A.V., Heckman, T., & Miley, G., 1985, ApJ, 293, 83
van Breugel, W.J.M., & Dey, A., 1993, ApJ, 414, 563
Vanzi, L., & Rieke, G.H., 1997, ApJ, 479, 694
von Linden, S., Biermann, P.L., Duschl, W.J., Lesch, H., & Schmutzler, T., 1993, A&A, 280, 468
Weedman, D.W., 1983, ApJ, 266, 479
Williams, D.M., Thompson, C.L., Rieke, G.H., & Montgomery, E.F., 1993, S.P.I.E., 1946, 482
Williams, R.J.R., Baker, A.C., & Perry, J.J., 1999, MNRAS, 310, 913
This preprint was prepared with the AAS LATEX macros v4.0.

– 26 –
Fig. 1.— Spectra of the sample galaxies, in order of increasing R.A., continuum-divided (i.e. all
continua were normalized to 1) and shifted vertically for display purposes by adding shiftss (from
bottom to top: 0, 1, 2, ..., 8 for the K-band spectra, and 0, 0.8, 1.6 for the H-band), i.e. for
each spectrum, the flux interval from zero to the continuum level (F slK , mJy in Table 4) spans one
arbitrary flux unit. 1σ noise spectrum (see section2.1) is shown above each spectrum, on the same
scale. For galaxies with multiple spectra all spectra are shown. The galaxy names and Seyfert
types are indicated. Vertical dot lines show some features of interest. (a)-(d) K-band spectra. (e)
H-band spectra.
Fig. 2.— Histogram of the observed and corrected values of the CO index in Type 1-1.5 Seyferts
(dotted line), in Type 1.8-2 Seyferts (solid line), and in starbursts (dashed line). The top panel
shows the observed CO indices, the middle panel shows the CO indices corrected starting from
K-band neglecting the reddening (AV = 0) in starbursts, and the bottom panel shows again the
corrected CO indices but the colors of starburst have been dereddened prior to the CO correction.
Ticks on the horizontal axis show the bin borders. The ellipticals fall into 0.18-0.22 bin. See section
3.1 for details.
Fig. 3.— CO index vs. K − L diagram. The solid dots represent Seyfert galaxies of Type 1.8 and
later, and the open circles represent the earlier Type Seyfert galaxies. The grid represents the CO
index and infrared colors of a combination of an elliptical galaxy spectrum and a diluting black
body (solid lines, the temperature is labeled on the top) spectrum, in various ratios (dashed lines,
the black body-to-elliptical spectrum ratio is labeled on the right).
Fig. 4.— Color-color diagrams for Seyfert galaxies. See section 3.2 for explanations.

– 27 –

– 28 –

– 29 –

– 30 –
– 31 –

– 32 –

– 33 –

– 34 –


