Embed Size (px)
Citation preview

The addition of high manganese to a copper-deficient diet further depresses
copper status and growth of cattle
Stephanie L. Hansen, Melissa S. Ashwell, Leon R. Legleiter, Robert S. Fry, Karen E. Lloyd
and Jerry W. Spears*
Department of Animal Science, North Carolina State University, Raleigh, NC 27695, USA
(Received 21 May 2008 – Revised 16 July 2008 – Accepted 16 July 2008 – First published online 8 September 2008)
A study was conducted evaluating the effect of long-term Cu deficiency, with or without high Mn, on growth, gene expression and Cu status of
beef cattle. Twenty-one Angus calves were born to cows receiving one of the following treatments: (1) 10mg supplemental Cu/kg DM (þCu); (2)
no supplemental Cu and 2mg Mo/kg DM (2Cu); (3) 2Cu diet plus 500mg supplemental Mn/kg DM (2Cu þ Mn). Calves were weaned at
approximately 183 d of age and individually fed throughout the growing and finishing phases. Plasma Cu was lower (P,0·01) in 2Cu calves
compared with þCu calves while high dietary Mn further depressed (P,0·01) plasma Cu in 2Cu þ Mn calves v. 2Cu calves. Liver Cu con-
centrations in þCu calves were greater (P,0·01) than in 2Cu calves, with no differences between 2Cu and 2Cu þ Mn calves. The daily
body-weight gain of þCu calves was greater (P,0·01) than 2Cu calves during the period from birth to weaning, but did not differ during
the growing phase. 2Cu þ Mn calves gained less (P,0·05) than 2Cu calves during the growing phase. DM intake was lower (P,0·01) in
2Cu þ Mn calves v. 2Cu calves, and did not differ among þCu and 2Cu calves. The relative gene expression of cytochrome c oxidase in
the liver was lower (P,0·05) in 2Cu calves compared with þCu or 2Cu þ Mn calves. In conclusion, feeding a Cu 2 deficient diet in combi-
nation with high Mn negatively affected the growth and Cu status of beef cattle.
Cattle: Copper: Growth: Manganese
Cu deficiency in ruminants is a problem worldwide, often dueto the presence of high levels of a Cu antagonist in the diet(1).In beef cattle, Cu deficiency may present in the form ofdepressed growth, hair depigmentation and anaemia. Thesesigns can be explained by the reduced activity of cuproen-zymes such as cytochrome c oxidase, tyrosinase and caerulo-plasmin, which are important in energy production, melaninproduction and Fe metabolism, respectively(2). Several res-earchers have investigated the effect of Cu deficiency ongrowth in beef cattle, with varying results(3). Suttle &Angus(4) induced Cu deficiency in young calves through sup-plementation of 1·5mg Mo/kg DM and reported that deficientcalves weighed approximately 30% less than their sup-plemented (7mg Cu/kg DM) counterparts after 24 weeks onexperimental diets. More recently, Ward et al. (5) experimen-tally induced Cu deficiency in calves through Mo and Ssupplementation for 98 d and reported minimal negativeeffects on growth. Alternately, Gengelbach et al. (6) notedthat Cu deficiency induced through Mo supplementationresulted in depressed growth of calves compared with calvessupplemented with Cu. It is possible that the effect of Cudeficiency on the growth of cattle is dependent on the durationand severity of Cu deficiency. The age of the animal also
appears to play a role in the susceptibility to Cu deficiency.Poole & Rogers(7) suggested that the young calf is most vul-nerable to Cu deficiency and that even when the deficiencyis treated, long-term impacts on growth are observed. To ourknowledge, no work has examined the effects of a life-long,severe Cu deficiency in beef cattle.
Cu-deficient soils are a problem worldwide, and are of par-ticular concern in locations such as the British Isles which alsohave elevated soil concentrations of the Cu antagonist Mo(8,9).Mn is another potential Cu antagonist, and excessive dietaryMn from feedstuffs, industrial contamination or soil ingestionmay have negative impacts onCu absorption.Mnconcentrationsin some forages may be greater than 100mg/kg DM, while theCu content of forages is typically low(10). Limited studies exam-ining the antagonistic effects of Mn on Cu have been conducted;however, research with rats has demonstrated a complicatedinteraction between the effects of dietary Mn (10 or 50mg/kgDM) and Cu (,1 or 6mg/kg DM) on indices of Cu and Festatus(11). These authors reported that 50mgMn/kgDM reducedduodenal tissue Cu concentrations in rats receiving 6mg Cu/kgDM, but had no effect on rats consuming the low-Cu diet. It wasalso observed that increasing dietaryMn reduced serumCu con-centrations when rats were fed Cu-adequate diets but had no
*Corresponding author: Dr Jerry W. Spears, fax þ1 919 515 4463, email [email protected]
Abbreviations: CCS, Cu chaperone protein; COX1, cytochrome c oxidase subunit 1; þ Cu, 10mg supplemental Cu/kg DM; 2 Cu, no supplemental Cu and 2mg
Mo/kg DM; 2 Cu þ Mn, 2 Cu diet plus 500mg supplemental Mn/kg DM; DMT1, divalent metal transporter 1; rps9, ribosomal protein S9; SOD1, superoxide
dismutase 1.
British Journal of Nutrition (2009), 101, 1068–1078 doi:10.1017/S0007114508057589q The Authors 2008
British
Journal
ofNutrition

effect when rats were fed Cu-deficient diets(11). It has recentlybeen suggested that Cu and Mn may share a common pathwayfor intestinal absorption, via a protein known as divalent metaltransporter 1 (DMT1)(12). Competition for this transporter mayexplain decreased duodenal and serum Cu concentrationsobserved when high Mn was fed to rats(11). Additionally,changes in a Cu-specific importer known as Cu transporter 1in response to a severely Cu-deficient diet may have counter-acted the impact of high Mn in Cu-deficient rats. Clearly a com-plicated relationship exists between Mn and Cu absorption.
Few data on the effect of high dietary Mn on Cu absorptionhave been reported in ruminants. Ivan & Grieve(13) foundthat the addition of 50mg Mn/kg DM to a diet containing12mg Mn/kg DM resulted in decreased net Cu absorptionthroughout the gastrointestinal tract of young Holsteincalves; however, the dynamics of this antagonism in ruminantsare not understood.
Manipulation of planes of nutrition has been shown to alterliver gene expression in cattle(14). For example, restrictingprepartum energy intake in Holstein cows was associatedwith the up-regulation of genes involved in liver fatty acidoxidation, gluconeogenesis and the synthesis of cholesterol.Dietary manipulation of essential minerals such as Cu andMn may also induce a transcriptional response in these ani-mals, affecting genes associated with oxidative stress andenergy status. Cytochrome c oxidase subunit 1 (COX1) andsuperoxide dismutase 1 (SOD1) are proteins which play arole in oxidative phosphorylation and oxidant protection,respectively, and require Cu for proper enzymic function.The effect of dietary Cu and Mn concentrations on theexpression of genes encoding these important proteins hasnot been determined in cattle.
Therefore, the objective of the present study was to deter-mine the impacts of a long-term, severe Cu deficiency, inthe presence or absence of high dietary Mn, on Cu status,growth and gene expression of beef cattle.
Experimental methods
Animals and experimental design
Experimental procedures were reviewed and approved by theNorth Carolina State University Animal Care and Use Commit-tee. Twenty-one Angus calves (eleven Angus steers and nineAngus heifers (38·9 (SE 2·4) kg body weight at birth)) wereused in the present study. Calves were born to cows that werepart of a previous study examining the impact of a long-termdietary Cu and Mn imbalance on the biology of brain prionproteins(15). By the time calves in the present study wereborn, dams had been on their respective dietary treatments forat least 410 d. Approximately 33 d before calving, cows weremoved into a covered facility with slatted floors and groupfed by treatment in pens of two or three cows. Cows calvedover a 36 d period, and birth of the calves was considered day0 of the study, and all days mentioned are based on averagecalf age on that day. Cows remained in the pens with theircalves until weaning when calves averaged age 183 d.After weaning, calves were vaccinated against infectiousbovine rhinotracheitis, bovine viral diarrhoea (I and II), parain-fluenza-3, bovine respiratory syncytial virus (Titanium 5; Agri-Labs, St Joseph, MO, USA), Clostridia (Vision 7; Intervet,
Millsboro, DE, USA) and Moraxella bovis (Piliguard Pin-keye-1 Trivalent; Schering-Plough Animal Health, Ltd,Wellington, New Zealand). Calves were also treated for internaland external parasites (Privermectin; First Priority, Inc., Elgin,IL, USA). Following weaning, calves remained in the pens andwere bunk fed by treatment for a period of 43 d. On day 226,calves were moved to pens with electronic Calan gate feeders(American Calan, Northwood, NH, USA) and were fed indivi-dually for the remainder of the trial.
Treatments included: (1) 10mg supplemental Cu/kg DM and20mg supplementalMn/kgDM (Cu adequate,þCu; n 6); (2) nosupplemental Cu, 20mg supplemental Mn/kg DM and 2mgsupplemental Mo/kg DM (Cu deficient, 2Cu; n 8); (3) nosupplemental Cu, 500mg supplemental Mn/kg DM and 2mgMo/kg DM (Cu deficient plus Mn, 2Cu þ Mn; n 7). Cuwas provided as Cu2(OH)3Cl, Mo as NaMoO4 and Mn asMnSO4.H2O. Calves were fed a maize silage-based diet(analysed 7mg Cu/kg DM and 59mg Mn/kg DM) throughthe 136 d growing phase and a ground maize-based diet (ana-lysed 4mg Cu/kg DM and 32mg Mn/kg DM) through the139 d finishing phase. Diets were formulated to meet orexceed all National Research Council requirements(2), with theexception of Cu. Ingredient compositions of the basal dietsare shown in Table 1. Calves were fed once daily, with feedamounts based on consumption in a 24 h period. Individualbody weights were taken at birth and on days 73, 114, 183,217, 241, 269, 297, 325, 353, 416, 459 and 490. Jugular bloodsamples were collected at birth and on days 114, 183, 241,297, 422, 459 and 490 for analysis of plasma Cu. Liver biopsysamples were obtained as previously described(16) on days114, 183, 297 and 422 for mineral determination.
Tissue collection and analytical procedures
On day 492 of the study calves were transported to a commer-cial abattoir approximately 40 km from our research facility,
Table 1. Ingredient composition of the growing and finishing diets
IngredientGrowing phase(% DM)*
Finishing phase(% DM)†
Maize silage 86·88 –Ground maize – 83·80Soyabean meal (48 %) 9·00 7·00Cottonseed hulls – 5·00Urea 1·00 0·80CaSO4 0·80 0·80Limestone 0·10 0·40NaCl 0·20 0·20Vitamin premix‡ 0·01 0·01Trace mineral premix§ 0·01 0·01Monensink – þ
Treatment supplement{ 2·00 2·00
* Analysed 7 mg Cu/kg DM and 59 mg Mn/kg DM.† Analysed 4 mg Cu/kg DM and 32 mg Mn/kg DM.‡ Provided (per kg premix): 1·98 g all-trans retinol; 38 mg cholecalciferol; 4·2 g
DL-a-tocopheryl acetate.§ Provided (per kg diet): 30 mg Zn as ZnSO4; 0·5 mg I as Ca(IO3)2(H2O); 0·2 mg
Se as Na2SeO3; 0·1 mg Co as CoCO3.kProvided 33 mg monensin/kg DM.{A ground maize supplement provided the following treatments: þCu (10 mg
Cu/kg DM, 20 mg Mn/kg DM); 2Cu (20 mg Mn/kg DM, 2 mg Mo/kg DM);2Cu þ Mn (500 mg Mn/kg DM, 2 mg Mo/kg DM).
Manganese depresses copper status of cattle 1069
British
Journal
ofNutrition
housed overnight and harvested the following morning. Liversamples were collected for mineral determination andgene expression analysis. Samples were flash frozen inliquid N2 to protect against RNA degradation. Approximately20–30min after calves were stunned, intestinal samples werecollected in the following manner: a segment of duodenumapproximately 25 cm long, extending from just below thepyloric sphincter, was removed from the gastrointestinaltract of the animal. The segment was flushed several timeswith physiological saline (0·9% saline, pH 7) and cut openlongitudinally. The segment was rinsed briefly with salineonce again to remove any remaining digesta. Using a cleanglass microscope slide, approximately three scrapings of mod-erate pressure were taken of the exposed intestinal mucosa.The scrapings were flash frozen in liquid N2, placed into poly-propylene tubes and stored on dry ice for transportation backto the laboratory where samples were stored at 2808C untilprotein extraction could be performed. Scrapings were ana-lysed for the Cu chaperone protein (CCS) that shuttles Cuthrough the cytosol to Cu–Zn superoxide dismutase.Approximately 0·5 g of chilled duodenal tissue was hom-
ogenised in 3ml of a modified Radio Immuno PrecipitationAssay buffer (20mM-2-amino-2-hydroxymethyl-propane-1,3-diol (Tris)–HCl, 150mM-NaCl, 1% NP-40 (v/v), 0·5%sodium deoxycholate (w/v), 0·1% SDS (w/v), 2mM-EDTAand a protease inhibitor cocktail (Sigma Protease InhibitorCocktail P2714; Sigma Aldrich, St Louis, MO, USA)) forCCS determination. After 30min on ice the 16% homogenatewas centrifuged at 10 000 g for 30min at 48C. The clarifiedsupernatant fraction was removed and measured for proteincontent using the DC Protein Assay (Bio-Rad Laboratories,Hercules, CA, USA). Samples were equilibrated for proteincontent, sampled into microcentrifuge tubes and storedat 2808C until analysis.All electrophoresis and Western blot equipment and
supplies were purchased from Invitrogen Corp. (Carlsbad,CA, USA) unless otherwise stated. Before electrophoresis,samples were heated at 708C for 10min. PAGE was performedusing precast NuPage Novex 4–12% Bis–Tris gels and theNovex X-Cell Surelock Mini-Cell electrophoresis system.Magic Mark XP Western Protein Standards were used formolecular weight determination.Approximately 33mg total protein were loaded into
each well. Proteins were separated under reducing and dena-turing conditions and transferred onto a polyvinylidenediflouride membrane. Membranes were blocked for 30minusing the blocking solution provided in the WesternBreeze Chemiluminescent Kit and probed for 1 h at room tem-perature with polyclonal rabbit anti-CCS (kindly provided by
Dr Joseph Prohaska, University of Minnesota; 1:500 dilution).After incubation with the primary antibody, membranes werewashed four times in 0·01 M-PBS (pH 7·1) containing 0·05%Tween-20 (v/v), incubated for 30min with the appropriatealkaline phosphatase-linked secondary antibody and thenwashed four times with the PBS-Tween 20 wash. Membraneswere rinsed two times with water and then visualised usingEnhanced Chemiluminescent Substrate (Western Breeze Kit;Invitrogen). Images were captured on autoradiography film(CL-XPosure Film; Pierce, Rockford, IL, USA) and band den-sities were semi-quantified using Image Quant TL software(Amersham Biosciences, Piscataway, NJ, USA). Membraneswere stripped with Restore Western Blot Stripping Buffer(Pierce) and reprobed with b-actin (Abcam; 1:5000 dilutionfor 1 h at room temperature) as a loading control. Resultsare reported as b-actin-adjusted relative optical intensities inarbitrary units.
Blood was collected in trace mineral-free heparinisedvacuum tubes designed for trace mineral analysis (BectonDickenson, Rutherford, NJ, USA), transferred on ice to thelaboratory and centrifuged at 1200 g for 20min at 208C.Plasma was removed and stored at 2208C until analysed forCu concentration. Plasma was prepared for Cu analysis as pre-viously described(17). Feed and liver samples were preparedfor analysis by wet ashing using microwave digestion(Mars 5; CEM Corp., Matthews, NC, USA) as described byGengelbach et al. (6). The mineral content of plasma, feed,and liver samples was determined by flame atomic absorptionspectroscopy (model AA-6701F; Shimadzu Scientific Instru-ments, Kyoto, Japan).
RNA isolation and real-time reverse transcriptase polymerasechain reaction
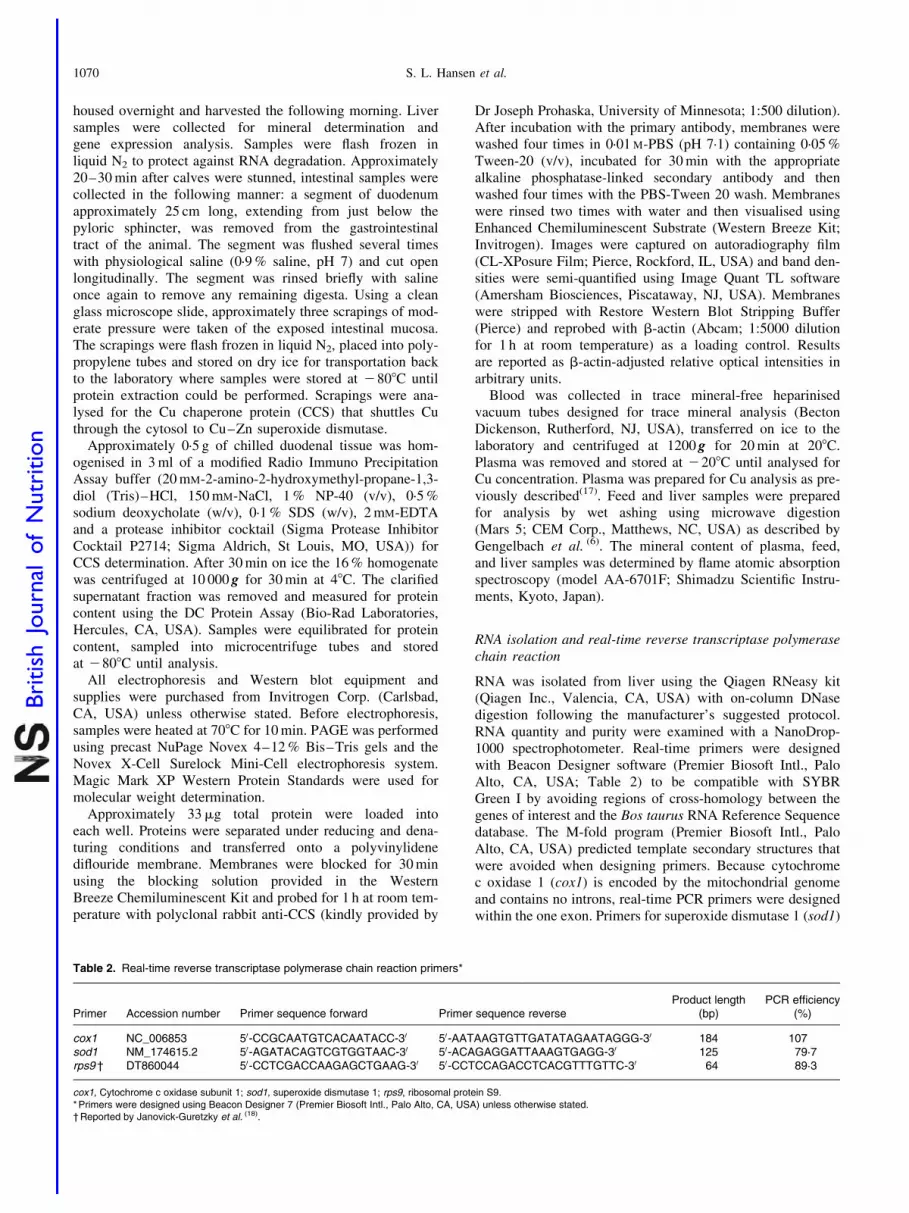
RNA was isolated from liver using the Qiagen RNeasy kit(Qiagen Inc., Valencia, CA, USA) with on-column DNasedigestion following the manufacturer’s suggested protocol.RNA quantity and purity were examined with a NanoDrop-1000 spectrophotometer. Real-time primers were designedwith Beacon Designer software (Premier Biosoft Intl., PaloAlto, CA, USA; Table 2) to be compatible with SYBRGreen I by avoiding regions of cross-homology between thegenes of interest and the Bos taurus RNA Reference Sequencedatabase. The M-fold program (Premier Biosoft Intl., PaloAlto, CA, USA) predicted template secondary structures thatwere avoided when designing primers. Because cytochromec oxidase 1 (cox1) is encoded by the mitochondrial genomeand contains no introns, real-time PCR primers were designedwithin the one exon. Primers for superoxide dismutase 1 (sod1)
Table 2. Real-time reverse transcriptase polymerase chain reaction primers*
Primer Accession number Primer sequence forward Primer sequence reverseProduct length
(bp)PCR efficiency
(%)
cox1 NC_006853 50-CCGCAATGTCACAATACC-30 50-AATAAGTGTTGATATAGAATAGGG-30 184 107sod1 NM_174615.2 50-AGATACAGTCGTGGTAAC-30 50-ACAGAGGATTAAAGTGAGG-30 125 79·7rps9† DT860044 50-CCTCGACCAAGAGCTGAAG-30 50-CCTCCAGACCTCACGTTTGTTC-30 64 89·3
cox1, Cytochrome c oxidase subunit 1; sod1, superoxide dismutase 1; rps9, ribosomal protein S9.* Primers were designed using Beacon Designer 7 (Premier Biosoft Intl., Palo Alto, CA, USA) unless otherwise stated.† Reported by Janovick-Guretzky et al. (18).
S. L. Hansen et al.1070
British
Journal
ofNutrition

were designed to amplify across at least one predictedexon–intron boundary so that genomic DNA contaminationcould be detected. Ribosomal protein S9 (rps9) was selectedas the internal housekeeping gene based on findings reportedby Janovick-Guretzky et al. (18). Melting curves for eachPCR reaction were generated to assess specificity of the reac-tion and one amplicon generated by each primer pair wassequenced to confirm the identity of the PCR product.
The High Capacity cDNA Reverse Transcription Kit(Applied Biosystems, Inc., Foster City, CA, USA) was usedto synthesise cDNA from 1mg of RNA following the manu-facturer’s instructions. Real-time PCR was performed in aBio-Rad iCycler IQ thermocycler (Hercules, CA, USA) with1X Applied Biosystems Power SYBR Green PCR MasterMix (Applied Biosystems, Foster City, CA, USA), 300 nMforward and reverse primers, 10 nM-fluorescein, and cDNA.Reactions were heated for 7min at 95 8C, followed by fiftycycles of 95 8C for 30 s, 51 8C for 30 s, and 72 8C for 30 sand a final extension step at 72 8C for 5min. Sampleswere amplified in triplicate and cycle threshold (CT) valueswere averaged for each sample.
PCR amplification efficiencies for each primer pairwere estimated from standard curves of fluorescence intensityon cDNA concentration. Standard curves were generated byamplifying five 1:3 serial dilutions of pooled cDNA in thesame plate as samples, all in triplicate. Fluorescence intensitywas plotted by dilution series to estimate amplification effi-ciencies using the iCycler IQ Real-Time PCR DetectionSystem Software v3.1 (Bio-Rad, Hercules, CA, USA).
Statistical analysis
Statistical analysis of performance data was performed byANOVA for a completely randomised design using theMIXED procedure of SAS (SAS Institute Inc., Cary, NC,USA). All performance and mineral analysis data were testedfor the effect of calf sex, which was found to be non-significant,and was subsequently removed from the model. The modelfor the performance data included the fixed effect oftreatment. Age was used as a covariate for body-weight data.When treatment was significant (P#0·10), differences amongmeans were separated using single df orthogonal contrasts.The comparisons made included: þCu v. 2Cu and 2Cu v.2Cu þ Mn. Liver Cu and plasma Cu data were log10 trans-formed to account for heterogeneity of variances. Plasma Cu,liver Cu and liver Mn were analysed as repeated measureswith individual animals serving as the experimental unit. Themodel included the fixed effects of treatment, time and theirinteraction. When a treatment £ time interaction was observed,data were further analysed by sampling day. Interactionsthat were not significant (P.0·05) for the measurement ofinterest were removed from the model. The previously statedcontrasts were also used for the analysis of these data.
CT values were collected for each reaction. The thresholdvalue for each reaction was set empirically at a value whereamplification was proceeding exponentially. Samples expres-sing high levels of transcript will exceed the threshold valueat an earlier PCR cycle than samples expressing low levelsof transcript. Therefore, samples with lower CT values weretranscribing more transcripts than samples with higher CTvalues. Before significance testing of RT-PCR data, gene
expression was normalised to the housekeeping gene rps9for each sample as follows:
CTN ¼ CTT=CTrps9;
where CTT is the CT value for the target gene (gene of inter-est), CTrps9 is the CT value for the housekeeping gene rps9and CTN is the normalised CT value. Higher values of CTNhave lower gene expression than lower values of CTN. Afternormalisation, a one-way ANOVA was used to estimate theeffect of sex and diet on CTN for each gene. JMP 7 (SASInstitute Inc.) software was used to perform the one-wayANOVA. P values ,0·05 were considered to be statisticallysignificant. Fold-changes for each gene between treatmentswere calculated by the Pfaffl method(19) adjusting values forPCR amplification efficiencies.
Results
Copper status
Plasma Cu averaged across all sampling dates was lower(P¼0·0001) in calves consuming the 2Cu diet comparedwith the þCu diet, and concentrations were further depressed(P¼0·01) in 2Cu þ Mn calves compared with 2Cu calves(Table 3). Plasma Cu was affected by a time £ treatment inter-action (P¼0·0001). Plasma Cu concentrations at birth did notdiffer due to dietary treatment; however, 2Cu calves hadlower plasma Cu values than þCu calves on all other datesof the study. From day 114 through to day 490, plasma Cuconcentrations in þCu calves were well within normalranges. Following birth, plasma Cu concentrations in 2Cucalves dropped, with the exception of a slight increase onday 422 during the finishing period. Plasma Cu concentrationsin 2Cu þ Mn calves never rose above the 4·82mmol/lmeasured at birth and were lower than 2Cu concentrationson days 114, 297, 422 and 459 of the study.
Liver Cu concentrations were greater (P¼0·0001) in þCucalves compared with 2Cu calves and tended (P¼0·088) tobe lower in 2Cu þ Mn calves compared with 2Cu calves(Table 4). Cu concentrations in the liver of calves receivingthe 2Cu and 2Cu þ Mn diets were well below the thresholdfor Cu deficiency in cattle (0·31mmol/g DM; see Under-wood(20)). Liver Cu was affected by a time £ treatment inter-action (P¼0·001). Liver Cu concentrations in þCu calveswere similar on days 114 and 183, but dipped slightly onday 297 before increasing on days 422 and 493. Concen-trations of liver Cu in 2Cu calves decreased from days 114to 297 before increasing slightly during the finishing period(days 422 and 493). Liver Cu concentrations in 2Cu þ Mncalves remained low with the exception of a mild increaseon day 297. In addition, 2Cu þ Mn calf liver Cu concen-trations were lower than 2Cu liver Cu concentrations ondays 114, 422 and 493 of the trial.
Liver Mn concentrations were greater (P¼0·01) in calvesreceiving 500mg supplemental Mn/kg DM compared withcalves consuming the 2Cu diet, and did not differ (P¼0·92)between the þCu and 2Cu treatment groups (Table 5).Liver Mn was affected by a time £ treatment interaction(P¼0·001). Liver Mn concentrations in þCu calves werefairly constant over the course of the study, dipping slightlyon days 183 and 422. Similarly, 2Cu calves exhibited
Manganese depresses copper status of cattle 1071
British
Journal
ofNutrition

steady liver Mn concentrations with minor decreases observedon days 114, 183 and 422. Calves receiving excess sup-plemental Mn exhibited an increase in liver Mn concentrationsover the course of the study.Duodenal concentrations of CCS were increased (P¼0·03)
in 2Cu calves compared with þCu calves and did notdiffer (P¼0·65) in 2Cu þ Mn calves compared with 2Cucalves (Fig. 1).
Gene expression analysis
Relative gene expressions of cox1 and sod1 in the liver wereinvestigated in the present study. Rps9 was selected as thehousekeeping gene for the present study based on resultsfrom Janovick-Guretzky et al. (18). They examined housekeep-ing gene expression in liver samples acquired from cows indifferent dietary treatments, physiological states and feedintake amounts. Their results indicated that rps9 was one ofthe most stably expressed genes they examined across differ-ent experimental groups; therefore, this was the housekeepinggene we selected for the present study. Gene expression forthe cox1 gene was lower (P,0·05) in animals that receivedthe 2Cu diet compared with those that received either theþCu diet or the 2Cu þ Mn diet (Table 6). There was a ten-dency (P,0·11) for the sod1 gene to be down-regulated in theanimals receiving the 2Cu diet relative to those fed the þCuor 2Cu þ Mn diets.
Growth
Average daily gain, DM intake and gain:feed ratio data areshown in Table 7. Calves born to cows fed 2Cu þ Mn dietstended (P¼0·13) to be lighter (35·1 (SE 2·7 kg)) at birth thancalves born to dams fed 2Cu diets (40·8 (SE 1·8 kg)). Birthweights did not differ between calves born to cows fed 2Cuand þCu diets (40·7 (SE 2·7 kg)). Calves receiving the þCudiet had greater (P¼0·009) average daily gain for the periodbetween birth and weaning than calves of nursing cows in the2Cu treatment. Similarly, the average daily gain of2Cu þ Mn calves was also low and did not differ (P¼0·6)from 2Cu calves for the period between birth and weaning.However, during the growing phase calves receiving the 2Cudiet gained more (P¼0·02) when compared with 2Cu þ Mncalves. In fact, during the growing phase 2Cu calves actuallygained at a rate comparable with calves receiving the Cu-adequate diet (P¼0·6). During the finishing phase the averagedaily gain of calves receiving the 2Cu diet increased, with2Cu calves gaining more than the þCu calves (P¼0·04) andtending (P¼0·12) to gain more than the 2Cu þ Mn treatmentgroup. Intake did not differ between þCu and 2Cu calvesduring the growing phase (P¼0·58), but tended (P¼0·08) tobe higher in 2Cu calves compared with þCu calves duringthe finishing period. Supplementation of 500mg Mn/kg DM toa diet low in Cu depressed (P,0·01) DM intake duringboth the growing and finishing phases when compared withthe 2Cu treatment group.
Table 4. Effect of dietary copper and manganese on liver copper concentration (mmol/g DM) in growing calves
(Raw mean values and pooled standard errors)
Treatment Contrasts
Calf age þCu 2Cu 2Cu þ Mn SEM þCu v. 2Cu: P * 2Cu v. 2Cu þ Mn: P *
Overall† 2·040 0·107 0·096 0·066 0·001 0·088Day 114 1·880 0·135 0·077 0·081 0·001 0·045Day 183 1·700 0·102 0·083 0·116 0·001 0·166Day 297 1·303 0·077 0·175 0·186 0·001 0·386Day 422 2·068 0·109 0·063 0·198 0·001 0·005Day 493 3·279 0·109 0·082 0·122 0·001 0·025
þCu, Cu adequate; 2Cu, Cu deficient; 2Cu þ Mn, Cu deficient plus high Mn.*P values shown are based on log10 transformation of data.† Time £ treatment effect (P,0·001).
Table 3. Effect of dietary copper and manganese on plasma copper concentration (mmol/l) in growing calves
(Raw mean values and pooled standard errors)
Treatment Contrasts
Calf age þCu 2Cu 2Cu þ Mn SEM þCu v. 2Cu: P * 2Cu v. 2Cu þ Mn: P *
Overall†‡ 16·81 3·45 1·87 0·37 0·001 0·01Birth 5·22 4·46 4·82 0·41 0·335 0·499Day 114 13·53 1·51 0·90 0·70 0·001 0·091Day 183 16·58 2·05 0·98 0·73 0·001 0·318Day 241 16·42 1·99 1·68 0·73 0·001 0·778Day 297 17·84 2·05 1·44 0·73 0·001 0·066Day 422 21·09 6·36 1·42 1·23 0·001 0·001Day 459 24·02 3·45 2·01 1·24 0·001 0·014Day 490 19·84 3·69 1·76 0·93 0·001 0·125
þCu, Cu adequate; 2Cu, Cu deficient; 2Cu þ Mn, Cu deficient plus high Mn.*P values shown are based on log10 transformation of data.† Time effect (P,0·001).‡ Time £ treatment effect (P,0·001).
S. L. Hansen et al.1072
British
Journal
ofNutrition

Weight-gain curves for calves in the various treatments aredepicted in Fig. 2. Calves receiving the þCu diet weighedmore (P¼0·10) than 2Cu calves on days 325 and 353 ofthe study. Body weights did not differ between þCu and2Cu calves for the duration of the finishing phase; however,2Cu þ Mn calves weighed less (P,0·05) than 2Cu calvesfrom day 422 through to the end of the study. In addition,calves receiving the 2Cu þ Mn diet weighed 14% less(P¼0·008; 473 (SE 19·9) kg) than calves receiving the 2Cutreatment (551 (SE 13·4) kg) at harvest, while there wasno difference (P¼0·5) between the 2Cu and þCu (560(SE 19·6) kg) groups at this time point.
Discussion
We have previously capitalised on the strong dietary antagon-ism that exists between Mo and Cu to induce and maintain adeficiency of Cu in cattle via the addition of sodium molyb-date to a diet low in Cu(17,21). However, the present study isunique in that both the duration and severity of the inducedCu deficiency were very extensive. Calves used in the presentstudy were exposed to their respective treatment from the timeof conception through to harvest, creating a distinct opportu-nity to examine the impact of a lifetime Cu deficiency ongrowth and performance in beef calves.
Plasma Cu concentrations of calves were low at birth,regardless of Cu content of the diet. This appears to be
due to low hepatic production of caeruloplasmin, a proteinimportant in Cu mobilisation, during the first few days oflife(22). Supplementation of Mo to cows fed a diet low in Curesulted in lower plasma Cu concentrations of both the cowsand their offspring(15). In addition, low plasma Cu concen-trations in 2Cu and 2Cu þ Mn calves were maintainedthrough continued supplementation of Mo to calves followingweaning. At all sampling dates after birth, plasma Cu concen-trations for þCu calves were within the normal range, whilecalves receiving the 2Cu diet never exceeded the thresholdof Cu deficiency (7·9mmol/l plasma; see Underwood(20)).In addition, plasma Cu was even further depressed in thosecalves receiving the 2Cu þ Mn diet, at one point dippingas low as 0·90mmol/l plasma.
Liver Cu values for both Cu-deficient treatments were wellbelow 0·31mmol Cu/g DM, a threshold below which cattle areconsidered Cu deficient(1), at all time points measured duringthe study. With the exception of day 297 for the 2Cu þ Mntreatment group, liver Cu concentrations of Cu-deficientcalves never exceeded 0·16mmol Cu/g DM, suggesting thatCu deficiency was indeed very severe. As previously dis-cussed by Ward & Spears(23), liver Cu concentrations below0·110mmol Cu/g DM have rarely been observed in our labora-tory. Liver Cu concentrations in the present study were as lowat 0·063mmol Cu/g DM, underscoring the severity of Cudeficiency these cattle were experiencing. Once Cu concen-trations in the liver have dropped to these levels, it is likelythat any measurable Cu is tightly bound in cuproenzymesand is relatively unavailable for mobilisation and use by extra-hepatic tissues. In the present study, liver Cu concentrationswere significantly (P,0·05) lower in 2Cu þ Mn calves com-pared with 2Cu calves on days 114, 422 and 493 of the study.The lower liver Cu concentrations coupled with lower plasmaCu values in 2Cu þ Mn compared with 2Cu calves suggeststhat supplementation of 500mg Mn/kg DM may have negativeimplications on Cu absorption beyond that of Mo supplemen-tation alone.
Intestinal CCS concentrations were measured to determinethe effect of Cu deficiency on cellular processes requiringCu. CCS is required for the intracellular transport of Cu tosuperoxide dismutase. Investigations in rodents have revealedthat tissue CCS concentrations are elevated in response to diet-ary Cu deficiency, and that this elevation is probably the resultof decreased degradation of CCS due to Cu deficiency ratherthan increased synthesis, as mRNA of CCS was not enhanced
Fig. 1. Relative concentrations (relative optical intensities; ROI) of Cu
chaperone protein in duodenal mucosal scrapings of beef cattle based on
Western blot analysis. Values are means, with standard errors represented
by vertical bars. a,b Mean values with unlike letters were significantly different
(P¼0·03).
Table 5. Effect of dietary copper and manganese on liver manganese concentration (mmol/g DM) in growing calves
(Raw mean values and pooled standard errors)
Treatment Contrasts
Calf age þCu 2Cu 2Cu þ Mn SEM þCu v. 2Cu: P 2Cu v. 2Cu þ Mn: P
Overall*† 0·206 0·207 0·297 0·008 0·92 0·01Day 114 0·200 0·151 0·217 0·023 0·26 0·08Day 183 0·167 0·175 0·266 0·017 0·69 0·02Day 297 0·240 0·226 0·260 0·018 0·58 0·28Day 422 0·178 0·218 0·333 0·024 0·27 0·03Day 493 0·246 0·269 0·440 0·022 0·43 0·01
þCu, Cu adequate; 2Cu, Cu deficient; 2Cu þ Mn, Cu deficient plus high Mn.* Time effect (P,0·001).† Time £ treatment effect (P,0·001).
Manganese depresses copper status of cattle 1073
British
Journal
ofNutrition

in these studies(24,25). In the present study, an increase in CCSdue to Cu deficiency was observed, probably because of lowintracellular Cu concentrations and increased demand for Cutransport to apo-superoxide dismutase (SOD lacking Cu).Interestingly, CCS concentrations were not increased furtherin 2Cu þ Mn calves compared with 2Cu calves.The present results suggest that supplementation of high
dietary Mn to a Cu-deficient diet further exacerbates Cudeficiency. This antagonism may result from competitionbetween Cu and Mn for transport into absorptive enterocytes.Research using rodent models and intestinal cell lines hassuggested that intestinal Cu absorption may occur throughmore than one route. Among the transporters characterisedfor Cu are Cu transporter 1(26) and DMT1(27), with as muchas 50% of the Cu transported into the enterocyte being con-tributed to DMT1(12). It is interesting to note that both Feand Mn are also transported via DMT1, and, in fact, it hasbeen demonstrated that DMT1 has a rather high affinity forMn when compared with other divalent metals(27). Our labora-tory has recently demonstrated the presence of DMT1 inbovine duodenal tissue taken from calves in the presentstudy. We observed that DMT1 concentrations did not differbetween þCu and 2Cu calves, but that DMT1 levels weredecreased in 2Cu þ Mn calves compared with 2Cu calves.This decrease in DMT1 protein is probably due to decreased
Cu-dependent ferroxidase activity limiting Fe export fromthe enterocyte, causing Fe to build up in the cell and feedback on DMT1, resulting in increased degradation of the pro-tein in order to prevent further import of Fe. These resultssuggest that DMT1 concentrations in the intestine wereindirectly reduced as a result of high dietary Mn, resultingin decreased transporter availability for not only Mn and Fe,but possibly Cu as well(28).
Visibly, the effects of Cu deficiency in the2Cu and2Cu þ
Mn treatments were evident both before weaning and duringthe growing phase of the trial. Depigmentation of the haircoat, particularly around the eyes, ears and muzzle was appar-ent in these treatments when compared with the Cu-adequatecontrol calves. Mottled skin was also observed when calveswere shaved before liver biopsies were performed. Millset al. (29) reported calves receiving a diet of less than 1mgCu/kg DM developed stilted gaits, a knock-kneed appearanceand a grey-brown cast to their normally black hair coats.Discolouration of the hair coat is a commonly reported signof Cu deficiency, arising from the role of Cu in tyrosinase,an enzyme involved in melanin pigment biosynthesis(30).
Visible signs of Cu deficiency were less obvious aftercalves entered the finishing phase of the present study.Calves in both Cu-deficient treatments, but particularlythose receiving the 2Cu diet, showed fewer signs of
Table 6. Gene expression profiles in liver
(Mean values with their standard errors)
Treatment. . .þCu 2Cu 2Cu þ Mn
CT ratio* CT ratio* CT ratio*
Target Mean SE Fold change† Mean SE Fold change† Mean SE Fold change†
cox1 0·690a,b 0·014 1·00 0·670a 0·007 0·65 0·711b 0·010 1·35sod1 0·864a 0·003 1·00 0·861a 0·002 0·82 0·875a 0·007 1·04
þ Cu, Cu adequate; 2Cu, Cu deficient; 2Cu þ Mn, Cu deficient plus high Mn; CT, cycle threshold; cox1, cytochrome c oxidase subunit 1; sod1, superoxidedismutase 1; rps9, ribosomal protein S9.
a,b Mean values within a row with unlike superscript letters were significantly different (P,0·05; Tukey-Kramer mean comparison procedure).* CT ratios are shown as the target gene:rps9 ratio.† The mRNA-fold change was calculated relative to the adequate Cu diet values using Relative Expression Software Tool (RESTq) adjusting for differences
in PCR amplification efficiencies for the target genes and rps9 (19).
Table 7. Effect of dietary copper and manganese on growth characteristics of beef cattle
(Raw mean values and pooled standard errors)
Treatment Contrasts
Item þCu 2Cu 2Cu þ Mn SEM þCu v. 2Cu: P 2Cu v. 2Cu þ Mn: P
Gain (kg/d)Nursing* 1·08 0·87 0·83 0·050 0·01 0·57Growing† 1·09 1·05 0·86 0·054 0·64 0·02Finishing‡ 1·08 1·29 1·14 0·068 0·04 0·12
DM intake (kg/d)Growing† 7·36 7·08 5·39 0·350 0·58 0·01Finishing‡ 7·75 8·38 7·29 0·234 0·08 0·01
Gain:feedGrowing† 0·141 0·138 0·154 0·008 0·80 0·16Finishing‡ 0·139 0·154 0·155 0·007 0·15 0·91
þCu, Cu adequate; 2Cu, Cu deficient; 2Cu þ Mn, Cu deficient plus high Mn.* Defined as the period between birth and weaning.† The growing phase lasted 136 d.‡ The finishing phase lasted 139 d.
S. L. Hansen et al.1074
British
Journal
ofNutrition

depigmentation. These changes occurred despite the fact thatthe finishing diet contained approximately half as much Cuas the growing diet (4 v. 7mg Cu/kg DM). The concentrate-based finishing diet probably resulted in a lower ruminal pHwhich may have allowed more dietary Cu to remain in sol-ution rather than be bound in insoluble forms. In general, alltreatments demonstrated slight increases in plasma Cu concen-trations in the finishing phase compared with the growingphase, though both 2Cu and 2Cu þ Mn plasma Cu valuesremained well below normal throughout this time period.This increase was most noticeable on day 459 in þCucalves and day 422 in 2Cu calves, while minor increases inplasma Cu concentrations in 2Cu þ Mn calves wereobserved during the finishing phase (Table 3). Increases inplasma Cu concentrations in þCu and 2Cu calves duringthe finishing phase may have been due to higher bioavailabil-ity of Cu from the finishing diet relative to the growing diet.However, the temporary increase in plasma Cu noted inþCu and 2Cu calves appeared to be negated by the presenceof high dietary Mn in 2Cu þ Mn calves. The molecularmechanism behind this response is unclear at the present time.
To examine the effect of Cu status of the calves on theexpression of genes important in cellular metabolism, theexpression of cox1 and sod1 genes were examined byRT-PCR. In the present study, expression of the cox1 genewas lower in 2Cu calves compared with 2Cu þ Mncalves. Cytochrome c oxidase, of which COX1 is a subunit,is a cuproenzyme that is a part of the final respiratory complexin the electron transport chain in mitochondria. Numerousstudies have reported a decreased activity of liver cytochromec oxidase in animals consuming low 2 Cu diets(31,32). As aresult, Cu deficiency may have a negative impact on growthdue to a decrease in cytochrome c oxidase activity andreduced energy production. However, it is unclear whetherthis was true in the present study, because hepatic cytochromec oxidase activity was not measured.
Recent work has suggested that decreased cytochrome coxidase activity during Cu deficiency is not necessarily fromlow Cu incorporation into the enzyme alone. Zeng et al. (33)
reported protein levels of COX1 were lower in heart-proteinextracts from rats fed a Cu-deficient diet compared with
rats fed a Cu-adequate diet. These authors speculated thatdecreased COX1 protein concentrations in this study mayhave resulted from a combination of increased protein degra-dation due to an accumulation of apo-COX1 (COX1 lackingCu) and repressed gene expression due to negative feedbackfrom this protein buildup. This theory would explain whycox1 gene expression was lowered in 2Cu calves; however,if expression of the cox1 gene is affected by Cu status, onewould expect similar expression levels between calves receiv-ing the 2Cu and 2Cu þ Mn diets. It is unclear why cox1expression was not changed in 2Cu þ Mn calves, althoughMn is thought to affect thyroid function(34) and thyroid hor-mone has been shown to regulate gene expression of COXsubunits(35). Therefore, high Mn levels may affect cox1 geneexpression, explaining why cox1 expression was unchangedin the animals fed the 2Cu þ Mn diet.
There was a tendency (P,0·11) for the sod1 gene to bedown-regulated in the animals receiving the 2Cu diet rela-tive to those fed the þCu or 2Cu þ Mn diets. The Cu–Zn superoxide dismutase (Cu–Zn SOD) enzyme serves animportant role in antioxidant protection for cells by conver-ting the superoxide anion to H2O2 and oxygen. Initially wehypothesised that sod1 expression would be lower in the2Cu þ Mn animals than in the 2Cu animals. However,Ramesh et al. (36) demonstrated that low-level Mn exposureactivates the transcription factor NF-kB, and NF-kB hasbeen reported to transcriptionally regulate sod1 (37). DiSilves-tro & Marten(38) reported that livers from rats fed Cu-deficient diets demonstrated decreased Cu–Zn SOD activitycompared with rats fed Cu-adequate diets; however, theimmunoreactive protein concentration of Cu–Zn SOD wasnot different due to dietary Cu level. Prohaska(39) reportedsimilar results, with Cu–Zn SOD activity in liver decreasingdue to dietary Cu deficiency.
The growth of calves was negatively affected by severe Cudeficiency in the present study (Table 7). While still nursingtheir dams, calves on the þCu treatment out-gained their2Cu counterparts by an average of 0·2 kg/d. The increasedrate of gain observed in 2Cu calves during the finishingphase may be at least partially explained by the increasedplasma Cu concentration observed on day 422 in this
Fig. 2. Growth curves of growing beef cattle fed diets either adequate in Cu (þCu; –D–), deficient in Cu (2Cu; –O–) or deficient in Cu plus high dietary Mn
(2Cu þ Mn; –A–) from birth through to harvest. Values are means. * Mean value for the 2Cu calves was significantly different from that for the 2Cu þ Mn
calves (P,0·05). † Mean value for the þCu calves was marginally significantly different from that for the 2Cu calves (P,0·10).
Manganese depresses copper status of cattle 1075
British
Journal
ofNutrition

treatment, suggesting an increase in available Cu during thistime. Alternatively, the increased daily gain may reflect anadaptation of 2Cu calves to the low-Cu diet.The growth curves depicted in Fig. 2 demonstrate that
calves receiving the 2Cu þ Mn diet were generally lighterthan calves in the other two treatments throughout the study.In addition, 2Cu þ Mn calves consumed less feed duringboth the growing and finishing phases of the trial. It is possiblethat the high level of MnSO4·H2O affected the palatability ofthe diet for 2Cu þ Mn calves, resulting in the observeddecrease in feed intake. It should be noted that calves receiv-ing the 2Cu þ Mn diet consumed approximately 16% lessdietary DM than 2Cu calves during the growing phase and26% less during the finishing phase. As a result, Cu intakeduring the growing phase was approximately 49·6mg in2Cu þ Mn calves and 58·7mg in 2Cu calves whileCu intake in the finishing phase averaged 21·6mg in2Cu þ Mn calves and 29·2mg in 2Cu calves. Plasma Cuwas also analysed statistically using DM intake as a covariateto determine if this overall reduction in Cu intake by2Cu þ Mn calves contributed to the lower plasma Cu con-centrations in 2Cu þ Mn calves compared with 2Cucalves. This analysis did not significantly affect interpretationof the data; therefore, it appears that while reduced DM intakeby 2Cu þ Mn calves probably contributed to the slowergrowth of these calves, it does not appear to fully explainthe observed reduction in plasma Cu levels. In a similarstudy, Legleiter(15) also reported that plasma Cu concen-trations were lower in 2Cu þ Mn calves compared with2Cu calves on days 360 and 440 of the study, while no differ-ences in DM intake were reported.While the 500mg supplemental Mn/kg DM provided in the
present study was below the accepted threshold for Mn toxico-sis in adult cattle (1000mg Mn/kg DM), it is quite possiblethat the severe Cu deficiency these calves were experiencingmade them more susceptible to Mn toxicity(40). Previouslyreported signs of Mn toxicosis in cattle included decreasedgrowth and feed intake(41,42). Excessive Mn has also beenshown to negatively affect Fe metabolism in cattle, resultingin lowered packed cell volume, decreased Hb and decreasedtotal Fe-binding capacity in serum(41–43). Therefore, thedecreased performance in 2Cu þ Mn calves may be due totoxic effects of Mn, depressed Fe status, or a combination ofthe two rather than Cu deficiency alone.The calves used in the present study represent the second
set of offspring born to cows receiving the three respectiveCu treatments (þCu, 2Cu or 2Cu þ Mn). The first set ofcalves were born approximately 60–90 d after cows beganreceiving dietary treatments and limited liver and plasmaCu data as well as all growth data for the first set ofcalves have been published(21). Calves used in the presentstudy were born to cows receiving dietary treatments forat least 410 d before calving. Therefore, calves in the pre-sent study were exposed to a low Cu environment fromthe time of conception through to harvest. Liver Cu valuesfor each treatment were similar between the two studies,but plasma Cu concentrations in the present study for2Cu and 2Cu þ Mn calves were slightly lower than inthe study by Legleiter & Spears(21). In addition, plasmalevels dropped more rapidly in Cu-deficient calves in thepresent study.
Legleiter & Spears(21) also reported lower average dailygain during the growing phase in Cu þ Mn calves v. 2Cucalves; however, the authors noted no differences in perform-ance between treatments (þCu, 2Cu or 2Cu þ Mn) duringthe finishing period. It is interesting to note that DM intakedid not differ between treatments during either period in thestudy by Legleiter & Spears(21), suggesting that the additionof 500mg Mn/kg DM did not affect feed consumption bycalves. Collectively, this information suggests that the calvesin the present study were experiencing a more severe Cudeficiency and the depressive effects of Cu deficiency ongrowth of 2Cu þ Mn calves in the present study may be aresult of increased susceptibility to Mn toxicity rather thanCu deficiency alone.
While levels of dietary Mn in excess of 500mg/kg DM arenot commonly found in production settings, many foragesoften contain levels of Mn much greater than the 40mgMn/kg DM recommended by the National Research Councilfor beef cattle(2). For example, Grace et al. (10) reported thatMn concentrations of forages in New Zealand are often greaterthan 400mg/kg DM. In situations of low dietary Cu, suchas those found when soil Cu concentrations are low or concen-trations of Cu antagonists in feedstuffs are high, increaseddietary Mn may further exacerbate Cu deficiency in ruminants.Further research exploring the effects of varying levels of diet-ary Mn on Cu metabolism in cattle provided with adequatedietary Cu is warranted.
Conclusion
The present results show that feeding a diet high in Mn to beefcattle may result in the depression of Cu status and growthbeyond that caused by feeding of the Cu antagonist Moalone. A reduction in DM intake in the present study probablycontributed to the depressed growth of 2Cu þ Mn calves, butusing DM intake in a covariate analysis did not significantlyexplain differences in plasma Cu status between the Cu-deficient treatments. In both the present study and the exper-iment conducted by Legleiter & Spears(21) supplementationwith high dietary Mn decreased plasma Cu levels in beefcalves that were already severely Cu deficient. Therefore, itseems plausible that high dietary Mn could have a depressiveeffect on the Cu status of animals fed moderately low or evennormal Cu concentrations. It is possible that this result is dueto competition between Mn and Cu for a common intestinaltransporter, DMT1. However, further research is necessaryto elucidate the exact mechanism by which excessive dietaryMn negatively affects Cu absorption in the ruminant.
Acknowledgements
Funding for the present study was provided by the NorthCarolina Agriculture Research Service. The authors declareno conflict of interest. J. W. S. designed the study and assistedwith writing the manuscript. M. S. A. designed, conducted andanalysed all gene expression work and contributed to themanuscript. S. L. H. conducted laboratory and data analysisand wrote the manuscript. L. R. L., R. S. F. and K. E. L.assisted with sample collection and analysis. The authors aregrateful to Greg Shaeffer, Jay Woodlief and Andrew
S. L. Hansen et al.1076
British
Journal
ofNutrition

Collicutt for expert care of experimental animals and toAudrey O’Nan, Michael Gonda, Mary E. Drewnoski, ValenciaRillington and Callie P. McAdams for assistance in samplecollection and analysis.
References
1. Underwood EJ & Suttle NF (1999) The Mineral Nutrition of
Livestock, 3rd ed. Wallingford, UK: CABI Publishing.
2. National Research Council (1996) Nutrient Requirements of
Beef Cattle, 7th ed. Washington, DC: National Academy Press.
3. Spears JW, Ward JD & Gengelbach GP (1996) The role of
copper in immunity, production and reproduction. In Proceed-
ings of the Northwest Chapter of American Registry of
Professional Animal Scientists Symposium: Copper and Health
in Ruminants, pp. 31–41. Champaign, IL: Northwest Chapter
of American Registry of Professional Animal Scientists.
4. Suttle NF & Angus KW (1976) Experimental copper deficiency
in the calf. J Comp Pathol 86, 595–608.5. Ward JD, Spears JW & Kegley EB (1993) Effect of copper level
and source (copper lysine vs. copper sulfate) on copper status,
performance, and immune response in growing steers fed diets
with or without supplemental molybdenum and sulfur. J Anim
Sci 71, 2748–2755.6. Gengelbach GP, Ward JD & Spears JW (1994) Effect of dietary
copper, iron, and molybdenum on growth and copper status of
beef cows and calves. J Anim Sci 72, 2722–2727.7. Poole DBR & Rogers PAM (1980) The nature, incidence
and control of bovine copper deficiency in Ireland. In
3. Spurenelement-Symposium Arsen, pp. 225–231 [M Anke,
HJ Schneider and C Bruckner, editors]. Jena, Germany: Frie-
drich-Schiller-Universitat.
8. Suttle NF (1991) The interactions between copper, molyb-
denum, and sulphur in ruminant nutrition. Annu Rev Nutr 11,121–140.
9. Thornton I (2002) Geochemistry and the mineral nutrition of
agricultural livestock and wildlife. Appl Geochem 17,1017–1028.
10. Grace ND (1973) Effect of high dietary Mn levels on the growth
rate and the level of mineral elements in the plasma and soft
tissues of sheep. New Zeal J Agric Res 16, 177–180.11. Reeves PG, Ralston NVC, Idso JP & Lukaski H (2004) Con-
trasting and cooperative effects of copper and iron deficiencies
in male rats fed different concentrations of manganese and
different sources of sulfur amino acids in an AIN-93G-based
diet. J Nutr 134, 416–425.12. Arredondo M, Munoz P, Mura CV & Nunez M (2003) DMT1, a
physiologically relevant apical Cu1þ transporter of intestinal
cells. Am J Physiol Cell Physiol 284, C1525–C1530.13. Ivan M & Grieve CM (1976) Effects of zinc, copper and manga-
nese supplementation of high-concentrate ration on gastrointes-
tinal absorption of copper and manganese in Holstein cows.
J Dairy Sci 59, 1764–1768.14. Loor JJ, Dann HM, Janovick-Guretzky NA, Everts RE, Oliveira
R, Green CA, Litherland NB, Rodriguez-Zas SL, Lewin HA &
Drackley JK (2006) Plane of nutrition prepartum alters hepatic
gene expression and function in dairy cows as assessed
by longitudinal transcript and metabolic profiling. Physiol
Genomics 27, 29–41.15. Legleiter LR (2006) The relationship between copper, manga-
nese, and bovine brain prion proteins: implications for trace
mineral nutrition and bovine spongiform encephalopathy. PhD
Thesis, North Carolina State University
16. Engle TE & Spears JW (2000) Effects of dietary copper concen-
tration and source on performance and copper status of growing
and finishing steers. J Anim Sci 78, 2446–2451.
17. Hansen SL, Schlegal P, Legleiter LR, Lloyd KE & Spears JW
(2008) Bioavailability of copper from copper glycinate in
steers fed high dietary sulfur and molybdenum. J Anim Sci
86, 173–179.18. Janovick-Guretzky NA, Dann HM, Carlson DB, Murphy MR,
Loor JJ & Drackley JK (2007) Housekeeping gene expression
in bovine liver is affected by physiological state, feed intake,
and dietary treatment. J Dairy Sci 90, 2246–2252.19. Pfaffl MW, Horgan GW & Dempfle L (2002) Relative
expression software tool (REST) for group-wise comparison
and statistical analysis of relative expression results in real-
time PCR. Nucleic Acids Res 30, e36.20. Underwood EJ (1981) The Mineral Nutrition of Livestock, 2nd
ed. Wallingford, UK: CABI Publishing.
21. Legleiter LR & Spears JW (2007) Plasma diamine oxidase: a
biomarker of copper deficiency in the bovine. J Anim Sci 85,2198–2204.
22. Salmenpera L, Perheentupa J, Pakarinen P & Siimes MA (1986)
Cu nutrition in infants during prolonged exclusive breast-feed-
ing: low intake but rising serum concentrations of Cu and ceru-
loplasmin. Am J Clin Nutr 43, 251–257.23. Ward JD & Spears JW (1997) Long-term effects of consump-
tion of low-copper diets with or without supplemental
molybdenum on copper status, performance, and carcass charac-
teristics of cattle. J Anim Sci 75, 3057–3065.24. Prohaska JR & Gybina AA (2004) Intracellular copper transport
in mammals. J Nutr 134, 1003–1006.25. Bertinato J & L’Abbe MR (2003) Copper modulates the degra-
dation of copper chaperone for Cu,Zn superoxide dismutase by
the 26 S proteosome. J Biol Chem 278, 35071–35078.26. Kuo YM, Gybina AA, Pyatskowit JW, Gitschier J & Prohaska
JR (2006) Copper transport protein (Ctr1) levels in mice are
tissue specific and dependent on copper status. J Nutr 136,21–26.
27. Arredondo M & Nunez MT (2005) Iron and copper metabolism.
Mol Aspects Med 26, 313–327.28. Hansen SL & Spears JW (2008) Impact of copper deficiency in
cattle on proteins involved in iron metabolism. FASEB J 22,443–445.
29. Mills CF, Dalgarno AC & Wenham G (1976) Biochemical and
pathological changes in tissues of Friesian cattle during the
experimental induction of copper deficiency. Br J Nutr 35,309–331.
30. Seo K, Mohanty TR, Choi T & Hwang I (2007) Biology of
epidermal and hair pigmentation in cattle: a mini-review. Vet
Dermatol 18, 392–400.31. Johnson WT, Johnson LK & Lukaski HC (2005) Serum super-
oxide dismutase 3 (extracellular superoxide dismutase) activity
is a sensitive indicator of Cu status in rats. J Nutr Biochem
16, 682–692.32. Prohaska JR (1983) Changes in tissue growth, concentrations of
copper, iron, cytochrome oxidase and superoxide dismutase sub-
sequent to dietary or genetic copper deficiency in mice. J Nutr
113, 2148–2158.33. Zeng H, Saari JT & Johnson WT (2007) Copper deficiency
decreases complex IV but not complex I, II, III, or V in the
mitochondrial respiratory chain in rat heart. J Nutr 137, 14–18.34. Soldin OP & Aschner M (2007) Effects of manganese on thyr-
oid hormone homeostasis: potential links. Neurotoxicology 28,951–956.
35. Sheehan TE, Kumar PA & Hood DA (2004) Tissue-specific
regulation of cytochrome c oxidase subunit expression by
thyroid hormone. Am J Physiol Endocrinol Metab 286,E968–E974.
36. Ramesh GT, Ghosh D & Gunasekar PG (2002) Activation of
early signaling transcription factor, NF-kB following low-level
manganese exposure. Toxicol Lett 136, 151–158.
Manganese depresses copper status of cattle 1077
British
Journal
ofNutrition

37. Rojo AI, Salinas M, Martin D, Perona R & Cuadrado A (2004)
Regulation of Cu/Zn-superoxide dismutase expression via the
phosphatidylinositol 3 kinase/Akt pathway and nuclear factor-
kB. J Neurosci 23, 7324–7334.38. DiSilvestro RA & Marten JT (1990) Effects of inflam-
mation and copper intake on rat liver and erythrocyte
Cu–Zn superoxide dismutase activity levels. J Nutr 120,1223–1227.
39. Prohaska JR (1991) Changes in Cu,Zn-superoxide dismutase,
cytochrome c oxidase, glutathione peroxidase and glutathione
transferase activities in copper-deficient mice and rats. J Nutr
121, 355–363.
40. National Research Council (2005) Manganese. In Mineral Tol-
erance of Domestic Animals, 2nd ed., pp. 235–247. Washing-
ton, DC: National Academy Press.
41. Cunningham GN, Wise MB & Barrick ER (1966) Effect of high
dietary levels of manganese on the performance and blood
constituents of calves. J Anim Sci 25, 532–538.42. Jenkins KJ & Hidiroglou M (1991) Tolerance of the prerumi-
nant calf for excess manganese or zinc in milk replacer.
J Dairy Sci 74, 1047–1053.43. Ho SY, Miller WJ, Gentry RP, Neathery MW & Blackmon DM
(1984) Effects of high but nontoxic dietary manganese and iron
on their metabolism by calves. J Dairy Sci 67, 1489–1495.
S. L. Hansen et al.1078
British
Journal
ofNutrition


![Copper(II) and manganese(III) complexes of N′-[(2-hydroxy phenyl) carbonothioyl] pyridine-2-carbohydrazide: novel therapeutic agents for cancer](https://img.pdfslide.net/doc/110x75/6356cc24dffe30f4b50c4c72/copperii-andmanganeseiii-complexes-ofn-2-hydroxy-phenyl-carbonothioyl.jpg)


