Embed Size (px)
Citation preview

Appl. Phys. B 55, 3-12 (1992) Applied physics
Physics B "" Chemistry
© Springer-Verlag 1992
The Antarctic Ozone LIDAR System
L. Stefanutti 1, F. Castagnoli 1, M. Del Guasta 1, M. Morandi 1, V.M. Sacco 1, L. Zuccagnoli 1, S. Godin 2, G. Megie 2, and J. Porteneuve 2
t lstituto di Ricerca sulle Onde Elettromagnetiche, Consiglio Nazionale delle Ricerche, Via Panciatichi 64, 1-50127 Florence, Italy 2 Service d'Aeronomie du C.N.R.S., Universit6 P. et M. Curie, F-75252 Paris, France
Received 29 November 1991/Accepted 31 March 1992
Abstract. A new complex lidar, designed to measure tropospheric and stratospheric ozone, strato- spheric aerosols and polar stratospheric clouds and tropospheric clouds has been designed by IROE- CNR and SA-CNRS and implemented at the French antarctic base of Dumont d'Urville. Here, we report a description of the system and some preliminary measurements carried out during the antarctic winter 1991.
PACS: 42.68.Ay, 42.68.Mj, 42.68.Kh, 93.30.Ca
A complex ozone lidar systems has been designed under an Italo-French cooperative program for operation in the Antarctic within the polar ozone lidar experiment in the frame of the network of detection of stratospheric change (POLE-NDSC). This transportable system combines in one single instrument, and in a relatively limited space, solu- tions which have already been proposed by other research groups. Ozone lidars operating with excimer lasers and Ra- man shifters are operational since the beginning of the eight- ies [1]; tropospheric ozone lidars have been tested both at SA-CNRS [2] and at JPL at the Table Mountain facility [3].
This system, designed for both low altitude (2kin to 12 km) and high altitude ozone measurements (10 to 40 km), is operating at the French Antarctic base of Dumont d'Urville (66°S, 140°E) since January 1991.
The POLE system underwent a test campaign at the Ob- servatoire d-Haute Provence from July to September 1990. Subsequently, at the end of September 1990 it was shipped to the Antartic, where it is operating in the frame of NDSC.
1 The POLE System
1.1 Philosophy of the System
The main purpose of such a lidar is the measurement of significant parameters involved in the ozone chemistry in the troposphere and stratosphere. The parameters which may be measured are: • ozone vertical distribution, • stratospheric temperature, • aerosol distribution and polar stratospheric clouds.
The differential absorption technique is used to measure the ozone vertical distribution. In the absence of a strong atmospheric aerosol loading in the stratosphere, the on- and off-lines may be chosen far from one another, typically at 308nm and 355nm, respectively, inside and outside the ozone absorption band [1]. In the troposphere the effect of aerosols may bcome a severe problem for the ozone mea- surement because the effect of aerosols is not easy to model and hence to take into account in the retrieval of the ozone concentration. Two lines, therefore, both in the absorption band of ozone are used with the on-line at 289 nm, hav- ing a larger absorption cross section, and the off-line at 299 nm. For tropospheric ozone measurements the choice of the optimal pairs of lines, which depends on the opticM thickness of the medium, has been studied by Pelon and coworkers [2]. Contamination from other minor constituents should be taken into account, especially from SO2, which presents an absorption band in the same region of ozone. If the aerosol loading becomes too high, both in the strato- sphere as in the troposphere, other wavelengths, outside the ozone absorption band may be necessary. From the inversion of the lidar signatures outside the ozone absorption band, the Mie extinction coefficient and the Angstr6m coefficient will be estimated. Consequently, the Mie component may be re- moved from the two signatures used to measure ozone. This is extremely important in the stratosphere in the presence of heavy aerosol loading, as it is now due to the Pinatubo, and in the presence of polar stratospheric clouds.
The temperature measurements can be performed by in- verting the lidar signature from very high altitudes down to about 25 km [4], that is down to the height of the aerosols Junge layer. In the absence of aerosols, the signature is di-

L. Stefanutti et al.
R~NAT. " i
,~ CHOPPER I-~ i L . . . . . . . J i ! !
~SPECIROME!ER ~'80~£8 BEAMSPLIITER 1 [
B ~ ii ii i i
INT. I F I L T E R
532 nM / /
I
i f
i J ,l Vo w, ., RA,S.o 0]T ERo I . . . .
i ' " ~ "
il ,'
~99 ['
PMT
PMT
PMT
PMT
PC
(i i i i ! i
'J i
!
l
i LASER CLOCR
$VNC.
I ~ SHG ?HG b N D : ~AG FHG
{ I T
X e C 1 LASER
D2 RAMAN SFIIF?£R
!t2 RAMAhl SHiF?£R
II I I I
T T o N
|
S C A M A C
C O U N T I N G
532 n~
i 289 n~
355 n~
| 299 n~
ii| 308 nM
P O L E L I D ~ R
Fig. 1. Block diagram of the POLE lidar; between the dichroic beamsplitter and the spectrometer a mechanical chopper can be inserted. All PMTs have a gating circuit
rectly proportional to the air density and hence, through the ideal gas law, to temperature. Since the molecular backscat- tering coefficient is proportional to the inverse of the fourth power of the wavelength, it may be convenient to carry out such measurements in the violet region of the spectrum, just outside the ozone absorption band [5].
Finally, tropospheric aerosols and clouds, stratospheric aerosols, and polar stratospheric clouds are measured by means of the depolarization technique at the 532 nm wave- length. The measurement technique has been already tested with the backscattering lidar [6], which was operated by our group during the years 1988, 1989, and 1990 in the Antarc- tic.
1.2 Description of the Antarctic 03 Lidar
Figure 1 shows a block diagram of the system. This lidar is actually the sum of different lidar systems.
a) Rayleigh lidar for the measurement of temperature in the high stratosphere, formed by the emission of the third- harmonic of Nd:YAG laser, a large receiving telescope, a 355 nm detection channel, and a photon counting chain.
b) An upper stratospheric ozone lidar, formed by the transmission of the 355 nm emission of third-harmonic of the Nd :YAG laser and the 308 nm emission of the XeC1 excimer laser, and their respective detection channels. The measurement range is from 12 to 40kin. Both analog and photon counting techniques are implemented.

The Antarctic Ozone LIDAR System 5
c) A low altitude or tropospheric ozone lidar, using the 289 nm and 299 nm first Stokes emissions [7] obtained by Raman shifting the fourth-harmonic radiation at 266 nm of the N d : Y A G laser, the relative detection channels and both analog and photon counting channels. The system has been recently equipped with a 355 nm low altitude channel. Such a system operates between 2 km to 12 km altitude.
d) An aerosol backscattering depolarization lidar, operat- ing at 532 nm for tropospheric and stratospheric clouds and aerosol measurements (range 2 -30km) . Such a system has two crossed-polarized detection channels, one parallel to the emitted radiation and one perpendicular to it. At present only analog mode detection is provided.
Table 1. Characteristics of Quanta System SYL 202
Output energy at 1064nm 0.85 J Output energy at 532 nm 0.45 J Pulse repetition rate 10 Hz Beam divergency (full angle) 0.5 mrad Ganssian resonator
Table 2. Characteristics of Lambda Physik EMG 150 MSC
Output energy at 308 nm Pulse repetition rate up to Beam divergency (full angle)
0.18J 80 Hz
>0.2 mrad
1.3 The Transmitter
As indicated in Fig. 1 the transmitter consists of two lasers (Table 1), a Nd: YAG laser (Quanta System model SYL 202) with a Gaussian resonator and an XeC1 excimer laser (Lamb- da Physik model EMG 150 MSC).
The Nd: YAG laser is fol lowed by a second-harmonic generator (SHG) mounted inside the laser head housing and by a Quanta System harmonic generation unit shown in Fig. 2. Two modes of operation are possible: the tropospheric mode and the stratospheric mode. In the tropospheric mode second-, third-, and fourth-harmonic radiations are obtained. A dichroic mirror is used to send the 532nm radiation to a fourth-harmonic generator. The 266 nm radiation was split into two parts, in a 30% and 70% ratio, to pump two Raman shifters filled with hydrogen and deuterium, respectively. In this way the first Raman Stokes lines at 299 nm and 289 nm were obtained. Recently the scheme to generate the fourth- harmonic radiation has been changed. The 532 nm beam is split into two parts (35% and 65%) that are sent to two separate, fourth-harmonic generators. This solution permits to obtain a more stable fourth-harmonic radiation. Simul-
taneously to the 266 nm radiation both 532 nm and 355 nm radiations are obtained by the conversion of the residual part of 1064 nm (see Fig. 2). A second third-harmonic generator (THG) has been added to provide aerosol corrections for tropospheric measurements.
When high altitude 03 measurements have to be per- formed, a total reflection prism is inserted into the laser beam path. Then the 1064nm and the 532nm radiation are sent to a third-harmonic generator. The 355 nm and the residual 532 nm emissions, together with the 308 nm generated by the XeCI laser are coupled out into the atmosphere.
The characteristics of XeC1 laser are listed in Table 2. The system is formed by an injection locked master oscillator and an amplifier.
In Fig. 3 the ozone lidar is shown: the 289 nm, 299 nm, 355 rim, and the 532 nm radiations are coupled out into the atmosphere near the receiving telescope, while the 355 nm, the 532 nm, and the 308 nm are coupled out at the far end at more than 3 m from the receive telescope 's center. This is done in order to reduce as much as possible overloading of the photodetectors from the lower levels of the atmosphere.
532+355nm 532 nm
30 '/. -~266nm ~
70'/, -266nm II F]IF IjH
1084÷ 532nm ,....~
Fig. 2 i,""
1064nm
532+355nm
UV DIAL CHANNELS (SPECTROMETER)
ALIGNMENT MIRRORS ~
L\,,'ELA',CHAOKSCATTER'""
L / " \X," L,'E, Fig. 2. The harmonic box generating unit: the first element is a totally reflecting prism, mounted on a movable slit. When inserted into the optical path, the 1064 nm and the 532 nm radiation are coupled to the THG. When the slit is removed, the 532 nm radiation is sent to the FHG, and by means of a partially reflective and a totally reflective mirror, the 266nm radiation is divided into two beams. The residual 1064nm radiation is sent to a SHG and a THG. The obtained 532nm and 355 nm radiations are used for the tropospheric measurements Fig. 3. A schematic view of the POLE ozone lidar

6
The Nd:YAG laser is designed to operate at a 10Hz repetition rate, while the excimer laser operates at 80 Hz.
1.4 The Receiving System
The receiver is formed by an 0.8 m F/9 aluminum Cassegrain telescope. The beam is collimated and by means of a dichroic beamsplitter the UV radiation is separated from the green radiation. The radiation at 532 nm is thus sent to a narrow band interference filter (0.15 nm bandwidth) and then to two cube polarizers, where the two polarizations are separated. Finally, the signals reach the EM19658 S-20 2" photomul- tipliers. The photomultipliers can be gated as in the case of the backscattering system [6].
After the dichroic beamsplitter, the UV radiation is cou- pled to a spectrometer (Fig. 4), either directly or by pass- ing through a mechanical chopper. The spectrometer uses a holographic grating with 3600 lines/mm, which separates the different UV lines, thus permitting a simultaneous detec- tion of all the UV radiation. Particular care has been taken to avoid crosstalk between channels. For each channel a Hamamatsu 1" photomultiplier has been used. The circuitry of such tubes has been designed to operate both in the ana- log and in the photon counting mode. Wideband 200 MHz preamplifiers have been designed and mounted at the output of the tubes. A gating circuitry has been implemented in the photomultiplier circuitry, as an alternative to the chopper.
1.5 The Detection Electronics
Both A/D conversion and photon counting techniques have been adopted. The analog detection uses a quad waveform recorder LeCroy model 6810 5MHz/12bits. There are two photon counting chains, each one using the following LeCroy units: - model 3521, multichannel scaler, 1 gs minute dwell time, 100 MHz max. counting rate; - MM8206A, 64 Kbyte/16 bits auxiliary memory module; - 8501 programmable clock generator.
L. Stefanutti et al.
A LeCroy MAGIC (Manual & Automatic General pur- pose Interface to Camac) controller model 6010 is used both to control all the previous instruments and to interface the LeCroy CAMAC bus to the GPIB port of the host computer. By means of such a controller fast averaging and acquisition rates up to 80 shots/s are possible.
Two 386 based rack-mounted P.I.CO (Personal Industrial Computer) by ASEM Industria have been installed. One of these computers is used as host for the acquisition mode of the lidar signals, while the second one is used both to drive the stepping motors for the alignment of the mirrors in the optical path and for data processing.
The whole system is housed in two 20 feet long shelters, particularly designed to operate in the Antarctic.
2 Tests Performed
2.1 The Fourth-Harmonic Generation Unit
Tests of fourth-harmonic generation by means of a BBO crystal were performed [8], but the results were not encour- aging. Maximum efficiency lower than 20% was measured with a maximum output energy of 38 mJ at 266 nm. An effect of saturation seemed to happen and an increase in the pump- ing energy did not produce more intense 266 nm radiation. Such a value of 38 mJ was too low to pump simultaneously two Raman shifters. With KD*P FHG 70mJ output energy was obtained. Operation at 10Hz was not possible due to the absorption of UV radiation. The repetition rate had to be reduced to 3 Hz. In this way a reasonable good enegy stability over periods of the order of more than 30 rain were obtained.
2.2 The Generation of the Raman Stokes Lines
The Raman cells are one meter long, made of stainless steel with windows mounted at Brewster angle. The 266 nm ra- diation is focused at approximately the center of the cells. About 15 mJ at 289nm and 8 mJ at 299nm were obtained by pumping the hydrogen and the deuterium Raman shifters
J
AL MIRROR
299nm 3600 L/mm
289nm
300nm 355nm
SPHERICAL MIRROR Fig. 4. Scheme of the spectrometer: the system is formed by a holo- graphic grating with 3600 lines/mm and 2 spherical mirrors

The Antarctic Ozone LIDAR System 7
14 ̧
12 ̧
lO
~, 8 ..=.
6
4
N 2 RAMAN SHIFTING- H 2 25bar+N 2
~ 266nm
• $1 * $2 . f
20 40
Total pressure (bar)
14 ̧
12
10
6.
D 2 RAMAN SHIFTING - D225bar+N 2
,~ 266nm
• $1 * $2
20 lO lotul pressure (bur)
Fig. 5, The upper graph refers to the H2 Raman cell, the lower to the D2 Raman cell. The output energy vs total pressure is plotted for the case of H2 partial pressure of 25 bar and N2 as buffer gas. S1 and 5'2 indicate the first and second Stokes lines
with 30% and 70% of the 266 nm energy obtained by means of the KD*P FHG. Several tests have been carried out to optimize the gas mixture in the Raman cells. Nitrogen has been used as buffer gas. Figures 5 and 6 display the energy and the efficiency of the Stokes lines vs total pressure for the H2 and D2 Raman shifters (partial pressure 25 bar). With this partial pressure the best efficiency and the best output energy were measured. Simultaneously the maximum reduction of the second Stokes component was obtained [9].
2.3 Acquisition Programs
The acquisition procedures are written using the LeCroy 6910-DEV software development package. This software provides the necessary tools to develop custom applications to be executed locally in the LeCroy 6010 MAGIC Con- troller. Since the LeCroy 6010 resides in the CAMAC bus (IEEE-583), rapid access to the full line of LeCroy instru- mentation is possible (see also Sect. 1.5). A high level of integration is achievable including rapid processing, local display on an auxiliary monitor and full access to the GPIB communication port to the host computer.
All the operation of acquisition, controlling, and averag- ing are made locally into the LeCroy instrumentation and the host computer has only to transfer the acquisition pro- cedures on the LeCroy controller and wait for the averaged data to be stored.
"5
40
20
H2 RAMAN SHIFTING- H 225 bar+ N 2
j o
. / /
/ /
20
Total pressure (bar)
D 2 RAMAN SHIFTING- D225bar+N2
40
u,a
40
20
j ° 1 / •
, j ° J
20 40 latul pressure [bur)
Fig. 6. Efficiency vs total pressure plotted for the cases of Fig. 5
3 L idar M e a s u r e m e n t
3.1 Tropospheric Ozone Profiles
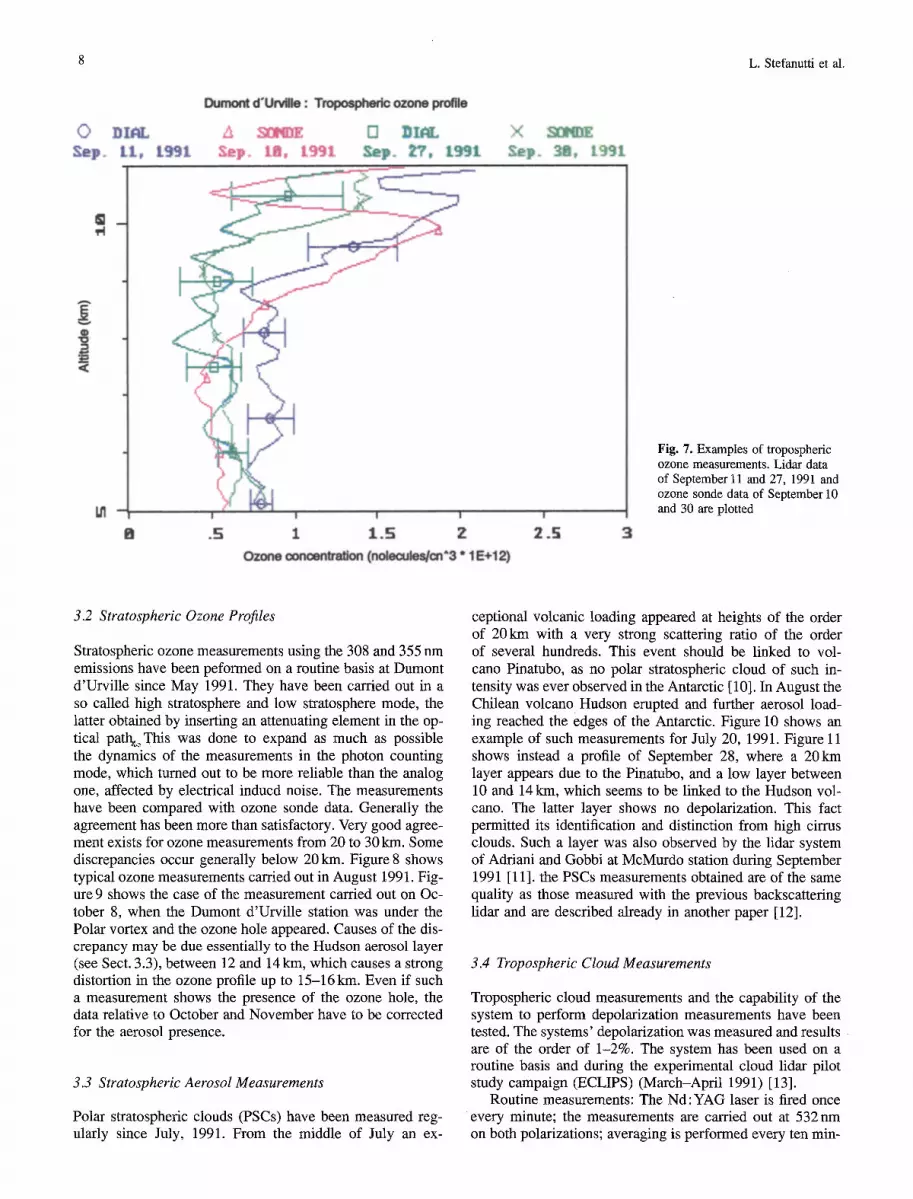
Several tests of tropospheric ozone measurements have been performed at the French base of Dumont d'Urville since September 1991. Such measurements are carried out by fir- ing the Nd: YAG laser at a pulse repetition rate of 3 Hz. Averaging over several shots is necessary in order to ob- tain a good signal to noise ratio. A good lidar measurement requires an averaging time of about 30rain. With this tech- nique measurements up to 10-12km seem generally pos- sible. Figure 7 shows a group of tropospheric ozone mea- surements carded out at Dumont d'Urville on September 11 and 27, 1991. The obtained ozone profiles seem consistent with the data obtained with ozone sondes on September 10 and 30, respectively. Differences appearing between the lidar and the ozone sonde data may be due to two main causes: 1) the measurements are generally not performed at the same time, with time intervals of several hours or more likely of some days, as in the case shown, 2) the lidar data have not been corrected for possible aerosol interferences. The differ- ences appearing in the lower stratosphere above 10 km may be therefore caused by the presence of the Hudson aerosol layer, about which we report in Sect. 3.3.
Measurements utilizing also the 355 nm wavelength, nec- essary to perform aerosol correction, have been started in March 1992.
8 L. Stefanutti et al.
Sep~ 1.1., t99::It
Dumont d'Urville : Tropospheric ozone profile
A sONl~ [] ~ , L X ~ep. I.A, L991 Sep. ~?, L991 ~sp.
¢P
<:
~d
n - | ,
el . 5 I I l
1 1.5 Z Ozone concentration (nolecules/cn'3 * 1 E+12)
~MI~E
!
2 . 5 3
Fig. 7. Examples of tropospheric ozone measurements. Lidar data of September 11 and 27, 1991 and ozone sonde data of September 10 and 30 are plotted
3.2 Stratospheric Ozone Profiles
Stratospheric ozone measurements using the 308 and 355 nm emissions have been peformed on a routine basis at Dumont d'Urville since May 1991. They have been carried out in a so called high stratosphere and low stratosphere mode, the latter obtained by inserting an attenuating element in the op- tical pattk~This was done to expand as much as possible the dynamics of the measurements in the photon counting mode, which turned out to be more reliable than the analog one, affected by electrical inducd noise. The measurements have been compared with ozone sonde data. Generally the agreement has been more than satisfactory. Very good agree- ment exists for ozone measurements from 20 to 30 kin. Some discrepancies occur generally below 20 kin. Figure 8 shows typical ozone measurements carried out in August 1991. Fig- ure 9 shows the case of the measurement carried out on Oc- tober 8, when the Dumont d'Urville station was under the Polar vortex and the ozone hole appeared. Causes of the dis- crepancy may be due essentially to the Hudson aerosol layer (see Sect. 3.3), between 12 and 14km, which causes a strong distortion in the ozone profile up to 15-16kin. Even if such a measurement shows the presence of the ozone hole, the data relative to October and November have to be corrected for the aerosol presence.
3.3 Stratospheric Aerosol Measurements
Polar stratospheric clouds (PSCs) have been measured reg- ularly since July, 1991. From the middle of July an ex-
ceptional volcanic loading appeared at heights of the order of 20 km with a very strong scattering ratio of the order of several hundreds. This event should be linked to vol- cano Pinatubo, as no polar stratospheric cloud of such in- tensity was ever observed in the Antarctic [10]. In August the Chilean volcano Hudson erupted and further aerosol load- ing reached the edges of the Antarctic. Figure 10 shows an example of such measurements for July 20, 1991. Figure 11 shows instead a profile of September 28, where a 20km layer appears due to the Pinatubo, and a low layer between 10 and 14km, which seems to be linked to the Hudson vol- cano. The latter layer shows no depolarization. This fact permitted its identification and distinction from high cirrus clouds. Such a layer was also observed by the lidar system of Adriani and Gobbi at McMurdo station during September 1991 [11]. the PSCs measurements obtained are of the same quality as those measured with the previous backscattering lidar and are described already in another paper [12].
3.4 Tropospheric Cloud Measurements
Tropospheric cloud measurements and the capability of the system to perform depolarization measurements have been tested. The systems' depolarization was measured and results are of the order of 1-2%. The system has been used on a routine basis and during the experimental cloud lidar pilot study campaign (ECLIPS) (March-April 1991) [13].
Routine measurements: The Nd:YAG laser is fired once every minute; the measurements are carried out at 532nm on both polarizations; averaging is performed every ten rain-

The Antarctic Ozone LIDAR System
Dumont d'Urville : Stratospheric ozone profile
© DIaL & DIAL ~] l~IaL )~-( ~ J E
01
' 1 0
< Ul id
id
8 I
1 I I I I I
Z 3 4 S Ih
Ozone concentration (nolecules/cn^3 * 1 E+12)
¢
7
~9~ ~991
Fig. 8. Three lidar profiles are shown relative to August 12, 1991. The closest ozone sonde profiles are plotted, relative to August 12 and August 19
A E
<
© Dumont d'Urville : Stratospheric ozone profile
~. t~Z Oct. 88, L99~ (~ 88, L991
8 I I I I
2 3 4 ¢; Ozone concentration (nolecules/cn ̂ 3 * 1 E+12)
r-,
Fig. 9. In the lower altitude below 20 km the agreement is not good, due to the presence of the Hudson volcano aerosols, but the ozone hole is evident

10 L. Stefanutti et al.
D---'_mor% D'- Oi-~ i 1 ie 28/87/1991 13 . . . . . . . 8a~,~e le~gg}~ '--~<' ~ -_--- --2& _ . ~ ,--2&2
N l N
]
f ,=4 N
7
i'! i]
I {A./' ii '~i / Scattering
'~ii
."J' 'i / Depolarization [ .--/~ '~ ~..
~. ,~,r~_.--~.~ .... ~ i ~-
! ....... ._ ._,--...'[A~'v-~-;-,Jb~'~:_<,<,~.o~...,~_.~o~ i ] '~. k~,~% ............... .,,~,.~..,. ,.,...~...,, ......
Heigh% (~m]
N
Fig. 10. The scattering ratio (R - 1) = tiM/fiR and the depolariza- tion ratio, defined here as the crossed polarized signal vs the total detected signal are plotted vs height for the elas- tic backscattering signal of July 20, 1991. /3M,R are respectively the Mie and Rayleigh backscattering coefficient. This very strong aerosol loading may be linked to a plume of Pinatubo
N'.mo-.-,i% #; Ui-v i I i e 28/89/199i iZ :38:25
8~at t -er in_~ Ra'~ fe
2 , i "i' ~]
°i
• / ij' "i
Heigh% (~m)
Fig. 11. The same as Fig. 10, but for Septem- ber 28, 1991. The lower layer between 10and 14km could be linked to the volcano Hudson, which erupted in August 1991, the upper layer to Pinatubo. From the temperature analysis Du- mont d'Urville was outside the polar vortex in this period
utes. This type of mesurements permits to obtain information on cloud base height and cloud optical parameters over the whole year.
ECLIPS measurements: During the experimental cloud lidar pilot study (ECLIPS) campaign from March to May, 1991, lidar measurements have been carried out as for the routine case, but the laser was fired every 10 s, with averag- ing every minute. Measurements have been carried out dur- ing AVHRR satellite overpasses, and specifically one hour before, 20 min during and one hour after the overpass.
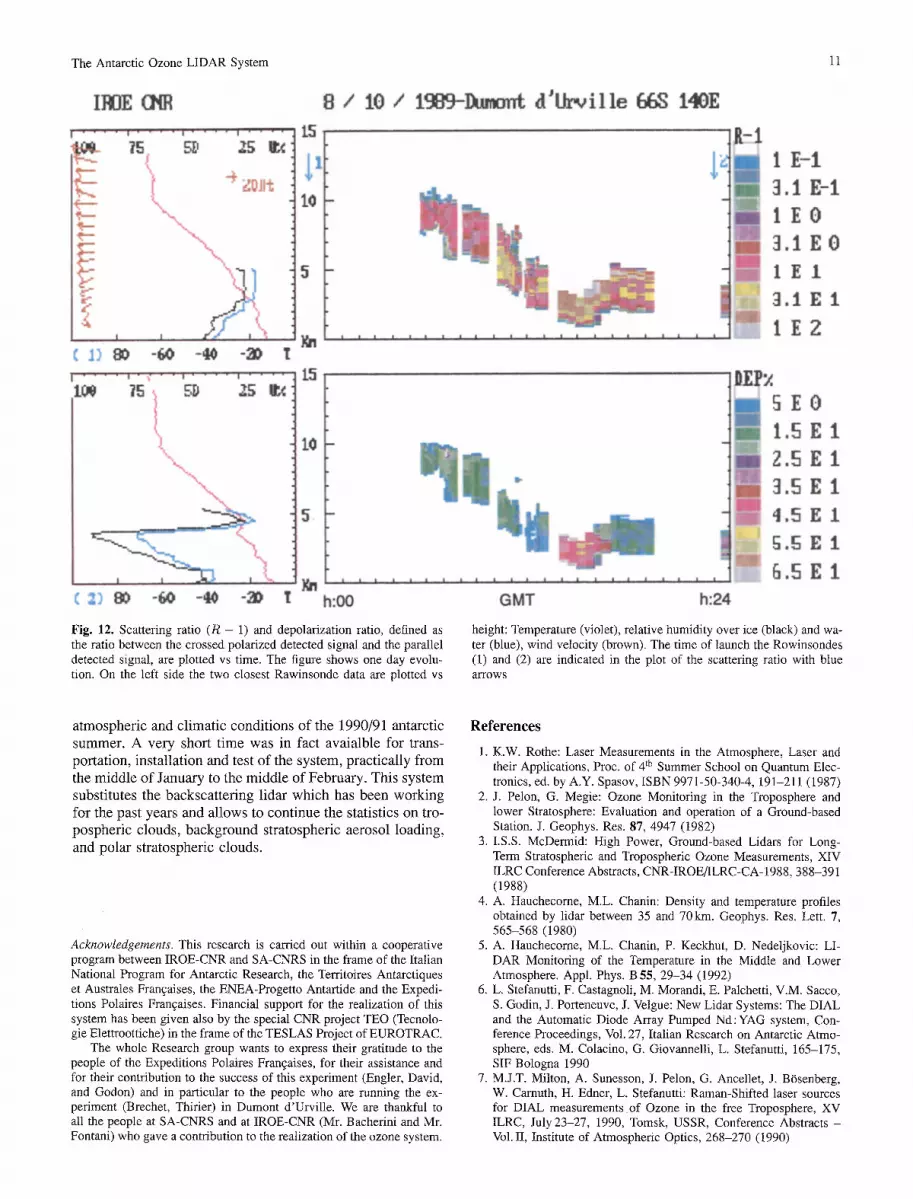
Data relative to the ECLIPS campaign 1991 have not yet been processed. As an example, in Fig. 12 we report similar data from the ECLIPS campaign 1989. In the upper figures on the left one radiosounding is plotted, on the right- hand side the scattering ratio (R - 1) as a function of time. The plot refers to a one day measurements. In the lower
figures the subsequent radiosounding (24 hours interval) and the depolarization ratio for the same day are plotted.
4 C o n c l u s i o n s
This ozone lidar is the first to be installed permanently in the Antarctic. It operates in the frame of the network for detection of stratospheric change (NDSC). The first year of of operation has permitted to evaluate the various opera- tional and instrumental problems involved. It permitted to follow with great detail the evolution of the ozone hole phe- nomenon at the edge of the polar vortex and the unexpected stratospheric volcanic aerosol loading [10, 14]. The results obtained, the capability itself to install it at Dumont d 'Urvi l le indicate a success, taking into account the particular severe
The Antarctic Ozone LIDAR System 11
I] E (HR
r . . , .=
I 1
.l~1 80 -60
I . . . . I . . . . ! . . . .
?5 S[' 25 UZ
",%
.-~ -:3)
8 , ' tSr
t l
5
15
1 0 / 1989-- d'U i 1 le 668
1 . . . . . . ~ ' q " " 1 . . . . I . . . . .
:1.¢~ 75 i g[a 25 IIg~ •
t0 - "-.,..
2) ~) -,r~, - ~ -30, ! h:00 Fig. 12. Scattering ratio (R - 1) and depolarization ratio, defined as the ratio between the crossed polarized detected signal and the parallel detected signal, are plotted vs time. The figure shows one day evolu- tion. On the left side the two closest Rawinsonde data are plotted vs
1 E-1 3.1 E-1 1 E 0 3 ,1E0 1 E 1
~t.1 E 1
1 E 2
i SEO -i 1 , S E I
~: g ,g E 1 @
GMT h:24 height: Temperature (violet), relative humidity over ice (black) and wa- ter (blue), wind velocity (brown). The time of launch the Rowinsondes (1) and (2) are indicated in the plot of the scattering ratio with blue arrows
atmospheric and climatic conditions of the 1990/91 antarctic summer. A very short time was in fact avaialble for trans- portation, installation and test of the system, practically from the middle of January to the middle of February. This system substitutes the backscattering lidar which has been working for the past years and allows to continue the statistics on tro- pospheric clouds, background stratospheric aerosol loading, and polar stratospheric clouds•
Acknowledgements. This research is carried out within a cooperative program between IROE-CNR and SA-CNRS in the frame of the Italian National Program for Antarctic Research, the Territoires Antarctiques et Australes Fran~alses, the ENEA-Progetto Antartide and the Expedi- tions Polalres Frangaises. Financial support for the realization of this system has been given also by the special CNR project TEO (Tecnolo- gie Elettroottiche) in the frame of the TESLAS Project of EUROTRAC.
The whole Research group wants to express their gratitude to the people of the Expeditions Polaires Fran~aises, for their assistance and for their contribution to the success of this experiment (Engler, David, and Godon) and in particular to the people who are running the ex- periment (Brechet, Thirier) in Dumont d'Urville. We are thankful to all the people at SA-CNRS and at IROE-CNR (Mr. Bacherini and Mr. Fontani) who gave a contribution to the realization of the ozone system.
References
1. K.W. Rothe: Laser Measurements in the Atmosphere, Laser and their Applications, Proc. of 4 th Summer School on Quantum Elec- tronics, ed. by A.Y. Spasov, ISBN 9971-50-340-4, 191-211 (1987)
2. J. Pelon, G. Megie: Ozone Monitoring in the Troposphere and lower Stratosphere: Evaluation and operation of a Ground-based Station. J. Geophys. Res. 87, 4947 (1982)
3. I.S.S. McDermid: High Power, Ground-based Lidars for Long- Term Stratospheric and Tropospheric Ozone Measurements, XIV ILRC Conference Abstracts, CNR-IROE/ILRC-CA- 1988,388-391 (1988)
4. A. Hauchecorne, M.L. Chanin: Density and temperature profiles obtained by lidar between 35 and 70km. Geophys. Res. Lett. 7, 565-568 (1980)
5. A. Hauchecome, M.L. Chanin, P. Keclchut, D. Nedeljkovic: LI- DAR Monitoring of the Temperature in the Middle and Lower Atmosphere. Appl. Phys. B 85, 29-34 (1992)
6. L. Stefanutti, F. Castagnoli, M. Morandi, E. Palchetti, V.M. Sacco, S. Godin, J. Porteneuve, J. Velgue: New Lidar Systems: The DIAL and the Automatic Diode Array Pumped Nd:YAG system, Con- ference Proceedings, Vol. 27, Italian Research on Antarctic Atmo- sphere, eds. M. Colacino, G. Giovannelli, L. Stefanutti, 165-175, SIF Bologna 1990
7. M.J.T. Milton, A. Sunesson, J. Pelon, G. Ancellet, J. B6senberg, W. Carnuth, H. Edner, L. Stefanutti: Raman-Shifted laser sources for DIAL measurements o f Ozone in the free Troposphere, XV ILRC, July23-27, 1990, Tomsk, USSR, Conference Abstracts - Vol. II, Institute of Atmospheric Optics, 268-270 (1990)

12 L. Stefanutti et al.
8. L. Stefanutti, F. Castagnoli, M. Morandi, V.M. Sacco, G. Megie, S. Godin, J. Porteneuve: A new Ozone Lidar for operation in the Antarctic, XV ILRC, July 23-27, 1990, Tomsk, USSR, Confer- ence Abstracts - Vol. II, Institute of Atmospheric Optics, 275-278 (1990)
9. L. Stefanutti, V.M. Sacco, F. Castagnoli, M. Morandi: TODUL lidar system for tropospheric ozone measurements, Proceedings of EUROTRAC Symposium 90, ed. P. Borrell, SPB Academic Publishing bv, The Hague, The Netherlands, 455-458 (1991)
10. L. Stefanutti, M. Morandi, M. DelGuasta, S. Godin, C. David, J. Brechet, F. Thirier: Pinatubo in the Antarctic?, Proceedings of the IV Workshop - Italian Research on Antarctic Atmosphere, Porano October 21-23, 1991, Italy, ed. by M. Colacino, G. Giovannelli, L. Stefanutti, Ed. Compositori, Bologna iin press)
11. A. Adriani, G. Di Donfrancesco: Lidar Monitoring of the strato- sphere over McMurdo, Antarctica. August October 1991, Proceed-
12.
13.
14.
ings of the IV Workshop - Italian Research on Antarctic Atmo- sphere, Porano October 21-23, 1991, Italy, ed. by M. Colacino, G. Giovannelli, L. Stefanutti, Ed. Compositori, Bologna (in press) L. Stefanutti, M. Morandi, M. Del Guasta, S. Godin, G. Megie, J. Brechet, J. Piquard: Polar Stratospheric Cloud Observations over the Antarctic Continent at Dumont d'Urville. J. Geophys. Res. 96, 975-987 (1991) An Experimental Cloud Lidar Pilot Study (ECLIPS): Report of the WCRP/CSIRO Workshop on Cloud Base Measurement, WCRP- 14, Sep. 1988, WMO/TD-No. 251 L. Stefanutti, F. Castagnoli, M. Del Guasta, M. Morandi, S. Godin, G. Megie, J. Brechet, P. Thirier: Preliminary Ozone Measurements by means of DIAL in Dumont d'Urville, Proceedings of the IV Workshop - Italian Research on Antarctic Atmosphere, Porano October 21-23, 1991, Italy, ed. by M. Colacino, G. Giovannelli, L. Stefanutti, Ed. Compositori, Bologna (in press)


