Embed Size (px)
Citation preview

Accepted to the Astrophysical JournalPreprint typeset using LATEX style emulateapj v. 11/10/09
THE BALLOON-BORNE LARGE APERTURE SUBMILLIMETER TELESCOPE (BLAST) 2005: A 10 DEG2
SURVEY OF STAR FORMATION IN CYGNUS X
Arabindo Roy,1,† Peter A. R. Ade,2 James J. Bock,3,4 Edward L. Chapin,5 Mark J. Devlin,6 Simon R. Dicker,6
Kevin France,7 Andrew G. Gibb,5 Matthew Griffin,2 Joshua O. Gundersen,8 Mark Halpern,5
Peter C. Hargrave,2 David H. Hughes,9 Jeff Klein,6 Gaelen Marsden,5 Peter G. Martin,10 Philip Mauskopf,2
Jorge L. Morales Ortiz,11 Calvin B. Netterfield,1,12 Alberto Noriega-Crespo,13 Luca Olmi,11,14
Guillaume Patanchon,15 Marie Rex,16 Douglas Scott,5 Christopher Semisch,6 Matthew D. P. Truch,6
Carole Tucker,2 Gregory S. Tucker,17 Marco P. Viero,1,4 Donald V. Wiebe5
Accepted to the Astrophysical Journal
ABSTRACT
We present Cygnus X in a new multi-wavelength perspective based on an unbiased BLAST surveyat 250, 350, and 500 µm, combined with rich datasets for this well-studied region. Our primary goalis to investigate the early stages of high mass star formation. We have detected 184 compact sourcesin various stages of evolution across all three BLAST bands. From their well-constrained spectralenergy distributions, we obtain the physical properties mass, surface density, bolometric luminosity,and dust temperature. Some of the bright sources reaching 40 K contain well-known compact H IIregions. We relate these to other sources at earlier stages of evolution via the energetics as deducedfrom their position in the luminosity-mass (L-M) diagram. The BLAST spectral coverage, near thepeak of the spectral energy distribution of the dust, reveals fainter sources too cool (∼ 10 K) to beseen by earlier shorter-wavelength surveys like IRAS. We detect thermal emission from infrared darkclouds and investigate the phenomenon of cold “starless cores” more generally. Spitzer images ofthese cold sources often show stellar nurseries, but these potential sites for massive star formationare “starless” in the sense that to date there is no massive protostar in a vigorous accretion phase.We discuss evolution in the context of the L-M diagram. Theory raises some interesting possibilities:some cold massive compact sources might never form a cluster containing massive stars; and clusterswith massive stars might not have an identifiable compact cold massive precursor.Subject headings: submillimeter — stars: formation — ISM: clouds — balloons
1 Department of Astronomy & Astrophysics, University ofToronto, 50 St. George Street, Toronto, ON M5S 3H4, Canada
2 Department of Physics & Astronomy, Cardiff University, 5The Parade, Cardiff, CF24 3AA, UK
3 Jet Propulsion Laboratory, Pasadena, CA 91109-80994 Observational Cosmology, MS 59-33, California Institute of
Technology, Pasadena, CA 911255 Department of Physics & Astronomy, University of
British Columbia, 6224 Agricultural Road, Vancouver, BCV6T 1Z1,Canada
6 Department of Physics and Astronomy, University of Penn-sylvania, 209 South 33rd Street, Philadelphia, PA 19104
7 Center for Astrophysics and Space Astronomy, University ofColorado, Boulder CO, 8030
8 Department of Physics, University of Miami, 1320 CampoSano Drive, Carol Gables, FL 33146
9 Instituto Nacional de Astrofısica Optica y Electronica(INAOE), Aptdo. Postal 51 y 72000 Puebla, Mexico
10 Canadian Institute for Theoretical Astrophysics, Universityof Toronto, 60 St. George Street, Toronto, ON M5S 3H8, Canada
11 University of Puerto Rico, Rio Piedras Campus, PhysicsDept., Box 23343, UPR station, San Juan, Puerto Rico
12 Department of Physics, University of Toronto, 60 St.George Street, Toronto, ON M5S 1A7, Canada
13 Spitzer Science Center, California Institute of Technology,Mail Code 314-6, Pasadena, CA 91125
14 Istituto di Radioastronomia, Largo E. Fermi 5, I-50125,Firenze, Italy
15 Laboratoire APC, 10, rue Alice Domon et Leonie Duquet75205 Paris, France
16 Steward Observatory, University of Arizona, 933 N. CherryAve, Tucson, AZ 85721, USA
17 Department of Physics, Brown University, 182 Hope Street,Providence, RI 02912† [email protected]
1. INTRODUCTION
We report on an unbiased survey of the Cygnus X(Cyg X) high-mass star formation region, conducted in2005 by the Balloon-borne Large Aperture SubmillimeterTelescope (BLAST), a 2-m stratospheric telescope thatmaps simultaneously at 250, 350, and 500 µm (Pascaleet al. 2008). A primary ambition for BLAST was to studythe earliest stages of massive protostellar evolution. Mas-sive stars play an important role in Galactic ecology, ini-tially through protostellar outflows and later through ra-diation pressure, ionization, stellar winds, and supernovaexplosions, and yet, in spite of their pivotal role, very lit-tle is known about their formation (Zinnecker & Yorke2007).
Massive molecular clouds are favorable sites for mas-sive star formation. If they are sufficiently dense tobe self-gravitating, then they also have high extinction.Even in the near to mid infrared they have significant op-tical depth, affecting observations of any embedded pro-tostars, and leading to the “infrared dark cloud” (IRDC)phenomenon seen by ISO (Perault et al. 1996), MSX(Egan et al. 1998; Simon et al. 2006), and Spitzer IRACand MIPS (Carey et al. 2005; Kraemer et al. 2010a).Some IRDCs are nurseries of young protostellar objectsand protoclusters (Simon et al. 2006). However, IRDCs,by definition found in silhouette, require a luminous dif-fuse background. Massive clouds can be discovered di-rectly, without this detection bias, by their far-infrared tomm-wave optically-thin thermal dust emission. BLAST
arX
iv:1
009.
2972
v2 [
astr
o-ph
.GA
] 1
8 N
ov 2
010

2 Roy et al.
exploits this fact.We introduce the BLAST imaging of Cyg X in § 2.
BLAST detects thermal emission from dust in largelyneutral regions and so provides a complementary view ofthe interstellar medium (ISM) compared to, for example,radio emission from ionized gas (§ 2.1; though both areultimately dependent on the local stellar radiation fieldand so are related spatially in some predictable ways).An important feature of BLAST imaging is its capabil-ity of observing and characterizing extended structuresin the star-forming environment at different spatial scales(§§ 2.3 and 2.4). In §§ 2.5 and 2.6 we describe the iden-tification and quantification of BLAST compact sources.Appendix A discusses measurement of their flux densitiesat different wavelengths for use in the multi-wavelengthspectral energy distribution (SED).
Blind submillimeter surveys with BLAST (Chapinet al. 2008; Netterfield et al. 2009), precursors to thosewith Herschel (e.g., Molinari et al. 2010), are ideallysuited for finding and characterizing cold sources, be-cause of the designed coverage near the peak of the colddust spectral energy distribution (SED). This allows usto determine where the dust temperature T is low, akey requirement before determining the cold dust col-umn densities and masses. BLAST of course also sees thelater evolutionary stages when the dust is warmed up bythe forming protostars, and again the multi-wavelengthcoverage tightly constrains both dust temperature andbolometric luminosity (Lbol).
In order to interpret the BLAST emission more fully,and place the compact sources in context, we make use ofmany different surveys of Cyg X in other tracers, includ-ing both continuum emission and molecular lines. Theserich multi-wavelength, multi-species surveys of Cyg X arethe basis of a brief overview of the physical environmentin § 3.
The spectral energy distributions (SEDs) and deducedproperties T , L, and mass M of the compact sources arepresented in § 4. As we discuss in § 4.6, the mass of thecompact source, along with its luminosity (which mapsinto T ), determine its position on an evolutionary trackin the L-M diagram (Molinari et al. 2008). Investigat-ing the stages of high mass protostellar and protoclusterevolution is a prime aspect of this paper.
In the earliest stages, before there is any (significant)internal source of energy from accretion or nuclear burn-ing, the dust is heated only by the external radiationfield. Because of the high extinction the dust is cold,with T typically ∼ 15 K or lower, but in any case colderthan the “ambient” temperature of diffuse dust in thesame external radiative environment (which near thesestar forming molecular clouds might be much more in-tense than the local interstellar radiation field). Suchcold clouds, and the initial gravitationally-bound con-densations within them are therefore rather invisible toIRAS, but are in principle detectable by BLAST andground-based surveys targeting regions of high extinction(e.g., Motte et al. 2007 using MAMBO at 1.2 mm). Ac-cording to the time sequence and nomenclature used forlow mass star formation, sources detected in this earlierevolutionary stage could be called “class −1.” However,as a reminder of the energetics, we prefer the physically-motivated shorthand “stage E” (from Externally heated,but also usefully Earliest – see § 5.6). Likewise, we call
sources in the subsequent evolutionary stage, when thereis sufficiently vigorous accretion power internally to raisethe dust to the ambient or higher temperature, “stage A”(see § 5.5; the low mass analog would be “class 0”).
An illustrated view of the evolutionary stages of mas-sive star formation, illuminated from the BLAST sub-millimeter perspective, is presented in § 5.
A key factor that is important to the interpretationof our particular observations is that massive stars formin stellar groups and star clusters (Lada & Lada 2003).The approximately 1′ angular resolution (FWHM) of theBLAST images corresponds to 0.5 pc at 1.7 kpc. Thisis the size scale (sometimes called a “clump” – Bergin& Tafalla 2007) of the observed embedded and newly-emerging clusters in Cyg X (Le Duigou & Knodlseder2002; § 3.1). Thus it is relatively straightforward tosearch for the precursors to these protoclusters, withinwhich massive protostars will be the dominant sourceof luminosity and ionizing radiation. However, resolvingprotoclusters into unconfused condensations (a smallerlinear scale sometimes called “cores”) that are destinedto form single (proto)stars requires more angular resolu-tion than has been available in surveys (even with the11′′ beam of MAMBO2 which is smaller than achievedhere with BLAST). Submillimeter observations with thelarger telescope of Herschel will be better (18′′ at 250 µmwith the SPIRE camera), but not immune to these con-siderations.
Empirically, Bontemps et al. (2009) have made an ex-tensive study of fragmentation and sub-fragmentation in-side targeted molecular dense cores in the Cyg X regionwith interferometric observations at Plateau de Bure.Theoretically, it is still unclear how clusters containingmassive stars form (McKee & Tan 2003; Krumholz & Mc-Kee 2008; Bonnell et al. 1997, 2001, 2007; Smith et al.2009; Wang et al. 2010). Some insight provided by theBLAST observations and ancillary data, coupled withcurrent theory is the focus of the discussion in § 6.
2. BLAST IMAGING OF Cyg X
Cyg X, positioned in the Galactic Plane at aboutl = 80◦ and about 1.7 kpc away from the Sun (Schneideret al. 2006), has long been known for its massive star for-mation. With BLAST (Pascale et al. 2008; Truch et al.2008) we surveyed 10 deg2 in Cyg X for 10.6 hr dur-ing the June 2005 flight (BLAST05), mapping the areaon three visits to provide cross-linked scanning. In ad-dition, a significant amount of calibration-related timewas spent observing a circular cap of radius 1◦ centredon W75N, resulting in even higher signal to noise anddynamic range there.
Final maps on 15′′ pixels were produced using themap-maker SANEPIC (Patanchon et al. 2008). Thecombination of high scan speed and low 1/f knee, to-gether with the cross-linking and common-mode removalin SANEPIC, produces a map retaining diffuse low spa-tial frequency emission, in contrast to current ground-based mm-wave mapping which contends with the atmo-sphere and therefore is spatially filtered and emphasizesthe compact structures. However, preprocessing of thetime-ordered data to remove very low frequency driftsmakes the SANEPIC map average near zero, the DClevel having been effectively removed.
BLAST05 was designed to produce diffraction-limited

BLAST Survey of Cygnus X 3
Fig. 1.— Upper: enlarged section of 250 µm BLAST05 imagein Fig. 2. Lower: deconvolved image using a Lucy-Richardsonalgorithm. Full width half maxima of the deconvolved sources areabout 1′.
beams with FWHM 30′′, 42′′, and 60′′ at 250, 350, and500 µm, respectively. However, BLAST05 suffered froman uncharacterized failure relating to the primary mirrorfigure and focus. Nevertheless, even with the corruptedbeam the resolution is about 3′ full width half power(Truch et al. 2008; Roy et al. 2010), comparable to IRAS,though disappointing compared to the diffraction-limitedimages obtained in the 2006 flight (Truch et al. 2009;Netterfield et al. 2009).
The characteristic beam shape can be seen clearly atmany locations throughout the field, indicating the pres-ence of point sources with angular size comparable to thediffraction limit. Obviously we want to work with imageswith as good resolution as possible. We removed theworst effects of the corrupted beam (see Roy et al. 2010,in preparation) by a Lucy-Richardson deconvolution al-gorithm (Richardson 1972; Lucy 1974). The significantimprovement is illustrated in Figure 1. Even so the effec-tive resolution is about 1′, less dependent on wavelengththan for diffraction (which has the silver-lining benefitthat beam matching is not an issue). Moreover, thereare artefacts introduced near very strong sources. Math-ematically, Lucy-Richardson deconvolution should con-serve flux, and we have verified this through simulationsand measurements on isolated compact sources (§ 2.6).The astrometric accuracy is good, about 5′′ when the de-convolved maps (§ 2.6) are aligned with compact sourcesin common with MAMBO2 (Motte et al. 2007) and/orSCUBA (Di Francesco et al. 2008).
The full 250-µm map is shown in the upper panel ofFigure 2. BLAST measures the dust continuum emissionalong the line of sight and probes the major star-formingsites in the region by detecting reprocessed stellar or pro-tostellar radiation. The positions of luminous stars inthe Cyg OB association (Negueruela et al. 2008) and anumber of stellar clusters (§ 3.1) are indicated for refer-
ence. Expanding H II regions, bubbles, and stellar out-flows, and the interplay with structures in the interstel-lar medium make the morphology of extended emissionin the Cyg X region quite complex. A comprehensivereview covering important physical aspects of Cyg X ispresented by Reipurth & Schneider (2008).
2.1. A Complementary View using Radio ContinuumEmission
A complementary way to see the effects of the high-energy radiation from hot massive stars is via radio emis-sion from the ionized gas. The lower panel of Figure 2shows the 21-cm continuum map from the CGPS (Tayloret al. 2003), which has 1′ resolution, about the same res-olution as the BLAST maps. A number of H II regionsare labelled for reference: numerals n are DRn regionsfrom Downes & Rinehart (1966), ECX6-* from Wendkeret al. (1991), and otherwise Gl (accurate coordinates forthese three regions being G79.957+0.866, G80.451+1.041and G81.445 + 0.480). Note that the recombination linevelocity for G79.9 is −14.8 km s−1and for ECX6-27 is−64.4 km s−1(Lockman 1989), putting these beyond theCyg OB2 association.
In diffuse regions the free-free emission is optically thin,but for the most dense compact H II regions, it can beself-absorbed. There is rough correspondence with thedust emission, as might be expected given the impact ofOB star radiation on both. Note, however, that unlikethe dust emission, which depends on the column den-sity, the H II emission depends on the emission mea-sure, involving the square of the local density. Further-more, ionizing radiation is obviously essential to producethe plasma. This radiation, the rest of the non-ionizingstarlight, trapped Lyman-α, and cooling lines all heatany dust surviving in the plasma. Most of the sub-ionizing radiation escapes the plasma to heat any dustoutside the H II region. In an edge-on geometry, as oc-curs in extended regions like DR22, the warm dust imme-diately outside the arc-shaped ionization front (I-front)can be seen (Fig. 2 and magnified views in figures be-low). In a related way, in DR23 the ionization is clearlystopped on the right by a dense cloud which forms a“bay” in the radio emission, and a corresponding brightfeature in the dust map.
There are also large scale ionized structures denotedCXRn (Cyg X Ridges) by Wendker et al. (1991). Thosein the BLAST region are labelled in Figure 2. Theseare seen dimly in the BLAST image because they haverelatively low column density (they also do not show verystrongly in the extinction map; § 3.4). A much betterdust emission tracer (§ 2.3) of these ionized ridges, indeedof all of the diffuse ionized gas, is the 24 µm MIPS image,from the Spitzer Cyg X Legacy Survey (Hora et al. 2009),which looks remarkably like the radio continuum image.
2.2. Planck Cold Core Survey
In the midst of this turmoil, we search for relativelycold structures which could be the precursors of the nextgeneration of stars. This is also the goal of the lower-resolution Planck Cold Core survey (Juvela et al. 2010),an unbiased search using the Planck all-sky maps of sub-millimeter dust emission. Cold cores are characterizedby a lack of corresponding IRAS 100 µm emission. Be-cause the Planck high-frequency angular resolution is 4′,

4 Roy et al.
Fig. 2.— Upper panel: BLAST05 deconvolved 250 µm dust emission map of Cyg X. Contours are of 21-cm radio continuum emissionfrom the CGPS in the lower panel. The large dashed circle of radius 60′ shows the extent of the Cyg OB2 association (Knodlseder 2000)and the stars are the most luminous O stars in the list of Negueruela et al. (2008) (see text). Circles denote the positions (not extent) ofstar clusters (see § 3.1 for nomenclature). Lower panel: The radio image in turn has contours from the BLAST05 image. Prominent H IIregions and diffuse ridges are marked (see § 2.1 for nomenclature).

BLAST Survey of Cygnus X 5
clumps – even if more extended than the BLAST clumps– will appear as point sources, and smaller structures willbe beam-diluted. Even for relatively nearby regions likeCyg X, the Planck beam would correspond to a spatialextent of about 2 pc.
The highest-frequency Planck channels correspond ap-proximately to 350 and 500 µm. Prior to the availabilityof Planck imaging data, we explored the possibilities byconvolving the two longer-wavelength BLAST images tothe Planck resolution and combining them with IRAS100 µm in a three-color image (Fig. 3). At this resolu-tion, BLAST stage E sources like C116 (§ 4 and § 5.6.1)still stand out as being cool. More extended, elongatedstructures like the cool IRDC ridge near DR15 (§ 5.6.2)and the DR17 molecular pillar (§ 3.6 and § 5.1.1) arealso preserved. Of course the regions of warmer dust arehighlighted in this image as well.
2.3. Diffuse Emission
BLAST maps measure surface brightness (MJy sr−1),hence column density of the dust Md:
Iν = MdκνBν(T ) = rµmHNHκνBν(T ), (1)
where r is the dust to gas ratio, NH is the H column den-sity, and κν is the mass absorption coefficient of the dust.For later characterization of the SED we note that thespectral dependence of κν is usually scaled with respectto a fiducial frequency as κν/κ0 = (ν/ν0)β . Note alsothat for absolute measures of column density we wouldhave to restore the zero point (DC level) of the maps, aswe did for the Cas A region (Sibthorpe et al. 2010) butnot here.
In the Galactic Plane, cirrus-like structures in the formof bright diffuse emission, termed “interstellar froth”(Waller & Boulanger 1994), are distributed everywhere.With the compact structures removed, either explicitlyor by clipping (Miville-Deschenes et al. 2007), the diffuseemission has a cirrus-like power spectrum, with lowerfluctuations at high spatial frequencies. In fact, we havefound that for this region the power spectrum is quite likethat for IRAS 100 µm, with amplitude simply scaled bythe SED2 for the appropriate cirrus temperature (Royet al. 2010).
Somehow, through turbulent motions, thermal insta-bilities, and phase transitions, massive localized regionsbecome self-gravitating and so at high spatial frequen-cies they stand out from the dwindling cirrus structureas compact sources. A distribution of masses is expected,but the cirrus confusion limits our ability to distinguishlower mass sources (§ 2.5). This situation improves withangular resolution, but even for Herschel it is a dominantlimitation (Martin et al. 2010).
Actually, the diffuse emission in the submillimeter andmid-infrared wavelengths comes from three different dustcomponents, distinguished principally by their size distri-bution (Desert et al. 1990; Li & Draine 2001, Compiegneet al., in preparation): Big Grains (BGs), Very SmallGrains (VSGs), and polycyclic aromatic hydrocarbons(PAHs). The BGs, which account for the most of thedust mass and therefore most of the longer wavelengthemission, are in thermal equilibrium. The VSGs have arelatively lower share of the total dust mass, even smallerin dense regions. They are small enough to experience
non-equilibrium heating and so broaden the spectrumtoward shorter wavelengths, beyond the spectral peak ofthe BG emission. Compared to what is expected fromequilibrium BGs alone, this excess non-equilibrium emis-sion appears typically at 60 µm and shorter wavelengths.PAHs are also non-equilibrium emitters, in strong spec-tral bands pumped by far-ultraviolet radiation. The rel-ative amounts of emission in these three components canvary from region to region. Schneider et al. (2006) usedthe MSX band A images (8.3 µm; Carey et al. 2005) ef-fectively as a tracer of PAHs and the environment. Weuse Spitzer IRAC band 4 images (8.6 µm; Werner et al.2004) from the Cyg X Legacy Survey (Hora et al. 2009)for the same purpose (§ 3.3), since they have better sensi-tivity and resolution. Spitzer MIPS 24 µm images traceVSG emission generally, and the hotter grains associatedwith ionized gas, and so, as commented above, look re-markably like the radio continuum images.
2.4. Dust Temperature from the Diffuse Emission
From the above equation it is clear that the BG emis-sion that BLAST sees is modulated by the dust temper-ature T which is in equilibrium with the local radiationfield, whether in the diffuse medium or within a com-pact source. We concentrate here on the former. For ourexploratory work here on the BGs, we adopt a single-temperature SED and therefore fit only data at 100 µmand larger to avoid contamination by VSG emission.
For a sufficiently large and homogeneous region an es-timate of the characteristic temperature can be obtainedby fitting an SED to the square root of the amplitudes ofpower spectra. By this method using data at 100, 250,350, and 500 µm, Roy et al. (2010) obtained a cirrus dusttemperature of 19.9±1.3 K for a relatively uncrowded re-gion (basically the right half of the BLAST map). How-ever, this more global power spectrum method is notpractical when the region considered is relatively small,inhomogeneous, and/or focusing primarily on particularsub-structures.
An alternative approach for smaller regions begins withpixel-by-pixel correlations of images with respect to somereference image (here 250 µm). Small scale structuresare remarkably well correlated across the three BLASTbands. The slopes of these correlations describe the rel-ative SED of the spatially-varying dust emission that ischanging in common across these images. Note that thisapproach cannot give the dust temperature pixel by pixel(that would require the DC offsets too). On the otherhand, the emission in each pixel is from dust of differenttemperatures along the line of sight, whereas our ap-proach isolates and characterizes certain more localizedspatial components.
For quantification of the size of the changes in temper-ature, we selected regions that appeared to have differentcolors in a map like Figure 3.
The first region, shown in 500 µm emission in the leftpanel of Figure 4, is within the relative void created bythe Cyg OB2 stars, near CXR12 (Fig. 2). Here thereis relatively strong 100 and 60 µm emission. When theSED (left panel of Fig. 5) is fit using β = 1.5, whichis consistent with the value adopted for the analyses ofcompact sources in this paper, the derived dust equilib-rium temperature T = 29.7 ± 2.3 K. For β = 2, appro-priate for local diffuse dust in the atomic gas at high

6 Roy et al.
Fig. 3.— Three color BLAST plus IRAS image of Cyg X (500, 350, and 100 µm are represented by red, green, and blue, respectively).Images are first convolved to the Planck high frequency 4′ resolution.
Fig. 4.— Two small regions in Cyg X selected on the basis of athree-color 500, 250, and 100 µm image to have warm (left) andrelatively cold dust (images here at 500 µm). Note that as in otherfigures, white represents lower intensity.
latitudes (Boulanger et al. 1996; Li & Draine 2001), Tis 25.4±2.3 K. This can be compared to the local high-latitude equilibrium temperature, 17.5 K. The higher Tin Cyg X results from the much higher effective interstel-lar radiation field from the OB association. The ridge ofwarm dust emission and this particular selected warmregion above and to the left are also prominent in dif-fuse H II emission (Fig. 2) and 24 µm emission, whichsupports the view that the local radiation field is highhere. This region is particularly devoid of CO emission(§ 3.5). However, the material emitting in the submil-limeter must be neutral, because the associated extinc-tion ∆AV is up to 3 mag above the local background(and is spatially well correlated with the BLAST emis-sion; § 3.4). To the lower right of the CXR12 ridge, thedust is cooler, and there is some CO emission. CXR12is oriented roughly tangentially to the direction to thecenter of the OB association, and might involve material
swept up. However, the geometry is unclear, not im-mediately recalling a classical edge-on photodissociationregion (PDR) in a molecular cloud.
The selected cooler region, judged from relatively low100 and 60 µm emission, is shown by a circle in the rightpanel of Figure 4. Its SED (right panel of Fig. 5) yieldsan equilibrium temperature of 21.6 ± 0.5 K. The lower Twould imply a lower effective interstellar radiation field,due to the high extinction, with AV for this molecularstructure (§ 3.5) up to 6 mag above the local background.
2.5. Compact Sources
When Iν in equation (1) is integrated over a suitablesolid angle, accounting for the background, the flux den-sity Sν (typically in Jy) of a “source” is obtained. Like-wise, the source mass M (gas plus dust) is related to theintegrated column density when the distance D is known,so that
Sν = Lν/(4πD2) = MD−2rκνBν(T ). (2)
Note that “source” refers to the dust emission that isbeing observed, not what heats the dust, and so in par-ticular does not imply that there is an embedded sourceof energy (a star or protostar) within the volume of dustbeing measured.
The definition and characterization of what is a com-pact source is a difficult challenge, and different ex-traction schemes, like Clumpfind (Williams et al. 1994),Gaussclump (Stutzki & Guesten 1990; Kramer et al.1998), or the multi-scale method of Motte et al. (2007),can produce different catalogs and source characteris-tics. Operationally what is called a “compact source”is often basically a structure comparable in size to thebeam. This immediately cautions that what is a com-

BLAST Survey of Cygnus X 7
Fig. 5.— Left: Relative SED normalized at 250 µm corresponding to the circular region shown in the left-hand image of Fig. 4. Triangleshows the relative value unity at 250 µm. The SED fitted using β = 1.5 has a temperature of 29.7 ± 2.3 K. The 60 µm relative brightness(represented by a circle) is not used in the fit. Right: Relative SED corresponding to circular region shown in right-hand image of Fig. 4.The fit temperature is 21.6± 0.5 K.
pact source to one instrument could become resolved intomultiple components at higher resolution, as has been il-lustrated by submm/mm interferometric observations ofIRAS protoclusters and hot cores (e.g., with the SMAand IRAM Plateau de Bure, Beuther et al. 2007a,b; Bon-temps et al. 2009).
As mentioned above, massive stars form in clusters.What BLAST can hope to detect in this survey at 1′ res-olution is unlikely to be a single protostar or its progen-itor, but rather a protocluster or stellar nursery possiblycontaining many unresolved objects. Of course, depend-ing on the mass function, a single object among thesemight dominate the luminosity and ionizing flux.
We have taken a pragmatic view that since whateverunderlying structure that is smeared out as a compactstructure does appear quite like a Gaussian, this is anadequate model for extracting flux densities. Further-more, the deconvolved beam for this BLAST05 survey isof similar size at all three bands, so that the same volumeof dust is being examined. A corollary is that when weuse other initially higher-resolution data to expand thespectral coverage of multi-wavelength photometry (Ap-pendix A), we measured the flux density consistently byfirst convolving these maps to the BLAST05 resolution.
2.6. Compact Source Identification and Photometry
For compact source identification we used the IDL-implemented DAOPHOT “FIND” routine, keeping ascandidates detected peaks that were above the localbackground in both the 250 and 350 µm images by 3σ(empirical local rms fluctuation). Both source identifica-tion and photometry on individual sources are affectedby the presence of cirrus noise; for example, at 250 µm
the 1 − σ cirrus noise level was evaluated to be ∼ 4 Jyin the fainter right portion of the map (Roy et al. 2010),although it is expected to vary over the map according tothe median brightness of the region (making catalog com-pleteness a function of position in the map). The 500 µmmap was not productive for further independent identi-fications due to at least as great apparent relative confu-sion noise. In fact, for 14 faint sources among the aboveit was not possible to measure a reliable 500 µm fluxdensity. Given this noise and also the deconvolution arte-facts near the brightest sources, we visually checked ourcandidates from the automated list. Since we were notdepending on a complete survey – for example, to finda mass function or relative lifetimes of different stages– we were conservative in rejecting sources and a fewwere even added to the list. We were most concernedwith having sources with accurately determined SEDs,so that reliable physical parameters could be determined(§ 4).
Photometry was carried out using a Gaussian non-linear fit, with amplitude, FWHM, position, and lin-ear background as free parameters. Model-independentaperture photometry for isolated sources gave the samefluxes within 7%, confirming that this is an acceptableapproach. Cyg X has a sufficiently flat background lo-cally that fitting a linear background is an adequateapproximation. However, in a complex crowded star-forming region like much of Cyg X, it is often not possi-ble to extract fluxes by aperture photometry or by fittinga single Gaussian. In such cases, we adopted a multipleGaussian technique, fitting simultaneously to all candi-dates within a 2.5′ radius about the parent source. If aparent source in a crowded region had a low signal to

8 Roy et al.
noise ratio compared to its neighbors then we fixed theirpositions and/or FWHMs as required.
Positions and flux densities for 184 sources are givenin Table 1. These Cyg X sources are referred to belowas ‘Cn’ where ‘n’ is an up-to-three digit number, rangingfrom 0 to 183.
3. CONTEXT: GLOBAL ENVIRONMENT ANDSTRUCTURAL DETAIL
3.1. Cyg OB2 Association and Star Clusters
Cyg OB2 is among the more impressive assemblies ofOB stars in the Galaxy. It is more compact than a nor-mal association and rich enough to have been called a“young globular cluster” (Knodlseder 2000). The latestcensus indicates that it contains some 60-70 O-type stars(Negueruela et al. 2008). From their semi-observationalHR diagram, Negueruela et al. (2008) favor a distance1.5 kpc, with 1.8 kpc being noticeably too large. Ouradopted distance of 1.7 kpc, consistent with Schneideret al. (2006) and Motte et al. (2007), is close to this anda 10% uncertainty in distance is of no consequence in theanalysis that follows.
The most luminous hot stars (selected as Mbol ≤ −9.2,log Teff ≥ 4.56 and Mbol ≤ −9.9, 4.46 ≤ log Teff ≤ 4.53)are plotted in Figure 2 with positions from Massey &Thompson (1991) and Comeron et al. (2002). Note thatstar A37 (at G80.240+0.135) has what appears to be abow-shock to its right in the Spitzer images and so mightbe a runaway star from LK8 in DR15. Kobulnicky et al.(2010) studied the bow-shock morphology of A37 (andothers), placing this star slightly behind Cyg OB2 at adistance of 2.1 kpc.
According to Knodlseder (2000), Cyg OB2 extends toa radius of 1◦ (30 pc), with half-light radius 13′ (6.4 pc).Examination of the sub-structure reveals two open clus-ters in the core (BBD1 and BBD2; Bica et al. 2003), eachof radius ∼ 2′ yet separated by only 6′ and appearing toform a physical pair.
A number of highly reddened OB clusters and stel-lar groups have been found in the surrounding molecularclouds using 2MASS. Dutra & Bica (2001) performed atargeted search toward large angular size H II regions inCyg X; eight clusters and four stellar groups are in thisBLAST survey region. Five of these have been recoveredand characterized by Le Duigou & Knodlseder (2002),including the half-population radius R50 and central den-sity. They also describe two new clusters. Comeron& Torra (1999) studied DR18, finding a stellar group,and Comeron et al. (2002) targeted other ECX (Wend-ker et al. 1991) compact H II regions finding four clusterswithin the BLAST area. The new one, ECX6-27, has arecombination line velocity of −62.4 km s−1 (Lockman1989) and so is much more distant than Cyg OB2, morelike 10 kpc. It has a “double concentration” of stars(Comeron et al. 2002) and also a complex double struc-ture in the Spitzer images. The catalog of Bica et al.(2003) also includes the W75N and DR21 (W75S) in-frared clusters. In total there are thirteen clusters andfive stellar groups (see Table 2). Their positions (not ex-tents) are shown in Figure 2, with names in precedenceLK, DB, and ECX6-* where the lists overlap. In sub-sequent figures, to indicate the cluster angular size weuse R50 for the OB star population where available (LeDuigou & Knodlseder 2002), otherwise a radius of 1′.
3.2. The Radiative Environment: Ionization
The signature of radio emission in this region of theGalactic Plane, as distinct from the radio galaxy CygnusA, led to the name Cyg X (Piddington & Minnett 1952).A more contemporary large scale view is given in Fig-ure 5 of Uyanıker et al. (2001). Radio surveys conductedat different frequencies have catalogued the main H IIregion complexes (1390 MHz, Westerhout 1958; 5 GHz,Downes & Rinehart 1966; multifrequency, Wendker et al.1991). What we have observed with BLAST is only thecentral portion, all projected within the Cygnus super-bubble. The corresponding 1420 MHz image from theCGPS, including the diffuse emission, is shown in Fig-ure 2.
The free-free emission traces the compact sources andextended structures like I-fronts, elephant trunks andpillars, and material that is being sculpted by winds.Figure 2 shows a striking ridge of emission CXR11 ex-tending downward from DR15. Sculpting seen in theSpitzer images indicates illumination from the upper left(Cyg OB2), but like CXR12, this does not appear to bea classical I-front, because the expected neutral tracersin the PDR (§ 3.3) are not present immediately to theright.
In a closed geometry, the bolometric luminosity of thedust emission is a calorimeter for radiation from any em-bedded (proto)stars. Likewise, the spatially-integratedradio flux from the same region is a measure of the num-ber of ionizing photons. Thus one can check for consis-tency, which is particularly useful in assessing the distri-bution of masses within an unresolved cluster. For ex-ample, dividing the luminosity among several lower massstars will produce a lower ionizing flux. There are com-plications of course, in addition to the relative coveringfactors. For example, one must know the distance. If thedistance is overestimated, then the luminosity will implymore massive stars and so a relatively higher ionizingflux (Comeron & Torra 2001). Furthermore, the radioemission is also affected by self-absorption. Thus theionized zone around young OB stars deeply embeddedin dense gas (ultracompact and hypercompact H II re-gions) can appear to be underluminous. Multifrequencyobservations (not pursued here) can of course reveal self-absorption by its spectral signature in the radio SED (seethe discussion of DR21 in Wendker et al. 1991), or by thehigh brightness temperature if the source is resolved.
3.3. The Radiative Environment: Far Ultraviolet
The non-ionizing radiation heats dust beyond any ion-ization front (I-front). This is the main source of theextended submillimeter emission surrounding the H IIregions. As described above, in cases with “edge-on” ge-ometries, like in DR22, there is a clear displacement ofthe BLAST emission to the side of the I-front away fromthe ionizing stars.
The non-ionizing radiation induces non-equilibriumemission when the relevant species, VSGs and PAHs, arepresent. Diffuse PAH emission is well traced by MSXband A; the MSX map of Cyg X is discussed by Schnei-der et al. (2006). PAH emission can now be seen in moreexquisite detail in the IRAC band 4 images. Where thegeometry is favorable, this reveals impressive PAH-fronts(defined by where the exciting radiation is attenuated)

BLAST Survey of Cygnus X 9
outside the I-fronts. There is also a sweeping arc to thelower right of DR15. This is not immediately adjacent tothe ionized ridge CXR11 mentioned above (thus not thestandard I-front-PDR geometry). The arc (and ridge)can be seen as well in MIPS 24 µm emission (Hora et al.2009), which we interpret there as VSG emission.
MIPS 24 µm dust emission also turns out to be a goodtracer of the plasma, although because of the differentphysics there is not a complete morphological or bright-ness correspondence. In the figures for the selected re-gions below (§ 3.6), we show the 24 µm emission over-plotted with 21-cm radio emission contours to illustratetheir correlation, and also the relationship to clusters andthe BLAST compact sources.
3.4. Extinction
Another tracer of column density is near-infrared ex-tinction (often expressed as its equivalent in AV ), whichcan be estimated from the colors of 2MASS sources. Sucha map by S. Bontemps (private communication) is pre-sented in Figure 1 in Motte et al. (2007). AV and BLASTemission are well correlated. This correlation can be usedto calibrate the dust opacity (Martin et al. in prepara-tion). In their Figure 1, Schneider et al. (2006) show anHα image which strikingly shows the foreground opticalextinction called the Great Cygnus Rift.
3.5. The Molecular Reservoir
Numerous surveys of the Cyg X giant molecular cloud(GMC) have been carried out in the molecular line tran-sition 12CO J = 1 → 0 (Cong 1977; Dame et al. 1987;Leung & Thaddeus 1992). Schneider et al. (2006) reporton an extensive multi-transition survey with KOSMA(13CO J = 2→ 1, 3→ 2, and 12CO J = 3→ 2) to studyin detail the spatial structural variations and physicalconditions. The relative intensity of 13CO J = 3 → 2 to13CO J = 2 → 1 depends on the local density and ki-netic temperature. Their 13CO J = 2 → 1 channel mapsshow elongated filamentary structure at scales of 10′ to20′, and smaller sub-structures (CO clumps) embeddedin the larger cloud fragments. The peaks of the CO emis-sion profiles occur over a wide range of radial velocitiessurveyed from +20 to −20 km s−1 (there is not much gasbeyond −10 km s−1 and gas at more negative “Perseusarm velocities” is not included).
Schneider et al. (2006) provide a comprehensive treat-ment of the region from this molecular line perspective.They estimate 4×10⁶ M� of molecular gas, at the largeend of GMC masses in the Milky Way. Thus, despitethe prior star formation, there remains a tremendousreservoir of gas pregnant with star formation, offeringthe opportunity to study many evolutionary stages. Tothis end, Motte et al. (2007) have carried out a contin-uum survey at 1.2 mm with MAMBO further revealingthrough dust emission the complex and hierarchical mor-phology in the region. They find that Cyg X hosts about40 massive protostars destined to be OB stars. As dis-cussed in § 5.4, the more massive protostars are alreadyforming (ultra)compact H II regions, famous examplesbeing DR21 (Downes & Rinehart 1966), W75N (Wester-hout 1958), and AFGL2591, the strongest submillimetercompact sources within the BLAST coverage. Table 3lists the correspondences between the cores and clumpsof Motte et al. (2007) and our BLAST sources.
CO emission integrated over the line profile (W ) is of-ten taken as a surrogate of the column density of molec-ular hydrogen and so should be correlated with BLASTemission. We note the good correspondence and explorethis in the examples below. Radiation from massive starscan of course in time destroy CO and the detailed corre-spondence with dust emission.
Neither dust continuum emission nor W is sufficientfor describing the complete physical environment and ge-ometry of the star formation region. Additional insightcan be gained by examination of the CO velocity cubes(Schneider et al. 2006). Where there is CO coverage inour BLAST map, most of the identified BLAST compactsources are correlated with CO emission features (withinthe CO clumps mentioned above), thus associating thedust emission with gas at a certain velocity. In § 3.6,we provide a few examples using their 13CO J = 2 → 1cube to emphasize that objects seen closely together inprojection in a dust emission image can have quite differ-ent velocities. In principle the velocity associations couldbe used to sort the sources with respect to distance. InCyg X Schneider et al. (2006) have argued that the mainvelocity systems are all at roughly the same distance,1.7 kpc. Nevertheless, the association with different COclumps having differing velocities does indicate that theBLAST compact sources are in distinguishable environ-ments, and there certainly are some sources behind themain Cyg OB2 complex (§ 4.2).
3.6. Selected Regions
In this section we show the BLAST compact sourcesin the context of the diffuse submillimeter emission andother tracers discussed above. They are marked in thefigures with a 1.3 ′ square, characteristic of their apparentsize in the deconvolved image. In each example, startingwith Figure 6, the left panel shows the BLAST 250 µmimage. On this are contours of the 13CO J = 2 → 1emission integrated over velocity ranges which highlightthe CO clumps discussed in Appendix C of Schneideret al. (2006). Good correlations between BLAST emis-sion and CO are revealed. The coordinate system chosenfor these enlarged views is Equatorial to facilitate com-parison with the cutout regions in the annotated figuresin Schneider et al. (2006). Star clusters, local sources ofpower, ionization, and pressure, are also noted (§ 3.1). Inthe right panel is the MIPS 24 µm image with contoursof the 21-cm radio emission from the CGPS map shownin Figure 2. Motte et al. (2007) show pairs consistingof their 1.2 mm MAMBO image and the correspondingMSX 8.3 µm image, but with no contours of CO or ra-dio emission. The MIPS image here is more sensitive topoint-like sources, many coinciding with BLAST sources.
The regions are presented in order of the number ofthe DR H II region in the field, whose nominal positionis marked with an arrow or filled triangle in the righthand panel. To locate the regions in the large overviewimage in Galactic coordinates (Fig. 2), see the DR num-bers marked there. Details of the nature of the BLASTcompact sources and their evolution are deferred to §§ 4and 5.
DR7. The first region highlighted is a field includingDR7, as shown in Figure 6. Immediately outside the DR7H II region itself is a rim of BLAST emission containingseveral compact sources. The typical rim shaped geome-

10 Roy et al.
Fig. 6.— Left: BLAST 250 µm image including DR7 overlaid with contours of 13CO J = 2 → 1 emission integrated over velocity rangeschosen to highlight the clumps discussed by Schneider et al. (2006), Fig. B.4. Solid, dash, and dot contour lines correspond to the ranges 3to 9, −7 to −1, and −13.5 to −8 km s−1, respectively. Circle represents position and extent R50 of star cluster (Le Duigou & Knodlseder2002). Right: 24 µm MIPS map of the same region, with contours of the 21-cm radio continuum emission from the CGPS (see Fig. 2).BLAST compact sources are marked in each image by square boxes of 1.3′ width. Note the MIPS counterparts to many BLAST sources.
try of the DR7 region has been formed by the star clus-ter (LK09) now residing in the cavity. Interestingly, theDR7 H II region along with its cluster are not associatedwith the contours of CO shown. This H II region hasa recombination line velocity of −40 km s−1 (Lockman1989) and CO velocity −50 km s−1 beyond the velocitycoverage in Schneider et al. (2006), placing it well behindthe Cyg OB2 complex, at 3.6 to 7.5 kpc, possibly in thePerseus arm. Another indicator of the larger distanceis the lack of signature in the extinction map, which isbased on colors of detectable 2MASS stars.
There are, however, several CO clumps that do coin-cide with BLAST emission and compact sources. Thestrong BLAST emission (with compact sources withMIPS counterparts) to the south coincides with clump5. Not all clumps (which have different W) are easilyseen in the BLAST emission (e.g., clumps 7, 8, and 9).The bright BLAST source at the top, in clump 1, hasa compact H II region and a cometary tail linking it toCyg OB2 (§ 5.1.2).
The emission at the upper left, associated with clump2, is perhaps the most interesting, having a chaotic mor-phology in both MIPS and BLAST images (see alsoFig. 1). In the ridge we find three BLAST sources. Al-though in projection the center of Cyg OB2 is close by,about 15′ to the east (left), there is no sign of interaction;furthermore, there is a parallel ridge of H II emission onthe right, suggesting illumination from that side. It co-incides with G79.957+0.866 for which the recombinationline velocity is −14.8 km s−1(Lockman 1989), close to theCO velocity of −11 km s−1. In the entire map, this COcloud is unique in this velocity range < −10 km s−1 andnot obviously connected to the other Cyg X molecularcomplexes. This then seems to be an object somewhatmore distant, beyond the influence of Cyg OB2 (§ 5.1.2).
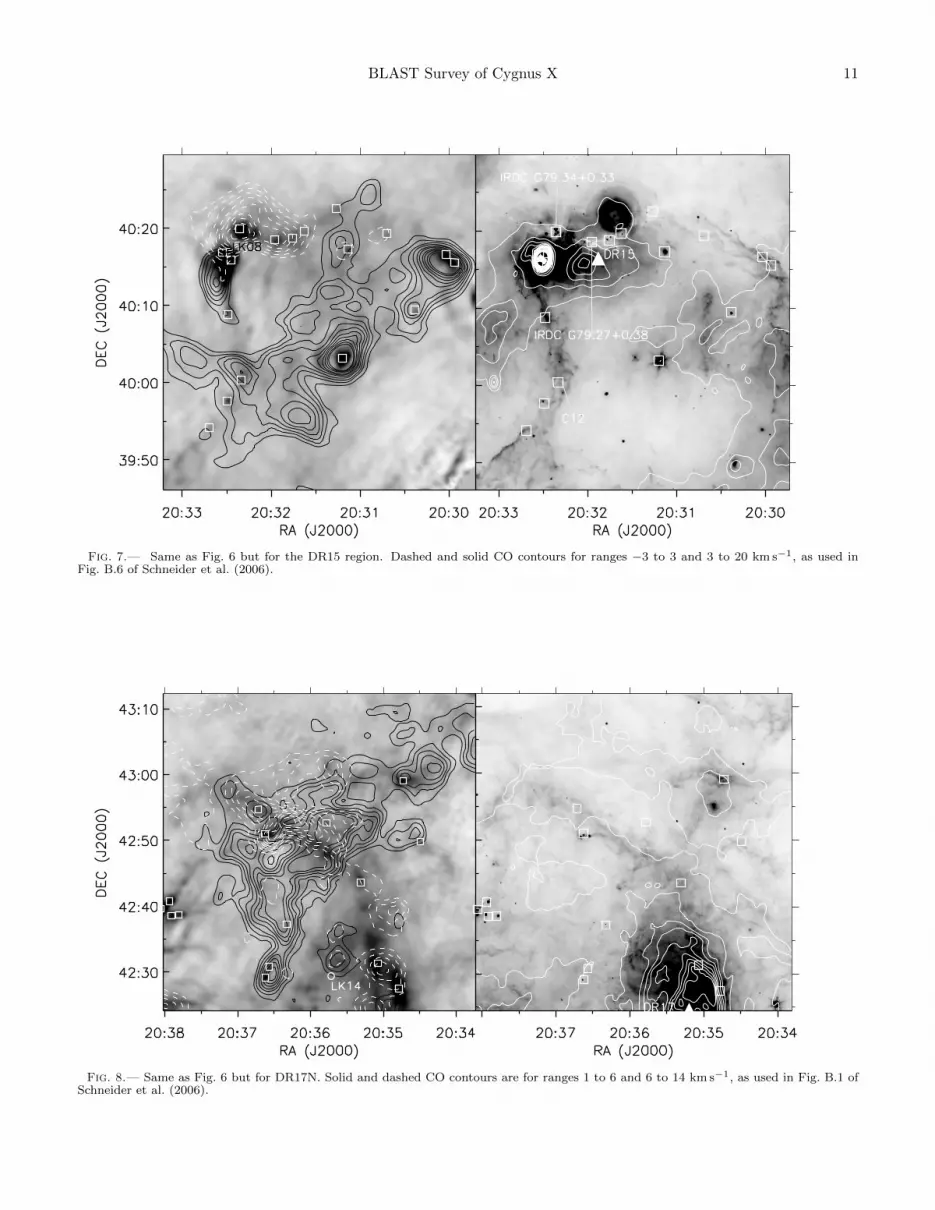
DR15. Figure 7 shows the fascinating region contain-ing DR15 and the above-mentioned PAH arc. Schneideret al. (2006) argue that the DR15 molecular cloud com-
plex near 0 km s−1 is being influenced by Cyg OB2 off tothe upper left (see also § 5.1.2). This range also traces theIRDC ridge containing G79.34+0.33 and G79.27+0.38.As shown in Figure 3 and in more detail in § 5.6.2,BLAST sees this cold ridge in emission and resolves sev-eral compact sources; in the MIPS image, some embed-ded protostars shine faintly through. Toward the centerof this field is the protostar IRAS 20293+3952, part ofa different CO system at positive velocity. The pair ofBLAST sources to the upper right are associated withstreamers in the MIPS image which appear to be “blown”from the right.
DR17N. The lower portion of Figure 8 shows the north-ern part of the extended DR17 region (see also Fig. 2 and§ 5.4). A major arc-shaped extended structure crossesBLAST and MIPS images, and is seen in 8 µm PAHemission as well, confining the H II emission influencedby the OB clusters inside DR17. CO in the higher ve-locity range 6 to 14 km s−1 best traces the arc. Thelower velocity system projects across this, and has itsown BLAST emission and compact sources.
DR17-Pillars. Schneider et al. (2006) identified“molecular pillars” (their Fig. B.1) in the higher velocityrange whose orientation points to the influence of the OBstars in DR17. BLAST finds compact sources associatedwith these pillars as shown in Figure 9. Compared toother dust in DR17, the above-mentioned arc and thesemolecular pillars are cool (Fig. 3). There is another H IIregion to the left in the image, with BLAST emissionand compact sources along its interface as in DR7. Thisis the “Diamond Ring” (Marston et al. 2004) at an inter-mediate velocity (8 km s−1), as described further in theDR21 discussion below.
DR20. Figure 10 shows DR20, which is at the end ofa prominent ridge seen in the low-velocity CO (clump 1)and BLAST emission (see Fig. 13 in § 4.1 below). Thereare several BLAST compact sources here and in the com-plex to the west (clump 2, DR20W). The source in the
BLAST Survey of Cygnus X 11
Fig. 7.— Same as Fig. 6 but for the DR15 region. Dashed and solid CO contours for ranges −3 to 3 and 3 to 20 km s−1, as used inFig. B.6 of Schneider et al. (2006).
Fig. 8.— Same as Fig. 6 but for DR17N. Solid and dashed CO contours are for ranges 1 to 6 and 6 to 14 km s−1, as used in Fig. B.1 ofSchneider et al. (2006).

12 Roy et al.
Fig. 9.— Same as Fig. 8 but for the DR17-Pillars region to its south (Schneider et al. 2006). Solid and dashed CO contours are for ranges1 to 6 and 14 to 20 km s−1, as used in Fig. B.1 of Schneider et al. (2006). The long molecular pillar on the right is that labelled in Fig. 3.A non-thermal extragalactic radio source 18P 69 (Wendker et al. 1991) also prominent in Fig. 2 is marked.
Fig. 10.— Same as Fig. 6 but for DR20. Solid and dashed CO contours for ranges −10 to 1 and 6 to 14 km s−1, as used in Fig. B.2 ofSchneider et al. (2006). They called the molecular clump to the right DR20W, in the same velocity system as DR20, and that containingC85, in a different velocity system of a prominent elephant trunk (§ 5.1.1) DR20NW.

BLAST Survey of Cygnus X 13
middle of this image is associated with higher velocitygas (clump 3, DR20NW), as is more diffuse emission andother compact sources along the pillar toward the upperleft (§ 5.1.1), possibly connected to the velocity systemof the DR17 molecular pillars and arc.
DR21 and W75N. The DR21 and W75N regions shownin Figure 11 is obviously very active. The ridge ofBLAST emission including DR21 and DR21(OH) pointsdeceptively to W75N. However, the peak CO emissionon the ridge (clumps 3 and 4) and clump 8 containingthe BLAST sources to the north west of W75N are at−3 km s−1 (the low velocity system), whereas clump 10of W75N is in a quite different higher velocity compo-nent at +10 km s−1. The low velocity system is fairlywidespread, including a complex to the south west (over-lapping the lower edge of the eastern-most DR17 molec-ular pillar) and extending down to DR23 and DR22(Fig. 12). The mass column density traced by BLASTcorrelates well with the CO emission. A fascinating fea-ture is the extension of the DR21 ridge to the south,which shows up as a very narrow dark lane in the 24 µmimage. This linear feature is at −4.5 km s−1(see alsoFig. 28 in § 5.6.2 below).
The higher velocity gas also contains prominent sourcesother than W75N, including the “Diamond” (clump 5)of the “Diamond Ring” (Marston et al. 2004). The moreextended H II region along the “Ring” appears to bedefined by both velocity systems.
DR22 and DR23. The CO cloud structures in theDR22 and DR23 regions shown in Figure 12 correlatewell with the BLAST dust emission. Immediately to thesouth west of DR23 is a dim bay in the MIPS image,where the main CO cloud (clump 1) of the low-velocitysystem confines the H II region. Along this interfaceare three BLAST compact sources, including C132,perhaps triggered by the earlier generation of starsin the DR23 cluster DB17. The two DR regions areinterconnected by a CO filament (several clumps) inthe lower velocity range. Along this filament there areBLAST compact sources and dark clouds, one (clump 3)with a protostellar nursery visible with MIPS and IRAC(§ 5.6.2). For DR22, the complementary detail providedby IRAC emission (see Fig. 23 in § 5.2) confirms aclassical PDR geometry, with the lower left being mostedge on. The location of the BLAST sources, not justthe compact H II region but all around the periphery, issuggestive of triggering.
4. PROPERTIES OF COMPACT SOURCES
4.1. Submillimeter-MIR SEDs
The SED for cold dust emission at temperature ∼ 13 Kand emissivity index β = 1.5 peaks at 250 µm, and sothe combination of the three BLAST filters alone is wellsuited for determining the dust temperature. Neverthe-less, there is a range of temperature among sources (§ 4.3)and it is always preferable to have a broad wavelengthcoverage spanning both sides of the peak. Fortunately,Cyg X is well covered by both blind and more-targetedsurveys. An example of the multi-wavelength coverage isgiven in Figure 13. Clearly, resolution changes from map
to map. Also, for the central source here, the centroidchanges at shorter wavelengths (and in the radio). Asdescribed in § 2.5, we have extracted flux densities con-sistently within the same size beam, to characterize thesame physical structure.
We fit an idealized single-temperature SED expressedby equation (2) to data at all available wavelengths todetermine temperature, mass, and total luminosity ofeach source (see Chapin et al. 2008 and Truch et al.2008 for details). We adopt the same parameter val-ues, namely κ0 = 10 cm2 g−1, r = 0.01, and β = 1.5,and D = 1.7 kpc except for a few distant sources (§ 4.2).Single-temperature SEDs based on this value of β fit thedata of typical sources well. One of the main systematicuncertainties is the value of κ0r which is probably notknown within a factor of two.
We treated ancillary photometric data for wavelengthsless than 100 µm (see Appendix A) in the specific contextof each individual SED, including them as upper lim-its where available/necessary. Upper limits come withan additional penalty function in the χ2 minimizationthrough a survival equation (Chapin et al. 2008; Truchet al. 2008).
BLAST filters have large spectral widths about thecentral wavelength. Color correction to monochromaticflux density is carried out as part of the SED fitting de-scribed by Truch et al. (2008). The factors are close tounity and fairly consistent from source to source for therange of temperatures encountered here: 1.04, 1.07, and0.99 for 250, 350, and 500 µm, respectively.
An example of a multi-wavelength SED fit is shownfor C169 in Figure 14; this is one of the most luminoussources, W75N, and one of the hottest, with a best fittemperature for mm-FIR data of 36 K. In contrast tothis, the SED of one of the colder sources is shown inFigure 15; this is C116 with a temperature of 17 K.
In Table 4 we record T , M , Σ, and L and their uncer-tainties for 170 individual sources, there being no entriesfor the 14 faint sources either near the map edge or withunreliable 500 µm flux densities. The uncertainties in T ,M , and L, and the corresponding 68% confidence enve-lope of possible modified blackbodies, were obtained bythe Monte Carlo technique described by Chapin et al.(2008).
4.2. Sources Behind Cyg OB2
There are eight sources at distances larger than themain Cyg OB2 complex, C27, C30, C33, and C35 in DR7(§ 3.6), C59, C60, and C61 in G79.957 + 0.866 (§§ 3.6and 5.1.2), and C71 in ECX6-27 (§§ 2.1 and 3.1). Forcalculating L and M we assigned these rough distancesof 6.8, 3.4, and 8.5 kpc, respectively, making L and M16, 4, and 25 times larger than if the Cyg OB2 distanceof 1.7 kpc were adopted. This makes C30 the most lu-minous source and C71 the most massive. Both are ofcourse integrated over much larger spatial scales thanfor the sources at 1.7 kpc. Note that L/M and T arepreserved.
4.3. Temperature
Temperature is obtained directly as a free parameterof the SED fit. Figure 16 shows the temperature his-togram of BLAST sources detected in the Cyg X field.

14 Roy et al.
Fig. 11.— Same as Fig. 6 but for DR21 and W75N regions. Solid and dashed CO contours are for ranges −10 to 1 and 6 to 14 km s−1
as used in Fig. B.3 of Schneider et al. (2006).
The superimposed histogram is for the Vulpecula region(Chapin et al. 2008). The median of the distribution inCyg X is about 22 K which is comparable to the medianfor Vulpecula at 21 K. Recall that these are for β = 1.5.A somewhat higher β combined with a temperature dis-tribution might be a more realistic model (Netterfieldet al. 2009), though in the simple model here there is asingle T . For β = 2, the temperatures would be about10% lower.
4.4. Mass
Source mass M is obtained from the best fit amplitudeand temperature of the SED and equation (2), whichshows how any uncertainties in κ, r, and D are propa-gated as systematic errors. Recall that our sources typi-cally have an apparent FWHM of 1′, which correspondsto about 0.5 pc. This is more characteristic of a “clump”mass, as distinguished from the high resolution measure-ments of “cores” by Motte et al. (2007). (Note that thevalues adopted for κ0 and β do provide consistency withthe 1.2 mm opacity of 1 cm2 g−1 adopted by Motte et al.(2007), following Ossenkopf & Henning (1994). However,without the multi-wavelength coverage, they were forcedto adopt a temperature.) From these derived masses,ranging from 10 to 2000 M�, the BLAST sources havethe potential to form (many) massive stars under favor-able physical conditions. For example, in the contextof the turbulent core model Krumholz & McKee (2008)predicted a critical surface density for the formation of
massive stars, as opposed to fragmentation into muchlower masses (see § 6.3 for further discussion).
The surface column density for fragments of radius Ris given by
Σ = 2.7× 10⁻²
(M
100 M�
)(R
0.5 pc
)−2
g cm−2. (3)
We adopt the deconvolved FWHM of the brightness pro-file as the radius. Surface densities of the cores (andclumps) of Motte et al. (2007) are listed in Table 3. (Notethat the assumption of a temperature of 20 K for thecores means that the surface density reported might bean upper limit.) As discussed below, the surface densityof BLAST clumps is somewhat lower, in part becauseof the low angular resolution which limits the ability todiscern sub-structure at small R.
Following equation (2) of Motte et al. (2007), thevolume-averaged molecular hydrogen density is
〈nH2〉 = 3.3× 10³M/(100 M�) cm−3. (4)
Because of the BLAST beam size, these clump densitiesare more than an order of magnitude lower than for theembedded cores found by Motte et al. (2007). The cor-responding free-fall time scale (Stahler & Palla 2005) isalso longer,
tff = 5.6× 10⁵[M/(100 M�)]−1/2 yr. (5)

BLAST Survey of Cygnus X 15
Fig. 12.— Same as Fig. 11 but for DR22 and DR23 regions to its south.
4.5. Luminosity
The best fit single-temperature SED is a good and inte-grable interpolating function from which the far-infraredluminosity L is derived analytically. The frequencies atwhich the most important contributions arise can be vi-sualized most readily when the SED is plotted in νFνform like Figure 14.
Often the short-wavelength mid-infrared data lie in ex-cess of this simple SED and to allow for that we sim-ply integrate the piecewise curve connecting that short-wavelength data where available. This is normally asmall contribution to the total bolometric luminosityLbol (Table 4). For example, for W75N (C169, Fig. 14)L rises from 6.2 to 6.6× 10⁴ L�. In the context of posi-tion in the logarithmic L-M plot below, this is not a bigcorrection.
The luminosity range in Cyg X is large, extending overthree orders of magnitude from 7×10⁴ L� down to 40 L�,beyond which we lose many sources in the (cirrus) noise(note that the approximate 250 µm completeness line isabout 30 Jy; see Chapin et al. 2008).
4.6. The L−M Diagram
The L −M diagram can be exploited to assess evolu-tionary stages (Molinari et al. 2008). Figure 17 shows ourresults in the L −M plane for those sources at the dis-tance of Cyg OB2; the results for the few distant sources(§ 4.2) are in Figure 18 (note the scales to larger masses
and luminosities).Lines of constant T are diagonal lines (constant L/M)
in this L-M diagram: a mass M radiates a predictableL, depending on κ0r and β. To be consistent with theanalytical loci, we plot L from the SED fit rather than theonly slightly larger Lbol. “Orthogonal” to these diagonallines are loci of constant 250 µm flux density. Note thatthere are relatively fewer sources between the 30 and10 Jy loci because of the growing effect of cirrus noise.
In this diagram the “error ellipse” determined by theMonte Carlo technique is elongated along the locus forthe source flux density and the extent is well describedby ∆T/T . We examined the histogram of ∆T/T andrejected outliers > 0.19; these were 18 sources withpoorly constrained SEDs, usually lacking in definitivedata near 100 µm combined with their poor image qual-ity at 500 µm.
The dashed and dot-dash thick lines, roughly lines ofconstant T , are the loci obtained empirically by Molinariet al. (2008) for sources thought to be in the accretionstage and the later nuclear burning stage (when envelopedispersal begins), respectively. For single low mass stars,these would correspond to the spectroscopically defined“class 0” and “class 1,” respectively. With BLAST, wedetect sources of the size of “clumps” and furthermoreeven smaller angular-size high-mass “cores” are capableof forming multiple stars. This warns against a simpleinterpretation of this diagram based on single-star evo-lutionary tracks, although it is possible that once high

16 Roy et al.
Fig. 13.— Thumbnails zooming in on a 14′ by 18′ section ofthe BLAST survey area containing DR20 (Galactic coordinates;cf. Fig. 10) at multiple wavelengths available for photometry. Rel-ative appearance of structures changes because of different dusttemperatures. The lowest in the vertical chain of three sources,seen only at wavelengths 500 µm and longer and so not cataloguedas a BLAST source, must be quite cold. At IRAS 60 µm (IGA,after HIRES processing), sources appear elliptical across the scandirection. At IRAS 100 µm, the emission of crowded sources isoften blended.
mass stars form, the most massive will dominate the lu-minosity and ionization (this will depend on the IMF,star formation efficiency, and also small-number statis-tics).
We think that the most illuminating way to think ofpre-stellar evolution in this diagram is in terms of theenergy source for the clump, which determines the ap-propriate equilibrium temperature T for the approximateSED. In the very earliest stages being sought in submil-limeter surveys, the energy source for the clumps is pre-dominantly external, namely the impinging interstellarradiation field. In Cyg X the radiation field is in princi-ple higher than in the local interstellar medium becauseof all the massive stars that have already formed, butthis radiation is attenuated by the dusty molecular ma-terial in which the pre-stellar clumps are embedded. Auseful point of reference is the equilibrium temperaturecorresponding to L = M , which for the adopted κ0r andβ (§ 4.1) is 16.2 K.
Massive sources located below this L = M locus (see§ 5.6) still can have substantial L by virtue of a lot ofmass, but cannot have any predominant internal sourceof energy (either accretion or nuclear), and so could becalled “starless.” This term is probably best avoided forthese clumps, within which there might actually be a few
Fig. 14.— SED of C169 (W75N). To show intuitively wherethe most important contributions to the bolometric luminosityarise, this particular log-log plot uses νFν , obtained by multiply-ing flux densities by ν/ν250 with ν250 corresponding to 250 µm.The central solid curve shows the best-fit modified blackbody us-ing data at λ ≥ 60 µm with β = 1.5. The MSX data shownby the circles are not used in the fit but are important in con-straining Lbol (§ 4.5). The bracketing curves represent the 68%confidence envelope of modified blackbody models obtained fromMonte Carlo simulations. Best fit parameters are T = 36.2± 3.6 K,M = (7.6± 1.2)× 102 M�, and L = (6.2± 2.2)× 104 L�.
Fig. 15.— Like Fig. 14 but for one of the colder sources in Cyg X,C116. At 70 µm we plot the 1-σ (arrow) and 3-σ upper limits(Appendix A); upper limits constrain the SED through a penaltyfunction (Chapin et al. 2008). Best fit parameters are T = 17.1±0.9 K, M = (1.7 ± 0.2) × 102 M�, and L = (2.2 ± 0.4) × 102
L�. The 24 µm MIPS image in the upper panel of Fig. 26 revealsa deeply embedded stellar nursery but it is not yet very luminous.

BLAST Survey of Cygnus X 17
Fig. 16.— Light grey histogram shows the distribution of sourcetemperatures for the Cyg X field. Dark over-plotted histogram isfor the BLAST05 Vulpecula field (Chapin et al. 2008).
low mass stars already forming and detectable by sensi-tive telescopes like Spitzer (§ 6.2). The key considera-tion is what is the dominant source of energy determin-ing T . As mentioned in the introduction, these clumpscould be said to be in stage E (“E” for “external” or“earliest”), which seems to us a better terminology than“starless,” or “class −1” for single-star pre-stellar cores.Figure 17 shows that there are many clumps in this stage.We can calculate the Bonner-Ebert mass, above which(within the assumptions) a clump is gravitationally un-stable (e.g., Stahler & Palla 2005):
MBE = 1 [Tg/(10 K)]3/2[nH2/(104 cm−3)]−1/2 M�. (6)
Thus, assuming that Tg ≤ T , the low-luminosity, low-temperature BLAST clumps are unstable. As discussedbelow, in the simplest theory they would evolve intothe higher-luminosity, higher-temperature clumps seenhigher in the diagram at the same M .
As gravitational collapse progresses, more and moremass accretes into protostellar cores. The actual lumi-nosity in this accretion-powered stage depends on theaccretion rate and the potential well. In recognition ofthe underlying energetics, these clumps could be said tobe in stage A (“A” for accretion-powered). Consistentwith this interpretation, sources observed to be in thispart of the L-M diagram have a characteristic signatureof active accretion (§ 5.5).
Ultimately, nuclear fusion becomes the dominantsource of power. Unlike for low mass stars, massivepre-main sequence stars probably continue accreting af-
Fig. 17.— Distribution of BLAST sources in the Cyg OB2 com-plex in the L-M plane. Those to the right of the steep dash-dot(gray) curve are above the Bonner-Ebert mass. Solid diagonal linesare loci of constant T or L/M . The dotted line (red) is L = M .Dot-dash curves “orthogonal” to these are for constant 250 µm fluxdensity. Dash (green) and dot-dash (blue) lines denote the locationof sources powered by accretion and nuclear burning, respectively,as derived empirically in Fig. 9 of Molinari et al. (2008). Coolsources discovered by BLAST with low L/M still are externallyheated (stage E). These appear to be gravitationally bound, buthave no significant internal power from star formation yet. The ver-tical arrow indicates the direction of evolution in this diagram asprotostar formation takes hold within a clump. The horizontal ar-row indicates the direction of evolution as the embedding materialis dispersed by the formed stars/cluster, assuming the surroundingdust still reprocesses most of the internally-generated L. Other-wise (as appears to be the case), the re-radiated L, measured here,is less. Black filled circles are BLAST sources corresponding toclumps of Motte et al. (2007) (Table 3). Crosses are sources withmorphological evidence of mass-stripping from radiative interac-tion with Cyg OB2; some at lower luminosity exhibit the effects ofexternal ionization.
ter first beginning nuclear burning, increasing their massfurther (Zinnecker & Yorke 2007). When this accretionends, an individual star is at its final position on theZAMS. It will still be embedded, and so optically ob-scured, but its vast power reprocessed will produce a rel-atively warm far-infrared source. For sufficiently massivestars, significant ionization of the surroundings will en-sue, producing a hypercompact H II region. There couldbe many within a single clump, for example (Rivera-Ingraham et al. 2010). These clumps would appear inthe L −M diagram near the empirical nuclear burninglocus (see § 5.4).
As the massive stars clear their local environmentthrough the expansion of the H II region and via ra-diation pressure on dust (successively ultracompact then

18 Roy et al.
Fig. 18.— Like Fig. 17, but for sources more distant thanCyg OB2 (§ 4.2). Triangles, circles, and square represent sourcesabout 3.4, 6.8, and 8.5 kpc away, respectively. These include themost luminous and most massive sources in the survey.
compact H II regions), the individual objects will becomemore extended far-infrared sources. The strong short-wavelength stellar radiation field will enhance both ther-mal emission and non-equilibrium emission from PAHsin nearby photodissociation region material, making theSED of the integrated re-emission of the clump broaderand more complex. Evolution in the L-M diagram willinitially be at constant L with decreasing M ; ultimately,the optical depth and/or covering factor would decreaseso that the reprocessed L will fall.
A stellar cluster with an extended H II region wouldemerge. Even though such clusters are found in Cyg X,they are not detected as compact BLAST sources andso do not appear in the L-M diagram; only objects liketheir precursors would.
4.7. Census
It is interesting to ask how many objects are in eachevolutionary stage. To address this we have concentratedon the mass range between 50 and 500 M� where there isan abundance of sources (100 omitting the sources moredistant than Cyg OB2) and the lower luminosity end isminimally affected by completeness, at least down to L =M . Figure 19 presents a histogram showing the relativepopulations in terms of L/M , which we have argued is atleast qualitatively related to the successive stages. Notethat this figure looks quite similar to Figure 16, therebeing a non-linear mapping of L/M into T .
Figure 19 shows that there are many sources in stageE (L/M < 1 L�/M�), even though it is clear thatthere are selection effects (basically the combination oflow flux density and cirrus noise) beginning to limit theirdetectability. Most of the sources are in the accretion-dominated stage A (L/M up to about 30 or T = 30 K).The relatively fewer hotter sources, where nuclear burn-ing is taking over, presumably reflects the shorter lifetime
Stage E Stage A
Fig. 19.— Histogram of L/M ratio of the Cyg X compact sourcesin the mass range 50 – 500 M�. The dotted vertical line separatesstage E sources below the locus L = M in Fig. 17. Most sources arein the accretion-powered stage A, up to the dashed line (L/M ≈30 L�/M�), beyond which nuclear burning becomes predominant.
of this stage, which could be characterized by more rapidfinal collapse and then envelope dispersal.
5. EVOLUTIONARY STAGES
Although our BLAST survey is “blind and unbiased”,in surveying the entire region rather than selecting sub-regions with, say, high extinction (Schneider et al. 2006;Motte et al. 2007), it is not unbiased in another sense.This region is obviously well known for its GMC andhaving formed the Cyg OB2 association, which has dra-matically influenced the surrounding molecular material(§ 5.1). In such a region one expects there to be bothtriggered and/or sequential star formation, supplement-ing spontaneous star formation. The conditions could bequite different now than what preceded the formation ofCyg OB2. We find no evidence for the precursor of an-other such massive compact association. Nevertheless,within this reservoir several smaller, but still notable,embedded clusters have been identified (§ 3.1). The OBstars in the more evolved ones have produced extendedH II regions like DR17 and DR22 (Downes & Rinehart1966).
As discussed in § 3.5, in their 13CO J = 2 → 1data cubes, Schneider et al. (2006) have identified manyclumps (detailed in their Appendix C). Where the cov-erage overlaps, each of the BLAST compact sources canbe linked through the morphology to one of these clumps(see examples in § 3.6). In Figure 20 we compare thesum of the masses of the BLAST sources (§ 4.4) within

BLAST Survey of Cygnus X 19
Fig. 20.— Sum of the masses of the BLAST sources within COclumps of Schneider et al. (2006) versus the CO-estimated clumpmass. Linear correlation has a slope of 0.05. An outlier at 3000M� along the y direction, pointed to by the arrow, is not includedin the fit.
each clump to the tabulated CO-estimated clump mass.These are fairly well correlated, and we find typicallythat only a few percent of the material over these ex-tended regions is in the form of compact sources, in someway related to the (potential) star formation efficiency.This plus the timescales for clump evolution indicate thatthere is still an interesting future for star formation inthis GMC.
From this perspective on the complex range of star for-mation going on in Cyg X, our goal is to work towardsubmillimeter evidence for the earliest stages of massivestar formation. The somewhat later stages have been de-tected by a variety of earlier observations, and BLASTsees these too. The many clusters in Cyg X are agentsproducing complex morphologies in the medium, throughexpanding H II regions and strong UV radiation fields,and they might play a pivotal role in inducing furtherstar formation in the molecular clouds. We work in re-verse chronological order, finding what the outcome of aparticular stage looks like in multi-wavelength data, andthen asking what this tells us to look for in the stagesthat came before.
5.1. The Influence of the Massive Cluster Cyg OB2
Comparing the estimated mass of Cyg OB2 (§ 3.1),4 to 10 × 104 M� (Knodlseder 2000) to the remainingmolecular reserve in Cyg X, 4×10⁶ M� (§ 3.5; Schneideret al. 2006), indicates that formation of this OB2 associa-tion was the major event for this GMC, perhaps not to berepeated. Both of the central clusters, BBD1 and BBD2,are more massive than the Trapezium. Again, will therebe more elsewhere in Cyg X? There is no BLAST clumpthat could be a precursor to such a prominent clusterand even adding the mass of an embedding CO clump(the most massive of which is 2 × 10⁴ M�) would fallshort. Nevertheless, in unevolved GMCs, massive and
compact precursors to such clusters might be detectablein the Planck Cold Core survey (§ 2.2; Juvela et al. 2010).It will of course depend on how long-lived the precursorstage is.
Massive young stars, through ionization and radia-tion pressure, dramatically influence their environment.Cyg OB2 has an age of about 2.5 × 10⁶ yr (Negueruelaet al. 2008), and in that time has created in the ISMa lower density region of radius 1◦ (30 pc), ionized inthe interior (see Fig. 2) and surrounded by distinctivemolecular cloud complexes. The connectivity of theseclouds in the CO data cube and the signs of interactionthrough UV radiation (MSX Band A data) led Schnei-der et al. (2006) to conclude that they were all locatedat the same distance. While obviously not yet disrupted,the clouds have been reorganized and so Cyg OB2 mighthave induced some of the further star formation that ison-going.
Above Cyg OB2 in Figure 2 is a relative void (nev-ertheless, it is projected on an emission and extinc-tion plateau), with no high-contrast structures of sig-nificant column density in any tracer (molecules, dust,ionized gas). The right hand edge is defined by CXR9whereas the left, though well-defined and containingsome BLAST emission too, is unnamed. This void couldbe a “chimney” blown out by Cyg OB2, channeling highpressure gas out of the Galactic disk.
5.1.1. Pillars
Radiative forces sculpt pillars, where there are pre-existing dense molecular structures. The range of radia-tive influence of Cyg OB2 extends to a radius of at least2◦ (60 pc), as illustrated by the prominent pillars nearG79.4-1.1 and G81.4+2.2 in the Spitzer IRAC and 24 µmMIPS images. Figure 21 shows an example of a long pil-lar or elephant trunk pointing toward the Cyg OB2 core.At the end of the trunk is a luminous BLAST clumpC85. In CO emission, it is called DR20NW by Schnei-der et al. (2006), with CO velocity +12 km s−1 (see alsoFig. 10). The clump is the obstruction defining the trunkstructure. Star formation is occurring in this clump, sug-gestive of triggering by Cyg OB2. This geometry is seenelsewhere; for example, C75 on the left edge of the chim-ney is also at the head of a pillar facing Cyg OB2 (seealso the cometary tails below).
Such a peninsular structure is continually eroded,which would produce eventually an isolated clump witha cometary tail, but this particular trunk appears tobe attached to the molecular cloud, curving round andbroadening out to include C91, C98, and C100 along theinterface. These structures also evolve due to instabili-ties at the interface of the H II region and the neutralmolecular cloud, and evidently on-going star formationis commonly induced.
Note that DR20 (C88, C87, C90) is at a projected dis-tance of 6′ from this trunk, and yet does not display thesame hallmark interactions. However, this complex is ata very different velocity −3 km s−1, more closely associ-ated with DR21. Schneider et al. (2006) note that clumpDR20W, at the same velocity, does have an elongatedshape pointing to Cyg OB2 (see Fig. 10). BLAST C80is at the brighter head of its CO emission and C83 inthe dimmer tail. Inspection of the Spitzer images showssigns of interaction with nearby stars in Cyg OB2, but

20 Roy et al.
Fig. 21.— IRAC band 4 image showing a prominent pillar or“elephant trunk” structure pointing to Cyg OB2. Squares areBLAST sources and stars show the position of the OB stars.
at a different position angle than the CO clump which isoriented more toward the core.
Schneider et al. (2006) also identify other molecularpillars in the CO channel maps, the most prominentof which is the long “DR17 pillar” at a velocity about−13 km s−1 (Fig. 9). From its direction of elongation, itappears to be influenced by the cluster LK12 in DR17,but there is not perfect alignment (possibly there is someinfluence of LK14 to the north). This cluster does pro-duce a bright mid-infrared interface at BLAST C115,near the end of the pillar. The molecular pillar stretchesfrom C115 through C114, C112, C113, and C108 to C109and possibly C106 (Fig. 9). The CO channel maps hintat a connection between this DR17 pillar and the above-mentioned elephant trunk, but this pillar does not appearto be influenced by Cyg OB2.
5.1.2. Cometary Tails
Further striking evidence for interaction is providedby cometary tails in more detached structures, pointingaway from the core of Cyg OB2. These too are seen mostclearly in Spitzer IRAC and 24 µm MIPS images.
DR18 is a large scale prototype, with a ionized edgefacing the Cyg OB2 core, the BLAST clump C73 in theneutral region next to this, and an extended tail seenin both CO and dust emission (mid-infrared to submm).It is actually more complicated than this in detail, be-cause a loose aggregate of early B stars has formed (trig-gered?) near the leading edge adding additional ionizingpower and sculpting of the immediate PDR environment
Fig. 22.— 24 µm MIPS image showing two BLAST sources,C38 and C17, with cometary tails. The spatial extents of the tailsare roughly 1.5 and 3 pc, respectively. Contours of 21-cm radioemission from CGPS show ridge CXR11.
(Comeron & Torra 1999).Another interesting example in the opposite direction
is the cluster ECX6-21 (DB12) containing BLAST C55in the head. C55 corresponds to OB2 globule 2 of Schnei-der et al. (2006) with CO velocity −4.5 km s−1. About5′ “downstream” is a miniature version containing C53.These are located on the inner edge of the ionized ridgeCXR9.
Further afield from Cyg OB2 is DR15, with a clusterand two BLAST clumps, C32 and C28. Here the puta-tive tail (see Fig. 7) appears to be part of an extendedstructure prominent in presumed PAH emission, whichbends significantly toward lower latitude at a distance of17′, near C12. There are several other BLAST clumpsalong this structure, C21 before the bend, and C11, C9,C4, and C3 beyond.
Figure 22 shows a field quite close by, spanning theionized ridge CXR11. There are two BLAST clumpsC38 (on the left) and C17 with material ablated fromthe clump clearly being blown away. However, in theBLAST image these cometary tails are not detected be-cause of low column density. C38 is massive enough tohave a detectable ionized edge. The C17 tail extends toan angular distance of 6′ or about 3 pc in spatial scale.If, for illustration, the clump lifetime were 105 yr the re-quired material speed would be 30 kms−1 to reach suchan extent.
There are many other sources like this with obviousinteractions. Their positions in the L-M diagram arehighlighted in Figure 17. For these exposed sources, itis clear that a sizable amount of mass is lost due to thiserosion, and so the more evolved sources occupy a regiontowards the lower end of the mass axis in the L-M plot.
The ridge of submillimeter emission containing sourcesC59, C61, and C60 provides an interesting counter-example. The superimposed CO ridge is called “OB2globule 1” by Schneider et al. (2006) who suggest aninteraction due to its compactness and proximity to thecore of Cyg OB2, in projection about 15′ away. However,inspection of the detailed Spitzer images now availablereveals no signs of interaction. Furthermore, the dis-placed ionized ridge parallel to the dust emission is onthe side away from Cyg OB2 (see Fig. 6). Together with

BLAST Survey of Cygnus X 21
Fig. 23.— IRAC band 4 (8.6 µm) image of DR22. Circle marksthe position and size (R50) of the LK11 OB star cluster (Le Duigou& Knodlseder 2002). Overlaid contours are 21-cm radio continuumemission from the CGPS. Squares indicate the BLAST sources,embedded in arcs of submillimeter emission outside the ionizationfront (Fig. 12).
the peculiar velocity, the evidence is that this object ismore distant, beyond the influence of Cyg OB2.
5.2. Clusters and Extended H II Regions
Interactions of clusters with the ISM produces largescale complex structures and directly affect the nextgeneration star formation efficiency in the region. TheCyg X region hosts numerous young open clusters (§ 3.1).In the BLAST region, there are five which have well-resolved H II regions with a fairly classical geometry.Expansion of the ionized gas, stellar winds, and radiationpressure have evacuated the core of the parent molecularcloud and produced a dense shell which appears in anarc-shaped geometry surrounding the cavity and cluster.Partial shells are suggestive of a blow-out or blister ge-ometry. The 21-cm radio emission traces the ionizationfront, and slightly outside of this is the FIR and submil-limeter continuum, where dust in the shell absorbs theFUV radiation emitted by the star cluster.
To illustrate this, Figure 23 shows an IRAC band 4image highlighting the most massive of these clusters,LK11, with about 80 OB stars powering the DR22 region.Note that the PAH emission in this image is from thePDR, outside the ionization front, whereas the 24 µmemission in Figure 12 shows greater correlation with theionized gas. The BLAST sources occur along CO ridgesto the north and south-east, the latter clearly arc-shaped(making this the “smiley nebula”). The most luminoussource C92, coincident with a compact H II region, mustbe internally powered (see below). LK11 is shaping thisclump and both the geometry and proximity suggest thatstar formation has been triggered there.
Similar geometrical statements can be made aboutLK09 and C30 (and C27, C33) in DR7 (Fig. 6),LK12 and C115 in DR17 (Fig. 9), LK13 and C127 inG81.445+0.485 (the Diamond; Fig. 11), and DB22 andC182 (and C177, C178) in ECX6-33.
Although these H II regions have evolved, the excitingclusters are still quite young; their stellar density is typi-cally five times higher than for evolved open clusters (LeDuigou & Knodlseder 2002). Thus their radii R50 (half
population radius), about 1′ (0.5 pc), are perhaps indica-tive of the size of the precursor molecular clump. Thestellar masses are estimated by Le Duigou & Knodlseder(2002) to be 300 to 2000 M� (a few times more forDR22) and so the precursor clump would be more mas-sive still. BLAST clumps are of this angular size, butnot nearly as massive, not even up to these stellar masseslet alone allowing for inefficiency of star formation. Weconclude that there are presently no BLAST clumps ca-pable of forming such massive clusters. The embeddingCO clumps are perhaps massive enough, but would haveto condense considerably to form a concentrated cluster.The lifetime of these condensations could be quite short,lowering the likelihood of detecting this stage in a singleGMC.
5.3. Triggered Star Formation
Spatially, a massive star cluster can promote furtherstar formation in nearby molecular material by driv-ing winds and shocks, which both sweep up materialand overrun and compress pre-existing condensations.Subsequent gravitational instability and/or radiatively-driven implosion of the overrun condensations collec-tively lead to what is known as “triggered” star formation(Elmegreen 1998; Zinnecker & Yorke 2007; Koenig et al.2008). Thus a sequence of generations of star formationcan occur with spatial ordering (recognized as “sequen-tial” star formation). For example, Koenig et al. (2008)studied these phenomena in W5 with Spitzer.
As discussed, in the vicinity of the OB star clusters inCyg X there is evidence of further star formation. Themost persuasive, if circumstantial, evidence for triggeringis in the DR22, DR8, DR17, and DR15 molecular clouds.
5.4. Compact H II Regions
Earlier in their development, when massive protostarsfirst become hot enough to emit ionizing UV photons,they initially ionize only a dense core, producing a hy-percompact H II region, potentially optically thick atlower radio frequencies. Subsequent expansion of theionized gas leads successively to ultracompact, compact,and then evolved H II regions (Churchwell 2002). Theinitial stage, which occurs when accretion is still strong,is accompanied by energetic bipolar outflows.
Circumstellar dust reprocesses the absorbed radiationfrom the protostar, re-radiating the energy at infraredwavelengths. Thus in the Galactic Plane, embedded H IIregions are the most luminous objects observed in themid and far-infrared, first by IRAS and then MSX.
Hot cores, dense molecular clouds with temperature≥ 100 K as classified by Kurtz et al. (2000), are oftenthought to be precursors of UC H II regions. In our sur-vey, we do not detect any source warmer than ∼ 40 K.Nevertheless, some of the brightest sources detected byBLAST in Cyg X are found among well-known H II re-gions, with previous studies revealing them to be com-pact or ultracompact; they are all detectable in 21-cmradio continuum emission in the CGPS. Five of thesestudied by Motte et al. (2007) are tablulated in Table 5and discussed in the next subsection. Motte et al. (2007)obtained masses of these sources assuming a dust tem-perature of 40 K. We are actually able to measure thetemperature, finding 30 to 40 K. Still, it should be re-

22 Roy et al.
Fig. 24.— Same as Fig. 17, but highlighting physical propertiesdeduced from ancillary data. Many of the most luminous sourcesare ionizing and have associated radio continuum emission. Closeto the nuclear burning locus, these contain deeply embedded mas-sive stars (Motte et al. 2007): 4 HCH II; © UCH II; O CH II.Grey filled circles are other BLAST sources with compact 21-cmcontinuum emission, outside the survey area of MAMBO. Proto-stars in stage A are at somewhat smaller L/M than the compactH II regions, near the accretion locus. These are classified by Motteet al. (2007) as 2 HLIRPC; � MIRQP; and F IRQP. At the lowestL/M , clumps are externally heated (stage E), while at intermediatevalues the clumps are probably powered by low mass protostars;the thick dashed lines are the model predictions of Krumholz &McKee (2008) (eq. 7 in § 6.3) for surface densities Σ = 1.0, 0.1,and 0.01 g cm−2. The vertical arrow signifies the result of evo-lution in L as star formation progresses in a clump. This mightbe interpreted as the result of the evolution of a single massiveprotostar (Molinari et al. 2008). However, the initial rise seemsmore likely to be the result of power from low-mass YSOs (§ 6.2).According to the model of Krumholz & McKee (2008), unless Σexceeds a critical value near 1.0 g cm−2, a massive star will notform and so the rise in L will be arrested (§ 6.4); this possibility isindicated schematically by the short horizontal arrow. Finally, thearrow segment pointing to the upper right represents qualitativelythe evolution in the simulations by Smith et al. (2009) and Wanget al. (2010), where mass is fed into gravitational potential minimafrom larger scale structure.
membered that BLAST measures dust emission includ-ing the outer envelope of these sources, which is coolerthan dust near the core; with higher angular resolutionMAMBO should sample slightly warmer dust on average.
These five sources are marked in Figure 24 with specialsymbols. They are clearly internally powered, beyondthe transition to predominant nuclear burning. For ref-erence, a 20 M� zero-age main sequence star of spectraltype O9V has Lbol = 105 L� (Schaerer & de Koter 1997).Even the most luminous of these embedded stars at thedistance of Cyg OB2 is not that luminous. Given the
mass of these clumps, > 100 M�, they also seem likelyto host more than a single star.
The precursors to these sources should be cooler, atsimilar mass. In the range of a few 100 M�, there aremany such BLAST sources in Figure 24, the earlier stagesto be discussed below. However, there do not seem to bethe cooler equivalents of most massive sources (W75N,DR21, DR21 OH), suggesting that the precursor stage tothe most massive (dense) clumps is relatively short-livedor that when cooler the clump is too extended to havebeen classified as a BLAST source (§ 6.4).
Also recorded in Table 5 are another 11 instances (in-cluding two distant ones) of BLAST sources with appar-ently associated compact 21-cm radio emission, not tar-geted by Motte et al. (2007). These are slightly cooler,with median temperature 27 K. These are marked in Fig-ures 18 and 24 with grey filled circles.
A histogram of the bolometric luminosities of all ofthese sources, including the luminosity corrections forthe two distant ones, is given in Figure 25. The lumi-nosities of the five marked sources are at the high end,whereas most of the others have much lower luminosities.The luminosities can be used to calculate the correspond-ing photoionizing flux Q0 and check for consistent radioemission (assuming no optical depth; see § 3.2). The low-est luminosity sources in Figure 25 would not account forthe associated H II emission. Inspection of the IRAC im-age reveals all but C76 to have cometary structure (thoseof higher mass and luminosity were already mentionedabove: C55, C73, C80; all but C14 appear to be influ-enced by Cyg OB2) and our interpretation is that theradio emission comes from external ionization. C76 liesin close projection to the O7 V star MT771.
5.4.1. Specific Embedded H II Regions in Cyg X
Here we make brief comments on the five markedsources from Motte et al. (2007) in Table 5, plus threeothers that appear to be in the same advanced stage ofevolution.
C1, AFGL 2591: C1 coincides with AFGL 2591, anUC H II region that is among the most luminous sourcesin Cyg X. Motte et al. (2007) identify a core S26 withina clump S5. We find dust temperature 40 K, bolomet-ric luminosity 2.7 × 10⁴ L�, and mass 190 M�. Camp-bell (1984) discovered that AFGL 2591 is comprised of ayoung stellar group and deduced that the H II region isbeing generated by B0 stars. This region also has pow-erful outflows (Bally & Lada 1983; Poetzel et al. 1992).Schneider et al. (2006) argue that the cometary shape isdue to the influence of Cyg OB2.
C88, DR20: Compared to C1, C88 is slightly cooler(32 K), less luminous (8.6 × 10³ L�), but equally mas-sive (190 M�). It corresponds to clump N4 (core N10) ofMotte et al. (2007). The embedding region (see Fig. 10)is bright in 21-cm radio continuum, mid-infrared, andPAH emission. C88 and C87 are two bright sources alonga ridge containing C90. C88 is closest to the CGPS radiopeak, but offset to lower longitude, whereas the UC H IIregion G80.86+0.4 observed by Kurtz et al. (1994) is cen-tered on C88. C88 also coincides with IRAS 20350+4126.Odenwald et al. (1990) suggest excitation by an O5-6ZAMS star, but this seems too early.
The source C87 (clump N6, core N14) is relatively cold,27 K, with no free-free emission. Its position on the L-
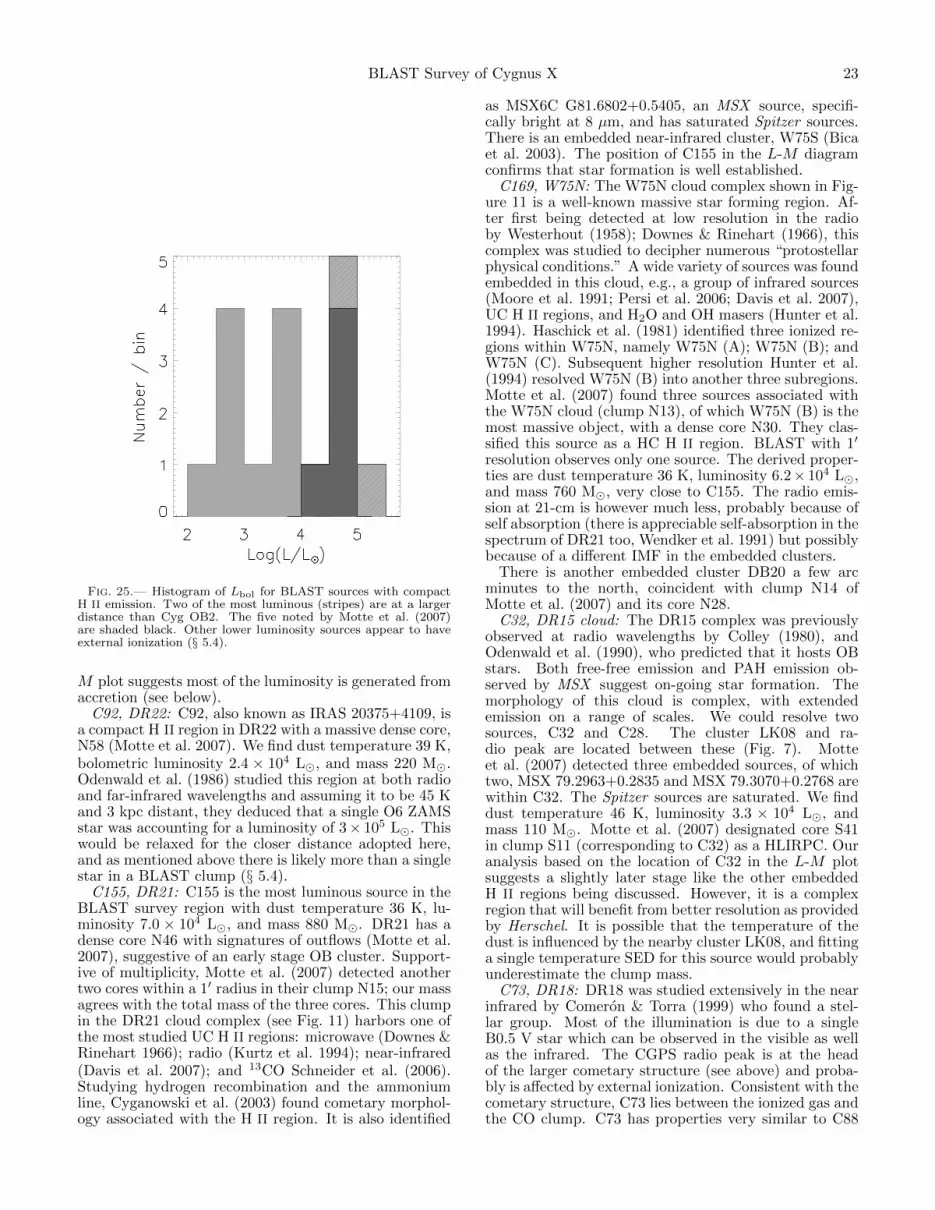
BLAST Survey of Cygnus X 23
Fig. 25.— Histogram of Lbol for BLAST sources with compactH II emission. Two of the most luminous (stripes) are at a largerdistance than Cyg OB2. The five noted by Motte et al. (2007)are shaded black. Other lower luminosity sources appear to haveexternal ionization (§ 5.4).
M plot suggests most of the luminosity is generated fromaccretion (see below).
C92, DR22: C92, also known as IRAS 20375+4109, isa compact H II region in DR22 with a massive dense core,N58 (Motte et al. 2007). We find dust temperature 39 K,bolometric luminosity 2.4 × 10⁴ L�, and mass 220 M�.Odenwald et al. (1986) studied this region at both radioand far-infrared wavelengths and assuming it to be 45 Kand 3 kpc distant, they deduced that a single O6 ZAMSstar was accounting for a luminosity of 3× 10⁵ L�. Thiswould be relaxed for the closer distance adopted here,and as mentioned above there is likely more than a singlestar in a BLAST clump (§ 5.4).
C155, DR21: C155 is the most luminous source in theBLAST survey region with dust temperature 36 K, lu-minosity 7.0 × 10⁴ L�, and mass 880 M�. DR21 has adense core N46 with signatures of outflows (Motte et al.2007), suggestive of an early stage OB cluster. Support-ive of multiplicity, Motte et al. (2007) detected anothertwo cores within a 1′ radius in their clump N15; our massagrees with the total mass of the three cores. This clumpin the DR21 cloud complex (see Fig. 11) harbors one ofthe most studied UC H II regions: microwave (Downes &Rinehart 1966); radio (Kurtz et al. 1994); near-infrared(Davis et al. 2007); and 13CO Schneider et al. (2006).Studying hydrogen recombination and the ammoniumline, Cyganowski et al. (2003) found cometary morphol-ogy associated with the H II region. It is also identified
as MSX6C G81.6802+0.5405, an MSX source, specifi-cally bright at 8 µm, and has saturated Spitzer sources.There is an embedded near-infrared cluster, W75S (Bicaet al. 2003). The position of C155 in the L-M diagramconfirms that star formation is well established.
C169, W75N: The W75N cloud complex shown in Fig-ure 11 is a well-known massive star forming region. Af-ter first being detected at low resolution in the radioby Westerhout (1958); Downes & Rinehart (1966), thiscomplex was studied to decipher numerous “protostellarphysical conditions.” A wide variety of sources was foundembedded in this cloud, e.g., a group of infrared sources(Moore et al. 1991; Persi et al. 2006; Davis et al. 2007),UC H II regions, and H2O and OH masers (Hunter et al.1994). Haschick et al. (1981) identified three ionized re-gions within W75N, namely W75N (A); W75N (B); andW75N (C). Subsequent higher resolution Hunter et al.(1994) resolved W75N (B) into another three subregions.Motte et al. (2007) found three sources associated withthe W75N cloud (clump N13), of which W75N (B) is themost massive object, with a dense core N30. They clas-sified this source as a HC H II region. BLAST with 1′
resolution observes only one source. The derived proper-ties are dust temperature 36 K, luminosity 6.2× 10⁴ L�,and mass 760 M�, very close to C155. The radio emis-sion at 21-cm is however much less, probably because ofself absorption (there is appreciable self-absorption in thespectrum of DR21 too, Wendker et al. 1991) but possiblybecause of a different IMF in the embedded clusters.
There is another embedded cluster DB20 a few arcminutes to the north, coincident with clump N14 ofMotte et al. (2007) and its core N28.
C32, DR15 cloud: The DR15 complex was previouslyobserved at radio wavelengths by Colley (1980), andOdenwald et al. (1990), who predicted that it hosts OBstars. Both free-free emission and PAH emission ob-served by MSX suggest on-going star formation. Themorphology of this cloud is complex, with extendedemission on a range of scales. We could resolve twosources, C32 and C28. The cluster LK08 and ra-dio peak are located between these (Fig. 7). Motteet al. (2007) detected three embedded sources, of whichtwo, MSX 79.2963+0.2835 and MSX 79.3070+0.2768 arewithin C32. The Spitzer sources are saturated. We finddust temperature 46 K, luminosity 3.3 × 10⁴ L�, andmass 110 M�. Motte et al. (2007) designated core S41in clump S11 (corresponding to C32) as a HLIRPC. Ouranalysis based on the location of C32 in the L-M plotsuggests a slightly later stage like the other embeddedH II regions being discussed. However, it is a complexregion that will benefit from better resolution as providedby Herschel. It is possible that the temperature of thedust is influenced by the nearby cluster LK08, and fittinga single temperature SED for this source would probablyunderestimate the clump mass.
C73, DR18: DR18 was studied extensively in the nearinfrared by Comeron & Torra (1999) who found a stel-lar group. Most of the illumination is due to a singleB0.5 V star which can be observed in the visible as wellas the infrared. The CGPS radio peak is at the headof the larger cometary structure (see above) and proba-bly is affected by external ionization. Consistent with thecometary structure, C73 lies between the ionized gas andthe CO clump. C73 has properties very similar to C88

24 Roy et al.
in DR20. This interesting region is outside the coverageof Motte et al. (2007).
C30, DR7: Figure 6 shows LK09 located in the centreof the DR7 H II region arc. The CGPS H II emissionpeak and ECX6-18 lie between BLAST sources C30 andC27, the former much more massive. This region is notcovered by Motte et al. (2007). The derived parametersfor C30 are very close to those for C32, assuming thesame distance. However, as remarked in § 3.6, its velocityplaces it well behind the Cyg OB2 complex, at 3.6 to7.5 kpc (we adopted 6.8 kpc in § 4.2). Thus this sourceshould be about 16 times more massive and luminous,as listed in Table 5, ranking it with the most powerfulsources in this survey.
5.5. Stage A: Accretion Power, Protostars, and MYSOs
As mentioned, BLAST cannot hope to see single stars,though the clump might be dominated by the most mas-sive member of the group. During the next earlier stage,precursor to the embedded H II regions, matter collapsesunder gravity at multiple sites inside the clump, whichare newly born stellar cores (Mac Low & Klessen 2004).The luminosity of the clump originates from the cumula-tive energy of accretion onto cores. During this accretionstage, protostars build up luminosity with little loss ofenvelope mass. In our L-M diagram (Fig. 24), the evolu-tion should be vertical, crossing the region between thedotted red line (L/M = 1 L�/M�) and the dashed greenline. The former is coincidentally close to diffuse cirrusemission in equilibrium with interstellar radiation field at17.5 K (Boulanger et al. 1996). The latter, taken fromFigure 9 of Molinari et al. (2008), is a best fit to class 0sources. Sources plotting in this region would have coolerdust temperatures, in the range 18 − 25 K and L/M≥ 1 L�/M� would clearly indicate internally poweredsources.
Motte et al. (2007) have identified several massive in-frared quiet protostellar cores (MIRQP), sources withmass greater than 40 M� with at least some evidenceof stellar activity and yet weak emission in the mid in-frared. All of the massive infrared-quiet cores are associ-ated with high velocity SiO emission, providing convinc-ing evidence of powerful outflows and on-going accretion.The SiO emission of MIRQPs is typically stronger thanfrom high luminosity infrared protostellar cores (HLIR-PCs), indicating that the former are in a more vigorousaccretion phase.
Of the 17 MIRQP, 8 are within our BLAST survey areaand are readily detected and characterized (Table 5). Inthe L-M evolutionary diagram, they occupy the pre-dicted region (see diamonds in Fig. 24). Judging fromFigure 24, there are many other BLAST sources withsimilar properties. The sensitive Spitzer images revealthe sub-structure, with many accreting cores over a rangeof fluxes (see also § 6.2).
C157, DR 21(OH): The most luminous MIRQP isin DR21(OH), which is lacking in 21-cm radio free-freeemission. However, high-sensitivity subarcsecond ob-servations with the VLA at centimeter wavelengths byAraya et al. (2009) reveal a cluster of radio sources; thestrongest emission is toward the molecular core MM1,but is perhaps from shock-ionized gas in a jet rather thanfrom a nascent compact H II region. C157 is also coolerthan the strongly ionizing sources discussed above, as
one might expect. It has a dense core N14 along withfive neighboring fragments (Motte et al. 2007) in clumpN14. Harvey-Smith et al. (2008) have observed 6.7 GHzmethanol emission in all five spots, but only two of them(DR21(OH) and DR21(OH)N) exhibited strong peaks.Our limited resolution integrates the dust emission fromall nearby fragments. Though Motte et al. (2007) hasclassified the core as MIRQP, we note that the signif-icant bolometric luminosity of C157, 2.9 × 10⁴ L�, isprobably indicative of the entire cluster, detected in thenear-infrared as DB19.
The next most luminous MIRQPs are in C7 and C115.C7 is an isolated source whereas C115 is at the tip ofthe DR17 molecular pillar. C119 is similarly at the tipof an adjacent pillar (Fig. 9). C36, among the coolest,is just north of DR15, at the most evolved end of theIRDC G79.34+0.33 discussed below(§ 5.6.2). There is avariety of indications of star formation (Redman et al.2003), and Spitzer images indicate a rich stellar group.
There are two sources classified as infrared quiet pro-tostar (IRQP, not so massive as MIRQP) by Motte et al.(2007) which appear to BLAST to be as luminous as theMIRQP-containing sources. The more luminous is C104(N62 in clump N20 to the north-east of DR22) in themolecular filament (velocity −5 km s−1) extending fromDR22 through MIRQP C107 to MIRQPs C141, C145 andcluster LK15 in DR23 (see Fig. 12). The most prominentmolecular clump along this filament contains C138 (N69,in clump N23); it defines the boundary of brightest ion-ized part of DR23, powered by cluster DB17 to the east(Fig. 12). The other is C167 (N24 in clump N10 to thenorth-west of W75N). At CO velocity −3 km s−1, this isin the DR21 cloud complex (Fig. 11). The Spitzer im-ages indicate widespread embedded star formation in theC167 cloud and adjacent BLAST sources.
The two HLIRPC (other than C32 discussed above)plot toward the high luminosity (high temperature) sideof this region in the L-M plane. These correspond tothe BLAST sources C85 and C87. C85 contains sourceN6 in clump N3 of Motte et al. (2007). It coincideswith DR20NW (Schneider et al. 2006) at the head ofthe above-mentioned elephant trunk. There is an ion-ized rim on the face toward Cyg OB2, but apparentlylittle internal ionization. Its position on the L-M plotsuggests most of the luminosity is generated from ac-cretion. Compared to C88 also in the DR20 molecularcloud, C87 (clump N6, core N14) is relatively cold, 27 K,with no free-free emission.
5.6. Stage E: Externally-heated Cold Early Stage
Prior to the stage of active accretion, there must pre-exist a cold molecular clump with only external heat-ing. A low temperature and corresponding low lumi-nosity to mass ratio (L/M ≤ 1 L�/M�) would bediagnostic of this stage. As a forerunner of SPIRE onHerschel, BLAST was designed to search for the submil-limeter emission from such objects in the earliest stagesof pre-stellar evolution, and according to Figure 17 hasbeen quite successful, with 28 sources down to the ap-proximate 250 µm completeness line of about 30 Jy.These compact sources are sufficiently cold and massiveto be above the nominal Bonnor-Ebert critical mass. Thehigher mass objects can be considered as potential pre-

BLAST Survey of Cygnus X 25
Fig. 26.— Left: cool BLAST sources at 250 µm. Right: corre-sponding 24 µm MIPS images, showing evidence for nascent starformation. Top: C116. Bottom: C36 at the transition to MIRQP,in IRDC G79.34+0.33. Radius of circles 1.3′.
cursors of the MIRQP accretion-powered stage.
5.6.1. Cold Clouds with Nascent Star Formation
It is a general consensus that massive stars should be-gin to form within stellar nurseries deeply embedded ina dense envelope of dust and molecular gas. BecauseSpitzer is so sensitive and probes at wavelengths wherethe dust can be penetrated, evidence for such nascentstar formation (not a lot of total power) is readily found.Figure 26 shows two examples. One is a cold BLASTsource C116 (along the DR22 to DR23 filament) cor-responding to the Motte et al. (2007) core N70. Wefind dust temperature 17.1±0.8 K, bolometric luminos-ity (2.2± 0.4)× 102 L�, and mass (1.6± 0.4)× 102 M�.The other is C36, already containing a low temperatureMIRQP (§ 5.5), embedded in an IRDC (§ 5.6.2).
5.6.2. IRDCs
Given the appropriate geometry, highly dense, massivemolecular clouds with significantly large extinction canbe seen in silhouette as infrared dark clouds (IRDC).With the spatial resolution and sensitivity of MSX, manyIRDCs have been found at Band A (8.6 µm) (Simon et al.2006). The signature of an IRDC without a developedprotostar is lack of dust emission at mid-infrared IRASwavelengths (Egan et al. 1998). However, that does notmean there is no low-power nascent star formation, asillustrated below.
Because of the high column density, BLAST seesprominent IRDCs in emission. An example is the ridge(filament) shown in Figure 27 which contains the IRDCsG79.34+0.33 and G79.27+0.38 (Egan et al. 1998) withcorresponding BLAST clumps C36 and C26, respectively.Although it was initially suspected that G79.34+0.33 wasassociated with the DR15 cloud, later Redman et al.(2003) found no such evidence. This filamentary ridge
Fig. 27.— Multi-wavelength views of the IRDC ridge in Cyg Xnear l = 79◦.23 and b = 0◦.45. Each thumbnail has dimension12′× 16′.
is associated with distinct 13CO emission at velocitiesnear 1 km s−1 (Fig. 7). G79.27+0.38 in the central partof the ridge was studied by Wu & Yang (2005).
Finer details can be found with the Spitzer images,both in extinction and in the presence of point sources.Both of these BLAST sources show evidence of nascentstar formation (Figs. 26 and 27). In fact there are embed-ded mid-infrared objects right along the filament, eventhe upper part of the ridge where the less massive con-densations are C25, C24, and C23.
Note that this ridge is seen in extinction against theshell of the LBV star G79.29+0.46 (Wendker et al. 1991),providing relative distance information which locates thestar behind the Cyg X region. The shell, even the faintouter halo seen at 24 µm, shows no signs of interactionwith Cyg OB2, indicating considerable separation. Krae-mer et al. (2010b) have quantified this using the stellarparameters, obtaining a distance of 3 kpc.
Figure 28 shows an interesting long filament that showsup well in the 24 µm image, in emission but changing toabsorption in front of a bright band of cirrus. At IRAC8 µm it is only in emission, the bright cirrus band beingabsent. This structure is detected in BLAST emissionas well as CO, extending the DR21 ridge to the south(Fig. 11). The characteristic CO velocity, −3 km s−1,confirms that this is related to the DR21 molecular cloud.The extended mid-infrared source in the upper part isapparently warm and has no BLAST counterpart.
5.6.3. Starless Cold Clouds

26 Roy et al.
Fig. 28.— MIPS 24 µm image showing dark lane extending fromDR21 ridge. BLAST sees this lane in emission (Fig. 11). Thecontours are 13CO emission (Schneider et al. 2006) integrated over−7 to 1 km s−1.
Focusing on the earliest stage, are there any sourcesthat are so far starless? The best candidates to searchshould be those in the region with L/M < 1 L�/M�.In terms of internally generated power, they all can beconsidered “starless.” But when examined in the MIPS24 µm image, most of these candidates do in fact havepoint sources, indicating nascent star formation thoughprobably only low mass YSOs (§ 6.2).
However, we found one instance that is apparentlystarless at 24 µm, C81, an isolated feeble source with aweak CO signature at +6 km s−1. While there are somepoint sources at IRAC 8 µm, these do not have spectrarising to 24 µm as might be expected of YSOs; also thereis no special concentration to the BLAST source and sothey are probably field star contamination. The IRACimage also shows several small IRDCs.
Two other possibilities are C103 and C121. (Curiously,C103 exhibits diffuse emission at 24 µm including beingcrossed by a partial thin shell of radius 2.8′ centered atG81.0425-0.1155.) C108, clump N2 of Motte et al. (2007)with no core, is crossed by IRDCs at 24 and 8 µm, andmight be another good example of a starless clump.
6. DISCUSSION
The L-M diagram (Figs. 17 and 24) can be adoptedas a diagnostic tool for describing the early evolutionarystages of massive star formation (Molinari et al. 2008).With our sample of compact sources now covering abroad range of luminosity and mass, particularly extend-ing to low L/M , we are in a position to further assess itsutility. We first review how independent empirical evi-
dence for evolutionary stages relates to the characteristicposition in the L-M diagram and then, to the extent pos-sible, use theoretical models to provide insight into theevolution.
6.1. High L/M
In the Cyg X region, 16 BLAST sources have de-tectable compact 21-cm continuum emission. All havestrong 100 µm emission and so are not background radiogalaxies. Our detections of these sources are representedby filled light-grey circles in Figure 24. Five of thesewere also noted and classified for H II region compact-ness by Motte et al. (2007) and are marked as triangles,circles, and inverted triangles. All of these clumps ap-pear in the higher T (> 30 K) and L/M region, nearthe nuclear burning locus, above the stage A sources andthe empirically-obtained accretion line. An extensive dis-cussion of individual embedded H II regions in Cyg Xhas been presented in § 5.4. High mass protostars insidethese massive clumps account for the high ionization rateand luminosity. We do not have the angular resolutionto distinguish multiplicity, but the clumps contain multi-ple sources when examined in the near and mid infrared(§ 6.2).
SiO (2 → 1) emission is often used as a tracer ofshocked gas, associated with outflows which are an in-trinsic consequence of accretion process. After the onsetof nuclear burning stage, massive stars build up an in-tense radiation pressure which halts further accretion. Inaccordance with this expectation, the luminous sourcesDR21 and W75N have only low intensity SiO (2 → 1)emission (Motte et al. 2007). In fact, all of their highluminosity IR Protostellar cores (HLIRPC) correspondto BLAST sources with high L/M and also do not havea striking molecular emission accretion signature.
Slightly earlier in the evolution, clumps are alreadyquite luminous, near the empirical accretion locus formassive stars; single-star cores within them would beclassified as class 0, at least for lower mass stars. Onthe basis of their position in this region in the L-M plot,we would expect these BLAST sources to show indepen-dent and direct evidence of (bipolar) outflow and indeedthis is the case (§ 5.5). Motte et al. (2007) identifieda class of massive IR-quiet protostellar cores (MIRQP)with strong SiO(2→1) emission, indicative of on-goingactive accretion. The eight BLAST sources correspond-ing to their MIRQP are marked by diamonds in Figure 24and all of them lie in the stage A accretion-dominatedregion of the diagram.
6.2. Low L/M
In the Cyg X region we have discovered a significantfraction of the clumps with low L/M devoid of massiveprotostellar cores. This low L/M regime is for us themost intriguing part of the L-M diagram, potentiallycontaining the story of the earliest stages of massive starformation. Molinari et al. (2008) show vertical tracks cor-responding to the evolution of a single and massive pro-tostar, and this is suggested by the vertical arrow in ourL-M diagram. However, this is probably a misleadinginterpretation for low L/M . Even though these clumpsappear above the ‘L = M ’ line, and are arguably self-luminous, there is no obvious signature of a high mass
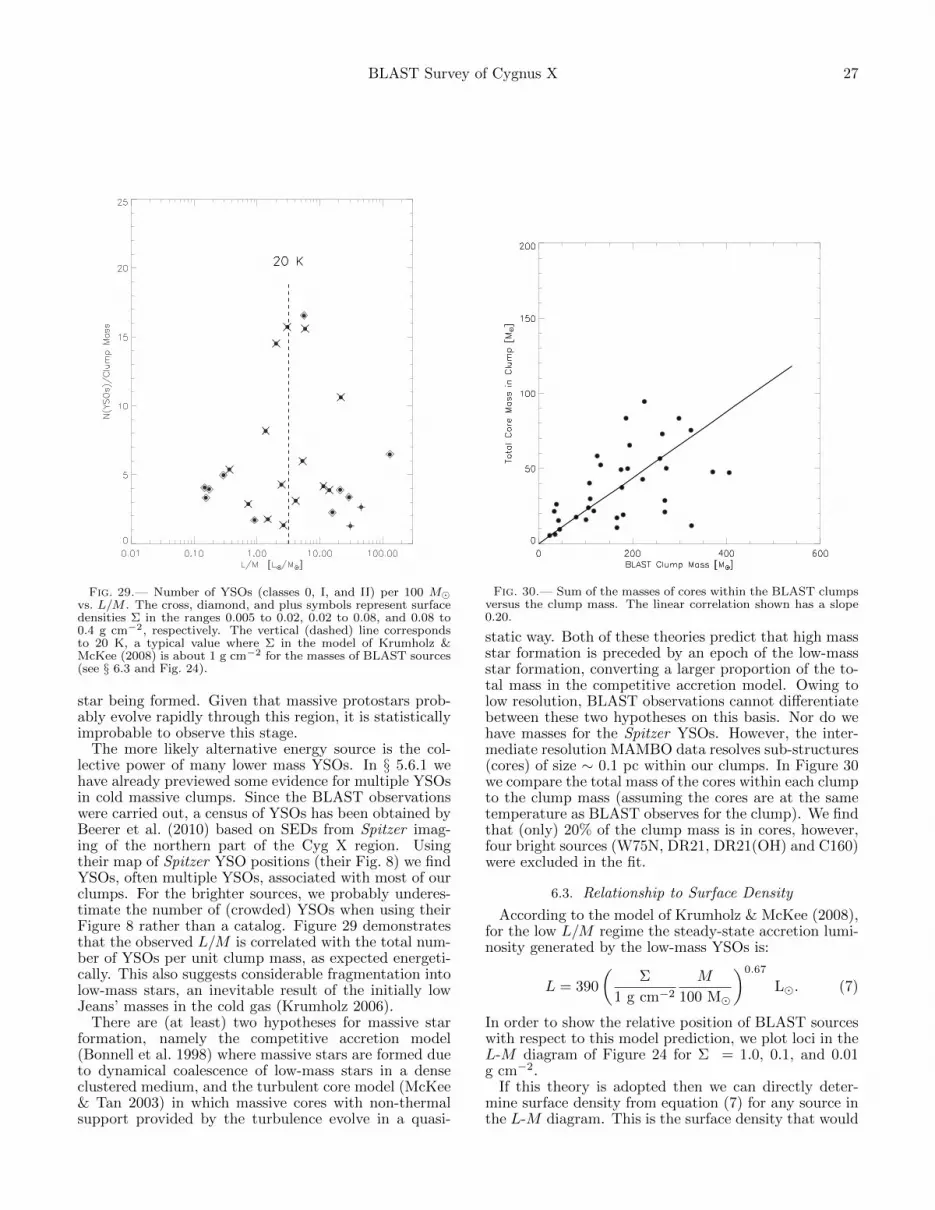
BLAST Survey of Cygnus X 27
Fig. 29.— Number of YSOs (classes 0, I, and II) per 100 M�vs. L/M . The cross, diamond, and plus symbols represent surfacedensities Σ in the ranges 0.005 to 0.02, 0.02 to 0.08, and 0.08 to0.4 g cm−2, respectively. The vertical (dashed) line correspondsto 20 K, a typical value where Σ in the model of Krumholz &McKee (2008) is about 1 g cm−2 for the masses of BLAST sources(see § 6.3 and Fig. 24).
star being formed. Given that massive protostars prob-ably evolve rapidly through this region, it is statisticallyimprobable to observe this stage.
The more likely alternative energy source is the col-lective power of many lower mass YSOs. In § 5.6.1 wehave already previewed some evidence for multiple YSOsin cold massive clumps. Since the BLAST observationswere carried out, a census of YSOs has been obtained byBeerer et al. (2010) based on SEDs from Spitzer imag-ing of the northern part of the Cyg X region. Usingtheir map of Spitzer YSO positions (their Fig. 8) we findYSOs, often multiple YSOs, associated with most of ourclumps. For the brighter sources, we probably underes-timate the number of (crowded) YSOs when using theirFigure 8 rather than a catalog. Figure 29 demonstratesthat the observed L/M is correlated with the total num-ber of YSOs per unit clump mass, as expected energeti-cally. This also suggests considerable fragmentation intolow-mass stars, an inevitable result of the initially lowJeans’ masses in the cold gas (Krumholz 2006).
There are (at least) two hypotheses for massive starformation, namely the competitive accretion model(Bonnell et al. 1998) where massive stars are formed dueto dynamical coalescence of low-mass stars in a denseclustered medium, and the turbulent core model (McKee& Tan 2003) in which massive cores with non-thermalsupport provided by the turbulence evolve in a quasi-
Fig. 30.— Sum of the masses of cores within the BLAST clumpsversus the clump mass. The linear correlation shown has a slope0.20.
static way. Both of these theories predict that high massstar formation is preceded by an epoch of the low-massstar formation, converting a larger proportion of the to-tal mass in the competitive accretion model. Owing tolow resolution, BLAST observations cannot differentiatebetween these two hypotheses on this basis. Nor do wehave masses for the Spitzer YSOs. However, the inter-mediate resolution MAMBO data resolves sub-structures(cores) of size ∼ 0.1 pc within our clumps. In Figure 30we compare the total mass of the cores within each clumpto the clump mass (assuming the cores are at the sametemperature as BLAST observes for the clump). We findthat (only) 20% of the clump mass is in cores, however,four bright sources (W75N, DR21, DR21(OH) and C160)were excluded in the fit.
6.3. Relationship to Surface Density
According to the model of Krumholz & McKee (2008),for the low L/M regime the steady-state accretion lumi-nosity generated by the low-mass YSOs is:
L = 390
(Σ
1 g cm−2
M
100 M�
)0.67
L�. (7)
In order to show the relative position of BLAST sourceswith respect to this model prediction, we plot loci in theL-M diagram of Figure 24 for Σ = 1.0, 0.1, and 0.01g cm−2.
If this theory is adopted then we can directly deter-mine surface density from equation (7) for any source inthe L-M diagram. This is the surface density that would

28 Roy et al.
Fig. 31.— Observed surface density of BLAST clumps withL/M < 6 L�/M� vs. the surface density required in the low-mass YSOs model of Krumholz & McKee (2008) to produce theobserved L given the observed M . Sources above the one-to-oneline (dashed) are under-luminous compared to the prediction fromthe model, and so possibly very young. The source shown by across is near the map edge at 500 µm. Sources with model surfacedensity more than 1 g cm−2 are highlighted.
be required for a clump of mass M to produce a lumi-nosity of L. However, we can also measure the surfacedensity directly. In Figure 31, we plot surface densitiesof BLAST sources versus the model surface density, forsources below L/M < 6 L�/M� where most of the lu-minosity arguably comes from low-mass stars. The mea-sured surface density of the most of the sources is belowthe one-to-one line. This might be because we have un-derestimated Σ owing to poor angular resolution; qual-itative support for this is the evidence of sub-structure(§ 6.2). However, there are about 8 sources with surfacedensity above the one-to-one line. These are very inter-esting, possibly a very early stage where the presumedsteady state of low mass YSO formation has not beenachieved. We have confirmed that there is a lower num-ber of YSOs associated with these sources, except for thesource shown by a cross in Figure 31 which was difficultto measure near the edge of the image at 500 µm.
Krumholz & McKee (2008) note that because coreswith higher Σ are warmer due to the power of the low-mass YSOs, there is a critical Σ such that by the timethe steady-state heating is achieved fragmentation intofurther low-mass YSOs halts. The threshold surface den-sity is about 1 g cm−2 and this is plotted in Figure 24.This characteristic surface density should be a markerof (potential) massive star forming regions, and there is
some evidence consistent with this, at least for evolvedobjects. In the BLAST survey we find that the few mostluminous sources containing compact H II regions havesuch a high surface density. The MAMBO cores contain-ing compact H II regions and MIRQPs with strong SiOemission also have a high measured surface density (Ta-ble 3). Similarly, Garay et al. (2006) found an averagesurface density of 0.8 g cm−2 for dense cores of ultra-compact H II regions. We find that the typical surfacedensity of massive embedded star clusters observed byLe Duigou & Knodlseder (2002) in the Cyg X region isabout 1 g cm−2 (allowing for the presence of some addi-tional gas – now dispersed – in the precursor).
An observed high Σ associated with MYSOs might notbe a signature unique to the turbulent core model, oreven a prerequisite. In the simulations by Smith et al.(2009) of a competitive accretion model, “massive starswere not formed from a single massive thermally sup-ported fragment, but instead from a smaller core whichaccreted additional material channelled towards it by thepotential of the forming stellar cluster.” Likewise, in thesimulations by Wang et al. (2010) of a model of “clump-fed massive star formation” regulated by outflow feed-back (ORCF), “the most massive object is not formedout of a pre-existing dense core” but rather “is controlledby the global clump dynamics.” Recently Csengeri et al.(2010) observed a few of the massive young dense cores(C107, C115, C119, DR21(OH), DR21) in Cyg X tostudy the kinematic properties of the underlying envi-ronment. They found that non-thermal support due toturbulence at the scale of the dense core is not enoughfor a quasi-static evolution of the massive protostars aspredicted by the turbulent core model of McKee & Tan(2003), and they favor competitive accretion.
Therefore, a key question in investigating the mode ofevolution is whether there is evidence for cold high-Σclumps or cores before high mass protostar(s), and eventhe preceding low-mass YSOs, are established. Evenif the evolution timescale were favorably long, this isdifficult with BLAST, as can be seen directly fromequation (3): at the spatial resolution of 0.5 pc about4000 M� is needed to produce a surface density of1 g cm−2. We have noted that we do not see such mas-sive cold objects; if such dense cold objects do exist atlower mass, we cannot identify them by directly measur-ing their true Σ. Higher resolution is required for such de-tections; for example, MAMBO observations at the reso-lution of 0.1 pc in Cyg X need a mass of only 150 M� toproduce equivalent contrast. The predominantly low sur-face densities obtained by Elia et al. (2010) suggest thateven the Herschel resolution is not sufficient for findingsuch dense sub-structures in most cold sources.
6.4. Vertical Evolution in the L-M Diagram?
Given the different theories, it is still unclear to uswhich of the low L/M BLAST clumps will give rise tomassive star formation. If there is a universal IMF, thenstatistically a massive clump will be required to give birthto massive protostars. Therefore, the massive clumpsidentified by BLAST are certainly of interest in this re-gard. Naively, the evolution in the L-M diagram wouldbe vertical (constant M) as the luminosity increases fromaccretion onto the massive protostar and then nuclear

BLAST Survey of Cygnus X 29
burning. Even this is complicated because the powerproduced by low mass YSOs in most theories can maskthe earliest low L stage of the massive protostar.
However, it does not follow that massive clumps/coresalways form massive stars. In fact, the model byKrumholz & McKee (2008) explicitly predicts that thiswill not happen unless Σ is above a critical value of about1 g cm−2. Otherwise, their prediction is that the clumpis destined to continue to produce only low mass stars,at some presumed steady-state rate. Thus the verticalrise in L is arrested at a ceiling for a given Σ. We havemarked such a possibility in Figure 24 with a horizon-tal red arrow at a level which would correspond to thesub-critical Σ of the clump. The end result is a clusteror association of only low mass stars, i.e., one with atruncated IMF. Because the precursor is of low Σ the re-sulting assemblage of stars must be as well, making themmore difficult to detect, and there is no high mass star todraw attention to the region by its high luminosity andionization.
The empirical context, a snapshot of the stages of evo-lution, is that there is a hierarchy of structures. BLASTidentifies compact sources of size about 0.5 pc within theCO clumps of spatial extent about 10 pc (Schneider et al.2006). Within most of the BLAST clumps, MAMBO isable to find smaller and denser sub-structures of scale0.1 pc. Presumably these structures have been createdand evolve by accumulating mass in the dynamical envi-ronment of the larger reservoir and possibly also simul-taneously transfer mass to the immediately lower scalesub-structures. At any given time these structures willeach have a characteristic Σ. At some point does thisbecome frozen in time so that we can discuss the fate ofobjects of fixed Σ? Or tracking a clump, could Σ and Mevolve, allowing evolution toward the upper right in theL-M diagram? We have indicated this latter possibilityas well in Figure 24 – of course only schematically. Re-cent numerical simulations of the competitive accretionmodel (Smith et al. 2009), and the ORCF model (Wanget al. 2010) which has features of both competitive ac-cretion and the turbulent core model, show a channelingof mass to bound potential energy minima of the parsec-scale dense clumps studied, emphasizing the importanceof clump-level dynamics. In these models, when the ma-terial is cold it is more distributed and so would not beidentified as a high mass, high Σ, cold clump. By thetime that mass builds up in massive cores, accreting onmassive protostars, the compact source would have lowmass YSOs as well and have been warmed up. Thus thecold precursors of dense clusters might be more extendedobjects than clumps, a massive reservoir yet to be chan-neled by gravity into a higher surface density state. Somecold IRDCs (§ 5.6.2, Fig. 3), within which BLAST iden-tifies substructure as sources, might fit into this scenario,but dynamical diagnostics would be needed to pursue therelevance of this possibility.
7. CONCLUSION AND FUTURE WORK
An unbiased survey conducted by BLAST has enabledus to detect both compact sources and the embeddingdiffuse emission as a basis for studying the earliest stagesof star formation. We have quantified contrasting dusttemperatures of diffuse extended structures by correlat-ing the fluctuating emission in IRAS and BLAST bands.
To reveal the global morphology, we have studied the re-lationship between dust continuum emission and radio,mid-infrared, and 13CO line emission. Comparing thetotal mass present in the BLAST compact sources withthe parent 13CO clump mass (Schneider et al. 2006),we have obtained a linear correlation with slope of 0.05,which might be indicative of the star formation efficiencybut also relates to the relative lifetime of the compactclump phase. With multi-wavelength photometry wehave tightly constrained the dust emission SEDs of thecompact sources to measure temperature, luminosity andmass. We have diagnosed the earliest stages of star for-mation in Cyg X, and the evolution, in the context ofthe luminosity – mass diagram of the compact sources.We have studied eight DR regions which are known asmassive star formation sites in Cyg X. We have identified16 sources which have compact H II emission and foundan average dust temperature of 33 K. Not all of theseidentified sources have sufficient luminosity to be ioniz-ing sources, pointing to the influence of Cyg OB2 creatingexternal ionization. The complex morphology along withthe direction of cometary shapes of some compact sourcesprovide direct evidence of interaction with the massiveCyg OB2 association. Along the periphery of the evac-uated H II region created by some of the more evolvedstellar clusters, there is a signature of triggered star for-mation. We have observed a complex of infrared quietdark clouds where star formation has already started totake place. To BLAST, and also SCUBA and MAMBO,this appears as an impressive ridge of cold dust emission.However, in sensitive high resolution 24 µm MIPS and8 µm IRAC images, there is evidence of a stellar nurs-ery, indicating a potential site of massive star formation.In our search for the precursors of clusters, however, wehave not found any cold compact clump which is massiveenough to become a star cluster like the Cyg OB2 asso-ciation or even the other lesser embedded clusters. Inthe future, the unbiased Planck Cold Core survey mightfind such objects in unevolved GMCs, possibly in a moreextended lower surface density state than in the finalcluster. Resolving multi-scale structures is a new chal-lenge underlying investigations of the earliest stages ofstar formation. BLAST with its limited resolution couldonly resolve spatial structures of 0.5 pc at 1.7 kpc away.On the other hand, MAMBO with its 11′′ resolution wassuccessful in separating sub-structures on a scale of 0.1pc; further progress should be possible with Herschel.To determine the role of surface density and more gener-ally which cold high mass clumps will evolve to producehigh mass protostars even higher resolution observationswill be required, and so there appears to be a rich fu-ture in uncovering the unseen story using SCUBA2 (8′′
resolution at 450 µm, Holland et al. 2006), CCAT (3.5′′
at 350 µm, Sebring 2010), and ALMA19 (down to sub-arcsecond resolution at submillimeter wavelengths
The BLAST collaboration acknowledges the supportof NASA through grant numbers NAG5-12785, NAG5-13301, and NNGO-6GI11G, the Canadian Space Agency(CSA), the UK Particle Physics & Astronomy Research
19 http://www.almaobservatory.org/en/about-alma/essentials/numbers

30 Roy et al.
Council (PPARC), and Canada’s Natural Sciences andEngineering Research Council (NSERC). We would alsolike to thank the Columbia Scientific Balloon Facility(CSBF) staff for their outstanding work.

BLAST Survey of Cygnus X 31
TABLE 1
MEASURED FLUX DENSITY
BLAST Source l b S1200 S850 S500 S450 S350 S250 S100 S60ID Name (Degree) (Degree) (Jy) (Jy) (Jy) (Jy) (Jy) (Jy) (Jy) (Jy)
C0 J203057+394248 78.6760 0.1902 · · · · · · 22.0± 3.9 · · · 85.8± 3.4 110.7± 5.6 15.6u · · ·C1 J202925+401118 78.8861 0.7091 8.1 28.3 151.5± 2.9 226.9 375.3± 8.0 1029.3± 35.2 5819.4 5699.0C2 J202904+401506 78.8980 0.8006 · · · · · · 90.7± 32.4 · · · 79.1± 17.8 59.9± 6.7 40.3 1.3C3 J203329+394127 78.9454 −0.2135 · · · · · · 23.7± 1.3 · · · 50.9± 2.9 85.4± 5.0 41.1u 7.7u
C4 J203323+394253 78.9546 −0.1860 · · · · · · 33.0± 1.3 · · · 68.8± 2.9 130.7± 5.6 118.2u 6.9u
C5 J202653+403717 78.9566 1.3528 · · · · · · 5.1± 0.4 · · · 7.7± 0.5 11.3± 0.9 11.2u 6.1u
C6 J203023+400926 78.9702 0.5401 · · · · · · 15.2± 0.9 · · · 50.3± 2.4 74.4± 4.4 · · · 1.0u
C7 J203112+400310 78.9778 0.3528 6.6 17.6 133.8± 3.0 187.6 287.8± 5.1 512.5± 10.1 935.1 688.1C8 J202957+401533 79.0029 0.6686 4.0 · · · 42.0± 2.5 · · · 80.6± 4.8 150.8± 10.2 876.7u 253.0u
C9 J203242+395409 79.0262 0.0331 · · · · · · 9.7± 1.3 · · · 20.9± 2.1 43.3± 4.2 40.2u 39.8u
C10 J203002+401637 79.0279 0.6645 4.0 · · · 91.3± 5.6 · · · 145.5± 7.5 198.4± 13.0 195.5u 51.8u
C11 J203230+395738 79.0499 0.0986 · · · · · · 16.3± 1.4 · · · 37.0± 3.0 70.2± 5.3 89.3 52.0C12 J203220+400021 79.0687 0.1497 · · · · · · 11.9± 1.6 · · · 26.3± 4.4 71.9± 7.4 201.8u 42.0u
C13 J202903+402817 79.0746 0.9314 · · · · · · 10.9± 2.3 · · · 28.0± 5.7 46.2± 10.1 10.8u 18.8u
C14 J202720+404234 79.0776 1.3350 · · · · · · 8.9± 1.0 · · · 19.8± 2.6 32.8± 2.9 116.3 53.2C15 J202904+403148 79.1237 0.9637 · · · · · · 107.1± 6.9 · · · 175.6± 7.6 259.2± 9.4 292.2 122.7u
C16 J203442+394448 79.1312 −0.3696 · · · · · · 95.9± 5.0 · · · 167.0± 4.0 286.2± 6.0 540.8 85.4C17 J203326+395612 79.1370 −0.0594 · · · 1.3 5.9± 1.1 9.4 10.6± 1.6 29.2± 3.4 112.1u 20.3u
C18 J203042+401921 79.1388 0.5894 · · · · · · 11.2± 1.4 · · · 22.3± 3.0 32.4± 3.5 18.2u · · ·C19 J203108+401718 79.1606 0.5016 · · · · · · 13.0± 1.1 · · · 29.7± 3.1 76.0± 4.1 452.1 178.2C20 J203229+400848 79.1987 0.2105 · · · · · · 19.3± 3.5 · · · 38.7± 6.0 91.9± 11.3 428.5u 137.3u
C21 J202655+405517 79.2044 1.5223 · · · · · · 22.7± 2.5 · · · 53.7± 3.4 94.8± 8.5 12.6u 2.3u
C22 J202923+403603 79.2173 0.9549 · · · · · · 32.7± 2.7 · · · 82.1± 9.5 92.9± 11.3 27.8u 8.7u
C23 J203116+402231 79.2462 0.5321 · · · · · · 31.3± 3.2 · · · 99.8± 22.9 92.7± 12.6 · · · 0.1u
C24 J203138+401939 79.2477 0.4492 · · · · · · 15.5± 3.4 · · · 10.1± 6.4 9.0± 4.6 · · · 69.8u
C25 J203146+401843 79.2499 0.4198 · · · 6.8 67.4± 2.1 · · · 133.5± 7.7 121.1± 7.2 · · · · · ·C26 J203158+401833 79.2702 0.3877 3.2 10.1 44.2± 2.2 135.1 70.1± 4.1 87.3± 4.5 319.5u 45.7u
C27 J202806+405127 79.2822 1.3037 · · · · · · 32.3± 1.8 · · · 124.4± 8.3 292.5± 18.7 1312.2 1217.3C28 J203227+401554 79.2903 0.2855 5.4 · · · 44.3± 4.9 · · · 92.2± 8.4 307.5± 31.2 2885.4 2740.1C29 J202738+405706 79.3081 1.4293 · · · · · · 8.0± 1.1 · · · 12.8± 2.2 26.2± 2.4 129.3u 21.4u
C30 J202809+405301 79.3099 1.3099 · · · · · · 91.9± 3.1 · · · 199.9± 7.8 453.2± 16.4 2654.2 2324.4C31 J203518+395310 79.3107 −0.3767 · · · · · · 36.9± 2.1 · · · 100.8± 5.2 141.7± 7.1 651.7u 289.6u
C32 J203233+401651 79.3145 0.2796 5.1 · · · 107.2± 5.5 · · · 275.0± 9.8 666.5± 31.4 8224.0 6221.7C33 J202818+405309 79.3275 1.2893 · · · · · · 21.7± 3.3 · · · 22.4± 4.8 84.9± 10.8 3271.4u 1948.1u
C34 J203525+395328 79.3278 −0.3913 · · · · · · 14.1± 1.9 · · · 33.8± 3.2 93.7± 7.1 272.3u 161.9u
C35 J202823+405234 79.3292 1.2704 · · · · · · 6.9± 11.2 · · · 19.2± 12.7 73.1± 34.6 2234.4u 913.7u
C36 J203222+401955 79.3337 0.3394 6.6 20.4 123.8± 3.3 172.8 238.5± 5.5 386.5± 13.3 1139.2 277.0C37 J202802+405636 79.3459 1.3622 · · · · · · 11.6± 1.1 · · · 19.0± 2.1 42.8± 3.7 382.5u 65.3u
C38 J203349+400832 79.3471 0.0025 · · · · · · 29.8± 0.9 · · · 68.3± 1.9 172.1± 3.9 978.1 988.4C39 J203530+395438 79.3531 −0.3928 · · · · · · 17.6± 1.7 · · · 57.9± 5.0 74.2± 8.7 444.6u 270.6u
C40 J203508+395725 79.3492 −0.3102 · · · · · · 32.0± 3.2 · · · 44.3± 2.6 103.2± 9.2 23.8u 1.3u
C41 J202818+405638 79.3746 1.3231 · · · · · · 4.2± 0.4 · · · 12.4± 2.6 51.0± 5.1 479.9u 121.4u
C42 J203530+400053 79.4371 −0.3311 · · · · · · 21.4± 3.0 · · · 32.8± 2.0 44.8± 3.2 101.6u 11.6u
C43 J202952+404842 79.4415 1.0049 · · · · · · 21.2± 1.0 · · · 50.9± 1.9 81.5± 2.9 245.8 137.6C44 J202754+410505 79.4460 1.4651 · · · · · · 13.5± 1.1 · · · 39.4± 3.4 82.3± 6.7 100.4 15.7C45 J203616+395728 79.4807 −0.4836 · · · · · · 19.7± 3.3 · · · 63.7± 3.5 137.7± 5.7 87.1 7.1C46 J203412+401634 79.4985 0.0231 · · · · · · 17.7± 1.4 · · · 32.8± 2.0 71.3± 8.5 7.6u 2.7u
C47 J203417+401840 79.5360 0.0314 · · · · · · 16.1± 0.8 · · · 32.0± 1.6 26.2± 2.2 19.4u 12.4u
C48 J203423+403039 79.7073 0.1358 · · · · · · 28.6± 3.3 · · · 77.8± 10.7 55.7± 4.7 46.4u 5.2u
C49 J203311+404138 79.7185 0.4278 · · · · · · 6.4± 0.4 · · · 11.8± 0.6 29.2± 1.1 102.4 49.2C50 J203610+401716 79.7318 −0.2685 · · · · · · 14.7± 1.1 · · · 36.6± 2.4 45.3± 3.4 · · · · · ·C51 J203050+410224 79.7340 0.9909 · · · · · · 24.3± 0.8 · · · 50.9± 1.7 79.5± 2.3 95.2 55.4u
C52 J203119+410049 79.7670 0.9011 · · · · · · 6.0± 0.6 · · · 13.4± 0.9 22.2± 1.7 33.4u 19.7u
C53 J202958+411639 79.8299 1.2628 · · · · · · 10.1± 0.6 · · · 34.6± 1.4 53.6± 2.2 133.0 84.4C54 J203134+410357 79.8364 0.8949 · · · · · · 8.4± 0.8 · · · 16.3± 1.6 14.8± 1.5 53.6u 1.6u
C55 J203029+411556 79.8764 1.1790 · · · · · · 90.0± 2.8 · · · 200.4± 3.5 442.4± 7.0 1470.4 820.4C56 J203208+410524 79.9188 0.8234 · · · · · · 90.0± 2.8 · · · 200.4± 3.5 442.4± 7.0 · · · · · ·C57 J203148+410836 79.9241 0.9065 · · · · · · −21.5± 26.8 · · · 3.9± 1.4 15.6± 3.0 166.0u 79.9u
C58 J203319+405858 79.9643 0.5814 · · · · · · 4.3± 0.9 · · · 16.5± 2.9 25.6± 4.1 112.4 51.6C59 J203223+410748 79.9787 0.8099 · · · · · · 7.3± 0.7 · · · 24.5± 0.9 40.6± 1.4 258.5u 242.7u
C60 J203201+411053 79.9789 0.8963 · · · · · · 32.1± 2.1 · · · 72.6± 5.3 115.4± 8.3 579.5u 51.7u
C61 J203216+410860 79.9813 0.8397 · · · · · · 63.5± 11.3 · · · 133.0± 19.8 206.6± 35.5 889.9 184.1C62 J203437+405147 80.0149 0.3127 · · · · · · 87.2± 4.1 · · · 171.6± 7.4 311.9± 13.1 63.0u 70.2u
C63 J203745+402529 80.0234 −0.4268 · · · · · · 3.9± 0.6 · · · 9.4± 1.5 15.7± 1.6 41.7u · · ·C64 J203443+405308 80.0457 0.3090 · · · · · · 20.9± 1.1 · · · 61.7± 5.0 96.7± 10.9 126.0 59.7C65 J203309+411603 80.1752 0.7749 · · · · · · 10.5± 0.7 · · · 17.1± 0.9 36.0± 1.5 265.8 70.0C66 J203414+410808 80.1903 0.5331 · · · · · · 57.6± 3.5 · · · 94.2± 3.4 168.6± 7.3 70.8 76.6C67 J203345+411415 80.2188 0.6657 · · · · · · 7.9± 1.1 · · · 12.7± 0.9 22.8± 1.6 208.1 73.9C68 J203520+410551 80.2851 0.3429 · · · · · · 16.0± 0.7 · · · 43.0± 1.3 79.9± 2.1 23.6u · · ·C69 J203112+414229 80.3133 1.3307 · · · · · · 11.4± 0.7 · · · 39.2± 3.1 45.2± 3.4 31.4 4.0C70 J203537+410615 80.3220 0.3050 · · · · · · 5.1± 0.4 · · · 13.0± 1.1 18.0± 1.1 32.3 60.7u
Continued on Next Page. . .

32 Roy et al.
TABLE 1 – Continued
BLAST Source l b S1200 S850 S500 S450 S350 S250 S100 S60ID Name (Degree) (Degree) (Jy) (Jy) (Jy) (Jy) (Jy) (Jy) (Jy) (Jy)
C71 J203358+412230 80.3536 0.7148 · · · · · · 3.8± 1.1 · · · 9.9± 1.1 14.7± 1.6 814.3 443.2C72 J203347+412449 80.3638 0.7658 · · · · · · 53.3± 1.6 · · · 126.0± 2.1 264.7± 5.1 337.5u 38.6u
C73 J203509+411331 80.3665 0.4474 · · · · · · 201.3± 102.4 · · · 12.1± 1.9 24.2± 3.9 2737.9 1256.9C74 J203525+411428 80.4095 0.4162 · · · · · · 110.5± 3.4 · · · 221.4± 7.0 575.7± 17.4 1158.3 184.8C75 J203252+413846 80.4475 1.0436 · · · · · · 11.8± 5.9 · · · 21.7± 7.8 58.1± 15.0 167.3 100.5C76 J203430+413044 80.5233 0.7168 · · · · · · 6.2± 0.5 · · · 24.5± 0.9 37.9± 1.7 549.0 255.2C77 J203554+411919 80.5275 0.3939 · · · · · · 41.4± 1.8 · · · 102.0± 3.8 212.2± 6.0 55.1u 9.3u
C78 J203215+415540 80.6069 1.3023 · · · · · · 2.6± 0.8 · · · 157.2± 641.0 11.1± 1.7 70.2u 21.6u
C79 J203224+415616 80.6316 1.2855 · · · · · · 16.9± 5.4 · · · 10.5± 0.9 22.8± 1.7 113.7u 37.1u
C80 J203500+413451 80.6344 0.6827 · · · 14.6 6.4± 1.3 91.9 17.4± 1.2 48.9± 3.6 1287.8 969.8C81 J203722+411452 80.6348 0.1286 · · · · · · 96.4± 2.8 · · · 221.8± 5.6 413.7± 7.0 5.5u · · ·C82 J203229+415729 80.6566 1.2855 · · · · · · 9.7± 1.2 · · · 32.5± 2.2 26.8± 2.0 74.3u 5.8u
C83 J203509+413827 80.6992 0.6963 · · · · · · 13.3± 3.4 · · · 16.4± 2.0 19.3± 1.9 370.4 157.7C84 J203614+413412 80.7631 0.4933 · · · · · · 55.5± 16.7 · · · 54.1± 4.2 141.8± 6.1 117.1u 20.8u
C85 J203608+413959 80.8287 0.5666 5.7 15.8 21.5± 3.7 66.5 40.6± 5.1 73.9± 5.4 1130.5 666.6C86 J203900+411722 80.8550 −0.0910 · · · · · · 71.6± 1.6 · · · 171.7± 4.1 328.5± 6.9 85.3u 78.5u
C87 J203702+413457 80.8634 0.3814 4.0 18.3 37.7± 2.1 135.0 74.5± 3.5 117.4± 6.4 1286.0 190.1C88 J203652+413620 80.8634 0.4198 6.3 21.2 64.3± 3.2 225.5 197.9± 12.0 368.9± 18.0 3598.8 1299.8C89 J203944+411155 80.8659 −0.2543 · · · · · · 97.8± 3.3 · · · 259.1± 8.3 554.8± 14.5 471.9u 37.1u
C90 J203724+413257 80.8785 0.3064 · · · · · · 3.7± 1.8 · · · 12.7± 4.0 67.2± 10.6 609.8u 28.2u
C91 J203634+414338 80.9270 0.5373 · · · · · · 61.1± 15.8 · · · 114.8± 20.0 199.9± 46.2 58.4u 10.1u
C92 J203927+412023 80.9460 −0.1272 7.1 · · · 78.1± 32.1 · · · 53.6± 7.7 122.4± 21.5 6232.1 5024.8C93 J204011+411432 80.9519 −0.2949 · · · · · · 210.7± 10.2 · · · 446.2± 14.1 826.5± 25.2 1331.5u 208.0u
C94 J203936+411959 80.9566 −0.1519 1.8 · · · 54.5± 6.7 · · · 129.1± 19.0 262.7± 25.2 5171.0 2497.3C95 J203709+414130 80.9641 0.4293 · · · · · · 4.4± 2.0 · · · 3.3± 2.9 134.9± 15.8 395.1u 98.9u
C96 J203941+412111 80.9816 −0.1519 · · · · · · 9.8± 0.6 · · · 20.6± 1.2 52.5± 3.6 3351.5u 616.0u
C97 J203923+412538 81.0071 −0.0632 · · · · · · 450.6± 117.3 · · · 3592.9± 1145.6 286.1± 58.8 657.1u 44.1u
C98 J203646+414744 81.0046 0.5480 · · · · · · 72.6± 5.2 · · · 156.4± 10.9 340.5± 20.2 103.3 23.6C99 J204023+411801 81.0211 −0.2892 · · · · · · 49.6± 5.4 · · · 118.7± 10.9 198.7± 15.9 763.4 81.4C100 J203644+415112 81.0454 0.5895 · · · · · · 47.5± 6.1 · · · 107.0± 12.2 218.7± 24.4 188.9u 26.1u
C101 J203954+412407 81.0470 −0.1563 · · · · · · 8.1± 1.0 · · · 22.3± 2.0 57.3± 5.6 812.8 218.2C102 J204025+412009 81.0536 −0.2733 · · · · · · 60.5± 3.5 · · · 179.9± 8.0 395.2± 20.0 426.7u 48.0u
C103 J203936+412741 81.0583 −0.0735 · · · · · · 15.9± 3.2 · · · 42.4± 5.8 112.0± 13.2 308.6u 49.1u
C104 J204004+412828 81.1230 −0.1364 4.5 · · · 70.5± 79.9 · · · 47.2± 17.7 62.5± 11.9 1790.2 611.5C105 J203713+415407 81.1394 0.5463 · · · · · · 85.2± 2.9 · · · 250.0± 6.4 502.0± 15.9 160.0u 18.1u
C106 J203636+415947 81.1457 0.6944 · · · · · · 18.1± 1.3 · · · 36.8± 2.5 76.7± 5.1 35.6u 6.2u
C107 J204005+413212 81.1736 −0.1002 3.0 · · · 30.2± 1.3 · · · 64.7± 2.4 97.0± 4.5 526.0u 65.8u
C108 J203605+420851 81.2080 0.8627 · · · · · · 41.1± 2.5 · · · 94.0± 5.5 169.3± 7.8 164.7u · · ·C109 J203620+420702 81.2115 0.8075 · · · · · · 93.0± 7.8 · · · 193.0± 24.0 353.2± 46.7 51.4u 7.2u
C110 J203527+421435 81.2137 1.0143 · · · · · · 12.7± 1.5 · · · 26.1± 3.4 87.9± 42.1 575.6 173.7C111 J203506+421957 81.2465 1.1197 · · · · · · 67.5± 7.9 · · · 74.1± 4.2 224.8± 12.4 481.4u 67.2u
C112 J203546+421513 81.2580 0.9729 · · · · · · 21.3± 2.1 · · · 56.9± 4.7 121.8± 7.8 199.2u 7.2u
C113 J203601+421336 81.2640 0.9199 · · · · · · 34.5± 4.1 · · · 73.7± 6.1 141.8± 11.0 247.9u 19.4u
C114 J203541+421649 81.2692 1.0022 · · · · · · 20.4± 2.7 · · · 51.7± 5.7 126.7± 17.5 · · · 12.6u
C115 J203534+422009 81.3014 1.0517 7.1 · · · 23.0± 2.0 · · · 54.9± 3.6 107.6± 6.5 1031.4 239.3C116 J204034+413836 81.3126 −0.1053 2.0 · · · 97.0± 2.6 · · · 199.9± 5.8 384.0± 8.8 · · · · · ·C117 J203448+422732 81.3152 1.2389 · · · · · · 35.4± 1.6 · · · 73.7± 3.0 117.8± 4.4 1567.2 444.0C118 J203708+420841 81.3240 0.7043 · · · · · · 43.7± 3.9 · · · 121.0± 12.7 329.0± 32.1 · · · 1.8C119 J203658+421128 81.3407 0.7592 7.8 · · · 5.5± 2.2 · · · 8.0± 3.1 25.0± 7.6 450.9 75.8C120 J203740+420707 81.3616 0.6119 · · · · · · 107.5± 2.7 · · · 247.4± 6.2 316.4± 9.7 54.2u 11.5u
C121 J203720+421112 81.3784 0.7021 · · · · · · 27.4± 10.0 · · · 45.3± 8.5 140.3± 23.8 101.4u · · ·C122 J204029+414530 81.3955 −0.0248 · · · · · · 15.8± 2.3 · · · 24.5± 4.4 37.9± 5.7 336.3u 25.9u
C123 J203505+423125 81.3984 1.2355 · · · · · · 51.2± 3.1 · · · 98.2± 6.6 113.5± 10.9 695.4u 203.3u
C124 J203559+422518 81.4155 1.0428 0.6 · · · 37.9± 4.5 · · · 97.5± 13.6 207.8± 27.8 28.3u · · ·C125 J203611+422417 81.4249 1.0021 · · · · · · 8.4± 0.8 · · · 60.2± 6.2 145.2± 17.0 148.5 64.8C126 J203730+421353 81.4339 0.7030 4.0 · · · 9.7± 0.9 · · · 29.1± 3.4 57.0± 5.7 591.4 45.3C127 J203831+420549 81.4400 0.4731 4.5 · · · 105.6± 7.5 · · · 225.9± 17.8 440.2± 30.1 4000.4 1385.3C128 J203718+421630 81.4454 0.7598 1.4 · · · 137.3± 25.8 · · · 362.1± 89.3 955.5± 172.6 111.6u 70.3C129 J203836+420700 81.4650 0.4731 4.5 · · · 14.9± 3.5 · · · 34.1± 10.3 64.1± 13.1 3421.1u 980.6u
C130 J204046+414844 81.4703 −0.0331 · · · · · · 73.4± 8.2 · · · 189.5± 21.6 282.2± 40.1 230.5u 14.6u
C131 J204052+414756 81.4707 −0.0555 · · · · · · 15.4± 4.7 · · · 33.5± 9.8 111.5± 16.3 785.9u 133.2u
C132 J204035+415057 81.4779 0.0172 5.0 · · · 8.1± 2.5 · · · 7.6± 4.7 28.8± 12.7 1449.3u · · ·C133 J203831+420938 81.4919 0.5099 · · · · · · 268.0± 12.9 · · · 596.3± 29.0 1082.0± 51.9 1723.5u 159.4u
C134 J203822+421144 81.5024 0.5537 1.6 · · · 19.9± 5.3 · · · 45.6± 13.2 171.1± 39.3 1036.8u 107.5u
C135 J203957+415918 81.5163 0.1952 1.6 4.8 41.3± 5.6 · · · 115.0± 11.6 240.6± 27.4 122.4 75.5C136 J203954+420055 81.5319 0.2191 · · · · · · 18.8± 1.1 · · · 34.2± 2.2 73.9± 3.7 263.4u 19.0u
C137 J203514+423936 81.5230 1.2966 · · · · · · 64.8± 2.8 · · · 165.6± 9.1 190.5± 10.3 413.8 54.8C138 J203725+422217 81.5360 0.8000 · · · · · · 54.9± 22.5 · · · 44.4± 3.9 575.7± 203.2 157.0 16.2C139 J203638+422921 81.5424 0.9868 0.5 · · · 9.4± 3.2 · · · 9.4± 3.3 23.9± 6.6 34.1u 12.3u
C140 J204104+415147 81.5438 −0.0453 · · · · · · 34.4± 1.2 · · · 53.6± 2.8 88.2± 3.6 973.0u 168.0u
C141 J204029+415717 81.5502 0.0965 3.3 9.8 50.9± 2.5 65.4 150.7± 6.6 396.5± 22.9 230.3 36.9C142 J203944+420413 81.5566 0.2772 · · · · · · 66.1± 1.6 · · · 143.3± 5.3 234.9± 9.4 254.6u 14.6u
C143 J203635+423047 81.5552 1.0095 · · · · · · 13.1± 1.5 · · · 33.1± 3.9 67.3± 5.8 14.9u · · ·
Continued on Next Page. . .

BLAST Survey of Cygnus X 33
TABLE 1 – Continued
BLAST Source l b S1200 S850 S500 S450 S350 S250 S100 S60ID Name (Degree) (Degree) (Jy) (Jy) (Jy) (Jy) (Jy) (Jy) (Jy) (Jy)
C144 J203931+420634 81.5630 0.3331 · · · · · · 22.7± 1.6 · · · 35.8± 2.8 61.3± 4.3 · · · · · ·C145 J204033+415857 81.5804 0.1026 1.8 6.2 11.6± 1.5 38.9 36.4± 3.1 68.4± 6.2 733.3u 81.7u
C146 J203430+424933 81.5759 1.5032 · · · · · · 56.4± 1.6 · · · 109.0± 4.7 188.7± 8.7 186.8u 16.8u
C147 J203931+420821 81.5869 0.3510 · · · · · · 66.6± 13.2 · · · 125.5± 23.7 166.0± 20.3 · · · · · ·C148 J203520+424413 81.5967 1.3267 · · · · · · 24.2± 6.9 · · · 27.0± 5.8 44.3± 9.1 257.7u 25.7u
C149 J204048+415757 81.5948 0.0568 2.2 · · · 10.3± 1.2 · · · 27.5± 2.6 72.7± 4.5 128.0u 2.2u
C150 J203449+424829 81.5973 1.4446 · · · · · · 21.2± 4.4 · · · 63.1± 9.3 132.5± 19.7 109.1 10.0C151 J203914+421221 81.6081 0.4326 · · · · · · 26.2± 21.9 · · · 14.4± 3.0 34.4± 4.6 162.3 4.8C152 J203620+423723 81.6164 1.1110 · · · · · · 21.4± 4.7 · · · 38.5± 8.7 114.2± 16.6 59.0u 10.8u
C153 J204044+420129 81.6349 0.1012 · · · · · · 14.4± 1.1 · · · 34.0± 2.6 74.0± 5.3 93.9u 101.8u
C154 J203807+422443 81.6468 0.7213 · · · · · · 16.0± 4.5 · · · 95.7± 24.7 80.1± 16.2 184.7u 10.8u
C155 J203902+421939 81.6811 0.5372 48.7 127.1 33.2± 3.9 738.0 78.9± 8.2 164.6± 23.2 19911.5 13058.7C156 J204046+420536 81.6920 0.1397 · · · · · · 578.6± 27.7 · · · 1391.9± 68.2 3391.8± 113.3 207.3 55.2C157 J203901+422249 81.7217 0.5713 46.8 146.7 15.8± 1.1 1160.0 56.0± 3.6 135.9± 10.1 16765.7 2429.5C158 J204103+420547 81.7269 0.0994 · · · · · · 838.8± 22.4 · · · 1917.1± 61.7 4111.7± 98.7 312.1u 26.3u
C159 J203444+425911 81.7312 1.5634 · · · · · · 4.0± 0.9 · · · 18.2± 1.4 42.7± 2.8 848.0 257.5C160 J203901+422506 81.7524 0.5938 27.1 91.6 35.4± 3.3 621.3 91.5± 6.9 195.7± 13.2 7777.6 1145.1C161 J204236+415454 81.7603 −0.2385 · · · · · · 597.2± 75.6 · · · 1501.2± 272.6 1700.2± 301.4 297.3 24.4C162 J203548+425243 81.7607 1.3445 · · · · · · 9.9± 1.8 · · · 24.8± 3.6 46.5± 4.7 · · · · · ·C163 J203749+423846 81.7992 0.9075 0.6 · · · 22.6± 2.3 · · · 31.1± 3.7 47.3± 7.4 283.9u 56.6u
C164 J203755+423840 81.8093 0.8919 0.6 · · · 31.1± 1.6 · · · 46.8± 8.0 98.2± 8.6 451.8u 87.6u
C165 J203810+423817 81.8316 0.8521 1.6 · · · 29.7± 3.6 · · · 67.2± 8.7 73.2± 11.7 432.5 142.7C166 J203639+425112 81.8337 1.2052 2.4 · · · 62.1± 5.6 · · · 96.3± 16.5 233.3± 16.0 307.5 82.3C167 J203804+423945 81.8399 0.8813 5.4 · · · 45.7± 2.7 · · · 139.2± 6.5 215.2± 11.3 812.8u 99.0u
C168 J203757+424050 81.8410 0.9098 · · · · · · 88.1± 3.3 · · · 204.0± 10.2 347.9± 14.1 404.6 26.5C169 J203837+423738 81.8733 0.7795 36.5 87.3 22.5± 3.0 1008.0 33.6± 6.3 49.5± 12.1 15488.2 11970.0C170 J203644+425507 81.8961 1.2309 · · · · · · 515.9± 9.8 · · · 1140.6± 28.2 3202.4± 46.1 125.5u 13.6u
C171 J204237+422613 82.1734 0.0809 · · · · · · 10.6± 1.5 · · · 38.8± 3.7 80.4± 3.9 219.5 154.5C172 J204234+422726 82.1836 0.1005 · · · · · · 24.8± 1.6 · · · 55.7± 3.3 107.7± 4.4 98.9u 37.1u
C173 J204013+425459 82.2814 0.7228 · · · · · · 23.0± 1.4 · · · 40.4± 2.8 55.0± 3.4 81.9u 4.7u
C174 J204017+425624 82.3073 0.7280 · · · · · · 17.5± 0.7 · · · 25.5± 1.5 21.8± 5.2 126.1u 40.6u
C175 J204227+424151 82.3591 0.2663 · · · · · · 14.8± 0.7 · · · 31.7± 1.6 56.6± 2.1 22.3u 3.7u
C176 J204159+424812 82.3909 0.3972 · · · · · · 65.6± 5.6 · · · 91.2± 5.3 147.6± 8.1 185.1u 41.4u
C177 J204211+425258 82.4752 0.4182 · · · · · · 13.9± 1.1 · · · 31.4± 2.3 80.8± 6.1 526.3 80.5C178 J204209+425519 82.5020 0.4479 · · · · · · 68.2± 4.7 · · · 97.4± 6.6 222.5± 12.8 618.1u 77.6u
C179 J204341+424355 82.5271 0.1077 · · · · · · 17.3± 1.7 · · · 10.0± 5.3 78.2± 9.9 54.9u 4.1u
C180 J204234+425649 82.5689 0.4029 · · · · · · 80.7± 15.1 · · · 88.9± 5.6 141.9± 10.1 573.4 769.8C181 J204346+424707 82.5787 0.1285 · · · · · · 14.3± 1.4 · · · 53.0± 4.1 125.3± 6.6 9.4u · · ·C182 J204222+425831 82.5695 0.4482 · · · · · · 31.4± 3.3 · · · 27.3± 2.2 32.1± 3.9 500.2 179.1C183 J204329+424954 82.5826 0.1985 · · · · · · 20.5± 4.7 · · · 103.8± 6.3 222.2± 14.0 168.4 95.5
u Upper limit.

34 Roy et al.
TABLE 2Clusters and Stellar Groups
Clustera l b OtherID Degree Degree Names
LK08 79.302 0.286 DB10, ECX6-25LK09 79.301 1.291 DB11, ECX6-18DB12sg 79.879 1.178 ECX6-21ECX6-27 80.354 0.728 · · ·DR18sg 80.357 0.450 · · ·LK11 80.935 -0.167 DB13, DB14sg
LK12 81.298 1.096 DB15LK13 81.445 0.483 DB16LK14 81.441 1.122 · · ·DB17 81.566 -0.719 · · ·LK15 81.610 0.142 · · ·DB18sg 81.661 -0.017 · · ·DR21 81.680 0.540 · · ·DB19sg 81.711 0.582 · · ·W75N 81.870 0.779 · · ·DB20 81.896 0.797 · · ·DB22 82.567 0.404 · · ·
a LK, DB, and ECX6 are the cluster IDs byLe Duigou & Knodlseder (2002), Dutra & Bica(2001), and Comeron et al. (2002), respectively.sg Stellar group.
TABLE 3Structures observed at 1.2 mm associated with BLAST clumps
BLAST Corea Clumpa Σcorea Σclump
a
ID ID ID g cm−2 g cm−2
C1 S26 Cl-S5 0.58 0.33C7 S30, S31 Cl-S7 0.21 0.18C8 S29 Cl-S6 0.08 0.08C26 S34 Cl-S9 0.08 0.08C28 S39 · · · 0.12 · · ·C32 S40, S41 Cl-S11 0.13 0.11C36 S36, S37, S38 Cl-S10 0.16 0.12C85 N5, N6 Cl-N3 0.15 0.15C87 N14 Cl-N6 0.48 0.14C88 N10 Cl-N4 0.43 0.18C90 N17 · · · 0.15 · · ·C92 N58, N59 Cl-N17 0.22 0.18C104 N62 Cl-N20 0.08 0.09C107 N63 Cl-N21 0.96 0.28C115 N1, N2 Cl-N1 0.56 0.29C116 N70 · · · 0.07 · · ·C119 N12, N13 Cl-N5 0.58 0.21C126 N18 Cl-N9 0.07 0.07C127 N29 Cl-N11 0.06 0.08C128 N16 · · · 0.13 · · ·C132 N67, N69 Cl-N23 0.05 0.09C134 N26 · · · 0.06 · · ·C135 N61 · · · 0.07 · · ·C139 N8 · · · 0.12 · · ·C141 N65, N64 Cl-N22 0.14 0.10C145 N68 · · · 0.29 · · ·C149 N72 · · · 0.05 · · ·C155 N42, N46, N47 Cl-15 2.30 1.67C157 N36, N38, N41, N44, N48 Cl-N14 1.92 1.24C160 N37, N43, N51, N53, N54 Cl-N16 0.45 0.45C163 N20 · · · 0.18 · · ·C166 N9 · · · 0.05 · · ·C167 N21, N22, N24 Cl-N10 0.08 0.10C169 N30, N31, N32 Cl-N13 2.49 1.27
a Core, Clump ID, and surface density are from Motte et al. (2007)

BLAST Survey of Cygnus X 35
TABLE 4
RESULTS FROM SED FITS
BLAST T M Σ L Lbol
ID (K) (100 M�) (g cm−2) (100 L�) (100 L�)
C0 15.5± 0.7 1.8± 0.4 0.033 1.4± 0.2 · · ·C1 40.1± 4.0 1.9± 0.4 0.121 277.2± 100.7 489.4C3 16.6± 1.1 1.4± 0.3 0.021 1.6± 0.4 · · ·C4 17.5± 0.7 1.7± 0.3 0.022 2.6± 0.4 · · ·C5 13.2± 1.3 0.5± 0.2 0.022 0.1± 0.0 · · ·C6 19.6± 0.6 0.7± 0.1 0.009 1.8± 0.2 2.0C7 25.8± 0.8 2.6± 0.3 0.084 33.4± 3.3 50.2C8 17.3± 1.6 2.2± 0.6 0.038 3.1± 1.0 · · ·C9 20.4± 2.0 0.4± 0.1 0.006 1.3± 0.4 · · ·C10 15.7± 1.3 4.1± 1.0 0.051 3.4± 1.0 · · ·C11 25.7± 0.8 0.4± 0.1 0.008 4.4± 0.4 · · ·C12 20.9± 0.6 0.4± 0.1 0.007 1.8± 0.2 · · ·C13 15.7± 0.8 0.8± 0.2 0.014 0.7± 0.1 · · ·C14 29.9± 1.7 0.1± 0.0 0.003 3.8± 0.6 4.5C15 20.8± 0.9 2.7± 0.5 0.024 10.5± 1.1 15.3C16 23.7± 0.6 2.1± 0.3 0.096 16.5± 1.4 · · ·C17 21.5± 1.8 0.2± 0.0 0.005 1.0± 0.3 · · ·C18 15.1± 2.0 0.8± 0.3 0.015 0.5± 0.2 · · ·C19 32.5± 1.1 0.2± 0.0 0.003 9.8± 1.2 10.1C20 23.6± 3.8 0.5± 0.2 0.006 4.1± 1.8 · · ·C21 15.2± 0.6 1.6± 0.3 0.009 1.1± 0.1 · · ·C22 14.7± 1.2 2.5± 0.7 0.021 1.5± 0.3 2.3C23 15.0± 1.6 2.2± 0.8 0.015 1.5± 0.5 · · ·C25 15.1± 1.2 2.4± 0.5 0.018 1.6± 0.5 · · ·C26 13.4± 0.9 3.7± 0.6 0.059 1.3± 0.3 · · ·C27a 40.1± 4.2 0.4± 0.1 0.007 62.3± 24.9 55.4C28 47.0± 9.7 0.4± 0.1 0.009 144.3± 211.5 113.5C29 17.3± 2.7 0.4± 0.2 0.007 0.5± 0.2 · · ·C30a 37.7± 4.6 1.1± 0.5 0.020 110.6± 37.2 102.5C31 18.0± 2.3 1.8± 0.6 0.033 3.3± 1.2 · · ·C32 46.2± 2.8 1.1± 0.2 0.024 330.7± 72.1 · · ·C34 25.4± 1.3 0.4± 0.1 0.006 4.3± 0.7 · · ·C36 25.5± 1.1 2.6± 0.4 0.039 30.6± 4.3 · · ·C37 18.8± 2.5 0.4± 0.2 0.011 1.0± 0.4 · · ·C38 37.6± 1.9 0.4± 0.1 0.014 38.3± 6.0 48.7C39 19.4± 2.8 0.8± 0.3 0.010 2.0± 1.3 · · ·C40 15.5± 1.2 1.7± 0.5 0.009 1.3± 0.3 · · ·C41 35.1± 1.9 0.1± 0.0 0.002 4.4± 0.9 5.4C42 13.0± 1.6 2.0± 0.8 0.027 0.6± 0.2 · · ·C43 28.9± 1.1 0.4± 0.1 0.010 8.4± 0.9 · · ·C44 23.0± 0.5 0.4± 0.1 0.003 3.0± 0.2 · · ·C45 18.4± 0.3 1.1± 0.1 0.012 2.2± 0.2 · · ·C46 14.9± 0.7 1.2± 0.3 0.004 0.8± 0.1 · · ·C47 11.0± 0.9 2.6± 0.7 0.032 0.3± 0.1 0.9C48 11.8± 1.2 3.8± 1.3 0.025 0.7± 0.2 · · ·C49 27.0± 0.9 0.1± 0.0 0.005 2.1± 0.2 2.8C50 15.3± 1.7 1.0± 0.3 0.010 0.8± 0.2 · · ·C51 22.2± 1.0 0.7± 0.1 0.026 3.7± 0.5 5.0C52 17.8± 3.0 0.3± 0.1 0.005 0.5± 0.1 1.2C53 27.8± 1.1 0.2± 0.0 0.005 4.2± 0.5 4.9C54 11.5± 1.1 1.2± 0.4 0.055 0.2± 0.0 · · ·C55 30.2± 1.3 1.6± 0.2 0.117 48.2± 6.2 52.9C57 28.8± 1.4 0.1± 0.0 0.004 2.3± 0.4 3.6C58 28.3± 1.0 0.2± 0.0 0.007 3.3± 0.4 4.1C59a 17.6± 1.9 1.7± 0.5 0.053 2.6± 0.9 6.8C60a 16.4± 1.3 3.8± 1.6 0.021 4.0± 2.4 · · ·C61a 25.7± 0.9 1.8± 0.2 0.029 22.8± 2.9 24.8C63 17.5± 0.7 1.1± 0.3 0.006 1.7± 0.2 · · ·C64 30.6± 1.7 0.1± 0.0 0.006 4.3± 0.6 6.0C65 24.4± 0.9 1.1± 0.2 0.008 10.0± 0.9 · · ·C66 30.5± 1.7 0.1± 0.0 0.003 2.6± 0.4 8.0C67 25.5± 0.8 0.4± 0.0 0.009 4.9± 0.5 5.6C68 17.2± 1.5 0.6± 0.1 0.006 0.8± 0.3 · · ·C69 22.4± 0.6 0.1± 0.0 0.008 0.9± 0.1 · · ·C70 34.3± 2.3 0.0± 0.0 0.001 2.6± 0.4 · · ·C71a 30.7± 1.3 0.9± 0.1 0.016 30.6± 4.5 31.3C73 33.4± 1.5 1.6± 0.2 0.030 84.3± 17.1 87.6C74 23.2± 2.6 0.3± 0.3 0.006 2.3± 0.7 3.1C75 34.8± 2.6 0.1± 0.0 0.002 6.2± 1.3 6.3C76 28.4± 1.0 0.8± 0.1 0.016 18.3± 2.1 21.8
Continued on Next Page. . .

36 Roy et al.
TABLE 4 – Continued
BLAST T M Σ L Lbol
ID (K) (100 M�) (g cm−2) (100 L�) (100 L�)
C78 21.9± 2.9 0.2± 0.1 0.003 0.8± 0.3 · · ·C79 27.4± 1.4 0.2± 0.0 0.002 2.8± 0.4 · · ·C80 30.0± 1.0 1.5± 0.2 0.056 43.4± 5.1 48.9C81 13.5± 1.2 0.9± 0.3 0.017 0.3± 0.1 · · ·C82 11.5± 1.3 1.5± 0.8 0.037 0.2± 0.1 · · ·C83 28.8± 1.1 0.5± 0.1 0.007 10.8± 1.3 11.6C84 23.4± 0.8 0.5± 0.1 0.006 3.7± 0.4 · · ·C85 29.9± 1.0 1.2± 0.1 0.053 35.4± 5.0 51.8C86 16.0± 1.9 2.3± 0.8 0.025 2.1± 0.6 · · ·C87 26.8± 1.0 1.8± 0.2 0.058 28.0± 4.9 33.6C88 32.5± 1.1 1.9± 0.2 0.091 85.7± 11.3 106.0C89 25.7± 1.2 0.1± 0.0 0.002 1.8± 0.3 · · ·C90 16.8± 2.3 3.3± 1.7 0.019 4.0± 1.3 · · ·C91 17.2± 1.2 1.5± 2.3 0.008 2.0± 0.4 · · ·C92 39.3± 5.5 1.9± 0.7 0.024 240.6± 91.8 323.2C93 22.0± 2.1 1.8± 0.5 0.015 9.7± 2.1 · · ·C95 24.4± 1.7 0.3± 0.1 0.001 2.4± 0.6 · · ·C97 21.0± 1.2 2.6± 0.5 0.013 10.6± 2.0 · · ·C98 19.1± 0.5 2.1± 0.3 0.009 5.1± 0.4 · · ·C99 25.3± 0.9 1.2± 0.2 0.007 13.7± 2.0 · · ·C100 23.5± 0.6 0.3± 0.0 0.002 1.9± 0.2 · · ·C101 26.3± 0.8 1.6± 0.2 0.013 21.9± 2.4 23.0C102 22.4± 0.7 0.6± 0.1 0.007 3.4± 0.3 · · ·C104 28.2± 0.9 1.8± 0.2 0.027 37.7± 3.8 44.7C105 19.9± 1.7 0.7± 0.2 0.007 2.1± 0.6 · · ·C106 15.6± 1.3 2.0± 0.5 0.018 1.6± 0.4 · · ·C107 22.2± 0.6 1.3± 0.2 0.071 7.3± 0.7 · · ·C108 15.4± 0.6 6.4± 1.1 0.029 4.8± 0.7 · · ·C109 16.6± 2.8 0.7± 0.2 0.003 0.8± 0.4 · · ·C110 28.7± 0.9 0.7± 0.1 0.006 15.5± 1.5 · · ·C111 23.6± 1.4 0.6± 0.1 0.008 5.0± 0.9 · · ·C112 19.5± 0.5 1.4± 0.2 0.015 3.9± 0.4 · · ·C113 17.7± 0.5 1.1± 0.2 0.012 1.7± 0.2 · · ·C114 19.6± 0.8 1.0± 0.2 0.021 2.7± 0.4 · · ·C115 25.6± 0.8 2.2± 0.3 0.115 27.5± 3.1 31.4C116 17.1± 0.9 1.7± 0.2 0.022 2.2± 0.4 · · ·C117 32.1± 0.9 0.8± 0.1 0.005 34.6± 3.6 · · ·C118 18.3± 2.4 0.2± 0.5 0.006 0.4± 0.2 · · ·C119 21.8± 0.5 3.0± 0.5 0.115 15.2± 1.5 · · ·C120 17.1± 0.7 1.3± 0.3 0.009 1.8± 0.3 · · ·C121 13.8± 2.2 1.3± 0.6 0.033 0.5± 0.3 · · ·C122 12.9± 1.2 5.4± 1.5 0.079 1.5± 0.4 · · ·C123 21.0± 0.9 1.4± 0.2 0.008 5.9± 0.8 · · ·C124 22.4± 1.2 0.2± 0.0 0.001 1.4± 0.3 · · ·C125 28.1± 0.8 0.2± 0.0 0.002 4.4± 0.6 5.0C126 21.9± 1.1 2.7± 0.4 0.019 14.0± 3.4 15.1C127 33.9± 3.7 1.7± 0.3 0.006 95.1± 71.1 91.3C128 27.1± 1.6 0.3± 0.1 0.012 5.4± 0.9 6.9C129 20.3± 2.3 2.7± 0.7 0.026 9.1± 3.8 25.7C130 23.2± 1.2 0.5± 0.1 0.008 3.7± 0.7 · · ·C132 27.2± 1.5 2.7± 0.5 0.015 46.0± 9.3 · · ·C133 23.1± 1.3 0.6± 0.2 0.004 4.5± 0.9 · · ·C134 22.7± 0.6 1.0± 0.1 0.009 6.4± 0.6 · · ·C135 25.5± 1.3 0.4± 0.1 0.011 5.3± 0.8 7.5C136 14.6± 1.1 5.1± 1.2 0.040 2.9± 0.6 · · ·C139 20.7± 0.7 0.4± 0.1 0.011 1.4± 0.2 · · ·C140 22.0± 0.6 1.7± 0.2 0.009 9.1± 1.0 · · ·C141 21.5± 0.6 1.7± 0.2 0.041 8.3± 0.7 8.9C142 21.6± 1.1 0.5± 0.1 0.007 2.3± 0.4 · · ·C143 14.6± 1.5 1.6± 0.5 0.034 0.9± 0.3 · · ·C144 19.4± 0.7 0.5± 0.1 0.006 1.4± 0.2 · · ·C145 21.9± 1.2 1.1± 0.1 0.026 5.6± 1.2 · · ·C146 13.8± 1.9 5.8± 2.7 0.027 2.4± 0.8 · · ·C147 13.3± 2.5 1.7± 1.9 0.022 0.6± 0.3 · · ·C148 21.9± 0.6 0.4± 0.0 0.002 1.8± 0.2 · · ·C149 19.5± 0.8 1.1± 0.2 0.022 3.0± 0.6 · · ·C150 19.3± 0.9 0.3± 0.1 0.004 0.8± 0.1 · · ·C151 20.2± 0.9 0.8± 0.2 0.014 2.7± 0.4 · · ·C152 18.9± 0.8 0.6± 0.1 0.006 1.5± 0.2 · · ·C153 19.7± 2.5 0.7± 0.3 0.019 2.2± 0.7 · · ·C154 17.4± 0.8 1.8± 0.3 0.013 2.7± 0.4 · · ·C155 36.0± 4.4 8.8± 2.4 0.432 697.6± 250.4 776.6C156 26.1± 0.7 0.4± 0.1 0.004 5.5± 0.6 · · ·
Continued on Next Page. . .
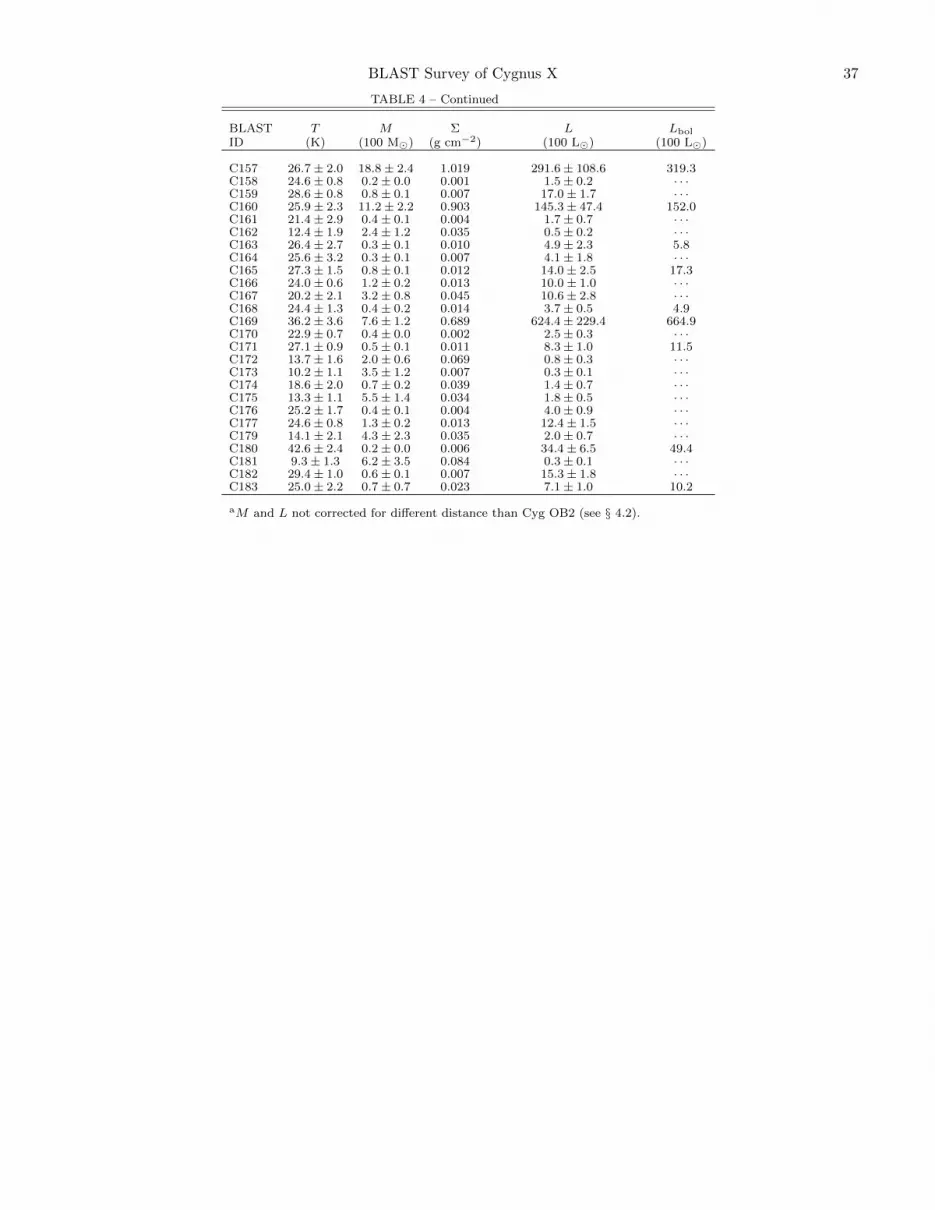
BLAST Survey of Cygnus X 37
TABLE 4 – Continued
BLAST T M Σ L Lbol
ID (K) (100 M�) (g cm−2) (100 L�) (100 L�)
C157 26.7± 2.0 18.8± 2.4 1.019 291.6± 108.6 319.3C158 24.6± 0.8 0.2± 0.0 0.001 1.5± 0.2 · · ·C159 28.6± 0.8 0.8± 0.1 0.007 17.0± 1.7 · · ·C160 25.9± 2.3 11.2± 2.2 0.903 145.3± 47.4 152.0C161 21.4± 2.9 0.4± 0.1 0.004 1.7± 0.7 · · ·C162 12.4± 1.9 2.4± 1.2 0.035 0.5± 0.2 · · ·C163 26.4± 2.7 0.3± 0.1 0.010 4.9± 2.3 5.8C164 25.6± 3.2 0.3± 0.1 0.007 4.1± 1.8 · · ·C165 27.3± 1.5 0.8± 0.1 0.012 14.0± 2.5 17.3C166 24.0± 0.6 1.2± 0.2 0.013 10.0± 1.0 · · ·C167 20.2± 2.1 3.2± 0.8 0.045 10.6± 2.8 · · ·C168 24.4± 1.3 0.4± 0.2 0.014 3.7± 0.5 4.9C169 36.2± 3.6 7.6± 1.2 0.689 624.4± 229.4 664.9C170 22.9± 0.7 0.4± 0.0 0.002 2.5± 0.3 · · ·C171 27.1± 0.9 0.5± 0.1 0.011 8.3± 1.0 11.5C172 13.7± 1.6 2.0± 0.6 0.069 0.8± 0.3 · · ·C173 10.2± 1.1 3.5± 1.2 0.007 0.3± 0.1 · · ·C174 18.6± 2.0 0.7± 0.2 0.039 1.4± 0.7 · · ·C175 13.3± 1.1 5.5± 1.4 0.034 1.8± 0.5 · · ·C176 25.2± 1.7 0.4± 0.1 0.004 4.0± 0.9 · · ·C177 24.6± 0.8 1.3± 0.2 0.013 12.4± 1.5 · · ·C179 14.1± 2.1 4.3± 2.3 0.035 2.0± 0.7 · · ·C180 42.6± 2.4 0.2± 0.0 0.006 34.4± 6.5 49.4C181 9.3± 1.3 6.2± 3.5 0.084 0.3± 0.1 · · ·C182 29.4± 1.0 0.6± 0.1 0.007 15.3± 1.8 · · ·C183 25.0± 2.2 0.7± 0.7 0.023 7.1± 1.0 10.2
aM and L not corrected for different distance than Cyg OB2 (see § 4.2).

38 Roy et al.
TABLE 5Compact HII regions and protostars
BLAST T M L Source MAMBO Figurea
ID (K) (100 M�) (100 L�) Name 1.2 mm No
C1 40 1.9 489.0 S26, AFGL2591 UCH II 7C7 26 2.6 50.2 S30, IRAS 20293+3952 MIRQP 7C14 30 3.8 4.5 IRAS 20255+4032 · · · 6C30b 38 17.6 1640.0 IRAS 20264+4042 · · · · · ·C32 46 1.1 330.7 S41, IRAS 20306+4005 HLIRPC 7C36 26 2.6 30.6 S37, IRAS 20305+4010 MIRQP 7C38 38 0.4 48.7 IRAS 20319+3958 · · · · · ·C49 27 0.1 2.8 · · · · · · · · ·C55 30 1.6 52.9 IRAS 20286+4105 · · · · · ·C58 28 0.2 4.1 IRAS 20315+4046 · · · · · ·C64 31 0.1 6.0 IRAS 20328+4042 · · · · · ·C71b 31 22.5 782.5 IRAS 20320+4115 · · · · · ·C73 33 1.6 87.6 IRAS 20333+4102 · · · · · ·C76 28 0.8 21.8 IRAS 20327+4120 · · · · · ·C80 30 1.5 48.9 IRAS 20332+4124 · · · · · ·C85 30 1.2 51.8 N6, IRAS 20343+4129 HLIRPC 10C87 27 1.8 33.6 N14, IRAS 20352+4124 HLIRPC 10C88 33 1.9 106.3 N10, IRAS 20350+4126 UCH II 10C92 39 1.9 323.2 N58, IRAS 20375+4109 CH II 12C104 28 1.8 44.7 N62 IRQP 12C107 22 1.3 7.3 N63 MIRP 12C115 26 2.2 31.4 N3 MIRQP 9C119 22 3.0 15.2 N12 MIRQP 9C141 22 1.7 8.9 N65 MIRQP 12C145 22 1.1 10.7 N68 MIRQP 12C155 36 8.8 776.6 N46, DR21 UCH II 11C157 27 18.8 319.3 N44, DR21(OH) MIRQP 11C167 20 3.2 10.6 N24 IRQP 11C169 36 7.6 664.1 N30, W75N HCH II 11
a Figure number of the images containing individual sources.b M and L corrected for distance (see § 4.2).

BLAST Survey of Cygnus X 39
APPENDIX
MULTI-WAVELENGTH PHOTOMETRY
Flux densities at many supplementary wavelengths are presented in Table 1 and Table 6. They were obtained asfollows.
MAMBO 1200 µm. The MAMBO camera mounted on the IRAM 30-m telescope imaged all regions having columndensity greater than (AV ≥ 15) at wavelength of 1.2 mm (Motte et al. 2007). With its 11′′ beam, MAMBO hasthe ability to resolve multiple cores (if present) within BLAST clumps. Combining our data with MAMBO helps inmulti-wavelength photometry, especially when any cold source is undetected in the mid to far-infrared spectrum. Toobtain consistent photometry, we first convolved the MAMBO map to 1′, about the resolution of the BLAST maps.This has two effects: blending together any MAMBO cores; and bringing in flux from the more extended emission(halo or plateau) usually associated with these multi-scale structures. Gaussian photometry was performed on theconvolved map.
SCUBA 850 and 450 µm. The archival data from the Submillimeter Common User Bolometer (SCUBA) on the15-m James Clerk Maxwell Telescope (JCMT), Di Francesco et al. (2008) sample many high extinction regions of theGalactic Plane, including Cyg X, with diffraction-limited beams of 14.5′′ and 7.5′′, at 850 and 450 µm, respectively.Due to the higher spatial resolution, SCUBA can also identify numerous small-scale cores. The archival images consistof discontinuous smaller maps and so could not be convolved to BLAST resolution prior to photometry. Instead, weused flux densities using the SCUBA legacy catalogs of Di Francesco et al. (2008). We obtained flux densities from theExtended Map Object Catalog (EMOC) and added up all flux densities for sources within 1′ of the BLAST source.Because of the small SCUBA maps, some BLAST sources are not completely scanned near the map edges and theresulting flux density is low.
IRAS 100 and 60 µm. Bright dust emission is observed at 100 and 60 µm throughout Cyg X, and for most of themore luminous, hotter BLAST sources these IRAS bands cover the peak of the SED. The IRAS point source catalogdoes not have any entries for about half of our Cyg X region. This arose because of the very bright source DR21(C. Beichman, private communication). Nevertheless, the IRAS images that have been made subsequently are notseriously affected. We extract flux densities at 100 and 60 µm from the Infrared Galaxy Atlas images (IGA; Cao et al.1997), made using HIRES (Aumann et al. 1990), a resolution enhancing algorithm. There is some elongation of sourcesacross the dominant scan direction. The resolution at 100 and 60 µm is about 2′ and 1′, respectively, substantiallybetter resolution than in the original ISSA product. Most of the isolated BLAST sources are warm enough to havea counterpart in the IGA map. BLAST counterparts at 100 µm were measured with a circular aperture of 2.4′.Similarly, at 60 µm elliptical apertures of dimension 1.8′ × 1.2′ were placed with the major axis aligned across thescan direction. In the crowded regions, multiple Gaussian photometry (elliptical in the case of 60 µm) was carried outby fixing centroids of nearby sources.
The counterparts to BLAST sources in the 60 µm images are often affected by extended cirrus-like structure andsometimes by deconvolution artefacts. Such sources show inconsistent structure between the 100 and 60 µm images.We preferred not to use such photometric data as detections to constrain the Wien part of the SED, rather using themas upper limits through a penalty function (Chapin et al. 2008). In crowded regions, the flux density measurementsof fainter sources are highly uncertain and for such cases we also used the photometric data as an upper limit. Theseupper limits are indicated by a superscript ‘u’ in Table 1.
MIPS 70 µm. Spitzer MIPS observations at 70 µm have better resolution and sensitivity than IRAS IGA 60 µmdata and so are particularly useful for detecting or placing upper limits on colder and fainter BLAST sources. TheMIPS images were destriped, which is advantageous for probing faint sources, and corrected at the pixel level for non-linearity (Dale et al. 2007). Measurements using a Gaussian model of fixed FWHM 40′′ (typical extent of actual MIPSsources) at the positions of 39 faint BLAST sources where we have found no apparent counterparts in the MIPS imagegive an rms flux density of 5.7 Jy. This provides a very useful upper limit for these sources, constraining the SED onthe Wien side of the peak. For flux densities of somewhat brighter sources, we first convolved the 70 µm map to 1′, tobe comparable to BLAST, and then made measurements using multi-Gaussian photometry with a linear backgroundmodel. This provided useful detections for 56 sources and upper limits for the others. For six BLAST sources, pixelsat the peaks of the bright MIPS counterparts are blanked; however, the IRAS data for these are sufficient to constrainthe SED. The resolution of our convolved maps is also closer to the IGA 60 µm resolution, facilitating a comparisonwith isolated sources with a good IRAS detection. We find that the MIPS flux densities are slightly higher than at60 µm (F60/F70 = 0.78), as expected for these SEDs. At the native resolution, without beam matching, the MIPSflux densities are systematically lower, as is discussed by Mottram et al. (2010).
MSX 8, 12, 14, and 21 µm. MSX (Price et al. 2001) observed in A, C, D, and E bands at 8.3, 12.1, 14.7 and21.3 µm, respectively. Among the four bands, A is the most sensitive and is dominated by diffuse emission from PAHmolecules. It has angular resolution 18.3′′.
MSX sources have relatively small positional uncertainties (within 4′′ - 5′′). MSX sources were identified within asearch radius of 30′′ about the BLAST coordinate. After visual inspection, we rejected some MSX “matches” thatwere either in a PDR and/or excited by some nearby OB stars, and so had nothing to do with the star formationhistory of the subject BLAST source.
We extracted flux densities from the map in its native resolution directly by fitting multiple Gaussians, assuminga constant (not tilted) background. We find that our flux densities in all the bands are systematically higher thanreported in the MSX point source catalog, and the deviation is more noticeable for less bright sources. This trend was

40 Roy et al.
TABLE 6MSX counterparts
BLAST ∆αa ∆δa S8 S12 S14 S25
ID (′′) (′′) (Jy) (Jy) (Jy) (Jy)
C1 5.9 3.0 313.8 568.0 798.5 1023.4C6 −1.5 6.0 0.2 0.8 0.6 1.6C7 −7.8 13.7 17.1 23.5 23.4 100.0C14 11.6 −5.1 0.4 1.0 1.2 2.4C15 17.2 −6.2 4.6 5.8 3.7 13.6C19 4.4 2.3 1.8 1.7 0.9 1.3C22 −27.6 15.4 0.7 1.3 2.0 2.5C27 15.4 −6.3 2.1 4.7 3.0 8.7C28 34.4 −12.6 4.8 9.1 6.6 37.7C30 −35.0 −12.5 0.5 4.0 7.6 13.8C38 8.7 3.6 12.5 13.4 11.1 64.3C41 8.0 −5.8 1.0 1.0 0.7 2.0C47 −4.4 −10.7 0.2 0.6 1.3 1.5C49 3.9 −0.7 0.7 1.4 1.3 2.7C51 6.9 −1.5 0.2 0.6 0.7 2.3C52 11.6 4.7 0.4 1.0 0.4 1.5C53 4.1 −4.8 0.8 1.6 1.0 1.4C55 −18.3 −6.0 6.3 8.1 4.0 13.2C57 10.2 6.4 0.5 0.8 0.4 1.8C58 −3.7 −6.3 0.7 1.2 1.1 2.5C59 −5.3 18.7 0.7 1.2 2.3 2.7C61 17.2 0.7 2.7 3.5 1.8 3.7C64 2.1 0.6 2.6 4.7 4.2 5.7C66 2.1 5.9 9.1 15.9 20.2 26.8C67 −2.0 −1.4 1.0 1.6 0.4 1.3C71 0.3 10.5 1.0 1.9 1.4 2.8C73 −17.3 −2.2 3.2 5.8 7.0 19.5C74 28.1 −12.9 0.4 0.8 0.5 1.3C75 1.0 3.1 0.5 0.6 0.5 1.2C76 0.1 −7.6 7.9 9.1 8.2 7.4C80 6.9 −5.2 4.7 5.7 3.9 18.5C83 −1.2 −6.4 1.3 1.6 0.7 1.5C85 2.7 0.8 10.2 17.1 23.7 90.9C87 0.8 9.6 3.4 6.3 9.6 19.7C88 9.2 −0.0 5.4 14.6 26.2 99.3C92 −21.6 0.2 27.1 66.1 98.5 634.1C101 1.6 −13.0 1.5 1.7 1.6 1.4C104 −6.0 12.4 4.9 5.7 4.4 26.6C115 4.9 8.8 1.5 2.7 3.0 3.7C125 −1.2 15.0 0.6 0.9 0.7 1.2C126 −1.0 32.9 1.4 1.7 1.5 2.0C127 −13.5 22.0 1.9 3.4 2.3 5.8C128 −6.5 16.7 3.1 4.0 1.8 3.9C129 11.6 18.3 0.8 1.0 0.7 1.3C135 8.0 −7.8 0.8 2.7 5.2 11.6C141 2.1 −13.7 0.3 0.6 0.7 1.4C155 3.3 15.6 8.8 29.6 68.4 543.9C157 −31.6 26.6 9.2 16.3 21.6 72.7C160 62.8 13.0 2.8 3.3 3.4 10.8C163 −14.0 16.5 0.3 0.8 1.2 2.1C165 2.6 31.5 6.2 6.1 4.3 10.4C168 −10.4 11.2 0.5 1.3 2.4 3.7C169 19.9 8.7 15.0 27.1 55.4 331.8C171 −0.4 −6.4 3.2 4.1 3.3 17.0C180 0.9 2.5 11.5 17.0 23.8 124.5C183 3.2 11.8 2.9 6.5 10.0 13.3
a Offsets of MSX sources with respect to BLAST counter-parts.
also observed by Molinari et al. (2008).Results of MSX photometry are given in Table 6. In our present analysis, MSX flux densities in no way constrain
temperature and total mass. We use MSX flux densities in the SEDs only to calculate a small correction to thebolometric luminosity by connecting data points piecewise continuously (Chapin et al. 2008). See for example, theSED for W75N in Figure 14; note the “rising spectrum” from 4 to 21 µm, characteristic of a MYSO. We find that thiscorrection does not change the results significantly as the Cyg X sources detected by BLAST are quite cool.
REFERENCES
Araya, E. D., Kurtz, S., Hofner, P., & Linz, H. 2009, ApJ, 698,1321
Aumann, H. H., Fowler, J. W., & Melnyk, M. 1990, AJ, 99, 1674Bally, J. & Lada, C. J. 1983, ApJ, 265, 824

BLAST Survey of Cygnus X 41
Beerer, I. M., Koenig, X. P., Hora, J. L., Gutermuth, R. A.,Bontemps, S., Megeath, S. T., Schneider, N., Motte, F., Carey,S., Simon, R., Keto, E., Smith, H. A., Allen, L. E., Fazio,G. G., Kraemer, K. E., Price, S., Mizuno, D., Adams, J. D.,Hernandez, J., & Lucas, P. W. 2010, ApJ, 720, 679
Bergin, E. A. & Tafalla, M. 2007, ARA&A, 45, 339Beuther, H., Leurini, S., Schilke, P., Wyrowski, F., Menten,
K. M., & Zhang, Q. 2007a, A&A, 466, 1065Beuther, H., Zhang, Q., Bergin, E. A., Sridharan, T. K., Hunter,
T. R., & Leurini, S. 2007b, A&A, 468, 1045Bica, E., Bonatto, C., & Dutra, C. M. 2003, A&A, 405, 991Bonnell, I. A., Bate, M. R., Clarke, C. J., & Pringle, J. E. 1997,
MNRAS, 285, 201—. 2001, MNRAS, 323, 785Bonnell, I. A., Bate, M. R., & Zinnecker, H. 1998, MNRAS, 298,
93Bonnell, I. A., Larson, R. B., & Zinnecker, H. 2007, Protostars
and Planets V, 149Bontemps, S., Motte, F., Csengeri, T., & Schneider, N. 2009,
ArXiv e-printsBoulanger, F., Abergel, A., Bernard, J.-P., Burton, W. B.,
Desert, F.-X., Hartmann, D., Lagache, G., & Puget, J.-L. 1996,A&A, 312, 256
Campbell, B. 1984, ApJ, 287, 334Cao, Y., Terebey, S., Prince, T. A., & Beichman, C. A. 1997,
ApJS, 111, 387Carey, S. J., Noriega-Crespo, A., Price, S. D., Padgett, D. L.,
Kraemer, K. E., Indebetouw, R., Mizuno, D. R., Ali, B.,Berriman, G. B., Boulanger, F., Cutri, R. M., Ingalls, J. G.,Kuchar, T. A., Latter, W. B., Marleau, F. R.,Miville-Deschenes, M. A., Molinari, S., Rebull, L. M., & Testi,L. 2005, in Bulletin of the American Astronomical Society,1252–+
Chapin, E. L., Ade, P. A. R., Bock, J. J., Brunt, C., Devlin,M. J., Dicker, S., Griffin, M., Gundersen, J. O., Halpern, M.,Hargrave, P. C., Hughes, D. H., Klein, J., Marsden, G., Martin,P. G., Mauskopf, P., Netterfield, C. B., Olmi, L., Pascale, E.,Patanchon, G., Rex, M., Scott, D., Semisch, C., Truch,M. D. P., Tucker, C., Tucker, G. S., Viero, M. P., & Wiebe,D. V. 2008, ApJ, 681, 428
Churchwell, E. 2002, ARA&A, 40, 27Colley, D. 1980, MNRAS, 192, 377Comeron, F., Pasquali, A., Rodighiero, G., Stanishev, V., De
Filippis, E., Lopez Martı, B., Galvez Ortiz, M. C., Stankov, A.,& Gredel, R. 2002, A&A, 389, 874
Comeron, F. & Torra, J. 1999, A&A, 349, 605—. 2001, A&A, 375, 539Cong, H. I. L. 1977, PhD thesis, National Aeronautics and Space
Administration. Goddard Space Flight Center, Greenbelt, MD.Csengeri, T., Bontemps, S., Schneider, N., Motte, F., & Dib, S.
2010, ArXiv e-printsCyganowski, C. J., Reid, M. J., Fish, V. L., & Ho, P. T. P. 2003,
ApJ, 596, 344Dale, D. A., Gil de Paz, A., Gordon, K. D., Hanson, H. M.,
Armus, L., Bendo, G. J., Bianchi, L., Block, M., Boissier, S.,Boselli, A., Buckalew, B. A., Buat, V., Burgarella, D., Calzetti,D., Cannon, J. M., Engelbracht, C. W., Helou, G., Hollenbach,D. J., Jarrett, T. H., Kennicutt, R. C., Leitherer, C., Li, A.,Madore, B. F., Martin, D. C., Meyer, M. J., Murphy, E. J.,Regan, M. W., Roussel, H., Smith, J. D. T., Sosey, M. L.,Thilker, D. A., & Walter, F. 2007, ApJ, 655, 863
Dame, T. M., Ungerechts, H., Cohen, R. S., de Geus, E. J.,Grenier, I. A., May, J., Murphy, D. C., Nyman, L., &Thaddeus, P. 1987, ApJ, 322, 706
Davis, C. J., Kumar, M. S. N., Sandell, G., Froebrich, D., Smith,M. D., & Currie, M. J. 2007, MNRAS, 374, 29
Desert, F., Boulanger, F., & Puget, J. L. 1990, A&A, 237, 215Di Francesco, J., Johnstone, D., Kirk, H., MacKenzie, T., &
Ledwosinska, E. 2008, ApJS, 175, 277Downes, D. & Rinehart, R. 1966, ApJ, 144, 937Dutra, C. M. & Bica, E. 2001, A&A, 376, 434Egan, M. P., Shipman, R. F., Price, S. D., Carey, S. J., Clark,
F. O., & Cohen, M. 1998, ApJ, 494, L199+
Elia, D., Schisano, E., Molinari, S., Robitaille, T., Angles-Alcazar,D., Bally, J., Battersby, C., Benedettini, M., Billot, N.,Calzoletti, L., di Giorgio, A. M., Faustini, F., Li, J. Z., Martin,P., Morgan, L., Motte, F., Mottram, J. C., Natoli, P., Olmi, L.,Paladini, R., Piacentini, F., Pestalozzi, M., Pezzuto, S.,Polychroni, D., Smith, M. D., Strafella, F., Stringfellow, G. S.,Testi, L., Thompson, M. A., Traficante, A., & Veneziani, M.2010, A&A, 518, L97+
Elmegreen, B. G. 1998, in Astronomical Society of the PacificConference Series, Vol. 148, Origins, ed. C. E. Woodward,J. M. Shull, & H. A. Thronson Jr., 150–+
Garay, G., Brooks, K. J., Mardones, D., & Norris, R. P. 2006,ApJ, 651, 914
Harvey-Smith, L., Soria-Ruiz, R., Duarte-Cabral, A., & Cohen,R. J. 2008, MNRAS, 384, 719
Haschick, A. D., Reid, M. J., Burke, B. F., Moran, J. M., &Miller, G. 1981, ApJ, 244, 76
Holland, W., MacIntosh, M., Fairley, A., Kelly, D., Montgomery,D., Gostick, D., Atad-Ettedgui, E., Ellis, M., Robson, I.,Hollister, M., Woodcraft, A., Ade, P., Walker, I., Irwin, K.,Hilton, G., Duncan, W., Reintsema, C., Walton, A., Parkes,W., Dunare, C., Fich, M., Kycia, J., Halpern, M., Scott, D.,Gibb, A., Molnar, J., Chapin, E., Bintley, D., Craig, S.,Chylek, T., Jenness, T., Economou, F., & Davis, G. 2006, inSociety of Photo-Optical Instrumentation Engineers (SPIE)Conference Series, Vol. 6275, Society of Photo-OpticalInstrumentation Engineers (SPIE) Conference Series
Hora, J. L., Bontemps, S., Megeath, S. T., Schneider, N., Motte,F., Carey, S., Simon, R., Keto, E., Smith, H. A., Allen, L. E.,Gutermuth, R., Fazio, G. G., Adams, J. D., & Cygnus-X 24Micron Data Processing Team. 2009, in Bulletin of theAmerican Astronomical Society, Vol. 41, Bulletin of theAmerican Astronomical Society, 498–+
Hunter, T. R., Taylor, G. B., Felli, M., & Tofani, G. 1994, A&A,284, 215
Juvela, M., Ristorcelli, I., Montier, L. A., Marshall, D. J.,Pelkonen, V., Malinen, J., Ysard, N., Toth, L. V., Harju, J.,Bernard, J., Schneider, N., Verebelyi, E., Anderson, L., Andre,P., Giard, M., Krause, O., Lehtinen, K., Macias-Perez, J.,Martin, P., McGehee, P. M., Meny, C., Motte, F., Pagani, L.,Paladini, R., Reach, W., Valenziano, L., Ward-Thompson, D.,& Zavagno, A. 2010, A&A, 518, L93+
Knodlseder, J. 2000, A&A, 360, 539Kobulnicky, H. A., Gilbert, I. J., & Kiminki, D. C. 2010, ApJ,
710, 549Koenig, X. P., Allen, L. E., Gutermuth, R. A., Hora, J. L., Brunt,
C. M., & Muzerolle, J. 2008, ApJ, 688, 1142Kraemer, K. E., Hora, J. L., Adams, J., Allen, L. E., Bontemps,
S., Carey, S. J., Fazio, G. G., Gutermuth, R., Keto, E., Koenig,X., Megeath, S. T., Mizuno, D. R., Motte, F., Price, S. D.,Schneider, N., Simon, R., & Smith, H. A. 2010a, in Bulletin ofthe American Astronomical Society, Vol. 42, Bulletin of theAmerican Astronomical Society, 253–+
Kraemer, K. E., Hora, J. L., Egan, M. P., Adams, J., Allen, L. E.,Bontemps, S., Carey, S. J., Fazio, G. G., Gutermuth, R., Keto,E., Koenig, X. P., Megeath, S. T., Mizuno, D. R., Motte, F.,Price, S. D., Schneider, N., Simon, R., & Smith, H. A. 2010b,AJ, 139, 2319
Kramer, C., Stutzki, J., Rohrig, R., & Corneliussen, U. 1998,A&A, 329, 249
Krumholz, M. R. 2006, ApJ, 641, L45Krumholz, M. R. & McKee, C. F. 2008, Nature, 451, 1082Kurtz, S., Cesaroni, R., Churchwell, E., Hofner, P., & Walmsley,
C. M. 2000, Protostars and Planets IV, 299Kurtz, S., Churchwell, E., & Wood, D. O. S. 1994, ApJS, 91, 659Lada, C. J. & Lada, E. A. 2003, ARA&A, 41, 57Le Duigou, J.-M. & Knodlseder, J. 2002, A&A, 392, 869Leung, H. O. & Thaddeus, P. 1992, ApJS, 81, 267Li, A. & Draine, B. T. 2001, ApJ, 554, 778Lockman, F. J. 1989, ApJS, 71, 469Lucy, L. B. 1974, AJ, 79, 745Mac Low, M.-M. & Klessen, R. S. 2004, Reviews of Modern
Physics, 76, 125Marston, A. P., Reach, W. T., Noriega-Crespo, A., Rho, J.,
Smith, H. A., Melnick, G., Fazio, G., Rieke, G., Carey, S.,Rebull, L., Muzerolle, J., Egami, E., Watson, D. M., Pipher,J. L., Latter, W. B., & Stapelfeldt, K. 2004, ApJS, 154, 333

42 Roy et al.
Martin, P. G., Miville-Deschenes, M., Roy, A., Bernard, J.,Molinari, S., Billot, N., Brunt, C., Calzoletti, L., Digiorgio,A. M., Elia, D., Faustini, F., Joncas, G., Mottram, J. C., Natoli,P., Noriega-Crespo, A., Paladini, R., Robitaille, J. F., Strafella,F., Traficante, A., & Veneziani, M. 2010, A&A, 518, L105+
Massey, P. & Thompson, A. B. 1991, AJ, 101, 1408McKee, C. F. & Tan, J. C. 2003, ApJ, 585, 850Miville-Deschenes, M.-A., Lagache, G., Boulanger, F., & Puget,
J.-L. 2007, A&A, 469, 595Molinari, S., Pezzuto, S., Cesaroni, R., Brand, J., Faustini, F., &
Testi, L. 2008, A&A, 481, 345Molinari, S., Swinyard, B., Bally, J., Barlow, M., Bernard, J.,
Martin, P., Moore, T., Noriega-Crespo, A., Plume, R., Testi,L., Zavagno, A., Abergel, A., Ali, B., Andre, P., Baluteau, J.,Benedettini, M., Berne, O., Billot, N. P., Blommaert, J.,Bontemps, S., Boulanger, F., Brand, J., Brunt, C., Burton, M.,Campeggio, L., Carey, S., Caselli, P., Cesaroni, R., Cernicharo,J., Chakrabarti, S., Chrysostomou, A., Codella, C., Cohen, M.,Compiegne, M., Davis, C. J., de Bernardis, P., de Gasperis, G.,Di Francesco, J., di Giorgio, A. M., Elia, D., Faustini, F.,Fischera, J. F., Fukui, Y., Fuller, G. A., Ganga, K.,Garcia-Lario, P., Giard, M., Giardino, G., Glenn, J. .,Goldsmith, P., Griffin, M., Hoare, M., Huang, M., Jiang, B.,Joblin, C., Joncas, G., Juvela, M., Kirk, J., Lagache, G., Li,J. Z., Lim, T. L., Lord, S. D., Lucas, P. W., Maiolo, B.,Marengo, M., Marshall, D., Masi, S., Massi, F., Matsuura, M.,Meny, C., Minier, V., Miville-Deschenes, M., Montier, L.,Motte, F., Muller, T. G., Natoli, P., Neves, J., Olmi, L.,Paladini, R., Paradis, D., Pestalozzi, M., Pezzuto, S.,Piacentini, F., Pomares, M., Popescu, C. C., Reach, W. T.,Richer, J., Ristorcelli, I., Roy, A., Royer, P., Russeil, D.,Saraceno, P., Sauvage, M., Schilke, P., Schneider-Bontemps, N.,Schuller, F., Schultz, B., Shepherd, D. S., Sibthorpe, B., Smith,H. A., Smith, M. D., Spinoglio, L., Stamatellos, D., Strafella,F., Stringfellow, G., Sturm, E., Taylor, R., Thompson, M. A.,Tuffs, R. J., Umana, G., Valenziano, L., Vavrek, R., Viti, S.,Waelkens, C., Ward-Thompson, D., White, G., Wyrowski, F.,Yorke, H. W., & Zhang, Q. 2010, PASP, 122, 314
Moore, T. J. T., Mountain, C. M., & Yamashita, T. 1991,MNRAS, 248, 79
Motte, F., Bontemps, S., Schilke, P., Schneider, N., Menten,K. M., & Broguiere, D. 2007, A&A, 476, 1243
Mottram, J. C., Hoare, M. G., Lumsden, S. L., Oudmaijer, R. D.,Urquhart, J. S., Meade, M. R., Moore, T. J. T., & Stead, J. J.2010, A&A, 510, A89+
Negueruela, I., Marco, A., Herrero, A., & Clark, J. S. 2008, A&A,487, 575
Netterfield, C. B., Ade, P. A. R., Bock, J. J., Chapin, E. L.,Devlin, M. J., Griffin, M., Gundersen, J. O., Halpern, M.,Hargrave, P. C., Hughes, D. H., Klein, J., Marsden, G., Martin,P. G., Mauskopf, P., Olmi, L., Pascale, E., Patanchon, G., Rex,M., Roy, A., Scott, D., Semisch, C., Thomas, N., Truch,M. D. P., Tucker, C., Tucker, G. S., Viero, M. P., & Wiebe,D. V. 2009, ApJ, 707, 1824
Odenwald, S., Shivanandan, K., Campbell, M., Fazio, G.,Schwartz, P., & Moseley, H. 1986, ApJ, 306, 122
Odenwald, S. F., Campbell, M. F., Shivanandan, K., Schwartz,P., Fazio, G. G., & Moseley, H. 1990, AJ, 99, 288
Ossenkopf, V. & Henning, T. 1994, A&A, 291, 943Pascale, E., Ade, P. A. R., Bock, J. J., Chapin, E. L., Chung, J.,
Devlin, M. J., Dicker, S., Griffin, M., Gundersen, J. O.,Halpern, M., Hargrave, P. C., Hughes, D. H., Klein, J.,MacTavish, C. J., Marsden, G., Martin, P. G., Martin, T. G.,Mauskopf, P., Netterfield, C. B., Olmi, L., Patanchon, G., Rex,M., Scott, D., Semisch, C., Thomas, N., Truch, M. D. P.,Tucker, C., Tucker, G. S., Viero, M. P., & Wiebe, D. V. 2008,ApJ, 681, 400
Patanchon, G., Ade, P. A. R., Bock, J. J., Chapin, E. L., Devlin,M. J., Dicker, S., Griffin, M., Gundersen, J. O., Halpern, M.,Hargrave, P. C., Hughes, D. H., Klein, J., Marsden, G., Martin,P. G., Mauskopf, P., Netterfield, C. B., Olmi, L., Pascale, E.,Rex, M., Scott, D., Semisch, C., Truch, M. D. P., Tucker, C.,Tucker, G. S., Viero, M. P., & Wiebe, D. V. 2008, ApJ, 681, 708
Perault, M., Omont, A., Simon, G., Seguin, P., Ojha, D.,Blommaert, J., Felli, M., Gilmore, G., Guglielmo, F., Habing,H., Price, S., Robin, A., de Batz, B., Cesarsky, C., Elbaz, D.,Epchtein, N., Fouque, P., Guest, S., Levine, D., Pollock, A.,Prusti, T., Siebenmorgen, R., Testi, L., & Tiphene, D. 1996,A&A, 315, L165
Persi, P., Tapia, M., & Smith, H. A. 2006, A&A, 445, 971Piddington, J. H. & Minnett, H. C. 1952, Australian Journal of
Scientific Research A Physical Sciences, 5, 17Poetzel, R., Mundt, R., & Ray, T. P. 1992, A&A, 262, 229Price, S. D., Egan, M. P., Carey, S. J., Mizuno, D. R., & Kuchar,
T. A. 2001, AJ, 121, 2819Redman, R. O., Feldman, P. A., Wyrowski, F., Cote, S., Carey,
S. J., & Egan, M. P. 2003, ApJ, 586, 1127Reipurth, B. & Schneider, N. Star Formation and Young Clusters
in Cygnus, ed. Reipurth, B., 36–+Richardson, W. H. 1972, Journal of the Optical Society of
America (1917-1983), 62, 55Rivera-Ingraham, A., Ade, P. A. R., Bock, J. J., Chapin, E. L.,
Devlin, M. J., Dicker, S. R., Griffin, M., Gundersen, J. O.,Halpern, M., Hargrave, P. C., Hughes, D. H., Klein, J.,Marsden, G., Martin, P. G., Mauskopf, P., Netterfield, C. B.,Olmi, L., Patanchon, G., Rex, M., Scott, D., Semisch, C.,Truch, M. D. P., Tucker, C., Tucker, G. S., Viero, M. P., &Wiebe, D. V. 2010, ArXiv e-prints
Roy, A., Ade, P. A. R., Bock, J. J., Chapin, E. L., Devlin, M. J.,Dicker, S. R., Griffin, M., Gundersen, J. O., Halpern, M.,Hargrave, P. C., Hughes, D. H., Klein, J., Marsden, G., Martin,P. G., Mauskopf, P., Miville-Deschenes, M., Netterfield, C. B.,Olmi, L., Patanchon, G., Rex, M., Scott, D., Semisch, C.,Truch, M. D. P., Tucker, C., Tucker, G. S., Viero, M. P., &Wiebe, D. V. 2010, ApJ, 708, 1611
Schaerer, D. & de Koter, A. 1997, A&A, 322, 598Schneider, N., Bontemps, S., Simon, R., Jakob, H., Motte, F.,
Miller, M., Kramer, C., & Stutzki, J. 2006, A&A, 458, 855Sebring, T. 2010, in Society of Photo-Optical Instrumentation
Engineers (SPIE) Conference Series, Vol. 7733, Society ofPhoto-Optical Instrumentation Engineers (SPIE) ConferenceSeries
Sibthorpe, B., Ade, P. A. R., Bock, J. J., Chapin, E. L., Devlin,M. J., Dicker, S., Griffin, M., Gundersen, J. O., Halpern, M.,Hargrave, P. C., Hughes, D. H., Jeong, W., Kaneda, H., Klein,J., Koo, B., Lee, H., Marsden, G., Martin, P. G., Mauskopf, P.,Moon, D., Netterfield, C. B., Olmi, L., Pascale, E., Patanchon,G., Rex, M., Roy, A., Scott, D., Semisch, C., Truch, M. D. P.,Tucker, C., Tucker, G. S., Viero, M. P., & Wiebe, D. V. 2010,ApJ, 719, 1553
Simon, R., Rathborne, J. M., Shah, R. Y., Jackson, J. M., &Chambers, E. T. 2006, ApJ, 653, 1325
Smith, R. J., Longmore, S., & Bonnell, I. 2009, MNRAS, 400,1775
Stahler, S. W. & Palla, F. 2005, The Formation of Stars, ed.Stahler, S. W. & Palla, F.
Stutzki, J. & Guesten, R. 1990, ApJ, 356, 513Taylor, A. R., Gibson, S. J., Peracaula, M., Martin, P. G.,
Landecker, T. L., Brunt, C. M., Dewdney, P. E., Dougherty,S. M., Gray, A. D., Higgs, L. A., Kerton, C. R., Knee, L. B. G.,Kothes, R., Purton, C. R., Uyaniker, B., Wallace, B. J., Willis,A. G., & Durand, D. 2003, AJ, 125, 3145
Truch, M. D. P., Ade, P. A. R., Bock, J. J., Chapin, E. L., Devlin,M. J., Dicker, S., Griffin, M., Gundersen, J. O., Halpern, M.,Hargrave, P. C., Hughes, D. H., Klein, J., Marsden, G., Martin,P. G., Mauskopf, P., Netterfield, C. B., Olmi, L., Pascale, E.,Patanchon, G., Rex, M., Scott, D., Semisch, C., Tucker, C.,Tucker, G. S., Viero, M. P., & Wiebe, D. V. 2008, ApJ, 681, 415
Truch, M. D. P., Ade, P. A. R., Bock, J. J., Chapin, E. L.,Devlin, M. J., Dicker, S. R., Griffin, M., Gundersen, J. O.,Halpern, M., Hargrave, P. C., Hughes, D. H., Klein, J.,Marsden, G., Martin, P. G., Mauskopf, P., Moncelsi, L., BarthNetterfield, C., Olmi, L., Pascale, E., Patanchon, G., Rex, M.,Scott, D., Semisch, C., Thomas, N. E., Tucker, C., Tucker,G. S., Viero, M. P., & Wiebe, D. V. 2009, ApJ, 707, 1723
Uyanıker, B., Furst, E., Reich, W., Aschenbach, B., &Wielebinski, R. 2001, A&A, 371, 675

BLAST Survey of Cygnus X 43
Waller, W. H. & Boulanger, F. 1994, in Astronomical Society ofthe Pacific Conference Series, Vol. 58, The First Symposium onthe Infrared Cirrus and Diffuse Interstellar Clouds, ed. R. M.Cutri & W. B. Latter, 129
Wang, P., Li, Z., Abel, T., & Nakamura, F. 2010, ApJ, 709, 27Wendker, H. J., Higgs, L. A., & Landecker, T. L. 1991, A&A,
241, 551
Werner, M. W., Roellig, T. L., Low, F. J., Rieke, G. H., Rieke,M., Hoffmann, W. F., Young, E., Houck, J. R., Brandl, B.,Fazio, G. G., Hora, J. L., Gehrz, R. D., Helou, G., Soifer, B. T.,Stauffer, J., Keene, J., Eisenhardt, P., Gallagher, D., Gautier,T. N., Irace, W., Lawrence, C. R., Simmons, L., Van Cleve,J. E., Jura, M., Wright, E. L., & Cruikshank, D. P. 2004,ApJS, 154, 1
Westerhout, G. 1958, Bull. Astron. Inst. Netherlands, 14, 215Williams, J. P., de Geus, E. J., & Blitz, L. 1994, ApJ, 428, 693Wu, L.-X. & Yang, J. 2005, Chinese Astronomy and Astrophysics,
29, 370Zinnecker, H. & Yorke, H. W. 2007, ARA&A, 45, 481


