Embed Size (px)
Citation preview
THE BENEFITS OF MONITORING WASTE (SHRINK) GO
WELL BEYOND REDUCING COSTS
CASE STUDY
This project was funded in part through Growing Forward 2 (GF2), a federal-provincial-territorial
initiative. The Agricultural Adaptation Council assists in the delivery of GF2 in Ontario.
1
Preface
Retailers benefit from implementing systems that increase the effectiveness and efficiency of their
operations, which, in turn, creates added value for consumers. The result: reduced waste (referred
to by retailers as “shrink”), reduced costs, increased sales and higher margins/profitability. The
ability to predict and deliver consistently high quality products enables retailers to differentiate
themselves in an increasingly competitive market, defined by unprecedented consumer demand for
freshness, convenience, taste and excitement. The revenue lost from discounting products – to sell
them at a lower price when they become blemished, but before they are of a quality that is entirely
unacceptable to consumers – can also be considered waste.
Retailing is a high volume, low margin business. Slim margins mean that retailers have to sell many
items (perhaps 10 or more) to simply break even on every item that is lost.1 Consistent, predictable
quality is therefore critical to enabling retailers and their vendors to remain profitable. As part of
the Ontario Produce Marketing Association’s (OPMA) food waste reduction initiative, Value Chain
Management International (VCMI) worked with the Apple Factory to implement monitoring and
reporting systems tailored to their needs. Daily management tools established during the project
are enabling Apple Factory to capture value by driving reductions in shrink. The same tools are also
enabling Apple Factory to identify new market opportunities and compare the effectiveness of new
merchandizing practices.
Key Finding
By using straightforward process improvement tools and publicly available online software, Apple
Factory is able to target a $32,000 reduction in annual shrink, plus associated costs, while
simultaneously improving merchandizing arrangements and sales.
1 See VCMI 2014 report for details on the rationale behind this statement
2
Apple Factory
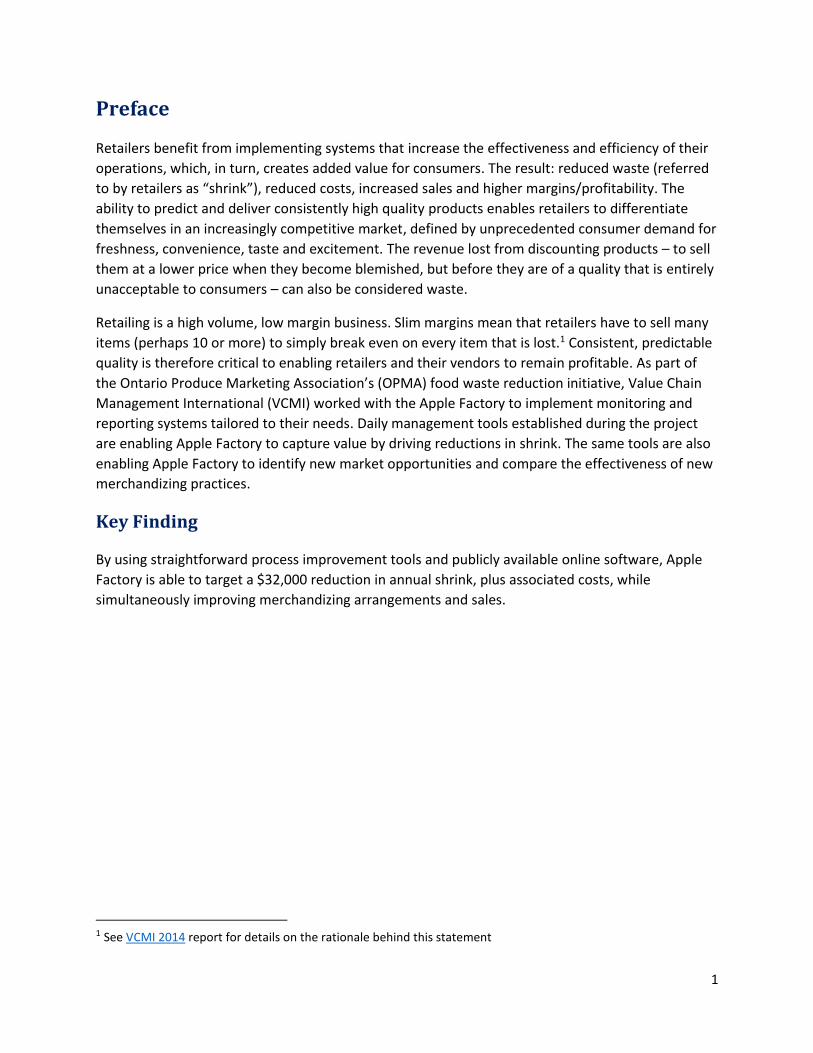
Produce is a destination department, with many consumers basing their store of choice on quality
and service at a fair price – not the lowest price. Located in Brampton, Ontario, the Apple Factory
(AF) is an independent grocery store, which engages consumers by having created an entertaining
and satisfying shopping experience for the whole family. AF’s points of differentiation include
merchandizing the highest quality produce year-round, while providing excellent customer service
for adults and a theatre for children. “The Jamboree” includes a fruit and vegetable themed puppet
band, country-style displays, home-made pies sold by the thousands, and a farm animal zoo.
The assortment of produce carried by AF and the relative popularity of certain items differs by
season.
December/January to May — foreign grown produce represents the majority of sales. Items grown offshore account for the majority of sales, particularly in perishable items (e.g. fruit).
May to August/September — soft Ontario grown produce are popular among consumers, including asparagus, berries, stone fruit, sweetcorn and new potatoes.
August/September to December/January — the season for hard and high weight/volume Ontario grown products, including apples, squash, cabbage, onions, parsnips and main crop potatoes.
The produce assortment and the format in which they are sold (including prepacked or loose, pack
size/weight, and whether priced by weight or unit) differ between seasons. The optimal location of
items within the store also differs by season. Challenges associated with particular items also differ
by season. For example, while sweetcorn is available all year, consumers are drawn to the
experience of shucking locally grown cobs of corn in summer. However, compared to prepackaged
corn, the shelf life of fresh sweetcorn is relatively short; and the succulent taste associated with
local sweetcorn begins deteriorating shortly after harvest. Costs incurred from selling local
sweetcorn (e.g. disposing of husks from the instore shucking of cobs) can be significant.
Year-round challenges include the quality of berries received from the Toronto Food Terminal. For
example, on occasion, sixty percent or more of strawberries are culled, due to poor quality – never
reaching the retail shelf. The shelf life of hardier crops, such as potatoes, can be as short as four
days, due to greening or other deterioration when not chilled.
3
The above examples illustrate why proactively managing quality and supply to minimize costs and
optimize sales is critical to success. While some produce, not of sufficient quality to sell fresh, is
used by other departments (e.g. in the production of entrees and pies, or sold frozen as kits for
making home-made preserves), there is a limit to the volume and types of fruits and vegetables that
can be diverted to alternative uses.
Current Information Systems
Retailers typically have lots of data at their disposal. However, this data may not be aligned with the
information that they need; it may be inaccurate or out of context. Too much data and information
can limit a managers’ ability to make informed decisions and monitor the impact of their decisions
on business performance. The most valuable information is produced by continuous measurable
data (CMD). CMD enables managers to control the root causes of issues impacting their business,
and implement continual improvement programs in ways that are not otherwise possible.
Knowing what to measure, along with when and how to measure, and how to report the resulting
information in a form that can be acted upon, is critical to success. Only a few key performance
indicators (KPIs) may need to be monitored closely to create valuable CMD.
Not possessing the financial or technological resources available to a larger retailer meant that AF
needed a cost-effective straightforward means of balancing supply with demand, and managing
operations. This would be achieved by tracking shrink to produce insights that would enable its root
cause(s) – whether in the store or along the supply chain – to be proactively controlled. In so doing,
the envisioned processes would form the foundation of a continual improvement program that
could be replicated across other departments and the entire store.
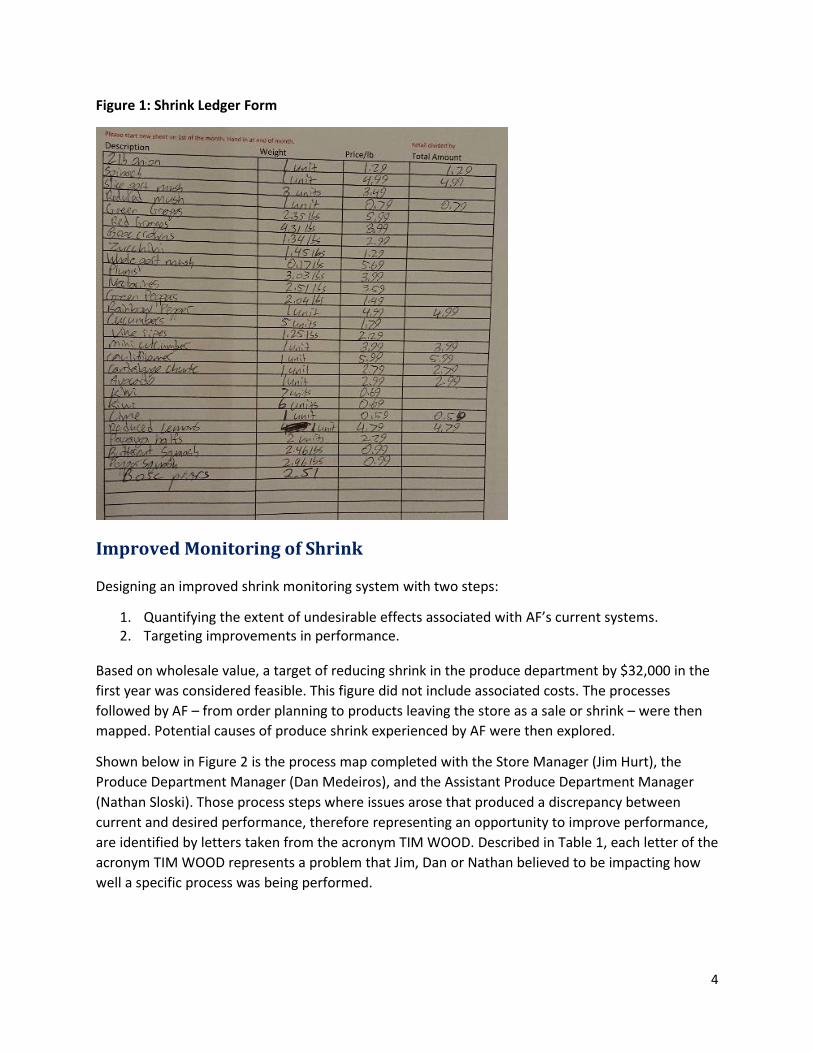
Prior to the OPMA initiative, AF’s employees tracked shrink by manually recording culled product on
a printed ledger (Figure 1). Ledgers are straightforward, though of limited value for enabling
informed management decisions. While manually recording shrink in a ledger is cheap, it has
hidden costs. Translating manual ledgers into meaningful operational and financial reports is labour
intensive – involving double or triple handling, as individual lines are transcribed into Excel or
totalled up on a calculator. Capturing the CMD required to implement a continuous improvement
initiative is essentially impossible using a ledger. Ledger-based systems are also prone to error.
4
Figure 1: Shrink Ledger Form
Improved Monitoring of Shrink
Designing an improved shrink monitoring system with two steps:
1. Quantifying the extent of undesirable effects associated with AF’s current systems. 2. Targeting improvements in performance.
Based on wholesale value, a target of reducing shrink in the produce department by $32,000 in the
first year was considered feasible. This figure did not include associated costs. The processes
followed by AF – from order planning to products leaving the store as a sale or shrink – were then
mapped. Potential causes of produce shrink experienced by AF were then explored.
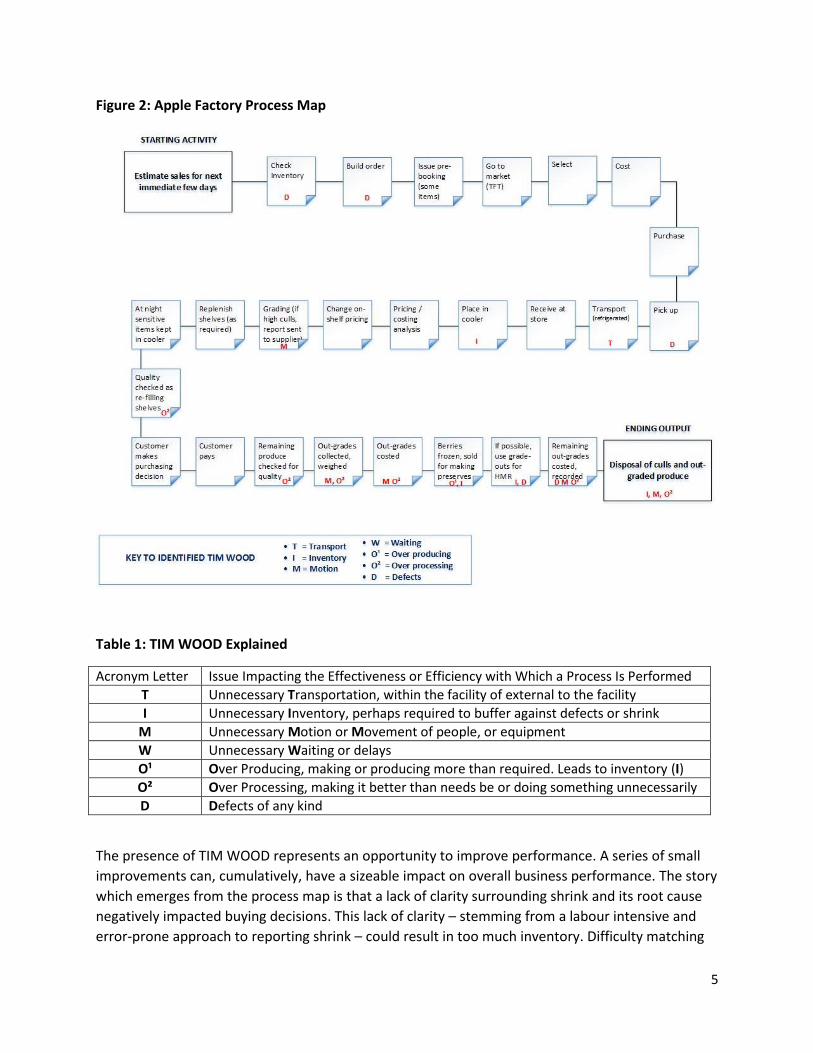
Shown below in Figure 2 is the process map completed with the Store Manager (Jim Hurt), the
Produce Department Manager (Dan Medeiros), and the Assistant Produce Department Manager
(Nathan Sloski). Those process steps where issues arose that produced a discrepancy between
current and desired performance, therefore representing an opportunity to improve performance,
are identified by letters taken from the acronym TIM WOOD. Described in Table 1, each letter of the
acronym TIM WOOD represents a problem that Jim, Dan or Nathan believed to be impacting how
well a specific process was being performed.
5
Figure 2: Apple Factory Process Map
Table 1: TIM WOOD Explained
Acronym Letter Issue Impacting the Effectiveness or Efficiency with Which a Process Is Performed
T Unnecessary Transportation, within the facility of external to the facility
I Unnecessary Inventory, perhaps required to buffer against defects or shrink
M Unnecessary Motion or Movement of people, or equipment
W Unnecessary Waiting or delays
O¹ Over Producing, making or producing more than required. Leads to inventory (I)
O² Over Processing, making it better than needs be or doing something unnecessarily
D Defects of any kind
The presence of TIM WOOD represents an opportunity to improve performance. A series of small
improvements can, cumulatively, have a sizeable impact on overall business performance. The story
which emerges from the process map is that a lack of clarity surrounding shrink and its root cause
negatively impacted buying decisions. This lack of clarity – stemming from a labour intensive and
error-prone approach to reporting shrink – could result in too much inventory. Difficulty matching
6
supply and demand increased the likelihood of products having to be graded, with culled produce
never reaching the shelf, or being stored for longer than expected — resulting in rapid deterioration
on the shelf and discounting. For highly perishable products, such as strawberries, up to 75 per cent
of what arrives at the store might never reach consumers. This level of culling creates availability
issues and reduced sales; it also creates costs that cannot be recouped.
Having identified the need for a more effective shrink reporting system, attention now moved to
identifying the information required for AF’s team to address the root causes of current
inefficiencies. This would enable a decision to be made on what information was “crucial” versus
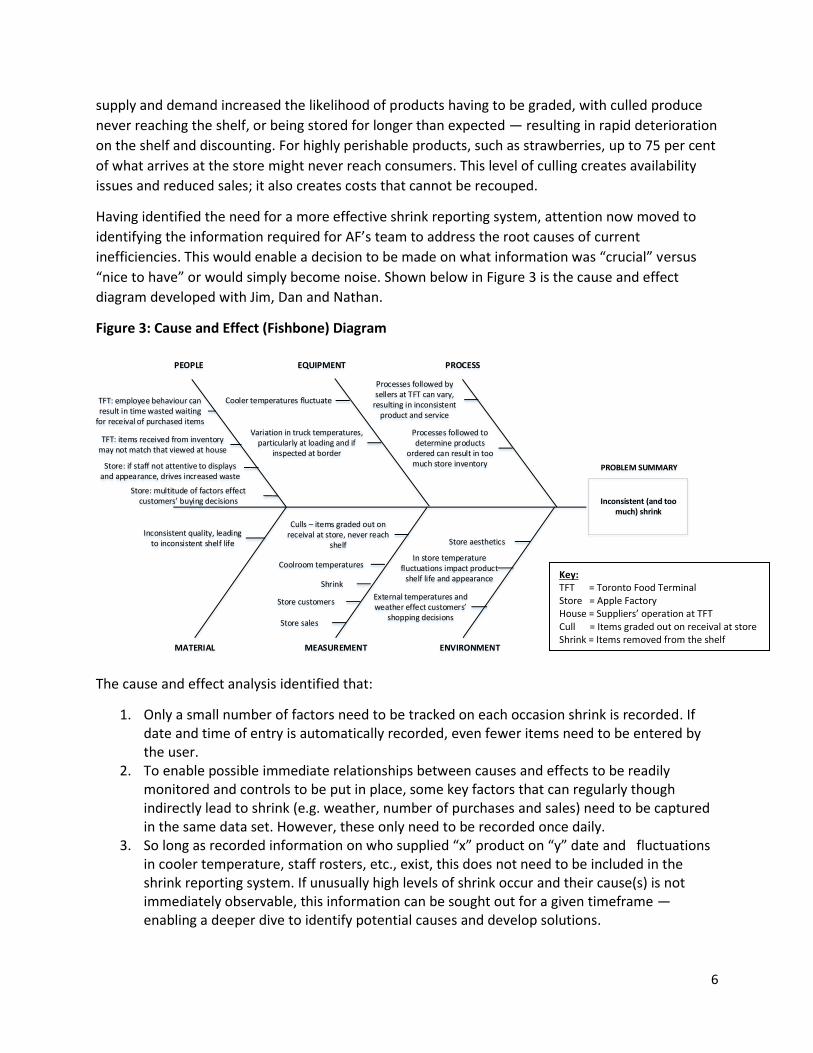
“nice to have” or would simply become noise. Shown below in Figure 3 is the cause and effect
diagram developed with Jim, Dan and Nathan.
Figure 3: Cause and Effect (Fishbone) Diagram
PEOPLE EQUIPMENT PROCESS
TFT: employee behaviour can result in time wasted waiting
for receival of purchased items
Store: if staff not attentive to displays and appearance, drives increased waste
Cooler temperatures fluctuate
Variation in truck temperatures, particularly at loading and if
inspected at border
Processes followed by sellers at TFT can vary,
resulting in inconsistent product and service
Processes followed to determine products
ordered can result in too much store inventory PROBLEM SUMMARY
Inconsistent (and too much) shrink
TFT: items received from inventory may not match that viewed at house
Store: multitude of factors effect customers’ buying decisions
MATERIAL MEASUREMENT ENVIRONMENT
Store sales
Shrink
Inconsistent quality, leading to inconsistent shelf life
External temperatures and weather effect customers’
shopping decisions
Store aesthetics
Store customers
Coolroom temperatures
Culls – items graded out on receival at store, never reach
shelf
In store temperature fluctuations impact product
shelf life and appearance
The cause and effect analysis identified that:
1. Only a small number of factors need to be tracked on each occasion shrink is recorded. If date and time of entry is automatically recorded, even fewer items need to be entered by the user.
2. To enable possible immediate relationships between causes and effects to be readily monitored and controls to be put in place, some key factors that can regularly though indirectly lead to shrink (e.g. weather, number of purchases and sales) need to be captured in the same data set. However, these only need to be recorded once daily.
3. So long as recorded information on who supplied “x” product on “y” date and fluctuations in cooler temperature, staff rosters, etc., exist, this does not need to be included in the shrink reporting system. If unusually high levels of shrink occur and their cause(s) is not immediately observable, this information can be sought out for a given timeframe — enabling a deeper dive to identify potential causes and develop solutions.
Key: TFT = Toronto Food Terminal Store = Apple Factory House = Suppliers’ operation at TFT Cull = Items graded out on receival at store Shrink = Items removed from the shelf
7
System Development
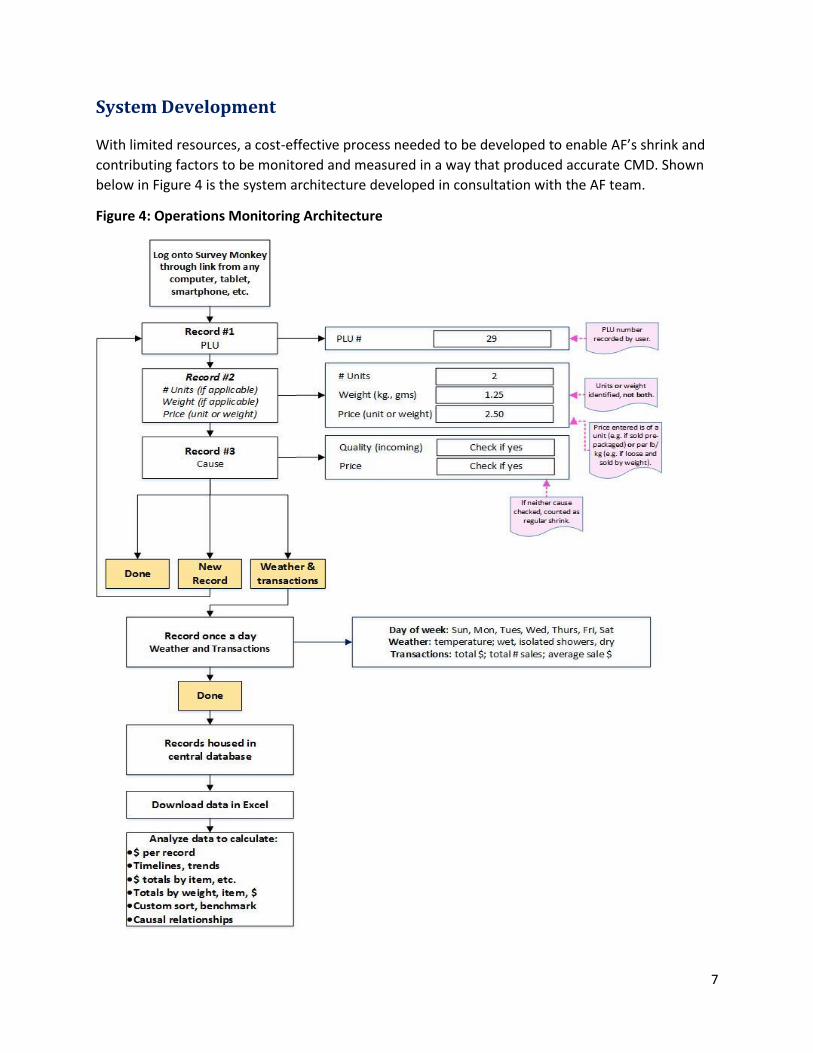
With limited resources, a cost-effective process needed to be developed to enable AF’s shrink and
contributing factors to be monitored and measured in a way that produced accurate CMD. Shown
below in Figure 4 is the system architecture developed in consultation with the AF team.
Figure 4: Operations Monitoring Architecture
8
The monitoring system enabled by the above architecture provides greater insights than the
recording of shrink and identification of causal factors in a ledger. It enables retailers to accurately
compare the effectiveness of merchandizing practices and its impact on profitability. It also enables
retailers to monitor suppliers’ performance, and accurately identify the impact of causal
relationship associated with factors relating to within and outside of the store. An example of this is
the effect that year, day of the week, pack size, price charged or weather has on the sale of Honey
Crisp versus Granny Smith apples. The long-term value of implementing an effective shrink
reporting system is therefore considerable.
To enable access by multiple users from multiple locations and departments, Survey Monkey2 was
chosen as the vehicle to implement the shrink recording system.3 Depending on the desired
functionalities, the cost of Survey Monkey ranges from free to a few hundred dollars annually. All
entries are automatically individually timed and date stamped. Records are password protected and
therefore confidential. Summaries of recorded data are available online at anytime from anywhere,
via internet connection. Additional benefits provided by Survey Monkey include that all of the data
is held in a central cloud-based database, which can be downloaded in Excel. This can be analyzed
without any manipulation required, or transferred to a more sophisticated analytical software, such
as Minitab — enabling the impact of multiple causal relationships to be compared simultaneously.
Analysis
To protect AF’s confidentiality, the results presented below include representative data. The
process of analysis and reporting is described accurately. Shown below are a selection of shrink
reports produced on three items: apples, head lettuce and romaine lettuce. Each report details the
total shrink that occurred in a given period, presented in weight (lbs) or number of units (count).
The remedial actions taken to address the root causes of shrink are then presented. These actions
include changing merchandizing mechanics, the impact of which is monitored over time, using the
shrink reporting system. The person responsible for each action’s implementation is also identified.
The final report categorizes the total number of reported shrink incidents by root cause.
The analysis of CMD produced in Excel by the shrink reporting system enables correlations to be
identified between multiple factors. The statistical occurrence of issues and their financial impact
can also be quantified. Correlations between SKUs, day of the week, time of day, where issues arise
(e.g. on receipt at store vs. on the shelf), why shrink occurred, and source (e.g. a specific house
operating at the Toronto Food Terminal vs. a local grower supplying direct) can be quantified.
2 https://www.surveymonkey.net/ 3 Alternative options include recording data directly into Excel using a central device, or online software, such as
Google Forms, Microsoft Surveys and Typeform.
9
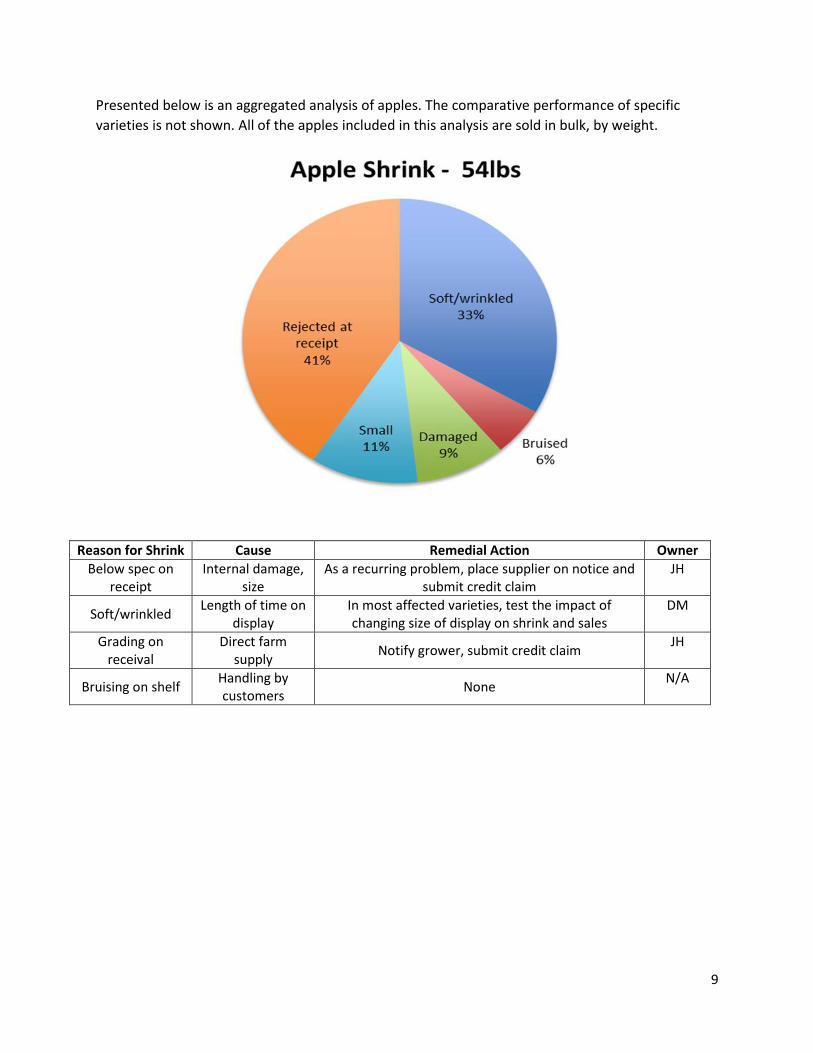
Presented below is an aggregated analysis of apples. The comparative performance of specific
varieties is not shown. All of the apples included in this analysis are sold in bulk, by weight.
Reason for Shrink Cause Remedial Action Owner
Below spec on receipt
Internal damage, size
As a recurring problem, place supplier on notice and submit credit claim
JH
Soft/wrinkled Length of time on
display In most affected varieties, test the impact of changing size of display on shrink and sales
DM
Grading on receival
Direct farm supply
Notify grower, submit credit claim JH
Bruising on shelf Handling by customers
None N/A
10
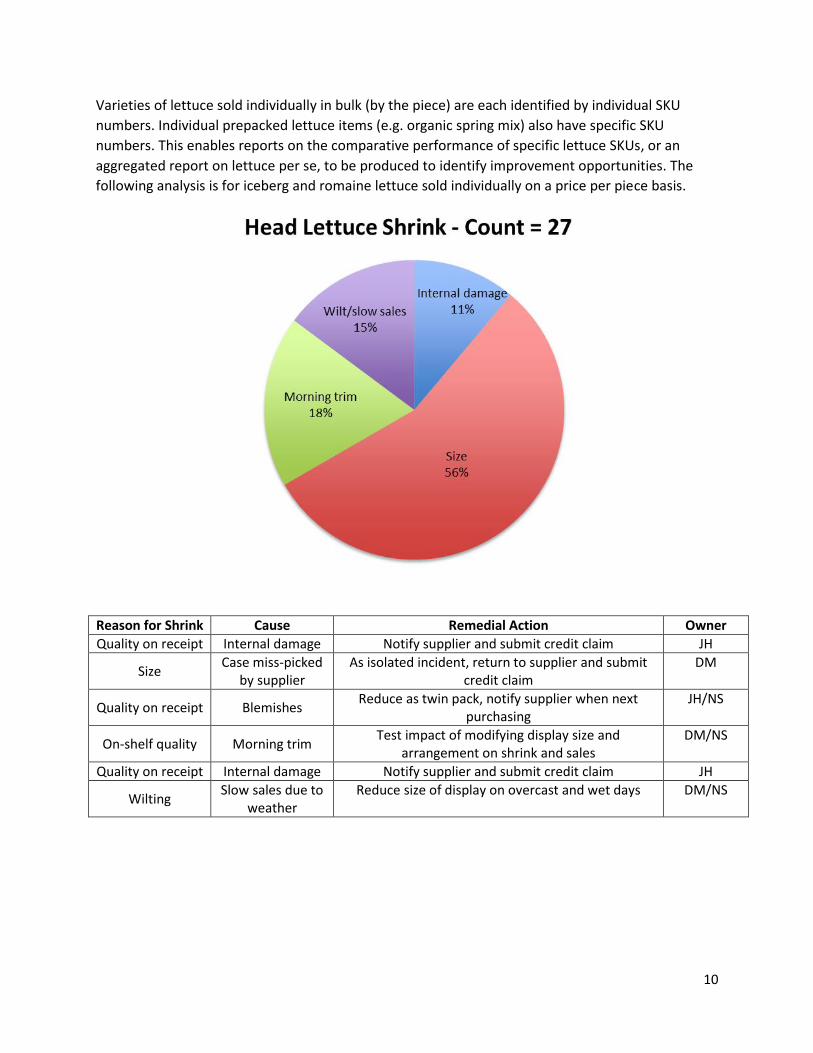
Varieties of lettuce sold individually in bulk (by the piece) are each identified by individual SKU
numbers. Individual prepacked lettuce items (e.g. organic spring mix) also have specific SKU
numbers. This enables reports on the comparative performance of specific lettuce SKUs, or an
aggregated report on lettuce per se, to be produced to identify improvement opportunities. The
following analysis is for iceberg and romaine lettuce sold individually on a price per piece basis.
Reason for Shrink Cause Remedial Action Owner
Quality on receipt Internal damage Notify supplier and submit credit claim JH
Size Case miss-picked
by supplier As isolated incident, return to supplier and submit
credit claim DM
Quality on receipt Blemishes Reduce as twin pack, notify supplier when next
purchasing JH/NS
On-shelf quality Morning trim Test impact of modifying display size and
arrangement on shrink and sales DM/NS
Quality on receipt Internal damage Notify supplier and submit credit claim JH
Wilting Slow sales due to
weather Reduce size of display on overcast and wet days DM/NS
11
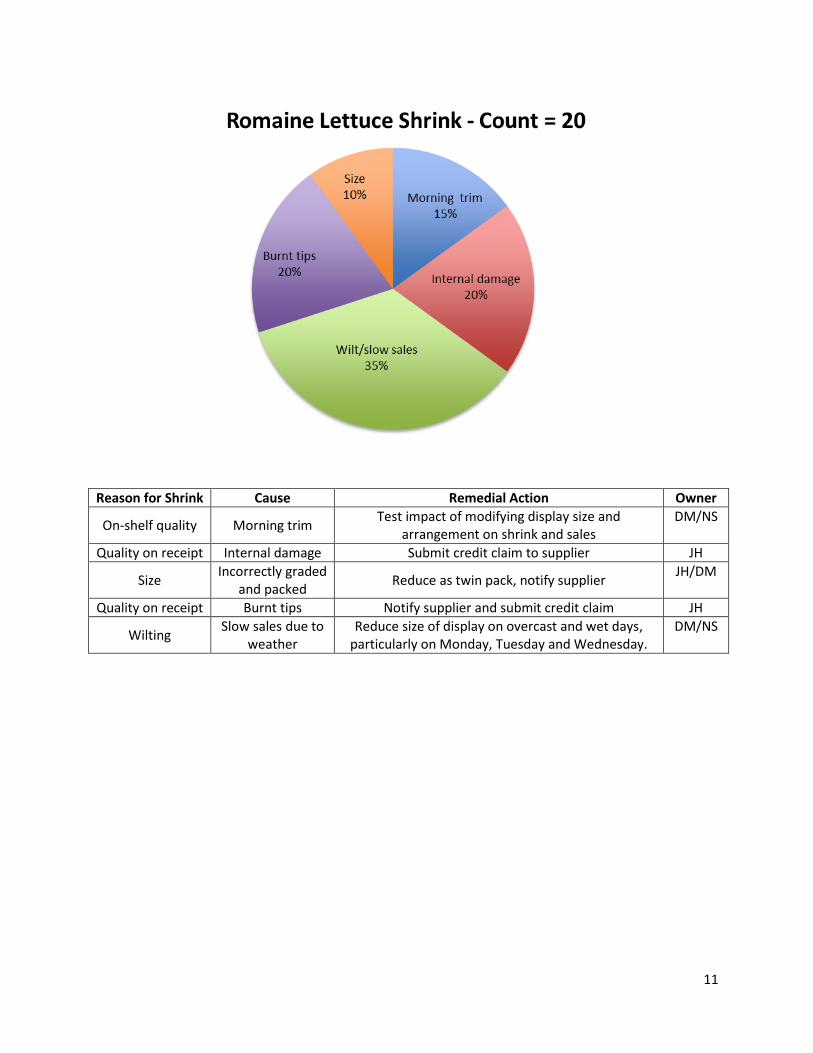
Reason for Shrink Cause Remedial Action Owner
On-shelf quality Morning trim Test impact of modifying display size and
arrangement on shrink and sales DM/NS
Quality on receipt Internal damage Submit credit claim to supplier JH
Size Incorrectly graded
and packed Reduce as twin pack, notify supplier
JH/DM
Quality on receipt Burnt tips Notify supplier and submit credit claim JH
Wilting Slow sales due to
weather Reduce size of display on overcast and wet days,
particularly on Monday, Tuesday and Wednesday. DM/NS
12
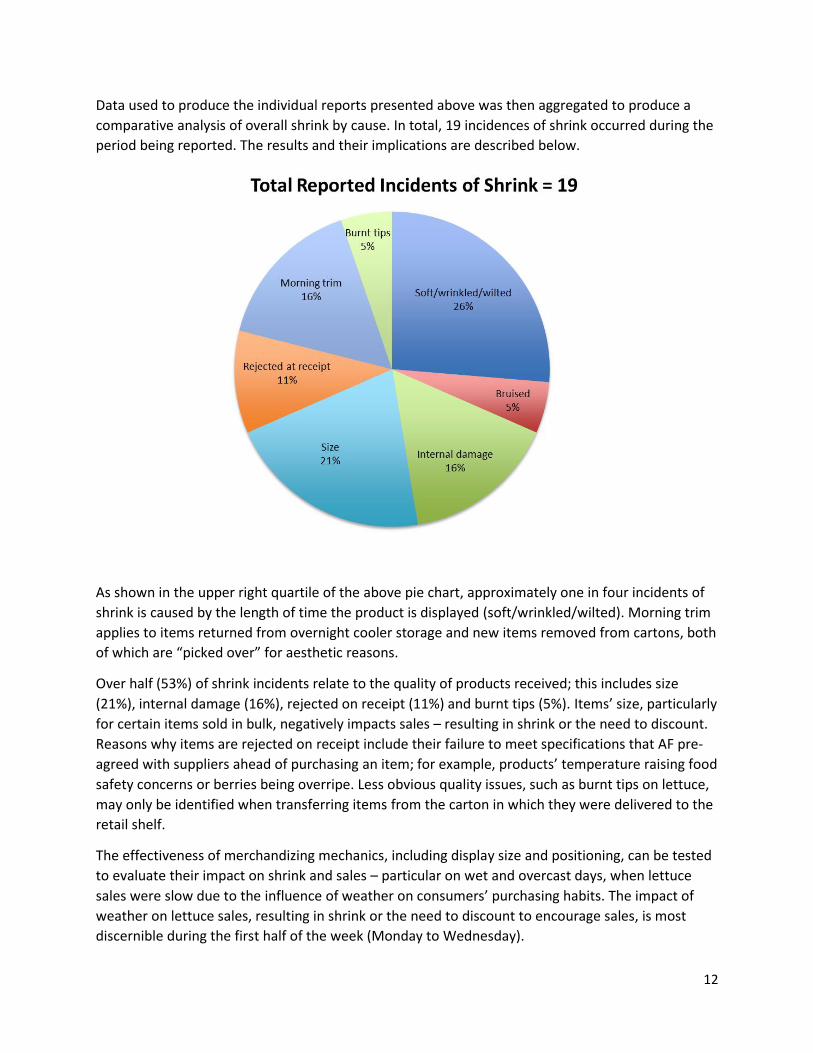
Data used to produce the individual reports presented above was then aggregated to produce a
comparative analysis of overall shrink by cause. In total, 19 incidences of shrink occurred during the
period being reported. The results and their implications are described below.
As shown in the upper right quartile of the above pie chart, approximately one in four incidents of
shrink is caused by the length of time the product is displayed (soft/wrinkled/wilted). Morning trim
applies to items returned from overnight cooler storage and new items removed from cartons, both
of which are “picked over” for aesthetic reasons.
Over half (53%) of shrink incidents relate to the quality of products received; this includes size
(21%), internal damage (16%), rejected on receipt (11%) and burnt tips (5%). Items’ size, particularly
for certain items sold in bulk, negatively impacts sales – resulting in shrink or the need to discount.
Reasons why items are rejected on receipt include their failure to meet specifications that AF pre-
agreed with suppliers ahead of purchasing an item; for example, products’ temperature raising food
safety concerns or berries being overripe. Less obvious quality issues, such as burnt tips on lettuce,
may only be identified when transferring items from the carton in which they were delivered to the
retail shelf.
The effectiveness of merchandizing mechanics, including display size and positioning, can be tested
to evaluate their impact on shrink and sales – particular on wet and overcast days, when lettuce
sales were slow due to the influence of weather on consumers’ purchasing habits. The impact of
weather on lettuce sales, resulting in shrink or the need to discount to encourage sales, is most
discernible during the first half of the week (Monday to Wednesday).
13
Conclusions
The project is enabling AF to measurably improve the efficiency and effectiveness of its reporting
systems, and is producing results that are being applied to other areas of their business. Where
appropriate, letters from the acronym TIM WOOD are listed alongside the results achieved to date:
Improving the accuracy, speed and cost of shrink monitoring practices (I, M, O², D);
Enabling the building of more accurate orders and informed buying decisions (T, I, M, D);
Identification of quick wins, along with immediate and longer-term opportunities to
improve store performance (T, I, M, W, O¹, O², D); and
Creation of IT capabilities, skills, tools and techniques that will be replicated across store
departments and categories of food.
Method of Analysis
The study began with AF’s staff participating in a food waste reduction workshop, hosted by OPMA
and conducted by VCMI at the Toronto Food Terminal. During the workshop, targeted
improvements and project scope were determined, along with the Process Map and Cause and
Effect analysis presented earlier. Subsequent visits by VCMI to AF provided greater background on
challenges and opportunities, which guided the recording system’s design and overall architecture.
Data produced by the system was analyzed as described above. Further testing of the system to
reduce shrink and increase the effectiveness of merchandizing mechanics is ongoing.
AF’s team members who participated in the study were:
Jim Hurt – Store Manager/Produce Buyer
Dan Medeiros – Produce Department Manager
Nathan Sloski – Assistant Produce Department Manager
Contact information:
Virginia Zimm, President
The Ontario Produce Marketing Association
Tel: 416-519-9390 ext 234
Email: [email protected]
Martin Gooch, Chief Executive Officer
Value Chain Management International Inc.
Tel: 416-997-7779
Email: [email protected]
October 2017