Embed Size (px)
Citation preview

THE CLUSTER ION SPECTROMETRY (CIS) EXPERIMENT
H. REME, J. M. BOSQUED, J. A. SAUVAUD, A. CROS, J. DANDOURAS,C. AOUSTIN, J. BOUYSSOU, Th. CAMUS, J. CUVILO, C. MARTZ, J. L. MEDALE,
H. PERRIER, D. ROMEFORT, J. ROUZAUD and C. d’USTONCESR, BP 4346, 31028 Toulouse Cedex 4, France
E. MOBIUS, K. CROCKER, M. GRANOFF, L. M. KISTLER and M. POPECKIUNH, Durham, U.S.A.
D. HOVESTADT, B. KLECKER, G. PASCHMANN and M. SCHOLERMPE, Garching, Germany
C. W. CARLSON, D. W. CURTIS, R. P. LIN and J. P. McFADDENSSL, Berkeley, U.S.A.
V. FORMISANO, E. AMATA, M. B. BAVASSANO-CATTANEO, P. BALDETTI,G. BELLUCI, R. BRUNO, G. CHIONCHIO and A. DI LELLIS
IFSI, Frascati, Italy
E. G. SHELLEY, A. G. GHIELMETTI and W. LENNARTSSONLockheed, Palo Alto, U.S.A.
A. KORTH and H. ROSENBAUERMPAE, Lindau, Germany
R. LUNDIN and S. OLSENSISP, Kiruna, Sweden
G. K. PARKS and M. McCARTHYU.W., Seattle, U.S.A.
H. BALSIGERBern University, Bern, Switzerland
Abstract. The Cluster Ion Spectrometry (CIS) experiment is a comprehensive ionic plasma spec-trometry package on-board the four Cluster spacecraft capable of obtaining full three-dimensionalion distributions with good time resolution (one spacecraft spin) with mass per charge compositiondetermination. The requirements to cover the scientific objectives cannot be met with a single instru-ment. The CIS package therefore consists of two different instruments, a Hot Ion Analyser (HIA) anda time-of-flight ion COmposition and DIstribution Function analyser (CODIF), plus a sophisticateddual-processor-based instrument-control and Data-Processing System (DPS), which permits extens-ive on-board data-processing. Both analysers use symmetric optics resulting in continuous, uniform,and well-characterised phase space coverage. CODIF measures the distributions of the major ions(H+, He+, He++, and O+) with energies from�0 to 40 keV/e with medium (22.5�) angular resolu-tion and two different sensitivities. HIA does not offer mass resolution but, also having two differentsensitivities, increases the dynamic range, and has an angular resolution capability (5:6� � 5:6�)adequate for ion-beam and solar-wind measurements.
Space Science Reviews 79: 303–350, 1997.c 1997 Kluwer Academic Publishers. Printed in Belgium.

304 H. REME ET AL.
1. Scientific Objectives and Experiment Capabilities
The prime scientific objective of CIS is the study of the dynamics of magnetisedplasma structures in the vicinity of the Earth’s magnetosphere, with emphasis on thephysics of the Earth’s bow shock, the magnetopause boundary, the polar cusp, thegeomagnetic tail and the plasma sheet. Past experience has demonstrated that thestudy of the macrophysics and microphysics requires that the local orientation andthe state of motion of the plasma structures be determined as accurately as possible.The four Cluster spacecraft with relative separation distances that can be adjustedto spatial scales of the structures (a few hundred kilometers to several thousandkilometers) give for the first time the unambiguous possibility to distinguish spatialfrom temporal variations. These scientific objectives require the investigation ofmany different phenomena, including solar-wind/magnetopause interactions, sub-storms and auroras, reconnection, generation of field-aligned currents, polar cuspsand upstream foreshock dynamics.
The Cluster spacecraft will encounter ionic plasma of vastly diverse character-istics in the course of one year (Figure 1). A highly versatile and reliable ionicplasma experiment is therefore needed.
The variety of conditions encountered in the various magnetospheric regionssets a number of requirements in order to provide scientifically valuable productseverywhere.
(1) A great dynamic range is necessary in order to detect fluxes as low as thoseof the lobes, but also those as high as solar-wind fluxes, throughout the solar cycle.
(2) Hot populations are present in vast regions of the magnetosphere and ofthe magneto-sheath. In order to provide a satisfactory and uniform coverage of thephase space with sufficient resolution, a broad energy range and a full 4� angularcoverage are necessary. The angular resolution should be sufficient to be able toseparate multiple populations, such as gyrating or transmitted ions from the mainpopulation downstream of the bow shock, and to be able to detect fine structuresin the distributions.
(3) Cold beams, such as the solar wind, require a high angular and energyresolution in a limited energy and angular range. Because of the limited energyrange required, a beam tracking algorithm should be implemented in order to beable to follow the beam in velocity space. Moreover, for example in the foreshockregions, any study of backstreaming ions requires the simultaneous observation ofthe solar-wind cold beam and of the backstreaming particles. Therefore, togetherwith the solar-wind coverage described above, a coverage of the entire phase spaceexcepting the sunward sector, with broad energy range, is also required.
(4) In the case of sharp boundaries, such as discontinuities or boundary cross-ings, it is necessary not to miss any information at the discontinuity, thus a veryefficient means of mode change, which allows adaptation to the local plasma con-ditions, should be provided.

THE CLUSTER ION SPECTROMETRY (CIS) EXPERIMENT 305
Figure 1. Representative ion differential directional energy fluxes to be encountered in the solar wind(SW), the magnetopause (MP), the magnetosheath (MSH), the plasma mantle (PM), the magneto-sphere (MSPH), the plasma sheet (PS), the lobe and upwelling ions (UPW). The range studied by thelow sensitivity of HIA is limited by - � - � - � - � - � - � - � - � -, the range of the high sensitivity of HIAby - - - - - - - - - - - - - - - - - - - - - - -, the range of low sensitivity of CODIF by full lines, and the range ofhigh sensitivity of CODIF by - �� - �� - �� - �� - �� - �� - �� - ��.
(5) Moments of the whole three-dimensional (3D) distribution (and of the sun-ward sector, in solar-wind mode) should be computed on-board , with high time

306 H. REME ET AL.
resolution, to continuously generate key parameters, necessary for event identific-ation.
(6) To study detailed phenomena of magnetospheric plasma physics all theparticle populations must be identified and characterized, therefore a 3D distributionis needed. In order to transmit the full 3D distribution, while overcoming thetelemetry rate limitations, a compression algorithm must be introduced, whichallows an increased amount of information to be transmitted.
So, to meet the scientific objectives, the CIS instrumentation has been designedto satisfy the following criteria, simultaneously on the 4 spacecraft:
– Provide uniform coverage for ions over the entire 4� steradian solid anglewith good angular resolution.
– Separate the major mass ion species, i.e., those which contribute significantlyto the total mass density of the plasma (generally H+, He++, He+, and O+).
– Have high sensitivity and large dynamic range (� 107) to support high-time-resolution measurements over the wide range of plasma conditions to beencountered in the Cluster mission (Figure 1).
– Have high (5:6� � 5:6�) and flexible angular sampling resolution to supportmeasurements of ion beams and solar wind.
– Have the ability to routinely generate on-board the fundamental plasmaparameters for major ion species and with one spacecraft spin time resolution (4 s).These parameters include the density (n), velocity vector (V), pressure tensor (P),and heat flux vector (H).
– Cover a wide range of energies, from spacecraft potential to 40 keV e�1.– Have versatile and easily programmable operating modes and data-processing
routines to optimize the data collection for specific scientific studies and widelyvarying plasma regimes.
– Rely as much as possible on well-proven sensor designs flown successfullyon the AMPTE and Giotto missions.
To satisfy all these criteria, the CIS package consists of two different instru-ments: a Hot Ion Analyser (HIA) sensor and a time-of-flight ion COmposition andDIstribution Function (CODIF) sensor.
The CIS plasma package is versatile and is capable of measuring both thecold and hot ions of Maxwellian and non-Maxwellian populations (for example,beams) from the solar wind, the magnetosheath, and the magnetosphere (includingthe ionosphere) with sufficient angular, energy and mass resolutions to meet thescientific objectives. The time resolution of the instrument is sufficiently high tofollow density or flux oscillations at the gyrofrequency of H+ ions in a magneticfield of 10 nT or less. Such field strengths will be frequently encountered by theCluster mission. Oscillations of O+ at the gyrofrequency can be resolved outside 6–7 RE . So this instrument package will provide all of the ionic plasma data requiredto meet the Cluster science objectives (Escoubet and Schmidt, 1997).
Cluster has been conceived as a global instrument which allows, using fourspacecraft, vorticity, gradients, divergences, ... to be determined and thus enables

THE CLUSTER ION SPECTROMETRY (CIS) EXPERIMENT 307
macroscopic quantities, for example the electric current from the Curl-B to bemeasured. Electric currents perpendicular to the magnetic field can also beendetermined from the pressure gradient of particles. In the simplest case of anideal magneto-hydromagnetic equilibrium, the perpendicular current density canbe written J? = (B �rP )=B2. More details about therP method accuracy canbe found in Martz (1993) and in Martz and Sauvaud (1995). For a satellite distancewhich is small compared to the current filament transverse dimensions, the rPmethod gives good results. The Curl-B method can give less accurate results dueto errors on the magnetic field and the satellite separation. On the contrary fora satellite distance which is comparable to the current filament dimensions, themathematical error introduced by the non-linear variations of the pressure drivesan error which becomes very large when a satellite is located outside the currentfilament. The Curl-B method is free of this latter error. Thus the Curl-B methodand the pressure-gradient methods are complementary for estimating the electriccurrents.
With its capability to provide three-dimensional distribution functions simul-taneously for several major species with high time resolution, the CIS instrumentwill make substantial contributions to the study of the solar-wind magnetosphereinteraction, the dynamics of the magnetosphere, the physics of the magnetopauseboundary, the polar cusp and the plasma sheet boundary layer, the upstream fore-shock and solar-wind dynamics, the magnetic reconnection and the field-alignedcurrent phenomena. For example an important contribution will be made to theunderstanding of the formation of the bow shock and its role in the heating andacceleration of incoming ion populations, to take just an example.
At the quasi-perpendicular bow shock the specular reflection of ions, theirsubsequent energy gain in the upstream Vsw � B convection electric field, andtheir final escape into the downstream region, are known to be important in thedissipation of energy at the shock. The scale length on which the scattering of theoriginal ring distribution and the final thermalisation occurs can at best be guessed(Sckopke et al., 1990). With separation distances from a few 100 km to a few1000 km the vital scales of several ion gyro radii can be covered with the spacecraftconfiguration. In addition, CIS will provide the ion distribution functions separatelyfor all major species with a time resolution of one spacecraft spin. Therefore, it willbe possible to study the behaviour of He++ at the shock. Because of their higherenergy all He++ ions penetrate the shock. Their bulk velocity is larger than that ofthe protons, and the entire He++ population therefore gyrates in the downstreamregion. This difference is particularly important. Although the He++ ions make uponly � 6% of the solar wind density, their contribution to the heating downstreamof the shock must be comparable to that of the few percent of protons which arereflected and then start to gyrate. Finally, He+ pick-up ions of interstellar origin inthe solar wind (Mobius et al., 1985, 1988; Gloeckler et al., 1993) present anotherimportant source for ion reflection and downstream heating and thermalization.Because pick-up ions fill a sphere in velocity space with a radius equal to the solar

308 H. REME ET AL.
wind speed, centred around the solar wind, ions will interact differently with theshock depending on their origin in velocity space. CIS will provide the resolutionto determine the original pick-up distribution and the fate of the reflected ions.
The quasi-parallel bow shock is known to be the source of a diffuse energetic ionpopulation and low-frequency waves. The recent success with hybrid simulationshas demonstrated that the energetic ion and wave activity are necessary ingredientsof the shock formation which itself is a high dynamic (or even quasi-cyclic) process(e.g., Quest, 1988; Burgess, 1989; Scholer and Terasawa, 1990). This simulationwork has paved the way for a combined in-depth study of the evolution of the iondistributions across the shock and their temporal variation with the CIS instrument.As has been shown in a modelling with simulated spacecraft (Giacalone et al.,1994), a close collaboration between the data analysis and simulations will beneeded for this task. It can also be expected that the association of ion densityenhancements with magnetic pulses upstream of the shock can be identified withCIS and the multi-spacecraft capabilities (Scholer, 1995) as opposed to statisticalstudies which only yield an average spatial distribution (Trattner et al., 1994). Thesenew measurements will significantly further our understanding of the wave-particleinteractions at the bow shock and their importance for ion acceleration and shockstructure.
2. The Hot Ion Analyser (HIA)
The Hot Ion Analyser (HIA) instrument combines the selection of incoming ionsaccording to the ion energy per charge ratio by electrostatic deflection in a symmet-rical quadrispherical analyser which has a uniform angle-energy response with a fastimaging particle detection system. This particle imaging is based on microchannelplate (MCP) electron multipliers and position encoding discrete anodes.
2.1. ELECTROSTATIC ANALYSER DESCRIPTION
Basically the analyser design is a symmetrical quadrispherical electrostatic analyserwhich has a uniform 360� disc-shaped field of view (FOV) and extremely narrowangular resolution capability. This symmetric quadrisphere or ‘top hat’ geometry(Carlson et al., 1982) has been successfully used on numerous sounding rocketflights as well as on the AMPTE/IRM, Giotto and WIND spacecraft (Paschmannet al., 1985; Reme et al., 1987; Lin et al., 1995).
The operating principles of the analyser are illustrated by cross-section and topviews in Figure 2. The symmetric quadrisphere consists of three concentric spher-ical elements. These three elements are an inner hemisphere, an outer hemispherewhich contains a circular opening, and a small circular top cap which defines theentrance aperture. This analyser is classified as quadrispherical simply because theparticles are deflected through 90�. In either analyser a potential is applied between

THE CLUSTER ION SPECTROMETRY (CIS) EXPERIMENT 309
Figure 2. Particle orbits in a normal quadrisphere and in a symmetrical quadrisphere.
the inner and outer plates and only charged particles with a limited range of energyand initial azimuth angle are transmitted. The particle exit position is a measureof the incident polar angle which can be resolved by a suitable position-sensitivedetector system. The symmetric quadrisphere makes the entire analyser, includingthe entrance aperture, rotationally symmetric. Trajectories are shown to illustrate

310 H. REME ET AL.
Figure 3. Principle of the HIA electrostatic analyser.
the focusing characteristics which are independent of polar angle. Throughout thepaper we will use the following convention: the angle about the spin axis is theazimuth angle whereas the angle out of the spin plane is called polar angle.
In conclusion the symmetrical quadrispherical analyser has good focusing prop-erties, sufficient energy resolution, and the large geometrical factor of a quadri-sphere. Because of symmetry, it does not have the deficiencies of the conventionalquadrisphere, namely limited polar angle range and severely distorted responsecharacteristics at large polar angles, and it has an uniform polar response.
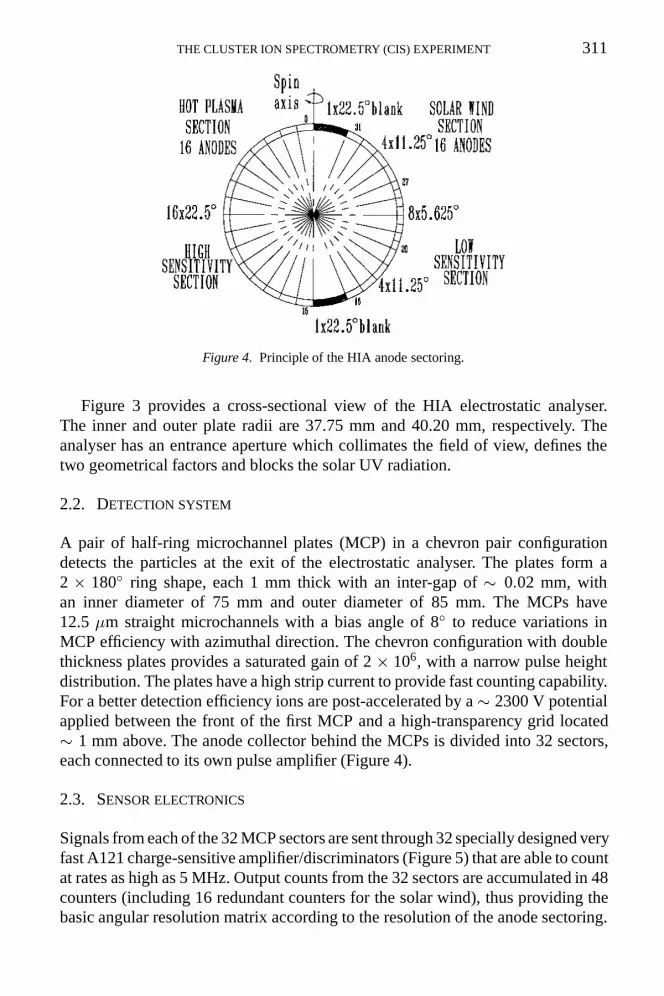
The HIA instrument has 2 � 180� FOV sections parallel to the spin axis withtwo different sensitivities, with a ratio 20–30 (depending of the flight model andprecisely known from calibrations), corresponding respectively to the ‘high G’and ‘low g’ sections. The ‘low g’ section allows detection of the solar wind andthe required high angular resolution is achieved through the use of 8 � 5:625�
central anodes, the remaining 8 sectors having in principle 11.25� resolution; the180� ‘high G’ section is divided into 16 anodes, 11.25� each. In reality, sectoringangles are respectively � 5:1� and � 9:7�, as demonstrated by calibrations (seeSection 2.5). This configuration provides ‘instantaneous’ 2D distributions sampledonce per 62.5 ms ( 1
64 of one spin, i.e., 5.625� in azimuth, which is the nominalsweep rate of the high voltage applied to the inner plate of the electrostatic analyserto select the energy of the transmitted particles. For each sensitivity section a full4� steradian scan is completed every spin of the spacecraft, i.e., 4 s, giving a full3D distribution of ions in the energy range� 5 eV e�1 to 32 keV e�1 (the analyserconstant being � 6:70).
THE CLUSTER ION SPECTROMETRY (CIS) EXPERIMENT 311
Figure 4. Principle of the HIA anode sectoring.
Figure 3 provides a cross-sectional view of the HIA electrostatic analyser.The inner and outer plate radii are 37.75 mm and 40.20 mm, respectively. Theanalyser has an entrance aperture which collimates the field of view, defines thetwo geometrical factors and blocks the solar UV radiation.
2.2. DETECTION SYSTEM
A pair of half-ring microchannel plates (MCP) in a chevron pair configurationdetects the particles at the exit of the electrostatic analyser. The plates form a2 � 180� ring shape, each 1 mm thick with an inter-gap of � 0:02 mm, withan inner diameter of 75 mm and outer diameter of 85 mm. The MCPs have12.5 �m straight microchannels with a bias angle of 8� to reduce variations inMCP efficiency with azimuthal direction. The chevron configuration with doublethickness plates provides a saturated gain of 2 � 106, with a narrow pulse heightdistribution. The plates have a high strip current to provide fast counting capability.For a better detection efficiency ions are post-accelerated by a � 2300 V potentialapplied between the front of the first MCP and a high-transparency grid located� 1 mm above. The anode collector behind the MCPs is divided into 32 sectors,each connected to its own pulse amplifier (Figure 4).
2.3. SENSOR ELECTRONICS
Signals from each of the 32 MCP sectors are sent through 32 specially designed veryfast A121 charge-sensitive amplifier/discriminators (Figure 5) that are able to countat rates as high as 5 MHz. Output counts from the 32 sectors are accumulated in 48counters (including 16 redundant counters for the solar wind), thus providing thebasic angular resolution matrix according to the resolution of the anode sectoring.
312 H. REME ET AL.
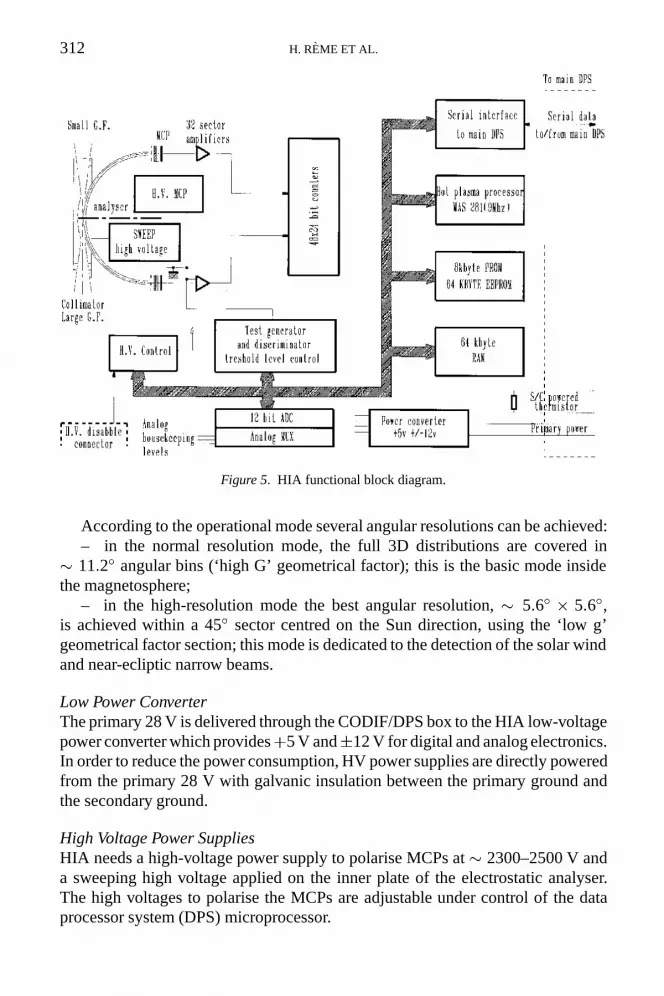
Figure 5. HIA functional block diagram.
According to the operational mode several angular resolutions can be achieved:– in the normal resolution mode, the full 3D distributions are covered in
� 11:2� angular bins (‘high G’ geometrical factor); this is the basic mode insidethe magnetosphere;
– in the high-resolution mode the best angular resolution, � 5:6� � 5:6�,is achieved within a 45� sector centred on the Sun direction, using the ‘low g’geometrical factor section; this mode is dedicated to the detection of the solar windand near-ecliptic narrow beams.
Low Power ConverterThe primary 28 V is delivered through the CODIF/DPS box to the HIA low-voltagepower converter which provides+5 V and�12 V for digital and analog electronics.In order to reduce the power consumption, HV power supplies are directly poweredfrom the primary 28 V with galvanic insulation between the primary ground andthe secondary ground.
High Voltage Power SuppliesHIA needs a high-voltage power supply to polarise MCPs at � 2300–2500 V anda sweeping high voltage applied on the inner plate of the electrostatic analyser.The high voltages to polarise the MCPs are adjustable under control of the dataprocessor system (DPS) microprocessor.

THE CLUSTER ION SPECTROMETRY (CIS) EXPERIMENT 313
The energy/charge of the transmitted ions is selected by varying the deflectionvoltage applied to the inner plate of the electrostatic analyser, between 4800 and0.7 V. The exponential sweep variation of the deflection voltage is synchronisedwith the spacecraft spin period. The sweep should consist of many small steps thatgive effectively a continuous sweep. The counter accumulation time defines thenumber of energy steps, i.e., 31 or 62 count intervals per sweep. The covered energyrange and the sweeping time are controlled by the onboard processor through a12-bit DAC and a division in two ranges for the sweeping high voltage. So thenumber of sweeps per spin, the amplitude of each sweep and the sweeping energyrange can be adjusted according to the mode of operation (solar wind tracking,beam tracking, etc.). In the basic and nominal mode the sweep of the total energyrange is repeated 64 times per spin, i.e., once every 62.5 ms, giving a � 5:6�
resolution in azimuth resolution.The HIA block diagram is shown in Figure 5.
2.4. IN-FLIGHT CALIBRATION TEST
A pulse generator can stimulate the 32 amplifiers under processor control. Thisway all important functions of the HIA instrument and of the associated on-boardprocessing can easily be tested. A special test mode is implemented for healthchecking of the microprocessor by making ROM checksums and RAM tests. Thesweeping high voltage can be tested by measuring the voltage value of each indi-vidual step and the MCP gain can be checked by occasionally stepping MCP HVand by adjusting the discrimination level of charge amplifiers.
Performances of the HIA sensor are shown in Table I and in Figure 1. The fullsensor is shown in Figure 6.
2.5. HIA PERFORMANCES
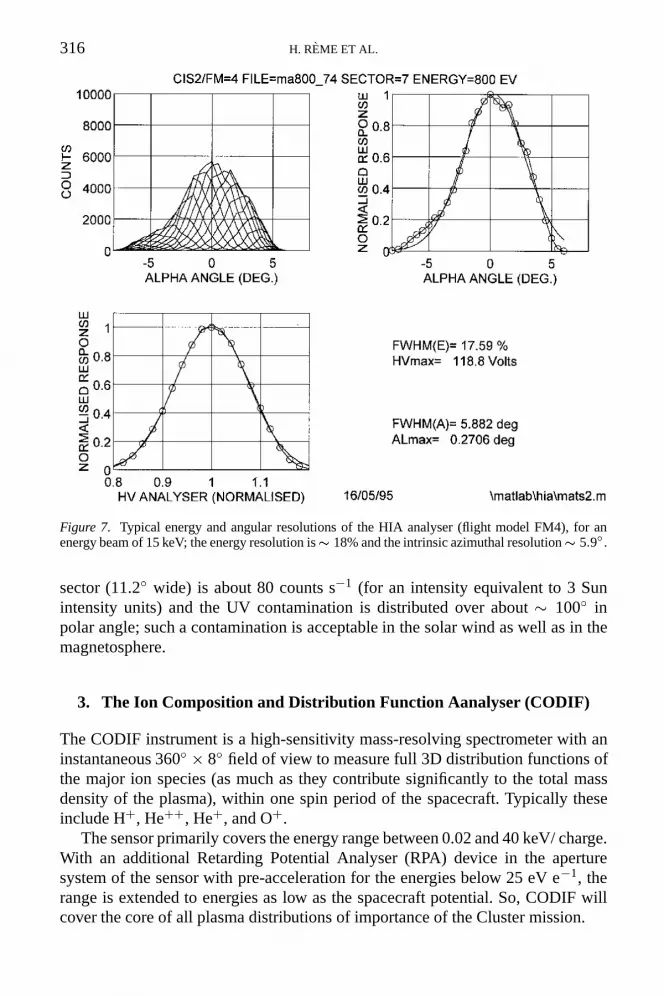
Pre-flight and extensive calibrations of all four HIA flight models were performedat the CESR vacuum test facilities in Toulouse, using large and stable ion beamsof different ion species and variable energies, detailed studies of MCPs and gainlevel variations, MCP matching, angular-energy resolution for each sector froma few tens of eV up to 30 keV. Typical performances of the HIA instrument arereproduced in Figure 7. The analyser energy resolution�E=E (FWHM) is�18%,almost independent of anode sectors and energy; thus the intrinsic HIA velocityresolution is �9%, only about half of the average solar wind spread value. This isequivalent to an angular resolution of � 5� and is thus quite consistent with theangular resolution capabilities of the instrument, i.e.,� 5:9� (FWHM) in azimuthalangle, as indicated in Figure 7, and � 5:6� in polar angle. The polar resolutionstays, as expected, almost constant, � 9:70�, over the 16 sectors (anodes 0 to 15)constituting the ‘high G’ section (Figure 8). Anodes 16 to 31 correspond to the‘low g’ section and their response transmission is attenuated by a factor of 20–30

314H
.RE
ME
ET
AL
.Table I
Main-measured parameters

316 H. REME ET AL.
Figure 7. Typical energy and angular resolutions of the HIA analyser (flight model FM4), for anenergy beam of 15 keV; the energy resolution is� 18% and the intrinsic azimuthal resolution� 5:9�.
sector (11.2� wide) is about 80 counts s�1 (for an intensity equivalent to 3 Sunintensity units) and the UV contamination is distributed over about � 100� inpolar angle; such a contamination is acceptable in the solar wind as well as in themagnetosphere.
3. The Ion Composition and Distribution Function Aanalyser (CODIF)
The CODIF instrument is a high-sensitivity mass-resolving spectrometer with aninstantaneous 360� � 8� field of view to measure full 3D distribution functions ofthe major ion species (as much as they contribute significantly to the total massdensity of the plasma), within one spin period of the spacecraft. Typically theseinclude H+, He++, He+, and O+.
The sensor primarily covers the energy range between 0.02 and 40 keV/ charge.With an additional Retarding Potential Analyser (RPA) device in the aperturesystem of the sensor with pre-acceleration for the energies below 25 eV e�1, therange is extended to energies as low as the spacecraft potential. So, CODIF willcover the core of all plasma distributions of importance of the Cluster mission.

THE CLUSTER ION SPECTROMETRY (CIS) EXPERIMENT 317
Figure 8. Calibrated relative transmission of the HIA polar sectors (beta angle in the vacuumchamber). Sectors 0–15 have � 9:7� (FHWM) angular resolution; transmission of sectors 16–31 isattenuated by a factor of� 25 and equatorial sectors 20–27 have� 5:1� (FWHM) angular resolution.0–180� axis corresponds to the spacecraft spin axis.
Figure 9. Azimuthal distribution of the solar UV count rate for each sector; the UV source is centeredon sector 7 and the polar angle is�5� (when the UV sunlight hits the inner hemisphere). L� intensitymeasured by a windowless Au photodiode is equivalent to �3 Sun units.
To cover the large dynamic range required for accurate measurements in thelow-density plasma of the magnetotail on the one hand and the dense plasma inthe magnetosheath/cusp/boundary layer on the other, it is mandatory that CODIF

318 H. REME ET AL.
employs two different sensitivities. The minimum number of counts in a distributionneeded for computing the basic plasma parameters, such as the density, is about100. These must be accumulated in 1 spin to provide the necessary time resolution.However, the maximum count rate which the time-of-flight system can handleis � 105 counts s�1 or 4 � 105 counts spin�1. This means the dynamic rangeachievable with a single sensitivity is only 4� 103.
Figure 1 shows the covered fluxes ranging from magnetosheath/magnetopauseprotons to tail lobe ions (which consist of protons and heavier ions); fluxes from� 103 to over 108 must be covered, requiring a dynamic range of larger than 105.This can only be achieved if CODIF incorporates two sensitivities, differing by afactor of 100. CODIF therefore will consist of two sections, each with 180� field ofview, with different (by a factor of 100) geometrical factors. This way one sectionwill always have count rates which are statistically meaningful and at the sametime can be handled by the time-of-flight electronics. The exception is solar windH+ which will often saturate the instrument, but will be measured with HIA.
The CODIF instrument combines ion energy per charge selection by deflectionin a rotationally symmetric toroidal electrostatic analyser with a subsequent time-of-flight analysis after post-acceleration to �20 keV e�1. A cross section of thesensor showing the basic principles of operations is presented in Figure 10.
The energy-per-charge analyser is of a rotationally symmetric toroidal type,which is basically similar to the quadrispheric top-hat analysers. It has an uniformresponse over 360� of polar angle. The energy per charge selected by the electrostat-ic analyserE=Q, the energy gained by post-acceleration eUACC , and the measuredtime-of-flight through the lengthd of the time-of-flight (TOF) unit, � , yield the massper charge of the ion M=Q according to M=Q = 2(E=Q+ eUACC)=(d=�)
2�. Thequantity� represents the effect of energy loss in the thin carbon foil (� 3 �g cm�2)at the entry of the TOF section and depends on particle species and incident energy.
3.1. ELECTROSTATIC ANALYSER DESCRIPTION
The electrostatic analyser (ESA) has a toroidal geometry which provides optimalimaging just past the ESA exit. This property was first demonstrated by Young et al.(1988). The ESA consists of inner and outer analyser deflectors, a top-hat cover anda collimator. The inner deflector consists of toroidal and spherical sections whichjoin at the outer deflector entrance opening (angle of 17.9�). The spherical sectionhas a radius of 100 mm and extends from 0 to 17.9� about the z-axis. The toroidalsection has a radius of 61 mm in the poloidal plane and extends from 17.9� to 90�.The outer deflector covers the toroidal section and has a radius of 65 mm. The top-hat cover consists of a spherical section with a radius of 113.2 mm, which extendsfrom 0 to 16.2�. It thus fits inside the entrance aperture of the outer deflector. Thetop-hat cover contains an O-ring outside the spherical section, which together witha lip on the outer deflector provides a seal of the sensor interior during integrationand launch activities when the protection retractable cover will be closed. The outer

THE CLUSTER ION SPECTROMETRY (CIS) EXPERIMENT 319
Figure 10. Cross-sectional view of the CODIF sensor. The voltages in the TOF section are shownfor a 25 kV post-acceleration.
deflector and the top-hat cover will be at signal ground under normal operation,but will be biased at about�100 V during RPA operation. The inner deflector willbe biased with voltages varying from �1.9 to �4950 V to cover the energy rangein normal ESA operation and set to about�113 V for the RPA.
The fact that the analyser has complete cylindrical symmetry provides theuniform response in polar angle. A beam of parallel ion trajectories is focused toa certain location at the exit plane of the analyser. The exit position, and thus theincident polar angle of the ions, is identified using the information from the startdetector (see Section 3.2) . The full angular range of the analyser is divided into16 channels of 22.5� each. The broadening of the focus at the entrance of the TOFsection is small compared to the width of the angular channels.
As illustrated in Figure 10, the analyser is surrounded by a cylindrical collimatorwhich serves to define the acceptance angles and restricts UV light. The collimatorconsists of a cylindrical can with an inner radius of 96 mm. The entrance is covered
320 H. REME ET AL.
by an attenuation grid with a radius of 98 mm which is kept at spacecraft ground.The grid has a 1% transmission factor over 50% of the analyser entrance and>95%transmission over the remaining 50%. The high transmission portion extends overthe azimuthal angle range of 0 to 180� where 0� is defined along the spacecraftspin axis. The low transmission portion, whose active entrance only extends from22.5� to 157.5� in order to avoid the counting of any crossover from the otherhalf, has a geometric factor that is reduced by a factor of ' 100 in order to extendthe dynamic range to higher flux levels. On the low-sensitivity half, the collimatorconsists of a series of 12 small holes vertically spaced by approximately 1.9�
around the cylinder. These apertures have acceptance angles of 5� FWHM, sothere are no gaps in the polar angle coverage. The ion distributions near the polaraxis are highly over-sampled during one spin relative to the equatorial portionof the aperture. Therefore, count rates must be weighted by the sine of the polarangle to normalise the solid-angle sampling for the moment calculations and 3Ddistributions.
The analyser has a characteristic energy response of about 7.6, and an intrinsicenergy resolution of �E=E ' 0:16. The entrance fan covers a viewing angle of360� in polar angle and 8� in azimuth. With an analyser voltage of 1.9–4950 V,the energy range for ions is 15–40 000 eV e�1. The deflection voltage is varied inan exponential sweep. The full energy sweep with 30 contiguous energy channelsis performed 32 times per spin. Thus a partial two-dimensional cut through thedistribution function in polar angle is obtained every 1
32 of the spacecraft spin. Thefull 4� ion distributions are obtained in a spacecraft spin period. Including theeffects of grid transparencies and support posts in the collimator each 22.5� sectorhas a respective geometric factor A�E=E���=8 = 2:16 � 10�3 cm2sr in thehigh sensitivity side and 2:3� 10�5 cm2sr where A denotes the aperture area and�� the acceptance angle in azimuth. The acceptance in polar angle is �=8. Thedetection efficiencies of the time-of-flight system vary with particle energy, speciesand individual MCP assembly and therefore are treated separately in Section 3.5.
The outer plate of the analyser is serrated in order to minimize the transmissionof scattered ions and UV. For the same reason the analyser plates are coveredwith a copper black coating. Behind the analyser the ions are accelerated by apost-acceleration voltage of 16–25 kV, such that also thermal ions have sufficientenergy before entering the TOF section.
Retarding Potential AnalyserIn order to extend the energy range of the CODIF sensor to energies below15 eV e�1, an RPA assembly is incorporated in the two CODIF apertures (seeFigures 11 and 12). The RPA provides a way selecting low-energy ions as input tothe CODIF analyser without requiring the ESA inner deflector to be set accuratelynear 0 V. The RPA collimates the ions, provides a sharp low-energy cutoff at anormal incident grid, pre-accelerates the ions to 100 eV after the grid, and deflectsthe ions into the ESA entrance aperture. The RPA will pass a 1 mm wide beam with

THE CLUSTER ION SPECTROMETRY (CIS) EXPERIMENT 321
�5� of polar angle range and to about 10� of azimuthal angle about the center axisof each of the entrance apertures over the 360� field of view, giving a geometricfactor of 0.035 cm2 sr. Collimation in azimuthal angle to�10� of normal incidenceto the RPA grid limits the entrance area to about half. The energy pass of the ESAis about 5–6 eV at 100 eV of pre-acceleration, assuming all deflection voltages areoptimised. This energy pass is very sensitive to the actual RPA deflection optics,so that deflection voltages will have to be determined at about the 1% level.
The RPA consists of a collimator, RPA grid and pre-acceleration region, anddeflection plates. The collimator section is kept at spacecraft ground.
The deflection system provides a method of steering the RPA low-energy ionsinto the CODIF ESA.
The RPA grid and pre-acceleration region consist of a pair of cylindrical rings,sandwiched between resistive ceramic material. Both inner and outer cylindricalrings contain apertures separated by posts every 22.5�, similar to the ESA collimatorentrance, to allow the ions to pass through the assembly. The RPA grid is attachedto the inner surface of the outer cylindrical ring. This outer ring has a small ledgewhich captures the RPA grid and which also provides the initial optical lens thatis crucial to the RPA operation. Both inner and outer cylindrical rings are in goodelectrical contact with the resistive kapton (silver epoxy). During RPA operation theouter cylindrical ring is biased from spacecraft ground to about+25 V and providesthe sharp low-energy RPA cutoff. This voltage is designatedVrpa in Figure 11. Theinner cylindrical ring tracks the outer ring voltage and is biased at �100 V +Vrpa.The inner cylindrical ring, the ESA outer deflector, and the ESA top-hat cover areelectrically tied to the RPA deflector.
The RPA deflection plates consist of three toroidal deflectors located abovethe ESA collimator entrance and one deflector disk located below the collimatorentrance. The three toroidal deflectors are used to deflect the ions into the ESA. Thedeflector disk is used to prevent low-energy ions from entering the main apertureand to collect any photoelectrons produced inside the analyser, while in RPA mode.
3.2. TIME-OF-FLIGHT AND DETECTION SYSTEM
The CODIF sensor uses a time-of-flight technology (Mobius et al., 1985). Thespecific parameters of the time-of-flight spectrometer have been chosen such thata high detection efficiency of the ions is guaranteed. High efficiency is not onlyimportant for maximizing the overall sensor sensitivity, but it is especially importantfor minimising false mass identification resulting from false coincidence at highcounting rate. Too thin a carbon foil would result in a significant reduction in theefficiency of secondary electron production for the ‘start’ signal, while an increasein thickness does not change the secondary electron emission significantly (Ritter,1985). Under these conditions a post-acceleration of �20 kV is necessary for themass resolution of the sensor.

322 H. REME ET AL.
Figure 11. Geometry of the CODIF RPA.
After passing the ESA the ions are focussed onto a plane close to the entrancefoil of the time-of-flight section (Figure 12). The TOF section is held at the post-acceleration potential (between �16 kV and �25 kV) in order to accelerate theions into the TOF section with a minimum energy greater than 20 keV charge�1.With this potential configuration the ion image on the foil extends from r = 70 mm

THE CLUSTER ION SPECTROMETRY (CIS) EXPERIMENT 323
Figure 12. Schematics of CODIF sensor.

324 H. REME ET AL.
to r = 80 mm at high energies, and the image diameter is reduced to 3 mm or lessat energies lower than 5 keV.
In the TOF section, the velocity of the incoming ions is measured. The flightpath of the ions is defined by the 3 cm distance between the carbon foil at theentrance and the surface of the ‘stop’ microchannel plate (MCP). The start signalis provided by secondary electrons, which are emitted from the carbon foil duringthe passage of the ions. The entrance window of the TOF section is a 3 �g cm�2
carbon foil, which is an optimum thickness between the needs of low-energy lossand straggling in the foil and high efficiency for secondary electron production.The electrons are accelerated to 2 keV and deflected onto the start MCP assemblyby a suitable potential configuration.
The secondary electrons also provide the position information for the angularsectoring. The carbon foil is made up of separate 22.5� sectors, separated by narrowmetal strips. The electron optics are designed to strongly focus secondary electronsoriginating at a foil onto the corresponding MCP start sector.
Between the two sections with different geometrical factors a non-conductingplate with conducting strips in the appropriate equipotential configuration willensure that no electrons and ions can penetrate into the other section.
The MCP assemblies are ring-shaped with inner and outer radii of 6 � 9 cmand 3 � 5 cm for the stop and start detectors, respectively. In order to achieve ahigh efficiency for the detection of ions at the stop MCP, a positive bias voltage isapplied to collect secondary electrons from the 40% dead area of the MCP and thecarbon foil.
The signal output of the MCPs is collected on a set of segmented plates behindthe start MCPs (22.5� each), behind the stop MCPs (90� each), and on thin wiregrids with�50% transmission at a distance of 10 mm in front of the signal plates, allbeing at ground potential (see Figure 10). Thus almost all of the post-accelerationvoltage is applied between the rear side of the MCPs and the signal anodes. Allsignal outputs are coupled to 50 impedance preamplifier inputs via a capacitor-resistor network. The timing signals are derived from the 50% transmission grids,separately for the high- and the low-sensitivity TOF section. The position signals,providing the angular information in terms of 22.5� sectors, are derived from thesignal plates behind the start MCP.
Table I summarises the main performances of the HIA and CODIF sensors.
3.3. SENSOR ELECTRONICS
The sensor electronics (Figure 13) of the instrument comprise two time-to-amplitudeconverters (TACs) to measure the time-of-flight of the ions between the start carbonfoil and the stop MCPs, two sets of eight position discriminators at the start MCPs,two sets of two position discriminators at the stop MCPs, and the event selectionlogic. Each individual ion is pulse-height-analysed according to its time-of-flight,

THE CLUSTER ION SPECTROMETRY (CIS) EXPERIMENT 325
Figure 13. Functional block diagram of the CODIF sensor electronics.

326 H. REME ET AL.
incidence in azimuthal (given by the spacecraft spin) and polar angle (given by thestart position), and the actual deflection voltage.
The eight position signals for each TOF section (in order to achieve the 22.5�
resolution in polar angle) are independently derived from the signal anodes, whilethe timing signals are taken from the grids in front of the anodes. Likewise, thestop MCPs, consisting of four individual MCPs, are treated separately to carryalong partial redundancy. By this technique the TOF and the position signals areelectrically separate in the sensor. The position pulses are fed into charge-sensitiveamplifiers and identified by pulse discriminators, the signal of which is directly fedinto the event selection logic.
The TOF unit is divided into two TOF channels. The outputs of the 50% trans-mission grids in front of the signal anode of the MCPs are capacitively coupled totwo input stages of the TOF electronics. These input stages consist of a preamplifier(rise time <0.9 ns) and a fast timing discriminator using a tunnel diode, and arecontained in custom-made hybrids. The outputs of these hybrids are used to drivethe TAC. The TAC provides an output signal whose amplitude is proportional tothe time delay between the start and stop pulses. In addition, the TAC generateslogical output signals for each start and stop pulse. The measured overall timingaccuracy of the electronics for an amplitude of 100 mV of the start and stop pulseis 0.2 ns. The TAC output pulse is pulse-height analysed by a fast analog-to-digitalconverter (ADC) with a conversion time of <6 �s.
The conditions for valid events are established in the event-selection logic. Therespective coincidence conditions can be changed via ground command. Severalcount rates are accumulated in the sensor electronics. There are monitor rates ofthe individual start and stop detectors to allow continuous monitoring of the carbonfoil and MCP performance. The total count rates of TOF coincidence show thevalid events accumulated for each TOF section. These rates can be compared withthe total stop count rates in order to monitor in-flight the efficiency of the start andstop assemblies. There is a digital monitoring of all essential housekeeping values,like the deflection HVs, the post-acceleration voltage, the MCP HVs, and all thesupply voltages of the electronics. In addition, the temperatures of the detector andelectronics compartment are monitored. A simplified block diagram of the CODIFsensor electronics is presented in Figure 14.
In order to protect the MCPs, the solar-wind protons and the solar-wind alphaparticles will be blocked from detection by a simple scheme during the sweepingcycle, as shown in Figure 15. The sweep, starting at high energies, is shown forthe high-sensitivity section in the upper panel and for the low-sensitivity section inthe lower panel in logE and azimuthal angle. The location of solar-wind protonsand alphas in phase space is known from the HIA. By the use of this informationthe voltage sweep, which starts at high energies, is stopped above the alphas whenthe high-sensitivity section is facing the solar wind, and above the protons whenthe low-sensitivity section is facing the solar wind. The result is a small data gapfor both sections of the sensor simultaneously. The primary purpose introducing

THE CLUSTER ION SPECTROMETRY (CIS) EXPERIMENT 327
Figure 14. CODIF overall functional block diagram.
this scheme is to avoid short-time gain depression of the MCP area which wouldotherwise persist for the order of 1 s after the impulsive high count rate that wouldresult from the solar wind.
3.3.1. Counters and Incrementing MemoryEach half of the CODIF sensor (high and low sensitivity) has eight angular binsand at least 64 TOF bins. A look-up table is used to combine TOF and energyinto four mass species. The 32 combined mass/angle signals from each of the twoparts of the analyser are sent into a selector circuit. The CODIF processor selectswhich part of the analyser is used. The 32 selected mass/angle signals feed the 48counters, which are read out by the CODIF processor once per energy step. Thesecounter values are used for moments, distribution functions, etc.
In addition to the counters, the CODIF has an incrementing memory accumulatorused to make high-mass-resolution spectrograms. This memory can hold a fulldistribution (with limited angular resolution), so that long time averages can bemade without using processor resources (memory, read-out time). According tothe actual count rates, the CODIF processor selects which sensivity range (hencewhich half of the analyser) to accumulate. The TOF data from the selected half ofthe analyser are combined with the energy step and a look-up table and accumulated

328 H. REME ET AL.
Figure 15. Energy sweeping scheme of CODIF in the solar wind. The sweep is shown in logEversus azimuthal angle for the high-sensitivity section (upper panel) and low-sensitivity section(lower panel), starting at the high energy end. When looking into the solar wind, the sweep stopsabove the alpha particles for the high-sensitivity section and above the protons for the low-sensitivitysection.
into 64 mass channels. The eight angle bins from the selected half are combinedwith the spacecraft rotation sweep angle with another look-up table into 16 angularsectors with about 45� resolution. The 16 angles and 64 masses are combined with16 energy bins to address the incrementing memory. The incrementing memoryrequires 16� 64� 16 = 16 384 accumulators.
3.3.2. High Voltage SystemA sweep-voltage high-voltage power supply generates an exponential voltage wave-form from 1.9 to 4950 V for the electrostatic analyser. A �20 kV static supplyfeeds the post-acceleration voltage, which can be adjusted via ground command.Another adjustable supply is used for the MCPs and the collection of secondaryelectrons. It supplies up to 5 kV and is floated on top of post-acceleration voltage.All high-voltage power supplies are run from the spacecraft raw power instead offrom the low-voltage power converter. Thus the efficiency factor of the low-voltage

THE CLUSTER ION SPECTROMETRY (CIS) EXPERIMENT 329
power converter does not apply to the corresponding power consumption. Ourdesign still garantees a galvanic separation of secondary and primary power.
3.4. OTHER ELEMENTS
3.4.1. Retractable CoverA retractable cover is used for CODIF, mainly to avoid carbon foil damage duringlaunch operations.
3.4.2. In-flight CalibrationRoutinely an in-flight-calibration (IFC) pulse generator stimulates the two inde-pendent TOF branches of the electronics according to a predefined program. Withinthis program all important functions of the sensor electronics and the subsequenton-board processing of the data can be automatically tested. Temporal variationsof calibration parameters can be measured. The in-flight calibration can also betriggered by ground command in a very flexible way, e.g., for trouble shootingpurposes. In addition, the known prominent location of the proton signal can, ifnecessary, serve as a tracer of changes in the sensor itself.
3.5. CODIF PERFORMANCES
3.5.1. Resolution in Mass per ChargeThe instrumental resolution in mass per charge is determined by a combination ofthe following effects:
– energy resolution of the electrostatic deflection analyser (�E=E = 0:16);– TOF dispersion caused by the angular spread of the ion trajectories because of
the characteristics of the analyser and the straggling in the carbon foil (the angularspread of = 13� leads to ��=� = 0:03);
– TOF dispersion caused by energy straggling in the carbon foil (��=� up to= 0:08 for 25 keV O+);
– electronic noise in the TOF electronics and secondary-electron flight timedispersion (typically 0.3 ns).
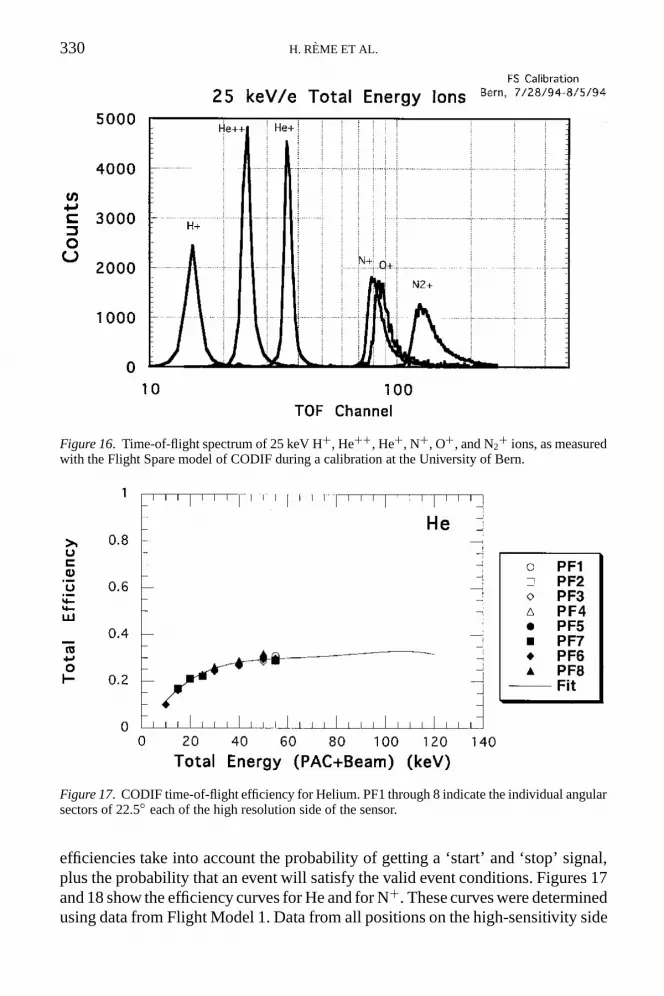
The resulting TOF dispersion amount ��=� � 0:1, which finally leads to aM=Q resolution between 0.15 for H+ and 0.25 for low-energy O+. A sampleTOF spectrum for various 25 keV ions is shown in Figure 16 from calibrationmeasurements with the CODIF sensor. It is demonstrated that all major ions arewell separated by the sensor.
3.5.2. Time-of-Flight Efficiency CurvesThe TOF efficiency is a function of the ion species and the total energy, the sumof the original ion energy plus the energy gained in the post-acceleration potential.The efficiency was also found to be a function of the position at which the ion entersthe instrument. An efficiency versus energy curve is determined for each species,with an overall normalisation factor necessary for each azimuthal position. The
330 H. REME ET AL.
Figure 16. Time-of-flight spectrum of 25 keV H+, He++, He+, N+, O+, and N2+ ions, as measured
with the Flight Spare model of CODIF during a calibration at the University of Bern.
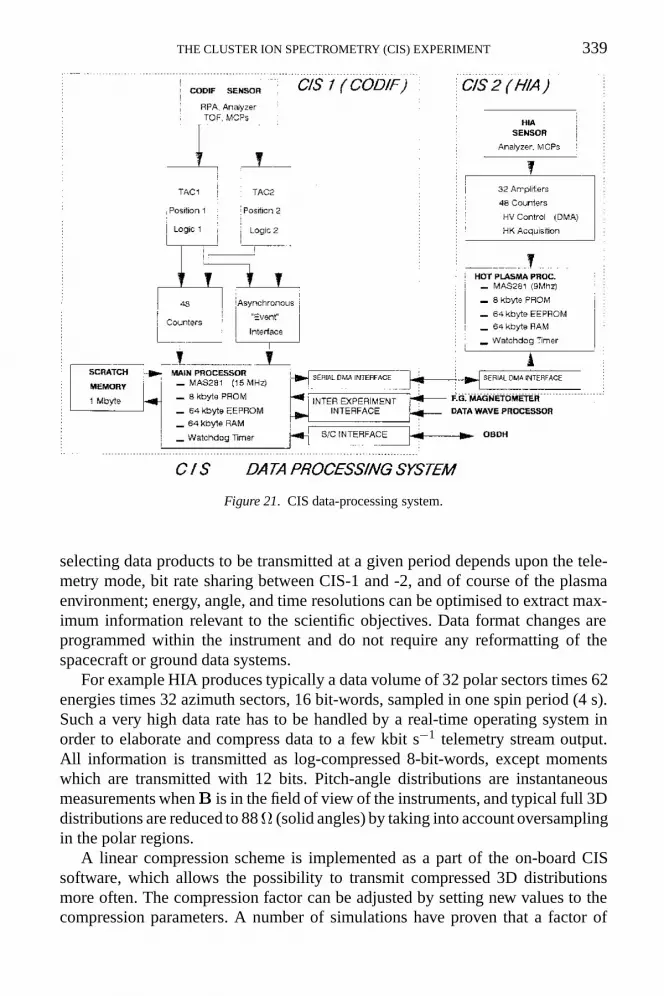
Figure 17. CODIF time-of-flight efficiency for Helium. PF1 through 8 indicate the individual angularsectors of 22.5� each of the high resolution side of the sensor.
efficiencies take into account the probability of getting a ‘start’ and ‘stop’ signal,plus the probability that an event will satisfy the valid event conditions. Figures 17and 18 show the efficiency curves for He and for N+. These curves were determinedusing data from Flight Model 1. Data from all positions on the high-sensitivity side

THE CLUSTER ION SPECTROMETRY (CIS) EXPERIMENT 331
Table IITotal position adjustment for CIS flight model 1
of the instrument are shown. The He curve is applicable to both He+ and He++.The N+ and O+ efficiencies are quite close, so the N+ curve is used to representthe N+ and O+ group measured by the instrument. The final H+curve has not yetbeen determined. Table II shows the position factors needed for each pixel andspecies for Flight Model 1. Note that this information is model-dependent, and thisTable is shown just as an example of the amount of variablity that is observed.

332 H. REME ET AL.
Figure 18. CODIF time-of-flight efficiency for N+ ions.
3.5.3. Immunity to BackgroundCompared to a single detector instrument, the TOF sensors have an inherentlybetter immunity to background, because of the start-stop coincidence requirement.The main source of background in these instruments is chance coincidence countsdue to penetrating radiation and to events not detected by either start or stop MCPbecause detection efficiencies are less than 100% according to the relation:
RCHANCE = R2SIGNAL�1(1� �2)�2(1� �1)�� ; (1)
where RSIGNAL is the input rate of the ion species with maximum flux, �� isthe total TOF window, and �1 and �2 are the efficiencies of the start and stopassemblies, respectively. It can be easily seen that low efficiencies reduce thesignal-to-noise ratio significantly. Therefore, great care has been applied to ensureas high efficiencies as possible for both start and stop detectors. The stop detectorhas an efficiency exceeding 90%. The efficiency of the start detector assembly islimited by the secondary electron emission of the foil. For protons of 25 keV theemission efficiency is reduced to � 50% (Ritter, 1985). Similar values have beenreached with the laboratory model of the sensor. Figure 19 shows the background-to-signal ratio versus incident proton flux level for 25 keV O+ (the TOF window forthe integration of counts is ��=� = 0:25). It is demonstrated that the mass densityof the plasma can still be determined with an accuracy of 10% (O+/H+ ratio betterthan 0.006) for proton fluxes as high as = 108 (1010) ions s�1 cm�2 sr�1 with thefull (or reduced) aperture, respectively.
A possible background due to UV photons is negligible, since the deflectionplates are covered with copper black and photons undergo at least three scatteringsbefore reaching the TOF system.

THE CLUSTER ION SPECTROMETRY (CIS) EXPERIMENT 333
Figure 19. Background-to-signal ratio versus absolute proton flux for background due to chancecoincidence of events creating only a start or a stop pulse (full line, computed for the actual startand stop efficiencies of CODIF). At low flux levels the background due to penetrating radiationand intrinsic effects of the MCPs prevails (broken line, taken from AMPTE SULEICA flight data(Mobius et al., 1985)). The combination of both effects is shown by the solid circles. The horizontalline represents the limit for 10% accuracy of the mass density, if O+ is the minor species.
3.5.4. Dynamic RangeThe design of the electrostatic analyser guarantees a large geometrical factor in thehigh-sensitivity section A�E=E��� = 0:025 cm2 sr. The energy bandwidth is�E=E = 0:16. The efficiency of the TOF unit is about 0.5. Differential energyfluxes as low as � 3� 103 ions s�1 cm�2 sr�1 can be detected by the instrumentwith the full time resolution of 1 spin period and about 5 counts energy�1 channel.The sensitivity is increased for longer integration time accordingly. Thereforethe dynamic range reaches seven decades. The upper flux limit of the instrumentamounts to 3�109 ions s�1 cm�2 sr�1, which leads to a count rate of 105 counts s�1


THE CLUSTER ION SPECTROMETRY (CIS) EXPERIMENT 335
on-board the tremendous amount of data to maximise the scientific return despitethe limited CIS telemetry allocation. The DPS and the CODIF instrument areintegrated in one box called CIS-1 and HIA is integrated in another box calledCIS-2.
4.1.1. MomentsMoments of the distribution functions measured by the analysers will be computedby the DPS and continuously transmitted with maximum time resolution (1 spinperiod or 4 s). Main on-board calculated moments for CODIF and HIA instruments,to within a multiplicative factor dependent on the analyser geometrical factors,are given by the sums of Table III. These moments include particle density Ni
(including partial densities over several energy ranges for CODIF, and sunwardand anti-sunward densities for HIA), the three components of the flow vector Vi,the six unique components of the momentum flux tensor, and the heat flux vector.From these, the full pressure tensor can be deduced as well as the temperatureanisotropies Tk=T?. We anticipate that full 4� space coverage of the analysersand their clean response function will guarantee a high accuracy for the on-boardcomputed moments. To calculate moments, integrals over the distribution functionare approximated by summing products of measured count rates with appropriateenergy/angle weighting over the sampled distribution. As already said, momentsfor HIA and for CODIF (for four masses) are computed once per spin.
Besides instrument sensitivity and calibration, the accuracy of computedmoments is mainly affected by the finite energy and angle resolution, and by thefinite energy range. The requirement on instrumental accuracy is best demonstratedin the measurements of mass flow through the magnetospheric boundary and in thecomputation of the current density in current layers like the magnetopause and theFlux Transfer Events (FTEs). Directional errors in the bulk velocity of less than 2�
and relative errors less than 5% in the product of bulk velocity times number densityof the different species are highly desirable. As for the mass flow, quantitative testsof other conservation laws (stress and energy balance) require measurements ofplasma moments with uncertainties less than 5%. Paschmann et al. (1986) testedthe capability of the AMPTE/IRM plasma instrument in a simulation study. Forparameters typically observed in high-speed flow events, the simulation showsthat density, velocity, temperature and pressure are accurately measured to within5%. With the better azimuthal coverage and resolution of the CIS instruments,improved accuracy (in comparison to AMPTE/ IRM) of the plasma moments isexpected (Martz, 1993). The accuracy requirements concerning the analysis oftwo- and three-dimensional current structures as well as shear and vortex flows,i.e. measurements strongly related to the four spacecraft aspect, are fulfilled by thecapability of the instrument.

336H
.RE
ME
ET
AL
.
Table IIIMoment definitions

THE CLUSTER ION SPECTROMETRY (CIS) EXPERIMENT 337
4.1.2. Reduced DistributionsOther reduced distributions, including pitch-angle distributions, averages (over 2to 5 spin periods) or snapshots of the 3D distributions, will be computed withresolutions dependent upon the specific scientific objectives and telemetry rate.The two-dimensional pitch-angle distribution requires far less telemetry than thefull distribution, thus allowing higher time resolution. Pitch-angle distributionscan be transmitted when the magnetic field direction (provided on-board by themagnetometer) is in the field of view of the detector.
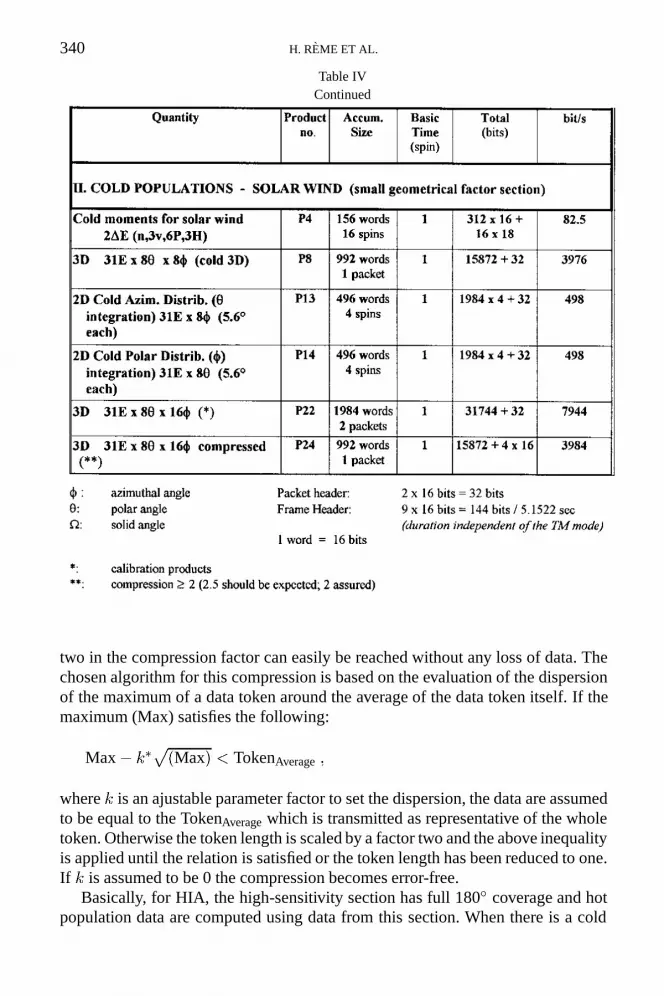
4.1.3. On-Board Processing UnitAccomplishing these computations in real time is a heavy processing burden,and requires a sophisticated data system, both in terms of hardware and soft-ware. The data system is based on a set of two microprocessors (Figure 21). Themain processor, located in the CIS-1 box, interfaces with the spacecraft On-BoardData Handling System (OBDH), the magnetometer, the plasma wave experiments(DWP), and the CIS-2 processor. It is in charge of formatting telemetry data,receiving and executing commands or passing them to the other processor, andcontrolling the burst memory. It also controls, collects and analyses data from theCODIF. The second processor is included in CIS-2 box and controls, collects andanalyses data from the HIA. The main processor is interfaced with the second oneby a serial data line; the HIA processor will compress the data so that the seriallink can transmit at the highest data rates.
Each processor system consists of a Marconi MAS281 microprocessor, togetherwith RAM, EEPROM and ROM memories, and a ‘watchdog’ timer. The ‘watch-dog’ timer is used to monitor the health of the operation, software and reset theprocessor if the operation is abnormal. This allows the processors to recover auto-matically from transient problems such as radiation-induced single-event upsets.The software is designed to come up in a safe operating mode on reset. All hardwareis radiation-hardened to the greatest extent possible, with spot shielding being usedon any parts that are not sufficiently hard to withstand the Cluster environment.
4.1.4. Scratch MemoryThe CIS experiment acquires data at nearly the fastest useful rate. In order to storea series of many two- and three-dimensional distributions at full time resolution,a 1 Mbyte memory is included in the instrument, so that discontinuities can bestudied in detail.
4.2. TELEMETRY
4.2.1. Data ProductsTables IV and V give HIA and CODIF scientific telemetry products, respect-ively. Products consist of on-board computed moments, one-, two-, and three-dimenstional distributions and pitch-angle distributions. The high flexibility in

338 H. REME ET AL.
Table IVHIA scientific telemetry products
THE CLUSTER ION SPECTROMETRY (CIS) EXPERIMENT 339
Figure 21. CIS data-processing system.
selecting data products to be transmitted at a given period depends upon the tele-metry mode, bit rate sharing between CIS-1 and -2, and of course of the plasmaenvironment; energy, angle, and time resolutions can be optimised to extract max-imum information relevant to the scientific objectives. Data format changes areprogrammed within the instrument and do not require any reformatting of thespacecraft or ground data systems.
For example HIA produces typically a data volume of 32 polar sectors times 62energies times 32 azimuth sectors, 16 bit-words, sampled in one spin period (4 s).Such a very high data rate has to be handled by a real-time operating system inorder to elaborate and compress data to a few kbit s�1 telemetry stream output.All information is transmitted as log-compressed 8-bit-words, except momentswhich are transmitted with 12 bits. Pitch-angle distributions are instantaneousmeasurements whenB is in the field of view of the instruments, and typical full 3Ddistributions are reduced to 88 (solid angles) by taking into account oversamplingin the polar regions.
A linear compression scheme is implemented as a part of the on-board CISsoftware, which allows the possibility to transmit compressed 3D distributionsmore often. The compression factor can be adjusted by setting new values to thecompression parameters. A number of simulations have proven that a factor of
340 H. REME ET AL.
Table IVContinued
two in the compression factor can easily be reached without any loss of data. Thechosen algorithm for this compression is based on the evaluation of the dispersionof the maximum of a data token around the average of the data token itself. If themaximum (Max) satisfies the following:
Max� k�p(Max) < TokenAverage ;
where k is an ajustable parameter factor to set the dispersion, the data are assumedto be equal to the TokenAverage which is transmitted as representative of the wholetoken. Otherwise the token length is scaled by a factor two and the above inequalityis applied until the relation is satisfied or the token length has been reduced to one.If k is assumed to be 0 the compression becomes error-free.
Basically, for HIA, the high-sensitivity section has full 180� coverage and hotpopulation data are computed using data from this section. When there is a cold

THE CLUSTER ION SPECTROMETRY (CIS) EXPERIMENT 341
Table VCODIF scientific telemetry products

342 H. REME ET AL.
population like the solar wind, the rest of the spin (360�–45�) is not be ignored,but, using the large geometrical factor section, data are taken and transmitted.
For CODIF, 4M stands for the four major species: H+, He++, O+, and He+.64M 3D distributions can be read out at a slow rate. They give more detailedinformation about the presence of minor species. 4M, 88 (solid angles), 3Ddistributions should be read out as often as possible, after all the other data typeshave been accommodated. A priority scheme for the time resolution is givenaccording to the abundance of the species:
H+ highest resolution,He++ or O+ highest resolution or slower by a factor of 2,He+ or other species factor of 2 or factor 4 slower.
4.2.2. Remote-sensing DistributionClose to boundaries a distribution of four angles at 90� pitch-angle (phase 0�,90�, 180�, 270�) is accumulated for two species (H+ and O+) in the four highestenergies. This allows the boundary motions to be traced.
4.2.3. Live Pulse Height DataFor each particle CODIF measures the following parameters:
Time-of-flight: 8 bits (giving 256 values)Azimuthal position: 5 bits (32 sectors)Proton mode: 1 bitEnergy step: 7 bits (one between 128 elementary steps)Pixel number: 3 bitsTotal: 24 bits each
4.2.4. Monitor RatesTo check the performance and the counting efficiency of CODIF certain monitorrates have to be accumulated and transmitted with the science data:
2 Start (each time-to-amplitude converter)2 Coincidence (each time-to-amplitude converter)16 Start position4 Stop position
To cut down in bit rate a specific scheme is proposed by which only every fourthenergy step and every eighth sector are transmitted at a time. A cycle is completedafter 32 spins.
4.2.5. Telemetry FormatsInstrument science and housekeeping data are read out over a single serial interface;the two types are differentiated by separate word gates. Telemetry is collected as a

THE CLUSTER ION SPECTROMETRY (CIS) EXPERIMENT 343
series of blocks, a fixed number per telemetry frame. Telemetry frames are always5.152222 s in duration independent of telemetry mode, and are synchronised bya ‘Reset’ pulse that occurs at the beginning of each frame. Housekeeping dataconsists of 54 bytes per telemetry frame. Science can be collected in a varietyof modes with different bit-rates; these modes are subdivided into ‘Normal’ and‘Burst’ Modes, differentiated by the number of blocks per frame (10 for normal and62 for burst). The different bit rates for Normal Mode are generated by changingthe number of words per block.
Mode Name Bit s�1 Block size Blocks/frame Bytes/frame
NM1 Normal mode 5 527 356 10 3 560
NM2 Ion mode 6 521 420 10 4 200
NM3 Electron mode 4 503 290 10 2 900
BM1 Normal burst mode 26 762 278 62 17 236
BM2 WEC/WBB TR mode 6 546 68 62 4 216
BM3 Event memory readout 29 456 306 62 18 972
BM3 is a special mode to dump the instrument scratch memory only; it is notan ordinary operating mode.
Two contingency modes exist in which all available data will go either to CIS-1(CODIF) or to CIS-2 (HIA).
The four Cluster spacecraft will fly through a number of different plasma envir-onments, and there must be a mechanism to change the mode of the instrumentwith a minimum number of commands when moving from one region to another.The CIS instruments have a large amount of flexibility either in the selection ofthe operating mode and in the reduction of the data necessary to fit the availabletelemetry bandwith. The instrument must be capable of making many changes tothe operational details in response to a few commands.
Table VI shows the 16 CIS basic operation modes with the bit-rate sharingbetween CODIF and HIA, defined for each spacecraft bit-rate mode. The CISinstruments will operate in the different regions of the Earth’s environment in these16 operative modes that, for the five telemetry regimes foreseen (forgetting HKand BM3 modes), give a total amount of 80 science data transmission schemes.Each basic scheme corresponds to a given sequence of products, spanning fromthe momenta of the ion distributions to the 3D.
Roughly speaking, all these 16 operative regimes can be grouped into solar-wind tracking oriented modes, solar-wind study modes with the priority on thebackstreaming ions, magnetospheric modes, an RPA mode and a calibration mode.Moreover, part of these solar-wind and magnetospheric modes are duplicated in asimilar mode in which 3D compression is introduced.
For the HIA instrument two basic modes of operations, mixing basic productsdefined in Table IV have been implemented according to the plasma populations

344H
.RE
ME
ET
AL
.Table VI
CIS operation modes

THE CLUSTER ION SPECTROMETRY (CIS) EXPERIMENT 345
encountered along the Cluster orbit: so-called (a) ‘magnetospheric’ modes, and(b) ‘solar-wind’ modes. In both modes moments are systematically transmitted,computed every spin from the data acquired on the high-sensitive half-hemisphere(‘high G’ section) when the spacecraft are inside the magnetosphere, from theattenuated half-hemisphere section (‘low g’) when the spacecraft are in the inter-planetary medium. This way one of the goals of the mission, i.e., to be able toproduce high-resolution (4 s) moments by on-board computation, has been full-filled for all the listed regimes apart from the calibration mode. The computedmoments are used on-board to drive automatic operative mode changes (when thisoption has been remotely enabled) to better follow fluctuations which require fast-sensitivity-adapting capabilities or to select the best energy sweep regime to coverthe local solar wind distribution.
‘Magnetosphere’ basic modes stay relatively simple, i.e., the full energy-angleranges are systematically covered and the different data products (includingmoments) are deduced from the 62E� 88 energy solid angle count rate matricesaccumulated on the ‘high G’ section.
‘Solar wind’ modes allow a precise and fast measurement (4s) of the ion flowparameters (H+, He++). For that, in the solar wind, the sweep energy range isautomatically reduced and adapted every spin, centred on the main solar windvelocity by using a criterion based on the H+ thermal and bulk velocities computedduring the previous spin. Moreover, detailed 3D distributions (e.g., for upstreamingions and/or for interplanetary disturbances) are included in the basic productstransmitted to the telemetry.
In both regions, and within the HIA telemetry allocation, a maximum bit ratehas been allowed for transmission as often as possible of full size (or reduced)3D distributions. From Table VII it can be anticipated that Burst Modes should beconsidered as those having the highest expected scientific return.
Finally, to best fit the sampling activity to the plasma environment, if an auto-switching variable has been asserted, it is possible to run the instrument in the auto-change mode from magnetospheric to solar-wind configuration and vice versa. Theswitching criteria are presently based on locally measured plasma Mach numberchecks.
Science data packets include a number of data products from both HIA andCODIF in a flexible format. Data are time-tagged in such a way as to allowabsolute timing of the data on the ground. The format allows bit rate allocationsto the various data products to be changed relatively easily with minimal impacton ground processing. All auxiliary data necessary to analyse the data, such asinstrument operational mode and timing information, are included in science dataproducts, as it could be difficult to recombine housekeeping packets with the sciencepackets.
Finally, housekeeping data (81 bit s�1), extensively used during spacecraftdevelopment tests, give all the information needed to follow the health and safetyof the instrument.

346 H. REME ET AL.
Table VIIExamples of basic operational modes of the CIS-2 (HIA) experiment grouped in 4 tables accordingto the space region of interest. For each telemetry mode (NM1, NM2, ...) different combinations ofscientific products (see their definition in Table IV) are defined, computed from count rates providedby the high-sensitive half analyser (‘high G’ section) and/or the low geometrical factor half (‘low g’section). Each basic mode (MAG-1, MAG-2, ..., SW-2, SW-3, ...) in a given telemetry mode refers toTable VI.

THE CLUSTER ION SPECTROMETRY (CIS) EXPERIMENT 347
Table VII shows the scientific products of HIA transmitted nominally in thevarious telemetry modes.
4.3. MODES OF OPERATION
4.3.1. TelemetryOne of the decisive variables which affects the instrument operation is the telemetrymode; when the telemetry mode changes, the CIS instrument receives a singlecommand and changes accordingly its bit rate allocation and data product collectionmechanism to match the available telemetry. Some instrument parameters staymode-independent and are programmable, such as MCP voltage.
The DPS is made of a small PROM, some EEPROM, and some RAM memor-ies. The non-volatile EEPROM memory contains most of the on-board code andparameter tables, the RAM memory is used primarily to hold data blocks and someoperational parameters and the PROM memory contains the bootstrap code neededto load or change the EEPROM. The EEPROM memory cannot be read while it isbeing programmed, and programming takes several millisec per block; it containsmost of the operational parameters so that they do not have to be reloaded onpower-up.
As a basic philosophy the default operational parameters are kept in EEPROMmemory, while the current operational parameters are in RAM memory. The tele-metry mode independent parameters are copied from the defaults on processor reset(this is called the ‘Fixed Table’). The ‘Operational Mode Table’ is copied from thedefault table to set up a new mode after commanding. Sometimes it may also bedesirable to follow automatic operational mode changes based only on science data(e.g., moments) collected by the instrument. The ‘Telemetry Allocation Table’ isa subset of the Operational Mode default Table; when the telemetry rate changes,the appropriate Telemetry Allocation Table is copied from the default table for thenew rate and the current operational mode.
The CIS-1 and CIS-2 instruments have separate tables, but of course are con-trolled by the same telemetry rate and operation mode commands.
4.4. GROUND SCIENCE DATA PROCESSING
The CIS raw telemetry will be pipeline-processed at the French Cluster DataCentre at CNES, Toulouse, where CESR-developed software will be running.Level-1 and Level-2 data products will thus be systematically generated. Level-1files correspond to decommutated and decompressed data, organised in flat files,in full time resolution, one file per spacecraft-day-data product. Level-2 files areCDF files in physical units, and they include density for the major ion species,bulk velocity, parallel and perpendicular temperature. These files will be organisedfollowing the Cluster Science Data System (CSDS) recommendations, and theywill populate two data bases: the Prime Parameter Data Base (PPDB: 4 spacecraft,4 s resolution) and the Summary Parameter Data Base (SPDB: 1 spacecraft, 1 min

348 H. REME ET AL.
resolution). The contents of these data bases will be distributed to other NationalData Centres on a daily basis. The PPDB will be accessible to the whole Clustercommunity, and the SPDB will be public domain. Due to their broad accessibility,and to the quality of their data products, these data bases will permit joint analysis ofplasma parameters from several instruments, further enhancing the science returnof the Cluster mission.
The health and the performance of the CIS instrument will be monitored atvarious levels, by using files retrieved via the network from the Cluster DataDisposition System (DDS) , both at JSOC and at CESR.
5. Conclusion
The general characteristics of the two CIS instruments, including scientific perform-ances, weight and raw power, are summarised in Table I. Note that the entranceof each sensor is put about 10 cm outside the spacecraft platform in order to havean unobstructed field of view and to minimise the effect of the spacecraft potentialon the trajectories of the detected low-energy particles. The two planes of view ofCODIF and HIA are parallel and tangential to the spacecraft body. The free fieldof view of the two sensors is 15� � 360� (Figure 22).
In summary, by their unique features, the CIS instruments will provide fastmeasurements of the major plasma ion species with greatly improved accuracyand resolution. The inherent flexibility of the instrument control will allow a per-manent optimisation of the scientific operation according to the various situationsencountered all along the Cluster mission. The extensive on-board data processingwill not only improve the time resolution of the measurements and significantlyreduce data ground-processing costs, but will also make the plasma fundamentalparameters quickly and directly available in an usable form to other investigators.
Acknowledgements
The CIS instrument was supported by many institutions. At CESR financial sup-port came from CNES grant No. 208. The contribution of MPE Garching wassupported by the Bunderministerium fur Forschung und Technologie, Germany,under grant number 50 OC 89069. The high voltage supply of CIS-2 was providedby MPAE Lindau with the support of the Max-Planck-Gesellschaft zur Forderungder Wissenschaften and DARA grant 50 OC 89030. For IFSI CIS experiment wassupported by Italian Space Agency (ASI). The work at the University of Wash-ington, UNH, LPARL and UC Berkeley was supported by NASA contract. TheSwedish participation was funded by the Swedish National Space Board and theSwiss participation by the Swiss National Science Foundation and the State ofBern.

THE CLUSTER ION SPECTROMETRY (CIS) EXPERIMENT 349
Figure 22. Position of the two sensors on the spacecraft and their fields of view.
We would like to thank J. P. Thouvenin for his permanent support and J. Y.Prado, H. Poussin, and M. Nonon-Latapie at CNES Toulouse, all the Cluster ESAProject staff at ESTEC and at ESOC for their excellent cooperation and the JSOCstaff and particularly P. Chaizy in charge of the CIS instrument at JSOC.
The authors thank the 2 referees for their very efficient work.
References
Burgess, D.: 1989, ‘Cyclic Behaviour at Quasi-Parallel Collisionless Shocks’, Geophys. Res. Letters16, 345.
Carlson, C. W. et al.: 1982, ‘An Instrument for Rapidly Measuring Plasma Distribution Functionswith High Resolution’, Adv. Space Res. 2 (7), 67.
Escoubet, P. C. and Schmidt, R.: 1997, ‘Cluster Science and Mission Overview’, Space Sci. Rev., thisissue.

350 H. REME ET AL.
Giacalone, J. et al.: 1994, ‘Artificial Spacecraft in Hybrid Simulations of the Quasi-parallel Earth’sBow Shock: Analysis of Time Series Versus Spatial Profiles and a Separation Strategy for Cluster’,Ann. Geophys. 12, 591.
Gloeckler, G. et al.: 1993, ‘Detection of Interstellar Pick-up Hydrogen in the Solar System’, Science261, 70.
Lin, R. P. et al.: 1995, ‘A Three-dimensional Plasma and Energetic Particle Investigation for the WindSpacecraft’, Space Sci. Rev. 71, 125.
Martz, C.: 1993, ‘Spectrometrie Ionique dans la Magnetosphere et le Vent Solaire. Simulation etPrecision des Mesures Coordonnees au Moyen des 4 Satellites de la Mission Cluster’, Thesis,Paul Sabatier Toulouse University.
Martz, C. and Sauvaud, J. A.: 1995, Accuracy of Ion Distribution Measurements and Related Para-meters Using Top-hat Ion Spectrometers; Application to the CIS Cluster Experiment, submittedto Rev. Sci. Instruments.
Mobius, E. et al.: 1985, ‘The Time-of-Flight Spectrometer SULEICA for Ions of the Energy Range5-270 keV/charge on AMPTE IRM’, IEEE Trans. Geosc. Remote Sens. GE-23, 274.
Mobius, E. et al.: 1985, ‘Direct Observation of He+ Pick-up Ions of Interstellar Origin in the SolarWind’, Nature 318, 426.
Mobius, E. et al.: 1988, ‘Interaction of Interstellar Pick-up Ions with the Solar Wind’, Astrophys.Space Sci. 144, 487.
Paschmann, G. et al.: 1985, ‘The Plasma Instrument for AMPTE IRM’, IEEE Trans. Geosci. RemoteSens. GE-23, 262.
Paschmann, G. et al.: 1986, ‘The Magnetopause for Large Magnetic Shear: AMPTE/IRM Observa-tions’, J. Geophys. Res. 91, 11099.
Quest, K. B.: 1988, ‘Theory and Simulation of Collisionless Parallel Shocks’, J. Geophys. Res. 93,9649.
Reme, H. et al.: 1987, ‘The Giotto Electron Plasma Experiment’, J. Phys. E: Sci. Instrum. 20, 721.Ritter, H.: 1985, ‘Sekundarelektronenemission von Kohlenstoffolien beim Durchgang von Ionen im
Energiebereich von 40 bis 500 keV’, MPE Report 190.Scholer, M.: ‘Interaction of Upstream Diffuse Ions with the Solar Wind’, Adv. Space Sci., in press.Scholer, M. and Terasawa, T.: 1990, ‘Ion Reflection and Dissipation at Quasi-parallel Collisionless
Shocks’, Geophys. Res. Letters 17, 119.Sckopke, N. et al.: 1990, ‘Ion Thermalization in Quasi-perpendicular Shocks Involving Reflected
Ions’, J. Geophys. Res. 95, 6337.Trattner, K. et al.: 1994, ‘Statistical Analysis of Diffuse Ion Events Upstream at the Earth’s Bow
Shock’, J. Geophys. Res. 99, 13389.Young, D. et al.: 1988, ‘2�-radian Field-of-View Toroidal Electrostatic Analyzer’, Rev. Sci. Instr. 59,
743.

![Octahedral ruthenium(II) complexes cis,cis-[RuX2(CNR)(CO)(P∧P)] and cis,cis,cis-[RuX2(CO)2(P∧P)] (X=Cl, Br; P∧P=1,1′-bis(diphenylphosphino)ferrocene, 1,1′-bis(diisopropylphosphino)ferrocene):](https://img.pdfslide.net/doc/110x75/6350510356d5ddd7dc052b00/octahedral-rutheniumii-complexes-ciscis-rux2cnrcopp-and-cisciscis-rux2co2pp.jpg)