Embed Size (px)
Citation preview
The Lahore Journal of Economics 17 : 1 (Summer 2012): pp. 33–44
The Consequences of Easy Credit Policy, High Gearing, and
Firms’ Profitability in Pakistan’s Textile Sector: A Panel
Data Analysis
Ijaz Hussain*
Abstract
This study uses panel data on 75 textile firms for the period 2000–09 to examine the consequences of an easy credit policy followed by high gearing, increased financing costs, and other determinants of corporate profitability. Five out of nine explanatory variables—including gearing, financing costs, inflation, tax provisions, and the industry’s capacity utilization ratio—have a negative impact, while the remaining four variables—working capital management, asset turnover, exports, competitiveness, and devaluation—have a positive impact on firms’ profitability.
Keywords: Easy credit, energy crisis, corporate profitability, textile sector, panel data, Pakistan.
JEL Classification: L78, L69, F14.
1. Introduction
Both the nonfinancial corporate sector (private and public enterprises) and financial sector play a critical role in a country’s economic growth, because they produce goods and services for local as well as foreign markets, create job opportunities, contribute to government tax revenues to finance public expenditure on economic and social infrastructure, and sometimes also to foreign exchange reserves, thus playing an important part in the forward and backward linkages of the value chain.
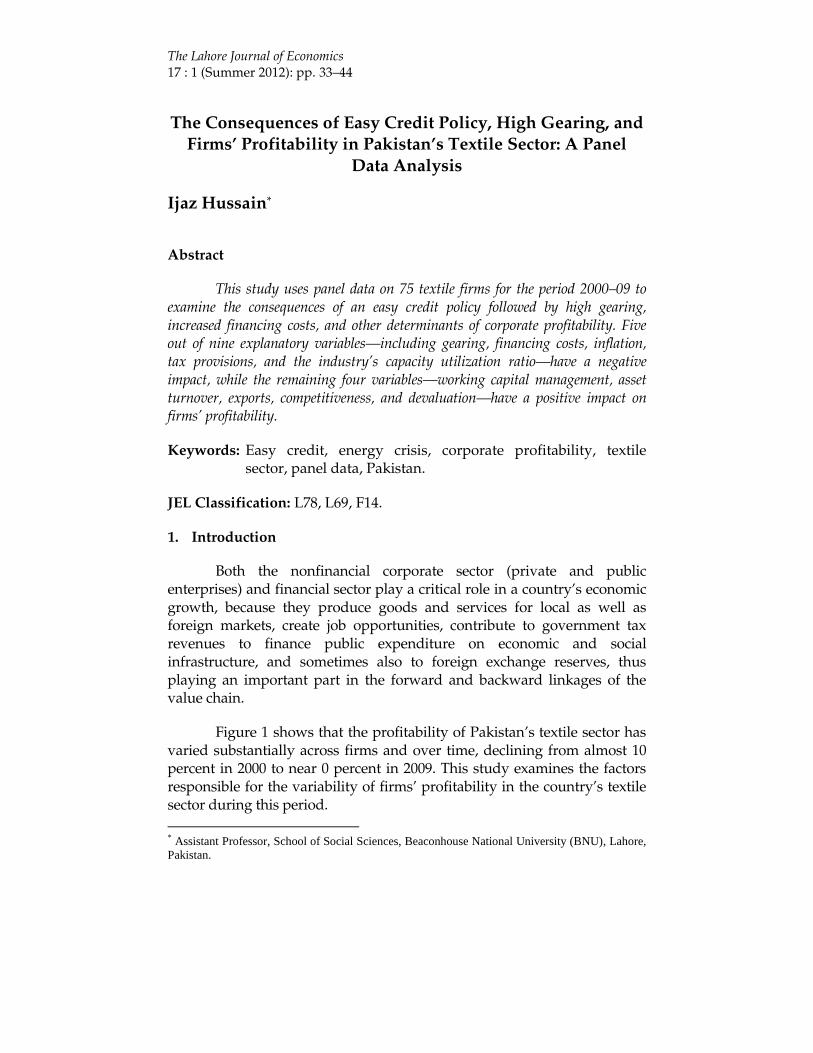
Figure 1 shows that the profitability of Pakistan’s textile sector has varied substantially across firms and over time, declining from almost 10 percent in 2000 to near 0 percent in 2009. This study examines the factors responsible for the variability of firms’ profitability in the country’s textile sector during this period.
* Assistant Professor, School of Social Sciences, Beaconhouse National University (BNU), Lahore,
Pakistan.
34 Ijaz Hussain
Figure 1: Profitability vs. financing costs in Pakistan’s textile sector
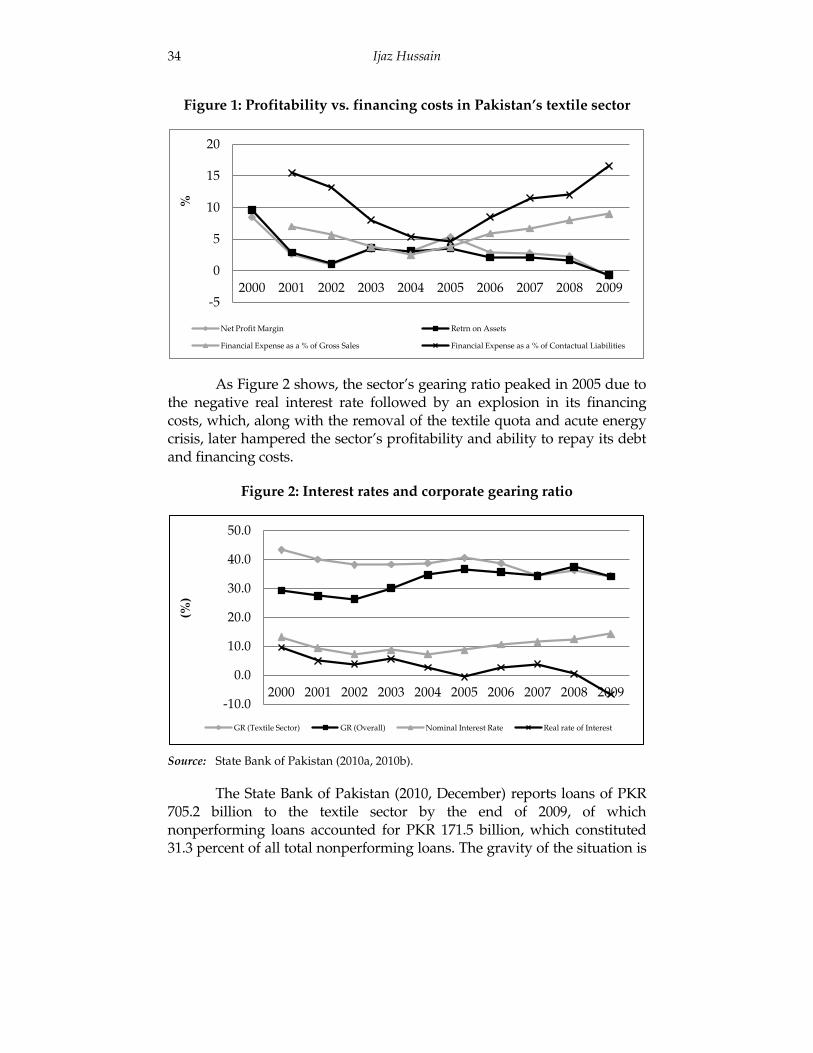
As Figure 2 shows, the sector’s gearing ratio peaked in 2005 due to the negative real interest rate followed by an explosion in its financing costs, which, along with the removal of the textile quota and acute energy crisis, later hampered the sector’s profitability and ability to repay its debt and financing costs.
Figure 2: Interest rates and corporate gearing ratio
Source: State Bank of Pakistan (2010a, 2010b).
The State Bank of Pakistan (2010, December) reports loans of PKR 705.2 billion to the textile sector by the end of 2009, of which nonperforming loans accounted for PKR 171.5 billion, which constituted 31.3 percent of all total nonperforming loans. The gravity of the situation is
-5
0
5
10
15
20
2000 2001 2002 2003 2004 2005 2006 2007 2008 2009
%
Net Profit Margin Retrn on Assets
Financial Expense as a % of Gross Sales Financial Expense as a % of Contactual Liabilities
-10.0
0.0
10.0
20.0
30.0
40.0
50.0
2000 2001 2002 2003 2004 2005 2006 2007 2008 2009
(%)
GR (Textile Sector) GR (Overall) Nominal Interest Rate Real rate of Interest
Easy Credit Policy, High Gearing, and Profitability in the Textile Sector 35
evident from the fact that there were 189 textile firms in existence in 2004, which number fell to 164 in 2010 with the closure of 25 companies. This makes it important to understand the consequences of an easy credit policy followed by high gearing, increased financing costs, and other determinants of corporate profitability for textile firms in Pakistan.
The paper is organized as follows: Section 2 provides a review of the literature. Section 3 describes the data sources used, variables, and methodology. Section 4 presents our findings, and Section 5 puts forward a conclusion and policy recommendations.
2. A Review of the Literature
The empirical research on the determinants of corporate profitability can be classified into two categories: (i) structure-conduct performance models, and (ii) firm effect models (Mauri & Michaels, 1998; Schmalensee, 1989; Stierwald, 2010). The first explain profitability based on industry effects (concentration) while the second explain profitability based on variations in firms’ characteristics (Stierwald, 2010). As noted by Bain (1951), a high industry concentration allows firms to exercise higher monopoly power in the market and makes collusion possible between firms, and thus gives them an opportunity to earn more profits. Barriers to entry of new firms allow existing firms to earn higher profits (Bain, 1956).
Lambson (1991), Jovanovic (1982), and Bartelsman and Doms (2000) highlight the persistent variation in firms’ productivity. Demsetz (1973) points out that there is substantial variation in firms’ characteristics, and that firms with higher productivity or efficiency earn higher profits. Ammar, Hanna, Nordheim, and Russell (2003) note that small, medium, and large firms differ significantly from one other in terms of their profit rate—profitability drops as firms grow beyond USD 50 million in sales.
Treacy (1980) identifies a strong negative correlation between firm size and the variance in returns on equity, and a moderate correlation between firm size and average returns on equity. As noted by Whittington (1980), the positive relationship between size and profitability is interesting because the larger firm size contributes to the high degree of concentration and monopoly power, and also to efficient cost structure due to scale economies.
Using a nonparametric approach, Grazzi (2009) proves that exporting activity is not systematically associated with firms’ higher profitability. Based on the pecking order theory and using six years’ data
36 Ijaz Hussain
on textile firms in Pakistan, Amjed (2007) confirms the negative relationship between long-term debt and profitability, and the positive relationship between short-term debt and profitability. Ali (2011) analyze the association between working capital management and profitability in Pakistan’s textile sector. He finds that average days in inventory, average days receivable, and average days payable have a significant economic impact upon return on assets.
Chhapra and Naqvi (2010) show that there is a strong positive and
significant relationship between working capital management and firm profitability in Pakistan’s textile sector. They also establish a significant relationship between the cost of production, size (capital), and profitability. Their results, however, indicate a significant negative relationship between a firm’s debt and its profitability. Finally, Raza, Farooq, and Khan (forthcoming) provide evidence of a significant relationship between firm effects, industry effects, and market share and two measures of profitability, i.e., returns on equity and returns on assets.
3. Dataset, Variables, and Methodology
3.1. Data Sample
We use secondary data from the State Bank of Pakistan’s (n.d.) Balance Sheet Analysis of Joint Stock Companies Listed on the Karachi Stock Exchange for the period 2000–09. The study’s sample covers 75 firms of the textile industry (of a total of 164) with a complete and consistent 10-year data series. We exclude any firms that have an incomplete and/or inconsistent data series, or those that have negative equity.
3.2. Dependent and Explanatory Variables
The dependent variable is profitability, which is measured by the firm’s return on assets (ROA).
The explanatory variables are as follows.
1. The financial gearing ratio (GR) equals long-term liabilities divided by total assets. This variable captures the impact of high gearing on profitability, followed by easy credit policy in the form of very low or negative interest rates.
2. Financing costs are represented by FCGS, and measured as a percentage of gross sales. This variable captures the impact of easy credit policy in the form of increased financing costs as an aspect of high gearing.
Easy Credit Policy, High Gearing, and Profitability in the Textile Sector 37
3. Efficiency is represented by asset turnover (ATO), which equals gross sales divided by the book value of total assets. This variable captures the impact of the extent of effective utilization of the firm’s assets.
4. Size is represented by relative market share (RMS), and equals the firm’s gross sales divided by the textile sector’s gross sales. This captures the impact of an efficient cost structure due to economies of scale.
5. The capacity utilization ratio (CUR) is measured as actual operating spindles and looms divided by installed capacity, i.e., the impact of the industry’s output supply on profitability.
6. Exports are represented by X, and are measured as sales to foreign countries. This variable captures the composite impact of changes in foreign demand on account of an increase in the international price of cotton, global financial crises, and removal of US quotas.
7. Competitiveness and devaluation are measured by the real effective exchange rate (REER), which captures their impact on the firm’s profitability.
8. INF represents the rate of inflation.
9. TP represents tax provision in the firm’s income statement.
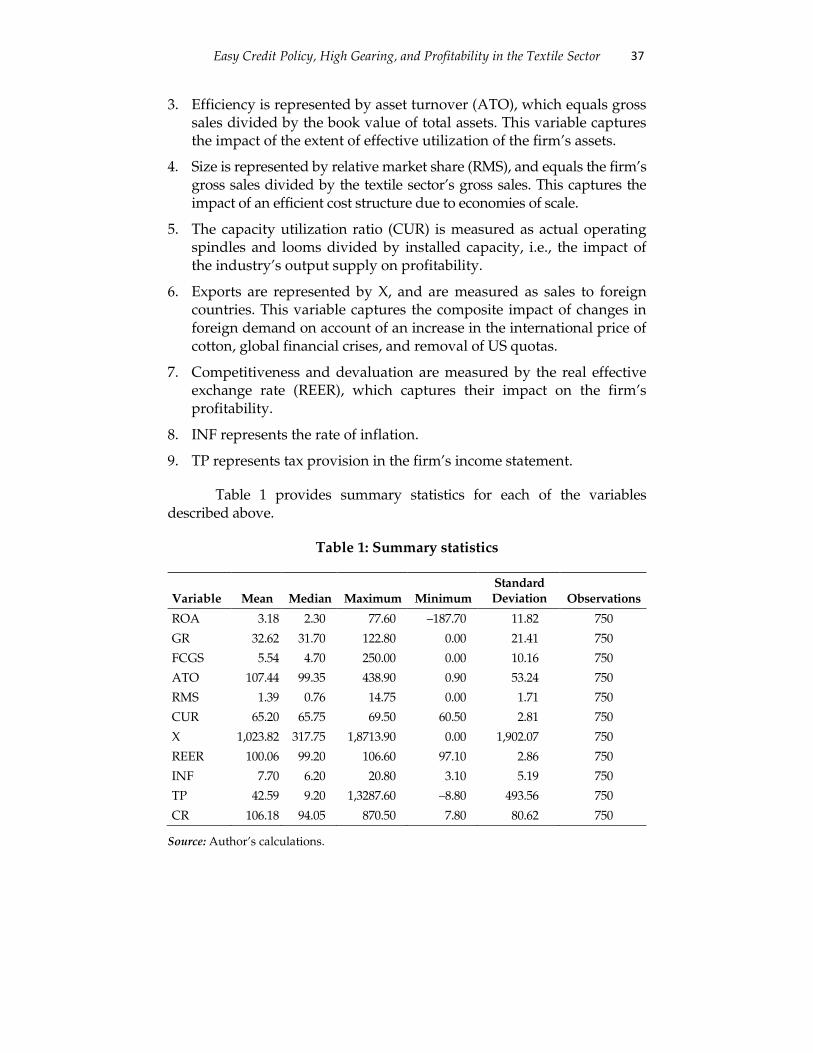
Table 1 provides summary statistics for each of the variables described above.
Table 1: Summary statistics
Variable Mean Median Maximum Minimum
Standard Deviation Observations
ROA 3.18 2.30 77.60 –187.70 11.82 750
GR 32.62 31.70 122.80 0.00 21.41 750
FCGS 5.54 4.70 250.00 0.00 10.16 750
ATO 107.44 99.35 438.90 0.90 53.24 750
RMS 1.39 0.76 14.75 0.00 1.71 750
CUR 65.20 65.75 69.50 60.50 2.81 750
X 1,023.82 317.75 1,8713.90 0.00 1,902.07 750
REER 100.06 99.20 106.60 97.10 2.86 750
INF 7.70 6.20 20.80 3.10 5.19 750
TP 42.59 9.20 1,3287.60 –8.80 493.56 750
CR 106.18 94.05 870.50 7.80 80.62 750
Source: Author’s calculations.
38 Ijaz Hussain
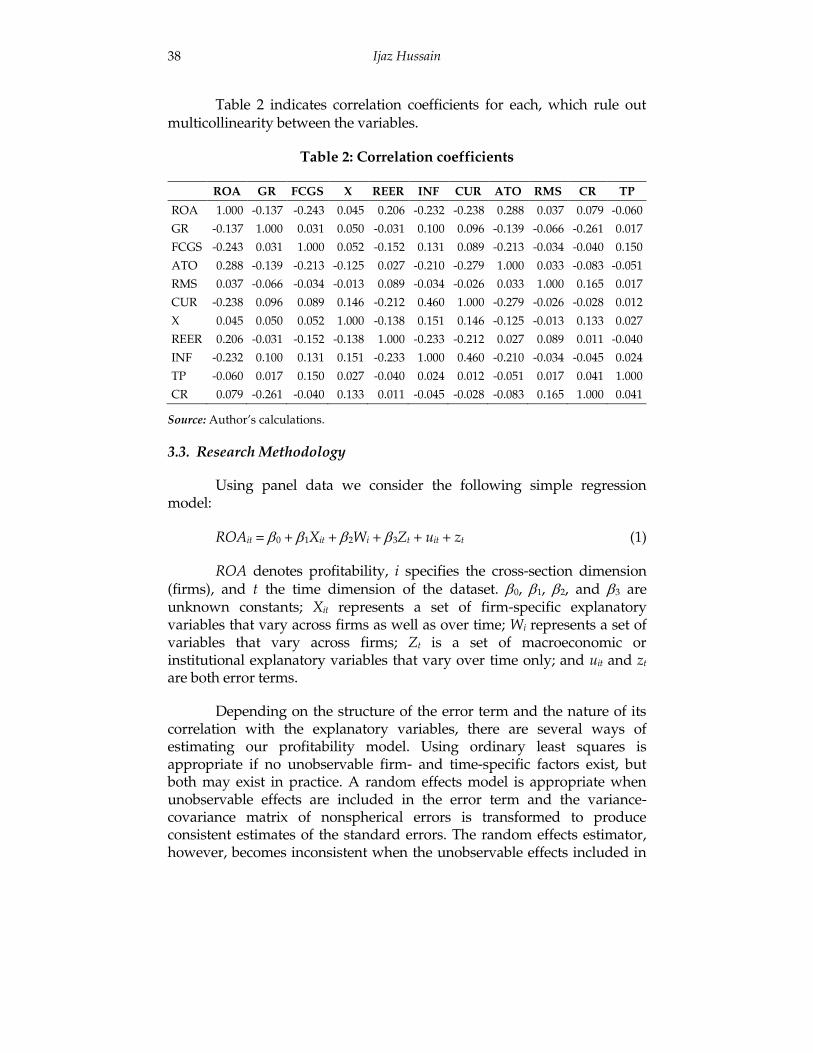
Table 2 indicates correlation coefficients for each, which rule out multicollinearity between the variables.
Table 2: Correlation coefficients
ROA GR FCGS X REER INF CUR ATO RMS CR TP
ROA 1.000 -0.137 -0.243 0.045 0.206 -0.232 -0.238 0.288 0.037 0.079 -0.060
GR -0.137 1.000 0.031 0.050 -0.031 0.100 0.096 -0.139 -0.066 -0.261 0.017
FCGS -0.243 0.031 1.000 0.052 -0.152 0.131 0.089 -0.213 -0.034 -0.040 0.150
ATO 0.288 -0.139 -0.213 -0.125 0.027 -0.210 -0.279 1.000 0.033 -0.083 -0.051
RMS 0.037 -0.066 -0.034 -0.013 0.089 -0.034 -0.026 0.033 1.000 0.165 0.017
CUR -0.238 0.096 0.089 0.146 -0.212 0.460 1.000 -0.279 -0.026 -0.028 0.012
X 0.045 0.050 0.052 1.000 -0.138 0.151 0.146 -0.125 -0.013 0.133 0.027
REER 0.206 -0.031 -0.152 -0.138 1.000 -0.233 -0.212 0.027 0.089 0.011 -0.040
INF -0.232 0.100 0.131 0.151 -0.233 1.000 0.460 -0.210 -0.034 -0.045 0.024
TP -0.060 0.017 0.150 0.027 -0.040 0.024 0.012 -0.051 0.017 0.041 1.000
CR 0.079 -0.261 -0.040 0.133 0.011 -0.045 -0.028 -0.083 0.165 1.000 0.041
Source: Author’s calculations.
3.3. Research Methodology
Using panel data we consider the following simple regression model:
ROAit = 0 + 1Xit + 2Wi + 3Zt + uit + zt (1)
ROA denotes profitability, i specifies the cross-section dimension (firms), and t the time dimension of the dataset. 0, 1, 2, and 3 are unknown constants; Xit represents a set of firm-specific explanatory variables that vary across firms as well as over time; Wi represents a set of variables that vary across firms; Zt is a set of macroeconomic or institutional explanatory variables that vary over time only; and uit and zt are both error terms.
Depending on the structure of the error term and the nature of its correlation with the explanatory variables, there are several ways of estimating our profitability model. Using ordinary least squares is appropriate if no unobservable firm- and time-specific factors exist, but both may exist in practice. A random effects model is appropriate when unobservable effects are included in the error term and the variance-covariance matrix of nonspherical errors is transformed to produce consistent estimates of the standard errors. The random effects estimator, however, becomes inconsistent when the unobservable effects included in
Easy Credit Policy, High Gearing, and Profitability in the Textile Sector 39
the error term are correlated with some or all of the regressors. Though relatively inefficient, an alternative is the fixed effects model, which provides consistent estimates regardless of the aforementioned correlation.
Setting 0 + 2Wi = i in equation (1).
We can rewrite the equation as
ROAit = 1Xit + Zt + i + uit + zt (2)
In this fixed effects the slope coefficient 1 is the same for all firms;
the intercept term i varies across firms but is constant over time.
4. Findings
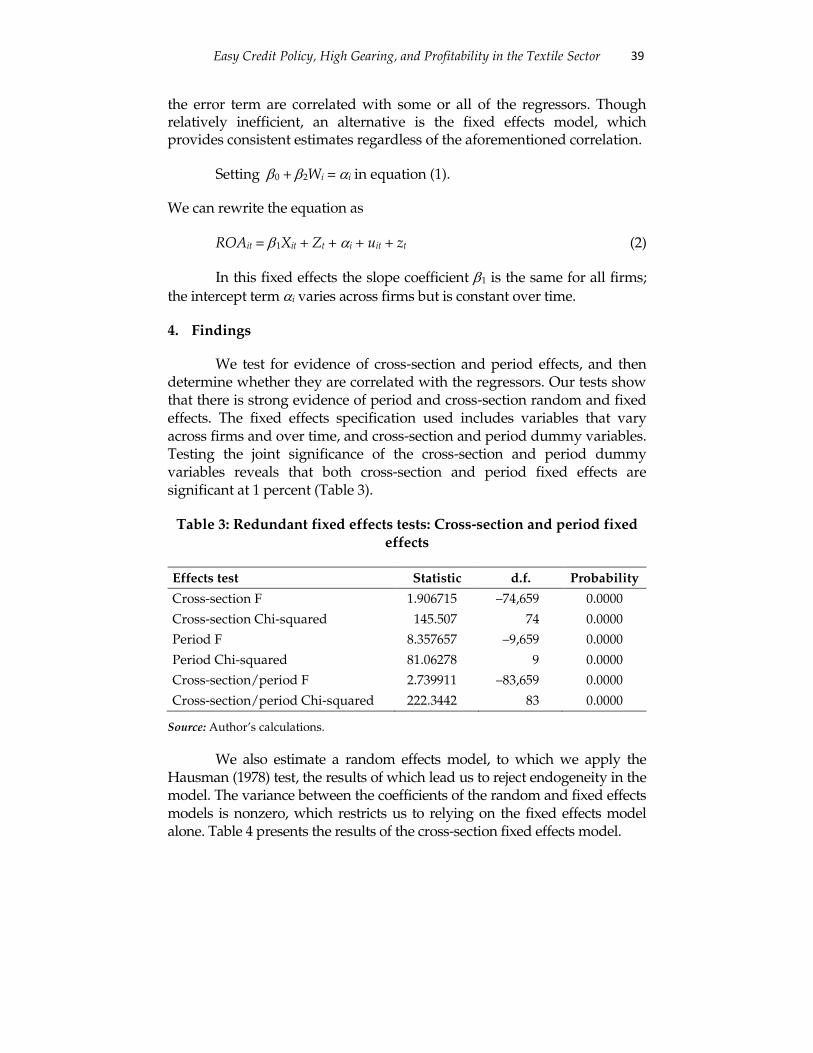
We test for evidence of cross-section and period effects, and then determine whether they are correlated with the regressors. Our tests show that there is strong evidence of period and cross-section random and fixed effects. The fixed effects specification used includes variables that vary across firms and over time, and cross-section and period dummy variables. Testing the joint significance of the cross-section and period dummy variables reveals that both cross-section and period fixed effects are significant at 1 percent (Table 3).
Table 3: Redundant fixed effects tests: Cross-section and period fixed effects
Effects test Statistic d.f. Probability
Cross-section F 1.906715 –74,659 0.0000
Cross-section Chi-squared 145.507 74 0.0000
Period F 8.357657 –9,659 0.0000
Period Chi-squared 81.06278 9 0.0000
Cross-section/period F 2.739911 –83,659 0.0000
Cross-section/period Chi-squared 222.3442 83 0.0000
Source: Author’s calculations.
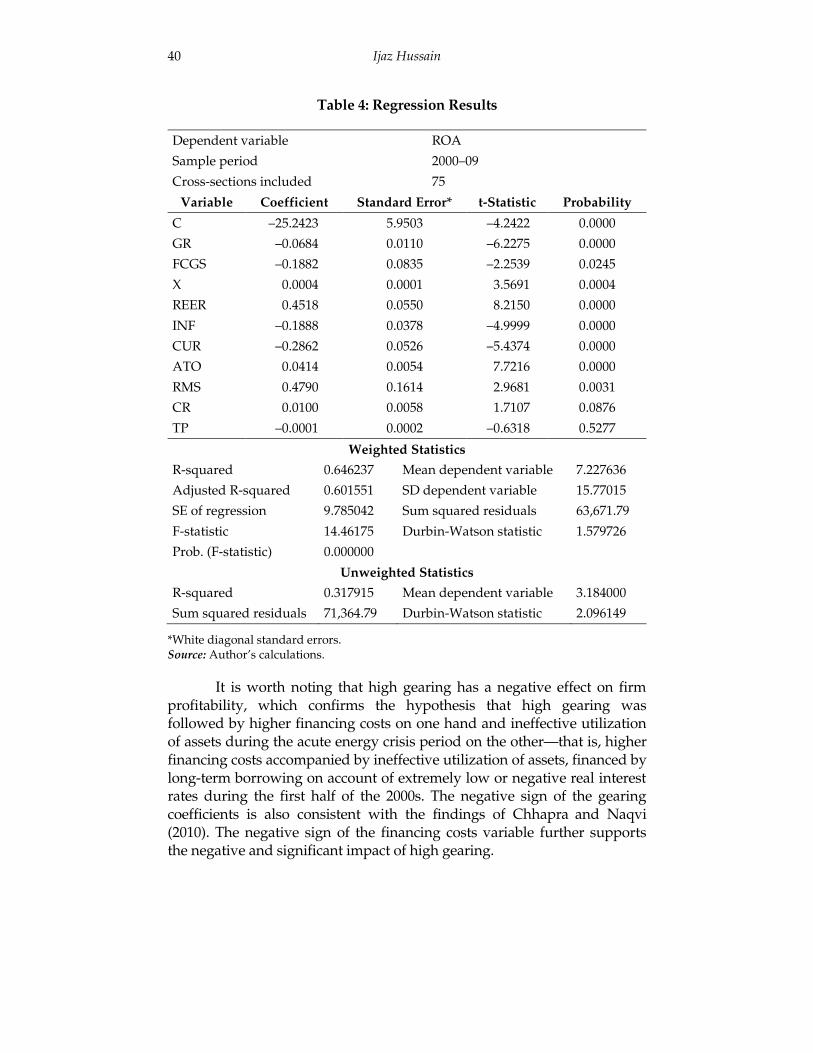
We also estimate a random effects model, to which we apply the Hausman (1978) test, the results of which lead us to reject endogeneity in the model. The variance between the coefficients of the random and fixed effects models is nonzero, which restricts us to relying on the fixed effects model alone. Table 4 presents the results of the cross-section fixed effects model.
40 Ijaz Hussain
Table 4: Regression Results
Dependent variable ROA
Sample period 2000–09
Cross-sections included 75
Variable Coefficient Standard Error* t-Statistic Probability
C –25.2423 5.9503 –4.2422 0.0000
GR –0.0684 0.0110 –6.2275 0.0000
FCGS –0.1882 0.0835 –2.2539 0.0245
X 0.0004 0.0001 3.5691 0.0004
REER 0.4518 0.0550 8.2150 0.0000
INF –0.1888 0.0378 –4.9999 0.0000
CUR –0.2862 0.0526 –5.4374 0.0000
ATO 0.0414 0.0054 7.7216 0.0000
RMS 0.4790 0.1614 2.9681 0.0031
CR 0.0100 0.0058 1.7107 0.0876
TP –0.0001 0.0002 –0.6318 0.5277
Weighted Statistics
R-squared 0.646237 Mean dependent variable 7.227636
Adjusted R-squared 0.601551 SD dependent variable 15.77015
SE of regression 9.785042 Sum squared residuals 63,671.79
F-statistic 14.46175 Durbin-Watson statistic 1.579726
Prob. (F-statistic) 0.000000
Unweighted Statistics
R-squared 0.317915 Mean dependent variable 3.184000
Sum squared residuals 71,364.79 Durbin-Watson statistic 2.096149
*White diagonal standard errors. Source: Author’s calculations.
It is worth noting that high gearing has a negative effect on firm profitability, which confirms the hypothesis that high gearing was followed by higher financing costs on one hand and ineffective utilization of assets during the acute energy crisis period on the other—that is, higher financing costs accompanied by ineffective utilization of assets, financed by long-term borrowing on account of extremely low or negative real interest rates during the first half of the 2000s. The negative sign of the gearing coefficients is also consistent with the findings of Chhapra
and Naqvi
(2010). The negative sign of the financing costs variable further supports the negative and significant impact of high gearing.
Easy Credit Policy, High Gearing, and Profitability in the Textile Sector 41
The study’s regression results show that, despite the global financial crisis, devaluation and the increase in international cotton prices have led to an improvement in the profitability of exporting firms.1 The positive sign of competitiveness and devaluation variable (REER) also supports the positive sign of the exports variable (X).
The negative impact of inflation is worth noting because a higher rate of inflation in Pakistan may cause foreign importers to switch to other countries, reducing demand and, therefore, firms’ operations to below capacity, in turn causing the latter’s profitability to decline. The negative sign of the industry’s CUR variable reveals that a higher CUR increases the market supply of textile output, leading to a decline in the price of textile products and, hence, in profitability.
Efficient firms, or firms with a higher ATO (those that make relatively more effective use of their assets) have a higher profitability rate. The positive relationship between size and profitability is interesting because larger firm size contributes to a more efficient cost structure due to the presence of economies of scale (see Whittington, 1980). The positive sign of the size variable contradicts the findings of Treacy (1980) and Ammar et al. (2003). The positive sign of the current ratio indicates that firms with better working capital management are more profitable. Tax provisions, however, have a negative but insignificant impact on firms’ profitability.
Those firms that opted for higher gearing in 2005 due to the extremely low nominal interest rate and negative real interest rate prevailing at the time have recently begun to face the consequences of high gearing. The subsequent energy crisis in the country has significantly impacted firms’ operations and, as a consequence, those with squeezed sales and higher financing costs on account of the higher interest-bearing debt are now subject to lower profitability or losses. This, in turn, has contributed to nonperforming loans, which could prove a challenge for the financial sector.
5. Conclusion and Policy Implications
This paper has examined the impact of an easy credit policy followed by high gearing, increased financing costs, and other determinants of the corporate profitability of textile firms in Pakistan. Of nine explanatory variables, including gearing, financing costs, inflation, tax
1 This is, however, not consistent with Grazzi’s (2009) results.
42 Ijaz Hussain
provisions, and the industry’s capacity utilization ratio, five have a negative impact on firm profitability, while four variables, including working capital management, asset turnover, exports, and competitiveness and devaluation, have a positive impact.
These results have serious implications for corporate managers and policymakers. They highlight that the consequences of a liberal credit policy must be considered in terms of corporate profitability and that corporate managers should be cautioned to refrain from opting for high financial leverage, instead keeping in mind likely long-term changes in economic conditions and the external environment. Managers can improve corporate profitability by better managing their working capital, improving asset turnover, benefitting from economies of scale by adjusting size in the long run, and enhancing export capacity especially during a devaluation of the local currency. Managers should also attempt to improve the quality of their products so that they are more competitive in international markets, which in turn will increase firms’ exports and profitability.
Easy Credit Policy, High Gearing, and Profitability in the Textile Sector 43
References
Ali, S. (2011). Working capital management and the profitability of the manufacturing sector: A case study of Pakistan’s textile industry. The Lahore Journal of Economics, 16 (2), 141–178.
Ammar, A., Hanna, A. S., Nordheim, E. V., & Russell, J. S. (2003). Indicator variables model of firm’s size-profitability relationship of electrical contractors using financial and economic data. Journal of Construction Engineering and Management, 129(2), 192–197.
Amjed, S. (2007, September). The impact of financial structure on profitability: Study of Pakistan’s textile sector . Poster session presented at the Management of International Business and Economic Systems Conference, Larissa, Greece. Retrieved from (http://mibes.teilar.gr/proceedings/2007/poster/Amjed.pdf).
Bain, J. S. (1951). Relation of profit rate to industry concentration: American manufacturing, 1936–1940. Quarterly Journal of Economics, 65(3), 293–324.
Bain, J. S. (1956). Barriers to new competition: Their character and consequences in manufacturing industries. Cambridge, MA: Harvard University Press.
Bartelsman, E. J., & Doms, M. (2000). Understanding productivity: Lessons from longitudinal microdata. Journal of Economic Literature, 38(3), 569–594.
Chhapra, I. O., & Naqvi, N. A. (2010). Relationship between efficiency level of working capital management and profitability of firms in the textile sector of Pakistan. Indus Journal of Management and Social Sciences, 4(1), 30–42.
Demsetz, H. (1973). Industry structure, market rivalry, and public policy. Journal of Law and Economics, 16(1), 1–9.
Government of Punjab. (n.d.). Production report, 2000–2011. Lahore, Pakistan: Textile Commissioner’s Organization. Retrieved from (http://www.tco.gov.pk/).
Grazzi, M. (2009). Trade and profitability: Is there an export premium? Evidence from Italian manufacturing firms (Working Paper No. 16). Pisa, Italy: Scuola Superiore Sant'Anna, Laboratory of Economics and Management.
44 Ijaz Hussain
Hausman, J. A. (1978). Specification tests in econometrics. Econometrica, 46(6), 1251–1271.
Jovanovic, B. (1982). Selection and the evolution of industry. Econometrica, 50(3), 649–670.
Lambson, V. E. (1991). Industry evolution with sunk costs and uncertain market conditions. International Journal of Industrial Organization, 9, 171–196.
Mauri, A. J., & Michaels, M. P. (1998). Firm and industry effects within strategic management: An empirical examination. Strategic Management Journal, 19(3), 211–219.
Raza, S. A., Farooq, M. S., & Khan, N. (forthcoming). Firm and industry effects on firm profitability: An empirical analysis of KSE. International Research Journal of Finance and Economics.
Schmalensee, R. (1989). Inter-industry studies of structure and performance. In R. Schmalensee & R. D. Willlig (Eds.), Handbook of industrial organization (Vol. II, pp. 952–1009). Amsterdam: North-Holland.
State Bank of Pakistan. (n.d.). Balance sheet analysis of joint stock companies listed on the Karachi Stock Exchange, Volume II, (2000–2009). Karachi.
State Bank of Pakistan. (2010a). Financial statements analysis of companies (non-financial) listed at Karachi Stock Exchange (2005–2010). Karachi.
State Bank of Pakistan. (2010b). Handbook of statistics on Pakistan economy. Karachi.
State Bank of Pakistan. (2010, December). Quarterly performance review of the banking system. Karachi.
State Bank of Pakistan. (2011, June). Financial soundness indicators (FSIs). Karachi.
Stierwald, A. (2010). Determinants of profitability: An analysis of large Australian firms (Working Paper No. 3/10). Melbourne: University of Melbourne, Melbourne Institute of Applied Economic and Social Research.
Treacy, M. (1980). Profitability patterns and firm size (Working Paper No. 1109-80). Cambridge, MA: Massachusetts Institute of Technology, Alfred P. Sloan School of Management.
Whittington, G. (1980). The profitability and size of United Kingdom companies, 1960–74. Journal of Industrial Economics, 28(4), 335–352.


