Embed Size (px)
Citation preview
IOSR Journal of Engineering (IOSRJEN) www.iosrjen.org
ISSN (e): 2250-3021, ISSN (p): 2278-8719
Vol. 04, Issue 12 (December 2014), ||V1|| PP 30-40
International organization of Scientific Research 30 | P a g e
The correlation of dry density and porosity of some rocks from
the Karoo Supergroup: A case study of selected rock types
between Grahamstown and Queenstown in the Eastern Cape
Province, South Africa
C. Baiyegunhi1, T.L. Oloniniyi
2, and O. Gwavava
1
1Department of Geology, Faculty of Science and Agriculture, University of Fort Hare, Private Bag X1314,
Alice, 5700, Eastern Cape Province, South Africa 2Department of Geology and Mining, Faculty of Natural and Applied Sciences, Nasarawa State University,
Keffi, Nasarawa State, Nigeria
Abstract: The correlation of dry density and porosity of some rocks from the Karoo Supergroup in the Eastern
Cape Province of South Africa was carried out in order to establish a relationship between the two parameters
that will possibly serve as a guide on the engineering design, especially on the type of casing materials to be
used when considering fracturing of the Karoo for shale gas. The densities of rock samples were determined
using the buoyancy determined volume. The correlation was determined by plotting a chart of particle density
against the porosity and fitting a least squares line through the data. The average densityvaluesrange from
2.5258 - 2.7723cm-3
.The average porosity values range from 0.4931–3.3095 %.The correlation coefficient
values R range from 0.9491 - 0.9982.The meanof the porosity values obtained from the model and those
determined in the laboratory are 1.7459 and 1.7476 respectively. The variance and standard deviation are
6.29 × 10⁻⁶and 2.51 × 10⁻³ respectively. It was deduced that the variables are closely correlated, thus
should be considered during engineering design.
Keywords: coefficient of correlation, dry density, porosity,Karoo Supergroup
I. Introduction
The Karoo Supergroup is a sedimentary basin with the most extensive stratigraphic unit in Africa,
making it part of the 75 % of sediments and sedimentary rocks covering the Earth (Tarbuck and Lutgens, 2011).
It was deposited nearly300 to 200 million years ago in the Late Carboniferous to Middle Jurassic period and has
its rocks covering almost half of the area of South Africa (Lurie, 2008).According to Catuneanu et al.(1998), the
Karoo Supergroup is believed to have originated from the Gondwana Supercontinent.Evidence in support of this
has been noted from the similarities in strata of the Carboniferous to Jurassic period, which is alike in all the
continents and islands of the Southern Hemisphere (Eicher, 1976).According to Smith (1990) in Catuneanu et
al. (1998), the main Karoo Basin in South Africa is a unique type of basin of all the Karoo basins in southern
Africabecause it contains the most complete, thickest and large sequence of the Late Carboniferous - Early
Jurassic age basins of palaeo-southwestern Gondwana that serves as a datum for classifying Karoo basins in
central and southern Africa (Figure 1).The Karoo Supergroup attains a maximum thickness of 12 km in the
southern part of the main Karoo Basin towards the eastern end of the Karoo(Catuneanu et al., 1998). The rocks
of the Karoo Supergroup occur in the main Karoo Basin in South Africa and other basins in the southern and
eastern Africa (Johnson et al., 1996;Bordy, et al.,2010). The majority of Southern Africa onshore fossil fuel is
found in the rocks of Karoo and current hydrocarbon(shale gas) investigations are focused mainly on the lower
Ecca Group (Prince Albert, Whitehill, and Collingham Formations).
The correlation of dry density and porosity of some rocks from the Karoo Supergroup: A case study of
International organization of Scientific Research 31 | P a g e
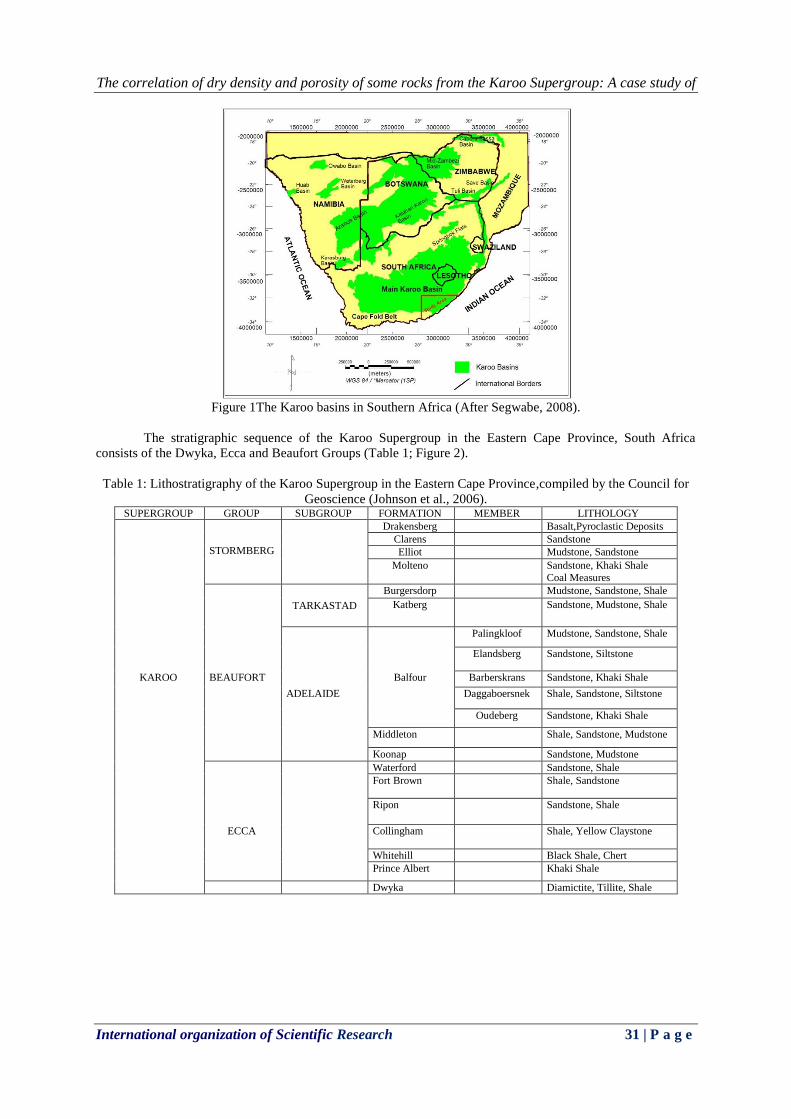
Figure 1The Karoo basins in Southern Africa (After Segwabe, 2008).
The stratigraphic sequence of the Karoo Supergroup in the Eastern Cape Province, South Africa
consists of the Dwyka, Ecca and Beaufort Groups (Table 1; Figure 2).
Table 1: Lithostratigraphy of the Karoo Supergroup in the Eastern Cape Province,compiled by the Council for
Geoscience (Johnson et al., 2006). SUPERGROUP GROUP SUBGROUP FORMATION MEMBER LITHOLOGY
STORMBERG
Drakensberg Basalt,Pyroclastic Deposits
Clarens Sandstone
Elliot Mudstone, Sandstone
Molteno Sandstone, Khaki Shale
Coal Measures
TARKASTAD
Burgersdorp Mudstone, Sandstone, Shale
Katberg Sandstone, Mudstone, Shale
Palingkloof Mudstone, Sandstone, Shale
Elandsberg Sandstone, Siltstone
KAROO BEAUFORT Balfour Barberskrans Sandstone, Khaki Shale
ADELAIDE Daggaboersnek Shale, Sandstone, Siltstone
Oudeberg Sandstone, Khaki Shale
Middleton Shale, Sandstone, Mudstone
Koonap Sandstone, Mudstone
Waterford Sandstone, Shale
Fort Brown Shale, Sandstone
Ripon Sandstone, Shale
ECCA Collingham Shale, Yellow Claystone
Whitehill Black Shale, Chert
Prince Albert Khaki Shale
Dwyka Diamictite, Tillite, Shale
The correlation of dry density and porosity of some rocks from the Karoo Supergroup: A case study of
International organization of Scientific Research 32 | P a g e
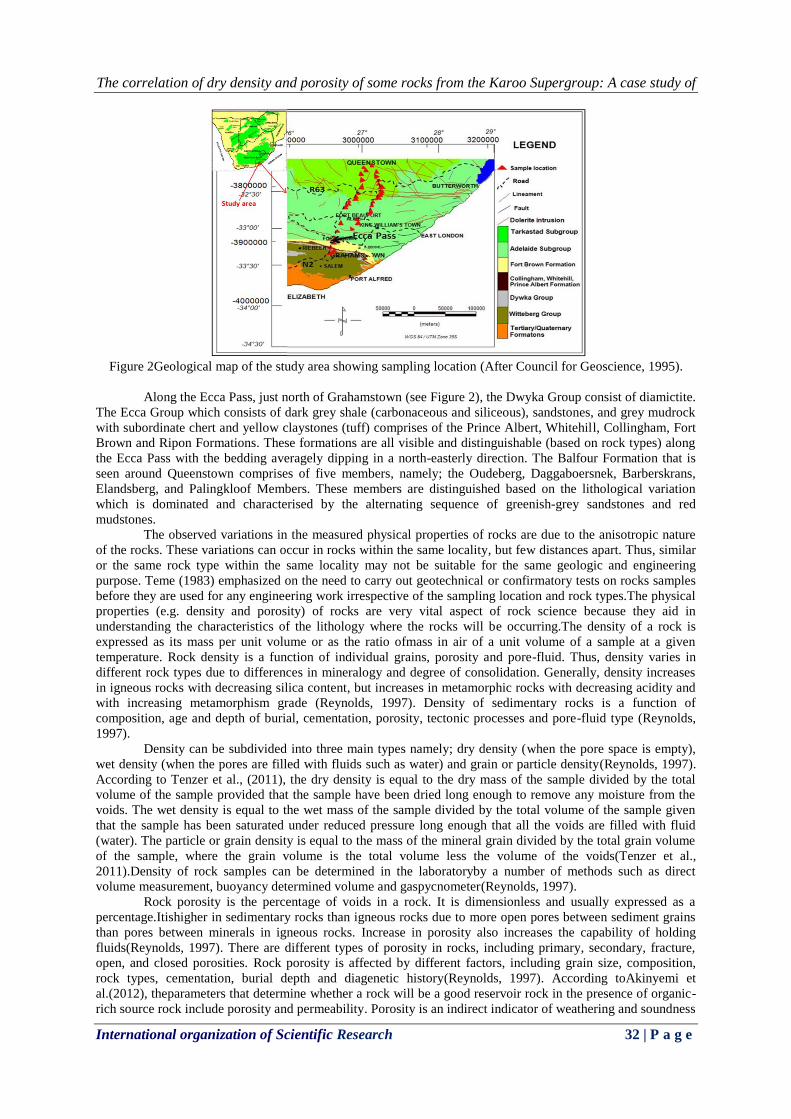
Figure 2Geological map of the study area showing sampling location (After Council for Geoscience, 1995).
Along the Ecca Pass, just north of Grahamstown (see Figure 2), the Dwyka Group consist of diamictite.
The Ecca Group which consists of dark grey shale (carbonaceous and siliceous), sandstones, and grey mudrock
with subordinate chert and yellow claystones (tuff) comprises of the Prince Albert, Whitehill, Collingham, Fort
Brown and Ripon Formations. These formations are all visible and distinguishable (based on rock types) along
the Ecca Pass with the bedding averagely dipping in a north-easterly direction. The Balfour Formation that is
seen around Queenstown comprises of five members, namely; the Oudeberg, Daggaboersnek, Barberskrans,
Elandsberg, and Palingkloof Members. These members are distinguished based on the lithological variation
which is dominated and characterised by the alternating sequence of greenish-grey sandstones and red
mudstones.
The observed variations in the measured physical properties of rocks are due to the anisotropic nature
of the rocks. These variations can occur in rocks within the same locality, but few distances apart. Thus, similar
or the same rock type within the same locality may not be suitable for the same geologic and engineering
purpose. Teme (1983) emphasized on the need to carry out geotechnical or confirmatory tests on rocks samples
before they are used for any engineering work irrespective of the sampling location and rock types.The physical
properties (e.g. density and porosity) of rocks are very vital aspect of rock science because they aid in
understanding the characteristics of the lithology where the rocks will be occurring.The density of a rock is
expressed as its mass per unit volume or as the ratio ofmass in air of a unit volume of a sample at a given
temperature. Rock density is a function of individual grains, porosity and pore-fluid. Thus, density varies in
different rock types due to differences in mineralogy and degree of consolidation. Generally, density increases
in igneous rocks with decreasing silica content, but increases in metamorphic rocks with decreasing acidity and
with increasing metamorphism grade (Reynolds, 1997). Density of sedimentary rocks is a function of
composition, age and depth of burial, cementation, porosity, tectonic processes and pore-fluid type (Reynolds,
1997).
Density can be subdivided into three main types namely; dry density (when the pore space is empty),
wet density (when the pores are filled with fluids such as water) and grain or particle density(Reynolds, 1997).
According to Tenzer et al., (2011), the dry density is equal to the dry mass of the sample divided by the total
volume of the sample provided that the sample have been dried long enough to remove any moisture from the
voids. The wet density is equal to the wet mass of the sample divided by the total volume of the sample given
that the sample has been saturated under reduced pressure long enough that all the voids are filled with fluid
(water). The particle or grain density is equal to the mass of the mineral grain divided by the total grain volume
of the sample, where the grain volume is the total volume less the volume of the voids(Tenzer et al.,
2011).Density of rock samples can be determined in the laboratoryby a number of methods such as direct
volume measurement, buoyancy determined volume and gaspycnometer(Reynolds, 1997).
Rock porosity is the percentage of voids in a rock. It is dimensionless and usually expressed as a
percentage.Itishigher in sedimentary rocks than igneous rocks due to more open pores between sediment grains
than pores between minerals in igneous rocks. Increase in porosity also increases the capability of holding
fluids(Reynolds, 1997). There are different types of porosity in rocks, including primary, secondary, fracture,
open, and closed porosities. Rock porosity is affected by different factors, including grain size, composition,
rock types, cementation, burial depth and diagenetic history(Reynolds, 1997). According toAkinyemi et
al.(2012), theparameters that determine whether a rock will be a good reservoir rock in the presence of organic-
rich source rock include porosity and permeability. Porosity is an indirect indicator of weathering and soundness
The correlation of dry density and porosity of some rocks from the Karoo Supergroup: A case study of
International organization of Scientific Research 33 | P a g e
and itgive clues to permeability as well as affects density of rocks.It can be determined indirectly and thus the
volume of fluids (e.g. water and hydrocarbon) in the pores can be estimated(Adameso et al., 2012; Akinyemi et
al., 2012).
Density and porosity of rocks from the Karoo Supergroup are important physical properties that
significantly affect mechanical properties of the rocks.Thus it help in determining geologic section, whether
rocks will support accumulation of hydrocarbon in areas that host source rock potential as well as designing
physical foundations that will aid in assessing the accumulated hydrocarbon from the surface(Adameso et al.,
2012). Researchers usually neglect establishing a relationship between particle density and porosity possibly due
to the fact that it is time and energy consuming and involve very low values that seem irrelevant, but very small
change in these values can lead to significant changes in the mechanical strength due to variation in the Uniaxial
Compressive Strength (UCS)(Akinyemiet al.,(2012). Thus, it might result in the destruction of the engineering
design leading to loss of lives and property. The correlation of density and porosity as well as performing
confirmatory test on the rocks will possibly help in solving this problem.
II. Methodology A total of one hundred and thirty-three (133) samples were collected along road cut exposure for
density measurement. The densities of rock samples were determined using the buoyancy determined volume,
which uses Archimedes’ principle.Mass of rocksamples were measured and recorded for each formation
according to how they were grouped during the field work. The recorded data were input in the Microsoft Excel
spreadsheet in preparation of density and porosity calculation. The correlation was determined by plotting a
chart of porosity against the particle density and fitting a least squares line through the data using the chart tools.
2.1 Procedures for measuring density of rock samples
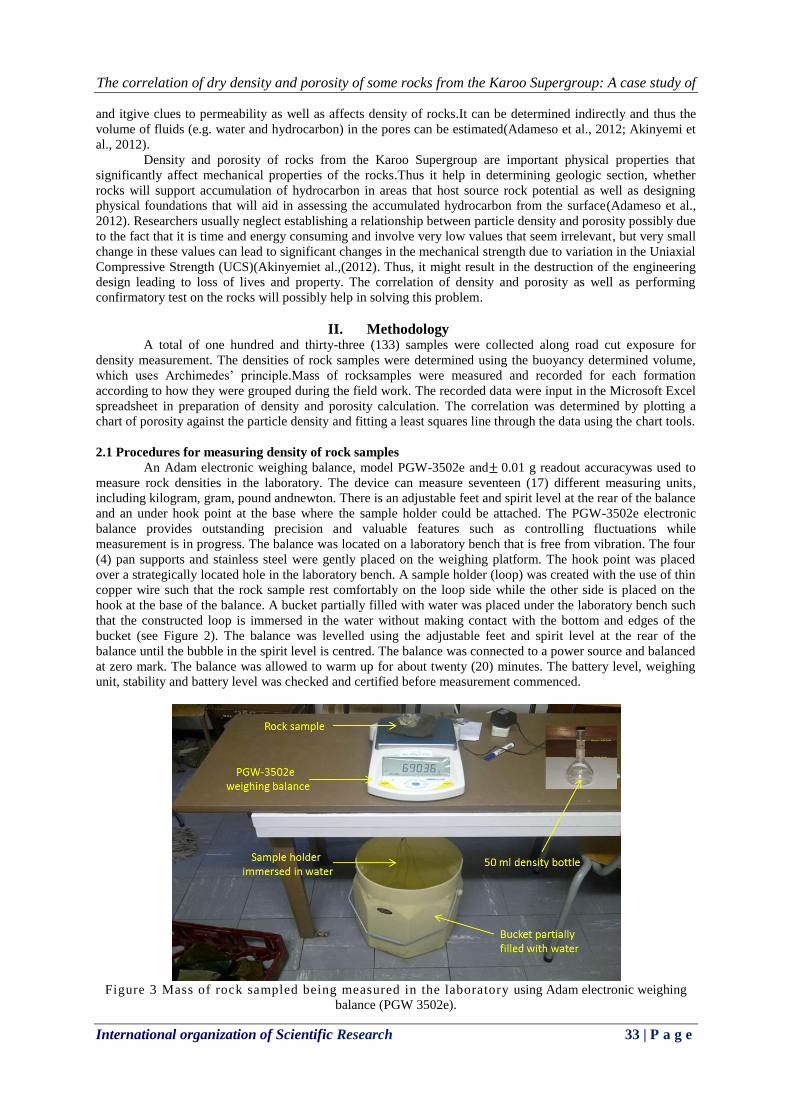
An Adam electronic weighing balance, model PGW-3502e and± 0.01 g readout accuracywas used to
measure rock densities in the laboratory. The device can measure seventeen (17) different measuring units,
including kilogram, gram, pound andnewton. There is an adjustable feet and spirit level at the rear of the balance
and an under hook point at the base where the sample holder could be attached. The PGW-3502e electronic
balance provides outstanding precision and valuable features such as controlling fluctuations while
measurement is in progress. The balance was located on a laboratory bench that is free from vibration. The four
(4) pan supports and stainless steel were gently placed on the weighing platform. The hook point was placed
over a strategically located hole in the laboratory bench. A sample holder (loop) was created with the use of thin
copper wire such that the rock sample rest comfortably on the loop side while the other side is placed on the
hook at the base of the balance. A bucket partially filled with water was placed under the laboratory bench such
that the constructed loop is immersed in the water without making contact with the bottom and edges of the
bucket (see Figure 2). The balance was levelled using the adjustable feet and spirit level at the rear of the
balance until the bubble in the spirit level is centred. The balance was connected to a power source and balanced
at zero mark. The balance was allowed to warm up for about twenty (20) minutes. The battery level, weighing
unit, stability and battery level was checked and certified before measurement commenced.
Figure 3 Mass of rock sampled being measured in the laboratory using Adam electronic weighing
balance (PGW 3502e).
The correlation of dry density and porosity of some rocks from the Karoo Supergroup: A case study of
International organization of Scientific Research 34 | P a g e
2.2 Determination of dry density
To determine dry densities for the samples, the rock samples were sun dried for days instead of oven
drying the samples to avoid damaging (cooking) of rock samples like shale. The sample was dried long enough
(e.g. in the sun or oven) to remove any moisture from the voids. The dry sample was placed on the weighing
balance and the mass in air was recorded as dMa . The same sample was placed on the loop that was immersed in
the water and the reading was quickly taken and recorded asdMb . This procedure was repeated for all other dry
samples. The dry density of the rock is expressed as:
Dry density ρdry
= dM a
dM a − dM b × ρ
w (1)
wheredMa = mass of dry sample in air; dMb= mass of sample in water and ρw
= density of water.
2.3 Determination of particle density
To determine the particle density, the samples were soaked for at least 24 hours in a container filled
with water to ensure that the pores spaces are completely filled or saturated with water. The soaked sample was
quickly transferred from the bath of water and placed on the loop that was immersed in the water in the bucket
and the reading was taken and recorded as dMc . This procedure was repeated for all other soaked rock samples.
The particle density of the rock is expressed as:
Particle density ρp =
dM a
dM a − dM c × ρ
w (2)
wheredMa= mass of sample in air; dMc= mass of wet sample in water and ρw
= density of water.
2.4 Determination of porosity
The sample porosity (Φ) was determined as the percentage of one (1) minus the ratio of dry density to
particle density (equation 3).
Porosity(Φ) = 1 − ρd
ρp
× 100% (3)
whereρd= dry density andρ
p = particle density.
2.5 Determination of wet density
The wet density was determined as the sum of dry density (ρdry
) with the product of porosity and
density of water (equation 4).
ρwet
= ρd
+ Φ × ρw (4)
whereρwet
= wet density;ρd= dry density; Φ = porosity; ρ
w= density of water.
The formulae for dry and particle densities require the density of water and without this; the
expressions are simply specific densities. In order to meet this requirement, a 50 ml density bottle was used to
determine the water density. The density bottle was weighed empty on the Adam PGW-3502e electronic
weighing balance and the mass recorded, and then it was completely filled with water, tightly sealed with the
stopper and weighed. The mass of the water was determined and the density was calculated.This was repeated
every hour throughout the course of weighing samples. An average water density of 1.022 g/cm3 was accurately
determined and applied when calculating the densities and porosities of the rock samples. It was observed that
the effect of temperature and pressure on the water density is negligible because the hourly densities of water
are almost constant throughout the experiment. The porosity and wet density were determined by applying the
derived formulae.
2.6 Determination of porosity and density relationship
The relationship between porosity and density was determined by plotting a graph of porosity against
particle density and a least squares best line fitted through the data using Microsoft Excel. The correlation
coefficient (R) and the coefficient of determination (R2) for the relationship between the two parameters were
determined and presented in Table 3.The equationfor all the formations was calculated and compared with the
values determined in the laboratory.
III. Results and discussion The results of the average dry, wet and particle densities and porosity of all the rock samples for the
several formations of the Karoo Supergroup is tabulated in Table 2.
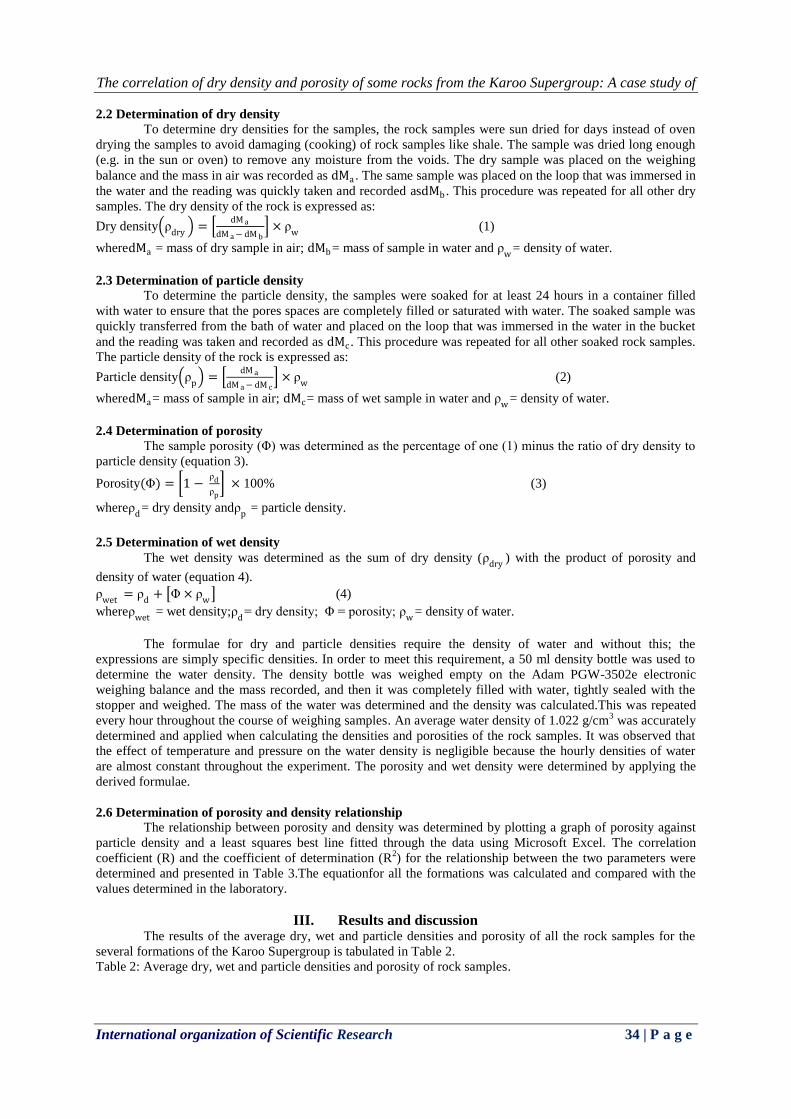
Table 2: Average dry, wet and particle densities and porosity of rock samples.
The correlation of dry density and porosity of some rocks from the Karoo Supergroup: A case study of
International organization of Scientific Research 35 | P a g e
FORMATION LITHOLOGY NUMBER
OF
SAMPLE
S
AVERAG
E
DRY
DENSITY
(gcm-3)
AVERAG
E
WET
DENSITY
(gcm-3)
AVERAGE
PARTICLE
DENSITY
(gcm-3)
AVERAGE
POROSIT
Y
(%)
Burgersdorp Sandstone 6 2.7407 2.7480 2.7604 0.7119
Katberg Sandstone 10 2.7430 2.7514 2.7659 0.8282
Palingkloof Sandstone 17 2.7163 2.7277 2.7469 1.1150
Elandsberg Sandstone 18 2.6740 2.6867 2.7075 1.2413
Barberskrans Sandstone 14 2.6831 2.6927 2.7084 0.9357
Daggaboersnek Sandstone 15 2.6985 2.7083 2.7244 0.9562
Oudeberg Sandstone 17 2.7723 2.7840 2.8044 1.1442
Middleton Mudstone 13 2.7316 2.7547 2.7949 2.2670
Koonap Sandstone 12 2.7708 2.7913 2.8277 2.0127
Fort Brown Shale 8 2.7564 2.7663 2.7835 0.9744
Ripon Shale 8 2.7615 2.7707 2.7867 0.9053
Collingham Shale/ tuff 12 2.6978 2.7122 2.7363 1.4075
Whitehill Black shale 23 2.5258 2.5596 2.6102 3.3095
Prince Albert Khaki shale 15 2.6411 2.6540 2.6748 1.2601
Dwyka Diamictite 11 2.6621 2.6671 2.6753 0.4931
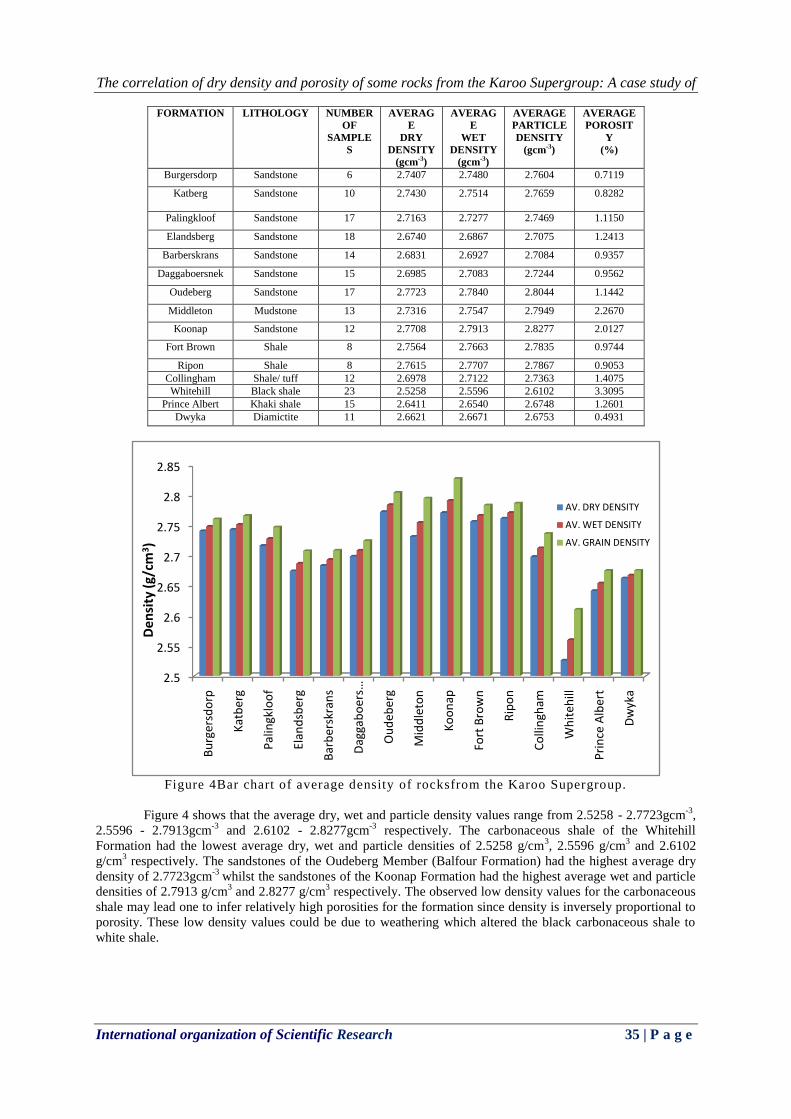
Figure 4Bar chart of average density of rocksfrom the Karoo Supergroup.
Figure 4 shows that the average dry, wet and particle density values range from 2.5258 - 2.7723gcm-3
,
2.5596 - 2.7913gcm-3
and 2.6102 - 2.8277gcm-3
respectively. The carbonaceous shale of the Whitehill
Formation had the lowest average dry, wet and particle densities of 2.5258 g/cm3, 2.5596 g/cm
3 and 2.6102
g/cm3 respectively. The sandstones of the Oudeberg Member (Balfour Formation) had the highest average dry
density of 2.7723gcm-3
whilst the sandstones of the Koonap Formation had the highest average wet and particle
densities of 2.7913 g/cm3 and 2.8277 g/cm
3 respectively. The observed low density values for the carbonaceous
shale may lead one to infer relatively high porosities for the formation since density is inversely proportional to
porosity. These low density values could be due to weathering which altered the black carbonaceous shale to
white shale.
2.5
2.55
2.6
2.65
2.7
2.75
2.8
2.85
Bu
rger
sdo
rp
Kat
ber
g
Pal
ingk
loo
f
Elan
dsb
erg
Bar
ber
skra
ns
Dag
gab
oer
s…
Ou
deb
erg
Mid
dle
ton
Ko
on
ap
Fort
Bro
wn
Rip
on
Co
llin
gham
Wh
iteh
ill
Pri
nce
Alb
ert
Dw
yka
De
nsi
ty (
g/cm
3)
AV. DRY DENSITY
AV. WET DENSITY
AV. GRAIN DENSITY
The correlation of dry density and porosity of some rocks from the Karoo Supergroup: A case study of
International organization of Scientific Research 36 | P a g e
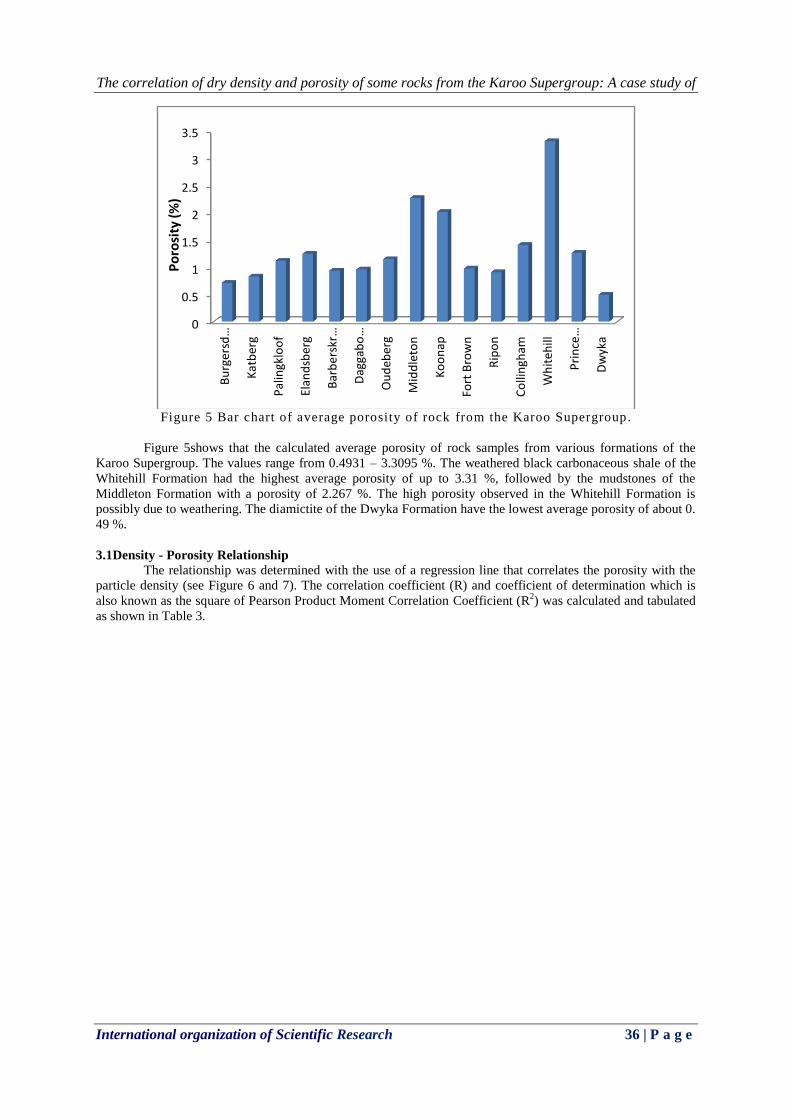
Figure 5 Bar chart of average porosity of rock from the Karoo Supergroup.
Figure 5shows that the calculated average porosity of rock samples from various formations of the
Karoo Supergroup. The values range from 0.4931 – 3.3095 %. The weathered black carbonaceous shale of the
Whitehill Formation had the highest average porosity of up to 3.31 %, followed by the mudstones of the
Middleton Formation with a porosity of 2.267 %. The high porosity observed in the Whitehill Formation is
possibly due to weathering. The diamictite of the Dwyka Formation have the lowest average porosity of about 0.
49 %.
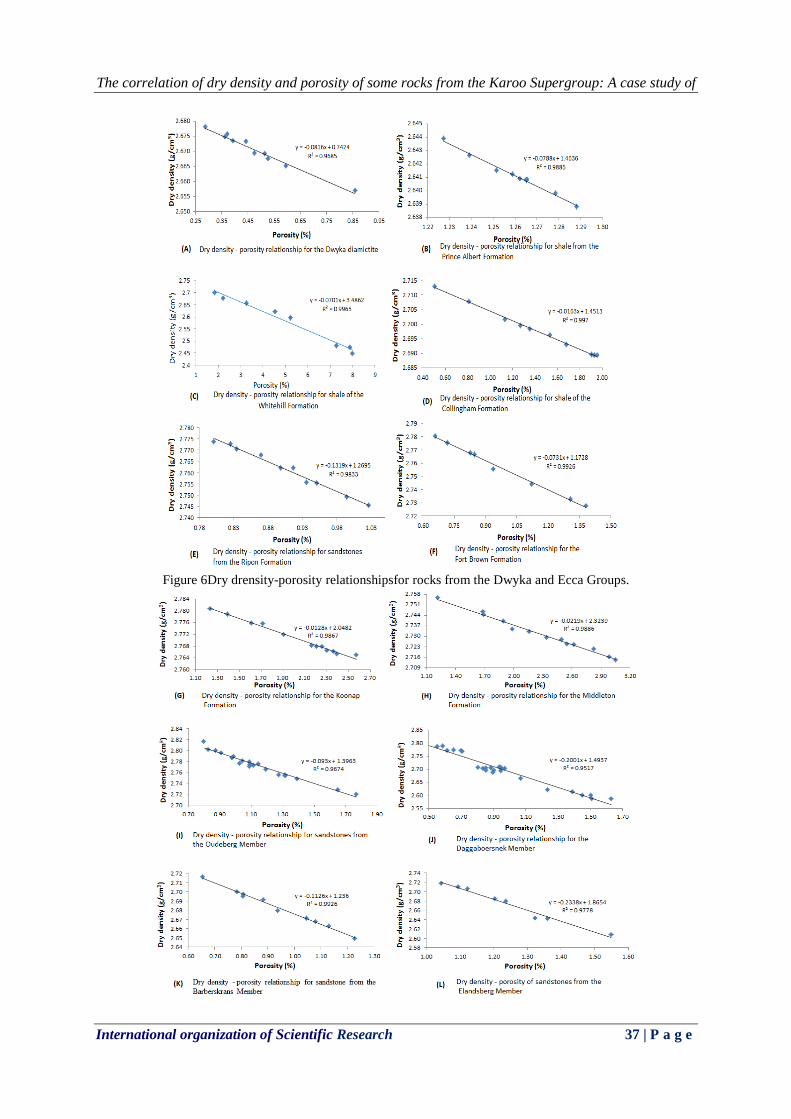
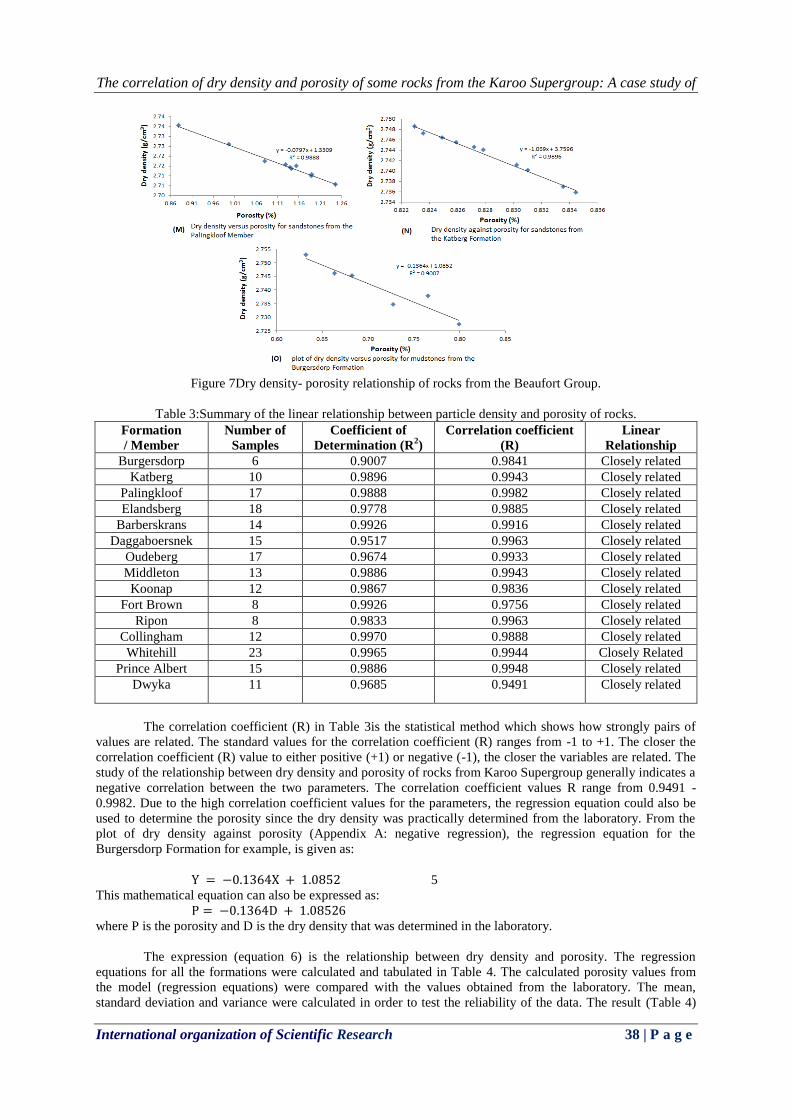
3.1Density - Porosity Relationship
The relationship was determined with the use of a regression line that correlates the porosity with the
particle density (see Figure 6 and 7). The correlation coefficient (R) and coefficient of determination which is
also known as the square of Pearson Product Moment Correlation Coefficient (R2) was calculated and tabulated
as shown in Table 3.
0
0.5
1
1.5
2
2.5
3
3.5
Bu
rger
sd…
Kat
ber
g
Pal
ingk
loo
f
Elan
dsb
erg
Bar
ber
skr…
Dag
gab
o…
Ou
deb
erg
Mid
dle
ton
Ko
on
ap
Fort
Bro
wn
Rip
on
Co
llin
gham
Wh
iteh
ill
Pri
nce
…
Dw
yka
Po
rosi
ty (
%)
The correlation of dry density and porosity of some rocks from the Karoo Supergroup: A case study of
International organization of Scientific Research 37 | P a g e
Figure 6Dry drensity-porosity relationshipsfor rocks from the Dwyka and Ecca Groups.
The correlation of dry density and porosity of some rocks from the Karoo Supergroup: A case study of
International organization of Scientific Research 38 | P a g e
Figure 7Dry density- porosity relationship of rocks from the Beaufort Group.
Table 3:Summary of the linear relationship between particle density and porosity of rocks.
Formation
/ Member
Number of
Samples
Coefficient of
Determination (R2)
Correlation coefficient
(R)
Linear
Relationship
Burgersdorp 6 0.9007 0.9841 Closely related
Katberg 10 0.9896 0.9943 Closely related
Palingkloof 17 0.9888 0.9982 Closely related
Elandsberg 18 0.9778 0.9885 Closely related
Barberskrans 14 0.9926 0.9916 Closely related
Daggaboersnek 15 0.9517 0.9963 Closely related
Oudeberg 17 0.9674 0.9933 Closely related
Middleton 13 0.9886 0.9943 Closely related
Koonap 12 0.9867 0.9836 Closely related
Fort Brown 8 0.9926 0.9756 Closely related
Ripon 8 0.9833 0.9963 Closely related
Collingham 12 0.9970 0.9888 Closely related
Whitehill 23 0.9965 0.9944 Closely Related
Prince Albert 15 0.9886 0.9948 Closely related
Dwyka 11 0.9685 0.9491 Closely related
The correlation coefficient (R) in Table 3is the statistical method which shows how strongly pairs of
values are related. The standard values for the correlation coefficient (R) ranges from -1 to +1. The closer the
correlation coefficient (R) value to either positive (+1) or negative (-1), the closer the variables are related. The
study of the relationship between dry density and porosity of rocks from Karoo Supergroup generally indicates a
negative correlation between the two parameters. The correlation coefficient values R range from 0.9491 -
0.9982. Due to the high correlation coefficient values for the parameters, the regression equation could also be
used to determine the porosity since the dry density was practically determined from the laboratory. From the
plot of dry density against porosity (Appendix A: negative regression), the regression equation for the
Burgersdorp Formation for example, is given as:
Y = −0.1364X + 1.0852 5
This mathematical equation can also be expressed as:
P = −0.1364D + 1.08526
where P is the porosity and D is the dry density that was determined in the laboratory.
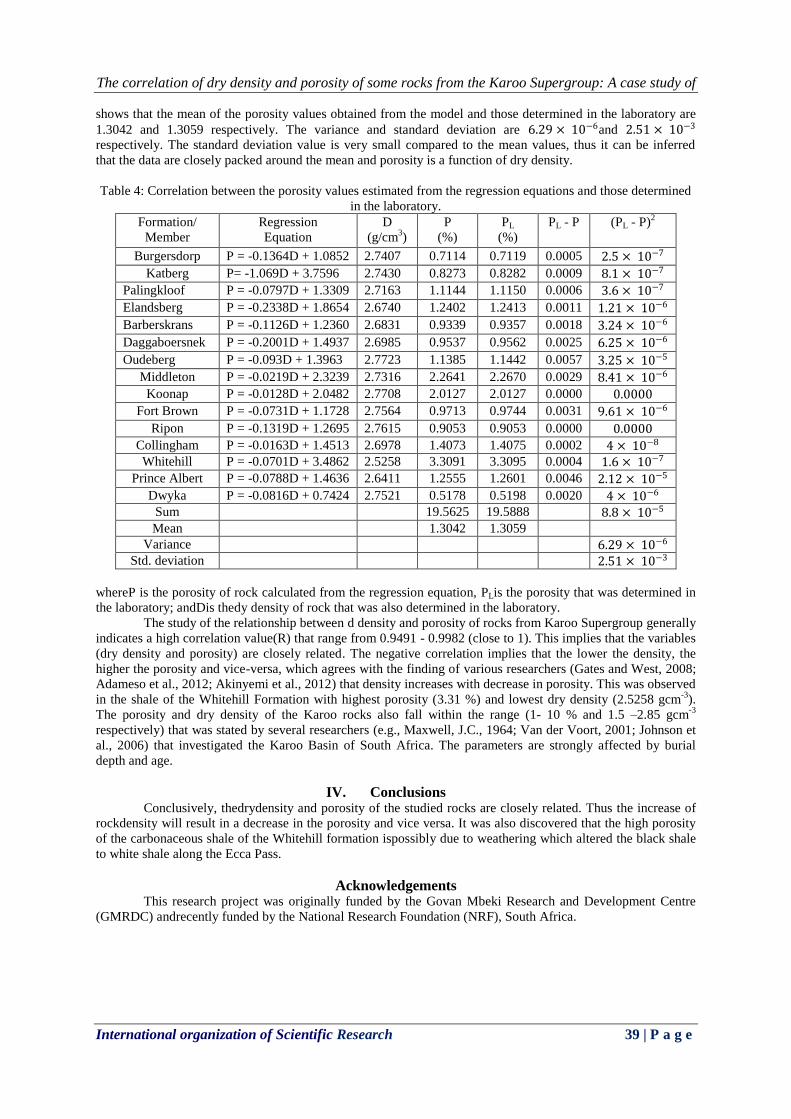
The expression (equation 6) is the relationship between dry density and porosity. The regression
equations for all the formations were calculated and tabulated in Table 4. The calculated porosity values from
the model (regression equations) were compared with the values obtained from the laboratory. The mean,
standard deviation and variance were calculated in order to test the reliability of the data. The result (Table 4)
The correlation of dry density and porosity of some rocks from the Karoo Supergroup: A case study of
International organization of Scientific Research 39 | P a g e
shows that the mean of the porosity values obtained from the model and those determined in the laboratory are
1.3042 and 1.3059 respectively. The variance and standard deviation are 6.29 × 10⁻⁶and 2.51 × 10⁻³
respectively. The standard deviation value is very small compared to the mean values, thus it can be inferred
that the data are closely packed around the mean and porosity is a function of dry density.
Table 4: Correlation between the porosity values estimated from the regression equations and those determined
in the laboratory.
Formation/
Member
Regression
Equation
D
(g/cm3)
P
(%)
PL
(%)
PL - P (PL - P)2
Burgersdorp P = -0.1364D + 1.0852 2.7407 0.7114 0.7119 0.0005 2.5 × 10⁻⁷
Katberg P= -1.069D + 3.7596 2.7430 0.8273 0.8282 0.0009 8.1 × 10⁻⁷
Palingkloof P = -0.0797D + 1.3309 2.7163 1.1144 1.1150 0.0006 3.6 × 10⁻⁷
Elandsberg P = -0.2338D + 1.8654 2.6740 1.2402 1.2413 0.0011 1.21 × 10⁻⁶
Barberskrans P = -0.1126D + 1.2360 2.6831 0.9339 0.9357 0.0018 3.24 × 10⁻⁶
Daggaboersnek P = -0.2001D + 1.4937 2.6985 0.9537 0.9562 0.0025 6.25 × 10⁻⁶
Oudeberg P = -0.093D + 1.3963 2.7723 1.1385 1.1442 0.0057 3.25 × 10⁻⁵
Middleton P = -0.0219D + 2.3239 2.7316 2.2641 2.2670 0.0029 8.41 × 10⁻⁶
Koonap P = -0.0128D + 2.0482 2.7708 2.0127 2.0127 0.0000 0.0000
Fort Brown P = -0.0731D + 1.1728 2.7564 0.9713 0.9744 0.0031 9.61 × 10⁻⁶
Ripon P = -0.1319D + 1.2695 2.7615 0.9053 0.9053 0.0000 0.0000
Collingham P = -0.0163D + 1.4513 2.6978 1.4073 1.4075 0.0002 4 × 10⁻⁸
Whitehill P = -0.0701D + 3.4862 2.5258 3.3091 3.3095 0.0004 1.6 × 10⁻⁷
Prince Albert P = -0.0788D + 1.4636 2.6411 1.2555 1.2601 0.0046 2.12 × 10⁻⁵
Dwyka P = -0.0816D + 0.7424 2.7521 0.5178 0.5198 0.0020 4 × 10⁻⁶
Sum 19.5625 19.5888 8.8 × 10⁻⁵
Mean 1.3042 1.3059
Variance 6.29 × 10⁻⁶
Std. deviation 2.51 × 10⁻³
whereP is the porosity of rock calculated from the regression equation, PLis the porosity that was determined in
the laboratory; andDis thedy density of rock that was also determined in the laboratory.
The study of the relationship between d density and porosity of rocks from Karoo Supergroup generally
indicates a high correlation value(R) that range from 0.9491 - 0.9982 (close to 1). This implies that the variables
(dry density and porosity) are closely related. The negative correlation implies that the lower the density, the
higher the porosity and vice-versa, which agrees with the finding of various researchers (Gates and West, 2008;
Adameso et al., 2012; Akinyemi et al., 2012) that density increases with decrease in porosity. This was observed
in the shale of the Whitehill Formation with highest porosity (3.31 %) and lowest dry density (2.5258 gcm-3
).
The porosity and dry density of the Karoo rocks also fall within the range (1- 10 % and 1.5 –2.85 gcm-3
respectively) that was stated by several researchers (e.g., Maxwell, J.C., 1964; Van der Voort, 2001; Johnson et
al., 2006) that investigated the Karoo Basin of South Africa. The parameters are strongly affected by burial
depth and age.
IV. Conclusions Conclusively, thedrydensity and porosity of the studied rocks are closely related. Thus the increase of
rockdensity will result in a decrease in the porosity and vice versa. It was also discovered that the high porosity
of the carbonaceous shale of the Whitehill formation ispossibly due to weathering which altered the black shale
to white shale along the Ecca Pass.
Acknowledgements This research project was originally funded by the Govan Mbeki Research and Development Centre
(GMRDC) andrecently funded by the National Research Foundation (NRF), South Africa.
The correlation of dry density and porosity of some rocks from the Karoo Supergroup: A case study of
International organization of Scientific Research 40 | P a g e
References [1]. O.A.Adameso, J.A.Adekoya, and B.M. Olaleye, The inter-relationship of bulk density and porosity of
some crystalline basement complex rocks: A case study of some rock type in South-western Nigeria.
ISOR Journal of Engineering, vol. 2 (4),2012, 555 -562.
[2]. O.D.Akinyemi, A.A.Alabi, A.I.Ojo, and O.E. Adewusi, Characterization of Density and Porosity of
Rocks Samples from Ogun State of Nigeria. Journal of African Earth Science Research, vol. 1, Issue
2,2012, 98p.
[3]. E. Bordy, T. Segwabe, and B, Makuke,Sedimentology of the Upper Triassic–Lower Jurassic Mosolotsane
Formation (Karoo Supergroup), Kalahari Karoo Basin, Botswana.Journal of African Earth Sciences, vol.
58, Issue 1,2010, 127 – 140.
[4]. E.T. Brown,Rock characterization, testing and monitoring - ISRM suggested methods, Pergamon Press.
201, 1981, 113-116.
[5]. O.Catuneanu, P.J. Hancox, and B.S. Rubidge, Reciprocal flexural behaviour and contrasting
stratigraphies: a new basin development model for the Karoo retroarc foreland system, South Africa.
Basin Research, vol. 10,1998, 417-439.
[6]. O.Catuneanu, H.Wopfner, P.G.Eriksson, B.Cairncross, B.S.Rubidge, R.M.H. Smith, and P.J. Hancox,
The Karoo basins of south-central Africa. Journal of African Earth Sciences, vol. 43,2005, 211-253.
[7]. Council for Geoscience/South African Institute of engineering and environmental geologists. Guideline
for engineering-geological characterisation and development of dolomitic land. Council for Geoscience
internal report 2006-0178, 2003, 10p.
[8]. D.L. Eicher, Geologic time (Prentice-Hall Publishers. 1976,87-89).
[9]. W.C.B. Gates, and P.K.West, Estimating the unconfined compressive strength of vessicular basalts via
bulk specific gravity of the rock Sample. The 42nd
U.S. Rock Mechanics Symposium, San Francisco, CA.
Paper No. 08, 2008, 131p.
[10]. M.R.Johnson, C.J.van Vuuren, W.F.Hegenberger, R.Key, and U. Shoko, Stratigraphy of the Karoo
Supergroup in southern Africa: an overview. Journal of African Earth Sciences, vol. 23,1996, 3–15.
[11]. M.R.Johnson, C.J.van Vuuren,J.N.J.Visser, D.I.Cole, H. de V.Wickens,A.D.M. Christie, D.L. Roberts,
and G. Brandl, Sedimentary Rocks of the Karoo Supergroup. In: M.R. Johnson,C.R. Anhaeusser, and
R.L. Thomas (Eds.), the Geology of South Africa. Geological Society of South Africa,
Johannesberg/Council for Geoscience, Pretoria. 2006, 461-499.
[12]. J. Lurie, South African Geology for mining, metallurgical, hydrological and civil engineering(10th
Edition. Lupon Publishing. 2008, 53-55).
[13]. J.C. Maxwell, Influence of depth; temperature and geological age on porosity of quartzose sandstones.
Bull. Amer. Assoc. Petrol. Geol., vol. 48, issue 5,1964, 697-709.
[14]. J.M.Reynold, An introduction to applied and environmental geophysics(John Wiley and Sons, NY, 1997,
35 – 42).
[15]. B. S. Rubidge, P. J.Hancox, and O.Catuneanu, Sequence analysis of the Ecca-Beaufort contact in the
Southern Karoo of South Africa. South Africa Journal of Geology, vol. 103,2000, 81-96.
[16]. T. Segwabe, The Geological Framework and Depositional Environments of the Coal-Bearing Karoo
Strata in the Central Kalahari Karoo Basin, Botswana. M.Sc thesis (unpublished.), Rhodes University,
South Africa, (2008). http://eprints.ru.ac.za/1737/1/Segwabe.pdf
[17]. E.J. Tarbuck, and F.K.Lutgens, Earth an introduction to physical geology (10th
Edition. Person Prentice
Hall Publishers.2011, 199–200).
[18]. S. C.Teme, The Engineering Geological Significance of the Point-Load Index Tests in Rock Material
Strength Evaluation. Nigerian Journal of Mining and Geology, vol. 20 (1&2),1983, 87-93.
[19]. R. Tenzer, P. Sirguey, M. Rattenbury, and J. Nicolson, A digital rock density map of Zealand. Computers
and Geosciences, vol. 37, issue 8,2011, 1181-1191.
[20]. I. Van der Voort, Risk based decision tool for managing and protecting groundwater resources. PhD
Thesis University of the Free State, Bloemfontein (unpublished),(2001).


