Embed Size (px)
Citation preview
Electronic copy available at: http://ssrn.com/abstract=1561926
The Dilemma of Direct Democracy
CRAIG M. BURNETT, ELIZABETH GARRETT & MATHEW D. McCUBBINS* The dilemma of direct democracy is that voters may not always be able to make welfare-
improving decisions. Lupia’s seminal work has led us to believe that voters can substitute voting
cues for substantive policy knowledge. Lupia, however, emphasized that cues were valuable
under certain conditions and not others. In what follows, we present three main findings
regarding voters and what they know about California’s Proposition 7. First, much like Lupia
reported, we show voters who are able to recall endorsements for or against a ballot measure
vote similarly to people who recall certain basic facts about the initiative. We show, second, that
voters whose stated policy preferences would otherwise suggest they would favor the “no”
position cast their ballots with far less error than do people who favor the “yes” position. One
thing this suggests is that many voters may employ a “defensive no” strategy when faced with
complex policy choices on the ballot. Our third result is a bit surprising: we find that better-
informed voters, whether this information is derived from factual knowledge of the initiative or
from knowledge of well-publicized voting cues, are no more likely to make reasoned decisions
than those who are, by our measure, uninformed. This suggests that existing theories of voter
choice, especially in direct democracy, may be inadequate. We conclude with some preliminary
policy recommendations that could help improve the information environment for initiatives and
referenda by providing key information on the ballot.
* Craig M. Burnett is Assistant Professor of Political Science at Appalachian State University. Elizabeth Garrett is Frances R. and John J. Duggan Professor of Law, Political Science and Public Policy at the University of Southern California Gould School of Law. Mathew D. McCubbins is Provost Professor of Business, Law, and Political Economy at the University of Southern California Marshall School of Business, Gould School of Law, and Department of Political Science. The authors thank Paul Moorman of the USC Law Library and Maya Herr-Anderson, Jonder Ho, Kloe Kmiec, David Lourie and A.J. Merton for research assistance. They also thank Bruce Cain, Chris Elmendorf, Rick Hasen, Vladimir Kogan, Daniel Lowenstein, John Shockley, Bob Stern, and two anonymous reviewers for helpful comments. Professor Garrett currently serves on the Fair Political Practices Commission, but the views expressed in this article do not necessarily reflect the views of other commissioners or FPPC staff.

Electronic copy available at: http://ssrn.com/abstract=1561926
1
I. Introduction
Democracy demands much of its citizens. Democracy asks them to hold office, to assess
facts as jurors, to provide testimony in public hearings, to select dozens of public officials at all
levels of government, and to approve public policy directly through popular initiatives,
constitutional amendments, and the approval or rejection of bond measures. While there are
questions about the ability of citizens to perform any and all of these activities, there is particular
consternation regarding vote choice, which is fundamental to a well-functioning democracy.1
The ability of voters to translate their preferences into ballot choices has long been the topic of
scholarly debate. The dilemma of direct democracy is that voters may not be capable of making
policy choices through initiatives and referenda that improve their welfare.
Daniel Lowenstein has pioneered the diagnosis and rehabilitation of this particular
dilemma. Many of his articles over the past three decades have focused on institutions that
govern the process of qualifying, campaigning, and voting on initiatives.2 His empirical
scholarship has shown how and when voters can make reasoned policy choices.3 Lowenstein has
also forcefully articulated the concern that voters who rely on voting cues provided by campaign
communications, such as slate mailers, are susceptible to manipulation by savvy political
1 See, e.g., Walter Lippmann, Public Opinion (1922); Angus Campbell, Philip E. Converse, Warren E. Miller & David E. Stokes, The American Voter (1960); Philip E. Converse, “The Nature of Belief Systems in Mass Publics,” in Ideology and Discontent (D.E. Apter ed., 1964); Larry M. Bartels, Uninformed Votes: Information Effects in Presidential Elections, 40 Am. J. Pol. Sci. 194 (1996). 2 See, e.g., Daniel Hays Lowenstein, Campaign Spending and Ballot Propositions: Recent Experience, Public Choice Theory and the First Amendment, 29 UCLA L. Rev. 505 (1982); Daniel H. Lowenstein, California Initiatives and the Single-Subject Rule, 30 UCLA L. Rev. 936 (1983). 3 See, e.g., Shanto Iyengar, Daniel H. Lowenstein & Seth Masket, The Stealth Campaign: Experimental Studies of Slate Mail in California, 17 J. L. & Pol. 295 (2001).

Electronic copy available at: http://ssrn.com/abstract=1561926
2
consultants hired by moneyed interests.4 Lowenstein’s empirical analysis grounds his proposals
to reform direct democracy so that initiatives and referenda can better serve the goal of
empowering ordinary citizens and grassroots movements.5
Drawing on Lowenstein’s work, as well as on other scholarship assessing voting
shortcuts, we seek to measure empirically what people know when they vote on a typical
initiative. Lupia’s influential paper on voting cues and voter competence in initiative elections
has shown that voters can learn from endorsements publicized during initiative campaigns.6 In
this article, we provide an additional empirical test of the efficacy of voting cues, using the
results of an exit poll concerning California’s Proposition 7 on the statewide ballot in November
2008.7 Proposition 7 would have required California public utilities to generate at least 50
percent of their energy output from renewable energy sources by the year 2025.
Analysis of our exit poll yields three main findings. First, we agree with Lupia’s
conclusion: voters who report knowing an information shortcut (e.g., who knew that the
electricity utilities opposed Proposition 7) make decisions that are indistinguishable from voters
who recall a basic set of facts about the measure (i.e., who could answer a short list of summary
questions about the proposed policy). Lupia’s analysis – and subsequent research on direct
democracy – assumes, but never tests, that knowledgeable voters will be better able to translate
their preferences into a vote choice. Surprisingly, we discover that this is not so: knowledge is
not power. Whether or not voters knew the set of facts we asked regarding Proposition 7 and
4 See, e.g., id. at 330-32. 5 See, e.g., Daniel Hays Lowenstein & Robert M. Stern, The First Amendment and Paid Initiative Petition Circulators: A Dissenting View and a Proposal, 17 Hastings Const. L.Q. 175 (1989). 6 Arthur Lupia, Shortcuts versus Encyclopedias: Information and Voting Behavior in California Insurance Reform Elections, 88 Am. Pol. Sci. Rev. 63 (1994). Arthur Lupia & Mathew D. McCubbins, The Democratic Dilemma: Can Citizens Learn What They Need to Know? (1998), extended, formalized, and tested Lupia’s theory experimentally and found additional support for his empirical results. 7 For a description of Proposition 7, including its text, see Secretary of State, Official Voter Information Guide for the California General Election on November 4, 2008, available at http://voterguide.sos.ca.gov/past/2008/general/title-sum/prop7-title-sum.htm.

3
whether or not voters knew the voting cue of the utility companies’ position against Proposition
7, they were invariable in their ability to make vote choices that aligned with their stated policy
preferences. Specifically, our second finding is that most voters – even those who could not
recall credible voting cues or the most basic details of the ballot proposition – cast their votes in
a manner consistent with their stated policy preferences regarding the state’s energy policy.8 The
lack of a palliative effect of recalled knowledge on this initiative vote stands in stark contrast to
findings concerning votes in candidate elections.9 Third, our results are also consistent with
Bowler and Donovan’s conclusion that voters seem to cast a “no” vote as a defense against
complicated ballot measures.10 In particular, we discover that the proportion of voters who
expressed support for renewable energy but voted against the measure is far greater than the
proportion of voters who voted in favor of the measure despite opposing renewable energy.11
Following Lowenstein’s example, our results suggest the need to consider certain reforms
to the institutional structure of direct democracy in California. Specifically, we recommend that
ballot measures themselves could contain more – and more useful – information, thereby
increasing the chance that voters will find and use trustworthy cues. Additional information on
the ballot would provide voters with more facts at the “point of sale”; even for knowledgeable
voters, it reminds them to use the information they already posses. Although we find that most
voters, no matter what their level of knowledge, vote consistently with their preferences, there
8 We use the terms “reasoned voting,” “consistent voting,” and “competent voting” to mean the same thing, namely, that voters “cast the same votes they would have cast had they possessed all available knowledge about the policy consequences of this decision.” Elisabeth R. Gerber & Arthur Lupia, “Voter Competence in Direct Legislation Elections,” in Citizen Competence and Democratic Institutions 147, 149 (S.L. Elkins & K.E. Soltan eds., 1999). See also Craig M. Burnett & Mathew D. McCubbins, Informed Democracy? 11 (unpublished manuscript 2010). 9 Bartels, for example, finds that voters who have less knowledge of presidential candidates make decisions inconsistent with their policy preferences more often than informed voters. Bartels, supra note 1, at 209, 221. 10 Shaun Bowler & Todd Donovan, Demanding Choices: Opinion, Voting, and Direct Democracy 33-35 (1998). 11 Of course, as has been suggested to us, it is possible that Proposition 7 was not very good policy, and thus voters who supported renewable energy may have voted against it not out of error but instead out of a deeper understanding of the proposed policy. If this is true, then all of the other voters who preferred renewable energy, but who voted for the measure, cast erroneous votes; we have to question voters’ ability to cast informed votes at all.

4
are still significant numbers of voters who seem to make erratic vote choices. Including crucial
information on the ballot could improve the decision-making of these voters. In making this
recommendation, we are aware that information provided on the ballot itself may carry with it
disproportionate power to set the agenda, and we suggest ways to attenuate the official power to
inform.
This article proceeds as follows. In Part II, we provide a brief discussion of the previous
theoretical, experimental, and empirical scholarship regarding voter competence and direct
democracy. We also formulate a set of hypotheses based on that scholarship. In Part III, we
describe our data and the proposition that we studied. In Part IV, we outline our research design
and methods. In Part V, we present our results. We conclude in Part VI with discussion of what
our results mean for direct democracy, and we offer, in a preliminary way, reforms that may help
improve voter competence in low-information elections.
II. Voting Cues and Voter Competence: A Brief Review
Political scientists have observed that ordinary citizens do not know much about
candidates, politics, or policy.12 Voters know even less about the relevant facts and arguments
concerning most ballot measures than they do about candidates (at least those candidates at the
top of the ticket who capture the attention of most scholars). Moreover, propositions do not
provide voters with effective voting cues found on the ballot in candidate elections: gender,
ethnicity, occupation (in some states), and, especially, partisan affiliation.13
12 See, e.g., Michael X. Delli Carpini & Scott Keeter, What Americans Know About Politics and Why It Matters (1996); Philip E. Converse, “Voting Systems and the Representation of Public Opinion,” in Handbook of Political Science 79 (F.I. Greenstein & N.W. Polsby eds., 1975). 13 For work discussing the strength of the party cue in candidate elections, see, e.g., Campbell, Converse, Miller & Stokes, supra note 1; Gary C. Jacobson, The Politics of Congressional Elections 119-22 (7th ed. 2009). On the relevance of demographic information, see, e.g., Samuel L. Popkin, The Reasoning Voter: Communication and Persuasion in Presidential Campaigns 60-65 (1991). On the relevance of race, gender and occupation, see, e.g., Monika L. McDermott, Race and Gender Cues in Low-Information Elections, 51 Pol. Res. Q. 895 (1998); Monika L. McDermott, Candidate Occupations and Voter Information Shortcuts, 67 J. Pol. 201 (2005).

5
Scholars have produced theoretical, experimental, and empirical work designed to
identify when shortcuts can enhance voter competence. Lupia and McCubbins provide a
theoretical framework for determining when voters can learn from endorsements and can
therefore substitute this cue for personal knowledge and experience.14 They find that under some
conditions, endorsements by knowledgeable and trustworthy groups or individuals can provide
voters effective cues for initiatives and referenda. Additionally, they demonstrate that
institutions can establish some of the conditions for trust by imposing penalties for lying, by
providing credible methods of verification, or by disclosing the expenditures of groups seeking
to communicate their positions. For example, accurately knowing the position of a group with
well-known ideological commitments or economic interests, such as the National Rifle
Association, the Sierra Club, the American Association of Retired Persons, the insurance
industry, tobacco companies, or labor unions, can provide a shortcut. Information about how
much money the group is spending in the campaign can enhance the effectiveness of the
endorsement as a voting cue by suggesting the intensity with which the group and its members
hold their views.15 A vigorous two-sided campaign that may catch the eye of uninterested voters
does not accompany all state ballot measures, however. As a result, not all the information
provided to voters through official channels or material generated by campaigns can serve as
effective voting cues.
Do voters, when facing complex decision environments, choose to “just vote no”?
Bowler and Donovan believe that they do, and argue that the “defensive no” is the default
14 Lupia & McCubbins, supra note 6. 15 For a discussion of such cues, see Elizabeth Garrett, “Direct Democracy,” in Research Handbook in Public Choice and Public Law 137, 151-55 (D.A. Farber & A.J. O’Connell eds., forthcoming 2010).

6
position for voters who they assume are generally risk averse.16 To date, however, there has
been no direct test of this hypothesized default response.
With this background in mind, we formulate a set of hypotheses about knowledge and
voting. In particular, we examine four hypotheses based on the extant literature’s predictions:
• First, as Lupia and Lupia and McCubbins have found, knowing a trustworthy
endorsement can equal knowledge of the facts in their influence on vote choice.
We therefore hypothesize that voters who know a trustworthy endorsement will
make reasoned choices – that is, they will cast votes that are consistent with their
policy preferences – as often as do voters who know basic facts about the
proposed policy.
• Second, we hypothesize that individuals who recall the basic facts of a ballot
measure will be able to make reasoned choices more often than do voters who
have neither a basic knowledge of the facts nor a trustworthy voting cue.
• Third, we hypothesize that individuals who have knowledge of a trustworthy
endorsement will be able to make reasoned choices more often than do voters
who have neither a basic knowledge of the facts nor a trustworthy voting cue.
• Fourth, if voters adopt a “defensive no strategy,” then we hypothesize that
individuals who disfavor a proposed policy will vote in accordance with their
policy preference more often than voters who favor a proposed policy.
These hypotheses, of course, hold all other factors constant. If we reject any of the above
predictions, we need to rethink the existing theories concerning how voters make decisions on
ballot measures.
16 Bowler & Donovan, supra note 10, at 34-35.

7
III. Surveying Voters’ Knowledge about California’s Proposition 7
We use data from interviews undertaken during the November 4, 2008, general election
to test our four hypotheses. We conducted the survey in San Diego, California, at 13 polling
locations covering 19 precincts. We gathered responses from voters as they exited their voting
location from the opening (7:00 a.m.) to the closing (8:00 p.m.) of the polls. Student volunteers
asked every other departing voter to participate in an interview in order to randomize our
sample.17 We asked 2,053 voters to participate; 1,002 complied, for a response rate of 49.9
percent. While not a representative sample, we are confident that this sampling structure allows
us to assess our hypotheses using a within-subjects design. 18 In other words, we do not have any
reason to suspect that our sampling structure correlates with our treatment variables. Similar to
Lupia’s study, we sample a single city during one election; however, we do not believe that our
San Diego sample differs substantially from other cities in California.
17 We trained our student volunteers about how to conduct interviews about a week before the election. Each student volunteer worked a three and one-half hour shift; our volunteers received extra credit for their effort. 18 As the table below highlights, our respondents are more likely to be Caucasian and more educated than the 2000 Census. Moreover, our sample was 8 percent more likely to vote for Obama in the 2008 election. The remaining demographics come close to matching the 2000 Census, which suggests that we obtained a reasonable snapshot of San Diego voters. Because we obtained a reasonable sample, we are confident that our results would not be different if we had a 100 percent response rate.
Survey 2000 Census of San Diegoa
Age Median between 36-45; 7.8% > 65 yrs. Median age 32b; 10.5% > 65 yrs. Household Income Median between $50-100,000 $45,733 HS Diploma (Age > 25) 99% 82.8% College Degree (Age > 25) 71.9% 35% Female 48.6% 49.6% Asian or Pacific Islander 8.2% 13.6% Black 2.7% 7.9% Latino 8.4% 25.4% Caucasian 72.7% 60.2% More than one race 4.3% – Vote % for Obama 70.9% 62.6%c
a Census data are available here: http://quickfacts.census.gov/qfd/states/06/0666000.html b Median age provided by the city of San Diego, available here: http://www.sandiego.gov/economic-development/glance/sdfacts.shtml c Presidential vote results by city are available from the California Secretary of State: http://www.sos.ca.gov/elections/sov/2008_general/ssov/5-pres-political-dists-within-counties.xls

8
Among other things, we asked respondents to answer questions about California’s
Proposition 7.19 Proposition 7 was a complicated policy proposal with potentially large effects
on each household. It would have required California’s public utility companies to generate at
least 50 percent of their energy from renewable sources by 2025. Significantly, the initiative did
not limit how much California residents’ utility bills could increase; large increases in the
average utility bill were probable.20
The campaign surrounding Proposition 7 was typical for California initiatives that affect
well-funded interests. We sought to avoid ballot questions on the one hand that commanded
extraordinary public interest or were characterized by prodigious political campaigns, and on the
other hand that were entirely obscure. Notwithstanding its likely effect on voters’ welfare,
Proposition 7 did not capture the interest of most voters, in part because on the same November
2008 ballot there was a momentous presidential election and two controversial and expensive
initiatives (Propositions 4 and 8).21 Proposition 7 was not obscure, however. The supporting and
opposing campaigns spent almost $10 million and $30 million, respectively.22 Peter Sperling,
heir to the University of Phoenix fortune,23 bankrolled the campaign in support of Proposition 7.
19 The official title, summary, and voter information guide provided by the Secretary of State are available here: http://voterguide.sos.ca.gov/past/2008/general/title-sum/prop7-title-sum.htm. 20 The official fiscal analysis of Proposition 7 – prepared by the Legislative Analyst – concluded that “[i]n the short term, the prospects for higher rates – and therefore higher costs, lower sales and income tax revenues, and higher local utility tax revenues – are more likely. In the long term, the impact on electricity rates, and therefore state and local government costs and revenues, is unknown.” See Official Voter Information Guide, available at http://voterguide.sos.ca.gov/past/2008/general/title-sum/prop7-title-sum.htm. 21 Proposition 4 (http://voterguide.sos.ca.gov/past/2008/general/title-sum/prop4-title-sum.htm) was an initiative constitutional amendment that would have required doctors to provide notification to the legal guardian(s) of a minor seeking an abortion. Proposition 8 (http://voterguide.sos.ca.gov/past/2008/general/title-sum/prop8-title-sum.htm) defined marriage as a union between a man and a woman. It generated a substantial campaign with endorsers and opponents spending well over $70 million. 22 For campaign finance details, see the California Secretary of State campaign finance database: http://cal-access.ss.ca.gov/Campaign/Measures/Detail.aspx?id=1303161&session=2007. 23 See infra text accompanying notes 61 through 62 (discussing Sperling’s involvement in the Proposition 7 campaign).

9
The coalition of groups opposing Proposition 7 included Edison International, Pacific Gas &
Electric (PG&E), and Sempra Energy.
We asked our respondents to answer five questions about Proposition 7, interspersed
among questions about other ballot measures, candidates, and many individual-level covariates.
The questions directly relevant to Proposition 7, in the order we asked them, are:
(1) Do you favor or oppose requiring California’s public utilities to increase the amount
of power they generate from renewable energy substantially, even if it means higher
electricity rates?
(2) Under Proposition 7, what percent of California’s energy would be required to come
from renewable sources by 2025? (The correct answer was 50 percent.)
(3) True or False: Proposition 7 does not limit potential energy bill increases for
Californians. (That statement is true.)
(4) How did you vote on Proposition 7?
(5) Do you happen to know if gas and electric companies supported, opposed or took no
position on Proposition 7 (the one about renewable energy generation)? (They had
opposed the proposition.)
The first question assessed the voters’ underlying preferences about renewable energy
even if their own electricity bills might increase. We asked Question (1) at the beginning of the
survey before asking Question (2) through (5) to obtain voters’ fundamental policy preference on
the issue raised by the proposition. This question sets our baseline for evaluating whether voters
were able to make a reasoned choice; that is, to what extent they report voting consistently with
10
their answer to Question (1).24 By design, Question (1) does not measure the respondent’s actual
support for Proposition 7. We discuss the importance of this below.
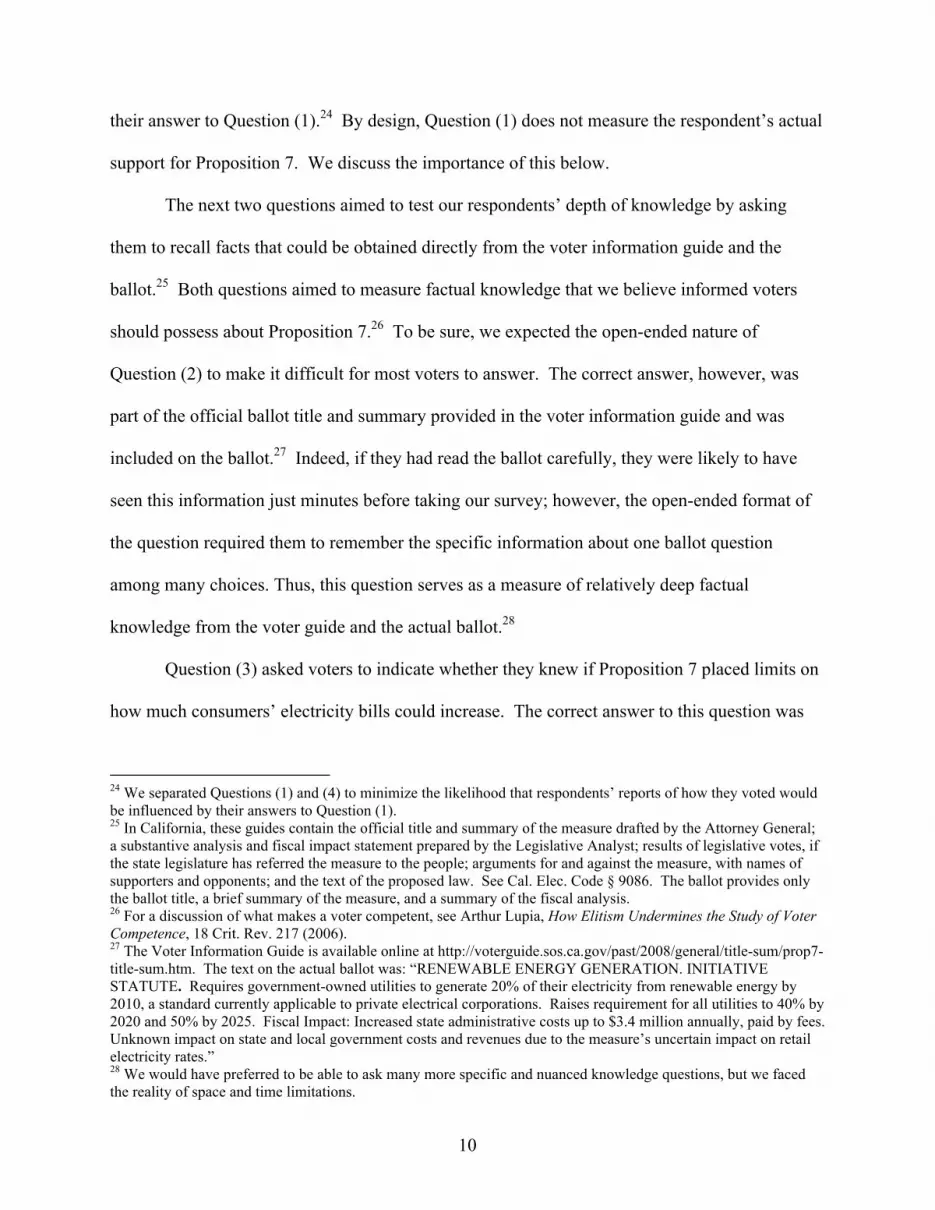
The next two questions aimed to test our respondents’ depth of knowledge by asking
them to recall facts that could be obtained directly from the voter information guide and the
ballot.25 Both questions aimed to measure factual knowledge that we believe informed voters
should possess about Proposition 7.26 To be sure, we expected the open-ended nature of
Question (2) to make it difficult for most voters to answer. The correct answer, however, was
part of the official ballot title and summary provided in the voter information guide and was
included on the ballot.27 Indeed, if they had read the ballot carefully, they were likely to have
seen this information just minutes before taking our survey; however, the open-ended format of
the question required them to remember the specific information about one ballot question
among many choices. Thus, this question serves as a measure of relatively deep factual
knowledge from the voter guide and the actual ballot.28
Question (3) asked voters to indicate whether they knew if Proposition 7 placed limits on
how much consumers’ electricity bills could increase. The correct answer to this question was
24 We separated Questions (1) and (4) to minimize the likelihood that respondents’ reports of how they voted would be influenced by their answers to Question (1). 25 In California, these guides contain the official title and summary of the measure drafted by the Attorney General; a substantive analysis and fiscal impact statement prepared by the Legislative Analyst; results of legislative votes, if the state legislature has referred the measure to the people; arguments for and against the measure, with names of supporters and opponents; and the text of the proposed law. See Cal. Elec. Code § 9086. The ballot provides only the ballot title, a brief summary of the measure, and a summary of the fiscal analysis. 26 For a discussion of what makes a voter competent, see Arthur Lupia, How Elitism Undermines the Study of Voter Competence, 18 Crit. Rev. 217 (2006). 27 The Voter Information Guide is available online at http://voterguide.sos.ca.gov/past/2008/general/title-sum/prop7-title-sum.htm. The text on the actual ballot was: “RENEWABLE ENERGY GENERATION. INITIATIVE STATUTE. Requires government-owned utilities to generate 20% of their electricity from renewable energy by 2010, a standard currently applicable to private electrical corporations. Raises requirement for all utilities to 40% by 2020 and 50% by 2025. Fiscal Impact: Increased state administrative costs up to $3.4 million annually, paid by fees. Unknown impact on state and local government costs and revenues due to the measure’s uncertain impact on retail electricity rates.” 28 We would have preferred to be able to ask many more specific and nuanced knowledge questions, but we faced the reality of space and time limitations.

11
not as clear from the officially sanctioned sources of information as was the answer to Question
(2). The fiscal impact summary contained on the ballot stated only that the measure would have
an “uncertain impact on retail electricity rates.” Accordingly, we used a true or false question
format to provide our respondents with a binary choice. We chose this question because the
opponents of the measure emphasized in their arguments in the voter information guide and in
ads funded by the electricity companies that consumer electricity bills could increase
substantially, given the absence of rate controls in the measure.
Question (4), whether the respondent voted “yes” or “no,” is the dependent variable in
our study. Much of our analysis is based on the assumption that Questions (1) and (4) should
elicit similar responses from rational voters informed of the content of Proposition 7. Using a
baseline policy preference (Question (1)) to account for vote choice on a ballot measure
(Question (4)) is equivalent to using self-reported party identification or ideology to account for
candidate vote choice, a common approach in voting behavior studies.
Question (5) asked respondents to report whether they knew the position that the
electricity companies took on Proposition 7, as they were the most prominent opponents of the
bill. This was arguably the most effective information shortcut for the ballot measure. The
electricity companies bankrolled the almost $30 million campaign to defeat the proposition,
thereby concretely demonstrating the intensity of their preference to retain the status quo. The
industry’s position was hard for attentive voters to miss. Moreover, utilities were credible cue-
givers because they have expertise about electricity generation and they have a well-defined and
understandable profit motive. Voters can assess whether the interests of the energy companies
align with their own interests. Thus, this question allowed us to measure the differences between
those voters who knew and those who did not know about a key group endorsement.

12
There were 41 questions on the survey. A typical interview took about ten minutes to
complete. Accordingly, there was a significant buffer between each question relevant to our
study. For example, there would be about an eight-minute gap between Question (1) and (4) for
the average respondent. By spacing out the questions pertaining to Proposition 7, we hoped to
minimize priming and framing effects.
IV. Research Design and Methods
Our research examines whether voter knowledge, as measured by our questions, helps
individuals make reasoned choices on ballot measures. In what follows, we test the four
hypotheses that we derived from the existing literature. We employ a post-test only factorial
design that utilizes logit regression and post-regression Monte Carlo simulations to test our
hypotheses. Our test is post-test only in that we observe votes only after they exit a polling
booth. By importing and interacting several factors, such as answers to questions and statements
about the policy in Proposition 7, we seek to enhance our ability to find the effect of each factor.
Our dependent variable is the respondent’s reported vote on Proposition 7. In line with spatial
and other theories of voting, we assume that voters prefer their votes to be in accord with their
policy preferences, as reflected in their answers to Question (1). 29 A preference for renewable
energy even with more expensive electricity should then yield a “yes” vote on Proposition 7.
Lack of such a preference should yield a “no” vote.30 We interact the dichotomous policy
preference variable (Question 1) with our knowledge variables (Questions 2, 3, and 5).
29 By controlling for policy preference, we follow the lead of voting behavior scholars who use party identification, candidate thermometers, and ideology to estimate vote choice. This design allows us to reduce the variance between disparate groups of individuals – in our case, individuals who have different policy preferences – and isolate the treatment effect. In fact, if we excluded policy preference we would suffer from omitted variable bias. Moreover, if policy preferences are endogenous, we should include them in our econometric model. Unfortunately, we cannot assess whether our measure is endogenous and we do not have an instrument that can account for policy preference. In future research, we will conduct panel studies that will help us account for endogeneity. 30 By including a measure of policy preference, we correct for Lupia’s lack of explicit assumptions about how voters should decide. See Lupia, supra note 6.

13
Two concerns arise from using policy preference as an explanatory variable. First, as
noted above, we expect that policy preference will be an excellent predictor of vote choice. But
if our baseline policy preference measure was a perfect or nearly perfect predictor of vote choice,
our research could not yield any results and our regression equation would be an identity.
Fortunately for our research, our policy preference measure, while being a strong predictor of
vote choice on Proposition 7, is far from perfect: overall, 26.4 percent of our sample reported
that they voted against their stated policy preference.31 This suggests that there is still significant
variation between stated policy preference and reported voting behavior. 32 In essence, by
including policy preference as one of our factors, our study focuses on the differences between
those respondents who voted in accordance with their stated preferences and those who did not.
The second concern is one of endogeneity. It is possible that some underlying and
unmeasured variable predicts both stated policy preference and knowledge of Proposition 7. We
consider this possibility very slight. Furthermore, we think our policy preference question
measures a stable attitude about renewable energy. Similar to studies of voting behavior that
employ feeling thermometers, party identification, and ideology to predict votes, we treat the
responses to Question (1) as exogenous.
We use a simple logit model to evaluate our hypotheses. We provide a formal
representation of our estimated model in Equation (1).
31 A closer look reveals that 12.5 percent of the respondents who did not favor renewable energy still supported the measure, and 35.7 percent of respondents who favored renewable energy voted against the measure. This disparity further demonstrates the need for us to control for policy preference. 32 To add context to our measure, only 10.3 percent of our sample’s self-identified Democrats and Republicans voted against their party’s nominee. While there is more variation between policy preference and votes on Proposition 7 than party identification and votes for president, our measure of policy preference predicts a large majority of the votes.

14
Pr(yi=1) = 1 / (1+e-ni)
ni =( β0 + β1CUEi + β2REQi + β3BILLi + β4CUE*REQi + β5CUE*BILLi +
β6CUE*REQ*BILLi + β7REQ*BILLi + β8Favori + β9Favor*CUEi + β10Favor*REQi +
β11Favor*BILLi + β12Favor*CUE*REQi + β13Favor*CUE*BILLi +
β14Favor*CUE*REQ*BILLi + β15Favor*REQ*BILLi + β16Xi)
(1)
In Equation (1), yi is respondent i’s likelihood of voting yes on Proposition 7, where a “0”
represents a “no” vote and a “1” signifies a “yes” vote, and ni defines the model we use to find
respondent i’s probability. Henceforth, dropping the subscript i for each respondent, CUE is a
dichotomous variable that denotes whether the respondent knew that the electricity companies
opposed Proposition 7 (“1” for knew cue, “0” for did not know). REQ is a dichotomous measure
of whether a respondent knew Proposition 7’s proposed renewable energy requirement by 2025
(“1” for knew requirement, “0” for did not know). BILL measures whether respondent i knew
that Proposition 7 did not include limits on how much an electricity bill could increase (“1” for
knew of the absence of limits, “0” for did not know). Finally, Favor is a dichotomous measure
of whether respondent i supported renewable energy even if the policy resulted in higher energy
rates (“1” for favor, “0” for oppose).
The interaction terms in Equation (1) allow us to estimate the effects of knowledge on
vote choice, holding constant policy preference. We separate respondents into two groupings
based on policy preference with Favor. We then interact Favor with our knowledge factors
(CUE, REQ, and BILL), thereby implementing our factorial design. At base, the interacted terms
measure the effects of knowledge for individuals who supported renewable energy; the non-
interacted terms measure the effects of knowledge for individuals who did not support renewable
energy.

15
We also use five additional covariates in our regression. In Equation (1), X denotes a
matrix of covariates that includes Age, Income, Education, Party Identification, Ideology, and
General Political Knowledge.33 We utilize these variables in our regression since they are
common predictors of individual voting behavior.
V. Results
We present our results in three steps. First, we use descriptive statistics to assess how
much voters knew about Proposition 7. Second, we report and interpret our regression results for
Equation (1). Third, we generate predicted probabilities of respondents voting “yes” on
Proposition 7 for those who favored renewable energy and voting “no” otherwise. To begin, we
calculated averages and correlations for the survey respondents’ policy preferences, knowledge
of Proposition 7, and the covariates we defined in the previous section.
Of the 1,002 completed surveys, 717 voters gave answers to the questions that we include
in the regression.34 In Table 1, we provide basic descriptive statistics of respondents’ knowledge
about Proposition 7. For the two rows, we separated our respondents by policy preference.
Across the columns, we divided the respondents according to their level of knowledge
concerning Proposition 7. All of the percentages and raw numbers reported in Table 1 are
independent of each other and each respondent appears only once. That is, the cell percentages
total to 100. For example, someone who appears in the “Knew All” category does not also
appear in the “Knew Cue Only” category, even though someone who “Knew All” knew the cue.
33 To measure General Political Knowledge, we constructed an index of correctly reporting these five facts: 1) Dick Cheney was the Vice President; 2) the percent of votes required for Congress to override a presidential veto; 3) John Roberts was the Chief Justice of the Supreme Court; 4) the Democrats had the most seats in the House of Representatives; and 5) the Supreme Court can declare laws unconstitutional. 34 We drop respondents from the analysis if they did not answer any of the questions we use in our regression. In our sample, 878 respondents voted on Proposition 7 – a roll off rate of about 12.4 percent. 891 respondents indicated their policy preference; 850 respondents answered the question about the position of the energy companies; 978 respondents answered the question about the 2025 renewable energy requirement; and 873 respondents answered the question about energy bills.

16
[Table 1 About Here]
We can make two generalizations from Table 1. The first generalization is that a sizeable
majority of voters knew something about Proposition 7, but a significant minority of voters knew
nothing—or, at least, could answer none of our questions correctly. Indeed, only 2.4 percent of
voters knew the correct answer to all three of the knowledge questions. Most voters knew
something about the proposition insofar as we could measure it, but strong majority of voters
could not answer more than one of our three questions correctly.
The second generalization we can make is that policy preferences and knowledge about
Proposition 7 are, by our measures, only modestly related. For example, 1.9 percent of
respondents who favored renewable energy and 3.1 percent of respondents who did not favor
renewable energy knew the correct answer to all three knowledge questions. In fact, the largest
gap in knowledge between the two preference groupings occurs in recognizing that the
proposition did not have pre-set limits on how much an energy bill could increase (with a slim
4.2 percent difference). Policy preferences did not explain how much information a person could
recall about Proposition 7.
Next, we analyzed the data to see if there are significant differences in policy preference
and knowledge based on our regression covariates. Table 2 includes descriptive statistics for
party identification and ideology.35 For policy preference, we see substantial though not
overwhelming differences between partisans and ideologues. Whereas Democrats favored
renewable energy 66.7 percent of the time, Republicans favored renewable energy only 43.8
percent of the time – a difference of more than twenty percent. Likewise, 69.7 percent of liberals
supported renewable energy, while only 40.4 percent of conservatives supported renewable
35 In the regression equation, Party Identification is a seven-point ordinal variable and Ideology is a five-point ordinal variable. For simplicity, we have collapsed both variables into three categories. Here, we combine party identification “leaners” with their respective partisans.

17
energy – a difference of almost 30 percent. These results confirm the findings of national polls
that show major differences in policy preferences about energy between partisans and
ideologues.36
[Table 2 About Here]
The partisan and ideological differences, however, do not extend to knowledge of
Proposition 7. Partisans and ideologues differ very little in their ability to answer our set of
factual questions and our cue questions, and only one difference is significant. Moderates were
about seven percent less likely than liberals and conservatives to know that Proposition 7 did not
provide an energy bill ceiling. This single aberration, however, is not indicative of a pattern in
the data, and we would expect one significant difference at random. Overall, knowledge about
Proposition 7 does not vary across partisan or ideological groups. This is indeed what drives our
later results.
Preferences for renewable energy do not correlate with most of the covariates from
Equation (1). As shown in Table 3, an individual’s policy preference about renewable energy
does not correlate significantly with age, income, or having general political knowledge. By
contrast, individual preferences do correlate positively with increased education, but the
correlation is negligible.
[Table 3 About Here]
Table 3 also contains correlations for knowledge about Proposition 7. Similar to the just
stated results, knowledge about the initiative correlates with few of our covariates. In sum,
Tables 2 and 3 demonstrate that we cannot rely on the covariates from Equation (1) to explain
preferences for renewable energy or knowledge about Proposition 7 in any systematic way.
They also demonstrate that multicollinearity will not be a problem for our estimation. 36 See, e.g., Eric R. A. N. Smith, Energy, the Environment, and Public Opinion, Chapter 5 (2002).

18
To summarize the demographic results, most voters knew something about the
proposition; a significant minority of voters, however, knew nothing. Moreover, we did not find
any systematic patterns within the data that could explain which respondents were likely to recall
factual or cue-like information about the initiative. We also cannot predict how much an
individual will learn about the initiative. This evidence suggests that 1) the two policy
preference groups are indistinguishable from each other in regard to knowledge about the
proposition; 2) the regression covariates do not explain policy preferences (with the exception of
partisanship and ideology); and 3) the regression covariates are unrelated to knowledge of the
ballot measure.
Our next task is to calculate whether policy preferences and knowledge about Proposition
7 influenced individual voting decisions. We present the results of our logit regression in Table
4.
[Table 4 About Here]
The logit regression results provide some surprising insights. First, the recollection of
facts or a cue about Proposition 7 appeared to have no measurable effect on decision-making.
Once we account for policy preference (using the interactive terms), voters who could recall
either a basic set of facts or a cue about the initiative are not different statistically from those
voters who knew nothing about the initiative. With these raw coefficients, we find tentative
support for the first hypothesis and theories of Lupia and Lupia and McCubbins: voters with
knowledge of the ballot measure are indistinguishable from voters who knew nothing more than
a voting cue. The regression results, however, require us to reject the second and third
hypotheses: voters who could recall basic facts about Proposition 7 or who had knowledge of a
voting cue made decisions that are statistically equivalent to decisions of voters who were unable

19
to recall this information. In other words, knowing some facts and knowing a cue does not
appear to influence vote choice in this instance at least.
The second conclusion we can draw from the regression is that the two remaining
significant terms, Education and General Political Knowledge, suggest that voters who were
more educated and knew more about the political world tended to vote against Proposition 7.
Education and general political knowledge could have a negative effect for many reasons. One
obvious possibility is that educated and politically-knowledgeable voters were more aware of the
drawbacks of Proposition 7 and they voted “no” to avoid a potential policy blunder.
We next generate Monte Carlo predictions based on the logit results in Table 4.
Predictions are useful for exploring the magnitude of the regression coefficients from which we
can generate simple graphical representations. We used King, Tomz, and Wittenberg’s Clarify
software for Stata37 to estimate predicted probabilities and confidence intervals of voting “yes”
for respondents who supported renewable energy.38 We then calculated predicted probabilities
and confidence intervals of voting against Proposition 7 for respondents who did not support
renewable energy. For each set of predictions, we varied the type of knowledge individuals
recalled, holding the covariates at their mean value. In keeping with our research design, we
present our predicted probabilities first for those who favored renewable energy and then for
those who opposed it. We present these two sets of predictions, respectively, in Figures 1 and 2.
By estimating these probabilities, we can move beyond the four hypotheses we set out to
test and, within the limits of the power of our estimates, we can test some additional conditions.
If knowledge is power and the ability to recall facts or cues equates to knowledge about the
37 Gary King, Michael Tomz & Jason Wittenberg, Making the Most of Statistical Analyses: Improving Interpretation and Presentation, 44 Am. J. Pol. Sci. 341 (2000). 38 We anticipate, however, that some of our Monte Carlo estimates will have very large confidence intervals because some of our groupings – e.g., voters who provided more than one correct answer – have very few observations.

20
ballot measure, then we can rank voters in line with their ability to answer our three knowledge
questions. With binary responses and three questions, we have eight possible outcomes, which
we rank below from the highest level of recalled knowledge to the lowest. We would expect to
see a decline in the predicted probability of voting consistently with policy preference moving
left to right in the figures, following our predicted ranking of the combination of recalled
knowledge:
(1) Voters who knew all pieces of information (“Knew All”)
(2) Voters who knew the 2025 renewable energy requirement and the lack of a limit on
consumer energy bills (“Knew Requirement and No Limit”)
(3) Voters who knew the 2025 renewable energy requirement and the position of the
energy companies (“Knew Requirement and Cue”)
(4) Voters who knew the lack of a limit and the position of the energy companies (“Knew
No Limit and Cue”)
(5) Voters who knew the information shortcut only (“Knew Cue Only”)
(6) Voters who knew the 2025 renewable energy requirement only (“Knew Requirement
Only”)
(7) Voters who knew that the initiative did not provide limits on how much an electricity
bill could increase (“Knew No Limit Only”)
(8) Voters who did not know any of the three knowledge questions asked (“Knew
Nothing”)
[Figure 1 About Here]
[Figure 2 About Here]

21
Each figure contains predictions for the eight levels of knowledge just described; the
black bars represent the 95 percent confidence intervals for each prediction. Figure 1 shows that
voters across all eight knowledge groupings are indistinguishable from one another. For
example, we find that the most knowledgeable voters – Knew All – who favored renewable
energy voted in accordance with their policy preference 61.9 percent of the time. We also
predict that voters who had two pieces of information – Knew Requirement and No Limit at 35.9
percent, Knew Requirement and Cue at 57.3 percent, and Knew No Limit and Cue at 60.1
percent – voted consistently with their policy preferences at rates that were statistically
equivalent not only from each other, but from every other level of knowledge. Likewise, voters
who knew only one piece of information and voters who did not provide a correct answer to any
of the knowledge questions are indistinguishable. In fact, every error band overlaps, which
indicates that none of the predicted probabilities is statistically different from any other. In other
words, for respondents who favored renewable energy, the type and amount of information about
Proposition 7 that a voter knew did not influence vote choice, and voters who had the least
knowledge voted the same as individuals who knew everything about the proposition that we
asked them.
Similar to Figure 1, Figure 2 shows that voters across all eight knowledge groupings who
opposed renewable energy made decisions that were indistinguishable from one another. Such
voters who knew all the information we tested voted “no” 78.7 percent of the time. All the other
groupings were close to this figure and statistically indistinguishable from it. As with the voters
who favored renewable energy, the predictions presented in Figure 2 are statistically equivalent,
as every error bar overlaps.

22
The results from the simulations contained in Figures 1 and 2 offer further support for the
preliminary conclusions from the regression results. Specifically, we accept the first hypothesis:
voters who knew the basic facts and voters who knew an endorsement had statistically similar
voting behavior. Our results, however, require us to reject the second and third hypotheses. In
the initiative we analyzed, voters with knowledge of a set of basic facts or knowledge of a voting
cue did not have greater success in translating their policy preferences into reasoned votes than
voters who knew less or perhaps nothing about the initiative. Finally, voters who did not favor
renewable energy (Figure 2) had an easier time casting a consistent vote (voting “no”) than
voters who favored renewable energy (Figure 1) had (voting “yes”). Indeed, voters who favored
renewable energy were more likely to vote against their policy preferences than voters who
disfavored renewable energy. This means that the majority of the policy preference defections
were “no” votes. As a result, we take this finding to be supportive of the Bowler and Donovan
“defensive no” and of our fourth hypothesis. This finding, however, is not definitive: it is
possible that some voters who favor renewable energy even if it brings higher energy prices still
had other reasons for opposing Proposition 7 and voted in accordance with those reasons rather
than because of a “when in doubt vote no” policy.
While it would have been more satisfying to have found some evidence about the effect
of knowledge on vote choice, our results should not be over-interpreted. It is quite possible that
voters learned, at one time or another, the information they needed to make a reasoned choice
and then forgot the facts or the cues that guided them, and thus did poorly on the recall questions

23
in our survey.39 Nonetheless, we expected to see some observable differences depending on the
voters’ knowledge.
VI. Discussion
We did not find support for two of our four hypotheses. Unexpectedly, we have shown
that uninformed voters appear to make decisions that are indistinguishable from voters who have
knowledge of key facts and voters who have knowledge of a voting cue. As a result, we reject
the overall model of initiative voting that Lupia presents. Unlike Lupia’s and other previous
studies of ballot measures, we do not find evidence to suggest that the ability to recall basic facts
and voting cues has a systematic effect on vote choice. We think that our study is an
improvement upon the existing empirical research because we account for policy preference in
voter choice. That is, even if preferences are endogenous, we include a control for this potential
problem in research design.
We do not know whether our results, or Lupia’s, are generalizable, or which ballot
measures fit which model. At one end of the spectrum, Lupia found that voters who were aware
of a cue or knew the basic facts of an initiative made statistically identical voting choices, and he
assumed that each group was using its different form of knowledge to attain similar results. In
our study, voters did not appear to use either facts about the proposition or a cue to make
decisions different from voters lacking both forms of knowledge. Our study is the only one that
considers voters lacking both knowledge and a cue; however, it deals only with a single election.
With additional research, we can estimate whether our finding is generalizable at all and, if so,
whether there is any pattern for identifying propositions for which it is likely to be applicable and
others for which it is not.
39 See, e.g., Morris P. Fiorina, Retrospective Voting in American National Elections (1981); Lupia & McCubbins, supra note 6; Popkin, supra note 13; Milton Lodge, Kathleen M. McGraw, & Patrick Stroh, An Impression-Driven Model of Candidate Evaluation, 83 Am. Pol. Sci. Rev. 399 (1989).
24
This returns us to the question that has been at the core of Lowenstein’s scholarship. Do
we need to improve the information environment for voters, and if so, how? Our survey revealed
that more than 34 percent of voters lacked any of the knowledge our questions sought to
measure. Moreover, approximately 34.7 percent of those voting “yes” cast a ballot that may
have been inconsistent with their preferences, and around 13.9 percent of those voting “no”
could not vote competently by this standard. Although our results suggest caution about easy
assumptions regarding the value of information for voters deciding on initiatives, at the same
time it would rash to conclude from one study of one proposition that information is unimportant
to voters.
We speculate that our results may reflect the possibility that the information environment
is not helping all voters make competent decisions. Compared to candidates, ballot measures
rely more heavily on an adversarial information environment – namely political campaigns – to
inform voters. Voters understand that campaign materials may be biased or misleading.40
Moreover, not every ballot measure has a meaningful supporting and opposing campaign.
Voters are often too busy to follow closely even those measures that do.
A long history of research on voting behavior suggests that decisions improve with useful
information. Why, then, did we find that neither factual knowledge nor knowledge of a cue
influenced voters’ decisions on Proposition 7? Part of the answer, we suspect, is that in direct
democracy voters do not receive a reminder to use their knowledge at the point when they vote.
We therefore believe that providing effective voting cues and other key information in credible
and salient ways at the time voters casts their ballot could prompt them to use information they
already have. Moreover, additional credible information on the ballot could inform voters who
40 Id. at 781; John Zaller, A New Standard of News Quality: Burglar Alarms for the Monitorial Citizen, 20 Pol. Comm. 109, 119 (2003).

25
were not aware of the facts before they entered the voting booth and could provide verification
for other information that voters encounter in the campaign, perhaps from broadcast
advertisements or slate mailers.
Previous research has shown that voters often identify official voter information
pamphlets as an important source of information about initiatives and referenda.41 We do not
know, however, how many of our respondents had read a voter pamphlet before the election, or
how many might have brought the pamphlet with them to consult as they voted. We propose that
policymakers reduce the burden on official voter information guides and campaigns to credibly
inform voters about ballot measures; instead, the ballot itself should provide more information to
voters. While the ballot now contains a title and summary for each measure and a statement of
fiscal impact, policymakers could design it to provide more and better cues. We have found few
studies that asked voters about their use of information appearing on the ballot rather than facts
and arguments provided in the voter information pamphlet.42
Although additional empirical research should concentrate on the role of the ballot in
shaping voter choice, we believe it may well be a powerful force in determining electoral
outcomes for several reasons. First, the state issues the ballot, and this frame offers the
credibility of an official announcement.43 Of course, this advantage also provides reason for
caution, as state actors are neither necessarily disinterested nor perfectly competent. Voters may
41 In California, nearly half of respondents in a 1997 Field Poll reported using guides as their main or secondary source of information for deciding how to vote on ballot measures. Shaun Bowler & Todd Donovan, Do Voters Have a Cue? Television Advertisements as a Source of Information in Citizen-Initiated Referendum Campaigns, 41 Eur. J. Pol. Res. 777, 781-82 and Table 1 (2002). 42 One exception is Roger Gafke & David Leuthold, The Effect on Voters of Misleading, Confusing, and Difficult Ballot Titles, 43 Pub. Op. Q. 394 (1979). The authors focus on the effect of confusing titles on voter decisions, finding that certain voters, such as those with less information before they enter the polling booth or who are less politically active, are more susceptible to confusion that interferes with their ability to vote according to their policy preferences. 43 See Elizabeth Garrett, The Law and Economics of “Informed Voter” Ballot Notations, 85 Va. L. Rev. 1533, 1552-53 (1999).

26
not appreciate this, however, because the ballot is not associated in their minds with any
particular political actor. Instead, the ballot is an official statement that the state endorses and
therefore has the capacity to be particularly influential. Second, not only does the ballot present
the most timely information for the act of voting – an important aspect of cues on the ballot as
the effects of information tends to dissipate over time44 – but it is also the information available
at the pivotal moment when voters mark their choice. Third, though other information is
available to voters throughout the campaign – and perhaps even when they vote if they bring
voter information pamphlets to the polls or use them at home when they vote there – the ballot is
the one source of cues and information that we are confident every voter sees.
We argue that ballot summaries should resemble nutrition labels. Individuals do not have
the time or resources to study the details about a particular food product; likewise, voters do not
have the time or resources to examine every ballot measure closely. With labels, consumers can
discern nutrition facts quickly and use them to make decisions. Additional credible information
on the ballot will make the summaries closer to nutrition labels, which would help voters make
reasoned choices. To be sure, some voters may choose to ignore the additional information in
the summary, as many consumers ignore nutrition labels; however, both voters seeking new
information and voters who receive a reminder to use the information they already know will
benefit.
We recognize that providing more information on the ballot may face challenges.
Partisan, elected officials will have views and positions on most ballot measures, controversial or
44 See, e.g., James N. Druckman & Arthur Lupia, Preference Formation, 3 Ann. Rev. Pol. Sci. 1, 8-9 (2000); Shanto Iyengar, The Accessibility Bias in Politics: Television News and Public Opinion, 2 Int’l J. Pub. Op. Res. 1 (1990); John Zaller & Stanley Feldman, A Simple Theory of the Survey Response: Answering Questions versus Revealing Preferences, 36 Am. J. Pol. Sci. 579, 592-93, 607 (1992).

27
not. Moreover, they are likely to disagree, perhaps vehemently, with many citizen initiatives.45
Even if officials act in good faith and try to provide neutral wording, drafting the titles and
summaries involves judgments that their views on the merits of the policy will influence,
consciously or not. We propose a solution to this impediment below.
Furthermore, political actors currently devote much attention to trying to shape what
information appears on the ballot; that attention will increase as more, and more helpful,
information is added to the ballot. It is no surprise that the number of challenges to the wording
of ballot titles and summaries has increased substantially since the 1990s.46 Some of this rise is a
function of the accelerating use of initiatives over the same time period. The increase is also
related, however, to a greater recognition by campaign professionals of the potential influence of
information available on the ballot on voters’ decisions. For example, in some states ballot
measure proponents commonly use a technique called “ballot title shopping” to file multiple
versions of an initiative and obtain different titles and summaries, which they then test through
focus groups and polls to determine which tend to increase voter support. They use the most
favorable wording when they circulate petitions.47
California has seen several recent legal challenges to ballot titles and summaries written
by the Attorney General. The law requires the Attorney General to prepare a title and summary
45 See Elisabeth R. Gerber, Arthur Lupia & Mathew D. McCubbins, When Does Government Limit the Impact of Voter Initiatives? The Politics of Implementation and Enforcement, 66 J. Pol. 43 (2004). 46 Kenneth P. Miller, Direct Democracy and the Courts 103 (2009). 47 William A. Lund, What’s in a Name? The Battle over Ballot Titles in Oregon, 34 Willamette L. Rev. 143, 156 (1998). See also Rick Attig, Initiative: No More “Ballot Shopping” with Your Tax Dollars, The Oregonian, Jan. 4, 2009, available at http://www.oregonlive.com/opinion/index.ssf/2009/01/initiative_no_more_ballot_shop.html. The ability to use this tactic depends on state law. Oregon recently changed its law to reduce the opportunity for ballot title shopping. See Ore. Elect. Code 250.045(1). In California, the ballot title is not the same as the title appearing on the petitions and is written after the initiative qualifies for the ballot. There are concerns about title-shopping even with these protections, however. See Bill Analysis of AB 436 (Saldana) for a Hearing in the Assembly Committee on Elections and Redistricting, March 31, 2009 (proposing to increase fee to $2,000 and noting that in 2007-08 proponents of Proposition 9 submitted four version for titling but circulated only one), available at http://info.sen.ca.gov/pub/09-10/bill/asm/ab_0401-0450/ab_436_cfa_20090327_140712_asm_comm.html.

28
to highlight the “chief purposes and points” of the proposed measure.48 The title and summary
cannot exceed 100 words, and must be “true and impartial, and not argumentative [or] likely to
create prejudice for or against the measure.”49 After the Attorney General submits the title and
summary to the Secretary of State, interested parties can challenge them in pre-election
litigation. In such litigation, the court defers to the Attorney General’s drafting if “reasonable
minds can differ” on whether the summary is an accurate depiction that captures the chief
purposes and points of the proposition.50
Given the presumption in favor of the Attorney General, challenges to ballot titles and
summaries in California often fail. For example, the title for Proposition 8, the measure that
made same-sex marriages illegal in California, was challenged by supporters who objected to the
word “eliminates” in the title drafted by Attorney General Jerry Brown: “Eliminates the Right of
Same-Sex Couples to Marry.” Proponents sought more positive language that avoided
highlighting the elimination of a right but that arguably more closely tracked the language of the
proposition, preferring a title such as “Only Marriage Between a Man and a Woman is Valid or
Recognized in California.”51 The state supreme court ruled that Californians of the same sex had
won the right to marry in the time after the certification of the original title and before the
preparation of the ballot.52 Thus, the court upheld the Attorney General’s wording as accurately
reflecting the effect of the proposition on the legal status quo.
Although California law contemplates that the Attorney General will generally draft
ballot measure titles and summaries, increasingly the legislature is demanding that privilege 48 Cal. Const., Art. II, § 10(d); Cal. Elec. Code § 9004. 49 Amador Valley Joint Union High School District v. State Board of Equalization, 22 Cal. 3d 208, 243 (1978); Cal. Elec. Code § 9051. 50 Epperson v. Jordan, 12 Cal 2d 61, 70 (1938). See also Zaremberg v. Superior Court of Sacramento County, 115 Cal. App. 4th 111 (2004). 51 Jansson v. Bowen, Case No. 34-2008-00017351 (Cal. Super. Ct. Sacramento) (Aug. 7, 2008), available at http://ag.ca.gov/cms_attachments/press/pdfs/n1597_ruling_on_proposition_8.pdf. 52 See In re Marriage Cases, 43 Cal. 4th 757 (2008).

29
when it places a measure on the ballot, demonstrating lawmakers’ belief that the wording affects
outcomes.53 This practice can prompt judicial challenges to the ballot title, such as the litigation
and negotiations surrounding two of the measures placed on the ballot by the legislature and
Governor in 2009 in an effort to close the state’s substantial budget gap.54
There is a dearth of research on when, where, and how voters learn about ballot
measures, and whether the wording of ballot titles and summaries can influence vote choice. In
future research, we will focus on these gaps in the literature. For now, we tentatively propose
two reforms aimed at California, one designed to provide relevant information on the ballot in
addition to the title and summary and one aimed at the process of drafting a ballot title and
summary.
A. Increasing the Information Provided to Voters on the Ballot
We propose as our first major reform that California provide more information to voters
on the ballot itself. Our goal is to make ballot summaries analogous to nutrition labels. If
adopted, the ballot summaries will provide enough information to remind knowledgeable voters
to use what they already know and inform voters who are searching for information. We
propose several related changes to the current ballot format.
First, increasing the California ballot summary to about 250 words or so would allow the
ballot to offer more information without substantially increasing the demands on voters. For
example, in Oregon, the ballot includes a 15-word title, 25 words describing the effect of a “yes”
vote and another 25 words describing the effect of a “no” vote, and 125 words summarizing the 53 See, e.g., Dan Walters, Politicos Use Ballot Titles to Sway Voters, Sac. Bee, Mar. 3, 2009, at A3. 54 See Act of Feb. 20, 2009, ch. 7, 2009 Cal. Legis. Serv. 842 (West) (originally enacted as Act of Feb. 20, 2009, ch. 6, 2009 Cal. Legis. Serv. 837 (West)). See also Howard Jarvis Taxpayers Ass’n v. Bowen, Case No. 34-2009-80000182-CU-WM-GDS (Cal. Super. Ct. Sacramento) (March 5, 2009), available at http://www.sos.ca.gov/elections/ccrov/pdf/2009/march/09029jh.pdf (ruling that the title for Proposition 1A, concerning the state’s rainy day stabilization fund, must use the word “changes” rather than “reforms” with respect to its effect on the budget process and deleting “unsustainable” as a modifier to describe state spending because the word carried too much emotional impact).
30
measure.55 In essence, ballots, like nutrition labels, should provide ordinary voters with
information about the effect of the measure on their lives, such as their tax burdens, the level of
government service they will receive, the effect on the state’s economy, and quality of life for its
citizens.
Second, California and other states should also consider enhancing the information
provided by fiscal statements appearing in the voter information pamphlet and, in very
abbreviated form, on the ballot. One concern with decision-making in direct democracy is that
voters do not have a full sense of the costs and trade-offs entailed in approving a ballot measure
or keeping the status quo. Because states operate with limited resources, decisions to spend
money in one area mean that funds will not be available for other purposes. Revenues raised for
a particular government service will reduce the flexibility of the state to raise revenue for other
services. When the Legislative Analyst abbreviates the fiscal impact statement on the ballot, she
should detail the costs of the proposal and the effects on state and local revenues. In other
words, the summary should convey a more concrete sense of the fiscal consequences of the
proposal to voters in terms they can understand. As a result, the fiscal summary on the ballot
may need to be slightly longer.
We require additional research to determine how best to communicate this relatively
complex information. Even for legislative bodies with full-time lawmakers and expert staffs, the
fiscal impact of most policies is vital to decision-making and yet acknowledged to be difficult to
project. Federal budget rules including PAYGO requirements seek to equip members of
Congress with a basic understanding of a proposed policy’s budgetary ramifications; while they
may be better than no such attempt to quantify fiscal consequences, they are subject to much
55 Ore. Elec. Code 250-035. Idaho appears to allow the most words for a ballot measure summary, requiring the purpose of the measure be described in 200 words or less. Idaho Elect. Code § 34-1809.
31
criticism.56 Nonetheless, the federal PAYGO model could serve as starting place to think about
how a ballot measure’s fiscal impact statement could provide an effective cue for voters. It may
be that such information cannot be conveyed in a way that voters can easily understand with
limited attention and knowledge, or that such simple language designed to describe fiscal trade-
offs would be too controversial. Nonetheless, we urge more study and consideration of possible
ways to increase the usefulness of fiscal impact statements.
Third, and most importantly, the ballot should inform voters of the main groups
supporting and opposing a ballot measure. Not only would such information arm citizens with
some of the strongest and most effective cues likely to increase voter competence, but the
availability of the shortcut on the ballot would also send a powerful signal to voters that they
should use the shortcuts.57 If the legislature placed the measure on the ballot, or the legislature
has considered the proposal, the ballot could include the overall vote totals, as well as the votes
of the state legislators, identified by name and party affiliation, who represent the voters at that
particular polling place.58 The other key voting cue is support and opposition by groups with
well-known reputations for particular ideological positions or economic interests. The voter
information guide provides information about proponents and opponents, but these groups are
not always the groups we would propose to disclose on the ballot. Instead, voters will learn
more if they know the groups that are spending the most money in the campaign on either side of
a ballot measure; these are the groups demonstrating a costly commitment to their positions.
56 See, e.g., Elizabeth Garrett, Harnessing Politics: The Dynamics of Offset Requirements in the Tax Legislative Process, 65 U. Chi. L. Rev. 501 (1998); Edward D. Kleinbard, Tax Expenditure Framework Legislation, 63 Nat’l Tax J. 353 (2010). 57 Burnett & McCubbins, supra note 8, at 23-24. 58 For a similar proposal aimed at the voter information pamphlet, see Elisabeth R. Gerber, “Reforming the California Initiative Process: A Proposal to Increase Flexibility and Legislative Accountability,” in Constitutional Reform in California: Making State Government More Effective and Responsive 291, 301 (B.E. Cain & R.G. Noll eds., 1995).

32
Proposition 7 is an example of how advocates can manipulate the information provided
by the official voter information pamphlet about the groups supporting and opposing a ballot
measure. The groups bankrolling the opposition to the renewable energy measure were utility
companies, with PG&E and Edison each spending more than $13.5 million and Sempra spending
more than $2 million.59 Yet, the opposing groups signing the arguments against Proposition 7, as
well as the groups they listed in their arguments as part of their coalition, did not include a single
major utility company. Instead, representatives of groups such as the California Taxpayers
Association and the California Small Business Association signed the voter pamphlet. While
some of these groups might serve as voting cues for ordinary people,60 none would be as
effective as information about the substantial spending by the state’s largest energy companies.
In some cases, knowing the top financial backers and opponents of a proposition may not
provide effective cues, however. In the case of Proposition 7, the main proponent, Peter
Sperling, contributed over $9 million.61 Sperling is a part-time resident of California (with a
primary residence in Arizona) and a billionaire through his family’s involvement in the
University of Phoenix.62 Knowing his identity and involvement would not provide many voters
a shortcut to competent decision-making. He is not an elected representative or a representative
of any business with an obvious economic interest in renewable energy. Even providing his
occupation on the ballot – as voter pamphlets did for proponent Donald Aitken, described as a
“renewable energy scientist” – would not provide sufficient information about Sperling’s
59 Secretary of State, Campaign Finance, Contributions Received by Californians Against Another Costly Energy Scheme – No on 7, available at http://cal-access.sos.ca.gov/Campaign/Committees/Detail.aspx?id=1304245&session=2007&view=received. 60 For example, the Taxpayers Association has a well-known political brand name. 61 Secretary of State, Campaign Finance, Contributions Received by Yes on Proposition 7 – Californians for Solar and Clean Energy, available at http://cal-access.sos.ca.gov/Campaign/Committees/Detail.aspx?id=1302703&session=2007&view=received. 62 See Forbes List of Billionaires, #562 Peter Sperling (Mar. 11, 2009), available at http://www.forbes.com/lists/2006/10/RQWL.html.

33
interests regarding renewable energy for voters to learn. The individual endorsers of Proposition
7 listed in the voter pamphlet were probably more helpful to voters than knowing the major
sources of campaign funding. Those signing the arguments included the co-founder of a labor
union and several former and current well-known politicians, although the pamphlet did not
provide information about these politicians’ party affiliation. The group affiliation of other
signers – such as the Californians for Solar and Clean Energy – provided no helpful information.
Such groups are merely attractive names designed to appeal to voters and often to veil the real
parties in interest behind initiative campaigns.63
Our preliminary proposal for providing voting cues on the ballot through information
about financial and other backers accounts for this complex information environment. We
advocate including on the ballot the top three sources of funding on both sides at the time the
ballot is printed. If such sources are individuals, and therefore not particularly effective voting
cues, the ballot should provide their occupations. If the sources are organizations, the ballot
should include information about the business or group that provided financial support over a
particular, relatively high threshold. If a group providing funding is a front to shield individuals,
businesses, economic interests, or ideological groups from disclosure (for example, “Americans
for a Healthier America” funded by the pharmaceutical industry), the ballot should pierce the
veil so that the voters receive information about the actual sources of funding. In addition, if any
elected officeholder, candidate for office, or committee controlled by such a person has provided
more than a minimal amount of funding to support or oppose an initiative, the ballot should
disclose that information, along with the office held or sought, and party affiliation.
63 See Elizabeth Garrett & Daniel A. Smith, Veiled Political Actors and Campaign Disclosure Laws in Direct Democracy, 4 Election L.J. 295 (2005).

34
One serious challenge facing our recommendation is that the state prints ballots 60 to 70
days before an election.64 It may not be clear at the time the state prints the ballots who the
major funders of the campaigns will be. Moreover, political actors seeking to avoid publicity on
the ballot can wait to make substantial contributions until after the ballot has gone to the printer.
Such delay would not hamper many campaigns because the groups or individuals backing the
campaign could promise future financial support so the consultants running the campaign could
enter into contracts to spend the money with confidence. While the significant cost of funding
the petition circulation drive occurs early in the campaign, major expenditures for broadcast
advertisements, political consulting, and slate mailers happen toward the end of the campaign. It
is difficult to compress production time for ballots because there must be a period to publicly
display the ballot, to hear challenges, and to translate the ballot into several foreign languages.
Although technology may reduce the time between the finalization of a ballot and the
election period, we do not expect California to adopt Internet voting or other technological
advances anytime soon. If the state must continue to produce ballots about more than two
months in advance, the additional information provided on the ballot that we propose above may
not be helpful enough for voters to justify its addition. Providing more information on the ballot
is not costless; it lengthens the ballot and the time for voting, thereby contributing to voter
fatigue and, on Election Day, the length of time people must wait to enter the voting booth. As
more Californians vote by mail, however, the state could provide this information via the
Internet, perhaps with instructions on the ballot guiding voters to the website.
64 This timeline develops from the interplay of several statutory provisions, including the last date for measures to qualify for the ballot (Cal. Elec. Code § 9016 & § 10403); time provided for public inspection of the ballot (id. at § 13313); the need to send ballots abroad to absentee voters (id. at § 3103); and the requirements surrounding the vote by mail procedure (id. at § 3001). Telephone Interview with Diane Jones, Voter Services Manager, Sacramento County, conducted by Jonder Ho, Feb. 9, 2010 (notes on file with authors).

35
A second challenge to our proposal is that, if accepted, there will be opportunities for
political actors to manipulate the additional information to serve their purposes. As we outline
below, we recommend relying on a nonpartisan or bipartisan entity for discretionary aspects of
our proposals. We have already pointed out that officials are often interested in the outcome of
ballot measure elections and, even when they are disinterested, cannot necessarily achieve
neutrality. Members of a nonpartisan or bipartisan entity will not be exempt from these human
imperfections, but relying on them is intended to increase the likelihood that the information will
assist voters rather than one side or the other in the campaign.
B. Delegating the Power to Draft Ballot Titles and Summaries to Nonpartisan Institutions
Our second proposal is to transfer the responsibility of writing ballot titles, summaries
and other information away from elected political officials, such as the Attorney General and
Secretary of State in California.65 Most states allocate this responsibility to elected, partisan state
officials.66 Others allow more power to individuals necessarily on one side of the issue, such as
those in which the proponents of the initiative write the official title and summary, with review
by a state official.67 The process is nearly always political, either overtly by involving the
proponents of the proposition or inevitably by delegating the power to elected officials with
partisan goals. Yet, the ballot obscures the involvement of partisan actors with political agendas
and reinforces the sense that the titles and descriptions of the measures are impartial and
removed from the give-and-take of politics.
65 For general discussion of reforms in election rules to shift responsibilities to nonpartisan and unelected officials, see Daniel P. Tokaji, The Future of Election Reform: From Rules to Institutions, 28 Yale L. & Pol’y. Rev. 125, 131-34, 144-53 (2009). 66 M. Dane Waters, Initiative and Referendum Almanac 16-17 (2003). 67 This is the case in Arkansas, Florida, Illinois, and Ohio. In Arizona, the proponent writes the title but not the summary. Id. at 17.

36
To reduce the influence of political actors over the crucial text that appears on the ballot,
we recommend that California empower a nonpartisan, unelected entity with the responsibility of
devising ballot titles and summaries. This procedure should be followed for all ballot measures –
those initiated by the people through petitions and those placed on the ballot by the legislature.
This proposal is not without precedent, although it is unusual. Utah delegates the job of drafting
“impartial” ballot titles to the Office of Legislative Research and General Counsel.68 Colorado
has adopted a hybrid process in which a Title Setting Board, composed of the Secretary of State,
the Attorney General, and the head of the Office of Legislative Legal Services, drafts initiative
titles and summaries.69 We do not expect that moving drafting responsibility to a less partisan
entity will eliminate all challenges. There is no guarantee that even a nonpartisan entity will
always be disinterested. Even when it is, contending parties will seek advantage through
favorable wording and even relatively neutral language can prompt disagreement.70 Measures
can be accurately summarized in multiple ways. Presumably, however, the process of drafting
the influential ballot title and summary is less susceptible to partisan manipulation when it is
delegated to nonpartisan, expert staffs rather than elected officials.
In California, the job of drafting ballot titles and summaries could be delegated to the
Legislative Analyst,71 who is already involved in the initiative process through the preparation of
fiscal impact statements. The Legislative Analyst has sole authority to draft an analysis of each
proposal for the voter information pamphlet and to advise voters of the effect of a “yes” or “no”
68 Utah Elec. Code 20A-7-209. 69 Co. Elect. Code 1-40-106, 1-40-107; Richard J. Ellis, Democratic Delusions: The Initiative Process in America 152 (2002). 70 Colorado has seen an increasing number of challenges to ballot titles and summaries. Its Supreme Court has frequently been willing to revise the wording, often in conjunction with a finding that the measure violates the single-subject rule. Ellis, supra note 74, at 152. Utah’s courts have also been aggressive in reviewing and rewriting titles. Id. at 156. 71 For a description of the Office of Legislative Analyst, see http://www.lao.ca.gov/laoapp/main.aspx.
37
vote through a neutral statement of a few sentences.72 The office has existed for nearly seven
decades, served as the model for the federal Congressional Budget Office, and has a reputation
as a repository of expertise and nonpartisan perspectives.73 The high regard with which the
office is held and its reputation for independence have led to proposals that the responsibility to
draft ballot titles and summaries for initiatives be delegated to the Legislative Analyst.74
Another possibility is delegating the power to prepare titles and summaries to the Office
of Legislative Counsel; its staff provides nonpartisan legislative services to elected lawmakers,
including bill drafting and legal advice on statutes and other legislative activity.75 In addition,
the Office offers drafting advice to proponents of ballot measures when 25 or more voters
request assistance. Indeed, the Legislative Counsel will draft the text of the measure if
proponents request her to do so and she determines that the proposition is reasonably likely to
qualify for the ballot.76 Some observers, however, perceive the Legislative Counsel to be too
closely aligned with lawmakers, who are the main clients of the office, and therefore not
sufficiently impartial.
Alternatively, California could rely on a nonpartisan or bipartisan commission to write
ballot titles and summaries. For example, given sufficient resources, the legal staff of the Fair
Political Practices Commission (FPPC) could draft titles and summaries. The commission has
72 The Legislative Analyst submits the analysis to a committee of five citizens, including an expert in education, a bilingual citizen, and a professional writer, to ensure that the average voter can understand the text. Cal. Elec. Code § 9087. 73 See Elizabeth G. Hill, California’s Legislative Analyst’s Office: An Isle of Independence, Spectrum: the Journal of State Government 26, 27-28 (Fall 2003). Ms. Hill is a former Legislative Analyst. 74 See, e.g., California Assembly Constitutional Amendment 20, proposed by Roger Niello (R) in 2009 (proposing that the Legislative Analyst have primary responsibility for ballot titles), available at http://www.leginfo.ca.gov/pub/09-10/bill/asm/ab_0001-0050/aca_20_cfa_20090622_092656_asm_comm.html. 75 See Office of Legislative Counsel, Firm Overview, available at http://www.legislativecounsel.ca.gov/portal/site/OLCInternet/menuitem.5fb4241e84ab3773facec79ae131b65a/?vgnextoid=a249142510585110VgnVCM1000001e136ba5RCRD&vgnextfmt=default. 76 See Waters, supra note 71, at 142. Furthermore, current law delegates the responsibility of writing ballot titles and summaries to the Legislative Counsel in circumstances where the Attorney General is a proponent of the measure. Cal. Elec. Code § 9003.

38
five members with representatives of both major parties appointed by the Governor (two
appointees), Secretary of State, Attorney General and Controller. They each serve one four-year
term without the possibility of reappointment. Alternatively, a new nonpartisan body could be
created for this purpose. Garrett and McCubbins have proposed a substantial reform of the
initiative process that would include establishing a Citizens Initiative Implementation Oversight
Commission (CIIOC) to ensure more effective implementation of ballot measures that voters
have passed.77 Each successful initiative would name one person to serve a single term on the
CIIOC. The commission’s staff could play the primary role in drafting titles and summaries, and
the CIIOC would hear the first appeal from displeased parties to reduce the amount of litigation
in the courts.
The advantage of using a commission such as the CIIOC is that its jurisdiction focuses
solely on the initiative process, unlike the other entities discussed above, which have jurisdiction
over aspects of the regular legislative process or over elections and campaigns generally.
Moreover, all the members of the CIIOC or some similar specialized commission will have been
active in the initiative process, albeit to pursue a variety of policies. Therefore, they may be
more sensitive to the kind of information that will empower voters to make competent decisions.
Importantly, the commission would include no elected officials and the ideology of members
would be diverse since many different political and economic interests use the initiative process
to effect policy change.
Notwithstanding the evidence that political actors understand the importance of
information on the ballot and our own sense that it affects outcomes, we acknowledge the need
for more research. In particular, we need to survey voters with regard to additional ballot
77 Elizabeth Garrett & Mathew D. McCubbins, The Dual Path Initiative Framework, 80 S. Cal. L. Rev. 299, 332-40 (2007).

39
measures. We also would prefer to conduct panel studies of voters during an entire election to
estimate what they learn, when they learn, where they learn, and how they use what they know to
form opinions. We intend to focus questions on the ballot itself, as well as other sources of
information, to attempt to disentangle the influence of various sources of cues.
Despite the challenges outlined above, policy makers should begin to focus on the
question of how to provide crucial information to voters at the critical time of voting and in a
way that encourages them to use such ballot information, either as a credible cue or as
verification for the trustworthiness of information obtained in other ways throughout the
campaign. In our view, more information would empower the knowledgeable voter, who is now
lost in the noise of campaigns, unable to use credible information to vote more competently than
voters with no information at all.

40
Figure 1 – Probability of Voting Yes on Proposition 7 (Respondents Favored Renewable Energy)
61.9%
35.9%
57.3% 60.1%
77.1%
67.8% 62.3% 64.7%
0%
10%
20%
30%
40%
50%
60%
70%
80%
90%
100%
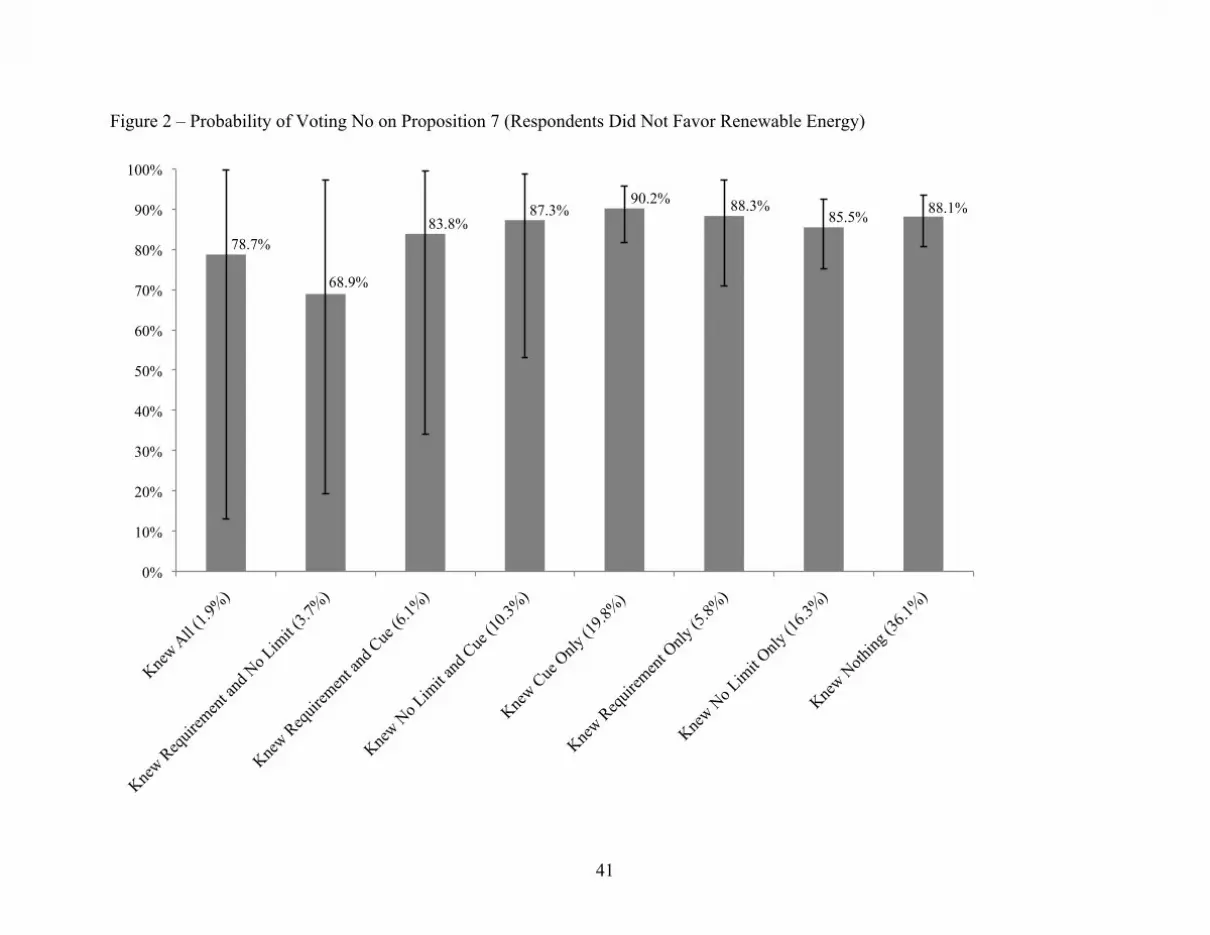
41
Figure 2 – Probability of Voting No on Proposition 7 (Respondents Did Not Favor Renewable Energy)
78.7%
68.9%
83.8% 87.3%
90.2% 88.3% 85.5% 88.1%
0%
10%
20%
30%
40%
50%
60%
70%
80%
90%
100%

42
Table 1 – Voter Knowledge about Proposition 7, by Policy Preference
Knew All
Knew Requirement
and No Limit
Knew Requirement
and Cue
Knew No Limit and
Cue Knew Cue
Only
Knew Requirement
Only Knew No
Limit Only Knew
Nothing Total Favored Renewable Energy
1.9% (8)
3.7% (16)
6.1% (26)
10.3% (44)
19.8% (85)
5.8% (25)
16.3% (70)
36.1% (155)
59.8% (429)
Did Not Favor Renewable Energy
3.1% (9)
2.1% (6)
5.2% (15)
8.3% (24)
22.9% (66)
5.6% (16)
20.5% (59)
32.3% (93)
40.2% (288)
Total
2.4% (17)
3.1% (22)
5.7% (41)
9.5% (68)
21.1% (151)
5.7% (41)
18.0% (129)
34.6% (248)
100.0% (717)
Raw numbers are in parentheses.

43
Table 2 – Descriptive Statistics for Proposition 7 and Regression Covariates Democrats Independents Republicans Liberals Moderates Conservatives Favored Renewable Energy
66.7% (302)
57.0% (49)
43.8% (78)
69.7% (225)
59.7% (139)
40.4% (65)
Knew Requirement
15.7% (71)
18.6% (16)
19.1% (34)
17.7% (57)
16.7% (39)
15.5% (25)
Knew No Limit
33.3% (151)
32.6% (28)
32.0% (57)
35.9% (116)
27.5% (64)
34.8% (56)
Knew Cue
38.0% (172)
39.5% (34)
39.9% (71)
37.8% (122)
38.2% (89)
41.0% (66)
Raw numbers are in parentheses. N=717

44
Table 3 – Pair-wise Correlations of Knowledge Treatments Regarding Proposition 7 and Common Covariates General Political Knowledge Age Income Education Favored Renewable Energy 0.03 -0.03 -0.01 0.11 Knew Requirements -0.02 -0.14 -0.10 -0.02 Knew No Limit 0.06 0.02 0.00 0.13 Knew Cue 0.22 0.00 0.02 0.06
Bold denotes significant correlation coefficients at the p<.05 level.

45
Table 4 – Logit Regression Results for Vote on Proposition 778 Knew Electricity Co. Opposed (CUE) -0.246 (0.51) Knew 50% Requirement (REQ) -0.178 (0.75) Knew No Limits on Energy Bill (BILL) 0.241 (0.47) CUE*REQ -0.170 (1.35) CUE*BILL -0.283 (0.97) CUE*REQ*BILL -0.133 (2.13) REQ*BILL 1.007 (1.23) Favored Renewable Energy (Favor) 2.653** (0.36) Favor*CUE 0.700 (0.59) Favor*REQ 0.286 (0.90) Favor*INC -0.084 (0.57) Favor*CUE*REQ -0.197 (1.52) Favor*CUE*BILL -0.147 (1.10) Favor*CUE*REQ*BILL 0.348 (2.44) Favor*REQ*BILL -1.425 (1.45) Age -0.124 (0.06) Income 0.031 (0.09) Education -0.196 (0.10) Party Identification 0.067 (0.06) Ideology 0.011 (0.12)
78 We ran two additional regressions. The first regression is identical to the model that Lupia uses. That is, we did not include a measure of policy preference. For this model, only Age and Political Knowledge were significant (and both negative). In the second unreported regression, we excluded the common covariates (Age, Income, Education, Party Identification, Ideology, and Political Knowledge). The magnitude, direction, and significance of the coefficients for all of our treatment variables were the same as the results reported in Table 4.

46
General Political Knowledge -1.968** (0.40) Constant 0.238 (0.73) Pseudo-R2 .258 N 717
Logit Regression of Binary Vote Choice; 0 = Vote against Proposition 7, 1 = Vote for Proposition 7 Standard errors are in parentheses. * p<0.05, ** p<0.01