Embed Size (px)
Citation preview
THEDEMOCRACY
INDEX
THEDEMOCRACY
INDEX

This page intentionally left blank
Princeton University PressPrinceton and Oxford
THEDEMOCRACY
INDEX
THEDEMOCRACY
INDEXWHY OUR ELECTION SYSTEM
IS FAILING AND HOW TO FIX IT
HEATHER K. GERKEN
Copyright © 2009 by Princeton University Press
Requests for permission to reproduce material from this work should be sent to Permissions,
Princeton University Press
Published by Princeton University Press, 41 William Street, Princeton, New Jersey 08540
In the United Kingdom: Princeton University Press, 6 Oxford Street, Woodstock,
Oxfordshire OX20 1TW
All Rights Reserved
Library of Congress Cataloging-in-Publication Data
Gerken, Heather K., 1969–
The democracy index : why our election system is failing and how to fix it / Heather K. Gerken.
p. cm.
Includes bibliographical references and index.
ISBN 978-0-691-13694-3 (hardcover : alk. paper) 1. Voting—United States.
2. Elections—United States. 3. Voter registration—United States. I. Title.
JK1976.G47 2008
320.60973—dc22
2008047802
British Library Cataloging-in-Publication Data is available
This book has been composed in Adobe Garamond pro
Printed on acid-free paper. �
press.princeton.edu
Printed in the United States of America
1 3 5 7 9 10 8 6 4 2

For my remarkable parents

This page intentionally left blank
Contents
ACKNOWLEDGMENTS ix
INTRODUCTION Why We Need a Democracy Index 1
1 The Perverse Politics of Election ReformWhy (We Think) Elections Are Run Badly, and What to Do about It 11
2 The Promise of Data-driven Reform 38
3 The Politics of Reform and the Promise of Ranking 66
4 Is the Game Worth the Candle? 91
5 Getting from Here to There in MiniatureMaking the Democracy Index a Reality 108
ConclusionGetting from “Here to There” Redux 132
AFTERWORD 137
NOTES 143
INDEX 173

This page intentionally left blank
Acknowledgments
A few years ago, the Tobin Project asked me to pull together a group ofscholars to explore the ways in which our work connected to ongoing pol-icy debates. Academics have become increasingly distant from the world ofpolicy, and our goal was to rebuild the ties that once existed between schol-ars and lawmakers. During our first meeting, I challenged the scholars to present a genuinely “modest proposal,” a small-scale intervention thatwould improve the way our democracy works. That’s where I first pre-sented my idea for a Democracy Index. At the time, I thought that the ideawould take up a few days and a bit of ink. Instead, it caught hold, and I’vespent a good chunk of the last eighteen months thinking and writing aboutit. Shortly after I published an editorial on the idea in the Legal Times, Sen-ators Barack Obama and Hillary Clinton each put the idea into proposedlegislation. Within the year, Congress set aside $10 million to fund modeldata-collection programs in five states, and several foundations—includingthe Pew Center on the States—funded conferences and initial research on the idea. All of this activity prompted me to write this book, whichmakes the case for creating the Index and offers my own take on how itshould be designed.
I am deeply indebted to Michael Caudell-Feagan, Doug Chapin, NedFoley, John Fortier, and Paul Gronke, along with their staff at the PewCenter on the States, electionline, the Moritz College of Law at Ohio State,AEI/Brookings, and Reed College’s Early Voting Information Center.They all worked tirelessly to shape the proposal and move it toward reality,offering advice, financial support, and organizational muscle to push theidea forward. I wouldn’t have made it past the editorial stage without them.I owe great thanks to the people who patiently read the entire draft: BruceAckerman, Doug Chapin, Ned Foley, Barry Gerken, Thad Hall, MichaelKang, Justin Levitt, Ben Sachs, David Schleicher, Dan Tokaji, three anony-mous reviewers, and my editor at Princeton, Chuck Myers, and copy edi-tor Richard Isomaki. Over the course of the last eighteen months, I have
also received helpful comments from Ian Ayres, Kim Brace, Richard Brooks,Kareem Crayton, Chris Elmendorf, Dan Esty, Deborah Goldberg, RickHasen, Steve Huefner, Christine Jolls, Katerina Linos, Jerry Mashaw,Michael McDonald, Rick Pildes, Charles Stewart, and Jonathan Zittrain;the staff and advisers who helped Senator Barack Obama put the idea intopending legislation; the faculty of Oklahoma City University Law School;and audience members at the Section on Legislation session at the 2007meeting of the Association of American Law Schools. I’ve benefited greatlyfrom the thoughts and criticisms offered by the participants in the Design-ing a Democracy Index conference sponsored by the Pew Center on theStates, the Joyce Foundation, and the Mortiz College of Law; the partici-pants in the 2007 Academics’ Conference sponsored by the AEI-BrookingsElection Reform Project; and the participants in the Data for DemocracyConference sponsored by the Pew Charitable Trusts and the JEHT Foun-dation. I am especially grateful for the many reformers, academics and elec-tion officials (including three secretaries of state) who took time from theirbusy schedules to talk to me about the work they do. You will see theirnames scattered throughout the book. Thanks also to David Pervin for sug-gesting I write this book and to the Tobin Project for pushing me to thinkabout this project in the first place. I am grateful for the financial supportprovided by the Oscar M. Ruebhausen Fund and the Yale Law School andthe assistance provided by Theresa Cullen and the staff of the Yale Law Li-brary. Scott Grinsell, Sarah Burg, Jill Habig, Dina Mishra, John Nann, AriWeisbard, Saumya Manohar, William Rinner, and Marin Levy providedexcellent research support. I must give special thanks to Manav Bhatnagar,who did the bulk of the research and responded to all requests with excep-tional speed and good cheer, and to Scott Grinsell, who patently readthrough an early draft. Peter Miller provided invaluable help in putting to-gether the ranking of state disclosures, and Daniel Bowen was very helpfulin assessing initial measurement processes. Finally, thanks to my husband,David Simon, who makes all things possible and who would blush if Iwrote what he means to me.
x Acknowledgments
Introduction:Why We Need a Democracy Index
Our election system is run badly. Although many people are aware of theproblem and eager for a solution, reform efforts have gotten surprisinglylittle traction. This book explains why election reform has yet to catch holdand offers a promising new solution for getting change passed: a “Democ-racy Index,” which would rank states and localities based on how their elec-tion systems perform.
THE PROBLEM
The best evidence we have suggests that our election system is clunky atbest and dysfunctional at worst.* Ballots are discarded. Poll workers arepoorly trained. Registration lists work badly. Lines can be too long. Ma-chines malfunction. Partisan officials change the rules of the game to helpthemselves and hurt their enemies. Election administrators cannot agreeon what constitutes a best practice, or even whether there is any such thing.Authority is decentralized, so it’s hard to know who’s to blame when aproblem occurs. Most experts agree that the system we use to run our elec-tions is chronically underfunded, often poorly run, and sometimes admin-istered in a partisan fashion.
*Rather than repeat the phrase “the best evidence we have” in every other sentence of this book, letme offer a general caveat about the diagnoses offered here. As chapter 2 makes clear, it is difficult tomake precise claims about the current state of the election system because the data are so sparse. WhatI describe here are the symptoms that experts routinely see and the field’s best guesses as to their rootcauses. These assessments are based on the best information available, but better information would benecessary to state these claims with certainty. One of the main points of the book is that we should bedeeply troubled by our inability to know whether the system is working or not.
People assume that the fiascos we saw in Florida in 2000 and Ohio in2004 are outliers, crises caused by a level of partisanship and mismanage-ment that does not exist elsewhere. Partisanship and mismanagementsurely played a role in those debacles. But both states were also in thewrong place at the wrong time, victims of a turnout tsunami that too fewstates are equipped to handle. A crisis is not around every bend in theUnited States. But that’s only because elections usually aren’t close enoughfor these routine problems to affect the outcome. Unless we fix the under-lying causes, debacles can occur almost anywhere.
In 2006, a hotly contested congressional race took place in Florida. Themargin of victory? 373 votes. The number of people who went into thevoting booth but did not cast a ballot that counted? 18,000.1 A malfunc-tioning computer in Carteret County, North Carolina, lost 4,400 votesduring the 2004 election, with no means of recovering them.2 The sameyear poll workers in Orange County, California, gave the wrong ballots to7,000 people in a primary election, a mistake that may have affected theresults in several races.3 During a 2006 primary, election workers in Mary-land forgot the cards they needed to start up the election machinery. Morethan 200 precincts could not open until late morning.4 That same year, agroup of computer scientists discovered it was surprisingly easy to stealvotes by inserting a virus into the electronic voting machines used by 10percent of Americans.5 In Colorado, long lines at polling places deterredabout 20,000 people from voting, 20 percent of expected turnout.6 A sub-sequent review largely blamed Colorado’s new software, which was “of de-cidedly sub-professional architecture and construction and appears neverto have been tested in any meaningful manner.”7 That’s expert speak for“tut, tut, tut.”
Cuyahoga County, Ohio, is probably lucky that MSNBC’s Keith Ol-bermann doesn’t choose a “worst election system in the world.” Problemsseem to occur every cycle. After suffering the long lines and chaos thatafflicted many Ohio counties in 2004, Cuyahoga denizens opened theirmorning papers to read headlines like “Election Staff Convicted in Re-count Rig.”8 In May 2006, election workers lost 70 computer memorycards containing voting records, 15,000 absentee ballots had to be hand-counted because the machines could not read them, and numerouspolling problems occurred. It took five days to report the results.9 All of
2 Introduction
this led Ohio’s new secretary of state, Jennifer Brunner, to demand theresignations of the entire board.10 But problems persist. In November2007, the server used to count votes repeatedly froze and crashed.11
Worse, administrators discovered that “20 percent of the printouts fromtouch-screen voting machines were unreadable and had to be re-printed.”12 All of this might be quite funny—a local government versionof The Office—if election results weren’t riding on it. “God help us,” saidone county official, if the next presidential race “depend[s] on CuyahogaCounty.”13
At first glance, it looks like reform ought to be easy to pass in the UnitedStates. There’s a good deal of agreement that we have a problem and a myr-iad of proposals for solving it. Not a week goes by without someone issu-ing a report or proposing a change. In 2007, close to one hundred reformbills were circulated in Congress, with more than nineteen hundred pro-posed in state legislatures. Hundreds of academic articles addressed reformissues. Dozens of good-governance groups offered hundreds of reports andproposals on their websites.
The political environment also seems receptive to change. Who, afterall, is against democracy working better? One suspects that the word dem-ocratic is routinely appended to policy proposals only because it conveysmore gravitas than “motherhood” or “apple pie.”
Finally, the fiascos we’ve seen in recent years should have provided apowerful impetus for change. Reform is a notoriously crisis-driven indus-try. It is always tough to get anything on the legislative agenda. But “elec-toral meltdowns”14 have been a regular occurrence in recent years. Just askany academic who specializes in elections. Many of us have moved from la-boring in obscurity to serving as commentators on CNN. Like a plague oftweed-clad cicadas, we return from academic hibernation every couple ofyears to feed on whatever election controversy is brewing.
Despite all of this, serious reform has not yet gotten traction in thiscountry. Even in the wake of the 2000 fiasco—which made the UnitedStates an international laughing stock—all Congress could do was pass therelatively toothless Help America Vote Act. The Act has helped us makegenuine progress in several areas, as I explain in the next chapter. But it ad-dressed only the symptoms of the Florida debacle, not its root causes: in-adequate funding, amateur staffing, and partisanship.
Introduction 3
Just think about that for a moment. There’s a strong consensus that wehave a problem, lots of potential solutions, a reform community ready toact, and a cause that voters support. Yet even a crisis like the 2000 electionprompted only modest reform. If that’s not a sign that we need a new ap-proach to reform, I don’t know what is.
WHY WE HAVEN’T FIXED THE PROBLEM
Why hasn’t reform gotten much traction in the United States? Partisanshipand localism generate political tides that run against change. Unlike mostdeveloped democracies, state and local officials run our elections, leadingto what one scholar has termed “hyper-decentralization.”15 Worse, manyof those local officials have strong partisan ties. This unusual combinationof partisanship and localism not only results in a poorly run system, butmakes change hard to come by. At worst, election officials administer elec-tions in a partisan or unprofessional fashion. At best, they have few incen-tives to invest in the system and lots of reasons to resist change. Thesefactors combine to stymie reform.
Unfortunately, voters and reformers have been unable to alter this per-verse political dynamic. Voters have only a haphazard sense of how wellelections are run, and no comparative data that would tell them which sys-tems work and which don’t. We do not even know how many people casta ballot during our last presidential election,16 let alone how well our elec-tion system is performing. Voters learn that there’s a problem only when anelection is so close that the outcome is in doubt. That’s like measuring an-nual rainfall by counting how often lightning strikes.
Reformers similarly struggle in today’s political environment. Evenwhen lightning strikes—when there’s a crisis that could energize a coali-tion for change—debates about reform quickly descend into highly tech-nical arguments that voters have no yardstick for judging. Even when re-formers manage to get policymakers’ attention, they lack the informationthey need to make a credible case for change. Reformers work hard toovercome these obstacles, but most ask policymakers to ignore their self-interest and do the right thing. Little wonder that reform hasn’t yet got-ten much traction.
4 Introduction
The dilemma is clear. While the basic ingredients for change exist—anational consensus that there’s a problem, an active reform community, anintuitively popular cause, and semiregular crises to place the issue on theagenda—political incentives create a drag on reform efforts. The problemis hardly insurmountable. If reformers can persuade legislators to restorethe voting rights of felons,17 improving our election system is surely a causewith political legs. But we need to align the incentives of politicians withthe interests of voters on this issue. We need to give local officials a reasonto pay attention. We need a new approach to election reform.
A NEW APPROACH
This book offers a new approach. It argues that we should create a Democ-racy Index that ranks states and localities based on election performance.The Index would function as the rough equivalent of the U.S. News andWorld Report rankings for colleges and graduate schools.* It would focus onissues that matter to all voters: how long did you spend in line? how manyballots were discarded? how often did voting machines break down? TheIndex would tell voters not only whether things are working in their ownstate, but how their state compares to its neighbors.
The Democracy Index is unusual because it works with political incen-tives, not against them. By providing the right information in the rightform, it has the potential to create an environment that is receptive tochange. It is a data-driven, information-forcing device designed to gener-ate pressure for reform while helping us make more sensible choices aboutwhich reforms to pursue.
First, the Democracy Index pulls together the right information: com-parative data on state and local performance. Comparative data on bottomline results should reveal problems that haphazard data conceal, helping uspinpoint solutions and make the case for change. Today reformers and
Introduction 5
*This sentence might not inspire confidence in those familiar with the foolishness the U.S. Newsand World Report rankings have engendered. As I explain in chapters 2 and 4, however, the Index ad-dresses easily quantifiable, nuts-and-bolts issues that lend themselves to quantitative measurement in away that educational quality does not. Moreover, while “teaching to the test” is always a worry for anyranking, a well-designed Democracy Index is a good deal better than having no test at all.
election officials argue incessantly about which direction we should go. Butno one has a map that tells us where we are now. Comparative data wouldgive us that map.
Second, the Index packages the data in the right form: it ranks states andlocalities against one another. By distilling performance data into a highlyaccessible form, the Index gives voters a rough sense of how well their sys-tem is doing, precisely the information they need to call election officialsto account. A ranking should work for the simplest of reasons: no onewants to be at the bottom of the list.
Because the Democracy Index provides the right information in the rightform, it should harness the two major obstacles to reform—partisanshipand localism—in the service of reform. An Index would make electionproblems visible and concrete to voters and policymakers alike. And it wouldgive politicians a reason to care about how well the system is working.
Even if the Democracy Index failed to gin up political support for re-form, it should still improve the handling of elections. We typically assumethat voters and politicians alone can hold administrators accountable fortheir missteps. In many fields, however, bureaucrats police themselves basedon shared professional norms. Peer pressure, it turns out, can be just aseffective in the workplace as it is in high school. By providing a professionaltouchstone in the field, the Democracy Index could help generate a consen-sus on best practices, something sorely needed in election administration.
GETTING FROM HERE TO THERE
IN ELECTION REFORM
While the book’s central purpose is to make the case for a DemocracyIndex, it is animated by a larger theme. We have a “here to there” problemin election reform. We spend a great deal of time thinking about what’swrong with our election system (the “here”) and how to fix it (the “there”).But we spend almost no time thinking about how to get from here tothere—how to create an environment in which reform can actually takeroot. Reform advocates work tirelessly to help specific projects blossom.But they are fighting this battle on difficult terrain, and almost no one is
6 Introduction
thinking about how to change the terrain itself. We’ve spent too much timeidentifying the journey’s end and not enough time figuring out how tosmooth the road that leads there.
There is little point in continuing to fight the same fight in the vaguehope that something will eventually take. We should take a step back andfigure out how to create an environment that is more receptive to changegenerally. It is time to think less about the end game and more about the interim strategies and institutional tweaks that will help us get fromhere to there. The Democracy Index is just such a solution.
The “Here to There” Problem
The “here to there” problem is endemic in election reform circles. Scholarlyproposals often have a “just add water” quality, as if merely announcing agood idea is enough to get it passed. The problem is perfectly captured bya New Yorker cartoon, with two professors poring over a complicated mathproblem. A simple notation explains the key step in the equation: “Then amiracle occurs.” To be fair, some academics have thought hard about whyreform is difficult to pass, with partisanship and localism being the usualsuspects in most analyses. But phrases like “the perils of partisanship” orthe “problem of localism” are usually punch lines to the story, not startingpoints for the analysis.
A handful of scholars have written sporadically about the here-to-therequestion.18 Unlike scholars who specialize in areas like campaign finance orredistricting, however, we do not think of ourselves as addressing the samequestion or writing in the same field.19 We haven’t thought systematicallyabout what connects our work to each other’s or to the broader project ofelection reform.
This is surprising. After all, most arguments for election reform dependon a single premise: process shapes substance. Academics are quick to tellyou that the structure of our political process (campaign finance law, redis-tricting rules) helps determine the substance of our policies (who getselected, what gets passed). But they do not apply that lesson to election re-form. The structure of our political process also determines what kind ofelection reform gets passed. Or, in the case of the United States, it createsan environment where precious little gets passed.
Introduction 7
The here-to-there problem is not confined to the academy. Blue-ribbonpanels and good-governance groups often propose overhauling our elec-tion system or enacting laundry lists of nuts-and-bolts proposals. Thoughreformers who labor in the political trenches are painfully aware that wecannot “just add water” to get change passed, most spend too much timedescribing the change they want and too little time thinking about fash-ioning a political environment that is receptive to it. Take a look at the finalreport of the Carter-Baker Commission,20 the most high profile reformeffort in recent years. It offers pages of detailed recommendations but saysalmost nothing about what we could do to ensure that at least some ofthese recommendations see the light of day.
Reformers, of course, spend a lot of time thinking about the here-to-there problem for specific projects. They work tirelessly to build supportfor this or that proposal—educating the public, lobbying officials, filinglawsuits. But good-governance groups lack the resources they need to grap-ple with the here-to-there problem writ large. That’s because reformers arebeholden to funders. And funders tend favor big over small, end goals overinterim solutions, silver bullets over institutional tweaks, substantive pro-posals over procedural fixes. As one reform advocate ruefully told me, “Pro-cess is not sexy.”21 And the here-to-there question is process squared—changing the reform process to make more significant procedural reformspossible. For funders anxious to see concrete results—bills passed, reportsissued, news articles written—“smoothing the path for election reform”looks like a nebulous project indeed.22 The result is that the people whoknow the most about how the reform process works have the fewest oppor-tunities to change it.
Solving the Here-to-There Problem
If the work of reformers is to be something other than a Sisyphean task,process should be our main focus, and smoothing the path for changeought to be at the top of the reform agenda. Here-to-there proposals mayseem modest when compared to typical reform proposals, like calls forpublic financing or nonpartisan election administration. But these wide-ranging reform proposals have been met with a deafening silence. We haveplenty of ideas about what kind of change we want. What we need is anenvironment in which change can happen.
8 Introduction
The Democracy Index offers a quintessentially here-to-there solution. Itdoes not create national performance standards. It does not take poweraway from partisan officials. It does not even endorse a set of best practicesfor administering elections. Instead, it pushes in the direction of better per-formance, less partisanship, and greater professionalism. The Index does sonot by trying to resist the fierce push against change generated by our po-litical system’s twin engines—partisan warfare and local competition—butby harnessing partisanship and localism in the service of change. It is amodest reform that makes bigger, better reform possible. It gets us fromhere to there.
This book is organized as follows.Chapter 1 canvasses the problems we see in our election system and
identifies their root causes: partisanship and localism, which have pro-duced a badly run system and stymied efforts to change it. The chapter ar-gues that the first step toward meaningful reform is to reverse the politicaltides that have run so long against reform. A Democracy Index—describedin some detail at the end of the chapter—represents one such solution.
Chapters 2 and 3 explain why the Democracy Index should alter the po-litical incentives that too often prevent reform from getting traction. Whilemost businesses and government agencies measure relentlessly, electionadministration—which is ripe for quantitative analysis—is a world withoutdata. These chapters show how difficult it is to run an election system—letalone improve it—in a world without data. And they explain why a rank-ing system represents a particularly effective strategy for distilling electionperformance data and prodding election officials to improve. An Indexshould affect the three major leverage points in the reform process, givingvoters the information they need to hold election officials accountable,putting pressure on policymakers to do the right thing, and helping ad-ministrators police themselves.
While a Democracy Index can correct the perverse political incentivesthat stymie reform, chapter 4 warns that it could also introduce differentproblems into the reform calculus. A poorly designed ranking might pushstates to compete along the wrong dimensions and create incentives forelection administrators to cook the books. There are strategies for mitigating
Introduction 9
these problems, but these risks go hand in hand with the benefits associ-ated with ranking, and it is important not to ignore them.
Chapter 5 considers the here-to-there question in miniature—how tomake the Democracy Index a reality. This chapter first addresses the politicalquestion—whether the Democracy Index itself is likely to get traction. Theproposal has already garnered significant attention from policymakers, ac-ademics, and foundations. It has been incorporated into separate legisla-tion by Senators Hillary Clinton and Barack Obama. Congress has setaside ten million dollars to fund model data-collection efforts by the states.And several major foundations have already poured significant resourcesinto the early stages of the Index’s development. Nonetheless, as further de-tailed in this chapter, obstacles remain. Chief among them are collectingthe necessary data and getting buy-in from election administrators. Whilethere are reasons to be optimistic about the idea’s future, even a modestproposal like this one will need some help along the way.
This chapter also returns to the question introduced in chapter 1—whatshould a Democracy Index look like? It details the challenges involved increating one. Any effort to assemble it will involve what political scientistPaul Gronke calls a “pushmi-pullyu” process.* The designers of the De-mocracy Index will have to toggle between the ideal and the real—thethings they want to measure and the data that actually exist—in determin-ing what is ultimately included in the Index. This chapter suggests somecreative strategies for obtaining the data we need and offers examples of themetrics the Index might include.
The book concludes by returning to the broader theme that animates it:how to get from “here to there” in election reform. The Democracy Indexis part of a larger shift in reform circles. The new generation of reformersis moving away from top-down regulation to market-driven solutions.They eschew civil-rights rhetoric for data-driven policymaking. Unyield-ing in their idealism, they are pragmatic, even eclectic, in their approach.The concluding chapter notes that the Democracy Index offers some largerlessons about what drives reform and argues that the Index beats out mostother reform proposals for a simple reason: it should help make those pro-posals a reality.
10 Introduction
*One hopes that the process gets farther than did the magical creature in the Dr. Dolittle books.
1 The Perverse Politicsof Election Reform
Why (We Think) Elections Are Run Badly, and What to Do about It
The best evidence available suggests that our election system suffers fromthe same problem that afflicts the nation’s physical infrastructure: deferredmaintenance. We have not invested enough resources in buying voting ma-chines, designing polling places, training poll workers, and updating poli-cies. Politics and localism are the root causes of these symptoms. These un-usual features of the U.S. system not only undermine its quality, but thwartefforts to improve it. If we want to get from “here to there” in election re-form, we must alter this perverse dynamic. One of the most promisingstrategies to do so is a Democracy Index.
THE PROBLEMDeferred Maintenance
During the last few years, we’ve witnessed bridges collapsing, dams burst-ing, even a giant sinkhole in Portland that swallowed the truck sent to fixit.1 These problems were all caused by a phenomenon long familiar to ex-perts and bureaucrats: deferred maintenance, a phrase that made its wayinto national headlines when a bridge in Minnesota collapsed in 2007.2
The phrase captures a simple idea: we aren’t taking care of the nation’sphysical infrastructure.3
We aren’t taking care of the nation’s democratic infrastructure, either. Itis made up of people instead of bridges, voting machines instead of high-ways, regulations instead of dams. The evidence of neglect can be seen
across the country. Registration systems function badly. Voting machinesbreak down. Poll workers are often poorly trained and badly compen-sated.4 Too many ballots go uncounted because of bad ballot design or mal-functioning machinery. Eligible voters are sometimes turned away fromthe polls or leave in frustration because of long lines or hassles they en-counter at the polling place.5 Polling places can be hard to reach, poorlylaid out, and in need of more parking.6
People describing this problem usually start with the 2000 presidentialelection.7 Thousands of eligible voters were improperly purged from regis-tration lists and denied a chance to vote. Thousands more appear to havevoted for the wrong presidential candidate because of bad ballot design.Outdated voting machines prevented still more voters from casting a bal-lot that could be counted. While these problems can happen in any elec-tion, they mattered a great deal in a race with a 537-vote margin, where theoutcome would determine our next president.
There is a danger, however, in starting any discussion about our electionsystem with a story like Florida. Not every dam, bridge, or highway rampis going to collapse. So, too, debacles like Florida’s are not around every bend.That’s why this chapter began by describing the problem as deferred main-tenance, not outright crisis. Because most elections are won by large mar-gins, votes discarded and voters deterred usually won’t affect the outcome.
Nonetheless, if it’s a mistake to conclude that the system is about to fallapart based on what occurred in Florida, it’s also a mistake to conclude thatthings are working well in the many places where a crisis has not occurred.When elections are competitive—when lots of new voters want to register,when turnout is high, when elections are decided by a small margin—weput more pressure on our creaky system than it can bear. It is preciselywhen we care most about an election’s outcome—when voters are ener-gized and the race is hard fought—that we will be least confident about theresults. It’s tempting to say we are playing Russian roulette with our de-mocracy. But that’s the wrong metaphor; the odds of disaster aren’t thatsteep. The problem is that we aren’t prepared for the electoral equivalent ofa Category 4 or 5 hurricane. The human costs of neglect are strikingly dif-ferent in elections and hurricanes. But the metaphor captures both the pre-dictability and unpredictability of problems that arise from deferred main-tenance. It’s hard to tell where disaster will strike, but it doesn’t make sense
12 Chapter 1
to bet against disaster in the long haul. We can’t all rely on what RickHasen terms “the election administrator’s prayer: ‘Lord, let this electionnot be close.’”8
The State of Our Election System
The introduction describes some of the specific problems associated withdeferred maintenance. Statistics can offer a more systemic view, thoughthey come with the same caveat I offered in the introduction: we don’t haveenough data to be sure of the diagnoses I offer below. We ought to be deeplyembarrassed that the phrase “we think” had to be included in the title ofthis chapter.
What evidence we do have indicates that between one and a half andthree million votes were lost solely because of problems with the registra-tion process during the 2000 election, with several million more lost toother causes.9 According to the 2000 U.S. census, about one million regis-tered voters said that they did not vote because polling lines were too longor polling hours were too short.10 In 2004, we were missing one-quarter ofthe two million poll workers needed to administer the election.11 In 2006,43 percent of local officials surveyed about the prior presidential electionreported that an electronic voting system malfunctioned, with 11 percentreporting a breakdown that could not be fixed. Twenty-one percent ofthose officials reported that poll workers did not understand their jobs, and10 percent had problems with poll workers failing to show up to work.Twelve percent admitted that there were “excessively long lines” on Elec-tion Day.12
The risks associated with deferred maintenance are especially high forthe intensely competitive elections that have become commonplace in re-cent years. In 2000, it took us more than a month to figure out who wouldbe president. In 2004, we were not that far from a similar disaster. Had the Electoral College count come down to New Mexico (where Bush won by only 6,000 votes) instead of Ohio (where Bush enjoyed a 135,000-vote margin),13 we might have witnessed the same type of brouhaha thatled Fidel Castro—admittedly not a man cursed with self awareness—tooffer to send election monitors in 2000.14 The same problems, minus theintervention of a puckish Cuban dictator, afflict state and local elections.
Perverse Politics of Election Reform 13
Washington’s 2004 gubernatorial election took seven months to resolveand continues to generate bad will and conspiracy theories on both sidesof the political aisle.15
Too Little Progress Made since 2000
While these problems are known to every seasoned politician–one scholarcalls them “election administration’s family secret”16—too little has beendone to fix them. Some things got a good deal better in the wake of 2000,largely because of the Help America Vote Act (HAVA) passed by Congressin 2002.17 HAVA provided much-needed funding for new voting machinesand made some sensible adjustments to state balloting processes. The fund-ing has been particularly important in replacing outdated technology,helping to reduce the number of ballots lost to machine problems.
Still, even these important reforms seem quite modest when comparedto the crisis that prompted them. HAVA failed to create comprehensive na-tional standards for running our elections. It failed to provide for adequateenforcement of the few standards it did set. It even failed to fund theagency it created to coordinate the act’s new policies. As one AP report ex-plains, two years after HAVA passed, the Election Assistance Commissionit created “had no desks, no computers, and no office to put them in. It hadneither an address nor a phone number. Early meetings convened in a Star-bucks near a Metro stop in downtown Washington.”18
Perhaps most importantly, while HAVA addressed the symptoms we sawin Florida 2000, it failed to address their root causes: the election system isusually underfunded, often run by people without adequate training, andoccasionally hijacked to serve partisan ends. As long as Congress focuses onsymptoms rather than root causes, it will be engaged in the policymakingequivalent of whack-a-mole.
Little wonder that serious problems persist. The same problems we sawin Florida—discarded ballots, improperly purged registration lists, poorballot design—continue to rear their ugly heads. And a slew of new prob-lems has emerged in HAVA’s wake. For example, many jurisdictions usedHAVA funds to purchase touch-screen machines that “are too easily com-promised or hacked” and have an unacceptably high failure rate.19 A groupof computer scientists at Princeton conducted a security test on the coun-
14 Chapter 1
try’s most widely used electronic voting machines. They discovered thatsomeone with one minute’s access to the machine could upload a virus thatwould change vote totals without detection and, worse, spread the virus toother machines.20
We deserve better. Our democratic practices fall too short of our demo-cratic ideals. Many describe voting as a civic sacrament. Paeans to the rightto vote abound. People have put their lives on the line to exercise the right.And yet we neglect virtually every aspect of the process by which ballots are cast and counted. At a time when the United States is trying to spreaddemocracy abroad, our election system falls well short of our peers’. Wedeserve a system that makes it easy for voters to register and cast a ballot.We deserve a system that counts votes accurately. We deserve a system thatcannot be hijacked for political ends. We deserve a system that gives us theinformation we need to know how it’s working. We deserve better.
THE CAUSE OF THE PROBLEM
It is bewildering that our system works as badly as the evidence suggests.After all, it’s hard to find a more superficially appealing cause than demo-cratic reform. How did we end up in this mess, and why can’t we fix it?
Partisanship and localism—two features that distinguish our systemfrom other developed democracies—are the main culprits. We leave theregulation of politics to politics; partisan officials administer large swaths ofour election system. And ours is a highly decentralized system; we vest atremendous amount of power in the hands of state and local officials. Thecombined effect of partisanship and localism undermines the quality ofour election system and makes change hard to come by.
Foxes Guarding the Henhouse: The Problem of Partisanship
The United States is an outlier among mature democracies. Every other es-tablished democracy relies on professional administrators, insulated frompolitical interference, to run its elections.21 Here we depend on partisans.22
The problem is so pervasive that academics routinely describe it as “foxesguarding the henhouse.”23
Perverse Politics of Election Reform 15
Partisan bias. It’s easy to see why it is a bad idea to have partisan offi-
cials run our elections. We don’t let people referee the game they are play-ing, and with good reason. It creates too many opportunities for partisanmischief. The problem is not just that election officials are likely to root fortheir own political party. The problem is that election officials depend ontheir party for their jobs.
Consider the dilemma faced by an elected secretary of state, the mostcommon overseer of elections in the United States. The position is widelythought to be a stepping stone for higher office. What matters most for themany secretaries of state who want to run for governor or Congress? Polit-ical support, not professional performance. When voters have little infor-mation about how well the election system is working, the fate of a secre-tary of state depends heavily on her standing within the party, which willprovide resources and support for her next campaign. The current state ofaffairs creates the wrong kinds of incentives for secretaries of state—and themany partisan officials below them, whose careers similarly depend on par-tisan rather than professional credentials. As Chris Nelson, South Dakota’sstraight-shooting secretary of state, told me, “Being nonpartisan doesn’tearn a lot of points with the party faithful.”24
The most disturbing consequence of partisans administering our elec-tions is political bias. Politics, after all, is a game devoted to helping yourfriends and hurting your enemies. It is possible to do both when adminis-tering elections. Most election policies have partisan consequences. Mak-ing it easier to vote is thought to help Democrats; making it harder to voteis thought to help Republicans. If you think that older people are likely tovote for your candidate, you will want to make it easier to vote absentee.Because people can be deterred by long lines, you will want to reduce thenumber of polling places or voting machines in areas where your oppo-nent’s supporters live.
Unsurprisingly, those with the motive and opportunity to engage in par-tisan shenanigans sometimes do the dirty deed. The authors of an impor-tant new study examining the election systems of five Midwestern stateswrite that “it has been disconcerting to learn the extent to which the mind-set of elected policymakers is not on how to design the voting process for the public’s benefit, but rather on how to advance one’s candidacy orparty.”25 One of the authors of that study, Ohio State professor Dan Tokaji,
16 Chapter 1
terms efforts to hijack election rules to further partisan ends “the new votedenial.”26 The irony, of course, is that the “new vote denial” looks a lot likethe old vote denial. We are back to worrying about the use of basic admin-istrative practices to prevent citizens from voting. The new vote denialtechniques may not work as directly as the strategies of Jim Crow. Butpoliticians plainly think they are effective enough to use them.
Kenneth Blackwell, who served as Ohio’s secretary of state during the2004 presidential election, is a favorite target of complaint.27 A Republi-can who was then chair of the Bush reelection campaign in Ohio, Black-well publicly campaigned for President Bush and other conservative causesduring his tenure. Blackwell was roundly criticized for administering thepresidential election in a partisan fashion. Ohio was a battleground state,and both parties were fighting hard for every vote. The conventional wis-dom was that high turnout would favor Kerry. Many thus suspectedBlackwell’s motives when he repeatedly made it more difficult to registerand cast a ballot. For example, Blackwell ruled that voter registration cardshad to be submitted on eighty-pound card stock, the heavy paper used for wedding invitations. It is difficult to imagine a sensible justification for such a rule, and easy to see how it could advance the Republicans’chances. Little wonder, then, that even members of Blackwell’s own partywere unwilling to stand by his decision, forcing him eventually to with-draw the regulation. Blackwell generated more controversy when he in-voked his title in recording an automated telephone message urging vot-ers to vote in favor of a constitutional amendment prohibiting same-sexunions.
Blackwell did little to improve his reputation during 2006, when heserved as Ohio’s chief elections officer at the same time that he ran for gov-ernor. Though Blackwell recused himself from ruling directly on a chal-lenge to his opponent’s eligibility, he made several decisions that werethought to improve the political fortunes of Republicans, including him-self. For example, Blackwell interpreted Ohio’s election code to requirepaid registration drive workers to return registration forms in person. Thedecision outraged get-out-the-vote groups and was ultimately enjoined bya state court. We will never know, of course, whether partisanship moti-vated Blackwell in making these decisions. At the very least, his actions cre-ated the appearance of political bias.
Perverse Politics of Election Reform 17
While most secretaries of state don’t prompt such a ruckus, the perils ofpartisanship loom over them. In the words of Kentucky’s dynamic youngsecretary of state, Trey Grayson, partisan affiliation puts election officers ina “potentially tough situation” if they plan to run for higher office.28
Grayson argues that you “can’t take the politics out” of these decision andyou shouldn’t “pretend there’s not a problem.”29 Transparency, he insists, isthe only solution.
The lack of professionalism. While bias is the most disturbing conse-quence of partisanship, it’s not the most common. The vast majority ofelection administrators are people of good faith who do a very hard jobwith very few resources. But the problem of partisanship goes deeper thanthe biased administration of elections.
One unfortunate by-product of partisanship is a lack of professionalism.A system that depends on the political parties to staff it is unlikely to bestaffed with trained experts. Just talk to Conny McCormack, L.A. County’sformer registrar-recorder. One of the most widely respected election ad-ministrators in the field, she exudes such competence that you sometimeswonder whether she’d be running IBM if her career path had taken a dif-ferent turn.
McCormack is scathing about the role politics plays in election admin-istration. She has run into enough tussles to recognize that some politick-ing is inevitable in the job. But the politicking goes too far, in her view, instates where secretaries of state are elected. McCormack argues that electedsecretaries of state are not interested in “best practices or technical details.”Those issues won’t help them “get headlines and run for governor,” shenotes acidly. Top elections officials are largely focused on “raw partisan pol-itics”; one succeeds by being a “charismatic campaigner, not a good admin-istrator.” The core problem, says McCormack, is that the skills necessary torun a campaign and the skills necessary to run an election system “don’tnecessarily match up.”30
Though McCormack is too generous to admit it,31 the lack of pro-fessionalism is a problem that runs through the system. Even at the locallevel, the overriding qualification for administering elections is often partymembership, not professional qualifications. As a result, local election ad-ministrators are usually amateurs. They are people of good faith, but they
18 Chapter 1
lack the professional training or experience enjoyed by election administra-tors in other mature democracies. Moreover, like candidates for secretary ofstate, some harbor higher political ambitions. As a result, as election lawyerBob Bauer observes, “Even the best-intentioned have other plans and com-mitments, priorities higher than the conduct of flawless elections, and a setof skills that do not necessarily include a deft touch for management.”32
Resistance to change. Partisanship not only causes many of the prob-lems in our election system, but makes it resistant to change. The obvioussolution to the problem of partisanship is to replace politicians with bu-reaucrats whose jobs do not depend on their political standing. But whenfoxes are guarding the henhouse, it is hard to jettison them from that pow-erful station. The people who decide who decides—the federal and statelegislators who have the power to place our election system in the hands ofnonpartisans—are partisans themselves. And if you are the party in con-trol, what incentive do you have to abandon this important weapon inyour political arsenal? It’s not a coincidence that election reform proposalstend to come from the party out of power, which loses interest in reformthe moment it gains a majority of seats.
I once testified in favor of a nonpartisan districting in front of the Mas-sachusetts state legislature. One bemused representative asked the questionthat I suspect was on the mind of many of his Democratic colleagues. Why,he asked, should Massachusetts Democrats “unilaterally disarm,” giving upthe power to draw districting plans that favored Democrats, without aguarantee that Texas Republicans would do the same? My job, of course,was to play the straight man to his cynical barb, so I blathered on aboutMassachusetts’s leadership role in pushing progressive reform. The truthwas that he had a point. It was not in the interests of Massachusetts Dem-ocrats to give up the power to district.
Politicians can even be reluctant to make changes that help their ownparty. Just ask Joe Mansky, who moved from a career in hydrology to be-come a highly respected elections official in Minnesota. Politicians, he says,“are reluctant to change the system that got them elected.”33 It’s not hardto see the logic. If you granted politicians one wish for the next election,they’d all ask for the same thing: a voting pool that looks exactly like it didin the last election. You don’t want anyone new from the other party to
Perverse Politics of Election Reform 19
vote. And adding more members of your own party to the voter rolls mightjust invite a primary challenge.
Even when elections are administered by bipartisan boards, the partieshave every reason to maintain the status quo. The one thing that Republi-cans and Democrats can generally agree upon is that the rules that got theirincumbents elected should be kept in place. Moreover, local officials are re-luctant to cede their jobs to nonpartisan boards. Those positions can be apolitical plum that the parties dole out to their most loyal supporters. It’sthe same problem McCormack sees in top offices: being a savvy politicianis not the same thing as being a skilled administrator.
Local Competition and the Race to the Bottom
Localism is the other main source of the problems we see in election ad-ministration. While most mature democracies use a national bureaucracyto administer elections, the American system is highly decentralized. Statesrun all of our elections, and most vest considerable authority in localitiesto carry out basic tasks like registering voters and counting ballots.
Decentralization is often a very good idea. It can encourage experimen-tation and policies tailored to local needs. In the elections context, how-ever, decentralization has caused so many problems that scholars condemnit as “hyper-decentralization”34 or “failed federalism.”35
The crux of the problem is that many election jurisdictions in theUnited States are starved for resources. Half the jurisdictions in the UnitedStates have fewer than 1,400 voters; two-thirds have fewer than 10,000voters.36 Small jurisdictions like these simply cannot hire enough people tostaff elections. Most make due by having their election superintendentswork part-time or perform multiple roles. These folks barely have time tocarry out basic duties, let alone do the things we’d ideally want them to do.
If you want to know how hard the job is, just talk to Joy Streater, thecounty clerk for Comal County in Texas.37 I was recently at a conferenceon collecting election data. A number of high-powered academics and bigplayers in election administration flagged the challenges involved in col-lecting the information. No one was more effective than Streater. Her se-cret? She just described, in a low-key Texas drawl, what her average daylooked like. It was fun to watch optimistic calls for change neatly deflatedby Streater’s aw-shucks-I’m-just-a-simple-country-clerk speech.
20 Chapter 1
Think you have a hard job? Imagine your office had to register birthsand deaths; issue marriage licenses; record official public records; and re-cord subdivisions plats, modifications, and amendments. Imagine youserved as the clerk of the Commissioners Court and the County Court, therecords management officer for all county offices processing all mentalcommitments, and a member of the Bail Bond Board, the ReclassificationCommittee, and some strange institution called the Wellness Committee.And, by the way, you are also supposed to run all local, state, and federalelections. If you are Joy Streater, you’ll also win a bunch of awards, testifyregularly before the state legislature, and serve on various advisory boards.
Streater is quick to remind you that she’s actually better off than mostcounty clerks. Comal County is a fairly large jurisdiction by Texas stan-dards. She has only one part-time person running elections, but at least thatperson has 34 years of experience and has been able to make due with thetemporary help they hire around election time. But resources are still tight.When I spoke with Streater last June, she’d just come back from a meetingto plan for the general election. The problem on her mind? People wantedthe county to keep all the early voting sites open for two weeks prior to theelection. Sounds pretty reasonable, doesn’t it?
“How much would it cost?” I asked her. “One hundred thousand dollars,” she said calmly. “What is your overall budget?” I queried.“We’ve got $125,000,” she responded in honeyed tones, “so we’d have
$25,000 left for everything else.”Reformers and academics have a bad tendency to genuflect toward the
problem of local resources and then blithely go ahead and demand morefrom election administrators. I’ve done it more often than I care to admit.Talking to Joy Streater provides a bracing reminder of the challenges de-centralization poses for those interested in reform.
Since you probably won’t have a chance to watch Streater in action, letme give you some hard numbers on the resource challenges local officialsface. The best study available was done by Eric Fischer, a senior specialistat the Congressional Research Service, along with his fellow CRS analystKevin Coleman.38 With his bushy hair, booming voice, and amusing sto-ries about John Bolton’s adolescence (Bolton’s dislike of the United Na-tions apparently dates back to seventh grade), Fischer seems like the lastperson you’d imagine studying a topic as dry as election administration. He
Perverse Politics of Election Reform 21
is, after all, a man who has been attacked by Costa Rican peccaries and cantalk for hours about the sex life of hermaphroditic sharks. But in the wakeof the 2000 election, CRS needed someone to develop expertise in thefield, and Fischer was happy to step up.
Fischer’s national survey revealed that the average election official doesn’tpossess a college degree and earns less than $50,000 per year, with somelocal officials earning as little as $10,000 per year.39 The average local offi-
cial oversees a wide range of responsibilities beyond running elections buthas received fewer than twenty hours of training.40 Most local officials areworried about future funding.41
If you want a more granular view of the resource issue, you should talkto Gary Smith,42 a man who could not be more different from Fischer.Smith, the director of elections in Forsyth County, Georgia, is a business-man’s businessman. He speaks in a low-key but commanding style, and it’shard to imagine that a hermaphroditic fish would dare cross his path.Smith became the director of elections after retiring from a high-poweredposition in the private sector, where he oversaw international operationsfor a company with 250,000 employees. At the time, he thought electionadministration would be nice way to ease into retirement.
Smith conducted a comprehensive wage and benefits survey43 of Geor-gia’s election system for a simple reason.
“You get what you pay for,” he says. When Smith first saw what his ownsalary would be, he assumed it was a part-time job. As he learned, “Theonly thing part-time about this job is the salary.” Coming from the privatesector, Smith had thought that applying private sector practices to govern-ment would quickly improve the system. “I didn’t realize all of the con-straints that people in the public sector have to deal with,” he observeswryly. “It is a lot different.” Imagine moving from a top corporate office toa place where staffers address envelopes by hand. Smith was thus acutelyaware of the need for resources in election administration.
Smith approached the resource question just as any sensible business-person would. He gathered data to assess whether there was a problem,something he’s done for every job he’s had. “It’s like taking a snapshot,” henotes. The results of his survey are stunning. Most registrars in Georgiamake less than ten dollars an hour, with some getting paid roughly theminimum wage. Almost half of the survey respondents aren’t covered by aretirement plan, the vast majority receive neither overtime nor comp time,
22 Chapter 1
and 79 percent report that they cannot expand their staff to keep up withtheir expanding workload. About half of the counties cannot afford to hirean elections superintendent, so the work gets done by probate judges, whoare also poorly paid. Smith estimates that 80 percent of election adminis-trators in Georgia don’t possess a college degree. As with many states, Geor-gia’s large jurisdictions have more staff and more resources. The problem,as Smith points out, is that while large counties may have more votes toprocess, the technical and legal responsibilities for small and large countiesare the same. Failed federalism, indeed.
If you believe that you get what you pay for, it’s a wonder that there areany Joy Streaters or Gary Smiths running our elections. Doug Chapin ofelectionline.org calls election administrators “grenade catchers,”44 and rightlyso. They deal with one potential crisis after another. They do a very hardjob with remarkably few resources. And they are paid very little for per-forming a thankless task. When things go well, nobody notices. Whenthings go badly, guess who ends up getting blamed?
Resistance to Change
As with partisanship, localism doesn’t just undermine the quality of oursystem; it makes it hard to put a better one in place. When partisanshipblocks change, it is because politics are working badly; representatives areputting their own interests ahead of their constituents’. But even when pol-itics are working correctly—when politicians are attentive to what voterswant—political incentives run the wrong way in election reform. That isbecause the costs of deferred maintenance are mostly invisible to voters.When a problem is invisible, local competition gives politicians every rea-son to neglect it.
The Problem of Invisibility
While problems in our voting system occur regularly, voters become awareof them only when an election is so close that they affect the outcome. Be-cause such crises occur episodically, voters have a haphazard sense of howwell our elections are run and no comparative data to tell them which sys-tems work and which don’t. The result is a failure of the political market.
Perverse Politics of Election Reform 23
In a federal system like our own, the invisibility of election problemsreduces the incentives for even reform-minded politicians to invest in thesystem. One reason to favor decentralization is that states and localitieswill compete to win the hearts and minds of citizens, leading them to tryto outdo each other in providing useful services and passing good policies.But states and localities will compete only along the dimensions that vot-ers can see. When election problems are invisible, localities will invest in projects that voters can readily observe—roads, new schools, more cops on the beat. Just ask Matt Damschroder, former chair of the Frank-lin County Board of Elections in Ohio. “People don’t view funding elec-tions as a priority,” he notes. They “throw resources” at reform only “aftera crisis.”45
Here again, academics use shorthand to describe this problem: “the raceto the bottom.”46 We want local competition to create a virtuous race tothe top, but sometimes it leads in the opposite direction. In a world whereelection problems are hard to detect, any jurisdiction that spends a lot onthe election system is likely to be handicapped in competing for hearts andminds because it is diverting money from the visible to the invisible. In thisrespect, our failure to maintain our election infrastructure is quite similarto our failure to maintain our physical infrastructure. Both occur becausevoters see only the occasional and haphazardly distributed results of neglectbut have no means to gauge how things are working generally. Deferredmaintenance is a consequence of localism.
Problems compounded. The problems of localism compound the per-ils of partisanship in our election system. The partisan officials and ama-teurs who run the system do so with too little money and too few staff. Itis hard for local administrators to perform basic election functions, letalone spend time on activities that would improve the system, like collect-ing performance data or studying best practices.
If the problem of invisibility weren’t enough, partisanship makes it evenharder for election officials to lobby for much-needed resources. Becausepoliticians would much prefer to fund projects that are visible to voters,they are unlikely to be happy if a secretary of state or local administratorfrom their own party raises a ruckus about inadequate funding. It’s therough equivalent of airing the party’s dirty laundry in public. As Secretary
24 Chapter 1
of State Grayson notes in his gentle southern drawl, “Calling them on it canmake your friends mad.”47 If your job depends on your standing within theparty, the incentives to stay quiet are significant.
It’s not just your friends, though. As Grayson points out, things don’t getany easier for the elections official seeking funding from members of theopposing party. While that official will feel comfortable drawing attentionto funding shortfalls—he might even do so for partisan gain—the oppos-ing party won’t want to fix the problem. After all, why would a politiciando anything that might promote the success of someone from the otherparty, especially someone who is likely to run for higher office in the fu-ture?48 Ohio’s secretary of state, Jennifer Brunner, told me that the sameproblem plays out at the local level.49 In Ohio, for instance, a Democraticdirector of the local board of elections might be seeking resources from acounty commission with a Republican majority, or vice versa.
Even when reform isn’t costly, the tide of local competition runs againstchange. The financial capital of states and localities is limited, but so istheir political capital. There are only so many issues that can make it on theagenda of top-level policymakers. Governors, legislators, even secretaries ofstate must pick and choose what issues will occupy their time. If votersdon’t pay much attention to a question, the odds are that state and localofficials won’t either.
Localism also makes it harder to create professional norms that wouldpush election officials to do better. It’s not just that local administratorsbarely have the time and resources to do their jobs, let alone travel to con-ferences or study up on best practices. Localism means that professional as-sociations are organized at the state level, thus preventing the cross-stateinteractions that help good ideas spread.
Partisanship and localism combine to create a system that is deeply flawedand resistant to change. When politics work badly, partisanship taints theway elections are administered and makes the foxes reluctant to give upguarding the henhouse. When politics work well, states and localities com-pete to fund projects that voters can see, and neglect problems that voterscan’t. In both cases, our election system suffers. The perils of partisanship
Perverse Politics of Election Reform 25
and the problems of localism explain why a cause as appealing as electionreform has yet to take root.
THE SOLUTIONA Democracy Index
A Democracy Index represents a promising here-to-there strategy for redi-recting the political incentives that run against reform. As I explain in de-tail in the next two chapters, we have shockingly little data on how our sys-tem is working, a problem that handicaps reform efforts from start tofinish. By presenting the right information in the right form, a DemocracyIndex has the potential to harness partisanship and local competition in theservice of reform. Indeed, at every stage of the reform process—from figur-ing out what reform is needed to getting change passed—the DemocracyIndex should help smooth the path for change.
What Should a Democracy Index Look Like? An Initial Take
Before making the case for a Democracy Index, it seems useful to explainwhat an Index would look like. Here I’ll outline basic criteria for creatingthe Index and a brief explanation for why I chose them, leaving a discus-sion of methodological challenges and specific metrics for chapter 5. Theanalysis comes with some caveats.
First, this sketch is an opening gambit in a long-term conversation. Aca-demics sometimes bear an uncomfortable resemblance to Henry Luce,about whom it was said, “Sometimes right, sometimes wrong, never indoubt.” It would be foolish to have a firm view on how the Index shouldbe designed at this early stage of the process. The Index must appeal to awide range of stakeholders—voters, experts, election administrators, poli-cymakers, and reformers. Their input will necessarily and quite properlygive shape to the Index. Moreover, any effort to create a Democracy Indexwill involve a “pushmi-pullyu” process. Whether designers of the Indexbegin with the ideal or the real, they will have to toggle back and forth be-tween what we want to measure and what we can measure.
Second, what I sketch below is an ideal. As the next chapter makes clear,we don’t yet have the data we need to build the Index I describe here. I’ll
26 Chapter 1
have a lot more to say about collecting the data in chapter 5. For now, I’lljust describe what we should be shooting for.
Finally, in order to avoid getting bogged down in too many details thisearly in the game, I offer more detailed justifications and responses tocounterarguments in the endnotes. If you flip to them, you’ll see some-thing that would look excessive to anyone but a law professor.
A Nuts-and-Bolts Approach
What should the Democracy Index measure? Should it focus on nuts-and-bolts issues (the basic mechanics of election administration) or the broaderdemocratic health of the polity (something that would look to campaignfinance laws, the quality of public debate, and civil-rights issues)? I stronglyflavor a nuts-and-bolts approach. If the Index is going to help get us fromhere to there, it must get political traction. Designers of the Index shouldtherefore be risk averse in the way politicians are risk averse, avoiding met-rics that could create enough controversy to sink the entire endeavor. Thatmeans focusing on the lived experience of the average voter while eschew-ing hot-button topics like felon disenfranchisement or campaign finance.Public opinion matters, especially in choosing the basic measurement cat-egories. But we should also leave room for technical issues that appear onthe radar screens of experts but not voters. The goal here is simply to iden-tify commonsense criteria on which a large number of people could agreeif those criteria were explained.
The Democracy Index should also focus on issues squarely within elec-tion administrators’ control rather than punish them for problems that ex-ceed their grasp. For example, some problems in the election system areoutside an administrator’s control. Low turnout, for instance, is caused inpart by socioeconomics and the absence of competitive elections. Admin-istrators in low-ranked states will not bother with a ranking that expectsthem to remedy systemic problems associated with poverty or compensatefor a lack of excitement about a race. If you are going to look to turnout to assess how well the system is working, you’ll have to be able to disen-tangle the problems within an election administrator’s control (like mak-ing it hard to register or to cast a ballot) and those outside of it. The keyis to differentiate between “luck and skill,” as political scientist Thad Hallputs it.50
Perverse Politics of Election Reform 27
Three Simple Things
These two criteria—what should matter to the average voter? what is fairlywithin the ambit of an election administrator’s control?—suggest that theIndex ought to focus on three simple things: (1) registering voters, (2) cast-ing ballots, and (3) counting votes.* These represent simple, intuitive cat-egories built around the experiences of voters, and they mirror the cyclicalrhythms of the administrator’s job.
Measure Performance
The next question, of course, is how to measure these three simple things.We could assess election systems based on the quality of their policy “in-puts.” How good is the registration system? Does the jurisdiction train itspoll workers properly? Are ballots counted using best practices? Alterna-tively, we could assess the system based on performance “outputs.” Howmany errors are in the registration lists? How long were the lines? Howmany ballots got discarded?51
I strongly favor assessing election systems based on performance outputswhenever the data can be had. At the end of the day, voters and top-levelpolicymakers—two key audiences for the Index—don’t care what policiesa jurisdiction chooses; they care about the results of those choices. More-over, because we don’t yet have good comparative data on performanceoutputs, it’s not clear that we really know what constitutes good policy andwhat doesn’t. Finally, performance data are considerably easier to use formaking comparisons. Those data are not yet standardized, but they can be.Comparing policy inputs against one another, in contrast, is tough. It’shard to envision a benchmark other than a gut-level instinct that some-thing is “better.” For example, it should be easier to compare the numberof complaints from poll workers that a jurisdiction receives than to decidewhether the best way to train poll workers is through an online system, anin-person lecture, or a hands-on demonstration. It will be easier to com-
28 Chapter 1
*Needless to say, the architects of the Index should answer these questions based on focus group re-search and polling. Though I haven’t had a fleet of polls to inform my views, I have had the good for-tune to receive a number of thoughtful comments from social scientists, law professors, and election ad-ministrators.
pare the number of people who try to register but fail than to make an at-mospheric assessment of whether the registration system is a good one.
If we cast our three simple categories in performance terms, the Indexshould assess how close a jurisdiction comes to reaching these goals:
Every eligible voter who wants to register can do so.
Every registered voter who wants to cast a ballot can do so.
Every ballot cast is counted properly.
Hard Data over Subjective Assessments
In measuring performance, the Index should rely on hard data over subjec-tive assessments wherever possible. Quantitative data will be more con-vincing to voters and policymakers than atmospheric assessments. Andquantitative data offer a more sensible baseline for comparing election per-formance across jurisdictions.*
Balancing Values: Convenience, Integrity, and Accuracy
Note that our three simple performance categories encompass the twomajor values invoked in any election debate: convenience and integrity.52
When reform debates take place, liberals typically emphasize the importanceof convenience—making it easier to register or cast a ballot—whereas con-servatives tend to talk about integrity, by which they mean preventing
Perverse Politics of Election Reform 29
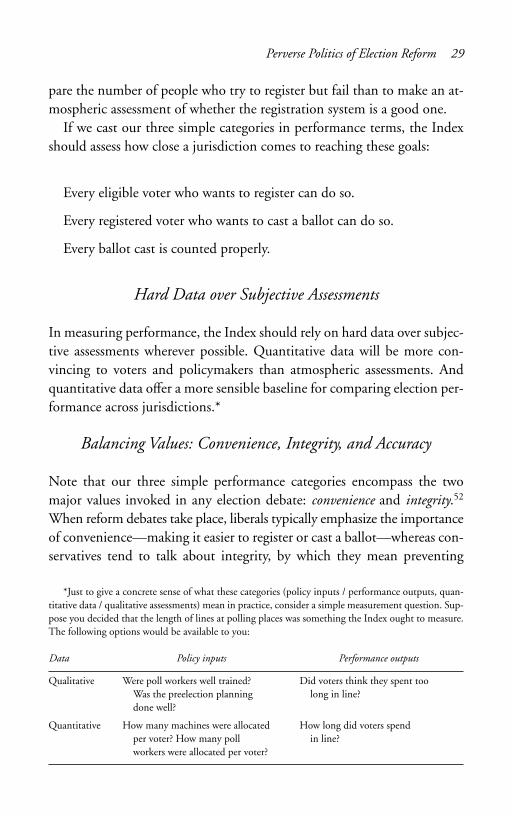
*Just to give a concrete sense of what these categories (policy inputs / performance outputs, quan-titative data / qualitative assessments) mean in practice, consider a simple measurement question. Sup-pose you decided that the length of lines at polling places was something the Index ought to measure.The following options would be available to you:
Data Policy inputs Performance outputs
Qualitative Were poll workers well trained? Did voters think they spent tooWas the preelection planning long in line?done well?
Quantitative How many machines were allocated How long did voters spendper voter? How many poll in line?workers were allocated per voter?
fraud. It’s the electoral equivalent of the “tastes great / less filling” debate,and just about as illuminating. Any outsider to this debate would thinkthat we are required to make some existential choice—convenience orintegrity, making it easier to vote or preventing fraud—in creating an elec-tion system. But both values matter, and the best we can do is make sensi-ble trade-offs between them.
There is a third value that is rarely mentioned in partisan fights, presum-ably because everyone believes in it: accuracy. People on both sides of thepartisan divide believe that registration information should be transferredaccurately onto the voter roll, that ballots should correctly register the pref-erence of the person who cast it, and that the vote count should preciselyreflect the ballots cast.
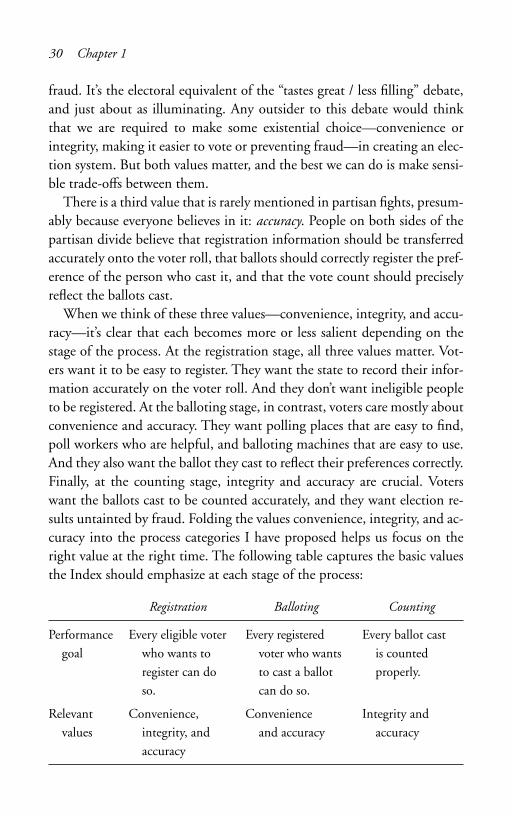
When we think of these three values—convenience, integrity, and accu-racy—it’s clear that each becomes more or less salient depending on thestage of the process. At the registration stage, all three values matter. Vot-ers want it to be easy to register. They want the state to record their infor-mation accurately on the voter roll. And they don’t want ineligible peopleto be registered. At the balloting stage, in contrast, voters care mostly aboutconvenience and accuracy. They want polling places that are easy to find,poll workers who are helpful, and balloting machines that are easy to use.And they also want the ballot they cast to reflect their preferences correctly.Finally, at the counting stage, integrity and accuracy are crucial. Voterswant the ballots cast to be counted accurately, and they want election re-sults untainted by fraud. Folding the values convenience, integrity, and ac-curacy into the process categories I have proposed helps us focus on theright value at the right time. The following table captures the basic valuesthe Index should emphasize at each stage of the process:
Registration Balloting Counting
Performance Every eligible voter Every registered Every ballot cast goal who wants to voter who wants is counted
register can do to cast a ballot properly.so. can do so.
Relevant Convenience, Convenience Integrity and values integrity, and and accuracy accuracy
accuracy
30 Chapter 1
Simple Categories, Reasonably Comprehensive Metrics
Albert Einstein once said that things should be as simple as possible, butno simpler, a useful aphorism for designing the Index. Because the basicperformance categories that structure the Index are its “public face,”53 theyshould be as simple and intuitive as possible. These categories “receive[ ]the vast majority of the attention” from the public and policymakers,54
says David Roodman, chief architect of the Commitment to DevelopmentIndex. “Top level accessibility is invaluable,” he continues, because “areader who can easily understand the ideal and overall structure of an Indexwill feel oriented and more prepared to buy into the whole construct.”55 Itis for precisely this reason that I’ve suggested organizing the data aroundthree intuitive categories that capture the most important aspects of theelection process from both the voter’s and administrator’s perspective.
As one moves from top-level categories to individual metrics, however, theIndex’s architects should use reasonably comprehensive metrics within eachcategory. I am not suggesting comprehensiveness for its own sake. The closera single metric gets to measuring what we want to measure, the fewer metricsthe Index will need. Think, for instance, about the elegant simplicity of theresidual vote rate, a measurement that political scientists at the Caltech/MITVoting Technology Project invented in the wake of the 2000 election.56 Theresidual vote rate measures the difference “between the number of voters ap-pearing on Election Day and the number of ballots actually counted.”57
We wouldn’t expect the residual vote rate to be zero; even in a well-runsystem, some voters cast a ballot without voting for anyone for president.But it makes an excellent comparative measure. That’s because we’d expectthe number of people who don’t vote for a presidential candidate to beroughly constant. If a jurisdiction’s residual vote rate is higher than aver-age, it’s a good bet that the number is caused by problems we would expectelection officials to correct—poor machines, bad ballot design, or tabula-tion errors. Moreover, the residual vote rate is a pure performance measurethat captures something that really matters to voters—whether their bal-lots got counted.
If we could come up with rough equivalent of a residual vote rate foreach of the three categories noted above, we’d be most of the way to con-structing an Index. But at least early on, we won’t have data sets that perfectlycapture what we want to measure. We’ll thus have to rely on imperfect
Perverse Politics of Election Reform 31
substitutes. Redundancy can serve a useful purpose in this context. It canhelp us gauge whether the proxies we have chosen are working (because wecan see whether metrics rise and fall together), discourage jurisdictionsfrom diverting resources just to improve their scores (because it will be harder to focus on improving one or two measurements while neglect-ing their other duties), and provide a backstop against cheating (becausewe can see if self-reported data are radically different from data obtainedelsewhere).58
Proxies and Pragmatism
The guidelines above tell us what the Democracy Index would look like inthe ideal. It’s an attainable ideal, but an ideal nonetheless. The question iswhat we should do in the meantime.
At a minimum, early versions of the Index will have to rely on proxiesto measure election performance. Sometimes that means using subjectivemeasures or policy inputs. Sometimes we will have to measure pieces of theproblem because we cannot assess the whole. Sometimes the data will be soflawed that we’ll have to drop a metric until better data are found.
As designers of other indices will attest, pragmatism is the key. “Don’t letthe perfect be the enemy of the good” is a trite, worn-out, pedestrianphrase that ought to be confined to the dustbin of literary history. Butthere’s a reason for that. Whenever I have spoken with someone who’d as-sembled an index, he or she has emphasized the need to use reasonableproxies to measure what you want to measure (in a transparent fashion, ofcourse). An imperfect prototype is one of the best tools for pushing datacollection forward. It not only publicizes gaps in the data, but lays down atemplate for what information should be collected going forward.
Consider, for instance, what happened in the wake of the creation of theQuality Counts schools assessment. When the first report was released,only a handful of school systems collected the information Quality Countswanted. By creating a necessarily imperfect but nonetheless useful first report,Quality Counts laid down a marker for what information a school ought tocollect if it is “serious about performance,” says Lynn Olson. Over time, thatmarker has prompted many school systems to collect precisely the informa-tion that the first version of Quality Counts had identified as important.59
32 Chapter 1
Let me give you a quick example of the way proxies could work for theDemocracy Index. In chapter 5, I’ll suggest that a reasonably comprehen-sive, performance-based measure for assessing the registration process wouldbe how many eligible voters who tried to register were able to do so suc-cessfully. That’s hard to measure right now. So what proxies might we useto get a read on how well the registration process is working? We might tryto identify the reasons why registration systems fail and assess them seri-atim. For instance, one reason that people might be deterred from register-ing is because it’s too hard. So we might use testers to figure out how easyit is for people to register to vote. Or rely on what I call “Nielsen voters”—randomly chosen voters who would record their experience with the vot-ing process—to give us a rough sense of how easy it is to register. Or ran-domly tag some fraction of the registration cards being filed and followthose cards through the process.60 Similarly, another reason that peoplewho try to register might fail is that election administrators enter the information into the system incorrectly. One way to get a rough sense of how well the data-entry process is working is to count the number ofempty “fields” in the state’s registration database or compare the state’sregistration list against the database of a mail solicitation or credit cardcompany, which have compiled extremely accurate databases. These kindsof metrics should serve as good proxies for what we are really trying toassess.
Weight Scores in the Top-level Categories in a Simple, Transparent Fashion
Once the metrics in each category have been assembled, you’ll have to aggre-gate them into an Index. Scores in the top-level categories—registration, bal-loting, and counting—should be weighted equally, just as one calculates agrade point average. This weighting strategy is highly intuitive, and thereis no obvious principle that would dictate a different strategy At least untilwe have more information about what how voters and policymakers thinkabout these questions, it makes sense to go with the simplest, most trans-parent strategy. I’ll say more about the weighting question in chapter 4. Fornow, I’ll just note that the method I propose here comports with the expe-riences of the creators of other indices.61
Perverse Politics of Election Reform 33
Within Categories, Weight Based on What’s Available
Although we should use a simple weighting strategy when adding thebroad categories of the Index together, we can’t do that with individualmetrics. Here the costs of simplicity are too great. For instance, imaginethat we came up with twenty-five different ways to measure the length oflines but only one reasonable metric for assessing the service provided bypoll workers. It’s hard to imagine using a twenty-five-to-one ratio forweighting the two categories. Or imagine that fifty thousand people endedup waiting in line for more than an hour in both Rhode Island and Cali-fornia. Needless to say, it wouldn’t be fair to compare those numbers giventhe population disparities between the states. You also can’t just add num-bers together across categories. Imagine that fifty thousand people stood inlong lines it Rhode Island, and fifty-three of its polling places opened late.No one would think that adding those two numbers together would pro-duce a meaningful measure. As these examples suggest, some statistical workwill be necessary to convert raw data into standardized metrics that can besensibly compared.62
Rank, Don’t Grade
If the data are good enough, the Index should rank, not grade—aggregat-ing the data into a single, composite ranking (e.g., rank the states 1–50).There are alternatives, of course. The Index might rank jurisdictions withincategories but provide no composite ranking. Or it could award jurisdic-tions one or more letter grades. Assuming the data are good enough, rank-ing is the best option. Rankings get more political traction than the alter-natives, precisely because they reduce the data to their simplest form.63
Rank Localities
If the data are good enough, the Index should rank not just states, but lo-calities. In many places, local jurisdictions are where the action is. More-over, ranking localities helps protect state officials from being punishedwhen the state’s ranking falls because of the poor performance of a few local
34 Chapter 1
outliers. Given the amount of variation within states, ranking localitieswould also help us identify best practices and the drivers of performance.
Be Transparent
No matter how the Index is designed, the choices made—and the reasonsbehind them—should be as transparent as possible. Not only should thedesigners of the Index explain each category and metric, but they shoulddescribe how the data were aggregated and explain how different choicesmight have affected the results. The layout of the Index’s website and re-port should mirror the structure of the Index itself, with simple explana-tions provided at the front and more detailed, technical information avail-able to anyone who wants to drill down into the details.64 And all of thedata and calculations should be posted for review and critique.
Offer One-stop Shopping
Although the Index should rank states and localities based on performanceoutputs, it should not ignore policy inputs. To the contrary, our best hopefor identifying best practices and the drivers of performance is to knowwhich policies led to which results. Ideally, the Index should give electionofficials the policymaking equivalent of one-stop shopping. Imagine, forinstance, you were an election official unhappy with your score. The Indexwould be most useful if you could identify the categories where your stateunderperformed and figure out what states did well. The website would de-scribe the policies that led to high scores and link to information and re-sources that would help you implement a similar policy.
Adapt, Adapt, Adapt
Needless to say, the Index should change over time. It will take time to de-velop the right kind of data. It will take time to work out the kinks in thedesign. It will take time to spot problems and remedy them. Moreover,there is likely to be a natural growth cycle for the Index. At the beginning,the dearth of data will narrow the Index’s focus. If and when the Index
Perverse Politics of Election Reform 35
catches on, we’ll have to deal with different problems, like states gamingthe numbers. The key is to imagine each version of the Democracy Indexas a step in the conversation, not a final answer.
None of this should discourage us from trying. It always takes time todevelop a good index. The gross domestic product—among the most re-spected and useful indices ever developed—has taken more than 70 yearsto perfect. Every decade since its inception, changes in economic condi-tions and advances in economic theory have resulted in significant modifi-cations to the measure. Similarly, each of the indices discussed in this bookhas been retooled as its creators learned from past mistakes. If anyone hasmanaged to design an index correctly the first time, he is either a mad ge-nius or should head to Vegas before his luck runs out.
CONCLUSION
The perverse politics of election reform are well known in election circles.But phrases like “the foxes guarding the henhouse” or “the race to the bot-tom” are typically conclusions to an argument, not a starting point for fur-ther inquiry. Academics and reformers often argue that elections should beadministered by a centralized bureaucracy fully insulated from politics. Buta nonpartisan, centralized system for administering elections does notspring, as did Athena, fully formed from the head of a god. It has to becreated by somebody, usually an elected somebody, and that is where thehere-to-there question kicks in. Those in power have every incentive tomaintain the status quo. Reformers thus spend a good deal of time askingpoliticians and local officials to do something contrary to their self-interest.Perhaps unsurprisingly, that strategy has not yielded terribly impressiveresults.
Rather than focusing on proposals that require the foxes to stop guard-ing the henhouse or imagining that our centuries-old tradition of localismwill vanish overnight, we should think more about how to domesticate thefoxes and harness the power of local competition. While this type of here-to-there strategy may not seem as grand as an overhaul of the system, itoffers a more realistic hope of effecting change in the long run. We do nothave an ideal system in place. But we might as well take advantage of the
36 Chapter 1
best features of the current system—the powerful engine of partisanshipand the intriguing possibilities associated with local competition—to cre-ate an environment in which bigger and better reform is possible.
A Democracy Index is promising strategy for getting from here to therebecause it puts the right information into the right form. An Index wouldmeasure the basic things that matter to voters: registering, balloting, andcounting. Whenever possible, it would emphasize hard data and bottom-line results. And the Index would weight the data in a simple, intuitivefashion in order to rank states and localities based on their performance.There are devils in those details, as I discuss in chapters 4 and 5. But fornow, this should suffice as a rough blueprint for the Index. In the next twochapters, I’ll explain why putting the right information in the right form canhelp reverse the political tides that have so long run against reform.
Perverse Politics of Election Reform 37
2 The Promise of Data-driven Reform
As chapter 1 makes clear, partisanship and localism generate political tidesthat run against election reform. If we want to get from “here to there,” weneed a solution that will redirect those tides. Ranking states and localitiesbased on performance can do just that. At every stage of the process, a De-mocracy Index should help smooth the path for change.
This chapter tells a tale of two reformers. The first is Spencer Overton,an election reformer who fights the good fight in a world without data. Thesecond is Dan Esty, who has used data-driven performance rankings tochange the way we talk about environmental policy. The chapter closes byexplaining why the Democracy Index should help us chose intelligent so-lutions for the problems that face us, leaving for the next chapter a discus-sion of how the Index can help get those solutions passed.
A TALE OF TWO REFORMERS
A New-style Reformer Encounters an Old Problem
Spencer Overton, professor of law at George Washington University, doesn’tfit the stereotype of an election reformer.1 Polished and professional, it’seasier to imagine him in Armani than Birkenstocks. Overton draws his ide-alism from a civil-rights background, and he is capable of talking about theright to vote in stirring terms. But with his Harvard Law degree and mea-sured baritone, it’s as easy to imagine him relating to corporate executivesas to public interest lawyers. Perhaps unsurprisingly, Overton has often served
as a translator for the reform community. His first book recast complex andsometimes arcane election law questions in terms that everyone can under-stand.2 In Overton’s words, the goal of the book is to show “the relation-ship between the technical details of election administration and big ques-tions of power.”3
People have written a good deal about the new generation of reformers.Entrepreneurial and pragmatic, they eschew old political divides andattack problems with the hard head of a corporate executive. They look toa variety of institutions (the market, administrative agencies), not just thecourts, for solutions. They are as likely to appeal to business-mindedideas—accountability, competition—as progressive values like participationand empowerment. Overton perfectly embodies this new style.
Overton’s problem is that he is fighting for change in a world withoutdata. Indeed, he found himself in the middle of one of the biggest electionreform battles we’ve seen in recent years—one that made it all the way tothe Supreme Court—and lost in large part because he didn’t have the datahe needed to make his case.
The fight was over voter identification—the requirement that votersshow a government-issued photo ID when they cast a ballot at the polls.Voter ID has been a significant source of contention in election circles.Conservative commentators insist that an ID requirement deters fraud.Liberal commentators counter that the requirement is a disguised effort tosuppress (largely Democratic) votes.* The rhetoric on both sides of theissue has been quite heated, with one side talking about stolen electionsand the other side equating ID requirements with vote suppression.
Overton became embroiled in the issue when it was taken up by theCommission on Federal Election Reform, chaired by former Democraticpresident Jimmy Carter and former Republican secretary of state JamesBaker. Though most of the members of the bipartisan commission hadstrong political ties, it included a handful of academics, including Overton.
The Carter-Baker Commission eventually staked out a position on voterID that looked an awful lot like a political deal.4 It roughly tracked thecompromise that would emerge if a prominent Democrat and a prominent
The Promise of Data-driven Reform 39
*That’s because many people from traditionally Democratic constituencies—poor people, racialminorities—lack a driver’s license and would find it cumbersome to get an ID.
Republican sat down to work out something both sides could live with.The commission blessed the ID requirement (something Republicans usu-ally want) while demanding that the state take affirmative steps to distrib-ute IDs (something that Democrats would want if forced to accept an IDrequirement).
Deal or no deal, the main problem with the commission’s position wasthat it was utterly unsupported by empirical evidence. A pure politicalcompromise can be produced without coming to grips with the empirics;a sound decision cannot. Although the commission did an excellent job ofamassing data on how our election system is run in many areas, this wasnot one where it managed to find much. As the commission itself stated,there is “no extensive evidence of fraud in the United States.”5 To the ex-tent there is any evidence of fraud, it is almost entirely due to absentee vot-ing scams or ballot-box stuffing, not the type of fraudulent in-personvoting that photo ID is supposed to deter. The only other justification thatthe commission offered for its decision was that a photo ID requirementwould enhance public trust in the system. That claim, too, was unsupportedby empirical evidence (and may have been misplaced).6
Overton did his best to persuade the other members of the commissionnot to endorse an ID requirement. Most advocates contesting voter IDhave simply invoked civil-rights rhetoric. Overton called upon that tradi-tion, but he mainly focused on the kind of cold-blooded cost-benefit argu-ments that conservatives stereotypically use. Working with the BrennanCenter, he tried to amass data on the effects, good and bad, of photo ID.When he failed to change the majority’s mind, he published a forcefullyworded dissent. I saw Overton a day after the fight went public. I’ve neverseen anyone more exhausted.
The reason Overton faced such an uphill slog is that the data were hap-hazard and inconsistent. As he discovered, “No systematic, empirical studyof the magnitude of voter fraud has been conducted at either the nationallevel or in any state to date.”7 Nor were there any good studies on an IDrequirement’s effect on voter behavior. Overton pulled together some basicnumbers (how many voters lack ID, how many fraudulent votes mighthave been prevented by an ID requirement). Based on these numbers, heargued that it would be a mistake to endorse voter ID at this stage becausethe commission could not show that it “would exclude even one fraudu-
40 Chapter 2
lent vote for every 1000 eligible voters excluded.”8 But Overton candidlyadmitted that his data, standing alone, could not tell you what would hap-pen if an ID requirement were enacted.9
Overton and the Carter-Baker Commission as a whole had the sameproblem: they were fighting about reform in a world without data. TheCarter-Baker Commission justified its conclusions with the only evidenceavailable: anecdote. Overton believed that anecdotal evidence led the com-mission to overestimate both the problem of fraud and the likelihood thatan ID requirement would solve it.10 Overton did not spare his allies crit-icism, either. He rebuked opponents of voter ID because they “regularlyrecite talking points about threats to voter participation by the poor andminorities, but often fail to quantify this assertion.”11 Overton’s frustra-tion about the debate remains palpable: “I’m an academic,” he says. “I be-lieve in facts.”12
The same year that the Carter-Baker Commission released its report, theRepublican-dominated Indiana legislature passed a photo ID requirementin a straight party-line vote. The state conceded it was not aware of a singleepisode of in-person voter fraud in its entire history, and the legislaturefailed to do anything about the security of absentee ballots (the one areawhere Indiana had recently had a fraud problem). “Let’s not beat aroundthe bush,” wrote one of the lower-court judges reviewing the case. “The In-diana voter photo ID law is a not-too-thinly-veiled attempt to discourageelection-day turnout by certain folks believed to skew Democratic.”13
When the lawsuit challenging Indiana’s law worked its way to theSupreme Court, Justice Stevens, writing for the plurality, upheld the re-quirement.14 He concluded that photo ID was a reasonable strategy forcombating fraud and building voter confidence. What evidence did JusticeStevens cite in support? A funny anecdote dating back to Tammany Hall,the fact that one person had voted fraudulently in a Washington guberna-torial election . . . and the Carter-Baker Report.
The problem is obvious. The Supreme Court didn’t have much evidenceto cite for its view that in-person vote fraud was a problem. So it cited the Carter-Baker Report, which in turn didn’t have much evidence to cite.The Supreme Court had no evidence to cite for its intuition that an ID re-quirement boosts voter confidence. So it cited the Carter-Baker Commis-sion, which in turn had no evidence to cite. It’s turtles all the way down.
The Promise of Data-driven Reform 41
The Bigger Story
The debate over voter ID is part of a larger story about reform in a worldwithout data. The story has an obvious moral—whether your intuitionsare closer to Justice Stevens’s or Spencer Overton’s, surely you’d prefer thedecision rested on data. But it also gives you a flavor for what reform de-bates look like in a world without data.
Note, for instance, what kind of reform proposals get traction in a worldwithout data. Most reforms never see the light of day, as I discussed in thelast chapter. The rare proposals that do get traction are those with intuitiveappeal, like an ID requirement. Middle-class voters are accustomed toshowing ID to get on a plane or pay with a credit card, so it’s easy to framethe issue in a way that they can understand. (Think about the only otherissue to get traction in recent years—paper trails for voting machines. It’sanother issue people can wrap their hands around.) There’s no reason, ofcourse, to think that intuitively appealing reform is the right reform. But thebest strategy for defeat mistaken intuitions—testing them empirically—isimpossible in a world without data.
Worse, in the absence of data, reform debates are completely at themercy of politics. The reason photo ID got passed in Indiana is because italigned with partisan incentives and the other side couldn’t build a caseagainst it. (Lest you think I’m picking on the Republicans, I should em-phasize that Democrats are similarly inclined to oppose photo ID becauseof their own political interests. Remember, the Indiana law was passedwithout a single Democratic defector.) Similarly, when the Carter-BakerCommission announced its position on voter ID, it had no empirical basisto think it was announcing good policy. All that the Carter-Baker Com-mission could offer was a position that both political parties could livewith. Here again, there is no reason to think that “change the parties canlive with” bears any resemblance to the change we need.
Just think about how hard it is to referee this fight. There are lots of ac-cusations and few facts. The Republicans and Democrats shout about par-tisanship. Reformers hint darkly about voter suppression. Whether you area voter or a Supreme Court justice, it’s hard to figure out who is right unlessyou subscribe to Lev Tolstoy’s wry claim that “among coachmen, as amongus all, whoever starts shouting at others with the greatest self-assurance,and shouts first, is right.”15
42 Chapter 2
Finally, and most importantly, note that the ultimate referees of thisfight—members of the Supreme Court—were hungry for guidance. TheCourt encountered the dilemma we all face in the elections context: distin-guishing between legitimate efforts to regulate the election system andillicit attempts to hijack it for political ends. The justices were plainly onthe hunt for a yardstick to evaluate the Indiana law. Justice Stevens wasn’tthe only one to rely on the Carter-Baker Report. The dissenting justices didso as well. Unfortunately, it wasn’t a very good yardstick for the justices touse. The Carter-Baker Commission had nothing to go on except atmos-pherics and anecdote. All it could offer is a compromise that smelled like apolitical deal. The voter ID fight makes clear just how powerful a yardstickcan be in election debates. Even an imperfect baseline—a bipartisan com-promise unsupported by empirical evidence—was enough to sway theSupreme Court. Imagine what a better metric could achieve.
ELECTION ADMINISTRATIONA World without Data
The story of the photo ID looks a lot like the story of election reform gen-erally. Reform battles take place in a world without data. We know moreabout the companies in which we invest, the performance of our local base-ball team, even our dishwashers, than we do about how our election sys-tem is working. The institutions that administer our election system—thelinchpin of any democracy—don’t give us the information we need toevaluate how they are performing. The limited data that exist are often un-dependable, unverifiable, and too inconsistent to allow for comparisonsacross jurisdictions. It is remarkable that we spend so much time arguingabout which direction election reform should take when we don’t evenhave the data we need to map where we are now.
The Absence of Data
Consider a few remarkable facts. We do not know how many people cast aballot during our last presidential election because 20 percent of the statesdo not report this information; they disclose only how many ballots weresuccessfully counted.16 We do not know how many voters stood in long
The Promise of Data-driven Reform 43
lines. We do not know how many poll workers showed up to work. We donot know what percentage of voting machines broke down on Election Day.
Our data problems are so basic that in October 2004, the Caltech/MITVoting Technology Project, composed of some of the most highly re-spected political scientists in the country, issued a plea for all states and lo-calities to collect data on such rudimentary questions as the number of reg-istered voters, the number of ballots cast, and the types of ballots includedin the official count.17 Four years later, we still don’t have that information.
The data are so sparse that it is hard even to evaluate how much thingshave improved since the 2000 election. As Charles Stewart of MIT has ob-served, “For all the attention focused on the problem [of election adminis-tration] since November 2000 and all the money thrown at improving vot-ing in the United States, it is impossible to demonstrate anything but themost basic improvements in voting, nationwide, using systematic data.”18
The jurisdictions that do keep data often define basic terms differently.As the University of Utah’s Thad Hall and Ohio State’s Dan Tokaji have ex-plained, states do not have “a common definition regarding what consti-tutes an early or absentee ballot.”19 Even the states that report residual voterates—that elegant metric political scientists invented to assess ballotingproblems—record that number inconsistently. In category after category,cross-jurisdiction comparisons cannot be trusted because election admin-istrators do not adhere to the same protocols for gathering information.
Even states that keep rudimentary data on election performance fail torecord the information we need to identify problems and figure out solu-tions. For instance, most of the jurisdictions that keep information on howmany ballots were cast but not counted cannot tell us why these ballotweren’t counted. The same holds true for the registration process. As theCarter-Baker Commission found, “We still do not know how many peopleare unable to vote because their name is missing from the registration listor their identification was rejected at the polls. We also have no idea aboutthe level of fraud or the accuracy and completeness of voter registrationlists.”20
If you need further evidence of the woeful state of the data, look no far-ther than the latest survey of state practices conducted by the Election Assis-tance Commission,21 the federal agency charged with helping states improve
44 Chapter 2
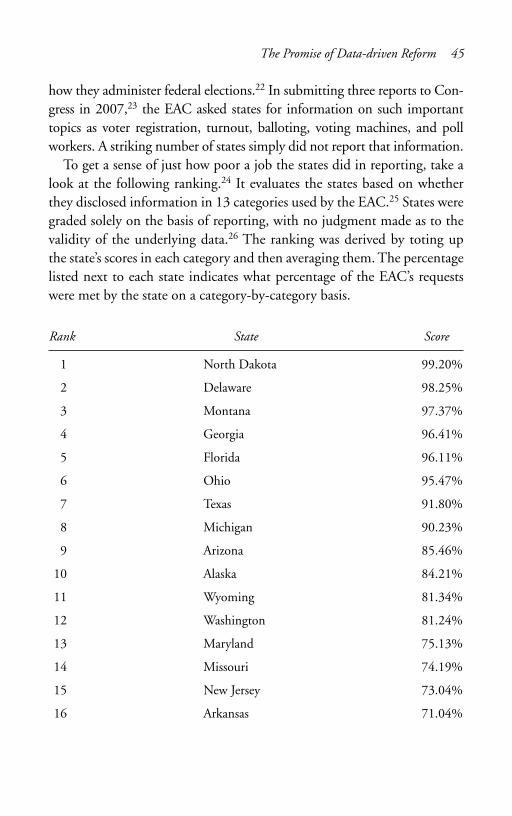
how they administer federal elections.22 In submitting three reports to Con-gress in 2007,23 the EAC asked states for information on such importanttopics as voter registration, turnout, balloting, voting machines, and pollworkers. A striking number of states simply did not report that information.
To get a sense of just how poor a job the states did in reporting, take alook at the following ranking.24 It evaluates the states based on whetherthey disclosed information in 13 categories used by the EAC.25 States weregraded solely on the basis of reporting, with no judgment made as to thevalidity of the underlying data.26 The ranking was derived by toting up the state’s scores in each category and then averaging them. The percentagelisted next to each state indicates what percentage of the EAC’s requestswere met by the state on a category-by-category basis.
Rank State Score
1 North Dakota 99.20%
2 Delaware 98.25%
3 Montana 97.37%
4 Georgia 96.41%
5 Florida 96.11%
6 Ohio 95.47%
7 Texas 91.80%
8 Michigan 90.23%
9 Arizona 85.46%
10 Alaska 84.21%
11 Wyoming 81.34%
12 Washington 81.24%
13 Maryland 75.13%
14 Missouri 74.19%
15 New Jersey 73.04%
16 Arkansas 71.04%
The Promise of Data-driven Reform 45
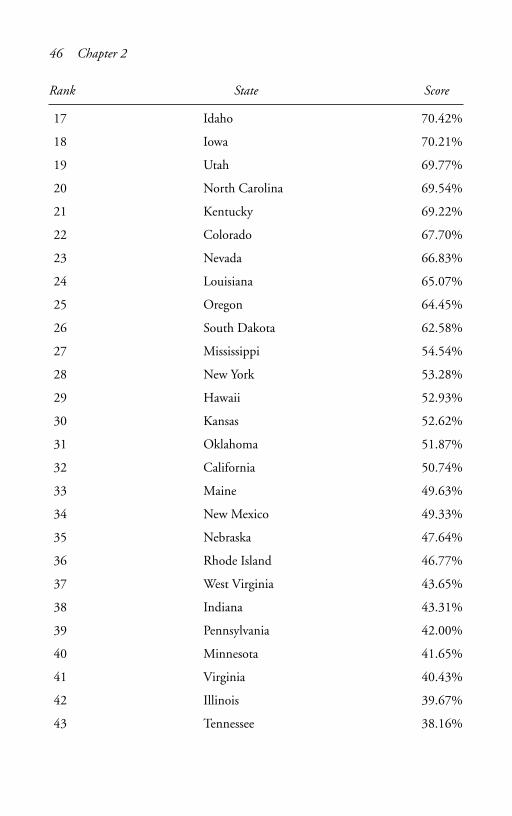
Rank State Score
17 Idaho 70.42%
18 Iowa 70.21%
19 Utah 69.77%
20 North Carolina 69.54%
21 Kentucky 69.22%
22 Colorado 67.70%
23 Nevada 66.83%
24 Louisiana 65.07%
25 Oregon 64.45%
26 South Dakota 62.58%
27 Mississippi 54.54%
28 New York 53.28%
29 Hawaii 52.93%
30 Kansas 52.62%
31 Oklahoma 51.87%
32 California 50.74%
33 Maine 49.63%
34 New Mexico 49.33%
35 Nebraska 47.64%
36 Rhode Island 46.77%
37 West Virginia 43.65%
38 Indiana 43.31%
39 Pennsylvania 42.00%
40 Minnesota 41.65%
41 Virginia 40.43%
42 Illinois 39.67%
43 Tennessee 38.16%
46 Chapter 2
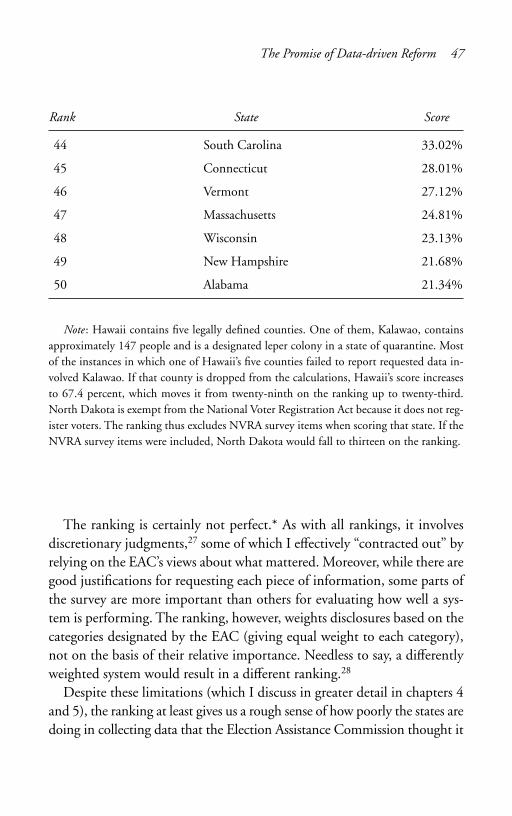
Rank State Score
44 South Carolina 33.02%
45 Connecticut 28.01%
46 Vermont 27.12%
47 Massachusetts 24.81%
48 Wisconsin 23.13%
49 New Hampshire 21.68%
50 Alabama 21.34%
Note : Hawaii contains five legally defined counties. One of them, Kalawao, containsapproximately 147 people and is a designated leper colony in a state of quarantine. Mostof the instances in which one of Hawaii’s five counties failed to report requested data in-volved Kalawao. If that county is dropped from the calculations, Hawaii’s score increasesto 67.4 percent, which moves it from twenty-ninth on the ranking up to twenty-third.North Dakota is exempt from the National Voter Registration Act because it does not reg-ister voters. The ranking thus excludes NVRA survey items when scoring that state. If theNVRA survey items were included, North Dakota would fall to thirteen on the ranking.
The ranking is certainly not perfect.* As with all rankings, it involvesdiscretionary judgments,27 some of which I effectively “contracted out” byrelying on the EAC’s views about what mattered. Moreover, while there aregood justifications for requesting each piece of information, some parts ofthe survey are more important than others for evaluating how well a sys-tem is performing. The ranking, however, weights disclosures based on thecategories designated by the EAC (giving equal weight to each category),not on the basis of their relative importance. Needless to say, a differentlyweighted system would result in a different ranking.28
Despite these limitations (which I discuss in greater detail in chapters 4and 5), the ranking at least gives us a rough sense of how poorly the states aredoing in collecting data that the Election Assistance Commission thought it
The Promise of Data-driven Reform 47
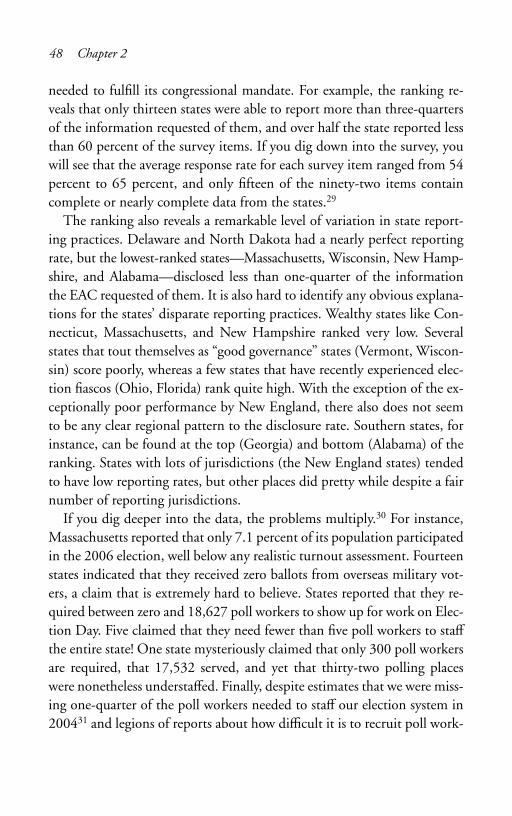
needed to fulfill its congressional mandate. For example, the ranking re-veals that only thirteen states were able to report more than three-quartersof the information requested of them, and over half the state reported lessthan 60 percent of the survey items. If you dig down into the survey, youwill see that the average response rate for each survey item ranged from 54percent to 65 percent, and only fifteen of the ninety-two items containcomplete or nearly complete data from the states.29
The ranking also reveals a remarkable level of variation in state report-ing practices. Delaware and North Dakota had a nearly perfect reportingrate, but the lowest-ranked states—Massachusetts, Wisconsin, New Hamp-shire, and Alabama—disclosed less than one-quarter of the informationthe EAC requested of them. It is also hard to identify any obvious explana-tions for the states’ disparate reporting practices. Wealthy states like Con-necticut, Massachusetts, and New Hampshire ranked very low. Severalstates that tout themselves as “good governance” states (Vermont, Wiscon-sin) score poorly, whereas a few states that have recently experienced elec-tion fiascos (Ohio, Florida) rank quite high. With the exception of the ex-ceptionally poor performance by New England, there also does not seemto be any clear regional pattern to the disclosure rate. Southern states, forinstance, can be found at the top (Georgia) and bottom (Alabama) of theranking. States with lots of jurisdictions (the New England states) tendedto have low reporting rates, but other places did pretty while despite a fairnumber of reporting jurisdictions.
If you dig deeper into the data, the problems multiply.30 For instance,Massachusetts reported that only 7.1 percent of its population participatedin the 2006 election, well below any realistic turnout assessment. Fourteenstates indicated that they received zero ballots from overseas military vot-ers, a claim that is extremely hard to believe. States reported that they re-quired between zero and 18,627 poll workers to show up for work on Elec-tion Day. Five claimed that they need fewer than five poll workers to staff
the entire state! One state mysteriously claimed that only 300 poll workersare required, that 17,532 served, and yet that thirty-two polling placeswere nonetheless understaffed. Finally, despite estimates that we were miss-ing one-quarter of the poll workers needed to staff our election system in200431 and legions of reports about how difficult it is to recruit poll work-
48 Chapter 2
ers, only one state—Ohio—reported that the number of poll workers whoshowed up was less than the number of poll workers it required. Perhapsthe other forty-nine states managed to eliminate recruitment challenges in just two years, but I suspect it is actually Ohio that should be com-mended here.
Worse still, what we see in the EAC report is actually a good deal betterthan what the states initially reported. Sometimes states did not even botherto fill in information. Others reported answers that were obviously wrongon their face. EAC staffers and consultants spent countless hours trackingdown officials about their disclosures and pounding the data into shape. Evenafter all that effort, many states still failed to report all the data requested,and it is hard to draw state-by-state comparisons in many categories be-cause of inconsistencies in reporting practices.
A COMPARATIVE VIEWThe Private Sector
To place these data-collection problems in perspective, it is worth consid-ering how many public and private organizations have come to rely ondata-driven policymaking. My colleague Ian Ayres has written about “super-crunchers” who use data-driven analysis to build sports teams, diagnosedisease, evaluate loan risk, assess the quality of a new wine, predict the fu-ture price of plane tickets, calculate the likelihood that a parolee will com-mit another crime, choose which passenger will be bumped off an airlineflight, and inform car dealers how far they can push a customer on price.32
Take Wal-Mart, for instance. Wal-Mart’s database is gigantic; only thefederal government keeps more data.33 The company mines that data re-lentlessly to increase sales. For example, Wal-Mart’s data revealed that ba-nanas are the grocery item that its customers purchase most often. Thecompany therefore made sure that bananas were available not just in theproduce aisle, but near the cereal. Wal-Mart’s data are so precise that itknows that strawberry Pop-Tarts sell at seven times their usual rate justbefore a hurricane. It now stocks not just extra flashlights, but boxes ofPop-Tarts, in advance of a storm.34 Wal-Mart has similarly used data on
The Promise of Data-driven Reform 49
customer satisfaction to identify where it could most easily improve, lead-ing it to create faster checkout processes and cleaner stores.35 Wal-Martmay represent an extreme example, but data-crunching and benchmarkingare routine practices in Fortune 500 companies.
It’s easy to see why. Would you invest in a company that kept as littleperformance data as election administrators collect? Imagine a corporationthat didn’t know how many people it employed, how many customers ithad, or what percentage of its business came from Internet sales. (Manystates and localities cannot tell you how many poll workers showed up onelection day, how many people were registered to vote or cast a ballot dur-ing the last election, or what share of the ballots came from absentee orearly voters.) Imagine a company that didn’t know its customers’ prefer-ences or why they went elsewhere to make their purchases. (Election ad-ministrators generally don’t survey voters about their voting experiences orkeep track of how many voters tried to register and cast a ballot but failed.)Imagine a company that never sent testers to evaluate whether it was easyto navigate its stores or purchase its products, or one that failed to conductregular audits of its accounting books. (Election administrators don’t de-ploy testers to evaluate, and many fail to conduct adequate postelection au-dits.) Imagine that the corporation never engaged in the routine businesspractice of benchmarking—comparing its performance against other com-panies to identify where it could do better. (Benchmarking rarely occurs inthe elections context.) Imagine a company that didn’t know its own mar-ket share. (Election administrators often don’t know what percentage oftheir jurisdiction’s eligible citizens they serve.)
My guess is that you wouldn’t invest a dime in the company I justdescribed. So why are you willing to entrust the nation’s most preciousnoncommodity—the vote—to an election system like ours?
You don’t have to be a supercruncher to care about performance data.Think of something much simpler: buying a dishwasher. If you want tochoose a dishwasher, Consumer Reports offers extensive comparative informa-tion about performance, price, and repair histories. Election officials, how-ever, cannot give you comparable information about how well the state’s reg-istration system or ballot-counting process is working. Voting machines, ofcourse, have received the greatest scrutiny. Researchers have generated some
50 Chapter 2
information about their reliability and performance,36 though even here thedata fall short.37 In other areas, though, we have almost nothing to go on.
The Public SectorLest you think that data matter only to the private sector, governmentagencies at the state38 and federal levels39 routinely rely on data-drivenanalysis to improve their performance.40 One of the best-known programsis called CitiStat, which was modeled on the Comstat program thatbrought the New York Police Department so much success.41 CitiStat wasfirst used in Baltimore with impressive results.42 The city’s mayor met reg-ularly with department heads to create performance targets and assessprogress toward them using data generated and collected by the city. Forinstance, the mayor decided that every pothole should be fixed withinforty-eight hours of someone reporting it. The city then used performancedata to evaluate its progress in reaching that goal.43 Data-driven analysishas been used in a variety of public institutions, ranging from police de-partments44 to housing agencies,45 from transportation agencies46 to edu-cation departments.47
Data-driven analysis has a long and distinguished historical pedigree aswell. Just think about the vast amount of economic data that the govern-ment collects. We’re all familiar with the GDP, which aggregates the valueof goods and services over a set time period. The GDP has become a keymetric for evaluating economic performance, providing a universal quan-titative reference point for evaluating economic conditions.
The GDP gives us the snapshot that Gary Smith, the businessmanturned election official, insists on having whenever he starts a new job. Itmaps where we are and helps us chart our future path. For instance, whenthe GDP shows a particular level of decline, we know we are in a recession,a diagnosis that prompts policy responses to jumpstart the economy. In the nineteenth century, in sharp contrast, economic downturns oftenprompted panics. As the name suggests, the term refers to “‘a sudden frightwithout cause,’”48 an apt description for a financial crisis that occurs in aworld without aggregate economic data. In a world without data, it’s hardto tell the difference between a genuine problem and a statistical glitch, be-tween a recession and a random economic dip.
The Promise of Data-driven Reform 51
The economy isn’t the only area where our government constantly mea-sures. We conduct a full-blown census every ten years. Almost one hundredfederal agencies boast data-collection programs.49 We collect statistics onthe environment, transportation, crime, prisons, farming, disease, hous-ing, childcare, immigration, aging, patents, the labor market, internationaldevelopment, medical services, imports and exports, and gas prices. Weeven try to measure things that many people believe can’t be measured, likethe quality of a public education.
Election Administration: The Mysterious Outlier
Given how pervasive data-driven policymaking is, the mystery is why some-thing that so naturally lends itself to measurement—election perform-ance—is barely measured at all. Most of the arguments against data-drivenanalysis—debates over the widespread use of CitiStat by government agen-cies, the U.S. News and World Report rankings, No Child Left Behind—boil down to a worry that institutional performance can’t be measured.People argue, with some justification, that quantitative measures can’t pos-sibly capture how well a school educates its students or whether the gov-ernment is providing the right social services.
The main thrust of these arguments is that gauging institutional per-formance requires us to make value judgments, and data can’t make thosejudgments for us. Data-driven analysis may be a natural tool in the busi-ness arena, some argue, because the goal is clear: businesses are supposed tomake money. Government agencies and educational institutions, in con-trast, are supposed to carry out a variety of tasks that necessarily requiremore complex normative assessments.
While it is plainly true that judging election performance requires us tomake value-laden decisions about what matters and why, as I explain inchapters 4 and 5, some government activities lend themselves more easilyto measurement than others. Election data fall on the comfortable end ofthis sliding scale. People call election administration practices the “nutsand bolts” with good reason. These aren’t the issues that have riven thosewho want to improve elections, like campaign finance or felon disenfran-chisement. Even if the parties have a tendency to play politics on some is-
52 Chapter 2
The Promise of Data-driven Reform 53
sues, there’s actually a good deal of agreement on how an election systemshould work. Moreover, much of what we value in election administrationcan be captured in a statistic: how long were the lines? how many ballotsgot discarded? how often did the machines break down? how many peoplecomplained about their poll workers?
We haven’t yet had the debate about numbers that has already occurredin the many areas of governance where policymakers have turned to quan-titative evidence to inform their decisions, and it would take an entire bookto rehash those arguments here. Nonetheless, based on the results of thosedebates thus far, it is hard to imagine that election administration won’tend up moving toward a greater reliance on quantitative data. After all, itis hard to make the case that election administration involves more com-plex normative judgments than are made in the vast swaths of our lives—employment, health, education—where policymakers have decided thatnumbers are necessary. It is harder still to argue that the normative judg-ments we are already making in election administration should not be in-formed by good data.
THE NEW FACE OF ENVIRONMENTAL REFORM
I began this chapter with Spencer Overton’s story, a tale about new-style re-former struggling with an old problem. Now let me tell you about DanEsty. Think of the word environmentalist and the first image that springs tomind may be your college roommate who recycled everything or Tiva-shodbaby boomers trying save the polar bear. Dan Esty, a professor of environ-mental law and policy at Yale, is nothing like the stereotype. Clad in a well-tailored suit, porting the latest in cell phone technology, he speaks in theclipped sentences of a corporate executive. It is easy to imagine him in hisfirst job as a trade lawyer at a top-flight Washington law firm. Though Estyis more than capable of talking idealistically about why environmentalreform matters, he usually sounds more like a McKinsey consultant than a Sierra Club member. His arguments are punctuated by phrases you won’t hear at an Earth Day celebration: performance goals, data-drivenanalysis, action items, benchmarking, leveraging, and competition. In an
area dominated by starry-eyed idealists, Esty’s style is that of a hardheadedcorporative executive.50
Esty’s style is also what makes him so effective. He’s the rare environmen-talist who has the ear of big business. That’s because Esty has always had onefoot in the world of reform and the other in the world of business. WhenEsty was a young lawyer, he divided his time between pro bono environmen-tal clients and paying trade clients. He quickly noticed that the two groupswere always talking past one another. Like Overton, Esty serves the role oftranslator between two worlds. His first book was devoted to casting envi-ronmental claims in terms that trade policymakers could understand.51
In working on that project, Esty realized that environmentalists have aproblem. If you want to improve the environment, business matters. Butbusinesspeople are exceedingly skeptical of reformers. It isn’t just a questionof language. Businesspeople often worry that environmentalists haven’tcome to grips with the costly trade-offs associated with reform, and theyget irritated with what Esty calls reformers’ “holier-than-thou-ness.” Estyalso believes that environmentalists have as much to learn from business-people as businesspeople do from environmentalists. However, routinebusiness practices like data-driven analysis and benchmarking were simply“not the ethos of the environmental culture.”52
Esty’s vision of data-driven reform crystallized when he attended the1998 meeting of the World Economic Forum in Davos. There he wasstruck by the success of the Forum’s Global Competitiveness Index, whichranks countries based on their potential for economic growth.53 It was clearthat the ranking mattered a great deal to the business and governmentalleaders gathered there. Esty could also trace its effects on economic policiesthroughout the world.
Esty worried that the Global Competitiveness Index captured only partof the story. It did not provide similar comparative data on countries’ en-vironmental performance. That meant that nation-states were compet-ing fiercely to move up the rankings on the financial side but feeling nopressure to do so on the environmental side. Esty’s mantra is that “whatmatters gets measured,”54 and environmental performance wasn’t beingmeasured.
Esty and a group of environmentalists at the conference came up with aplan to rank countries based on their environmental performance. With
54 Chapter 2
the support of a philanthropist and academic centers at Columbia andYale, they pulled together publicly available environmental data to createwhat has become the Environmental Performance Index.55 The EPI ranks149 countries along twenty-five performance indicators. It allows us tomake detailed comparisons of the progress nation-states have made in pro-moting human health and protecting the ecosystem.
Remember when I asked you at the end of Spencer Overton’s story toimagine what a reliable yardstick for judging election reform debates couldachieve? Dan Esty can tell you exactly what such a metric can achieve. TheEPI has affected environmental debates across the globe. Consider whatoccurred in Belgium after the first version of the Environmental Perfor-mance Index was released. Belgian environmentalists had long tried to per-suade legislators that the country’s environmental practices were subpar.But without any concrete, comparative information on performance, allenvironmentalists in Belgium could do was exhort the government to domore or engage policymakers in complex discussions well beyond the graspof most citizens. These debates about inputs (funding levels, regulatorychoices) had gotten nowhere.
When the EPI showed that Belgium fell well below its European coun-terparts on the ranking system—roughly in the same range as Cameroon,Mozambique, and Albania56—the conversation changed. The story madeheadlines in the country’s major newspapers, and reformers suddenly hada rather large stick to beat legislators into doing something. Governmentofficials could go on and on about the merits of Belgian policies. But theycould not dispute the bottom line: Belgium was not keeping up with itspeers along a wide range of performance measures. The EPI precipitated asizable political crisis in Belgium, and the result was genuine reform.
Or take the example of South Korea. It ranks forty-second on the 2006EPI.57 Eager to improve its standing, South Korea has assembled a team ofthirty people—at a cost of roughly $5 million a year—to figure out how todo better. By way of comparison, Esty’s team is composed of ten peopleand spends about $1 million each year to put the ranking together.58
The aggregate numbers measuring the EPI’s influence are equally im-pressive. There have been one million hits on the EPI website. More thansixty governments have consulted with the EPI team about improving theirenvironmental policies. And the push toward quantification appears to be
The Promise of Data-driven Reform 55
taking root among environmentalists, as others have tried to find sensible,easily communicated measures of environmental performance. Some en-vironmentalists, for instance, now challenge individuals and businesses toimprove their carbon footprint, which measures energy consumption inunits of carbon dioxide.59
The EPI is clearly a here-to-there strategy. It does not mandate a par-ticular policy or set any regulatory baselines. Instead, it helps change theconversation about environmental reform, creating incentives for policy-makers to do the right thing. The result is that, at least in some places, en-vironmental reform has taken root.
Esty is quite clear about why the EPI has worked. It packages environmen-tal concerns in the language of business, providing policymakers and votershard data and comparative benchmarks to assess their nation’s performance.Esty notes that when the EPI was first created, people were “shocked that youcould put hard numbers to environmental performance.”60
According to Esty, the numbers matter. A ranking enables reformers todistill a wide-ranging set of concerns into something accessible to—andnoticed by—the press and top-level governing officials. Reports by envi-ronmental reform groups tend to get relatively little press. The EPI regu-larly makes headlines. Most environmental reformers spend their timelobbying legislators or cajoling bureaucrats. Esty’s group meets regularlywith prime ministers and presidents.
A performance ranking also helps reformers and policymakers pinpointproblems and identify where they can do better. As Esty notes, it is a com-monplace among corporate executives that “accounting gives context for choice.”61 Environmental accounting serves a similar purpose. Theconventional model for environmental reform, Esty says, is “guru-baseddecisionmaking,”62 which relies on movement heroes to articulate a plat-form. That approach succeeded in the early days of the environmentalmovement, says Esty, because there was a lot of “low-hanging fruit”—virtually any proposal represented an improvement on the status quo. ButEsty thinks that regulatory choices are harder today than they were twenty-five years ago, and the demand that governments “do better, do more” isno longer enough to convince policymakers.63
Hard, comparative data have also given environmentalists a better senseof the drivers of performance. There has been a long debate among envi-
56 Chapter 2
ronmentalists as to what matters most for environmental performance:money? strong regulations? enforcement? capacity building? Everyone hadan intuition, but it was hard to figure out whose intuitions were correct.The EPI has moved us one step closer to an answer by providing data thatcan be used to figure out what correlates with strong environmental per-formance. The conventional wisdom was that money matters, that richcountries always do a better job of protecting the environment than poorones. Because the EPI keeps track not just of performance outputs (ozonemeasures, child mortality rates, air quality assessments) but policy inputs(economic wealth, good governance), Esty and his team can test the con-ventional wisdom. Regression analysis suggests that the conventional wis-dom is only partially right. Rich countries generally do better than poorcountries on the EPI. But there is a good deal of variation within bothgroups, and that variation seems to be driven largely by good-governancefactors, like strong environmental regulations, protections against corrup-tion, and public debate over environmental issues. To be sure, we are farfrom having a definitive answer about what drives environmental reform(and the question itself is too complex to measure with absolute confi-dence). Nonetheless, the Environmental Performance Index has at leasthelped reformers get a preliminary read on these issues.
THE IMPORTANCE OF DATA-DRIVEN
POLICYMAKING
In the next chapter, I’ll argue that the world would look quite different ifelection reformers like Spencer Overton possessed the same tool that DanEsty wields. Before turning to that discussion, however, I want to move be-yond Overton’s story and talk more generally about what election reformdebates look like in today’s environment.
The problem with reform battles in a world without data is that we all end up acting too much like Lev Tolstoy’s coachmen. When there’s noevidence to analyze, there’s not much left to do but shout. For too manyelection issues, we are in exactly the same position as Spencer Overton orthe Carter-Baker Commission or Justice Stevens. We lack the informa-tion we need to be confident that we’ve correctly identified the problem
The Promise of Data-driven Reform 57
and chosen the right solution. We argue incessantly about which path elec-tion reform should take even though no one can even map where we areright now.
Photo ID is a question to which most election reformers think that theCarter-Baker Commission and the Supreme Court got the wrong answer.But reformers make plenty of claims that aren’t supported by empirical ev-idence. They don’t have much of a choice. Without good data, there is notmuch but intuition and anecdote to go on. Commonsense intuitions canget you reasonably far, but at some point the absence of data calls intoquestion the basic facts on which those intuitions are based. As OhioState’s Dan Tokaji argued in a rather pointed rebuke the reform commu-nity, “Efforts at election reform have been based on an intuition-basedapproach . . . [that] places too much weight on seat-of-the-pants assess-ments of what makes for good elections.”64
It is not surprising that Tokaji is acutely aware of the shortcomings ofthe current debate. He’s a baseball nut. When Tokaji isn’t teaching electionlaw, he’s traveling around the country in his quest to see a baseball game inevery stadium in the country. Don’t even try to talk to him about the RedSox. Legend has it that he threatened to toss his roommate, a Mets fan, outthe window during the heartbreaking 1986 World Series. And Dan’s beena lot happier since the Red Sox hired Bill James, the number guru whommany credit with the Sox’s recent success.
Baseball, of course, is an American institution where statistics have al-ways mattered. As sportswriter Roger Angell notes, “Every player in everygame is subjected to a cold and ceaseless accounting; no ball is thrown andno base is gained without an instant responding judgment—ball or strike, hitor error, yea or nay—and an ensuing statistic.”65 Supercrunchers like BillJames have played an increasingly important role in the sport, as MichaelLewis documents in Moneyball: The Art of Winning an Unfair Game.66
There Lewis describes the success of the Oakland A’s, whose managementdrastically improved the team’s performance by hiring based on hard, com-parative data instead of the gut-level judgments of baseball scouts.
Drawing on Lewis’s book, Tokaji argues that we need to take a “money-ball” approach to election reform.67 He writes that arguments for electionreform have too often been based on the same approach as “the old-time
58 Chapter 2
scouts in Lewis’s book, . . . . neglecting serious empirical research into whatworks and doesn’t work in the real world.”68 Tokaji says we need “hard dataand rigorous analysis” in place of “the anecdotal approach that has toooften dominated election reform conversations.”69
A Democracy Index fits neatly with Tokaji’s moneyball approach.Rather than focusing on necessarily atmospheric judgments about whatproblems exist, the Index would provide concrete, comparative data onbottom-line results. It would allow us to figure out not just what is hap-pening in a given state or locality, but how its performance compares tosimilarly situated jurisdictions’. It would help us spot, surface, and solvethe problems that afflict our system. The Democracy Index would, inshort, give us the same diagnostic tool used routinely by corporations andgovernment agencies to figure out what’s working and what’s not.
Identifying Problems and Solutions
The absence of good data poses the most basic of dilemmas for those whocare about reform: it is hard to figure out whether and where problemsexist in a world without information. Election experts can name thesymptoms they see routinely; even the haphazard information availablenow reveals this much. But if you were to identify a specific election sys-tem and ask whether the problem existed there, experts might not be ableto answer your question. Problems are hard to pinpoint in a world with-out data.
For example, we would presumably be worried if a large number ofpeople tried to cast a ballot in the last presidential but failed to do so. Itmight be a sign that registration systems weren’t functioning properly, thatpoll workers were doing a bad job, that ballots were designed poorly, orthat machines were not working well. Yet 20 percent of states cannot eventell you how many people cast a ballot that wasn’t counted, let alone howmany were turned away before they filled out a ballot.
Remember Conny McCormack, who just retired as the county clerk/recorder-registrar of Los Angeles County? She has been better situated thanmost election officials to identify cost-effective strategies for reducing thenumber of lost ballots. The reason is simple: L.A. County keeps better data
The Promise of Data-driven Reform 59
than most states and localities. Her staff routinely tracked not just howmany ballots were cast but not counted, but why ballots weren’t counted.For instance, McCormack could tell you how many absentee ballotsweren’t counted because they arrived after the deadline, lacked a necessarysignature, or were returned as undeliverable.
Because L.A. County tracks these numbers, McCormack was able toidentify when she had a problem. For instance, early on in her tenure, Mc-Cormack and her staff realized that a large number of absentee ballotsweren’t counted because they arrived after the deadline. Taking a look atthe packets sent to voters, McCormack realized that the deadline was an-nounced only inside the packet. She and her staff then redesigned theenvelope so that it informed voters in red letters when the ballot had tobe received. By placing this information in a more prominent place forvoters, L.A. County was able to reduce the number of absentee ballotsthat were disqualified on timing grounds. It was a simple, virtually cost-free solution.
There are many examples where data have helped election administra-tors do a better job. Take Bob Murphy, who is Maryland’s Electronic PollBook Project monitor.70 A poll book is what election staff use to check youin when you vote. Murphy, a computer junkie, realized that Maryland’snew electronic poll books contained extremely helpful information onturnout patterns. “We always knew who voted before,” says Murphy, “butnow we know when they voted.” When Murphy started playing aroundwith the data, he realized that people’s voting patterns depended on thingslike where they lived and how old they were. The elderly, for instance, tendto vote midmorning, which means you’ll want to staff up polling places inareas with large elderly populations during those periods. Murphy evendiscovered that the “conventional wisdom” that there’s a noontime rush inpolling places is true only for a small percentage of Maryland’s polling sites.Armed with four elections’ worth of data, Murphy can figure out exactlyhow much equipment and staff he needs in a given precinct to prevent linesfrom developing.
Gary Smith, the businessman turned election administrator, has also putdata on turnout patterns to good use. Like many election administrators,Smith has to figure out “how to disperse my assets in a more efficient way.”
60 Chapter 2
He’s not only used data on turnout patterns to distribute his voting ma-chines efficiently, but to ensure that every community in his jurisdictionreceives equal service, not just an equal number of machines.71 For in-stance, Smith has mapped the residence of all the people who vote early inone of Forsyth County’s early voting sites.72 He’s thus able to make surethat the early voting sites are serving every community equally. Moreover,Smith can tell when an early voting site is being underused and fix theproblem (perhaps by providing better signage or switching locations).Those adjustments don’t just make it easier for Atlanta residents to vote.They reduce the number of people who vote absentee. Because absenteeballots are more expensive to process than early votes, Smith’s adjustmentshave a direct effect on his office’s bottom line.
Joe Mansky, the scientist turned election administrator, has used data toimprove the design of Minnesota ballots. Badly designed ballots lead vot-ers to make mistakes when they vote; they can vote for the wrong candi-date (remember Palm Beach County’s infamous butterfly ballot?) or cast an invalid ballot. Mansky oversaw one of the earliest rollouts of optical scanmachines, and there were a lot of questions about how best to design anoptical scan ballot at the time. By gathering data during the early stages ofthe process, his staff learned how to fashion the ballots so that voters madefewer mistakes in marking them.73
Distinguishing between a Glitch and a Trend
Even when we can identify a potential problem with good data, it’s hard tofigure out where that problem looms largest or to distinguish between astatistical blip and a genuine pattern. Tammy Patrick, an election adminis-trator for Maricopa County in Arizona, can tell you a lot about distinguish-ing between glitches and trends. Like most people in election administration,Patrick fell into the job through some combination of happenstance andinterest. Most of her career was spent working in sales in the private sector.Patrick was eventually tapped to be Maricopa’s federal compliance officerat a time when the county was tussling with the Department of Justice overfederal language assistance requirements. The county eventually agreed tocreate a program to track compliance with those provisions. But Patrick
The Promise of Data-driven Reform 61
thought that it could do much more. Why not create a system that couldtrack election problems of all types?
When Patrick came up with the idea, voter complaints were all trackedon slips of paper. Patrick and her coworkers created an online database fortracking complaints in real time. Patrick’s sales experience paid off here.She made sure that the software “prepopulated” data and minimized thenumber of keystrokes needed to enter a complaint. The resulting programhas been a great success, earning the county national recognition. It notonly allows the staff to dispatch troubleshooters to deal with discrete prob-lems, but provides for systemwide solutions when the data reveal a trou-bling trend. Maricopa’s reporting system doesn’t just allow for midcoursecorrections. It also serves as a long-term diagnostics tool so that countyofficials who evaluate employee performance can do a better job of train-ing going forward.
I asked Patrick to give me an example of how her system worked. Shetold me to imagine that I’d gotten a report from Precinct X—the ink hadrun dry in the pens voters need to fill in their ballots (a reasonably com-mon problem in a desert community). Maybe it’s a glitch (perhaps that’sthe precinct where the pens sat in the hot delivery truck the longest, so Ican fix the problem just by sending a new box of pens there). Maybe it’s atrend (the manufacturer sent bad pens, and the problem is going to shutdown the voting process). Needless to say, I’d want to find out quicklywhether it’s a glitch or a trend. “We can do that in real time,” she notedproudly.
Benchmarking
The secret to Tammy Patrick’s idea is that it provides the right informationin the right form. As Patrick recognized, a reporting system is a good start,but those bits of data are most useful if they are pulled together into a us-able form.
The Democracy Index is Tammy Patrick’s idea writ large. Good policyrequires something more than a bunch of individual jurisdictions collect-ing data on their own performance. It requires us to benchmark. Bench-marking is a routine practice in the business world, as corporations con-
62 Chapter 2
stantly compare their performance with that of their competitors to iden-tify best practices and figure out where they can improve.
Most of the benchmarking studies we have were done by social scien-tists, who wangled enough funding to gather the necessary data. But thosestudies are inherently limited. They tend to be small-scale and focus onnarrow questions. More importantly, they cannot provide grounds fordrawing conclusions across widely varying jurisdictions. Election adminis-tration is too complex and too varied to be captured by studying a smallsample. As several scholars have explained, an election system is like an“ecosystem”: “Changes in any one part of the system are likely to affectother areas, sometimes profoundly.”74 When ecosystems vary as much asthey do in the elections context, large-scale, cross-jurisdictional studies areessential.
Put differently, election reformers and policymakers today function alot like doctors did in the old days. Based on limited information theyhave about the symptoms of the problem (lots of ballots are discarded, thelines seem long), they try to identify the underlying disease (is the prob-lem badly trained poll workers? malfunctioning machinery?). Like thedoctors of yore, election reformers and administrators may even try onefix, followed by another, hoping that their educated guesses turn out tobe correct. The problem is that their educated guesses are still just that—guesses.
Even when someone comes up with a good guess as to a solution, wecan’t tell how much improvement it will bring or how its effects wouldcompare to other, less costly solutions. In today’s environment of tightbudgets and limited resources, this lack of precision undermines the casefor change.
What we need is what modern medicine provides: large-scale, compar-ative studies that tell us what works and what doesn’t. The DemocracyIndex is a first step in that direction. It would provide comparative data re-garding both policy inputs (registration practices, balloting rules, trainingprograms) and performance outputs (data on discarded ballots, the lengthof lines, the number of voter complaints). Those numbers would allow usto run the large, cross-jurisdictional studies that we need to identify bestpractices.
The Promise of Data-driven Reform 63
Figuring Out What Drives Performance
The dearth of data doesn’t just make it hard to cure specific ailments in ourelection system. It also prevents us from inoculating the system against fu-ture disease. Put yourselves in the shoes of a reformer or an election admin-istrator and you can see why comparative data are crucial. While you arecertainly interested in specific fixes for discrete problems, you really want arobust system capable of self-correction so that problems can be avoidedrather than corrected. You want to identify not just best practices, but thebasic drivers of performance.
If you are interested in the drivers of performance, absolute numbersmatter to you, but comparative numbers are far more useful. After all, ifyou can’t even identify who’s doing well, it is hard to figure out preciselywhat drives good performance. Without comparative data on perform-ance, we cannot know whether, for instance, well-funded systems tend tosucceed, or whether the key is centralization, better training, or nonparti-san administration.75 Because the Democracy Index ranks states and local-ities based on overall performance, it provides precisely the comparative in-formation we need.
CONCLUSION
Whether we are arguing about discrete policy solutions or the drivers ofperformance, too much of the debate takes place in a world without data.The Democracy Index would help address this problem by giving us thesame tool that doctors, businessmen, and now environmentalists possess:comparative information on bottom-line results. By providing the right in-formation in the right form, the Index would enable reformers and elec-tion administrators to figure out which jurisdictions do well in individualcategories and which ones run the best systems overall.
The Democracy Index is especially intriguing because it would help turnone of the biggest obstacles to reform—decentralization—into an advan-tage. Academics like to tell you that one of the benefits of decentralizationis that it allows states and localities to function as “laboratories of democ-racy,”76 with different jurisdictions coming up with different solutions for
64 Chapter 2
the same problem. But there is little point to having laboratories of democ-racy if no one reports the results of the experiments.
If the Democracy Index did nothing more than give us a map—helpingus identify where we are and figure out where we want to go—it would rep-resent a significant improvement on the status quo. At the very least, we’dhave some confidence in our assessment of the problems we face (the“here”) and the solutions we should pursue (the “there”). But the Index hasthe potential to do a good deal more than that. It has the potential to helpus get from there to there, a subject to which I turn in the next chapter.
The Promise of Data-driven Reform 65
3 The Politics of Reform and the
Promise of Ranking
In the last chapter, I offered a tale of two reformers. Spencer Overton fightsfor election reform in a world without data. Dan Esty battles for environ-mental change with an important weapon: an index that ranks countriesbased on performance. In this chapter, I’ll explain why the DemocracyIndex could provide a similarly powerful tool for election reformers. In-deed, if we focus on the key leverage points in the reform process—voters,policymakers, and election administrators—it is clear that a DemocracyIndex could do a great deal to smooth the path for change.
VOTERS AS LEVERAGE POINTSRealigning Partisan and Local Incentives
Voters are a key leverage point in the reform process. We wouldn’t worryabout partisanship or local competition if voters pressured elected officialsto do the right thing. Unfortunately, it is often tough for reform proposalsto get traction with voters. That might seem strange given that the worddemocracy is invoked with reverence by schoolchildren and politiciansalike. Everyone is affected by a badly run system. So why aren’t voters en-ergized about these issues?1
Framing the Issue
While voters care about how elections are run, discussions about reform arelargely inaccessible to them. In most policy debates, voters need a “frame”2
to help them understand the problem and get behind a solution. Just think
about how the 2008 presidential candidates framed difficult policy issueslike health care coverage or the U.S. policy in Iraq. Reformers, of course,are engaged in precisely the same endeavor. By providing stories, slogans,and analogies, reformers tee up issues for voters and develop constituenciesfor change.
Most election issues are hard to frame for voters. The discussion eithertakes place at such a high level of generality that people have no sense ofwhat ought to be done, or it descends into a sea of incomprehensible de-tail that would try the patience of even the wonkiest voter.
When reformers make their pitch, they often speak in stirring terms, in-voking democracy, the dignity of the ballot, the right to vote. You can prac-tically hear the National Anthem playing in the background. This is all welland good, but the National Anthem doesn’t give a citizen much to go on.Moreover, everyone can play the patriotism game; you can expect electionofficials will also claim the moral high ground and accuse the other side ofneglecting fundamental principles. As any parent knows, it is hard to re-solve an argument whose basic rhetorical structure is some variant of “amnot, are too.”
Things are little better when reformers and election officials swoop fromthese lofty heights to what election scholars call “the weeds.” Reformers“have to talk mostly in generalities,” observes Jonah Goldman of the Na-tional Campaign for Fair Elections, because the underlying policy debatesseem so “dull.”3 The subject matter is arcane. Fights often involve intricatedebates about counting ballots, jargon-filled discussions of election ma-chinery, and disputes about nitty-gritty registration requirements. Evenelection junkies rarely have the stomach for it.
More importantly, these are debates that voters have no yardstick forjudging. Reformers point to a problem—an inadequate registration sys-tem, outdated machinery, a poor system for training poll workers—andargue that the state can do better. Election officials respond by talkingabout regulations issued, resources allocated, and staff trained. Reformerstalk about discarded ballots or unregistered voters. Election officials assureus these numbers are normal.
For voters, these debates are reminiscent of that famous Far Side cartoonentitled “What Dogs Hear.” The clueless owner prattles away to his pet,and all the dog hears is “——, ——, ——, Ginger. ——, ——, Ginger,——.” So what do voters hear when reformers and administrators go at it?
Reform and Ranking 67
A stream of technical details, occasionally punctuated with grand termslike the right to vote or democracy.
Voters are not stupid.4 But none of us is born into the world with astrongly held intuition about whether optical scan systems are a good idea,or whether provisional ballots should be counted only if they are cast in thecorrect precinct. Voters are in the same position as the Supreme Court jus-tices were in the voter ID case. They need a yardstick to help them figureout who’s right.
The atmospherics of election reform do little to help the cause. In theabsence of a reliable yardstick, voters’ only strategy for resolving these de-bates is to pick someone to trust. But neither side is likely to engenderwidespread confidence. On one side you have elected politicians and em-battled bureaucrats, whose pleas that they are doing the best they can areas likely to elicit cynicism as sympathy from the electorate. On the otherside of the debate are election-reform advocates, who are often brandedwith the same stereotypes attached to other reformers: idealistic, liberal,naive. In private, election reformers are about as cynical as anyone can getabout politics. In public, their mantra—“Do better, do more”—is the sameone environmentalists used before people like Dan Esty arrived on thescene. Even if reformers start to get any traction in these debates, there is agood chance that the political party in power, fiercely protective of its priv-ileges, will label them as partisan zealots or sore losers.5
The Democracy Index could help change these dynamics by giving vot-ers a yardstick to judge these fights. First, it gives voters the right informa-tion. Rather than bogging voters down in technical details about how theideal system would be run or making vague assertions that we could do bet-ter, reformers could give voters information on something they can evalu-ate: bottom-line results.
Second, the Democracy Index presents the information in the rightform by distilling the data into a highly intuitive, accessible format: a rank-ing. Moreover, because the Index grades election systems “on a curve”—measuring them against one another instead of some ideal standard—voterscan feel confident that they are rewarding those who have succeeded whileholding those on the bottom rung to a realistic standard of performance.
The Democracy Index ought to shift the rhetoric of reform debates, al-lowing starry-eyed idealists to speak in the pragmatic cadence of corporate
68 Chapter 3
executives. In place of anecdote and idealism, reformers could offer cold,hard statistics about a locality’s performance. Rather than relying on ab-stract invocations of the right to vote or bogging down voters in the tech-nical details, reformers could let the numbers speak for themselves. TheDemocracy Index would thus expand the reformers’ vocabulary, enablingthem to speak more concretely about trade-offs and second-best solutionsand to appeal to business-minded ideas like accountability and competition.
Jumpstarting grassroots organizing. The most optimistic hope for theIndex is that it will encourage voters to get more engaged with grassrootsactivities. It is not surprising that voters have been passive about electionreform until now. Current debates put voters in a situation where they havenothing to contribute. Everyone can invoke the same vague generalitiesabout the right to vote. But if voters are going to talk about policy, they’llhave to spend their weekends reading the posts on electionline.org or theCaltech/MIT Voting Technology Project website instead of wiling awaythose hours watching Extreme Ironing,6 the U.S. Rock/Paper/ScissorsLeague,7 or the Canadian Mixed Curling Championship.8 To put this lessfacetiously, ask yourself this question: If the average voter had some im-pulse to write her representative or call a radio talk show or organize a pe-tition drive, what exactly would she say?9
Ranking systems are useful because, as Dan Esty observes, they “democ-ratize who can render an opinion.”10 (Whether you think the opinion isproperly informed is a different question, explored in chapter 4.) Everyonecan express a view on whether his state ought to be ranked higher thanforty-fifth on the Democracy Index. By giving voters an issue they canwrap their hands around, it may be possible to get voters exercised aboutelection reform. After all, the rare instances in which voters have gottenengaged with grassroots organizing—paper trails, voter ID—have all in-volved issues that appeal to people’s intuitions.
The Democracy Index would also expand the grassroots organizer’s timeframe. In a world without data, the only time people are riled up about re-form is when there’s a crisis. Once a winner is picked, the media coveragethat keeps voters engaged ends abruptly. Reformers thus have a very shorttime to organize a coalition for change. An Index, however, ensures that thereform remains salient long after a crisis (and even in its absence). A rank-ing creates a durable reminder that a problem exists. By expanding the
Reform and Ranking 69
organizer’s time horizon, the Index may help build support for change overthe long haul.
Giving Voters an Information Shortcut
Even if the Democracy Index does not spawn new grassroots organizing,we would at least expect it to help voters do something that they alreadydo: cast a vote. The great advantage of ranking systems is that they offervoters an information shortcut for holding elected officials accountable fortheir missteps. Creating a new shorthand for voters ought to affect the po-litical incentives that currently run against reform.
Against shorthand? Some might well bristle at the idea of voters’ usingshorthand to evaluate the way our elections are run. Shorthand, of course,is always an imperfect substitute for informed decision-making. Skepticsmight worry that a ranking system is so simple as to be simplistic. Why notpresent voters with a full range of information rather than “spoon-feed”them a ranking?
Though the concern is well taken, it misstates the question. The choiceis not between “spoon feeding” voters or providing them with a full buffetof information. Voters will inevitably use some sort of shorthand in cast-ing a ballot. The choice is what kind of shorthand to supply.
Consider, for instance, how most voters cast their ballots. They usuallyknow very little about the substantive positions of the candidates they elect.11
Yet voters make surprisingly good decisions about how to cast a vote. Theirdecisions are by no means perfect and reveal predictable biases. But votershave figured out a pretty good strategy for choosing a candidate without sort-ing through the huge amount of information relevant to that decision.
How do voters do it? They use the party label as a shorthand—what po-litical scientists would term a “heuristic”—in choosing a candidate.12 Thelabel Democrat or Republican functions like a Good Housekeeping Seal ofApproval. It tells the voter that the candidate in question subscribes to val-ues or policy preferences that are close enough to the voter’s to choosehim.13 As several scholars have explained, if a voter “knows the big thingabout the parties, he does not need to know all the little things.”14
Political scientists have devoted a lot of energy to making party cuesfunction more effectively for a simple reason: they are a good deal better
70 Chapter 3
than the other types of shorthand voters might use.15 Without the partyheuristic, voters would be more likely to base their votes on something un-appetizing, such as a candidate’s race or gender. Or they might cast ballotsrandomly so that voter preferences are disconnected from electoral out-comes. The basic defense of party labels is not that they are perfect—farfrom it—but that they are the best thing we’ve got. If you ask a politicalscientist whether it is a good idea for voters to rely on party cues, the likelyresponse will be a sarcastic, “As opposed to what?”
If we think about that question here, a ranking system looks a good dealmore appealing. Think about the proxies voters are likely to use today incasting their vote for election officials. The best bets seem to be (1) anec-dotal evidence, (2) news about a widely reported crisis, or (3) partisan cues.For all its potential shortcomings, a ranking system is superior to each ofthese alternatives.
Anecdotal evidence is, of course, just that. While a bewildering number ofacademics think that what their taxi driver said on the drive to the confer-ence constitutes reputable proof, a glitch here and there is not good evidenceof a full-fledged problem. A ranking system, in contrast, focuses voters on thebigger picture, directing their attention to systemic concerns instead of themodest anomalies that can afflict even well-run systems. It also directs theirattention to the good as well as the bad and the ugly, revealing which statesand localities have done an especially impressive job of running elections.
Even evidence of a crisis may not be a useful guide for voters. While theworst-run systems are more vulnerable to a crisis, not all badly run systemswill experience one. Indeed, given the dearth of the data, we cannot defini-tively rule out the possibility that recent brouhahas have happened in rel-atively well-run systems, places that just happened to be in the path of aturnout tsunami. Crisis-based voting also has the flavor of closing the barndoor after the horse has been stolen. Voters need a tool that will help themprevent crises rather than merely react to them.
Finally, partisan cues don’t provide a dependable heuristic for voters inthis context. A party label can tell a voter whether a candidate is liberal orconservative, something that may map on to particular approaches to cam-paign finance or felon disenfranchisement. But in choosing an election ad-ministrator, voters need shorthand for evaluating professionalism and per-formance, and the party cue does not help. Democrats and Republicans areequally susceptible to running elections badly.
Reform and Ranking 71
For all of these reasons, the Democracy Index has the potential to pro-vide voters with a much-needed shorthand for casting a vote. By conveyinginformation about the “big thing” in election administration—a rough senseof how well the system performs overall—it enables voters to make sensibledecisions without knowing all of “the little things” buried in the data.
If the Democracy Index provides voters with a useable shorthand, it oughtto generate a new political dynamic in the reform environment.16 Thecurrent system offers politicians and local officials few reasons to pay atten-tion to reform issues. You can bet that will change if votes start to turn onperformance.
Realigning partisan incentives. Consider, for instance, the fate ofOhio’s secretary of state, Kenneth Blackwell, whose travails were describedin chapter 1. In 2006, Blackwell ran for governor. Imagine if Ted Strickland,the Democrat running against him, could have shown that Ohio was oneof the worst-run election systems in the country. Surely Strickland wouldhave trumpeted those results whenever he could. You can also be sure thatsecretaries of state across country would take notice of that campaign.
An Index would also be invoked by election officials whose systems rankhigh. Candidates are always on the hunt for something to distinguish themfrom their opponents, some theme to attract voters’ attention. We see lotsof examples of this type of self-promotion with other rankings. For in-stance, the latest release of the Government Performance Project, whichgrades state management practices, prompted immediate press releases bythe governors of the top-ranked states.17
The Index won’t only matter during the campaign season. It’s also likelyto be used in any recount battle. Parties wage recount wars on two fronts.In court, the parties’ job is to get their ballots counted and their opponents’excluded. Any lawyer worth her salt will try to introduce the Index intoevidence if it helps her case.
Parties also battle in the arena of public opinion, trying to enlist votersin their effort to win the legal battle and score political points. It’s hard toimagine that neither party would invoke the Democracy Index in framingthe recount debate for public consumption. After all, if the state rankedlow, it would provide further evidence that the party in power failed to do
72 Chapter 3
its job properly. Conversely, if the state generally scored high on the Index,the party in power could use it as a shield against the accusations beinglevied by its opponents.
Should the Democracy Index be deployed in either context, it ought tohelp raise public awareness about the need for reform and create incentivesfor politicians to get behind it. If there’s any lesson to be drawn from suc-cessful efforts at election reform in other countries, it is that the most effec-tive proponent of reform is usually the opposing party. When the party outof power has a weapon—an advisory commission report, a judicial ruling,a ranking system—it will use it to beat on the other party at every oppor-tunity. It’s ugly, but effective.
Even setting aside political races and recount wars, one can imagine otherways in which the Index might be used as a sword or shield in partisan pol-itics. For instance, election officials at the bottom of the list might be vul-nerable to targeted fund-raising or get-out-the-vote organizing by politicalblogs (Daily Kos or RedState). Similarly, any politician dissatisfied with anelection rule would surely invoke the Index. The Index, after all, makes aninstance of special pleading look like a defense of the public interest.
For all of these reasons, the Democracy Index should hang like a swordof Damocles over politicians, a notoriously risk-averse group. While it willnot be salient in every race, it should matter in some. That would meanthat at least some of the time, the fate of elections officials would hinge inpart on their professional performance, not just their party standing. In-stead of asking an election official to stop thinking about her political in-terests in administering the election process, the Democracy Index linksher political fate to her professional performance.
Would party heuristics trump? A skeptic might still insist that theparty heuristic—whether someone has an R or D by her name—is all thatreally matters for low-salience campaigns like races for the secretary ofstate.18 The worry is that party labels will drown out any competing infor-mation about candidates except during well-publicized campaigns for higheroffice, like Kenneth Blackwell’s gubernatorial campaign. But even if parti-san heuristics generally trump all else, a low ranking could still affect a can-didate’s political fate.19
To begin, the Index ought to matter when the party heuristic is unavail-able—during the primary, when candidates compete against members of
Reform and Ranking 73
their own party, or during the general election in a nonpartisan race. Inthese low-information races, voters don’t have a party label to sort candi-dates, so any means of distinguishing one candidate from another is poten-tially important. Indeed, not only should the Index itself provide a heuris-tic for voters, but it should also affect which organizations and newspapersendorse the candidate, thus influencing another basis on which voters casttheir ballots.
Further, even in races where the party heuristic matters, the Index mayaffect the behind-the-scenes maneuvering that determines which candi-dates get put forward. Party elites play an important role in selecting thecandidates who eventually run. During this “invisible primary,”20 their de-cisions about funding and endorsements can determine who ends up run-ning and winning the party primary. Imagine that you were a party leader,major donor, or get-out-the-vote organizer. There are a large number ofcandidates competing for your support. Why would you back someonewhose ranking has rendered him potentially damaged goods? And wouldn’ta high ranking increase a candidate’s standing in your eyes? Even if theranking will matter only rarely, a risk-averse political operative will preferto place a bet on someone without any handicaps. These behind-the-scenesdecisions all matter to a candidate’s political fate, and they all increase thelikelihood that politicians will care about how their state or locality rankson the Index.
Deflection? A skeptic might also worry that a Democracy Index cannottemper existing political incentives because it is too easy to deflect politi-cally.21 Deflection is, of course, a routine move in political debate. Onemight imagine, for instance, a secretary of state arguing that it’s not herfault that the state ranks poorly because the legislature hasn’t granted hersufficient resources or local officials are at fault.
This claim, however, underestimates the power of rankings. Rankingswork precisely because most citizens will not pay enough attention to movepast the ranking itself. As I explain in the next chapter, even if voters actu-ally paid enough attention to what was said during that ensuing debate, auseful conversation might emerge.
A more likely deflection strategy would be a claim of political bias. If theDemocracy Index is put out by a group that voters easily identify as liberalor conservative, it is unlikely to get the right kind of traction. Voters need
74 Chapter 3
not look beyond the ranking for deflection to work; they just need to knowwho released the ranking to dismiss it. For all of their glories, the ACLUand the Cato Institute are not the right groups to put out the Index.*
Realigning local incentives. As noted in chapter 1, partisanship isn’tthe only reason our election system does not function as well as it should.Even when politics are working correctly—when politicians are attentiveto what voters want—political incentives run against election reform.Local officials compete only on issues that voters can see. When a problemis invisible, a race to the bottom ensues.
A ranking system not only makes the problems in our election systemvisible to voters, but it casts those issues in explicitly competitive terms. Byranking states and localities against one another, the Democracy Indexshould help shame local officials into doing the right thing.
Consider, for instance, the competition that seems to have been spurredby one of the rare comparative metrics we have in election administration:the residual vote rate. In the wake of the 2000 election, reformers and po-litical scientists used the residual vote rate as a rough proxy for assessinghow many votes had been lost to machine problems, bad ballot design, andthe like. As a Caltech/MIT study observes, when jurisdictions “were toldthey had high residual rates in 2000,” many “worked to cut them to a frac-tion of what they were by 2002,”22 even before Congress provided fundingfor new machines. Georgia, for example, had a high (3.2 percent) residualvote rate in 2000 but reduced it to 0.9 percent by 2002.23 Reformers con-tinue to rely on the residual vote rate to pressure localities to do better. Arecent Brennan Center report, for instance, argues that residual vote ratesshould not be higher than 1 percent.24
We see a similar effect with other ranking systems. Take the GovernmentPerformance Project, a Pew Center on the States effort, which grades statesbased on their management practices.25 The GPP was in large part thebrainchild of Katherine Barrett and Richard Greene. This married coupleused to write for major magazines, with Barrett focusing on public policyissues and Greene working on fiscal accountability in the private sector.Their jobs led to an unusual form of pillow talk: “Two spouses usually
Reform and Ranking 75
*Similarly, it is essential that the Index’s metrics appeal to all voters. If the ranking’s opponents canpoint to a set of metrics reliably identified with one side of the partisan divide, the Index may lose itspower.
don’t talk about reforming public health systems in the Northeast,” laughsGreene.26 The more the two talked, the more they realized they were writ-ing about a common question: management, particularly management inthe public sector. The couple also began to notice that while “people alwaystalk about [top officials’] politics and policies,” there wasn’t “a way to holdgovernment accountable for how it managed itself.” The GPP was de-signed to do just that.
The GPP has had a remarkable amount of success pushing states to dobetter on the management front. For instance, its emphasis “on the impor-tance of workforce planning appeared to be central to enormous advancesin the area,” says Greene. While half of the states did such planning in2005, forty-one did so by 2008.27
You can also see the GPP’s effects on individual states. In Georgia, forinstance, the governor made the state’s midlevel ranking a central platformof change. The state began to measure itself against the GPP’s criteria andhas improved dramatically in a short time, moving itself from a B� to aB� in three years.28 Similarly, when the first GPP gave Alabama the low-est grade received by any state, state officials invited the GPP’s architects tospeak to its leadership and has been “getting steadily better” on manyfronts, says Greene. Greene thinks Alabama’s improvement is particularlyimpressive because success “is a moving target,” as many of the states areimproving at the same time.
Resting on one’s laurels or keeping up with the Joneses? One mightworry that even if the Democracy Index encourages states at the bottom ofthe list to improve, it won’t create incentives for top-ranked states to dobetter. This situation would still represent an improvement on the statusquo—at least the Index would provide an impetus for change somewhere inthe system. But it is also possible that a ranking system will encourage top-ranked states to compete among themselves.
Consider, for instance, what took place when the first version of the En-vironmental Performance Index was released, showing Norway ranked sec-ond on the worldwide ranking.29 As soon as the ranking was released, Nor-way invited Esty’s team to visit. Members of the team expected to be greetedby press conferences and government ceremonies trumpeting Norway’s ex-traordinary achievement. Instead, they were quietly ushered into closed-door sessions with top-level policymakers to discuss how Norway could im-
76 Chapter 3
prove its position. Norwegian leaders didn’t care that they were ranked aheadof 120 other states. What mattered to them? Finland was number one.
As Esty has learned from administering the EPI, people don’t expectevery country to do equally well given wide disparities in resources. Peergroups are what matters for spurring healthy competition,30 an observationconfirmed by cutting-edge social science research.31 The crisis the EPIranking prompted in Belgium, for instance, occurred because it was rankedwell below its European counterparts. Cameron Quinn, who served as thetop elections officer under Virginia’s Governor Jim Gilmore, confirms thatelection administrators look to peers for solutions. She says that when sheneeded help, she talked to her colleagues in North Carolina and Maryland,the states “aligned with Virginia.”32
Given the salience of peer groups, we might expect that the jurisdictionsmost likely to be influenced by the Democracy Index are those that falloutside of where we might expect them to land given their resources or rep-utation or geography. People would take notice if a resource-rich states likeConnecticut or New York fell low in the rankings or if one of the Midwest-ern states fell well below its neighbors. We might similarly expect thelowest-ranked states to care less about who is number one and more aboutwho is at the bottom of the list. It’s an idea nicely captured in the movieAnnapolis, where the second-worst plebe in the outfit explains to the herothat Arkansas needs Mississippi to keep it from “being the worst state inthe whole country.” The plebe tells the hero, who’s at the very bottom ofthe class, that he needs him to stay: “You’re my Mississippi. . . . [I]f Missis-sippi quits, then all of a sudden Arkansas is the worst state in the wholecountry.”33 Even states in the middle of the ranking should be influencedby peer group rankings. As the Brennan Center’s Justin Levitt notes, “Peergroups turn B students into D students”34—that is, those who don’t im-prove will drop in the rankings because we are using a different yardstick.
A skeptic might worry that local competition matters only for issues thatare important enough for people to “vote with their feet,” like schools andtaxes.35 If someone at a cocktail party told you she was going to move to adifferent state in order to find better polling places or an easier registrationsystem, you’d probably decide it’s time for a refill.
It is a mistake, however, to assume that people must vote with their feetbefore local officials will pay attention. Politicians pay attention to issueseven when they have what academics would call “a captive constituency.”
Reform and Ranking 77
They do so for a simple reason. They are risk averse and would ratherrepresent happy constituents. Local officials worry not only about latentcrises that might develop, but the cumulative effect of one bad headlineafter another. They also like to tout their successes, which is why one oftensees high rankings proudly announced on local and state websites.
The worry about captive constituencies is nonetheless well taken. It re-minds us to recognize the limits of any strategy designed to generate a “raceto the top” in election reform. There are lots of issues competing for vot-ers’ attention, and a ranking system is not going to push election reformahead of bread-and-butter issues like jobs and the economy. States willcontinue to feel pressure to commit resources to the many other problemsthey face. What the Democracy Index does is give election reform a much-needed boost in this competition for resources. And that is a good deal bet-ter than nothing.
Do People Care Enough about Election Reform for an Index to Work?
The arguments above depend on a crucial assumption: that some voterswill care about election administration some of the time. We already havemost of the raw ingredients for a successful movement: a superficially pop-ular issue, a rough consensus that there’s a problem, an engaged reformcommunity, and semiregular crises to place the issue on the legislativeagenda. The question is whether voters will get engaged enough to reversethe political incentives that run against change.
A skeptic might argue that voters will never care enough about reformto pay attention to a ranking. After all, the U.S. News and World Reportranking is read by so many people because anyone with a kid applying tocollege has a personal stake in the question. But our relationship to elec-tion administration is more tenuous and less personal.
Although we can’t know for sure whether a Democracy Index would havean effect on voters, it would be a mistake to infer that voter preferences arefixed. We are dealing with what political scientists call an endogeneityproblem. Voter opinions tend to be quite fluid. They are shaped by insti-tutions, the media, and political elites. Political scientists E. E. Schatt-schneider argued that the ability to define a problem and its solution “is the
78 Chapter 3
supreme instrument of power,”36 an idea buttressed by a long-standing po-litical science literature on the importance of “framing.”37 The endogene-ity problem makes it hard to figure out whether the Democracy Index willbe enough to change voter preferences. In thinking about this question,however, we must think in dynamic terms.
There are several reasons to be optimistic about the Index’s poten-tial. First, other indices have made a splash even though they don’t in-volve issues that affect people as directly as the quality of their children’seducation. The Environmental Performance Index, for instance, had aneffect on environmental policy well before global warming became ahousehold word and everyone began to fancy himself an environmenta-list. And the Government Performance Project’s evaluation of state man-agement systems—a topic that surely ranks above election reform on theboredom scale—generates hundreds of news stories whenever it is released.Unless reporters and politicians have a tin ear, that’s a sign that somethingis afoot.
Second, reformers have been able to get traction on election issues whenthey can frame them effectively. As Jonah Goldman points out, debatesabout paper trails have become salient in large part because reformers cameup with a simple metaphor for capturing the problem: if we can get a re-ceipt from an ATM, why can’t touch-screen vote machines generate a papertrail?38 That frame drives some experts crazy because they think it fundamen-tally mischaracterizes the problem.39 But it’s certainly driven policymaking,40
confirming physicist G. C. Lichtenberg’s observation that “a good metaphoris something even the police should keep an eye on.” If the Index can pro-vide a similarly intuitive frame for the public, it too ought to get traction withvoters. At the very least, there are enough stories on election administrationcontroversies these days that a Democracy Index would surely generate somepress, even if it were only a sidebar to ongoing reporting.
Finally and most importantly, the key difference between the Democ-racy Index and many other indices is that the Democracy Index has aready-made ally that cares deeply about this information: political parties.As is clear from the preceding discussion, political parties can use the Indexfor partisan advantage if they get the word out. Partisan politics—the en-gine that drives most public debates41—offers a built-in publicity machinefor the Democracy Index.
Reform and Ranking 79
The problem for election reformers in the past is that they have had a hard time harnessing political competition in the service of electionreform. Though reform issues bubble up during an election crisis, for themost part politicians ignore them. Without political entrepreneurs to takeup the cause, it is hard to get reform on the agenda. The fact that the De-mocracy Index turns election reform into a source of political advantageincreases the likelihood that entrepreneurs will take up the cause. Whenpoliticians see a useful weapon, they are going to fire it.42
POLICYMAKERS AS LEVERAGE POINTSAppealing to Politicians’ Inner Wonk
The arguments above portray politicians in a rather bad light—as cravencreatures motivated by self-interest. Political incentives plainly matter toelected officials, and it is important to be aware of them in thinking aboutthe here-to-there problem. But the vast majority of elected officials try to do the right thing within existing political constraints. We thereforeshouldn’t underestimate the appeal of the right answer to politicians. Andthe appeal of the right answer is another reason that the Democracy Indexshould get the attention of the top-level officials who set policy and holdthe purse strings. A performance index is something that appeals to everypolitician’s inner wonk.
Giving politicians a baseline. In many ways, the Index serves the samepurpose for top-level policymakers as it does for voters: it gives them abaseline for refereeing debates between the election administrators whowork for them and the reformers who lobby them. Policymakers hearplenty of untrustworthy arguments from administrators who aren’t doingtheir job properly. And they grow pretty tired of the insistent drumbeat forchange emanating from reformers. Top-level policymakers face the samedilemma that the Supreme Court justices did in the voter ID case. Theyhave to pick sides, and they need a guide to do so.
While top policymakers may be reluctant to hold election officials ac-countable based on the necessarily atmospheric opinions of reformers, theyare likely to be convinced by hard numbers and comparative data. Election
80 Chapter 3
administrators can talk all they want about what they have done. But theycannot get around the stark reality of a ranking: Is the system working ornot? And why is the state next door doing so much better?
Consider, for example, the success that election reformers have had withthe Election Incident Reporting System (EIRS),43 a web-based system thatallows voter protection groups and individuals to report problems they’veencountered in the last few elections. As Charles Stewart of MIT explains,the results of the EIRS are “suggestive at best”44 because they depend on re-porting rather than random sampling, the gold standard of social scienceresearch.
Nonetheless, the EIRS data have become an important tool for reform-ers.45 That is because the data are available at the state and county level, al-lowing reformers to tell state legislators and local council members thatproblems exist in their neighborhoods. If the EIRS, despite its flaws, hashelped reformers make headway in reform debates, imagine what a morerigorous yardstick could do to smooth the path for reform.
Identifying policy priorities. Rankings also attract the attention of top-level officials because they flag policymaking priorities. Legislators andgovernors are often bombarded with information. They hear lots of com-plaints, listen to lots of requests for funding, and sift through lots of re-ports. What they need is something that helps them separate the genuineproblems from run-of-the-mill complaints, a means of distinguishing thesignal from the static. A ranking can perform that role, as it focuses on sys-temic problems and provides a realistic baseline for judging performance.
Consider, for instance, what occurred in Mexico when the first versionof the Environmental Performance Index (then called the EnvironmentalSustainability Index) was released.46 Environmentalists had spent a lot oftime trying to convince Mexico it had a problem. They ended up spend-ing most of their time addressing low-level bureaucrats. When the first ver-sion of the EPI came out, ranking Mexico in the bottom fifth of the coun-tries evaluated, it caught the attention of Mexico’s president. Dan Esty’steam received dozens of calls and emails from Mexican officials up anddown the political hierarchy, all complaining about Mexico’s ranking and,eventually, trying to figure out how to fix it. Mexican bureaucrats cared be-cause the president cared.
Reform and Ranking 81
ELECTION ADMINISTRATORS
AS LEVERAGE POINTSBuilding Alliances and Encouraging Self-Policing
A final, and often underappreciated, leverage point for reform is electionadministrators—the people who do the day-to-day work of running ourelection system. We usually assume that pressure for change can only comefrom the outside—from voters or reformers or top-level policymakers. Butsome of the most effective lobbyists for change are people working insidethe system. Moreover, the long-term health of any administrative agencydepends heavily on bureaucrats’ policing themselves through professionalnorms. The Democracy Index would help on both fronts. It gives electionadministrators the information they need to lobby for much-needed re-sources. At the same time, the Index has the potential to promote strongerprofessional norms within the field.
Arming existing allies. The Democracy Index would be useful in arm-ing existing allies, giving administrators already sympathetic to reform theinformation they need to make the case for change. The Index should beespecially helpful in lobbying for resources. As one political scientist toldme, “The people really to blame [for election problems] are the legislatorsand county commissioners,” who have starved election administrators ofresources. The Democracy Index, he says, is just what local administratorsneed to “beat the crap out of them.”47
Lynn Olson of Quality Counts, a system that grades states based on theireducational policies, confirms how useful rankings can be for bureaucrats.A bad ranking provides a justification for getting more resources; a goodranking helps them protect a policy that is under attack.48 Philip Joyce—alongtime leader in the Government Performance Project—agrees. For in-stance, he notes that after Alabama received a lackluster C� from the GPP,state administrators used the report to build support for the governor’s re-form plans.49 Ranking systems have already served a useful purpose in theelections context. For instance, Kentucky secretary of state Trey Graysonused a ranking that showed Kentucky lagging behind on campaign financereform to push for a new bill.50
82 Chapter 3
Generating more alliances. The Democracy Index might do morethan help sympathetic bureaucrats lobby for reform from the inside; itmight also create more allies within the system. There has been a long andnot so merry war between election reformers and administrators. The wordpoisonous is often used to describe it. Needless to say, tense relations be-tween reformers and administrators are an obstacle to change. As EdwardHailes of the Advancement Project observes, it is much better for reform-ers “to get inside election administrators’ heads than in their faces.”51
While reformers and bureaucrats in other arenas don’t always get along,relations seem particularly strained in the elections context, a problem thatmay be partially traceable to the absence of data. That’s because the absenceof data makes it possible for one side to be obdurate and the other to en-gage in occasional histrionics. It’s like the policymaking version of TheOdd Couple.
Election administrators play Oscar Madison’s role. They preside over amessy, chaotic system. In a world without data, it can be easier for an ad-ministrator to deny that a problem exists than buckle down to fix it. Putyourselves in the shoes of the Joy Streaters of the world, struggling to do abig job with few resources. Is it surprising that change seems like a pain,and the people needling you to change seem like a bigger pain? Surely wecan forgive election administrators’ bristling at the “holier-than-thou-ness”sometimes displayed by reformers. Election administrators are the onegroup that does a harder job and makes less money than reformers. Thetemptation is to shut reformers out instead of turning to them for help. It’sno wonder that election administrators sometimes come off as grumpy,gruff, and cynical.
Reformers, in turn, sometimes play the role of the histrionic Felix Unger(minus the suit). The absence of data may lead reformers to up the rhetor-ical ante in reform debates. Without concrete data on performance, it isvery hard to get policymakers’ attention. So reformers are tempted to over-state the problem or present solutions as silver bullets.52 Fearing that anyconcession will license election administrators to ignore real problems (theold worry about “giving ‘em an inch”), reformers sometimes speak as if asingle discarded ballot or a single voter deterred is one too many.
The truth is that there are trade-offs involved in designing any elec-tion system, something that comparative performance data would reveal.
Reform and Ranking 83
Guaranteeing a precise ballot count may delay election results. Making iteasy for members of one group to cast a ballot may make it harder for thosein another. An easier registration system may make the balloting processmore chaotic. Moreover, as with every reform project, there is always apoint of diminishing returns. Sometimes localities ought to be investing incops and teachers rather than spending large amounts of money to makemarginal improvements to their voting systems. In a world without data,the risk is that election reformers appear unduly fastidious and reinforceelection administrators’ sense that their demands are excessive and theirclaims are oversold.
Election administrators and reformers should not be playing to thesestereotypes. They are serious people doing serious work, and they needeach other to get the job done. A Democracy Index might provide a disci-plining device, improving arguments on both sides. Reformers won’t needto resort to heavy-handed rhetoric to make their case, and it will be harderfor election administrators to deny they have a problem. But data will alsoforce reformers to choose their fights wisely, giving election administratorsgrounds for pushing back when a costly reform seems unlikely to produceresults.
As to the not so merry war, my own guess is that the absence of data isespecially damaging to election administrators. That’s a counterintuitiveclaim, as most people think that election administrators’ incentives run theother way. But the absence of data, combined with the episodic way thatwe learn about problems, poses a devastating risk for election administra-tors. In a world without data, voters learn about problems only when thereis a crisis, and they lack a comparative baseline for assessing what’s goingon. When an election fiasco occurs, voters tend to leap to the conclusionthat the problem was deliberately engineered. After all, elections are a vir-tual black box. Voters know only that there’s a crisis, that other places aren’texperiencing the same problem, and that the person in charge has a parti-san affiliation. It is all too easy to connect the dots.
Having learned a great deal from the Joy Streaters and Gary Smiths ofthe world, my assumption is that most election problems are caused by aresource shortage, not partisanship. There is a rule often invoked by com-puter programmers called “Hanlon’s razor” which says that one shouldnever attribute something to malice that can be adequately explained by
84 Chapter 3
stupidity. I wish we would adopt a similar rule in the elections arena: neverattribute to partisanship that which can be adequately explained by de-ferred maintenance.
Take Matt Damschroder, former director of the Franklin County Boardof Elections in Columbus, Ohio. In 2004, Franklin County had too fewmachines to deal with the extraordinarily high turnout for that race. Peoplewaited in line for as long as five or six hours to vote, and many voters leftin frustration before they cast their ballots. Damschroder’s own motherwaited two hours in line, “and I still hear about it,” he observes wryly.
I offer this controversial example quite deliberately, because the story ofFranklin County is as close to Rashomon as an election controversy can get.Some use the phrase Franklin County as an epithet and cast Matt Dam-schroder as the story’s chief villain. In the wake of the election, allegationsflew that Franklin County had deliberately failed to put enough voting ma-chines in its polling places. People also accused the elections board of allo-cating voting machines in a discriminatory fashion, putting fewer inprecincts dominated by racial minorities and Democrats in order to deterthem from voting.
Others tell a story about Franklin County that will be familiar by now—the story of deferred maintenance. While Monday morning quarterbacksthink that the Franklin County elections board could have done better,particularly in distributing machines among polling places, they refuse toaccept the Damschroder-as-Ohio’s-Karl-Rove story. Damschroder, afterall, is well respected by experts and has made a name for himself in Ohioas a straight shooter. He was well known for “criticiz[ing] and sometimesdef[ying]” the policies of fellow Republican Kenneth Blackwell becausethey would “hinder voter registration.”53 Moreover, Franklin County’sBoard of Elections was bipartisan. Indeed, William Anthony, a Democraticmember and then-chair of the board, was prominently quoted in the pa-pers as saying, “I am a black man. Why would I sit there and disenfranchisevoters in my own community? . . . I’ve fought my whole life for people’sright to vote.”54
Moreover, as Damschroder’s supporters point out, it shouldn’t be sur-prising that Franklin County didn’t have enough machines, or that itsboard didn’t do a great job planning for the election. During the prior twoyears, the Franklin County commissioners had granted the elections board
Reform and Ranking 85
only half of the funding it had requested to prepare for the 2004 election.55
The county commissioners did what any self-interested politicians woulddo—funded the problems that were visible to their constituents. Want toguess which departments received full funding those years? Children’s Ser-vices and the Sheriff’s Office.
So what happened in Franklin County? Partisan mischief or deferredmaintenance? The point here is not to resolve this debate. The point is thatwe can’t resolve this debate. Our inability to get a firm read even on a highlypublicized brouhaha like this one is something that should worry everyone.It should worry voters and policymakers because we don’t know whetherwe are holding someone accountable or savaging an innocent person’s rep-utation. And it should especially worry election administrators, becausenone of them wants to be the next Matt Damschroder.
A Democracy Index might help change this unfortunate dynamic. Itwould make systemic problems like deferred maintenance visible to votersand policymakers. It would help us distinguish between partisan shenani-gans and the ailments that afflict most jurisdictions—a lack of professionalexpertise, poorly trained poll workers, too few resources. It would ensurethat we reward the many election administrators doing a good job despiteintense resource handicaps. And perhaps it could provide a partial antidoteto the “poison” that has seeped into reform debates.
Helping Election Administrators Police Themselves
Perhaps the most important role an Index could play with election admin-istrators is to help create a consensus on best practices. When we thinkabout improving a system, we generally assume that the pressure for reformcomes from the outside. But the long-term health of any system dependson administrators policing themselves based on shared professional norms.Indeed, professional norms may ultimately be more important to a well-run system than pressures from the outside.
Why Professional Norms Matter
Professional norms are what my colleague Jerry Mashaw calls “soft law”56
because they rely on an informal source of power—peer pressure. Theywork because government workers are just like the rest of us. They care
86 Chapter 3
what other people think, and they are likely to care most about the opin-ions of people in their own professional tribe.
Anyone who lives with a teenager—in fact, anyone who has been ateenager—knows that peer pressure can affect people’s behavior. Social sci-entists have done extensive work identifying the ways in which the pressureto conform affects individual behavior.57 Although peer pressure is respon-sible for some ridiculous things—Chia pets, tongue rings, the sartorialchoices of the 1970s—it can serve useful ends in policymaking. Many pro-fessional groups—lawyers, accountants, engineers—possess shared normsabout best practices. While these norms are often informal, they cabin therange of acceptable behavior. When professional identity becomes inter-twined with particular practices, people’s own sense that they are doing agood job depends on conforming to these norms. For those of us trying tosuppress memories of high school, it’s nice to know that the herd instinctcan do a bit of good in the world.
It’s not just peer pressure that causes people to conform to professionalstandards; it’s also time constraints. No one has the time to think throughthe practical and moral considerations involved in every decision. Like vot-ers, administrators need shorthand to guide their behavior. A professionalconsensus on best practices can represent a sensible heuristic for figuringout the right choice.
Peer pressure not only can shape individual behavior, but can push in-stitutions to adopt reforms that experts have christened as best practices.Social science research on the “global polity”58 reveals that despite vast cul-tural and resource differences among nation-states, countries follow whatsocial scientist calls “common models or scripts of what a nation-stateought to be.”59 Mimicry even happens in areas where you’d think thatcultural or economic differences would trump. For instance, landlockednations seem to follow global standards when designing their militaries,leaving them with navies without ports.60 Countries where “scientists andengineers comprise less than 0.2 percent of the population, and researchand development spending is infinitesimal,” create science policy reviewboards to issue ethics reports and give guidance to scientists.61
We similarly see a great deal of imitation by state and local governmentsin the United States—instances where the adoption of a policy by a hand-ful of institutions pushes others to adopt the same policy. At least since the late 1960s,62 social scientists have documented the ways in which policies
Reform and Ranking 87
spread from state to state.63 As one of the most recent and comprehensivestudies explains, policy ideas of all sorts—from the adoption of city coun-cil–manager systems to crime control policies—can spread rapidly from“city to city [and] from state to state.”64
Institutions imitate each other for roughly the same reasons that indi-viduals do. Sociologists and anthropologists tend to emphasize peer pres-sure and social meaning—the ways in which behavioral “scripts” signalprestige and become the model for institutional behavior. Political scien-tists, in contrast, tend to emphasize the ways in which time pressures leadofficials to use the decisions of others—particularly their peers—as aheuristic to guide their behavior.65 Legislators in New York and Pennsylva-nia, for instance, might ask “WWJD?”—“What would Jersey do?”
The absence of professional norms in election administration. Un-fortunately, professional norms that could shape individual and institutionalbehavior are largely absent in the elections arena, as are the vehicles for cre-ating and spreading them. There is no accreditation system or training pro-gram used by election administrators across the country, nor is there a widelyread trade magazine in the field. Although there are membership groups,most are locally oriented and do not have a sufficient membership to gener-ate a fieldwide consensus.66 These groups also do not provide as much sup-port and service as other local government organizations, like the NationalAssociation of Counties or the National Conference of State Legislatures.67
Most importantly, the members of these associations are often reluctantto endorse best practices. For instance, one of the few nationwide groupsin the field, the National Association of Secretaries of State, uses the termshared practices on the ground that local variation prevents the associationfrom identifying which practice is best.68 Similarly, Ray Martinez, a formercommissioner of the Election Assistance Commission, the federal agencycharged with issues of election administration, notes that whenever theEAC even raises the possibility of promoting best practices, it receives“pushback.”69 One political scientist bemoaned the field’s resistance to bestpractices. “Every time I go to a conference, people tell me, ‘That won’twork where I’m from,’ as if they lived on a different planet.”70
The institution that seems to have made the most headway in promot-ing professional norms is the Election Center, a Texas-based nonprofit
88 Chapter 3
headed up by Doug Lewis. The Election Center offers training and contin-uing education to election administrators while serving as an advocate fortheir interests. Gary Smith, who heads up elections in Forsyth County,Georgia, felt so despondent about improving the system that he consideredquitting, but then someone suggested he attend an Election Center confer-ence. It “changed how I felt about elections,”71 he told me—a high com-pliment from someone not prone to exaggerate. Unfortunately, the Elec-tion Center isn’t yet big enough to reach most election administrators.
Can the Democracy Index Help?
The Democracy Index might provide a useful start toward building profes-sional norms and disseminating good policies. If we focus on the issuesdeemed salient to sociologists and anthropologists, the question is whetherthe Democracy Index could generate professional peer pressure amongelection administrators or disseminate a “script” as to what constitutes awell-run system.
It’s easy to see how the Democracy Index would at least provide a focalpoint for election administrators’ attention. Surely it would be hard foranyone to resist checking how his state or locality measured up on theranking. Administrators would want to peek at the Index for the same rea-son that people “Google” their own names or give a book a “Washingtonread” (scanning the Index to see what was said about them). If the Indexwere well designed and put out by a credible group, there is good reason tothink that one’s professional prestige would be increased by a high ranking,something that would be quite useful in a world where individuals andrulemaking bodies tend to mimic high-status people and institutions.72
The Index might develop into a professional touchstone for the field.In addition to generating professional peer pressure, the Democracy
Index could help disseminate best practices. As election administrators andpolitical scientists work through the data, they should be able to identifywhat policies succeed and thus help create scripts for a well-run system.
Consider, for example, the role that the GPP has played in generatingand disseminating best practices among government administrators. Whydo state administrators pay attention to the GPP? Philip Joyce, one of itsarchitects, argues that the GPP is so effective because it is published by
Reform and Ranking 89
Governing, a trade publication widely read and widely respected by stateadministrators.73 State administrators care about the GPP report eventhough Governing is read mostly by other state administrators. It may notaffect an administrator’s political standing, but it matters to her profes-sional standing.
Someone might worry that, consistent with the view of the National As-sociation of Secretaries of State, there is too much local variation for a setof best practices to emerge within the field of election administration. I amfrankly skeptical about that claim, at least when it is cast in broad terms. Itis hard to imagine that we will not be able to identify some broad poli-cies—funding, training policies, registration systems—that would be use-ful across jurisdictions.
I had a conversation about this with South Dakota’s level-headed secre-tary of state, Chris Nelson. Like many people in the field, Nelson insiststhat local variation precludes the development of best practices and offeredme trenchant examples of federal regulations that were ill-suited to hisstate’s demographics. But he also told me about creating an electronic voterregistration with the Department of Motor Vehicles that resulted in athirteen-fold increase in registrations from one county alone.74 That typeof innovation seems like just the kind of idea that could be exported toother states. For this reason, I think Ohio’s secretary of state, Jennifer Brun-ner, gets it right when she attributes the absence of a consensus on bestpractices to the dearth of data. Election administrators, she says, are “un-derstaffed, overworked, [and] have often not documented their procedures,”so how could best practices develop? Brunner is accordingly creating a stateclearinghouse to collect and disseminate them.75
Even if it is impossible to create a consensus on model policy inputs, itshould still be possible to generate professional norms about performanceoutputs. The Democracy Index could create something akin to a linguafranca in the realm of election administration, shared performance stan-dards that would apply to localities regardless of their practices. For in-stance, a professional norm might deem that voting machines should notproduce a residual vote rate higher than 1 percent. The Index might simi-larly generate performance baselines regarding the number of errors in theregistration process or the number of poll worker complaints that fallwithin an acceptable range for a well-run system.
90 Chapter 3
If we focus on the political science work on policy diffusion, we can sim-ilarly identify ways in which the Democracy Index might promote bestpractices among election administrators and institutions. Political scien-tists think that policy diffusion is most likely to occur when innovations inother states are visible. That’s because policymakers tend to rely on infor-mation that is “timely, available, and salient.”76 One of the reasons thatprofessional associations,77 “policy entrepreneurs,”78 and public interestgroups or think tanks79 matter, says Professor Andrew Karch, is that they“typically provide timelier, more accessible, and more detailed informationabout policy innovations” than other sources of information.80
The Democracy Index could be useful in this regard, because it can helppolicymakers to identify the innovation needle in a haystack of widelyvarying practices. It’s just the kind of “information shortcut” that scholarslike Karch argue policymakers need. The Index would give us a pretty goodsense about which states and localities have performed best, and, if it isproperly designed, should simultaneously offer information about whichpolicy inputs drove that success. If, as Karch argues, “the most influentialcausal mechanisms” of the agenda-setting process are “those that canheighten the visibility of a policy innovation,”81 the Index moves at leastone step in the right direction.
Second, the Democracy Index might provide an opportunity to create apoor man’s substitute for a vibrant professional network. Imagine, for in-stance, that the Democracy Index website provided not just the rankingsand the underlying performance data, but tables and charts within eachcategory identifying which jurisdictions followed which policies. The web-site might also provide links to extant research on the subject, even ex-amples of implementing legislation and contact information for jurisdic-tions that have implemented the policy successfully. The Index would thusprovide a portal that not only identifies which policies are succeeding, butgives policymakers instant access to the best available information on howto implement them. Here again, if the problem for officials is how “to siftthrough the massive amount of information that is available to find whatis needed,”82 perhaps a well-designed DemocracyIndex.com site could playa useful role.
There’s limited evidence that rankings can promote this type of con-tact and information sharing between jurisdictions. For instance, Richard
Reform and Ranking 91
Greene, senior consultant to the Government Performance Project, saysthat states that earn a good grade on the GPP are regularly contacted byother states for more information about their policies. In Greene’s words,“States are absolutely hungry for good, solid, well-researched informationto help them do what they do better.”83
The Democracy Index is not a perfect substitute for the many mecha-nisms that social scientists have identified for creating professional normsand diffusing policy innovations—far from it. But a ranking system doeshave the potential to move us in the right direction.
CONCLUSION
If we want to get from “here to there” in election reform, a DemocracyIndex would help reformers target the three main leverage points in the re-form process: voters, top policymakers, and election administrators. Aranking can provide a useful shorthand for voters and top policymakers,helping them hold election officials accountable for their missteps. Bymaking election problems visible, it also has the potential to harness thetwin engines of partisanship and local competition in the service of reform.While the Democracy Index won’t shame every politician into doing bet-ter, it should hang like the sword of Damocles over the political ambitionsof partisan and local officials. It should thus soften parts of the terrain onwhich reform battles are fought.
Even if the Index fails on the political front, it should nonetheless helpelection administrators make the case for change and develop the profes-sional norms that are crucial to a well-functioning system. By providing aprofessional touchstone and making successful policies visible to electionadministrators and policymakers, the Index should help push in the direc-tion of more professional management and better policies.
92 Chapter 3
4 Is the Game Worth the Candle?
In the prior chapters, I identified the many reasons to think that a Democ-racy Index could help us get from here to there in election reform. In thischapter I focus on the other side of the cost-benefit equation, examiningthe problems associated with ranking and strategies to mitigate them.Rankings create at least four kinds of problems:
• People imbue them with an objectivity they don’t deserve.
• They can target the wrong people.
• They may induce institutions to compete along the wrong dimen-sions.
• They create an incentive to cheat.
The first two problems are the natural consequences of distillation. Rank-ing requires a trade-off between precision and accessibility, and there arecosts associated with this trade-off no matter what choice you make. Thesecond two issues are what you might call “happiness problems”; theyoccur if the Index starts to get traction, but they can undermine its successin the long term. Below, I discuss each in turn and offer my own take onhow the costs and benefits play out.
THE TRADE-OFF BETWEEN PRECISION
AND ACCESSIBILITY
Rankings simplify. It is an inevitable consequence of trying “to provide oneanswer to a question when that answer depends on several bits of data,” inthe words of Oxford’s Stein Ringen.1 Distilling information can serve
many useful ends, but any effort to rank necessarily involves a trade-off be-tween precision and accessibility, or “rigor and intuition,” to use Dan Esty’sphrase.2
This trade-off pops up in just about every policymaking debate, not justwhen we talk about rankings. Just think about the title of this book. Be-cause my proposed ranking measures the performance of an election sys-tem, it is more accurately termed a “Democratic Performance Index” oreven an “Election Administration Performance Index.”3 So what is theright choice? Pick the most accurate title, even if it sounds technical anddry? Or choose a name that voters will remember?
It is a mistake, however, to insist that rankings necessarily oversimplify,as if any type of shorthand is necessarily illegitimate in policymaking.Policymaking would be impossible without shorthand. If all shorthandwere eliminated, we wouldn’t have a GDP and thus couldn’t distinguishbetween an economic blip and a recession. Congress would never stopholding hearings, because there would always be more testimony to collect.Consumer Reports would go out of business. Lord knows what the NewYork Stock Exchange would do.
Even disaggregated data are a form of shorthand. As Dan Esty notes,“Quantification is about distillation.”4 The raw ingredients of the Democ-racy Index are stand-ins for a vast and complicated process that no individualcould possibly evaluate firsthand. The very purpose of data is to distinguishbetween what Esty calls “signal” and “noise.”5 Consider, for instance, RogerAngell’s evocative description of baseball box scores:
A box score is more than a capsule archive. It is a precisely etchedminiature of the sport itself . . . . [that] permits the baseball fan, aidedby experience and memory, to extract from a box score the same joy,the same hallucinatory reality, that prickles the scalp of a musicianwhen he glances at a score of Don Giovanni and actually hears bassosand sopranos, woodwinds and violins.6
Because shorthand is inevitable, the real question is what kind of short-hand to use. In the prior chapters, I’ve offered a lot of reasons to favor rank-ing as a form of shorthand. But there are costs that accompany thosebenefits. The first is that voters will imbue the results with greater precision
94 Chapter 4
and accuracy than they deserve. The second is that a ranking may providesuch a blunt tool for holding people accountable that it ends up puttingpressure on the wrong people.
No Ranking Is Objective
You might worry about rankings because people think they are precise andobjective when they aren’t. Attaching a number to an assessment lends itan aura of absolute truth. People are sure that the institution ranked first isbetter than the one ranked second, and they think that a ranking conveysmeaningful information about the distance between, say, first and secondor thirty-fourth and thirty-fifth. Indexes suggest not only precision, butanother quality associated with mathematics: objectivity. Perhaps our af-fection for ranking stems from the fact that we were all once muddled ado-lescents, longing for answers in a place where only the football coaches andmath teachers were certain about anything.
Needless to say, the reality is quite different from the perception. Rank-ing requires a large number of discretionary (and thus debatable) choices.Every stop along the way—deciding what to measure, how to measure it, andhow to add the measurements together—requires a normative judgment.
David Roodman, chief architect of the Commitment to DevelopmentIndex, is well aware of these trade-offs. Roodman’s unusual background inmath and communications gives him an acute sense of ranking’s theoreti-cal shortcomings and its practical utility as a “communications vehicle.”7
The challenge involved in ranking, he jokes, is “to do something that is an-alytically impossible in a way that is analytically credible.”8
The most debatable aspect of ranking. Just to ground the analysis abit, let me focus on what’s likely to be the most debatable choice for anyranking: how to weight the data. Even when most people can agree onwhat to measure and how to measure it, there will be considerable disagree-ment about how to aggregate the data into a single ranking.
The trade-off between precision and accessibility is particular acute inthis context because the most sophisticated weighting techniques are likelyto be the least transparent. The easiest, most transparent strategy is to pickcommonsense categories and average the scores assigned to each category,
Is the Game Worth the Candle? 95
just as one would calculate a grade point average. I propose just such astrategy for the Democracy Index. Needless to say, there will be other waysto aggregate the data (after all, what are the odds that everything is equallyimportant?). Or take the mini-index I offered in chapter 2, which ranksstates based on how much data they disclosed to the Election AssistanceCommission. When I got to the weighting question, I favored trans-parency over methodological sophistication and thus weighted each cate-gory equally. The idea that the thirteen categories designated by the EACare equally important is, needless to say, debatable.
Why would one choose an equal weighting strategy, as I did and as manyindex designers have done? The reason is simple: other weighting strategiesare just as debatable and a good deal less transparent. As Ringen observes,“If the weights are not objectively known . . . go[ing] by the simplest as-sumption” is a sensible choice.9
While I think the decision to weight categories equally is defensible, noone would suggest that there is an easy way to resolve these debates, saveperhaps the clueless husband in the New Yorker cartoon who asks his wife,“You want a child, I want a dog. Can’t we compromise?”10 As a practicalmatter, the only way to settle these debates is to settle them.
Still, I don’t want to overstate the costs of simplification here. As RichardGreene of the GPP observes, “It’s okay for people to debate” the choicesmade, as long as “no one thinks they are foolish.”11 Stein Ringen offers themost cogent argument for ranking. “We always rely on conventions of somekind or other in any effort at measurement, and indexing is in that respectnot extraordinary,” he writes. “As long as we use sensible conventions andexplain the procedures, there is nothing unscientific in it.”12
Dan Esty would surely agree. The designers of the EPI, after consultingnumerous experts, chose to divide the environmental performance metricsthey were using into two main categories—measures of environmentalhealth (which includes things like child mortality rates, drinking waterquality, sanitation) and measures of ecosystem vitality (which includesthings like timber harvest rates, overfishing, and renewable energy).13 Re-markably, although this fifty-fifty weighting is in theory the most con-testable part of the EPI, in practice it’s been the least contested.14 Esty at-tributes that fact to two things. The fifty-fifty breakdown is intuitive. Andno one has come up with a better strategy.
96 Chapter 4
Similarly, David Roodman, the chief architect of the Commitment toDevelopment Index, argues that in the absence of a consensus on weight-ing, an equal weighting strategy represents the simplest and most transpar-ent method for assembling the CDI. Roodman told me that months ofconsulting with academic experts convinced him that his simple weightingstrategy was the right one. Why? No one else had a suggestion that couldgarner a consensus. For every category, there was always one expert or an-other suggesting it was entitled to more weight than it got.15 For this rea-son, Roodman chose the most transparent one. “Weighting things equally,”he says, “says that I don’t know the answer.”16
Mitigating Strategies
The costs associated with ranking are inevitable, but they can be mitigatedby choices the Index’s architects make in designing and publicizing theranking.
Don’t oversell. In order to reduce the costs associated with ranking, de-signers of the Index must also be careful about overselling its objectivity oraccuracy. It’s tough to exercise restraint. Including caveats in every sentenceis a surefire recipe for rhetorical constipation. Remember that I opened thisbook by noting that the dearth of data made it difficult to be confident inany claims about our election system. Just think about how long this bookwould be if I began every sentence with “The best evidence available suggeststhat . . .” But even a well-designed Index can offer only a rough sense of howstates and localities are doing based on reasonable but nonetheless debatablechoices. The Index won’t allow us to draw fine-grained distinctions. The dif-ference between first and second—or even first and sixth—may be illusory.
The designers of the Index should thus acknowledge those limitationsearly and often. Problems in the data should be discussed forthrightly. The designers of the Index should note its lack of precision. They shouldalso identify—and explain—the judgment calls they made along the way.Brochures and websites that accompany the Index should clearly explainthe normative and methodological choices that were made in assemblingthe it. All of the data should be publicly available, and the mechanism foraggregating the data should be transparent.
Is the Game Worth the Candle? 97
Ideally, the materials accompanying the Index should not only make thedesigners’ choices clear, but show how those choices affected the rankingthemselves. One way to do that is to show how a different choice wouldaffect the rankings. Take, for instance, the disclosure index I offered inchapter 2. As close readers might notice, there’s a note indicating thatHawaii may have been unfairly handicapped because much of its underre-porting was due to a quarantined leper colony with a population of 147people. Should I have eliminated that county from the ranking because—to use a phrase I never expected to pen—“Come on, it’s a quarantined lepercolony of 147 people!”? Should I have kept the county in, on the theorythat there are other places with reporting handicaps? Given that bothchoices seemed reasonable, the best solution seemed to be to go ahead withthe ranking but show precisely how that judgment affected Hawaii’s stand-ing and where Hawaii would rank were the quarantined county excluded.
Alternatively, designers of the Index could show how their judgmentsinfluenced the rankings by allowing people to rerun the rankings them-selves using their own criteria17—the election geek’s version of “chooseyour own adventure.” It is likely, for instance, that the relative weight givento different components of the Index will matter a good deal to the results.Designers of the Index might therefore create a website that asks someoneto identify which issues matter to him and how he evaluates their relativeimportance. The website would then calculate a new state-by-state rankingbased on the choices the person has made.
One might worry that every low-ranked jurisdiction will immediatelytry to rejigger the rankings to improve its standing. The designers of theDemocracy Index ought to welcome such efforts. Some jurisdictions willimprove their standing only if they make implausible choices, somethingthat reform groups will be quick to point out. Some jurisdictions may findan equally sensible ranking system that raises their standing, perhaps evenrevealing problems in the Index along the way. Given that one of the mainpurposes of the Index is to start a more productive conversation about elec-tion reform, this is all to the good. The conversation about election admin-istration will improve, and the Index may improve along with it.
Reevaluate constantly. Another important strategy for a successful De-mocracy Index is constant reevaluation. People who create indexes intro-duce prototypes and updates for the same reason that software engineers
98 Chapter 4
release beta versions of their programs: to work out the bugs. The Democ-racy Index 1.0 is likely to be quite different from subsequent iterations.18
Before, during, and after each version of the Index is released, it will be cru-cial to get feedback on the ranking and the judgments that go into it.
In this respect, designers of the Index should think like academics. Thebest scholars are those who hear serious criticisms of their work . . . and arethrilled by it. They want criticism to come in the same form as goodwhiskey—straight up. So, too, the architects of the Index should put theprototype—and every iteration thereafter—in front of a “murderers’ row”of its toughest critics. Designers of the Index should similarly welcome crit-icism from the people being evaluated. Dan Esty argues that “angry juris-dictions are good”19 because they are going to help you make your indexbetter. Moreover, as David Roodman points out, if the goal of the Index isto raise awareness about a problem, “An attack on an index is a victory.”20
Evaluating the Tradeoff between Precision and Accessibility
While the mitigating strategies described above are useful, they cannoteliminate the costs associated with oversimplification. Even if the Index’sarchitects rigorously adhere to the suggestions outlined above, voters arestill likely to overestimate the objectivity and accuracy of the ranking. Toreturn to the Gary Larson cartoon about what dogs hear, there is a dangerthat even when the Democracy Index is presented with caveats and cau-tious warnings, all that voters will hear is “——, ——, my state rankedforty-ninth, ——.”
Indeed, the reasons the Democracy Index is likely to succeed are pre-cisely the reasons that we are wary of indexes in the first place: voters maynot look past the ranking itself. The costs associated with ranking aresimply the flip side of its benefits: accessibility, simplicity, popular appeal.Given that we cannot make these problems go away, we ought to be clear-eyed about acknowledging them.
So how do we balance the benefits of accessibility against the costs of im-precision? While the concerns described in this section are serious, in myview the benefits still outweigh them. To begin, even if voters vest toomuch faith in an Index, at least they’ll be putting their trust in what oughtto be a pretty good measure of democratic performance. The fact that there
Is the Game Worth the Candle? 99
isn’t an objective answer on these issues doesn’t mean that the Index’s archi-tects will have a license to engage in free-form democratic engineering.There are answers to these questions, and some answers will be better thanothers. If the Index is properly designed, even those who quibble with a de-cision should nonetheless think it was a reasonable one.
On the other side of the equation, there are costs associated with nothaving a ranking. We’re back to the “As opposed to what?” question. Aranking will surely oversimplify the state of affairs. But, as Ringen observes,“While some information gets lost, something else is gained.”21 Reams ofcomparative data cannot give us a clear view of how jurisdictions are per-forming overall. As with party labels, rankings tell voters about the “bigthing” even if they lose track of the “little things.” A well-designed Indexfares particularly well when it is compared to the other shorthand citizensuse in evaluating voting processes—anecdote, haphazard evidence of a cri-sis, or partisan labels. The public places unwarranted faith in each of theseheuristics. Each leads to oversimplification and mistake of a more sig-nificant sort than a well-designed Index will. And not one of them gets usany closer to improving our failing system. In this context, somethingseems better than nothing.*
The bottom line here depends almost entirely on what you think theDemocracy Index is for.22 If the goal is simply to convey information, theanswer is obvious: don’t rank. Presenting data in disaggregated form will al-most always be better than ranking. But if the goal is to improve the policy-making process—to correct a failure in the political market—the onlything that beats a good ranking is a better one.
Targeting the Right People
There is another cost to a ranking like the Democracy Index: it can leadvoters to target the wrong people. In earlier chapters, I’ve loosely lumpedtogether the people who decide how our elections get administered. Butthe identity of these “deciders,” to borrow one of George Bush’s favoriteterms, will vary from state to state, and these variations matter if we want
100 Chapter 4
*None of this is to say that we will improve the political process by giving people bad information.As America’s Manolo-shod philosopher, Carrie Bradshaw, once observed, at some point “the art ofcompromise become[es] compromising.” Something is not always better than nothing. But a prettygood something usually is.
the Index to work. In some places, local officials play an important role inallocating money and setting rules. In other places, state officials mattermost. Moreover, at both levels, control over elections is often divided. Atthe state level, it may be shared by a secretary of state and a legislature; atthe local level, an elections board and county council may be in charge.
Decentralization poses a problem for the Democracy Index. The goal ofthe ranking is to put pressure on the right people. But the Index will some-times be too blunt a tool to do so. It could end up placing pressure on offi-
cials who can’t do much about what is happening on the ground. A singleranking tells us that “the state” or “the county” has a problem, but it doesnot tell us who within that jurisdiction is at fault.
Imagine, for instance, that the Democracy Index ranked a state forty-seventh in the nation, and voters began to pester its secretary of state. Shemight legitimately complain that the real problems with the system stemfrom decisions made at the local level. Or she might blame the legislatureor vice versa. How do voters figure out who’s at fault?
Mitigating Strategies
There are several things that designers of the Index could do to help ensurethat the right people are held accountable when the Index is released. First,if the data permit, the Index should rank localities within the states, just asit ranks the states. An intrastate ranking would allow the media—andtherefore perhaps voters—to identify where the biggest problems are. Ifmost of the scores that depressed the state’s ranking came from one or twocounties, the secretary of state should be able to redirect the media’s atten-tion to local administrators. Alternatively, the intrastate comparison mayreveal that the blame lies with the state. Comparative data on local per-formance, for instance, would reveal issues that might not be visible if weexamine only state-level data. For example, many political scientists thinkthat small and rural election systems are especially likely to be understaffedand underfunded. An intrastate ranking would help states identify thatproblem and fix it.
Similarly, by helping identify the drivers of performance, the Indexcould help the media target the right culprit. Imagine, for instance, that alow ranking spurred an “am not, are too” debate between the secretary ofstate and state legislators, each blaming the other for the state’s low ranking.
Is the Game Worth the Candle? 101
If funding mattered most, the secretary of state could point her finger atthe legislature and would have good evidence to feed reporters. If trainingpoll workers was the key to success, the press would know to hound thesecretary of state.
The Costs and Benefits of the Blame Game
Although the strategies noted above may reduce the likelihood that the Indexwill lead voters to target the wrong officials, they aren’t foolproof. As notedin the previous chapter, people tend to pay attention to the numbers, not thenuances, when looking at rankings. The danger is that voters won’t pay at-tention to the debate that ensues after the Index is released. That makes anIndex a necessarily blunt and imperfect tool for holding people accountable.
The real issue, then, is whether we can live with this cost. If we returnto the crucial question —“As opposed to what?”—a ranking system stillseems superior to nothing. At present, pressure is rarely placed on any elec-tion official, so no one needs to bother with finger pointing. Bickeringabout which officials are doing their job seems like a better conversation tobe having than no discussion at all.
Moreover, even if the Democracy Index cannot tell us precisely who isresponsible for a state’s low ranking, it creates an incentive for every elec-tion official to make the case that he, at least, is doing everything he should.While the Index may not resolve the debate in the eyes of voters, it shouldat least jump-start a conversation that we ought to be having. After all, youcan’t finger-point without endorsing a solution. These debates should helpgenerate some new allies in the election system, or at least put some offi-
cials on the record as supporting change. A litigator would probably tell you that there’s no need to worry about
any of this. Plaintiffs sometimes run into the same problem voters do: theyknow who is to blame generally for a problem but can’t pinpoint the exactculprit. For instance, when a plaintiff isn’t sure how to apportion blame foran injury among several defendants, it can cause a problem. If the case goesto trial, the defendants can spend all of their time denying that they are toblame, and the plaintiff may go home empty-handed through no fault ofher own. Here’s a hypothetical I always give my Civil Procedure class.Imagine that three companies dumped chemicals in the river, but the vic-
102 Chapter 4
tim doesn’t know which one caused the harm. For each company, there’sonly a 33 percent chance that it was the one that caused the injury. A jurymight be 100 percent confident that one of the three defendants did thedirty deed, but it can’t say that it was more likely than not that CompanyA (or B or C) was guilty.
Courts have come up with a smart solution to this problem: they holdall of the defendants “jointly and severally liable.” That means that the vic-tim can demand full payment from any one of defendants, and the defen-dant who pays can in turn demand that the other defendants pay theirshare. The court, in effect, tells the defendants responsible for the harm toplay the blame game among themselves. In practice, the strategy usuallyleads the defendants to use their considerable resources to get the goods oneach other, something that gets us much closer to the truth. “Joint and sev-eral liability” puts the defendants to work for the victim.
The Index is the policymaking equivalent of “joint and several liability”for election officials. If voters put pressure on a secretary of state for a poorranking when the state legislature really deserves the blame, it becomes thejob of the secretary of state—not the voters—to make the case against thelegislature. While that may seem unfair, the truth is that the secretary ofstate has more information than voters do, and she is better situated to di-rect attention to the source of the problem than anyone else. “Joint andseveral liability” in politics puts election official to work for the voters.
The case for some version of joint and several liability is even strongerwhen voters hold state officials’ feet to the fire for the missteps of local ju-risdictions. At the end of the day, the states decide how much money andpower localities have. State officials may squawk that it is unfair to punishthem for mistakes made by local officials over whom they purportedly haveno control. But the final responsibility for determining how much controllocal officials exercise lies with the state. If top state officials choose tomaintain a decentralized system that isn’t working, they should live withthe consequences of that choice.
“Joint and several liability” may even work better here than in the litiga-tion context. In a lawsuit, the defendants just fight with each other and gohome. In the election context, placing local and state officials on the samehook might encourage them to cooperate more often. After all, they allhave a stake in raising the state’s ranking.
Is the Game Worth the Candle? 103
HAPPINESS PROBLEMS
In addition to the two problems noted above—both having to do with thetrade-off between precision and accessibility—there are at least two otherpotential pitfalls involved with ranking. Both involve competition run amok:a ranking can encourage election administrators (1) to compete along thewrong dimensions, and (2) to cook the books. Each is thus some variant ofa happiness problem. Competition is, of course, exactly what we do nothave now, so both of these developments would be a heartening sign thatthe Index had gotten some traction. But competition can have perverseconsequences if the Index is poorly designed.
Competing along the Wrong Dimensions
Rankings are designed to spur healthy competition, but they can some-times cause people to compete along the wrong dimensions. When apoorly designed index starts to get traction, it can lead institutions to dounproductive, even silly things, to improve their standing.
Academics are especially quick to identify this problem because theyhave long lived with the U.S. News & World Report rankings,23 which areinfamous for causing foolishness of all sorts. Say the word “ranking” to alaw professor, and she will immediately remind you of all the ridiculousploys that schools have used to improve their standing. Columbia LawSchool, for instance, pushed its faculty to take their leaves in the springrather than the fall because student-teacher ratios are assessed only in thefall. As a result, the school had to hire thirty-two part-time teachers to ac-commodate spring teaching needs.24 In order to jack up its score on stu-dent expenditures, the University of Illinois’s law school counted the fairmarket value of its students’ Westlaw/Lexis subscriptions (which toted upto a cool $8.78 million). Given that both research services heavily discounttheir fees in order to woo future users, that “expenditure” was eighty timeswhat Illinois actually paid.25 Stanford Law School’s entrepreneurial dean,Larry Kramer, has devoted part of his deanship to convincing the centraluniversity to let the law school “write a check” for its utilities rather thanhave the university deduct them automatically from student tuition. The
104 Chapter 4
reason for this accounting switch? It would allow the law school to countthese expenses as student expenditures.26 “The notion that I’m losing stu-dents because of this is insane,” Kramer told the New York Times.27
If the Democracy Index were poorly designed, it could lead to as muchsilliness as the U.S. News & World Report rankings, creating problems thatare more serious than the accounting hocus-pocus described above. Takefraud. Most voters care about fraud, so it would be perfectly sensible to in-clude a fraud metric in the Index. The question, however, is how to mea-sure fraud without creating perverse incentives. We don’t want unsubstan-tiated fraud prosecutions or roving posses of state officials’ accosting votersoutside of polling places. These techniques have long been associated withvote suppression, and one would hardly want to give partisan officials anexcuse to use them.
The Index might also create more systemic problems. Returning to Esty’smantra that “we measure what matters,” we can’t always measure every-thing that matters. Data-driven analysis creates a risk that people will ne-glect important issues that can’t be captured in a statistic.28 Some data willbe too costly to gather; some issues will be too difficult to quantify. A rank-ing might lead states to compete on the things that can be measured whileignoring those that can’t. Imagine, for instance, that it is too difficult to as-sess whether a registration system is easy for voters to navigate. States mightbe reluctant to put money into building a better registration system whenthey can improve their score, even if only marginally, by investing in some-thing else.
Mitigating Strategies
There are, of course, strategies one can use to reduce the likelihood of fool-ish competition. The first is regular reevaluation and revision of the Index.If and when a problem arises, the designers of the Index should do theirbest to identify a metric that will redirect competitive energies into moreproductive channels.
A second strategy for avoiding foolish competition is to create a compre-hensive Index. Because the extant data are sparse, early versions of theIndex are likely to be narrow in scope and will not cover every aspect of the
Is the Game Worth the Candle? 105
election process. A sparse Index has its virtues, but there are costs associ-ated with parsimony. If there are only a handful of metrics in the Index, itis easier to improve one’s standing by focusing on one or two. Further, ifmany aspects of election administration are left out of the Index, a state caneasily divert resources from the parts of its system that aren’t being mea-sured to the parts that are.
Consider the examples noted above. If a state tried to increase its fraudscore by engaging in techniques that deterred voters from casting a ballot,it might lower its score on any “ease of voting” metrics included in theIndex. Comprehensiveness might similarly help with the problem of resourcediversion. The more that is measured, the fewer tasks the state can neglectwith impunity. For instance, returning to the example above, if the stateneglects its registration system, it may find that lots of voters—mistakenlythinking that they’ve properly registered—will show up to vote. Thatwould create administrative headaches for poll workers and longer lines forproperly registered voters, problems that would reduce the state’s overallscore.
Do the Costs Outweigh the Benefits?
Here again, the costs and benefits associated with ranking are flip sides of the same coin. An index encourages election officials to compete alongthe dimensions it measures. If the ranking is well designed, this is all to the good. “Teaching to the test” is a problem, however, if the test is poorlydesigned.
In order to figure out whether teaching to the test is a problem, we needto know whether it’s a good test and what kind of teaching takes placewhen there’s no test. Right now, we are in a world with no test; we lack eventhe most basic data for evaluating the performance of our election system.If the Index works, it will surely reorient state and local priorities, perhapscausing them to neglect concerns that the Index doesn’t measure. The costmight be significant enough to eschew data-driven analysis if the most ofthe basic components of election administration can’t be captured in a sta-tistic. We’re back to the question, “As opposed to what?” A well-designedDemocracy Index is surely better than the alternative . . . a world withoutdata, one with no test at all.
106 Chapter 4
Cheating
A final potential cost associated with ranking is cheating. The worry is thatstates will cook the books to improve their rankings. Like the concernabout states’ competing along the wrong dimensions, this worry is a vari-ant of the happiness problem. If the Democracy Index were having such apowerful effect on election officials that they were tempted to cheat, wewould already have come a long way. Nonetheless, for the Index to be atrustworthy guide for voters, reformers, and policymakers, the underlyingdata must be dependable.
Consider, for instance, a potential problem with the mini-Index I of-fered in chapter 2, which ranks states based on how much data they dis-closed to the EAC. As I noted there, the Index accepts state disclosures atface value; it doesn’t inquire whether the data provided are accurate. I madethat choice out of necessity; it would require an army of political scientiststo assess the underlying accuracy of each piece of data in the EAC survey.At present, that judgment represents a defensible compromise. Becausestates were unaware that they would be ranked when they responded to theEAC survey, there was little incentive to cheat at the time the survey wasassembled. Should people begin to put pressure on the states about theirdisclosure rates, however, future rankings will have to create a system forverifying the validity of the underlying data.
Mitigating Strategies
There are two obvious strategies for dealing with the problem of cheating.The first is to rely on data from outside sources whenever possible. Votersurveys, for instance, can provide a pretty good mechanism for gatheringbasic data on many parts of the election process. “Testers” can similarlyhelp us evaluate information that is otherwise in the state’s control.
For the pieces of data that can come only from the state, the obvious so-lution to cheating is verification. For example, one strategy for double-checking state disclosures is random sampling. Random sampling mightbe prohibitively expensive on a large scale. But it can be used to spot-checkstate data from time to time. In spot-checking state disclosures, designers
Is the Game Worth the Candle? 107
of the Index might even be able to piggyback on existing research. Politi-cal scientists spend a good deal of time using random samples to investi-gate basic questions about how the election system works, and the design-ers of the Index could use that research as an outside check on internal statereporting.
The designers of the Democracy Index could also follow the lead ofother Index architects, who rely on many sources to verify informationpassed on by state officials. The designers of the Government PerformanceProject, for instance, use a triangulation strategy, asking the same questionof many different actors in the state.29 Similarly, the architects of the De-mocracy Index might talk to local polling officials, civil-rights watchdogs,and local reporters to identify problems that have gone unreported by stateofficials. This sort of qualitative read should help designers of the Indexfigure out whether they are working with decent quantitative information.
If Congress decides to mandate that states disclose performance data,something I discuss in chapter 5, it could also create backstops againstcheating. Congress might, for instance, require states to certify the data orobtain an outside expert’s blessings, just corporations are required to dounder the Sarbanes-Oxley Act.30
Finally, designers of the Index could use the ranking system to punishstates for faking the data. The people who put together the EnvironmentalPerformance Index, for instance, routinely toss data that don’t seem plau-sible.31 A state that is caught cooking the books could be punished by im-puting the lowest possible number for the relevant portion of the ranking.Or the Democracy Index could include a “disclosure” component thatwould reward states that adopt the sort of certification practices describedabove.
The Right Approach to the Problem of Cheating
Cheating may be the most difficult problem posed by ranking. It is hard todetect and thus costly to avoid. While cheating would in some ways be asign of the ranking’s success—no one would bother to cheat if the Indexdidn’t matter—it would also jeopardize the Index’s power in the long run.The “As opposed to what?” question is tougher here, too. It is hard to argue
108 Chapter 4
that it’s better to have states rampantly cheating to improve their rankingsthan not to have a ranking system at all.
There are a few reasons not to throw in the towel, however. Cheating ismost likely to happen when the Index is getting traction—when it is start-ing to affect debates and influence behavior. And the more traction theIndex gets, the more reasons that foundations and Congress will have to in-vest in it, perhaps providing the resources necessary to create alternativesources of data or better policing strategies. Further, the more comprehen-sive the Index becomes, the harder it will be to fake enough data to affectthe state’s ranking. If the only metrics on which the state performs well arethose that involve self-reporting, people will suspect that something isafoot. To put it differently, as the Index grows in importance, its designersshould have more tools available to police the cheating that might accom-pany that growth.
CONCLUSION
If we take a hard look at the costs associated with ranking, it is clear thatthey are genuine and genuinely important. The question is whether, inlight of these costs, the game is still worth the candle.
We cannot answer that question by evaluating these trade-offs in the ab-stract. We have to think about how they play out in the real world, and thatmeans answering another question, “As opposed to what?” In the abstract,the costs seem quite weighty: rankings are accorded more objectivity thanthey deserve, they can place pressure on the wrong people, they can en-courage institutions to compete along the wrong dimensions, and they cre-ate an incentive for cheating. But the real-world alternative is one in whichvoters rest their decisions on far sillier shorthand, election officials feel al-most no pressure to change, localities have few incentives to compete, andthere isn’t any test to cheat on. Editorial writer Meg Greenfield once ob-served, “Everybody’s for democracy—in principle. It’s only in practice thatthe thing gives rise to stiff objections.”32 It’s just the reverse for rankings.It’s easy to be against rankings in principle. It’s only in practice that theystart to look good.
Is the Game Worth the Candle? 109
5 Getting from Here toThere in MiniatureMaking the Democracy Index a Reality
Most of this book has been devoted to explaining why the DemocracyIndex should help us get from “here to there” in reforming our election sys-tem, changing the terrain on which reform battles are fought. Here I’ll talkabout getting from here to there in miniature—how to make the Democ-racy Index a reality. As with any other reform proposal, we cannot just addwater and hope a Democracy Index will spring up. Even a modest reformlike this one will take work to bring it to life. In this chapter, I’ll discussmovement thus far, analyze the key challenges involved in assembling aDemocracy Index, and lay out the steps we should take. The first half ofthe chapter is devoted to what are largely political questions (smoothing theway for data collection, creating an Index that will succeed in this politicalenvironment); the second half addresses the methodological challenges(creative strategies for getting the numbers we need, suggested metrics).
MOVEMENT THUS FAR
At the time of this writing, developments on the Democracy Index suggestgrounds for genuine optimism. I first proposed creating a DemocracyIndex in the Legal Times in early 2007. Within two months, SenatorsHillary Clinton and Barack Obama each put the idea into proposed legis-lation. Within the year, Congress set aside $10 million to fund the effortsof five states to improve their data-collection processes. During the sameperiod, foundations and think tanks have organized several meetings todiscuss the proposal. The idea has attracted keen interest from several foun-dations, including the Pew Trusts’ Center on the States, which has played
a leading role in improving state governance and promoting data-drivendecision-making. Needless to say, reform proposals rarely get this kind ofattention so quickly. The fact that so much has happened in such a shorttime suggests that the Democracy Index has a fighting chance.
It is not a coincidence that the Index has attracted the attention of twotop-tier presidential candidates and major foundations. People are hungryfor new ideas to get reform moving in this country. The Democracy Indexoffers a fresh vision of reform, one that shifts away from traditional civil-rights rhetoric toward a results-oriented, data-driven approach. Most re-form proposals adopt a top-down, command-and-control approach to re-form. The Democracy Index, in contrast, would allow us to improve theelection system without Congress issuing a single regulation, leaving roomfor experimentation and innovation at the local level. Most reform appealsto the political interests of one party or another. The Democracy Index, incontrast, emphasizes transparency and accountability, values that ought toelicit support from both sides of the aisle. None of these differences guar-antees the Index will come to pass. But they certainly suggest that the Indexhas a better chance of succeeding than most proposals for change.
NEXT STEPSThe Political Front
There are a variety of things we can do to improve the chances that theIndex will succeed. Needless to say, the most important task that lies aheadis to pull together reliable comparative data on state and local performance,an issue I will discuss in the second half of this chapter. But proponents ofthe Index should also think hard about the best strategies for assemblingand selling it.
Smoothing the Way for Data Collection
The most significant obstacle to creating an Index is the shocking dearthof data on how well our system is working. We will need more and betterdata to build a Democracy Index, and there are a number of strategies wecan deploy to reach that goal.
Getting from Here to There 111
Identifying the data we need. As is clear from the discussion in chap-ter 1, we need to do a good deal more work before we will have a precisesense of what data we need to build the Democracy Index. This will requireproponents of the Index not only to consult with experts, election admin-istrators, and policymakers, but to survey public opinion and consult withpolitical and media experts
Happily, several important steps are being taken in that direction. ThePew Center on the States has run two conferences to identify what data ajurisdiction would collect if it were “serious about performance,” to useLynn Olson’s phrase. The goal of these conferences is to lay down a markerabout what kind of data jurisdictions ought to be collecting routinely.
Congress’s model data-collection program should also be very useful inthis regard. The lessons learned in those five states will tell us a good dealabout what data can be collected and the most efficient strategies for doingso. It will also help us develop the software and infrastructure necessary tohelp other states establish data-collection programs of their own.
Raising awareness. At the same time that we are figuring out what datawe need to assemble an Index, it is crucial to raise awareness about the needfor better data.
Here again, Pew has started moving forward on this front. It is puttingtogether a an assessment of state data-collecting practices that should be su-perior to the one I offered in chapter 2. My ranking “contracted out” thejudgment calls about what data should be collected by relying on the EAC’sjudgment. Pew, in contrast, is getting input from the EAC, election admin-istrators, reformers, and political scientists about what data matter andhow to weight them. My index, out of necessity, focused only on state dis-closures to the EAC. Pew will unleash a small army of trained staffers to ex-amine whether the states make that information accessible to the public.
Modeling success. Another useful technique for building support is tocreate small-scale models of the Index to show how it works in the realworld. Congress’s effort to fund model data-collection programs amongthe states is a good example. It is very hard for critics to claim data collec-tion can’t be done when several states are already doing it.
112 Chapter 5
It would be similarly useful to create a miniversion of the DemocracyIndex to get a sense of whether and how it will work. One option wouldbe to create a Democracy Index for a single state, ranking localities againstone another. Presumably an entrepreneurial secretary of state would valuethe opportunity to take part in the experiment. She’d be able to get much-needed resources to update the state’s information systems. The Indexwould offer her a tool to put pressure on outlier localities to do better. Andthe secretary of state could certainly trumpet her participation in this in-novative, data-driven experiment during her next run for office.
Alternatively, designers of the Index might create a small version of theDemocracy Index by picking four or five important metrics and ranking allof the states on that basis. This strategy, too, would give designers of theIndex a sense of whether and how the Index will affect the policymakingenvironment. Seeing how a small-scale version of the Index works mightalso help generate the support necessary to create a larger one.
Eliminating barriers to data collection. Another item on the “to do”list of the Index’s supporters is to eliminate existing barriers to data collec-tion. In a number of states regulations now prevent us from gathering theinformation we need to create an Index. Ohio, for instance, bans electionobservers in polling places,1 something that would make it impossible touse randomly placed observers to record basic information about how wellthe state’s election process is working.
Thad Hall has proposed that we address this problem by creating a“Transparency Index,” which would rank the states based on how open theelection process is. Like the Democracy Index, the Transparency Indexmight produce a useful shaming device to encourage states to do better.
Another important obstacle to data collection is the lack of standardiza-tion. Jurisdictions use markedly different terms and protocols in classifyingdata. The people who ran the EAC’s Election Day Survey are excruciatinglyfamiliar with this problem. Almost every section of the report mentions theissue. Without standard definitions, data collection is likely to be a meaning-less exercise. Election administration is desperately in need of a lingua franca.
The EAC is particularly well suited to create those universal terms. Ad-ministering the Election Day Survey has given its staff more information
Getting from Here to There 113
than anyone else has about the source of the problem. As the federal agencycharged with monitoring federal elections, it also enjoys the regulatory au-thority to devise standard definitions and disseminate them among statesand localities.
Getting Election Administrators to Buy In
If we want to collect performance data from states and localities, it is cru-cial that we persuade election administrators that the game is worth thecandle. If election administrators don’t take data collection seriously, wewon’t get serious data from them.
Some of the resistance we see from election administrators may simplycome from a lack of familiarity. Over the course of my interviews, I beganto notice that many of the leaders on the data-collection front came fromjobs where data collection is routine. Gary Smith moved to elections fromthe corporate world. Tammy Patrick drew on her background in sales. BobMurphy was a computer junkie before he got involved in election admin-istration. Joe Mansky started out as a scientist. For him—as for these otherleaders in the field—looking at data was the most natural strategy for“making sense of the world.”2
Familiarizing election officials with data collection is not going to beenough. The source of resistance runs deeper. No one likes to be evaluated,and resistance to monitoring seems to be particularly prevalent amongelection administrators. Consider what happened when the Election Assis-tance Commission was first created. Although the commission was under-funded and had no enforcement powers, the National Association of Sec-retaries of State demanded that Congress dismantle it even before all of itsmembers had been appointed. The episode had the flavor of Hera sendingsnakes to kill Hercules in his cradle.
To overcome the resistance of election administrators, we must be ableto make the case that data collection is in their interest. If we can’t answerthe question so many election administrators posed to me—“What are yougoing to do with all that data?”—we’re unlikely to get the assistance weneed from election folks. I’ve already talked about a few of the reasons whydata matter to the lives of elections officials. Data can help election admin-istrators do a better job, which is why it’s so important to showcase the in-
114 Chapter 5
novative programs I’ve talked about in this book. Data can also help elec-tion administrators put pressure on the state legislators and local commis-sioners for resources. The comparative data the Index would supply wouldalso make strong election performance visible, rewarding election admin-istrators for their successes.
Perhaps most importantly, as savvy election administrators have begunto realize, good data can serve as shield for election officials in today’sheated political environment. Election administrators may not liked beingevaluated, but the fact is that they are already being evaluated. The prob-lem is that they are being judged in an information vacuum, somethingthat all but guarantees that people will draw the wrong conclusions. As Inoted in chapter 3, in a world without data, where voters become aware ofproblems only when there’s a crisis, it’s natural to connect the dots. Voterssee a problem, the problem isn’t visible elsewhere, and the election officialusually has a partisan affiliation. It’s all too easy to conclude the crisis hasbeen caused by partisan shenanigans rather than deferred maintenance. AsMatt Damschroder observes, any appointment system in which one “get[s]to have a position because of one’s partisan affiliation” will create the im-pression that the “office is being run in a partisan manner.”3
There’s little an administrator can say in response to these accusations,as she has no means to establish her professional credentials or competence.We are quickly back to the “am not, are too” debate that no one can referee.
Things have deteriorated in the wake of the 2000 and 2004 controver-sies over the presidential elections. An outspoken subset of the reformcommunity has begun to treat election administrators “as if they were co-conspirators to hand elections over to the Republican party,”4 says oneclose observer. If election administrators were capable of even a fraction ofthe machinations attributed to them, they would make Machiavelli looklike a rank amateur. Demonization is just too easy in a world without data.
While election administrators assume that the Democracy Index willserve as a sword for reformers, they often miss the fact that it will simulta-neously provide them a shield. A ranking system that showed that a local-ity ran one of the best election systems in the country would go far to de-fend against unfair accusations. Even a ranking system that showed that ajurisdiction was near the bottom of the list might be useful, as voters wouldsee that other jurisdictions suffered from the same problems. It would be
Getting from Here to There 115
easier to understand that the problem is caused by deferred maintenance,not partisan malice.
Think about some of the people I’ve talked about in this book. For ex-ample, L.A. County’s Conny McCormack and Franklin County’s MattDamschroder have both been excoriated at some point by reform groups(McCormack for her defense of punch-card ballots and, later, touch-screenvoting systems;5 Damschroder for the debacle that took place in FranklinCounty in 2004).6 Both also enjoy a great deal of respect from experts andother election administrators. Tom Mann, a senior fellow at the BrookingsInstitute, recently praised L.A. County as one of the best-run systems in thecountry because of McCormack’s “extraordinarily competent leadership.”7
And Damschroder was elected president of the Ohio Association of ElectionOfficials8 and is held in high regard by people knowledgeable about Ohio’ssystem. Regardless whether you think McCormack and Damschroder arevillains or heroes, it is hard to know if you are correct in a world withoutdata. The Democracy Index would at least help the conversation start atthe right place.
Savvy election administrators have begun to catch on to the fact thatdata can serve as a shield when a controversy occurs. Tammy Patrick toldme about the role that Maricopa County’s election tracking system playedduring Arizona’s 2008 presidential primary election.9 Contrary to usualpractice, the primaries were closed, which meant that only registered Dem-ocrats could vote in the Democratic primary and only registered Republi-cans could vote in the Republican primary. Unsurprisingly, a number ofindependent voters were (properly) turned away. Because people didn’tunderstand why they were being turned away, rumors began to fly. For in-stance, one radio show claimed that thousands of Hispanic voters had beenimproperly purged from the registration lists. Maricopa’s tracking system en-abled the county to figure out exactly what was going on and quickly sharethe information with the press. “It made a huge difference,” says Patrick.
We saw a similar story in L.A. County during the presidential primar-ies. Because of a badly designed ballot, voters who weren’t registered asmembers of a party in Los Angeles had to fill in two bubbles if they wantedto vote for a presidential candidate in the Democratic primary. Reports in-dicated that thousands, perhaps hundreds of thousands of voters had failedto fill in both bubbles. Accusations began to fly that the “double bubble”problem would end up costing Barack Obama delegates in the hotly con-
116 Chapter 5
tested race. As is always the case with election controversies, people werequick to raise questions about political mischief. L.A. County respondedby doing statistical sampling and putting the data online to show that mostvoters filled out the ballots properly and that the number of voters who hadfailed to do so, while large, was not enough to affect the outcome of therace.10 In the words of Kim Alexander, president of the California VoterFoundation, L.A. County’s efforts “quelled the controversy.”11
As these examples suggest, transparency is a powerful weapon in politics,and good data are the “antidote to anecdote,” in the words of Steve Weir, thecounty clerk-recorder for Contra Costa County.12 That’s just why one majorelection official with whom I spoke is considering hiring a full-time numberscruncher on the staff to help his office sort through controversies like these.
When I talk about these stories with election officials, they often nodtheir heads in agreement but continue to worry about the misuse of data.Even if election officials have good data, they worry that their critics willbe able to twist those numbers. After all, few jurisdictions can afford a full-time number cruncher on their stuff to respond to unfounded accusations.
Political scientists could help allay these worries by agreeing to referee con-troversies over the data, serving as the teched-up equivalent of factcheck.org.At present, political scientists ask a lot of favors of election administrators,who provide the information scholars need for their research (academicsare always grateful to the person who helped them get tenure). So howabout a quid pro quo? If election administrators start providing better,publicly available data, political scientists should agree to help sort out datacontroversies that swirl around elections. This already happens informally.In the wake of the 2004 election, for instance, study after study emergedpurporting to show that the election was stolen. Political scientists wouldvet each paper, figure out what was wrong with it, and calm the waters bytelling reporters and talking heads not to trust it.
Finally, even if bureaucratic resistance to data collection is close to animmovable object, data-driven policymaking is likely to be an irresistibleforce. Programs like CitiStat have begun to sweep through local and stategovernments, and election administration lends itself to measurement inways that many state-run services do not. Whether or not the DemocracyIndex is assembled, we will see a push for data. Jonah Goldman of the Na-tional Campaign for Fair Elections notes that reformers have been tryingto “cobble together” good data “with duct tape” for a long time.13 The same
Getting from Here to There 117
is true of reformers with a conservative bent, as is evident from the fightover voter ID.
Ray Martinez, the former EAC commissioner, is not worried about theproblem of bureaucratic resistance. He has seen a new generation of elec-tion administrators taking over. They are “younger, more technologicallysavvy, less resistant to change, and looking for help”—just the kind ofpeople who ought to find the Democracy Index attractive. “The reasonswhy reform is hard are going away,” says Martinez. “They are retiring.”14
Getting the Data
Once we identify the data we want, raise awareness about its importance,and smooth the path for data collection, there are two obvious routes forobtaining the data. The first would look to Congress to mandate and fundgood data collection. The second would rely on a private foundation togather the information we need.
FEDERAL MANDATES
The most straightforward strategy for creating an Index would be for Con-gress to pass something like Senator Obama’s or Senator Clinton’s pro-posed bill. If the federal government required states to disclose most of the data necessary to create the Index, it would be fairly easy for a well-respected, nonpartisan organization like the Pew Center on the States orthe AEI/Brookings Election Reform Project to assemble it into an Index.
Money, money, money. Needless to say, Congress needs to do more thanwave its regulatory wand for good data to appear. First, Congress shouldgive localities the money they need to collect the information. As ThadHall and Dan Tokaji have pointed out, federal elections “are the country’soldest unfunded mandate.”15 States and localities run federal electionswithout receiving adequate resources to do so. Congress should not imposeyet another duty on these jurisdictions without providing more resources.It should heed Hall and Tokaji’s advice by trading states “money for data.”As Secretary of State Brunner notes, one of the main reasons that admin-istrators resist change is that they are tired of fighting for the money they
118 Chapter 5
need to implement it. She argues that the most effective strategy for get-ting good data is to make money available to collect it.16
A key question, of course, is how much the Democracy Index will cost.We don’t yet have enough information to put a price tag on the Index, andanything I offered here would the worst sort of seat-of-the-pants calcula-tion. One of the most important things that will come from Congress’s in-novative effort to fund model data-collection efforts at the state level is anumber. Putting a price tag on data collection is essential if you want Con-gress to fund it.
We may, of course, discover that data collection is so costly that thegame is not worth the candle. But I doubt it. While the start-up costs willbe significant, it’s important to keep in mind that there are economies ofscale here. Maricopa County’s sophisticated, real-time monitoring systemcost about $14,000 to create, but only a fraction of that to maintain. If, asI suggest in the next section, a foundation or Congress were to “think likea computer programmer” and create a master software program that juris-dictions could download and adapt for free, a good chunk of the start-upcosts for data collection would be eliminated. And once data collection be-comes a routine practice, the costs of collecting data will decline.
Routine data collection, of course, still costs real money. Will that pricetag be prohibitively high? Perhaps. But keep in mind that corporations,where the bottom line is all that matters, think the benefits outweigh thecosts. So, too, do the countless government agencies that collect data to in-form their policymaking. Perhaps some of this is information for informa-tion’s sake. But the data-collection trendline suggests otherwise.
It’s not enough for Congress to trade money for data. It should also sup-plement its monetary carrots with regulatory sticks. It ought to learn from themistakes it made with HAVA, where it failed to provide adequate enforce-ment mechanisms. At a minimum, Congress should grant the EAC regula-tory authority to punish localities for failing to collect the numbers we need.
A skeptic might think there is little chance that the Index will garnercongressional support. While it would be foolish to predict that anythingwill be enacted by Congress, the Index’s long-term chances are fairly good.As noted, Senators Barack Obama and Hillary Clinton have already putthe idea into proposed legislation. Both presidential candidates, Obamaand John McCain, have long been interested in election reform (Obama
Getting from Here to There 119
even taught election law at the University of Chicago). Moreover, reformis a notoriously crisis-driven industry. When the next crisis comes—as itinevitably will—politicians will be looking for something to do. The De-mocracy Index has a better chance than most proposals of getting adoptedwhen members of Congress are ready to appear reform-minded. After all,it seems more likely that Congress will ask states to disclose basic informa-tion about how the election system is run than to regulate state election sys-tems top-down, as most reformers propose.
Moreover, precisely because the Democracy Index is an intermediatestrategy—designed to change the debates on reform rather than enact aparticular kind of reform—it doesn’t have an obvious political valence. Itis not hard to figure out which party will be helped by a particular cam-paign finance law or a voter registration rule. A here-to-there proposal likethe Democracy Index, in contrast, seems less likely to favor one party oranother precisely because it is one step removed from substantive propos-als. It’s just the kind of proposal capable of garnering widespread support.
Private support. Even if the skeptic is correct that Congress will notpass legislation to mandate data collection, a private foundation couldfund the creation of a good portion of the data that we would want for theIndex. As I note in the next section, a foundation could commission sur-veys, hire observers and testers, create a network of “Nielsen voters,” or hireexperts to evaluate how each system is working. A foundation could alsopersuade researchers to tweak existing studies to get the data we need.17
As to the remaining information we’d need to assemble an Index—thedata that a private foundation could not independently produce—a privatefoundation should have the political muscle and moral standing to call ju-risdictions to account for not disclosing basic performance data. By layingdown a marker for what data jurisdictions should collect, a private founda-tion could push election administrators in the right direction. Rememberthe Quality Counts educational report. It began in a world without data,but it has gradually shamed school systems into collecting better infor-mation. So, too, the Environmental Performance Index has helped pushnation-states to do a better job collecting information on environmentalperformance. The development of these indexes suggests a modified ver-sion of the Field of Dreams mantra: if you build it, they will come around.18
120 Chapter 5
The Election Assistance Commission is likely to be a useful ally in thisregard. It is a commission in search of a mission, and data collection is themost obvious mission to choose. As election insiders are well aware, theEAC has been politically embattled since its inception. Although Congressintended the commission to improve how elections are run, it gave the newagency a modest mandate, little money, and less clout. As I noted in chap-ter 2, two years after the EAC was created, Congress hadn’t yet given it anoperating budget, which means that it didn’t have an office and had to holdits first meetings at a Starbucks.19 If you want to get a sense of how precar-ious a position the EAC has occupied, talk to Ray Martinez, one of its firstcommissioners. He’ll tell you about moving a young family to Washington,D.C., and worrying every night that the agency wouldn’t have enoughmoney to pay his salary.20
As Martinez acknowledges, the “biggest challenge” for the EAC has beento make itself “relevant.”21 And the one thing that this embattled agencyhas been able to do since its creation is gather data. The EAC’s ElectionDay Survey has already moved us closer to being able to assemble an Index,and that survey should become even more useful as states get into the habitof responding to it. Moreover, the EAC has every incentive to do better onthe data-collection front. Agencies always have to explain their existence toCongress to get the funding they need. Information gathering is a prettygood justification for the EAC’s existence. Who, after all, is against sun-shine? Data collection is a mission that places the EAC beyond political re-proach while serving a genuinely useful purpose.
Selling the Index
The final political task for designers of the Index will be to sell it. There are,of course, obvious public relations challenges associated with introducingthe Index—creating a website, generating press, educating the public, dis-seminating it to policymakers.
Here I want to talk about a less obvious, but no less important, strategyfor selling the Index: politicking. Perhaps the most important thing thatdesigners of the Index can do to sell the Index after it’s assembled is tospend a lot of time talking about the choices that go into the Index beforeit’s assembled. As corny as it sounds, talking things through is crucially
Getting from Here to There 121
important in this context. The Index will incorporate a number of valuejudgments, and its success will depend on widespread acceptance. It istherefore essential that the Index’s architects hear what other people—voters,election administrators, academics, policymakers—think about the choicesbeing made.
Academics unthinkingly translate admonitions to “talk things through”as an instruction to “deliberate”22—to engage in respectful debate, offeringarguments that any reasonable person can accept. That’s not what I mean.Though reasoned deliberation is all to the good, the Index’s architectsshould also engage in what partisans call politicking and corporate execu-tives call market research. For instance, the Index’s architects should usepolling and focus groups to be sure that they are including metrics thatappeal to most voters. They should try to get a sense from seasoned politi-cians whether placing this or that metric in the Index will trip it up polit-ically, perhaps asking Republican or Democratic operatives how they wouldsink the Index in a debate. Given that election administrators are likely toplay a crucial role in implementing the Index, its architects should be surethat they are focusing on measures that administrators can live with.
It might seem distasteful to engage in even a modest amount of politick-ing when designing the Index. A purist might insist that the Index shouldbe based entirely on the views of experts, who are distant from the politi-cal fray and immune to the exigencies of day-to-day politics. It would be amistake, however, to quarantine the Index from the concerns of everydaypolitics.23 For the Index to work in the real world, it is going to have to sur-vive in a political swamp. It is therefore crucial that we inoculate it againstthe diseases that infest that unfortunate terrain. A little bit of politickingcan go a long way in helping change take root.
Politicking is also important for a more idealistic reason. Designers ofthe Index are going to make a number of normative choices about howelections systems should be run. Rather than handing down those deci-sions from on high, they ought to pay attention to the stakeholders in thisdebate—voters, reformers, politicians, and election administrators.
None of this is to say that the integrity of the Index should be so com-promised that it is rejected by experts in the field. The Index needs the sup-port of experts in order to succeed. But it should be possible to inoculateit against political opposition without risking a full-blown political infec-tion. Here, again, the key is to strike the right balance.
122 Chapter 5
ASSEMBLING THE INDEX
If we want to get the Democracy Index from “here to there,” we’ll have toaddress not just political obstacles, but methodological ones. How exactly,will we collect the numbers we need to build the Index, and what kinds ofmetrics should we choose?
In chapter 1, I offered a preliminary sketch of what a Democracy Indexought to look like. In this section, I’ll talk more about the challenges in-volved in creating an Index and the methodologies and metrics that its ar-chitects Index might use. Anyone hoping to find a full blueprint Index inthis chapter will be disappointed, however. As I explained in chapter 1, itwould be foolhardy to try to describe the Index in intimate detail at thisearly stage. We don’t yet know how crucial stakeholders—voters, electionadministrators, policymakers—think about these questions. We don’t yetknow what kind of data will be available when the Index is first assembled.We don’t yet know what Congress’s model program will tell us about thecosts involved in collecting the data. Assembling an Index will involves apushmi-pullyu process, requiring us to toggle between the real and theideal. Until we know more about the “real” side of the equation, a finelydetailed blueprint would serve little purpose. It would bear an uncomfort-able resemblance to the old joke about how many economists it takes tochange a lightbulb. The answer is two: one to change the lightbulb, andone to assume the existence of a ladder.24
Rather than assume the existence of a ladder and pretend that a yet-to-be-identified set of data will exist at the yet-to-be-specified time the Indexis created, here I’ll work through some of the broader implementationquestions involved in designing an Index. While I won’t provide a detailedblueprint, I will describe the basic building materials available to the Index’sarchitects.
The Ideal
As I noted in chapter 1, the Index should measure three simple things—registration, balloting, counting—using hard data and performance mea-sures. Ideally, we’d like numbers to evaluate whether (1) every eligible voterwho wants to register can do so, (2) every registered voter who wants to casta ballot can do so, and (3) every ballot cast is counted properly.25
Getting from Here to There 123
Now that you’ve had a crash course in election administration, youmight notice that the performance goals I describe bear some resemblanceto the residual vote rate, the elegant metric that political scientists in theCaltech/MIT Voting Project created to assess whether too many ballotswere getting discarded. It’s not a perfect metric, but it offers a good proxyfor figuring out whether there is a problem with voting machines. Thethree basic performance categories I suggest might be thought of as a resid-ual registration rate, a residual balloting rate, and a residual counting rate.*
If we could assess residual rates for registration, balloting, and counting,we would have a close-to-ideal set of metrics. These metrics wouldn’t, ofcourse, capture everything we want to assess. For instance, we’d want to besure that the voters being registered are eligible, and we’d want to be surethat the ballots being counted were cast by eligible voters. Nonetheless, ifwe could measure these three performance goals, we would be well on ourway toward assembling an Index. The metrics are easy to explain and jus-tify. They offer us hard numbers, not qualitative assessments. They mea-sure performance outputs (how well is the system actually working?) ratherthan policy inputs (what policies do we think work best?). They give us abasic read on each part of the process—both how easy voters find voting tobe, and whether the state is doing its part. Finally, they heed MIT politicalscientist Charles Stewart’s wise suggestion that it is better to measure a fewthings well than to measure many things badly.26
Getting to the Ideal
Needless to say, we ain’t there yet. Some states don’t even track the residualvote rate. Getting even a rough sense of roll-off—the number of people whotry to register or vote but fail—during each part of the process is obviouslymuch harder. For this reason, in assembling the Democracy Index 1.0, we’llhave to find real-world proxies for capturing the information we’d want in anideal world. Here again, though, the biggest obstacle is getting the data.
124 Chapter 5
*Someone might sensibly object that the “best” registration or balloting system will not be able toregister every eligible voter or help every voter cast a ballot. Remember the dark secret of election ad-ministration—no election system is perfect. It may not be cost-effective or even possible to create a sys-tem that prevents every type of voter error. Even if we think an excellent system would have some roll-off, however, ranking builds that into the equation. A Democracy Index doesn’t hold jurisdictions upto an ideal standard but measures them against one another. There’s no need to debate what the opti-mal roll-off is because that number will, in effect, be folded into the comparison for every state.
As I noted above, there are two avenues for collecting the numbers weneed: (1) mandated or voluntarily disclosure by states and localities, and(2) private efforts. Here, I’ll talk about the here-to-there question for bothstrategies. I’ll explain how we can make it easier for states and localities tocollect the information we need, and I’ll show that there are a variety ofmeans to gather information that don’t depend on state or local disclosures.
Making It Easier for State and Localities to Disclose Information
Needless to say, no matter how varied our strategy for collecting data, if we are going to evaluate election systems based on performance, there issome information that we’d like state and localities to disclose. So how canwe make it easier for states and localities to collect the numbers we want?
Think like the Census Bureau. If you want to think creatively aboutreducing the costs of data collection, you should talk to Eric Fischer, theCongressional Research Service analyst who speaks as knowledgeably abouthermaphroditic sharks as John Bolton’s adolescence. In thinking about thechallenges involved in gathering data, Fischer argues that it’s a mistake tothink that we need massive amounts of data from every single jurisdiction toget a good read on whether the system is working. He suggests that anyoneinterested in collecting better election data should think like the Census Bu-reau.27 The Census Bureau knows that it needs some kinds of informationfrom everyone. It thus sends every household a “short form” once every tenyears to ask basic demographic questions—age, sex, race, and ethnicity. TheBureau then sends a long form to a subset of the population to pull togethermore detailed data on issues like jobs, education, and housing.
The Democracy Index might similarly use a short form/long form ap-proach. We could ask every jurisdiction to collect basic information. Wecould then use random sampling to glean the rest of the data we’d like tohave. This strategy would reduce the burdens on election administrators,particularly those at the local level, while still giving us a good sense of howwell the system is working.
Think like Congress. Another strategy for reducing the cost of data col-lection is to think like Congress. Many federal statutes—from Title VII tothe Fair Labor Standards Act—exempt small businesses from their ambit.
Getting from Here to There 125
There are some requirements that are just too onerous to place upon mom-and-pop businesses, instances where the game is indeed not worth the candle.The same may be true of election administration. There may be some caseswhere it makes sense to exempt the smallest localities from the reportingrequirements we try to achieve elsewhere.
Think like Wal-Mart. Another simple strategy for collecting perform-ance data is to follow the example of Wal-Mart. When you pay with acredit card at Wal-Mart, two messages pop up when you sign the signaturekey pad. The first is whether you are ready to accept the signature. The sec-ond is a simple question, like “Was the store clean today?” The survey isnot intrusive; you can complete your purchase without answering thequestion. But it’s easy to do, which means that it generates a lot of infor-mation about the conditions of Wal-Mart’s stores.
Imagine applying the Wal-Mart solution in the elections context. Avoter-registration form, for instance, might give voters the option of indi-cating how long it took them to procure and fill out the form. A voterreceiving an optical scan ballot might be given one more sheet of paperwith an optional question—How long did you spend in line? Was it easyto find your polling place today? Do you have any complaints about theservice your poll worker provided? A computerized voting system might dothe same, prompting voters after they’d approved their ballot to answer onemore question. Although the numbers generated would not represent apurely random survey—we wouldn’t expect everyone to answer the ques-tion at the same rates—it will target a much bigger population than mostrandom surveys and thus provide sufficient quantities of data that politicalscientists could generate meaningful cross-jurisdictional comparisons.
Care to guess which election administrator already thinks like Wal-Mart?Gary Smith, of course, the businessman who “retired” by becoming the headof elections in Forsyth County, Georgia. When I told him about my Wal-Mart idea, he proudly showed me the survey card he distributes to voters.Smith says that the survey costs very little to administer and gets him lotsof information on how well elections are running in his jurisdiction.28
Think like somebody who is ahead of the curve. The reason thatcollecting data on election performance is such a daunting task is that wedon’t do it now. Election administration is way behind the many other gov-
126 Chapter 5
ernment agencies that collect information. That’s the bad news. The goodnews is that there are some advantages to being behind the curve. Indeed,sometimes it’s possible to be so far behind the curve that you are ahead of it.
One advantage to playing catch-up is that it’s possible to learn from oth-ers’ mistakes. We know a lot more about collecting data than we did twentyyears ago. Think about Tammy Patrick’s experience in Maricopa County.The county moved from relying on slips of paper to a state-of-the-art track-ing system that resembled the databases Patrick saw while working in sales.Patrick was able to avoid beginners’ mistakes, like failing to prepopulatethe data and requiring too many keystrokes to enter the data. As MaricopaCounty’s experiences show, the costs of transitioning to a robust data-collection process are real, but less significant than they would have beenin prior years.
A second advantage to being behind the curve is that technology has im-proved dramatically, which means that it will be easier to put in place aworkable system than it was even ten years ago. Call it the lesson of the Af-rican phone system. Many people used to worry that it would be impos-sible for developing countries in Africa to create a modern phone system.How would these poor countries obtain the resources and technology theyneeded to lay down phone lines to every home and business? Then camethe cell phone, which doesn’t require costly land lines or a complicated in-frastructure. The result? Africa was able to make a remarkable advance intelecommunications without making the costly investments that more de-veloped nations had made to get to roughly the same place.
We’re also close to starting from scratch in collecting data on electionperformance. That means that we can put in a system that incorporates allthe advantages that technology now affords rather than try to tweak the ex-isting system to catch up with changing technology.
Think like a computer programmer. Few jurisdictions, of course, canafford to create a data-collection system from scratch, the way that MaricopaCounty did. But here’s where we should think like a computer program-mer and imagine developing the elections equivalent of GNU/Linux. Un-like Microsoft’s operating system, GNU/Linux is free. Better yet, anyonecan make changes to it, and then share those changes with others.
One of the advantages associated with being behind the curve is that thetime is ripe for a foundation to create the rough cognate to GNU/Linux—a
Getting from Here to There 127
universal data-collection program that could be downloaded and modifiedfor free by any jurisdiction. Creating a free, reliable software system to helpjurisdictions collect data and share information would be a timely inter-vention in the process. And it’s a good deal cheaper than asking each juris-diction to build its own system separately.
Think like a mass transit official. Bob Murphy, the computer junkieturned election administrator, came up with another idea for making data-collection easier. “What you need,” he told me, is “something like a MassTransit Authority for collecting data.”29 It’s easy to see the logic. As withtransportation, data collection is an area where there are economies ofscale. It’s easier for a centralized authority to push for a mass transit systemthan to depend on every small town to act on its own. So, too, it’s easier tobuild an information superhighway in the elections context if a centralizedauthority could coordinate efforts. As Murphy points out, mass transit au-thorities give cities and towns the leverage they need to get the job done.And they can save every small jurisdiction from having to reinvent thedata-collection wheel by providing a model for everyone. Needless to say,the obvious candidate for serving this role will often be the secretary ofstate’s office.
Private Sources of Performance Data
As I noted above, it is also possible to gather useful information on elec-tion performance without relying on states and localities to disclose it.Here are some examples of the strategies a private foundation could use toget the numbers we need for the Index.
Testers/observers. One promising solution for gathering performancedata is to rely on testers. In The Mystery of Capital, Hernando DeSoto de-scribes his elegant strategy for evaluating the quality of corporate regula-tions. He simply sent testers to different counties to try to register a busi-ness there. Based on their feedback, he gathered useful quantitative andqualitative data on how each process worked.30
Imagine we wanted to evaluate how well the registration system is work-ing for citizens. Following DeSoto’s example, we could send out a diverse
128 Chapter 5
group of eligible voters—someone who lives in a rural area, someone wholives in the inner city, someone who is blind, someone who has a seventh-grade education, someone who requires language assistance, an overseasvoter—and see whether they are able to register and how long it takes themto do so.
Election observers could serve a similarly useful role. For instance, if youwant to get a read on how well the balloting process is working, you couldrandomly assign observers to polling places and ask them to count howmany people showed up at the wrong polling place or how many peopletried to vote only to be told they weren’t registered. Randomly placed ob-servers could similarly record how long the lines were, whether the parkinglot was full, and whether poll workers answered questions correctly.
Nielsen voters. Alternatively, imagine we created the voting equivalentof “Nielsen families,”31 the individuals who record their television watch-ing habits for the Nielsen ratings service. Designers of the Index could askrandomly selected voters to record information about their experienceswith the election process. For instance, a Nielsen voter might be asked howlong it took her to register, whether she thought her polling place was con-veniently located, and whether she found the ballot design confusing. Al-ternatively, as MIT’s Charles Stewart has suggested, designers of the Indexmight randomly tag some registration cards or ballots and follow themthrough the process.32
Voter surveys. Voter surveys also provide a useful strategy for gatheringinformation on state performance. Asking a randomly sampled group ofvoters about their experience can generate a good deal of informationabout how the system is working. Voters could be asked whether they triedto register but failed, how hard it was to find their polling place, whetherthey encountered any problems with poll workers, and how long they stoodin line.33 Relying on voters’ recollections may not give us a precise answerto these questions. For instance, voters may systematically under- or over-report certain problems. But all that matters for the Index is reliable com-parative data. As long as voter recollections are not systematically skewed(that is, as long as voters in Idaho overreport by roughly the same amountas do voters in New York), the comparative information is still useful.
Getting from Here to There 129
Imagine, for example, you want to get a sense of how well the registra-tion system is working. In order to measure that in performance terms, youcould use survey data to identify how many voters get lost in the registra-tion process or learn that they are not properly registered when they showup at the polls.
Survey data won’t give you a perfect read on how well the system isworking. It might sweep in voters who think they are eligible to vote butaren’t (and thus should be prevented registering by a well-functioning sys-tem). Further, we know that people sometimes misreport voting behavior(more people claim that they voted than actually vote), and postelectionevents (media reports, having one’s preferred candidate lose) can affect whatvoters say when an election is over. But some of these problems can befixed. You could conduct surveys right after the close of registration inorder to reduce the effect of media coverage or election outcomes on self-reporting. Other problems drop out because we are comparing states toone another. For instance, if misreporting occurs at the same level acrossstates, the problem falls away when we assess the data comparatively. Whilethere are details yet to be worked out, a preliminary study by MIT’s CharlesStewart offers some cautious optimism about the use of survey data forthese purposes.34
Other Potential Metrics
Haven given you a general sense of the measurement strategies the archi-tects of the Index might use to get the numbers they need, let me show youa representative sample of what experts think is achievable in the shortterm. All of these examples are drawn from discussions that took place dur-ing a 2007 conference on the Democracy Index sponsored by the PewCenter on the States, the Joyce Foundation, the AEI-Brookings ElectionReform Project, and the Ohio State University Moritz College of Law. Overthe course of the conference, political scientists, law professors, and elec-tion administrators brainstormed about what a Democracy Index shouldlook like. At the end of the conference, the discussion had moved forwardenough for the moderators to ask the experts each to name three reason-able metrics that are either available today or could be reasonably collected
130 Chapter 5
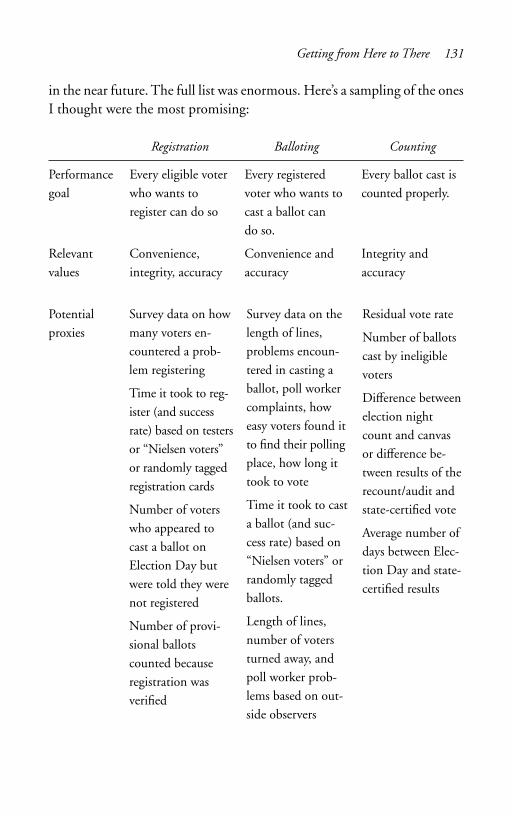
in the near future. The full list was enormous. Here’s a sampling of the onesI thought were the most promising:
Registration Balloting Counting
Performance Every eligible voter Every registered Every ballot cast isgoal who wants to voter who wants to counted properly.
register can do so cast a ballot can do so.
Relevant Convenience, Convenience and Integrity and values integrity, accuracy accuracy accuracy
Potential proxies
Getting from Here to There 131
Survey data on howmany voters en-countered a prob-lem registering
Time it took to reg-ister (and successrate) based on testersor “Nielsen voters”or randomly taggedregistration cards
Number of voterswho appeared tocast a ballot onElection Day butwere told they werenot registered
Number of provi-sional ballotscounted becauseregistration wasverified
Survey data on thelength of lines,problems encoun-tered in casting aballot, poll workercomplaints, howeasy voters found itto find their pollingplace, how long ittook to vote
Time it took to casta ballot (and suc-cess rate) based on“Nielsen voters” orrandomly taggedballots.
Length of lines,number of votersturned away, andpoll worker prob-lems based on out-side observers
Residual vote rate
Number of ballotscast by ineligiblevoters
Difference betweenelection nightcount and canvasor difference be-tween results of therecount/audit andstate-certified vote
Average number ofdays between Elec-tion Day and state-certified results
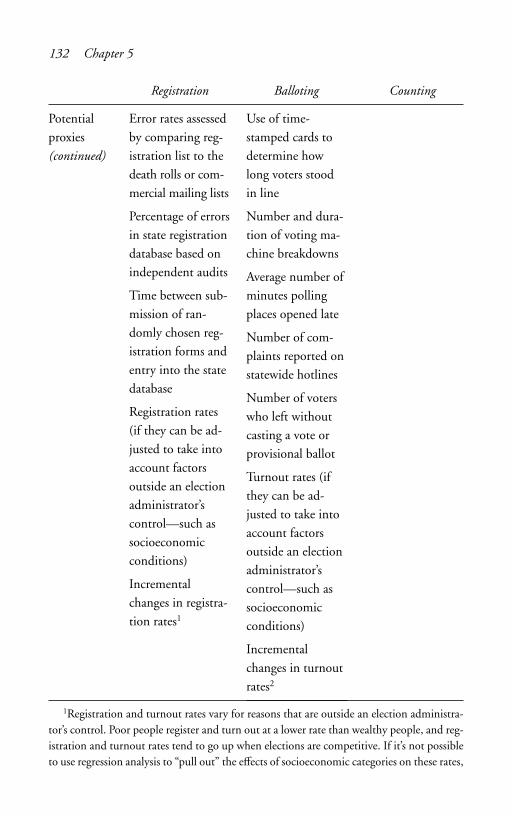
Registration Balloting Counting
Potential proxies (continued)
132 Chapter 5
Error rates assessedby comparing reg-istration list to thedeath rolls or com-mercial mailing lists
Percentage of errorsin state registrationdatabase based onindependent audits
Time between sub-mission of ran-domly chosen reg-istration forms andentry into the statedatabase
Registration rates(if they can be ad-justed to take intoaccount factorsoutside an electionadministrator’scontrol—such associoeconomicconditions)
Incrementalchanges in registra-tion rates1
Use of time-stamped cards todetermine howlong voters stoodin line
Number and dura-tion of voting ma-chine breakdowns
Average number ofminutes pollingplaces opened late
Number of com-plaints reported onstatewide hotlines
Number of voterswho left withoutcasting a vote orprovisional ballot
Turnout rates (ifthey can be ad-justed to take intoaccount factorsoutside an electionadministrator’scontrol—such associoeconomicconditions)
Incrementalchanges in turnoutrates2
1Registration and turnout rates vary for reasons that are outside an election administra-tor’s control. Poor people register and turn out at a lower rate than wealthy people, and reg-istration and turnout rates tend to go up when elections are competitive. If it’s not possibleto use regression analysis to “pull out” the effects of socioeconomic categories on these rates,
one might look to incremental changes in registration and turnout rates as an appropriatemetric. For instance, imagine you picked a baseline—registration numbers from the lastpresidential election—and ranked states based on whether they were able to improve regis-tration numbers by the next presidential race. The hope would be that such a measurewould filter out socioeconomic factors and the effects of competition. The key, as with allmetrics in the index, is to ensure that it does not pull in too many factors beyond an elec-tion administrator’s control, becoming a measure of luck, not skill.
2See prior note to this table.
CONCLUSION
Though some of the steps involved in getting a Democracy Index fromhere to there may seem a bit daunting, it is worth asking once again, “Asopposed to what?” The Democracy Index has garnered more support andmade more progress than most proposals ever do. The ideas also seems eas-ier to push through the process than most types of reform.
As to the biggest obstacle to creating the Index—collecting the data—it’s worth taking the long view here. Election administrators are not thefirst people to face these problems. Every government agency that I dis-cussed in chapter 2 began where we are now, in a world without data. Thespecific obstacles involved may differ, but this is not the first field to con-front decentralization, limited resources, and measurement challenges.
Moreover, while the challenges involved in assembling an Index can bedaunting, they are the same challenges faced by the designers of other suc-cessful indexes. Dan Esty still complains about the need for more environ-mental performance data. When the developers of the Quality Countseducational report began, few school systems collected even a fraction ofthe data necessary for a good performance Index. Today, most of them do.Over the course of the last two years, I have interviewed many people whohave been involved in creating an Index. Every one of them started outworrying that the data-collection problems were insurmountable. Andevery one of them managed to move their projects from here to there.
Getting from Here to There 133
ConclusionGetting from “Here to There” Redux
Much of this book has been devoted to describing a promising new strat-egy for improving the way we run elections: a Democracy Index. The De-mocracy Index is a quintessentially here-to-there solution. It doesn’t im-pose standards on how our elections are run. It doesn’t take power awayfrom partisan officials. It doesn’t professionalize the bureaucracy that runsour elections. Instead, it pushes in the direction of better performance, lesspartisanship, and greater professionalism. By giving voters, policymakers,and election administrators the right information in the right form, it cre-ates the conditions in which bigger and better reform is possible.
The New Style of Reform
The Index is of a piece with a larger shift in reform movement. New YorkTimes editorialist David Brooks could be describing many of the people inthis book when he writes about the new generation of social entrepreneurs:
These thoroughly modern do-gooders dress like venture capitalists.They talk like them. They even think like them. . . . Almost willfullyblind to ideological issues, they will tell you, even before you have achance to ask, that they are data-driven and accountability-oriented.1
Ian Ayres has argued that “supercrunchers”—the masters of data-drivenanalysis—are involved in almost every aspect of our lives, from wine rat-ings to plane tickets. His book has made the New York Times best-seller listand is being translated into eleven languages. Cass Sunstein and Richard
Thaler have argued that the future path of reform is not top-down govern-ment mandates, but softer “nudges” that a government can provide bydoing a better job of framing questions, choosing defaults, and providingdecision-making shortcuts.
The Democracy Index mines a similar vein. Rather than relying upon acivil-rights enforcement strategy or a New Deal command-and-control ap-proach, the Index deploys a data-driven, market-oriented approach. It istailor-made for the new generation of election reformers like SpencerOverton, who fought the good fight on voter ID, or Dan Tokaji, the base-ball nut who insists on hard numbers and “moneyball” reforms. The elec-tion reformers of this new generation may be unyielding in their idealism,but they are pragmatic in their approach. They are willing to look to a va-riety of institutions (the market, administrative agencies), not just thecourts, for solutions. And they are as likely to appeal to hardheaded ideas—accountability, competition—as soft-hearted values like participation andempowerment.
Like Thaler and Sunstein’s “nudge” approach, the Index provides betterdecision-making tools than we have now. It improves the policymakingprocess by creating better information shortcuts for voters, policymakers,and election administrators. The Index gives voters a better cue to cast avote. It gives policymakers the shorthand they need to figure out whethera problem exists and how to fix it. It might even provide a professionaltouchstone for election administrators, helping identify the kinds of bestpractices that professionals have long used as a decision-making shortcut.
While the Index ought to shame policymakers and election officials intodoing better, it is shaming of an unusual sort. It looks nothing like the col-lective “tut-tuts” that often slip from the mouths of academics, nor does itresemble the “Do more, do better” mantra that reformers must invoke ina world without data. Instead, the Index is a shaming device of a quitepragmatic sort. It does not turn on some ideal standard, but holds poorperformers up to a realistic baseline, challenging them to do as well as theirneighbors. It rests on the simple idea that showing something can be doneis better than claiming it can be.
The Democracy Index reflects an equally pragmatic approach toward pol-itics. Partisanship and localism provide powerful incentives that push against
From “Here to There” Redux 135
reform. Most reform efforts involve an effort to swim upstream against thosepowerful currents. The Democracy Index, in contrast, realigns partisanand local incentives by linking officials’ political fates to their professionalperformance and giving top policymakers a reason to care about reform.Further, because the Index can serve as both sword and shield in partisanwarfare, the Index should encourage the political parties to do the work ofreform for us. It thus promises to change these vicious political cycles intovirtuous ones.
Finally, in a world where reformers tend to look for national solutions tonational problems, the Index turns decentralization to our advantage. Oneof the reasons change is hard to come by is that the election system is runby so many institutions (administrative agencies, legislatures, local boards)at so many levels of government (local, state, federal). A system like oursdoes have two advantages, however. First, it facilitates experimentation thatwill help us identify best practices and promising policies. Second, it allowsus to appeal to an actor in one part of the system to help regulate actors inanother part, thus mitigating the self-interest that usually short-circuitsmeaningful reform.
The Democracy Index takes advantage of both features of localism. It al-lows local jurisdictions to serve as laboratories of democracy while helpingus disseminate the results of the most successful experiments. And it helpsvoters, policymakers, and election administrators do a better job of moni-toring the system. The Democracy Index, in short, takes advantage of themost useful features associated with decentralization while avoiding itsworst excesses.
A World with a Democracy Index
I’ve spent a lot of time in this book talking about what the reform environ-ment looks like in a world without data. It’s a world where everyone arguesover which direction to go even though no one can map where we are now.Where calls for change are too often based on anecdotes and idealism.Where the reformer’s mantra is “Do better, do more.” Where voters haveno means of refereeing the debates they hear. Where election officials can’tassess their own performance, let alone figure out how to improve. Where
136 Conclusion
politicians have every reason to ignore pleas for change. Where any elec-tion administrator hit by a turnout tsunami is at risk of being demonized.Where strong performance is ignored and failures are rarely noticed. Whereelection administrators have no means of finding the innovative needle inthe policymaking haystack.
A world with a Democracy Index ought to look different. It would giveus a map of where we are so we could chart where we want to go. Starry-eyed reformers would be able to speak in the cadence of corporate execu-tives. Election administrators would have a lingua franca to describe thestandards a well-functioning election system should meet. And voters andpolicymakers wouldn’t need anyone to translate those debates for them be-cause the Index would do it for them. A world with a Democracy Indexshould be one where politicians and election administrators are rewardedfor doing well and feel pressured when they could do better. But they’d alsobe able to defend themselves against unfair accusations. It might even be aworld where election administrators could start to build the professionalnorms essential to any well-functioning system.
As Opposed to What?
Perhaps the best reason to favor the Democracy Index returns us to a ques-tion I’ve asked repeatedly in this book: as opposed to what? You may notlike the idea that voters use a ranking as a shorthand, but a well-designedranking is better shorthand than what voters now use. You may think it’s abad idea for policymakers to rely on the Index as an information shortcut.But it’s a better information shortcut than they have now. You might notlike the idea that election administrators will be tempted to “teach to thetest,” but teaching to a well-designed test is better than having no test atall. As I noted in Chapter 4, it’s easy to be against rankings in principle. It’sonly in practice that they start to look good. The “As opposed to what?”question also helps us assess whether creating a Democracy Index is worthits costs. I’ve tried to make the best case possible that an Index would work.Even if you don’t buy everything I’ve said, it’s worth asking yourself thisquestion: As opposed to what? Is there a better reform proposal on thehorizon?
From “Here to There” Redux 137
I believe the answer is no. There are, of course, a plethora of reform pro-posals that could do a great deal of good in the world. But those proposalswill not pass until we solve the here-to-there problem. The Index is a mod-est reform. But it’s a modest reform that can make bigger, better reformpossible. The Index beats out most alternatives for a simple reason: itshould help make those alternatives possible.
138 Conclusion
Afterword
THE INVISIBLE ELECTION
The 2008 presidential election was one of those remarkable moments inpolitics when the nation was paying attention. The general election washard fought, and the stakes could not have been higher. The storybookending in Grant Park—where a black man accepted the presidency—wasone that touched every American, from Obama’s most ardent supporters tothe people who accorded him the dignity of voting against him on the mer-its. I stood twenty feet away when Senator Obama became President-electObama. I watched as he pivoted from politician to president, as the paeanto our history that had inspired Obama’s supporters in New Hampshire be-came a sobering reminder of the enormous challenges the nation now faces.“Yes we can” was once a muscular chant invoked at partisan rallies. AtGrant Park, it was quietly repeated by 100,000 people, as if it were part ofa call-and-response between the president-elect and the nation, a secularamen.
The reason I was in Grant Park that night was that, as part of the cam-paign’s election protection team, I had spent the previous nineteen hoursworking in the “boiler room,” the spare office where ninety-six people ranthe campaign’s national election-day operations. As was typical of the noto-riously thrifty campaign, the room was furnished cheaply and covered inindustrial dust. Just after the networks called Ohio and everyone knew therace was over, the superstitious campaign staffers who had cried and cheeredat the call suddenly scattered to find some genuine wood to knock on amidstthe shoddy, plastic furniture.
While the furnishings were minimal, the campaign’s election protec-tion apparatus was well funded, precisely planned, and remarkably organized.Our goal was simple: to ensure that administrative slip-ups and partisan
shenanigans did not prevent voters from casting a ballot and having thatballot counted. Over the course of the day, thousands of lawyers, campaignstaff, and volunteers reported the problems they were seeing in pollingplaces across the country. A sophisticated computer program allowed us toreview these reports in real time so that we could assess whether and whatcorrective action needed to be taken.
What ran across my computer screen that day was the invisible election,the nuts-and-bolts details that journalists rarely report and citizens rarelysee. Reports the day after claimed that the election had run smoothly, thatthere had been almost no problems, that we had dodged a bullet. In somejurisdictions, the reports were accurate. There were glitches, to be sure, butthere were enough poll workers and election administrators to fix them asthey came along.
In other jurisdictions, the reports bore no resemblance to what I sawscrolling across my computer screen. Many jurisdictions simply fell apartas wave after wave of voters crashed down upon them. Thousands ofpeople had to wait three hours or more to vote. In some places, thereweren’t enough machines to process all the voters. In others, there wereplenty of voting machines, but voting booths stood empty because thereweren’t enough poll workers to check people in. Machines broke down.Parking lots were full. Polling places were hard to find or had been movedat the last minute. Poll workers didn’t know basic rules about provisionalballots and election protocols. Far too many people showed up at the pollsthinking they had registered, only to be told they weren’t on the rolls. Abewildering number of polling places needed pens by mid-day becausetheirs had run out of ink. Many polling places simply ran out of ballots.
These problems occurred even though more voters than ever before (anestimated third of the electorate) cast their ballots before Election Day. Theyoccurred even though everyone knew that turnout would be extremely high.They occurred even though at least the Obama campaign—recognizingthat victory depended on an election system capable of processing hundredsof thousands of new voters—had done an extraordinary amount of workin helping election administrators get ready for the turnout tsunami thatwas approaching.
What I saw in the boiler room was, in some ways, comforting. It seemedclear that most of the problems were caused not by partisan mischief, but
140 Afterword
by neglect—too little funding, too few resources devoted to planning, evensomething as simple as not enough poll workers showing up. It confirmedmy view that we should never attribute to partisanship that which can beadequately explained by inadequate resources. It also became clear to methat it is possible to collect the data we need to build a Democracy Index.The Obama campaign was able to collect useful information on lines, reg-istration problems, poll-worker mistakes, and machine breakdowns. There’sno reason that state and localities, with adequate financial support and thehelp of nonprofit groups, can’t do the same.
What matters most for our purposes, however, is this: these problemswere all but invisible. They weren’t reported anywhere, save a few mediamentions of long lines. The reason, of course, is simple. The election wasn’tclose. The race didn’t end up turning on the votes that were lost becausepeople weren’t properly registered or left the line in frustration. No one isgoing to investigate, let alone write a story about, problems that didn’t affect the outcome. And even when social scientists get around to crunch-ing the data, those data are so sparse that they will give us only a partialsense of what occurred.
Eight years have passed since the 2000 election transfixed the nation. Yetthe same problems remain: long lines, registration problems, a dearth of pollworkers, machine breakdowns. The same will be true for many elections tocome unless we solve the “here to there” problem. The reason things haven’tchanged is that it’s hard for reform to get traction in the United States.Until we change the reform environment—until we make election problemsvisible to voters and give politicians a reason to pay attention to them—we’ll have to continue relying on the election administrator’s prayer: “Lord,let this election not be close.”
LOOKING TO THE FUTURE:
By the time this book goes to print in 2009, Barack Obama will havestarted his first term. Ask yourself what advice you would give him aboutnext steps for improving our election system. I would urge our new presi-dent to start with the “here to there” problem and focus on creating an environment in which reform can actually get passed. Perhaps President
Afterword 141
Obama will instantly be able to achieve what many have tried to do butfailed, like creating national standards for administering elections or tak-ing partisanship out of the process. But given how hard it is to get reformpassed (and given that partisanship and localism can sometimes serve a use-ful role), my guess is that the first, realistic step toward reform is unlikelyto involve proposals that would require partisan foxes to stop guarding thehenhouse or our centuries-old tradition of localism to vanish overnight.Instead, the president should start by domesticating the foxes and harness-ing the power of local competition. We may not have an ideal system inplace. But we might as well take advantage of the best features of the cur-rent system—the powerful engine of partisanship and the intriguing pos-sibilities associated with local competition. The Democracy Index does justthat.
Were I offering advice, I’d tell our new president to start there . . . or,rather, to start with the “here to there.” Given then-Senator Obama’s deci-sion to put the Democracy Index into proposed legislation, I suspect healready knows that. As he said on the Senate floor, the Index is “an impor-tant first step toward improving the health of our democracy” because it “willempower voters” and “encourage healthy competition among the states,”helping us “work toward the goal we all share: an election system that makesus all proud.”1
The Democracy Index is not the end of the reform process; it is the beginning. It’s one of the best shots we have for creating an environmentin which more far-reaching reform can take place. President-elect Obamais right. It’s time to get started.
New Haven, ConnecticutNovember 15, 2008
142 Afterword
Notes
INTRODUCTION: WHY WE NEED A DEMOCRACY INDEX
1. Abby Goodenough, “In Florida, Echoes of 2000 as Vote QuestionsEmerge,” New York Times, November 10, 2006.
2. Building Confidence in U.S. Elections: Report of the Federal Commission onElection Reform, September 2005, available at http://american.edu/ia/cfer/.
3. Thad Hall et al., “Are Americans Confident Their Ballots Are Counted?” 3,unpublished draft, 2007.
4. Electionline, Briefing: The 2006 Election, 7 (2006), http://www.pewcenteronthestates.org/report_detail.aspx?id=32758.
5. Ariel J. Feldman, J. Alex Halderman, and Edward W. Felten, “SecurityAnalysis of the Diebold AccuVote-TS Voting Machine,” September 2006,http://itpolicy.princeton.edu/voting/summary.html.
6. Fred Hessler and Matt Smith, City and County of Denver 2006 ElectionTechnical and Operational Assessment, December 8, 2006, 5, http://www.votetrustusa.org/pdfs/Colorado_Folder/Denver_Report.pdf.
7. Hessler and Smith, Denver 2006 Election Technical and Operational Assess-ment.
8. M. R. Kropko, “Election Staff Convicted in Recount Rig,” washington.com,January 24, 2005.
9. “Ohio’s Largest County Finishes Tabulating Votes Five Days after Primary,”CantonRep.com, May 8, 2006; Dan Tokaji, “Cuyahoga County’s ElectionWoes,” Equal Vote Blog, May 9, 2006.
10. Press release, “Brunner Calls for Clean Slate in Cuyahoga County,”http://www.sos.state.oh.us/.
11. Clive Thompson, “Can You Count on These Machines?” New York TimesMagazine, January 6, 2008.
12. Joe Guillen, “20 Percent of Election Printouts Were Unreadable,” Cleve-land Plain Dealer, November 28, 2007; see also Thompson, “Can You Count onThese Machines?”
13. Guillen, “20 Percent of Election Printouts.”14. The term was coined by Rick Hasen. See Richard L. Hasen, “Beyond the
Margin of Litigation: Reforming Election Administration to Avoid ElectoralMeltdown,” 52 Washington & Lee Law Review 937 (2005).
15. Daniel P. Tokaji, “The Birth and Rebirth of Election Administration,” 7Election Law Journal 118, 121 (2007), reviewing Roy G. Saltman, The Historyand Politics of Voting Technology: In Quest of Integrity and Public Confidence.
16. Twenty percent of states do not report this information; they disclose onlyhow many ballots were successfully counted. Thad Hall and Daniel Tokaji, “Moneyfor Data: Funding the Oldest Unfunded Mandate,” June 5, 2007, http://moritzlaw.osu.edu/blogs/tokaji/2007/06/money-for-data-funding-oldest-unfunded.html.
17. See, e.g., http://www.aclu.org/votingrights/exoffenders/statelegispolicy2007.html.
18. See, e.g., Chris Elmendorf, “Representation Reinforcement through Advi-sory Commissions: The Case of Election Law,” 80 New York University Law Re-view 1366 (2005); Heather K. Gerken, “The Double-Edged Sword of Indepen-dence: Inoculating Electoral Reform Commissions against Everyday Politics,” 6Election Law Journal 184 (2007); Heather K. Gerken, “A Third Way for the Vot-ing Rights Act: Section 5 and the Opt-in Approach,” 106 Columbia Law Review708 (2006); Heather K. Gerken, “Citizens Must Drive Electoral Reform,” RollCall, November 15, 2005; Heather Gerken and Chris Elmendorf, “Next Time,Start with the People,” http://balkin.blogspot.com/2005/11/next-time-start-with-people.html; Michael Kang, “De-rigging Elections: Direct Democracy andthe Future of Redistricting Reform,” 84 Washington University Law Review 667(2006); Dan Tokaji, “The Moneyball Approach to Election Reform,” http://moritzlaw.osu.edu/electionlaw/comments/2005/051018.php.
19. I wrote about the “here to there” question in a series of blogs during thesummer of 2007. See Heather K. Gerken, “A New Agenda for Election LawScholarship,” Balkinization, http://balkin.blogspot.com/ (series of posts datedJune 18–22, 2007). At roughly the same time, political scientist Bruce Cain waswriting about the need to create “a new sub-field of political reform” for an arti-cle that came out in PS in October, 2007. Bruce E. Cain, “Reform Studies:Political Science on the Firing Line,” 15 PS 635, 635 (2007). Cain’s focus isquite different from mine. The field he has in mind addresses reform writ largeand includes existing work on redistricting, election administration, and cam-paign finance—the topics that make up the “there” part of the “here to there”
144 Notes to Introduction
equation. Cain is absolutely right to emphasize the importance of pulling to-gether these academic camps and doing a better job of integrating the norma-tive, descriptive, and analytical components of our research. In my view, how-ever, studying the reform process—the “here to there” problem—should be asubfield within the broad field of political reform that Cain proposes.
20. Carter-Baker Commission, Building Confidence in U.S. Elections, 25–26.21. Interview with Justin Levitt, June 14, 2007.22. There is, of course, an irony here. Funders are often reluctant to support
projects like this one because it is hard to measure whether they are succeeding.As I note in chapter 2, however, one need not endorse the witless notion thateverything can be measured to believe that election performance is susceptible todata-driven analysis.
CHAPTER 1: THE PERVERSE POLITICS OF ELECTION REFORM
1. These examples were all drawn from American Society of Civil Engineers’“Report Card for America’s Infrastructure,” which provides a state-by-stateanalysis of the problems associated with deferred maintenance, at http://www.asce.org/reportcard/2005/Index.cfm.
2. While most assumed at the time that deferred maintenance was the causethe Minnesota debacle, subsequent investigations suggest that a design problemled to the collapse. Matthew L. Wald, “Controversy Dogs Inquiry on BridgeCollapse,” New York Times, January 30, 2008, 13.
3. The American Society of Civil Engineers estimates that we need to spend$1.6 trillion to “bring the nation’s infrastructure to good condition.” Ameri-can Society of Civil Engineers, “Report Card for America’s Infrastructure.” TheGovernment Performance Project gives the country a B� for its efforts to main-tain our physical infrastructure. See http://www.pewcenteronthestates.org/gpp_report_card_details.aspx?id=35348.http://www.asce.org/reportcard/2005/index.cfm
4. For a useful survey of the problems associated with poll workers as well as acomparison of state training and compensation practices, see electionline.org,“Helping Americans Vote: Poll Workers,” September 2007; Thad Hall and QuinMonson, “The Human Dimension of Elections: How Poll Workers Shape PublicConfidence in Elections, 2007, unpublished draft, 3–4.
Notes to Introduction 145
5. For useful surveys of the problems described in this paragraph, see, e.g.,Caltech/MIT Voting Technology Project, “What Is, What Could Be,” July 2001,www.votingtechnologyproject.org; Carter-Baker Commission, Building Confi-dence in U.S. Elections; General Accounting Office, “Elections: Perspectives onActivities and Challenges across the Nation,” GAO-02-3, October 2001; Thad E.Hall and R. Michael Alvarez, “Why Everything That Can Go Wrong OftenDoes: An Analysis of Election Administration Problems,” Caltech/MIT VotingTechnology Project, VTP Working Paper 10, November 2003; Steven Huefner,Daniel P. Tokaji, and Edward B. Foley, From Registration to Recounts: The Elec-tion Ecosystems of Five Midwestern States (Columbus: Ohio State UniversityMichael E. Moritz College of Law, 2007).
6. For initial research on making polling places more accessible, see J. G. Gim-pel and J. E. Schuknecht, “Political Participation and the Accessibility of the Bal-lot Box,” 22 Political Geography 471, 471 (2003); Moshe Haspel and H. GibbsKnotts, “Location, Location, Location: Precinct Placement and the Costs ofVoting,” 67 Journal of Politics 560, 561 (2005); Robert M. Stein and Greg Von-nahme, “Election Day Voter Centers and Voter Turnout,” unpublished manu-script, 2006; Robert M. Stein and Patricia A. Garcia-Monet, “Voting Early butNot Often,” 78 Social Science Quarterly 657 (1997).
7. I draw these statistics from estimates offered in Alan Agresti and Brett Pres-nell, “Misvotes, Undervotes, and Overvotes: The 2000 Presidential Election inFlorida,” 17 Statistical Science 436 (2002), and the U.S. Commission on CivilRights, Voting Irregularities in Florida during the 2000 Presidential Election(Washington, D.C.: Government Printing Office, 2001). More detailed ac-counts of these events can be found in the large number of books on the subject,including Ronald Dworkin, ed., A Badly Flawed Election: Debating Bush v. Gore,the Supreme Court, and American Democracy (New York: New Press, 2002);Bruce Ackerman, ed., Bush v. Gore: The Question of Legitimacy (New Haven: YaleUniversity Press, 2002); Arthur Jacobson and Michael Rosenfeld, eds., TheLongest Night: Polemics and Perspectives on Election 2000 (Berkeley and Los Ange-les: University of California Press, 2002); Richard A. Posner, Breaking the Dead-lock: The 2000 Election, the Constitution, and the Courts (Princeton, N.J.: Prince-ton University Press, 2001); Jack Rakove, ed., The Unfinished Election of 2000(New York: Basic Books, 2001); and Cass R. Sunstein and Richard A. Epstein,eds., The Vote: Bush, Gore, and the Supreme Court (Chicago: University of Chi-cago Press, 2001).
146 Notes to Chapter 1
8. Richard Hasen, “Voting System Is Haunted by Democratic Meltdown,Canberra Times, January 22, 2008.
9. Caltech/MIT Voting Project, “What Is, What Could Be,” 8.10. Caltech/MIT Voting Technology Project, “Immediate Steps to Avoid
Lost Votes in the 2004 Presidential Election: Recommendations for the ElectionAssistance Commission,” 2004, 3.
11. Carter-Baker Commission, Building Confidence in U.S. Elections, 54.12. Eric A. Fischer and Kevin J. Coleman, Election Reform and Local Election
Officials: Results of Two National Surveys, Congressional Research Service Reportfor Congress, RL-34363, February 7, 2008.
13. See http://www.washingtonpost.com/wp-dyn/politics/elections/2004/ forstate-by-state election results for 2004 presidential race.
14. Richard Lacayo, “Eye of the Storm,” Time, November 20, 2000.15. See, e.g., Timothy Egan, “Questions Linger as Governor Takes Over
Washington,” New York Times, January 13, 2005, A20; Mike Francher, “Gover-nor’s Race to Make Many Voters Feel Cheated,” Seattle Times, December 26,2004; Sarah Kershaw, “Governor-Elect Declared in Washington Recounts,” NewYork Times, December 31, 2006, A18.
16. Roy G. Saltman, The History and Politics of Voting Technology: In Quest ofIntegrity and Public Confidence (New York: Palgrave Macmillan, 2006), 185.
17. For a granular analysis of changes since 2000 and the effects of HAVA, seeelectionline.org, “Election Reform: What’s Changed, What Hasn’t and Why,”November 2006; electionline.org, “The Help America Vote Act,” 2007, 5.
18. Deborah Hastings, “Problems, Funding Plague Voting Panel,” AssociatedPress, June 23, 2008.
19. See, e.g., Norm Ornstein, “Voting Machine Mess Can’t Just Be Fixed byCongressional Bilks,” Roll Call, November 26, 2007.
20. Feldman, Halderman, and Felten, “Security Analysis.”21. As the Carter-Baker Commission has observed, “Most other democratic
countries have found ways to insulate election administration from politics andpartisanship by establishing truly autonomous, professional, and nonpartisanindependent national election commissions that function almost like a fourthbranch of government” (Building Confidence in U.S. Elections, 49). For helpfulcomparative surveys, see Michael Gallagher and Paul Mitchell, eds., The Politicsof Electoral Systems (New York: Oxford University Press, 2005); Louis Massicotte,Andreï Blais, and Antoine Yoshinaka, Establishing the Rules of the Game: Election
Notes to Chapter 1 147
Laws in Democracies (Toronto: University of Toronto Press, 2004); Administra-tion and Cost of Elections Project Survey, http://aceproject.org/.
22. For instance, most secretaries of state are elected, and many subsidiary elec-tion positions, such as membership on election boards, are either elected or awardedbased on partisan affiliation. See Hasen, “Beyond the Margin of Litigation,” 974.
23. Compare Samuel Issacharoff, “Gerrymandering and Political Cartels,”116 Harvard Law Review 593 (2002), with Nathan Persily, “In Defense of Foxes Guarding Henhouses: The Case for Judicial Acquiescence to Incumbent-Protecting Gerrymanders,” 116 Harvard Law Review 649 (2002).
24. Interview with Chris Nelson, January 25, 2008.25. Huefner, Tokaji, and Foley, From Registration to Recounts, 170; see also
David C. Kimball, Martha Kropf, and Lindsay Battles, “Helping America Vote?Election Administration, Partisanship, and Provisional Voting in the 2004 Elec-tion,” 5 Election Law Journal 447 (2006), which finds some evidence that parti-sanship influenced choices on provisional balloting rules.
26. Dan Tokaji, “The New Vote Denial: Where Election Reform Meets theVoting Rights Act,” 57 South Carolina Law Review 689 (2006).
27. The facts in this paragraph and the next are drawn from Huefner, Tokaji,and Foley, From Registration to Recounts, chap. 3; Laura A. Bischoff, “BlackwellPlays Pivotal Role in Elections, Dayton Daily News, October 4, 2004, 1A; JoeHallette, “Campaign Consequences: Blackwell Faces Own Referendum on Elec-tion Day,” Columbus Dispatch, October 19, 2004, 1A.
28. Interview with Trey Grayson, January 9, 2008.29. Grayson, interview.30. Interview with Conny McCormack, October 26, 2007.31. McCormack argues that there are “professional politicians” at the top and
“professional administrators” at the bottom of the election administration hierar-chy (McCormack, interview).
32. Robert Bauer, “Partisanship and the Dark Side of Election Law,”http://www.moresoftmoneyhardlaw.com/.
33. Interview with Joe Mansky, June 6, 2008.34. Tokaji, “Birth and Rebirth,” 121.35. Saltman, History and Politics, 185. 36. Kimball Brace, testimony before the Committee on House Administra-
tion, April 15, 2008.
148 Notes to Chapter 1
37. What follows is drawn from an interview conducted on June 23, 2008,and a handout Streater authored entitled “Duties of a County Clerk.”
38. Fischer and Coleman, “Election Reform.”39. Fischer and Coleman, “Election Reform,” 2–3, 6.40. Fischer and Coleman, “Election Reform,” 6.41. Fischer and Coleman, “Election Reform,” 31.42. Except where indicated, the quotations and information in the next three
paragraphs are drawn from an interview with Gary Smith on May 21, 2008.43. “GEOA Wage and Benefit Survey—2005” (on file with the author).44. Pew Election 2008 Forum, Washington, D.C., December 10, 2007.45. Interview with Matthew Damschroder, October 29, 2007.46. Or, perhaps more accurately, in elections we see a race to get as close to
the bottom as one can get without the entire system breaking down.47. Grayson, interview.48. Grayson, interview.49. Interview with Jennifer Brunner, January 28, 2008.50. The problem, of course, is that a standard with wiggle room will invite
reformers to shoehorn their favorite causes into the Index. Many reformers areconvinced that if they had a chance to sit down with everyday citizens, theycould persuade them of the importance of reforming campaign finance or re-enfranchising felons. We are likely to see a push from parts of the reform com-munity to expand the Democracy Index to measure not just the performance ofelection administrators, but the democratic health of the state itself. They maywant to rank states low for disenfranchising felons or failing to make affirmativeefforts to overcome the effects of poverty on participation rates. Reformers willargue, with some justification, that some of what I want to exclude from theIndex could properly be classified as mismanagement, or at least a departurefrom internationally defined best practices.
Though I am deeply sympathetic to these arguments, let me make the case forrestraint. If the Index is going to influence voters and policymakers, it must beperceived as a straight-down-the-middle, nonpartisan effort to measure howelection systems perform. It will be too easy to deflect politically if it becomesyet another laundry list of reformers’ (liberal) pet projects. Supporters of theIndex will spend all of their time arguing about the morality of felon disenfran-chisement or the sociology of poverty rather than whether ballots are being
Notes to Chapter 1 149
counted properly. To the election administrators in poor states whose buy-in isessential for the Index to work, it will seem that they have to do more than oth-ers to achieve the same score, that the Index measures luck, not skill. Remedyingthese bigger problems is important, but the Index is not the right tool to fix them.
51. The line between a policy input and a performance output can be fuzzy.For instance, a badly maintained registration list might be classified as a per-formance output, the result of a poor data-entry system. Or it might be thoughtof as a policy input in the voting process, one that will result in voters beingturned away from the polls on Election Day.
52. I am indebted to Cameron Quinn, the chief elections officer under Vir-ginia governor Jim Gilmore, for pushing me on these issues.
53. David Roodman, “Building and Running an Effective Policy Index:Lessons from the Commitment to Development Index,” March 2006, availableat http://www.cgdev.org/content/publications/detail/6661.
54. Roodman, “Building and Running an Index,” 7.55. Roodman, “Building and Running an Index,” 12.56. Charles Stewart III, “Residual Vote in the 2004 Election,” 5 Election Law
Journal 158 (2006).57. Stephen Ansolabehere and Charles Steward II, “Residual Vote Rates
Attributable to Technology,” 67 Journal of Politics 365, 366 (2005). 58. Let me expand on each of these points. During the early stages of develop-
ment, redundancy provides a safety net that helps us gauge whether each of themetrics is working. For instance, if the metrics don’t rise and fall together, thatshould tell us something useful about whether they are measuring the samething. Even setting aside the problem of uncertainty, a comprehensive set ofmetrics will make it harder for a jurisdiction to improve its standing by focusingon one or two problems and neglecting the rest of its duties. Any effort to divertresources to one metric will likely have ripple effects on other parts of the juris-diction’s scorecard. Moreover, trade-offs are inevitable in election reform; achange in one part of the system can cause problems elsewhere. We need to beconfident that both the costs and the benefits of any trade-offs are captured inthe Index, lest jurisdictions adopt policies that generate modest gains for some-thing included in the Index while creating problems in an areas not measured bythe Index. Finally, comprehensive metrics should provide a useful backstopagainst cheating. Multiple measurement strategies make it harder for jurisdic-tions to game the numbers. This strategy is particularly important when we are
150 Notes to Chapter 1
relying on jurisdictions to report their own data. Having at least one roughproxy from another source helps us figure out whether someone is cooking thebooks.
59. Presentation of Lynn Olson, Designing a Democracy Index Conference,September 28, 2007.
60. Charles Stewart III, “Measuring the Improvement (or Lack of Improve-ment) in Voting since 2000 in the U.S.,” Caltech/MIT Voting Technology Proj-ect, VTP Working Paper 36, August 2005, 7.
61. See chapter 4.62. Any effort at standardization will also require some statistical work. For
instance, designers of the Index will have to figure out what to do with the rawdata in order to compare numbers across states. Does one rank the states 1–50for each metric and then add up their rankings within a given category? Followthe example of the Environmental Performance Index and use a “proximity-to-target” approach, which estimates how close each state gets to the performancetarget in each area? For the EPI approach, see Yale Center for EnvironmentalLaw and Policy, Yale University, and Center for International Earth Science In-formation Network (CIESIN), Columbia University, Pilot 2006 EnvironmentalPerformance Index Report, 281, http://www.yale.edu/epi/2006EPI_Report_Full.pdf. Similarly, designers of the Index must figure out what to do with data thatfall at the tail end of the distribution. The danger is that a score in one categorymay be so low as to swamp all of the remaining categories when they are addedtogether. Statistical techniques are necessary to be sure you hold a state account-able for an unusually low score without making the entire Index turn on thatscore. The designers of the EPI, for instance, “winsorize” the lowest fifth percen-tile of the data; anything that falls below the fifth percentile mark is automaticallyconverted to the value that corresponds to the fifth percentile (EPI Report, 281).
63. Interview with Dan Esty, October 24, 2007; Roodman, “Building andRunning an Index,” 5; see also chapter 4 in this book. For instance, Philip Joyce,who has been involved in putting together the Government Performance Pro-ject, argues that the GPP could not use a single, composite ranking because it“implies a level of specificity that the data don’t really back up” (interview withPhilip Joyce, September 19, 2007). Another reason not to provide a single, com-posite ranking is that you believe the categories involved are sufficiently distinctthat you want to reward a state for doing well in one area even if it falls short inanother. This is the justification for the Quality Counts approach, which gives
Notes to Chapter 1 151
states letter grades in six areas but refuses to provide a single ranking (Olson,presentation at Designing a Democracy Index Conference).
64. Roodman, “Building and Running an Index.”
CHAPTER 2: THE PROMISE OF DATA-DRIVEN REFORM
1. What follows below is drawn from Spencer Overton’s published dissent tothe Carter-Baker Commission, “Dissenting Statement,” http://www.carterbakerdissent.com/dissent.php; an article he wrote on the controversy, “VoterIdentification,” 105 Michigan Law Review 631 (2007); and two phone inter-views. Direct quotations are attributed to the specific source in each instance.
2. Spencer Overton, Stealing Democracy: The New Politics of Voter Suppression(New York: Norton, 2006).
3. Interview with Spencer Overton, November 15, 2007.4. Carter-Baker Commission, Building Confidence in U.S. Elections.5. Carter-Baker Commission, Building Confidence in U.S. Elections, 18.6. Stephen Ansolabehere and Nathan Persily, “Voter Fraud in the Eye of the
Beholder: The Role of Public Opinion in the Challenge to Voter IdentificationRequirements,” 121 Harvard Law Review 1737 (2008).
7. Overton, “Voter Identification,” 634.8. Overton, “Dissenting Statement.”9. On the one hand, as Overton observed, his numbers might lead one to
overestimate the effect of an identification requirement. For example, voters whodon’t possess ID may “have lower participation rates,” so that an identificationrequirement may not have a significant effect on turnout (Overton, “VoterIdentification,” 660). Moreover, people who do not currently possess an IDmight try to get one rather than sit out an election (“Voter Identification,” 661).On the other hand, Overton’s numbers may underestimate the effect of anidentification requirement. For instance, even people who possess ID might bedeterred from voting because of the hassle involved in bringing it to the polls.(“Voter Identification,” 661).
10. Overton, “Voter Identification,” 636.11. Overton, “Voter Identification,” 635.12. Overton, interview.13. Crawford v. Marion County Election Board, 472 F.3d 949, 954 (2007)
(Evans, J., dissenting).
152 Notes to Chapter 1
14. Crawford v. Marion County Election Bd., 128 S. Ct. 1610 (2008).15. Lev Tolstoy, as translated by Diego Gambetta in “‘Claro! An Essay on Dis-
cursive Machismo,” in Deliberative Democracy, ed. Jon Elster (New York: Cam-bridge University Press, 1998), 19.
16. Hall and Tokaji, “Money for Data.” 17. Cal Tech/MIT Voting Technology Project, “Insuring the Integrity of the
Election Process: Recommendations for Consistent and Complete Reporting ofElection Data,” October 2004.
18. Stewart, “Measuring the Improvement,” 35.19. Hall and Tokaji, ”Money for Data.” The difference between absentee and
early ballots is complicated. If you are ever at an election administration cocktailparty and don’t know what to say, just raise the question, step back, and enjoyyour martini.
20. Carter-Baker Commission, Building Confidence in U.S. Elections, 57. 21. Election Assistance Commission, 2006 Election Administration and
Voting Survey, http://www.eac.gov/News/press/clearinghouse/2006-election-administration-and-voting-survey.
22. 42 U.S.C. § 15322.23. The three reports that the EAC published on election administration are
2006 Election Administration and Voting Survey, 2005–2006 National Voter Regis-tration Act Survey, and 2006 Uniformed and Overseas Citizen Voting Act, all avail-able at http://www.eac.gov/clearinghouse/reports-and-surveys/.
24. Many thanks to Peter Miller for his work in creating this ranking and tothe folks at the Pew Center on the States and electionline.org for suggesting theidea in the first place. For a full view of the scoring prior to aggregation, seedemocracyindex.com.
25. These included (1) the numbers of active and inactive voters, (2) the num-ber of voters registered on Election Day (for the states that allow for ElectionDay registration), (3) the manner and location voters were registered, (4) thenumber of registrations rejected and the reasons for the rejection, (5) the num-ber of registrations removed and reasons for the removal, (6) the number of bal-lots cast and counted, (7) reasons for rejecting provisional ballots, (8) the reasonsfor rejecting domestic absentee ballots, (9) the number of undervotes and over-votes, (10) information regarding the number of precincts and polling places,poll worker information, and information regarding the accessibility of pollingplaces for people with disabilities, (11) the number of ballots cast and counted
Notes to Chapter 2 153
from voters covered by UOCAVA (overseas voters, domestic military voters, andoverseas civilian voters), (12) the number of absentee ballots sent and receivedunder UOCAVA, (13) the number of UOCAVA ballots that were rejected.These categories correspond to the data categories in each report. Because the ju-risdiction count was unavailable for overvote and undervote reporting below thestate level, this category was excluded from the ranking.
26. A state that reported 100 percent of its data in a given category wasawarded a 1. A state that reported all of the data requested for only half of itsjurisdictions would receive a 0.5 in that category. For a state like Alaska, whichreports only at the state level, the state was treated as a single jurisdiction. So,too, a state that reported half of the data requested for all of its jurisdictionswould receive a 0.5 in that category as well.
27. For instance, localities that reported a 0 in a given category (rather thanleaving it blank) were counted as properly reporting their data even when it wasdifficult to believe that the score represents an accurate report. As noted in thetext, several states reported that there were zero votes were cast by overseas mili-tary voters. Further, as noted above, because the jurisdiction count was unavail-able for overvotes and undervotes reporting below the state level, this categorywas excluded from the ranking.
28. Alabama, for instance, tended to have high reporting rates for some por-tions of each survey but quite low reporting rates for others, resulting in a verylow overall ranking. Similarly, Vermont provided complete or near-completedata for basic questions (e.g., how many provisional ballots or absentee ballotswere rejected) but failed to report data on the reasons why these ballots wererejected. While the latter information is important for reasons I outline below,Vermont at least had good data on the primary questions.
29.. For the full table, see democracyindex.com. 30. The information in this and the next paragraph was provided by Peter
Miller, who played a significant role in pulling the EAC study together.31. Carter-Baker Commission, Building Confidence in U.S. Elections, 54.32. Ian Ayres, Super Crunchers: Why Thinking-by-Numbers Is the New Way to
Be Smart (New York: Bantam, 2007).33. Emily Nelson, “Retailing: Why Wal-Mart Sings, ‘Yes, We Have Bananas!’”
Wall Street Journal, October 6, 1998, B1.34. Constance L. Hays, “What Wal-Mart Knows about Customers’ Habits,”
New York Times, November 14, 2005.
154 Notes to Chapter 2
35. “Priority Is Clear: Improve the Shopping Experience,” MMR, December11, 2006, 53.
36. See, e.g., Brennan Center for Justice, The Machinery of Democracy: VotingSystem Security, Accessibility, Usability, and Cost, 2006, http://brennan.3cdn.net/cb325689a9bbe2930e_0am6b09p4.pdf.
37. Stewart, “Measuring the Improvement,” 23 (“The best data we have to trackhow the use of voting machines is evolving is still imprecise and incomplete”).
38. See, e.g., Julia Melkers and Katherine Willoughby, Staying the Course: TheUse of Performance Measurements in State Governments, IBM Center for Businessand Government, November 2004, http://www.businessofgovernment.org/pdfs/MelkersReport.pdf.
39. For a survey, see Harry P. Hatry, Elaine Morley, Shelli B. Rossman, andJoseph S. Wholey, How Federal Programs Use Outcome Information: Opportunitiesfor Federal Managers, IBM Center for Business and Government, May 2003,http://www.businessofgovernment.org/pdfs/HatryReport.pdf.
40. For a useful sampling of these programs, see Daniel C. Esty and ReeceRushing, Governing by the Numbers: The Promise of Data-Driven Policymaking inthe Information Age, April 23, 2007, http://www.americanprogress.org/issues/2007/04/data_driven_policy.html.
41. See, e.g., Paul O’Connell, Using Performance Data for Accountability: TheNew York City Police Department’s CompStat Model of Police Management, IBMCenter for Business and Government, August 2001, http://www.businessofgovernment.org/pdfs/Oconnell_Report.pdf.
42. For a comprehensive but perhaps unduly cheerful analysis of CitiStat, seeRobert D. Behn, What All Mayors Would Like to Know about Baltimore’s CitiStatPerformance Strategy, IBM Center for Business and Government, 2007, http://www.businessofgovernment.org/pdfs/BehnReportCiti.pdf.
43. Behn, What All Mayors Would Like to Know, 9.44. O’Connell, Using Performance Data for Accountability.45. Hatry et al., How Federal Programs Use Outcome Information, 37–43.46. Hatry et al., How Federal Programs Use Outcome Information, 57–58.47. Hatry et al., How Federal Programs Use Outcome Information, 21–30.48. Charles P. Kindleberger, Manias, Panics, and Crashes: A History of Finan-
cial Crises, 4th ed. (New York: Wiley, 2000), 105.49. Federal Agencies with Statistical Programs, http://www.fedstats.gov/
agencies/.
Notes to Chapter 2 155
50. The facts in this section were drawn from interviews I conducted withEsty as well as his writings. Direct quotations from those interviews and his writ-ings are cited individually.
51. Daniel Esty, Greening the GATT: Trade, Environment, and the Future(Washington, D.C.: Institute for International Economics, 1994).
52. Esty, interview.53. The report is available at http://www.weforum.org/en/initiatives/gcp/
Global%20Competitiveness%20Report/Index.htm. 54. Dan Esty, presentation at Designing a Democracy Index Conference,
Columbus, Ohio, September 29, 2007.55. The ranking and information on its constructions is available at http://
www.yale.edu/epi/. 56. See http://sedac.ciesin.columbia.edu/es/esi/rank_01.html.57. http://www.yale.edu/epi/.58. Esty, presentation at Designing a Democracy Index Conference.59. http://www.carbonfootprint.com/. 60. Esty, interview.61. Esty, interview.62. Esty, interview.63. Esty, interview. 64. Tokaji, “Moneyball Approach.”65. Roger Angell, Once More around the Park: A Baseball Reader (New York:
Ballantine, 1991), 4. Many thanks to Doug Chapin for sharing this with me.66. Michael Lewis, Moneyball: The Art of Winning an Unfair Game (New
York: Norton, 2003).67. Tokaji, “Moneyball Approach.”68. Tokaji, “Moneyball Approach.”69. Tokaji, “Moneyball Approach.”70. The information in this paragraph is all drawn from an interview with
Bob Murphy, July 8, 2008.71. Smith, interview.72. Gary Smith, “Using GIS Data to Confirm Viability of Early Voting Sites,”
http://datafordemocracy.org/blog/?q=node/17. 73. Interview with Joe Mansky, May 6, 2008.74. Huefner, Tokaji, and Foley, From Registration to Recounts, v.
156 Notes to Chapter 2
75. Some initial answers to these questions have been offered by a group ofscholars based on an in-depth, qualitative study of five election systems in theMidwest (Huefner, Tokaji, and Foley, From Registration to Recounts). This impor-tant study should be immensely useful in trying to figure out how to generateanswers to these questions on a larger scale once better data becomes available.
76. New State Ice Co. v. Liebmann, 285 U.S. 262, 311 (1932) (Brandeis, J.,dissenting). Scholars of “democratic experimentalism” have explored the practi-cal and theoretical dimensions of benchmarking in the governance context. See, e.g., Joshua Cohen and Charles Sabel, “Directly-Deliberative Polyarchy,” 3 European Law Journal 313 (1997); Michael Dorf and Charles F. Sabel, “AConstitution of Democratic Experimentalism,” 98 Columbia Law Review267 (1988).
CHAPTER 3: THE POLITICS OF REFORM AND THE PROMISE OF RANKING
1. Public choice scholars would not be surprised that an issue that affectseveryone is not at the forefront of the political agenda. Oddly enough, minoritygroups—sometimes condemned as “special interests”—are often the ones thatsucceed best in a majoritarian system like our own. See, e.g., Bruce Ackerman,“Beyond Carolene Products,” 98 Harvard Law Review 713 (1985). Political scien-tist Robert Dahl famously claimed that “minorities rule” in the United States;coalitions of organized interest groups join together to form majorities and getlegislation passed. Robert Dahl, A Preface to Democratic Theory (Chicago: Uni-versity of Chicago Press, 1956), 133. Or, as Jesse Jackson put it, “In politics, anorganized minority is a political majority” (CNN, Both Sides with Jesse Jackson,Transcript 0013000V49, January 30, 2000). What matters in a system where“minorities rule” is the ability to organize—to turn out the vote, lobby represen-tatives, and raise money. And it is often easier to organize a small, easilyidentified group with a concrete complaint than it is to get a large majorityaffected by a diffuse harm to coalesce. The public choice explanation is not, ofcourse, a complete answer. Other problems that impose diffuse harms are salientto voters and thus to politicians. For instance, politicians are careful to sketchout positions on things like the environment or foreign policy. Moreover, politi-cians are notoriously risk averse; none of them is going to be enthusiastic about
Notes to Chapter 2 157
flouting the preferences of the majority even when no special interest group isthere to fight about it.
2. Building on the work of Erving Goffman in Frame Analysis: An Essay on theOrganization of Experience (New York: Harper and Row, 1974), social scientistshave extensively analyzed the ways that issues are presented to, and affect the be-havior of, voters. For a sampling of this literature, see Frank R. Baumgartner andBryan D. Jones, Agendas and Instability in American Politics (Chicago: Universityof Chicago Press, 1993); Dennis Chong and James N. Druckman, “FramingTheory,” 10 American Review of Political Science 103 (2007); James N. Druck-man, “Political Preference Formation: Competition, Deliberation, and the(Ir)relevance of Framing Effects,” 98 American Political Science Review 671(2004); Shanto Iyengar and Donald Kinder, News That Matters: Television andAmerican Opinion (Chicago: University of Chicago Press, 1987); William H.Riker, The Art of Political Manipulation (New Haven: Yale University Press,1986); Deborah A. Stone, Policy Paradox and Political Reason (Glenview, Ill.:Scott, Foresman, 1988); Deborah A. Stone, “Causal Stories and the Formationof Policy Agendas,” 104 Political Science Quarterly 281 (1989).
3. Interview with Jonah Goldman, January 4, 2008.4. Lest you think that only a law professor would feel the need to footnote
this claim, it is worth noting that many scholars argue, with some evidence, thatvoters cast their ballots in an irrational fashion. See, e.g., Bryan Caplan, TheMyth of the Rational Voter: Why Democracies Choose Bad Policies (Princeton, N.J.:Princeton University Press, 2007). Arguments like these often underestimate theuseful role that heuristics can play in guiding voting behavior, a point nicelymade by David Schleicher in his review of Caplan’s book in “Irrational Voters,Rational Voting,” 7 Election Law Journal 149.
5. Take a look at the fights that recently took place over redistricting reform inOhio and California. Rightly or wrongly, those were precisely the kinds of accu-sations levied against those trying to prevent legislators from drawing their owndistricts. In Ohio, for instance, critics of the initiative repeatedly branded it aDemocratic power grab. See, e.g., “Case against Issue 4 Takes a Hit,” DaytonDaily News, November 3, 2005, at A14 (“From the beginning of the debateabout Issue 4, critics have portrayed it as a Democratic effort to take power fromRepublicans”); Kevin O’Brien, “Reform Ohio Now? No, No, and No,” Cleve-land Plain Dealer, October 19, 2005, B11 (“It’s easy to see why Republicansdon’t want to see Ohio change the rules that govern political fund-raising, leg-
158 Notes to Chapter 3
islative district mapping, elections supervision and political fund-raising. Theyhold all of the high cards at the moment. . . . It’s just as easy to see why theDemocrats are dying to change the rules. They’re so short of high cards, they’vepractically been dealt out of the game”).
6. Aha. I knew you’d be curious enough to peek at the note. See http://www.natives.co.uk/news/2002/0502/08iron.htm.
7. See http://www.usarps.com/Index.php. I should emphasize here that I sidewith Demetri Martin, who is flummoxed as to why paper can beat rock just bycovering it. He proposes instead that the game should be called, “rock, dynamitewith a cuttable wick, scissors” (http://www.devilducky.com/media/79750/).
8. See http://www.westmountgolf.com/mcindex.htm. 9. A recent study reveals that two of five voters surveyed stated that “they
could not evaluate their local election administrator.” Lonna R. Atkeson andKyle L. Saunders, “The Effect of Election Administration on Voter Confidence:A Local Matter?” 15 PS 655, 659 (2007).
10. Esty, interview.11. See, e.g., Samuel L. Popkin, The Reasoning Voter: Communication and
Persuasion in Presidential Campaigns, 2nd ed. (Chicago: University of ChicagoPress, 1994).
12. For early work in what is now a vast literature, see, e.g., John H. Aldrich,Why Parties? The Origin and Transformation of Political Parties in America (Chi-cago: University of Chicago Press, 1995); Bernard R. Berelson, Paul F. Lazars-feld, and William N. McPhee, Voting: A Study of Opinion Formation in Presiden-tial Campaigns (Chicago: University of Chicago Press, 1954); Angus Campbell,Philip E. Converse, Warren E. Miller, and Donald E. Stokes, The American Voter(New York: Wiley, 1960); V. O. Key, Jr. and Frank Munger, “Social Determin-ism and Electoral Decisions: The Case of Indiana,” in American Voting Behavior,ed. Eugene Burdick and Arthur J. Brodbeck (Glencoe, Ill.: Free Press, 1959).
13. See, e.g., Richard R. Lau and David P. Redlawski, “Voting Correctly,” 91American Political Science Review 585, 590 (1997); Arthur Lupia, “Shortcuts ver-sus Encyclopedias: Information and Voting Behavior in California Insurance Re-form Elections,” 88 American Political Science Review 63 (1994); Arthur Lupia,“Dumber Than Chimps? An Assessment of Direct Democracy Voters,” in Dan-gerous Democracy? The Battle over Ballot Initiatives in American, ed. Larry Sabato,Howard R. Ernst, and Bruce A. Larson (Lanham, Md.: Rowman and Littlefield,2001); Popkin, The Reasoning Voter.
Notes to Chapter 3 159
14. Berelson, Lazarsfeld, and McPhee, Voting, 321.15. Indeed, a major movement within political science insists that we need
strong, cohesive parties in order to give voters a better predictive cue as to howcandidates will vote. Better party cues, the argument goes, means greater ac-countability. This notion of “responsible party government” was first endorsedby the American Political Science Association’s Committee on Political Parties in1950. See American Political Science Association, “Toward a More ResponsibleTwo-Party System: A Report of the Committee on Political Parties,” 44 Ameri-can Political Science Review (Supp. Sept. 1950).
16. This sentence oversimplifies things a bit. As I have noted, whether theDemocracy Index gets traction will depend on what is happening in the politicalarena.
17. News release, Office of Governor Chris Gregoire, “Washington Earns TopRating for Managing Public Resources,” March 3, 2008; news release, “VirginiaGets Top Grade in Performance,” March 3, 2008.
18. See, e.g., David Schleicher, “Why Is There No Partisan Competition inLocal Elections? The Role of Election Law,” 23 Journal of Law and Politics 419(2008).
19. I am indebted to David Schleicher, whose work on the role of partisanheuristics in local elections suggested this line of criticism and whose conversa-tion helped me work out a response.
20. Michael S. Kang, “The Hydraulics of Politics and Party Regulation,” 91Iowa Law Review 131, 151 (2005).
21. Thanks to an anonymous reviewer for suggesting this line of critique.22. Caltech/MIT Voting Technology Project, “Insuring the Integrity.”23. Caltech/MIT Voting Technology Project, “Insuring the Integrity.”24. Press release, “Brennan Center Report Finds New Improvements in New
Voting Technology Being Implemented in Several States,” http://www.brennancenter.org/content/resource/brennan_center_report_finds_improvements_in_new_voting_technology_being_imp.
25. Government Performance Project: “About Us,”http://www.gpponline.org/AboutUs.aspx.
26. Unless otherwise noted, what follows in the next two paragraphs is drawnfrom an interview with Richard Greene conducted on June 12, 2008.
27. David S. Broder, “Managing: An Affair of States,” Washington Post, March9, 2008, B7.
160 Notes to Chapter 3
28. Pew Center for the States, Government Performance Project, http://www.pewcenteronthestates.org/states_overview.aspx?abrv=GA.
29. http://sedac.ciesin.columbia.edu/es/esi/rank_01.html.30. Esty, interview.31. For a survey of this literature, see the section “Can the Democracy Index
Help?” in this chapter.32. Interview with Cameron Quinn, December 21, 2007.33. http://www.imdb.com/title/tt0417433/quotes. Many thanks to David
Pervin for suggesting the reference.34. Levitt, interview.35. Thanks to an anonymous reviewer for offering this critique.36. E. E. Schattschneider, The Semisovereign People: A Realist’s View of Democ-
racy in America (New York: Holt, Rinehart and Winston, 1960), 68.37. See the works cited in note 2 to this chapter.38. Goldman, interview. For an excellent overview of the role of framing in
this debate, see R. Michael Alvarez and Thad E. Hall, Electronic Elections: ThePerils and Promises of Digital Democracy (Princeton, N.J.: Princeton UniversityPress, 2008).
39. See, e.g., Daniel Tokaji, “The Paperless Trail: Electronic Voting and Dem-ocratic Values,” 73 Fordham Law Review 1711 (2005).
40. See, e.g., HR 811 (the “Holt bill”).41. Political competition represents an important force in shaping public
opinion. As Robert Bennett explains, “American democracy is an extraordinaryengine for producing a conversation about democratic affairs” that ultimatelyshapes “the content of public policy decisions.” Robert W. Bennett, Talking ItThrough: Puzzles of American Democracy (Ithaca, N.Y.: Cornell University Press,2003), 2. The fuel for that engine is political competition, as political leaderscompete against one another to “shape, coordinate, and frame the public’sunderstanding about electoral politics, public policy, and civic affairs.” MichaelKang, “Race and Democratic Contestation,” Yale Law Journal, forthcoming,draft at 15–16. The literature on the relationship between political competitionand public opinion dates back at least to the work of venerable political scientistslike V. O. Key and Schattschneider. See, e.g., V. O. Key, The Responsible Elec-torate: Rationality in Presidential Voting, 1936–1960 (Cambridge: Belknap Pressof Harvard University Press, 1966); and Schattschneider, The SemisovereignPeople. Scholars often call these leaders “political entrepreneurs” because of the
Notes to Chapter 3 161
creative ways in which they forge new platforms, frame issues, and exploit latentpolitical energies in the process of building new political coalitions. See, e.g.,Kang, “Race and Democratic Contestation,” 4 n. 17. For a necessarily incom-plete sampling of the seminal work in this area, see William H. Riker, TheStrategy of Rhetoric: Campaigning for the American Constitution, ed. Randall L.Calvert, John Mueller, and Rick K. Wilson (New Haven: Yale University Press,1996); Schattschneider, The Semisovereign People; Key; The Responsible Electorate;Roger W. Cobb and Charles D. Elder, Participation in American Politics: TheDynamics of Agenda-Building (Boston: Allyn and Bacon, 1972).
42. One could, of course, make an argument like this about most “latent”reform platforms that are amenable to effective framing. But few issues are asclosely linked to partisan politics as this one. We are already waging politicalbattles in which the Index could be used as a partisan weapon.
43. http://eirs.cs.net:8080/EIRS_WEB/User/findHome.do. 44. Stewart, “Measuring the Improvement,” 16.45. Goldman, interview.46. Goldman, interview.47. Anonymous interview, April 15, 2008.48. Presentation of Lynn Olson, Designing a Democracy Index Conference,
September 28, 2007.49. Joyce, interview.50. Grayson, interview.51. Pew Journalists Forum, December 10, 2007.52. As Bruce Cain observes:
[T]he real effects of reform are usually smaller in every direction . . .mainly because of their intermingling with other factors that work in theopposite direction. . . . Because reform is usually made in a politicallycharged setting, the claims and counter-claims of opposing sides are oftenexaggerated and simplistic. Campaign finance reformers, for example,often imply that a proposed change will lessen corruption or lower elec-tion costs. Redistricting changes promise neutral and fair procedures, orhigher levels of competition. New voting technology was supposed to endvoter confusion and restore confidence in the election process. . . . In fact,the claims on both sides rarely live up to the hype. (“Reform Studies,” 637)
53. Doug Caruso, “Vendor’s Donation Questioned,” Columbus Dispatch, July16, 2005.
162 Notes to Chapter 3

54. See, e.g., Farhad Manjoo, “Was the 2004 Election Stolen? No,” http://www.salon.com (making this argument and quoting William Anthony).
55. http://www.franklincountyohio.gov/commissioners/budget.56. Jerry L. Mashaw, “Structuring a “Dense Complexity”: Accountability
and the Project of Administrative Law,” Issues in Legal Scholarship, March 2005,http://www.bepress.com/ils/iss6.art4.
57. Cass Sunstein and others, for instance, have written about the pressures ofconformity upon individuals. Cass R. Sunstein, Why Societies Need Dissent(Cambridge: Harvard University Press, 2003). One of the results of conformityis a decision-making “cascade” (Sunstein, 10–11). If one set of decision makersor “early movers” converges on a particular option, subsequent decision makers—influenced by the agreement of the first movers—make the same choice even ifthey would not have reached such a decision independently (Sunstein, 10–11,defining conformity and cascades). Sunstein also explains both why reasonablepeople rely on the decisions of first movers and why this tendency sometimes hasunfortunate consequences (54–73).
58. The global polity “consists of much more than a ‘system of states’ or‘world economy’ or ‘international system.’ Rather, the global environment is asea teaming with a great variety of social units—states and their associated poli-ties, military alliances, business enterprises, social movements, terrorists, politicalactivists, nongovernmental organizations—all of which may be involved in rela-tions with the polity.” John Boli, “Sovereignty from a World Polity Perspective,”in Problematic Sovereignty: Contested Rules and Political Possibilities, ed. StephenD. Krasner (New York: Columbia University Press, 2001), 59–60. For a helpfulsurvey of this literature, see John W. Meyer, “The World Polity and the Author-ity of the Nation-States,” in Studies of the Modern World-System, ed. AlbertBergesen (New York: Academic Press, 1980); John W. Meyer, John Boli, GeorgeM. Thomas, and Francisco O. Ramirez, “World Society and the Nation-State,”103 American Journal of Sociology 144 (1997); Martha Finnemore, “Norms, Cul-ture, and World Politics: Insights from Sociology’s Institutionalism,” 50 Interna-tional Organization 325 (1996); Gili Drori, John W. Meyer, and Hokyu Hwang,eds., Globalization and Organization: World Society and Organizational Change(New York: Oxford University Press, 2006). For a general introduction to thesocial science behind the global polity literature, see W. Richard Scott, Institu-tions and Organizations, 2nd ed. (Thousand Oaks, Calif.: Sage, 2001). RyanGoodman and Derek Jinks have led the way in connecting this literature to legal
Notes to Chapter 3 163
scholarship and exploring its potential ramifications for international law, par-ticularly human rights law. See Ryan Goodman and Derek Jinks, “Towards anInstitutional Theory of Sovereignty,” 55 Stanford Law Review 1749 (2003); RyanGoodman and Derek Jinks, “How to Influence States: Socialization and Inter-national Human Rights Law,” 54 Duke Law Journal 621 (2004).
59. Gili Drori, John W. Meyer, Francisco O. Ramirez, and Evan Schofer, Sci-ence in the Modern World Polity: Institutionalization and Globalization (Stanford,Calif.: Stanford University Press, 2003), ix. For instance, nation-states deploysimilar record-keeping systems and mandate mass education in school systemsusing similar curricula and administrative structures. Isomorphism and decou-pling have been found in “constitutional forms emphasizing both state powerand individual rights, mass schooling systems organized around a fairly standardcurriculum, rationalized economic and demographic record keeping and datesystems, antinatalist population control policies intended to enhance nationaldevelopment, formally equalized female states and rights, expanded humanrights in general, expansive environmental policies, development-orientedeconomic policy, universalistic welfare systems, standard definitions of diseaseand health care and even some basic demographic variables.” See Meyer et al.,“World Society and the Nation-State, 152–53. See also David John Frank, Suk-Ying Wong, John W. Meyer, and Francisco O. Ramirez, “What Counts as His-tory: A Cross-National and Longitudinal Study of University Curricula,” 44Comparative Education Review 29 (2000); John W. Meyer, “The Changing Cul-tural Content of World Society,” in State/Culture: State-Formation after the Cul-tural Turn, ed. George Steinmetz (Ithaca, N.Y.: Cornell University Press, 1999);Karen Bradley and Francisco O. Ramirez, “World Polity Promotion of GenderParity: Women’s Share of Higher Education, 1965–85,” 11 Research in Sociologyof Education and Socialization 63 (1996).
60. See Finnemore, “Norms, Culture, and World Politics,” 336–37. Similarly,the enrollment of women in institutions of higher education, for example, in-creased around the world at roughly the same rate and at about the same time inWestern and non-Western countries. See Bradley and Ramirez, “World PolityPromotion.”
61. Martha Finnemore, “International Organizations as Teachers of Norms:The United Nations Educational, Scientific, and Cultural Organization and Sci-ence Policy,” 47 International Organization 567, 593 (1993).
164 Notes to Chapter 3
62. See, e.g., Jack L. Walker, “The Diffusion of Innovations among the Amer-ican States,” 63 American Political Science Review 880 (1969); Virginia Gray, “In-novation in the States: A Diffusion Study,” 67 American Political Science Review1174 (1973).
63. This literature is vast, so what follows is only a sampling drawn primarilyfrom the work of sociologists and political scientists. See, e.g., Frances StokesBerry and William D. Berry, “State Lottery Adoptions as Policy Innovations: An Event History Analysis,” 84 American Political Science Review 395 (1990);Frances Stokes Berry and William D. Berry, “Tax Innovation in the States: Capi-talizing on Political Opportunity,” 36 American Journal of Political Science 715(1992); Frances Stokes Berry and William D. Berry, “Innovation and DiffusionModels in Policy Research,” in Theories of the Policy Process, ed. Paul A. Sabatier(Boulder, Colo.: Westview Press, 1999); Karen Mossberger, The Politics of Ideasand the Spread of Enterprise Zones (Washington, D.C.: Georgetown UniversityPress, 2000); Henry R. Glick, The Right to Die: Policy Innovation and Its Conse-quences (New York: Columbia University Press, 1992); Michael Mintrom, “Pol-icy Entrepreneurs and the Diffusion of Innovation,” 41 American Journal ofPolitical Science 738 (1997); Michael Mintrom and Sandra Vergari, “Policy Net-works and Innovation Diffusion: The Case of State Education Reforms,” 60Journal of Politics 126 (1998); Andrew Karch, Democratic Laboratories: PolicyDiffusion among the American States (Ann Arbor: University of Michigan Press,2007); Anne Schneider and Helen Ingram, “Systematically Pitching Ideas: AComparative Approach to Policy Design,” 8 Journal of Public Policy 61, 62(1988); Richard Rose, Lesson-Drawing in Public Policy: A Guide to Learningacross Time and Space (Chatham, N.J.: Chatham House, 1993); David L.Weimer, “The Current State of Design Craft: Borrowing, Tinkering, and Prob-lem Solving,” 55 Public Administration Review 110 (1993); Steven J. Balla, “Interstate Professional Associations and the Diffusion of Policy Innovations,”29 American Politics Research 221 (2001); Harold Wolman and Ed Page, “PolicyTransfer among Local Governments: An Information-Theory Approach, 15Governance 477, 496–98 (2002). For a critical take on some of this work, seeChristopher Z. Mooney, “Modeling Regional Effects on State Policy Diffusion,”54 Political Research Quarterly 103 (2001) (questioning whether regional effectson diffusion are as pronounced as prior work has suggested). For examination ofinterstate diffusion among European Union states and Canadian provinces, see
Notes to Chapter 3 165
Katerina Linos, “When Do Policy Innovations Spread? Lessons for Advocates ofLine Drawing,” 199 Harvard Law Review 1467 (2006); Katerina Linos, “HowCan International Organizations Shape National Welfare States? Evidence fromCompliance with European Union Directives,” 40 Comparative Political Studies547 (2007); James M. Luz, “Emulation and Policy Adoptions in CanadianProvinces,” 22 Canadian Journal of Political Studies 147 (1989); Dale H. Pole,“The Diffusion of Legislation among Canadian Provinces: A Statistical Analy-sis,” 9 Canadian Journal of Political Studies 605 (1976). For a survey of the litera-ture on diffusion among nonstate organizations, see David Strang and Sarah A.Soule, “Diffusion in Organizations and Social Movements: From Hybrid Cornto Poison Pills,” 24 Annual Review of Sociology 265 (1998). As one of the earliestpieces in the field explains, policy diffusion takes place within “a national systemof emulation and competition” (Walker, “Diffusion of Innovations,” 898). Anetwork that “links together the centers of research and generation of new ideas,national associations of professional administrators, interest groups, and volun-tary associations” helps establish “a set of norms or national standards for properadministration” (898).
64. Karch, Democratic Laboratories, 2–3.65. Karch, Democratic Laboratories, 7–8.66. A recent survey indicates that 60 percent of local officials do not belong to
a national professional association, and one-quarter of local officials do not be-long to any professional association. Eric A. Fischer and Kevin J. Coleman,“Election Reform and Local Election Officials: Results of Two National Sur-veys,” Congressional Research Service Report for Congress, RL-34363, February 7,2008, 5–6.
67. Grayson, interview; Goldman, interview; interview with anonymous elec-tion official. It is worth noting that these organizations lack the resources theyneed to provide such broad services to their members. The National Associationof Secretaries of State, for instance, has an extraordinarily small staff and has ac-complished an impressive amount with the staff it possesses.
68. Interview with Leslie Reynolds, December 11, 2007.69. Interview with Ray Martinez, January 24, 2008.70. Anonymous interview, April 15, 2008.71. Smith, interview.72. Linos, “When Do Policy Innovations Spread?” 1473; Strang and Soule,
“Diffusion in Organizations,” 274–75.
166 Notes to Chapter 3
73. Joyce, interview.74. Nelson, interview.75. Nelson, interview.76. Karch, Democratic Laboratories, 8. This is, to be sure, not a conclusion
reached only by political scientists. Sociologists Harold Wolman and Ed Page,for instance, have reached a similar conclusion. Harold Wolman and EdwardPage, “Policy Transfers among Local Governments,” 15 Governance 477, 498(2002).
77. Balla, “Interstate Professional Associations”; Karch, Democratic Laborato-ries, 105–43. For work in sociology exploring similar themes in the context ofprivate institutions, see, e.g., Lauren B. Edelman, Christopher Uggen, andHoward S. Erlanger, “The Endogeneity of Legal Regulation: Grievance Proce-dures as Rational Myth,” 105 American Journal of Sociology 406 (1999); LaurenEdelman, “Legal Environments and Organizational Governance: The Expansionof Due Process in the Workplace,” 95 American Journal of Sociology 1401 (1999).
78. Mintrom, “Policy Entrepreneurs”; Mintrom and Vergari, “Policy Networks.”79. Karch, Democratic Laboratories.80. Karch, Democratic Laboratories, 31.81. Karch, Democratic Laboratories, 8.82. Karch, Democratic Laboratories, 9.83. Greene, interview.
CHAPTER 4: IS THE GAME WORTH THE CANDLE?
1. Stein Ringen, What Democracy Is For: On Freedom and Moral Government283 (Princeton, N.J.: Princeton University Press, 2007).
2. Esty, interview.3. Indeed, this is true of both of the democracy indexes that exist—the
“Index of democracy” put out by the Economist, www.economist.com/media/DEMOCRACY_INDEX_2007_v3.pdf, and the “Democracy Index” put out byFair Vote, http://www.fairvote.org/?page=729.
4. Esty, interview.5. Esty, interview.6. Angell, Once More around the Park, 4.7. Interview with David Roodman, February 1, 2008.8. Roodman, “Building and Running an Index.” 2
Notes to Chapter 3 167
9. Ringen, What Democracy Is For, 284.10. Michael Maslin, cartoon, New Yorker July 23, 2001.11. Greene, interview.12. Ringen, What Democracy Is For, 284.13. Yale Center for Environmental Law and Policy and CIESIN, EPI Report,
285.14. Esty, interview.15. Roodman, interview.16. Roodman, interview.17. Thanks to Christine Jolls for offering this suggestion.18. There is, needless to say, a cost to change. As David Roodman, an archi-
tect of the Commitment to Development Index, observes, when an Index“jump[s] from year to year,” it undermines the Index’s ability to serve as a “policymetric.” Nonetheless, Roodman argues—correctly, in my view—“the benefits ofpublic learning—a more credible Index—will outweigh the costs provided thatthe Index methodology stabilizes in due course.” Roodman, “Building and Run-ning an Index,” 8.
19. Esty, presentation at Designing a Democracy Index Conference.20. Roodman, “Building and Running an Index,” 12.21. Ringen, What Democracy Is For, 284.22. Oxford’s Stein Ringen frames the question similarly but offers a different
answer. He argues that the decision whether to rank depends on whether onewants to “guide decisionmakers towards good decisions” or “assist towards arational political process” (What Democracy Is For, 285). In his view, these cate-gories boil down to “measurement” and “social reporting” (286). When deci-sion makers just need information about facts on the ground in order to decide,indexing is a sensible strategy. But, argues Ringen, when the issue at stake in-volves “political, normative, or moral questions,” indexing improperly short-circuits the deliberative process (285–86).
23. For the substantive pros and cons of the U.S. News & World Report rank-ings, with most people firmly in the con camp, compare, e.g., Ronald G. Ehren-berg, “Method or Madness: Inside the U.S. News & World Report Rankings,” 29Journal of College Admission 29 (2005); Stephen Klein and Laura Hamilton,“The Validity of the U.S. News & World Report Ranking of ABA Law Schools,”report commissioned by the American Association of Law Schools, February 18,1998, http://www.aals.org/reports/validity.html; Shuky Ehrenberg, “A Question
168 Notes to Chapter 4
of Rank: An Empirical Investigation into Law School Rank Maximizing Strate-gies, with a Focus on Admissions Decisions,” 10, http://papers.ssrn.com/sol3/papers.cfm?abstract_id=976200; and Michael Sauder and Ryan Lancaster, “DoRankings Matter? The Effects of U.S. News & World Report Rankings on theAdmissions Process of Law Schools,” 40 Law and Society Review 105, 106(2006); with Mitchell Berger, “Why the U.S. News and World Report Law SchoolRankings Are Both Useful and Important,” 51 Journal of Legal Education 487(2001); and “Indiana University School of Law 2005 Symposium on the NextGeneration of Law School Rankings,” 81 Indiana Law Journal 1 (2006). It isworth noting that some critics of the U.S. News & World Report rankings quarrelwith its methodology, but not the idea of ranking itself. For instance, BrianLeiter, one of the most trenchant critics, believes that a good ranking is possible.See “Brian Leiter’s Law School Rankings,” http://www.leiterrankings.com/.
24. Alex Wellen, “The $8.78 Million Maneuver,” New York Times, July 31,2005.
25. Wellen, “The $8.78 Million Maneuver.”26. Wellen, “The $8.78 Million Maneuver.”27. Wellen, “The $8.78 Million Maneuver.” 28. For a useful analysis of this problem, see Esty and Rushing, Governing by
the Numbers, 38.29. Joyce, interview.30. It is worth noting that this requirement has generated a good deal of debate
and controversy among corporations and academics. Congress would have tothink hard about the lessons learned from Sarbanes-Oxley before taking this path.
31. Esty, interview.32. Megan Greenfield, “The People’s Revenge,” Washington Post, June 14,
1978, A27.
CHAPTER 5: GETTING FROM HERE TO THERE IN MINIATURE
1. Ohio Rev. Code § 3501.35.2. Mansky, interview, May 6, 2008.3. Damschroder, interview.4. Interview with anonymous reformer, January 8, 2008.5. Andrew Gumbel, “Connie [sic] McCormack: 3rd Degree,” Los Angeles City
Beat, http://www.lacitybeat.com/article.php?id=942&IssueNum=51; Andrew
Notes to Chapter 4 169
Gumbel, “Conny’s Final Ballot,” Los Angles City Beat, http://www.lacitybeat.com/article.php?id=6118&IssueNum=222.
6. See, e.g., Robert F. Kennedy, Jr., “Was the 2004 Election Stolen?” RollingStone Magazine, June 1, 2006.
7. Thomas Mann, Pew Journalists Forum, December 10, 2007, Washington, D.C.8. Mark Niquette, “Franklin County Elections Chief to Lead Statewide
Group,” Columbus Dispatch, March 13, 2007.9. Interview with Tammy Patrick, June 5, 2008.10. Dean C. Logan, Memorandum, Preliminary Findings and Analysis of
Sample Set of Non-partisan Ballots Cast in the February 5, 2008 PresidentialPrimary Election, February 11, 2008.
11. Email from Kim Alexander to Heather Gerken, June 30, 2008.12. Thanks to Steve Weir for letting me use this phrase.13. Goldman, interview.14. Martinez, interview. 15. “Tokaji and Hall, “Money for Data.” 16. Brunner, interview.17. Some privately funded studies have large sample sizes but classify voters by
region, not by state or locality. Others classify voters by state but don’t surveyenough voters within each state or locality to offer trustworthy samples. Stillother studies just don’t ask the right questions. With the support of political sci-entists and foundations, however, it is possible to imagine correcting these prob-lems in order to piggyback on existing research.
18. I borrow the Field of Dreams reference from Edward B. Foley, “A ModelCourt for Contested Elections (or the ‘Field of Dreams’ Approach to ElectionLaw Reform),” http://moritzlaw.osu.edu/electionlaw/comments/articles.php?ID=157.
19. Deborah Hastings, “Problems, Funding Plague Voting Panel,” AssociatedPress, June 23, 2008.
20. Martinez, interview.21. Martinez, interview.22. For an extended analysis of deliberation and its role in contemporary poli-
tics, see Amy Gutmann and Dennis Thompson, Democracy and Disagreement(Cambridge: Belknap Press of Harvard University Press, 1996).
23. I make this argument in extended form in “Double-Edged Sword of Inde-pendence.”
170 Notes to Chapter 5
24. http://www.csuchico.edu/econ/old/links/econhumor.html. 25. Thanks to Doug Chapin and Charles Stewart for formulating the issue
this way.26. Charles Stewart, Data for Democracy Conference, Pew Center on the
States, May 12–13, 2008.27. Eric Fischer, Data for Democracy Conference, Pew Center on the States,
May 12–13, 2008.28. Smith, interview.29. Murphy, interview.30. Hernando de Soto, The Mystery of Capital: Why Capitalism Triumphs in
the West and Fails Everywhere Else (New York: Basic Books, 2000), 28.31. For information on Nielsen families, see http://www.nielsenmedia.com/
nc/portal/site/Public/. Many thanks to David Schleicher for the great analogy.32. Stewart, “Measuring the Improvement,” 7.33. The 2006 Cooperative Congressional Election Study (CCES), an opt-in
Internet-based survey put together by several universities, already asks peoplehow long they stood in line and whether they encountered any problems in reg-istering to vote.
34. Stewart, “Measuring the Improvement,” 12–13.
CONCLUSION: GETTING FROM “HERE TO THERE” REDUX
1. David Brooks, “Thoroughly Modern Do-Gooders,” op-ed, New YorkTimes, March 21, 2008. For more systemic studies, see David Bornstein, How toChange the World: Social Entrepreneurs and the Power of New Ideas (New York:Oxford University Press, 2004); Charles Leadbetter, The Rise of the Social Entre-preneur (London: Demos, 1997); and Johanna Mair et al., eds., Social Entrepre-neurship (New York: Palgrave Macmillan, 2006).
AFTERWORD
1. 153 Cong. Rec. S 2503 (2007).
Notes to Chapter 5 171

This page intentionally left blank
Index
absentee ballots: cost of, 61; early bal-lots distinguished from, 153n.19;redesigning an envelope for, 60
AEI/Brookings Election Reform Project, 118, 130
Africa, cell phones in, 127Alabama: impact of the Government
Performance Project on, 76, 82; reporting rates on EAC surveys,154n.28
Alaska, 154n.26Alexander, Kim, 117American Society of Civil Engineers,
145n.3Angell, Roger, 58, 94Annapolis, 77Anthony, William, 85Arizona, problem tracking in Mari-
copa County, 61–62, 116, 119, 127Ayres, Ian, 49, 134
Baker, James, 39Barrett, Katherine, 75–76baseball, 58Bauer, Bob, 19Belgium, 55, 77benchmarking, 50, 62–63, 157n.76Bennett, Robert, 161n.41best practices: data requirements for
identifying, 63; the DemocracyIndex and creating consensus on,86; the Democracy Index and
promotion of, 89–90; reluctance to endorse by organizations of election administrators, 88. See also professional norms
Blackwell, Kenneth, 17, 72–73, 85Boli, John, 163n.58Bolton, John, 21, 125Bradshaw, Carrie, 100nBrooks, David, 134Brunner, Jennifer, 3, 25, 90Bush, George W., 100
Cain, Bruce, 145n.19, 162n.52California: electoral fiascos in, 2;
Los Angeles County (see Los Ange-les County); redistricting reform,fights over, 158–59n.5
Caltech/MIT Voting Technology Project, 44, 124
carbon footprint, 56Carter, Jimmy, 39Carter-Baker Commission: on elec-
tion administration insulated frompolitics in other democratic coun-tries, 147n.21; here-to-there prob-lem not addressed by, 8; registra-tion process, lack of data regarding,44; voter identification require-ments, position on, 39–43, 58
Castro, Fidel, 13Census Bureau, U.S., approach to
data collection by, 125
Chapin, Doug, 23CitiStat, 51–52, 117Clinton, Hillary, 10, 110, 118–19Coleman, Kevin, 21Colorado, 2Columbia Law School, 104Commission on Federal Election
Reform. See Carter-Baker Com-mission
Commitment to Development Index,97
Congress, U.S.: data collection andthe Democracy Index, funding andregulatory support for, 118–21;Election Assistance Commission,creation of (see Election AssistanceCommission); model data collec-tion program, 112; reducing costof data collection by thinking like,125–26
Cooperative Congressional ElectionStudy, 171n.33
Dahl, Robert, 157n.1Damschroder, Matt, 24, 85–86,
115–16data: barriers to collecting, 113–14;
baseball and, 58; cheating and thedependability of, 107–9; collectionof by Obama campaign, 141; com-parative, advantages and uses of,62–64; Congress’s model data col-lection program, 112; cost for col-lecting, 119, 125–26; the Democ-racy Index, as foundation of, 5–6,111–18; the Democracy Index assource of, 59; election administra-tion and, 43–49, 52–53; election
administrators and, 59–61, 84,114–18; election reform in a worldwithout, problems of, 42–43,57–59; environmental reform and,53–57; identifying problems andsolutions with, 59–62; politiciansand, 80–81; private sector collec-tion and use of, 49–51, 128–30;public sector collection and use of,51–52; rankings, use in construct-ing (see rankings); reducing costsfor collecting, 125–28; sources/funding for collecting, 118–21;strategies for acquiring more andbetter, 111–13; survey, 129–30;survey of state practices, 44–49;voter identification requirementsand the lack of, 40–43, 58
decentralization: as an advantagefrom the Democracy Index per-spective, 136; as an advantagewhen data is reported, 64–65; ofelections, 20. See also localism
decision-making cascades, 163n.57deferred maintenance: localism as a
cause of, 24 (see also localism); ofthe nation’s physical infrastructure,11, 145n.3; persistence of, 14–15;as problem for the election system,11–13, 85–86; statistics illustratingimpact of, 13–14
deflection, 74–75Democracy Index, the: balancing
major values in, 29–30; cost of,119; data as key to (see data); de-flection and the political impact of,74–75; design of, 35, 123–33,151n.62; development over time
174 Index
of, 35–36, 98–99, 110–11; earlyversions of, 32–36; election reformand (see reform, the DemocracyIndex and); ideal form of, 26–32,123–24; measuring performance,28–29, 32–33, 123–24; metricsfor, 31–32, 123–25, 130–33,150–51n.58; partisanship and,72–74, 79–80, 135–36; politicalsteps needed to implement, 111–18, 121–22; politicians, appeal to, 80–81; proxies, use of, 32–33;restraint in the design of, need for,149–50n.50; state and local politi-cal incentives and, 75–78, 125–28,135–36; targeting the right people,potential problem of, 100–3; votersand (see voters); weighting strate-gies, 33–34, 96
“democratic experimentalism,”157n.76
DeSoto, Hernando, 128
EAC. See Election Assistance Com-mission
Einstein, Albert, 31election administration: data, absence
and inadequacy of, 43–49, 84;data, use of to identify problemsand solutions, 59–62; data-drivenanalysis, arguments for and against,52–53; decentralized, 20; fundingof (see funding of elections); local-ism, impact of (see localism); majorvalues of, 29–30; politicians andadministrators in the hierarchy of,148n.31; private sector data-drivenanalysis and, comparison of, 49–51;
problems of national in 2008,139–41; problems of state andlocal, 13–14; reform of (see elec-tion reform); standardization ofterms and protocols, need for,113–14; voter concern regarding,78–79
election administrators: best practices,resistance to, 88; data collection,positions regarding, 114–18; theDemocracy Index and leverage forreform among, 82–92; incentivesto resist reform, 4; partisanship of,impact of (see partisanship); prayerof, 13, 141; professional norms for(see professional norms); reformers,relations with, 83–86, 115; surveyof Georgia officials, 22–23; surveyof national officials, 22; targetingthe right official through rankings,problem of, 100–3
Election Assistance Commission(EAC): best practices, pushbackagainst promoting, 88; data collec-tion and the battle for relevance of,121; funding for, 14; opposition of the National Association of Sec-retaries of State to, 114; regulatoryauthority needed by, 119; stan-dardization of terms and protocols,proposal for, 113–14; survey ofstate practices, 44–49, 112
election behavior. See votingElection Center, 88–89Election Incident Reporting System
(EIRS), 81election reform: advice to a new presi-
dent regarding, 141–42; debates
Index 175
election reform (continued )over convenience vs. integrity,29–30; the Democracy Index and(see reform, the Democracy Indexand); election administrators asleverage points for, 82–92 (see alsoelection administrators); environ-ment for and the here-to-thereproblem (see here-to-there prob-lem); incumbents’ lack of interestin, 19–20; lack of serious, 3–4,14–15; localism as a barrier to, 4,24–26 (see also localism); “money-ball” approach to, 58–59; need fornew approach to, 1–4; partisanshipas a barrier to, 4, 19–20, 25–26(see also partisanship); political entrepreneurs and, 80; political incentives as a barrier to, 4–5 (seealso political incentives); politiciansas leverage points for, 80–81; pro-cess and substance, relationship of,7; voter concern regarding, 78–79;voter identification, lack of data in the fight over, 38–43; voters asleverage points for, 66–80 (see alsovoters); in a world with a Democ-racy Index, 137–38; in a worldwithout data, problems of, 42–43,57–58, 136–37 (see also data)
election system: basic values: conven-ience, integrity, accuracy, 29–30;deferred maintenance of, problemsassociated with, 11–13; factors undermining (see localism; parti-sanship); functioning of in 2008,140–41; the problem of invisibilityin, 23–24; problems of, 1–3; reform
of (see election reform; reform, theDemocracy Index and)
election technology: optical scan ballots, 61; touch-screen machines,14–15; 79
Environmental Performance Index(EPI): competition among coun-tries resulting from, 76–77; cre-ation and impact of, 55–57; datacollection, promotion of, 120; environmental policy, effect on, 79; implausible data, disregardingof, 108; Mexico, impact in, 81;“proximity-to-target” approach of,151n.62; weighting strategy of, 96
environmental reform: the businessworld and, 53–54; the Environ-mental Performance Index (seeEnvironmental Performance Index)
EPI. See Environmental PerformanceIndex
Esty, Dan: angry jurisdictions as benefiting indexes, 99; data-drivenperformance rankings, use of, 38;description of, 53–54; environ-mental performance data, need formore, 133; the Environmental Performance Index, 54–57, 66,76–77, 81, 96; measure what matters, 105; on ranking systems,69; on the trade-off between rigorand intuition in rankings, 94
Far Side (Larson), “What DogsHear,” 67, 99
felons, restoring voting rights to, 5Field of Dreams mantra, 120Fischer, Eric, 21–22, 125
176 Index
Florida, 2, 12framing: of election reform for voters,
66–70, 79; of issues for voters,158n.2
funding of elections: Election Assis-tance Commission, failure to fund,14; federal elections as unfundedmandate, 118; partisanship and,24–25; as a problem for local juris-dictions, 20–23, 85–86; the prob-lem of invisibility and, 24
GDP (gross domestic product), 51Georgia: data-based distribution of
resources in, 60–61; election offi-cials, survey of, 22–23; the Govern-ment Performance Project’s impacton, 76; residual vote rate in, 75
Global Competitiveness Index, 54global polity, 87, 163–64nn.58–59Goffman, Erving, 158n.2Goldman, Jonah, 67, 79, 117Governing, 90Government Performance Project
(GPP): best practices among government administrators, roleplayed regarding, 89–90; cheating,strategy against, 108; creation of,75–76; media response to release of rankings by, 79; physical infra-structure, the nation’s grade onmaintaining its, 145n.3; QualityCounts approach rather than asingle ranking, 151–52n.63; self-promotion by top-ranked states,72; sharing of information amongstates, role played regarding, 92;state management, effect on, 76
GPP. See Government PerformanceProject
Grant Park (Chicago, Illinois), 139grassroots organizing, the Democracy
Index and, 69–70Grayson, Trey, 18, 25, 82Greene, Richard, 75–76, 91–92, 96Greenfield, Meg, 109Gronke, Paul, 10
Hailes, Edward, 83Hall, Thad, 27, 44, 113, 118“Hanlon’s razor,” 84–85Hasen, Rick, 13HAVA. See Help America Vote ActHawaii, 47, 98Help America Vote Act (HAVA), 3,
14–15, 119. See also Election Assis-tance Commission
here-to-there problem: continuingneed to solve, the election of 2008and, 141–42; the DemocracyIndex as solution to (see Democ-racy Index, the); leverage points for addressing, 66, 92; political reform and, 145n.19; pragmaticapproach to, 36–37; prevalence of, 6–8; solving the, 8–9
identification requirement for voters.See voter identification
Illinois, law school of the Universityof, 104
implementation. See here-to-thereproblem
Jackson, Jesse, 157n.1James, Bill, 58
Index 177
joint and several liability, 103Joyce, Philip, 82, 89–90, 151n.63Joyce Foundation, 130
Karch, Andrew, 91Kentucky, 82Korea, Republic of (South Korea), 55Kramer, Larry, 104–5
Larson, Gary, “What Dogs Hear” cartoon, 67, 99
Leiter, Brian, 169n.23Levitt, Justin, 77Lewis, Doug, 89Lewis, Michael, 58–59Lichtenberg, G. C., 79localism: as a barrier to reform, 4, 7,
25; decentralization of elections,20; the Democracy Index and, 9,75, 135–36; invisibility as a prob-lem with, 23–24, 75; partisanshipand the resource problem, 24–25;ranking systems, impact of, 75–78;resource problem for election administrators, 20–23
Los Angeles County: data collectedby, absentee ballot problem and,59–60; “double bubble” problemin, 116–17. See also McCormack,Conny
Luce, Henry, 26
Mann, Tom, 116Mansky, Joe, 19, 61, 114Martin, Demetri, 159n.7Martinez, Ray, 88, 118, 121Maryland: electoral fiascos in, 2;
Electronic Poll Book Project, 60
Mashaw, Jerry, 86Massachusetts, 48McCain, John, 119McCormack, Conny, 18, 20, 59–60,
116, 148n.31Mexico, 81Miller, Peter, 153n.24, 154n.30Minnesota: ballot design in, 61;
bridge collapse in, 11, 145n.2Murphy, Bob, 60, 114, 128
National Association of Secretaries of State, 88, 90, 114, 166n.67
National Voter Registration Act, 47Nelson, Chris, 16, 90“Nielsen voters,” 33, 120, 129North Carolina, 2North Dakota, 47Norway, 76–77
Obama, Barack, 10, 110, 118–20,139, 141–42
Ohio: election administration data reported by, 49; election observersbanned from polling places in,113; electoral fiascos in, 2–3;Franklin County, inadequate number of voting machines in,85–86; partisanship of secretary of state, 17; redistricting reform,fights over, 158–59n.5. See alsoDamschroder, Matt
Ohio Association of Election Offi-cials, 116
Ohio State University Moritz Collegeof Law, 130
Olbermann, Keith, 2Olson, Lynn, 32, 82, 112
178 Index
optical scan ballots, 61Overton, Spencer, 38–42, 57, 66,
135, 152n.9
Page, Ed, 167n.76partisanship: as barrier to reform,
4, 7, 19–20, 135; debates over convenience vs. integrity of voting,29–30; the Democracy Index and,9, 72–74, 79–80, 135–36, 162n.42;funding of elections, as impedi-ment to, 24–25; as a heuristic forvoters, 70–71; political bias amongelection administrators, 16–18;professionalism among election administrators, lack of, 18–19;provisional balloting rules influ-enced by, 148n.25; voter identifi-cation requirements and, 39–42
Patrick, Tammy, 61–62, 114, 116,127
peer pressure, 86–88Pew Center on the States, 75, 110–12,
118, 130, 153n.24. See also Govern-ment Performance Project (GPP)
political entrepreneurs, 80,161–62n.41
political incentives: as a barrier to reform, 4–5; impact of ranking systems on state and local, 75–78;impact of the Democracy Index onpartisan, 72–75; invisibility of elec-tion problems as perverse, 23–24,140–41; partisan concerns amongelection administrators as perverse,16–19; performance indexes as,80–81. See also localism; partisan-ship
politicians: appeal of performance indexes to, 80–81; interest of in-cumbents in maintaining the statusquo, 19–20
politics: the Democracy Index vs. partyheuristics in, 70–74; interest in re-form, party standing/incumbencyand, 19–20; Obama’s election protection team in 2008, 139–40;organized minorities/interest groupsin American politics, success of,157–58n.1; partisanship, impact of (see partisanship); political com-petition and public opinion, rela-tionship of, 161–62n.41; processand substance, relationship of, 7;responsible party government, advocacy for, 160n.15; voter identification requirements and,39–41. See also localism; parti-sanship
professional norms: absence of inelection administration, 88–89; the Democracy Index and promo-tion of, 89–92; membership inprofessional associations by localofficials, 166n.66; peer pressureand, 86–88. See also best practices
Quality Counts schools assessment,32, 120, 133
Quinn, Cameron, 77, 150n.52
rankings: benefits to election admin-istrators from, 115–16; cheating,cost of, 107–9; of colleges andgraduate schools by U.S. News & World Reports, 5, 78, 104–5,
Index 179
rankings (continued )168–69n.23; competing along thewrong dimensions, 104–6; costscreated by, 93, 109; data for (seedata); the Democracy Index (seeDemocracy Index, the); the Envi-ronmental Performance Index (see Environmental PerformanceIndex); by the Government Perfor-mance Project (see GovernmentPerformance Project); happinessproblems, 104–9; objectivity, appearance of, 95, 99–100; over-simplification and weighting strate-gies in, 95–100; precision and accessibility, trade-off between,93–103; as a shorthand for voters,6, 137; targeting the right official,problem of, 100–3
reform, the Democracy Index and: asa data-driven approach, 5–7, 59,62–65 (see also data); decentraliza-tion, taking advantage of, 134–36;as a here-to-there strategy, 26, 37;partisanship/localism and the rela-tionship between, 9; president-elect Obama and, 142; reasons for optimism regarding, 111,137–38. See also election reform;here-to-there problem; reformers
reformers: business world skepticismregarding, 54; the DemocracyIndex as a powerful tool for, 66,68–70; election administrators, relations with, 83–86, 115; grass-roots organizers, 69–70; the here-to-there problem and, 8; new gen-eration of, 39, 134; performance
rankings used by, 56–57; restraintin limiting the Index to nonparti-san issues of election administra-tion, need for, 149–50n.50; strug-gles facing, 4
registration process: data lacking regarding, 44; proxies for measur-ing, 33
residual vote rate, 31, 75, 90, 124responsible party government,
160n.15Ringen, Stein, 93, 96, 100, 168n.22Roodman, David, 31, 95, 97, 99,
168n.18
Sarbanes-Oxley Act, 108Schattschneider, E. E., 78–79Schleicher, David, 160n.19Smith, Gary: career path of, 22, 114;
data collection by, 22–23, 51, 60–61, 126; Election Center confer-ence, attending a, 89; the resourceissue, addressing, 22–23; voterturnout, using data on, 60–61
South Korea. See Korea, Republic ofStanford Law School, 104–5states: Government Performance Pro-
ject impact on management of (seeGovernment Performance Project);ranking systems, potential impactof, 76–78; spread of policies across,87–88; survey of election adminis-tration practices, 44–49
Stevens, John Paul, 41–43Stewart, Charles, 44, 81, 124, 129–30Streater, Joy, 20–21Strickland, Ted, 72Sunstein, Cass, 134–35, 163n.57
180 Index
Supreme Court, United States, deci-sion regarding Indiana voter identi-fication law, 41–43, 58
Thaler, Richard, 134–35Tokaji, Dan, 16–17, 44, 58–59, 118,
135Tolstoy, Lev, 42, 57Transparency Index, 113
U.S. News & World Report rankings,5, 78, 104–5, 168–69n.23
Vermont, 154n.28Virginia, 77vote denial, 17voter identification (ID): the Carter-
Baker Commission on, 39–41, 58;estimating the effect of require-ment for, 152n.9; Indiana law requiring, fight over, 41, 58
voters: the Democracy Index vs. parti-sanship as influence on, 72–74;election reform, the DemocracyIndex and level of concern regard-
ing, 78–80; election reform issue,framing of, 66–70, 79; “Nielsen,”33, 120, 129; reform proposals,limited interest in, 66; surveys of, 129–30; visibility of electionsfor, 75–76, 141
voting: as a civic sacrament, 15; con-venience, integrity, and accuracy asbasic values of, 29–30; heuristics/shorthand/information shortcuts as guide for, 70–72, 137, 158n.4;partisan consequences of rules for,16–17; residual vote rate, 31;turnout as outside election admin-istrators’ control, 27, 132–33n.1
Wal-Mart, 49–50, 126Washington, 14weighting: within categories in early
versions of the index, 34; debata-bility of, 95–97; simple strategy for broad categories in early ver-sions of the index, 33
Weir, Steve, 117Wolman, Harold, 167n.76
Index 181


![Social Democracy and the Nationalities Question [Hungarian Social Democracy before 1945]](https://img.pdfslide.net/doc/110x75/63373fda9c13609c6c0eea46/social-democracy-and-the-nationalities-question-hungarian-social-democracy-before.jpg)