Embed Size (px)
Citation preview

The discovery of the Taylor House at the Petersburg National Battlefieldby: Bruce W. Bevan (Geosight), David G. Orr (National Park Service), and Brooke S. Blades (National Park Service)
This is a pre-publication version of an article that was published in the journal, HistoricalArchaeology, volume 18, number 2, 1984, pages 64 - 74. That published article isavailable at:https://sha.org/shop/vol-18-1984/the-discovery-of-the-taylor-house-at-the-petersburg-national-battlefield/It is also available for reading at:http://www.jstor.org/stable/25615498?seq=1#page_scan_tab_contents
The radar profiles in that published article were unfortunately printed with a highcontrast, and the images are difficult to see. The lower contrast in the figures here isbetter. Blue text indicates hyperlinks to the figures which follow the text.

Page 1
The Discovery of the Taylor House at the Petersburg National BattlefieldBruce W. Bevan, David G. Orr, and Brooke S. Blades
AbstractDuring the siege of Petersburg, Virginia, in 1864, a dwelling occupied by William
Taylor was destroyed. Geophysical exploration and test excavations have located a cellarwhich is apparently the remains of that dwelling. Ground-penetrating radar mapped a buriedplanar interface in an area where excavation revealed a cellar floor overlain with rubble.
Introduction During the summer of 1978 excavations were conducted at the Taylor Farm (“Spring
Garden”) site at Petersburg National Battlefield, Petersburg, Virginia. The purpose of theexcavations was to locate the house which was destroyed in 1864 by the Union Army duringthe siege of Petersburg. A standing ruin had been incorrectly interpreted as the TaylorHouse itself, although this structure is clearly a quarters out-building. The 1978 excavationsyielded much valuable occupational data concerning the 19th century history of the site,including the location of the outbuildings, but failed to locate the Taylor Farm house. Aground-penetrating radar survey was then scheduled in an attempt to pinpoint the exactlocation of the elusive Taylor House, and the nature and success of this survey are thesubject of this paper.
The Principle of Ground-Penetrating RadarGround-penetrating radar is an excellent instrument for estimating the
three-dimensional shape and size of buried features. While it is far from perfect, it can give amore distinct image than other geophysical techniques.
Unlike most radars, the signal from a ground-penetrating radar is beamed into the soil,rather than into the air. The radar signal is a series of very short radio pulses. When any ofthese pulses meets an interface, such as a change in the type of soil, part of the signal isreflected back to the radar. The delay time of this echo indicates the depth of the objectwhich caused the echo. By moving the radar along a line, these echoes can generate a twodimensional profile of the object. Parallel lines will add the third dimension.
A wide variety of different objects can be detected by the radar. Metals, in particularwires or pipes, cause strong echoes. Cavities in the ground, such as tunnels, are also easyto detect. Architectural structures of stone, brick, cement, or wood are all detectable; similar,but natural, features can make the radar profiles very complex. Earth contrasts resulting fromrefilled pits or trenches or debris middens have all been detected and mapped by radar; hereagain, natural features can mimic cultural features.
The instrument which does all of this is illustrated in Figure 1. The central part of theradar system is within the low, wheeled cart; the cart is about a yard square and has a T-barhandle for pulling it. This cart has the radar antenna on its cylindrical lower surface; thetransmitter and receiver are also included in the cart. The transmitter is very low power; its

The principle of ground-penetrating radar
Page 2
signal is less than that of a citizen’s band radio.The radar’s control and recording equipment is bulky and fairly delicate, so it is
stationed in a vehicle outside the view of Figure 1. A 200 foot long electrical cable connectsthe antenna cart to the control and recording equipment. The control box adjusts the differentparameters of the radar; the principal variable is the maximum depth of the radar profiles. There are two recorders. One is called a graphic recorder; this provides a paper copy of theradar profile as it is generated. By having an immediate indication of results, the survey canbe immediately modified to further examine a feature which has been discovered. All of theradar profiles can be stored on a magnetic tape recorder. By playing this magnetic tape backto the graphic recorder at a later time, additional copies of the radar profiles can be made. These copies can also be at a large scale so that small features can be more readilydetected. This article contains many examples of the radar profiles as they are generated bythe graphic recorder. Further information on the radar can be found in Bevan and Kenyon(1975). The ground-penetrating radar employed at Petersburg was a SIR System-7manufactured by Geophysical Survey Systems. The antenna was model 3055, having amaximum in the spectrum of its pulse at about 120 MHz. A model 705D transceiver wasused.
While the equipment is fairly complex, the operation of a radar survey is easy and onlyone person is usually needed. A calibrated rope is stretched along the line for which a profileis desired; this rope has painted bands at five foot intervals. This line is usually 100 - 300feet long. An operator walks backward down this line, pulling the radar antenna at a speed ofabout one-half to one mile per hour. As the midpoint of the antenna passes each paintedband on the rope, the operator pushes a button on the handle of the antenna; this puts amark on the radar profile so that its horizontal scale is known.
An area is usually surveyed by making parallel traverses with the radar antenna. Thespacing between these parallel lines is often about five feet but this will change depending onthe size of the features which are to be detected. The radar does detect objects to the leftand right of its traverse line, although not too far. The radar beam is roughly a 90/ cone;therefore, at a depth of 3 feet the radar can detect objects as far away as about 3 feet left orright of the traverse line.
Linear structures such as wall foundations are most readily detected when the antennacrosses them in a perpendicular direction. The antenna used for this survey can detectobjects as small as one foot in size: if smaller objects are to be detected, other antennas canbe used.
Figure 2 is an example of a radar profile. The horizontal distance is about 30 feet; thevertical lines through the profile mark 5-foot intervals. The depth scale is estimated; the totaldepth indicated on this profile is about 12 feet. Note that the horizontal scale is compressedrelative to the vertical scale.
The upper three or four black bands on this profile represent the transmitted pulse,

The result of the radar survey
Page 3
which leaks into the receiver. The black bands below indicate echoes from undergroundobjects. The horizontal bands between two and four feet probably result from reflections atnear-surface soil layers.
The important echo is the arc pattern beginning at a depth of 4 feet. The cause of thepattern is almost assuredly a metal bar or tube at a depth of 4.5 feet at the Y = 14 feet pointon the traverse. The bar is oriented perpendicular to the line of traverse and is probablyabout 2.5 feet (or 5 feet) long; its diameter is uncertain but is probably less than six inches.
Note the three arcs between a depth of 4 - 6 feet. These three represent one echo ofthe transmitted signal; the three bands result from the fact that the transmitted signal actuallyhas three ‘‘pulses”; it would be desirable to have only one pulse and one echo band, but thisis essentially impossible for electronics to do. The arc pattern is due to the changing distanceto the metal bar as the antenna passes overhead. The antenna detects the bar before itreaches it; the distance decreases to a minimum as the antenna passes directly over it, andthen increases again. The depth scale on this and other profiles is actually the echo delaytime; it is converted to approximate distance, or depth, by estimating the speed of the radarpulse in the soil. If there is an object at a known depth, the scale can be easily determined. There are also technical tests which are based on the curvature of the echo arcs, like those inFigure 2, which will determine the depth of objects.
There are two other echo triplets in Figure 2, around “depths” of 8 and 11 feet. Themetal bar is such an excellent reflector for the radar pulse that the signal reverberatesbetween the bar and a near-surface layer several times, causing these spurious echoes.
With the radar antenna used for this survey, it is difficult to detect features in the upper1.5 feet of the ground; this is because the transmitted pulse interferes with echoes in thisrange. The maximum depths of echoes on the radar profiles are determined by how stronglythe soil attenuates the radar signal, Sandy soils allow deep profiles while clayey soils limit theprofiles to a shallow depth, often less than 5 feet. At Petersburg, the soils are sandy. Beforethe start of this survey, the soils at the site were tested with a measurement of their electricalresistivity using a standard four-point resistivity probe. The indicated value of 400ohm-meters showed that the radar could profile quite deeply; in fact, echoes were receivedfrom 10 feet and below on this survey. This preliminary test would be valuable at other sitesalso, for it is a good predictor of profiling depth; the higher the electrical resistivity, the deeperthe profiles.
The radar survey was done on four days between 19 - 24 September, 1979; a totallength of 13,930 feet was profiled in an area of 2.2 acres.
The Result of the Radar SurveyThe radar survey was centered at the standing brick structure at the site and extended
for at least 100 feet around it. At a distance of 75 feet north of the standing structure, theradar profiles revealed a flat structure buried at a depth of 4 - 4.5 feet underground. Figure 3

Other geophysical tests
Page 4
illustrates that this feature is about 55 feet long, extending between Y = -22 and Y = 33. Fivefeet farther south, a similar pattern was found; see Figure 4. The ground plan of this buriedfeature, delineated by these and other profiles, is mapped in Figure 5. The straight lines inthe area of X = 90, Y = 0 indicate the segments of the profiles where the planar structure wasfound; while most of the traverses for this survey were made going to the west, this structurewas further defined by perpendicular traverses.
This buried feature has dimensions of about 50 - 55 feet by 20 - 25 feet. It is roughlyrectangular, with sides parallel to the standing foundation. The irregularities of the edges ofthis feature are probably due to random rubble and destruction at its periphery.
Figures 3 and 4 show that the feature is generally flat but that it has some objectsabove it which cause echoes; this is probably rubble. Also, in Figure 4 at Y = 10, it appearsthat there is an object beneath the floor at a depth of about 5.5 feet. While this could be afilled pit or even a well, this feature can be defined only by future excavation.
Other Geophysical Tests on the Buried StructureWhile radar provided the best evidence of the buried floor, other tests were made
before the excavation of this feature.On 26 May, 1980, aerial photographs were taken of the site. These were low altitude,
oblique photos taken with 35 mm cameras and both normal color and color infrared film. Conditions were excellent for the detection of anomalous features, for the grassy vegetationon the site was high and in flower, yielding sharp contrasts between species. However, therewere no clear anomalies which matched the location of the feature found with the radar.
On this same day, three traverses were made over the buried feature with a protonmagnetometer. There was a magnetic anomaly coincident with the radar anomaly; amagnetic high of 100 - 150 nT was found toward the south side of this feature and a 10 - 50nT magnetic low was found to the north. (The symbol nT stands for nanotesla, the unit ofmagnetic flux density; it is equivalent to the older unit called the gamma.) This is a normalbipolar anomaly; however there were not enough measurements made to accurately definethe anomaly. Nevertheless, it indicated that there was likely to be brick or possibly ironassociated with the radar anomaly. This was important, because the radar cannot distinguishold brick from modem cement. The site is not an ideal one for magnetic surveys, however,because of the scatter of brick and iron artifacts in the soil. This was known before the startof this survey and was the reason for the emphasis on the radar survey.
Also on 26 May, an electromagnetic test was made coincident with the magneticsurvey. A Geonics EM31 meter indicated the electrical conductivity of the soil; it was used asa fast substitute for slow resistivity profiling (Bevan 1983). This instrument, however,indicated no conductivity anomaly in the area in which the magnetic and radar surveys foundone.

Test excavations
Page 5
Results of Test ExcavationsTest excavations were conducted in June and September 1981 on the site of the
anomaly located by ground-penetrating radar survey. These excavations exposed thenortheast and southwest comers of a brick-lined cellar measuring 55 by 19 feet (Figure 6). This cellar marked the location of the frame dwelling occupied by William Byrd Taylor anddestroyed in June 1864 as the battle of Petersburg began.
The brick lining of the cellar was 13 inches (or three bricks) wide, laid in courses ofFlemish bond in oyster shell, lime mortar. The bottom of the cellar lay four feet below moderngrade; its dimensions suggested that the dwelling which once stood overhead possessed aground-floor plan of two rooms divided by a broad central passage. These architecturalfeatures may be associated with an eighteenth-century Tidewater Virginia plantation manorhouse. Ceramics dating to the third and fourth quarters of the 18th century were recovered inthe vicinity of the dwelling, and early 19th century artifacts were found in the southwest comerof the cellar. The material culture evidence thus strongly suggests that the tradition whichassociates this site with “Spring Garden” is correct and that the dwelling was erected byRichard Taylor in the period 1760-70.
The correspondence between the ground-penetrating radar data and the physicalremains was quite marked. The actual positions of the northeast and southwest comers ofthe foundation were within one foot of the radar plot. The cellar depth of four feet wasindicated by the radar profile. A small portion of the cellar was actually excavated at thesouthwest corner. This test excavation revealed that the cellar floor was not paved with brickbut was composed of natural clay subsoil. Since brick rubble was spread throughout the fill,the impression of a brick floor may have been conveyed by this rubble. It is possible thatother portions of the cellar were paved with brick. (The stratigraphy suggested that portionsof the foundation walls had been dismantled during two separate periods and that the framebuilding had been partially or completely consumed by fire. Excavations at the northeastcorner revealed that the walls were heavily disturbed by subsequent salvage efforts.)
Other Findings of the Radar SurveyIn the course of finding and mapping the planar feature which turned out to be the
Taylor House, the radar located a number of other buried features. Most of these appear tobe random artifacts buried in the soil. Many of them are metal objects. As seen in Figure 2,these objects can cause a strong echo for the radar; with the antenna used for this survey,the objects must be at least one foot in size. A metal object causes the pattern a Y = 66 inFigure 3. This is a typical pattern; an object at a shallow depth causes a reverberating echo. The depth of this object is uncertain but is probably less than 2 feet. The location of thismetal object and the other likely ones found by this survey are plotted in Figure 5 withasterisks. Many other small objects were found during the survey and are plotted as circlesin Figure 5; these objects could be stones, brick, soil changes, or even metal, but all are

Capabilities and limitations of radar
Page 6
probably 1 - 2 feet in size and less than 4 feet deep. Sometimes these were so closelypacked that they could not be separately distinguished on the radar profiles; in this case theirlateral extent is marked by a curlicue line.
A large area, buried soil interface, was found about 50 feet south of the area shown inFigure 5; it appears that this is a remnant of a leveled fortification. There is no surficialevidence for this, but the radar detected this feature and Figures 7 and 8 illustrate it. Twobroad arcs are seen in both of these profiles. One is centered at about Y = 35 and the otherone at around Y = 90. Both probably result from an abrupt change in the soil. The radarprofiles, by themselves, cannot always distinguish a filled depression, such as a pit or trench,from a superficial feature such as a mound; both appear as dipping arcs to indicate thelensatic shape of the feature’s cross-section. However, Figures 7 and 8 give a clue. Theright soil feature at Y = 90 contains many metal objects, seen by the characteristicreverberating pattern. The other soil arc, at Y = 35, reveals few metal objects. It seemspossible that the arc at Y = 90 is a refilled ditch while the arc at Y = 35 is the remnant of amound or fortification parapet which has been almost completely leveled.
Study of historical records suggests that Fort Morton was situated about 500 feetsoutheast of the survey area at the Taylor House. This fort was completely leveled forfarming after the Civil War and there is no present trace of it. Several radar profiles weremade in the likely area of the former fort. These revealed complex underground earthcontrasts. While these extended along lines and might result from refilled entrenchments, thetest was too small an area to be sure.
The Capabilities and Limitations of Radar SurveysGround-penetrating radar accomplished the goal of the survey by aiding in the locating
of the Taylor House. At some other sites this instrument has given as good or better resultsthan at this site; however, at some sites it has yielded little information. It is important tounderstand what radar can do best and for which sites it is most suitable.
At Petersburg, the floor surface of the Taylor House stood out clearly on the radarprofiles. Had the area inside and outside the floor been densely cluttered with debris, theprofiles could have been so chaotic that the linear extent of the floor could have beenmasked. In this case, it still might have been possible to map the concentration of debris andpostulate that there might be or have been a structure within it.
Wall foundations can sometimes be mapped by radar; their linear extent gives a goodclue to their identification. However, once again, they can be hidden if they are surroundedby construction rubble, but then the delineation of the rubble itself can be valuable.
Radar is outstanding as a void detector. It is probably better than any othergeophysical technique for locating buried cellar vaults and tunnels. It is also excellent formapping multiple strata. The radar signal will be partly transmitted through shallow featuresand will detect several deeper ones. This is a very valuable capability which few other

Summary
Page 7
instruments have. It is especially useful as often near-surface features are uninterestingmodem debris.
While radar has many positive attributes it has its limits. The most important limitationof radar is its shallow profiling depth in some soils. This is particularly true for clayey soils,but saline soils are also a problem. A simple knowledge of soil type can be a good aid inestimating the profiling depth before trying radar. Sandy soils usually allow very deepprofiles, sometimes in excess of 30 feet. On the other hand river floodplains often are densewith clays and silts and profiles may be as shallow as three feet. Glacial terrain can be quitevariable. The electrical resistivity measurement, as mentioned above, can provide a goodguide before planning a survey. If the resistivity is greater than 100 ohm-meter, the radar canusually profile to a depth of at least 5 feet.
Further affecting the successful use of ground-penetrating radar is the antenna used. There are a variety of different radar antennas available for different applications. The radarused for this survey has fairly low resolution in that it cannot detect objects smaller than aboutone foot in size. If smaller features are to be located, higher resolution antennas can beutilized. There are versions available for seeing objects as small as three inches or less. However, these high resolution antennas cannot profile as deeply as the lower resolutionantennas. These high resolution antennas are suitable for probing into walls.
Ground-penetrating radar is primarily a surface or interface detector; some soilcontrasts can be so diffuse that they will provide no echo for the radar. In these cases,instruments such as magnetometers or resistivity meters which detect the volume of anobject rather than its surface can be a better survey instrument.
SummaryThe ground-penetrating radar mapped a cellar floor. Test excavation showed that the
size, shape, orientation, location, and depth of the cellar were all as approximatelydetermined by geophysics. This cellar appears to be a remnant of the original Taylor House.
AcknowledgmentsThe geophysical survey at Petersburg was sponsored by National Park Service under
Order No PX4000-9-0609; thanks go to the Park Service personnel at the site for their helpwith this work. We would like to especially thank former Superintendent Wallace Elms andpresent Superintendent Glenn Clark for their support during this project. A special thanks isalso extended to John Davis and Bill Fluharty for their interest in Petersburg Archaeology.

References
Page 8
ReferencesBevan, Bruce, 1983, Electromagnetics for Mapping Buried Earth Features. Journal of FieldArchaeology 10(1):47-54.Bevan, Bruce, and Jeffrey Kenyon, 1975, Ground-Penetrating Radar for HistoricalArchaeology. MASCA Newsletter 11(2):2-7.
Bruce W. BevanGeosightP.O. Box 135Pitman, New Jersey 08071
David G. OrrBrooke S. BladesNational Park ServiceMid-Atlantic Region143 South Third StreetPhiladelphia, Pennsylvania 19106

Figure 1: This wheeled sled, about a yard square, contains the antenna, transmitter, andreceiver of the ground-penetrating radar. An electrical cable connects it to bulky control andrecording equipment nearby. The antenna sled is sitting in the middle of the geophysicalanomaly which, on later excavation, was found to be a buried floor. The Taylor FarmQuarters ruin is visible in the background.
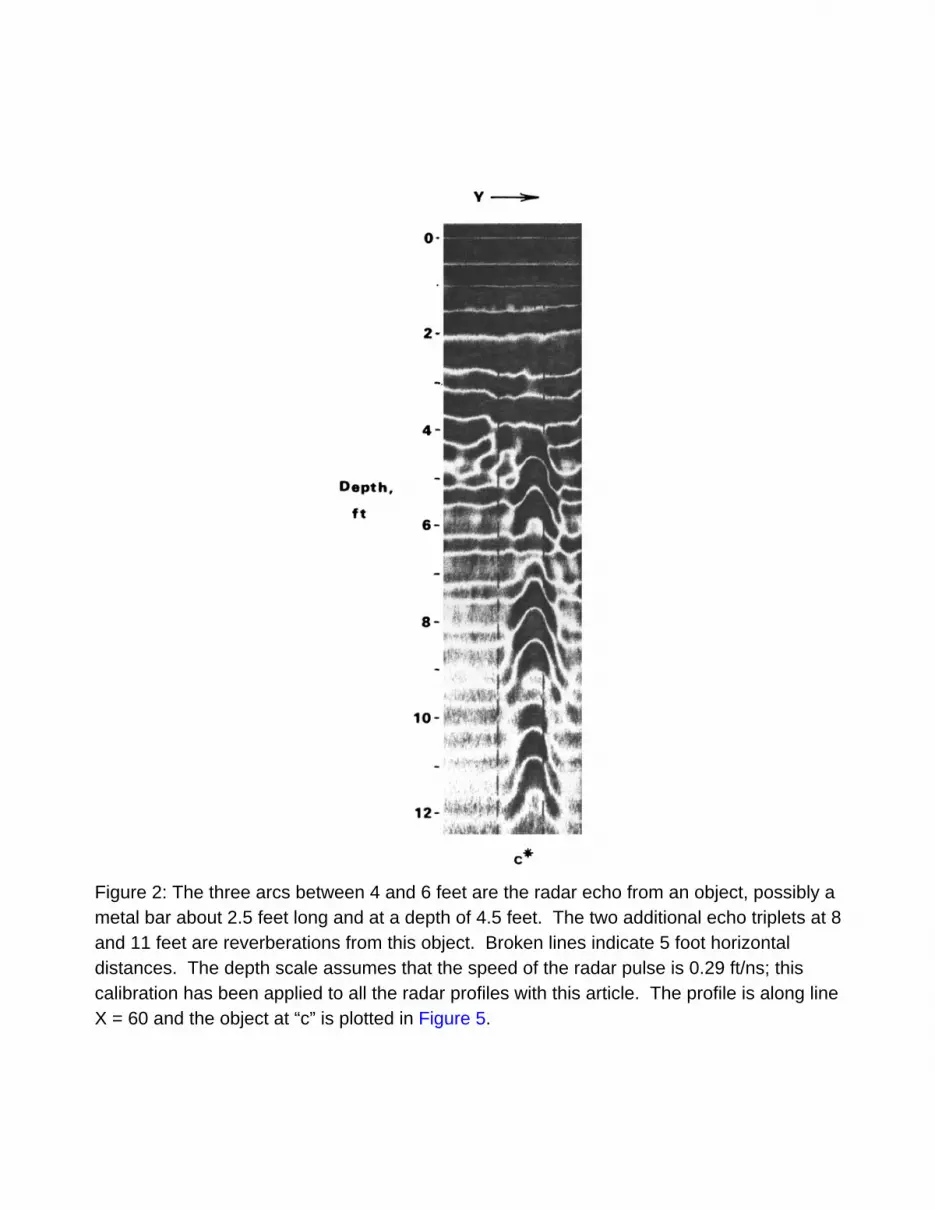
Figure 2: The three arcs between 4 and 6 feet are the radar echo from an object, possibly ametal bar about 2.5 feet long and at a depth of 4.5 feet. The two additional echo triplets at 8and 11 feet are reverberations from this object. Broken lines indicate 5 foot horizontaldistances. The depth scale assumes that the speed of the radar pulse is 0.29 ft/ns; thiscalibration has been applied to all the radar profiles with this article. The profile is along lineX = 60 and the object at “c” is plotted in Figure 5.

Figure 3: A distinct planar echo is seen at “b” at a depth of about 4.5 feet. Broken lines mark5 foot horizontal distances and this feature is about 55 feet long. Excavation revealed thatthis anomaly was caused by a buried floor. A shallow metal object is detected at the Y = 66foot point and is marked by an asterisk, the metal causes the radar pulse from the antenna toring like a bell, yielding this extended pattern. This profile is line X = 95.

Figure 4: Another cross-section of the planar echo; this is line X = 90 and just 5 feet south ofFigure 3.

Figure 5: Plan map of the radar anomalies. The standing brick structure is at “a”, and theburied planar structure delineated by the radar is at “b”. Asterisks indicate likely metalobjects that are buried. Circles indicate other small objects. Curlicue lines mark whereseveral objects were detected which were too close together to map separately. Dotted linesindicate other clusters of smaller objects. The object at “c” is profiled in Figure 2. The echoat “d” appears to coincide with a previously-excavated wall. Magnetic north is indicated.

Figure 6: The Taylor House site. This figure covers about the same area as Figure 5. Testexcavation in 1981 revealed the cellar. This feature was the cause of the radar echo in area“b” of Figure 5.

Figure 7: A possible subsurface earthwork is indicated at “e” and “f” by shallow arcs. The arcat “e” could indicate the remnant of surface soil from a fortification parapet, while the arc at “f”could locate a refilled ditch. This profile is along line X = -60 and is just south of the areamapped in Figure 5.

Figure 8: This profile is line x = -35 and therefore 25 feet north of Figure 7. This radar profileagain indicates the twin arcs that may locate a buried earthwork, however, there are no cluesto its presence in the surface topography. The vertically-extended echoes result fromnear-surface metal objects.


