Embed Size (px)
Citation preview
THE EFFECT OF WASTE TYRE PYROLYSIS-
DERIVED CARBON BLACK ON THE VARIOUS
PROPERTIES OF NATURAL RUBBER/STYRENE-
BUTADIENE RUBBER BLENDS
S. KETELO
2020
THE EFFECT OF WASTE TYRE PYROLYSIS-DERIVED CARBON BLACK ON
THE VARIOUS PROPERTIES OF NATURAL RUBBER/STYRENE-BUTADIENE
RUBBER BLENDS
BY
SISONKE KETELO
Submitted in fulfilment of the requirements for the degree of Magister Scientiae
in the
FACULTY OF SCIENCE
at the
NELSON MANDELA UNIVERSITY
Supervisor: Dr S.P. Hlangothi
Co-supervisor: Dr M.A. Sibeko
Co-supervisor: Dr J. Carson
December 2020
i
DECLARATION
I, SISONKE KETELO (216602599), hereby declare by Rule G5.6.3 that the research
in this dissertation for the award of Magister Scientiae is my original work and has not
been submitted for assessment or completion of any postgraduate qualification in
another University.
………………………………………….
Sisonke Ketelo
……12…May…2020………………….
Date:
ii
ACKNOWLEDGEMENTS
First and foremost, I would like to express my gratitude to my supervisor Dr S.P.
Hlangothi for his valuable and constructive suggestions during the planning and
development of this research work. His willingness to generously give his time has
been very much appreciated.
I would also like to show gratitude to my co-supervisors, Dr. M.A. Sibeko and Dr. J.
Carson for their valuable input, guidance and prompt feedback throughout the study.
I also wish to acknowledge the prompt advice and assistance offered by Mr. Lukanyo
Bolo, Mr. Sihle Nyakaza and the entire Centre for Rubber Science and Technology
(CRST) team.
I wish to express my sincere thanks to Global Asset Management for providing the
pyrolysis-derived waste tyre carbon black used in this study and DST-CSIR for the
financial support.
Finally, I express my gratitude to my friends and family especially Mrs. P. Ketelo and
Thando Sivatho Mabija for providing me with unfailing support and continuous
encouragement.
iii
ABSTRACT
Disposal of waste tyres into landfills is common in developing countries, including
South Africa. This behaviour is detrimental to human health as well as other living
organisms and the environment itself. There are several recycling methods and
processes that have been adopted in various countries to mitigate the situation. These
include the recovery of materials such as rubber for re-use; shredding of tyres into
small crumb particles for secondary applications in various industries such as civil
engineering and the automotive sector; and commonly through heating tyres under a
controlled environment to produce oil in a process called pyrolysis. The latter is of
interest to the study, with a specific interest in valorization of the process’ resultant
char/pyrolysis carbon black. In principle, this study considers the advancement of
waste tyre material recovery by finding applications for pyrolysis-derived carbon black
(pCB) recovered from waste tyres as it is one of the significant products of pyrolysis.
The study involved investigating the effectiveness of pyrolysis-derived carbon black in
its ability to improve the properties of natural rubber/styrene-butadiene rubber blends
for the conveyor belting industry and other related industries.
The pyrolysis-derived carbon black was characterized and compared to commercial
grades of carbon blacks on properties such as surface area, thermal stability, heat
absorption, structure and morphology using various laboratory techniques such as
XRD, XRF, TGA, BET, DSC and SEM. It was found that the properties of the
unmodified pCB closely matched those of commercial carbon black grade N660.
Through internal mixing, rubber compounds were prepared using 40 phr of pCB and
of the selected carbon black grades. Improvements were observed in the mechanical
properties of the polymer for application specifications, especially tensile properties
and abrasion resistance. Pyrolysis-derived carbon black improved tensile properties
to a similar magnitude as a reinforcing carbon black grade and produced similar cure
times. Partial replacement of a commercial carbon black grade with pCB of 5 to 20 phr
in NR/SBR yielded intermediate results. The unmodified pCB can be used to improve
the physical properties of natural rubber/styrene-butadiene rubber blends because it
exhibits filler behaviour.

iv
LIST OF ACRONYMS AND ABBREVIATIONS
ASTM American Society for Testing and Materials
ɣ Gamma
BET Brunauer-Emmett-Teller
BEC Back electron scattering
β Beta
CB Carbon black
CR Crumb rubber
CSBR Conical spouted bed reactor
DMA Dynamic Mechanical Analyzer
D-RPA Dynamic Rubber Processor Analyzer
DSC Differential Scanning Calorimetry
E’ Loss modulus
E” Storage modulus
IIR Butyl Rubber
ISO International Organization for Standardization
MBTS 2-2’-dithiobis(benzothiazole)
MDR Moving Die Rheometer
MC Wax Microcrystalline wax
MH Maximum torque
ML Minimum torque
v
NR Natural rubber
pCB Pyrolysis-derived waste tyre carbon black
phr Parts per hundred rubber
ppm Parts per million
rpm Revolutions per minute
SATRP South African Tyre Recycling Process Company
SBR Styrene-butadiene rubber
SEM Scanning electron microscopy
SED Secondary electron dopant
SMR 20 Natural rubber
Tan δ Tan delta
TGA Thermogravimetric analysis
Tg Glass transition temperature
TMQ Trimethyl-dihydroquinolines
TMTD Tetramethylthiuram
T90 Cure time
UTS Ultimate tensile strength
XRD X-ray Diffraction
XRF X-ray Fluorescence
ZnO Zinc oxide
ZnS Zinc sulfide
6ppd N-(1,3-Dimethylbutyl)-N'-phenyl-p-phenylenediamine
vi
TABLE OF CONTENTS
Page
Declaration ................................................................................................................ i
Acknowledgements ................................................................................................. ii
Abstract ................................................................................................................... iii
List of Acronyms and Abbreviations .................................................................... iv
List of Tables .......................................................................................................... xi
List Of Figures ...................................................................................................... xiii
CHAPTER 1
INTRODUCTION
1.1 TYRES ............................................................................................................. 1
1.1.1 Tyre components ................................................................................ 2
1.2 RUBBER COMPONENT IN A TYRE ............................................................... 2
1.2.1 Styrene-butadiene rubber ................................................................... 3
1.2.2 Natural rubber ..................................................................................... 4
1.2.3 Natural rubber/ styrene-butadiene rubber blends ................................ 4
1.3 FILLERS IN A TYRE ........................................................................................ 5
1.3.1 Carbon black ....................................................................................... 5
1.3.1.1 Different types of carbon black ............................................... 6
1.3.1.2 Carbon black grades............................................................... 7
1.4 CHALLENGES OF WASTE TYRES ................................................................ 8
1.4.1 The current state of waste tyre management practices and
legislation ............................................................................................ 9
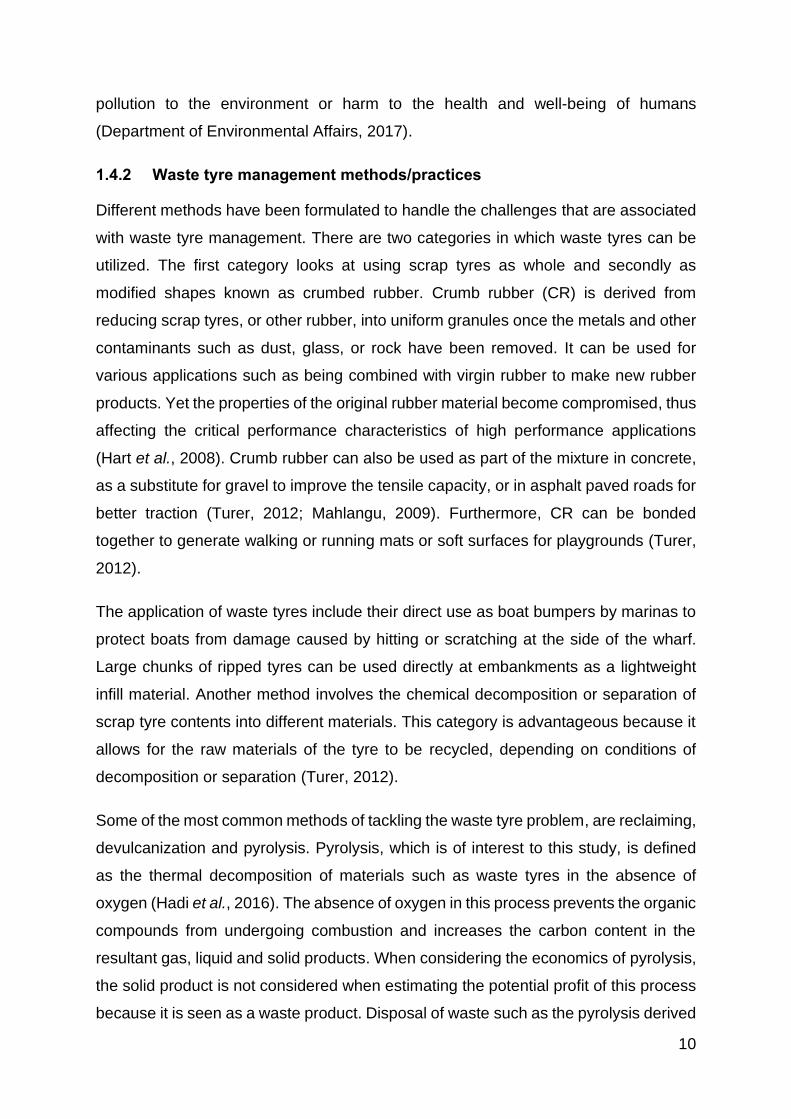
1.4.2 Waste tyre management methods/practices ..................................... 10
1.5 THE IDEA OF CIRCULAR ECONOMY ......................................................... 11
vii
1.6 RESEARCH STATEMENT ............................................................................ 12
1.7 RESEARCH QUESTIONS ............................................................................. 13
1.7.1 Problem Statement ........................................................................... 13
1.7.2 Hypothesis ........................................................................................ 13
1.7.3 Key research question ...................................................................... 13
1.7.4 Research aims and objectives .......................................................... 13
CHAPTER 2
LITERATURE REVIEW
2.1 PYROLYSIS OF WASTE TYRES .................................................................. 15
2.1.1 Types of pyrolysis reactors ............................................................... 16
2.1.1.1 Conical spouted bed reactor (CSBR).................................... 17
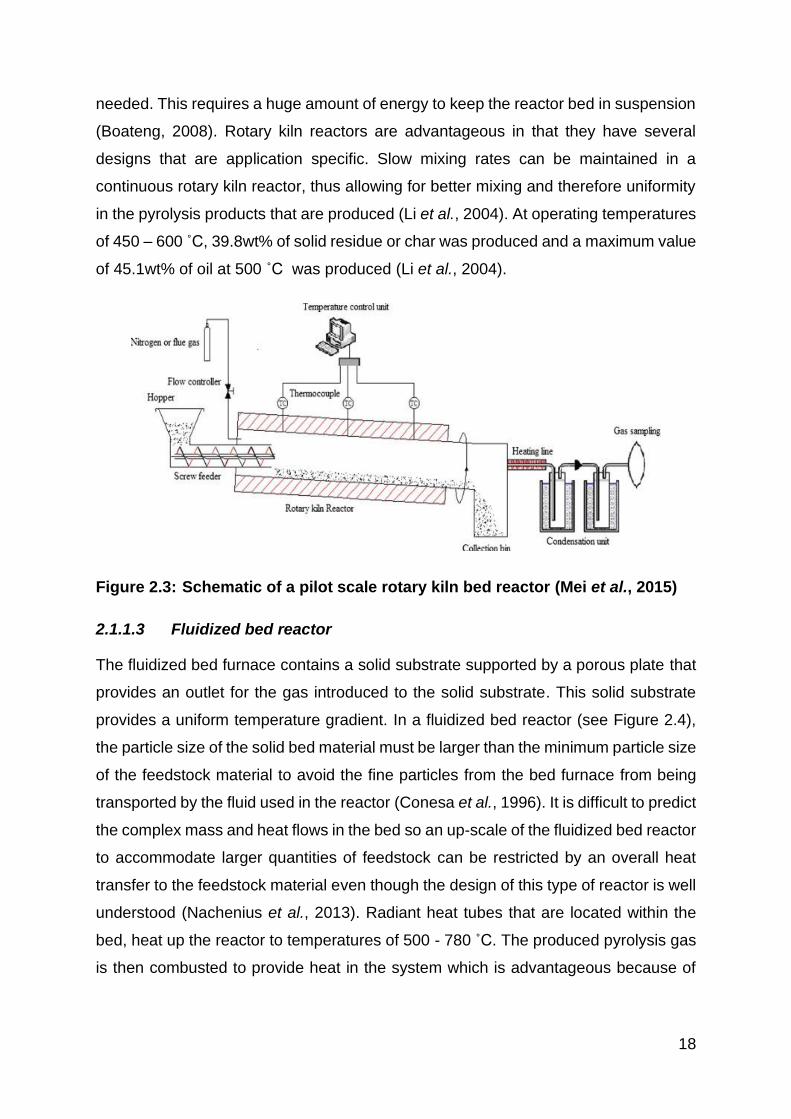
2.1.1.2 Rotary kiln reactors ............................................................... 17
2.1.1.3 Fluidized bed reactor ............................................................ 18
2.1.2 Pyrolysis conditions........................................................................... 19
2.1.2.1 Influence of temperature and pressure ................................. 19
2.1.2.2 Influence of secondary factors .............................................. 20
2.1.3 Pyrolysis products ............................................................................. 22
2.1.3.1 The liquid fraction ................................................................. 22
2.1.3.2 The gas fraction .................................................................... 22
2.1.3.3 The solid residue .................................................................. 23
2.2 EFFECT OF CARBON BLACK ON THE PROPERTIES OF
ELASTOMERS .............................................................................................. 23
2.3 PYROLYSIS-DERIVED CARBON BLACK .................................................... 26
2.4 COMPARISON OF THE EFFECT OF CB AND PCB ON PROPERTIES
OF ELASTOMERS ........................................................................................ 27
2.4.1 Elastomeric mechanical properties ................................................... 27
2.4.1.1 Effect of ash presence on the effectiveness of CB and
pCB as fillers in elastomers .................................................. 28
viii
2.4.2 Dynamic mechanical properties ........................................................ 29
2.5 APPLICATIONS OF CB/RUBBER COMPOUNDS IN CONVEYOR
BELTING ....................................................................................................... 30
2.5.1 Conveyor belts .................................................................................. 30
2.5.1.1 Conveyor belts categories .................................................... 31
2.6 ABRASION RESISTANCE ............................................................................ 31
2.7 AGING ........................................................................................................... 33
2.8 PARTIAL REPLACEMENT OF CB WITH PCB.............................................. 34
CHAPTER 3
MATERIALS AND METHODS
3.1 MATERIALS .................................................................................................. 36
3.1.1 Elastomer and curatives .................................................................... 36
3.1.2 Curatives ........................................................................................... 36
3.1.3 Fillers ................................................................................................ 36
3.1.3.1 Characterization of pyrolysis-derived carbon black .............. 37
3.1.3.1.1 Brunauer-Emmett-Teller (BET) Analysis ............................ 37
3.1.3.1.2 X-ray Fluorescence (XRF) analysis ................................... 38
3.1.3.1.3 X-ray Powder Diffraction (XRD) Analysis ........................... 39
3.1.3.1.4 Thermogravimetric Analysis (TGA) .................................... 39
3.1.3.1.5 Scanning Electron Microscopy (SEM) ................................ 40
3.2 SAMPLE PREPARATION ............................................................................. 41
3.2.1 Weighing ........................................................................................... 41
3.2.2 Mixing ................................................................................................ 41
3.2.3 Curing ............................................................................................... 44
3.2.3.1 Rheometer ............................................................................ 44
3.2.3.2 Test sheets ........................................................................... 44
3.2.3.3 Testing blocks ....................................................................... 44
3.2.3.4 Testing buttons ..................................................................... 45
ix
3.3 MORPHOLOGY ............................................................................................. 45
3.3.1 Scanning Electron Microscopy (SEM) ............................................... 45
3.4 THERMAL ANALYSIS ................................................................................... 45
3.4.1 Dynamic Mechanical Analysis (DMA) ............................................... 45
3.4.2 Differential Scanning Calorimetry (DSC) ........................................... 46
3.5 PHYSICAL PROPERTY MEASUREMENTS ................................................. 46
3.5.1 Hardness test .................................................................................... 46
3.5.2 Rebound test ..................................................................................... 47
3.5.3 Tensile testing ................................................................................... 47
3.5.4 Abrasion test ..................................................................................... 48
3.6 PAYNE EFFECT ............................................................................................ 49
CHAPTER 4
CHARACTERIZATION OF PYROLYSIS-DERIVED CARBON BLACK
4.1 THERMAL STABILITY ................................................................................... 50
4.2 HEAT ABSORPTION ..................................................................................... 51
4.3 INORGANIC RESIDUE ................................................................................. 52
4.4 SURFACE CHEMISTRY AND MORPHOLOGY ............................................ 54
CHAPTER 5
EVALUATION OF THE MECHANICAL PROPERTIES OF PCB AND
COMMERCIAL CB FILLED NR/SBR BLENDS
5.1 INFLUENCE OF CARBON BLACK FILLERS ON THE MECHANICAL
PROPERTIES OF NR/SBR BLENDS ............................................................ 60
5.1.1 Hardness ........................................................................................... 60
5.1.2 Rebound resilience ........................................................................... 61
5.1.3 Tan delta ........................................................................................... 62
5.1.4 Abrasion resistance........................................................................... 65
5.1.5 Tensile properties ............................................................................. 66
5.2 BLENDED FILLER: PARTIAL REPLACEMENT OF N330 BY PCB ............. 68
x
5.2.1 Hardness ........................................................................................... 69
5.2.2 Rebound ........................................................................................... 69
5.2.3 Tan delta ........................................................................................... 70
5.2.4 Abrasion resistance........................................................................... 72
5.2.5 Tensile strength ................................................................................ 73
5.3 COST OF COMPOUNDS BASED ON INGREDIENTS USED ...................... 76
CHAPTER 6
CURE AND MORPHOLOGICAL PROPERTIES OF PCB AND COMMERCIAL CB
FILLED NR/SBR BLENDS
6.1 CURE CHARACTERISTICS OF COMMERCIAL AND PYROLYSIS CARBON
BLACK FILLED NR/SBR BLEND .................................................................. 79
6.2 PAYNE EFFECT ............................................................................................ 81
6.3 MORPHOLOGY ............................................................................................. 82
6.3.1 Scanning Electron Microscopy (SEM) ............................................... 82
6.3.1.1 Linearity ................................................................................ 83
6.3.1.2 Crystallinity ........................................................................... 86
CHAPTER 7
OVERALL SUMMARY AND RECOMMENDED FUTURE WORK
7.1 OVERVIEW ................................................................................................... 90
7.2 CHARACTERIZATION OF PYROLYSIS-DERIVED WASTE TYRE
CARBON BLACK ........................................................................................... 90
7.3 KEY FINDINGS ON APPLICATION OF PCB AS A FILLER IN NATURAL
RUBBER/STYRENE-BUTADIENE RUBBER ................................................ 91
7.3.1 Influence of pCB on mechanical properties of natural rubber/
styrene-butadiene rubber .................................................................. 91
7.4 RECOMMENDATIONS AND FUTURE WORK ............................................. 92
REFERENCES ......................................................................................................... 94
xi
LIST OF TABLES
Page
Table 1.1: Carbon black grades, surface area limits and particle size
diameter (Jean-Baptiste and Voet, 1976) ............................................ 7
Table 2.1: Effect of temperature on pyrolysis by-products yield
(Barbootib et al., 2004) ...................................................................... 20
Table 3.1: Typical formulation of a conveyor belt ............................................... 42
Table 3.2: The ratio of carbon black to pyrolysis-derived carbon black used ..... 43
Table 4.1: In-organic detection of pyrolysis derived carbon by XRF analysis .... 53
Table 4.2: Tabulated values of the surface area of carbon black grades
and pyrolysis-derived carbon black ................................................... 55
Table 5.1.1: Summary of mechanical properties influenced by commercial and
pyrolysis carbons .............................................................................. 64
Table 5.1.2: Tabulated values of the tensile properties of the parent fillers .......... 68
Table 5.1.3: Properties important for conveyor belting products ........................... 68
Table 5.2.1: Summary of mechanical properties influenced by pCB/CB blend ..... 72
Table 5.2.2: Tabulated values of the tensile properties of N330 and pCB blends . 74
Table 5.3.1: Cost of filler at 1 kg each ................................................................... 76
Table 5.3.2: Cost of NR/SBR blend with N330 ..................................................... 76
Table 5.3.3: Cost of NR/SBR blend of 5:35 (pCB:N330) ....................................... 77
Table 5.3.4: Cost of NR/SBR blend of 10:30 (pCB:N330) ..................................... 77
Table 5.3.5: Cost of NR/SBR blend with pCB ....................................................... 77

xii
Table 5.3.6: Summary of the cost of compounds .................................................. 78
Table 6.1: Cure characteristics of CB, pCB and pCB/CB of NR/SBR blend ...... 80
xiii
LIST OF FIGURES
Page
Figure 1.1: Typical structure of a tyre (TIREBUYER, 2017) .................................. 2
Figure 1.2: Structure of styrene-butadiene rubber produced by styrene
and butadiene copolymers (Gardner, 1994) ....................................... 4
Figure 1.3: The structure of carbon black (Mitsubishi, 2009) ................................ 6
Figure 1.4: Circular economy model (WRAP, 2018) ........................................... 12
Figure 2.1: An outline showing the various steps involved in the pyrolysis of
waste tyres (Zafar, 2018, Nkosi and Muzenda, 2014) ....................... 16
Figure 2.2: Schematic of a conical spouted bed bench scale plant
(Barbarias et al., 2019) ...................................................................... 17
Figure 2.3: Schematic of a pilot scale rotary kiln bed reactor (Mei et al., 2015) .. 18
Figure 2.4: Schematic of a fluidized bed reactor (Brems et al., 2013) ................. 19
Figure 2.5: Conveyor belt elements (Metallurgist, 2018)…………………………… 30
Figure 3.1: An illustration of the X-ray fluorescence electron excitation
principle (Robb, 2019) ....................................................................... 38
Figure 3.2: Rubber blocks from block moulds used for hardness and
rebound testing ................................................................................. 47
Figure 3.3: Image of dumbbell-shaped rubber material used for tensile testing .. 48
Figure 4.1: Overlay of TGA thermograph of commercial and
pyrolysis carbon blacks…………………………………………………... 51
Figure 4.2: Heat capacity overlay of neat and carbon-filled NR/SBR blend ........ 52
Figure 4.3: Diagram illustrating the breaker package and tyre tread
(Anon., 2020) .................................................................................... 53
xiv
Figure 4.4: P-XRD analysis overlay of the various virgin CB standards and
the pCB ............................................................................................. 54
Figure 4.5: SEM micrographs of virgin N330 at various magnifications ............ 56
Figure 4.6: SEM micrographs of virgin N660 at various magnifications ............ 57
Figure 4.7: SEM micrographs of pyrolysis recovered carbon black
at various magnifications ................................................................ 58
Figure 4.8: Inorganic material on pyrolysis recovered carbon black ................. 59
Figure 5.1.1: Shore A hardness of carbon filled NR-SBR blend ........................... 61
Figure 5.1.2: Influence of carbons on rebound resilience on NR/SBR ....................
blend ............................................................................................... 62
Figure 5.1.3: Effect of carbon grades on the DMA tan delta of the ...........................
NR-SBR blend ................................................................................ 64
Figure 5.1.4: Influence of carbons on the abrasion resistance of ............................
NR/SBR blend ................................................................................. 66
Figure 5.2.1: Shore A hardness values of CB, pCB and pCB/CB blends ............. 69
Figure 5.2.2: Rebound resilience of CB, pCB and pCB/CB blends ...................... 70
Figure 5.2.3: DMA tan delta of parent fillers and blends ....................................... 71
Figure 5.2.4: Effect of abrasion depression with pCB loading ................... 73
Figure 5.2.5.1: Strength contribution by pCB on NR-SBR N330 .....................
containing blends ................................................................. 75
Figure 5.2.5.2: Influence of pCB on the elastic property of NR-SBR ..............
blend in the presence of N330 .............................................. 75
Figure 6.2.1: Payne effect with pyrolysis-derived carbon black loading in
pCB/CB blends ..................................................................... 81
xv
Figure 6.2.2: Diagram explaining the Payne effect (Jayalakshmy
and Mishra, 2019) ................................................................ 82
Figure 6.3.1: Influence of N330 and pCB on tensile break orientation ...... 84
Figure 6.3.2: Influence of pCB and pCB/CB blends on tensile break
orientation ............................................................................. 85
Figure 6.3.3: Diagram illustrating the network structure of a carbon filled
elastomer (Li et al., 2008b) ................................................... 86
Figure 6.3.4: Influence of N330 (a and c) and pCB (b and d) on polymer
crystallinity ............................................................................ 87
Figure 6.3.5: Influence of 10:30 pCB/CB blend on crystallinity .................. 88
Figure 6.3.6: Influence of 20:20 pCB/CB blend on polymer crystallinity .... 89
1
CHAPTER 1
INTRODUCTION
The history of tyres can be traced back to 1845 when Robert Thompson invented the
first pneumatic tyre. There were several problems with his invention such as rapid
aging and cracking because only natural rubber was used. These tyres had a small
cross section and performed at high pressures because they were primarily designed
for bicycles. In the 1920s, a larger tyre was developed for the mushrooming motor
vehicle industry and in the early 1950s improvements were made on the rim design of
the tubeless tyres. Belted bias tyres followed in the late 1960s and gained a lot of
popularity (Gent and Walter, 2005). However the radial tyres which were introduced
to Europe in the early 1970s now dominate the market and are mostly used in
passenger vehicles and most 4-wheel drive and heavy vehicles (McMahon, 2013).
1.1 TYRES
A tyre is defined as a rubber covering, typically inflated or surrounding an inflated inner
tube, placed round a wheel to form a soft contact with the road. It is mainly made-up
of a combination of natural and synthetic rubbers, encircling a wheel, whether new,
used or retreaded (Department of Environmental Affairs, 2017). Tyres are made up of
60-65 wt% rubber, 25-35 wt% of carbon black and the rest comprises of accelerators,
antidegradants, processing oils and fillers which are added during the compounding
process (Anon., 2008). These additives help to improve production time and lower
production cost while also providing an overall high performing product (von Berg,
2016a).
Tyres play a major role in our society today, especially in the transportation sector.
Their growth in production has largely been impacted by the automotive sector
(Continental, 2013). This has, in turn, led to tyre production having a great influence
on the elastomer industry, since 70% of the rubber that is produced in the world goes
into tyre production (Anon., 2008). Tyres are known to be an important component of
a vehicle and they are expected to perform several functions.
Those functions include cushioning, supporting the weight of the vehicle, dampening,
providing good directional stability and longevity of the tyre (Continental, 2013; Anon.,
2
2018). All of these functions have to be maintained under different environmental
conditions, such as when the road is wet and slippery or when it is covered with
ice/snow (Continental, 2013).
1.1.1 Tyre components
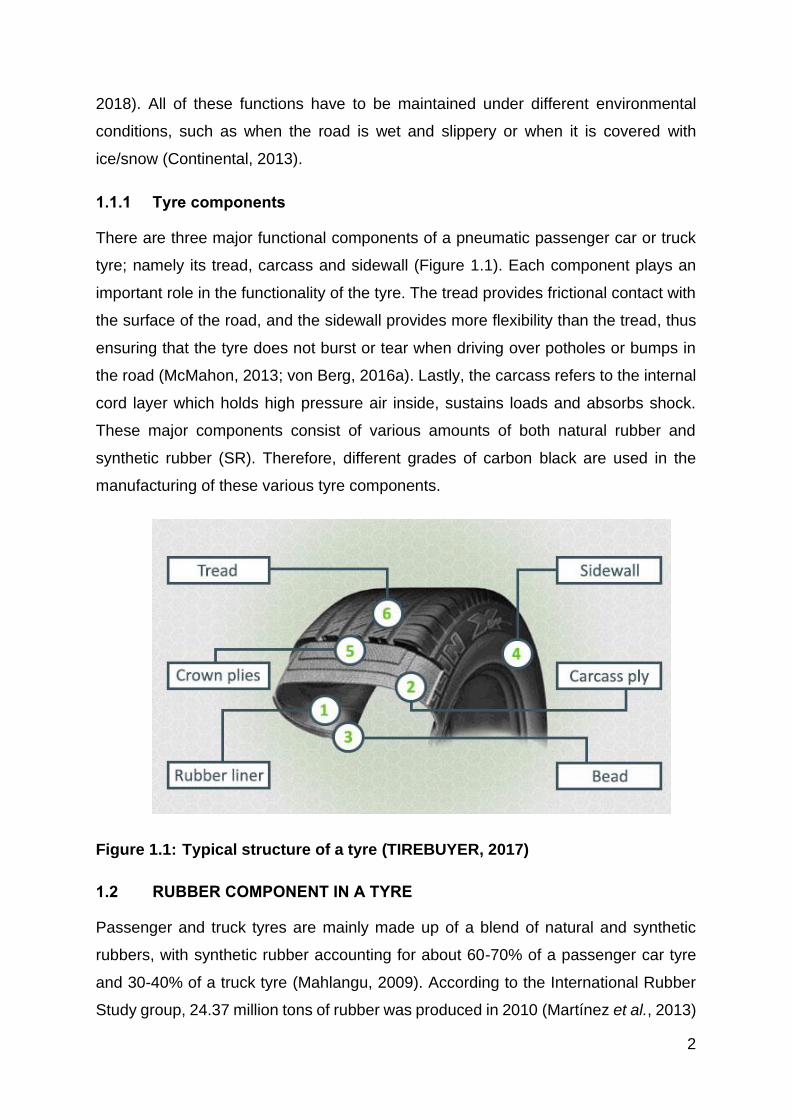
There are three major functional components of a pneumatic passenger car or truck
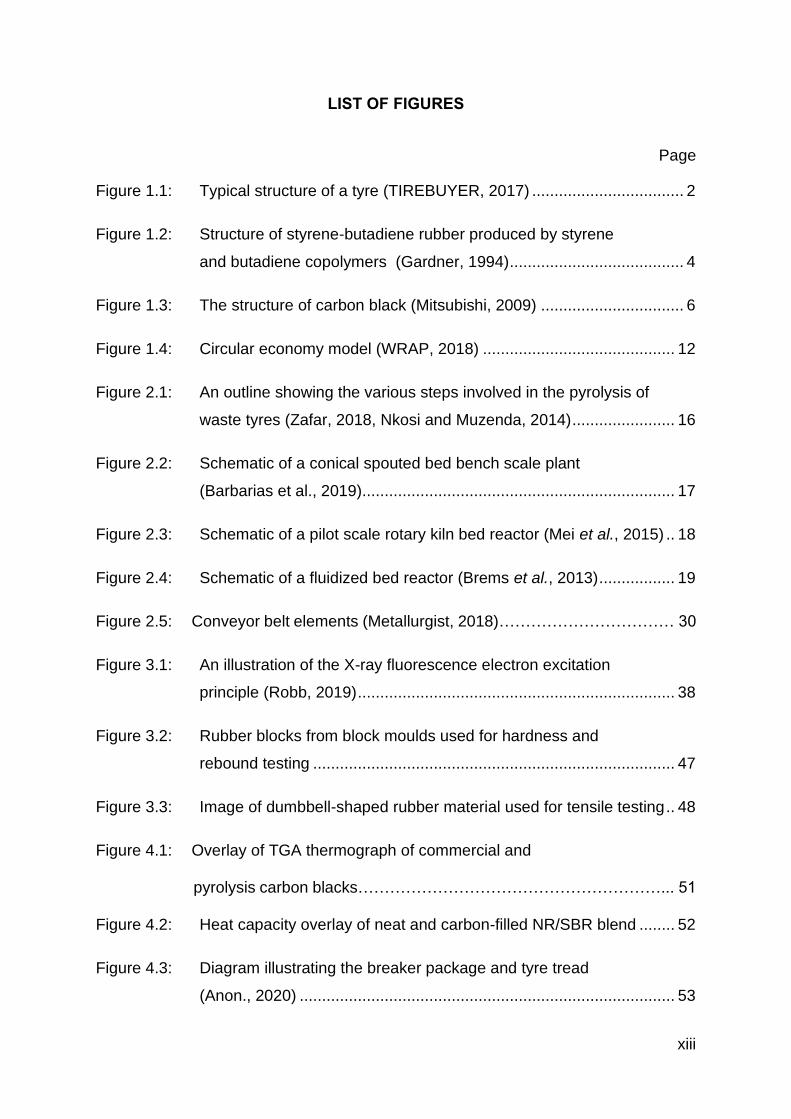
tyre; namely its tread, carcass and sidewall (Figure 1.1). Each component plays an
important role in the functionality of the tyre. The tread provides frictional contact with
the surface of the road, and the sidewall provides more flexibility than the tread, thus
ensuring that the tyre does not burst or tear when driving over potholes or bumps in
the road (McMahon, 2013; von Berg, 2016a). Lastly, the carcass refers to the internal
cord layer which holds high pressure air inside, sustains loads and absorbs shock.
These major components consist of various amounts of both natural rubber and
synthetic rubber (SR). Therefore, different grades of carbon black are used in the
manufacturing of these various tyre components.
Figure 1.1: Typical structure of a tyre (TIREBUYER, 2017)
1.2 RUBBER COMPONENT IN A TYRE
Passenger and truck tyres are mainly made up of a blend of natural and synthetic
rubbers, with synthetic rubber accounting for about 60-70% of a passenger car tyre
and 30-40% of a truck tyre (Mahlangu, 2009). According to the International Rubber
Study group, 24.37 million tons of rubber was produced in 2010 (Martínez et al., 2013)
3
and of this amount, 42% of the produced rubber was natural rubber (NR) and 58%
was synthetic rubber. Synthetic rubbers such as butyl rubber (IIR) and styrene-
butadiene rubber (SBR) copolymers have managed to penetrate the market with SBR
being the most common general-purpose synthetic rubber in the world. It is produced
at high volumes because it is cost effective, has good abrasion resistance, and it
possesses a higher level of product uniformity than that of natural rubber (Niyogi,
2007). The majority of SBR is used in tyre production, yet its low cost and its adequate
physical properties allows it to be employed in other products such as mechanical
goods, footwear, hosing and belting (Plantation, 2010).
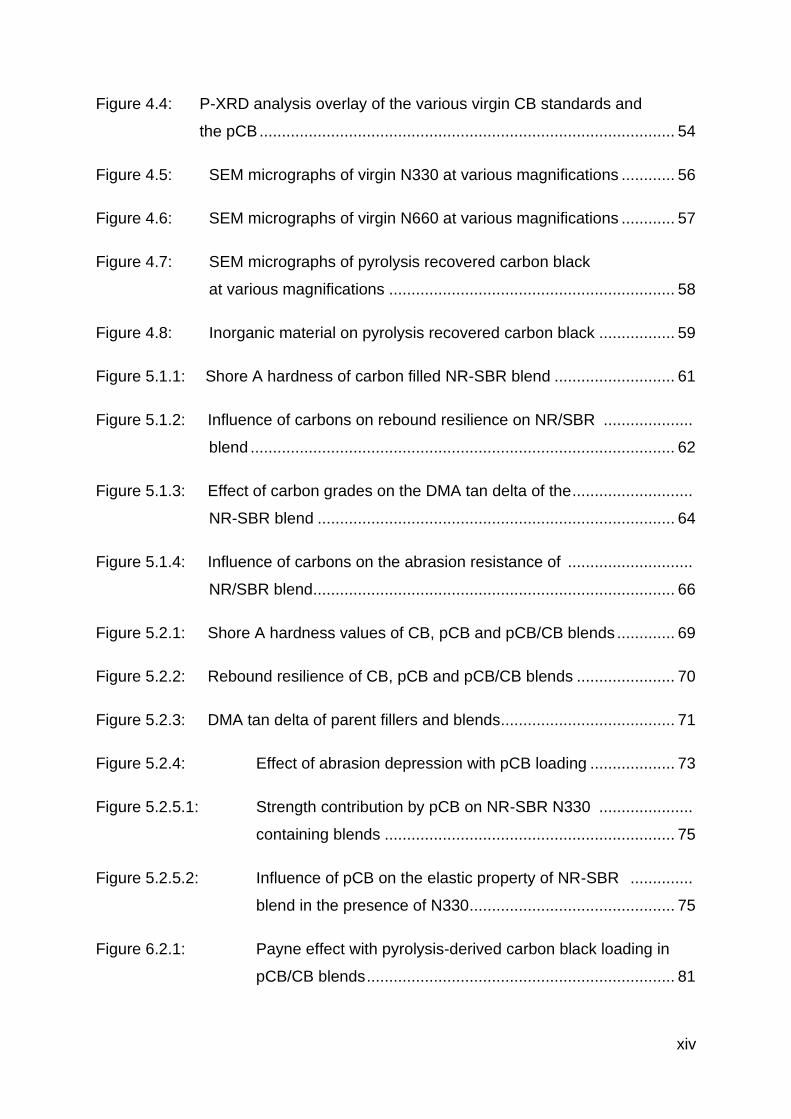
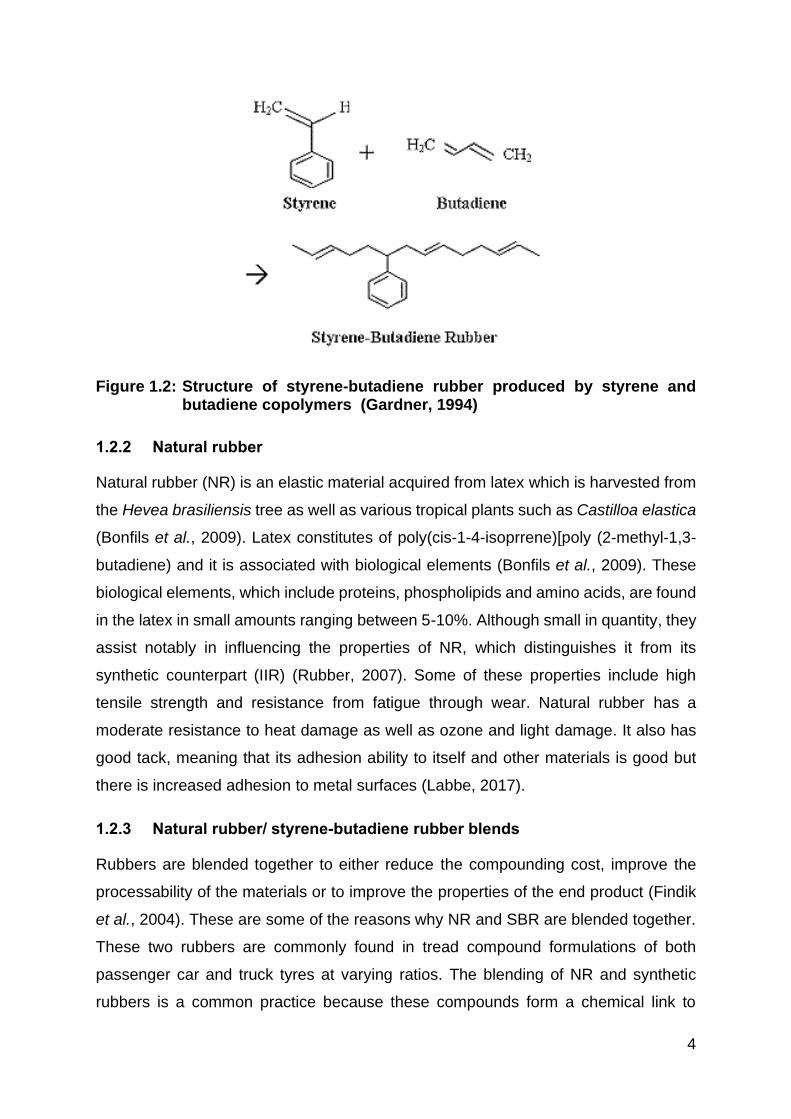
1.2.1 Styrene-butadiene rubber
Styrene-butadiene rubber is produced from styrene and butadiene monomers, as
shown in Figure 1.2. The arrangement of the copolymers can be random, partially-
block or block in character (Norman, 2007). Styrene-butadiene rubber (SBR) is mainly
used in passenger and truck tyres as a blend of NR and IIR, generally as an abrasion
resistant and crack resistant option to natural rubber. Furthermore, SBR reduces the
rebound percentage and provides good aging properties. The properties of SBR are
not influenced by micro and macrostructures only but also by the content of styrene
(Norman, 2007). An increase in styrene content and 1.2 structural units results in an
increase in the glass transition temperature (Tg) of SBR (Norman, 2007). Typically,
SBR has good thermal resistance and elasticity. A higher Tg value means that SBR is
rubberier and more flexible at room temperature, hence the elasticity. It increases heat
capacity, thus making it more thermally stable while increasing the window of
operation. Styrene-butadiene rubber with low styrene content is suitable for low
temperature applications.
4
Figure 1.2: Structure of styrene-butadiene rubber produced by styrene and butadiene copolymers (Gardner, 1994)
1.2.2 Natural rubber
Natural rubber (NR) is an elastic material acquired from latex which is harvested from
the Hevea brasiliensis tree as well as various tropical plants such as Castilloa elastica
(Bonfils et al., 2009). Latex constitutes of poly(cis-1-4-isoprrene)[poly (2-methyl-1,3-
butadiene) and it is associated with biological elements (Bonfils et al., 2009). These
biological elements, which include proteins, phospholipids and amino acids, are found
in the latex in small amounts ranging between 5-10%. Although small in quantity, they
assist notably in influencing the properties of NR, which distinguishes it from its
synthetic counterpart (IIR) (Rubber, 2007). Some of these properties include high
tensile strength and resistance from fatigue through wear. Natural rubber has a
moderate resistance to heat damage as well as ozone and light damage. It also has
good tack, meaning that its adhesion ability to itself and other materials is good but
there is increased adhesion to metal surfaces (Labbe, 2017).
1.2.3 Natural rubber/ styrene-butadiene rubber blends
Rubbers are blended together to either reduce the compounding cost, improve the
processability of the materials or to improve the properties of the end product (Findik
et al., 2004). These are some of the reasons why NR and SBR are blended together.
These two rubbers are commonly found in tread compound formulations of both
passenger car and truck tyres at varying ratios. The blending of NR and synthetic
rubbers is a common practice because these compounds form a chemical link to
5
produce a technologically compatible blend. This is evident in passenger and truck
tyres where NR and SBR are used at varying ratios to enhance physical properties,
(Oleiwi et al., 2011). The addition of NR improves the tensile strength because this
polymer has more reactive sites to form crosslinks during vulcanization than SBR, (
Barani et al., 2010; Oleiwi et al., 2011). It also reduces the optimum cure time as well
as the torque, meaning that the compound becomes less resistant to rotational
movement and this, therefore, improves processability (George et al., 2000). Styrene-
butadiene rubber improves the abrasion resistance and the elongation as well as the
storage modulus of NR and thus decreases the tan delta since the resilience
percentage increases with the NR content.
Mechanical properties such as tensile strength are improved with a higher NR content
because a small addition of NR to SBR disrupts the homogeneity of SBR, thus
reducing elongation (Barani et al., 2010).
1.3 FILLERS IN A TYRE
The properties of vulcanized and unvulcanized rubber can be further modified by
incorporating fillers. The presence of a filler in compounding fulfils the purpose of either
reinforcing or cheapening the compound (Bijarimi et al., 2010b). Other benefits of
using fillers are that they produce longer-wearing products and they increase the
strength of tyres. There are several fillers that are used in rubber compounding, such
as carbon black, calcium silicate, calcium carbonate, clay and silica (Bijarimi et al.,
2010b). Amongst them, reinforcing fillers that have been extensively used in the rubber
industry for decades, are silica and carbon black (Mostafa et al., 2010b; Anon., 2012).
Silica mostly helps with reducing greenhouse gas emissions by reducing the rolling
resistance of tyres, which ultimately decreases CO2 emissions (Anon., 2012). Carbon
black (CB) is the most commonly used filler in rubber compounds, mainly because it
enhances the properties of nearly any base elastomer system. It is therefore a filler of
interest in this study.
1.3.1 Carbon black
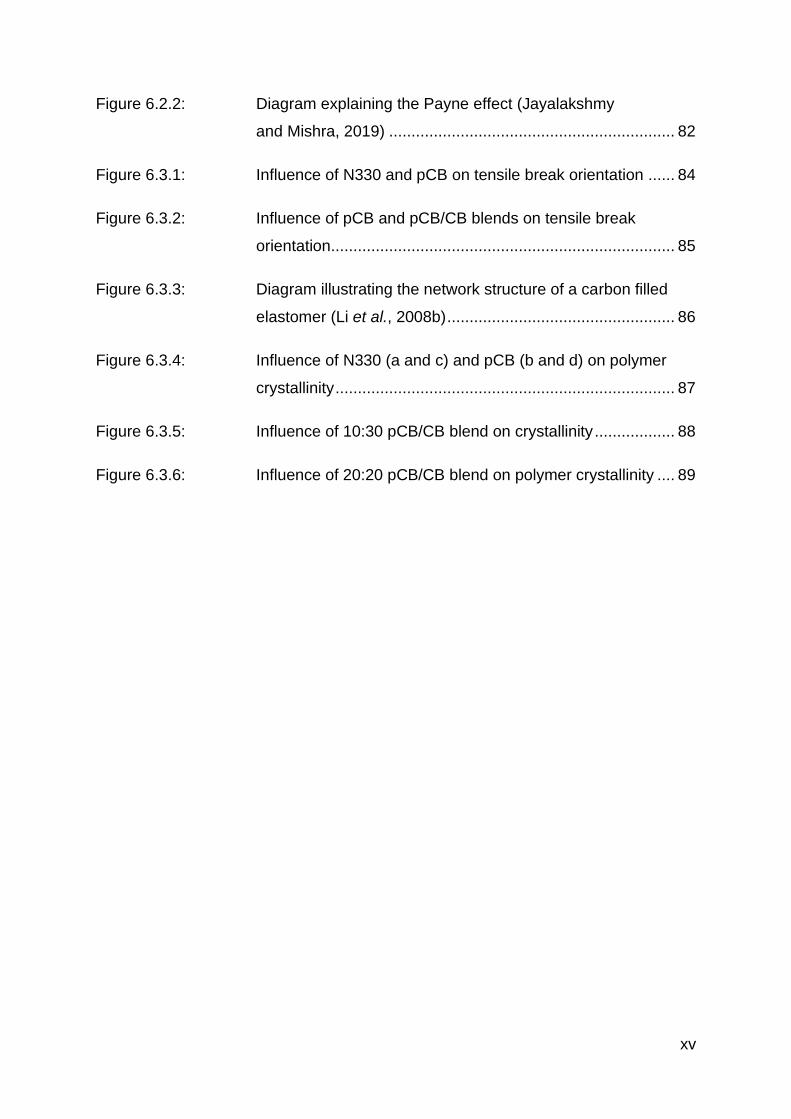
Carbon black is elemental carbon in the form of fine particles that are produced from
controlled combustion (Donnet, 1993). Carbon black (CB) is made up of particles that,
when tightly bound together, form aggregates. Large interfacial areas of aggregates
6
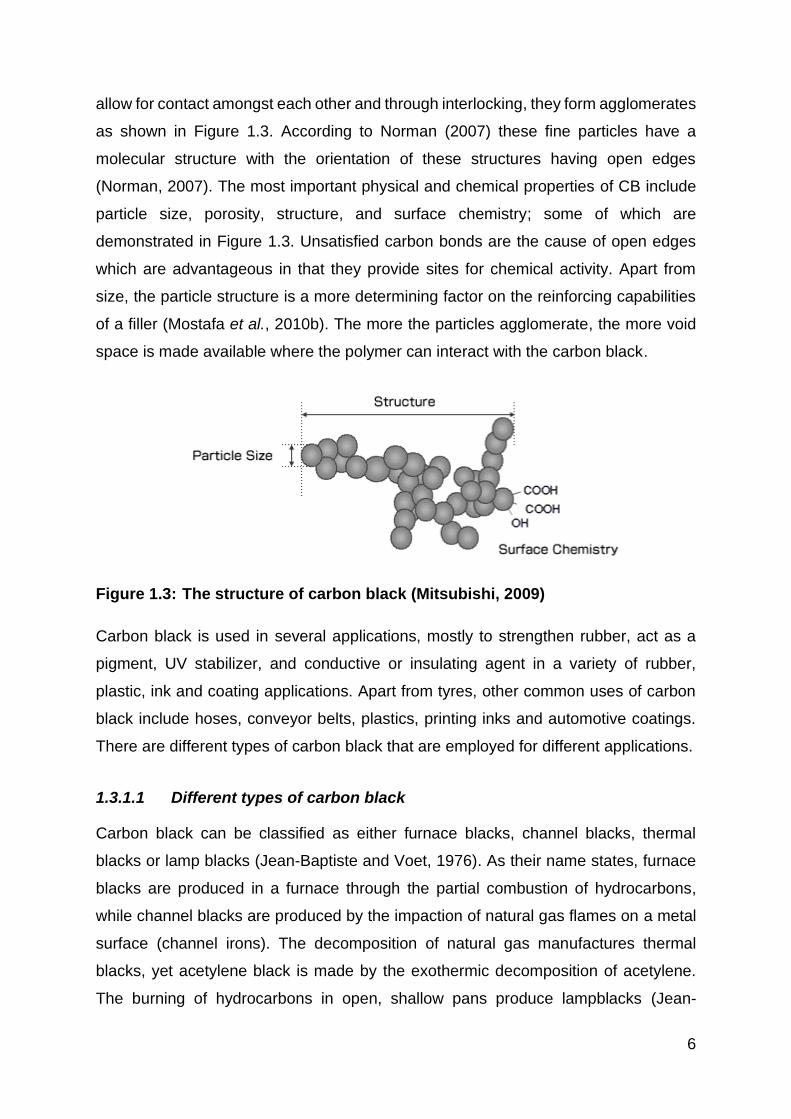
allow for contact amongst each other and through interlocking, they form agglomerates
as shown in Figure 1.3. According to Norman (2007) these fine particles have a
molecular structure with the orientation of these structures having open edges
(Norman, 2007). The most important physical and chemical properties of CB include
particle size, porosity, structure, and surface chemistry; some of which are
demonstrated in Figure 1.3. Unsatisfied carbon bonds are the cause of open edges
which are advantageous in that they provide sites for chemical activity. Apart from
size, the particle structure is a more determining factor on the reinforcing capabilities
of a filler (Mostafa et al., 2010b). The more the particles agglomerate, the more void
space is made available where the polymer can interact with the carbon black.
Figure 1.3: The structure of carbon black (Mitsubishi, 2009)
Carbon black is used in several applications, mostly to strengthen rubber, act as a
pigment, UV stabilizer, and conductive or insulating agent in a variety of rubber,
plastic, ink and coating applications. Apart from tyres, other common uses of carbon
black include hoses, conveyor belts, plastics, printing inks and automotive coatings.
There are different types of carbon black that are employed for different applications.
1.3.1.1 Different types of carbon black
Carbon black can be classified as either furnace blacks, channel blacks, thermal
blacks or lamp blacks (Jean-Baptiste and Voet, 1976). As their name states, furnace
blacks are produced in a furnace through the partial combustion of hydrocarbons,
while channel blacks are produced by the impaction of natural gas flames on a metal
surface (channel irons). The decomposition of natural gas manufactures thermal
blacks, yet acetylene black is made by the exothermic decomposition of acetylene.
The burning of hydrocarbons in open, shallow pans produce lampblacks (Jean-
7
Baptiste and Voet, 1976). These processes can produce different carbon black grades
with varying properties.
1.3.1.2 Carbon black grades
A variety of fillers can be compounded with elastomers, but not all have reinforcing
ability. In the rubber industry, carbon blacks are classified by their reinforcing ability,
as either reinforcing, semi-reinforcing or as thermal blacks. The carbon black grades
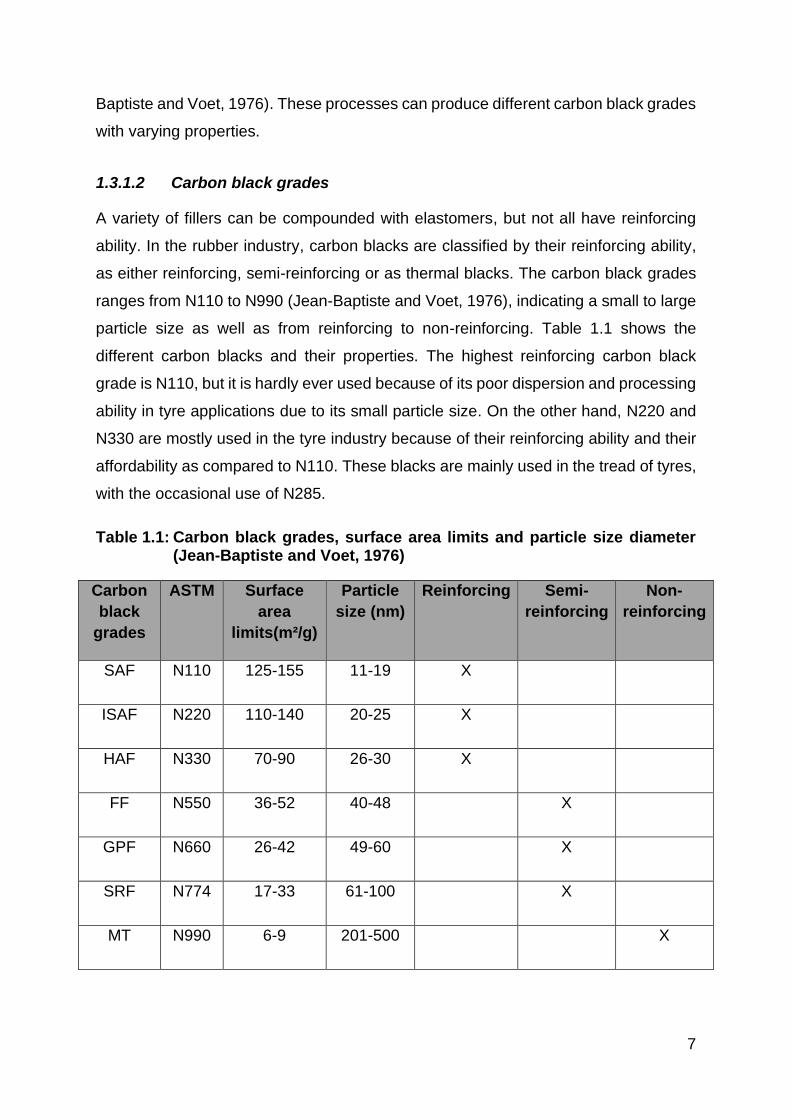
ranges from N110 to N990 (Jean-Baptiste and Voet, 1976), indicating a small to large
particle size as well as from reinforcing to non-reinforcing. Table 1.1 shows the
different carbon blacks and their properties. The highest reinforcing carbon black
grade is N110, but it is hardly ever used because of its poor dispersion and processing
ability in tyre applications due to its small particle size. On the other hand, N220 and
N330 are mostly used in the tyre industry because of their reinforcing ability and their
affordability as compared to N110. These blacks are mainly used in the tread of tyres,
with the occasional use of N285.
Table 1.1: Carbon black grades, surface area limits and particle size diameter (Jean-Baptiste and Voet, 1976)
Carbon
black
grades
ASTM Surface
area
limits(m²/g)
Particle
size (nm)
Reinforcing Semi-
reinforcing
Non-
reinforcing
SAF N110 125-155 11-19 X
ISAF N220 110-140 20-25 X
HAF N330 70-90 26-30 X
FF N550 36-52 40-48 X
GPF N660 26-42 49-60 X
SRF N774 17-33 61-100 X
MT N990 6-9 201-500 X
8
SAF, Super Abrasion Furnace Black; ISAF, Intermediate Super Abrasion Furnace Black; HAF,
High Abrasion Furnace Black; FF, Fast-Extruding Furnace Black; GPF, General Purpose
Furnace Black; SRF, Semi-reinforcing Furnace Black; MT, Medium Thermal Black
Semi-reinforcing carbon blacks require a higher loading and are easier to process.
They provide excellent flexing resistance, meaning a resistance to crack growth in the
rubber material which can negatively affect the performance of the end product. They
also provide good resilience to rubber and are preferred in mechanical goods, belts,
hoses and cable jackets (Jean-Baptiste and Voet, 1976). These blacks are preferred
in applications where high reinforcement is not required. An example is N660, which
is known as a general-purpose carbon black (CB). The lowest reinforcing CBs such
as N880 and N990 are classified as thermal blacks. They require a very high loading
and yield a low modulus and high elasticity when incorporated in to rubber. Thermal
blacks are the most cost effective and are used in cable applications, particularly for
insulation jackets.
1.4 CHALLENGES OF WASTE TYRES
The design process of the tyre had to take the ability of the tyre to be strong enough
to support the weight of the vehicle without adding too much to the total weight and
the ability to be able to endure the forces that come with normal operations, into
consideration. It is this very complexity that makes the tyre materials difficult to
decompose under normal atmospheric conditions.
The unrelenting annual increase in the global generation of waste tyres presents great
difficulty for waste management. It is estimated that 1 billion tyres are disposed of
globally every year. A report published by the South African Tyre Recycling Process
Company (SATRP) in 2008 stated that 160 000 tons of scrap tyres are generated in
South Africa each year and 28 million used tyres are dumped illegally or burnt to
recover steel wire (Mahlangu, 2009). In 2011, a total of 246 631 tons was generated
with only 4% of that number being recycled (Venter, 2018). The general lifetime of
waste tyres within landfills is 80-100 years (Martínez et al., 2013), and as such their
disposal in landfills leads to serious environmental hazards. For instance, they provide
ideal living conditions for mosquitoes, rodents and insects. This poses a threat to
human health because of the serious associated hygiene issues that are brought on
by their presence. Furthermore, accidental fires that are known to be difficult to
9
extinguish, may occur. For example, in 1989, an underground dumpsite in Wales
comprising of 10 million tyres burned for more than 15 years, releasing toxic gases
into the environment (Zsuzsanna et al., 2018). These resultant fires cause pollution
within the environment because they release great amounts of volatile organic
materials and toxic substances such as dioxins and carbon monoxide. Unfortunately,
in most rural areas, tyres are burned especially in the winter season for heat
generation and as a result, humans are exposed to these harmful chemicals
(Mahlangu, 2009, Hadi et al., 2016).
1.4.1 The current state of waste tyre management practices and legislation
The current regulations in the area of waste tyre management in South Africa are said
to be 20-30 years behind those of developed countries (Godfrey and Oelofse, 2017).
This is due to the fact that large number of waste generated in South Africa continues
to be sent to landfills, which is a commonly used method in developing countries
(Godfrey and Oelofse, 2017). The popularity of this disposal method was often due to
low landfill gate fees, unwillingness of municipalities and companies that generate
waste to find alternative methods.
Disposal of waste tyres in landfills is appealing in that it allows whole tyres to be
disposed of without any processing costs. Yet this method of waste tyre management
is increasingly concerning due to several reasons such as depleting landfill space and
the increasing costs that are associated with landfill gate fees (Godfrey and Oelofse,
2017). For instance, landfill gate fees charged by various municipalities in South Africa
is reported to be around €10–15 per tonne (Godfrey and Oelofse, 2017). Although
these South African fees are cheaper when compared to the rates in most European
countries, the present shortage in landfill space in most municipalities has resulted in
them increasing the gate fees to around €25–40 per tonne.
Nevertheless, the disposal of tyres within landfills is still considered because the
current gate fees are still a cheaper alternative compared to processing costs to
reduce used tyre waste, therefore making it very difficult to implement high-cost
alternative waste management methods. This occurs despite several regulations and
prohibitions that apply in all provinces of South Africa; some of which clearly specify
that one may not recover or dispose of a waste tyre in a manner that is likely to cause
10
pollution to the environment or harm to the health and well-being of humans
(Department of Environmental Affairs, 2017).
1.4.2 Waste tyre management methods/practices
Different methods have been formulated to handle the challenges that are associated
with waste tyre management. There are two categories in which waste tyres can be
utilized. The first category looks at using scrap tyres as whole and secondly as
modified shapes known as crumbed rubber. Crumb rubber (CR) is derived from
reducing scrap tyres, or other rubber, into uniform granules once the metals and other
contaminants such as dust, glass, or rock have been removed. It can be used for
various applications such as being combined with virgin rubber to make new rubber
products. Yet the properties of the original rubber material become compromised, thus
affecting the critical performance characteristics of high performance applications
(Hart et al., 2008). Crumb rubber can also be used as part of the mixture in concrete,
as a substitute for gravel to improve the tensile capacity, or in asphalt paved roads for
better traction (Turer, 2012; Mahlangu, 2009). Furthermore, CR can be bonded
together to generate walking or running mats or soft surfaces for playgrounds (Turer,
2012).
The application of waste tyres include their direct use as boat bumpers by marinas to
protect boats from damage caused by hitting or scratching at the side of the wharf.
Large chunks of ripped tyres can be used directly at embankments as a lightweight
infill material. Another method involves the chemical decomposition or separation of
scrap tyre contents into different materials. This category is advantageous because it
allows for the raw materials of the tyre to be recycled, depending on conditions of
decomposition or separation (Turer, 2012).
Some of the most common methods of tackling the waste tyre problem, are reclaiming,
devulcanization and pyrolysis. Pyrolysis, which is of interest to this study, is defined
as the thermal decomposition of materials such as waste tyres in the absence of
oxygen (Hadi et al., 2016). The absence of oxygen in this process prevents the organic
compounds from undergoing combustion and increases the carbon content in the
resultant gas, liquid and solid products. When considering the economics of pyrolysis,
the solid product is not considered when estimating the potential profit of this process
because it is seen as a waste product. Disposal of waste such as the pyrolysis derived
11
carbon black can be costly and therefore finding alternative applications for the
material can make the whole process more profitable.
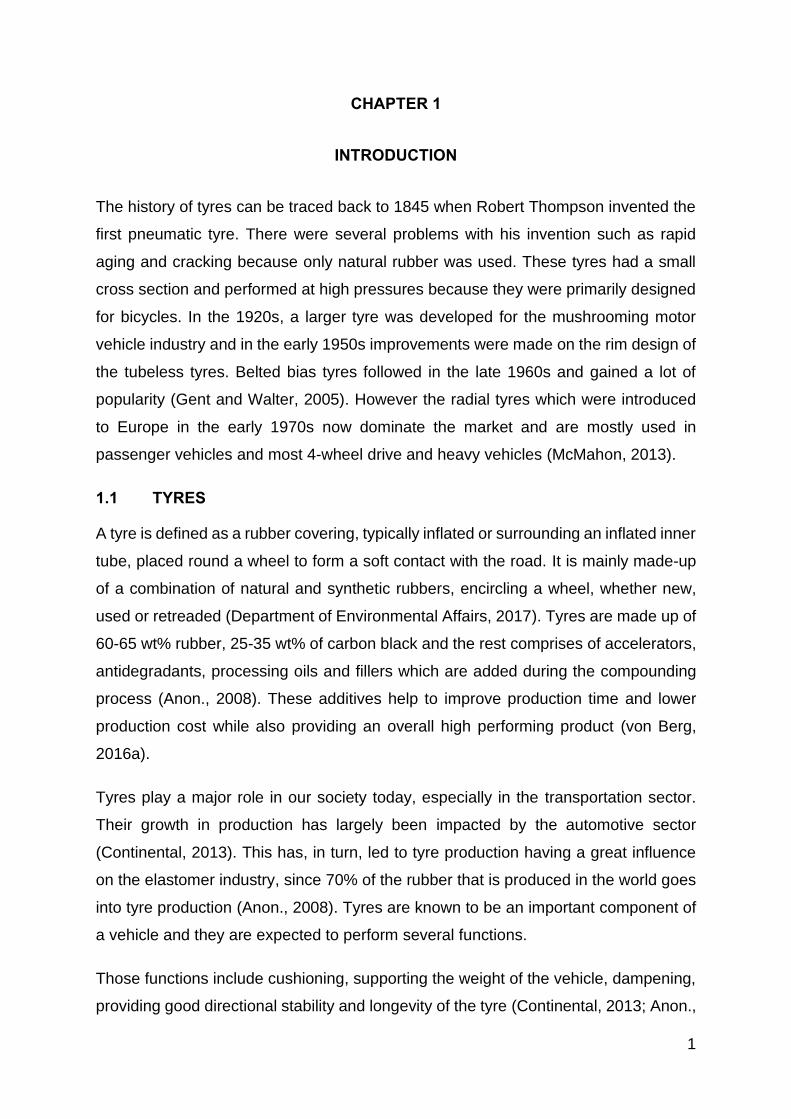
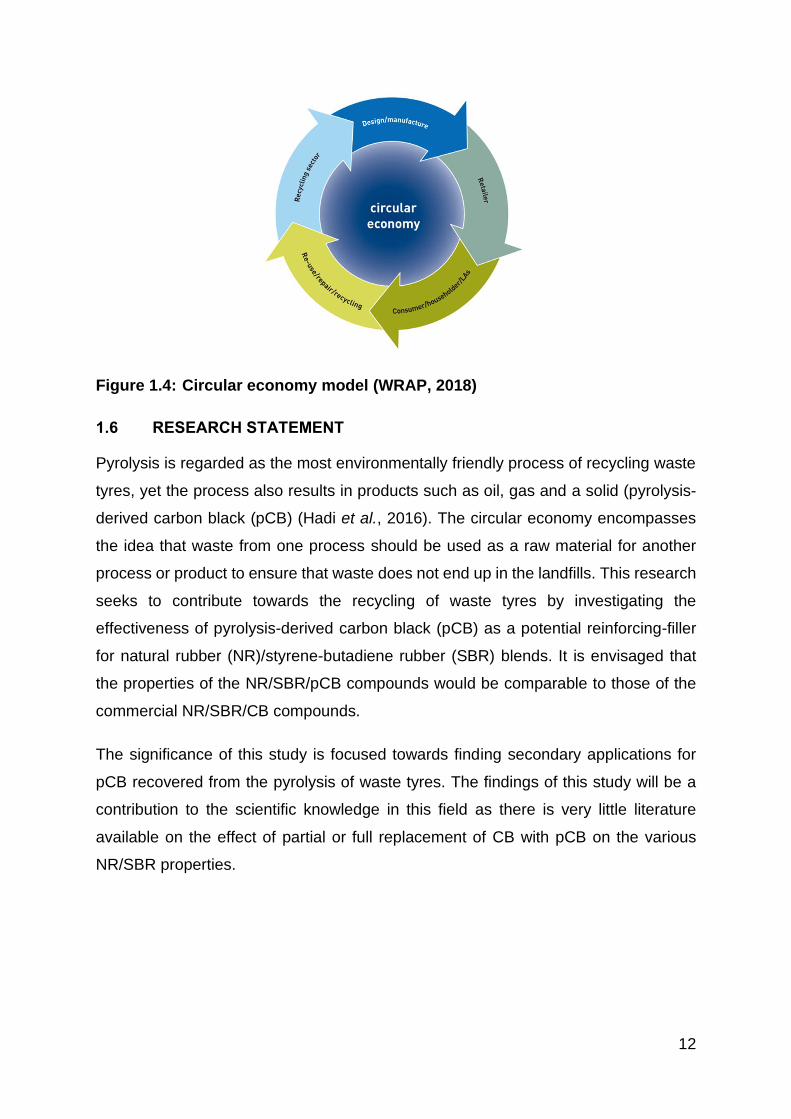
1.5 THE IDEA OF CIRCULAR ECONOMY
The idea of a circular economy which deals with a serious waste management and
pollution problem is finding its way into the tyre industry. A circular economy is an
alternative to a traditional linear economy (make, use, dispose) in which resources are
kept in use for as long as possible. This means extracting the maximum value from
them whilst in use, then recovering and regenerating products and materials at the
end of each service life (WRAP, 2018). It is a regenerative system in which resource
input and waste, emission and energy are minimized by slowing, closing and
narrowing material and energy loops as can be seen in Figure 1.4. This idea is gaining
a lot of attraction as it looks at the possibility of income generation to assist in boosting
the economy while reducing the demand for raw materials (WRAP, 2018).
Consequently, businesses are increasingly driven to look at alternative manufacturing
and processing methods due to the ever-growing constraints on the availability of
natural resources.
The success of a circular economy could be accelerated if global major economies
and their governments provide incentives to encourage more companies to rethink
their product design, and to manufacture products that can be reused and recycled.
Furthermore, awareness must be created for the wealth generation potential through
the waste management of materials such as tyres. The comparison of waste
management techniques of South Africa and other countries, allows the former the
opportunity to adopt policies from developed countries as an example on how to best
go about shifting towards waste prevention methods, and the reuse, recycling and
recovery of materials (Godfrey and Oelofse, 2017; Lee and Jung, 2017).
12
Figure 1.4: Circular economy model (WRAP, 2018)
1.6 RESEARCH STATEMENT
Pyrolysis is regarded as the most environmentally friendly process of recycling waste
tyres, yet the process also results in products such as oil, gas and a solid (pyrolysis-
derived carbon black (pCB) (Hadi et al., 2016). The circular economy encompasses
the idea that waste from one process should be used as a raw material for another
process or product to ensure that waste does not end up in the landfills. This research
seeks to contribute towards the recycling of waste tyres by investigating the
effectiveness of pyrolysis-derived carbon black (pCB) as a potential reinforcing-filler
for natural rubber (NR)/styrene-butadiene rubber (SBR) blends. It is envisaged that
the properties of the NR/SBR/pCB compounds would be comparable to those of the
commercial NR/SBR/CB compounds.
The significance of this study is focused towards finding secondary applications for
pCB recovered from the pyrolysis of waste tyres. The findings of this study will be a
contribution to the scientific knowledge in this field as there is very little literature
available on the effect of partial or full replacement of CB with pCB on the various
NR/SBR properties.
13
1.7 RESEARCH QUESTIONS
1.7.1 Problem Statement
Waste tyres pose a threat to the environment on a global scale because under normal
atmospheric conditions, their durability makes them difficult to decompose as they
were designed to be highly resistant to chemical, physical and biological degradation
(Hadi et al., 2016). Through pyrolysis a significant amount of pCB is recovered at
varying amounts depending on the pyrolysis conditions and type of reactor. From the
limited literature review compiled in section 2.4, it has been reported that pyrolysis-
derived carbon black can be used to improve the physical, mechanical and rheological
properties of natural rubber and styrene-butadiene rubber. This is because it has been
found that the properties of pCB are close to those of commercial reinforcing or semi-
reinforcing carbon blacks of grades N330 – N770.
1.7.2 Hypothesis
Pyrolysis-derived carbon black can be used as a carbon black substitute to improve
the properties of natural rubber/styrene-butadiene rubber blends.
1.7.3 Key research question
• Does the pyrolysis-derived carbon black have similar properties such as
surface area, thermal stability and morphology to any commercial carbon
blacks? If so, which grade will be used to conduct a comparative study with
pyrolysis-derived carbon black?
• Can the replacement of CB with a pyrolysis-derived carbon black improve
mechanical, physical and thermal properties of NR/SBR? If it does, at which
loading will the pyrolysis-derived carbon black have maximum improvement in
NR/SBR properties?
1.7.4 Research aims and objectives
The research aims are as follows:
• To find another alternative use of pyrolysis-derived carbon black (pCB) in
rubber applications.
14
• To study the effect of carbon reinforcement in natural rubber (NR)/styrene-
butadiene (SBR) compounds.
• To develop alternative filling formulations of NR/SBR for specific applications.
The objectives of this study are therefore:
• To characterise the pyrolysis-derived carbon black and compare it with
commonly used carbon blacks.
• To develop various filling formulations of NR/SBR using pCB and/or pCB/CB
blend
• To investigate the effect of the pyrolytic carbon black on the rheological,
morphological, thermal and physical properties of NR/SBR.
• To suggest its suitability for specific applications of various formulations of
NR/SBR filled with pCB and/or pCB/CB blends.
15
CHAPTER 2
LITERATURE REVIEW
The consciousness over the health and environmental impact of waste tyres has
increased over the years and it has driven major efforts to develop new innovative
materials for various end-use applications. Due to the current global state of waste
tyre pollution, several methods have been implemented to prevent the further disposal
and presence of waste tyres in the environment. Recycling and reuse of waste tyres
have been utilized to minimize and ultimately eradicate waste tyres in landfills. The
recycling of waste tyres through processes such as crumbing, reclamation and
pyrolysis, have increased in many countries worldwide. Of these processes, pyrolysis
is the most common, and therefore it is the process of interest in this study, which will
explore the possible application of the solid by-product of pyrolysis in rubber
applications.
2.1 PYROLYSIS OF WASTE TYRES
Pyrolysis is defined as the thermal decomposition of materials in the absence of
oxygen (Hadi et al., 2016). The absence of oxygen in this process prevents the organic
compounds from undergoing combustion and increases the carbon content in the
resulting products. This process can utilize a wide variety of feedstocks such as
biomass, plastics and waste tyres (Czajczyńska et al., 2017). Pyrolysis involves the
transformation of waste into three phase products of solid, liquid and gas through a
thermo-chemical conversion. Figure 2.1 outlines the steps involved in the pyrolysis
process and its final products.
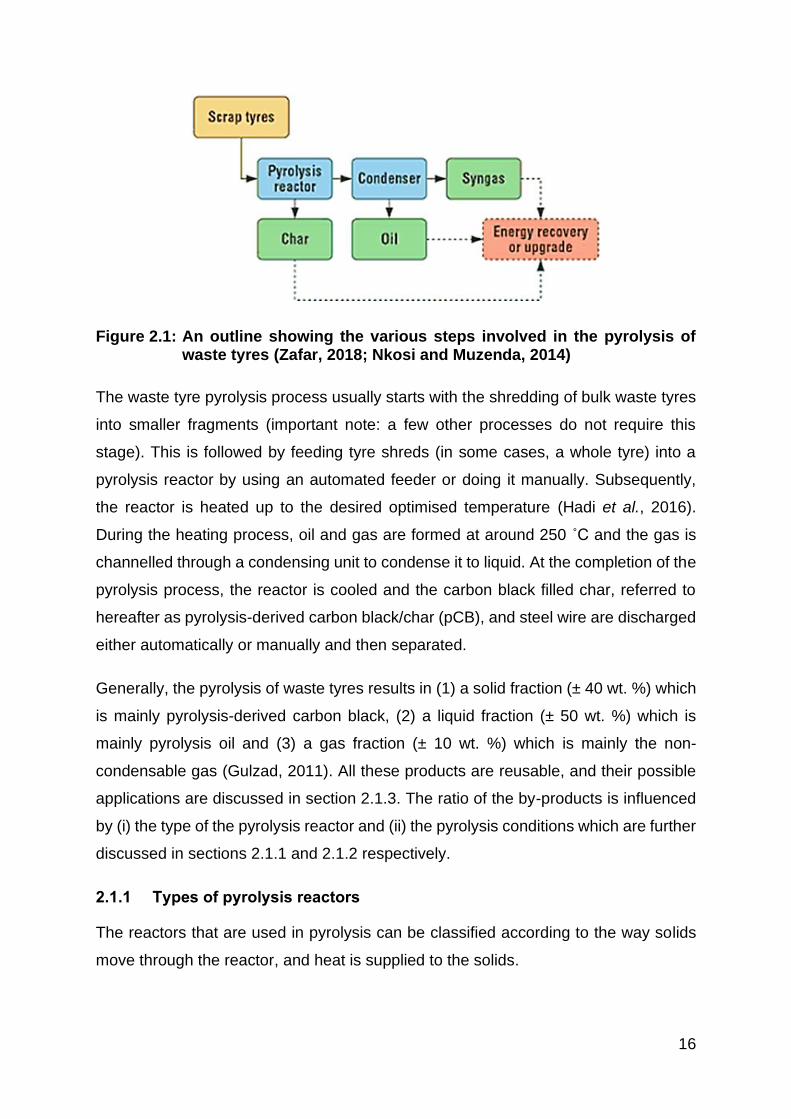
16
Figure 2.1: An outline showing the various steps involved in the pyrolysis of waste tyres (Zafar, 2018; Nkosi and Muzenda, 2014)
The waste tyre pyrolysis process usually starts with the shredding of bulk waste tyres
into smaller fragments (important note: a few other processes do not require this
stage). This is followed by feeding tyre shreds (in some cases, a whole tyre) into a
pyrolysis reactor by using an automated feeder or doing it manually. Subsequently,
the reactor is heated up to the desired optimised temperature (Hadi et al., 2016).
During the heating process, oil and gas are formed at around 250 ˚C and the gas is
channelled through a condensing unit to condense it to liquid. At the completion of the
pyrolysis process, the reactor is cooled and the carbon black filled char, referred to
hereafter as pyrolysis-derived carbon black/char (pCB), and steel wire are discharged
either automatically or manually and then separated.
Generally, the pyrolysis of waste tyres results in (1) a solid fraction (± 40 wt. %) which
is mainly pyrolysis-derived carbon black, (2) a liquid fraction (± 50 wt. %) which is
mainly pyrolysis oil and (3) a gas fraction (± 10 wt. %) which is mainly the non-
condensable gas (Gulzad, 2011). All these products are reusable, and their possible
applications are discussed in section 2.1.3. The ratio of the by-products is influenced
by (i) the type of the pyrolysis reactor and (ii) the pyrolysis conditions which are further
discussed in sections 2.1.1 and 2.1.2 respectively.
2.1.1 Types of pyrolysis reactors
The reactors that are used in pyrolysis can be classified according to the way solids
move through the reactor, and heat is supplied to the solids.
17
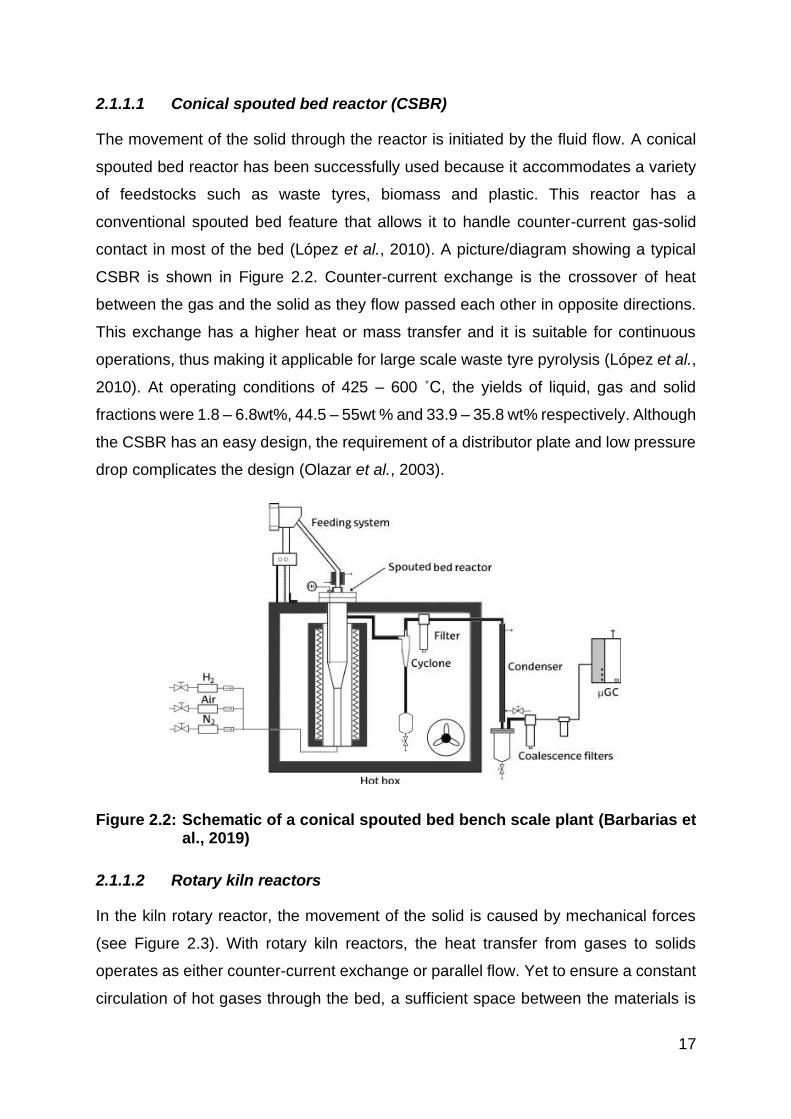
2.1.1.1 Conical spouted bed reactor (CSBR)
The movement of the solid through the reactor is initiated by the fluid flow. A conical
spouted bed reactor has been successfully used because it accommodates a variety
of feedstocks such as waste tyres, biomass and plastic. This reactor has a
conventional spouted bed feature that allows it to handle counter-current gas-solid
contact in most of the bed (López et al., 2010). A picture/diagram showing a typical
CSBR is shown in Figure 2.2. Counter-current exchange is the crossover of heat
between the gas and the solid as they flow passed each other in opposite directions.
This exchange has a higher heat or mass transfer and it is suitable for continuous
operations, thus making it applicable for large scale waste tyre pyrolysis (López et al.,
2010). At operating conditions of 425 – 600 ˚C, the yields of liquid, gas and solid
fractions were 1.8 – 6.8wt%, 44.5 – 55wt % and 33.9 – 35.8 wt% respectively. Although
the CSBR has an easy design, the requirement of a distributor plate and low pressure
drop complicates the design (Olazar et al., 2003).
Figure 2.2: Schematic of a conical spouted bed bench scale plant (Barbarias et al., 2019)
2.1.1.2 Rotary kiln reactors
In the kiln rotary reactor, the movement of the solid is caused by mechanical forces
(see Figure 2.3). With rotary kiln reactors, the heat transfer from gases to solids
operates as either counter-current exchange or parallel flow. Yet to ensure a constant
circulation of hot gases through the bed, a sufficient space between the materials is
18
needed. This requires a huge amount of energy to keep the reactor bed in suspension
(Boateng, 2008). Rotary kiln reactors are advantageous in that they have several
designs that are application specific. Slow mixing rates can be maintained in a
continuous rotary kiln reactor, thus allowing for better mixing and therefore uniformity
in the pyrolysis products that are produced (Li et al., 2004). At operating temperatures
of 450 – 600 ˚C, 39.8wt% of solid residue or char was produced and a maximum value
of 45.1wt% of oil at 500 ˚C was produced (Li et al., 2004).
Figure 2.3: Schematic of a pilot scale rotary kiln bed reactor (Mei et al., 2015)
2.1.1.3 Fluidized bed reactor
The fluidized bed furnace contains a solid substrate supported by a porous plate that
provides an outlet for the gas introduced to the solid substrate. This solid substrate
provides a uniform temperature gradient. In a fluidized bed reactor (see Figure 2.4),
the particle size of the solid bed material must be larger than the minimum particle size
of the feedstock material to avoid the fine particles from the bed furnace from being
transported by the fluid used in the reactor (Conesa et al., 1996). It is difficult to predict
the complex mass and heat flows in the bed so an up-scale of the fluidized bed reactor
to accommodate larger quantities of feedstock can be restricted by an overall heat
transfer to the feedstock material even though the design of this type of reactor is well
understood (Nachenius et al., 2013). Radiant heat tubes that are located within the
bed, heat up the reactor to temperatures of 500 - 780 ˚C. The produced pyrolysis gas
is then combusted to provide heat in the system which is advantageous because of
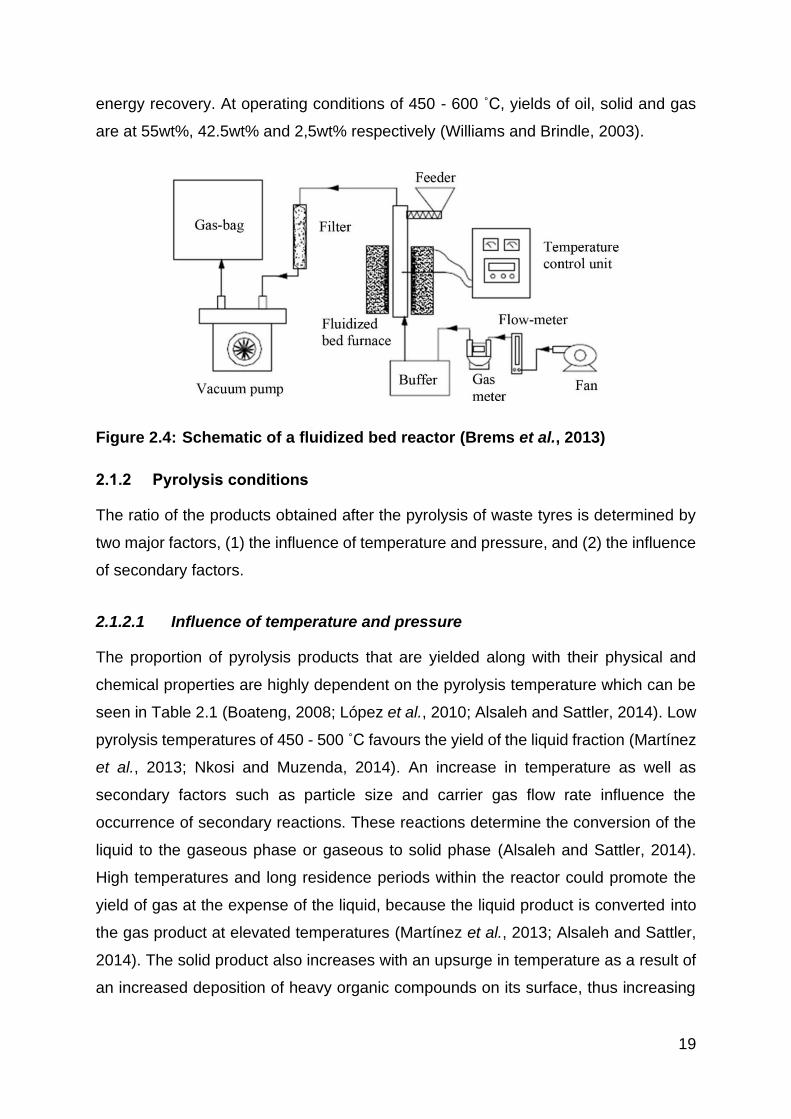
19
energy recovery. At operating conditions of 450 - 600 ˚C, yields of oil, solid and gas
are at 55wt%, 42.5wt% and 2,5wt% respectively (Williams and Brindle, 2003).
Figure 2.4: Schematic of a fluidized bed reactor (Brems et al., 2013)
2.1.2 Pyrolysis conditions
The ratio of the products obtained after the pyrolysis of waste tyres is determined by
two major factors, (1) the influence of temperature and pressure, and (2) the influence
of secondary factors.
2.1.2.1 Influence of temperature and pressure
The proportion of pyrolysis products that are yielded along with their physical and
chemical properties are highly dependent on the pyrolysis temperature which can be
seen in Table 2.1 (Boateng, 2008; López et al., 2010; Alsaleh and Sattler, 2014). Low
pyrolysis temperatures of 450 - 500 ˚C favours the yield of the liquid fraction (Martínez
et al., 2013; Nkosi and Muzenda, 2014). An increase in temperature as well as
secondary factors such as particle size and carrier gas flow rate influence the
occurrence of secondary reactions. These reactions determine the conversion of the
liquid to the gaseous phase or gaseous to solid phase (Alsaleh and Sattler, 2014).
High temperatures and long residence periods within the reactor could promote the
yield of gas at the expense of the liquid, because the liquid product is converted into
the gas product at elevated temperatures (Martínez et al., 2013; Alsaleh and Sattler,
2014). The solid product also increases with an upsurge in temperature as a result of
an increased deposition of heavy organic compounds on its surface, thus increasing
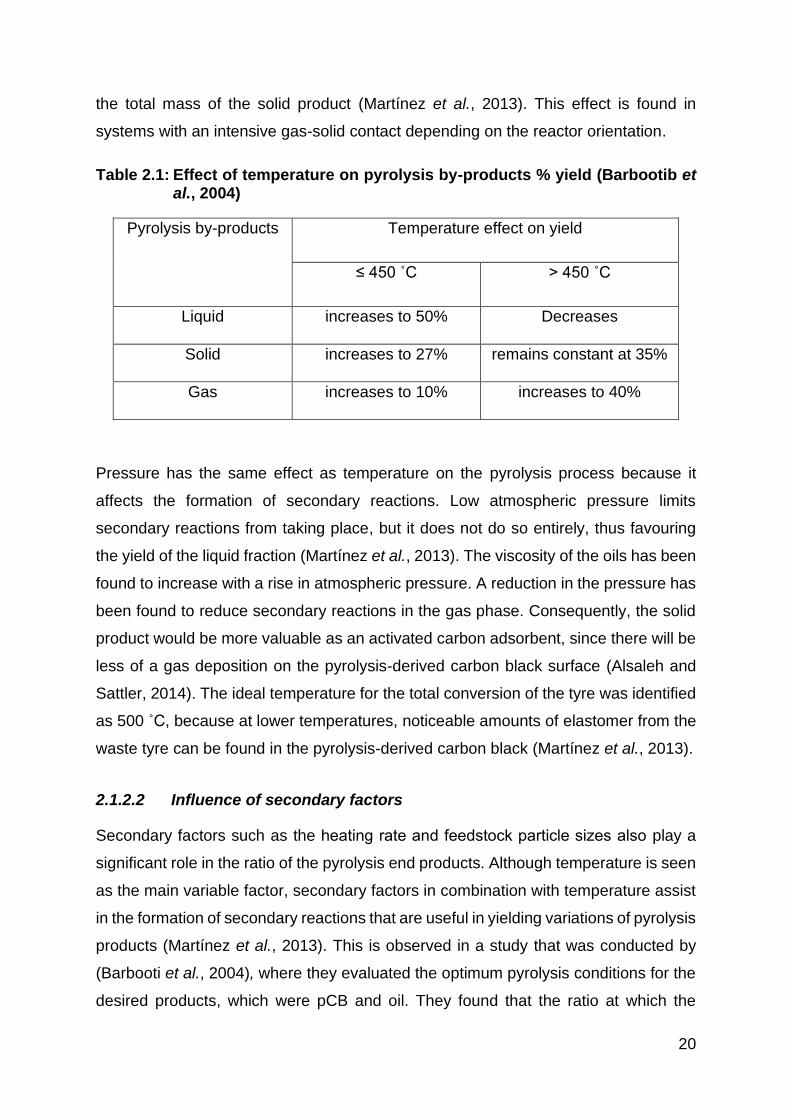
20
the total mass of the solid product (Martínez et al., 2013). This effect is found in
systems with an intensive gas-solid contact depending on the reactor orientation.
Table 2.1: Effect of temperature on pyrolysis by-products % yield (Barbootib et al., 2004)
Pyrolysis by-products Temperature effect on yield
≤ 450 ˚C ˃ 450 ˚C
Liquid increases to 50% Decreases
Solid increases to 27% remains constant at 35%
Gas increases to 10% increases to 40%
Pressure has the same effect as temperature on the pyrolysis process because it
affects the formation of secondary reactions. Low atmospheric pressure limits
secondary reactions from taking place, but it does not do so entirely, thus favouring
the yield of the liquid fraction (Martínez et al., 2013). The viscosity of the oils has been
found to increase with a rise in atmospheric pressure. A reduction in the pressure has
been found to reduce secondary reactions in the gas phase. Consequently, the solid
product would be more valuable as an activated carbon adsorbent, since there will be
less of a gas deposition on the pyrolysis-derived carbon black surface (Alsaleh and
Sattler, 2014). The ideal temperature for the total conversion of the tyre was identified
as 500 ˚C, because at lower temperatures, noticeable amounts of elastomer from the
waste tyre can be found in the pyrolysis-derived carbon black (Martínez et al., 2013).
2.1.2.2 Influence of secondary factors
Secondary factors such as the heating rate and feedstock particle sizes also play a
significant role in the ratio of the pyrolysis end products. Although temperature is seen
as the main variable factor, secondary factors in combination with temperature assist
in the formation of secondary reactions that are useful in yielding variations of pyrolysis
products (Martínez et al., 2013). This is observed in a study that was conducted by
(Barbooti et al., 2004), where they evaluated the optimum pyrolysis conditions for the
desired products, which were pCB and oil. They found that the ratio at which the
21
products of interest could be obtained, were reliant on the nitrogen flow rate as well
as the temperature and particles size of scrap tyres (Barbooti et al., 2004). By utilising
the Box-Wilson design method which is an empirical modelling technique that
evaluates relationships between controlled experimental factors, it was found that a
pCB yield of 32.5wt% was obtained at the optimum values of 0.35 m³hˉ¹, 430 ˚C and
10 mm of the mentioned factors (Barbooti et al., 2004).
Smaller feed particles of sizes 2-20mm showed a decrease in solid product yield, while
the larger particles of 16-20mm remained constant as the temperature is increased.
This was attributed to the applied heat only being distributed up to a certain depth
within the larger particles, while complete thermal degradation was achieved in the
smaller particles with the given time for the pyrolysis process (Barbooti et al., 2004).
In another study, the particle size of 0.32 mm produced more of a liquid-phase of
around 50 wt.% at a constant temperature of 500 ˚C when compared to particles with
size of 0.8 mm which produced around 40 wt.% at the same temperature (Dai et al.,
2001). Feedstock particle size for both small and large particles showed a decrease
in the liquid fraction yield as the temperature increased (Martínez et al., 2013).
A decrease in heating rate in a study by Acevedo and Barriocanal (2015) showed no
change in the solid yield whereas the liquid yield was higher and the gas yield lower
over time. This was attributed to volatile matter being removed much easier and having
enough time to condense, thus adding to the oil yield. Gas product can be increased
by a higher heating rate, since it leads to higher temperatures and thus more
secondary reactions (Alsaleh and Sattler, 2014). Heating rate also impacts the amount
of energy required for pyrolysis as well as the time needed to complete the process,
because a smaller feed size presents a larger surface area for a reaction to occur and
therefore the rapid decomposition of the rubber requires less time within the pyrolysis
process (Alsaleh and Sattler, 2014, Nkosi and Muzenda, 2014).
Although these factors might positively influence the yield amount, what is of concern
is the yield quality. There is a small variation in the yield quality of the pCB from
commercial CB grades (Berki and Karger-Kocsis, 2016).
22
2.1.3 Pyrolysis products
2.1.3.1 The liquid fraction
It has been estimated that over 100 compounds have been identified in the liquid
fraction of pyrolysis oils; with most of them being hydrocarbons C₅ - C₂₀ (Alsaleh and
Sattler, 2014). The light fraction and a heavy fraction of these hydrocarbons are found
in pyrolysis oils and they can be used for various purposes. The former can yield
refined chemicals such as styrene, and the latter can be used to enhance asphalt
properties (Alsaleh and Sattler, 2014). The reusability of the liquid fraction is seen in
the use of the pyrolysis oil directly as fuel in diesel engines when blended with diesel
or as an addition to petroleum refinery feedstocks (Hadi et al., 2016; Williams, 2013).
The petrochemical industry can benefit from the use of light olefins and aromatics in
the synthesis of chemicals such as isoprene and 1,3-butadiene as needed for tyre
manufacturing (Alsaleh and Sattler, 2014).
The type of tyre, whether passenger or truck, does not have a significant influence on
the yield of pyrolysis products, but it does influence the composition of the derived oils
and gases (Williams, 2013). In the case where the rubber composition of the tyre is
taken into consideration, it influences the aromatic content found in the oils (Alsaleh
and Sattler, 2014). For instance, truck tyres yielded oil with a lower aromatic content
than the passenger tyre. Furthermore, oil yielded from truck tyres were found to be
relatively more and contained a lower sulphur content in comparison to the passenger
tyre (Alsaleh and Sattler, 2014).
2.1.3.2 The gas fraction
A variety of studies compiled by Williams (2013), found that the major constituents of
the gas produced during tyre pyrolysis, included hydrogen, methane, ethane, ethene
and propane. It was reported that their composition is dependent on the temperature
of pyrolysis and the rubbers that are used in the manufacturing of tyres (Alsaleh and
Sattler, 2014). The gas fraction has a heating value of about 30 - 40 MJ/Nm³, which is
similar to that of natural gas (Hadi et al., 2016; Czajczyńska et al., 2017), and therefore
it can also be used as fuel. It is this heating value that contributes to the pyrolysis
method having a minimal influence on air pollution, because most of the generated
gas is reused as an energy source in the pyrolysis process (Chesbro et al., 1996).
23
2.1.3.3 The solid residue
The solid residue or pyrolysis char consists mainly of carbon black, and the inorganic
matter present in the tyre such as zinc oxide and Fe2O3. This residue is also referred
to as pyrolysis-derived carbon black (pCB) because of the inherent carbon added
during the making of tyres and it is its largest component. The pCB can be used as a
filler in the rubber industry, as a pigment and also as activated carbon or as smokeless
fuel after further processing (Pilusa and Muzenda, 2013).
A study conducted by Petrich (2000) focused on finding applications for pCB. They
reported that pyrolysis-derived carbon black is better suited for engineering materials,
other than pneumatic tyres. The reasoning behind this was that more than one grade
of carbon black is used to manufacture the different components of a tyre. As such,
when a tyre is introduced into the pyrolysis process, the resultant solid residue consists
of a mixture of these CB grades. This complexity is the main reason for the low quality
pCB when compared to virgin CB, which rendered the pCB undesirability as a
reinforcing-filler for tyres and other high-performance engineering products.
Nonetheless, pCB remains as one of the most important products of the pyrolysis
process, making up 30 – 35% of the resultant waste. The yield is high because of the
carbon black content in the original tyre (Alsaleh and Sattler, 2014). Several studies
have incorporated pCB in their rubber compounds and those studies will be discussed
further in sections 2.3 and 2.4.
2.2 EFFECT OF CARBON BLACK ON THE PROPERTIES OF ELASTOMERS
Some of the factors that affect the structure, mechanical and physical properties of
elastomers are filler loading, filler structure and the formation of agglomerates. In all
rubber materials, the reinforcing ability of carbon black (CB) is linked to its particle
size. The primary particle size of CB is in the nanoscale, yet during their handling as
raw materials they are in micrometers because of aggregation and agglomeration
(Anon., 2012), as demonstrated earlier in Figure 1.4. Numerous studies have been
done to determine the effect of carbon black on the structure, physical and mechanical
properties of various elastomers. It has been reported that carbon black interacts more
easily with different rubber compounds because it has a weaker filler-filler interaction,
thus allowing for a better interaction with rubber matrices (Ulfah et al., 2015).
24
Several studies were conducted to highlight the influence that carbon black has on the
mechanical properties of Natural rubber, and NR/SBR blends by varying the amount
of carbon black, carbon black type and the type of mixing. Ultimately these studies
showcased that, not only can a high surface area carbon black yield high tensile
strength, it can also result in a compound with poor dispersion. The road to the end-
product of a rubber compound is the combination of filler loading, the microstructure,
homo/hetero-geneous mixing and blend type according to Norman (1990), Savetlana
et al (2017), Ismail et al (2018b), Findik et al (2004), Bijarimi et al (2010a), Al-Abadi
and Hamzah (2013), Ulfah et al (2015), Li et al (2008a), Olweiwi et al (2011) and Nik
Yahya et al (2016).
Savetlana et al (2017) showed that optimum tensile strength on a NR based
compound can be achieved at a loading of 20 wt% for CB grades N220-N660 while
maintaining a good dispersion. According to Norman, loadings above 30 wt% result in
agglomeration and a suspension of aggregates, which leads to poor dispersion and a
drop in the ultimate tensile strength (UTS). Yet a better dispersion and higher UTS in
these loadings can be achieved by employing homogeneous mixing, as stated by
Savetlana et al (2017). Composites with a high tensile strength showed homogeneity
in the SEM images and heterogeneity was observed for compounds with poorly
dispersed CB. An increased agglomeration for NR/CB composites was seen for N330
and N550 than that of N220 and N660 and as a result, the tensile strengths of NR filled
with N220 and N660 were much higher than those of N330 and N550 filled NR, even
though they have a higher surface area when compared to CB grade N660. The
authors postulated that the high strain of natural rubber filled with N660 carbon black
was due to the shape of the aggregate (Savetlana et al., 2017).
The degree of aggregation or the agglomeration of CB particles was further seen in a
study conducted by Ismail et al (2018b) where the effect of carbon black loading was
evaluated. Tensile stress values increased with filler loading until an optimum value
was reached at 40 phr. Increased loading beyond the optimum, decreased the UTS
due to the interactions of the agglomerates within the polymer. Furthermore, an
increase in the UTS of the elastomer was observed as the CB particle size decreased
(Ismail et al., 2018b). Generally, a higher surface area of CB contributes to a high
degree of interaction between the CB and the elastomer, therefore increasing the
25
mechanical properties of the elastomer such as hardness (Al-Abadi and Hamzah,
2013). This trend was observed in the studies by Ulfah et al (2015) and Li et al (2008a)
where carbon black grades N330 and N220 respectively, were used and an
improvement in hardness was observed.
Further investigation on the influence of carbon black on elastomers was carried out
towards the binary blends of NR and SBR. One of these investigations is a study
carried out by Findik et al (2004) where Abrasive Furnace blacks (ISAF & HAF) were
loaded at 85 phr with varying the ratios of NR and SBR while monitoring the UTS.
Strain-induced crystallization of NR was expected to increase the tensile strength of
the blend as the NR content increased. These expectations were met and the UTS
increased with an increase in NR content for both Abrasive Furnace blacks. Yet, an
increase of SBR in the blends resulted in the decrease of the UTS values of the blends
containing ISAF (Findik et al., 2004). These observations are supported by Oleiwi et
al (2011) who stated that the tensile strength increased as the amount of NR increased
in the blends. Yet where the ratio of NR and SBR were kept constant, the UTS values
that were produced by reinforcing fillers with differing structures were similar (Bijarimi
et al., 2010a). In the same study by Bijarimi et al (2010a), findings were reported of
similar UTS values for NR compounds with semi-reinforcing grades N550 and N660.
The influence of CB in binary blends regarding other mechanical properties such as
elongation at break and hardness were also investigated. Styrene-butadiene content
was predicted to assist in increasing the elongation of the resultant material (Findik et
al., 2004). There was no significant difference observed in the elongation % of the
blends with an increase in SBR, irrespective of the filler introduced (Findik et al., 2004).
The elongation at break for NR/SBR blends in a study carried out by Nik Yahya et al
(2016) showed no major differences in value when compared to the neat compounds,
even when different CB grades were used. An increase in elongation was reported for
fillers with relatively small particle sizes in both NR and NR/SBR compounds (Bijarimi
et al., 2010a).
The presence of fillers with a small particle size such as N375 and N326, produced
superior hardness when compared to N660 because of their larger surface area
(Bijarimi et al., 2010a). A difference in hardness and rebound resilience was seen for
NR/SBR blends in formulations that did not include oils during compounding (Bijarimi
26
et al., 2010a). Hardness values increased with an increase in CB loading and SBR
content. Copolymer nature of SBR acts as a harder component which increases the
degree of hardness of SBR (Oleiwi et al., 2011). This was evident in the hardness
values of the neat SBR that are higher than that of neat NR in the Nik Yahya et al.,
(2016) study.
2.3 PYROLYSIS-DERIVED CARBON BLACK
Application of pyrolysis-derived carbon black (pCB) depends on factors such as its
chemical composition, adsorption activity and colloidal properties (Nkosi and
Muzenda, 2014). The study done by Petrich (2000) focused on the comparison of pCB
with silver impregnated activated carbon. The comparison was done to monitor the
performance of the beneficiated pCB as a sorbent. The results showed a promising
use of pCB as a sorbent because it was found to be equal to the silver impregnated
activated carbon (Petrich, 2000). Pyrolysis-derived carbon black has a high calorific
value comparable to coal, meaning that it can be potentially useful as solid fuel (Nkosi
and Muzenda, 2014). In a study done by Petrich (2000) and Nkosi and Muzenda
(2014), pyrolysis-derived carbon black was tested for its use as a carrier media for
waste generated by paint, ink and coating industries. The waste consisted of aliphatic
and aromatic solvents that were dispersed with pigment, filler, plasticizer and resins.
A range of 7 - 11% was used for the addition of pCB, which created a mixture that saw
a complete evolution of the solvents used and the absorption of the remaining waste
constituents creating a dry solid matrix (Petrich, 2000). Its absorptivity characteristic
allows for its use in water and air purification systems (Nkosi and Muzenda, 2014).
In addition, the pyrolysis-derived carbon black was added to blends of vinyl and rubber
cements at percentages of 3 - 7. This lowered the cost of the raw material with no
significant loss regarding the chemical and physical properties. These modified
cements were tested in floor adhesives, tile adhesives and panel-stick compounds,
and it was reported that the addition of pCB had no negative effect on the permanent
bonds in the cement (Petrich, 2000). For the past decade, the use of pyrolysis-derived
carbon black as a replacement for CB in several applications that do not require
reinforcement, has been explored.
27
2.4 COMPARISON OF THE EFFECT OF CB AND PCB ON PROPERTIES OF
ELASTOMERS
There have been reports on the use of pCB in rubbers such as NR, SBR and the
combination of the two rubbers (Berki et al., 2017; Savetlana et al., 2017; Bijarimi et
al., 2010a). A study conducted by Berki et al (2017), stated that these reports have
found a common factor regarding the pCBs of different origins being used in rubber
mixes. This commonality is owed to the properties of pCB which are close to those of
commercial reinforcing and semi-reinforcing furnace CBs in the range of N330 to
N770, thus making them suitable to replace CBs (Berki and Karger-Kocsis, 2016;
Norris et al., 2014).
2.4.1 Elastomeric mechanical properties
Berki and Karger-Kocsis (2016) investigated the influence that pCB, commercial CB
and organoclay have on SBR. The obtained trend showed that the highest tensile
strength was that of conventional CB, followed by the blend of pCB and conventional
CB (N660), then SBR containing pCB and lastly the compound with organoclay (Berki
and Karger-Kocsis, 2016). The lowest tensile strength was observed for the
combination of all three constituents CB/pCB/ organoclay at 20/20/10 phr. In another
study done by Karabork and Tipirdamaz (2016), the processing properties of pyrolysis-
derived carbon black in the NR/SBR blends were compared to commercial carbon
black grade N550. The authors highlighted that the mechanical properties such as the
tensile strength and elongation at break of NR/SBR blends decreased as the content
of pCB increased to a maximum of 50 parts per hundred (phr). A maximum drop in
tensile strength from 10.91 to 2.03 N/mm² was seen at a 50 phr loading of pCB relative
to N550. Limitations in the performance of pCB as a reinforcing filler were attributed
to its high ash content and low surface area (Karabork and Tipirdamaz, 2016; Delchev
et al., 2014).
On the contrary, Du et al (2008) observed a continuous increase in tensile strength
and modulus of SBR with the addition of pCB from 10 to 50 phr. Yet when comparing
the reinforcing ability of pCB with N330, N774 and CaCO3 on the mechanical
properties of SBR, the tensile strength and the modulus of SBR with pCB approached
that of N774, which was higher than CaCO3. This was associated with the presence
of ash.
28
2.4.1.1 Effect of ash presence on the effectiveness of CB and pCB as fillers
in elastomers
Pyrolysis-derived carbon black consists of recovered carbon black, inorganic rubber
additives, carbonaceous deposits and non-volatile hydrocarbons (Li et al., 2005). The
carbon content of pyrolysis-derived carbon black due to the CB filler in tyres can be
up to 90 wt% and the ash content due to the inorganic additives during manufacturing
can range from 8.27 – 15.33 wt% (Williams, 2013). Pyrolysis-derived carbon black
characteristics were investigated by with variation in reactors and temperature.
Temperature was the most influential on the resultant content of pCB. At increased
temperatures of 600 – 750 ˚C, the volatile and hydrogen content decreased but the
metal content is only reduced at 1000 ˚C (Cunliffe and Williams, 1999; Conesa et al.,
2004).
It was reported that the ash content compromises the physical structure of pyrolysis-
derived carbon black, which is a factor that affects the interaction of the rubber matrix
and filler (Karabork and Tipirdamaz, 2016). The SEM images of N550 showed a rough
surface morphology, indicating a higher structure while the untreated pCB had a
smooth surface morphology due to a lower structure that was caused by the deposition
of ash. Delchev et al (2014) looked at modifying pCB by reducing the ash content from
16 to 8.6% through an acid treatment using hydrochloric acid. This modification
resulted in a slight increase in the tensile strength and hardness of the modified pCB
in SBR composites, yet a decrease in the elongation at break was observed (Delchev
et al., 2014). Tensile strength was higher at lower loadings of both modified and
unmodified pCB/SBR composites, but an opposite effect was observed in the case of
the hardness values. Hardness values from Karabork and Tipirdamaz (2016) reduced
as the pCB content increased with an ash content of 15.36%. The surface area of the
untreated pCB was observed to be lower than that of N550. The presence of ash limits
the reinforcing ability of pCB meaning that the amount of the untreated pCB used is a
portion less than N550 used (Karabork and Tipirdamaz, 2016).
The ash content of pCB and N330 was studied using thermogravimetric analysis
(TGA), which resulted in a residue of 18.39% and 0.48% respectively (Berki et al.,
2017). These findings support the claim by Norris et al (2014) who stated that there is
a reduced filler-filler interaction of pCB rather than CB because of a reduced carbon
29
content. Thermogravimetric analysis (TGA) showed that there are contents of
inorganic matter that reduce the total carbon content of pCB rather than CB. An
average carbon content of CB was measured as 97.7% with volatiles and an ash
content of 2.3%, while a measured average CB content of 61.3 - 85.4% was reported
for pCB. This means that, at the same phr, the amount of carbon present in the
polymer during compounding is not the same for both CB and pCB (Norris et al., 2014).
Thus, the reinforcing ability can be reduced based on the amount of pCB used during
compounding.
2.4.2 Dynamic mechanical properties
The storage modulus (E’’), loss modulus (E’) and Tan delta (Tan δ) curves can be
obtained from the DMA analysis. Tan δ, known as the damping effect is a ratio
between the dynamic loss modulus (E’’) and dynamic storage modulus (E’), (Karabork
and Tipirdamaz, 2016). There is an inversely proportional relationship between the tan
δ and storage modulus. A lower tan δ indicates a reduced mechanical loss, meaning
that less of an energy input is required for the motion of the molecular chains of the
polymer as the polymer transition is approached (Berki and Karger-Kocsis, 2016).
Based on the findings of the various studies conducted by Norris et al (2014), Berki et
al (2017), Berki and Karger-Kocsis (2016) and Karabork and Tipirdamaz (2016),
rubber compounds prepared with commercial CBs such as N330, N550 and N772
showed higher storage modulus values than pCB. Norris et al (2014) regarded pCB
as a semi-reinforcing filler falling into the N660 - N770 range. Analysis through the
plotting of the elastic moduli and loss moduli, showed that pCB values did not exceed
but lie between commercial CBs N550 - N770. This is the same trend as seen in a
study by Berki et al (2017) where the storage modulus of SBR increased with an
increase in CB content at temperatures above and below the glass transition
temperature (Tg) of -30 ˚C with pCB compounds not exceeding the CB compounds.
The overall storage modulus values are higher in the glassy region than the rubbery
region. Tan δ values decrease below 1.0 for CB at a maximum loading of 60 phr,
whereas the equivalent for pCB yielded a value is above 1.0. This supports the
expectation that commercial CB is more active than pCB in reducing the heat build-up
of the rubber compound. Glass transition temperature however showed no significant
change as a function of filler type or the amount used (Berki et al., 2017). These
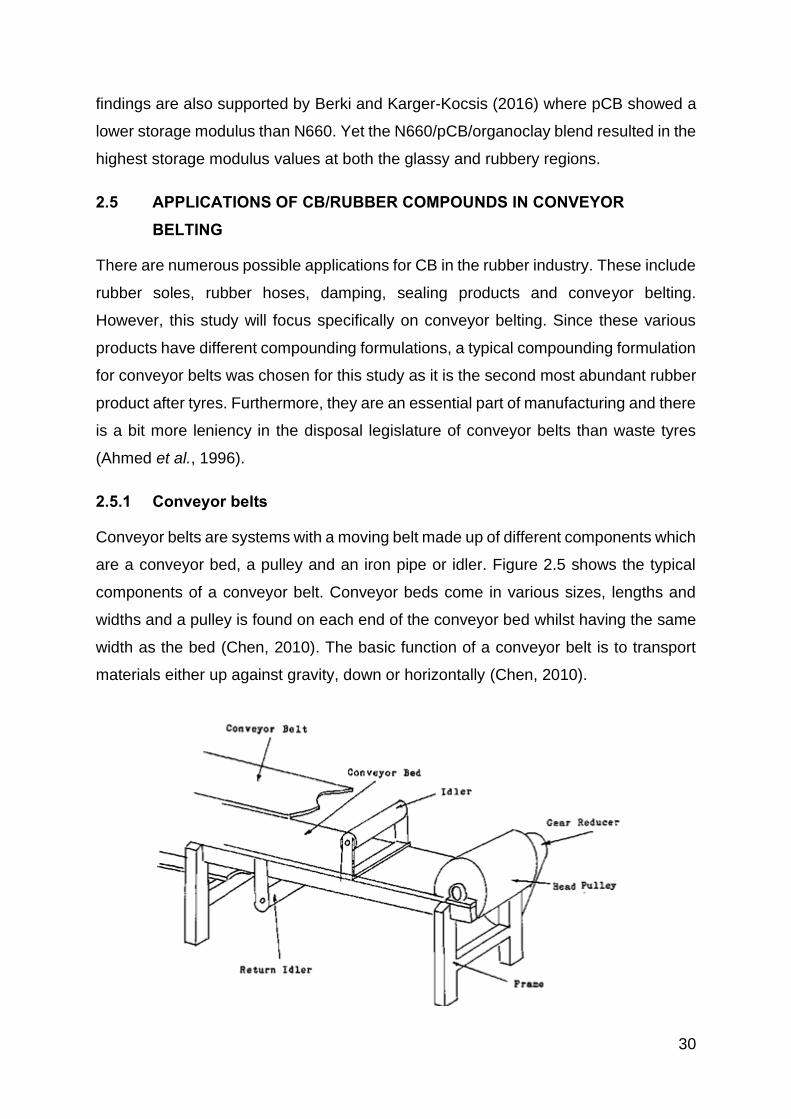
30
findings are also supported by Berki and Karger-Kocsis (2016) where pCB showed a
lower storage modulus than N660. Yet the N660/pCB/organoclay blend resulted in the
highest storage modulus values at both the glassy and rubbery regions.
2.5 APPLICATIONS OF CB/RUBBER COMPOUNDS IN CONVEYOR
BELTING
There are numerous possible applications for CB in the rubber industry. These include
rubber soles, rubber hoses, damping, sealing products and conveyor belting.
However, this study will focus specifically on conveyor belting. Since these various
products have different compounding formulations, a typical compounding formulation
for conveyor belts was chosen for this study as it is the second most abundant rubber
product after tyres. Furthermore, they are an essential part of manufacturing and there
is a bit more leniency in the disposal legislature of conveyor belts than waste tyres
(Ahmed et al., 1996).
2.5.1 Conveyor belts
Conveyor belts are systems with a moving belt made up of different components which
are a conveyor bed, a pulley and an iron pipe or idler. Figure 2.5 shows the typical
components of a conveyor belt. Conveyor beds come in various sizes, lengths and
widths and a pulley is found on each end of the conveyor bed whilst having the same
width as the bed (Chen, 2010). The basic function of a conveyor belt is to transport
materials either up against gravity, down or horizontally (Chen, 2010).
31
Figure 2.5: Conveyor belt elements (Metallurgist, 2018)
2.5.1.1 Conveyor belts categories
In order to boost the efficiency and service life, a suitable belt should be chosen based
on working conditions. Rubber belts and plastic belts are the two categories of
conveyor belts. Amongst the two categories, rubber belts have a wide range of
applications such as hard application transportation in the mining industry and light
application for low technical assessment use in foundry shops (Vanamane and Mane,
2012).
The rubber belt is made up of the belt core and covering layer. The core makes up the
framework of the belt and is made up of coated layers, while the cover is made from
NR, SBR, BR and CR etc. depending on the application. The elastomer forms a
protective layer which is designed to prevent wear, corrosion and impact to the core
(Industrial, 2015; Chen, 2010). For the rubber to maintain its strength under different
applications and load, several materials and chemicals are added into the rubber
compounds. Such materials/chemicals include raw rubber and/or synthetic rubber,
processing oils, zinc oxide, stearic acid, anti-oxidant, accelerators, sulphur and carbon
black. Rubber compounds that are used in conveyor belts are constantly in motion,
friction and exposure to atmospheric conditions is the predominant factor that can
cause the deterioration of the materials. To predict the lifetime of the rubber material,
abrasion and tare tests are normally performed.
2.6 ABRASION RESISTANCE
Abrasion resistance refers to the ability of materials or structures to withstand any form
of wearing down or scrapping away by means of friction (Wisojodharmo et al., 2017).
This ability helps the material to maintain its original structure, appearance and to
resist mechanical wear (Arayapranee, 2012). Abrasion resistance testing is important
where the materials’ integrity is critical for their function (Arayapranee, 2012). In many
applications such as printing rolls and conveyor belts, abrasion wear is a major failure
mode of rubbers. Although the durability and flexibility of rubber can allow it to
withstand or absorb a single strike of large deformation, micro-tears can form when
rubber is in contact with moving parts, more so where there are sharp or rough edges.
32
These edges can gradually compromise the integrity of rubber and eventually result in
the discontinuation of the functional life of rubber (Arayapranee, 2012).
The abrasion process involves the removal of small particles (1-5μm), leaving behind
pits on the material’s surface. These pits initiate the abrasion of the material because
larger particles (>5μm) then become removed as a result. Although it is expected that
larger particles contribute the most to weight loss, it has been reported that it is the
detachment of the smaller particles that, in fact, initiates the abrasion process
(Arayapranee, 2012, Adamiak, 2012). The authors postulated that this could be
caused by a variety of factors such as localised stress in the rubber, crack growth, the
nature of the vulcanising system, dirt and voids. For example, a foreign object can
initiate cracking by creating a microcrack, which will then propagate and result in the
failure of a material (Persson et al., 2005). Different vulcanising systems produce
different types of sulphur crosslinking. The proportion of cross-linking to chain scission
influences the physical properties, particularly the modulus and tensile strength
(Shuhaimi et al., 2014). The more polysulfidic and disulfidic crosslinks present, the
better the mechanical properties of rubber will be (Zhao et al., 2011). Dirt and voids
that cavitate lead to internal subsurface failure (Adamiak, 2012) which also influences
the detachments of the particles of the material (Arayapranee, 2012).
Fillers such as abrasive furnace carbon black (total surface area >90 m2/g) and silica
have been identified to influence the abrasion resistance of rubber compounds
because they improve the stiffness and strength of rubbers. This, in turn, improves
abrasion resistance by suppressing the tearing failure of rubber (Adamiak, 2012). Our
focus will be on CB and its influence on the abrasion resistance of rubber compounds.
Both the particle size and the structure of carbon black have a significant influence on
the abrasion resistance of filled rubber compounds, as they affect the rubber-filler
interaction by controlling the surface area that is available for an interaction to occur.
As the surface area increases, the number of rubber chains entangling with the carbon
black aggregates also increases (Li et al., 2008b). The physical structure of carbon
black is influenced by the fusing of primary particles to form aggregates, which are
branched clusters, and the further fusing of aggregates form agglomerates. High
structure CBs have a high number of primary particles per aggregate, while low
structure CBs exhibit only weak aggregation (Al-Hartomy et al., 2011). Furthermore,
the carbon black structure influences the movement of rubber under deformation. With
33
high structured CBs, the stiffness of the rubber compound is increased because there
is less agglomeration present, thus allowing the CB structure to have increased
interaction with the rubber and resulting in better reinforcement.
Hong et al (2007) evaluated the influence of the CB particle size on the abrasion
resistance of SBR, by incorporating various carbon black grades (N103, N351, N550
and N990) to a SBR compound. The SBR filled with CBs was more resistant to
abrasion when compared to pristine SBR because the incorporation of CB increases
the strength of the rubber material, thus reducing tearing. The rate of abrasion
resistance increased with a decrease in particle size (Hong et al., 2007). Particle size
is inversely proportional to the surface area meaning that an increased surface area
allows for an increased polymer-filler interaction. Poor interaction increases the
amount of free rubber that becomes removed when an abrasive motion is in effect. A
smaller particle size and a high structure of CB in the Hong et al (2007) study, showed
narrower spaced ridges on the worn surface after abrasion testing had been done.
This is an indication of better abrasion resistance. Gahlin and Jacobson (1999) also
concluded that an increase in particle size results in a decrease in abrasion resistance.
Oleiwi et al (2011) observed an inversely proportional relationship between the
abrasion wear rate and CB loading. A decreased wear rate was observed due to an
increased filler amount in the compound. The presence of the filler increases the
effective hardness of the material, thus reducing the amount of material removed
during abrasion. An increase of SBR content in NR increases the wear resistance.
2.7 AGING
Thermal aging refers to long-term, irreversible changes in the structure, composition
and morphology of materials that are exposed to temperatures that are likely to be
encountered in service (Plummer, 2014). Yet aging can be a result of chemical
changes that occur when a sample is exposed to atmospheric oxygen, which is the
most important aging factor. This is formally known as thermo-oxidative aging, where
rubbers such as SBR and NR lead to a hardened surface layer when exposed to air
(Blümich et al., 1998).
Testing for aging on rubber materials allows one to simulate the environment that will
be encountered during service to observe the stability of the product during use. The
aging rate of products is of importance to determine the potential degradation and to
34
determine how products will perform over time (Team, 2018). Modifying or changing
the properties of rubber materials due to the aging processes lead to physical and/or
irreversible chemical processes such as polymer chain cleavage and crosslinking,
which affects the materials strength, stiffness, hardness and toughness. Different
rubber materials are more susceptible to aging than others based on the presence of
double bonds on the main chain of the polymer (Oßwald et al., 2017). Double bonds
are stronger than single bonds because more heat energy is required to break them
due to their higher bond enthalpy. Higher concentrations of 1,4-units in the polymer
structure of NR lowers the resistance of the polymer to thermo-oxidative aging
whereas the presence of vinyl 1,2-units and styrene units in SBR increases resistance
(Giese et al., 2012).
Oßwald et al (2017) investigated the aging resistance of vulcanised CB filled NR and
SBR, by exposing them to oxygen, heat and then testing the effect on mechanical
properties such as tensile strength and hardness. Carbon black grade N234 at 20 –
60 phr loadings was used and the vulcanisates underwent aging at 70 and 80 ˚C.
Tensile strength values of NR vulcanisates with 20 phr CB decreased slightly in
comparison to neat NR as the temperature increased. When it came to hardness, 20
phr filled NR and 60 phr SBR values increased independently. This behaviour was
attributed to the post-curing that occurred during thermo-oxidative aging. A
comparison of unaged NR with aged NR, both filled with 45 phr of CB grade N550,
was studied (Ali et al., 2010). A similar trend as reported by Oßwald et al (2017) for
the hardness that was observed, where an increase was seen as the aging period
increased from 0 – 168 hours. Significant increase in the hardness value was seen at
the maximum time of the aging process. Aging at a temperature of 100 ˚C produced
higher hardness values than 70 ˚C. However, a decrease in tensile strength was
observed as the aging period progressed. The elongation at break percentage values
also showed a decrease with an increase in the aging temperature and time (Ali et al.,
2010).
2.8 PARTIAL REPLACEMENT OF CB WITH PCB
There is a lack of studies on the partial replacement of CB with pCB in rubber
compound formulations, and to the best of our knowledge, only one study has
investigated the effect of the combination of the two fillers on the properties of SBR.
35
This study was conducted by Berki et al (2017), where two ratios of pCB:CB
combinations in SBR matrix (1:9) and (1:1), were used.
Commercial CB N330 was used because its specific surface area was close to that of
the pelletized pCB used in the study. These ratios were added in phr amounts of 30,
45 and 60. They reported that N330 is a more active reinforcing filler than pCB at the
various phr amounts and the partially replaced compounds showed intermediate
values. Commercial CB showed superiority in the mechanical properties, yet the tear
strength yielded a different result with pCB and pCB/CB values being higher than
N330. This was attributed to the larger particle size and better dispersion of pCB in the
SBR matrix (Berki et al., 2017).
With increased academic and industrial research interest, the application of carbon
black blend technology within commercial utility has grown significantly (REN21,
2019). The physical nature of the polymer blends obtained by blending of different
carbon black grades, is an important parameter that dictates the various end-
applications. Modifications of existing polymers by blending and evaluating the effect
of pCB allows for the economical tailoring of materials to have desirable properties
that have a cost to performance ratio that makes it very attractive for the given
application.
Other than tyres, carbon black is largely used as a filler in conveyor belts. In this study,
the effect of pCB on the wear strength, mechanical, physical and thermal properties
of the NR/SBR blend will be evaluated by partially and/or fully replacing CB with
untreated pCB. Since the pyrolysis process has a significant influence on the physical
and structural properties of pCB, the limited studies have only focused on replacing
N330 or carbon black ranges in the reinforcing category with pCB (Bijarimi et al., 2010,
Du et al., 2008) The loadings of the pCB used in these studies ranged from 10 – 50
phr (Du et al., 2008), while in the current study the loading ranges from 5 - 40 phr.
36
CHAPTER 3
MATERIALS AND METHODS
3.1 MATERIALS
3.1.1 Elastomer and curatives
Natural rubber (SMR 20) and styrene-butadiene rubber (SBR 1502) were provided by
NuvoTM Rubber Compounders (KwaZulu-Natal, South Africa). No purification
processes took place before use.
3.1.2 Curatives
The curatives that were used were of an industrial grade and were used as they were
received from the supplier, NuvoTM Rubber Compounders (KwaZulu-Natal, South
Africa). These curatives were zinc oxide (ZnO), stearic acid, trimethyl-
dihydroquinolines (TMQ), microcrystalline wax (MC Wax), sulphur, 2-
bisbenzothiazole-2,2’-disulfide (MBTS), tetramethylthiuram disulfide (TMTD) and N-
(1,3-Dimethylbutyl)-N'-phenyl-p-phenylenediamine (6ppd).
3.1.3 Fillers
Different grades of carbon black (N330, N660 and N990) were obtained from the
manufacturer, Orion Engineered Carbon (Port Elizabeth, South Africa), and used for
reference purposes. The pyrolysis-derived waste tyre carbon black (pCB) was
obtained from Global Asset Management (Johannesburg, South Africa).
This study sought to investigate the effect of partial and/or full replacement of a
commercial carbon black (CB) with pCB on the properties of natural rubber/styrene-
butadiene rubber blends. As different grades of CB have different characteristics, it
was deemed necessary to first identify the commercial CB grade category that has
comparable properties to the pCB. Details are provided in section 3.1.3.1. Since CB
is categorized based on its reinforcing ability, i.e. reinforcing, semi-reinforcing and non-
reinforcing, the three CB grades were chosen to be used as reference materials
because they form the upper most limit of each reinforcing ability category.
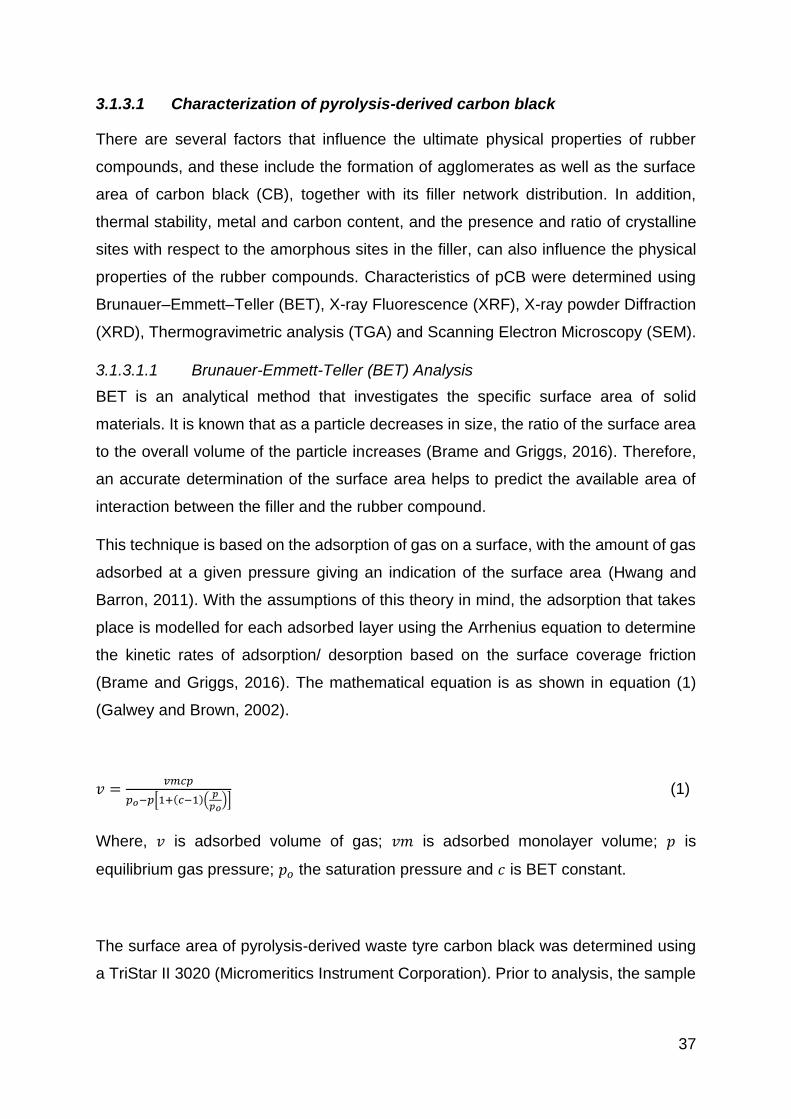
37
3.1.3.1 Characterization of pyrolysis-derived carbon black
There are several factors that influence the ultimate physical properties of rubber
compounds, and these include the formation of agglomerates as well as the surface
area of carbon black (CB), together with its filler network distribution. In addition,
thermal stability, metal and carbon content, and the presence and ratio of crystalline
sites with respect to the amorphous sites in the filler, can also influence the physical
properties of the rubber compounds. Characteristics of pCB were determined using
Brunauer–Emmett–Teller (BET), X-ray Fluorescence (XRF), X-ray powder Diffraction
(XRD), Thermogravimetric analysis (TGA) and Scanning Electron Microscopy (SEM).
3.1.3.1.1 Brunauer-Emmett-Teller (BET) Analysis
BET is an analytical method that investigates the specific surface area of solid
materials. It is known that as a particle decreases in size, the ratio of the surface area
to the overall volume of the particle increases (Brame and Griggs, 2016). Therefore,
an accurate determination of the surface area helps to predict the available area of
interaction between the filler and the rubber compound.
This technique is based on the adsorption of gas on a surface, with the amount of gas
adsorbed at a given pressure giving an indication of the surface area (Hwang and
Barron, 2011). With the assumptions of this theory in mind, the adsorption that takes
place is modelled for each adsorbed layer using the Arrhenius equation to determine
the kinetic rates of adsorption/ desorption based on the surface coverage friction
(Brame and Griggs, 2016). The mathematical equation is as shown in equation (1)
(Galwey and Brown, 2002).
𝑣 =𝑣𝑚𝑐𝑝
𝑝𝑜−𝑝[1+(𝑐−1)(𝑝
𝑝𝑜)]
(1)
Where, 𝑣 is adsorbed volume of gas; 𝑣𝑚 is adsorbed monolayer volume; 𝑝 is
equilibrium gas pressure; 𝑝𝑜 the saturation pressure and 𝑐 is BET constant.
The surface area of pyrolysis-derived waste tyre carbon black was determined using
a TriStar II 3020 (Micromeritics Instrument Corporation). Prior to analysis, the sample
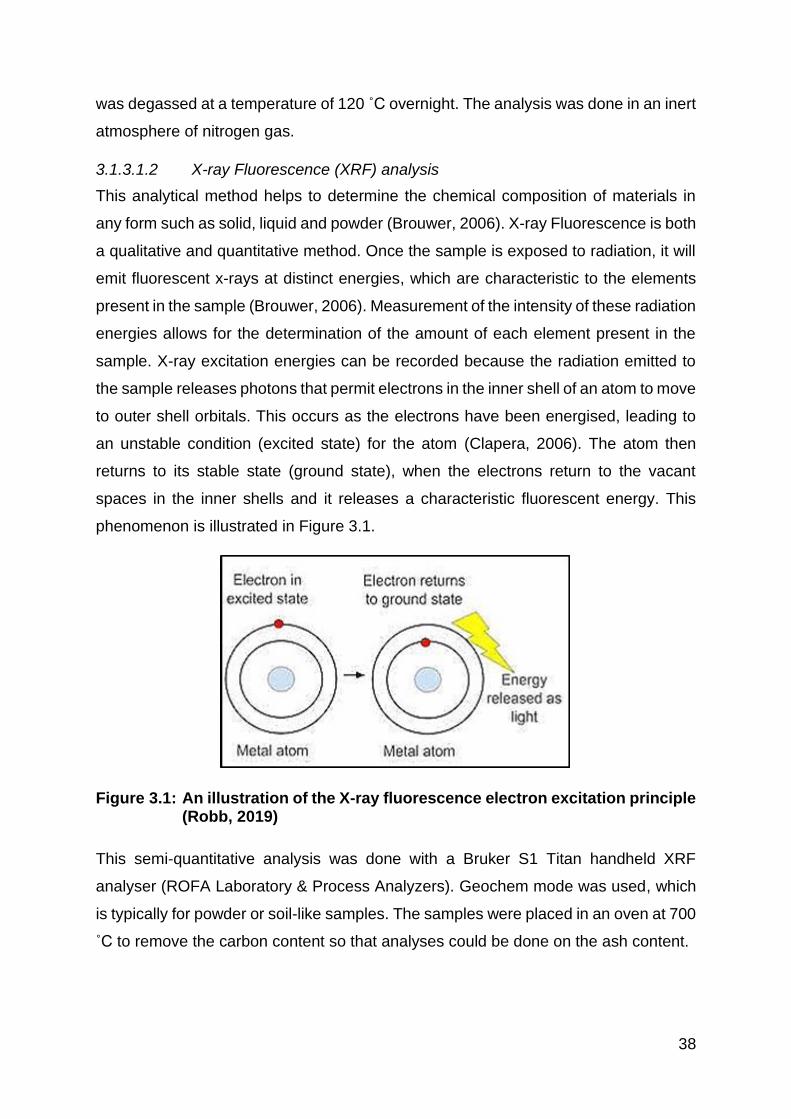
38
was degassed at a temperature of 120 ˚C overnight. The analysis was done in an inert
atmosphere of nitrogen gas.
3.1.3.1.2 X-ray Fluorescence (XRF) analysis
This analytical method helps to determine the chemical composition of materials in
any form such as solid, liquid and powder (Brouwer, 2006). X-ray Fluorescence is both
a qualitative and quantitative method. Once the sample is exposed to radiation, it will
emit fluorescent x-rays at distinct energies, which are characteristic to the elements
present in the sample (Brouwer, 2006). Measurement of the intensity of these radiation
energies allows for the determination of the amount of each element present in the
sample. X-ray excitation energies can be recorded because the radiation emitted to
the sample releases photons that permit electrons in the inner shell of an atom to move
to outer shell orbitals. This occurs as the electrons have been energised, leading to
an unstable condition (excited state) for the atom (Clapera, 2006). The atom then
returns to its stable state (ground state), when the electrons return to the vacant
spaces in the inner shells and it releases a characteristic fluorescent energy. This
phenomenon is illustrated in Figure 3.1.
Figure 3.1: An illustration of the X-ray fluorescence electron excitation principle (Robb, 2019)
This semi-quantitative analysis was done with a Bruker S1 Titan handheld XRF
analyser (ROFA Laboratory & Process Analyzers). Geochem mode was used, which
is typically for powder or soil-like samples. The samples were placed in an oven at 700
˚C to remove the carbon content so that analyses could be done on the ash content.
39
3.1.3.1.3 X-ray Powder Diffraction (XRD) Analysis
This technique uses X-ray (or neutron) diffraction on powder or microcrystalline
samples, where ideally, every possible crystalline orientation is represented equally
(Dutrow and Clark, 2018). Determination of a mixture of phases (crystalline, semi-
crystalline and amorphous) in a material is also possible. The resulting orientation
averaging, causes the three dimensional reciprocal space that is studied in single
crystal diffraction to be projected onto a single dimension (Dutrow and Clark, 2018).
The determination of which atoms are present and how they are arranged is achieved
when x-rays scatter off at the atoms in a sample (Lutterotti, 2018).
The diffraction process occurs when the Bragg’s law, as expressed in equation (2), is
satisfied.
𝑛𝜆 = 2𝑑𝑠𝑖𝑛𝜃 (2)
Where, 𝑛 is the interger; λ is the wavelength; 𝑑 is the interplanar spacing and 𝜃 is the
x-ray angle
In this study, an XRD analysis was done using a Bruker D2 phaser. Samples were
prepared by placing them into a sample holder where they were moved around to give
a random orientation for a better diffraction graph.
3.1.3.1.4 Thermogravimetric Analysis (TGA)
Thermogravimetric analysis is a thermal technique in which the mass of a sample is
measured or monitored over time, as the temperature changes in a controlled
atmosphere and temperature programme (Perkin-Elmer, 2015). It can be used in both
routine analysis as well as in the research and development of various substances
such as solids and liquids because it assists with the acquiring of knowledge about the
thermal behaviour and at times even the composition of materials (Netzsch, 2016,
Mohomed, 2014).
The technique can characterize materials that exhibit weight loss or gain due to the
sorption/desorption of volatiles, decomposition, oxidation and reduction. During the
analysis a small amount of a sample is heated in an inert atmosphere. The different
components of the sample often decompose or evaporate at different temperature
ranges. By measuring the mass loss across a certain temperature range under a set
heating program, the amount of a specific material can be determined. A swap to an
40
oxygen/air atmosphere at higher temperatures will burn off any residual carbon black.
This allows the carbon black content of the sample to be determined.
The compositions of the pyrolysis-derived waste tyre carbon black, and the virgin
carbon black grades used in this study, were analysed using a Hi-Res TGA (Discovery
series TGA, TA Instruments). The High Resolution (Hi-Res) feature of the instrument
allows the heating rate of the sample to change in response to the rate of
decomposition of the same sample. This enables high heating rates to be used where
no weight changes are occurring (Tolentino et al., 2012); meaning that the heating rate
reduces only when necessary. Resolution was set at 4 and sensitivity at 1. A dynamic
heating rate was used for a natural rubber/styrene-butadiene rubber blend with a
temperature ramp rate of 50 ˚C/min from room temperature to 600 ˚C. The
temperature ramp rate for pyrolysis-derived carbon black and the other grades of
carbon black was 50 ˚C/min to 900 ˚C. Nitrogen baseline 5.0, as supplied by Afrox,
was used as a purge gas at a flow rate of 50mL/min from room temperature to 600 ˚C.
3.1.3.1.5 Scanning Electron Microscopy (SEM)
Scanning Electron Microscope is a magnification instrument that makes use of
focused beams of electrons in a vacuum to obtain topographical, morphological and
compositional information (Choudhary and Priyanka, 2017). This information is
achieved by tracing a sample in a raster pattern with an electron beam. With detailed
three-dimensional imaging, SEMs have a variety of applications in a number of
scientific and industry-related fields, especially where the characterizations of solid
materials are beneficial (Choudhary and Priyanka, 2017).
The analysis usually begins with an electron gun generating a beam of energetic
electrons down the column and onto a series of electromagnetic lenses. These lenses
are tubes, wrapped in coil and referred to as solenoids. The coils are adjusted to focus
the incident electron beam onto the stage where the sample is situated. When the
incident electrons encounter the sample, energetic electrons are released from the
surface of the sample. The scatter patterns offer a topological picture of the sample
(Choudhary and Priyanka, 2017).
Selected carbon blacks (N330 and N660) and pCB powders were imaged using a
JEOL JSM-IT200 at 5.0 kV. Secondary electron and back-scattered electron detectors
were used to image the gold-coated samples.
41
After successfully identifying the properties of pCB, NR/SBR compounds were
prepared with pCB as a partial replacement filler of the commercial CB grade.
3.2 SAMPLE PREPARATION
3.2.1 Weighing
All materials; elastomers, curatives and fillers were pre-weighed before mixing using
a Mettler BB 240 top pan balance. A Mettler Toledo AB204-S was used for the
abrasion test specimens.
3.2.2 Mixing
The intended applications for this research project cuts across various rubber and
related engineering products; however, the general-purpose conveyor belt seems to
be the low hanging fruit and thus a conveyor belt formulation (shown in Table 3.1) was
used. These types of conveyor belts require reinforcing carbon black grades because
their working conditions may involve the movement of material at inclined angles, so
semi-reinforcing carbon black grades are not sufficient. The only modification to this
formulation was the ratio of CB to pCB, which can be seen in Table 3.2. Pyrolysis-
derived waste tyre carbon black (pCB) was added as a substitute for N330, where
partial replacement of CB by pCB was done.
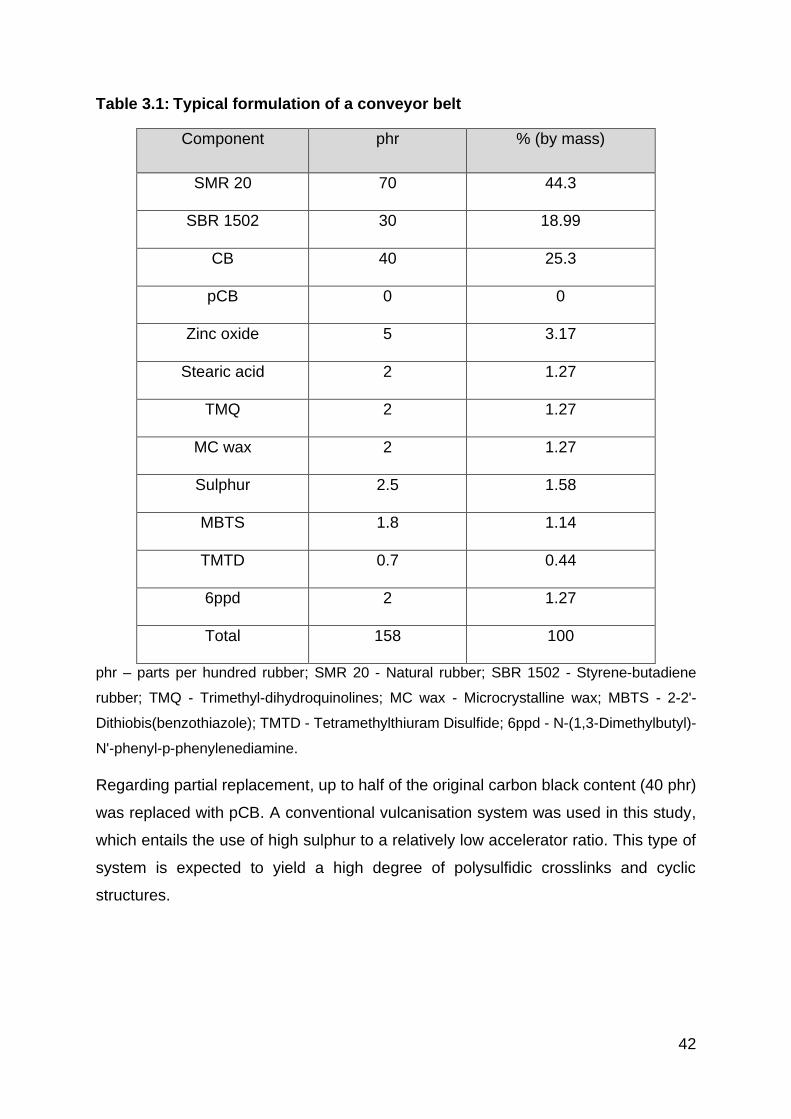
42
Table 3.1: Typical formulation of a conveyor belt
Component phr % (by mass)
SMR 20 70 44.3
SBR 1502 30 18.99
CB 40 25.3
pCB 0 0
Zinc oxide 5 3.17
Stearic acid 2 1.27
TMQ 2 1.27
MC wax 2 1.27
Sulphur 2.5 1.58
MBTS 1.8 1.14
TMTD 0.7 0.44
6ppd 2 1.27
Total 158 100
phr – parts per hundred rubber; SMR 20 - Natural rubber; SBR 1502 - Styrene-butadiene
rubber; TMQ - Trimethyl-dihydroquinolines; MC wax - Microcrystalline wax; MBTS - 2-2'-
Dithiobis(benzothiazole); TMTD - Tetramethylthiuram Disulfide; 6ppd - N-(1,3-Dimethylbutyl)-
N'-phenyl-p-phenylenediamine.
Regarding partial replacement, up to half of the original carbon black content (40 phr)
was replaced with pCB. A conventional vulcanisation system was used in this study,
which entails the use of high sulphur to a relatively low accelerator ratio. This type of
system is expected to yield a high degree of polysulfidic crosslinks and cyclic
structures.
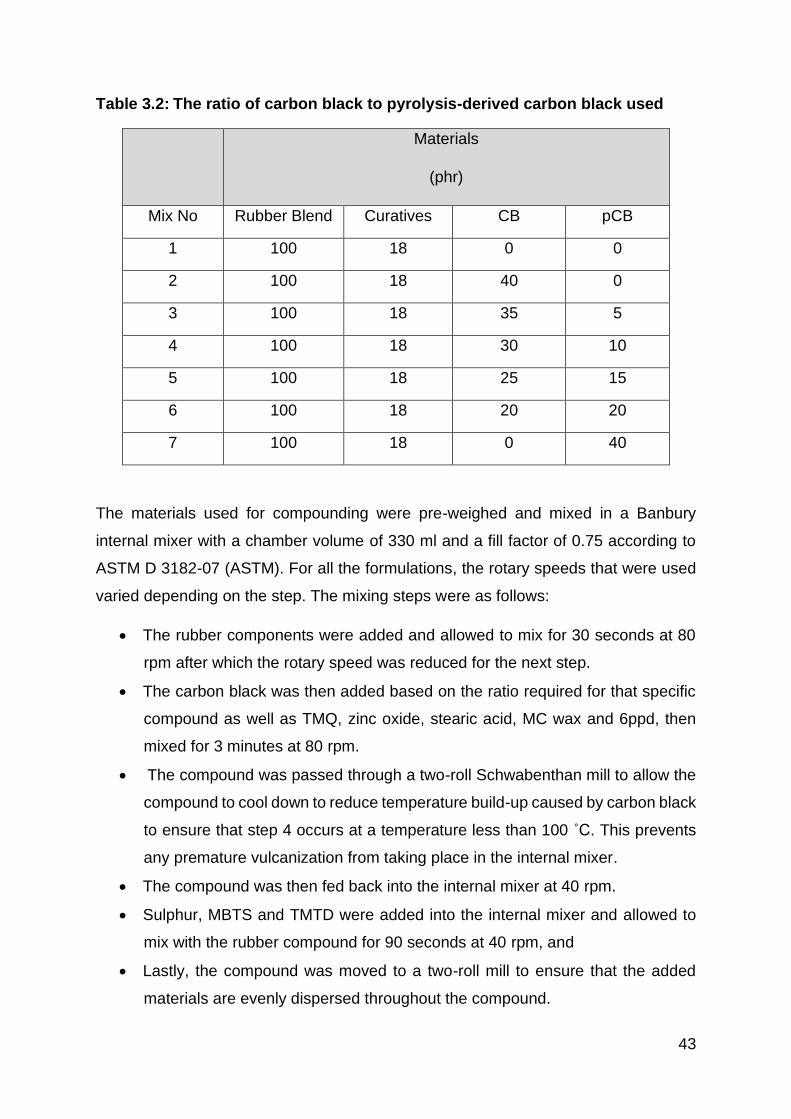
43
Table 3.2: The ratio of carbon black to pyrolysis-derived carbon black used
Materials
(phr)
Mix No Rubber Blend Curatives CB pCB
1 100 18 0 0
2 100 18 40 0
3 100 18 35 5
4 100 18 30 10
5 100 18 25 15
6 100 18 20 20
7 100 18 0 40
The materials used for compounding were pre-weighed and mixed in a Banbury
internal mixer with a chamber volume of 330 ml and a fill factor of 0.75 according to
ASTM D 3182-07 (ASTM). For all the formulations, the rotary speeds that were used
varied depending on the step. The mixing steps were as follows:
• The rubber components were added and allowed to mix for 30 seconds at 80
rpm after which the rotary speed was reduced for the next step.
• The carbon black was then added based on the ratio required for that specific
compound as well as TMQ, zinc oxide, stearic acid, MC wax and 6ppd, then
mixed for 3 minutes at 80 rpm.
• The compound was passed through a two-roll Schwabenthan mill to allow the
compound to cool down to reduce temperature build-up caused by carbon black
to ensure that step 4 occurs at a temperature less than 100 ˚C. This prevents
any premature vulcanization from taking place in the internal mixer.
• The compound was then fed back into the internal mixer at 40 rpm.
• Sulphur, MBTS and TMTD were added into the internal mixer and allowed to
mix with the rubber compound for 90 seconds at 40 rpm, and
• Lastly, the compound was moved to a two-roll mill to ensure that the added
materials are evenly dispersed throughout the compound.
44
3.2.3 Curing
3.2.3.1 Rheometer
A Montech Dynamic Rubber Process Analyzer (D-RPA) was used, in Moving Die
Rheometer (MDR) mode, to find the cure times (T90) of the unvulcanised compounds.
Pre-heating of the rheometer prior to the introduction of the compound took place. The
curing temperature used, was 150 ˚C, other parameters were a frequency of 1.67 Hz
and an angle of 0.5° for 30 minutes which further reduced to 15 minutes upon
observing that the cure times were below 10 minutes. All samples were approximately
9 g.
3.2.3.2 Test sheets
The uncured rubber compounds were cured at an isothermal temperature of 150 ˚C
and pressure of 5 MPs in an electrically heated cure press. An approximate 50 g of
uncured rubber compound was placed between two thin mylar sheets to assist in the
removal of the end-product of cured rubber from the cure press plates. Once the curing
of the samples was achieved, the cured samples were removed and immediately
placed into a bucket of water. This was done to quench the vulcanization process to
ensure that over-curing does not take place. Over curing can decrease the properties
of the cured rubber (Wu et al., 2015). In a typical MDR vulcanization curve, the time
to achieve the optimum network density at a given temperature, is the time required
for the torque to reach 90% of the maximum achievable torque (Khimi and Pickering,
2014). Therefore, T₉₀ is calculated as follows:
𝑇90 = 𝑇𝑚𝑖𝑛 + 0.9(𝑇𝑚𝑎𝑥 − 𝑇𝑚𝑖𝑛) (3)
Tmin and Tmax represent the minimum and maximum torque values.
3.2.3.3 Testing blocks
Approximately 50 g of uncured rubber compound was weighed and placed into pre-
heated block moulds that are placed in between the two plates that are used to hold
the rubber material in the moulds. An isothermal temperature of 150 ˚C was used and
20 minutes was added to the T₉₀ time given by the rheometer. This is done to ensure
that heat is distributed throughout the sample because the sheets and the blocks differ
45
in thickness and therefore the time was added. The test blocks were prepared for
rebound and hardness.
3.2.3.4 Testing buttons
A button mould was pre-heated at an isothermal temperature of 150 ˚C, then
approximately 12 g of uncured rubber compound was placed in each hole. This
uncured rubber compound filled up 6 - 8 buttons per compound. The test specimens
were cylindrical in shape with a diameter 16 ± 0.2 mm and a minimum thickness of 6.0
mm. Curing times for each compound was determined by the T₉₀ values that were
obtained from the rheometer. Buttons were used for abrasion testing.
3.3 MORPHOLOGY
3.3.1 Scanning Electron Microscopy (SEM)
The tensile fracture surfaces of the NR/SBR compounds filled with pCB as a partial
replacement filler of the commercial CB grade N330, were imaged using a JEOL JSM-
IT200 at 5.0 kV. Secondary electron and back-scattered electron detectors were used
to image the gold coated samples. The carbon samples were imaged at 20 kV.
3.4 THERMAL ANALYSIS
3.4.1 Dynamic Mechanical Analysis (DMA)
Dynamic mechanical analysis is a technique used to characterize the mechanical
properties of a rubber or polymeric material in response to the temperature, frequency,
stress, atmosphere of a combination of these parameters (Schranz, 1997). It is used
to study the visco-elastic properties of polymers that exhibit both viscous and elastic
characteristics when undergoing deformation.
Tan delta, which is the ratio of loss modulus to storage modulus, was analysed using
the DMA Q800 from TA instruments. An iso-frequency-strain mode was utilized with a
1% strain at 1Hz on a Tension Film Clamp. The procedure was as follows: The sample
was cooled to -80 ˚C using liquid nitrogen, kept isothermal for 1 minute and then
heated to 40 ˚C at 5 ˚C/min.
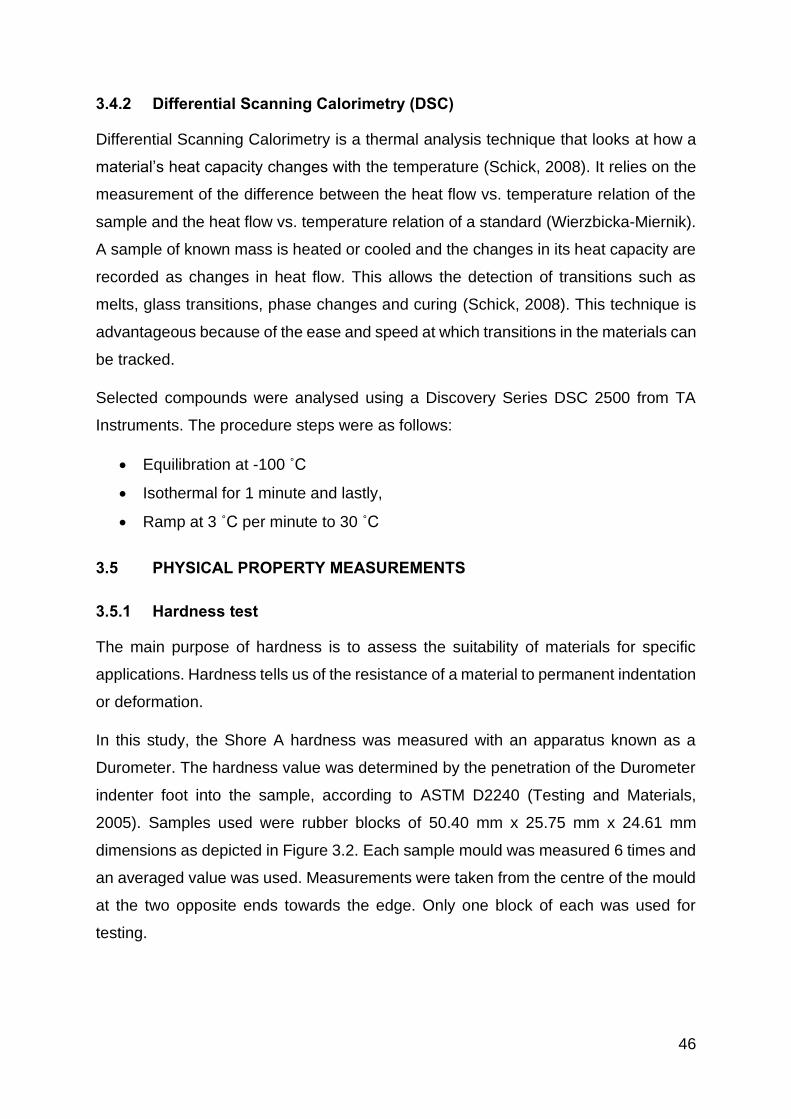
46
3.4.2 Differential Scanning Calorimetry (DSC)
Differential Scanning Calorimetry is a thermal analysis technique that looks at how a
material’s heat capacity changes with the temperature (Schick, 2008). It relies on the
measurement of the difference between the heat flow vs. temperature relation of the
sample and the heat flow vs. temperature relation of a standard (Wierzbicka-Miernik).
A sample of known mass is heated or cooled and the changes in its heat capacity are
recorded as changes in heat flow. This allows the detection of transitions such as
melts, glass transitions, phase changes and curing (Schick, 2008). This technique is
advantageous because of the ease and speed at which transitions in the materials can
be tracked.
Selected compounds were analysed using a Discovery Series DSC 2500 from TA
Instruments. The procedure steps were as follows:
• Equilibration at -100 ˚C
• Isothermal for 1 minute and lastly,
• Ramp at 3 ˚C per minute to 30 ˚C
3.5 PHYSICAL PROPERTY MEASUREMENTS
3.5.1 Hardness test
The main purpose of hardness is to assess the suitability of materials for specific
applications. Hardness tells us of the resistance of a material to permanent indentation
or deformation.
In this study, the Shore A hardness was measured with an apparatus known as a
Durometer. The hardness value was determined by the penetration of the Durometer
indenter foot into the sample, according to ASTM D2240 (Testing and Materials,
2005). Samples used were rubber blocks of 50.40 mm x 25.75 mm x 24.61 mm
dimensions as depicted in Figure 3.2. Each sample mould was measured 6 times and
an averaged value was used. Measurements were taken from the centre of the mould
at the two opposite ends towards the edge. Only one block of each was used for
testing.
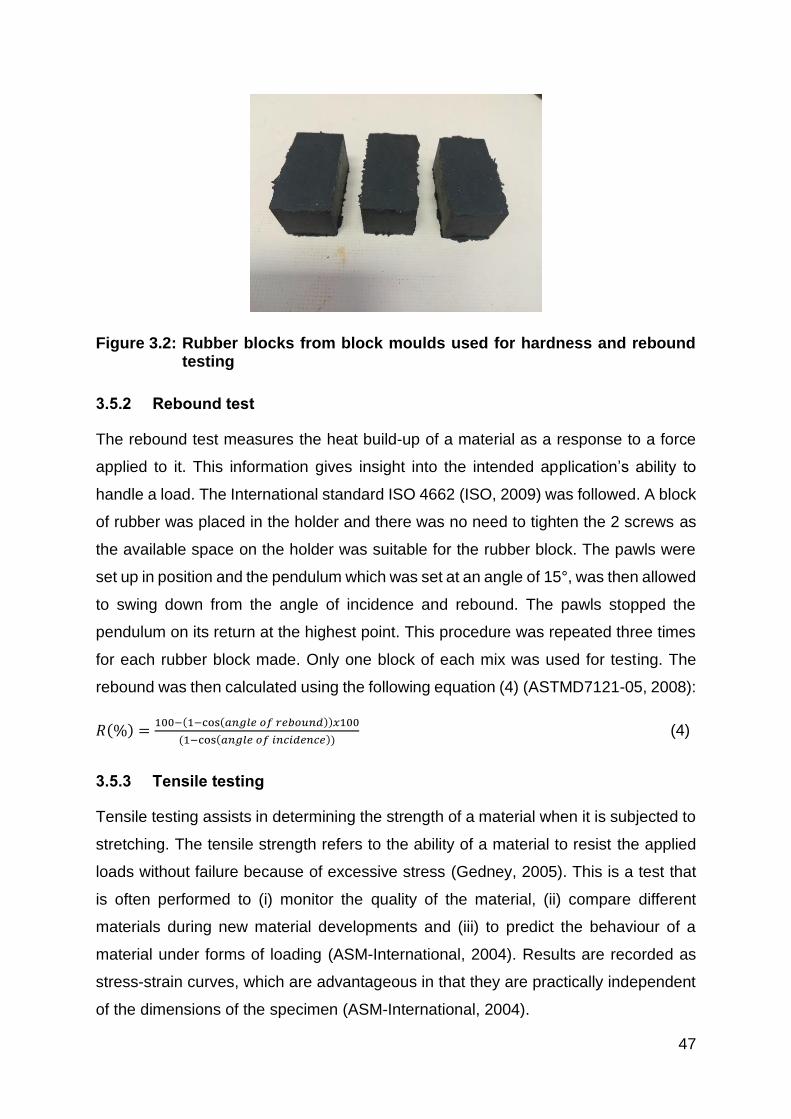
47
Figure 3.2: Rubber blocks from block moulds used for hardness and rebound testing
3.5.2 Rebound test
The rebound test measures the heat build-up of a material as a response to a force
applied to it. This information gives insight into the intended application’s ability to
handle a load. The International standard ISO 4662 (ISO, 2009) was followed. A block
of rubber was placed in the holder and there was no need to tighten the 2 screws as
the available space on the holder was suitable for the rubber block. The pawls were
set up in position and the pendulum which was set at an angle of 15°, was then allowed
to swing down from the angle of incidence and rebound. The pawls stopped the
pendulum on its return at the highest point. This procedure was repeated three times
for each rubber block made. Only one block of each mix was used for testing. The
rebound was then calculated using the following equation (4) (ASTMD7121-05, 2008):
𝑅(%) =100−(1−cos(𝑎𝑛𝑔𝑙𝑒 𝑜𝑓 𝑟𝑒𝑏𝑜𝑢𝑛𝑑))𝑥100
(1−cos(𝑎𝑛𝑔𝑙𝑒 𝑜𝑓 𝑖𝑛𝑐𝑖𝑑𝑒𝑛𝑐𝑒)) (4)
3.5.3 Tensile testing
Tensile testing assists in determining the strength of a material when it is subjected to
stretching. The tensile strength refers to the ability of a material to resist the applied
loads without failure because of excessive stress (Gedney, 2005). This is a test that
is often performed to (i) monitor the quality of the material, (ii) compare different
materials during new material developments and (iii) to predict the behaviour of a
material under forms of loading (ASM-International, 2004). Results are recorded as
stress-strain curves, which are advantageous in that they are practically independent
of the dimensions of the specimen (ASM-International, 2004).
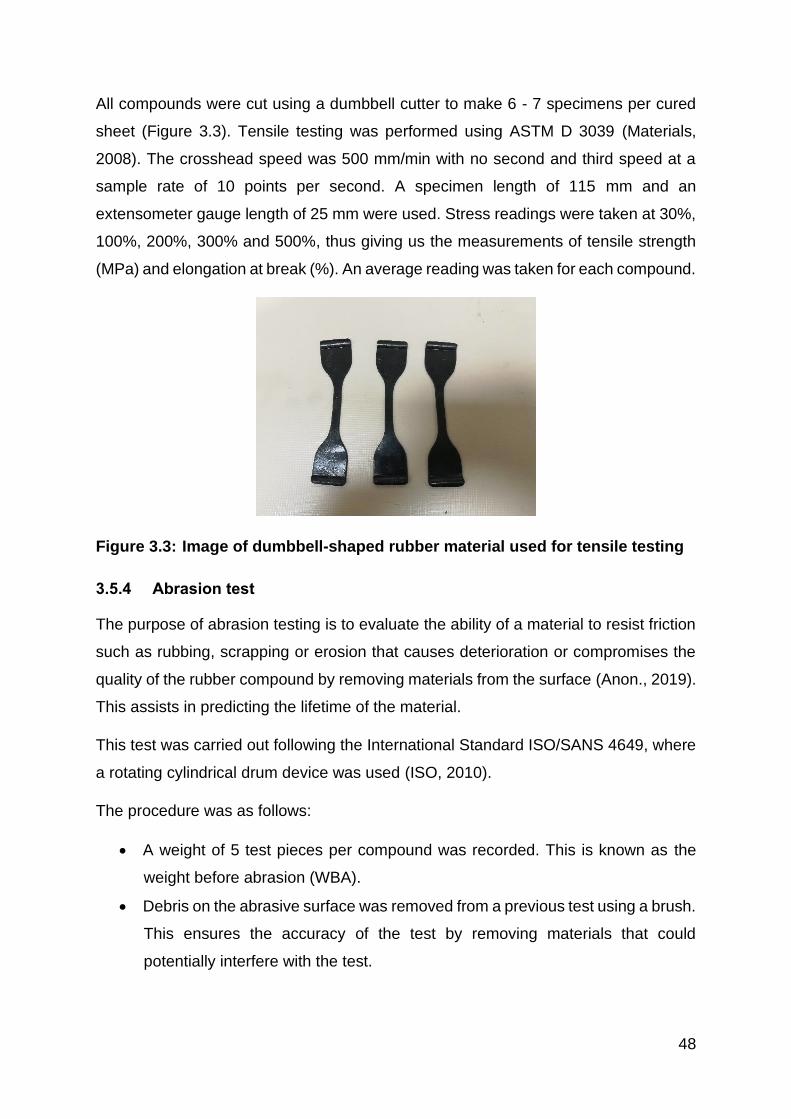
48
All compounds were cut using a dumbbell cutter to make 6 - 7 specimens per cured
sheet (Figure 3.3). Tensile testing was performed using ASTM D 3039 (Materials,
2008). The crosshead speed was 500 mm/min with no second and third speed at a
sample rate of 10 points per second. A specimen length of 115 mm and an
extensometer gauge length of 25 mm were used. Stress readings were taken at 30%,
100%, 200%, 300% and 500%, thus giving us the measurements of tensile strength
(MPa) and elongation at break (%). An average reading was taken for each compound.
Figure 3.3: Image of dumbbell-shaped rubber material used for tensile testing
3.5.4 Abrasion test
The purpose of abrasion testing is to evaluate the ability of a material to resist friction
such as rubbing, scrapping or erosion that causes deterioration or compromises the
quality of the rubber compound by removing materials from the surface (Anon., 2019).
This assists in predicting the lifetime of the material.
This test was carried out following the International Standard ISO/SANS 4649, where
a rotating cylindrical drum device was used (ISO, 2010).
The procedure was as follows:
• A weight of 5 test pieces per compound was recorded. This is known as the
weight before abrasion (WBA).
• Debris on the abrasive surface was removed from a previous test using a brush.
This ensures the accuracy of the test by removing materials that could
potentially interfere with the test.
49
• The test piece holder assembly was lifted and slid to the far left of the
instrument,
• The test piece was placed in the test piece holder, locked and set to protrude
at approximately 2 mm from the opening,
• Upon which the instrument was switched on to set the cylinder in motion.
• The test piece holder assembly automatically lifted after travelling 40 cm and
switched off. The test piece was removed from the holder and small edges
hanging from the test piece.
• The weight after abrasion (WAA) was recorded and,
• The mass loss (WBA – WAA) was recorded as ΔMT using the following formula:
Relative Abrasion loss = (ΔMT x 200) / (S.G of test compound x ΔMR) (5)
Where ΔMT = is the mass loss in mg of the test compound; ΔMR = is the mass loss
in mg of the reference compound; S.G = is the density in mg/mm3 of the rubber being
tested; 200 = constant based on the standard reference compound.
A standard reference compound is used which undergoes the same procedure
mentioned above.
3.6 PAYNE EFFECT
The purpose of Payne effect is to better understand the performance of rubber
enhanced by the presence of a filler. Carbon black is the oldest and one of the most
important fillers widely used in rubber formulations (Fröhlich et al., 2005). It is therefore
important to know how carbon black affects properties of rubber vulcanizates.
The analysis was carried out on 8g of uncured rubber compound according to TA
Instruments test method at 60 ˚C for all compounds. The procedure was as follows:
• Initialization step, which allows the rubber compound to relax before testing
occurs.
• Isothermal test for 5 minutes, at an angle of 0.5 and a frequency of 0.1 Hz.
• An amplitude sweep for a duration of 3.3 minutes at an angle of 0.01 and
frequency of 1 Hz was done.
• An isothermal test for 1 minute at an angle of 0.5 and a frequency of 1.670 Hz.
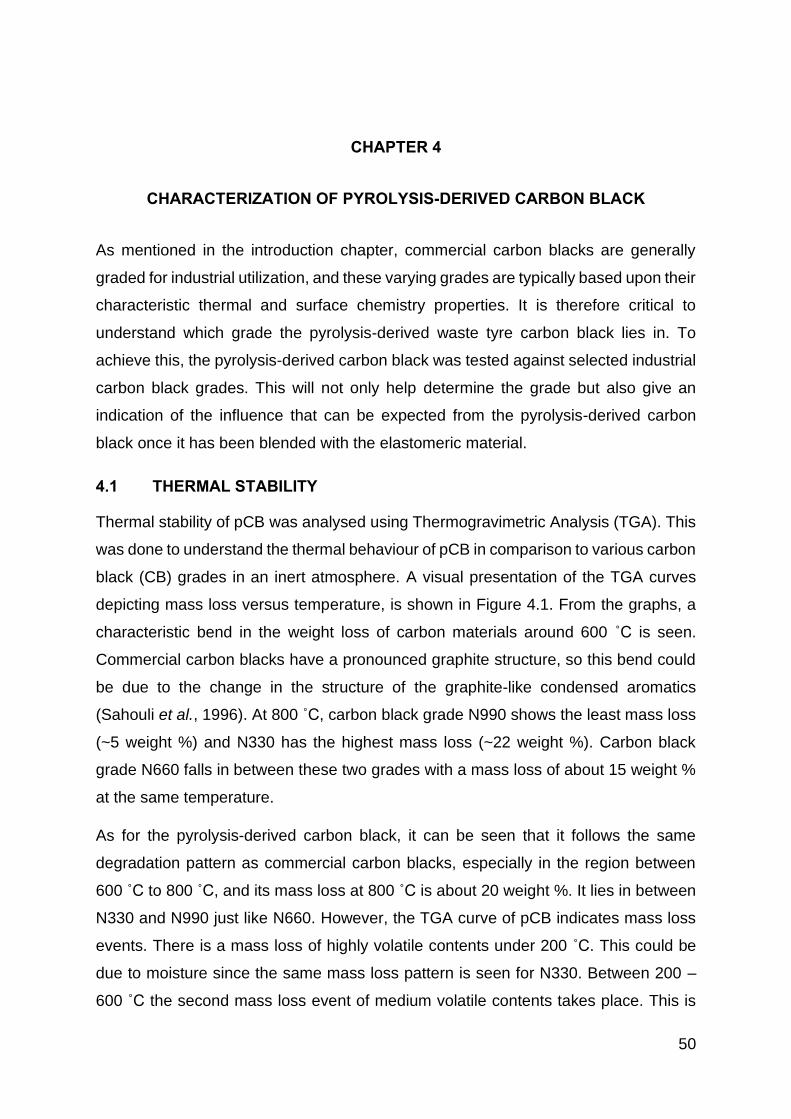
50
CHAPTER 4
CHARACTERIZATION OF PYROLYSIS-DERIVED CARBON BLACK
As mentioned in the introduction chapter, commercial carbon blacks are generally
graded for industrial utilization, and these varying grades are typically based upon their
characteristic thermal and surface chemistry properties. It is therefore critical to
understand which grade the pyrolysis-derived waste tyre carbon black lies in. To
achieve this, the pyrolysis-derived carbon black was tested against selected industrial
carbon black grades. This will not only help determine the grade but also give an
indication of the influence that can be expected from the pyrolysis-derived carbon
black once it has been blended with the elastomeric material.
4.1 THERMAL STABILITY
Thermal stability of pCB was analysed using Thermogravimetric Analysis (TGA). This
was done to understand the thermal behaviour of pCB in comparison to various carbon
black (CB) grades in an inert atmosphere. A visual presentation of the TGA curves
depicting mass loss versus temperature, is shown in Figure 4.1. From the graphs, a
characteristic bend in the weight loss of carbon materials around 600 ˚C is seen.
Commercial carbon blacks have a pronounced graphite structure, so this bend could
be due to the change in the structure of the graphite-like condensed aromatics
(Sahouli et al., 1996). At 800 ˚C, carbon black grade N990 shows the least mass loss
(~5 weight %) and N330 has the highest mass loss (~22 weight %). Carbon black
grade N660 falls in between these two grades with a mass loss of about 15 weight %
at the same temperature.
As for the pyrolysis-derived carbon black, it can be seen that it follows the same
degradation pattern as commercial carbon blacks, especially in the region between
600 ˚C to 800 ˚C, and its mass loss at 800 ˚C is about 20 weight %. It lies in between
N330 and N990 just like N660. However, the TGA curve of pCB indicates mass loss
events. There is a mass loss of highly volatile contents under 200 ˚C. This could be
due to moisture since the same mass loss pattern is seen for N330. Between 200 –
600 ˚C the second mass loss event of medium volatile contents takes place. This is
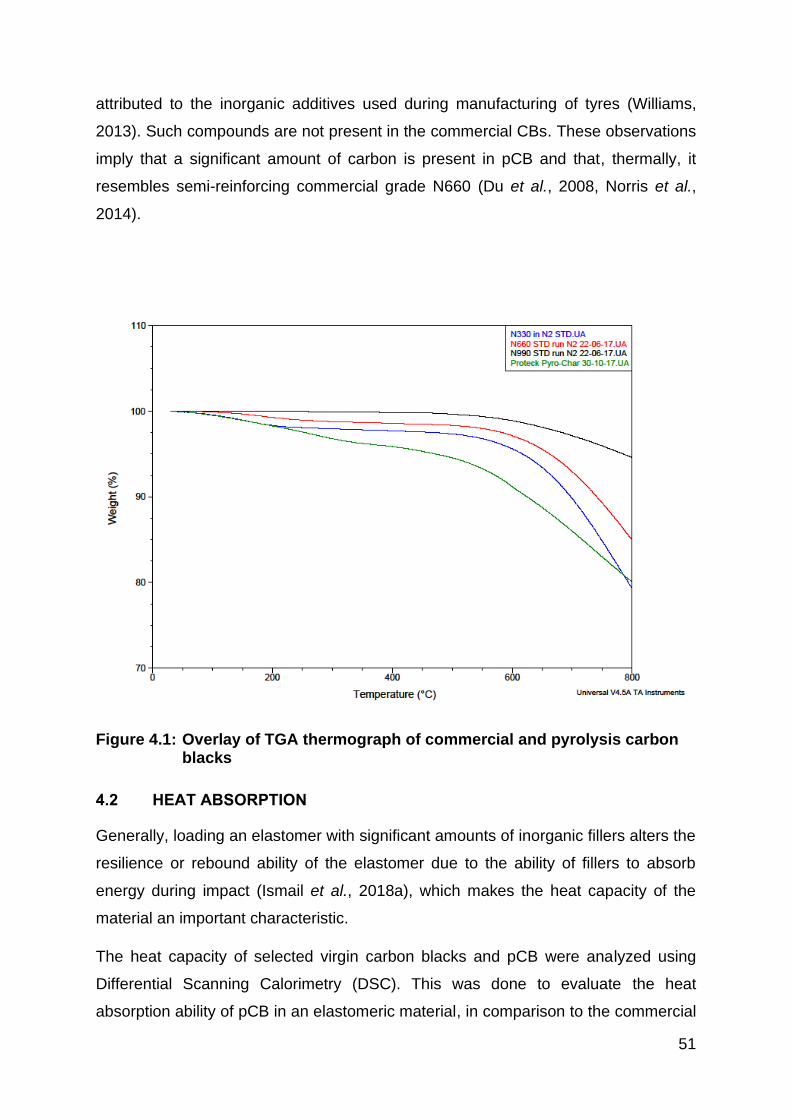
51
attributed to the inorganic additives used during manufacturing of tyres (Williams,
2013). Such compounds are not present in the commercial CBs. These observations
imply that a significant amount of carbon is present in pCB and that, thermally, it
resembles semi-reinforcing commercial grade N660 (Du et al., 2008, Norris et al.,
2014).
Figure 4.1: Overlay of TGA thermograph of commercial and pyrolysis carbon blacks
4.2 HEAT ABSORPTION
Generally, loading an elastomer with significant amounts of inorganic fillers alters the
resilience or rebound ability of the elastomer due to the ability of fillers to absorb
energy during impact (Ismail et al., 2018a), which makes the heat capacity of the
material an important characteristic.
The heat capacity of selected virgin carbon blacks and pCB were analyzed using
Differential Scanning Calorimetry (DSC). This was done to evaluate the heat
absorption ability of pCB in an elastomeric material, in comparison to the commercial
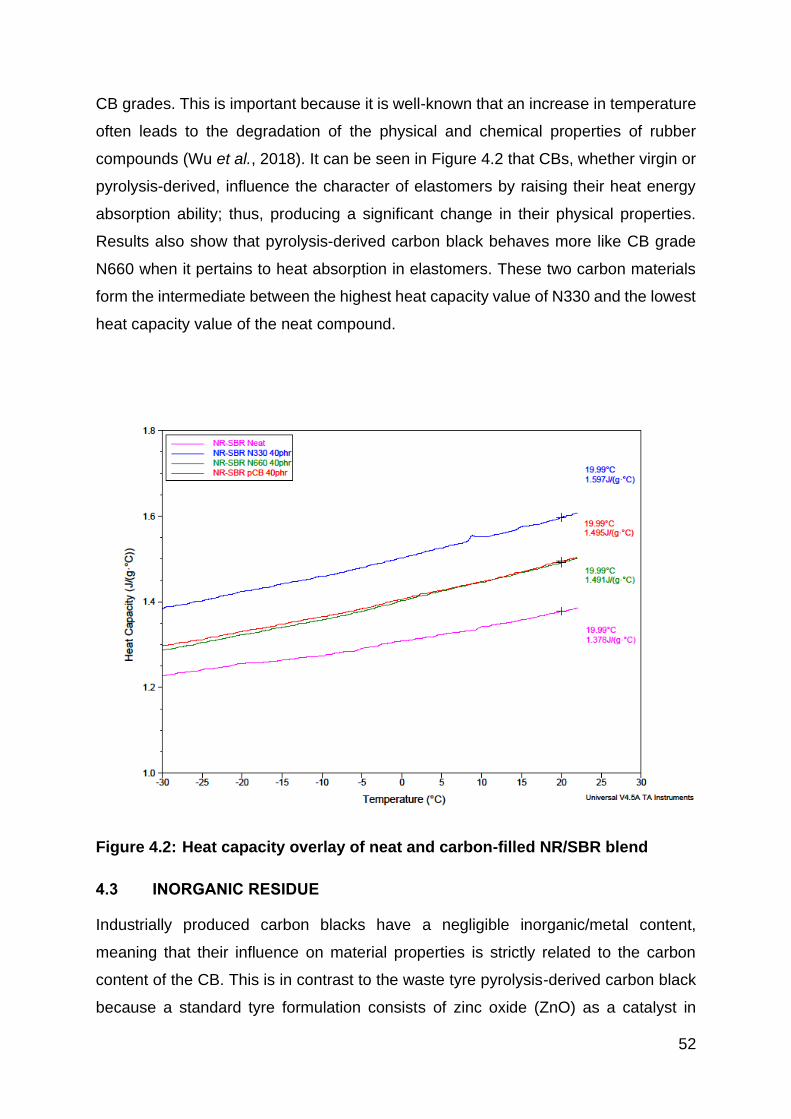
52
CB grades. This is important because it is well-known that an increase in temperature
often leads to the degradation of the physical and chemical properties of rubber
compounds (Wu et al., 2018). It can be seen in Figure 4.2 that CBs, whether virgin or
pyrolysis-derived, influence the character of elastomers by raising their heat energy
absorption ability; thus, producing a significant change in their physical properties.
Results also show that pyrolysis-derived carbon black behaves more like CB grade
N660 when it pertains to heat absorption in elastomers. These two carbon materials
form the intermediate between the highest heat capacity value of N330 and the lowest
heat capacity value of the neat compound.
Figure 4.2: Heat capacity overlay of neat and carbon-filled NR/SBR blend
4.3 INORGANIC RESIDUE
Industrially produced carbon blacks have a negligible inorganic/metal content,
meaning that their influence on material properties is strictly related to the carbon
content of the CB. This is in contrast to the waste tyre pyrolysis-derived carbon black
because a standard tyre formulation consists of zinc oxide (ZnO) as a catalyst in
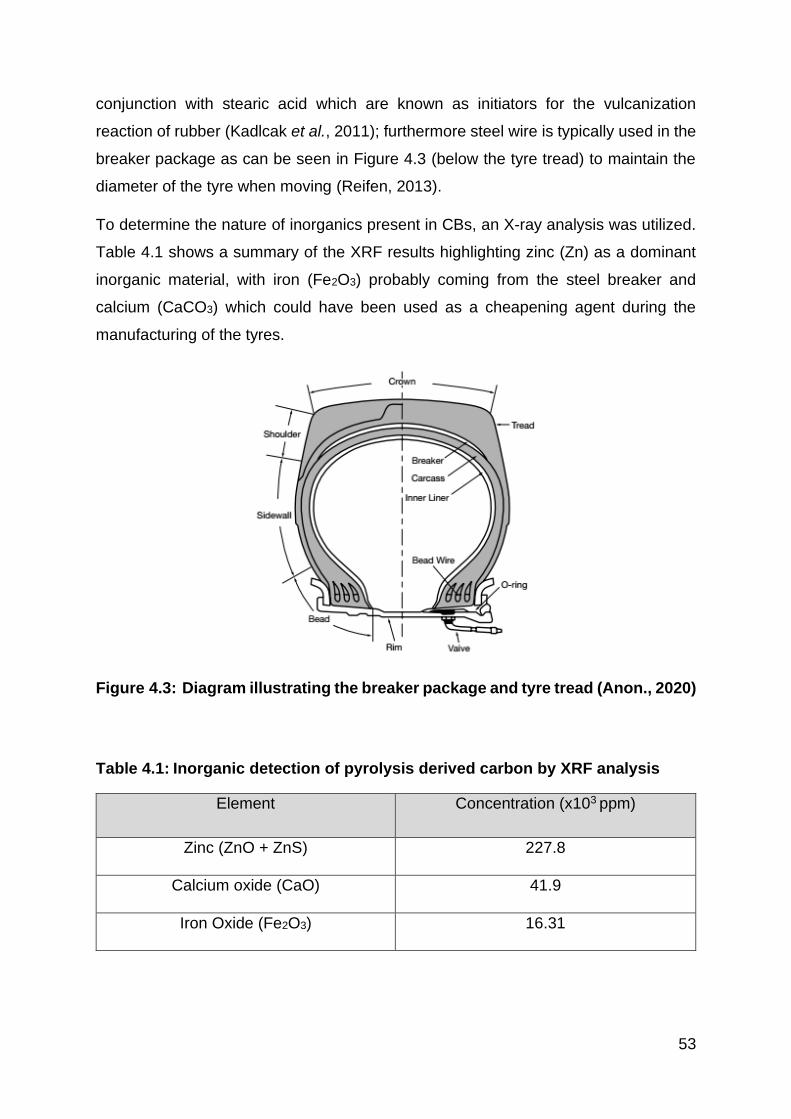
53
conjunction with stearic acid which are known as initiators for the vulcanization
reaction of rubber (Kadlcak et al., 2011); furthermore steel wire is typically used in the
breaker package as can be seen in Figure 4.3 (below the tyre tread) to maintain the
diameter of the tyre when moving (Reifen, 2013).
To determine the nature of inorganics present in CBs, an X-ray analysis was utilized.
Table 4.1 shows a summary of the XRF results highlighting zinc (Zn) as a dominant
inorganic material, with iron (Fe2O3) probably coming from the steel breaker and
calcium (CaCO3) which could have been used as a cheapening agent during the
manufacturing of the tyres.
Figure 4.3: Diagram illustrating the breaker package and tyre tread (Anon., 2020)
Table 4.1: Inorganic detection of pyrolysis derived carbon by XRF analysis
Element Concentration (x103 ppm)
Zinc (ZnO + ZnS) 227.8
Calcium oxide (CaO) 41.9
Iron Oxide (Fe2O3) 16.31
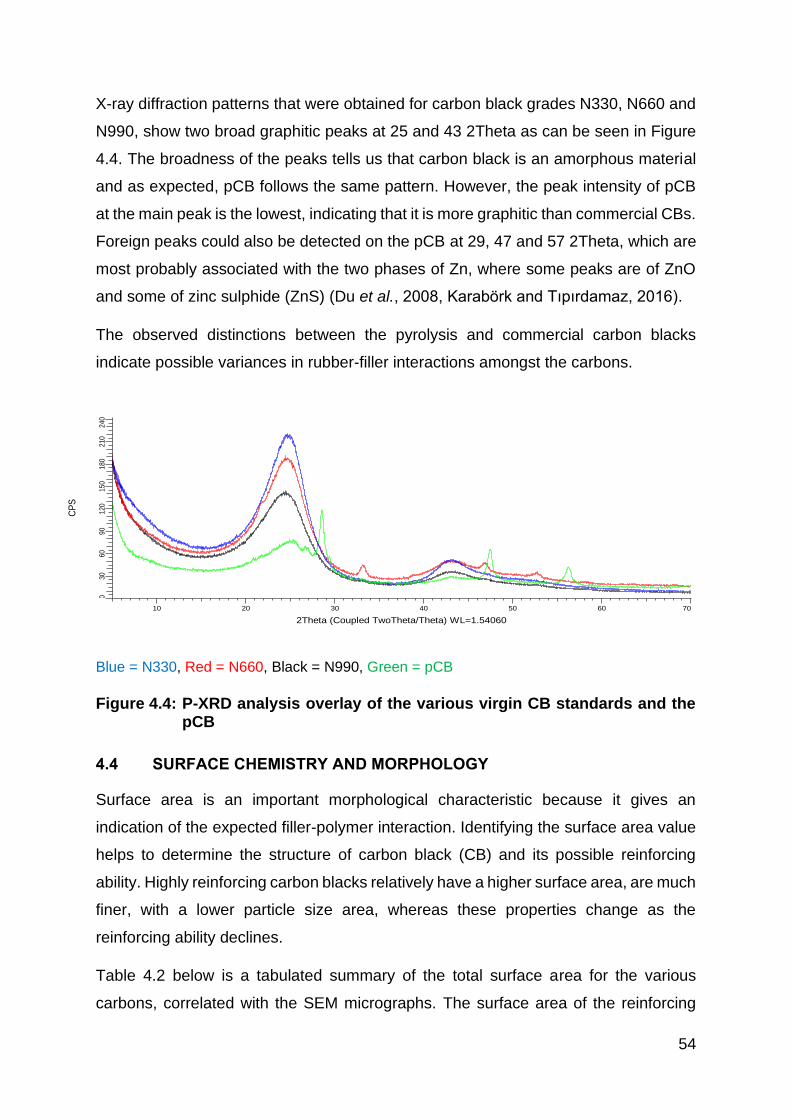
54
X-ray diffraction patterns that were obtained for carbon black grades N330, N660 and
N990, show two broad graphitic peaks at 25 and 43 2Theta as can be seen in Figure
4.4. The broadness of the peaks tells us that carbon black is an amorphous material
and as expected, pCB follows the same pattern. However, the peak intensity of pCB
at the main peak is the lowest, indicating that it is more graphitic than commercial CBs.
Foreign peaks could also be detected on the pCB at 29, 47 and 57 2Theta, which are
most probably associated with the two phases of Zn, where some peaks are of ZnO
and some of zinc sulphide (ZnS) (Du et al., 2008, Karabörk and Tıpırdamaz, 2016).
The observed distinctions between the pyrolysis and commercial carbon blacks
indicate possible variances in rubber-filler interactions amongst the carbons.
Blue = N330, Red = N660, Black = N990, Green = pCB
Figure 4.4: P-XRD analysis overlay of the various virgin CB standards and the pCB
4.4 SURFACE CHEMISTRY AND MORPHOLOGY
Surface area is an important morphological characteristic because it gives an
indication of the expected filler-polymer interaction. Identifying the surface area value
helps to determine the structure of carbon black (CB) and its possible reinforcing
ability. Highly reinforcing carbon blacks relatively have a higher surface area, are much
finer, with a lower particle size area, whereas these properties change as the
reinforcing ability declines.
Table 4.2 below is a tabulated summary of the total surface area for the various
carbons, correlated with the SEM micrographs. The surface area of the reinforcing
030
60
90
120
150
180
210
240
CP
S
10 20 30 40 50 60 70
2Theta (Coupled TwoTheta/Theta) WL=1.54060
N330 12-10-17
N660 06-11-17
N990 13-10-17
Pyro Char 8 Oct 2018
55
carbon black N330 is much higher than that of the non-reinforcing virgin carbon blacks
(N660 and N990). It is also notable that the commercial N660 has an equivalent
surface area of about 35 m2/g as pCB, which correlates with the obtained SEM findings
in terms of particle size distribution. Figures 4.5 to 4.7 display the obtained morphology
images of the various carbon blacks, where a correlation between the obtained surface
area values is observed. Furthermore, Figures 4.6 and 4.7 are consistent with one
another throughout their low to high magnifications, where the spherical particle
networks are of a similar size range between the two carbons. This strengthens the
argument of the grading of the pyrolysis-derived carbon as an N660 grade of carbon
black as far as its characteristics are concerned. Nevertheless, there are some
distinctive differences between the commercial blacks and the pyrolysis-derived
carbon black; these are illustrated in Figure 4.8, where irregular non-spherical particles
are observed at lower magnifications on the pCB, and at a higher magnification,
needle-shaped particles, which could be inorganic components from the tyre material
before the pyrolysis process.
Table 4.2: Tabulated values of the surface area of carbon black grades and pyrolysis-derived carbon black
Carbon black BET (m²/g)
N330 80
N660 35
N990 9
pCB 34
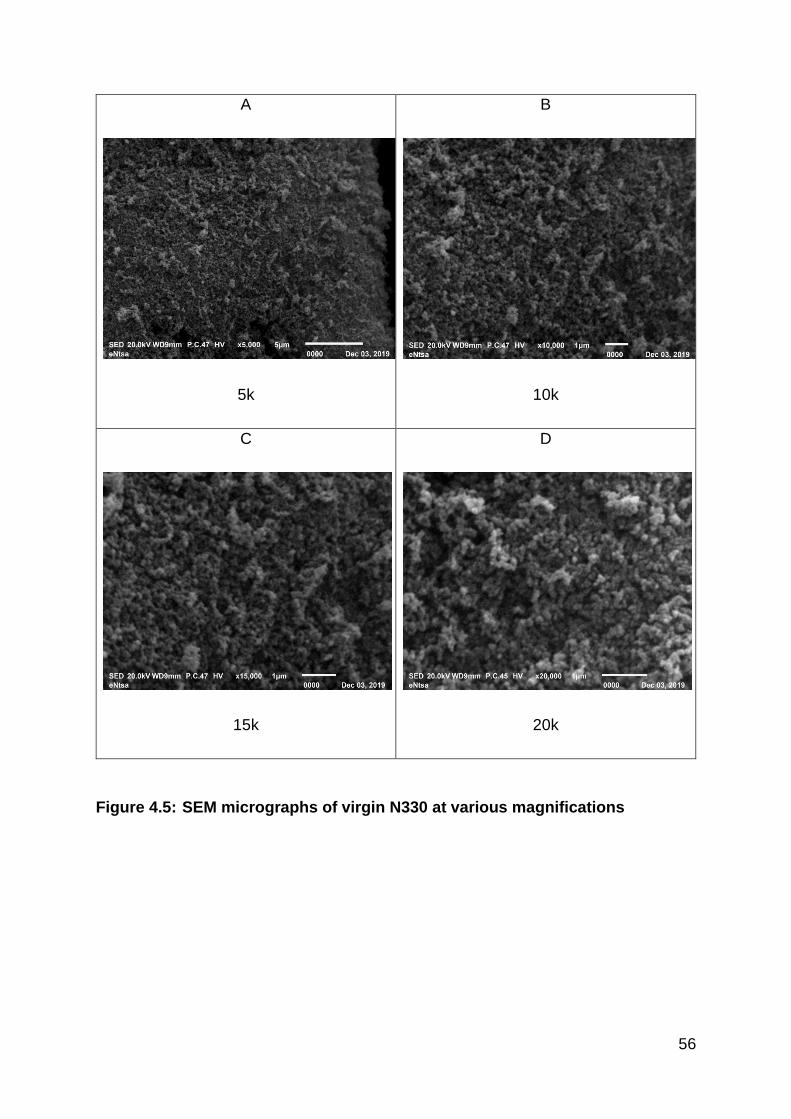
56
A
5k
B
10k
C
15k
D
20k
Figure 4.5: SEM micrographs of virgin N330 at various magnifications
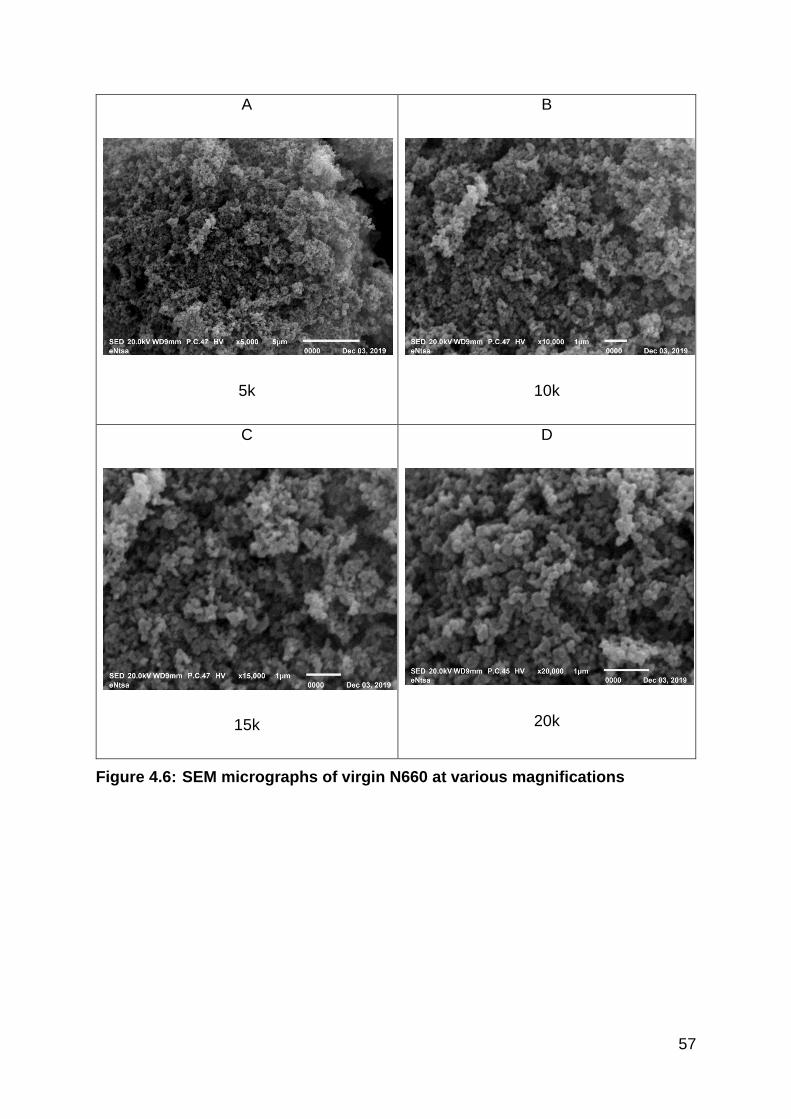
57
A
5k
B
10k
C
15k
D
20k
Figure 4.6: SEM micrographs of virgin N660 at various magnifications
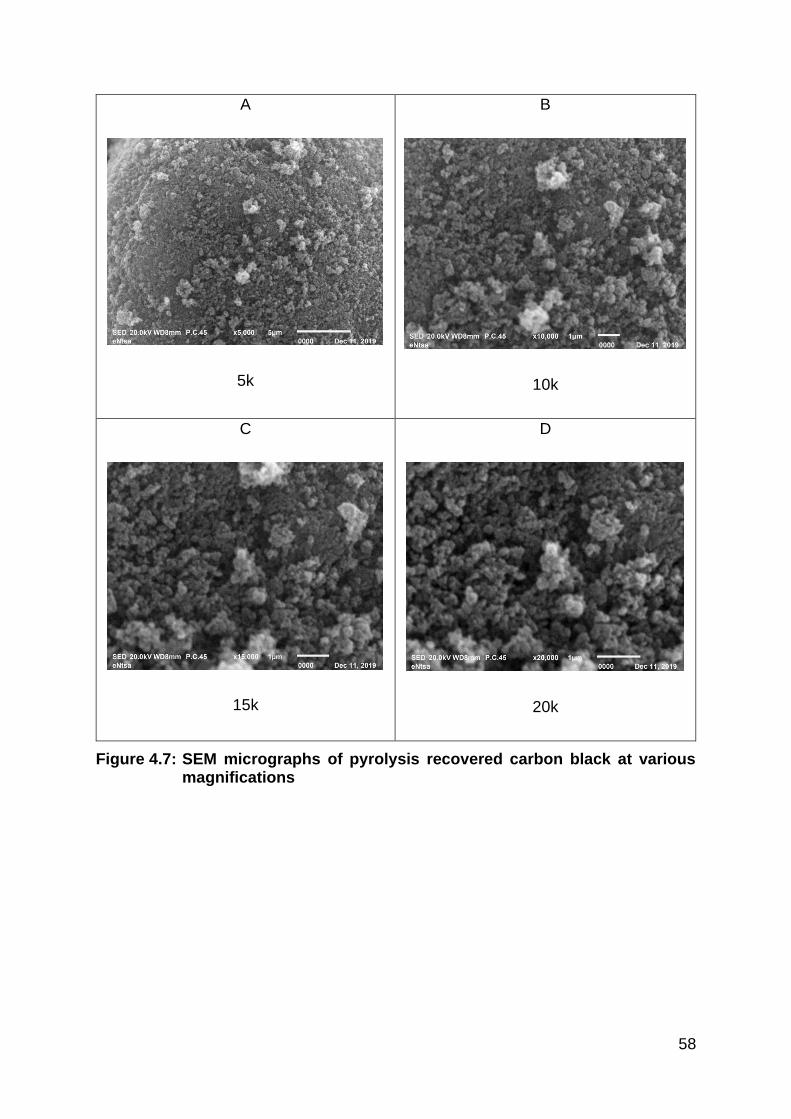
58
A
5k
B
10k
C
15k
D
20k
Figure 4.7: SEM micrographs of pyrolysis recovered carbon black at various magnifications
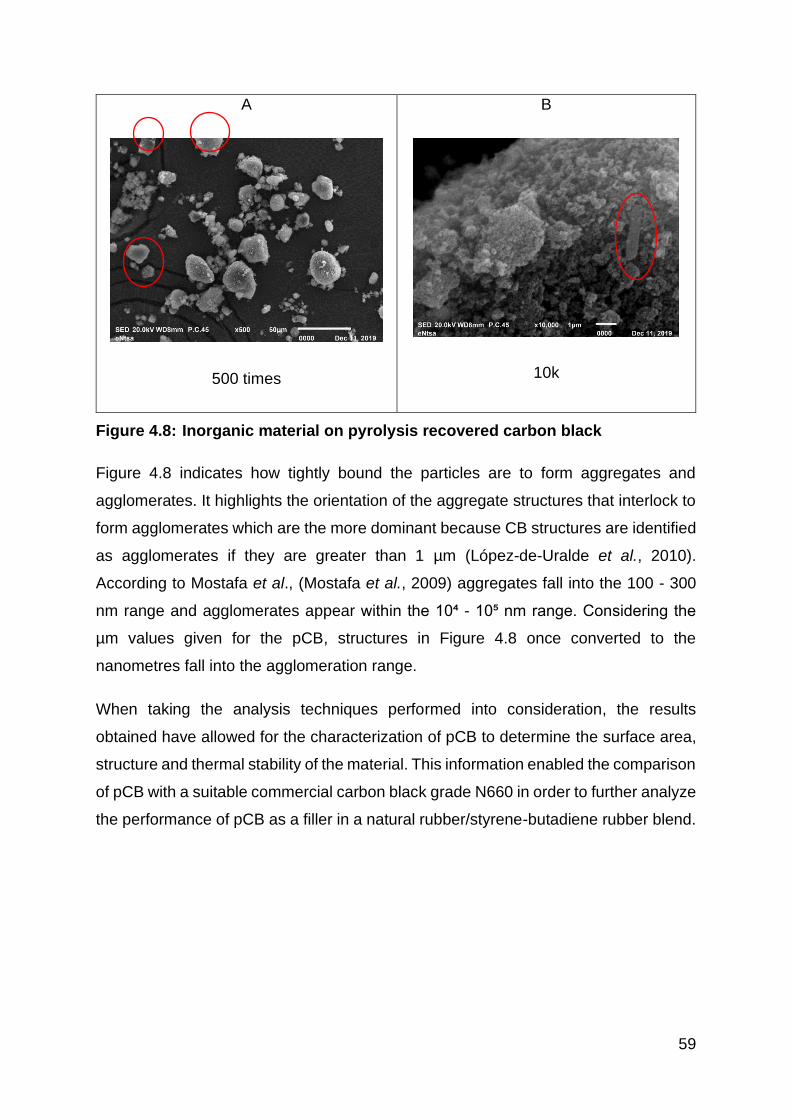
59
A
500 times
B
10k
Figure 4.8: Inorganic material on pyrolysis recovered carbon black
Figure 4.8 indicates how tightly bound the particles are to form aggregates and
agglomerates. It highlights the orientation of the aggregate structures that interlock to
form agglomerates which are the more dominant because CB structures are identified
as agglomerates if they are greater than 1 µm (López-de-Uralde et al., 2010).
According to Mostafa et al., (Mostafa et al., 2009) aggregates fall into the 100 - 300
nm range and agglomerates appear within the 10⁴ - 10⁵ nm range. Considering the
µm values given for the pCB, structures in Figure 4.8 once converted to the
nanometres fall into the agglomeration range.
When taking the analysis techniques performed into consideration, the results
obtained have allowed for the characterization of pCB to determine the surface area,
structure and thermal stability of the material. This information enabled the comparison
of pCB with a suitable commercial carbon black grade N660 in order to further analyze
the performance of pCB as a filler in a natural rubber/styrene-butadiene rubber blend.
60
CHAPTER 5
EVALUATION OF THE MECHANICAL PROPERTIES OF PCB AND
COMMERCIAL CB FILLED NR/SBR BLENDS
Basic properties of pyrolysis-derived carbon black (pCB) were characterized in the
previous chapter using various techniques. In principle, pyrolysis-derived carbon black
showed similar characteristic properties as semi-reinforcing, commercial carbon black
(CB) grade N660. This chapter investigates the effect of different CBs and pCB on the
mechanical properties of NR/SBR blends and the suitability of pCB for the intended
application in conveyor belting. The suitability was determined through the selection
of a commercial grade CB as a reference using tensile strength and lastly, comparing
the behavior of pCB to CB grade chosen for the intended application.
5.1 INFLUENCE OF CARBON BLACK FILLERS ON THE MECHANICAL
PROPERTIES OF NR/SBR BLENDS
This part of the chapter focuses on the influence that the individual commercial and
pyrolysis-derived carbon materials have on the mechanical properties of a polymer
blend. Findings obtained in this chapter will help to assess the performance of the
pCB, as it is expected to perform as N660 due to the obtained findings in chapter 4. It
is well understood that polymers have varying mechanical properties; however this
study has only focused on basic mechanical properties associated with conveyor
belting products; where properties of interest are hardness, abrasion resistance,
tensile strength, rolling resistance and dynamic mechanical properties.
5.1.1 Hardness
Figure 5.1.1 shows the effect of the individual filler grades on the hardness of NR-SBR
(70-30) blend. This polymeric blend was selected because generally top layers of
conveyor belts consist of NR or SBR (Hakami et al., 2017). Natural rubber has a strain-
induced crystallization behaviour thus having a superior strength property than SBR.
However, a simple conveyor belt system consists of two or more pulleys where the
belt rotates around (Hakami et al., 2017) requiring a certain level of elongation
contributed by the SBR content.
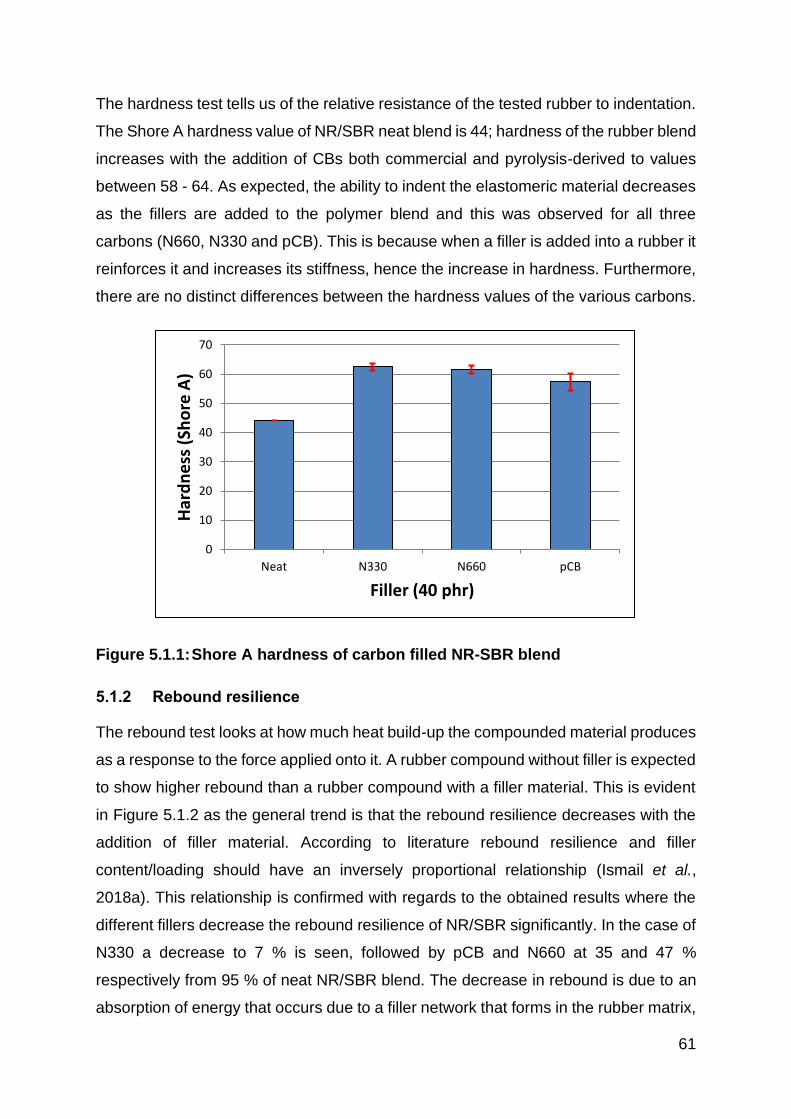
61
The hardness test tells us of the relative resistance of the tested rubber to indentation.
The Shore A hardness value of NR/SBR neat blend is 44; hardness of the rubber blend
increases with the addition of CBs both commercial and pyrolysis-derived to values
between 58 - 64. As expected, the ability to indent the elastomeric material decreases
as the fillers are added to the polymer blend and this was observed for all three
carbons (N660, N330 and pCB). This is because when a filler is added into a rubber it
reinforces it and increases its stiffness, hence the increase in hardness. Furthermore,
there are no distinct differences between the hardness values of the various carbons.
Figure 5.1.1: Shore A hardness of carbon filled NR-SBR blend
5.1.2 Rebound resilience
The rebound test looks at how much heat build-up the compounded material produces
as a response to the force applied onto it. A rubber compound without filler is expected
to show higher rebound than a rubber compound with a filler material. This is evident
in Figure 5.1.2 as the general trend is that the rebound resilience decreases with the
addition of filler material. According to literature rebound resilience and filler
content/loading should have an inversely proportional relationship (Ismail et al.,
2018a). This relationship is confirmed with regards to the obtained results where the
different fillers decrease the rebound resilience of NR/SBR significantly. In the case of
N330 a decrease to 7 % is seen, followed by pCB and N660 at 35 and 47 %
respectively from 95 % of neat NR/SBR blend. The decrease in rebound is due to an
absorption of energy that occurs due to a filler network that forms in the rubber matrix,
0
10
20
30
40
50
60
70
Neat N330 N660 pCB
Har
dn
ess
(Sh
ore
A)
Filler (40 phr)
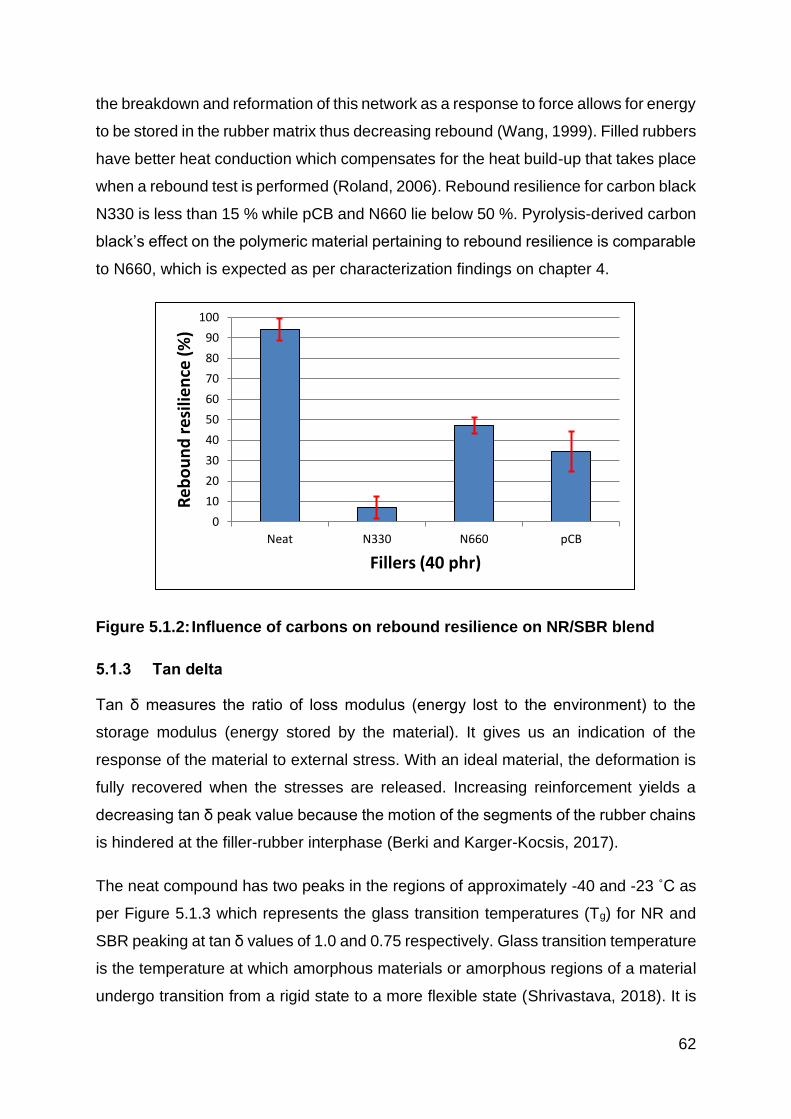
62
the breakdown and reformation of this network as a response to force allows for energy
to be stored in the rubber matrix thus decreasing rebound (Wang, 1999). Filled rubbers
have better heat conduction which compensates for the heat build-up that takes place
when a rebound test is performed (Roland, 2006). Rebound resilience for carbon black
N330 is less than 15 % while pCB and N660 lie below 50 %. Pyrolysis-derived carbon
black’s effect on the polymeric material pertaining to rebound resilience is comparable
to N660, which is expected as per characterization findings on chapter 4.
Figure 5.1.2: Influence of carbons on rebound resilience on NR/SBR blend
5.1.3 Tan delta
Tan δ measures the ratio of loss modulus (energy lost to the environment) to the
storage modulus (energy stored by the material). It gives us an indication of the
response of the material to external stress. With an ideal material, the deformation is
fully recovered when the stresses are released. Increasing reinforcement yields a
decreasing tan δ peak value because the motion of the segments of the rubber chains
is hindered at the filler-rubber interphase (Berki and Karger-Kocsis, 2017).
The neat compound has two peaks in the regions of approximately -40 and -23 ˚C as
per Figure 5.1.3 which represents the glass transition temperatures (Tg) for NR and
SBR peaking at tan δ values of 1.0 and 0.75 respectively. Glass transition temperature
is the temperature at which amorphous materials or amorphous regions of a material
undergo transition from a rigid state to a more flexible state (Shrivastava, 2018). It is
0
10
20
30
40
50
60
70
80
90
100
Neat N330 N660 pCB
Re
bo
un
d r
esi
lien
ce (
%)
Fillers (40 phr)
63
an important property to consider for the end-use of a polymer product. Two Tg values
are observed because NR is generally not miscible with synthetic rubbers such as
SBR due to the differences in surface free energies at a molecular level (Klat et al.,
2018). Styrene-butadiene rubber has a bulky styrene component in its structure that
hinders the polymer chain movement at lower temperatures compared to NR, hence
the higher Tg value (D’Escamard et al., 2016).
The other three filler containing compounds show two distinct peaks of the two
polymers used (NR/SBR blend) with a common shoulder peak that is not present in
the neat compound. The sensitivity of Dynamic Mechanical Analyzer (DMA) makes it
easier to monitor transitions like Tg in filled materials because the change in modulus
of the material is of a higher magnitude; hence the distinct separation of the polymer
peaks when N330, N660 and pCB are used (Crompton, 2013). Detection of secondary
transitions such as ɣ and β relaxations in filled compounds are also possible. Polymers
exhibit a primary relaxation process (ɣ) and a low-temperature relaxation process (β).
The β relaxation process can be observed below the Tg value and originate from the
motion of the polymer chain backbone and act as a precursor for ɣ-relaxation which
are observed above the Tg value (Smith and Bedrov, 2007). In Figure 5.1.3 we observe
a shoulder peak at -40 ˚C for all three of the filled compounds. Movement from very
low temperatures where molecules are tightly compressed to higher temperatures
increases the free volume of the chains (Menard, 1999). There is increased chain
mobility allowing movement in various directions as the temperature increases. The
shoulder peak is indicative of the relaxation of the fillers since it is not made up of long
chains, so relaxation is experienced a lot sooner compared to the two polymers used
in the blend. With that said peak one and peak two that are observed above the
shoulder peak temperature refer to NR and SBR respectively.
The introduction of the commercial carbon black grade N330 causes a significant
change of 20 ˚C towards higher temperatures in the NR peak region compared to the
neat compound whereas N660 and pCB results in a 13 ˚C and 10 ˚C shift respectively.
Glass transition shift for SBR is only seen for N330 to -10 ˚C. Pyrolysis-derived carbon
black brings about a notable change in the Tan δ value of SBR which is increased to
a value above 0.8 whereas the rest lie below 0.8, in the case of the second peak.
These values are summarized in Table 5.1.2. Natural rubber glass transition
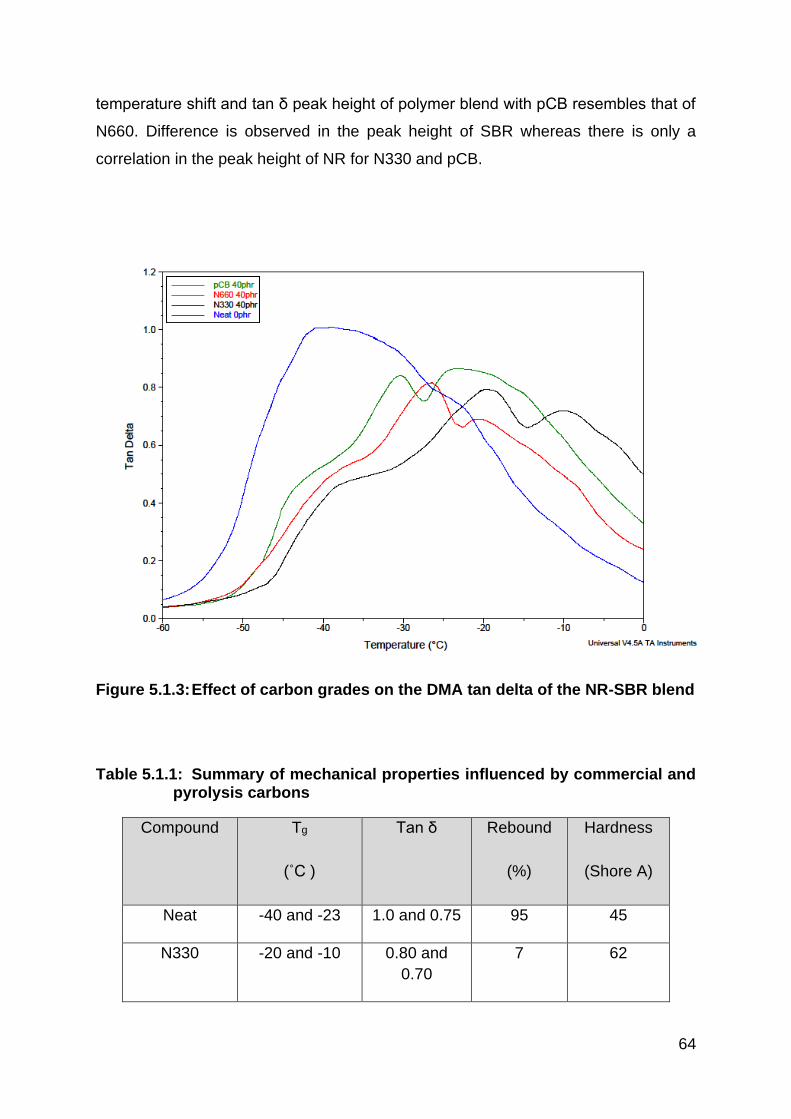
64
temperature shift and tan δ peak height of polymer blend with pCB resembles that of
N660. Difference is observed in the peak height of SBR whereas there is only a
correlation in the peak height of NR for N330 and pCB.
Figure 5.1.3: Effect of carbon grades on the DMA tan delta of the NR-SBR blend
Table 5.1.1: Summary of mechanical properties influenced by commercial and pyrolysis carbons
Compound Tg
(˚C )
Tan δ Rebound
(%)
Hardness
(Shore A)
Neat -40 and -23 1.0 and 0.75 95 45
N330 -20 and -10 0.80 and
0.70
7 62
65
N660 -27 and -20 0.81 and
0.68
44 61
pCB -30 and -22 0.82 and
0.85
37 57
5.1.4 Abrasion resistance
Depending upon the application, conveyor belts are typically subjected to various
goods and materials across their surfaces where they are exposed to light, mild and
serve abrasion. Applications such as mining, where stones and rocks are dumped
require the belt to resist abrasion, which brings us to another property that is of interest
to the study. Elastomers present poor abrasion properties in the absence of any filler.
Improvement of these abrasion properties depends on the type of filler and its
reinforcing ability on the rubber (Mostafa et al., 2010a). Unlike hardness, abrasion
resistance is more achieved with a filler of a much smaller particle size and high
surface area such as carbon blacks N330, N234, N220 and N115 (Sebok and Taylor,
2001).
The data on Figure 5.1.4 shows the obtained findings for abrasion resistance, where
there is improvement by introducing commercial fillers. However, the fillers show
different effects on this property: N330 >>> N660 > pCB. It is clearly observable that
the pCB has insufficient influence on the abrasion resistance just like N660, and the
N330 grade has achieved a greater influence of resistance. This means commercial
grade N660 and pCB filled compounds may not be suitable for heavy duty conveyor
belts such as those used in mines, where abrasion resistance is important. Instead,
they may be used in light duty belts such as those used in supermarkets.
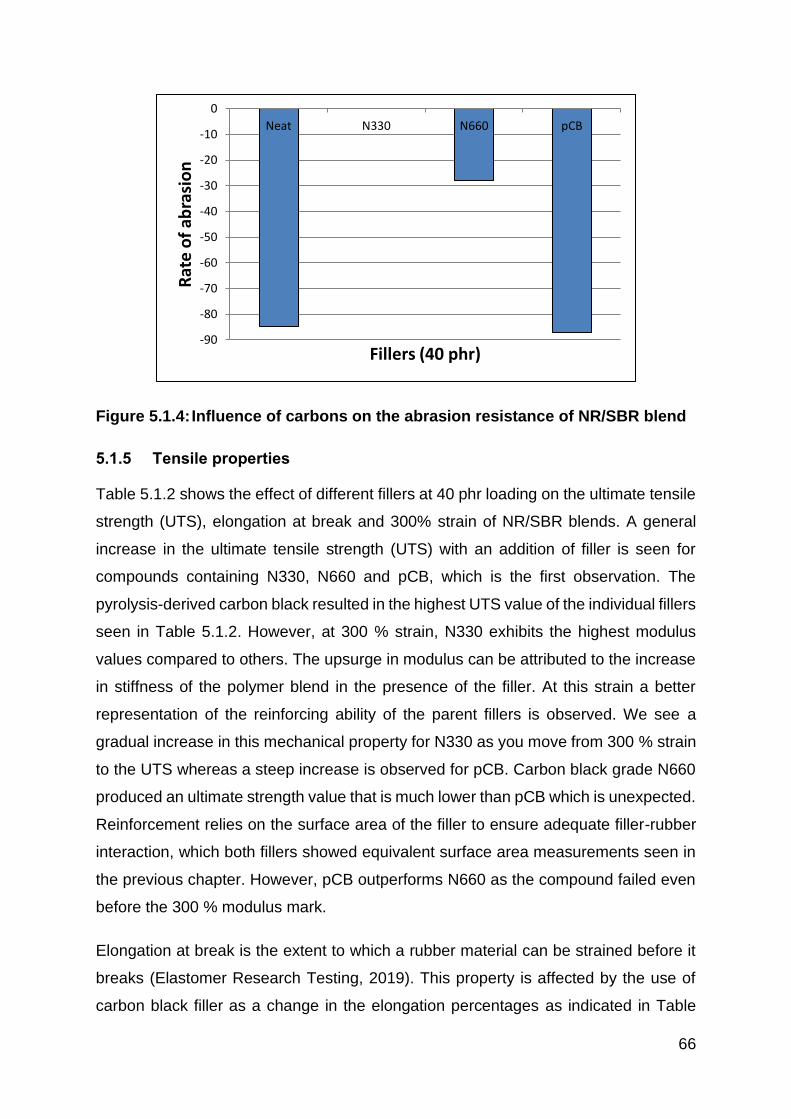
66
Figure 5.1.4: Influence of carbons on the abrasion resistance of NR/SBR blend
5.1.5 Tensile properties
Table 5.1.2 shows the effect of different fillers at 40 phr loading on the ultimate tensile
strength (UTS), elongation at break and 300% strain of NR/SBR blends. A general
increase in the ultimate tensile strength (UTS) with an addition of filler is seen for
compounds containing N330, N660 and pCB, which is the first observation. The
pyrolysis-derived carbon black resulted in the highest UTS value of the individual fillers
seen in Table 5.1.2. However, at 300 % strain, N330 exhibits the highest modulus
values compared to others. The upsurge in modulus can be attributed to the increase
in stiffness of the polymer blend in the presence of the filler. At this strain a better
representation of the reinforcing ability of the parent fillers is observed. We see a
gradual increase in this mechanical property for N330 as you move from 300 % strain
to the UTS whereas a steep increase is observed for pCB. Carbon black grade N660
produced an ultimate strength value that is much lower than pCB which is unexpected.
Reinforcement relies on the surface area of the filler to ensure adequate filler-rubber
interaction, which both fillers showed equivalent surface area measurements seen in
the previous chapter. However, pCB outperforms N660 as the compound failed even
before the 300 % modulus mark.
Elongation at break is the extent to which a rubber material can be strained before it
breaks (Elastomer Research Testing, 2019). This property is affected by the use of
carbon black filler as a change in the elongation percentages as indicated in Table
-90
-80
-70
-60
-50
-40
-30
-20
-10
0
Neat N330 N660 pCB
Rat
e o
f ab
rasi
on
Fillers (40 phr)

67
5.1.2. An increase is observed with the use of carbon black N330 and pCB. Carbon
black content in this case whether it can be commercial CB or pCB, is influential except
for N660 which did not improve elongation. Ultimately where tensile strength is
concerned, pCB ˃> N660 and pCB ≥ N330.
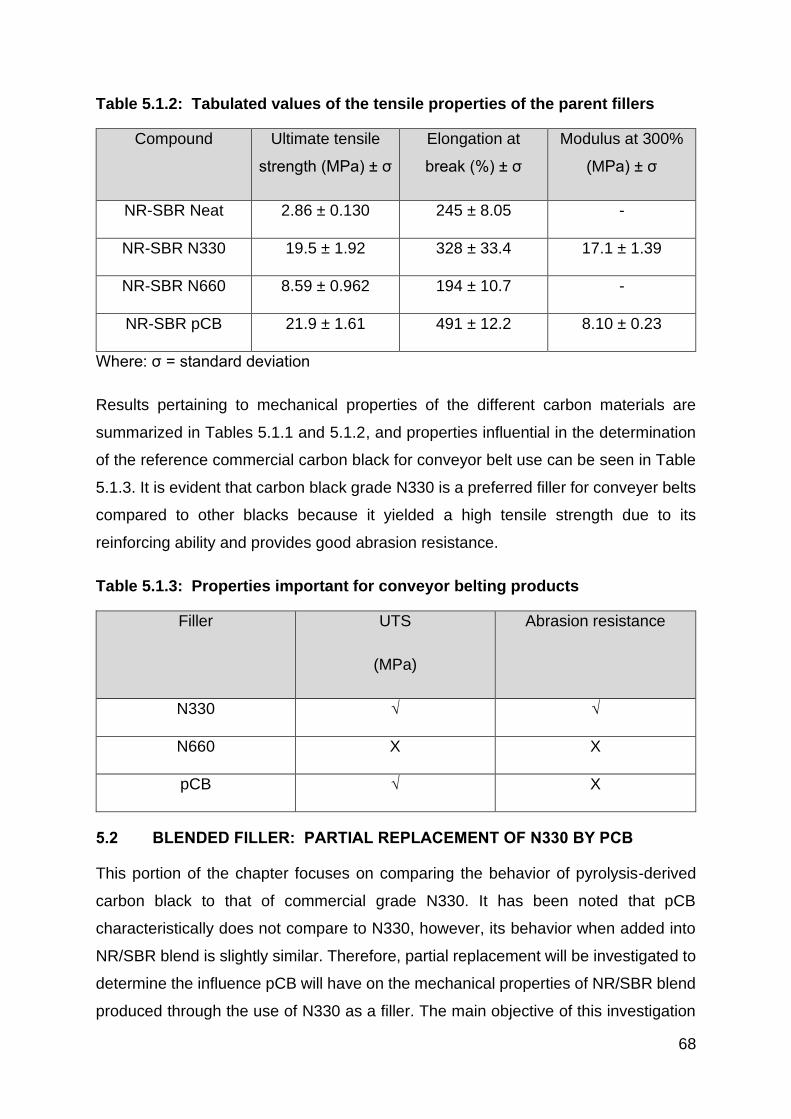
68
Table 5.1.2: Tabulated values of the tensile properties of the parent fillers
Compound Ultimate tensile
strength (MPa) ± σ
Elongation at
break (%) ± σ
Modulus at 300%
(MPa) ± σ
NR-SBR Neat 2.86 ± 0.130 245 ± 8.05 -
NR-SBR N330 19.5 ± 1.92 328 ± 33.4 17.1 ± 1.39
NR-SBR N660 8.59 ± 0.962 194 ± 10.7 -
NR-SBR pCB 21.9 ± 1.61 491 ± 12.2 8.10 ± 0.23
Where: σ = standard deviation
Results pertaining to mechanical properties of the different carbon materials are
summarized in Tables 5.1.1 and 5.1.2, and properties influential in the determination
of the reference commercial carbon black for conveyor belt use can be seen in Table
5.1.3. It is evident that carbon black grade N330 is a preferred filler for conveyer belts
compared to other blacks because it yielded a high tensile strength due to its
reinforcing ability and provides good abrasion resistance.
Table 5.1.3: Properties important for conveyor belting products
Filler UTS
(MPa)
Abrasion resistance
N330 √ √
N660 X X
pCB √ X
5.2 BLENDED FILLER: PARTIAL REPLACEMENT OF N330 BY PCB
This portion of the chapter focuses on comparing the behavior of pyrolysis-derived
carbon black to that of commercial grade N330. It has been noted that pCB
characteristically does not compare to N330, however, its behavior when added into
NR/SBR blend is slightly similar. Therefore, partial replacement will be investigated to
determine the influence pCB will have on the mechanical properties of NR/SBR blend
produced through the use of N330 as a filler. The main objective of this investigation
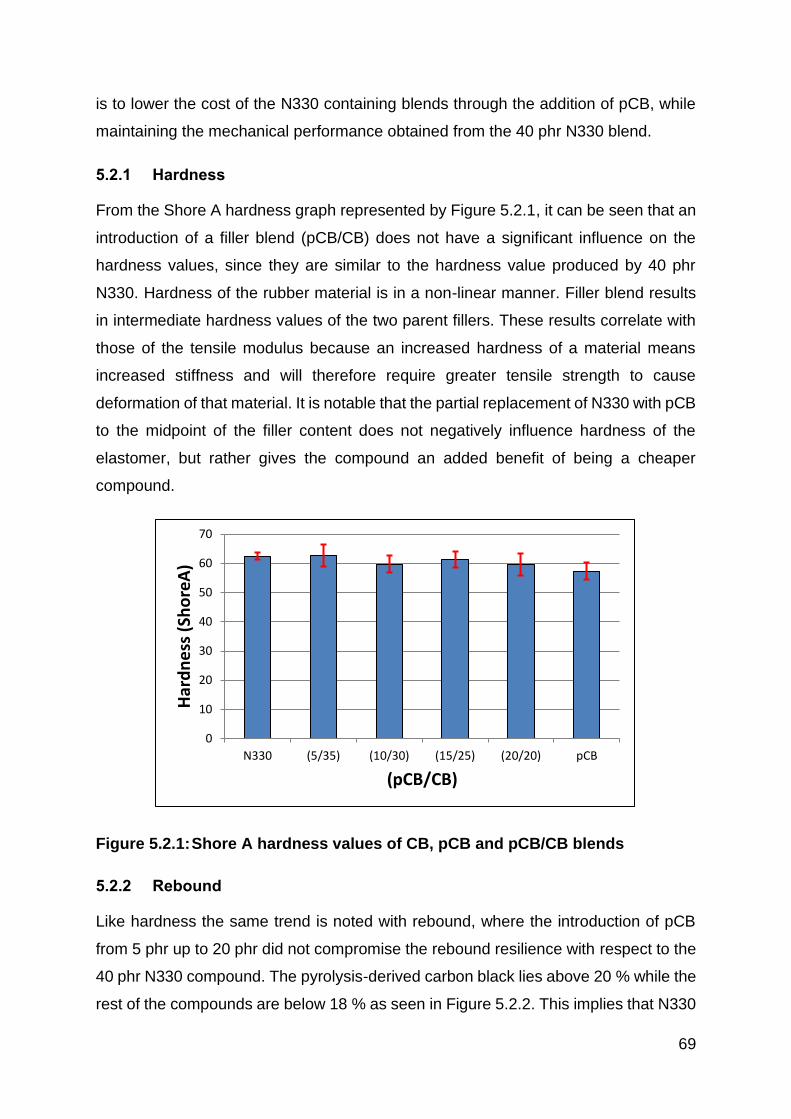
69
is to lower the cost of the N330 containing blends through the addition of pCB, while
maintaining the mechanical performance obtained from the 40 phr N330 blend.
5.2.1 Hardness
From the Shore A hardness graph represented by Figure 5.2.1, it can be seen that an
introduction of a filler blend (pCB/CB) does not have a significant influence on the
hardness values, since they are similar to the hardness value produced by 40 phr
N330. Hardness of the rubber material is in a non-linear manner. Filler blend results
in intermediate hardness values of the two parent fillers. These results correlate with
those of the tensile modulus because an increased hardness of a material means
increased stiffness and will therefore require greater tensile strength to cause
deformation of that material. It is notable that the partial replacement of N330 with pCB
to the midpoint of the filler content does not negatively influence hardness of the
elastomer, but rather gives the compound an added benefit of being a cheaper
compound.
Figure 5.2.1: Shore A hardness values of CB, pCB and pCB/CB blends
5.2.2 Rebound
Like hardness the same trend is noted with rebound, where the introduction of pCB
from 5 phr up to 20 phr did not compromise the rebound resilience with respect to the
40 phr N330 compound. The pyrolysis-derived carbon black lies above 20 % while the
rest of the compounds are below 18 % as seen in Figure 5.2.2. This implies that N330
0
10
20
30
40
50
60
70
N330 (5/35) (10/30) (15/25) (20/20) pCB
Har
dn
ess
(Sh
ore
A)
(pCB/CB)
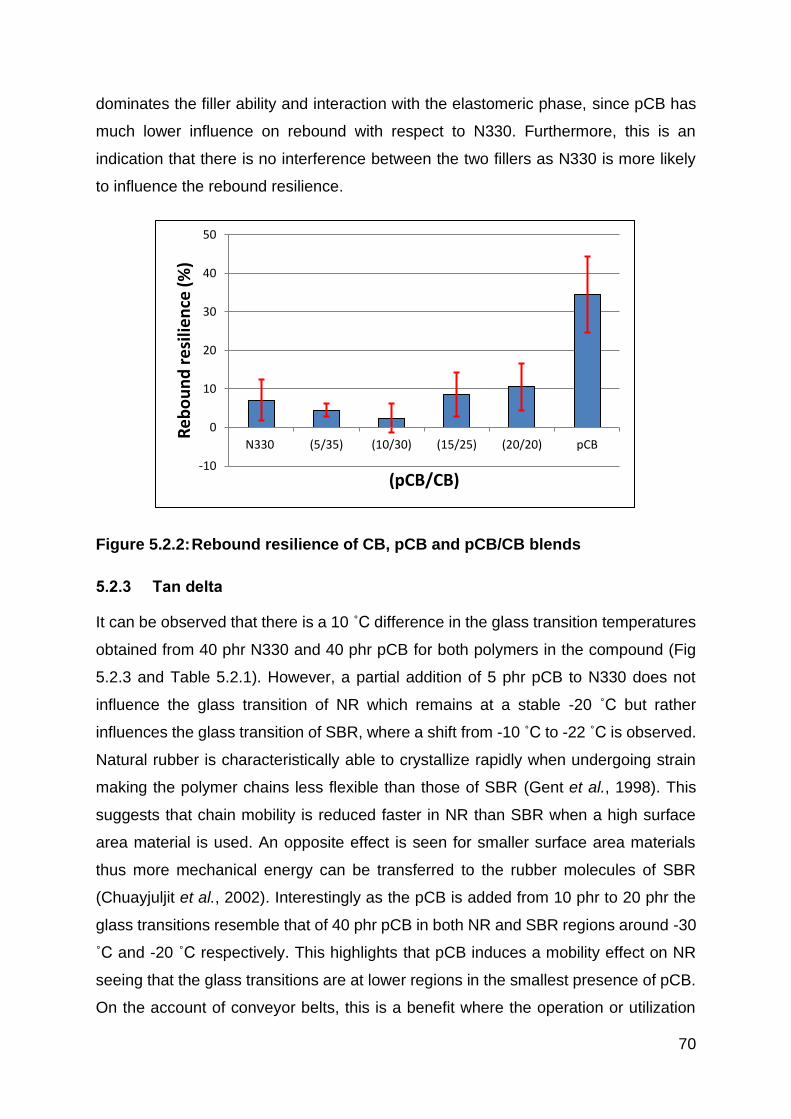
70
dominates the filler ability and interaction with the elastomeric phase, since pCB has
much lower influence on rebound with respect to N330. Furthermore, this is an
indication that there is no interference between the two fillers as N330 is more likely
to influence the rebound resilience.
Figure 5.2.2: Rebound resilience of CB, pCB and pCB/CB blends
5.2.3 Tan delta
It can be observed that there is a 10 ˚C difference in the glass transition temperatures
obtained from 40 phr N330 and 40 phr pCB for both polymers in the compound (Fig
5.2.3 and Table 5.2.1). However, a partial addition of 5 phr pCB to N330 does not
influence the glass transition of NR which remains at a stable -20 ˚C but rather
influences the glass transition of SBR, where a shift from -10 ˚C to -22 ˚C is observed.
Natural rubber is characteristically able to crystallize rapidly when undergoing strain
making the polymer chains less flexible than those of SBR (Gent et al., 1998). This
suggests that chain mobility is reduced faster in NR than SBR when a high surface
area material is used. An opposite effect is seen for smaller surface area materials
thus more mechanical energy can be transferred to the rubber molecules of SBR
(Chuayjuljit et al., 2002). Interestingly as the pCB is added from 10 phr to 20 phr the
glass transitions resemble that of 40 phr pCB in both NR and SBR regions around -30
˚C and -20 ˚C respectively. This highlights that pCB induces a mobility effect on NR
seeing that the glass transitions are at lower regions in the smallest presence of pCB.
On the account of conveyor belts, this is a benefit where the operation or utilization
-10
0
10
20
30
40
50
N330 (5/35) (10/30) (15/25) (20/20) pCB
Re
bo
un
d r
esi
lien
ce (
%)
(pCB/CB)
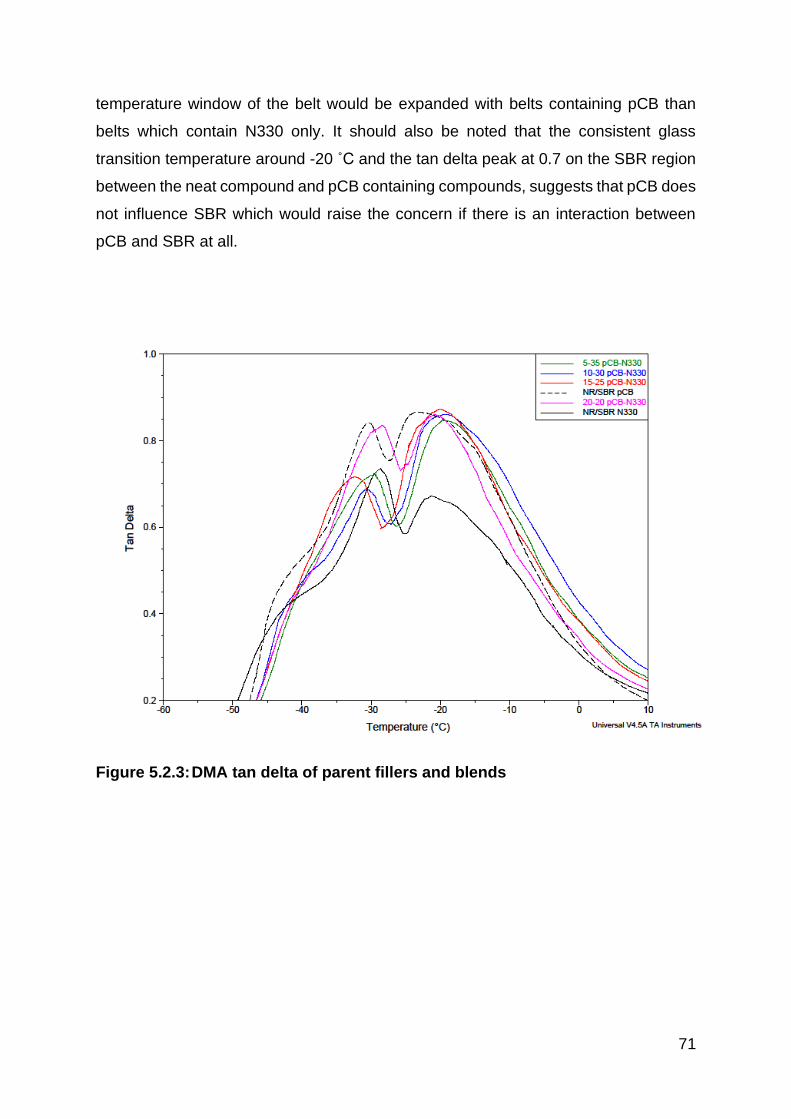
71
temperature window of the belt would be expanded with belts containing pCB than
belts which contain N330 only. It should also be noted that the consistent glass
transition temperature around -20 ˚C and the tan delta peak at 0.7 on the SBR region
between the neat compound and pCB containing compounds, suggests that pCB does
not influence SBR which would raise the concern if there is an interaction between
pCB and SBR at all.
Figure 5.2.3: DMA tan delta of parent fillers and blends
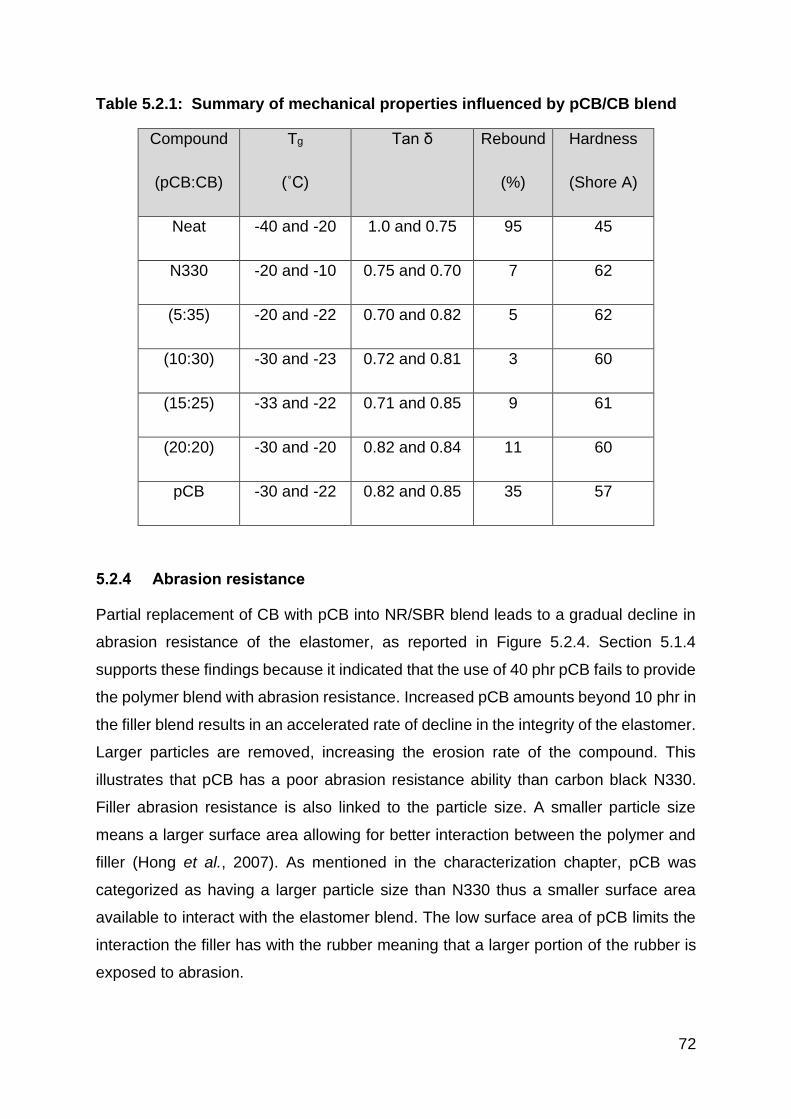
72
Table 5.2.1: Summary of mechanical properties influenced by pCB/CB blend
Compound
(pCB:CB)
Tg
(˚C)
Tan δ Rebound
(%)
Hardness
(Shore A)
Neat -40 and -20 1.0 and 0.75 95 45
N330 -20 and -10 0.75 and 0.70 7 62
(5:35) -20 and -22 0.70 and 0.82 5 62
(10:30) -30 and -23 0.72 and 0.81 3 60
(15:25) -33 and -22 0.71 and 0.85 9 61
(20:20) -30 and -20 0.82 and 0.84 11 60
pCB -30 and -22 0.82 and 0.85 35 57
5.2.4 Abrasion resistance
Partial replacement of CB with pCB into NR/SBR blend leads to a gradual decline in
abrasion resistance of the elastomer, as reported in Figure 5.2.4. Section 5.1.4
supports these findings because it indicated that the use of 40 phr pCB fails to provide
the polymer blend with abrasion resistance. Increased pCB amounts beyond 10 phr in
the filler blend results in an accelerated rate of decline in the integrity of the elastomer.
Larger particles are removed, increasing the erosion rate of the compound. This
illustrates that pCB has a poor abrasion resistance ability than carbon black N330.
Filler abrasion resistance is also linked to the particle size. A smaller particle size
means a larger surface area allowing for better interaction between the polymer and
filler (Hong et al., 2007). As mentioned in the characterization chapter, pCB was
categorized as having a larger particle size than N330 thus a smaller surface area
available to interact with the elastomer blend. The low surface area of pCB limits the
interaction the filler has with the rubber meaning that a larger portion of the rubber is
exposed to abrasion.
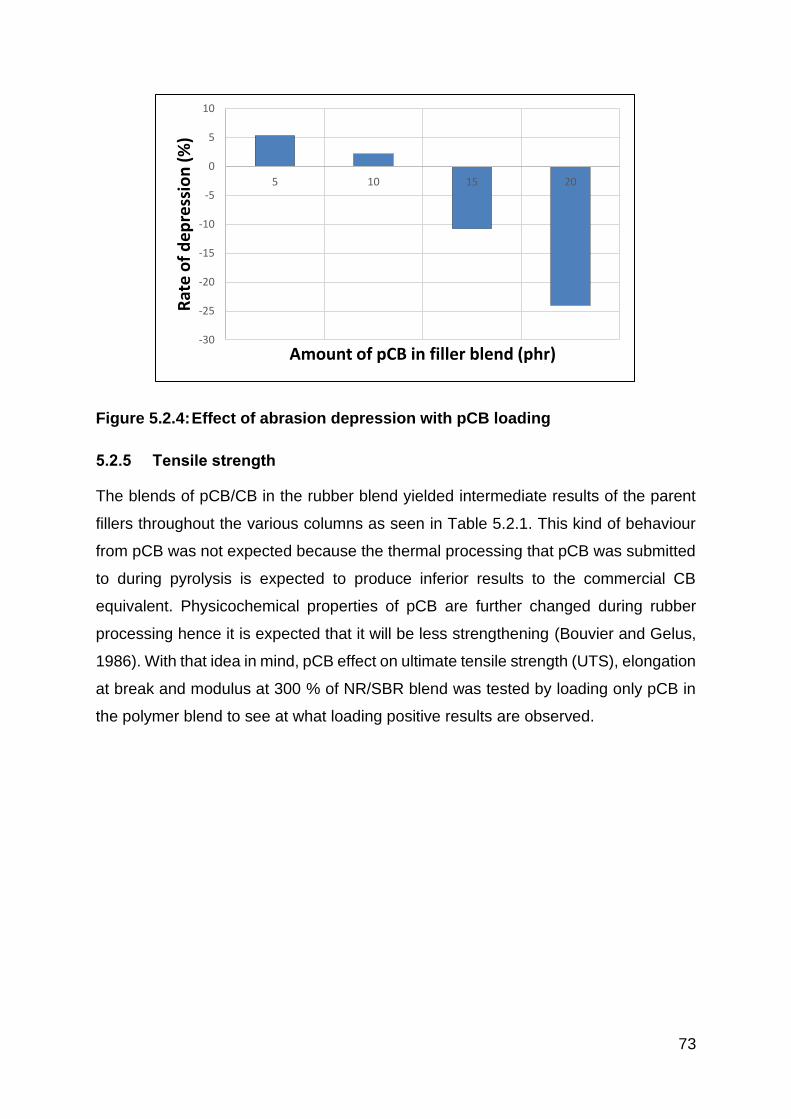
73
Figure 5.2.4: Effect of abrasion depression with pCB loading
5.2.5 Tensile strength
The blends of pCB/CB in the rubber blend yielded intermediate results of the parent
fillers throughout the various columns as seen in Table 5.2.1. This kind of behaviour
from pCB was not expected because the thermal processing that pCB was submitted
to during pyrolysis is expected to produce inferior results to the commercial CB
equivalent. Physicochemical properties of pCB are further changed during rubber
processing hence it is expected that it will be less strengthening (Bouvier and Gelus,
1986). With that idea in mind, pCB effect on ultimate tensile strength (UTS), elongation
at break and modulus at 300 % of NR/SBR blend was tested by loading only pCB in
the polymer blend to see at what loading positive results are observed.
-30
-25
-20
-15
-10
-5
0
5
10
5 10 15 20R
ate
of
de
pre
ssio
n (
%)
Amount of pCB in filler blend (phr)
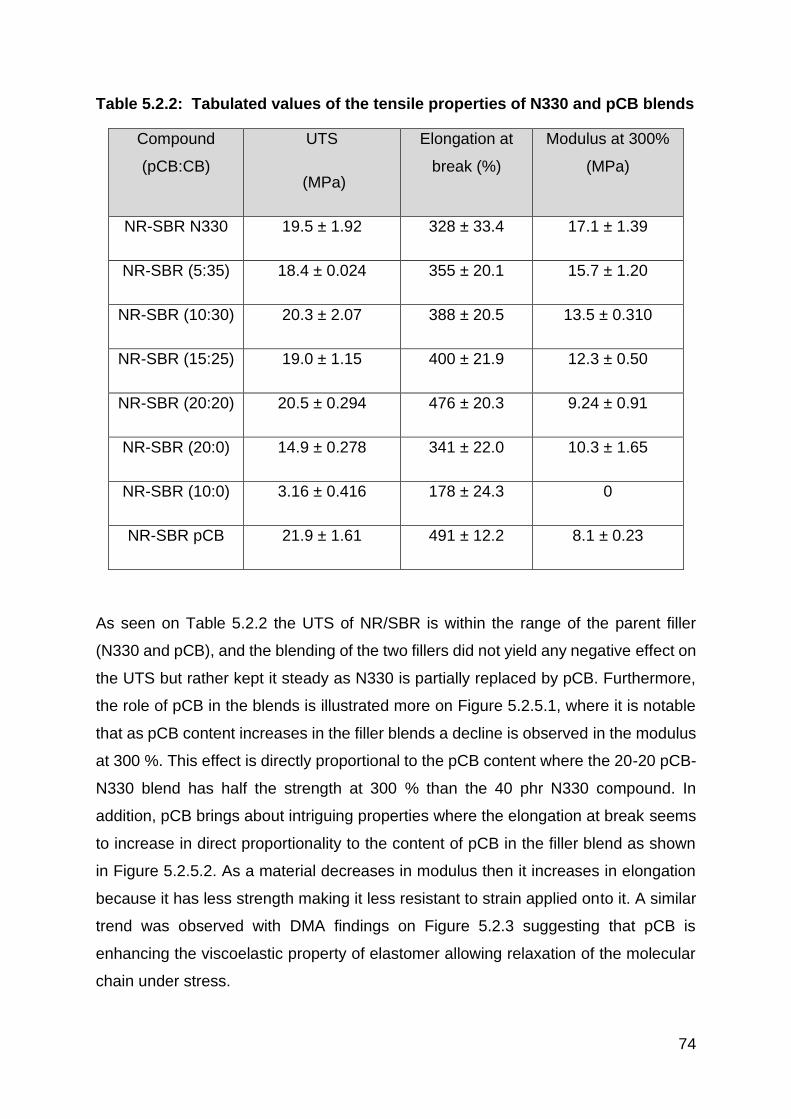
74
Table 5.2.2: Tabulated values of the tensile properties of N330 and pCB blends
Compound
(pCB:CB)
UTS
(MPa)
Elongation at
break (%)
Modulus at 300%
(MPa)
NR-SBR N330 19.5 ± 1.92 328 ± 33.4 17.1 ± 1.39
NR-SBR (5:35) 18.4 ± 0.024 355 ± 20.1 15.7 ± 1.20
NR-SBR (10:30) 20.3 ± 2.07 388 ± 20.5 13.5 ± 0.310
NR-SBR (15:25) 19.0 ± 1.15 400 ± 21.9 12.3 ± 0.50
NR-SBR (20:20) 20.5 ± 0.294 476 ± 20.3 9.24 ± 0.91
NR-SBR (20:0) 14.9 ± 0.278 341 ± 22.0 10.3 ± 1.65
NR-SBR (10:0) 3.16 ± 0.416 178 ± 24.3 0
NR-SBR pCB 21.9 ± 1.61 491 ± 12.2 8.1 ± 0.23
As seen on Table 5.2.2 the UTS of NR/SBR is within the range of the parent filler
(N330 and pCB), and the blending of the two fillers did not yield any negative effect on
the UTS but rather kept it steady as N330 is partially replaced by pCB. Furthermore,
the role of pCB in the blends is illustrated more on Figure 5.2.5.1, where it is notable
that as pCB content increases in the filler blends a decline is observed in the modulus
at 300 %. This effect is directly proportional to the pCB content where the 20-20 pCB-
N330 blend has half the strength at 300 % than the 40 phr N330 compound. In
addition, pCB brings about intriguing properties where the elongation at break seems
to increase in direct proportionality to the content of pCB in the filler blend as shown
in Figure 5.2.5.2. As a material decreases in modulus then it increases in elongation
because it has less strength making it less resistant to strain applied onto it. A similar
trend was observed with DMA findings on Figure 5.2.3 suggesting that pCB is
enhancing the viscoelastic property of elastomer allowing relaxation of the molecular
chain under stress.
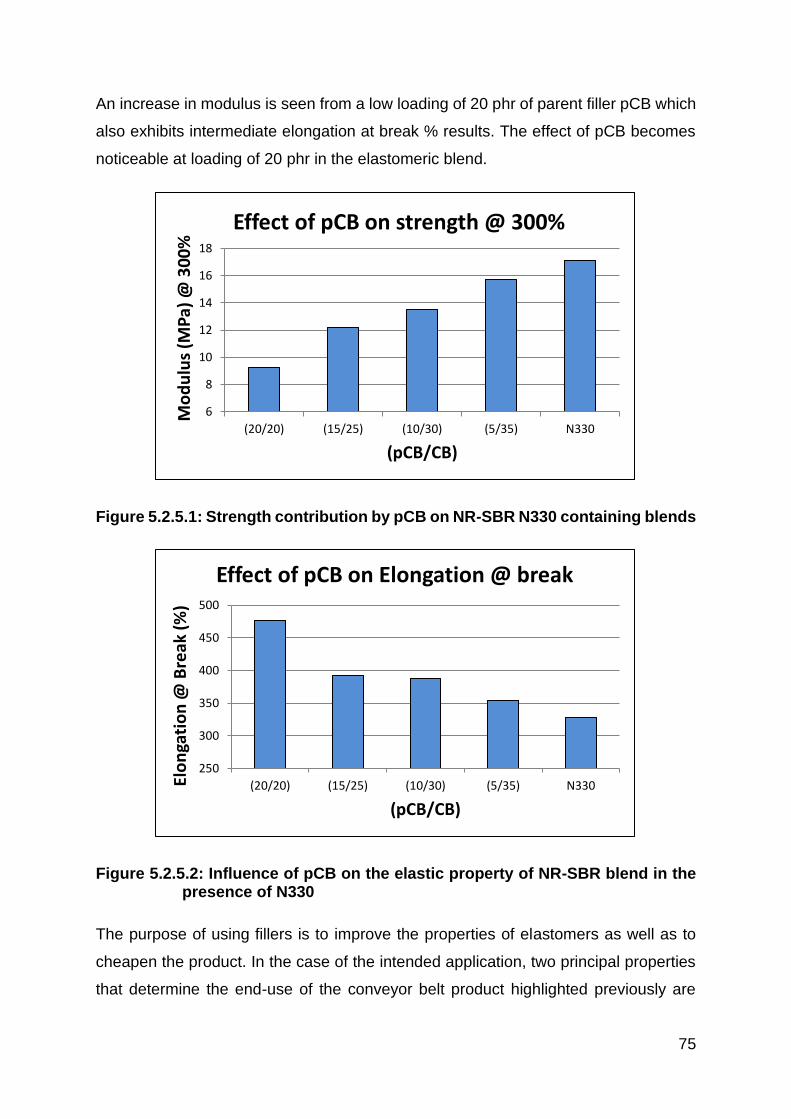
75
An increase in modulus is seen from a low loading of 20 phr of parent filler pCB which
also exhibits intermediate elongation at break % results. The effect of pCB becomes
noticeable at loading of 20 phr in the elastomeric blend.
Figure 5.2.5.1: Strength contribution by pCB on NR-SBR N330 containing blends
Figure 5.2.5.2: Influence of pCB on the elastic property of NR-SBR blend in the presence of N330
The purpose of using fillers is to improve the properties of elastomers as well as to
cheapen the product. In the case of the intended application, two principal properties
that determine the end-use of the conveyor belt product highlighted previously are
6
8
10
12
14
16
18
(20/20) (15/25) (10/30) (5/35) N330
Mo
du
lus
(MP
a) @
30
0%
(pCB/CB)
Effect of pCB on strength @ 300%
250
300
350
400
450
500
(20/20) (15/25) (10/30) (5/35) N330Elo
nga
tio
n @
Bre
ak (
%)
(pCB/CB)
Effect of pCB on Elongation @ break
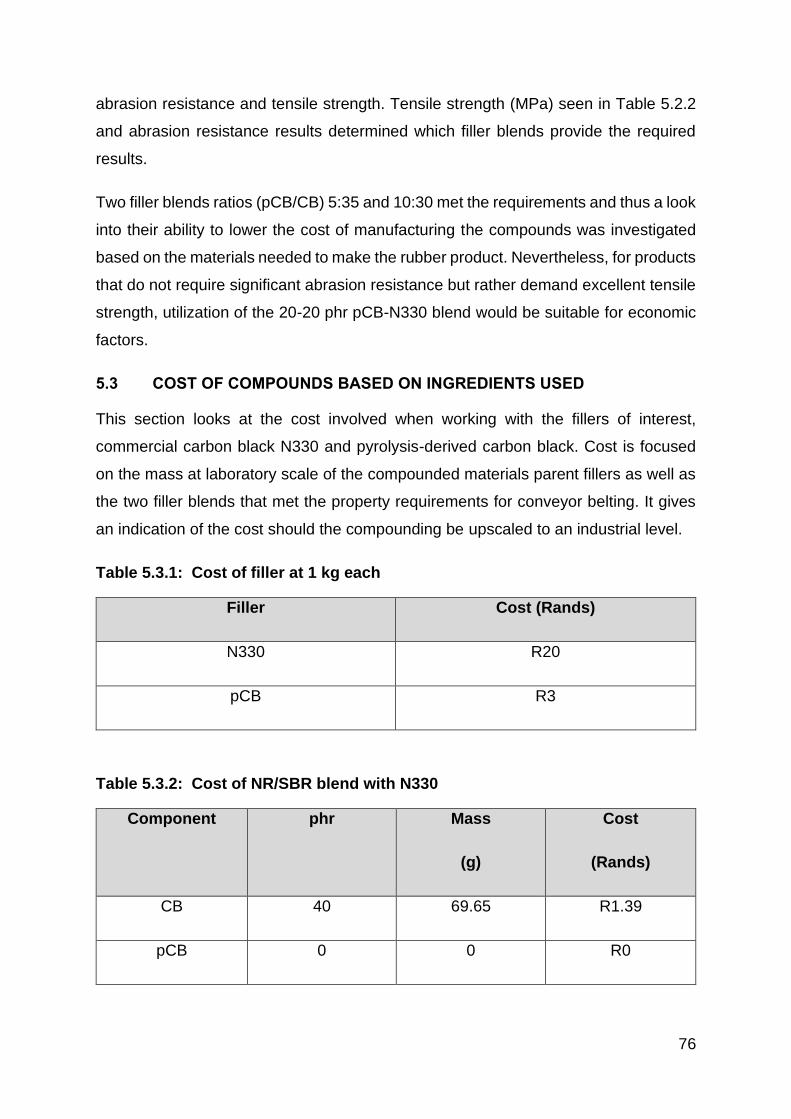
76
abrasion resistance and tensile strength. Tensile strength (MPa) seen in Table 5.2.2
and abrasion resistance results determined which filler blends provide the required
results.
Two filler blends ratios (pCB/CB) 5:35 and 10:30 met the requirements and thus a look
into their ability to lower the cost of manufacturing the compounds was investigated
based on the materials needed to make the rubber product. Nevertheless, for products
that do not require significant abrasion resistance but rather demand excellent tensile
strength, utilization of the 20-20 phr pCB-N330 blend would be suitable for economic
factors.
5.3 COST OF COMPOUNDS BASED ON INGREDIENTS USED
This section looks at the cost involved when working with the fillers of interest,
commercial carbon black N330 and pyrolysis-derived carbon black. Cost is focused
on the mass at laboratory scale of the compounded materials parent fillers as well as
the two filler blends that met the property requirements for conveyor belting. It gives
an indication of the cost should the compounding be upscaled to an industrial level.
Table 5.3.1: Cost of filler at 1 kg each
Filler Cost (Rands)
N330 R20
pCB R3
Table 5.3.2: Cost of NR/SBR blend with N330
Component phr Mass
(g)
Cost
(Rands)
CB 40 69.65 R1.39
pCB 0 0 R0
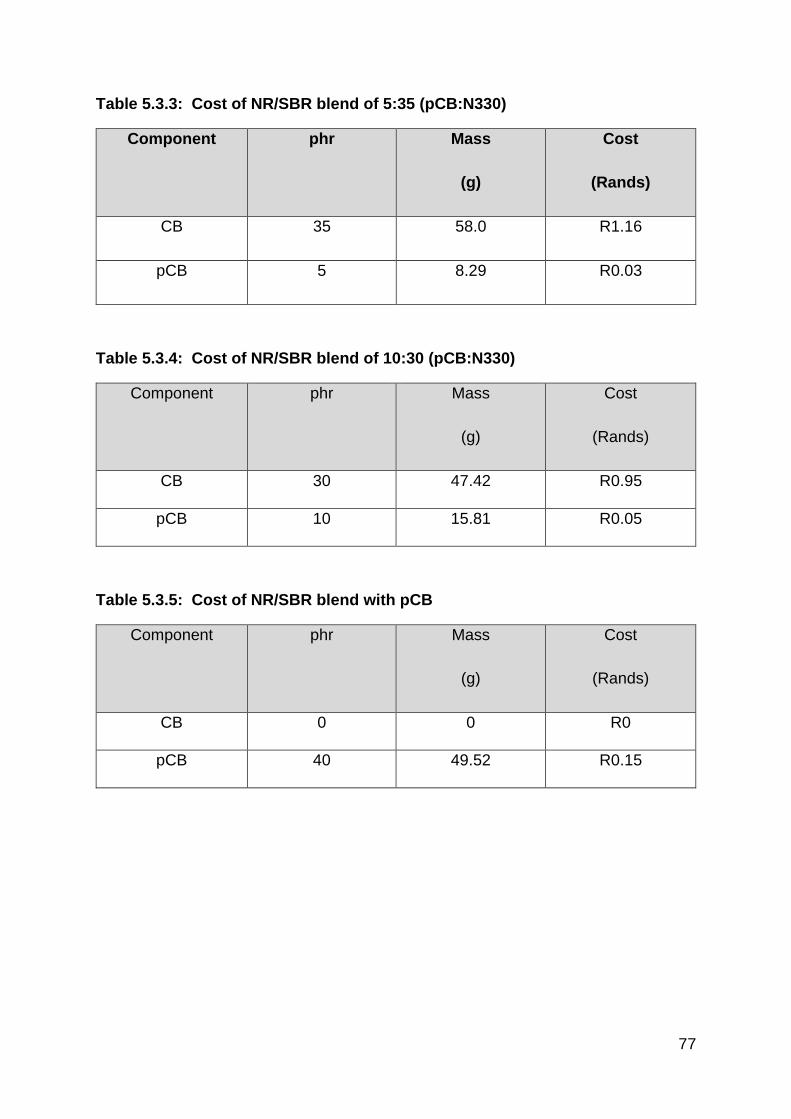
77
Table 5.3.3: Cost of NR/SBR blend of 5:35 (pCB:N330)
Component phr Mass
(g)
Cost
(Rands)
CB 35 58.0 R1.16
pCB 5 8.29 R0.03
Table 5.3.4: Cost of NR/SBR blend of 10:30 (pCB:N330)
Component phr Mass
(g)
Cost
(Rands)
CB 30 47.42 R0.95
pCB 10 15.81 R0.05
Table 5.3.5: Cost of NR/SBR blend with pCB
Component phr Mass
(g)
Cost
(Rands)
CB 0 0 R0
pCB 40 49.52 R0.15
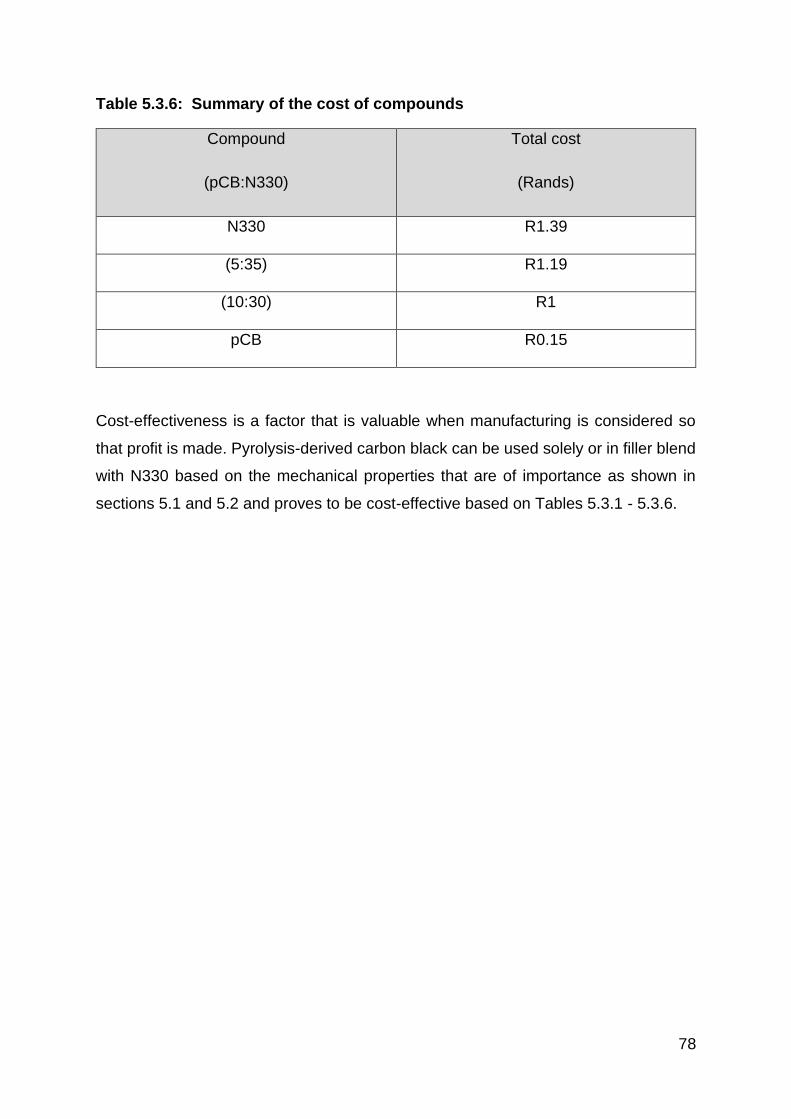
78
Table 5.3.6: Summary of the cost of compounds
Compound
(pCB:N330)
Total cost
(Rands)
N330 R1.39
(5:35) R1.19
(10:30) R1
pCB R0.15
Cost-effectiveness is a factor that is valuable when manufacturing is considered so
that profit is made. Pyrolysis-derived carbon black can be used solely or in filler blend
with N330 based on the mechanical properties that are of importance as shown in
sections 5.1 and 5.2 and proves to be cost-effective based on Tables 5.3.1 - 5.3.6.
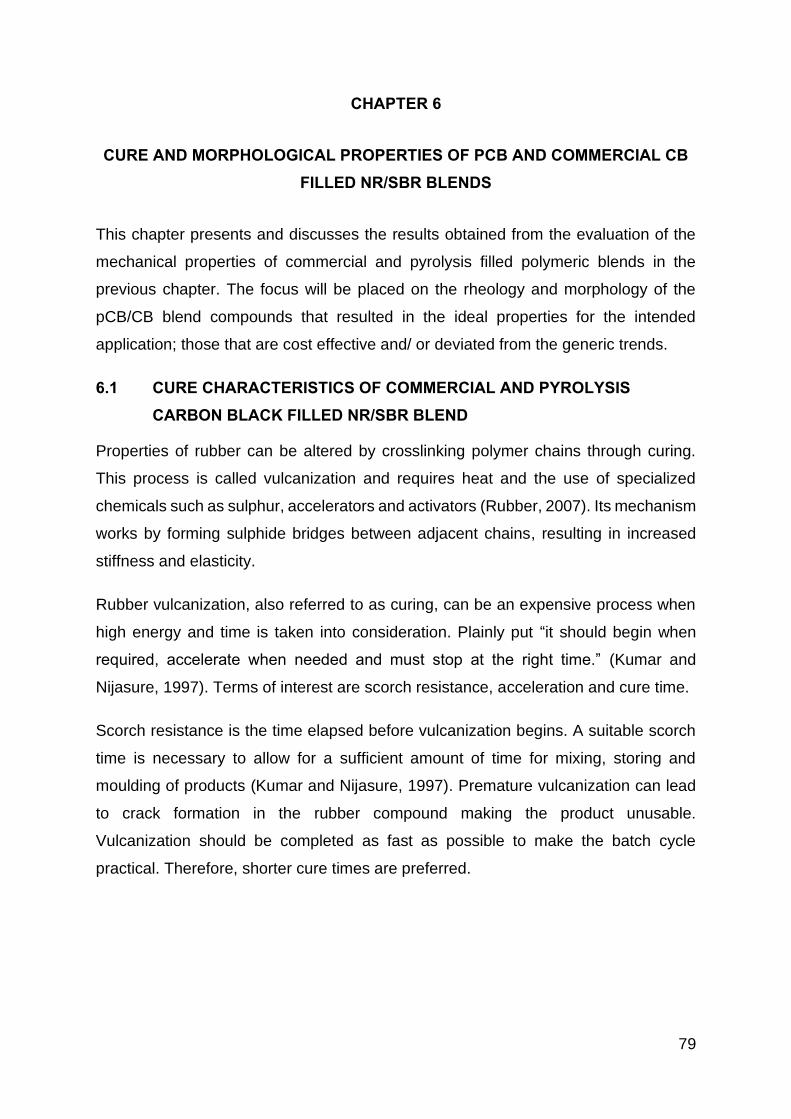
79
CHAPTER 6
CURE AND MORPHOLOGICAL PROPERTIES OF PCB AND COMMERCIAL CB
FILLED NR/SBR BLENDS
This chapter presents and discusses the results obtained from the evaluation of the
mechanical properties of commercial and pyrolysis filled polymeric blends in the
previous chapter. The focus will be placed on the rheology and morphology of the
pCB/CB blend compounds that resulted in the ideal properties for the intended
application; those that are cost effective and/ or deviated from the generic trends.
6.1 CURE CHARACTERISTICS OF COMMERCIAL AND PYROLYSIS
CARBON BLACK FILLED NR/SBR BLEND
Properties of rubber can be altered by crosslinking polymer chains through curing.
This process is called vulcanization and requires heat and the use of specialized
chemicals such as sulphur, accelerators and activators (Rubber, 2007). Its mechanism
works by forming sulphide bridges between adjacent chains, resulting in increased
stiffness and elasticity.
Rubber vulcanization, also referred to as curing, can be an expensive process when
high energy and time is taken into consideration. Plainly put “it should begin when
required, accelerate when needed and must stop at the right time.” (Kumar and
Nijasure, 1997). Terms of interest are scorch resistance, acceleration and cure time.
Scorch resistance is the time elapsed before vulcanization begins. A suitable scorch
time is necessary to allow for a sufficient amount of time for mixing, storing and
moulding of products (Kumar and Nijasure, 1997). Premature vulcanization can lead
to crack formation in the rubber compound making the product unusable.
Vulcanization should be completed as fast as possible to make the batch cycle
practical. Therefore, shorter cure times are preferred.
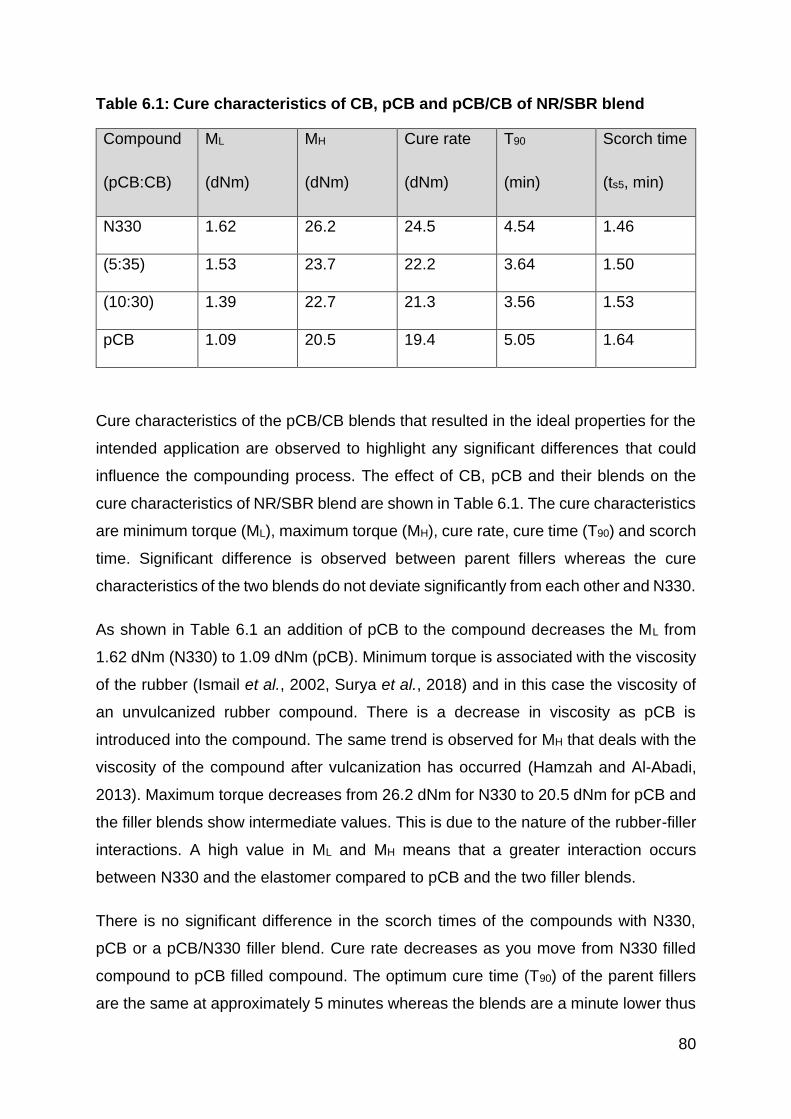
80
Table 6.1: Cure characteristics of CB, pCB and pCB/CB of NR/SBR blend
Compound
(pCB:CB)
ML
(dNm)
MH
(dNm)
Cure rate
(dNm)
T90
(min)
Scorch time
(ts5, min)
N330 1.62 26.2 24.5 4.54 1.46
(5:35) 1.53 23.7 22.2 3.64 1.50
(10:30) 1.39 22.7 21.3 3.56 1.53
pCB 1.09 20.5 19.4 5.05 1.64
Cure characteristics of the pCB/CB blends that resulted in the ideal properties for the
intended application are observed to highlight any significant differences that could
influence the compounding process. The effect of CB, pCB and their blends on the
cure characteristics of NR/SBR blend are shown in Table 6.1. The cure characteristics
are minimum torque (ML), maximum torque (MH), cure rate, cure time (T90) and scorch
time. Significant difference is observed between parent fillers whereas the cure
characteristics of the two blends do not deviate significantly from each other and N330.
As shown in Table 6.1 an addition of pCB to the compound decreases the ML from
1.62 dNm (N330) to 1.09 dNm (pCB). Minimum torque is associated with the viscosity
of the rubber (Ismail et al., 2002, Surya et al., 2018) and in this case the viscosity of
an unvulcanized rubber compound. There is a decrease in viscosity as pCB is
introduced into the compound. The same trend is observed for MH that deals with the
viscosity of the compound after vulcanization has occurred (Hamzah and Al-Abadi,
2013). Maximum torque decreases from 26.2 dNm for N330 to 20.5 dNm for pCB and
the filler blends show intermediate values. This is due to the nature of the rubber-filler
interactions. A high value in ML and MH means that a greater interaction occurs
between N330 and the elastomer compared to pCB and the two filler blends.
There is no significant difference in the scorch times of the compounds with N330,
pCB or a pCB/N330 filler blend. Cure rate decreases as you move from N330 filled
compound to pCB filled compound. The optimum cure time (T90) of the parent fillers
are the same at approximately 5 minutes whereas the blends are a minute lower thus
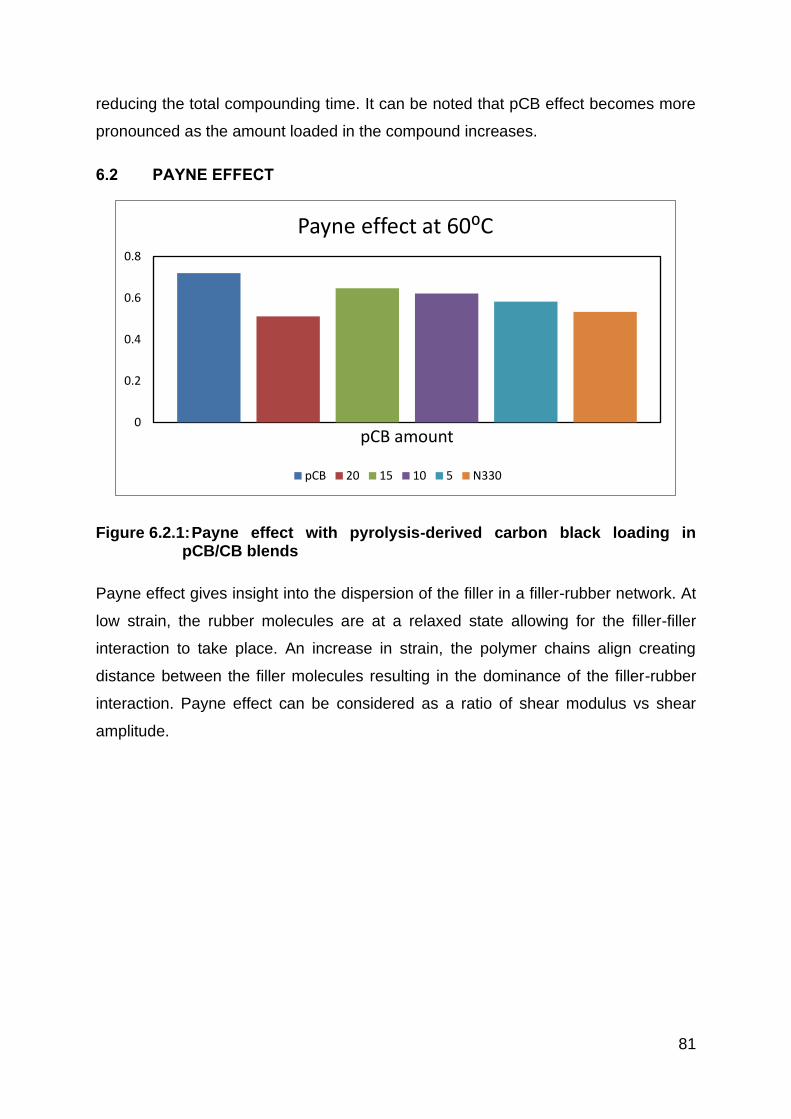
81
reducing the total compounding time. It can be noted that pCB effect becomes more
pronounced as the amount loaded in the compound increases.
6.2 PAYNE EFFECT
Figure 6.2.1: Payne effect with pyrolysis-derived carbon black loading in pCB/CB blends
Payne effect gives insight into the dispersion of the filler in a filler-rubber network. At
low strain, the rubber molecules are at a relaxed state allowing for the filler-filler
interaction to take place. An increase in strain, the polymer chains align creating
distance between the filler molecules resulting in the dominance of the filler-rubber
interaction. Payne effect can be considered as a ratio of shear modulus vs shear
amplitude.
0
0.2
0.4
0.6
0.8
pCB amount
Payne effect at 60⁰C
pCB 20 15 10 5 N330
82
Figure 6.2.2: Diagram explaining the Payne effect (Jayalakshmy and Mishra, 2019)
The higher the shear modulus the closer the value will be to 1, meaning that the filler
easily disperses in the rubber material; however, the shear modulus and elastic
modulus of the rubber will be greatly changed according to the differences in the
concentration and number of carbon black particles (Huang et al., 2018).
Figure 6.2.1 shows the pCB/CB filler loadings of a maximum of 40 phr. The legend
from left to right shows 40 phr of pCB to 40 phr CB and the pCB/CB blends in between.
Pyrolysis-derived carbon black has a higher Payne effect compared to CB N330.
Taking into consideration that these two parent fillers differ in total surface area at least
by a factor of two, helps us to understand the observed differences in Payne effect.
Carbon black N330 has twice the surface area of pCB, implying that at a loading of 40
phr N330 would fill up a lot more of the polymer than pCB. This would then lead to
varying filler-filler interaction in a 40 phr compound. However partial replacement of
N330 by pCB allows more dominance of the rubber-filler interaction and reduction in
the filler-filler interaction due to the addition of a lower surface area filler.
6.3 MORPHOLOGY
6.3.1 Scanning Electron Microscopy (SEM)
Rubber systems are enhanced by the incorporation of fillers. Such reinforcements are
related to the structure of the filler particles (agglomeration) and rubber-filler interaction
(Mostafa et al., 2011). It is accepted that tensile stress at a relatively large strain is
closely related to the rubber-filler interactions (Mostafa et al, 2011). With that in mind
the SEM images of the tensile break samples of selected compounds were examined.
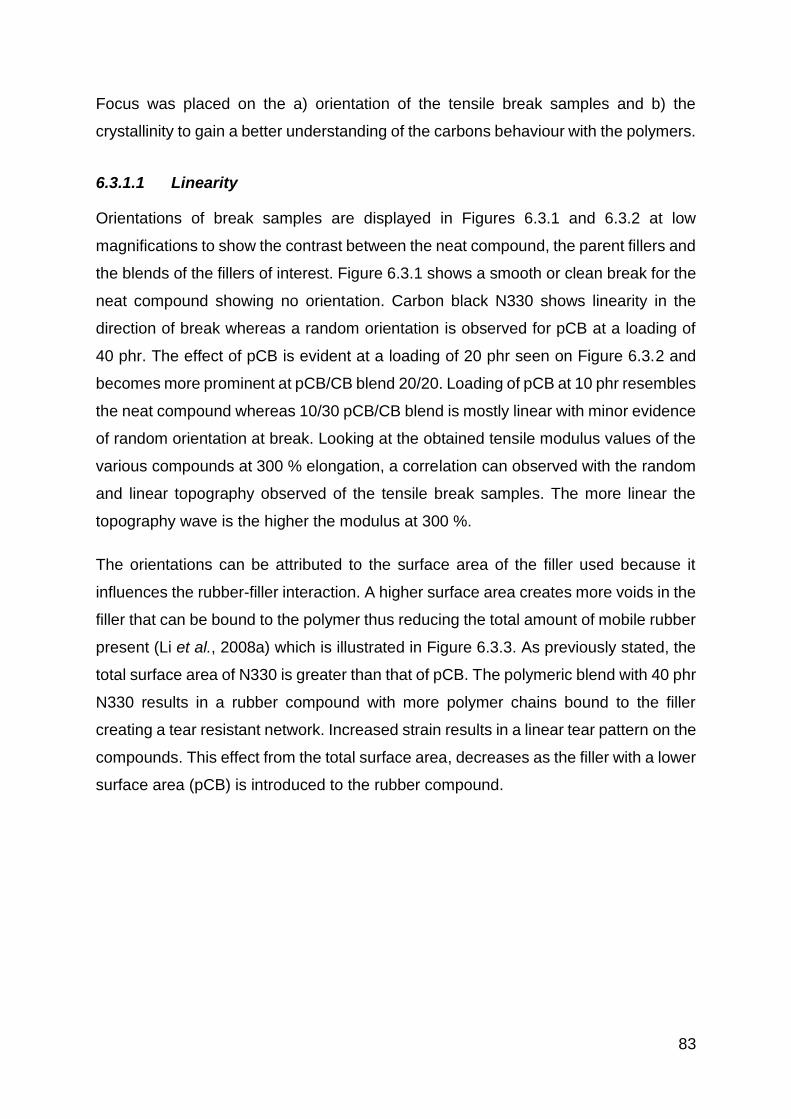
83
Focus was placed on the a) orientation of the tensile break samples and b) the
crystallinity to gain a better understanding of the carbons behaviour with the polymers.
6.3.1.1 Linearity
Orientations of break samples are displayed in Figures 6.3.1 and 6.3.2 at low
magnifications to show the contrast between the neat compound, the parent fillers and
the blends of the fillers of interest. Figure 6.3.1 shows a smooth or clean break for the
neat compound showing no orientation. Carbon black N330 shows linearity in the
direction of break whereas a random orientation is observed for pCB at a loading of
40 phr. The effect of pCB is evident at a loading of 20 phr seen on Figure 6.3.2 and
becomes more prominent at pCB/CB blend 20/20. Loading of pCB at 10 phr resembles
the neat compound whereas 10/30 pCB/CB blend is mostly linear with minor evidence
of random orientation at break. Looking at the obtained tensile modulus values of the
various compounds at 300 % elongation, a correlation can observed with the random
and linear topography observed of the tensile break samples. The more linear the
topography wave is the higher the modulus at 300 %.
The orientations can be attributed to the surface area of the filler used because it
influences the rubber-filler interaction. A higher surface area creates more voids in the
filler that can be bound to the polymer thus reducing the total amount of mobile rubber
present (Li et al., 2008a) which is illustrated in Figure 6.3.3. As previously stated, the
total surface area of N330 is greater than that of pCB. The polymeric blend with 40 phr
N330 results in a rubber compound with more polymer chains bound to the filler
creating a tear resistant network. Increased strain results in a linear tear pattern on the
compounds. This effect from the total surface area, decreases as the filler with a lower
surface area (pCB) is introduced to the rubber compound.
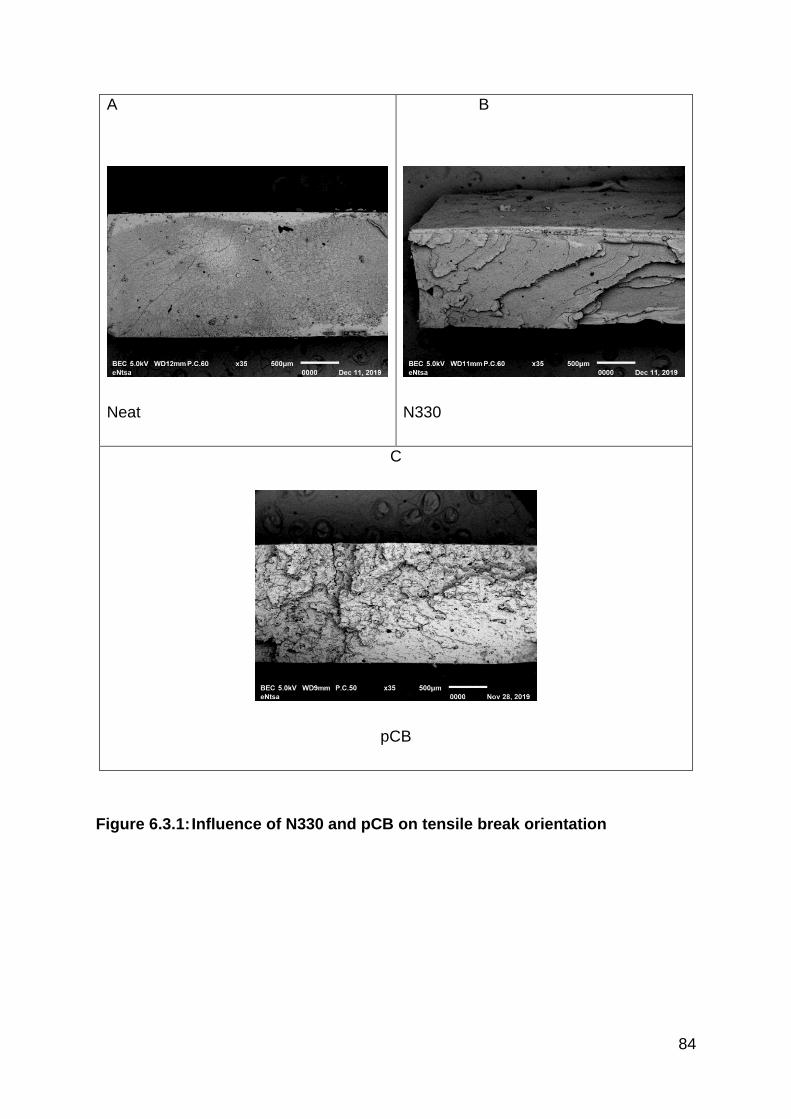
84
A
Neat
B
N330
C
pCB
Figure 6.3.1: Influence of N330 and pCB on tensile break orientation
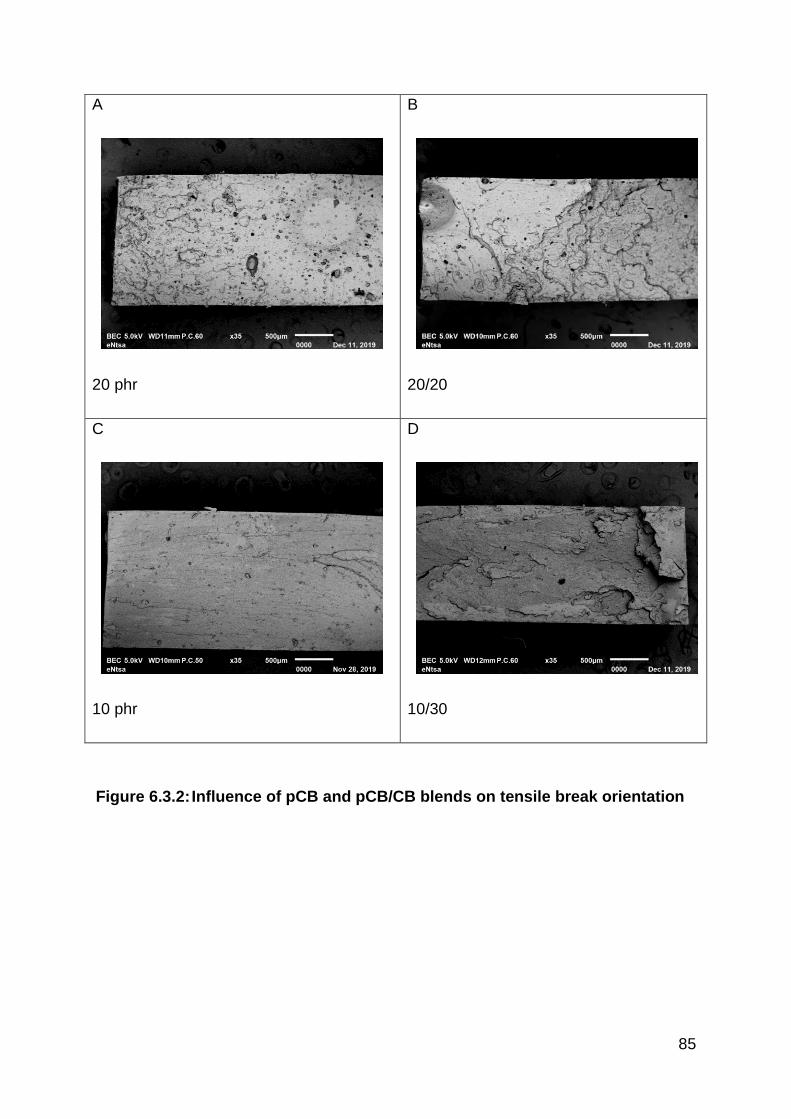
85
A
20 phr
B
20/20
C
10 phr
D
10/30
Figure 6.3.2: Influence of pCB and pCB/CB blends on tensile break orientation
86
Figure 6.3.3: Diagram illustrating the network structure of a carbon filled elastomer (Li et al., 2008b)
6.3.1.2 Crystallinity
The binary blend is made up of polymers with differing structures. Natural rubber is
more crystalline while SBR is more amorphous. Polymer crystallinity is displayed in
Figures 6.3.4 to 6.3.6. We see that in both back electron scattering (BEC) and
secondary electron dopant (SED) modes, defined wave-like structures are formed with
the presence of N330 (Figure 6.3.5). These structures decrease in intensity with the
addition of pCB where 40 phr of pCB at varying magnifications is placed in contrast to
40 phr N330 at those magnifications. Figures 6.3.5 and 6.3.6 show a decrease in
intensity of the wave-like structures when pCB is blended with N330 at 10/30 and
20/20 phr respectively. More previously stated in this chapter, there is a possibility that
N330 induces crystallization of NR at a higher rate than pCB which seems to
preferentially interact with SBR which delays the crystallization of NR. This statement
can be argued more by the obtained DMA data, where a preferential influence on SBR
between N330 and pCB was observed. N330 showed to be affecting SBR more than
pCB, meaning that SBR has delayed structural alignment by adding pCB resulting in
higher elongation.
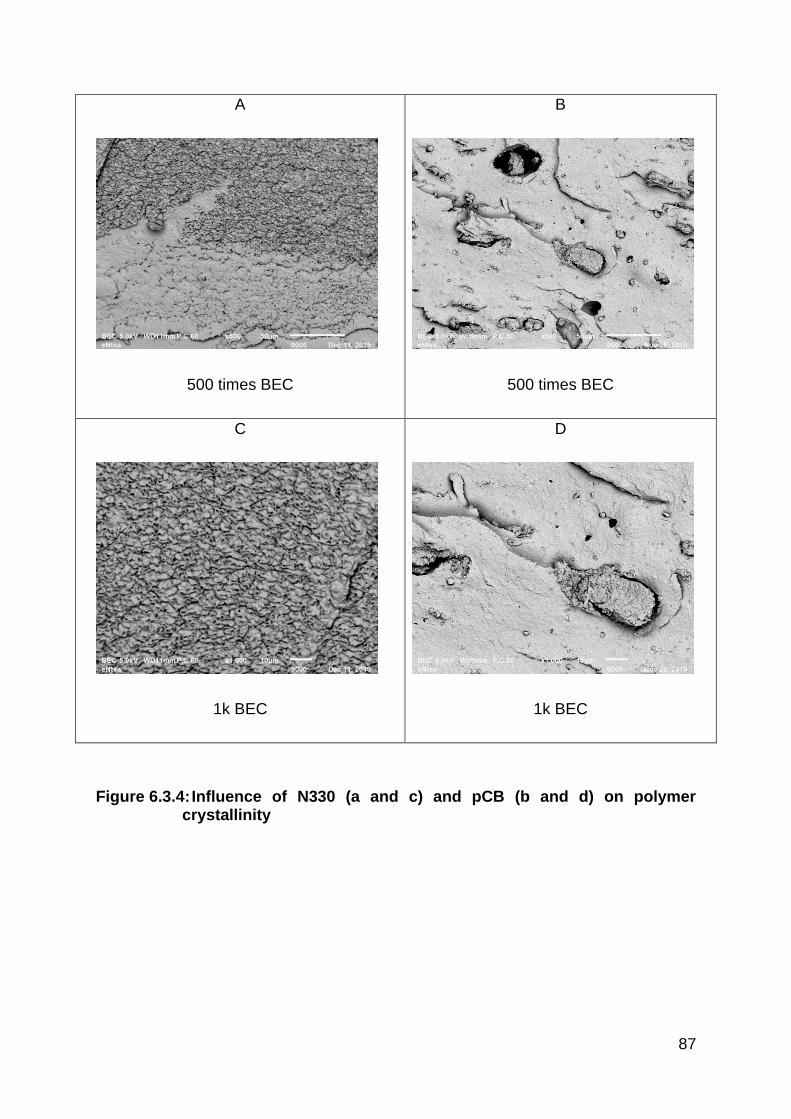
87
A
500 times BEC
B
500 times BEC
C
1k BEC
D
1k BEC
Figure 6.3.4: Influence of N330 (a and c) and pCB (b and d) on polymer crystallinity
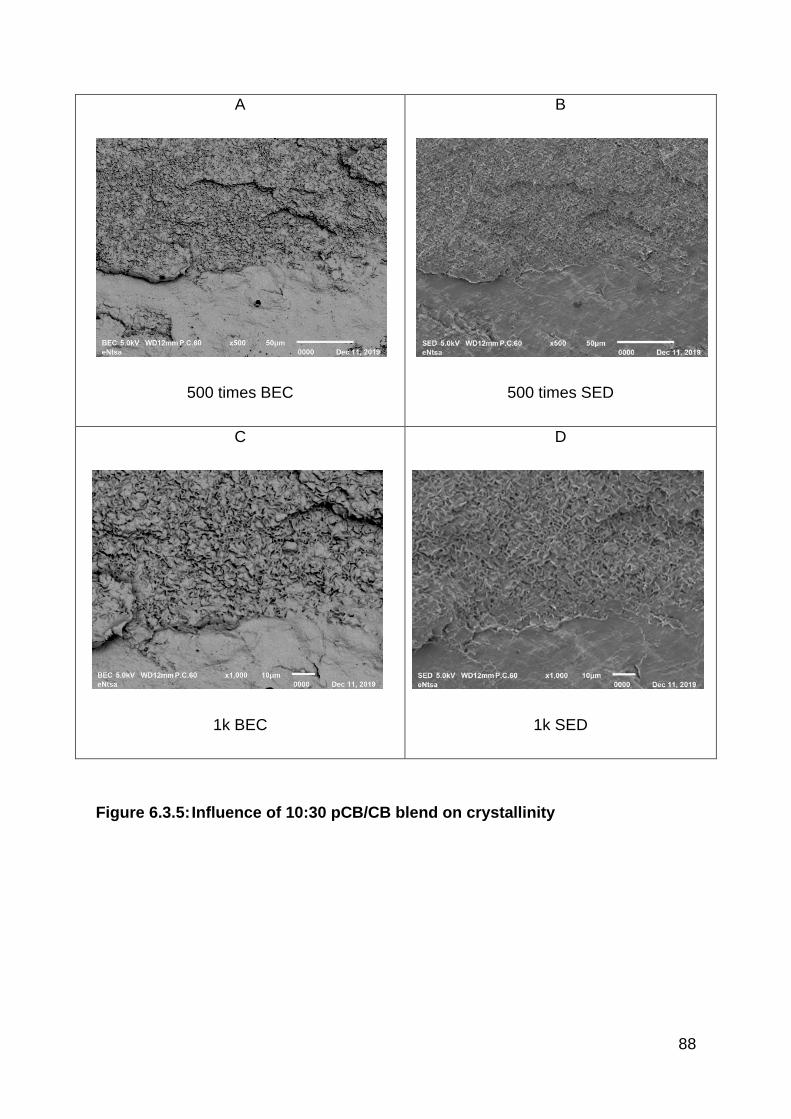
88
A
500 times BEC
B
500 times SED
C
1k BEC
D
1k SED
Figure 6.3.5: Influence of 10:30 pCB/CB blend on crystallinity
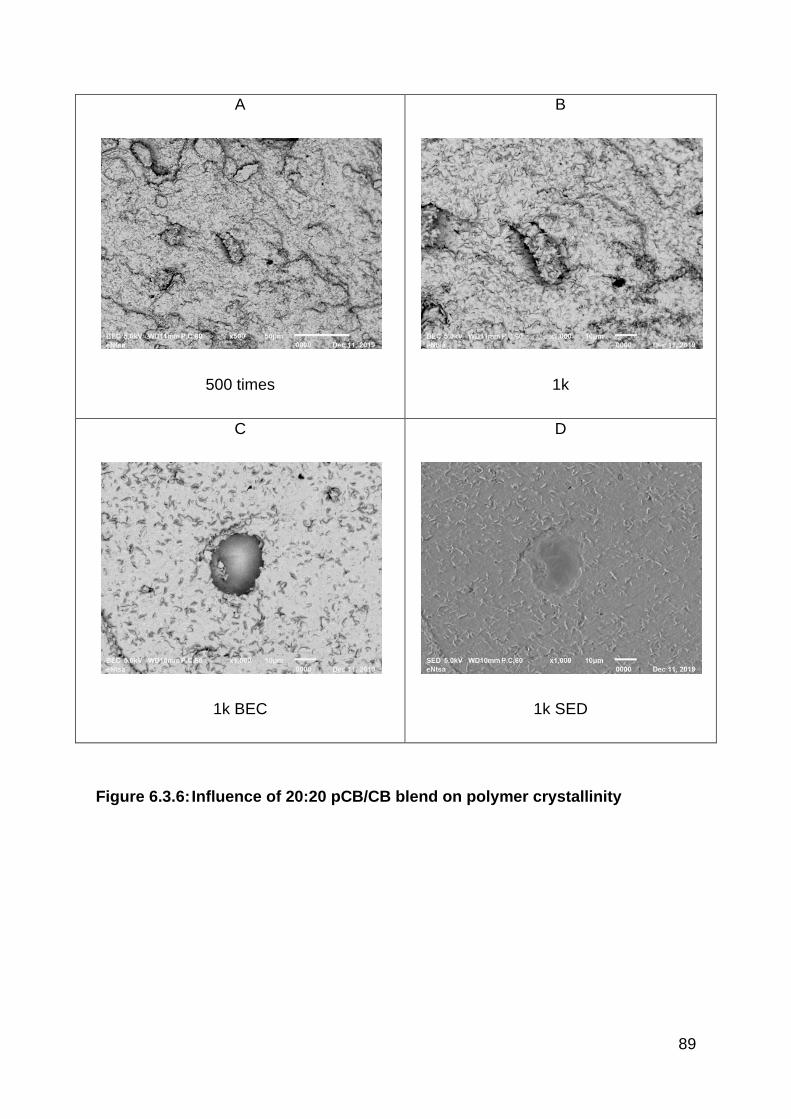
89
A
500 times
B
1k
C
1k BEC
D
1k SED
Figure 6.3.6: Influence of 20:20 pCB/CB blend on polymer crystallinity
90
CHAPTER 7
OVERALL SUMMARY AND RECOMMENDED FUTURE WORK
7.1 OVERVIEW
The aim of the study was to investigate the effect of pyrolysis-derived waste tyre
carbon black (pCB) on the properties of natural rubber/styrene-butadiene rubber
blends for an intended application. The purpose was to find an alternative use for this
carbon material to aid waste management. To achieve this, the pyrolysis-derived
carbon black had to be characterized to compare its performance to a commercially
available carbon black. Analysis techniques such as BET, XRD, XRF, TGA and SEM
were utilized to determine the characteristic qualities of pCB for comparison with a
commercial grade. Rubber composites containing pCB and the selected commercial
carbon blacks were compounded. Their mechanical properties were assessed to
determine the suitability for the intended application which is a conveyor belt cover.
The commercial carbon black grade that met application requirements was blended
with pCB to evaluate any deviations or improvements based on results obtained from
the use of the commercial carbon black grade. This section contains a brief summary
of each objective and the recommended future work.
7.2 CHARACTERIZATION OF PYROLYSIS-DERIVED WASTE TYRE
CARBON BLACK
Pyrolysis-derived waste tyre carbon black was characterized in order to grade the
carbon material in an attempt to predict its behaviour in the polymer blend. Grading
was based on thermal and surface area characteristics.
Thermal stability using TGA indicated a characteristic graphitic structural change at
600 ˚C found in commercial carbon blacks. The resultant mass loss of pCB in an inert
atmosphere with temperatures ranging from 0 to 800 ˚C was 14 %. This mass loss
percentage formed an intermediate between N330 and N990 just like carbon black
grade N660 which was 15 %. Heat absorption of pCB in the polymer blend was
analyzed using a DSC which resulted in a similar heat capacity value as carbon black
grade N660. X-ray diffraction pattern obtained showed two main broad peaks
indicative of the amorphous nature of pCB however semi-crystalline peaks were
91
observed. The presence of inorganic material through the utilization of XRF showed
the presence of zinc; iron (Fe2O3) and calcium (CaCO3). The BET surface area of pCB
was determined to be 35 m2/g which was similar to commercial grade N660. This
correlated with the SEM images that highlighted particle distribution of the carbon
black materials. Pyrolysis-derived carbon black showed similar thermal stability,
structure and surface area as N660.
7.3 KEY FINDINGS ON APPLICATION OF PCB AS A FILLER IN NATURAL
RUBBER/STYRENE-BUTADIENE RUBBER
7.3.1 Influence of pCB on mechanical properties of natural rubber/styrene-
butadiene rubber
• Taking into consideration the comparison between N660 and pCB in NR/SBR
blends, N660 did not show any distinctive performance that was greater than
pCB where hardness and rebound are concerned. It came as a
recommendation to fully replace N660 with pCB for the aforementioned
properties.
• The grading characterization techniques used in the study proved to be
tangible, where pCB was found to have characteristic properties comparable to
N660. However, considering the investigation of tensile properties where pCB
outperformed N660, it is a suggestion that pCB might be a slightly greater grade
than N660; much closer to N550.
• N330 has more than twice the surface area of pCB, which as expected showed
a greater influence on the abrasion resistance of NR/SBR blends.
Nevertheless, pCB surprisingly displayed the unexpected where it obtained
comparable UTS as N330; Suggesting that for rubber products where abrasion
resistance is not a significant property of interest, but tensile properties are,
then the replacement of N330 by pCB can be considered.
• The partial replacement of N330 by pCB proved to be viable to minimize
production cost, since the findings obtained from these blends were
intermediate from the findings of 40 phr N330 and pCB. This is an indication of
the potential that pCB has in abrasion resistance requiring products, where at
most pCB can be 25% of carbon filler while N330 can make up 75% and reduce
production costs with no compromise on the properties.
92
• The interaction of pCB and the elastomer showed to be somewhat different to
that observed with the carbon blacks. SEM tensile break specimens’
micrographs showed the varying patterns between N330 and pCB filled
compounds, which can be used to explain the higher elongation at break
obtained from pCB compounds. Furthermore, the DMA tan delta supports
selective interaction between pCB and NR-SBR blends, where variations were
observed on the mobility of NR with an increasing pCB content in the
compound.
7.4 RECOMMENDATIONS AND FUTURE WORK
The following recommendations are made for future studies to better understand the
influence of pCB on the polymer blend.
• This study was carried out on a polymer blend of NR and SBR at 70 and 30 phr
respectively. However various properties studied suggested preferential
interaction between pCB and the rubber components. To better understand this
phenomenon and reach a more concrete conclusion, a variation of NR/SBR
blends with a consistent pCB loading should be investigated. DMA should be
the subject matter, looking at the drifts and shift on the tan delta peaks of the
two polymers. This will shed some light on our speculation on preferential
interaction between pCB and NR/SBR blends.
• Due to the obtained evidence that pCB outperformed N660 and matched up
with N330 on tensile properties, further comparative studies should be carried
on pCB which is produced from different pyrolysis conditions, and mostly with
shredded tyres which would reduce ash content in pCB.
• The study showed that pCB has a potential to compete with industrial grade
carbon black fillers. However, the study did not show or explain how pCB
outperformed N660 and matched up with N330 reinforcing ability; therefore
further investigation on surface chemistry of pCB should be considered. For
example, RAMAN Spectroscopy, where surface functional groups are of the
highest consideration, and microstructure configuration using TEM and high-
resolution SEM.
• It should also be noted that the compounds were only prepared using an
internal mixer; it would be of great importance to evaluate the same

93
formulations prepared using a mixer of a different nature and capacity like an
extruder; where the rheological stability of pCB would be challenged for
dispersion, despite the positive data obtained from the PAYNE effect results.
This will help solidify the motivation of pCB for large scale industrial production.
94
REFERENCES
Acevedo, B., & Barriocanal, C. 2015. The influence of the pyrolysis conditions in a
rotary oven on the characteristics of the products. Fuel processing technology,
131, 109-116.
Adamiak, M. 2012. Abrasion resistance of materials, BoD–Books on Demand.
Ahmed, R., Klundert, A. V. D., & Lardinois, I. 1996. Rubber waste: options for small-
scale resource recovery. Urban solid waste series 3. Netherlands: WASTE.40.
Al-Abadi, A. A., & Hamzah, M. N. 2013. Effect Of Carbon Black Type On The
Mechanical Behaviour Of Elastomeric Material Under Dynamic Loading. Al-
Qadisiya Journal for Engineering Sciences, 6, 268-286.
Al-Hartomy, O. A., Al-Solamy, F., Al-Ghamdi, A., Dishovsky, N., Ivanov, M., Mihaylov,
M., & El-Tantawy, F. 2011. Influence of carbon black structure and specific
surface area on the mechanical and dielectric properties of filled rubber
composites. International Journal of Polymer Science, 2011, 4.
Ali, A., Hosseini, M., & Sahari, B. 2010. Heat-aging effects on tensile properties of
vulcanized natural rubber. International Review of Mechanical Engineering, 4,
422-424.
Alsaleh, A., & Sattler, M. L. 2014. Waste Tire Pyrolysis: Influential Parameters and
Product Properties. Current Sustainable/Renewable Energy Reports, 1, 129-
135.
ANON. 2008. Vehicles and tyre [Online]. United Kingdom. Available:
http://www.therubbereconomist.com/The_Rubber_Economist/Vehicle_and_tyre
.html [Accessed 10 July 2018].
ANON. 2012. Reinforcing fillers in the rubber industry [Online]. Brussels, Belgium.
Available: https://www.etrma.org/wp-content/uploads/2019/09/201201-etrma-
fact-sheet-carbon-black-and-silica-2.pdf [Accessed 29 September 2018]
95
ANON. 2018. Functions of tires [Online]. Hankook Tires. Available:
https://www.hankooktire.com/global/tires-services/tire-guide/functions-of-
tires.html [Accessed 14 July 2018].
ANON. 2019. Abrasion & Wear Testing [Online]. Available: https://www.element.
com/materials-testing-services/abrasion-and-wear-testing.[Accessed 18 August
2019]
ANON. 2020. XTHRA Tyres mining and construction [Online]. Hong Kong. Available:
http://xthra.com/en/contact-xthra-tyres.php [Accessed 27 January 2020].
Arayapranee, W. 2012. Rubber abrasion resistance. Abrasion resistance of materials.
Rijeka: In Tech, 147-166.
ASM-INTERNATIONAL 2004. Tensile Testing, Ohio, The Materials Society.
ASTMD7121-05 2008. Determining the rebound resilience of rubber using the Schob
pendulum
ASTD3182-07. - Standard practice for materials, equipment and procedures for mixing
standard compounds and preparing vulcanized sheets. ASTM International, 3-
4.
Barani, H.M., Kamkaredalake, A., Usefi, A., & Haji, A. 2010. A study on the physical
and mechanical properties of NR-IR-SBR blends. Journal of Material Science, 8,
1-8.
Barbarias, I., Artetxe, M., Lopez, G., Arregi, A., Santamaria, L., Bilbao, J., & Olazar,
M. 2019. Catalyst Performance in the HDPE Pyrolysis-Reforming under
Reaction-Regeneration Cycles. Catalysts, 9, 414.
Barbooti, M. M., Mohamed, T. J., Hussain, A. A., & Abas, F. O. 2004. Optimization of
pyrolysis conditions of scrap tires under inert gas atmosphere. Journal of
Analytical and Applied Pyrolysis, 72, 165-170.
Berki, P., Göbl, R., & Karger-Kocsis, J. 2017. Structure and properties of styrene-
butadiene rubber (SBR) with pyrolytic and industrial carbon black. Polymer
Testing, 61, 404-415.
96
Berki, P., & Karger-Kocsis, J. 2016. Comparative properties of styrene-butadiene
rubbers (SBR) containing pyrolytic carbon black, conventional carbon black, and
organoclay. Journal of Macromolecular Science, Part B, 55, 749-763.
Bijarimi, M., Zulkafli, H., & Beg, M. 2010. Mechanical properties of industrial tyre
rubber compounds. Journal of Applied Sciences (Faisalabad), 10, 1345-1348.
Blümich, B., Blümler, P., & Saito, K. 1998. Chapter 5 - Nmr Imaging and Spatial
Information. In: Ando, I. & Asakura, T. (eds.) Studies in Physical and Theoretical
Chemistry. Elsevier.
Boateng, A. A. 2008. Rotary Kilns Transport_Phenomena_and_Transport_
Processes., Oxford, Elsevier.
Bonfils, F., Sainte-Beuve, J., Thaler, P., & Vaysse, L. 2009. Natural rubber. RSC
Green Chemistry, 339-362.
Bouvier, J., & Gelus, M. 1986. Pyrolysis of rubber wastes in heavy oils and use of the
products. Resources and Conservation, 12, 77-93.
Brame, J., & Griggs, C. 2016. Surface Area Analysis Using the Brunauer- Emmett-
Teller (BET) Method Environmental Quality and Technology Research Program
Washington: The U.S. Army Engineer Research and Development Center
(ERDC).
Brems, A., Dewil, R., Baeyens, J., & Zhang, R. 2013. Gasification of plastic waste as
waste-to-energy or waste-to-syngas recovery route. Natural Science, 5, 695-704
Brouwer, P. 2006. Theory of XRF. Almelo, Netherlands: PANalytical BV. 7-10
Chen, H. 2010. Optimizing Belt Conveyor Manufacturing, Savonia University of
Applied Sciences, Finland.
Chesbro, W., Gotch, J., & Relis, P. 1996. Effects of waste tires, waste tire facilities,
and waste tire projects on the environment. In: CHANDLER, R. E. (ed.).
California: California Intergrated Waste Management Board. 31-36.
97
Choudhary, O. P., & Priyanka 2017. Scanning Electron Microscope: Advantages and
Disadvantages in Imaging Components International Journal of Current
Microbiology and Applied Sciences 5, 1877-1882
Chuayjuljit, S., Imvittaya, A., Na-Ranong, N., & Potiyaraj, P. 2002. Effects of Particle
Size and Amount of Carbon Black and Calcium Carbonate on Curing
Characteristics and Dynamic Mechanical Properties of Natural Rubber. Journal
of Metals, Materials and Minerals, 12, 51-57.
Clapera, R. S. 2006. Energy Dispersive X-Ray Fluorescence: Measuring Elements in
Solid and Liquid Matrices, Universitat de Girona, Spain.
Conesa, J. A., Font, R. & Marcilla, A. 1996. Gas from the pyrolysis of scrap tires in a
fluidized bed reactor. Energy & Fuels, 10, 134-140.
Conesa, J., Martian-Gulloan, I., Font, R., Jauhiainen, J., 2004. Complete study of
thepyrolysis and gasification of scrap tires in a pilot plant reactor. Environmental
Science and Technology 38, 3189–3194.
Continental 2013. Tyre basics passenger car tyres. Deutschland. Available:
https://blobs.continental-
tires.com/www8/servlet/blob/590522/d2e4d4663a7c79ca81011ab47715e911/d
ownload-tire-basics-data.pdf [Accessed 20 July 2018]
Crompton, T. R. 2013. 'Resin Cure Studies', in Smithers Rapra Technology Ltd. (ed.)
Thermal methods of polymer analysis, Shawbury,179-181
Cunliffe, A.M., Williams, P.T., 1999. Influence of process conditions on the rate of
activation of chars derived from pyrolysis of used tires. Energy and Fuels,
13,166–175.
Czajczyńska, D., Anguilano, L., Ghazal, H., Krzyżyńska, R., Reynolds, A., Spencer,
N., & Jouhara, H. 2017. Potential of pyrolysis processes in the waste
management sector. Thermal Science and Engineering Progress, 3, 171-197.
Dai, X., Yin, X., Wu, C., Zhang, W., & Chen, Y. 2001. Pyrolysis of waste tires in a
circulating fluidized-bed reactor. Energy, 26, 385-399.
98
Delchev, N., Malinova, P., Mihaylov, M., & Dishovsky, N. 2014. Effect of the modified
solid product from waste tyres pyrolysis on the properties of styrene-butadiene
rubber based composites. Journal of Chemical Technology & Metallurgy, 49,
525-534.
D'Escamard, G., De Rosa, C. & Auriemma, F. 2016. 'Predicting the glass transition
temperature as function of crosslink density and polymer interactions in rubber
compounds', AIP Conference Proceedings, 1736.
Donnet, J.B. 1993. Carbon black:Science and Technology, CRC Press, Florida, 20-
23.
Du, A., Wu, M., Su, C., & Chen, H. 2008. The characterization of pyrolytic carbon black
prepared from used tires and its application in styrene–butadiene rubber (SBR).
Journal of Macromolecular Science, Part B: Physics, 47, 268-275.
Dutrow, B. L., & Clark, C. M. 2018. X-ray Powder Diffraction (XRD) [Online]. United
States of America. Available: https://serc.carleton.edu/research_education/
geochemsheets/techniques/XRD.html. [Accessed 20 June 2019]
Findik, F., Yilmaz, R., & Köksal, T. 2004. Investigation of mechanical and physical
properties of several industrial rubbers. Materials & Design, 25, 269-276.
Fröhlich, J., Niedermeier, W., & Luginsland, H.D. 2005. The effect of filler–filler and
filler–elastomer interaction on rubber reinforcement. Composites Part A: Applied
Science and Manufacturing, 36, 449-460.
Gåhlin, R., & Jacobson, S. 1999. The particle size effect in abrasion studied by
controlled abrasive surfaces. Wear, 224, 118-125.
Galwey, A. K., & Brown, M. E. 2002. Application of the Arrhenius equation to solid
state kinetics: can this be justified? Thermochimica Acta, 386, 91-98.
Gardner, J. 1994. Chemistry and Biology Journal at Bedford School [Online].
Available: http://www.angelfire.com/oh/spectrumjournal/christmas97.html.
[Accessed 4 April 2019]
99
Department of Environmental Affairs(South Africa). 2017. National Environmental
Management: Waste Management Act (Act no. 59 of 2008): Waste Tyre
Regulations. (Notice 1064). Government Gazette, 41157, 29 September.
Gedney, R. 2005. Tensile testing basics, tips and trends. Admet Quality Test &
Inspection, 1-4.
Gent, A., Kawahara, S., & Zhao, J. 1998. Crystallization and strength of natural rubber
and synthetic cis-1, 4-polyisoprene. Rubber Chemistry and Technology, 71, 668-
678.
Gent, A. N., & Walter, J. D. 2005. The Pneumatic Tire. United States: National
Highway Traffic Safety Administration, 2-10.
George, S. C., Ninan, K., Groeninckx, G., & Thomas, S. 2000. Styrene–butadiene
rubber/natural rubber blends: morphology, transport behavior, and dynamic
mechanical and mechanical properties. Journal of Applied Polymer Science, 78,
1280-1303.
Giese, U., Santoso, M., & Navarro Torrejon, Y. 2012. Aging of Elastomers and
Effectiveness of Antioxidants. KGK. Kautschuk, Gummi, Kunststoffe, 65, 20-23.
Godfrey, L., & Oelofse, S. 2017. Historical review of waste management and recycling
in South Africa. Resources, 6, 57.
Gulzad, D. A. 2011. Recycling and pyrolysis of scrap tire. Bratislava: Slovak aid. 9
Hadi, P., Yeung, K. Y., Guo, J., Wang, H., & Mckay, G. 2016. Sustainable development
of tyre char-based activated carbons with different textural properties for value-
added applications. Journal of Environmental Management, 170, 1-7.
Hakami, F., Pramanik, A., Ridgway, N., & Basak, A. 2017. Developments of rubber
material wear in conveyer belt system. Tribology International, 111, 148-158.
Hamzah, M. N., & Al-Abadi, A. A. 2013. Effect of Carbon Black Type on the Mechanical
Behaviour of Elastomeric Material Under Dynamic Loading. Al-Qadisiyah Journal
for Engineering Sciences, 6, 268-286.
100
Hart, A. G., Stallwood, B., & Stevenson, K. 2008. Tire rubber recycling and
bioremediation: A review. Bioremediation Journal, 12, 1-11.
Hong, C. K., Kim, H., Ryu, C., Nah, C., Huh, Y.I., & Kaang, S. 2007. Effects of particle
size and structure of carbon blacks on the abrasion of filled elastomer
compounds. Journal of Materials Science, 42, 8391-8399.
Huang, L. H., Yang, X., & Gao, J. 2018. Study on Microstructure Effect of Carbon
Black Particles in Filled Rubber Composites. International Journal of Polymer
Science, 2018, 1-11.
Hwang, N., & Barron, A. R. 2011. BET surface area analysis of nanoparticles. The
Connexions project, 1-11.
Industrial, J. 2015. Conveyor belts [Online]. Cleveland: Jason Industrial Ltd UK.
Available: http://www.elementosindustriales.com/web/pdf/jason/bandaconveyor.pdf
[Accessed 20 October 2018]
Ismail, H., Nordin, R., & Noor, A. 2002. Cure characteristics, tensile properties and
swelling behaviour of recycled rubber powder-filled natural rubber compounds.
Polymer Testing, 21, 565-569.
Ismail, R., Mahadi, Z. A. & Ishak, I. S. 2018. The effect of carbon black filler to the
mechanical properties of natural rubber as base isolation system. IOP
Conference Series: Earth and Environmental Science, 140, 012133.
ISO, B. 2009. Rubber, vulcanized or thermoplastic–determination of rebound
resilience. BSI British Standards Limited.
ISO, B. 2010. 4649: 2010 Rubber, vulcanized or thermoplastic—Determination of
abrasion resistance using a rotating cylindrical drum device. British Standards
Institution: London, UK.
Jayalakshmy, M., & Mishra, R. K. 2019. Applications of Carbon-Based Nanofiller-
Incorporated Rubber Composites in the Fields of Tire Engineering, Flexible
Electronics and EMI Shielding. Carbon-Based Nanofiller and Their Rubber
Nanocomposites. Elsevier, 2019, 441-472.
101
Jean-Baptiste, D., & Voet, A. 1976. Carbon black: Physics, Chemistry and Elastomer
Reinforcement, New York, Marcel Dekker Inc, 20-23.
Kadlcak, J., Kuritka, I., Konecny, P., & Cermak, R. The effect of ZnO modification on
rubber compound properties. Proceedings of 4th WSEAS international
conference on energy and development, environment and biomedicine, July,
2011. 14-16.
Karabork, F., & Tipirdamaz, S. 2016. Influence of pyrolytic carbon black and pyrolytic
oil made from used tires on the curing and (dynamic) mechanical properties of
natural rubber (NR)/styrene-butadiene rubber (SBR) blends. Express Polymer
Letters, 10, 72.
Khimi, S. R., & Pickering, K. L. 2014. A new method to predict optimum cure time of
rubber compound using dynamic mechanical analysis. Journal of Applied
Polymer Science, 131, 1-6.
Klat, D., Karimi-Varzaneh, H.A., Lacayo-Pineda, J. 2018. Phase morphology of nr/sbr
blends: effect of curing temperature and curing time. Polymers, 10, 510.
Kumar, C., & Nijasure, A. M. 1997. Vulcanization of rubber. Resonance, 4, 55-59.
Labbe, M. 2017. Properties of Natural & Synthetic rubber [Online]. Sciencing.
Available: https://sciencing.com/properties-natural-synthetic-rubber-
7686133.html [Accessed 12 May 2019]
Lee, S., & Jung, K. 2017. Exploring effective incentive design to reduce food waste: A
natural experiment of policy change from community based charge to RFID
based weight charge. Sustainability, 9, 1-17.
Li, S.Q., Yao, Q., Chi, Y., Yan, J.H., & Cen, K.F. 2004. Pilot-scale pyrolysis of scrap
tires in a continuous rotary kiln reactor. Industrial & Engineering Chemistry
Research, 43, 5133-5145.
Li, S.Q., Yao, Q., Wen, S.E., Chi, Y. & Yan, J.H. 2005. Properties of Pyrolytic Chars
and Activated Carbons Derived from Pilot-Scale Pyrolysis of Used Tires. Journal
of the Air &Waste Management Association, 55:9, 1315-1326.
102
Li, Q., Ma, Y., Wu, C., & Qian, S. 2008a. Effect of carbon black nature on vulcanization
and mechanical properties of rubber. Journal of Macromolecular Science, Part
B, 47, 837-846
Li, Z., Zhang, J., & Chen, S. 2008b. Effects of carbon blacks with various structures
on vulcanization and reinforcement of filled ethylene-propylene-diene rubber.
Express Polymer Letters, 2, 695-704.
López-De-Uralde, J., Ruiz, I., Santos, I., Zubillaga, A., Bringas, P. G., Okariz, A., &
Guraya, T. 2010. Automatic morphological categorisation of carbon black nano-
aggregates. International Conference on Database and Expert Systems
Applications, Springer, 185-193.
López, G., Olazar, M., Aguado, R., & Bilbao, J. 2010. Continuous pyrolysis of waste
tyres in a conical spouted bed reactor. Fuel, 89, 1946-1952.
Lutterotti, L. 2018. X-ray diffraction: theory and applications to materials science and
engineering. University of Trento.
Mahlangu, M. L. 2009. Waste tyre management problems in South Africa and the
possible opportunities that can be created through the recycling thereof.
University of South Africa Pretoria.
Martínez, J. D., Puy, N., Murillo, R., García, T., Navarro, M. V., & Mastral, A. M. 2013.
Waste tyre pyrolysis–A review. Renewable and Sustainable Energy Reviews, 23,
179-213.
Materials, A. C. D.O. C. 2008. Standard test method for tensile properties of polymer
matrix composite materials, ASTM International.
Mcmahon, M. 2013. Trade of Motor Mechanic [Online]. SOLAS. Available:
https://local.ecollege.ie/Content/APPRENTICE/liu/motor_notes/Ver_2/m1_u1_v2.pdf
[Accessed 16 October 2019]
Mei, Y., Liu, R., Yang, Q., Yang, H., Shao, J., Draper, C., Zhang, S., & Chen, H. 2015.
Torrefaction of cedarwood in a pilot scale rotary kiln and the influence of industrial
flue gas. Bioresource Technology, 177, 355-360.
103
Menard, K. P. 1999. Dynamic Mechanical Analysis Basics: Part 2 Thermoplastic
Transitions and Properties [Online]. Perkin Elmer: Application Note. Available:
https://www.perkinelmer.com/lab-
solutions/resources/docs/app_thermaldynmechanalybasicspart2.pdf [Accessed 12
March 2020]
Metallurgist. 2018. Conveyor belts [Online]. Available:
https://www.911metallurgist.com/conveyor-belts/ [Accessed 23 November 2018
2018].
MITSUBISHI. 2009. Three main properties of carbon black [Online]. Mitsubishi
Chemical Corporation. https://www.carbonblack.jp/en/ [Accessed 10 October
2019].
Mohomed, K. 2014. Thermogravimetric Analysis (TGA): Theory and Applications
[Online]. TA Instruments
https://www.tainstruments.com/practical_series_thermal/ [Accessed 16
September 2018]
Mostafa, A., Abouel-Kasem, A., Bayoumi, M. & El-Sebaie, M. 2009. Insight into the
effect of CB loading on tension, compression, hardness and abrasion properties
of SBR and NBR filled compounds. Materials & Design, 30, 1785-1791.
Mostafa, A., Abouel-Kasem, A., Bayoumi, M. & El-Sebaie, M. 2010a. Rubber-filler
interactions and its effect in rheological and mechanical properties of filled
compounds. Journal of Testing and Evaluation, 38, 347-359.
Mostafa, A., Abouel-Kasem, A., Bayoumi, M.R., & El-Sebaie, M.G. 2010b. Rubber-
filler interactions and its effect in rheological and mechanical properties of filled
compounds. Journal of Testing and Evaluation, 38, 1-14.
Nachenius, R., Ronsse, F., Venderbosch, R., & Prins, W. 2013. Biomass pyrolysis.
Advances in chemical engineering, 42, 75-139.
Netzsch. 2016. Thermogravimetric Analysis – TGA Method, Technique, Applications
[Online]. Available: www.netzsch.com. [Accessed 15 July 2018]
104
Nik Yahya, N., Zulkepli, N.N., Ismail, H., Ting, S.S., Abdullah, M.M.A.B., Kamarudin,
H., & Hamzah, R. Properties of natural rubber/styrene butadiene rubber/recycled
nitrile glove (NR/SBR/rNBRg) blends: the effects of recycled nitrile glove (rNBRg)
particle sizes. Key Engineering Materials, 2016. Trans Tech Publ, 151-160.
Niyogi, U. K. 2007. Natural and Synthetic Rubber. Introduction to Fibre Science and
Rubber. Nature, 40, 489-490.
Nkosi, N., & Muzenda, E. 2014. 'A review and discussion of waste tyre pyrolysis and
derived products', Proceedings of the World Congress on Engineering (IAENG),
London, United Kingdom, 2-4 July.
Norman, D. 1990. Rubber grade carbon blacks. The Vanderbilt Rubber Handbook, 13,
397.
Norman, D. T. 2007. Rubber Grade Carbon Blacks. Texas: Product Development
Witco Corporation, 1-19.
Norris, C., Hale, M. & Bennett, M. 2014. Pyrolytic carbon: factors controlling in-rubber
performance. Plastics, Rubber and Composites, 43, 245-256.
Olazar, M., Alvarez, S., Aguado, R., & San José, M. J. 2003. Spouted bed reactors.
Chemical Engineering & Technology: Industrial Chemistry‐Plant Equipment‐
Process Engineering‐Biotechnology, 26, 845-852.
Oleiwi, J.K., Hamza, M.S., & Nassir, N.A. 2011. A study of the effect of carbon black
powder on the physical properties of SBR/NR blends used in passenger tire
treads. Engineering and Technology Journal, 29, 856-870.
Oßwald, K., Reincke, K., Döhler, S., Heuert, U., Langer, B., & Grellmann, W. 2017.
Aspects of the ageing of elastomeric materials. International Polymer Science
and Technology, 44, 1-10.
Perkin-Elmer 2015. Thermogravimetric Analysis (TGA) [Online]. Walton, USA: Perkin
Elmer Incorporation. Available: https://www.perkinelmer.com/lab-
solutions/resources/docs/faq_beginners-guide-to-thermogravimetric-
analysis_009380c_01.pdf [Accessed 16 August 2018]
105
Schick, C., PerkinElmer LAS Inc, 2008. Differential scanning calorimeter (DSC) with
temperature controlled furnace. U.S. Patent 7,371,006.
Shrivastava, A. 2018. Introduction to plastics engineering, New York:William Andrew
Publishing, 1-16.
Smith, G.D. & Bedrov, D. 2007. Relationship between the α- and β- relaxation
processes in amorphous polymers: Insight from atomistic molecular dynamics
simulations of 1,4-polybutadiene melts and blends. Journal of Polymer Science Part
B: Polymer Physics, 45, 627-643.
Persson, B., Albohr, O., Heinrich, G., & Ueba, H. 2005. Crack propagation in rubber-
like materials. Journal of Physics: Condensed Matter, 17, R1071.
Petrich, W. Novel uses for Tire Pyrolysis Char. Abstracts of Papers of The American
Chemical Society, 2000. American Chemical Society 1155 16th st, NW,
Washington, DC 20036 USA, U387-U387.
Pilusa, J. & Muzenda, E., 2013. Beneficiation of pyrolitic carbon black. International
Journal of Chemical, Nuclear, Metallurgical and Materials Engineering, 7(10),
392-396.
Plantation, N.R. 2010. The Complete Book on Rubber Processing and Compounding
Technology. In: ENGINEERS, N. B. O. C. A. (ed.), 33-34
Plummer, C.J.G. 2014. Assessing properties of conventional and specialized
materials. In: Saleem Hashmi, Chester J. Van Tyne, Gilmar Ferreira Batalha &
Yilbas, B. (eds.) Comprehensive materials processing. Elsevier.
Reifen, C. 2013. Tyre Basics-Passenger Car Tyres [Online], Deuchland, 2013/14.
Available: https://blobs.continental-
tires.com/www8/servlet/blob/585558/d2e4d4663a7c79ca81011ab47715e911/d
ownload-tire-basics-data.pdf [Accessed 12 November 2019]REN21 2019.
Renewables 2019: Global status report. REN21 Secretariat. Available:
106
https://www.ren21.net/wp-
content/uploads/2019/05/gsr_2019_full_report_en.pdf
Robb, A. 2019. Zinc Flame Test [Online]. Available: https://study.com/academy/lesson
zinc-flame-test.html [Accessed 26 November 2019].
Roland, C. 2006. Mechanical behavior of rubber at high strain rates. Rubber Chemistry
and Technology, 79, 429-459.
Rubber, M. 2007. Test Methods of Rubber Materials and Products. Edification and
Culture Leonardo da Vinci. S.R.O, M. R. 2007. Rubber Chemistry, VERT, 22-25.
Sahouli, B., Blacher, S., Brouers, F., Darmstadt, H., Roy, C. & Kaliaguine, S. 1996.
Surface morphology and chemistry of commercial carbon black and carbon black
From Vacuum Pyrolysis Of Used Tyres. Fuel, 75, 1244-1250.
Savetlana, S., Zulhendri, Sukmana, I. & Saputra, F. A. 2017. The effect of carbon black
loading and structure on tensile property of natural rubber composite. IOP
Conference Series: Materials Science and Engineering, 223, 012009.
Schranz, W. 1997. Dynamic mechanical analysis—a powerful tool for the study of
phase transitions. Phase Transitions: A Multinational Journal, 64, 103-114.
Sebok, E.B & Taylor, R.L., 2001. Carbon blacks. Encyclopedia of Materials: Science
and Technology, Elsevier, 2001, 902-906.
Shuhaimi, N. H. H., Ishak, N. S., Othman, N., Ismail, H. & Sasidharan, S. 2014. Effect
of different types of vulcanization systems on the mechanical properties of
natural rubber vulcanizates in the presence of oil palm leaves-based antioxidant.
Journal of Elastomers & Plastics, 46, 747-764.
Surya, I., Hayeemasae, N. & Ginting, M. Cure characteristics, crosslink density and
degree of filler dispersion of kaolin-filled natural rubber compounds in the
presence of alkanolamide. IOP Conference Series: Materials Science and
Engineering, 2018. IOP Publishing, 012009.
Team, P. S. N. 2018. Why do we perform aging studies? [Online]. Available:
https://www.polymersolutions.com/blog/aging-studies/ [Accessed 03 July 2019].
107
Testing, A.S.F. & Materials. Standard Test Method for Rubber Property--Durometer
Hardness. 2005. ASTM.
Tirebuyer. 2017. Tire anatomy and construction [Online]. Available:
https://www.tirebuyer.com/education/tire-anatomy-and-construction [Accessed
31 October 2018].
Tolentino, E.N., Scanlan, C.J. & Aboagye, A.R. 2012. High-resolution thermal
gravimetric analysis (HI-RES TGA) of bauxite and muds. Alumina Quality
Workshop. Perth, Australia: Technical Development, BHP Billiton Worsley
Alumina Pty., Ltd.
Turer, A. 2012. Recycling of scrap tires. Middle East Technical University, Turkey.
Ulfah, I.M., Fidyaningsih, R., Rahayu, S., Fitriani, D.A., Saputra, D.A., Winarto, D.A.,
& Wisojodharmo, L.A. 2015. Influence of Carbon Black and Silica Filler on the
Rheological and Mechanical Properties of Natural Rubber Compound. Procedia
Chemistry, 16, 258-264.
Vanamane, S.S., & Mane, P.A. 2012. Design, Manufacture and Analysis of Belt
Conveyor System used for Cooling of Mould. International Journal of Engineering
Research and Applications (IJERA), 2, 2162-2167.
Venter, I. 2018. Mathe Group expands tyre recycling facility, despite Redisa demise
[Online]. South Africa: Creamer Media. Available:
http://www.engineeringnews.co.za/article/mathe-group-expands-tyre-recycling-
facility-despite-redisa-demise-2018-04-09 [Accessed 17 september 2018].
Von Berg, S. 2016. 'The Characterization of and Formulation Development using a
Novel Tyre Devulcanizate', Masters, Nelson Mandela Metropolitan University,
Port Elizabeth.
Wang, M.J. 1999. The role of filler networking in dynamic properties of filled rubber.
Rubber Chemistry and Technology, 72, 430-448.
Wierzbicka-Miernik, A. Fundamentals of the differential scanning calorimetry
application in materials science. Europe: Instytut Metalurgii, 1-7.
108
Williams, P. & Brindle, A. 2003. Fluidised bed pyrolysis and catalytic pyrolysis of scrap
tyres. Environmental Technology, 24, 921-929.
Williams, P. T. 2013. Pyrolysis of waste tyres: a review. Waste Management, 33, 1714-
1728.
Wisojodharmo, L., Fidyaningsih, R., Fitriani, D., Arti, D., & Susanto, H. 2017 The
influence of natural rubber–butadiene rubber and carbon black type on the
mechanical properties of tread compound. IOP Conference Series: Materials
Science and Engineering, IOP Publishing, 012013.
Wrap. 2018. WRAP and the circular economy [Online]. Oxon. Available:
http://www.wrap.org.uk/about-us/about/wrap-and-circular-economy [Accessed
15 July 2018].
Wu, J., Bo, C., Wang, Y., Su, B., Liu, Q., & Zhao, J. 2015. Effect of curing time on
mechanical and dynamic mechanical properties of butyl rubber. Materials
Research Innovations, 19, S6-148-S6-152.
Wu, J., Chen, L., Li, H., Su, B., & Wang, Y. Effect of Temperature on Tensile Fatigue
Life of Natural Rubber. IOP Conference Series: Materials Science and
Engineering, 2018. IOP Publishing, 012024.
Zafar, S. 2018. Biomass Pyrolysis Process [Online]. Available:
https://www.bioenergyconsult.com/biomass-pyrolysis-process/. [Accessed 15
July 2019]
Zhao, F., Bi, W., & Zhao, S. 2011. Influence of crosslink density on mechanical
properties of natural rubber vulcanizates. Journal of Macromolecular Science,
Part B, 50, 1460-1469.
Zsuzsanna, K., Lublóy, É., & Kopecskó, K. 2018. Behaviour of tyres in fire:
Determination of burning characteristics of tyres. Journal of Thermal Analysis
and Calorimetry, 133 (2). pp. 279-287


