Embed Size (px)
Citation preview

This article appeared in a journal published by Elsevier. The attachedcopy is furnished to the author for internal non-commercial researchand education use, including for instruction at the authors institution
and sharing with colleagues.
Other uses, including reproduction and distribution, or selling orlicensing copies, or posting to personal, institutional or third party
websites are prohibited.
In most cases authors are permitted to post their version of thearticle (e.g. in Word or Tex form) to their personal website orinstitutional repository. Authors requiring further information
regarding Elsevier’s archiving and manuscript policies areencouraged to visit:
http://www.elsevier.com/copyright
Author's personal copy
The effects of altered freshwater inflows on catch rates ofnon-estuarine-dependent fish in a multispecies nearshore linefishery
Stephen J. Lamberth a,b,c,*, Laurent Drapeau b,d, George M. Branch a
aMarine Biology Research Centre, Department of Zoology, University of Cape Town, Private Bag, Rondebosch 7701, South AfricabMarine and Coastal Management, Department of Environmental Affairs and Tourism, Private Bag X2, Rogge Bay 8012, South Africac South African Institute for Aquatic Biodiversity (SAIAB), Private Bag 1015, Grahamstown 6140, South Africad Institut de Recherche pour le Developpement, France
a r t i c l e i n f o
Article history:Received 19 March 2009Accepted 23 July 2009Available online 30 July 2009
Keywords:river flowsfreshwater reservemarine linefisherycatch–flow relationshipsSouth AfricaKwazulu-NatalThukela Banks
a b s t r a c t
In KwaZulu-Natal on the east coast of South Africa, the commercial and recreational boat-based line-fishery is the largest fishery accounting for 1235 t (40%) of the total landed mass there. In particular, theThukela Banks are where most fishing takes place. Numerous developments ranging from dams to inter-basin transfer schemes either exist or have been proposed for the Thukela River, which is the largest of 17catchments entering the sea in the region and provides over 40% of the mean annual runoff. Exploratoryanalyses of the relationships between monthly flows and catch-per-unit-effort were performed usingspectral analysis and general linear models on a data set comprising 17 years of monthly commercialcatch-and-effort data for 140 species and monthly flow data from 17 catchments. Catchments havinga significant influence on catches were those providing the bulk of the runoff volume (75%) reaching thesea. Significant relationships existed between flow and the catches of 14 species, which provided over90% of the total linefish catch on the Thukela Banks. Time lags between flow events (wet and droughtperiods) and changes in catch-per-unit-effort corresponded in many cases to age at 50% maturity and/orage-at-first-capture of the species concerned. Under a future maximum-development scenario, corre-sponding to a 44% reduction in flow from the Thukela River, catches of slinger Chrysoblephus puniceusand squaretail kob Argyrosomus thorpei are forecast to decline by 36% and 28% respectively. These twospecies currently provide over 50% of the landed mass on the Thukela Banks. Some species shouldrespond positively to a reduction in flow, but any increases in their catches will be negligible, fallingwithin natural variability, and will be insufficient to offset losses of other species because their abun-dance is naturally low or has been fished down to low levels. National legislation requires that sufficientfreshwater flows be set aside to protect ecosystems, so these findings have important managementimplications, as marine needs for freshwater flows have not previously been addressed.
! 2009 Elsevier Ltd. All rights reserved.
1. Introduction
River flows influence marine fish and fisheries directly and indi-rectly through the export of nutrients, sediment and detritus (Houdeand Rutherford, 1993; Gillanders and Kingsford, 2002; Robins et al.,2005). Nutrient supply stimulates production of phytoplankton andzooplankton and, ultimately, the larval, juvenile and adult fish thatdependonthemas foodsources (Morganetal. 2005).Detritusmaybebroken down into useful nutrients, serve as a substrate for microor-ganisms or be consumed directly by detritivorous fish and
invertebrates (Whitfield, 1998; Blaber, 2000). Sediment exportreplenishes nearshore habitats that are continuously eroded byoceanic currents and provides a refuge for many fish by increasingturbidity (Cyrus and Blaber, 1992; Uotani et al., 1994; Halim et al.,1995). Turbidity also tends to increase the catchability of manyspecies, especially the larger individuals that move into the turbidenvironment in search of concentrated prey. Freshwater flows alsoprovide cues for the migration of estuarine-dependent juvenile andadult fish moving into and out of the estuarine environment (Whit-field, 1998). The strength of these cues will ultimately dictate howmany individuals of these species recruit into marine fisheries. Froma fisheries perspective, altered freshwater flows and consequentvariations in any of the above variables can cause changes in catchcomposition, resourcebase (e.g. demersalvs.pelagicfishabundance),
* Corresponding author at: Marine Biology Research Centre, Department ofZoology, University of Cape Town, Private Bag, Rondebosch 7701, South Africa.
E-mail address: [email protected] (S.J. Lamberth).
Contents lists available at ScienceDirect
Estuarine, Coastal and Shelf Science
journal homepage: www.elsevier .com/locate/ecss
0272-7714/$ – see front matter ! 2009 Elsevier Ltd. All rights reserved.doi:10.1016/j.ecss.2009.07.021
Estuarine, Coastal and Shelf Science 84 (2009) 527–538
Author's personal copy
fleet structure, the spatial and temporal distribution of effort andultimately the economic value of the fishery concerned (Binet et al.,1995; Loneragan and Bunn, 1999; Lamberth and Turpie, 2003).
A catchment-derived nutrient supply is especially important inoligotrophic nearshore waters such as the Thukela Banks off Kwa-Zulu-Natal in South Africa, which are fed by the nutrient-poorAgulhas Current and where nutrient supply from upwelling eventsis limited. More specifically, nutrient export from the largest of thelocal rivers, the Thukela, is likely to be greater than elsewhere inKwaZulu-Natal for two reasons. First. This river provides approxi-mately 40% of the regional annual river volume. Second, it hasa small estuarine area (and is hence classified as a rivermouth), andconsequently will export most of its nutrients whereas in ‘true’estuarine systems such as St Lucia most of the nutrients areincorporated into estuarine phytoplankton production before theyreach the marine environment (Whitfield, 1992; Turpie et al., 2002;DWAF, 2004). The Thukela also supplies the bulk of the terrigenoussediment reaching the adjacent marine banks: approximately 107
metric tons per year (Flemming and Hay, 1988). Reductions in flowand changing land-use practices in the catchment may see anincrease or decrease in the sediment load reaching the sea as wellas a change in the proportions of fine and coarse sediments. In thelong term, an increase in fine sediments would favour penaeidprawns and flatfish species, but be detrimental to filter-feedinginvertebrates and ultimately the reef-dwelling fish species thatprey on them. In the short-term, increased turbidity would providerefuge and foraging area for many fish species. Because the ThukelaEstuary is a river mouth, it is relatively unimportant as a nurseryarea and alterations to its freshwater flow are unlikely to be ofconsequence to the eventual recruitment of estuarine-dependentspecies into the marine fisheries. However, the opposite may be thecase for the Thukela Banks, where freshwater flows are likely toprovide cues for spawning and the recruitment of juveniles thatutilise the banks as a nursery area.
Numerous future developments, ranging in magnitude fromlocal water abstraction to large dams and inter-basin transferschemes, have been proposed for the Thukela River and itstributaries (DWAF, 2004). South Africanwater law governs decisionsabout such developments and the National Water Act of 1998requires that, for any given water resource, sufficient water be setaside to provide for basic human needs and the protection andmaintenance of aquatic ecosystems (Republic of South Africa, 1998;Thompson, 2006). The quantity and quality of water set aside isreferred to as the ‘Reserve’, further divided into ‘basic human needs’and ‘ecological’ components. In protecting aquatic systems, theEcological Reserve is aimed at securing ecologically sustainable useof thewater (Thompson, 2006). Establishing the basic human needsand ecosystem requirements of a water resource entails followingstrict guidelines and is referred to as a Reserve Determination.Methods have been developed for determining the EcologicalReserve of rivers and estuaries but not the adjacent marine envi-ronment (Taljaard et al., 2003; Van Ballegooyen et al., 2005).
The sheer magnitude of some of the envisaged developments inthe Thukela catchment required a robust Reserve Determinationfor the river and estuary to steer decisions (DWAF, 2004). Ninemost-likely future scenarios have been identified; six comprisingminor increases, one the status quo, one amoderate (16%) reductionand one a worst-case scenario constituting a 44% reduction in flowvolume (DWAF, 2004). This done, the point has been raised thatthere are also concerns that freshwater runoff has implications forthe marine environment, particularly the prawn trawl and line-fisheries. These may not be easy to quantify because runoff will beone amongst many environmental and anthropogenic factorsinfluencing their catches, but the focus of this paper is to addressthe relationship between runoff and linefish.
In terms of participation and catch, the commercial and recre-ational linefishery is the most important fishery in KwaZulu-Natal,accounting for 40% of the landed mass. At the time of this study thecommercial linefishery comprised approximately 100 boats and600 crew, at least half of which fished on the Thukela Banks(Penney et al., 1999). Typical of many subtropical fisheries, thecommercial linefishery has a diverse catch of approximately 140species, although fewer than 15 of these contribute more than 90%of the landed mass (Penney et al., 1999; Turpie et al., 2000; Joneset al., 2002). These 15 have a variety of life-history strategies andspan reef-dwelling Serranidae, shoaling Sparidae and pelagicScombridae. Few are, however, estuarine-dependent or have anyother known affinity for freshwater (Griffiths and Lamberth, 2002;Lamberth and Turpie, 2003). This said, anecdotal local fishing loresuggests that catches of at least one of these species, king mackerelScomberomorus commerson, reflect the magnitude of the previousyear’s rainfall (Govender et al., 2000a).
This paper examines two long-term data series, one constitutingdata on catchment flow and the other catch-and-effort data fromthe linefishery. The flow data comprise 17 years ofmonthly volumesfrom the 17 major catchments that discharge into the sea along thelength of the Thukela Banks. Correspondingly, the linefishery datacomprise monthly catch-and-effort data for more than 100 speciesover the same 17-year period. An exploratory and correlativeapproach was taken, using a combination of spectral analysis andgeneral linear models (GLMs). Spectral analysis helped to identifyreoccurring patterns shared by the two time series, whereas GLMsmeasured the intensity of the relationships between flow and catch.
Short and long-term flow and catch relationships were exam-ined with lags and cycles ranging from months to years. Somerelationships were obviously auto-correlative whereas others werereal. For example, spurious relationships existed where strongcorrelations were related to climate and rainfall, rather than beingcatchment-related. To avoid this problem, detailed analysis wasrestricted to about 20 species for which there were substantialcontinuous catch data over the entire time series. Real and spuriousrelationships were examined more specifically by detailed analysesof king mackerel Scomberomorus commerson, squaretail kobArgyrosomus thorpei and slinger Chrysoblephus puniceus, spanningrelationships that ranged from short-term 1–12-month seasonalpatterns and fluctuations in catchability, to long-term inter-annualvariability and survival.
2. Materials and methods
2.1. Study area
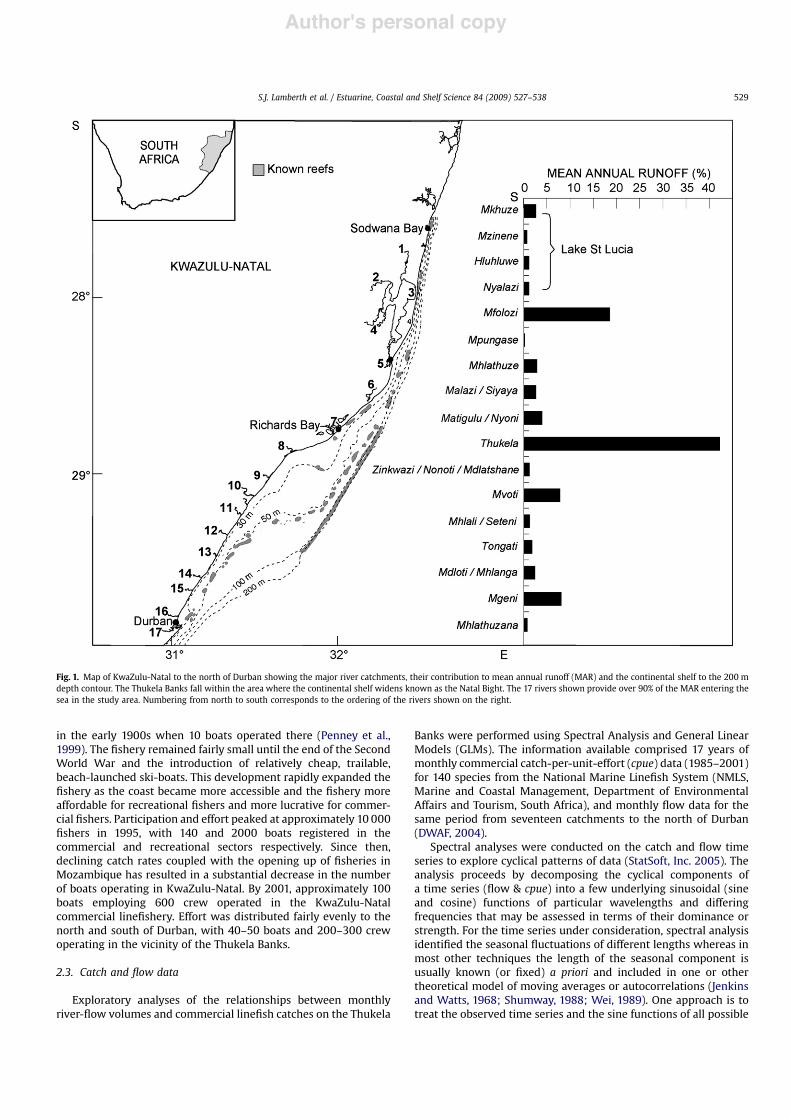
KwaZulu-Natal spans both the subtropical Natal and the tropicalDelagoa biogeographic provinces on the east coast of South Africa(Emanuel et al., 1992; Sink et al., 2005). The Thukela Banks,comprising much of the Natal Bight, stretches approximately150 km along the coastline to the north of Durban and is approxi-mately 50 km at its widest point at the edge of the continental shelf(Fig. 1). For the purpose of this study, the entire shelf region fromDurban to the Mozambique border was considered to fall withinthe range of the Thukela Bank linefishery. Seventeen catchments ofany consequence, providing over 90% of the mean annual runoff,enter the sea in this region. Of these, the Thukela, Mfolozi andMgeni rivers systems are the largest (Fig. 1).
2.2. The KwaZulu-Natal linefishery
The commercial and recreational boat-based linefishery is themost important marine fishery in KwaZulu-Natal, accounting for40% of the total landedmass there. The linefishery had its inception
S.J. Lamberth et al. / Estuarine, Coastal and Shelf Science 84 (2009) 527–538528
Author's personal copy
in the early 1900s when 10 boats operated there (Penney et al.,1999). The fishery remained fairly small until the end of the SecondWorld War and the introduction of relatively cheap, trailable,beach-launched ski-boats. This development rapidly expanded thefishery as the coast became more accessible and the fishery moreaffordable for recreational fishers and more lucrative for commer-cial fishers. Participation and effort peaked at approximately 10 000fishers in 1995, with 140 and 2000 boats registered in thecommercial and recreational sectors respectively. Since then,declining catch rates coupled with the opening up of fisheries inMozambique has resulted in a substantial decrease in the numberof boats operating in KwaZulu-Natal. By 2001, approximately 100boats employing 600 crew operated in the KwaZulu-Natalcommercial linefishery. Effort was distributed fairly evenly to thenorth and south of Durban, with 40–50 boats and 200–300 crewoperating in the vicinity of the Thukela Banks.
2.3. Catch and flow data
Exploratory analyses of the relationships between monthlyriver-flow volumes and commercial linefish catches on the Thukela
Banks were performed using Spectral Analysis and General LinearModels (GLMs). The information available comprised 17 years ofmonthly commercial catch-per-unit-effort (cpue) data (1985–2001)for 140 species from the National Marine Linefish System (NMLS,Marine and Coastal Management, Department of EnvironmentalAffairs and Tourism, South Africa), and monthly flow data for thesame period from seventeen catchments to the north of Durban(DWAF, 2004).
Spectral analyses were conducted on the catch and flow timeseries to explore cyclical patterns of data (StatSoft, Inc. 2005). Theanalysis proceeds by decomposing the cyclical components ofa time series (flow & cpue) into a few underlying sinusoidal (sineand cosine) functions of particular wavelengths and differingfrequencies that may be assessed in terms of their dominance orstrength. For the time series under consideration, spectral analysisidentified the seasonal fluctuations of different lengths whereas inmost other techniques the length of the seasonal component isusually known (or fixed) a priori and included in one or othertheoretical model of moving averages or autocorrelations (Jenkinsand Watts, 1968; Shumway, 1988; Wei, 1989). One approach is totreat the observed time series and the sine functions of all possible
Fig. 1. Map of KwaZulu-Natal to the north of Durban showing the major river catchments, their contribution to mean annual runoff (MAR) and the continental shelf to the 200 mdepth contour. The Thukela Banks fall within the area where the continental shelf widens known as the Natal Bight. The 17 rivers shown provide over 90% of the MAR entering thesea in the study area. Numbering from north to south corresponds to the ordering of the rivers shown on the right.
S.J. Lamberth et al. / Estuarine, Coastal and Shelf Science 84 (2009) 527–538 529
Author's personal copy
frequencies as the respective dependent and independent variablesof a linear multiple regression:
xt ! a0 "X
#akcos$lkt% " bksin$lkt%&
$for k ! 1 to q different sine and cosine functions%
where l is the frequency in radians per unit time and ak and bk areregression coefficients that indicate the strength of the correlation(StatSoft, Inc. 2005). If a large correlation (sine or cosine coefficient)is identified, it can be concluded that there is a strong periodicity ofthe respective frequency (or period) in the data.
To better understand the underlying relation between two setsof time series, we also used cross-spectral analysis, which uncoversthe correlations between two series at different frequencies(periods) based on their individual cycles. Briefly, cross-spectralanalysis is an extension of Single Spectrum (Fourier) Analysis to thesimultaneous analysis of two series. Both analyses were conductedwith STATISTICA, version 7.1 (StatSoft, Inc. 2005).
The GLMs were run using the direct monthly flow vs. cpue dataas well as with the lag-times associated with the highest cross-spectral densities from the spectral analysis. General LinearModels differ from multiple regression models in terms of thenumber of dependent variables that can be analysed and byallowing for linear transformations or linear combinations ofmultiple dependent variables. They also differ from multipleregression models in being able to provide a solution for thenormal equation when the dependant variables are not linearlyindependent. One can summarize the advantages of GLMs in twoways: 1. The random component can be something other thannormal, 2. It is possible to model a function of the mean. The GLMmodels were used to quantify the links between the time series.These analyses were also conducted with STATISTICA version 7.1(StatSoft, Inc. 2005).
For the GLMs the only species examined were those for whichcatches had been reported inmore than 50months over the 17-yearperiod, and lags corresponding to thehighest spectral densitieswereapplied to each catchment separately. The responses of king mack-erel Scomberomorus commerson, squaretail kob Argyrosomus thorpeiand slinger Chrysoblephus puniceus are discussed separately and inmore detail as exemplars of the patterns emerging.
3. Results
3.1. Catch composition
Over the period 1985–2001, 140 species, 60 of which can beregarded as important, were caught by the KZN linefishery, andapproximately 1235 tons were landed annually (Table 1). Therecreational and commercial sectors were responsible for 62% and38% of the value of this catch respectively. Some 90% of the catch,was however, contributed by 15 species. Of the commercial andrecreational catches, slinger Chrysoblephus puniceus, (3.8 & 31.1%respectively), king mackerel Scomberomorus commerson, (33.2 &3.4%), geelbek Atractoscion aequidens, (3.3 & 15.0%), yellowfin tunaThunnus albacares, (18.8 &1.3%), santer Cheimerius nufar, (2.4 &8.2%) and squaretail kob Argyrosomus thorpei, (3.9 & 7.2%) were themost important (Table 1).
The recreational and commercial sectors differed in thatScomberomorus commerson (33%) and Thunnus albacares (19%)provided the bulk of the recreational catch, whereas Chrysoblephuspuniceus (31%) and Atractoscion aequidens (15%) were the mostimportant commercial species. Overall, recreational fishers tendedto target the pelagic gamefish species, whereas the commercialfishers concentrated on the higher-value reef and shoaling species.
Chrysoblephus puniceus was commercially caught in equalnumbers throughout KZN comprising 31% and 36% of the overall
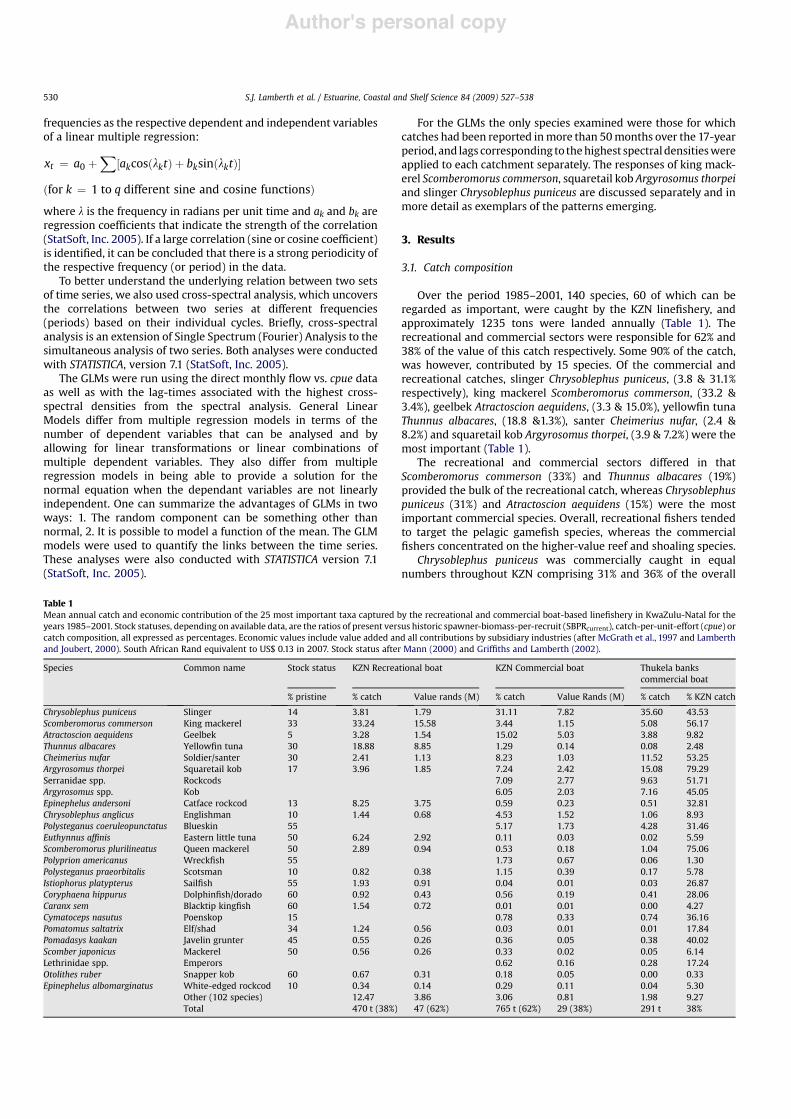
Table 1Mean annual catch and economic contribution of the 25 most important taxa captured by the recreational and commercial boat-based linefishery in KwaZulu-Natal for theyears 1985–2001. Stock statuses, depending on available data, are the ratios of present versus historic spawner-biomass-per-recruit (SBPRcurrent), catch-per-unit-effort (cpue) orcatch composition, all expressed as percentages. Economic values include value added and all contributions by subsidiary industries (after McGrath et al., 1997 and Lamberthand Joubert, 2000). South African Rand equivalent to US$ 0.13 in 2007. Stock status after Mann (2000) and Griffiths and Lamberth (2002).
Species Common name Stock status KZN Recreational boat KZN Commercial boat Thukela bankscommercial boat
% pristine % catch Value rands (M) % catch Value Rands (M) % catch % KZN catch
Chrysoblephus puniceus Slinger 14 3.81 1.79 31.11 7.82 35.60 43.53Scomberomorus commerson King mackerel 33 33.24 15.58 3.44 1.15 5.08 56.17Atractoscion aequidens Geelbek 5 3.28 1.54 15.02 5.03 3.88 9.82Thunnus albacares Yellowfin tuna 30 18.88 8.85 1.29 0.14 0.08 2.48Cheimerius nufar Soldier/santer 30 2.41 1.13 8.23 1.03 11.52 53.25Argyrosomus thorpei Squaretail kob 17 3.96 1.85 7.24 2.42 15.08 79.29Serranidae spp. Rockcods 7.09 2.77 9.63 51.71Argyrosomus spp. Kob 6.05 2.03 7.16 45.05Epinephelus andersoni Catface rockcod 13 8.25 3.75 0.59 0.23 0.51 32.81Chrysoblephus anglicus Englishman 10 1.44 0.68 4.53 1.52 1.06 8.93Polysteganus coeruleopunctatus Blueskin 55 5.17 1.73 4.28 31.46Euthynnus affinis Eastern little tuna 50 6.24 2.92 0.11 0.03 0.02 5.59Scomberomorus plurilineatus Queen mackerel 50 2.89 0.94 0.53 0.18 1.04 75.06Polyprion americanus Wreckfish 55 1.73 0.67 0.06 1.30Polysteganus praeorbitalis Scotsman 10 0.82 0.38 1.15 0.39 0.17 5.78Istiophorus platypterus Sailfish 55 1.93 0.91 0.04 0.01 0.03 26.87Coryphaena hippurus Dolphinfish/dorado 60 0.92 0.43 0.56 0.19 0.41 28.06Caranx sem Blacktip kingfish 60 1.54 0.72 0.01 0.01 0.00 4.27Cymatoceps nasutus Poenskop 15 0.78 0.33 0.74 36.16Pomatomus saltatrix Elf/shad 34 1.24 0.56 0.03 0.01 0.01 17.84Pomadasys kaakan Javelin grunter 45 0.55 0.26 0.36 0.05 0.38 40.02Scomber japonicus Mackerel 50 0.56 0.26 0.33 0.02 0.05 6.14Lethrinidae spp. Emperors 0.62 0.16 0.28 17.24Otolithes ruber Snapper kob 60 0.67 0.31 0.18 0.05 0.00 0.33Epinephelus albomarginatus White-edged rockcod 10 0.34 0.14 0.29 0.11 0.04 5.30
Other (102 species) 12.47 3.86 3.06 0.81 1.98 9.27Total 470 t (38%) 47 (62%) 765 t (62%) 29 (38%) 291 t 38%
S.J. Lamberth et al. / Estuarine, Coastal and Shelf Science 84 (2009) 527–538530
Author's personal copy
KZN and the Thukela Banks commercial linefish catches respec-tively (Table 1). Catch composition to the north and south ofDurban differed largely due to the bulk of the Argyrosomus thorpeicatch being taken to the north on the Thukela Banks whereit provided 15% as opposed to 7% of the overall commercialcatch (Table 1). Atractoscion aequidens provided 15% of the overallcommercial linefish catch but less than 4% of the Thukela Bankscatch to the north of Durban.
3.2. Catchment flows
During the time series September 1980–October 2001, the 17catchments analysed had a total mean annual runoff (MAR) of5'109 m3, 42% of which was contributed by the Thukela (Fig. 1).The Mfolozi (19%), Mvoti (8%) and Mgeni (8%) also contributedsubstantial proportions of the MAR whereas the remaining catch-ments provided less than 4% each (Fig. 1). Even collectively, the fourrivers flowing into St Lucia only provided 5% of the MAR. In mostyears, this volume of freshwater seldom reaches the sea as it firsthas to inundate the 40 000 ha extent of the lake system (Turpieet al., 2002). The Thukela, despite providing much of the MAR,sometimes closes to the sea and may experience zero flow in thewinter dry season. During the study period, monthly flow from theThukela varied from zero to a maximum of 1227'106 m3 duringthe 1984 wet season. In all, the Thukela, Mfolozi, Mlalazi, Matigulu,Mhlali, Mdloti, Mgeni and St Lucia (Mkhuze, Mzinene, Hluhluwe &Nyalazi) made significant contributions (p< 0.05) towards therelationship between flow and catch. These systems provided 85%of the mean annual runoff in KZN.
3.3. Spectral analysis
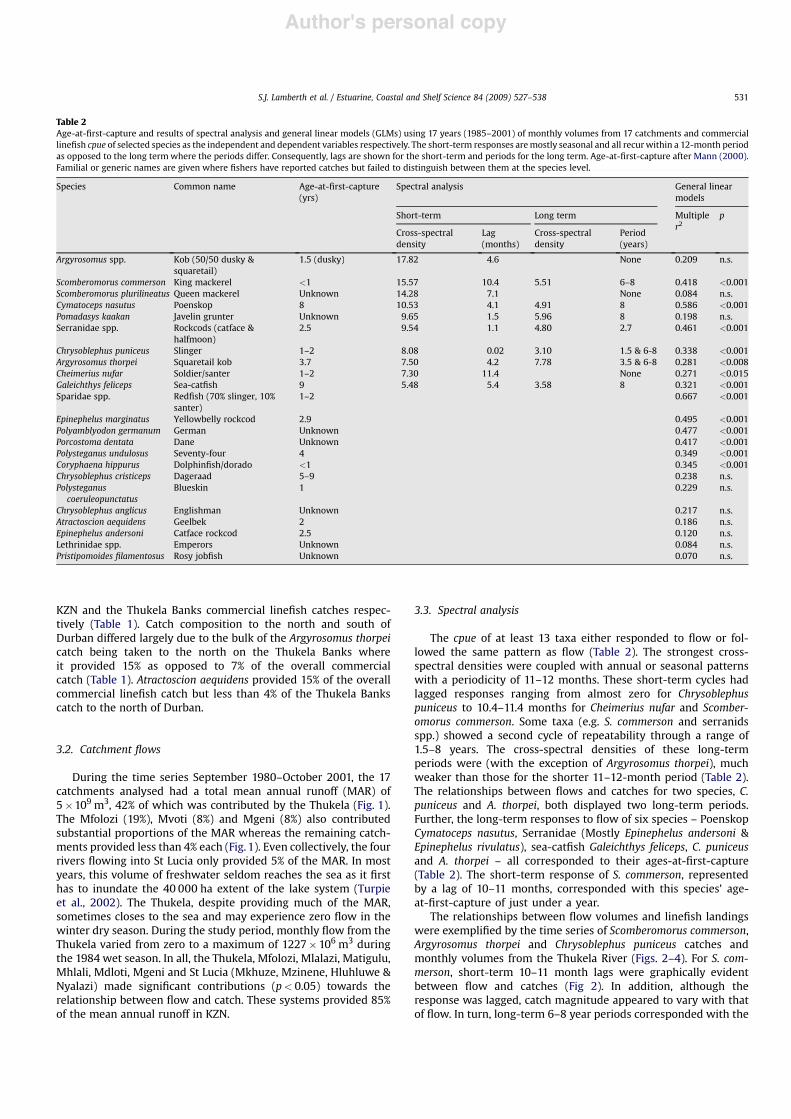
The cpue of at least 13 taxa either responded to flow or fol-lowed the same pattern as flow (Table 2). The strongest cross-spectral densities were coupled with annual or seasonal patternswith a periodicity of 11–12 months. These short-term cycles hadlagged responses ranging from almost zero for Chrysoblephuspuniceus to 10.4–11.4 months for Cheimerius nufar and Scomber-omorus commerson. Some taxa (e.g. S. commerson and serranidsspp.) showed a second cycle of repeatability through a range of1.5–8 years. The cross-spectral densities of these long-termperiods were (with the exception of Argyrosomus thorpei), muchweaker than those for the shorter 11–12-month period (Table 2).The relationships between flows and catches for two species, C.puniceus and A. thorpei, both displayed two long-term periods.Further, the long-term responses to flow of six species – PoenskopCymatoceps nasutus, Serranidae (Mostly Epinephelus andersoni &Epinephelus rivulatus), sea-catfish Galeichthys feliceps, C. puniceusand A. thorpei – all corresponded to their ages-at-first-capture(Table 2). The short-term response of S. commerson, representedby a lag of 10–11 months, corresponded with this species’ age-at-first-capture of just under a year.
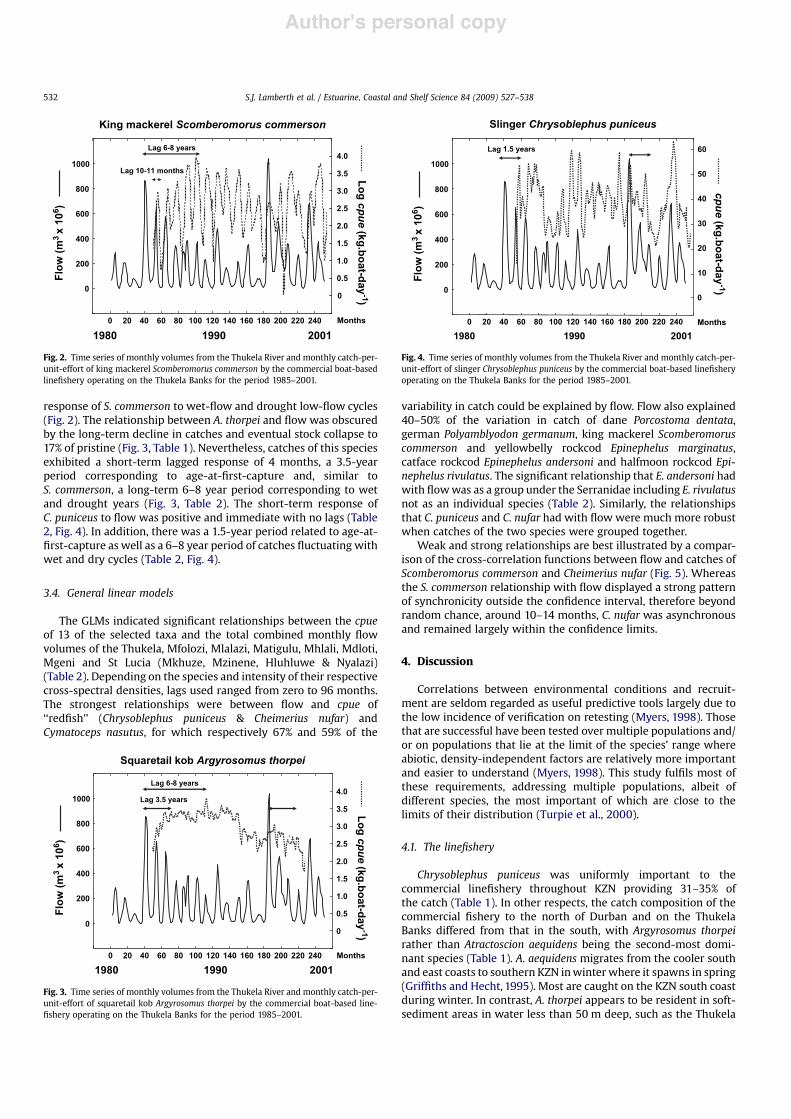
The relationships between flow volumes and linefish landingswere exemplified by the time series of Scomberomorus commerson,Argyrosomus thorpei and Chrysoblephus puniceus catches andmonthly volumes from the Thukela River (Figs. 2–4). For S. com-merson, short-term 10–11 month lags were graphically evidentbetween flow and catches (Fig 2). In addition, although theresponse was lagged, catch magnitude appeared to vary with thatof flow. In turn, long-term 6–8 year periods corresponded with the
Table 2Age-at-first-capture and results of spectral analysis and general linear models (GLMs) using 17 years (1985–2001) of monthly volumes from 17 catchments and commerciallinefish cpue of selected species as the independent and dependent variables respectively. The short-term responses aremostly seasonal and all recurwithin a 12-month periodas opposed to the long termwhere the periods differ. Consequently, lags are shown for the short-term and periods for the long term. Age-at-first-capture after Mann (2000).Familial or generic names are given where fishers have reported catches but failed to distinguish between them at the species level.
Species Common name Age-at-first-capture(yrs)
Spectral analysis General linearmodels
Short-term Long term Multipler2
p
Cross-spectraldensity
Lag(months)
Cross-spectraldensity
Period(years)
Argyrosomus spp. Kob (50/50 dusky &squaretail)
1.5 (dusky) 17.82 4.6 None 0.209 n.s.
Scomberomorus commerson King mackerel <1 15.57 10.4 5.51 6–8 0.418 <0.001Scomberomorus plurilineatus Queen mackerel Unknown 14.28 7.1 None 0.084 n.s.Cymatoceps nasutus Poenskop 8 10.53 4.1 4.91 8 0.586 <0.001Pomadasys kaakan Javelin grunter Unknown 9.65 1.5 5.96 8 0.198 n.s.Serranidae spp. Rockcods (catface &
halfmoon)2.5 9.54 1.1 4.80 2.7 0.461 <0.001
Chrysoblephus puniceus Slinger 1–2 8.08 0.02 3.10 1.5 & 6-8 0.338 <0.001Argyrosomus thorpei Squaretail kob 3.7 7.50 4.2 7.78 3.5 & 6-8 0.281 <0.008Cheimerius nufar Soldier/santer 1–2 7.30 11.4 None 0.271 <0.015Galeichthys feliceps Sea-catfish 9 5.48 5.4 3.58 8 0.321 <0.001Sparidae spp. Redfish (70% slinger, 10%
santer)1–2 0.667 <0.001
Epinephelus marginatus Yellowbelly rockcod 2.9 0.495 <0.001Polyamblyodon germanum German Unknown 0.477 <0.001Porcostoma dentata Dane Unknown 0.417 <0.001Polysteganus undulosus Seventy-four 4 0.349 <0.001Coryphaena hippurus Dolphinfish/dorado <1 0.345 <0.001Chrysoblephus cristiceps Dageraad 5–9 0.238 n.s.Polysteganus
coeruleopunctatusBlueskin 1 0.229 n.s.
Chrysoblephus anglicus Englishman Unknown 0.217 n.s.Atractoscion aequidens Geelbek 2 0.186 n.s.Epinephelus andersoni Catface rockcod 2.5 0.120 n.s.Lethrinidae spp. Emperors Unknown 0.084 n.s.Pristipomoides filamentosus Rosy jobfish Unknown 0.070 n.s.
S.J. Lamberth et al. / Estuarine, Coastal and Shelf Science 84 (2009) 527–538 531
Author's personal copy
response of S. commerson to wet-flow and drought low-flow cycles(Fig. 2). The relationship between A. thorpei and flow was obscuredby the long-term decline in catches and eventual stock collapse to17% of pristine (Fig. 3, Table 1). Nevertheless, catches of this speciesexhibited a short-term lagged response of 4 months, a 3.5-yearperiod corresponding to age-at-first-capture and, similar toS. commerson, a long-term 6–8 year period corresponding to wetand drought years (Fig. 3, Table 2). The short-term response ofC. puniceus to flow was positive and immediate with no lags (Table2, Fig. 4). In addition, there was a 1.5-year period related to age-at-first-capture as well as a 6–8 year period of catches fluctuating withwet and dry cycles (Table 2, Fig. 4).
3.4. General linear models
The GLMs indicated significant relationships between the cpueof 13 of the selected taxa and the total combined monthly flowvolumes of the Thukela, Mfolozi, Mlalazi, Matigulu, Mhlali, Mdloti,Mgeni and St Lucia (Mkhuze, Mzinene, Hluhluwe & Nyalazi)(Table 2). Depending on the species and intensity of their respectivecross-spectral densities, lags used ranged from zero to 96 months.The strongest relationships were between flow and cpue of‘‘redfish’’ (Chrysoblephus puniceus & Cheimerius nufar) andCymatoceps nasutus, for which respectively 67% and 59% of the
variability in catch could be explained by flow. Flow also explained40–50% of the variation in catch of dane Porcostoma dentata,german Polyamblyodon germanum, king mackerel Scomberomoruscommerson and yellowbelly rockcod Epinephelus marginatus,catface rockcod Epinephelus andersoni and halfmoon rockcod Epi-nephelus rivulatus. The significant relationship that E. andersoni hadwith flowwas as a group under the Serranidae including E. rivulatusnot as an individual species (Table 2). Similarly, the relationshipsthat C. puniceus and C. nufar had with flow were much more robustwhen catches of the two species were grouped together.
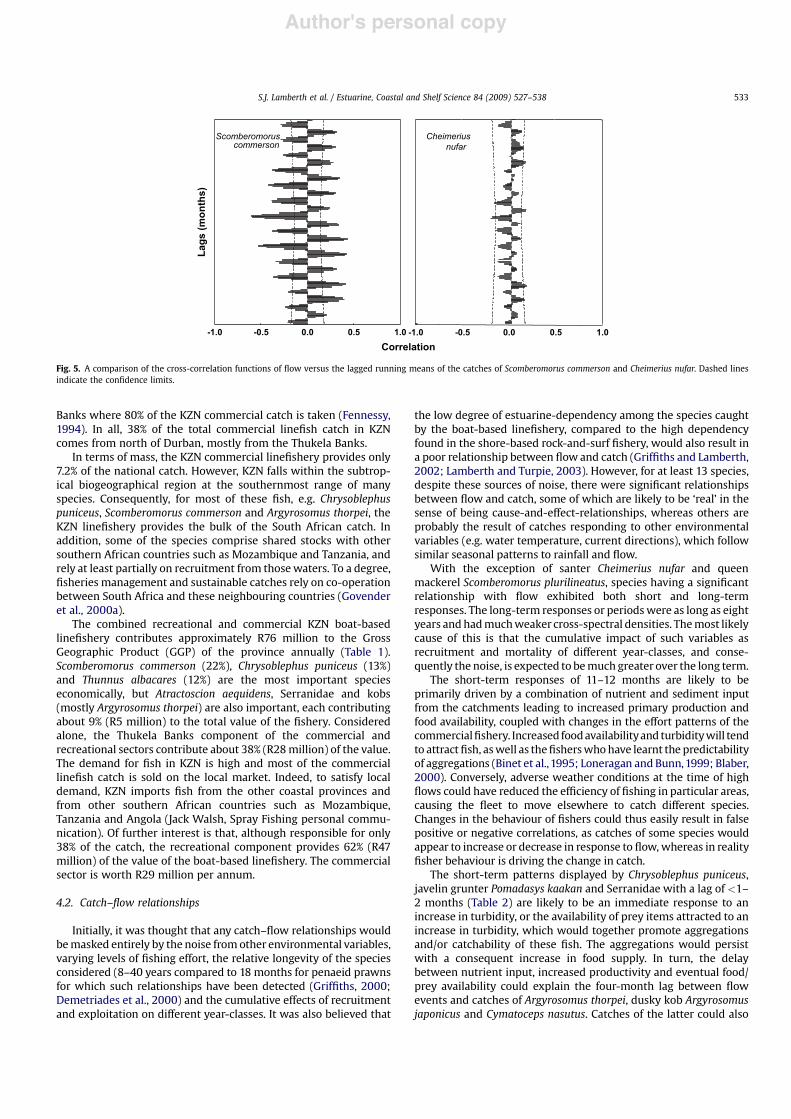
Weak and strong relationships are best illustrated by a compar-ison of the cross-correlation functions between flow and catches ofScomberomorus commerson and Cheimerius nufar (Fig. 5). Whereasthe S. commerson relationship with flow displayed a strong patternof synchronicity outside the confidence interval, therefore beyondrandom chance, around 10–14 months, C. nufar was asynchronousand remained largely within the confidence limits.
4. Discussion
Correlations between environmental conditions and recruit-ment are seldom regarded as useful predictive tools largely due tothe low incidence of verification on retesting (Myers, 1998). Thosethat are successful have been tested over multiple populations and/or on populations that lie at the limit of the species’ range whereabiotic, density-independent factors are relatively more importantand easier to understand (Myers, 1998). This study fulfils most ofthese requirements, addressing multiple populations, albeit ofdifferent species, the most important of which are close to thelimits of their distribution (Turpie et al., 2000).
4.1. The linefishery
Chrysoblephus puniceus was uniformly important to thecommercial linefishery throughout KZN providing 31–35% ofthe catch (Table 1). In other respects, the catch composition of thecommercial fishery to the north of Durban and on the ThukelaBanks differed from that in the south, with Argyrosomus thorpeirather than Atractoscion aequidens being the second-most domi-nant species (Table 1). A. aequidens migrates from the cooler southand east coasts to southern KZN inwinter where it spawns in spring(Griffiths and Hecht, 1995). Most are caught on the KZN south coastduring winter. In contrast, A. thorpei appears to be resident in soft-sediment areas in water less than 50 m deep, such as the Thukela
0 20 40 60 80 100 120 140 160 180 200 220 240
0
200
400
600
800
1000
0
0.5
1.0
1.5
2.0
2.5
3.0
3.5
4.0
Lo
g c
pu
e (
kg
.bo
at-d
ay
-1)
Flo
w (
m3
x 1
06)
1980 20011990
King mackerel Scomberomorus commerson
Lag 10-11 months
Lag 6-8 years
Months
Fig. 2. Time series of monthly volumes from the Thukela River and monthly catch-per-unit-effort of king mackerel Scomberomorus commerson by the commercial boat-basedlinefishery operating on the Thukela Banks for the period 1985–2001.
0 20 40 60 80 100 120 140 160 180 200 220 240
1980 20011990
Squaretail kob Argyrosomus thorpei
Lag 3.5 years
Lag 6-8 years
0
0.5
1.0
1.5
2.0
2.5
3.0
3.5
4.0
Lo
g c
pu
e (
kg
.bo
at-d
ay
-1)
Months
0
200
400
600
800
1000
Flo
w (
m3
x 1
06)
Fig. 3. Time series of monthly volumes from the Thukela River and monthly catch-per-unit-effort of squaretail kob Argyrosomus thorpei by the commercial boat-based line-fishery operating on the Thukela Banks for the period 1985–2001.
10
20
30
40
50
60
0 20 40 60 80 100 120 140 160 180 200 220 240
0
1980 20011990
Slinger Chrysoblephus puniceus
Lag 1.5 years
0
200
400
600
800
1000
Flo
w (
m3
x 1
06)
cp
ue (
kg
.bo
at-d
ay
-1)
Months
Fig. 4. Time series of monthly volumes from the Thukela River and monthly catch-per-unit-effort of slinger Chrysoblephus puniceus by the commercial boat-based linefisheryoperating on the Thukela Banks for the period 1985–2001.
S.J. Lamberth et al. / Estuarine, Coastal and Shelf Science 84 (2009) 527–538532
Author's personal copy
Banks where 80% of the KZN commercial catch is taken (Fennessy,1994). In all, 38% of the total commercial linefish catch in KZNcomes from north of Durban, mostly from the Thukela Banks.
In terms of mass, the KZN commercial linefishery provides only7.2% of the national catch. However, KZN falls within the subtrop-ical biogeographical region at the southernmost range of manyspecies. Consequently, for most of these fish, e.g. Chrysoblephuspuniceus, Scomberomorus commerson and Argyrosomus thorpei, theKZN linefishery provides the bulk of the South African catch. Inaddition, some of the species comprise shared stocks with othersouthern African countries such as Mozambique and Tanzania, andrely at least partially on recruitment from thosewaters. To a degree,fisheries management and sustainable catches rely on co-operationbetween South Africa and these neighbouring countries (Govenderet al., 2000a).
The combined recreational and commercial KZN boat-basedlinefishery contributes approximately R76 million to the GrossGeographic Product (GGP) of the province annually (Table 1).Scomberomorus commerson (22%), Chrysoblephus puniceus (13%)and Thunnus albacares (12%) are the most important specieseconomically, but Atractoscion aequidens, Serranidae and kobs(mostly Argyrosomus thorpei) are also important, each contributingabout 9% (R5 million) to the total value of the fishery. Consideredalone, the Thukela Banks component of the commercial andrecreational sectors contribute about 38% (R28million) of the value.The demand for fish in KZN is high and most of the commerciallinefish catch is sold on the local market. Indeed, to satisfy localdemand, KZN imports fish from the other coastal provinces andfrom other southern African countries such as Mozambique,Tanzania and Angola (Jack Walsh, Spray Fishing personal commu-nication). Of further interest is that, although responsible for only38% of the catch, the recreational component provides 62% (R47million) of the value of the boat-based linefishery. The commercialsector is worth R29 million per annum.
4.2. Catch–flow relationships
Initially, it was thought that any catch–flow relationships wouldbemasked entirely by the noise from other environmental variables,varying levels of fishing effort, the relative longevity of the speciesconsidered (8–40 years compared to 18 months for penaeid prawnsfor which such relationships have been detected (Griffiths, 2000;Demetriades et al., 2000) and the cumulative effects of recruitmentand exploitation on different year-classes. It was also believed that
the low degree of estuarine-dependency among the species caughtby the boat-based linefishery, compared to the high dependencyfound in the shore-based rock-and-surf fishery, would also result ina poor relationship between flow and catch (Griffiths and Lamberth,2002; Lamberth and Turpie, 2003). However, for at least 13 species,despite these sources of noise, there were significant relationshipsbetween flow and catch, some of which are likely to be ‘real’ in thesense of being cause-and-effect-relationships, whereas others areprobably the result of catches responding to other environmentalvariables (e.g. water temperature, current directions), which followsimilar seasonal patterns to rainfall and flow.
With the exception of santer Cheimerius nufar and queenmackerel Scomberomorus plurilineatus, species having a significantrelationship with flow exhibited both short and long-termresponses. The long-term responses or periodswere as long as eightyears andhadmuchweaker cross-spectral densities. Themost likelycause of this is that the cumulative impact of such variables asrecruitment and mortality of different year-classes, and conse-quently the noise, is expected to bemuch greater over the long term.
The short-term responses of 11–12 months are likely to beprimarily driven by a combination of nutrient and sediment inputfrom the catchments leading to increased primary production andfood availability, coupled with changes in the effort patterns of thecommercialfishery. Increased foodavailabilityand turbiditywill tendto attract fish, aswell as thefisherswhohave learnt the predictabilityof aggregations (Binet et al.,1995; Loneragan and Bunn,1999; Blaber,2000). Conversely, adverse weather conditions at the time of highflows could have reduced the efficiency of fishing in particular areas,causing the fleet to move elsewhere to catch different species.Changes in the behaviour of fishers could thus easily result in falsepositive or negative correlations, as catches of some species wouldappear to increase or decrease in response to flow,whereas in realityfisher behaviour is driving the change in catch.
The short-term patterns displayed by Chrysoblephus puniceus,javelin grunter Pomadasys kaakan and Serranidae with a lag of <1–2 months (Table 2) are likely to be an immediate response to anincrease in turbidity, or the availability of prey items attracted to anincrease in turbidity, which would together promote aggregationsand/or catchability of these fish. The aggregations would persistwith a consequent increase in food supply. In turn, the delaybetween nutrient input, increased productivity and eventual food/prey availability could explain the four-month lag between flowevents and catches of Argyrosomus thorpei, dusky kob Argyrosomusjaponicus and Cymatoceps nasutus. Catches of the latter could also
-1.0 -0.5 0.0 0.5 1.0-1.0 -0.5 0.0 0.5 1.0
Scomberomorus
commerson
Cheimerius
nufar
Correlation
Lag
s (
mo
nth
s)
Fig. 5. A comparison of the cross-correlation functions of flow versus the lagged running means of the catches of Scomberomorus commerson and Cheimerius nufar. Dashed linesindicate the confidence limits.
S.J. Lamberth et al. / Estuarine, Coastal and Shelf Science 84 (2009) 527–538 533
Author's personal copy
coincide with an annual spawning migration to KZN, but thiscannot be verified in the absence of size-frequency data (Buxtonand Clarke, 1989). Cpue of Scomberomorus commerson and Chei-merius nufar responded to flow events with a lag of 10–12 months.The age-at-first-capture of both these species ranges from <1 to 2years which suggests that the lag could represent recruitment intothe fishery after the previous years’ wet season provided suitableconditions or cues for successful spawning and egg, larval andjuvenile survival (Coetzee and Baird, 1981; Govender et al., 2000a).
Longer-term responses to flow, with periods of 6–8 years, wereevident for Pomadasys kaakan, Scomberomorus commerson,Cymatoceps nasutus,Galeichthys feliceps, Chrysoblephus puniceus andArgyrosomus thorpei. For these species, it appears that the catchesare fluctuating according to long-term wet and dry cycles, catchesbeing higher following wet years. The age-at-first-capture (and 50%sexual maturity) of C. nasutus andG. feliceps ranges between 8 and 9years, which hints that the life history of these two species may beadapted to optimise the benefits ofwet cycles. In addition,G. felicepsis an estuarine-dependent, paternalistic mouth brooder thatmigrates into estuaries and turbid inshorewaters during themouth-brooding phase (Tilney and Mann, 2000; Wilhem and Griffiths,2000). Access to estuaries (especially temporarily open systems),and consequently breeding success, is likely to be greaterduringwetyears. This said, longevity alone could be an adaptation to prolongedperiods of negative stress punctuated by infrequent good yearsconducive to breeding success.
Analysis of flow and the cpue of Serranidae, Chrysoblephuspuniceus and Argyrosomus thorpei revealed periods that more orless corresponded with their age-at-first-capture into the fishery.The age-at-first-capture of 3.7 years for A. thorpei corresponds witha catch versus flow period of 3.5 years (Table 2). The age-at-first-capture of 2.5 years for the Serranidae (mostly Epinephelusandersoni and Epinephelus rivulatus) corresponds well with a periodof 2.7 years, whereas that of C. puniceus (1–2 years) falls within thecatch versus flow period of 1.5 years. Although the cross-spectraldensities for all three were weak, there appeared to be a long-termrelationship between flow events and cpue, with wet yearsproviding suitable conditions for spawning and survival andeventual later recruitment into the fishery. The weak cross-spectraldensities are to be expected, given the cumulative impact of fisheryeffects and environmental factors other than flow on catches.
Overall, with the exception of Scomberomorus commerson, thestrongest relationships were for reef species that show a highdegree of residency and are unlikely to move much in response toenvironmental changes. Argyrosomus thorpei and Cheimerius nufar,although resident, are nomadic within the confines of the ThukelaBanks. This may partially explain why only 28% of the variation intheir catches could be attributed to flow. The same probably holdsfor the migratory Polysteganus undulosus and nomadic Galeichthysfeliceps for which respectively only 35 and 32% of the variation incatch could be explained by flow (Garret, 1988; Tilney and Mann,2000; Wilhem and Griffiths, 2000).
4.3. Freshwater reserves and catches
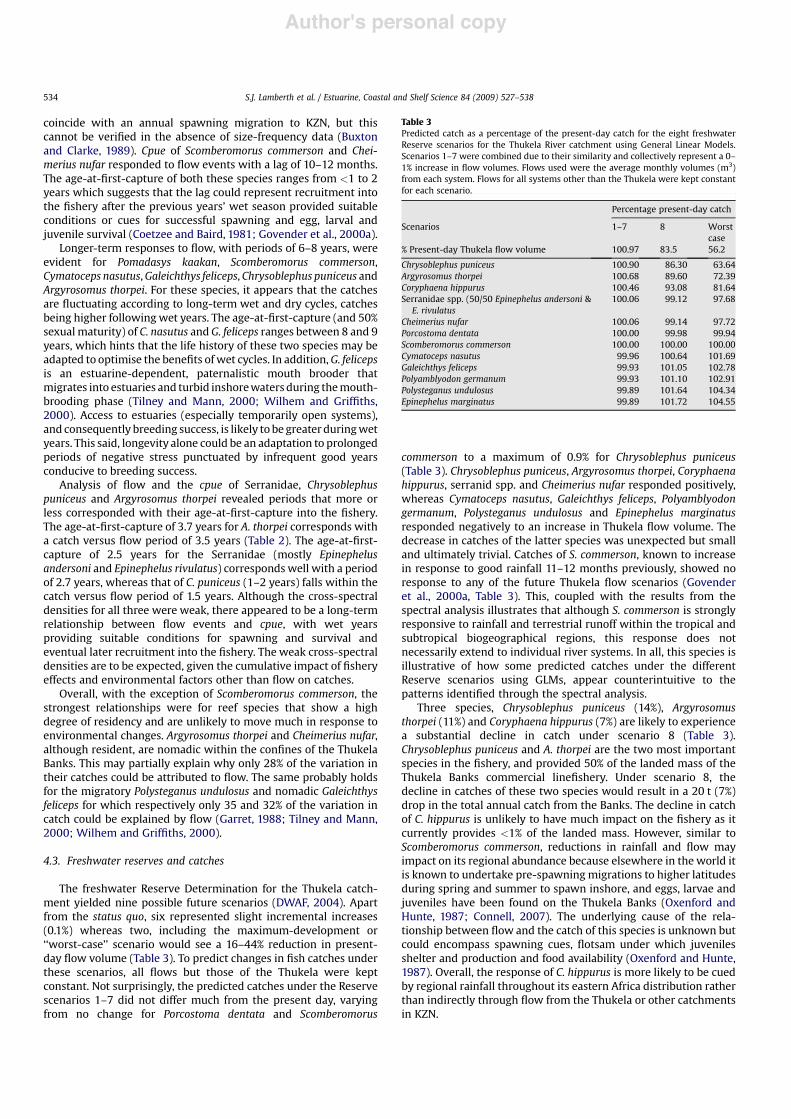
The freshwater Reserve Determination for the Thukela catch-ment yielded nine possible future scenarios (DWAF, 2004). Apartfrom the status quo, six represented slight incremental increases(0.1%) whereas two, including the maximum-development or‘‘worst-case’’ scenario would see a 16–44% reduction in present-day flow volume (Table 3). To predict changes in fish catches underthese scenarios, all flows but those of the Thukela were keptconstant. Not surprisingly, the predicted catches under the Reservescenarios 1–7 did not differ much from the present day, varyingfrom no change for Porcostoma dentata and Scomberomorus
commerson to a maximum of 0.9% for Chrysoblephus puniceus(Table 3). Chrysoblephus puniceus, Argyrosomus thorpei, Coryphaenahippurus, serranid spp. and Cheimerius nufar responded positively,whereas Cymatoceps nasutus, Galeichthys feliceps, Polyamblyodongermanum, Polysteganus undulosus and Epinephelus marginatusresponded negatively to an increase in Thukela flow volume. Thedecrease in catches of the latter species was unexpected but smalland ultimately trivial. Catches of S. commerson, known to increasein response to good rainfall 11–12 months previously, showed noresponse to any of the future Thukela flow scenarios (Govenderet al., 2000a, Table 3). This, coupled with the results from thespectral analysis illustrates that although S. commerson is stronglyresponsive to rainfall and terrestrial runoff within the tropical andsubtropical biogeographical regions, this response does notnecessarily extend to individual river systems. In all, this species isillustrative of how some predicted catches under the differentReserve scenarios using GLMs, appear counterintuitive to thepatterns identified through the spectral analysis.
Three species, Chrysoblephus puniceus (14%), Argyrosomusthorpei (11%) and Coryphaena hippurus (7%) are likely to experiencea substantial decline in catch under scenario 8 (Table 3).Chrysoblephus puniceus and A. thorpei are the two most importantspecies in the fishery, and provided 50% of the landed mass of theThukela Banks commercial linefishery. Under scenario 8, thedecline in catches of these two species would result in a 20 t (7%)drop in the total annual catch from the Banks. The decline in catchof C. hippurus is unlikely to have much impact on the fishery as itcurrently provides <1% of the landed mass. However, similar toScomberomorus commerson, reductions in rainfall and flow mayimpact on its regional abundance because elsewhere in the world itis known to undertake pre-spawningmigrations to higher latitudesduring spring and summer to spawn inshore, and eggs, larvae andjuveniles have been found on the Thukela Banks (Oxenford andHunte, 1987; Connell, 2007). The underlying cause of the rela-tionship between flow and the catch of this species is unknown butcould encompass spawning cues, flotsam under which juvenilesshelter and production and food availability (Oxenford and Hunte,1987). Overall, the response of C. hippurus is more likely to be cuedby regional rainfall throughout its eastern Africa distribution ratherthan indirectly through flow from the Thukela or other catchmentsin KZN.
Table 3Predicted catch as a percentage of the present-day catch for the eight freshwaterReserve scenarios for the Thukela River catchment using General Linear Models.Scenarios 1–7 were combined due to their similarity and collectively represent a 0–1% increase in flow volumes. Flows used were the average monthly volumes (m3)from each system. Flows for all systems other than the Thukela were kept constantfor each scenario.
Percentage present-day catch
Scenarios 1–7 8 Worstcase
% Present-day Thukela flow volume 100.97 83.5 56.2
Chrysoblephus puniceus 100.90 86.30 63.64Argyrosomus thorpei 100.68 89.60 72.39Coryphaena hippurus 100.46 93.08 81.64Serranidae spp. (50/50 Epinephelus andersoni &
E. rivulatus100.06 99.12 97.68
Cheimerius nufar 100.06 99.14 97.72Porcostoma dentata 100.00 99.98 99.94Scomberomorus commerson 100.00 100.00 100.00Cymatoceps nasutus 99.96 100.64 101.69Galeichthys feliceps 99.93 101.05 102.78Polyamblyodon germanum 99.93 101.10 102.91Polysteganus undulosus 99.89 101.64 104.34Epinephelus marginatus 99.89 101.72 104.55
S.J. Lamberth et al. / Estuarine, Coastal and Shelf Science 84 (2009) 527–538534
Author's personal copy
Under the ‘‘worst-case’’ scenario, catches of Chrysoblephuspuniceus, Argyrosomus thorpei and Coryphaena hippurus are forecastto decline by 36, 28 and 18% respectively (Table 3). This equates toa 50 t (17%) reduction in the total landed catch of the commerciallinefishery from the Thukela Banks (Table 1). Similar to scenario 8,reductions in flow may alter the distribution and abundance ofC. hippurus, but these changes are unlikely to have much impact onthe viability of the commercial linefishery. Catches of the Serrani-dae and Cheimerius nufar will undergo a 2% decline. On the otherhand, predicted catches of Cymatoceps nasutus, Galeichthys feliceps,Polyamblyodon germanum, Polysteganus undulosus and Epinephelusmarginatus will be 1–5% greater than present day. These are alllikely to be an artefact of an immediate drop in cpue usuallyexperienced at the time of high flows (0 lag) when rain and seaconditions make fishing difficult. Consequently, a modelleddecrease in flows will appear to have the effect of increasingcatches, even though poor fishing conditions persist. This problemis compounded by the short-term responses (0 lag) having muchless noise, and therefore appearing a lot stronger than the longer-term (1–36 month lag) responses.
Overall, under the worst-case scenario, and despite the pre-dicted increase in the cpue of some species, there is likely to bea 20% reduction in the total landed catch of the Thukela Bankscommercial linefishery. This would be largely due to the two maintarget species of the fishery, Chrysoblephus puniceus andArgyrosomus thorpei, exhibiting the strongest negative responses toa decline in river flow. Increased catches of those speciesresponding positively to a reduction in flow are trivial, probablywithin normal variability and unlikely to compensate for those lost.Most of the species that may increase either occur naturally in lowabundance, and/or have already been fished down to such anextent that attainment of sufficient increases in cpue to offset lossesis highly unlikely.
4.4. Responses of individual species
Consideration of three species constituting the bulk of the catchand for which more detailed information exists casts light on thelikely mechanisms in operation.
4.4.1. King mackerel Scomberomorus commersonScomberomorus commerson is a widespread Indo-Pacific species
with a southern African stock extending from Mozambique intoKwaZulu-Natal waters through to Mossel Bay on the south coast ofSouth Africa (Govender et al., 2000a; Heemstra and Heemstra,2004). Spawning is thought to occur off Mozambique in summerfrom November-March. The summer feeding-migration of adultsinto KZN waters mostly comprises immature fish <2 years of age(Govender et al., 2000a). It is the most important species in the KZNrecreational boat fishery where it provides 33% of the catch,although it makes up only 3% of the commercial linefish catch(Table 1). However, the Thukela Banks commercial linefisheryconstitutes 56% of the national catch of this species.
Scomberomorus commerson appear to respond to flowwith a lagof 10.4months and to follow thewet and dry cycles with a period of6–8 years (Table 2, Fig. 2). Using GLMs, the correlation betweenmonthly flows and catch was significant although only 42% of thevariation in catch was explained by flow. The predicted absence ofany change in catchwith reduced flows of the Thukela (Table 3) wasat firsthand counterintuitive, given the negative response expectedfrom the spectral analysis and from what could be inferred fromFig. 2. However, considering that this species had a significantrelationship with the combined flows from all catchments and notthat of the Thukela alone, then the absence of any response to flowreductions in the Thukela specifically becomes understandable.
The apparent 10.4 month response of Scomberomorus commer-son to higher flows as well as the correlation of catches with theThukela and other systems in KZN are likely to be artefactsreflecting responses of this species to conditions in Mozambiquerather than in KZN. High rainfalls and the input of freshwater intothe marine environment off Mozambique where S. commersonbreeds will provide good conditions for spawning and larvalsurvival there (Govender et al., 2000a,b). This is likely to result ingood catches when this fast-growing fish recruits into the fishery inKZN one year later (Govender et al., 2000a,b). Ultimately, goodcatches in KZN will rely on flows in Mozambique, not KZN, and thecorrelation between flows and catch in KZN is likely to be aby-product of the two regions falling within the same biogeo-graphical zone and experiencing a similar rainfall pattern. Thiswould also explain the low r2 value obtained for this species.
In the medium-term, within a particular season, any enhancedproduction associated with higher flows in KZN could influencecatches as Scomberomorus commerson migrates south and movesonto the Thukela Banks in response to increased prey availability. Inthe short-term (0 lag), the weather and fishing conditions associ-ated with higher flows could see a decline in cpue. This may be anadditional reason why the predicted response of S. commerson toflow reduction was relatively weak even when all the catchmentswere considered. Overall, reductions in flow from the Thukela orother catchments in KZN are unlikely to have much impact on thecatches of this species as the major factors driving recruitment intothe fishery depend on conditions in Mozambique.
4.4.2. Squaretail kob Argyrosomus thorpeiArgyrosomus thorpei is endemic to southern Africa with a range
extending fromMozambique to Algoa Bay in the southeastern Capeof South Africa (Heemstra and Heemstra, 2004). It is fairly residentin particular areas with the adults associated with rocky reefs andthe juveniles with soft sediments in water <50 m deep (Fennessy,1994). Age-at-first-capture is 3.7 years (Fennessy et al., 2000).The bulk of the national catch (99%) is landed in KZN, whereA. thorpei provides 4 and 7% of the recreational and commerciallinefish catches respectively (Table 1). On the Thukela Banks it isthe second-most important species and provides 15% of thecommercial catch. It also comprises a significant proportion of thebycatch in the prawn trawl fishery (Fennessy, 1994). Historically,A. thorpei comprised 37% of the total KZN commercial catch but thishas since declined to 4–5% and the stock is regarded as collapsed(Fennessy, 1994).
Argyrosomus thorpei responded to flowwith a lag of 4.2 months,and cpue followed the wet and dry cycles with a period of 6–8 years(Table 2, Fig 3). Catches also exhibited a response to flow witha period of 3.5 years that corresponds to the age-at-first-capture of3.7 years (Fennessy et al., 2000). Using GLMs, the response to flowwas significant but weak with only 28% of the variation in catchbeing explained by flow.
In the short-term (0 lag), the negative response of Argyrosomusthorpei cpue to higher flows was probably due to deterioratingfishing conditions at the time and/or due to fisher behaviour withthe fleet fishing elsewhere for more lucrative catches. A positiveshort-term response to increased flow occurred at a 4-month lagand may be due to nutrient input, production and an increase inprey availability. It may also partially be due to fishers targeting thisspecies where there is a known increase in availability orcatchability.
Spawning of Argyrosomus thorpei occurs from June-Septemberon the Thukela Banks (Fennessy et al., 2000). Higher flows in thefollowing summer months and associated increases in nutrients,production and turbidity are all conducive to larval and juvenilesurvival. Consequently, a good rainfall year is likely to have
S.J. Lamberth et al. / Estuarine, Coastal and Shelf Science 84 (2009) 527–538 535
Author's personal copy
a positive impact on recruitment into the fishery 3.5 years later.This response was apparent from the spectral analysis but therelationship was weak according to the GLM, probably due to thecumulative noise arising from the varying strengths of multipleyear-classes and flow events that occur between the flow event andthe time when the response is measured 3 years later. In addition,the relationship is likely to have been further weakened by the 90%reduction in cpue and the collapse of the stock that has occurredover the last 10 years or more (Fennessy, 1994).
Overall, despite the noise, flow from the Thukela River and otherKZN catchments, especially the Mfolozi and St Lucia appears tohave a significant impact on the catch of Argyrosomus thorpei witha reduction in catch of 28% predicted under the worst-casescenario.
4.4.3. Slinger Chrysoblephus puniceusChrysoblephus puniceus is a protogynous hermaphroditic
reef-dwelling sparid endemic to the eastern coast of Africa fromsouthern Mozambique to KZN and northern Transkei (Garratt,1985). Adult C. puniceus >4 years old are fairly sedentary whereasyounger fish may migrate northwards from KZN to Mozambique(Buxton, 1992; Punt et al., 1993). Juveniles and adults are abundanton reefs from the 12 to 100 m depth contours (Govender et al.,2000b; Mann et al., 2000). Age-at-first-capture is between 1 and 2years, corresponding to the age attained at its minimum size of250 mm, whereas age at 50% maturity is 3 years (Garratt et al.,1993). Chrysoblephus puniceus is the most important species in theKZN commercial linefishery with nearly half of the catch beingtaken to the north of Durban on the Thukela Banks (Table 1).However, reductions in mean size, skewed sex ratios anda spawner-biomass-per-recruit ratio of 14–16% of pristine areindicative of a collapsed stock (Punt et al., 1993; Garratt et al., 1993).
Chrysoblephus puniceus cpue exhibited longer-term cycles of 1.5and 6–8 years corresponding to age-at-first-capture and wet anddrought cycles respectively (Garratt et al., 1993, Table 2, Fig. 4).Similar to Argyrosomus thorpei, the cross-spectral densities werehigh and the relationships significant, with flow explaining 34% ofthe variation in catch. In contrast to most other linefish species, theminimum size and consequently age-at-first-capture of C. puniceusis set at approximately half the age at 50% maturity. The fact thatthe flow response of C. puniceus corresponds to the ‘‘artificially set’’1.5 year age-at-first-capture and not the 3.5 year age at 50%maturity strengthens the argument that the relationship with flow(or related environmental variables) is real and not an artefact ofthe species’ life-history characteristics.
In the short-term, the response of Chrysoblephus puniceus toflow was positive and instantaneous with zero-lag (Table 2, Fig 4).This may be a result of a change in fleet behaviour with weatherconditions causing fishers to move elsewhere. However, there is noevidence, anecdotal or otherwise, to substantiate this line ofargument. In all, catches were strongly seasonal and patternsmarkedly similar to those of flow (Fig. 4).
5. Conclusions
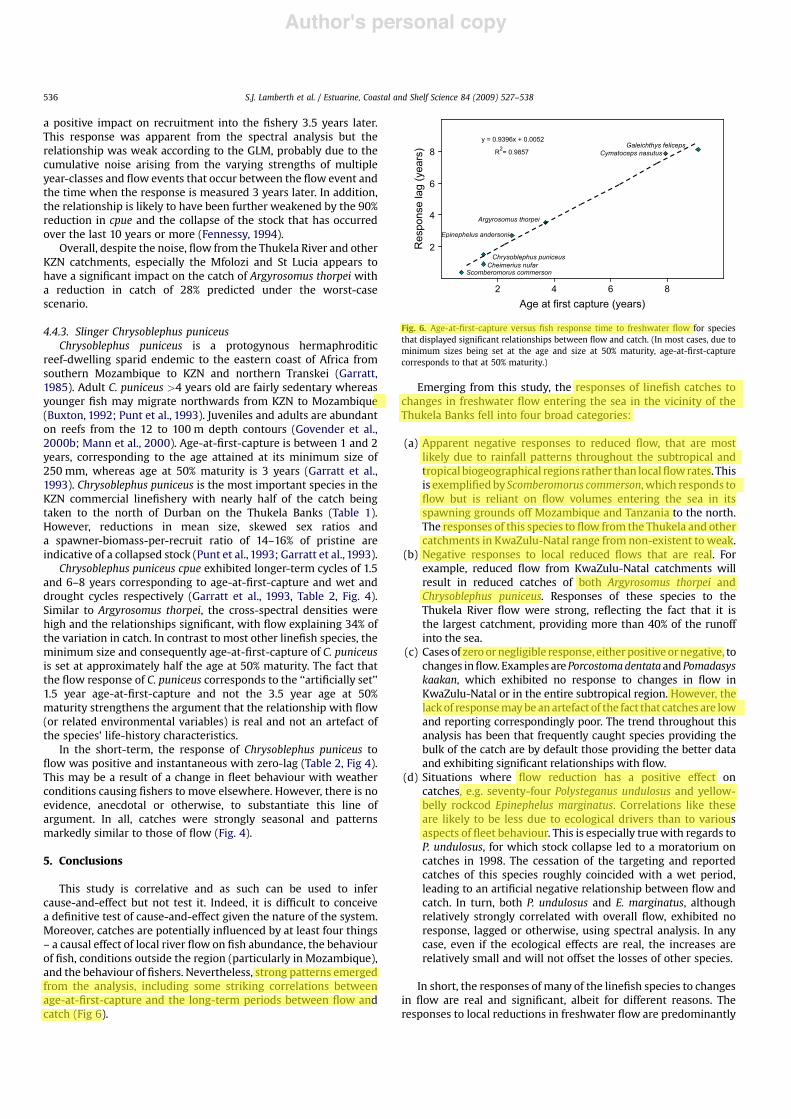
This study is correlative and as such can be used to infercause-and-effect but not test it. Indeed, it is difficult to conceivea definitive test of cause-and-effect given the nature of the system.Moreover, catches are potentially influenced by at least four things– a causal effect of local river flow on fish abundance, the behaviourof fish, conditions outside the region (particularly in Mozambique),and the behaviour of fishers. Nevertheless, strong patterns emergedfrom the analysis, including some striking correlations betweenage-at-first-capture and the long-term periods between flow andcatch (Fig 6).
Emerging from this study, the responses of linefish catches tochanges in freshwater flow entering the sea in the vicinity of theThukela Banks fell into four broad categories:
(a) Apparent negative responses to reduced flow, that are mostlikely due to rainfall patterns throughout the subtropical andtropical biogeographical regions rather than localflowrates. Thisis exemplifiedby Scomberomorus commerson, which responds toflow but is reliant on flow volumes entering the sea in itsspawning grounds off Mozambique and Tanzania to the north.The responses of this species to flow from the Thukela and othercatchments in KwaZulu-Natal range from non-existent to weak.
(b) Negative responses to local reduced flows that are real. Forexample, reduced flow from KwaZulu-Natal catchments willresult in reduced catches of both Argyrosomus thorpei andChrysoblephus puniceus. Responses of these species to theThukela River flow were strong, reflecting the fact that it isthe largest catchment, providing more than 40% of the runoffinto the sea.
(c) Cases of zeroornegligible response, eitherpositive ornegative, tochanges inflow. Examples arePorcostomadentataandPomadasyskaakan, which exhibited no response to changes in flow inKwaZulu-Natal or in the entire subtropical region. However, thelackof responsemaybeanartefact of the fact that catches are lowand reporting correspondingly poor. The trend throughout thisanalysis has been that frequently caught species providing thebulk of the catch are by default those providing the better dataand exhibiting significant relationships with flow.
(d) Situations where flow reduction has a positive effect oncatches, e.g. seventy-four Polysteganus undulosus and yellow-belly rockcod Epinephelus marginatus. Correlations like theseare likely to be less due to ecological drivers than to variousaspects of fleet behaviour. This is especially truewith regards toP. undulosus, for which stock collapse led to a moratorium oncatches in 1998. The cessation of the targeting and reportedcatches of this species roughly coincided with a wet period,leading to an artificial negative relationship between flow andcatch. In turn, both P. undulosus and E. marginatus, althoughrelatively strongly correlated with overall flow, exhibited noresponse, lagged or otherwise, using spectral analysis. In anycase, even if the ecological effects are real, the increases arerelatively small and will not offset the losses of other species.
In short, the responses of many of the linefish species to changesin flow are real and significant, albeit for different reasons. Theresponses to local reductions in freshwater flow are predominantly
y = 0.9396x + 0.0052
R2= 0.9857
2
4
6
8
2 4 6 8
Scomberomorus commerson
Cymatoceps nasutus
Epinephelus andersoni
Argyrosomus thorpei
Cheimerius nufar
Galeichthys feliceps
Chrysoblephus puniceus
Age at first capture (years)
Res
pons
e la
g (y
ears
)
Fig. 6. Age-at-first-capture versus fish response time to freshwater flow for speciesthat displayed significant relationships between flow and catch. (In most cases, due tominimum sizes being set at the age and size at 50% maturity, age-at-first-capturecorresponds to that at 50% maturity.)
S.J. Lamberth et al. / Estuarine, Coastal and Shelf Science 84 (2009) 527–538536
Author's personal copy
negative and associated with predicted declines in catches. Positiveresponses to flow reduction are limited to a few species, arenegligible in magnitude and are unlikely to compensate for lossesof other species. In South Africa, remedial measures aimed atrebuilding linefish stocks are almost exclusively confined tochanging fisher behaviour and limiting fishing effort. If the stocks ofmany are to be successfully rebuilt, management plans will have todeviate from the traditional path by incorporating environmentalvariables, including freshwater flow. Specifically, the influence ofthe Thukela and other KZN catchments must be taken intoconsideration.
Our findings have much greater generality than the particularsystems we investigated. First, they expand current ideas about theways in which river flows influence marine fish. The relationshipbetween river flow and estuarine-dependent fish is well estab-lished (Gillanders and Kingsford, 2002), but our work stronglyindicates that some commercially important open-sea species thatare not estuarine-dependent are also influenced by flow rates.Secondly, this in turn requires a rethink about the application ofnational laws. Much thought has gone into the Ecological Reserverequired for rivers and estuaries, but our findings demand that theneeds of open-sea marine systems also be incorporated.
Acknowledgements
This paper arose from the Thukela Water Project and a Fresh-water Reserve Determination study and workshop addressing theimpacts of future flow scenarios on prawn and fish catches on theThukela Banks, funded by the Department of Water Affairs andForestry (DWAF). The following are thanked for useful discussionsat the workshop: Paul Cowley (South African Institute for AquaticBiodiversity), Nicolette Demetriades & Ticky Forbes (Marine &Estuarine Research), Anton du Toit (Water Resource Planning),Dennis Hughes (Institute for Water Research, Rhodes University),Delana Louw & Shael Koekemoer (Institute for Water Research,Source to Sea), Jane Turpie (University of Cape Town) and Niel vanWyk (Department of Water Affairs & Forestry). Dennis Hughes andAnton du Toit compiled, modelled and manipulated the flow data.Funding would not have materialised without strong motivationfrom Delana Louw and Niel van Wyk. Liesl Jansen is thanked forextracting commercial linefish catch summaries from the NationalMarine Linefish System (Marine & Coastal Management, MCM).Sven Kerwath (MCM), and Bruce Mann and Sean Fennessy of theOceanographical Research Institute provided useful comment onearlier versions of the manuscript.
References
Binet, D., Le Reste, L., Diouf, P.S., 1995. The influence of runoff and fluvial outflow onthe ecosystems and living resources of West African coastal waters. In: FAOMarine Resources Service, Fishery Resources Division. Effects of Riverine Inputson Coastal Ecosytems and Fisheries Resources. FAO Fisheries Technical Paper,No. 349. FAO, Rome, pp. 89–118.
Blaber, S.J.M., 2000. Tropical estuarine fishes: ecology, exploitation and conserva-tion. In: Fish and Aquatic Resource Series. Blackwell Science, Oxford, UnitedKingdom, 271 pp.
Buxton, C.D., 1992. The application of yield-per-recruit models to two South Africansparid reef fishes, with special consideration to sex change. Fisheries Research15, 1–16.
Buxton, C.D., Clarke, J.R., 1989. The growth of Cymatoceps nasutus (Teleostei:Sparidae), with comments on diet and reproduction. South African Journal ofMarine Science 8, 57–65.
Coetzee, P.S., Baird, D., 1981. Age, growth and food of Cheimerius nufar (Ehrenberg1820) (Sparidae), collected off St Croix Island, Algoa Bay. South African Journalof Zoology 16 (3), 137–143.
Connell, A., 2007. Marine Fish Eggs and Larvae From the East Coast of South Africa.http://www.theselectgroup.co.za/fisheggs/Default.html Durban, South Africa.
Cyrus, D.P., Blaber, S.J.M., 1992. Turbidity and salinity in a tropical northernAustralian estuary and their influence on fish distribution. Estuarine, Coastaland Shelf Science 35, 545–563.
Demetriades, N.T., Forbes, A.T., Mwanyama, N., Quinn, N.W., 2000. Damming theThukela River: Impacts on the Thukela Bank shallow water prawn resource,Report for the Department of Water Affairs and Forestry, 22 pp. http://www.dwaf.gov.za/RDM/higherConfidence.asp.
DWAF (Department of Water Affairs and Forestry, South Africa), 2004. ThukelaBank: Impacts of Flow Scenarios on Prawn and Fish Catch Report – ReserveDetermination Study – Thukela River System. DWAF Report No. PBV000-00-10310. http://www.dwaf.gov.za/RDM/higherConfidence.asp.
Emanuel, B.P., Bustamante, R.H., Branch, G.M., Eekhout, S., Odendaal, F.J., 1992. Azoogeographic and functional approach to the selection of marine reserves onthe west coast of South Africa. South African Journal of Marine Science 12,341–354.
Fennessy, S.T., 1994. The impact of commercial prawn trawlers on linefish off thenorth coast of Natal, South Africa. South African Journal of marine Science 14,263–279.
Fennessy, S.T., Radebe, P.V., Griffiths, M.H., 2000. Squaretail kob, half kob (Argyr-osomus thorpei. In: Mann, B.Q. (Ed.), Southern African Marine Linefish StatusReports. Special Publication Oceanographic Research Institute, vol. 7, pp. 81–82.
Flemming, B., Hay, R., 1988. Sediment distribution and dynamics on the Natalcontinental shelf. In: Schumann, E.H. (Ed.), Coastal Ocean Studies off Natal,South Africa. Springer-Verlag, Berlin, pp. 47–80.
Garratt, P.A., 1985. The offshore linefishery of Natal: I: exploited populationstructures of the sparids Chrysoblephus puniceus and Cheimerius nufar. In:Oceanographic Research Institute Investigational Report 62. OceanographicResearch Institute, 21 pp.
Garratt, P.A., 1988. Note on seasonal abundance and spawning of some importantoffshore linefish in Natal and Transkei waters, southern Africa. South AfricanJournal of marine Science 7, 1–8.
Garratt, P.A., Govender, A., Punt, A.E., 1993. Growth acceleration at sex change in theprotogynous hermaphrodite Chrysoblephus puniceus (Pisces: Sparidae). SouthAfrican Journal of marine Science 13, 187–193.
Gillanders, B.M., Kingsford, M.J., 2002. Impact of changes in flow of freshwater onestuarine and open coastal habitats and the associated organisms. Oceanog-raphy and Marine Biology. An Annual Review 40, 233–309.
Govender, A., Radebe, P.V., Van der Elst, R.P., 2000a. King mackerel (Scomberomoruscommerson). In: Mann, B.Q. (Ed.), Southern African Marine Linefish StatusReports. Special Publication Oceanographic Research Institute, vol. 7, pp.99–100.
Govender, A., Radebe, P.V., Fennessy, S.T., 2000b. Slinger (Chrysblephus puniceus). In:Mann, B.Q. (Ed.), Southern African Marine Linefish Status Reports. SpecialPublication Oceanographic Research Institute, vol. 7, pp. 142–144.
Griffiths, M.H., 2000. Long-term trends in catch and effort of commercial linefish offSouth Africa’s Cape Province: snapshots of the 20th century. South AfricanJournal of Marine Science 22, 81–110.
Griffiths, M.H., Hecht, T., 1995. On the life history of Atractoscion aequidens,a migratory sciaenid off the east coast of southern Africa. Journal of Fish Biology47, 962–985.
Griffiths, M.H., Lamberth, S.J., 2002. Evaluating a marine sport fishery in SouthAfrica. In: Pitcher, T.J., Hollingworth, C.E. (Eds.), Recreational Fisheries:Ecological, Economic and Social Evaluation. Blackwell Science, Oxford, U.K.(Chapter 16: 227–251), 271 pp.
Halim, Y., Morcos, S.A., Rizkalla, S., El-Sayed, M.Kh., 1995. The impact of the Nile andthe Suez Canal on the living marine resources of the Egyptian Mediterraneanwaters (1958–1986). In: FAO Marine Resources Service, Fishery ResourcesDivision. Effects of Riverine Inputs on Coastal Ecosytems and FisheriesResources. FAO Fisheries Technical Paper, No. 349. FAO, Rome, pp. 19–58.
Heemstra, P., Heemstra, E., 2004. Coastal Fishes of Southern Africa. National EnquiryServices Centre and South African Institute of Aquatic Biodiversity,Grahamstown, 488 pp.
Houde, E.D., Rutherford, E.S., 1993. Recent trends in estuarine fisheries: predictionsof fish production and yield. Estuaries 16 (2), 161–176.
Jenkins, G.M., Watts, D.G., 1968. Spectral Analysis and its Applications. Holden-Day,San Francisco, 525 pp.
Jones, K.M.M., Fitzgerald, D.G., Sale, P.F., 2002. Comparative ecology of marine fishcommunities. In: Hart, J.B., Reynoldfs, J.D. (Eds.), Handbook of Fish Biology andFisheries. Fish Biology, vol. 2. Blackwell Science, Oxford, U.K. (Chapter 16:341–358), 413 pp.
Lamberth, S.J., Joubert, A.R., 2000. Prioritising linefish species for research andmanagement: a first attempt. In: Third South African Marine LinefishSymposium. SANCOR Occasional Report 5, 159 pp.
Lamberth, S.J., Turpie, J.K., 2003. The role of estuaries in South African fisheries:economic importance and management implications. African Journal of MarineScience 25, 131–157.
Loneragan, N.R., Bunn, S.E., 1999. River flows and estuarine ecosystems: implica-tions for coastal fisheries from a review and a case study of the Logan River,southeast Queensland. Australian Journal of Ecology 24, 431–440.
Mann, B.Q., 2000. Southern African marine linefish status reports. In: SpecialPublication Oceanogaphic Research Institute, vol. 7 155–157.
Mann, B.Q., Radebe, P.V., Griffiths, M.H., 2000. Santer, soldier (Cheimerius nufar. In:Mann, B.Q. (Ed.), Southern African Marine Linefish Status Reports. SpecialPublication Oceanographic Research Institute, vol. 7, pp. 129–131.
S.J. Lamberth et al. / Estuarine, Coastal and Shelf Science 84 (2009) 527–538 537
Author's personal copy
McGrath, M.D., Horner, C.M.M., Brouwer, S.L., Lamberth, S.J., Mann, B.Q.,Sauer, W.H.H., Erasmus, C., 1997. An economic evaluation of the South Africanlinefishery. South African Journal of Marine Science 18, 203–211.
Morgan, C.A., De Robertis, A., Zabel, W., 2005. Columbia River plume fronts. I.Hydrography, zooplankton distribution, and community composition. MarineEcology Progress Series 299, 19–31.
Myers, R.A., 1998. When do environment-recruitment correlations work? Reviewsin Fish Biology and Fisheries 8, 285–305.
Oxenford, H.A., Hunte, W., 1987. Long-term trends in abundance of the dolphin(Coryphaena hippurus) near Barbados. Proceedings of the Gulf and CaribbeanFisheries Institute 38, 510–527.
Penney, A.J., Mann-Lang, J.B., Van der Elst, R.P., Wilke, C.G., 1999. Long-term trendsin catch and effort in the KwaZulu-Natal nearshore linefisheries. South AfricanJournal of Marine Science 21, 51–76.
Punt, A.E., Garratt, P.A., Govender, A., 1993. On an approach for applying per-recruitmethods to a protogynous hermaphrodite, with an illustration for the slingerChrysoblephus puniceus (Pisces: Sparidae). South African Journal of MarineScience 13, 109–119.
Republic of South Africa, 1998. National Water Act, No 36 of 1998. GovernmentGazette, Pretoria.
Robins, J.B., Halliday, I.A., Staunton Smith, J., Mayer, D.G., Sellin, M.J., 2005.Freshwater-flow requirements of estuarine fisheries in tropical Australia:a review of the state of knowledge and application of a suggested approach.Marine and Freshwater Research 56, 343–360.
Shumway, R.H., 1988. Applied Statistical Time Series Analysis. Prentice Hall,Englewood Cliffs, NJ.
Sink, K.J., Branch, G.M., Harris, J.M., 2005. Biogeographic patterns in rocky intertidalcommunities in KwaZulu-Natal, South Africa. African Journal of Marine Science27 (1), 81–96.
StatSoft, Inc., 2005. STATISTICA (Data Analysis Software System), Version 7.1. www.statsoft.com.
Taljaard, S., Van Niekerk, L., Huizinga, P., Joubert, W., 2003. Resource MonitoringProcedures for Estuaries: For Application in the Ecological Reserve
Determination and Implementation Process. CSIR Report ENV-S-C 2003-059.http://www.wrc.org.za/publications_watersa.htm, 31 pp." 48 pp. App.
Thompson, H., 2006. Water Law. A Practical Approach to Resource Management andthe Provision of Services. Juta & Co Ltd, Cape Town, 769 pp.
Tilney, R.L., Mann, B.Q., 2000. White seabarbel, white seacatfish (Galeichthys feli-ceps). In: Mann, B.Q. (Ed.), Southern African Marine Linefish Status Reports.Special Publication Oceanographic Research Institute, vol. 7, pp. 8–9.
Turpie, J.K., Beckley, L.E., Katua, S.M., 2000. Biogeography and the selection ofpriority areas for conservation of South African coastal fishes. BiologicalConservation 92, 59–72.
Turpie, J.K., Adams, J.B., Joubert, A.R., Harrison, T., Colloty, B., Maree, R.,Whitfield, A.K., Wooldridge, T., Lamberth, S.J., Taljaard, S., Van Niekerk, L.,2002. Assessment of the conservation priority status of South Africanestuaries for use in management and water allocation. Water SA 28, 191–206.
Uotani, I., Iwakawa, T., Kawaguchi, K., 1994. Experimental study on the formationmechanisms of shirasu (postlarval Japanese anchovy) fishing grounds withspecial reference to turbidity. Bulletin of the Japanese Society of ScientificFisheries, Tokyo 60 (1), 73–78.
Van Ballegooyen, R.C., Van Niekerk, L., Lamberth, S.J., Weerts, S., Taljaard, S., 2005.Freshwater Requirements of the Coastal and Offshore Marine Environment ofSouth Africa: An Overview and Initial Assessment. http://www.wrc.org.za/publications_watersa.htm CSIR Report ENV-S-C 2005.
Wei, W.W., 1989. Time Series Analysis: Univariate and Multivariate Methods.Addison-Wesley, New York.
Whitfield, A.K., 1992. A characterization of southern African estuarine systems.Southern African Journal of Aquatic Sciences 18, 89–103.
Whitfield, A.K., 1998. Biology and ecology of fishes in southern African estuaries. In:Ichthyological Monographs of the J.L.B, vol. 2. Smith Institute of Ichthyology,223 pp.
Wilhem, M., Griffiths, M.H., 2000. Black seabarbel, black seacatfish (Galeichthysater). In: Mann, B.Q. (Ed.), Southern African Marine Linefish Status Reports.Special Publication Oceanographic Research Institute, vol. 7, pp. 6–7.
S.J. Lamberth et al. / Estuarine, Coastal and Shelf Science 84 (2009) 527–538538


