Embed Size (px)
Citation preview
Quarterly Report on Remittance Inflows in Bangladesh
October-December 2021
Research Department (External Economics Division)
Bangladesh Bank
2
Executive Summary
In October-December 2021, the remittance inflow achieved at USD 4831.23 million
amid the impact of COVID-19 which was 10.67 percent and 22.47 percent lower than
that of the previous quarter and the same quarter of the last year.
During FY21, remittance-GDP ratio stood at 6.03 percent, remittance-export earnings
ratio was 67.14 percent and remittance-import payments ratio was 40.83 percent.
The largest amount of remittance was received from KSA (USD 1130.95 million)
which was 23.41 percent of total remittance followed by USA (17.26 percent),
United Kingdom (8.87 percent) and Kuwait (8.24 percent) in the 2nd
Quarter of
FY22.
Total 299410 Bangladeshi employees migrated during the quarter of October-
December 2021 in which 31014 were female workers.
During 2nd Quarter of FY22, 210409 Bangladeshi workers migrated to KSA which
was 70.27 percent of total migration followed by Oman (10.26 percent) and UAE
(8.18 percent).
In October-December 2021, Private Commercial Banks, State-owned Commercial
Banks, Specialized Banks and Foreign Commercial Banks received USD 3759.38
million (77.81 percent of total), USD 953.65 million (19.74 percent of total), USD
94.23 million (1.95 percent of total) and USD 23.97 million (0.50 percent of total)
remittances respectively.
3
16
3.3
9
17
8.7
9
16
5.3
3
16
7.4
3
13
7.5
1
20
1.4
9
18
1.2
2
36
.18
0.2
75
CO
VID
-19
14
6.9
0
96
.91
73
.99
29
9.4
1
0
1000
2000
3000
4000
5000
6000
7000
8000
0.00
50.00
100.00
150.00
200.00
250.00
300.00
350.00
Jul-
Sep
18
Oct
-Dec
18
Jan
-Mar
19
Ap
r-Ju
n 1
9
Jul-
Sep
19
Oct
-Dec
19
Jan
-Mar
20
Ap
r-Ju
n 2
0
Jul-
Sep
20
Oct
-Dec
20
Jan
-Mar
21
Ap
r-Ju
n 2
1
Jul-
Sep
21
Oct
-Dec
21
(Mil
lion
US
D)
Em
plo
yee
nu
mb
er (0
00
)
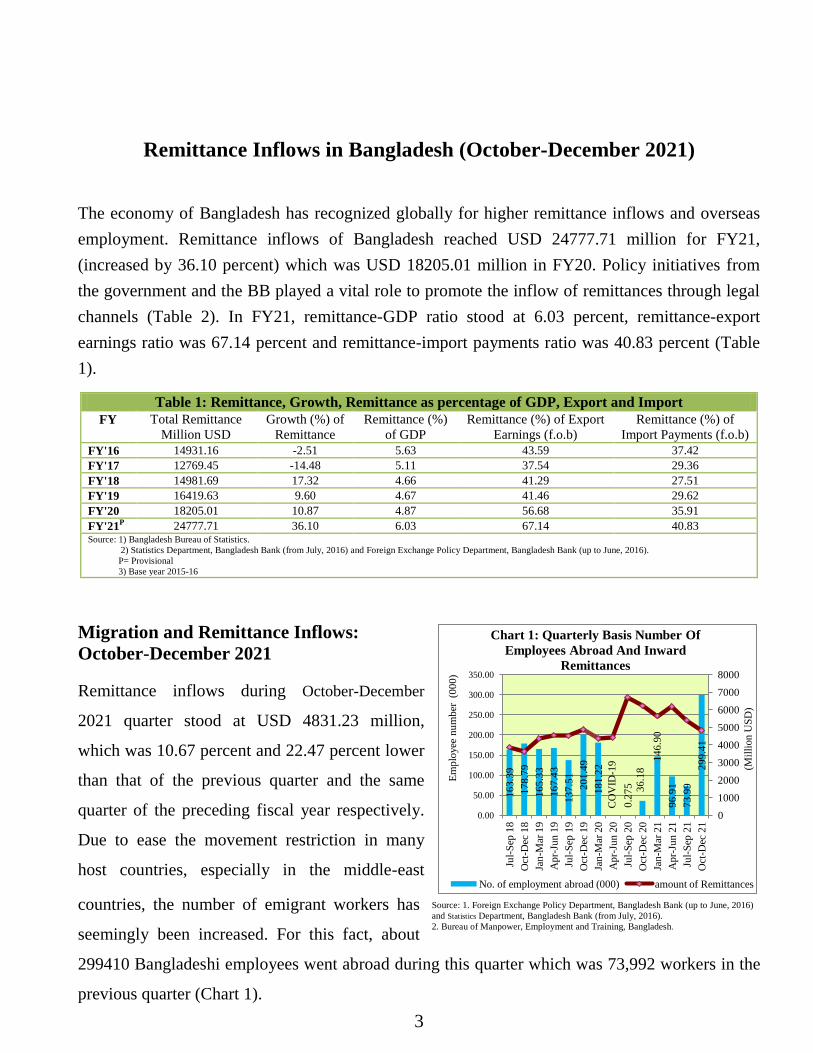
Chart 1: Quarterly Basis Number Of
Employees Abroad And Inward
Remittances
No. of employment abroad (000) amount of Remittances
Remittance Inflows in Bangladesh (October-December 2021)
The economy of Bangladesh has recognized globally for higher remittance inflows and overseas
employment. Remittance inflows of Bangladesh reached USD 24777.71 million for FY21,
(increased by 36.10 percent) which was USD 18205.01 million in FY20. Policy initiatives from
the government and the BB played a vital role to promote the inflow of remittances through legal
channels (Table 2). In FY21, remittance-GDP ratio stood at 6.03 percent, remittance-export
earnings ratio was 67.14 percent and remittance-import payments ratio was 40.83 percent (Table
1).
Table 1: Remittance, Growth, Remittance as percentage of GDP, Export and Import
FY Total Remittance
Million USD
Growth (%) of
Remittance
Remittance (%)
of GDP
Remittance (%) of Export
Earnings (f.o.b)
Remittance (%) of
Import Payments (f.o.b)
FY'16 14931.16 -2.51 5.63 43.59 37.42
FY'17 12769.45 -14.48 5.11 37.54 29.36
FY'18 14981.69 17.32 4.66 41.29 27.51
FY'19 16419.63 9.60 4.67 41.46 29.62
FY'20 18205.01 10.87 4.87 56.68 35.91
FY'21P 24777.71 36.10 6.03 67.14 40.83 Source: 1) Bangladesh Bureau of Statistics.
2) Statistics Department, Bangladesh Bank (from July, 2016) and Foreign Exchange Policy Department, Bangladesh Bank (up to June, 2016).
P= Provisional
3) Base year 2015-16
Migration and Remittance Inflows:
October-December 2021
Remittance inflows during October-December
2021 quarter stood at USD 4831.23 million,
which was 10.67 percent and 22.47 percent lower
than that of the previous quarter and the same
quarter of the preceding fiscal year respectively.
Due to ease the movement restriction in many
host countries, especially in the middle-east
countries, the number of emigrant workers has
seemingly been increased. For this fact, about
299410 Bangladeshi employees went abroad during this quarter which was 73,992 workers in the
previous quarter (Chart 1).
Source: 1. Foreign Exchange Policy Department, Bangladesh Bank (up to June, 2016)
and Statistics Department, Bangladesh Bank (from July, 2016).
2. Bureau of Manpower, Employment and Training, Bangladesh.
4
Islami Bank
Bangladesh
Ltd. 24.27%
Dutch Bangla
Bank Ltd.
10.99%
Agrani Bank
8.10%
Sonali Bank
6.37% Bank Asia
Ltd.
4.80%
Janata Bank
3.42%
Al-Arafah
Islami Bank
Ltd. 3.30%
Mutual Trust
Bank Ltd.
3.24%
Pubali Bank
Ltd.
3.22%
Southeast
Bank Ltd.
3.08%
Other Banks
29.19%
Chart 2: Bank-wise inflow of
remittances (Top 10 Banks) in October-
December 2021
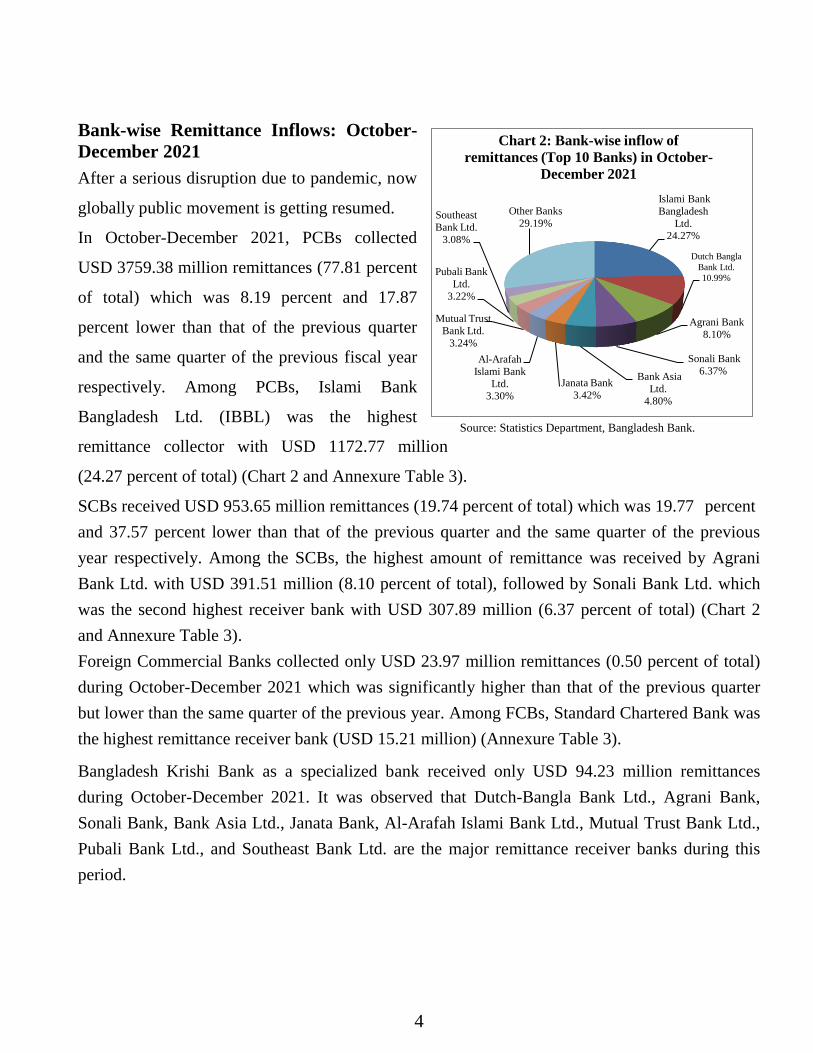
Bank-wise Remittance Inflows: October-
December 2021
After a serious disruption due to pandemic, now
globally public movement is getting resumed.
In October-December 2021, PCBs collected
USD 3759.38 million remittances (77.81 percent
of total) which was 8.19 percent and 17.87
percent lower than that of the previous quarter
and the same quarter of the previous fiscal year
respectively. Among PCBs, Islami Bank
Bangladesh Ltd. (IBBL) was the highest
remittance collector with USD 1172.77 million
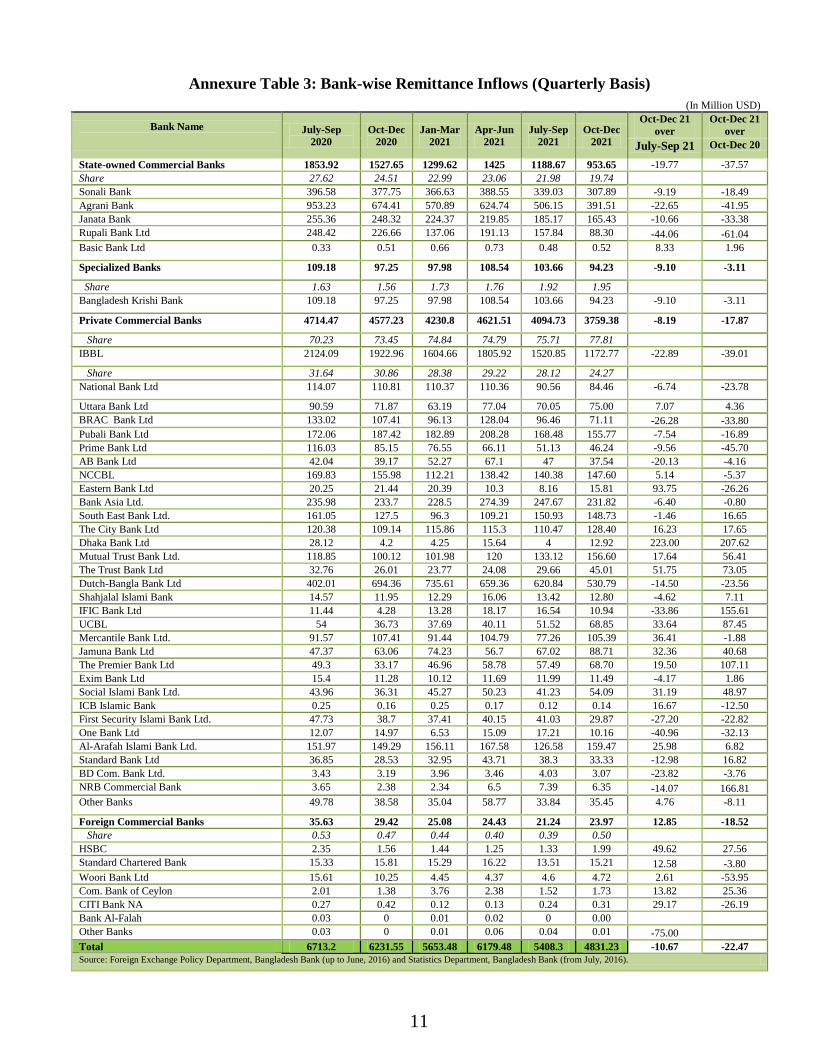
(24.27 percent of total) (Chart 2 and Annexure Table 3).
SCBs received USD 953.65 million remittances (19.74 percent of total) which was 19.77 percent
and 37.57 percent lower than that of the previous quarter and the same quarter of the previous
year respectively. Among the SCBs, the highest amount of remittance was received by Agrani
Bank Ltd. with USD 391.51 million (8.10 percent of total), followed by Sonali Bank Ltd. which
was the second highest receiver bank with USD 307.89 million (6.37 percent of total) (Chart 2
and Annexure Table 3).
Foreign Commercial Banks collected only USD 23.97 million remittances (0.50 percent of total)
during October-December 2021 which was significantly higher than that of the previous quarter
but lower than the same quarter of the previous year. Among FCBs, Standard Chartered Bank was
the highest remittance receiver bank (USD 15.21 million) (Annexure Table 3).
Bangladesh Krishi Bank as a specialized bank received only USD 94.23 million remittances
during October-December 2021. It was observed that Dutch-Bangla Bank Ltd., Agrani Bank,
Sonali Bank, Bank Asia Ltd., Janata Bank, Al-Arafah Islami Bank Ltd., Mutual Trust Bank Ltd.,
Pubali Bank Ltd., and Southeast Bank Ltd. are the major remittance receiver banks during this
period.
Source: Statistics Department, Bangladesh Bank.
5
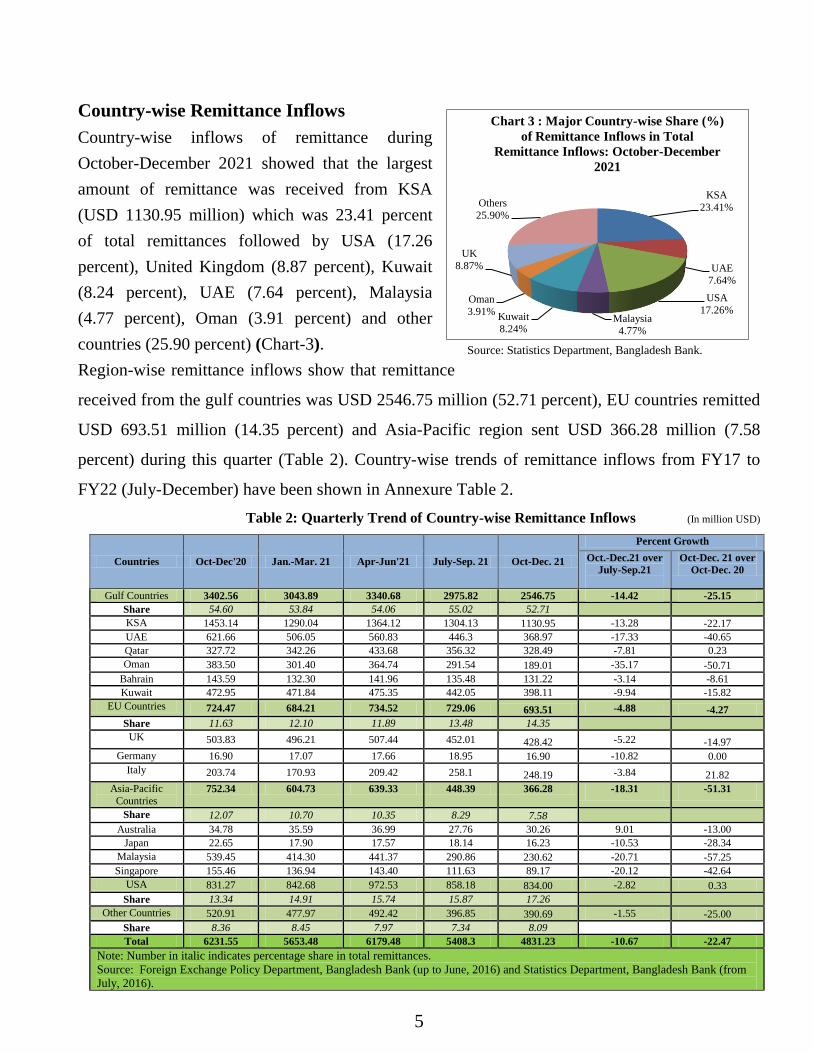
Country-wise Remittance Inflows
Country-wise inflows of remittance during
October-December 2021 showed that the largest
amount of remittance was received from KSA
(USD 1130.95 million) which was 23.41 percent
of total remittances followed by USA (17.26
percent), United Kingdom (8.87 percent), Kuwait
(8.24 percent), UAE (7.64 percent), Malaysia
(4.77 percent), Oman (3.91 percent) and other
countries (25.90 percent) (Chart-3).
Region-wise remittance inflows show that remittance
received from the gulf countries was USD 2546.75 million (52.71 percent), EU countries remitted
USD 693.51 million (14.35 percent) and Asia-Pacific region sent USD 366.28 million (7.58
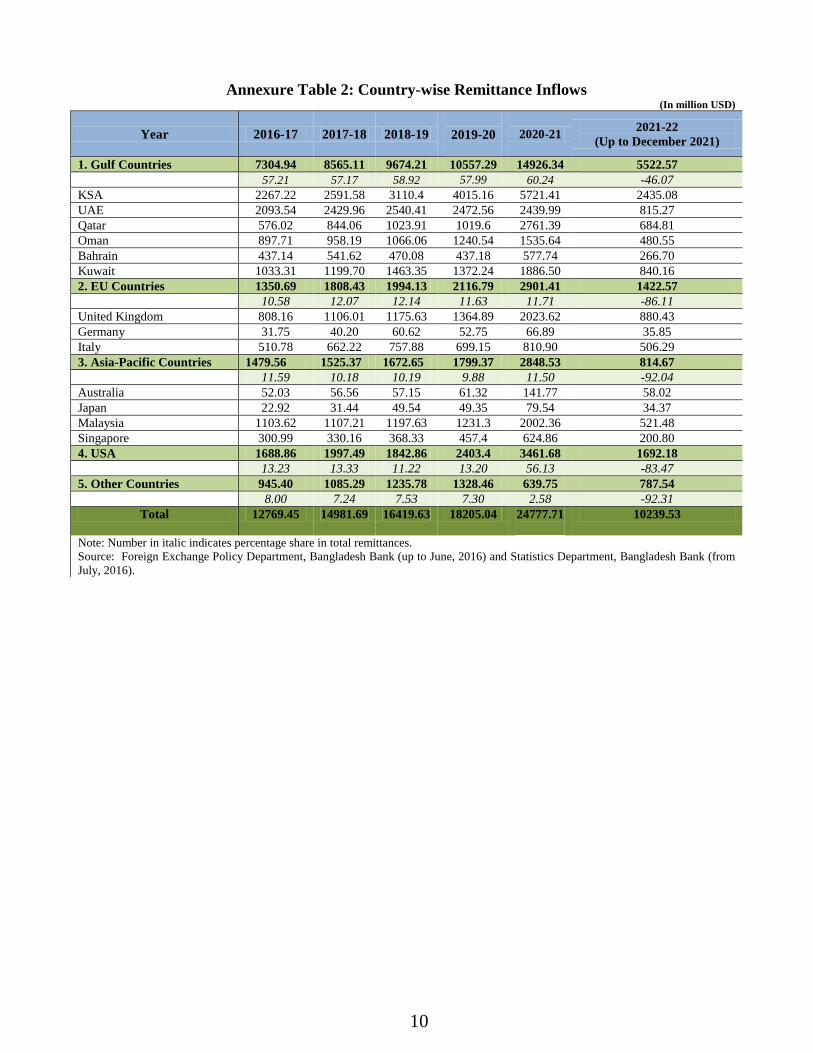
percent) during this quarter (Table 2). Country-wise trends of remittance inflows from FY17 to
FY22 (July-December) have been shown in Annexure Table 2.
Table 2: Quarterly Trend of Country-wise Remittance Inflows (In million USD)
Countries Oct-Dec'20 Jan.-Mar. 21 Apr-Jun'21 July-Sep. 21 Oct-Dec. 21
Percent Growth
Oct.-Dec.21 over
July-Sep.21
Oct-Dec. 21 over
Oct-Dec. 20
Gulf Countries 3402.56 3043.89 3340.68 2975.82 2546.75 -14.42 -25.15
Share 54.60 53.84 54.06 55.02 52.71
KSA 1453.14 1290.04 1364.12 1304.13 1130.95 -13.28 -22.17
UAE 621.66 506.05 560.83 446.3 368.97 -17.33 -40.65
Qatar 327.72 342.26 433.68 356.32 328.49 -7.81 0.23
Oman 383.50 301.40 364.74 291.54 189.01 -35.17 -50.71
Bahrain 143.59 132.30 141.96 135.48 131.22 -3.14 -8.61
Kuwait 472.95 471.84 475.35 442.05 398.11 -9.94 -15.82
EU Countries 724.47 684.21 734.52 729.06 693.51 -4.88 -4.27
Share 11.63 12.10 11.89 13.48 14.35
UK 503.83 496.21 507.44 452.01 428.42 -5.22 -14.97
Germany 16.90 17.07 17.66 18.95 16.90 -10.82 0.00
Italy 203.74 170.93 209.42 258.1 248.19 -3.84 21.82
Asia-Pacific
Countries 752.34 604.73 639.33 448.39 366.28 -18.31 -51.31
Share 12.07 10.70 10.35 8.29 7.58
Australia 34.78 35.59 36.99 27.76 30.26 9.01 -13.00
Japan 22.65 17.90 17.57 18.14 16.23 -10.53 -28.34
Malaysia 539.45 414.30 441.37 290.86 230.62 -20.71 -57.25
Singapore 155.46 136.94 143.40 111.63 89.17 -20.12 -42.64
USA 831.27 842.68 972.53 858.18 834.00 -2.82 0.33
Share 13.34 14.91 15.74 15.87 17.26
Other Countries 520.91 477.97 492.42 396.85 390.69 -1.55 -25.00
Share 8.36 8.45 7.97 7.34 8.09
Total 6231.55 5653.48 6179.48 5408.3 4831.23 -10.67 -22.47
Note: Number in italic indicates percentage share in total remittances.
Source: Foreign Exchange Policy Department, Bangladesh Bank (up to June, 2016) and Statistics Department, Bangladesh Bank (from
July, 2016).
Source: Statistics Department, Bangladesh Bank.
KSA
23.41%
UAE
7.64%
USA
17.26% Malaysia
4.77%
Kuwait
8.24%
Oman
3.91%
UK
8.87%
Others
25.90%
Chart 3 : Major Country-wise Share (%)
of Remittance Inflows in Total
Remittance Inflows: October-December
2021
6
KSA
70.27%
UAE
8.18%
Kuwait
0.54% Oman
10.26% Qatar
1.46% Lebanon
0.04%
Jordan
1.50%
Singapore
4.82% Others
2.91%
Chart 4: Country -wise migration -
Quarterly basis (October-December
2021)
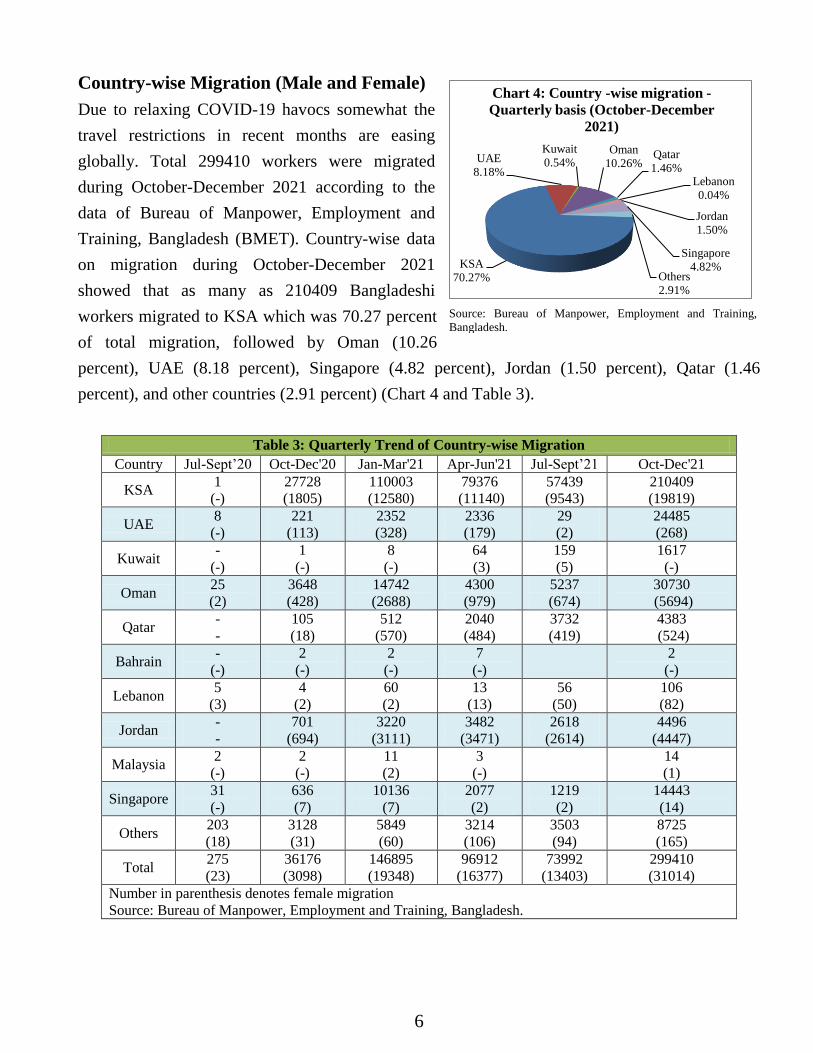
Country-wise Migration (Male and Female)
Due to relaxing COVID-19 havocs somewhat the
travel restrictions in recent months are easing
globally. Total 299410 workers were migrated
during October-December 2021 according to the
data of Bureau of Manpower, Employment and
Training, Bangladesh (BMET). Country-wise data
on migration during October-December 2021
showed that as many as 210409 Bangladeshi
workers migrated to KSA which was 70.27 percent
of total migration, followed by Oman (10.26
percent), UAE (8.18 percent), Singapore (4.82 percent), Jordan (1.50 percent), Qatar (1.46
percent), and other countries (2.91 percent) (Chart 4 and Table 3).
Table 3: Quarterly Trend of Country-wise Migration
Country Jul-Sept’20 Oct-Dec'20 Jan-Mar'21 Apr-Jun'21 Jul-Sept’21 Oct-Dec'21
KSA 1
(-)
27728
(1805)
110003
(12580)
79376
(11140)
57439
(9543)
210409
(19819)
UAE 8
(-)
221
(113)
2352
(328)
2336
(179)
29
(2)
24485
(268)
Kuwait -
(-)
1
(-)
8
(-)
64
(3)
159
(5)
1617
(-)
Oman 25
(2)
3648
(428)
14742
(2688)
4300
(979)
5237
(674)
30730
(5694)
Qatar -
-
105
(18)
512
(570)
2040
(484)
3732
(419)
4383
(524)
Bahrain -
(-)
2
(-)
2
(-)
7
(-)
2
(-)
Lebanon 5
(3)
4
(2)
60
(2)
13
(13)
56
(50)
106
(82)
Jordan -
-
701
(694)
3220
(3111)
3482
(3471)
2618
(2614)
4496
(4447)
Malaysia 2
(-)
2
(-)
11
(2)
3
(-)
14
(1)
Singapore 31
(-)
636
(7)
10136
(7)
2077
(2)
1219
(2)
14443
(14)
Others 203
(18)
3128
(31)
5849
(60)
3214
(106)
3503
(94)
8725
(165)
Total 275
(23)
36176
(3098)
146895
(19348)
96912
(16377)
73992
(13403)
299410
(31014)
Number in parenthesis denotes female migration
Source: Bureau of Manpower, Employment and Training, Bangladesh.
Source: Bureau of Manpower, Employment and Training,
Bangladesh.
7
During October-December 2021, the total number of
31,014 Bangladeshi female workers migrated to
different countries which was 10.36 percent of total
migration (Table 3 and Chart 5). Country-wise
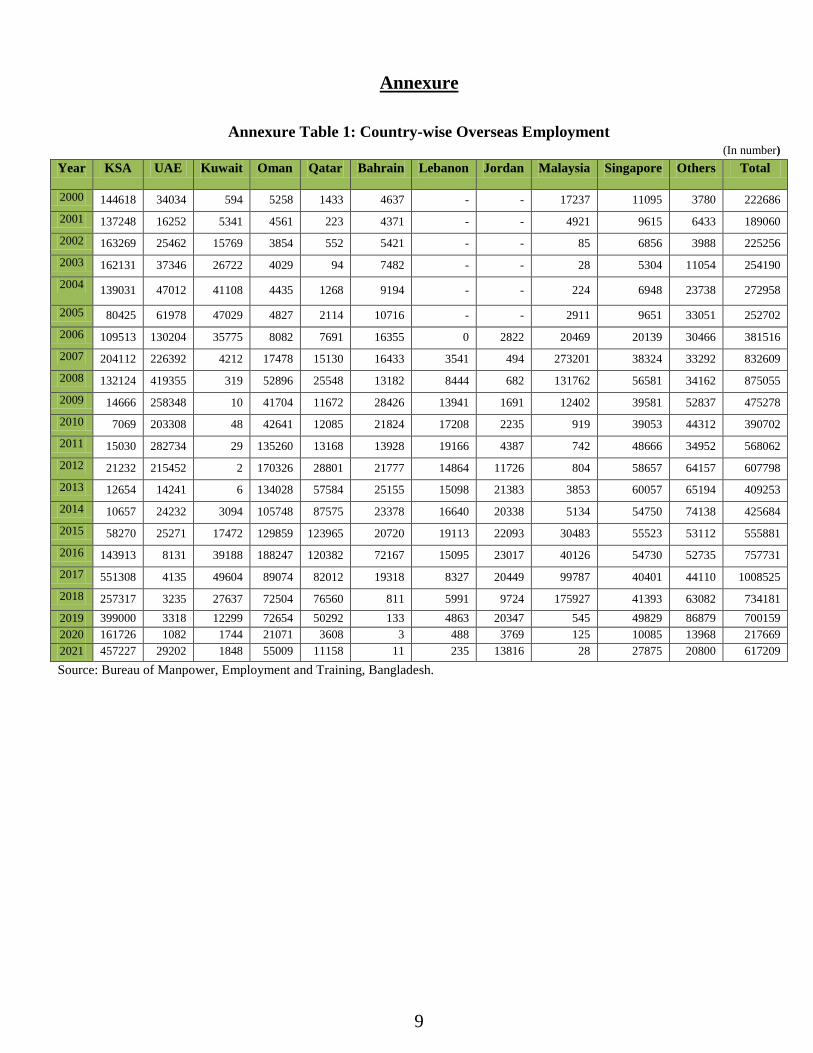
overseas employment (Yearly) data have been shown
in Annexure Table 1.
Source: Bureau of Manpower, Employment and Training, Bangladesh
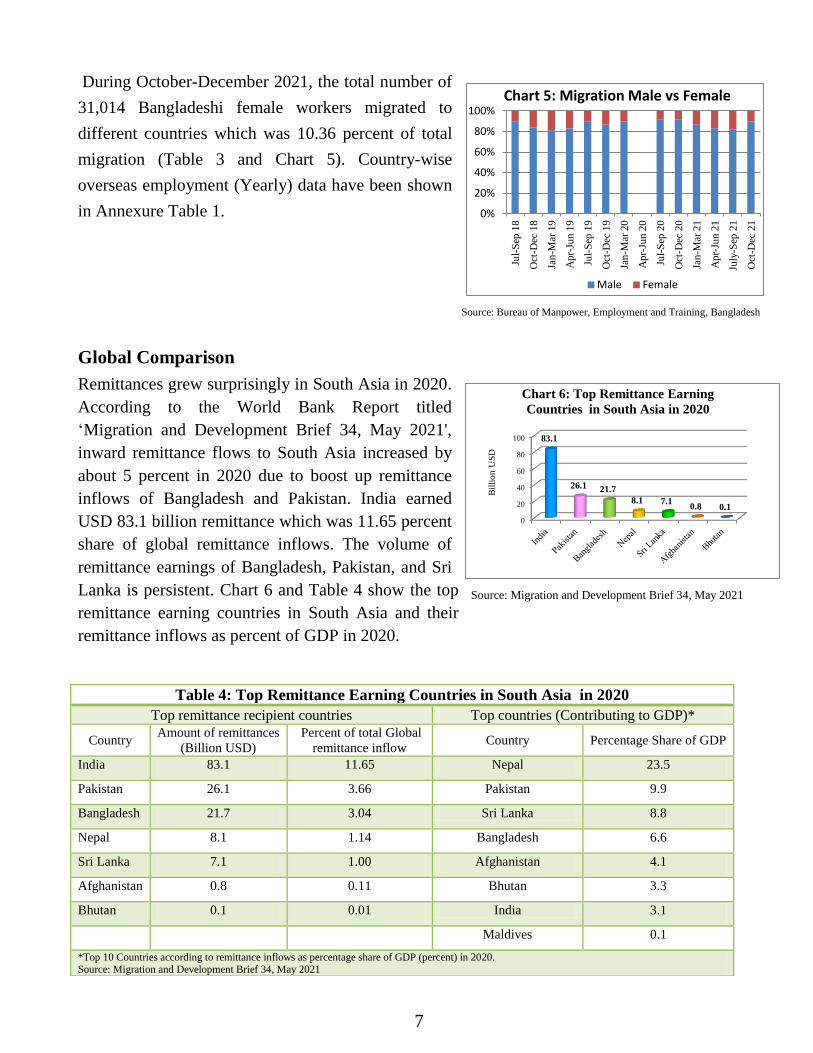
Global Comparison
Remittances grew surprisingly in South Asia in 2020.
According to the World Bank Report titled
‘Migration and Development Brief 34, May 2021',
inward remittance flows to South Asia increased by
about 5 percent in 2020 due to boost up remittance
inflows of Bangladesh and Pakistan. India earned
USD 83.1 billion remittance which was 11.65 percent
share of global remittance inflows. The volume of
remittance earnings of Bangladesh, Pakistan, and Sri
Lanka is persistent. Chart 6 and Table 4 show the top
remittance earning countries in South Asia and their
remittance inflows as percent of GDP in 2020.
Table 4: Top Remittance Earning Countries in South Asia in 2020
Top remittance recipient countries Top countries (Contributing to GDP)*
Country Amount of remittances
(Billion USD)
Percent of total Global
remittance inflow Country Percentage Share of GDP
India 83.1 11.65 Nepal 23.5
Pakistan 26.1 3.66 Pakistan 9.9
Bangladesh 21.7 3.04 Sri Lanka 8.8
Nepal 8.1 1.14 Bangladesh 6.6
Sri Lanka 7.1 1.00 Afghanistan 4.1
Afghanistan 0.8 0.11 Bhutan 3.3
Bhutan 0.1 0.01 India 3.1
Maldives 0.1
*Top 10 Countries according to remittance inflows as percentage share of GDP (percent) in 2020. Source: Migration and Development Brief 34, May 2021
Source: Bureau of Manpower, Employment and Training,
Bangladesh.
0
20
40
60
80
100 83.1
26.1 21.7
8.1 7.1 0.8 0.1
Bil
lio
n U
SD
Chart 6: Top Remittance Earning
Countries in South Asia in 2020
Source: Migration and Development Brief 34, May 2021
0%
20%
40%
60%
80%
100%
Jul-
Sep
18
Oct
-Dec
18
Jan
-Mar
19
Ap
r-Ju
n 1
9
Jul-
Sep
19
Oct
-Dec
19
Jan
-Mar
20
Ap
r-Ju
n 2
0
Jul-
Sep
20
Oct
-Dec
20
Jan
-Mar
21
Ap
r-Ju
n 2
1
July
-Sep
21
Oct
-Dec
21
Chart 5: Migration Male vs Female
Male Female
8
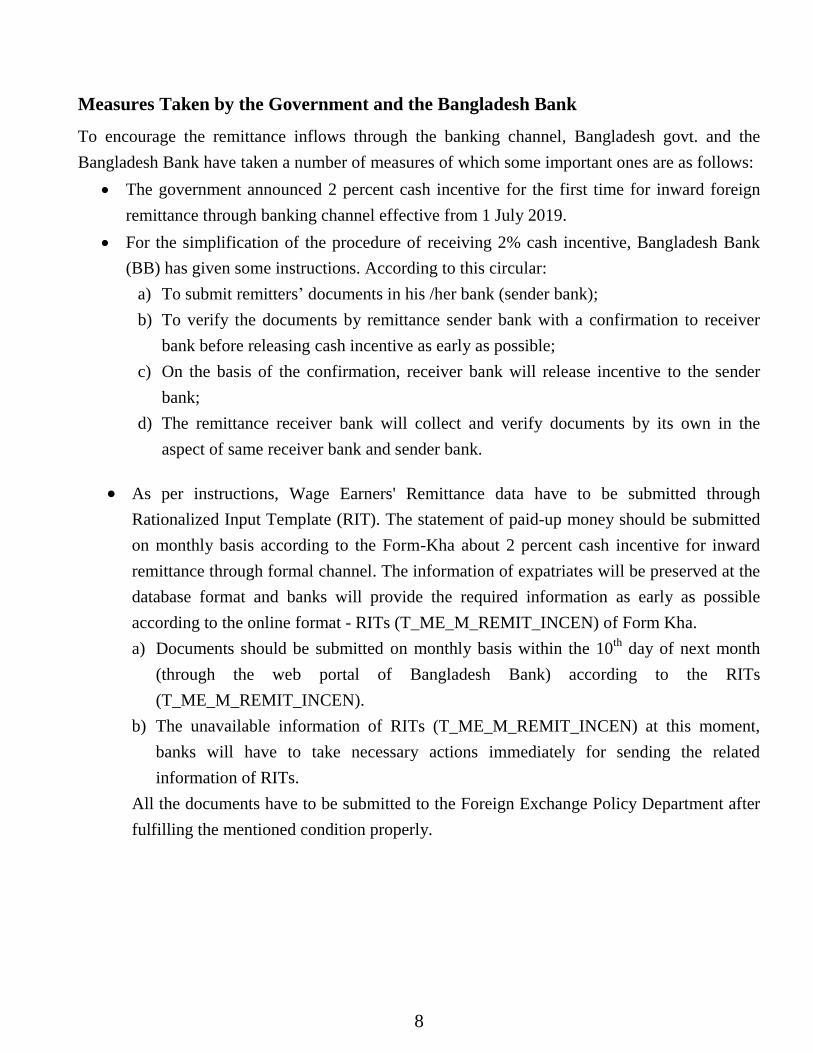
Measures Taken by the Government and the Bangladesh Bank
To encourage the remittance inflows through the banking channel, Bangladesh govt. and the
Bangladesh Bank have taken a number of measures of which some important ones are as follows:
The government announced 2 percent cash incentive for the first time for inward foreign
remittance through banking channel effective from 1 July 2019.
For the simplification of the procedure of receiving 2% cash incentive, Bangladesh Bank
(BB) has given some instructions. According to this circular:
a) To submit remitters’ documents in his /her bank (sender bank);
b) To verify the documents by remittance sender bank with a confirmation to receiver
bank before releasing cash incentive as early as possible;
c) On the basis of the confirmation, receiver bank will release incentive to the sender
bank;
d) The remittance receiver bank will collect and verify documents by its own in the
aspect of same receiver bank and sender bank.
As per instructions, Wage Earners' Remittance data have to be submitted through
Rationalized Input Template (RIT). The statement of paid-up money should be submitted
on monthly basis according to the Form-Kha about 2 percent cash incentive for inward
remittance through formal channel. The information of expatriates will be preserved at the
database format and banks will provide the required information as early as possible
according to the online format - RITs (T_ME_M_REMIT_INCEN) of Form Kha.
a) Documents should be submitted on monthly basis within the 10th
day of next month
(through the web portal of Bangladesh Bank) according to the RITs
(T_ME_M_REMIT_INCEN).
b) The unavailable information of RITs (T_ME_M_REMIT_INCEN) at this moment,
banks will have to take necessary actions immediately for sending the related
information of RITs.
All the documents have to be submitted to the Foreign Exchange Policy Department after
fulfilling the mentioned condition properly.
9
Annexure
Annexure Table 1: Country-wise Overseas Employment (In number)
Year KSA UAE Kuwait Oman Qatar Bahrain Lebanon Jordan Malaysia Singapore Others Total
2000 144618 34034 594 5258 1433 4637 - - 17237 11095 3780 222686
2001 137248 16252 5341 4561 223 4371 - - 4921 9615 6433 189060
2002 163269 25462 15769 3854 552 5421 - - 85 6856 3988 225256
2003 162131 37346 26722 4029 94 7482 - - 28 5304 11054 254190
2004 139031 47012 41108 4435 1268 9194 - - 224 6948 23738 272958
2005 80425 61978 47029 4827 2114 10716 - - 2911 9651 33051 252702
2006 109513 130204 35775 8082 7691 16355 0 2822 20469 20139 30466 381516
2007 204112 226392 4212 17478 15130 16433 3541 494 273201 38324 33292 832609
2008 132124 419355 319 52896 25548 13182 8444 682 131762 56581 34162 875055
2009 14666 258348 10 41704 11672 28426 13941 1691 12402 39581 52837 475278
2010 7069 203308 48 42641 12085 21824 17208 2235 919 39053 44312 390702
2011 15030 282734 29 135260 13168 13928 19166 4387 742 48666 34952 568062
2012 21232 215452 2 170326 28801 21777 14864 11726 804 58657 64157 607798
2013 12654 14241 6 134028 57584 25155 15098 21383 3853 60057 65194 409253
2014 10657 24232 3094 105748 87575 23378 16640 20338 5134 54750 74138 425684
2015 58270 25271 17472 129859 123965 20720 19113 22093 30483 55523 53112 555881
2016 143913 8131 39188 188247 120382 72167 15095 23017 40126 54730 52735 757731
2017 551308 4135 49604 89074 82012 19318 8327 20449 99787 40401 44110 1008525
2018 257317 3235 27637 72504 76560 811 5991 9724 175927 41393 63082 734181
2019 399000 3318 12299 72654 50292 133 4863 20347 545 49829 86879 700159
2020 161726 1082 1744 21071 3608 3 488 3769 125 10085 13968 217669
2021 457227 29202 1848 55009 11158 11 235 13816 28 27875 20800 617209
Source: Bureau of Manpower, Employment and Training, Bangladesh.
10
Annexure Table 2: Country-wise Remittance Inflows (In million USD)
Year 2016-17 2017-18 2018-19
2019-20
2020-21 2021-22
(Up to December 2021)
1. Gulf Countries 7304.94 8565.11 9674.21 10557.29 14926.34 5522.57
57.21 57.17 58.92 57.99 60.24 -46.07
KSA 2267.22 2591.58 3110.4 4015.16 5721.41 2435.08
UAE 2093.54 2429.96 2540.41 2472.56 2439.99 815.27
Qatar 576.02 844.06 1023.91 1019.6 2761.39 684.81
Oman 897.71 958.19 1066.06 1240.54 1535.64 480.55
Bahrain 437.14 541.62 470.08 437.18 577.74 266.70
Kuwait 1033.31 1199.70 1463.35 1372.24 1886.50 840.16
2. EU Countries 1350.69 1808.43 1994.13 2116.79 2901.41 1422.57
10.58 12.07 12.14 11.63 11.71 -86.11
United Kingdom 808.16 1106.01 1175.63 1364.89 2023.62 880.43
Germany 31.75 40.20 60.62 52.75 66.89 35.85
Italy 510.78 662.22 757.88 699.15 810.90 506.29
3. Asia-Pacific Countries 1479.56 1525.37 1672.65 1799.37 2848.53 814.67
11.59 10.18 10.19 9.88 11.50 -92.04
Australia 52.03 56.56 57.15 61.32 141.77 58.02
Japan 22.92 31.44 49.54 49.35 79.54 34.37
Malaysia 1103.62 1107.21 1197.63 1231.3 2002.36 521.48
Singapore 300.99 330.16 368.33 457.4 624.86 200.80
4. USA 1688.86 1997.49 1842.86 2403.4 3461.68 1692.18
13.23 13.33 11.22 13.20 56.13 -83.47
5. Other Countries 945.40 1085.29 1235.78 1328.46 639.75 787.54
8.00 7.24 7.53 7.30 2.58 -92.31
Total 12769.45 14981.69 16419.63 18205.04 24777.71
10239.53
Note: Number in italic indicates percentage share in total remittances.
Source: Foreign Exchange Policy Department, Bangladesh Bank (up to June, 2016) and Statistics Department, Bangladesh Bank (from
July, 2016).
11
Annexure Table 3: Bank-wise Remittance Inflows (Quarterly Basis)
(In Million USD)
Bank Name
July-Sep
2020
Oct-Dec
2020
Jan-Mar
2021
Apr-Jun
2021
July-Sep
2021
Oct-Dec
2021
Oct-Dec 21
over
Oct-Dec 21
over
July-Sep 21 Oct-Dec 20
State-owned Commercial Banks 1853.92 1527.65 1299.62 1425 1188.67 953.65 -19.77 -37.57
Share 27.62 24.51 22.99 23.06 21.98 19.74
Sonali Bank 396.58 377.75 366.63 388.55 339.03 307.89 -9.19 -18.49
Agrani Bank 953.23 674.41 570.89 624.74 506.15 391.51 -22.65 -41.95
Janata Bank 255.36 248.32 224.37 219.85 185.17 165.43 -10.66 -33.38
Rupali Bank Ltd 248.42 226.66 137.06 191.13 157.84 88.30 -44.06 -61.04
Basic Bank Ltd 0.33 0.51 0.66 0.73 0.48 0.52 8.33 1.96
Specialized Banks 109.18 97.25 97.98 108.54 103.66 94.23 -9.10 -3.11
Share 1.63 1.56 1.73 1.76 1.92 1.95
Bangladesh Krishi Bank 109.18 97.25 97.98 108.54 103.66 94.23 -9.10 -3.11
Private Commercial Banks 4714.47 4577.23 4230.8 4621.51 4094.73 3759.38 -8.19 -17.87
Share 70.23 73.45 74.84 74.79 75.71 77.81
IBBL 2124.09 1922.96 1604.66 1805.92 1520.85 1172.77 -22.89 -39.01
Share 31.64 30.86 28.38 29.22 28.12 24.27
National Bank Ltd 114.07 110.81 110.37 110.36 90.56 84.46 -6.74 -23.78
Uttara Bank Ltd 90.59 71.87 63.19 77.04 70.05 75.00 7.07 4.36
BRAC Bank Ltd 133.02 107.41 96.13 128.04 96.46 71.11 -26.28 -33.80
Pubali Bank Ltd 172.06 187.42 182.89 208.28 168.48 155.77 -7.54 -16.89
Prime Bank Ltd 116.03 85.15 76.55 66.11 51.13 46.24 -9.56 -45.70
AB Bank Ltd 42.04 39.17 52.27 67.1 47 37.54 -20.13 -4.16
NCCBL 169.83 155.98 112.21 138.42 140.38 147.60 5.14 -5.37
Eastern Bank Ltd 20.25 21.44 20.39 10.3 8.16 15.81 93.75 -26.26
Bank Asia Ltd. 235.98 233.7 228.5 274.39 247.67 231.82 -6.40 -0.80
South East Bank Ltd. 161.05 127.5 96.3 109.21 150.93 148.73 -1.46 16.65
The City Bank Ltd 120.38 109.14 115.86 115.3 110.47 128.40 16.23 17.65
Dhaka Bank Ltd 28.12 4.2 4.25 15.64 4 12.92 223.00 207.62
Mutual Trust Bank Ltd. 118.85 100.12 101.98 120 133.12 156.60 17.64 56.41
The Trust Bank Ltd 32.76 26.01 23.77 24.08 29.66 45.01 51.75 73.05
Dutch-Bangla Bank Ltd 402.01 694.36 735.61 659.36 620.84 530.79 -14.50 -23.56
Shahjalal Islami Bank 14.57 11.95 12.29 16.06 13.42 12.80 -4.62 7.11
IFIC Bank Ltd 11.44 4.28 13.28 18.17 16.54 10.94 -33.86 155.61
UCBL 54 36.73 37.69 40.11 51.52 68.85 33.64 87.45
Mercantile Bank Ltd. 91.57 107.41 91.44 104.79 77.26 105.39 36.41 -1.88
Jamuna Bank Ltd 47.37 63.06 74.23 56.7 67.02 88.71 32.36 40.68
The Premier Bank Ltd 49.3 33.17 46.96 58.78 57.49 68.70 19.50 107.11
Exim Bank Ltd 15.4 11.28 10.12 11.69 11.99 11.49 -4.17 1.86
Social Islami Bank Ltd. 43.96 36.31 45.27 50.23 41.23 54.09 31.19 48.97
ICB Islamic Bank 0.25 0.16 0.25 0.17 0.12 0.14 16.67 -12.50
First Security Islami Bank Ltd. 47.73 38.7 37.41 40.15 41.03 29.87 -27.20 -22.82
One Bank Ltd 12.07 14.97 6.53 15.09 17.21 10.16 -40.96 -32.13
Al-Arafah Islami Bank Ltd. 151.97 149.29 156.11 167.58 126.58 159.47 25.98 6.82
Standard Bank Ltd 36.85 28.53 32.95 43.71 38.3 33.33 -12.98 16.82
BD Com. Bank Ltd. 3.43 3.19 3.96 3.46 4.03 3.07 -23.82 -3.76
NRB Commercial Bank 3.65 2.38 2.34 6.5 7.39 6.35 -14.07 166.81
Other Banks 49.78 38.58 35.04 58.77 33.84 35.45 4.76 -8.11
Foreign Commercial Banks 35.63 29.42 25.08 24.43 21.24 23.97 12.85 -18.52
Share 0.53 0.47 0.44 0.40 0.39 0.50
HSBC 2.35 1.56 1.44 1.25 1.33 1.99 49.62 27.56
Standard Chartered Bank 15.33 15.81 15.29 16.22 13.51 15.21 12.58 -3.80
Woori Bank Ltd 15.61 10.25 4.45 4.37 4.6 4.72 2.61 -53.95
Com. Bank of Ceylon 2.01 1.38 3.76 2.38 1.52 1.73 13.82 25.36
CITI Bank NA 0.27 0.42 0.12 0.13 0.24 0.31 29.17 -26.19
Bank Al-Falah 0.03 0 0.01 0.02 0 0.00
Other Banks 0.03 0 0.01 0.06 0.04 0.01 -75.00
Total 6713.2 6231.55 5653.48 6179.48 5408.3 4831.23 -10.67 -22.47
Source: Foreign Exchange Policy Department, Bangladesh Bank (up to June, 2016) and Statistics Department, Bangladesh Bank (from July, 2016).