Embed Size (px)
Citation preview
1119Research Article
IntroductionInterphase chromatin is typically thought to be decondensed atlocations in which genes are transcribed and condensed where genesare silent (Wegel and Shaw, 2005). However, this generalization iscontradicted by observations that inactive genes may reside indomains of open chromatin, whereas active genes in regions of lowgene density can be embedded within compact chromatin fibers(Gilbert and Bickmore, 2006; Gilbert et al., 2004). A diversity oftheoretical models for the nuclear organization of active and silentchromatin (reviewed in Cremer et al., 2006; Spector, 2003) stemfrom our limited understanding of higher-order chromatin structurebeyond the 30-nm fiber, referred to as large-scale chromatinstructure. This limited understanding results from technicallimitations in imaging of chromatin by light microscopy (LM) andelectron microscopy (EM) (Horowitz-Scherer and Woodcock,2006), including sensitivity of higher levels of chromatin foldingto buffers and EM preparation methods (Belmont et al., 1989) andlack of suitable high-contrast DNA-specific staining methods forEM.
Traditional cytology classifies chromatin into less-condensedeuchromatin and more-condensed heterochromatin.Heterochromatin has been further subdivided into permanentlycondensed constitutive heterochromatin and facultativeheterochromatin, which becomes condensed/decondensed at somepoint during development (Wegel and Shaw, 2005). X inactivationin female mammals is a classic example of the formation offacultative heterochromatin. The inactive X chromosome (Xi)appears within interphase nuclei as a heteropycnotic Barr body
usually positioned at the nuclear or nucleolar periphery (Barr andCarr, 1962; Belmont et al., 1986; Puck and Johnson, 1996; Zhanget al., 2007). Inactivation of one of the X chromosomes in femalecells is the mechanism of mammalian dosage compensation of X-linked genes (Lyon, 1961).
A long-standing assumption has been that sequential epigeneticmodifications occurring during X inactivation directly lead to XiDNA compaction and increased condensation per se mightcontribute to gene silencing (Arney and Fisher, 2004; Chow andBrown, 2003). This assumption has been challenged by comparisonof the Xi and the active X chromosome (Xa) conformation using3D fluorescence in situ hybridization with X-specific whole-chromosome probes. In human amniotic cells, Xi and Xa territorieswere observed to occupy similar volumes but differed in shape andsurface area (Eils et al., 1996), suggesting the same averagechromatin compaction for both the Xi and Xa (Pollard andEarnshaw, 2004).
It has been proposed that the Xi in the interphase nucleus isorganized into a core of repetitive sequences surrounded by genicregions (Chaumeil et al., 2006; Clemson et al., 2006), but a detailedultrastructural analysis of the Xi has so far been lacking (Heard andDisteche, 2006; Straub and Becker, 2007). Here, we have combinedLM and EM of the Xi in human and mouse female fibroblasts todemonstrate that the Xi has a unique ultrastructure, containingcondensed, large-scale chromatin fibers/domains clearly distinctfrom those observed in euchromatic or constitutive heterochromatinregions. In addition, we demonstrate a distinct position of thisfacultative heterochromatin in the nucleus.
The mammalian inactive X chromosome (Xi) is a model forfacultative heterochromatin. Increased DNA compaction for theXi, and for facultative heterochromatin in general, has longbeen assumed based on recognition of a distinct Barr bodyusing nucleic-acid staining. This conclusion has been challengedby a report revealing equal volumes occupied by the inactiveand active X chromosomes. Here, we use light and electronmicroscopy to demonstrate in mouse and human fibroblasts aunique Xi ultrastructure, distinct from euchromatin andconstitutive heterochromatin, containing tightly packed,heterochromatic fibers/domains with diameters in some casesapproaching that of prophase chromatids. Significant spacebetween these packed structures is observed even within
condensed regions of the Xi. Serial-section analysis also revealsextensive contacts of the Xi with the nuclear envelope and/ornucleolus, with nuclear envelope association being observedin all cells. Implications of our results for models of Xigene silencing and chromosome territory organization arediscussed.
Supplementary material available online athttp://jcs.biologists.org/cgi/content/full/121/7/1119/DC1
Key words: Facultative heterochromatin, Large-scale chromatin,Electron microscopy, Chromocenters, The X chromosome
Summary
The facultative heterochromatin of the inactive Xchromosome has a distinctive condensedultrastructureAlena Rego, Paul B. Sinclair, Wei Tao*, Igor Kireev and Andrew S. Belmont‡
Department of Cell and Developmental Biology, University of Illinois, 601 South Goodwin Avenue, Urbana, IL 61801, USA*Present Address: Department of Cell Biology, College of Life Sciences, Peking University, Beijing 100871, Peopleʼs Republic of China‡Author for correspondence (e-mail: [email protected])
Accepted 8 January 2008J. Cell Sci. 121, 1119-1127 Published by The Company of Biologists 2008doi:10.1242/jcs.026104
Jour
nal o
f Cel
l Sci
ence
JCS ePress online publication date 11 March 2008

1120
ResultsThe Xi has a homogeneous size and appearance in confluentWI-38 cellsFor ultrastructural studies, we wanted a homogeneous cellpopulation in which the Xi was fully silenced and showed minimalvariation in appearance. The original concept of increased chromatincompaction of the Xi comes from its appearance at the LM levelas a distinct nuclear Barr body, which stains more intensely withnucleic-acid stains than the surrounding chromatin, implying ahigher DNA compaction.
We used human female primary fibroblasts, WI-38 cells, whichhave a high percentage of cells showing a distinct Barr body. Thispercentage peaked in confluent cells, 10 days after passage. TheBarr body was equated to a DAPI bright body with a unique intensityand size distinct from all other DAPI bright regions. Immunostainingagainst trimethylated histone H3 on lysine 27 (H3-3mK27) provideda robust, independent identification of the Xi/Barr body, with adiscrete, unique, high-contrast stained body recognizable in nearly100% of cells. In cells with a clearly defined Barr body, as definedby DAPI staining, the DAPI dense region colocalized nearlycompletely with the region of elevated H3-3mK27 staining (Fig.1A).
We used H3-3mK27 staining to confirm the identification of aDAPI-dense body as the Xi, to visualize the Xi in cells without arecognizable DAPI-dense body, and to assay the variability in Xisize and conformation. Failure to recognize a Barr body exclusivelyby DAPI staining was either due to the presence of multiple DAPI-dense bodies elsewhere in the nucleus (Fig. 1B), or because a change
in Xi conformation or orientation resulted in comparable DAPIcontrast as the surrounding chromatin (Fig. 1C). Inspection of single,unprocessed optical sections by two independent observers revealedthat, in ~85% of confluent cells (n=100), the Barr-body/Xicondensed core could be identified solely by the presence of a DAPI-dense body. This number rose to 95% for confluent cells whenoptical section stacks were inspected (n=131).
Xi/Barr-body area, as measured by the H3-3mK27 signal, wassmaller and showed a more uniform size distribution in confluentversus log-phase cells (2.7 versus 3.4 μm2) (Fig. 1D). We thereforeused confluent cells for most of our ultrastructural analysis.
Identifying sample-preparation methods that preserved XistructureA major problem in viewing chromatin ultrastructure bytransmission electron microscopy (TEM) is the lack of an adequateDNA-specific stain. To obtain satisfactory contrast of chromatinand to improve accessibility during pre-embedding immunogoldstaining, detergent extraction of the nucleoplasm prior to fixationis frequently used. However, the extreme sensitivity of large-scalechromatin structure to minor changes in buffer conditions leads tosignificant changes in ultrastructure dependent on the choice ofpermeabilization buffer (Belmont et al., 1989).
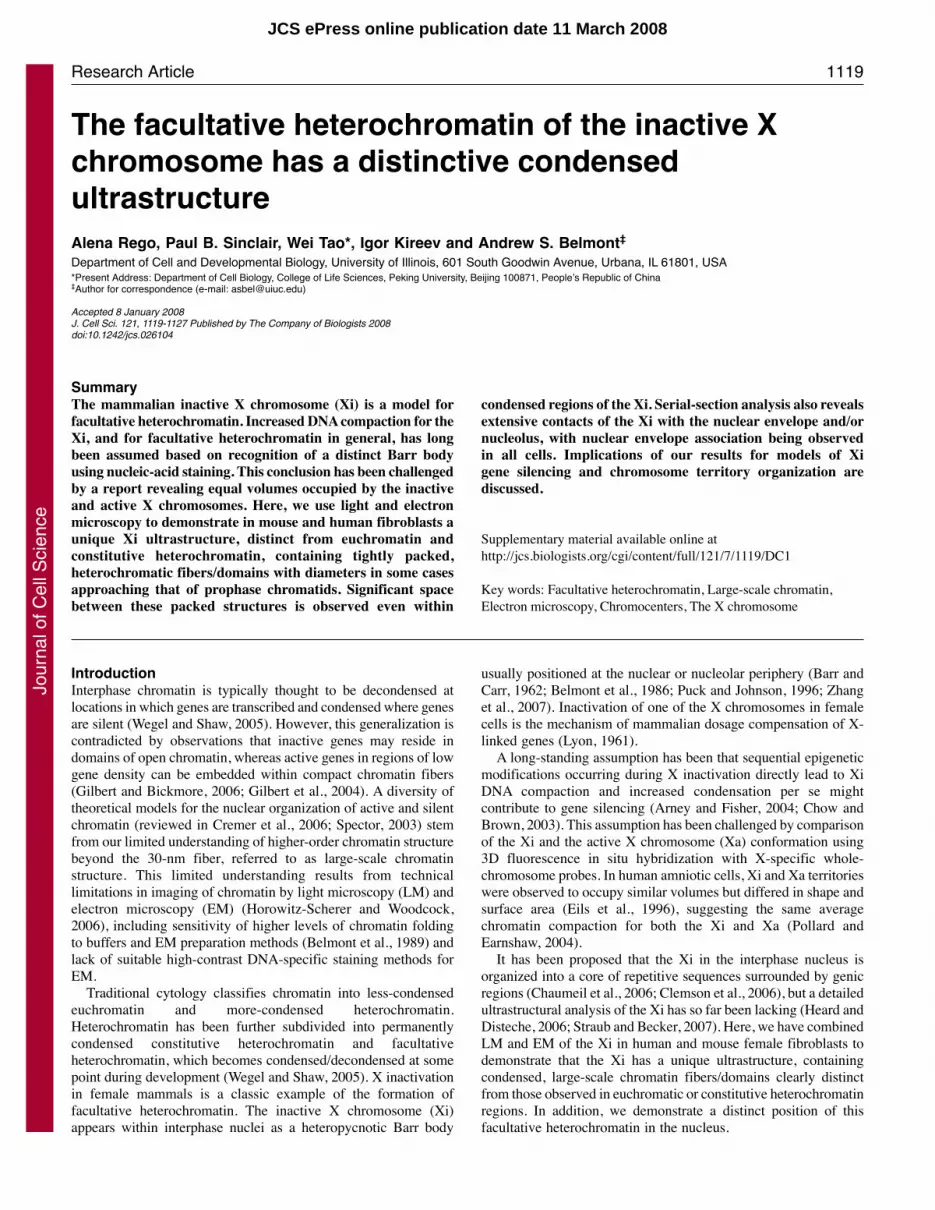
Here, we used the Barr-body appearance in live cells to optimizesample preparation and verify EM ultrastructural preservation. Incells expressing GFP-histone H2B, the GFP fluorescencedistribution was similar to the DAPI staining distribution, whichwe assume was due to its proportional enrichment based on DNAcontent. In deconvolved optical sections, the Barr body visualizedin live cells by GFP-H2B fluorescence displayed obvious fibersubstructures measuring 200-400 nm in width (Fig. 2A). After live-cell imaging, the same samples were then fixed or permeabilizedin various buffers prior to fixation in 2% glutaraldehyde (GA) anda repeat optical sectioning. Comparison of images before and afterfixation (data not shown) identified buffer A, used in our previouswork to preserve large-scale chromatin structures, as most suitablefor Barr-body structural preservation after permeabilization(Belmont et al., 1989).
As a higher-resolution test, we used the TEM appearance ofXi large-scale chromatin fibers in unextracted cells (Fig. 2B) toguide selection of buffer and fixation conditions preserving thesefibers during nucleoplasm extraction and immunostaining. Tominimize buffer-induced alterations in chromatin ultrastructure,we also explored the use of a UV pre-fixation procedure prior todetergent permeabilization and aldehyde fixation. Cross-linkingby UV alone or after blue-light irradiation of ethidium bromide(EtBr)-stained samples is reported to stabilize higher levels ofchromatin structure (Maeshima et al., 2005; Sheval et al., 2004).By combining these two approaches, we rapidly fixed higher-order chromatin structure by UV in the presence of EtBr. Thisprocedure provided higher-intensity pre-embedding immunogoldlabeling while better preserving large-scale chromatin fibersas compared to a light aldehyde-fixation step prior toimmunostaining.
A distinct heavy-metal-stained heterochromatic body, of similarsize and substructure to that observed for the Barr body by LM inlive cells, was observed by EM in cells fixed directly in 2% GA(Fig. 2B). We observed similar ultrastructure and improved contrastof chromatin with (Fig. 2C) or without (Fig. 2D) UV/EtBr cross-linking, followed by permeabilization in buffer A* and fixation with2% GA. Subsequent histone H3-3mK27 immunogold staining and
Journal of Cell Science 121 (7)
Fig. 1. Homogeneous Xi size and appearance in confluent female humanfibroblasts (WI-38 cells). (A-C) DAPI staining, blue; histone H3-3mK27immunostaining (mouse antibody) marking Xi, red. (A) 85% of cells show arecognizable, condensed Barr body in non-deconvolved single optical sections(95% if 3D data analyzed). (B,C) The remaining cells either show multipleDAPI-intense bodies of similar size to the Barr body (B) or no distinct DAPIbright body (C). (D) Histogram showing Xi area (μm2), based on H3-3mK27immunostaining, for confluent versus log-phase cells. (E,F) H3-3mK27immunostaining of Xi in log-phase cells frequently shows a fibrillarsubstructure protruding from the Xi core. Original image, top framed area;corresponding deconvolved optical section, lower inset. Arrows indicate theposition of the Xi. Scale bar: 2 μm.
Jour
nal o
f Cel
l Sci
ence
1121Ultrastructure of the Xi
serial sectioning confirmed that these heterochromatin structurescorresponded to the Barr bodies visualized by LM (see below).
The Barr body as visualized by EM shows a uniqueultrastructure distinct from constitutive heterochromatin orsurrounding euchromatinThe larger Xi examples visualized by H3-3mK27immunofluorescence from log-phase cells often showed distinctlarge-scale chromatin fibers/domains near to or protruding from adenser core (Fig. 1E,F). These structures were similar in diameterto chromatin substructures observed within the more compact Barrbodies of live confluent cells (Fig. 2A). Similarly, the Xiheterochromatin substructures visualized at higher resolution byTEM (Fig. 2B-D) were comparable to those visualized by LM. Theoverall shape and size of the entire heterochromatin domainvisualized by TEM correlated with Barr-body size and shape asdefined by H3-3mK27 or DAPI staining. Individual heterochromatinfibers/domains of the Xi appeared larger in diameter compared withsubstructures observed in the surrounding bulk chromatin by bothLM and EM.
To confirm that the heterochromatin structures visualized withinindividual sections by TEM corresponded to Barr bodies, we testedwhether they were present exactly once per nucleus and had ahigher-than-background level of H3-3mK27 immunogold staining.Serial 200-nm sections through the entire volume of 13 randomlyselected WI-38 nuclei (seven confluent, six log phase) revealed that12 nuclei contained one and only one heterochromatic body (Fig.3A,B, supplementary material Fig. S1), similar to the examplesshown in Fig. 2. The remaining nucleus was unusually large, verylikely tetraploid and contained two joined heterochromatin bodies,each of similar shape to the bodies seen in the other 12 nuclei. Noother condensed-chromatin region within these nuclei wascomparable in size and overall chromatin compaction. Some of these13 nuclei were from H3-3mK27-immunostained samples and eachof these showed higher-than-background immunogold stainingover the heterochromatic body (Fig. 3C).
In all 13 serial-section data sets, the Xi heterochromatin appearedas a non-solid volume containing spatially separated chromatinsubstructures that were 30-400 nm in diameter, with intervening
spaces of 50-400 nm. This was also true for the Xi as visualized fromsingle sections from an additional 189 cells prepared by variousprotocols (Fig. 2). When using buffer conditions preserving large-scale fibers, the Xi could be visualized as a tightly folded accumulationof large-scale chromatin fibers/domains with noticeably largerdiameters than observed elsewhere throughout most of the nucleus.
We wished to compare the appearance of facultative andconstitutive heterochromatin. In human cells, regions of constitutiveheterochromatin are small and not easily identified. We thereforeexamined female mouse embryonic fibroblasts (MEFs) containinglarge readily identifiable chromocenters formed by coalescence ofpericentric heterochromatin from several chromosomes. The Barrbodies in MEFs were identified by immunostaining against H3-3mK27. Although they showed above-background DAPI staining,the DAPI-staining intensity was considerably lower than overchromocenters, including those of similar or even smaller size (Fig.4A).
Complete serial-section sets through 11 nuclei showed verysimilar MEF Barr-body ultrastructure to that observed in WI-38cells. MEF Xi ultrastructure, with relatively loose packing ofheterochromatin fibers/domains, contrasted sharply with the denser,more uniform texture of chromocenters (Fig. 4). H3-3mK27immunogold staining clearly distinguished the facultativeheterochromatin of the Xi from the constitutive heterochromatin ofthe chromocenters (Fig. 4C). Because of the high chromatin packingdensity within the chromocenters, we cannot resolve whether large-scale chromatin fibers of similar diameter as in the Xi are alsopresent in the chromocenters, but not recognizable owing to theircloser packing, from the alternative possibility that the large-scalechromatin organization in chromocenters is fundamentally differentfrom that in the Xi.
The Barr body is not a solid mass of chromatin but insteadcontains folded heterochromatin fibers/domains with largeregions of interchromatin spacesReconstructions of four WI-38 nuclei were assembled usingnominally 40-nm-thick serial thin sections; based on the appearanceof large-scale chromatin fibers in x-z and y-z orthogonal views (seebelow), 60 nm was a better estimate of section thickness. Within
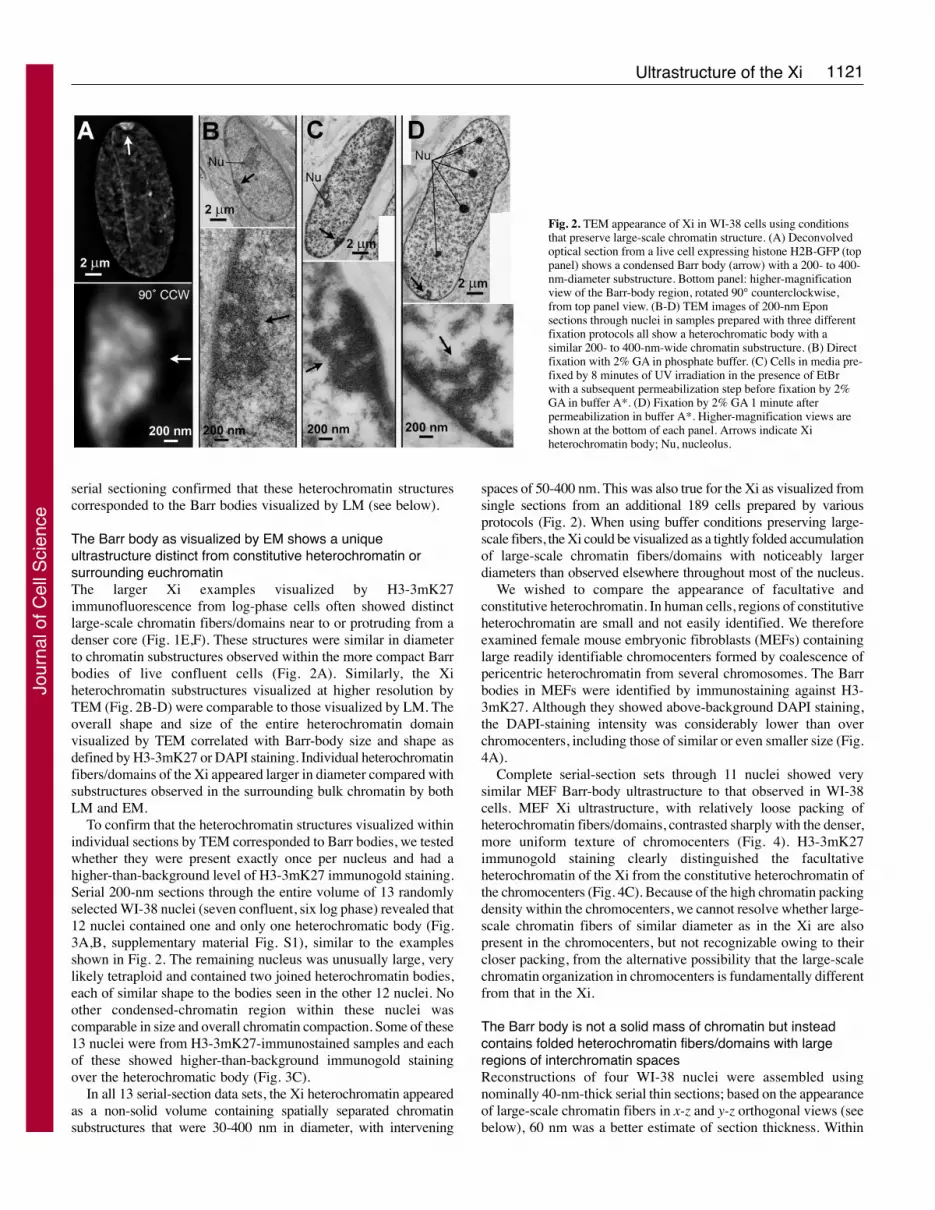
Fig. 2. TEM appearance of Xi in WI-38 cells using conditionsthat preserve large-scale chromatin structure. (A) Deconvolvedoptical section from a live cell expressing histone H2B-GFP (toppanel) shows a condensed Barr body (arrow) with a 200- to 400-nm-diameter substructure. Bottom panel: higher-magnificationview of the Barr-body region, rotated 90° counterclockwise,from top panel view. (B-D) TEM images of 200-nm Eponsections through nuclei in samples prepared with three differentfixation protocols all show a heterochromatic body with asimilar 200- to 400-nm-wide chromatin substructure. (B) Directfixation with 2% GA in phosphate buffer. (C) Cells in media pre-fixed by 8 minutes of UV irradiation in the presence of EtBrwith a subsequent permeabilization step before fixation by 2%GA in buffer A*. (D) Fixation by 2% GA 1 minute afterpermeabilization in buffer A*. Higher-magnification views areshown at the bottom of each panel. Arrows indicate Xiheterochromatin body; Nu, nucleolus.
Jour
nal o
f Cel
l Sci
ence

1122
individual sections, the overall nuclear chromatin distributionappeared relatively sparse or sponge-like, with the area occupiedby chromatin representing a small fraction of the total nuclear area(Fig. 5A, supplementary material Fig. S2A). Similarly, thecondensed region of the Xi also appeared significantly less solidthan impressions of the Barr body from LM (Fig. 1A) or thickerTEM sections (Figs 2-5). Maximal intensity projections (Fig. 5B)or additive intensity projections (supplementary material Fig.S2B,C) of aligned serial thin sections, however, showed a moresolid appearance of the Xi and a crowded nuclear interior, consistentwith single optical sections of DAPI/H3-3mK27 staining (Fig. 1A)or H2B-GFP fluorescence of live cells (supplementary material Fig.S2D). With ~20 sections per image stack, projections correspondedto an ~1.0- to 1.5-μm depth of volume, close to the expected LMdepth of field for a high-NA objective lens (±0.75 μm).
EM images of single thin sections showed that Xiheterochromatin is not a solid structure but rather an open structureof chromatin fibers/domains of variable diameters, from 30 to 600nm (Fig. 5A). In some regions, actual fiber segments could bevisualized as spatially distinct structures, with no overlap with otherchromatin domains, in adjacent serial sections. In other regions,fiber-like regions/domains had multiple contacts with neighboringchromatin condensed regions so the connectivity of DNA between
neighboring domains could not be determined unambiguously. Themost common structural motif was ~200 nm in diameter, largerthan the characteristic diameter of large-scale chromatin fibers inthe surrounding euchromatin. Interchromatin regions up to 400 nmin dimension separated Xi heterochromatin substructures. Thesechromatin-free subvolumes were contiguous with nuclear pores andwith the surrounding nucleoplasm (Fig. 5A, supplementary materialMovie 1). Deep extensions of nucleoplasm into the Barr-body corecould be clearly demonstrated by orthogonal views of interpolatedstacks (Fig. 5C). Moreover, orthogonal views revealed a connectionof nuclear pores with intrachromosomal spaces found within theBarr body (Fig. 5C; xz and yz slices, NP). A solid model of the Xiformed from density-threshold segmentation of the serial sectionreconstruction was calculated (Fig. 5D). 3D visualizations of theporous sponge-like substructure of the Xi is provided by differentviews of the reconstructed solid model (Fig. 5D�,D�, supplementarymaterial Movie 2) as well as by stereo pairs (Fig. 5D�).
The Xi is invariably attached to the nuclear envelope in humanand mouse fibroblasts with frequent, close connection to thenucleolusConsistent with previous findings in the literature (Belmont et al.,1986; Bourgeois et al., 1985; Zhang et al., 2007), we observed ~60%
of Barr bodies in WI-38 cells associated with thenuclear envelope, based on analysis of single opticalsections. However, our initial TEM experimentsshowed connections of the Xi with the nuclearenvelope in all examples examined. Therefore, weinvestigated the relationship of the Xi to the nuclearenvelope using a combination of 3D deconvolutionLM and 3D EM analysis.
Using H3-3mK27 staining to mark the Xi andnuclear-pore staining to mark the nuclear envelope,we found that 21/23 of Xi examples that were scoredas ‘interior’ based on single optical sections showedsome association with the nuclear envelope afteranalysis of 3D LM data. In the remaining two cells,the Xi position relative to the nuclear envelope wasunclear because of the extreme flatness of the nuclearenvelope adjacent to the coverslip and poor resolutionof LM in the z direction. In total, 14/23 cells showedthe Xi adjacent to the top surface of the nuclearenvelope, facing away from the coverslip(supplementary material Fig. S3A). Deepinvaginations of nuclear envelope reaching the Xiterritory were found in 6/23 cells (supplementarymaterial Fig. S3B). Two cells showed a connectionto the nuclear envelope through the attachment ofextended, H3-3mK27-stained large-scale chromatin
Journal of Cell Science 121 (7)
Fig. 3. Unique heterochromatin body visualized by TEMcorresponds to the Barr body. (A,B) Serial sections (200 nm)show one and only one heterochromatin body in a WI-38nucleus with the size, shape and characteristic chromatinultrastructure of the Barr body (comparable to LM images).(A) Two equatorial sections, 8 and 11 (S8, S11), of the wholenucleus. See supplementary material Fig. S1 for the completeset of serial sections. (B) Details of the heterochromatin bodyof the above nucleus, sections 5-12 (S5-S12). (C) H3-3mK27(rabbit antibody) immunogold labeling decorating the Xiheterochromatin periphery. Arrowheads and arrows point tothe Barr body; Nu, nucleolus.
Jour
nal o
f Cel
l Sci
ence

1123Ultrastructure of the Xi
fibers protruding from the Xi (supplementary material Fig. S3B).One cell showed both an attachment to a nuclear envelopeinvagination and an extended fiber reaching the main nuclearperiphery.
3D analysis by TEM using 200-nm serial sections revealed anattachment of the Xi to the nuclear envelope in essentially 100%of cells – 24/24 complete serial-section data sets and 7/7 incompleteserial-section data sets. These 31 randomly selected cells includedexamples from confluent and log-phase WI-38 cells and MEFs. Intotal, 20/31 cells showed close association of the Xi with the nuclearenvelope in sections parallel to the nuclear equatorial plane (Figs2-4). 8/31 cells showed the Xi attached to the nuclear envelope insections far from the equatorial plane, mostly on the top of thenucleus (Fig. 6A-C). The remaining 3/31 cells showed an internallylocated Xi attached to the nuclear envelope via an invagination ofthe nuclear envelope (Fig. 6D).
The observed association of the Xi with the nuclear envelopedoes not appear to be specific to the Xi facultative heterochromatin,because a similar association was observed for constitutiveheterochromatin of mouse chromocenters. 3D TEM analysis ofserial sections through MEF nuclei (n=11) revealed that all observedchromocenters were also attached to the nuclear envelope(supplementary material Fig. S4 and Movie 3).
Consistent with a reported ~50% of Xi association with thenucleolus in G0 and log-phase MEFs (Zhang et al., 2007), we founda 40% attachment (n=108) of the Xi to nucleoli by LM and 38%by TEM using serial sections through entire nuclei (9/24) inconfluent, quiescent WI-38 cells (supplementary material Fig. S5).All Xi in contact with the nucleolus maintained some contact withthe nuclear envelope.
DiscussionThe mammalian Xi has been a classic model for facultativeheterochromatin for nearly 50 years. Throughout most of this time,
Fig. 4. Xi and chromocenters have a different ultrastructure. (A) Fluorescentimages of a mouse embryonic fibroblast nucleus counterstained by DAPI(blue) show the Xi (arrows) identified by mouse anti H3-3mK27 antibody(pink) with weaker DAPI intensity than observed in chromocenters(arrowheads) but still noticeably above the background DAPI intensity level.(B,C) Electron micrographs of 200-nm sections of two nuclei demonstratelooser chromatin packing of the Xi (arrows) compared with that ofchromocenters (some marked by arrowheads). (C) Nanogold staining ofhistone H3-3mK27 (rabbit antibody) shows the comparison of the labeled Xifacultative heterochromatin (arrow) and heterochromatin of the adjacentchromocenter (arrowhead). Nu, nucleolus.
Fig. 5. 3D reconstruction of Xi heterochromatin. (A) Non-processed, 60-nm serial sections. Arrows indicate the Xi;arrowheads in zoomed insets point to specific large-scaleXi chromatin motifs of different dimensions: 30 nm(section 7), 215 nm (section 8) and 550 nm (section 10).Nuclear pores (NP) are present in the nuclear-enveloperegion adjacent to Xi heterochromatin and connect withinterchromatin tunnels of nucleoplasm within the Barr-body volume. (B-D) 21 intensity-inverted and normalized(to be proportional to electron scattering ‘mass’) serialsections were used for 3D reconstruction of the Barr body.See supplementary material Movie 1 for the completeserial section stack. (B) Maximum intensity projection ofaligned sections (~1300-nm depth) gives the impression ofa more-solid Barr body, similar to that visualized by LM.(C) Orthogonal views show large nucleoplasm channelspenetrating throughout the Barr-body interior andinterconnecting with NPs. Images for this reconstructionwere median filtered and interpolated in z to provideuniform x-y-z voxel dimensions. Green line, y-axis; blueline, x-axis; red line, z-axis. (D) An example of the inputimage after additional median filtering (originally section7) used for solid model rendering shown in D� and D�, andfor stereo-pair projections shown in D� (also seesupplementary material Fig. S6). All provide furtherillustration of the porous internal structure of Xiheterochromatin. See rotating solid model of the Barr bodyin supplementary material Movie 2. Scale bar: 1 μm (threeleft-most panels in A; B-D).
Jour
nal o
f Cel
l Sci
ence

1124
an increased chromatin compaction, as inferred by the appearanceof the pycnotic Barr body, has been assumed. Moreover, during thepast 10 years, a set of repressive epigenetic marks has beenassociated with X inactivation, correlating changes in chromatinhistone composition with X inactivation (Chow and Brown, 2003;Heard and Disteche, 2006). However, a FISH analysis revealedsimilar volumes for the Xa versus Xi, emphasizing insteaddifferences in shape rather than overall compaction as the majordistinguishing feature of the Xa versus Xi (Eils et al., 1996).Surprisingly, no careful ultrastructural analysis of the Barr bodywas available to address this apparent contradiction. Here, weidentified buffer and sample-preparation conditions preserving Xilarge-scale chromatin structure close to that visualized in live cells.A novel procedure was developed to provide improved preservationof Xi large-scale chromatin structure during immunogold-stainingprocedures.
Using these methods, here we show for the first time that thecondensed region of the Xi assumes a unique ultrastructure, distinctfrom surrounding euchromatin or constitutive heterochromatin,containing large-scale chromatin fibers/domains with noticeablylarger diameter than observed in the surrounding euchromatin
regions. In contrast to its appearance as a solid mass by wide-fieldLM without deconvolution, the Barr body at the ultrastructural levelclearly shows a relatively porous structure, formed by the tightfolding of large-scale chromatin fibers/domains within a compactvolume. The mean density of chromatin compaction is significantlyhigher than euchromatic chromosome regions but lower than thatobserved for mouse chromocenters. 3D ultrastructural analysis alsorevealed that essentially all Barr bodies maintain some contact withthe nuclear periphery, which in mammalian cells is correlated withrepression of gene expression (Taddei et al., 2004), with ~40% ofBarr bodies also in contact with the nucleolus in confluent WI-38cells.
Our results showing a distinctive, condensed ultrastructure forthe mouse and human Barr bodies appear to contradict a FISHanalysis that found similar volumes for both the Xa and Xi in humanamniotic cells (Eils et al., 1996), implying similar mean compactionfor both chromosomes (Pollard and Earnshaw, 2004). Severalpossibilities may account for this apparent contradiction. Thelimited resolution of LM relative to the size of the Barr body,combined with chromosomal volume changes induced by the FISHprocedure, might have led to errors in Xi and Xa volume estimation.Alternatively, our study examined the ultrastructure of the condensedregion of the Xi, corresponding to the Barr body visualized by DAPIstaining, whereas the FISH study measured the total Xi volume,which includes both the Barr body plus the chromosome regionsand active genes that escape silencing. In fact, the authors of theFISH study noted that the Xi chromosome territory appearedfrequently to have a denser core FISH signal, whereas the Xaterritory showed a more uniform FISH density throughout theterritory. The focus of the FISH study on volume comparison mighttherefore have missed the significant differences in chromatinstructure assumed by the condensed region of the Xi.
How higher levels of chromatin folding and chromosome territoryshape influence gene expression remains unclear. Based on low-resolution FISH chromosome paints, an interchromosome domain(ICD) model was proposed in which decondensed active genes arepositioned on the surface of compact chromosome domains,bordering an interchromosome space containing macromolecularcomplexes and nuclear bodies important for transcriptional activity(Zirbel et al., 1993). Additional LM analysis of chromosometerritories have instead shown less-solid chromosome territorystructures with more substructure, while also localizing transcriptionand active genes within chromosome territories (Mahy et al., 2002b;Osborne et al., 2004). This has prompted several refinements of theoriginal ICD model, so that more or less solid chromosometerritories contain extensive invaginations, leading to more-extensivecontact with an interchromatin space (Cremer et al., 2006; Williams,2003). In all of these models, however, the positioning of active orpotentially active genes to the exterior of a dense chromosometerritory such that they are accessible to the interchromosome spaceremains a key concept. Based on these models, the rounder,smoother shape of the Xi versus Xa might have functionalsignificance in gene repression by reducing the territory surfacearea in contact with the interchromosome space.
By contrast, our results show that chromatin occupies a relativelylow fraction of the nuclear volume in mouse and human fibroblasts,with the possibility for extensive space, not occupied by chromatin,for movement of large macromolecular complexes and even nuclearbodies. Even the relatively condensed Barr body still showsconsiderable intrachromosomal space separating distinct large-scalechromatin fibers/domains and contiguous with the nuclear pores
Journal of Cell Science 121 (7)
Fig. 6. Serial sections (200 nm) reveal the Xi–nuclear-envelope associationeven when the Xi appears interior in equatorial sections (confluent WI-38cells). (A-C) Three sections of the same immunostained (H3-3mK27) nucleuswith nanogold-labeled heterochromatin of the Xi (arrows). (A) The equatorialsection 4 shows the Xi and adjacent nucleolus (Nu) in the nuclear interior.(B,C) Top-two grazing sections of the above nucleus (section 2, section 1)show the attachment of the Xi and adjacent nucleolus to the overlying nuclearperiphery. (D) An example of the apparent intranuclear Xi (arrow) attached tothe deep nuclear envelope invagination (Inv).
Jour
nal o
f Cel
l Sci
ence

1125Ultrastructure of the Xi
and nuclear interior. Recent experiments have revealed looping ofMbp-sized gene-rich regions outside of chromosome territoriesaccompanying gene activation (Mahy et al., 2002a; Ragoczy et al.,2003; Volpi et al., 2000). Therefore, the rounder shape reported forthe Xi versus Xa (Eils et al., 1996) might be at least partly aconsequence rather than a cause of Xi gene silencing, with theelimination of the looping of active regions outside of the core Xichromosome territory.
In considering how Barr-body ultrastructure might influence genesilencing, we suggest the proper focus instead should be ondistinctly higher-level compaction of large-scale chromatinfibers/domains observed within the Barr body as compared tosurrounding euchromatin regions. This region of the Xi has beenlinked with transcriptional silencing (Chaumeil et al., 2006; Clemsonet al., 2006), with a movement of genes towards the interior of theXist-coated Xi core region accompanying gene silencing duringembryonic stem (ES) cell differentiation (Chaumeil et al., 2006).Our results show that this core also corresponds to the region ofH3K27 trimethyl modification and assumption of a distinctive,large-scale chromatin-folding motif. These correlations suggest aprobable functional link between the altered large-scale chromatinpacking and gene silencing.
Based on the biased localization of X-linked inactive genestowards the periphery of the condensed Xist-coated Barr body byFISH, together with the localization of Cot-1 DNA largely withinthe Barr body, Clemson and colleagues have suggested extensivelooping of both active and inactive genes outside or on the edge ofthe Barr body, which they propose is formed largely bytranscriptionally repressed repetitive DNA (Clemson et al., 2006).However, Chaumeil and colleagues observed X-linked genesprotruding from the Xist-coated Xi core very early during Xisilencing accompanying ES cell differentiation, with genesundergoing silencing shifting later during differentiation to a moreinterior position largely at the edge of the Xist-coated Xi core(Chaumeil et al., 2006).
In the Clemson et al. model, all X-linked genes, not just thosethat escape silencing, loop out from the dense Barr-body core(Clemson et al., 2006). Moreover, in this model, only centromericand Cot-1 repetitive DNA localizes within the dense Barr-body core,implying extensive looping of repetitive DNA sequences locatedin intergenic regions back into the Barr-body core. Therefore, thismodel would predict extensive looping on the same DNA distancescale as gene spacing – typically tens to hundreds of kb. Previously,we estimated a compaction of approximately 3 Mbp per μm for~100 nm large-scale chromatin fibers (Tumbar et al., 1999), withthe expected compaction of the thicker, ~200 nm diameter, large-scale chromatin fibers/domains in the Xi condensed regionsdescribed in this paper expected to be substantially higher.Therefore, with compactions corresponding to greater than 300 kbper 100-nm lengths of large-scale chromatin fibers, we should expectto see many looped-out genes protruding from the surfaces of thecondensed, large-scale chromatin fibers that make up the Barr body.However, in our serial thin sections, we did not see the extensivelooping of decondensed chromatin protruding outwards from theBarr body as would be expected by the Clemson et al. model(Clemson et al., 2006). However, we did see chromatin domainspackaged similarly to surrounding euchromatin – and thereforeestimated as being 100’s to 1000’s of kb in size – in close contactwith but extending outwards from the condensed, H3K27-trimethyl-labeled Barr body. Without any specific label, we could notunambiguously determine whether these chromatin domains were
part of the Xi, but it is possible that these chromatin regionscorrespond to X-linked genes, or more likely clusters of X-linkedgenes, that escape silencing.
Clearly, a large problem in extrapolating from the above-citedFISH studies to our own work is the large mismatch in structuralpreservation between the associated protocols. We have usedsample-preservation conditions that preserve the Barr-body size andinternal structure so that they are very close to that observed bylive-cell imaging, as well as by EM of unextracted cells underoptimal chemical-fixation methods used in conventional EM.Unfortunately, these fixation methods are too stringent to allowlocalization of specific genes or chromosome regions by FISHmethods. By contrast, the best 3D FISH procedures produce near-complete loss of large-scale chromatin ultrastructure as visualizedby EM (Solovei et al., 2002) and, at least in some cases, thesestructural perturbations are quite apparent even by LM (Robinettet al., 1996). Therefore, it is difficult at this time to reconciledifferences in possible models of Xi organization created by FISHmethods versus ultrastructural analysis.
In conclusion, we have demonstrated a distinct condensation ofXi chromatin and association of the Xi in all cells with the nuclearenvelope. These results are consistent with the idea that spatialsegregation of Xi chromatin helps maintain Xi silencing by limitingaccess to transcription factors (Heard and Disteche, 2006). Futureexperiments directly comparing the ultrastructure of X-linkedactive versus inactive genes, and correlating these differences withregulation of gene silencing, will require the development ofmethods for visualizing the location of specific genes andcomponents of the transcriptional machinery without perturbingchromatin ultrastructure.
Materials and MethodsCell cultureHuman female fibroblasts (WI-38) obtained from the American Type CultureCollection were maintained in minimum essential medium (Invitrogen) supplementedwith 10% FBS (HyClone Laboratories) at 37°C in 5% CO2. WI-38 cells at cumulativepopulation doublings between 20 and 40 were used 3 days (log-phase cells) or 10days (confluent cells) after plating. Female mouse embryonic fibroblasts (MEFs) wereprovided by Edith Heard (Curie Institute, Paris, France). MEFs were maintained inDulbecco’s modified Eagle’s medium (Invitrogen), 10% FBS (HyClone Laboratories)and 0.001% 2-mercaptoethanol (Sigma) at 37°C in 8% CO2. MEFs were culturedfor 3 days before they were placed in low serum (0.1% FBS) for an additional 72hours to obtain quiescent cells.
Live-cell observationWI-38 cells were transfected by FuGene6 (Roche) with plasmid pH2BGFP-N1 (Kandaet al., 1998). Cells were plated in delta-T dishes (Biotechs) or coverslips 2 days aftertransfection and cultured for another 10 days before live imaging.
ImmunofluorescenceStaining was performed essentially as described previously (Tumbar and Belmont,2001) with the following modifications. Cells were permeabilized in 0.1% Triton,fixed in 1.6% formaldehyde (Polysciences) at room temperature for 10 minutes, andblocked for 10 minutes with 5% NGS and 5% donkey serum. For Xi labeling, weapplied mouse anti-tri-methyl histone H3Lys27 (H3-3mK27) antibody (DannyReinberg, NYU College of Medicine, NY) diluted 1:2000. For double-staining ofthe Xi and nuclear membrane, rabbit anti H3-3mK27 antibody (Upstate) diluted 1:1000was used together with mouse monoclonal antibody RL1 against nuclear pore O-linked glycoprotein (ABR-Affinity BioReagents) diluted 1:750. For double-stainingof the Xi and nucleoli, mouse anti-H3-3mK27 antibody diluted 1:2000 was usedtogether with rabbit polyclonal anti-fibrillarin (Santa Cruz Biotechnology) antibodydiluted 1:100. Secondary antibodies (Texas-red-labeled donkey anti mouse, FITC-labeled goat anti rabbit) antibodies were diluted 1:500 and obtained from JacksonLaboratory. Cells were counterstained by DAPI.
Light microscopyImmunostained samples were observed with a 60� objective (NA=1.4) using anOlympus IMT-2 microscope. Live cells were imaged with a 100� objective(NA=1.40) using a Zeiss Axiovert 100M within 10 minutes after removal from the
Jour
nal o
f Cel
l Sci
ence

1126
incubator or maintained at 37°C in a closed chamber system (FCS2; Bioptechs). Dataacquisition and 3D deconvolution methods were processed as previously described(Chuang et al., 2006; Tumbar et al., 1999).
EM preparation of non-immunostained samplesCells were grown on glass coverslips. Several procedures designed to preserve large-scale chromatin fibers were used: (a) live cells were fixed directly in 0.1 phosphatebuffer, pH 7.4, in 2% GA (Polysciences) overnight at 4°C; (b) cells were permeabilizedwith 0.1% Triton X-100 (Pierce) in buffer A* (80 mM KCl, 20 mM NaCl, 2 mMEDTA, 0.5 mM EGTA, 15 mM Pipes, 0.5 mM spermidine, 0.2 mM spermine, 10μg/ml turkey egg white inhibitor, pH 7.0) for 30-180 seconds followed by fixationin 2% GA (25% solution added dropwise) overnight at 4°C; (c) cells on ice in mediawere UV irradiated (9000 J/m2) for 8 minutes (Stratalinker 1800 UV crosslinker,Stratagene). EtBr (20 μg/ml) was added to media before UV treatment. After UVfixation, coverslips were permeabilized with 0.1% Triton X-100 in buffer A* for 5minutes and then post-fixed overnight at 4°C in 2% GA in buffer A*.
Immunostaining procedure for EMTwo UV/EtBr cross-linking fixation methods were used prior to immunostaining:cells were permeabilized for 30 seconds with 0.1% Triton X-100 in buffer A* in thepresence of 20 μg/ml EtBr followed by 4 minutes of UV irradiation on ice (4500J/m2). Alternatively, live cells in media were placed on ice and 20 μg/ml EtBr wasadded prior to 8 minutes of UV irradiation (9000 J/m2).
Samples fixed by either method were washed in 0.1% Triton X-100 buffer A*.All following steps were performed in the same buffer unless specified otherwise.Cells were blocked in 1% BSA for 1 hour at room temperature and then rabbit antibody(Upstate) against histone H3-3mK27 diluted 1:1000 in blocking buffer was appliedat 4°C overnight. Specimens were washed three times followed by a second blockingstep for 30 minutes at room temperature with 0.1% fish gelatin (Sigma). Incubationwith secondary nanogold anti-rabbit antibody (Nanoprobes) was performed overnightat 4°C (antibody diluted in 0.1% fish gelatin, 1% BSA, 1:500). Specimens were washedthree times and post-fixed in 2% GA for 1 hour at room temperature. Samples werequenched with 150 mM glycine (3� 5 minutes) and then blocked with 0.1% fishgelatin in blocking buffer for 10 minutes at room temperature. Specimens were washed(5� 2 minutes) in double-distilled H2O before silver or gold enhancement of nanogoldby HQ Silver (Nanoprobes) for 6-10 minutes or by Gold Enhancement (Nanoprobes)for 2 minutes.
All EM samples were en bloc stained with uranyl acetate (1% in H2O) for 1 hourat room temperature, followed by dehydration in an ethanol series, and infiltrationand embedding in Epon 812 (Polysciences). Embedded cells were removed fromglass coverslips after boiling the Epon samples in H2O for several minutes. Sectionsof 60 or 200 nm on formvar support films were stained with uranyl acetate (2% inH2O) for 15 minutes and lead citrate (0.02% in 0.01 M NaOH) for 10 minutes. Carboncoating was applied after staining to grids used for serial section reconstructions.
Fixation and preparation conditions for specific figure panelsFor Fig. 2B, Fig. 6D and supplementary material Fig. S5C, samples were fixed in2% GA in 0.1 M phosphate buffer. For Fig. 2C, the sample was fixed by UV/EtBrcross-linking for 8 minutes prior to permeabilization and GA post-fixation. For Fig.2D, Fig. 3A,B, Fig. 4B, Fig. 6, and supplementary material Fig. S1, Fig. S2A-C, Fig.S4 and Fig. S5B, samples were fixed by 2% GA in buffer A* after partialpermeabilization for 30-90 seconds in buffer A*. For Fig. 3C, sample was fixed by10 minutes of UV irradiation with EtBr in medium. For Fig. 4C, Fig. 6A-C andsupplementary material Fig. S5D, samples were fixed after quick permeabilizationin EtBr/buffer A* by 4 minutes of UV irradiation.
Electron microscopySections were examined with a Philips CM 200 electron microscope operating at 120kV. Images were acquired using a Tietz Video and Image Processing Systems GmbH2k � 2k Peltier-cooled CCD camera and software.
Image processingLM and EM images were adjusted for brightness/contrast, superimposed,pseudocolored and assembled using Adobe Photoshop CS. Alignment of 200-nmserial sections was done manually in Photoshop and movies were created in WCIFImage J.
60-nm serial sections were aligned for 3D reconstructions using a cross-correlationalignment procedure including rotation, translation and a uniform magnificationadjustment as described previously (Belmont and Bruce, 1994; Kireeva et al., 2004).Aligned and normalized images were further processed in ImageJ. A 2D median filterwith a box size of 5�5 was applied to each section of a 512�512 cropped imagestack. The resolution was then reduced by a factor of two by summing 2�2 pixelsto produce 256�256 image sections. A cubic spline interpolation was used to producea uniform 14-nm pixel size in x, y and z. A final 3D smoothing filter (2�2�2) inthe Ortview plugin was applied and orthogonal images and stereo projections werethen generated. Xi solid models were calculated using density-threshold segmentationin Matlab 7.0 using the DIPimage toolbox (Quantitative Imaging Group, Departmentof Imaging Science and Technology, Delft University of Technology, Delft, The
Netherlands). AVI movies were created using a Camera Sequence MATLAB script(Olivier Salvado, CSIRO). ImageJ was used to convert movies to a compressedQuickTime format using QT Movie Writer plugin.
We thank Edith Heard (Curie Institute, France) for her commentson the manuscript as well as for providing MEFs. We thank Teru Kandaand Geoffrey Wahl (The Salk Institute for Biological Studies, USA)for providing the H2B-GFP expression vector (pH2BGFP-N1), as wellas Danny Reinberg (NYU, College of Medicine, USA) for the anti-H3-3mK27 mouse antibody. Electron microscopy was performed inThe Visualization, Media and Imaging Laboratory at the BeckmanInstitute, UIUC. This work was supported by HFSP RGP0019/2003and grant number R01 GM42516 from the National Institute of GeneralMedical Sciences (A.S.B.). The content is solely the responsibility ofthe authors and does not necessarily represent the official views of theNational Institute of General Medical Sciences or the National Institutesof Health.
ReferencesArney, K. L. and Fisher, A. G. (2004). Epigenetic aspects of differentiation. J. Cell Sci.
117, 4355-4363.Barr, M. L. and Carr, D. H. (1962). Correlations between sex chromatin and sex
chromosomes. Acta Cytol. 6, 34-45.Belmont, A. S. and Bruce, K. (1994). Visualization of G1 chromosomes: a folded, twisted,
supercoiled chromonema model of interphase chromatid structure. J. Cell Biol. 127,287-302.
Belmont, A. S., Bignone, F. and Ts’o, P. O. (1986). The relative intranuclear positionsof Barr bodies in XXX non-transformed human fibroblasts. Exp. Cell Res. 165, 165-179.
Belmont, A. S., Braunfeld, M. B., Sedat, J. W. and Agard, D. A. (1989). Large-scalechromatin structural domains within mitotic and interphase chromosomes in vivo andin vitro. Chromosoma 98, 129-143.
Bourgeois, C. A., Laquerriere, F., Hemon, D., Hubert, J. and Bouteille, M. (1985).New data on the in-situ position of the inactive X chromosome in the interphase nucleusof human fibroblasts. Hum. Genet. 69, 122-129.
Chaumeil, J., Le Baccon, P., Wutz, A. and Heard, E. (2006). A novel role for Xist RNAin the formation of a repressive nuclear compartment into which genes are recruitedwhen silenced. Genes Dev. 20, 2223-2237.
Chow, J. C. and Brown, C. J. (2003). Forming facultative heterochromatin: silencing ofan X chromosome in mammalian females. Cell. Mol. Life Sci. 60, 2586-2603.
Chuang, C. H., Carpenter, A. E., Fuchsova, B., Johnson, T., de Lanerolle, P. andBelmont, A. S. (2006). Long-range directional movement of an interphase chromosomesite. Curr. Biol. 16, 825-831.
Clemson, C. M., Hall, L. L., Byron, M., McNeil, J. and Lawrence, J. B. (2006). TheX chromosome is organized into a gene-rich outer rim and an internal core containingsilenced nongenic sequences. Proc. Natl. Acad. Sci. USA 103, 7688-7693.
Cremer, T., Cremer, M., Dietzel, S., Muller, S., Solovei, I. and Fakan, S. (2006).Chromosome territories-a functional nuclear landscape. Curr. Opin. Cell Biol. 18, 307-316.
Eils, R., Dietzel, S., Bertin, E., Schrock, E., Speicher, M. R., Ried, T., Robert-Nicoud,M., Cremer, C. and Cremer, T. (1996). Three-dimensional reconstruction of paintedhuman interphase chromosomes: active and inactive X chromosome territories havesimilar volumes but differ in shape and surface structure. J. Cell Biol. 135, 1427-1440.
Gilbert, N. and Bickmore, W. A. (2006). The relationship between higher-order chromatinstructure and transcription. Biochem. Soc. Symp. 73, 59-66.
Gilbert, N., Boyle, S., Fiegler, H., Woodfine, K., Carter, N. P. and Bickmore, W. A.(2004). Chromatin architecture of the human genome: gene-rich domains are enrichedin open chromatin fibers. Cell 118, 555-566.
Heard, E. and Disteche, C. M. (2006). Dosage compensation in mammals: fine-tuningthe expression of the X chromosome. Genes Dev. 20, 1848-1867.
Horowitz-Scherer, R. A. and Woodcock, C. L. (2006). Organization of interphasechromatin. Chromosoma 115, 1-14.
Kanda, T., Sullivan, K. F. and Wahl, G. M. (1998). Histone-GFP fusion protein enablessensitive analysis of chromosome dynamics in living mammalian cells. Curr. Biol. 8,377-385.
Kireeva, N., Lakonishok, M., Kireev, I., Hirano, T. and Belmont, A. S. (2004).Visualization of early chromosome condensation: a hierarchical folding, axial glue modelof chromosome structure. J. Cell Biol. 166, 775-785.
Lyon, M. F. (1961). Gene action in the X-chromosome of the mouse (Mus musculus L.).Nature 190, 372-373.
Maeshima, K., Eltsov, M. and Laemmli, U. K. (2005). Chromosome structure: improvedimmunolabeling for electron microscopy. Chromosoma 114, 365-375.
Mahy, N. L., Perry, P. E. and Bickmore, W. A. (2002a). Gene density and transcriptioninfluence the localization of chromatin outside of chromosome territories detectable byFISH. J. Cell Biol. 159, 753-763.
Mahy, N. L., Perry, P. E., Gilchrist, S., Baldock, R. A. and Bickmore, W. A. (2002b).Spatial organization of active and inactive genes and noncoding DNA within chromosometerritories. J. Cell Biol. 157, 579-589.
Journal of Cell Science 121 (7)
Jour
nal o
f Cel
l Sci
ence

1127Ultrastructure of the Xi
Osborne, C. S., Chakalova, L., Brown, K. E., Carter, D., Horton, A., Debrand, E.,Goyenechea, B., Mitchell, J. A., Lopes, S., Reik, W. et al. (2004). Active genesdynamically colocalize to shared sites of ongoing transcription. Nat. Genet. 36, 1065-1071.
Pollard, T. D. and Earnshaw, W. C. (2004). Cell Biology. Philadelphia: Elsevier.Puck, T. T. and Johnson, R. (1996). DNA exposure and condensation in the X and 21
chromosomes. Stem Cells 14, 548-557.Ragoczy, T., Telling, A., Sawado, T., Groudine, M. and Kosak, S. T. (2003). A genetic
analysis of chromosome territory looping: diverse roles for distal regulatory elements.Chromosome Res. 11, 513-525.
Robinett, C. C., Straight, A., Li, G., Willhelm, C., Sudlow, G., Murray, A. and Belmont,A. S. (1996). In vivo localization of DNA sequences and visualization of large-scalechromatin organization using lac operator/repressor recognition. J. Cell Biol. 135, 1685-1700.
Sheval, E. V., Kireev, I. I. and Polyakov, V. Y. (2004). Stabilization of macromolecularchromatin complexes in mitotic chromosomes by light irradiation in the presence ofethidium bromide. Cell Biol. Int. 28, 835-843.
Solovei, I., Cavallo, A., Schermelleh, L., Jaunin, F., Scasselati, C., Cmarko, D., Cremer,C., Fakan, S. and Cremer, T. (2002). Spatial preservation of nuclear chromatinarchitecture during three-dimensional fluorescence in situ hybridization (3D-FISH). Exp.Cell Res. 276, 10-23.
Spector, D. L. (2003). The dynamics of chromosome organization and gene regulation.Annu. Rev. Biochem. 72, 573-608.
Straub, T. and Becker, P. B. (2007). Dosage compensation: the beginning and end ofgeneralization. Nat. Rev. Genet. 8, 47-57.
Taddei, A., Hediger, F., Neumann, F. R. and Gasser, S. M. (2004). The function of nucleararchitecture: a genetic approach. Annu. Rev. Genet. 38, 305-345.
Tumbar, T. and Belmont, A. S. (2001). Interphase movements of a DNA chromosomeregion modulated by VP16 transcriptional activator. Nat. Cell Biol. 3, 134-139.
Tumbar, T., Sudlow, G. and Belmont, A. S. (1999). Large-scale chromatin unfolding andremodeling induced by VP16 acidic activation domain. J. Cell Biol. 145, 1341-1354.
Volpi, E. V., Chevret, E., Jones, T., Vatcheva, R., Williamson, J., Beck, S., Campbell,R. D., Goldsworthy, M., Powis, S. H., Ragoussis, J. et al. (2000). Large-scale chromatinorganization of the major histocompatibility complex and other regions of humanchromosome 6 and its response to interferon in interphase nuclei. J. Cell Sci. 113, 1565-1576.
Wegel, E. and Shaw, P. (2005). Gene activation and deactivation related changes in thethree-dimensional structure of chromatin. Chromosoma 114, 331-337.
Williams, R. R. (2003). Transcription and the territory: the ins and outs of gene positioning.Trends Genet. 19, 298-302.
Zhang, L. F., Huynh, K. D. and Lee, J. T. (2007). Perinucleolar targeting of the inactiveX during S phase: evidence for a role in the maintenance of silencing. Cell 129, 693-706.
Zirbel, R. M., Mathieu, U. R., Kurz, A., Cremer, T. and Lichter, P. (1993). Evidencefor a nuclear compartment of transcription and splicing located at chromosome domainboundaries. Chromosome Res. 1, 93-106.
Jour
nal o
f Cel
l Sci
ence


