Embed Size (px)
Citation preview
arX
iv:0
908.
1918
v2 [
astr
o-ph
.CO
] 2
1 Se
p 20
09
The fast declining Type Ia supernova 2003gs, and evidence for a
significant dispersion in near-infrared absolute magnitudes of fast
decliners at maximum light1
Kevin Krisciunas,2,3 G. H. Marion,2,4 Nicholas B. Suntzeff,2,3 Guillaume Blanc,5 Filomena
Bufano,6 Pablo Candia,7 Regis Cartier,8 Nancy Elias-Rosa,9 Juan Espinoza,10 David
Gonzalez,10 Luis Gonzalez,11 Sergio Gonzalez,11 Samuel D. Gooding,2 Mario Hamuy,8
Ethan A. Knox,12 Peter A. Milne,13 Nidia Morrell,11 Mark M. Phillips,11 Maximilian
Stritzinger,11 and Joanna Thomas-Osip11
ABSTRACT
1Based in part on observations taken at the Cerro Tololo Inter-American Observatory, National Optical
Astronomy Observatory, which is operated by the Association of Universities for Research in Astronomy,
Inc. (AURA) under cooperative agreement with the National Science Foundation. The near-IR photometry
from La Silla and Paranal was obtained by the European Supernova Collaboration (ESC).
2Texas A&M University, Department of Physics, 4242 TAMU, College Station, TX 77845-4242; krisciu-
[email protected], [email protected], [email protected]
3George P. and Cynthia Woods Mitchell Institute for Fundamental Physics & Astronomy, Texas A&M
University, Department of Physics, 4242 TAMU, College Station, TX 77845-4242
4University of Texas, Department of Astronomy, Austin, TX 78712; [email protected]
5APC, UMR 7164, CNRS, Universite Paris 7, CEA, Observatoire de Paris, 11 place Marcelin Berthelot,
F-75231, Paris, France; [email protected]
6INAF, Osservatorio Astronomico di Padova, Vicolo dell’Osservatorio 5, I-35122, Padova, Italy; filom-
7AURA/Gemini Observatory, Casilla 603, La Serena, Chile; [email protected]
8Universidad de Chile, Departamento de Astronomıa, Casilla 36-D, Santiago, Chile; [email protected],
9Spitzer Science Center, California Institute of Technology, 1200 E. California Blvd., Pasadena, CA 91125;
10Cerro Tololo Inter-American Observatory, Casilla 603, La Serena, Chile; [email protected]
11Las Campanas Observatory, Casilla 601, La Serena, Chile; [email protected] [email protected]
[email protected] [email protected]
12Humboldt State University, 1 Harpst Street, Arcata, CA 95521; [email protected]
13University of Arizona, Steward Observatory, 933 N. Cherry Ave., Tucson, AZ 85719; [email protected]
– 2 –
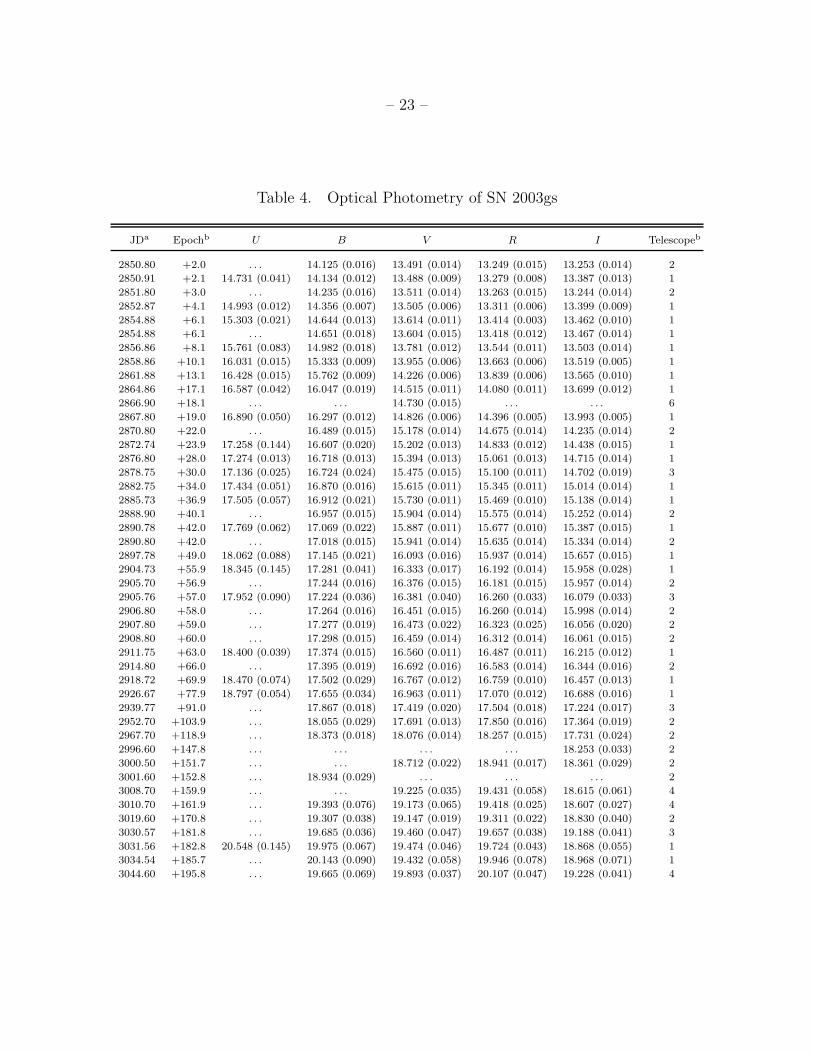
We obtained optical photometry of SN 2003gs on 49 nights, from 2 to
494 days after T(Bmax). We also obtained near-IR photometry on 21 nights.
SN 2003gs was the first fast declining Type Ia SN that has been well observed
since SN 1999by. While it was subluminous in optical bands compared to more
slowly declining Type Ia SNe, it was not subluminous at maximum light in the
near-IR bands. There appears to be a bimodal distribution in the near-IR ab-
solute magnitudes of Type Ia SNe at maximum light. Those that peak in the
near-IR after T(Bmax) are subluminous in the all bands. Those that peak in the
near-IR prior to T(Bmax), such as SN 2003gs, have effectively the same near-IR
absolute magnitudes at maximum light regardless of the decline rate ∆m15(B).
Near-IR spectral evidence suggests that opacities in the outer layers of
SN 2003gs are reduced much earlier than for normal Type Ia SNe. That may
allow γ rays that power the luminosity to escape more rapidly and accelerate
the decline rate. This conclusion is consistent with the photometric behavior of
SN 2003gs in the IR, which indicates a faster than normal decline from approxi-
mately normal peak brightness.
Subject headings: supernovae: individual (SN 2003gs) — techniques: photometric
1. Introduction
Type Ia supernovae (SNe) have been used to obtain accurate cosmological distances,
leading to the conclusion that the expansion of the universe is accelerating (Riess et al. 1998;
Perlmutter et al. 1999). Several pressing questions regarding the observed properties and the
underlying physics of the explosion remain unanswered.
The remarkable homogeneity of Type Ia SNe has led to general consensus regarding the
nature of the progenitor system. Type Ia SNe are believed to result from the thermonuclear
disruption of a carbon-oxygen white dwarf. In the favored scenario, the white dwarf is one
component of a close binary, and accretes hydrogen from its companion star. When the
white dwarf reaches the Chandrasekhar limit, explosive carbon burning sets in. Burning to
nuclear statistical equilibrium ensues, yielding radioactive 56Ni.
Although the intrinsic peak brightness of Type Ia SNe can vary by up to 2.5 magnitudes
in the B-band, there exists a tight correlation between the peak luminosity and the shape of
light curve which can be exploited to derive accurate relative distances. The peak brightness
is determined by the amount of radioactive 56Ni produced in the explosion. This amount
spans 0.09 – 0.93M⊙, although most events cluster in the 0.4-0.7M⊙ range (Stritzinger et al.
– 3 –
2006). The cause of this large variation is not understood. It is becoming increasingly clear
that Type Ia SNe are not a one-parameter family (Benetti et al. 2004b).
No two events illustrate this more than the intrinsically subluminous SN 1991bg (Filippenko et al.
1992b; Leibundgut et al. 1993) and the intrinsically overluminous SN 1991T (e.g. Filippenko et al.
1992a), both of which showed photometric and spectroscopic behavior that deviated substan-
tially from normal Type Ia SNe, although other highly peculiar events have been discovered
recently, such as SN 2002cx (Li et al. 2003; Branch et al. 2004; Jha et al. 2006).
One way of gaining physical insight is to assemble a sample of Type Ia SNe with com-
plete observational coverage from pre-maximum to nebular phases, over as wide a wavelength
range as possible. Such data can then be used to confront state-of-the-art explosion and
spectral synthesis models. Until recently, such data have been non-existent. For the very
nearby events (vhelio . 3000 km s−1), this shortcoming resulted in the setting up of the Eu-
ropean Supernova Collaboration (ESC) 14 which has already provided high quality data for
at least half a dozen Type Ia SNe: 2002bo (Benetti et al. 2004a), 2002cv (Elias-Rosa et al.
2008), 2002dj (Pignata et al. 2008), 2002er (Pignata et al. 2004; Kotak et al. 2005), 2003cg
(Elias-Rosa et al. 2006), 2003du (Stanishev et al. 2007), 2004dt (Altavilla et al. 2007),
2004eo (Pastorello et al. 2007b), 2005bl (Taubenberger et al. 2008), and 2005cf (Garavini et al.
2007; Pastorello et al. 2007a).
Important observational initiatives have been carried out at Las Campanas Observatory
and Cerro Tololo Iner-American Observatory whose goal was to obtain well-sampled optical
and near-IR light curves. These endeavors have not been limited to nearby Type Ia SNe.
Since Pskovskii (1977), Phillips (1993), and Hamuy et al. (1995) showed that the abso-
lute magnitudes at maximum light of Type Ia supernovae were correlated with their decline
rates,15 these objects have been subjected to ever more intense scrutiny. Meikle (2000),
Krisciunas, Phillips, & Suntzeff (2004a), Krisciunas et al. (2004b,c), and Wood-Vasey, et al.
(2008) have shown that over a wide range of decline rates the near-IR absolute magnitudes
of Type Ia SNe at some epoch with respect to maximum light are essentially constant. In
the near-IR most Type Ia SNe are not just standardizable candles, but very nearly standard
candles. The few exceptions are mostly identifiable by their unusual IR light curve shapes.
Near-IR spectra of SN 2003gs (Kotak et al. 2009) and SN 1986G (Frogel et al. 1987)
14http://www.mpa-garching.mpg.de/˜rtn/
15The light curve decline parameter, ∆m15(B), is defined as the decline in apparent brightness in the first
15 days following B-band maximum. The observed range of ∆m15(B) is 0.81 ± 0.04 (SN 1999aa) to 1.93 ±
0.10 (SN 1991bg) for the Prieto, Rest, & Suntzeff (2006) templates.
– 4 –
reveal the presence of lines from iron group elements that appeared earlier and created
stronger features than they do in spectra of normal Type Ia SNe. 56Co is produced by
the radioactive decay of 56Ni, which is the final burning product produced in the hottest
and densest regions of the SN during the explosion. The strong and early presence of iron
group elements in SN 2003gs suggests that the outer layers of partially burned ejecta have
lower opacities in SN 2003gs than they do in normal Type Ia SNe. This is an important
clue to understanding the photometric behavior of SN 2003gs, which indicates a faster than
normal decline from approximately normal peak brightness. In SN 2003gs, if the envelope
surrounding the iron and cobalt regions is not as deep or more transparent than it is in
normal Type Ia SNe, then γ rays that power the luminosity will escape more easily and the
decline rate will increase.
Here we present extensive optical (UBV RI) and near-IR (Y JHK) data of the nearby
Type Ia SN 2003gs. The Y -band is a new photometric band (Hillenbrand et al. 2002) which
exploits a relatively clean atmospheric window centred at ∼ 1.035µm.
2. Acquisition and reduction of photometry
SN 2003gs was visually discovered by Evans (2003) on 2003 July 29.75 UT. It was lo-
cated at RA = 02:27:38.36, DEC = −01◦09′35.′′4 (equinox 2000), 13.′′4 east and 14.′′6 south of
the nucleus of the barred spiral galaxy NGC 936. A spectrum obtained with the CTIO 1.5-m
telescope on July 30.4 UT revealed it to be a subluminous Type Ia SN similar to SNe 1991bg
and 1999by at roughly 1 day before maximum light (Suntzeff, Candia, & Stritzinger 2003;
Matheson & Suntzeff 2003). The spectroscopic typing was confirmed using a spectrum
obtained on July 31.33 with the 6.5-m Baade telescope at Las Campanas Observatory
(Hamuy, Gonzalez, & Morrell 2003). These authors also noted that the spectrum lacked
Na I D lines, suggesting that SN 2003gs is not significantly reddened by dust. Some pre-
liminary photometry was published in the IAU Circulars, including infrared photometry
accurate to ±0.1 mag (Mikolajewska & Szostek 2003), but here we will only consider our
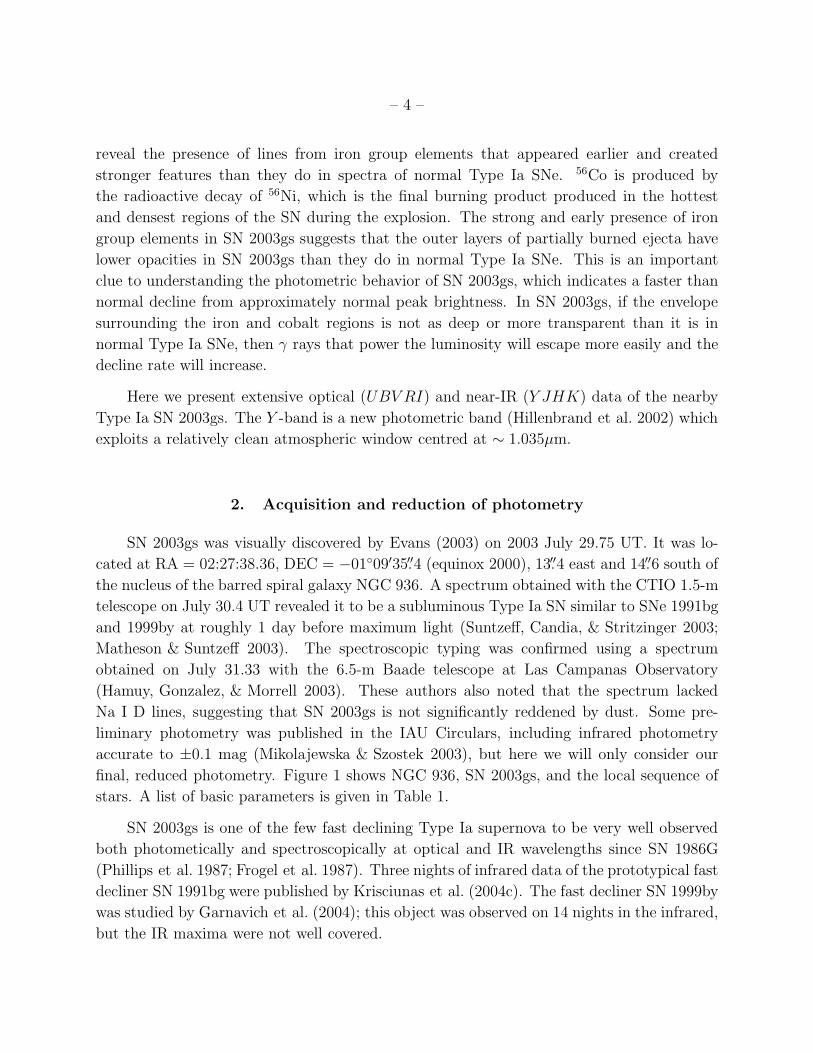
final, reduced photometry. Figure 1 shows NGC 936, SN 2003gs, and the local sequence of
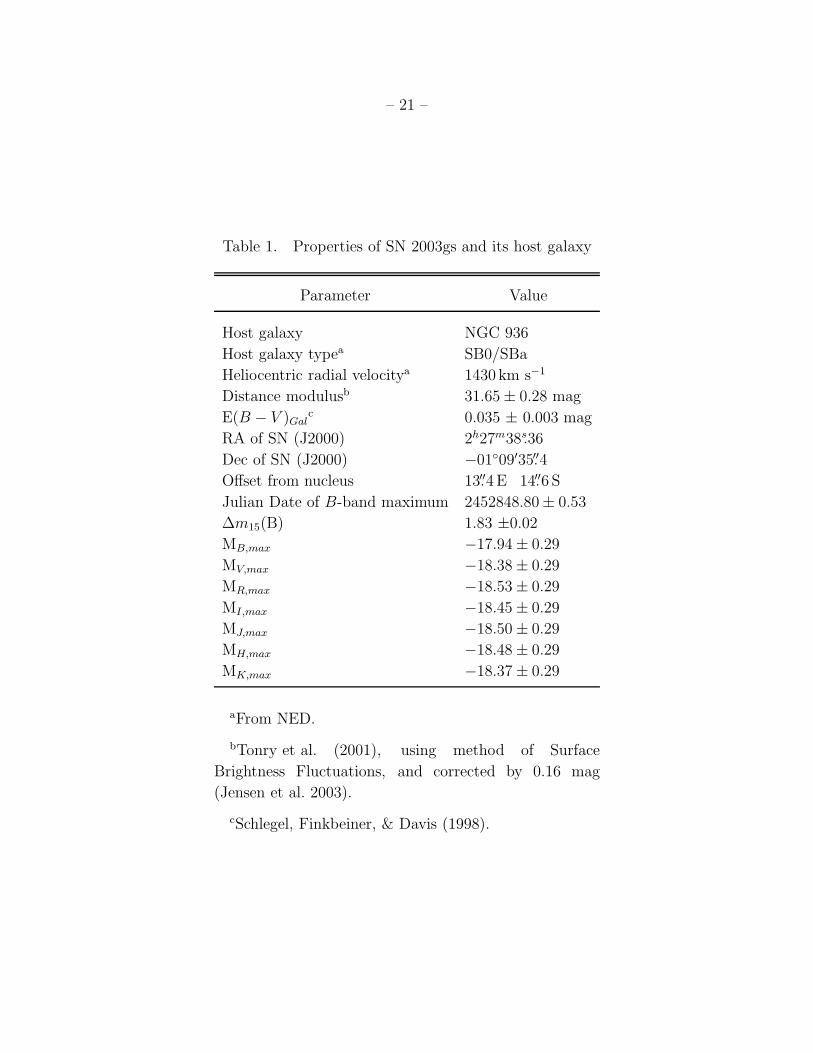
stars. A list of basic parameters is given in Table 1.
SN 2003gs is one of the few fast declining Type Ia supernova to be very well observed
both photometically and spectroscopically at optical and IR wavelengths since SN 1986G
(Phillips et al. 1987; Frogel et al. 1987). Three nights of infrared data of the prototypical fast
decliner SN 1991bg were published by Krisciunas et al. (2004c). The fast decliner SN 1999by
was studied by Garnavich et al. (2004); this object was observed on 14 nights in the infrared,
but the IR maxima were not well covered.
– 5 –
The fast decliners SNe 1991bg and 1999by are several tenths of a magnitude fainter
in the near-IR than more normal Type Ia SNe. See Figure 16 of Krisciunas et al. (2004c).
Given the rarity of fast declining Type Ia SNe, SN 2003gs gives us an opportunity to study
an object almost as extreme as these two other examples.16
Most of our photometry was obtained with the 1.3-m telescope at Cerro Tololo Inter-
American Observatory and the dual optical-infrared imager ANDICAM. The optical channel
gives images with a scale of 0.369 arcsec px−1. The gain is 2.3 electrons per analog-to-digital
unit (ADU). The readnoise is 6.5 electrons rms. For the IR channel the plate scale is 0.137
arcsec px−1, the gain is 7.2 electrons per ADU, and the readnoise is 20 electrons rms. The
optical photometry was derived using point spread function (PSF) magnitudes.
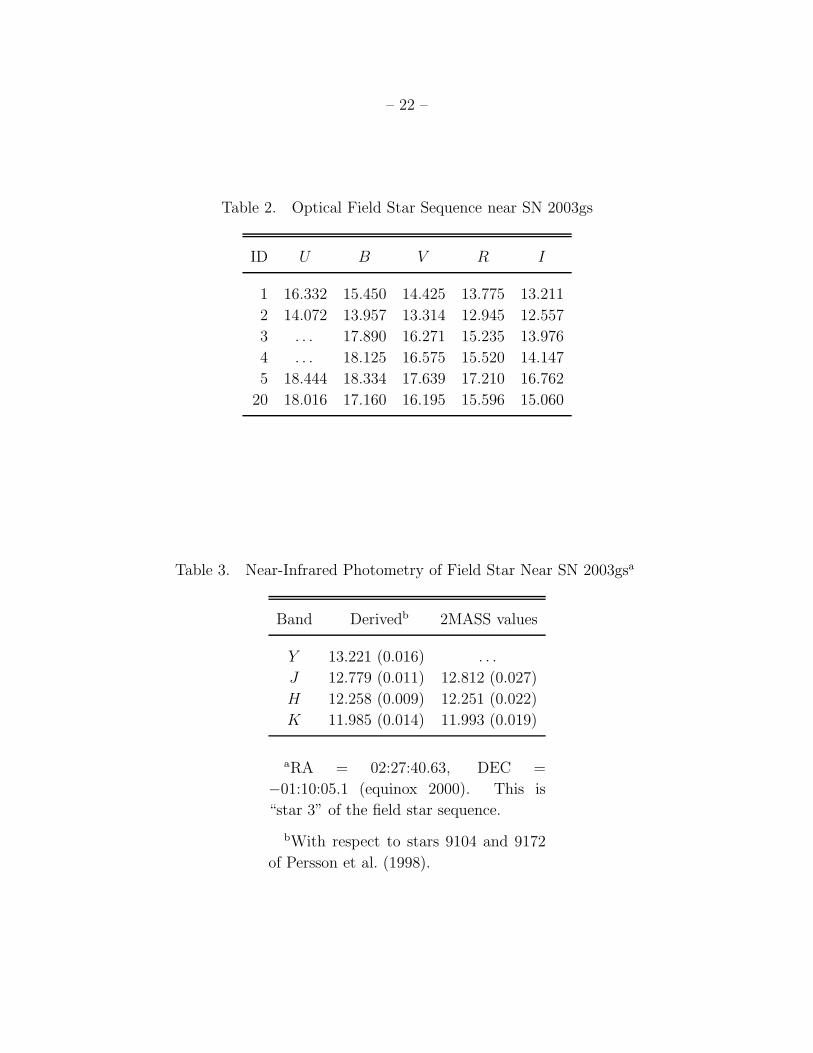
The optical photometry was calibrated by first determining the UBV RI magnitudes
of the field stars near SN 2003gs and tying them to Landolt (1992) standards. One or two
Landolt fields were observed along with the SN 2003gs field on nine ostensibly photometric
nights using the CTIO 1.3-m. The mean values of the photometry of the secondary standards
are given in Table 2. Four nights of optical photometry of the field stars, obtained with the
1-m Swope telescope at Las Campanas Observatory (LCO) and the CTIO 0.9-m telescope,
confirmed that the BV RI magnitudes of the field stars allowed photometric zeropoints to
be determined to better than ± 0.02 mag. There may be systematic and random errors in
our U band photometry at the 0.08 mag level owing to the non-zero color terms on different
systems and the inherently greater scatter of U -band photometry.
Optical imagery of SN 2003gs was obtained with the 1-m Swope telescope at LCO
on 16 nights during the Carnegie Type II Supernova (CATS) Survey (Hamuy et al. 2009).
Reduction of the photometry from the LCO 1-m system had to include a term for each filter
to account for non-linearities in the response of the CCD camera (Hamuy et al. 2006).
A further five epochs of optical photometry were obtained with the CTIO 0.9-m telescope
from 2003 August 27 through 2004 February 16 UT. The August 27 (CTIO) photometry
was reduced using PSF magnitudes. For the final four epochs of CTIO 0.9-m imagery and
the final three epochs of CTIO 1.3-m imagery we subtracted template images obtained with
the CTIO 0.9-m on 2007 October 19 UT, long after SN 2003gs had faded.
Some late time optical photometry was obtained with the University of Arizona 1.54-m
and 2.3-m telescopes. The results were derived using image subtraction templates obtained
16A slowly declining Type Ia SN has decline rate ∆m15(B) . 1.0. A mid-range decliner has 1.0 . ∆m15(B)
. 1.6. A fast decliner has ∆m15(B) & 1.6. There are spectroscopic differences between the three groups.
The slow decliners, for example, show the strongest lines due to doubly ionized species and the weakest lines
due to singly ionized species, because they have hotter temperatures.
– 6 –
in November and December of 2005.
Experiments with the CTIO 0.9-m imagery with and without image subtraction indicate
no statistically significant differences through 57 days after T(Bmax). At t = 91 days the
BV RI data obtained using image subtraction are on average 0.03 mag fainter than PSF
photometry without image subtraction. These differences are comparable to the random
errors of the photometry.
We observed two IR standards of Persson et al. (1998), P9104 and P9172, on 6 pho-
tometric nights along with the field of NGC 936 to calibrate the field star immediately
southeast of the SN (“star 3” of the photometric sequence). In Table 3 we give the mean
Y JHK values of this field star, along with the JHK values from the Two Micron All Sky
Survey (2MASS). As one can see, the agreement is good. Since not all the data were taken on
photometric nights when IR standards were observed, we derived differential filter-by-filter
magnitudes and added these differential values to our derived photometry of the key field
star in order to obtain the SN photometry found in Table 5.
We do not rely on measures of Y -band standards given by Hillenbrand et al. (2002).
Instead, we rely on synthetic photometry of Sirius, Vega, and the Sun. Krisciunas et al.
(2004b) give the following relation:
(Y − Ks) = −0.013 + 1.614 (Js − Ks) .
This expression allows us to use the Js and Ks magnitudes of Persson et al. (1998)
standards to estimate the Y -band magnitudes of those standards. The Y -band calibrations
should only be considered approximate (± 0.03 mag).
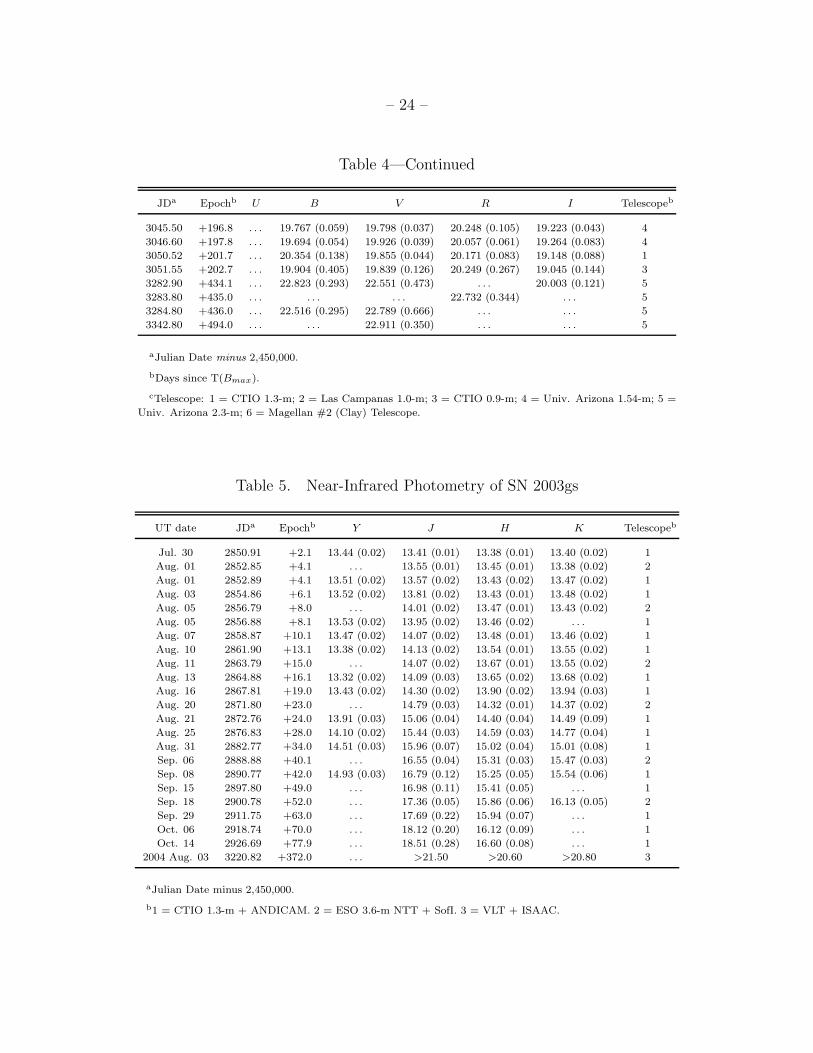
The UBV RI and Y JHK photometry of SN 2003gs is given in Tables 4 and 5. We note
that the K-band filter of ANDICAM on the CTIO 1.3-m is closer to the K-short filter used
at Las Campanas than a standard, wider K-band filter. Throughout this paper what we call
K-band photometry is really Ks photometry.
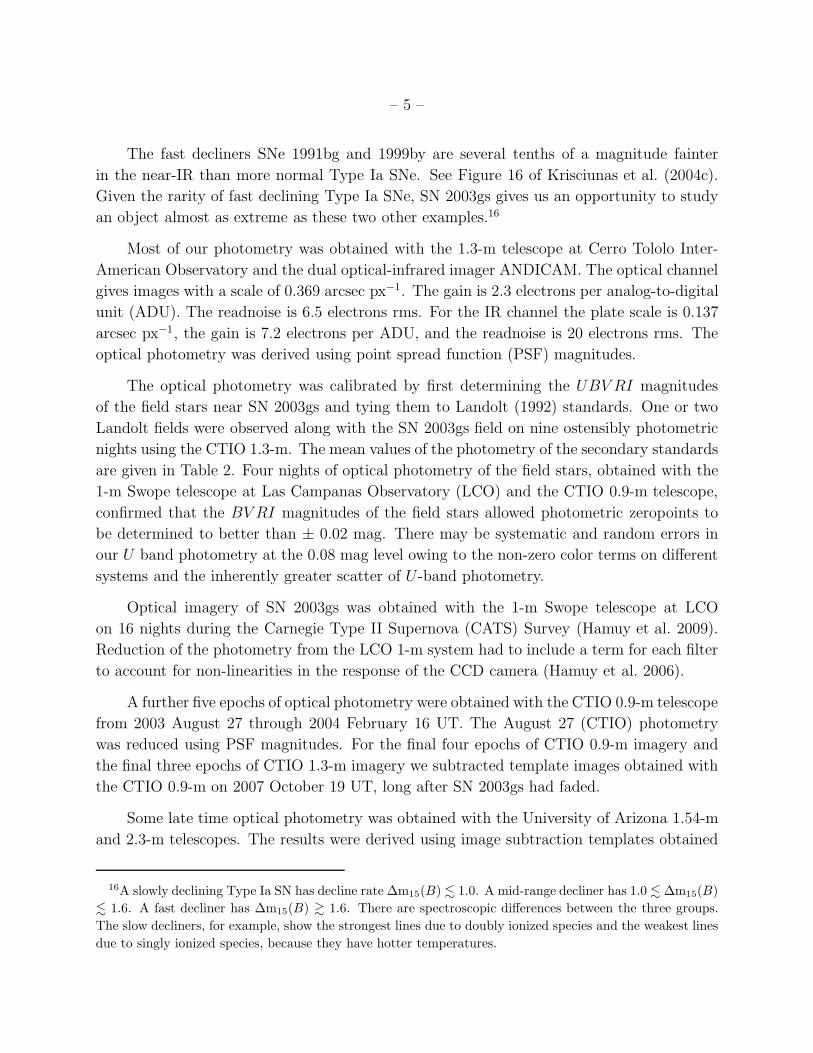
Figure 2 shows the UBV RI light curves. For the light curve fits we have corrected the
ANDICAM B- and V -band photometry to the filter system of Bessell (1990). These are
the so-called S-corrections (Stritzinger et al. 2002; Krisciunas et al. 2003). Without these
corrections the B − V colors of Type Ia SNe from ANDICAM are systematically too red by
as much as 0.1 mag.
To determine the time of maximum light and the decline rate we used the light curve
analysis method of Prieto, Rest, & Suntzeff (2006). This method relies on the well sampled
light curves of 14 objects. The two fastest decliners in the training set are SNe 1992bo
– 7 –
and 1991bg, which have ∆m15(B) = 1.69 and 1.93, respectively. We find that SN 2003gs
had a decline rate of ∆m15(B) = 1.83 ± 0.02. The time of B-band maximum was JD
2452848.80 ± 0.53. In Figure 2 we show the BV RI templates corresponding to ∆m15(B) =
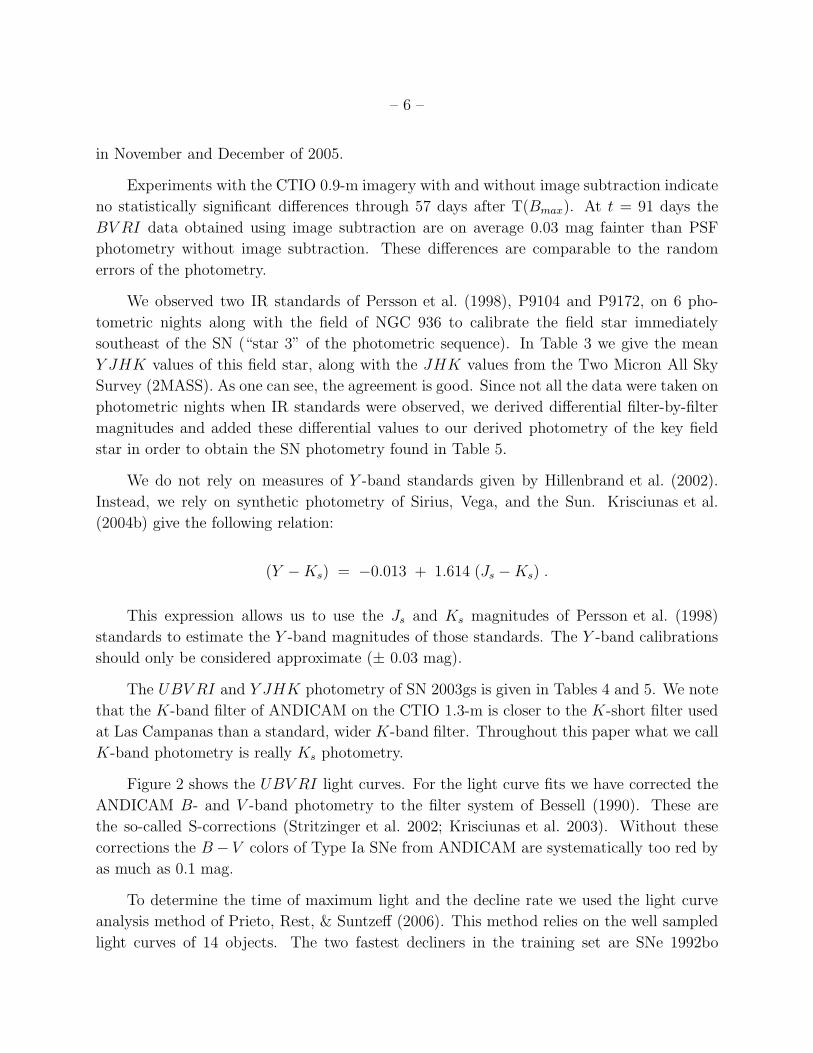
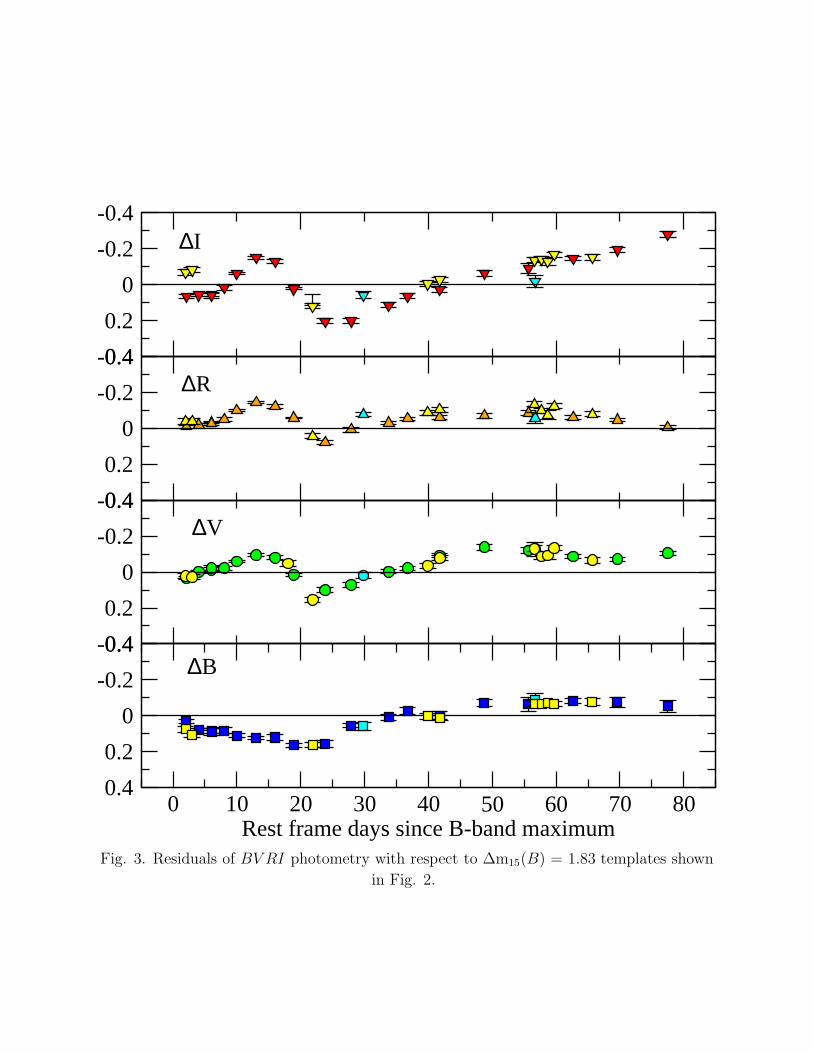
1.83 and adjusted in the Y-direction to give the best fits. Figure 3 shows the residuals of
the photometry with respect to the family of ∆m15(B) = 1.83 templates. The I-band data,
in particular, did not correspond well to any template of Prieto, Rest, & Suntzeff (2006).
We note with satisfaction, however, that data from different telescopes are in reasonable
agreement with each other, better in fact than the agreement of the data with the family of
∆m15(B) = 1.83 templates.
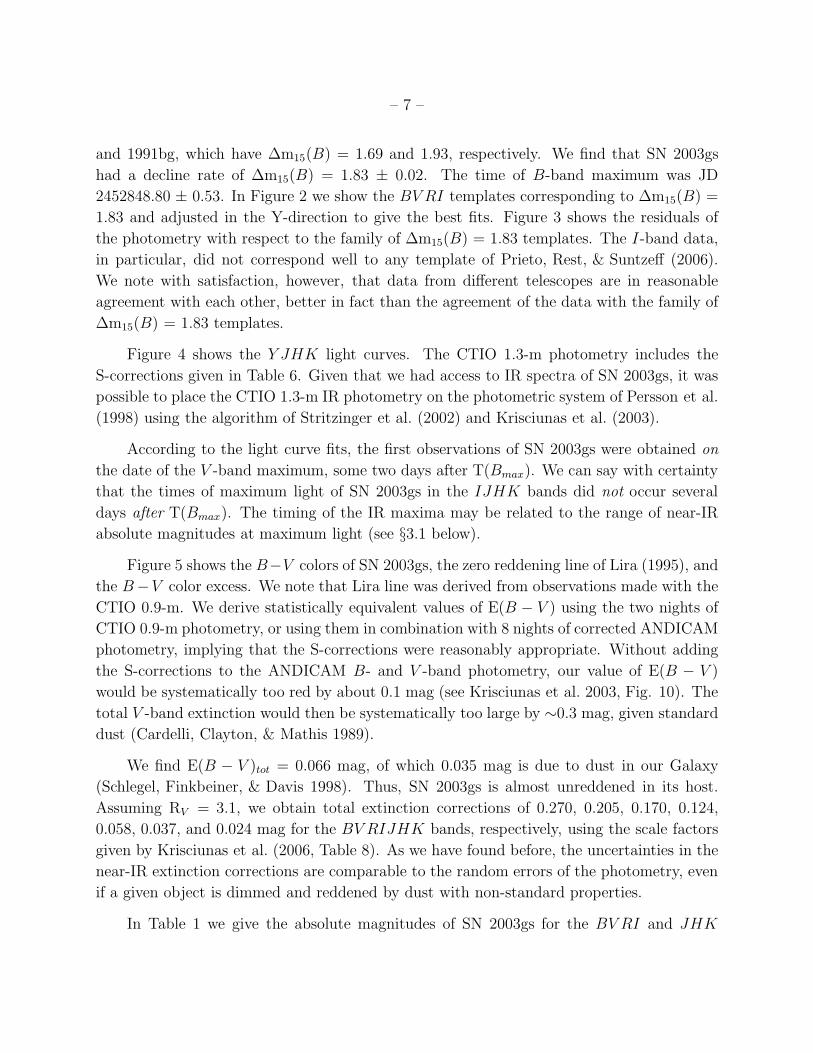
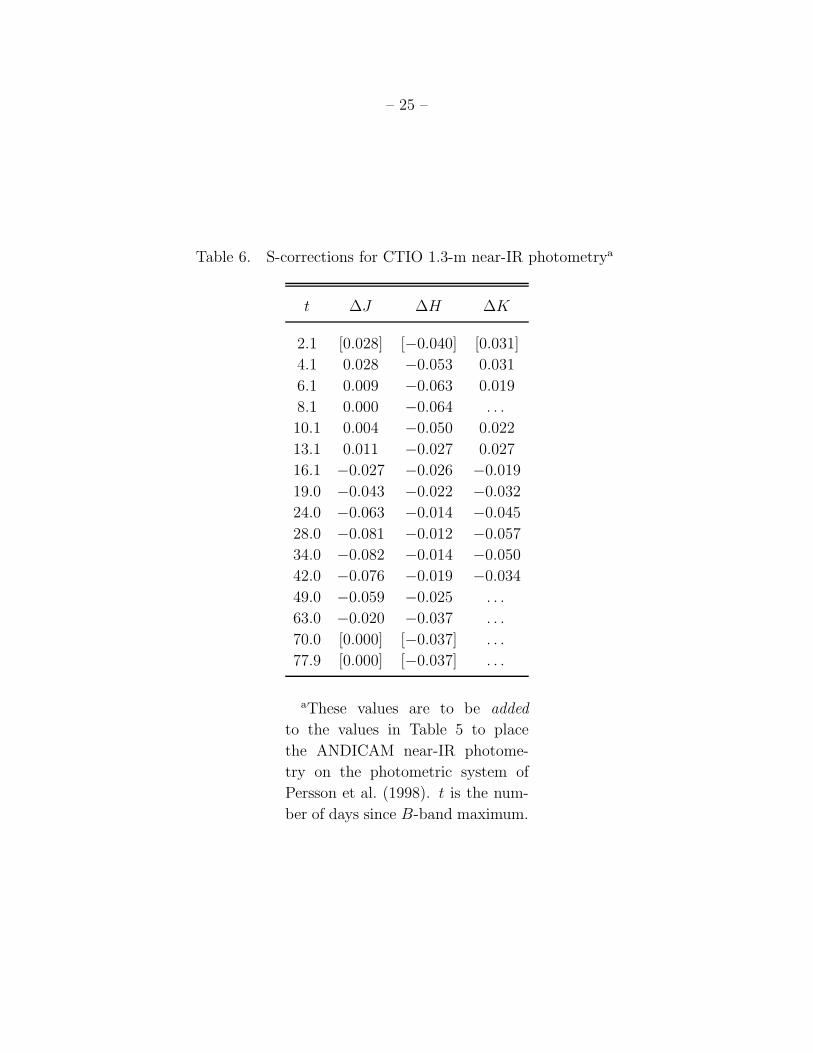
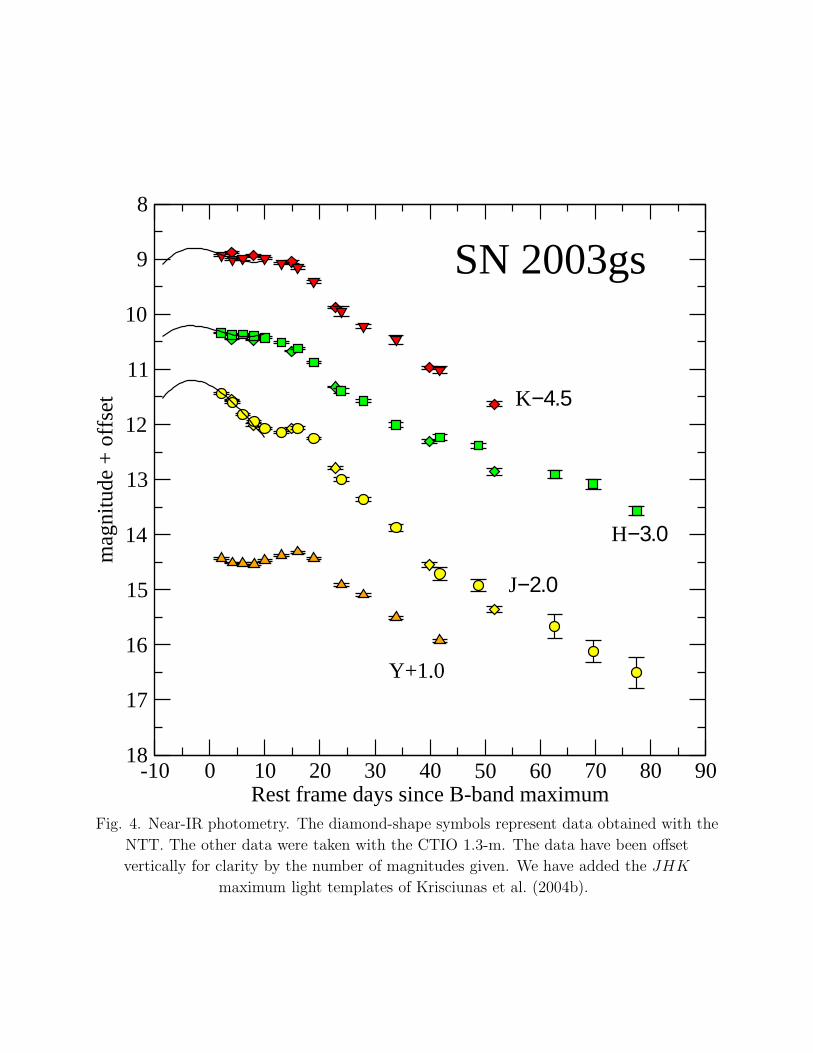
Figure 4 shows the Y JHK light curves. The CTIO 1.3-m photometry includes the
S-corrections given in Table 6. Given that we had access to IR spectra of SN 2003gs, it was
possible to place the CTIO 1.3-m IR photometry on the photometric system of Persson et al.
(1998) using the algorithm of Stritzinger et al. (2002) and Krisciunas et al. (2003).
According to the light curve fits, the first observations of SN 2003gs were obtained on
the date of the V -band maximum, some two days after T(Bmax). We can say with certainty
that the times of maximum light of SN 2003gs in the IJHK bands did not occur several
days after T(Bmax). The timing of the IR maxima may be related to the range of near-IR
absolute magnitudes at maximum light (see §3.1 below).
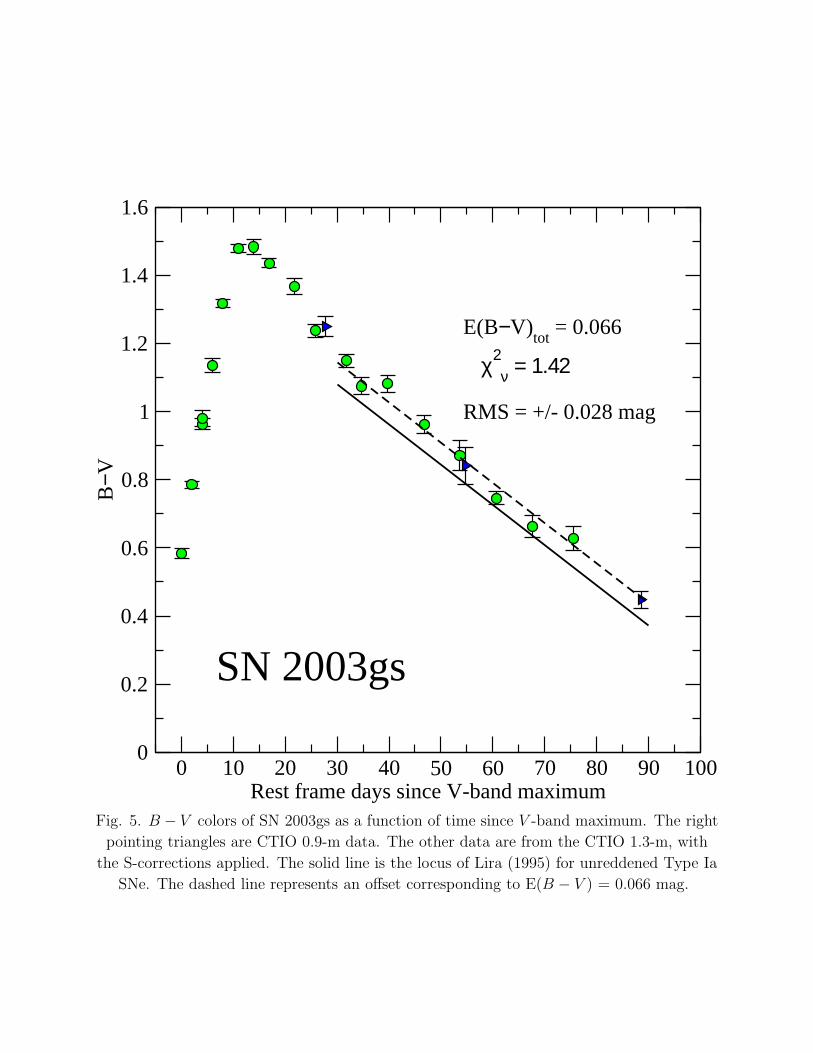
Figure 5 shows the B−V colors of SN 2003gs, the zero reddening line of Lira (1995), and
the B−V color excess. We note that Lira line was derived from observations made with the
CTIO 0.9-m. We derive statistically equivalent values of E(B − V ) using the two nights of
CTIO 0.9-m photometry, or using them in combination with 8 nights of corrected ANDICAM
photometry, implying that the S-corrections were reasonably appropriate. Without adding
the S-corrections to the ANDICAM B- and V -band photometry, our value of E(B − V )
would be systematically too red by about 0.1 mag (see Krisciunas et al. 2003, Fig. 10). The
total V -band extinction would then be systematically too large by ∼0.3 mag, given standard
dust (Cardelli, Clayton, & Mathis 1989).
We find E(B − V )tot = 0.066 mag, of which 0.035 mag is due to dust in our Galaxy
(Schlegel, Finkbeiner, & Davis 1998). Thus, SN 2003gs is almost unreddened in its host.
Assuming RV = 3.1, we obtain total extinction corrections of 0.270, 0.205, 0.170, 0.124,
0.058, 0.037, and 0.024 mag for the BV RIJHK bands, respectively, using the scale factors
given by Krisciunas et al. (2006, Table 8). As we have found before, the uncertainties in the
near-IR extinction corrections are comparable to the random errors of the photometry, even
if a given object is dimmed and reddened by dust with non-standard properties.
In Table 1 we give the absolute magnitudes of SN 2003gs for the BV RI and JHK
– 8 –
bands. These rely on the distance modulus of NGC 936 of m − M = 31.81 ± 0.28 mag
given by Tonry et al. (2001), based on the method of surface brightness fluctuations (SBFs),
and corrected by 0.16 mag to m − M = 31.65 to account for a systematic error in the
I-band Cepheid period-luminosity relation used for the calibration of the SBF distances
(Jensen et al. 2003). We have adopted the total extinction values given above.
Garnavich et al. (2004, Eqns. 2, 3, and 4) give exponential fits to the BV I decline
rate relations, which fit the absolute magnitudes over the full range of decline rates of Type
Ia SNe. While SN 2003gs was subluminous compared to mid-range decliners at optical
wavelengths, we find that SN 2003gs was 0.18, 0.15, and 0.30 mag brighter in the B-, V -,
and I-bands, respectively, than the values implied by the relationships of Garnavich et al.
(2004) for a Type Ia SN with ∆m15(B) = 1.83.
The J-band data just after maximum light are convincingly fit with the unstretched
template given by Krisciunas et al. (2004b). The implication is that the J-band maximum
was 0.23 mag brighter than our first (S-corrected) value, obtained 2.1 days after T(Bmax).
That the unstretched template fits the data is evidence that in the J-band the photometric
behavior of SN 2003gs was more like a mid-range decliner than a fast decliner. If we use the
unstretched maximum light H- and K-band templates of Krisciunas et al. (2004b), the H-
and K-band maxima were approximately 0.13 mag brighter than our earliest observations.
Along with the small near-IR extinctions and a distance modulus of 31.65 mag, the resulting
absolute magnitudes are MJ = −18.50, MH = −18.48, and MK = −18.37. These values
are 0.11 mag fainter in MJ , 0.18 mag brighter in MH , and 0.07 mag fainter in MK than the
mean values of the slow decliners and mid-range decliners (see below).
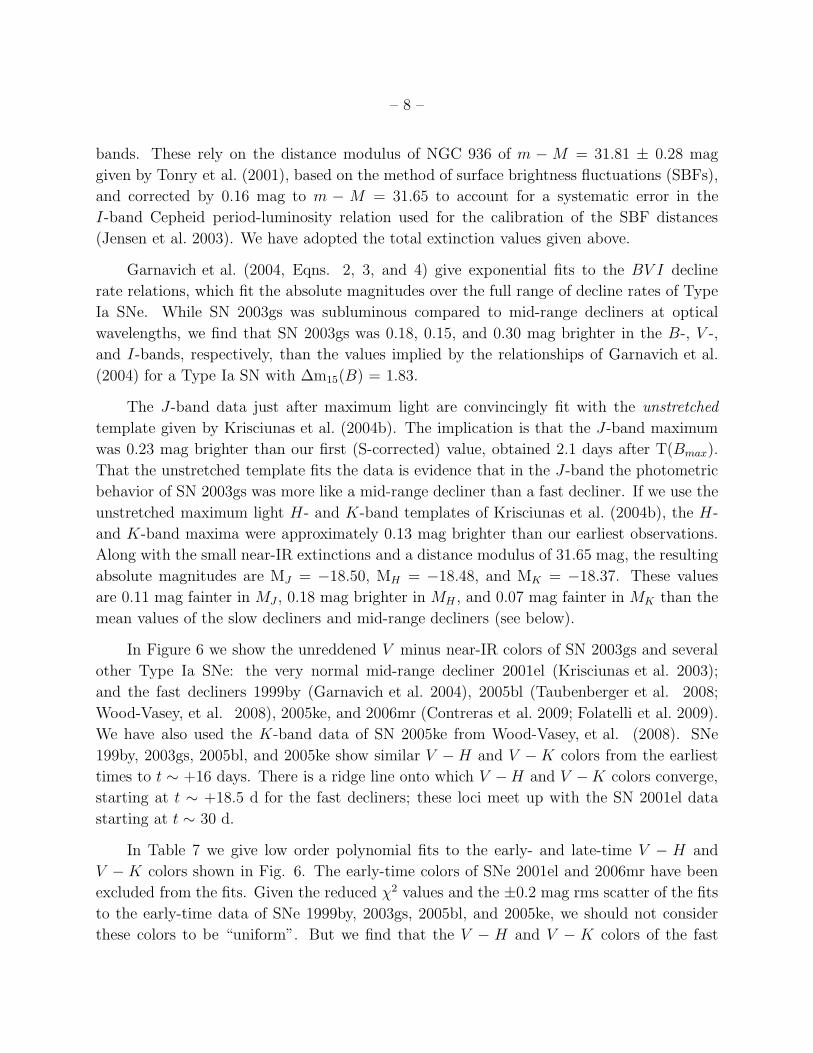
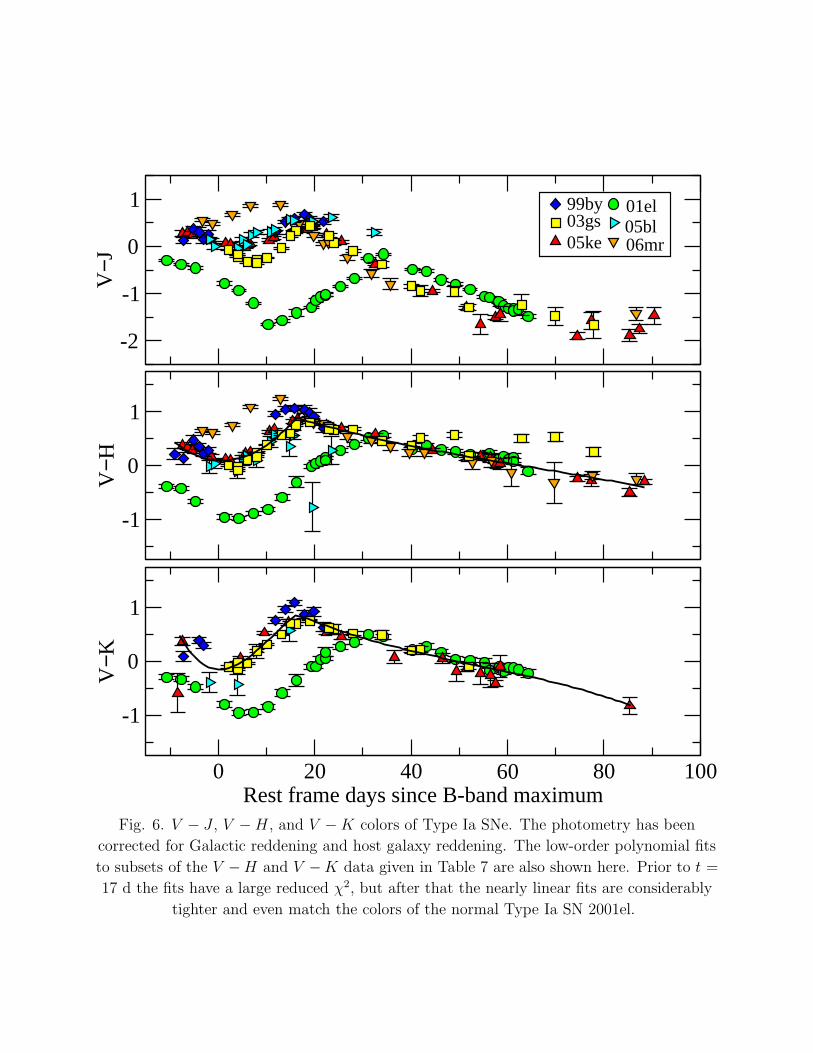
In Figure 6 we show the unreddened V minus near-IR colors of SN 2003gs and several
other Type Ia SNe: the very normal mid-range decliner 2001el (Krisciunas et al. 2003);
and the fast decliners 1999by (Garnavich et al. 2004), 2005bl (Taubenberger et al. 2008;
Wood-Vasey, et al. 2008), 2005ke, and 2006mr (Contreras et al. 2009; Folatelli et al. 2009).
We have also used the K-band data of SN 2005ke from Wood-Vasey, et al. (2008). SNe
199by, 2003gs, 2005bl, and 2005ke show similar V − H and V − K colors from the earliest
times to t ∼ +16 days. There is a ridge line onto which V −H and V −K colors converge,
starting at t ∼ +18.5 d for the fast decliners; these loci meet up with the SN 2001el data
starting at t ∼ 30 d.
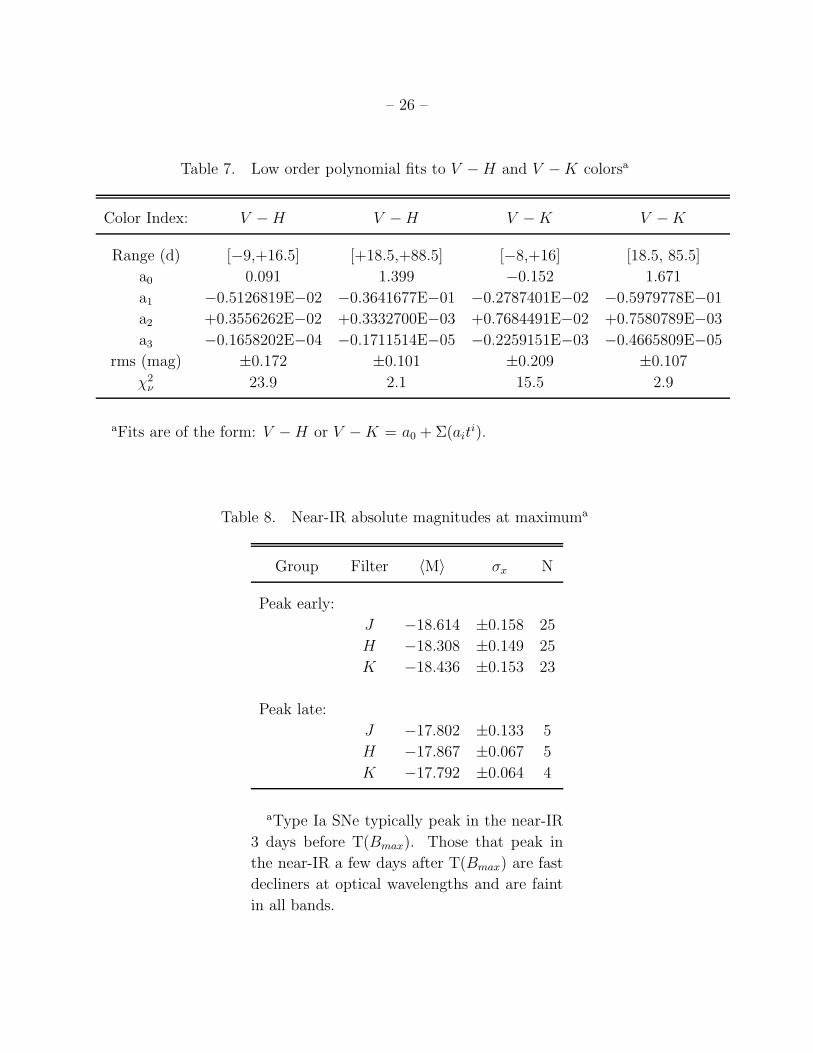
In Table 7 we give low order polynomial fits to the early- and late-time V − H and
V − K colors shown in Fig. 6. The early-time colors of SNe 2001el and 2006mr have been
excluded from the fits. Given the reduced χ2 values and the ±0.2 mag rms scatter of the fits
to the early-time data of SNe 1999by, 2003gs, 2005bl, and 2005ke, we should not consider
these colors to be “uniform”. But we find that the V − H and V − K colors of the fast
– 9 –
decliners are remarkably uniform after t ∼ +30 d, and identical to the unreddened colors
of the mid-range decliner SN 2001el. The rms scatter in the two color indices for the linear
decline is ±0.1 mag. We are reminded of the so-called “Lira law” for the B − V colors of
Type Ia SNe starting at t ∼ +32 d. The only late-time outliers in the V − H and V − K
plots are the V −H data of SN 2003gs, which are apparently redder than other objects due
to an interesting bump in the H-band spectra of SN 2003gs after t ∼ +45 d (Kotak et al.
2009).
3. Discussion
3.1. Photometry
3.1.1. Light curve morphology
Hamuy et al. (1996) first showed that a stack of I-band light curves, ordered by the
optical decline rate parameter, exhibits weaker and weaker secondary maxima as we proceed
from the slowest to the fastest decliners. If we consider the mean flux 20 to 40 days after
the time of B-band maximum, typical mid-range decliners have a secondary maximum that
is 0.5 times as strong as the I-band maximum (Krisciunas et al. 2001, Fig. 17). For the
fast decliners the second flux peak is weak enough that it just blends in with the principal
decline.
SN 2003gs exhibited no secondary hump in the I-, H- and K-bands. There is only a weak
J-band secondary hump. In the Y -band, however, SN 2003gs had a secondary maximum
that was brighter than the SN must have been at the time of B-band maximum. This was
also the case with the mid-range decliner SN 2000bh (Krisciunas et al. 2004b). Many Type
Ia SNe observed by the Carnegie Supernova Project17 (CSP) show the same phenomenon
Contreras et al. (2009). The secondary hump is apparently maximized in the 1.03 µm band.
According to Kasen (2006), it is due to a change of opacity, when the expanding fireball
undergoes a transition from primarily doubly ionized species to singly ionized ones.
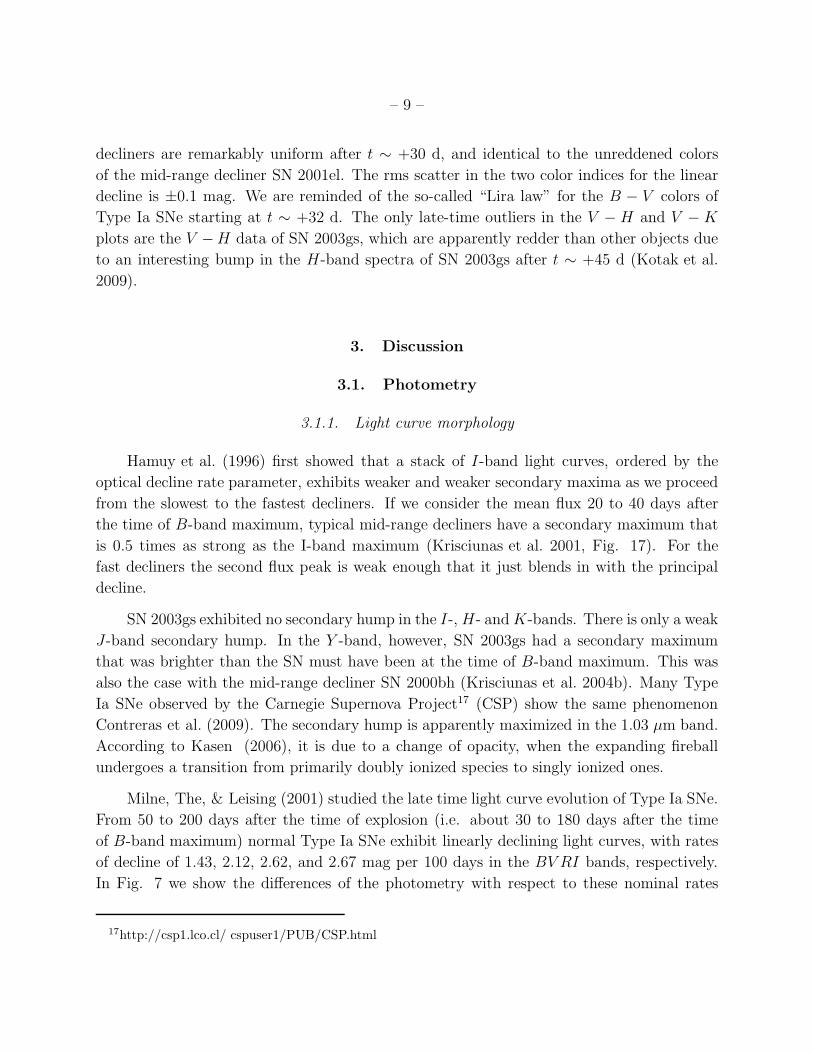
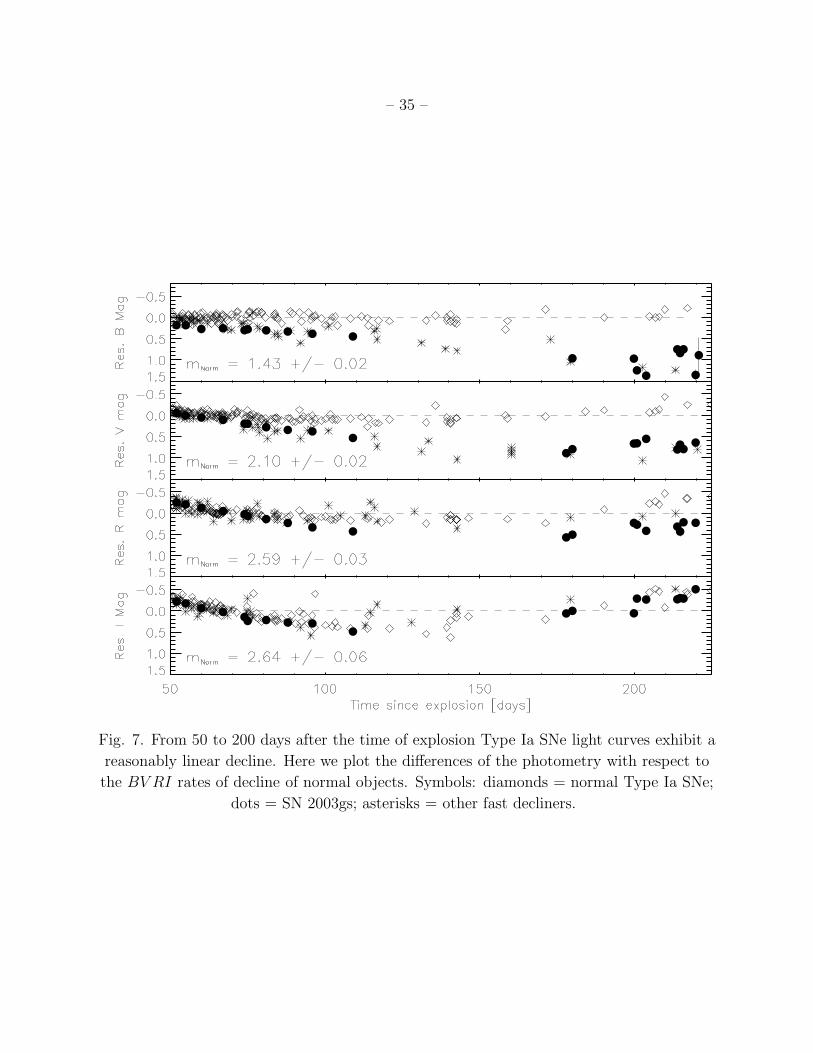
Milne, The, & Leising (2001) studied the late time light curve evolution of Type Ia SNe.
From 50 to 200 days after the time of explosion (i.e. about 30 to 180 days after the time
of B-band maximum) normal Type Ia SNe exhibit linearly declining light curves, with rates
of decline of 1.43, 2.12, 2.62, and 2.67 mag per 100 days in the BV RI bands, respectively.
In Fig. 7 we show the differences of the photometry with respect to these nominal rates
17http://csp1.lco.cl/ cspuser1/PUB/CSP.html
– 10 –
of decline. The 50 to 200 day rates of decline for SN 2003gs are similar, but not exact
matches, to the other six submulinous objects. The B- and V -band rates of decline for the
fast declining objects differ appreciably from the normal events, but for the R- and I-bands
there is less variation.
Two excellent reviews of the photometric and spectroscopic properties of fast declin-
ing Type Ia SNe have been published by Garnavich et al. (2004) and Taubenberger et al.
(2008). Of greatest interest to us here is the intrinsic brightness of SN 2003gs and other fast
decliners.
3.1.2. Fast decliners to consider
Krisciunas, Phillips, & Suntzeff (2004a) and Krisciunas et al. (2004c) have already con-
sidered the absolute peak magnitudes in the near-IR of SNe 1986G (Frogel et al. 1987;
Phillips et al. 1987), 1991bg (Filippenko et al. 1992b; Leibundgut et al. 1993) and 1999by
(Garnavich et al. 2004). Here we use a corrected distance modulus to NGC 5128 (the host
of SN 1986G) of m − M = 27.90 ± 0.14 mag by subtracting 0.16 mag (Jensen et al. 2003)
from the SBF distance modulus of Ajhar et al. (2001, Table 3). This is related to a system-
atic error in the calibration of the I-band Cepheid period-luminosity relation used to anchor
the SBF distances. Like SN 2003gs, SN 1986G appears to be a fast decliner that did not
peak “late” in the near-IR. One concern is that this object suffered significant extinction.
However, from polarimetry data we know that that RV = 2.4 is the appropriate value to
used for dust in the host of SN 1986G (Hough et al. 1987). As with many objects, a larger
source of uncertainty in the near-IR absolute magnitudes comes from the uncertainty of the
distance modulus, not the uncertainty in the near-IR extinction corrections.
Other fast decliners we can consider are these:
SN 2003hv. Leloudas et al. (2009) present spectra and extensive photometry. It had a
decline rate of ∆m15(B) = 1.61 ± 0.02. The distance modulus is m − M = 31.53 ± 0.30
mag (Tonry et al. 2001), which becomes m−M = 31.37 mag after applying the correction of
Jensen et al. (2003). This object was unreddened in its host. We estimate that SN 2003hv
peaked in the J-band 1.7 days prior to T(Bmax). The absolute magnitudes at maximum were
MJ ≈ −18.52, MH ≈ −18.17, and MK ≈ −18.33, with uncertainties of ± 0.31 mag. The
peak brightness and the application of Arnett’s Law (Arnett 1982) suggest that it produced
0.40 to 0.42 M⊙ of 56Ni, somewhat more than was produced by the fastest decliners (see
Table 9).
SN 2004gs (Contreras et al. 2009; Folatelli et al. 2009). ∆m15(B) = 1.54 ± 0.01. This
– 11 –
was a reasonably fast decliner, but the first IR data were obtained at +6.6 d after T(Bmax).
We do not know if it peaked early or late, and to extrapolate back to the IR maxima assumes
that its light curve obeyed templates based on other objects.
SN 2005bl (Taubenberger et al. 2008; Folatelli et al. 2009; Wood-Vasey, et al. 2008).
We adopt ∆m15(B) = 1.80 ± 0.04 (Folatelli et al. 2009). Taubenberger et al. (2008) give
∆m15(B) = 1.93 ± 0.10. The IJHK maxima occurred a few days after T(Bmax). The
distance modulus is m−M = 35.10 ± 0.09 mag, given the radial velocity in the frame of the
Cosmic Microwave Background, vCMB = 7534 km s−1Mpc−1, and a Hubble constant of 72
km s−1 Mpc−1 (Freedman et al. 2001). E(B − V )tot ≈ 0.20 ± 0.08, giving JHK extinctions
of 0.17, 0.11, and 0.07 mag, respectively, with uncertainties of 40 percent. Using the JHK
apparent magnitudes at maximum of Wood-Vasey, et al. (2008), these extinctions, and the
Hubble flow distance modulus, we obtain absolute magnitudes at maximum light of MJ =
−17.92 ± 0.12, MH = −17.88 ± 0.12, and MK = −17.70 ± 0.17.
SN 2005ke (Contreras et al. 2009; Folatelli et al. 2009). ∆m15(B) = 1.76 ± 0.01. The
near-IR maxima occurred 1-2 days after T(Bmax). Its host was NGC 1371, a member of the
Eridanus group. Tonry et al. (2001, Table 4) give an SBF distance modulus of m − M =
32.00 ± 0.08 mag for the group, which becomes m−M = 31.84 mag after the Jensen et al.
(2003) correction. Using the zero reddening line of Lira (1995), we find E(B − V )tot =
0.066, giving JHK extinctions of 0.058, 0.037, 0.024 mag. The Las Campanas photom-
etry gives Jmax = 14.00 ± 0.02, Hmax = 13.95 ± 0.03. We adopt Kmax = 14.03 ± 0.02
(Wood-Vasey, et al. 2008). The resulting absolute magnitudes are MJ = −17.90, MH =
−17.93, and MK = −17.83, to which we assign conservative uncertainties of ± 0.24 mag. We
note that SN 2005ke showed evidence of interacting with the nearby circumstellar medium,
based on X-ray observations with Swift (Immler et al. 2006).
SN 2006gt (Contreras et al. 2009; Folatelli et al. 2009). ∆m15(B) = 1.66 ± 0.03. This
was a distant fast decliner (redshift 0.0448). The J-band maximum clearly occurred prior
to T(Bmax). If we simply take the earliest available IR observations and apply no extinction
corrections at all, we get MJ = −18.45 and MH = −18.21. This appears to be another object
that peaked early and was not faint.
SN 2006mr (Contreras et al. 2009; Folatelli et al. 2009). ∆m15(B) = 1.82 ± 0.02. The
near-IR maxima occurred 3-4 days after T(Bmax). Its host was NGC 1316 (Fornax A),
whose distance modulus is m − M = 31.59 ± 0.08 mag (Cantiello et al. 2007). Using the
zero reddening line of Lira (1995) implies that this object has negative reddening, so we shall
adopt E(B − V )Gal = 0.021 (Schlegel, Finkbeiner, & Davis 1998) as the color excess. The
implied extinctions in the J- and H-bands are then 0.018 and 0.012 mag, respectively. The
Las Campanas photometry gives Jmax = 13.99 ± 0.03, Hmax = 13.85 ± 0.04. The resulting
– 12 –
absolute magnitudes are MJ = −17.62 ± 0.10 and MH = −17.75 ± 0.10.
We do not consider the fast decliner SN 2000bk, which had a decline rate of ∆m15(B)
= 1.63 (Krisciunas et al. 2001). The first optical photometry was only obtained 10.8 days
after the derived time of B-band maximum. The first near-IR data were obtained at t =
+5.9 d. We do not know if it peaked early or late in the near-IR compared to B. Also, the
H-band data were somewhat ragged.
Also, we do not consider the unusual SN 2005hk (Phillips et al. 2007). Along with
SN 2002cx (Li et al. 2003), it may belong to a new subclass of Type Ia SNe. In their paper
on the very subluminous SN 2008ha Foley et al. (2009) list 14 objects similar to SN 2002cx.
Valenti et al. (2009) even suggest that these SNe are core collapse objects, not Type Ia SNe.
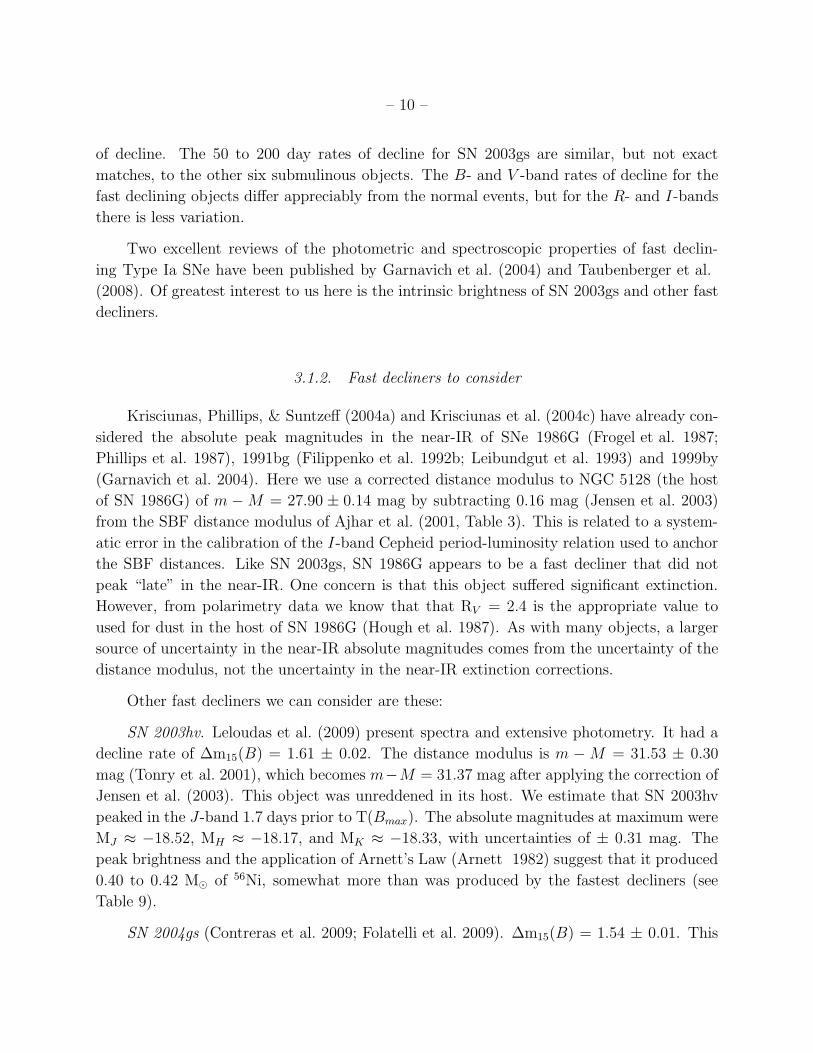
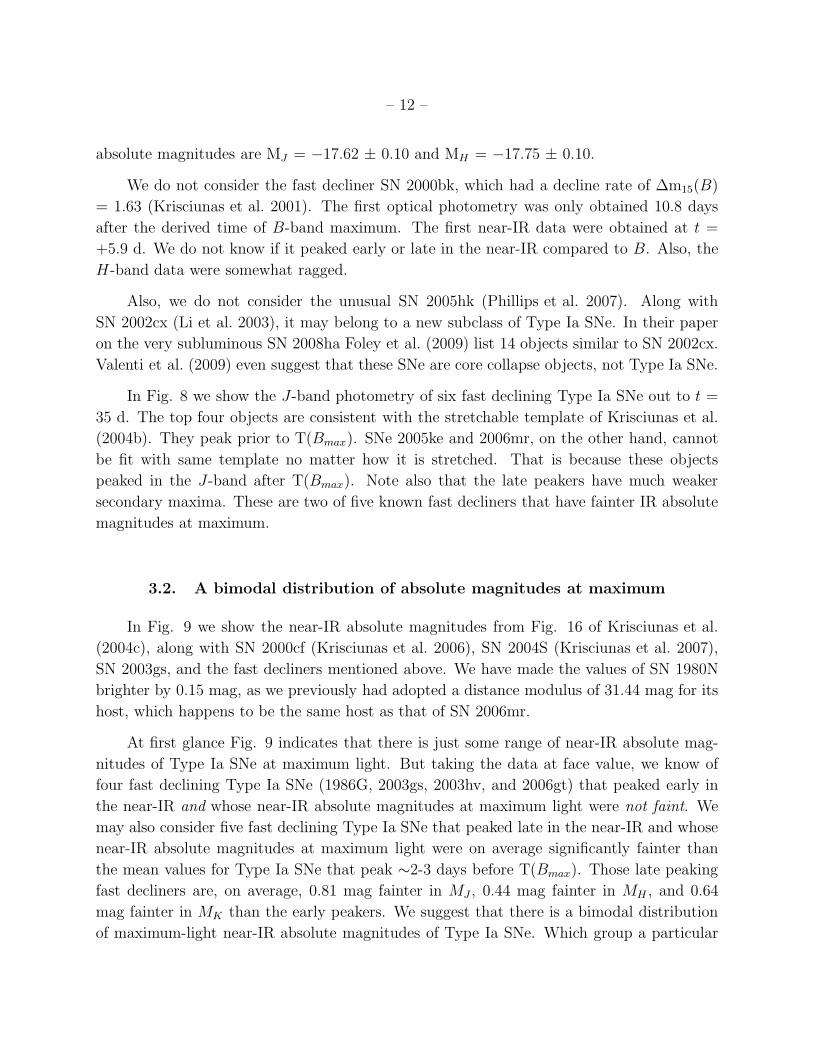
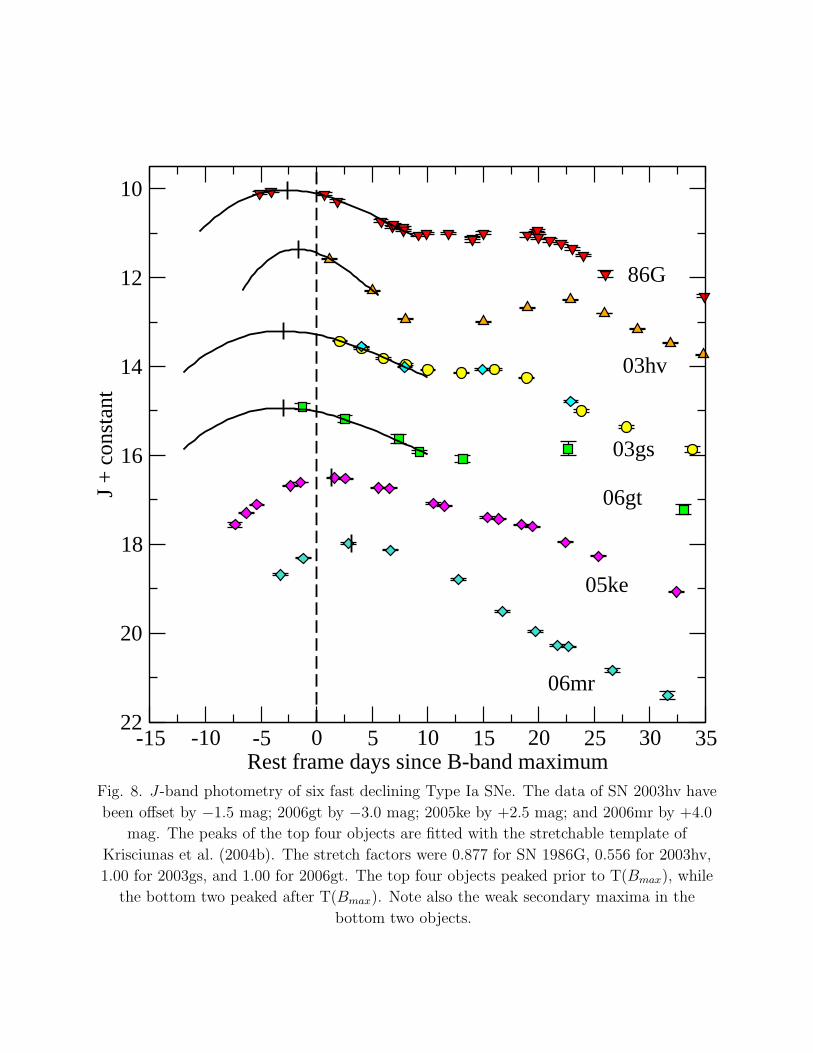
In Fig. 8 we show the J-band photometry of six fast declining Type Ia SNe out to t =
35 d. The top four objects are consistent with the stretchable template of Krisciunas et al.
(2004b). They peak prior to T(Bmax). SNe 2005ke and 2006mr, on the other hand, cannot
be fit with same template no matter how it is stretched. That is because these objects
peaked in the J-band after T(Bmax). Note also that the late peakers have much weaker
secondary maxima. These are two of five known fast decliners that have fainter IR absolute
magnitudes at maximum.
3.2. A bimodal distribution of absolute magnitudes at maximum
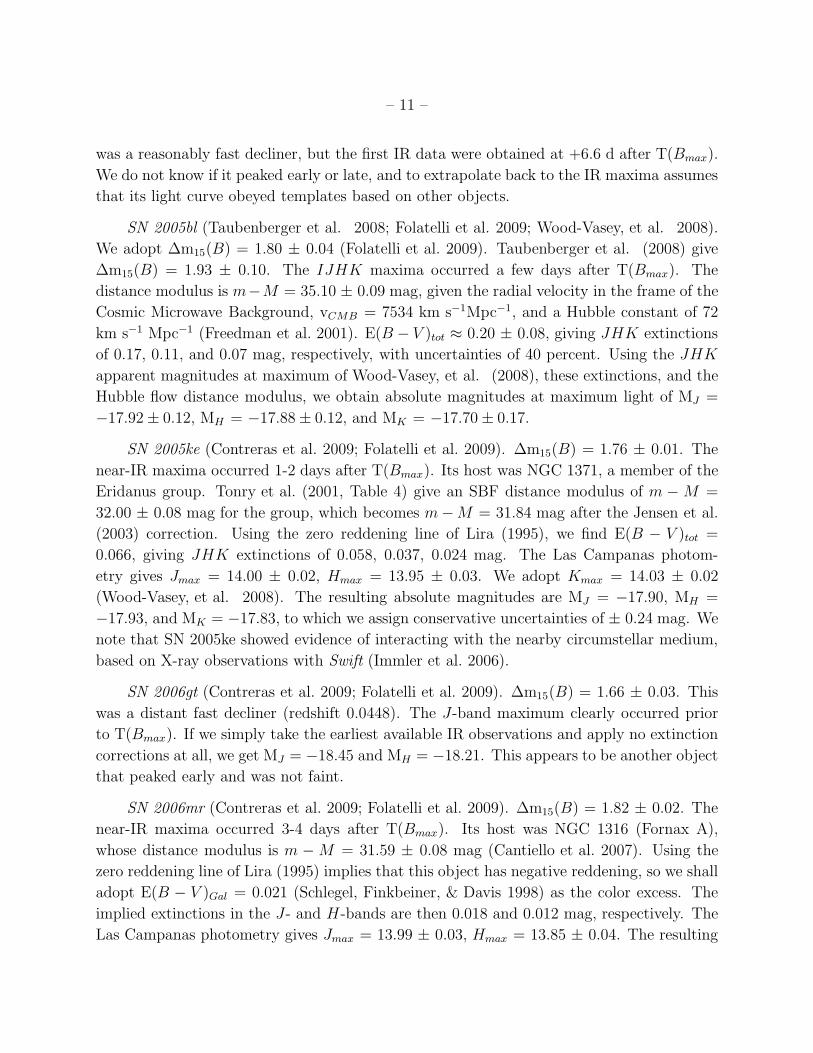
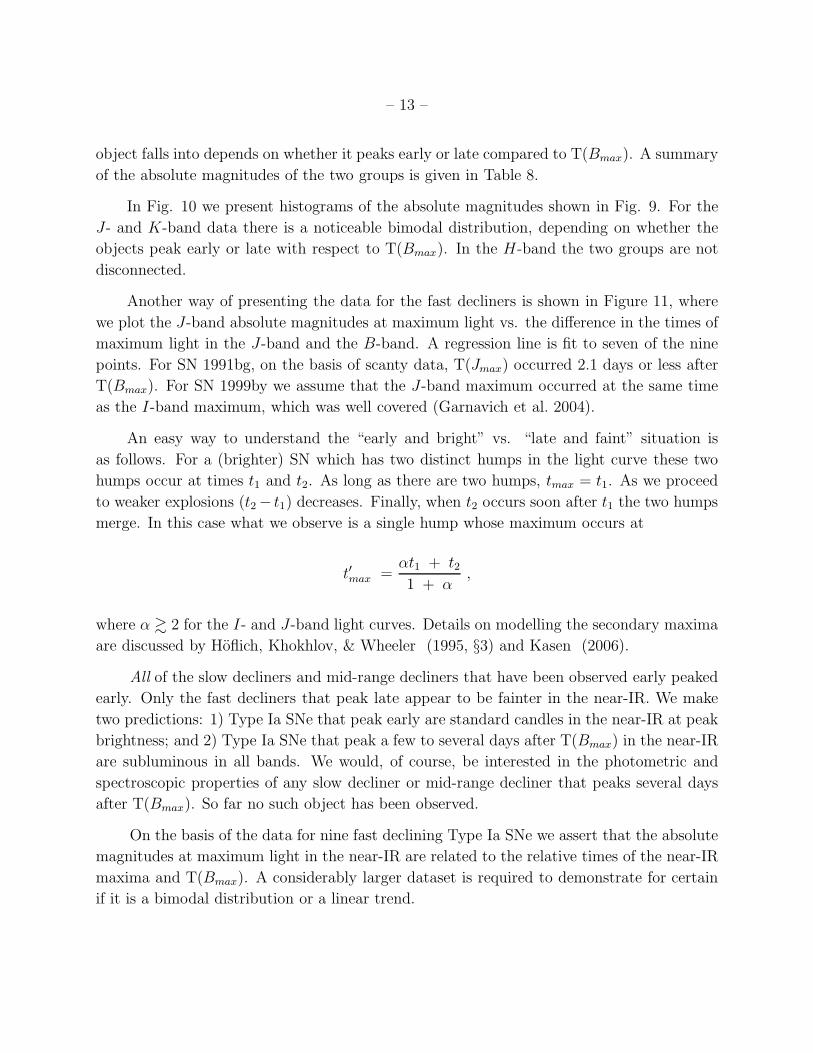
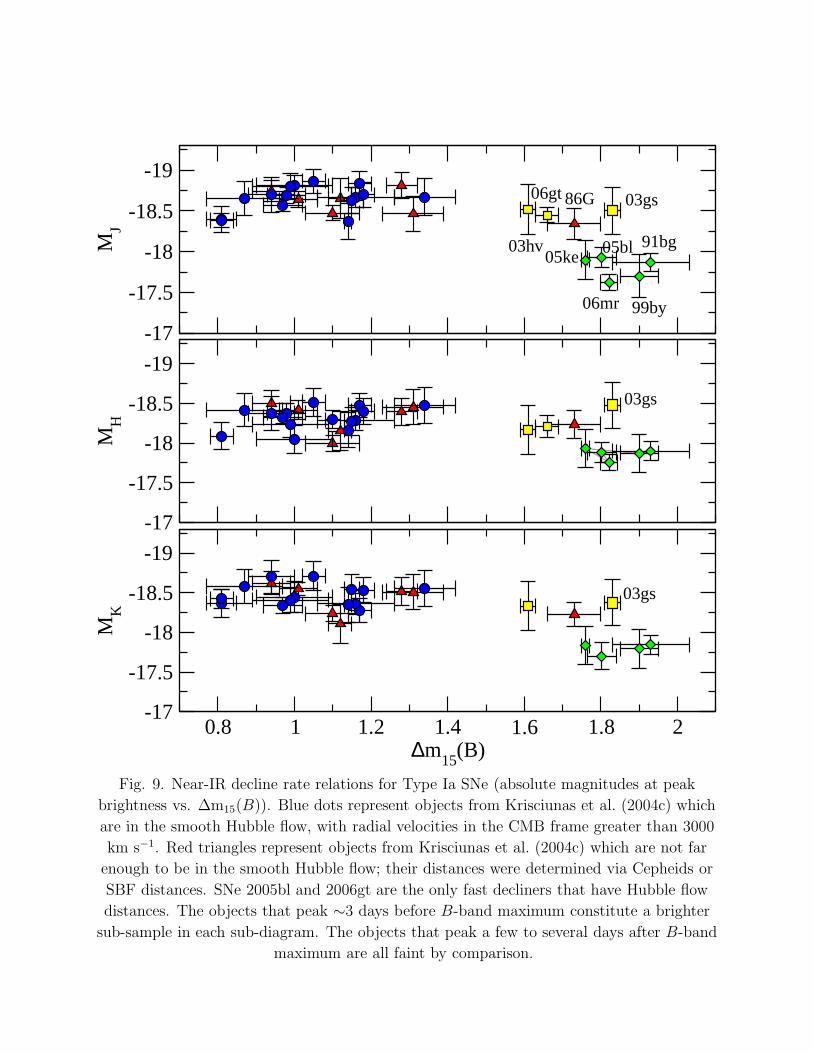
In Fig. 9 we show the near-IR absolute magnitudes from Fig. 16 of Krisciunas et al.
(2004c), along with SN 2000cf (Krisciunas et al. 2006), SN 2004S (Krisciunas et al. 2007),
SN 2003gs, and the fast decliners mentioned above. We have made the values of SN 1980N
brighter by 0.15 mag, as we previously had adopted a distance modulus of 31.44 mag for its
host, which happens to be the same host as that of SN 2006mr.
At first glance Fig. 9 indicates that there is just some range of near-IR absolute mag-
nitudes of Type Ia SNe at maximum light. But taking the data at face value, we know of
four fast declining Type Ia SNe (1986G, 2003gs, 2003hv, and 2006gt) that peaked early in
the near-IR and whose near-IR absolute magnitudes at maximum light were not faint. We
may also consider five fast declining Type Ia SNe that peaked late in the near-IR and whose
near-IR absolute magnitudes at maximum light were on average significantly fainter than
the mean values for Type Ia SNe that peak ∼2-3 days before T(Bmax). Those late peaking
fast decliners are, on average, 0.81 mag fainter in MJ , 0.44 mag fainter in MH , and 0.64
mag fainter in MK than the early peakers. We suggest that there is a bimodal distribution
of maximum-light near-IR absolute magnitudes of Type Ia SNe. Which group a particular
– 13 –
object falls into depends on whether it peaks early or late compared to T(Bmax). A summary
of the absolute magnitudes of the two groups is given in Table 8.
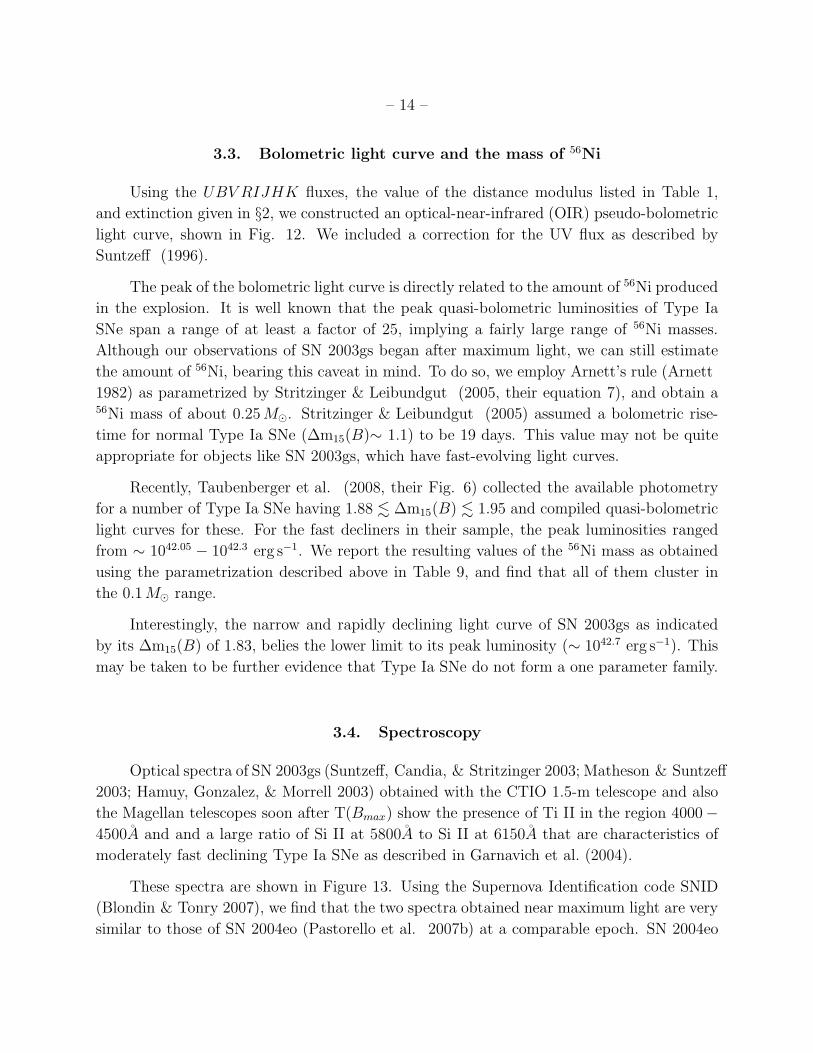
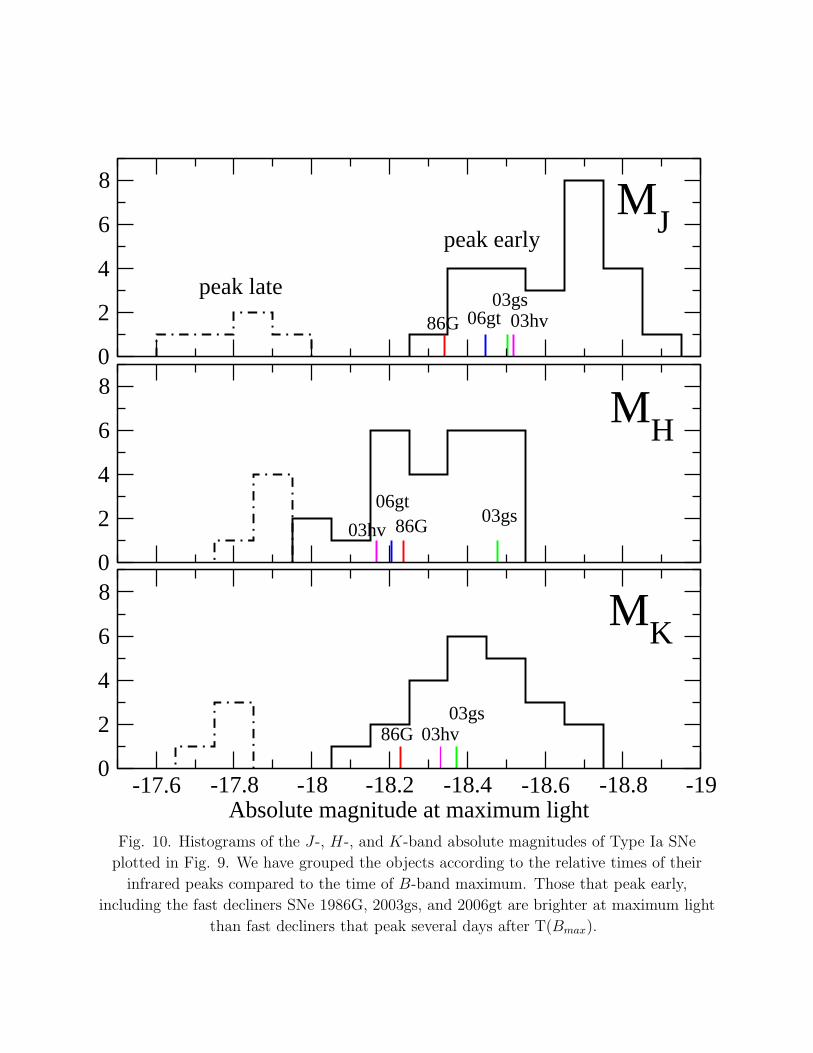
In Fig. 10 we present histograms of the absolute magnitudes shown in Fig. 9. For the
J- and K-band data there is a noticeable bimodal distribution, depending on whether the
objects peak early or late with respect to T(Bmax). In the H-band the two groups are not
disconnected.
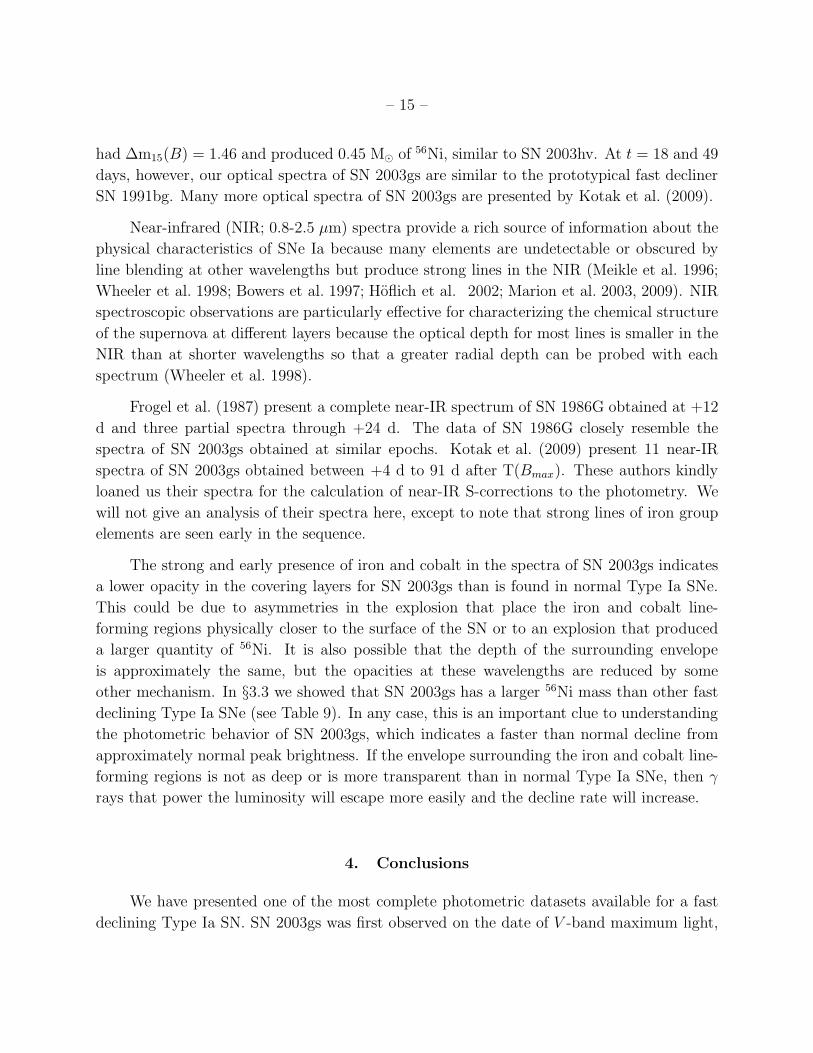
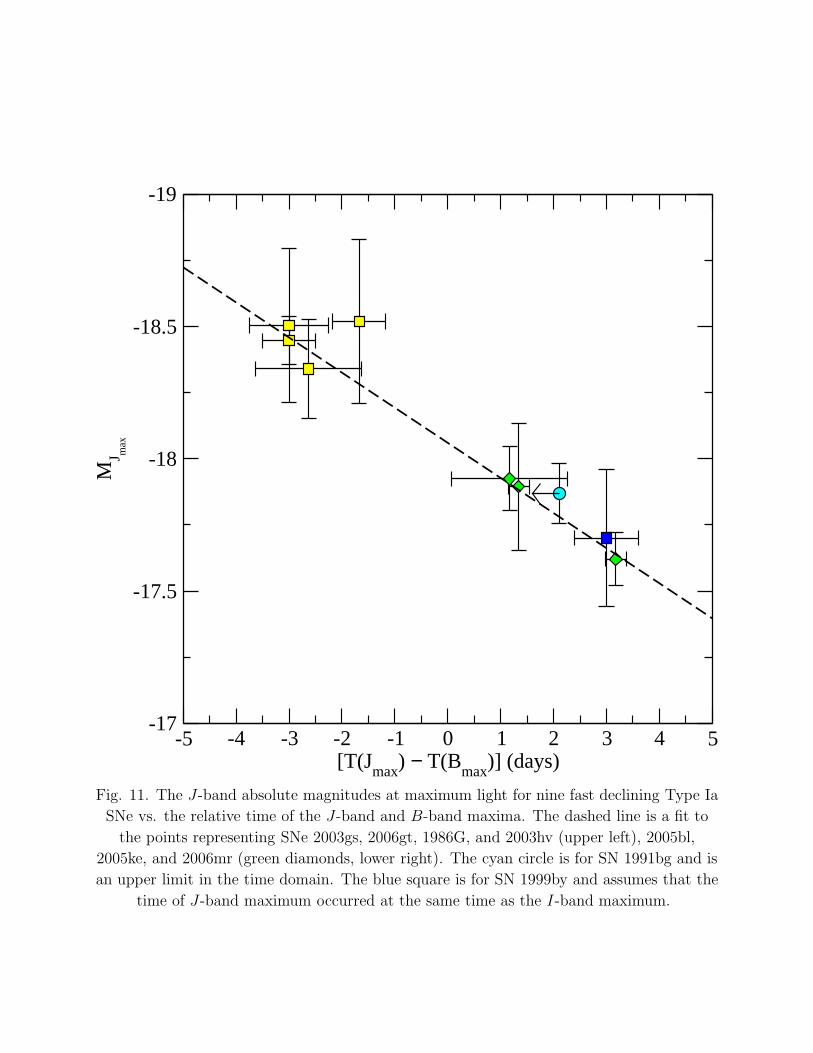
Another way of presenting the data for the fast decliners is shown in Figure 11, where
we plot the J-band absolute magnitudes at maximum light vs. the difference in the times of
maximum light in the J-band and the B-band. A regression line is fit to seven of the nine
points. For SN 1991bg, on the basis of scanty data, T(Jmax) occurred 2.1 days or less after
T(Bmax). For SN 1999by we assume that the J-band maximum occurred at the same time
as the I-band maximum, which was well covered (Garnavich et al. 2004).
An easy way to understand the “early and bright” vs. “late and faint” situation is
as follows. For a (brighter) SN which has two distinct humps in the light curve these two
humps occur at times t1 and t2. As long as there are two humps, tmax = t1. As we proceed
to weaker explosions (t2 − t1) decreases. Finally, when t2 occurs soon after t1 the two humps
merge. In this case what we observe is a single hump whose maximum occurs at
t′max =αt1 + t21 + α
,
where α & 2 for the I- and J-band light curves. Details on modelling the secondary maxima
are discussed by Hoflich, Khokhlov, & Wheeler (1995, §3) and Kasen (2006).
All of the slow decliners and mid-range decliners that have been observed early peaked
early. Only the fast decliners that peak late appear to be fainter in the near-IR. We make
two predictions: 1) Type Ia SNe that peak early are standard candles in the near-IR at peak
brightness; and 2) Type Ia SNe that peak a few to several days after T(Bmax) in the near-IR
are subluminous in all bands. We would, of course, be interested in the photometric and
spectroscopic properties of any slow decliner or mid-range decliner that peaks several days
after T(Bmax). So far no such object has been observed.
On the basis of the data for nine fast declining Type Ia SNe we assert that the absolute
magnitudes at maximum light in the near-IR are related to the relative times of the near-IR
maxima and T(Bmax). A considerably larger dataset is required to demonstrate for certain
if it is a bimodal distribution or a linear trend.
– 14 –
3.3. Bolometric light curve and the mass of 56Ni
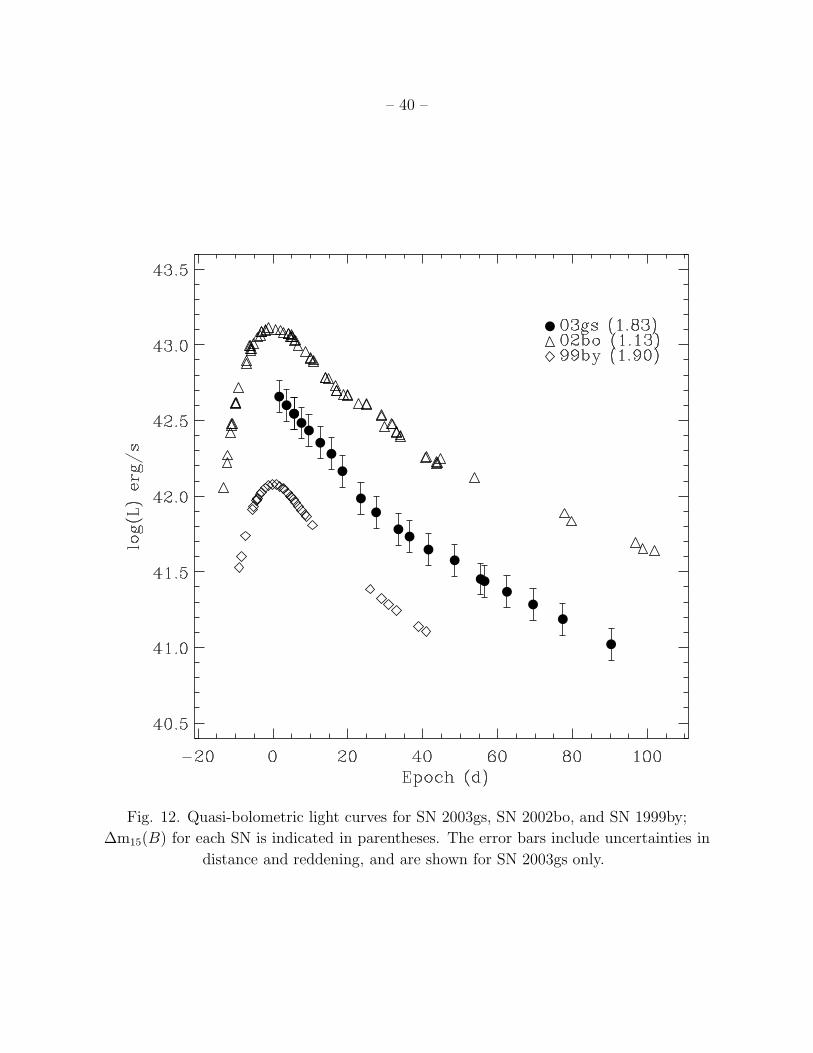
Using the UBV RIJHK fluxes, the value of the distance modulus listed in Table 1,
and extinction given in §2, we constructed an optical-near-infrared (OIR) pseudo-bolometric
light curve, shown in Fig. 12. We included a correction for the UV flux as described by
Suntzeff (1996).
The peak of the bolometric light curve is directly related to the amount of 56Ni produced
in the explosion. It is well known that the peak quasi-bolometric luminosities of Type Ia
SNe span a range of at least a factor of 25, implying a fairly large range of 56Ni masses.
Although our observations of SN 2003gs began after maximum light, we can still estimate
the amount of 56Ni, bearing this caveat in mind. To do so, we employ Arnett’s rule (Arnett
1982) as parametrized by Stritzinger & Leibundgut (2005, their equation 7), and obtain a56Ni mass of about 0.25 M⊙. Stritzinger & Leibundgut (2005) assumed a bolometric rise-
time for normal Type Ia SNe (∆m15(B)∼ 1.1) to be 19 days. This value may not be quite
appropriate for objects like SN 2003gs, which have fast-evolving light curves.
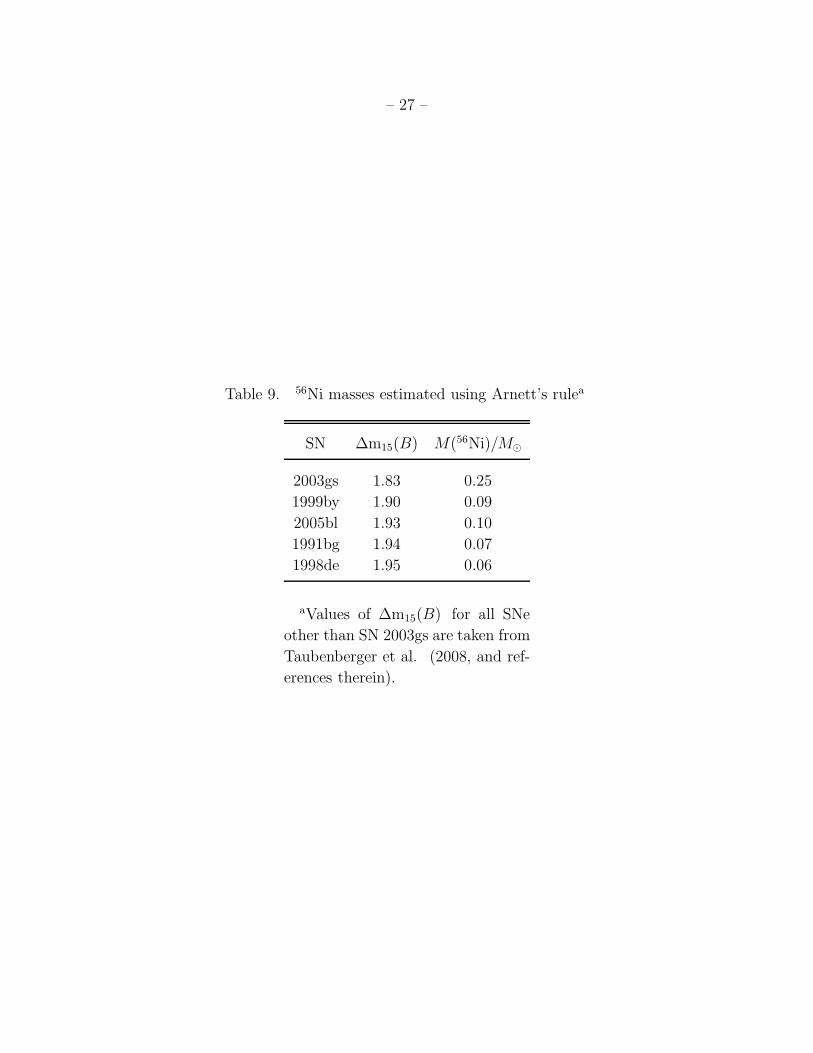
Recently, Taubenberger et al. (2008, their Fig. 6) collected the available photometry
for a number of Type Ia SNe having 1.88 . ∆m15(B) . 1.95 and compiled quasi-bolometric
light curves for these. For the fast decliners in their sample, the peak luminosities ranged
from ∼ 1042.05 − 1042.3 erg s−1. We report the resulting values of the 56Ni mass as obtained
using the parametrization described above in Table 9, and find that all of them cluster in
the 0.1M⊙ range.
Interestingly, the narrow and rapidly declining light curve of SN 2003gs as indicated
by its ∆m15(B) of 1.83, belies the lower limit to its peak luminosity (∼ 1042.7 erg s−1). This
may be taken to be further evidence that Type Ia SNe do not form a one parameter family.
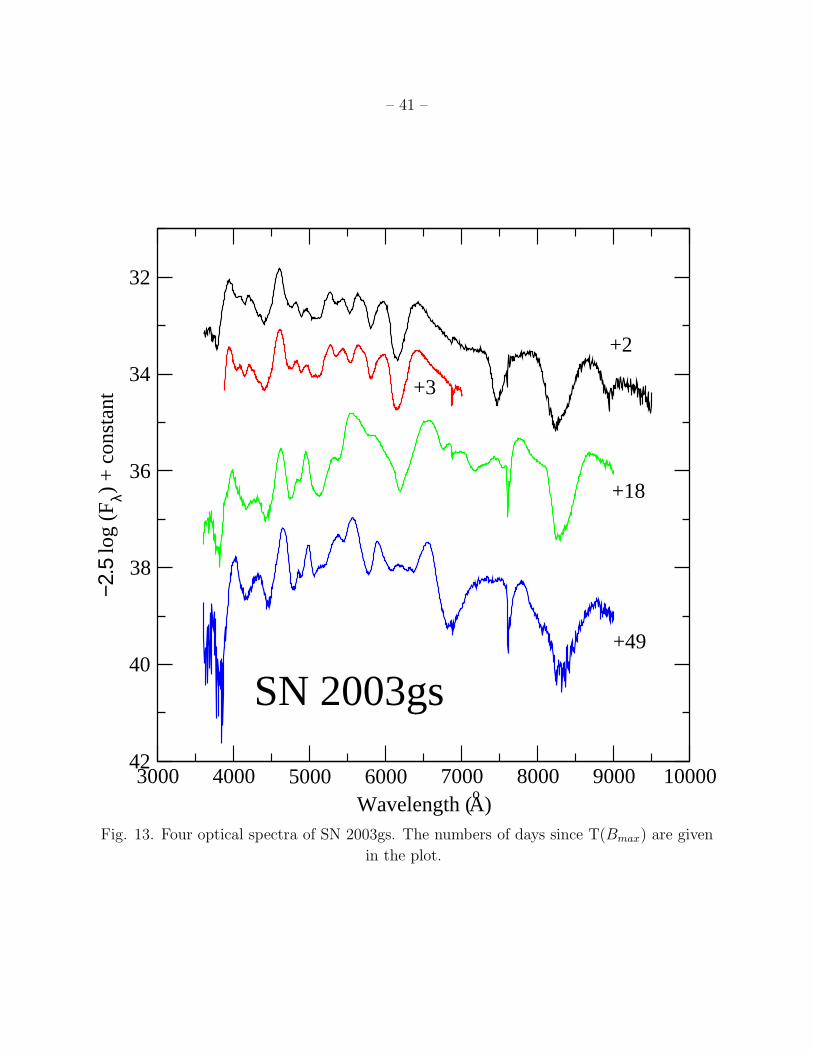
3.4. Spectroscopy
Optical spectra of SN 2003gs (Suntzeff, Candia, & Stritzinger 2003; Matheson & Suntzeff
2003; Hamuy, Gonzalez, & Morrell 2003) obtained with the CTIO 1.5-m telescope and also
the Magellan telescopes soon after T(Bmax) show the presence of Ti II in the region 4000−
4500A and and a large ratio of Si II at 5800A to Si II at 6150A that are characteristics of
moderately fast declining Type Ia SNe as described in Garnavich et al. (2004).
These spectra are shown in Figure 13. Using the Supernova Identification code SNID
(Blondin & Tonry 2007), we find that the two spectra obtained near maximum light are very
similar to those of SN 2004eo (Pastorello et al. 2007b) at a comparable epoch. SN 2004eo
– 15 –
had ∆m15(B) = 1.46 and produced 0.45 M⊙ of 56Ni, similar to SN 2003hv. At t = 18 and 49
days, however, our optical spectra of SN 2003gs are similar to the prototypical fast decliner
SN 1991bg. Many more optical spectra of SN 2003gs are presented by Kotak et al. (2009).
Near-infrared (NIR; 0.8-2.5 µm) spectra provide a rich source of information about the
physical characteristics of SNe Ia because many elements are undetectable or obscured by
line blending at other wavelengths but produce strong lines in the NIR (Meikle et al. 1996;
Wheeler et al. 1998; Bowers et al. 1997; Hoflich et al. 2002; Marion et al. 2003, 2009). NIR
spectroscopic observations are particularly effective for characterizing the chemical structure
of the supernova at different layers because the optical depth for most lines is smaller in the
NIR than at shorter wavelengths so that a greater radial depth can be probed with each
spectrum (Wheeler et al. 1998).
Frogel et al. (1987) present a complete near-IR spectrum of SN 1986G obtained at +12
d and three partial spectra through +24 d. The data of SN 1986G closely resemble the
spectra of SN 2003gs obtained at similar epochs. Kotak et al. (2009) present 11 near-IR
spectra of SN 2003gs obtained between +4 d to 91 d after T(Bmax). These authors kindly
loaned us their spectra for the calculation of near-IR S-corrections to the photometry. We
will not give an analysis of their spectra here, except to note that strong lines of iron group
elements are seen early in the sequence.
The strong and early presence of iron and cobalt in the spectra of SN 2003gs indicates
a lower opacity in the covering layers for SN 2003gs than is found in normal Type Ia SNe.
This could be due to asymmetries in the explosion that place the iron and cobalt line-
forming regions physically closer to the surface of the SN or to an explosion that produced
a larger quantity of 56Ni. It is also possible that the depth of the surrounding envelope
is approximately the same, but the opacities at these wavelengths are reduced by some
other mechanism. In §3.3 we showed that SN 2003gs has a larger 56Ni mass than other fast
declining Type Ia SNe (see Table 9). In any case, this is an important clue to understanding
the photometric behavior of SN 2003gs, which indicates a faster than normal decline from
approximately normal peak brightness. If the envelope surrounding the iron and cobalt line-
forming regions is not as deep or is more transparent than in normal Type Ia SNe, then γ
rays that power the luminosity will escape more easily and the decline rate will increase.
4. Conclusions
We have presented one of the most complete photometric datasets available for a fast
declining Type Ia SN. SN 2003gs was first observed on the date of V -band maximum light,
– 16 –
some two days after B-band maximum. Our coverage continued without any serious gaps
until t = 91 d. We also obtained some late time photometry.
We deduce that SNe 1986G, 2003gs, 2003hv, and 2006gt were fast declining objects that
shared some interesting photometric characteristics. These objects were subluminous in the
optical band passes, but their near-IR maximum light absolute magnitudes were statistically
equal to those of the slow decliners and mid-range decliners. Also, the near-IR maxima of
these four objects apparently occurred prior to the time of B-band maximum light. In the
case of SN 2003gs we can say that the near-IR maxima did not occur “late,” i.e. a few days
after T(Bmax). Type Ia SNe that had late near-IR maxima (SNe 1991bg, 1999by, 2005bl,
2005ke, and 2006mr) were subluminous at the times of the IR maxima. There appears to be
a bimodal distribution of near-IR absolute magnitudes of Type Ia SNe at maximum light.
Which group a particular object falls into depends on whether it peaked late or early. This
empirical finding is undoubtedly related to the opacity in the expanding fireball, and should
help us refine models of Type Ia SNe.
Near-IR spectral data appear to show that NIR opacities in the outer layers are lower in
SNe 1986G and 2003gs than they are in normal Type Ia SNe. If the γ rays are less confined,
then the observed luminosity decline rate would be accelerated. That result is consistent
with the photometric result for these objects that indicates a faster than normal decline from
approximately normal peak brightness in the NIR.
We thank Rubina Kotak for access to IR spectra of SN 2003gs ahead of publication
and for calculating the bolometric light curve of SN 2003gs. E. A. K. was supported by
the REU program of the National Science Foundation. We particularly thank the Carnegie
Supernova Project for access to data prior to publication. We thank Jose Luis Prieto for
his BV RI light curve fitting templates. We thank Peter Hoeflich for useful discussions
relating to the “late and faint” effect. We made use of the NASA/IPAC Extragalactic
Database (NED), data of the Two Micron All Sky Survey, and SIMBAD, operated at CDS,
Strasbourg, France. Most of the optical and IR photometry was obtained with the CTIO
1.3-m telescope, which is operated by the SMARTS consortium. Without the rapid response
made possible by SMARTS, this valuable dataset would not have been obtained. M.H. and
R.C. acknowledge support provided by FONDECYT through grant 1060808, the Millennium
Center for Supernova Science through grant P06-045-F, Centro de Astrofısica FONDAP
15010003, Center of Excellence in Astrophysics and Associated Technologies (PFB 06). R.
C. was supported by CONICYT through Programa Nacional de Becas de Postgrado grant
D-2108082.
– 17 –
REFERENCES
Ajhar, E. A., Tonry, J. L., Blakesless, J. P., Riess, A. G., & Schmidt, B. P. 2001, ApJ, 559,
584
Altavilla, G., et al. 2007, A&A, 475, 585
Arnett, W.D. 1982, ApJ, 253, 785
Benetti, S., Meikle, P., Stehle, M., et al. 2004a, MNRAS, 348, 261
Benetti, S., et al. 2004b, ApJ, 623, 1011
Bessell, M. S. 1990, PASP, 102, 1181
Blondin, S., & Tonry, J. L. 2007, ApJ, 666, 1024
Bowers, E.J.C., Meikle, W.P.S., Geballe, T.R., et al. 1997, MNRAS, 290, 663
Branch, D., Baron, E., Thomas, R. C., Kasen, D., Li, W. D., & Filippenko, A. V. 2004,
PASP, 116, 903
Cantiello, M., et al. 2007, ApJ, 668, 130
Cardelli, J. A., Clayton, G. C., & Mathis, J. S. 1989, ApJ, 345, 245
Contreras, C., et al. 2009, in press
Elias-Rosa, N., et al. 2006, MNRAS, 369, 1880
Elias-Rosa, N., et al. 2008, MNRAS, 384, 107
Evans, R. 2003, IAU Circ. 8171
Filippenko, A., et al. 1992a, ApJ, 384 , L15
Filippenko, A. 1992b, AJ, 104, 1543
Folatelli, G., et al. 2009, in press
Foley, R. J., et al. 2009, AJ, 138, 376
Freedman, W., et al. 2001, ApJ, 553, 47
Frogel, J. A., Gregory, B., Kawara, K., Laney, D., Phillips, M. M., Terndrup, D., Vrba, F.,
& Whitford, A. E. 1987, ApJ, 315, L129
– 18 –
Garavini, G., et al. 2007, A&A, 471, 527
Garnavich, P., et al. 2004, ApJ, 613, 1120
Hamuy, M., Phillips, M. M., Maza, J., Suntzeff, N. B., Schommer, R. A., Aviles, R. 1995,
AJ, 109, 1
Hamuy, M., Phillips, M. M., Suntzeff, N. B., Schommer, R. A., Maza, J., Smith, R. C., Lira,
P., & Aviles, R. 1996, AJ, 112, 2438
Hamuy, M., Gonzalez, L., & Morrell, N. 2003, IAU Circ. 8173
Hamuy, M., et al. 2006, PASP, 118, 2
Hamuy, M., et al. 2009, ApJ, in press
Hillenbrand, L. A., Foster, J. B., Persson, S. E., & Matthews, K. 2002, PASP, 114, 708
Hoflich, P., Khokhlov, A. M., & Wheeler, J. C. 1995, ApJ, 444, 831
Hoflich, P.A., Gerardy, C.L., Fesen, R.A. & Sakai, S. 2002, ApJ, 568, 791
Hough, J. H., Bailey, J. A., Rouse, M. F., & Whittet, D. C. B. 1987, MNRAS, 227, 1P
Immler, S., et al. 2006, ApJ, 648, L119
Jensen, J. B., et al. 2003, ApJ, 583, 712
Jha, S., Branch, D., Cornock, R., Foley, R., Li, W. D., Swift, B., Casebeer, D., & Filippenko,
A. V. 2006, AJ, 132, 189
Kasen, D. 2006, ApJ, 649, 939
Kotak, R., et al. 2005, A&A, 436, 1021
Kotak, R., et al. 2009, in preparation
Krisciunas, K., et al. 2001, AJ, 122, 1616
Krisciunas, K., et al. 2003, AJ, 125, 166
Krisciunas, K., Phillips, M. M., & Suntzeff, N. B. 2004a, ApJ, 602, L81
Krisciunas, K., et al. 2004b, AJ, 127, 1664
Krisciunas, K., et al. 2004c, AJ, 128, 3034
– 19 –
Krisciunas, K., Prieto, J. L., Garnavich, P., Riley, J.-L. G., Rest, A., Stubbs, C., & McMillan,
R. 2006, AJ, 131, 1639
Krisciunas, K., et al. 2007, AJ, 131, 58
Landolt, A. U. 1992, AJ, 104, 340
Leibundgut, B. 1993, AJ, 105, 301
Leloudas, G., et al. 2009, A&A, in press, arXiv:0908.0537
Li, W. D., et al. 2003, PASP, 115 453
Lira, P., 1995, Master’s thesis, Univ. Chile
Marion, G. H., Hoflich, P., Vacca, W.D., et al. 2003, ApJ, 591, 316
Marion, G. H., Hoflich, P., Gerardy, C. L, Vacca, W. D., Wheeler, J. C., & Robinson, E. L.
2009, AJ, submitted
Matheson, T., & Suntzeff, N. B. 2003, IAU Circ. 8172
Meikle, W. P. S. et al. 1996, MNRAS, 281, 263
Meikle, W. P. S. 2000, MNRAS, 314, 782
Mikolajewska, J., & Szostek, A. 2003, IAU Circ. 8175
Milne, P. A., The, L.-S., & Leising, M. D. 2001, ApJ, 559, 1019
Pastorello, A., et al. 2007a, MNRAS, 376, 1301
Pastorello, A., et al. 2007b, MNRAS, 377, 1531
Perlmutter, S., et al. 1999, ApJ, 517, 565
Persson. S. E., Murphy, D. C., Krzeminski, W., Roth, M., & Rieke, M. J. 1998, AJ, 116,
2475
Phillips, M. M., et al. 1987, PASP, 99, 592
Phillips, M. M. 1993, ApJ, 413, L105
Phillips, M. M., et al. 2007, PASP, 119, 360
Pignata, G., et al. 2004, MNRAS, 355, 178
– 20 –
Pignata, G., et al. 2008, MNRAS, 388, 971
Prieto, J. L., Rest, A., & Suntzeff, N. B. 2006, ApJ, 647, 501
Pskovskii, IU. P. 1977, Soviet Astron., 21, 675
Riess, A. G., et al. 1998, AJ, 116, 1009
Schlegel, D. J., Finkbeiner, D. P., & Davis, M. 1998, ApJ, 500, 525
Stanishev, V., et al. 2007, A&A, 469, 645
Stritzinger, M., Hamuy, M., Suntzeff, N. B., et al. 2002, AJ, 124, 2100
Stritzinger, M. & Leibundgut, B. 2005, A&A, 431, 423
Stritzinger, M., Leibundgut, B., Walch, S., & Contardo, G. 2006, A&A, 450, 241
Suntzeff, N. B., Candia, P., & Stritzinger, M. 2003, IAU Circ. 8171
Suntzeff, N.B. 1996, Proc. IAU Colloquium 145, “Supernovae and supernova remnants”,
Cambridge University Press, 41
Taubenberger, S., et al. 2008, MNRAS, 385, 75
Tonry, J. L., Dressler, A., Blakeslee, J. P., Ajhar, E. A., Fletcher, A. B., Luppino, G. A.,
Metzger, M. R. & Moore, C. B. 2001, ApJ, 546, 681
Valenti, S., et al. 2009, Nature, 459, 674
Wheeler, J.C., Hoflich, P., Harkness, R.P., & Spyromilio, J. 1998, ApJ, 496, 908
Wood-Vasey, W.M., et al. 2008, ApJ, 689, 377
This preprint was prepared with the AAS LATEX macros v5.2.
– 21 –
Table 1. Properties of SN 2003gs and its host galaxy
Parameter Value
Host galaxy NGC 936
Host galaxy typea SB0/SBa
Heliocentric radial velocitya 1430 km s−1
Distance modulusb 31.65 ± 0.28 mag
E(B − V )Galc 0.035 ± 0.003 mag
RA of SN (J2000) 2h27m38s.36
Dec of SN (J2000) −01◦09′35.′′4
Offset from nucleus 13.′′4E 14.′′6 S
Julian Date of B-band maximum 2452848.80± 0.53
∆m15(B) 1.83 ±0.02
MB,max −17.94 ± 0.29
MV,max −18.38 ± 0.29
MR,max −18.53 ± 0.29
MI,max −18.45 ± 0.29
MJ,max −18.50 ± 0.29
MH,max −18.48 ± 0.29
MK,max −18.37 ± 0.29
aFrom NED.
bTonry et al. (2001), using method of Surface
Brightness Fluctuations, and corrected by 0.16 mag
(Jensen et al. 2003).
cSchlegel, Finkbeiner, & Davis (1998).
– 22 –
Table 2. Optical Field Star Sequence near SN 2003gs
ID U B V R I
1 16.332 15.450 14.425 13.775 13.211
2 14.072 13.957 13.314 12.945 12.557
3 . . . 17.890 16.271 15.235 13.976
4 . . . 18.125 16.575 15.520 14.147
5 18.444 18.334 17.639 17.210 16.762
20 18.016 17.160 16.195 15.596 15.060
Table 3. Near-Infrared Photometry of Field Star Near SN 2003gsa
Band Derivedb 2MASS values
Y 13.221 (0.016) . . .
J 12.779 (0.011) 12.812 (0.027)
H 12.258 (0.009) 12.251 (0.022)
K 11.985 (0.014) 11.993 (0.019)
aRA = 02:27:40.63, DEC =
−01:10:05.1 (equinox 2000). This is
“star 3” of the field star sequence.
bWith respect to stars 9104 and 9172
of Persson et al. (1998).
– 23 –
Table 4. Optical Photometry of SN 2003gs
JDa Epochb U B V R I Telescopeb
2850.80 +2.0 . . . 14.125 (0.016) 13.491 (0.014) 13.249 (0.015) 13.253 (0.014) 2
2850.91 +2.1 14.731 (0.041) 14.134 (0.012) 13.488 (0.009) 13.279 (0.008) 13.387 (0.013) 1
2851.80 +3.0 . . . 14.235 (0.016) 13.511 (0.014) 13.263 (0.015) 13.244 (0.014) 2
2852.87 +4.1 14.993 (0.012) 14.356 (0.007) 13.505 (0.006) 13.311 (0.006) 13.399 (0.009) 1
2854.88 +6.1 15.303 (0.021) 14.644 (0.013) 13.614 (0.011) 13.414 (0.003) 13.462 (0.010) 1
2854.88 +6.1 . . . 14.651 (0.018) 13.604 (0.015) 13.418 (0.012) 13.467 (0.014) 1
2856.86 +8.1 15.761 (0.083) 14.982 (0.018) 13.781 (0.012) 13.544 (0.011) 13.503 (0.014) 1
2858.86 +10.1 16.031 (0.015) 15.333 (0.009) 13.955 (0.006) 13.663 (0.006) 13.519 (0.005) 1
2861.88 +13.1 16.428 (0.015) 15.762 (0.009) 14.226 (0.006) 13.839 (0.006) 13.565 (0.010) 1
2864.86 +17.1 16.587 (0.042) 16.047 (0.019) 14.515 (0.011) 14.080 (0.011) 13.699 (0.012) 1
2866.90 +18.1 . . . . . . 14.730 (0.015) . . . . . . 6
2867.80 +19.0 16.890 (0.050) 16.297 (0.012) 14.826 (0.006) 14.396 (0.005) 13.993 (0.005) 1
2870.80 +22.0 . . . 16.489 (0.015) 15.178 (0.014) 14.675 (0.014) 14.235 (0.014) 2
2872.74 +23.9 17.258 (0.144) 16.607 (0.020) 15.202 (0.013) 14.833 (0.012) 14.438 (0.015) 1
2876.80 +28.0 17.274 (0.013) 16.718 (0.013) 15.394 (0.013) 15.061 (0.013) 14.715 (0.014) 1
2878.75 +30.0 17.136 (0.025) 16.724 (0.024) 15.475 (0.015) 15.100 (0.011) 14.702 (0.019) 3
2882.75 +34.0 17.434 (0.051) 16.870 (0.016) 15.615 (0.011) 15.345 (0.011) 15.014 (0.014) 1
2885.73 +36.9 17.505 (0.057) 16.912 (0.021) 15.730 (0.011) 15.469 (0.010) 15.138 (0.014) 1
2888.90 +40.1 . . . 16.957 (0.015) 15.904 (0.014) 15.575 (0.014) 15.252 (0.014) 2
2890.78 +42.0 17.769 (0.062) 17.069 (0.022) 15.887 (0.011) 15.677 (0.010) 15.387 (0.015) 1
2890.80 +42.0 . . . 17.018 (0.015) 15.941 (0.014) 15.635 (0.014) 15.334 (0.014) 2
2897.78 +49.0 18.062 (0.088) 17.145 (0.021) 16.093 (0.016) 15.937 (0.014) 15.657 (0.015) 1
2904.73 +55.9 18.345 (0.145) 17.281 (0.041) 16.333 (0.017) 16.192 (0.014) 15.958 (0.028) 1
2905.70 +56.9 . . . 17.244 (0.016) 16.376 (0.015) 16.181 (0.015) 15.957 (0.014) 2
2905.76 +57.0 17.952 (0.090) 17.224 (0.036) 16.381 (0.040) 16.260 (0.033) 16.079 (0.033) 3
2906.80 +58.0 . . . 17.264 (0.016) 16.451 (0.015) 16.260 (0.014) 15.998 (0.014) 2
2907.80 +59.0 . . . 17.277 (0.019) 16.473 (0.022) 16.323 (0.025) 16.056 (0.020) 2
2908.80 +60.0 . . . 17.298 (0.015) 16.459 (0.014) 16.312 (0.014) 16.061 (0.015) 2
2911.75 +63.0 18.400 (0.039) 17.374 (0.015) 16.560 (0.011) 16.487 (0.011) 16.215 (0.012) 1
2914.80 +66.0 . . . 17.395 (0.019) 16.692 (0.016) 16.583 (0.014) 16.344 (0.016) 2
2918.72 +69.9 18.470 (0.074) 17.502 (0.029) 16.767 (0.012) 16.759 (0.010) 16.457 (0.013) 1
2926.67 +77.9 18.797 (0.054) 17.655 (0.034) 16.963 (0.011) 17.070 (0.012) 16.688 (0.016) 1
2939.77 +91.0 . . . 17.867 (0.018) 17.419 (0.020) 17.504 (0.018) 17.224 (0.017) 3
2952.70 +103.9 . . . 18.055 (0.029) 17.691 (0.013) 17.850 (0.016) 17.364 (0.019) 2
2967.70 +118.9 . . . 18.373 (0.018) 18.076 (0.014) 18.257 (0.015) 17.731 (0.024) 2
2996.60 +147.8 . . . . . . . . . . . . 18.253 (0.033) 2
3000.50 +151.7 . . . . . . 18.712 (0.022) 18.941 (0.017) 18.361 (0.029) 2
3001.60 +152.8 . . . 18.934 (0.029) . . . . . . . . . 2
3008.70 +159.9 . . . . . . 19.225 (0.035) 19.431 (0.058) 18.615 (0.061) 4
3010.70 +161.9 . . . 19.393 (0.076) 19.173 (0.065) 19.418 (0.025) 18.607 (0.027) 4
3019.60 +170.8 . . . 19.307 (0.038) 19.147 (0.019) 19.311 (0.022) 18.830 (0.040) 2
3030.57 +181.8 . . . 19.685 (0.036) 19.460 (0.047) 19.657 (0.038) 19.188 (0.041) 3
3031.56 +182.8 20.548 (0.145) 19.975 (0.067) 19.474 (0.046) 19.724 (0.043) 18.868 (0.055) 1
3034.54 +185.7 . . . 20.143 (0.090) 19.432 (0.058) 19.946 (0.078) 18.968 (0.071) 1
3044.60 +195.8 . . . 19.665 (0.069) 19.893 (0.037) 20.107 (0.047) 19.228 (0.041) 4
– 24 –
Table 4—Continued
JDa Epochb U B V R I Telescopeb
3045.50 +196.8 . . . 19.767 (0.059) 19.798 (0.037) 20.248 (0.105) 19.223 (0.043) 4
3046.60 +197.8 . . . 19.694 (0.054) 19.926 (0.039) 20.057 (0.061) 19.264 (0.083) 4
3050.52 +201.7 . . . 20.354 (0.138) 19.855 (0.044) 20.171 (0.083) 19.148 (0.088) 1
3051.55 +202.7 . . . 19.904 (0.405) 19.839 (0.126) 20.249 (0.267) 19.045 (0.144) 3
3282.90 +434.1 . . . 22.823 (0.293) 22.551 (0.473) . . . 20.003 (0.121) 5
3283.80 +435.0 . . . . . . . . . 22.732 (0.344) . . . 5
3284.80 +436.0 . . . 22.516 (0.295) 22.789 (0.666) . . . . . . 5
3342.80 +494.0 . . . . . . 22.911 (0.350) . . . . . . 5
aJulian Date minus 2,450,000.
bDays since T(Bmax).
cTelescope: 1 = CTIO 1.3-m; 2 = Las Campanas 1.0-m; 3 = CTIO 0.9-m; 4 = Univ. Arizona 1.54-m; 5 =
Univ. Arizona 2.3-m; 6 = Magellan #2 (Clay) Telescope.
Table 5. Near-Infrared Photometry of SN 2003gs
UT date JDa Epochb Y J H K Telescopeb
Jul. 30 2850.91 +2.1 13.44 (0.02) 13.41 (0.01) 13.38 (0.01) 13.40 (0.02) 1
Aug. 01 2852.85 +4.1 . . . 13.55 (0.01) 13.45 (0.01) 13.38 (0.02) 2
Aug. 01 2852.89 +4.1 13.51 (0.02) 13.57 (0.02) 13.43 (0.02) 13.47 (0.02) 1
Aug. 03 2854.86 +6.1 13.52 (0.02) 13.81 (0.02) 13.43 (0.01) 13.48 (0.02) 1
Aug. 05 2856.79 +8.0 . . . 14.01 (0.02) 13.47 (0.01) 13.43 (0.02) 2
Aug. 05 2856.88 +8.1 13.53 (0.02) 13.95 (0.02) 13.46 (0.02) . . . 1
Aug. 07 2858.87 +10.1 13.47 (0.02) 14.07 (0.02) 13.48 (0.01) 13.46 (0.02) 1
Aug. 10 2861.90 +13.1 13.38 (0.02) 14.13 (0.02) 13.54 (0.01) 13.55 (0.02) 1
Aug. 11 2863.79 +15.0 . . . 14.07 (0.02) 13.67 (0.01) 13.55 (0.02) 2
Aug. 13 2864.88 +16.1 13.32 (0.02) 14.09 (0.03) 13.65 (0.02) 13.68 (0.02) 1
Aug. 16 2867.81 +19.0 13.43 (0.02) 14.30 (0.02) 13.90 (0.02) 13.94 (0.03) 1
Aug. 20 2871.80 +23.0 . . . 14.79 (0.03) 14.32 (0.01) 14.37 (0.02) 2
Aug. 21 2872.76 +24.0 13.91 (0.03) 15.06 (0.04) 14.40 (0.04) 14.49 (0.09) 1
Aug. 25 2876.83 +28.0 14.10 (0.02) 15.44 (0.03) 14.59 (0.03) 14.77 (0.04) 1
Aug. 31 2882.77 +34.0 14.51 (0.03) 15.96 (0.07) 15.02 (0.04) 15.01 (0.08) 1
Sep. 06 2888.88 +40.1 . . . 16.55 (0.04) 15.31 (0.03) 15.47 (0.03) 2
Sep. 08 2890.77 +42.0 14.93 (0.03) 16.79 (0.12) 15.25 (0.05) 15.54 (0.06) 1
Sep. 15 2897.80 +49.0 . . . 16.98 (0.11) 15.41 (0.05) . . . 1
Sep. 18 2900.78 +52.0 . . . 17.36 (0.05) 15.86 (0.06) 16.13 (0.05) 2
Sep. 29 2911.75 +63.0 . . . 17.69 (0.22) 15.94 (0.07) . . . 1
Oct. 06 2918.74 +70.0 . . . 18.12 (0.20) 16.12 (0.09) . . . 1
Oct. 14 2926.69 +77.9 . . . 18.51 (0.28) 16.60 (0.08) . . . 1
2004 Aug. 03 3220.82 +372.0 . . . >21.50 >20.60 >20.80 3
aJulian Date minus 2,450,000.
b1 = CTIO 1.3-m + ANDICAM. 2 = ESO 3.6-m NTT + SofI. 3 = VLT + ISAAC.
– 25 –
Table 6. S-corrections for CTIO 1.3-m near-IR photometrya
t ∆J ∆H ∆K
2.1 [0.028] [−0.040] [0.031]
4.1 0.028 −0.053 0.031
6.1 0.009 −0.063 0.019
8.1 0.000 −0.064 . . .
10.1 0.004 −0.050 0.022
13.1 0.011 −0.027 0.027
16.1 −0.027 −0.026 −0.019
19.0 −0.043 −0.022 −0.032
24.0 −0.063 −0.014 −0.045
28.0 −0.081 −0.012 −0.057
34.0 −0.082 −0.014 −0.050
42.0 −0.076 −0.019 −0.034
49.0 −0.059 −0.025 . . .
63.0 −0.020 −0.037 . . .
70.0 [0.000] [−0.037] . . .
77.9 [0.000] [−0.037] . . .
aThese values are to be added
to the values in Table 5 to place
the ANDICAM near-IR photome-
try on the photometric system of
Persson et al. (1998). t is the num-
ber of days since B-band maximum.
– 26 –
Table 7. Low order polynomial fits to V − H and V − K colorsa
Color Index: V − H V − H V − K V − K
Range (d) [−9,+16.5] [+18.5,+88.5] [−8,+16] [18.5, 85.5]
a0 0.091 1.399 −0.152 1.671
a1 −0.5126819E−02 −0.3641677E−01 −0.2787401E−02 −0.5979778E−01
a2 +0.3556262E−02 +0.3332700E−03 +0.7684491E−02 +0.7580789E−03
a3 −0.1658202E−04 −0.1711514E−05 −0.2259151E−03 −0.4665809E−05
rms (mag) ±0.172 ±0.101 ±0.209 ±0.107
χ2ν 23.9 2.1 15.5 2.9
aFits are of the form: V − H or V − K = a0 + Σ(aiti).
Table 8. Near-IR absolute magnitudes at maximuma
Group Filter 〈M〉 σx N
Peak early:
J −18.614 ±0.158 25
H −18.308 ±0.149 25
K −18.436 ±0.153 23
Peak late:
J −17.802 ±0.133 5
H −17.867 ±0.067 5
K −17.792 ±0.064 4
aType Ia SNe typically peak in the near-IR
3 days before T(Bmax). Those that peak in
the near-IR a few days after T(Bmax) are fast
decliners at optical wavelengths and are faint
in all bands.
– 27 –
Table 9. 56Ni masses estimated using Arnett’s rulea
SN ∆m15(B) M(56Ni)/M⊙
2003gs 1.83 0.25
1999by 1.90 0.09
2005bl 1.93 0.10
1991bg 1.94 0.07
1998de 1.95 0.06
aValues of ∆m15(B) for all SNe
other than SN 2003gs are taken from
Taubenberger et al. (2008, and ref-
erences therein).
– 28 –
Fig. 1.— Finder chart.
Fig. 2.— Optical light curves of SN 2003gs.
Fig. 3.— Residuals of BV RI photometry with respect to ∆m15(B) = 1.83 templates shown
in Fig. 2.
Fig. 4.— Y JHK light curves of SN 2003gs.
Fig. 5.— B − V color curve and E(B − V ).
Fig. 6.— V minus IR color curves of fast decliners and SN 2001el.
Fig. 7.— Comparison of late-time light curves.
Fig. 8.— Comparison of J-band light curves.
Fig. 9.— Near-IR decline rate relations.
Fig. 10.— Histograms of absolute magnitudes at maximum light.
Fig. 11.— J-band absolute magnitudes vs. relative time of maximum with respect to B-
band.
Fig. 12.— Bolometric light curves.
Fig. 13.— Four optical spectra of SN 2003gs.
– 29 –
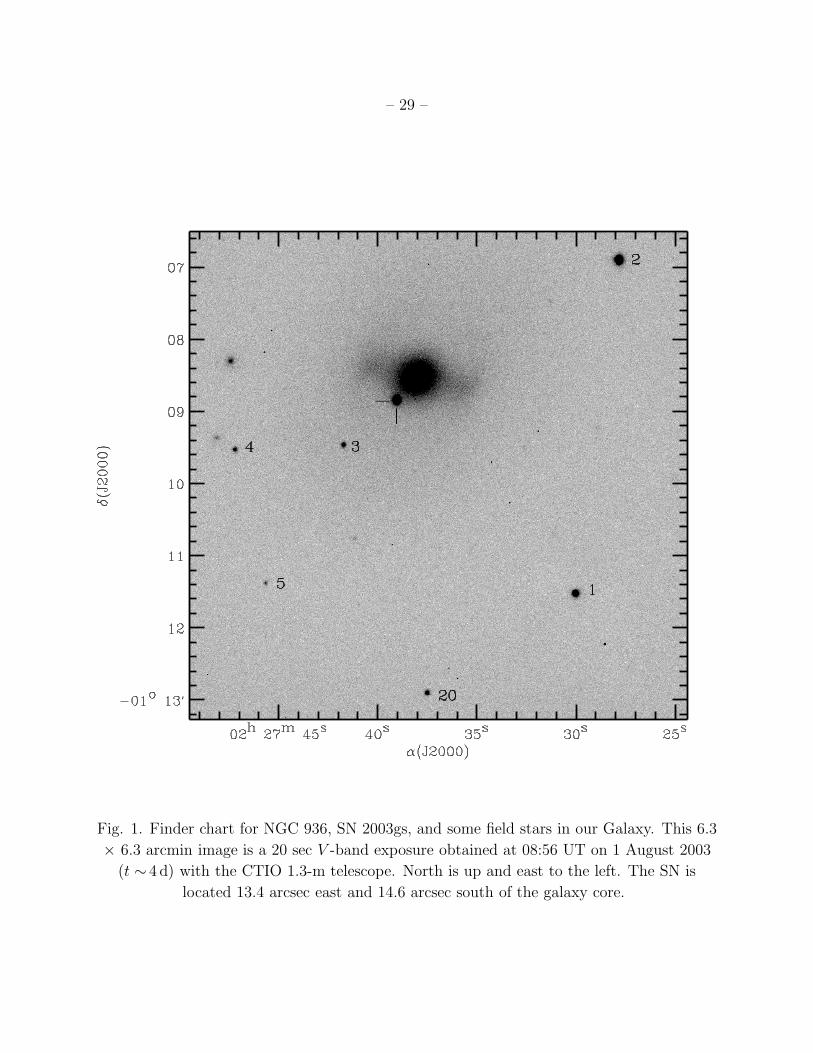
Fig. 1. Finder chart for NGC 936, SN 2003gs, and some field stars in our Galaxy. This 6.3
× 6.3 arcmin image is a 20 sec V -band exposure obtained at 08:56 UT on 1 August 2003
(t ∼ 4 d) with the CTIO 1.3-m telescope. North is up and east to the left. The SN is
located 13.4 arcsec east and 14.6 arcsec south of the galaxy core.
– 30 –
0 20 40 60 80 100 120 140 160 180 200Rest frame days since B-band maximum
11
12
13
14
15
16
17
18
19
20
21
22
23
mag
nitu
de +
off
set
I−2
R−1
V
B+1
U+2
SN 2003gs
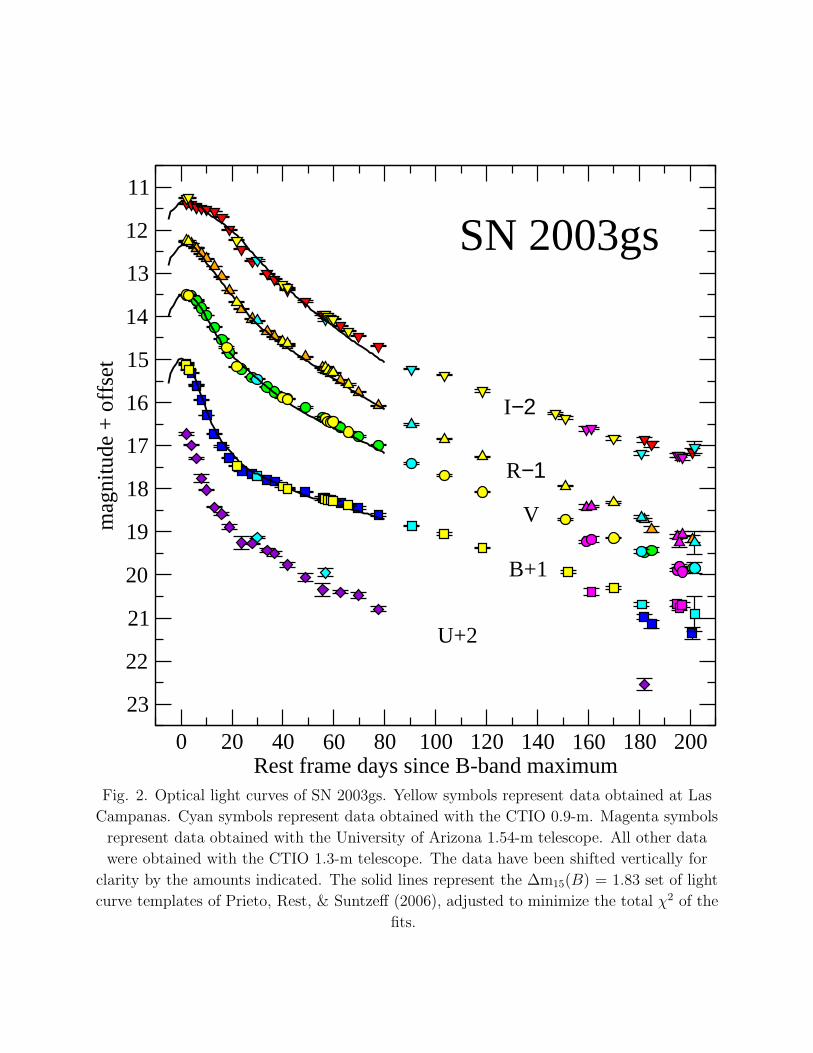
Fig. 2. Optical light curves of SN 2003gs. Yellow symbols represent data obtained at Las
Campanas. Cyan symbols represent data obtained with the CTIO 0.9-m. Magenta symbols
represent data obtained with the University of Arizona 1.54-m telescope. All other data
were obtained with the CTIO 1.3-m telescope. The data have been shifted vertically for
clarity by the amounts indicated. The solid lines represent the ∆m15(B) = 1.83 set of light
curve templates of Prieto, Rest, & Suntzeff (2006), adjusted to minimize the total χ2 of the
fits.
– 31 –
-0.4
-0.2
0
0.2
0.4-0.4
-0.2
0
0.2
0.4-0.4
-0.2
0
0.2
0.4
0 10 20 30 40 50 60 70 80Rest frame days since B-band maximum
-0.4
-0.2
0
0.2
0.4
∆I
∆R
∆V
∆B
Fig. 3. Residuals of BV RI photometry with respect to ∆m15(B) = 1.83 templates shown
in Fig. 2.
– 32 –
-10 0 10 20 30 40 50 60 70 80 90Rest frame days since B-band maximum
8
9
10
11
12
13
14
15
16
17
18
mag
nitu
de +
off
set
Y+1.0
J−2.0
H−3.0
K−4.5
SN 2003gs
Fig. 4. Near-IR photometry. The diamond-shape symbols represent data obtained with the
NTT. The other data were taken with the CTIO 1.3-m. The data have been offset
vertically for clarity by the number of magnitudes given. We have added the JHK
maximum light templates of Krisciunas et al. (2004b).
– 33 –
0 10 20 30 40 50 60 70 80 90 100Rest frame days since V-band maximum
0
0.2
0.4
0.6
0.8
1
1.2
1.4
1.6
B−V
E(B−V)tot
= 0.066
χ2ν = 1.42
RMS = +/- 0.028 mag
SN 2003gs
Fig. 5. B − V colors of SN 2003gs as a function of time since V -band maximum. The right
pointing triangles are CTIO 0.9-m data. The other data are from the CTIO 1.3-m, with
the S-corrections applied. The solid line is the locus of Lira (1995) for unreddened Type Ia
SNe. The dashed line represents an offset corresponding to E(B − V ) = 0.066 mag.
– 34 –
-2
-1
0
1
V−J
-1
0
1
V−H
0 20 40 60 80 100Rest frame days since B-band maximum
-1
0
1
V−K
99by 01el03gs05ke
05bl06mr
Fig. 6. V − J , V − H , and V − K colors of Type Ia SNe. The photometry has been
corrected for Galactic reddening and host galaxy reddening. The low-order polynomial fits
to subsets of the V −H and V −K data given in Table 7 are also shown here. Prior to t =
17 d the fits have a large reduced χ2, but after that the nearly linear fits are considerably
tighter and even match the colors of the normal Type Ia SN 2001el.
– 35 –
Fig. 7. From 50 to 200 days after the time of explosion Type Ia SNe light curves exhibit a
reasonably linear decline. Here we plot the differences of the photometry with respect to
the BV RI rates of decline of normal objects. Symbols: diamonds = normal Type Ia SNe;
dots = SN 2003gs; asterisks = other fast decliners.
– 36 –
-15 -10 -5 0 5 10 15 20 25 30 35Rest frame days since B-band maximum
10
12
14
16
18
20
22
J +
con
stan
t
86G
03hv
03gs
06gt
05ke
06mr
Fig. 8. J-band photometry of six fast declining Type Ia SNe. The data of SN 2003hv have
been offset by −1.5 mag; 2006gt by −3.0 mag; 2005ke by +2.5 mag; and 2006mr by +4.0
mag. The peaks of the top four objects are fitted with the stretchable template of
Krisciunas et al. (2004b). The stretch factors were 0.877 for SN 1986G, 0.556 for 2003hv,
1.00 for 2003gs, and 1.00 for 2006gt. The top four objects peaked prior to T(Bmax), while
the bottom two peaked after T(Bmax). Note also the weak secondary maxima in the
bottom two objects.
– 37 –
-19
-18.5
-18
-17.5
-17
MJ
-19
-18.5
-18
-17.5
-17
MH
0.8 1 1.2 1.4 1.6 1.8 2∆m
15(B)
-19
-18.5
-18
-17.5
-17
MK
03gs86G
91bg05bl05ke
06mr 99by
03gs
03gs
06gt
03hv
Fig. 9. Near-IR decline rate relations for Type Ia SNe (absolute magnitudes at peak
brightness vs. ∆m15(B)). Blue dots represent objects from Krisciunas et al. (2004c) which
are in the smooth Hubble flow, with radial velocities in the CMB frame greater than 3000
km s−1. Red triangles represent objects from Krisciunas et al. (2004c) which are not far
enough to be in the smooth Hubble flow; their distances were determined via Cepheids or
SBF distances. SNe 2005bl and 2006gt are the only fast decliners that have Hubble flow
distances. The objects that peak ∼3 days before B-band maximum constitute a brighter
sub-sample in each sub-diagram. The objects that peak a few to several days after B-band
maximum are all faint by comparison.
– 38 –
0
2
4
6
8
0
2
4
6
8
-19-18.8-18.6-18.4-18.2-18-17.8-17.6Absolute magnitude at maximum light
0
2
4
6
8
86G 06gt03gs
03hv
peak early
peak late
03gs86G06gt
03hv
03gs03hv86G
MJ
MH
MK
Fig. 10. Histograms of the J-, H-, and K-band absolute magnitudes of Type Ia SNe
plotted in Fig. 9. We have grouped the objects according to the relative times of their
infrared peaks compared to the time of B-band maximum. Those that peak early,
including the fast decliners SNe 1986G, 2003gs, and 2006gt are brighter at maximum light
than fast decliners that peak several days after T(Bmax).
– 39 –
-5 -4 -3 -2 -1 0 1 2 3 4 5[T(J
max) − T(B
max)] (days)
-19
-18.5
-18
-17.5
-17
MJ m
ax
Fig. 11. The J-band absolute magnitudes at maximum light for nine fast declining Type Ia
SNe vs. the relative time of the J-band and B-band maxima. The dashed line is a fit to
the points representing SNe 2003gs, 2006gt, 1986G, and 2003hv (upper left), 2005bl,
2005ke, and 2006mr (green diamonds, lower right). The cyan circle is for SN 1991bg and is
an upper limit in the time domain. The blue square is for SN 1999by and assumes that the
time of J-band maximum occurred at the same time as the I-band maximum.
– 40 –
Fig. 12. Quasi-bolometric light curves for SN 2003gs, SN 2002bo, and SN 1999by;
∆m15(B) for each SN is indicated in parentheses. The error bars include uncertainties in
distance and reddening, and are shown for SN 2003gs only.
– 41 –
3000 4000 5000 6000 7000 8000 9000 10000Wavelength (
oA)
32
34
36
38
40
42
−2.5
log
(Fλ)
+ c
onst
ant
+2
+3
+18
+49
SN 2003gs
Fig. 13. Four optical spectra of SN 2003gs. The numbers of days since T(Bmax) are given
in the plot.