Embed Size (px)
Citation preview

The financial crisis, internal corporate governance, and the performance of publicly-traded U.S. bank holding companies Marcia Millon Cornetta, Jamie John McNuttb, Hassan Tehranianc, *
a Bentley University, Waltham, MA 02452, USA b Southern Illinois University, Carbondale, IL 62901, USA c Boston College, Chestnut Hill, MA 02467, USA January 2010 Abstract We look at internal corporate governance mechanisms and the performance of publicly-traded U.S. banks before and during the financial crisis. Obviously, bank performance decreases dramatically during the crisis. This decrease occurs for all bank size groups. However, the largest banks see the largest losses. We find several measures of corporate governance, particularly CEO pay-for-performance sensitivity, executive ownership, and affiliated director ownership, decrease significantly just before and during the crisis. Large banks experience the largest changes in corporate governance. Finally, we find stronger relations between corporate governance variable changes and 2008 stock market returns for large banks than for small banks. JEL classification: G21, G30, G34 Keywords: Corporate governance; financial performance; financial institutions
The authors are grateful to Jim Booth, Ozgur Demirtas, Ed Kane, Darren Kisgen, Alan Marcus, Jim Musumeci, Jun Qian, Philip Strahan, René Stulz, Jerome Taillard, and seminar participants at Bentley University, Boston College, and Southern Illinois University for their helpful comments. * Corresponding author contact information: Tel. (617) 552-3944; fax: (617) 552-0431; e-mail: [email protected]

1
The financial crisis, internal corporate governance, and the performance of publicly-traded U.S. bank holding companies
“It is true that the top executives at (Bear Stearns and Lehman Brothers) suffered significant losses on shares they held when their companies collapsed. But our analysis, using data from Securities and Exchange Commission filings, shows the banks’ top five executives had cashed out such large amounts since the beginning of this decade that, even after the losses, their net pay-offs during this period were substantially positive…. executives regularly took large amounts of money off the table by unloading shares and options. Overall, in 2000-08 the top-five teams at Bear and Lehman cashed out close to $2bn in this way…Indeed, the teams sold more shares during the years preceding the firms’ collapse than they held when the music stopped in 2008”(Bankers Cashed in Before the Music Stopped, Financial Times, December 6, 2009)
This passage describes an internal corporate governance event: a significant portion of executive
ownership, meant to align executive and shareholder interests, is cashed out by two investment banks’
executives prior to their companies’ collapse. In this paper, we analyze the executive ownership, as well
as additional internal corporate governance mechanisms, of publicly-traded U.S. bank holding companies.
We investigate the performance of these holding companies before and during the financial crisis, and
how internal corporate governance mechanisms relate to performance. We find that banks performed well
prior to the crisis, from 2003 through 2006. Profits were high as loans and off-balance-sheet (OBS)
activities offered solid returns. However, as home foreclosures in the U.S. escalated in 2007, reached
record highs in late 2008, and continued to increase into 2009, the financial crisis hit the banking industry
hard. In the last quarter of 2008, expenses associated with rising loan losses and declining asset values
overwhelmed revenues and produced the industry’s first quarterly loss since 1990. Return on assets for
the quarter was the worst since the second quarter of 1987. For the full year 2008, net income was down
almost 90 percent from 2007 and return on assets was the lowest since 1987. Further, 24 percent of the
industry had negative profits in 2008 and 63 percent reported lower full-year earnings than in 2007. The
decrease in performance occurred for all bank size groups, but the largest bank size groups saw the most
significant losses. Off-balance-sheet business, especially in the derivatives area, slowed significantly.
Although the largest banks hold the vast majority of industry OBS securities, all bank size groups saw a
significant drop in total off-balance-sheet securities to total assets during the crisis.
2
We find several measures of internal corporate governance weaken significantly just before and
during the crisis. CEO pay-for-performance sensitivity, executive ownership, affiliated director
ownership, and board independence decrease, while the incidence of CEO golden parachutes increases.
These changes are most pronounced at the largest banks. Other key internal governance mechanisms do
not change significantly in the period around the crisis. Boards fail to meet more frequently, CEOs
continue to serve in the dual role as board chair, and nominating committees remain friendly to the CEO.
Further, we find that internal corporate governance mechanisms significantly relate to 2008 market
returns. Corporate governance controls weaken at smaller banks just prior to and during the financial
crisis. However, the reductions in these controls and the related drops in stock returns are not as large as
at larger banks. At a time when effective corporate governance seems most critical, banks, particularly
large banks, appear to decrease internal monitoring.
The remainder of the paper is organized as follows. Section 1 reviews internal corporate
governance literature and presents basic hypotheses. Section 2 describes the sample, data, and
methodology. Section 3 presents results of univariate and multivariate analyses, Section 4 describes
robustness tests and caveats, and Section 5 concludes.
1. Internal corporate governance
Internal corporate governance mechanisms are used by shareholders to mitigate the conflict
between managers and stockholders such that firm value is maximized. These controls largely fall into
two categories: i) mechanisms that motivate behavior and ii) mechanisms that constrain behavior.1 Not
surprisingly, internal governance mechanisms are the focus of a considerable body of academic research.
Indeed, four of the seven papers Bebchuk and Weisbach (2009) introduce in a forthcoming special journal
issue on corporate governance co-sponsored by the Review of Financial Studies and the National Bureau
of Economic Research review the state of academic research on internal corporate governance.
Specifically, Becht et al. (2009) and Gompers et al. (2009) examine issues related to shareholders, Ravina
1 By contrast, external corporate governance mechanisms are not under the immediate control of shareholders or boards. Examples include, but are not limited to, political pressure and the market for corporate control. We focus our analysis on internal corporate governance mechanisms.

3
and Sapienza (2009) examine issues related to corporate directors, and Kaplan and Rauh (2009) examine
executives and their compensation.2
The board of directors is the primary internal governance mechanism charged with overseeing
executive decisions. Recent evidence suggests more active and independent directors make better
monitors. For example, Vafeas (1999) finds that boards that meet more often are associated with better
firm performance. A number of studies find better stock returns and operating performance when outside
directors hold a significant number of board seats (e.g., Rosenstein and Wyatt, 1990; Byrd and Hickman,
1992; Cornett et al., 2008; and Ravina and Sapienza, 2009). However, boards may not be as independent
or as active when other internal corporate governance mechanisms are weak. Shivdasani and Yermak
(1999) find fewer independent outside directors get appointed when the CEO is on the nominating
committee (whose primary duty is to recruit qualified new directors) and when no nominating committee
exists. Further, the CEO is also the chairman of the board in roughly four out of five companies in the
U.S. (see Brickley et al., 1997). This concentration of power can permit the CEO to effectively control
information available to other board members and can impede effective monitoring (see Jensen, 1993).
Indeed, the Cadbury Committee recommends separating the roles of the CEO and board chair to ensure a
clear division of responsibilities at the head of the company.3 Not surprisingly, Carpeto et al. (2005) find
the decision to split the roles of CEO and board chair is associated with positive and significant abnormal
returns.
Compensation contracts and equity ownership are the primary internal governance mechanisms in
place designed to motivate managers and directors alike. Equity-laden contracts have been found to be
positively related to performance (e.g., Jensen and Murphy, 1990a and 1990b; Mehran, 1995; Yang et al.
2008). However, some research suggests executive equity incentives are associated with performance
manipulation rather than performance improvement (e.g., Cheng and Warfield, 2005; Cohen et al., 2005;
Bergstresser and Philippon, 2006). Similar to executive equity-based compensation, the aggregate equity
2 The three remaining papers study the political economy of corporate governance (Bebchuk and Neeman 2009) and international corporate governance issues (Aggarwal et al., 2009; Leuz et., 2009). 3 Report of the Committee on the Financial Aspects of Corporate Governance (Section 1.8), December 1, 1992.

4
ownership of executives can help align managers’ interests with those of shareholders. These two forms
of governance are intertwined as total equity ownership increases with the accumulation of yearly stock-
related compensation. As CEOs take larger equity stakes, they become (and presumably behave) more
like principals and less like agents. Indeed, many firms include target equity ownership guidelines for
their top executive officers. Stock ownership can also align the interests of directors with those of diverse
shareholders. Several studies suggest board stock ownership increases incentives to monitor and helps
resolve agency conflicts between directors and shareholders (e.g., Brickley et al., 1988; Brown and
Maloney, 1999; Bebchuk, Grinstein, and Peyer, 2009).
In addition to equity-based compensation, severance agreements (e.g., golden parachutes) are
commonly embedded in executive officer compensation contracts. These agreements specify benefits paid
upon early termination of employment, such as severance pay, cash bonuses, and stock options.
Proponents argue that golden parachutes make it easier to hire and retain executives, especially in
industries prone to mergers such as banking. Further, golden parachutes can keep executives objective
during takeovers and can dissuade unwanted takeover attempts. Lefanowicz et al. (2000) find golden
parachutes help mitigate the expected loss in salary when a manager’s share of acquisition gains does not
completely offset expected salary losses. However, critics point out that executives are well compensated
and do not deserve significant payouts upon termination. Further, executives have a fiduciary
responsibility to their companies, and therefore should not need additional incentives to stay objective.
Using the considerable extant body of corporate governance research as a guide, we define a
sample of publicly held U.S. bank holding companies, collect and quantify market and accounting-based
performance measures and internal corporate governance mechanisms, examine the measures and
mechanisms through time, and examine how the measures and mechanisms relate during the financial
crisis. Specifically, we test three basic null hypotheses:
H1: The performance of commercial banks is stable during the 2003 through 2008 period,
H2: The internal corporate governance mechanisms of commercial banks are stable during the 2003 through 2008 period, and

5
H3: The internal corporate governance mechanisms of commercial banks are not related to the performance of commercial banks during the 2003 through 2008 period.
2. Sample, data, and methodologies
2.1. Sample selection
Our sample includes all publicly-traded bank holding companies4 (BHCs), with available
accounting, stock price, and proxy information, that headquarter in the United States and that operate at
any time during the 2003 through 2008 period. We use the Center for Research in Securities Prices-
Federal Reserve Bank (CRSP-FRB) link found on the website of the Federal Reserve Bank of New York,
www.newyorkfed.org, to identify publicly traded banks and bank holding companies that have
information available through CRSP. Following Federal Deposit Insurance Corporation (FDIC) and
Federal Reserve guidelines, we segregate banks into five size groups based on year-end book value of
assets: i) greater than $10 billion; ii) between $3 billion and $10 billion; iii) between $1 billion and $3
billion; iv) between $500 million and $1 billion; and v) less than $500 million. Asset sizes of the BHCs as
well as all accounting data used throughout the study are obtained from Federal Financial Institutions
Examination Council (FFIEC) Call Reports of Condition and Income found on the website of the Federal
Reserve Bank of Chicago, www.chicagofed.org. We sum call report data at the highest holding company
level for multi-bank holding companies. Thus, when we refer to bank performance, we treat bank holding
companies as if they have only one bank subsidiary.5 Table 1 lists the distribution of the sample banks by
year (which declines from 419 banks in 2003 to 302 in 2008) and by total assets at the end of each year.
The first four years in the sample period (2003 through 2006) are years in which the U.S. economy is not
recessionary, while the last two years (2007 and 2008) are years in which the U.S. economy faces a
severe financial crisis.6
4 The Financial Services Modernization Act of 1999 allows BHCs to provide a wide variety of financial services through non-bank subsidiaries (e.g., insurance underwriting, merchant banking, securities dealing, etc.). These BHCs are now chartered as financial holding companies (FHCs). For simplicity of presentation, here and throughout, we refer to FHCs as BHCs or banks. 5 We note that data are not adjusted for intra-company transactions. 6 The CRSP-FRB link nets 2,358 firm-year observations with available call report data. We remove 130 observations where proxy statements are not available, ten observations where banks have split classes of stock that vote separately for split boards of directors, eight observations where proxy statements do not report complete stock option grant information, and three observations where fiscal year-end changes result in proxy statements that report activity for only a six month period. We begin

6
2.2. Market-based performance
We examine stock price performance for the banks before and during the financial crisis.
Specifically, we compute buy-and-hold abnormal returns for the sample banks each year during the
period 2003 through 2008. Buy-and-hold abnormal returns are estimated in a manner used in Spiess and
Affleck-Graves (1995), Safieddine and Titman (1999), and Cornett et al. (2006) and are similar to
variations explored in Barber and Lyon (1997) and Kothari and Warner (1997). Specifically, the
percentage buy-and-hold abnormal returns (BHAR) are calculated for bank i over each calendar year as:
)
12
1 ,1(12
1),1(
t tbenchmarkRt tiR
iBHAR (1)
where t = 1 is January, t = 12 is December, Rit is the is the monthly stock return for bank i in month t, and
Rbenchmark,t is the return on a benchmark portfolio for bank i. For each firm-year observation, sample banks
are matched to one of 125 benchmark portfolios using data from the year just prior to the year of BHAR
calculation. The benchmark portfolio consists of CRSP-listed stocks in the same size quintile, book-to-
market quintile, and momentum quintile (stock return performance over the previous year).7
2.3. Accounting-based performance
The accounting-based measures we use to test for changes in performance before and during the
financial crisis are similar to those in Cornett et al. (1998) and Cornett et al. (2006).8 We evaluate nine
common bank performance indicators:
1) Profitability Indicators Measure the bank’s overall performance;
2) Capital Adequacy Indicators Measure the bank’s ability to meet regulatory capital standards and still attract loans and deposits;
the analysis with a total of 2,207 bank-year observations. 7 We follow Daniel et al. (1997) and Cornett et al. (2006) in constructing 125 benchmark portfolios based on size, book-to-market ratio of equity, and share return momentum. The reference portfolios include firms that list on the NYSE, AMEX, and Nasdaq exchanges from 2002 through 2008 and that meet the following three conditions: (1) Compustat data are available for at least two years prior to the year of inclusion; (2) CRSP market value data are available at the ends of June and December of the year just prior to the year of inclusion; and (3) at least six monthly returns are available through CRSP during the year prior to the year of inclusion. First, we sort NYSE firms by market equity value on the last day of June of each year and divide the firms into quintiles. Second, we assign AMEX and Nasdaq firms to the quintiles based on their market equity values. Third, we sort the quintiles by book-to-market equity value ratios and then divide each quintile into five groups. Fourth, we sort each of the resulting 25 groups by their yearly stock return and divide each group into quintiles. Finally, we match each sample bank to one of the 125 benchmark portfolios based on the size, book-to-market, and momentum. 8 Cornett et al. (1998) look at performance around voluntary versus involuntary equity issuances by commercial banks and Cornett et al. (2006) look at merger-related operating performance at commercial banks.

7
3) Asset Quality Indicators Measure changes in the bank’s loan quality;
4) Operating Efficiency Indicators Measure the bank’s ability to generate revenue and pay expenses, and measure employee productivity;
5) Loan Composition Indicators Measure changes in the composition of and the return on the bank’s loan portfolio;
6) Non-interest Income Indicators Measure changes in income generated from non-lending activities at the bank;
7) Off-Balance-Sheet Indicators Measure changes in the bank’s off-balance-sheet activities;9
8) Liquidity Risk Indicators Measure changes in the bank’s cash position; and
9) Growth Indicators Measure the bank’s change in assets and deposits.
The forty-one specific measures we use to quantify the nine sets of indicators are defined in
Appendix A. We use calendar year-end values from call reports to calculate the ratios. Specifically, we
collect data for the sample banks both before and during the financial crisis and compare pre-crisis values
to those observed during crisis years.
2.4. Internal corporate governance mechanisms
Having defined market and accounting performance, we next examine internal corporate
governance. We collect board of director data from BHC proxy statements via the website of the Security
and Exchange Commission (SEC), http://idea.sec.gov. We use proxy statements for each year to obtain
board stock ownership, board composition, and board activity data, as well as executive compensation
and golden parachute information. We also collect CEO stock and options data from proxy statements,
including the information necessary to replicate ExecuComp’s Black-Scholes options value calculation
methodology (less than a third of the banks in our study are in the ExecuComp universe of firms). The
replication process also requires information from Compustat (for dividend yields), CRSP (for stock price
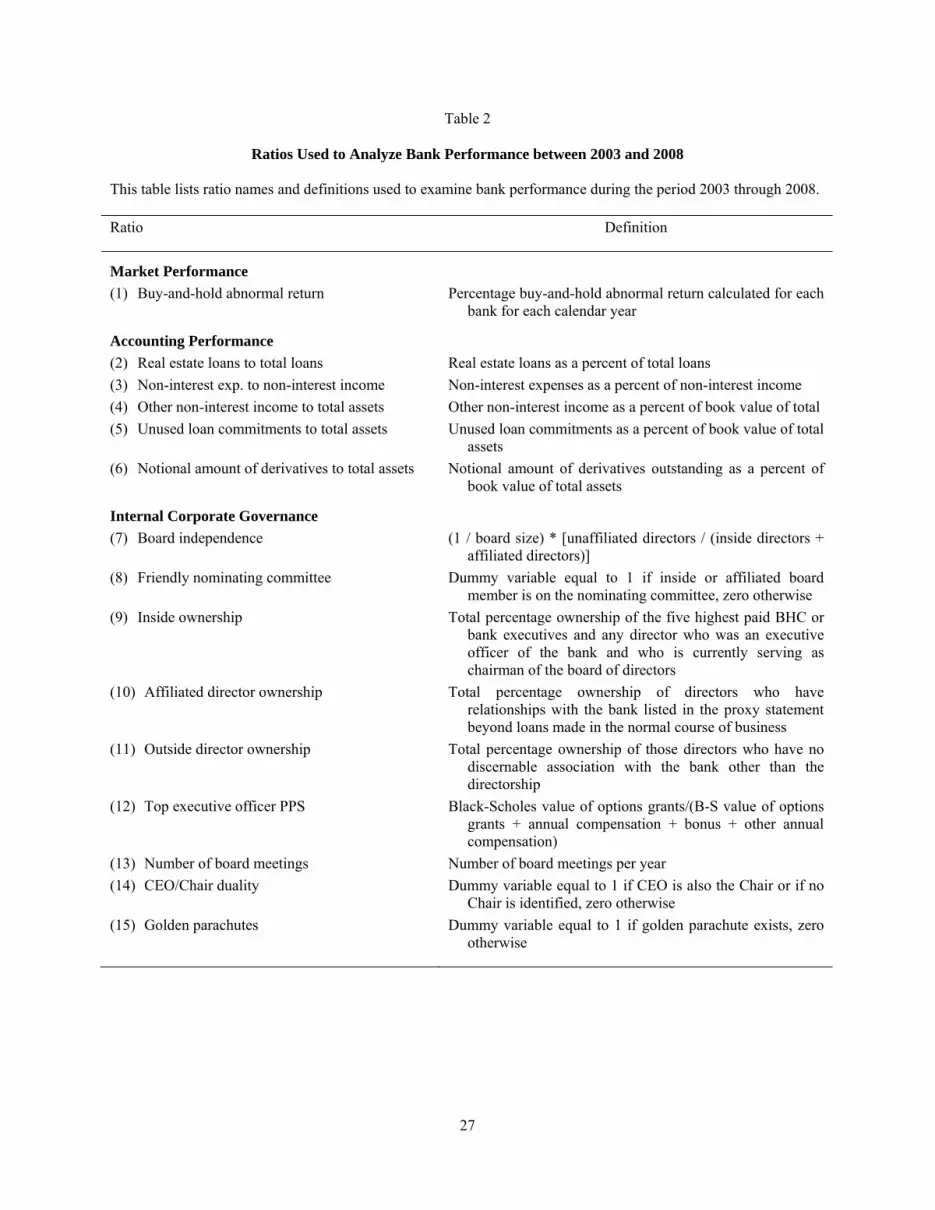
volatilities), and the U.S. Treasury website, www.ustreas.gov, (for risk-free rates). Table 2 lists and
defines the complete set of governance variables analyzed. We discuss each governance mechanism in
greater detail next.
2.4.1. Boards of directors
9 This does not include Special Investment Vehicles (SIV) or Special Purpose Vehicles (SPV). SIVs and SPVs are separate entities structured as operating companies that invest in assets that are designed to generate higher returns than the cost of funds.
8
We calculate board size as the total number of directors on the board. For all firm-year
observations, the mean board size is 11.38, the minimum is 3, and the maximum is 31. We categorize
board members into three groups based on their affiliation with the firm: inside, affiliated, and
unaffiliated directors. We define inside directors as those who are BHC or bank executives and those who
are past executives currently serving as chair of the board of directors. We define affiliated directors as
those who have relationships with the bank beyond loans made in the normal course of business.10 Finally,
we define outside (or unaffiliated) directors as those who have no discernable association with the bank
other than the directorship.11 While inside and affiliated board members are expected to be more easily
influenced by the CEO than outside board members, the average board is clearly dominated by outsiders
(unaffiliated board members hold nearly two-thirds of all board seats).12
We follow Brick et al. (2006) and combine board composition and board size into a composite
measure of board independence. Specifically, board independence is the inverse of board size times the
ratio of the number of outside directors to the number of affiliated and inside directors. Smaller boards
and/or boards with more outside directors increase board independence. Thus, a higher level of board
independence is associated with boards that are presumably in a better position to monitor and control
managers. The mean value of board independence is 0.268, the minimum is 0.000, and the maximum is 1.
2.4.2. Nominating committees
The Sarbanes-Oxley Act, enacted in 2002, generally requires nominating committees to be
independent.13 Accordingly, after 2002, few CEOs sit on the nominating committees of their companies.
However, nominating committees can still be "friendly" to the CEO in the selection process. We code an
indicator variable equal to one if an inside or affiliated board member is a member of the nominating
10 Examples of relationships include former bank executives, lawyers who perform legal services for the bank, property owners who lease property to the bank, directors with family relationships to insiders, and instances where the bank CEO sits on the board of directors of a company run by a bank director. 11 Outside directors are directors listed in proxy statements as managers in an unaffiliated non-financial firm, managers of an unaffiliated bank or insurance company, retired managers of another company, lawyers unaffiliated with the firm, and academics unaffiliated with the firm. 12 Booth et al. (2002) examine corporate governance mechanisms across industrial, bank, and utility firms and find that regulated firms have significantly more independent directors than industrial firms. 13 Some very tightly held companies are exempt from this requirement.

9
committee or if there is no nominating committee, and zero otherwise. We posit that when an executive or
an affiliated director is on the nominating committee, which selects nominees for open board positions,
the board of directors is less independent of management and monitoring of management is less effective.
An executive or an affiliated director is on the nominating committee for 1,273 of the 2,207 firm years
and is not on the nominating committee for the remaining 934 firm years.
2.4.3. Equity-based incentives
Compensation contracts at commercial bank holding companies are often heavily weighted
towards equity-based compensation. In addition to salary and annual cash bonuses, total annual
compensation to bank CEOs usually includes restricted stock and stock option grants (see Fahlenbrach
and Stulz, 2009). There are at least two approaches to analyzing the pay-for-performance sensitivity of
executives. One examines aggregate equity exposure by adding a delta weighted options term to the
percent of actual stock owned (e.g., Core and Guay, 1999; Benson and Davidson, 2009; Fahlenbrach and
Stulz, 2009). Another approach measures pay-for-performance as the proportion of the value of total
annual compensation that is stock option-based (e.g., Bergstresser and Philippon, 2006; Cornett et al.,
2009). We use the second approach in this paper. However, rather than ignore CEO equity ownership, we
include aggregate CEO equity ownership in a broader measure that includes the equity ownership of the
top five highest paid executives at the bank. We also collect overall board ownership information. We
explain the procedures used to measure these equity-based governance mechanisms in the following two
sections.
2.4.3.1. Executive and director stock ownership
We calculate total executive ownership as the sum of the total number of common shares owned
by the top five executives, ranked by total annual compensation, divided by the total shares outstanding
for each firm-year observation.14 The numerator includes common shares, restricted stock units, and stock
options exercisable within 60 days and the denominator includes all common shares issued and
14 The SEC requires proxy statements to detail the compensation and equity ownership of the five highest paid executives whose compensation exceeds $100,000. Some sample banks have fewer than five executives that exceed this compensation threshold.

10
outstanding.15 The top five insiders, who are not necessarily on the boards of directors, own an average of
7.06 percent of the bank’s stock. We also calculate the percentage ownership of affiliated and outside
directors as the total number of common shares owned by each group. The minimum value is 0.01 percent
and the maximum is 90.30 percent.16 Affiliated directors own an average of 1.72 percent of the bank’s
stock, the minimum value is 0.00 percent, and the maximum is 76.19 percent. Outside directors own an
average of 1.78 percent of the bank’s stock, a minimum of 0.00 percent, and a maximum of 54.30 percent.
2.4.3.2 CEO pay-for-performance contracts
A natural measure of the sensitivity of CEO compensation to firm performance compares the
value of options grants to other compensation. We calculate the Black-Scholes value of stock options
granted to bank CEOs for each firm-year observation in the sample. Because options grants are skewed,
however, the ratio of the value of options grants to other annual compensation can contain extreme
outliers. Therefore, as in Mehran (1995), we scale the value of the options grants by the sum of the value
of the grants plus other annual compensation. Note that we do not include annual cash bonus pay in the
numerator, but do in the denominator. That is, we measure that portion of the CEO’s current
compensation package that is sensitive to the future market performance of the firm, i.e., CEO pay-for-
performance sensitivity (PPS).17 This ratio of top executive officer PPS is similar to Bergstresser and
Philippon’s (2006) measure of incentives to manage firm performance and is constrained to lie between 0
and 1. The PPS of the top executive at our sample firms averages 0.151 and ranges from 0.000 to 1.000.
2.4.4. Additional governance mechanisms
We measure board activity as the number of times the board meets during the year. The average
number of board meetings for the sample banks over the entire sample period is 10.40 per year. We code
15 We do not distinguish whether changes in the ownership variables are due to changes in the numerator (i.e., shares owned) or the denominator (i.e., shares outstanding). We do note, however, that changes in the ownership variables are unlikely due to the Capital Purchase Program (CPP) implemented by the U.S. Treasury during the crisis. The CPP largely involves preferred stock and common stock warrants (a notable exception is Citigroup). Our measure of total shares outstanding does not include shares reserved for conversion via these warrants. 16 Reported ownership for each group includes ownership by related non-director blockholders. 17 Note also that our measure of PPS ignores past years' options grants (i.e., we do not include the value of options previously granted but still held). That is, we separate PPS from aggregate CEO stock and options ownership. See Fahlenbrach and Stulz (2009) for a study that examines the aggregate equity risk exposure of S&P1500 bank CEOs during the crisis.

11
an indicator variable equal to one if the CEO is the board chair, and zero otherwise. Of the 2,207 firm
years, 1,059 CEOs are also the board chair, while 1,148 CEOs are not. Finally, we document the
prevalence of CEO severance agreements at the sample banks. We code an indicator variable equal to one
if the principal executive officer has a golden parachute in place, and zero otherwise. Golden parachutes
are offered for 1,842 of the 2,207 firm years and are not offered for the remaining 365 firm years.
2.5. Regression Analysis
We are most interested in bank performance and how it relates to internal corporate governance
during the financial crisis. Therefore, we perform regression analysis using 2006 (just prior to the start of
the financial crisis) through 2008 (during the peak of the financial crisis) data. Specifically, we estimate
various forms of the following equation:
PERFORMit = a0 + b1 CORPGOVit + b2 CORPGOVit x Dneg + b3 SIZEDUMit + eit, (2)
where PERFORMi = bank i’s market or accounting based performance in year t (t = 2006 through 2008),
CORPGOVit = corporate governance measures for bank i in year t,
Dneg = an indicator variable set equal to one if the change in (executive or affiliated director) ownership is negative, and zero otherwise,
SIZEDUMi = a set of four indicator variables that classify bank i’s year-end asset class,
a0, b1, b2, and b3 = the coefficients to be estimated, and
e = the error term.
We first examine market-based performance (PERFORMit) in 2006 and 2008, respectively using
BHAR. The corporate governance variables (CORPGOVit) used in these regressions are a subset of those
discussed above and defined in Table 2. These include board independence (ratio 7 in Table 2), friendly
nominating committee (ratio 8), inside ownership (ratio 9), affiliated director ownership (ratio 10), top
executive officer PPS (ratio 12), number of board meetings per year (ratio 13), CEO/chair duality (ratio
14), and golden parachutes (ratio 15). For these regressions, we include the change in inside and affiliated
director ownership during the year to isolate the relation between changes in inside and affiliated director
stock ownership and bank performance.18 All other corporate governance measures are lagged one year.
18 We also run regressions using the year-end board stock ownership values. The results and conclusions from the coefficients in

12
We create two indicator variables, Dneg, which are set equal to one when the change in (inside or affiliated
director) ownership is negative, and zero otherwise. We interact the indicator variables with the executive
and affiliated director ownership variables. Thus, the relation between a positive change in ownership and
performance is given by the coefficient on the change in ownership variable coefficient, b1, and the
relation between a negative change in ownership and performance is given by the sum of the coefficients
on the change in ownership variable and the coefficient on the interaction term, b1 + b2. A decrease in
inside (or affiliated) ownership is unrelated to a decrease in performance when b1 + b2 = 0; a decrease in
ownership is related to a decrease in performance when b1 + b2 < 0. In a separate regression we look at
changes in BHAR from 2007 to 2008. In this regression, we include the change in executive and affiliated
director ownership during the year, 2007 to 2008, as well as the interaction terms. All other corporate
governance measures are year-end 2007 values.19
The first set of regressions analyzes the full sample, and includes four of the five size indicator
variables (SIZEDUM) that hold effects of variations in the dependent variable related to bank size
constant.20 In order to identify unique relations between returns and corporate governance measures based
on bank size, we also run the regressions one at a time for each of the five bank size categories.
We also examine how corporate governance mechanisms in place just prior to and during the
financial crisis relate to accounting variables most likely to be affected by the financial crisis.
Specifically, we choose a subset of balance sheet, income statement, and off-balance-sheet derived
variables from Section 2.3. above that measure real estate loan exposure, operating efficiency, non-
traditional banking income, off-balance-sheet liquidity exposure, and off-balance sheet trading activity.
Table 2 lists and defines these five accounting-based performance variables. In separate regressions,
PERFORMit is measured as the change, from 2007 to 2008, in real estate loans to total assets (ratio 2),
these alternate regressions are the same as in the reported regressions. 19 We also examine accounting-based measures of overall performance in 2006 and 2008, respectively: ROA, and ROE. Further, in separate regressions we look at changes in these return measures from 2007 to 2008. Results and conclusions for ROA and ROE regressions are similar to those for BHAR and are available from the authors upon request. 20 The hold-out group is banks with greater than $10 billion in total assets.

13
non-interest expense to non-interest income (ratio 3), other non-interest income to total assets21 (ratio 4),
unused loan commitments to total loans (ratio 5), and the notional amount of derivatives to total assets
(ratio 6). We regress changes in these accounting variables on the governance mechanisms to examine
how mechanisms in place at the beginning of each period relate to responses to the crisis (i.e., changes in
real estate lending exposure, efficiency, non-interest income, and off-balance-sheet activity). Similar to
the preceding regressions, we include the changes in executive and affiliated director ownership during
the year, 2007 to 2008, and the interaction terms. All other corporate governance measures are year-end
2007 values. Table 2 lists and defines the complete set of governance variables analyzed.
3. Empirical Results
We present the main results of our empirical examination in Tables 3, 4, and 5 (results of
additional analyses are presented in Appendices B, C, and D). Table 3 shows results of univariate
analyses of changes in the market performance, accounting performance, and internal corporate
governance mechanisms. Results for 2003 through 2006 are very similar; the biggest changes in
performance measures occur from 2006 to 2008. Thus, to make the Table 3 more readable, we report
results for only 2003, 2006, and 2008.22 Panel A of Table 3 reports results for banks with year-end book
value of total assets greater than $10 billion; Panel B lists results for banks with asset values between $3
billion and $10 billion; Panel C between $1 billion and $3 billion; Panel D between $500 million and $1
billion; and Panel E less than $500 million. Table 4 presents results of the regression equation
estimations. Panel A shows results when BHAR (and the change in BHAR) is regressed on the corporate
governance mechanisms and Panel B shows results when changes in the accounting-based variables are
regressed. Finally, Table 5 presents results of the five size group regressions of 2008 BHAR on the
internal corporate governance mechanisms.
3.1. Market performance
Table 3 lists the average annual percentage buy-and-hold abnormal returns (BHAR) for the
21 Other non-interest income includes investment banking, insurance, venture capital, and securitization income, servicing fees, and gains and losses on sales of loans and leases, other real estate owned, and other assets. 22 Results for other years are available from the authors upon request.

14
sample banks. BHAR increases significantly for all size groups between 2003 and 2006.23 For example,
the mean BHAR for the largest banks (Panel A) increases from 0.42% in 2003 to 1.09% in 2006. The
difference, 0.67%, is significant at better than the five percent level. Similarly, the mean BHAR for the
smallest banks (Panel E) increases from 0.22% in 2003 to 1.01% in 2006. The difference, 0.79%, is also
significant at better than the five percent level. In contrast, we see that, regardless of asset size, BHAR
decreases dramatically from 2006 to 2008. Furthermore, the largest banks see the largest drop in BHAR.
The mean BHAR for the largest banks (Panel A) decreases from 1.09% in 2006 to -4.82% in 2008. The
difference, -5.91%, is significant at better than the one percent level. The mean BHAR for the smallest
banks (Panel E) decreases from 1.01% in 2006 to -2.55% in 2008. The difference, -3.56%, is significant
at better than the one percent level. Clearly, the financial crisis significantly reduces the market value of
publicly traded banks, particularly the largest banks.
3.2. Accounting performance
Appendix B of the paper lists mean values for the forty-one accounting ratios grouped by year
and bank asset size. As with the market-based performance measures, results for 2003 through 2006 are
very similar and the biggest changes in the metrics occur from 2006 to 2008. Thus, to make Appendix B
more readable, we report results for only 2003, 2006, and 2008.24 We find that banks generally perform
well prior to the financial crisis, i.e., during the 2003 through 2006 period. Profits are high and both
traditional banking activity (e.g., return on loans) and non-traditional banking activity (e.g., non-interest
income to total assets) offer solid returns. However, as the financial crisis takes hold in 2007 and 2008,
bank performance decreases dramatically. While banks try to cut expenses as the crisis wears on, loan
losses continue to grow and performance deteriorates. The biggest banks see the largest losses. Further,
23 Differences in pre-crisis and crisis performance of the sample banks are tested using the t-statistic,
),/(/1
/)( NN
iNcrisispredcrisisdt
where crisisd reflects the performance of the banks in 2007 and 2008, crisispred measures the pre-crisis performance of the
banks, σ is the standard deviation of the distribution of the change in performance of the banks, and N is the numbers of banks in the sample. 24 Results for other years are available from the authors upon request.

15
off-balance-sheet business, especially in the derivatives area, slows significantly. All size groups see a
significant drop in total off-balance-sheet securities to total assets during the financial crisis. Finally,
during the financial crisis, bank business and consumer customers, frozen out of credit markets, draw on
preexisting loan commitments with commercial banks. Note that all size groups have unused loan
commitments off their balance sheets, but larger banks have considerably more loan commitments
relative to total assets.
Table 3 lists mean values and univariate tests for significant changes in the five particularly
relevant accounting-based measures noted above, grouped by year and bank asset class. As shown, real
estate loans increase as a percent of total assets from 2003 to 2006 for all size groups. This trend reverses
from 2006 to 2008 for only the largest banks. The mean level of real estate loans to total assets for the
largest banks (Panel A) increases from 35.52% in 2003 to 40.39% in 2006, and then decreases to 36.61%
by 2008. However, smaller banks maintain their level of real estate lending. For example, the mean level
of real estate loans to total assets for the smallest banks (Panel E) increases from 51.93% in 2003 to
56.42% in 2006 and does not change significantly thereafter, a decrease to 56.28% in 2008.
From Table 3 we see that all but the largest banks improve efficiency during the financial crisis.
Non-interest expense to non-interest income increases significantly for the largest banks (from 187.36%
in 2006 to 258.47% to 2008) and decreases significantly for the other four groups as they work to cut
operating expenses. These results appear at least partially due to a drop in non-interest income rather than
an increase in non-interest expenses. Non-traditional non-interest income (i.e., other non-interest income)
to total assets increases significantly for the two largest size groups between 2003 and 2006 and decreases
significantly for all five size groups between 2006 and 2008. For example, the mean other non-interest
income to total assets for the largest banks (ratio 4 in Panel A of Table 3) increases from 1.46% in 2003 to
2.67% in 2006, then decreases to 0.87% by 2008. Note that the drop in other non-interest income is
particularly large for the largest banks (Panel A). This could be attributed to the fact that the largest banks
make more loan commitments and participate more heavily in derivative securities markets.
Ratio 5 in Table 3 reports the ratio of unused loan commitments to total assets. We find evidence

16
that, during the financial crisis, business and consumer customers, presumably frozen out of the credit
markets, drew on preexisting loan commitments with commercial banks. For the largest banks (Panel A)
the ratio of unused loan commitments to total assets decreases from 37.67% in 2003, to 22.47% in 2006,
to 19.60% in 2008. No other size group has near this level of loan commitments (or the non-interest
income generated by these commitments). For the smallest banks (Panel E) the ratio increases from
9.53% in 2003, to 10.73% in 2006, then decreases to 7.09% in 2008. Finally, Ratio 6 reports the ratio of
the notional amount of derivatives to total assets. For the biggest banks this ratio increases from 239.35%
in 2003 to 294.84% in 2006, then decreases to 280.83% in 2008. Again, no other size group engages in
anywhere near this level of derivative securities related activity (or the non-interest income generated by
these securities).
3.3. Internal corporate governance mechanisms
Having found significant decreases in performance as expected, we next present results of
univariate analyses of changes in internal governance mechanisms.
3.3.1. Board of director independence
Our specification of board independence is the inverse of board size times the ratio of the number
of unaffiliated directors to the number of affiliated and inside directors. Ceteris paribus, smaller boards or
boards with more unaffiliated directors increase board independence. Thus, high levels of board
independence are presumably associated with boards of directors that are in a better position to monitor
managers. Table 3 reports that board independence (ratio 7) does not change significantly for any of the
bank size groups during the sample period. Further, the largest banks have the lowest levels of board
independence, suggesting these banks’ boards provide less monitoring than smaller banks’ boards. At the
largest banks (Panel A), board independence increases from 0.191 in 2003 to 0.234 in 2006, and then
decreases to 0.228 in 2008. At the smallest banks (Panel E), board independence increases from 0.269 in
2003 to 0.312 in 2006, and then decreases to 0.296 in 2008.
3.3.2. Friendly nominating committee
Table 3 reports that the majority of banks have “friendly” nominating committees (ratio 8). The

17
largest banks (Panel A) have the lowest percentage of friendly nominating committees: 50.91% in 2003
and 45.83% in 2008. In contrast, 63.64% of banks with assets between $500 million and $1 billion (Panel
D) have friendly nominating committees in 2008, down from 79.38% in 2003. Consistently, nominating
committees are friendly to the CEO.
3.3.3. Executive and director stock ownership
Table 3 reports that executive and director ownership changes significantly during the financial
crisis. At the largest banks, inside ownership (ratio 9) increases significantly from 4.85% in 2003 to
5.12% in 2006, then decreases significantly to 3.54% in 2008; affiliated director ownership (ratio 10)
decreases from 2.00% in 2003, to 1.65% in 2006, and to 1.42% in 2008; and outside director ownership
(ratio 11) decreases significantly from 0.71% in 2003, to 0.28% in 2006, and to 0.00% in 2008. For banks
with assets between $3 billion and $10 billion (Panel B), inside ownership decreases significantly from
8.18% in 2003, to 7.54% in 2006, and to 6.63% in 2008; affiliated director ownership decreases
significantly from 1.77% in 2003, to 0.85% in 2006, and to 0.41% in 2008. Outside director ownership,
however, increases from 0.23% in 2003, to 0.35% in 2006, and to 0.46% in 2008. For the smallest banks
(Panel E), inside ownership decreases significantly from 8.20% in 2003, to 7.13% in 2006, and to 5.63%
in 2008; affiliated director ownership increases from 2.03% in 2003 to 2.27% in 2006, then decreases
significantly to 1.16% in 2008. In contrast, outside director ownership increases significantly from 4.34%
in 2003, to 4.49% in 2006, and to 5.41% in 2008.25
3.3.4. CEO pay-for-performance sensitivity
Our measure of top executive officer pay-for-performance sensitivity (ratio 12) is the value of
annual stock options grants to total annual compensation and is constrained to lie between 0 and 1. Note
that CEOs at larger banks have the most equity-laden compensation schemes of any bank size group. The
largest banks consistently have PPS measures five to six times larger than the smallest banks. Further,
25 These results contrast with the findings of Fahlenbrach and Stulz (2009) who find that bank CEOs do not reduce their stock holdings before the financial crisis. However, note that our measure of inside ownership aggregates the equity stake of up to five executives and their family members, whereas Fahlenbrach and Stulz examine the equity-based incentives of the CEO specifically. Also, note that we examine the ownership proportions of groups of executives and directors through time rather than of individual executives or directors ownership through time.

18
PPS is significantly smaller in 2006 than in 2003 for all but small banks (i.e., those with assets less than
$1 billion) and PPS decreases significantly from 2006 to 2008 for all bank size groups. The largest banks
(Panel A) see PPS decreases from 0.445 in 2003 to 0.298 in 2006 and to 0.220 in 2008. For banks with
assets between $3 billion and $10 billion (Panel B), PPS decreases from 0.255 in 2003 to 0.208 in 2006
and to 0.151 in 2008. For the smallest banks (Panel E), PPS increases from 0.071 in 2003 to 0.090 in
2006 and then decreases to 0.030 in 2008. Thus, just before and during the financial crisis, top executive
officer pay becomes significantly less sensitive to the future market performance of the bank and this drop
in PPS is particularly significant at the largest banks.26
3.3.5. Additional governance mechanisms
From Table 3, we see that the number of board meetings per year (ratio 13) does not change
significantly during the sample period. For the largest banks (Panel A), the mean number of board
meetings is 8.33 in 2003, 8.67 in 2006, and 8.85 in 2008. As financial institutions face their greatest crisis
since the Great Depression, boards of directors, charged with guiding the banks through the crisis, fail to
meet more frequently.
Table 3 reports that, in general, CEO/chair duality (ratio 14) increases or does not change
significantly during the period of study. The two size groups of banks that are exceptions to this trend are
banks with assets between $3 billion and $10 billion (Panel B), where CEO/chair duality decreases
significantly, from 60.71% in 2003 to 45.00% in 2006, and banks with assets between $500 million to $1
billion (Panel D), where CEO/chair duality decreases from 43.30% in 2003 to 36.36% in 2006. Further,
boards at the largest banks have significantly more boards with CEO/chair duality, 80.00%, than any
other size group, which are consistently below 50%.
From Table 3 (ratio 15) we see that over 80% of the largest banks (Panel A) offer golden
parachutes to their top executives throughout the sample period (85.42% offer golden parachutes at the
end of 2008). Other size groups offer golden parachutes equally as often. In 2008, 88.33% of banks with
26 The drop in PPS is unlikely due to CEO turnover. Indeed, new CEOs are generally compensated more with equity-based incentives in their compensation contracts and less with traditional salary and bonuses.

19
assets between $3 billion and $10 billion (Panel B) offer golden parachutes to their top executives, up
from 78.57% in 2003, while 91.18% of banks with assets between $1 billion and $3 billion (Panel C)
offer golden parachutes to their top executives, up from 83.33% in 2003.
In summary, from the results in Table 3, we see that internal corporate governance mechanisms
do not strengthen during the period leading up to and including the financial crisis. Rather, if governance
changes at all, it weakens significantly. CEO pay-for-performance sensitivity, inside stock ownership,
affiliated director stock ownership, and board independence decrease during the crisis. Boards fail to meet
more frequently. CEOs continue to serve in the dual role as chief executive officer and chair of the board
of directors, nominating committees remain friendly to the CEO, and the occurrence of CEO golden
parachutes increases.
3.4. Regression results
The results so far suggest that market and accounting-based performance measures and corporate
governance variables change before and during the financial crisis. We next examine how corporate
governance mechanisms relate to market and accounting performance measures using regression analysis.
3.4.1. Market performance
Panel A of Table 4 shows results for regressions with either BHAR or the change in BHAR as the
dependent variable. The first column of results presents coefficient estimates and their associated t-
statistics from regression one, where buy-and-hold abnormal returns over the calendar-year just prior to
the start of the financial crisis, i.e., 2006 BHAR, are regressed on the corporate governance measures. The
second column presents results from regression two, where buy-and-hold abnormal returns over the
calendar-year that encompasses the height of the financial crisis, i.e., 2008 BHAR, are regressed on
corporate governance measures. The third regression uses the change in BHAR from 2007 to 2008 as the
dependent variable.
Note first that in 2006, before the start of the crisis, BHAR is related only to top executive PPS (t-
statistic = 3.43, significant at the one percent level) and the existence of golden parachutes (t-statistic =
-2.40, significant at five percent). That is, prior to the financial crisis, bank market-based performance

20
increases with the pay-for-performance sensitivity of the top executive and decreases with the incidence
of a top executive golden parachute, but appears unrelated to board of director characteristics and board
and executive ownership. From the 2008 BHAR and the change in BHAR from 2007 to 2008 regressions,
we see that, similar to the 2006 BHAR regressions, BHAR increases with top executive pay-for-
performance sensitivity and decreases with the incidence of a top executive golden parachute. In stark
contrast to the pre-crisis results, however, many corporate governance mechanisms significantly relate to
BHAR during the financial crisis.
Table 3 shows the mean change in inside and affiliated director ownership is significant and
negative during the financial crisis. Not surprisingly, Panel A of Table 4 shows changes in these
ownership variables strongly relate to BHAR during the crisis. The relation between a positive change in
inside ownership and performance, given by the coefficient on the change in inside ownership, is positive
and significant at the one percent level in both the second and third regressions. The relation between a
negative change in inside ownership and performance is given by the sum of the coefficients on the
change in inside ownership and the interaction term (0.181 + (-0.494) = -0.313 and 0.201 + (-0.554) =
-0.353, respectively in the second and third regressions, both significant at the one percent level (F-
statistic not shown)). We also find the relation between a positive change in affiliated ownership and
performance, given by the coefficient on the change in affiliated ownership, is significant at the one
percent level in both the second and third regressions. Again, the relation between a negative change in
affiliated ownership and performance is given by the sum of the coefficient on the change in affiliated
ownership and the interaction term (0.251 + (-0.441) = -0.190 and 0.247 + (-0.494) = -0.247, respectively
in the second and third regressions, both significant at the one percent level (F-statistic not shown)). From
these results, the positive relation between inside and affiliated board ownership and performance works
both ways during the financial crisis, i.e., equity stakes increase when BHAR (or the change in BHAR) is
higher, but decrease when BHAR (or the change in BHAR) is lower.
Board independence does not relate significantly to BHAR just prior to the financial crisis.
However, we find a positive relation between more independent boards and BHAR (and changes in

21
BHAR) during the crisis. Specifically, Panel A of Table 4 shows the coefficients on board independence,
0.169 and 0.126 in regressions two and three respectively, are significant at the one percent level.
However, in Table 3 we show that board independence does not change significantly during the crisis.
Thus, we find evidence that board independence does not relate to market performance in relatively
tranquil times and does not change during crises, but does appear to become tangible during times of
duress. Further, the largest banks have the lowest levels of board independence and it is these banks that
see the largest decrease in market-based returns during the crisis.
3.4.2. Accounting performance
Panel B of Table 4 presents results for regressions with the five previously mentioned accounting
performance measures as the dependent variables: real estate loans to total assets (ratio 2), non-interest
expense to non-interest income (ratio 3), other non-interest income to total assets (ratio 4), unused loan
commitments to total loans (ratio 5), and notional amount of derivatives to total assets (ratio 6).
The regression results for ratio 2 (change in real estate loans to total assets) show that banks with
higher top executive PPS, larger increases and smaller decreases in inside and affiliated director
ownership, more board independence, and without golden parachutes for their top executives experience
significantly larger decreases in real estate loans to total assets from 2007 to 2008. The more top
executive pay and board member wealth is affected by bank equity values, the more the bank decreases its
investment in the loans that are at the heart of the financial crisis. Also, the stronger the monitoring by a
more independent board and by a separate board chair, the more the bank reduces its investment in these
loans. Finally, banks that maintain golden parachutes for their executives see significant increases in real
estate loans to total assets.
The results for ratio 3 (non-interest income to non-interest expense) show that banks with higher
top executive PPS, with larger increases and smaller decreases in inside and affiliated director ownership,
with more board independence, with a separate board chair, and without golden parachutes for their top
executives experience significant operating efficiency improvements from 2007 to 2008. The stronger the
relation between top executive pay and bank stock prices, the larger the increase in efficiency during the

22
crisis. Similarly, efficiency positively and significantly relates to inside and affiliated director ownership.
Also, the stronger the monitoring by the board and by a separate board chair, the more the bank improves
efficiency. Finally, banks that guarantee a significant payoff to top executives upon early termination
have significant reductions in operating efficiency. Note too that the change in non-interest expenses to
non-interest income is significant and negative, i.e., this ratio fell by more for small banks (those with
assets less than $1 billion) relative to the largest banks.
The regression results for ratio 4 (non-interest income to total assets) show that banks with higher
top executive PPS, larger increases and smaller decreases in inside and affiliated director ownership, more
board independence, and without golden parachutes for their top executives experience significantly
smaller decreases in non-interest income to total assets from 2007 to 2008. As executive pay and wealth
(and board wealth) is more tied to equity values, when other monitoring mechanisms are stronger, and
when no golden parachute exists, banks see smaller declines in non-interest income relative to total assets.
Two major types of off-balance sheet activities for commercial banks are loan commitments and
derivative securities. The regression results for ratio 5 (change in unused loan commitments to total
assets) and for ratio 6 (change in notional amount of derivative securities to total assets) show that banks
with higher top executive PPS, larger increases and smaller decreases in inside and affiliated director
ownership, more board independence, and without golden parachutes for their top executives experience
significantly smaller decreases in unused loan commitments to total assets from 2007 to 2008 and
significantly larger decreases in derivative securities to total assets from 2007 to 2008. The results for
unused loan commitments are consistent with the possibility that banks with stronger corporate
governance mechanisms tend to initiate less risky loan commitments and thereby have fewer draw downs
by business and consumer customers frozen out of other credit markets. These banks also reduce their
derivative securities holdings during the crisis. Note too that the change in unused loan commitments to
total assets is significant and negative for smaller banks (those with assets less than $3 billion), i.e., this
ratio falls more at smaller banks than at the largest banks. Further, the change in notional value of
derivative securities to total assets is significant and positive for small banks (those with assets less than

23
$3 billion), this ratio falls less at small banks than at the largest banks.
3.4.3. Market performance by size group
Table 5 reports results of regressions that examine whether the relations between market
performance during the crisis, i.e., 2008 BHAR, and internal corporate governance are size specific.
Specifically, we estimate one regression for each of the five asset size groups listed in Table 3. These
regressions allow us to identify whether the significant relations between corporate governance
mechanisms and bank returns during the financial crisis are localized within a particular size group, or
whether these relations are consistent throughout all size groups.
The results confirm the full regression results and suggest stronger internal corporate governance
mechanisms are correlated with larger increases (or, more likely, smaller decreases) in market returns
during the financial crisis, i.e., 2008 BHAR. Three governance mechanisms are significant in all five
regressions. Top executive officer PPS, negative changes in inside ownership, and the incidence of golden
parachutes consistently significantly relate to 2008 BHAR across all size groups. However, we find that,
throughout Table 5, the significance of the relations at smaller banks is generally weaker than at larger
banks. The coefficient estimates that measure relations between positive changes in both inside and
affiliated director ownership and 2008 BHAR are positive and significant for the three largest size groups
and are positive but insignificant for the two smallest size groups. Negative changes in affiliated director
ownership are significantly related to 2008 BHAR for all but the smallest size group. The coefficient on
board independence remains significant and positive for only the two largest size groups. Finally, for the
first time and for only banks with assets greater than $10 billion, the coefficient on the CEO/chair duality
indicator variable is significantly negatively related to 2008 BHAR.
4. Robustness checks and caveats
Thus far, we have used regression analysis to examine the relation between bank performance
and internal corporate governance mechanisms holding only governance mechanisms constant. However,
bank specific operational factors can also impact bank performance. Similarly, the relationships between
performance and governance can be endogenously determined. We discuss these issues next.

24
4.1. Operational factors
We examine relationships between variations in operational factors and performance by
regressing bank BHAR on corporate governance and accounting variables27 using the sample of publicly
traded banks in 2006 and 2008. For these regressions, we include both the one year lag of executive and
affiliated director ownership and the change in these ownership variables during the year. We lag all other
corporate governance variables one year and the accounting measures are year-end values. We also
examine the change in BHAR from 2007 to 2008. In this regression, the accounting measures are
evaluated based on the change in their values from 2007 to 2008, while the corporate governance
measures are year-end 2007 values. The results are presented in Appendix C (where we list regressions
that analyze the full sample and a set of indicator variables capture variations in the dependent variable
related to differences across size groups) and in Appendix D (where we run the regressions one at a time
for each of our five bank size categories). Our results and conclusions regarding the relation between
bank performance and corporate governance mechanisms do not change.
4.2. Other corporate governance issues
We examine what we believe are key internal corporate governance mechanisms at commercial
bank holding companies. Specifically, we focus on board composition, board ownership, executive
ownership, and executive equity-based incentive compensation. However, the internal governance
mechanisms we examine are far from inclusive (e.g., Bebchuk, Cohen, and Ferrell, 2009). Additionally,
as noted above, we do not examine external governance mechanisms such as political pressure and the
market for corporate control. Also, until now, we have ignored endogeneity as it relates to corporate
governance, and a large body of empirical research suggests performance and corporate governance are
jointly determined. To address this issue, researchers often instrument suspected endogenous variables
(e.g., Agrawal and Knoeber, 1996; Brick et al., 2006; Cornett et al. 2008; Cornett et al. 2009). However,
27 We utilize a cross section of various accounting ratios listed in Appendices A and B: capital to assets, non-interest expense to non-interest revenue, personnel expense to assets, assets to employees, C&I loans to loans, real estate loans to loans, other non-interest income to assets, change in unused loan commitments to loans, notional amount of derivatives to assets, liquidity ratio, and deposit growth rate. Note that we include the change in loan commitments to loans to examine how draw downs in loan commitments relates to bank performance.

25
note that instrumenting corporate governance and performance variables often increases the significance
of the endogenous variable coefficient estimates (e.g., Cornett et al. 2009). While we do not directly test
or attempt to control for endogeneity, we do regress performance over a period against internal corporate
governance mechanisms in place at the beginning of that period (with the exception of the ownership
variables). For ownership, we include interaction terms to analyze relationship differentials related to the
sign of the change in ownership. Even so, to the extent that coefficient estimates are biased by the effects
of bi-directional causality, our results should be interpreted with caution; we observe only relationships
between internal corporate governance mechanisms and bank performance and make no claims as to the
direction of causality among these variables.
5. Conclusion
We explore the extent to which internal corporate governance mechanisms in the banking
industry change during the financial crisis and how these mechanisms relate to the performance of banks
during the period of the crisis. As expected, we find that bank performance declines significantly during
the period of the financial crisis. We also find that several measures of governance weaken significantly
just before and during the crisis. CEO pay-for-performance sensitivity, executive and affiliated director
stock ownership, and board independence decrease. Boards fail to meet more frequently. CEOs continue
to serve in the dual role as board chair. Nominating committees remain friendly to the CEO. The
incidence of CEO golden parachutes increases. These changes are most pronounced at the largest banks.
We find internal corporate governance mechanisms are significantly related to 2008 market returns for the
largest banks, but not as much for smaller banks. Banks with weaker corporate governance controls
perform worse during the financial crisis. While smaller banks weaken their corporate governance
controls prior to and during the financial crisis, the reductions in these controls and the related stock
performance declines are not as large as at larger banks. At a time when effective corporate governance
seems most vital, banks, particularly the largest banks, see decreases in internal monitoring.

26
Table 1
Number of Banks Examined between 2003 and 2008 The sample of publicly-traded U.S. bank holding companies is compiled using the CRSP-FRB link from the Federal Reserve Bank of New York website, www.newyorkfed.org. Asset values are from FFIEC Call Reports, available at the Federal Reserve Bank of Chicago website, www.chicagofed.org.
Year Number of
banks Total assets >
$10 billion Total assets $3b - $10b
Total assets $1b - $3b
Total assets $500m - $1b
Total assets < $500 million
2003 419 55 56 114 97 97
2004 401 52 61 107 103 78
2005 390 57 65 112 97 59
2006 363 55 60 115 88 45
2007 332 49 66 106 75 36
2008 302 48 60 102 66 26
Total 2,207 316 368 656 526 341
27
Table 2
Ratios Used to Analyze Bank Performance between 2003 and 2008 This table lists ratio names and definitions used to examine bank performance during the period 2003 through 2008.
Ratio Definition
Market Performance
(1) Buy-and-hold abnormal return Percentage buy-and-hold abnormal return calculated for each bank for each calendar year
Accounting Performance
(2) Real estate loans to total loans Real estate loans as a percent of total loans
(3) Non-interest exp. to non-interest income Non-interest expenses as a percent of non-interest income
(4) Other non-interest income to total assets Other non-interest income as a percent of book value of total
(5) Unused loan commitments to total assets Unused loan commitments as a percent of book value of total assets
(6) Notional amount of derivatives to total assets Notional amount of derivatives outstanding as a percent of book value of total assets
Internal Corporate Governance
(7) Board independence (1 / board size) * [unaffiliated directors / (inside directors + affiliated directors)]
(8) Friendly nominating committee Dummy variable equal to 1 if inside or affiliated board member is on the nominating committee, zero otherwise
(9) Inside ownership Total percentage ownership of the five highest paid BHC or bank executives and any director who was an executive officer of the bank and who is currently serving as chairman of the board of directors
(10) Affiliated director ownership Total percentage ownership of directors who have relationships with the bank listed in the proxy statement beyond loans made in the normal course of business
(11) Outside director ownership Total percentage ownership of those directors who have no discernable association with the bank other than the directorship
(12) Top executive officer PPS Black-Scholes value of options grants/(B-S value of options grants + annual compensation + bonus + other annual compensation)
(13) Number of board meetings Number of board meetings per year
(14) CEO/Chair duality Dummy variable equal to 1 if CEO is also the Chair or if no Chair is identified, zero otherwise
(15) Golden parachutes Dummy variable equal to 1 if golden parachute exists, zero otherwise

28
Table 3
Bank Performance between 2003 through 2008
This table lists mean performance statistics for the sample of publicly traded banks during the period 2003 through 2008. Banks are separated into five classifications based on year-end total assets: Panels A, B, C, D, and E show results for banks with assets greater than $10 billion, between $3 billion and $10 billion, between $1 billion and $3 billion, between $500 million and $1 billion, and less than $500 million, respectively. Financial statement data obtained from FFIEC Call Reports, available at the website of the Federal Reserve Bank of Chicago, www.chicagofed.org. We use proxy statements for each year to obtain board of director characteristics (i.e., the number of insiders, affiliated outsiders, and unaffiliated outsiders on the board, CEO/Chair duality). CEO stock and options ownership and compensation data are collected by hand from proxy statements, including the detailed options information necessary to replicate ExecuComp’s Black-Scholes options values calculations. The replication process also requires information from Compustat (for dividend yields), CRSP (for data to calculate stock price volatility), and the U.S. Treasury website, www.ustreas.gov, (for the risk free rate). Results of t-statistics for differences in mean values are also listed. a, b, and c indicate difference between 2003 and 2006 is significant at 1%, 5%, and 10% level respectively. d, e, f indicate difference between 2006 and 2008 is significant at 1%, 5%, and 10% level respectively.
Ratio 2003 2006 2008
Panel A: Banks with total assets greater than $10 billion
(1) Buy-and-hold abnormal return 0.42% 1.09% b -4.82% d
Accounting performance (2) Real estate loans to total assets 35.52% 40.39% a 36.61% e (3) Non-interest exp. to non-interest rev. 192.25% 187.36% 258.47% e (4) Other non-interest income to total assets 1.46% 2.67% a 0.87% d (5) Unused loan commitments to total assets 37.67% 22.47% a 19.60% d (6) Notional amount of derivatives to total assets 239.35% 294.84% a 280.83% f
Internal corporate governance
(7) Board independence 0.191 0.234 c 0.228 (8) Friendly nominating committee (% with) 50.91% 41.82% b 45.83% (9) Inside ownership 4.85% 5.12% b 3.54% d (10) Affiliated director ownership 2.00% 1.65% c 1.42% (11) Outside director ownership 0.71% 0.28% a 0.00% d (12) Top executive officer PPS 0.445 0.298 a 0.220 d (13) Number of board meetings 8.33 8.67 8.85 (14) CEO/Chair duality (% with) 80.00% 83.64% 81.25% (15) Golden parachutes (% with) 87.27% 83.64% 85.42%
Panel B: Banks with total assets between $3 billion and $10 billion
(1) Buy-and-hold abnormal return 0.52% 0.97% b -4.12% d
Accounting performance (2) Real estate loans to total assets 40.38% 49.64% b 47.69% f (3) Non-interest exp. to non-interest rev. 237.52% 366.59% 137.20% d (4) Other non-interest income to total assets 0.78% 1.23% a 0.44% d (5) Unused loan commitments to total assets 9.61% 11.72% a 8.21% d (6) Notional amount of derivatives to total assets 11.44% 4.61% a 6.04%
Internal corporate governance
(7) Board independence 0.276 0.220 0.233 (8) Friendly nominating committee (% with) 62.50% 55.00% b 61.67% e (9) Inside ownership 8.18% 7.54% c 6.63% e (10) Affiliated director ownership 1.77% 0.85% a 0.41% e (11) Outside director ownership 0.23% 0.35% b 0.46% e (12) Top executive officer PPS 0.255 0.208 a 0.151 d (13) Number of board meetings 8.27 9.12 9.07 (14) CEO/Chair duality (% with) 60.71% 45.00% a 43.33% (15) Golden parachutes (% with) 78.57% 83.30% b 88.33%
Panel C: Banks with total assets between $1 billion and $3 billion
(1) Buy-and-hold abnormal return 0.72% 0.89% b -3.83% d

29
Table 3 (continued)
Ratio 2003 2006 2008
Panel C (continued)
Accounting performance (2) Real estate loans to total assets 47.49% 55.15% b 56.86% (3) Non-interest exp. to non-interest rev. 294.75% 359.54% 327.58% f (4) Other non-interest income to total assets 0.67% 0.76% 0.38% d (5) Unused loan commitments to total assets 9.03% 11.50% a 7.49% d (6) Notional amount of derivatives to total assets 2.32% 2.14% 1.51% e
Internal corporate governance
(7) Board independence 0.254 0.267 0.295 (8) Friendly nominating committee (% with) 75.44% 50.43% a 53.92% (9) Inside ownership 8.91% 7.38% b 6.02% d (10) Affiliated director ownership 1.80% 1.36% c 0.93% f (11) Outside director ownership 1.22% 1.43% c 1.62% f (12) Top executive officer PPS 0.162 0.119 a 0. 093 e (13) Number of board meetings 10.39 11.36 11.26 (14) CEO/Chair duality (% with) 44.74% 41.74% 44.12% (15) Golden parachutes (% with) 83.33% 86.09% 91.18%
Panel D: Banks with total assets between $500 million and $1 billion
(1) Buy-and-hold abnormal return 0.47% 0.92% b -3.02% d
Accounting performance (2) Real estate loans to total assets 50.97% 58.00% a 58.16% (3) Non-interest exp. to non-interest rev. 312.88% 350.60% 322.75% f (4) Other non-interest income to total assets 0.67% 0.70% 0.46% f (5) Unused loan commitments to total assets 8.27% 10.75% a 7.47% d (6) Notional amount of derivatives to total assets 1.44% 2.06% 1.62%
Internal corporate governance
(7) Board independence 0.322 0.311 0.271 f (8) Friendly nominating committee (% with) 79.38% 50.00% a 63.64% e (9) Inside ownership 7.51% 7.48% 6.50% e (10) Affiliated director ownership 1.96% 1.99% 2.21% f (11) Outside director ownership 3.22% 3.36% 2.76% e (12) Top executive officer PPS 0.086 0.084 0.043d (13) Number of board meetings 10.70 12.45 c 11.67 (14) CEO/Chair duality (% with) 43.30% 36.36% b 37.88% (15) Golden parachutes (% with) 77.32% 84.09% c 85.85%
Panel E: Banks with total assets less than $500 million
(1) Buy-and-hold abnormal return 0.22% 1.01% b -2.55% d
Accounting performance (2) Real estate loans to total assets 51.93% 56.42% b 56.28% (3) Non-interest exp. to non-interest rev. 435.78% 465.41% 441.01% f (4) Other non-interest income to total assets 0.68% 0.74% 0.36% d (5) Unused loan commitments to total assets 9.53% 10.73% c 7.09% d (6) Notional amount of derivatives to total assets 0.35% 1.23% b 0.26% d
Internal corporate governance
(7) Board independence 0.269 0.312 0.296 (8) Friendly nominating committee (% with) 83.51% 60.00% a 53.85% (9) Inside ownership 8.20% 7.13% c 5.63% d (10) Affiliated director ownership 2.03% 2.27% 1.16% d (11) Outside director ownership 4.34% 4.49% 5.41% e (12) Top executive officer PPS 0.071 0.090 b 0.030 d (13) Number of board meetings 10.81 10.58 11.23 (14) CEO/Chair duality (% with) 30.93% 44.44% a 50.00% e (15) Golden parachutes (% with) 80.41% 80.00% 76.92%

30
Table 4
Regressions of Bank BHAR and Accounting-based Performance on Corporate Governance Variables
This table shows regression results of bank performance on various corporate governance variables for the sample of publicly traded banks. In Panel A, performance is the percentage buy-and-hold abnormal returns (BHAR) calculated for each bank over a calendar year. For the 2006 and 2008 regressions, we include the change in executive and affiliated director ownership during the year. All other corporate governance measures are lagged one year. Dneg, an indicator variable equal to one if the change in (executive or affiliated director) ownership is negative, and zero otherwise, is interacted with the ownership variables. Panel A also shows regression results of the change in BHAR from 2007 to 2008 on the corporate governance variables. For this regression, we include the change in executive and affiliated director ownership during 2008. All other corporate governance measures are year-end 2007 values. In Panel B, performance is the change, from 2007 to 2008, in various accounting-based ratios: real estate loans to total assets (ratio 2), non-interest expense to non-interest income (ratio 3), other non-interest income to total assets (ratio 4), unused loan commitments to total loans (ratio 5), and notional amount of derivatives to total assets (ratio 6). We include the change in executive and affiliated director ownership during the year, 2007 to 2008. All other corporate governance measures are year-end 2007 values. Governance data are from proxy statements, available at the website of the SEC, http://idea.sec.gov. CEO compensation data collected by hand from proxy statements, including the detailed options information necessary to replicate ExecuComp’s calculations of options grant values. This process requires data from Compustat (dividend yields), CRSP (stock price volatility), and the U.S. Treasury website, www.ustreas.gov, (the risk-free rate). Financial statement data are from FFIEC Call Reports, available at the website of the Federal Reserve Bank of Chicago, www.chicagofed.org. t-statistics in parentheses. a, b, and c denote significance at better than the 1%, 5%, and 10% levels respectively.
Panel A: Regressions of Bank BHAR on Corporate Governance Variables
Ratio 2006 BHAR 2008 BHAR ∆BHAR
2007 to 2008
Constant 0.045 (2.22) b
0.003 (0.36)
0.001 (0.18)
(7) Board independence 0.009 (0.96)
0.169 (2.75) a
0.126 (2.65) a
(8 ) Friendly nominating committee -0.004 (-0.55)
-0.017 (-0.96)
-0.003 (-0.49)
(9) Change in inside ownership
0.015 (0.85)
0.181 (2.77) a
0.201 (2.82) a
(9a) Change in inside ownership x Dneg
-0.058
(-1.17) -0.494
(-4.83) a -0.554
(-5.11) a
(10) Change in affiliated director ownership 0.020 (0.49)
0.251 (2.70) a
0.247 (2.73) a
(10a) Change in affiliated ownership x Dneg
-0.063 (-1.43)
-0.441 (-4.27) a
-0.494 (-4.49) a
(12) Top executive officer PPS 0.136 (3.43) a
0.097 (2.75) a
0.200 (3.16) a
(13) Number of board meetings 0.001 (0.98)
0.002 (0.83)
0.001 (0.96)
(14) CEO/Chair duality -0.006 (-0.40)
-0.027 (-1.40)
-0.020 (-1.13)
(15) Golden parachutes -0.061 (-2.40) b
-0.090 (-2.96) a
-0.102 (-2.89) a
Total assets between $3b. and $10b. 0.004 (0.80)
-0.003 (-0.82)
0.003 (0.51)
Total assets between $1b. and $3b. -0.008 (-0.79)
-0.008 (-0.88)
-0.009 (-0.95)
Total assets between $500m. and $1b. -0.012 (-1.35)
-0.027 (-1.19)
0.025 (1.24)
Total assets less than $500m. -0.017 (-1.18)
-0.031 (-1.20)
-0.039 (-1.11)
Adjusted R-Squared 48.05 52.71 51.47
F-stat 19.09 23.68 26.11
P-value 0.000 0.000 0.000

31
Table 4 (continued) Panel B: Regressions of Changes in Bank Accounting Performance on Corporate Governance Variables
Ratio ∆Ratio 2
2007 to 2008 ∆Ratio 3
2007 to 2008 ∆Ratio 4
2007 to 2008 ∆Ratio 5
2007 to 2008 ∆Ratio 6
2007 to 2008
Constant 0.037 (2.07) b
-0.004 (-0.25)
0.006 (0.45)
-0.011 (-0.24)
0.104 (1.22)
(7) Board independence -0.184 (-2.96) a
-0.259 (-2.75) a
0.845 (2.78) a
0.651 (2.52) b
-0.936 (-2.50) b
(8) Friendly nominating committee 0.033 (0.91)
0.094 (1.55)
-0.110 (-1.01)
-0.010 (-0.55)
0.125 (0.72)
(9) Change in inside ownership
-0.414 (-3.59) a
-0.156 (-2.82) a
0.934 (3.62) a
0.984 (3.55) a
-0.467 (-2.59) b
(9a) Change in inside ownership x Dneg
0.794
(4.67) a 0.449
(3.79) a -1.180
(-5.58) a -1.216
(-4.78) a 0.941
(4.36) a
(10) Change in affiliated director ownership
-0.571 (-2.97) a
-0.168 (-3.09) a
0.705 (3.47) a
0.756 (3.69) a
-1.161 (-2.85) a
(10a) Change in affiliated ownership x Dneg
0.960 (4.77) a
0.452 (4.99) a
-0.968 (-5.64) a
-1.083 (-4.99) a
1.456 (5.53) a
(12) Top executive officer PPS -0.313 (-3.09) a
-0.189 (-3.15) a
0.926 (2.91) a
1.061 (3.07) a
-1.110 (-3.29) a
(13) Number of board meetings -0.005 (-1.11)
-0.001 (-0.74)
0.007 (0.90)
0.011 (1.09)
-0.111 (-1.42)
(14) CEO/Chair duality 0.045 (1.25)
0.061 (1.81) c
-0.121 (-1.38)
-0.126 (-1.57)
0.095 (0.94)
(15) Golden parachutes 0.099 (2.59) b
0.276 (2.99) a
-0.571 (-2.91) a
-0.695 (-2.81) a
0.441 (2.42) b
Total assets between $3b. and $10b. 0.006 (0.82)
0.011 (0.98)
0.005 (0.77)
-0.006 (-0.78)
0.015 (0.69)
Total assets between $1b. and $3b. -0.008 (-0.88)
-0.007 (-0.83)
0.115 (1.79) c
-0.211 (-2.11) b
0.181 (2.49) b
Total assets between $500m. and $1b. -0.013 (-1.29)
-0.120 (-2.44) b
0.181 (2.17) b
-0.256 (-2.18) b
0.114 (2.27) b
Total assets less than $500m. -0.016 (-1.23)
-0.221 (-2.62) b
0.137 (2.09) b
-0.167 (-2.07) b
0.160 (2.55) b
Adjusted R-Squared 49.66 41.12 48.08 45.79 41.17
F-stat 23.78 18.95 22.03 19.99 17.62
P-value 0.000 0.000 0.000 0.000 0.000

32
Table 5
Regressions of 2008 BHAR on Corporate Governance Variables based on Bank Asset Size This table shows regression results of bank performance on various corporate governance variables for the sample of publicly traded banks. Performance is measured as the percentage buy-and-hold abnormal returns (BHAR) calculated for each bank over the 2008 calendar year. All corporate governance measures other than ownership variables are lagged one year. We include the change in executive and affiliated director ownership during the year. Dneg, an indicator variable equal to one if the change in (executive or affiliated director) ownership is negative, and zero otherwise, is interacted with the ownership variables. Governance data are from proxy statements, available at the website of the SEC, http://idea.sec.gov. CEO compensation data collected by hand from proxy statements, including the detailed options information necessary to replicate ExecuComp’s calculations of options grant values. This process also requires data from Compustat (dividend yields), CRSP (stock price volatility), and the U.S. Treasury website, www.ustreas.gov, (the risk-free rate). t-statistics in parentheses. a, b, and c denote significance at better than the 1%, 5%, and 10% levels respectively.
Ratio Total assets >
$10 billion Total assets $3b to $10b
Total assets $1b to $3b
Total assets $500m to $1b
Total assets < $500 million
Constant 0.002 (0.21)
0.008 (0.26)
0.009 (0.39)
-0.018 (-0.71)
0.011 (0.92)
(7) Board independence 0.191 (3.29) a
0.153 (2.91) a
0.022 (1.20)
0.019 (1.09)
0.011 (0.92)
(8) Friendly nominating committee -0.020 (-0.95)
-0.020 (-0.87)
-0.022 (-1.11)
0.020 (1.09)
0.004 (0.28)
(9) Change in inside ownership
0.431 (2.98) a
0.332 (2.88) a
0.155 (2.11) b
0.057 (0.96)
0.039 (0.53)
(9a) Change in inside ownership x Dneg
-0.793
(-5.12) a -0.557
(-4.94) a -0.306
(-2.99) a -0.125
(-2.31) b -0.097
(-1.89) c
(10) Change in affiliated director ownership
0.295 (2.65) a
0.225 (2.41) b
0.150 (2.12) b
0.075 (0.77)
0.054 (0.48)
(10a) Change in affiliated ownership x Dneg
-0.593
(-4.18) a -0.460
(-3.79) a -0.301
(-3.25) a -0.164
(-1.74) c -0.097
(-1.54)
(12) Top executive officer PPS 0.068 (3.28) a
0.050 (2.93) a
0.031 (2.39) b
0.014 (1.79) c
0.021 (1.96) c
(13) Number of board meetings 0.004 (0.69)
0.004 (0.91)
0.002 (0.49)
0.003 (0.97)
-0.002 (-0.61)
(14) CEO/Chair duality -0.058 (-2.41) b
-0.015 (-0.95)
-0.016 (-1.11)
0.008 (0.59)
-0.014 (-1.06)
(15) Golden parachutes -0.087 (-3.16) a
-0.051 (-2.89) a
-0.048 (-2.68) a
-0.080 (-2.97) a
-0.077 (-2.72) a
Adjusted R-Squared 64.39 61.08 60.11 60.85 46.13
F-stat 20.78 18.99 18.23 18.05 15.04
P-value 0.000 0.000 0.000 0.000 0.000

33
References
Aggarwal, A., and C.R. Knoeber, 1996, Firm performance and mechanisms to control agency problems between managers and shareholders, Journal of Financial and Quantitative Analysis 31, 377-397.
Aggarwal, R., I. Erel, R.M. Stulz, and R. Williamson, 2009, Differences in governance practices between U.S. and
foreign firms: Measurement, causes, and consequences, Review of Financial Studies, forthcoming. Barber, B.M., and J.D. Lyon, 1997, Detecting long-run abnormal stock returns: The empirical power and
specification of test statistics, Journal of Financial Economics 43, 341-372. Bebchuk, L.A., A., Cohen, and A. Ferrell, 2009, What matters most in corporate governance?, Review of Financial
Studies 22, 783-827. Bebchuk, L.A., Y. Grinstein, and U. Peyer, 2009, Lucky CEOs and lucky directors, Journal of Finance,
forthcoming. Bebchuk, L.A., and Z. Neeman, 2009, Investor protection and interest group politics, Review of Financial Studies,
forthcoming. Bebchuk, L.A., and M.S. Weisbach, 2009, The state of corporate governance research, Review of Financial Studies,
forthcoming. Becht, M., J. Franks, C. Mayer, and S. Rossi, 2009, Returns to shareholder activism: Evidence from a clinical study
of the Hermes U.K. focus fund, Review of Financial Studies, forthcoming. Benson, B.W., Davidson III, W.N., Reexamining the managerial ownership effect on firm value, Journal of
Corporate Finance 15, 573-586 Bergstresser, D., and T. Philippon, 2006, CEO incentives and earnings management, Journal of Financial
Economics 80, 511-529. Booth, J., M.M. Cornett, and H. Tehranian, 2002, Board of directors, ownership and regulation, Journal of Banking
and Finance 4, 1973-1996. Brick, I.E., D. Palia, and C. Wang, 2006, The joint impact of corporate governance mechanisms on firm
performance and each other, Working paper, Rutgers University. Brickley, J.A., J.L. Coles, and G. Jarrell, 1997, Leadership structure: Separating the CEO and chairman of the board,
Journal of Corporate Finance 3, 189-220. Brickley, J.A., R.D. Lease, and C.W. Smith, 1988, Ownership structure and voting on antitakeover amendments,
Journal of Financial Economics 20, 267-291. Brown, W.O., and M.T. Maloney, 1999, Exit, voice, and the role of corporate directors: Evidence from acquisition
performance, Working Paper, Claremont Colleges. Bryd, J., and K. Hickman, 1992, Do outside directors monitor managers? Evidence from tender offer bids, Journal
of Financial Economics 32, 195-222. Carapeto, M., M.A. Lasfer, and K. Machera, 2005, “Does duality destroy value? Cass Business School Research
Paper, available at SSRN: http://ssrn.com/abstract=686707. Cheng, Q., and T.D. Warfield, 2005, Equity incentives and earnings management, Accounting Review 80, 441-476.

34
Cohen, D.A., A. Dey, and T.Z. Lys, 2005, Trends in earnings management and informativeness of earnings announcements in the pre- and post-Sarbanes Oxley periods, available at SSRN: http://ssrn.com/abstract=1280708.
Core, J.E., and W. Guay, the use of equity grants to manage optimal equity incentive levels, Journal of Accounting
and Economics, 28, 151-184. Cornett, M.M., A.J. Marcus, and H. Tehranian, 2008, Corporate governance and pay-for-performance: The impact
of earnings management, Journal of Financial Economics 87, 357-373. Cornett, M.M., J.J. McNutt, and H. Tehranian, 2006, Performance changes around bank mergers: Revenue
enhancements versus cost reductions, Journal of Money, Credit, and Banking 38, 1013-1050. Cornett, M.M., J.J. McNutt, and H. Tehranian, 2009, Corporate governance and earnings management at large U.S,.
bank holding companies, Journal of Corporate Finance 15, 412-430. Cornett, M.M., H. Mehran, and H. Tehranian, 1998, Are financial markets overly optimistic about the prospects of
firms that issue equity? Evidence from voluntary versus involuntary equity issuances by banks, Journal of Finance 53, 2139-2159.
Daniel, K., M. Grinblat, S. Titman, and R. Wermers, 1997, Measuring fund performance with characteristic based
benchmarks, Journal of Finance 52, 1035-1058. Fahlenbrach, R., and R.M. Stulz, 2009, Bank CEO incentives and the credit crisis, Working Paper, Fisher College of
Business, The Ohio State University. Gompers, P.A., J. Ishii, and A. Metrick, 2009, Extreme governance: An analysis of dual-class firms in the United
States, Review of Financial Studies, forthcoming. Jensen, M., 1993, The modern industrial revolution, exit, and the failure of internal control systems, Journal of
Finance 48, 831-880. Jensen, M., and K. Murphy, 1990a, Performance pay and top-management incentives. Journal of Political Economy
98, 225-264.
Jensen, M., and K. Murphy, 1990b, CEO incentives: it’s not how much you pay, but how. Journal of Applied Corporate Finance 3, 36-49.
Kaplan, S.N., and J. Rauh, 2009, Wall street and main street: What contributes to the rise in the highest incomes? Review of Financial Studies, forthcoming.
Kothari, S.P, and J. B. Warner, 1997, Measuring long-horizon security performance, Journal of Financial
Economics 43, 301-339. Leuz, C., K.V. Lins, and F.E. Warnock, 2009, Do foreigners invest less in poorly governed firms? Review of
Financial Studies, forthcoming. Lefanowicz, C.E., J.R. Robinson, and R. Smith, 2000, Golden parachutes and managerial incentives in corporate
acquisitions: Evidence from the 1980s and 1990s, Journal of Corporate Finance 6, 215-239. Mehran, H., 1995, Executive compensation structure, ownership, and firm performance, Journal of Financial
Economics 38, 163-184. Ravina, E., and P. Sapienza, 2009, What do independent directors know? Evidence from their trading, Review of
Financial Studies, forthcoming.

35
Rosenstein, S., and J.G. Wyatt, 1990, Outside directors, board independence, and shareholder wealth, Journal of Financial Economics 26, 175-191.
Safieddine, A., and S. Titman, 1999, Leverage and corporate performance: Evidence from unsuccessful takeovers,
Journal of Finance 54, 547–580. Shivdasani, A., and D. Yermack, 1999, CEO involvement in the selection of new board members: An empirical
analysis, Journal of Finance 54, 1829-1853. Speiss, D.K., and J. Affleck-Graves, 1995, Underperformance in long-run stock returns following seasoned equity
offerings, Journal of Financial Economics 38, 243-267. Vafeas, N., 1999, Board meeting frequency and firm performance, Journal of Financial Economics 53, 113-142. Yang, L.A., H. Unal, and K. Minnick, 2008, Pay for performance? CEO compensation and acquirer returns in
BHCs, available at SSRN: http://ssrn.com/abstract=1108721.

36
Appendix A
Accounting Ratios Used to Analyze Bank Performance This table lists ratio names and definitions used to examine bank performance during the period 2003 through 2008. Ratio Definition
Profitability indicators
(a) Return on assets Net income after taxes as a percent of book value of total assets
(b) Return on equity Net income after taxes as a percent of book value of total equity capital
(c) Net interest margin Interest income minus interest expense as a percent of book value of total assets
Capital adequacy indicators
(d) Total capital to assets Total equity and subordinate debt as a percent of book value of total assets
(e) Loans to total capital Total loans as a percent of book value of total capital
(f) Deposits to total capital Total deposits as a percent of book value of total capital
Asset quality indicators
(g) Allowance for loan losses to loans Allowance for loan losses as a percent of total loans and leases
(h) Loan loss provision to loans Loan loss provision as a percent of total loans and leases
Operating efficiency indicators
(i) Non-interest exp. to non-interest income Non-interest expenses as a percent of non-interest income
(j) Non-interest exp. to net operating income Non-interest expenses as a percent of net interest income plus non-interest income
(k) Non-interest exp. to total assets Non-interest expenses as a percent of book value of total assets
(l) Personnel exp. to total assets Salaries and employees benefits as a percent of total assets
(m) Fixed assets to total assets Fixed assets as a percent of book value of total assets
(n) Total assets to employees Book value of total assets to number of employees
(o) Net income to employees Net income after taxes to number of employees
Loan composition indicators
(p) Return on loans Interest and fees on loans to total loans and leases
(q) Return on C&I loans Interest on commercial and industrial (C&I) loans to C&I loans
(r) Return on real estate loans Interest on real estate loans to real estate loans
(s) Return on consumer loans Interest on consumer loans to consumer loans
(t) C&I loans to total loans C&I loans as a percent of total loans
(u) Real estate loans to total loans Real estate loans as a percent of total loans
(v) Consumer loans to total loans Consumer loans as a percent of total loans
(w) C&I loans to total assets C&I loans as a percent of book value of total assets
(x) Real estate loans to total assets Real estate loans as a percent of book value of total assets
(y) Consumer loans to total assets Consumer loans as a percent of book value of total assets
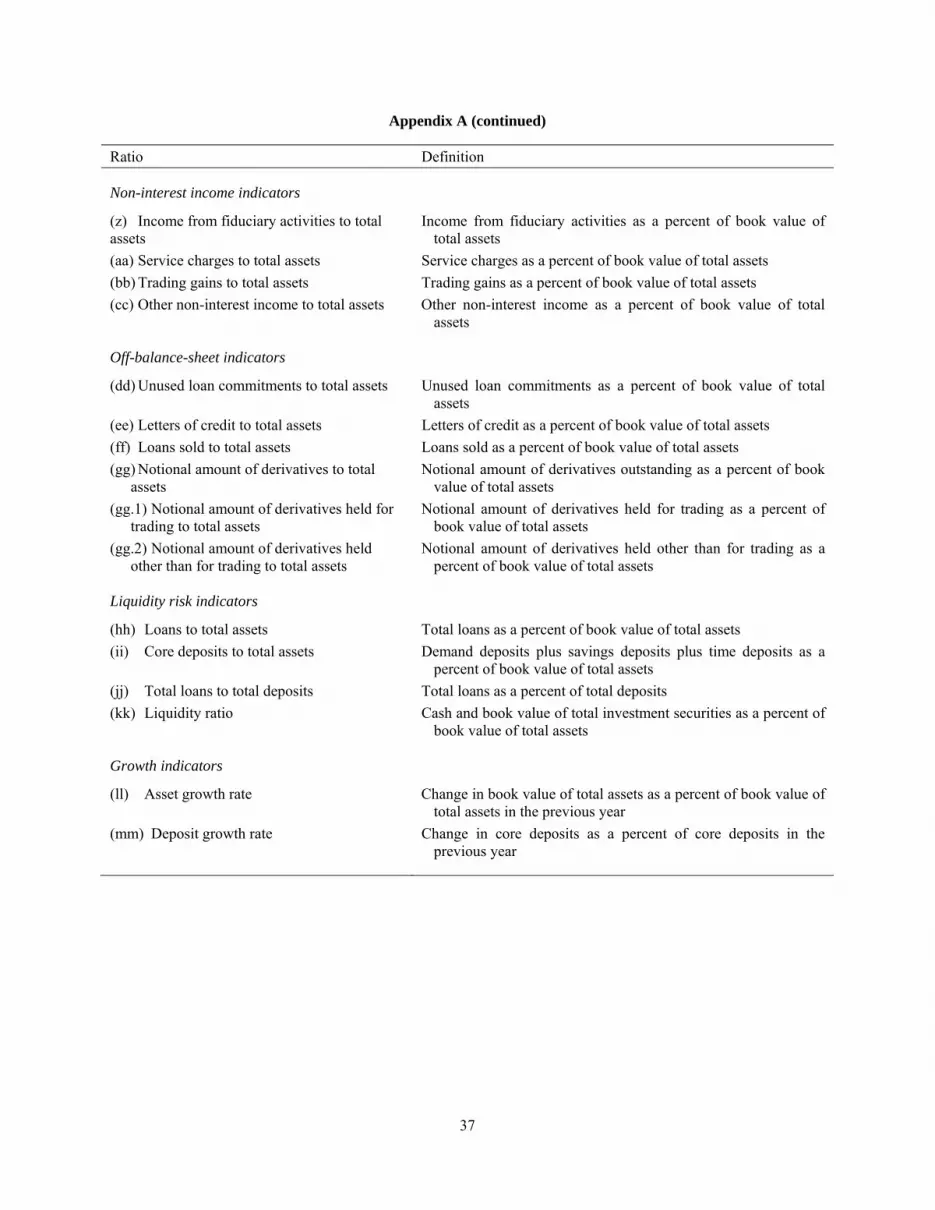
37
Appendix A (continued)
Ratio Definition
Non-interest income indicators
(z) Income from fiduciary activities to total assets
Income from fiduciary activities as a percent of book value of total assets
(aa) Service charges to total assets Service charges as a percent of book value of total assets
(bb) Trading gains to total assets Trading gains as a percent of book value of total assets
(cc) Other non-interest income to total assets Other non-interest income as a percent of book value of total assets
Off-balance-sheet indicators
(dd) Unused loan commitments to total assets Unused loan commitments as a percent of book value of total assets
(ee) Letters of credit to total assets Letters of credit as a percent of book value of total assets
(ff) Loans sold to total assets Loans sold as a percent of book value of total assets
(gg) Notional amount of derivatives to total assets
Notional amount of derivatives outstanding as a percent of book value of total assets
(gg.1) Notional amount of derivatives held for trading to total assets
Notional amount of derivatives held for trading as a percent of book value of total assets
(gg.2) Notional amount of derivatives held other than for trading to total assets
Notional amount of derivatives held other than for trading as a percent of book value of total assets
Liquidity risk indicators
(hh) Loans to total assets Total loans as a percent of book value of total assets
(ii) Core deposits to total assets Demand deposits plus savings deposits plus time deposits as a percent of book value of total assets
(jj) Total loans to total deposits Total loans as a percent of total deposits
(kk) Liquidity ratio Cash and book value of total investment securities as a percent of book value of total assets
Growth indicators
(ll) Asset growth rate Change in book value of total assets as a percent of book value of total assets in the previous year
(mm) Deposit growth rate Change in core deposits as a percent of core deposits in the previous year

38
Appendix B
Bank Performance between 2003 through 2008
This table lists mean performance statistics for the sample of publicly traded banks during the period 2003 through 2008. Banks are separated into five classifications based on year-end total assets: Panels A, B, C, D, and E show results for banks with year-end total assets greater than $10 billion, between $3 billion and $10 billion, between $1 billion and $3 billion, between $500 million and $1 billion, and less than $500 million, respectively. Financial statement data are obtained from FFIEC Call Reports, available at the website of the Federal Reserve Bank of Chicago, www.chicagofed.org. Results of t-statistics for differences in mean values are also listed. a, b, and c indicate difference between 2003 and 2006 is significant at 1%, 5%, and 10% level respectively. d, e, f indicate difference between 2006 and 2008 is significant at 1%, 5%, and 10% level respectively.
Panel A: Banks with total assets > $10 billion Ratio 2003 2006 2008 Profitability indicators (a) Return on assets 1.37% 1.29% 0.07% d (b) Return on equity 15.69% 16.09% 0.96% d (c) Net interest margin 3.02% 2.90% 2.86%
Capital adequacy indicators (d) Total capital to assets 8.78% 9.55% 9.62% (e) Loans to total capital 708.65% 678.05% 764.88% (f) Deposits to total capital 784.03% 772.17% 731.15%
Asset quality indicators (g) Allowance for loan losses to loans 1.46% 1.05% b 1.86% d (h) Loan loss provision to loans 0.56% 0.24% b 1.75% d
Operating efficiency indicators (i) Non-interest exp. to non-interest income 192.25% 187.36% 258.47% e (j) Non-interest exp. to net operating income 55.75% 57.48% 68.62% d (k) Non-interest exp. to total assets 3.12% 2.93% 3.04% (l) Personnel exp. total assets 1.47% 1.45% 1.30% (m) Fixed assets to total assets 1.19% 1.26% 1.34% (n) Total assets to employees (millions of $s) $5.25 $6.10 $5.94 (o) Net income to employees (thousands of $s) $66.18 $75.88 b $1.97 d
Loan composition indicators (p) Return on loans 5.21% 6.51% b 5.67% e (q) Return on C & I loans 5.13% 6.91% a 5.51% d (r) Return on real estate loans 5.14% 6.46% a 5.48% d (s) Return on consumer loans 6.89% 7.86% b 8.01% (t) C & I loans to total loans 18.70% 19.36% c 20.01% (u) Real estate loans to total loans 57.94% 60.95% b 61.23% (v) Consumer loans to total loans 12.65% 8.97% a 8.74% (w) C & I loans to total assets 11.25% 12.39% b 10.49% e (x) Real estate loans to total assets 35.52% 40.39% a 36.61% e (y) Consumer loans to total assets 6.55% 5.47% c 5.50%
Non-interest income indicators (z) Income from fiduciary activities to total assets 0.39% 0.63% a 0.70% (aa) Service charges to total assets 0.37% 0.39% 0.39% (bb) Trading gains to total assets 0.11% 0.29% a 0.07% d (cc) Other non-interest income to total assets 1.46% 2.67% a 0.87% d
Off-balance-sheet indicators (dd) Unused loan commitments to total assets 37.67% 22.47% a 19.60% d
(ee) Letters of credit to total assets 55.25% 60.28% b 55.34% e (ff) Loans sold to total assets 7.84% 7.00% 6.86% (gg) Notional amount of derivatives to total assets 239.35% 294.84% a 280.83% f (gg.1) Notional amount of derivatives held for trading to total assets 219.90% 274.58% a 260.57% f (gg.2) Notional amount of derivatives held other than for trading to total assets 19.45% 20.24% 20.26%
Liquidity risk indicators (hh) Loans to total assets 59.55% 62.56% b 64.42% f (ii) Core deposits to total assets 51.41% 50.94% 52.83% f (jj) Total loans to total deposits 91.79% 90.80% 95.12% d (kk) Liquidity ratio 33.61% 28.31% a 25.71% d
Growth indicators (ll) Asset growth rate 16.18% 18.66% b 12.70% d (mm) Deposit growth rate 13.13% 9.05% a 28.56% d

39
Appendix B (continued)
Panel B: Banks with total assets between $3 billion and $10 billion Ratio 2003 2006 2008 Profitability indicators (a) Return on assets 1.27% 1.21% -0.11% d (b) Return on equity 14.79% 13.81% -2.42% d (c) Net interest margin 3.39% 3.45% 3.15%
Capital adequacy indicators (d) Total capital to assets 9.01% 10.54% 10.27% (e) Loans to total capital 683.35% 679.92% 711.68% (f) Deposits to total capital 814.88% 744.53% 739.98%
Asset quality indicators (g) Allowance for loan losses to loans 1.45% 1.21% b 1.88% d (h) Loan loss provision to loans 0.39% 0.17% b 1.79% d
Operating efficiency indicators (i) Non-interest exp. to non-interest income 237.52% 366.59% 137.20% d (j) Non-interest exp. to net operating income 57.34% 56.31% 68.67% d (k) Non-interest exp. to total assets 2.81% 2.51% 2.78% (l) Personnel exp. total assets 1.42% 1.30% 1.24% (m) Fixed assets to total assets 1.37% 1.24% 1.29% (n) Total assets to employees (millions of $s) 4.44 6.59 5.95 (o) Net income to employees (thousands of $s) 57.02 65.47 b -21.48 d
Loan composition indicators (p) Return on loans 5.73% 7.01% a 6.14% f (q) Return on C & I loans 5.68% 8.01% a 6.59% e (r) Return on real estate loans 5.71% 6.73% a 5.90% e (s) Return on consumer loans 8.10% 8.86% 9.83% e (t) C & I loans to total loans 19.15% 18.06% b 17.72% (u) Real estate loans to total loans 65.52% 71.46% b 71.15% (v) Consumer loans to total loans 9.45% 6.26% a 5.41% e (w) C & I loans to total assets 11.54% 12.43% 11.62% f (x) Real estate loans to total assets 40.38% 49.64% b 47.69% f (y) Consumer loans to total assets 4.34% 4.12% 3.62% e
Non-interest income indicators (z) Income from fiduciary activities to total assets 0.21% 0.21% 0.11% d (aa) Service charges to total assets 0.41% 0.35% 0.37% (bb) Trading gains to total assets 0.02% 0.01% 0.01% (cc) Other non-interest income to total assets 0.78% 1.23% a 0.44% d
Off-balance-sheet indicators (dd) Unused loan commitments to total assets 9.61% 11.72% a 8.21% d
(ee) Letters of credit to total assets 19.66% 22.03% b 21.06% (ff) Loans sold to total assets 0.19% 0.29% b 0.19% e (gg) Notional amount of derivatives to total assets 11.44% 4.61% a 6.04% (gg.1) Notional amount of derivatives held for trading to total assets 0.07% 1.37% a 2.74% e (gg.2) Notional amount of derivatives held other than for trading to total assets 11.37% 3.23% a 3.30%
Liquidity risk indicators (hh) Loans to total assets 60.11% 69.03% a 69.52% (ii) Core deposits to total assets 58.92% 59.68% 59.92% (jj) Total loans to total deposits 84.81% 92.45% a 95.89% e (kk) Liquidity ratio 34.65% 24.54% a 23.45%
Growth indicators (ll) Asset growth rate 12.37% 14.22% b 12.47% e (mm) Deposit growth rate 10.11% 8.55% b 16.13% d

40
Appendix B (continued)
Panel C: Banks with total assets between $1 billion and $3 billion Ratio 2003 2006 2008 Profitability indicators (a) Return on assets 1.17% 1.12% -0.09% d (b) Return on equity 12.80% 11.63% -3.05% d (c) Net interest margin 3.45% 3.57% 3.27%
Capital adequacy indicators (d) Total capital to assets 9.54% 9.88% 9.48% (e) Loans to total capital 724.66% 757.28% 827.67% (f) Deposits to total capital 846.09% 821.80% 823.42%
Asset quality indicators (g) Allowance for loan losses to loans 1.41% 1.14% b 1.66% d (h) Loan loss provision to loans 0.36% 0.23% b 1.44% d
Operating efficiency indicators (i) Non-interest exp. to non-interest income 294.75% 359.54% 327.58% f (j) Non-interest exp. to net operating income 60.42% 59.25% 52.83% e (k) Non-interest exp. to total assets 2.81% 2.63% 2.91% (l) Personnel exp. total assets 1.45% 1.42% 1.37% (m) Fixed assets to total assets 1.48% 1.66% 1.73% (n) Total assets to employees (millions of $s) 4.16 4.35 4.84 (o) Net income to employees (thousands of $s) 42.22 49.14 b -6.56 d
Loan composition indicators (p) Return on loans 5.96% 7.12% a 6.26% d (q) Return on C & I loans 6.12% 8.06% a 6.89% e (r) Return on real estate loans 5.90% 6.98% a 6.15% (s) Return on consumer loans 11.16% 10.30% 8.62% e (t) C & I loans to total loans 16.34% 15.12% c 14.49% f (u) Real estate loans to total loans 71.99% 76.14%
c 77.06%
(v) Consumer loans to total loans 8.24% 5.36% a 5.21% (w) C & I loans to total assets 10.65% 10.89% 10.77% (x) Real estate loans to total assets 47.49% 55.15% b 56.86% (y) Consumer loans to total assets 3.10% 3.84% 3.74%
Non-interest income indicators (z) Income from fiduciary activities to total assets 0.16% 0.08% c 0.10% (aa) Service charges to total assets 0.41% 0.37% 0.37% (bb) Trading gains to total assets 0.00% 0.00% 0.00% (cc) Other non-interest income to total assets 0.67% 0.76% 0.38% d
Off-balance-sheet indicators (dd) Unused loan commitments to total assets 9.03% 11.50% a 7.49% d
(ee) Letters of credit to total assets 16.87% 16.09% 15.02% (ff) Loans sold to total assets 0.07% 0.01% 0.02% (gg) Notional amount of derivatives to total assets 2.32% 2.14% 1.51% e (gg.1) Notional amount of derivatives held for trading to total assets 0.01% 0.03% 0.00% (gg.2) Notional amount of derivatives held other than for trading to total assets 2.30% 2.12% 1.51% e
Liquidity risk indicators (hh) Loans to total assets 65.33% 72.21% a 74.65% f (ii) Core deposits to total assets 63.85% 60.76% c 60.69% (jj) Total loans to total deposits 86.51% 92.95% b 98.11% e (kk) Liquidity ratio 29.16% 21.81% a 19.32% f
Growth indicators (ll) Asset growth rate 14.36% 14.84% 8.84% d (mm) Deposit growth rate 14.94% 11.28% b 11.56%

41
Appendix B (continued)
Panel D: Banks with total assets between $500 million and $1 billion Ratio 2003 2006 2008 Profitability indicators (a) Return on assets 1.08% 0.62% -0.14% d (b) Return on equity 12.07% 9.60% -0.95% d (c) Net interest margin 3.58% 3.59% 3.27%
Capital adequacy indicators (d) Total capital to assets 9.14% 10.19% b 9.70% e (e) Loans to total capital 755.14% 759.99% 810.88% (f) Deposits to total capital 885.12% 833.86% 835.17%
Asset quality indicators (g) Allowance for loan losses to loans 1.36% 1.15% b 1.46% d (h) Loan loss provision to loans 0.43% 0.18% b 0.84% d
Operating efficiency indicators (i) Non-interest exp. to non-interest income 312.88% 350.60% 322.75% f (j) Non-interest exp. to net operating income 61.09% 67.34% 66.10% (k) Non-interest exp. to total assets 2.88% 3.40% 3.39% (l) Personnel exp. total assets 1.59% 1.60% 1.52% (m) Fixed assets to total assets 1.74% 1.66% 1.66% (n) Total assets to employees (millions of $s) 3.62 3.97 4.43 (o) Net income to employees (thousands of $s) 38.31 21.85 b -12.75 d
Loan composition indicators (p) Return on loans 6.30% 7.18% b 6.42% e (q) Return on C & I loans 6.21% 8.28% a 6.63% d (r) Return on real estate loans 6.20% 6.95% 6.30% (s) Return on consumer loans 8.73% 9.02% 8.96% (t) C & I loans to total loans 15.31% 12.59% a 12.92% (u) Real estate loans to total loans 75.93% 79.87% b 79.88% (v) Consumer loans to total loans 6.52% 5.23% b 5.03% (w) C & I loans to total assets 10.39% 8.97% a 9.16% (x) Real estate loans to total assets 50.97% 58.00% a 58.16% (y) Consumer loans to total assets 3.47% 3.57% 3.25%
Non-interest income indicators (z) Income from fiduciary activities to total assets 0.06% 0.21% b 0.25% (aa) Service charges to total assets 0.40% 0.31% 0.31% (bb) Trading gains to total assets 0.00% 0.00% 0.00% (cc) Other non-interest income to total assets 0.67% 0.70% 0.46% f
Off-balance-sheet indicators (dd) Unused loan commitments to total assets 8.27% 10.75% a 7.47% d
(ee) Letters of credit to total assets 15.48% 16.75% c 14.97% e (ff) Loans sold to total assets 0.48% 0.04% b 0.00% (gg) Notional amount of derivatives to total assets 1.44% 2.06% 1.62% (gg.1) Notional amount of derivatives held for trading to total assets 0.00% 0.00% 0.02% (gg.2) Notional amount of derivatives held other than for trading to total assets 1.44% 2.06% 1.59%
Liquidity risk indicators (hh) Loans to total assets 67.29% 71.89% a 73.10% (ii) Core deposits to total assets 66.16% 62.22% b 60.89% (jj) Total loans to total deposits 86.29% 91.28% b 96.43% e (kk) Liquidity ratio 28.30% 22.51% a 20.87% f
Growth indicators (ll) Asset growth rate 12.20% 12.86% 8.79% d (mm) Deposit growth rate 10.79% 9.06% c 8.38%

42
Appendix B (continued)
Panel E: Banks with total assets less than $500 million Ratio 2003 2006 2008 Profitability indicators (a) Return on assets 0.88% 0.97% -0.11% d (b) Return on equity 9.69% 10.35% -3.73% d (c) Net interest margin 3.41% 3.53% 3.21% Capital adequacy indicators (d) Total capital to assets 8.92% 9.43% 8.58% d (e) Loans to total capital 770.44% 760.32% 805.03% (f) Deposits to total capital 935.88% 867.89% 853.36% Asset quality indicators (g) Allowance for loan losses to loans 1.38% 1.19% b 1.55% d (h) Loan loss provision to loans 0.27% 0.19% b 0.96% d Operating efficiency indicators (i) Non-interest exp. to non-interest income 435.78% 465.41% 441.01% f (j) Non-interest exp. to net operating income 68.70% 63.99% 62.09% (k) Non-interest exp. to total assets 3.04% 2.76% 2.98% (l) Personnel exp. total assets 1.64% 1.49% 1.54% (m) Fixed assets to total assets 1.62% 1.75% 1.50% (n) Total assets to employees (millions of $s) 3.39 4.16 4.63 (o) Net income to employees (thousands of $s) 28.90 40.11 a -3.20 d Loan composition indicators (p) Return on loans 6.18% 7.18% b 6.40% e (q) Return on C & I loans 7.03% 8.14% b 7.01% e (r) Return on real estate loans 6.03% 7.05% c 6.27% (s) Return on consumer loans 8.98% 9.06% 8.77% (t) C & I loans to total loans 15.30% 13.61% b 11.16% e (u) Real estate loans to total loans 77.63% 79.98% 80.79% (v) Consumer loans to total loans 5.33% 4.28% b 3.49% e (w) C & I loans to total assets 10.53% 9.73% 8.79% (x) Real estate loans to total assets 51.93% 56.42% b 56.28% (y) Consumer loans to total assets 3.04% 2.83% 2.27% Non-interest income indicators (z) Income from fiduciary activities to total assets 0.03% 0.04% 0.04% (aa) Service charges to total assets 0.33% 0.28% 0.28% (bb) Trading gains to total assets 0.00% 0.00% 0.00% (cc) Other non-interest income to total assets 0.68% 0.74% 0.36% d Off-balance-sheet indicators (dd) Unused loan commitments to total assets 9.53% 10.73% c 7.09% d
(ee) Letters of credit to total assets 15.83% 15.22% 14.65% (ff) Loans sold to total assets 0.06% 0.01% 0.00% (gg) Notional amount of derivatives to total assets 0.35% 1.23% b 0.26% d (gg.1) Notional amount of derivatives held for trading to total assets 0.00% 0.00% 0.03% (gg.2) Notional amount of derivatives held other than for trading to total assets 0.35% 1.23% b 0.24% d Liquidity risk indicators (hh) Loans to total assets 67.20% 70.46% b 67.46% e (ii) Core deposits to total assets 68.12% 63.92% b 63.05% (jj) Total loans to total deposits 83.18% 88.16% b 89.72% (kk) Liquidity ratio 28.93% 25.14% a 27.56% f Growth indicators (ll) Asset growth rate 13.47% 8.36% a 4.24% d (mm) Deposit growth rate 12.65% 6.10% a 2.29% d

43
Appendix C
Regressions of Bank BHAR on Accounting and Corporate Governance Variables This table shows regression results of bank buy-and-hold abnormal returns (BHAR) on various accounting and corporate governance variables for the sample of publicly traded banks in 2006 and 2008. For the 2006 and 2008 regressions, the accounting measures are year-end values, while the corporate governance measures are lagged one year. The table also shows regression results of change in bank BHAR from 2007-2008 on various accounting and corporate governance variables. For this regression, the accounting measures are also evaluated based on the change in their values from 2007 to 2008, while the corporate governance measures are the year-end 2007 values. Financial statement data are obtained from FFIEC Call Report files, available at the website of the Federal Reserve Bank of Chicago, www.chicagofed.org. We use proxy statements for each year to obtain board of director characteristics (i.e., the number of insiders, affiliated outsiders, and unaffiliated outsiders on the board, CEO/Chair duality). CEO stock and options ownership and compensation data collected by hand from proxy statements, including the detailed options information necessary to replicate ExecuComp’s Black-Scholes calculations. This replication process requires detailed options information from proxy statements as well as information from Compustat (to get dividend yields), CRSP (to get data to calculate stock price volatility), and the U.S. Treasury website, www.ustreas.gov, (to get the risk free rate). t-statistics shown in brackets. a, b, and c denote significance at better than the 1%, 5%, and 10% levels respectively.
Ratio 2006 BHAR 2008 BHAR ∆BHAR
2007 to 2008
Constant 0.186 (6.28) a
0.004 (0.32)
-0.003 (-0.19)
(7) Board independence 0.004 (0.93)
0.148 (2.63) a
0.059 (2.55) b
(8) Friendly nominating committee -0.002 (-0.27)
-0.018 (-0.97)
-0.003 (-0.39)
(9) Total inside ownership 0.041 (1.25)
0.240 (3.14) a
0.150 (3.05) a
(9A) Change in inside ownership 0.044 (1.06)
0.380 (3.78) a
0.248 (3.51) a
(10) Affiliated director ownership 0.070 (1.83) c
0.274 (2.89) a
0.316 (2.75) a
(10A) Change in affiliated director ownership 0.058 (1.47)
0.316 (2.92) a
0.350 (2.84) a
(11) Top executive officer PPS 0.113 (3.35) a
0.062 (2.69) a
0.076 (3.08) a
(12) Number of board meetings 0.000 (1.05)
0.002 (0.82)
0.002 (1.02)
(13) CEO/Chair duality -0.005 (-0.37)
-0.027 (-1.48)
-0.025 (-1.29)
(14) Golden parachutes -0.041 (-2.42) b
-0.072 (-2.84) a
-0.075 (-2.93) a
(d) Total capital to assets 1.326 (12.79) a
2.997 (3.54) a
6.649 (11.16) a
(i) Non-interest exp. to non-interest inc. -0.006 (-5.52) a
-0.011 (-2.84) a
-0.003 (-2.59) b
(l) Personnel exp. to total assets -5.164 (-2.41) b
-7.199 (-2.69) a
-9.276 (-2.51) b
(n) Total assets to employees 1.062 (3.22) a
4.836 (2.85) a
5.116 (3.57) a
(w) C&I loans to total assets 0.017 (0.56)
0.006 (0.19)
-0.006 (-0.86)

44
Appendix C (continued)
Ratio 2006 BHAR 2008 BHAR ∆BHAR
2007 to 2008
(x) Real estate loans to total assets 0.026 (1.19)
-0.773 (-4.78) a
-0.267 (-5.58) a
(cc) Other non-interest income to total assets 2.637 (2.96) a
4.703 (3.62) a
8.623 (4.24) a
(dd) Change in unused loan commitments to total assets 0.136 (1.25)
2.864 (3.73) a
2.208 (3.66) a
(gg) Notional amount of derivatives to total assets 0.062 (1.25)
-2.326 (-3.55) a
-1.625 (-3.79) a
(kk) Liquidity ratio 0.029 (1.79) c
0.148 (2.38) b
0.099 (2.49) b
(mm) Deposit growth rate 0.104 (3.56) a
0.259 (2.59) b
0.080 (2.93) a
Total assets between $3b. and $10b. 0.005 (0.72)
-0.004 (-0.82)
0.003 (0.44)
Total assets between $1b. and $3b. -0.009 (-0.76)
-0.008 (-0.82)
-0.010 (-0.89)
Total assets between $500m. and $1b. -0.010 (-1.22)
-0.030 (-1.09)
0.023 (1.12)
Total assets less than $500m. -0.016 (-1.17)
-0.030 (-0.95)
-0.041 (-1.23)
Adjusted R-Squared 49.73 53.23 58.62
F-stat 16.95 17.73 18.76
P-value 0.000 0.000 0.000

45
Appendix D
Regressions of 2008 BHAR on Accounting and Corporate Governance Variables based on Bank Asset Size This table shows regression results of 2008 buy-and-hold abnormal returns (BHAR) on various accounting and corporate governance variables, where banks are grouped by asset size. For these regressions the accounting measures are year-end values, and the corporate governance measures are lagged one year. Financial statement data are obtained from FFIEC Call Report files, available at the website of the Federal Reserve Bank of Chicago, www.chicagofed.org. We use proxy statements for each year to obtain board of director characteristics (i.e., the number of insiders, affiliated outsiders, and unaffiliated outsiders on the board, CEO/Chair duality). CEO stock and options ownership and compensation data was collected by hand from proxy statements, including the detailed options information necessary to replicate ExecuComp’s Black-Scholes calculations. This replication process required detailed options information from proxy statements as well as information from Compustat (to get dividend yields), CRSP (to get data to calculate stock price volatility), and the U.S. Treasury website, www.ustreas.gov, (to get the risk free rate). t-statistics shown in brackets. a, b, and c denote significance at better than the 1%, 5%, and 10% levels respectively.
Ratio Total assets >
$10 billion Total assets $3b to $10b
Total assets $1b to $3b
Total assets $500m to $1b
Total assets < $500 million
Constant 0.002 (0.18)
0.008 (0.24)
0.009 (0.37)
-0.018 (-0.78)
0.011 (0.85)
(7) Board independence 0.191 (3.24) a
0.152 (2.86) a
0.022 (1.22)
0.019 (1.11)
0.011 (0.89)
(8) Golden parachutes -0.087 (-3.13) a
-0.051 (-2.86) a
-0.048 (-2.65) a
-0.080 (-2.86) a
-0.077 (-2.70) a
(9) Executive ownership 0.399 (3.32) a
0.257 (2.95) a
0.151 (2.59) b
0.055 (1.94) c
0.026 (1.30)
(9A) Change in executive ownership
0.730 (4.98) a
0.437 (3.18) a
0.236 (2.85) a
0.096 (2.16) b
0.037 (1.53)
(10) Affiliated ownership 0.317 (2.85) a
0.286 (3.01) a
0.225 (2.72) a
0.106 (1.19)
0.132 (1.41)
(10A) Change in affiliated ownership
0.464 (3.11) a
0.305 (2.92) a
0.285 (2.69) a
0.125 (1.67) c
0.107 (1.48)
(12) Top executive officer PPS 0.068 (3.24) a
0.050 (2.89) a
0.031 (2.32) b
0.014 (1.75) c
0.021 (1.89) c
(13) Number of board meetings 0.004 (0.64)
0.004 (0.86)
0.002 (0.45)
0.003 (0.90)
-0.002 (-0.47)
(14) CEO/Chair duality -0.058 (-2.26) b
-0.015 (-0.99)
-0.016 (-1.04)
0.008 (0.51)
-0.013 (-0.97)
(15) Friendly nominating committee -0.020 (-0.97)
-0.020 (-0.85)
-0.022 (-1.11)
0.020 (1.06)
0.004 (0.25)
(d) Total capital to assets 2.386 (3.21) a
2.974 (2.89) a
3.108 (3.79) a
4.458 (3.98) a
4.156 (3.43) a
(i) Non-interest exp. to non-interest inc.
-0.060 (-3.24) a
-0.013 (-1.80) c
0.000 (0.10)
-0.003 (-0.87)
-0.006 (-0.99)
(l) Personnel exp. to total assets -8.048 (-2.79) a
-5.314 (-2.60) a
-10.375 (-3.25) a
-4.756 (-2.47) b
-8.482 (-2.69) a
(n) Total assets to employees 6.414 (3.09) a
4.801 (2.70) a
2.024 (2.38) b
2.856 (2.29) b
4.847 (2.82) a
(w) C&I loans to total assets -0.006 (-0.47)
-0.008 (-0.42)
-0.010 (-0.64)
-0.009 (-0.71)
0.001 (0.15)
(x) Real estate loans to total assets -1.106 (-4.14) a
-0.813 (-3.76) a
-0.296 (-2.44) b
-0.459 (-2.53) b
-0.649 (-2.57) b

46
Appendix D (continued)
Ratio Total assets >
$10 billion Total assets $3b to $10b
Total assets $1b to $3b
Total assets $500m to $1b
Total assets < $500 million
(cc) Other non-interest income to total assets
9.104 (4.45) a
7.768 (3.81) a
3.806 (1.19)
1.856 (0.67)
0.940 (0.72)
(dd) Change in unused loan commitments to total assets
10.108 (5.33) a
3.029 (2.75) a
1.466 (1.19)
0.099 (0.65)
0.065 (0.43)
(gg) Notional amount of derivatives to total assets
-8.957 (-4.29) a
-3.227 (-2.92) a
-1.051 (-1.07)
-0.076 (-0.49)
-0.054 (-0.36)
(kk) Liquidity ratio 0.235 (2.42) b
0.136 (2.18) b
0.083 (1.93) c
0.095 (1.70) c
0.060 (1.25)
(mm) Deposit growth rate 0.272 (3.09) a
0.184 (2.71) a
0.121 (2.12) b
0.127 (2.09) b
0.075 (1.38)
Adjusted R-Squared 64.08 60.59 59.82 60.39 45.93
F-stat 20.31 18.22 17.53 18.05 14.84
P-value 0.000 0.000 0.000 0.000 0.000