Embed Size (px)
Citation preview
See important disclosures, including any required research certifications, beginning on page 33
China Consumer Discretionary
Investment case: We believe IMAX China is one of the most effective
ways for investors to gain exposure to both growing Mainland discretionary
incomes and fast-growing box-office revenue. Although the total number of
movie screens in China quadrupled from 2011-15 (40% CAGR), the
penetration rate in China, measured in terms of both demand (film
attendance per urban capita) and supply (screens per urban capita), has
remained low compared to other major economies (ie, the US and Korea).
We expect overall movie attendance in China to remain on an uptrend for
the foreseeable future, with the Mainland movie industry set to overtake the
US’s as the world’s largest by 2017. Given that IMAX is by far the most
recognised brand among the premium offerings in China, IMAX China
should remain a key beneficiary of the industry’s growth, whose top line we
forecast to rise at a CAGR of 22% for 2016-18.
Although our top- and bottom-line growth forecasts for the company show a
decelerating trend from 2015-18, we expect the quality of the company’s
earnings to gradually improve, as it derives a growing proportion of revenue
from a share of box-office takings. Specifically, we forecast recurring
revenue to account for 71% of total revenue by end-2017, up from 56% in
2015. We also like IMAX China’s relatively high revenue visibility, given it
has a theatre backlog equivalent to 90% of its existing network, and
because of its gradually expanding net margin, driven by the company’s
high operating leverage business model.
Catalysts: Announcements of IMAX China winning contracts to build new
major theatres, and strong monthly box-office numbers in China would be
share-price catalysts. Meanwhile, favourable regulatory changes and
improvements in China’s economy could also provide a boost.
Valuation: We initiate coverage of IMAX China with a Buy (1) call and 12-
month TP of HKD50.00, based on a target PER of 34x on the average of
our 2016-17E EPS, derived by applying a 20% premium to the average
trading multiple of its global exhibitors and studio peers. We believe IMAX
China deserves to trade at a substantial premium to these peers on: 1) its
superior asset-light business model, 2) the company’s exclusive positioning
in the world’s fastest growing cinema market, and 3) its substantially higher
net margins and ROE. As a cross-check, our DCF-derived valuation is
HKD48.8, 2% below our target price.
Risks: The primary risk to our call is the increasing number of premium
cinema technologies in China eroding IMAX China’s brand power and
subsequently weakening its future negotiations for box office revenue-
sharing rates.
16 June 2016
IMAX Chi na Hol ding
Initiation: a box-office hit
Key beneficiary of China becoming the largest cinema market by 2017
Earnings quality expected to improve significantly over 2016-18
Initiating with a Buy (1) call and target price of HKD50.00
Source: FactSet, Daiwa forecasts
IMAX China Holding (1970 HK)
Target price: HKD50.00
Share price (15 Jun): HKD39.55 | Up/downside: +26.4%
John Choi(852) 2773 8730
Carlton Lai(852) 2532 4349
90
113
135
158
180
30
38
45
53
60
Oct-15 Jan-16 Apr-16
Share price performance
IMAX (LHS) Relative to HSI (RHS)
(HKD) (%)
12-month range 34.25-59.70
Market cap (USDbn) 1.81
3m avg daily turnover (USDm) 7.24
Shares outstanding (m) 355
Major shareholder IMAX Corp (68.5%)
Financial summary (USD)
Year to 31 Dec 16E 17E 18E
Revenue (m) 148 174 201
Operating profit (m) 72 86 102
Net profit (m) 60 76 92
Core EPS (fully-diluted) 0.170 0.213 0.259
EPS change (%) 21.3 25.5 21.4
Daiwa vs Cons. EPS (%) (1.3) (4.1) (5.6)
PER (x) 30.0 23.9 19.7
Dividend yield (%) 0.0 0.0 0.0
DPS 0.000 0.000 0.000
PBR (x) 8.3 6.2 4.7
EV/EBITDA (x) 19.9 16.1 13.1
ROE (%) 32.1 29.6 27.1
2
IMAX China Holding (1970 HK): 16 June 2016
Table of contents
A huge appetite for movies ...................................................................................... 6
China’s entertainment segment: still nascent .....................................................................6
FAQ: How many theatres can IMAX ultimately open in China? ..........................................9
What’s different about IMAX? ............................................................................................9
FAQ: Will cinemas still be relevant in 5 years, given the major advances in home-theatre
technology? ..................................................................................................................... 10
“High-Definition” revenue visibility .......................................................................13
Shifting business models ................................................................................................. 13
Key assumptions for IMAX China box-office revenue ...................................................... 14
FAQ: How does China’s film quota affect IMAX China? ................................................... 17
Enhanced earnings quality .....................................................................................22
A prime reason for multiple expansion ............................................................................. 22
Valuation and Risks ................................................................................................24
Stock looks oversold ........................................................................................................ 24
Risks ................................................................................................................................ 27
Appendix: management/shareholder structure ....................................................28
3
IMAX China Holding (1970 HK): 16 June 2016
How do we justify our view?
Growth outlook Valuation Earnings revisions
Growth outlook IMAX China: adjusted operating profit and net profit
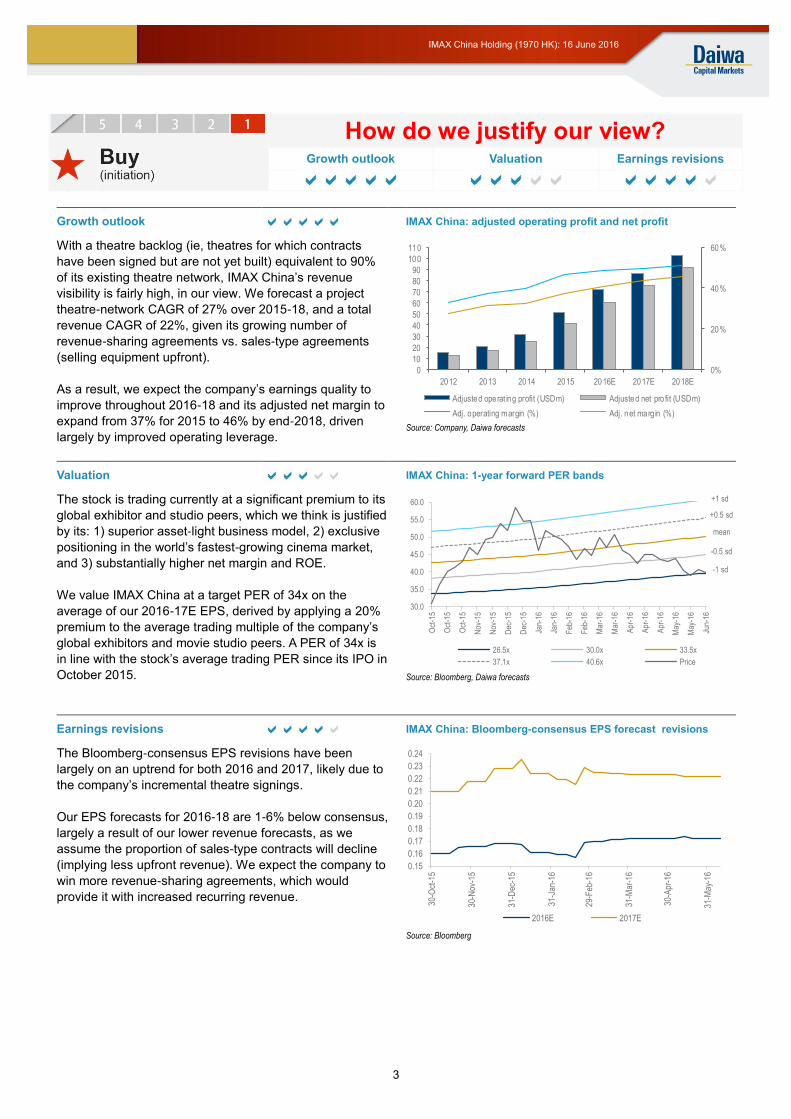
With a theatre backlog (ie, theatres for which contracts
have been signed but are not yet built) equivalent to 90%
of its existing theatre network, IMAX China’s revenue
visibility is fairly high, in our view. We forecast a project
theatre-network CAGR of 27% over 2015-18, and a total
revenue CAGR of 22%, given its growing number of
revenue-sharing agreements vs. sales-type agreements
(selling equipment upfront).
As a result, we expect the company’s earnings quality to
improve throughout 2016-18 and its adjusted net margin to
expand from 37% for 2015 to 46% by end-2018, driven
largely by improved operating leverage.
Source: Company, Daiwa forecasts
Valuation IMAX China: 1-year forward PER bands
The stock is trading currently at a significant premium to its
global exhibitor and studio peers, which we think is justified
by its: 1) superior asset-light business model, 2) exclusive
positioning in the world’s fastest-growing cinema market,
and 3) substantially higher net margin and ROE.
We value IMAX China at a target PER of 34x on the
average of our 2016-17E EPS, derived by applying a 20%
premium to the average trading multiple of the company’s
global exhibitors and movie studio peers. A PER of 34x is
in line with the stock’s average trading PER since its IPO in
October 2015.
Source: Bloomberg, Daiwa forecasts
Earnings revisions IMAX China: Bloomberg-consensus EPS forecast revisions
The Bloomberg-consensus EPS revisions have been
largely on an uptrend for both 2016 and 2017, likely due to
the company’s incremental theatre signings.
Our EPS forecasts for 2016-18 are 1-6% below consensus,
largely a result of our lower revenue forecasts, as we
assume the proportion of sales-type contracts will decline
(implying less upfront revenue). We expect the company to
win more revenue-sharing agreements, which would
provide it with increased recurring revenue.
Source: Bloomberg
0%
20%
40%
60%
0
10
20
30
40
50
60
70
80
90
100
110
2012 2013 2014 2015 2016E 2017E 2018E
Adjusted operat ing profit (USDm) Adjusted net pro fit (USDm)
Adj. operating margin (%) Adj. net marg in (%)
30.0
35.0
40.0
45.0
50.0
55.0
60.0
Oct
-15
Oct
-15
Oct
-15
Nov
-15
Nov
-15
Dec
-15
Dec
-15
Jan-
16
Jan-
16
Feb
-16
Feb
-16
Mar
-16
Mar
-16
Apr
-16
Apr
-16
Apr
-16
May
-16
May
-16
Jun-
16
26.5x 30.0x 33.5x
37.1x 40.6x Price
+0.5 sd
-0.5 sd
mean
-1 sd
+1 sd
0.15
0.16
0.17
0.18
0.19
0.20
0.21
0.22
0.23
0.24
30-O
ct-1
5
30-N
ov-1
5
31-D
ec-1
5
31-J
an-1
6
29-F
eb-1
6
31-M
ar-1
6
30-A
pr-1
6
31-M
ay-1
6
2016E 2017E
4
IMAX China Holding (1970 HK): 16 June 2016
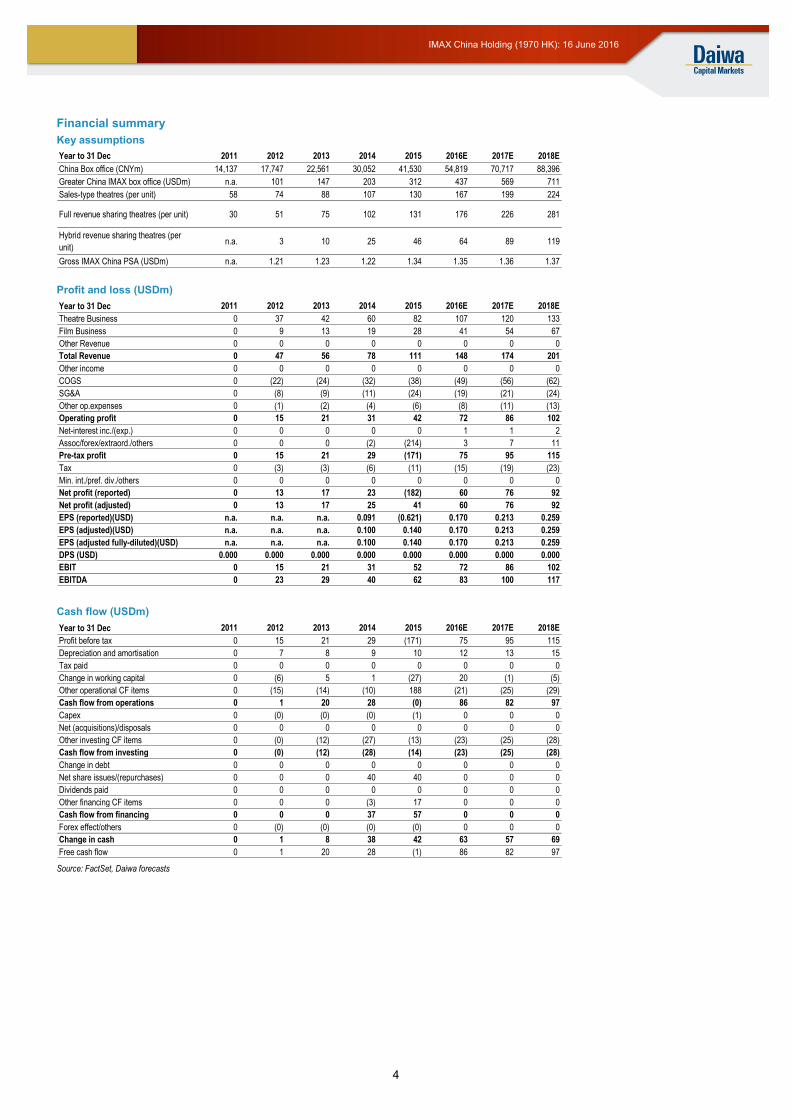
Financial summary
Key assumptions
Profit and loss (USDm)
Cash flow (USDm)
Source: FactSet, Daiwa forecasts
Year to 31 Dec 2011 2012 2013 2014 2015 2016E 2017E 2018E
China Box office (CNYm) 14,137 17,747 22,561 30,052 41,530 54,819 70,717 88,396
Greater China IMAX box office (USDm) n.a. 101 147 203 312 437 569 711
Sales-type theatres (per unit) 58 74 88 107 130 167 199 224
Full revenue sharing theatres (per unit) 30 51 75 102 131 176 226 281
Hybrid revenue sharing theatres (per
unit)n.a. 3 10 25 46 64 89 119
Gross IMAX China PSA (USDm) n.a. 1.21 1.23 1.22 1.34 1.35 1.36 1.37
Year to 31 Dec 2011 2012 2013 2014 2015 2016E 2017E 2018E
Theatre Business 0 37 42 60 82 107 120 133
Film Business 0 9 13 19 28 41 54 67
Other Revenue 0 0 0 0 0 0 0 0
Total Revenue 0 47 56 78 111 148 174 201
Other income 0 0 0 0 0 0 0 0
COGS 0 (22) (24) (32) (38) (49) (56) (62)
SG&A 0 (8) (9) (11) (24) (19) (21) (24)
Other op.expenses 0 (1) (2) (4) (6) (8) (11) (13)
Operating profit 0 15 21 31 42 72 86 102
Net-interest inc./(exp.) 0 0 0 0 0 1 1 2
Assoc/forex/extraord./others 0 0 0 (2) (214) 3 7 11
Pre-tax profit 0 15 21 29 (171) 75 95 115
Tax 0 (3) (3) (6) (11) (15) (19) (23)
Min. int./pref. div./others 0 0 0 0 0 0 0 0
Net profit (reported) 0 13 17 23 (182) 60 76 92
Net profit (adjusted) 0 13 17 25 41 60 76 92
EPS (reported)(USD) n.a. n.a. n.a. 0.091 (0.621) 0.170 0.213 0.259
EPS (adjusted)(USD) n.a. n.a. n.a. 0.100 0.140 0.170 0.213 0.259
EPS (adjusted fully-diluted)(USD) n.a. n.a. n.a. 0.100 0.140 0.170 0.213 0.259
DPS (USD) 0.000 0.000 0.000 0.000 0.000 0.000 0.000 0.000
EBIT 0 15 21 31 52 72 86 102
EBITDA 0 23 29 40 62 83 100 117
Year to 31 Dec 2011 2012 2013 2014 2015 2016E 2017E 2018E
Profit before tax 0 15 21 29 (171) 75 95 115
Depreciation and amortisation 0 7 8 9 10 12 13 15
Tax paid 0 0 0 0 0 0 0 0
Change in working capital 0 (6) 5 1 (27) 20 (1) (5)
Other operational CF items 0 (15) (14) (10) 188 (21) (25) (29)
Cash flow from operations 0 1 20 28 (0) 86 82 97
Capex 0 (0) (0) (0) (1) 0 0 0
Net (acquisitions)/disposals 0 0 0 0 0 0 0 0
Other investing CF items 0 (0) (12) (27) (13) (23) (25) (28)
Cash flow from investing 0 (0) (12) (28) (14) (23) (25) (28)
Change in debt 0 0 0 0 0 0 0 0
Net share issues/(repurchases) 0 0 0 40 40 0 0 0
Dividends paid 0 0 0 0 0 0 0 0
Other financing CF items 0 0 0 (3) 17 0 0 0
Cash flow from financing 0 0 0 37 57 0 0 0
Forex effect/others 0 (0) (0) (0) (0) 0 0 0
Change in cash 0 1 8 38 42 63 57 69
Free cash flow 0 1 20 28 (1) 86 82 97
5
IMAX China Holding (1970 HK): 16 June 2016
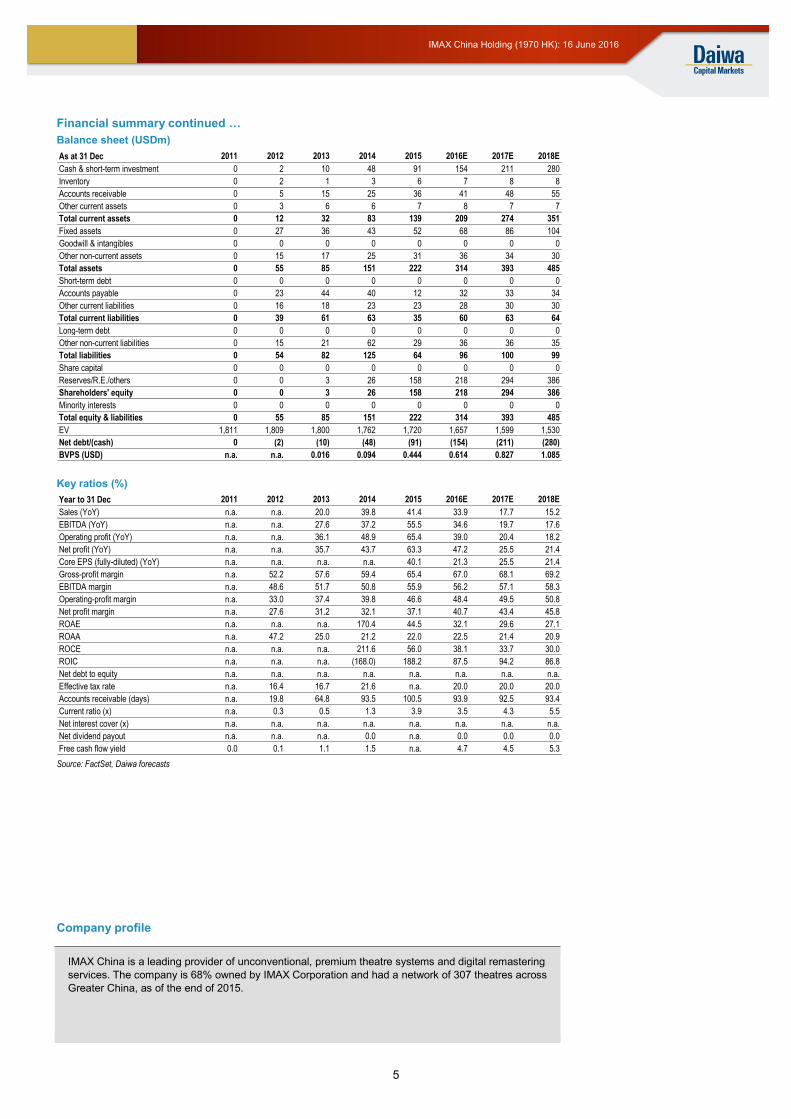
Financial summary continued …
Balance sheet (USDm)
Key ratios (%)
Source: FactSet, Daiwa forecasts
As at 31 Dec 2011 2012 2013 2014 2015 2016E 2017E 2018E
Cash & short-term investment 0 2 10 48 91 154 211 280
Inventory 0 2 1 3 6 7 8 8
Accounts receivable 0 5 15 25 36 41 48 55
Other current assets 0 3 6 6 7 8 7 7
Total current assets 0 12 32 83 139 209 274 351
Fixed assets 0 27 36 43 52 68 86 104
Goodwill & intangibles 0 0 0 0 0 0 0 0
Other non-current assets 0 15 17 25 31 36 34 30
Total assets 0 55 85 151 222 314 393 485
Short-term debt 0 0 0 0 0 0 0 0
Accounts payable 0 23 44 40 12 32 33 34
Other current liabilities 0 16 18 23 23 28 30 30
Total current liabilities 0 39 61 63 35 60 63 64
Long-term debt 0 0 0 0 0 0 0 0
Other non-current liabilities 0 15 21 62 29 36 36 35
Total liabilities 0 54 82 125 64 96 100 99
Share capital 0 0 0 0 0 0 0 0
Reserves/R.E./others 0 0 3 26 158 218 294 386
Shareholders' equity 0 0 3 26 158 218 294 386
Minority interests 0 0 0 0 0 0 0 0
Total equity & liabilities 0 55 85 151 222 314 393 485
EV 1,811 1,809 1,800 1,762 1,720 1,657 1,599 1,530
Net debt/(cash) 0 (2) (10) (48) (91) (154) (211) (280)
BVPS (USD) n.a. n.a. 0.016 0.094 0.444 0.614 0.827 1.085
Year to 31 Dec 2011 2012 2013 2014 2015 2016E 2017E 2018E
Sales (YoY) n.a. n.a. 20.0 39.8 41.4 33.9 17.7 15.2
EBITDA (YoY) n.a. n.a. 27.6 37.2 55.5 34.6 19.7 17.6
Operating profit (YoY) n.a. n.a. 36.1 48.9 65.4 39.0 20.4 18.2
Net profit (YoY) n.a. n.a. 35.7 43.7 63.3 47.2 25.5 21.4
Core EPS (fully-diluted) (YoY) n.a. n.a. n.a. n.a. 40.1 21.3 25.5 21.4
Gross-profit margin n.a. 52.2 57.6 59.4 65.4 67.0 68.1 69.2
EBITDA margin n.a. 48.6 51.7 50.8 55.9 56.2 57.1 58.3
Operating-profit margin n.a. 33.0 37.4 39.8 46.6 48.4 49.5 50.8
Net profit margin n.a. 27.6 31.2 32.1 37.1 40.7 43.4 45.8
ROAE n.a. n.a. n.a. 170.4 44.5 32.1 29.6 27.1
ROAA n.a. 47.2 25.0 21.2 22.0 22.5 21.4 20.9
ROCE n.a. n.a. n.a. 211.6 56.0 38.1 33.7 30.0
ROIC n.a. n.a. n.a. (168.0) 188.2 87.5 94.2 86.8
Net debt to equity n.a. n.a. n.a. n.a. n.a. n.a. n.a. n.a.
Effective tax rate n.a. 16.4 16.7 21.6 n.a. 20.0 20.0 20.0
Accounts receivable (days) n.a. 19.8 64.8 93.5 100.5 93.9 92.5 93.4
Current ratio (x) n.a. 0.3 0.5 1.3 3.9 3.5 4.3 5.5
Net interest cover (x) n.a. n.a. n.a. n.a. n.a. n.a. n.a. n.a.
Net dividend payout n.a. n.a. n.a. 0.0 n.a. 0.0 0.0 0.0
Free cash flow yield 0.0 0.1 1.1 1.5 n.a. 4.7 4.5 5.3
Company profile
IMAX China is a leading provider of unconventional, premium theatre systems and digital remastering
services. The company is 68% owned by IMAX Corporation and had a network of 307 theatres across
Greater China, as of the end of 2015.
6
IMAX China Holding (1970 HK): 16 June 2016
A huge appetite for movies
China’s entertainment segment: still nascent
Movie-going: second most-preferred leisure activity
We believe IMAX China is one of the most effective ways for investors to capture the
upside in the rise of Mainland consumer spending. Despite slowing economic growth in
China, we believe it is inevitable that the purchasing power of the average Mainland
consumer will continue to rise over the foreseeable future. Driven by the country’s
increasing urbanisation and growing wealth, the average disposable income per capita in
China rose by over 50% from 2011, to around CNY22,000 in 2015. At the current pace, it is
on track to meet McKinsey’s forecast of a doubling in the per capita disposable income
between 2010 and 2020.
Among the growth of household incomes in China, the millennials (otherwise known as
Generation Y) should enjoy the most buoyant income growth, and this is also typically the
demographic that spends the most on clothes and entertainment. In terms of entertainment
options, we believe movie-going remains one of the most affordable, easily accessible and
time-tested entertainment for youngsters. According to a report by Alibaba Pictures and
Huayi Brothers, 51% of movie audiences in 2015 were under 25 years old. In fact,
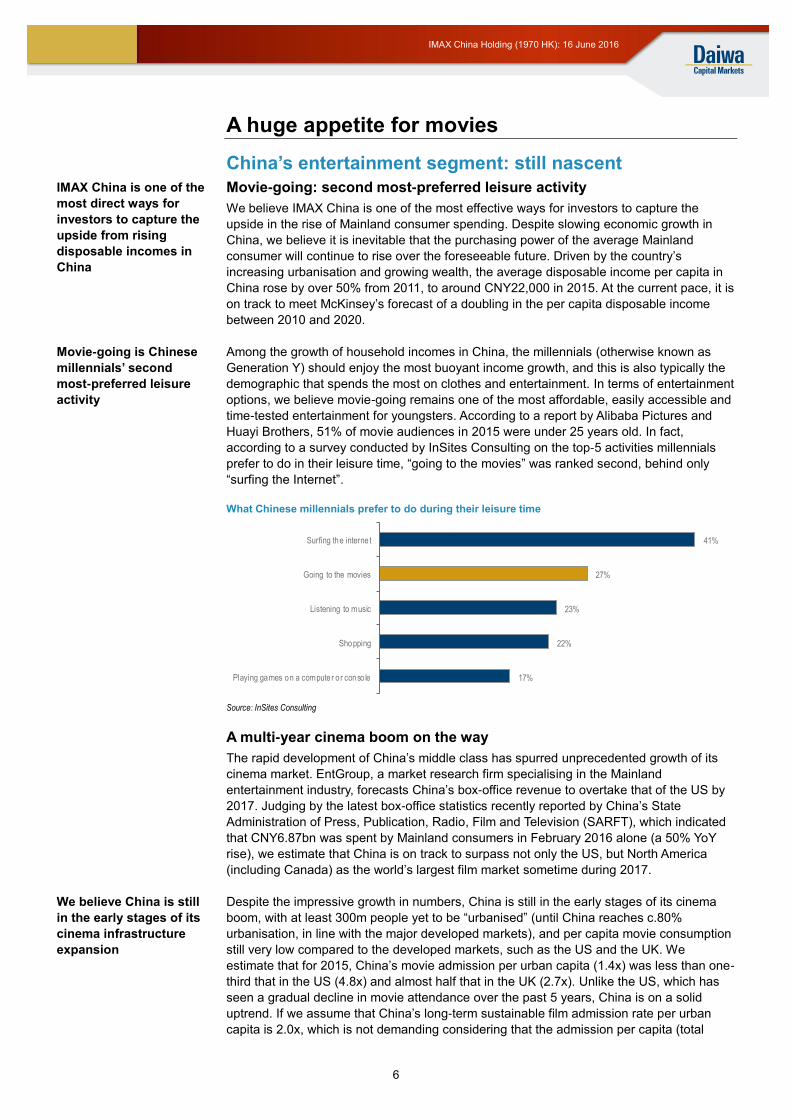
according to a survey conducted by InSites Consulting on the top-5 activities millennials
prefer to do in their leisure time, “going to the movies” was ranked second, behind only
“surfing the Internet”.
What Chinese millennials prefer to do during their leisure time
Source: InSites Consulting
A multi-year cinema boom on the way
The rapid development of China’s middle class has spurred unprecedented growth of its
cinema market. EntGroup, a market research firm specialising in the Mainland
entertainment industry, forecasts China’s box-office revenue to overtake that of the US by
2017. Judging by the latest box-office statistics recently reported by China’s State
Administration of Press, Publication, Radio, Film and Television (SARFT), which indicated
that CNY6.87bn was spent by Mainland consumers in February 2016 alone (a 50% YoY
rise), we estimate that China is on track to surpass not only the US, but North America
(including Canada) as the world’s largest film market sometime during 2017.
Despite the impressive growth in numbers, China is still in the early stages of its cinema
boom, with at least 300m people yet to be “urbanised” (until China reaches c.80%
urbanisation, in line with the major developed markets), and per capita movie consumption
still very low compared to the developed markets, such as the US and the UK. We
estimate that for 2015, China’s movie admission per urban capita (1.4x) was less than one-
third that in the US (4.8x) and almost half that in the UK (2.7x). Unlike the US, which has
seen a gradual decline in movie attendance over the past 5 years, China is on a solid
uptrend. If we assume that China’s long-term sustainable film admission rate per urban
capita is 2.0x, which is not demanding considering that the admission per capita (total
17%
22%
23%
27%
41%
Playing games on a computer or conso le
Shopping
Listening to music
Going to the movies
Surfing the internet
IMAX China is one of the
most direct ways for
investors to capture the
upside from rising
disposable incomes in
China
Movie-going is Chinese
millennials’ second
most-preferred leisure
activity
We believe China is still
in the early stages of its
cinema infrastructure
expansion
7
IMAX China Holding (1970 HK): 16 June 2016
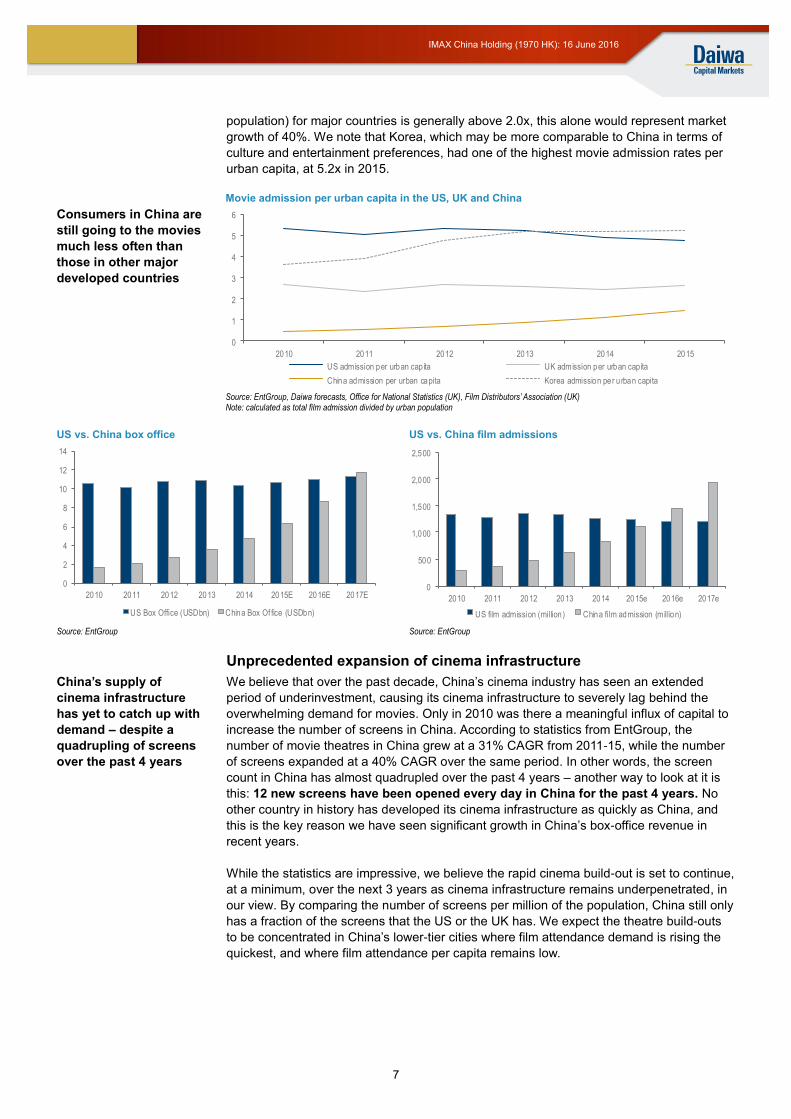
population) for major countries is generally above 2.0x, this alone would represent market
growth of 40%. We note that Korea, which may be more comparable to China in terms of
culture and entertainment preferences, had one of the highest movie admission rates per
urban capita, at 5.2x in 2015.
Movie admission per urban capita in the US, UK and China
Consumers in China are
still going to the movies
much less often than
those in other major
developed countries
Source: EntGroup, Daiwa forecasts, Office for National Statistics (UK), Film Distributors’ Association (UK)
Note: calculated as total film admission divided by urban population
US vs. China box office US vs. China film admissions
Source: EntGroup Source: EntGroup
Unprecedented expansion of cinema infrastructure
We believe that over the past decade, China’s cinema industry has seen an extended
period of underinvestment, causing its cinema infrastructure to severely lag behind the
overwhelming demand for movies. Only in 2010 was there a meaningful influx of capital to
increase the number of screens in China. According to statistics from EntGroup, the
number of movie theatres in China grew at a 31% CAGR from 2011-15, while the number
of screens expanded at a 40% CAGR over the same period. In other words, the screen
count in China has almost quadrupled over the past 4 years – another way to look at it is
this: 12 new screens have been opened every day in China for the past 4 years. No
other country in history has developed its cinema infrastructure as quickly as China, and
this is the key reason we have seen significant growth in China’s box-office revenue in
recent years.
While the statistics are impressive, we believe the rapid cinema build-out is set to continue,
at a minimum, over the next 3 years as cinema infrastructure remains underpenetrated, in
our view. By comparing the number of screens per million of the population, China still only
has a fraction of the screens that the US or the UK has. We expect the theatre build-outs
to be concentrated in China’s lower-tier cities where film attendance demand is rising the
quickest, and where film attendance per capita remains low.
0
1
2
3
4
5
6
2010 2011 2012 2013 2014 2015
US admission per urban cap ita UK admission per urban cap ita
China admission per urban capita Korea admission per u rban capita
0
2
4
6
8
10
12
14
2010 2011 2012 2013 2014 2015E 2016E 2017E
US Box Office (USDbn) China Box Of fice (USDbn)
0
500
1,000
1,500
2,000
2,500
2010 2011 2012 2013 2014 2015e 2016e 2017e
US film admission (million) China film admission (million)
China’s supply of
cinema infrastructure
has yet to catch up with
demand – despite a
quadrupling of screens
over the past 4 years
8
IMAX China Holding (1970 HK): 16 June 2016
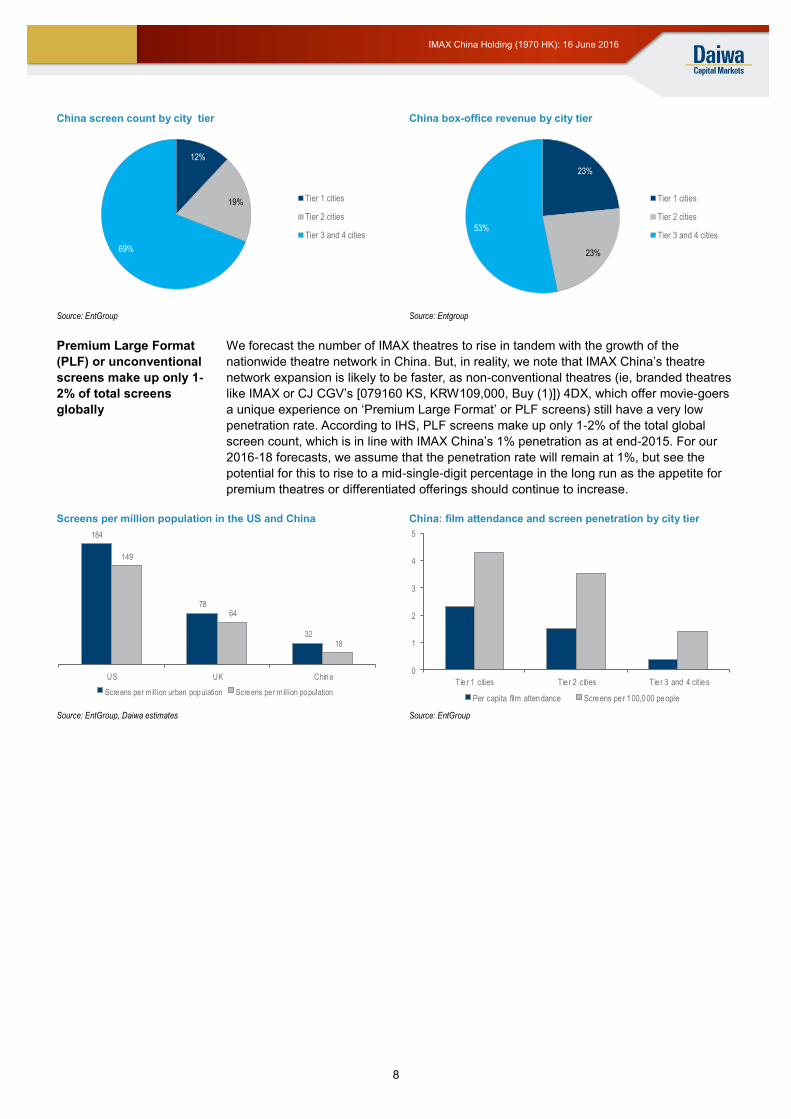
China screen count by city tier China box-office revenue by city tier
Source: EntGroup Source: Entgroup
We forecast the number of IMAX theatres to rise in tandem with the growth of the
nationwide theatre network in China. But, in reality, we note that IMAX China’s theatre
network expansion is likely to be faster, as non-conventional theatres (ie, branded theatres
like IMAX or CJ CGV’s [079160 KS, KRW109,000, Buy (1)]) 4DX, which offer movie-goers
a unique experience on ‘Premium Large Format’ or PLF screens) still have a very low
penetration rate. According to IHS, PLF screens make up only 1-2% of the total global
screen count, which is in line with IMAX China’s 1% penetration as at end-2015. For our
2016-18 forecasts, we assume that the penetration rate will remain at 1%, but see the
potential for this to rise to a mid-single-digit percentage in the long run as the appetite for
premium theatres or differentiated offerings should continue to increase.
Screens per million population in the US and China China: film attendance and screen penetration by city tier
Source: EntGroup, Daiwa estimates Source: EntGroup
12%
19%
69%
Tier 1 cities
Tier 2 cities
Tier 3 and 4 cities
23%
23%
53%
Tier 1 cities
Tier 2 cities
Tier 3 and 4 cities
184
78
32
149
64
18
US UK China
Screens per million urban population Screens per million population
0
1
2
3
4
5
Tier 1 cities Tier 2 cities Tier 3 and 4 cit ies
Per capita film attendance Screens per 100,000 people
Premium Large Format
(PLF) or unconventional
screens make up only 1-
2% of total screens
globally
9
IMAX China Holding (1970 HK): 16 June 2016
FAQ: How many theatres can IMAX ultimately open in China?
Short answer: 1,000 screens by 2022 looks feasible
In 4 years, the number of theatre screens in China quadrupled to 24,317 by the end of
2015, representing a CAGR of 40%. While this breakneck pace of cinema infrastructure
expansion is likely to slow due to the higher base in 2016, we forecast a new screen
CAGR of 20% over 2016-18, reaching 42,000 screens by 2018. However, at 18 screens
per million population in China, the penetration rate still lags greatly behind that of the US,
UK and Korea, at 149, 64 and 45 screens, respectively. Even if we conservatively assume
that China will ultimately match the UK’s penetration rate over the long term (less than half
of the US’s), this would imply a potential screen count of 88,064 screens, on the population
number for 2015, or 262% growth from the 2015 screen count.
Excluding the backlog, the 2015 penetration rates for IMAX screens in North America and
China were 1.1% and 1.3%, respectively, of the total screen count in each country. Taking
the average of 1.2% on the 88,064 screens, this implies that the potential screen count for
IMAX in China is 1,057 screens. We note that this is in line with management’s announced
“long-term target” of 1,000 IMAX screens in China. At the earliest, we estimate IMAX China
will be able to hit this target by 2022.
What’s different about IMAX?
The “IMAX Experience” vs. competitors
To watch a movie in an IMAX auditorium, movie-goers have to pay a premium on top of the
average movie ticket. In 2014, the average movie ticket price (non-IMAX or non-PLF) in
China was USD5.8, while the average ticket price for IMAX movies was USD11.0, a 90%
premium. What consumers are paying for is a thoroughly upgraded movie-going
experience, billed as the ‘IMAX Experience’.
The IMAX Experience generally comprises:
IMAX Digital Media Remastering (DMR) conversion: this is a highly automated,
proprietary process that digitally converts digital films or legacy 35mm films into a
larger resolution IMAX format.
Advanced high-resolution digital projectors: all the IMAX theatres that are part of
IMAX China’s network use IMAX digital xenon projection systems, which were first
rolled out by IMAX Corporation in 2008. These projectors are designed to deliver
superior, brighter and higher contrast images than a conventional projector.
Non-conventional theatre screens: an IMAX screen is typically one that spans wall-
to-wall and floor-to-ceiling (IMAX screens can be as large as 20 x 30 meters). The
screen is also curved and coated with a proprietary technology.
Proprietary theatre geometry: the shape of an IMAX auditorium is designed to
maximise the immersion effect experienced by the audience, by substantially enlarging
the field of view compared with what they get in a conventional theatre.
Specialised theatre acoustics and sound systems: IMAX claims that its acoustics
result in a 4-fold reduction in background noise compared to a conventional theatre. Its
sound-system components also deliver expansive sound and can pinpoint the
origination of sound to any specific spot in an IMAX theatre.
IMAX faces competition mainly from 3 other PLF providers in China: China Film Giant
Screen (not listed), Wanda’s (not rated) own X-Land cinemas, and to a lesser extent, CJ
CGV’s 4DX auditoriums. We believe China Film Giant Screen and X-Land are the closest
competitors, as both their target customers are looking for an enhanced movie experience
(through larger screens and upgraded sound systems), but at cheaper price than IMAX.
IMAX is able to charge a
90% premium for its
upgraded movie-going
experience
10
IMAX China Holding (1970 HK): 16 June 2016
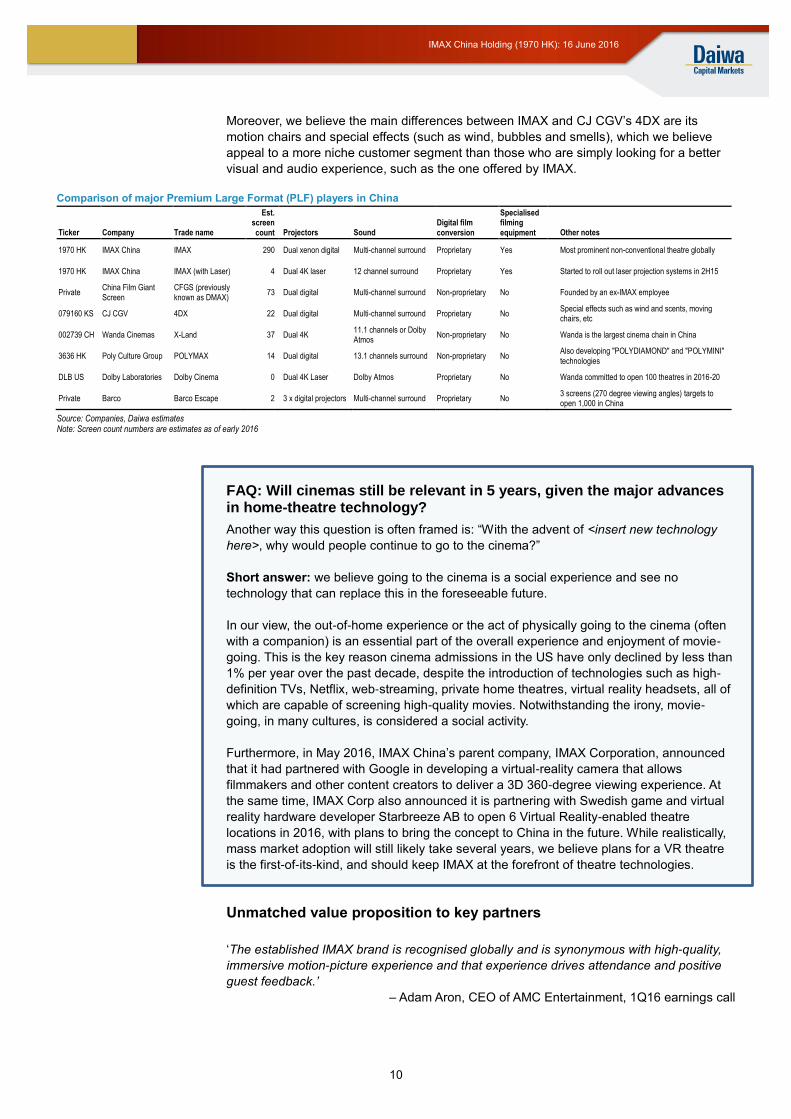
Moreover, we believe the main differences between IMAX and CJ CGV’s 4DX are its
motion chairs and special effects (such as wind, bubbles and smells), which we believe
appeal to a more niche customer segment than those who are simply looking for a better
visual and audio experience, such as the one offered by IMAX.
Comparison of major Premium Large Format (PLF) players in China
Ticker Company Trade name
Est. screen count Projectors Sound
Digital film conversion
Specialised filming equipment Other notes
1970 HK IMAX China IMAX 290 Dual xenon digital Multi-channel surround Proprietary Yes Most prominent non-conventional theatre globally
1970 HK IMAX China IMAX (with Laser) 4 Dual 4K laser 12 channel surround Proprietary Yes Started to roll out laser projection systems in 2H15
Private China Film Giant Screen
CFGS (previously known as DMAX)
73 Dual digital Multi-channel surround Non-proprietary No Founded by an ex-IMAX employee
079160 KS CJ CGV 4DX 22 Dual digital Multi-channel surround Proprietary No Special effects such as wind and scents, moving chairs, etc
002739 CH Wanda Cinemas X-Land 37 Dual 4K 11.1 channels or Dolby Atmos
Non-proprietary No Wanda is the largest cinema chain in China
3636 HK Poly Culture Group POLYMAX 14 Dual digital 13.1 channels surround Non-proprietary No Also developing "POLYDIAMOND" and "POLYMINI" technologies
DLB US Dolby Laboratories Dolby Cinema 0 Dual 4K Laser Dolby Atmos Proprietary No Wanda committed to open 100 theatres in 2016-20
Private Barco Barco Escape 2 3 x digital projectors Multi-channel surround Proprietary No 3 screens (270 degree viewing angles) targets to open 1,000 in China
Source: Companies, Daiwa estimates Note: Screen count numbers are estimates as of early 2016
FAQ: Will cinemas still be relevant in 5 years, given the major advances in home-theatre technology?
Another way this question is often framed is: “With the advent of <insert new technology
here>, why would people continue to go to the cinema?”
Short answer: we believe going to the cinema is a social experience and see no
technology that can replace this in the foreseeable future.
In our view, the out-of-home experience or the act of physically going to the cinema (often
with a companion) is an essential part of the overall experience and enjoyment of movie-
going. This is the key reason cinema admissions in the US have only declined by less than
1% per year over the past decade, despite the introduction of technologies such as high-
definition TVs, Netflix, web-streaming, private home theatres, virtual reality headsets, all of
which are capable of screening high-quality movies. Notwithstanding the irony, movie-
going, in many cultures, is considered a social activity.
Furthermore, in May 2016, IMAX China’s parent company, IMAX Corporation, announced
that it had partnered with Google in developing a virtual-reality camera that allows
filmmakers and other content creators to deliver a 3D 360-degree viewing experience. At
the same time, IMAX Corp also announced it is partnering with Swedish game and virtual
reality hardware developer Starbreeze AB to open 6 Virtual Reality-enabled theatre
locations in 2016, with plans to bring the concept to China in the future. While realistically,
mass market adoption will still likely take several years, we believe plans for a VR theatre
is the first-of-its-kind, and should keep IMAX at the forefront of theatre technologies.
Unmatched value proposition to key partners
‘The established IMAX brand is recognised globally and is synonymous with high-quality,
immersive motion-picture experience and that experience drives attendance and positive
guest feedback.’
– Adam Aron, CEO of AMC Entertainment, 1Q16 earnings call
11
IMAX China Holding (1970 HK): 16 June 2016
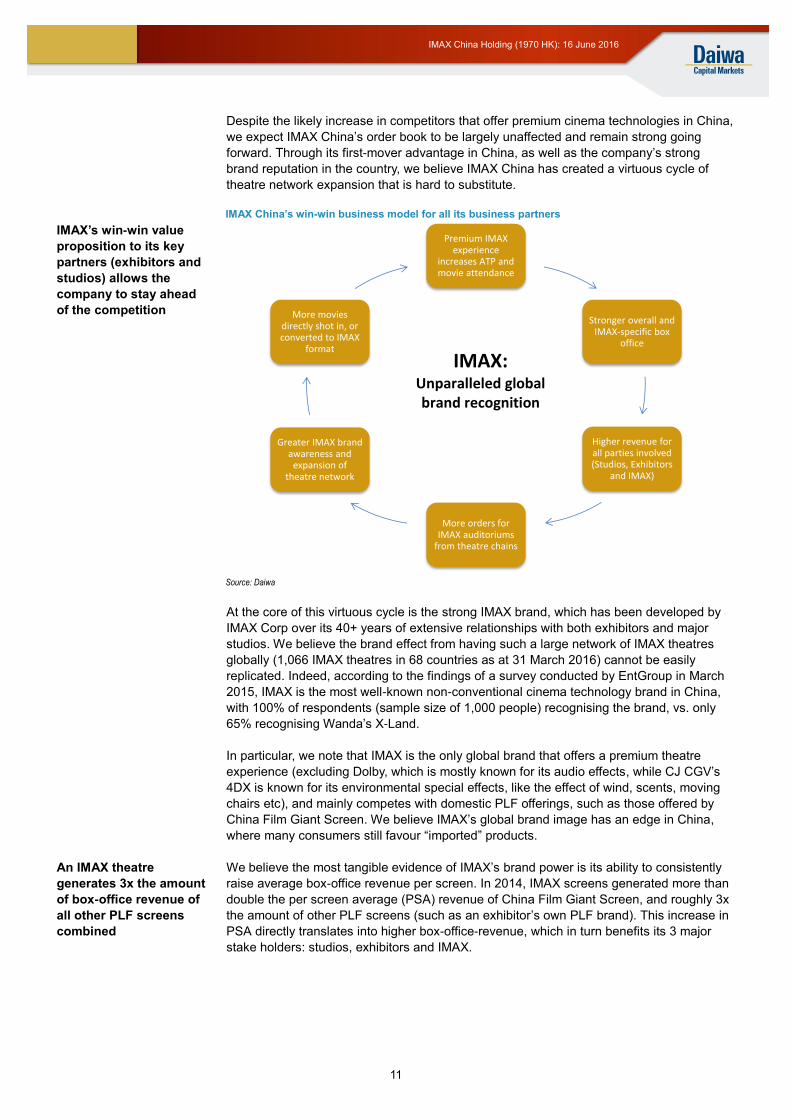
Despite the likely increase in competitors that offer premium cinema technologies in China,
we expect IMAX China’s order book to be largely unaffected and remain strong going
forward. Through its first-mover advantage in China, as well as the company’s strong
brand reputation in the country, we believe IMAX China has created a virtuous cycle of
theatre network expansion that is hard to substitute.
IMAX China’s win-win business model for all its business partners
IMAX’s win-win value
proposition to its key
partners (exhibitors and
studios) allows the
company to stay ahead
of the competition
Source: Daiwa
At the core of this virtuous cycle is the strong IMAX brand, which has been developed by
IMAX Corp over its 40+ years of extensive relationships with both exhibitors and major
studios. We believe the brand effect from having such a large network of IMAX theatres
globally (1,066 IMAX theatres in 68 countries as at 31 March 2016) cannot be easily
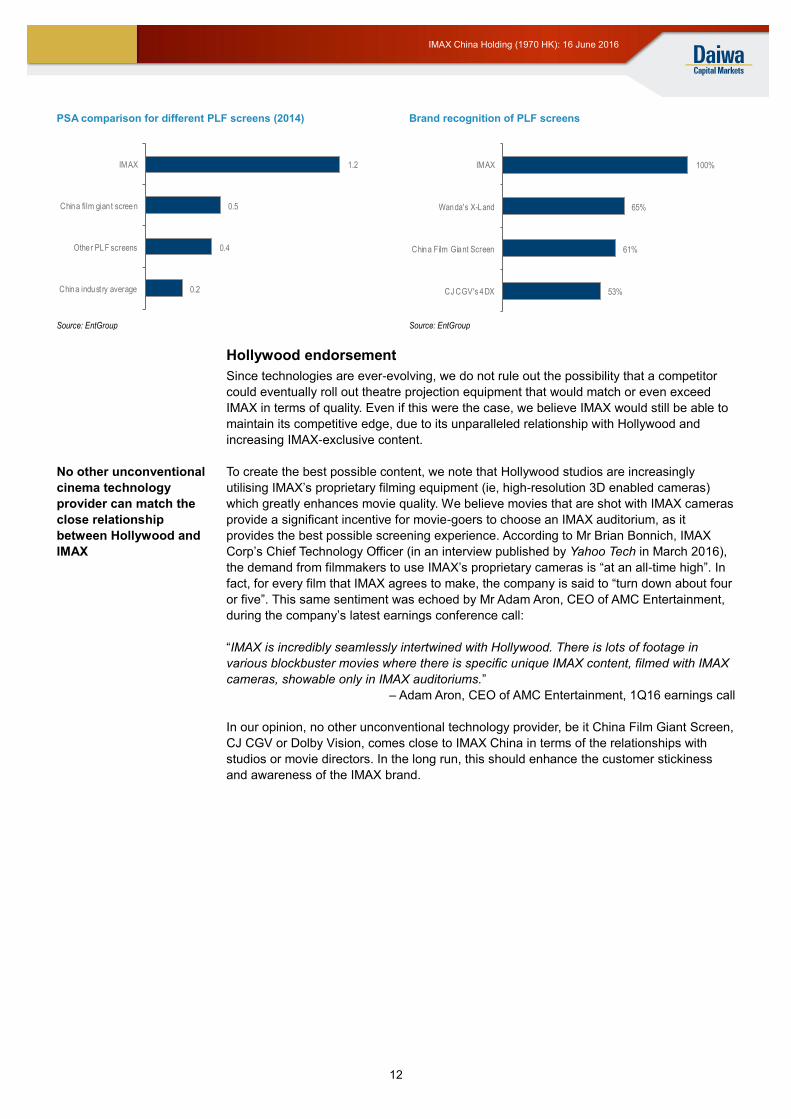
replicated. Indeed, according to the findings of a survey conducted by EntGroup in March
2015, IMAX is the most well-known non-conventional cinema technology brand in China,
with 100% of respondents (sample size of 1,000 people) recognising the brand, vs. only
65% recognising Wanda’s X-Land.
In particular, we note that IMAX is the only global brand that offers a premium theatre
experience (excluding Dolby, which is mostly known for its audio effects, while CJ CGV’s
4DX is known for its environmental special effects, like the effect of wind, scents, moving
chairs etc), and mainly competes with domestic PLF offerings, such as those offered by
China Film Giant Screen. We believe IMAX’s global brand image has an edge in China,
where many consumers still favour “imported” products.
We believe the most tangible evidence of IMAX’s brand power is its ability to consistently
raise average box-office revenue per screen. In 2014, IMAX screens generated more than
double the per screen average (PSA) revenue of China Film Giant Screen, and roughly 3x
the amount of other PLF screens (such as an exhibitor’s own PLF brand). This increase in
PSA directly translates into higher box-office-revenue, which in turn benefits its 3 major
stake holders: studios, exhibitors and IMAX.
Premium IMAX experience
increases ATP and movie attendance
Stronger overall and IMAX-specific box
office
Higher revenue for all parties involved (Studios, Exhibitors
and IMAX)
More orders for IMAX auditoriums
from theatre chains
Greater IMAX brand awareness and
expansion of theatre network
More movies directly shot in, or converted to IMAX
format
An IMAX theatre
generates 3x the amount
of box-office revenue of
all other PLF screens
combined
IMAX: Unparalleled global brand recognition
12
IMAX China Holding (1970 HK): 16 June 2016
PSA comparison for different PLF screens (2014) Brand recognition of PLF screens
Source: EntGroup Source: EntGroup
Hollywood endorsement
Since technologies are ever-evolving, we do not rule out the possibility that a competitor
could eventually roll out theatre projection equipment that would match or even exceed
IMAX in terms of quality. Even if this were the case, we believe IMAX would still be able to
maintain its competitive edge, due to its unparalleled relationship with Hollywood and
increasing IMAX-exclusive content.
To create the best possible content, we note that Hollywood studios are increasingly
utilising IMAX’s proprietary filming equipment (ie, high-resolution 3D enabled cameras)
which greatly enhances movie quality. We believe movies that are shot with IMAX cameras
provide a significant incentive for movie-goers to choose an IMAX auditorium, as it
provides the best possible screening experience. According to Mr Brian Bonnich, IMAX
Corp’s Chief Technology Officer (in an interview published by Yahoo Tech in March 2016),
the demand from filmmakers to use IMAX’s proprietary cameras is “at an all-time high”. In
fact, for every film that IMAX agrees to make, the company is said to “turn down about four
or five”. This same sentiment was echoed by Mr Adam Aron, CEO of AMC Entertainment,
during the company’s latest earnings conference call:
“IMAX is incredibly seamlessly intertwined with Hollywood. There is lots of footage in
various blockbuster movies where there is specific unique IMAX content, filmed with IMAX
cameras, showable only in IMAX auditoriums.”
– Adam Aron, CEO of AMC Entertainment, 1Q16 earnings call
In our opinion, no other unconventional technology provider, be it China Film Giant Screen,
CJ CGV or Dolby Vision, comes close to IMAX China in terms of the relationships with
studios or movie directors. In the long run, this should enhance the customer stickiness
and awareness of the IMAX brand.
0.2
0.4
0.5
1.2
China indust ry average
Other PLF screens
China film giant screen
IMAX
53%
61%
65%
100%
CJ CGV's 4DX
China Film Giant Screen
Wanda's X-Land
IMAX
No other unconventional
cinema technology
provider can match the
close relationship
between Hollywood and
IMAX
13
IMAX China Holding (1970 HK): 16 June 2016
“High-Definition” revenue visibility
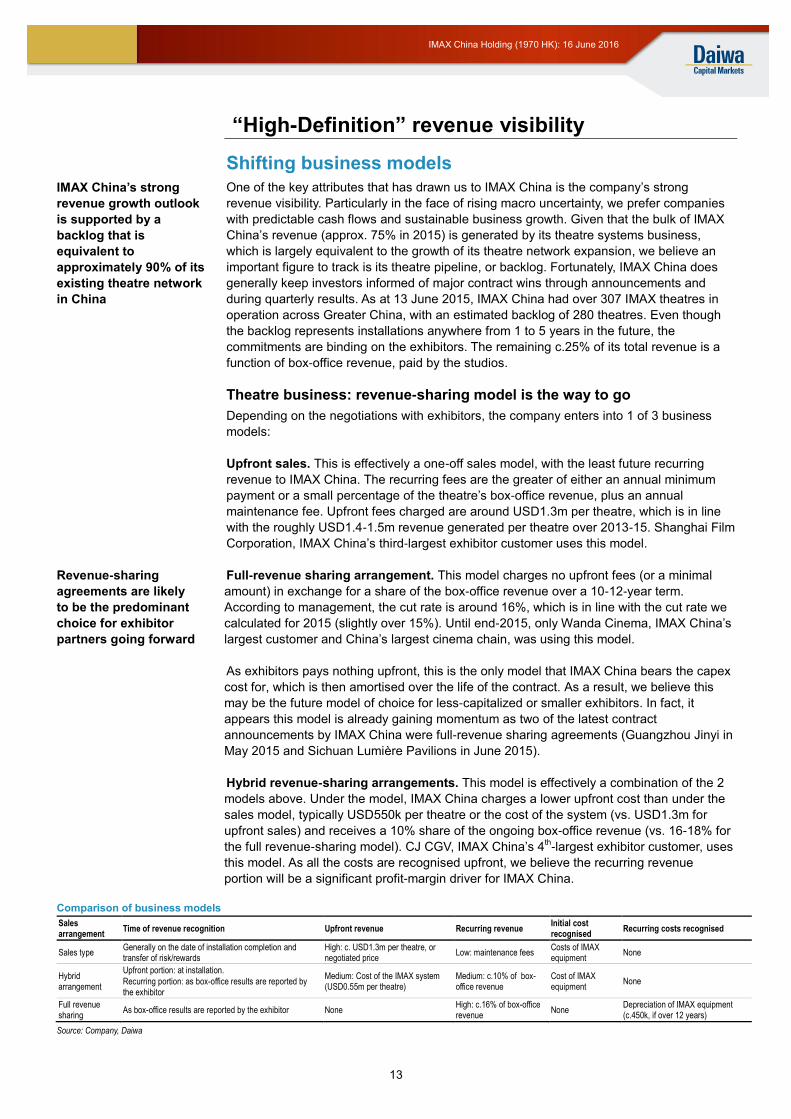
Shifting business models
One of the key attributes that has drawn us to IMAX China is the company’s strong
revenue visibility. Particularly in the face of rising macro uncertainty, we prefer companies
with predictable cash flows and sustainable business growth. Given that the bulk of IMAX
China’s revenue (approx. 75% in 2015) is generated by its theatre systems business,
which is largely equivalent to the growth of its theatre network expansion, we believe an
important figure to track is its theatre pipeline, or backlog. Fortunately, IMAX China does
generally keep investors informed of major contract wins through announcements and
during quarterly results. As at 13 June 2015, IMAX China had over 307 IMAX theatres in
operation across Greater China, with an estimated backlog of 280 theatres. Even though
the backlog represents installations anywhere from 1 to 5 years in the future, the
commitments are binding on the exhibitors. The remaining c.25% of its total revenue is a
function of box-office revenue, paid by the studios.
Theatre business: revenue-sharing model is the way to go
Depending on the negotiations with exhibitors, the company enters into 1 of 3 business
models:
Upfront sales. This is effectively a one-off sales model, with the least future recurring
revenue to IMAX China. The recurring fees are the greater of either an annual minimum
payment or a small percentage of the theatre’s box-office revenue, plus an annual
maintenance fee. Upfront fees charged are around USD1.3m per theatre, which is in line
with the roughly USD1.4-1.5m revenue generated per theatre over 2013-15. Shanghai Film
Corporation, IMAX China’s third-largest exhibitor customer uses this model.
Full-revenue sharing arrangement. This model charges no upfront fees (or a minimal
amount) in exchange for a share of the box-office revenue over a 10-12-year term.
According to management, the cut rate is around 16%, which is in line with the cut rate we
calculated for 2015 (slightly over 15%). Until end-2015, only Wanda Cinema, IMAX China’s
largest customer and China’s largest cinema chain, was using this model.
As exhibitors pays nothing upfront, this is the only model that IMAX China bears the capex
cost for, which is then amortised over the life of the contract. As a result, we believe this
may be the future model of choice for less-capitalized or smaller exhibitors. In fact, it
appears this model is already gaining momentum as two of the latest contract
announcements by IMAX China were full-revenue sharing agreements (Guangzhou Jinyi in
May 2015 and Sichuan Lumière Pavilions in June 2015).
Hybrid revenue-sharing arrangements. This model is effectively a combination of the 2
models above. Under the model, IMAX China charges a lower upfront cost than under the
sales model, typically USD550k per theatre or the cost of the system (vs. USD1.3m for
upfront sales) and receives a 10% share of the ongoing box-office revenue (vs. 16-18% for
the full revenue-sharing model). CJ CGV, IMAX China’s 4th-largest exhibitor customer, uses
this model. As all the costs are recognised upfront, we believe the recurring revenue
portion will be a significant profit-margin driver for IMAX China.
Comparison of business models
Sales arrangement
Time of revenue recognition Upfront revenue Recurring revenue Initial cost recognised
Recurring costs recognised
Sales type Generally on the date of installation completion and transfer of risk/rewards
High: c. USD1.3m per theatre, or negotiated price
Low: maintenance fees Costs of IMAX equipment
None
Hybrid arrangement
Upfront portion: at installation.
Recurring portion: as box-office results are reported by the exhibitor
Medium: Cost of the IMAX system (USD0.55m per theatre)
Medium: c.10% of box-office revenue
Cost of IMAX equipment
None
Full revenue sharing
As box-office results are reported by the exhibitor None High: c.16% of box-office revenue
None Depreciation of IMAX equipment (c.450k, if over 12 years)
Source: Company, Daiwa
IMAX China’s strong
revenue growth outlook
is supported by a
backlog that is
equivalent to
approximately 90% of its
existing theatre network
in China
Revenue-sharing
agreements are likely
to be the predominant
choice for exhibitor
partners going forward

14
IMAX China Holding (1970 HK): 16 June 2016
Film business: capturing the upside of a studio’s success
Apart from generating revenue from exhibitors, IMAX China also shares a portion of the
revenue collected by the studios, mainly for the DMR conversion process and the
exhibition of their films on IMAX’s theatre network. The revenue sharing rate is 9.5% for
Hollywood films and 12.5% for converted-IMAX Chinese films currently.
We believe the film business is a substantial gross- and net-margin driver for IMAX China
as this business has a very high operating leverage. We note that the cost of converting
the films into the IMAX format (DMR process) is fixed: USD150,000 for a 2D film and
USD200,000 for a 3D film. Hence, IMAX China’s revenue share with the studios would
also increase with China’s growing box-office revenue, but with almost no additional
associated costs. Theoretically, this could allow for a continuous improvement in IMAX
China’s operating leverage as long as the China box-office revenue keeps increasing.
Key assumptions for IMAX China box-office revenue
In 2015, roughly 47% of IMAX China’s total revenue was linked to its China box-office
performance. Due to the likely increase in revenue-sharing business models going forward,
we expect the proportion of recurring revenue for IMAX China to rise from 56% in 2015 to
71% in 2018E.
While for many companies, revenue is simply a function of quantity (akin to the number of
theatres in China) and the average price (akin to the average movie ticket price), we note
that a third variable also comes into play for box-office sales – the quality of the film slate
(or movie pipeline) – one that is admittedly hard to forecast or control. According to
Deloitte, much of annual movie box-office revenue (roughly 40%) is driven by just the top-5
blockbusters alone (based on US box-office analysis). Hence, if box-office revenue is weak
in any given year, the revenue of exhibitors, studios and IMAX could be negatively
affected.
Diversifying the swing factor (quality of the movie slate)
For IMAX China, we believe this swing factor will not have a noticeable impact on the
company’s top line over the near term as: 1) unlike the US, China’s movie attendance
remains on a solid uptrend and there are still many more years of growth to come, in our
view; and 2) the movies that are shown at IMAX theatres in China are even more
diversified than those in the US, as the company is increasing the number of Chinese-
language films that it runs.
We believe the key variables in the film slate that can affect IMAX China in terms of
revenue are the quality of the individual movies (box-office performance), the genre of
movies (action-oriented or super-hero movies typically attract higher attendance to IMAX
theatres) and the impact of regulations such as release windows (ie, the time frames within
which certain movies can be released) and film quotas (which includes the quality of the
movies actually chosen to be imported).
Viewing preferences of US and China audiences are not the same
While IMAX China has a much heavier reliance on Hollywood movies than other exhibitors
in China (75% of IMAX China’s box-office revenue in 2015 was accounted for by
Hollywood movies, vs. around 45% for a typical exhibitor in China), we assume that strong
box-office performance in the US immediately translates into similarly strong performance
for IMAX China. Although the likelihood of this happening tends to be high, we note that
there can be variability due to differences in release schedules and consumer behaviour.
We believe that the most important factor that can skew the box-office performance of a
film is the Chinese government’s restrictions on release windows, which favour
domestically produced films in order to protect the local film industry. Typically, there are 5
months of the year, namely February (Chinese New Year), July, August (summer holidays),
October (national holiday), and December (winter holidays) that are black-out periods for
Theoretically, the film
business could allow for
perpetual operating
leverage, as long as the
box office keeps rising
Restrictions on release
windows and differences
in consumer tastes
result in the US and
China box-office
performances differing
15
IMAX China Holding (1970 HK): 16 June 2016
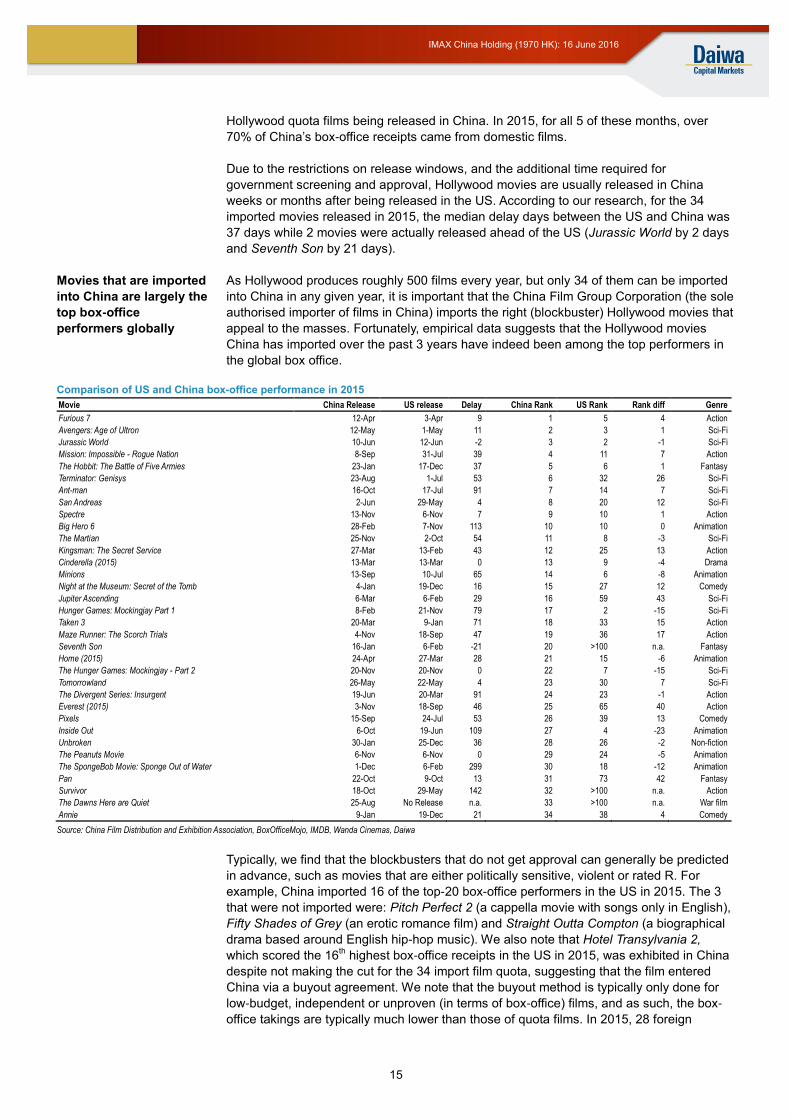
Hollywood quota films being released in China. In 2015, for all 5 of these months, over
70% of China’s box-office receipts came from domestic films.
Due to the restrictions on release windows, and the additional time required for
government screening and approval, Hollywood movies are usually released in China
weeks or months after being released in the US. According to our research, for the 34
imported movies released in 2015, the median delay days between the US and China was
37 days while 2 movies were actually released ahead of the US (Jurassic World by 2 days
and Seventh Son by 21 days).
As Hollywood produces roughly 500 films every year, but only 34 of them can be imported
into China in any given year, it is important that the China Film Group Corporation (the sole
authorised importer of films in China) imports the right (blockbuster) Hollywood movies that
appeal to the masses. Fortunately, empirical data suggests that the Hollywood movies
China has imported over the past 3 years have indeed been among the top performers in
the global box office.
Comparison of US and China box-office performance in 2015
Movie China Release US release Delay China Rank US Rank Rank diff Genre
Furious 7 12-Apr 3-Apr 9 1 5 4 Action
Avengers: Age of Ultron 12-May 1-May 11 2 3 1 Sci-Fi
Jurassic World 10-Jun 12-Jun -2 3 2 -1 Sci-Fi
Mission: Impossible - Rogue Nation 8-Sep 31-Jul 39 4 11 7 Action
The Hobbit: The Battle of Five Armies 23-Jan 17-Dec 37 5 6 1 Fantasy
Terminator: Genisys 23-Aug 1-Jul 53 6 32 26 Sci-Fi
Ant-man 16-Oct 17-Jul 91 7 14 7 Sci-Fi
San Andreas 2-Jun 29-May 4 8 20 12 Sci-Fi
Spectre 13-Nov 6-Nov 7 9 10 1 Action
Big Hero 6 28-Feb 7-Nov 113 10 10 0 Animation
The Martian 25-Nov 2-Oct 54 11 8 -3 Sci-Fi
Kingsman: The Secret Service 27-Mar 13-Feb 43 12 25 13 Action
Cinderella (2015) 13-Mar 13-Mar 0 13 9 -4 Drama
Minions 13-Sep 10-Jul 65 14 6 -8 Animation
Night at the Museum: Secret of the Tomb 4-Jan 19-Dec 16 15 27 12 Comedy
Jupiter Ascending 6-Mar 6-Feb 29 16 59 43 Sci-Fi
Hunger Games: Mockingjay Part 1 8-Feb 21-Nov 79 17 2 -15 Sci-Fi
Taken 3 20-Mar 9-Jan 71 18 33 15 Action
Maze Runner: The Scorch Trials 4-Nov 18-Sep 47 19 36 17 Action
Seventh Son 16-Jan 6-Feb -21 20 >100 n.a. Fantasy
Home (2015) 24-Apr 27-Mar 28 21 15 -6 Animation
The Hunger Games: Mockingjay - Part 2 20-Nov 20-Nov 0 22 7 -15 Sci-Fi
Tomorrowland 26-May 22-May 4 23 30 7 Sci-Fi
The Divergent Series: Insurgent 19-Jun 20-Mar 91 24 23 -1 Action
Everest (2015) 3-Nov 18-Sep 46 25 65 40 Action
Pixels 15-Sep 24-Jul 53 26 39 13 Comedy
Inside Out 6-Oct 19-Jun 109 27 4 -23 Animation
Unbroken 30-Jan 25-Dec 36 28 26 -2 Non-fiction
The Peanuts Movie 6-Nov 6-Nov 0 29 24 -5 Animation
The SpongeBob Movie: Sponge Out of Water 1-Dec 6-Feb 299 30 18 -12 Animation
Pan 22-Oct 9-Oct 13 31 73 42 Fantasy
Survivor 18-Oct 29-May 142 32 >100 n.a. Action
The Dawns Here are Quiet 25-Aug No Release n.a. 33 >100 n.a. War film
Annie 9-Jan 19-Dec 21 34 38 4 Comedy
Source: China Film Distribution and Exhibition Association, BoxOfficeMojo, IMDB, Wanda Cinemas, Daiwa
Typically, we find that the blockbusters that do not get approval can generally be predicted
in advance, such as movies that are either politically sensitive, violent or rated R. For
example, China imported 16 of the top-20 box-office performers in the US in 2015. The 3
that were not imported were: Pitch Perfect 2 (a cappella movie with songs only in English),
Fifty Shades of Grey (an erotic romance film) and Straight Outta Compton (a biographical
drama based around English hip-hop music). We also note that Hotel Transylvania 2,
which scored the 16th highest box-office receipts in the US in 2015, was exhibited in China
despite not making the cut for the 34 import film quota, suggesting that the film entered
China via a buyout agreement. We note that the buyout method is typically only done for
low-budget, independent or unproven (in terms of box-office) films, and as such, the box-
office takings are typically much lower than those of quota films. In 2015, 28 foreign
Movies that are imported
into China are largely the
top box-office
performers globally
16
IMAX China Holding (1970 HK): 16 June 2016
movies were imported via the buyout method, but only 5 managed to earn more than
CNY100m at the box office.
Importantly, of 2015’s top-10 movies at the box office in the US, all 10 were shown in
China. While most of the movies performed well in both countries in terms of box-office
rankings, there were a couple of exceptions. For example, 2 movies in China’s top-10 at
the box office had a ranking difference of over 10 spots compared with the US; namely
Terminator Genisys appeared to be a much bigger hit in China than in the US, coming in at
6th highest at the box office in China vs. only 32 in the US, while San Andreas came in at
8th position in China, but was ranked 20
th in the US.
A more recent example of how big China and US viewing preferences can differ: the
Warcraft movie, which was launched in the US on 10 June 2016, has been a clear flop,
having generated only USD28.4m over 5 days, according to BoxOfficeMojo (production
budget of approximately USD160m). In contrast, the Warcraft movie was launched in
China 2 days earlier (on 8 June 2016) but generated USD156m in 5 days, and appears set
to overtake Furious 7 as the highest grossing Hollywood film in China. While we believe it
is unlikely that there will be many other movies that would see a contrasting movie
reception of this magnitude (since the key reason for the movie’s success is that roughly
half of the game’s 5m players are from China), we believe it illustrates the complexity in
predicting box office successes.
After analysing box-office performance trends in China, we have observed 2 traits that
increase the likelihood of a strong box-office slate:
1) Action and sci-fi movies. It appears that Chinese movie goers prefer 2 genres the
most: action and science fiction (sci-fi) movies. Among the top-20 Hollywood movies in
China in 2015, 14 were either action or sci-fi movies vs. only 11 in the US. We note
that action and sci-fi movies are most often the candidates for an IMAX-formatted
movie, particularly for IMAX 3D.
2) Franchise films or super-hero movies. Over the past several years, we have
noticed that many of the top box-office performers in China have been typically part of
a renowned global franchise (like the Fast and Furious series) or super-hero movies
(from Marvel and DC Comics etc).
Action and sci-fi genres
as well as major
franchise films typically
do well at the box office
in China
17
IMAX China Holding (1970 HK): 16 June 2016
FAQ: How does China’s film quota affect IMAX China?
Short answer: unless the Chinese Government cuts the film import quota significantly (ie,
by more than 30%), we see no significant impact on IMAX China in terms of risk or reward.
Under China’s censorship rules and regulations, the number of films imported (mostly
Hollywood films) into China is restricted by a film quota. In general, only 20 Hollywood films
may be imported in to China per year; but in 2012, the Chinese Government signed an
agreement with the World Trade Organization to permit an additional 14 3D or IMAX format
films to be imported, on top of the previous quota of 20 Hollywood films. This amounts to
34 Hollywood films that IMAX China can work with every year. However, the 2012
agreement for an additional 14 3D or IMAX films is set to expire at the end of 2016 and is
subject to renegotiation.
Given the significant growth of China’s box-office takings (in turn benefiting the government
and social welfare through a 3.3% business tax and a 5% tax for the national special fund
for the film industry’s development), we believe the chance that this additional quota will
not be renewed is extremely slim. On the contrary, we see upside to the quota given the
appetite of Chinese movie-goers.
In terms of revenue growth or profitability, we believe the film quota itself does not
adversely affect IMAX China. Of the 34 Hollywood films that were imported into China in
2015, 23 were shown in IMAX, meaning the quota was around 30% under-utilised by
IMAX. Additionally, 23 films in a year averages just under 2 IMAX films per month. Given
that the average life cycle for a film is roughly 2 weeks in China, 23 films should already be
sufficient to utilise the IMAX theatre network efficiently, since there is typically only 1 IMAX
screen per location in China.
In reality, the Chinese Government has tight control over the release windows for
Hollywood films. Typically, Hollywood films are locked out of peak movie-going seasons,
such as December, when the best release windows are reserved for domestically
produced films. This means that during some months of the year, 3 or 4 Hollywood films
can be fighting for 1 IMAX screen per location. Hence, in the absence of a regulatory
change regarding the release windows for Hollywood films, we see limited upside from
having a significantly greater quota or even having the quota removed altogether.
2016 Hollywood slate is good, but 2017 could be even better
Judging by the first 4 months of box-office numbers, the strong appetite for movie-going
has carried into 2016, with total box-office receipts rising by 28% YoY to CNY17.6bn.
However, when broken down by domestic films and imported films, all of the incremental
growth was driven by domestic films, with a 54% YoY increase in box-office revenue, while
imported films actually recorded a 4% YoY decline. We believe the relatively poor
performance of imported films was a result of several domestic mega blockbusters, with 3
local films dominating the top-5 at the box office. Notably, Stephen Chow’s The Mermaid
was the first domestically produced film that exceeded CNY3bn at the box-office and so far
in 2016, has generated more than twice the box-office revenue of the second best film,
Zootopia, a Hollywood film. Journey to the West: Conquering Demons and From Vegas to
Macau III took number 3 and 4 spots in terms of box-office receipts.
Unfortunately, of the 3 domestic blockbusters, only Journey to the West: Conquering
Demons was shown in IMAX format. Hence, the lack of IMAX for the record-breaking
movie The Mermaid, likely dragged down IMAX China’s box-office performance. Although
the company did collect box-office receipts of CNY83.4m in Greater China in 1Q16,
representing a 33% YoY increase, we believe most of the growth was a result of its theatre
network expansion, which expanded by 31% YoY to 312 theatres. We believe a more
China domestic films
have dominated the top
box-office in 2016
18
IMAX China Holding (1970 HK): 16 June 2016
representative figure is the IMAX Greater China per screen average, which dropped from
USD295,400 to USD290,000 in 1Q16, a sign that the quality of the film slate declined.
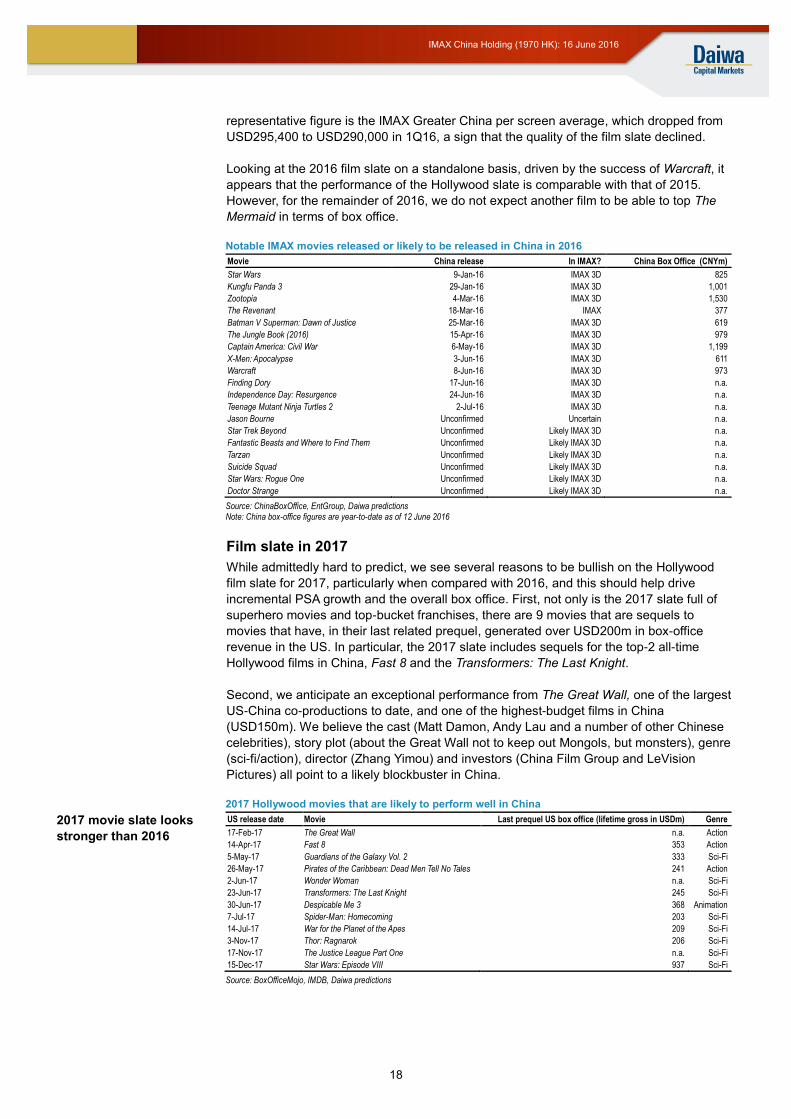
Looking at the 2016 film slate on a standalone basis, driven by the success of Warcraft, it
appears that the performance of the Hollywood slate is comparable with that of 2015.
However, for the remainder of 2016, we do not expect another film to be able to top The
Mermaid in terms of box office.
Notable IMAX movies released or likely to be released in China in 2016
Movie China release In IMAX? China Box Office (CNYm)
Star Wars 9-Jan-16 IMAX 3D 825
Kungfu Panda 3 29-Jan-16 IMAX 3D 1,001
Zootopia 4-Mar-16 IMAX 3D 1,530
The Revenant 18-Mar-16 IMAX 377
Batman V Superman: Dawn of Justice 25-Mar-16 IMAX 3D 619
The Jungle Book (2016) 15-Apr-16 IMAX 3D 979
Captain America: Civil War 6-May-16 IMAX 3D 1,199
X-Men: Apocalypse 3-Jun-16 IMAX 3D 611
Warcraft 8-Jun-16 IMAX 3D 973
Finding Dory 17-Jun-16 IMAX 3D n.a.
Independence Day: Resurgence 24-Jun-16 IMAX 3D n.a.
Teenage Mutant Ninja Turtles 2 2-Jul-16 IMAX 3D n.a.
Jason Bourne Unconfirmed Uncertain n.a.
Star Trek Beyond Unconfirmed Likely IMAX 3D n.a.
Fantastic Beasts and Where to Find Them Unconfirmed Likely IMAX 3D n.a.
Tarzan Unconfirmed Likely IMAX 3D n.a.
Suicide Squad Unconfirmed Likely IMAX 3D n.a.
Star Wars: Rogue One Unconfirmed Likely IMAX 3D n.a.
Doctor Strange Unconfirmed Likely IMAX 3D n.a.
Source: ChinaBoxOffice, EntGroup, Daiwa predictions Note: China box-office figures are year-to-date as of 12 June 2016
Film slate in 2017
While admittedly hard to predict, we see several reasons to be bullish on the Hollywood
film slate for 2017, particularly when compared with 2016, and this should help drive
incremental PSA growth and the overall box office. First, not only is the 2017 slate full of
superhero movies and top-bucket franchises, there are 9 movies that are sequels to
movies that have, in their last related prequel, generated over USD200m in box-office
revenue in the US. In particular, the 2017 slate includes sequels for the top-2 all-time
Hollywood films in China, Fast 8 and the Transformers: The Last Knight.
Second, we anticipate an exceptional performance from The Great Wall, one of the largest
US-China co-productions to date, and one of the highest-budget films in China
(USD150m). We believe the cast (Matt Damon, Andy Lau and a number of other Chinese
celebrities), story plot (about the Great Wall not to keep out Mongols, but monsters), genre
(sci-fi/action), director (Zhang Yimou) and investors (China Film Group and LeVision
Pictures) all point to a likely blockbuster in China.
2017 Hollywood movies that are likely to perform well in China
2017 movie slate looks
stronger than 2016
US release date Movie Last prequel US box office (lifetime gross in USDm) Genre
17-Feb-17 The Great Wall n.a. Action
14-Apr-17 Fast 8 353 Action
5-May-17 Guardians of the Galaxy Vol. 2 333 Sci-Fi
26-May-17 Pirates of the Caribbean: Dead Men Tell No Tales 241 Action
2-Jun-17 Wonder Woman n.a. Sci-Fi
23-Jun-17 Transformers: The Last Knight 245 Sci-Fi
30-Jun-17 Despicable Me 3 368 Animation
7-Jul-17 Spider-Man: Homecoming 203 Sci-Fi
14-Jul-17 War for the Planet of the Apes 209 Sci-Fi
3-Nov-17 Thor: Ragnarok 206 Sci-Fi
17-Nov-17 The Justice League Part One n.a. Sci-Fi
15-Dec-17 Star Wars: Episode VIII 937 Sci-Fi
Source: BoxOfficeMojo, IMDB, Daiwa predictions
19
IMAX China Holding (1970 HK): 16 June 2016
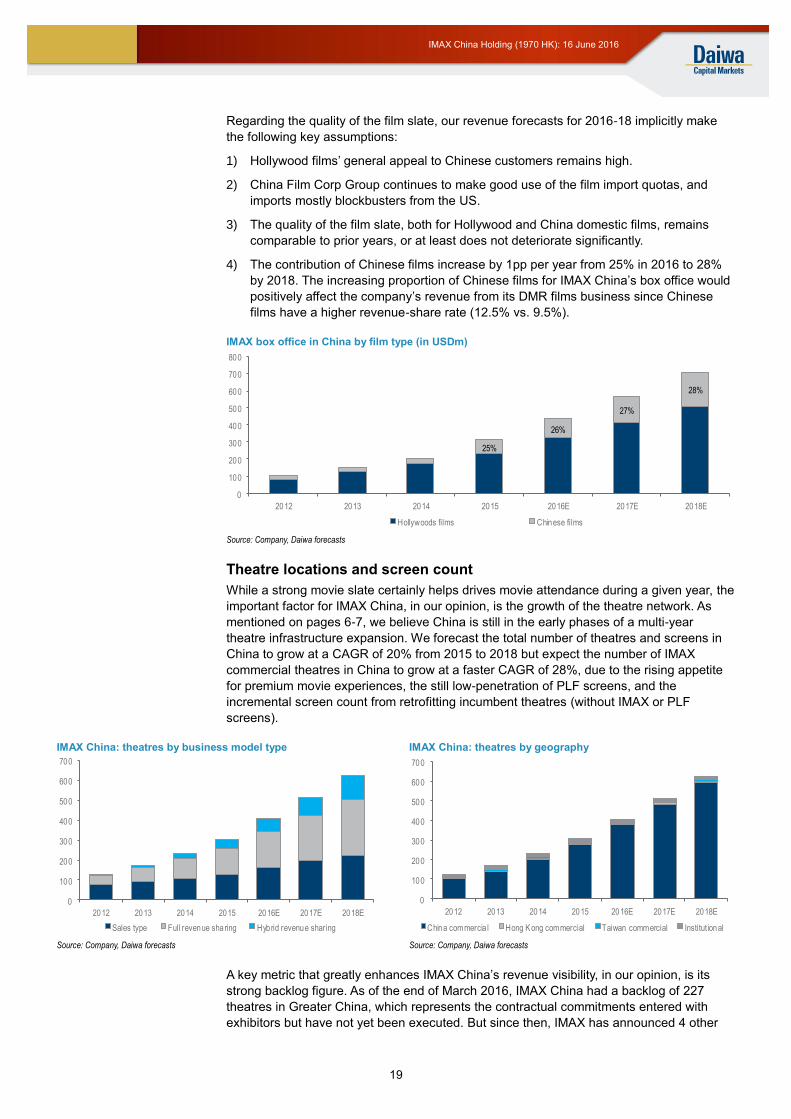
Regarding the quality of the film slate, our revenue forecasts for 2016-18 implicitly make
the following key assumptions:
1) Hollywood films’ general appeal to Chinese customers remains high.
2) China Film Corp Group continues to make good use of the film import quotas, and
imports mostly blockbusters from the US.
3) The quality of the film slate, both for Hollywood and China domestic films, remains
comparable to prior years, or at least does not deteriorate significantly.
4) The contribution of Chinese films increase by 1pp per year from 25% in 2016 to 28%
by 2018. The increasing proportion of Chinese films for IMAX China’s box office would
positively affect the company’s revenue from its DMR films business since Chinese
films have a higher revenue-share rate (12.5% vs. 9.5%).
IMAX box office in China by film type (in USDm)
Source: Company, Daiwa forecasts
Theatre locations and screen count
While a strong movie slate certainly helps drives movie attendance during a given year, the
important factor for IMAX China, in our opinion, is the growth of the theatre network. As
mentioned on pages 6-7, we believe China is still in the early phases of a multi-year
theatre infrastructure expansion. We forecast the total number of theatres and screens in
China to grow at a CAGR of 20% from 2015 to 2018 but expect the number of IMAX
commercial theatres in China to grow at a faster CAGR of 28%, due to the rising appetite
for premium movie experiences, the still low-penetration of PLF screens, and the
incremental screen count from retrofitting incumbent theatres (without IMAX or PLF
screens).
IMAX China: theatres by business model type IMAX China: theatres by geography
Source: Company, Daiwa forecasts Source: Company, Daiwa forecasts
A key metric that greatly enhances IMAX China’s revenue visibility, in our opinion, is its
strong backlog figure. As of the end of March 2016, IMAX China had a backlog of 227
theatres in Greater China, which represents the contractual commitments entered with
exhibitors but have not yet been executed. But since then, IMAX has announced 4 other
25%
26%
27%
28%
0
100
200
300
400
500
600
700
800
2012 2013 2014 2015 2016E 2017E 2018E
Hollywoods films Chinese films
0
100
200
300
400
500
600
700
2012 2013 2014 2015 2016E 2017E 2018E
Sales type Full revenue sharing Hybrid revenue sharing
0
100
200
300
400
500
600
700
2012 2013 2014 2015 2016E 2017E 2018E
China commercia l Hong Kong commercial Taiwan commercial Institut ional
20
IMAX China Holding (1970 HK): 16 June 2016
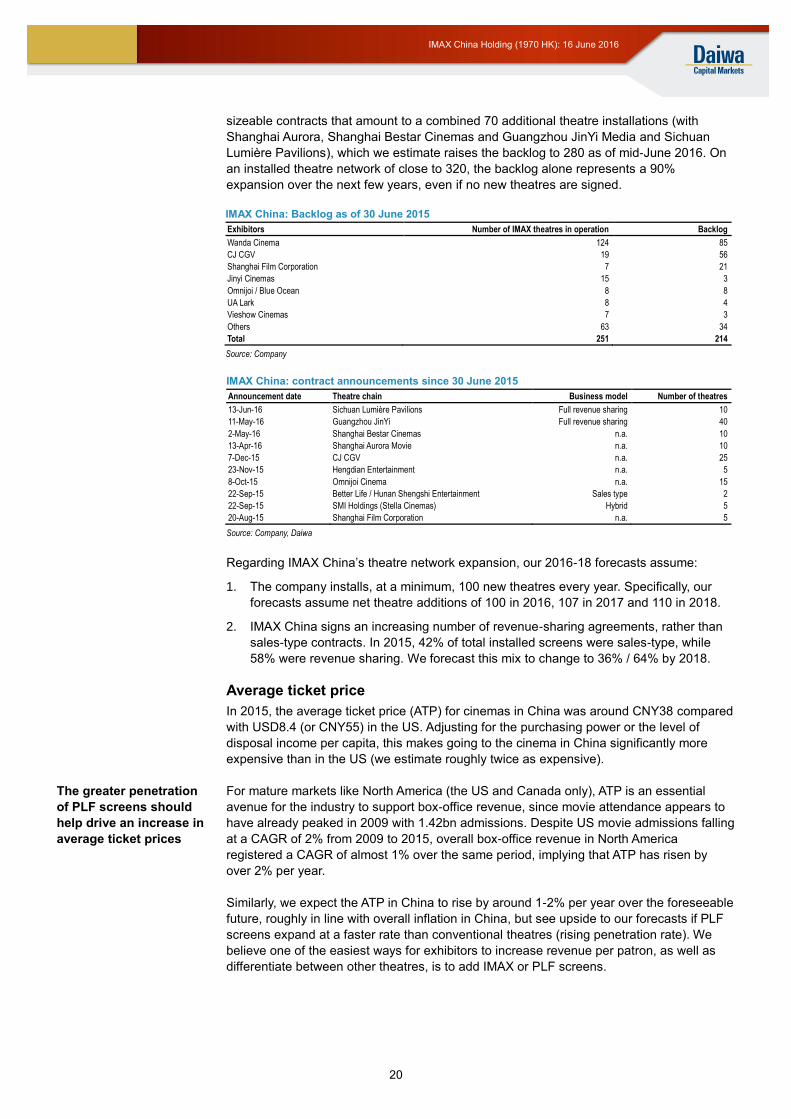
sizeable contracts that amount to a combined 70 additional theatre installations (with
Shanghai Aurora, Shanghai Bestar Cinemas and Guangzhou JinYi Media and Sichuan
Lumière Pavilions), which we estimate raises the backlog to 280 as of mid-June 2016. On
an installed theatre network of close to 320, the backlog alone represents a 90%
expansion over the next few years, even if no new theatres are signed.
IMAX China: Backlog as of 30 June 2015
Exhibitors Number of IMAX theatres in operation Backlog
Wanda Cinema 124 85
CJ CGV 19 56
Shanghai Film Corporation 7 21
Jinyi Cinemas 15 3
Omnijoi / Blue Ocean 8 8
UA Lark 8 4
Vieshow Cinemas 7 3
Others 63 34
Total 251 214
Source: Company
IMAX China: contract announcements since 30 June 2015
Announcement date Theatre chain Business model Number of theatres
13-Jun-16 Sichuan Lumière Pavilions Full revenue sharing 10
11-May-16 Guangzhou JinYi Full revenue sharing 40
2-May-16 Shanghai Bestar Cinemas n.a. 10
13-Apr-16 Shanghai Aurora Movie n.a. 10
7-Dec-15 CJ CGV n.a. 25
23-Nov-15 Hengdian Entertainment n.a. 5
8-Oct-15 Omnijoi Cinema n.a. 15
22-Sep-15 Better Life / Hunan Shengshi Entertainment Sales type 2
22-Sep-15 SMI Holdings (Stella Cinemas) Hybrid 5
20-Aug-15 Shanghai Film Corporation n.a. 5
Source: Company, Daiwa
Regarding IMAX China’s theatre network expansion, our 2016-18 forecasts assume:
1. The company installs, at a minimum, 100 new theatres every year. Specifically, our
forecasts assume net theatre additions of 100 in 2016, 107 in 2017 and 110 in 2018.
2. IMAX China signs an increasing number of revenue-sharing agreements, rather than
sales-type contracts. In 2015, 42% of total installed screens were sales-type, while
58% were revenue sharing. We forecast this mix to change to 36% / 64% by 2018.
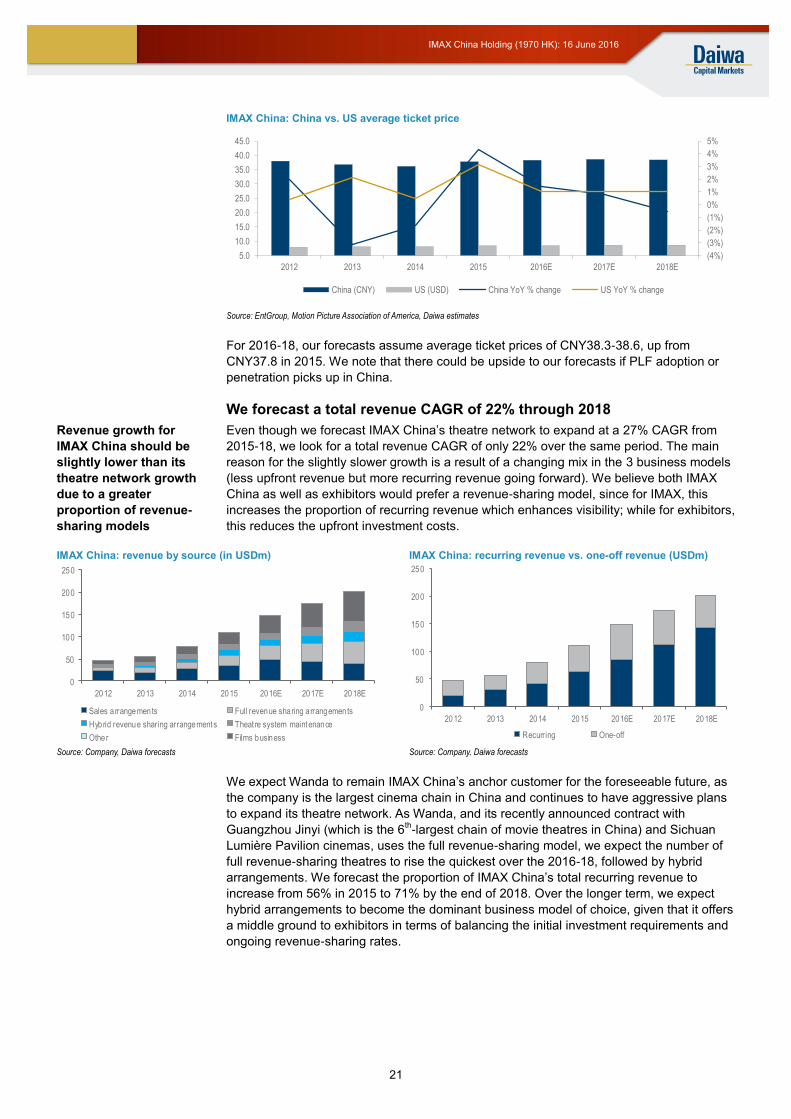
Average ticket price
In 2015, the average ticket price (ATP) for cinemas in China was around CNY38 compared
with USD8.4 (or CNY55) in the US. Adjusting for the purchasing power or the level of
disposal income per capita, this makes going to the cinema in China significantly more
expensive than in the US (we estimate roughly twice as expensive).
For mature markets like North America (the US and Canada only), ATP is an essential
avenue for the industry to support box-office revenue, since movie attendance appears to
have already peaked in 2009 with 1.42bn admissions. Despite US movie admissions falling
at a CAGR of 2% from 2009 to 2015, overall box-office revenue in North America
registered a CAGR of almost 1% over the same period, implying that ATP has risen by
over 2% per year.
Similarly, we expect the ATP in China to rise by around 1-2% per year over the foreseeable
future, roughly in line with overall inflation in China, but see upside to our forecasts if PLF
screens expand at a faster rate than conventional theatres (rising penetration rate). We
believe one of the easiest ways for exhibitors to increase revenue per patron, as well as
differentiate between other theatres, is to add IMAX or PLF screens.
The greater penetration
of PLF screens should
help drive an increase in
average ticket prices
21
IMAX China Holding (1970 HK): 16 June 2016
IMAX China: China vs. US average ticket price
Source: EntGroup, Motion Picture Association of America, Daiwa estimates
For 2016-18, our forecasts assume average ticket prices of CNY38.3-38.6, up from
CNY37.8 in 2015. We note that there could be upside to our forecasts if PLF adoption or
penetration picks up in China.
We forecast a total revenue CAGR of 22% through 2018
Even though we forecast IMAX China’s theatre network to expand at a 27% CAGR from
2015-18, we look for a total revenue CAGR of only 22% over the same period. The main
reason for the slightly slower growth is a result of a changing mix in the 3 business models
(less upfront revenue but more recurring revenue going forward). We believe both IMAX
China as well as exhibitors would prefer a revenue-sharing model, since for IMAX, this
increases the proportion of recurring revenue which enhances visibility; while for exhibitors,
this reduces the upfront investment costs.
IMAX China: revenue by source (in USDm) IMAX China: recurring revenue vs. one-off revenue (USDm)
Source: Company, Daiwa forecasts Source: Company, Daiwa forecasts
We expect Wanda to remain IMAX China’s anchor customer for the foreseeable future, as
the company is the largest cinema chain in China and continues to have aggressive plans
to expand its theatre network. As Wanda, and its recently announced contract with
Guangzhou Jinyi (which is the 6th-largest chain of movie theatres in China) and Sichuan
Lumière Pavilion cinemas, uses the full revenue-sharing model, we expect the number of
full revenue-sharing theatres to rise the quickest over the 2016-18, followed by hybrid
arrangements. We forecast the proportion of IMAX China’s total recurring revenue to
increase from 56% in 2015 to 71% by the end of 2018. Over the longer term, we expect
hybrid arrangements to become the dominant business model of choice, given that it offers
a middle ground to exhibitors in terms of balancing the initial investment requirements and
ongoing revenue-sharing rates.
(4%)
(3%)
(2%)
(1%)
0%
1%
2%
3%
4%
5%
5.0
10.0
15.0
20.0
25.0
30.0
35.0
40.0
45.0
2012 2013 2014 2015 2016E 2017E 2018E
China (CNY) US (USD) China YoY % change US YoY % change
0
50
100
150
200
250
2012 2013 2014 2015 2016E 2017E 2018E
Sales arrangements Full revenue sharing arrangements
Hybrid revenue sharing arrangements Theat re system maintenance
Other Films business
0
50
100
150
200
250
2012 2013 2014 2015 2016E 2017E 2018E
Recurring One-off
Revenue growth for
IMAX China should be
slightly lower than its
theatre network growth
due to a greater
proportion of revenue-
sharing models
22
IMAX China Holding (1970 HK): 16 June 2016
Enhanced earnings quality
A prime reason for multiple expansion
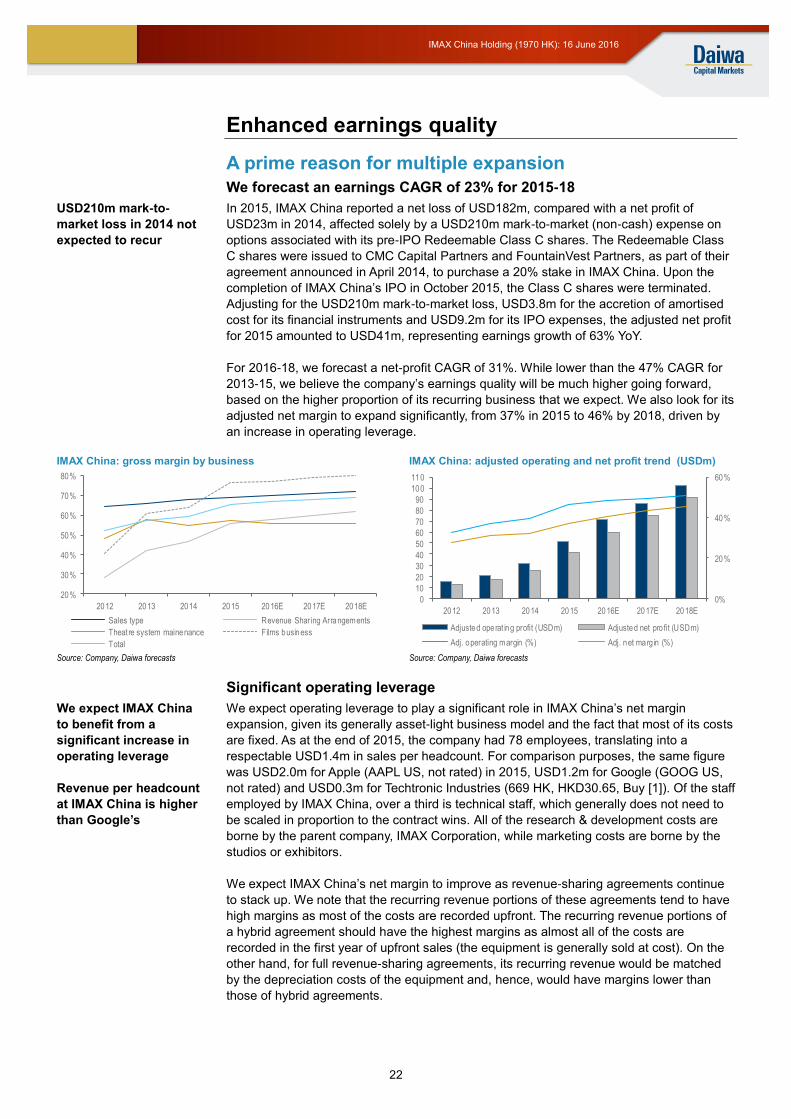
We forecast an earnings CAGR of 23% for 2015-18
In 2015, IMAX China reported a net loss of USD182m, compared with a net profit of
USD23m in 2014, affected solely by a USD210m mark-to-market (non-cash) expense on
options associated with its pre-IPO Redeemable Class C shares. The Redeemable Class
C shares were issued to CMC Capital Partners and FountainVest Partners, as part of their
agreement announced in April 2014, to purchase a 20% stake in IMAX China. Upon the
completion of IMAX China’s IPO in October 2015, the Class C shares were terminated.
Adjusting for the USD210m mark-to-market loss, USD3.8m for the accretion of amortised
cost for its financial instruments and USD9.2m for its IPO expenses, the adjusted net profit
for 2015 amounted to USD41m, representing earnings growth of 63% YoY.
For 2016-18, we forecast a net-profit CAGR of 31%. While lower than the 47% CAGR for
2013-15, we believe the company’s earnings quality will be much higher going forward,
based on the higher proportion of its recurring business that we expect. We also look for its
adjusted net margin to expand significantly, from 37% in 2015 to 46% by 2018, driven by
an increase in operating leverage.
IMAX China: gross margin by business IMAX China: adjusted operating and net profit trend (USDm)
Source: Company, Daiwa forecasts Source: Company, Daiwa forecasts
Significant operating leverage
We expect operating leverage to play a significant role in IMAX China’s net margin
expansion, given its generally asset-light business model and the fact that most of its costs
are fixed. As at the end of 2015, the company had 78 employees, translating into a
respectable USD1.4m in sales per headcount. For comparison purposes, the same figure
was USD2.0m for Apple (AAPL US, not rated) in 2015, USD1.2m for Google (GOOG US,
not rated) and USD0.3m for Techtronic Industries (669 HK, HKD30.65, Buy [1]). Of the staff
employed by IMAX China, over a third is technical staff, which generally does not need to
be scaled in proportion to the contract wins. All of the research & development costs are
borne by the parent company, IMAX Corporation, while marketing costs are borne by the
studios or exhibitors.
We expect IMAX China’s net margin to improve as revenue-sharing agreements continue
to stack up. We note that the recurring revenue portions of these agreements tend to have
high margins as most of the costs are recorded upfront. The recurring revenue portions of
a hybrid agreement should have the highest margins as almost all of the costs are
recorded in the first year of upfront sales (the equipment is generally sold at cost). On the
other hand, for full revenue-sharing agreements, its recurring revenue would be matched
by the depreciation costs of the equipment and, hence, would have margins lower than
those of hybrid agreements.
20%
30%
40%
50%
60%
70%
80%
2012 2013 2014 2015 2016E 2017E 2018E
Sales type Revenue Sharing Arrangements
Theat re system mainenance Films business
Total
0%
20%
40%
60%
0
10
20
30
40
50
60
70
80
90
100
110
2012 2013 2014 2015 2016E 2017E 2018E
Adjusted operat ing profit (USDm) Adjusted net pro fit (USDm)
Adj. operating margin (%) Adj. net marg in (%)
USD210m mark-to-
market loss in 2014 not
expected to recur
We expect IMAX China
to benefit from a
significant increase in
operating leverage
Revenue per headcount
at IMAX China is higher
than Google’s
23
IMAX China Holding (1970 HK): 16 June 2016
Chinese films to improve utilisation and margins
Lastly, we expect the utilisation rate of IMAX theatres to improve over time, which should
help expand margins. We see 2 types of utilisation rates relevant to IMAX China:
1) Theatre utilisation, ie, the number of admissions per auditorium. In our opinion, this is
not under the control of IMAX China as it is largely a result of the film-slate quality and
the operational effectiveness of the exhibitor, and
2) Strategic timing of movie releases. This pertains to the scheduling of movie
releases in China to ensure that there is always IMAX content playing at IMAX
theatres. We note that according to IMAX China’s agreements with exhibitors,
exhibitors can play non-IMAX films at IMAX auditoriums, but only if IMAX China cannot
provide IMAX content at any given time. As IMAX China plans to convert more
Chinese-language films, we believe this will improve the utilisation of IMAX China’s
theatres as: 1) Chinese films are not restricted by the blackout window release
periods, and 2) there is generally be more fresh content playing at IMAX theatres,
which should improve overall theatre attendance.
On 15 June 2016, IMAX Corporation and IMAX China announced that, along with their
partner China Media Capital, they established a USD50m film fund to co-finance
approximately 15 Mandarin-language tentpole films (films that are predicted to be a sure-
fire top blockbuster) over the next 3 years. We believe this fund could help accelerate the
expansion of IMAX China’s Chinese language content pipeline, as well as boost its
relationship with Chinese studios and directors.
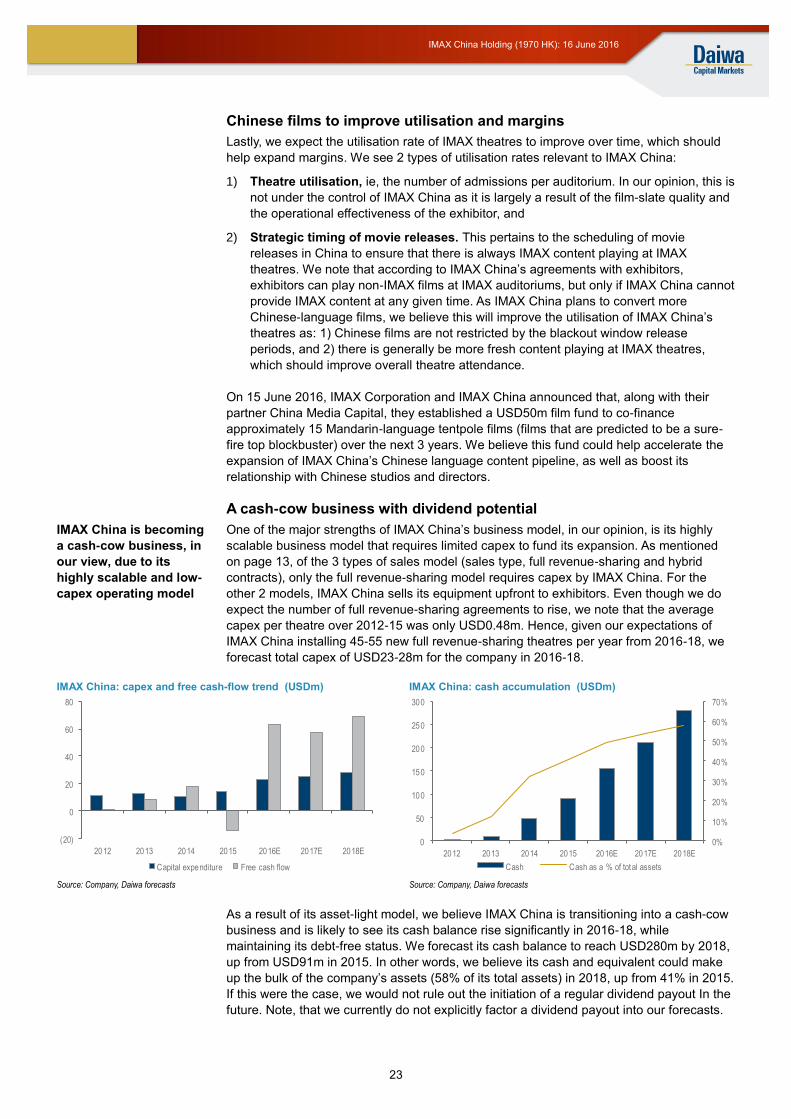
A cash-cow business with dividend potential
One of the major strengths of IMAX China’s business model, in our opinion, is its highly
scalable business model that requires limited capex to fund its expansion. As mentioned
on page 13, of the 3 types of sales model (sales type, full revenue-sharing and hybrid
contracts), only the full revenue-sharing model requires capex by IMAX China. For the
other 2 models, IMAX China sells its equipment upfront to exhibitors. Even though we do
expect the number of full revenue-sharing agreements to rise, we note that the average
capex per theatre over 2012-15 was only USD0.48m. Hence, given our expectations of
IMAX China installing 45-55 new full revenue-sharing theatres per year from 2016-18, we
forecast total capex of USD23-28m for the company in 2016-18.
IMAX China: capex and free cash-flow trend (USDm) IMAX China: cash accumulation (USDm)
Source: Company, Daiwa forecasts Source: Company, Daiwa forecasts
As a result of its asset-light model, we believe IMAX China is transitioning into a cash-cow
business and is likely to see its cash balance rise significantly in 2016-18, while
maintaining its debt-free status. We forecast its cash balance to reach USD280m by 2018,
up from USD91m in 2015. In other words, we believe its cash and equivalent could make
up the bulk of the company’s assets (58% of its total assets) in 2018, up from 41% in 2015.
If this were the case, we would not rule out the initiation of a regular dividend payout In the
future. Note, that we currently do not explicitly factor a dividend payout into our forecasts.
(20)
0
20
40
60
80
2012 2013 2014 2015 2016E 2017E 2018E
Capital expenditure Free cash flow
0%
10%
20%
30%
40%
50%
60%
70%
0
50
100
150
200
250
300
2012 2013 2014 2015 2016E 2017E 2018E
Cash Cash as a % of total assets
IMAX China is becoming
a cash-cow business, in
our view, due to its
highly scalable and low-
capex operating model
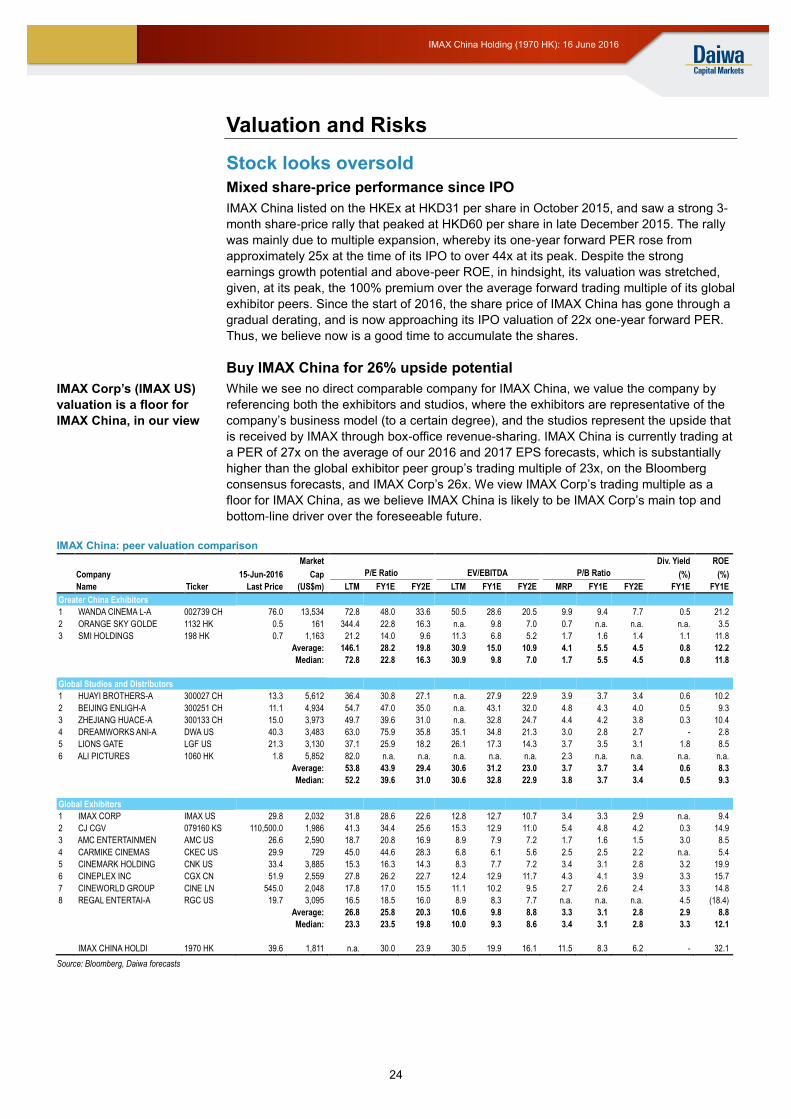
24
IMAX China Holding (1970 HK): 16 June 2016
Valuation and Risks
Stock looks oversold
Mixed share-price performance since IPO
IMAX China listed on the HKEx at HKD31 per share in October 2015, and saw a strong 3-
month share-price rally that peaked at HKD60 per share in late December 2015. The rally
was mainly due to multiple expansion, whereby its one-year forward PER rose from
approximately 25x at the time of its IPO to over 44x at its peak. Despite the strong
earnings growth potential and above-peer ROE, in hindsight, its valuation was stretched,
given, at its peak, the 100% premium over the average forward trading multiple of its global
exhibitor peers. Since the start of 2016, the share price of IMAX China has gone through a
gradual derating, and is now approaching its IPO valuation of 22x one-year forward PER.
Thus, we believe now is a good time to accumulate the shares.
Buy IMAX China for 26% upside potential
While we see no direct comparable company for IMAX China, we value the company by
referencing both the exhibitors and studios, where the exhibitors are representative of the
company’s business model (to a certain degree), and the studios represent the upside that
is received by IMAX through box-office revenue-sharing. IMAX China is currently trading at
a PER of 27x on the average of our 2016 and 2017 EPS forecasts, which is substantially
higher than the global exhibitor peer group’s trading multiple of 23x, on the Bloomberg
consensus forecasts, and IMAX Corp’s 26x. We view IMAX Corp’s trading multiple as a
floor for IMAX China, as we believe IMAX China is likely to be IMAX Corp’s main top and
bottom-line driver over the foreseeable future.
IMAX China: peer valuation comparison
Market Div. Yield ROE
Company
15-Jun-2016 Cap P/E Ratio EV/EBITDA P/B Ratio (%) (%)
Name Ticker Last Price (US$m) LTM FY1E FY2E LTM FY1E FY2E MRP FY1E FY2E FY1E FY1E
Greater China Exhibitors
1 WANDA CINEMA L-A 002739 CH 76.0 13,534 72.8 48.0 33.6 50.5 28.6 20.5 9.9 9.4 7.7 0.5 21.2
2 ORANGE SKY GOLDE 1132 HK 0.5 161 344.4 22.8 16.3 n.a. 9.8 7.0 0.7 n.a. n.a. n.a. 3.5
3 SMI HOLDINGS 198 HK 0.7 1,163 21.2 14.0 9.6 11.3 6.8 5.2 1.7 1.6 1.4 1.1 11.8
Average: 146.1 28.2 19.8 30.9 15.0 10.9 4.1 5.5 4.5 0.8 12.2
Median: 72.8 22.8 16.3 30.9 9.8 7.0 1.7 5.5 4.5 0.8 11.8
Global Studios and Distributors
1 HUAYI BROTHERS-A 300027 CH 13.3 5,612 36.4 30.8 27.1 n.a. 27.9 22.9 3.9 3.7 3.4 0.6 10.2
2 BEIJING ENLIGH-A 300251 CH 11.1 4,934 54.7 47.0 35.0 n.a. 43.1 32.0 4.8 4.3 4.0 0.5 9.3
3 ZHEJIANG HUACE-A 300133 CH 15.0 3,973 49.7 39.6 31.0 n.a. 32.8 24.7 4.4 4.2 3.8 0.3 10.4
4 DREAMWORKS ANI-A DWA US 40.3 3,483 63.0 75.9 35.8 35.1 34.8 21.3 3.0 2.8 2.7 - 2.8
5 LIONS GATE LGF US 21.3 3,130 37.1 25.9 18.2 26.1 17.3 14.3 3.7 3.5 3.1 1.8 8.5
6 ALI PICTURES 1060 HK 1.8 5,852 82.0 n.a. n.a. n.a. n.a. n.a. 2.3 n.a. n.a. n.a. n.a.
Average: 53.8 43.9 29.4 30.6 31.2 23.0 3.7 3.7 3.4 0.6 8.3
Median: 52.2 39.6 31.0 30.6 32.8 22.9 3.8 3.7 3.4 0.5 9.3
Global Exhibitors
1 IMAX CORP IMAX US 29.8 2,032 31.8 28.6 22.6 12.8 12.7 10.7 3.4 3.3 2.9 n.a. 9.4
2 CJ CGV 079160 KS 110,500.0 1,986 41.3 34.4 25.6 15.3 12.9 11.0 5.4 4.8 4.2 0.3 14.9
3 AMC ENTERTAINMEN AMC US 26.6 2,590 18.7 20.8 16.9 8.9 7.9 7.2 1.7 1.6 1.5 3.0 8.5
4 CARMIKE CINEMAS CKEC US 29.9 729 45.0 44.6 28.3 6.8 6.1 5.6 2.5 2.5 2.2 n.a. 5.4
5 CINEMARK HOLDING CNK US 33.4 3,885 15.3 16.3 14.3 8.3 7.7 7.2 3.4 3.1 2.8 3.2 19.9
6 CINEPLEX INC CGX CN 51.9 2,559 27.8 26.2 22.7 12.4 12.9 11.7 4.3 4.1 3.9 3.3 15.7
7 CINEWORLD GROUP CINE LN 545.0 2,048 17.8 17.0 15.5 11.1 10.2 9.5 2.7 2.6 2.4 3.3 14.8
8 REGAL ENTERTAI-A RGC US 19.7 3,095 16.5 18.5 16.0 8.9 8.3 7.7 n.a. n.a. n.a. 4.5 (18.4)
Average: 26.8 25.8 20.3 10.6 9.8 8.8 3.3 3.1 2.8 2.9 8.8
Median: 23.3 23.5 19.8 10.0 9.3 8.6 3.4 3.1 2.8 3.3 12.1
IMAX CHINA HOLDI 1970 HK 39.6 1,811 n.a. 30.0 23.9 30.5 19.9 16.1 11.5 8.3 6.2 - 32.1
Source: Bloomberg, Daiwa forecasts
IMAX Corp’s (IMAX US)
valuation is a floor for
IMAX China, in our view
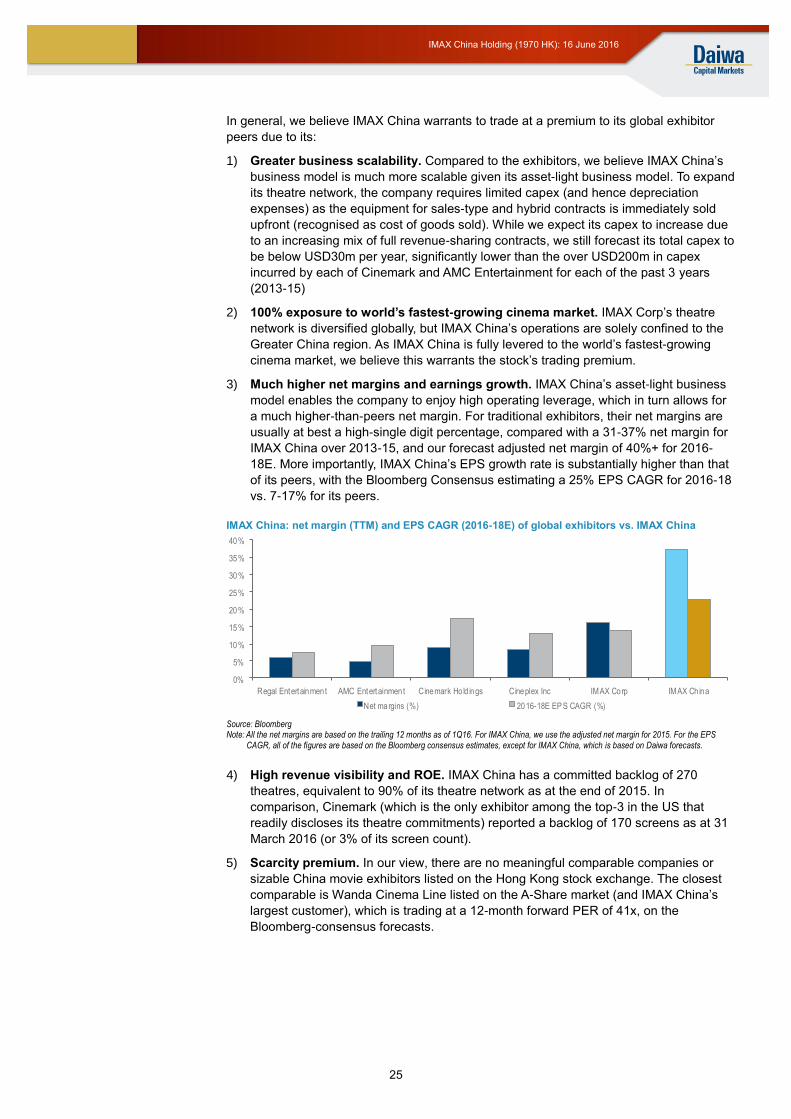
25
IMAX China Holding (1970 HK): 16 June 2016
In general, we believe IMAX China warrants to trade at a premium to its global exhibitor
peers due to its:
1) Greater business scalability. Compared to the exhibitors, we believe IMAX China’s
business model is much more scalable given its asset-light business model. To expand
its theatre network, the company requires limited capex (and hence depreciation
expenses) as the equipment for sales-type and hybrid contracts is immediately sold
upfront (recognised as cost of goods sold). While we expect its capex to increase due
to an increasing mix of full revenue-sharing contracts, we still forecast its total capex to
be below USD30m per year, significantly lower than the over USD200m in capex
incurred by each of Cinemark and AMC Entertainment for each of the past 3 years
(2013-15)
2) 100% exposure to world’s fastest-growing cinema market. IMAX Corp’s theatre
network is diversified globally, but IMAX China’s operations are solely confined to the
Greater China region. As IMAX China is fully levered to the world’s fastest-growing
cinema market, we believe this warrants the stock’s trading premium.
3) Much higher net margins and earnings growth. IMAX China’s asset-light business
model enables the company to enjoy high operating leverage, which in turn allows for
a much higher-than-peers net margin. For traditional exhibitors, their net margins are
usually at best a high-single digit percentage, compared with a 31-37% net margin for
IMAX China over 2013-15, and our forecast adjusted net margin of 40%+ for 2016-
18E. More importantly, IMAX China’s EPS growth rate is substantially higher than that
of its peers, with the Bloomberg Consensus estimating a 25% EPS CAGR for 2016-18
vs. 7-17% for its peers.
IMAX China: net margin (TTM) and EPS CAGR (2016-18E) of global exhibitors vs. IMAX China
Source: Bloomberg Note: All the net margins are based on the trailing 12 months as of 1Q16. For IMAX China, we use the adjusted net margin for 2015. For the EPS
CAGR, all of the figures are based on the Bloomberg consensus estimates, except for IMAX China, which is based on Daiwa forecasts.
4) High revenue visibility and ROE. IMAX China has a committed backlog of 270
theatres, equivalent to 90% of its theatre network as at the end of 2015. In
comparison, Cinemark (which is the only exhibitor among the top-3 in the US that
readily discloses its theatre commitments) reported a backlog of 170 screens as at 31
March 2016 (or 3% of its screen count).
5) Scarcity premium. In our view, there are no meaningful comparable companies or
sizable China movie exhibitors listed on the Hong Kong stock exchange. The closest
comparable is Wanda Cinema Line listed on the A-Share market (and IMAX China’s
largest customer), which is trading at a 12-month forward PER of 41x, on the
Bloomberg-consensus forecasts.
0%
5%
10%
15%
20%
25%
30%
35%
40%
Regal Entertainment AMC Entertainment Cinemark Ho ld ings Cineplex Inc IMAX Corp IMAX China
Net margins (%) 2016-18E EP S CAGR (%)
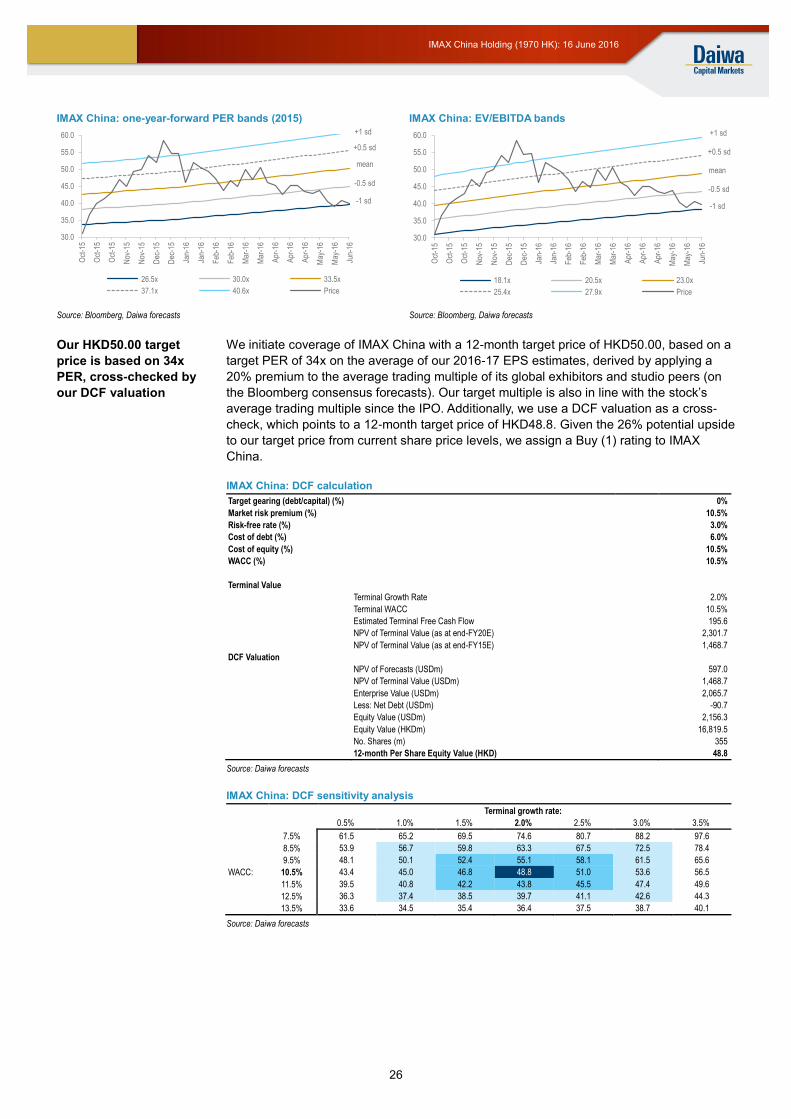
26
IMAX China Holding (1970 HK): 16 June 2016
IMAX China: one-year-forward PER bands (2015) IMAX China: EV/EBITDA bands
Source: Bloomberg, Daiwa forecasts Source: Bloomberg, Daiwa forecasts
We initiate coverage of IMAX China with a 12-month target price of HKD50.00, based on a
target PER of 34x on the average of our 2016-17 EPS estimates, derived by applying a
20% premium to the average trading multiple of its global exhibitors and studio peers (on
the Bloomberg consensus forecasts). Our target multiple is also in line with the stock’s
average trading multiple since the IPO. Additionally, we use a DCF valuation as a cross-
check, which points to a 12-month target price of HKD48.8. Given the 26% potential upside
to our target price from current share price levels, we assign a Buy (1) rating to IMAX
China.
IMAX China: DCF calculation
Target gearing (debt/capital) (%) 0%
Market risk premium (%) 10.5%
Risk-free rate (%) 3.0%
Cost of debt (%) 6.0%
Cost of equity (%) 10.5%
WACC (%) 10.5%
Terminal Value
Terminal Growth Rate 2.0%
Terminal WACC 10.5%
Estimated Terminal Free Cash Flow 195.6
NPV of Terminal Value (as at end-FY20E) 2,301.7
NPV of Terminal Value (as at end-FY15E) 1,468.7
DCF Valuation
NPV of Forecasts (USDm) 597.0
NPV of Terminal Value (USDm) 1,468.7
Enterprise Value (USDm) 2,065.7
Less: Net Debt (USDm) -90.7
Equity Value (USDm) 2,156.3
Equity Value (HKDm) 16,819.5
No. Shares (m) 355
12-month Per Share Equity Value (HKD) 48.8
Source: Daiwa forecasts
IMAX China: DCF sensitivity analysis
Terminal growth rate:
48.76 0.5% 1.0% 1.5% 2.0% 2.5% 3.0% 3.5%
7.5% 61.5 65.2 69.5 74.6 80.7 88.2 97.6
8.5% 53.9 56.7 59.8 63.3 67.5 72.5 78.4
9.5% 48.1 50.1 52.4 55.1 58.1 61.5 65.6
WACC: 10.5% 43.4 45.0 46.8 48.8 51.0 53.6 56.5
11.5% 39.5 40.8 42.2 43.8 45.5 47.4 49.6
12.5% 36.3 37.4 38.5 39.7 41.1 42.6 44.3
13.5% 33.6 34.5 35.4 36.4 37.5 38.7 40.1
Source: Daiwa forecasts
30.0
35.0
40.0
45.0
50.0
55.0
60.0
Oct
-15
Oct
-15
Oct
-15
Nov
-15
Nov
-15
Dec
-15
Dec
-15
Jan-
16
Jan-
16
Feb
-16
Feb
-16
Mar
-16
Mar
-16
Apr
-16
Apr
-16
Apr
-16
May
-16
May
-16
Jun-
16
26.5x 30.0x 33.5x
37.1x 40.6x Price
+0.5 sd
-0.5 sd
mean
-1 sd
+1 sd
30.0
35.0
40.0
45.0
50.0
55.0
60.0
Oct
-15
Oct
-15
Oct
-15
Nov
-15
Nov
-15
Dec
-15
Dec
-15
Jan-
16
Jan-
16
Feb
-16
Feb
-16
Mar
-16
Mar
-16
Apr
-16
Apr
-16
Apr
-16
May
-16
May
-16
Jun-
16
18.1x 20.5x 23.0x
25.4x 27.9x Price
+0.5 sd
-0.5 sd
mean
-1 sd
+1 sd
Our HKD50.00 target
price is based on 34x
PER, cross-checked by
our DCF valuation
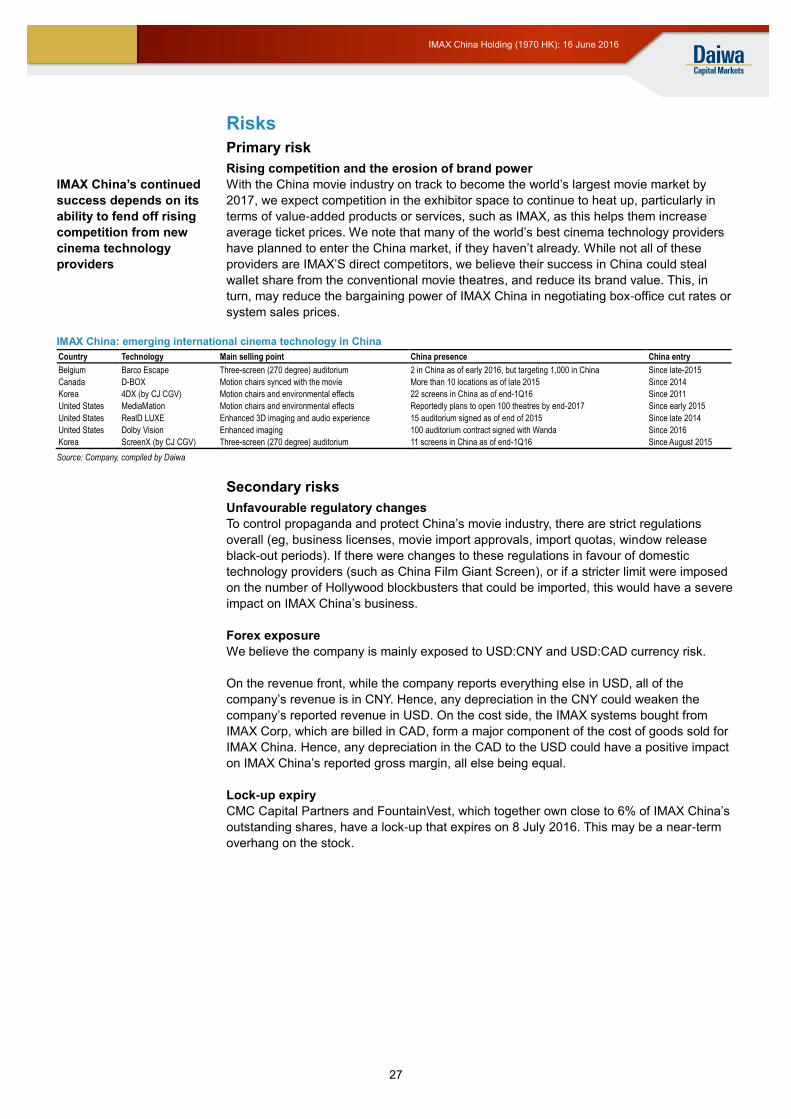
27
IMAX China Holding (1970 HK): 16 June 2016
Risks
Primary risk
Rising competition and the erosion of brand power
With the China movie industry on track to become the world’s largest movie market by
2017, we expect competition in the exhibitor space to continue to heat up, particularly in
terms of value-added products or services, such as IMAX, as this helps them increase
average ticket prices. We note that many of the world’s best cinema technology providers
have planned to enter the China market, if they haven’t already. While not all of these
providers are IMAX’S direct competitors, we believe their success in China could steal
wallet share from the conventional movie theatres, and reduce its brand value. This, in
turn, may reduce the bargaining power of IMAX China in negotiating box-office cut rates or
system sales prices.
IMAX China: emerging international cinema technology in China
Country Technology Main selling point China presence China entry
Belgium Barco Escape Three-screen (270 degree) auditorium 2 in China as of early 2016, but targeting 1,000 in China Since late-2015
Canada D-BOX Motion chairs synced with the movie More than 10 locations as of late 2015 Since 2014
Korea 4DX (by CJ CGV) Motion chairs and environmental effects 22 screens in China as of end-1Q16 Since 2011
United States MediaMation Motion chairs and environmental effects Reportedly plans to open 100 theatres by end-2017 Since early 2015
United States RealD LUXE Enhanced 3D imaging and audio experience 15 auditorium signed as of end of 2015 Since late 2014
United States Dolby Vision Enhanced imaging 100 auditorium contract signed with Wanda Since 2016
Korea ScreenX (by CJ CGV) Three-screen (270 degree) auditorium 11 screens in China as of end-1Q16 Since August 2015
Source: Company, compiled by Daiwa
Secondary risks
Unfavourable regulatory changes
To control propaganda and protect China’s movie industry, there are strict regulations
overall (eg, business licenses, movie import approvals, import quotas, window release
black-out periods). If there were changes to these regulations in favour of domestic
technology providers (such as China Film Giant Screen), or if a stricter limit were imposed
on the number of Hollywood blockbusters that could be imported, this would have a severe
impact on IMAX China’s business.
Forex exposure
We believe the company is mainly exposed to USD:CNY and USD:CAD currency risk.
On the revenue front, while the company reports everything else in USD, all of the
company’s revenue is in CNY. Hence, any depreciation in the CNY could weaken the
company’s reported revenue in USD. On the cost side, the IMAX systems bought from
IMAX Corp, which are billed in CAD, form a major component of the cost of goods sold for
IMAX China. Hence, any depreciation in the CAD to the USD could have a positive impact
on IMAX China’s reported gross margin, all else being equal.
Lock-up expiry
CMC Capital Partners and FountainVest, which together own close to 6% of IMAX China’s
outstanding shares, have a lock-up that expires on 8 July 2016. This may be a near-term
overhang on the stock.
IMAX China’s continued
success depends on its
ability to fend off rising
competition from new
cinema technology
providers
28
IMAX China Holding (1970 HK): 16 June 2016
Appendix: management/shareholder structure
Mr. Richard Gelfond, aged 61, has been the Chairman and Non-executive Director of the
company since 27 May 2015. He has been a director of the company since 30 August
2010 and was appointed as the Chairman of the Board on 4 August 2014. As Chief
Executive Officer of IMAX Corporation, the company’s majority shareholder, Mr. Gelfond
provides strategic advice and guidance on the business and operations of the group. Mr.
Gelfond has been the sole Chief Executive Officer and an executive director of IMAX
Corporation since 2009 and 1994, respectively. He also served as Co-Chairman of IMAX
Corporation from 1999 to 2009 and Co-Chief Executive Officer from 1996 to 2009. From
1994 to 1999, Mr. Gelfond served as the Vice Chairman of IMAX Corporation. Between
1979 and 1994, he worked in various law firms and investment banks. He graduated from
the State University of New York at Stony Brook, the US, with a Bachelor of Arts in May
1976 and from the Northwestern University School of Law, the US, with a juris doctor
degree in June 1979.
Mr. Jiande Chen, aged 60, has been the Chief Executive Officer of the company since 1
August 2011 and is responsible for directing the company’s expansion in Greater China,
and developing and executing strategies that have enabled the company to extend its
leadership position and involvement in the continuing development of the entertainment
industry in Greater China. He was appointed an executive director of the company on 27
May 2015.
Mr. Don Savant, aged 53, has represented the group as President, Theatre Development
& Film Distribution since September 2011. He has also served as Executive Vice President
and Managing Director, Asia Pacific of IMAX Corporation since January 2015. In his dual
role, Mr. Savant is responsible for overseeing IMAX Corporation’s sales, marketing and
operations in the Asia Pacific region, including Korea, Hong Kong and China. He is
employed by IMAX Corporation and devotes approximately 50% of his time to the
company under a legally binding secondment arrangement. Mr. Savant joined IMAX
Corporation in April 2000 as Vice President, Sales, Asia Pacific. He was promoted to
Senior Vice President and Managing Director, Asia Pacific. He has over 20 years of
experience in the entertainment industry and a total of 17 years’ experience in China and
Asia.
Mr. Jim Athanasopoulos, aged 45, assumed the role of Chief Financial Officer and Chief
Operating Officer of the company effective May 2015, and has served as the Chief
Financial Officer and Senior Vice President, Corporate Operations of the group since 1
August 2011. Mr. Athanasopoulos is responsible for the overall management of the group’s
finance and treasury matters. He was appointed an executive director on 27 May 2015.
Ms. Mei-Hui Chou (Jessie), aged 47, assumed the role of Chief Marketing Officer and
Head of Human Resources effective May 2015, and has served as the Senior Vice
President, Theatre Marketing & Operations, Human Resources of the group since 2012.
Ms. Chou is responsible for liaising with theatre operators to ensure successful theatre
openings and film launches. She was appointed an executive director on 27 May 2015.
Ms. Michelle Rosen, aged 37, has been the company’s General Counsel since 30 March
2015. She is responsible for overseeing legal and administrative matters. Ms. Rosen joined
IMAX Corporation in October 2008, where she held the position of Vice President and
Associate General Counsel until March 2015. She previously worked as an associate at
Shearman & Sterling LLP in New York, from October 2003 until October 2008 in the areas
of mergers and acquisitions, corporate law and securities law. Ms. Rosen graduated from
Dartmouth College with a bachelor’s degree in Comparative Literature in June 2000 and
from Cornell Law School in May 2003. Ms. Rosen has been a member of the New York Bar
since January 2004.
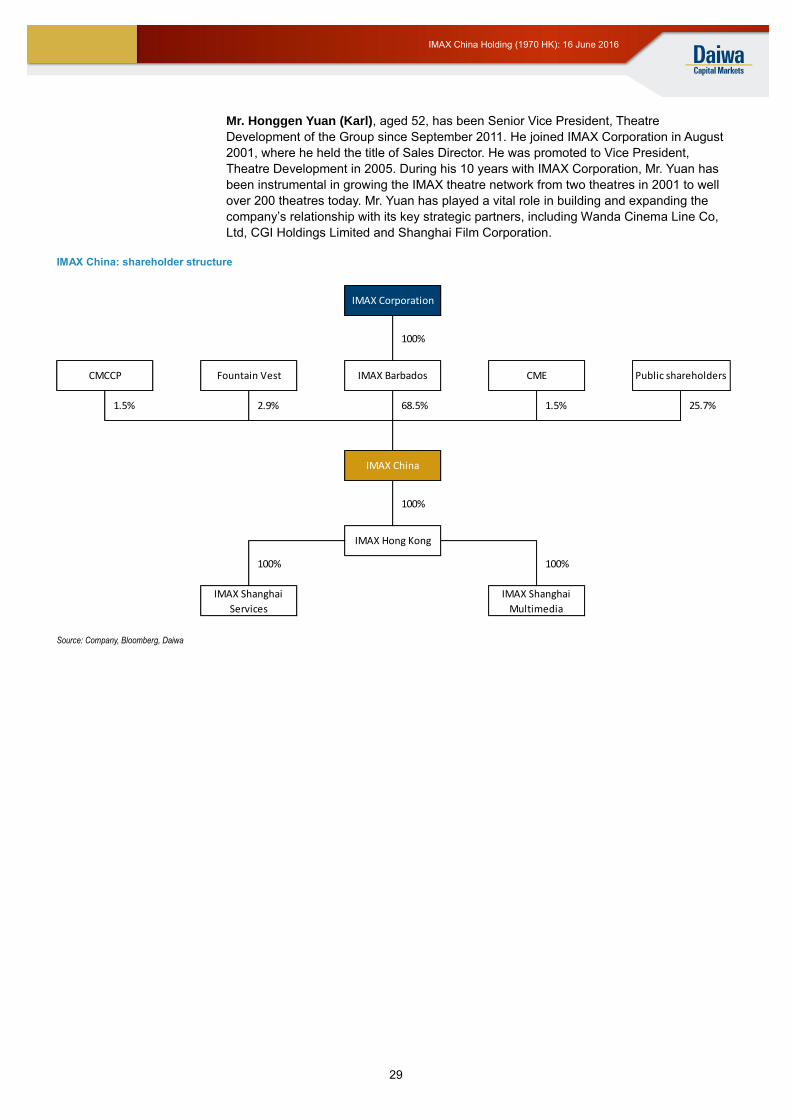
29
IMAX China Holding (1970 HK): 16 June 2016
Mr. Honggen Yuan (Karl), aged 52, has been Senior Vice President, Theatre
Development of the Group since September 2011. He joined IMAX Corporation in August
2001, where he held the title of Sales Director. He was promoted to Vice President,
Theatre Development in 2005. During his 10 years with IMAX Corporation, Mr. Yuan has
been instrumental in growing the IMAX theatre network from two theatres in 2001 to well
over 200 theatres today. Mr. Yuan has played a vital role in building and expanding the
company’s relationship with its key strategic partners, including Wanda Cinema Line Co,
Ltd, CGI Holdings Limited and Shanghai Film Corporation.
IMAX China: shareholder structure
Source: Company, Bloomberg, Daiwa
100%
100%
100% 100%
25.7%
IMAX Shanghai
Multimedia
IMAX Shanghai
Services
IMAX China
IMAX Hong Kong
1.5% 2.9% 68.5% 1.5%
IMAX BarbadosFountain VestCMCCP CME Public shareholders
IMAX Corporation
30
IMAX China Holding (1970 HK): 16 June 2016
Daiwa’s Asia Pacific Research Directory
HONG KONG
Takashi FUJIKURA (852) 2848 4051 [email protected]
Regional Research Head
John HETHERINGTON (852) 2773 8787 [email protected]
Regional Deputy Head of Asia Pacific Research
Rohan DALZIELL (852) 2848 4938 [email protected]
Regional Head of Asia Pacific Product Management
Kevin LAI (852) 2848 4926 [email protected]
Chief Economist for Asia ex-Japan; Macro Economics (Regional)
Jonas KAN (852) 2848 4439 [email protected]
Head of Hong Kong and China Property
Cynthia CHAN (852) 2773 8243 [email protected]
Property (China)
Leon QI (852) 2532 4381 [email protected]
Banking (Hong Kong/China); Broker (China); Insurance (China)
Anson CHAN (852) 2532 4350 [email protected]
Consumer (Hong Kong/China)
Jamie SOO (852) 2773 8529 [email protected]
Gaming and Leisure (Hong Kong/China)
Dennis IP (852) 2848 4068 [email protected]
Power; Utilities; Renewables and Environment (Hong Kong/China)
John CHOI (852) 2773 8730 [email protected]
Head of Hong Kong and China Internet; Regional Head of Small/Mid Cap
Kelvin LAU (852) 2848 4467 [email protected]
Head of Automobiles; Transportation and Industrial (Hong Kong/China)
Brian LAM (852) 2532 4341 [email protected]
Transportation – Railway; Construction and Engineering (China)
Thomas HO (852) 2773 8716 [email protected]
Custom Products Group
PHILIPPINES
Bianca SOLEMA (63) 2 737 3023 [email protected]
Utilities and Energy
SOUTH KOREA
Sung Yop CHUNG (82) 2 787 9157 [email protected]
Pan-Asia Co-head/Regional Head of Automobiles and Components; Automobiles; Shipbuilding; Steel
Mike OH (82) 2 787 9179 [email protected]
Banking; Capital Goods (Construction and Machinery)
Iris PARK (82) 2 787 9165 [email protected]
Consumer/Retail
SK KIM (82) 2 787 9173 [email protected]
IT/Electronics – Semiconductor/Display and Tech Hardware
Thomas Y KWON (82) 2 787 9181 [email protected]
Pan-Asia Head of Internet & Telecommunications; Software – Internet/On-line Game
Kevin JIN (82) 2 787 9168 [email protected]
Small/Mid Cap
TAIWAN
Rick HSU (886) 2 8758 6261 [email protected]
Head of Regional Technology; Head of Taiwan Research; Semiconductor/IC Design (Regional)
Christie CHIEN (886) 2 8758 6257 [email protected]
Banking; Insurance (Taiwan); Macro Economics (Regional)
Steven TSENG (886) 2 8758 6252 [email protected]
IT/Technology Hardware (PC Hardware)
Christine WANG (886) 2 8758 6249 [email protected]
IT/Technology Hardware (Automation); Pharmaceuticals and Healthcare; Consumer
Kylie HUANG (886) 2 8758 6248 [email protected]
IT/Technology Hardware (Handsets and Components)
Helen CHIEN (886) 2 8758 6254 [email protected]
Small/Mid Cap
INDIA
Punit SRIVASTAVA (91) 22 6622 1013 [email protected]
Head of India Research; Strategy; Banking/Finance
Saurabh MEHTA (91) 22 6622 1009 [email protected]
Capital Goods; Utilities
SINGAPORE
Ramakrishna MARUVADA (65) 6499 6543 [email protected]
Head of Singapore Research; Telecommunications (China/ASEAN/India)
Royston TAN (65) 6321 3086 [email protected]
Oil and Gas; Capital Goods
David LUM (65) 6329 2102 [email protected]
Banking; Property and REITs
Shane GOH (65) 64996546 [email protected]
Small/Mid Cap (Singapore)
Jame OSMAN (65) 6321 3092 [email protected]
Telecommunications (ASEAN/India); Pharmaceuticals and Healthcare; Consumer (Singapore)
31
IMAX China Holding (1970 HK): 16 June 2016
Daiwa’s Offices
Office / Branch / Affiliate Address Tel Fax
DAIWA SECURITIES GROUP INC
HEAD OFFICE Gran Tokyo North Tower, 1-9-1, Marunouchi, Chiyoda-ku, Tokyo, 100-6753 (81) 3 5555 3111 (81) 3 5555 0661
Daiwa Securities Trust Company One Evertrust Plaza, Jersey City, NJ 07302, U.S.A. (1) 201 333 7300 (1) 201 333 7726
Daiwa Securities Trust and Banking (Europe) PLC (Head Office) 5 King William Street, London EC4N 7JB, United Kingdom (44) 207 320 8000 (44) 207 410 0129
Daiwa Europe Trustees (Ireland) Ltd Level 3, Block 5, Harcourt Centre, Harcourt Road, Dublin 2, Ireland (353) 1 603 9900 (353) 1 478 3469
Daiwa Capital Markets America Inc. New York Head Office Financial Square, 32 Old Slip, New York, NY10005, U.S.A. (1) 212 612 7000 (1) 212 612 7100
Daiwa Capital Markets America Inc. San Francisco Branch 555 California Street, Suite 3360, San Francisco, CA 94104, U.S.A. (1) 415 955 8100 (1) 415 956 1935
Daiwa Capital Markets Europe Limited, London Head Office 5 King William Street, London EC4N 7AX, United Kingdom (44) 20 7597 8000 (44) 20 7597 8600
Daiwa Capital Markets Europe Limited, Frankfurt Branch Neue Mainzer Str. 1, 60311 Frankfurt/Main, Germany (49) 69 717 080 (49) 69 723 340
Daiwa Capital Markets Europe Limited, Paris Representative Office 17, rue de Surène 75008 Paris, France (33) 1 56 262 200 (33) 1 47 550 808
Daiwa Capital Markets Europe Limited, Geneva Branch 50 rue du Rhône, P.O.Box 3198, 1211 Geneva 3, Switzerland (41) 22 818 7400 (41) 22 818 7441
Daiwa Capital Markets Europe Limited, Moscow Representative Office
Midland Plaza 7th Floor, 10 Arbat Street, Moscow 119002, Russian Federation
(7) 495 641 3416 (7) 495 775 6238
Daiwa Capital Markets Europe Limited, Bahrain Branch 7th Floor, The Tower, Bahrain Commercial Complex, P.O. Box 30069, Manama, Bahrain
(973) 17 534 452 (973) 17 535 113
Daiwa Capital Markets Hong Kong Limited Level 28, One Pacific Place, 88 Queensway, Hong Kong (852) 2525 0121 (852) 2845 1621
Daiwa Capital Markets Singapore Limited 6 Shenton Way #26-08, OUE Downtown 2, Singapore 068809, Republic of Singapore
(65) 6220 3666 (65) 6223 6198
Daiwa Capital Markets Australia Limited Level 34, Rialto North Tower, 525 Collins Street, Melbourne, Victoria 3000, Australia
(61) 3 9916 1300 (61) 3 9916 1330
DBP-Daiwa Capital Markets Philippines, Inc 18th Floor, Citibank Tower, 8741 Paseo de Roxas, Salcedo Village, Makati City, Republic of the Philippines
(632) 813 7344 (632) 848 0105
Daiwa-Cathay Capital Markets Co Ltd 14/F, 200, Keelung Road, Sec 1, Taipei, Taiwan, R.O.C. (886) 2 2723 9698 (886) 2 2345 3638
Daiwa Securities Capital Markets Korea Co., Ltd. 20 Fl.& 21Fl. One IFC, 10 Gukjegeumyung-Ro, Yeongdeungpo-gu, Seoul, Korea
(82) 2 787 9100 (82) 2 787 9191
Daiwa Securities Co. Ltd., Beijing Representative Office Room 301/302,Kerry Center,1 Guanghua Road,Chaoyang District,
Beijing 100020, People’s Republic of China
(86) 10 6500 6688 (86) 10 6500 3594
Daiwa (Shanghai) Corporate Strategic Advisory Co. Ltd. 44/F, Hang Seng Bank Tower, 1000 Lujiazui Ring Road, Pudong, Shanghai China 200120 , People’s Republic of China
(86) 21 3858 2000 (86) 21 3858 2111
Daiwa Securities Co. Ltd., Bangkok Representative Office 18th Floor, M Thai Tower, All Seasons Place, 87 Wireless Road,
Lumpini, Pathumwan, Bangkok 10330, Thailand (66) 2 252 5650 (66) 2 252 5665
Daiwa Capital Markets India Private Ltd 10th Floor, 3 North Avenue, Maker Maxity, Bandra Kurla Complex, Bandra East, Mumbai – 400051, India
(91) 22 6622 1000 (91) 22 6622 1019
Daiwa Securities Co. Ltd., Hanoi Representative Office Suite 405, Pacific Palace Building, 83B, Ly Thuong Kiet Street, Hoan Kiem Dist. Hanoi, Vietnam
(84) 4 3946 0460 (84) 4 3946 0461
DAIWA INSTITUTE OF RESEARCH LTD
HEAD OFFICE 15-6, Fuyuki, Koto-ku, Tokyo, 135-8460, Japan (81) 3 5620 5100 (81) 3 5620 5603
MARUNOUCHI OFFICE Gran Tokyo North Tower, 1-9-1, Marunouchi, Chiyoda-ku, Tokyo, 100-6756 (81) 3 5555 7011 (81) 3 5202 2021
New York Research Center 11th Floor, Financial Square, 32 Old Slip, NY, NY 10005-3504, U.S.A. (1) 212 612 6100 (1) 212 612 8417
London Research Centre 3/F, 5 King William Street, London, EC4N 7AX, United Kingdom (44) 207 597 8000 (44) 207 597 8550
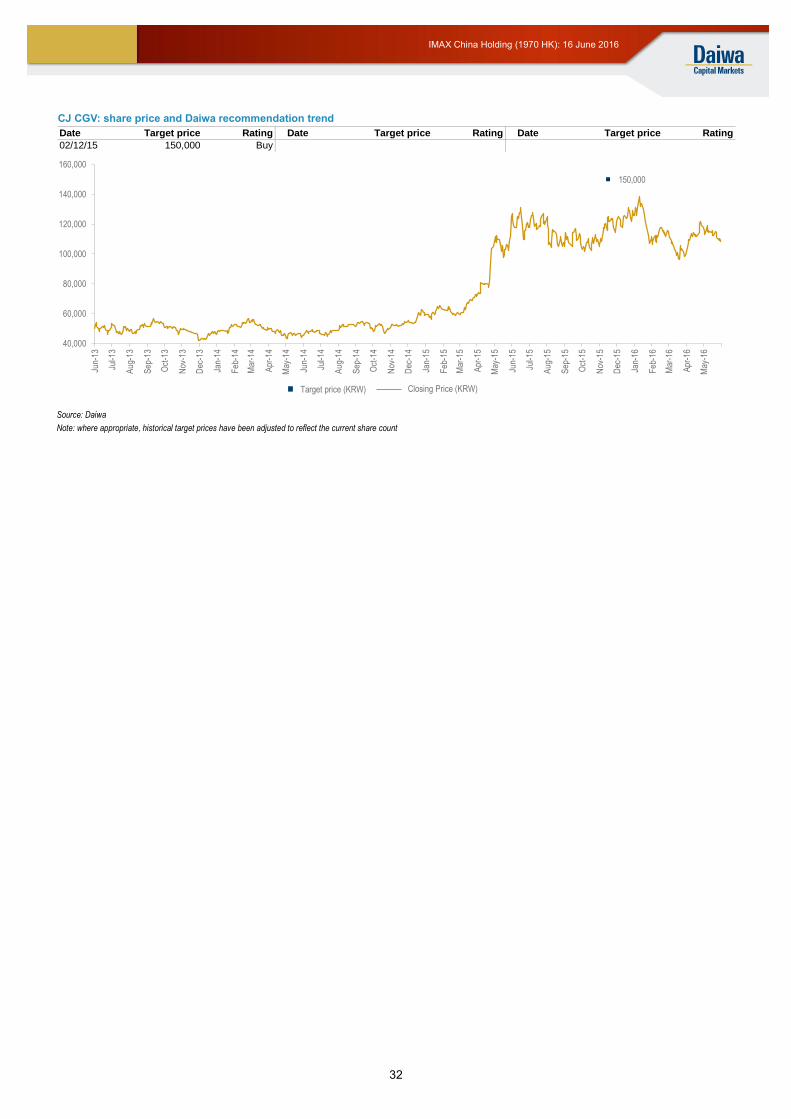
32
IMAX China Holding (1970 HK): 16 June 2016
CJ CGV: share price and Daiwa recommendation trend
Date Target price Rating Date Target price Rating Date Target price Rating
02/12/15 150,000 Buy
150,000
40,000
60,000
80,000
100,000
120,000
140,000
160,000
Jun-
13
Jul-1
3
Aug
-13
Sep
-13
Oct
-13
Nov
-13
Dec
-13
Jan-
14
Feb
-14
Mar
-14
Apr
-14
May
-14
Jun-
14
Jul-1
4
Aug
-14
Sep
-14
Oct
-14
Nov
-14
Dec
-14
Jan-
15
Feb
-15
Mar
-15
Apr
-15
May
-15
Jun-
15
Jul-1
5
Aug
-15
Sep
-15
Oct
-15
Nov
-15
Dec
-15
Jan-
16
Feb
-16
Mar
-16
Apr
-16
May
-16
Target price (KRW) Closing Price (KRW)
Source: Daiwa
Note: where appropriate, historical target prices have been adjusted to reflect the current share count
33
IMAX China Holding (1970 HK): 16 June 2016
Important Disclosures and Disclaimer
This publication is produced by Daiwa Securities Group Inc. and/or its non-U.S. affiliates, and distributed by Daiwa Securities Group Inc. and/or its non-U.S. affiliates, except to the extent expressly provided herein. This publication and the contents hereof are intended for information purposes only, and may be subject to change without further notice. Any use, disclosure, distribution, dissemination, copying, printing or reliance on this publication for any other purpose without our prior consent or approval is strictly prohibited. Neither Daiwa Securities Group Inc. nor any of its respective parent, holding, subsidiaries or affiliates, nor any of its respective directors, officers, servants and employees, represent nor warrant the accuracy or completeness of the information contained herein or as to the existence of other facts which might be significant, and will not accept any responsibility or liability whatsoever for any use of or reliance upon this publication or any of the contents hereof. Neither this publication, nor any content hereof, constitute, or are to be construed as, an offer or solicitation of an offer to buy or sell any of the securities or investments mentioned herein in any country or jurisdiction nor, unless expressly provided, any recommendation or investment opinion or advice. Any view, recommendation, opinion or advice expressed in this publication may not necessarily reflect those of Daiwa Securities Group Inc., and/or its affiliates nor any of its respective directors, officers, servants and employees except where the publication states otherwise. This research report is not to be relied upon by any person in making any investment decision or otherwise advising with respect to, or dealing in, the securities mentioned, as it does not take into account the specific investment objectives, financial situation and particular needs of any person. Daiwa Securities Group Inc., its subsidiaries or affiliates, or its or their respective directors, officers and employees from time to time have trades as principals, or have positions in, or have other interests in the securities of the company under research including market making activities, derivatives in respect of such securities or may have also performed investment banking and other services for the issuer of such securities. The following are additional disclosures.
Ownership of Securities
For “Ownership of Securities” information, please visit BlueMatrix disclosure link at https://daiwa3.bluematrix.com/sellside/Disclosures.action.
Investment Banking Relationship
For “Investment Banking Relationship”, please visit BlueMatrix disclosure link at https://daiwa3.bluematrix.com/sellside/Disclosures.action.
Japan
Daiwa Securities Co. Ltd. and Daiwa Securities Group Inc.
Daiwa Securities Co. Ltd. is a subsidiary of Daiwa Securities Group Inc.
Investment Banking Relationship
Within the preceding 12 months, the subsidiaries and/or affiliates of Daiwa Securities Group Inc. * has lead-managed public offerings and/or secondary offerings (excluding straight bonds) of the securities of the following companies: econtext Asia Ltd (1390 HK); Mirae Asset Life Insurance Co Ltd (085620 KS); China Reinsurance Group Corporation (1508 HK).
*Subsidiaries of Daiwa Securities Group Inc. for the purposes of this section shall mean any one or more of: Daiwa Capital Markets Hong Kong Limited (大和資本市場香港有限公司), Daiwa
Capital Markets Singapore Limited, Daiwa Capital Markets Australia Limited, Daiwa Capital Markets India Private Limited, Daiwa-Cathay Capital Markets Co., Ltd., Daiwa Securities Capital Markets Korea Co., Ltd.
Hong Kong
This research is distributed in Hong Kong by Daiwa Capital Markets Hong Kong Limited (大和資本市場香港有限公司) (“DHK”) which is regulated by the Hong Kong Securities and Futures
Commission. Recipients of this research in Hong Kong may contact DHK in respect of any matter arising from or in connection with this research. Relevant Relationship (DHK)
DHK may from time to time have an individual employed by or associated with it serves as an officer of any of the companies under its research coverage. Korea The developing analyst of this research and analysis material hereby states and confirms that the contents of this material correctly reflect the analyst’s views and opinions and that the analyst has not been placed under inappropriate pressure or interruption by an external party.
Name of Analyst :
Disclosure of Analysts’ Interests If an analyst engaging in or a person who exercises influences on the preparation or publication of a Research Report containing recommendations for general investors to trade financial investment instruments with regard to which the analyst or the influential person has personal interests and if the recommendations contained in the Report may have impacts on the personal interests, Daiwa Securities Capital Markets Korea Co., Ltd.(“Daiwa Securities Korea”)shall ensure that the Analyst or the influential person notifies that he/she has personal interests with regard to: 1. The equity, the equity-linked bonds and the instruments with the subscription right to the equity issued by the legal entity covered in the Research Report (or the legal entity subject to the investment recommendations); 2. The stock option granted by the legal entity covered in the Research Report (or the legal entity subject to the investment recommendations); or 3. The equity futures, the equity options and the equity-linked warrants backed by the equity prescribed in the preceding Paragraph 1 as the underlying assets. Legal Entities subject to Research Report Coverage Restrictions Daiwa Securities Korea hereby states and confirms that Daiwa Securities Korea has no conflicts of interests with the legal entity covered in this Research Report: 1. In that Daiwa Securities Korea does NOT offer direct or indirect payment guarantee for the legal entity by means of, for instance, guarantee, endorsement, provision of collaterals or the acquisition of debts; 2. In that Daiwa Securities Korea does NOT own one-hundredth (or 1/100) or more of the total number of outstanding equities issued by the legal entity; 3. In that The legal entity is NOT an affiliated company of Daiwa Securities Korea pursuant to Sub-paragraph 3, Article 2 of the Monopoly Regulation and Fair Trade Act of Korea; 4. In that, although Daiwa Securities Korea offers advisory services for the legal entity with regard to an M&A deal, the size of the M&A deal does NOT exceed five-hundredths (or 5/100) of the total asset size or the total number of equities issued and outstanding of the legal entity; 5. In that, although Daiwa Securities Korea acted in the capacity of a Lead Underwriter for the initial public offering of the legal entity, more than one-year has passed since the IPO date; 6. In that Daiwa Securities Korea is NOT designated by the legal entity as the ‘tender offer agent’ pursuant to the Paragraph 2, Article 133 of the Financial Services and Capital Market Act or the legal entity is NOT the issuer of the equity subject to the proposed tender offer; this requirement, however applies until the maturity of the tender offer period; or 7. In that Daiwa Securities Korea does NOT have significant or material interests with regard to the legal entity. Disclosure of Prior Distribution to Third Party This report has not been distributed to the third party in advance prior to public release. The following explains the rating system in the report as compared to KOSPI, based on the beliefs of the author(s) of this report. "1": the security could outperform the KOSPI by more than 15% over the next 12 months, unless otherwise stated. "2": the security is expected to outperform the KOSPI by 5-15% over the next 12 months, unless otherwise stated. "3": the security is expected to perform within 5% of the KOSPI (better or worse) over the next 12 months, unless otherwise stated. "4": the security is expected to underperform the KOSPI by 5-15% over the next 12 months, unless otherwise stated. "5": the security could underperform the KOSPI by more than 15% over the next 12 months, unless otherwise stated. “Positive” means that the analyst expects the sector to outperform the KOSPI over the next 12 months, unless otherwise stated. “Neutral” means that the analyst expects the sector to be in-line with the KOSPI over the next 12 months, unless otherwise stated. “Negative” means that the analyst expects the sector to underperform the KOSPI over the next 12 months, unless otherwise stated. Additional information may be available upon request.
Singapore
This research is distributed in Singapore by Daiwa Capital Markets Singapore Limited and it may only be distributed in Singapore to accredited investors, expert investors and institutional investors as defined in the Financial Advisers Regulations and the Securities and Futures Act (Chapter 289), as amended from time to time. By virtue of distribution to these category of investors, Daiwa Capital Markets Singapore Limited and its representatives are not required to comply with Section 36 of the Financial Advisers Act (Chapter 110) (Section 36 relates to disclosure of Daiwa Capital Markets Singapore Limited’s interest and/or its representative’s interest in securities). Recipients of this research in Singapore may contact Daiwa Capital Markets Singapore Limited in respect of any matter arising from or in connection with the research.
Australia
This research is distributed in Australia by Daiwa Capital Markets Australia Limited and it may only be distributed in Australia to wholesale investors within the meaning of the Corporations Act. Recipients of this research in Australia may contact Daiwa Capital Markets Stockbroking Limited in respect of any matter arising from or in connection with the research.
34
IMAX China Holding (1970 HK): 16 June 2016
India
This research is distributed in India to Institutional Clients only by Daiwa Capital Markets India Private Limited (Daiwa India) which is an intermediary registered with Securities & Exchange Board of India as a Stock Broker, Merchant Bank and Research Analyst. Daiwa India, its Research Analyst and their family members and its associates do not have any financial interest save as disclosed or other undisclosed material conflict of interest in the securities or derivatives of any companies under coverage. Daiwa India and its associates may have received compensation for any products other than Investment Banking (as disclosed) or brokerage services from the subject company in this report during the past 12 months. Unless otherwise stated in BlueMatrix disclosure link at https://daiwa3.bluematrix.com/sellside/Disclosures.action, Daiwa India and its associates do not hold more than 1% of any companies covered in this research report. There is no material disciplinary action against Daiwa India by any regulatory authority impacting equity research analysis activities as of the date of this report.
Taiwan
This research is distributed in Taiwan by Daiwa-Cathay Capital Markets Co., Ltd and it may only be distributed in Taiwan to institutional investors or specific investors who have signed recommendation contracts with Daiwa-Cathay Capital Markets Co., Ltd in accordance with the Operational Regulations Governing Securities Firms Recommending Trades in Securities to Customers. Recipients of this research in Taiwan may contact Daiwa-Cathay Capital Markets Co., Ltd in respect of any matter arising from or in connection with the research.
Philippines This research is distributed in the Philippines by DBP-Daiwa Capital Markets Philippines, Inc. which is regulated by the Philippines Securities and Exchange Commission and the Phil ippines Stock Exchange, Inc. Recipients of this research in the Philippines may contact DBP-Daiwa Capital Markets Philippines, Inc. in respect of any matter arising from or in connection with the research. DBP-Daiwa Capital Markets Philippines, Inc. recommends that investors independently assess, with a professional advisor, the specific financial risks as well as the legal, regulatory, tax, accounting, and other consequences of a proposed transaction. DBP-Daiwa Capital Markets Philippines, Inc. may have positions or may be materially interested in the securities in any of the markets mentioned in the publication or may have performed other services for the issuers of such securities.
For relevant securities and trading rules please visit SEC and PSE links at http://www.sec.gov.ph/irr/AmendedIRRfinalversion.pdf and http://www.pse.com.ph/ respectively.
Thailand
This research is distributed to only institutional investors in Thailand primarily by Thanachart Securities Public Company Limited (“TNS”).
This report is prepared by analysts who are employed by Daiwa Securities Group Inc. and/or its non-U.S. affiliates. This report is provided to you for informational purposes only and it is not, and is not to be construed as, an offer or an invitation to make an offer to sell or buy any securities. Neither Thanachart Securities Public Company Limited, Daiwa Securities Group Inc. nor any of their respective parent, holding, subsidiaries or affiliates, nor any of their respective directors, officers, servants and employees accept any liability whatsoever for any direct or consequential loss arising from any use of this research or its contents.
The information and opinions contained herein have been compiled or arrived at from sources believed to be reliable. However, Thanachart Securities Public Company Limited, Daiwa Securities Group Inc. nor any of their respective parent, holding, subsidiaries or affiliates, nor any of their respective directors, officers, servants and employees make no representation or warranty, express or implied, as to their accuracy or completeness. Expressions of opinion herein are subject to change without notice. The use of any information, forecasts and opinions contained in this report shall be at the sole discretion and risk of the user.
Daiwa Securities Group Inc. and/or its non-U.S. affiliates perform and seek to perform business with companies covered in this research. Thanachart Securities Public Company Limited, Daiwa Securities Group Inc., their respective parent, holding, subsidiaries or affiliates, their respective directors, officers, servants and employees may have positions and financial interest in securities mentioned in this research. Thanachart Securities Public Company Limited, Daiwa Securities Group Inc., their respective parent, holding, subsidiaries or affiliates may from time to time perform investment banking or other services for, or solicit investment banking or other business from, any entity mentioned in this research. Therefore, investors should be aware of conflict of interest that may affect the objectivity of this research.
United Kingdom This research report is produced by Daiwa Securities Co. Ltd. and/or its affiliates and is distributed in the European Union, Iceland, Liechtenstein, Norway and Switzerland. Daiwa Capital Markets Europe Limited is authorised and regulated by The Financial Conduct Authority (“FCA”) and is a member of the London Stock Exchange and Eurex. This publication is intended for investors who are not Retail Clients in the United Kingdom within the meaning of the Rules of the FCA and should not therefore be distributed to such Retail Clients in the United Kingdom. Should you enter into investment business with Daiwa Capital Markets Europe’s affiliates outside the United Kingdom, we are obliged to advise that the protection afforded by the United Kingdom regulatory system may not apply; in particular, the benefits of the Financial Services Compensation Scheme may not be available. Daiwa Capital Markets Europe Limited has in place organisational arrangements for the prevention and avoidance of conflicts of interest. Our conflict management policy is available at http://www.uk.daiwacm.com/about-us/corporate-governance-regulatory.
Germany
This document is distributed in Germany by Daiwa Capital Markets Europe Limited, Niederlassung Frankfurt which is regulated by BaFin (Bundesanstalt fuer Finanzdienstleistungsaufsicht) for the conduct of business in Germany.
Bahrain
This research material is distributed in Bahrain by Daiwa Capital Markets Europe Limited, Bahrain Branch, regulated by The Central Bank of Bahrain and holds Investment Business Firm – Category 2 license and having its official place of business at the Bahrain World Trade Centre, South Tower, 7th floor, P.O. Box 30069, Manama, Kingdom of Bahrain. Tel No. +973 17534452 Fax No. +973 535113
United States
This report is distributed in the U.S. by Daiwa Capital Markets America Inc. (DCMA). It may not be accurate or complete and should not be relied upon as such. It reflects the preparer’s views at the time of its preparation, but may not reflect events occurring after its preparation; nor does it reflect DCMA’s views at any time. Neither DCMA nor the preparer has any obligation to update this report or to continue to prepare research on this subject. This report is not an offer to sell or the solicitation of any offer to buy securities. Unless this report says otherwise, any recommendation it makes is risky and appropriate only for sophisticated speculative investors able to incur significant losses. Readers should consult their financial advisors to determine whether any such recommendation is consistent with their own investment objectives, financial situation and needs. This report does not recommend to U.S. recipients the use of any of DCMA’s non-U.S. affiliates to effect trades in any security and is not supplied with any understanding that U.S. recipients of this report will direct commission business to such non-U.S. entities. Unless applicable law permits otherwise, non-U.S. customers wishing to effect a transaction in any securities referenced in this material should contact a Daiwa entity in their local jurisdiction. Most countries throughout the world have their own laws regulating the types of securities and other investment products which may be offered to their residents, as well as a process for doing so. As a result, the securities discussed in this report may not be eligible for sales in some jurisdictions. Customers wishing to obtain further information about this report should contact DCMA: Daiwa Capital Markets America Inc., Financial Square, 32 Old Slip, New York, New York 10005 (Tel no. 212-612-7000).
Ownership of Securities
For “Ownership of Securities” information please visit BlueMatrix disclosure link at https://daiwa3.bluematrix.com/sellside/Disclosures.action.
Investment Banking Relationships
For “Investment Banking Relationships” please visit BlueMatrix disclosure link at https://daiwa3.bluematrix.com/sellside/Disclosures.action. DCMA Market Making
For “DCMA Market Making” please visit BlueMatrix disclosure link at https://daiwa3.bluematrix.com/sellside/Disclosures.action.
Research Analyst Conflicts
For updates on “Research Analyst Conflicts” please visit BlueMatrix disclosure link at https://daiwa3.bluematrix.com/sellside/Disclosures.action. The principal research analysts who prepared this report have no financial interest in securities of the issuers covered in the report, are not (nor are any members of their household) an officer, director or advisory board member of the issuer(s) covered in the report, and are not aware of any material relevant conflict of interest involving the analyst or DCMA, and did not receive any compensation from the issuer during the past 12 months except as noted: no exceptions.
Research Analyst Certification
For updates on “Research Analyst Certification” and “Rating System” please visit BlueMatrix disclosure link at https://daiwa3.bluematrix.com/sellside/Disclosures.action. The views about any and all of the subject securities and issuers expressed in this Research Report accurately reflect the personal views of the research analyst(s) primarily responsible for this report (or the views of the firm producing the report if no individual analysts[s] is named on the report); and no part of the compensation of such analyst(s) (or no part of the compensation of the firm if no individual analyst[s)] is named on the report) was, is, or will be directly or indirectly related to the specific recommendations or views contained in this Research Report.
The following explains the rating system in the report as compared to relevant local indices, unless otherwise stated, based on the beliefs of the author of the report.
"1": the security could outperform the local index by more than 15% over the next 12 months. "2": the security is expected to outperform the local index by 5-15% over the next 12 months. "3": the security is expected to perform within 5% of the local index (better or worse) over the next 12 months. "4": the security is expected to underperform the local index by 5-15% over the next 12 months. "5": the security could underperform the local index by more than 15% over the next 12 months.
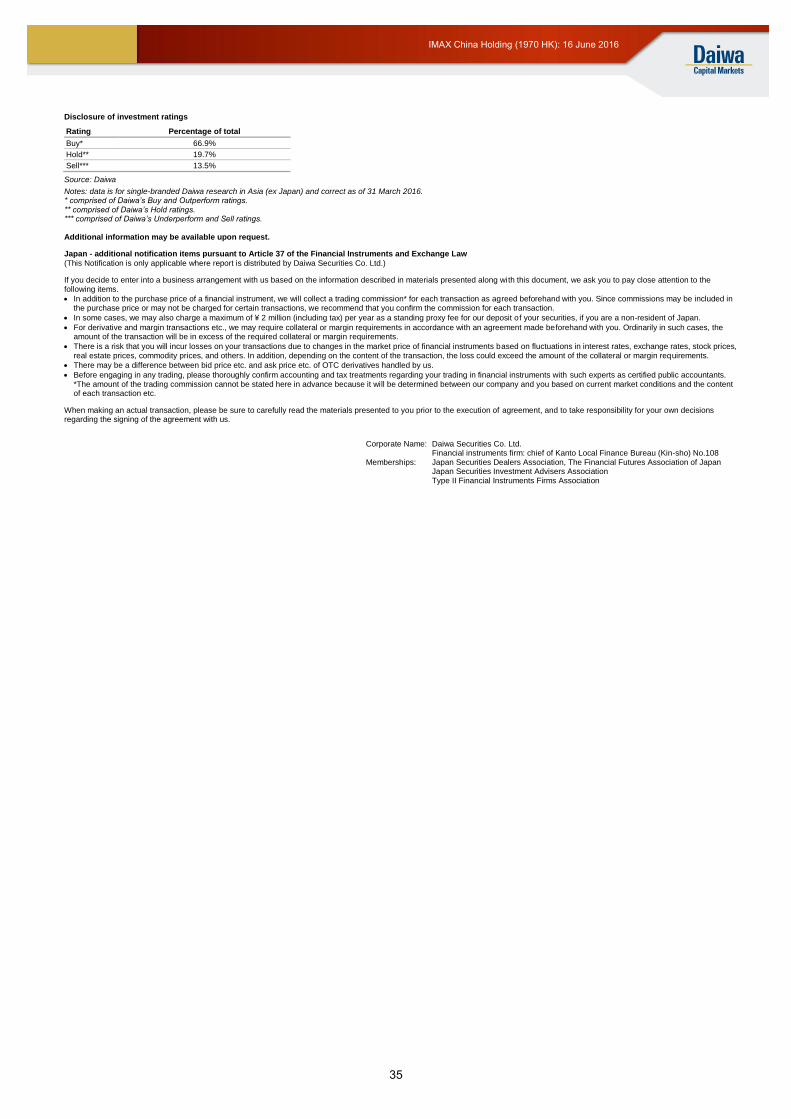
35
IMAX China Holding (1970 HK): 16 June 2016
Disclosure of investment ratings
Rating Percentage of total
Buy* 66.9%
Hold** 19.7%
Sell*** 13.5%
Source: Daiwa
Notes: data is for single-branded Daiwa research in Asia (ex Japan) and correct as of 31 March 2016. * comprised of Daiwa’s Buy and Outperform ratings. ** comprised of Daiwa’s Hold ratings. *** comprised of Daiwa’s Underperform and Sell ratings. Additional information may be available upon request.
Japan - additional notification items pursuant to Article 37 of the Financial Instruments and Exchange Law
(This Notification is only applicable where report is distributed by Daiwa Securities Co. Ltd.)
If you decide to enter into a business arrangement with us based on the information described in materials presented along with this document, we ask you to pay close attention to the following items.
In addition to the purchase price of a financial instrument, we will collect a trading commission* for each transaction as agreed beforehand with you. Since commissions may be included in the purchase price or may not be charged for certain transactions, we recommend that you confirm the commission for each transaction.
In some cases, we may also charge a maximum of ¥ 2 million (including tax) per year as a standing proxy fee for our deposit of your securities, if you are a non-resident of Japan.
For derivative and margin transactions etc., we may require collateral or margin requirements in accordance with an agreement made beforehand with you. Ordinarily in such cases, the amount of the transaction will be in excess of the required collateral or margin requirements.
There is a risk that you will incur losses on your transactions due to changes in the market price of financial instruments based on fluctuations in interest rates, exchange rates, stock prices, real estate prices, commodity prices, and others. In addition, depending on the content of the transaction, the loss could exceed the amount of the collateral or margin requirements.
There may be a difference between bid price etc. and ask price etc. of OTC derivatives handled by us.
Before engaging in any trading, please thoroughly confirm accounting and tax treatments regarding your trading in financial instruments with such experts as certified public accountants. *The amount of the trading commission cannot be stated here in advance because it will be determined between our company and you based on current market conditions and the content of each transaction etc.
When making an actual transaction, please be sure to carefully read the materials presented to you prior to the execution of agreement, and to take responsibility for your own decisions regarding the signing of the agreement with us.
Corporate Name: Daiwa Securities Co. Ltd. Financial instruments firm: chief of Kanto Local Finance Bureau (Kin-sho) No.108 Memberships: Japan Securities Dealers Association, The Financial Futures Association of Japan Japan Securities Investment Advisers Association Type II Financial Instruments Firms Association