Embed Size (px)
Citation preview

The Geography of ScientificCollaboration
Science is increasingly defined by multidimensional collaborative networks. Despitethe unprecedented growth of scientific collaboration around the globe–the collabora-tive turn–geography still matters for the cognitive enterprise. This book explores howgeography conditions scientific collaboration and how collaboration affects thespatiality of science.
This book offers a complex analysis of the spatial aspects of scientific collaboration,addressing the topic at a number of levels: individual, organizational, urban, regional,national, and international. Spatial patterns of scientific collaboration are analysedalong with their determinants and consequences. By combining a vast arrayof approaches, concepts, and methodologies, the volume offers a comprehensivetheoretical framework for the geography of scientific collaboration. The examples ofscientific collaboration policy discussed in the book are taken from the EuropeanUnion, the United States, and China. Through a number of case studies the authorsanalyse the background, development and evaluation of these policies.
This book will be of interest to researchers in diverse disciplines such as regionalstudies, scientometrics, R&D policy, socio-economic geography and networkanalysis. It will also be of interest to policymakers, and to managers of researchorganisations.
Agnieszka Olechnicka is an assistant professor and director at the Centre forEuropean Regional and Local Studies (EUROREG), University of Warsaw,Poland. She is the secretary of the Polish Section of Regional Studies Association.
Adam Ploszaj is an assistant professor at the University of Warsaw, Poland. Adamfrequently advises national and international institutions—including the EuropeanCommission, World Bank, and UNDP—on regional development and researchpolicy.
Dorota Celińska-Janowicz holds the position of counsellor for student affairsand assistant professor at the Centre for European Regional and Local Studies(EUROREG), University of Warsaw, Poland. She is also the treasurer of thePolish Section of Regional Studies Association.

Routledge Advances in Regional Economics, Science and Policy
21 Post-Metropolitan Territories and Urban SpaceEdited by Alessandro Balducci, Valeria Fedeli and Francesco Curci
22 Big Data for Regional ScienceEdited by Laurie A. Schintler and Zhenhua Chen
23 The Spatial and Economic Transformation of Mountain RegionsLandscapes as CommoditiesManfred Perlik
24 Neoliberalism and Urban Development in Latin AmericaThe Case of SantiagoEdited by Camillo Boano and Francisco Vergara-Perucich
25 Rural Housing and Economic DevelopmentEdited by Don E. Albrecht, Scott Loveridge, Stephan Goetz and Rachel Welborn
26 Creative Ageing CitiesPlace Design with Older People in Asian CitiesEdited Keng Hua CHONG and Mihye CHO
27 Competitiveness and KnowledgeAn International Comparison of Traditional FirmsKnut Ingar Westeren, Hanas Cader, Maria de Fátima Sales, Jan Ole Similä andJefferson Staduto
28 Gastronomy and Local DevelopmentThe Quality of Products, Places and ExperiencesEdited by Nicola Bellini, Cécile Clergeau and Olivier Etcheverria
29 The Geography of Scientific CollaborationAgnieszka Olechnicka, Adam Ploszaj and Dorota Celińska-Janowicz
For more information about this series, please visit www.routledge.com/series/RAIRESP

The Geography of ScientificCollaboration
Agnieszka Olechnicka, Adam Ploszajand Dorota Celińska-Janowicz

First published 2019by Routledge2 Park Square, Milton Park, Abingdon, Oxon OX14 4RN
and by Routledge711 Third Avenue, New York, NY 10017
Routledge is an imprint of the Taylor & Francis Group, an informa business
© 2019 Agnieszka Olechnicka, Adam Ploszaj and Dorota Celińska-Janowicz
The right of Agnieszka Olechnicka, Adam Ploszaj and DorotaCelińska-Janowicz to be identified as authors of this work has been assertedby them in accordance with sections 77 and 78 of the Copyright, Designsand Patents Act 1988.
All rights reserved. No part of this book may be reprinted or reproduced orutilised in any form or by any electronic, mechanical, or other means, nowknown or hereafter invented, including photocopying and recording, or inany information storage or retrieval system, without permission in writingfrom the publishers.
Trademark notice: Product or corporate names may be trademarks orregistered trademarks, and are used only for identification and explanationwithout intent to infringe.
British Library Cataloguing-in-Publication DataA catalogue record for this book is available from the British Library
Library of Congress Cataloging-in-Publication DataNames: Olechnicka, Agnieszka, author. | Ploszaj, Adam, author. |Celinska-Janowicz, Dorota, author.Title: The geography of scientific collaboration / Agnieszka Olechnicka,Adam Ploszaj, and Dorota Celinska-Janowicz.Description: Abingdon, Oxon ; New York, NY : Routledge, 2019. |Series: Routledge advances in regional economics, science and policy ;29 | Includes bibliographical references and index.Identifiers: LCCN 2018028640| ISBN 9781138203334 (hardback) |ISBN 9781315471921 (pdf) | ISBN 9781315471914 (epub) | ISBN9781315471907 (mobi)Subjects: LCSH: Science--International cooperation. |Communication in science.Classification: LCC Q172.5.I5 O44 2019 | DDC 507.2–dc23LC record available at https://lccn.loc.gov/2018028640
ISBN: 978-1-138-20333-4 (hbk)ISBN: 978-1-315-47193-8 (ebk)
Typeset in Bemboby Integra Software Services Pvt. Ltd.
Contents
List of illustrations viiAcknowledgements viii
Introduction 1
1 Places and spaces of science 41.1 Science takes place 41.2 From little science spots to the global geography of science 61.3 Driving forces of the geography of science 16
2 Scientists working together 272.1 Before the fourth age of research 282.2 The collaborative turn 342.3 What is scientific collaboration? 402.4 Why do scientists collaborate? 452.5 The collaboration life cycle and its challenges 52
3 Measuring scholarly collaboration in space 613.1 Collaborative data: sources and approaches 613.2 The reward triangle and research collaboration studies 643.3 Spatial scientometric measures 663.4 Methodological issues 72
4 Spatial patterns of scientific collaboration 774.1 Internationalisation 784.2 The global scientific network 894.3 Patterns of collaboration and research performance 964.4 The logic of centre and periphery 102

5 Theoretical approaches to scientific collaboration from aspatial perspective 1075.1 Explaining the growth of collaboration 1075.2 Explaining patterns of scientific collaboration 1115.3 Explaining the impacts of scientific collaboration 120
6 Scientific collaboration policy 1336.1 Policy through science and for science 1336.2 Policy shift towards collaboration 1356.3 Europe: towards the European Research Area 1376.4 The United States: collaborative culture 1456.5 China: (r)evolution in science policy 1546.6 Tools for scientific collaboration policy 163
7 Conclusions 1767.1 Research collaboration and the geography of science 1767.2 Future geographies of scientific collaboration 1787.3 Towards smart policies for scientific collaboration 181
References 185Index 222
vi Contents

Illustrations
Figures
1.1 Interweaving relationships between places and spaces of science 71.2 Scientific papers indexed in Web of Science, 2000–2009 161.3 Workplaces of leading scientists, 16th–19th centuries 252.1 Collaboration modes 434.1 Share of internationally co-authored articles, 1970–2013 804.2 Share of internationally co-authored articles in 2013 844.3 Research output and internationalisation at country level: articles
(left) and patents (right) 854.4 International cooperation in patents—share of patents with
foreign co-inventors in 2013 874.5 Internationally co-authored articles in the US in 2013 884.6 Share of internationally co-authored articles in European regions
in the period of 2007–2013 904.7 Research output and internationalisation in US states and EU
NUTS 2 regions (left), and NUTS 2 regions within selected EUcountries (right), 2007–2013 91
4.8 The network of internationally co-authored articles in 1980 934.9 The network of internationally co-authored articles in 1990 944.10 The network of internationally co-authored articles in 2000 954.11 The network of internationally co-authored articles in 2013 964.12 Scientific collaboration among global macro-regions in 2013 and
its evolution since 2000 974.13 World network of interurban scientific co-authorships in 2000 984.14 World network of interurban scientific co-authorships in 2013 994.15 The citation impact of scientific production and the extent of
international collaboration (2003–2012) 1014.16 Normalised mean citations of papers in which scholars from
a given country play the role of corresponding ornon-corresponding authors (2000–2013) 104
Table
2.1 Selected definitions of scientific collaboration 42

Acknowledgements
This collaborative book on the spatial aspects of research collaboration has itsorigins in a serendipitous temporal co-location. In 2008, aimlessly roaming theoffices of EUROREG at the University of Warsaw, Adam stopped in front ofthe screen filled by a large spreadsheet. It was Agnieszka’s computer, on which shewas parsing massive co-authorship data. It soon emerged that we had comple-mentary backgrounds, matching skills, and overlapping research interests. Ourcollaboration gradually developed and eventually resulted in the idea for thisvolume. While drafting the synopsis, it became apparent that we needed morecomprehensive expertise in geography. In this way, Dorota joined the team.
In a sense, the making of this book had a self-referential flavour. To a largedegree, our collaboration was based on spatial proximity. However, we encoun-tered periods of temporal geographical separation when we had to rely oninteractions mediated by information and communication technologies. Further-more, the book would not have been possible without countless fruitfulexchanges with our colleagues around the globe, both spatially close and distant.
We are particularly grateful to all those who read parts of the draft andshared their critical insights, brilliant ideas, and heart-warming encourage-ments: Katy Börner (Indiana University Bloomington), Thomas F. Gieryn(Indiana University Bloomington), Grzegorz Gorzelak (University of Warsaw),Noriko Hara (Indiana University Bloomington), Emanuel Kulczycki (AdamMickiewicz University), David N. Livingstone (Queen’s University Belfast),and Ewa Zegler-Poleska (Indiana University Bloomington).
A number of magnificent colleagues provided us with information onnational science policies: Jiří Blažek (Charles University in Prague), RobertaCapello (Polytechnic University of Milan), Andrea Caragliu (PolytechnicUniversity of Milan), David Charles (University of Strathclyde), MarcinDąbrowski (Delft University of Technology), Leszek Dolega (University ofLiverpool), Piotr Dutkiewicz (Carlton University), Martin Ferry (University ofStrathclyde), Balazs Lengyel (Hungarian Academy of Sciences), Moritz Lennert(Free University of Brussels), Marion Maisonobe (Paris-Est University andUniversity of Toulouse-Jean Jaurès), David Marek (Technology Centre of theAcademy of Sciences of the Czech Republic), Ben Martin (University ofSussex), Olga Mrinska (European Bank for Reconstruction and Development),

Maria Prezioso (University of Rome Tor Vergata), Ryszard Rózga-Luter(Mexico Metropolitan Autonomous University), Frédéric Santamaria (ParisDiderot University), André Spithoven (Ghent University), Yutao Sun (DalianUniversity of Technology and University of Nottingham), Josselin Tallec(University of Toulouse-Jean Jaurès), Attila Varga (University of Pécs), TingYan (China University of Political Science and Law), Sabine Zillmer (SpatialForesight, Luxembourg), and Arno Van Der Zwet (University of Strathclyde).
Also, we would like to thank the ResearchGate users who contributed to thediscussion about the book: Carlos Henrique Brito Cruz (University of Campi-nas), Jerry Decker (no active affiliation), Geoff Edwards (Griffith University),Brigid Freeman (University of Melbourne), Robert G. Healy (Duke Univer-sity), Merle Jacob (Lund University), James F. Peters (University of Manitoba),William Sheridan (Infometrica), Darly Henriques da Silva (Brazilian NationalCouncil for Scientific and Technological Development), and K. Brad Wray(Aarhus University). We hope that we will be able to meet off-line one day.
Marion Maisonobe (Paris-Est University and University of Toulouse-JeanJaurès) and Laurent Jégou (University of Toulouse-Jean Jaurès) graciouslyprovided figures 16-18 displayed in Chapter 4. We are grateful for yourcourtesy.
The positive feedback of the three anonymous Routledge reviewers havebeen of great help in the refinement of the initial book idea. We alsoappreciate the professional assistance of the Routledge editors, Elanor Best,Anna Cuthbert, Ananth Ganesan, Robert Langham, Lisa Lavelle, NatalieTomlinson, and our copy editors: Lucy Bindulska and Lori Goshert.
Funding for this work came from the Polish National Science Centre(project no.: 2011/03/B/HS4/05737), the grant provided by the vice-rectorfor Research and International Relations of the University of Warsaw, and theresources of the Centre for European Regional and Local Studies (EURO-REG) at the University of Warsaw.
Special gratitude should be given to Katy Börner and Pnina Fichman forhosting Adam at the Indiana University Bloomington in 2016. The excellentworking environment that you kindly offered proved critical for this bookproject and beyond.
Our closely co-located colleagues from the Centre for European Regionaland Local Studies (EUROREG) at the University of Warsaw should beacknowledged for their continuous support, sincere encouragement, andoccasional jokes about the never-ending book project.
Finally, we thank our families for their patience and love.
Acknowledgements ix

This page intentionally left blank

Introduction
In 1980, Stanley Presser opened a paper in Social Studies of Science with asomewhat alarming phrase: “The dramatic growth of collaborative researchover the last few decades has been clearly documented” (p. 95). Since Presserpublished his article, the average number of co-authors of scientific papers hasdoubled, the percentage of international collaborative publications hasincreased fivefold, and the mean distance between collaborating scholars is nolonger measured in hundreds, but in thousands of kilometres. If 40 years agothe growth of scientific collaboration was dramatic, what adjective should weuse today? Yes, science has always been a collective activity—a social systemwithin which the intersubjective understanding of the world has been craftedand negotiated. But today’s science is saturated with collaboration on anunprecedented scale. Multilevel and multimodal networks increasingly conditionand shape the contemporary cognitive enterprise. This collaborative turn not onlyalters the ways science is organised, managed, and performed but also enables newresearch objectives, accelerates knowledge production, and challenges practices ofestablishing the epistemic validity of science.
At the same time, in the contemporary technology-dependent and innovation-obsessed world, science occupies an emphasised place. And this is not only asymbolic zone in our imagination. Scientific inquiry takes place at very tangiblecoordinates: public and private laboratories, university campuses, research libraries,and remote research facilities, to name but a few. The spatial location of scientificactivity may seem trivial in contrast to the universal validity of science. But makeno mistake, geography matters. On the one hand, the specific conditions of placesinfluence the quantity and quality of scientific activity and its outputs and impacts.On the other hand, the presence of the science sector affects the economic andsocial development of neighbourhoods, towns, cities, regions, and whole nations.
The juxtaposition of these two broad topics laid the foundation of ourstudy. We started with straightforward questions of how geography conditionsscientific collaboration and how collaboration affects the spatiality of science.As we explored the subject, more intriguing questions emerged. Specifically,there is a tension between the seemingly disruptive capacity of the collaborativeturn and the persistence of social, economic, and spatial structures of science.Even though scientific enterprise has become increasingly collaborative,

networked, and internationalised, it also remains substantially hierarchical. Thosehierarchies largely reflect organisational, national, and international disparitiesingrained in the pre–collaborative-turn era. At the same time, the rise of newscientific hubs cannot be fully understood without accounting for collaborativenetworks. In this entangled system, scientific collaboration seems to play adisruptive—as defined by Schumpeter (1942) and Christensen (1997)—andsimultaneously a stabilising role.
The other intriguing tension is between proximity and distance. Despite thedevelopment of transportation and communication technologies that have over-hauled traditional time-space limits and greatly facilitated scientific collaborationon a global scale, proximate collaborative links tend to outnumber distantrelations. Spatial closeness constantly matters for the formation of researchcollaboration. Meanwhile, distant collaborations bring the promise of bolderresults and impacts. The combination of diverse capacities—more likely inbroader networks—seems to promote the expansion of the knowledge frontier.What, then, is the role of spatial proximity and distance in scientific collaboration?How should science policy respond to the proximity-distance dilemma?
Challenges imposed on science policy by the massive growth of researchcollaboration go well beyond the above-stated problem. Traditionally,collaboration-oriented science policy was aimed at intensifying collaboration.But since research collaboration has become semi-ubiquitous, the traditionalapproach is no longer adequate. The key issue is not how to increase collabora-tion, but rather how collaborative networks should be managed, how to evaluatetheir benefits and costs, and how to respond to the direct and indirect conse-quences of collaboration. The increasingly central role of collaboration inscientific enterprise implies the gradual amalgamation of science policy andscientific collaboration policies. Thus, understanding the processes and patternsof scientific collaboration becomes indispensable for crafting science policies in thecollaborative-turn era.
Before proceeding, it is essential to distinguish between the geography ofscientific collaboration—the research domain that we outline in this volume—and the geography of science. The relation between the two can be seenthrough the lens of the concept of knowledge stocks and flows (Machlup,1979). While the geography of science is preoccupied with the location ofresearch activities, the geography of scientific collaboration focuses on flowsbetween those places. Certainly, the two approaches cannot be separated. Onthe one hand, the localisation of research centres forms a playing field forscientific flows: after all, links do not exist without nodes. On the other hand,flows in the form of scholarly collaboration constitute a significant factor for theprogress and impact of scientific places. In a certain sense, “these places are notmeaningful in themselves but only as nodes of these networks” (Castells & Ince,2003, p. 57). Ultimately, spatial hubs of research collaboration fundamentallyoverlap with centres of scientific production and excellence.
In what follows, we deliberately seek a balance between broad and narrowapproaches. First of all, we use a broad, open definition of scientific
2 Introduction

collaboration: the act of working together to achieve common scientificobjectives. This tactic allows us to capture the phenomena in all its complexityand to avoid futile definitional considerations. Simultaneously, we limit ourfocus to relations among scientists and within science. As a result, we almostentirely pass by the issue of science-industry and science-business relations(already discussed at length by many great authors). Lastly, our theoreticalapproach is broad. Because there is no definite theory of scientific collaborationfrom a territorial perspective, we had wide latitude in testing a great variety ofconcepts, ideas, and frameworks developed within various intellectual schools,scientific fields, and research paradigms. In doing so, we were able to map theemerging theory of the geography of scientific collaboration.
Our journey through the places and spaces of scientific collaboration hasseven stages. The first two chapters pave the way for the remaining parts ofthe volume. To discuss the spatial aspects of research collaboration we needto understand the driving forces of the geography of science (Chapter 1) andthe processes that govern collaboration on the level of individuals, teams, andorganisations, as well as the historical developments that led to the contem-porary collaborative turn in science (Chapter 2). In Chapter 3 we overviewdata sources, measures, and methodological considerations for spatial studiesof research collaboration. Chapter 4 depicts and scrutinises the spatial patternsof scientific collaboration at several territorial levels. We focus on theinternationalisation of science, the evolution of global scientific networks,the geographical patterns of collaboration-performance nexus, and thecentre-periphery logic of the geography of scientific collaboration. Chapter 5provides explanations of the driving forces and processes that conditionresearch collaboration in space. Here we outline the theoretical frameworkfor the geography of scientific collaboration. Chapter 6 reviews researchcollaboration policies. It consists of policy case studies—set in Europe, theUnited States, and China—as well as a comprehensive catalogue of tools forscientific collaboration policy. The book closes with conclusions thatsummarise our key insights, reflect on possible future trajectories of thegeography of scientific collaboration, and discuss challenges for sciencepolicy in the collaborative-turn era.
Introduction 3

1 Places and spaces of science
Science, like every human activity, literally takes place. It goes without sayingthat space matters for scientific enterprise. Yet “There is something strangeabout science”, as David N. Livingstone notes in Putting Science in its Place, hisfundamental work on geographies of scientific knowledge. He points out thatscientific inquiry always takes place somewhere, often in highly specific sites,and at the same time knowledge produced in these places has universal valueand ubiquitous qualities.1 Thus “Scientific findings […] are both local andglobal; they are both particular and universal; they are both provincial andtranscendental” (2003, p. xi). We suggest that this paradoxical conundrum canbe solved by distinguishing—even if somewhat artificially—places and spacesof science. The former relate to particular locations and geographical terri-tories, the latter to the abstract, intangible realm of knowledge. This distinctionis analysed in the first part of the chapter. We then discuss selected types ofscience places and their relation to the development of modern science.Afterwards, we present the global variations of scientific activities. The closingpart of the chapter addresses the mechanisms and driving forces underlying thegeography of science.
1.1 Science takes place
Let us consider two types of scientific journey: one through physical placesand the other in the realm of immaterial spaces. For centuries, people havetravelled to remote places to discover new knowledge. The theory of evolu-tion would not be what it is without Charles Darwin’s (1809–1882) five-yearround-the-world expedition, which he elaborately described in his acclaimedThe Voyage of the Beagle (1839). Another scientific giant, Alexander vonHumboldt (1769–1859), also reaped exceptional gains from long travels. Hisfive-year Latin American trip enabled him to bring into being modern physicalgeography, plant geography, and meteorology (Wulf, 2015). The 20th centurysaw humanity reaching the Moon and sending probes further into the solarsystem. Now, at the beginning of the 21st century, the physical movement ofscholars is also vital, though more in the form of professional mobility andbrain circulation than adventurous exploration (Naylor & Ryan, 2010).
However, more and more research endeavour goes on in the endless space ofinformation that humanity has generated and is generating every single second.These expeditions into the digital wilderness—the Big Data Jungle—may seemless exciting. Nonetheless, they can certainly prove incredibly revealing.Scientific voyages into intangible spaces occurred long before those in virtualrealms and, in fact, form the bedrock of science. For the sake of brevity weneed only mention Plato’s (5th and 4th century BC) investigations into theworld of ideas (universal truths) and Karl Popper’s (1902–1994) theory of threeworlds, where the third world contains “objective knowledge” created bypeople (Jarvie, Milford, & Miller, 2006).
Places produce frames within which scientific endeavour takes place. Varioussites constitute core science infrastructure: laboratories, observatories, libraries,archives, university campuses, botanical gardens, agricultural experiment stations,research hospitals, corporate research parks, field sites, and remote researchstations, to name only the most obvious. Moreover, particular localities tendto foster intellectual and creative work. Oxford and Cambridge in the UK,Cambridge in Massachusetts, Silicon Valley in California, and Sophia Antipolis inFrance are immediately associated with science and technology. Larger territorialentities, such as regions or countries, can also be recognised as science places sincetheir state of scientific advancement varies significantly and can be attributed totheir individual history, geography, culture, society, politics, and economy.
On the other hand, science spaces reflect the relations between terms, notions,ideas, theories, paradigms, scientific disciplines, and fields. This space of relation-ships is fundamental for science, which can be understood as an inquiry into howand why phenomena interrelate. Moreover, knowledge as such can be seen as themeaningful organisation of information. Without entering the philosophicaldebate looming over the two previous statements,2 let us direct our voyage intospaces of science towards a down-to-earth object: a library catalogue drawer.Library classifications stand as a spectacular example of how relationships in thescientific space can be made visible. When, in 1876, Melvil Dewey (1851–1931)proposed his hierarchical Dewey Decimal Classification (DDC), he brought abouta major advance in knowledge management. The DDC helped to shelve booksthematically instead of putting them in the order of acquisition, which had beenthe common practice for centuries. More importantly, it also made it possible toimplement an easy-to-navigate, thematic library catalogue—a tool that signifi-cantly improved information access and administration.3
Much in the same way, classifications, catalogues, ontologies, and otherattempts to organise the growing amount of data and information capturedmeaningful relations in the scientific space and influenced progress in scientificknowledge (Wright, 2007). Linnaean taxonomy, developed in 1735 by Swedishscholar Carl Linnaeus (1707–1778), facilitated biological research, making com-munication between naturalists easier. The periodic table of chemical elements,published in 1869 by Russian chemist Dmitrij Mendeleev (1834–1907), repre-sented a magnificent milestone, as it foresaw the existence of elements that hadnot yet been discovered. Different attempts to capture science spaces are
Places and spaces of science 5

embodied in “science maps”: usually non-geospatial visualisations, also calledinfographics or information visualisations. During the 20th century, science mapsslowly became more and more popular. At the beginning of the 21st century,largely because of easy access to computing power and the appropriate software,science maps proliferated and permeated a broad spectrum of applications, frommapping scholarly genealogies, co-authorships, citations, and co-citations,through analysing relations between scientific fields, concepts, and paradigms,to showing under-researched topics or forecasting new research fronts (Börner,2010, 2015).
The concept of science spaces also relates to communities of scholars. Be itthe 17th-century Invisible College—a precursor to the Royal Society ofLondon. Be it the famous Republic of Letters in the Age of Enlightenment—an international community based on the circulation of handwritten letters, butalso printed materials. Be it the New Invisible College—global science networksfacilitated by the development of information technology (Wagner, 2008). Thistype of science space brings us back to the question of the relations betweenspaces and places of science. Scientific communities are simultaneously spatialand non-spatial. They can be purely virtual, but the individuals involved inthem occupy real places somewhere in the world. Therefore, it is possible toproduce a spatial map of the Republic of Letters (Chang et al., 2009) oronline scholarly communities. To shed some more light on the relationsbetween places and spaces of science, we can recall an antebellum drawing byPaul Otlet (1868–1944)—the Belgian visionary and great-grandfather of theinternet (Day, 2001; Wright, 2014). His imaginary vision of relationshipsbetween the world and scientific knowledge corresponds to our space-placedistinction (see Figure 1.1). From this perspective, scholars, their tools, andinfrastructures occupy distinct, physical places. Simultaneously, they operatein the space of interrelated ideas.
Certainly, places and spaces of science are inextricably connected. At thesame time, they differ considerably. Places are defined, particular, and physical.Spaces are abstract, ubiquitous, and nonmaterial. But, beyond a shadow of adoubt, both spaces and places are vital for the emergence and sustenance ofscience, its diffusion, and our understanding of these processes. Whileacknowledging the importance of science spaces, we will now put them asideand focus in this chapter—and the whole book—on places of science.
1.2 From little science spots to the global geography of science
The Cambridge History of Science, vol. 3: Early Modern Science dedicates morethan 130 pages to analysing the role of markets, piazzas, villages, homes,households, libraries, classrooms, courts, cabinets, workshops, academies, anat-omy theatres, botanical gardens, natural history collections, laboratories, sites ofmilitary science and technology, coffeehouses, and printshops. In the periodfrom 1490 to 1730, the diversity of science places was already striking. Today,this landscape can only be more complex. While it is always risky to paint with
6 Places and spaces of science

a broad brush, we would argue that for the sake of placing scientific collabora-tion, we are justified in focusing only on selected science places, namely thelaboratory, library and other humanities-related sites, and the universitycampus. This close-up view of science in places is then complemented by apanoramic view from a distance: the global geography of science.
1.2.1 The laboratory
The laboratory is unquestionably the most iconic place of contemporaryscience. First, modern science would not have become what it is todaywithout laboratories. As Louis Pasteur (1822–1895), French chemist, micro-biologist, and vaccination pioneer, allegedly put it, “Without laboratories menof science are soldiers without arms”. Second, the image of a laboratory sticksfirmly in the collective imagination and popular culture.
The term laboratory encompasses a very diverse set of sites. Medicallaboratories usually do not resemble metallurgical or industrial applied researchlabs. Wet laboratories used by chemists and biologists necessarily differ fromcomputer labs, where “wet” is not the most welcome condition. Furthermore,we use the term for both high-security, restricted-access facilities (e.g., those
The worldall objects of scientific investigation
Space of ideasknowledge created by humans
Scholars working in particular placesuniversity campuses, laboratories, etc.
Knowledge embodied in particular objects and placesbooks, catalogues, datasets, libraries, laboratories, research centres, etc.
Figure 1.1 Interweaving relationships between places and spaces of scienceSource: Drawing on the left from Otlet, 1934, p. 41; schema on the right—conception and design byAdam Ploszaj.
Places and spaces of science 7

dealing with biohazards or radioactivity), as well as much more open sites.Some laboratories take the form of colossal structures, like cyclotrons orradiotelescopes; others fit into a small office space. All these different placesare perceived as similar, not based on their appearance, but on the functionthey serve. Archetypally, the laboratory is a place where scientists carry outtheir observations and experiments. However, from time to time, the term isalso used in relation to units that have little to do with observations, experi-ments, or specialised apparatuses, but which rather resemble typical offices,where people work on their computers, read, write, meet, and discuss.Consequently, the broader definition of laboratory simply describes a placewhere scholarly work is done.
The laboratory is not merely a container for scientific work. It has institu-tional power that plays an essential role in the social construction of scientificknowledge (Latour & Woolgar, 1986). The idea that scientific facts are notdiscovered, but rather invented or constructed in a laboratory, might bedifficult to come to terms with. Indeed, the Latourian approach has beenheavily criticised as deeply relativistic (Boghossian, 2006). However, this lineof thought convincingly shows how the image of a laboratory is used to buildthe credibility of knowledge produced by scientists. David N. Livingstone’sanalysis of the basement laboratory of the first modern chemist, Robert Boyle(1627–1691), finishes with the remark that:
In order to achieve the status of “knowledge,” claims had to be producedin the right place and had to be validated by the right public. Wherescience was conducted—in what physical and social space—was thus acrucial ingredient in establishing whether an assertion was warranted
(2003, p. 23).
The symbolic authority of the laboratory has also been used to legitimateincipient sciences, e.g., psychology at the turn of the 19th into the 20thcentury. As James Capshew observed, “In the early years of the discipline,the laboratory was invested with an almost talismanic power and viewed as asacred space where scientific knowledge was created” (1992, p 132). This facetof places of science—i.e., establishing the credibility of scientific claims—iscaptured by the term “truth-spot”, coined by Thomas Gieryn (2018). Inter-estingly, it is not only a laboratory that can constitute a truth-spot, but alsofield sites or experimental farms (Gieryn, 2002). However, the laboratoryremains the key truth-spot for modern science.
The naissance and transformations of the laboratory closely relate to thedevelopment of modern science. The notion of the laboratory is rooted in thetradition of alchemy (Hannaway, 1986). This protoscientific grandmother ofchemistry consisted of somewhat obscure attempts to find the philosopher’sstone, transform readily available substances into gold, or produce an elixir ofimmortality. The alchemist’s workshop can be imagined through TerryPratchett’s (1948–2015) literary lens as a “room, heavily outfitted with the
8 Places and spaces of science

usual badly ventilated furnaces, rows of bubbling crucibles, and one stuffedalligator. Things floated in jars. The air smelled of a limited life expectancy”(1993, p. 122). Early modern laboratories resembled artisan workshops, and afurnace for (proto)chemical operations constituted its essential equipment(Shapin, 1988). During the 17th century, along with the formation ofmodern science, the laboratory steadily evolved into “one of the hallmarks ofthe new science – the site where theories and hypotheses were purportedlytested by experiment and from which new discoveries and useful knowledgeemerged” (Smith, 2006, p. 293). The rise of the modern laboratory goes handin hand with the naissance of modern science.
The second turning point was reached in the middle of the 20th century whenlittle science became big science (Price, 1963). Big science is characterised bylarge-scale projects, very often international and involving many researchers, andis, last but not least, considerably expensive. For instance, Forbes estimated thatthe total cost of finding the Higgs boson ran at about $13.25 billion (Knapp,2012). The laboratory played a central role in the transition from little to bigscience. Michael Hiltzik argues that the birth of big science can be represented bythe invention of a cyclotron (a type of particle accelerator) made in 1934 byErnest Orlando Lawrence (1901–1958) (Hiltzik, 2015). Big science needed biglaboratories and was willing to pay enormous sums of money to build and runthem. Furthermore, the rise of large-scale research infrastructure enabled furtheradvances of big science and led to developments that formed present-daytechnology, economy, and society. The most telling example here is the originof the contemporary digital revolution. The development of computers and theinternet was profoundly rooted in the World War II and Cold War large-scalemilitary technology research, including the Manhattan Project, which producedthe first nuclear weapons (Agar, 2012; Akera, 2007; Wolfe, 2013). The world-changing, simple, and elegant concept of the World Wide Web (WWW) is alsodirectly connected to big science. Tim Berners-Lee designed the WWW tofacilitate information management at CERN (European Organization forNuclear Research)—a large complex of high-energy physics laboratories locatednear Geneva, Switzerland (Berners-Lee & Fischetti, 1999).
The evolution of laboratories, from alchemists’ dens to the present-day cleanrooms, corporate research complexes, colossal underground cyclotrons, and theInternational Space Station, exemplifies changes in science itself, as well as its rolein the economy and society. Today, enormous research facilities can be seen asthe greatest achievements of our civilisation. The aforementioned CERNhouses the Large Hadron Collider, a ring 27 kilometres in circumference,placed a hundred metres underground. At the time of completion of thisbook, it remains the most expensive scientific instrument ever built and,unsurprisingly, it is also very costly to operate. The whole CERN complexannually uses as much electricity as 300 thousand homes in the United Kingdom(“Powering CERN”, n.d.). The enormous cost of the largest contemporaryresearch facilities means that they are hardly affordable by a single country,and thus international cooperation appears to be the only reasonable choice.
Places and spaces of science 9

Moreover, these cutting-edge laboratories lie almost exclusively in the mostadvanced and affluent nations. The interesting exception here is Chile—acountry which enjoys very favourable conditions for astronomical observations.Since the 1960s, dozens of telescopes have been erected there. It has beenestimated that by 2020 Chile will have 70 percent of the total surface area ofthe world’s telescopes (Matthews, 2012). However, Chilean astronomers havelimited access to this excellent infrastructure which is almost entirely owned byinternational consortia. Despite the significant growth of astronomy in Chile inrecent decades, its relations with foreign science remain largely locked in thecentre-periphery dependency model (Barandiaran, 2015). The Chilean examplebluntly shows how big science, with its large machinery and high costs,reproduces disparities in scientific potential on a global scale.
1.2.2 Humanities in their place
The discourse on science places is dominated by sites where natural, medical,and technical sciences are cultivated. But humanities scholars also have theirunique places. Research libraries, special archives, and collections are stillfavourable (Michael, 2016)—if not essential—spots for many humanities scho-lars, pre-eminently those engaged in historical research. The library has longbeen the crucial institution and site for the sciences—notably not only huma-nities—and as Albert Einstein (1879–1955) put it, “The only thing that youabsolutely have to know is the location of the library”. After all, knowledgeproduced by scientists has to be stored, preserved, and ready to share. And formany centuries, the library has been seen as “the intellectual central power plantof the college or university” (Klauder & Wise, 1929, p. 70). The rise of digitalhumanities (Burdick, Drucker, Lunenfeld, Presner, & Schnapp, 2012) and thegrowing online availability of scanned resources from the past (e.g., www.europeana.eu, the European Union digital platform for cultural heritage), hasnot resulted in the disappearance of libraries and archives. After all, not everylittle thing has been scanned and made available on the internet (at least not yet).Moreover—at least for a fraction of academics—immediate communing with aforerunner’s works in historic libraries creates a specific atmosphere favourablefor intellectual reflection. The smell of old manuscripts and the rustle ofparchment-bound volumes fire the imagination; being surrounded by valuableartefacts and reading handwritten notes can be inspiring.
Access to research resources sometimes goes hand in hand with a uniqueclimate or even genius loci. That might be the case of Villa I Tatti, a historicmanor with formal garden and estate located near Florence in Italy. Since 1961Villa I Tatti has been home to The Harvard University Center for ItalianRenaissance Studies. The villa—along with its extensive collection of books,photos, and works of art—was presented to Harvard by its alumnus, thecelebrated art historian and perseverant collector Bernard Berenson (1865–1959) (Weaver, 1997). Through the years, I Tatti has welcomed over onethousand scholars of the Renaissance. Many of them have enjoyed full-year
10 Places and spaces of science

research fellowships in this near-utopian environment. One of these luckypeople, Claudia Chierichini, testifies: “It’s a wonderful place […] a communityof scholars of the Italian Renaissance from several different disciplines. How-ever, this environment allows us to transcend those disciplinary boundaries”(Mitchell, 2009, para. 8). Her reference to the concept of community istelling. Being in a specific place with an exceptional group of scholars formsan excellent opportunity to develop a unique scientific community. It alsoshows how physical proximity, communication, and collaboration in scienceare inextricably related.
1.2.3 The university and its campus
Without a doubt, the university has become the most important setting ofcontemporary science. Almost all of the Nobel Prize laureates, at the time theywon the award, were affiliated with a university. Universities are responsiblefor the lion’s share of scientific publications and play an important role indeveloping basic research that might eventually result in revolutionary innova-tions. The physical setting of universities can therefore be seen as the mostimportant science place of our times. As Brian Edwards in his UniversityArchitecture puts it, “Few students and academics today would not recognisethe university as a distinctive place with its own blend of buildings, spaces andlandscaped gardens. The campus, as we increasingly refer to this environment,has a flavour all of its own” (2000, p. vii). However, the spatial aspect of theuniversity as a place of scientific activity is not as obvious as one might think atfirst glance. Universities are complex institutions and their campuses containvarious types of buildings, infrastructures, and landscapes not necessarily relatedto science (such as sports grounds or student facilities).
The complex nature of the university—and its campus—is mirrored in theconcept of its three roles. The university is primarily seen as a higher educationinstitution. Teaching and learning are university’s first—and classic—role(Lawton Smith, 2006; Wissema, 2009), and this is reflected in the provenanceof the term. The word “university” originates from the Latin phrase universitasmagistrorum et scholarium, which means “community of teachers and scholars”.The second role of the university is research. As German-Swiss philosopherKarl Jaspers (1883–1969) put it, “The university is a community of scholarsand students engaged in the task of seeking truth” (1959, p. 1). At thebeginning of the 21st century, the words of the German-Swiss philosophermay seem somewhat exalted, if not naïve. It is hard to see the hordes ofundergraduates circulating through campuses as seeking for truth. However,Jaspers’ words still have something important to say, i.e., that education andresearch at universities should be united. Many believe that conductingscientific research at a university remains indispensable for high-quality teach-ing and effective learning (Brew, 2006; Griffiths, 2004; Verburgh, Elen, &Lindblom-Ylänne, 2007). Despite this, not all higher education institutionsfocus on research. In the United States, out of 4,664 post-secondary
Places and spaces of science 11

institutions active in 2015, only 335 (7%) are classified as research universities(also known as doctoral universities).4 This does not necessarily mean thatcolleges not classified as research universities are not active in research at all,but certainly, most of them concentrate on providing professional educationrather than on conducting world-class research.
The third role of the university, or the third mission as it is referred to attimes, has only been recognised in recent years. The notion originated from theobservation that universities constitute an important part of local and regionaleconomies, not only as sources of skilled labour and scientific expertise, but alsoas employers and consumers of goods and services, as well as investors (Arbo &Benneworth, 2007; Drucker & Goldstein, 2007; Goddard & Vallance, 2011). Inmany towns and cities, the university is the largest employer and the mostprecious economic resource. It goes without saying that Cambridge and Oxfordare unimaginable without their universities. Although we can easily point outmany towns dominated by their academic population in Europe, it is in theUnited States that more than three hundred college towns5 form a distinctiveacademic archipelago (Gumprecht, 2008). However, the notion of the third rolegoes much further than viewing the university as a mere source of funds for thelocal economy (Trippl, Sinozic, & Lawton Smith, 2015; Uyarra, 2010). Uni-versities are often enablers or even leaders of regional economic development,being a crucial element of the regional innovation system (Gunasekara, 2006a;Mowery & Sampat, 2005). They are sources of spin-offs, spin-outs, and start-ups, and they transfer knowledge to local enterprises (Breznitz & Feldman, 2012;Rothaermel, Agung, & Jiang, 2007). Universities also collaborate with localgovernments and communities in designing and implementing knowledge-basedpolicies; they are sources of social innovations, form a creative milieu (Benne-worth & Hospers, 2007; Gertler & Vinodrai, 2005), reshape spatial developmentand urbanisation processes (Wiewel & Perry, 2015), serve local communities,and, last but not least, serve as hotspots of sports and the arts (Bridges, 2006).Many universities house art museums or galleries, and those with musicconservatories offer public concerts, frequently for no charge. For example,Jacobs School of Music of Indiana University in Bloomington in the early 2010soffered more than 1,100 performances a year, including fully staged operas.
All three roles of the university are reflected in the spatial shape of theinstitution. The scenic design for the first role includes lecture halls, seminarrooms, auditoriums, teaching laboratories, graduate and undergraduate halls,reading rooms, group work areas, and sport and recreational infrastructure.The second role is performed in laboratories, workshops, libraries (includingresearch libraries, rare book collections, and archives), and faculty rooms.Some universities have their own sky observatories, research stations, experi-mental farms, or art museums. The third role is played in technology transfercentres, university research parks, academic incubators, and also in many placesused primarily for teaching or research, but accessible to the local community.
Some of these places are clearly multifunctional and can serve as a stage formore than one role, for example, the laboratory, where students learn while
12 Places and spaces of science

participating in their professors’ research. Among these various types of spaces,some are centuries old (the library or lecture hall) and have evolved substan-tially over time (Pevsner, 1976), while others are relatively new, e.g., academicincubators with co-working areas, community centres, or IT rooms. In effect,the physical dimension of a contemporary university has become very com-plex, composed of many types of buildings and auxiliary infrastructure andareas. Large universities are almost like small cities. Moreover, research-relatedbuildings are not necessarily the most impressive or attractive structures. Agood example here are large stadiums and other sports venues that sprung upmainly at North American universities as a result of the enormous commer-cialisation of college sports (Gaul, 2015; Weigel, 2015).
The architecture and urbanistics of universities is a fascinating topic describedin many books. Most frequently these are monographs of a given institution,where the scientific and historical glory of the described alma mater is cele-brated. Another approach is to focus on a particular city, where one ornumerous universities are located (Wiewel & Perry, 2015). A notable examplehere is the work of Sharon Haar, The City as Campus: Urbanism and HigherEducation in Chicago (2011), in which she demonstrates how the universityinteracts with its urban context. Yet the most relevant works, in light of thisstudy, review the development of university architecture in the historicalperspective (Coulson, Roberts, & Taylor, 2011, 2015; Forgan, 1989). Interest-ingly, these books typically see the university as a mainly educational institution.The discussion of spatial arrangements and architectural features refers mostly toteaching and learning and, to some extent, to recreation, accommodation, andother auxiliary infrastructure and areas, while the second and third roles of theuniversity are somewhat overlooked. This pattern can be found in the classicalCollege Architecture in America (Klauder & Wise, 1929), the more contemporaryCampus: an American Planning Tradition (Turner, 1984), and recent works byCoulson et al. (2011, 2015) and Calvo-Sotelo (2011). However, a new approachis becoming more and more visible as the second and third roles gain greaterattention. For instance, Brian Edwards’ University Architecture (2000) included a14-page chapter (in a 164-page monograph) on laboratories and researchbuildings. A decade later, Katy Lee in her University Architecture (2011) devoteda quarter of its pages to the presentation of 12 examples of research andlaboratory facilities. Taking into account that the first role of universitiesdominates the architectural discourse relating to them, it may come as nosurprise to see growing discussions on planning spaces for creative and efficientlearning (Boys, 2011), but far less attention is paid to ideas on designing spacesfor enhancing specifically research-related environments (Galison & Thompson,1999). On the other hand, there is a lot of interest in the places shared by allthree roles of the university—physical environments that facilitate social contact,such as meeting places, cafeterias, common areas, dining halls, seminar rooms,and increasingly multipurpose libraries (Törnqvist, 2011).
Finally, universities can be seen as multi-level actors linking global, local,and national domains. The growing importance of the third role of the
Places and spaces of science 13

institution results in local engagement. At the same time, universities operatein an increasingly competitive international environment where rivalry forstudents, world-class lecturers, financial resources, prestige, and attention is thenorm. Successful universities are increasingly “both globally competitive andlocally engaged” (Goddard, Kempton, & Vallance, 2013, p. 43).
1.2.4 The spiky world of science
Scientific activity is spread unevenly across geographic space. This was true inprevious centuries and continues to be the case in today’s globalised world.Disparities in global scientific production reflect the socio-economic diversifi-cation of regions, countries, and continents. Despite the hopes that globalisa-tion and digital technologies would flatten the world, it remains uneven andspiky. Thomas L. Friedman in his provocatively titled book The World is Flat(2005) argued that globalisation and technological development make historicaland geographical divisions increasingly irrelevant. To which Richard Floridareplied that globalisation has indeed changed a lot, but it has not levelled theglobal divides, and hence “The World is Spiky” (2005). The dispute betweenthe two is just one of the latest flare-ups in a recurring debate on the death ofgeography or distance (Cairncross, 1997) and the rebuttal of this idea (Morgan,2004; Olson & Olson, 2000).
Economic disparities form, indeed, a weighty factor behind the spiky worldmap of science. Wealthy countries can sponsor more scientific research andattract brilliant scholars. Consequently, their ability to produce more scientificoutput rises. In 2013 high-income countries—as defined by the World Bank—published 1,192 scientific papers per million inhabitants (the World Bank usesdata from the Science Citation Index and Social Sciences Citation Index).6 Atthe same time, in low-income countries scholars published only 6.5 journalarticles per million inhabitants. Make no mistake, differences between coun-tries are even greater. The highest number of scientific papers per millioninhabitants is enjoyed by: Switzerland (2,603), Denmark (2,223), Australia(2,068), Sweden (2,017), Singapore (1,974), and Norway (1,940). Threescientific global powerhouses—the United Kingdom, the United States, andGermany—do not rank so high but, nevertheless, exceed the world average,scoring respectively 1,518, 1,304, and 1,231. At the other end of the spectrum,we find countries with literally zero published papers captured by globallyrecognised sources. These are usually small island nations, such as Aruba or theTurks and Caicos Islands. However, we can also point out several populouscountries with scientific activity measured by published papers close to zero,for example, the Democratic Republic of Congo with 0.2 articles per millioninhabitants, Chad with 0.5, Somalia with 0.6, Myanmar with 0.7, andAfghanistan with 0.9.
Not surprisingly, Nobel Prize awards are also very unevenly distributedamong countries. The vast majority of awards can be attributed to the US.However, the movement of laureates and changes of state borders since the
14 Places and spaces of science

prize inauguration in 1901 make it difficult to calculate the exact number ofawards per country. Numerous Nobel Prize winners lived and worked in theirlifetimes in different places. Many of the winners ended up in leading scientificinstitutions in the US or the UK. A sound example is Marie Sklodowska-Curie(1867–1934)—a double Nobel laureate in physics (1903) and chemistry (1911).She was born in Warsaw, the current capital of Poland, but at that time the citylay in Russian Empire territory (following the partition of Poland in the 18thcentury). In 1891, Sklodowska-Curie, aged 24, went to study in Paris, whereher career developed quickly, and she became the first woman professor at theUniversity of Paris. At the time of announcing the awards, she was evidentlymore linked professionally to France than to Poland. Thus, which countryshould be associated with Sklodowska-Curie’s two awards: Poland, France, orthe no-longer-existing Russian Empire? A simple solution to the problem wasproposed by BBC editors (“Which country has the best brains?”, 2010). Prizescan be allocated to the country or countries included in the winner’s biographyon the official website of the Nobel Prize committee (www.nobelprize.org).Where the website mentions multiple countries in relation to a prize winner(country of birth, country of citizenship, country of residence at the time ofaward), each of those countries is credited as having won the award.
Following this methodology, we find that for 1901–2015 prizes in thesciences (chemistry, physics, physiology-medicine, and economics, i.e.,excluding prizes in literature and the peace award), the United States holdsthe most privileged position, with 321 laureates. The United Kingdom securesthe second place, although with a significantly lower number of laureates: 99.The third place is occupied by Germany, with 89. Then comes France (36),Japan (21), Switzerland (20), and Canada (20). Thus, the predominance of theUS overwhelms. However, if we count the European Union as one entity (28countries, as of 2015), we find that its score comes close to that of the US. Itshows that almost all of the Nobel Prizes in the sciences go either to Europe orto North America, and almost none go to the rest of the world. Only about onepercent of Nobel laureates in the sciences can be attributed to Africa. LatinAmerica scores similarly low. Australia and New Zealand can be allocatedaround two percent of laureates. The position of Asia remains notably higher,with about seven percent of awards, although here one country—Japan—isresponsible for half of the continent’s achievement.
A closer look at the world map of science reveals that besides internationaldisparities, the spiky scientific landscape also dominates nationally. This is nosurprise when we take into account that scientific establishments—universities,research centres, etc.—usually concentrate in cities and metropolitan areas, as wellas in specialised spots, such as college towns or localities where laboratories,observatories, and other unique research infrastructure are based. High-resolution,local-level analysis of the number of publications from the Web of Science showssharp scientific peaks, clustered in archipelagos (above all in Europe, the US, andEastern China), surrounded by vast scholarly deserts (see Figure 1.2). A verysimilar pattern shows up in the global distribution of the scores obtained in
Places and spaces of science 15

university rankings (Jöns & Hoyler, 2013), as well as inventions measured bypatents (OECD, 2010).
The picture gets even more acute when the impact of publications is taken intoaccount. Analysis of how many citations a particular location receives in relationto the number of citations it gives to other locations—ratio of in-coming to out-going citations—exhibits the greatest knowledge sources and sinks. On the globalscale, only a few clusters of such defined knowledge sources emerge. These areabove all the east and west coasts of the US, England, the Netherlands, Germany(mostly southwest), Switzerland, and Japan (Mazloumian et al., 2013).
The spiky global landscape of science stays very stable in the short run, but inthe longer term it slowly evolves. Over the course of three decades, from 1981to 2011, a gradual global shift in science can be tracked. The decline of theformer Union of Soviet Socialist Republics (USSR) and the loss of NorthAmerica’s relative position have been accompanied by a steady growth ofscientific activities in the Asia-Pacific region—in recent years fuelled mainly byChina. Overall, a slight trend towards deconcentration of scientific activities hasemerged (Grossetti et al., 2014). However, the observed changes are largelyquantitative, as measured by the number of scientific publications, and much lessqualitative, as measured by received citations, which can be taken as a proxy forscientific impact (Radosevic & Yoruk, 2014). This clearly shows the persistenceof the global centre-periphery hierarchy in science (Schott, 1998), especiallywhen we focus on scientific excellence and cutting-edge research.
1.3 Driving forces of the geography of science
A broad spectrum of factors and processes underpins the spatial distribution ofscience. The following part of the chapter discusses the most important ones.
Number of papers
200 000
Figure 1.2 Scientific papers indexed in Web of Science, 2000–2009Source: Conception and design by Adam Ploszaj, based on data from Mazloumian, Helbing, Lozano,Light, & Börner, 2013.
16 Places and spaces of science

These factors can be spread along a necessity-possibility axis—some makescience possible and others make its development indispensable for society.Policy plays the role of a stand-alone factor, although different policies can also beplaced on the necessity-possibility axis. In the long run, additional circumstancesand processes grow in force—a discussion of the logic of long-term (r)evolutionsin the geography of science closes the chapter. But let us start with twoperspectives on the connection between science and place.
1.3.1 Science as a cause and as an effect
The relationship between science and places can be seen from two angles. Thefirst perspective investigates the influence of particular spatial settings on thedevelopment of science. The second approach looks at scientific research as afactor of socio-economic change in specific places: towns, cities, regions, andcountries. The former handles scientific activities as an effect, the latter as acause. In the real world, these two facets are closely intertwined. Scientificdiscovery has the potential to generate wealth that can be invested in furtherdevelopment of research. This process is captured by the concept of circularcumulative causation developed by Swedish economist Gunnar Myrdal (1957).In the long run, over multiple cycles, influences can accumulate, in a positiveor negative way. This is metaphorically referred to as the Matthew effect: “therich get richer and the poor get poorer” (Merton, 1973). In consequence, thedifferences in spatial distribution of scientific activities might not simply persist,but even increase over time.
The supposed relation, or at least co-occurrence, of scientific progress andsocio-economic development has caught the attention of scholars, as well aspoliticians. The recipe for arranging successful places for research endeavourand the commercialisation of its products has become a holy grail for sciencepolicy and broader development policy. Investigations of the most successfulscience and technology places—such as Silicon Valley, Route 186, or ThirdItaly—often seek to answer the conundrum: What was in the air, and can webottle it? The very question led Eric Weiner, the New York Times bestsellingauthor (yes! The topic is so hot that it appeals to the general readership), toscrutinise such unlike places as Hangzhou in China, Florence in Italy, Edinburghin Scotland, Calcutta in India, Vienna in Austria, and Silicon Valley in California,US. These different places share one unique feature: each of them was anunquestionable centre of scientific, technological, or cultural development in aspecific period of time in the past, starting from ancient Athens, through 12th–13th-century Hangzhou (Lin’an), Renaissance Florence, Scottish Enlightenmentin Edinburgh, 19th-century Calcutta, Vienna from the age of Wolfgang AmadeusMozart (1756–1791) to the age of Sigmund Freud (1856–1939), up to thecontemporary Silicon Valley.
So what is the magic formula for establishing a successful, cutting-edgeintellectual hot spot? Apparently, no simple answer has been found yet, if there is adefinitive answer to the question at all. The circumstances that shape the success of
Places and spaces of science 17

a given place are quite clear. However, at the same time, the set of factors variessubstantially from case to case and cannot be summarised into a simple formula,applicable everywhere and anytime (Weiner, 2016). In contrast, we can give a fairnumber of examples where policies aiming to boost growth based on science andtechnology have failed spectacularly: from underperforming USSR science towns(Josephson, 1997) to failed science parks in the US (Luger & Goldstein, 1991;Kefalides, 1991; Wallsten, 2004), Greece (Bakouros, Mardas, & Varsakelis, 2002),India (Phan, Siegel, & Wright, 2005), Poland (Najwyzsza Izba Kontroli, 2013),and the UK (Massey, Quintas, & Wield, 1992).
1.3.2 Between possibility and necessity
Cultivating science is not necessary for the survival of the individual or society.In a sense, science stands as a surplus human activity. One ancient belief saysthat the birth and development of science was possible only because peoplehad free time and resources to leave aside their daily routines, such as hunting,gathering, and—later in history—farming. This thesis surely seems simplistic, ifnot close to trivial, but ultimately, without surplus food and some spare time,Plato’s Symposium would not have been possible, just as probably the whole ofancient philosophy. Jumping a few centuries forward, a similar argument canbe applied to the development of early universities. John Kenneth Hydeformulated it as follows: “The spontaneous universities of Italy were formedin large, growing cities, distinguished, I think, by fat agricultural regions, with afood surplus which meant that relatively cheap living was possible for an idlestudent population” (1988, p. 14). In short, economic growth made possible theemergence of medieval universities, and ultimately the whole Renaissance.Jumping on a few centuries once again, to Victorian Britain, we witness aperiod when scientific advancement, technological invention, and economicdevelopment became not only inseparable from, but also admired by, society—according to David N. Livingstone, visitors to the Natural History Museum,which opened in 1881 in London, respectfully removed their hats whenentering the cathedral-like edifice (2003, p. 39).
Today, the connection between economic development and science seemsobvious. This belief is well grounded in the significant correlation between GDPper capita and the scientific production measured by scholarly papers, as well aspatents (Vinkler, 2008; Al & Taskın, 2015). However, in this case the “chickenor the egg” causality dilemma remains unsolved. Fortunately, this book setsmuch more modest goals than solving this conundrum. For our purposes, it issufficient to observe that in the era of big science (since around World War II),where large-scale projects have become the norm, substantial economic resourcesseem to be a necessary, but not sufficient, condition for scientific development(Galison & Hevly, 1992). This situation resonates with the growth of collabora-tion in science (but that is another story—see Chapter 2).
Access to resources makes science in certain places more possible than inothers. Meanwhile, in some places the need for new discoveries might be
18 Places and spaces of science

more urgent. This idea is captured by the old English-language proverb:necessity is the mother of invention. Harold Dorn (1991) used the argumentof necessity to explain the development of science in ancient Egypt andMesopotamia. Specifically, he argues that in arid and semi-arid places hydraulicengineering projects were a must for the survival and progress of society.Planning, implementation, and sustainment of irrigation and water-controlprojects was only possible with centralised societies and bureaucratic organisa-tion. Once established, strong, centralised states facilitated further developmentof scientific and technological progress. For example, in Babylonia:
we can see the solution of quadratic equations as necessitated by theproblems of deploying labour, while linear equations were solved todetermine the division of fields and the calculation of volumes was appliedto the construction of a hydraulic infrastructure
(Shortland, 1993, p. 130).
This approach can be easily criticised as too deterministic, reducing thedevelopment of science and technology to such factors as climate, soil, ortopography, and overlooking social and cultural factors (Kenzer, 1992). How-ever, in a broad sense, the claim is sound. Surely, a whole diapason of inventionsresulted from necessity.
Hard factors—such as a healthy economy and access to resources—can beseen as a necessary condition for the development of science. But very likely,this condition is not sufficient. Here, intangible factors—specific features ofinstitutions, society, and culture—make the difference. At the beginning of the21st century, the most well-known concept in this stream of thought isunarguably the theory of the creative class formed by Richard Florida (2002).The creative class lives—of course—in creative places or, more precisely, increative cities. The class is attracted and reproduced by places characterised bythe presence of the three Ts, namely talent, technology, and tolerance. Talentrefers to gifted people. Technology denotes a high level of technical andorganisational sophistication. Tolerance means that different lifestyles are largelyaccepted, if not celebrated. The third T makes a crucial point in Florida’stheory (as the two former are already largely accepted and profoundlyanalysed). It has also attracted the attention of the lay public, as Floridameasured the level of tolerance by the so-called gay index, understood as theregional proportion of homosexuals. He argues that creativity needs freedom,openness, and a safe social space for experiments—safe enough to accommo-date innovation “that is outside of the range of existing practice” (Schumpeter,1947, p. 50). This conclusion sounds fully in line with traditional ideas offreedom of science and academic autonomy.
Florida’s 3T theory belongs to the broad stream of concepts that appreciatethe role of intangible factors in regional development. In the context ofscience places, the notion of a creative milieu is especially noteworthy.According to Charles Landry
Places and spaces of science 19

A creative milieu is a place […] that contains the necessary preconditionsin terms of hard and soft infrastructure to generate a flow of ideas […].Such a milieu is a physical setting […] where face to face interactioncreates new ideas
(2008, p. 133).
This excerpt contains two vital messages. First, to explain the creativityof places we have to consider both tangible and intangible factors (e.g.,infrastructure and skills). Second, creativity needs interaction between people, aflow of ideas, and mutual inspiration. The role of a collaborative environmentis further underlined by Gunnar Törnqvist, an early creative milieu theorist,who in turn coined the sister-notion of scientific milieu. He argues that“Successful research settings are typified by fluent communication and livelyinformation sharing, both internal and external” (2011, p. 171). The impor-tance of external links for prosperous scientific milieus shows that the geo-graphy of science cannot be fully understood without the geography ofscientific collaboration.
The creative milieu has one more intriguing property. “It suffers fromstructural instability, like a river that enters a period of instability in its middlecourse” (Hall, 2000, p. 644). The chaotic nature of a creative milieu periodi-cally forces—or enables—scholars to leave their comfort zones and ventureinto new ideas or shift longstanding paradigms. A similar approach focusing oninstability—although applied on a much broader global scale—led MarkZachary Taylor to put forward the hypothesis of creative insecurity. Heconvincingly argues that countries for which external threats outweigh domes-tic tensions have higher innovation rates than countries where internal tensionsprevail (Taylor, 2016). Certainly, being innovative may be inhibited by anunstable domestic situation. But exposure to external competition is likely toelicit creativity. This statement brings us back to our initial focus on thenecessity factor in the development of science.
1.3.3 Science and policy
Necessity often takes the form of a science policy. A notable example is awhole mass of scientific and technological developments that resulted from theneed for precise determination of a ship’s position at sea. This need wasinstitutionalised by the British government in a system of longitude rewards(see Chapter 6.1) (Dunn & Higgitt, 2014). Similarly, in the Cold War era(1947–1991) the rapid progress of science and technology can be labelled asnecessity-driven. The arms race between the Soviet Union and the UnitedStates (and some other countries) needed cutting-edge science, including spacescience and exploration (Wolfe, 2013). Cold War science and technologypolicy, combined with industrial and defence policies, has left a major imprinton the geography of science, both in the West and the Communist bloc.To a large extent, the Cold War produced the Silicon Valley in the US
20 Places and spaces of science

(O’Mara, 2005)—an iconic area of the knowledge-based economy. It hosts theheadquarters and the research labs of dozens of global high-tech companies(Adobe, Apple, Cisco, Facebook, Google-Alphabet, HP, Intel, LockheedMartin, Netflix, Nvidia, Oracle, Tesla Motors, Visa, and Yahoo!, to nameonly a few major ones) as well as numerous universities and colleges, includingthe world-class Stanford University and the University of California, Berkeley(since 2003 occupying second, third, or at least fourth place in the AcademicRanking of World Universities).
Similarly, in the Soviet Union the spatial development of scientific institu-tions was unprecedented. In 1965 the newspaper Ekonomicheskaya Gazeta(Economic Gazette) proclaimed:
In our country, where the development of science has become one of thedetermining factors of social progress […] a completely new approach tothe planning of scientific research and even inventions is needed. One ofthe clearest examples of such an approach is the creation of huge scientificcomplexes—real cities of science—built with one goal: to make themvanguards of the advance into the unknown
(Nekhamkin, 1965).
A few years later an article in the scientific journal Priroda (Nature)remarked, “The degree of success in choosing locations for the new scientificcentres will have an effect on their subsequent fate” (Belyayev, 1973). Thenew science cities (naukogrady) in the USSR were often located in remoteareas—deep into Siberia, the Urals, or the Far East—to ensure security. Manyof them had the status of closed cities, and their existence was kept secretbecause of the military focus of the research conducted there.
The most illustrious example of a Soviet science city is Akademgorodok,located near Novosibirsk, in the middle of the Siberian birch forest,7 where theannual average temperature hardly reaches 2 °C (35 °F). The “little academicvillage” was founded in 1957 on the decision of Nikita Khrushchev—thenleader of the USSR—as part of a great vision to turn Siberia into a communistparadise. At its peak, Akademgorodok was home to 65,000 scientists, includingtheir families, and world-class research was carried out there. In 1994, ManuelCastells and Peter Hall described Akademgorodok as the boldest experiment offounding a new town as an instrument of science-based economic development.But the experiment went wrong:
The Akademgorodok experiment failed as a regional development project,as an instrument of technological modernization, and as an attempt tocreate a scientific complex. The quality of the research in its institutes wasvery high, simply because of the quality of the scientists who went towork there. But little added value resulted from the spatial proximitybetween the institutes
(1994, p. 56).
Places and spaces of science 21

Another reason why the Soviet Silicon Valley did not materialise was due tothe weak relations of Akademgorodok with industry, and its spatial andinstitutional isolation, which hindered the emergence of added value fromcollaborative networks. However, the story of Akademgorodok has not yetended and in new Russia an old dream is being dreamed again. With supportfrom Moscow and better embedment in the global economy, a new plan hasemerged to revive Akademgorodok—this time as a Siberian Silicon Forest(Wainwright, 2016).
The story of Akademgorodok shows the importance of policy in shaping thegeography of science. Be it Soviet-style creation ex nihilo decreed by theoverlord. Be it via an evidence-based participatory decision-making process.Political will can change the spatial organisation of science. Most often, policyaims to create a new scientific hotspot or to enlarge and strengthen existinginstitutions. But politics can also play the villain. Competition betweennations, organisations, individuals, and other entities can be fierce. Take, forexample, the curious history of the University of Wroclaw, Poland. Before theSecond World War it was the German Universität Breslau—as the city lay inGermany. The Leopoldina—as it was initially named—was founded in 1702.However, the first attempt to establish a university in Breslau was made asearly as 1505 by the town council and King Vladislaus II (1471–1516).Eventually the king’s request was rejected by Pope Julius II (1443–1513).Rumour has it that the decision was forced by the scholars from JagiellonianUniversity in Krakow (established in 1364), who wanted to thwart thecompetition in their catchment area (Reinkens, 1861).
Of course, the effects of political decisions are not guaranteed. In extremecases—when a new science spot is created in a remote area or when it isweakly embedded in the regional economy—there is a risk of building a“cathedral in the desert”. Impressive but expensive ventures create insufficientoutput and, in the end, are not very useful. Identifying the success and failurefactors of such initiatives is one of the most fascinating topics at the intersec-tion of development policy and regional studies. However, for our purposes itis enough to point out policy as a factor underlying the uneven distribution ofscience and technology centres: a factor that operates between the Scylla ofpossible and the Charybdis of necessary, sometimes—albeit unwittingly—trying to make the impossible possible.
1.3.4 Between Cardwell’s Law and the logic of longue durée
The geography of science evolves constantly. In the long term, scientificleadership moves from one place to another, be it a city, a region, a nation,or a continent. This is captured by the notion of Cardwell’s Law.8 It states thatno society has maintained high creativity for more than a short historicalperiod. Over the centuries, shifts of scientific excellence have followed therises and falls of great civilisations and societies, in very broad terms, from Asia,through Europe, to North America. In recent years, we have witnessed the
22 Places and spaces of science
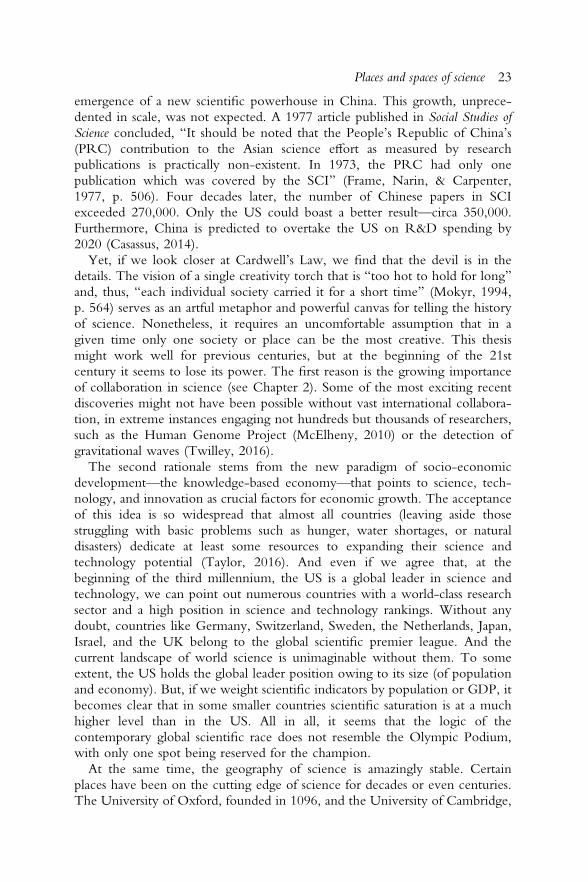
emergence of a new scientific powerhouse in China. This growth, unprece-dented in scale, was not expected. A 1977 article published in Social Studies ofScience concluded, “It should be noted that the People’s Republic of China’s(PRC) contribution to the Asian science effort as measured by researchpublications is practically non-existent. In 1973, the PRC had only onepublication which was covered by the SCI” (Frame, Narin, & Carpenter,1977, p. 506). Four decades later, the number of Chinese papers in SCIexceeded 270,000. Only the US could boast a better result—circa 350,000.Furthermore, China is predicted to overtake the US on R&D spending by2020 (Casassus, 2014).
Yet, if we look closer at Cardwell’s Law, we find that the devil is in thedetails. The vision of a single creativity torch that is “too hot to hold for long”and, thus, “each individual society carried it for a short time” (Mokyr, 1994,p. 564) serves as an artful metaphor and powerful canvas for telling the historyof science. Nonetheless, it requires an uncomfortable assumption that in agiven time only one society or place can be the most creative. This thesismight work well for previous centuries, but at the beginning of the 21stcentury it seems to lose its power. The first reason is the growing importanceof collaboration in science (see Chapter 2). Some of the most exciting recentdiscoveries might not have been possible without vast international collabora-tion, in extreme instances engaging not hundreds but thousands of researchers,such as the Human Genome Project (McElheny, 2010) or the detection ofgravitational waves (Twilley, 2016).
The second rationale stems from the new paradigm of socio-economicdevelopment—the knowledge-based economy—that points to science, tech-nology, and innovation as crucial factors for economic growth. The acceptanceof this idea is so widespread that almost all countries (leaving aside thosestruggling with basic problems such as hunger, water shortages, or naturaldisasters) dedicate at least some resources to expanding their science andtechnology potential (Taylor, 2016). And even if we agree that, at thebeginning of the third millennium, the US is a global leader in science andtechnology, we can point out numerous countries with a world-class researchsector and a high position in science and technology rankings. Without anydoubt, countries like Germany, Switzerland, Sweden, the Netherlands, Japan,Israel, and the UK belong to the global scientific premier league. And thecurrent landscape of world science is unimaginable without them. To someextent, the US holds the global leader position owing to its size (of populationand economy). But, if we weight scientific indicators by population or GDP, itbecomes clear that in some smaller countries scientific saturation is at a muchhigher level than in the US. All in all, it seems that the logic of thecontemporary global scientific race does not resemble the Olympic Podium,with only one spot being reserved for the champion.
At the same time, the geography of science is amazingly stable. Certainplaces have been on the cutting edge of science for decades or even centuries.The University of Oxford, founded in 1096, and the University of Cambridge,
Places and spaces of science 23

1209, have for hundreds of years had a great influence on the development ofscience. Today they still sit at the top of the global academic rankings.Moreover, their host cities enjoy well-developed, high-tech industry, closelyrelated to the universities (however, Cambridge outperforms Oxford in thiscase, see Castells & Hall, 1994). Oxbridge—as Oxford and Cambridge aresometimes jointly referred to—was at the forefront of science well before theUK took the scientific leadership as a country, and it still is, even after theleadership was handed over to the US. This example proves the importance ofspatial scale—in this case city vs. country—as well as the significance oftemporal scale. From the millennial perspective, Oxbridge is just a baton passin the scientific relay race ruled by Cardwell’s Law. From the centennialperspective, it serves as a fine example of the long-lasting phenomenon.These developments are driven by the logic of the longue durée, the termcoined by the prominent French historian Fernand Braudel. The notion refersto the processes embedded in long-term historical structures evolving overcenturies rather than decades or years (Braudel, 1958). The phenomenagoverned by the longue durée remain persistent and can be very unreceptiveto policy influences. Several well-known cases of regional developmentdisparities aptly illustrate this. Southern Italy, Eastern Germany, EasternPoland, and Appalachia in the US continue to be significantly less developedeconomically than other parts of these countries, despite intensive and con-tinuous developmental support from central governments (Gorzelak, 2010).This might come as bad news for policy makers promising to convert the localor regional economy into one more knowledge-based, as well as for heads ofaspiring universities, keen to jump up a few places in the academic rankings.
In the academic world age matters, at least to some extent. An analysis ofthe Times Higher Education World University Rankings suggests that olderuniversities tend to reach a higher rank than newer institutions. However, thecorrelation, although significant, is rather weak (Grove, 2016). Indeed, old agedoes not guarantee a high place in the rankings. The University of Bologna, theoldest higher-education institution in the world—established in 1088—securedonly 208th place in the 2016 QS World University Rankings. The relationshipbetween age and the quality, achievements, and reputation of universities ismuch more complex than simple linear correlation. Internal factors, such asaccumulated resources, knowledge, and symbolic capital (reputation), interrelatewith external circumstances such as the socio-economic context and the level offinancing available from national sources. In addition, path dependency phe-nomena are apparently at play here. Once an organisation has accumulatedcapital and a reputation, it holds a competitive advantage. But should it suffer adecline, then regaining its previous position may prove difficult.
Neither the longue durée nor Cardwell’s Law can fully explain the historicalevolution of the geography of science. It is rather a semi-random mixture ofthem both, a combination of stability and (un)expected shifts. Let us look atthe series of four maps depicting the workplaces of leading scientists in Europefrom the 16th to the 19th century (see Figure 1.3). We can easily spot the
24 Places and spaces of science

emergence of new centres (St. Petersburg, Stockholm, and Uppsala in the 17thcentury, or Berlin in the 18th century) and the decline of old ones (Padua—from stand-alone hub in the 16th century to putative loss of importance in the19th century), but we can also get a sense of their longevity, some lasting onlyfor two (Leiden from the 17th to 18th century) or three centuries (Bolognafrom the 16th to 18th century), with others enduring for the whole of theperiod covered (Paris and London).
* * *
19th century
17th century
18th century
16th century
London = 46
Berlin = 221
Padua = 45
Paris = 33
Figure 1.3 Workplaces of leading scientists, 16th–19th centuries** Workplace symbols proportional to places with the most career stops in each century. Source: Taylor,Hoyler, & Evans, 2008, p. 400.
Places and spaces of science 25

Places and spaces matter for science. From human-scale working environments toglobal geographical structures, the development of science is inseparable from itssocio-economic and spatial context; science shapes these settings and is shaped bythem. The rise and expansion of science has created new places and transformedold ones. The birth of the laboratory marked the rise of modern science. Similarly,large-scale research infrastructures accompanied the naissance of 20th-century bigscience. Over the centuries, the production of scientific knowledge has beenhighly concentrated spatially and has reflected global disparities, hierarchies, andtransformations, including those related to the growing role of scientificcollaboration.
Notes
1 In a similar way, Pierre Bourdieu reflected on science and history. He asked, “Howis it possible for a historical activity, such as scientific activity, to produce trans-historical truths, independent of history, detached from all bonds with both placeand time and therefore eternally and universally valid?” (2004, p. 1).
2 Science and knowledge can be seen as examples of essentially contested conceptsthat defy universal definition.
3 Although Dewey’s system was not the first library classification—this achievement isattributed to the Paris Bookseller’s classification developed in 1845 by JacquesCharles Brunet (1780–1867)—it has undoubtedly been the most influential.Dewey’s system not only inspired other classifications, but is also still in use inmany libraries.
4 The classification is prepared by the Carnegie Classification of Institutions of HigherEducation, an institution based at Indiana University Bloomington since 2015(Indiana University Center for Postsecondary Research, 2016).
5 Blake Gumprecht identified 305 cities in the US as college towns in 2000. Heanalysed enrolment—students in four-year colleges constituted at least 20 percent ofthe population—as well as some qualitative criteria (see: Gumprecht, 2008).
6 Data from the World Bank database: http://data.worldbank.org/7 The picturesque setting in pristine nature had unexpected inconveniences. As Castells
and Hall splendidly describe, “the area, although only 15 miles (25 kilometres) fromNovosibirsk, was absolutely uninhabited, allowing for a new settlement in totallyvirgin land. The decision to build the new town there was taken on the spot. But itturned out that there was a good reason why the area was empty. The beautiful forest,during springtime, was full of tree-leeches whose bite provokes meningitis. Becausespring is the only good weather period, this circumstance effectively makes the forestuseless for recreation. When Lavrentiev heard of the problem, after the decision tolocate the city had been made, he remained adamant: scientists would take care of theproblem, he argued, meaning that they would spray the forest with insecticides. Theydid. But in the process they also wiped out most of the birds, to the point that theyhad to stop the treatment. The insects came back en masse and have remained eversince. It was somehow representative of the hard realities that would attend thecreation of a scientific utopia in the ‘academic little village’” (1994, p. 44).
8 The notion of Cardwell’s Law was coined by Joel Mokyr (1990) based on Donald S.L.Cardwell’s observations included in his well-researched Turning points in Westerntechnology (1972).
26 Places and spaces of science

2 Scientists working together
Nicolas Bourbaki was one of the greatest mathematicians of the 20thcentury. His multivolume 7.7 thousand page treatise Éléments de mathématique(Elements of Mathematics) formed the foundation of modern mathematics.The contemporary concept of mathematical proof originated from his works.They also stimulated the emergence of “New Math” in the educationalsystem of the US and other nations (Aczel, 2006). Almost all of Bourbaki’sworks are single-authored. From the bibliometric perspective, this wouldimply that he worked mostly alone and had limited professional relationswith other scientists. This interpretation sounds all the more reasonablebecause mathematics is one of the scientific fields where collaboration is lessfrequent (Wuchty, Jones, & Uzzi, 2007). So why mention Bourbaki in thecontext of scientific collaboration? The reason is simple: Nicolas Bourbakirepresents one of the most extraordinary examples of collaboration, not onlyin mathematics, but in science overall.
A veil of mystery hangs over Bourbaki’s life. We know that his scientificactivity started in France before World War II (1939–1945), but it is not clearif he is still alive (Mashaal, 2006). His story can be traced back to 1934 whentwo young French mathematicians, André Weil (1906–1998) and HenriCartan (1904–2008), were struggling with teaching calculus at the Universityof Strasbourg. When the existing textbooks failed to meet their expectations,they had no choice but to draft a new reader in mathematical analysis. Thetask seemed challenging. Therefore, Weil and Cartan invited their colleaguesfrom École Normale Supérieure de Paris to help with the writing. In this way,Nicolas Bourbaki—a team of closely collaborating mathematicians—was born.The inspiration for this scientific mystification was a spoof lecture given in1923 for École Normale freshmen by a third-year student, Raoul Husson(1901–1967). Husson, pretending to be a guest lecturer, gave a nonsensicallecture, ending with the extravagant “Bourbaki’s Theorem”, all presented in asophisticated way.
The Bourbaki group, with changing composition, worked for about halfa century, meeting regularly for intensive workshops. Its founders decidedto work collectively and without any individual acknowledgements. Theyrenounced individual benefits, such as credit and recognition, remaining

anonymous members of the team for the sake of science (Borel, 1998;Richer, 2013). This approach may seem eccentric in the era of publish-or-perish pressure and the rocketing competition for attention, acclaim, andgrants that are frequently awarded to applicants with the longest publicationsections in their CVs.
Bourbaki’s story shows how scientific collaboration can be unexpected andelude simple classification. It also raises a number of questions that will beaddressed in this chapter: What is scientific collaboration? Why do scientistscollaborate? How does collaboration work?
2.1 Before the fourth age of research
Collaboration is not a new practice in scientific enterprise. Let us take theexample of the world’s first scientific journal, Philosophical Transactions. In itsinaugural 1665 edition, along with several single-authored articles, a fewcollaborative papers also appeared (Beaver & Rosen, 1978). Clearly, thenaissance of modern academic publishing and the co-authorship of scholarlypapers are inextricably connected. But scientific collaboration can be tracedeven further back in the past. The discussions of ancient philosophers depictedin Plato’s dialogue are in essence not very different from contemporaryacademic debates (though modern scholarly symposia differ from the ancientSymposium in the probability of wine consumption).
Even if scholars did work together through the ages, scientific collaborationwas not the norm, as it is today. Practices of collaboration, along with itsintensity and role in scientific endeavour, have evolved in the course ofhistory. Based on this evolution of scientific collaboration, Jonathan Adamsattempted to distinguish four ages in the global history of science: individual,institutional, national, and international. The first age lasted until the 19thcentury. It was the age of the individual, marked by such names as IsaacNewton (1643–1727), Gottfried Wilhelm Leibniz (1646–1716), and CharlesDarwin (1809–1882). Indeed, before the 19th century, the state of develop-ment in science did not induce scientific collaboration on a large scale. Overtime, the development of learned societies, scholarly journals, and scientificinfrastructure facilitated the professionalisation of science, gradually transform-ing it into Adams’ second age of research—the age of the institution, followedby the third age, of the national research enterprise (such as mission-ledResearch Councils in the UK). These changes prompted scientific collabora-tion, leading to the fourth era of research—the age of international researchnetworks (Adams, 2013). The growth of large-scale scientific collaborations,national and international, has also resulted from and enabled the rise of bigscience (Price, 1963). In the following section of the chapter we will describethe state of scientific collaboration before the fourth age of research, withparticular focus on the first signs of the future collaborative turn: the rise ofdistant collaborative networks and learned societies, the earliest global researchproject, and the first international scientific congress.
28 Scientists working together

2.1.1 The age of the individual
Before the fourth age of research, a single scholar was the key figure in thepractice of science. Collaboration was rare, as is evidenced by the fact thatduring the first centuries of scientific publishing multiple authorship was veryuncommon. Beaver and Rosen (1978), in their analysis of a sample of about10 percent of all scientific articles published between 1665 and 1800, foundthat only 2.2 percent of papers had more than one author. This individualskew was so strong that, even in the middle of the 20th century, when jointwork in science was becoming increasingly popular, it was not seen as acondition for success. In 1947, Albert Einstein wrote in his Atomic War orPeace, “One can organize to apply a discovery already made, but not to makeone. Only a free individual can make a discovery. […] Can you imagine anorganization of scientists making the discoveries of Charles Darwin?” (1994,p. 133). This perspective reserved the greatest discoveries for outstandingindividuals working alone—the lonely geniuses. It might have been true inDarwin’s time, although even the inventor of the evolution theory was notentirely working solo: he co-authored a paper with Alfred Russel Wallace(1823–1913). Albert Einstein also profited from a kind of collaborative process.Although Einstein described how he “lived in solitude in the country andnoticed how the monotony of a quiet life stimulates the creative mind” (1983,p. 29), he was not entirely isolated. For instance, in 1912 his friend MarcelGrossmann (1878–1936) brought him inspiration when Einstein was lookingfor a mathematical approach to general relativity, suggesting that Riemanniangeometry (a branch of differential geometry) might be useful in this case(Galenson, 2012). The key idea of the age of the individual is not that therewas no scientific collaboration at all, rather that collaboration was far lessfrequent, less intensive, and less acknowledged.
In the age of the individual, appreciation of the single scholar—reinforced byRomanticism’s cult of genius—was accompanied by a habit of overlooking thecontribution of a genius’s collaborators. Certainly, acknowledging the contribu-tions of collaborators was not always in line with contemporary customs. The17th-century Anglo-Irish chemist Robert Boyle (1627–1691)—one of the fathersof the modern experimental scientific method—published his work under hisname only, despite it being the result of joint work. One of Boyle’s collaborators,Denis Papin (1647–1713)—French physicist, mathematician and inventor—ranexperiments and also designed some of them, built scientific instruments, and evenwrote publications presenting the results as Boyle’s sole authorship. Althoughtoday this behaviour would be judged as ethically unacceptable, in the 17thcentury it did not arouse indignation. Boyle took all responsibility for what wasclaimed in his publications and was in charge of all the activities that took place inhis laboratory. That is why, in the age of the individual scientist, all the credit andrecognition was assigned to Boyle (Shapin, 1994). Today, the principal investi-gator also takes the main responsibility, but the contribution of assistants,researchers, and even students is usually properly acknowledged.
Scientists working together 29

2.1.2 Learned societies and academies
Institutionalisation in the form of scientific societies and academies marked amilestone in the process of creating modern science. Simultaneously, it showedthe importance of collaboration in science, as societies and academies providedorganisational space for knowledge exchange. The first scientific societiesemerged in the mid-15th century on the Apennine Peninsula. AccademiaPontaniana, founded in 1443 in Naples by the poet Antonio Beccadelli (1394–1471) and patronised by Alfonso V of Aragon (1396–1458), is one of the earliestexamples and it is still operating. Around the turn of the 16th century, privatelypatronised scientific associations spread across Europe. Among the most famousare the Bessarion’s Academy in Rome and the Platonic Academy in Florence.Between 1500 and 1800 in Europe about 2,500 learned societies wereestablished.1 In 1652 the Leopoldina—since 2008 operating under the name ofthe German National Academy of Sciences—was founded in Schweinfurt byfour physicians: Johann Laurentius Bausch (1605–1665), Johann Michael Fehr(1610–1688), Georg Balthasar Metzger (1623–1687), and Georg BalthasarWholfarth (1607–1674). Eight years later, the London Royal Society wasinitiated as a College for the Promoting of Physico-Mathematical ExperimentalLearning, aimed at holding weekly discussions about science and runningexperiments. Since 1665 the society has published one of the first scientificjournals: Philosophical Transactions, originally called Philosophical Transactions:Giving some Accompt of the present Undertakings, Studies and Labours of the Ingeniousin many considerable parts of the World. In 1666, Louis XIV (1638–1715) foundedthe French Academy of Sciences as part of the French government, although itwas expected to be apolitical (Conner, 2005). Over the centuries, scientificsocieties and academies were established all over the world.
Apart from formalised societies and academies, less organised scholarlycommunities built the ground for professional scientific collaborative struc-tures. One example could be the experimentalist network that grew up aroundthe French mathematician and philosopher Marin Mersenne (1588–1648). Itwas part of the pan-European informal Torricellian network, one of the firstinternational experimental scientist communities. The group gatheredresearchers around a mercury barometer invented by Evangelista Torricelli(1608–1647) in 1643. The barometer was a key element which served to linkthe group members by inspiring them to conduct various physical experi-ments. These ranged from the repetition and improvement of Torricelli’s firstexperiments by Blaise Pascal (1623–1662) and Pierre Petit (1594–1677) in1646 (following a description of the experiment received from Mersenne),through Otto von Guericke’s (1602–1686) construction of a vacuum pump in1654, to the pneumatic engine invented in 1659 by Robert Boyle (Wootton,2015). The Torricelli barometer experimental community exemplified thedyad that is essential to science, namely the coexistence of collaboration andcompetition—or coopetition, as this phenomenon is sometimes referred to(Merton, 1973; Hull, 1988; Walley, 2007).
30 Scientists working together

These early scientific networks, societies, and academies demonstrated thatcollaboration between scientists can be beneficial for individual researchers andscience as a whole. The contribution of scholarly communities to the institu-tionalisation of science was that they gave firm evidence to support theconviction that the exchange of knowledge could lead to more rapid progress.This idea was similar to Francis Bacon’s (1561–1626) perspective on science asa progressive, collective, collaborative, and long-range enterprise (Conner,2005). However, it should be noted that early scientific societies and academieswere not intentionally established in order to support collaboration. In its earlydays, the Royal Society was focused predominantly on individual scientistswho demonstrated experiments to a curious public. Collaborative publications,such as encyclopaedias, the tradition of which dates back to Roman times,were rather the result of combining works of many individual authors than theproduct of collective teamwork (Beaver & Rosen, 1978). Thus, although inthe history of science numerous examples of collaboration can be found, thereal age of international research networks (Adams, 2013), when collaborationbecame an inherent, unavoidable, and recognised element of scientific inquiry,is a rather recent phenomenon.
2.1.3 The republic of letters
Until the 19th century, letters were the only distant communication methodavailable for scholars, not counting time-consuming and often risky journeys.The intensive circulation of post in the late 17th and 18th centuries created analmost global scientific community: The Republic of Letters. The exchange ofhand-written mail in the scientific community was incredibly intensive. Vol-taire’s (1694–1778) correspondence alone consists of 19 thousand letters and it isestimated that an additional 9–10 thousand of his missives were not passed down(Edelstein et al., 2010). The German polymath Gottfried Wilhelm Leibniz(1646–1716) built up a network of circa 400 correspondents, not only Eur-opeans, but also Chinese mandarins. Meanwhile, the Rome-based Jesuit Atha-nasius Kircher (1602–1680) wrote to some 760 correspondents in Europe andoverseas (Harris, 2006). Circulating letters helped to exchange knowledge, ideas,and experimental results, discuss contentious issues, share inspirations, andestablish a common understanding (Kronick, 2001; Wootton, 2015).
Like today, in early scientific networks some scholars played the role of hubs,enabling the flow of ideas and knowledge between larger numbers of indivi-duals. The polymath Samuel Hartlib (1600–1662), whose network of contactscreated the foundation for the Royal Society of London, and Henry Oldenburg(1619–1677), the designer of the scientific peer review system,2 could both serveas examples of scientific gatekeepers (Knight, 1976). Although today the singlescientist’s role in knowledge dissemination seems to be diminishing, in 16th and17th-century Europe—during Adams’ first age of research—progress in scienceand the integration of the scientific community depended heavily on the activityof eminent scholars. The above-mentioned scientific activity of Mersenne
Scientists working together 31

perfectly exemplifies the role of a scholarly communication hub. In 1635,Mersenne established the informal, private Académie Parisienne. The institution,in which more than 100 astronomers, mathematicians and natural philosophersshared their ideas and research, laid the foundations for the establishment of theFrench Academy of Sciences (Sergescu, 1948). Mersenne also organised weeklymeetings in his Paris home and was engaged in regular, extensive correspon-dence with, inter alia, French philosopher René Descartes (1596–1650), Italianastronomer Galileo Galilei (1564–1642), French mathematician and inventorBlaise Pascal (1623–1662), and French lawyer and mathematician Pierre deFermat (1607–1665). Moreover, Fermat’s mutual friendship with Mersenneenabled communication among a group of French experimenters scatteredacross the country who, between 1646 and 1648, were concurrently workingon vacuum experiments (Shea, 2003; Wootton, 2015).
2.1.4 The first global research project
Contemporary science is inconceivable without large-scale international pro-jects involving hundreds of researchers. Similarly, some of the importantmilestones in science made in previous centuries would not have beenachieved without scholars cooperating, in spite of the lack of contemporarytransport and communication technologies. The transits of Venus across theSun in 1761 and 1769 provided the perfect occasion for the first globalscientific collaboration (Leverington, 2003). The British royal astronomerEdmond Halley (1656–1742) initiated the series of simultaneous astronomicalobservations of these events well in advance, in 1716. The exercise engagedabout 250 astronomers from different countries who intended to ascertain thedistance between the Earth and the Sun and, on that basis, using trigonometryand Kepler’s laws of planetary motion, to calculate the size of the solar system.The project, prepared and run by European scientific societies, received sub-stantial financial and organisational support from certain monarchs. For instance,Catherine the Great (1729–1796) sent observation teams across the RussianEmpire, Christian VII of Denmark (1749–1808) sent Hungarian astronomers tothe extreme northeastern part of Norway, and the British conducted transitobservations in North America and Tahiti during James Cook’s (1728–1779)Endeavour expedition (Wulf, 2012).
The astronomers, equipped with bulky and fragile instruments, travelled tovarious places which were frequently extremely wild, remote, and inaccessible,such as Tobolsk in Siberia, Madagascar, Mauritius, and Sumatra. Some of themdid not reach the observation point in time—not least because of travel constraintsresulting from the Seven Years’War (1756–1763). Others saw nothing because ofcloudy skies at the time of transit. Extreme bad luck accompanied Frenchastronomer Guillaume Le Gentil (1725–1792), who spent eight years travellingin an attempt to observe either of the transits but missed both. And yet, in the end,the project was successful. After years spent on data gathering and calculations,researchers came out with an excellent result (149.51–156.95 million miles), very
32 Scientists working together

close to the actual distance between the Earth and the Sun (149.60 million miles)(Wulf, 2012). None of the collaborating astronomers could have achieved theresults alone, without jointly planning the observation process and sharing data.The Venus transit observation proves that worldwide collaboration was possibleeven without the advanced communication tools which we enjoy today.
2.1.5 The rise of international conferences and congresses
In the present day, international gatherings are the bread and butter of thescientific profession. But it was not always the case. During the time of theRepublic of Letters, scientists from distant places rarely met in large numbers.International scientific meetings did not gain momentum until the middle ofthe 19th century, when the development of railways and steamships facilitatedlong-distance travel. Indeed, developments in transportation and communica-tion technologies have greatly influenced all kinds of long-distance collabora-tion, not only in science.
The importance of the rise of international meetings for science developmentcannot be overestimated. William Bynum, in his A Little History of Science(2012), gives a very convincing example of a chemists’ gathering in 1860.Leading chemists from eleven European countries, accompanied by one collea-gue from as far as Mexico, met for three days in Karlsruhe in Germany. Theevent was organised by three Germans: August Kekulé (1829–1896), AdolpheWurtz (1817–1884), and Karl Weltzien (1813–1870). They set the aim for themeeting: to agree on a common vocabulary, notation, and understanding ofsome basic concepts such as atoms and molecules (Leicester, 1956). Althoughthe delegates did not reach a firm consensus, the congress was a milestone in thedevelopment of modern chemistry. The gathering not only laid the cornerstonefor the global chemist association—The International Union of Pure andApplied Chemistry (Ihde, 1961)—but, and more importantly, it directlyinspired some breakthrough developments in chemistry. Dmitrij Mendeleev(1834–1907)—one of the meeting’s participants—was genuinely inspired bySicilian scholar Stanislao Cannizzaro (1826–1910) and his 1858 paper distributedduring the convention. In the paper Cannizzaro argued that relative atomicweights could be useful for cataloguing and understanding the nature of theelements. Mendeleev followed this path and created his groundbreaking periodictable, where the elements are indeed ordered by their relative atomic weight.
The 1860 Karlsruhe chemists’ congress is considered the first professionalinternational gathering. Further congresses followed soon and played an importantrole in the formation of contemporary science, including the rise of big science,which relies on and stimulates international scientific collaboration. However, themeaning of international scientific meetings could also be seen in a broaderperspective. As William Bynum argues, “They also announced to the world abelief widely shared by the scientific community: that science itself was objectiveand international, and above religion and politics, which often divided people andset whole nations at war with one another” (2012, pp. 178–179).
Scientists working together 33

2.2 The collaborative turn
A significant increase in scientific collaboration has been noticeable since thebeginning of the 20th century, but it is in the last few decades that we havewitnessed its exceptional acceleration and intensification all over the world and inall scientific disciplines. And now, before our very eyes, a collaborative turn istaking place in the modes of scientific production. This collaborative revolutionindicates something deeper than a growth in the number of collaborative papers,international projects, co-patents, and joint events, or the growing use of sharedfacilities and equipment. The collaborative turn represents a substantial change inthe making of science. Collaboration changes science not only quantitatively, butalso qualitatively. Many scientific achievements simply cannot arise from indivi-dual effort and, thus, large-scale collaboration makes the impossible possible. Butbefore we discuss the outcomes of the collaborative turn, let us scrutinise itsanatomy.
2.2.1 The anatomy of the collaborative turn
Derek John de Solla Price—the father of scientometrics—reported that in 1900over 80 percent of all papers in the periodical indexChemical Abstractswere single-authored, and almost all the rest had no more than two authors. He noticed thatby 1960 the share of multiple-authorship papers had increased to 60 percent, andthe pace of this increase was even greater for papers with a higher number ofauthors (Price, 1963). Cronin gave further evidence of the rise in scientificcollaboration. He noticed that between 1955 and 1999 the average number ofauthors per paper in the Science Citation Index (SCI) rose from 1.83 to 3.90(Cronin, 2001). Leydersdorf and Wagner (2008) confirmed these findings.They estimated that in just 15 years—between 1990 and 2005—the share ofinternationally co-authored papers in the SCI increased from 10.1 to 23.3percent. Even in a less collaborative field of science, namely mathematics, thepercentage of co-authored papers increased. While during the whole 19thcentury the share was at a stable and very low level (about 1–2 percent), a rapidrise was observed between 1900 and 1930, and in 1980 the rate was almost 50percent (Wagner-Döbler, 2001).
The collaborative turn is manifested by the increasing size of research teamsand scientific collaboration networks, as well as by the proliferation ofcollaboration crossing institutional, sectoral, national, and disciplinary borders(Doré et al., 1996; Georghiou, 1998; Glänzel, 2001). For example, between1975 and 2005 multi-university collaboration among the major US universitieswas the fastest-growing type of authorship collaboration (Jones, Wuchty, &Uzzi, 2008). Furthermore, an increase in teamwork has occurred in all fields ofscience (Wagner, 2008; Ma, Li, & Chen, 2014). In the Web of Science theshare of multi-authored papers in the natural and medical sciences increasedbetween 1900 and 2011 from 13 percent to 93 percent, and in the socialsciences and humanities from 3 to 62 percent. Additionally, in both groups of
34 Scientists working together

sciences, multi-authored and multi-institutional papers constituted the majorityof papers published in 2011 (Larivière, Gingras, Sugimoto, & Tsou, 2015).Between 1955 and 2000, the average number of authors per paper in the Webof Science database in science and engineering almost doubled, from 1.9 to3.5. With regard to inventions, there was an increase from 1.7 applicants perpatent in 1975 to 2.3 in 2000. At the same time, the share of social sciencearticles written by more than one author grew from 17.5 to 51.5 percent. Theshare of multi-authored papers in the arts and humanities still remains relativelylow (less than 10 percent in 2000) but, in these fields too, the trend towardsgreater collaboration is visible (Wuchty et al., 2007).
The collaborative turn can be tracked by other means than merely thepublication outcomes of scientific activity. For example, multiple laureates of theNobel Prize in physics, chemistry, and physiology (medicine) have become muchmore commonplace since the Second World War. The mean number of laureatescalculated for the 20-year intervals increased from around 1.5 in the mid-1940s to2.5 in the 21st century in all three categories mentioned.3 We should bear in mindthat the Nobel Prize cannot be awarded to more than three individuals. This tightcondition is against the collaboration trend in contemporary science, and itslegitimacy has been openly questioned (Casadevall & Fang, 2013). If the NobelCommittee would like to reward the detection of gravitational waves, announcedby the Advanced LIGO team in 2016, it would be a real dilemma as to whoshould get the prize. The team includes hundreds of researchers from all over theworld. The 16-page article presenting the discovery, published in the journalPhysical Review Letters, contains an alphabetical list of over one thousand authorsspread over three pages.
The collaborative turn increasingly affects members of the scientific commu-nity, no matter their position and experience. For centuries, the privilege ofworking with other researchers was reserved for the most prominent scholars(Beaver & Rosen, 1978). In the last few decades, teamwork has not onlyintensified within the scientific elite, but has also become more widespread inthe whole scientific community. Today, co-working with partners from allover the world has become an everyday reality for top scientists and forresearchers in non-elite institutions, as well as scientists from countries that afew decades ago were absent from the global scientific collaboration network(Schubert & Sooryamoorthy, 2010).
2.2.2 The roots of the collaborative turn
The collaborative turn is deeply rooted in globalisation processes. Internationalintegration and high interdependence among societies, facilitated by theliberalisation of capital, commodity, and people flows, as well as the incredibletechnological leap in recent decades have influenced scholars’ behaviour andhave caused the scientific community to become tightly linked as never before.The increased role of international organisations, multinational corporationsincluded, has changed the way in which knowledge is created and
Scientists working together 35

disseminated. Science policies have significantly reinforced these spontaneousprocesses. Various incentives and measures implemented by states and regionsfoster collaboration as a way of lifting research to a higher level (Katz &Martin, 1997; Sonnenwald, 2007). These changes influence the collaborativebehaviour of individuals, from academics settled at universities to researchersbased in enterprise laboratories.
Significant progress in transport and communication has facilitated the rise ofcollaboration on a global scale. Due to technological advancements in the last fewdecades we have witnessed a substantial drop in travel and communication costs,accompanied by an unprecedented decrease in journey times. The dense flightnetwork enables scientists to cover a distance of thousands of kilometres in just afew hours, and attend a conference or a project meeting on a one-day trip basis,without draining their travel budget. A 2016 study showed that the introductionof new, low-fare airline routes in the US significantly increased scientific colla-boration, with the greatest impact made on the collaborative behaviour of early-career scholars, who usually have fewer resources than established professors(Catalini, Fons-Rosen, & Gaulé, 2016). The reduction of travel costs means thatshipping costs of sending, for example, samples in experimental research are alsosubstantially less. Furthermore, in many cases the need for short-term relocation ofpeople has been significantly reduced, since modern information and commu-nications technologies (ICTs) enable instant and affordable communication fromand to any location.
E-working in science has become a standard nowadays, at least in less infra-structure-dependent disciplines. This is also because scientists are interested in theresearch opportunities that are dispersed worldwide. Traditional working spacesare redundant since many scholars are constantly on the go, and broadbandinternet connections enable them to stay online wherever they are with the useof a portable virtual office, equipped with ever more sophisticated devices. ICTsfacilitate fast, low-cost, and secure transfer of large amounts of data, and allow forjoint research irrespective of the partners’ location. Email communication doesnot require synchrony, which is especially important when partners live indifferent time zones or have very tight schedules (as many scientists do). Geo-graphically dispersed collaborations and projects with a large number of partnersparticularly benefit from these facilitating factors (Stokols, Misra, Moser, Hall, &Taylor, 2008).
In fact, ICTs assist both research activities, such as exchanging data ordiscussion, and project management (Bos et al., 2007). Here, basic tools suchas email or online video calls are complemented by more advanced techno-logical features such as shared file-hosting platforms and calendars, or onlinemeeting planners (Barjak, 2006; Sonnenwald, 2007; Walsh & Maloney,2007). Noticeably, although still at a very early stage of development, socialnetworking sites for scientists, such as ResearchGate, Academia, or Mende-ley, are gradually gaining interest among scholars. Like all social media tools,these portals can be used to foster collaboration between their users, espe-cially at the initial stages of the process (Van Noorden, 2014). It is also worth
36 Scientists working together

emphasising that the positive impact of ICTs on research collaboration isconditioned by the compatibility between new tools and existing practices(Duque et al., 2005).
Despite all the advantages of ICTs, face-to-face interaction is still important,or even essential, in establishing and conducting fruitful collaboration. This canapply not only to intensive integrated collaboration, but also joint work basedon relatively independent complementary tasks (Vasileiadou & Vliegenthart,2009). For many researchers, contact through the internet complements ratherthan substitutes for traditional face-to-face communication (Koku, Nazer, &Wellman, 2001). As already mentioned, since joint research is something morethan just exchanging data or results, interpersonal chemistry, trust, and mutualunderstanding are necessary for successful collaboration (Hara, Solomon, Kim,& Sonnenwald, 2003; Laudel, 2001; Numprasertchai & Igel, 2005). And thesemight be difficult to develop using internet-mediated communication alone.Vicens and Bourne describe this in a very outright way:
Nothing new here, it is the same as for friendship and marriage. Commu-nication is always better face-to-face if possible, for example by travellingto meet your collaborators, or by scheduling discussion related to yourcollaborations during conferences that the people involved will attend.Synchronous communication by telephone or video teleconferencing ispreferred over asynchronous collaboration by e-mail
(2007, p. 336).
Apart from new technologies, collaboration in science is made significantlyeasier by the new lingua franca of our age: English. Through the centuries ofscientific history several languages have been used for international commu-nication, with Latin, French, and German as examples. However, since the1930s, the role of English has been constantly increasing, marginalising otherlanguages. The proliferation of English might be seen as the fruition of thedream of a “Paradise lost, a moment of universal comity before the descent ofBabel” (Gordin, 2015, p. 24) that was supposed to have been realised by Latin.Today, the domination of English is turning into a monopoly, at least in somescientific disciplines. A symbolic date is January 1, 2012, when the InternationalCode of Nomenclature for algae, fungi and plants—the set of rules dealing withbotanical names—was allowed to include a non-Latin description of candidatesof a new species. Of course, the only alternative language to Latin was English.Using a common language has clear advantages for collaboration: it enablesscientific communication with partners from different countries, includingtransfer of knowledge, discussion, and peer review. Nowadays, even if papersare written in other languages, more or less popular, they are almost alwayssupplemented with an English title and abstract. A common language is alsocrucial in such areas as managing collaborative projects or distributing money,e.g., through international grants with calls announced and applications pro-cessed in English.
Scientists working together 37

2.2.3 Outcomes of scientific collaboration
The impetus of the collaborative turn comes from the individual scholars whostrive to build a network of collaborators, knowing that collaboration is key topursuing their scientific careers. Generally, scholars who collaborate intensivelypublish more, their articles gain more citations, and consequently their personalwork is recognised by a wider public (Sonnenwald, 2007). Collaboration’spositive effect on the number of scientific papers which an individual scientistcan publish results from the advantages of division of labour. In 1966, Price andBeaver explained the mechanism of how collaboration increases publicationproductivity, starting with the simplifying assumption that the number of articlesthat a scholar is able to write during his or her academic career can be determined.In the mid-1960s this value was relatively low—on average 0.96 for a five-yearperiod. Therefore, collaboration can be seen as “a method for squeezing papersout of the rather large population of people who have less than a whole paper inthem” (p. 1015). The large-scale 2016 study based on Web of Science data foundthat the number of articles published by early-career researchers (in their first 15years of publication activity) did not change significantly between 1900 and 2013if controlled for collaboration. The number of papers per researcher rose, butsimultaneously the number of collaborators increased from almost zero at thebeginning of the century to between two and seven in 2013 for various scientificfields, excluding the arts and humanities, where co-authorship is still quite rare. Ifwe take co-authorship into account and calculate fractional publication rates, i.e.,the ratio of the number of publications and the number of co-authors, it turns outthat the number of papers per researcher has not increased but has actually slightlydeclined in the course of the last century (Fanelli & Larivière, 2016). This showsthat co-authoring—and collaboration in general—is a powerful tool for increasingthe number of output items, but it does not necessarily translate into thesubstantially greater ability of a single scholar to produce more new knowledge.
Collaboration can also augment the quality of scientific production, and by thiswe mean the excellence of research outcomes that actually push forward the frontierof knowledge. Shared responsibility for a precisely limited piece of work makes itpossible to achieve better results in time-restricted projects. Collaboration brings intoplay the advantages of specialisation, complementarity, and synergy effects. Byworking together, scientists gain access to partners’ knowledge, expertise, and skills,giving them new ideas, solutions, and approaches. Furthermore, partners can jointlycontrol the accuracy of their results, detect errors, and comment on the methodsselected and techniques applied (Beaver, 2001; Franceschet & Costantini, 2010).
Collaborative publications generally gain more citations than single-authoredpapers (see Beaver, 2001; Franceschet & Costantini, 2010). There are two mainreasons for this. On the one hand, multi-authored publications can be of betterquality in terms of their originality, significance, and depth, and are therefore ofgreater interest to the scientific audience. Consequently, the results are morefrequently mentioned in other publications and are thus more visible. On theother hand, the visibility of collaborative papers can also be put down to the
38 Scientists working together

advertising factor. Authors bring their papers to the attention of people throughformal and informal personal contacts. Therefore, the fact that multi-authoredpublications are embedded in broader social networks may explain the highernumber of citations. In particular, publications with authors from differentinstitutions or countries can expect to have more citations due to this advertisingmechanism (Franceschet & Costantini, 2010; Goldfinch, Dale, & DeRouen,2003). In the case of less developed countries, there is a whole list of othertangible rewards related to collaboration. For example, a study of the local andforeign publication productivity of agricultural scientists in two Philippinelocations revealed that participation in collaborative research projects is mainlyaimed not at producing papers and citations, but at gaining access to otherprofessional opportunities. Through collaboration, scholars can acquire access toresearch project offers, domestic and foreign travel opportunities, and financialincentives in the form of additional income, honoraria, and per diems, as well ashigh prestige in the local scientific community (Ynalvez & Shrum 2011).
2.2.4 Multi-speed collaborative science
The clear and growing trend towards collaborative science is becoming moreand more widespread, although not uniform. Researchers’ individual charac-teristics, such as the stage of their career, age, and gender, greatly influence theproclivity for collaboration (Abramo, D’Angelo, & Murgia, 2014; Bozeman &Gaughan, 2011; Jeong, Choi, & Kim, 2011). Above all, collaboration levels arehighly diversified across the scientific fields. Despite the fact that the colla-borative turn is visible everywhere in the scientific universe, it has altered eachof the disciplines differently, and some types of teamwork have grown andspread more rapidly than others. We might say that there are as manycollaborative customs as there are scientific fields. Larivière and his collabora-tors (2015) analysed more than 28 million Web of Science papers from 1900–2011. They concluded that in the 20th century overall, co-authored publica-tions increased in both analysed categories, i.e., natural and medical sciences(NMS), and social sciences and humanities (SSH). However, while the share ofsingle-authored papers in NMS plummeted from 87 to just 7 percent, in SSHit fell less dramatically, from 97 to 38 percent.
A study of co-authorship published in Web of Science in the years 1996–2000revealed that the average number of authors spanned from 1.06 to 4.39 dependingon the scientific field (Wuchty et al., 2007). In some disciplines collaboration ismore a matter of choice than necessity, as in the case of theoretical sciences, suchas philosophy or history, where co-authorship is rare. On the other hand, in somefields where research requires access to unique resources, the number of co-authors exceeded four. Examples can be seen in clinical experiments, whereresearchers need to closely collaborate with doctors to obtain biological samples,or in experimental physics, where only some research centres have access to thespecial instruments or infrastructure required. In general, co-authorship is low inthe arts and humanities. In the social sciences, mathematics, and computer science
Scientists working together 39

it is moderate, while in the sciences and engineering co-authorship is the mostcommon and the broadest (Francescheta & Costantini, 2010; Wuchty et al.,2007). Furthermore, experimentalists tend to collaborate more with otherscientists than theoreticians, regardless of the scientific field (Gordon, 1980;Meadows & O’Connor, 1971; Price, 1963).
These discipline differences in the proclivity to collaborate could be explainedby variance in the modes of knowledge production and the nature of work typicalfor a specific scientific field (Birnholtz, 2007). However, empirical analyses havenot been able to identify which disciplinary characteristics play a crucial role in thismatter. For example, Wagner (2005) proposed a distinction between four types ofscientific fields—data-driven, resource-driven, equipment-driven, and theory-driven—but the results of her study did not show a clear pattern of relationsbetween collaboration propensity and the type of scientific discipline. Further-more, since most of the studies use co-authorship as a proxy of collaboration,differences between disciplines might also be the result of the authorship con-tribution rules and conventions typical for a specific scientific field. In somedisciplines, it is only the first author that gains significant credit for the publication(Engers, Gans, Grant, & King, 1999; Laband & Tollison, 2000), while in others allproject members are listed as authors in alphabetical order.
2.3 What is scientific collaboration?
It is often taken for granted that the concept of scientific collaboration is quiteobvious to most people and easily understood. Yet the truth is that undercloser scrutiny it remains a challenging and complex phenomenon (Katz &Martin, 1997). For instance, while a joint research project or co-authorship ofa scientific paper unquestionably exemplifies scientific collaboration, it is not asclear in the case of discussing research nuances during a conference coffeebreak. Can we still call this collaboration? Physicist Richard Feynman (1918–1988), the 1965 Nobel Prize laureate, wrote in his autobiography:
The questions of the students are often the source of new research. Theyoften ask profound questions that I’ve thought about at times and thengiven up on, so to speak, for a while. […] The students may not be able tosee the thing I want to answer, or the subtleties I want to think about, butthey remind me of a problem by asking questions in the neighbourhood ofthat problem. It’s not so easy to remind yourself of these things
(2010, pp. 91–92).
The boundary between collaboration and inspiration is blurred. Certainly,when we cite Richard Feynman we do not collaborate with him, even if weowe him a great deal of inspiration. But things get more complicated if weconsider receiving enlightening comments on our manuscript from anonymouspeer reviewers. We cannot cite them or list them as co-authors, but have they notconsciously worked with us and influenced the outcome of our efforts?
40 Scientists working together

2.3.1 Defining a fuzzy concept
The Oxford English Dictionary defines collaboration as “the act of working withanother person or group of people to create or produce something” (“Collabora-tion”, n.d.). Applying this approach to science, we can see scientific collaboration asthe act of scholars working together to make something. This something can bealmost anything, from a well-defined research proposal, a presentation abstract, or ajournal paper, to concepts less easy to grasp, such as new knowledge or advance-ment of science and technology. Two main components of scientific collaborationarise here. First, the collaborative process needs two or more collaborating sides:units, people, or groups of people. Second, collaborating parties act to achieve aparticular goal, to do something that would not be possible without collaboration,or would be significantly more difficult to achieve. The latter is crucial for theunderstanding of collaboration in science. The common goal component differ-entiates collaboration from other forms of interaction in science.
Not surprisingly, many attempts to define scientific collaboration focus onthe shared goal or common outcomes of the process. Katz and Martin definescientific collaboration as “the working together of researchers to achieve thecommon goal of producing new scientific knowledge” (1997, p. 7). Similarly,Laudel underlines the significance of shared goals as the main factor drivingjoint work. She defines scientific collaboration as “a system of researchactivities by several actors related in a functional way and coordinated toattain a research goal corresponding with these actors’ research goals orinterests” (2002, p. 5). Ynalvez and Shrum share this view when they describecollaboration as “the interaction of two or more scientists in a project with aspecific goal or objective, attained by sharing knowledge, skills or resources”(2009, p. 872). Meanwhile Schrage (1995) takes a broader stance and points toshared understanding as an outcome of scientific collaboration.
In some definitions, the common goal component remains implicit. This is thecase in the broad definition coined by Patel. According to him, scientific collabora-tion is “a process of functional interdependence between scholars in their attempt tocoordinate skills, tools and rewards” (1973, p. 80). The definition appears to makeno direct reference to a common goal, but we can argue that effective coordinationis not possible without shared outcomes in mind, even if they are as abstract asadvancement of the sciences. Similarly, the definition proposed by Melin andPersson (1996), which focuses on communication and sharing of competences andother resources (see Table 2.1), includes an implicit assumption that collaborationcan produce efficiencies in these areas—and it is this efficiency of scientificproduction that can be seen as the common goal of collaborators.
2.3.2 Weak and strong collaboration
Collaboration modes vary across different scientific disciplines and people, as wellas stages of research. Scientists can divide work and combine individual contribu-tions in a number of ways, depending on the specificity of the task, relations
Scientists working together 41

between team members, available resources, and the degree of functional andstrategic dependence among researchers. Some tasks can be performed sequen-tially, some have to be done concurrently, while others are inseparable and thusrequire joint work (Steiner, 1972; Whitley, 2000). Based on the work of Laudel(2002) we can distinguish two types of collaboration: (1) strong—tightly anddirectly related to the specific research process, and (2) weak—loosely associatedwith the specific research process or independent of it (see Figure 2.1).
Strong modes of collaboration rest upon horizontal specialisation, with variousstrengths of cooperative bonds as well as a creativity component. There are twomain forms of strong collaboration—creative and imitative. Creative collabora-tion involving the division of tasks is the most intensive and is characterised by ashared research goal and distribution of inventive work. An example could be aresearch project in an experimental discipline. Each phase of the project requiresjoint work and intensive interaction, which are essential for achieving finalsuccess. Hara et al. (2003) further distinguishes between two detailed subtypes ofcreative collaboration depending on the intensity of interaction and interdepen-dency between partners. The complementary collaboration subtype requires inputfrom a number of partners who can work to a large extent independently. Thistype does not require much interaction between partners and is based on theresults being put together by the project coordinator. Meanwhile, the integrative
Table 2.1 Selected definitions of scientific collaboration
Scientific collaboration is… Source
“a process of functional interdependence between scholars in theirattempt to coordinate skills, tools, and rewards”
Patel, 1973, p. 80
“the process of shared creation: two or more individuals withcomplementary skills interacting to create a shared understandingthat none had previously possessed or could have come to on theirown”
Schrage, 1995, p. 40
“an intense form of interaction, that allows for effectivecommunication as well as the sharing of competence and otherresources”
Melin & Persson,1996, p. 363
“the working together of researchers to achieve the common goal ofproducing new scientific knowledge; definition supplemented withthe putative criteria for distinguishing ‘collaborators’ from otherresearchers”
Katz & Martin,1997, p. 7
“a system of research activities by several actors related in afunctional way and coordinated to attain a research goalcorresponding with these actors’ research goals or interests”
Laudel, 2002, p. 5
“the interaction of two or more scientists in a project with aspecific goal or objective, attained by sharing knowledge,skills or resources”
Ynalvez & Shrum,2009, p. 872
Source: Own elaboration.
42 Scientists working together

collaboration subtype involves more intensive joint work on complex and ofteninterdisciplinary problems involving a large number of interdependent subtasks.Partners have to interact intensively during the whole project, discussing not onlythe research design and plan, but also solutions to emerging problems and theconsequences of partial results, as these may affect further stages in their jointwork. This kind of collaboration is based on close working relationships sinceintensive interaction occurs between all partners, and as a result it generatessynergy and provides support for collaborators (Hara et al., 2003).
Secondly, the imitative type of strong collaboration refers to service collaborationand provision of equipment. In such cases, the principal investigator (lead partner)sets the research goal and also performs all the creative work. Other partners’contribution is routine, and they might be called subcontractors. In the experi-mental sciences, such collaboration may occur when a research designer does notknow the method required or does not have access to research equipment, such aslarge telescopes or telescope arrays. Scientists from all over the world visit observa-tories that are often remotely located, use the equipment for a specific period oftime in order to collect data, and return to their host institutions to analyse theresults of the measurements. Wray (2002) underlines that in this form of subcon-tracting collaboration, all the credit and responsibility rest with the lead partner. Heproposed labelling such collaboration as collective but non-collaborative research.
As a separate subtype of imitative strong collaboration, Laudel (2002) distin-guished transfer of know-how—procedural knowledge in the form of advice,often as a response to a spontaneous, informal request, for example at a con-ference. As Subramanyam notes, “a brilliant suggestion made by a scientist duringcasual conversation may be more valuable in shaping the course and outcome of aresearch project than weeks of labour-intensive activity of a collaborating scientistin the laboratory” (1983, p. 35).
Collaboration modes
StrongRelated to
a specific research process
CreativeComplementary collaboration (division of tasks, teamwork)
Integrative collaboration (partnership)
ImitativeProvision of servicies
Provision of equipmentKnow-how transmission
WeakIndependent of
a specific research process
Result relatedSubauthorship collaboration
(trusted assesorship)
Side effectinspiration
Figure 2.1 Collaboration modesSource: Own elaboration based on Laudel (2002) and Hara et al. (2003).
Scientists working together 43
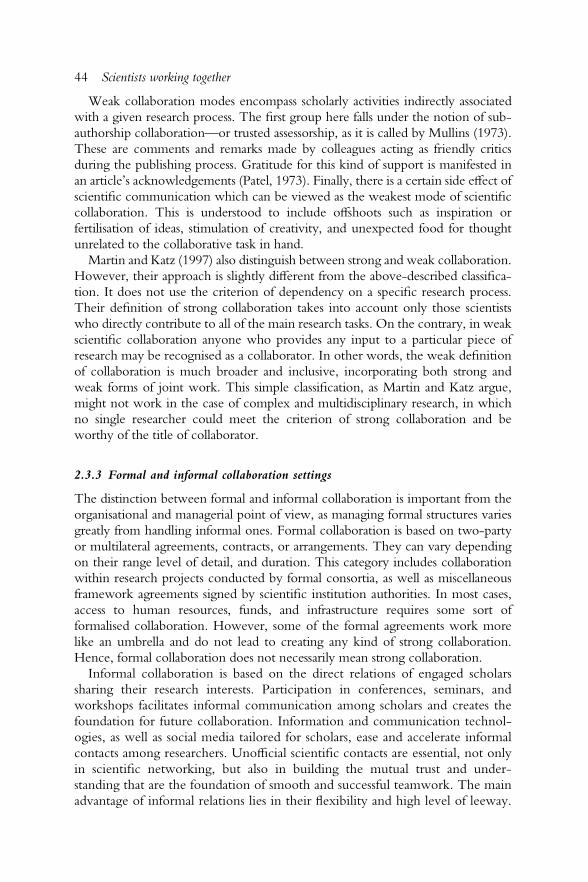
Weak collaboration modes encompass scholarly activities indirectly associatedwith a given research process. The first group here falls under the notion of sub-authorship collaboration—or trusted assessorship, as it is called by Mullins (1973).These are comments and remarks made by colleagues acting as friendly criticsduring the publishing process. Gratitude for this kind of support is manifested inan article’s acknowledgements (Patel, 1973). Finally, there is a certain side effect ofscientific communication which can be viewed as the weakest mode of scientificcollaboration. This is understood to include offshoots such as inspiration orfertilisation of ideas, stimulation of creativity, and unexpected food for thoughtunrelated to the collaborative task in hand.
Martin and Katz (1997) also distinguish between strong and weak collaboration.However, their approach is slightly different from the above-described classifica-tion. It does not use the criterion of dependency on a specific research process.Their definition of strong collaboration takes into account only those scientistswho directly contribute to all of the main research tasks. On the contrary, in weakscientific collaboration anyone who provides any input to a particular piece ofresearch may be recognised as a collaborator. In other words, the weak definitionof collaboration is much broader and inclusive, incorporating both strong andweak forms of joint work. This simple classification, as Martin and Katz argue,might not work in the case of complex and multidisciplinary research, in whichno single researcher could meet the criterion of strong collaboration and beworthy of the title of collaborator.
2.3.3 Formal and informal collaboration settings
The distinction between formal and informal collaboration is important from theorganisational and managerial point of view, as managing formal structures variesgreatly from handling informal ones. Formal collaboration is based on two-partyor multilateral agreements, contracts, or arrangements. They can vary dependingon their range level of detail, and duration. This category includes collaborationwithin research projects conducted by formal consortia, as well as miscellaneousframework agreements signed by scientific institution authorities. In most cases,access to human resources, funds, and infrastructure requires some sort offormalised collaboration. However, some of the formal agreements work morelike an umbrella and do not lead to creating any kind of strong collaboration.Hence, formal collaboration does not necessarily mean strong collaboration.
Informal collaboration is based on the direct relations of engaged scholarssharing their research interests. Participation in conferences, seminars, andworkshops facilitates informal communication among scholars and creates thefoundation for future collaboration. Information and communication technol-ogies, as well as social media tailored for scholars, ease and accelerate informalcontacts among researchers. Unofficial scientific contacts are essential, not onlyin scientific networking, but also in building the mutual trust and under-standing that are the foundation of smooth and successful teamwork. The mainadvantage of informal relations lies in their flexibility and high level of leeway.
44 Scientists working together

Informal collaboration works especially well when partners know and trust eachother. During their professional careers, scientists establish many informal colla-borations which form a substratum of their social network (Crane, 1972;Maglaughlin & Sonnenwald, 2005). It can serve as a source of inspiration and areservoir of possible partners for joint research and other activities requiringcooperation, such as inviting speakers for a conference or members of the editorialboard of a scientific journal. In social networks, not only are direct relationsimportant, but also those built indirectly through friends of friends. In this case,the person who matches up scholars acts as a bridge in knowledge flows. Based onempirical analysis of co-authorship in biomedical research, physics, and computerscience, Newman (2001b) proved that scientists are more likely to produce a jointpublication with someone with whom they have a common collaborator thanwith a randomly chosen partner.
Formal and informal collaborations occur simultaneously. Informal collaborationusually starts a process which, in further phases, may develop into formal coopera-tion; it gives impetus for the formation of strong collaboration modes (Price &Beaver, 1966; Lambert, 2003). On the other hand, when partners have differentinterests and goals (as in the case of science-business collaboration), formalisationmight be necessary in order to secure partners’ interests and avoid conflicts.However, formal arrangement may postpone the start of a project and causefurther delays during its lifespan since all necessary amendments and adjustmentsrequire additional negotiations and agreements (Katz & Martin, 1997).
2.4 Why do scientists collaborate?
Let us put it simply: scientists collaborate because they benefit from doing so.Collaboration allows them to conduct greater amounts of high-quality researchwith widely visible results—the desire of many scholars. Multiple motivationscome into play here. The scholarly profession is driven by the scientific ethos, theintrinsic desire to gain knowledge, or a dream to make the world a better place.But researchers also have much more prosaic motivations, like a good pay check,career development, and high prestige (Hull, 1988). In the case of an individualscientist, several incentives usually coincide, and not all of them are deliberate.Some are strongly rooted in miscellaneous personal motivations, while others aremore external, as when scientists must work with other people to have access tothe necessary samples or instruments, or due to the injunction of a superior. In theshort term, collaboration may be aimed at gaining access to unique resources(including knowledge), while in the long term, it may be seen as a way to build ascientific career and reputation (Rijnsoever, Hessels, & Vandeberg, 2008; Whit-ley, 2000).
2.4.1 Specialisation and the division of scientific labour
The umbrella term for the discussion on the motivations of scientific colla-boration is “division of scientific work”. Collaboration enables scientists to
Scientists working together 45

undertake more complex work, and in many cases it is a prerequisite forconducting research, especially that which requires many simultaneous obser-vations, as in the case of the 18th-century Venus transits. A deeper division oflabour has been triggered in recent years by the enormous growth of researchtasks, the increasingly interdisciplinary nature of research, increasing costs, andlimited access to expertise and tacit knowledge (Beaver, 2001; Katz & Martin1997; The Royal Society, 2011).
Contemporary science is increasingly complex and specialised. As a result, inmany scientific disciplines, especially experimental, “No individual scientistcan possess all of the knowledge, skills, or time required to make theoretical orapplied contributions in more than a very narrow area of research” (Hara et al.,2003, p. 953). The task of expanding the knowledge frontier is increasinglytoo demanding for a single scholar to cope with alone. The solution is thedivision of labour. According to Adam Smith, science can benefit from thedivision of labour because “Each individual becomes more expert in his ownpeculiar branch, more work is done upon the whole, and the quality of scienceis considerably increased by it” (1776, p. 8).
The advantages offered by the division of labour provide a powerful basisfor scientific collaboration. The concept appears so obvious that it is sometimesoverlooked. A good example is James Lovelock, British environmentalist andauthor of the Gaia hypothesis, which assumes that the Earth is a self-regulatingsystem. He postulates the need for independent scientists that are just asimportant as large research teams in the scientific progress. Lovelock gives hisown example as an autarkic scientist, working alone in his own laboratory,who does not need “immersion in a think-tank to excite ideas”. But at thesame time, Lovelock admits that
If there was something very complex that I could not easily make, such asan electron microscope or a new form of mass spectrometer, I consideredsolving my problem another way, or sought a friend who could sell ordonate spare time on his instrument, or could do the job for me
(2014, para. 12).
He thus acknowledges that collaboration—in this case in the form of divisionof labour or service provision—is necessary to conduct a research project, even ifsomeone is not a member of a research team.
Division of labour not only enables scientists to do more work in a giventime, but also to use partners’ knowledge, equipment, and technical skills,and thus save money and time on learning a new method or buyingequipment. By sharing work, scientists can conduct increasingly complexresearch, which enables them to tackle larger and more complicated pro-blems. On the other hand, the division of labour can also lead to diffusion ofresponsibility. This is especially important in ethically sensitive research areassuch as clinical trials, military technologies, or animal experiments (Wray,2002). Furthermore, collaboration depends on mutual trust that partners will
46 Scientists working together

provide reliable contributions. This issue cannot be underestimated, as thereis good evidence to suggest that collaborators of unreliable scholars usuallysuffer in terms of their career development (Mongeon & Larivière, 2015).Clearly, division of labour generates advantages, but it can also trigger costs.The balancing of costs and benefits therefore remains the key to successfulcollaboration.
2.4.2 Tacticians and buddies
Scientific collaboration involves relationships between people, thus, personalfactors may play an important role in this process. Personality and preferablemodes of scientific work influence a scientist’s proclivity for joint research. Somepeople prefer to work alone or in small research teams, others feel at home inlarger groups. Personal factors also affect the selection of partners and the ability tosustain the collaboration process. Especially vital qualities are mutual trust andunderstanding, compatible working styles, and the ability to get along (Creamer,2004; Hara et al., 2003; Maglaughlin & Sonnenwald, 2005). Although in manycases selection of collaborators is a matter of chance or external factors, it can alsobe a result of an intentional strategy. For some scientists—taskmasters—the mostimportant aspect is the reliability of a partner and sticking to a schedule, while forothers—nationalists—nationality and language proficiency play a crucial role.Experienced researchers often present a mentor approach, being motivated to helpyounger colleagues in their careers, whereas tacticians choose partners with skillscomplementary to their own. Now and then collaboration is forced by the requestof the administration (the follower strategy). The last type are buddies who choosecollaborators they have known for a longer time, with whom they have had goodprevious collaboration experiences, and find fun and entertaining. Of course,individual scientists may display features of two or more collaboration types, andthe same scientist can alter the criteria when selecting partners for differentactivities. This empirically grounded typology shows how diversified motivationscan be in the collaborators’ selection process, and that it is not always pragmaticeffectiveness that plays the decisive role (Bozeman & Corley, 2004).
Science as a social institution is based on the recognition and credit that areawarded to scientists and drive their professional career (Hull, 1988). Recogni-tion and credit usually follow scientific contributions and have a tendency toaccumulate. Thus, scholars who have once gained appreciation for their workfind it is easier to obtain further recognition in the future and, as a conse-quence, build their prestige (Merton, 1973). For less recognised scientists,collaboration with established researchers creates a chance to learn and gainprofessional experience, and it also allows some of the prestige to rub off onthem, thereby increasing their visibility. In this situation collaboration with ascientific star is perceived as a manifestation of the scientific community’sacceptance and recognition, and as a consequence it increases a researcher’scredibility. For younger scientists, it can also be a rite of passage (Hara et al.,2003; Mervis & Normile, 1998).
Scientists working together 47

Doing science with other people can also be fun, or “hard fun”—the notioncoined in the MIT Media Lab to describe an attitude towards tasks that arechallenging but also very rewarding (Moss, 2011). For some scientists, the sourceof pleasure could be contact with people with certain personality traits; othersplace more importance on the professional dimension of such relations, whichcan satisfy scientific curiosity and intellectual interest (Beaver, 2001). Thescholarly profession is very demanding and, since not all scientists achieve successand recognition, it can also be very frustrating. Joint work means that scientistscan share their victories, doubts, and failures with other people who are in thesame position. Sir Tim Hunt, British biochemist, molecular physiologist, and2001 Nobel Prize laureate, when asked if he enjoyed collaboration said:
I’ve always liked to collaborate with at least one other person on anyproject that I do, because you need somebody to cheer you up whenthings are going badly, and you need somebody to celebrate with whenyou have a small success […] The public maybe has an idea of the lonelyresearcher, but in my experiences it has never been that of loneliness, ithas been much more togetherness actually. And I like that very much
(Hunt, n.d.).
2.4.3 Access to facilities and resources
The uniqueness of an expensive scientific infrastructure fosters or even forcescollaboration. An extreme case in point involves unique facilities, such as theLarge Hadron Collider or the International Space Station. The motivation tocollaborate emerges when the costs of equipment exceed the possibilities of theindividual researcher, team, or institution. From the economic perspective, accessto a shared infrastructure eliminates redundancy of equipment and enhancesefficiency. However, in some cases the limited availability of the facilities andequipment results from its location rather than its cost. For example, astronomicalobservatories require exceptional geographical conditions to achieve the highestquality of observational data. They are usually located at high altitudes, tominimise the negative influence of the Earth’s atmosphere, and at a distancefrom urban areas, to avoid light pollution. Such sites are not available in everycountry, thus, astronomers and astrophysicists may need to collaborate withcolleagues based in places with more favourable conditions where observatoriesare located, such as Chile or Hawaii.
Another type of unique resource that can be reached through collaboration isdata. Their uniqueness may result from the originality of the population theyrepresent (e.g., medical samples in epidemiology), the length of the time series (e.g., long-term panel data in sociology), or the unique and costly method ofgathering, with an extreme example being moon rocks collected by the ApolloMissions. In some cases, access to data might be subject to exceptionally liberallegal conditions that allow specific research to be conducted in a given country.Such practices could be ethically controversial when rare data or samples are
48 Scientists working together

collected through morally doubtful clinical experiments or methods harmful tothe environment (Oldham, 2005). However, the rising competition in globalscience may encourage such practices. Sleeboom-Faulkner (2013) even arguesthat in some cases, permissive regulations, e.g., regarding stem cell research, maybe an element of a national science development strategy, aimed at attractingforeign collaborators.
Both access to data and the right to use the infrastructure are directly related tothe financial aspects of scientific research. The escalating costs of conductingfundamental science activity at the research frontiers is one of the reasons for therecent growth in scientific collaboration (Katz & Martin, 1997). The largestscientific projects can only be conducted within research consortia, concentratingfunds from public and private institutions from numerous countries. The mostillustrative example of such equipment is the above-mentioned Large HadronCollider—to date the world’s largest and most complex experimental facility—which cost over €3 billion and was possible to build only through the joint effortsof public and private agencies from 56 countries. Another example is the HumanGenome Project, the largest biological project in history, aimed at sequencing ahuman-sized genome. It was coordinated by two US institutions—the NationalInstitute of Health and the Department of Energy—and gathered partners fromthe UK, France, Germany, and Japan. The 13-year project, launched in 1990,ended up with an overall budget of $2.7 billion (Human Genome ProjectInformation Archive, 1990–2003).
2.4.4 Access to knowledge and expertise
In 2012, about 28,100 peer-reviewed scientific journals published almost 2million articles, according to the report of the International Association ofScientific, Technical and Medical Publishers (Ware & Mabe, 2015). Even ifabout half of the papers published in academic journals are read only by theauthor, the journal’s editor, and the referees (Meho, 2007), that still leaves a verylarge number of about 1 million scientific articles published every year to bedigested by scientists. Obviously, this number covers papers from all scientificdisciplines, but even if a single research area is considered, the volume of knowl-edge produced and published every year exceeds the cognitive possibilities of anyindividual scholar. In the most dynamic disciplines, scientists find it challenging tostay up to date with the latest results, sometimes even in their narrowly definedspecialisations. Building networks of collaborators can thus be indispensable as away of gaining access to expertise and knowledge.
Collaborating scientists can utilise others’ competences and obtain the max-imum advantage from their specialisation (Hoekman, Frenken, & van Oort,2009; Katz & Martin, 1997). In particular, collaboration cannot be under-estimated in the case of acquiring tacit knowledge, hardly transferable in writingor verbal communication. Direct access to a partner’s expertise and tacit knowl-edge also generates opportunities to learn something new by taking the knowl-edge, as it were, straight from the horse’s mouth. Additional knowledge and
Scientists working together 49

expertise not only enables scientists to extend the scope of the research andtackle larger problems, but also helps to foster innovation (Cummings & Kiesler,2003; Lambert, 2003).
Engaging more people in providing and assuring the accuracy of researchresults, through collective discussion and verification, increases the quality andprobability of success of the whole research project. When more eyes look atthe research and its results, flaws can be found more quickly and efficiently,and thus the risk of errors and mistakes diminishes. This additional advantageresults from the possibility of immediate intersubjective verification, expressingopinion and criticism (Beaver, 2001; Thagard, 1997).
2.4.5 Growing interdisciplinarity
Today we can witness the proliferation of interdisciplinary research thatnaturally reinforces collaboration involving representatives of various scientificfields. The 2006 report of the United States National Science Foundationpoints out that:
Discovery increasingly requires the expertise of individuals with differentperspectives—from different disciplines and often from different nations—working together to accommodate the extraordinary complexity of today’sscience and engineering challenges. The convergence of disciplines andthe cross-fertilization that characterizes contemporary science and engi-neering have made collaboration a centerpiece of the science and engi-neering enterprise
(2006. p. 2).
Interdisciplinary collaboration leads to the integration of knowledge frommore than one discipline (Klein, 1990; Palmer, 2001; Salter & Hearn 1996). Itcombines approaches, methods, and paradigms, and thus it can result in cross-fertilisation across disciplines through inspiration from different scientific back-grounds (Bozeman & Corley, 2004; Cummings & Kiesler, 2003). In the longrun, interdisciplinary collaboration can also lead to the emergence of newscientific disciplines and research areas, such as bioinformatics, which combinesmolecular biology with computer science, statistics, and engineering. This kindof collaboration requires intensive flows of resources (mostly intellectual, but alsofinancial and infrastructural) among disciplines. In order to utilise such coopera-tion, partners have to make an additional effort to build a common under-standing with representatives of distinct knowledge domains (Monteiro &Keating, 2009).
The teamwork of representatives from different scientific disciplines can be alsocalled multidisciplinary, although, as Sonnenwald (2007) points out, some authorsdifferentiate inter- and multidisciplinary collaboration: they define the latter asthat which adds and uses knowledge from different scientific disciplines, but doesnot synthesise or integrate it (Bruce, Lyall, Tait, & Williams 2004; Klein, 1990).
50 Scientists working together
Another term discussed in the literature is transdisciplinary collaboration, whichinvolves holistic schemes created by the integration of all knowledge important fora specific problem or issue, as well as actors from different sectors and groups(Klein, 1990; Klein, 2004). In this approach, only transdisciplinary teams gobeyond the discipline-specific bases of their members and build a commonconceptual framework (Rosenfield, 1992). This kind of collaboration usuallyapplies to the most complex and challenging problems that require not onlyknowledge from a larger number of scientific disciplines, but also creative andinnovative approaches to tackle questions that cannot be answered without suchcollaboration.
2.4.6 Collaboration in the shadow of publish or perish
Academic publishing is the most important form of dissemination of researchresults and is the basis of scientific knowledge circulation. Scientific results andconcepts have to be shared and distributed in order to be available for otherscientists’ use. Publishing is thus essential to the progress of science. But it alsobecomes critical for scientists’ professional careers since the quantity and quality ofscientific publications add significantly to weightings in the science evaluationsystems. In such circumstances, if scientists want to foster their academic careers,they should not only perform high-quality and sound research, but also publishextensively, mainly in the form of papers in highly ranked, peer-reviewedjournals. This pressure to publish is concisely described in the expression “publishor perish”. Eugene Garfield (1996) tracked the origins of the expression to the1942 Logan Wilson publication titled The Academic Man: A Study in the Sociology ofa Profession. We can read there, “The prevailing pragmatism forced upon theacademic group is that one must write something and get it into print. Situationalimperatives dictate a ‘publish or perish’ credo within the ranks” (1942, p. 197).
Several reasons explain why the publish or perish strategy fosters scientificcollaboration. First, it is easier to publish many co-authored papers, where theindividual contributions are fractional, than to publish many single-authoredworks. Second, collaboration may increase the quality of publications. When apaper is written collectively, the probability of tracing flaws or misstatements ishigher and, as a consequence, so is the quality of the paper. Using the tacitknowledge and writing skills of more experienced members of the team alsoincreases the scientific level of the publication. Third, collaboration between lessand more established scholars can help the former to break into highly selectivejournals. In particular, collaboration with a scientific star and placing him or heron the author list can increase the paper’s chances for publication in a prestigiousjournal. Authors may assume that if an article is authored by a prominent scientist,journal editors will mitigate the review criteria for such an article. The editors andreviewers can in turn assume that a well-recognised author can vouch for a paper’scontent and the credibility of the presented results (Merton, 1973).
This was the case of an infamous article presenting an astonishing newprocedure for obtaining the stimulus-triggered acquisition of pluripotency cells.
Scientists working together 51

Haruko Obokata and her mentor Charles Vacanti wanted to publish their paper ina top journal. They felt that adding a high-profile scientist as a co-author wouldsignificantly increase their chances of acceptance. The choice fell on TeruhikoWakayama, who gained his fame from being the first to clone a mouse. Theysubmitted the paper to Nature, but it was rejected. In turn, a fourth co-author goton board: Yoshiki Sasai (1962–2014), one of Japan’s leading developmentalbiologists. He had the advantage of being on good terms with Nature’s editors,and he also “had an instinct for how to frame the findings in the largerconversation about stem cells, embryology, and cell fate” (Goodyear, 2016,p. 51). After revisions, the paper appeared in Nature. But the luck did not lastlong. A fewmonths later the paper was retracted, in a scandalous atmosphere, aftermajor errors and the scientific misconduct of Obokata became evident. As aconsequence, Obokata’s PhD was revoked. But the highest price was paid by oneof her colleagues: Sasai hanged himself from a handrail on the staircase of thelaboratory (Goodyear, 2016; Meskus, Marelli, & D’Agostino, 2018). The caseexemplifies not only the power of a scientific star in facilitating publishing, butalso the risk of fraudulent behaviour or unconscious carelessness that may beinduced by skyrocketing competition in the publish or perish environment.
2.5 The collaboration life cycle and its challenges
Scientific collaboration proceeds in stages: foundation, formulation, sustain-ment, and conclusion (Sonnenwald, 2007). Each step brings specific chal-lenges. Depending on the level of trust among collaborators, these challengesare more or less difficult to solve. Mistrust can hamper collaboration through-out its life cycle—this will be discussed in the initial subchapter. In the subsequentthree sections we look more closely at selected key challenges that may occur atthe different stages of the collaboration process. Certainly, these challenges canoccur, or co-occur, at all stages of collaboration, but the probability of theiremerging and causing a damaging outcome changes during the project’s lifetime.To keep things simple, the foundation and formulation phases are addressed as asingle initial phase, followed by the sustainment and conclusion stages. We willdiscuss issues related to personal temperament, communication obstacles, compe-tition between collaborators, coordination and management challenges, andfinally, authorship recognition concerns.
2.5.1 Trust in collaboration
In the 1920s, Austrian biologist Paul Kammerer (1880–1926) claimed to haveproved the theory of Lamarckian inheritance (inheritance of acquired character-istics) by causing the male midwife toad, which lacks pigmented thumb pads, toinherit such bumps (by forcing the toads to mate in water). In 1926, GladwynKingsley Noble (1894–1940) revealed that the pigmented pads were in factinjected with Indian ink. Kammerer suggested that one of his assistants mighthave done the injection independently. Shortly after, Kammerer committed
52 Scientists working together

suicide, most likely as a result of his public humiliation and undermined credibility(Gliboff, 2010; Vargas, 2009). The story perfectly illustrates that trust is aprerequisite of any collaboration and breach of trust may have disastrousconsequences.
Trust in scientific collaboration has two dimensions. Affective trust relates tointerpersonal bonds among people and is manifested in the feeling of security andperceived strength of a relationship. Cognitive trust is based on judgments of apartner’s scientific credibility, competence, and reliability, confirmed by theirreputation (Johnson & Grayson, 2005; Sonnenwald, 2003). The increasing scale ofscientific collaboration has caused the second dimension to prevail. Collaboratingscholars from various institutions, countries, and cultures often have limitedpossibilities to build mutual trust based on personal relations. Moreover, the levelof trust depends on the spatial and social proximity of collaborators. Scientistscloser in space and closer socially (e.g., long-term friends) are more likely toestablish collaboration (Agrawal, Kapur, & McHale, 2008) and profit from asmooth transition of tacit knowledge (Coleman, 1988).
In professionally managed projects lack of mutual trust can, to some extent, berectified by explicit collaboration rules, conventional practices, and controlprocedures that minimise risk and uncertainty. However, one can never rule outunintentional mistakes, measurement errors, or intentional misconduct, whichmay be made by an individual but affect all the collaborating parties. An illustrativeexample could be one of the threads of the Korean stem cell scandal, which brokeout in 2005.Woo-suk Hwang, a South Korean veterinarian and professor at SeoulNational University, reported in 2004 and 2005 in Science that he had clonedhuman embryonic stem cells. When the experiments were revealed as fraudulent,not only was Hwang’s credibility undermined, but also that of his collaborators(Strange, 2008; University of Pittsburgh, 2006).
2.5.2 Initiation
Not everyone is lucky enough to work with a spouse, like Marie Skłodowska-Curie, who was awarded a Nobel Prize in 1906 for the joint work with herhusband Pierre Curie (1859–1906); or with a companion, like a 1912 Nobel Prizewinner, Alexis Carrel (1873–1944), who invented a perfusion pump with his closefriend Charles Lindbergh (1902–1974). In the initial stages of collaboration, apositive attitude and personal chemistry seem to be vital. They facilitate theallocation of tasks and responsibilities as well as setting the communication rulesand information flow (Maglaughlin & Sonnenwald, 2005; Olson, Olson, &Cooney, 2008). A partner’s character, competences, and personal features maybe crucial here. Niels Bohr (1885–1962)—one of the fathers of the Americanatomic bomb and 1922 Nobel Prize winner—highly valued his collaboration withRichard Feynman precisely because of his temperament. Bohr once allegedly said:
Remember the name of that little fellow in the back over there? He’s theonly guy who’s not afraid of me, and will say when I’ve got a crazy idea.
Scientists working together 53

So, next time when we want to discuss ideas, we’re not going to be ableto do it with these guys who say everything is “yes, yes, Dr. Bohr.” Getthat guy and we’ll talk with him first
(Feynman, 2010, p. 71–72).
However, every so often a new collaborator’s character turns out to be notas favourable as expected. But if these difficult partners possess uniqueresources, joint work is desirable, if not essential.
Collaboration demands smooth communication. Therefore, misunderstand-ings and communication bottlenecks are nightmares for collaborative projectmanagers. Communication obstacles refer chiefly to differences in perceptionand language barriers that can impede discussion and understanding of visions,goals, and tasks (Jeffrey, 2003; Maglaughlin & Sonnenwald, 2005; Palmer,2001; Traoré & Landry, 1997; Walsh & Maloney, 2007). Apparent languageproblems spring from the fact that the scholarly community nowadays com-municates in English, while most scientists are from outside the Anglosphere(Hwang, 2012).
Particularly in distant collaborations, communication can be challenging.Exchanges between partners who rely almost fully on interaction via ICTtools can suffer from the lack of non-verbal signals. Indirect communicationcan consume more time than face-to-face information exchange and canoften lead to misinterpretations. Moreover, greater physical distancebetween partners is often accompanied by larger social differences. Althoughscientists all over the world share similar scientific values and standards(scientific ethos), cultural differences may affect communication and colla-boration. Organisations and individuals, even from the same country, differin research working modes, management and coordination approaches,priorities, vocabularies, and communication styles. Not surprisingly, scholarssituated in historically linked places and sharing similar cultures collaboratemore often than those having no common ground (Wagner & Leydesdorff,2005). Indeed, spatial and non-spatial proximity (social, organisational,economic, etc.) play a major role in forming collaborative links (Ponds,van Oort, & Frenken, 2007).
Interdisciplinary collaboration seems to be the most challenging, becausedifferent disciplines may use the same terms with various meanings(Sonnenwald, 2007). A good illustration is the term “map”, originatingfrom geography, where it usually refers to a generalised, mathematicallydefined representation of all or a portion of the planet’s surface, includingdiscernible elements of scale, projection, and symbolisation, showing the distribu-tion, state, and relations of various natural and social phenomena. For geographers,a visual presentation which does not meet all the above-mentioned criteria cannotbe called a map, although for non-geographers it might look like a map. Today,the word “map” is commonly used to describe diagrams, schemes, or graphs inmany scientific disciplines, having very little in common with the original mean-ing of the term. A few examples include a mind map (a tool to visually organise
54 Scientists working together

information), a road map (a plan of action), a brain map (in neuroscience), and amap as a morphism in category theory (in mathematics).
Even when partners come from the same country and represent the samescientific field, communication problems may occur, often resulting from a failureto give full or precise information. Hidden assumptions, taken for granted bypartners, might not be the same for all team members. Sometimes they refer tovery basic issues, such as units of measurement, which are treated as obvious andthus as something that does not require explicit description. That was the casewith the $125 million NASA probe, Mars Climate Orbiter. Its mission failed in1999 due to a large deviation of the probe from the planned trajectory, caused bydifferences between the units of measure used by the probe’s constructor, NASA(metric system), and the producer of the ground software, Lockheed-Martin(United States customary system) (Hotz, 1999).
2.5.3 Sustainment
The main challenges at the sustainment stage of the collaboration process relate tounexpected perturbations, delays, and tensions between collaborators. The ten-sions can be triggered—among other things—by increasing competition in a team(Beaver, 2001; Latour, 1987). Competition increases especially at critical points ofthe project, when team members feel that a breakthrough is coming. One of theresearchers interviewed by Atkinson and his colleagues put it this way:
You can see it every time […] the one who has the best publication getsthe money, so it would be a stupid thing to tell everybody what you havefound before you have your paper in press and we always say wecollaborate with other people, but if you look at it really objectively,every group does its own thing and in the end they do collaborate, buteverybody tries to get the most out of it for their group
(Atkinson, Batchelor, & Parsons, 1998, p. 269).
To reduce obstacles related to collaboration, especially in large and spatiallydispersed teams, efficient management is needed. Even a research team of highlyskilled specialists can fail if not well managed. Planning, managing resources,internal and external communication, monitoring, reporting and evaluation,building trust, tuning up, and reconciling different opinions and points of view—all of these aspects require time and effort, and can present difficulties for scholars,who usually do not have a professional management background. Additionally,individuals sometimes have strong, introverted, or conflicting personalities, thus,smooth coordination of the collaboration requires strong leadership (Schiff, 2002;Stokols, Harvey, Gress, Fuqua, & Phillips, 2005). In many projects, especially largeones, professional managers are hired. However, a situation where the manager isnot familiar with the idiosyncrasies of scientific inquiry often produces additionalcosts and may involve the risk of conflict and misunderstanding (see Chompalov,Genuth, & Shrum, 2002). On the other hand, a scholar who simultaneously plays
Scientists working together 55

the role of project manager might feel torn between the role of scientist andmanager and become frustrated by having to deal with project coordination at theexpense of scientific activity.
Delays in a project or lack of satisfactory results can be more difficult to identifyand address when larger teams are involved. Changes in the organisationalstructure of a team or personnel replacements affect the course of the project andmay negatively impact on meeting the deadlines and achieving the expectedresults (Cummings & Kiesler, 2003). Moreover, the more partners involved andthe more diverse they are, the more sources of unexpected perturbations and thelonger time necessary to diagnose the problem, revisit a project’s goals andmethods, and reach a new shared understanding. An extreme example might bethe International Thermonuclear Experimental Reactor (ITER), aimed at devel-oping the technology of clean nuclear energy produced by fusing atoms (a processsimilar to what happens on the Sun) and recognised as the largest scientific projectto date. ITER, gathering scientists from 35 countries, has cost over €15 billion atthe time of this writing. The project has been delayed at least nine years due to—among other things—an extensive design review conducted at the beginning ofthe project, and the 2011 earthquake in Japan (Gibney, 2014).
Institutional differences can disturb collaboration, even between organisationsof the same type, which theoretically are close in terms of organisational distance.A 2005 study of 62 projects of the US National Science Foundation revealed thatprojects involving a larger number of universities were systematically moreproblematic in terms of coordination and achieving positive outcomes thanprojects with principal investigators from fewer universities (Cummings & Kiesler,2005). Interdisciplinary research, including that carried out within a single institu-tion, can face obstacles related to the organisational structure. Universities aredivided into departments, which traditionally conduct research and educationlimited to one scientific field. The creation of an interdisciplinary research teamwithin the department, or participation in an interdisciplinary project, the aims ofwhich go beyond the department’s scientific portfolio, may lead to tensionsamong co-workers.
Scientific collaboration increasingly goes beyond academia. Partnershipsbetween scientific and business sectors are seen as beneficial for both sides, e.g., byenabling access to facilities and intangible resources, as well as funds, includingfrom sources designated exclusively for business-academia initiatives (Autio,Hameri, & Nordberg, 1996; Lambert, 2003). However, scientific collaborationthat crosses sectoral boundaries can be exceptionally challenging since it triggersthe need to combine different goals, work modes, and attitudes to disseminatingresults. Businesses usually focus on pragmatic and immediate solutions with directcommercial application, while academics prefer to work with a longer-termperspective (Mathiassen, 2002). Moreover, companies tend to be reluctant towidely disclose the research outcomes, while this remains essential for an aca-demic’s professional career. This divergence of goals may lead to prejudices andconflicts. Collaboration with business can also give rise to doubts and concernswhich are harmful to the collaborating scientists’ reputations. These concerns
56 Scientists working together

relate to the credibility and impartiality of research financed by companies whoseprofits heavily depend on the inquiry’s results (Resnik, 2005).
2.5.4 The first author et al.4
The conclusion stage delivers the products of research. Collaboration, espe-cially when the number of partners is large, inevitably means a diffusion ofepistemic responsibility. In such projects, it is very difficult to determine thecontributions of individuals and thus define the range of their responsibility.This issue becomes especially important when research results are going to beawarded or—at the other extreme—questioned (Merton & Zuckerman, 1973;Wray, 2002). This was the case of Gerald Schatten from Pittsburgh University,who was listed as the last author of some questioned articles on cloned humanembryonic stem cells. According to the authorship rules in the biomedicalsciences, Schatten was assumed to be the principal investigator and seniorauthor of these publications. In his defence, he claimed that he had worked onthe manuscripts but had not been aware that they presented forged results andhad had little interaction with most of the research team members, includingHwang Woo-suk, who was accused of fabricating the experiments. As theInvestigative Board of Pittsburgh University described it:
We feel that he did not exercise a sufficiently critical perspective as a scientist.For example, he did not ask what event in Hwang’s lab prompted the changein the reporting of some data differently in two successive versions of thesame table. In another example, he reported that he was told by Dr. Hwangin the middle of January, 2005 that some contamination of the cells hadoccurred. Dr. Schatten’s reaction was apparently to accept Dr. Hwang’sassurance that this problem was a minor nuisance
(University of Pittsburgh, 2006, p. 7).
Apart from the research misbehaviour in assigning the articles’ authorship,the Schatten example shows how much harm can ensue from lack of criticismand precaution in scientific collaboration (Strange, 2008; University of Pitts-burgh, 2006).
The choice of a suitable channel for disseminating findings may dividecollaborating scholars, especially when it comes to interdisciplinary research. Forexample, computer scientists prefer conference publications over journal papers,which are the traditional and first-choice dissemination channel for most scientificdisciplines. Thus, if a project involves specialists from the computer sciences aswell as other disciplines, choosing where to publish research results might provokea conflict. Scholars may also fall out over issues related to appreciation andrecognition of accomplishments. Historically, authorship was attributed to thosewho made a major contribution to the research and the resulting paper. However,in some disciplines today, research problems are so complex that they require thecollaboration of not only dozens, but even hundreds or thousands of people. With
Scientists working together 57

the increasing number of authors and the growing role of publications in scientists’professional careers, the need to clarify authorship rules is becoming more evident.Some of the most prestigious journals, such as Science, Nature, or Proceedings of theNational Academy of Sciences, introduce explicit rules about authorship, requiring astructured description of each author’s contribution before the article can beaccepted (Venkatraman, 2010). Some organisations have even introduced theirown authorship rules. High-energy physics is a good example (Galison, 2003).The official authorship policy of the ATLAS Collaboration specifies that allATLAS publications are signed in alphabetical order by all ATLAS members,including engineers and technicians (ATLAS Authorship Policy, 2013). In otherdisciplines, like the social sciences or arts and humanities, such a practice would beseen as inappropriate and unethical, violating scientific standards and rules whichrequire that the authors of the paper are those who actually worked on themanuscript.
Collaborators have to decide on the content of the authors list. The mainarea of controversy here is whether a scientist’s contribution to the researchand writing of the paper was sufficient to warrant a place on the list of authors.Various forms of authorship misappropriations can be distinguished here. Forexample, an honorary, guest, or gift authorship is granted to a person who hasnot contributed significantly to the research presented in the article. Mean-while, ghost authorship takes place when a person who provided significantcontribution to the study is not listed as an author (Flanagin et al., 1998;Mowatt et al., 2002).
Moreover, the order of listing authors can also be disputable. In rare instances,the order may be completely unrelated to the research itself, as in the case ofMichael P. Hassell and Robert M. May, who determined the authorship orderfrom a 25-game croquet series held at Imperial College Field Station.5 Authorshipordering rules depend largely on the specific customs of a scientific discipline,thus, multidisciplinary papers create the greatest challenges. However, at least inmost of the natural sciences, the typical pattern is that the first author should be theperson who has done the most work, the second is the one who contributed thesecond largest amount of work, etc. The last place in the authorship list is securedfor the principal investigator—usually the head of the lab or research group (He,Ding, & Yan, 2012). Still, assessing the levels of contribution is challenging andlargely subjective. A 2007 study of 919 authors of 201 articles submitted to ageneral medical journal found that two-thirds of corresponding authors disagreedwith their co-authors regarding the contributions of each author (Ilakovac, Fister,Marusic, & Marusic, 2007). Therefore, it could be argued that the most neutralapproach would be to list authors in alphabetical order (Laband & Tollison,2000; Joseph, Laband, & Patil, 2005). Yet this has its own drawbacks too, as itfavours scholars with particular surnames. This is why Georges Aad, a physicistfrom Fribourg University and CERN, is “the most prominent name in particlephysics” (Hotz, 2015, para. 1). In particular, publications with just a fewauthors are usually recognised by the name of the first author only (Riesenberg& Lundberg, 1990). Readers habitually read and remember only the first
58 Scientists working together

name, and the remaining co-authors are “essentially anonymous ‘fractional’scientists” (Beaver, 2001, p. 370). This is why the authorship order is not just amatter of a courtesy.
This first-author bias is an aspect of a broader phenomenon that Robert K.Merton called the Matthew effect (Merton, 1968)—a complex pattern of creditmisallocation and accumulation of advantage. This effect is visible when asignificant difference between the scientific positions and statuses of the article’sauthors occurs. When a less experienced scientist publishes along with a moreexperienced one, tenure and evaluation bodies may diversify their assumedcontribution to the research and publication, and give disproportionally highercredit to the eminent scientists. This recognition and credit bias may affect earlycareer scientists, less recognised scholars, and women, regardless of their age andexperience (Sarsons, 2015). Belittlement of female scientists’ contribution andattribution of their work to their male collaborators was described byMargaret W. Rossiter (1993). She called it the Matilda effect (analogouslyto Merton’s Matthew effect), after Matilda Joslyn Gage (1826–1898)—theAmerican women’s rights activist and the leader of the National AmericanWoman Suffrage Association.
* * *
Joint research is no longer a distinct form of doing science, but rather a defaultmode of the process. Research teams are expanding to enormous sizes, hyper-authorship is booming, and international collaboration is proliferating. The rise ofmass collaboration in science has been accompanied by the decline of solitaryscholars, who are gradually becoming a rare—if not endangered—species. On theone hand, the collaborative turn has resulted from the increasing specialisation,interdisciplinarity, and complexity of contemporary science. On the other, theintensifying collaboration allows for even more specialised, interdisciplinary, andcomplex research endeavours. Consequently, the collaborative turn is both a signand a factor of changes in contemporary scholarship.
Notes
1 Most of learned societies did not last to the present day. For example, AcademiaSecretorum Naturae operated in Naples from 1560 to 1578, when it was closed byorder of Pope Gregory XIII under suspicion of sorcery.
2 Henry Oldenberg was the editor of the Philosophical Transactions of the Royal Society,the first journal devoted purely to science, established in 1665 in London. He startedsending manuscripts submitted to the journal to experts who appraised them beforepublication.
3 Own elaboration based on http://www.nobelprize.org/4 Have you ever wondered who the most cited scientist is? It is “Professor et al.”,
enjoying 2,477,068 citations (at the end of 2016). Her Google Scholar profileincludes only 333 publications but, due to their extremely high impact (almost 200thousand citations of the top paper), her h-index is 333. This astonishing publicationportfolio covers papers representing various disciplines from biology, chemistry,
Scientists working together 59

medicine, and physics to language studies, management, and social psychology(Dingemanse, 2016). Moreover, probably accidentally, her name matches the shortform of “et alia”, which in Latin means “and others”, and is used in scientificwriting for referencing multi-authored papers (following the name of the firstauthor). These absurd records result from the design and algorithms of GoogleScholar, the largest browser of scientific publications. It allows scientists to createprofiles with an automatically updated list of publications and citations. In mostcases, the profiles are set up by actual scientists, but several are fake, created in orderto show deficiencies of the system (e.g., the profile of “A. Author” from the“Department of Citation Analysis, University of University”). Et al’s profile, aswell as A. Author’s, was created by Mark Dingemanse from the Language andCognition department of the Max Planck Institute for Psycholinguistics. In themiddle of 2016, Google Scholar blocked the profile from appearing in the browser’stop rankings. The full story can be read on Dingemanse’s blog: http://ideophone.org/some-things-you-need-to-know-about-google-scholar/
5 See the footnote in Hassell & May, 1974.
60 Scientists working together

3 Measuring scholarly collaborationin space
The sudden expansion of scientific collaboration has been accompanied by therapid development of sources and methods applicable to studying researchcollaboration. Collaboration in science has become a hot topic in the burgeon-ing field of informetrics, which comprises bibliometrics (statistical analysis ofpublications), scientometrics (the quantitative study of science, technology, andinnovation), and their younger sister webometrics (measurement of the WorldWide Web) (Bar-Ilan, 2008; Egghe, 2005). This development would not havebeen possible without contemporary information and communication techno-logies that enable efficient storage and manipulation of scientometrics data, aswell as contributions from other fields, with network science in the first place(Barabási, 2002; Börner & Scharnhorst, 2009).
Spatial studies of scientific collaboration are based on generic scientometricideas, sources, and methods. Simultaneously, they are intrinsically interdisci-plinary because they add a geographical dimension to scientometrics. This spatialaspect is often of minor importance—particularly in country-level analyses,which usually do not account for the location of, or distance between,collaborators. But, at times, geolocation plays a central role in scholarly colla-boration studies. In such cases, cutting-edge approaches are frequently employedthat are simultaneously grounded in and lead to advances in social and economicgeography, spatial analysis, and regional science.
The following sections review established and novel approaches, sources,and measures for spatially oriented studies in scientific collaboration. Then, themain methodological issues of the field are discussed. Due to space limitationsand the breadth of the topic—note that the Handbook of Bibliometric Indicators,published in 2016 by Roberto Todeschini and Alberto Baccini, has 483 pages—only selected topics are discussed at length.
3.1 Collaborative data: sources and approaches
The essential information needed to measure scientific collaboration in space isthe geolocation of collaborators. The level of location accuracy depends on theaim of the analysis and the data availability. It spans from continents andcountries, through regions, cities, and campuses, to inside-building location

(see for instance: Lee, Brownstein, Mills, & Kohane, 2010; Maisonobe, Eckert,Grossetti, Jégou, & Milard, 2016; Matthiessen, Schwarz, & Find, 2010).Information on the geolocation of collaborators is obtained from primary andsecondary sources. The former takes direct account of collaboration; the latterinfers collaborative behaviour from artefacts of scientific work. Primary sourcesconsist of self-reported surveys and interviews (Landry, Traoré, & Godin,1996; Isabelle & Heslop, 2011; Kwiek, 2017), active and passive participantobservation of collaboration practices, surveillance of real and virtual meetings(Hara et al., 2003; Vasileiadou, 2009), mail and email exchanges (Kossinets &Watts, 2006), phone calls (Button et al., 1993), and approaches based ontracking devices: geolocation, co-location, and proximity data gathered fromGPS units, mobile phones, RFID networks, and other innovative devices(Cattuto et al., 2010; Eagle, Pentland, & Lazer, 2009). Secondary data sourcesare based on the outputs of scientific work, mainly in the form of co-authoredpublications, patents, and conference presentations, or on other informationthat suggests collaborative processes, such as joint-project data. Secondary dataare primarily derived from databases but can also be gathered one by one, forexample, from individual publications or researchers’ curricula vitae (Costa, daSilva Pedro, & de Macedo, 2013; Lee & Bozeman, 2005).
Both primary and secondary sources have advantages and drawbacks (see forinstance: Lee & Bozeman, 2005), but they provide equal and complementarycontributions to understanding the phenomenon of scientific collaboration.Information provided in surveys and interviews can significantly supplementquantitative approaches—typically based on secondary data—by assessing themotivations for, challenges of, and peculiarities regarding collaboration (Mirskaya,1997). This approach makes it possible to understand the social dynamics ofknowledge creation as it goes beyond the knowledge encapsulated in the form of ascientific paper or other tangible scientific output. Moreover, in countries withlimited sources of secondary data it might be the preferred way to evaluatecollaboration, for example, in the cases of the Philippines (Ynalvez & Shrum,2011) and Kenya (Muriithi, Horner, & Pemberton, 2013). However, the draw-backs of directly obtained data are usually their limited scope, high cost, and lackof comparability.
By and large, spatial studies of scientific collaboration predominately employsecondary data sources. Two proprietary databases dominate the special sciento-metrics landscape: Web of Science and Scopus. Web of Science (under differentnames) was originally provided by the Institute for Scientific Information fundedby Eugene Garfield in Philadelphia in 1960. The service was acquired byThomson Reuters in 1992, who subsequently sold it to Clarivate Analytics atthe end of 2016. Scopus was founded in 2004 by Elsevier, a large publisher andscientific information provider based in Amsterdam, the Netherlands. Bothservices provide data on scientific publications derived from indexed journals,conference proceedings, and, recently, academic books.
Apart from comprehensive bibliometric databases, various subject-orientedsources can be mined for scientific collaboration data. MEDLINE, curated by
62 Measuring scholarly collaboration in space

the US National Library of Medicine, provides bibliographic data on lifesciences and biomedical topics. The service is freely available through PubMed,an online search engine (Vanni et al., 2014). Correspondingly, open-accessINSPIRE-HEP compiles bibliographic data in the field of high-energy physics(Lorigo & Pellacini, 2007), DBLP in a computer science bibliography (Rahm &Thor, 2005), and ADS in astronomy and physics (Chang & Huang, 2013), whilethe proprietary GEOBASE, operated by Elsevier, gathers bibliographies ofgeography, ecology, and earth science (Sun & Manson, 2011).
A further source of collaborative data consists of informetric databasescovering a single nation or group of countries. Noteworthy examples includethe Ibero-American SciELO (De Sordi, Conejero, & Meireles, 2016; Macías-Chapula, 2010) and Redalyc (López, Silva, García-Cepero, Bustamante, &López, 2011), the Brazilian Lattes Platform (Sidone, Haddad, & Mena-Chalco,2016), the Researcher database provided by Taiwan’s National Science Council(Velema, 2012), the Rated Researchers database curated by the NationalResearch Foundation of South Africa (Barnard, Cowan, & Müller, 2012), theChinese Science Citation Database hosted by Clarivate Analytics as a part ofWeb of Science (Liang & Zhu, 2002), and the Italian Research AssessmentExercise (Carillo, Papagni, & Sapio, 2013; Franceschet & Costantini, 2010).These sources have been developed mainly, but not only, for the purpose ofindividual and institutional research performance evaluation. For this reason,some of them, aside from bibliographies, include other information valuable forspatial scientometric exercises, such as data on grants, participation in projects,and academic mobility.
The input for scholarly collaboration analyses can be retrieved from the localarchives of research institutions. This has been done using institutional data-bases such as the Korea Institute of Machinery and Materials database (Jeonget al., 2011) and the database of the University of Salerno in Italy (De Stefano,Giordano, & Vitale, 2011), as well as annual reports of collaborative projects,for example, the analysis of the Center for Embedded Networked Sensing,jointly operated by five universities in California (Pepe, 2011). Notably, anumber of papers compare results based on both international and local sources(for the details see: De Stefano, Fuccella, Vitale, & Zaccarin, 2013; Hennemann,Wang, & Liefner, 2011).
The spatial aspects of scholarly collaboration have also been investigatedusing patent data. Patent-based analyses reflect collaboration in applied science.They are used in innovation or technological development studies of countriesand regions and generally portray intersectoral or business-to-business collabora-tion (Maurseth & Verspagen, 2002). Patent analyses are usually based on data fromthe European Patent Office (Ejermo & Karlsson, 2006; Hoekman et al., 2009;Maggioni, Nosvelli, & Uberti, 2007; Maurseth & Verspagen, 2002) or the UnitedStates Patent and Trademark Office (Zheng, Zhao, Zhang, Chen, & Huang,2014) and—less frequently—national data sources, for instance, the ChinesePatent Office database (Hong, 2008; Ma, Fang, Pang, & Wang, 2015). Thesedata sources contain primarily contemporary patents, while historical data is rather
Measuring scholarly collaboration in space 63

difficult to deal with (even if digitalised copies have been prepared, the data arebarely structured). However, an important step has been made recently1 with thedevelopment of the HistPat online database, which provides geolocalised data, atcounty level, on US patents from the period 1836–1975 (Petralia, Balland, &Rigby, 2016).
Collaborative programmes and projects provide one more useful source forspatial scientometrics. While analyses regarding subsequent editions of theEuropean Union Framework Programmes (see Chapter 6 for details) prevailin such studies (Gusmão, 2001; Scherngell & Barber, 2009; Ukrainski, Masso,& Kanep, 2014), other initiatives are also studied. Examples include the studybased on the Portuguese Foundation for Science and Technology projects(Gama, Barros, & Fernandes, 2018), the US National Science Foundationgrants (Cummings & Kiesler, 2005), and the Polish Federation of EngineeringAssociations-Chief Technical Organization programme (Olechnicka, 2013).
Recently, many alternative data sources and measures, dubbed altmetrics, havebeen gaining the attention of scholars investigating research collaboration. Promis-ing sources include scholarly blogs, web hyperlinks (Kretschmer, Kretschmer, &Kretschmer, 2007), online reference managers (e.g., CiteULike, Mendeley, andZotero), scholarly search engines (with the predominant role of Google Scholar,and the comparatively less well-known Microsoft Academic and its predecessorMicrosoft Academic Search—see Ortega, 2014), social networking servicestargeted at the general public (mainly Facebook, LinkedIn, and Twitter), andservices designed for scholars (among which the most popular are ResearchGateand Academia.edu). However—to date—altmetrics derived from online tools andenvironments have tended to supplement traditional sources of collaborative data,particularly with regard to impact and dissemination indicators (Abbasi, Altmann,& Hossain, 2011; Kousha & Thelwall, 2007), rather than allowing for analysis ofthe spatial aspects of scientific collaboration based on altmetrics alone.
3.2 The reward triangle and research collaboration studies
Among the various sources of collaborative data, the information collectedfrom publications is the most widely used and valuable owing to its broadscope, easy availability, and comparatively low cost. Moreover, the collectionof bibliometric data does not interfere with the practices of scientific work andresearch collaboration. Three complementary types of bibliometric informa-tion can be employed to illustrate spatial patterns of scholarly collaboration:authorship, citations, and acknowledgements—the components of the so-calledreward triangle as coined by Blaise Cronin and Sherrill Weaver-Wozniak in1993 (Desrochers, Paul-Hus, & Larivière, 2016).
Co-authorship as the key mechanism of linking scholars is the most palpable,reliable, and universally accepted approximation of scientific collaboration(see: Kumar, 2015; and Chapter 2). Since the late 1970s, the trailblazing Webof Science database has systematically included the full affiliation addresses for allauthors of indexed publications. Web of Science and its younger brother Scopus
64 Measuring scholarly collaboration in space

allow researchers to mine the raw data of scholarly journal articles, conferenceproceedings, books, and book chapters. The mechanism of using these databasesis analogous. Each bibliographic record contains detailed information about theauthors’ affiliations, making it possible to precisely determine the collaborativelinks in geographic space. Scientific authorship is increasingly complemented bycontributorship statements, which are required more and more frequently byjournal publishers. From the analytical point of view, contributorship statementsprovide additional detailed knowledge about the functions that authors have inthe reported research and the preparation of the paper (and allow these functionsto be correlated with the authorship order). Such contributorship statements cansignificantly enrich our understanding of the division of labour in knowledgeproduction (Larivière et al., 2016).
Alongside co-authorship, the study of citations offers other means of trackingscholarly collaboration. Firstly, we can distinguish approaches that use citationsreceived by the set of papers affiliated to the given institution or location to findout what kind of authors and readers are linked and how (Bornmann, Stefaner,de Moya Anegón, & Mutz, 2014; Gorraiz, Reiman, & Gumpenberger, 2012;Huang, Tang, & Chen, 2011; Rahm & Thor, 2005). Secondly, there are studiesbased on the co-occurrence of citations. They investigate networks formedamong documents appearing in the reference list of the given paper—so-calledco-citations—or among documents that cite the same scientific articles, anapproach known as bibliographic coupling. Thirdly, a few studies use a complexapproach to citations. For instance, the combination of citations and referencesof geolocalised papers produces a network of citing and cited places—a “scien-tific food web” that enables us to identify areas where more knowledge isproduced than consumed, and those who tend to consume more than produce(Mazloumian et al., 2013; Zhang, Perra, Gonçalves, Ciulla, & Vespignani,2013). Whereas co-authorship attempts to investigate collaboration patternsamong scholars or organisations, citations, co-citations, and bibliographic cou-pling predominately depict relations between ideas. The former can be mappedin geographic space, the latter in the space of ideas (as defined in the introduc-tory section of Chapter 1). Citation-based measures are used to identify researchfronts. This type of analysis allows us to detect clusters of interrelated scholars,scientific specialisations, and invisible colleges. Studies in this scientometricresearch stream concentrate on revealing the names of scholars and their sciencedomains, rarely on their geographical locations, although the spatial approach isalso sometimes applied (see: Ahlgren, Persson, & Tijssen, 2013; Gmür, 2003;Wallace, Gingras, & Duhon, 2009).
The citation approach is equally relevant for patents. Patent citations arecommonly used for depicting knowledge flows among different locations, forinstance, regions (Nomaler & Verspagen, 2016) or cities (Rigby, 2015).Furthermore, altmetrics gives increasingly new opportunities for assessingwho (and where) is interested in the given piece of scientific output producedin a certain location. Altmetrics provides information—complementary tostandard citation analysis—on the fame and impact of research. It enables us
Measuring scholarly collaboration in space 65

to measure how many times a scientific work was viewed, saved, bookmarked,downloaded, mentioned, or discussed in the online media (Haustein, Costas, &Larivière, 2015; Thelwall, Haustein, Larivière, & Sugimoto, 2013; Todeschini& Baccini, 2016). This tactic has been applied, for instance, to track readershipwithin Mendeley—a reference manager and online social network service forresearchers (Sud & Thelwall, 2016).
Of the scholarly rewards, acknowledgements are the most demanding to usefor studies in scholarly collaboration. The reason for this lies in the usuallyloosely structured and incomplete data on acknowledgements, difficulties inname disambiguation of acknowledged individuals and organisations, and thevaried position of acknowledgements in scientific publications (Desrochers,Paul-Hus, & Pecoskie, 2015). In comparison to co-authorship, acknowledge-ments are less tangible and also rarely employed in depicting spatial patterns ofresearch collaboration. So far, spatially oriented acknowledgement analyseshave referred mostly to university-industry collaboration (see for instance:Morillo, 2016; Wang & Shapira, 2015). The development of this approachwas facilitated in 2008 by the introduction of the Funding Text field by theWeb of Science, which made the acknowledgement data available on amassive scale and opened up new research possibilities (Paul-Hus, Desrochers,& Costas, 2016). The advantage of using acknowledgements lies in their abilityto expand our view on collaboration by going beyond co-authorship (Cronin& Weaver-Wozniak, 1993; Laudel, 2002). Recent advancements in acknowl-edgement studies show their ability to explain differences in team sizes amongdisciplines—namely, with regard to the social sciences and humanities, whichare less saturated with co-authorships than science—and thus, they mightexpand our knowledge of patterns of scientific collaboration in variousdisciplines (Paul-Hus, Mongeon, Sainte-Marie, & Larivière, 2017).
3.3 Spatial scientometric measures
This section surveys selected measures of scientific collaboration.2 The reviewhas been narrowed to the most important and frequently used spatially relatedindicators, although the distinction between spatial and non-spatial scientificcollaboration measures is not easy to make. We should bear in mind thatindividual scholars in a given time have their own distinctive spots in space,their unique geolocations. Hence, collaboration between individuals alwaystakes place in space, no matter what the distance, and thus every collaborationmeasure has a spatial dimension. Even the mean number of authors perpublication (the collaborative index, as termed by Stephen Majebi Lawani in1980) can be compared using spatially meaningful units (see for example:Karpagam, Gopalakrishnan, Babu, & Natarajan, 2012). However, the simpleproportion of multi-authored papers, referred to as the degree of collaboration bySubramanyam in 1983, is more frequently used in spatial scientometrics.Initially, the index was applied to bibliometrics, but it can be generalised as
66 Measuring scholarly collaboration in space

the ratio of collaborative artefacts or events to all artefacts or events of a givenkind. It can be written as:
DEGREE OF COLLABORATION ¼ PCOLL
PCOLL þ PSINGLE¼ 1� PSINGLE
P
where P denotes research artefacts (usually publications or patents) or events(most frequently projects) attributed to a given unit (be it a single scholar,research organisation, region, or country). PCOLL and PSINGLE represent,respectively, P involving collaboration or P without collaboration. The ana-lyses presented in section 3.2 of this paper are largely based on the degree ofcollaboration.
The degree of collaboration is frequently used in scientometrics, mostly dueto its simplicity and comprehensibility. An important limitation of the degreeof collaboration is that it gives information about the level of scientificcollaboration, but it cannot capture the direction of collaboration or itsstrength. The same is true of the so-called collaboration coefficient, a singlemeasure that combines the collaborative index and the degree of collaboration(Ajiferuke, Burell, & Tague, 1988) and the subsequent modified collaborativecoefficient (Savanur & Srikanth, 2010; see also: Rousseau, 2010).
Accordingly, various indicators—derived from the degree of collaboration—have been proposed to measure the direction of collaboration and its strength.The idea is simple: different types of collaboration can be distinguished and themeasures calculated respectively. As a result, we can use the degree of interna-tional collaboration (sometimes referred to as the internationalisation degree), degreeof domestic collaboration, and many other variations, namely, inter-regional andintra-regional or inter-institutional and intra-institutional collaboration. Thisapproach is frequently applied in spatially oriented scientometric studies,mostly at the global or country level (Gazni, Sugimoto, & Didegah, 2012;Leclerc & Gagné, 1994), but also at the subnational level. For example, in1996, Canadian scholars Benoit Godin and Marie-Pierre Ippersiel scrutinisedthe international, intra-regional, and inter-regional collaboration of five regionsin Quebec (other examples of regional-level applications of variations on thedegree of collaboration include: Chinchilla-Rodríguez, Vargas-Quesada,Hassan-Montero, González-Molina, & Moya-Anegóna, 2010; Hansen, 2013;Olechnicka & Ploszaj, 2010a).
Another approach which can be used to enrich the degree of collaborationis focused on bilateral relations. A bundle of measures is used to evaluate theinclination of a given unit, be it a country, region, or an institution, tocollaborate with another unit. Among measures reflecting such bilateral rela-tions, Salton’s cosine, Jaccard’s index, and the affinity index are the most popular.Salton’s cosine measures the strength of bilateral collaboration by comparingcollaboration between i and j (Pij)—where P can be joint projects,co-authored publications, or co-patents, and i and j can be organisations,
Measuring scholarly collaboration in space 67

cities, regions or countries—to the square root of the product of totalcollaborations of i (Pi) and j (Pj):
SALTON’S COSINEij ¼ PijffiffiffiffiffiffiffiffiffiffiffiffiffiffiPi � Pj
p
Jaccard’s index is based on an analogous approach, but its denominator iscalculated in a different way:
JACCARD’S INDEXij ¼ Pij
Pi þ Pj � Pij� �
The values of both measures vary from 0 to 1, where 0 means no collaborationbetween the two analysed units and 1 means that all P involves collaboration in theanalysed pair. Due to the mathematical features of the measures, Salton’s cosineunderestimates the collaboration of smaller entities with larger units. In effect,Jaccard’s index is preferable to Salton’s cosine in analyses that involve entities ofsignificantly different scale, which is usually the case of studies on internationalcollaboration between countries, e.g., Finland and the US (Luukkonen, Tijssen,Persson, & Sivertsen, 1993). Nevertheless, both measures are frequently applied inspatial scientometrics (see for example: Bolaños-Pizarro, Thijs, & Glänzel, 2010;Glänzel & Schubert, 2001; Glänzel, Schubert, & Czerwon, 1999).
The affinity index is built on a slightly different approach to bilateralrelations. While Salton’s and Jaccard’s indices are essentially symmetric—thereis one value of the measure for the pair i and j—the affinity index nearlyalways produces two different scores for two collaborating entities. The affinityindex is defined as:
AFFINITY INDEXij ¼ Pij
PCOLL i
This relates the amount of collaboration P (joint projects, co-authoredpublications, or co-patents) between i and j (most frequently countries) toPCOLL i (the total collaboration of the given i) with the whole set of units of agiven type (for instance international collaboration with the entire world). Theindex calculated for collaboration between i and j more often than notachieves different values because of various denominators (i.e., a differentoverall number of collaborations—PCOLL). In effect, the index measuresasymmetrical collaborative relations. If country i has a higher affinity indexthan its collaborator j, it suggests that j is a much more important collaboratorfor i, than i is for j. Examples of studies based on the affinity index includeCampbell, Roberge, Haustein, & Archamba, 2013; Costa et al., 2013; Glänzel,2001; Leclerc & Gagné, 1994; and Nagpaul, 1999.
68 Measuring scholarly collaboration in space

Even more detailed patterns of scientific collaboration may be uncovered bythe tools derived from social network analysis (Wasserman & Faust, 2007). Thenetwork approach is frequently used to visualise research collaboration. Theavailability of user-friendly visualisation tools—e.g., CiteSpace, CitNetExplorer,Science of Science (Sci2) Tool, and VOSviewer (Cobo, López-Herrera, Herrera-Viedma, & Herrera, 2011)—has powered a growing stream of collaborativenetwork visuals on various levels, from individual scholars, through researchgroups, networks, and organisations, to regional, trans-regional, national, andalso supranational levels. Network graphs can at times be difficult to comprehendand analyse—especially if they take the form of a dense “hedgehog”—but variousnetwork measures enable us to make sense of even extremely complex systems ofrelations. On the one hand, network-level metrics inform us about the propertiesof the overall network. For instance, network density measures the proportionbetween existing direct ties among nodes in a network and the total number ofpossible ties. Meanwhile, average path length indicates the mean number of stepsalong the shortest paths between all pairs of nodes in the network. Both measuresallow us to evaluate how well the nodes in a network are connected. In thecontext of spatial scientometrics, network density and average path length arefrequently used to investigate the evolution of a given network or to comparethe overall features of different collaborative networks (see inter alia: Cassi,Corrocher, Malerba, & Vonortas, 2009; Fraunhofer ISI, Idea Consult, & SPRU,2009; Vonortas, 2013; Zhai, Yan, Shibchurn, & Song, 2014).
On the other hand, node-level metrics measure how an individual node—be it an individual scholar, organisation, region, or country—is embedded in agiven network. To this end, centrality measures are the most commonly usedin spatial scientometric studies. They enable us to differentiate between nodes’positions in a network in terms of their possible influence over the network,access to the network resources, and control of information flows in thenetwork. The most basic centrality measure is degree centrality, defined as thenumber of direct links that a node has with other nodes in the network:
DEGREE CENTRALITYi ¼X
jDIRECT LINKSij
Degree centrality is interpreted as the involvement of a given node or itsnetwork activity. For instance, in the case of co-authorship networks at theregional level, the degree centrality is defined as the number of co-author-ship relations that a region has. Furthermore, degree centrality can beenriched by taking account of the strength of these ties—instead of simplycounting the existence of links, they can be weighted based on the numberof relations between given nodes, e.g., the number of co-publicationsbetween countries. Regions directly connected to many other regions—and in the weighted version, by multiple relations—play the most importantrole in a network. Degree centrality is simple to calculate and comprehend,
Measuring scholarly collaboration in space 69

but as it concentrates on direct links, it simultaneously omits the globalstructure of the network. For example, a region might be connected tomany others, but if these connections occupy peripheral network positions,they might be less valuable than a single link to the key network player. Inother words, the number of a node’s connections matters, but the connec-tions of its collaborators can matter more. To address this issue, manycentrality measures take account not only of direct ties, but also of indirectconnections. Among them is closeness centrality, which measures how close,on average, a node is to all other nodes in the network, not only those inimmediate proximity. Closeness centrality is defined as:
CLOSENESS CENTRALITYi ¼ V � 1XjNETWORK DISTANCEij
where V is the number of nodes in the network, andNETWORK DISTANCEij
is the number of edges between verticesi and j. Closeness centrality can beinterpreted as the connectedness or reachability of a given node. High values ofcloseness centrality suggest that the given node can easily reach other nodes in thenetwork, either through direct or indirect ties. Thus, it has an advantage based onaccess to its collaborators’ knowledge and resources. The next centrality measuregoes even further and tries to capture the power of a node to control flows in thenetwork. Betweenness centrality is obtained by determining how often a particularnode is found on the shortest path between any pair of nodes (that are not directlyconnected). It is defined as:
BETWEENNESS CENTRALITYi ¼XV�1
k¼1
XV
j¼kþ1
minPATHkj ið ÞminPATHkj
k; j≠i
where minPATHkj is the number of shortest paths linking nodes k and j, andminPATHkj ið Þ is the shortest path between k and j that goes through thenode i. A high value of betweenness centrality means that the node is the mostprobable connector between nodes that are not directly connected. Thisnetwork position enables the node to control the flow of information. Thispower can be used either to facilitate the flow of information (in this case thenode plays the role of a bridge or knowledge broker) or to tame it (e.g., inorder to secure the node’s competitive advantage).
Another approach which can be used to capture a node’s network positionis eigenvector centrality. Eigencentrality combines the number of links and theirquality. It is based on the idea that a node is more central if connected to otherhighly central nodes. The eigenvector centrality of a node i can be understoodas the sum of the centralities of nodes adjacent to the node i. As such, it isbased not only on the centralities of directly connected nodes, but also on thecentralities calculated for connections of connections (and so on). Eigenvector
70 Measuring scholarly collaboration in space

centrality is believed to measure a node’s importance and its influence over thenetwork. A high value of the measure shows that the node is tightly connectedto the most important players in the network.
The four discussed centralities are the most frequently used network measuresin scientometric studies, mostly at the individual level (Liu, Bollen, Nelson, &Van de Sompel, 2005; Uddin, Hossain, Abbasi, & Rasmussen, 2012; Vidgen,Henneberg, & Naudé, 2007), but also in more spatially oriented studies con-cerned with networks of organisations, cities, regions, or countries (for instance:Choi, 2011; Kumar, Rohani, & Ratnavelu, 2014). Notably, node-level measurescan be aggregated at the network level in the form of average centralities. In thislight, the above-mentioned average path length can be seen as a network-levelmean of closeness centralities. This approach to network-level analysis is alsofrequently encountered in spatial scientometrics (e.g., Franceschet, 2012; Guan &Liu, 2014; Ortega, 2014; Pan, Sinha, Kaski, & Saramäki, 2012).
Next to the most popular centrality measures, others can also be incorpo-rated into the spatial analysis of collaboration in science. The followingremarkable approaches can be pointed out: average ties strength and efficiency(Abbasi et al., 2011), load centrality (De Stefano et al., 2011), subgraph centrality(He, Ding, & Ni, 2011), and various community detection algorithms: leadingeigenvector, walktrap, edge betweenness, and spinglass (Rodriguez & Pepe, 2008).A distinctive stream of advanced measures combines network and non-network features to produce comprehensive collaboration indicators. A parti-cularly remarkable example of this approach is the ego network quality proposedby Tamás Sebestyén and Attila Varga from University of Pécs in Hungary.Notably, the index was constructed for the purpose of spatial analysis. The egonetwork quality reflects both the network position and node characteristics(attributes). It takes into account three dimensions of the network of knowledgeflows: (1) the knowledge potential of a given node, which is derived from theknowledge stock of its direct and indirect neighbours (knowledge potential ofpartners), (2) the extent of collaboration among partners calculated as the averagenumber of links in the node neighbourhood (local connectivity), and (3) thestructure of the network behind the region’s immediate neighbourhood (globalembeddedness). The ego network quality is thus based on a similar idea toeigenvector centrality, but it adds node-specific characteristics (Sebestyén &Varga, 2013a, 2013b; Sebestyén, Hau-Horváth, & Varga, 2017).
Another approach to unfolding spatial collaboration patterns—somewhatsurprisingly not heavily exploited—relies on studying the physical distancebetween collaborating scholars, institutions, or various spatial entities. Anexample might be the bundle of indicators based on the so-called geographicalcollaboration distance (GCD). This is defined as the largest geographical distancebetween collaborating units, for instance the authors’ affiliation addressesincluded in a particular publication’s address list. Based on the concept of thegeographical collaboration distance, other measures can be derived, such as themean geographical collaboration distance (average GCD of a set of collaborations,e.g., co-publications) or the percentage of collaborations at a given distance
Measuring scholarly collaboration in space 71

(e.g., percentage of publications with a GCD of more than 5,000 km) (fordetails see: Waltman, Tijssen, & van Eck, 2011). Moreover, the spatial distancebetween collaborating units can be comprehended not only as the distancemeasured along the surface of the earth (“as the crow flies”), between pointswhich are defined by geographical coordinates in terms of latitude and long-itude, but also on the basis of accessibility, measured as transport accessibility(Andersson & Ejermo, 2005) or on a micro scale as the walking distancebetween researchers in laboratories and offices.
In addition, a more nuanced approach brings into play the concept offunctional proximity (or functional distance) among collaborators—by andlarge individuals—taking into account not only the shortest distance betweentwo scholars but also aspects of the spatial layouts of possible interactionsbetween them. Studies on relations among researchers at the campus orbuilding level proposed—in addition to the physical distance and the walkingdistance—the path overlap measure, calculated as the total length of the over-lapping paths of two individuals. Interestingly, examination of the correlationsbetween measures of physical distance and path overlap revealed that theycapture complementary aspects of collaboration in space (Kabo, Cotton-Nessler,Hwang, Levenstein, & Owen-Smith, 2014; Kabo, Hwang, Levenstein, &Owen-Smith, 2015).
3.4 Methodological issues
Spatially oriented studies of scholarly collaborations face specific methodo-logical challenges. These issues relate to the dual nature of the field: some ofthe challenges stem from the scientometric methodology; the others derivefrom spatial analysis. The scientometric perspective raises questions on:(1) counting collaborators’ contributions, (2) quantifying collaborative net-works, (3) aggregating individual data at various organisational levels, and(4) accounting for disciplinary differences. The geospatial perspective addsfurther issues of: (5) geolocalisation, (6) distance measurement, and (7) modifi-able spatial units. These seven intertwined issues may modify the results ofcollaboration analysis and may also affect related studies, for instance thoseaddressing collaboration effects on scientific productivity and impact (see forinstance Luukkonen et al., 1993).
The first methodological question is how to quantify the contribution ofcollaborators. The issue is extensively discussed in the bibliometric tradition,but it equally applies to other scientometric data, mainly patents and projects.For example, if three scholars co-authored a paper (or a patent, or workedtogether on a project), how should this paper (patent or project) be assigned toeach individual? There are two main solutions: full counting and fractionalcounting (the former is sometimes referred to as whole, standard, normal,complete, or total, while the latter as adjusted or uniform). In the case of theabove example, triple co-authorship, the full counting method assigns fullcredit to each author, while fractional counting assigns only one-third of the
72 Measuring scholarly collaboration in space

credit. In effect, the first method inflates the total sum of articles assigned toindividuals, whereas the second method keeps the sum as one. In the fullcounting method, the credit given to an author does not depend on thenumber of co-authors. In fractional counting, the number of co-authors istaken into account, but the differences in contributions are not addressed.Consequently, more sophisticated approaches have been proposed (e.g., pro-portional, geometric, and harmonic counting) to capture the different levels ofcontribution to a joint work. For instance, the name sequence in the bylinecan be taken into account, or credit can be assigned only to the first and lastco-author (first/last counting). The counting method applied to credit attribu-tion in studies of scholarly collaboration influences its conclusions. In their 2005article, Sooho Lee and Barry Bozeman revealed that the authorship countingprocedure greatly affects scientific productivity measures. In this study, colla-boration and publishing productivity were found to be significantly related whenthe full counting method for ascribing publications to their authors was applied,but the relationship disappeared when fractional counting was used. Similarly, atthe country level, the distorting effect of various counting procedures can beobserved. Marianne Gauffriau and her team (2007) showed that the full count-ing scheme boosts the position of more internationally tied countries with arelatively weak science base in relation to those scientifically stronger, yet lessinternationally connected.
The second methodological issue is how to quantify collaborative links. Thereasoning behind this challenge mirrors that behind counting contributions.Coming back to the example of a paper co-authored by three individuals,collaborative relations can be fully or fractionally counted. In the full countingapproach, each relation is assigned a full score, while in the fractional methodeach of the three links is attributed with one-third of the score. The intuitionunderlying the fractional counting of collaborative relations is that collaborationbetween two individuals is hardly comparable to collaboration among dozensor hundreds of scholars: the former is expected to be more intensive than thelatter. Interestingly, while the quandary regarding whole/fractional counting ofpublications—and scientometric indicators in general—is addressed every sooften in the literature, the application of this approach to bibliometric networksis a relatively new development (see: Leydesdorff & Park, 2017; Perianes-Rodriguez, Waltman, & van Eck, 2016). Another variant on the issue ofcollaborative links quantification relates to the classification of publications bycollaboration type, most frequently, internationally, nationally, locally, institu-tionally co-authored, or sole-authored. In the so-called hierarchical coding,foreign addresses are looked for first, and papers with at least one such addressare identified as international (even if they enlist national, local, or organisationalauthors). National, local, or organisational papers are then identified correspond-ingly. The procedure is problematic because an internationally co-authoredpaper may have more local than international co-authors. In effect, hierarchicalcoding devalues local and domestic collaboration, and at the same time over-estimates international collaboration (2009). An alternative approach is a
Measuring scholarly collaboration in space 73

comprehensive coding. In this case, all of the possible variants are taken intoaccount, e.g., for a simple classification into nationally and internationally co-authored papers, an additional mixed category of papers that have both nationaland international co-authors can be added. The downside of comprehensivecoding is the multiplication of mixed categories that follows from the addition ofeach basic category. It can result in constructing categories that are too narrowand too difficult to be used in the analyses (such as “papers co-authored locallyand internationally, but not organisationally and nationally”).
The third issue is how to deal with various organisational levels, particularlyin the case of overgeneralised aggregation or imprecise names of organisationsas recorded in various data sources. For instance, Li and Willett (2009), in theirChinese study, observed methodological constraints relating to the way inwhich large, multicomponent scientific organisations are described in the Webof Science. The authors claim that this causes significant distortions in theinterpretation of data on collaboration. In fact, the number of nationalcollaborative articles in China is substantially higher than presented by theWeb of Science data. This stems from the fact that the authors of many articleswork for various units within the Chinese Academy of Sciences, which arealso often spatially dispersed.
The fourth challenge concerns the disciplinary differences of scientific colla-boration intensity and impact. Various fields of science are altered by collabora-tion differently. Scholarly disciplines feature distinctive collaborative customsresulting from discipline-specific factors (see for instance: Larivière et al., 2015;Luukkonen, Persson, & Sivertsen, 1992; Wuchty et al., 2007). Paragraph 2.2.4refers in detail to these issues and provides numerous examples of variationsamong disciplines and their possible explanations. Next to field-by-field analysis,some more general regularities can be traced based on the collaborative perfor-mance of specific disciplines. The differentiating factor may be the level ofapplicability of the given discipline (Bordons, Gomez, Fernández, Zulueta, &Mendez, 1996; Muriithi et al., 2013) or the level of its advancement in a givencountry (Peclin, Južnic
, Blagus, Sajko, & Stare, 2012). Remarkably, the positive
impact of collaboration on productivity and citation levels tends to be weak orabsent in the social sciences (Avkiran, 1997; Endenich & Trapp, 2015; Hart,2007; Hollis, 2001; Leimu & Koricheva, 2005; Medoff, 2003). To account forinterdisciplinary differences and to make field comparisons feasible, normal-isation procedures of bibliometric indicators are implemented (van Raan,2005). Nevertheless, the discipline-specific characteristics call for caution in theinterpretation of multidisciplinary studies results.
The fifth concern is the geolocalisation of collaborators. To begin with, theprecise geolocalisation of scientometric data is a non-trivial, time-consumingtask due to the ambiguity and incompleteness of affiliations and addressesincluded in publications and patents. Although the overall quality of addressdata in the major scientometric sources has been continuously improving,along with more sophisticated geolocalisation techniques, the intrinsic limitationspersist. An address reported with the scholar’s affiliation does not necessarily
74 Measuring scholarly collaboration in space

indicate the exact location where the research was conducted. This might be thecase of complex research organisations or studies that involve multiple organisa-tions or that require scholars to be mobile. Furthermore, some authors reportmore than one address. Those double or multiple co-affiliations might resultfrom simultaneous affiliations to different institutions or from academic mobilityduring the process of a paper’s preparation and publishing. In this case,co-affiliations might be mistakenly interpreted as collaboration between indivi-duals. Certainly, a scholar affiliated with multiple organisations can play the roleof collaboration broker between them, but the meaning of such a link “is clearlydifferent from a project where multiple researchers from different organisationsare involved” (Frenken, Hardeman, & Hoekman, 2009, p. 226).
The ambiguity of geolocalisation translates into the sixth challenge, which iscalculating the physical distance between collaborators. When high-resolutiondata—geolocated at organisation or city level—is not available, a proxy forcalculating the distance has to be adopted. For instance, in the case of country-level studies, the geographical distance between collaborators can be computedusing either the distances between the capital cities or the weighted average ofthe distances between the biggest cities of those countries. The city weightingscan reflect science-related features, such as research and development (R&D)employment, the number of publications and patents, or general socio-economicindicators, for example population or gross domestic product (Nomaler, Frenken,& Heimeriks, 2013).
Finally, the last issue concerns the aggregation of geolocalised data atdifferent spatial levels and units. This relates to the observation that spatialanalyses are sensitive to the way in which considered spatial units are defined.This issue is referred to in geography as the modifiable areal unit problem(Grasland & Madelin, 2006; Openshaw, 1983). Spatial scientometrics dealswith various geographical levels: a single address can be aggregated to the levelof a neighbourhood, town, city, metropolitan area, region, province, country,or continent, to name only a few. Analyses performed on various levels oftengive dissimilar results, mainly due to the loss of information at higher levels ofaggregation (Patuelli, Vaona, & Grimpe, 2010). Therefore, the choice of thespatial level of analysis for a particular problem remains fundamental. Naturally,researchers are frequently constrained by the availability of data on a givenspatial level. Even if scientometric address data can be flexibly aggregated,other relevant data—e.g., R&D expenditures and employment—can beobtained only for predefined entities. These units usually reflect administrativeareas, which are not always the most appropriate for spatial scientometrics oreasily comparable across countries. It is argued that labour market areasconsisting of a central city and its commuting area are most suited to local-level studies (Frenken et al., 2009; Hoekman et al., 2009). If delimitation ofadequate functional areas is not available, custom spatial units can beconstructed (usually by the aggregation of lower-level areas or analyses ofraster data on population density—see: Eckert, Baron, & Jégou, 2013 andGrossetti et al., 2014). Furthermore, comparison across spatial levels can raise a
Measuring scholarly collaboration in space 75

number of questions. Consider a comparative study of international collabora-tion between the US and European countries. What should be compared: singleEuropean countries to the US, the whole of Europe to the US, or individualEuropean countries to individual states of the US? Each of these alternativesgives markedly different results (Kamalski & Plume, 2013).
* * *
Spatial studies of scientific collaboration combine methods and approachesdeveloped within informetrics, and the broadly defined science of science,with spatial sciences. The policy importance and relative novelty of spatialscientometrics have fuelled rapid advancements in data sources, techniques,and methodologies. In consequence, the research field is inherently interdisci-plinary, internally diverse, and paradigmatically blurred. Further developmentof the geography of scientific collaboration increasingly depends on theestablishment of a coherent theoretical framework. A well-defined researchparadigm is needed to enhance causal inference.
Notes
1 Another impressive development regarding historical sources for the quantitativeanalysis of scientific collaboration is Electronic Enlightenment—an online collectionof correspondence among intellectuals from the early 17th to the mid-19th century.Geolocation of this correspondence has been prepared within the Mapping theRepublic of Letters project run by Stanford University (Chang et al., 2009). Aninteractive visualisation of the geolocalised correspondence network is available at:http://stanford.edu/group/toolingup/rplviz/rplviz.swf
2 The Handbook of Bibliometric Indicators by Todeschini and Baccini (2016) offers anexhaustive review of bibliometric indicators.
76 Measuring scholarly collaboration in space

4 Spatial patterns of scientificcollaboration
This chapter develops around four issues: (1) internationalisation of science andits varied dynamics, (2) formation and evolution of global scientific networks,(3) the collaboration-performance nexus in the geography of science, and(4) the centre-periphery logic of the geography of scientific collaboration.Before we go into details, it is worth taking some time to discuss the rationalesand assumptions underlying the presented approach.
To begin with, patterns of scientific collaboration can be observed at variousspatial levels, from the micro-level of individual scholars, buildings, andcampuses, through mezzo-levels of towns, cities, and other subnational entitiessuch as counties, regions, or states, to the macro-level of countries and theirgroupings. The micro-level—where individuals and organisations get theirhands dirty with everyday collaboration—is addressed at length in Chapter 2and is given suitable attention in Chapters 5 and 6. In this section, we focusprimarily on the mezzo and macro levels, as they are the most relevant fromthe perspective of the global geography of science.
Research collaboration in space constantly evolves. The temporal dimensionis especially vital in an era of unprecedented growth in scientific collaboration.The rise of global research collaboration networks—analysed here on countryand city levels—provides the ultimate illustration of the collaborative turn inscience. However, the dynamics of research internationalisation are unequallyspread across the world, and the resulting global network is not horizontal, butshows a clear centre-periphery pattern.
The structural aspect of research networks is accompanied by a functionaldimension. Structures formed by scientific collaboration serve particular func-tions, such as establishing scientific hierarchies or increasing the quantity andquality of scientific enterprise. The geography of science clearly reflects thisfunctional aspect. For instance, the positive impact of collaboration isspatially diversified not only due to the varied intensity of scientific colla-boration, but also because of the inherent disparities between collaborators.Hence, the advantages of collaboration are not necessarily evenly distributedamong collaborating units. In this chapter, the functional dimension ofscientific collaboration is addressed mainly by analysing the relationshipbetween co-authorship and citations.

Last but not least, there are many types of scientific collaboration (seeChapter 2), and these can be measured using various data (see Chapter 3).Consequently, the observed patterns of scientific collaboration depend on thedata and methods employed. This chapter draws primarily on bibliometric datasourced from the Web of Science database. However, to enrich and cross-validate the analysis, it is complemented by publication and citation data fromthe Scopus database, information on patents sourced from OECD, and selectedresults and conclusions provided by the rich empirical literature on the spatialaspects of scientific collaboration.
4.1 Internationalisation
The growth of international scientific collaboration in the last few decades can beseen as the most remarkable feature of the global geography of science. Forcenturies, international co-authorship was extremely rare. Even in 1970, inter-nationally co-authored papers constituted only 1.9 percent of articles indexed inWeb of Science.1 Since then, the number has been growing steadily. In 1980, theshare of internationally co-authored papers amounted to 4.6%. In the followingyears, the value almost doubled every decade. It reached 8.9% in 1990 and 16.1%in 2000. Finally, in 2013, almost every fourth publication—23.1%—had authorsfrom more than one country (comparable results are reported by Leydesdorff &Wagner, 2008; Wagner, Park, & Leydesdorff, 2015).
On the national level, the percentage of internationally co-authored articlesoften significantly exceeds the global average. Values over 50%—which means thatmore than half(!) of the publications affiliated with a given country are co-authoredinternationally—are not uncommon. As of 2013, this was the case, for instance, inSwitzerland (69%), Belgium (64.7%), Sweden (60.2%), the Netherlands (58.8%),France (56.2%), Germany (53.2%), the United Kingdom (53%), and Canada(50.1%)—to point out only selected countries with large overall scientific output.The remarkable difference between the world average and national averagesmay seem illogical. Yet the numbers are correct. The inconsistency stems fromthe nature of the phenomenon, which can be understood as an example ofSimpson’s paradox (altered trends or averages in aggregated and subdivided data,see Ramanana-Rahary, Zitt, & Rousseau, 2009). Furthermore, we have to bear inmind that collaborative relations are not necessarily bilateral. Of course, interna-tionally co-authored publications result most frequently from collaborationbetween scholars from two countries (17.8% of the total number of articlespublished in 2013), and definitely less often from three (3.7%) or four (0.9%).Publications produced by researchers from five or more countries account for 0.7%of global research output as indexed by Web of Science in 2013. The last categorymay seem tiny—applying to less than one in a hundred publications—but let usthink about the quantity of international relations associated with the aforemen-tioned categories. For example, co-authorship among four countries translates intosix bilateral relations between countries, in the case of five-country co-authorshipwe already have ten bilateral relations, and with six-country co-authorship 15, and
78 Spatial patterns of scientific collaboration

so on.2 Hence, even a low number of multi-country publications contributessignificantly to the number of bilateral collaborative relations and inflates inter-nationalisation rates.
The dynamics of internationalisation differ among countries (see Figure 4.1). Inrecent decades, the majority of nations have experienced a steady increase in thepercentage of foreign co-authored papers—for instance the US and the UK,Germany, France, Canada, and Italy. Meanwhile, in some other countries theindicator has stagnated, as epitomised by China. In others, after an initial increase,there has been a noticeable decline in internationalisation, as in the case of Iran,Poland, and Romania. Particularly large fluctuations in the internationalisationrate affect countries with a low number of Web of Science–indexed papers in agiven period. This explains the spectacular peaks and valleys recorded in SouthKorea, Singapore, and Saudi Arabia throughout the 1970s and 1980s, in China inthe 1970s, and in Egypt, Thailand, and Colombia—with other examples easilynoticeable in the charts placed on the following pages.
As a result of diversified paths of internationalisation, the participation ofindividual countries in global scientific cooperation varies considerably (seeFigure 4.2). In the 32 most productive countries—defined as having more than10,000 articles published in 2013—the degree of internationalisation can be as lowas 20.9% in the case of Turkey, 22.5% for India, and 22.9% for Iran. At the otherend of the spectrum, internationalisation is seen to reach 69% in Switzerland, 66.6%in Austria, and 64.7% in Belgium. However, the given values are not record-breaking. Many of the less scientifically advanced countries have even higher ratesof internationalisation. In the group of countries that published between 5,001 and10,000 articles in 2013, Saudi Arabia reached a rate of 75.9%. In the group of1,001–5,000 published papers, Kenya attained an internationalisation rate of 86.7%,which was only narrowly higher than the value for Indonesia, 84.8%. Next, amongcountries with 101 to 1,000 publications, the internationalisation rate oftenapproaches 100% (e.g., Mongolia—98.6%, Zambia—96.3%, Cambodia—96.1%).Predictably, some countries with a very limited scientific sector (from 10 to 100papers in 2013) publish only internationally co-authored articles.
Clearly, the highest rates of internationalisation do not apply to the globalscientific powerhouses. The two most scientifically productive nations in terms ofthe number of published papers, the US and China, display relatively modestinternationalisation rates of 35.1% and 24.3%, respectively. The explanation of thisphenomenon lies in the mass of a particular national science system. On the globalscale, there is a strong negative correlation between the number of articles and thedegree of their internationalisation (see Figure 4.3). There are two main reasonsfor this. For countries with the largest science sectors, there are plenty of—andsometimes entirely sufficient—internal possibilities to collaborate, while for theleast developed, international collaboration may be the only means of entering theglobal world of science. For authors from less scientifically advanced areas, due tolow endogenous scientific capacities, publishing in the world’s top, usuallyEnglish-language, journals might be difficult. One way to overcome this obstacleis to collaborate with foreign, often more experienced, established, and visible
Spatial patterns of scientific collaboration 79

0%
10%
20%
30%
40%
50%
60%
70%
1970
1980
1990
2000
2010
USA
0%
10%
20%
30%
40%
50%
60%
70%
1970
1980
1990
2000
2010
CHINA
0%
10%
20%
30%
40%
50%
60%
70%
1970
1980
1990
2000
2010
UNITED KINGDOM
0%
10%
20%
30%
40%
50%
60%
70%
1970
1980
1990
2000
2010
GERMANY
EAST0%
10%
20%
30%
40%
50%
60%
70%
1970
1980
1990
2000
2010
JAPAN
0%
10%
20%
30%
40%
50%
60%
70%
1970
1980
1990
2000
2010
FRANCE
0%
10%
20%
30%
40%
50%
60%
70%
1970
1980
1990
2000
2010
CANADA
0%
10%
20%
30%
40%
50%
60%
70%
1970
1980
1990
2000
2010
ITALY
0%
10%
20%
30%
40%
50%
60%
70%
1970
1980
1990
2000
2010
SPAIN
0%
10%
20%
30%
40%
50%
60%
70%
1970
1980
1990
2000
2010
AUSTRALIA
0%
10%
20%
30%
40%
50%
60%
70%
1970
1980
1990
2000
2010
INDIA
0%
10%
20%
30%
40%
50%
60%
70%
1970
1980
1990
2000
2010
SOUTH KOREA
WEST
Figure 4.1 Share of internationally co-authored articles, 1970–2013The figure includes countries with the highest number of articles in 2013, sorted in descending order.Source: Conception and design by Adam Ploszaj, based on Web of Science data.
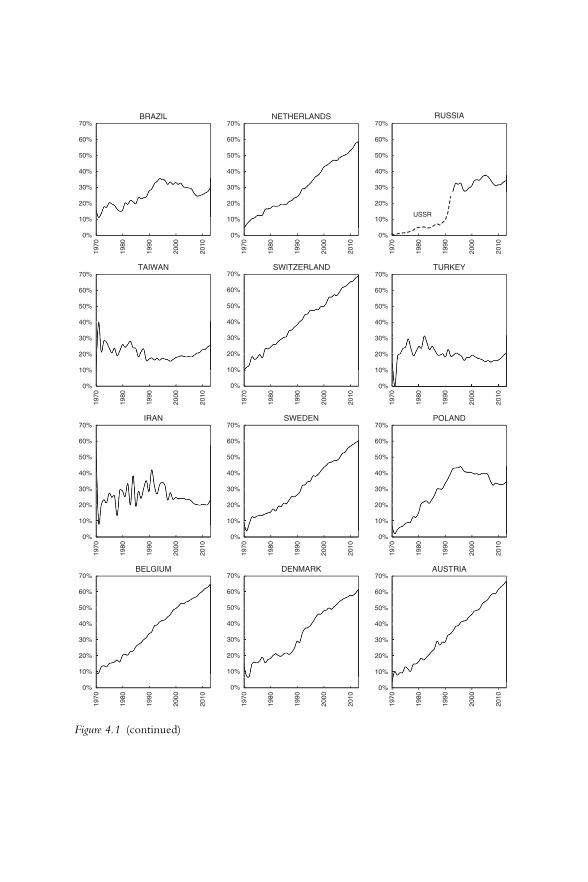
0%
10%
20%
30%
40%
50%
60%
70%
1970
1980
1990
2000
2010
BRAZIL
0%
10%
20%
30%
40%
50%
60%
70%
1970
1980
1990
2000
2010
NETHERLANDS
0%
10%
20%
30%
40%
50%
60%
70%
1970
1980
1990
2000
2010
RUSSIA
USSR
0%
10%
20%
30%
40%
50%
60%
70%
1970
1980
1990
2000
2010
TAIWAN
0%
10%
20%
30%
40%
50%
60%
70%
1970
1980
1990
2000
2010
SWITZERLAND
0%
10%
20%
30%
40%
50%
60%
70%
1970
1980
1990
2000
2010
TURKEY
0%
10%
20%
30%
40%
50%
60%
70%
1970
1980
1990
2000
2010
IRAN
0%
10%
20%
30%
40%
50%
60%
70%
1970
1980
1990
2000
2010
SWEDEN
0%
10%
20%
30%
40%
50%
60%
70%
1970
1980
1990
2000
2010
POLAND
0%
10%
20%
30%
40%
50%
60%
70%
1970
1980
1990
2000
2010
BELGIUM
0%
10%
20%
30%
40%
50%
60%
70%
1970
1980
1990
2000
2010
DENMARK
0%
10%
20%
30%
40%
50%
60%
70%
1970
1980
1990
2000
2010
AUSTRIA
Figure 4.1 (continued)

0%
10%
20%
30%
40%
50%
60%
70%
1970
1980
1990
2000
2010
PORTUGAL
0%
10%
20%
30%
40%
50%
60%
70%
1970
1980
1990
2000
2010
ISRAEL
0%
10%
20%
30%
40%
50%
60%
70%
1970
1980
1990
2000
2010
NORWAY
0%
10%
20%
30%
40%
50%
60%
70%
1970
1980
1990
2000
2010
FINLAND
0%
10%
20%
30%
40%
50%
60%
70%
1970
1980
1990
2000
2010
MEXICO
0%
10%
20%
30%
40%
50%
60%
70%
1970
1980
1990
2000
2010
SINGAPORE
0%
10%
20%
30%
40%
50%
60%
70%
1970
1980
1990
2000
2010
CZECH REPUBLIC & SLOVAKIA
0%
10%
20%
30%
40%
50%
60%
70%
1970
1980
1990
2000
2010
SOUTH AFRICA
0%
10%
20%
30%
40%
50%
60%
70%
1970
1980
1990
2000
2010
GREECE
0%
10%
20%
30%
40%
50%
60%
70%
1970
1980
1990
2000
2010
MALAYSIA
0%
10%
20%
30%
40%
50%
60%
70%
1970
1980
1990
2000
2010
SAUDI ARABIA
0%
10%
20%
30%
40%
50%
60%
70%
1970
1980
1990
2000
2010
NEW ZEALAND
SLOVAKIA
CZECH R.
CZECHOSLOVAKIA
Figure 4.1 (continued)

0%
10%
20%
30%
40%
50%
60%
70%
1970
1980
1990
2000
2010
ARGENTINA
0%
10%
20%
30%
40%
50%
60%
70%
1970
1980
1990
2000
2010
ROMANIA
0%
10%
20%
30%
40%
50%
60%
70%
1970
1980
1990
2000
2010
EGYPT
0%
10%
20%
30%
40%
50%
60%
70%
1970
1980
1990
2000
2010
IRELAND
0%
10%
20%
30%
40%
50%
60%
70%
1970
1980
1990
2000
2010
THAILAND
0%
10%
20%
30%
40%
50%
60%
70%
1970
1980
1990
2000
2010
PAKISTAN
0%
10%
20%
30%
40%
50%
60%
70%
1970
1980
1990
2000
2010
HUNGARY
0%
10%
20%
30%
40%
50%
60%
70%
1970
1980
1990
2000
2010
CHILE
0%
10%
20%
30%
40%
50%
60%
70%
1970
1980
1990
2000
2010
COLOMBIA
0%
10%
20%
30%
40%
50%
60%
70%
1970
1980
1990
2000
2010
TUNISIA
0%
10%
20%
30%
40%
50%
60%
70%
1970
1980
1990
2000
2010
UKRAINE
0%
10%
20%
30%
40%
50%
60%
70%
1970
1980
1990
2000
2010
BULGARIA
Figure 4.1 (continued)

20,9
% –
30%
Inte
rnat
iona
lisat
ion
degr
ee
30,1
% –
40%
40,1
% –
50%
50,1
% –
60%
60,1
% –
70%
70,1
% –
80%
80,1
% –
90%
90,1
% –
100
%
Figure4.2
Shareof
internationally
co-autho
redarticlesin
2013
Source:Con
ceptionanddesig
nby
Adam
Ploszaj,basedon
Web
ofSciencedata.

0%20%
40%
60%
80%
100%
1010
010
0010
000
1000
0010
0000
0
Internationalisation degree
Num
ber
of a
rtic
les
(log
scal
e)
0%20%
40%
60%
80%
100%
1010
010
0010
000
1000
00
Internationalisation degree
Num
ber
of p
aten
t app
licat
ions
(lo
g sc
ale)
Figure4.3
Researchou
tput
andinternationalisationatcoun
trylevel:articles(left)
andpatents(right)
Source:Con
ceptionanddesig
nby
Adam
Ploszaj,basedon
data
from
Web
ofScience(left)
andOECD
(right).

partners from more scientifically advanced countries (Didegah, Thelwall, &Gazni, 2012; Zanotto, Haeffner, & Guimarães, 2016).
Parallel patterns of internationalisation can be found in patenting activities.Firstly, international co-patenting has been gradually increasing in recent decades(see: De Prato & Nepelski, 2014; Frietsch & Jung, 2009; Picci, 2010; Su, 2017).However, the achieved level of foreign co-patenting is lower than in the case offoreign co-publications. In 2013, for the group of countries included in theOECD statistics, the degree of patent internationalisation totalled circa 6.7–8.2%,with the exact value depending on the type of patent application, i.e., applicationsto the European Patent Office or the US Patent and Trademark Office, or patentsfiled under the Patent Co-operation Treaty. Secondly, countries differ signifi-cantly in terms of patent internationalisation (see Figure 4.4). The percentageof international patent co-applications can be as high as in the Slovak Republic(44–67%), Luxembourg (56–66%), or Indonesia (60–73%), or as low as in Japan(2–3.1%) or South Korea (3.2–3.4%). Thirdly, the degree of patent internationa-lisation is related to the overall number of patent applications filed by inventors inindividual countries. It tends to be higher for small countries and for countrieswith less developed science sectors (Guellec & de la Potterie, 2001; Lei et al.,2013). Nevertheless, this pattern is less apparent in the case of co-patents than inthe case of international scholarly co-authorship (see Figure 4.2).
Spatial diversity in the internationalisation of science is manifested not onlyin differences among countries, but also at subnational levels, where it reflectsregional variations in the overall level of socio-economic development, thedistribution of a unique research infrastructure, and the scientific potentialaccumulated as a result of Braudelian long-term processes (see Chapter 1).Similar regularities can be seen in both North America and Europe, despite thehigher overall level of internationalisation of science on the old continent.While in the European NUTS 2 regions (subnational statistical units) thepercentage of internationally co-authored articles quite often exceeds 50% oreven 60%, in the US no state even approaches 50% (see: Kamalski & Plume,2013).3 According to the US data for 2013, the lowest percentages of foreignco-authored articles—less than 30%—were recorded in Arkansas (27.1%),Kentucky (29.2%), North Dakota (29.5%), Idaho (29.6%), and West Virginia(29.7%). In turn, the highest levels—around 40%—occurred in the north-eastern and southwestern states: Arizona (39.1%), Maryland (39.5%), NewMexico (39.7%), California (39.9%), New Jersey (40.2%), and Massachusetts(41.4%) (see Figure 4.5). A glance at the map of science internationalisationrates in the US suffices to state that the pattern is not random. Clearly, thehigh level of internationalisation of science tends to coincide with well-developed research capacities. However, the relationship is not unambiguous,and unexpected variability of the indicator can be noticed, especially in thecase of states where a smaller number of articles have been affiliated.
In Europe, the highest rates of internationally co-authored papers occurredpredominately in key metropolitan areas and in regions where major univer-sities are located. Internationalisation degrees exceeding 50% were recorded in
86 Spatial patterns of scientific collaboration

0% 10% 20% 30% 40% 50% 60% 70% 80%
IndonesiaLuxembourg
Slovak RepublicCyprus
ArgentinaRomania
IrelandSingapore
SwitzerlandCzech Republic
IcelandHungary
IndiaBelgiumMexico
MaltaBrazil
PolandRussiaGreeceCanadaAustria
United KingdomNew Zealand
NorwayNetherlands
PortugalDenmarkAustraliaSweden
LatviaSlovenia
SpainIsrael
FranceFinland
Chinese TaipeiChile
GermanySouth Africa
TurkeyItaly
ChinaLithuania
European UnionUnited StatesSouth Korea
Japan
EPOPCTUSPTO
Figure 4.4 International cooperation in patents—share of patents with foreign co-inventors in2013
EPO—European Patent Office; PTC—Patent Co-operation Treaty; USPTO—United States Patentand Trademark Office.Source: Conception and design by Adam Ploszaj, based on data from OECD.Stat.

Inte
rnat
ion
alis
atio
nd
egre
e 27,1
% –
30,
4%
30,5
% –
32,
6%
32,7
% –
34,
7%
34,8
% –
37,
1%
37,2
% –
41,
5%
Inte
rnat
ion
ally
co-a
uth
ore
dar
ticl
es
26 0
0015
000
5 00
0
Figure4.5
Internationally
co-autho
redarticlesintheUSin
2013
Source:Con
ceptionanddesig
nby
Adam
Ploszaj,basedon
Web
ofSciencedata.

the NUTS 2 regions of Oxford, Cambridge, London, and Edinburgh in theUK, Dutch Groningen, Belgian Leuven and Louvain-la-Neuve, Zurich andLausanne in Switzerland, Stockholm and Uppsala in Sweden, Berlin andMunich in Germany, and regions hosting unique research infrastructure, suchas Dutch Drenthe with its large radio telescope and Geneva with the CERNheadquarters. Moreover, a distinct latitudinal belt of high internationalisationrates can be seen to spread from Barcelona in Spain, through the Frenchsouthern regions, Switzerland, and Austria, to Bratislava in Slovakia andBudapest in Hungary. Meanwhile, the less scientifically internationalisedregions tend to cluster in European economic peripheries. The majority ofregions with less than 33% of internationally co-authored articles are located inthe eastern flank of the European Union—in Bulgaria, Lithuania, Poland, andRomania (see Figure 4.6).
The previously discussed relationship between the number of publicationsand internationalisation rates occurring at the cross-country level (Figure 4.3) isalso manifested at the subnational level. But, curiously, the direction of therelationship is entirely reversed. For both the US states and European NUTS 2regions, the number of publications positively correlates with the degree ofinternationalisation (at the global cross-national level the relationship is nega-tive). In other words, regions and states with higher scientific output alsoexhibit higher internationalisation rates. The volume of scientific papers has agreater effect on internationalisation in the case of the European NUTS 2regions than in the case of American states (Figure 4.7 left). For the former, atenfold increase in the number of papers translates into a circa six percentagepoint increase in the internationalisation rate. For the latter, the effect is onlyabout 2.8 percentage points. Furthermore, cross-national differences matterconsiderably in Europe. For the whole set of European regions, the relation-ship between the number of papers and internationalisation is only weaklylinear—Pearson’s correlation coefficient equals circa 0.28. The correlationbecomes stronger when regions within individual countries are taken intoaccount (Figure 4.7 right). This is the case, for instance, of France (0.48), theUK (0.51), Spain (0.60), Germany (0.61), Poland (0.73), Romania (0.74), andSweden (0.85) (but not of Italy and the Netherlands, where the correlation isnegligible). The analysed phenomenon shows the multilevel nature of thegeography of scientific cooperation: the direction of the relationship betweenthe volume of scientific production and the intensity of international researchcollaboration differs across levels of analysis. At the level of global internationalcomparisons it is clearly negative, while at the subnational level the relation-ship tends to be positive.
4.2 The global scientific network
The increasing collaboration and internationalisation in science have led to theformation of global scientific networks that connect researchers, organisations,cities, and countries. Worldwide flows of knowledge are decreasingly
Spatial patterns of scientific collaboration 89

19%
– 3
3%
Inte
rnat
ion
alis
atio
n d
egre
e
34%
– 4
2%
43%
– 4
9%
50%
– 5
9%
60%
– 8
1%
No
data
Figure4.6
Shareof
internationally
co-autho
redarticlesin
Europ
eanregion
sintheperiod
of2007–2013
Source:Con
ceptionanddesig
nby
Adam
Ploszaj,basedon
Web
ofSciencedata.

US
EU
28
0%20%
40%
60%
80%
100%
1010
010
0010
000
1000
0010
0000
0
Internationalisation degree
Num
ber
of a
rtic
les
(log
scal
e)
FR
UK
DE
RO
SE
0%20%
40%
60%
80%
100%
1010
010
0010
000
1000
0010
0000
0
Internationalisation degree
Num
ber
of a
rtic
les
(log
scal
e)
ES PL
Figure4.7
Researchou
tput
andinternationalisationin
USstates
andEU
NUTS2region
s(left),and
NUTS2region
swith
inselected
EU
coun
tries
(right),2007–2013
Source:Con
ceptionanddesig
nby
Adam
Ploszaj,basedon
Web
ofSciencedata.

characterised by pair-wise, bilateral relations and increasingly by the logic ofnetworks. Two countries—or other types of nodes—that have the samenumber of external scientific connections can occupy radically different posi-tions in the global scientific web because not only should the number ofrelations be taken into account, but also where they lead. It is the pattern ofinterlinked components that matters, as well as the position of nodes in thenetwork and the architecture of relationships (Strogatz, 2003).
The contemporary global scientific network is woven around the US. Itscentral role is largely derived from the superior mass of the US research anddevelopment sector. A large number of scholars, research organisations, andscientific undertakings create numerous opportunities for international colla-boration and put the US at the centre of the scientific network of nations. Formost countries, the US is usually the most important collaborator, at leastwhen we consider the scale of cooperation measured in absolute numbers. Onthe other hand, the international scientific network is getting denser as moreand more of the possible links between countries are actually forged.
Both phenomena are well illustrated by the international co-authorship net-work of the 30 countries with the highest number of scientific articles indexedin the Web of Science in 2013 (see Figure 4.11). Firstly, the US is undeniablythe most important collaboration partner for the remaining 29 countries, witheach of them having at least 1,000 papers co-authored with the US. Secondly,all 30 countries are fully interconnected. Of course, the number of collaborativepapers in particular pairs of countries differs according to the size of theirscientific output (e.g., US-China: 24.6 thousand, France-UK: 6.6, and Japan-Poland: 0.4). But all of the 435 possible collaborative relations among thecountries in question are actually realised, with at least 25 co-authored papersfor any country-pair in the sample. Moreover, for one-third of the possiblecollaborative relations, the actual number of co-authored articles exceeds 1,000.
Such a dense network appeared only recently. Figures 4.8–4.11 show itsformation. The evolution of the network is characterised by an exponentialincrease in the absolute numbers of co-authored papers, densification, andthe successive entrance of new nodes. In 1980, only 17 country-pairs in thesample had more than 100 co-authored articles.4 In 1990, the number grewto 73, and a decade later—in 2000—it rose to 238. Finally, in 2013, thenumber of country-pairs with at least 100 co-authored papers hit 417—which represents 96% of all possible collaborative relations between the 30most scientifically productive countries. Furthermore, in 1980 there was nosingle country-to-country relation with 1,000 co-authored papers, in 1990there were five such cases, in 2000 it rose to 42, and in 2013 as many as 143.This network growth and densification have been accompanied by theevolution of particular nodes’ positions in the global collaboration. In thisrespect, two features should be given particular attention. First, the USconstantly occupies a stable position as the central hub of the global scientificcollaboration network. Second, China has gained a prominent position in thenetwork in the first decade of the third millennium.
92 Spatial patterns of scientific collaboration

The unparalleled rise of the Chinese presence in the global scientificnetwork, combined with the significant expansion of India and South Korea,and the already solid position of Japan, has resulted in a great shift of world-wide knowledge flows. Between 2000 and 2013 East Asia became one of thethree key macro-regional nodes of the global scientific network (seeFigure 4.12). North America and Europe, the other two primary nodes, havealso developed their external scientific collaboration. Notably, their bilateralrelations have intensified relatively less than their collaboration with East Asia,as well as with secondary nodes—the Maghreb and the Middle East, LatinAmerica, Sub-Saharan Africa, Oceania, and Southeast Asia (see also: Maiso-nobe, Grossetti, Milard, Eckert, & Jégou, 2016).
Macro-regional analysis gives the basis for one more observation. TreatingEuropean countries as one unit of analysis—justified by integration within the
US
JP
CA
UK
IT
CH
NL SE
FRG
IL
FR
AU
Figure 4.8 The network of internationally co-authored articles in 1980The size of nodes is proportional to the overall number of articles. Only nodes with at least one edgewith 100 or more co-publications are shown. Correspondingly, only edges with 100 or more co-publications are displayed.Source: Conception and design by Adam Ploszaj, based on Web of Science data.
Spatial patterns of scientific collaboration 93

European Research Area (see Chapter 6)—considerably reshapes the globalscientific network. The single European Research Area node becomes com-parable with the US, which is responsible for the lion’s share of scientificactivity in North America. This suggests that the contemporary global scien-tific network at the country level is not organised around a single core (US),but instead can be characterised as a dual-core system (US-EU). Furthermore,expansion of science in East Asia, especially China, is leading to the develop-ment of a triple-core model (US-EU-China).
Countries and global macro-regions are somewhat abstract entities for theanalysis of scientific collaboration, even in the context of the geography of science.After all, research activity within individual countries is typically extremelyunevenly distributed. Thus, subnational entities—such as regions, towns, andcities—better reflect the real nature of the phenomenon. This more detailedapproach demonstrates that the mean distance between collaborating units is
JP
CA
USSR
BR
ES
UK
CN
US
AU
IN
IL
AT
DKBE
SENL
FR
DE
CH
PL
IT
Figure 4.9 The network of internationally co-authored articles in 1990The size of nodes is proportional to the overall number of articles. Only nodes with at least one edgewith 200 or more co-publications are shown. Correspondingly, only edges with 200 or more co-publications are displayed.Source: Conception and design by Adam Ploszaj, based on Web of Science data.
94 Spatial patterns of scientific collaboration

continuously increasing. Between 1980 and 2009 the average collaborationdistance per publication grew from 334 to 1,553 kilometres (Waltman et al.,2011; see also Agrawal, McHale, & Oettl, 2014). Despite this incredible rise indistant collaboration, spatial proximity is of great importance. The likelihood ofcollaboration decreases as the distance increases. Collaboration with collocatedcolleagues within the same organisation is obviously more likely than collabora-tion with scholars from the other side of the globe (see Chapter 5).
The finer spatial granularity reveals the crucial role of a limited number ofmajor research hubs in the global scientific cooperation network, first andforemost the so-called world cities (Matthiessen et al., 2010). Global metropo-lises such as London, New York, Paris, and Tokyo are not only very wellconnected to each other, but they also serve as national and macro-regionalcollaboration gateways. This effect is clearly visible in Figures 4.13 and 4.14,presenting the most essential cities and interurban co-authorship relations in
IN
KR
TW
CN
JP
MX
CA
UK
ES
IT
PL
CH
NL NO SE
FI
BE DK
AT
ILDE
US
AU
FR
BR
RU
Figure 4.10 The network of internationally co-authored articles in 2000The size of nodes is proportional to the overall number of articles. Only nodes with at least one edgewith 500 or more co-publications are shown. Correspondingly, only edges with 500 or more co-publications are displayed.Source: Conception and design by Adam Ploszaj, based on Web of Science data.
Spatial patterns of scientific collaboration 95

2000 and 2013.5 On both graphs, collaborative relations that cross nationalborders are almost exclusively those that connect major global metropolises.The vast majority of relations are of an intra-national nature. This demon-strates that, despite the ongoing internationalisation of scientific collaboration,the intra-national dimension remains more important than it might seem(Maisonobe, Eckert et al., 2016). Furthermore, comparison of graphs from2000 and 2013 confirms the already discussed dynamic entry of China into theglobal arena of scientific cooperation.
4.3 Patterns of collaboration and research performance
The geography of scientific collaboration simultaneously shapes and is shapedby the geography of scientific performance. The relationship is two-way. On
KR
IN
SG
TR
IL
AT
DKBE
FI
SENONLCH
PL
IT
PT
ES
BR
RU
UK
CA
JP
MX
IR
AU
TW
US
CN
DE
FR
Figure 4.11 The network of internationally co-authored articles in 2013The size of nodes is proportional to the overall number of articles. Only nodes with at least one edgewith 1,000 or more co-publications are shown. Correspondingly, only edges with 1,000 or more co-publications are displayed.Source: Conception and design by Adam Ploszaj, based on Web of Science data.
96 Spatial patterns of scientific collaboration

the one hand, high-performing places of science attract collaborators. On theother, more intensively collaborating sites, hubs of scientific collaboration,outperform less collaborative places. This effect is visible in terms of theexpanding quantity of scientific production (Ductor, 2015)—although thequantitative surplus of collaboration tends to diminish or even disappearwhen fractional counting is applied (Fanelli & Larivière, 2016). More remark-ably, collaboration is supposed to enhance the quality of research outputs.Collaborative papers are cited more frequently (Lawani, 1986; Persson,
48 900
20 3006 7002 200130
380200
100
Collaborations2013
2000–2013 Evolution percentages
Base map : UMS RIATE Conception, realisation : M. Maisonobe and L. Jégou
140
500
172 500105 700
18 3002 500
Figure 4.12 Scientific collaboration among global macro-regions in 2013 and its evolutionsince 2000
Source: Courtesy of Marion Maisonobe and Laurent Jégou.
Spatial patterns of scientific collaboration 97

Seo
ul
Dae
jon
Wei
ghte
d de
gree
*11
400
6000
1200
Sci
entif
ic c
olla
bora
tions
line
s su
perio
r to
60
coau
thor
ship
s in
200
0*S
cien
tific
agg
lom
erat
ions
with
a w
eigh
ted
degr
ee v
alue
upp
er th
an 1
000
in 2
000*
Lay
ou
t al
go
rith
m:
Kam
ada
kaw
ai a
pplie
d on
the
netw
ork
stru
ctur
e in
201
3*
Line
val
ues* 13
0055
015
5
2900
Th
resh
old
s:
Den
ver
Bou
lder
Min
neap
olis
Chi
cago
Dav
is
Sen
dai
Co
-au
tho
rsh
ip v
olu
me
*Wh
ole
No
rmal
ized
Co
un
tin
g, m
ovin
g a
vera
ge
(3 y
ears
)
Tsu
kubaKyo
to
Fuk
uoka
Nag
oya
Hon
g-K
ong
Bei
jing
San
-Die
go Toky
o
Syd
ney
Mel
bour
neC
ambr
idge
Hei
delb
erg
Man
ches
ter-
Live
rpoo
lB
risto
l-Bat
h
Fran
cfor
tB
erlin
Mun
ich
Vie
nna
Oxf
ord
Bir
min
gham
Gla
sgow
Edi
nbur
gh
Ruh
r-D
usse
ldor
f
Los-
Ang
eles
Sai
nt-L
ouis
Sha
ngha
i
Lond
onTe
l-Avi
v
New
-Yor
k
Bos
ton
Was
hing
ton
Phi
lade
lphi
aN
ew-H
aven
Ann
-Arb
or
Van
couv
er
Mon
trea
l
Mad
ridB
arce
lona
Bol
ogna
Rot
terd
amAm
ster
dam
Nijm
egen
Utr
echt
Gen
eva
Lund
-Mal
mo
Sto
ckho
lm
Wo
rld
net
wo
rk o
f in
teru
rban
sci
enti
fic
colla
bo
rati
on
s in
200
0*
Upp
sala
Got
henb
urg
Lyon
Gre
nobl
eBru
ssel
sMos
cow
St-
Pet
ersb
urg
Ham
burg
Aac
hen-
Julic
h
Leuv
en
Mila
n-P
avia
Rom
eP
aris
Pitt
sbur
gh Bal
timor
e
Sea
ttle
Toro
nto
Hou
ston
Dur
ham
Atla
nta
Prin
ceto
n
Str
asbo
urg
Toul
ouse
Otta
wa
San
-Fra
ncis
co
Figure4.13
World
netw
orkof
interurban
scientificco-autho
rships
in2000
Source:Cou
rtesyof
MarionMaisono
be.

Wo
rld
net
wo
rk o
f in
teru
rban
sci
enti
fic
colla
bo
rati
on
s in
201
3*
Utr
echt
N
ijmeg
en
Am
ster
dam
Rot
terd
am
Zur
ich
Laus
anne
Leuv
en
Bru
ssel
s
Ham
burg R
uhr-
Dus
seld
orf
Ber
linF
ranc
fort
Mun
ich
Hei
delb
erg
Bol
ogna
Mila
n-P
avia
Rom
e
Tou
lous
eLy
onG
reno
ble
Par
isE
dinb
urgh
Birm
ingh
amO
xfor
dM
anch
este
r-Li
verp
ool
Bris
tol-B
ath
Cam
brid
geM
elbo
urne
Bris
bane
Bar
celo
naM
adrid
Lond
onS
ydne
yP
erth
Otta
wa
Mon
trea
l
Tor
ontoS
eattl
ePitt
sbur
gh Hou
ston
New
-Yor
kS
hang
hai
Hef
eiX
ian
Che
ngdu Cha
ngch
unV
anco
uver
Dur
ham
Bal
timor
eB
osto
nLo
s-A
ngel
es
Bei
jing
Har
bin
Atla
nta
Was
hing
ton
San
-Fra
ncis
coS
inga
pore
Hon
g-K
ong
Wuh
anT
aich
ung
Ann
-Arb
orN
ew-H
aven
Chi
cago
Dav
is
Phi
lade
lphi
a
San
-Die
go
Tia
njin
Gua
ngzh
ou
Han
gzho
uN
anjin
gCha
ngsh
aH
sinc
hu
Tai
pei
Kao
hsiu
ngP
usan
Seo
ul
Dae
jon
Sen
dai
Tok
yo
Kyo
to
Tsu
kuba
Nag
oya
Co
-au
tho
rsh
ip v
olu
me
Wei
ghte
d de
gree
*
Line
s va
lues
*
1140
0 29
00T
hre
sho
lds:
6000
1300
Sci
entif
ic c
olla
bora
tions
line
s su
perio
r to
154
coa
utho
rshi
ps in
201
3*
1200
550
Sci
entif
ic a
gglo
mer
atio
ns w
ith a
wei
ghte
d de
gree
val
ue u
pper
than
114
8 in
201
3*
155
Lay
ou
t al
go
rith
m:
Kam
ada
Kaw
ai a
pplie
d on
the
netw
ork
stru
ctur
e in
201
3**W
ho
le N
orm
aliz
ed C
ou
nti
ng
, mo
vin
g a
vera
ge
(3 y
ears
)
Figure4.14
World
netw
orkof
interurban
scientificco-autho
rships
in2013
Source:Cou
rtesyof
MarionMaisono
be.

Glänzel, & Danell, 2004; Tahamtan, Afshar, & Ahamdzadeh, 2016), are lessoften rejected from publication (Presser, 1980), and receive more positive peerreviews (Carillo et al., 2013; Franceschet & Costantini, 2010).
Furthermore, the type of collaborative links and the scope of collaborationaffect the strength of the impact. In other words, the influence of thecollaboration factor is not zero-one but rather gradual. Firstly, links tostronger partners are more valuable than links to less developed ones.Higher citation gains from co-authorship with more developed collaborators, ascompared to co-authorship with less developed ones, can be observed onvarious levels: individual researchers (Pravdic & Oluic-Vukovic, 1986), organisa-tions (Ahn, Oh, & Lee, 2014), and countries (Tang & Shapira, 2011). Secondly,more collaboration translates into greater impact. The number of citationsreceived by a publication grows not only with the growing number of co-authors but also with the increasing number of unique organisations, cities, andcountries involved in the preparation of a collaborative publication (Hsiehchen,Espinoza, & Hsieh, 2015; Larivière et al., 2015; Pan, Kaski, & Fortunato, 2012).Thirdly, research performance depends not only on the number and character-istics of collaborators but also on their position in the overall collaborationnetwork. At the individual level, it is particularly beneficial to work with variousestablished scholars or groups that are otherwise not too strongly interconnected.In short, higher betweenness centrality corresponds with more significant impact(Ortega, 2014). Parallel effects can be observed at the regional level. Forinstance, a study of European regions showed that the research productivity ofa region is related to the quality of its inter-regional knowledge network,understood as the extent of collaboration among partners, the position ofpartners in the entire knowledge network, and knowledge accumulated by thepartners (Sebestyén & Varga, 2013a).
In the context of the geography of science, the distinction between foreignand domestic collaboration is of particular interest. Internationally co-authoredpapers tend to receive more citations than papers involving only domesticcollaborators. This observation is confirmed by cross-national analyses (e.g.,Didegah & Thelwall, 2013; Glänzel et al., 1999; Narin, Stevens, & Whitlow,1991) as well as by case studies of particular countries, for instance Brazil (Kim,1999), China (Ma & Guang, 2005; Zhou & Leydesdorff, 2006), South Korea(Leta & Chaimovich, 2002), Poland (Olechnicka & Ploszaj, 2010b), Spain(Bolaños-Pizarro et al., 2010), and the UK (Katz & Hicks, 1997).6 Moreover,it is suggested that international collaboration is crucial, in particular, forgeographically peripheral countries—such as New Zealand—since it createsopportunities for improved visibility of research outputs (Goldfinch et al., 2003).
Superior citation returns to international collaboration—the effect some-times referred to as the international collaboration premium—imply thathigher internationalisation rates translate into greater citation rates. Thisregularity can be seen in the example of Scopus data for economicallyadvanced countries defined as members of the Organisation for EconomicCo-operation and Development (OECD). The greater the percentage of
100 Spatial patterns of scientific collaboration

internationally co-authored articles, the higher the field-normalised citationimpact (see Figure 4.15). In the subgroup of countries that achieved a normal-ised citation impact above the world average, all but one exceeded the 35%threshold of internationally co-authored publications. The US is the only outlierin this subgroup. The US relative citation impact, 45% higher than the worldaverage, significantly outperforms its internationalisation. The reason for this istwofold. First, the size of the US science system provides enough opportunitiesto collaborate internally and, as a result, it is less focused on internationalcollaboration (see subchapter 6.4). Second, internationalisation is not the onlyfactor influencing scientific performance, and other variables also have to betaken into account: human capital, established institutions, accumulated knowl-edge, and research funding (see: King, 2004). The second aspect also applies tothe other group of outliers, namely those countries that have a lower citationimpact than they should, given their level of internationalisation—for instance,Indonesia, Russia, and Chile.
US
CN
UK
DE
JP
FR
CA
IT
IN
ES
AU
KR
NL
BR
RU
CH
PL
SE
TR
BE
AUIL
DK
GR
FI
MX
CZ
NO
PT
NZ
ZA
IE
HU CL
SK
SIID
EE
IS
LU
0.4
0.6
0.8
1
1.2
1.4
1.6
1.8
2
0 10 20 30 40 50 60 70 80
Nor
mal
ised
cita
tion
impa
ct
International collaboration among institutions (%)
World average = 1
Figure 4.15 The citation impact of scientific production and the extent of internationalcollaboration (2003–2012)
Source: Based on OECD 2015.
Spatial patterns of scientific collaboration 101
International collaboration indicates that collaborators are separated by asignificant geographic distance, greater than domestic collaborators. This maysuggest that not only can the fact of crossing the national border modify theresearch impact, but perhaps the geographic separation between collaboratorsalso matters. The study by Nomaler, Frenken, and Heimeriks (2013) ofinternational co-authorship networks among European countries provides theevidence for this thesis. It showed that an increase of 1,000 km in the distancebetween collaborating units leads to a rise in citations by seven to nine percent.In other words, it is beneficial to have remote collaborators because the greaterthe kilometric distance, the more citation impact the collaborative paper canachieve.7 On this basis, a noteworthy conclusion can be drawn on the relationsbetween geographic distance, propensity to collaborate, and collaborationimpact. Growing spatial distance, on the one hand, reduces the probabilityof collaboration and, on the other, increases the probability of achievingabove-average effects from collaboration.
4.4 The logic of centre and periphery
We would expect that the escalation of international collaboration in science isaccompanied by decreasing cross-country disparities in scientific performance.But this is not necessarily the case. The network structure of global scientificcollaboration does not imply that horizontal relations among countries prevail.On the contrary, the system can be described as hierarchical. Although hori-zontal and hierarchical relations coexist in this system, they are not uniformlydistributed in the global space. While relations among the most scientificallydeveloped countries are largely horizontal, the relationships between strongerand weaker science players are rather hierarchical. Hereby, the world of sciencereproduces the global structure of centre and periphery (Schott, 1993; Shils,1991). This can be further explained in the light of the world-system theorycrafted by the influential American intellectual Immanuel Wallerstein (2004).Core and periphery play complementary roles in the global system. The core isat the forefront of socio-economic and technological development, while theperiphery provides cheap labour and low-processed resources. In the case ofscience, this is manifested by the fact that new ideas are generated predominatelyin the centre and then imitated in the periphery. Furthermore, the world-systemis composed not only of core and periphery, but also of semi-periphery. Thesemi-periphery acts as a periphery to the core and as a core to the periphery.The hierarchy of the global scientific system is thus multi-level (Hwang, 2008).At the same time, the system is segmented into macro-regions within whichhorizontal relations are dense. Horizontal relations occur especially among corecountries, while between core and periphery relations tend towards dominationand subordination.
Research collaboration is one of the means that the centre uses—even ifunintentionally—to ensure its scientific domination over the periphery(Schott, 1998). This process has various dimensions. First, core countries
102 Spatial patterns of scientific collaboration
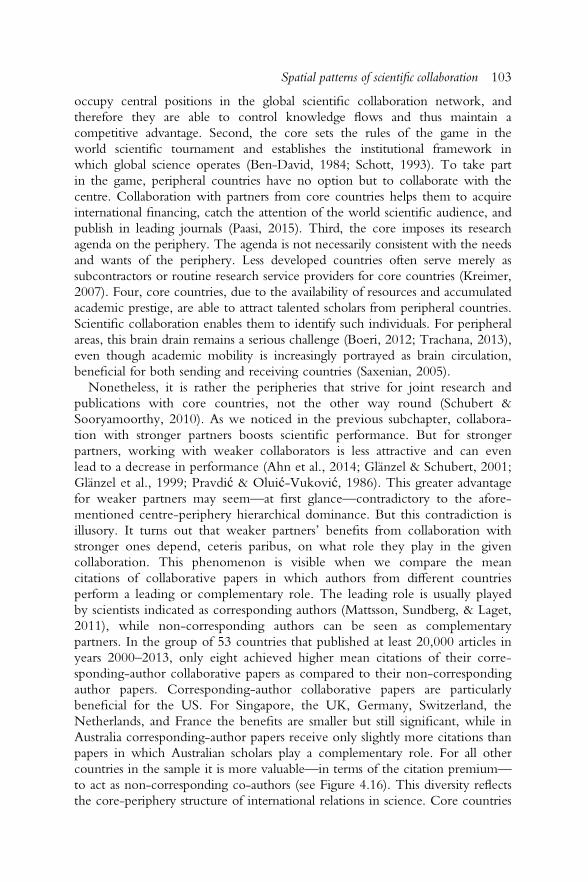
occupy central positions in the global scientific collaboration network, andtherefore they are able to control knowledge flows and thus maintain acompetitive advantage. Second, the core sets the rules of the game in theworld scientific tournament and establishes the institutional framework inwhich global science operates (Ben-David, 1984; Schott, 1993). To take partin the game, peripheral countries have no option but to collaborate with thecentre. Collaboration with partners from core countries helps them to acquireinternational financing, catch the attention of the world scientific audience, andpublish in leading journals (Paasi, 2015). Third, the core imposes its researchagenda on the periphery. The agenda is not necessarily consistent with the needsand wants of the periphery. Less developed countries often serve merely assubcontractors or routine research service providers for core countries (Kreimer,2007). Four, core countries, due to the availability of resources and accumulatedacademic prestige, are able to attract talented scholars from peripheral countries.Scientific collaboration enables them to identify such individuals. For peripheralareas, this brain drain remains a serious challenge (Boeri, 2012; Trachana, 2013),even though academic mobility is increasingly portrayed as brain circulation,beneficial for both sending and receiving countries (Saxenian, 2005).
Nonetheless, it is rather the peripheries that strive for joint research andpublications with core countries, not the other way round (Schubert &Sooryamoorthy, 2010). As we noticed in the previous subchapter, collabora-tion with stronger partners boosts scientific performance. But for strongerpartners, working with weaker collaborators is less attractive and can evenlead to a decrease in performance (Ahn et al., 2014; Glänzel & Schubert, 2001;Glänzel et al., 1999; Pravdić & Oluić-Vuković, 1986). This greater advantagefor weaker partners may seem—at first glance—contradictory to the afore-mentioned centre-periphery hierarchical dominance. But this contradiction isillusory. It turns out that weaker partners’ benefits from collaboration withstronger ones depend, ceteris paribus, on what role they play in the givencollaboration. This phenomenon is visible when we compare the meancitations of collaborative papers in which authors from different countriesperform a leading or complementary role. The leading role is usually playedby scientists indicated as corresponding authors (Mattsson, Sundberg, & Laget,2011), while non-corresponding authors can be seen as complementarypartners. In the group of 53 countries that published at least 20,000 articles inyears 2000–2013, only eight achieved higher mean citations of their corre-sponding-author collaborative papers as compared to their non-correspondingauthor papers. Corresponding-author collaborative papers are particularlybeneficial for the US. For Singapore, the UK, Germany, Switzerland, theNetherlands, and France the benefits are smaller but still significant, while inAustralia corresponding-author papers receive only slightly more citations thanpapers in which Australian scholars play a complementary role. For all othercountries in the sample it is more valuable—in terms of the citation premium—to act as non-corresponding co-authors (see Figure 4.16). This diversity reflectsthe core-periphery structure of international relations in science. Core countries
Spatial patterns of scientific collaboration 103

0.0 0.2 0.4 0.6 0.8 1.0 1.2 1.4
United StatesSwitzerlandNetherlands
SingaporeUnited Kingdom
GermanyDenmarkAustraliaCanadaSwedenFrance
ItalyBelgiumFinland
IsraelAustriaNorway
SpainChina
IrelandJapan
New ZealandPortugalGreece
Republic of KoreaSouth Africa
IndiaCzech Republic
SloveniaChile
IranArgentinaHungary
BrazilTurkey
ThailandSaudi Arabia
PolandMexico
LithuaniaEgypt
SerbiaRomania
CroatiaMalaysiaPakistan
RussiaSlovakiaBulgaria
ColombiaTunisiaUkraineNigeria
Corresponding
Non-corresponding
Figure 4.16 Normalised mean citations of papers in which scholars from a given country playthe role of corresponding or non-corresponding authors (2000–2013)
To reduce the influence of hyper-authorship, only papers co-authored by scholars from exactly twocountries are taken into account. Moreover, we disregarded papers where scholars from two countriessimultaneously serve as corresponding co-authors.Source: Conception and design by Adam Ploszaj, based on Web of Science data.

benefit most from international cooperation when they lead the research, whileperipheral countries benefit most from being led.
The core-periphery structure of global science is very stable (Schubert &Sooryamoorthy, 2010). Breaking the vicious cycle of lasting peripheralisation israrely possible. A negative feedback loop—from low performance, to stagnatingor falling funding, then to aggravating brain drain, and in turn to even poorerperformance—keeps the periphery in a peripheral position. What is more, someactions taken in the periphery to overcome peripherality reproduce the periph-eral logic. For instance, authors publishing in predatory journals are, for the mostpart, inexperienced researchers from developing countries (Xia et al., 2015).They fall into a trap while trying to meet the expectations of contemporarypublish or perish academic culture. Another example is provided by the dubiousacquisition of co-affiliated scholars. One of the strategies to overcome peripher-ality is to bring, even temporarily, prominent scientists from core institutions.This type of collaboration can generally be very positive and beneficial,especially in the long run, due to the diffusion of innovation and spillovereffects (see Rogers, 2003). However, it sometimes turns into a caricature or atleast raises questions. This was the case of King Abdulaziz University in Jeddah,Saudi Arabia. The university contacted highly cited world-class mathematiciansand invited them to serve as adjunct faculty for $72,000 per annum. Thecontract terms, according to a recruiting letter, assumed that “the mathemati-cians had to work three weeks a year in Saudi Arabia. The university would flythem there in business class and put them up at a five-star hotel” (O’Neil, 2016,p. 62). In return, scientists had to change their affiliations in the Web of Sciencedatabase. As a result, King Abdulaziz University has become the institution withthe largest number of co-affiliated highly cited scientists and has quicklyconquered the global rankings of universities (Pachter, 2014). However, long-term results of such strategies are not at all certain, and in the short-term, itrather undermined the reputation of the university than enhanced its prestige.
On the other hand, the recent examples of Singapore, South Korea and, inparticular, China indicate that transfer from periphery to semi-periphery, or evento the core, is possible. Research collaboration is an important ingredient of asuccessful attempt to catch up with leading scientific countries. Indeed, there aredozens of scientific collaboration tools and measures that can boost the scientificperformance of nations (see Chapter 6). However, we cannot expect that thewidespread use of these tools will result in the disappearance of scientificperipheries and the global levelling of scientific performance. The structuralhierarchy is an immanent feature of global science, as it is in the case of the overallworld-system. Despite constant evolution in the positions of countries, there willalways be some sort of scientific centre and some sort of scientific periphery.
* * *
Geography is of constant importance for scientific collaboration. Despite theunprecedented intensification of collaborative relations around the globe, the
Spatial patterns of scientific collaboration 105

location of collaborators matters. Spatial distance modulates both the propen-sity to collaborate and the expected impact of collaborative work. Further-more, places that have accumulated great scientific capacities are betterprepared to take part in the collaborative turn and fully profit from its effects.As a result, the geography of scientific collaboration reflects the core-peripherystructures embedded in long-term historical processes. The dynamic collabora-tive turn strengthens—somewhat paradoxically—the persistency of the globaldistribution of research excellence.
Notes
1 Web of Science data presented in this chapter—unless a different source is indicated—are based on the in-house Web of Science dataset provided by the Network ScienceInstitute and the Cyberinfrastructure for Network Science Center at Indiana Uni-versity Bloomington. All presented numbers refer strictly to the publication type“article” (book chapters, conference proceedings, reviews, letters, etc. are not takeninto account) included in Science Citation Index, Social Sciences Citation Index, andArts & Humanities Citation Index.
2 For a symmetric network with n nodes (in our case countries), the number ofundirected relations between nodes equals n(n – 1)/2.
3 However, it has to be remembered that the American states and European NUTS 2regions are not equivalent, and it is even argued that states are more comparablewith countries, see, e.g., Kamalski & Plume, 2013.
4 Note that the sample reflects geopolitical changes, i.e., for 1980 two German statesare taken into account—the German Democratic Republic (GDR) and the FederalRepublic of Germany (FRG)—while for 1980 and 1990 the Union of SovietSocialist Republics (USSR) is treated as a predecessor of present-day Russia.
5 To ensure decent comparability between 2000 and 2013, displayed nodes (cities) andlinks (co-authorships) meet identical criteria for both maps. First, only cities with thehighest number of collaborations are shown. The visible cities are those which, rankedin descending order, are involved in 55% of all interurban collaborations. Second, onlylinks with the highest number of co-authorships are included. The visible links are thosewhich, ranked in descending order, account for 20% of all interurban collaborations (forthe details see: Maisonobe, Eckert, Grossetti, Jégou, & Milard, 2016).
6 However, it should be noted that a limited number of studies negate the significanceof the international collaboration premium (Abbasi & Jaafari, 2013; He, 2009;Landry, Traoré, & Godin, 1996).
7 It should be emphasised that the issue of the relationship between citation andphysical distance between collaborators is still under-researched. Moreover, somestudies attempt to prove the existence of an inverse relationship, at least in the caseof intra-organisational research collaboration (Lee et al., 2010).
106 Spatial patterns of scientific collaboration

5 Theoretical approaches toscientific collaboration froma spatial perspective
There is no specific theory of the geography of scientific collaboration. Further-more, there is no complete, widely accepted theory on research collaboration ingeneral. The increasing importance of scientific collaboration has attracted a lot ofattention and stimulated almost countless empirical analyses. At the same time,the theoretical pillar of the discipline can hardly catch up with the deluge of newscientometric data and the increasing enthusiasm among science policymakers forevidence-based knowledge. Make no mistake, a broad spectrum of concepts andtheoretical approaches relate to—or can be (re)interpreted as relating to—thegeography of scientific collaboration. But usually these are either fragmentary orovergeneralised. Furthermore, their relevance may be diminishing due to therapidly evolving ways of doing science. Conceivably, the collaborative advantagegained from international collaboration is less significant nowadays than it was adecade or two ago, when scholars collaborated internationally far less frequently.As a result, theories sourced from empirical analyses embedded in a significantlydifferent historical context of scientific collaboration might be incompatible withthe contemporary situation. All in all, there is a growing need for a comprehen-sive conceptual synthesis. An overall theory of scholarly collaboration, properlyaddressing its spatial dimension, could facilitate the standardisation of the field,the increase of its epistemic validity, and the enhancement of scientometricsresearch replicability.
This chapter does not pretend to construct a single theory of the geography ofscientific collaboration. Its aim is modest: it draws a map of the issues and ideasthat such a comprehensive theory should embrace. Four questions occupy centralpositions in this theoretical territory. Why does scientific collaboration grow?How are spatial patterns of scholarly collaboration shaped? How does collabora-tion impact research outcomes? What is the role of scientific collaboration inlocal and regional development? A review of possible answers to these questionsis presented in the four following subchapters.
5.1 Explaining the growth of collaboration
The picture of intensifying scientific collaboration on various spatial levelspresented in Chapter 4 entails the fundamental question of the causes and

factors behind this process. This issue was already touched on in Chapter 2, inwhich the roots of the collaborative turn and benefits of collaboration for theindividual researcher were elaborated. However, the aforementioned discussionfocused on the description of key processes and evidence, primarily on theindividual level, while little theorising was offered. This section evokes the maintheoretical concepts that can be used to explain the unprecedented intensifica-tion of spatially embedded research collaboration. The scrutinised concepts andtheories are rooted in diverse fields and methodological approaches: economics,sociology (primarily the sociology of science), management and organisationstudies (predominately inter-organisational relations and innovation manage-ment), and interdisciplinary science studies. The variety of ideas can be groupedinto three categories that jointly explain the contemporary growth of researchcollaboration: the collaborative advantage, the changing role of research organi-sations, and the costs of collaboration.
5.1.1 The collaborative advantage
The escalation of scholarly collaboration—in general and in its spatial dimen-sion in particular—lies in the sophistication of contemporary science. Theincreasing complexity of research questions makes contemporary science moreand more problem focused, less discipline oriented. Unsurprisingly in such anenvironment, the preference is given to collaborative performance rather thanindividual scientific achievement (Gibbons et al., 1994). The tendency ismanifested in a blurring of disciplinary boundaries, the emergence of newfields of science, and the omnipresence of inter-, multi-, and cross-disciplinaryresearch (Nowotny, Scott, & Gibbons, 2003). The interdisciplinary networksof individual scholars, research teams, and scholarly institutions emerge andevolve according to the new scientific challenges. As expected, this results inpractices that involve mixtures of institutions—often spatially scattered—suchas universities, research centres, spin-offs, laboratories, consultancies, and thinktanks. These processes—described by the Mode 2 knowledge productiontheory as transdisciplinarity and heterogeneity—explain the growth of dynamicinter-institutional collaboration in the socially and territorially dispersed processof knowledge production (Gibbons et al., 1994).
The concept of Mode 2 knowledge production was presented by MichaelGibbons and colleagues in contrast to the traditional way of doing science1—purely academic, scholar-oriented, and discipline-based—labelled as Mode1. The shift towards intensification of collaboration among different institu-tions in various spatial configurations was also referred to by the concept ofopen innovation—one of the hottest ideas in the early 21st century, rooted inthe theory of innovation management. Open innovation was proposed byHenry William Chesbrough as an alternative and a successor to the closeinnovation approach,2 comparable to the introduction of Mode 2 vs. Mode 1by Gibbons and colleagues. Organisations which operate in the closed innova-tion formula—typical of large 20th-century corporations—carry out all the
108 Theoretical approaches to scientific collaboration from a spatial perspective

R&D activities on their own: they individually develop, implement, andintroduce innovations into the market. In contrast, organisations which haveadopted the open innovation approach are porous. They rely on the inflow ofknowledge developed elsewhere: R&D produced by other firms or researchorganisations. At the same time, open innovation companies allow their intern-ally produced knowledge to cross organisational boundaries. They spread newideas in the form of spin-offs, spin-outs, licencing agreements, technologytransfer, or even completely freely, without any direct benefit to themselves(Chesbrough, 2003). Such an approach naturally extends collaboration, bothamong spatially dispersed individuals and organisations.
The focal point of the open innovation concept is the advantage whichorganisations can achieve by higher integration with the outside environmentthrough openness to outflows and inflows of information and expertise. Openinnovation—like other free-flow concepts: free information (Brand, 1987),free culture (Lessig, 2005), free software (Berry, 2008), and open science(Nielsen, 2011)—is built on the assumption that lack of restrictions in devel-oping someone else’s ideas, combined with collaboration in non-hierarchicalnetworks that can be widely distributed spatially, makes it possible to developsolutions that would otherwise be difficult to comprehend, or even not viableto accomplish. In other words, benefits can be achieved from the ordinarydivision of labour or sharing resources and knowledge, but also—and moreimportantly—from the synergy effects that emerge in the process of collabora-tion. The added value of collaboration is perfectly mirrored by the concept ofcollaborative advantage developed in the field of organisation and managementstudies. Elisabeth Lank, in her study of inter-institutional relations, defined thecollaborative advantage as “the benefits achieved when an organization accom-plishes more than it would have independently, by developing effectiveworking relationships with other organizations” (2006, p. 7). This definitioncan be straightforwardly extended beyond the corporate realm and covervarious types of organisations (universities, public research centres, non-profitlaboratories), as well as territorial units (cities, regions, countries). Suchcollaborative advantage at the regional level has been described by Anne LeeSaxenian in her comparative study of Silicon Valley and Boston Route 128.She concluded that “industrial systems built on regional networks are moreflexible and technologically dynamic than those in which experimentation andlearning are confined to individual firms” (1994, p. 161).
5.1.2 The changing role of research organisations
The growth in scientific collaboration can also be theorised as a result of thechanging role of science in contemporary society and the economy. Univer-sities and other research organisations are expected to meet external require-ments to a greater extent than ever before. Scholars become more concernedabout the expectations of the recipients of their work and more conscious ofthe economic, social, political, and cultural repercussions of their research
Theoretical approaches to scientific collaboration from a spatial perspective 109

endeavours. In consequence, the scope of scientific collaboration expandsbeyond the academic community’s interest. Mode 2 knowledge productionrefers to this by emphasising the social accountability and reflexivity of science.Social accountability permeates the entire process of knowledge production,which means that challenges targeted by scholars are derived from societalneeds or inspired by public interest, as well as the fact that scientific outcomesare assessed in the context of their application. In this respect, the Mode 2concept relates to the research classification proposed by Donald Stokes. Hisfamous Pasteur’s quadrant defines three types of scientific research: pure basicresearch (exemplified by the work of Neils Bohr), pure applied research(Thomas Edison type), and user-inspired basic research (Louis Pasteur type).The unique feature of the latter is that it combines consideration for thepotential use of research results (as in applied research) with the quest forfundamental understanding (as in basic research) (Stokes, 1997).
The changing role of modern academia has attracted a lot of attention andresulted in a number of descriptive and prescriptive theories. This heterogeneousplethora of ideas has, however, at least one leitmotif: intensifying connectionsbetween scientific organisations and their local and regional environment. In themid-1990s, Burton Clark—a classic theorist of the university as an organisation—identified features of the so-called entrepreneurial university, among whichenhancing collaboration with the local environment was mentioned next tostructural changes, modern management, new funding sources, and promotionof an entrepreneurial culture (Clark, 1998). Another closely related concept—the engaged university—was coined in the framework of the learning regiontheory (Goldstain, 2010). It underlines the developmental role of the universityin the region and stresses the ability of a university to adapt to the regional andlocal needs (Gunasekara, 2006b). In a similar manner, John Goddard (2013)argued for the civic university, which combines local and global engagement.The changing role of the university, motivated by increasing awareness of theimportance of local contexts and features for the process of collective learningand knowledge production, was also referred to as the concept of the Mode 2university (Harloe & Perry, 2004) by the innovation systems theory (seesubchapter 5.3), as well as by many other theoretical attempts (see for instance:Kukliński, 2001; Lawton Smith, 2006; Youtie & Shapira, 2008). All in all, thechanging role of universities—and research organisations in general—translatesinto more links crossing the boundaries of the ivory tower, more inter-organisational cooperation, and, as a result, more spatially distinct patterns ofresearch collaboration.
5.1.3 Costs of collaboration
The benefits from collaboration need to be examined in juxtaposition with thecosts and risks of collaborative work—some of them directly associated with thegeographical dimension of scientific collaboration. The decision to engage inscholarly collaboration is based on the trade-off between the effort of
110 Theoretical approaches to scientific collaboration from a spatial perspective

collaboration and its expected effects (Bikard, Murray, & Gans, 2015). Maintain-ing too many or too demanding external relations with closer and more distantpartners can lead to high costs of collaboration resulting from, among others,information overload, unclear responsibility, and communication constraints ofdiverse origins. The costs are captured by the notion of coordination costs.Coordination costs are higher in inter-institutional and geographically dispersedcollaborative networks than in single-institution projects. The costs are derivedfrom both institutional features (e.g., publication practices, salary scales, perfor-mance assessment practices) and geographical characteristics of the collaboratinginstitutions. Spatial separation of collaborating organisations may significantlyadd to coordination costs. For instance, Cummings and Kiesler noticed that“Geographical distance can slow group communication and consensus making,and a problem at one location may go unnoticed by researchers at the otheruniversities” (2007, p. 1621). Enormous progress in transportation and commu-nication technologies, as well as effective management practices, may substantiallyreduce coordination costs, although this might be more straightforward formonetary than for non-monetary costs. The former category relates to travellingbetween different places and virtual communication, while the latter is associatedwith variances in partners’ semantic models, which have to be coordinated in termsof their research background, collaboration portfolio, and territory-dependentfactors like institutions, language, and culture (Button et al., 1993).
The concept of coordination costs relates to the broader theory of transactioncost economics. This theory addresses the costs involved in market exchange as afactor that shapes the behaviour of individuals and organisations. Oliver E.Williamson—following the findings of Ronald Coase included in his famouspaper “The Nature of the Firm” (1937)—claimed that economic organisationsemerge from cost-minimising behaviour, including the strive to reduce transac-tion costs, in conditions of limited information and opportunism (Williamson,1991). This way of thinking can be applied to scholarly collaboration. Colla-boration occurs when the resources needed for the specific units are less costlyto mobilise in the network of relations than on the market (e.g., acquisition ofresearch results) or with the use of internal potential (e.g., by means of the giveninstitutions). This leads to the emergence of a hybrid organisation (or networkorganisation) which may take the form of various vertically integrated partnershipsand agreements. The increasing complexity and monetary costs of contemporaryresearch raise the transactional costs involved, resulting in more collaboration inscience. Transaction cost economics also sheds light on the limits of collaboration:at a certain level of coordination costs, collaboration reaches its limit, and itbecomes uncompetitive with more hierarchical forms of knowledge acquisitionand creation.
5.2 Explaining patterns of scientific collaboration
Scientific collaboration flows unevenly across space. Some places are morelikely to become hubs of collaboration; others persistently occupy peripheries
Theoretical approaches to scientific collaboration from a spatial perspective 111

of the global scientific web. Some nodes in this network tend to stick together,while others are unlikely to unite. Geography—certainly—plays its role here.But other, non-spatial factors also affect the formation and evolution ofcollaborative networks in space. This section evokes the most prominentconcepts, models, and theories that make sense of the complex spatial patternsof research collaboration.
The review begins with spatial proximity—the rudimentary concept that,actually, explains a great deal of the geography of scientific collaboration. Theprobability of collaboration between people, organisations, or territories dependson the distance separating them: the lesser the distance, the higher the likelihoodof collaboration. The extreme case of spatial proximity is collocation, i.e., beingin the same place at the same time, either permanently (working in the same lab,building, or campus) or temporarily (during short visiting scholarships, projectmeetings, or conferences). Furthermore, proximity is a multifaceted feature, as itnot only has a geographical dimension, but also non-spatial aspects: cognitive,cultural, economic, institutional, organisational, social, and technological. Byand large, proximity can be imagined as a kind of similarity. Scholars specialisingin the same field are cognitively closer than those working in different disciplines.Even spatial proximity can be conceptualised as similarity—for instance, researchersfrom the same lab are similar in terms of their working environment. This leadsto an even more general notion that explains collaboration patterns: homophily,i.e., the tendency to connect with similar others.
Nonetheless, the triad collocation-proximity-homophily does not fullyexplain the complexity of scientific collaboration patterns. Despite the tendencyto work with those located nearby, remote links are not uncommon. A numberof explanations can be useful here. First, non-spatial proximities indicateadvantages of spatially distant collaborations (e.g., in the case of laboratoriesworking on the same topic but located on different continents). Second,collaboration is often based on complementarity, which means that collaborativelinks arise between dissimilar individuals or organisations—a tendency calledheterophily. Third, nodes in collaboration networks—be they individuals,organisations, cities, regions, or countries—vary in their collaborative attractive-ness. Those already well connected are generally preferred, and this is capturedby the notion of preferential attachment. Also, those with larger capacities arethe most favoured, which is explained by the gravity and node fitness models ofcollaboration. Finally, the characteristics of scientific fields, or even the uniquefeatures of particular research problems or methods, shape spatial patterns ofresearch collaboration. Some scientific domains require organisation of researchthat is spatially concentrated or distributed in a strictly defined way, while forothers geography is largely irrelevant.
5.2.1 Spatial proximity
Spatial proximity is the central category in the geography of scientific colla-boration. This concept has been discussed in economic geography since the
112 Theoretical approaches to scientific collaboration from a spatial perspective

early 19th century, in the seminal works of Johann Heinrich von Thünen (1826)on the location of urban and agricultural activities, and Alfred Marshall (1890) onindustrial districts. In simple words, proximity is a small distance between units, bethey individuals, organisations, cities, or countries. What is understood by a “smalldistance” depends on the scale in which the given phenomena occur and in whichthe analysis is conducted. On one occasion, a small distance may be measured inkilometres, on others in metres. Very close proximity often equals collocation—astate of being in the same place at the same time.
At the individual level, spatial proximity enables face-to-face communication,which in turn can lead to collaboration. The relation between communicationand distance in the workspace is captured by the so-called Allen curve, namedafter Thomas J. Allen from the MIT Sloan School of Management. In the1970s, Allen showed that the frequency of communication between individualsin science and engineering organisations drops exponentially with the growingdistance between their offices. The study identified the distance of 50 metres ascritical for the probability of communication. Distances exceeding 50 metres didnot differentiate the probability of communication, whereas distances below thisthreshold strongly encouraged interactions (Allen, 1977).
Spatial proximity can be thought of as physical or functional. The former isa simple linear distance between the units in question. The latter takes intoaccount relationships among spaces visited by individuals in their daily rou-tines. Lifts, stairwells, mailboxes, print rooms, coffee rooms, and restrooms—among others—create the opportunity to encounter colleagues from outsideone’s team and, in effect, increase the probability of establishing new colla-borations. Consequently, two individuals are more likely to collaborate if theirpaths cross frequently or largely overlap (Festinger, Schachter, & Back, 1950;Kabo et al., 2014; Kabo et al., 2015).
The concepts of physical and functional spatial proximity can be combinedwith the notion of collocation. A long-term collocation equals high physicalcloseness—depending on the scale of an analysis it can be exemplified byworking in the same lab, building, or campus. Meanwhile, functional proxi-mity might be based on a short-term collocation. Again, depending on thespatial-temporal scale of an analysis, short-term collocation may refer to rapidencounters in lifts, minutes at workplace cafeteria tables, or substantially longermeetings at conferences or during visiting scholarships. The acknowledgementof the significant role of temporal collocation in stimulating collaboration hasled to more pro-collaborative organisational and architectural designs (see:Allen & Henn, 2007). This pursuit has been described, somewhat teasingly,by Diane H. Sonnenwald: “universities should have only one water cooler orcoffee machine, so that scientists would meet and get to know each anotherinformally” (2007, p. 656).
All in all, the relation between spatial proximity and collaboration relies ontwo complementary mechanisms. On the one hand, proximity increases thelikelihood of interaction. Those located closer to each other are more likely tomeet, communicate, and initiate collaboration. On the other hand, proximity
Theoretical approaches to scientific collaboration from a spatial perspective 113

facilitates collaboration by reducing the transactional costs of initiating andconducting joint research. Communication and other interactions became lessdemanding if the interacting units are nearby or collocated. Therefore, spatiallyclose collaboration is not only more likely to be initiated, but also sustainedover a longer period.
5.2.2 Gravity versus distance
If spatial proximity explains a great deal of scientific collaboration, why in somecases do intensive scientific flows link places separated by thousands of kilo-metres? Chapter 4 showed that the global collaboration network in science issewn together by the seams between world cities. Some of them, such as NewYork and Tokyo, are geographically separated, yet the scientific collaborationbetween them thrives. The proximity approach fails to explain this phenom-enon. Other factors are apparently at play. New York and Tokyo collaboratedespite the large distance separating them because they have amassed greatscientific potential that makes the collaboration possible and attractive. In thecomplex network theory this phenomenon is referred to as the concept of nodefitness. Nodes can vary in their inherent capability of attracting other nodes. Thefitter the node, the more links it attracts (Bianconi & Barabási, 2001; Ke, 2013).This largely parallels the earlier and humbler idea: the gravity model. The modelassumes that not only does the distance between collaborating units matter, buttheir masses should also be taken into account.
The socioeconomic gravity model is conceptually based on the well-knownuniversal law of gravitation formulated by Isaac Newton. He realised that thegravitational force between two objects is proportional to their masses andinversely proportional to the square of their distance of separation. Against thebackground of scientific collaboration gravity, the model can be rephrased as:
INTERACTIONij ¼ αMASS β1
i MASS β2j
DISTANCE β3ij
where INTERACTIONij is the intensity of flows (e.g., common projects,co-authorships, co-inventions) between units i and j (countries, cities, organi-sations, etc.). MASS is the size of interacting units (e.g., number of publica-tions, value of R&D spending, counts of research personnel). DISTANCE isthe measure of separation between units i and j. β1 and β2 are parametersmodifying the influence of unit masses. The distinction between β1 and β2makes it possible to capture directed flows, which are interactions where a senderand a receiver can be distinguished (citations, researcher mobility, coordinator-partner relations in inter-organisational projects, etc.). In such cases β1 can beunderstood as the potential to generate flows, and β2 as the potential to attractthem (e.g., citing and being cited). In the case of undirected or reciprocalinteractions, when the direction of flows is not determined (co-citation,
114 Theoretical approaches to scientific collaboration from a spatial perspective
co-authorship, co-invention, etc.), β1 will be equal to β2. Furthermore,parameter β3 modifies the influence of the distance between i and j (e.g.,decreasing rate of interactions with additional unit of distance). Finally, α is themodel coefficient.
The gravity model was applied in social science to analyse migration flows asearly as the 19th century (Carey, 1867; Ravenstein, 1885). Later, in the 1930s, itwas used to examine patterns in retail (Reilly, 1931), and since the 1960s it hashelped to portray spatial tendencies in international trade (Anderson, 2010). Asmight be expected, studies related to the spatial dimension of scientific colla-boration have also been using the gravitational approach. The picture is clear:the probability and intensity of research collaboration are negatively related tothe geographical distance which separates the units in question and are positivelyaffected by their accumulated research potential (see: Andersson & Persson,1993; Fischer, Scherngell, & Jansberger, 2006; Hoekman, Frenken, & Tijssen,2010; Hoekman, Scherngell, Frenken, & Tijssen, 2013; Maggioni et al., 2007;Peri, 2005; Picci, 2010; Plotnikova & Rake, 2014; Ponds et al., 2007; Schern-gell & Barber, 2009; Scherngell & Hu, 2011).
5.2.3 Beyond spatial proximity
Neither spatial closeness nor the force of collaborative gravity constitutes asufficient condition for collaboration. Boschma and Iammarino put it straight-forwardly: “it is unclear what a pig farmer can learn from a microchipcompany even though they are neighbours” (2009, p. 292). Indeed, evenclose neighbours need a minimal level of collaborative capacity to engage inmeaningful cooperation. This capacity can be understood in terms of non-spatial proximities—a concept developed in the second half of the 20thcentury (Torre & Gilly, 2000). Various forms of non-spatial proximity—anddistance—have been suggested: cognitive, cultural, economic, institutional,organisational, social, and technological, to name only those regularly discussedin the literature (see: Knoben & Oerlemans, 2006). In the context of researchcollaboration, the most prominent approach has been proposed by the afore-quoted Dutch economist and geographer Ron Boschma (2005). His analyticalframework encompasses five proximities, one geographical and four non-spatial: cognitive, organisational, social, and institutional.
Cognitive proximity is interpreted as similarity in the way actors perceive,understand, and evaluate the world (Wuyts, Colomb, Dutta, & Nooteboom,2005). In every type of interaction, a minimum level of cognitive proximity—common basic knowledge—is necessary for effective communication. However,the role of cognitive proximity might be particularly important in the case ofresearch collaboration due to the high level of reasoning capacities required toabsorb, interpret, and communicate scientific knowledge (Broekel, 2015; Huber,2012). Some authors focus on a subtype of cognitive proximity, i.e., technologicalproximity. This encompasses shared experiences and knowledge relating toparticular technologies (Knoben & Oerlemans, 2006; Scherngell & Barber, 2009).
Theoretical approaches to scientific collaboration from a spatial perspective 115

Organisational proximity refers to (1) organisational membership, forinstance, people in the same organisation or organisations belonging to thesame network, and (2) organisational similarity, for example, a university isorganisationally closer to other higher education institutions than to anykind of industrial enterprise. The second approach is related to institutionalproximity. It can be understood as the similarity of macro-level institutionalframeworks that determine the way people’s behaviour is coordinated(Ponds et al., 2007). This definition is derived from the understanding ofinstitutions as socially constructed frameworks of political, economic, andsocial interaction. The rules can be informal, such as customs, traditions,and codes of conduct, or formal, usually identified with laws and otherofficial regulations (North, 1991). The common space of mental models,norms, and procedures (e.g., scientific reward schemes) eases communica-tion and transfer of knowledge (Kirat & Lung, 1999). Thus, in general,collaboration between scientists from the same institutional context, coun-try, region, or sector, flows more smoothly than when it is international orintersectoral (Cassi, Morrison, & Rabellotti, 2015; Ponds et al., 2007;Hoekman et al., 2010).
Social proximity relates to belonging to the same space of social relationsbased on friendship, kinship, and joint experiences. This proximity is some-times called personal (Schamp, Rentmeister, & Lo, 2004) or relational(Coenen, Moodysson, & Asheim, 2004). Scientific collaboration benefitsfrom social proximity because it facilitates open communication, durablenon-opportunistic relationships, and the exchange of tacit knowledge.Although trust, friendship, and kinship are personal characteristics, studieson the role of social proximity in scholarly collaboration often focus on suchrelations between organisations or territories—in this case, social proximity isattributed to groups, not to individuals (Autant-Bernard, Billand, Frachisse,& Massard, 2007; Balland, 2012). An example of such an approach is thestudy of scientific collaboration among European regions conducted byCapello and Caragliu (2018). They defined social proximity as a similarityin the level of regional social capital, measured using survey data from theEuropean Values Study.
The concept of non-spatial proximities is particularly important for thegeography of science in the extent to which non-spatial proximities correlatewith spatial distance. For instance, social proximity often arises from close spatialproximity or collocation. Institutional proximity can also be associated withphysical closeness, since formal and informal institutions are often embedded atnational level. Individuals located in a given country operate within the sameinstitutional framework. This means that—as a rule—they are characterised by ahigh level of institutional proximity. At the same time, in the majority of cases,possible collaborators within the same country are spatially much closer thanthose from the overseas. This leads to the so-called same (or own) countrypreference—the tendency to collaborate with individuals within the samecountry (as well as the same organisation, city, or region). By the same token,
116 Theoretical approaches to scientific collaboration from a spatial perspective

neighbouring or nearby countries often share socioeconomic, historical, andcultural backgrounds—in this case spatial and non-spatial proximities are alsoentangled (Kato & Ando, 2017).
5.2.4 The Goldilocks principle
In many circumstances, the most wanted partners for collaboration are not theclosest, neither spatially nor non-spatially. For instance, all interdisciplinarycollaborations rely on links between cognitively distant individuals or organisa-tions. Furthermore, it is believed that innovation and creativity ripen in the sunof diversity. The most difficult and demanding problems have a better chance ofbeing solved by multidisciplinary teams, frequently composed of scientists fromdifferent countries, representing varied scientific cultures or even other para-digms (Gazni et al., 2012; van Rijnsoever & Hessels, 2011). The engagement ofdissimilar partners prevents cognitive lock-in—the situation when the similarityof collaborators’ knowledge, skills, and competences is so high that it inhibitsinnovativeness (Heringa, Horlings, van der Zouwen, van den Besselaar, & vanVierssen, 2014; Nooteboom, Van Haverbeke, Duysters, Gilsing, & van denOord, 2007; Visser & Boschma, 2004).
This leads to the observation that collaborators do not simply aim to minimalisethe distance, but rather to reach a point of equilibrium on the close-distantcontinuum. The tendency to collaborate with similar others is balanced by theneed to unite resources, skills, and efforts with dissimilar ones. The first tendencyis known as homophily (love of the same), the second as heterophily (love of thedifferent). The interplay of these two opposing tendencies governs scientificcollaboration patterns. It can be seen as an example of the Goldilocks principle:collaborative networks arise between partners that are neither too close nor too far(Fitjar, Huber, & Rodríguez-Pose, 2016), or—more realistically—between unitsthat are close in one dimension and far in the other. For instance, the analysis of280 collaboration networks in Germany revealed that increasing geographicaldistance is correlated with increasing cognitive proximity between organisations.Spatially close knowledge contacts—in some cases—tend to be more cognitivelydiverse, while geographically distant links require higher levels of cognitivecloseness (Broekel, 2015). Congruent conclusions stem from the analysis of aninformation technology cluster located in Cambridge, UK (Huber, 2012), a casestudy of the Tallinn University of Technology, Estonia (Kuttim, 2016), and thecross-sectional study of interregional research collaboration networks in Europe(Capello & Caragliu, 2018). This implies that different types of proximities inscientific collaboration not only co-occur (as for instance spatial and institutionalproximity), but can sometimes substitute each other. In the aforementionedexamples, cognitive closeness can be treated as a substitution for physical proxi-mity. Similarly, this kind of substitutive mechanism can be seen in the relationbetween spatial and organisational proximity. Being a part of the same organisa-tion, even distributed worldwide, not only facilitates collaboration, but can indeedimpose collaboration on previously non-collaborating members.
Theoretical approaches to scientific collaboration from a spatial perspective 117

5.2.5 Preferential attachment
While at the level of links between individual nodes—as described in theprevious section—some moderating tendencies can be found; at the networklevel, the opposite, cumulative trends prevail. In research networks, typically,a small fraction of nodes have many links, while the large majority have justa few. The pattern closely resembles the so-called scale-free network: anetwork characterised by the power-law degree distribution (in contrast tothe normal, Gaussian distribution) (Clauset, Shalizi, & Newman, 2009;Newman, 2004).3 In such networks, the key positions are occupied by avery limited number of hubs directly linked to many other, sparsely con-nected nodes. In science this role is played by star scientists, world-classresearch institutions, and—in the spatial perspective—places that concentratethe two previously mentioned.
The star, or the hub-and-spoke, phenomenon in scientific collaboration iswell exemplified by Hungarian mathematician Paul Erdos (1913–1996). Erdos,with a publication count of about 1,500, is believed to be the most prolificmathematician known. He was also one of the most collaborative—the list ofhis co-authors exceeds 500. In recognition of his enormous output, hiscolleagues created a scientific parlour game of calculating the Erdos number.The measure describes the number of handshakes between a person and thefamous mathematician, as measured by the co-authorship of papers. For Erdosthe number is 0, for his co-author it is 1, for co-authors of Erdos’s co-authorsit is 2, etc. (Castro & Grossman, 1999; Goffman, 1969). Apparently, theextensive collaboration network developed by Erdos is an outstanding exceptionin comparison to the average scholar’s collaborative engagement.
But why do scholars like Erdos—and by the same token certain institutions orlocations—attract such a disproportionate number of collaborators? Some expla-nations have been already presented in the above sections. These are, namely,amassed capacities and node fitness: the variables that can be roughly thought ofas quantitative and qualitative characteristics of nodes. Meanwhile, the scale-freenetwork theory offers a different explanation, one focused not on a node’sattributes, but on its position in the network: the concept of preferentialattachment. According to this mechanism, a new node preferentially attaches tothose that are already well connected. In other words, the likelihood of a newlink being created is proportional to the nodes’ degree (Barabási & Albert,1999). As a result, units that are well connected become even better connected.This prompts one of the better known concepts in the sociology of science: theMatthew effect. The term—coined by a couple of American sociologists,Harriet Zuckerman and Robert Merton—originally referred to the cumulativeadvantage of credit allocation in scientific communities (Merton, 1968; Merton,1988).4 But the notion of the Matthew effect equally depicts the processof accumulating new collaborative relationships by units—either individuals,organisations, cities, regions, or even countries—that already have extensivecollaboration networks.
118 Theoretical approaches to scientific collaboration from a spatial perspective

5.2.6 Disciplinary spatial bias
All the above described mechanisms shaping spatial patterns of scientificcollaborations can be found in every scientific discipline. However, thelevel of their expression—the genetic analogy comes in handy—varies inaccordance with the field and the type of scientific endeavour. This effectgoes far beyond the frequently discussed discipline differences in the meannumber of authors per paper or the typical project team size. Consider thestructure of collaboration networks in particle physics, where large teams ofresearchers depend on a unique infrastructure, as opposed to the collaborativepatterns in mathematics, where specialised equipment is rarely required, andwhere solo or small team projects prevail (mavericks of the Erdos type beingnotable exceptions). Undoubtedly, collaboration in experimental particle physicsis far more spatially bound than collaboration in the field of theoreticalmathematics.
Caroline Wagner (2008) proposed a systematic approach that makes sense ofthese differences. She distinguished two dimensions that frame collaborativeundertakings in contemporary science: spatial and organisational. The spatial axisranges from geographically centralised to spatially distributed research. The first endof the continuum is exemplified by projects that either need a unique infrastructure(say a large cyclotron) or have to be conducted in a unique environment (e.g., adistinctive Himalayan ecosystem). The other limit of the range encompassesresearch that can be performed in any—in principle at least—location (such asthe previously mentioned theoretical mathematics). The organisational axisrefers to the way the research is initiated and managed, from the top-down,hierarchical, precisely planned organisation (typical in drug research), to thebottom-up, networked, ad-hoc organisation (frequently encountered in cross-country comparative studies in social sciences). The juxtaposition of the twoaxes results in four types of collaborative research: megascience (centralised andtop-down), geotic (centralised and bottom-up), participatory (distributed andtop-down), and coordinated (distributed and bottom-up).
Each of Wagner’s four types is associated with specific spatial patterns ofresearch collaboration. Megascience is defined by a distinctive large-scale researchinfrastructure, such as Fermilab near Chicago or CERN in Switzerland—thelandmarks of big science. This category of research typically involves manyindividuals, numbering hundreds or thousands. Noticeably, not all of the research-ers involved have to conglomerate in the spot where the key equipment is located.On the contrary, megascience teams are frequently spread all over the world(particularly when it comes to the analysis of large amounts of data produced bymegascience projects, which can be performed in spatially distant locations).
Geotic research is spatially anchored by unique research conditions. In manydisciplines, some places simply need to be visited in order to investigate themor run experiments in specific, unreproducible environments (e.g., the SouthPole, a rainforest, or an archaeological site). Researchers from all over theworld travel to these unique locations, spend some time there, and return to
Theoretical approaches to scientific collaboration from a spatial perspective 119

their home institutions. This temporary collocation, in turn, creates a favour-able environment for establishing new spontaneous collaborative relations.
For participatory and coordinated collaborative projects, the exact location ofconducted research is largely irrelevant. The difference between the two is in theorganisation of the collaborative work. Participatory research projects are initiatedin a top-down process and are centrally managed. For example, the HumanGenome Project was executed in dozens of laboratories all over the world, eachof which had precisely defined responsibilities in order to avoid unnecessaryduplication. In contrast, coordinated projects are organised in a bottom-upmanner. An example might be the Global Biodiversity Information Facility—aninternational collaboration focused on collecting and sharing scientific data onbiodiversity. Participatory and coordinated research projects often take the formof inter-organisational networks that are characterised—inter alia—by voluntarymembership and collaborative governance (Alter & Hage, 1993; Chisholm, 1998;Kilduff & Tsai, 2007). However, a participatory, top-down organisation ofresearch incorporates hierarchical network structures, while coordinated projectsinvolve more horizontal coordination within flat organisational structures.
Participatory and coordinated projects typically make extensive use of informa-tion and communication technologies. In this instance, the site that drawscollaborators together is not a physical place, but a virtual space, such as a website,common database, or another virtual room created by collaborative software.Undoubtedly, an information and communication infrastructure is important in allfour types of research. But with regard to coordinated and participatory research,virtual spaces are much more important, as they typically have no specific placewhere collaborators need to assemble. Does this mean that these two modes ofcollaborative projects have no spatial dimension? Certainly not. The conclusion isslightly more moderate: spatial patterns of participatory and coordinated researchare subject to the general forces that shape spatial patterns of scientific collabora-tion: spatial and non-spatial distance, gravity and fitness of nodes, and thepreferential attachment principle. In contrast, megascience and geotic researchcan modify the way in which these forces operate—for instance, the establishmentof a unique infrastructure generates new proximities and new forces of attraction.
5.3 Explaining the impacts of scientific collaboration
The preceding subchapter considered selected concepts, explaining how terri-torial features influence scientific collaboration. The current part focuses on theother side of the relationship: the impact of scientific collaboration on theterritory. In this context the most vital question is how scientific collaborationboosts progress in science and—at the end of the day—the economic develop-ment of cities, communities, and regions. The first part of the question lies inthe main current of scholarly debate, however, the answers are often limited tothe immediate effects rather than long-term impacts. The second part of thequestion is rarely, if ever, asked explicitly. A rich variety of regional and localdevelopment theories discuss the role of research capacities and processes. The
120 Theoretical approaches to scientific collaboration from a spatial perspective

debate focuses, in particular, on mechanisms of innovativeness and on inter-sectoral links—namely, knowledge flows between science and industry—whilepurely scientific collaboration remains in the background. However, under-standing the processes of socioeconomic development through the lenses ofscientific collaboration is not feasible without accounting for the mechanisms ofscientific collaboration impact on the science sector itself.
This part of the book brings to light factors and processes that determine theimpacts of scientific collaboration on science and on regional development. Thereview covers sources from theories developed within various disciplines, such associology of science, economic geography, innovation studies, and organisationmanagement. As regards perspective, the theories span from micro-levelapproaches oriented on organisational units, such as the industrial district, clustersconcepts, and the strength of weak ties, towards macro-level approaches that areregionally oriented, such as the regional innovation systems, the triple helix, andthe learning region. The concepts in question differ in many dimensions, but interms of the impacts of scientific collaboration, their common interests areimportant. First, the intersectorality of research collaboration, which is accoun-table for the processes of collective learning that relate to the production andapplication of knowledge, as well as to enhancing the institutional component ofregional development. Second, the concomitance of competition and collabora-tion, which facilitates gaining an advantage in both science and regional develop-ment. Third, the spatial aspect of collaboration, upon which the final rewardsfrom collaboration substantially depend. In this spirit the remaining part of thesubchapter will be constructed, heralded by a general reflection on the mechan-isms behind the direct and indirect impacts of scientific collaboration.
5.3.1 Direct and indirect effects
Scientific collaboration provides direct and indirect stimuli for the development ofscience. The direct impact applies to a given collaboration case, while the indirectimpact spills over spatially and temporally. The allegedly superior significance andinfluence of joint work in comparison to individual research has induced scholarsto reflect on possible explanations (Beaver, 2004). A remarkable answer to thisproblem was formulated by philosopher K. Brad Wray as the concept of theepistemic significance of collaborative research. Wray argues that the power ofcollaborative research lies in its ability to justify scientific discoveries by thescholarly community. The results achieved by a group of collaborating researcherswith different backgrounds, knowledge, and methodological approaches aresupposed to have a more objective overtone. Collaboration allows for not onlythe cross-fertilisation of ideas, but also for a cross-validation of assumptions,processes, and outcomes. In turn, the results of collaborative work are morelikely to be acknowledged by the academic community. In other words, colla-borative work enhances the epistemic validity of research outputs (Wray, 2002).
The indirect impact of collaboration on the development of science relieson the intensification of knowledge spillovers across members of the research
Theoretical approaches to scientific collaboration from a spatial perspective 121

community. This mechanism works as a side effect. Cross-fertilisation amongcollaborators can go beyond the specific subject of the current collaboration.Such knowledge spillovers reinforce the effect of their current and futurecollaborative research endeavours, undertaken individually or in a differentconfiguration of partners. The way to depict the presence of knowledgespillovers is to look for the consequences of collaborative relationship dissolu-tion. The premature death of a scholar provides a quasi-experimental situationin which collaboration is ended by an exogenous factor. The study of thecollaborative networks of 112 eminent life scientists who unexpectedly passedaway confirmed lasting detrimental effects on the research performance of theircollaborators. The long-term decline in their quality-adjusted publication ratewas shown to be as high as 5–8 percent (Azoulay, Graff Zivin, & Wang,2010). Congruent conclusions stem from another quasi-experimental situation.During World War I, the world split into two: the Allied camp (the UnitedKingdom, France, the United States, and a number of smaller countries) and theCentral camp (Germany, Austria-Hungary, the Ottoman Empire, Bulgaria).This resulted in the disruption of knowledge flows between scholars belongingto the two detached groups. This was visible in the decrease in citations betweenthem and the dissimilarity of the titles of scientific papers produced by theseparated groups of scholars. The lower accessibility of recent knowledgenegatively affected the quality of scientific outcomes: scholars who based theirwork on frontier, cutting-edge science published fewer papers in top scientificjournals, took part in fewer Nobel Prize–nominated research projects, andintroduced fewer novel scientific words in both papers and patent applications(Iaria, Schwarz, & Waldinger, 2018).
The indirect impacts of scientific collaboration are even more evident innon-science sectors, where knowledge spills over into activities undertaken byother regional actors. The reason for this is twofold. First, scientific endeavourstake place in various kinds of organisations, not only universities and researchinstitutes, but also companies, corporations, and non-profit private laboratories.Second, the outputs of research carried out in the R&D sector are translatedinto socioeconomic practice. In other words, applied knowledge very oftenresults from collaborative work. Hence, scientific collaboration indirectlyinfluences regional development. Nevertheless, there is also a reverse causationflow from the regional environment to scientific practice. The external environ-ment elicits new ideas and provides opportunities (and funding) to develop, test,and modify scientific theories (see for instance Goddard & Vallance, 2013;Sánchez-Barrioluengo, 2014). However, the so-called environmental effectdepends on the region’s level of development and technological advancement.On one end of the continuum there are economically lagging regions with lowlevels of innovativeness, on the other—highly developed locations and stronginnovators. Developed regions have the advantage of a vibrant business sector.In such regions, companies are characterised by greater accumulated expertise,higher capacities to absorb new knowledge, more employment opportunities foruniversity graduates, and greater willingness to collaborate with the R&D sector,
122 Theoretical approaches to scientific collaboration from a spatial perspective

contrary to their counterparts from peripheral regions (Bonaccorsi & Secondi,2017). This logic also applies to the inverted science-region relationship. On theone hand, a weak science sector is able to produce knowledge flows of imitativecharacter, which can only be of mediocre use to regional development. On theother, high-value knowledge can lead to more spectacular development andmay also be applied more broadly, beyond the regional boundaries.
5.3.2 Intersectoral knowledge flows
The indirect impacts of scientific collaboration on science advancement andknowledge-based regional development are facilitated by intersectorality. Thisworks on different levels and dimensions, as intersectorality greases the wheels ofknowledge production, circulation, and application that require links amongvarious sectors. The application stage is essential for processes of regional devel-opment because the balance between the demand and the supply of knowledgecan be achieved in the process of intersectoral collaboration. Strongly connectedproducers, transmitters, and users of knowledge of different sectoral provenancesensure that knowledge is attuned to the regional needs. This can increaseinnovativeness and, in the long run, positively affect regional performance.
Regional development theories see scientific collaboration predominantly as anintersectoral phenomenon which takes place in diverse environments amongmanifold interrelated actors involved in multilevel knowledge production, trans-fer, and utilisation. The names of some theories directly allude to the meaningfulcontribution of intersectoral processes to regional growth. For instance, the nameof the triple helix theory, formulated by the duo of eminent innovation scholars,Henry Etzkowitz and Loet Leydesdorff (1995), uses a metaphor borrowed fromthe natural sciences. It suggests the presence of interactions among three systems,referred to here as helices: science, business, and public administration. Theabove-mentioned theoretical concepts derive intersectorality from different pre-mises. The regional system of innovation perceives collaboration as a consequenceof the systemic nature of innovation, which requires interactions among sectors.The triple helix concept derives intersectorality from the growing role in regionaldevelopment played by science and its interactions with other sectors. Meanwhile,the cluster theory explains intersectorality as the requirements of businesses in theknowledge-based economy.
Two complementary mechanisms are triggered by intersectorality: collectivelearning and the regulatory role of institutions. Regional collective learning is adynamic, interactive, and cumulative process which brings about the enlarge-ment and improvement of knowledge. Intersectorality allows each sector tocapitalise on the resources and skills of other sectors, thus triggering synergiesin the region through the common use of available knowledge, mutualevaluation of ideas, and monitoring of each sector’s outputs. To put it simply,regional collective learning is a “territorial counterpart of the learning thattakes place within the firm” (Capello, 2007, pp. 198–199). This suppositioncreates foundations for the milieu innovateur concept, developed in the 1980s by
Theoretical approaches to scientific collaboration from a spatial perspective 123

the Groupe de Recherche Européen (GREMI) (Aydalot, 1986). Knowledgespillovers within the milieu are facilitated by high mobility of the labour force,cooperation for innovation among knowledge suppliers and users, and localspin-offs (Camagni, 1991b). Based on the assumption that the region acts as afocal point for knowledge creation and learning, Richard Florida coined thenotion of the learning region (1995). This has been further autonomouslydeveloped in the groundbreaking works of Bengt-Åke Lundvall (1996), BjørnAsheim (1996), Kevin Morgan (1997), and many others (see: Rutten &Boekema, 2007). While the learning region concentrates on the processes oflearning based on interactions among sectors in the region, the triple helixunderlines the role of functional substitution in these sectors: universities areincreasingly involved in the commercialisation of knowledge, enterprises aredeveloping academic functions, and administration is becoming entrepreneurial(Etzkowitz & Leydesdorff, 1995).
At the same time, all the above-mentioned concepts highlight the key roleof regional institutions in the process of multisectoral collective learning.Institutions are represented by the set of norms, codes, and rules in whichregional actors operate. Moreover, these rules of the game are embodied inconcrete institutions, i.e., organisations. The relative richness or scarcity ofinstitutional structures—so-called institutional thickness—allegedly determinesthe economic development of regions (Beer & Lester, 2015; Henry & Pinch,2001). Synergies of interacting institutions facilitate interactive learning (Amin& Thrift, 1994). A unique institutional infrastructure supports innovationwithin the production structure of the region (Asheim & Gertler, 2005). Therole of institutions in the cluster concept is to ensure its smooth and effectiveoperation (Porter, 1998). Interacting institutions in regions are hypothesised toform distinct regional innovation systems—a concept framed by Philip Cooke(1992). The regional innovation system sustains intensive knowledge interactionsthat take place within and between two institutional subsystems: (1) knowledgegeneration and diffusion, and (2) knowledge application and exploitation. Bothsubsystems are embedded in a common regional socioeconomic and culturalsetting, influenced by regional policy and linked to national and internationalinnovation systems (Autio, 1998; Cooke, 1998a; Tödtling & Trippl, 2005). Theinstitutional layer is also an important element of the triple helix concept, althoughhere the emphasis is placed on the establishment of new institutions triggered bythe interrelation of regional subsectors. Intermediate institutions such as spin-offs,academic incubators, technology transfer centres, technological parks, patentoffices, and local production agreements integrate the functions of the threehelices and ease interactions within the whole regional system. This, in turn,stimulates knowledge production (as in Mode 2 described in section 5.1) andfacilitates knowledge transfer and consumption (Etzkowitz & Leydesdorff, 2000).
Recent progress in the presented concepts gives even more weight to thegrowing role of intersectorality. This is evident in the case of the triple helix,the evolution of which led to two more sectors being added to the initialconcept (Carayannis, Campbell, & Rehman, 2016). The quadruple helix adds
124 Theoretical approaches to scientific collaboration from a spatial perspective

a social dimension—the civil society helix. This helix defines the demand forinnovation. The quintuple helix incorporates the helix of the natural environ-ment. These developments place the system of collaborative knowledge creationand use in an up-to-date context, acknowledging the role of social innovationand sustainable development.
5.3.3 Coopetition
Relationships among individuals and organisations are not necessarily colla-borative. Collaboration is frequently—perhaps always and necessarily—accom-panied by competition. The effects of collaboration can be more spectacular ifachieved in a competitive environment. At the same time, competition isstimulated by collaboration, which is crucial to gaining advantage both inscience and in regional development. The relationship between collaborationand competition is thus interdependent: “Collaboration and competition arenot mutually exclusive, they are two aspects of the same more general process”(Atkinson et al., 1998, p. 230). Moreover, as David Smith aptly noticed,“Collaboration and competition co-exist along a continuum; the boundarybetween the two is rarely neat or tidy” (2001, p. 142). The co-occurrence anddynamic equilibrium between competition and collaboration is referred ascoopetition, a term coined within the framework of business management(Brandenburger & Nalebuff, 1996).
The processes of collaboration and competition might seem contradictory,as they are based on opposing logics of interaction. However, the coexistenceof collaboration and competition is common. Numerous examples from thebusiness sector, mostly involving large companies, confirm that cooperation withcompetitors is seen as the most advantageous strategy for improving businessperformance, in particular in the field of innovation (Bengtsson & Kock, 2000;Gnyawali & Park, 2011). But make no mistake: coopetition also contributes tothe development of small and medium-size enterprises, as already acknowledgedby Italian scholars, the fathers of industrial district theory (Ottati, 1994). More-over, the positive influence of coopetition can also be extended beyond thebusiness sector. It can be applied equally well to the science sector.
The naïve picture of scholars who avoid competitive behaviour and preferto collaborate is out of touch with the complex realm of scientific work.Robert Merton, in his pioneering work on the sociology of science (1973),described science as a process of competitive cooperation. He describedscientists as competitive peers (compeers) to underline that science is as muchcompetitive as collaborative. It is undeniable that the scientific rewards go tothose scholars who win the race to a new discovery, are first to observe a newphenomenon, or present brand new results. Simultaneously, one can hardlywin a competition without being part of cooperative structures. Thus, whilescholars and research organisations rival each other, to gain success they readilystrive to join their efforts, resources, and knowledge. Researchers compete toachieve breakthrough results and, correspondingly, gain access to funds awarded
Theoretical approaches to scientific collaboration from a spatial perspective 125

by a grant formula. Scholarly organisations compete for talented staff andstudents, as well as for a high-profile reputation as shown in various rankings.Yet, simultaneously, collaboration occurs and is necessary in the same fields ascompetition: Teams of excellent scholars are better prepared to win researchgrants. A pool of talented staff can be created through collaboration. Theorganisation of larger scientific endeavours or events, such as internationalcongresses, is easier in larger teams, while joint promotional actions abroadfacilitate student enrolment. Collaboration enhances competition, but the reversecausation also applies here: a competitive environment is a prerequisite for betterresults of scholarly collaboration. Joint research performed under pressure ofrivalry limits negative outcomes, such as duplication of efforts or experiments,delays in preparing probes or data, lack of peer feedback, or publishing only partialresults (Atkinson et al., 1998; Nickelsen & Krämer, 2016).
Coopetition strategies adopted by scientific institutions, likewise enterprises,depend on various variables, e.g., the overlap of their fields of specialisation, thenumber of interacting partners, the temporal dimension, and spatial collocation(Gnyawali, He, & Madhavan, 2008). Collaboration among competitors mightbe impeded by geographical overlapping. In this case, the relevance of bothcollaboration (for example joint purchases) and competition (for instance forstudents) becomes very high (Dal-Soto & Monticelli, 2017). The temporaldimension of coopetition depends on the dynamics of the relationships betweenresearch institutions, which can cooperate and compete simultaneously, atdifferent points in time or sequentially (Chien & Peng, 2005).
Natalie Angier, a science writer, observed that “To thrive in science, you mustbe both a consummate collaborator and a relentless competitor. You mustbalance, with an almost gymnastic precision, the need to cooperate against thecall to battle” (1988, p. 14). The trick is to understand the mechanisms behindcoopetition in order to adopt an appropriate strategy in which rivalry does notprevail, but is stimulating enough to gain the most from collaboration. A tellingexample is the analysis of the micropolitics of an informal research coalition whichled to the breakthrough discovery of the gene responsible for myotonic dystrophy,followed by the simultaneous publication of three collaborative papers in Nature.The dynamics of collaboration and competition among these research groupsdepended on the phase of the research. Open flows of information and probes—however carefully managed—as well as personal ties among researchers belongingto different groups gradually decreased as the study progressed. The fiercestrivalry, combined with harsh relations among scholars, occurred when thediscovery was about to be published. The individual race for publication and therelated rewards in the form of recognition, access to funding, and career enhance-ment replaced collective work. The pendulum swung again in favour of colla-boration after the disclosure of the discovery. It set up the research scene anew:once more, each group of scholars possessed the same knowledge and had nomarginal advantage related to timing, research material, or methodology. It wasalso a period of playing straight because new lines of scientific inquiry needed tobe mapped out and new coalitions had to be formed (Atkinson et al., 1998).
126 Theoretical approaches to scientific collaboration from a spatial perspective
Besides relations within the science sector, ties existing among scientificinstitutions, enterprises, and public administration also bear the hallmarks ofcoopetition. Such ties are forged within “a coalition which brings togetheractively involved people who belong to different sectors, but share the sameinterests, values and common goals” (Daidj & Jung, 2011, p. 40). Coopetitionincreases the dynamic of relations, spurs the process of mutual learning, and, as aresult, can improve the efficiency of the whole regional economy. In other words,coopetition works as a catalyst of relations among various regional players and asan accelerator of positive synergies leading to regional growth. The coopetitiveapproach provides the essence of cluster theory (Porter, 1990) and theories ofregional growth in general, although intersectoral relations are investigated lesscommonly than those among enterprises (Bengtsson & Raza-Ullah, 2016). Thetriple helix concept, due to the overlapping roles of different sectors, is naturallybased on the competition of collaborating partners (Mongkhonvanit, 2014). Thisinterplay among the roles of helices may cause positive outcomes, likewise theconcurrence of three types of interaction within systems of innovation (Edquist,2005): competition, networking, and transaction. Together they constitute agrowth-friendly environment and increase the performance of the given systemof innovation (OECD, 2002; Stamboulis, 2007).
However, apart from positive results, coopetition may challenge regionaldevelopment by demanding greater coordination and dynamic adjustment ofeach actor’s strategy. For instance, the level of coopetitive tension influencesenterprises’ inclination to adopt an open model of innovation (Mention,2011). Corporate strategy choices may further impact the behaviour of otherregional actors (including those from the science sector), limit the innovative-ness of the whole system, and detrimentally influence regional performance(Ritala, Huizingh, Almpanopoulou, & Wijbenga, 2017).
5.3.4 Local and global networks
The impacts of scientific collaboration, both direct and indirect, are spatiallydependent. The space dividing collaborators modulates the results of researchcollaboration. However, it is not clear whether close or distant partnerships areof greater value. Concurrent concepts and approaches provide seeminglycontradictory evidence: some underline the role of proximity; others favourdistance. Theories that favour proximity rely on the assumption that theregional environment provides an optimum mix of factors for knowledge-based development. The favourable conditions for the innovative interplayamong various regional actors enhance dissemination of tacit knowledge that isbelieved to be socially and economically sticky (Cowan, David, & Foray,2000). The positive influence of actors’ proximity on collaboration impact isrooted in the concept of industrial districts, initialised in the late 19th centuryby Alfred Marshal. He noticed that the spatial concentration of business entitiesgives a number of advantages for the entire network of firms in the givenlocation (Lazerson & Lorenzoni, 1999). The importance of regional settings
Theoretical approaches to scientific collaboration from a spatial perspective 127

was afterwards tested through investigating the miracle of the so-called ThirdItaly observed during the economic crisis of the 1970s (Becattini, 2002;Capello, 2007). Michael Porter explained these regularities within the frame-work of the diamond of competitiveness, in which geographic proximity is thefundamental factor for cluster development.5 The fact that geographicalproximity of partners releases positive outcomes of collaboration is also under-lined in other concepts, such as the regional innovation system, the innovativemilieu, and the learning region (Lorentzen, 2008).
Concurrently, regional scientists have long suggested that being reliant mostly,or even exclusively, on proximate, intraregional links limits the positive outcomesthat could be achieved by the local economy. The proximity approach graduallybecame out of tune with globalisation trends. In the globalised economy, the mainplayers build their competitive advantage on multi-locality, not restricting them-selves to the immediate environment in obtaining resources, knowledge inparticular. The same applies to regions which are less (or perceived as less) self-contained, autarkic systems, but rather entities operating in the global context. AsRoberto Camagni argues, local milieu need to be linked to the global network toavoid an “entropic death” (1991a). Amin and Thrift (1992) follow his argumentand perceive clusters of locally embedded firms as neo-Marshallian nodes in globalnetworks, while Tödtling (1994) underlines that place cannot be seen as anexclusive driving force for innovative firms to develop, as they are becomingincreasingly integrated into the global economy.
Acknowledging that both proximity and distance might influence the impactof collaborative endeavours brings more complexity into regional developmenttheories, but also makes them better able to reflect the economic reality. Thecontradicting perspectives setting local and global relations in opposition havebeen replaced by the thesis that collaboration limited to specific geographicalboundaries is insufficient in most cases, in particular in the context of theknowledge-based economy (McCann, 2007). As Bathelt aptly noticed, “localcannot be seen in isolation from other spatial levels” (2011, p. 150). Theexposure to new perspectives boosts the creativity of the whole system andprevents a cognitive lock-in effect (Fleming et al., 2007). The role of differentexternal links of national, inter-regional, and global character for the purpose ofmaximising collaboration impact became the key point in the evolution of theindustrial district concept (Rabellotti, Carabelli, & Hirsch, 2009). Processes ofknowledge creation and application typically involve collaboration on variousspatial levels, as underlined in the complex interrelations among theories ofsectoral, regional, national, and global innovation systems (Asheim & Gertler,2005; Binz & Truffer, 2017; Lundvall, 2007). Remarkably, this open approach isnot recent—it was already present in Phillip Cooke’s classic typology of regionalinnovation systems (Cooke, 1998b).
In the context of scientific collaboration, the empirical evidence for thesuperior importance of distant relations prevails. Papers co-authored withremote collaborators have a greater chance of accumulating citations thanpapers co-authored by spatially proximate groups. Long distance usually
128 Theoretical approaches to scientific collaboration from a spatial perspective

equates to international collaboration—thus, a higher level of internationalisationis associated with greater impact, at least when measured by citations (for a detaileddiscussion of the evidence, see section 4.3). However, this does not mean thatlocal cooperation is irrelevant. The key distinction is not between local and long-distance collaboration, but between collaboration and its absence. As Katz andHicks stated in their classic work on collaboration and citations, the impact ofpapers is higher “if there is collaboration of some kind” (1997, p. 554). Consider-ing the quality, visibility, and impact of research outputs, local collaboration isdefinitely better than solitary work. Furthermore, a wider, more distant networkof collaboration is more advantageous than exclusively local links.
The discussion has so far focused on demonstrating the complexity of therelationship between the extent of cooperation and its impact, both within therealms of science and in the wider context of regional and local development.However, the key question is, how can one explain the positive impacts of bothproximity and distance on collaboration effects? One possible answer is given bythe theory of the strength of weak ties, coined by Mark Granovetter in the1970s. The American sociologist showed that not only strong ties—i.e., thoseamong family members, friends, or close collaborators—have practical value.Weak ties—those with distant acquaintances—in some circumstances might beeven more valuable, as they provide access to information and opportunities notaccessible via strong ties (Granovetter, 1973). Similar conclusions can be drawnfrom the later theory of structural holes proposed by American sociologistRonald Stuart Burt. A structural hole is an existing or possible relation betweentwo nodes in a network, connecting groups of nodes that are otherwise isolated.Being in the position of a structural gap in the network is particularly beneficialbecause it gives access to complementary sources of information and can evenallow you to control the flows of information in the network (Burt, 1992). Wecan assume—somewhat simplistically—that Burt’s structural holes are equivalentto Granovetter’s weak ties (Borgatti & Lopez-Kidwell, 2011). Moreover, in thecontext of geography, we can expect that as the distance between nodes grows,the relationships between them are increasingly likely to be weaker and to becharacterised as structural holes.
Further application of this approach to innovative studies has led to theconclusion that strong and weak relations have different impacts on thecollaboration result. Strong ties, understood as intensive and close links amongvarious units (peoples, organisations, territories) facilitate flows of tacit and highlycomplex knowledge because closely related units tend to have a commonknowledge base. On the contrary, weak ties that loosely link distant entitiesfeaturing limited knowledge redundancy are characteristic of the transmission ofcodified and less compound knowledge (Fleming, King, & Juda, 2007). In theinnovative process, weak ties provide opportunities to access new sources ofknowledge and can lead to groundbreaking inventions. That is hardly possible inthe case of strong ties, which lead rather to incremental innovations (Hauser,Tappeiner, & Walde, 2007). Additionally, weak ties can compensate for aperipheral position in the network by providing access to the most influential
Theoretical approaches to scientific collaboration from a spatial perspective 129

nodes and offering the chance to gain a fine share of the knowledge pie. This isdue to the fact that the position in the network matters more than the strengthof relations.
The model of local buzz versus global pipelines adapts the strength of theweak ties concept to the spatial context. The point of departure for the idea ofglobal pipelines was a refutation of the thesis that sustained, direct, and stronginteractions related to knowledge flows in the local environment are sufficientfor innovative development (Storper & Venables, 2004). Local buzz—whichresults from physical as well as cognitive, organisational, and technologicalproximity—usually does not provide enough input for knowledge-baseddevelopment. Insufficient openness to impulses from outside the regionhinders regional performance (Bathelt, Malmberg, & Maskell, 2004). Effectiveknowledge creation and learning processes therefore require the co-occurrenceof both local and non-local research relations (Amin & Robins, 1991; Asheim& Isaksen, 2002; De Noni, Ganzaroli, & Orsi, 2017; Torre & Rallet, 2005).Collaboration with distant partners can secure advantages of a totally differentkind than collaboration with close neighbours (Oinas & Lagendijk, 2005).
An analogous approach can be directly applied to collaborative relations inscience. Among US information management scholars, a higher g-index6 isobtained by those that established numerous connections with top peers, engagein long-lasting collaboration, and avoid co-authoring with researchers within thesame cluster of partners (Abassi, Altman, & Hossain, 2011). According to Ortega(2014), scholars with dense, overlapping collaboration networks achieve poorerscientific performance than those with sparser networks. Both studies are clearlyin line with the assumptions of the structural holes theory: a position in anetwork that provides good access to complementary resources, expertise, andknowledge is a good predictor of a superior research performance.
The structural holes theory also gives an interesting perspective to academicmobility in enhancing collaboration impact. The moderating role of returningscholars has been observed in Chinese nanotechnology: articles prepared byChinese scholars together with returnees were published in journals with ahigher impact factor than those written with no such support (Tang & Shapira,2012). Similarly, the foreign work experience of Argentinian returnees increasedthe propensity to publish collaborative papers in high impact factor journals(Jonkers & Cruz-Castro, 2013). In this case co-authorship with returnees servedas a substitute for international collaboration: a large share of collaborative paperswith returnees was published without international co-authorship. In otherwords, valuable knowledge improvements may be achieved by filling thestructural hole with international ties either directly, through internationalcollaboration, or indirectly, by the linkages—and foreign experience—of return-ing scholars. The returnees constitute an important asset for a national, regional,or local R&D sector since their strong embeddedness in exterior networksfacilitates knowledge flows to the internal network (Jonkers & Tijssen, 2008).
Establishing and maintaining global pipelines can be particularly beneficialfor lagging regions.7 Due to the feeble science sector and low absorptive
130 Theoretical approaches to scientific collaboration from a spatial perspective
capacity of resident businesses, these regions are not able to benefit from localbuzz. To gain access to new sources of knowledge and to stimulate weakendogenous potential for innovative growth, regional actors must refer toglobal pipelines (Fitjar & Rodriguez-Pose, 2011; Lorentzen, 2007; Wanzenböck,Scherngell, & Brenner, 2014; Žížalová, 2010). However, since small and weakorganisations, typical of less developed regions, usually have limited absorptivecapacity, it is often beyond their capabilities to engage in both regional andextra-regional interactions simultaneously. In this case, maintaining only one ofthe two types of relations is not only necessary, but indeed can provide optimaleffects (Aarstad, Kvitastein, & Jakobsen, 2016). Similarly, the performanceargument explained above is also used in the case of impacts in the sciencesector. The level of advancement of a given discipline in a country mayinfluence the strength of the relation between collaboration and citation levels.More developed scientific fields are less dependent on international co-author-ship. The Slovenian case provides evidence for this hypothesis through contrast-ing patterns observed in traditionally strong fields (physics and chemistry) andless developed ones (biomedicine) (Peclin, Južnic
, Blagus, Sajko, & Stare, 2012).
This example fits well into the local buzz and global pipelines theory. In the caseof strong national environments, dense relations among highly performingscientific entities—local buzz—are the most beneficial, while in case of weakenvironments, global pipelines act as a vital fuel for scientific excellence.
* * *
Although there is no specific theory of scientific collaboration in the territorialperspective, this chapter provides a framework for such a theory. It should addressthree key aspects of the geography of scientific collaboration, namely: (1) thegrowth of collaboration, (2) the formation and evolution of its spatial patterns, and(3) the impacts of research collaboration on science and regional development.Furthermore, the theory should not be built from scratch, but it can be based onthe numerous concepts, approaches, and traditions analysed throughout thechapter. Some of them are complementary; others lead to ambiguous and some-times even contradictory conclusions. One of the most attention-grabbing ten-sions is related to the role of spatial proximity. While spatial proximity isconducive to establishing cooperation, the impact of collective work—on thecontrary—positively correlates with greater distance, or at least with an adequateproportion between distant and close links. The contradiction between circum-stances in favour of establishing collaboration and those assuring advantages fromjoint research may have far-reaching consequences, not only for spatial sciento-metrics, but also for scientific collaboration policy.
Notes
1 Later polemics have revealed, by using examples from the history of science, thatMode 2 was already in effect as far back as the 17th century, before the professiona-lisation of science (Etzkowitz & Leydesdorff, 2000). The long prevalence of Mode 1
Theoretical approaches to scientific collaboration from a spatial perspective 131

stemmed from the need to assure the independence of scientific endeavours ratherthan weak links between science and its socioeconomic environment (Hessels & vanLente, 2008).
2 Trott and Hartmann claimed that Chesbrough created a false dichotomy, and that theneed for external linkages of firms was already underlined in the 1960s, thus, openinnovation is an “old wine in a new bottle” case (Trott & Hartmann, 2009). Similarcriticisms can be applied to the dichotomous concepts of Mode 2 vs. Mode 1.
3 Technically, scientific collaboration networks cannot be named as scale free—asphysicist Mark Newman from the University of Michigan argues. The node degreedistribution is not a proper power law, but power law with an exponential cutoff(Newman, 2004; see also Clauset, Shalizi, & Newman, 2009).
4 The Matthew effect was originally used to describe the phenomenon that eminent,famous scholars tend to gain more credit than less known researchers, even if theirwork is equally solid and significant.
5 According to Porter’s definition a cluster is “a geographic proximate group ofinterconnected companies and associated institutions in a particular field, linked bycommonalities and complementarities” (2000, p. 16).
6 An alternative to the h-index measure of scientific productivity on the individuallevel developed by Egghe (2006).
7 Nevertheless, even in highly innovative locations, the assumption of the prevalenceof internal technological knowledge spillovers, thus relying on the local buzz, can bequestioned (Huber, 2012).
132 Theoretical approaches to scientific collaboration from a spatial perspective

6 Scientific collaboration policy
Scientific collaboration policy is a set of ideas and measures intended tomanage scientific collaboration. Often it is understood as actions aimed atincreasing scientific collaboration (Achachi et al., 2016; Amanatidou, 2002;Melin & Persson, 1996). However, its scope is much wider. From theperspective of policy objectives, it can be targeted not only at increasingcollaboration, but also its effectiveness and efficiency, which might includetermination of needless or underperforming partnerships. Moreover, scientificcollaboration policy can be seen as (1) a subset of science policy and (2) a feature ofscience policy. In the first approach, measures directly aimed at collaboration—e.g., funding schemes supporting international research projects—are used tocomplement the science policy toolbox. In the second approach, science policyaddresses scientific collaboration in a horizontal manner. The present-day ubiquityof scientific collaboration makes the second approach progressively more valid anduseful for science policy analysis, development, and evaluation. Contemporaryscience policy simply cannot ignore multilevel networks that link scholars,research units, institutions, and countries.
The collaborative thread has to be carefully unwoven from the complexfabric of science policy. To this aim, we have based the present chapter onthree case studies. We review scientific collaboration policies and theirdeterminants and circumstances in three contexts: the United States, Europe(with the focus on the European Union level), and China. Our analysis focuseson central government policies, although subnational or institutional levels arealso mentioned if needed for a proper understanding of a given setting. Thechapter concludes with the mapping of the main scientific collaboration policytools and some evidence shedding light on the evaluation of their effectivenessand efficiency. Before reaching this point, we have to begin our inquiry byplacing scientific collaboration policy in the wider context of science policy—itsorigins, varieties, and developments.
6.1 Policy through science and for science
Initially, state incentives for research and innovation focused primarily onpractical aims. They sought to exploit scientific discoveries for the benefit of

areas of governmental concern. Jean-Jacques Salomon (1929–2008), a promi-nent French science scholar, called it a policy through science (Salomon, 1977). Thepioneering example of such an initiative is the Longitude Act—passed by theBritish Parliament in 1714—which provided a lucrative reward amounting tocirca $3 million (in 2016 dollars) for the precise determination of a ship’slongitude at sea. The British government desperately sought to solve theso-called longitude problem since they managed the largest navy and merchantfleet in the world (Woolfson, 2015). The British Scientific Society, despite yearsof effort and with the brightest naturalists on board—it suffices to mention one ofthem: Isaac Newton—failed to solve the puzzle. At that point, the brain teaser waspresented to the general public in the form of—using contemporary terms—a callfor proposals. Fifty years later, self-taught clockmaker and carpenter John Harrison(1693–1776) found the answer: the marine chronometer, H4, or simply sea watch(Sobel, 1996). This invention, the result of a targeted science policy intervention,gave additional power to British global expansion, and in turn built its colonialempire.
The Longitude Act, although 300 years old, could still serve as an example ofgood practice for designing incentives of the policy through science type(Spencer, 2012). It outlined a specific goal and showed its strategic significance.It clearly described the desired outcome, but it did not suggest or excludeparticular solutions. It defined the way in which the achievement of thisoutcome would be identified and evaluated. For this task, a distinct reviewbody—the Board of Longitude—was established, and its tasks and competenceswere specified. Another significant feature of the Longitude Act was the set ofconditions for granting rewards. It was assumed that the solution to the problemcould be more or less accurate—and even less successful attempts should besomehow valued, because they could consequently lead to better ones. In thisvein, the Act offered the full prize for the best solution, but also lesser prizes forless accurate tries. Last but not least, the call was wide open. There were norestrictions to participating—and this approach proved wise, as the best solutionwas invented by a self-educated commoner.
In the first half of the 20th century, science policy progressively attractedthe strategic attention of policymakers, and it became more organised andinstitutionalised. It was the time when policy through science was combinedwith and complemented by policy for science (Salomon, 1977). The latter meansthe provision of favourable conditions for science and technology developmentbut without specific expectations of direct and prompt profits from scientificresearch. This shift was perhaps most clearly visible in the US. Until the 1930s,American scholars depended almost entirely on funds provided by industry orphilanthropists (Dupree, 1957). In the early 1940s, the first noteworthy federalfunding was assigned for improving research and development in agricultureand public health (Bok, 2015). But the real change came with World War IIand its aftermath. On the one hand, the atomic bomb made within theframework of the Manhattan Project—a clear example of policy throughscience—made the ultimate argument for the importance of science. On the
134 Scientific collaboration policy

other hand, generous federal funding for military-oriented research enhancedUS scientific capacity. After the war, federal engagement in science wascontinued, and it largely took the form of policy for science. An authoritativefigure behind this policy development was Vannevar Bush (1890–1974) withhis influential 1945 report to the president of the United States entitled Science,The Endless Frontier. Bush emphasised the critical importance of basic research:
Basic research leads to new knowledge. It provides scientific capital. Itcreates the fund from which the practical applications of knowledge must bedrawn. New products and new processes do not appear full-grown. Theyare founded on new principles and new conceptions, which in turn arepainstakingly developed by research in the purest realms of science. Today,it is truer than ever that basic research is the pacemaker of technologicalprogress. […] A nation which depends upon others for its new basicscientific knowledge will be slow in its industrial progress and weak in itscompetitive position in world trade, regardless of its mechanical skill
(1945, p. 13–14).
In this vein, the American taxpayers’ money was channelled into supportingbasic research—which has become the main task of the National ScienceFoundation established in 1950. However, as the above quote from VannevarBush shows, from a policy perspective, even basic research is expected toinduce profits for society and the economy. The main difference betweenpolicy through science and policy for science is that the first expects directeconomic and social profits, while the other accepts long-term, indirect, andunanticipated impacts.
6.2 Policy shift towards collaboration
In the second half of the 20th century and at the dawn of the thirdmillennium, science policy changed substantially in response to contemporarychallenges and the logic of a collaborative turn in science. As early as 1996, anarticle in Scientometrics observed that “From a science policy perspectiveresearch collaboration has become a central issue” (Melin & Persson, 1996,p. 363–364). Two decades later, Ben Martin (2016) emphasised the gradualshift from science policy focused on an individual researcher, single laboratory,or an enterprise, to policy aimed at collaborations and networks. He points outthat this policy change is intertwined with other shifts: from linear to systemicthinking about R&D and innovation, from national to multilevel governance,and from individual policies to policy mixes. That runs in line with theargument of Caroline Wagner who noticed the “shift from a nationallycentred scientific system to a global one in which researchers, not nationalauthorities, set the rules” (2008, p. 10). She claims that contemporary globalscience can be understood as a “new invisible college”—the term Wagner usedas the title of her 2009 book. There she argues that the emergence of the new
Scientific collaboration policy 135

invisible college challenged traditional governmental science policies that havehad to be reoriented to include new collaborative and open circumstances indesigning incentives for science.
Many national and regional governments, as well as non-governmentalinstitutions, have already reacted to the new collaborative logic of scientificactivity and have implemented various instruments aimed at strengthening linksamong scholars (see: Caloghirou, Vonortas, & Ioannides, 2002; Cooke & Hilton,2015; Cunningham & Gök, 2012; Hicks & Katz, 1996; Sakakibara & Cho, 2002;Stephan, 2012; Turpin, Garrett-Jones, & Woolley, 2011). For instance, inGermany the annual number of publicly subsidised collaborative R&D projectsexceeded the number of single projects as early as 1999 (Czarnitzki & Fier, 2003).Since then, joint research ventures have significantly outnumbered single-institution grants funded by the German Federal Government. All in all, animpressive number of circa 60,000 collaborative projects were carried out inGermany in the period 1969–2012, more than one-third of the overall numberof federally funded research studies. Cross-sectoral, science-industry jointresearch ventures largely contributed to this figure (Umlauf, 2016).
For the most scientifically advanced and wealthy nations, research collabora-tion—often international—is a way to amass resources and target the endlessfrontier of science with a force unfeasible for a single country. This tactic ledto the rise of big science, exemplified by the European Organization forNuclear Research widely known as CERN (an abbreviation derived from itshistoric French name, Conseil Européen pour la Recherche Nucléaire). CERN, thebrainchild of atomic physicists, was established in 1954 by 12 Europeancountries with the general mission to “provide for collaboration amongEuropean States in nuclear research of a pure scientific and fundamentalcharacter”, as stated in the CERN Convention (“Convention for theEstablishment of a European Organization for Nuclear Research”, 1953,Article II). The idea behind CERN was to rebuild Europe’s research capabilityand effectively face the intense competition with the US in the field of nuclearphysics. Today, CERN includes 22 member states and involves a further 60countries outside Europe. The laboratory employs about 15,000 scientists fromaround the world. Several revolutionary discoveries encapsulate the tremendousresults of the CERN operation till today. Two of them were honoured withNobel Prizes: the discoveries of the W and Z bosons by Simon van derMeer (1925–2011) and Carlo Rubbia (born in 1934), and the invention anddevelopment of particle detectors by Georges Charpak (1924–2010).
The promise of scientific excellence, improved by linking scientists in colla-borative networks, turns out to be particularly attractive in resource-constrainedconditions. The expectation arises that collaboration can substitute—at least tosome degree—for R&D spending and lack of local skills and knowledgeresources. This approach is essentially valid for less scientifically advanced andless well-off institutions and countries. In their case, science policy focusedsolely on the development of endogenous capacities is very unlikely to besuccessful. They need to look for exogenous resources and find ways to plug
136 Scientific collaboration policy
themselves into the global scientific networks. In practice, however, bothendogenous and exogenous approaches have to be combined in a policymix appropriate for the given institution or country; the reason for this is thata certain level of internal assets—or absorptive capacity (see: Cohen &Levinthal, 1990; Criscuolo & Narula, 2008)—is a prerequisite for effectiveuse of external feeds. Caroline Wagner labels it a dual strategy, where “sink-ing” of investments on local territory is combined with “linking” to the globalnetwork (Wagner, 2008). The call for a dual strategy is—not surprisingly—equally applicable to scientifically lagging and developing as well as advancedcountries. The three case studies described in the coming pages illustrate therich variety of possible policy mixes in terms of scientific collaboration policyand its place in the overall science policy in a given national or institutionalmilieu.
6.3 Europe: towards the European Research Area
After World War II, the unprecedented integration process in Europe created aunique political framework—the European Union—for a variety of collaborativeactivities, including science. The main feature of the scientific collaborationpolicy in Europe is multilevel governance. It consists of, and emerges from,national policies and activities, intergovernmental agreements between sovereigncountries, and supranational regulations and programmes at the EU level. Yet theEuropean level of science policy is quite modest in comparison to policies at otherlevels. The average annual budget of Horizon 2020—the largest EU sciencepolicy instrument—accounts for only about 3.5 percent of the total annual grossdomestic expenditure on research and development of the 28 UE Member Statesas of 2014 (“Breakdown of Horizon 2020 budget”, 2011). Nevertheless, the EUscience policy realises the central goal of stimulating transnational collaboration(Calvert & Martin, 2001; Hoekman et al., 2013), which has always been the appleof the EU policy makers’ eye. As Luke Georghiou describes it, “The basic tenet ofEU RTD [research and technological development] policy is the promotion ofco-operation” (2001, p. 893). It is seen as essential to overcome fragmentation—Europe’s main disadvantage, blamed for the continent’s lagging in the worldwideR&D race (Georghiou, 2001). This chapter presents the reasoning, evolution, andarchitecture of the European scientific collaboration policy, within the EU andwith non-EU countries. The main focus is on the EU-level initiatives. However,several examples from the country level are also presented.
6.3.1 Integrating Europe
The rationale behind supporting scientific collaboration on the EU level istwofold: (1) to enhance Europe’s scientific excellence, and (2) to spur Europeanintegration. The scientific motivation is derived from the advantages of jointresearch in comparison to non-collaborative undertakings. Collaboration boostsscientific performance and impact, which may, in the long term, increase
Scientific collaboration policy 137

innovativeness and competitiveness, crucial drivers of the contemporary knowl-edge-based economy as it is understood and underlined in various EuropeanUnion policy papers and strategies (e.g., the Lisbon Strategy from 2000 and theEurope 2020 strategy proposed in 2010). The integrative reasoning originatesfrom the assumption that any form of collaboration strengthens EU integration(Gorzelak & Zawalińska, 2013). Fostering international collaboration is thusjustified even if the only positive outcome is bringing European countriestogether. The strong support that scientific collaboration receives from the EU ismanifested in numerous programmes, projects, actions, and regulations, as well asspecific institutions.
This rich instrumentation did not appear out of the blue. The initial wave ofpro-collaborative initiatives appeared in Europe during the first post-war decades,when several organisations supporting joint research were established, such as theaforementioned CERN established in 1954, the European Organization forAstronomical Research in the Southern Hemisphere launched in 1962, and theEuropean Molecular Biology Organization established in 1964. The idea ofa common policy supporting European science regardless of the disciplinematerialised in 1971 in the form of the European Cooperation in Science andTechnology (COST). COST is the longest-running European intergovernmentalframework aimed directly at supporting scientific collaboration through providingresearchers with the opportunity to participate in science and technologynetworks. Three years later the EU policymakers set up two more institutions tofoster and facilitate collaboration: Scientific and Technical Research Committee(CREST) and European Science Foundation (Commission of the EuropeanCommunities, 1975).
The next wave of pro-collaborative impetus came to the surface in the first halfof the 1980s. In 1983 the first European Strategic Programme for Research inInformation Technologies (ESPRIT) was launched. Four editions of ESPRITprovided cross-sectoral financial support for information technology research andindustrial technology transfer to industry. Two years after ESPRIT, EUREKAwas founded as an intergovernmental organisation for funding and coordinatingpan-European research and development, involving both EU and non-EUcountries. It represents a bottom-up approach in which private companies decidethemselves which research projects should be developed. The FrameworkProgramme for Research and Technological Development (FP), the flagshipinitiative of EU scientific collaboration policy, was also initiated in the 1980s.The programme was intended to address the problem of insufficient coordinationof individual R&D activities at the EU level, all of them requiring a large numberof the European Council’s decisions (Georghiou, 2001).
At the beginning of the 21st century, EU science policy goals started tomove from coordination of national policies towards genuine integration ofEuropean research. The emphasis was no longer on collaboration per se, butmore on global competition and research excellence (Luukkonen & Nedeva,2010). Stronger focus on competition actually fosters research collaboration sincestaying at the frontier of worldwide science requires joint effort and resources
138 Scientific collaboration policy

(Cruz-Castro, Jonkers, & Sanz-Menéndez, 2015). This shift was compliant withincreased interest at EU political forums in research and knowledge production,as manifested in the Lisbon Strategy. The document called for making the EU“the most competitive and dynamic knowledge-based economy in the world”(Lisbon European Council, 2000, para. 5).
The idea to deepen European scientific integration was promoted as early as the1970s by EU Commissioner for Research, Science, and Education,Ralf Dahrendorf (1929–2009). But it was only in 2000 when the concept materi-alised in the form of the European Research Area (ERA). The aim of ERA is tocreate
a unified research area open to the world based on the Internal Market, inwhich researchers, scientific knowledge and technology circulate freelyand through which the Union and its Member States strengthen theirscientific and technological bases, their competitiveness and their capacityto collectively address grand challenges
(European Commission, 2012).
ERA is not a single programme, but rather a European-level policy that isimplemented through various initiatives, in many cases already pre-existing, suchas the Framework Programmes. ERA’s aim to foster free circulation of researchers,knowledge, and technology—the so-called “fifth freedom”—supplements fourfundamental EU freedoms of movement: of capital, goods, services, and people(Andrée, 2009; Madesn, 2010; Nedeva & Stampfer, 2012).
Apart from the Framework Programmes, ERA is implemented through othercollaborative instruments, although their budgets are smaller. An example couldbe the Joint Programming Initiatives, commenced at the end of 2008 and aimed atmajor societal challenges, such as Alzheimer’s disease, water challenges, anddemographic changes (Commission of the European Communities, 2008). Upuntil 2016, ten initiatives were launched, gathering partners from 29 countries(including eight non-EU countries), with a total budget of around €500 million(European Commission, 2016a). 2008 also witnessed the birth of anothercollaboration initiative—the European Institute of Innovation and Technology(EIIT). The idea of a network organisation combining world-class education andresearch with innovation and application was inspired by the MassachusettsInstitute of Technology (Gilbert, 2011). The EIIT, supported with almost€3 billion, was intended to fuel the EU’s innovativeness by transferring knowledgefrom academia to business. A recent audit revealed that this ambitious goal hasbeen held back by oversized bureaucracy, management deficiencies, and defectivedesign. This has been reflected in geographical dispersion as a result ofarguments between EU member states about who will host the EIIT’s head-quarters (Schiermeier, 2016). This perfectly exemplifies the challenges that EUscientific collaboration policy has been facing since its very beginning: the tensionsbetween EU-level priorities and national interests, as well as the nature ofscientific collaboration, which is difficult to impose in a top-down manner.
Scientific collaboration policy 139

6.3.2 The world’s largest collaborative programme
The Framework Programmes for Research and Technological Developmentbecame the flagship of the EU science policy: “the behemoth of the Community’sscience engagement” (Madsen, 2010, p. 196). They enabled breakthroughdiscoveries, such as contributing to the development of the global standard for2G and 3G mobile phone communications or a wearable artificial kidney toreplace dialysis (Migliaccio & Philipsen, 2006). In the mid-1980s, when theprogramme was launched, the main operational aim of its initiator, ÉtienneDavignon (the European Commissioner for Industrial Affairs and Energy), wasto coordinate numerous R&D activities taken at the EU level that linkedresearchers with big industrial players, in order to identify and implementsolutions needed to compete with the US and Japan (Georghiou, 2001; Nedeva,2013). The approach applied in the programme design was based on the model ofsuccessful Japanese R&D collaborative networks of the Ministry of InternationalTrade and Industry, adapted to the European context (Andrée, 2009; FraunhoferISI, Idea Consult, & SPRU, 2009). FPs have evolved in terms of scale and design,as well as thematic focus, yet their strategic objective of fostering scientificcollaboration has remained unchanged.
The FPs’ budget has grown systematically, from €0.8 billion per year in the firstfour-year edition (1984–1987) to €11.3 billion per year in the last seven-yearedition (2014–2020). In effect, over eight editions of the FPs, European sciencehas received almost €200 billion (European Parliamentary Research Service,2015). Most of the FP funds are dedicated to consortia that include partners fromdifferent countries, preferably geographically dispersed. During the programme’slifespan the requirement for international collaboration has systematically evolved.Initially, project consortia had to be composed of institutions from at least two EUcountries. Since the sixth FP (2002–2006), the requirement has been strengthenedto include participants based in at least three different EU member states. In anincreasingly competitive scientific environment this precondition may lead tohonorary project partnership (similar to the honorary authorship described inChapter 2), where an institution is added to the consortium only—or mostly—inorder to meet the formal criteria, although the project would also be feasiblewithout its involvement.
Apart from supporting collaboration through grants dedicated to transna-tional consortia, all editions of the FPs have provided funds for researchers’international mobility through special initiatives: Stimulation in FP1, Sciencein FP2, and since FP3 as one of the programme’s thematic axes. All theseinitiatives have paved the way for the largest EU mobility programme: MarieSkłodowska-Curie Actions (MSCA), launched in 1996. Up until 2013, theMSCA supported the international mobility of more than 65,000 researchersfrom over 130 countries, with 30 percent of them coming from outsideEurope (European Commission, 2013). Each year about 9,000 scientistsreceive support under MSCA to move within the EU, to the EU, or fromthe EU to third countries.
140 Scientific collaboration policy

Increases in the budget and changes in the programme’s design were madein line with its evolving priorities: from those of an almost purely applied,industry-led instrument focused on several thematic areas, to those of a compre-hensive multi-theme initiative providing funds for both basic and applied research(European Commission, 2011). The first edition of the Framework Programmewas largely industry oriented. Half of its budget was dedicated to energy research,especially nuclear energy and thermonuclear fusion, while one-fifth went to newtechnologies, such as IT, biotechnology, and telecommunications (Boekholt,1994). The second FP edition (1987–91) was marked by a shift towards IT, inaccordance with the OECD recommendation to follow the spectacular Japaneseachievements in consumer electronics of the late 1970s. In this edition, to provideaccess to the unique scientific infrastructure, especially for scientists from smallercountries, a special programme was launched: Access to Research Infrastructure.The third FP round (1990–94) was characterised by a diminishing role ofnuclear energy in favour of, among others, environmental research. In 1993, theMaastricht Treaty came into force, adding new FP criteria. The addendum madeit possible to include almost any research topic as an FP theme. From the time ofFP4 (1994–98), the set of themes supported by the programme was broadenedby a few new topics, such as socioeconomic research. Apart from thematic axes,horizontal programmes were also introduced, including those facilitating colla-boration: the promotion of cooperation with third countries and internationalorganisations (INCO), as well as the training and mobility of researchers.The horizontal themes were even more emphasised in the FP’s fifth edition(1998–2002) as one more collaborative theme was added: promotion of innova-tion and encouraging the participation of small and medium-sized enterprises(SME). The SME component was strengthened in FP6 (2002–06) through theCRAFT programme (Co-operative Research), dedicated to SMEs in cross-border innovative research partnerships. In 2002, new instruments related to theEuropean Research Area were introduced: ERA-NET (a bottom-up schemesupporting coordination of national and regional programmes), Integrated Projects(large research projects), and Network of Excellence (supporting coordinationbetween research organisations) (ERA-NET Review 2006, 2006). The themessupported in the last two editions of the Programme (FP7 and Horizon 2020)have been very diverse and wide-ranging, covering almost all scientific disciplines.However, as for the whole FP lifespan, the topics of the specific calls for proposalshave always been defined by the European Commission.
The last completed edition of the Framework Programmes, FP7, financedabout 26,000 joint projects1 and generated over 500,000 pairs of collaborativelinks between scientific institutions (Abbott, Butler, Gibney, Schiermeier, & VanNoorden, 2016). The number of organisations per average FP7 collaborativeproject2 reached 10.5, while the number of countries represented by collaboratinginstitutions amounted to 6.2. Joint research within FP7 resulted in many multi-institutional publications. The average share of international co-publicationsfrom programme participants increased by 10 percentage points (from 49 to 59percent) in comparison to their achievements before joining the programme. For
Scientific collaboration policy 141

sub-programmes dedicated exclusively to research teams (not individual scientists)the difference amounted to almost 12 percentage points (Science-Metrix, Fraun-hofer ISI, & Oxford Research, 2015). Moreover, qualitative studies reveal that 90percent of evaluated researchers confirm that participation in FPs has had a markedeffect on their international networks of collaborators (Idea Consult, iFQ, &PPMI, 2014).
6.3.3 Connecting Europe with third countries
The idea of the European Research Area—creating a common research space—isunquestionably alluring, although it can be criticised on the grounds that it mightlead to the continent’s lock-in by hampering collaboration with non-EU partners.One way to address the risk of lock-in is to improve institutionalised scientificcooperation of the European Union with so-called third countries. This dates backto 1983 when the Science and Technology for Development programme waslaunched. Twenty-five years later, the Strategic Forum for International Scienceand Technology Cooperation (SFIC) was set up—a platform for establishing thecommon strategy of EU member states for scientific collaboration with selectednon-EU partners. Targeted strategies of research collaboration with third countriestake the form of multiannual roadmaps. Up until 2015, the EU had signed bilateralagreements with 20 countries. The partners are chosen based on specific scientific,economic, and political criteria and include both emerging scientific powers(China, India, Brazil) and established global science players (US, Canada, Japan,South Korea) (European Parliament, 2015). Scientific collaboration with non-EUcountries was also treated as a way to integrate future EU member states. Anexample could be the scheme for Central and Eastern European countrieslaunched in 1992. As potential future members of the union, they gained accessto €55 million for collaboration with EU countries through joint projects,researcher mobility, and networking (CESAER, 2016). Furthermore, the partici-pation of new member states in research consortia has always been positivelyassessed during proposal evaluations (Arnold et al., 2008).
Let us take the Framework Programmes as an example of third countries’involvement in scientific collaboration with European countries. One in five ofthe FP7 projects included partners from neither the EU nor associated countries,accounting for about five percent of the total number of FP7 participants. Inthe current Framework Programme edition—Horizon 2020—partners fromnon-EU countries can participate in all programmes and projects, even if thecall for proposals does not have an explicit condition of such participation.Additionally, several thematic areas strongly encourage, or sometimes require,cooperation with third countries, e.g., climate change, food production, andmigration. Such projects accounted for about 20 percent of the Horizon 2020calls for proposals in 2014–2015. Although today participation in the FP is veryopen, non-EU countries vary in terms of their level of eligibility for EU FPfunds. Partners from enlargement and neighbourhood countries associated withthe Horizon 2020 contribute to the FP budget and share both the rights and
142 Scientific collaboration policy

obligations of their EU counterparts.3 More than 120 developing countries forma group of International Cooperation Partner Countries (ICPC) and are able toparticipate in the FP without the status of an associated country (EuropeanParliament, 2015). The rest of the world has the status of non-EU countries notautomatically eligible for funding, which means that they can participate in theprojects but have to fund the participation of their institutions themselves, withthe exception of cases when their participation is recognised as essential for theproject (European Commission, 2016b).
Collaboration with non-EU partners is also driven by the unique scientificinfrastructure marking the European scientific landscape, like the emblematicLarge Hadron Collider (Hallonsten, 2016; Nedeva & Stampfer, 2012). For thelast 60 years, the most expensive and advanced facilities and installations havebeen built in Europe based on intergovernmental agreements and multinationalfunds. Since 2002 these kinds of research investments have been coordinated andexamined by the European Strategy Forum on Research Infrastructures throughspecial biannual roadmaps of new research infrastructure of pan-Europeaninterest. The forum gathers representatives of the EU member states and theEuropean Commission, as well as associated countries.
6.3.4 From national interests to European added value
Scientific collaboration in Europe also receives support through numerous policyinitiatives implemented at the national level, where the majority of R&D fundsare managed (Delanghe, Muldur, & Soete, 2009). The most common are grantsfor projects carried out by international or national research teams, such as theCollaborative Research Grants of the Carnegie Trust for the Universities ofScotland, the Scientific Networks within the Individual Grants Programme ofthe German Research Foundation, the Research Network grant scheme of theDanish Council for Independent Research, the Harmonia programme of thePolish National Science Centre, the Academy Project funding scheme in Finland,International Collaborative Research Projects of the French National ResearchAgency, the TOP grants for research groups of the Netherlands Organisation forScientific Research, and the NordForsk programmes in the Nordic region. Thepro-collaborative dimension is also present in measures supporting researchermobility, such as the DFF-MOBILEX mobility grants of the Danish Council forIndependent Research, the Arts & Humanities Research Council InternationalPlacement Scheme in the UK, and the International Short Visits scheme of theSwiss National Science Foundation. Some countries dedicate special programmesto foreign researchers visiting national institutions, e.g., the POLONEZprogramme of the Polish National Science Centre, the Visiting Scientist Pro-gramme of the Hungarian Academy of Sciences, the Visitor’s Travel Grants of theNetherlands Organisation for Scientific Research, or the grants for recruitment ofleading researchers of the Swedish Research Council. European governments alsooffer a range of instruments aimed directly at fostering and facilitating theestablishment of collaboration, partly through building mutual trust. The British
Scientific collaboration policy 143

Arts & Humanities Research Council established the Research NetworkingScheme, which supports multi-institutional applicants in the process of exchangeof ideas on a specific issue. Within the scheme, custom-made networkingactivities can be financed, especially those enabling the crossing of boundaries—disciplinary, theoretical, methodological, and international.
National support for scientific collaboration, as with the EU-level interventions,also has an integrative dimension. A telling example is Belgium which, in order todeal with its Flemish-Walloon internal divisions, launched, through the BelgianFederal Science Policy Office, the Interuniversity Attraction Poles (IAP) pro-gramme. During the seventh five-year phase of the IAP programme, a total budgetof about €671 million was allocated to stimulate the development of the excellentinteruniversity networks in basic research representing various disciplines. In themost recent phase, which started in 2012, it is envisaged that €156 million will beallocated to support 47 networks with circa 370 partners, from which more than110 are from abroad. Each network comprises at least four partners representinguniversities from the two Belgian regions, Flanders andWallonia. This will make itpossible to achieve both aims: to create a sufficient critical mass of human andmaterial resources and help Belgian researchers find a place in the internationalscientific landscape, as well as to build long-term, structured cooperation linksbetween scientific institutions from the different linguistic communities. Spatialbalance is one of the programme’s concerns—the last completed programmereveals that 56 percent of the IAP’s budget was allocated to universities of theFlemish Community and 44 percent to institutions in the French part of Belgium(Idea Consult & ADE, 2011).
National scientific budgets also support collaboration with third countries.According to the 2014 ERA survey,4 funders in two-thirds of the EU memberstates allocate on average 0.7 percent5 of their budgets to this type of scientificcollaboration. The highest shares (above 2.5 percent) are granted by Germany(a European leader in collaboration with the US and Russia), France (focusingon cooperation with BRIC6 countries, Japan, and South Korea), and Portugal(distinguished by collaboration with Portuguese-speaking countries) (EuropeanCommission, 2014).
Initiatives supporting scientific collaboration at the European Union level workin parallel with national science policies, which also address joint research invarious ways. In the last few decades, along with the rising number and budgets oftransnational programmes and initiatives, the role of EU-level interventions hasbeen increasing. However, the national dimension is still strong. The compatiblecoexistence of the two levels is a result of political negotiations, bargains, andtensions that create and maintain the balance between supporting collaboration atthe EU level, aimed at the common good, and national self-interests. Europeancollaboration “is not undertaken at the expense of self-interest; it is rather thepursuit of one’s interests by other means” (Krige, 2003, p. 900).
The rationale for many EU policies, balanced between national interests anda common goal, is derived from the subsidiarity rule, which states that actionsat the EU level are undertaken only if and in so far as the objectives cannot be
144 Scientific collaboration policy
achieved by the member states and can be better achieved at the EU level.This applies especially to issues with a strong international aspect, thus, thoseinvolving or even requiring collaboration. In these cases, EU-level policybrings additional benefits called European added value (Georghiou, 1998). Itis understood as “the value resulting from an EU intervention which isadditional to the value that would have been otherwise created by MemberState action alone” (European Commission, 2011, p. 2). Scientific cooperationand networking is the very sphere in which European added value can becreated.
6.4 The United States: collaborative culture
There is no distinct scientific collaboration policy in the US. Despite this fact—which runs in line with the American tradition of limited government—collaboration among American scientists flourishes, including inter-organisationaland inter-state collaboration. The well-developed and amply financed USscience sector operates in an environment that enables collaborative behaviour.The high spatial mobility of the population, inclusive organisational culture, andcommon language are all factors that make scientific collaboration far easier than,say, between countries in Europe. Even so, when it comes to internationalcollaboration, the US to some extent lags behind the most scientificallycollaborative nations (compare Chapter 4). On these grounds, there have beennew calls for greater appreciation of the considerable benefits of internationalscientific collaboration to American prosperity (see: Lyons et al., 2016). Thisdoes not mean that there is no scientific collaboration policy in the US. On thecontrary, it is easy to find numerous initiatives of different scale, origin, andsignificance. The point is that central (federal) and strategic coordination of theseundertakings is limited (Hane, 2008). Hence, the overall scientific collaborationpolicy in the US can be seen as a largely bottom-up, emerging phenomenon. Ofcourse, large-scale research is powered by federal agencies, but the bread andbutter of everyday scientific collaboration has a predominantly grassroots flavour.
This section focuses on selected features of the American scientific collaborationpolicy and its particular underpinnings, from the diversity of sources of sciencepolicy, through its collaborative culture, to the importance of science-industrycooperation and academic mobility, and finally to its multilevel internationalcollaboration efforts.
6.4.1 Multitudes of science policies in the US
In the second half of the 20th century, the United States became an unquestionableleader in science. The US formed a highly competitive national innovation system,characterised by a vast scale and institutional complexity (Nelson, 1993). The largenumber of players on the American R&D scene produce almost unlimitedopportunities to collaborate. On the other hand, institutional complexity relatesto the diversity of actors involved in the framing of science policy, including
Scientific collaboration policy 145

scientific collaboration policy. This diversity has three facets. First, on the federallevel, the task of making and implementing science policy is distributed amongvarious organisations. High-level policy decisions involve the president and thecongress. On the implementation side, many federal departments and agenciesmanage their own R&D budgets. The Department of Defense controls by far thebulkiest science funds ($66.1 billion in 2014).7 The Department of Health andHuman Services has the second largest R&D budget ($30.8 billion). Then comesNASA—the National Aeronautics and Space Administration ($11.5 billion) andthe Department of Energy ($11.4 billion). The National Science Foundation—theonly federal agency with the principal objective of funding science—has aconsiderably smaller budget ($5.5 billion). The combined R&D budgets of theother departments amount to about $10 billion. In such circumstances,the resultant federal science policy does not only originate from the largelyindependent decisions of a good dozen organisations, but it is also well-alignedwith other policies (security, health, energy, etc.), and this—in turn—strengthensthe applicatory flavour of US science.
Second, science policy in the US is characterised by multilevel governance.In the American intergovernmental system (Stephens & Wikstrom, 2007) themaking of science policy is not limited to the central government—as it is inthe case of many countries—but the process engages states and even localgovernments. However, science policy at the state level is usually seen not asan independent political field, but rather as an instrument in the service ofeconomic development. This makes state-level science policies largely orientedon research, technology transfer, and university-industry relations (Rees &Bradley, 1988). A well-known example of such state-level policies, operatingsince 1982, is Pennsylvania’s Ben Franklin Technology Partners, previouslybranded as the Ben Franklin Partnership Program (Rahm & Luce, 1992).However, some state initiatives also target basic research. This is the case of theCalifornia Institute for Regenerative Medicine, established in 2004 afterapproval in a state-wide referendum, which focuses its funding on basic stemcell research (Adelson & Weinberg, 2010).
Third, the profile of US science is shaped by both governmental and non-governmental institutions. The nongovernmental actors—companies and non-profits—do not only influence government decisions but also proactively shapescience policy. They control significant R&D budgets that can be allocated topursuing research themes independent of the current administration’s sciencepriorities. Certainly, in almost every industrialised country, a substantial part ofR&D budgets comes from nongovernmental sources (primarily business). Butagain, the US seems outstanding in this respect because of the abundance ofwealthy corporations, private foundations (e.g., the Kavli Foundation, AlfredP. Sloan Foundation, and the Research Corporation for Science Advancement,to name only a few landmark ones),8 and, last but not least, private universities,many of which enjoy multi-billion-dollar endowments (the world’s largest isHarvard University’s endowment, amounting to $36.5 billion in 2015). Theinterest from endowments, royalties from patents and copyrights, and tuition fees
146 Scientific collaboration policy

provide US universities (mainly private ones) with resources that make themautonomous and significant players in framing their own science policies and theresultant national policy.
All in all, science policy in the US can be seen as the sum of variousinitiatives pursued by a diverse group of (semi)independent actors. In such aninstitutional ecosystem, keeping track of scientific collaboration policies andmeasures is not a straightforward task. Take, for instance, one of the latestcomprehensive overviews of US science policy, Beyond Sputnik: US SciencePolicy in the Twenty-First Century (Neal, Smith, & McCormick, 2008). Thisalmost-400-page volume does not include a specific section dedicated toscientific collaboration policies, but make no mistake—the topic is present,though scattered across various chapters and sections.
6.4.2 Scientific collaboration in collaborative culture
Scientific collaboration in the US largely relies on the policies of individualinstitutions, which voluntarily form various—often overlapping—networks. It canbe seen as a form of “low-level” policy—in contrast to “high-level” policies madeby federal and state governments. The wide variety of academic associations are acase in point, from the inclusive Association of American Colleges & Universities,comprising nearly 1,400 member institutions, through the field-specific Associationof Independent Technological Universities, to the elite Association of AmericanUniversities, which has 60 members in the US and two in Canada. Many initiativesbring together institutions from numerous states, but there are also single-stateforms of cooperation, for instance, the University Research Corridor in Michigan:an alliance of Michigan State University, the University of Michigan, and WayneState University.
Interestingly and specifically, many territorial groupings of US universities arelinked to the inter-college sports competitions which are organised into regionalassociations (conferences). The prestigious Ivy League—a grouping of eightworld-class, excellent, and selective northeastern universities9—originated as acollegiate athletic conference. Collaboration among Ivy League institutionsextends far beyond sporting rivalries. The partnership is coordinated by theCouncil of Ivy Group Presidents and by the student-led Ivy Council. Anotherexample might be the Big Ten Academic Alliance (from its founding in 1958until June 2016 known as the Committee on Institutional Cooperation). Thisgrouping of 14 large, mainly public universities10 located in the northeastern andmidwestern states has evolved as an academic counterpart of the inter-collegesports Big Ten Conference. The alliance initiatives cover a broad range ofactivities, from somewhat traditional reciprocal library borrowing, throughshared courses, organisational know-how exchanges, capacity-building initiatives,and common purchasing, to IT support for collaborative research (a cutting-edgefibre optic network between participating universities) and joint research projects.The coalition does not limit its activities to enhancing internal collaboration. Theparticipating institutions build on their outstanding joint capacity to improve their
Scientific collaboration policy 147

external collaboration and outreach. They share study abroad programmes andwork together to increase national and international research collaboration. A casein point is the Traumatic Brain Injury Research Collaboration. The initiativebrings together the Big Ten and aforementioned Ivy League institutions to studythe causes and long-term effects of sport-related concussion and head injuries. Thefeasibility and success of the project rely on the unique resources of the 23participating universities, namely, circa 17,500 student athletes.
A variety of collaborative frameworks in the US can be attributed to the uniqueAmerican culture of collaboration. Formal, as well as informal, un-codifiedpartnerships play a critical role in the US science and innovation system (Atkinson,2014; Committee on Science and Technology, 1998). This collaborative cultureis deeply rooted in the American national character and is famously portrayed by19th-century French intellectual Alexis de Tocqueville (1805–1859). In his epicDemocracy in America, Tocqueville declared:
In America I encountered sorts of associations of which, I confess, I hadno idea, and I often admired the infinite art with which the inhabitants ofthe United States managed to fix a common goal to the efforts of manymen and to get them to advance to it freely
(2000, p. 489).
In the context of the contemporary American R&D sector, collaborative cultureis displayed—inter alia—in the rise of open innovation (Chesbrough, 2003). Atthe beginning of the third millennium about two-thirds of award-winningUS innovations (as recognised by R&D Magazine) involved inter-organisationalcollaboration between business and government, including federal laboratories andresearch universities (Block & Keller, 2009).
6.4.3 Scientific collaboration and industrial R&D policies
A solid chunk of science policy in the US focuses on science-industrycollaboration. Make no mistake, policies supporting collaboration betweenscience and industry are not limited to the US; quite the contrary—they canbe found in all developed countries. Nonetheless, it is in the US that theapplication of research outcomes is particularly emphasised and extensivelysupported, e.g., through intellectual property law (Bayh-Dole Act), whichpermits universities and other non-profit research institutions to benefit frominventions made with federal funding. Technology transfer—or in broaderterms, knowledge transfer—from the R&D sector to business and socialpractice extends beyond the scope and aims of this book. Moreover, a vastbody of literature already covers this topic (see: Link, Siegel, & Wright, 2015).Nevertheless, it is indispensable to highlight that some science-industry colla-boration measures directly influence science-science collaboration. This is thecase, firstly, when science-sector-based scholars collaborate with researchers incompany-run R&D labs, for instance in the framework of Cooperative
148 Scientific collaboration policy

Research and Development Agreements—CRADAs (Kraemer, 2006; Neal et al.,2008). Secondly, measures aimed at creating links between science and industrycan—directly or indirectly—encourage collaboration between scientific institu-tions which, working together, can increase their critical mass and offer morecomprehensive solutions for their business partners. A good example of a policyinstrument targeted at the industrial application of research, which at the sametime directly reinforces science-science collaboration, is the Industry-UniversityCooperative Research Centers (IUCRC) programme.
The IUCRC is a programme led by the National Science Foundation (NSF)since 1973. The programme’s main objective is to transfer new knowledge andtechnology from science to industry. However, it also has supplementarygoals, such as enhancing the engineering and science workforce, developingthe research infrastructure base, and stimulating additional funding for pre-competitive research from the industrial sector. Each centre has to be dedicatedto a specific research or technology area (IUCRCs should not overlap in theirresearch foci). Centres are run by higher education institutions and have toinvolve members from business, government, and non-profit sectors (in thespirit of the triple-helix approach—see Chapter 5). Such an approach, whereuniversities mediate industry-government relations, enables the government toreduce the risk of being blamed for “picking winners and losers in the privatesector” (Neal et al., 2008, p. 144).
Formally, an IUCRC can be run by a single university, but the NSF explicitlyfavours institutional partnerships: “multi-university IUCRCs are preferred tosingle-university IUCRCs because multi-university Centers contribute to anincreased research base as well as to increased interaction among Center partici-pants” (“About the IUCRC Program”, n.d., para. 4). In this way, the policymeasure focused on technology transfer supports—somewhat incidentally—collaboration between universities. However, the multi-university preference isrelatively new. Initially, a vast majority of IUCRCs were established at a singleuniversity. Only in 2002 did the number of multi-site centres exceed the sum ofsingle-site centres (respectively 26 to 19). In 2016, almost all of the centres weremulti-site (63) and only five were run by a single university. Altogether,68 IUCRCs involved 182 universities from virtually all states, i.e., circa 2.6universities per single collaborative centre (Leonchuk, McGowen, & Gray,2016). Additionally, five centres formally partnered up with foreign universities(KU Leuven, Belgium; Dubna International University, Russia; Dharmsinh DesaiUniversity, India; Tampere University of Technology, Finland; Leibniz Univer-sity, Germany). The programme—along with another similar initiative of theNSF: the Engineering Research Center program (for more details see Section6.6.3)—proved to be successful and also contributed to the popularisation of thecooperative research centre (CRC) model of supporting knowledge and techno-logy transfer and cross-sector collaboration. Rivers and Gray (2013) estimate thatbetween 15 and 25 percent of the 24,000 government or university-based andother non-profit research centres in the US and Canada meet the characteristics ofthe cooperative research centre.
Scientific collaboration policy 149

Similarly, science policies on the state level also lean toward science-industrycollaboration. This is the case with the above-mentioned Ben Franklin Partner-ship Program in Pennsylvania, but parallel initiatives have been adopted by manyother states, for example, Ohio’s Thomas Edison Program launched in 1983(Wessner, 2013), the Georgia Research Alliance established in 1990 (Lambright,2000), and Michigan’s Life Sciences Corridor initiated in 1999 and slowed downjust a few years later due to state budget limitations (Geiger & Sá, 2005).
6.4.4 Academic mobility in a mobile society
US internal scientific collaboration is facilitated by the significant spatial mobilityof researchers. According to a study based on affiliations of publications publishedin the period of 1996–2011 and indexed in Scopus, almost one in four USresearchers reported affiliations to institutions located in two or more US states.This can be roughly interpreted as inter-state mobility. If we assume that the USinter-state mobility is analogous to the inter-country mobility in Europe, anintriguing picture arises: European researchers move within Europe more thanthree times less frequently than Americans move inter-state (6.8 versus 22.2percent). Moreover, fewer European scientists experience mobility outside thecontinent than Americans do outside the US (5.5 versus 8.4 percent) (Kamalski &Plume, 2013).
Academic mobility in the United States fits squarely into the Americanculture of geographic mobility. Americans are one of the most spatially mobilenations. A Gallup survey conducted in 2011 and 2012 showed that in a five-yeartimeframe, 24 percent of US adults reported moving house within the country,while the world average was only eight percent (Esipova, Pugliese, & Ray,2013). An average American changes residence much more frequently thanEuropeans do. The Federal Census Bureau estimated that, as of 2007, a typicalAmerican moves 11.7 times in his or her lifetime (Chalabi, 2015). Estimatesfrom 2016 showed that an average European moves about four times (Chandler,2016)—with some nations significantly less prone to mobility (in Poland,Slovakia, and Spain the average is around two moves) and others visibly moremobile (in Finland, Sweden, and Switzerland people typically move six times, inthe UK five times) (RE/MAX, 2015).
This mobility of researchers within the US results in them forming anetwork of former colleagues, which facilitates inter-institutional and inter-state collaboration—with social closeness being the major enabling factor. Thisprocess, in turn, is amplified by the fact that a vast majority of America’sprofessors earned PhDs from a very narrow group of universities. A 2015careful study of nearly 19,000 faculty in three disciplines—computer science,business, and history—showed that 71 to 86 percent of all tenure-track faculty(depending on the discipline) originated from only 25 percent of institutions(Clauset, Arbesman, & Larremore, 2015). Acquaintances and friends made ingraduate schools or during postdocs often prove handy collaborators at furthersteps of an academic career.
150 Scientific collaboration policy

Furthermore, the international dimension of academic mobility also shapesthe American R&D sector. The US is exceptionally efficacious in attractingexternal talent. Foreign-born and foreign-educated scholars make an exceptionalcontribution to American science. This is evidenced by higher-than-expectedrepresentation of foreign-born individuals (1) elected to the National Academyof Sciences and National Academy of Engineering, (2) being most citedauthors, being authors of (3) “citation classics”, and (4) highly-cited patents,and (5) playing a crucial role in launching biotechnology enterprises (Stephan &Levin, 2001). This extraordinary gravitational pull gives rise to accusations of abrain drain that profits the US at the expense of other countries, mostly lessdeveloped. As The Economist forcefully summarised:
Depending on your point of view, America is either a land of opportunityin which genius blossoms in ways that are impossible at home; or a talent-sucking vampire that bleeds other countries of their human capital bywickedly paying more and offering better laboratory facilities
(“Proteins and particles”, 1999, p. 85).
Real life, though, eludes this simple binomial model. The brain drain andgain approach is gradually being replaced by the notion of brain circulation(Saxenian, 2002), which emphasises that both receiving and sending countriescan profit from accelerated mobility. Even if migrating scholars do not return,they often collaborate with colleagues in their former country (Scellato,Franzoni, & Stephan, 2015).
Various policies influence international academic mobility. By and large,American efforts are focused on attracting foreign students and exceptionallyskilled scientists. Many universities make significant efforts to take their pieceof the global higher education market. These efforts range from intensiveadvertising to offering free online courses and educational material, fundingshort and long-term incoming and outgoing scholarships, and launching over-seas offices. In 2016, eight out of fourteen members of the above-mentionedBig Ten Academic Alliance operated permanently staffed foreign offices—some of them in up to four different locations—mostly in China, but also inBrazil, Colombia, Germany, India, Qatar, Turkey, and the United ArabEmirates. Overseas offices focus on recruiting students, but their missionoften includes support for faculty research collaboration (Big Ten AcademicAlliance, 2016). The initiatives of numerous individual institutions contributeto the critical mass that draws foreign talent to American higher education andR&D sector. Nevertheless, the landmark academic mobility policy lies at thefederal level: this is the Fulbright Program, named after Senator James WilliamFulbright (1905–1995), who envisioned the international exchange program.Founded in 1946, the Fulbright Program provides grants for foreigners topursue study, teaching, or research in the US, as well as for American studentsand researchers to go abroad (in recent years the programme has providedgrants to circa 8,000 individuals annually). There is tangible evidence that the
Scientific collaboration policy 151

brain circulation stimulated by the Fulbright Program has increased internationalcollaboration. Foreign Fulbright scholars, after returning to their countries oforigin, are highly likely to continue collaboration with their US colleagues, asshown by the co-authorship of scientific papers (Kahn & MacGarvie, 2011;Røsdal, Lekve, Scordato, Aanstad, & Piro, 2014).
6.4.5 International focus
The Fulbright Program and other efforts to stimulate academic mobility are only apart of US international scientific collaboration policy. In fact, it occurs throughmultiple channels and on multiple levels. First, the US takes part in large-scaleinternational projects—for example, the HumanGenome Project, the InternationalThermonuclear Experimental Reactor, and the International Space Station. TheUS frequently plays a leading role in such projects, not necessarily as an officialleader, but de facto as a major contributor. Second, large-scale, often multilateralinitiatives are accompanied by bilateral cooperation frameworks, which the UShas established with almost all countries. This can take the form of high-levelgovernment-to-government agreements and resulting coordination bodies such asthe US-China Joint Commission on Science and Technology Cooperation and theUS-France Science and Technology Cooperation. High-level official arrangementsare essential tools of science diplomacy, but they do not necessarily directly translateinto specific cooperation programmes and actual funding. Typically, the USgovernment—through its various agencies—backs the US side of collaborativeprojects, expecting the foreign part to be financed by cooperating country sources.Nonetheless, the US fully funds or co-funds collaborative research programmeswith many countries. These programmes frequently focus on a particular topic orchallenge, as for instance, the US-India Collaborative Vision Research program,the US-China Clean Energy Cooperation, or the US-Israel Collaboration inComputer Science.
Federal-level science funding organisations pursue numerous internationalcollaboration actions. For instance, the National Institute of Health (NIH)—anagency of the Department of Health and Human Services—through itsExtramural Research Program supports international collaboration by awardingresearch grants, as well as exchange and educational projects. Many of theNIH’s 27 institutes and centres conduct or promote international collaborationin specific disciplines of biomedical science. One of the NIH centres isspecifically devoted to international collaboration. This is Fogarty InternationalCenter (FIC), named after Congressman John Edward Fogarty (1913–1967),an avid advocate of international health research. Initially named Health forPeace, FIC was opened in 1968. Today FIC runs projects that connect USscientists with colleagues from over 100 countries.
The organisational variety of US international scientific collaboration frame-works can be illustrated by the Global Innovation Initiative launched in 2013.This is a competitive grant program, financed jointly by the US and the UK,directed to university consortia in science, technology, engineering, and
152 Scientific collaboration policy

mathematics, focusing on issues of global significance (e.g., access to safedrinking water and the relation between land use changes and infectiousvector-borne diseases). The programme funds multilateral projects betweenUK and US institutions and one—or more—from designated emergingeconomies (Brazil, China, India, and Indonesia). For the sake of streamliningthe management of the programme, grants are administered either by the US(Institute of International Education—operating on behalf of the Departmentof State) or the UK side (British Council). Without a doubt, the GlobalInnovation Initiative creates opportunities to foster international collaboration,but the scale of the programme is fairly small. In the first round, 23 projectswere awarded a total of $5.1 million. The second cycle resulted in only14 awarded grants.11
Apart from governmental programmes, which are vulnerable to domestic andinternational political and economic turbulences and, as such, are temporaryby nature, international collaboration frameworks in some cases take a morepersistent institutional form. This is the case of the US-Israel Binational ScienceFoundation (BSF) endowed in equal parts by the two countries in 1972. Throughthe decades, BSF has awarded over 4,000 collaborative research projects, with acombined budget amounting to almost $0.5 billion. In 2012, facing the growingcosts of research undertakings and stagnating returns on endowments, the BSFbegan a joint funding program with the National Science Foundation (in 2016 thejoint NSF-BSF programme awarded 53 grants). Bilateral scientific collaborationframeworks occasionally take the form of public-private partnerships and involvenon-profit, non-governmental organisations. This approach is exemplified by thePartner University Fund (PUF), which supports research collaboration betweenFrench and American institutions. The PUF was established in 2007 by theFrench government and the US-based French American Cultural ExchangeFoundation, along with American private donors.
Individual scientific institutions also often have their own collaboration policiesfocused on the international dimension. This is particularly seen in the case of themost affluent and prestigious universities, which largely operate on the globalscale. Take for example Massachusetts Institute of Technology (MIT). Its GlobalSeed Funds support new collaborations between MIT scholars and theirforeign colleagues. Besides this general fund, MIT provides distinct funding fordeveloping collaboration with institutions from 16 selected countries. Certaininstitutions go even further and establish overseas satellite campuses or partnerwith foreign counterparts in developing new joint study programmes or institutes.In 2011, MIT joined up with the Russian government to launch SkolkovoInstitute of Science and Technology (Skoltech), which is intended to becomeone of the R&D engines of the Skolkovo Innovation Center—a high-tech parkon Moscow’s outskirts (Stone, 2016). Four American universities—the Universityof Wisconsin-Madison, the University of Pittsburgh, Duke University, and theUniversity of Pennsylvania—have partnered with Kazakhstan’s newly established(in 2010) Nazarbayev University in its aim to quickly secure an above-averageposition in international university league tables (Mahon & Niklas, 2016). After
Scientific collaboration policy 153

2000, several American universities opened branches or programmes in thePersian Gulf states, which were quickly developing and eager to wisely investtheir petrodollars. These initiatives include, among others, Weill Cornell MedicalCollege of Cornell University in Doha, Qatar, and New York UniversityAbu Dhabi and Heriot-Watt University Dubai in the United Arab Emirates(Miller-Idriss & Hanauer, 2011). These ventures focus largely on education, butin the long run, they can evolve into more research-oriented partnerships.However, the proliferation of branch campuses around the world is accompaniedby rising doubts as to their long-term sustainability (Altbach, 2010), especiallysince many satellite campuses operate in countries vulnerable to political tensionsand turnarounds.
International scientific collaboration is also susceptible to domestic politicalburdens. In the US context, these are chiefly related to national security.Technologies considered to have military relevance are principally off-limits tocollaborative efforts with scholars from other countries (Vest, 2007). Nationalsecurity should be treated very seriously, but it sometimes leads to constrictionsin scientific collaboration that is only at first glance connected to top-secrettechnologies. Consider the case of the physicist Xiaoxing Xi from TempleUniversity. In 2015, the FBI arrested him for leaking classified semiconductortechnology to China. At last—after several expert opinions—it turned out thatthe FBI agents had confounded different technologies and Xi’s research hadnothing to do with classified technologies (Otto, 2016).
6.5 China: (r)evolution in science policy
There is nothing small about China, nor about Chinese science. The Chinesescientific sector has experienced incredible growth and one cannot deny that inthe last 40 years government policy—with the visible hand of the Chinesestate—has played a crucial role in these developments (Liu, Simon, Sun, & Cao,2011). Although state support for science and innovation has a very longtradition in the Middle Kingdom (Gelber, 2001; Needham, 1954; Wilson,1999), the Chinese government recognised the vital role of collaboration inthis process quite late, i.e., in 1980s. Scientific collaboration policy in China ischaracterised by high selectivity in three dimensions: thematic, institutional, andgeographical (Jakobson, 2007). Firstly, R&D resources have been channelled tothe most promising disciplines, to a large extent those giving internationalrecognition to the country. This prioritisation trend has been visible since1978, when the open-up policy was launched. In 2006, priority was given to,inter alia, information technology, nanotechnology, and biotechnology (StateCouncil of the People’s Republic of China, 2006; Cao, Suttmeier, & Simon,2006; Zhou, 2015). Secondly, institutional selectivity is visible in the state’ssupport of selected universities. The mid-1990s State Plan structured thehigher education sector in a very hierarchical way, distinguishing elite research-intensive universities from the vast pool of higher education institutions.Specifically, special central government funding packages were provided to
154 Scientific collaboration policy

build world-class universities, which are also supported by subsidies frommunicipal funds (Zha, 2009). This policy has led to spatial variations in thequality of the Chinese science sector. Only a small proportion of the Chinesehigher education institutions, predominantly located in the eastern and coastalregions, constitutes the “national team”, homed in on the highest qualityscientific research (Kafouros, Wang, Piperopoulos, & Zhang, 2015). The thirdfocus area of Chinese scientific collaboration policy is international outreach. Atthe same time, internal collaboration has been somewhat overlooked and hasfaced numerous obstacles deeply rooted in the Chinese culture and society.
6.5.1 Collaboration in uncollaborative settings
From the science policy point of view, scientific collaboration among Chineseinstitutions remains at an unsatisfactory level. Papers co-authored by researchersaffiliated in two or more Chinese provinces comprise a meagre 14 percentof papers indexed in the Chinese Science Citation Database. In-provincecollaboration is slightly more frequent, with 20 percent of papers co-authoredby scientists from different institutions but located in the same Chinese province(Libo, 2015). The Chinese Patent Office (SIPO) data demonstrates even lowerlevels of inter-organisational collaboration in China. Only 1.3 percent of nearly767,000 patent applications received by SIPO in the years 1985–2008 were theoutcomes of intra-regional collaboration, and just one percent resulted frominterregional collaborative research. Moreover, the numbers hardly changedduring the period in question (Sun & Cao, 2015). These scientometricdata show two noteworthy concerns. Firstly, collaborative inter-organisationalbehaviour in China is much more frequent in the case of research with less directmarket value—note the different order of magnitude between co-authorship(14–20) and co-patenting (1–1.3) collaboration rates. Secondly, spatial proximitymatters: in-province collaboration is clearly more frequent than collaborationthat crosses provincial borders, both for co-publications (20 vs. 14 percent) andjoint patent applications (1.3 vs. 1 percent).
Research collaboration in China develops in an environment that can bedubbed uncollaborative. A number of factors contribute to this condition. Theroots of the uncollaborative environment are deeply embedded in Chineseculture and history. The grim legacy of the Cultural Revolution (1966–76) ledby Mao Zedong (1893–1976) still casts a shadow on Chinese scholarship.During this difficult period Chinese universities were shut down, scientificinstitutes were dismantled, scholarly journals ceased publication, intellectualswere punished, and millions of students and researchers were sent to thecountryside to learn political virtue from poor and uneducated peasants(Wilsdon, 2007). The most significant and long-lasting consequence of thisperiod was the loss of a whole generation of scholars (Jakobson, 2007).
The Confucian tradition does not support collaborative behaviour. It attachesgreat importance to the social hierarchy, loyalty, and subordination to authority.Chinese education traditionally does not encourage critical thinking and
Scientific collaboration policy 155
expression of personal opinions (Qiu, 2014). Further, interpersonal relations inChinese society are determined by guanxi—a concept closely related to thephilosophy of Confucianism. Guanxi describes a complex system of interpersonalrelationships which facilitate private and professional dealings. Development andmaintenance of one’s guanxi network is based on the exchange of reciprocalfavours. Those informal relationships do not only shape collaboration networks inscience, but they also regulate access to resources and funding for research projects.This is a big issue in China in the context of the thousands of returnees, whoappreciate transparency in the financial system and grant policy (Cao, Li, Li, &Liu, 2013). Moreover, Chinese returnees, after many years spent abroad, may bemet with mistrust and reluctance to collaborate, partially derived from their lack ofappropriate guanxi (Wang & Bao, 2015). In effect, collaboration among Chinesescholars seems to be more difficult than in more open and less hierarchicalorganisational cultures (as in the US, for example).
Despite various modernisation reforms and political efforts, the state’sorganisation and the rules of its operation hamper scientific collaboration inthe Middle Kingdom. An example could be the complex system of rightsamong different organisations and individuals. It was not until 1999, when theChinese government issued the Decision on Strengthening TechnologicalInnovation, Developing High Technology and Realizing Industrialization, thatany organisation could freely decide whether and with whom to collaborate,based on its own interests and the market rules. Before this date, in the earlystages of the science and technology sector development and transition towardsa market-oriented economy, Chinese organisations were constricted by tiao(ministerial/departmental) and kuai (regional) relationships (Sun & Cao, 2015).Moreover, unclear rules regarding profit distribution, risk sharing, and owner-ship of intellectual property rights intensify the reluctance to collaborate. Last butnot least, the lack of democracy and freedom in the field of policy and social lifealso affects scientific collaboration in China. Laura Jakobson aptly concludes inher book that “The S&T [science and technology] landscape faces the sameproblems as society at large” (2007, p. 28). The political system in Chinahampers the freedom of choice of scientific topics and partners for collaboration,and the freedom of speech. As such, it is in conflict with the notion ofinnovativeness and creativity.
The unsatisfactory level of collaboration within the Chinese science sectoralso results from the all-pervasive bureaucracy and central planning. The numberof agencies responsible for science and technology development is enormous,and the institutional system complicated, with insufficient coordination and lackof transparency of financial flows. Several dozen independent research budgetholders operate under China’s State Council, and only recently (in 2011) has theChinese government obliged its agencies to disclose information on their R&Dexpenditures to the wider public. The Ministry of Science and Technology, theChinese Academy of Sciences, and the Natural Science Foundation of Chinacontrol more than 70 percent of the central R&D spending through 71 agenciesthat disclosed their budgets in 2011 (Sun & Cao, 2014). Other important players
156 Scientific collaboration policy

are the Ministry of Industry and Information Technology, the Ministry ofEducation, the Ministry of Agriculture, the Ministry of Health, and the NationalDevelopment and Reform Commission. At the same time, the top governingbody of the science and technology system—the Leading Group of Science,Technology and Education, which operates within the Chinese CommunistParty Central Committee—is blamed for inefficient coordination of activitiesamong numerous agencies. For instance, although the Leading Group comprisesheads of ministries involved in science and other related areas, it failed toefficiently coordinate scientific activities and resources in the face of the SARSsyndrome in 2003 (Cao, 2014).
Insufficient exchange of information within and among founding bodies and alack of national quality standards lead to misuse of funds. Different governmentalagencies announce calls for the same undertakings without any coordination(IDRC & State Science and Technology Commission People’s Republic ofChina, 1998; Sun & Liu, 2014), while scholars submit identical research proposalssimultaneously to many funding bodies. Moreover, budgets for single grants areusually insufficient, forcing researchers to apply for several projects at the sametime. Interviews with members of the Chinese Academy of Sciences revealed thatmore than half are under acute pressure to compete for funds because they canbarely cover their basic living expenses (Luo, Ordonez-Matamoros, & Kuhlmann,2015). Fierce competition for resources hampers collaboration and makes theresearch projects fragmented (Poo & Wang, 2014).
Another issue influencing Chinese scholars’ attitudes to teamwork is thesystem of research evaluation. This is based almost entirely on publicationoutput and therefore strongly encourages the publish or perish strategy.Domestic institutions judge scholars’ status by the number of papers publishedeach year. The story of Tu Youyou, the 2015 Nobel Prize winner inPhysiology or Medicine, revealed how inadequate the system is in recognisingtalent. Although Youyou’s discovery of a new cure for malaria becameglobally recognised and has saved millions of lives, she has never been electedto be an academician—the top domestic title for a Chinese researcher(“Reform of scientific research still needed despite Tu’s Nobel”, 2015).Furthermore, the evaluation system undervalues the contributions fromresearchers who are neither the first nor the corresponding author. This rulehampers young scientists in particular, who at the same time experience highpressure to publish in high-impact journals (Qiu, 2015). The system reduceswillingness to collaborate because collaborative papers are less valuable thanindependent works. This means that in many situations, Chinese researchersdo not work together, even if it would be more beneficial for nationalscientific capability (Qiu, 2014). The evaluation system also boosts plagiarismtendencies among researchers (Cao, 2014), and thereby increases mistrustwithin the scientific community. Ze Zhong, the former vice president ofBeijing University of Technology, bitterly summarises, “Collaborationbecomes very difficult. You can’t trust people not to steal your work. Every-one works with the door closed, in secret” (Wilsdon, 2007).
Scientific collaboration policy 157

6.5.2 Reshaping institutions for collaboration
The Chinese science sector has been through significant changes over the lastfew decades. Deep organisational reforms have affected scientific collaborationAn example of a policy aimed at spurring internal collaboration among Chinesescholars is the institutional reform of the Chinese Academy of Sciences (CAS).The CAS was established in the first month of the People’s Republic of Chinain 1949 and still dominates the scientific landscape, serving over 70 percent ofnational science infrastructure and facilities. Zhou Enlai (1898–1976), the thenpremier of the State Council of the People’s Republic of China, was determinedto pool the resources of the whole nation in order to set up the CAS. Hecommented, “Give them people if they need people, land if they need land,buildings if they need buildings” (Poo & Wang, 2014, p. 3). Outstandingscientists, among them returnees from abroad, were concentrated in the newinstitution. Moreover, financial resources guaranteed the CAS an unquestionableposition not only in science itself, but also in science policy. The institutionadopted a very broad and complex mission. Until today it has undertaken basicand technological research, knowledge transfer, and commercialisation activities,conducted nationally strategic research for long-term development, developedhigher education, run big-science facilities, and supplied advice on science policydecision-making. To fulfil its various functions, CAS employs 48,500 researchersand more than 12,000 other staff in 1,000 sites and stations across the country. Itconsists of 104 research institutes, 12 branch academies and three universities.12
Due to its multiple tasks, mammoth size, and complex structure, governance ofthe CAS became very challenging and caused tensions among various actors andinstitutions. On this account, in the last two decades several reforms have beenundertaken to simplify the CAS structures and increase its strategic and financialefficiency: the Knowledge Innovation Programme (KIP) in the years 1997–2010,CAS Innovation 2020 in 2006, Innovation 2050 in 2009, and, most recently, thePioneer Action Plan initiated in 2014 (Luo et al., 2015). In the framework of theKIP, research institutes were restructured and categorised under 10 prioritisedfunding fields. As a result, the number of independent institutes was reduced byone-fifth. Moreover, to decrease maintenance costs, about 25,000 researchers inCAS lost tenured positions. Nevertheless, the KIP reform brought positive resultsto the academy’s productivity, which improved by 12.5 percent.
Another turning point was the CAS conference held in 2012. During theevent, Bai Chunli, president of the academy, drew attention to the lack ofcollaboration among researchers running interrelated, but not linked, researchprogrammes on LED employed in 20 different CAS institutes. The same wastrue for nearly 20 biological institutes. The scientists were not aware of theircolleagues’ work and were reluctant to discuss research results and shareknowledge with the industry (Poo & Wang, 2014). To boost teamworkwithin the academy, consolidate research efforts, and limit the fragmentationof research programmes, the CAS institutes have been grouped into four broadcategories: (1) innovation academies dealing with applied research in the fields
158 Scientific collaboration policy

of microsatellites, space science, marine information science, information technol-ogy, drug development, and nuclear energy, (2) centres of excellence performingbasic science research, (3) big science facilities, such as the Particle Collider inBeijing or the Heavy Ion Source Facility in Guangzhou, and (4) specialisedinstitutes responsible for relevant regional research, such as the environmental andsocial effects of natural disasters. Promising scientists were invited to work in theseorganisations, with assurance of better working conditions and higher salaries(which were previously lower than the Chinese average and therefore madescientists dependent on short-term grants). By this, the CAS encouraged scientiststo collaborate on fewer, larger problems, rather than diverting their efforts tomarginal advances in disparate projects (Cyranoski, 2014; Poo &Wang, 2014).
Similar deep reforms were applied to Chinese higher education. Until 1995, theinstitutional structure of higher education in China did not support collaboration.Different scientific disciplines were strictly separated within dedicated highereducation institutions governed either by one of the ministries within centralgovernment, or by provincial and even local authorities. The reform mergeduniversities and colleges into comprehensive institutions. By 2000, 556 universitieshad been merged and an additional 232 dissolved (Huang & Zhang, 2000; Mok,2005). The reform assumed that merging mono-disciplinary institutions intocomprehensive universities would improve managerial efficiency and internationalrecognition, and increase opportunities to interdisciplinary collaboration.
6.5.3 China goes global
In recent decades, fostering international collaboration in science, technology, andinnovation has been a strategic aim of the Chinese approach towards development.Each of the government’s three major agencies for science and technology—theMinistry of Science and Technology, the National Natural Science Foundation ofChina, and the Chinese Academy of Sciences—has its own international depart-ments to promote collaboration (Tian, 2015). Due to intensive science diplomacy,the Chinese science system is today closely intertwined with the worldwidenetwork of connections (Bound, Saunders, Wildson, & Adams, 2013). Accordingto figures from 2014, China has established scientific cooperation relations withover 150 countries and regions, signed over 100 intergovernmental collaborationagreements, and joined more than 200 international science and technologycooperation organisations (Simon, 2014).
The priority given by the Chinese government to international scientificcollaboration is manifested in the Chinese presence in numerous internationalresearch projects, including the largest and the most cutting-edge. Examplescould be the International Thermonuclear Experimental Reactor, Galileo, theIntegrated Ocean Drilling Program, fourth gen nuclear energy, the GlobalEarth Observation System, CERN Large Hadron Collider, the HumanGenome Project, the Alpha Magnetic Spectrometer, and the World ClimateResearch Programme. The Middle Kingdom actively participated in the latestdiscoveries and changes in the international scientific landscape. In response to
Scientific collaboration policy 159

the detection of gravitational waves by the LIGO project in February 2016, theChinese government has initiated a 15-billion-yuan (circa $2.3 billion in 2016dollars) research project led by Sun Yat-Sen University. The TianQuin projectwill study space-borne gravitational waves with the use of three spacecrafts inEarth’s orbit and other exceptional equipment such as an ultra-quiet cavelaboratory. To foster interest in the project and attract international talent, anew funding scheme for overseas scholars was launched, with competitiveannual salaries of up to $153,000 (Chi, 2016; Luo et al., 2016; Xinhua, 2016a,2016b; Yingqi, 2016).
Apart from individual projects, China is also involved in many large scientificprogrammes established by international organisations or based on bilateralagreements. For instance, the research collaboration agreement between Chinaand the European Union was signed initially in 1998 and renewed in 2009. Thevolume of joint research has gradually increased under the European Union’sFramework Programmes, placing China third, after the US and Russia, in termsof the total number of non-European participants (Bound et al., 2013). 383Chinese organisations participated in 274 collaborative research projects between2007 and 2013, with a total EU contribution of €35 million. In relation to theHorizon 2020 programme, the EU and China have launched a new Co-FundingMechanism to support joint research and innovation activities. Each year, morethan €100 million from the EU will be matched by at least 200 million yuan(almost €30 million) from Chinese programmes of the Ministry of Science andTechnology for projects involving partners from Europe (Tian, 2015).
China consistently links its science sector to the international corporate R&Dscene through the inflow and outflow of foreign direct investments. Many largeChinese companies are now firmly established overseas. The flagship telecommu-nication company Huawei operates several of its many R&D centres all over theworld, e.g., in France, Germany, India, Italy, Sweden, Russia, the US, and theUK. The same stands for another renowned telecommunication equipmentmanufacturer, ZTE Corporation, which established its first R&D site in theUnited States, and later on also in Sweden, France, and Canada. The 2007OECD review of the innovation policy in China reported that Chinese companiesincreasingly place their R&D centres in prestigious locations. Haier (consumerelectronics and home appliances), Konka (electronics and telecommunications),Suning Commerce Group (retail), BAIC Group (automobiles and machinery),and DJI (a leading company in the civilian-drone industry) all set up their R&Dsites in Silicon Valley (Sedgwick, 2015; Somerville, 2013; Terdiman, 2015).
Despite the increasing scale of international collaboration, the big issue is thecharacter of the involvement of Chinese participants in international scientificprojects. The role of Chinese scholars is gradually changing, from being passiveworkers to proactive collaborators, based on a win-win basis and with moreequal responsibilities and tasks (Zhou, 2015). “International cooperation isboth an effective means to bring in, absorb, and utilize worldwide scientificprogress, resources, and talent for innovation, and a way for CAS to contributeto the global science progress and the tackling of various global challenges,”
160 Scientific collaboration policy

says Bai Chunli, president of the Chinese Academy of Sciences, underlining themutual benefits of international collaboration for Chinese and non-Chineseindividuals and organisations (Jing, 2011).
The nature of involvement in a research project depends heavily on the maturityof the given scientific discipline or specialisation in China. As Jian Lin, marinegeophysicist at the Woods Hole Oceanographic Institution in Massachusetts, said,“In many areas of research, Chinese scientists have changed from being a raw-dataexporter to the source of creative ideas” (Qiu, 2015, p. 243). A major exampleof this shift in scientific partnerships is the Human Liver Proteome Project,the large-scale international collaborative initiative proposed in 2002 aimed atgenerating a comprehensive protein atlas of the human liver. Fuchu He, the chiefscientist of CAS, initially co-chaired the project and developed its scientificstrategy (Zhou, 2015). Another factor facilitating the change in the role of Chinesescientists in international research initiatives is the increased funding coming fromChinese institutes. Nevertheless, the key factor behind these processes is thegrowing international experience of Chinese scholars gained through studyingand working abroad.
6.5.4 From brain drain to brain circulation
Since the 1890s, China has been sending its students abroad to rejuvenate theancient civilisation (Gelber, 2001). The returnees from the early days haveplayed important roles in the modernisation of Chinese society, bringing backexperience, knowledge and international contacts. Statistics reveal that:
81% of members of the Chinese Academy of Sciences, 54% of engineeringschools research fellows, and 72% of researchers in charge of the large 863state-financed research projects have studied abroad […] 77% of theuniversity rectors of MoE[Chinese Ministry of Education]-administereduniversities are returnees, as are 94% of recipients of the prestigiousYangtze Scholars scheme
(Welch, 2015, p. 99).
Sending students and scientists abroad is beneficial for the individuals, butat the state level it can lead to a brain drain—a loss of the most valuable partof the country’s human capital. Of the 2.24 million students and scholarsthat went overseas in the years 1978–2012, only one-third have returned toChina (Tai & Truex, 2015). This loss of human capital has been a majorconcern for the Chinese government. Thus, it is not surprising that Chinahas implemented many programmes focused on its highly skilled overseasdiaspora. The most prestigious Chinese schemes to attract academics fromabroad are the Distinguished Young Scholars programme introduced by theNational Natural Science Foundation of China in 1994 and the Chang JiangScholars Program co-founded by the Li Ka Shing Foundation and theMinistry of Education in 1998. Another recent scheme is the Recruitment
Scientific collaboration policy 161

Program of Global Experts, known as 1,000 Talents, designed to attract Chinese-born scientists to return from overseas. Over a period of 5–10 years, the programhas sought to attract about 2,000 leading scholars aged below 55, holdingprofessorships or equivalent positions in renowned research institutions oruniversities (Welch & Hao, 2014). From its initiation in 2008 to mid-2014, theprogram helped to attract more than 4,000 (two times more than initiallyexpected) top-level scientists from abroad. The overall number of returnees iseven more impressive. In 2014, the cumulative number of returned PhD holdersreached 110,000 (Zhou, 2015). However, the search for top-notch human capitalis not only restricted to Chinese nationals. Several talent schemes are directedtowards highly skilled overseas scholars, regardless of their nationality, such as the100 Talent Program of the Chinese Academy of Sciences or the Chang JiangScholars Program (Welch & Hao, 2014). In 2007, the CAS also launched theAward for International Cooperation in Science and Technology, and in 2011,the International Cooperation Award for Overseas Young Scientists to furtherencourage cross-cultural exchanges and scientific cooperation (Jing, 2011).
Apart from central government action, provincial and municipal programsalso try to attract talented people to specific places. Usually, these projects aim toraise the number of innovative start-ups funded by highly skilled specialists fromabroad, promote returnee entrepreneurship, and attract quality scholars. Forinstance, Beijing Overseas Talents Center (BOTC) established in 2008, the firstprovincial-level service unit for overseas talents established in China, undertakesmultifaceted activities on behalf of the Beijing municipal government. BOTC,under the so-called Haiju Program, head-hunts scholars worldwide and offersthem comprehensive assistance when they return to their homeland: it awardsgrants of up to 1 million yuan, provides medical insurance and educationstipends for dependents, and resolves visa and other formal issues. BOTCarranges visits to Australia, the US, and the UK to look for overseas Chinesehigh-level talents and present Beijing’s preferential policies to returnees. TheBeijing Forum for Overseas Talents, organised by BOTC, integrates thereturnee community in Beijing and provides assistance with everyday difficultiesin order to facilitate adaptation to current Chinese circumstances. By 2015,BOTC had recruited 627 high-level experts and entrepreneurs (Huang, 2015).
The diaspora policy is also reflected in the preference for returnees in theChinese residential regulations. A powerful policy in favour of returnees is theconferment of local hukou, a Chinese household registration system that segregatesthe workforce according to regions. The situation regarding hukou is different forgraduates of domestic and foreign higher education institutions. For the formergroup it remains extremely difficult to transfer their hukou to another location.Even if they work in a given city for a long period of time, they lack the formalstatus of a local resident, and consequently cannot enjoy the welfare entitlementsprovided by the city government. This means that they are not eligible for localgovernment services, education, and health care. In contrast, the overseas Chinesegraduates are allowed to select their preferred city of employment and transfertheir hukou accordingly (Welch & Hao, 2014).
162 Scientific collaboration policy

An important policy development occurred in 2001, when China shifted itsdiaspora policy from the notion of “return and serve the homeland” (huiguofuwu) to a more flexible “serve the homeland” (weiguo fuwu), which meanskeeping contacts with the homeland, collaborating from a distance, andsupporting the development of Chinese science, but not necessarily returningto China (Cai, 2012). This new approach was clearly expressed in the speechgiven by Chinese President Xi Jinping in 2013 at the 100th anniversarycelebration of the establishment of the Western Returned Scholars Associationin Beijing: “We welcome overseas-educated talent, whether at home orabroad, to contribute to China’s development” (Jun, 2016). This is in linewith recent observations that the concepts of brain drain and brain gain are nolonger appropriate in the globalised world and should be replaced by the morecomprehensive idea of brain circulation. A country profits not only whenemigrants eventually return to the homeland, but also when they act as foreignliaisons that facilitate international collaboration, and connect local institutionsto the global scientific network.
6.6 Tools for scientific collaboration policy
With the growth of collaborative practices in today’s world of research, scientificcollaboration policy becomes a must-have for every scientifically active nation. Thecase studies of China, Europe, and the United States revealed the wealth ofinitiatives and environments stimulating scientific collaboration. Governmentalscientific collaboration policy is usually accompanied by policies formulated andimplemented by various individual organisations: funding agencies, universities,R&D institutions, NGOs, enterprises, and international organisations. To accuratelymake sense of this abundant variety of scientific collaboration tools, a systematicclassification would be beneficial.
Tools for scientific collaboration policy can be thought of as direct or indirect.Direct tools explicitly aim at the development of scientific collaboration. Indirecttools embrace the collaborative component implicitly. The first type activelypromotes scientific joint ventures, while the second merely enables collaborationand reduces barriers to its development. Thus, the two approaches differprimarily in perspective. Ultimately, both recognise scientific collaboration as ameasure that supports the attainment of other science policy goals, namelyenhancement of research quantity and quality. Therefore, scientific collaborationis a tool of science policy, not its target.
Direct and indirect scientific collaboration tools relate to Jean-JacquesSalomon’s distinction between policy for science and policy through science(Salomon, 1977). They can be named, respectively: science policy for scientificcollaboration and science policy through scientific collaboration. Remarkably,the difference between the two approaches is, to some extent, country specific.EU science policy resembles the first type, while in the US the secondcategory prevails. Risking overgeneralisation, it is arguable that in Europe—atthe EU level and in individual countries—policies towards scientific
Scientific collaboration policy 163

collaboration are mostly top-down, actively promoting collaboration and employ-ing funding mechanisms. In contrast, the US policy towards scientific collaborationis rather bottom-up, enabling and employing regulatory mechanisms (Caloghirouet al., 2002). This diversity is expected, since scientific collaboration policy mixesvary considerably among countries. National innovation systems are countryspecific, thus, “To govern these systems, policymakers must understand theirdynamics and then devise incentives that will lead individual scientists to make thedecisions they want” (Wagner, 2008, p. 106).
The following paragraphs summarise broad categories of scientific collaborationtools, their objectives, underlying mechanisms, and—if applicable—unexpectedby-products. The review covers science diplomacy, infrastructure for collaboration,collaborative projects and programmes, R&D network management,mobility programmes, the collaborative regulatory environment, and researchevaluation criteria. Naturally, the proposed categories overlap, due to the fact thatthey concern various policy levels. For instance, science diplomacy prepares theground for other measures to be implemented in the international setting. Researchevaluation criteria constitute a part of a wider collaborative regulatory environment.And good practices in R&D network management apply to all of the categories.
6.6.1 Science diplomacy
Science diplomacy creates the overall framework for the international researchcollaboration of a given nation. It can take the form of bilateral agreements thatacknowledge the common will to collaborate in the area of science. Moreprecisely, science diplomacy is “the process by which states represent themselvesand their interests in the international arena when it comes to areas of knowledge”(Turekian et al., 2014, p. 4). Science diplomacy consists of three types of activity:(1) diplomacy for science, (2) science for diplomacy, and (3) science in diplomacy.The latter refers to providing policy makers with adequate knowledge of theglobalised world and its current challenges together with policy recommendations.The Intergovernmental Panel on Climate Change, established in 1988 by theWorld Meteorological Organization and the United Nations EnvironmentProgramme, can serve as an illustration. Hence, science in diplomacy does notconcentrate on science or scientific collaboration, but rather on a state’s foreignpolicy goals (The Royal Society, 2010). Meanwhile, the first two types largely relyon international scientific collaboration.
Diplomacy for science facilitates international scientific collaboration throughinternational agreements, bi- and multilateral collaborative programmes, mobilityactions, and joint institutions (both big-science initiatives—such as CERN, theSquare Kilometre Array, or the International Thermonuclear ExperimentalReactor—and small-scale institutes). High-level government talks often precedeworking relations and the launch of concrete scientific collaboration policymeasures. Diplomacy for science also includes international research marketing—a broad spectrum of measures homed in on the promotion of a given country as aleading location for conducting science, a destination for academic mobility, or a
164 Scientific collaboration policy

valuable scientific collaborator. Germany has adopted a comprehensiveapproach to international research marketing. Since 2006, the Federal Ministryof Education and Research has carried out an initiative called “PromotingInnovation and Research in Germany”. It aims to attract to Germany foreignR&D investments and highly skilled researchers, as well as fostering interna-tional scientific collaboration (Fähnrich, 2015). The initiative is implemented,inter alia, by the network of science representatives based in German embas-sies, foreign representative offices of German research and intermediaryorganisations, the alliance for international research marketing,13 several dozensof temporary R&D networks, international events, and two comprehensiveportals: Research in Germany—Land of Ideas (www.research-in-germany.de)and Kooperation international (www.kooperation-international.de). The formertargets foreigners interested in R&D collaboration with German partners orwilling to pursue study or research in Germany. The latter provides informationon international cooperation opportunities for German scientists and companies(Federal Ministry of Education and Research, 2014).
Science for diplomacy means using science cooperation to improveinternational relations between countries, particularly in a situation where thepolitical environment is tense and official political relations are limited.Examples include the US-Japan Committee on Science Cooperation inauguratedin 1961, the scientific collaboration between Israel’s Weizmann Institute andGermany’s Max Planck Society initiated in the late 1950s, and the Middle EastResearch Cooperation programme run by the US Agency for InternationalDevelopment, which since 1981 has established scientific collaboration withArab and Israeli partners. These initiatives illustrate that scientific interactions canlay the foundation for bringing back diplomatic relations between countries.Science for diplomacy takes the form of mobility programmes, educationalscholarships, or science festivals and exhibitions—activities that can beundertaken even if diplomatic relations between countries are frozen (see:Bound et al., 2013).
6.6.2 Infrastructure for collaboration
Collaboration patterns in science are shaped, to some extent, by the availabilityof specific infrastructure. Two types of infrastructure for scientific collaborationcan be distinguished: (1) unique facilities, often—but not necessarily—related tobig science, and (2) communication and virtual collaboration tools. The uniqueinfrastructure attracts researchers and, consequently, the places where it is locatedbecome collaboration hubs. Here, three cases in point are CERN near Genevain Switzerland, Fermilab near Chicago in the US, and the Very Large Telescopeobservatory in the Atacama Desert of northern Chile. Megascience infrastructuredoes not only play a role in organising scientific collaboration. The uniquenessof facilities and equipment operates on various scales, from globally uniquestructures (such as the International Space Station), through one-and-only facilitiesin a country or a region, to single apparatuses within a given organisation. The
Scientific collaboration policy 165
context-specific uniqueness of infrastructure constitutes its collaborative capability.For this reason, collaboration based solely on shared infrastructure can be easily cutoff when collaborators acquire their own facilities. Such a process was observed inPoland after its accession to the European Union in 2004, when many universitiesand research institutes obtained scientific instruments sponsored by EuropeanUnion Funds. Consequently, some of the infrastructure-based collaborationsbecame irrelevant and were terminated (Celińska-Janowicz, Wojnar, Olechnicka,& Ploszaj, 2017).
The second type of collaborative infrastructure—communication technologiesand virtual collaboration tools—derives its collaborative capability not fromuniqueness, but from ubiquity. According to the logic of network externalities,the utility of a given communication tool rises with the number of connectedpeople—the more individuals use telephone, fax, email, or a social networkingservice, the more useful it is for everyone (Katz & Shapiro, 1985; Rogers, 2003).The enabling and facilitating role of information and communication technologiesin scientific collaboration is undeniable. It is no accident that internationalscientific collaboration gradually increased with the worldwide proliferation ofthe internet, initiated in the early 1990s and quickly transforming global societyand economy (Castells, 1996). Contemporary science is unimaginable withoutinformation and communication technologies, which have become omnipresentand almost translucent to the point where it is hard to differentiate betweenscholars’ collaborative behaviour and productivity. A 2009 paper published inResearch Policy concluded that:
At earlier stages of the introduction of the internet, its use might have givenresearchers who were early adopters an added advantage in informationexchange and coordination from a distance. However, in a context whereuse of email has become an everyday routine, email communication provednot as important for research productivity
(Vasileiadou & Vliegenthart, 2009, p. 1266).
But make no mistake, the diminishing impact of ICT on scientificcollaboration concerns primarily the most basic tools (e.g., email), whichhave become almost universally available, even for scholars in developingcountries (Shrum et al., 2014). It is the quality of the ICT infrastructure thatmakes a difference—for instance, the availability of higher internet bandwidthscorrelates with academic productivity (da Fonseca Pachi, Yamamoto, daCosta, & Lopez, 2012). Furthermore, the vast diversity of advanced virtualcollaboration tool types—collaboratories, e-Science, cyber-infrastructure,virtual research environments, collaborative software, groupware, remote con-ferencing services, scholarly social networking sites, and workflow systems, topoint out only a few of many categories and competing concepts—is progres-sively transforming the practices of scientific collaboration (for details andexamples, see: Carusi & Reimer, 2010; Jirotka, Lee, & Olson, 2013; Olson &Olson, 2013; Olson, Zimmerman, & Bos, 2008).
166 Scientific collaboration policy

6.6.3 Collaborative projects and programmes
The most apparent collaboration policy tool is a collaborative project. The idea isstraightforward: funding agencies can specify collaboration as a prerequisite forapproving a project, or include collaboration incentives in the evaluation criteriafor project selection, which in turn makes joint proposals more likely to befunded. Many grant competitions use one of these approaches. This is the casewith cross-sectoral programmes, mainly those focused on cooperation betweenscience and business, or programmes for inter-firm research joint ventures (see:Vonortas, 1997). Support schemes available primarily for R&D institutions alsoapply this approach. For instance, participation in the Framework Programmes—the main measure used to stimulate international scientific collaboration in theEuropean Union—initially required at least two partner institutions from differentcountries. Following the EU enlargements, the bar was raised to include three ormore organisations based in the various countries.
Programmes for collaborative projects are often focused on internationalcollaboration. However, there are a number of worthy examples of measuresaimed at domestic networks. Taking the US as an example, we can mentionthe well-known Engineering Research Centers programme (and its oldersister, the Industry-University Cooperative Research Centers programmedepicted in Section 6.4.3 above). The Engineering Research Centers initiativewas authorised by the US Congress in 1985 to bridge university research,education, and industrial innovation. The programme funded consortia com-posed primarily of research universities that were expected to form partnershipswith industry (Bozeman & Boardman, 2004). The first (1985–1990) andsecond (1994–2006) generations of the programme financed 40 centres. Thethird generation started in 2008 and, by 2016, had awarded ten centres. Thecollaboration requirement varied over time. In the current iteration of theprogramme, partnerships are expected to include not only domestic partners—alead university plus one to four partner universities—but also one to threeforeign higher education institutions. One of the large-scale and long-operatingEngineering Research Centers was the Mid-America Earthquake (MAE)Center. MAE was led by the University of Illinois at Urbana-Champaign incollaboration with Georgia Institute of Technology, the University of Memphis,Massachusetts Institute of Technology, St. Louis University, Texas A&MUniversity, and Washington University. A well-grounded evaluation of theMAE Center proved that it increased collaborative behaviour. Its memberscollaborated more often than non-affiliates, in particular with industryand in cross-disciplinary teams. The various opportunities to interact acrossorganisational, sectoral, and disciplinary boundaries provided by collaborativeresearch centres was shown to increase not only collaboration, but also researchproductivity (Ponomariov & Boardman 2010).
Another example of measures directly aimed at intensifying domestic scientificcollaboration is the German Excellence Programme. This joint initiative ofGerman federal and state government started in 2006 and is implemented by
Scientific collaboration policy 167

the German Research Foundation and the German Council of Science andHumanities. The programme has amassed a weighty budget of up to 3.2 percent ofthe R&D expenditure of the German higher education system. It aims to enhancescientific excellence through intensifying domestic collaboration among universitiesand major non-university institutions, namely, the Helmholtz Association, theMax Planck Society, the Leibniz Association and the Fraunhofer Society. Theunderlying premise of the programme—and an essential feature of the Germanscience system—is that non-university research organisations accumulate a great dealof top-level scientific activities. Thus, universities were expected to significantlyprofit from intensified collaboration with these research organisations, not onlyincreasing their scientific performance but also climbing in global university rank-ings. The programme resulted in the growth of highly cited joint publications ofuniversities and non-university institutions. However, the positive effect was greaterfor the latter (Möller, Schmidt, & Hornbostel, 2016), providing a conspicuousexample of the Matthew effect generated by science policy.
A distinct category of collaborative schemes is formed by big science projects.Firstly, they are very uncommon for the simple reason that they generateextremely high costs. Secondly, scientific collaboration plays a major role in bigscience—large, often international partnerships are needed to amass the necessaryresources and skills. In this case, collaboration can be seen as a sine qua noncondition for a project execution. As such, big science projects are responsiblefor increased scientific collaboration, and consequently for the collaborative turnin science. However, they can hardly be seen as a policy tool aimed directly atscientific collaboration. Policy makers do not fund cutting-edge, large-scale,expensive research to merely influence scientific collaboration, but to enablediscoveries and inventions, solve pressing social problems, boost the economy, orachieve military supremacy. Big science clearly shows that scientific collaborationis—ultimately—a measure of science policy, not its objective.
6.6.4 R&D network management
This broad category of scientific collaboration tools focuses on (1) initiating newlinks between researchers, and (2) developing and enhancing the efficiency ofexisting R&D networks. Scientific network management initiatives usually takethe form of small-scale soft measures which directly address research collabora-tion. In essence, they supplement initiatives oriented towards research outcomes.A typical example is a small grant scheme aimed at establishing new partnerships,which subsequently can apply for a collaborative project or funding for sharedinfrastructure. This kind of “glue money”, or “seed grant”, supports meetings,covers travel costs, brings scientists together, and facilitates communication. Suchsimple activities can be highly beneficial, specifically with regard to internationaland interdisciplinary partnerships—typically harder to establish compared todomestic and same-discipline collaborations (Cooke & Hilton, 2015).
On a micro scale, the management of interactions among researchers can bebased on the pro-collaborative design of campuses, laboratories, and office
168 Scientific collaboration policy

spaces. Scientific collaboration is “a body-contact sport—people have to berunning into each other to make it work” (National Academies et al., 2005,p. 94). Many organisations deliberately arrange various shared spaces, cafeterias,common rooms, and corridors in a way that increases the number of occasionsfor people to mingle together. There is growing empirical evidence—on top ofcommon-sense intuition—that the physical features of a workplace environmentcan impact collaborative behaviour (Doorley & Witthoft, 2012; Owen-Smith,2013; Sailer & McColloh, 2012; Toker & Gray, 2008). Here, the key role isplayed by co-location, either long-term or temporary (Boudreau et al., 2017;Catalini, 2017; Kabo et al., 2014).
Efficient research collaboration requires specific personal skills, organisationalarrangements, and managerial practices. Collaboration can be risky and inefficient,and it can fail if not managed properly. The need for insight into the mechanismsgoverning research collaboration and practical advice to manage it well hasmotivated the rise of a new area of inquiry: the science of team science. Thisexamines “the processes by which scientific teams organize, communicate andconduct research” (Börner et al., 2010). Simultaneously, a number of manuals,handbooks, and best-practices compendia for effective and efficient researchcollaboration have been proposed. The US National Academy of Sciences hasprepared two particularly remarkable practice-oriented publications: FacilitatingInterdisciplinary Research in 2005 (National Academies et al., 2005) and Enhancingthe Effectiveness of Team Science in 2015 (Cooke & Hilton, 2015).
6.6.5 Mobility programmes
Mobility programmes create possibilities for students and researchers to spend aperiod of time in another institution, usually abroad. This is a very commonmeasure implemented on a governmental level by almost all scientificallyadvanced countries. The most representative example is the US FulbrightProgram, while the largest—regarding the number of participants—is thestudent-oriented EU Erasmus Programme. Many research organisations havealso adopted mobility programmes, for example, in the form of bilateral exchangearrangements or subsidised overseas sabbaticals. The temporary relocation ofstudents and researchers is believed to have a positive influence on their knowl-edge and skills; hence, the main aim of academic mobility is to improve humancapital. However, it turns out that the mobility of students and researchers alsooften results in increased scientific collaboration (Scellato et al., 2015).
There are two mechanisms for gaining collaborative benefits from mobilityprogrammes: return and circulation. The returnmechanism relies on the assumptionthat home-coming scientists bring back and make available their foreign contacts,along with their knowledge and expertise gained abroad. Less-performing countries,like China, India, Argentina, or many African states, build their merit in science byrelying on the international exchange of students and scholars. As Jacob and Meekstated, “Mobility and internationalization are increasingly becoming entry costs forengaging in scientific research in some fields of endeavour” (2013, p. 333). The
Scientific collaboration policy 169

example of China, which since the late 1990s has introduced numerous schemes forreturnees, such as the Yangtze River Scholar Plan, the 100 Talents Program and the1,000 Talents Program, shows that the policy towards returnees was able to bringback its citizens, and they have had an impact on Chinese international scientificcollaboration (Hao, Yan, Guo, &Wang, 2017; Xian, 2015). However, the bottomline is that the most talented scholars—meaning also those most engaged incollaboration—rarely returned to China (Zweig &Wang, 2013).
The circulation mechanism can be seen from two opposite perspectives. Fromthe standpoint of the outflow country, it relies on building strong links betweenthe diasporas and the domestic scholar community. Chinese evidence shows thatscientists working in China benefited in particular from collaboration withoverseas Chinese, thus, encouraging greater collaboration with the scientificdiaspora can contribute significantly to scientific progress (Fangmeng, 2016). Onthe other hand, from the perspective of the inflow country, the circulationmechanism relies on the establishment of long-lasting collaboration with visitingscholars who eventually go back to their homelands. A meticulous study of 1,800academics from 93 countries who visited Germany under the Humboldt ResearchFellowship programme during the second half of the 20th century reveals thepositive outcomes of international collaboration. After their return, Humboldtresearch fellows collaborated with German peers more intensively than otherresearchers. The study concludes that the Humboldt mobility programmecontributed significantly to Germany’s strong position in the global scientificcollaboration network (Jöns, 2009).
6.6.6 The collaborative regulatory environment
The regulatory environment constitutes a framework in which legal incentivesand deterrents shape collaborative behaviour. The impact of legislation onscientific collaboration can be powerful. This is exemplified by the AmericanBayh-Dole Act adopted in 1980. The legislation, officially named as the Patentand Trademark Law Amendments Act, permitted universities, small businesses,and non-profit institutions to benefit from inventions made with federalfunding. This new regulatory environment contributed to the amplificationof university-industry R&D collaboration in the US in the 1980s and 1990s(National Academies et al., 2005). On the other hand, the intellectual propertymonetary value of university research, strengthened by the Bayh-Dole Act, isoccasionally blamed for deterring international scientific collaboration, espe-cially between developing and developed nations. Clemente Forero-Pineda,from the University of los Andes in Bogotá, Colombia, mentioned the case ofa failed attempt at collaboration between a South American institution and aUS research university. The cooperative research agreement was not signedbecause the US university insisted on keeping all the patent rights resultingfrom the collaboration (Forero-Pineda, 2006).
Another example of legislation relevant to R&D collaboration is immigrationlaw. Easy movement of scholars across borders is of growing importance in the
170 Scientific collaboration policy

increasingly internationalised science sector. The idea of the free circulation ofresearchers is central to the policy framework of the European Research Area.Besides, many developed countries have implemented specific immigrationregulations streamlining the entry of foreign scientists. For instance, the US hasadopted a visa category for “aliens of extraordinary ability”. Under the law,outstanding scholars are granted temporary or permanent residency visas.
Intellectual property rights and immigration law are examples of national-levelregulations that can influence scientific collaboration. However, other sciencepolicy levels are also relevant here. Above all, research funding agencies have attheir disposal a number of regulatory tools that can facilitate or boost collaboration.Simple recognition that a project can be led by multiple principal investigators canfacilitate research joint ventures—this approach is implemented, for example, bythe US National Institute of Health (McGovern, 2009). However, the largestpossible impact of pro-collaborative rules relates to international collaboration.Typically, funding agencies operate within national borders. Crossing countryborders in the framework of a funded project is usually impossible or requiressignificant additional administrative effort. Funding agencies reduce this burden bythe application of specific regulations. A guide prepared in 2014 by ScienceEurope—an association of major European research funding and researchperforming organisations—recommends three models to facilitate cross-bordercollaboration: (1) money follows researcher, (2) money follows cooperation line,and (3) the lead agency procedure.
The first scheme allows for cross-border transferability of grants. Aresearcher relocating to another country can take his or her current grant andcontinue to work on it in a new research organisation abroad. The modeltargets international collaboration, somewhat indirectly, by easing internationalacademic mobility. It is argued that “the start at a new host institution and in anew country is easier for the scientists if they are able to bring along their ownresearch funds in a simple and non-bureaucratic way” (Science Europe, 2014,p. 8). Such an approach was initiated in 2003 by the German ResearchFoundation, the Austrian Science Fund, and the Swiss National ScienceFoundation. The agreement allows the cross-border transfer of national grantsbetween Austria, Germany, and Switzerland.
The second scheme (money follows co-operation line) allows for the funding offoreign investigators directly, in a national grant. The method enables internationalcollaboration in a simple manner: there is no need for the involvement of foreignfunding organisations or any additional international decision-making process.This was implemented in 2007 by the UK’s Economic and Social ResearchCouncil under the name “International Co-investigators Policy”. After severalrounds of funding, the council declared that the proposals which included inter-national co-investigators achieved significantly higher success rates in comparisonto the purely UK-based proposals (Science Europe, 2014).
The idea of the third scheme, the lead agency procedure, is straightforward:international research projects are funded by national agencies in parallel—i.e.,each agency funds its own part of the project and no money is transferred
Scientific collaboration policy 171

across borders—while one of the cooperating agencies takes the responsibility ofreviewing and recommending project applications. However, this is also a morecomplex model than the two discussed above. The lead agency procedure requiresnot only a substantial agreement between research funding organisations, but alsoa high degree of mutual trust. Cooperating organisations have to agree onprocedures (which can significantly differ from those to which they are accus-tomed) and rely on the leading agency’s work quality. This additional effort isoutweighed by the benefits of simplifying the application process for internationalpartnerships, which need to prepare only one proposal instead of multipleapplications submitted separately in each country. Likewise, research fundingorganisations also benefit from the reduction in processing the same proposalsconcurrently. The scheme has been adopted by the American National ScienceFoundation, which partners with the Netherlands Organisation for ScientificResearch, and by the French National Research Agency and the Austrian ScienceFund, as well as by the Luxembourg National Research Fund and the SwissNational Science Foundation—to name only a few examples (for more details see:Science Europe, 2014).
6.6.7 Research evaluation criteria
Scientific performance evaluation can be a powerful framework for influencing thecollaborative behaviour of individuals, as well as institutional policies towardscollaboration. The influence can be particularly strong when the result ofan evaluation translates into individual or institutional profits, such as careerdevelopment or access to finance. The latter case relates particularly to perfor-mance-based research funding systems implemented in many countries, such asthose initiated by the UK in 1986, then followed by Australia and New Zealand,Hong Kong, and a number of European Countries, in particular the Nordic states,but also Belgium (the Flemish Community), Italy, Poland, Portugal, the SlovakRepublic, and Spain (Hicks, 2012). Research evaluation frameworks addresscollaboration in two ways: (1) explicitly, when collaboration is one of the assessmentcriteria, and (2) implicitly, when other criteria affect collaborative behaviour (e.g.,fractional or whole counting of publications). Furthermore, collaborative perfor-mance assessment targets individuals or organisations. Expected behavioural changemechanisms vary across these two levels. However, personal and organisationallevels of evaluation are to some degree intertwined, due to the fact that institutionalevaluation criteria are often seen as a point of reference for individual assessments. Inthis way, incentives of national performance-based research funding systems trickledown to the level of a single scholar (Aagaard, 2015).
On the individual level, the most obvious and explicit evaluation-inducedincentives for collaboration are related to career development. The ability todevelop collaborative networks, evidenced by a vast, heterogeneous constellationof collaborators, is a significant plus on the academic job market. Many institutions,in advertising job posts, include experience in scientific collaboration (ofteninternational or with industry) as a prerequisite or an appreciated advantage.
172 Scientific collaboration policy

Likewise, engagement in collaboration can be checked during periodic perfor-mance assessments and tenure or promotion reviews. This can provide a clearmessage for scholars that might easily translate into more collaborative under-takings. The issue is more complicated than one might expect. Collaboration isoften seen as the tricky part of promotion and tenure reviews. Even thoughscience is increasingly collaborative, the key to getting tenure is individualperformance (McGovern, 2009; Misra, Smith-Doerr, Dasgupta, Weaver, &Normanly, 2017; Zucker, 2012). Not surprisingly, “A common piece of advicethat is given to job candidates and newly hired assistant professors is that it isimportant to work independently of other faculty so that one’s accomplishmentscan be measured easily” (Jorgensen, 2007, p. 2967). However, the main point isnot to discourage collaboration, but to adjust performance assessment rule booksto the contemporary collaborative era in science. Some comprehensiveframeworks to evaluate individual performance in highly collaborative contextshave already been proposed (see: Mazumdar et al., 2015). A significant relateddevelopment that facilitates individual performance assessment is the proliferationof scientific journal policies requiring a detailed description of each author’scontribution to the given paper (Marušić, Bošnjak, & Jerončić, 2011; Rennie,Yank, & Emanuel, 1997; Tscharntke, Hochberg, Rand, Resh, & Krauss, 2007).
Collaboration as a criterion for evaluation of individual scientists may be closelyconnected to academic mobility. Experience gained in various institutions (oftenabroad) is seen not only as an enhancement of one’s knowledge and skills but alsoas a sign of relational capital: the capital of relationships with former colleagues thatcan be turned into new inter-organisational collaborations. In North America, atypical—and expected by tenure-track search committees—education and careerpath includes at least two or three major stops at different institutions (under-graduate program, graduate school, and postdoctoral fellowship, for example).Remarkably, this mobility requirement operates largely as an unwritten rule,deeply embedded in the American academic culture. This contrasts with Europe,where academic mobility is decidedly lower, and policymakers try to stimulate oreven—occasionally—force institutional mobility. A case in point is Germany,where a rigid mobility requirement has been introduced. PhD graduates are notallowed to work at their alma mater for a period of six years after graduation(Enders, 2001). However, the mobility requirement is usually less strict. Forexample, in the Czech Republic, some experience abroad is one of the prerequi-sites for a PhD defence—and in this case, the requirement can be satisfied byparticipation in summer schools or even academic conferences.
Research performance assessments on the institutional level can approachcollaboration criteria qualitatively or quantitatively. Qualitative approaches,based on peer review (such as the Research Excellence Framework in theUK), rarely directly focus on scientific collaboration, due to the fact thatevaluators can directly assess the quality and impact of the examined institution.In this instance, scientific collaboration is properly handled as a means, not anend. In quantitative approaches, based on metrics (applied in, inter alia, Australia,China, Denmark, Italy, Norway, and Poland), the criterion of collaboration
Scientific collaboration policy 173

plays a much more important role and is applied in many ways, from countingepisodes of collaboration and mobility, through taking into account the monetaryvalue of collaborative projects, up to measuring the outcomes of collaboration,namely co-authored publications or patent applications. In relation to collaborativeprojects, different weights can be assigned to various types of projects (e.g.,domestic or international) and the roles of an assessed institution (e.g., overallcoordination, coordination of a working package, or just participation in aconsortium).
Quantitative performance assessment frameworks raise concerns over theirindirect—either intentional or unintentional—impact on collaborative beha-viour. This is particularly the case with bibliometric indicators. It has beenspeculated that fractional counting may discourage co-authorships for the reasonthat co-authored works give fewer credits than those that are single authored;this applies primarily to fields in which publications typically involve dozens oreven hundreds of authors or institutions (Bloch & Schneider, 2016). On thecontrary, whole counting is seen as a favourable approach to co-authorshipbecause it allocates full credit to all collaborating parties. Some even argue that itcan induce “an artificial collaboration initiated only for the purpose of dealingwith the evaluation system” (Kulczycki, 2017). However, to date, there is nosolid evidence of either effect. Analyses of evaluation models applied in Australia(whole counting), Norway (fractional counting), and Denmark (fractionalcounting with a bonus for collaborative publications—institutional fractions aremultiplied by 1.25) find no relationship between the method of countingpublications in performance assessments and collaborative behaviour (Aagaard,Bloch, & Schneider, 2015; Schneider, Aagaard, & Bloch, 2016; Schneider,2009; Ingwersen & Larsen, 2014; Sivertsen, 2016).
* * *
Due to the omnipresence of collaboration in contemporary science, there isalmost no area of science policy that does not affect research collaboration.Besides the plethora of specific tools for scientific collaboration, network-oriented science policy encompasses measures that influence collaborationindirectly. In consequence, scientific collaboration policy has to be seen as anincreasingly horizontal and inherent feature of science policy, not merely asubset of its objectives and tools. This fusion of scientific collaboration policiesand overall science policy certainly makes decision-making and policy-makingprocesses more challenging. Nonetheless, it also opens up possibilities for morecomprehensive and effective science policy that is collaboration-aware.
Notes
1 Not all FP7 projects were collaborative. Two programme axes—Ideas and People—were not specifically designed to support cooperation (i.e., collaboration was not aprerequisite requirement).
2 Excluding the two non-collaborative programme axes: People and Ideas.
174 Scientific collaboration policy

3 As of 1 January 2017, the countries associated with Horizon 2020 are Iceland,Norway, Albania, Bosnia and Herzegovina, the Former Yugoslav Republic ofMacedonia, Montenegro, Serbia, Turkey, Israel, Moldova, Switzerland, FaroeIslands, Ukraine, Tunisia, Georgia, and Armenia.
4 The survey was addressed to around 600 European public funders and 8,500research-performing organisations, of which 1,265 responded (representing one-third of the total government budget appropriations or outlays for research anddevelopment in the EU).
5 For comparison, 0.35 percent of the FP7 budget was allocated for internationalcooperation with non-EU countries.
6 Brazil, Russia, India, and China.7 The data are sourced from UNESCO, 2015.8 According to the Science Philanthropy Alliance, private funding for basic research
in life sciences reached more than $1 billion in 2015 (“Private funding for science”,2016).
9 The eight institutions are Brown University, Columbia University, Cornell Uni-versity, Dartmouth College, Harvard University, the University of Pennsylvania,Princeton University, and Yale University.
10 Indiana University, Michigan State University, Northwestern University, OhioState University, Penn State University, Purdue University, Rutgers University,University of Illinois, University of Iowa, University of Maryland, University ofMichigan, University of Minnesota, University of Nebraska-Lincoln, University ofWisconsin-Madison.
11 As of the beginning of 2017, the continuation of the initiative is neither confirmednor foredoomed. http://global-innovation-initiative.org/
12 Data from http://english.cas.cn, visited 17.02.16.13 The alliance joins four key players of the German innovation system: Alexander
von Humboldt Foundation (AvH), German Academic Exchange Service (DAAD),German Research Foundation (DFG), and the Fraunhofer Gesellschaft (FhG).
Scientific collaboration policy 175

7 Conclusions
The accelerating accumulation of scientific knowledge, increasing specialisation,and competition for resources and recognition make the way to the knowledgefrontier increasingly difficult for a sole scientist, an individual organisation, or asingle country. Consequently, policymakers, research organisation managers, andindividual scholars recognise collaboration as a valuable tool to allocate resourcesefficiently and to increase the quantity and quality of scholarly outputs. Everyonejumps on the collaborative bandwagon, as it brings the promise of increasedcapacities to push forward the knowledge frontier. The unprecedented contem-porary growth of research collaboration—the collaborative turn—is transformingscientific endeavour. The organisation of research and scholarly work is progres-sively defined by multidimensional networks, which connect researchers, organi-sations, policymakers, infrastructures, professional and general media, and the laypublic. However, at the same time, the global geography of science has notchanged substantially. Similarly, the highly hierarchical structure of scholarshipremains fundamentally constant. The collaborative turn has not flattened theworld of science, as globalisation has not levelled global socioeconomic disparities.The overall global landscape of science remains spiky.
On the one hand, the collaborative turn disrupts the processes and practicesof doing science. On the other, spatial structures of scientific endeavour can beseen to persist rather than considerably transform. The closing section of thebook reflects on this tension. We summarise the mutual relations betweenscientific collaboration and the geography of science. Then, we look to thefuture of scientific collaboration and its possible impact on the spatial featuresof research and scholarship. The chapter concludes with thoughts on sciencepolicy challenges in the collaborative turn era.
7.1 Research collaboration and the geography of science
Geography matters in scientific collaboration. The spatial location of researchinfrastructure, higher education institutions, and individual scholars definespossible nodes of scientific collaboration networks. The geographic distributionof research activities provides a scaffold over which the web of collaboration isstretched. This scaffolding was set up long before the collaborative turn in

science materialised. The increasing research collaboration has filled existingstructures, rather reinforcing than reshaping the geography of science.
Furthermore, the spatial distance between the nodes in scientific networksmodulates the likelihood of collaborative links emerging, as well as thedevelopment and intensity of collaboration. Despite significant improvementsin transportation, along with advances in information and communicationtechnologies—which have reduced the costs and smoothed the flows ofgoods, people, and ideas on a global scale—spatially separated organisationsand scholars are less likely to collaborate than those located in proximity toeach other. However, the role of the proximity-distance variable is differentwhen it comes to the impact of collaborative research. Spatially distantcollaboration tends to provide more sound results than short-haul relations.The latter are likely to have overlapping capacities, while spatially separatedcollaborations create opportunities to combine complementary skills andresources. Thus, overcoming the hardships of distant collaboration can be asmart strategy in order to invade the cutting edge of science. On this account,we can understand why distant collaboration in science is constantly on the risedespite the persistent significance of spatial proximity.
On the other hand, scientific collaboration matters for the geographyof science. Research collaboration cements the long-term, hierarchical, core-periphery structure of the global distribution of research excellence. Top-notchresearch organisations tend to collaborate with each other. In effect, they gainadditional advantage over scientifically less developed entities. Collaborationbetween more and less scientifically advanced organisations, places, or countrieshappens very often. However, the effects of such cooperation are not necessarilyevenly distributed among partners. Although less scientifically advanced partnersbenefit—through the diffusion of knowledge—from relations with more devel-oped collaborators, the latter profit even more because they are able to imposetheir own paradigms, research agendas, and long-term objectives.
Simultaneously, less advanced players, positioned on the outskirts of the globalscientific collaboration network, have no other option to increase their perfor-mance but to collaborate with the scientific core. Yet collaboration is not asufficient factor to turn scientific latecomers into state-of-the-art performers.The recent rise of China as a new scientific superpower—a rare breakthrough inthe petrified structure of the contemporary global science system—provides aprime example here. The outstanding development of the research sector inChina has resulted predominantly from massive investments from the Chinesegovernment and has less to do with networks and collaboration. Moreover, thisamazing rise has taken place despite the cultural and organisational obstacles toscientific collaboration in China. On the one hand, it implies that even ifcontemporary science is highly saturated by the logic of collaboration, tangibleresources remain the most important stimuli for the development of the researchsector. On the other hand, one can hypothesise that cultural and institutionalimpediments to collaboration may hinder further expansion of the researchsector in specific national or organisational environments.
Conclusions 177

The tension between the collaborative turn that disrupts scientific endeavourand the persistency of the global geography of science can be further understoodin light of spatial transaction and transmission costs. Interacting across geogra-phical space involves specific spatial transaction costs. Among them, a subgroupof spatial transmission costs related to moving information, goods, and peoplecan be distinguished. Due to the development of transportation, information,and communication technologies, spatial transmission costs have been signifi-cantly reduced in recent decades (Gaspar & Glaeser, 1998; Glaeser & Kohlhase,2004). This fall in spatial transmission costs has contributed to the rise ofscientific collaboration. However, once basic information can be transmittedvirtually for free, access to complex knowledge, typically of tacit nature, gainssignificance in building a competitive advantage. The cost of handling complexknowledge across space remains relatively high because it requires face-to-faceinteraction and long-term, trusted relationships. In consequence, the overallspatial transaction costs have risen, even if spatial transmission costs have fallen(McCann, 2013). The fact that there are more collaborative flows in the globalresearch network does not necessarily change its structure. The tide of collabora-tion has raised all boats, but those that were already in the centre are still there,and those that were far away still drift on the periphery.
Moreover, the relations between space and scientific collaboration take placeon many levels, from the location and movements of individual scholars,through the internal organisation of research facilities, offices, and campuses, aswell as inter-organisational relations, to interurban, inter-regional, and interna-tional mega-spaces of knowledge flows. Notably, the multidimensional nature ofscientific collaboration in space goes beyond the simple observation that flowsoccur on different scales. Some regularities vary across spatial levels. Thisphenomenon is well illustrated by three facets of research internationalisation.First, despite the exceptional growth of international collaboration, domestic—interurban—collaboration not only remains significant but tends to grow fasterthan international collaboration. Second, due to the aggregation bias, theinternationalisation degree tends to be higher at the subnational level than atthe national or global scale. Third, at the global level, the relationship betweenthe volume of scientific production and its internationalisation is negative, whileat the subnational level, areas with higher scientific output tend to be moreinvolved in international research collaboration. As a result, the comprehensivetheoretical approaches to the geography of scientific collaboration shouldembrace micro and macro perspectives. The two approaches can be simulta-neously complementary and contradictory—as in the case of classical andquantum physics or micro and macroeconomics—but both are indispensable tounderstanding scientific collaboration in space.
7.2 Future geographies of scientific collaboration
The collaborative turn in science is not over—it constantly develops. Mostlikely, it will continue to change the scholarship in the years to come. We can
178 Conclusions

expect that the future geographies of science will be increasingly conditionedby collaboration, in accordance with the logic of networks. As Manuel Castellsobserved:
dominant functions and processes in the Information Age are increasinglyorganized around networks. Networks constitute the new social morphologyof our societies, and the diffusion of networking logic substantially modifiesthe operation and outcomes in processes of production, experience, power,and culture
(1996, p. 467).
It is indeed difficult to predict what the future will look like. Still, we can reflecton key contemporary trends in scientific cooperation and try to imagine how theymight impact the future geographies of science. Four issues are particularlyimportant: (1) the further growth of mass collaboration, (2) the rise of citizenscience, (3) the limits of collaboration, and (4) threats to global research networks.
Mass collaboration refers to situations in which collaboration exceeds a typicalscale. This is epitomised by scientific hyper-authorship. In 1993, the Ig NobelPrize went to a group of 972 scholars recognised for co-authoring an article thathad 100 times as many authors as pages (Cho &McKee, 2002). As of March 2018,the highest number of co-authors—precisely 5,154—was achieved by a paperestimating the size of the Higgs boson published in Physical Review Letters in 2015.The achievement was accurately depicted in Nature: “Only the first nine pages inthe 33-page article […] describe the research itself—including references. Theother 24 pages list the authors and their institutions” (Castelvecchi, 2015, para. 2).New co-authorship records can only be a matter of time. Large-scale, multi-organisational, and multi-national collaborations proliferate. The sizes of researchteams that were incredible yesterday are today typical, and tomorrow will be seenas modest. So what could be the spatial impact of these increasingly common,enormous research teams? Recent years have shown that more flows and densernetworks do not necessarily mean that the spatial distribution of network nodesevolves. On the contrary, the network logic seems to replicate pre-existing spatialstructures. On this basis, we can hypothesise that larger research teams will createeven greater benefits for current cores and increase their advantage over thescientific periphery. Larger teams need more coordination, and if coordinating ateam gives power, coordinating a larger team gives even more power. The newlogic of networks goes hand in hand here with the old logic of the Matthew effect.
If teams of collaborating scholars can grow to enormous sizes, citizen science—also known as networked science or crowd science—means even larger collabora-tions. The first iteration of the Galaxy Zoo crowdsourced astronomy projectattracted 150,000 citizen scientists who classified 900,000 galaxies (Lintott et al.,2010). Another astronomy project, SETI@home, involved, as of 2016, about1.5 million volunteers from all over the world who agreed to allocate theirpersonal computers’ idle processing resources to analyse radio signals in search ofextra-terrestrial intelligence.1 Although citizen science has limitations—as it is
Conclusions 179

useful only in specific cases—and raises concerns about the quality of results (Therise of…, 2015; Thelen & Thiet, 2008), it has already contributed to the develop-ment of scientific knowledge. A good example is the online puzzle video gameknown as Foldit. The aim of the game is to fold structures of proteins—ademanding task that requires strong spatial imagination. The game has attractedhundreds of thousands of players and has contributed to significant discoveries. In2011, Foldit gamers solved the crystal structure of a monomeric retroviralprotease, a long-unsolved problem in HIV/AIDS research (Khatib et al., 2011).A year later, the volunteer crowd reengineered a protein widely used in syntheticchemistry, increasing its activity by more than 18 times (Eiben et al., 2012). Thenumber of citizen science initiatives is impressive: in late 2016, the website namedSciStarter—a crowd science directory—listed circa 1,000 active projects.Although at present the number of publications based on citizen science is ratherlow (e.g., 124 in 2010 and 402 in 2015), it is growing faster than the overallpublication output (Kullenberg & Kasperowski, 2016). So, perhaps citizen sciencecan flatten the spiky geography of science? Empty hopes. Involvement in citizenscience projects usually requires access to personal computers and a stable internetconnection (technology), some basic skills and competencies (human capital),and—last but not least—the luxury of spending time on this type of activity(quality of life). Such capacities are unequally distributed across the globe. Again,better-developed places occupy a privileged position, while underdevelopedlocations often cannot even take part in the race.
Throughout the book we have frequently focused on increasing collaborationin science. But we cannot assume that collaboration will grow endlessly. Thegrowth of collaboration has its limits. This is well demonstrated in the case ofinternationalisation (Ponds, 2009). In many countries the share of papersco-authored with foreign collaborators has been rising linearly in recent decades.As a result, in numerous cases, the percentage of internationally co-authoredpublications exceeds 50 or 60 percent (see Chapter 4). Common sense suggeststhat this increase will be less and less dynamic as it approaches 100 percent. Atsome point, the growth curve will flatten out. The saturation point will beachieved. Similarly, at the individual and organisational level, collaborationcannot increase forever. Indeed, “no one can collaborate with an infinitenumber of people in a finite period of time” (Newman, 2001a, p. 9). We canexpect that further increases in scientific collaboration will fall under the law ofdiminishing marginal returns. At some point, an additional collaborator bringsfewer and fewer benefits. Moreover, when collaboration becomes a new norm,its beneficial impact may cease to matter or will at least be significantly reduced.In the context of geography, this means that collaborative flows may haveincreasingly less capacity to redefine the fundamental spatial structures of science.
Last but not least, we cannot dismiss the scenario in which research collaborationdeclines. In recent years, we have become accustomed to the successive increaseof collaboration, especially in its international dimension. But what if nationalisolationism once more gains an advantage over international cooperation andintegration? The UK’s withdrawal from the EU, a process that began after the
180 Conclusions

Brexit referendum in 2016, poses a significant threat to the prospects andcapacities of the European Research Area. Isolationist tendencies under theDonald Trump administration—e.g., the travel ban for citizens of selected countriesand quarrels with Mexico and China—undermine the international connections ofUS research and higher education institutions. Threats related to international affairsare strengthened by centrifugal social forces. Anti-science movements, epitomisedby climate change denial and anti-vaccine beliefs, are gaining momentum all overthe world (Otto, 2016). The collapse of international scientific networks, althoughunlikely, looms on the horizon. If an unfavourable scenario comes true, the lessscientifically advanced countries will be the most exposed to negative consequencesdue to their dependency on knowledge flows from the scientific core. But, moreimportantly, the biggest loser will be scientific advancement. In turn, the overallsocial and economic progress of humanity may slow down. The advantages of thecontemporary collaborative turn in science are not given once and for all. Wisepolicies are necessary to sustain global scientific networks.
7.3 Towards smart policies for scientific collaboration
The journey that has taken us from historical, through present, to upcomingplaces and spaces of scientific collaboration concludes with takeaways forscience policy. Ready-to-use recommendations often fail to fulfil their pro-mises, particularly in the long run. Thus, to avoid the trap of one-size-fits-alladvice, we have formulated several policy challenges to be addressed in orderto craft smart policies in given circumstances. The smart approach towardsscientific collaboration policy is necessary for at least two reasons: the hor-izontal nature of scientific collaboration policies, and the variety of levels atwhich science policies can be designed and implemented.
The horizontality of scientific collaboration policy calls for integratedapproaches. Because contemporary science is increasingly collaborative, the over-all science policy should be collaboration-aware, even in areas where connectionsto collaboration are indirect, such as the architectural design of research facilities oracademic promotion criteria. On the other hand, scientific collaboration policyshould be coherent with the broader context of science policy. If researchcollaboration is treated as a distinct policy focus, the risk of inefficiency arises.This comes from two sources. The first source is found within scientific colla-boration policy. Once this policy area is delineated, a goal of increasing collabora-tion tends to be pursued, irrespective of its overall long-term usefulness and itscost-benefit ratio. The second source relates to the overall science policy. If thepolicy sees scientific collaboration as overseen by designated, separate pro-grammes, measures, and initiatives, the threat of unintended and undesirableinterference arises. In an extreme scenario, the overall science policy mightcountervail the undertakings of a “department for scientific collaboration”. Thismight be exemplified by research performance assessment criteria that do notproperly take into account the collaborative nature of contemporary science,thereby hindering joint research.
Conclusions 181

Scholarly collaboration relates to multiple policy levels: individual, organisa-tional, local, regional, national, transnational, and even global. These levelsvary in relevance and their capacity to impact the prospects of collaboration.By and large, the most significant role is played by nation-state policies, as theyprovide frameworks for organisational and individual strategies. Subnational(local, urban, regional) and supranational levels are less relevant. A special caseis the European Union, in which the transnational level has gained muchimportance. All in all, the spectrum of possible policy options depends on thelevel considered. Furthermore, various policy levels are interdependent. Suchmultilevel relations can release synergies. However, at times, policy objectivesformulated at different levels can contradict each other and successively producesuboptimal outcomes. Consequently, the answers to the collaboration-relevantpolicy questions are determined—to some extent—by the place of the givenentity in the global knowledge production system.
The fundamental question relates to the ultimate objective of science policy.Should the policy focus on cutting-edge science that pushes back the globalknowledge frontier? Or, alternatively, should the policy strive for the develop-ment of those research capacities that will contribute to the reinforcement of agiven urban, regional, or national economy? The two approaches converge in thelong run, but in the short run, they tend to translate into divergent mid-term aims,measures, and milestones. The difference is particularly vital for less scientificallyadvanced places. In their case, the cutting-edge research agenda is not onlyimplausible, but is also of little use for local socioeconomic development. In suchcircumstances, focusing on research goals related to local capacities and challengesmight prove more reasonable. All things considered, possible strategies forscientific cooperation are conditioned by two approaches. The approach thatfavours cutting-edge science most likely translates into policies that concentrate oncollaboration between highly performing organisations and places. In conse-quence, less scientifically developed areas can be overlooked and their peripheralposition may become more firmly cemented. The approach that gives priority tothe applied value of research as an essential factor of urban and regional develop-ment has a slightly different policy-choice spectrum. In this case, the encourage-ment of collaboration between places with varied levels of scientific capacities ismore desirable, as it supports knowledge diffusion from the core—a process thatcan fuel the development of scientific peripheries.
Though less often than core-core collaborations, core-periphery partnershipscan also produce cutting-edge science. This implies that the range of scientificcollaboration policy goes beyond the duality delineated in the previous para-graph. The idea of place-based and place-neutral policies helps make sense ofthis variety. The place-neutral approach—also known as spatially-blind—deliberately ignores geography in order to fulfil the ideal of a policy thattreats all its subjects impartially. In contrast, the place-based approach takes intoaccount the specific needs, challenges, and capacities of a given territory(Barca, McCann, & Rodríguez-Pose, 2012). As such, the place-neutralapproach fits into the cutting-edge science agenda, while the place-based
182 Conclusions

approach leans towards a research strategy that enhances local or regional devel-opment. However, other combinations are also possible. Specifically, the place-neutral science policy can be focused on developmental goals defined at thenational level. In this scenario, subnational diversity is not taken into account, andthe policy can even increase the pre-existing diversity of scientific capacities acrossgeographical space. Likewise, the place-based approach can be combined with thecutting-edge science agenda. Now and then, the specific features of a giventerritory make it a particularly convenient place to achieve outstanding scientificresults. As a result, the territory attracts collaborators regardless of its scientificcapacity. For example, specific conditions for astronomical observations fuelcollaboration between Chile and many other nations. On the whole, the place-based policy of international scientific collaboration can aim at cutting-edgescience, especially within clearly defined research domains or problems, such asenvironmental management, neglected diseases, or public health.
Science policy should also take into account the hierarchical structure ofscientific collaboration grounded in the uneven distribution of collaborativeadvantage among collaborators. Should the policy focus on supporting collabora-tion between the best so that they can become even better? Alternatively, should itstimulate knowledge flows between weaker and stronger partners to enhance theoverall knowledge production system? The resulting policy options span frompolarisation to cohesion. Supporting collaboration among the most advancedentities certainly increases the chance of groundbreaking discoveries, but it alsoreinforces tendencies of polarisation that are intrinsic to research collaboration.Supporting collaboration between more and less scientifically advanced areas willundoubtedly benefit the latter, and in turn, it can foster more cohesive distributionof research capacities and impacts—but it might be less effective in advancingscientific progress, at least in the short-term. However, cooperation within ahierarchical structure can also lead to polarisation. Stronger partners have thepower to impose research topics, objectives, and paradigms on their collaborators.In an extreme scenario, weaker partners might be exploited rather than advan-taged. Thus, the cohesion approach in scientific collaboration policy should notonly consider how to encourage stronger partners to collaborate with lessadvanced ones, but also how to secure a fair—though not necessarily equal—distribution of benefits from collaboration.
The unique scientific collaboration policy challenge relates to the proximity-distance nexus. Proximate collaboration is easier to establish and sustain, whiledistant collaboration unlocks more unusual possibilities and tends to bring moreresounding impact. So, in which circumstances is greater proximity needed andin which is greater distance preferred? Or, what would be the right mix of closeand distant collaboration? A lack of collaboration calls for simple solutions:facilitating joint research with geographically closer partners. Successively,experience from initial collaborations and accumulated relational capital cansupport the establishment of more demanding, often distant, partnerships.When the reservoir of possible partners becomes larger, the tactics of partnerselection gain importance, particularly in relation to the expected impact of
Conclusions 183

collaboration. Moreover, the geographical dimension of the proximity-distancedilemma intertwines with other types of proximities: cognitive, cultural, eco-nomic, institutional, organisational, social, and technological. Therefore, theactual policy challenge is to find the proper equilibrium on the multilevelproximity-distance continuum.
A responsible policy approach to scientific collaboration should consider notonly the benefits from collaboration but also its associated costs. By and large,both benefits and costs increase with an expanding collaboration range, be itgeographical distance, the number of scholars, the variety of scientific disciplines,or the cultural and organisational diversification of research teams. But, to whatpoint do the benefits from expanding collaboration offset its rising costs? Howextensive or selective should collaboration be in a given case? The choicebetween extensive and selective collaboration strategies calls for a careful cost-benefit analysis, which is no trivial task, given the complex nature of researchcollaboration. On the one hand, we have collaboration’s direct effects andindirect impacts—often significantly postponed—on the other hand, there aredirect material costs and overheads, as well as alternative (opportunity) costs.
The final policy challenge relates to the tension between collaboration andcompetition in science. Relations that drive the research universe are notlimited to scientific collaboration. Competition has always been widespread inacademia. In fact, both types of relationships coexist, and this is captured bythe concept of coopetition. On that basis, important policy questions arise:What is the right mix of collaboration and competition in science? In whichcircumstances is collaboration desirable and when does competition providesignificant efficiencies? The competition-collaboration dilemma is particularlyrelevant for policy levels that create overall frameworks for scientific commu-nities. In particular, national science policies must carefully address this issuewhen crafting research funding schemes, intellectual property rights, andresearch performance assessment criteria. The adequate balance between com-petition and cooperation should not only maximise the overall efficiency of aresearch sector, but also ensure the social value of science.
Note
1 The rise of citizen science is greatly facilitated by the development of informationand communication technologies, but the origins of this movement are neither newnor related to ICT. Very early examples of citizen science were of an entirelyanalogue character. The North American Bird Phenology Program ran from 1881to 1970. At its peak, the programme involved about 3,000 volunteers whodocumented observations of birds’ arrival dates on about six million MigrationObserver Cards (Miller-Rushing, Primack, & Bonney, 2012).
184 Conclusions
References
Aagaard, K. (2015). How Incentives Trickle Down: Local Use of a National Bibliometric IndicatorSystem. Science & Public Policy, 42(5), 725–737.
Aagaard, K., Bloch, C., & Schneider, J. W. (2015). Impacts of Performance-Based ResearchFunding Systems: The Case of the Norwegian Publication Indicator. Research Evaluation, 24(2),106–117. doi:10.1093/reseval/rvv003
Aarstad, J., Kvitastein, O. A., & Jakobsen, S. E. (2016). Local Buzz, Global Pipelines, or SimplyToo Much Buzz? A Critical Study. Geoforum, 75, 129–133.
Abbasi, A., Altmann, J., & Hossain, L. (2011). Identifying the Effects of Co-Authorship Networks onthe Performance of Scholars: A Correlation and Regression Analysis of Performance Measures andSocial Network Analysis Measures. Journal of Informetrics, 5(4), 594–607.
Abbasi, A., & Jaafari, A. (2013). Research Impact and Scholars’ Geographical Diversity. Journal ofInformetrics, 7(3), 683–692.
Abbott, A., Butler, D., Gibney, E., Schiermeier, Q., & Van Noorden, R. (2016). Boon or Burden:What Has the EU Ever Done for Science? Nature, 534, 307–309.
Abramo, G., D’Angelo, C. A., & Murgia, G. (2014). Variation in Research Collaboration Patternsacross Academic Ranks. Scientometrics, 98(3), 2275–2294.
Achachi, H., Amor, Z., Dahel-Mekhancha, C. C., Cherraj, M., Bouabid, H., Selmanovic, S., &Larivière, V. (2016). Factors Affecting Researchers’ Collaborative Patterns: A Case Study fromMaghreb Universities/Les Facteurs Affectant Les Pratiques De Collaboration Des Chercheurs: UneÉtude De Cas Des Universités Maghrébines.Canadian Journal of Information and Library Science, 40(3),234–253.
Aczel, A. D. (2006). The Artist and the Mathematician: The Story of Nicolas Bourbaki, the GeniusMathematician Who Never Existed. New York, NY: Thunder’s Mouth Press.
Adams, J. (2013). The Fourth Age of Research. Nature, 497, 557–560.Idea Conslut & ADE. (2011, January). Ex-Post Evaluation of the IAP Programme (Phase VI, 2007–
2011). Brussels. Retrieved from http://www.belspo.be/belspo/iap/publ/iap%20evaluation%20-%20main%20report.pdf
Adelson, J. W., & Weinberg, J. K. (2010). The California Stem Cell Initiative: Persuasion, Politics,and Public Science. American Journal of Public Health, 100(3), 446–451.
Agar, J. (2012). Science in the Twentieth Century and Beyond. Cambridge, UK: Polity Press.Agrawal, A., Kapur, D., & McHale, J. (2008). How Do Spatial and Social Proximity
Influence Knowledge Flows? Evidence from Patent Data. Journal of Urban Economics, 64(2),258–269.
Agrawal, A., McHale, J., & Oettl, A. (2014). Collaboration, Stars, and the Changing Organization ofScience: Evidence from Evolutionary Biology. In A. B. Jaffe & B. F. Jones (Eds.), The ChangingFrontier: Rethinking Science and Innovation Policy (pp. 75–102). Chicago, IL: University of ChicagoPress.

Ahlgren, P., Persson, O., & Tijssen, R. (2013). Geographical Distance in Bibliometric Relationswithin Epistemic Communities. Scientometrics, 95(2), 771–784.
Ahn, J., Oh, D. H., & Lee, J. D. (2014). The Scientific Impact and Partner Selection inCollaborative Research at Korean Universities. Scientometrics, 100(1), 173–188.
Ajiferuke, I., Burell, Q., & Tague, J. (1988). Collaborative Coefficient: A Single Measure of theDegree of Collaboration in Research. Scientometrics, 14(5–6), 421–433.
Akera, A. (2007). Calculating a Natural World: Scientists, Engineers, and Computers during the Rise ofU.S. Cold War Research. Cambridge, MA: MIT Press.
Al, U., & Taskın, Z. (2015). Relationship between Economic Development and IntellectualProduction. Collnet Journal of Scientometrics and Information Management, 9(1), 25–35.
Allen, J. T. (1977). Managing the Flow of Technology: Technology Transfer and the Dissemination ofTechnologycal Information within the R&D Organization. Cambridge, MA: The MassachusettsInstitute of Technology.
Allen, J. T., & Henn, G. (2007). The Organization and Architecture of Innovation: Managing the Flow ofTechnology. Amsterdam, Netherlands: Elsevier.
Altbach, P. (2010). Why Branch Campuses may be Unsustainable. International Higher Education, 58,2–3.
Alter, C., & Hage, J. (1993). Organizations Working Together. London, UK: Sage.Amanatidou, E. (2002). Foreign Policy and International R&D Collaboration Policy in Greece.
Science and Public Policy, 29(6), 439–450.Amin, A., & Robins, K. (1991). These are Not Marshallian Times. In R. Camagni (Ed.), Innovation
Network: Spatial Perspective (pp. 105–120). London, UK: Belhaven.Amin, A., & Thrift, N. (1992). Neo-Marshallian Nodes in Global Networks. International Journal of
Urban and Regional Research, 16(4), 571–587.Amin, A., & Thrift, N. (1994). Living in the Global. In A. Amin & N. Thrift (Eds.), Globalization,
Institutions, and Regional Development in Europe (pp. 1–22). Oxford, UK: Oxford University Press.Anderson, J. E. (2010). The Gravity Model. NBER Working Papers 16576. Cambridge, MA:
National Bureau of Economic Research, Inc.Andersson, Å. E., & Persson, O. (1993). Networking Scientists. The Annals of Regional Science,
27(1), 11–21.Andersson, M., & Ejermo, O. (2005). How Does Accessibility to Knowledge Sources Affect the
Innovativeness of Corporations?—Evidence from Sweden. The Annals of Regional Science, 39(4),741–765.
Andrée, D. (2009). Priority-Setting in the European Research Framework Programmes. VINNOVA-Swedish Governmental Agency for Innovation Systems. Retrieved from https://www.vinnova.se/publikationer/priority-setting-in-the-european-research-framework-programmes/
Angier, N. (1988). Nice Guys Don’t Win Nobel Prizes [Review of the Book Science as a Process: AnEvolutionary Account of the Social and Conceptual Development of Science, by D. L. Hull]. The NewYork Times, pp. 14–16.
Arbo, P., & Benneworth, P. (2007). Understanding the Regional Contribution of Higher EducationInstitutions: A Literature Review. OECD Education Working Papers. 9. Paris, France: OECDPublishing. http://doi.org/10.1787/161208155312
Arnold, E., Åström, T., Boekholt, P., Brown, N., Good, B., Holmberg, R., . . . & Van Der Veen, G.(2008). Impacts of the Framework Programme in Sweden. VINNOVA-Swedish Governmental Agencyfor Innovation Systems. Retrieved from https://www.vinnova.se/en/publikationer/impacts-of-the-framework-programme-in-sweden/
Asheim, B. R. T. (1996). Industrial Districts as ‘Learning Regions’: A Condition for Prosperity.European Planning Studies, 4(4), 379–400.
Asheim, B. R. T., & Gertler, M. S. (2005). The Geography of Innovation: Regional InnovationSystems. In J. Fagerberg, D. C. Mowery & R. R. Nelson (Eds.), The Oxford Handbook ofInnovation (pp. 292–317). Oxford, UK: Oxford University Press.
186 References

Asheim, B. R. T., & Isaksen, A. (2002). Regional Innovation Systems: The Integration of Local‘Sticky’ and Global ‘Ubiquitous’ Knowledge. The Journal of Technology Transfer, 27(1), 77–86.
Atkinson, P., Batchelor, C., & Parsons, E. (1998). Trajectories of Collaboration and Competition in aMedical Discovery. Science, Technology, & Human Values, 23(3), 259–284.
Atkinson, R. D. (2014, June). Understanding the US National Innovation System. The InformationTechnology & Innovation Foundation. Retrieved from https://papers.ssrn.com/sol3/papers.cfm?abstract_id=3079822
ATLAS Authorship Committee. (2013, February 8). ATLAS Authorship Policy. Retrieved fromhttps://www.cppm.in2p3.fr/~nagy/ATLAS/qualification/A74_AUTHOR_policy_76.pdf
Autant-Bernard, C., Billand, P., Frachisse, D., & Massard, N. (2007). Social Distance versus SpatialDistance in R&D Cooperation: Empirical Evidence from European Collaboration Choices inMicro and Nanotechnologies. Papers in Regional Science, 86(3), 495–519.
Autio, E. (1998). Evaluation of RTD in Regional Systems of Innovation. European Planning Studies,6(2), 131–140.
Autio, E., Hameri, A. P., & Nordberg, M. (1996). A Framework of Motivations for Industry-BigScience Collaboration: A Case Study. Journal of Engineering and Technology Management, 13(3),301–314.
Avkiran, N. (1997). Scientific Collaboration in Finance Does Not Lead to Better Quality Research.Scientometrics, 39(2), 173–184.
Aydalot, P. (Ed.). (1986). Milieux Innovateurs En Europe. Paris, France: GREMI.Azoulay, P., Graff Zivin, J. S., & Wang, J. (2010). Superstar Extinction. The Quarterly Journal of
Economics, 125(2), 549–589.Bakouros, Y. L., Mardas, D. C., & Varsakelis, N. C. (2002). Science Park, a High Tech Fantasy?:
An Analysis of the Science Parks of Greece. Technovation, 22(2), 123–128.Balland, P. A. (2012). Proximity and the Evolution of Collaboration Networks: Evidence from
Research and Development Projects within the Global Navigation Satellite System (GNSS)Industry. Regional Studies, 46(6), 741–756.
Barabási, A. L. (2002). Linked: The New Science of Networks. Cambridge, MA: Perseus Publishing.Barabási, A. L., & Albert, R. (1999). Emergence of Scaling in Random Networks. Science, 286
(5439), 509–512.Barandiaran, J. (2015). Reaching for the Stars? Astronomy and Growth in Chile. Minerva, 53(2),
141–164.Barca, F., McCann, P., & Rodríguez-Pose, A. (2012). The Case for Regional Development
Intervention: Place-Based versus Place-Neutral Approaches. Journal of Regional Science, 52(1),134–152.
Bar-Ilan, J. (2008). Informetrics at the Beginning of the 21st century—A Review. Journal ofInformetrics, 2(1), 1–52.
Barjak, F. (2006). The Role of the Internet in Informal Scholarly Communication. Journal of theAmerican Society for Information Science and Technology, 57(10), 1350–1367.
Barnard, H., Cowan, R., & Müller, M. (2012). Global Excellence at the Expense of LocalDiffusion, or a Bridge between Two Worlds? Research in Science and Technology in theDeveloping World. Research Policy, 41(4), 756–769.
Bathelt, H. (2011). Innovation, Learning and Knowledge Creation in Co-Localized and DistantContexts. In A. Pike, A. Rodríguez-Pose, & J. Tomaney (Eds.), Handbook of Local and RegionalDevelopment (pp. 149–161). London, UK: Routledge.
Bathelt, H., Malmberg, A., & Maskell, P. (2004). Clusters and Knowledge: Local Buzz, GlobalPipelines and the Process of Knowledge Creation. Progress in Human Geography, 28(1), 31–56.
Beaver, D. D. (2001). Reflections on Scientific Collaboration (And Its Study): Past, Present, andFuture. Scientometrics, 52(3), 365–377.
Beaver, D. D. (2004). Does Collaborative Research Have Greater Epistemic Authority? Sciento-metrics, 60(3), 399–408.
References 187

Beaver, D. D., & Rosen, R. (1978). Studies in Scientific Collaboration: Part I. The ProfessionalOrigins of Scientific Co-Authorship. Scientometrics, 1(1), 65–84.
Becattini, G. (2002). From Marshall’s to the Italian “Industrial Districts”. A Brief CriticalReconstruction. In A. Quadrio Curzio & M. Fortis (Eds.), Complexity and Industrial Clusters(pp. 83–106). New York, NY: Physica-Verlag.
Beer, A., & Lester, L. (2015). Institutional Thickness and Institutional Effectiveness: DevelopingRegional Indices for Policy and Practice in Australia. Regional Studies, Regional Science, 2(1),205–228.
Belyayev, Ye. A. (1973). Geography of Science—Past and Present. Priroda (Nature), 8, 91–93.March 28. ( Joint Publication Research Service, JPRS-58596, Trans.) (Original work published1972).
Ben-David, J. (1984). The Scientist’s Role in Society: A Comparative Study (2nd ed.). Chicago, IL:University of Chicago Press.
Bengtsson, M., & Kock, S. (2000). “Coopetition” in Business Networks—To Cooperate andCompete Simultaneously. Industrial Marketing Management, 29(5), 411–426.
Bengtsson, M., & Raza-Ullah, T. (2016). A Systematic Review of Research on Coopetition: TowardA Multilevel Understanding. Industrial Marketing Management, 57, 23–39.
Benneworth, P., & Hospers, G. J. (2007). Urban Competitiveness in the Knowledge Economy:Universities as New Planning Animateurs. Progress in Planning, 67(2), 105–197.
Berners-Lee, T., & Fischetti, M. (1999). Weaving the Web: The Original Design and Ultimate Destinyof the World Wide Web by Its Inventor. San Francisco, CA: Harper San Francisco.
Berry, D.M. (2008).Copy, Rip, Burn: The Politics of Copyleft and Open Source. London, UK: Pluto Press.Bianconi, G., & Barabási, A. L. (2001). Competition and Multiscaling in Evolving Networks.
Europhysics Letters, 54(4), 436.Big Ten Academic Alliance. (2016). Executive Brief: Overseas Offices. Retrieved from http://www.
btaa.org/docs/default-source/international/global-brief—overseas-offices—july-2016.pdf?sfvrsn=4
Bikard, M., Murray, F., & Gans, J. S. (2015). Exploring Trade-Offs in the Organization ofScientific Work: Collaboration and Scientific Reward. Management Science, 61(7), 1473–1495.
Binz, C., & Truffer, B. (2017). Global Innovation Systems—A Conceptual Framework for Innova-tion Dynamics in Transnational Contexts. Research Policy, 46(7), 1284–1298.
Birnholtz, J. P. (2007). When Do Researchers Collaborate? Toward a Model of CollaborationPropensity. Journal of the American Society for Information Science and Technology, 58(14), 2226–2239.
Bloch, C., & Schneider, J. W. (2016). Performance-Based Funding Models and ResearcherBehavior: An Analysis of the Influence of the Norwegian Publication Indicator at the IndividualLevel. Research Evaluation, 25(4), 371–382.
Block, F., & Keller, M. R. (2009). Where Do Innovations Come From? Transformations in the USEconomy, 1970–2006. Socio-Economic Review, 7(3), 459–483.
Boekholt, P. E. B. (1994). The European Community and Innovation Policy: Reorienting TowardsDiffusion (Doctoral Dissertation). Retrieved from Aston University.
Boeri, T. (Ed.). (2012). Brain Drain and Brain Gain: The Global Competition to Attract High-SkilledMigrants. Oxford, UK: Oxford University Press.
Boghossian, P. A. (2006). Fear of Knowledge: Against Relativism and Constructivism. Oxford, UK:Oxford University Press.
Bok, D. C. (2015).Higher Education in America (Revised ed.). Princeton, NJ: Princeton University Press.Bolaños-Pizarro, M., Thijs, B., & Glänzel, W. (2010). Cardiovascular Research in Spain. A
Comparative Scientometric Study. Scientometrics, 85(2), 509–526.Bonaccorsi, A., & Secondi, L. (2017). The Determinants of Research Performance in European
Universities: A Large Scale Multilevel Analysis. Scientometrics, 112(3), 1147–1178.Bordons, M., Gomez, I., Fernández, M., Zulueta, M., & Mendez, A. (1996). Local, Domestic and
International Scientific Collaboration in Biomedical Research. Scientometrics, 37(2), 279–295.
188 References

Borel, A. (1998). Twenty-Five Years with Nicolas Bourbaki, 1949–1973. Notices of the AmericanMathematical Society, 45(3), 373–380.
Borgatti, S. P., & Lopez-Kidwell, V. (2011). Network Theory. In J. Scott & P. J. Carrington (Eds.),The SAGE Handbook of Social Network Analysis (pp. 40–54). London, UK: SAGE.
Börner, K. (2010). Atlas of Science: Visualizing What We Know. Cambridge, MA: MIT Press.Börner, K. (2015). Atlas of Knowledge: Anyone Can Map. Cambridge, MA: MIT Press.Börner, K., Contractor, N., Falk-Krzesinski, H. J., Fiore, S. M., Hall, K. L., Keyton, J.,…&Uzzi, B.
(2010). A Multi-Level Systems Perspective for the Science of Team Science. Science TranslationalMedicine, 2(49), 49cm24.
Börner, K., & Scharnhorst, A. (2009). Visual Conceptualizations and Models of Science. Journal ofInformetrics, 3, 161–172.
Bornmann, L., Stefaner, M., De Moya Anegón, F., & Mutz, R. (2014). Ranking and Mapping ofUniversities and Research-Focused Institutions Worldwide Based on Highly-Cited Papers: AVisualisation of Results from Multi-Level Models. Online Information Review, 38(1), 43–58.
Bos, N., Zimmerman, A., Olson, J., Yew, J., Yerkie, J., Dahl, E., & Olson, G. (2007). From SharedDatabases to Communities of Practice: A Taxonomy of Collaboratories. Journal of Computer-Mediated Communication, 12(2), 652–672.
Boschma, R. (2005). Proximity and Innovation: A Critical Assessment.Regional Studies, 39(1), 61–74.Boschma, R., & Iammarino, S. (2009). Related Variety, Trade Linkages, and Regional Growth in
Italy. Economic Geography, 85(3), 289–311.Boudreau, K. J., Brady, T., Ganguli, I., Gaule, P., Guinan, E., Hollenberg, A., & Lakhani, K. R.
(2017). A Field Experiment on Search Costs and the Formation of Scientific Collaborations.Review of Economics and Statistics, 99(4), 565–576.
Bound, K., Saunders, T., Wilsdon, J., & Adams, J. (2013). China’s Absorptive State: Research,Innovation and the Prospects for China-UK Collaboration. London, UK: NESTA.
Bourdieu, P. (2004). Science of Science and Reflexivity (R. Nice, Trans.). Chicago, IL: University ofChicago Press. Original work published 2001.
Boys, J. (2011). Towards Creative Learning Spaces: Re-Thinking the Architecture of Post-CompulsoryEducation. Abingdon, UK: Routledge.
Bozeman, B., & Boardman, P.C. (2004). The NSF Engineering Research Centers andthe University–Industry Research Revolution. The Journal of Technology Transfer, 29(3–4), 365–375.
Bozeman, B., & Corley, E. (2004). Scientists’ Collaboration Strategies: Implications for Scientificand Technical Human Capital. Research Policy, 33(4), 599–616.
Bozeman, B., & Gaughan, M. (2011). How Do Men and Women Differ in Research Collabora-tions? An Analysis of the Collaborative Motives and Strategies of Academic Researchers. ResearchPolicy, 40(10), 1393–1402.
Brand, S. (1987). The Media Lab: Inventing the Future at MIT. New York, NY: Viking.Brandenburger, A. M., & Nalebuff, B. J. (1996). Co-Opetition. New York, NY: Doubleday.Braudel, F. (1958). Histoire Et Sciences Sociales: La Longue Durée. Annales. Histoire, Sciences
Sociales, 13(4), 725–753.Breakdown of Horizon 2020 Budget. (2011). Retrieved from http://ec.europa.eu/research/
horizon2020/pdf/press/horizon_2020_budget_constant_2011.pdfBrew, A. (2006). Research and Teaching: Beyond the Divide. Houndmills, UK: Palgrave Macmillan.Breznitz, S. M., & Feldman, M. P. (2012). The Engaged University. The Journal of Technology
Transfer, 37(2), 139–157.Bridges, D. (2006). The Role of the University in Regional Economic Development. In D.
Bridges, P. Juceviciene, R. Jucevicius, T. H. Mclaughlin, & J. Stankeviciute (Eds.), HigherEducation and National Development: Universities and Societies in Transition (pp. 103–119). London,UK: Routledge.
Broekel, T. (2015). The Co-Evolution of Proximities–A Network Level Study. Regional Studies,49(6), 921–935.
References 189

Bruce, A., Lyall, C., Tait, J., & Williams, R. (2004). Interdisciplinary Integration in Europe: TheCase of the Fifth Framework Programme. Futures, 36(4), 457–470.
Burdick, A., Drucker, J., Lunenfeld, P., Presner, T., & Schnapp, J. (2012). Digital_Humanities.Cambridge, MA: MIT Press.
Burt, R. S. (1992). Structural Holes: The Social Structure of Competition. Cambridge, MA: HarvardUniversity Press.
Bush, V. (1945). Science, the Endless Frontier: A Report to the President. United States Office ofScientific Research and Development. Washington, DC: U.S. Govt. Print. Off.
Button, K., Brown, P., Fischer, M., Maggi, R., Ouwersloot, H., Rammer, C., … Salomon, I.(1993). Academic Links and Communications (Studies of Science in Europe). Aldershot, UK: Avebury.
Bynum, W. (2012). A Little History of Science. New Haven, CT: Yale University Press.Cai, H. (2012). Deploying the Chinese Knowledge Diaspora: A Case Study of Peking University.
Asia Pacific Journal of Education, 32(3), 367–379.Cairncross, F. (1997). The Death of Distance: How the Communications Revolution Will Change Our
Lives. Boston, MA: Harvard Business School Press.Caloghirou, Y., Vonortas, N. S., & Ioannides, S. (2002). Science and Technology Policies Towards
Research Joint Ventures. Science and Public Policy, 29(2), 82–94.Calvert, J., & Martin, B. (2001). Science Funding: Europe. In International Encyclopedia of the Social and
Behavioural Sciences (Vol. 20, pp. 13676–13680). Amsterdam, Netherlands: Elsevier.Calvo-Sotelo, C. (2011). Identidad, Innovación Y Entorno En La Universidad Española. Proyectos De
Campus De Excelencia Internacional. Madrid, Spain: Ministerio Educación, Secretaría General deUniversidades.
Camagni, R. (1991a). Local ‘Milieu’, Uncertainty and Innovation Networks: Towards a NewDynamic Theory of Economic Space. In R. Camagni (Ed.), Innovation Networks: SpatialPerspectives (pp. 121–142). London, UK: Belhaven.
Camagni, R. (Ed.). (1991b). Innovation Networks: Spatial Perspectives. London, UK: Belhaven.Campbell, D., Roberge, G., Haustein, S., & Archamba, E. (2013). Intra-European Cooperation
Compared to International Collaboration of the ERA Countries. Brussels: European Commission.Cao, C. (2014). The Universal Values of Science and China’s Nobel Prize Pursuit. Minerva, 52(2),
141–160.Cao, C., Li, N., Li, X., & Liu, L. (2013). Reforming China’s S&T System. Science, 341(6145), 460–462.Cao, C., Suttmeier, R. P., & Simon, D. F. (2006). China’s 15-Year Science and Technology Plan.
Physics Today, 59(12), 38.Capello, R. (2007). Regional Economics. Oxon, UK: Routledge.Capello, R., & Caragliu, A. (2018). Proximities and the Intensity of Scientific Relations: Synergies
and Nonlinearities. International Regional Science Review, 41(1), 7–44.Capshew, J. H. (1992). Psychologists on Site: A Reconnaissance of the Historiography of the
Laboratory. American Psychologist, 47(2), 132–142. doi:10.1037/0003-066X.47.2.132Carayannis, E. G., Campbell, D. F., & Rehman, S. S. (2016). Mode 3 Knowledge Production:
Systems and Systems Theory, Clusters and Networks. Journal of Innovation and Entrepreneurship,5(1), 1–24.
Cardwell, D. S. L. (1972). Turning Points in Western Technology: A Study of Technology, Science andHistory. New York, NY: Science History Publications.
Carey, H. C. (1867). Principles of Social Science (Vol. 3). JB Lippincott & Company.Carillo, M. R., Papagni, E., & Sapio, A. (2013). Do Collaborations Enhance the High-Quality
Output of Scientific Institutions? Evidence from the Italian Research Assessment Exercise. TheJournal of Socio-Economics, 47, 25–36.
Carusi, A., & Reimer, T. (2010). Virtual Research Environment Collaborative Landscape Study. Bristol,UK: JISC.
Casadevall, A., & Fang, F. C. (2013). Is the Nobel Prize Good for Science? The FASEB Journal,27(12), 4682–4690.
190 References

Casassus, B. (2014). China Predicted to Outspend the US on Science by 2020. Nature. November12. doi:10.1038/nature.2014.16329
Cassi, L., Corrocher, N., Malerba, F., & Vonortas, N. S. (2009). Evaluating the Links betweenResearch and Deployment Networks of Innovation in Information Society in Europe. InF. Malerba & N. S. Vonortas (Eds.), Innovation Networks in Industries (Chapter 10). Cheltenham,UK: Edward Elgar.
Cassi, L., Morrison, A., & Rabellotti, R. (2015). Proximity and Scientific Collaboration: Evidencefrom the Global Wine Industry. Tijdschrift Voor Economische En Sociale Geografie, 106(2), 205–219.
Castells, M. (1996). The Rise of the Network Society. Cambridge, MA: Blackwell Publishers.Castells, M., & Hall, P. (1994). Technopoles of the World: The Making of Twenty-First-Century
Industrial Complexes. London, UK: Routledge.Castells, M., & Ince, M. (2003). Conversations with Manuel Castells. Cambridge, UK: Polity Press.Castelvecchi, D. (2015). Physics Paper Sets Record with More than 5,000 Authors.Nature. May 15.
doi:10.1038/nature.2015.17567Castro, R., & Grossman, J. W. (1999). Famous Trails to Paul Erdos. The Mathematical Intelligencer,
3(21), 51–53.Catalini, C. (2017). Microgeography and the Direction of Inventive Activity.Management Science. doi:
http://doi.org/10.1287/mnsc.2017.2798Catalini, C., Fons-Rosen, C., & Gaulé, P. (2016). Did Cheaper Flights Change the Geography of
Scientific Collaboration? MIT Sloan Research Paper No. 5172-16.Cattuto, C., Van Den Broeck, W., Barrat, A., Colizza, V., Pinton, J. F., & Vespignani, A. (2010).
Dynamics of Person-To-Person Interactions from Distributed RFID Sensor Networks. PLoSONE, 5(7), e11596.
Celińska-Janowicz, D., Wojnar, K., Olechnicka, A., & Ploszaj, A. (2017). Znaczenie Bliskóci WNawiazywaniu Współpracy Naukowej Przez Polskich Naukowców. Zagadnienia Naukoz-nawstwa, 53(3), 285–308.
CESAER. (2016, October 21). Statement for the Interim Evaluation Horizon 2020. Conference ofEuropean Schools for Advanced Engineering Education and Research, Leuven.
Chalabi, M. (2015, January 29). How Many Times Does The Average Person Move? Five ThirtyEight. Retrieved from http://fivethirtyeight.com/datalab/how-many-times-the-average-person-moves/
Chandler, A. (2016, October 21). Why Do Americans Move So Much More Than Europeans? TheAtlantic. Retrieved from http://www.theatlantic.com/business/archive/2016/10/us-geographic-mobility/504968/
Chang, D., Ge, Y., Song, S., Coleman, N., Christensen, J., & Heer, J. (2009). Visualizing theRepublic of Letters. Stanford, CA: Stanford University. Retrieved from http://web.stanford.edu/group/toolingup/rplviz/papers/Vis_RofL_2009
Chang, H. W., & Huang, M. H. (2013). Prominent Institutions in International CollaborationNetwork in Astronomy and Astrophysics. Scientometrics, 97(2), 443–460.
Chesbrough, H. W. (2003). Open Innovation: The New Imperative for Creating and Profiting fromTechnology. Boston, MA: Harvard Business School Press.
Chi, M. (2016, February 24). China-Led Gravitational Wave Venture Seeks Global Talent. ChinaDaily. Retrieved from http://www.chinadaily.com.cn/china/2016-02/24/content_23626552.htm
Chien, T. H., & Peng, T. J. (2005). Competition and Cooperation Intensity in a Network–A CaseStudy in Taiwan Simulator Industry. Journal of American Academy of Business, 7(2), 150–155.
Chinchilla-Rodríguez, Z., Vargas-Quesada, B., Hassan-Montero, Y., González-Molina, A., &Moya-Anegóna, F. (2010). New Approach to the Visualization of International Scientific Colla-boration. Information Visualization, 9(4), 277–287.
Chisholm, R. F. (1998). Developing Network Organizations: Learning from Practice and Theory. Reading,UK: Addison Wesley Longman.
References 191
Cho, M., & McKee, M. (2002, March 1). Authorship in Biomedical Research—Realities and Expecta-tions. Retrieved from http://www.sciencemag.org/careers/2002/03/authorship-biomedical-research-realities-and-expectations
Choi, S. (2011). Core-Periphery, New Clusters, or Rising Stars?: International Scientific Colla-boration among ‘Advanced’ countries in the Era of Globalization. Scientometrics, 90(1), 25–41.
Chompalov, I., Genuth, J., & Shrum, W. (2002). The Organization of Scientific Collaborations.Research Policy, 31(5), 749–767.
Christensen, C. M. (1997). The Innovator’s Dilemma: When New Technologies Cause Great Firms toFail. Boston, MA: Harvard Business School Press.
Clark B. (1998). Creating Entrepreneurial Universities: Organizational Pathways of Transformation.Oxford, UK: Pergamon for IEU Press.
Clauset, A., Arbesman, S., & Larremore, D. B. (2015). Systematic Inequality and Hierarchy in FacultyHiring Networks. Science Advances, 1(1), February 12. doi:http://doi.org/10.1126/sciadv.1400005
Clauset, A., Shalizi, C. R., & Newman, M. E. (2009). Power-Law Distributions in Empirical Data.SIAM Review, 51(4), 661–703.
Coase, R. (1937). The Nature of the Firm. Economica, New Series, 4(16), 386–405.Cobo, M. J., López-Herrera, A. G., Herrera-Viedma, E., & Herrera, F. (2011). Science Mapping
Software Tools: Review, Analysis, and Cooperative Study among Tools. Journal of the AmericanSociety for Information Science and Technology, 62(7), 1382–1402.
Coenen, L., Moodysson, J., & Asheim, B. T. (2004). Nodes, Networks and Proximities: On theKnowledge Dynamics of the Medicon Valley Biotech Cluster. European Planning Studies, 12(7),1003–1018.
Cohen, W., & Levinthal, D. (1990). Absorptive Capacity: A New Perspective on Learning andInnovation. Administrative Science Quarterly, 35(1), 128–152. doi:http://doi.org/10.2307/2393553
Coleman, J. (1988). Social Capital in the Creation of Human Capital. American Journal of Sociology,94, S95–S120.
Collaboration. (n.d.). In Oxford English Dictionary Online. Retrieved from http://www.oed.com/Commission of the European Communities. (1975). The Scientific and Technical Research Committee
(CREST). Its Origin, Role and Function. Retrieved from https://publications.europa.eu/de/publication-detail/-/publication/ff82cd76-5f90-4deb-b26e-b2d5182e1791
Commission of the European Communities. (2008). Communication from the Commission to theEuropean Parliament, the Council, the European Economic and Social Committee and the Committee ofthe Regions. Towards Joint Programming in Research: Working Together to Tackle Common ChallengesMore Effectively. Brussels, 15.7.2008, COM(2008) 468 final. Retrieved from https://eur-lex.europa.eu/legal-content/EN/TXT/?uri=celex%3A52008DC0468
Committee on Science and Technology (1998, September 1). Unlocking Our Future: Toward a NewNational Science Policy. 105th Congress, 2nd Session, Congressional Committee Materials. U.S.Government Publishing Office. Retrieved from https://www.gpo.gov/fdsys/pkg/GPO-CPRT-105hprt105-b/content-detail.html
Conner, C. (2005). A People’s History of Science: Miners, Midwives, and Low Mechanicks. New York,NY: Nation Books.
Convention for the Establishment of a European Organization for Nuclear Research. (1953, July1). Paris. Retrieved from https://council.web.cern.ch/en/content/convention-establishment-european-organization-nuclear-research
Cooke, N. J., & Hilton, M. L. (Eds.). (2015). Enhancing the Effectiveness of Team Science. Washington,DC: The National Academies Press.
Cooke, P. (1992). Regional Innovation Systems: Competitive Regulation in the New Europe.Geoforum, 23(3), 365–382.
Cooke, P. (1998a). Global Clustering and Regional Innovation. Systemic Integration inWales. In H. J. Braczyk, P. Cooke, & M. Heidenreich (Eds.), Regional Innovation Systems:The Role of Governances in a Globalized World (pp. 245–262). London, UK: UCL Press.
192 References

Cooke, P. (1998b). Introduction: The Origin of the Concept. In H. J. Braczyk, P. Cooke, &M. Heidenreich (Eds.), Regional Innovation Systems: The Role of Governances in a Globalized World(pp. 2–25). London, UK: UCL Press.
Costa, B. M. G., Da Silva Pedro, E., & De Macedo, G. R. (2013). Scientific Collaboration inBiotechnology: The Case of the Northeast Region in Brazil. Scientometrics, 95(2), 571–592.
Coulson, J., Roberts, P., & Taylor, I. (2011). University Planning and Architecture: The Search forPerfection. Abingdon, UK: Routledge.
Coulson, J., Roberts, P., & Taylor, I. (2015). University Trends: Contemporary Campus Design.London, UK: Routledge.
Cowan, R., David, P. A., & Foray, D. (2000). The Explicit Economics of Knowledge Codificationand Tacitness. Industrial and Corporate Change, 9(2), 211–253.
Crane, D. (1972). Invisible Colleges: Diffusion of Knowledge in Scientific Communities. Chicago, IL:University of Chicago Press.
Creamer, E. G. (2004). Assessing Outcomes of Long-Term Research Collaboration. The CanadianJournal of Higher Education, 34(1), 27–46.
Criscuolo, P., & Narula, R. (2008). A Novel Approach to National Technological Accumulationand Absorptive Capacity: Aggregating Cohen and Levinthal. The European Journal of DevelopmentResearch, 20(1), 56–73.
Cronin, B. (2001). Hyperauthorship: A Postmodern Perversion or Evidence of A Structural Shift inScholarly Communication Practices? Journal of the American Society for Information Science andTechnology, 52(7), 558–569.
Cronin, B., & Weaver-Wozniak, S. (1993). Online Access to Acknowledgements. In M. E.Williams (Ed.), Proceedings of the 14th National Online Meeting (pp. 93–98). Medford, NJ: LearnedInformation.
Cruz-Castro, L., Jonkers, K., & Sanz-Menéndez, L. (2015). The Internationalisation of ResearchInstitutes. In L. Wedlin & M. Nedeva (Eds.), Towards European Science: Dynamics and Policy of anEvolving European Research Space (pp. 175–198). Cheltenham, UK: Edward Elgar Publishing.
Cummings, J. N., & Kiesler, S. (2003). Coordination and Success in Multidisciplinary ScientificCollaborations. ICIS 2003 Proceedings, 25. Retrieved from http://aisel.aisnet.org/icis2003/25
Cummings, J. N., & Kiesler, S. (2005). Collaborative Research across Disciplinary and Organiza-tional Boundaries. Social Studies of Science, 35(5), 703–722.
Cummings, J. N., & Kiesler, S. (2007). Coordination Costs and Project Outcomes in Multi-University Collaborations. Research Policy, 36(10), 1620–1634.
Cunningham, P., & Gök, A. (2012). The Impact and Effectiveness of Policies to Support Collaboration forR&D and Innovation. Nesta Working Paper No. 12/06.
Cyranoski, D. (2014). Chinese Science Gets Mass Transformation. Nature, 513(7519), 468–469.Czarnitzki, D., & Fier, A. (2003). Publicly Funded R&D Collaborations and Patent Outcome in
Germany. ZEW Discussion Papers, 03-24. Center for European Economic Research.Da Fonseca Pachi, C. G., Yamamoto, J. F., Da Costa, A. P. A., & Lopez, L. F. (2012). Relationship
between Connectivity and Academic Productivity. Scientometrics, 93(2), 265–278.Daidj, N., & Jung, J. (2011). Strategies in the Media Industry: Towards the Development of
Co-Opetition Practices? Journal of Media Business Studies, 8(4), 37–57.Dal-Soto, F., & Monticelli, J. (2017). Coopetition Strategies in the Brazilian Higher Education.
Revista De Administração De Empresas, 57(1), 65–78.Day, R. E. (2001). The Modern Invention of Information: Discourse, History, and Power. Carbondale, IL:
Southern Illinois University Press.De Noni, I., Ganzaroli, A., & Orsi, L. (2017). The Impact of Intra-And Inter-Regional Knowledge
Collaboration and Technological Variety on the Knowledge Productivity of European Regions.Technological Forecasting and Social Change, 117, 108–118.
De Prato, G., & Nepelski, D. (2014). Global Technological Collaboration Network: NetworkAnalysis of International Co-Inventions. The Journal of Technology Transfer, 39(3), 358–375.
References 193

De Sordi, J. O., Conejero, M. A., & Meireles, M. (2016). Bibliometric Indicators in the Context ofRegional Repositories: Proposing the D-Index. Scientometrics, 107(1), 235–258.
De Stefano, D., Fuccella, V., Vitale, M. P., & Zaccarin, S. (2013). The Use of Different DataSources in the Analysis of Co-Authorship Networks and Scientific Performance. Social Networks,35(3), 370–381.
De Stefano, D., Giordano, G., & Vitale, M. P. (2011). Issues in the Analysis of Co-AuthorshipNetworks. Quality & Quantity, 45(5), 1091–1107.
Delanghe, H., Muldur, U., & Soete, L. (Eds.). (2009). European Science and Technology Policy:Towards Integration or Fragmentation? Cheltenham, UK: Edward Elgar.
Desrochers, N., Paul-Hus, A., & Larivière, V. (2016). The Angle Sum Theory: Exploring theLiterature on Acknowledgments in Scholarly Communication. In C. R. Sugimoto (Ed.), Theoriesof Informetrics and Scholarly Communication (pp. 225–247). Berlin, Germany: De Gruyter Mouton.
Desrochers, N., Paul-Hus, A., & Pecoskie, J. (2015). Founding Concepts and Foundational Work:Establishing the Framework for the Use of Acknowledgments as Indicators. Proceedings of the 15thInternational Conference on Scientometrics and Informetrics, 890–894.
Didegah, F., & Thelwall, M. (2013). Which Factors Help Authors Produce the Highest ImpactResearch? Collaboration, Journal and Document Properties. Journal of Informetrics, 7(4), 861–873.
Didegah, F., Thelwall, M., & Gazni, A. (2012). An International Comparison of Journal Publishingand Citing Behaviours. Journal of Informetrics, 6(4), 516–531.
Dingemanse, M. (2016, June 27). Some Things You Need to Know about Google Scholar.Retrieved from http://ideophone.org/some-things-you-need-to-know-about-google-scholar/
Doorley, S., & Witthoft, S. (2012). Make Space: How to Set the Stage for Creative Collaboration.Hoboken, NJ: John Wiley & Sons.
Doré, J. C., Ojasoo, T., Okubo, Y., Durand, T., Dudognon, G., & Miquel, J. F. (1996).Correspondence Factor Analysis of the Publication Patterns of 48 Countries over the Period1981–1992. Journal of the American Society for Information Science, 47(8), 588–602.
Dorn, H. (1991). The Geography of Science. Baltimore, MD: Johns Hopkins University Press.Drucker, J., & Goldstein, H. (2007). Assessing the Regional Economic Development Impacts
of Universities: A Review of Current Approaches. International Regional Science Review, 30(1),20–46.
Ductor, L. (2015). Does Co-Authorship Lead to Higher Academic Productivity? Oxford Bulletin ofEconomics and Statistics, 77(3), 385–407.
Dunn, R., & Higgitt, R. (2014). Finding Longitude: How Ships, Clocks and Stars Helped Solve theLongitude Problem. Glasgow, UK: Harper Collins UK.
Dupree, A. H. (1957). Science in the Federal Government: A History of Policies and Activities to 1940.Cambridge, MA: Belknap Press of Harvard University Press.
Duque, R. B., Ynalvez, M., Sooryamoorthy, R., Mbatia, P., Dzorgbo, D. B. S., & Shrum, W.(2005). Collaboration Paradox Scientific Productivity, the Internet, and Problems of Research inDeveloping Areas. Social Studies of Science, 35(5), 755–785.
Eagle, N., Pentland, A. S., & Lazer, D. (2009). Inferring Friendship Network Structure by UsingMobile Phone Data. Proceedings of the National Academy of Sciences, 106(36), 15274–15278.
Eckert, D., Baron, M., & Jégou, L. (2013). Les Villes Et La Science: Apports De La SpatialisationDes Données Bibliométriques Mondiales.M@Ppemonde, 110(2). Retrieved from https://mappemonde-archive.mgm.fr/num38/articles/art13201.html
Edelstein, D., Comsa, M., Conroy, M., Kassabova, B., Willan, C., Edmundson, C., Nyaosi, B.(2010). Voltaire and the Enlightenment. A Case Study within the “Mapping the Republic of Letters”Project. Retrieved from http://republicofletters.stanford.edu/casestudies/voltaire.html
Edquist, C. (2005). Systems of Innovation. Perspectives and Challenges. In J. Fagerberg, D. C.Mowery, & R. R. Nelson (Eds.), The Oxford Handbook of Innovation (pp. 181–208). Oxford, UK:Oxford University Press.
Edwards, B. (2000). University Architecture. London, UK: Spon Press.
194 References

Egghe, L. (2005). Expansion of the field of Informetrics: Origins and Consequences. InformationProcessing and Management, 41, 1311–1316.
Egghe, L. (2006). Theory and Practise of the G-Index. Scientometrics, 69(1), 131–152.Eiben, C. B., Siegel, J. B., Bale, J. B., Cooper, S., Khatib, F., Shen, B. W., … & Baker, D. (2012).
Increased Diels-Alderase Activity through Backbone Remodeling Guided by Foldit Players.Nature. Biotechnology, 30(2), 190–192.
Einstein, A. (1983). Essays in Humanism. New York, NY: Philosophical Library.Einstein, A. (1994). Ideas and Opinions. New York, NY: The Modern Library.Ejermo, O., & Karlsson, C. (2006). Interregional Inventor Networks as Studied by Patent
Coinventorships. Research Policy, 35(3), 412–430.Endenich, C., & Trapp, R. (2015). Cooperation for Publication? an Analysis of Co-Authorship
Patterns in Leading Accounting Journals. European Accounting Review, 25(3), 613–633.Enders, J. (2001). A Chair System in Transition: Appointments, Promotions, and Gate-Keeping in
German Higher Education. Higher Education, 41(1–2), 3–25.Engers, M., Gans, J., Grant, S., & King, S. (1999). First Author Conditions. Journal of Political
Economy, 107(4), 859–883.ERA-NET Review 2006. (2006, December). Retrieved from https://ec.europa.eu/info/research-
and-innovation_enEsipova, N., Pugliese, A., & Ray, J. (2013). The Demographics of Global Internal Migration.
Migration Policy Practice, 3(2), 3–5.Etzkowitz, H., & Leydesdorff, L. (1995). The Triple Helix–University-industry-government Relations:
A Laboratory for Knowledge Based Economic Development. EASST Review, 14(1), 14–19.Etzkowitz, H., & Leydesdorff, L. (2000). The Dynamics of Innovation: From National Systems and
“Mode 2” to a Triple Helix of University–Industry–Government Relations. Research Policy,29(2), 109–123.
European Commission. (2011). Commission Staff Working Paper: The Added Value of the EU Budget.Accompanying the Document Commission Communication – A Budget for Europe 2020. Brussels,29.6.2011, SEC(2011) 867 final. Retrieved from http://ec.europa.eu/budget/library/biblio/documents/fin_fwk1420/working_paper_added_value_EU_budget_SEC-867_en.pdf
European Commission. (2012).Communication from the Commission to the European Parliament, the Council,the European Economic and Social Committee and the Committee of the Regions: A Reinforced EuropeanResearch Area Partnership for Excellence and Growth. Brussels, 17.7.2012, COM/2012/0392 final.Retrieved from https://eur-lex.europa.eu/legal-content/EN/TXT/?uri=COM:2012:0392:FIN
European Commission. (2013, October 23). Fact Sheet: International Participation in Horizon 2020.Retrieved from http://ec.europa.eu/programmes/horizon2020/sites/horizon2020/files/Factsheet_international_participation.pdf
European Commission. (2014). European Research Area Progress Report 2014. Retrieved from http://ec.europa.eu/research/era/eraprogress2014_en.htm
European Commission. (2016a). Evaluation of Joint Programming to Address Grand Societal ChallengesFinal Report of the Expert Group. Retrieved from https://www.era-learn.eu/publications/ec-publications/evaluation-of-joint-programming-to-address-grand-societal-challenges-final-report-of-the-expert-group
European Commission. (2016b). Horizon 2020 Open to the World! Funding of Applicants from non-EUCountries & International Organisations. Retrieved from http://transvac.org/assets/img/PDF/h2020-hi-3cpart-en.pdf
European Parliament. (2015, July). EU Scientific Cooperation with Third Countries. Briefing.Retrieved from http://www.europarl.europa.eu/thinktank/en/document.html?reference=EPRS_BRI(2015)564393
European Parliamentary Research Service. (2015, November). Horizon 2020 Budget and Implemen-tation. A Guide to the Structure of the Programme. Retrieved from http://www.europarl.europa.eu/RegData/etudes/IDAN/2015/571312/EPRS_IDA%282015%29571312_EN.pdf
References 195

Fähnrich, B. (2015). Science Diplomacy: Investigating the Perspective of Scholars on Politics–Science Collaboration in International Affairs. Public Understanding of Science. First Published 21Nov 2016. doi:10.1177/0963662515616552
Fanelli, D., & Larivière, V. (2016). Researchers’ Individual Publication Rate Has Not Increased in aCentury. PLoS ONE, 11(3), e0149504.
Fangmeng, T. (2016). Brain Circulation, Diaspora and Scientific Progress: A Study of theInternational Migration of Chinese Scientists, 1998–2006. Asian and Pacific Migration Journal,25(3), 296–319.
Federal Ministry of Eduaction and Research. (2014). International Cooperation. Action Plan of theFederal Ministry of Education and Research (BMBF). Retrieved from. https://www.bmbf.de/pub/Action_Plan_International_Cooperation.pdf
Festinger, L., Schachter, S., & Back, K. (1950). The Spatial Ecology of Group Formation. InL. Festinger, S. Schachter, & K. Back (Eds.), Social Pressure in Informal Groups (pp. 141–161). NewYork, NY: Harper & Bros.
Feynman, R. P. (2010). “Surely You’re Joking, Mr. Feynman!”: Adventures of a Curious Character. NewYork, NY: W. W. Norton & Company.
Fischer, M. M., Scherngell, T., & Jansenberger, E. (2006). The Geography of Knowledge Spilloversbetween High-Technology Firms in Europe: Evidence from a Spatial Interaction ModelingPerspective. Geographical Analysis, 38(3), 288–309.
Fitjar, R. D., Huber, F., & Rodríguez-Pose, A. (2016). Not Too Close, Not Too Far: Testing theGoldilocks Principle of ‘Optimal’distance in Innovation Networks. Industry and Innovation, 23(6),465–487.
Fitjar, R. D., & Rodriguez-Pose, A. (2011). When Local Interaction Does Not Suffice: Sources ofFirm Innovation in Urban Norway. Environment and Planning A, 43(6), 1248–1267.
Flanagin, A., Carey, L. A., Fontanarosa, P. B., Phillips, S. G., Pace, B. P., Lundberg, G. D., &Rennie, D. (1998). Prevalence of Articles with Honorary Authors and Ghost Authors in Peer-Reviewed Medical Journals. Jama, 280(3), 222–224.
Fleming, L., King, C., & Juda, A. I. (2007). Small Worlds and Regional Innovation. OrganizationScience, 18(6), 938–954.
Florida, R. (1995). Toward the Learning Region. Futures, 27(5), 527–536.Florida, R. (2002). The Rise of the Creative Class: And How It’s Transforming Work, Leisure,
Community and Everyday Life. New York, NY: Basic Books.Florida, R. (2005). The World Is Spiky: Globalization Has Changed the Economic Playing Field,
but Hasn’t Levelled It. Atlantic Monthly, 296(3), 48.Forero-Pineda, C. (2006). The Impact of Stronger Intellectual Property Rights on Science and
Technology in Developing Countries. Research Policy, 35(6), 808–824.Forgan, S. (1989). The Architecture of Science and the Idea of a University. Studies in History and
Philosophy of Science Part A, 20(4), 405–434.Frame, J. D., Narin, F., & Carpenter, M. P. (1977). The Distribution of World Science. Social
Studies of Science, 7(4), 501–516.Franceschet, M. (2012). The Large-Scale Structure of Journal Citation Networks. Journal of the
Association for Information Science and Technology, 63(4), 837–842.Franceschet, M., & Costantini, A. (2010). The Effect of Scholar Collaboration on Impact and
Quality of Academic Papers. Journal of Informetrics, 4(4), 540–553.Frenken, K., Hardeman, S., & Hoekman, J. (2009). Spatial Scientometrics: Towards a Cumulative
Research Program. Journal of Informetrics, 3(3), 222–232.Friedman, T. L. (2005). The World Is Flat: A Brief History of the Twenty-First Century. New York,
NY: Farrar, Straus and Giroux.Frietsch, R., & Jung, T. (2009). Transnational Patents: Structures, Trends and Recent Developments.
Studien zum deutschen Innovationssystem, 7. Karlsruhe, Germany: Fraunhofer Institute forSystems and Innovation Research.
196 References

Galenson, D. (2012, March 7). Collaboration in Science and Art. Huffington Post. Retrieved fromhttp://www.huffingtonpost.com/david-galenson/collaboration-in-science-_b_ 1687024.html
Galison, P. (2003). The Collective Author. In M. Biagioli & P. Galison (Eds.), Scientific Authorship:Credit and Intellectual Property in Science (pp. 327–355). New York, NY: Routledge.
Galison, P., & Hevly, B. W. (1992). Big Science: The Growth of Large-Scale Research. Stanford, CA:Stanford University Press.
Galison, P., & Thompson, E. (Eds.). (1999). The Architecture of Science. Cambridge, MA: MIT Press.Gama, R., Barros, C., & Fernandes, R. (2018). Science Policy, R&D and Knowledge in Portugal:
An Application of Social Network Analysis. Journal of the Knowledge Economy, 9(2), 329–358.Garfield, E. (1996). What Is the Primordial Reference for the Phrase ‘Publish or Perish’?
[Commentary]. The Scientist, 10(12), 11. Retrieved from http://the-scientist.com/17052Gaspar, J., & Glaeser, E. L. (1998). Information Technology and the Future of Cities. Journal of
Urban Economics, 43(1), 136–156.Gauffriau, M., Larsen, P., Maye, I., Roulin-Perriard, A., & von Ins, M. (2007). Publication,
Cooperation and Productivity Measures in Scientific Research. Scientometrics, 73(2), 175–214.Gaul, G. M. (2015). Billion-Dollar Ball: A Journey through the Big-Money Culture of College Football.
New York, NY: Penguin Books.Gazni, A., Sugimoto, C. R., & Didegah, F. (2012). Mapping World Scientific Collaboration:
Authors, Institutions, and Countries. Journal of the Association for Information Science and Technology,63(2), 323–335.
Geiger, R. L., & Sá, C. (2005). Beyond Technology Transfer: US State Policies to HarnessUniversity Research for Economic Development.Minerva, 43(1), 1–21.
Gelber, H. (2001). Nations Out of Empires. European Nationalism and the Transformation of Asia.Hampshire, UK: Palgrave.
Georghiou, L. (1998). Global Cooperation in Research. Research Policy, 27(6), 611–626.Georghiou, L. (2001). Evolving Frameworks for European Collaboration in Research and Tech-
nology. Research Policy, 30(6), 891–903.Gertler, M. S., & Vinodrai, T. (2005). Anchors of Creativity: How Do Public Universities Create
Competitive and Cohesive Communities. In F. Iacobucci & C. J. Tuohy (Eds.), Taking PublicUniversities Seriously (pp. 293–315). Toronto, Canada: University of Toronto Press.
Gibbons, M., Limoges, C., Nowotny, H., Schwartzman, S., Scott, P., & Trow, M. (1994). TheNew Production of Knowledge: The Dynamics of Science and Research in Contemporary Societies. LosAngeles, CA: Sage.
Gibney, E. (2014, July 31). Five-Year Delay Would Spell End of ITER. Nature. Retrieved fromhttp://www.nature.com/news/five-year-delay-would-spell-end-of-iter-1.15621
Gieryn, T. F. (2002). Three Truth-Spots. Journal of the History of the Behavioral Sciences, 38(2),113–132.
Gieryn, T. F. (2018). Truth-Spots. Chicago, IL: The University of Chicago Press.Gilbert, N. (2011). Europe’s Innovation Hub Finally KICs Off: Large Networks of Researchers and
Companies Aim to Develop and CommercializeMarketable Products.Nature, 470(7335), 450–451.Gliboff, S. (2010). Did Paul Kammerer discover epigenetic inheritance? No and why not. Journal of
Experimental Zoology Part B: Molecular and Developmental Evolution, 314(8), 616-624.Glaeser, E. L., & Kohlhase, J. E. (2004). Cities, Regions and the Decline of Transport Costs. In
R. J. G. M. Florax & D. Plane (Eds.), Fifty Years of Regional Science (pp. 197–228). Berlin,Germany: Springer.
Glänzel, W. (2001). National Characteristics in International Scientific Co-Authorship Relations.Scientometrics, 51(1), 69–115.
Glänzel, W., & Schubert, A. (2001). Double Effort= Double Impact? A Critical View at Interna-tional Co-Authorship in Chemistry. Scientometrics, 50(2), 199–214.
Glänzel, W., Schubert, A., & Czerwon, H. J. (1999). A Bibliometric Analysis of InternationalScientific Cooperation of the European Union (1985–1995). Scientometrics, 45(2), 185–202.
References 197

Gmür, M. (2003). Co-Citation Analysis and the Search for Invisible Colleges: A MethodologicalEvaluation. Scientometrics, 57(1), 27–57.
Gnyawali, D. R., He, J.,& Madhavan, R. (2008). Co-Opetition: Promises and Challenges. InC. Wankel (Ed.), 21st Century Management: A Reference Handbook (pp. 386–398). Thousand Oaks,CA: Sage.
Gnyawali, D. R., & Park, B. J. R. (2011). Coopetition between Giants: Collaboration withCompetitors for Technological Innovation. Research Policy, 40(5), 650–663.
Goddard, J. (2013). Keep Universities Anchored. Research Fortnight, 422, 20–22.Goddard, J., Kempton, L., Vallance P. (2013). The Civic University: Connecting the Global and
the Local. In R. Cappello, A. Olechnicka, & G. Gorzelak (Eds.), Universities, Cities and Regions:Loci for Knowledge and Innovation Creation (pp. 43–63). New York, NY: Routledge.
Goddard, J., & Vallance, P. (2011). Universities and Regional Development. In A. Pike,A. Rodríguez-Pose, & J. Tomaney (Eds.), Handbook of Local and Regional Development (pp. 425–437). London, UK: Routledge.
Goddard, J., & Vallance, P. (2013). The University and the City. London, UK: Routledge.Godin, B., & Ippersiel, M. P. (1996). Scientific Collaboration at the Regional Level: The Case of a
Small Country. Scientometrics, 36(1), 59–68.Goffman, C. (1969). And What Is Your Erdos Number? The American Mathematical Monthly, 76(7),
791–791.Goldfinch, S., Dale, T., & DeRouen, K. (2003). Science from the Periphery: Publication,
Collaboration and ‘Periphery Effects’ in Article Citation Rates of the New Zealand CrownResearch Institutes 1995–2000. Scientometrics, 57(3), 321–337.
Goldstain, H. (2010). The ‘Entrepreneurial Turn’ and Regional Economic Development Missionof Universities. Annals of Regional Science, 44(1), 83–109.
Goodyear, D. (2016, February 29). The Stress Test. The New Yorker. Retrieved from http://www.newyorker.com/magazine/2016/02/29/the-stem-cell-scandal
Gordin, M. D. (2015). Scientific Babel: How Science Was Done before and after Global English. Chicago,IL: University of Chicago Press.
Gordon, M. (1980). A Critical Reassessment of Inferred Relations between Multiple Authorship,Scientific Collaboration, the Production of Papers and Their Acceptance for Publication. Sciento-metrics, 2(3), 193–201.
Gorraiz, J., Reimann, R., & Gumpenberger, C. (2012). Key Factors and Considerations in theAssessment of International Collaboration: A Case Study for Austria and Six Countries. Sciento-metrics, 91(2), 417–433.
Gorzelak, G. (2010). Facts and Myths of Regional Development, Studia Regionalne I Lokalne, 5–28.Special Issue.
Gorzelak, G., & Zawalińska, K. (Eds.). (2013). European Territories: From Cooperation to Integration?Warsaw, Poland: Scholar.
Granovetter, M. S. (1973). The Strength ofWeak Ties. American Journal of Sociology, 78(6), 1360–1380.Grasland, C., & Madelin, M. (Eds.). (2006). The Modifiable Areas Unit Problem. ESPON 3.4.3 Final
Report. Luxembourg: ESPON.Griffiths, R. (2004). Knowledge Production and the Research–Teaching Nexus: The Case of the
Built Environment Disciplines. Studies in Higher Education, 29(6), 709–726.Grossetti, M., Eckert, D., Gingras, Y., Jégou, L., Larivière, V., & Milard, B. (2014). Cities and the
Geographical Deconcentration of Scientific Activity: A Multilevel Analysis of Publications(1987–2007). Urban Studies, 51(10), 2219–2234.
Grove, J. (2016, March 31). Can a Young University Be a World-Leading University? Times HigherEducation. Retrieved from https://www.timeshighereducation.com/features/can-a-young-university-be-a-world-leading-university
Guan, J., & Liu, N. (2014). Measuring Scientific Research in Emerging Nano-Energy Field. Journalof Nanoparticle Research, 16(4), 2356.
198 References

Guellec, D., & De La Potterie, B. V. P. (2001). The Internationalisation of Technology Analysedwith Patent Data. Research Policy, 30(8), 1253–1266.
Gumprecht, B. (2008). The American College Town. Amherst, MA: University of Massachusetts Press.Gunasekara, C. (2006a). Reframing the Role of Universities in the Development of Regional
Innovation Systems. The Journal of Technology Transfer, 31(1), 101–113.Gunasekara, C. (2006b). The Generative and Developmental Roles of Universities in Regional
Innovation Systems. Science and Public Policy, 33, 137–150.Gusmão, R. (2001). Research Networks as a Means of European Integration. Technology in Society,
23(3), 383–393.Haar, S. (2011). The City as Campus: Urbanism and Higher Education in Chicago. Minneapolis, MN:
Unieversity of Minnesota Press.Hall, P. (2000). Creative Cities and Economic Development. Urban Studies, 37(4), 639–649.Hallonsten, O. (2016). Big Science Transformed: Science, Politics and Organization in Europe and the
United States. New York, NY: Macmillan Publishers Limited.Hane, G. (2008). Science, Technology, and Global Reengagement. Issues in Science and Technology,
25(1), 85–90.Hannaway, O. (1986). Laboratory Design and the Aim of Science: Andreas Libavius versus Tycho
Brahe. Isis, 77(4), 585–610.Hansen, T. (2013). Bridging Regional Innovation: Cross-Border Collaboration in the Øresund
Region. Geografisk Tidsskrift-Danish Journal of Geography, 113(1), 25–38.Hao, X., Yan, K., Guo, S., & Wang, M. (2017). Chinese Returnees’ Motivation, Post-Return
Status and Impact of Return: A Systematic Review. Asian and Pacific Migration Journal, 26(1),143–157.
Hara, N., Solomon, P., Kim, S. L., & Sonnenwald, D. H. (2003). An Emerging View of ScientificCollaboration: Scientists’ Perspectives on Collaboration and Factors that Impact Collaboration.Journal of the American Society for Information Science and Technology, 54(10), 952–965.
Harloe, M., & Perry, B. (2004). Universities, Localities and Regional Development: TheEmergence of the ‘Mode 2’ university? International Journal of Urban and Regional Research,28(1), 212–223.
Harris, S. J. (2006). Networks of Travel, Correspondence, and Exchange. In D. C. Lindberg, R. L.Numbers, & R. Porter (Eds.), The Cambridge History of Science (Vol. 3, pp. 341–362). Cambridge,UK: Cambridge University Press.
Hart, R. L. (2007). Collaboration and Article Quality in the Literature of Academic Librarianship.The Journal of Academic Librarianship, 33(2), 190–195.
Hassell, M. P., & May, R. M. (1974). Aggregation of Predators and Insect Parasites and Its Effect onStability. The Journal of Animal Ecology, 43(2), 567–594.
Hauser, C., Tappeiner, G., &Walde, J. (2007). The Learning Region: The Impact of Social Capitaland Weak Ties on Innovation. Regional Studies, 41(1), 75–88.
Haustein, S., Costas, R., & Larivière, V. (2015). Characterizing Social Media Metrics of ScholarlyPapers: The Effect of Document Properties and Collaboration Patterns. PLoS One, 10(3),e0120495.
He, B., Ding, Y., & Ni, C. (2011). Mining Enriched Contextual Information of ScientificCollaboration: A Meso Perspective. Journal of the American Society for Information Science andTechnology, 62(5), 831–845.
He, B., Ding, Y., & Yan, E. (2012). Mining Patterns of Author Orders in Scientific Publications.Journal of Informetrics, 6(3), 359–367.
He, Z. L. (2009). International Collaboration Does Not Have Greater Epistemic Authority. Journalof the American Society for Information Science and Technology, 60(10), 2151–2164.
Hennemann, S., Wang, T., & Liefner, I. (2011). Measuring Regional Science Networks in China:A Comparison of International and Domestic Bibliographic Data Sources. Scientometrics, 88(2),535–554.
References 199

Henry, N., & Pinch, S. (2001). Neo-Marshallian Nodes, Institutional Thickness, and Britain’s‘Motor Sport Valley’: Thick or Thin? Environment and Planning A, 33(7), 1169–1183.
Heringa, P. W., Horlings, E., Van Der Zouwen, M., Van Den Besselaar, P., & Van Vierssen, W.(2014). How Do Dimensions of Proximity Relate to the Outcomes of Collaboration? A Surveyof Knowledge-Intensive Networks in the Dutch Water Sector. Economics of Innovation and NewTechnology, 23(7), 689–716.
Hessels, L. K., & Van Lente, H. (2008). Re-Thinking New Knowledge Production: A LiteratureReview and A Research Agenda. Research Policy, 37(4), 740–760.
Hicks, D. (2012). Performance-Based University Research Funding Systems. Research Policy, 41(2),251–261.
Hicks, D., & Katz, J. S. (1996). Science Policy for a Highly Collaborative Science System. Scienceand Public Policy, 23(1), 39–44.
Hiltzik, M. A. (2015). Big Science: Ernest Lawrence and the Invention that Launched the Military-IndustrialComplex. New York, NY: Simon & Schuster.
Hoekman, J., Frenken, K., & Tijssen, R. J. (2010). Research Collaboration at a Distance:Changing Spatial Patterns of Scientific Collaboration within Europe. Research Policy, 39(5),662–673.
Hoekman, J., Frenken, K., & Van Oort, F. (2009). The Geography of Collaborative KnowledgeProduction in Europe. The Annals of Regional Science, 43(3), 721–738.
Hoekman, J., Scherngell, T., Frenken, K., & Tijssen, R. (2013). Acquisition of European ResearchFunds and Its Effect on International Scientific Collaboration. Journal of Economic Geography, 13(1),23–52.
Hollis, A. (2001). Co-Authorship and the Output of Academic Economists. Labour Economics, 8,503–530.
Hong, W. (2008). Decline of the Center: The Decentralizing Process of Knowledge Transfer ofChinese Universities from 1985 to 2004. Research Policy, 37(4), 580–595.
Hotz, R. L. (1999, October 1). Mars Probe Lost Due to Simple Math Error. Los Angeles Times.Retrieved from http://articles.latimes.com/1999/oct/01/news/mn-17288
Hotz, R. L. (2015, August 10). How Many Scientists Does It Take to Write a Paper? Apparently,Thousands. The Wall Street Journal. Retrieved from http://www.wsj.com/articles/how-many-scientists-does-it-take-to-write-a-paper-apparently-thousands-1439169200
Hsiehchen, D., Espinoza, M., & Hsieh, A. (2015). Multinational Teams and Diseconomies of Scalein Collaborative Research. Science Advances, 1(8), e1500211.
Huang, H. W., & Zhang, S. L. (2000). College and University Mergers: Impact on AcademicLibraries in China. College & Research Libraries, 61(2), 121–125.
Huang, M. H., Tang, M. C., & Chen, D. Z. (2011). Inequality of Publishing Performance andInternational Collaboration in Physics. Journal of the American Society for Information Science andTechnology, 62(6), 1156–1165.
Huang, Z. (2015, November 10). Modern Talent Scout - Yuan Fang, Director of the BeijingOverseas Talents Center. China Today. Retrieved from http://www.chinatoday.com.cn/english/society/2015-11/10/content_708024.htm
Huber, F. (2012). Do Clusters Really Matter for Innovation Practices in Information Technology?Questioning the Significance of Technological Knowledge Spillovers. Journal of EconomicGeography, 12(1), 107–126.
Hull, D. L. (1988). Science as a Process: An Evolutionary Account of the Social and Conceptual Developmentof Science. Chicago, IL: University of Chicago Press.
Human Genome Project Information Archive. (1990–2003). Retrieved From http://web.ornl.gov/sci/techresources/Human_Genome/index.shtml
Hunt, T. (Interviewee) (n.d.). Do You Enjoy Collaboration. Nobel Prize Inspiration Initiative[Interview’s video podcast]. Retrieved from http://www.nobelprizeii.org/videos/do-you-enjoy-collaboration/
200 References

Hwang, K. (2008). International Collaboration in Multilayered Center-Periphery in the Globaliza-tion of Science and Technology. Science, Technology, & Human Values, 33(1), 101–133.
Hwang, K. (2012). Effects of the Language Barrier on Processes and Performance of InternationalScientific Collaboration, Collaborators’ Participation, Organizational Integrity, and Interorgani-zational Relationships. Science Communication, 35(1), 3–31.
Hyde, J. K. (1988). Universities and Cities in Medieval Italy. In T. Bender (Ed.), The University andthe City: From Medieval Origins to the Present (pp. 13–21). New York, NY: Oxford UniversityPress.
Iaria, A., Schwarz, C., & Waldinger, F. (2018). Frontier Knowledge and Scientific Production:Evidence from the Collapse of International Science. The Quarterly Journal of Economics, 133(2),927–991.
IDRC & State Science and Technology Commission People’s Republic of China. (1998). A Decadeof Reform: Science & Technology Policy in China. Ottawa: International Development ResearchCentre. Retrieved from https://www.idrc.ca/en/book/decade-reform-science-and-technology-policy-china
Ihde, A. J. (1961). The Karlsruhe Congress: A Centennial Retrospective. Journal of ChemicalEducation, 38(2), 83–86.
Ilakovac, V., Fister, K., Marusic, M., & Marusic, A. (2007). Reliability of Disclosure Forms ofAuthors’ Contributions. Canadian Medical Association Journal, 176(1), 41–46.
Indiana University Center for Postsecondary Research. (2016). Carnegie Classifications 2015Public Data File. Retrieved form http://carnegieclassifications.iu.edu/downloads/CCIHE2015-PublicDataFile.xlsx
Ingwersen, P., & Larsen, B. (2014). Influence of a Performance Indicator on Danish ResearchProduction and Citation Impact 2000–12. Scientometrics, 101(2), 1325–1344.
Isabelle, D. A., & Heslop, L. A. (2011). Managing for Success in International Scientific Collabora-tions: Views from Canadian Government Senior Science Managers. Science and Public Policy, 38(5), 349.
Jacob, M., & Meek, V. L. (2013). Scientific Mobility and International Research Networks: Trendsand Policy Tools for Promoting Research Excellence and Capacity Building. Studies in HigherEducation, 38(3), 331–344.
Jakobson, L. (2007). China Aims High in Science and Technology: An Overview of the ChallengesAhead. In L. Jakobson (Ed.), Innovation with Chinese Characteristics: High-Tech Research in China(pp. 1–36). New York, NY: Palgrave Macmillan.
Jarvie, I. C., Milford, K., & Miller, D. W. (Eds.). (2006). Karl Popper: Metaphysics and Epistemology.Aldershot, UK: Ashgate Publishing.
Jaspers, K. (1959). The Idea of the University. London, UK: Owen.Jeffrey, P. (2003). Smoothing the Waters Observations on the Process of Cross-Disciplinary
Research Collaboration. Social Studies of Science, 33(4), 539–562.Jeong, S., Choi, J. Y., & Kim, J. (2011). The Determinants of Research Collaboration Modes:
Exploring the Effects of Research and Researcher Characteristics on Co-Authorship. Sciento-metrics, 89(3), 967–983.
Jing, Z. (2011, June 5). International Scientific Co-Op Urged. China Daily. Retrieved from http://europe.chinadaily.com.cn/china/2011-06/09/content_12667946.htm
Jirotka, M., Lee, C. P., & Olson, G. M. (2013). Supporting Scientific Collaboration: Methods,Tools and Concepts. Computer Supported Cooperative Work, 22(4–6), 667–715.
Johnson, D., & Grayson, K. (2005). Cognitive and Affective Trust in Service Relationships. Journal ofBusiness Research, 58(4), 500–507.
Jones, B. F., Wuchty, S., & Uzzi, B. (2008). Multi-University Research Teams: Shifting Impact,Geography, and Stratification in Science. Science, 322(5905), 1259–1262.
Jonkers, K., & Cruz-Castro, L. (2013). Research upon Return: The Effect of InternationalMobility on Scientific Ties, Production and Impact. Research Policy, 42(8), 1366–1377.
References 201

Jonkers, K., & Tijssen, R. (2008). Chinese Researchers Returning Home: Impacts of InternationalMobility on Research Collaboration and Scientific Productivity. Scientometrics, 77(2), 309–333.
Jöns, H. (2009). ‘Brain Circulation’ and Transnational Knowledge Networks: Studying Long-Term Effects of Academic Mobility to Germany, 1954–2000. Global Networks, 9(3), 315–338.
Jöns, H., & Hoyler, M. (2013). Global Geographies of Higher Education: The Perspective of WorldUniversity Rankings. Geoforum, 46, 45–59.
Jorgensen, R. (2007). Rewarding Collaboration [Editorial]. The Plant Cell, 19(10), 2967.Joseph, K., Laband, D. N., & Patil, V. (2005). Author Order and Research Quality. Southern
Economic Journal, 71(3), 545–555.Josephson, P. R. (1997). New Atlantis Revisited: Akademgorodok, the Siberian City of Science.
Princeton, NJ: Princeton University Press.Jun, C. (2016, January 19). Innovation Contest Pushes Forward US-china Cooperation. China Daily.
Retrieved from http://usa.chinadaily.com.cn/opinion/2016-01/19/content_23155992.htmKabo, F. W., Cotton-Nessler, N., Hwang, Y., Levenstein, M. C., & Owen-Smith, J. (2014).
Proximity Effects on the Dynamics and Outcomes of Scientific Collaborations. Research Policy,43(9), 1469–1485.
Kabo, F. W., Hwang, Y., Levenstein, M., & Owen-Smith, J. (2015). Shared Paths to the Lab: ASociospatial Network Analysis of Collaboration. Environment and Behavior, 47(1), 57–84.
Kafouros, M., Wang, C., Piperopoulos, P., & Zhang, M. (2015). Academic Collaborations andFirm Innovation Performance in China: The Role of Region-Specific Institutions. ResearchPolicy, 44(3), 803–817.
Kahn, S., & MacGarvie, M. (2011). The Effects of the Foreign Fulbright Program on KnowledgeCreation in Science and Engineering. In J. Lerner & S. Stern (Eds.), The Rate and Direction ofInventive Activity Revisited (pp. 161–197). Chicago, IL: University of Chicago Press.
Kamalski, J., & Plume, A. (2013, September). Comparative Benchmarking of European and US ResearchCollaboration and Researchers Mobility: A Report Prepared in Collaboration Between Science Europe andElsevier’s SciVal Analytics. Science Europe, Elsevier. Retrieved from https://www.elsevier.com/research-intelligence/resource-library/comparative-benchmarking-of-european-and-us-research-collaboration-and-researcher-mobility
Karpagam, R., Gopalakrishnan, S., Babu, B. R., & Natarajan, M. (2012). Scientometric Analysis ofStem Cell Research: A Comparative Study of India and Other Countries. Collnet Journal ofScientometrics and Information Management, 6(2), 229–252.
Kato, M., & Ando, A. (2017). National Ties of International Scientific Collaboration andResearcher Mobility Found in Nature and Science. Scientometrics, 110(2), 673–694.
Katz, J. S., & Hicks, D. (1997). How Much Is A Collaboration Worth? A Calibrated BibliometricModel. Scientometrics, 40(3), 541–554.
Katz, J. S., & Martin, B. R. (1997). What Is Research Collaboration? Research Policy, 26(1), 1–18.Katz, M. L., & Shapiro, C. (1985). Network Externalities, Competition, and Compatibility. The
American Economic Review, 75(3), 424–440.Ke, W. (2013). A Fitness Model for Scholarly Impact Analysis. Scientometrics, 94(3), 981–998.Kefalides, P. (1991, September). Proliferation of Research Parks Conceals Uneven Success
Pattern. The Scientist. Retrieved from https://www.the-scientist.com/?articles.view/articleNo/12020/title/Proliferation-Of-Research-Parks-Conceals-Uneven-Success-Pattern/
Kenzer, M. S. (1992). Review [Review of the Book the Geography of Science, by H. Dorn]. Isis,83(4), 634–635.
Khatib, F., DiMaio, F., Cooper, S., Kazmierczyk, M., Gilski, M., Krzywda, S., … & Baker, D.(2011). Crystal Structure of a Monomeric Retroviral Protease Solved by Protein Folding GamePlayers. Nature Structural and Molecular Biology, 18(10), 1175.
Kilduff, M., & Tsai, W. (2007). Social Networks and Organizations. Thousand Oaks, CA: Sage.Kim, M.-J. (1999). Korean International Co-Authorship in Science 1994–1996. Journal of Informa-
tion Science, 25, 403–412.
202 References

King, D. A. (2004). The Scientific Impact of Nations. Nature, 430(6997), 311–316.Kirat, T., & Lung, Y. (1999). Innovation and Proximity: Territories as Loci of Collective Learning
Processes. European Urban and Regional Studies, 6(1), 27–38.Klauder, C. Z., & Wise, H. C. (1929). College Architecture in America and Its Part in the Development of
the Campus. New York, NY: C. Scribner’s Sons.Klein, J. T. (1990). Interdisciplinarity: History, Theory, and Practice. Detroit: Wayne state University Press.Klein, J. T. (2004). Prospects for Transdisciplinarity. Futures, 36(4), 515–526.Knapp, A. (2012, July 5). HowMuch Does It Cost to Find a Higgs Boson? Forbes Online. Retrieved
from How Much Does it Cost to Find a Higgs BosonKnight, D. M. (1976). The Nature of Science: The History of Science in Western Culture since 1600.
London, UK: André Deutsch.Knoben, J., & Oerlemans, L. A. (2006). Proximity and Inter-Organizational Collaboration: A
Literature Review. International Journal of Management Reviews, 8(2), 71–89.Koku, E., Nazer, N., & Wellman, B. (2001). Netting Scholars Online and Offline. American
Behavioral Scientist, 44(10), 1752–1774.Kossinets, G., &Watts, D. J. (2006). Empirical Analysis of an Evolving Social Network. Science, 311
(5757), 88–90.Kousha, K., & Thelwall, M. (2007). Google Scholar Citations and Google Web/URL Citations: A
Multidiscipline Exploratory Analysis. Journal of the American Society for Information Science andTechnology, 57(7), 1055–1065.
Kraemer, S. K. (2006). Science and Technology Policy in the United States: Open Systems in Action. NewBrunswick, NJ: Rutgers University Press.
Kreimer, P. (2007). Relevancia Del Conocimiento Social En América Latina: De La Internacionaliza-ción “Neoliberal” a La División Internacional Del Trabajo Científico. Perfiles Educativos, 28, 84–101.
Kretschmer, H., Kretschmer, U., & Kretschmer, T. (2007). Reflection of Co-Authorship Networksin the Web: Web Hyperlinks versus Web Visibility Rates. Scientometrics, 70(2), 519–540.
Krige, J. (2003). The Politics of European Scientific Collaboration. In J. Krige & D. Pestre (Eds.),Companion to Science in the Twentieth Century (pp. 897–918). London, UK: Routledge.
Kronick, D. A. (2001). The Commerce of Letters: Networks And “Invisible Colleges” inSeventeenth-And Eighteenth-Century Europe. The Library Quarterly: Information, Community,Policy, 71(1), 28–43.
Kuklinski A. (2001). The Role of Universities in Stimulating Regional Development and EducatingGlobal Elites. Higher Education in Europe, 26(3), 437–445.
Kulczycki, E. (2017). Assessing Publications through a Bibliometric Indicator: The Case ofComprehensive Evaluation of Scientific Units in Poland. Research Evaluation, 26(1), 41–52.
Kullenberg, C., & Kasperowski, D. (2016). What Is Citizen science?–A Scientometric Meta-Analysis. PLoS ONE, 11(1), e0147152.
Kumar, S. (2015). Co-Authorship Networks: A Review of the Literature. Aslib Journal of InformationManagement, 67(1), 55–73.
Kumar, S., Rohani, V. A., & Ratnavelu, K. (2014). International Research Collaborations ofASEAN Nations in Economics, 1979–2010. Scientometrics, 101(1), 847–867.
Kuttim, M. (2016). The Role of Spatial and Non-Spatial Forms of Proximity in Knowledge Transfer:A Case of Technical University. European Journal of Innovation Management, 19(4), 468–491.
Kwiek, M. (2017). International Research Collaboration and International Research Orientation:Comparative Findings about European Academics. Journal of Studies in International Education,22(2), 136–160.
Laband, D. N., & Tollison, R. D. (2000). Intellectual Collaboration. Journal of Political Economy,108(3), 632–662.
Lambert, R. (2003). Lambert Review of Business-University Collaboration: Final Report. University ofIllinois at Urbana-Champaign’s Academy for Entrepreneurial Leadership Historical ResearchReference in Entrepreneurship. Retrieved from https://ssrn.com/abstract=1509981
References 203

Lambright, W. H. (2000). Catalyzing Research Competitiveness: The Georgia Research Alliance.Prometheus, 18(4), 357–372.
Landry, C. (2008). The Creative City: A Toolkit for Urban Innovators (2nd ed.). New Stroud:Comedia.
Landry, R., Traoré, N., & Godin, B. (1996). An Econometric Analysis of the Effect of Collabora-tion on Academic Research Productivity. Higher Education, 32(3), 283–301.
Lank, E. (2006). Collaborative Advantage. How Organizations Win by Working Together. London, UK:Palgrave Macmillan.
Larivière, V., Desrochers, N., Macaluso, B., Mongeon, P., Paul-Hus, A., & Sugimoto, C. R.(2016). Contributorship and Division of Labor in Knowledge Production. Social Studies of Science,46(3), 417–435.
Larivière, V., Gingras, Y., Sugimoto, C. R., & Tsou, A. (2015). Team Size Matters: Collaborationand Scientific Impact since 1900. Journal of the Association for Information Science and Technology,66(7), 1323–1332.
Latour, B. (1987). Science in Action: How to Follow Scientists and Engineers through Society. Cambridge,MA: Harvard University Press.
Latour, B., & Woolgar, S. (1986). Laboratory Life: The Construction of Scientific Facts. Princeton, NJ:Princeton University Press.
Laudel, G. (2001). Collaboration, Creativity and Rewards: Why and How Scientists Collaborate.International Journal of Technology Management, 22(7–8), 762–781.
Laudel, G. (2002). What Do We Measure by Co-Authorships? Research Evaluation, 11(1), 3–15.Lawani, S. M. (1980). Quality, Collaboration and Citations in Cancer Research: A Bibliometric Study
(Doctoral Dissertation). Florida State University.Lawani, S. M. (1986). Some Bibliometric Correlates of Quality in Scientific Research. Sciento-
metrics, 9(1–2), 13–25.Lawton Smith, H. (2006). Universities, Innovation and the Economy. London, UK: Routledge.Lazerson, M., & Lorenzoni, G. (1999). Resisting Organizational Inertia: The Evolution of
Industrial Districts. Journal of Management and Governance, 3(4), 361–377.Leclerc, M., & Gagné, J. (1994). International Scientific Cooperation: The Continentalization of
Science. Scientometrics, 31(3), 261–292.Lee, K. (2011). University Architecture. Shenyang, China: Liaoning Science & Technology Publish-
ing House.Lee, K., Brownstein, J. S., Mills, R. G., & Kohane, I. S. (2010). Does Collocation Inform the
Impact of Collaboration? PLoS ONE, 5(12), e14279.Lee, S., & Bozeman, B. (2005). The Impact of Research Collaboration on Scientific Productivity.
Social Studies of Science, 35(5), 673–702.Lei, X. P., Zhao, Z. Y., Zhang, X., Chen, D. Z., Huang, M. H., Zheng, J., … & Zhao, Y. H.
(2013). Technological Collaboration Patterns in Solar Cell Industry Based on Patent Inventorsand Assignees Analysis. Scientometrics, 96(2), 427–441.
Leicester, H. M. (1956). The Historical Background of Chemistry. New York, NY: John Wiley andSons.
Leimu, R., & Koricheva, J. (2005). Does Scientific Collaboration Increase the Impact of EcologicalArticles? AIBS Bulletin, 55(5), 438–443.
Leonchuk, L., McGowen, L.C., & Gray, D.O. (2016). IUCRC Program Findings from the CenterStructure Database [PDF Document]. Retrieved from https://projects.ncsu.edu/iucrc/Jan-Jun%2716/2014-2015%20CD%20Report%20Slides_standardized%20Final.pdf
Lessig, L. (2005). Free Culture: The Nature and Future of Creativity. New York, NY: Penguin.Leta, J., & Chaimovich, H. (2002). Recognition and International Collaboration: The Brazilian
Case. Scientometrics, 53(3), 325–335.Leverington, D. (2003). Babylon to Voyager and Beyond: A History of Planetary Astronomy. Cambridge,
UK: Cambridge University Press.
204 References

Leydesdorff, L., & Park, H. W. (2017). Full and Fractional Counting in Bibliometric Networks.Journal of Informetrics, 11(1), 117–120.
Leydesdorff, L., & Wagner, C. S. (2008). International Collaboration in Science and the Formationof a Core Group. Journal of Informetrics, 2(4), 317–325.
Li, J., & Willett, P. (2009). Bibliometric Analysis of Chinese Research on Cyclization, MALDI-TOF, and Antibiotics. Journal of Chemical Information and Modeling, 50(1), 22–29.
Liang, L., & Zhu, L. (2002). Major Factors Affecting China’s Inter-Regional Research Collabora-tion: Regional Scientific Productivity and Geographical Proximity. Scientometrics, 55(2), 287–316.
Libo, Z. (2015). A Scientometrics Study on Cooperation of Chinese S&T Research over the pastDecade. Journal of Intelligence, 1, 023.
Link, A. N., Siegel, D. S., & Wright, M. (Eds.). (2015). The Chicago Handbook of UniversityTechnology Transfer and Academic Entrepreneurship. Chicago, IL: University of Chicago Press.
Lintott, C., Schawinski, K., Bamford, S., Slosar, A., Land, K., Thomas, D., … & Vandenberg, J.(2010). Galaxy Zoo 1: Data Release of Morphological Classifications for Nearly 900 000Galaxies. Monthly Notices of the Royal Astronomical Society, 410(1), 166–178.
Lisbon European Council. (2000, March 23 and 24). Presidency Conclusions. Retrieved fromhttp://www.europarl.europa.eu/summits/lis1_en.htm
Liu, F. C., Simon, D. F., Sun, Y. T., & Cao, C. (2011). China’s Innovation Policies: Evolution,Institutional Structure, and Trajectory. Research Policy, 40(7), 917–931.
Liu, X., Bollen, J., Nelson, M. L., & Van De Sompel, H. (2005). Co-Authorship Networks in theDigital Library Research Community. Information Processing & Management, 41(6), 1462–1480.
Livingstone, D. N. (2003). Putting Science in Its Place: Geographies of Scientific Knowledge. Chicago, IL:University of Chicago Press.
López, W. L., Silva, L. M., García-Cepero, M. C., Bustamante, M. C. A., & López, E. A. (2011).Retos Para La Colaboración Nacional E Internacional En La Psicología Latinoamericana: UnAnálisis Del Sistema Redalyc, 2005–2007. Estudos De Psicologia (Natal), 16(1), 17–22.
Lorentzen, A. (2007). The Geography of Knowledge sourcing—A Case Study of Polish Manu-facturing Enterprises. European Planning Studies, 15(4), 467–486.
Lorentzen, A. (2008). Knowledge Networks in Local and Global Space. Entrepreneurship andRegional Development, 20(6), 533–545.
Lorigo, L., & Pellacini, F. (2007). Frequency and Structure of Long Distance Scholarly Collabora-tions in a Physics Community. Journal of the American Society for Information Science and Technology,58(10), 1497–1502.
Lovelock, J. (2014, March 26). We Need Lone Scientists. The Independent. Retrieved from http://www.independent.co.uk/life-style/health-and-families/features/james-lovelock-we-need-lone-scientists-9215280.html
Luger, M. I, & Goldstein, H. A. (1991). Technology in the Garden: Research Parks and RegionalEconomic Development. Chapel Hill, NC: University of North Carolina Press.
Lundvall, B. Å. (1996). The social dimension of the learning economy. DRUID Working Papers 96-1,DRUID, Copenhagen Business School, Aalborg University.
Lundvall, B. Å. (2007). National Innovation Systems—Analytical Concept and Development Tool.Industry and Innovation, 14(1), 95–119.
Luo, J., Chen, L. S., Duan, H. Z., Gong, Y. G., Hu, S., Ji, J.,… & Shao, C. G. (2016). TianQin: ASpace-Borne Gravitational Wave Detector. Classical and Quantum Gravity, 33(3), 035010.
Luo, J., Ordonez-Matamoros, G., & Kuhlmann, S. (2015). Aggregated Governance by R&DEvaluation Mechanism-Case Study of Chinese Academy of Sciences. Asian Research Policy, 6(1),56–72.
Luukkonen, T., & Nedeva, M. (2010). Towards Understanding Integration in Research andResearch Policy. Research Policy, 39(5), 674–686.
Luukkonen, T., Persson, O., & Sivertsen, G. (1992). Understanding Patterns of InternationalScientific Collaboration. Science, Technology, & Human Values, 17(1), 101–126.
References 205

Luukkonen, T., Tijssen, R., Persson, O., & Sivertsen, G. (1993). The Measurement of Interna-tional Scientific Collaboration. Scientometrics, 28(1), 15–36.
Lyons, E. E., Colglazier, E. W., Wagner, C. S., Börner, K., Dooley, D. M., Mote Jr., C. D., &Roco, M. C. (2016). How Collaborating in International Science Helps America. Science &Diplomacy, 5(2), 56–79.
Ma, F., Li, Y., & Chen, B. (2014). Study of the Collaboration in the Field of the ChineseHumanities and Social Sciences. Scientometrics, 100(2), 439–458.
Ma, H., Fang, C., Pang, B., & Wang, S. (2015). Structure of Chinese City Network as Driven byTechnological Knowledge Flows. Chinese Geographical Science, 25(4), 498–510.
Ma, N., & Guan, J. (2005). An Exploratory Study on Collaboration Profiles of Chinese Publica-tions in Molecular Biology. Scientometrics, 65(3), 343–355.
Machlup, F. (1979). Stocks and Flows of Knowledge. Kyklos, 32(1-2), 400–411.Macías-Chapula, C. A. (2010). Influence of Local and Regional Publications in the Production of
Public Health Research Papers in Latin America. Scientometrics, 84(3), 703–716.Madsen, C. (2010). Scientific Europe: Policies and Politics of the European Research Area. Brentwood:
Multi-Science Pub.Maggioni, M. A., Nosvelli, M., & Uberti, T. E. (2007). Space versus Networks in the
Geography of Innovation: A European Analysis. Papers in Regional Science, 86(3), 471–493.Maglaughlin, K. L. & Sonnenwald, D. H. (2005). Factors that Impact Interdisciplinary Natural
Science Research Collaboration in Academia. Proceedings from International Society for Scientometricsand Informetrics (ISSI) 2005 Conference. 24–25.
Mahon, D., & Niklas, R. (2016). The Evolution of a Foundation Program: Reflections on the FiveYear Partnership between University College London and Nazarbayev University. In P. Bles-singer (Ed.), University Partnerships for Academic Programs and Professional Development (pp. 93–109).Bingley, UK: Emerald Group Publishing Limited.
Maisonobe, M., Eckert, D., Grossetti, M., Jégou, L., & Milard, B. (2016). The World Network ofScientific Collaborations between Cities: Domestic or International Dynamics? Journal of Infor-metrics, 10(4), 1025–1036.
Maisonobe, M., Grossetti, M., Milard, B., Eckert, D., & Jégou, L. (2016). L’évolution MondialeDes Réseaux De Collaborations Scientifiques Entre Villes: Des Échelles Multiples. RevueFrançaise De Sociologie, 57(3), 417–441.
Marshall, A. (1890). Principles of Economics. London, UK: Macmillan.Martin, B. R. (2016). R&D Policy Instruments–A Critical Review of What We Do and Don’t
Know. Industry and Innovation, 23(2), 157–176.Marušic, A., Bošnjak, L., & Jerončic, A. (2011). A Systematic Review of Research on the Meaning,
Ethics and Practices of Authorship across Scholarly Disciplines. PLoS ONE, 6(9), e23477.Mashaal, M. (2006). Bourbaki: A Secret Society of Mathematics. Providence, RI: American Mathema-
tical Society.Massey, D. B, Quintas, P., & Wield, D. (1992). High-Tech Fantasies: Science Parks in Society, Science,
and Space. London, UK: Routledge.Mathiassen, L. (2002). Collaborative Practice Research. Information Technology & People, 15(4),
321–345.Matthews, J. N. (2012). Chile Aims to Better Exploit Role as Telescope Host. Physics Today, 65(1), 20.Matthiessen, C. W., Schwarz, A. W., & Find, S. (2010). World Cities of Scientific Knowledge:
Systems, Networks and Potential Dynamics. An Analysis Based on Bibliometric Indicators.Urban Studies, 47(9), 1879–1897.
Mattsson, P., Sundberg, C. J., & Laget, P. (2011). Is Correspondence Reflected in the AuthorPosition? A Bibliometric Study of the Relation between Corresponding Author and BylinePosition. Scientometrics, 87(1), 99–105.
Maurseth, P. B., & Verspagen, B. (2002). Knowledge Spillovers in Europe: A Patent CitationsAnalysis. The Scandinavian Journal of Economics, 104(4), 531–545.
206 References

Mazloumian, A., Helbing, D., Lozano, S., Light, R. P., & Börner, K. (2013). Global Multi-LevelAnalysis of the ‘Scientific Food Web’. Scientific Reports, 3, 1167.
Mazumdar, M., Messinger, S., Finkelstein, D. M., Goldberg, J. D., Lindsell, C. J., Morton, S. C.,…Parker R. A. (2015). Evaluating Academic Scientists Collaborating in Team-Based Research: AProposed Framework. Academic Medicine: Journal of the Association of American Medical Colleges,90(10), 1302–1308.
McCann, P. (2007). Sketching Out a Model of Innovation, Face-To-Face Interaction andEconomic Geography. Spatial Economic Analysis, 2(2), 117–134.
McCann, P. (2013). Modern Urban and Regional Economics (2nd ed.). Oxford, UK: OxfordUniversity Press.
McElheny, V. K. (2010). Drawing the Map of Life: Inside the Human Genome Project. New York, NY:Basic Books.
McGovern, V. (2009, July 31). Perspective: How to Succeed in Big Science and Still Get Tenure.Science Career Magazine. DOI: 10.1126/science.caredit.a0900092
Meadows, A. J., & O’connor, J. G. (1971). Bibliographical Statistics as a Guide to Growth Points inScience. Social Studies of Science, 1(1), 95–99.
Medoff, M. H. (2003). Collaboration and the Quality of Economics Research. Labour Economics,10, 597–608.
Meho, L. I. (2007). The Rise and Rise of Citation Analysis. Physics World, 20(1), 32.Melin, G., & Persson, O. (1996). Studying Research Collaboration Using Co-Authorships. Sciento-
metrics, 36(3), 363–377.Mention, A. L. (2011). Co-Operation and Co-Opetition as Open Innovation Practices in the
Service Sector: Which Influence on Innovation Novelty? Technovation, 31(1), 44–53.Merton, R. K. (1968). The Matthew Effect in Science. Science, 159(3810), 56–63.Merton, R. K. (1973). The Sociology of Science: Theoretical and Empirical Investigations. Chicago, IL:
University of Chicago Press.Merton, R. K. (1988). The Matthew Effect in Science, II: Cumulative Advantage and the
Symbolism of Intellectual Property. Isis, 79(4), 606–623.Merton, R. K. & Zuckerman, H. (1973). Age, Aging, and Age Structure in Science. In R. K.
Merton, The Sociology of Science: Theoretical and Empirical Investigations (pp. 497–559). Chicago, IL:University of Chicago Press.
Mervis, J., & Normile, D. (1998). North-South Relations: Lopsided Partnerships Give Way toReal Collaboration. Science, 279, 1477.
Meskus, M., Marelli, L., & D’Agostino, G. (2018). Research Misconduct in the Age of OpenScience: The Case of STAP Stem Cells. Science as Culture, 27(1), 1-23.
Michael, A. E. (2016, October 19). It’s Not Too Late to Save the Stacks. The Chronicle of HigherEducation. Retrieved from https://www.chronicle.com/article/Its-Not-Too-Late-to-Save-the/238106
Migliaccio, A. R., & Philipsen, S. (2006). The Return of Romeo. Scientists’ International Mobilityand the Future of Research in Europe. EMBO Reports, 7(11), 1067–1071.
Miller-Idriss, C., & Hanauer, E. (2011). Transnational Higher Education: Offshore Campuses inthe Middle East. Comparative Education, 47(2), 181–207.
Miller-Rushing, A., Primack, R., & Bonney, R. (2012). The History of Public Participation inEcological Research. Frontiers in Ecology and the Environment, 10(6), 285–290.
Mirskaya, E. Z. (1997). International Scientific Collaboration in the Post-Communist Countries:Modern Trends and Priorities. Science and Public Policy, 24(5), 301–308.
Misra, J., Smith-Doerr, L., Dasgupta, N., Weaver, G., & Normanly, J. (2017). Collaboration andGender Equity among Academic Scientists. Social Sciences, 6(1), 1–25.
Mitchell, R. P. (2009, December 17). Where the Renaissance Still Lives. The Harvard Gazette.Retrieved from https://news.harvard.edu/gazette/story/2009/12/where-the-renaissance-still-lives/
References 207

Mok, K. (2005). Globalization and Educational Restructuring: University Merging and ChangingGovernance in China. Higher Education, 50(1), 57–88.
Mokyr, J. (1990). The Lever of Riches: Technological Creativity and Economic Progress. New York, NY:Oxford University Press.
Mokyr, J. (1994). Cardwell’s Law and the Political Economy of Technological Progress. ResearchPolicy, 23(5), 561–574.
Möller, T., Schmidt, M., & Hornbostel, S. (2016). Assessing the Effects of the German ExcellenceInitiative with Bibliometric Methods. Scientometrics, 109(3), 2217–2239.
Mongeon, P., & Larivière, V. (2015). Costly Collaborations: The Impact of Scientific Fraud onCo-Authors’ Careers. Journal of the Association for Information Science and Technology, 67, 535–542.
Mongkhonvanit, J. (2014). Coopetition for Regional Competitiveness: The Role of Academe in Knowledge-Based Industrial Clustering. Singapore: Springer.
Monteiro, M., & Keating, E. (2009). Managing Misunderstandings: The Role of Language inInterdisciplinary Scientific Collaboration. Science Communication, 31(1), 6–28.
Morgan, K. (1997). The Learning Region: Institutions, Innovation and Regional Renewal.Regional Studies, 41(S1), 147–159.
Morgan, K. (2004). The Exaggerated Death of Geography: Learning, Proximity and TerritorialInnovation Systems. Journal of Economic Geography, 4(1), 3–21.
Morillo, F. (2016). Public–Private Interactions Reflected through the Funding Acknowledgements.Scientometrics, 108(3), 1193–1204.
Moss, F. (2011). The Sorcerers and Their Apprentices: How the Digital Magicians of the MIT Media Lab areCreating the Innovative Technologies that Will Transform Our Lives. New York, NY: Crown Business.
Mowatt, G., Shirran, L., Grimshaw, J. M., Rennie, D., Flanagin, A., Yank, V., … Bero, L. A.(2002). Prevalence of Honorary and Ghost Authorship in Cochrane Reviews. Jama, 287(21),2769–2771.
Mowery, D., & Sampat, B. (2005). Universities in National Innovation Systems. In J. Fagerberg, D.C. Mowery, & R. R. Nelson (Eds.), The Oxford Handbook of Innovation (pp. 209–239). Oxford:Oxford University Press.
Mullins, N.C. (1973). Theory and Theory Groups in Contemporary American Sociology. New York, NY:Harper and Row.
Muriithi, P., Horner, D., & Pemberton, L. (2013). Understanding Factors Influencing the Effect ofScientific Collaboration on Productivity in a Developing Country: Kenya. Proceedings of theAmerican Society for Information Science and Technology, 50(1), 1–10.
Myrdal, G. (1957). Economic Theory and Under-Developed Regions. London, UK: G. Duckworth.Nagpaul, P. (1999). Transnational Linkages of Indian Science: A Structural Analysis. Scientometrics,
46(1), 109–140.Najwyzsza Izba Kontroli. (2013). Wdrazanie Innowacji Przez Szkoły Wyzsze I Parki Technologiczne,
Informacja O Wynikach Kontroli. lbi-4101-08-00/2012. Warsaw, Poland: Najwyzsza IzbaKontroli.
Narin, F., Stevens, K., & Whitlow, E. S. (1991). Scientific Co-Operation in Europe and theCitation of Multinationally Authored Papers. Scientometrics, 21(3), 313–323.
National Academies, Committee on Science, Engineering, and Public Policy, National Academy ofSciences, National Academy of Engineering, & Institute of Medicine. (2005). FacilitatingInterdisciplinary Research. Washington, DC: National Academies Press.
National Science Foundation. (2006). Investing in America’s Future. Strategic Plan FY 2006–2011.Arlington, VA: National Science Foundation. Retrieved from https://www.nsf.gov/pubs/2006/nsf0648/NSF-06-48.pdf
Naylor, S., & Ryan, J. R. (2010). New Spaces of Exploration: Geographies of Discovery in the TwentiethCentury. London, UK: Tauris.
Neal, H. A., Smith, T. L., & McCormick, J. B. (2008). Beyond Sputnik: US Science Policy in theTwenty-First Century. Ann Arbor: University of Michigan Press.
208 References

Nedeva, M. (2013). Between the Global and the National: Organising European Science. ResearchPolicy, 42(1), 220–230.
Nedeva, M., & Stampfer, M. (2012). From “Science in Europe” to “European Science”. Science,336(6084), 982–983.
Needham, J. (1954). Science and Civilization in China. Vol. 1 Introductory Orientations. Cambridge,UK: The Syndics of the Cambridge University Press.
Nekhamkin, I. (1965, June 11). “Science City” in Novosibirsk Solves Various Scientific andTechnical Problems. Ekonomicheskaya Gazeta (Economic Gazette), p. 7. (Joint PublicationResearch Service, Trans.). Washington. (Original work published in Moscow, 1965, May 12).
Nelson, R. R. (Ed.). (1993). National Innovation Systems: A Comparative Analysis. New York, NY:Oxford University Press.
Newman, M. E. (2001a). Clustering and Preferential Attachment in Growing Networks. PhysicalReview E, 64(2), 025102.
Newman, M. E. (2001b). The Structure of Scientific Collaboration Networks. Proceedings of theNational Academy of Sciences, 98(2), 404–409.
Newman, M. E. (2004). Coauthorship Networks and Patterns of Scientific Collaboration. Proceedingsof the National Academy of Sciences, 101(S 1), 5200–5205.
Nickelsen, K., & Krämer, F. (2016). Introduction: Cooperation and Competition in the Sciences.NTM Zeitschrift Für Geschichte Der Wissenschaften, Technik Und Medizin, 24(2), 119–123.
Nielsen, M. A. (2011). Reinventing Discovery: The New Era of Networked Science. Princeton, NJ:Princeton University Press.
Nomaler, Ö., Frenken, K., & Heimeriks, G. (2013). Do More Distant Collaborations Have MoreCitation Impact? Journal of Informetrics, 7(4), 966–971.
Nomaler, Ö., & Verspagen, B. (2016). River Deep, Mountain High: Of Long Run KnowledgeTrajectories within and between Innovation Clusters. Journal of Economic Geography, 16(6),1259–1278.
Nooteboom, B., Van Haverbeke, W., Duysters, G., Gilsing, V., & Van Den Oord, A. (2007).Optimal Cognitive Distance and Absorptive Capacity. Research Policy, 36(7), 1016–1034.
North, D. C. (1991). Institutions. Journal of Economic Perspectives, 5(1), 97–112.Nowotny, H., Scott, P., & Gibbons, M. (2003). Introduction. ‘Mode 2ʹ Revisited: The New
Production of Knowledge. Minerva, 41(3), 179–194.Numprasertchai, S., & Igel, B. (2005). Managing Knowledge through Collaboration: Multiple Case
Studies of Managing Research in University Laboratories in Thailand. Technovation, 25(10),1173–1182.
O’Mara, M. P. (2005). Cities of Knowledge: Cold War Science and the Search for the Next Silicon Valley.Princeton, NJ: Princeton University Press.
O’Neil, C. (2016). Weapons of Math Destruction: How Big Data Increases Inequality and ThreatensDemocracy. New York, NY: Crown.
OECD. (2002). Dynamising National Innovation Systems. Paris, France: OECD Publishing.OECD. (2007). OECD Reviews of Innovation Policy. China. Synthesis Report. Paris, France: OECD
Publishing.OECD. (2010). Measuring Innovation: A New Perspective. Paris, France: OECD Publishing.OECD. (2015). OECD Science, Technology and Industry Scoreboard 2015: Innovation for Growth and
Society. Paris, France: OECD Publishing.Oinas P., & Lagendijk A. (2005). Toward Understanding Proximity, Distance and Diversity in
Economic Interaction and Local Development. In A. Lagendijk & P. Oinas (Eds.), Proximity,Distance and Diversity. Issues on Economic Interaction and Local Development (pp. 307–333). Aldershot,UK: Ashgate.
Oldham, G. (2005, April 1). International Scientific Collaboration: Policy Briefs, Science and DevelopmentNetwork. Retrieved from www.scidev.net/dossiers/index.cfm?fuseaction=policybrief&dossier=13&policy=60
References 209

Olechnicka, A. (2013). Regional Cooperation or External Links? Spatial Proximity in Sicence-Bussiness Relations in Poland. In R. Capello, A. Olechnicka, & G. Gorzelak (Eds.), Universities,Cities and Regions: Loci for Knowledge and Innovation Creation (pp. 99–120). Oxon, UK: Routledge.
Olechnicka, A., & Ploszaj, A. (2010a). Mapping the Regional Science Performance. Evidence fromPoland. Collnet Journal of Scientometrics and Information Management, 4(1), 21–27.
Olechnicka, A., & Ploszaj, A. (2010b). Spatial Aspects of Collaborative Networks in Science –
Lessons from Poland, Studia Regionalne I Lokalne, 106–123. Special Issue 2010.Olson, G. M., & Olson, J. S. (2000). Distance Matters.Human-Computer Interaction, 15(2), 139–178.Olson, G. M, Zimmerman, A., & Bos, N. (2008). Scientific Collaboration on the Internet. Cambridge,
MA: MIT Press.Olson, J. S., & Olson, G. M. (2013). Working Together Apart: Collaboration over the Internet.
Synthesis Lectures on Human-Centered Informatics, 6(5), 1–151.Olson, J. S., Olson, G. M., & Cooney, D. (2008). Success Factors: Bridging Distance in
Collaboration. In G. M. Olson, A. Zimmerman, & N. Bos (Eds.), Scientific collaboration on theInternet. Cambridge, MA: MIT Press.
Openshaw, S. (1983). The Modifiable Areal Unit Problem. Norwich, UK: Geo Books.Ortega, J. L. (2014). Influence of Co-Authorship Networks in the Research Impact: Ego
Network Analyses from Microsoft Academic Search. Journal of Informetrics, 8(3), 728–737.Otlet, P. (1934). Traité De Documentation: Le Livresur Le Livre, Théorie Etpratique. Brussels: Editiones
Mundaneum.Ottati, G. D. (1994). Cooperation and Competition in the Industrial District as an Organization
Model. European Planning Studies, 2(4), 463–483.Otto, S. L. (2016). The War on Science: Who’s Waging It, Why It Matters, What We Can Do about It.
Minneapolis, MN: Milkweed Editions.Owen-Smith, J. (2013). Workplace Design, Collaboration, and Discovery. Paper presented at the
National Research Council Workshop on Institutional and Organizational Supports for TeamScience. Washington, DC. Retrieved from http://sites.nationalacademies.org/DBASSE/
Paasi, A. (2015). “Hot Spots, Dark-Side Dots, Tin Pots”: The Uneven Internationalism of the GlobalAcademicMarket. In P. Meusburger, D. Gregory, & L. Suarsana (Eds.),Geographies of Knowledge andPower (pp. 247–262). Dordrecht, The Netherlands: Springer.
Pachter, L. (2014, October 31). To Some a Citation Is Worth $3 per Year. Retrieved fromhttps://liorpachter.wordpress.com/2014/10/31/to-some-a-citation-is-worth-3-per-year/
Palmer, C. L. (2001). Work at the Boundaries of Science: Information and the Interdisciplinary ResearchProcess. Dordrecht, Netherlands: Kluwer Academic Publishers.
Pan, R. K., Kaski, K., & Fortunato, S. (2012). World Citation and Collaboration Networks:Uncovering the Role of Geography in Science. Scientific Reports, 2, 902.
Pan, R. K., Sinha, S., Kaski, K., & Saramäki, J. (2012). The Evolution of Interdisciplinarity inPhysics Research. Scientific Reports, 2, 551.
Patel, N. (1973). Collaboration in the Professional Growth of American Sociology. Social ScienceInformation, 6, 77–92.
Patuelli, R., Vaona, A., & Grimpe, C. (2010). The German East-West Divide in KnowledgeProduction: An Application to Nanomaterial Patenting. Tijdschrift Voor Economische En SocialeGeografie, 101(5), 568–582.
Paul-Hus, A., Desrochers, N., & Costas, R. (2016). Characterization, Description, and Considera-tions for the Use of Funding Acknowledgement Data in Web of Science. Scientometrics, 108(1),167–182.
Paul-Hus, A., Mongeon, P., Sainte-Marie, M., & Larivière, V. (2017). The Sum of It All:Revealing Collaboration Patterns by Combining Authorship and Acknowledgements. Journal ofInformetrics, 11(1), 80–87.
Pečlin, S., Južnič, P., Blagus, R., Sajko, M. C., & Stare, J. (2012). Effects of InternationalCollaboration and Status of Journal on Impact of Papers. Scientometrics, 93(3), 937–948.
210 References

Pepe, A. (2011). The Relationship between Acquaintanceship and Coauthorship in ScientificCollaboration Networks. Journal of the American Society for Information Science and Technology,62(11), 2121–2132.
Peri, G. (2005). Determinants of Knowledge Flows and Their Effect on Innovation. Review ofEconomics and Statistics, 87(2), 308–322.
Perianes-Rodriguez, A.,Waltman, L., & Van Eck,N. J. (2016). Constructing Bibliometric Networks:A Comparison between Full and Fractional Counting. Journal of Informetrics, 10(4), 1178–1195.
Persson, O., Glänzel, W., & Danell, R. (2004). Inflationary Bibliometric Values: The Role ofScientific Collaboration and the Need for Relative Indicators in Evaluative Studies. Scientometrics,60(3), 421–432.
Petralia, S., Balland, P. A., & Rigby, D. L. (2016). Unveiling the Geography of Historical Patents inthe United States from 1836 to 1975. Scientific Data, 3, 160074.
Pevsner, N. (1976). A History of Building Types. Princeton, NJ: Princeton University Press.Phan, P. H., Siegel, D. S., & Wright, M. (2005). Science Parks and Incubators: Observations,
Synthesis and Future Research. Journal of Business Venturing, 20(2), 165–182.Picci, L. (2010). The Internationalization of Inventive Activity: A Gravity Model Using Patent
Data. Research Policy, 39(8), 1070–1081.Plotnikova, T., & Rake, B. (2014). Collaboration in Pharmaceutical Research: Exploration of
Country-Level Determinants. Scientometrics, 98(2), 1173–1202.Ponds, R. (2009). The Limits to Internationalization of Scientific Research Collaboration. The Journal
of Technology Transfer, 34(1), 76–94.Ponds, R., Van Oort, F., & Frenken, K. (2007). The Geographical and Institutional Proximity of
Research Collaboration. Papers in Regional Science, 86(3), 423–443.Ponomariov, B. L., & Boardman, P. C. (2010). Influencing Scientists’ Collaboration and Produc-
tivity Patterns through New Institutions: University Research Centers and Scientific andTechnical Human Capital. Research Policy, 39(5), 613–624.
Poo, M. M., & Wang, L. (2014). On CAS Reform and Pioneer Action Plan. National ScienceReview, 2(1), 1–12.
Porter, M. E. (1990). The Competitive Advantage of Nations. New York, NY: The Free Press.Porter, M. E. (1998). Clusters and the New Economics of Competition.Harvard Business Review, 76
(6), 77–90.Porter, M. E. (2000). Location, Competition, and Economic Development: Local Clusters in a
Global Economy. Economic Development Quarterly, 14(1), 15–34.Powering CERN. (n.d.). Retrieved From https://home.cern/about/engineering/powering-cernIdea ConsultiFQPPMI. (2014). Study on Assessing the Contribution of the Framework Programmes to the
Development of Human Research Capacity. Brussels: European Commission. Retrieved fromhttps://publications.europa.eu/en/publication-detail/-/publication/cd7726a9-17d0-4291-b6f9-60e832efcc83/language-en
Pratchett, T. (1993). Men at Arms. London, UK: Orion Publishing Group.Pravdic, N., & Oluic-Vukovic, V. (1986). Dual Approach to Multiple Authorship in the Study of
Collaboration/Scientific Output Relationship. Scientometrics, 10(5-6), 259–280.Presser, S. (1980). Collaboration and the Quality of Research. Social Studies of Science, 10(1), 95–101.Price, D. J. De S. (1963). Little Science, Big Science. New York, NY: Columbia University Press.Price, D. J. de S., & Beaver, D. (1966). Collaboration in an Invisible College. American Psychologist,
21(11), 1011.Private funding for science. (2016). [Editorial]. Nature Methods, 13(7),537. Retrieved from https://
www.nature.com/articles/nmeth.3923Proteins and Particles. (1999, October 16). The Economist, 84–85. Retrieved from https://www.
economist.com/science-and-technology/2015/10/08/particle-biologyQiu, J. (2014). International Collaboration in Science: A Chinese Perspective. National Science
Review, 1(2), 318–321.
References 211

Qiu, J. (2015). International Collaboration and Science in China: A Western Perspective. NationalScience Review, 2(2), 241–245.
Rabellotti, R., Carabelli, A., & Hirsch, G. (2009). Italian Industrial Districts on the Move: Whereare They Going? European Planning Studies, 17(1), 19–41.
Radosevic, S., & Yoruk, E. (2014). Are There Global Shifts in the World Science Base? Analysingthe Catching up and Falling behind of World Regions. Scientometrics, 101(3), 1897–1924.
Rahm, D., & Luce, T. F. Jr. (1992). Issues in the Design of State Science-And Technology-BasedEconomic Development Programs: The Case of Pennsylvania’s Ben Franklin Partnership.Economic Development Quarterly, 6(1), 41–51.
Rahm, E., & Thor, A. (2005). Citation Analysis of Database Publications. ACM Sigmod Record,34(4), 48–53.
Ramanana-Rahary, S., Zitt, M., & Rousseau, R. (2009). Aggregation Properties of RelativeImpact and Other Classical Indicators: Convexity Issues and the Yule-Simpson Paradox.Scientometrics, 79(2), 311–327.
Ravenstein, E. G. (1885). The Laws of Migration. Journal of the Statistical Society of London, 48(2),167–235.
RE/MAX. (2015). At Home in Europe. Vienna, Austria: RE/MAX. Retrieved from http://www.at-home-in-europe.eu/
Rees, J., & Bradley, R. (1988). Research Policy and Review 24. State Science Policy andEconomic Development in the United States: A Critical Perspective. Environment and PlanningA, 20(8), 999–1012.
Reform of scientific research still needed despite Tu’s Nobel. (2015, October 8). China Daily.Retrieved from http://usa.chinadaily.com.cn/epaper/2015-10/08/content_22132708.htm on1. 03.2016+A24
Reilly, W. J. (1931). The Law of Retail Gravitation. New York, NY: Knickerbocker Press.Reinkens, J. H. (1861). Die Universität Zu Breslau Von Der Vereinigung Der Frankfurter Viadrina Mit
Der Leopoldina. Festschrift Der Katholisch-Theologischen Facultät. Breslau: Georg Philipp Aderholz.Rennie, D., Yank, V., & Emanuel, L. (1997). When Authorship Fails: A Proposal to Make
Contributors Accountable. Jama, 278(7), 579–585.Resnik, D. B. (2005). The Ethics of Science: An Introduction. London: Routledge.Richer, E. (2013). Bourbaki, Nicolas. In Encyclopedia PlanetMath.org. Retrieved from http://
planetmath.org/bourbakinicolasRiesenberg, D., & Lundberg, G. D. (1990). The Order of Authorship: Who’s on First? Jama,
264(14), 1857–1857.Rigby, D. L. (2015). Technological Relatedness and Knowledge Space: Entry and Exit of US Cities
from Patent Classes. Regional Studies, 49(11), 1922–1937.Ritala, P., Huizingh, E., Almpanopoulou, A., &Wijbenga, P. (2017). Tensions in R&DNetworks:
Implications for Knowledge Search and Integration. Technological Forecasting and Social Change,120, 311–322.
Rivers, D., & Gray, D. O. (2013). Cooperative Research Centers as Small Business: Uncoveringthe Marketing and Recruiting Practices of University-Based Cooperative Research Centers. InC. Boardman, D. O. Gray, & D. Rivers (Eds.), Cooperative Research Centers and TechnicalInnovation: Government Policies, Industry Strategies, and Organizational Dynamics (pp. 175–198).New York, NY: Springer.
Rodriguez, M. A., & Pepe, A. (2008). On the Relationship between the Structural and Socio-academic Communities of a Coauthorship Network. Journal of Informetrics, 2(3), 195–201.
Rogers, E. M. (2003). Diffusion of Innovations (5th ed., Free Press trade pbk. ed.). New York, NY:Free Press.
Røsdal, T., Lekve, K., Scordato, L., Aanstad, S., & Piro, F. (2014). Building Lasting Relationships:Evaluation of the Fulbright Norway Subsidy Scheme. Oslo, Norway: Nordic Institute for Studies inInnovation, Research and Education (NIFU).
212 References
Rosenfield, P. L. (1992). The Potential of Transdisciplinary Research for Sustaining and ExtendingLinkages between the Health and Social Sciences. Social Science & Medicine, 35(11), 1343–1357.
Rossiter, M. W. (1993). The Matthew Matilda Effect in Science. Social Studies of Science, 23(2),325–341.
Rothaermel, F. T., Agung, S. D., & Jiang, L. (2007). University Entrepreneurship: A Taxonomy ofthe Literature. Industrial and Corporate Change, 16(4), 691–791.
Rousseau, R. (2010). Comments on the Modified Collaborative Coefficient. Scientometrics, 87(1),171–174.
The Royal Society. (2010, January). New Frontiers in Science Diplomacy. Policy document 01/10.London, UK: The Royal Society.
The Royal Society. (2011, March). Knowledge, Networks and Nations: Global Scientific Collaborationin the 21st Century. Policy document 03/11. London, UK: The Royal Society.
Rutten, R., & Boekema, F. (Eds.). (2007). The Learning Region: Foundations, State-Of-The-Art,Future. Cheltenham, UK: Edward Elgar.
Sailer, K., & McColloh, I. (2012). Social Networks and Spatial configuration—How OfficeLayouts Drive Social Interaction. Social Networks, 34(1), 47–58.
Sakakibara, M., & Cho, D. S. (2002). Cooperative R&D in Japan and Korea: A Comparison ofIndustrial Policy. Research Policy, 31, 673–692.
Salomon, J. J. (1977). Science Policy Studies and the Development of Science Policy. Science, Technology andSociety: A Cross-Disciplinary Perspective. London, UK: SAGE.
Salter, L., & Hearn, A. (1996).Outside the Lines: Issues in Interdisciplinary Research. Montreal, Canada:McGill-Queen’s Press.
Sánchez-Barrioluengo, M. (2014). ‘Turning the Tables’: Regions Shaping University Performance.Regional Science, 1(1), 276–285.
Sarsons, H. (2015, December 3). Gender Differences in Recognition for Group Work. HarvardUniversity Working Paper. Retrieved from https://scholar.harvard.edu/sarsons/publications/note-gender-differences-recognition-group-work
Savanur, K., & Srikanth, R. (2010). Modified Collaborative Coefficient: A New Measure forQuantifying the Degree of Research Collaboration. Scientometrics, 84(2), 365–371.
Saxenian, A. (1994). Regional Advantage: Culture and Competition in Silicon Valley and Route 128.Cambridge, MA: Harvard University Press.
Saxenian, A. (2002). Brain Drain or Brain Circulation: How High- Skill Immigration MakesEveryone Better Off. Brookings Review, 20(1), 28–31.
Saxenian, A. (2005). From Brain Drain to Brain Circulation: Transnational Communities andRegional Upgrading in India and China. Studies in Comparative International Development, 40(2),35–61.
Scellato, G., Franzoni, C., & Stephan, P. (2015). Migrant Scientists and International Networks.Research Policy, 44(1), 108–120.
Schamp, E. W., Rentmeister, B., & Lo, V. (2004). Dimensions of Proximity in Knowledge-BasedNetworks: The Cases of Investment Banking and Automobile Design. European Planning Studies,12(5), 607–624.
Scherngell, T., & Barber, M. J. (2009). Spatial Interaction Modelling of Cross-Region R&DCollaborations: Empirical Evidence from the 5th EU Framework Programme. Papers in RegionalScience, 88(3), 531–546.
Scherngell, T., & Hu, Y. (2011). Collaborative Knowledge Production in China: RegionalEvidence from a Gravity Model Approach. Regional Studies, 45(6), 755–772.
Schiermeier, Q. (2016). Multibillion-Euro Innovation Hub Slammed by Auditors. Nature,532, 291.
Schiff, L. (2002). Developing Successful Models for Large-Scale, Collaborative Biomedical Research Projects.Boston: Cure Project Educational Paper. Retrieved from www.bostoncure.org/downloads/collaborative-science.pdf
References 213

Schneider, J. W. (2009). An Outline of the Bibliometric Indicator Used for Performance-BasedFunding of Research Institutions in Norway. European Political Science, 8(3), 364–378.
Schneider, J. W., Aagaard, K., & Bloch, C. W. (2016). What Happens When National ResearchFunding Is Linked to Differentiated Publication Counts? A Comparison of the Australian andNorwegian Publication-Based Funding Models. Research Evaluation, 25(3), 244–256.
Schott, T. (1993). World Science: Globalization of Institutions and Participation. Science, Technology,& Human Values, 18(2), 196–208.
Schott, T. (1998). Ties between Center and Periphery in the Scientific World-System: Accumula-tion of Rewards, Dominance and Self-Reliance in the Center. Journal of World-Systems Research,4(2), 112–144.
Schrage, M. (1995). No More Teams: Mastering the Dynamics of Creative Collaboration. New York,NY: Currency and Doubleday.
Schubert, T., & Sooryamoorthy, R. (2010). Can the Centre–Periphery Model Explain Patterns ofInternational Scientific Collaboration among Threshold and Industrialised Countries? the Caseof South Africa and Germany. Scientometrics, 83(1), 181–203.
Schumpeter, J. A. (1942). Capitalism, Socialism, and Democracy. New York: Harper.Schumpeter, J. A. (1947). The Creative Response in Economic History. The Journal of Economic
History, 7(2), 149–159.Science Europe. (2014). Practical Guide to Three Approaches to Cross-Border Collaboration. Brussels,
Belgium: Science Europe.Science-Metrix, Fraunhofer ISI, & Oxford Research. (2015). Study on Network Analysis of the 7th
Framework Programme Participation. Brussels, Belgium: European Commission.Sebestyén, T., Hau-Horváth, O., & Varga, A. (2017). How to Get from the Periphery into the
Core? the Role of Geographical Location and Scientific Performance in Network Position in theField of Neuroscience. Letters in Spatial and Resource Sciences, 10(3), 297–325.
Sebestyén, T., & Varga, A. (2013a). Research Productivity and the Quality of InterregionalKnowledge Networks. The Annals of Regional Science, 51(1), 155–189.
Sebestyén, T., & Varga, A. (2013b). A Novel Comprehensive Index of Network Position andNode Characteristics in Knowledge Networks: Ego Network Quality. In T. Scherngell (Ed.),The Geography of Networks and R&D Collaborations (pp. 71–97). Cham, Switzerland: Springer.
Sedgwick, D. (2015, September 10). Automotive News China’s BAIC Opens R&D Center inSilicon Valley. Automotive News. Retrieved from www.autonews.com
Sergescu, P. (1948). Mersenne L’animateur: 8 Septembre 1588-1 Er Septembre 1648. RevueD’histoire Des Sciences Et De Leurs Applications, 2(1), 5–12.
Shapin, S. (1988). The House of Experiment in Seventeenth-Century England. Isis, 79(3), 373–404.Shapin, S. (1994). A Social History of Truth. Chicago, IL: University of Chicago Press.Shea, W. R. (2003). Designing Experiments & Games of Chance: The Unconventional Science of Blaise
Pascal. Canton, China: Science History Publications.Shils, E. (1991). Reflections on Tradition, Centre and Periphery and the Universal Validity of
Science: The Significance of the Life of S. Ramanujan. Minerva, 29(4), 393–419.Shortland, M. (1993). Book Review [Review of the Book the Geography of Science, by H. Dorn].
The British Journal for the History of Science, 26(1), 130–132.Shrum, W., Palackal, A., Dzorgbo, D. B., Mbatia, P., Schafer, M., & Miller, P. (2014). What
Happened to the Internet? Scientific Communities in Three Low-Income Areas, 2000–2010.Perspectives on Global Development and Technology, 13(3), 301–331.
Sidone, O. J. G., Haddad, E. A., & Mena-Chalco, J. P. (2016). Scholarly Publication andCollaboration in Brazil: The Role of Geography. Journal of the Association for Information Scienceand Technology, 68(1), 243–258.
Simon, D. F. (2014). Key Drivers Underlying China’s International S&T Relations. Presentation toPCAST, Washington. Retrieved from https://www.whitehouse.gov/sites/default/files/microsites/ostp/simon_denis.pdf.
214 References

Sivertsen, G. (2016). Publication-Based Funding: The Norwegian Model. In H. Daniel,M. Ochsner, & S. E. Hug (Eds.), Research Assessment in the Humanities: Towards Criteria andProcedures (pp. 79–90). New York, NY: Springer.
Sleeboom-Faulkner, M. (2013). Latent Science Collaboration: Strategies of Bioethical CapacityBuilding in Mainland China’s Stem Cell World. BioSocieties, 8(1), 7–24.
Smith, A. (1776). An Inquiry into the Wealth of Nations. London, UK: Strahan and Cadell.Smith, D. (2001). Collaborative Research: Policy and the Management of Knowledge Creation in
UK Universities. Higher Education Quarterly, 55(2), 131–157.Smith, P. H. (2006). Laboratories. In D. C. Lindberg, R. L. Numbers, & R. Porter (Eds.),
The Cambridge History of Science (pp. 290–305). Vol. 3. Cambridge: Cambridge University Press.Sobel, D. (1996). Longitude. London, UK: Fourth Estate.Somerville, H. (2013, November 20). China’s Largest Retailer Opens Tech Lab in Palo Alto. San
Jose Mercury News. Retrieved from www.mercurynews.comSonnenwald, D. H. (2003). Managing Cognitive and Affective Trust in the Conceptual R&D
Organization. In M. Huotari & M. Iivonen (Eds.), Trust in Knowledge Management and Systems inOrganizations (pp. 82–106). Hershey, PA: PA Idea Publishing.
Sonnenwald, D. H. (2007). Scientific Collaboration. Annual Review of Information Science andTechnology, 41(1), 643–681.
Spencer, R. W. (2012). Open Innovation in the Eighteenth Century. Research-Technology Manage-ment, 55(4), 39–43.
Fraunhofer ISI Idea Consult SPRU. (2009). The Impact of Collaboration on Europe’s Scientific andTechnological Performance. Final Report to the European Commission, DG Research. Karlsruhe,Germany: Fraunhofer, Idea Consult, SPRU.
Stamboulis, Y. A. (2007). Towards a Systems Approach to Innovation Systems and Policy.International Journal of Technology and Globalisation, 3(1), 42–55.
State Council of the People’s Republic of China. (2006). The National Medium- and Long-TermProgram for Science and Technology Development (2006–2020). An Outline. Retrieved from https://www.itu.int/en/ITU-D/Cybersecurity/Documents/National_Strategies_Repository/China_2006.pdf
Steiner, I.D. (1972). Group Processes and Productivity. New York, NY: Academic Press.Stephan, P. E. (2012). How Economics Shapes Science. Cambridge, MA: Harvard University Press.Stephan, P. E., & Levin, S. G. (2001). Exceptional Contributions to US Science by the Foreign-
Born and Foreign-Educated. Population Research and Policy Review, 20(1–2), 59–79.Stephens, G. R., & Wikstrom, N. (2007). American Intergovernmental Relations: A Fragmented Federal
Policy. New York, NY: Oxford University Press.Stokes, D. E. (1997). Pasteur’s Quadrant: Basic Science and Technological Innovation. Washington, DC:
Brookings Institution Press.Stokols, D., Harvey, R., Gress, J., Fuqua, J., & Phillips, K. (2005). In Vivo Studies of Transdisci-
plinary Scientific Collaboration: Lessons Learned and Implications for Active Living Research.American Journal of Preventive Medicine, 28(2), 202–213.
Stokols, D., Misra, S., Moser, R. P., Hall, K. L., & Taylor, B. K. (2008). The Ecology of TeamScience: Understanding Contextual Influences on Transdisciplinary Collaboration. AmericanJournal of Preventive Medicine, 35(2), S96–S115.
Stone, R. (2016). Global Tensions Rile Experimental University. Science, 352(6282), 136–137.Storper, M., & Venables, A. J. (2004). Buzz: Face-To-Face Contact and the Urban Economy.
Journal of Economic Geography, 4(4), 351–370.Strange, K. (2008). Authorship: Why Not Just Toss a Coin? American Journal of Physiology-Cell
Physiology, 295(3), C567–C575.Strogatz, S. H. (2003). Sync: The Emerging Science of Spontaneous Order. New York, NY: Theia.Su, H. N. (2017). Global Interdependence of Collaborative R&D-Typology and Association of
International Co-Patenting. Sustainability, 9(4), 541.
References 215

Subramanyam, K. (1983). Bibliometric Studies of Research Collaboration: A Review. Journal ofInformation Science, 6(1), 33–38.
Sud, P., & Thelwall, M. (2016). Not All International Collaboration Is Beneficial: The MendeleyReadership and Citation Impact of Biochemical Research Collaboration. Journal of the Associationfor Information Science and Technology, 67(8), 1849–1857.
Sun, S., & Manson, S. M. (2011). Social Network Analysis of the Academic GIScience Community.The Professional Geographer, 63(1), 18–33.
Sun, Y., & Cao, C. (2014). Demystifying Central Government R&D Spending in China. Science,345(6200), 1006–1008.
Sun, Y., & Cao, C. (2015). Intra-And Inter-Regional Research Collaboration across OrganizationalBoundaries: Evolving Patterns in China. Technological Forecasting and Social Change, 96, 215–231.
Sun, Y., & Liu, F. (2014). New Trends in Chinese Innovation Policies since 2009–A SystemFramework of Policy Analysis. International Journal of Technology Management, 65(1–4), 6–23.
Tahamtan, I., Afshar, A. S., & Ahamdzadeh, K. (2016). Factors Affecting Number of Citations: AComprehensive Review of the Literature. Scientometrics, 107(3), 1195–1225.
Tai, Q., & Truex, R. (2015). Public Opinion Towards Return Migration: A Survey Experiment ofChinese Netizens. China Quarterly, 223, 770–786.
Tang, L., & Shapira, P. (2011). China–US Scientific Collaboration in Nanotechnology: Patternsand Dynamics. Scientometrics, 88(1). doi:10.1007/s11192-011-0376-z
Tang, L., & Shapira, P. (2012). Effects of International Collaboration and Knowledge Moderationon China’s Nanotechnology Research Impacts. Journal of Technology Management in China, 7(1),94–110.
Taylor, M. Z. (2016). The Politics of Innovation: Why Some Countries are Better than Others at Scienceand Technology. New York, NY: Oxford University Press.
Taylor, P. J., Hoyler, M., & Evans, D. M. (2008). A Geohistorical Study of ‘The Rise of ModernScience’: Mapping Scientific Practice through Urban Networks, 1500–1900. Minerva, 46(4),391–410.
Terdiman, D. (2015, May 11). Why Chinese Drone Giant DJI Is Opening A Silicon Valley R&D Lab.Fast Company. Retrieved from https://www.fastcompany.com/3053220/why-chinese-drone-giant-dji-is-opening-a-silicon-valley-rd-lab
Thagard, P. (1997). Collaborative Knowledge. Noûs, 31, 242–261.Thelen, B. A., & Thiet, R. K. (2008). Cultivating Connection: Incorporating Meaningful Citizen
Science into Cape Cod National Seashore’s Estuarine Research and Monitoring Programs. ParkScience, 25(1), 74–80.
Thelwall, M., Haustein, S., Larivière, V., & Sugimoto, C. R. (2013). Do Altmetrics Work? Twitterand Ten Other Social Web Services. PLoS ONE, 8(5), e64841.
Thünen, J. H. von. (1826). Der Isolierte Staat in Beziehung Auf Landwirtschaft Und Nationalökonomie.Hamburg, Germany: Friedrich Perthes.
Tian, P. (2015). China’s Diaspora Brings It Home. Nature, 7577(527), 68–71. Retrieved from http://www.nature.com/nature/journal/v527/n7577_supp/full/527S68a.html
Tocqueville, A. de. (2000). Democracy in America. (H. C. Mansfield & D. Winthrop, Trans).Chicago, IL: University of Chicago Press.
Todeschini, R., & Baccini, A. (2016). Handbook of Bibliometric Indicators: Quantitative Tools forStudying and Evaluating Research. Weinheim, Germany: Wiley-VCH.
Tödtling, F. (1994). The Uneven Landscape of Innovation Poles: Local Embeddedness and GlobalNetworks. In A. Amin & N. Thrift (Eds.), Globalization, Institutions, and Regional Development inEurope (pp. 68–90). Oxford, UK: Oxford University Press.
Tödtling, F., & Trippl, M. (2005). One Size Fits All?: Towards a Differentiated RegionalInnovation Policy Approach. Research Policy, 34(8), 1203–1219.
Toker, U., & Gray, D.O. (2008). Innovation Spaces: Workspace Planning and Innovation in U.S.University Research Centers. Research Policy, 37(2), 309–329.
216 References

Törnqvist, G. (2011). The Geography of Creativity. Cheltenham, UK: Edward Elgar.Torre, A., & Gilly, J. P. (2000). On the Analytical Dimension of Proximity Dynamics. Regional
Studies, 34(2), 169–180.Torre, A., & Rallet, A. (2005). Proximity and Localization. Regional Studies, 39(1), 47–59.Trachana, V. (2013). Austerity-Led Brain Drain Is Killing Greek Science: Lack of Funding and
Recruitment Freezes are Driving Young Researchers Out of the Country. Nature, 496(7445),271–272.
Traoré, N., & Landry, R. (1997). On the Determinants of Scientists’ Collaboration. ScienceCommunication, 19(2), 124–140.
Trippl, M., Sinozic, T., & Lawton Smith, H. (2015). The Role of Universities in RegionalDevelopment: Conceptual Models and Policy Institutions in the UK, Sweden and Austria.European Planning Studies, 23(9), 1722–1740.
Trott, P., & Hartmann, D. (2009). Why ‘Open Innovation’ Is Old Wine in New Bottles.International Journal of Innovation Management, 13(04), 715–736.
Tscharntke, T., Hochberg, M.E., Rand, T.A., Resh, V.H., & Krauss, J. (2007). Author Sequenceand Credit for Contributions in Multiauthored Publications. PLoS Biology, 5(1), e18. doi:http://doi.org/10.1371/journal.pbio.0050018
Turekian, V. C., Macindoe, S., Copeland, D., Davis, L. S., Patman R. G., & Pozza, M. (2014). TheEmergence of Science Diplomacy. In L. S. Davis (Ed.), Science Diplomacy: New Day Or FalseDawn? (pp. 3–24). New Jersey: World Scientific Publishing.
Turner, P. V. (1984). Campus: An American Planning Tradition. New York, NY: ArchitecturalHistory Foundation.
Turpin, T., Garrett-Jones, S., & Woolley, R. (2011). Cross-Sector Research Collaboration inAustralia: The Cooperative Research Centres Program at the Crossroads. Science and Public Policy,38(2), 87–98.
Twilley, N. (2016, February 11). Gravitational Waves Exist: The inside Story of How ScientistsFinally Found Them. The New Yorker. Retrieved from https://www.newyorker.com/tech/elements/gravitational-waves-exist-heres-how-scientists-finally-found-them.
Uddin, S., Hossain, L., Abbasi, A., & Rasmussen, K. (2012). Trend and Efficiency Analysis ofCo-Authorship Network. Scientometrics, 90(2), 687–699.
Ukrainski, K., Masso, J., & Kanep, H. (2014). Cooperation Patterns in Science within Europe: TheStandpoint of Small Countries. Scientometrics, 99(3), 845–863.
Umlauf, F. (2016). Structure and Dynamics of Policy Induced Networks in Systems of Innovation (Doctoraldissertation). Universität Bremen, Bremen. Retrieved from https://d-nb.info/1111020760/34
UNESCO. (2015). UNESCO Science Report: Towards 2030. Paris, France: UNESCO.University of Pittsburgh. (2006, February 8). Summary investigative report on allegations of possible
scientific misconduct on the part of Gerald P. Schatten, Ph.D. Retrieved from http://hdl.handle.net/1813/11589
Uyarra, E. (2010). Conceptualizing the Regional Roles of Universities, Implications and Contra-dictions. European Planning Studies, 18(8), 1227–1246.
Van Noorden, R. (2014). Online Collaboration: Scientists and the Social Network. Nature,512(7513), 126–129.
Van Raan, A. F. (2005). Measurement of Central Aspects of Scientific Research: Performance,Interdisciplinarity, Structure. Measurement: Interdisciplinary Research and Perspectives, 3(1), 1–19.
Van Rijnsoever, F. J., & Hessels, L. K. (2011). Factors Associated with Disciplinary and Inter-disciplinary Research Collaboration. Research Policy, 40(3), 463–472.
Van Rijnsoever, F. J., Hessels, L. K., & Vandeberg, R. L. (2008). A Resource-Based Viewon the Interactions of University Researchers. Research Policy, 37(8), 1255–1266.
Vanni, T., Mesa-Frias, M., Sanchez-Garcia, R., Roesler, R., Schwartsmann, G., Goldani, M. Z., &Foss, A. M. (2014). International Scientific Collaboration in HIV and HPV: A NetworkAnalysis. PLoS ONE, 9(3), e93376.
References 217

Vargas, A. O. (2009). Did Paul Kammerer Discover Epigenetic Inheritance? A Modern Look at theControversial Midwife Toad Experiments. Journal of Experimental Zoology Part B: Molecular andDevelopmental Evolution, 312(7), 667–678.
Vasileiadou, E. (2009). Stabilisation Operationalised: Using Time Series Analysis to Understandthe Dynamics of Research Collaboration. Journal of Informetrics, 3(1), 36–48.
Vasileiadou, E., & Vliegenthart, R. (2009). Research Productivity in the Era of the InternetRevisited. Research Policy, 38(8), 1260–1268.
Velema, T. A. (2012). The Contingent Nature of Brain Gain and Brain Circulation: Their ForeignContext and the Impact of Return Scientists on the Scientific Community in Their Country ofOrigin. Scientometrics, 93(3), 893–913.
Venkatraman, V. (2010, April 16),Conventions of Scientific Authorship, Science. Retrievedfrom http://www.sciencemag.org/careers/2010/04/conventions-scientific-authorship
Verburgh, A., Elen, J., & Lindblom-Ylänne, S. (2007). Investigating the Myth of the Relationshipbetween Teaching and Research in Higher Education: A Review of Empirical Research. Studiesin Philosophy and Education, 26(5), 449–465.
Vest, C. M. (2007). The American Research University from World War II to World Wide Web:Governments, the Private Sector, and the Emerging Meta-University. Berkeley, CA: Center for Studiesin Higher Education and University of California Press.
Vicens, Q., & Bourne, P. E. (2007). Ten Simple Rules for a Successful Collaboration. PLOSComputational Biology, 3(3), e44.
Vidgen, R., Henneberg, S., & Naudé, P. (2007). What Sort of Community Is the EuropeanConference on Information Systems? A Social Network Analysis 1993–2005. European Journal ofInformation Systems, 16(1), 5–19.
Vinkler, P. (2008). Correlation between the Structure of Scientific Research, ScientometricIndicators and GDP in EU and non-EU Countries. Scientometrics, 74(2), 237–254.
Visser, E. J., & Boschma, R. (2004). Learning in Districts: Novelty and Lock-In in a RegionalContext. European Planning Studies, 12(6), 793–808.
Vonortas, N. S. (1997). Cooperation in Research and Development. New York, NY: Springer Science+Business Media.
Vonortas, N. S. (2013). Social Networks in R&D Program Evaluation. The Journal of TechnologyTransfer, 38(5), 577–606.
Wagner, C. S. (2005). Six Case Studies of International Collaboration in Science. Scientometrics,62(1), 3–26.
Wagner, C. S. (2008). The New Invisible College: Science for Development. Washington, DC:Brookings Institution Press.
Wagner, C. S., & Leydesdorff, L. (2005). Network Structure, Self-Organization, and theGrowth of International Collaboration in Science. Research Policy, 34(10), 1608–1618.
Wagner, C. S., Park, H. W., & Leydesdorff, L. (2015). The Continuing Growth of GlobalCooperation Networks in Research: A Conundrum for National Governments. PLoS ONE,10(7), e0131816.
Wagner-Döbler, R. (2001). Continuity and Discontinuity of Collaboration Behaviour since1800—From a Bibliometric Point of View. Scientometrics, 52(3), 503–517.
Wainwright, O. (2016, January 5). Step into Silicon Forest, Putin’s Secret Weapon in the GlobalTech Race. The Guardian. Retrieved from https://www.theguardian.com/artanddesign/2016/jan/05/silicon-forest-putin-secret-weapon-global-tech-race-siberia-russia
Wallace, M. L., Gingras, Y. & Duhon, R. (2009). A New Approach for Detecting ScientificSpecialties from Raw Cocitation Networks. Journal of the Association for Information Science andTechnology, 60, 240–246.
Wallerstein, I. M. (2004).World-Systems Analysis: An Introduction. Durham, UK: Duke University Press.Walley, K. (2007). Coopetition: An Introduction to the Subject and an Agenda for Research.
International Studies of Management & Organization, 37(2), 11–31.
218 References
Wallsten, S. (2004). Do Science Parks Generate Regional Economic Growth? an EmpiricalAnalysis of Their Effects on Job Growth and Venture Capital. Working Paper 04-40. AEI-Brookings Joint Center for Regulatory Studies.
Walsh, J. P., & Maloney, N. G. (2007). Collaboration Structure, Communication Media, andProblems in Scientific Work Teams. Journal of Computer-Mediated Communication, 12(2),712–732.
Waltman, L., Tijssen, R. J., & Van Eck, N. J. (2011). Globalisation of Science in Kilometres. Journalof Informetrics, 5(4), 574–582.
Wang, H., & Bao, Y. (2015). Reverse Migration in Contemporary China: Returnees, Entrepreneurship andthe Chinese Economy. Houndmills, UK: Palgrave Macmillan.
Wang, J., & Shapira, P. (2015). Is There a Relationship between Research Sponsorship andPublication Impact? an Analysis of Funding Acknowledgments in Nanotechnology Papers. PLoSONE, 10(2), e0117727.
Wanzenböck, I., Scherngell, T., & Brenner, T. (2014). Embeddedness of Regions in EuropeanKnowledge Networks: A Comparative Analysis of Inter-Regional R&D Collaborations,Co-Patents and Co-Publications. The Annals of Regional Science, 53(2), 337–368.
Ware, M., & Mabe, M. (2015, March). The STMReport. An Overview of Scientific and ScholarlyJournal Publishing (4th Ed.). Retrieved from https://www.stm-assoc.org/2015_02_20_STM_Report_2015.pdf
Wasserman S., & Faust K. (2007). Social Network Analysis: Methods and Applications. New York, NY:Cambridge University Press.
Weaver, W. (1997). A Legacy of Excellence: The Story of Villa I Tatti. New York, NY: Harry N.Abrams.
Weigel, A. (2015). Amateur Ambition: How Athletic Programs Shape University Policy. ArizonaState University Sports & Entertainment Law Journal, 5(1), 80–88.
Weiner, E. (2016). The Geography of Genius: A Search for the World’s Most Creative Places from AncientAthens to Silicon Valley. New York, NY: Simon & Schuster.
Welch, A. (2015). A New Epistemic Silk Road? the Chinese Knowledge Diaspora, and ItsImplications for the Europe of Knowledge. European Review, 23, S95–S111.
Welch, A., & Hao, J. (2014). Hai Gui and Hai Dai: The Job-Seeking Experiences of High-SkilledReturnees to China. In Mok, K.-H. (Ed.), Internationalization of Higher Education in East Asia:Trends of Student Mobility and Impact on Education Governance (pp. 90–114). London, UK:Routledge.
Wessner, C. W. (2013). Best Practices in State and Regional Innovation Initiatives: Competing in the 21stCentury. Washington, DC: National Academies Press. Retrieved from http://www.nap.edu/openbook.php?record_id=18364
Which country has the best brains? (2010, October 8). BBC News Magazine. Retrieved fromhttp://www.bbc.co.uk/news/magazine-11500373
Whitley, R. (2000). The Intellectual and Social Organization of the Sciences. Oxford, UK: OxfordUniversity Press.
Wiewel, W., & Perry, D. C. (2015). Global Universities and Urban Development: Case Studies andAnalysis. Armonk, NY: M.E. Sharpe.
Williamson, O. E. (1991). Comparative Economic Organization: The Analysis of DiscreteStructural Alternatives. Administrative Science Quarterly, 36(2), 269–296.
Wilsdon, J. (2007). China: The Next Science Superpower? Engineering & Technology, 2(3), 28–31.Wilson, L. (1942). The Academic Man: A Study in the Sociology of A Profession. London, UK: Oxford
University Press.Wilson, S. M. (1999). The Emperor’s Giraffe and Other Stories of Cultures in Contact. Boulder, CO:
Westview Press.Wissema, J. G. (2009). Towards the Third Generation University: Managing the University in Transition.
Cheltenham: Edward Elgar Publishing.
References 219

Wolfe, A. J. (2013). Competing with the Soviets: Science, Technology, and the State in Cold War America.Baltimore, MD: Johns Hopkins University Press.
Woolfson, M. M. (2015). Time and Age: Time Machines, Relativity, and Fossils. London, UK:Imperial College Press.
Wootton, D. (2015). The Invention of Science: A New History of Scientific Revolution. London, UK:Allen Lane.
Wray, K. B. (2002). The Epistemic Significance of Collaborative Research. Philosophy of Science,69(1), 150–168.
Wright, A. (2007). Glut: Mastering Information through the Ages. Washington, DC: Joseph HenryPress.
Wright, A. (2014). Cataloging the World: Paul Otlet and the Birth of the Information Age. OxfordUniversity Press.
Wuchty, S., Jones, B. F., & Uzzi, B. (2007). The Increasing Dominance of Teams in Production ofKnowledge. Science, 316(5827), 1036–1039.
Wulf, A. (2012). Chasing Venus: The Race to Measure the Heavens. New York, NY: Alfred A. Knopf.Wulf, A. (2015). The Invention of Nature: Alexander Von Humboldt’s New World. New York, NY:
Alfred A. Knopf.Wuyts, S., Colombo, M. G., Dutta, S., & Nooteboom, B. (2005). Empirical Tests of Optimal
Cognitive Distance. Journal of Economic Behavior & Organization, 58(2), 277–302.Xia, J., Harmon, J. L., Connolly, K. G., Donnelly, R. M., Anderson, M. R., & Howard, H. A.
(2015). Who Publishes in “Predatory” Journals? Journal of the Association for Information Science andTechnology, 66(7), 1406–1417.
Xian, W. (2015). A Quantitative Study of the Internationalization of the Academics and ResearchProductivity: Case Study of China. Chinese Education & Society, 48(4), 265–279.
Xinhua (2016a, February 14). Chinese Contribute to Detection of Gravitational Wave-TsinghuaProfessor. China Daily. Retrieved from http://www.chinadaily.com.cn/china/2016-02/15/content_23480315.htm
Xinhua (2016b, February 15). China Plans More Gravitational Wave Research. China Daily.Retrieved from http://www.chinadaily.com.cn/china/2016-02/15/content_23480376.htm
Yingqi, C. (2016, February 17). Researchers Hope to Catch Next Big Wave. China Daily.Retrieved from http://europe.chinadaily.com.cn/china/2016-02/17/content_23515129.htm
Ynalvez, M. A., & Shrum, W. M. (2009). International Graduate Science Training and ScientificCollaboration. International Sociology, 24(6), 870–901.
Ynalvez, M. A., & Shrum, W. M. (2011). Professional Networks, Scientific Collaboration, andPublication Productivity in Resource-Constrained Research Institutions in a DevelopingCountry. Research Policy, 40(2), 204–216.
Youtie, J., & Shapira P. (2008). Building an Innovation Hub: A Case Study of the Transformationof University Roles in Regional Technological and Economic Development. Research Policy,37(8), 1188–1204.
Zanotto, S. R., Haeffner, C., & Guimarães, J. A. (2016). Unbalanced International CollaborationAffects Adversely the Usefulness of Countries’ Scientific Output as Well as Their Technologicaland Social Impact. Scientometrics, 109(3), 1789.
Zha, Q. (2009). Diversification or Homogenization: How Governments and Markets HaveCombined to (Re)Shape Chinese Higher Education in Its Recent Massification Process. HigherEducation, 58(1), 41–58.
Zhai, L., Yan, X., Shibchurn, J., & Song, X. (2014). Evolutionary Analysis of InternationalCollaboration Network of Chinese Scholars in Management Research. Scientometrics, 98(2),1435–1454.
Zhang, Q., Perra, N., Gonçalves, B., Ciulla, F., & Vespignani, A. (2013). Characterizing ScientificProduction and Consumption in Physics. Scientific Reports, 3, 1640.
220 References

Zheng, J., Zhao, Z. Y., Zhang, X., Chen, D. Z., & Huang, M. H. (2014). InternationalCollaboration Development in Nanotechnology: A Perspective of Patent Network Analysis.Scientometrics, 98(1), 683–702.
Zhou, P., & Leydesdorff, L. (2006). The Emergence of China as a Leading Nation in Science.Research Policy, 35(1), 83–104.
Zhou, Y. (2015). The Rapid Rise of a Research Nation. Nature, 528, 170–173.Žížalová, P. (2010). Geography of Knowledge-Based Collaboration in a Post-Communist Country:
Specific Experience or Generalized Pattern? European Planning Studies, 18(5), 791–814.Zucker, D. (2012). Developing Your Career in an Age of Team Science. Journal of Investigative
Medicine, 60(5), 779–784.Zweig, D., & Wang, H. (2013). Can China Bring Back the Best? the Communist Party Organizes
China’s Search for Talent. The China Quarterly, 215, 590–615.
Web sites
http://data.worldbank.orghttp://english.cas.cnhttps://urcmich.orgwww.btaa.orgwww.europeana.euwww.global-innovation-initiative.orgwww.kooperation-international.dewww.nobelprize.orgwww.research-in-germany.de
References 221
Index
Académie Parisienne 32Academy of Sciences: Chinese 74,156–159, 161–162; French 30, 32;German 30; Hungarian 143; USNational Academy 151, 169
acknowledgements 27, 44, 64, 66Adams, Jonathan 28Adams’ age of research 28, 31added value: European 143, 145; ofcollaboration 21–22, 109
ages of research see Adams JonathanAkademgorodok 21–22altmetrics: types 64–65; advantages 64–65Amsterdam 62, 98, 99Antipolis, Sophia 5article: collaborative 28, 34, 38, 74, 92, 97,102–103, 126, 130, 157; per millioninhabitants 14; in scientific journal 21,23, 29, 35, 38, 57–59, 65, 78, 86, 89,92–96, 101, 103, 106, 130, 135
ATLAS 58Australia 14–15, 80, 87, 103–104, 162,172–174
Austria 17, 79, 81, 87, 89, 104, 171authorship (author): corresponding103–104, 157; first 40, 57, 60, 157; seealso first author bias; ghost 58; guest 58;gift 58; honorary 58, 140; hyper- 59,104, 179; multi- 29, 34–35, 38, 60, 66;order 40, 58–59; standards 58; single/sole 27–29, 34, 38, 51, 174;subautorship 43–44; see alsoco-authorship
Belgium 78–79, 81, 87, 104, 144, 149bias: aggregation 178; first-author 59;disciplinary 119; spatial 119
bibliometrics: data sources 61–64;methods 66
big data 5
big science 9–10, 18, 26, 28, 33, 119, 136,158–159, 164–165, 168
Bologna 24, 25, 98, 99Bourbaki, Nicolas also Bourbaki’sTheorem, Bourbaki group 27
Boyle Robert 8, 29, 30brain: circulation 4, 152, 161–163; drain103, 105, 151, 161–163; map 55
Bratislava 89Brazil 81, 87, 100, 104, 142, 151,153, 175
Brown University 175Bush, Vannevar 135business – as a collaboration partner 56,123, 139, 148, 149, 167
Cambridge: city (UK) 5, 12, 24, 89, 98,99, 117; city (USA) 5; University 23
Canada 15, 78–80, 87, 104, 142, 147,149, 160
Cartan, Henri 27Cardwell’s Law 22–24, 26Castells, Manuel 21, 25, 179centrality – types 69–71, 100centre-periphery: hierarchy 16; logic 3,77, 102–106; model 102; pattern 77;relations 10, 103, 177, 182
Conseil Européen pour la RechercheNucléaire (CERN) 9, 58, 89, 119, 136,138, 159, 164, 165
Charpak, Georges 136China 3, 15, 16, 17, 23, 74, 79, 80, 87, 92,94, 96, 100, 104, 105, 133, 142, 151,153, 154–163, 169, 170, 173, 175,177, 181
citation: in-coming 16; out-going 16; as acollaboration measure 6, 38–39, 64–65,77–78, 100–103, 128–129, 151
citizen science (also networked science,crowd science) 179–180, 184
cluster 65, 89, 117, 121, 123–124,127,128, 130, 132
co-affiliation 75, 105co-authorship (co-author) 1, 6, 28, 34,38–40, 45, 51, 52, 58, 59, 62, 64–69,73, 74, 77–80, 84, 86, 88–96, 98–102,104, 115, 118, 128, 130, 152, 155, 174,179–180
coding: comprehensive 74; hierarchical73–74
collaboration: interdisciplinary 50, 54, 56,59, 108, 117, 159, 168; intersectoral 63,116, 121, 123–125, 127; life-cycle52–60; measures 66–72, 148; modes43–44; network 34–35, 77, 92, 100,103, 112, 114, 117–119, 130, 132, 156,170, 174, 176–177; policy see policy;transdisciplinary 51
collaborative: advantage 107–109, 183;culture 145, 147–148; environment 20;turn 1–3, 28, 34–38, 39, 59, 106, 108,135, 176, 178, 181
collaborator types 47College for the Promoting of Physico-Mathematical Experimental Learning seeRoyal Society
college town 12, 15, 26collocation 112–113, 116, 120, 126Columbia University 175communication 2,5, 11, 20, 31–33, 37,41–42, 44, 49, 52–55, 61, 111,113–116, 120, 165–168, 177–178, 184
Community of scholars (also: invisiblecollege, Invisible College) 6, 11–13, 65,135–136
competition 20, 22, 28, 30, 49, 52, 55,121, 125–127, 136, 138, 157, 176, 184
conference/congress 33, 36–37, 40,43–45, 57, 62, 65, 106, 112–113,147, 158
Cooperative Research and DevelopmentAgreement (CRADA) 148–149
coopetition 30, 125–127, 184coordination 41, 52, 54–56, 111, 120,127, 138, 141, 145, 152, 156, 157, 166,174, 179
core/centre 94, 102, 103, 105, 177Cornell University 154, 175costs: of collaboration 36, 46–49, 107,110–114; coordination 111; transaction111, 114, 178
counting (fractional, full/whole) 72–73,97–98, 172, 174
creative class 19cross-fertilisation 50, 121–122crowd science see citizen science
Dartmouth College 175Darwin, Charles 4, 28–29discipline – specificity 51, 74distance: as a barrier 33; changing nature of36; functional 72; geographicalcollaboration (GCD) 71, 75; impact oncollaboration 2, 61, 102, 106, 111–117,129, 131; measures 75; network 70;organizational 56; vs proximity 2,127–129, 177, 183–184
division of labour 38, 45–47, 65, 109
Einstein, Albert 10, 29environment: collaborative/uncollaborative 155, 163, 164,170; competitive 108, 125–126;international 14; local 110, 130; online64; national 131, 177; natural 125;research/science/scientific 13, 108,140, 166; regional 110, 122, 127;regulatory 164, 170; socioeconomic132; working/workplace 11, 26,112, 169
epistemic: responsibility 57; significance121; validity 1, 107
Erdos, Paul 118et al. 57–59European Cooperation in Science andTechnology (COST) 138
European Research Area 94, 137–145,171, 181
European Southern Observatory see VeryLarge Telescope
European Union (EU) 1, 10, 15, 87,89, 133, 137–138, 142, 144, 160,166–167, 182
Feynman, Richard 40Fogarty, John Edward 152Fogarty International Center (FIC) 152Framework Programme (FrameworkProgrammes for Research andTechnological Development) 64,140–142
France 5, 15, 27, 49, 78–80, 87, 89, 103,104, 122, 144, 160
Francis, Bacon 31Fulbright, James William 151Fulbright Program 151–152, 169
Index 223

Garfield, Eugene 51, 62geography of collaboration: driving factors16–17; evolution 24; significance 1–7,14, 22–24, 105–106, 176–178;theoretical framework 131
geolocalisation 61–62, 72, 74–76Germany 14–16, 22–24, 33, 49, 78–80,87, 89, 103–104, 106, 117, 122,136, 144, 149, 151, 160, 165, 170,171, 173
global pipelines 130–131Goldilocks principle 117gravity model 114–115, 120growth: economic 18, 23; of collaboration1–2, 18, 107–111, 131, 163, 180
guanxi 156
Harrison, John 134Harvard University 10, 146, 175helix: triple 121, 123–125, 127, 149;quadruple 124; quintuple 125
heterophily 112, 117hierarchical structure 2, 5, 16, 102–103,105, 119, 120, 156, 176, 177
homophily 112, 117hub 25, 32, 92hukou 162Human Genome Project 23, 49, 120,152, 159
humanities 10, 34, 35, 38, 39, 58, 66, 106,143, 144, 168
Humboldt, Alexander 4Humboldt Research Fellowship 170
India 17–18, 79–80, 87, 93, 104, 142, 149,151, 153, 160, 169, 175
individual scientist (scholar) 29, 31, 38,45–47, 49, 66, 69, 77, 108, 142, 164,173 176, 178
industrial district 113, 121, 125, 127–128Information and CommunicationTechnologies (ICT): impact onscientific communication 36–37, 54,166, 184
innovation 1, 11, 12, 19, 20, 23, 50,61, 63, 105, 108–110, 117, 121–125,127, 128, 132, 133, 135, 139, 141,145, 148, 152–154, 156, 158–160,164–167, 175
inspiration 20, 31, 40, 43–45, 50interaction: difference from collaboration41; influence of distance/proximity113–115; face-to-face 20, 37, 54, 113,
178; via ICT 54; management of 168;measure 114–115; types of 127
internationalisation 77–91, 96, 100–101,129, 178–180
Internet see Information andCommunication Technologies (ICT)
Israel 23, 82, 87, 104, 175Italy 10, 17–18, 24, 63, 79–80, 87, 89,104, 128, 160, 172–173
Ivy League 147–148
Japan 15–16, 23, 49, 56, 80, 86–87, 93,104, 140, 142, 144
knowledge: access to 49–50; broker 70;circulation/flows 45, 51, 65, 71, 89, 93,103, 121–125, 129–130, 178, 181–183;creation/production 26, 35, 38, 40–42,62, 65, 108–111, 121, 128, 139, 182;dissemination 31, 35–36; exchange30–31; integration 50–51; network 100;procedural (know-how) 43; resource24, 45–46, 70, 100, 117, 128, 136,161; spillovers 122, 132; tacit 46, 51, 53,127, 129; transfer 37, 43, 116, 139,148–149, 158
laboratory (lab) 7–10, 12, 13, 26,135, 151
language: barriers 54, 111; English 37,54, 79; lingua franca/common language37, 145
law: as a regulation 116, 170–171; as aprinciple 22–26, 32, 114, 118, 132, 180;intellectual property law 148, 156,170–171, 180
Leibniz, Gottfried Wilhelm 28, 31Leibniz University 149Leibniz Association 168Large Hadron Collider (LHC) 9, 48, 49,143, 159
library: as a building (space) 7, 13; as aninstitution 10, 147; catalogue 5, 26
Linnaean taxonomy 5Linnaeus Carl 5Livingston David N. 4, 8, 18local buzz 130–131location 16, 21, 36, 48, 61, 65,75, 106, 111, 118–120, 122,127, 132, 151, 160, 176,178, 180
Longitude Act 134longue durée 22–26
224 Index

management – role in collaboration 52,54–55, 111, 139, 164, 168
Manhattan Project 9, 134map (visual presentation): in geographicalterms 54; of science 6, 86
Marie Skłodowska-Curie Actions(MSCA) 140
Matilda effect 59Matthew effect 17, 59, 118, 132, 168Mendeleev, Dmitrij 5, 33Merton, Robert 59, 118, 125metropolis 95–96milieu: creative 12, 19–20; innovateur123–124; institutional 137; local 128
Massachusetts Institute of Technology(MIT) 113, 153
mobility (academic/professional) 4, 63, 75,103, 114, 130, 140–143, 145, 150–152,164–165, 169, 170–171, 174
mode 1, mode 2 of knowledge production108–110, 124, 131–132
multidisciplinary research 44, 50
National Institute of Health (NIH) 49,152, 171
Nature – scientific journal 52, 58,126, 179
New Invisible College 6, 135Newton, Isaac 28, 114, 134Nobel Prize laureates 11, 14–15, 35, 40,48, 53, 59, 122, 136, 157, 179
node (in the network) 2, 69–71, 92–96,106, 111–112, 114, 118, 129, 132
open innovation 108–109, 132, 148Oxbridge 24Oxford: city (UK) 5,12, 24, 89, 98–99;University 23
paper see articlePapin, Denis 29Pasteur, Louis 7, 110patent 35, 63, 65, 72, 85–87, 122, 124,155, 170, 174
path: in the network 69–72; as a route 113performance (research/scientific) 96,100–103, 105, 108, 122, 130–131, 137,168, 177; assessment/evaluation of 51,59, 63, 111, 157, 164, 172–174
Philosophical Transactions - scientificjournal 28, 30, 59
Physical Review Letters - scientific journal35, 179
place: of scientific activity/of collaboration4–26, 54, 97, 106, 111–114, 118–120,162, 165, 177, 180, 182; of innovation128; place-based 182–183; place-neutral182–183; relation with space see space
Poland 15, 18, 22, 24, 79, 81, 87, 89, 100,104, 150, 166, 172–173
policy: science 3, 17, 20, 133–175,181–183; scientific collaboration133–175; through science 133–135, 163
policymaker 107, 134, 138, 164, 173, 176preferential attachment 112, 118, 120Princeton University 175project – research 28, 32, 39, 40, 42–44,46, 50, 120, 122, 133, 138, 141, 143,147, 153, 156–161, 171
proximity: cultural 112, 184; cognitive112, 115, 117, 184; economic 54, 112,184; functional 72; institutional 112,115–117, 184; organisational 54, 112;social 53–54, 112, 184; spatial (physical)2, 11, 21, 54, 95, 112–117, 131, 155,177; technological 112, 184; non-spatial115–117, 184; significance/importance95, 112–117, 177
publish or perish 51–52, 105, 157, 164,173, 176
R&D: centre/institution 160, 163, 167;collaboration 140, 164–165, 170.;employment 75; expenditure 75, 114,136–137, 140, 146, 154, 156, 168;project 136; sector 122, 130, 148, 151
recognition 126, 154, 159, 176region: R&D sector 129–131; assubnational entity 18, 19, 22, 24, 36, 61,63, 67, 70, 75, 77, 86, 89–95, 100, 102,106, 109, 116, 118, 120, 122–123,127–128; learning 110, 121, 124, 128
regional development: policy 17, 22;relations with scientific collaboration19, 107, 120–123, 125, 127–131
regional innovation system 12,121–124, 128
regulations see lawrelations: bilateral 67–68, 78–79, 92, 93,142, 152, 153, 160, 164, 169; informal44, 156; interpersonal 156; strengthof 130
Republic of Letters 6, 31–33, 35, 76research: applied 7, 110, 141, 158; basic11, 110, 135, 144, 146, 175
Index 225

research evaluationresearch policy see science policyreturnee 130, 156, 158, 161–162, 170Royal Society 30Rubbia, Carlo 136Russia 22, 81, 87, 101, 104, 106, 144, 149,160, 175
Salomon, Jean-Jacques 134,163science: infrastructure 5, 28, 48, 141, 143,158, 165; park/town 18
Science Citation Index seeWeb of Sciencescience diplomacy 164–165science evaluation: see performanceevaluation
scientific: community 11, 31, 33, 35, 39,47, 157; disciplines/fields 5, 34, 37,40–41, 46, 49–51, 54, 57–58, 119, 141,159, 160, 184; ethos 45, 54; frontier 49,136, 138; journal 58; types (Wagner)40, 119
scientific collaboration: definition 2–3,41–42; types 42, 67, 119; geography76–107; benefits/costs 2, 27, 47, 103,108–109, 110–111, 116, 145, 169, 180;consequences 2, 47, 51, 122, 131,181–182; effects/impact 38, 44, 72, 95,100, 102, 106, 109, 111, 113, 119–123,184; measures 66–72; weak/strong41–44; modes 42–44; goals 41–43, 45,54, 127, 137; limits 53,179–180; future176, 178–184
Scientometrics – scientific journal 135Scopus 62, 64–65, 78, 100, 150Silicon Valley 5, 17, 20, 22, 109, 160Singapore 14, 79, 82, 87, 99, 103–105Skłodowska-Curie, Marie 15South Korea 79, 80, 86–87, 93, 100,104–105, 142, 144
space: common 116, 142; geographic 65,178, 183; global 102; of ideas 65;mega-spaces 178; relation with place 3,4–26; organizational 30; relation withscientific collaboration 3, 53, 66, 72,111, 127, 178; shared office 169;virtual 120
spatial scientometrics – measures, methods63, 64, 66–76, 131
spatial structure 1, 176, 179–180specialisation 38, 42, 49, 59, 65, 126,161, 176
spin-off, spin-out, start-up 12, 108,109, 124
structural hole 129–130student – as collaborator 11, 12, 29, 40, 126Sweden 14, 23, 78, 71, 77, 89, 104,150, 160
Switzerland 9, 14–16, 23, 78–81,87, 89, 103–104, 119, 150, 165,171, 175
synergy 38, 43, 109
Tallinn University of Technology 117task: allocation/division 37, 42–44, 53,160; specificity 41; types 42, 46
team 27–28, 31, 34–35, 42–44,46–48, 50–51, 55–57, 66, 73, 113,117, 119, 126, 142–143, 155, 157–158,179, 184
teamwork see teamthree Ts 19; see also creative classTorricelli, Evangelista 30trust 37, 44–47, 52–53, 55, 116, 143,172, 178
truth-spot 8turn see collaborative turn
Union of Soviet Socialist Republics(USSR) 16, 20, 21, 106
United Kingdom (UK) 9, 14, 15, 20, 78,80, 87, 104, 122
United States (US, USA) 3, 11, 12, 14, 15,20, 50, 55, 87, 104, 122, 133, 135,145–154, 160, 163
university: campus 1, 5, 7, 11, 61, 72, 113,153, 154, 168; entrepreneurial 110, 124;higher educational institution 116, 149,154, 155, 158, 159, 162, 167, 176;rankings 16, 21, 24, 105, 126, 168; thirdmission (role) 12–13
University of Pennsylvania 175
van der Meer Simon 136Venus – transit 32–33, 46Very Large Telescope 165
Wagner, Caroline 119, 135, 137weak ties 121, 129–130Web of Science: as data source 15–16,34–35, 38–39, 62–66, 74, 78–80, 92,105–106; components (Social sciencesCitation Index, Science Citation Index)14, 34, 106
Weil, André 27
Yale University 175
226 Index


