Embed Size (px)
Citation preview
The Good, the Bad, and the Ugly: The Influence of SkullReconstructions and Intraspecific Variability in Studies ofCranial Morphometrics in Theropods and BasalSaurischiansChristian Foth1,2*, Oliver W. M. Rauhut1,2,3
1 SNSB, Bayerische Staatssammlung für Paläontologie und Geologie, Richard-Wagner-Str. 10, Munich, Germany, 2 Department of Earth and EnvironmentalSciences, Ludwig-Maximilians-University, Richard-Wagner-str. 10, Munich, Germany, 3 GeoBioCenter, Ludwig-Maximilians-University; Richard-Wagner-str. 10,Munich, Germany
Abstract
Several studies investigating macroevolutionary skull shape variation in fossil reptiles were published recently, oftenusing skull reconstructions taken from the scientific literature. However, this approach could be potentiallyproblematic, because skull reconstructions might differ notably due to incompleteness and/or deformation of thematerial. Furthermore, the influence of intraspecific variation has usually not been explored in these studies. Bothpoints could influence the results of morphometric analyses by affecting the relative position of species to each otherwithin the morphospace. The aim of the current study is to investigate the variation in morphometric data betweenskull reconstructions based on the same specimen, and to compare the results to shape variation occurring in skullreconstructions based on different specimens of the same species (intraspecific variation) and skulls of closelyrelated species (intraspecific variation). Based on the current results, shape variation of different skull reconstructionsbased on the same specimen seems to have generally little influence on the results of a geometric morphometricanalysis, although it cannot be excluded that some erroneous reconstructions of poorly preserved specimens mightcause problems occasionally. In contrast, for different specimens of the same species the variation is generallyhigher than between different reconstructions based on the same specimen. For closely related species, at least withsimilar ecological preferences in respect to the dietary spectrum, the degree of interspecific variation can overlap withthat of intraspecific variation, most probably due to similar biomechanical constraints.
Citation: Foth C, Rauhut OWM (2013) The Good, the Bad, and the Ugly: The Influence of Skull Reconstructions and Intraspecific Variability in Studies ofCranial Morphometrics in Theropods and Basal Saurischians. PLoS ONE 8(8): e72007. doi:10.1371/journal.pone.0072007
Editor: Andrew A. Farke, Raymond M. Alf Museum of Paleontology, United States of America
Received February 22, 2013; Accepted July 8, 2013; Published August 8, 2013
Copyright: © 2013 Foth et al. This is an open-access article distributed under the terms of the Creative Commons Attribution License, which permitsunrestricted use, distribution, and reproduction in any medium, provided the original author and source are credited.
Funding: Funding provided by Deutsche Forschungsgemeinschaft (http://www.dfg.de) grant number: RA1012/12−1. The funders had no role in studydesign, data collection and analysis, decision to publish, or preparation of the manuscript.
Competing interests: The authors have declared that no competing interests exist.
* E-mail: [email protected]
Introduction
Recent years have seen an increase in studies onmacroevolutionary patterns of skull shape in fossil reptilesusing geometric morphometrics (e.g. [1–6]). However,undistorted, complete, and three-dimensionally preservedskulls are an exception in fossil taxa. Thus, in all of thesestudies the sampling of skulls was based mainly onreconstructed skulls and at least partly on reconstructionstaken from the scientific literature. However, this approachcould be potentially problematic as a) skull reconstructionsmight differ considerably due to incompleteness and/ordeformation of the material, and b) the influence of intraspecificvariation is partly ignored in these macroevolutionaryapproaches, as is ontogenetic variation in most cases (with the
exception of the study of Bhullar et al. [3]). The quality of thereconstructions is crucial, because the position of landmarks onreconstructed skulls as well as the position of species withinthe morphospace depends on the shape of the whole craniumand the precise relations between its individual bones.Furthermore, the position of species within the morphospacemay also vary due to intraspecific variation. In the past somestudies have tried to quantify intraspecific variation in dinosaurskulls with the help of morphometric and geometricmorphometric methods, e.g. [7–12], whereas variation causedby taphonomic deformation was well-documented by Carpenter[7] and Chapman [9]. However, a comprehensive review of thevariability of morphometric data due to differentialreconstructions or as a result of intraspecific variation for anydinosaur lineage has not been published yet.
PLOS ONE | www.plosone.org 1 August 2013 | Volume 8 | Issue 8 | e72007
The aim of the current study is to investigate the variation inmorphometric data between skull reconstructions based on thesame specimen with the help of geometric morphometricmethods. We furthermore analysed which skull regions mightparticularly be affected by high variation within thesereconstructions. The results are compared to shape variationoccurring in skull reconstructions based on different specimensof the same species and skulls of closely related species, inorder to investigate whether this potential source of variation ingeometric morphometric data might be comparable totaxonomically or even phylogenetically significant variation.
Material and Methods
Three different datasets for basal Saurischia, basalTetanurae, and Tyrannosauroidea were created, by collectingskull reconstructions in lateral view (Table S1 in File S1). Thetaxon sample was, of course, limited to taxa for which severalskulls are known and for which various reconstructions basedon the same specimen could be found in the literature. Alldatasets include a) skull reconstructions based on the samespecimen, b) skull reconstructions of different specimens of thesame species and c) skull reconstruction of closely relatedspecies. Plateosaurus and Allosaurus were treated as eachbeing represented by a single species, following Weishampel &Chapman [13], Möser [14] and Carpenter [8]. The specimenFMNH PR308, which was originally described as Gorgosaurus[15], is placed in Daspletosaurus, following Carr [16].
The skull shape of all species/specimens was captured by 22homologous landmarks, which are figured in Figure 1 and listedin Table S2 in File S1, using the program tpsDig [17]. Thisprogram outputs a tps (thin plate spline) file with two-dimensional landmark coordinates and scale (size) data foreach specimen. The tps file was loaded into MorphoJ [18] andsuperimposed using Generalized Procrustes Analyses GPA,which align landmarks from all specimens by minimizing non-shape variation like size, location, orientation and rotation [19].
Afterwards, the datasets were divided into differentsubgroups containing the Procrustes coordinates of a) singlespecimens, b) different specimens of the same species and c)different, closely related species, respectively. To estimate thedegree of variation of skull shape within single specimens,species and between different species a method was used thatwas originally developed for estimating the methodologicalerror for plotting landmarks on specimens by hand [20]. On thebasis of the Procrustes coordinates the mean Procrustesdistances to the respective consensus coordinates of eachlandmark were calculated. Then, the relation of these distancesto the mean distance of the consensus landmarks to thecentroid of the consensus shape was calculated as apercentage of the former from the latter. A further tps file wascreated for each dataset including a single skull reconstructionof only one specimen (n = 10) to calculate the methodologicalerror of plotting landmarks on the skull reconstruction asmentioned above. The mean error for plotting landmarks (=0.364%) was computed and subtracted from the percentageerrors for individual landmarks. Afterwards, the median of thepercentage error of each landmark and its 25th and 75th
percentiles (interquartile range) were computed in PAST 2.17b[21] and compared between the different subgroups. Using thismethod for the purpose mentioned above, the results do notrepresent methodological errors, but a measure formorphological variation of overall shape (disparity, see 22,23).If the median is more than 5.0% skull shape, variation within asample was considered as significant. Thus, skullreconstructions from sample with significant variation couldpotentially affect the results of a geometric morphometricanalyses and should be treated with caution. To verify theresults, Procrustes coordinates were additionally used tocalculate the Euclidian distances for every sample within eachgroup [24]. As in the previous case, the median Euclidiandistance and its 25th and 75th percentiles were calculated.
Furthermore, we wanted to know, which skull regions areparticularly affected by significant shape variation withinreconstructions of the same specimen, the same species andclosely related taxa, respectively. For this, the median and its25th and 75th percentiles were calculated for each landmarkwithin the different subgroups mentioned above.
Due to the generally small numbers of skull reconstructionsfor most samples, we tested the robustness of the ‘original’results in relation to sample size by computing randomsamples in the program R [25] with a standard number of ten‘hypothetical reconstructions’ per sample on the basis of theProcrustes coordinates of the original data. The function usedcomputed ten normal pseudorandom variates based on themean and the standard deviation of all Procrustes coordinatesrelated to a corresponding landmark within the original sample[26]. Afterwards, all methods described above were repeatedwith randomized samples and compared to the original data. Ifboth kinds of data produce similar results one can concludethat the results of the original data are robust in relation tosample size.
Results
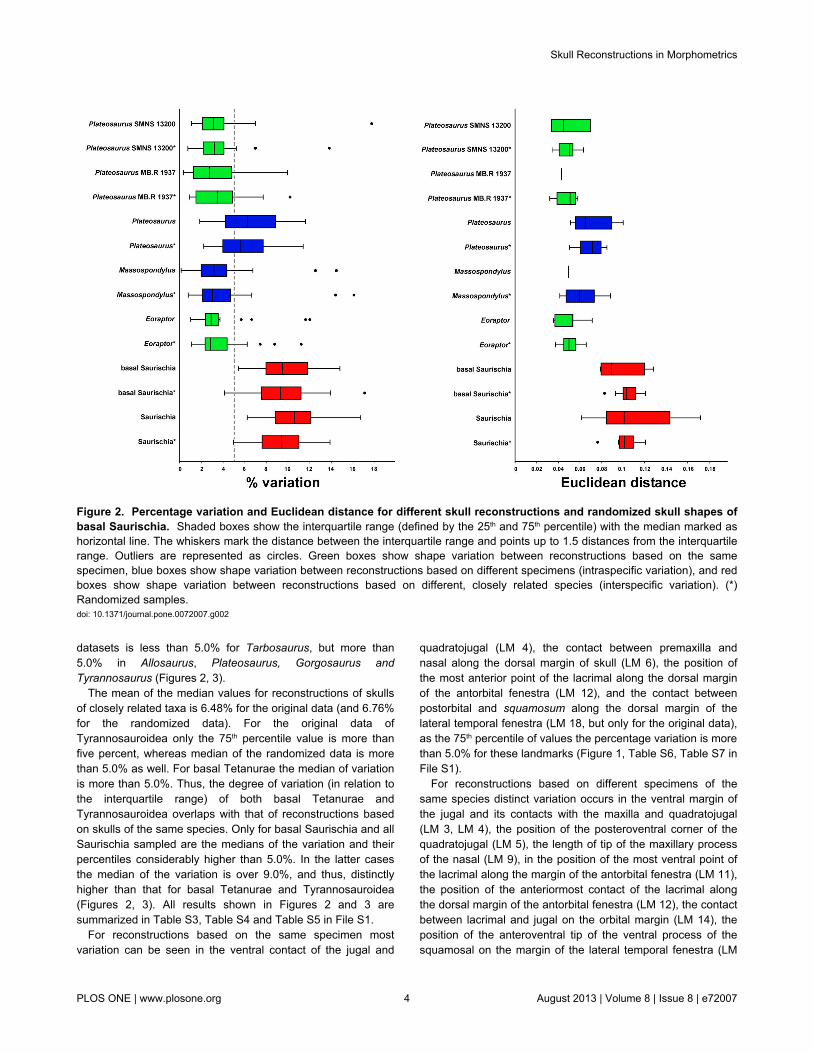
Both the values of the median of landmark variation (medianof variation) and Euclidean distances show generally similardistributions between the single samples of the threesubgroups. This is also true for the comparison betweenoriginal and randomized data. However, for the Euclideandistances the interquartile range of the randomized data isusually smaller than for the original data (for all samples withmore than two reconstructions) with exception of Gorgosaurus,Tarbosaurus and the Daspletosaurus specimen FMNH PR308.In contrast, the range of interquartiles are comparable for bothkinds of data with the exception of Eoraptor, Massospondylusand Tarbosaurus (here the interquartile range of therandomized data is slightly bigger than in the original data) aswell as Plateosaurus, Acrocanthosaurus and theTyrannosaurus specimen AMNH 5027 (here the interquartilerange of the randomized data is slightly smaller than in theoriginal data, Figures 2, 3).
In all sampled cases the median of the variation forreconstructions based on the same specimen is less than5.0%. In the Allosaurus specimen AMNH 600 (tworeconstructions) and the Daspletosaurus specimens NMC 8506
Skull Reconstructions in Morphometrics
PLOS ONE | www.plosone.org 2 August 2013 | Volume 8 | Issue 8 | e72007
(four reconstructions) and FMNH PR308 (threereconstructions) the median of variation is even less than 1.0%.The mean for the median values of the original data is 2.08%(and 2.27% for the randomized data). Only inMonolophosaurus is the 75th percentile value higher than 5.0%both original and randomized data.
The mean of the median values for skull reconstructionsbased on different specimens of the same species is 4.74% forthe original data (and 4.78% for the randomized data), in whichthe median of the variation of the original data is less than
5.0% for Daspletosaurus, Massospondylus andTyrannosaurus. Here, the 75th percentile value is less than5.0% in the former two genera as well. Thus, the median of thevariation of Daspletosaurus and Massospondylus stronglyoverlaps with that of reconstructions based on the samespecimen for most taxa. In contrast, the median of the variationof the original data of Allosaurus, Plateosaurus, Tarbosaurusand Gorgosaurus is more than five percent, but only forAllosaurus is the 25th percentile value higher than five percent.In contrast, the median of the variation in the randomized
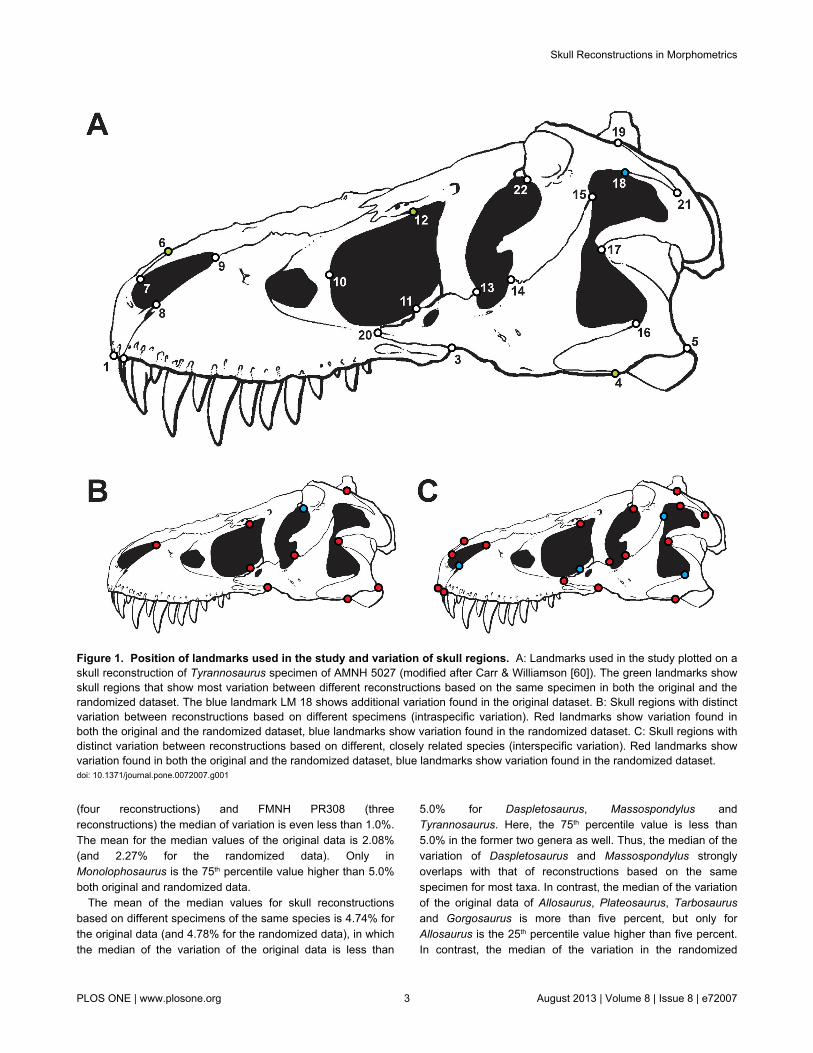
Figure 1. Position of landmarks used in the study and variation of skull regions. A: Landmarks used in the study plotted on askull reconstruction of Tyrannosaurus specimen of AMNH 5027 (modified after Carr & Williamson [60]). The green landmarks showskull regions that show most variation between different reconstructions based on the same specimen in both the original and therandomized dataset. The blue landmark LM 18 shows additional variation found in the original dataset. B: Skull regions with distinctvariation between reconstructions based on different specimens (intraspecific variation). Red landmarks show variation found inboth the original and the randomized dataset, blue landmarks show variation found in the randomized dataset. C: Skull regions withdistinct variation between reconstructions based on different, closely related species (interspecific variation). Red landmarks showvariation found in both the original and the randomized dataset, blue landmarks show variation found in the randomized dataset.doi: 10.1371/journal.pone.0072007.g001
Skull Reconstructions in Morphometrics
PLOS ONE | www.plosone.org 3 August 2013 | Volume 8 | Issue 8 | e72007
datasets is less than 5.0% for Tarbosaurus, but more than5.0% in Allosaurus, Plateosaurus, Gorgosaurus andTyrannosaurus (Figures 2, 3).
The mean of the median values for reconstructions of skullsof closely related taxa is 6.48% for the original data (and 6.76%for the randomized data). For the original data ofTyrannosauroidea only the 75th percentile value is more thanfive percent, whereas median of the randomized data is morethan 5.0% as well. For basal Tetanurae the median of variationis more than 5.0%. Thus, the degree of variation (in relation tothe interquartile range) of both basal Tetanurae andTyrannosauroidea overlaps with that of reconstructions basedon skulls of the same species. Only for basal Saurischia and allSaurischia sampled are the medians of the variation and theirpercentiles considerably higher than 5.0%. In the latter casesthe median of the variation is over 9.0%, and thus, distinctlyhigher than that for basal Tetanurae and Tyrannosauroidea(Figures 2, 3). All results shown in Figures 2 and 3 aresummarized in Table S3, Table S4 and Table S5 in File S1.
For reconstructions based on the same specimen mostvariation can be seen in the ventral contact of the jugal and
quadratojugal (LM 4), the contact between premaxilla andnasal along the dorsal margin of skull (LM 6), the position ofthe most anterior point of the lacrimal along the dorsal marginof the antorbital fenestra (LM 12), and the contact betweenpostorbital and squamosum along the dorsal margin of thelateral temporal fenestra (LM 18, but only for the original data),as the 75th percentile of values the percentage variation is morethan 5.0% for these landmarks (Figure 1, Table S6, Table S7 inFile S1).
For reconstructions based on different specimens of thesame species distinct variation occurs in the ventral margin ofthe jugal and its contacts with the maxilla and quadratojugal(LM 3, LM 4), the position of the posteroventral corner of thequadratojugal (LM 5), the length of tip of the maxillary processof the nasal (LM 9), in the position of the most ventral point ofthe lacrimal along the margin of the antorbital fenestra (LM 11),the position of the anteriormost contact of the lacrimal alongthe dorsal margin of the antorbital fenestra (LM 12), the contactbetween lacrimal and jugal on the orbital margin (LM 14), theposition of the anteroventral tip of the ventral process of thesquamosal on the margin of the lateral temporal fenestra (LM
Figure 2. Percentage variation and Euclidean distance for different skull reconstructions and randomized skull shapes ofbasal Saurischia. Shaded boxes show the interquartile range (defined by the 25th and 75th percentile) with the median marked ashorizontal line. The whiskers mark the distance between the interquartile range and points up to 1.5 distances from the interquartilerange. Outliers are represented as circles. Green boxes show shape variation between reconstructions based on the samespecimen, blue boxes show shape variation between reconstructions based on different specimens (intraspecific variation), and redboxes show shape variation between reconstructions based on different, closely related species (interspecific variation). (*)Randomized samples.doi: 10.1371/journal.pone.0072007.g002
Skull Reconstructions in Morphometrics
PLOS ONE | www.plosone.org 4 August 2013 | Volume 8 | Issue 8 | e72007
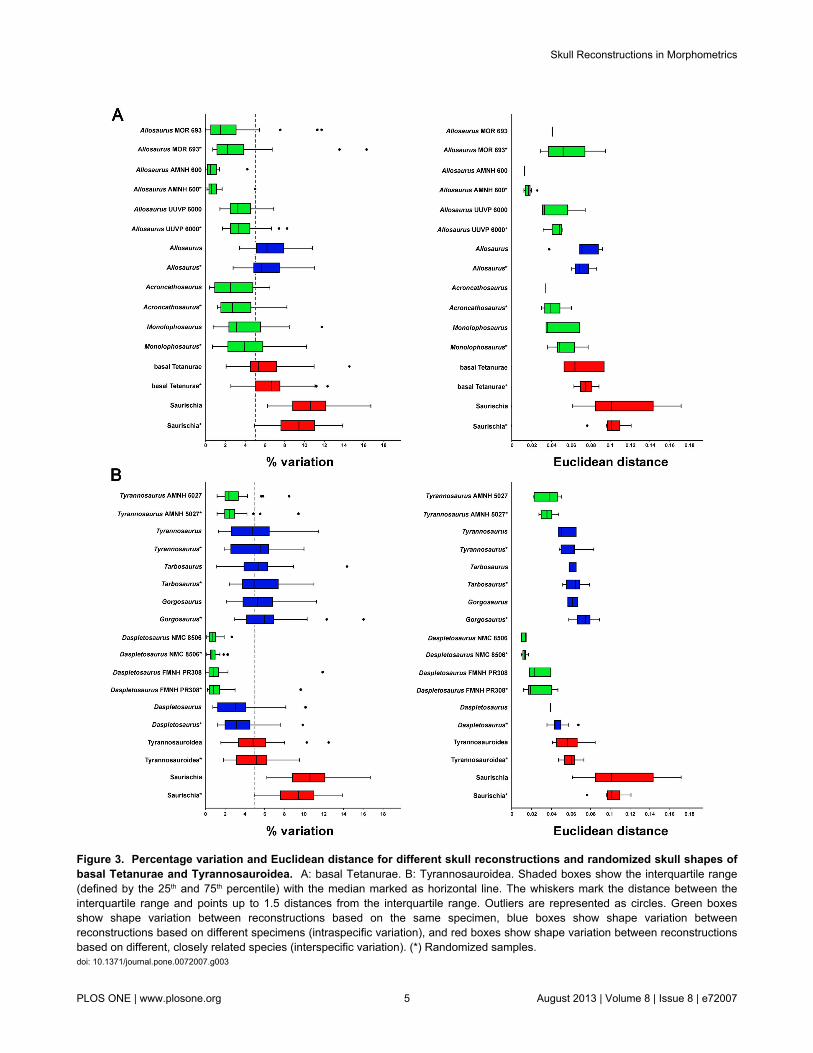
Figure 3. Percentage variation and Euclidean distance for different skull reconstructions and randomized skull shapes ofbasal Tetanurae and Tyrannosauroidea. A: basal Tetanurae. B: Tyrannosauroidea. Shaded boxes show the interquartile range(defined by the 25th and 75th percentile) with the median marked as horizontal line. The whiskers mark the distance between theinterquartile range and points up to 1.5 distances from the interquartile range. Outliers are represented as circles. Green boxesshow shape variation between reconstructions based on the same specimen, blue boxes show shape variation betweenreconstructions based on different specimens (intraspecific variation), and red boxes show shape variation between reconstructionsbased on different, closely related species (interspecific variation). (*) Randomized samples.doi: 10.1371/journal.pone.0072007.g003
Skull Reconstructions in Morphometrics
PLOS ONE | www.plosone.org 5 August 2013 | Volume 8 | Issue 8 | e72007
17), and in the dorsal contact between postorbital andsquamosal (LM 19). For the randomized data the contactbetween frontal and postorbital on the dorsal margin of the orbit(LM 22) was found to be significant as well (Figure 1, Table S6,Table S7 in File S1).
In comparison, for skull reconstructions of closely relatedtaxa, distinct landmark variation affects almost the entire skull,with the exception of the length of the anterior process of themaxillary body (LM 8), the position of the anteriormost point ofthe antorbital fenestra (LM 10), the contact of the jugal withboth the squamosal and the quadratojugal on the margin of thelateral temporal fenestra (LM 15, LM 16). For the randomizeddata all landmarks except of LM 10 showed significant variation(Figure 1, Table S6, Table S7 in File S1).
Discussion
Based on the results presented above, we can conclude thatthe shape variation of skull reconstruction (in relation to themedian of variation and the interquartile range) based on thesame specimen seems usually to be negligible in geometricmorphometric studies (only in Monolophosaurus the 75th
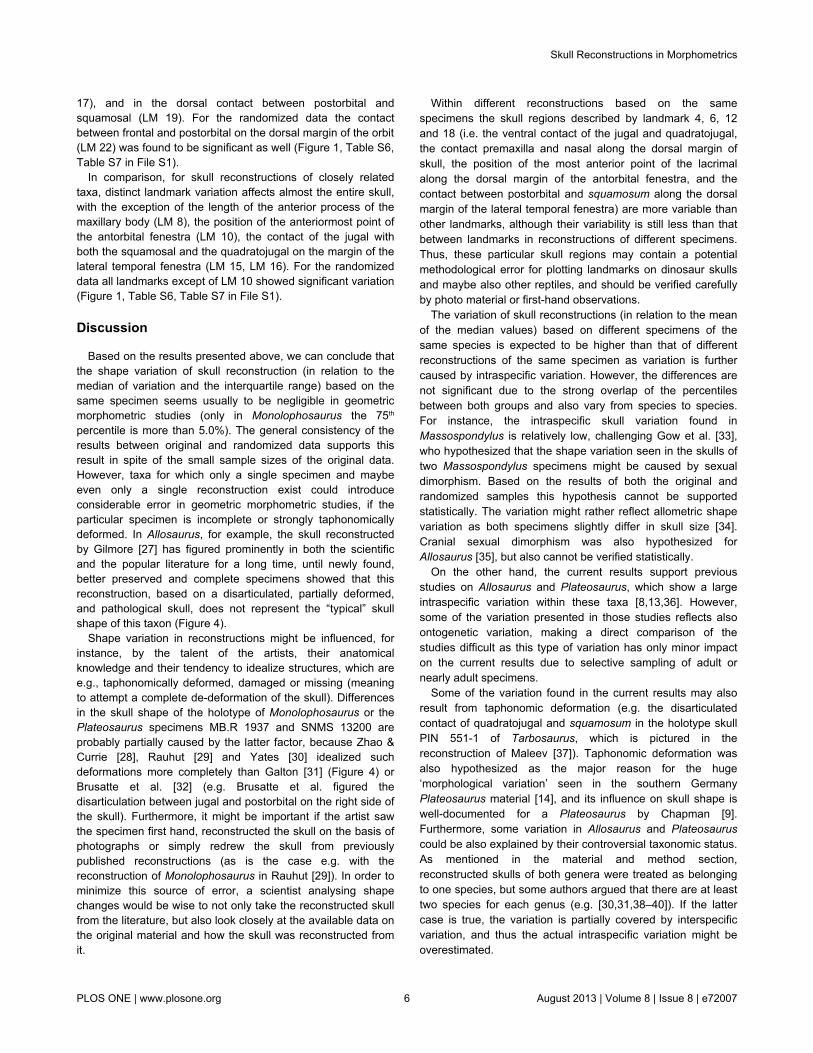
percentile is more than 5.0%). The general consistency of theresults between original and randomized data supports thisresult in spite of the small sample sizes of the original data.However, taxa for which only a single specimen and maybeeven only a single reconstruction exist could introduceconsiderable error in geometric morphometric studies, if theparticular specimen is incomplete or strongly taphonomicallydeformed. In Allosaurus, for example, the skull reconstructedby Gilmore [27] has figured prominently in both the scientificand the popular literature for a long time, until newly found,better preserved and complete specimens showed that thisreconstruction, based on a disarticulated, partially deformed,and pathological skull, does not represent the “typical” skullshape of this taxon (Figure 4).
Shape variation in reconstructions might be influenced, forinstance, by the talent of the artists, their anatomicalknowledge and their tendency to idealize structures, which aree.g., taphonomically deformed, damaged or missing (meaningto attempt a complete de-deformation of the skull). Differencesin the skull shape of the holotype of Monolophosaurus or thePlateosaurus specimens MB.R 1937 and SNMS 13200 areprobably partially caused by the latter factor, because Zhao &Currie [28], Rauhut [29] and Yates [30] idealized suchdeformations more completely than Galton [31] (Figure 4) orBrusatte et al. [32] (e.g. Brusatte et al. figured thedisarticulation between jugal and postorbital on the right side ofthe skull). Furthermore, it might be important if the artist sawthe specimen first hand, reconstructed the skull on the basis ofphotographs or simply redrew the skull from previouslypublished reconstructions (as is the case e.g. with thereconstruction of Monolophosaurus in Rauhut [29]). In order tominimize this source of error, a scientist analysing shapechanges would be wise to not only take the reconstructed skullfrom the literature, but also look closely at the available data onthe original material and how the skull was reconstructed fromit.
Within different reconstructions based on the samespecimens the skull regions described by landmark 4, 6, 12and 18 (i.e. the ventral contact of the jugal and quadratojugal,the contact premaxilla and nasal along the dorsal margin ofskull, the position of the most anterior point of the lacrimalalong the dorsal margin of the antorbital fenestra, and thecontact between postorbital and squamosum along the dorsalmargin of the lateral temporal fenestra) are more variable thanother landmarks, although their variability is still less than thatbetween landmarks in reconstructions of different specimens.Thus, these particular skull regions may contain a potentialmethodological error for plotting landmarks on dinosaur skullsand maybe also other reptiles, and should be verified carefullyby photo material or first-hand observations.
The variation of skull reconstructions (in relation to the meanof the median values) based on different specimens of thesame species is expected to be higher than that of differentreconstructions of the same specimen as variation is furthercaused by intraspecific variation. However, the differences arenot significant due to the strong overlap of the percentilesbetween both groups and also vary from species to species.For instance, the intraspecific skull variation found inMassospondylus is relatively low, challenging Gow et al. [33],who hypothesized that the shape variation seen in the skulls oftwo Massospondylus specimens might be caused by sexualdimorphism. Based on the results of both the original andrandomized samples this hypothesis cannot be supportedstatistically. The variation might rather reflect allometric shapevariation as both specimens slightly differ in skull size [34].Cranial sexual dimorphism was also hypothesized forAllosaurus [35], but also cannot be verified statistically.
On the other hand, the current results support previousstudies on Allosaurus and Plateosaurus, which show a largeintraspecific variation within these taxa [8,13,36]. However,some of the variation presented in those studies reflects alsoontogenetic variation, making a direct comparison of thestudies difficult as this type of variation has only minor impacton the current results due to selective sampling of adult ornearly adult specimens.
Some of the variation found in the current results may alsoresult from taphonomic deformation (e.g. the disarticulatedcontact of quadratojugal and squamosum in the holotype skullPIN 551-1 of Tarbosaurus, which is pictured in thereconstruction of Maleev [37]). Taphonomic deformation wasalso hypothesized as the major reason for the huge‘morphological variation’ seen in the southern GermanyPlateosaurus material [14], and its influence on skull shape iswell-documented for a Plateosaurus by Chapman [9].Furthermore, some variation in Allosaurus and Plateosauruscould be also explained by their controversial taxonomic status.As mentioned in the material and method section,reconstructed skulls of both genera were treated as belongingto one species, but some authors argued that there are at leasttwo species for each genus (e.g. [30,31,38–40]). If the lattercase is true, the variation is partially covered by interspecificvariation, and thus the actual intraspecific variation might beoverestimated.
Skull Reconstructions in Morphometrics
PLOS ONE | www.plosone.org 6 August 2013 | Volume 8 | Issue 8 | e72007
Figure 4. Skull reconstructions of the Plateosaurus specimen SMNS 13200 and different Allosaurus specimens. A: Skullreconstruction of SMNS 13200 after Galton [31]. B: Skull reconstruction of the SMNS 13200 after Yates [30] (modified after Nesbitt[51]). C: Line drawing of the left side of the original material of SMNS 13200 after Galton [61]. D: Line drawing of the right side of theoriginal material of SMNS 13200 after Galton [61]. Arrows show shape differences in the reconstructions by Galton and Yates andthe morphology of the respective structure of the original material of SMNS 13200. Here, the skull reconstruction of SMNS 13200 byGalton resembles the original material more in respect to the shape of the anterior margin of the premaxilla and its contact to thenasal, the shape of the anterior margin of the external naris, the contact between nasal and maxilla, the contact between maxilla,jugal and lacrimal, the shape of the dorsal margin of the skull, the shape of the postorbital and its contacts to the frontal and thesquamosum, and the shape of the ventral margin of the quadratojugal. E: ‘Short-snouted’ Allosaurus specimen USNM 4735described by Gilmore [61], which was based on a disarticulated, partially deformed, and pathological skull (modified after Henderson[62]). F: ‘Typical’ Allosaurus skull based on MOR 693 (modified after Rauhut [29]).doi: 10.1371/journal.pone.0072007.g004
Skull Reconstructions in Morphometrics
PLOS ONE | www.plosone.org 7 August 2013 | Volume 8 | Issue 8 | e72007
To minimize the ‘error’ of intraspecific variation inmacroevolutionary approaches, taxa for which there areseveral good quality reconstructions of different specimensshould be tested for intraspecific variation. This can be done ina separate small dataset with the same landmark configurationused in the macroevolutionary study by calculating theProcrustes coordinates for each specimen and estimating therespective Euclidean distances to the consensus shape of thesmall dataset. Subsequently, the specimen with the smallestdistance to the consensus shape might be used for the study.
The examples of interspecific variation (in relation to themedian of variation) presented in this study show all significantvariation, except for the original sample of Tyrannosauroidea.However, the latter exception could be the result of a smallsample size (n = 5). Interestingly, the interspecific shapevariation (in relation to the interquartile range) of basalTetanurae and Tyrannosauroidea strongly overlaps with theshape variation of the intraspecific variation of Allosaurus,Tyrannosaurus, Tarbosaurus and Gorgosaurus. The estimatedintraspecific variation is even slightly higher than the estimatedinterspecific variation of the respective groups. At first glancethis result is surprising, as one would expect that interspecificvariation should be larger than intraspecific variation, as seenin basal Saurischia. Methodically, the overlap could be a falsesignal resulting from small sample sizes (see 41). However, thedifferences between the numbers of reconstructions used for asingle species and for different, closely related species arerather small, making this explanation rather unlikely.Furthermore, because the results of the randomized data aresimilar to that of the original one, the sample size does notseem to influence the current result significantly. However, it ispossible that the chosen landmark configuration does notcapture skull regions that underlie strong interspecific variationin basal Tetanurae or Tyrannosauroidea, like the dorsal marginof the nasal (e.g. Monolophosaurus) or the dorsal margin of thelacrimal horn (e.g. Allosaurus). Furthermore, semi-landmarkanalysis of overall skull shape, in combination with a landmark-based analysis, might capture variations in skull shape morecompletely and thus yield different results. Thus, it is possiblethat the present analyses underestimate the actual interspecificvariation between those taxa. Furthermore, it is to be expectedthat interspecific skull variability increases with increasing thesample size of taxa analysed, as it is indeed demonstrated bythe higher variation seen in the data set for basal saurischiansor saurischians as a whole. By expanding the data set tospecies with more derived skull morphologies (e.g. long-snouted spinosaurids for basal Tetanurae), an increase of theinterspecific variation even in rather closely related forms wouldalso be expected. This is supported by several studies oncrustacean, pterosaur and coelurosaur diversity for instance,which all show that disparity of larger taxonomic clades ishigher than in the respective internal subclades (see 4,42–44).On the other hand, an overlap of intraspecific and interspecificvariation in closely related taxa has also been demonstrated forinstance in the cranial shape of recent Hominoidea [24], theosteology of skinks [45] or in molecular sequences of differentbilaterian clades (e.g. [46–48]), and the phenomenon is
therefore neither restricted to theropod dinosaurs, nor to skullshape.
In comparison with this rather small variation seen in closelyrelated theropod taxa, basal Saurischia in total possess a verylarge interspecific variation. One reason for this could be theinclusion of Eoraptor, the taxonomic position of which is stilldebated, e.g. [49–51]. However, excluding Eoraptor from thedata set does not change the result (median of variation =9.66%). Thus, the large variation seen in the skull shape mightbe due to diverging dietary preferences in basal saurischians,towards carnivory in many basal theropods, with omnivory andfinally herbivory in sauropodmorphs [52–55]. Indeed, thischange in diet might lead to the evolutionary trend from slenderand elongate skulls to short and broad skulls seen in the earlyevolution of Sauropodomorpha [56]. A similar pattern regardingdiet preferences was also found in theropods by Brusatte et al.[2] and Foth & Rauhut [6], who have shown that bothcarnivorous and non-carnivorous taxa occupy large areaswithin the morphospace, but non-carnivorous taxa tend todevelop more diverse, sometimes aberrant skull morphologies(e.g. Oviraptorosauria). In contrast, large-bodied carnivoroustheropods tend to cluster closely together within morphospace[2,6], and show a smaller disparity in skull shape in comparisonto smaller theropods with a broad dietary spectrum [2]. Thismight be due to a constrained biomechanical adaptation forhigh bite forces [57–59], including an oval orbit, a deep jugalbody and a short postorbital region [6,58].
Conclusion
The median of variation of different skull reconstructionsbased on the same specimen seems to have generally littleinfluence on the results of a geometric morphometric analysisof skull shape in theropods and basal saurischians. Shapedifferences seem to be mainly influenced by the talent of theartists, their anatomical knowledge, and their tendency toidealize structures that are damaged, missing ortaphonomically deformed. In general, it is advisable to verifyreconstructions used on the basis of the original material orphotographs thereof. For different specimens of the samespecies the variation (in relation to the mean of the medianvalues) is generally higher than in the previous example,indicating that intraspecific variation cannot be neglected,although this apparent variation might in some cases beoverestimated due to uncertain taxonomy. For closely relatedspecies, at least with similar ecological preferences, the degreeof interspecific variation (in relation to the median of variationand its percentiles) overlaps with that of intraspecific variation.This probably reflects considerable constraints in the skulls oftheropods with similar feeding strategies. As would beexpected, variation in morphometric data might increase withincreased phylogenetic and/or ecological sampling, but thishave to be tested in future studies in more detail. Given thenature of fossil data, our analysis is necessarily based onrather small sample sizes, and more investigations of therelation between intraspecific and interspecific variation ingeometric morphometric data in recent animals, for whichhigher sample sizes are available, would be desirable.
Skull Reconstructions in Morphometrics
PLOS ONE | www.plosone.org 8 August 2013 | Volume 8 | Issue 8 | e72007
Supporting Information
File S1. Including institutional abbreviations, sources ofskull reconstructions, Allosaurus specimens, descriptionof landmarks and error of landmarks(PDF)
File S2. Including geometric morphometric data forMorphoJ (txt). Data also deposited at Dryad: http://datadryad.org. Accessed 2013 July 15. doi:10.5061/dryad.6ss84.(TXT)
Acknowledgements
We would like to thank Martin Schwentner (University ofRostock), Serjoscha Evers and Richard Butler (both Ludwig-
Maximillians-Univeristät, München) for discussion and twoanonymous reviewers for critical comments, which helped toimprove the manuscript. Furthermore, we want to thank Hans-Jakob Siber and Thomas Bollinger (Sauriermuseum Aathal)and Raimund Albersdörfer for access to Allosaurus material.
Author Contributions
Conceived and designed the experiments: CF OWMR.Performed the experiments: CF. Analyzed the data: CF. Wrotethe manuscript: CF OWMR.
References
1. Jones ME (2008) Skull shape and feeding strategy in Sphenodon andother Rhynchocephalia (Diapsida: Lepidosauria). J Morphol 269: 945–966. doi:10.1002/jmor.10634. PubMed: 18512698.
2. Brusatte SL, Montanari S, Sakamoto M, Harcourt-Smith WEH (2012)The evolution of cranial form and function in theropod dinosaurs: insightfrom geometric morphometrics. J Evol Biol 25: 365–377. doi:10.1111/j.1420-9101.2011.02427.x. PubMed: 22111918.
3. Bhullar B-A, Marugán-Lobón J, Racimo F, Bever GS, Rowe TB et al.(2012) Birds have paedomorphic dinosaur skulls. Nature 487: 223–226.doi:10.1038/nature11146. PubMed: 22722850.
4. Foth C, Brusatte SL, Butler RJ (2012) Do different disparity proxiesconverge on a common signal? Insights from the cranial morphometricsand evolutionary history of Pterosauria (Diapsida: Archosauria). J EvolBiol 25: 904–915. doi:10.1111/j.1420-9101.2012.02479.x. PubMed:22356676.
5. Meloro C, Jones ME (2012) Tooth and cranial disparity in the fossilrelatives of Sphenodon (Rhynchocephalia) dispute the persistent “livingfossil” label. J Evol Biol 25: 2194–2209. doi:10.1111/j.1420-9101.2012.02595.x. PubMed: 22905810.
6. Foth C, Rauhut OWM (2013) Macroevolutionary and morphofunctionalpatterns in theropod skulls: a morphometric approach. Acta PalaeontolPol 58: 1–16.
7. Carpenter K (1990) Variation in Tyrannosaurus rex. In: K CarpenterPJCurrie. Dinosaur systematics: approaches and perspectives.Cambridge: Cambridge University Press. pp. 141–145.
8. Carpenter K (2010) Variation in a population of Theropoda(Dinosauria): Allosaurus from the Cleveland-Lloyd Quarry (UpperJurassic), Utah, USA. Palaeontol Res 14: 250–259. doi:10.2517/1342-8144-14.4.250.
9. Chapman RE (1990) Shape analysis in the study of dinosaurmorphology. In: K CarpenterPJ Currie. Dinosaur systematics:approaches and perspectives. Cambridge: Cambridge UniversityPress. pp. 21–42.
10. Larson PL (2008) Variation and sexual dimorphism in Tyrannosaurusrex. In: P LarsonK Carpenter. Tyrannosaurus rex, the tyrant king.Bloomington: Indiana University Press. pp. 103–128.
11. Campione NE, Evans DC (2011) Cranial growth and variation inedmontosaurs (Dinosauria: Hadrosauridae): implications for LatestCretaceous megaherbivore diversity in North America. PLOS ONE 6:e25186. doi:10.1371/journal.pone.0025186. PubMed: 21969872.
12. Mallon JC, Holmes R, Eberth DA, Ryan MJ, Anderson JS (2011)Variation in the skull of Anchiceratops (Dinosauria, Ceratopsidae) fromthe Horseshoe Canyon Formation (Upper Cretaceous) of Alberta. JVertebr Paleontol 31: 1047–1071. doi:10.1080/02724634.2011.601484.
13. Weishampel DB, Chapman RE (1990) Morphometric study ofPlateosaurus from Trossingen (Baden-Württemberg, Federal Republicof Germany). In: K CarpenterPJ Currie. Dinosaur systematics:approaches and perspectives. Cambridge: Cambridge UniversityPress. pp. 43–51.
14. Moser M (2003) Plateosaurus engelhardti Meyer, 1937 (Dinosauria:Sauropodomorpha) aus dem Feuerletten (Mittelkeuper; Obertrias) vonBayern. Zitteliana: B24: 3–186
15. Russell DA (1970) Tyrannosaurs from the Late Cretaceous of westernCanada. National Museum of Natural Sciences, Publications inPalaeontology 1: 1–34.
16. Carr TD (1999) Craniofacial ontogeny in Tyrannosauridae (Dinosauria,Coelurosauria). J Vertebr Paleontol 19: 497–520. doi:10.1080/02724634.1999.10011161.
17. Rohlf FJ (2005) tpsDig, digitize landmarks and outlines, version 2.05.18. Klingenberg CP (2011) MorphoJ: an integrated software package for
geometric morphometrics. Mol Ecol Resour 11: 353–357. doi:10.1111/j.1755-0998.2010.02924.x. PubMed: 21429143.
19. Zelditch ML, Swiderski DL, Sheets HD, Fink WL (2004) Geometricmorphometrics for biologist: a primer. San Diego: Elsevier AcademicPress.
20. Singleton M (2002) Patterns of cranial shape variation in the Papionini(Primates: Cercopithecinae). J Hum Evol 42: 547–578. doi:10.1006/jhev.2001.0539. PubMed: 11969297.
21. Hammer O, Harper DAT, Ryan PD (2001) PAST: paleontologicalstatistics software package for education and data analysis. PalaeontolElectron 4: 1–9.
22. Foote M (1991) Morphological and taxonomic diversity in a clade’shistory: the blastoid record and stochastic simulations. ContributionsMuseums Paleontol Univ Mich 28: 101–140.
23. Wills MA, Briggs DEG, Fortey RA (1994) Disparity as an evolutionaryindex: a comparison of Cambrian and Recent arthropods. Paleobiology20: 93–130.
24. Lockwood CA, Kimbel WH, Lynch JM (2005) Variation in early hominintemporal bone morphology and its implications for species diversity.Trans R Soc SA 60: 1–5. doi:10.1080/00359190509519178.
25. R-Development-Core-Team (2011) R: a language and environment forstatistical computing. Available: http://www.r-project.org. Accessed:2013 July 15.
26. Braun WJ, Murdoch DJ (2008) A first course in statistical programmingwith R Cambridge. Cambridge University Press.
27. Gilmore GW (1920) Osteology of the carnivorous dinosauria in theUnited States National Museum, with special reference to the generaAntrodemus (Allosaurus) and Ceratosaurus. Bulletin United States NatlMuseums 110: 1–159.
28. Zhao X, Currie PJ (1993) A large crested theropod from the Jurassic ofXinjiang, People’s Republic of China. Can J Earth Sci 30: 2027–2036.doi:10.1139/e93-178.
29. Rauhut OWM (2003) The interrelationships and evolution of basaltheropod dinosaurs. Special Papers in Palaeontology 69: 1–213.
30. Yates A (2003) The species taxonomy of the sauropodomorphdinosaurs from the Löwenstein Formation (Norian, Late Triassic) ofGermany. Palaeontology 46: 317–337. doi:10.1111/j.0031-0239.2003.00301.x.
Skull Reconstructions in Morphometrics
PLOS ONE | www.plosone.org 9 August 2013 | Volume 8 | Issue 8 | e72007
31. Galton PM (2001) The prosauropod dinosaur Plateosaurus Meyer,1837 (Saurischia: Sauropodomorpha; Upper Triassic). II. Notes on thereferred species. Rev Paleobiol 20: 435–502.
32. Brusatte SL, Benson RBJ, Currie PJ, Zhao X (2010) The skull ofMonolophosaurus jiangi (Dinosauria: Theropoda) and its implicationsfor early theropod phylogeny and evolution. Zool J Linn Soc 158: 573–607. doi:10.1111/j.1096-3642.2009.00563.x.
33. Gow CE, Kitching JW, Raath MA (1990) Skulls of the prosauropoddinosaur Massospondylus carinatus Owen in the collections of theBernand Price Institute for Palaeontological Research. Palaeontol Afr27: 45–58.
34. Hinić S (2002) Cranial osteology of Massospondylus carinatus Owen,1854 and its implications for prosauropod phylogeny. University ofToronto.
35. Molnar RE (2005) Sexual selection and sexual dimorphism intheropods. In: K Carpenter. The carnivorous dinosaurs. Bloomington:Indiana University Press. pp. 284–312.
36. Smith DK (1998) A morphometric analysis of Allosaurus. J VertebrPaleontol 18: 126–142. doi:10.1080/02724634.1998.10011039.
37. Maleev EA (1974) Giant carnosaurs of the family Tyrannosauridae. TrSovmestnaya SovetskoMongolskaya PaleontologicheskayaEkspeditsiya 1: 132–191.
38. Chure DJ (2000) A new species of Allosaurus from the MorrisonFormation of Dinosaur National Monument (UT-CO) and a revision ofthe theropod family Allosauridae Columbia University.
39. Loewen MA (2009) Variation in the Late Jurassic theropod dinosaurAllosaurus: ontogenetic, functional, and taxonomic implications.Department of Geology and Geophysics, University of Utah. pp. 1-326.
40. Prieto-Márquez A, Norell MA (2011) Redescription of a nearly completeskull of Plateosaurus (Dinosauria: Sauropodomorpha) from the LateTriassic of Trossingen (Germany). Am Museum Nov 3727: 1–58. doi:10.1206/3727.2.
41. Molnar RE (1990) Variation in theory and in theropods. In: KCarpenterPJ Currie. Dinosaur systematics: approaches andperspectives. Cambridge: Cambridge University Press. pp. 71–79.
42. Wills MA (1998) Crustacean disparity through the Phanerozoic:comparing morphological and stratigraphic data. Biol J Linn Soc 65:455–500. doi:10.1111/j.1095-8312.1998.tb01149.x.
43. Prentice KC, Ruta M, Benton MJ (2011) Evolution of morphologicaldisparity in pterosaurs. J Syst Palaeontol 9: 337–353. doi:10.1080/14772019.2011.565081.
44. Brusatte SL, Butler RJ, Prieto-Márquez A, Norell MA (2012) Dinosaurmorphological diversity and the end-Cretaceous extinction. NatCommunications 3(804): 1–8. doi:10.1038/ncomms1815. PubMed:22549833.
45. Czechura GV, Wombey J (1982) Three new striped skinks (Ctenotus,Lacertilia, Scincidae) from Queensland. Qld Museums Memoirs 20:639–645.
46. Meyer CP, Paulay G (2005) DNA bar coding: error rates based oncomprehensive sampling. PLOS Biol 3: e422. doi:10.1371/journal.pbio.0030422. PubMed: 16336051.
47. Meier R, Shiyang K, Vaidya G, Ng PKL (2006) DNA bar coding andtaxonomy in Diptera: a tale of high intraspecific variability and low
identification success. Syst Biol 55: 715–728. doi:10.1080/10635150600969864. PubMed: 17060194.
48. Meier R, Zhang G, Ali F (2008) The use of mean instead of smallestinterspecific distances exaggerates the size of the “barcoding gap” andleads to misidentification. Syst Biol 57: 809–813. doi:10.1080/10635150802406343. PubMed: 18853366.
49. Martinez RN, Alcober OA (2009) A basal sauropodomorph (Dinosauria:Saurischia) from the Ischigualasto Formation (Triassic, Carnian) andthe early evolution of Sauropodomorpha. PLOS ONE 4: e4397. doi:10.1371/journal.pone.0004397. PubMed: 19209223.
50. Martinez RN, Sereno PC, Alcober OA, Colombi CE, Renne PR et al.(2011) A basal dinosaur from the dawn of the dinosaur era insouthwestern Pangaea. Science 331: 206–210. doi:10.1126/science.1198467. PubMed: 21233386.
51. Nesbitt SJ (2011) The early evolution of archosaurs: relationships andthe origin of major clades. Bull Am Museum Nat Hist 352: 1–292. doi:10.1206/352.1.
52. Barrett PM (2000) Prosauropod dinosaurs and iguanas: speculationson the diets of extinct reptiles. In: H-D Sues. Evolution of herbivory interrestrial vertebrates. Cambridge: Cambridge University Press. pp.42–78.
53. Galton PM, Upchurch P (2004) Prosauropoda. In: DB WeishampelPDodsonH Osmólska. The Dinosauria. Berkeley: University of CaliforniaPress. pp. 232–258.
54. Langer MC, Ezcurra MD, Bittencourt JS, Novas FE (2009) The originand early evolution of dinosaurs. Biol Rev 84: 1–56. doi:10.1111/j.1469-185X.2008.00058.x. PubMed: 19046402.
55. Barrett PM, Butler RJ, Nesbitt SJ (2011) The roles of herbivory andomnivory in early dinosaur evolution. Earth Environ ScienceTransactions R Soc Edinb 101: 383–396.
56. Rauhut OWM, Fechner R, Remes K, Reis K (2011) How to get big inthe Mesozoic: the evolution of the sauropodomorph body plan. In: NKleinK RemesCT GeePM Sander. Biology of the sauropod dinosaurs:understanding the life of giants. Bloomington: Indiana University Press.pp. 119–149.
57. Erickson GM, van Kirk SD, Su J, Levenston ME, Caler WE et al. (1996)Bite-force estimation for Tyrannosaurus rex from tooth-marked bones.Nature 382: 706–708. doi:10.1038/382706a0.
58. Henderson DM (2002) The eyes have it: The sizes, shapes, andorientations of theropod orbits as indicators of skull strength and biteforce. J Vertebr Paleontol 22: 766–778.
59. Sakamoto M (2010) Jaw biomechanics and the evolution of bitingperformance in theropod dinosaurs. Proc R Soc Lond B 277: 3327–3333. doi:10.1098/rspb.2010.0794. PubMed: 20534620.
60. Carr TD, Williamson TE (2004) Diversity of late MaastrichtianTyrannosauridae (Dinosauria: Theropoda) from western North America.Zool J Linn Soc 142: 479–523. doi:10.1111/j.1096-3642.2004.00130.x.
61. Galton PM (1984) Cranial anatomy of the prosauropod dinosaurPlateosaurus from the Knollenmergel (Middle Keuper, Upper Triassic)of Germany. Geologica Palaeontol 18: 139–171.
62. Henderson DM (2000) Skull and tooth morphology as indicators ofniche partitioning in sympatric Morrison Formation theropods. GAIA 15:219–226.
Skull Reconstructions in Morphometrics
PLOS ONE | www.plosone.org 10 August 2013 | Volume 8 | Issue 8 | e72007


