Embed Size (px)
Citation preview
State University of New York College at Buffalo - Buffalo State CollegeDigital Commons at Buffalo State
Public Administration Master’s Projects Public Administration
12-2017
The Impact of Casino Revenue-Sharing onTourism Efforts in Niagara Falls USA: 2006-2016Anthony L. AstranState University of New York College at Buffalo - Buffalo State College, [email protected]
AdvisorLaurie A. Buonanno, Ph.D.First ReaderLaurie A. Buonanno, Ph.D.Second ReaderFrank V. Ciaccia, MPAThird ReaderJames A. Gold, Ph.D.
To learn more about the and its educational programs, research, and resources, go tohttp://publicadministration.buffalostate.edu/.
Follow this and additional works at: http://digitalcommons.buffalostate.edu/mpa_projects
Part of the Advertising and Promotion Management Commons, Gaming and Casino Operations Management Commons, Marketing Commons,Public Administration Commons, Public Relations and Advertising Commons, Recreation, Parks and Tourism Administration Commons, TourismCommons, Tourism and Travel Commons, Urban Studies Commons, and the Urban Studies and Planning Commons
Recommended CitationAstran, Anthony L., "The Impact of Casino Revenue-Sharing on Tourism Efforts in Niagara Falls USA: 2006-2016" (2017). PublicAdministration Master’s Projects. 22.http://digitalcommons.buffalostate.edu/mpa_projects/22
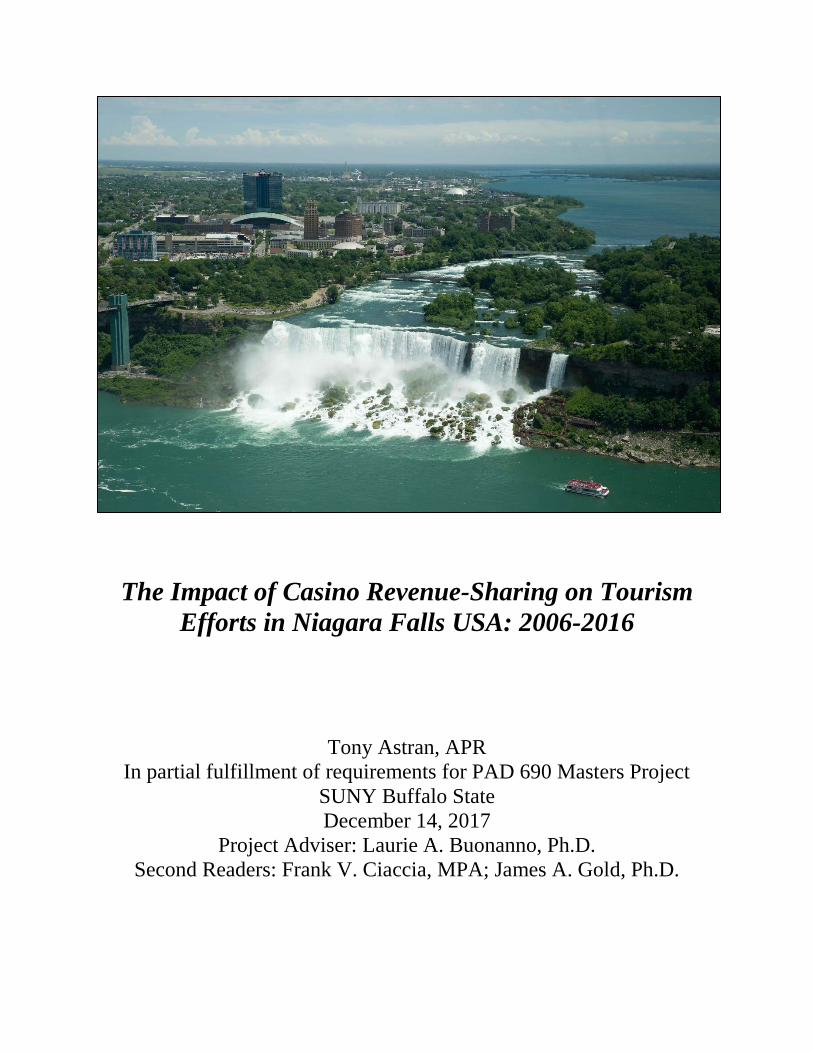
The Impact of Casino Revenue-Sharing on Tourism
Efforts in Niagara Falls USA: 2006-2016
Tony Astran, APR
In partial fulfillment of requirements for PAD 690 Masters Project
SUNY Buffalo State
December 14, 2017
Project Adviser: Laurie A. Buonanno, Ph.D.
Second Readers: Frank V. Ciaccia, MPA; James A. Gold, Ph.D.
i
ABSTRACT
This qualitative case study examines the intersection of a Native-owned casino, revenue-
sharing with its host community, and the impact of tourism marketing efforts vis-à-vis funds
provided to the community’s tourism agency. Specifically, this report studies downtown Niagara
Falls USA from the time period between 2006 and 2016, and seeks to determine whether and
how funds from Seneca Niagara Resort & Casino boosted tourism marketing efforts by Niagara
Tourism & Convention Corporation (NTCC). Background research and a series of elite
interviews with city officials and tourism agency leaders uncovered overall positivity in terms of
growth in Niagara Falls USA’s tourism efforts and results. Interviewees also tended to describe
the amount of 7 percent of the City’s revenue-sharing funds going to NTCC as fairly generous.
Despite these shared views, City officials past and present lamented missed opportunities to
better manage its overall casino revenue-sharing funds from New York State, as improvements
in other sectors of Niagara Falls may have influenced greater tourism marketing effectiveness.
City officials also believed their share from New York State (25 percent) to be inadequate for
further economic development. The results of this case study show that a set level of tourism
funding from casino revenue-sharing can have a positive effect on destination marketing efforts.
Future casino resorts in metropolitan areas and near natural-wonder attractions can leverage the
constructs of Niagara Falls USA’s revenue-sharing to determine revenue-sharing models of their
own. Nevertheless, host community tourism agencies should be mindful not to depend on these
resources being consistently available, particularly because of withholdings due to disputes
between Native nations and state governments.
Keywords: casino, revenue-sharing, tourism, marketing, tourism marketing, Niagara Falls,
Seneca, Native American, New York State, gaming
ii
ACKNOWLEDGEMENTS
Pursuing a master’s degree in public administration was a “slow burn” from 2008
through 2017. The journey was long but steady, and without the help of key individuals keeping
me motivated and focused, the end-point may have drifted further and further away.
I would first like to thank my adviser, Dr. Laurie Buonanno, for alerting me to the
possibility of a new master’s program in public administration, way back in 2007 during my first
of three years working at SUNY Buffalo State. I went right into the working world upon
graduating Loyola University Chicago in 2002 with a bachelor’s degree in communication. I
moved back to my hometown of Buffalo, N.Y. by choice in 2004, with the desire to be closer to
family and friends while making a difference in the region where I was raised. Initially, I had
never considered any need or desire to further my educational studies, but my professional and
personal relationship with Dr. Buonanno changed my thinking. The idea of earning a master’s
degree in public administration seemed like a logical branch from my existing public relations
and writing skills into government and community development, and I still believe that to be
true. Dr. Buonanno kept me on track every step of the way, and laid the groundwork for a
program that was equal parts academic and practical. While I won’t be SUNY Buffalo State’s
first M.P.A. graduate, I can proudly say I was in its first class.
I thank and fondly remember the late Dr. Keith Henderson, my initial adviser and
professor of the intro to public administration class. He set the tone for exciting learning by
having our classes at Buffalo City Hall. I will never forget his kindness and his words of
encouragement that I should never be afraid to “think bigger.”
To Dr. Jim Gold, a second reader of this paper: I offer my sincere thanks for teaching
three of the 12 classes as part of this program. Your energy, wisdom, and sincere care helped me
iii
to enjoy every moment of the master’s program. You also brought a non-governmental,
psychological, and humanistic perspective to my writing and thinking. I credit you for reminding
me to consider others first and to value multiple viewpoints prior to formulating my own.
I dedicate this paper to the memory of my father, who passed away just prior to the start
of my master’s classes. If he were here today physically, he would no doubt express how proud
he was to see me continue to challenge myself and complete this endeavor.
Finally and most importantly, I thank my wife Alyssa for all that she endured as a result
of my pursuit. There were many evenings where I missed dinner due to class, left her to take care
of our son Alex while I read book chapters, and worried her to no end due to my last-minute
style of completing assignments. She was, and always will be, my rock. For this paper, anything
I needed – from a meal delivered right to my laptop to a quick shoulder rub – was there like
magic, and often times without me even having to ask. I am a lucky person, thanks to her true
love and selflessness. As she has jokingly said, but I fully agree, this degree is “as much hers” as
it is mine.
iv
TABLE OF CONTENTS
CHAPTER I: INTRODUCTION AND BACKGROUND INFORMATION 1
Why Native Casinos? 3
Native Casinos in New York and Connecticut 5
Linkages between Native Casino Revenue-Sharing and Host Community Tourism Agencies 7
Linkages Examined for Additional Native Casinos 11
Introduction Summary 17
CHAPTER II: LITERATURE REVIEW 18
Introduction 18
Revenue-Sharing Research 19
Revenue-Sharing and Tourism Studies Involving Other Casinos in the U.S. 24
Few Specific Studies Available 26
Macro-Level Studies on Casinos and Tourism 32
Concluding Thoughts on Literature Review 38
CHAPTER III: METHODOLOGY AND JUSTIFICATION 40
An Important Note about the Latest Nation-State Impasse of 2017 42
Justifications for and Potential Limitations of a Case Study Approach 43
CHAPTER IV: RESULTS AND ANALYSIS 47
Funding Put to Use by Niagara Tourism & Convention Corporation (NTCC) 47
Impasses Throw Planning and Budgeting in a Tailspin 48
New Hotels as a Sign of Impact 49
7 Percent of Funding to NTCC Set at ‘Very Fair’ Level; State Receiving Too Much? 50
Without Seneca Niagara, Old Convention Center Would Have Been Problematic 51
Seneca Niagara Resort & Casino Adds to Niagara Falls’ Tourism Repertoire 52
More Attractions Needed; Seneca Niagara as an ‘Island’ 53
Beyond Tourism: Pitfalls of the Effects of Revenue-Sharing 54
CHAPTER V: CONCLUSIONS, IMPLICATIONS, AND LIMITATIONS 56
REFERENCES 61
APPENDIX A:
City of Niagara Falls, NY Casino Funds Revenues & Expenditures to Date 67
APPENDIX B:
Niagara Tourism and Convention Corporation – Casino Summary Report: 2006-2016 79
1
CHAPTER I: INTRODUCTION
Love them or hate them – casinos are now seemingly ubiquitous across the United States.
Some may view casinos simply as entertainment; others may view casinos as harbingers of
societal detriments, such as gambling addiction and greed. Regardless, casinos do provide a
source of revenue for their host communities, particularly due to revenue-sharing agreements
with state governments. Those funds can then be allocated for state and local programs. One
interesting symbiotic relationship of note is that of casinos and their host community tourism
agencies. As new casinos become more profitable over time, so too ought the tourism agency see
more funding as a result – whether directly through an agreed-upon stream, or indirectly as a
result of overall economic development in the community. And with greater funding, the tourism
agency ought to be in a better position to market the casino as a local attraction.
But even though casinos provide another stream of dollars, do tourism agencies notice a
positive difference? Beyond this initial question, how is this revenue-sharing agreement
developed when the casino in question is owned by Native Americans? Native Americans, by
virtue of being classified as sovereign nations, are exempt from paying sales tax – which may
appear to give them a business advantage in the community. Could a revenue-sharing agreement,
in turn, be a de facto substitute for paying sales tax? Furthermore, once the money reaches the
host community, how it is spent?
As a recent seven-year employee of Seneca Gaming Corporation in Western New York, I
have witnessed first-hand multiple cases of resentment from local business owners, who believe
that Native-owned casinos hurt tourism and economic development due to the notion of an unfair
business advantage. When I try to look an issue from an unbiased standpoint, I understand the
spirit of the concern. But I see the benefits as well.
2
The intersection of Native American casinos, revenue-sharing, and host community
tourism efforts is, in my opinion, more of a hot-button issue in Niagara Falls USA than anywhere
else in the country. Yet, as my project will show, there is a dearth of research on this topic as a
whole. Niagara Falls is known worldwide for its natural wonder, and a grand casino was built in
the 2000s, in part, to bolster tourism – but the verdict on the growth of Niagara Falls USA is still,
to this day, debated. Thus, I would like to investigate the following questions: did the presence of
and revenue-sharing from the Seneca Niagara casino resort serve as a key impetus for tourism
growth in Niagara Falls? Furthermore, was the amount of revenue-sharing dollars set at an
appropriate level to make a positive difference?
As a byproduct of these concerns, I proposed to undertake an intensive case study to
examine the growth of tourism in Niagara Falls USA relative to the Seneca Niagara casino resort
during the years of 2006 through 2016. Qualitative interviews with Niagara Tourism &
Convention Corporation (now known as Destination Niagara USA as of 2017, but referred to as
NTCC for the purposes of this report) and city leaders, past and present, explored the linkages
between the casino’s revenue-sharing dollars and the efforts of NTCC to promote the host
community.
My initial hope, upon undertaking this project, is that the findings may serve as a guide
for intergovernmental relations between Native American nations, states, and host communities
when arranging revenue-sharing agreements for new casino resorts in tourist destinations. Put
another way: as a result of this study, community governments will gain a better understanding
on how State Government and Native Nation negotiated payments ultimately affect their tourism
agency budgets and efforts.
3
I believe this is an issue worth studying not simply because I worked for a Native-owned
gaming corporation, but also because I believe that casino revenue dollars can bolster tourism
efforts – which will ultimately bolster the surrounding community. I believe that as more and
more casinos continue to be added across the country, it would be helpful to examine how
dollars are allocated – particularly to tourism agencies. And finally, on a local and state level, the
Western New York region and New York State as a whole is in a unique position where most of
its casinos are Native-owned. There is a real possibility that more Native-owned casinos will
open in New York State in the near future.
Why Native Casinos?
Native Americans, the original inhabitants of the U.S. prior to 17th century colonization
and 18th century independence, have found business success in the casino gaming industry
during the past three decades. The Indian Gaming Regulatory Act (1988), passed by the U.S.
Congress near the end of President Ronald Reagan’s term, set the precedent for Native Nations
to operate casinos on sovereign land. Measures within the Act regulate Native gaming, ensure
that tribes are the primary beneficiaries of gaming operations, as well as pave the way for certain
competitive advantages, such as no sales tax charged on Native casino properties (see
§2710(d)(4)). The Indian Gaming Regulatory Act, however, does require tribes to negotiate a
compact with their respective states, a provision that Schapp (2010) describes as “a continuing
source of controversy between the tribes and state and local governments” (p. 366).
According to the Native American Journalists Association (2014), while not all Native
Americans support casinos, the industry is generally popular among Nations, especially because
gambling has been part of their general culture for hundreds of years (Chapter 7, Question 68;
see also: Rand (2008), p. 519). Furthermore, as a result of the Indian Gaming Regulatory Act,
4
certain portions of gaming revenue must be allocated to help the larger Native Nation. Thus, the
casino enterprise is not only a potentially lucrative business venture, but also a means to sustain
and grow a Native Nation’s way of life (Indian Gaming Regulatory Act (1988), §2701(4)). In my
personal experience at Seneca Gaming Corporation, I additionally heard on many occasions from
our leaders that we also sought to give back to the larger community. A prevailing value for the
Senecas was to be a good caretaker of the community and strive for shared success, particularly
since the tribe would never relocate.
One could describe the growth of Native-owned casinos in the U.S. as staggering. Even
early on, they made a major impact in the gaming industry as a whole. According to Eadington
(1999), eight Native-owned casinos alone accounted for 40 percent of total gaming revenue in
1996, and there were 109 total Native-owned casinos at the time. According to Ackerman &
Bunch (2012), more than 440 Native-owned casinos were operating in 28 states as of 2008.
Additionally, gaming revenues among all Native-owned casinos in the U.S. were $121 million in
1988, $8.5 billion in 1998, and $26.7 billion in 2008. Schaap (2010) also investigated Native-
owned casinos by regions throughout the U.S., and found the each region experienced steady
growth between the years of 2001 and 2007.
According to the latest State of the States Report by the American Gaming Association
(2016), 2015 consumer spending at both commercial and tribal casinos totaled $68.44 billion and
the industry as a whole supported 350,000 jobs (see pp. 5, 7). In a separate section of the report
devoted to tribal gaming, the Association cited a record year in 2015 of $29.9 billion in gaming
revenues and a general willingness of tribes to enter into revenue-sharing agreements with state
governments as a means to boost local communities (see p. 40).
5
Native Casinos in New York and Connecticut
One of the first Native Nations to take action after the passing of the Indian Gaming
Regulatory Act was the Mashantucket Pequot Nation in Connecticut. They opened the Foxwoods
Resort Casino in 1992. Soon after in 1996, the Mohegan Tribe opened Mohegan Sun just 10
miles away. Much has been written about both casinos, which are among the largest in North
America. Together, they have changed the surrounding landscape both financially and socially –
with major arenas for entertainment, improvements to highways, and increased tourism
throughout the Greater Mystic region of the state (Benedict 2000 and Anthes 2008).
New York State is home to five Class III Native-owned casinos. The Seneca Nation in
Western New York owns three such properties through Seneca Gaming Corporation: Seneca
Niagara Resort & Casino in Niagara Falls (opened in 2002 as Seneca Niagara Casino), Seneca
Allegany Resort & Casino in Salamanca (opened in 2004 as Seneca Allegany Casino), and
Seneca Buffalo Creek Casino (opened in 2007). The Oneida Nation owns Turning Stone Resort
Casino in Verona – with Syracuse and Utica each located about a 30-minute drive away to the
west and east, respectively. Finally, the St. Regis Mohawk Tribe owns Akwesasne Mohawk
Casino Resort in northern New York, just 10 miles from Massena and close to the Canadian
border.
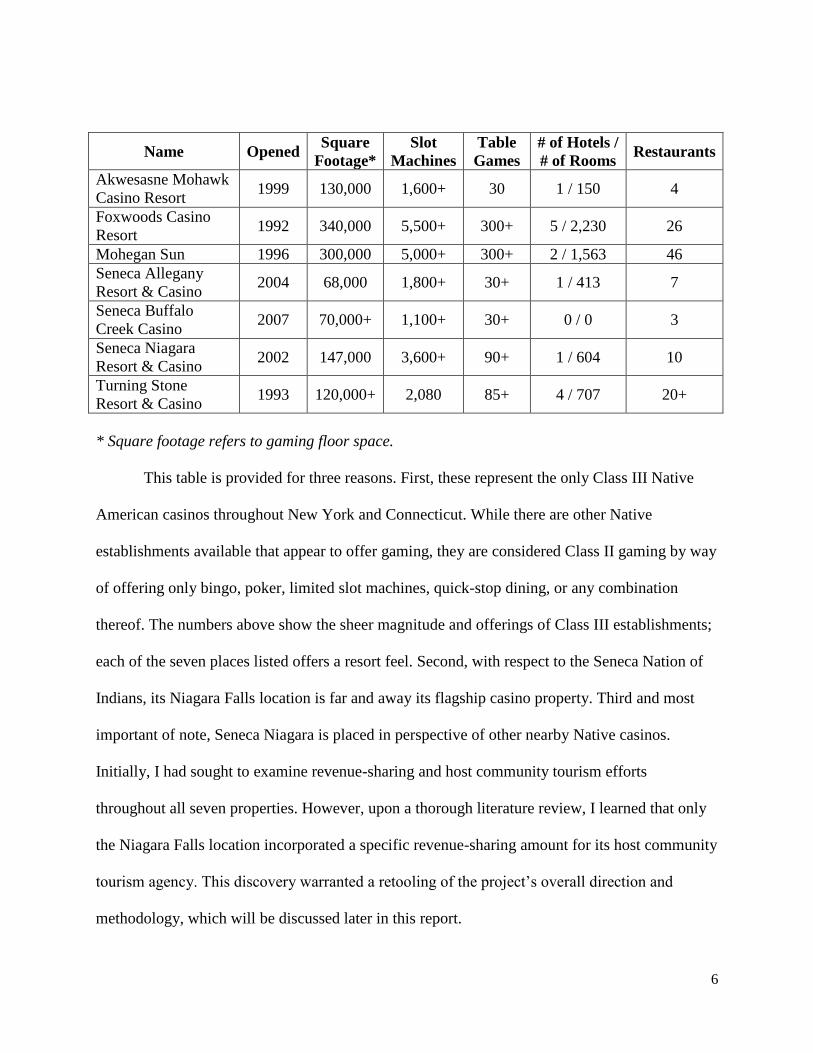
As reported from each casino’s website, here is the breakdown of characteristics for each
of the seven Native-owned casinos (see: Akwesasne Mohawk Casino Resort (2017), Foxwoods
Resort Casino (2015) (2017a) (2017b), Mohegan Sun (2017a) (2017b) (2017c), Seneca Gaming
Corporation (2017a) (2017b) (2017c), Turning Stone Resort Casino (2017)):
6
Name Opened Square
Footage*
Slot
Machines
Table
Games
# of Hotels /
# of Rooms Restaurants
Akwesasne Mohawk
Casino Resort 1999 130,000 1,600+ 30 1 / 150 4
Foxwoods Casino
Resort 1992 340,000 5,500+ 300+ 5 / 2,230 26
Mohegan Sun 1996 300,000 5,000+ 300+ 2 / 1,563 46
Seneca Allegany
Resort & Casino 2004 68,000 1,800+ 30+ 1 / 413 7
Seneca Buffalo
Creek Casino 2007 70,000+ 1,100+ 30+ 0 / 0 3
Seneca Niagara
Resort & Casino 2002 147,000 3,600+ 90+ 1 / 604 10
Turning Stone
Resort & Casino 1993 120,000+ 2,080 85+ 4 / 707 20+
* Square footage refers to gaming floor space.
This table is provided for three reasons. First, these represent the only Class III Native
American casinos throughout New York and Connecticut. While there are other Native
establishments available that appear to offer gaming, they are considered Class II gaming by way
of offering only bingo, poker, limited slot machines, quick-stop dining, or any combination
thereof. The numbers above show the sheer magnitude and offerings of Class III establishments;
each of the seven places listed offers a resort feel. Second, with respect to the Seneca Nation of
Indians, its Niagara Falls location is far and away its flagship casino property. Third and most
important of note, Seneca Niagara is placed in perspective of other nearby Native casinos.
Initially, I had sought to examine revenue-sharing and host community tourism efforts
throughout all seven properties. However, upon a thorough literature review, I learned that only
the Niagara Falls location incorporated a specific revenue-sharing amount for its host community
tourism agency. This discovery warranted a retooling of the project’s overall direction and
methodology, which will be discussed later in this report.
7
Linkages between Native Casino Revenue-Sharing and Host Community Tourism Agencies
At the heart of the importance of this proposed study is the question of how the revenue-
sharing is allocated through state compacts, and what the dollars should be spent on. One could
argue that some host cities and their tourism agencies have become dependent on the dollars. In a
Buffalo Business First article on June 14, 2013, reporter Jim Fink describes the head of the
NTCC, John Percy, as being “ecstatic” that revenue-sharing payments were finally returning
after being on hold for nearly three-and-a-half years. (The Seneca Nation held payments in
escrow as it resolved a dispute over exclusivity rights with New York State.) Fink reported:
“Percy said because of the dispute, his annual marketing budget went from $400,000 down to
just $60,000.” One year later on June 19, 2014, Fink discussed a $3 million deal where Seneca
Gaming Corporation would partner with Visit Buffalo Niagara (Buffalo’s tourism agency) to
better promote Western New York to a large regional radius, extending to cities such as
Cleveland, Toronto, Rochester, and Pittsburgh.
To further grasp the magnitude of this issue, it is important to understand the history of
the Seneca Nation of Indians’ casino enterprises, particularly Seneca Niagara Resort & Casino.
After Seneca Niagara’s opening on December 31, 2002 and addition of a 604-room hotel and
other amenities exactly three years later, prospects seemed bright for the local community to
cash in the casino’s success – figuratively and literally. Per the Nation-State Gaming Compact
between the Seneca Nation of Indians and the State of New York (April 12, 2002), the Senecas
would share 18 percent of slot revenues during the first four years of gaming operations, 22
percent during years five through seven, and 25 percent during years eight through 14 (Recital 12
b.). In a July 4, 2006 article in The Buffalo News titled, “Casino revenue boosts Falls effort to
attract more tourists,” reporter Gail Franklin described an agreement reached with city, county,
8
and state leaders to determine how to divvy funds in the area. Two million dollars was
earmarked for the NTCC – and of that money, $250,000 would go toward a summer radio
campaign and “first-ever winter campaign encouraging Canadians to shop, eat and stay in
Niagara Falls,” and another $1 million would allow the agency “to plan for a full-fledged
campaign in 2007 to include TV, radio, print and billboards” (p. B1).
According to City of Niagara Falls records (2017), the NTCC received nearly $10.4
million during the time period from 2009 through September 2016. That same document shows 7
percent of funds going to the Niagara Frontier Transportation Authority and 5.5 percent each
going to the Niagara Falls School District and the Niagara Falls Memorial Hospital (see
Appendix A for further details). Otherwise, per New York State Finance Law § 99-H, 73.5
percent of the funds received by the City of Niagara Falls is designated “for such public purposes
as are determined, by the city, to be necessary and desirable to accommodate and enhance
economic development, neighborhood revitalization, public health and safety, and infrastructure
improvement in the city” (see part 4(a.)(i.)). Part 4 (a) (ii) (3) of the law also specifically states
that “seven percent in each year shall be transferred to the Niagara tourism and convention center
corporation for marketing and tourism promotion in the county of Niagara including the city of
Niagara Falls.”
With such delineated breakdowns, however, political players continued to quarrel over
how funds should be spent. According to a March 19, 2009 article in The Buffalo News by
reporter Tom Prohaska, Niagara Falls Councilman Samuel Fruscione argued for cutting back the
share of NTCC’s share of casino funds to repair streets instead. He also “contended that the
agency doesn’t do enough for Niagara Falls and spends too much effort promoting other parts of
9
the county.” In that same article, John Percy, president of the NTCC, countered that “in 2007, the
agency’s marketing efforts returned $16 to the local economy for every $1 spent” (p. B1).
But not long after this article, the focus of community players shifted from how to
allocate funds, to whether or not funds would even be available. The aforementioned
withholding of payments to New York State between late 2009 and mid-2013 had far-reaching
effects in the community. Even about halfway into this time period, reporter Denise Jewell Gee
of The Buffalo News reported on the damage that the withholding caused to all three host
communities in Western New York:
The loss of that money -- used in recent years to plug the state budget and pay for local
services -- is beginning to show. The City of Salamanca has laid off 49 workers,
including five firefighters, and trimmed more than half the police force. A Niagara
County tourism agency has slashed its budget and cut 20 percent of its work force. And
Buffalo will have to make up more than $1 million in withheld revenue. (March 16, 2011,
p. A1)
The article also mentioned that the Senecas were willing to share money directly with the host
communities instead of the state, but the state would not agree to such an agreement.
Finally, on June 13, 2013, Governor Andrew M. Cuomo and the Seneca Nation resolved
the years-long dispute. The local communities received the full amount of the 25 percent that had
been held in escrow since 2009. Meanwhile, according to a press release that day from the
Governor’s office (2013, June 13), “New York State and the Seneca Nation will equally split
75% of $560 million in past payments from Seneca casino operations in Buffalo, Niagara Falls
and Salamanca.” The agreement reaffirmed the Senecas’ right to exclusivity; however, it also
allowed “video lottery terminals” (which look and function exactly like slot machines) to remain
in operation at three racetrack sites within Western New York – located in Hamburg, Batavia,
and Farmington. Those sites, however, could no longer be refer to themselves as “casinos,” but
rather, places of “gaming.”
10
The resolution spelled immediate relief for NTCC. The very next day, Buffalo Business
First covered this in an online article titled, “Casino deal replenishes NF tourism group.”
Reporter Jim Fink interviewed NTCC president John Percy and wrote the following:
Percy said because of the dispute, his annual marketing budget went from $400,000 down
to just $60,000. Marketing and advertising allocations account for 35 percent of the
NTCC’s annual $1.2 million budget. “We are going to be very busy, making up for lost
time and opportunities,” Percy said. Percy said he has a marketing and advertising game
plan, but was waiting for the Seneca dollars to make their way into the NTCC’s account
before embarking on the effort. (June 14, 2013)
Although funds returned to Niagara Falls, the larger issue of how the money was
allocated remained precarious. In short, the city had become dependent on funds and tied the
dollars to their annual budget. An online story in the February 8, 2016 issue of The Buffalo News
shed light on the city using dollars for the general fund rather than investment, with reporter
Nancy Fischer noting that the city used $16 million of casino money for the 2016 budget
compared to $4.3 million in 2009.
While Niagara Falls had concerns about dependency on casino funds, Buffalo had
concerns about the Senecas following through with a promise of funds to bolster tourism
marketing. In a front-page story of The Buffalo News on March 23, 2014, reporter Jill Terreri
questioned whether the Seneca Nation lived up to a 2006 agreement with the City of Buffalo in
order to open a casino downtown. The article stated, “Documentation on whether the Seneca
Nation spent $1.7 million a year to market the casino outside the region - spending required by
the 2006 deal - proved hard to come by. The Seneca Gaming Corp. has not filed the required
annual certifications” (p. A1). While Terreri published a Seneca-provided list of marketing
activities, she noted that marketing the casino “to those who live more than 10 miles from the
casino does not necessarily mean the casino is reaching out to people in Pennsylvania or Ohio.”
11
This exposé – at least, in part – led to the Senecas agreeing to spend $3 million over the
course of a year specifically for tourism promotion. As reported online by Jill Terreri in The
Buffalo News, “The new funding from the casino corporation will significantly increase the
marketing efforts of Visit Buffalo Niagara, said Patrick J. Kaler, president and CEO of the
tourism promotion organization” (June 19, 2014). The article also stated that Visit Buffalo
Niagara’s existing advertising budget was between $750,000 and $1 million, and detailed the
ways that the Senecas would further incorporate tourism in their casino marketing mix. On the
same day as the article in The Buffalo News, Jim Fink of Buffalo Business First also spelled out
details online of the $3 million campaign, stating:
The multi-media campaign, which begins next month, targets such cities as Toronto,
Rochester, Erie, Cleveland and Youngstown, Ohio. Ads will appear in newspapers,
magazines, email, social media, trade shows, television and mobile apps. Central to the
campaign will be regional highlights include shots of the Buffalo skyline, Niagara Falls,
special events and, Seneca Gaming’s local casinos. (June 19, 2014)
Linkages Examined for Additional Native Casinos
A review of the additional nations in New York and Connecticut is not nearly as
extensive as the Seneca Nation, if simply for the fact that the nexus of revenue-sharing and host
community tourism does not exhibit the numerous layers of issues as hitherto described. The
discovery of a lack of direct funding for the tourism agencies also serves as the impetus for
studying Niagara Falls in-depth as a case study, rather than comparing the Native casinos across
New York and Connecticut through a mixed-methods research approach.
Unlike the Seneca Casinos, the Oneida Indian Nation’s Turning Stone Resort Casino is
not located in or near a major city. Situated in Verona, the Central New York location is more
than 30 miles east of Syracuse and more than 20 miles west of Utica. One could argue that the
resort is a tourist destination onto itself. Turning Stone Resort Casino’s closest tourism agency,
12
Oneida County Tourism, nevertheless considers the resort as a major attraction across a wide
swath of Central New York, and credits it as a major factor for increased visitors to the region. In
a recent press release (July 29, 2015), Oneida County Tourism cited traveler spending in eight
counties of Central New York rising 4.7 percent in 2014 to a total of $2.015 billion. Oneida
County Executive Anthony J. Picente, Jr. mentioned the casino first in the press release’s
opening quote, stating, “From the Turning Stone Resort Casino, Utica Comets AHL Hockey,
regional sporting events like the American Legion Baseball Tournament to our 4 season outdoor
recreation, historic theatres, world class brewery, race tracks and speedways, and burgeoning
Agri-Tourism industry, these attractions and many more plus our continued focus on tourism
initiatives has resulted in a 5% increase in visitor dollars spent in 2014.”
In a recent fact sheet, the Oneida Indian Nation (2016) claims to have invested more than
$5.7 billion to the state and local communities. They cite Turning Stone Resort Casino as “one of
the largest tourism attractions in New York State, drawing more than 4.5 million visitors
annually (12,000 per day), creating a boon in local sales and bed tax revenues, and spurring
several small businesses to locate near the resort.”
The 2013 compact resolution with New York State granted the Oneida Indian Nation a
zone of exclusivity while allowing state-run Vernon Downs (six miles away) to continue offering
“video lottery terminals.” According to a press release issued by the Governor’s Office (May 16,
2013), New York State would grant 25 percent of its share to Oneida County, but also grant $3.5
million per year to nearby Madison County. Turning Stone Resort Casino is located less than
five miles from the county line.
Akwesasne Mohawk Casino Resort, owned and operated by the St. Regis Mohawk Tribe,
is located in northern New York State near the Canadian border. It is not close to any major
13
cities; Ottawa is more than 70 miles northwest and Montreal is more than 80 miles northeast. In a
24-page publication from the St. Regis Mohawks, titled, “Benefits of Gaming: How Gaming
Supports the Community of Akwesasne 2011-2013,” the nation claimed it provided “more than
$136 million to fund essential community services and tribal programs” (2013, p. 4) since 1999,
with nearly $20 million provided in 2013. Nothing is explicitly stated for tourism benefits, but
the nation does note that “these payments are equally divided between St. Lawrence and Franklin
Counties and help strengthen county budgets” (p. 5). According to nearby Canadian newspaper
Cornwall Standard-Freeholder, the St. Regis Mohawks touted the publication in a press release
and stated that their “gaming enterprises on territory attract 2.8 million visitors annually”
(December 3, 2014).
According to the Casino City website (2017), in November 2010 the council of the St.
Regis Mohawk Tribe “refused to make payments to the state because it believed the state of New
York violated its tribal compact by allowing gaming at another Indian community within the
Mohawk Tribe’s exclusivity zone” (http://newyork.casinocity.com/tribal-gaming). The website
mentions that the nation resolved the dispute in May 2013 with Governor Cuomo, which
reaffirmed its exclusivity zone and funneled $30 million of withheld funds back to the state.
While little is reported on the Akwesasne Mohawk Casino Resort in terms of tourism,
Owen Sound, Ont.-based MacLeod Farley & Associates worked with seven nation-related
entities to prepare the Akwesasne Tourism Strategic Action Plan (May 4, 2016). This collective,
known as the Akwesasne Tourism Working Group, devised a plan of activities through 2021 and
beyond to organize various cultural attractions under a unified “Experience Akwesasne” brand
and possibly create a destination management and marketing organization (p. 41).
14
As for the casinos in Connecticut, although Foxwoods Resort Casino and Mohegan Sun
are separate casinos run by separate tribes, it is empirical to study them in a mostly combined
fashion. They represent two of the largest casinos in North America as well as two of the
earliest-opened Native casinos, and they also are the only two casinos in Connecticut – with a
distance of merely 10 miles in between.
While Foxwoods began operating Class III gaming in 1992 and Mohegan Sun opened in
1996, both nations worked with the State of Connecticut on compacts simultaneously in the mid-
1990s – the Pequots to renegotiate their initial compact, and the Mohegans to enter into their
own. According to Connecticut’s Office of Legislative Research, the compacts are virtually
identical and provide that “each tribe contributes 25% of its gross slot machine revenue to the
state monthly. If either tribe’s contribution falls below $80 million in any year, its rate increases
to 30%” (Chen, D., December 17, 2015, p. 2).
The nations themselves tout their revenue-sharing to Connecticut and impact on tourism.
Under a section titled “Tribal Commitments” on the Mashantucket Pequot Tribal Nation’s
website, the nation claims it has given more than $3 billion to the state since 1993 and that “the
increased tourism and proceeds that follow Foxwoods have a dramatic effect on the economy.
Foxwoods has consistently drawn around 14 million visits each year, about half of which come
from guests who live in other states” (2017, https://www.mptn-nsn.gov/Commitments.aspx).
Separately, a pamphlet by the Mohegans titled, “The Mohegan Tribe and Connecticut: A
Partnership Marked by Success” (2011), mentions the 25 percent revenue-share and notes: “If
Mohegan Sun paid the standard state corporate tax rate, even with an additional eight percent
gaming tax, the Mohegan Tribe’s contribution to the state would be cut in half” (p. 5). The
15
pamphlet also describes Mohegan Sun’s role as a major player in state tourism, touting “12.7
million visitors annually to the region” (p. 7).
In a May 2011 dissertation for a doctorate degree, Adam D. Bubb’s 403-page report on
“Cashing in on Indian Casinos” investigated the efforts of four U.S. tribes to offer off-reservation
gaming. In his chapter about the Mashantucket Pequots, he noted the impact of both Foxwoods
and Mohegan Sun on the surrounding community, stating that the decision to open the casinos
paid huge dividends for the state and that Eastern Connecticut had otherwise been a “rural area
with low economic activity” (p. 197). He furthermore states that Connecticut “profits greatly
from these two casinos as they are the 5th
highest producer of revenue for the state” (p. 198).
Most other related literature available about the Connecticut casinos tends to focus on
Foxwoods Casino Resort. The University of Connecticut’s Center for Economic Analysis
published an economic impact report on Foxwoods on November 28, 2000, ultimately finding
that the casino had an overall positive impact on the state. Of the many topics covered by the
authors, they led with a discussion on tourism, stating:
Foxwoods Resort Casino hosts nearly 41,000 people per day on average, with 73 percent
of the customers coming from out-of-state. This high tourism rate has a significant effect
on the region’s lodging and dining businesses because tourists buy gas, souvenirs, meals,
and lodging in the region. Tourists are attracted not only by gaming opportunities but also
by a variety of entertainment (concerts, nightclubs, boxing) and restaurants. (Carstensen
et. al., p. 2)
Dr. Anne-Marie d’Hauteserre has extensively studied Foxwoods Resort Casino and its
impact on the local community. In a study published in Tourism Management titled, “Lessons in
Managed Destination Competitiveness: The Case of Foxwoods Casino Resort” (2000), she
discusses the Pequots’ policy to support the “creation of a synergistic tourism destination in
southeastern Connecticut, in cooperation with managers of other tourist facilities in the area” (p.
29). She subsequently noted Foxwoods’ influx of visitors as a driver of visitations to other
16
nearby tourist attractions. Another published study the following year by d’Hauteserre in
Tourism Geographies examined why residents in neighborhoods surrounding Foxwoods Resort
Casino felt they were losing a sense of rurality due to factors such as increased traffic and
pollution. D’Hauteserre ultimately concluded that “the attitudes of non-Indian residents are not
born from an opposition to casinos as tourism destinations or as dens of gambling, but of
hostility to the new-found wealth of a tribe” (p. 407).
With a look towards the future, representatives from both Foxwoods and Mohegan Sun
and other community leaders formed the Greater Mystic Tourism Marketing Committee in
January 2017. According to a press release from the Chamber of Commerce of Eastern
Connecticut, this 12-person committee is a unit of the Chamber and replaces the recently
dissolved Greater Mystic Visitors Bureau. Among the committee’s duties are providing strategic
direction of the region’s brand and “serving as the region’s tourism partner with the Connecticut
Office of Tourism (COT) and the state’s tourism website: www.CTVisit.com” (January 25,
2017).
Finally, linkages between Native casino revenue-sharing and tourism efforts are not
confined just to New York and Connecticut. As shown in one example, an article in the Tucson
Citizen on May 31, 2005 detailed the many organizations and initiatives that benefitted from
Native casinos in the two years since the passage of Proposition 202, which provided revenue-
sharing throughout the state. Reporter Teya Vitu noted that the Arizona Office of Tourism
received $6.8 million in each of the two years, and also wrote the following:
The voter-approved measure allowed the tourism office to launch its first international
marketing campaigns, which included four trade shows in Great Britain and the showing
of a 45-minute, large-screen Grand Canyon film at IMAX theaters in London,
Manchester, Bournemouth, Bristol, Bradford and Glasgow. The campaign spread into
Mexico and Canada, too. Casino money also led to increased tourism marketing in target
cities such as Minneapolis, Chicago, Denver, Dallas and Portland, Ore. The tourism
17
office also launched a direct-response television campaign. (p. A1)
Introduction Summary
Casinos certainly do not represent a be-all-end-all for tourism, nor are they the sole factor
for the success of tourism agencies in their host communities. But with the continued growth of
the Native gaming industry, I believe this nexus of topics warrants further investigation.
Ultimately, if the case of Niagara Falls shows that its tourism agency operated more effectively
due in part to the existence of the nearby Native casino and the revenue-sharing, the findings
could provide a framework for Nation-State contracts with regard to future casinos. Just as one
example, it has been long-rumored that the Seneca Nation has interest in building a casino resort
in Rochester. Could such an addition be a boon for the tourism organization Visit Rochester and
– ultimately – the community as a whole?
18
CHAPTER II: LITERATURE REVIEW
Introduction
With regard to Native American casinos, revenue-sharing to host communities, and the
impact on host community tourism marketing effects, there is virtually no research available that
covers the nexus of these topics. Furthermore, very few studies exist on somewhat related topics,
such as use of local funds or effects to economic development. Most studies about casinos tend
to focus on problem gambling, local traffic, and general attitudes towards the presence of a
casino.
Because my proposed study will be unique, this literature review is broken down into
four distinct yet interrelated parts. The first part of this literature review examines larger issues of
Native casinos and state/local revenue-sharing. Second, this literature review will offer a brief
look at these issues with regard to other casinos in the United States. Third, the very few studies
available that are related to my specific topics and Northeast Native casinos will be presented
and analyzed in greater detail. Finally, this review will examine macro-level studies related to
casinos and tourism. While the first two parts of this literature review could appear to double as
background information, the reporting will serve to frame and inform the few specific research
studies that are available.
It should be noted that part of the reason for the lack of available research is the fact that
the proliferation of Class III gaming beyond Las Vegas and Atlantic City is still a relatively new
phenomenon. And particularly where Native American casinos are concerned, the country has
experienced rapid growth in a short period of time. At the moment, there appears to be a perfect
storm of not enough research taking place with regard to casinos and tourism or casinos and
revenue-sharing, combined with a lack of more modern research that could take into account
19
today’s much larger casino industry. It is possible, for example, that studies during the 1990s
about casinos in the U.S. could be dated today due to market saturation. Regardless, the industry
continues to grow, and informed studies about the linkages between casinos, revenue-sharing,
and host community tourism efforts could make the case for strategic placements of future
casinos. And particularly where Native American casinos are involved, such research would help
state and local leaders determine how to set revenue-sharing percentages and delineate funds.
Revenue-Sharing Research
Before proceeding to other topics within the literature review, I believe it is imperative to
first understand the background of local/state revenue-sharing – both in terms of challenges as a
whole as well as agreed-upon payout percentage breakdowns from the Native nations to states
and local communities.
John Anderson (2005), an economics professor at the University of Nebraska, prepared a
report titled “Casino Taxation in the United States” that was published in the National Tax
Journal. He sought to provide an overview of taxes applied to casinos by state and local
governments, and analyze taxes and fees from a policy perspective. In a section of his report
labeled “Uses of Casino Tax Revenues,” he explains that casino revenue payments are often
earmarked for state and local government purposes, such as “gambling addiction programs,
tourism promotion, historic preservation, education, state fair, mental health programs, horse
racing commission, and elderly and disabled programs” (p. 314). This is one of the few research
studies available that specifically cites tourism promotion as byproduct of revenue-sharing.
Anderson also is one of the few researchers to comment on the lack of research surrounding
Native casino compacts and their effectiveness on host communities:
The fiscal aspects of these compacts appear to be completely ad hoc with no evidence of
fundamental public finance principles being applied in their design by states and tribes,
20
much less consideration being given to the design of optimal fiscal compacts in any
sense. While state lotteries have benefited from the economic analysis of the optimal
design of the prize structure (e.g., see Quiggin (1991)), there is as yet no economic
analysis of optimal compacts for tribes to share the revenues with state and local
governments. One area in need of additional research, consequently, is the question of
designing appropriate state-tribal compacts. In this regard, the literature on revenue-
sharing can be brought to bear. (p. 305)
This passage indicates the need for more analysis regarding the effectiveness of revenue-sharing
structures between Native-owned casinos and state/local governments. While Anderson’s
research serves as partial justification for my own study, it should be noted that he only briefly
touches upon Native casinos in his report. For his analysis, he studied non-Native commercial
casinos in 11 states, including riverboat and race-track establishments. New York was not
included.
Anderson’s report cited the National Gambling Impact Study Commission (1999), which
was an Act of Congress for the purpose of reporting on the economic and social impacts of all
forms of gambling in the United States. Chapter 6 of the study is specifically titled “Native
American Tribal Gaming.” While this chapter focuses primarily on the history of tribal gaming
and its impact on members of tribes, there is a section on state-tribal compacts that is relevant to
my research. Particularly, the Commission explored the topic of “exclusivity payments” with
regard to Native casinos, offering the Mashantucket Pequot Tribal Nation’s Foxwoods Resort
Casino in Connecticut as the “first such agreement” and “clearest example” of a state agreeing to
no local competition in exchange for a high percentage of revenues (p. 21). The Commission
also ultimately recommended that Native nations, states, and local government work together to
resolve “issues of mutual concern,” rather than rely upon federal law (p. 23). Furthermore, they
recommend that “gambling tribes, states, and local governments should recognize the mutual
benefits that may flow to communities from Indian gambling” and enter into reciprocal
21
agreements “to balance the rights of tribal, state and local governments, tribal members, and
other citizens” (p. 23). But while the above passages highlight the importance of collaboration,
there is no mention of the need to allocate funds to host communities for tourism. Furthermore,
the Commission’s findings were published in 1999 – an early point in time for the growth of
Native casinos, and a point in time in which the Seneca Nation of Indians had not yet entered the
casino resort industry.
In a study published in the UNLV Gaming Research & Review Journal, Patricia Janes
and James Collison (2004) explored the social and economic impacts of Indian gaming under the
construct of a particular Midwestern community (not identified) through in-depth interviews
with eight non-Native community leaders. Some of those leaders have very similar titles to
whom I intend to interview, such as a Chamber of Commerce Executive Director, City Manager,
Convention and Visitor Bureau Executive Director, and an Executive Director of Economic
Development (p. 19). Janes and Collison ultimately concluded, based on existing literature and
their own unique case study, that Native casinos generate positive economic gains for their host
communities. With regard to state compacts, they also advised that compacts “should mandate
that local governments have control over funding and these allocations should be monitored” (p.
27). Janes and Collison hoped that their findings would inform decision-making both for local
officials and the Native nation as the casino prepared for an expansion from 20,000 square feet to
200,000 square feet (see p. 18). Clearly, their research has limitations for larger generalizability
due to the fact that their in-depth approach focused on a relatively small-size casino in the
Midwest and interviews with just eight individuals. For the purposes of my study, while the rural
Midwest and Niagara Falls are two different locales, Janes and Collison’s work and my own
research nevertheless focuses on interviewing targeted host community leaders to examine
22
revenue sharing and impacts that a Native-owned casino has for issues related to local economic
development.
As of 2016, each of the five Native nations in New York and Connecticut provided 25
percent of slot revenues for state/local disbursement. According to the State of the States annual
review by the American Gaming Association (2016), this put all of the nations among those
offering the largest state/local shares in the entire country. Revenue-sharing agreements, which
are meant to “help pay for regulatory costs and offset some of the impacts of their operations on
local communities,” are found in 69 percent of Native casinos in the U.S., and only 5 percent of
all Native casinos in the U.S. provide anywhere from 20 to 25 percent of sharing (p. 60). The
report did not mention how it gathered this data or what specifically the revenue-sharing went
towards, other than to say that the percentages were determined by data from “a 2015 report on
Indian gaming by the U.S. Government Accountability Office.” Nevertheless, I believe this data
will make my final study all the more compelling, due to the fact that the Native casinos’ host
communities in New York and Connecticut are all receiving the highest percentage of sharing in
the U.S., and that very few other casinos share as much. It should be noted, however, that the
report’s gaming and tax revenues for each of the 24 states with commercial casinos do not
include additional contributions made by Native casinos. And in terms of gathering statistics, the
report also states that “when a property or even an entire state declined to participate, the
associated economic impact was treated as zero” (p. 4). Thus, while the report appears to be
thorough, there is concern about its true completeness.
Specific to New York State, Comptroller Thomas DiNapoli in recent years has weighed
in on the issue of exclusivity payments and host communities’ use of funds. In a 2014 report
titled “Trends in New York State Lottery Revenues and Gaming Expansions,” he added two
23
pages about funds from Native casinos and discussed recent compact disputes (pp. 17-18). As
was previously discussed in Chapter I of this report, Governor Andrew M. Cuomo settled
compact disputes with all three tribes in May and June of 2013. DiNapoli’s report detailed the
history of events leading up to the three resolutions. In particular, the Senecas and St. Regis
Mohawks had withheld payments to the state since 2009 and 2010, respectively, due to claims of
state-operated gaming infringing on their exclusivity zones. For the Oneida Indian Nation, their
resolution settled an issue of land claims, and consequently granted Turning Stone Resort Casino
its own zone of exclusivity. DiNapoli’s report as a whole was intended to provide an overview of
types of gaming and its impacts (positive and negative, such as job creation and problem
gambling, respectively) in New York State, as a means to inform discussion about the upcoming
expansion of video lottery terminals. (One recent example of the expansion coming to fruition is
the February 2017 opening of Del Lago Resort & Casino in the Finger Lakes Region.) The
historical perspective of this report shows that while Native casinos exist in New York State,
they face competition from many other forms of state-run gaming. The issues of sovereignty and
exclusivity zones could potentially loom large during in-depth discussions with NTCC and City
of Niagara Falls leaders about the impacts of revenue-sharing on tourism efforts.
Another report from DiNapoli in 2015 examined financial activity in the City of
Salamanca, which hosts Seneca Allegany Resort & Casino. His report, which serves as an audit,
is intended “to review City officials’ financial management practices and collection of overdue
real property taxes and ambulance service charges” (p. 2). While the report does not necessarily
pertain to Niagara Falls, it is interesting to note DiNapoli’s observations with regard to another
Seneca-owned casino. In particular, he warns that the city is “heavily reliant” on casino funds,
stating they account for “approximately 50 percent of the City’s total revenues” (p. 1).
24
Furthermore in this report, as an example of the state-local structures for accessibility to the
funds, he faults the City of Salamanca’s Comptroller for not applying for 2014-2015 funds in a
timely manner, claiming “the City would have received an additional $3.5 million in revenues
during 2014-15 and the general fund’s unrestricted fund balance would have increased to
approximately $14.5 million, or more than 174 percent of the 2015-16 budget” (p. 8). Ultimately,
the audit showed that the City of Salamanca was doing an inadequate job of managing its
finances, and DiNapoli issued a corrective action for the City Council to undertake within 90
days. While the City agreed that it needed to do better, they rebutted that many of their
shortcomings resulted due to funds withheld during the 2010-2013 compact dispute. Likewise, in
the case of Niagara Falls, it will be telling to learn more about the perspectives of leaders on
what kind of dependency the casino compact has created. Ultimately, it is precisely this nexus of
local fund allocation, access to funds, and proper use of funds that is at the heart of affecting host
community tourism marketing efforts.
Revenue-Sharing and Tourism Studies Involving Other Casinos in the U.S.
Although literature on revenue-sharing and tourism for other Native casinos does not
appear to be as extensive as the literature available for New York and Connecticut, similar topics
have been discussed throughout the country – particularly out west. In a study published in the
Journal of the Community Development Society, Antell, Blevins & Jensen (2000) examined
issues of local economic development and revenue-sharing for select Native casinos in Arizona,
California, Colorado, New Mexico, Oregon, and Wisconsin. Their study was intended to
examine the broad scope of how Native casinos were investing their profits, particularly with
respect to “community infrastructure, social welfare projects, and economic diversification” (p.
1). With the exception of some casinos failing in Arizona (p. 6), economic developments across
25
these six states were positive, leading to improved infrastructure, increased tourism, decreases in
welfare, multiplier effects on job creation, and more. The study, however, also pointed out faults
in reporting from Native nations, from the use of unrealistic multipliers (p. 8) to independence
from state oversight in collecting and reporting economic data (p. 9). Despite these limitations,
the information as a whole provides a detailed review of issues with selected tribes – particularly
successes with regard to community investment amidst ongoing battles with states over
definitions of sovereignty. Likewise, the Senecas have experienced much of the same issues in
Niagara Falls. Ultimately, while Antell, Blevins & Jensen’s study is becoming dated, I believe it
is intended to paint a picture of success with respect to Native gaming and still has relevance
today.
In an American Indian Quarterly journal article from Fall 2016 titled, “The Development
of a Gaming Enterprise for the Navajo Nation,” Susan Fae Carder provided an in-depth
qualitative analysis of the Navajo Nation’s history and their relatively late foray into gaming
operations in New Mexico and Arizona, calling the Nation “one of the last holdouts against
gaming” (p. 307). While her study focuses primarily on the gaming industry effects on the
Navajos’ cultural identity, Carder also delved into the struggles for additional economic
development to take place on their land. Specifically, she mentioned that for other businesses to
open, they had to “jump through numerous hoops of tribal regulations” (p. 320). While the
Seneca Niagara casino is on its own plot of sovereign land in Niagara Falls, it nevertheless is in
the heart of downtown and within a mere 10-minute walk to the waterfalls. In my interviews, I
should be mindful to listen for and/or explore issues of how Seneca Niagara fits with the rest of
downtown, and whether it adds to the tourism mix or creates barriers for growth. In the case of
26
the Navajos, Carder does ultimately contend that the benefits outweigh the costs for the Navajos’
ventures into gaming.
Finally, reporter Jeff Schweers (December 4, 1999) of the Las Vegas Business Press
published a cover story about advertising budgets for Las Vegas casinos dwarfing the budget of
the Las Vegas Convention and Visitors Authority (LVCVA). His intention was to highlight the
controversy on whether casinos need tax-subsidized quasi-public advertising and marketing, and
also discuss how casino advertising was targeting tourists. The particular timing of the piece was
due to an approaching July 1, 2000 deadline for the LVCVA to turn over to the school district a
portion of room tax revenue. One particular highlight of the article involved his interview with
Sheldon Adelson, owner of The Venetian. Adelson complained about LVCVA’s efforts, saying,
“They’re selling Las Vegas as cheap, cheap, cheap, cheap. That’s contradictory to the new
direction Las Vegas is going. Do you think (Mirage Resorts Chairman) Steve Wynn is happy
they’re promoting Las Vegas as cheap with his Bellagio just opening?" (p. 1). Ultimately, the
article was designed to present the pros and cons of whether or not LVCVA should turn over the
money, coupled with the context of what the LVCVA is doing to advertise Las Vegas versus the
nearby casinos. For my own study, this brings to light an interesting dilemma to keep in mind
when interviewing the leaders of NTCC: can casino advertising be in conflict with host
community tourism efforts? While Las Vegas is very different from Native casinos, I believe the
overall notion of multiple (and potentially competing) marketing campaigns will be important to
consider when conducting and analyzing interviews.
Few Specific Studies Available
Of five comprehensive studies found on New York and Connecticut Native casinos with
linkages to tourism, four focus on the two casinos in Connecticut. I will discuss those four
27
because of their relevance to my study, even though I am now honing my research squarely on
Niagara Falls as opposed to all seven Native casinos in New York and Connecticut.
The lone New York study was conducted in 2005 by Kent Gardner with the Center for
Governmental Research and Gaming and Resort Development. The thorough report provided an
economic analysis of Seneca Niagara Casino’s impact to Niagara Falls as well as additional
benefits provided to the community, and was commissioned by USA Niagara Development
Corporation. Gardner points out factors that could skew overall findings, such as the addition of
the casino hotel not yet available (which eventually opened on December 31, 2005) and the lack
of a true convention center at the time. But ultimately, he suggests that a portion of the
exclusivity fee should be regarded as a “payment in lieu of taxes” to be spent at the City of
Niagara Falls’ sole discretion. He also stated, “Recognizing that economic activity stimulated by
the Casino has driven up costs to the City, we propose that this sum be doubled” (p. 75). Gardner
also studied revenue-sharing agreements with six Native casinos throughout the U.S., and
concluded that “dedicating some of the funds to public safety, economic development and
infrastructure improvements would be most consistent with how funds are spent in other
communities” (p. 56). Gardner additionally touched upon tourism efforts throughout his piece,
citing discussion with heads of local attractions such as Maid of the Mist – but he ultimately
determined that the casino was still too new for interviewees to determine if casino visitors
boosted attendance for nearby attractions. In fact, Gardner ultimately claimed that Seneca
Niagara Casino’s off-site impacts were small, but also acknowledged that it “takes time for a
major new tourism asset to become integrated into the economy” (p. 90). I think Gardner’s study
provides good insight for my own approach, both in terms of its thoroughness and its
recommendations – the latter of which I hope to build upon with my own in-depth analysis. It is
28
unfortunate, however, that this is the only in-depth study available regarding Seneca Niagara and
the local community – especially because it is so dated. Specific payments to the local
community hadn’t fully kicked in at this point in time, the overall revenue-sharing was much less
in the early years (18 percent to the state), and no hotel or additional amenities at Seneca Niagara
meant less revenue. Gardner’s study, in my view, provides good historical context but also
serves to highlight the need for the study I am proposing.
Spectrum Gaming Group, a casino gaming research company, was commissioned by the
Connecticut Division of Special Revenue to conduct a comprehensive report titled “Gambling in
Connecticut: Analyzing the Economic and Social Impacts” (June 22, 2009). The 390-page report
was intended to ultimately inform state leaders on revising and creating gaming policies. To
perhaps no surprise, the report offered extensive data on Foxwoods Resort Casino and Mohegan
Sun, the two primary gaming centers for the state. Together, the properties attracted 24 million
visits in 2007, contributed $411.4 million to the state in 2008 (from a starting point of $30
million in 1993), and attracted nearly half of its visitors from out-of-state (p. 8). Interestingly, the
report noted that while 78 percent of the gaming revenue state’s General Fund went to local
municipalities in 1994, the figure was down to 21 percent as of 2007 (p. 11). Later in the report,
Spectrum Gaming Group provided a detailed breakdown of the share, stating: “The amount each
town receives from the 25 percent slot contribution varies widely based on a complicated
formula that results in most of the money going to the state’s three largest municipalities – New
Haven, Hartford and Bridgeport” (p. 136). The most relevant part of this study, however, comes
in a seven-page section titled “Tribal Impact on State’s Tourism Strategy.” Spectrum Gaming
Group interviewed a variety of regional tourism agency leaders, who collectively agreed that
“additional state support could increase the impact of casino marketing, a move that would
29
support tourism in the eastern region and for the state as a whole” (p. 133). The section also
discussed the symbiotic relationship between casinos and local attractions, giving examples of
how they support each other’s growth. Finally, the report also states as one of its major themes in
its findings that “gaming in its various forms is not fully woven into the state’s tourism policies,
which has resulted in lost opportunities to enhance gaming’s value – as well as state revenue –
by not fully leveraging spending from out-of-state residents” (p. 22). Like Gardner’s study, I
believe that parts of this report can serve as a model for my own – especially the topics explored
in the qualitative interviews with tourism agency leaders. However, tourism efforts in
Connecticut appear to be centralized at a state level, rather than by regions. With that in mind, it
is imperative I glean insight from the spirit of this study, rather than specifics, for my own
research.
As an addendum to the study above, Spectrum Gaming Group also included results of
The 2008 Survey of Eastern Connecticut Businesses from local tourism and economic
development agencies, which showed 44 percent versus 16 percent of local businesses believing
the casinos had a positive versus a negative impact on the region, as well as 45 percent believing
that “state government should increase funding for state tourism marketing and advertising” (p.
130). Unfortunately, I am unable to locate this specific study, other than to cite Spectrum
Gaming Group’s footnote that it was sponsored by Liberty Bank and commissioned by the
Chamber of Commerce of Eastern Connecticut, Greater Mystic Chamber of Commerce, and the
Connecticut Business and Industry Association. I provide this paragraph as part of this literature
review to show that despite the overall lack of available research, tourism agencies in
Connecticut have tried to ascertain the importance of tourism marketing vis-à-vis casinos. Again,
30
my study will be different compared to Connecticut, but will certainly add to the existing limited
pool of related research.
A study by Jeff Dense and Clyde W. Barrow, published in the Journal of Travel
Research (May 2003), examined out-of-state patrons to the two Connecticut casinos and
estimated associated expenditures. They hoped to be able show the impact that out-of-state
visitors had on gross revenue (which, they determined to be 66% of the overall total, as shown
on page 430). They also hoped their results would provide implications for policy makers; for
example, stating that “state tourism agencies can use this research method to determine whether
to highlight casino gaming as part of its marketing strategy” (p. 413). However, I believe their
methodology has severe limitations. The authors certainly took an exhaustive effort to examine
more than 13,000 license plates and registrations in casino parking lots during a five-day stretch
in February 1999 through President’s Day in order to determine the aforementioned 66% figure.
However, even the authors noted that five days may not be representative of behavior throughout
the year and that “casino activity may prove to be seasonal in a number of locales” (p. 414).
From my own experience working in casinos, weekends and holidays dramatically boost visits
compared to mid-week, the first three months of the calendar year tend to be the least frequented
due to a trail-off after December holidays (as spending among guests can become tight with the
start of a new calendar year), and summer is high season. This study nevertheless is part of the
limited pool of available research. For the purposes of my own study, Dense and Barrow’s report
serves as a reminder that casinos have the potential to lure out-of-area visitors. I hope to learn
more through my interviews whether NTCC and City of Niagara Falls leaders view Seneca
Niagara Resort & Casino as a starting point for out-of-area guests to explore more of what
Niagara Falls has to offer.
31
A tool mentioned by multiple researchers for studying tourism is the Tourism Impact
Attitude Scale (TIAS), a comprehensive Likert-scale questionnaire developed by Lankford and
Howard (1994). For her University of Connecticut doctoral dissertation, Jan Louise Jones (2003)
employed a modified TIAS to examine casino impacts and resident attitudes surrounding
Mohegan Sun. She used a simple random sample (400) of 8,500 registered voters in Montville,
Connecticut to determine her findings. Overall results were mixed from her 27-question survey,
with residents “not being particularly impressed with the Mohegan Sun Casino,” but “not
adamantly opposed to it either” (p. 125). While Jones cited the TIAS as a reliable model and
while her study overlaps somewhat in theme to my own, I do not believe it bears a great deal of
relevance with regard to my in-depth interviews. After all, even though I am exploring tourism
attitudes, I do not plan to use a survey, nor do I plan to target residents. Still, this is one of the
very few studies even remotely similar to what I propose.
A final, more recent relevant study was published in Tourism Economics on the topic of
tourism growth vis-à-vis municipal revenues and expenditures. The authors, Timothy Tyrrell and
Robert Johnston (2009), conducted an econometric analysis to show the impacts of Foxwoods
and Mohegan Sun on New London County (21 municipalities) over the period of 1993 to 2002 –
looking specifically at residential locations of new employees, locations of new tourism
enterprises, and increased traffic patterns by new visitors. Tyrrell and Johnston examined six
distinct financial measures using a model called ordinary least squares regression, or OLS, and
found that the tourism growth reduced the cost of government per capita and property but
increased the cost of education in urban areas (p. 12). On the whole for the nine-year span, they
reported that revenues for the municipalities grew from $468 million to $639 million, and that
“roughly one-third of that increase, or US$57 million, can be attributed to tourism growth” (pp.
32
8-9). While the study examined multiple variables together and produced a “95% confidence
interval” (p. 8), it was ultimately quantitative in design and did not assess attitudes. In addition,
while the study’s timeframe was selected because it was the period in which the two casinos
came into existence, the overall study positions the casinos as a backdrop and looks at the totality
of tourism with respect to economic growth. Clearly, my study will not be like this one.
However, the study again is one of the few available with regard to Native casinos in the
Northeast. The specific timeframe (1993-2002) also draws a parallel to my proposed timeframe
(2006-2016), as both studies have intentionally designed periods in which to examine proposed
phenomena.
Macro-Level Studies on Casinos and Tourism
Additional literature can help inform linkages between the casino and tourism industries,
as well as elucidate the benefits of casinos to tourism efforts. John Bowen’s study, “Casinos as
an Antecedent of Tourism” in Worldwide Hospitality and Tourism Themes (2009), examined
popular casino locations throughout the U.S. and discussed how casinos themselves offer new
tourist amenities, such as restaurants, hotel rooms, and conventions. His report was designed to
be a literature review that could inform tourism and casino executives how to maximize tourism
benefits within or near a casino, such as through offerings of other entertainment options like live
entertainment and restaurants. He states that the “economic benefits of bringing in tourists are
much greater than those of attracting local players or bus passengers to a casino” (p. 339). His
arguments make the overall point that casinos can play an important role in the overall marketing
mix. However, in the case of Seneca Niagara, the resort itself offers additional entertainment
such as concerts and restaurants. It will be interesting to discover whether NTCC and Niagara
Falls city leaders view Seneca Niagara’s offerings as a boost to the community or as a hindrance
33
to other businesses. Bowen ultimately argues that casinos plus added amenities provide an
overall boost to tourism in host communities; however, the casinos he explored were not Native-
owned. Might the inherent business advantages of Native casinos – such as no sales tax –
effectively eliminate competition from other nearby hotels, restaurants, and retail outlets?
In a published article in Tourism Management, Chun-Hung Tang and SooCheong Jang
(2009) analyzed the relationships between the performance of four tourism-related industries –
airlines, casinos, hotels, and restaurants – and GDP in the U.S., using cointegration and Granger
causality tests. Where casinos were concerned, there were two findings. First, they found that
airlines were unidirectional to casinos. Second, hotels and casinos exhibited the only
bidirectional relationship of all the variables, and the authors said this “suggests that there exists
some potential value associated with bundling the services of these two industries” (p. 557).
These findings were determined through complicated formulas by using general sales data. On
one hand, I find this research unique compared to other literature I reviewed, in the sense that it
makes use of quantitative data to forum an argument. And certainly, I anticipate my interviewees
to find Seneca Niagara’s hotel tower (along with added amenities) – combined with an
increasing influx of more hotels and restaurants nearby – as a boost for tourism. On the other
hand, the data from this study is extremely broad, and even the authors point out that sales
figures would include non-tourism (e.g., local patrons) dollars. Nevertheless, the point is taken
that casinos and hotels can have a symbiotic relationship for promoting tourism.
Deepak Chhabra (2007) suggested that his study of native casinos, published in the
UNLV Gaming Research & Review Journal, was one of the first to examine impacts on residents
within a Social Exchange Theory framework. He claimed that Social Exchange Theory stipulates
that gaming support happens on the basis of a positive exchange, leading to a positive correlation
34
between personal benefits of tourism and support for tourism development (p. 32). His study,
which incorporated random phone surveys to residents of three counties in Iowa, showed general
support for Native casinos but yielded very few statistically significant correlations among a
variety of variables. For two correlations of note, one was negative and one was positive. The
negative correlation was that residents generally thought that Native American casinos ought to
do a better job of managing their distribution of funds to the community (p. 44). On the positive
side, Chhabra noted that his findings pointed to an increase in overall economic activity for host
communities, particularly in terms of “decrease in unemployment rates, unemployment
insurance, and stimulation of ancillary sectors such as lodging and other amusement operations”
(p. 45). While the findings of this study tie to Seneca Niagara because of the Native-owned
casino aspect, Chhabra’s research was targeted to rural Iowa – which is inherently a much
different environment than the worldwide wonder of Niagara Falls. I also do not plan to study
perceptions of Niagara Falls residents. Nevertheless, this study highlights the need for me to be
mindful of leaders’ perceptions on whether or not the existence of Seneca Niagara spurs
additional tourism growth and contributes to the vitality of the community.
In a more recent study published in Growth and Change, Michael Wenz (2014) used the
Rosen-Roback model to examine the value of casinos as an amenity for their neighborhoods. His
aim was to “evaluate the bottom line impact of casinos on quality of life and on business
productivity in their local area” (p. 136) using a different model as opposed to traditional cost-
benefit analyses – instead examining surrounding housing values as his guide. This study has
implications for my own research in the fact that Wenz delineates between Native and non-
Native casinos. He found that when comparing regular casinos to Native casinos, Native casinos
tended to do better in terms of generating positive business productivity effects and were
35
strongly viewed as a positive amenity (p. 156). He also acknowledged, however, that many
Native casinos are located in sparsely populated areas and also noted gaming compacts as a
factor in perception, stating, “Native American casinos are more effective at returning casino
profits to local community infrastructure through local tribal ownership or through the terms of
their state gaming compacts, while non-Native American casinos see their profits dispersed
widely to shareholders and broader state governments” (p. 156). The points of this study, taken
together with the revenue-sharing percentage breakdowns available for Niagara Falls, lead me to
ponder whether NTCC leaders appreciate the fact that they know how funds are being spent, or
whether the transparency (of their 7 percent versus the 73.5 percent that the City gets to choose)
creates feelings of being short-changed. An additional point of note: because Wenz grouped
Native casinos as a whole and because most were located in sparsely populated areas, the
findings might not be applicable to Niagara Falls. Niagara Falls, after all, is a city – albeit a small
one. In addition, the housing stock near the casino is largely older and targeted for those with
low income. I have often heard critics question Seneca Niagara’s value to economic
development, given the fact that nearby streets look incredibly run-down.
As perhaps a forerunner to Wenz’s study, Taylor, Krepps & Wang (2000) repurposed
data of 100 communities that was compiled for the National Gambling Impact Study
Commission and found that “the positive and economic social impact of Indian casinos is
measurably greater on surrounding communities than the impact on non-Indian casinos” (p. 1).
Their report was conducted through the Harvard Project on American Indian Economic
Development – which could be considered as either adding credibility or perhaps bias.
Regardless, the authors examined at five factors:
36
Destination Effects – the ability of casinos to lure visitors, leading to spending at
other nearby establishments
Substitution Effects – the ability of casinos to act as a replacement for other
leisure and hospitality options in the community
Cannibalization Effects – the ability of casinos to add to the larger gambling mix
in the community (potentially cutting into competing alternatives such as
lotteries)
Multiplier Effects – the ability of casinos to have ripple effects in the local
economy, such as increased spending and employment
Intensity Effects – the ability of casinos to lure consumers to spend more on
hospitality and leisure activities, rather than other expendable income choices
such as luxury cars
The authors found all five effects to have overall positive correlations for both native
reservations and surrounding communities with the opening of a Native casino, with the
exception of negative substitution and cannibalization effects for the communities (p. 6). While
this study provides some justification for Native casinos having a symbiotic relationship with
host community tourism efforts, one must question how much Native casinos act as a deterrent
for existing or potential similar businesses. Thus, this is why I intend to not only ask whether the
revenue-sharing for tourism is set at an appropriate level, but also whether the very existence of
Seneca Niagara benefits or hinders tourism efforts for Niagara Falls USA.
In a report published in Gaming Law Review and Economics, William Thompson (2011)
studied multiple non-Native casinos and their associated state taxes. The purpose of his study
was to explore whether casino taxes were major tools in solving state budget needs, how taxes
37
were related to jobs, and the impact of those taxes on other related economic development such
as hotels and restaurants. Among his conclusions, he argued that casino taxes should not be
considered as a major source of revenue in the future, and that “the rate of casino taxes is
inversely correlated with development in the tourism sector of the economy. Higher taxes stifle
economic growth” (p. 608). Ultimately, Thompson believes that higher tax rates will result in
fewer jobs, fewer hotel rooms, less convention space, and fewer entertainment opportunities. He
was able to make his conclusions by analyzing data from the American Gaming Association,
specifically with regard to gaming revenue and taxes. He was also able to assess data from 13
states on areas such as casino jobs, average worker salaries, casino revenue per one job, gaming
revenue per casino hotel rooms, gaming revenue per convention center square foot, gaming
revenue per casino restaurant, and gaming revenue per casino entertainment venue. While
Thompson’s study does not pertain to Native casinos, it is interesting to speculate whether larger
revenue-sharing percentages in Nation-state compacts could hinder Native nations’ abilities to
grow their own properties – despite a potentially larger pool of money going back to the
community for economic development. In the case of Seneca Niagara Resort & Casino, one
could argue that the property itself is a major tourist attraction in Niagara Falls, and that it needs
to continually reinvent itself in order to draw more and more visitors to the property – thereby
boosting Niagara Falls tourism as a whole. Unfortunately, there does not appear to be research
along these lines available for Native casinos – presumably because such monetary data is not
readily available from Native nations.
Finally, in a lead story in Indian Gaming Business, Dave Palermo (December 2007)
explored the boom of Native casinos as a means to increase cultural tourism efforts – particularly
via visits to reservations and Native museums. He noted that “tourism officials believe it is
38
worthwhile for a tribe to expand their casino resort marketing to include all potential activities”
(p. 3), and that “while it’s generally recognized that gamblers don’t normally veer away from the
casino to engage in geo-tourism and cultural activities, tribal officials believe there should be
more coordination between a tribe’s tourism enterprises and its resort and casino” (p. 4). While
Palermo interviewed a variety of Native tourism experts in his article, states were limited to the
West Coast and Midwest. Nevertheless, this calls into question the role of Native culture as an
added tourist draw for host communities with Native casinos. It would be interesting to learn
whether Niagara Falls leaders view the Seneca Nation heritage another selling point to draw
visitors to downtown.
Concluding Thoughts on Literature Review
Combined, the literature covered in this paper paints a picture of Native casinos generally
yielding positive benefits for tourism in host communities. But while the state compacts for New
York and Connecticut Native casinos are among the most generous with 25 percent revenue-
sharing, the host communities are often “held hostage” due to Nation-State issues. From
withholdings in New York due to exclusivity breaches, to the State of Connecticut usurping
more of the share to municipalities, to the Senecas now possibly ending revenue-sharing
payments to New York State altogether and potentially leaving host communities in funding
jeopardy (see Chapter III of this paper for more about current events in 2017), funds available for
tourism efforts are certainly not guaranteed to be consistent or timely.
The local and national literature combined shows an abundance of studies on Native
casinos with regard to economic development but only limited offerings with regard to tourism.
Furthermore, there is extremely little research that explores host community tourism marketing
efforts, short of interviews in very large reports (see Spectrum Gaming Group 2009, Center for

39
Governmental Research and Gaming and Resort Development 2005). My proposed in-depth case
study will be very unique and may indeed be the first of its kind.
40
CHAPTER III: METHODOLOGY AND JUSTIFICATION
Because my research focuses specifically on Niagara Falls, I believe that an in-depth
qualitative case study is the best approach to take. My initial plan was to conduct a series of face-
to-face elite interviews with key individuals at NTCC and the City of Niagara Falls. To best
capture the evolution of the 10-year span, I sought individuals in the following roles during the
years of 2006, 2011, and 2016:
NTCC President and CEO
NTCC Chief Financial Officer
NTCC Vice President of Marketing
City of Niagara Falls Mayor
City of Niagara Falls Controller
Some of the people have stayed in their roles for all or most of the span of 10-year time
frame, such as: John Percy, the NTCC President and CEO (2006); Paul Dyster, the City of
Niagara Falls Mayor (2008), and; Pam Fekete, the NTCC Chief Financial Officer (2009). Julie
Gilbert (NTCC Vice President of Marketing) is relatively new to her role (2014). Maria Brown
and served as the City of Niagara Falls Controller from 2000 to 2016. Fortunately, I have worked
with most of these individuals on a number of occasions. My selection for these particular
interviewees are to capture both NTCC’s and the City’s perspectives, as well as to capture
perspectives from administrative, financial, and marketing mindsets.
With all interviewees, I asked for their perspectives on topics such as the revenue-sharing
model, whether and how funds benefitted tourism marketing efforts, and how the very presence
of Seneca Niagara Resort & Casino impacts tourism. Questions were as follows:
41
How has the addition of Seneca Niagara Resort & Casino boosted overall tourism
efforts for Niagara Falls?
In what ways do you find the revenue-sharing agreement to be helpful for tourism
efforts?
In what ways do you find the revenue-sharing agreement to be a hindrance for
tourism efforts?
Do you think the 25 percent portion of the State’s funds to the City is set at an
appropriate level? Why or why not?
Do you think the 7 percent portion of the City’s funds to NTCC is set at an
appropriate level? Why or why not?
If Seneca Niagara Resort & Casino were not part of Niagara Falls USA, what
effects would this have on tourism efforts?
How instrumental was the revenue-sharing for creating effective tourism
marketing campaigns?
Do you find Seneca Niagara Resort & Casino to be a good partner for tourism
efforts? Why or why not?
What was it like in Niagara Falls, especially with respect to tourism efforts, in the
early 2010’s when revenue-sharing monies were temporarily withheld by the
Senecas?
Most questions were asked uniformly of all interviewees, and most interviews ranged between
25 to 45 minutes in length, although an hour of time was budgeted for each person.
42
An Important Note about the Latest Nation-State Impasse of 2017
Before further explaining the methodology, it is critical to comment on current events
that altered the overall conversation from interviewees and created issues for connecting with the
City of Niagara Falls. In March 2017, the Seneca Nation announced that it would cease
providing revenue-sharing payments to the state, as the original compact only spelled out the
agreement for 14 years, through 2016 (Mroziak, March 27, 2017). New York State, however,
countered that the obligation for payments continues through 2023, the length of the agreement
for exclusivity. After months of bickering through the media and multiple cancelled face-to-face
meetings, New York State declared the Seneca Nation in breach of contract and called for
arbitration to settle the dispute (Prohaska, September 15, 2017). As of November, both sides had
chosen an arbitrator but the overall issue was still unresolved, with host communities having to
prepare budgets without casino funds (Spectrum News Buffalo, November 1, 2017).
Unfortunately, due to this latest impasse between New York State and the Seneca Nation,
as well as a busy budget and election season in Fall 2017, neither Mayor Paul Dyster nor Former
Controller Maria Brown felt comfortable conducting in-person interviews. They did, however,
receive the questions. Instead, taking their place – with the intention to provide viewpoints for
the City of Niagara Falls government as a whole – was City Administrator Nicholas Melson,
who joined the organization in 2015 and has served in his current role since early 2016. (I will
mention, as an interesting aside, that Melson had previously worked for the New York State
Assembly from 2013 to 2015.) In addition to Melson and the others listed above, I interviewed
Vince Anello, the mayor of Niagara Falls from 2004 through 2007. I also interviewed Kate
Scaglione, Director of Marketing & Communications for NTCC from 2003 to 2010, who now
works at the Buffalo Niagara Partnership (regional chamber of commerce) as its Member
43
Services Manager. I was unable to interview Melissa Morinello – Scaglione’s successor at
NTCC between 2010 and 2012 – due to the birth of her second child.
Justifications for and Potential Limitations of a Case Study Approach
According to researcher John Gerring (2004), a case study is an “intensive study of a
single unit with an aim to generalize across a larger set of units” (p. 352). He furthermore argues
that well-constructed case studies can help readers understand causes and effects (p. 348). This
approach to my research, while limited in scope to Niagara Falls, could serve as a guide for the
construction of future revenue-sharing agreements for new casinos in existing tourist
destinations.
The case study approach also carries a number of advantages. Gerring (2004) cites its
depth of analysis, or “detail, richness, completeness, wholeness, or degree of variance that is
accounted for by an explanation” (p. 348). Creswell (2013) also describes case studies as being
bounded by time and activity, where researchers “collect detailed information using a variety of
data collection procedures over a sustained period of time” (p. 14). Likewise, I am limiting my
study to a 10-year span (2006-2016) with the rationale that Seneca Niagara’s 604-room hotel
tower and additional amenities did not begin until December 31, 2005, that direct payments to
NTCC also began during this time frame, and also to avoid the new impasse that has consumed
2017. Regardless of current events, I expect to uncover a wealth of detail that has not previously
been explored as part of a study.
For all the valuable insights I may find, there are inherent limitations to the case study
approach. For starters, Gerring (2004) notes that single-unit case studies “often fall short in their
representativeness – the degree to which causal relationships evidenced by that single unit may
be assumed to be true for a larger set of (unstudied) units” (p. 348). For as much utility as I hope
44
my results to have, it may turn out that Niagara Falls presents such unique issues that may not
offer much understanding or interest beyond this local region.
On a related note, the primary method for data collection – interviewing – also presents
limitations. Creswell (2013) notes that face-to-face interviews provide “indirect information
filtered through the views of interviewees” (p. 191). I may be uncovering information from
people whose roles appear to have the best fits for my topic, but just how biased may their
responses be? And how honest might their responses be? The topic of casinos alone is inherently
touchy – which might only be magnified in my particular study due to the perpetual nature of
Niagara Falls USA’s politically charged environment.
Taylor, Bogdan & DeVault (2015) cite a similar limitation of honesty with in-depth
interviews. They claim that because the interview itself is a particular situation, the interviewer
“cannot assume that what a person says during an interview is what that person believes or will
say or do in other situations” (p. 105). However, the authors say that “few if any researchers
would argue for abandoning interviewing” (p. 106). In terms of relevance to my particular study,
the authors cite in-depth interviewing as a means to “reconstruct past events that cannot be
observed by the researcher” (p. 104). I may have worked for Seneca Gaming Corporation from
2010 to 2017, but was so immersed in my job that I hardly reflected upon tourism other than as it
related to Seneca Niagara Resort & Casino itself.
In addition, the fact that my encounters constitute “elite interviews” presents a host of
challenges. Just because I know most of the interviewees, does not mean it will be easy to secure
one-on-one time. As evidenced by the replacement of Melson instead of Dyster and Brown for
City of Niagara Falls perspectives, this indeed was the case for me. Aberbach and Rockman
(2002) also note that even when an interview is conducted, the interviewer may have to approach
45
questions in a conversational tone as opposed to structured questioning – which requires a great
amount of attention on the interviewer’s part (p. 674). They do believe, however, that open-
ended questions “provide a greater opportunity for respondents to organize their answers within
their own frameworks” (p. 674). Thus, while I may be at the mercy of the interviewees’ egos
and/or limited availability, I have the opportunity to gather fascinating insights from Niagara
Falls’ leaders and tourism authorities.
As noted throughout this paper, I had initially considered a mixed-methods approach to
research but then eschewed it once the facts presented Niagara Falls as a unique case. I had
thoughts of conducting surveys as a means of triangulation. But while a survey could ultimately
yield numerical analysis, doing a survey for survey’s sake may be an inefficient use of time and
resources. Shine and Dulisse (2012) do mention a number of advantages for conducting web-
based surveys, such as low cost, built-in analytics for some survey programs, convenience for
survey-takers, and the ability to reach many people at once (pp. 367-368). On the other hand,
they mention limitations such as coverage bias, reduced generalizability, and non-response (pp.
368-369). Ultimately, because the nexus of my topics directly involve only a select few (e.g.,
NTCC personnel and City of Niagara Falls officials), I believe the in-depth interviews suffice for
gathering data. A survey would likely not be relevant, and also could waste resources such as
time and money.
Going into the interviews, I expected I may find general support for Seneca Niagara
Resort & Casino among the interviewees. Nevertheless, it remained to be seen that how much of
a help they believe the revenue-sharing arrangement is for tourism. Some may view it as a vital
resource for boosting overall efforts; others could view the arrangement as having too many
outside costs attached and serving as a hindrance to sustainability. And by the term costs, I mean

46
it not solely as a financial connotation, but also in terms of time spent, potential missed
opportunities for tourism marketing and/or economic development, and societal ills such as
crime and problem gambling.
47
CHAPTER IV: RESULTS AND ANALYSIS
Funding Put to Use by Niagara Tourism & Convention Corporation (NTCC)
Officials with the NTCC, past and present, expressed positive favorability towards the
casino revenue-sharing and were able to cite many examples of the use of funds. Even in the
early years, Kate Scaglione noted that having a yearly marketing budget of nearly $750,000
versus $200,000 prior to the funds made a huge difference. She recalled a fall campaign called
“Frights and Sights” that included newspaper inserts, in-room hotel magazines, and brochure
distribution. John Percy commented that over the time period, the revenue-sharing funds to
NTCC paid for TV, radio, and print spots, and more recently for digital marketing such as direct
email campaigns and boosting website traffic through pay-per-click online ads and search engine
optimization.
NTCC officials also took great pride in their transparency, consistency, and return-on-
investment of fund use. According to Percy, “Our Board of Directors has always taken the
position that those casino revenues, all 100 percent of them, would be used for marketing and
tourism promotion.” Percy considers the funds to be “hugely beneficial” and having a true return
on marketing investment (ROMI). Upon meeting with Pam Fekete, she had a spreadsheet
available showing each year’s amount of funds since 2006 (see Appendix B), and made it a point
to say that funds were for activities such as “marketing programs, print ads, content design, trade
show registration, collateral printing, collateral distribution – we didn’t use it for travel
reimbursement, we didn’t use it for any overhead, we didn’t use it for employee salaries or fringe
benefits. We wanted it to be specific to programming.” Julie Gilbert added, “We don’t spend any
money unless we can track it and have an ROI on it.” She further discussed five different types
of software programs that the NTCC uses to track visits as a result of marketing efforts.
48
The funds also bolstered NTCC’s reach beyond the region. Gilbert recalled a recent
campaign where NTCC coordinated a visit from Florida-based travel writers, and said the writers
“absolutely fell in love with the [Seneca Niagara] hotel, resort, the spa, and were extremely
impressed. […] It’s a product that benefits the destination.” Percy said that NTCC used to focus
on marketing efforts within a 400 to 500 mile radius, and now is able to “hit some markets like
Florida, California, Texas, and Virginia […] digitally and expand our reach much further, hitting
markets that are serviced by airlines.”
Impasses Throw Planning and Budgeting in a Tailspin
The impasse between the Seneca Nation and New York State during the early 2010s
weighed on the minds of all interviewees. For NTCC, they learned the lesson to keep more of the
funds aside for “rainy day purposes.” When a lump check came in for $6 million in 2013, Percy
said NTCC and its Board set aside $4 million into an investment account for the future –
particularly with an eye towards the gaming compact’s end-date of 2023. Despite this, Percy still
worries that the NTCC’s 2018 budget could require as much as a 30 percent decrease due to the
latest impasse.
Scaglione recalled the hardships during her final year with NTCC in 2010: “It was
[originally] easy to be proactive with budgeting [because of the funds]. When all of that got
frozen, we did not know what the results were going to be in terms of when an agreement would
be reached, so we actually had to prepare three different budgets – […] whether we’d have some
funds of not be funded at all.”
Fekete and Gilbert did recall one unintended positive outcome as a result of the impasse
in the 2010s. Because funds were tight, NTCC shifted its focused in marketing efforts from
traditional advertising to digital marketing and social media. According to Fekete, the budget
49
reduction “forced us to become more strategic […] and pushed us into this new arena [of digital
marketing] quicker than maybe we would have [decided].” Gilbert added that she noticed prior
to her arrival that NTCC had focused more on “printed collateral and old marketing techniques.”
City officials, meanwhile, recognized the overall positive impact on tourism due to casino
funds, but also believed that impasses between the Senecas and New York State create major
burdens for sustainable growth. Melson did say that the funds to NTCC represent “money
flowing in marketing the destination that we wouldn’t otherwise have. […] The data shows that
the money that goes to the NTCC is money well spent.” However, Melson recalled that the City
had a “large fund balance during the last impasse,” but does not have one now. He said that they
are cutting the overall budget by at least 10 percent, have instituted a hiring freeze, and that
“infrastructure improvements will suffer.”
Anello, meanwhile, said that he always viewed the revenue stream as something that
would “not last forever,” and that he left a surplus of money at the end of his mayoral tenure to
be “protective” of funds. He lamented the misuse of funds towards the City’s operating budget
rather than towards economic development and “seed money for our future.” He cited the long-
stalled Niagara Experience Center and the still-not-built WonderFalls hotel and multi-use
complex as missed opportunities.
New Hotels as a Sign of Impact
All interviewees pointed to the recent opening of new hotels in downtown Niagara Falls
USA as a positive sign of the revenue-sharing. “We have 30 to 35 percent more dollars to put
into strategic marketing campaigns, which ultimately impacted this destination to a positive
outcome,” Percy said. “ROMI has risen year after year; attractions have seen improvement in
numbers; hotels have seen improvement in occupancy. You would not have new hotels being
50
built if it were not for improved attendance, improved occupancy, and improved visitation
overall.”
Melson said that bed-nights (stays) have steadily increased. “It starting to flatten out a
little bit, but it looks as though that’s because we’ve brought more rooms,” he said. Melson
believes that despite demand staying flat in recent years, the City increased close to 700 rooms –
showing a steady increase in tourism “based on investments in the sector.”
7 Percent of Funding to NTCC Set at ‘Very Fair’ Level; State Receiving Too Much?
In terms of NTCC’s revenue-sharing funds set at 7 percent of the City’s overall pool, no
one commented that the funds were inadequate. Percy categorized the 7 percent as “very fair and
equitable,” especially as it is a permanent percentage and not capped. Percy said that if Seneca
Niagara Resort & Casino instead paid bed-tax like other hotels, NTCC would not receive as
much money from them.
Melson agreed that the 7 percent for NTCC is fair, but thought the dollars should come
from New York State’s share rather than from the City of Niagara Falls’ share. “I have a tax levy
that hasn’t grown with inflation over the last 12 years, so I really need that money.” He further
questioned and worried about the City Council’s approach to use casino funds to offset losses in
the tax levy.
Beyond local tourism dollars, Melson also had a strong opinion about the City’s overall
share of 25 percent received from the State’s funds. “The City of Niagara Falls does not receive
nearly enough revenue from the casino that we should. The State’s share is much too large, and
we believe wholeheartedly that there should be a floor put in to the casino revenue to make sure
the City of Niagara Falls receives approximately 20 to 25 million dollars per year. The floor of
our highest year was around $24 million.” Similarly, Fekete thought the City should have more
51
funds and the State should have less. “I think our organization has done a good job – with the
amount of money we get – being transparent and purposeful with the spending,” she said. “I
think the local area should be receiving more. I don’t understand why people in New York City
have the benefit of reduction in taxes to the overall budget, and we’re struggling here.”
Anello actually thought the 7 percent level was potentially set too high for NTCC. He
preferred funds to be capped, since NTCC already received bed tax. “My position is that once
they’re more successful [due to improved tourism] […], why should the City keep giving them
more money when they’re self-sufficient?” However, Anello did note that the City of Niagara
Falls “would be in dire straits without the casino.”
Without Seneca Niagara, Old Convention Center Would Have Been Problematic
Echoing off Anello’s last comment, there was fascinating discussion and speculation
about what the City of Niagara Falls might be like if Seneca Niagara were not built. Anello said
“there would be no 3rd Street, or Old Falls Street, or new Convention Center.” Percy pointed to
renovations and additions at the nearby Sheraton Hotel and improved winter occupancy rates.
Scaglione said that before the casino opened, there was no attraction or entertainment downtown
“other than Niagara Falls State Park,” and that Seneca Niagara represented a “massive
investment in a poor community – not just in terms of finances but in terms of tourism product.”
Interviewees also pointed to the existing convention center site – now the gaming floor of
Seneca Niagara Resort & Casino – as a major problem that would have hampered economic
development and tourism efforts. “The convention center was outdated, went severely
underfunded, was underdeveloped, and lacked severe renovations,” Percy said. “I don’t know
what would have come of that building. I don’t know how we could have sold that building at
that time in 2002 in its condition. It was in bad shape – it needed 42 million dollars just to bring
52
it up to code.” Percy speculated that the building would have needed $100 to $150 million in
renovations just to sell it, and that the existing space was too big for the destination. Anello
added that the existing convention center had a leaking roof and very poor air quality.
Seneca Niagara Resort & Casino Adds to Niagara Falls’ Tourism Repertoire
In a similar vein, interviewees regarded Seneca Niagara Resort & Casino itself as a
tourist destination, in some cases even bringing new elements to downtown. Melson noted that
Seneca Niagara puts on concert and events. “It’s good – we need to have attractions, we need to
have events,” he said. “We need to lure people into the city and keep them here for a few days.”
Fekete said the Seneca Niagara hotel’s four-diamond rating from the AAA is “good to promote”
and that the resort offers “year-round attractions.” Both Fekete and Gilbert mentioned bus trips
to the region as another benefit of having Seneca Niagara. “The casino is a draw for bus trips,
which suits this destination well,” Fekete said. “Seneca Niagara offers us a luxury product – spa,
restaurants, a hotel,” Gilbert added. “There’s nothing that can compare to their spa. And
entertainment – we push that to a degree in our calendar of events.”
Interviewees found officials at Seneca Niagara to generally be good partners for tourism
efforts. Frequent regime changes and the two impasses, however, tempered overall feelings. “It
depends on who’s in office and who’s in the administration,” Percy said. “But for the most part
they have been a solid and cooperative partner all the way.” Scaglione noted a shift in more
cooperation as years passed – potentially in part because originally, the local casino industry was
not as competitive and Seneca Niagara could focus more autonomously on marketing efforts.
Looking to more recent years, Gilbert thought the NTCC could do even more to promote Seneca
Niagara and its amenities. Likewise, Gilbert said, “I think the resort and casino [leadership] has
53
recognized that, to be successful, they have to be a good partner [with the community] – and I
think they want to be a good partner.”
Anello also generally found the Seneca Nation to be good partners; however, as for their
role in promoting tourism, he questioned their motives. “I never really got the sense from the
Senecas that they wanted to bring tourists in, because the casino was the draw,” Anello said.
“What they wanted was the city to look better, be more appealing – put people in a better mood,
and spend more.” Anello thought the overall tourism momentum in Niagara Falls might now be
even further along, had Seneca Niagara and NTCC “pushed each other more” in the earlier years.
More Attractions Needed; Seneca Niagara as an ‘Island’
All interviewees cited the need for more attractions and entertainment in Niagara Falls,
despite modest growth along 3rd Street and Old Falls Street as well as Seneca Niagara’s
continued evolution as a resort. Melson said that attractions “extend the stay” and represent
“where the City needs to go.” “Every study that comes out says we don’t have enough
attractions, and we know that,” he said. “The main attraction here is the Falls – you can get up
close and personal on this side [compared to Canada]. At the end of the day, it’s all about
maximizing what we already have – and what benefit having a casino here adds to that, I think is
debatable at best.” Melson hoped that with construction efforts under way such as the removal of
the Robert Moses Parkway to make way for parkland and pedestrian access, the City of Niagara
Falls would begin to capitalize more on its “natural beauty.”
Fekete cautioned about the types of people coming to Niagara Falls because of Seneca
Niagara – specifically, whether they plan to enjoy more in the region or are coming just for
gaming purposes. “Sometimes there’s a conflict between the marketing segments for someone
that would come specifically to a destination because of a casino versus someone who would
54
come to this destination because of the natural beauty, because of the Falls and different things
like that,” she said. Gilbert did think that Seneca Niagara understood visitors coming because of
the destination lure of the Niagara Falls waterfalls. When it comes to looking at extended trips to
Niagara Falls and what visitors plan to do with their time, Gilbert said, “We don’t know enough
[through research] if the casino is an afterthought or an actual attractor.”
Anello also wondered if visitors’ money was only being spent in the casino. He posited,
“Is there documentation that would show that the casino has influenced tourism visits? Yes, but
the money is being spent in the casino.”
Beyond Tourism: Pitfalls of the Effects of Revenue-Sharing
One of the first comments from City Administrator Nicholas Melson was a caution about
studying tourism in a vacuum and perceiving success as a result of revenue-sharing payments.
“It’s not easy to draw a straight line to the impact it’s had on tourism,” he said. Melson
commented on the City’s “loss of its own sovereignty” with the state turning over lands on
“prime development space” to the Seneca Nation. “They tore down two hotels to build that
casino. So not only did we have to surrender those revenues, but we also had to provide police,
fire, emergency medical services for the largest building in our city. It’s not cheap.”
Throughout his interview, Anello stressed that the City’s funds should be used for
economic development. He did admit and was glad that during his mayoral tenure, revenue-
sharing funds helped improve essential day-to-day operational needs such as snow plowing, new
police cars, better computers for government workers, and improvements to the parks. But
Anello particularly envisioned the funds would help spawn neighborhood development and
market-rate housing. In turn, he argued, these improvements would benefit both overall tourism
efforts and Seneca Niagara itself – particularly from an “aesthetics” standpoint of making the
55
surrounding area look nicer and thus making the casino appear more attractive. “My goal was to
involve them [the Seneca Nation] in economic development, because once you cross that curb on
Niagara Street, all that development across the street would be private money.” Anello said. He
believes that with a strategic plan and investment of dollars, there could be a great neighborhood
around the casino – and more people living nearby would create customers for businesses. “If
that had been a focus downtown, that [area] could have been a new community for Niagara
Falls,” he said.
56
CHAPTER V: CONCLUSIONS, IMPLICATIONS, AND LIMITATIONS
A few things seem certain as a result of this study. First, the 7 percent level of funding for
NTCC is adequate, and funds were put to transparent use that improved tourism marketing. Since
the opening of Seneca Niagara and particularly in recent years, more hotels have opened
downtown, and additional investments have been made for overall downtown offerings – such as
Old Falls Street, a new convention center, and more 3rd Street establishments.
City officials in particular, however, looked at the bigger picture and lamented missed
opportunities to better manage the larger pool of casino revenue-sharing funds from New York
State, particularly for bolstering economic development and neighborhood growth. Perhaps more
of the overall funds (than 25 percent) should, in fact, go to host communities rather than the
state. In the case of Niagara Falls, the Seneca Niagara footprint is in the heart of prime
development space – which takes away from the City’s self-determination. Regardless, it is clear
that a set level of the casino’s funds being devoted to the tourism agency yields an overall
positive effect on destination marketing efforts. In turn, this benefits the entire community.
Future casino resorts in metropolitan areas and near natural-wonder attractions can
leverage the constructs of Niagara Falls USA’s revenue-sharing to determine revenue-sharing
models of their own. As mentioned earlier in this paper, it has been long-rumored that the Seneca
Nation has interest in building a new casino in downtown Rochester – roughly 80 miles east of
Niagara Falls. A new compact, with all-new funding allocations, would be required. Plus, while
the thought of casinos on-site at or near other “natural wonder” or “tourist” locations like the
Grand Canyon, Yellowstone National Park, Navy Pier, and Williamsburg might sound farfetched
now, the industry continues to rapidly grow. Niagara Falls USA might be a unique place onto
57
itself, but 25 years ago, could anyone have imagined a massive casino resort being located
downtown – and owned by Native Americans, at that?
Nevertheless, host community tourism agencies should be mindful not to depend on
Native casino-revenue sharing funds, particularly due to the possibility of withholdings when
disputes arise between Native nations and state governments. And even in the absence of
disputes, state and/or local governments could, in theory, usurp monies unless there is an iron-
clad agreement as to where funds are directed. But on the positive side, Niagara Falls serves as
an example of benefitting from an agreement to have a set amount of funds allocated toward its
tourism agency. In contrast, for example, the Seneca Salamanca Chamber of Commerce
promotes tourism for the City of Salamanca but does not receive funds as a result of Seneca
Allegany Resort & Casino revenue-sharing. No such agreement exists.
On one hand, I believe that this study greatly adds to a very lacking body of research on
casino revenue-sharing and tourism. As stated early in this paper, most research about casinos
tends to focus on negative societal effects such as gambling addictions and increased crime. On
the other hand, this case study is not without its limitations. For starters, timing is everything.
While the latest impasse between the Seneca Nation and New York State heightened relevancy
of my work, it undoubtedly hindered the chances for me to speak with a few City officials
directly. One also could wonder if responses from all interviewees would be different without the
impasse. For as much as the case study was directed to the specific time frame of 2006 to 2016,
the current year of 2017 was on everyone’s mind – both in terms of positives (e.g., new hotels
built, developments to the parks and the former Robert Moses Parkway) and especially the
negatives (e.g., worries about budgets, concern about recent economic development momentum
grinding to a halt, even second-guessing if the casino was a good deal for Niagara Falls).
58
Furthermore, from a pragmatic standpoint, interviews in the fall are generally tricky to schedule,
due to budget season and election season. However, interviews conducted during the summer
might have skewed an even greater sense of positive feelings, as sunshine and warmth make
Niagara Falls bustling with activity.
While the selection of particular interviewees was intended to create a sharper focus on
the issues of tourism marketing and funding levels, many arguments could be made that
involving others would paint a fuller picture of whether NTCC’s efforts have been effective and
whether the community feels that 7 percent of funding to NTCC is appropriate and worthwhile.
Future research studies could gather viewpoints from host community citizens, regular tourists,
and tourism agencies in nearby communities to ascertain perceptions of overall destination
desirableness and effectiveness of marketing campaigns. But while those groups would be
compelling for interviews, I think talking to four specific groups of people could either further
validate or invalidate my findings: 1.) New York State; 2.) Seneca Nation / Seneca Gaming
Corporation; 3.) leaders of other major tourist attractions, and; 4.) leaders of other major
recipients of the Niagara Falls revenue-sharing funds.
In the case of New York State, one could argue that leaving their perspective out of this
study positions the state as the “bad guy.” Perhaps they have good reason to manage 75 percent
of the share. Does any of their share go towards the state’s “I Love NY” tourism campaign,
which could ultimately benefit Niagara Falls?
In the case of the Seneca Nation and Seneca Gaming Corporation, I would imagine
officials would be quick to say that although the Nation functions as another government, all
proceeds inherently benefit the local community. They may also be quick to argue that the
impasses with New York State, despite negatively affecting host communities, are ultimately
59
intended to protect local monies from being taken by the state. The Marketing Department at
Seneca Gaming Corporation also could discuss their relationship and collaborations with NTCC,
perhaps even elaborating on joint efforts that boosted tourism.
As for the other major tourist attractions, such as Maid of the Mist and the Niagara Falls
Aquarium, it would be interesting to learn just how effective they view the tourism marketing
efforts of NTCC. Do they, in fact, notice a difference due to casino funds? Or do they sense no
real change or even feel overlooked? In terms of their relationship with Seneca Niagara, do they
feel any sense of synergy? Does the casino’s draw have a spill-over effect on visitors to
additional attractions? Or could the casino actually take away from potential visitors, especially
since the casino tends to not be geared towards families?
Finally, although organizations such as Niagara Falls Memorial Medical Center, the
Niagara Falls School District, and the Niagara Frontier Transportation Authority are not focused
on tourism, they do happen to be recipients of specific revenue-sharing levels at 5.5, 5.5, and 7
percent, respectively. When taking the 2006 to 2016 period into consideration, what would be
their viewpoints on the effectiveness of NTCC and Seneca Niagara’s benefits to tourism? Percy
considers tourism to be an economic driver, but might these other three recipients believe that
funds are needed elsewhere? With schools, for example, there is a potential chicken-or-the-egg
question: do we need more funding for schools in order to better educate the community and
thereby improve it, so that it’s suitable to be marketed as a tourist destination? Or do we first
need to better market the area so that more people populate the community and, therefore, enrich
the schools?
In closing, I think any topic involving the word “casino” with residents of Niagara Falls
can lead to a heated discussion. My aim, however, was to look specifically at the unique
60
arrangement of casino funds for the tourism agency. Regardless of whether one loves or hates
Seneca Niagara (or casinos in general), I think this study’s findings make a compelling case that
the revenue-sharing led to overall improved tourism marketing. In terms of how effective those
efforts were, can be up for debate and certainly complicated to measure. But I believe the
arrangement and the revenue-sharing level of 7 percent undoubtedly generated a positive
outcome – of which Native nations and government officials can take note when developing
future casino resorts.
61
References
Aberbach, J. D. & B. A. Rockman. (2002). Conducting and coding elite interviews. PS: Political
Science & Politics, 35(4): 673-676.
Ackerman, W. V., & Bunch, R. L. (2012). A comparative analysis of Indian gaming in the
United States. American Indian Quarterly, 36(1): 50-74.
Akwesasne Mohawk Casino Resort. (2017). About Us. Retrieved March 2, 2017, from
http://mohawkcasino.com/about/
American Gaming Association. (2016). 2016 state of the states: The AGA survey of the casino
industry. Washington, D.C.: Freeman, G.
Anderson, J. E. (June 2005). Casino taxation in the United States. National Tax Journal, 58(2):
303-324.
Antell, J., Blevins, A. & Jensen, K. (2000). American Indian casino gambling: issues of tribal
sovereignty and economic development. Journal of the Community Development Society,
31(1): 1-18.
Anthes, B. (2008). Learning from Foxwoods: visualizing the Mashantucket Pequot tribal nation.
American Indian Quarterly, 32(2): 204-218.
Benedict, J. (2000). Without reservation: the making of America’s most powerful Indian tribe
and Foxwoods, the world’s largest casino. New York, NY: HarperCollins Publishers,
Inc.
Bowen, J. (2009). Casinos as an antecedent of tourism development. Worldwide Hospitality and
Tourism Themes, 1(4): 332-343.
Bubb, A. D. (2011). Cashing in on Indian casinos: the impacts of “off-reservation” casinos on
sovereignty, the gaming industry, surrounding communities, reservations, and tribal
identities [Unpublished doctoral dissertation]. Retrieved March 29, 2017, from
http://digitalrepository.unm.edu/amst_etds/4
Carder, S. F. (Fall 2016). The development of a gaming enterprise for the Navajo Nation.
American Indian Quarterly, 40(4): 295-332.
Carstensen, F., Lott, W., McMillen, S., Alimov, B., Dawson, N. L., & Ray, T. (2000, November
28). The economic impact of the Mashantucket Pequot Tribal Nation operations on
Connecticut [Report]. University of Connecticut Center for Economic Analysis.
Casino City, Inc. (2017). New York tribal gaming. Retrieved March 29, 2017, from
http://newyork.casinocity.com/tribal-gaming/
62
Center for Governmental Research and Gaming and Resort Development. (2005). Seneca
Niagara Casino: fiscal & economic impact on Niagara Falls, NY [Report]. Rochester,
NY: Gardner, K.
Chamber of Commerce of Eastern Connecticut. (2017, January 25). Chamber of Commerce of
Eastern CT announces formation of Greater Mystic Tourism Marketing Committee [Press
release]. Retrieved March 29, 2017, from
http://info.chamberect.com/news/details/chamber-of-commerce-of-eastern-ct-announces-
formation-of-greater-mystic-tourism-marketing-committee
Chen, D. (2015, December 17). Connecticut tribal gaming timeline (State of Connecticut, Office
of Legislative Research). Retrieved March 29, 2017, from
https://www.cga.ct.gov/2015/rpt/pdf/2015-R-0284.pdf
Chhabra, D. (2007). Exploring social exchange theory dynamics in Native American casino
settings. UNLV Gaming Research & Review Journal, 11(2), 31-48.
City of Niagara Falls, NY. (2017). Casino funds revenues and expenditures to date [Report].
Retrieved November 27, 2017 from
http://niagarafallsusa.org/download/Finance/casino_funds/2017/CASINOFUNDS323201
7v1.pdf
Creswell, J. (2013). Research design: qualitative, quantitative, and mixed methods approaches,
4th Edition (pp. 155-181). Washington, D.C.: Sage Publications.
Dense, J & Barrow, C. W. (May 2003). Estimating casino expenditures by out-of-state patrons:
Native American gaming in Connecticut. Journal of Travel Research, 41: 410-415.
d’Hauteserre, A. (2000). Lessons in managed destination competitiveness: the case of Foxwoods
Casino Resort. Tourism Management, 21, 23-32.
d’Hauteserre, A. (2001). Representations of rurality: is Foxwoods Casino Resort threatening the
quality of life in southeastern Connecticut? Tourism Geographies, 3(4), 405-429.
DiNapoli, T. P. (May 2014). City of Salamanca, selected financial activities. New York State,
Office of the State Comptroller, Division of Local Government & School Accountability.
DiNapoli, T. P. (2015). Trends in New York State Lottery Revenues and Gaming Expansions.
New York State, Office of the State Comptroller.
Eadington, W. R. (2000). Trends in casino and tourism for the 21st century. In W. C. Gartner &
D. W. Lime (Eds.), Trends in outdoor recreation, leisure and tourism (155-163).
Cambridge, MA: CABI Publishing.
Fink, J. (2013, June 14). Casino deal replenishes NF tourism group. Buffalo Business First.
Retrieved March 29, 2017, from
63
http://www.bizjournals.com/buffalo/news/2013/06/14/casino-settlement-replenishes-
nf.html
Fink, J. (2014, June 19). Senecas get behind $3M regional marketing campaign. Buffalo Business
First. Retrieved March 29, 2017, from
http://www.bizjournals.com/buffalo/news/2014/06/19/senecas-get-behind-3m-regional-
marketing-campaign.html
Fischer, N. (2016, February 8). City advisory board tells Niagara Falls to stop using casino
money to balance budget. The Buffalo News. Retrieved March 29, 2017, from
http://buffalonews.com/2016/02/08/city-advisory-board-tells-niagara-falls-to-stop-using-
casino-money-to-balance-budget/
Foxwoods Resort Casino. (2015). Property Map [Brochure]. Retrieved March 2, 2017, from
https://www.foxwoods.com/uploadedFiles/Pages/About_Foxwoods/Property_Brochure_1
20215.pdf
Foxwoods Resort Casino. (2017a). Accommodations. Retrieved March 2, 2017, from
http://www.foxwoodsmeetingsandevents.com/accommodations/
Foxwoods Resort Casino. (2017b). FAQs | Gaming. Retrieved March 2, 2017, from
https://www.foxwoods.com/faqgaming.aspx
Franklin, G. (2006, July 4). Casino revenue boosts Falls effort to attract more tourists. The
Buffalo News, B1.
Gee, D. J. (2011, March 16). Dispute over slots revenue takes toll on cities; host communities
trim budgets, staffs to make up for losses. The Buffalo News, A1.
Gerring, J. (2004). What is a case study and what is it good for? The American Political Science
Review, 98(2): 341-354.
Indian Gaming Regulatory Act of 1988, 25 U.S.C. §§ 2701–2721 (1988).
Janes, P. L. & Collison, J. (2004). Community leader perceptions of the social and economic
impacts of Indian gaming. UNLV Gaming Research & Review Journal, 8(1), 13-30.
Jones, J. L. (2003). Modifying the tourism impact attitude scale (TIAS) to explore casino impacts
and resident attitudes [Unpublished doctoral dissertation]. University of Connecticut.
Lankford, S. V. & Howard, D. R. (1994). Developing a tourism impact attitude scale. Annals of
Tourism Research, 21(1): 121-139.
MacLeod Farley & Associates. (2016, May 4). Akwesasne tourism strategic action plan (ATSAP)
prepared for Akwesasne Tourism Working Group [Report].
64
Mashantucket Pequot Tribal Nation. (2017). Tribal commitments. Retrieved March 29, 2017,
from https://www.mptn-nsn.gov/Commitments.aspx
Mohegan Sun. (2017a). About Mohegan Sun. Retrieved March 2, 2017, from
https://mohegansun.com/about-mohegan-sun.html
Mohegan Sun. (2017b). Dining. Retrieved March 2, 2017, from
https://mohegansun.com/poi/dining.html
Mohegan Sun. (2017c). Play Casino Games. Retrieved March 2, 2017, from
https://mohegansun.com/playing.html
Mohegan Tribe. (2011). The Mohegan Tribe and Connecticut: a partnership marked by success
[Pamphlet].
Mroziak, M. (2017, March 27). Leaders in Niagara Falls urge arbitration to resolve Seneca
casino payment dispute. WBFO. Retrieved March 29, 2017, from
http://news.wbfo.org/post/leaders-niagara-falls-urge-arbitration-resolve-seneca-casino-
payment-dispute
National Gambling Impact and Policy Commission (U.S.). (1999). The National Gambling
Impact Study Commission: final report (pp. 1-24). Washington, D.C.: The Commission.
Nation-State Gaming Compact between the Seneca Nation of Indians and the State of New York.
(April 12, 2002). Retrieved March 29, 2017, from https://sni.org/media/2940/gaming.pdf
Native American Journalists Association. (2014). 100 questions, 500 nations: A guide to Native
America: Covering tribes, treaties, sovereignty, casinos, reservations, Indian health,
education, religion, culture and tribal membership. Canton, MI: David Crumm Media.
New York State, Governor Andrew M. Cuomo. (2013, May 16). Governor Cuomo announces
landmark agreement between State, Oneida Nation, and Oneida and Madison counties
[Press release]. Retrieved March 29, 2017, from
https://www.governor.ny.gov/news/governor-cuomo-announces-landmark-agreement-
between-state-oneida-nation-and-oneida-and-madison
New York State, Governor Andrew M. Cuomo. (2013, June 13). Governor Cuomo and Seneca
Nation of Indians announce landmark agreement [Press release]. Retrieved March 29,
2017, from https://www.governor.ny.gov/news/governor-cuomo-and-seneca-nation-
indians-announce-landmark-agreement
Oneida County Tourism. (2015, July 29). Tourism rises in central New York [Press release].
Retrieved March 29, 2017, from http://www.oneidacountytourism.com/about-
us/news/tourism-rises-in-central-new-york
Oneida Indian Nation. (July 2016). Fact sheet: positive economic impact of the Oneida Indian
65
Nation [Report]. Retrieved March 29, 2017, from
http://www.oneidaindiannation.com/wp-content/uploads/2016/07/FACT-SHEET-The-
Economic-Impact-of-the-Oneida-Indian-Nation.doc
Palermo, D. (December 2007). Tribal gaming ignites boom in visitors to Indian country. Indian
Gaming Business, 1-5.
Prohaska, T. (2009, March 19). Tourism agency's use of funds challenged; Falls lawmaker seeks
portion to fix streets. The Buffalo News, B1.
Prohaska, T. (2017, September 15). Senecas ‘ready for arbritation’ over dispute with state on
casino profits. The Buffalo News. Retrieved November 25, 2017, from
http://buffalonews.com/2017/09/15/cuomo-senecas-continue-to-spar-over-casino-cash.
Rand, K. R. L. (2008). Native American gaming. In Schaefer, R. T. (Ed.), Encyclopedia of Race,
Ethnicity, and Society (519-522). Thousands Oaks, CA: SAGE Publications, Inc.
Schaap, J. I. (2010). The growth of the Native American gaming industry: what has the past
provided, and what does the future hold? American Indian Quarterly, 34(3): 365-389.
Schweers, J. (1999, December 4). Casino ad budgets dwarf LVCVA’s. Las Vegas Business
Press, 16(16): 1-2.
Seneca Gaming Corporation. (2017a). Seneca Allegany Resort & Casino. Retrieved March 2,
2017, from http://senecagamingcorporation.com/overview/seneca-allegany-resort-casino/
Seneca Gaming Corporation. (2017b). Seneca Buffalo Creek Casino. Retrieved March 2, 2017,
from http://senecagamingcorporation.com/overview/seneca-buffalo-creek-casino/
Seneca Gaming Corporation. (2017c). Seneca Niagara Resort & Casino. Retrieved March 2,
2017, from http://senecagamingcorporation.com/overview/seneca-niagara/
Shine, B. and B. Dulisse. (2012). Does paying more mean getting a better product: comparison
of modes of survey administration. In L. Gideon (Ed.). Handbook of Survey Methodology
for the Social Sciences (pp. 361-373). New York, NY: Springer.
Spectrum Gaming Group. (2009, June 22). Gambling in Connecticut: analyzing the economic
and social impacts [Report]. Linwood, NJ: Diamond, M.
Spectrum News Buffalo. (2017, November 1). Seneca Nation and New York State select
arbitrators for casino dispute. Retrieved November 25, 2017, from
http://spectrumlocalnews.com/nys/buffalo/politics/2017/11/01/seneca-nation-and-new-
york-state-select-arbitrators-for-casino-dispute.html.
St. Regis Mohawk Tribe. (2013). Benefits of gaming: how gaming supports the community of
Akwesasne 2011-2013 [Pamphlet].
66
Tang, C. & Jang, S. (2009). The tourism–economy causality in the United States: a sub-industry
level examination. Tourism Management, 30(4), 553-558.
Taylor, J. B., Krepps, M. B. & Wang, P. (April 2000). The national evidence on the
socioeconomic impacts of American Indian gaming on non-Indian communities [Report].
Boston: The Harvard Project on American Indian Economic Development, Malcolm
Wiener Center for Social Policy, John F. Kennedy School of Government, Harvard
University.
Taylor, S. J., Bogdan, R., & DeVault, M. L. (2015). Introduction to qualitative research
methods: a guidebook and resource (4th ed.). Hoboken, NJ: John Wiley & Sons, Inc.
Terreri, J. (2014, March 23). New casino falls short of meeting city pact; size of building, pitches
to tourists scaled down. The Buffalo News, A1.
Terreri, J. (2014, June 19). Seneca Gaming agrees to spend $3 million promoting Buffalo
attractions. The Buffalo News. Retrieved March 29, 2017, from
http://buffalonews.com/2014/06/19/seneca-gaming-agrees-to-spend-3-million-promoting-
buffalo-attractions/
Thompson, W. N. (2011). Casino taxes – accentuating the negative. Gaming Law Review and
Economics, 15(10), 599-608.
Tribal gaming funds over 100 programs offered by St. Regis Mohawks. (2014, December 3).
Cornwall Standard-Freeholder. Retrieved March 29, 2017, from http://www.standard-
freeholder.com/2014/12/03/tribal-gaming-funds-over-100-programs-offered-by-st-regis-
mohawks
Tribal-state compact revenue account. NY State Finance Law § 99-H (2017). Retrieved March
29, 2017, from https://www.nysenate.gov/legislation/laws/STF/99-H
Turning Stone Resort Casino. (2017). 2016 Fact Sheet. Retrieved March 2, 2017, from
https://turningstone.com/press/press-kits/2016-fact-sheet
Tyrrell, T. J. & Johnston, R. J. (December 2009). An econometric analysis of the effects of
tourism growth on municipal revenues and expenditures. Tourism Economics, 15(4): 771-
783.
Vitu, T. (2005, May 31). Who wins when you lose: $103M went to hospital, teachers, sheep.
Tuscon Citizen, p. A1.
Wenz, M. (2014). Valuing casinos as a local amenity. Growth and Change, 45(1), 136-158.
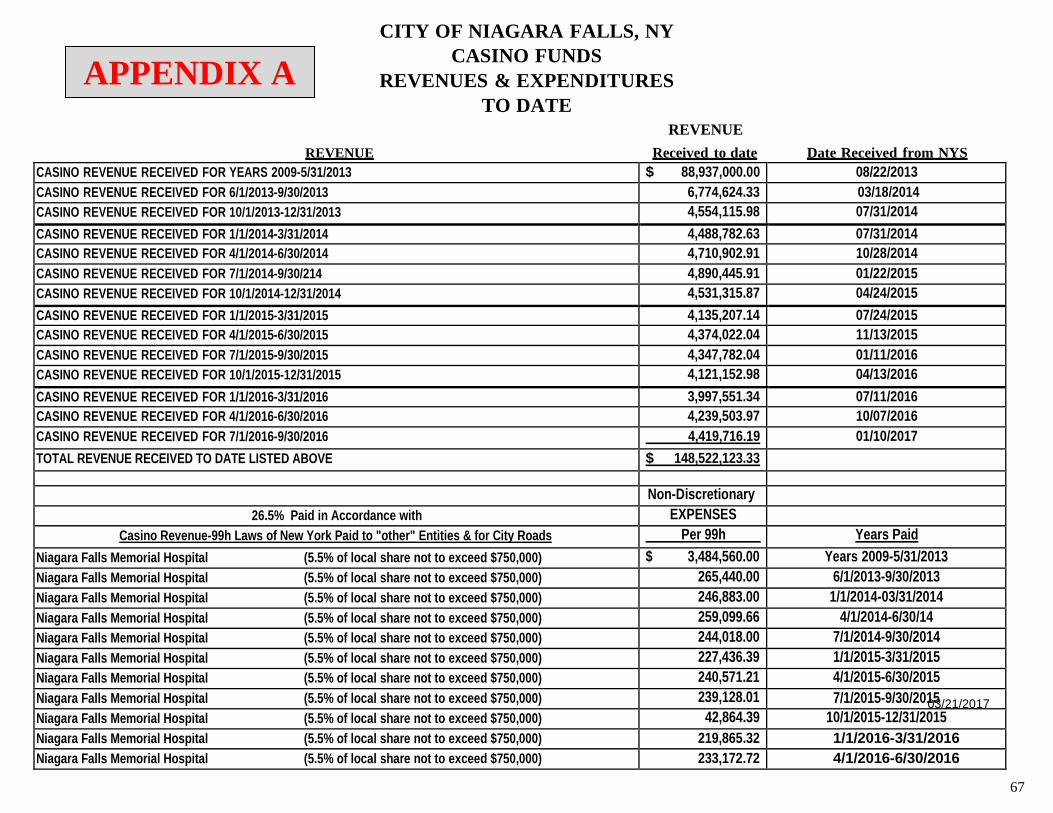
67
CITY OF NIAGARA FALLS, NY
CASINO FUNDS REVENUES & EXPENDITURES
TO DATE REVENUE
REVENUE Received to date Date Received from NYS
CASINO REVENUE RECEIVED FOR YEARS 2009-5/31/2013 $ 88,937,000.00 08/22/2013
CASINO REVENUE RECEIVED FOR 6/1/2013-9/30/2013 6,774,624.33 03/18/2014
CASINO REVENUE RECEIVED FOR 10/1/2013-12/31/2013 4,554,115.98 07/31/2014
CASINO REVENUE RECEIVED FOR 1/1/2014-3/31/2014 4,488,782.63 07/31/2014
CASINO REVENUE RECEIVED FOR 4/1/2014-6/30/2014 4,710,902.91 10/28/2014
CASINO REVENUE RECEIVED FOR 7/1/2014-9/30/214 4,890,445.91 01/22/2015
CASINO REVENUE RECEIVED FOR 10/1/2014-12/31/2014 4,531,315.87 04/24/2015
CASINO REVENUE RECEIVED FOR 1/1/2015-3/31/2015 4,135,207.14 07/24/2015
CASINO REVENUE RECEIVED FOR 4/1/2015-6/30/2015 4,374,022.04 11/13/2015
CASINO REVENUE RECEIVED FOR 7/1/2015-9/30/2015 4,347,782.04 01/11/2016
CASINO REVENUE RECEIVED FOR 10/1/2015-12/31/2015 4,121,152.98 04/13/2016
CASINO REVENUE RECEIVED FOR 1/1/2016-3/31/2016 3,997,551.34 07/11/2016
CASINO REVENUE RECEIVED FOR 4/1/2016-6/30/2016 4,239,503.97 10/07/2016
CASINO REVENUE RECEIVED FOR 7/1/2016-9/30/2016 4,419,716.19 01/10/2017
TOTAL REVENUE RECEIVED TO DATE LISTED ABOVE $ 148,522,123.33
Non-Discretionary
26.5% Paid in Accordance with EXPENSES
Casino Revenue-99h Laws of New York Paid to "other" Entities & for City Roads Per 99h Years Paid
Niagara Falls Memorial Hospital (5.5% of local share not to exceed $750,000) $ 3,484,560.00 Years 2009-5/31/2013
Niagara Falls Memorial Hospital (5.5% of local share not to exceed $750,000) 265,440.00 6/1/2013-9/30/2013
Niagara Falls Memorial Hospital (5.5% of local share not to exceed $750,000) 246,883.00 1/1/2014-03/31/2014
Niagara Falls Memorial Hospital (5.5% of local share not to exceed $750,000) 259,099.66 4/1/2014-6/30/14
Niagara Falls Memorial Hospital (5.5% of local share not to exceed $750,000) 244,018.00 7/1/2014-9/30/2014
Niagara Falls Memorial Hospital (5.5% of local share not to exceed $750,000) 227,436.39 1/1/2015-3/31/2015
Niagara Falls Memorial Hospital (5.5% of local share not to exceed $750,000) 240,571.21 4/1/2015-6/30/2015
Niagara Falls Memorial Hospital (5.5% of local share not to exceed $750,000) 239,128.01 7/1/2015-9/30/201053/21/2017
Niagara Falls Memorial Hospital (5.5% of local share not to exceed $750,000) 42,864.39 10/1/2015-12/31/2015
Niagara Falls Memorial Hospital (5.5% of local share not to exceed $750,000) 219,865.32 1/1/2016-3/31/2016
Niagara Falls Memorial Hospital (5.5% of local share not to exceed $750,000) 233,172.72 4/1/2016-6/30/2016
APPENDIX A
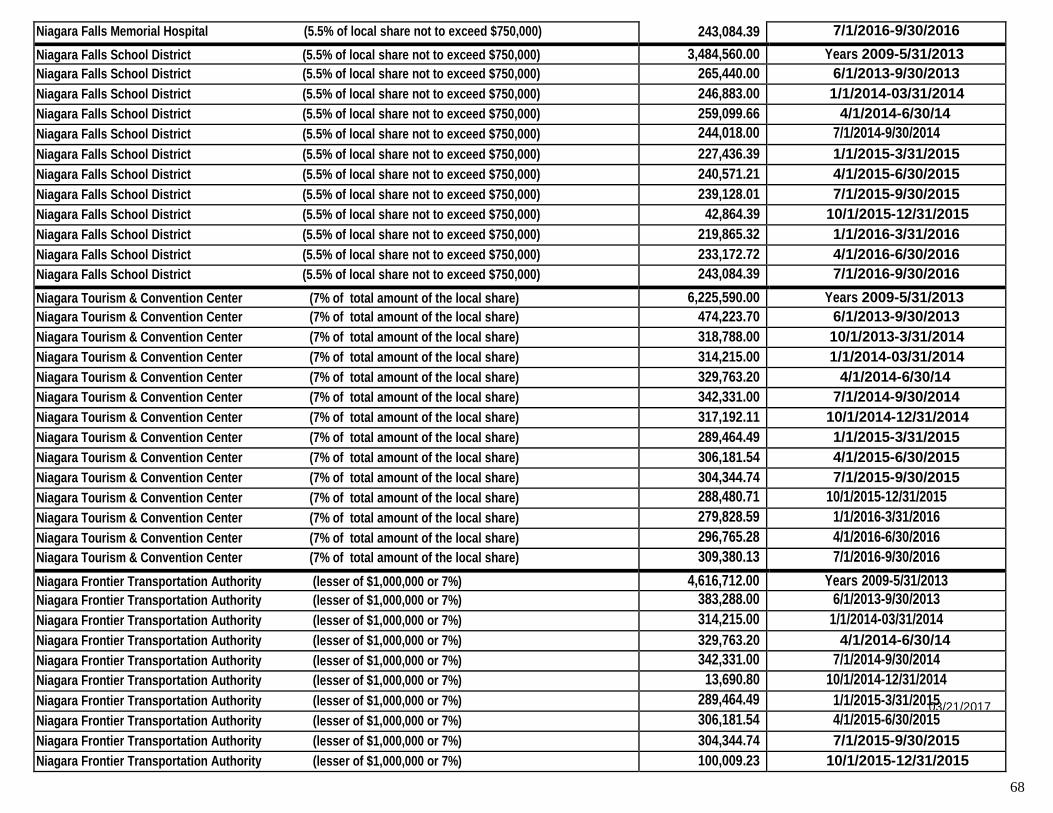
68
Niagara Falls Memorial Hospital (5.5% of local share not to exceed $750,000) 243,084.39 7/1/2016-9/30/2016
Niagara Falls School District (5.5% of local share not to exceed $750,000) 3,484,560.00 Years 2009-5/31/2013
Niagara Falls School District (5.5% of local share not to exceed $750,000) 265,440.00 6/1/2013-9/30/2013
Niagara Falls School District (5.5% of local share not to exceed $750,000) 246,883.00 1/1/2014-03/31/2014
Niagara Falls School District (5.5% of local share not to exceed $750,000) 259,099.66 4/1/2014-6/30/14
Niagara Falls School District (5.5% of local share not to exceed $750,000) 244,018.00 7/1/2014-9/30/2014
Niagara Falls School District (5.5% of local share not to exceed $750,000) 227,436.39 1/1/2015-3/31/2015
Niagara Falls School District (5.5% of local share not to exceed $750,000) 240,571.21 4/1/2015-6/30/2015
Niagara Falls School District (5.5% of local share not to exceed $750,000) 239,128.01 7/1/2015-9/30/2015
Niagara Falls School District (5.5% of local share not to exceed $750,000) 42,864.39 10/1/2015-12/31/2015
Niagara Falls School District (5.5% of local share not to exceed $750,000) 219,865.32 1/1/2016-3/31/2016
Niagara Falls School District (5.5% of local share not to exceed $750,000) 233,172.72 4/1/2016-6/30/2016
Niagara Falls School District (5.5% of local share not to exceed $750,000) 243,084.39 7/1/2016-9/30/2016
Niagara Tourism & Convention Center (7% of total amount of the local share) 6,225,590.00 Years 2009-5/31/2013
Niagara Tourism & Convention Center (7% of total amount of the local share) 474,223.70 6/1/2013-9/30/2013
Niagara Tourism & Convention Center (7% of total amount of the local share) 318,788.00 10/1/2013-3/31/2014
Niagara Tourism & Convention Center (7% of total amount of the local share) 314,215.00 1/1/2014-03/31/2014
Niagara Tourism & Convention Center (7% of total amount of the local share) 329,763.20 4/1/2014-6/30/14
Niagara Tourism & Convention Center (7% of total amount of the local share) 342,331.00 7/1/2014-9/30/2014
Niagara Tourism & Convention Center (7% of total amount of the local share) 317,192.11 10/1/2014-12/31/2014
Niagara Tourism & Convention Center (7% of total amount of the local share) 289,464.49 1/1/2015-3/31/2015
Niagara Tourism & Convention Center (7% of total amount of the local share) 306,181.54 4/1/2015-6/30/2015
Niagara Tourism & Convention Center (7% of total amount of the local share) 304,344.74 7/1/2015-9/30/2015
Niagara Tourism & Convention Center (7% of total amount of the local share) 288,480.71 10/1/2015-12/31/2015
Niagara Tourism & Convention Center (7% of total amount of the local share) 279,828.59 1/1/2016-3/31/2016
Niagara Tourism & Convention Center (7% of total amount of the local share) 296,765.28 4/1/2016-6/30/2016
Niagara Tourism & Convention Center (7% of total amount of the local share) 309,380.13 7/1/2016-9/30/2016
Niagara Frontier Transportation Authority (lesser of $1,000,000 or 7%) 4,616,712.00 Years 2009-5/31/2013
Niagara Frontier Transportation Authority (lesser of $1,000,000 or 7%) 383,288.00 6/1/2013-9/30/2013
Niagara Frontier Transportation Authority (lesser of $1,000,000 or 7%) 314,215.00 1/1/2014-03/31/2014
Niagara Frontier Transportation Authority (lesser of $1,000,000 or 7%) 329,763.20 4/1/2014-6/30/14
Niagara Frontier Transportation Authority (lesser of $1,000,000 or 7%) 342,331.00 7/1/2014-9/30/2014
Niagara Frontier Transportation Authority (lesser of $1,000,000 or 7%) 13,690.80 10/1/2014-12/31/2014
Niagara Frontier Transportation Authority (lesser of $1,000,000 or 7%) 289,464.49 1/1/2015-3/31/2015 03/21/2017
Niagara Frontier Transportation Authority (lesser of $1,000,000 or 7%) 306,181.54 4/1/2015-6/30/2015
Niagara Frontier Transportation Authority (lesser of $1,000,000 or 7%) 304,344.74 7/1/2015-9/30/2015
Niagara Frontier Transportation Authority (lesser of $1,000,000 or 7%) 100,009.23 10/1/2015-12/31/2015
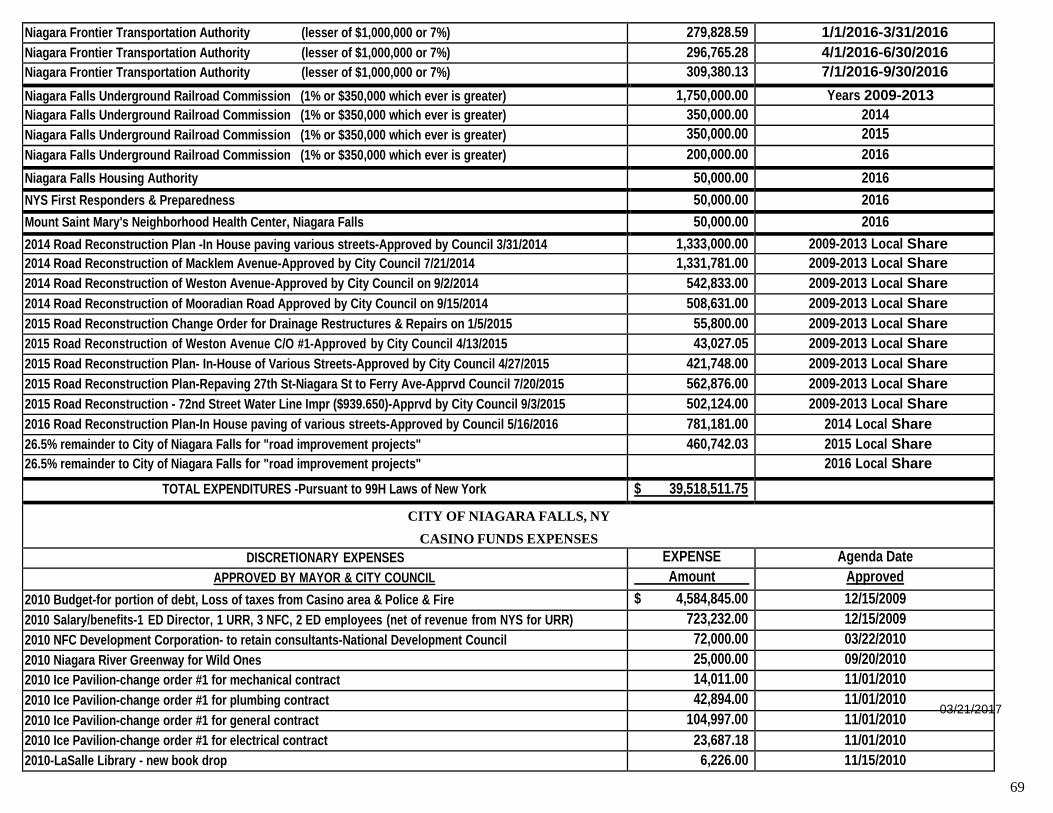
69
Niagara Frontier Transportation Authority (lesser of $1,000,000 or 7%) 279,828.59 1/1/2016-3/31/2016
Niagara Frontier Transportation Authority (lesser of $1,000,000 or 7%) 296,765.28 4/1/2016-6/30/2016
Niagara Frontier Transportation Authority (lesser of $1,000,000 or 7%) 309,380.13 7/1/2016-9/30/2016
Niagara Falls Underground Railroad Commission (1% or $350,000 which ever is greater) 1,750,000.00 Years 2009-2013
Niagara Falls Underground Railroad Commission (1% or $350,000 which ever is greater) 350,000.00 2014
Niagara Falls Underground Railroad Commission (1% or $350,000 which ever is greater) 350,000.00 2015
Niagara Falls Underground Railroad Commission (1% or $350,000 which ever is greater) 200,000.00 2016
Niagara Falls Housing Authority 50,000.00 2016
NYS First Responders & Preparedness 50,000.00 2016
Mount Saint Mary's Neighborhood Health Center, Niagara Falls 50,000.00 2016
2014 Road Reconstruction Plan -In House paving various streets-Approved by Council 3/31/2014 1,333,000.00 2009-2013 Local Share
2014 Road Reconstruction of Macklem Avenue-Approved by City Council 7/21/2014 1,331,781.00 2009-2013 Local Share
2014 Road Reconstruction of Weston Avenue-Approved by City Council on 9/2/2014 542,833.00 2009-2013 Local Share
2014 Road Reconstruction of Mooradian Road Approved by City Council on 9/15/2014 508,631.00 2009-2013 Local Share
2015 Road Reconstruction Change Order for Drainage Restructures & Repairs on 1/5/2015 55,800.00 2009-2013 Local Share
2015 Road Reconstruction of Weston Avenue C/O #1-Approved by City Council 4/13/2015 43,027.05 2009-2013 Local Share
2015 Road Reconstruction Plan- In-House of Various Streets-Approved by City Council 4/27/2015 421,748.00 2009-2013 Local Share
2015 Road Reconstruction Plan-Repaving 27th St-Niagara St to Ferry Ave-Apprvd Council 7/20/2015 562,876.00 2009-2013 Local Share
2015 Road Reconstruction - 72nd Street Water Line Impr ($939.650)-Apprvd by City Council 9/3/2015 502,124.00 2009-2013 Local Share
2016 Road Reconstruction Plan-In House paving of various streets-Approved by Council 5/16/2016 781,181.00 2014 Local Share
26.5% remainder to City of Niagara Falls for "road improvement projects" 460,742.03 2015 Local Share
26.5% remainder to City of Niagara Falls for "road improvement projects" 2016 Local Share
TOTAL EXPENDITURES -Pursuant to 99H Laws of New York $ 39,518,511.75
CITY OF NIAGARA FALLS, NY
CASINO FUNDS EXPENSES
DISCRETIONARY EXPENSES EXPENSE Agenda Date
APPROVED BY MAYOR & CITY COUNCIL Amount Approved
2010 Budget-for portion of debt, Loss of taxes from Casino area & Police & Fire $ 4,584,845.00 12/15/2009
2010 Salary/benefits-1 ED Director, 1 URR, 3 NFC, 2 ED employees (net of revenue from NYS for URR) 723,232.00 12/15/2009
2010 NFC Development Corporation- to retain consultants-National Development Council 72,000.00 03/22/2010
2010 Niagara River Greenway for Wild Ones 25,000.00 09/20/2010
2010 Ice Pavilion-change order #1 for mechanical contract 14,011.00 11/01/2010
2010 Ice Pavilion-change order #1 for plumbing contract 42,894.00 11/01/2010
2010 Ice Pavilion-change order #1 for general contract 104,997.00 11/01/2010
2010 Ice Pavilion-change order #1 for electrical contract 23,687.18 11/01/2010
2010-LaSalle Library - new book drop 6,226.00 11/15/2010
03/21/2017
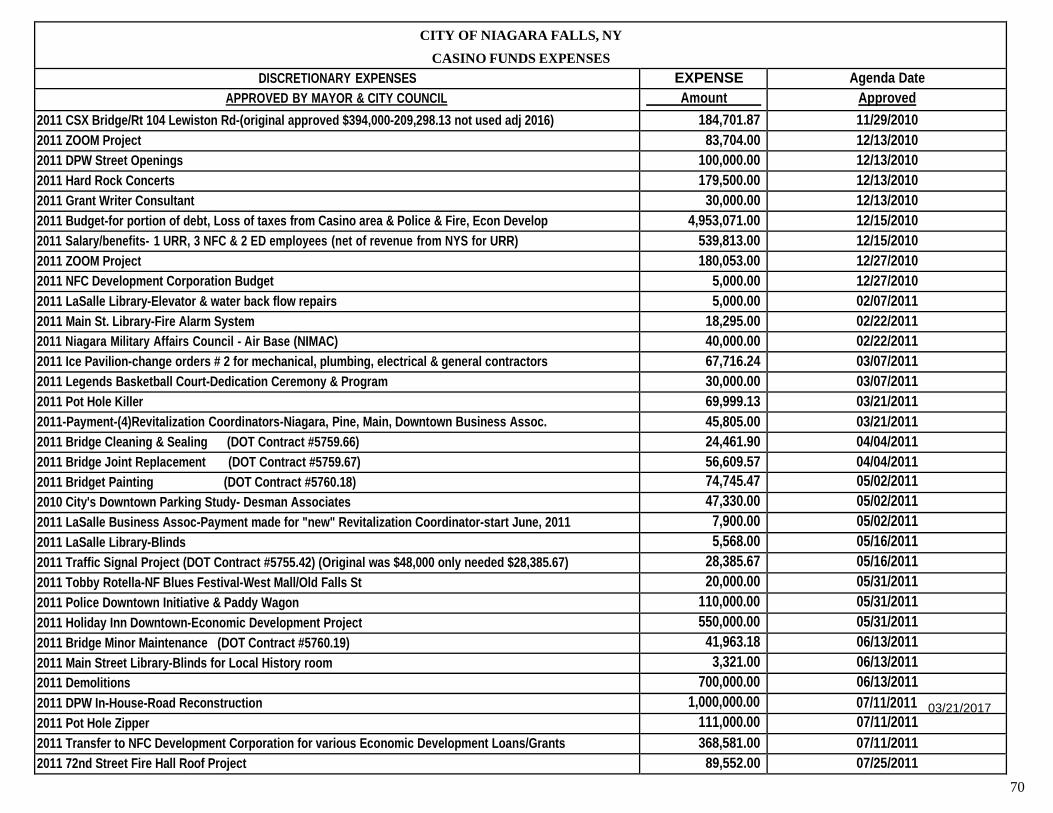
70
CITY OF NIAGARA FALLS, NY
CASINO FUNDS EXPENSES
DISCRETIONARY EXPENSES EXPENSE Agenda Date
APPROVED BY MAYOR & CITY COUNCIL Amount Approved
2011 CSX Bridge/Rt 104 Lewiston Rd-(original approved $394,000-209,298.13 not used adj 2016) 184,701.87 11/29/2010
2011 ZOOM Project 83,704.00 12/13/2010
2011 DPW Street Openings 100,000.00 12/13/2010
2011 Hard Rock Concerts 179,500.00 12/13/2010
2011 Grant Writer Consultant 30,000.00 12/13/2010
2011 Budget-for portion of debt, Loss of taxes from Casino area & Police & Fire, Econ Develop 4,953,071.00 12/15/2010
2011 Salary/benefits- 1 URR, 3 NFC & 2 ED employees (net of revenue from NYS for URR) 539,813.00 12/15/2010
2011 ZOOM Project 180,053.00 12/27/2010
2011 NFC Development Corporation Budget 5,000.00 12/27/2010
2011 LaSalle Library-Elevator & water back flow repairs 5,000.00 02/07/2011
2011 Main St. Library-Fire Alarm System 18,295.00 02/22/2011
2011 Niagara Military Affairs Council - Air Base (NIMAC) 40,000.00 02/22/2011
2011 Ice Pavilion-change orders # 2 for mechanical, plumbing, electrical & general contractors 67,716.24 03/07/2011
2011 Legends Basketball Court-Dedication Ceremony & Program 30,000.00 03/07/2011
2011 Pot Hole Killer 69,999.13 03/21/2011
2011-Payment-(4)Revitalization Coordinators-Niagara, Pine, Main, Downtown Business Assoc. 45,805.00 03/21/2011
2011 Bridge Cleaning & Sealing (DOT Contract #5759.66) 24,461.90 04/04/2011
2011 Bridge Joint Replacement (DOT Contract #5759.67) 56,609.57 04/04/2011
2011 Bridget Painting (DOT Contract #5760.18) 74,745.47 05/02/2011
2010 City's Downtown Parking Study- Desman Associates 47,330.00 05/02/2011
2011 LaSalle Business Assoc-Payment made for "new" Revitalization Coordinator-start June, 2011 7,900.00 05/02/2011
2011 LaSalle Library-Blinds 5,568.00 05/16/2011
2011 Traffic Signal Project (DOT Contract #5755.42) (Original was $48,000 only needed $28,385.67) 28,385.67 05/16/2011
2011 Tobby Rotella-NF Blues Festival-West Mall/Old Falls St 20,000.00 05/31/2011
2011 Police Downtown Initiative & Paddy Wagon 110,000.00 05/31/2011
2011 Holiday Inn Downtown-Economic Development Project 550,000.00 05/31/2011
2011 Bridge Minor Maintenance (DOT Contract #5760.19) 41,963.18 06/13/2011
2011 Main Street Library-Blinds for Local History room 3,321.00 06/13/2011
2011 Demolitions 700,000.00 06/13/2011
2011 DPW In-House-Road Reconstruction 1,000,000.00 07/11/2011 03/21/2017
2011 Pot Hole Zipper 111,000.00 07/11/2011
2011 Transfer to NFC Development Corporation for various Economic Development Loans/Grants 368,581.00 07/11/2011
2011 72nd Street Fire Hall Roof Project 89,552.00 07/25/2011
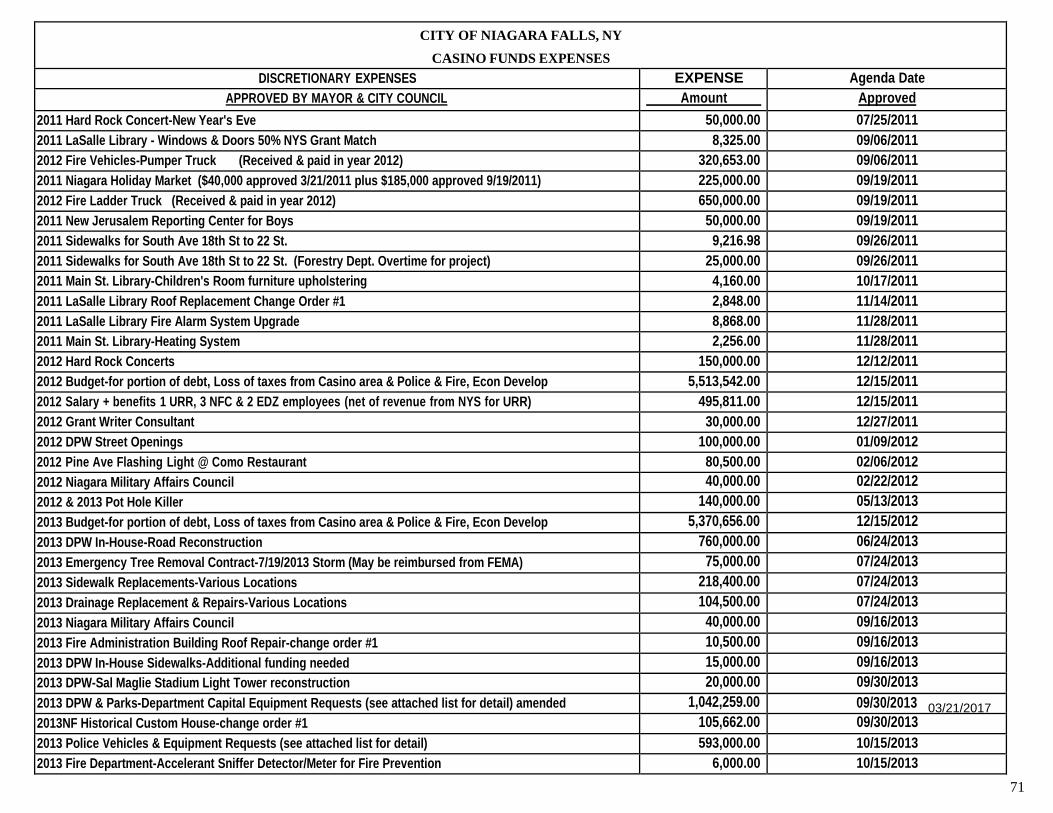
71
CITY OF NIAGARA FALLS, NY
CASINO FUNDS EXPENSES
DISCRETIONARY EXPENSES EXPENSE Agenda Date
APPROVED BY MAYOR & CITY COUNCIL Amount Approved
2011 Hard Rock Concert-New Year's Eve 50,000.00 07/25/2011
2011 LaSalle Library - Windows & Doors 50% NYS Grant Match 8,325.00 09/06/2011
2012 Fire Vehicles-Pumper Truck (Received & paid in year 2012) 320,653.00 09/06/2011
2011 Niagara Holiday Market ($40,000 approved 3/21/2011 plus $185,000 approved 9/19/2011) 225,000.00 09/19/2011
2012 Fire Ladder Truck (Received & paid in year 2012) 650,000.00 09/19/2011
2011 New Jerusalem Reporting Center for Boys 50,000.00 09/19/2011
2011 Sidewalks for South Ave 18th St to 22 St. 9,216.98 09/26/2011
2011 Sidewalks for South Ave 18th St to 22 St. (Forestry Dept. Overtime for project) 25,000.00 09/26/2011
2011 Main St. Library-Children's Room furniture upholstering 4,160.00 10/17/2011
2011 LaSalle Library Roof Replacement Change Order #1 2,848.00 11/14/2011
2011 LaSalle Library Fire Alarm System Upgrade 8,868.00 11/28/2011
2011 Main St. Library-Heating System 2,256.00 11/28/2011
2012 Hard Rock Concerts 150,000.00 12/12/2011
2012 Budget-for portion of debt, Loss of taxes from Casino area & Police & Fire, Econ Develop 5,513,542.00 12/15/2011
2012 Salary + benefits 1 URR, 3 NFC & 2 EDZ employees (net of revenue from NYS for URR) 495,811.00 12/15/2011
2012 Grant Writer Consultant 30,000.00 12/27/2011
2012 DPW Street Openings 100,000.00 01/09/2012
2012 Pine Ave Flashing Light @ Como Restaurant 80,500.00 02/06/2012
2012 Niagara Military Affairs Council 40,000.00 02/22/2012
2012 & 2013 Pot Hole Killer 140,000.00 05/13/2013
2013 Budget-for portion of debt, Loss of taxes from Casino area & Police & Fire, Econ Develop 5,370,656.00 12/15/2012
2013 DPW In-House-Road Reconstruction 760,000.00 06/24/2013
2013 Emergency Tree Removal Contract-7/19/2013 Storm (May be reimbursed from FEMA) 75,000.00 07/24/2013
2013 Sidewalk Replacements-Various Locations 218,400.00 07/24/2013
2013 Drainage Replacement & Repairs-Various Locations 104,500.00 07/24/2013
2013 Niagara Military Affairs Council 40,000.00 09/16/2013
2013 Fire Administration Building Roof Repair-change order #1 10,500.00 09/16/2013
2013 DPW In-House Sidewalks-Additional funding needed 15,000.00 09/16/2013
2013 DPW-Sal Maglie Stadium Light Tower reconstruction 20,000.00 09/30/2013
2013 DPW & Parks-Department Capital Equipment Requests (see attached list for detail) amended 1,042,259.00 09/30/2013 03/21/2017
2013NF Historical Custom House-change order #1 105,662.00 09/30/2013
2013 Police Vehicles & Equipment Requests (see attached list for detail) 593,000.00 10/15/2013
2013 Fire Department-Accelerant Sniffer Detector/Meter for Fire Prevention 6,000.00 10/15/2013
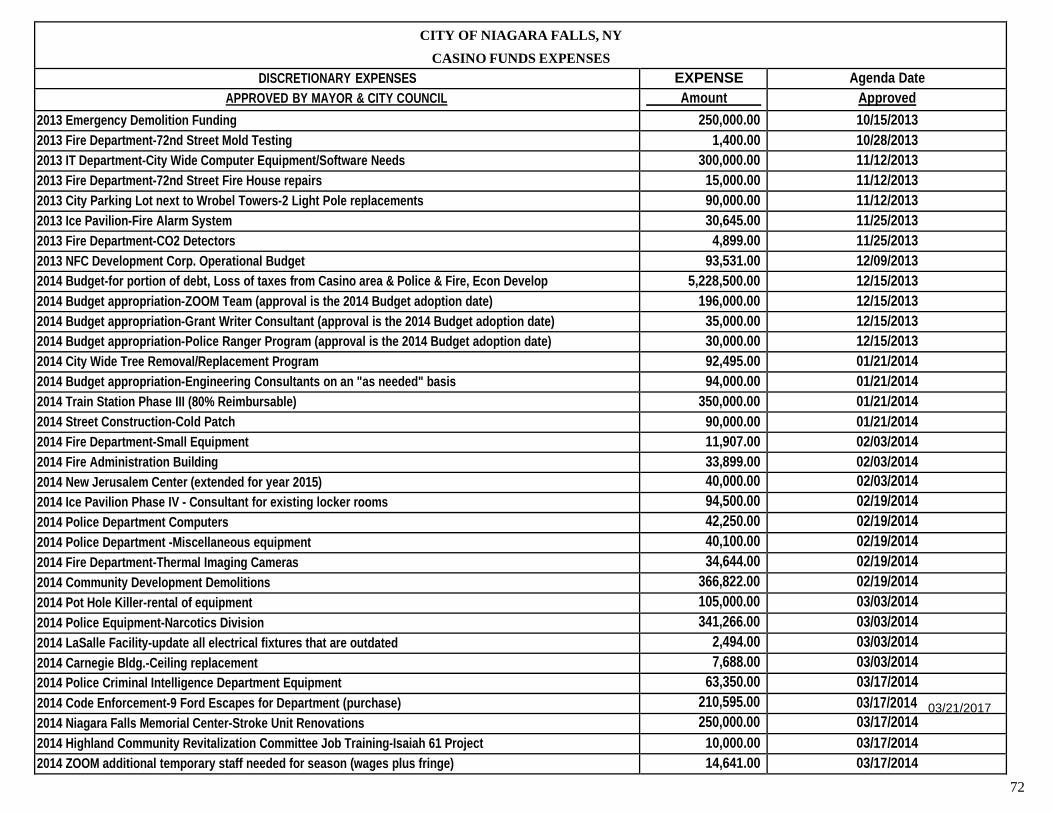
72
CITY OF NIAGARA FALLS, NY
CASINO FUNDS EXPENSES
DISCRETIONARY EXPENSES EXPENSE Agenda Date
APPROVED BY MAYOR & CITY COUNCIL Amount Approved
2013 Emergency Demolition Funding 250,000.00 10/15/2013
2013 Fire Department-72nd Street Mold Testing 1,400.00 10/28/2013
2013 IT Department-City Wide Computer Equipment/Software Needs 300,000.00 11/12/2013
2013 Fire Department-72nd Street Fire House repairs 15,000.00 11/12/2013
2013 City Parking Lot next to Wrobel Towers-2 Light Pole replacements 90,000.00 11/12/2013
2013 Ice Pavilion-Fire Alarm System 30,645.00 11/25/2013
2013 Fire Department-CO2 Detectors 4,899.00 11/25/2013
2013 NFC Development Corp. Operational Budget 93,531.00 12/09/2013
2014 Budget-for portion of debt, Loss of taxes from Casino area & Police & Fire, Econ Develop 5,228,500.00 12/15/2013
2014 Budget appropriation-ZOOM Team (approval is the 2014 Budget adoption date) 196,000.00 12/15/2013
2014 Budget appropriation-Grant Writer Consultant (approval is the 2014 Budget adoption date) 35,000.00 12/15/2013
2014 Budget appropriation-Police Ranger Program (approval is the 2014 Budget adoption date) 30,000.00 12/15/2013
2014 City Wide Tree Removal/Replacement Program 92,495.00 01/21/2014
2014 Budget appropriation-Engineering Consultants on an "as needed" basis 94,000.00 01/21/2014
2014 Train Station Phase III (80% Reimbursable) 350,000.00 01/21/2014
2014 Street Construction-Cold Patch 90,000.00 01/21/2014
2014 Fire Department-Small Equipment 11,907.00 02/03/2014
2014 Fire Administration Building 33,899.00 02/03/2014
2014 New Jerusalem Center (extended for year 2015) 40,000.00 02/03/2014
2014 Ice Pavilion Phase IV - Consultant for existing locker rooms 94,500.00 02/19/2014
2014 Police Department Computers 42,250.00 02/19/2014
2014 Police Department -Miscellaneous equipment 40,100.00 02/19/2014
2014 Fire Department-Thermal Imaging Cameras 34,644.00 02/19/2014
2014 Community Development Demolitions 366,822.00 02/19/2014
2014 Pot Hole Killer-rental of equipment 105,000.00 03/03/2014
2014 Police Equipment-Narcotics Division 341,266.00 03/03/2014
2014 LaSalle Facility-update all electrical fixtures that are outdated 2,494.00 03/03/2014
2014 Carnegie Bldg.-Ceiling replacement 7,688.00 03/03/2014
2014 Police Criminal Intelligence Department Equipment 63,350.00 03/17/2014
2014 Code Enforcement-9 Ford Escapes for Department (purchase) 210,595.00 03/17/2014 03/21/2017
2014 Niagara Falls Memorial Center-Stroke Unit Renovations 250,000.00 03/17/2014
2014 Highland Community Revitalization Committee Job Training-Isaiah 61 Project 10,000.00 03/17/2014
2014 ZOOM additional temporary staff needed for season (wages plus fringe) 14,641.00 03/17/2014
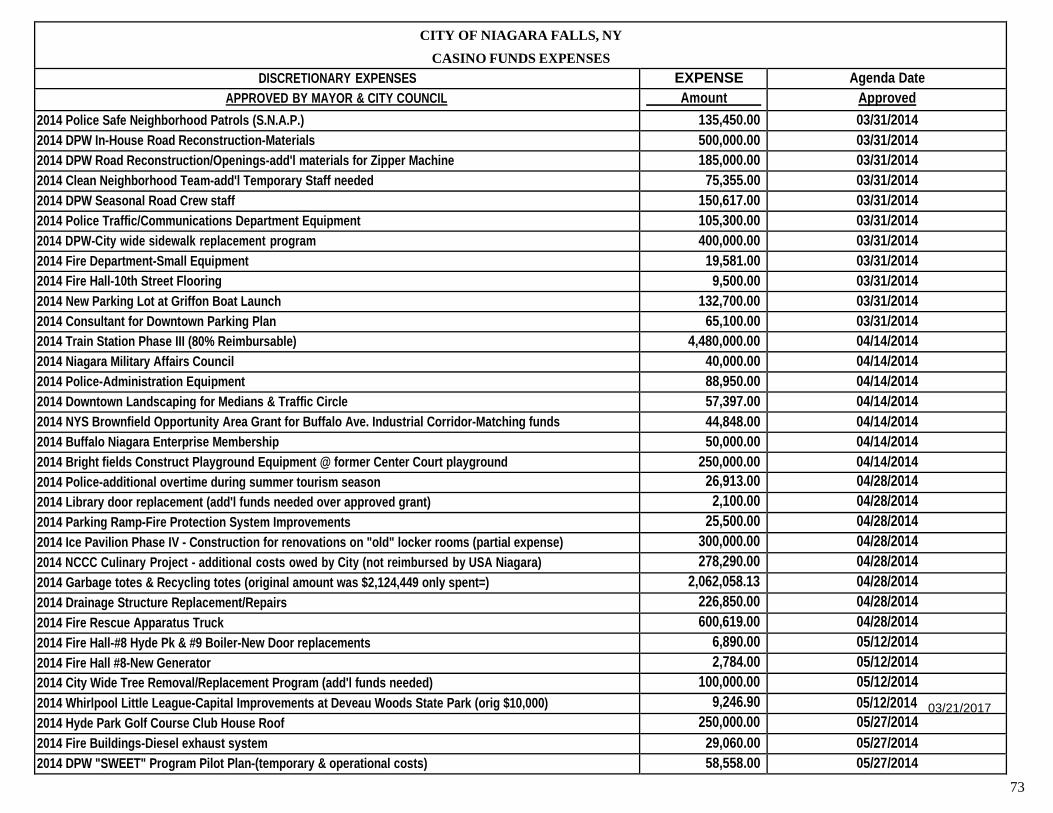
73
CITY OF NIAGARA FALLS, NY
CASINO FUNDS EXPENSES
DISCRETIONARY EXPENSES EXPENSE Agenda Date
APPROVED BY MAYOR & CITY COUNCIL Amount Approved
2014 Police Safe Neighborhood Patrols (S.N.A.P.) 135,450.00 03/31/2014
2014 DPW In-House Road Reconstruction-Materials 500,000.00 03/31/2014
2014 DPW Road Reconstruction/Openings-add'l materials for Zipper Machine 185,000.00 03/31/2014
2014 Clean Neighborhood Team-add'l Temporary Staff needed 75,355.00 03/31/2014
2014 DPW Seasonal Road Crew staff 150,617.00 03/31/2014
2014 Police Traffic/Communications Department Equipment 105,300.00 03/31/2014
2014 DPW-City wide sidewalk replacement program 400,000.00 03/31/2014
2014 Fire Department-Small Equipment 19,581.00 03/31/2014
2014 Fire Hall-10th Street Flooring 9,500.00 03/31/2014
2014 New Parking Lot at Griffon Boat Launch 132,700.00 03/31/2014
2014 Consultant for Downtown Parking Plan 65,100.00 03/31/2014
2014 Train Station Phase III (80% Reimbursable) 4,480,000.00 04/14/2014
2014 Niagara Military Affairs Council 40,000.00 04/14/2014
2014 Police-Administration Equipment 88,950.00 04/14/2014
2014 Downtown Landscaping for Medians & Traffic Circle 57,397.00 04/14/2014
2014 NYS Brownfield Opportunity Area Grant for Buffalo Ave. Industrial Corridor-Matching funds 44,848.00 04/14/2014
2014 Buffalo Niagara Enterprise Membership 50,000.00 04/14/2014
2014 Bright fields Construct Playground Equipment @ former Center Court playground 250,000.00 04/14/2014
2014 Police-additional overtime during summer tourism season 26,913.00 04/28/2014
2014 Library door replacement (add'l funds needed over approved grant) 2,100.00 04/28/2014
2014 Parking Ramp-Fire Protection System Improvements 25,500.00 04/28/2014
2014 Ice Pavilion Phase IV - Construction for renovations on "old" locker rooms (partial expense) 300,000.00 04/28/2014
2014 NCCC Culinary Project - additional costs owed by City (not reimbursed by USA Niagara) 278,290.00 04/28/2014
2014 Garbage totes & Recycling totes (original amount was $2,124,449 only spent=) 2,062,058.13 04/28/2014
2014 Drainage Structure Replacement/Repairs 226,850.00 04/28/2014
2014 Fire Rescue Apparatus Truck 600,619.00 04/28/2014
2014 Fire Hall-#8 Hyde Pk & #9 Boiler-New Door replacements 6,890.00 05/12/2014
2014 Fire Hall #8-New Generator 2,784.00 05/12/2014
2014 City Wide Tree Removal/Replacement Program (add'l funds needed) 100,000.00 05/12/2014
2014 Whirlpool Little League-Capital Improvements at Deveau Woods State Park (orig $10,000) 9,246.90 05/12/2014 03/21/2017
2014 Hyde Park Golf Course Club House Roof 250,000.00 05/27/2014
2014 Fire Buildings-Diesel exhaust system 29,060.00 05/27/2014
2014 DPW "SWEET" Program Pilot Plan-(temporary & operational costs) 58,558.00 05/27/2014
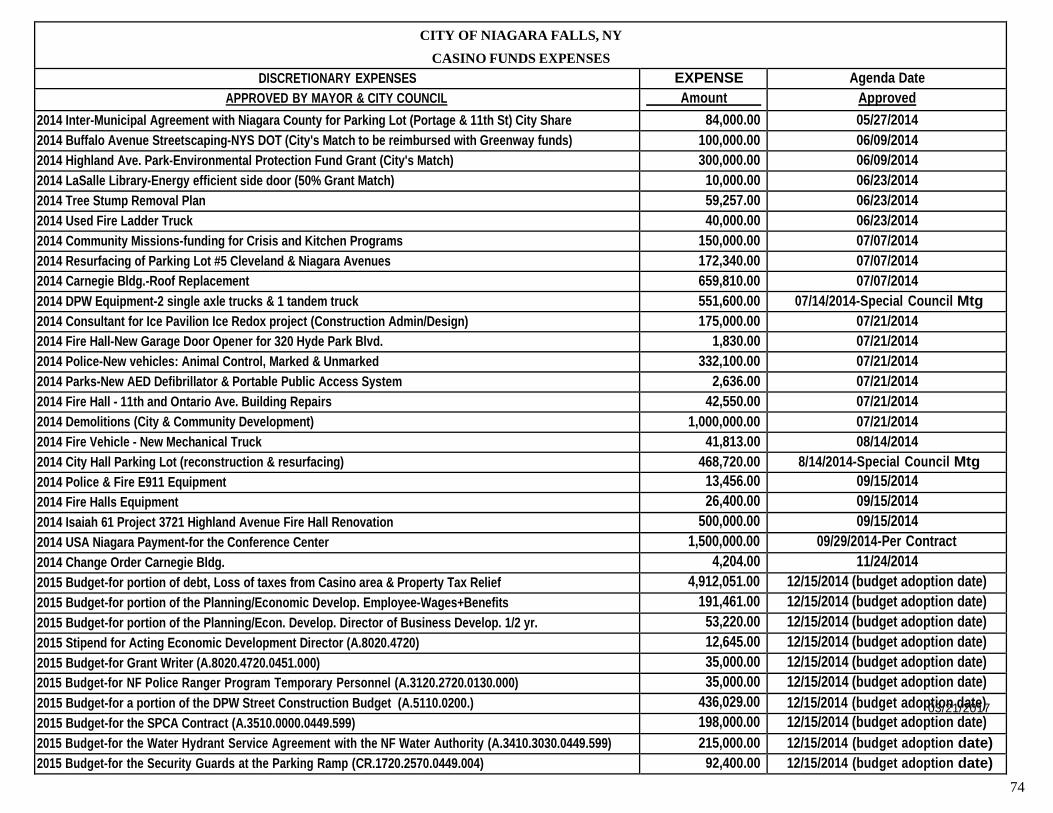
74
CITY OF NIAGARA FALLS, NY
CASINO FUNDS EXPENSES
DISCRETIONARY EXPENSES EXPENSE Agenda Date
APPROVED BY MAYOR & CITY COUNCIL Amount Approved
2014 Inter-Municipal Agreement with Niagara County for Parking Lot (Portage & 11th St) City Share 84,000.00 05/27/2014
2014 Buffalo Avenue Streetscaping-NYS DOT (City's Match to be reimbursed with Greenway funds) 100,000.00 06/09/2014
2014 Highland Ave. Park-Environmental Protection Fund Grant (City's Match) 300,000.00 06/09/2014
2014 LaSalle Library-Energy efficient side door (50% Grant Match) 10,000.00 06/23/2014
2014 Tree Stump Removal Plan 59,257.00 06/23/2014
2014 Used Fire Ladder Truck 40,000.00 06/23/2014
2014 Community Missions-funding for Crisis and Kitchen Programs 150,000.00 07/07/2014
2014 Resurfacing of Parking Lot #5 Cleveland & Niagara Avenues 172,340.00 07/07/2014
2014 Carnegie Bldg.-Roof Replacement 659,810.00 07/07/2014
2014 DPW Equipment-2 single axle trucks & 1 tandem truck 551,600.00 07/14/2014-Special Council Mtg
2014 Consultant for Ice Pavilion Ice Redox project (Construction Admin/Design) 175,000.00 07/21/2014
2014 Fire Hall-New Garage Door Opener for 320 Hyde Park Blvd. 1,830.00 07/21/2014
2014 Police-New vehicles: Animal Control, Marked & Unmarked 332,100.00 07/21/2014
2014 Parks-New AED Defibrillator & Portable Public Access System 2,636.00 07/21/2014
2014 Fire Hall - 11th and Ontario Ave. Building Repairs 42,550.00 07/21/2014
2014 Demolitions (City & Community Development) 1,000,000.00 07/21/2014
2014 Fire Vehicle - New Mechanical Truck 41,813.00 08/14/2014
2014 City Hall Parking Lot (reconstruction & resurfacing) 468,720.00 8/14/2014-Special Council Mtg
2014 Police & Fire E911 Equipment 13,456.00 09/15/2014
2014 Fire Halls Equipment 26,400.00 09/15/2014
2014 Isaiah 61 Project 3721 Highland Avenue Fire Hall Renovation 500,000.00 09/15/2014
2014 USA Niagara Payment-for the Conference Center 1,500,000.00 09/29/2014-Per Contract
2014 Change Order Carnegie Bldg. 4,204.00 11/24/2014
2015 Budget-for portion of debt, Loss of taxes from Casino area & Property Tax Relief 4,912,051.00 12/15/2014 (budget adoption date)
2015 Budget-for portion of the Planning/Economic Develop. Employee-Wages+Benefits 191,461.00 12/15/2014 (budget adoption date)
2015 Budget-for portion of the Planning/Econ. Develop. Director of Business Develop. 1/2 yr. 53,220.00 12/15/2014 (budget adoption date)
2015 Stipend for Acting Economic Development Director (A.8020.4720) 12,645.00 12/15/2014 (budget adoption date)
2015 Budget-for Grant Writer (A.8020.4720.0451.000) 35,000.00 12/15/2014 (budget adoption date)
2015 Budget-for NF Police Ranger Program Temporary Personnel (A.3120.2720.0130.000) 35,000.00 12/15/2014 (budget adoption date)
2015 Budget-for a portion of the DPW Street Construction Budget (A.5110.0200.) 436,029.00 12/15/2014 (budget adop0t3io/2n1d/2a0te1)7
2015 Budget-for the SPCA Contract (A.3510.0000.0449.599) 198,000.00 12/15/2014 (budget adoption date)
2015 Budget-for the Water Hydrant Service Agreement with the NF Water Authority (A.3410.3030.0449.599) 215,000.00 12/15/2014 (budget adoption date)
2015 Budget-for the Security Guards at the Parking Ramp (CR.1720.2570.0449.004) 92,400.00 12/15/2014 (budget adoption date)
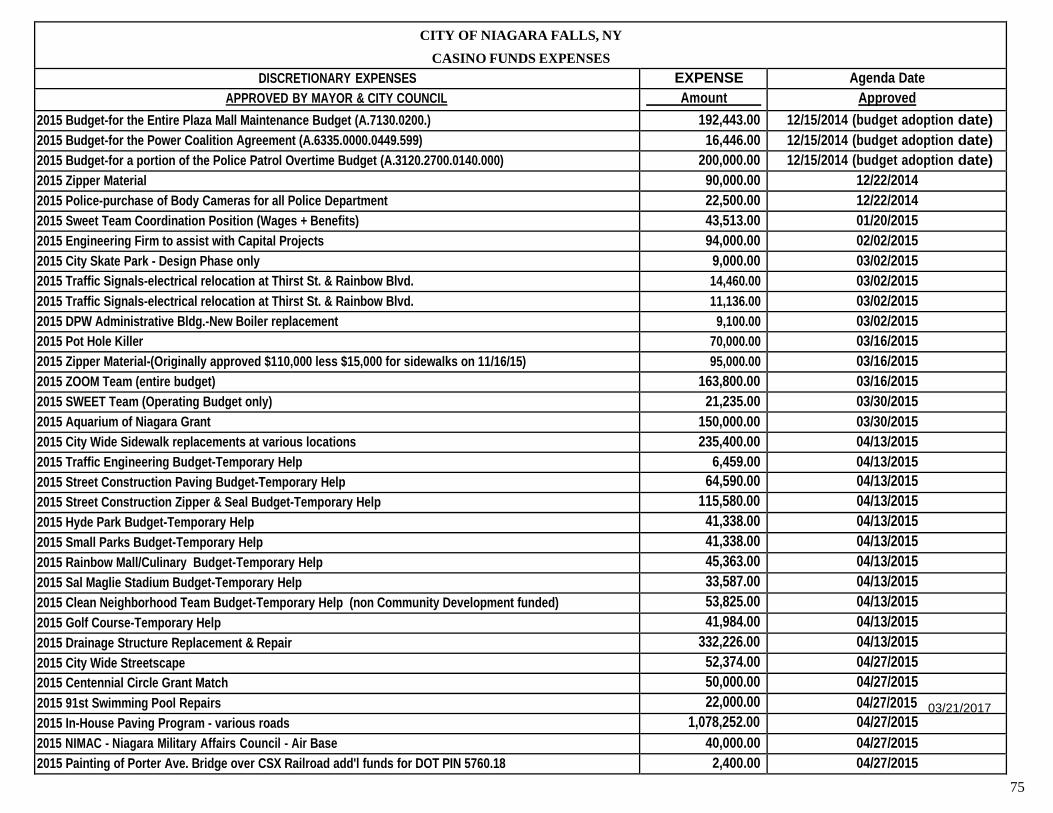
75
CITY OF NIAGARA FALLS, NY
CASINO FUNDS EXPENSES
DISCRETIONARY EXPENSES EXPENSE Agenda Date
APPROVED BY MAYOR & CITY COUNCIL Amount Approved
2015 Budget-for the Entire Plaza Mall Maintenance Budget (A.7130.0200.) 192,443.00 12/15/2014 (budget adoption date)
2015 Budget-for the Power Coalition Agreement (A.6335.0000.0449.599) 16,446.00 12/15/2014 (budget adoption date)
2015 Budget-for a portion of the Police Patrol Overtime Budget (A.3120.2700.0140.000) 200,000.00 12/15/2014 (budget adoption date)
2015 Zipper Material 90,000.00 12/22/2014
2015 Police-purchase of Body Cameras for all Police Department 22,500.00 12/22/2014
2015 Sweet Team Coordination Position (Wages + Benefits) 43,513.00 01/20/2015
2015 Engineering Firm to assist with Capital Projects 94,000.00 02/02/2015
2015 City Skate Park - Design Phase only 9,000.00 03/02/2015
2015 Traffic Signals-electrical relocation at Thirst St. & Rainbow Blvd. 14,460.00 03/02/2015
2015 Traffic Signals-electrical relocation at Thirst St. & Rainbow Blvd. 11,136.00 03/02/2015
2015 DPW Administrative Bldg.-New Boiler replacement 9,100.00 03/02/2015
2015 Pot Hole Killer 70,000.00 03/16/2015
2015 Zipper Material-(Originally approved $110,000 less $15,000 for sidewalks on 11/16/15) 95,000.00 03/16/2015
2015 ZOOM Team (entire budget) 163,800.00 03/16/2015
2015 SWEET Team (Operating Budget only) 21,235.00 03/30/2015
2015 Aquarium of Niagara Grant 150,000.00 03/30/2015
2015 City Wide Sidewalk replacements at various locations 235,400.00 04/13/2015
2015 Traffic Engineering Budget-Temporary Help 6,459.00 04/13/2015
2015 Street Construction Paving Budget-Temporary Help 64,590.00 04/13/2015
2015 Street Construction Zipper & Seal Budget-Temporary Help 115,580.00 04/13/2015
2015 Hyde Park Budget-Temporary Help 41,338.00 04/13/2015
2015 Small Parks Budget-Temporary Help 41,338.00 04/13/2015
2015 Rainbow Mall/Culinary Budget-Temporary Help 45,363.00 04/13/2015
2015 Sal Maglie Stadium Budget-Temporary Help 33,587.00 04/13/2015
2015 Clean Neighborhood Team Budget-Temporary Help (non Community Development funded) 53,825.00 04/13/2015
2015 Golf Course-Temporary Help 41,984.00 04/13/2015
2015 Drainage Structure Replacement & Repair 332,226.00 04/13/2015
2015 City Wide Streetscape 52,374.00 04/27/2015
2015 Centennial Circle Grant Match 50,000.00 04/27/2015
2015 91st Swimming Pool Repairs 22,000.00 04/27/2015 03/21/2017
2015 In-House Paving Program - various roads 1,078,252.00 04/27/2015
2015 NIMAC - Niagara Military Affairs Council - Air Base 40,000.00 04/27/2015
2015 Painting of Porter Ave. Bridge over CSX Railroad add'l funds for DOT PIN 5760.18 2,400.00 04/27/2015
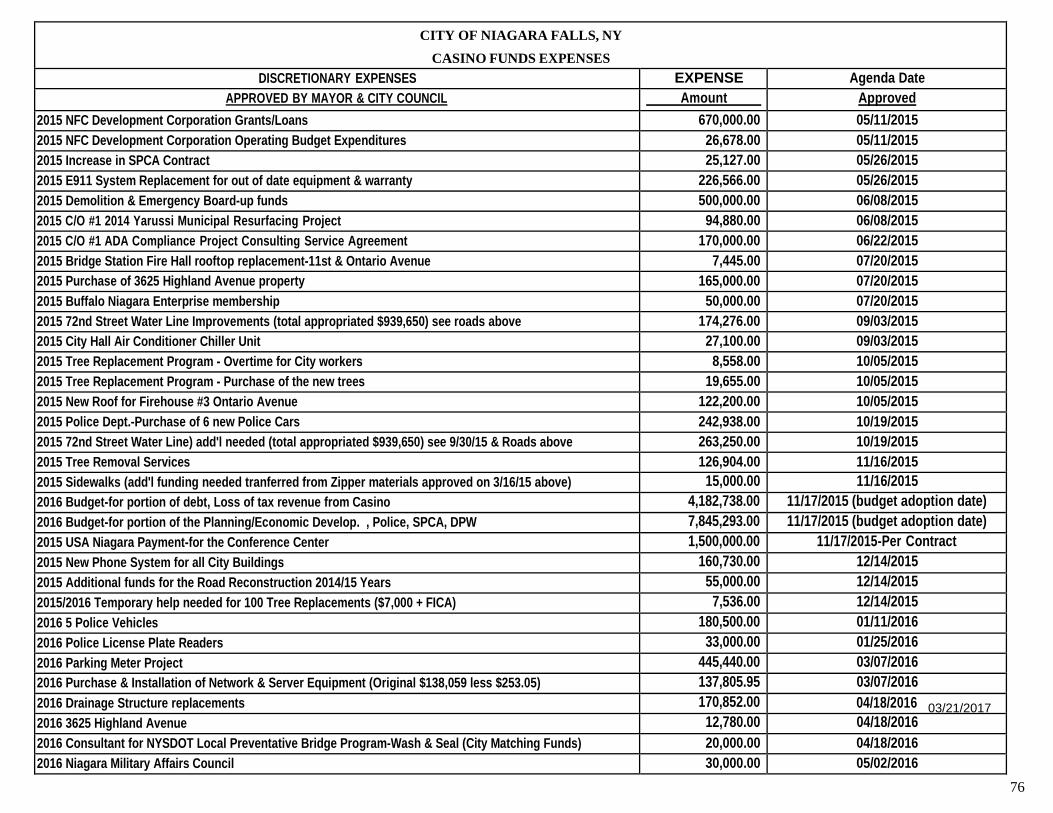
76
CITY OF NIAGARA FALLS, NY
CASINO FUNDS EXPENSES
DISCRETIONARY EXPENSES EXPENSE Agenda Date
APPROVED BY MAYOR & CITY COUNCIL Amount Approved
2015 NFC Development Corporation Grants/Loans 670,000.00 05/11/2015
2015 NFC Development Corporation Operating Budget Expenditures 26,678.00 05/11/2015
2015 Increase in SPCA Contract 25,127.00 05/26/2015
2015 E911 System Replacement for out of date equipment & warranty 226,566.00 05/26/2015
2015 Demolition & Emergency Board-up funds 500,000.00 06/08/2015
2015 C/O #1 2014 Yarussi Municipal Resurfacing Project 94,880.00 06/08/2015
2015 C/O #1 ADA Compliance Project Consulting Service Agreement 170,000.00 06/22/2015
2015 Bridge Station Fire Hall rooftop replacement-11st & Ontario Avenue 7,445.00 07/20/2015
2015 Purchase of 3625 Highland Avenue property 165,000.00 07/20/2015
2015 Buffalo Niagara Enterprise membership 50,000.00 07/20/2015
2015 72nd Street Water Line Improvements (total appropriated $939,650) see roads above 174,276.00 09/03/2015
2015 City Hall Air Conditioner Chiller Unit 27,100.00 09/03/2015
2015 Tree Replacement Program - Overtime for City workers 8,558.00 10/05/2015
2015 Tree Replacement Program - Purchase of the new trees 19,655.00 10/05/2015
2015 New Roof for Firehouse #3 Ontario Avenue 122,200.00 10/05/2015
2015 Police Dept.-Purchase of 6 new Police Cars 242,938.00 10/19/2015
2015 72nd Street Water Line) add'l needed (total appropriated $939,650) see 9/30/15 & Roads above 263,250.00 10/19/2015
2015 Tree Removal Services 126,904.00 11/16/2015
2015 Sidewalks (add'l funding needed tranferred from Zipper materials approved on 3/16/15 above) 15,000.00 11/16/2015
2016 Budget-for portion of debt, Loss of tax revenue from Casino 4,182,738.00 11/17/2015 (budget adoption date)
2016 Budget-for portion of the Planning/Economic Develop. , Police, SPCA, DPW 7,845,293.00 11/17/2015 (budget adoption date)
2015 USA Niagara Payment-for the Conference Center 1,500,000.00 11/17/2015-Per Contract
2015 New Phone System for all City Buildings 160,730.00 12/14/2015
2015 Additional funds for the Road Reconstruction 2014/15 Years 55,000.00 12/14/2015
2015/2016 Temporary help needed for 100 Tree Replacements ($7,000 + FICA) 7,536.00 12/14/2015
2016 5 Police Vehicles 180,500.00 01/11/2016
2016 Police License Plate Readers 33,000.00 01/25/2016
2016 Parking Meter Project 445,440.00 03/07/2016
2016 Purchase & Installation of Network & Server Equipment (Original $138,059 less $253.05) 137,805.95 03/07/2016
2016 Drainage Structure replacements 170,852.00 04/18/2016 03/21/2017
2016 3625 Highland Avenue 12,780.00 04/18/2016
2016 Consultant for NYSDOT Local Preventative Bridge Program-Wash & Seal (City Matching Funds) 20,000.00 04/18/2016
2016 Niagara Military Affairs Council 30,000.00 05/02/2016
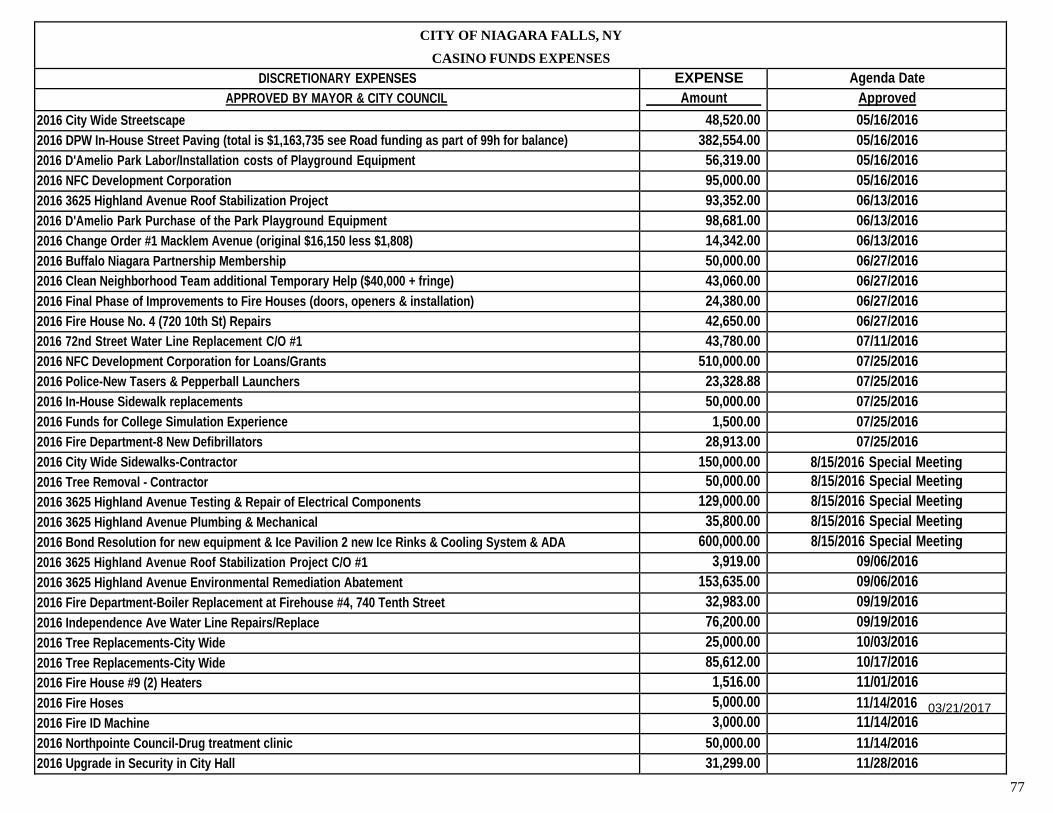
77
CITY OF NIAGARA FALLS, NY
CASINO FUNDS EXPENSES
DISCRETIONARY EXPENSES EXPENSE Agenda Date
APPROVED BY MAYOR & CITY COUNCIL Amount Approved
2016 City Wide Streetscape 48,520.00 05/16/2016
2016 DPW In-House Street Paving (total is $1,163,735 see Road funding as part of 99h for balance) 382,554.00 05/16/2016
2016 D'Amelio Park Labor/Installation costs of Playground Equipment 56,319.00 05/16/2016
2016 NFC Development Corporation 95,000.00 05/16/2016
2016 3625 Highland Avenue Roof Stabilization Project 93,352.00 06/13/2016
2016 D'Amelio Park Purchase of the Park Playground Equipment 98,681.00 06/13/2016
2016 Change Order #1 Macklem Avenue (original $16,150 less $1,808) 14,342.00 06/13/2016
2016 Buffalo Niagara Partnership Membership 50,000.00 06/27/2016
2016 Clean Neighborhood Team additional Temporary Help ($40,000 + fringe) 43,060.00 06/27/2016
2016 Final Phase of Improvements to Fire Houses (doors, openers & installation) 24,380.00 06/27/2016
2016 Fire House No. 4 (720 10th St) Repairs 42,650.00 06/27/2016
2016 72nd Street Water Line Replacement C/O #1 43,780.00 07/11/2016
2016 NFC Development Corporation for Loans/Grants 510,000.00 07/25/2016
2016 Police-New Tasers & Pepperball Launchers 23,328.88 07/25/2016
2016 In-House Sidewalk replacements 50,000.00 07/25/2016
2016 Funds for College Simulation Experience 1,500.00 07/25/2016
2016 Fire Department-8 New Defibrillators 28,913.00 07/25/2016
2016 City Wide Sidewalks-Contractor 150,000.00 8/15/2016 Special Meeting
2016 Tree Removal - Contractor 50,000.00 8/15/2016 Special Meeting
2016 3625 Highland Avenue Testing & Repair of Electrical Components 129,000.00 8/15/2016 Special Meeting
2016 3625 Highland Avenue Plumbing & Mechanical 35,800.00 8/15/2016 Special Meeting
2016 Bond Resolution for new equipment & Ice Pavilion 2 new Ice Rinks & Cooling System & ADA 600,000.00 8/15/2016 Special Meeting
2016 3625 Highland Avenue Roof Stabilization Project C/O #1 3,919.00 09/06/2016
2016 3625 Highland Avenue Environmental Remediation Abatement 153,635.00 09/06/2016
2016 Fire Department-Boiler Replacement at Firehouse #4, 740 Tenth Street 32,983.00 09/19/2016
2016 Independence Ave Water Line Repairs/Replace 76,200.00 09/19/2016
2016 Tree Replacements-City Wide 25,000.00 10/03/2016
2016 Tree Replacements-City Wide 85,612.00 10/17/2016
2016 Fire House #9 (2) Heaters 1,516.00 11/01/2016
2016 Fire Hoses 5,000.00 11/14/2016 03/21/2017
2016 Fire ID Machine 3,000.00 11/14/2016
2016 Northpointe Council-Drug treatment clinic 50,000.00 11/14/2016
2016 Upgrade in Security in City Hall 31,299.00 11/28/2016
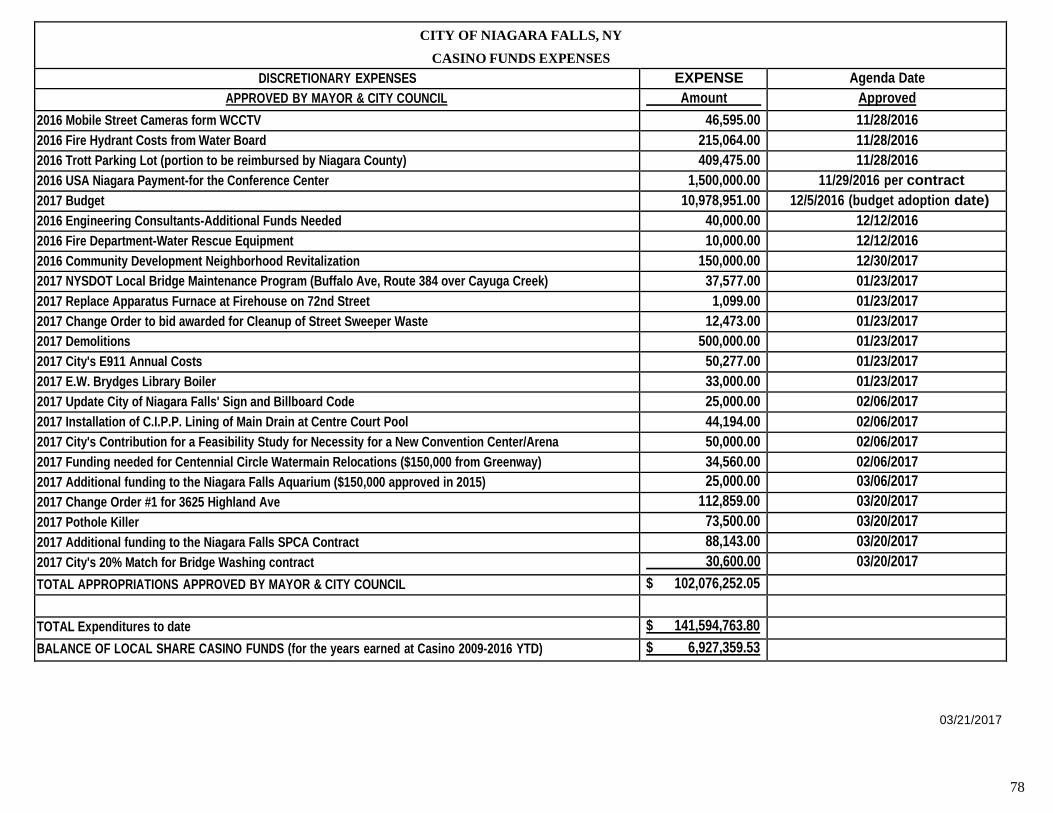
78
CITY OF NIAGARA FALLS, NY
CASINO FUNDS EXPENSES
DISCRETIONARY EXPENSES EXPENSE Agenda Date
APPROVED BY MAYOR & CITY COUNCIL Amount Approved
2016 Mobile Street Cameras form WCCTV 46,595.00 11/28/2016
2016 Fire Hydrant Costs from Water Board 215,064.00 11/28/2016
2016 Trott Parking Lot (portion to be reimbursed by Niagara County) 409,475.00 11/28/2016
2016 USA Niagara Payment-for the Conference Center 1,500,000.00 11/29/2016 per contract
2017 Budget 10,978,951.00 12/5/2016 (budget adoption date)
2016 Engineering Consultants-Additional Funds Needed 40,000.00 12/12/2016
2016 Fire Department-Water Rescue Equipment 10,000.00 12/12/2016
2016 Community Development Neighborhood Revitalization 150,000.00 12/30/2017
2017 NYSDOT Local Bridge Maintenance Program (Buffalo Ave, Route 384 over Cayuga Creek) 37,577.00 01/23/2017
2017 Replace Apparatus Furnace at Firehouse on 72nd Street 1,099.00 01/23/2017
2017 Change Order to bid awarded for Cleanup of Street Sweeper Waste 12,473.00 01/23/2017
2017 Demolitions 500,000.00 01/23/2017
2017 City's E911 Annual Costs 50,277.00 01/23/2017
2017 E.W. Brydges Library Boiler 33,000.00 01/23/2017
2017 Update City of Niagara Falls' Sign and Billboard Code 25,000.00 02/06/2017
2017 Installation of C.I.P.P. Lining of Main Drain at Centre Court Pool 44,194.00 02/06/2017
2017 City's Contribution for a Feasibility Study for Necessity for a New Convention Center/Arena 50,000.00 02/06/2017
2017 Funding needed for Centennial Circle Watermain Relocations ($150,000 from Greenway) 34,560.00 02/06/2017
2017 Additional funding to the Niagara Falls Aquarium ($150,000 approved in 2015) 25,000.00 03/06/2017
2017 Change Order #1 for 3625 Highland Ave 112,859.00 03/20/2017
2017 Pothole Killer 73,500.00 03/20/2017
2017 Additional funding to the Niagara Falls SPCA Contract 88,143.00 03/20/2017
2017 City's 20% Match for Bridge Washing contract 30,600.00 03/20/2017
TOTAL APPROPRIATIONS APPROVED BY MAYOR & CITY COUNCIL $ 102,076,252.05
TOTAL Expenditures to date $ 141,594,763.80
BALANCE OF LOCAL SHARE CASINO FUNDS (for the years earned at Casino 2009-2016 YTD) $ 6,927,359.53
03/21/2017
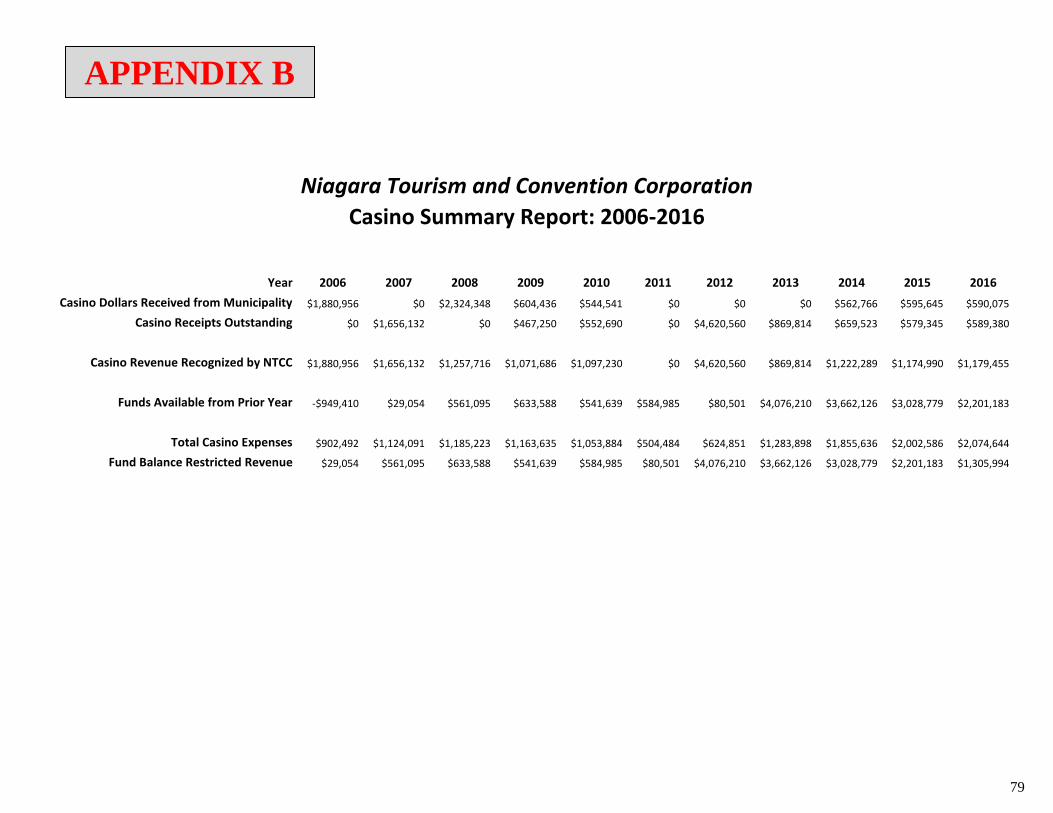
79
Niagara Tourism and Convention Corporation
Casino Summary Report: 2006-2016
Year 2006 2007 2008 2009 2010 2011 2012 2013 2014 2015 2016
Casino Dollars Received from Municipality $1,880,956 $0 $2,324,348 $604,436 $544,541 $0 $0 $0 $562,766 $595,645 $590,075
Casino Receipts Outstanding $0 $1,656,132 $0 $467,250 $552,690 $0 $4,620,560 $869,814 $659,523 $579,345 $589,380
Casino Revenue Recognized by NTCC $1,880,956 $1,656,132 $1,257,716 $1,071,686 $1,097,230 $0 $4,620,560 $869,814 $1,222,289 $1,174,990 $1,179,455
Funds Available from Prior Year -$949,410 $29,054 $561,095 $633,588 $541,639 $584,985 $80,501 $4,076,210 $3,662,126 $3,028,779 $2,201,183
Total Casino Expenses $902,492 $1,124,091 $1,185,223 $1,163,635 $1,053,884 $504,484 $624,851 $1,283,898 $1,855,636 $2,002,586 $2,074,644
Fund Balance Restricted Revenue $29,054 $561,095 $633,588 $541,639 $584,985 $80,501 $4,076,210 $3,662,126 $3,028,779 $2,201,183 $1,305,994
APPENDIX B


