Embed Size (px)
Citation preview
Walden UniversityScholarWorks
Walden Dissertations and Doctoral Studies Walden Dissertations and Doctoral StudiesCollection
2017
The Impact of Corporate Governance on WorkingCapital Management in Nigerian OrganizationsGeorge Chibuzo NjokuWalden University
Follow this and additional works at: https://scholarworks.waldenu.edu/dissertations
Part of the Finance and Financial Management Commons
This Dissertation is brought to you for free and open access by the Walden Dissertations and Doctoral Studies Collection at ScholarWorks. It has beenaccepted for inclusion in Walden Dissertations and Doctoral Studies by an authorized administrator of ScholarWorks. For more information, pleasecontact [email protected].
Walden University
College of Management and Technology
This is to certify that the doctoral dissertation by
George Njoku
has been found to be complete and satisfactory in all respects,
and that any and all revisions required by
the review committee have been made.
Review Committee
Dr. Mohammad Sharifzadeh, Committee Chairperson, Management Faculty
Dr. Steven Tippins, Committee Member, Management Faculty Dr. Robert Haussmann, University Reviewer, Management Faculty
Chief Academic Officer
Eric Riedel, Ph.D.
Walden University
2017
Abstract
The Impact of Corporate Governance on Working Capital Management in Nigerian
Organizations
by
George Chibuzo Njoku
MSc, University of Maryland, 2013
Dissertation Submitted in Partial Fulfillment
Of the Requirements for the Degree of
Doctor of Philosophy
Management: Finance
Walden University
November 2017
Abstract
Many Nigerian firms have faced working capital management (WCM) inconsistencies,
which have remained a source of tremendous concern in the face of high competition. In
this study, the research problem explored was how inefficient working capital policies are
still negatively affecting shareholders’ wealth several years after the economic crisis,
constraining sustainable development. The purpose of this quantitative research study
was to examine how corporate governance has affected WCM within Nigerian
organizations. The research question was about how corporate governance practices
expand WCM efficiency. A random sample of 89 Nigerian organizations was used, and
publicly available ethical ratings and financial information data on the companies
involved were obtained. This quantitative study utilized a multiple regression
methodology to determine the extent to which CEO duality, CEO tenure, board size (BS),
and an audit committee (AC) can predict WCM performance. The findings specifically
determined that board size and audit committee size were significantly related to WCM,
while CEO tenure and CEO duality were not related to WCM. The results were
consistent with previous studies suggesting that the impact of corporate governance in
Nigerian organizations relates to WCM. The results of this study may help Nigerian
organizations adopt and operate an appropriate corporate governance structure that will
enhance their organizational effectiveness, aid business managers in allocating resources,
and allow them to continue their corporate social responsibility missions of providing
services to their communities and transforming society.
The Impact of Corporate Governance on Working Capital Management in Nigerian
Organizations
by
George Chibuzo Njoku
MS, University of Maryland, College Park, 2013
Dissertation Submitted in Partial Fulfillment
of the Requirements for the Degree of
Doctor of Philosophy
Management: Finance
Walden University
November 2017

Dedication
Firstly, I thank the Almighty God for affording me the intelligence and
enthusiasm that have been so crucial to completing my doctoral journey.
I dedicate this work to my wife, Prisca Njoku, who advanced beyond her role to
support me during the many years of my doctoral study, with the sincerest appreciation.
Without her encouragement and inspiration, I would not have attained this milestone. I
also pay special tribute to my daughter, Cecilia Njoku; my mother, Sabina Njoku; and my
sister, Felicia Ndukwe, who were all patient with me and understood that I could not
provide them with total support because I had to study and complete my assignments. I
pray that my achievement will inspire my family members and children to also pursue
education.

Acknowledgments
I want to thank Dr. Mohammad Sharifzadeh whose insight, leadership, and
knowledge propelled me to successfully complete this project. Dr. Sharifzadeh was a
great motivator, was always available when I needed help, and encouraged me to do my
best. I also had a close relationship with Dr. Sharifzadeh, who always reviewed my work
and said my progress was satisfactory. Sir, you are not only a distinguished professor,
but you are also a motivator who kindly encourages people to do their best.
I also owe a sincere gratitude to Dr. Steven Tippins, my committee member who
inspired me with his charisma during my last residency. I was fortunate enough to have
taken courses with both Dr. Sharifzadeh and Dr. Tippins. I believe these courses
equipped me with the knowledge and skills to conduct this quantitative research study.
I thank my fellow students and other reviewers who immensely contributed to my
study, as their observations helped me build a quality dissertation.
I also thank my family members and friends, who provided me with the
opportunity to embark on this project and encouraged me to keep going despite the
obstacles I encountered along the way.
i
Table of Contents
List of Figures ................................................................................................................... vii
List of Tables ..................................................................................................................... ix
Chapter 1: Introduction to the Study ....................................................................................1
Background of the Study ...............................................................................................4
Problem Statement .........................................................................................................6
Purpose of the Study ......................................................................................................7
Research Questions and Hypotheses .............................................................................7
Conceptualization ....................................................................................................7
Design of the Variables ............................................................................................9
Research Questions and Hypotheses .......................................................................9
Statistical Model ....................................................................................................11
Independent and Dependent Variables ..................................................................11
Theoretical Framework of the Study ...........................................................................12
Nature of the Study ......................................................................................................14
Definition of Terms......................................................................................................15
Assumptions .................................................................................................................19
Scope and Delimitations ..............................................................................................19
Limitations ...................................................................................................................20
Significance of the Study .............................................................................................20
Summary and Transition ..............................................................................................21
Chapter 2: Literature Review .............................................................................................23
ii
Literature Search Strategy............................................................................................23
Working Capital ...........................................................................................................24
Working Capital Components......................................................................................25
CA ..........................................................................................................................25
Accounts receivables............................................................................................................ 26
Inventory. ............................................................................................................................. 27
CL ..........................................................................................................................28
Accounts payables. .............................................................................................................. 29
Short-term debt. .................................................................................................................. 29
CR ..........................................................................................................................30
Working Capital Measures ..........................................................................................31
Net Working Capital Measures (NWCM) ...................................................................31
Operating Working Capital Measures .........................................................................32
Importance of Adequate Working Capital ...................................................................32
Ability to Face Crisis .............................................................................................32
Credit-Worthiness ..................................................................................................33
Liquidity and Solvency ..........................................................................................34
WCM............................................................................................................................35
Corporate Governance .................................................................................................36
Corporate Governance Theories ..................................................................................37
Agency Theory.......................................................................................................37
iii
Stakeholder Theory ................................................................................................38
Stewardship Theory ...............................................................................................39
Legitimacy Theory .................................................................................................40
Multiple Theories Approach ..................................................................................41
CEO Duality...........................................................................................................42
AC 43
Summary of Gaps in the Current Literature ................................................................55
Plan to Fill the Identified Gaps in the Literature ...................................................56
Chapter Summary ........................................................................................................56
Chapter 3: Research Method ..............................................................................................58
Introduction ..................................................................................................................58
Research Design and Rationale ...................................................................................60
Description of the Research Design .............................................................................60
Definition/Measurement of the Variables of the Study .........................................61
Independent Variables of the Study .......................................................................61
CEO duality/CEO tenure. ................................................................................................... 61
BS. ......................................................................................................................................... 62
AC. ........................................................................................................................................ 62
Dependent Variables of the Study .........................................................................62
CA. ........................................................................................................................................ 62
CL. ........................................................................................................................................ 63
iv
CR. ........................................................................................................................................ 63
The CCC............................................................................................................................... 63
SG. ........................................................................................................................................ 64
Justification ............................................................................................................64
Target Population .........................................................................................................67
Sampling Method .........................................................................................................68
Sampling Design ....................................................................................................68
Screening and Eligibility Criteria ..........................................................................69
Sampling Frame .....................................................................................................69
Sample Size and Rationale.....................................................................................70
Instrumentation ............................................................................................................71
Measurement ..........................................................................................................71
Measurement validity. ......................................................................................................... 73
Measurement reliability. ..................................................................................................... 74
Data Collection ............................................................................................................75
Research Questions ......................................................................................................76
Hypothesis Formulation ...............................................................................................77
Data Analysis ...............................................................................................................78
Statistical Analysis .................................................................................................79
Protection of Selected Organizations in the Study ................................................81
Dissemination of Findings .....................................................................................81
v
Summary ......................................................................................................................82
Chapter 4: Results ..............................................................................................................83
Data Collection ............................................................................................................84
Institutional Review Board (IRB) Approval for Data Collection ..........................84
Sources of Collected Data ......................................................................................85
Data Analysis: Descriptive Statistics ...........................................................................85
CAs ........................................................................................................................86
CLs .........................................................................................................................87
CR ..........................................................................................................................88
CCC........................................................................................................................89
CEO Tenure ...........................................................................................................90
CEO Duality...........................................................................................................91
BS ...........................................................................................................................92
AC ..........................................................................................................................93
SG ..........................................................................................................................94
Data Analysis: Valuation of Statistical Assumptions and Hypothesis Testing ...........95
Evaluating the Current Assets Regression Model .......................................................95
Evaluation of Normality Assumption in the Current Asset Model..............................98
The Assumption of Independent Variables: Categorical or Continuous ...................100
Test of Assumptions of Collinearity in the Current Asset Model .............................100
vi
Evaluating the Current Liability Regression Model ............................................101
Evaluation of Normality Assumption in the Current Liability Model .......................104
Test of Assumptions of Collinearity in the Current Liability Model.........................106
Evaluating the Current Ratio Regression Model .......................................................107
Evaluation of Normality Assumption in the Current Ratio Model ............................110
Test of Assumptions of Collinearity in the CR Model ..............................................112
Evaluating the CCC Regression Model .....................................................................113
Evaluation of Normality Assumption in the CCC .....................................................116
Test of Assumptions of Collinearity in the CCC Model............................................118
Summary ....................................................................................................................119
Chapter 5: Discussion, Conclusions, and Recommendations ..........................................121
Summary of Findings .................................................................................................121
CEO Tenure, CEO Duality, BS, AC Size, and CAs ..................................................123
CEO Tenure, CEO Duality, BS, AC Size, and CL ....................................................125
CEO Tenure, CEO Duality, BS, AC Size, and CR ....................................................126
CEO Tenure, CEO Duality, BS, AC Size, and CCC .................................................127
Additional Interpretations ..........................................................................................128
Limitations of the Study.............................................................................................129
Recommendations for Further Research ....................................................................131
Implications for Social Change ..................................................................................132
Conclusions ................................................................................................................134
References ........................................................................................................................136
vii
List of Figures
Figure 1. Conceptual model. ................................................................................................8
Figure 2. Bar graph showing central tendency and dispersion of current assets. .............87
Figure 3. Bar graph showing central tendency and dispersion of current liabilities.........88
Figure 4. Bar graph showing central tendency and dispersion of current ratio. ...............89
Figure 5. Bar graph showing central tendency and dispersion of cash conversion cycle. 90
Figure 6. Bar graph showing central tendency and dispersion of CEO tenure duration. .91
Figure 7. Bar graph showing CEO duality of Nigerian firms. ..........................................92
Figure 8. Bar graph showing central tendency and dispersion of board size. ..................93
Figure 9. Bar graph showing central tendency and dispersion of audit committee size. ..94
Figure 10. Bar graph showing central tendency and dispersion of sales growth. .............95
Figure 11. Histogram of distributed residual of current assets. ........................................99
Figure 12. Normal P-P plot of distributed residuals of current assets. .............................99
Figure 13. Detrended P-P plot of current assets .............................................................100
Figure 14. Histogram of almost normally distributed residual of current liability. ........105
Figure 15. Normal P-P plot of current liabilities. ...........................................................105
Figure 16. Detrended normal P-P plot of current liability. .............................................106
Figure 17. Histogram of almost normally distributed residual of current ratio. .............111
Figure 18. Normal P-P plot of almost normally distributed residuals of current ratio. ..111
Figure 19. Detrended normal P-P plot of current ratio. ..................................................112
Figure 20. Histogram of distributed residual of cash conversion cycle. .........................117

viii
Figure 21. Normal P-P plot of distributed residuals of cash conversion cycle. ..............117
Figure 22. Detrended P-P plot of cash conversion cycle. ...............................................118
ix
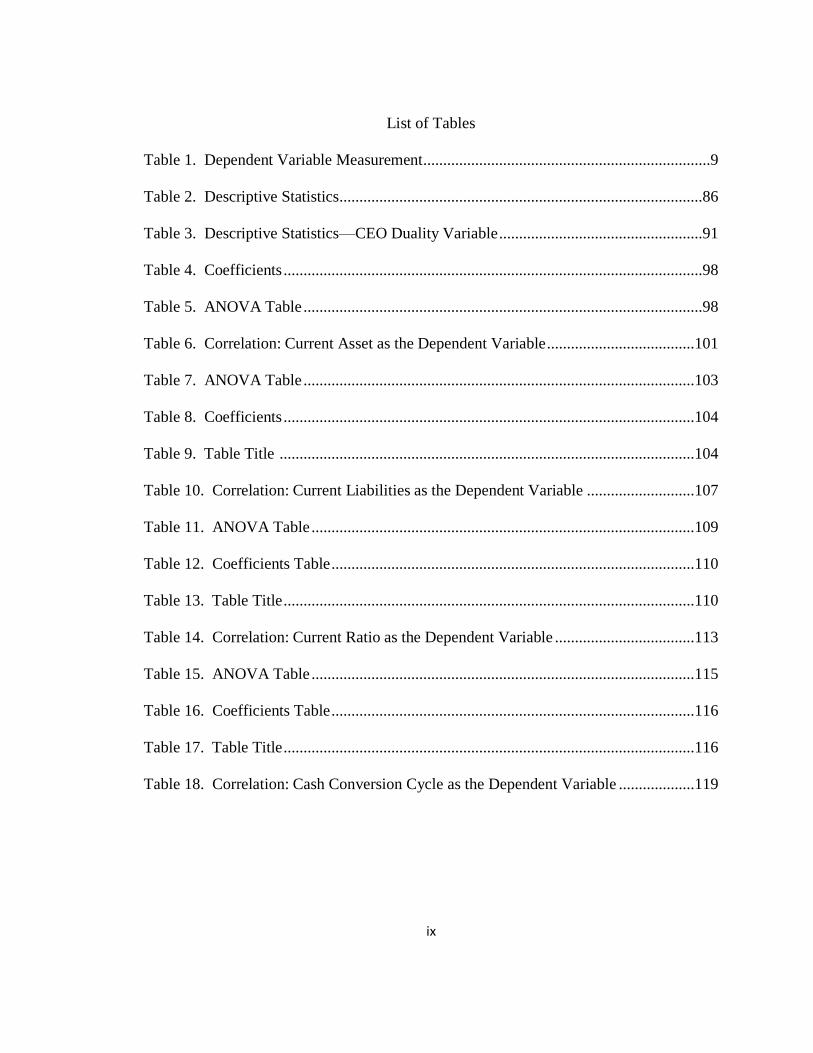
List of Tables
Table 1. Dependent Variable Measurement........................................................................9
Table 2. Descriptive Statistics...........................................................................................86
Table 3. Descriptive Statistics—CEO Duality Variable ...................................................91
Table 4. Coefficients .........................................................................................................98
Table 5. ANOVA Table ....................................................................................................98
Table 6. Correlation: Current Asset as the Dependent Variable .....................................101
Table 7. ANOVA Table ..................................................................................................103
Table 8. Coefficients .......................................................................................................104
Table 9. Table Title ........................................................................................................104
Table 10. Correlation: Current Liabilities as the Dependent Variable ...........................107
Table 11. ANOVA Table ................................................................................................109
Table 12. Coefficients Table ...........................................................................................110
Table 13. Table Title .......................................................................................................110
Table 14. Correlation: Current Ratio as the Dependent Variable ...................................113
Table 15. ANOVA Table ................................................................................................115
Table 16. Coefficients Table ...........................................................................................116
Table 17. Table Title .......................................................................................................116
Table 18. Correlation: Cash Conversion Cycle as the Dependent Variable ...................119
1
Chapter 1: Introduction to the Study
Introduction
Since the 2008 recession, the world has witnessed a chaotic financial situation.
There was a boom in the economy shortly after the recession, but later, the economy
turned sour after the downturn. In Price, Water, and Coopers’ (2013) global working
capital review, the authors noted that working capital levels had declined by 2% globally,
which they said was an economic condition that applied to all industries. Therefore,
adequate working capital management (WCM) is essential for all sectors. In the context
of this study, I regarded working capital as an efficient use of cash. Al Shubiri (2011)
described working capital as current assets (CA) minus current liabilities (CL), noting
that it is a trading capital that firms need to meet their short-term financial requirements.
In the context of this study, CA included cash and other short-term assets while CL
included creditors and other applicable 1-year current liabilities.
Sagner (2014) stated that optimizing working capital components could help
reduce the requirement of having liquidity and free cash flow to make future purchases.
This is because the efficient use of working capital is fundamental to the continual
existence of any organization, as firms in developed and developing countries aim to
ensure that they have the necessary cash flow to fund their capital requirements (Agyei &
Yeboah, 2011). Recent Nigerian studies have indicated that high promising investments
have yielded negative returns for shareholders because of poor corporate governance
(Ademola, 2014). Therefore, promoting a high quality corporate governance principle
could ensure that firms have adequate control of their working capital assets (Cuomo,
2
Mallin, & Zattoni, 2015). Numerous experts have stated that corporate governance is a
significant determinant in WCM (Goel, Bansal, & Sharma, 2015). During the last
decade, corporate governance has received a lot of attention because of certain reforms to
deal with the several economic debacles during the last financial crisis. Researchers have
attributed the evolution of corporate governance to changes in ownership structure and
control (Gill & Biger, 2013). These changes provoked variations that have differed from
country to country (Mulili & Wong, 2011).
In this study, I explored CA and CL, but focused on cash because high liquidity
exposes management’s reckless behavior (see Isshag et al., 2009). Lau and Block (2012)
stated that cash is an essential component of working capital that helps organizations stay
afloat. Isshag et al. (2009) viewed cash as available funds to invest in capital assets and
distribute to a firm's shareholders. Per the Keynesian economic theory, firms hold money
for several reasons, including that they have precautionary, speculative, and transaction
motives (Gill & Biger, 2013). A transaction motive is the money used to conduct daily
business transactions and pay for goods and services (Gill & Shah, 2012). The
precautionary motive is the money saved in case of an emergency, while the speculative
motive is the money used to pay for any expenses that arise (Gill & Shah, 2012, p. 70).
Kim, Kim, and Woods (2012) stated that both the precautionary and transitionary motives
could explain a firm’s determinant for cash holdings. Having too much cash does not
necessarily bode well for an organization; therefore, a surplus of cash could be because of
poor corporate governance.
3
Brealey, Myers, and Allen (2010) stated that the way firms make decisions about
financial matters is questionable. This is partially related to the trade-off and pecking
order theories. The trade-off theory assumes that firms allocate their resources by
comparing debt tax benefits and bankruptcy costs, thereby targeting the optimal debt ratio
(De & Banerjee, 2017). The pecking order theory disputes the trade-off theory, noting
that firms value the sequential choice to the funding sources (Adair & Adaskou, 2015).
Adair & Adaskou (2015) further noted that per pecking order theory, external financing
should be avoided when there is an internal funding source available.
Though the pecking order theory and the concept of free cash flow have explained
patterns of capital requirements, unnecessary cash surpluses might also occur because of
poor corporate governance. Afza, Amarjit, and Gill (2013) argued that having proper
liquidity facilitated smooth organizational operations and that top management and board
members were responsible for setting policies to this effect. Therefore, the board plays a
key role in making decisions concerning working capital assets. Poor corporate decisions
regarding working capital could adversely impact cash flow and provoke agency
problems (Khan & Haque, 2017). Since the inception of Beile and Means’ (1996)
research on the topic, corporate governance has concentrated on separating ownership
from management. This process gave birth to pedals, which metamorphosed into the
principal-agent relationship, because of dispersed ownership (Ali, 2014). Yusoff and
Alhaji (2012) viewed corporate governance as a channel in which the company’s board
of directors and top management were both considered to be watchdogs used to reduce
conflict concerning the principal-agent relationship. In this context, the top
4
administrators of an organization are the agents, the owners are the principals, and the
board of directors is the monitoring apparatus (Haslindar, Fazilah, & Abdul, 2011). In
this study, I focused on the effects of corporate governance on WCM within Nigerian
organizations.
In this chapter, I will present the background of the study, a comprehensive
description of the problem, and the goal of the research. My research questions and
hypotheses were designed to support the goals of the study. I will review the conceptual
framework and the definitions, assumptions, scope, delimitations, and limitations. Then I
will explain the significance of the research, emphasizing how it could lead to social
change in certain parts of society. I will conclude the chapter with the definitions of
terms and a summary.
Background of the Study
Strong corporate governance sets the stage for effective financial management
decisions. Corporate governance implies that companies should carry out strategies that
are compatible with their short, medium, and long-term goals and their shareholders’
interests (Achchuthan & Rajendran, 2013). WCM is a short-term mechanism that is
considered vital to making financial management decisions, and practitioners regard
working capital as the strategy used to fill the gap between CA and CL (Tran et al, 2017).
It is fundamental for organizations to ensure smooth daily operations and take advantage
of occasional opportunities.
Researchers have highlighted three strategic approaches to working capital
financing: maturity matching, or hedging; the conservative strategy; and the aggressive
5
strategy (Talonpoika et al., 2016). In the traditional strategy, Talonpoika et al. noted that
liquidity is important because long-term funds are used and there are chances to take
advantage of immediate business opportunities. Also, profitability is low, with respect to
working capital decisions because of long-term fund costs (Aktas, Croci, & Petmezas,
2015). Interest rate costs also reduce profitability because of minimization (Aktas, Croci
& Petmezas, 2015). The aggressive approach has low liquidity because of its greater
dependency on short-term funds (Afza & Nazir, 2007). The aggressive method does not
use idle capital but saves debt interest costs. Afza & Nazir (2007) also noted that the
hedging strategy strikes a balance between liquidity and the value of unused funds. The
average profitability maintained in the hedging strategy is greater than that maintained in
the conservative approach but is less than that maintained in the aggressive approach.
Therefore, the hedging strategy moderates profitability and stabilizes interest costs.
Working capital impacts liquidity, which creates value for firms (Bagchi & Khamrui,
2012).
Researchers have asserted that sustaining solvency is vital to maintaining
competitive advantages (Ivanovic, Baresa, & Bogdan, 2011). Lau and Block (2012) used
the Edgar database to collect data from the Standard and Poor 500 to determine whether
the involvement of founders and family members fundamentally affected a firm’s value
and cash flow. The authors found that pioneered companies held higher basic levels of
cash than family firms. Gill and Shah (2012) stated that CEO duality, board size (BS),
and the audit committee (AC) played important organizational roles in maintaining and
controlling adequate levels of working capital. Raheman, Afza, Qayyum, and Bodla
6
(2010) said working capital was a central determinant for survival and profitability.
Nigerian firms should build better frameworks for WCM, establishing corporate
governance practices to solve their ongoing problems. Researching corporate governance
practices among Nigerian firms could add to the literature on WCM in organizations.
Problem Statement
Many Nigerian firms have faced WCM inconsistencies, which have remained a
source of tremendous concern (Ademola, 2014; Luqman, 2014). Price, Waterhouse, and
Coopers (2013) noted that working capital levels have deteriorated by 2% globally, a
situation that has applied to all industries (Erumban & Vries, 2014). About 70% of
Nigerian firms have failed in the past 10 years because of bad WCM (My Financial
Intelligence, 2013). The general problem I addressed in this study was the lack of
literature on the impact of corporate governance on WCM. Nadiri (1969) initiated a
study on adequate levels of real cash balances, but a deeper understanding of the impact
of corporate governance policies on WCM is needed (see Gill & Biger, 2013). The
specific problem that I addressed in this study was the lack of knowledge in optimizing
WCM, especially in minimizing working capital requirement to improve the relationship
between corporate governance and the efficiency of WCM within Nigerian firms. I
employed a correlational design in this quantitative research study to investigate the
relationship between corporate governance and WCM among 89 companies listed on the
Nigerian Stock Exchange (NSE).
7
Purpose of the Study
My objective in this quantitative research study was to examine the impact of
corporate governance practices on the efficiency of WCM within firms listed on the NSE.
I used a correlational and nonexperimental research design for this study. I obtained
secondary data from the NSE to aid in the analysis of the results. The dependent
variables of this study were CA, CL, current ratios (CR), and the cash conversion cycle
(CCC). The independent variables were CEO tenure, CEO duality, BS, and the AC,
while the control variables were sales growth (SG), firm size, firm performance, and
internationalization of the firm. My results provided insight into how corporate
governance might significantly enhance WCM efficiency. The results of this study may
also help financial managers and investors to better understand some of the essential
characteristics of corporate governance practices.
Research Questions and Hypotheses
In this study, I explored the impact of corporate governance on WCM within
companies listed on the NSE. I chose this topic because WCM is a significant
component of an organizational system that should be seriously considered at the
governance level (Gill & Biger, 2013). To guide this study, I developed the following
overarching research question: How do corporate governance practices impact WCM
efficiency?
Conceptualization
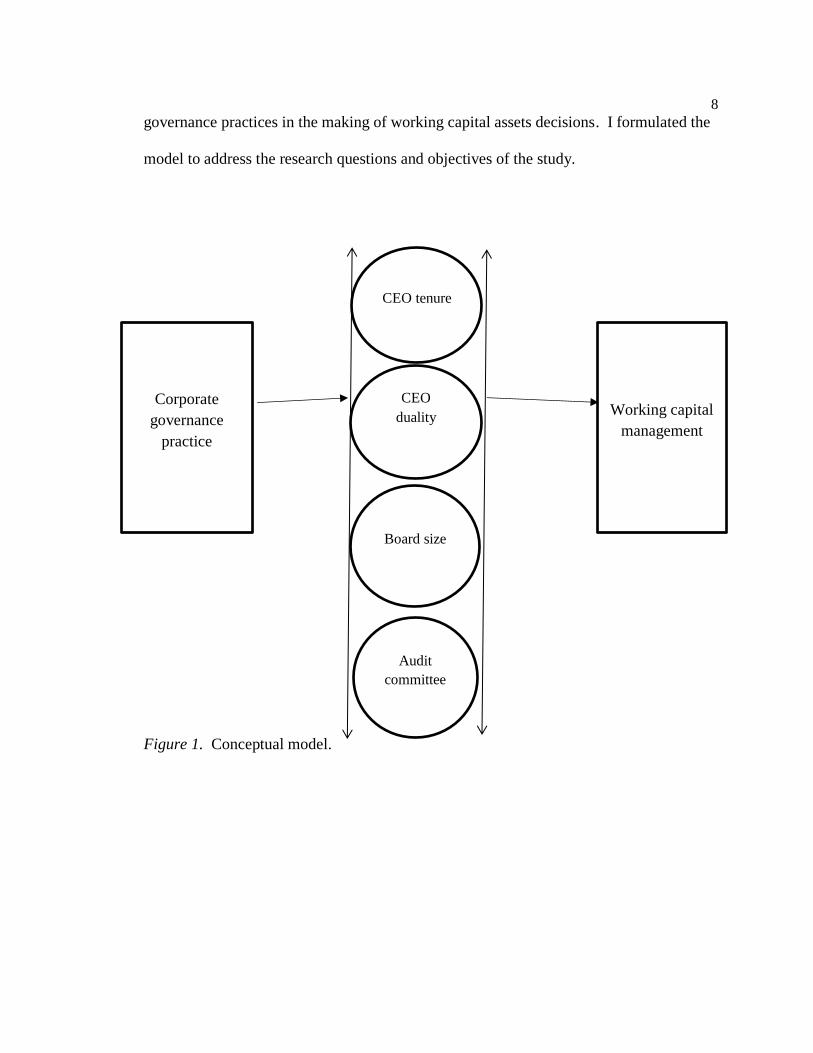
Figure 1 provides a conceptual model that describes the fundamental aspects of
corporate governance practices. The model illustrates the effectiveness of corporate
8
governance practices in the making of working capital assets decisions. I formulated the
model to address the research questions and objectives of the study.
Figure 1. Conceptual model.
Corporate
governance
practice
Working capital
management
CEO
duality
Board size
CEO tenure
Audit
committee
9
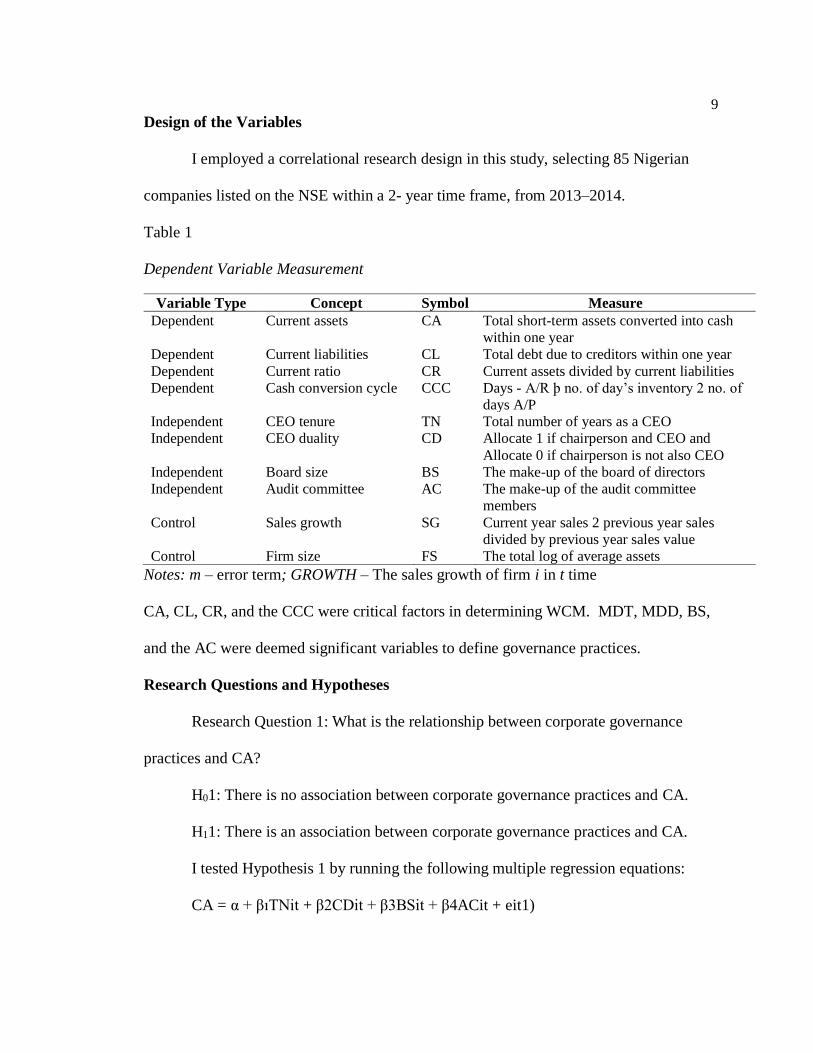
Design of the Variables
I employed a correlational research design in this study, selecting 85 Nigerian
companies listed on the NSE within a 2- year time frame, from 2013–2014.
Table 1
Dependent Variable Measurement
Variable Type Concept Symbol Measure
Dependent Current assets CA Total short-term assets converted into cash
within one year
Dependent Current liabilities CL Total debt due to creditors within one year
Dependent Current ratio CR Current assets divided by current liabilities
Dependent Cash conversion cycle CCC Days - A/R þ no. of day’s inventory 2 no. of
days A/P
Independent CEO tenure TN Total number of years as a CEO
Independent CEO duality CD Allocate 1 if chairperson and CEO and
Allocate 0 if chairperson is not also CEO
Independent Board size BS The make-up of the board of directors
Independent Audit committee AC The make-up of the audit committee
members
Control Sales growth SG Current year sales 2 previous year sales
divided by previous year sales value
Control Firm size FS The total log of average assets
Notes: m – error term; GROWTH – The sales growth of firm i in t time
CA, CL, CR, and the CCC were critical factors in determining WCM. MDT, MDD, BS,
and the AC were deemed significant variables to define governance practices.
Research Questions and Hypotheses
Research Question 1: What is the relationship between corporate governance
practices and CA?
H01: There is no association between corporate governance practices and CA.
H11: There is an association between corporate governance practices and CA.
I tested Hypothesis 1 by running the following multiple regression equations:
CA = α + βıTNit + β2CDit + β3BSit + β4ACit + eit1)
10
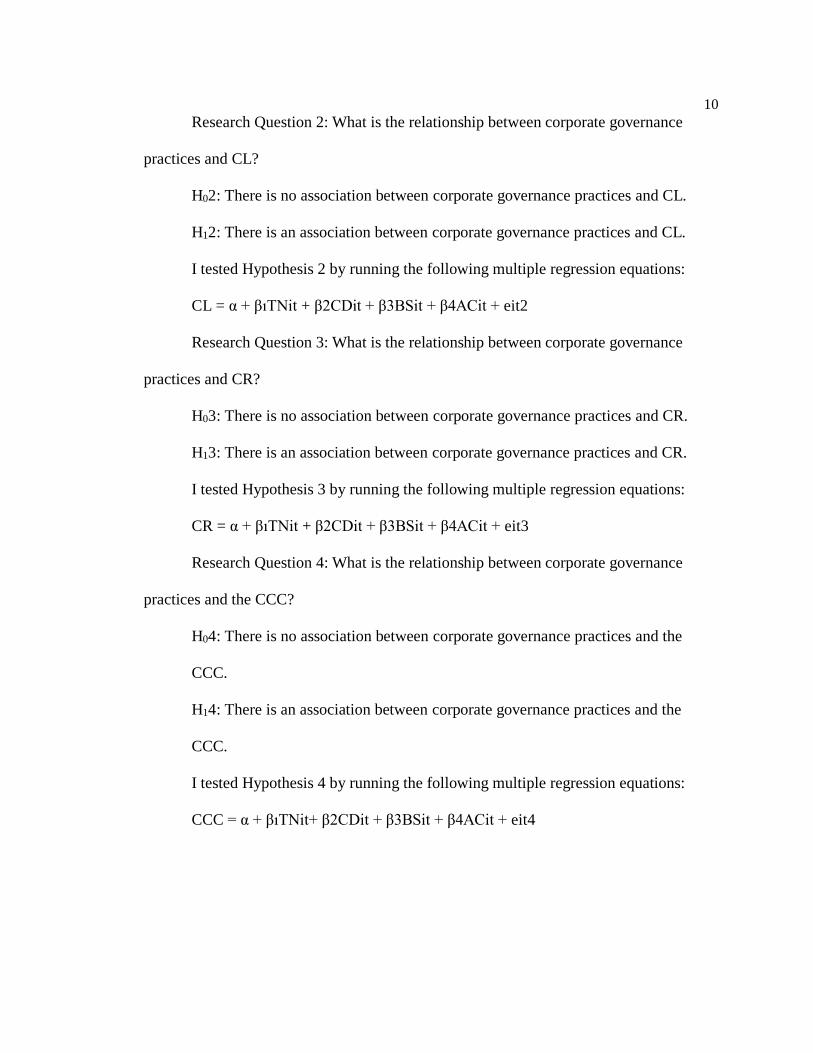
Research Question 2: What is the relationship between corporate governance
practices and CL?
H02: There is no association between corporate governance practices and CL.
H12: There is an association between corporate governance practices and CL.
I tested Hypothesis 2 by running the following multiple regression equations:
CL = α + βıTNit + β2CDit + β3BSit + β4ACit + eit2
Research Question 3: What is the relationship between corporate governance
practices and CR?
H03: There is no association between corporate governance practices and CR.
H13: There is an association between corporate governance practices and CR.
I tested Hypothesis 3 by running the following multiple regression equations:
CR = α + βıTNit + β2CDit + β3BSit + β4ACit + eit3
Research Question 4: What is the relationship between corporate governance
practices and the CCC?
H04: There is no association between corporate governance practices and the
CCC.
H14: There is an association between corporate governance practices and the
CCC.
I tested Hypothesis 4 by running the following multiple regression equations:
CCC = α + βıTNit+ β2CDit + β3BSit + β4ACit + eit4
11
Statistical Model
In this quantitative research study, I sought to determine if there was a
relationship between CEO tenure, CEO duality, BS, AC, and WCM components. I
employed a correlational design to investigate the relationship between several
independent and dependent variables. Multiple regression analysis was the most suitable
statistical model to explain the relationship between various independent and dependent
variables. Hence, I used the multiple regression model to test the hypotheses of the study
and take the control variables, such as SG, firm size, and firm performance, into
consideration.
Independent and Dependent Variables
I structured the hypotheses and research questions to investigate if a relationship
existed between corporate governance and WCM. The independent variables for the
hypotheses were CEO tenure, CEO duality, BS, and the AC. The dependent variables for
the hypotheses were CA, CL, CR, and the CCC.
To calculate CEO tenure, I considered the number of years the individuals served
as CEOs. For CEO duality, a value of 1 was assigned if the same person occupied the
position of the chairman of the board and the CEO, and a value of 0 was assigned if one
person did not occupy both positions. BS was calculated according to the number of
directors serving on the board, while the AC was calculated according to the number of
AC members. The measurements applied to the independent variables were also applied
to the hypotheses and the alternative hypotheses.
12
To measure the dependent variables in the first hypothesis, I used the CA to
estimate the value of all items converted into cash within one year. To measure the
dependent variable in Hypothesis 2, I used the CL to gauge the amount due to creditors
within one year. To measure the dependent variable of the CR in Hypothesis 3, CA was
divided by CL. The CCC in Hypothesis 4 was used to measure days’ inventory
outstanding (DIO) plus days sales outstanding (DSO) minus days purchases outstanding
(DPO). I will explain the measurements in further detail in Chapter 3.
Theoretical Framework of the Study
The theoretical framework serves as a barometer to direct a research study
(Thorne, 2016). By using a theoretical framework, I could hypothesize and describe the
meanings of CEO tenure, CEO duality, BS, and AC as attributes of sound corporate
governance that affect shareholders’ wealth and resource management. Gill and Shah’s
(2012) corporate cash holdings, tradeoff, pecking order, free cash flow, and the corporate
governance theory served as lenses to guide this study, in which I examined the impact of
corporate governance on WCM within Nigerian organizations. Trade-off approach
implies that firms choose how to allocate their resources by comparing the debt tax
benefits and bankruptcy costs, thus aiming at the optimal debt ratio (Gill & Biger, 2013).
The pecking order theory disputes the trade-off approach, noting that firms consider the
sequential choice to the funding sources (Dinh Phạm Anh, 2013). The pecking order
theory states that external financing should be avoided when there is an internal funding
source available, to stop increased equity when a firm can engage in new debt obligations
(De & Banerjee, 2017). Gill and Shah’s theory of corporate cash holdings states that
13
though accounts receivables, inventory, and accounts payables are critical, cash is
vulnerable because of management’s reckless behavior.
According to Keynesian economic theory, firms hold money for several reasons,
including that they have precautionary, speculative, and transaction motives (Rezende,
2015). A transaction motive is the money used to conduct daily business transactions and
pay for goods and services. The precautionary reason is the money saved in case of an
emergency, while the speculative motive is the money used to pay for any bargain
expenses that arise (Gill & Shah, 2012). Kim et al. (2012) stated that both the
precautionary and transitionary motives could explain a firm’s determinant for cash
holdings. Gill and Shah (2012) agreed with Kim et al. (2012), reporting both
precautionary and transitionary motives could explain a firm’s determinant for cash
holdings, and further stating that the separation of control and CEO duality could impact
cash policies within specific organizational cash holding levels. In this study, the
explanatory variables were similar to those used in other studies on WCM. I included
explanatory variables in this study such as firm size, internationalization of firms, SG,
cash holdings, the CCC, firm performance, accounts receivables, inventory, accounts
payables, cash conversion efficiency, and the CR of the sample firms.
There is a need for researchers to identify governance models that Nigerian
organizations could adopt to enhance their overall usefulness and performance levels.
Kajananthan (2012) found that American organizations, specifically manufacturing
organizations with governance structures, performed better than companies without
corporate governance structures (Ianniello, 2015). However, the impact of corporate
14
governance on WCM efficiency within Nigerian organizations has not been fully
explored. According to Ademola (2014), the challenges that many Nigerian firms have
experienced, in relation to working capital inconsistencies, have remained an ongoing
source of concern. Therefore, I explored the four components of corporate governance
(CEO tenure, CEO duality, BS, and the AC) to help build an ideal management model for
Nigerian companies.
I did not attempt to establish causation in this quantitative study related to how
corporate governance impacts working capital efficiency because establishing causation
involves incorporating other variables related to cultural, legal, business, social
environment, and many other factors. Therefore, I did not establish all the variables that
could cause working capital efficiency. In Chapter 3, I will discuss the research design,
data resources, financial measurement techniques, statistical data analysis, and statistical
models of this study.
Nature of the Study
Using a quantitative research approach, in this study I analyzed available
secondary data to document the relationship between CEO tenure, CEO duality, BS, the
AC, and WCM within Nigerian organizations. My goal was to clarify questions
regarding the relationship between CEO tenure, CEO duality, BS, the AC, and WCM
within Nigerian organizations. It was advantageous to utilize secondary data for this
study concerning financial statements and corporate governance because of the extensive
availability of data on Nigerian organizations.
15
I collected financial data on the 85 organizations chosen for the study from the
NSE database and organizational websites. Since the study data were quantitative in
nature, it was analyzed through multiple regression, using SPSS.
Definition of Terms
AC: AC is the operating arm of a company’s board of directors that oversees the
administration of financial reports and disclosures. AC members are integral members of
a company’s board because they are responsible for rolling out policies to improve
financial reporting. The AC members and the chairperson are selected from a company's
board. The AC sustains communication with the chief financial officer and has the
authority to perform audits if accounting practices are worrisome or if there are issues
with company personnel. The AC also monitors policies, oversees external auditors and
regulatory compliance, and develops risk management policies with administrative
management (Nuryanab & Islam, 2011).
BS: Lipton and Lorch (1992) stated that the size of the board is a company’s
preference. Therefore, within the framework of this study, a BS of three members is
reasonable, but some states also permit boards that consist of a single board member.
Board members function as representatives to reflect their constituency.
CCC: The CCC measures the length of time in days that a firm ties up a net dollar
input in the purchasing, making, and selling of goods and services, before converting the
resource inputs into cash flows (Das, 2016). A low number, in comparison to the
industry average, indicates a strong cash flow creation from internal operations. The
lower the number, the better. The metrics examine the length of time required to sell
16
inventory, the length of time needed to receive money from customers, and the length of
time needed for a company to pay a bill without incurring late penalties.
CEO duality: CEO duality exists when a company’s CEO serves as a managing
director and the chairperson of its board (Lawal, 2012).
Corporate governance: Scholar practitioners define corporate governance as the
procedures and processes through which organizations are directed and controlled. It is a
system of rules and processes that reflects how a company is directed and managed.
Corporate governance enables a corporation to develop mechanisms for monitoring
policies, making decisions, and responding to a sound regulatory environment. The
management techniques allow organizations to pursue objectives, align stakeholders’
interests, and eventually distribute the rights and responsibilities of the board of directors,
managers, employees, shareholders, and other parties (Ballinger & Marcel, 2010).
Corporate governance also emphasizes the benefits of having sponsors in an organization.
Ballinger & Marcel noted that these sponsors might include management, shareholders,
suppliers, customers, financiers, government, and the community.
CA: CA are defined as balance sheet items that describe the value of all items that
can be converted into cash within one year or consumed in the operating cycle (Delen,
Kuzey, & Uyar, 2013). The operating cycle constitutes the time frame between acquiring
raw materials to produce and selling goods. Analysts include CA on the balance sheet
when they are converted into cash. In this study, CA included cash and cash equivalents,
accounts receivables, inventory, marketable securities, prepaid expenses, and other near
17
cash equivalents. On balance sheets, liquidity levels usually display CA (Damar, Meh, &
Terajima, 2013).
CL: CL are debt accounts in the balance sheet that are due within one calendar
year and include short-term debt obligations, accounts payable, accrued liabilities, and
other financial obligations. CL are bills that must be paid to creditors and contractors
within a short period. Usually, companies take out CA to defray the costs of their CL.
Analysts adopt the CR or the quick ratio to determine if a company can cover its current
obligations. Since companies must fulfill these requirements in the future, this provokes
a corresponding liability. In summary, liabilities that are due within one calendar year or
due on demand are described as CL in balance sheets (Hoskin, Fizzell, & Cherry, 2014).
CR: The CR is a financial and efficiency ratio that gauges a company's ability to
pay its outstanding short-term and long-term obligations. Financial analysts divide the
total of CA by the sum of a company’s CL to decide whether they should invest in a
project. The CR is adopted to highlight a firm’s ability to pay back its obligations with
its assets. Analysts assert that a higher CR indicates that a company could pay its
financial obligations, since it has a considerable proportion of asset value to liability
value. A ratio under 1 could indicate a company’s inability to pay its financial
obligations, because this implies that it has a considerable proportion of debt value to
asset value.
DIO: The DIO is an inventory that expresses the amount of stocks in days of all
the costs of goods that are sold. It shows the value of inventory the organization has tied
up in stock across its supply chain. In other words, DIO shows how long it takes to turn
18
inventory into sales. This measure can be aggregated for all inventories, works in
progress, and finished goods. A reduction in the day’s inventory implies that there has
been an improvement in working capital and an increase in deterioration. Firms use this
measure monthly (Kroes, & Manikas, 2014).
DPO: The DPO is a measure of a business's outstanding payment liability. The
DPO metrics measure how long it takes a firm to pay its invoices from trade creditors,
such as the firm's external suppliers. This working capital metric is important because it
indicates the accepted payment terms that a company follows. Businesses use this metric
on a quarterly or yearly basis. Most DPO takes about 30 days, indicating that it takes an
average of 1 month to pay vendors (Yazdanfar, & Öhman, 2014).
DSO: The DSO is the average number of days it takes a company to be paid
following a sale. It is a relative means of a debtor business process. The DSO is usually
determined monthly, quarterly, or annually, and is calculated by dividing accounts
receivables within a given period by the sum value of total credit sales within the same
period, and then multiplying this result by the number of days within the same period that
is being measured (Kroes, & Manikas, 2014).
WCM: WCM is the monitoring and employment of the two most fundamental
aspects of working capital, CA and CL or short-term assets and short-term liabilities.
WCM is the totality of the management of cash, debtors, prepayments, stocks, creditors,
accruals, and short-term loans to facilitate profitability and ensure that an operation runs
smoothly (Tran, Abbott, & Jin Yap, 2017).
19
Assumptions
To conduct this research study, I made the following assumptions:
• The secondary data used were accurate and complete.
• The information provided by the NSE and the participating companies was
correct, reliable, and timely compared to the self-reported management
information of the selected companies.
• The social ratings and the financial data of the involved companies were
complete and accurate.
Scope and Delimitations
I confined this study to Nigerian organizations. This geographic area was chosen
for two reasons. Firstly, it was chosen because Nigeria is a developing nation that lacks a
comprehensive corporate governance framework. Secondly, it was chosen because I am
from Nigeria, and it was convenient for me to conduct the study there. This study was
further confined to companies listed on the NSE and limited to the period from 2013–
2014. Researchers must consider and anticipate limitations when developing their
research plans to reduce the effects of the noted limitations (Patton, 2003). Using
secondary data that was not consistent with Nigerian organizations could have potentially
introduced errors to the study. For instance, Nigerian organizations are not used to
practicing CEO duality. The results of this study can only be generalized to Nigerian
organizations. Also, in this study I examined the relationship between BS, CEO tenure,
CEO duality, and working capital efficiency; some variables, such as organizational
leverage and CEO identification, were not necessarily present in the analysis model.
20
Future studies could explore other variables and make different assumptions to expand
this area of research.
Limitations
In this study, I investigated the impact of corporate governance on WCM in
Nigerian organizations, focusing on BS, CEO tenure, CEO duality, and the AC. The
sample size consisted of 89 large organizations listed on the NSE over a 2-year period. I
used public data reported on the NSE and on participating companies’ financial
statements to compute a statistical analysis, employing SPSS software. The results of
this study could not be confidently used to explain situations concerning organizations in
other countries.
Significance of the Study
This result might contribute to the literature on the factors that enhance WCM
efficiency and the relationship between factors of corporate governance and WCM
efficiency. The findings might be helpful for financial managers, investors, consultants,
researchers, financial management, and other stakeholders to use as evidence that
corporate governance plays a useful role in improving WCM efficiency. The results of
my study might also assist Nigerian financial organizations and practitioners alike to
develop appropriate governance mechanisms that would promote their corporate
performance and satisfy oversight regulations. The findings from this study could also
provide a better understanding of how managing different working capital assets might
positively influence organizational shareholders. By examining CEO tenure, CEO
duality, BS, and the AC, and the impact of corporate governance on WCM, the results of
21
this study could potentially help Nigerian organizations more efficiently manage their
finances. Therefore, this study might help Nigerian organizations adopt and operate
appropriate corporate governance structures that could enhance their overall
effectiveness, aid business managers in allocating resources, and allow them to continue
their corporate social responsibility missions of providing services to their communities
and transforming society.
Summary and Transition
In this chapter, I presented the background for the study in the context of Nigerian
organizations. I identified the research problem within the current empirical literature,
with a description of the shortcomings of prior research works. I stated the purpose of
the study and explained the research variables and the two research questions and
hypotheses that guided the inquiry. The conceptual model in the study addressed the
board of directors’ proper control and monitoring effectiveness, as informed by the
theoretical framework of stewardship. I explained and justified the intervening variables
believed to mediate the results between CG theories and WCM. The study rested on
some significant assumptions which I identified and described. I also defined the scope,
delimitations, and the significance of the research to necessitate a controlled analysis. I
ended the chapter by stating that the result of the study could not be confidently used to
explain situations concerning organizations in other countries.
In Chapter 2, I will review the discrepancies in prior studies concerning the
relationship between CG and WCM efficiency within Nigerian organizations. I ensured
that the sources cited were mostly within the last five years, as stipulated by Walden
22
University. I commence the literature review with a brief introductory explanation of
how the resources used for the review were acquired, then describe the relevant topics
covered, including WC, WCM components, WCM measures, CG theories, and the recent
empirical findings on CG-WCM efficiency. In each of these topics, I distinguish the sub-
themes, gave adequate analysis for their evaluation, and provided a reason for their
relevance to the study. The end of the chapter analyzes the identified gaps and how I
addressed these differences in the research study.
In Chapter 3, I will describe the methodology for conducting the research and the
considerations of the chosen design. I will start the chapter by examining the accepted
paradigm of the study, then discussed the design of the research and defined the
dependent, independent and control variables of the study. I identify the features of the
target population, supported by the description of the sampling method and the sampling
frame that guided how I selected the sampling items. Also, I describe the
instrumentation, data collection procedures, and data analysis method taking into
considerations the reviewed literature. Finally, I present the four hypotheses that guided
the research and justify their inclusion.
23
Chapter 2: Literature Review
Introduction
In this chapter, I will review prior studies on corporate governance and WCM
efficiency. The review of the literature will begin with general information concerning
WCM and narrow to specifically focus on the topic at hand. In this chapter, I will also
discuss corporate governance issues related to CEO duality, CEO tenure, AC, and BS,
and will focus on working capital policies. The literature review will include the
relationships between the dependent variables, CA, CL, CR, and the CCC, and the
independent variables, CEO tenure, CEO duality, BS, and the AC, and a discussion on
the impact of corporate governance on Nigerian organizations. In this section, I also
discuss the concept of WCM, focusing on reasons for controlling and addressing the
entrenchment of corporate governance on organizational structures. This chapter will
also include a discussion of the theories that I used as the theoretical framework for the
study. In this chapter, I will also address corporate governance themes as they are related
to WCM efficiency within organizations. As a whole, I will review existing studies,
highlighting gaps in the current literature that I addressed with this study. The keyword
search terms I used in this literature review included: CEO tenure, CEO duality, BS, AC,
the board of directors, CR, CA, CL, cash conversion efficiency, firm’s performance,
accounts receivables, inventory, accounts payables, SG, and corporate governance.
Literature Search Strategy
I used several databases within the Walden University Library, such as Business
Source Complete/Premier, ABI/Inform Complete, Emerald Management Journals, and
24
Sage Premier, to find relevant research studies to review. The literature review will only
include articles published within the last 5 years; however, since there was a lot of
research on WCM, studies that were more than 5-years-old were also reviewed to paint a
clearer picture of the theories underlying the study (see Krause, Semadeni, & Cannella,
2013). I used advanced search options to find this literature, such as searching the
Thoreau Multiple Databases using the Boolean operation on subjects such as working
capital, WCM, working capital components, working capital measures, working capital
performance, corporate governance, and corporate governance theories. I also used
resources relevant to the theoretical and empirical growth of WCM and corporate
governance constructs.
Working Capital
Economic literature and empirical evidence concerning working capital are very
scant. Tanwar and Arora (2014) defined working capital as the funds an organization
needs for its daily operations. Sagner (2014) said working capital was the financial
health of an organization and connected it to profitability and growth. Talonpoika, Karri,
Pirttila, and Monto (2016) described net working capital as CA less CL. Operational
working capital consists of inventories, accounts receivables, and accounts payables,
while financial working capital includes the net working capital that is not tied into
operations, such as cash (Knauer & Wohrmann, 2013). After the financial crisis,
working capital research boomed and Pirttilä (2014) linked this to the increased study of
operational working capital.
25
Operational working capital components include inventories, accounts payables,
such as money to pay suppliers, and accounts receivables, such as payments received
from business partners after sales (Talonpoika et al., 2016). Proper working capital
entails adequate financing for cash receivables and net of inventory payables (Deloof,
2003). The proportion of receivables and payables occasionally changes during the
money management circle (Bendavid, Herer, & Yucesan, 2017). The requirements of
working capital help determine the profitability of a firm and the impact of financing and
investing decisions (Enqvist, Graham, & Nikkinen, 2014). Fewer working capital
requirements necessitate less long-term investments and free more cash for company
shareholders (Wasiuzzaman & Arumugam, 2013). On the other hand, Wasiuzzaman, &
Arumugam noted that less working capital could lead to lost sales and profitability.
Working Capital Components
CA
Jain, Singh, and Yadav (2013) stated that CA management is meant to be the goal
of WCM. Therefore, CA management needs attention when funds are limited. CA are
balance sheet accounts that describe the value of all items that analysts can convert into
cash within one year (Nobanee & Abraham, 2015). Analysts include CA on balance
sheets when they are converted into cash.
Managing CA by controlling the proportion of their components is crucial to a
business’ health and its ability to meet its short- and long-term cash needs. Jain et al.
(2013) stated that the performance of a firm relies on its CA management. Talonpoika et
al. (2016) noted that reducing receivables requires strict collection policies and fewer
26
credit sales. Many businesses now invoice as much as possible, and do not pay attention
to receiving invoiced goods in the future (Singh et al., 2017). These conditions have
allowed credit organizations to thrive because institutions have been unable to recover
these funds after the terminal credit periods end. Singh et al. (2017) noted that reduced
receivables might cause a firm to increase capital inflows and decrease sales and profits.
Maximizing account payables by using longer loan windows from suppliers might also
result in companies receiving poor quality materials that could lead to lost sales;
therefore, to sustain CA and increase growth, companies must aim to balance the best
proportions of their components to achieve profits to finance long-term capital projects
(Jain et al., 2013). In this study, CA included short-term assets, such as receivables,
inventory, and other assets, which companies could sell or consume within an operating
cycle or fiscal year, whichever is longer.
Accounts receivables. Accounts receivables occur when companies sell products
or goods on credit rather than immediately collecting cash (Singhania, Sharma, & Rohit,
2014). The process is used to build cordial relationships with customers and is an
alternative to cost reduction (Cheng & Pike, 2003). The process of selling goods on
credit comes at a price; however, as capital gets tied up. Customers create risks when
they are unable to redeem debts as their loan periods elapse and because of their inability
to redeem invoices, in accordance with the agreed upon terms of their transactions
(Ramiah, et al., 2016). Ramiah, et al. (2016), went ahead to assert that the process
highlights the value that firms place on risk reduction and customer satisfaction, as they
incorporate different policies on what they consider to be the greatest benefits. Default is
27
predominant within European countries (Hilscher, Pollet, & Wilson, 2015). Default
problems caused organizations to reduce the number of contractual days and the duration
of payment (Li & Tang, 2016). The economic recession also revealed that most of the
problems encountered in this period occurred because organizations were unable to
determine if their customers could pay them, which resulted in default and bankruptcy
(Hilscher & Wilson, 2016). Good credit administration involves credit risk assessment,
credit granting, accounts receivables financing, credit collection, and credit risk bearing
(Nehf, 2017). Organizations should emphasize the need for appropriate credit policies to
be put into place through different mechanisms, such as factoring and issuing
collateralized debt (Karminsky & Polozov, 2016).
Inventory. Inventory is a company’s raw materials, supplies, and works in
progress used in finished goods (Muller, 2011). Firms must have appropriate levels of
stock, as it is critical to their performance because improved inventory management is
intimately related to improved financial results (Shin, Ennis, & Spurlin, 2015).
Therefore, production schedules dictate proper inventory levels. Inventory is a
component of a firm’s CA but is expensive to maintain when businesses wait too long to
convert it into sales (Shin, Wood, & Jun, 2016). Kim and Chung (1990) proposed “the
modified square root formula” to evaluate inventory (p. 388). Organizational stock
differs, as organizations possess different types of stock. Kim and Chung (1990) further
noted that retailers might refer to their inventory as finished goods because they do not
add value to the manufacturing process. A manufacturing firm’s inventory might consist
of raw materials and finished goods that were produced and are available for shipment
28
(Berk & Gurler, 2016). When CA are grouped into their most liquid form, inventory is
also grouped into its most liquid form; some stock types are more liquid than others
(Preve & Sarria-Allende, 2010). Preve and Sarria-Allende argued that a large ship could
be less liquid than a bag of potatoes in a company’s inventory. Inventory management,
therefore, could be defined as the process of preparing, directing, and controlling
inventory to maximize an organization’s cash flow and profitability.
Organizations with well-planned inventories have excellent reputations, meet
variations in supply and demand of raw materials, and enable flexibility in the production
process (Feng et al., 2014). The optimal inventory is the advantage of the economic
order quantity, such as the result of ensuring a balance between the cost of ordering
goods and holding inventory (Chen, Cardenas-Barron, & Teng, 2014). Organizational
inventory policies might differ for various reasons. Some organizations might hold
stocks for larger capital retention, while others might hold little inventory to avoid tying
down capital.
CL
CL are short-term debt obligations that a company must pay within a year
(Nobanee & Abraham, 2015). CL constitute debt accounts in the balance sheet that are
due within 1 calendar year and include short-term debt obligations, accounts payables,
accrued liabilities, and other financial obligations (Lyngstadaas & Berg, 2016). CL are
bills that must be paid to creditors and contractors within a short period. Usually,
companies take out CA to defray the costs of their CL (Konak & Güner, 2016). Analysts
adopt the CR, or the quick ratio, to find out if a company can cover its current obligations
29
(Bibi & Amjad, 2017). Bibi & Amjad (2017) noted that since companies must fulfill
these requirements in the future, this provokes a corresponding liability. In this study,
CL included accounts payables that are within one calendar year and short-term debt
obligations that are due on demand.
Accounts payables. Talonpoika et al. (2016) described accounts receivables as a
process created when customers pay for transactions on credit. Accounts payables are the
opposite of accounts receivables. Talonpoika et al. (2016) asserted that account payables
exist because manufacturers sell goods to organizations on credit. Organizations desire
accounts payables because they create money and release cash liquidity to pay for goods
or other pressing needs (Desai, Foley, & Hines Jr., 2016). Firms create space for liquid
funds through credit bargaining (Kaiser & Young, 2009). Creating accounts payables
could also lead to the reduction of transaction costs and provide quality assurance for a
supplier’s products (Moodley, Ward, & Muller, 2017). Some dealers offer discounts to
customers to collect early payment as Kaiser & Young noted. In contrast to this, buyers
could also delay paying for goods and services to reduce working capital in the short-run.
Short-term debt. Kahl, Shivdasani, and Wang (2015) described short-term debt
as a significant component of a firm’s capital structure that could take the form of either
bank debt or non-intermediated short-term debt. Short-term debt is the obligation for a
company to pay within a year or money that a firm has borrowed for less than one year
(Konig & Pothier, 2016). Konig and Pothier (2016) further noted that short-term debt
often comes in the form of a line of credit that the company extends at its own discretion,
and typically, the company adopts the proceeds for a short-term period. At times, the
30
amount of long-term debt that a company must extinguish within a year must be
combined into this line of debt (Kahl, Shivdasani, & Wang, 2015). Short-term borrowing
must be taken seriously, especially when a corporation is in financial distress and needs
to pay back an enormous number of dividends to shareholders (Konig & Pothier, 2016).
In this study, short-term liabilities included accrued expenses, short-term notes payables,
and income tax payables.
CR
O'Mara (2015) described CR as a business’ ability to meet its short-term financial
obligations using short-term assets. The CR is a financial and efficiency ratio that gauges
a company's ability to pay its short-term and long-term outstanding obligations (Salam et
al., 2016). Kirkham (2012) stated that CA are an indicator of a company's liquidity. In
other words, CA that are associated with some CL provide leeway for companies to settle
their outstanding obligations. Salam et al. (2016), noted that professionals often compare
their CR to that of other businesses in the same industry and to trends for a given
company over time, to determine if the CR is improving or deteriorating over time. To
determine a company’s ability to invest in a project, financial analysts divide its total
amount of CA by the sum of its CL.
The various factors of WCM that have been described are important for sustaining
an organization. If firms managed these components well, they would have funds that
could be used to finance long-term projects. Many firms have suffered setbacks because
of poor WCM, subjective decision-making, and ad hoc strategies concerning WCM
(Khoury et al., 1999).
31
Working Capital Measures
Various working capital measures provide different perspectives on working
capital. These perspectives are used to make financial decisions, and, therefore, variety is
needed for proper reporting (Talonpoika et al., 2016). Marttonen, Viskari, and Karri
(2013) mentioned three measures of working capital, including position measures,
leverage measures, and activity measures. In this study, I focused on the position
method, which is used to measure net working capital, and the activity method, which is
used to report operating working capital. Different working capital measures have grown
over the years, thereby changing the notion of including working capital as part of
liquidity.
Net Working Capital Measures (NWCM)
Practitioners typically express the net working capital rule in current and quick
ratios. The NWCM is a static measure that presents a general view of NWCM.
Talonpoika et al. (2016) noted that practitioners used ratios to measure working capital
because of their simplicity, and argued that using financial ratios was no longer relevant
in the dispensation in estimating working capital. The current and quick ratios are
typically used in financial statement analyses, and, therefore, could provide views of net
working capital. However, Petersen and Plenborg (2012) asked if the CA could ever be
used to cover short-term liabilities. The CR divides CA by CL, while the quick ratio
divides cash, securities, and receivables by CL less advance payments. Analysts adopt
the quick ratio when they are uncertain if CA should be liquidated in their books. As
earlier stated, working capital can be described in many ways, and the working capital
32
turnover ratio is the most recognized ratio (Talonpoika et al., 2016). Working capital
turnover has been defined as sales divided by net assets, and it could be used to describe a
company’s efficiency in producing sales.
Operating Working Capital Measures
Operating working capital indicates cycle times and measures the effectiveness
of WCM. The operating working capital sheds light on accounts receivables, accounts
payables, and inventory and could be regarded as the only effective capital measure used
in managerial decision-making (Grosse-Ruyken, Wagner, & Jönke, 2011). Hofmann and
Kotzab (2010) stated that operating working capital could also be used to measure the
efficiency of financial supply chain management. Criticism of this ratio resulted in the
development of the CCC. Knauer and Wohrmann (2013) said the CCC was the most
relevant measure of operational working capital and could be used to determine the
length of outstanding stock plus DSO and DPO.
Importance of Adequate Working Capital
WCM is at the heart of many businesses (Talonpoika et al., 2016). Inefficient
working capital prevents organizations from properly functioning as expected, thereby
creating the possibility of bankruptcy. Some of the benefits of adequate working capital
implementation are described in the following paragraphs.
Ability to Face Crisis
Good WCM allows organizations to efficiently handle emergencies (Guariglia &
Mateut, 2016). If organizations had adequate financial backups and liquidity, they could
have better handled contingencies that arose during the global recession. Organizations
33
with liquidity backups withstood the economic recession.
Contented Labor Forces
Enough working capital allows companies to reward individuals for excellent
performance. Organizations that have enough working capital are able to satisfy and pay
their workers when payment is due. This would contribute to a contented labor force that
would be happy to increase the production of quality goods and services.
Regular Supply of Raw Materials
Organizations that have adequate amounts of working capital can carry enough
inventory to satisfactorily serve customer needs. These organizations would also be able
to facilitate the regular supply of raw materials for future continuous production and
market expansion. Organizations would be able to create favorable market conditions
that could, in turn, allow them to purchase required materials at lower rates and hold
stock for higher rates.
Credit-Worthiness
Good WCM enables a firm to efficiently run its business, with no delays in bank
services or services from other external financial institutions. Properly managing
liquidity would allow an organization to create an environment for lenders to extend
credit under natural and favorable conditions. Therefore, the ability for an organization
to borrow money depends on their ability to repay the loan and behave in a financially
responsible manner.
34
Liquidity and Solvency
A good WCM position would enable organizations to make dividend payments
when they were due to investors (Ding, Guariglia, & Knight, 2013). This would give
organizations good reputations. This would also create confidence in the outside world,
including among company shareholders. Additionally, this would create good conditions
for a favorable market environment to raise funds in the future. Nwankwo and Oso
(2010) noted that a firm's inability to pay its obligations when they were due might have
adverse effects on its reputation (Guariglia & Mateut, 2016). Hofmann and Kotzab
(2010) stated that cash was the most liquid asset among the working capital components
of firms, but noted that though cash holdings were essential, too much idle money was
also not a good idea. The optimization of working capital entails minimizing WCM
needs and realizing maximum revenues for long-term financing. Good WCM increases a
firm’s cash flow, which automatically increases its growth potential, since there would be
enough funds to invest in long-term investments. The availability of funds for long-term
investments enhances organizational growth potential and increases shareholder returns.
Organizations should time cash flow, to ensure that it is positive. Gill and Shah (2012)
stated that optimal levels of capital, which are based on organizational needs, are
important to a firm’s survival. Corporate governance, therefore, helps an organization
manage its working capital assets. Well-managed working capital assets promote growth
and protect shareholder interests (Hofmann & Kotzab, 2010). Researchers have asserted
that corporate governance has significant implications on economic growth. Proper
corporate governance practices are essential for mitigating risks for investors, bringing in
35
investments, and enhancing the efficiency of company operations (Velnampy &
Pratheepkanth, 2012).
WCM
Muhammad, Rabi, Ibrahim, and Ahmad (2015) stated that WCM involves using
funds needed for daily organizational affairs to achieve an organization’s goals. WCM
applies to managing cash, cash equivalents, debtors, prepayments, stocks, creditors,
accruals, and short-term loans to increase profitability and make an organization run
smoothly (Kehinde, 2011). Having enough working capital does not guarantee
profitability, but incorporating corporate governance policies into organizational assets
management could guarantee profitability and shareholder dividends. Therefore, WCM
could be described as using proper corporate governance policies to administer CA and
CL.
WCM implies that an optimal balance of probabilities exists in working capital
assets investments (Binti Mohamad & Elias, 2013). In other words, organizations should
avoid making rash decisions while managing working capital, to achieve optimal balance,
in terms of the growth and survival of a firm (Osundina & Osundina, 2014). Since proper
WCM is essential to business health, organizational boards and management should
administer proper corporate governance mechanisms, taking factors such as size, business
environment, and market share into consideration to enhance growth and shareholder
value.
36
Corporate Governance
Many practitioners view corporate governance as a critical factor in WCM,
because of its role in policy formulation. During the last decade, corporate governance
has received a lot of attention because of various reforms. These reforms occurred
because of the last financial crisis. Researchers have attributed the evolution of corporate
governance to changes between ownership structure and control. These changes
provoked variations that have differed by country (Mulili & Wong, 2011). There are
several different approaches to corporate governance, but this study focused on agency
theory and stewardship theory. Kiel and Nicholson (2003) described agency theory as
the division of ownership and control, while stewardship theory indicates that
professional managers should manage to benefit the company owners. Top management
members are given significant stock ownership, ensuring a positive correlation between
governance practices and the volume of stock that senior management owns (Mulini &
Wong, 2011). The stewardship approach is a stakeholder theory, and suggests that the
board of directors and the CEO are encouraged to act in a business’ best interests (Mulini
& Wong, 2011). Kajananthan (2012) identified different dimensions of corporate
governance practice, including leadership style, such as CEO duality, CEO tenure, AC,
BS, and the composition of the board of directors. The roles of CEO duality, BS, and the
AC in maintaining and controlling adequate levels of working capital in organizations
should not be taken for granted (Gill & Shah, 2012).
37
Corporate Governance Theories
In this section, I reviewed various corporate governance theories. These various
corporate governance theories include: agency theory, resource dependency, stakeholder
theory, stewardship theory, and the political theory. Altogether, these theories will show
that sound corporate governance contributes to a firm’s performance.
Agency Theory
The importance of agency theory cannot be overemphasized when discussing
corporate governance research. In fact, most of the research on agency theory is derived
from the tenets of corporate governance (Yusoff & Alhaji, 2012). Since Beile and Means
first studied corporate governance, it has concentrated on the division of ownership from
management. This process gave birth to pedals, which metamorphosed into the principal-
agent relationship, because of dispersed ownership. Yusoff and Alhaji (2012) viewed
corporate governance as a channel, in which the board of directors and top management
were both considered to be watchdogs used to reduce conflict concerning the principal-
agent relationship. In this context, the top administrators of an organization are the
agents, the owners are the principals, and the board of directors is the monitoring
apparatus (Haslindar et al., 2011).
The literature on corporate governance focuses on two participants: managers and
shareholders. It implies that humans are consumed with their own personal interests and
are disinterested in helping others. Therefore, directors oversee the governance
responsibilities of the board, rendering services to shareholders by monitoring
management’s decision-making processes and actions. The board of directors oversees
38
maximizing shareholder wealth. However, this created uncertainty due to differences in
information (Deegan, 2012). Managers could take actions to further their personal
agendas, because of inside knowledge, which would give them an advantage over
business owners. Therefore, the monitoring process has been structured to protect
shareholders’ interests. However, it is often a struggle to balance probabilities to ensure
that agents act in the principal’s best interests. This could result in agency costs, as it
involves the principal monitoring the agent’s expenditures to guarantee that reckless
actions are not taken. Johansson and Ostergen (2010) stated that agency theory provided
profound insights into corporate governance, but that it only applied to countries using
Anglo-Saxon governance systems. Therefore, firms in different countries would have
different methods of solving the agency problem.
Stakeholder Theory
Stakeholder theory focuses on the issues involving the stakeholders in a firm. The
theory argues that companies want to satisfy each interest group in the institution
(Abraham, 1951). Coleman, Hacking, Stover, Fisher-Yoshida, and Nowak (2008) stated
that the theory implies that shareholders are the only interest groups within companies.
Stakeholder theory explains the importance of corporate governance better than agency
theory, because it recognizes that different parties constitute the structure of a firm.
Firms recognize shareholders as business owners, and try to put their needs first (Yusoff
& Alhaji, 2012). In the modern-day dispensation, a firm converts the efforts of its
employees, investors, and suppliers into marketable aspects to benefit customers. The
theory takes the needs of employees, investors, suppliers, and customers into
39
consideration. The theory also focuses on governmental bodies, political groups, trade
unions, communities, business associations, prospective employees, and the public.
Researchers have argued that business activities affect a wide audience, and, thus,
businesses must be accountable to groups other than their shareholders. Therefore, it has
been argued that firm performance should be measured in different ways, rather than just
being measured by shareholder returns.
Stewardship Theory
The stewardship theory reflects a different style of management, in contrast to the
agency theory. The theory presents middle managers as good stewards that act in
business owners’ best interests (Yusoff & Alhaji, 2012). Stewardship theory is affiliated
with the social psychology doctrine, which focuses on the behavior of business
executives. The theory has been associated with pro-organization and collectivist
thought, and focuses on the interests of the firm. Stewards do not seek to achieve their
personal interests before achieving corporate interests. Therefore, steward behavior
should not depart from organizational behavior, as stewards continually seek to achieve
organizational objectives (Pham, 2015). Smallman (2004) stated that since steward
objectives do not depart from organizational objectives, maximizing shareholder wealth
also maximizes a steward’s utility. Smallman also noted that stewards balance the needs
of different beneficiaries and interest groups, such as having one person serve as CEO
and a board member. Therefore, stewardship satisfies all interested parties, resulting in
more balanced corporate governance and overall value. The theory implies that there is a
strong relationship between management and a firm’s success, and a firm’s performance
40
could protect and maximize shareholder wealth (Yusoff & Alhaji, 2012). Thus, when a
CEO is also named chairperson of the board, he or she has the power to determine the
success of and make decisions for an organization. Stewardship theory focuses on
empowerment, rather than on monitoring and exercising control. The stewardship model
encourages appointing one individual to serve as CEO and chairperson of the board.
Legitimacy Theory
Legitimacy theory is also important in corporate governance literature. The
theory is a generalized process, in which an entity’s actions are assumed to be desirable,
appropriate, and proper regarding some constructed social values, norms, beliefs, and
definitions (Yusoff & Alhaji, 2012). Researchers view this theory as a contract between
an organization and society. Legitimacy theory depends on the tenet that a firm receives
permission from the community to operate a business. The company is then accountable
to society, regarding its influence to own, use resources and recruit employees (Deegan,
2012). In a capitalist society, maximizing profits is a measure of a firm’s performance,
but legitimacy theory states that profit maximization provides organizational legitimacy.
Many researchers have studied legitimacy theory, because organizations must take the
rights and privileges of the public and company investors into consideration. Therefore,
failure to meet societal expectations could result in various restrictions being imposed on
a firm’s resources, operations, and the demand for its products. The theory implies that
there is an association between a firm’s disclosure and community expectations (Deegan,
2012).
41
Multiple Theories Approach
In this study, I explored various corporate governance theories. Agency theory
concentrates on the different relationship between agents and principals. Stakeholder
theory concentrates on the diverse interests of stakeholders, while resource dependency
theory underscores the significance of the board of directors as a resource and predicts a
function beyond its original control function (Deegan, 2012). The legitimacy theory of
corporate governance implies that there is a social tenet between a firm and society.
Agency theory is the most popular, as it has received a large amount of attention from the
academic world. Agency theory has set the foundation for institutions to develop various
governance standards, principles, and codes (Yusoff & Alhaji, 2012). Company
shareholders appoint the board of directors to monitor and control managerial decision-
making and protect shareholders’ interests. It was expected that independent directors
would hold supervisory roles, with one serving as a chairperson and one serving as the
CEO, contradicting the idea of CEO duality. However, theories such as stewardship
theory, resource dependency theory, and stakeholder theory have recently become better
known. Boyd (1995) and Hillman and Dalziel (2003) have taken different perspectives
on these theories. For example, Boyd argued that the seemingly contradictory views
presented in the agency and stewardship theories could both be corrected if a contingency
approach was used. Other practitioners have also combined the agency and the resource
dependency viewpoints, contending that company boards have assets that affect their
monitoring and support capabilities, and that board wealth lessens these effects (Yusoff
& Alhaji, 2012). These viewpoints are intended to be complimentary to, but not serve as
42
a substitute for, agency theory. The best method seems to be to adopt an integrated
approach to understanding sound corporate governance. Therefore, the need for an
integrated approach to corporate governance theories to better understand board
dynamics cannot be overemphasized (Roberts et al., 2005).
Corporate governance plays a critical role in WCM efficiency through the
formation of the appropriate policies and procedures. Corporate governance is used to
determine how WCM policies will be monitored and controlled. CEO duality, CEO
tenure, the AC, and BS must be considered to monitor and control the corporate
governance process. Gill and Shah (2012) noted that CEO duality and BS ensured proper
amounts of working capital within an organization. The CEO’s dual management roles
benefits the management team and shields the board’s interests by creating added value.
Kyereboah also stated that firms should have small boards to encourage effective
communication and decision-making. Lipton (1992) and Yermack (1996) also said small
boards could make faster decisions.
CEO Duality
CEO duality focuses on power, as power dictates the direction of an organization.
CEO duality occurs when one person assumes the position of CEO and chairperson of the
board of directors (Krause et al., 2013; Lawal, 2012). The board of directors is structured
to monitor top management, including the CEO, on behalf of a company’s shareholders.
Together, the CEO and the board of directors make policies to better an organization,
including policies related to sound WCM. Research has shown that small boards of
directors make more effective and faster decisions than larger boards. The board
43
oversees negotiating compensation contracts and hiring and dismissing the CEO. Some
organizations allow their managing directors to serve as chairpersons, while other firms
split the position between two separate individuals. Carty and Weiss (2012) noted that
CEO duality contrasts with the agency theory doctrine. However, CEO duality has been
beneficial in many cases, especially when the CEO works closely with the board to add
value. CEO duality better serves management interests and prevents management from
holding excessive corporate liquidity. Research has shown that creating a top unit of
command sends positive messages to shareholders. Carty and Weiss found that every
federal regulator and 25 states have deemed CEO duality permissible under existing rules
and regulations. Also, most regulatory authorities agreed that their banking codes
allowed CEO duality, and some noted that business regulations did not forbid CEO
duality. Some did not actively support CEO duality, but said banks could practice CEO
duality. Also, one state mentioned that its state banking regulations did not include
corporate officer structure rules, but that its state corporate code allowed CEO duality.
However, Ugwoke, Onyeanu, and Obodoekwe (2014) recommended that CEO duality be
reduced. Carty and Weiss also stated that a correlation between CEO duality and
organizational performance did not exist.
AC
Bansal and Sharma (2016) noted that the AC was one of the most important
elements of corporate governance. Ameer et al. (2010) stated that different regulatory
committees across the globe have recommended the universal adoption of and expanded
roles for AC. AC have adopted an expanded role in the United States, as evidenced by
44
the establishment of the Sarbanes-Oxley Act of 2002, the Australian Treasury report of
2002, and Higgs’ (2003) United Kingdom review. The AC represents another internal
governance mechanism. AC significantly impact the quality of financial management.
Practitioners have asserted that AC should have at least three members to promote
independence. When one CEO serves for a long period of time, executive management
and board interests are often better served. Longer CEO terms might also impact WCM
efficiency. AC members are also integral constituents of a company’s board of directors,
and are responsible for rolling out policies to improve business health (Bansal & Sharma,
2016). If an AC presents fair financial statements to the board, the board is in a better
position to develop a plan to increase a firm’s accomplishments (Bhardwaj & Rao, 2015).
Independent AC could also help ensure the reliability of top management’s financial
reporting through checks and balances (Cohen, Gaynor, Krishnamoorthy, & Wright,
2011). Corporate governance monitoring organizations throughout the world have
demanded that firms have fair and modest AC to mitigate fraud (Bansal & Sharma,
2016). Arslan et al. (2014), Bouaziz and Triki (2012), Nuryanah and Islam (2011), and
Yasser, Entebang, and Mansor (2011) highlighted the importance of AC in improving the
quality of reporting and performance. Al-Mamun, Yasser, Rahman, Wickramasinghe,
and Nathan (2014) argued that frequent AC meetings could help minimize agency
problems and ensure fair and current investor information. The AC assesses financial
statements and interacts with managers, internal and external auditors, and directors, to
help ensure proper communication (Nuryanab & Islam, 2011).
45
According to Jensen (1993), the absence of independent leadership makes it
difficult for the board of directors to monitor an organization’s top management. Jensen
stated that combining the decision-making authority and management under one role
impacted the board of directors’ ability to monitor senior management. Therefore,
bureaucratic tendencies are eliminated when the CEO serves as the chair and a member
of senior management (Kyereboah-Coleman, 2007). Hence, CEO duality could improve
WCM efficiency. Dittmar et al. (2003) agreed with Jensen, as the authors conducted a
study on 11,000 companies from 45 nations and found that countries that did not protect
shareholder rights held twice the amount of cash as countries that had shareholder
protection. Therefore, having weak shareholder protection renders asymmetric
information and investment opportunities less important.
There is little research on the impact of corporate governance on WCM efficiency
within Nigerian organizations, but some theoretical and practical research has been
conducted. Dittmar et al. (2003) indicated that managers seek to hold a certain level of
cash in their organizations for personal reasons, rather than to maintain shareholder
wealth. The authors conducted a study on 11,000 companies from 45 nations and found
that countries that did not protect shareholder rights held twice the amount of cash as
countries that had shareholder protection. In other words, the motives of holding cash
were less important in certain countries. However, Opler et al. (1999) investigated the
hierarchy aspect of corporate cash holdings from 1952–1994 and found that firms held
more cash when they were smaller, invested more in research, had more investment
opportunities, and had lower amounts of working capital. Hartford (1999) noted that an
46
organization’s level of cash holdings depended on its number of acquisitions, and that
rich firms were likely to make more purchases. Dittmar et al. also stated that corporate
cash holdings were related to agency problems, making a case for sound corporate
governance structures. Inconsistencies in the study results occurred because of
measurement problems, which were caused by international differences in accounting
information. Thus, corporate governance is essential when agency problems arise in the
determinant of corporate cash holdings.
Padachi (2006) stated that huge investments in inventories and accounts
receivables were related to lower profitability. The author studied the return on total
assets of 58 lower level manufacturing firms in Mauritius from 1998–2003. In the study,
the author found that the short-run financing of working capital components increased.
Deloof (2003) and Shin and Soenen (1998) also stated that there was a strong relationship
between measures of working management and profitability. However, Christopher and
Kamalavalli (2009) found that working capital components, such as CR, cash turnover
ratio, CA, operating income, and debt ratio, negatively affected profitability. Therefore,
this study focused on the importance of corporate policies concerning the short-run
financing of working capital components.
Saddour (2006) studied the determinant of cash holdings within French
companies from 1998–2012, as well as the impact of cash holdings on organizational
market value. Saddour developed a model by dividing the study sample into growth and
matured firms. The results of the study indicated that growth firms held increased levels
of cash, in comparison to matured companies, and that the trade-off and pecking order
47
theories played a significant role in describing the effects of cash holdings on matured
and growth firms. In the study, the author also found that firm’s values by Tobin’s Q
propositions had a positive relationship with cash holdings. In addition, Kalcheva and
Lins (2003) carried out a similar study and found that market value was not only
dependent on cash, but also on other determinants, such as investment and cash flow
levels, leverage, and investments. Therefore, managers of firms in debt might not take on
negative net present value projects, which are beneficial to organizational shareholders
(McConnell & Servaes, 1995). Growth companies have more cash than mature
companies, which supports the current study. The conflict of interest that exists between
a company’s shareholders and its management is a significant determinant of corporate
cash holdings (Dittmar et al., 2007). It is necessary that managers make decisions that
will increase shareholder value. Therefore, strong corporate governance is essential to
curtail management’s personal interests.
Afza and Nazir (2007) investigated the aggressive working capital policies of 208
companies listed on the Karachi Stock Exchange (KSE) from 1998–2005. The authors
used the cross-sectional regression model to examine the impact of aggressive working
capital investment on financing policies. In the study, the authors found that a negative
relationship existed between profitability measures and aggressive working capital
investment and financing policies. Carpenter and Johnson (1983) also found that there
was no significant relationship between conservative working capital policies and
operating risk. However, Afza and Nazir’s study contradicted Irene and Ice’s (2007)
study. Irene and Ice (2007) investigated WCM practices of some well-rated Malaysian
48
public companies and found that a perfect linearity existed between profitability and the
level of WCM. The inconsistencies in the study results might have been provoked by the
volatile nature of the Pakistani nation in 2007.
Dittmar et al. (2007) conducted a study of 297 firms in France from 1998–2002,
incorporating the trade-off and pecking other theories. The authors noted that growth
firms accumulated higher cash levels than experienced companies. However, Drobetz
and Gruninger (2007) found a positive relationship between CEO duality and cash
holdings, and found an association between BS and cash holdings. However, it is not
typical for growth firms to accumulate higher cash levels than experienced companies.
Drobetz and Gruninger (2007) examined the cash holdings and cash equivalents
of 156 non-financial firms in Switzerland from 1995–2004. In the study, the authors
examined the significant influences of various variables on cash holdings. The authors
found that there was a positive relationship between higher cash holdings and CEO
duality, and a negative relationship between BS and cash holdings. In addition, Kim et
al. (2011) determined that a positive relationship existed between cash holdings, dividend
payments, and firm size, corroborating Drobetz and Gruninger’s (2007) study. However,
Megginson and Wei (2010) determined that a negative relationship existed between net
working capital, debt, and cash holdings, contradicting Drobetz and Grunninger’s study.
The positive relationship between CEO duality and cash holdings supported the purpose
of the current study, in determining the impact of corporate governance on WCM within
Nigerian organizations.
Nazir (2009) analyzed the impact of aggressive working capital investment and
49
financial policies on 204 non-listed firms in the KSE in Pakistan from 1998–2005. In the
study, the author evaluated the firms’ returns, using the returns on asset and Tobin's Q
approach. The authors found that firms that adopted aggressive working capital policies
had increased firm value, and that investors preferred firms that adopted aggressive
approaches to manage their short-term liabilities. Rehman (2006) conducted a similar
study on the impact of WCM on the profitability of 94 Pakistani firms from 1999-2004.
The author found a negative relationship between profitability and working capital ratios.
However, Afza and Nazir (2007) investigated the impact of aggressive and conservative
policies on WCM within 17 industrialized groups in the KSE. The authors determined
that there was a significant difference between working capital investment and financial
policies in various industries. Therefore, Afza and Nazir validated the notion that
aggressive working capital policies increase profitability.
Kuan, Li, and Chu (2011) examined the relationship between corporate
governance and family firms’ cash policies. The authors found that the impact of
corporate governance on the division of control rights and cash flow privileges varied
between family-controlled and family-oriented firms. In addition, the authors found that
the cash rights distinction significantly affected the various levels of cash positions in the
firm. In addition, Ozkan and Ozkan (2004) supported the notion that the district role of
outside directors could reduce the asymmetry of information that occurred between firms
and investors. However, Chen and Ho (2009) found that the impact of the level of
director’s ownership on a firm’s policies differed between family-controlled and
nonfamily-controlled firms. Brenes, Madrigal, and Requena (2011) also found that
50
outside monitoring improved shareholder protection and the performances of family-
controlled businesses. Therefore, the study contributed to the notion that corporate
governance affected the need to stockpile cash in Taiwan controlled firms.
Bana (2012) examined whether WCM efficiency enhanced Jordanian firms’
accountability and value from 2000–2008. In the study, the author determined whether
wealth maximization was stakeholders’ sole objective. The author found that
profitability had a significant relationship with the CCC, noting that profit-oriented firms
were less concerned with WCM. Rahemen et al. (2010) and Hayajneh and Yassine
(2011) also found that the longer the cash conversion ratio, the greater the profitability
within firms that adopted generous credit policies. However, Karadumah et al. (2011)
stated that longer CCCs decreased company profitability and shareholders created value
when managers reduced the number of days of accounts receivables and accounts
payables. Therefore, policy makers, managers, and shareholders should pay attention to
WCM.
Lau and Block (2012) took a sample from the Standard and Poor’s 500 and the
Edgar database to examine whether the presence of majority founder and family-held
firms significantly influenced cash holdings. The authors found that founder companies
held higher levels of cash than family and widely held organizations. Also, they found a
positive relationship between founder management and cash holdings, indicating that the
presence of patrons as managers helped mitigate agency costs of holding cash. However,
having a massive amount of family members who serve as shareholders might lead to
higher levels of cash, but lower firm value (Kalcheva & Lins, 2007; Ozkan & Ozkan,
51
2004). Invariably, controlling family shareholders often used their influence to hoard
cash at the expense of minority shareholders. However, Anderson, Mansi, and Reeb
(2003) found that a small amount of agency conflict existed in family firms. The authors
did not conclude that having controlling member shareholders and families lead to higher
levels of cash.
Gill and Shah (2012) studied 166 Canadian firms listed on the Toronto Stock
Exchange from 2008–2010, to explore the factors that determined corporate cash
holdings in Canada. The results showed that CEO duality, market-to-book ratio, firm
size, liquidity, leverage, net working capital, and BS affected the corporate cash holdings
in Canada. In addition, Afza and Adnan (2007) conducted similar studies and indicated
that CEO duality and BS positively affected net working capital. However, Rizwan and
Javed (2011) obtained data from 300 Pakistani firms listed on the KSE and found that a
negative correlation existed between working capital and corporate cash holdings within
Pakistani companies. A limitation of the study was that the measures used in the survey
were adopted from Afza and Adnan’s research, except for BS and CEO duality. This
study is useful to the current study, because it contributed to the literature on the issues
that govern corporate cash holdings and might provide useful information for financial
managers, investors, and financial management consultants.
Valipour et al. (2012) examined the effects of company features on WCM within
83 firms listed on the Tehran Stock Exchange from 2001–2010. In the study, the authors
used the CCC to describe company profitability, operating cash flow, size, SG, and
current, quick, and debt ratios. The levels indicated that effective factors included
52
profitability, company size, and SG, but the levels were impacted by profitability, SG,
CR, quick, and debt ratio. The study results aligned with Nilsson et al.’s (2010) research,
which indicated that a negative relationship existed between SG and the CCC. However,
the results showed great inconsistencies when compared to theoretical postulations.
Therefore, the theories were not consistent, as theoretical literature does not support the
relationship that exists between SG and the CCC.
Velnampy and Pratheepkanth (2012) stated that effective corporate governance
practices are essential to minimizing risks for investors, increasing investment
opportunities, and improving company performance. They observed the evolution of
governance practices, in terms of changes between ownership and control. The authors
further identified that agency theory and stewardship theory were most important to
corporate governance.
Gill and Biger (2013) addressed how inefficient policies on WCM could
negatively impact shareholder wealth. The authors used information on 180 firms listed
on the New York Stock Exchange to document the impact of corporate governance on
WCM efficiency within American manufacturing companies. The authors used a
correlational and non-experimental research design, and studied published reports from
the companies that participated. The study indicated that correlational designs provide
both mathematical expressions and empirical observations of quantitative relationships.
The authors stated that corporate governance played a fundamental role in enhancing
working capital efficiency. The study supported Gill and Shah (2012), Kuan et al. (2011),
and Lau and Block’s (2012) research. However, the study indicated that larger BS
53
negated the improvement of working capital efficiency, which might not benefit
American manufacturing companies overall. Therefore, the study could help financial
managers and investors understand vital characteristics of corporate governance
practices.
Venancio and Godfred (2013) examined the relative importance of WCM by
measuring the CCC and how inventory, accounts receivables, and accounts payables
impacted the profitability of small and medium sized organizations. The authors
observed that accounts payables and accounts receivables were perfectly correlated to
profitability, while company inventory and the CCC were not correlated to profitability.
Stephen and Elvis (2011) also found a perfect correlation between accounts receivables
and profitability. However, Karaduman, Akbas, Caliskan, and Durer (2011), Hayajneh
and Yassine (2011), and Raheman et al. (2010) found a significant negative correlation
between the CCC and profitability. The overall findings were relevant to this study, since
the results are consistent with the working capital literature.
Ianniello (2015) noted that auditor and director independence provide protection
for shareholders and other stakeholders. The author stated that providing non–auditing
services to clients could affect an auditor’s independence. Furthermore, the researcher
noted that the ratio of outside independent directors to the total number of directors
presented two significant questions. The questions were whether providing non-auditing
services to clients impaired an auditor’s independence, thus, lowering earnings quality,
and whether the board of director’s independence played a significant role in improving
54
earnings quality. The authors found that the board of director’s independence did not
play a significant role in improving earnings quality.
Pham (2015) addressed the ambiguity between CEO duality and firm
performance. The author’s study focused on the relationship between CEO duality and
the performances of not-for-profit hospitals. The purpose was to study the relationship
between CEO duality, including physicians on the governance board, size, and the
financial performances of not-for-profit hospitals. The author used multiple regression
analysis to study 146 not-for-profit hospitals in the United States from 2009-2012. Pham
found that CEO duality and including physicians on healthcare firm governance boards
were not correlated to the financial performances of not-for-profit hospitals. In addition,
Green (2005) stated that the Sarbanes-Oxley Act of 2002 affected not-for-profit
hospitals’ abilities to achieve external regulations and implement appropriate governance
structures. However, Krause et al. (2013) and Lawal (2012) obtained different results,
based on how structure influenced firm performance. Therefore, a significant
relationship did not exist between CEO duality and the presence of physicians on not-for-
profit hospital boards.
Akshita and Chandan (2016) examined the effects of corporate governance on
firm performance within large manufacturing firms in India from 2001–2010. The
authors’ analysis and estimation methods included tackling the problem of endogeneity.
The authors found that larger boards had deep knowledge, which, in turn, enhanced firm
performance. However, Pham (2015) also found that CEO duality was not related to firm
performance. This is applicable to the current study, because the authors asserted that
55
businesses in the developing world that complied with sound corporate governance
policies tended to achieve higher levels of performance. To conclude, the literature
review showed that corporate governance could affect WCM efficiency.
Summary of Gaps in the Current Literature
Identification of Gaps in Current Literature
There are a few relevant gaps in the current literature. Firstly, there were many
inconsistencies in the research on WCM, which indicated a lack of depth of research on
corporate governance interaction. Scholars could resolve this by furthering research in
this area. Secondly, the frequent application of pooled data and cross-sectional research
often resulted in heteroscedasticity (Raheman & Nasr, 2007). Given this limitation, the
reviewed studies used general least square analysis with a combination of cross section
weights (Gill & Biger, 2013). Also, only a handful of studies explored the individual
components of corporate governance, indicating a significant gap in the current literature.
Economic literature on working capital and the impact of corporate governance on WCM
is very scant. Therefore, the dearth of studies on specific industries and countries
constitutes a weakness in the current literature that needs to be addressed. Unpopular
policies regarding working capital have an adverse impact on cash and often cause
agency problems. The situation stems from management maintaining balances that
endanger the maximization of shareholder wealth (Gill & Shah, 2012). There is a lack of
comprehensive assessments on these adverse impacts, which indicates a gap in the
current literature that needs urgent attention. Finally, endogeneity issues crept up,
because of the use of multiple regression analysis. To mitigate endogeneity problems,
56
the current study incorporated the most relevant variables that impact WCM. Since many
studies only examined companies within specific time frames, there might have also been
selection bias issues. Also, because of the scope of the research concerning the
relationship between BS, CEO tenure, CEO duality, and working capital efficiency, some
variables, such as organizational leverage and organizational CEO identification, were
not necessarily present in the analysis model. Future research could address and expand
on the current study by exploring other notable variables with different assumptions.
Plan to Fill the Identified Gaps in the Literature
In conjunction with most studies on corporate governance and WCM interaction,
this study adopted the traditional form of measurement, using the multivariate regression
analysis model. The multiple regression model was used to explore some control
variables that were common in the literature. The study results might help address the
gaps in the literature, and enable managers and decision makers in Nigerian organizations
to efficiently allocate scarce corporate resources to working capital assets.
Chapter Summary
In this literature review, I concentrated on corporate governance theories, with an
emphasis on the trade-off theory of cash holdings, which was vital to the study of the
relationship between the characteristics of corporate governance and working capital
efficiency. Also, in the literature review I elaborated on the precautionary and transition
motives and explained the vital role that both models played in explaining the
determinants of cash holdings by Nigerian firms. My discussion also covered various
subjects, such as CEO duality, CEO tenure, corporate governance theories, AC structures,
57
and the major concepts of WCM. To conclude, the scarcity of literature showed that
corporate governance positively influenced WCM efficiency, but this idea needed to be
further explored. In the next chapter of this dissertation, I will discuss the research
methodology and detail the research analysis that I used to determine the relationship
between BS, CEO tenure, CEO duality, AC, and working capital efficiency within
Nigerian organizations.
58
Chapter 3: Research Method
Introduction
The purpose of this study was to evaluate the impact of corporate governance on
WCM within Nigerian organizations. Nigerian organizations face significant challenges
with working capital variance in part, related to operational efficiency, market standings,
and working capital viability (Ademola, 2014; Luqman, 2014). Imeokparia (2015),
Luqman (2014), and Ogundipe et al. (2012) expressed tremendous concerns about the
lack of policies concerning WCM in Nigeria, and encouraged a review of policies
concerning collection, payment, and cash conversion. The Nigerian government has
through corporate governance mechanisms and other forms of control have increasingly
pressed Nigerian firms to add value to firms to benefit the nation (Okike et al., 2015).
The Code of Corporate Governance, which was passed in Nigeria in 2011, encouraged
companies to improve their performances with support from the Nigerian government
(Adeoye, 2015). Also, the passage of the Sarbanes-Oxley Act in 2002 and the
development of the Organization for Economic Cooperation and Development have
immensely strengthened the economy (Okike, et al., 2015). These acts and organizations
have provided opportunities to develop efficient WCM policies for Nigerian
organizations. It is important for industry practitioners and researchers to understand that
appropriate governance models will enhance overall effectiveness and aid business
managers in allocating resources; Nigerian organizations could utilize these models to
improve their efficiency.
59
The research problem I addressed in this study was whether there was an
association between corporate governance and WCM efficiency within Nigerian
organizations. Consequently, I evaluated the impact of corporate governance on WCM
efficiency within Nigerian organizations in this study. The results of this study might
help Nigerian organizations seek appropriate corporate governance structures that could
enhance their effectiveness and lead to sound WCM policies.
In this chapter, I will discuss the research methodology. Firstly, I will outline the
research design and methodology, along with reasons for choosing both. Secondly, I will
discuss the study setting and sampling methods. In these sections, I will explain (a) the
study population; and (b) the sampling method frame that will include the criteria for my
selection of the firms for the study, the sampling frame, the size of the sample, and the
reason for the sample size. A section on instrumentation will include the tools adopted to
measure the variables in by researchers in previous studies, including how I examined the
relationship that exists between corporate governance and WCM efficiency in this study.
Also, in the instrumentation section I will explore working capital performance and
explain the definitions and share the calculation methods of the dependent and
independent variables. Data collection methods will then be discussed, and the inclusion
of secondary data attained from private and public databases will be explained. I will
then review the data analysis methods, followed by a discussion of the hypotheses.
Finally, I will conclude the chapter by explaining how participating companies were
protected and how the findings were shared.
60
Research Design and Rationale
In this quantitative research study, I employed a multiple regression analysis
approach and used secondary data as input variables to ascertain if there was a significant
relationship between corporate governance and WCM efficiency within Nigerian
organizations.
Description of the Research Design
In this correlational study, I applied multivariate regression analysis to examine
the relationship between corporate governance and WCM as well as the working capital
performance model. Boldina and Beninger (2016) stated that two or more predictors are
present in multiple regression analysis, unlike the simple, linear regression model, in
which practitioners only examine one outcome variable on a predictor variable. Boldina
and Beninger also stated that using the multiple regression analysis is appropriate when
the research involves determining the linear combination of predictors that correlate with
the dependent variables. Therefore, I designed this study to determine the relationship
between corporate governance factors and WCM within Nigerian organizations. In this
study, my aim was to optimize the factors that positively relate to WCM efficiency to
create value and expose corporate governance factors that do not positively correlate to
WCM. Usually, the following formula characterizes a multiple regression model: Yi ==
α + βıTNit+β2CDit+ β3BSit+ β4ACit +µit. The subscript α refers to the Alfa and µit
denotes the error term. Yi is the outcome or dependent variable, in the case of this study,
either CA, CL, CR, and the CCC. µit is the growth of firm i in time t. TNit is the CEO
tenure. CDit is the CEO duality. BSit is the BS. ACit is the audit committee. βı is the
61
coefficient of the predictor of TN. β2 is the coefficient of the predictor CD. β3 is the
coefficient of the predictor of BS, and β4 is the coefficient of the predictor AC.
Definition/Measurement of the Variables of the Study
Frankfort-Nachmias and Nachmias (2008) identified three classes of properties of
variables in quantitative research: the analytical, measurement, and relational properties.
The authors noted that the analytical aspect of the variables explained the role each
variable played in the systematic scheme of research and distinguished the three kinds of
variables: the dependent or outcome variable, the independent variable, and control
variables. The dependent variable is the output that is studied, while the independent
variable represents the inputs and potential reason for the variation (Flannelly, Flannelly,
& Jankowski, 2014). Control variables, as Flannelly, Flannelly, and Jankowski (2014)
opined, were included in their model to avoid misinterpretation and to describe what will
remain constant to minimize the level of the explanatory power of the model. The
measurement dimensions of the variable properties related to whether the variables
observed in the study correctly aligned to help assess the subjects. Lastly, Frankfort-
Nachmias and Nachmias (2008) stated that the relational dimension explained the
similarities exist between the variables. This relationship could either have been positive
or negative, demonstrating a significant or insignificant association.
Independent Variables of the Study
CEO duality/CEO tenure. CEO duality is regarded as a situation in which the
CEO of a company is also named the chairman of the board (Tang, 2017). To measure
CEO duality in this study, I assigned a value of 1 if the same person occupied the position
62
of CEO and chairman of the board and assigned a value of 0 if one person did not hold
both positions. While CEO tenure is defined as the number of years a CEO has served,
CEO duality focused on whether the CEO also serves on the board.
BS. A board is the group of people that work together to create the best outcomes
for an organization (Huang & Wang, 2015). Several studies have been conducted on the
effectiveness of collective decision-making. Researchers determined that the optimal
size for a decision-making group was seven people, but others found that the most
efficient size was five people (Desender et al., 2013). However, board composition could
range from five to 20 members, since the number of participants does not increase or
decrease the effectiveness of decision-making. The Investor Service (2014) noted that an
effective BS in hospitals consisted of eight to 20 members. For this study, I calculated
BS by counting the number of directors on the governance board.
AC. The AC is the selected number of members of the operating committee of
the board of directors who are charged with overseeing financial reporting and
disclosures (Mnif Sellami et al., 2017). The AC comprises all the AC members.
Members are selected from a company's board, and a chairperson is selected from the
existing committee members (Juhmani, 2017).
Dependent Variables of the Study
CA. Damar, Meh, and Terajima (2013) noted that CA are balance sheet accounts
that describe the value of all items that analysts can convert into cash within one year or
consume in the operating cycle. The CA will estimate the value of all elements turned
63
into cash within one year. In this study, CA included cash and cash equivalents, accounts
receivables, inventory, marketable securities, prepaid expenses, and other near cash.
CL. Hoskin, Fizzell, & Cherry (2014) noted that CL constitute debt accounts in
the balance sheet that are due within 1 calendar year and include short-term debt
obligations, accounts payables, accrued liabilities, and other financial obligations. The
CL measured the amount due to creditors within one year. Therefore, liabilities within
one year are classified as current liabilities on a firm's balance sheet
CR. The CR is a financial and efficiency ratio that gauges a company's ability to
pay its short-term and long-term outstanding obligations by dividing CA by CL (Rezaei
& Jafari, 2015). Rezaei and Jafari (2015) noted that this liquidity ratio is used to give
insight into a company’s capability to defray its liabilities with its assets. Liabilities
comprise debts and accounts payables, while assets are comprised of cash, short-term
securities, inventories, and accounts receivables (Liang et al., 2016). The ratio was
calculated using the below formula:
CR = CA/CL
The CCC. The CCC is a metric that measures the length of time in days a firm
ties up net dollar inputs in the purchasing, making, and selling of goods and services
before converting them into cash flows (Das, 2016). The estimate calculates how quickly
a firm can turn the liquidity it has on hand at a particular point in time into inventory and
payables, through sales revenue and receivables, and then back to cash. It was calculated
by adding DIO and DSO and subtracting DPO. The CCC is calculated using the below
formula: CCC = (DIO + DSO – DPO) * 365
64
SG. The measure by which the average sales size of a company's products or
services has increased or decreased from year to year. In this study, the SG measured the
current year’s sales minus the previous year’s sales divided by the previous year’s sales.
I have summarized the SG by the below formula to help account for the monthly or
yearly increase in revenue:
SG = CYS – PYS / PYS,
where
SG = Sales Growth
CYS = Current Year Sales
PYS = Previous Year Sales
Justification
Since the goal of the study was to investigate the association between the
independent and dependent variables, a quantitative method was the most suitable
approach. The process of measurement used in correlational research designs is central
to the quantitative approach (Creswell, 2013). Gill and Biger (2013) noted that the
qualitative research approach is fashioned for an exploratory study and is often used
when theories are not known. Practitioners have not regarded the principles of corporate
governance and WCM as exploratory in nature. For this reason, I chose the WCM and
corporate governance theories to serve as the theoretical framework for this study.
Creswell (2013) noted that the quantitative method is used to determine what variables
influence an outcome in problem situations. In this study, quantitative research was
appropriate because it allowed the study results to be presented in mathematical
65
expressions and explored the empirical relationships between the variables (see Gill &
Biger, 2013).
There are many positive aspects associated with the quantitative method, but there
are also aspects that might have interfered with the study outcomes. However, the
advantages of the quantitative method outweighed its limitations. Using the quantitative
method allowed me to create a rich database of records, and these records provided
unbiased viewpoints. The qualitative approach could have provided more biased
viewpoints, making it less appropriate for this study. Using databases containing
information on Nigerian organizations provided a more reliable outcome (see Anderson,
Prause, & Silver, 2011).
Researchers have used a combination of both the quantitative and qualitative
approaches to study corporate governance and WCM (Ostlund et al., 2011). However,
the qualitative approach provides personal opinions, and therefore, study results cannot
be widely generalized to provide a vivid description of the working capital phenomenon.
The outcome of a study that is based on a manager’s perspective would be subjective and
present biased results. Therefore, qualitative studies on WCM efficiency and corporate
governance have not presented meaningful results (Pham, 2015). Also, qualitative
studies are often difficult to replicate as Pham (2015) noted.
Quantitative research involves various designs, such as the cross-sectional design,
quasi‒experimental design, pre‒experimental design, and secondary data. However,
according to Frankfort-Nachmias and Nachmias (2008), the cross-sectional method is
often adopted in studies that distribute surveys, while the quasi-experimental design is
66
similar to the experimental design but involves more than one sample of events over an
extended period. In pre‒experimental designs, researchers conduct experiments (Gandhi,
Thomas, & Desai, 2017). Because of the nature and goal of this study, these research
designs were not suitable.
The quantitative research method was chosen to address the problem statements
that were indicated in Chapter 1 of this dissertation. In this quantitative study, I
investigated the impact of corporate governance on WCM within Nigerian organizations.
The measurement of WCM is not new, as many firms have tested working capital
principles using different models. Researchers have used archived data collected in
various disciplines to compare and derive interferences from the data (Singleton &
Straits, 2005).
Pham (2015) noted that secondary data included public and private records, and
that the advantage of using secondary data was its availability. Frankfort-Nachmias and
Nachmias (2008) stated that secondary data cost less and that some research problems
were investigated using only secondary data. Using secondary data also allowed for
confirmation of past studies, increased the sample size and the validity of findings, and
allowed the study to be generalized to the larger population. Researchers have explored
the impact of corporate governance on WCM theories in different situations across
different industries. Therefore, my study advanced past research because the goal was to
investigate the impact corporate governance has on WCM efficiency within Nigerian
organizations. Thus, using secondary data was suitable for this study.
67
Researchers have recently used multiple regression models to study corporate
governance and WCM. For example, Gill and Biger (2013) used the regression analysis
model to research the impact of corporate governance on WCM within American
manufacturing firms. Amba (2013) used the ordinary least square approach to study the
relationship between CEO duality and company performance. Since the goal of this
study was to examine the relationship between various independent and dependent
variables, the multiple regression analysis model was used instead of other statistical
models, such as the ANOVA, correlation analysis, and non-parametric analysis. The
ANOVA test evaluates if the group means of the dependent variables significantly differ,
while non-parametric analysis is suitable for measuring nominal and ordinal levels
(Green, Salkind, & Akey, 2011). Also, Gill and Biger stated that both correlation
analysis and bivariate linear regression analysis only examine two variables, the
dependent and independent variable, which made these two models less than ideal for this
study.
Target Population
In the study, the target population was 89 organizations listed on the NSE.
Information on the boards of directors and corporate governance policies was obtained
from the NSE portal. Frankfort-Nachmias and Nachmias (2008) stated that the selection
process is vital, because the population must satisfy conditions to build the study sample.
The Security and Exchange Commission (SEC) database contained information on
Nigerian organizations that are registered and deregistered, based on criteria set by the
68
SEC. In total, 89 large firms represented Nigerian organizations, and these companies
followed SEC conditions for registration with the SEC database.
Sampling Method
In this section, I will explain the sampling method, the sampling frame that I used
to choose participating companies, the sample size, and the rationale for the sample size.
Sampling criteria are the list of features that are crucial for eligibility in the study. In the
following sections, I will explain the eligibility requirements for the Nigerian firms.
Sampling Design
I used a correlational and non-experimental research design in this study, to
explain the impact of corporate governance on WCM within Nigerian organizations.
Participating companies were selected from the NSE database and other online sources to
collect a random sample of organizations. Only 89 of 200 financial reports from public
companies from 2013-2014 were used. Generalizations are not always possible in all
studies, so this study used a smaller sample size to represent the larger population. To
arrive at proper inferences, the sampling plan that was used helped to eliminate errors,
such as incomplete structures and clusters of elements. The sampling frame included
companies that are engaged in public trading. It is mandatory for all publicly traded
companies to register with the SEC, so only firms registered with the SEC were selected.
I used the simple random sampling strategy in this study, because systematic sampling,
stratified sampling, and cluster sampling require intervals, sizes, and group levels.
69
Screening and Eligibility Criteria
To streamline the study to include a more manageable number of organizations
and choose a representative sample of the population, I used a screening process and a
simple random sampling process to select organizations from the SEC registry. Nigerian
companies from the SEC registry had to meet the following criteria:
• Firms must have met the SEC’s registration eligibility for the period.
• Firms must have had corporate governance information in their financial
reports for 2013- 2014, including CEO duality and an AC.
• Firms must have had reports of their financial information and working capital
margins from 2013–2014.
• Firms must have had market values of at least $2 million.
The criteria were chosen based on the assumption that Nigerian Corporations were more
likely to utilize corporate governance structures.
Sampling Frame
I used a simple random sampling process to select organizations for this study.
Probability sampling was used, because it allows researchers to ensure that every member
of the population has an equal probability of inclusion in the analysis. According to Joshi
and Rajarshi (2016), probability sampling ensures that the selected organizations
represent the target population, and, therefore, make it possible to present study findings
with confidence.
70
Sample Size and Rationale
The total number of publicly registered companies in Nigeria is small, as
compared to the developed world. There are over 200 publicly registered businesses in
the NSE. I utilized a simple random sample, in which I examined the financial
statements of 89 firms. The sample size was appropriate, because of the number of listed
companies on the NSE and the popularity of the topic in the developing world. Statistical
tests were used to evaluate each of the organization's financial statements from 2012-
2013. Lwanga and Lemeshow (2015) stated that determining the sample size is
dependent on the standard error value and the confidence interval that the researcher
indicates. Sharperis (2010) also stated that investigators could only rely on statistical
power to determine if study results were significant. Gill and Biger (2013) examined 500
financial reports from publicly traded companies from 2009-2011, to determine the
impact of corporate governance on American manufacturing firms. Many companies
listed on the NSE were small and had incomplete data, so companies that were listed on
the NSE website formed the initial study sample. The sample size was 89 top Nigerian
companies with good earning capacities in the main sectors of the economy. The
segments included agriculture, conglomerates, construction/real estate, consumer goods,
financial services, healthcare, information and communication technology (ICT),
industrial goods, natural resources, and oil and gas services (NSE, 2016). Numbers were
assigned to each Nigerian company in the preselected list in the spreadsheet and 89
companies were randomly selected by using G*Power Analysis. This returned an equally
distributed random sample size.
71
To determine a sample size that is representative of study population, version
3.0.10 of G*Power Analysis software was used. After using the software, a sample size
of 89 Nigerian organizations drawn from the sampling frame was revealed. The
parameters incorporated into the G*Power 3 software include effect size 0.015, α error.
Prob. 0.05, pow. (1- β error. Prob.) 0.8, and the number of independent variables (four)
resulted in a total sample size of 89. However, only 46 of the Nigerian organizations
could be selected to ensure that the included institutions also had the necessary financial
data. A sample size of 89 organizations was adequate for this study, as many previous
studies used smaller sample sizes.
Instrumentation
Research on WCM efficiency and corporate governance is non-existent. Many
researchers have introduced various definitions and categorizations regarding
instrumentation. Previous studies have used several different instruments to measure
working capital efficiency and corporate governance.
Measurement
Milfont and Fischer (2015) indirectly linked measurement to operational
definitions. To study the impact of corporate governance on WCM efficiency within
Nigerian organizations, CEO tenure, CEO duality, BS, and AC will be defined, along
with working capital performance measures were used in the study. Researchers often
use different levels of measurement to complete their studies. I chose to use the nominal,
interval, and ratio levels of measurement.
72
From a statistical viewpoint, nominal measurement is the lowest level of
measurement (Bond & Fox, 2015). The operational definitions of the independent
variables, which are CEO duality, CEO tenure, BS, and the AC, were connected through
this level of measurement. A nominal scale, as the name indicates, places data into
categories using any type of order and structure. In a survey, “yes” or “no” questions
demonstrate the nominal level of measurement, as no order or distance exists between
“yes” and “no.” The most nominal level of measurement in statistics is in the non-
parametric group, including modes and cross tabulation. There is a record of highly
sophisticated modeling techniques present for nominal data. I used nominal
measurement to classify firms into two classes. For example, companies with CEO
duality were assigned a value of 1, and companies without CEO duality were assigned a
value of 0.
The ordinal scale of measurement involves ranking. When participants are asked
to rank several items from most flavorful to the least delicious, a researcher might be
indirectly asking participants to produce an ordinal scale of their preferences. In the
ordinal scale of measurement, there is no objective distance between items. Scientists
use the ordinal scale to interpret gross order instead of positional ranges (Portney &
Watkins, 2015). Ordinal data includes mode and median, without non-parametric
statistics. Modeling techniques are most often used to determine ordinal data. I did not
examine independent and dependent variables that possess ordinal characteristics.
Therefore, it was not appropriate to use the ordinal scale of measurement for this study.
73
The interval scale is a standard survey rating scale (Bond & Fox, 2015). When a
researcher asks participants to rate their satisfaction on a point scale from dissatisfied to
satisfied, the researcher is using an interval scale, because interval scales are assumed to
be equidistant. Researchers can interpret the differences in the distances along the scale.
This scale differs from ordinal scales, because the differences are not described in order.
Interval scale data in research statistics involves parametric statistical techniques, such as
regression, correlation, mean, standard deviation, analysis of variance, and factor
analysis, including various modeling and multivariate techniques. Consequently, the
dependent variables, including financial working capital indicators, such as CR and the
CCC, could be measured using interval and ratio scales. Similarly, some of the
remaining variables, such as the BS, could also be measured using the interval and ratio
levels of measurement.
Measurement validity. Researchers have established measurement validity,
which comprises content, empirical, and current validity, to ensure that changes in the
dependent variables occur because of changes in the independent variables (Frankfort-
Nachmias & Nachmias, 2008). Content validity ensures that the measurement instrument
answers the research questions. I used a sample of the targeted population of Nigerian
organizations, and used the appropriate research design to answer the research questions
and hypotheses.
Pham (2015) stated that empirical validity of a measurement instrument focuses
on the relationship between the measuring instrument and the measured outcome. Some
researchers might compare study results with those obtained in previous studies. I
74
measured working capital operating outcomes, such as the CCC, working capital
margins, and the cash conversion efficiency of Nigerian organizations. To ensure
empirical validity, the measurement instrument for this study measured what it was
intended to measure. Construct validity was not relevant to this study. Construct validity
is present when researchers distribute questionnaires to participants that are designed to
answer the research questions (Frankfort-Nachmias & Nachmias, 2008). I did not
distribute questionnaires in this study, as secondary data of financial indicators were
used, along with descriptive statistics and multiple regression testing.
Measurement reliability. Pham (2015) stated that every study contains some
errors. The author associated variable errors with factors such as instruction ambiguity,
which influences participants’ responses to questionnaires. I did not use a questionnaire.
Researchers approach measurement reliability by examining the reliability
measure, which calculates the extent of error in a research study. Pham (2015) noted that
the reliability measure ranged from 0 to 1, with a value of 0 or 1 indicating that the
measurement contained all variable errors or no error at all. Gill and Biger (2013) and
Pandya (2011) used secondary data to determine the impact of organizational
effectiveness. The authors used multicollinearity analysis to determine if two or more
independent variables were correlated. Hence, measurement reliability indicates that the
measurement of the independent variables is similar. This will be further discussed in
Chapter 4.
75
Data Collection
Financial reports from 89 Nigerian companies from 2013-2014 were used in this
study. The data collection methods tested four proposed hypotheses and four alternates
to answer the research questions, which focused on the association between corporate
governance and WCM. As stated in the literature review, it was expected that corporate
governance practices were positively related to WCM components.
I also incorporated secondary data from the NSE database, gathering financial
data, BS, board tenure, and AC information from each participating company’s website.
The financial reports included data from a two-year period, from January 2013 to
December 2014. I collected data such as CA, CL, CR, and CCCs from each company’s
reported information. Then, the average values of these data were calculated. The CR,
cash holdings, and cash conversion efficiency ratios were derived from the average
values of the financial information. CEO tenure, CEO duality, BS, and the AC were also
examined. I selected 89 Nigerian companies to create the sample. The sample did
include organizations from the following sectors:
• Financial services (10 Firms)
• Consumer goods (12 Firms)
• Oil and gas (Eight Firms)
• Agriculture (Three Firms)
• Conglomerates (Eight Firms)
• Construction/real estate (Seven Firms)
• ICT (Six Firms)
76
• Industrial goods (Eight Firms)
• Natural resources (Two Firms)
• Healthcare (Eight Firms)
• Services (14 Firms)
Research Questions
The four research questions, four hypotheses, and four associated hypotheses
were as follows:
Research Question 1: What is the relationship between corporate governance
practices and CA?
Hypothesis 1:
H01: There is no association between corporate governance practices and CA.
H11: There is an association between corporate governance practices and CA.
I tested Hypothesis 1 by running the following multiple regression equations:
CA= α + βıTNit+β2CDit+ β3BSit+ β4ACit1
Research Question 2: What is the relationship between corporate governance
practices and CL?
Hypothesis 2:
H20 - There is no association between corporate governance practices and CL.
H2 - There is an association between corporate governance practices and CL.
I tested Hypothesis 2 by running the following multiple regression equations:
CL = α + βıTNit+β2CDit+ β3BSit+ β4ACit +еit2
77
Research Question 3: What is the relationship between corporate governance
practices and CR?
Hypothesis 3:
H0 - There is no association between corporate governance practices and CR.
H3 - There is an association between corporate governance practices and CR.
I tested Hypothesis 3 by running the following multiple regression equations:
CR= α + βıTNit+β2CDit+ β3BSit+ β4ACit +еit3
Research Question 4: What is the relationship between corporate governance
practices and the CCC?
Hypothesis 4:
H0 - There is no association between corporate governance practices and the CCC.
H4 - There is an association between corporate governance practices and the CCC.
I tested Hypothesis 4 by running the following multiple regression equations:
CCC= α + βıTNit+β2CDit+ β3BSit+ β4ACit +еit4
Hypothesis Formulation
The statistical f test was used to ascertain if there is a linear relationship between
the working capital components and any of the independent variables (CEO tenure, CEO
duality, BS, and audit committee). The hypotheses are listed below:
Hypothesis 1: H01: βı=β2=β3=β4=0
H11: Not all the βı (i = 1….4) were 0
Hypothesis 2: H02: βı=β2=β3=β4=0
H12: Not all the βı (i = 1….4) were 0
78
Hypothesis 3: H03: βı=β2=β3=β4=0
H13: Not all the βı (i = 1….4) were 0
Hypothesis 4: H04: βı=β2=β3=β4=0
H14: Not all the βı (i = 1….4) were 0
In the analysis, a α of 5% level of significance was used, rejecting the null
hypothesis if the calculated p-value is ≤ (less than) .05 (Field, 2009). In other words, if
the null hypothesis was correct, there would be no linear relationship between WCM
efficiency and any of the independent variables in the stated regression equation.
Nevertheless, if the null hypothesis was rejected, there would be a statistical indication of
a regression association between working capital efficiency and one of the independent
variables in the analysis. If a regression relationship was found, t-tests were conducted
for each of the beta coefficients to determine if the independent variables aided in the
explanation of the variation in the values of the dependent variables. The independent
variables with no explanatory power, or no significant increase in how the model predicts
the outcome variable, were taken out of the regression model using the stepwise method.
Data Analysis
After the data analysis, data collection, and calculation of the variables, the
researcher input and analyzed the data using SPSS. The four equations that were used for
the multiple regression models are below:
CA= α + βıTNit+β2CDit+ β3BSit+ β4ACit +еit
CL = α + βıTNit+β2CDit+ β3BSit+ β4ACit +еit
CR= α + βıTNit+β2CDit+ β3BSit+ β4ACit +еit
79
CCC= α + βıTNit+β2CDit+ β3BSit+ β4ACit +еit
Notes: CCC = cash conversion cycle, α = alfa, β = beta, TNit = CEO tenure, CDit = CEO
duality, BSit = board size, ACit = audit committee, µit = the error, CA = current assets,
CL = current liabilities, and CR= current ratio. The same independent variables used in
all four equations to determine their effects on CA, CL, CR, and the CCCs of the
organizations.
Statistical Analysis
There are several assumptions in multiple regression analysis that are outlined in
the current empirical literature. Gbadamosi (2016) noted that these assumptions must be
verified before any meaningful conclusions about a population are determined. The
author examined the following nine assumptions:
• Measurement of variables,
• Presence of variance,
• Absence of perfect multicollinearity among the predictors,
• No strong correlation between the predictors and the external variables,
• Presence of homoscedasticity,
• Lack of autocorrelation of error terms,
• Normally distributed errors,
• Independence of data, and
• The linearity of relationship.
Greene (2012) added more assumptions to this list. In the study, the researcher
ensured that the following assumptions and conditions were met:
80
• No notable outliers exist in the data sets of dependent variables.
• Normally, there is a distribution of the dependent variable in the population
for each blend of levels of the independent variables.
• The residuals in the analysis design are random and distributed with zero
means.
• The arrived scores on the variables are independent of other scores on the
same variables.
Before performing statistical analysis, I ensured that there were no existing
outliers in the data set. To check for the normality of variables, I used descriptive data to
screen the data set that is comprised of minimum, maximum, mean, and standard
deviations. To monitor the integrity and the reliability of data, I performed
multicollinearity and homogeneity tests. To comply with all of the outlined assumptions,
I examined the regression output, F-ratio, R-squared, and the adjusted R-squared.
After all the assumptions were met and the regression outputs were examined, I
reported the F-ratio of ANOVA to demonstrate the entire regression analysis that was
used for the data analysis, and determined if the independent variables predicted the
dependent variables. The R value shows the quality of the prediction of the dependent
variables in CA, CR, CR, and the CCC. The coefficient of determination described as R2
denotes how appropriately the study data fits the statistical model. The coefficient of
determination varies from 0 to 1. R² of 1 indicates that the regression lines fit the data,
while a R² of 2 shows that the line does not fit the data. Therefore, R illustrated the
proportion of variance in the dependent variables of CA, CR, CR, and the CCC that could
81
be incorporated to explain the independent variables of TNit, CDit, BSit, and ACit.
Moreover, I determined the statistical significance of TNit, CDit, BSit, and ACit by
interpreting the t value and p-value together, to determine if their coefficients were
significantly different from 0.
Protection of Selected Organizations in the Study
Walden University requires that each study comply with the University’s ethical
standards and any applicable international guidelines. With this in mind, I did not
involve human subjects in my study, but instead collected data from the organizations
involved. Statistical analysis was conducted on secondary data, which included
published financial reports from Nigerian companies from 2013–2014. SPSS software
was used to analyze the data. Ethical dilemmas are of paramount importance. Therefore,
I ensured data integrity and confidentiality, to prevent unforeseen events from affecting
the Nigerian firms. The names of the Nigerian organizations were not included to
maintain their privacy. Only the committee chair, the methodologist, and the researcher
had access to the raw data to ensure data integrity. The data were shielded from persons
and organizations that were not a part of the project for security reasons. The data will be
stored for five years and later discarded for safety reasons.
Dissemination of Findings
Presenting posters at symposiums and conferences is an effective way of sharing
research with the public. This will allow me to develop academic experience and
network with other faculty and students who share similar research interests. To promote
82
scholarly activity, I will share this study in poster sessions with Walden University’s
permission. I will only share the study’s findings and will not share my personal beliefs.
Summary
In Chapter 3 I discussed the research design that was used to test the hypotheses
and research questions, which were developed based on the literature review. There is a
need to explore the relationship between corporate governance practices and WCM
efficiency within Nigerian organizations. In Chapter 3 I offered a rationale for using
quantitative research and secondary data to conduct this study. This chapter discussed all
of the elements associated with quantitative research and shared that the multiple
regression model was employed to test the recommended hypotheses and the alternative
hypotheses. In Chapter 4, I will present the results of this study. Also, in Chapter 5, I will
provide a complete summary of this study and will share the findings and make
suggestions that might help Nigerian organizations choose appropriate corporate
governance models to increase the effectiveness of their institutions.
83
Chapter 4: Results
Introduction
In this study, I examined the association between CG and WCM efficiency of
Nigerian organizations. The purpose of this quantitative correlational study was to add to
the ongoing discussion as to whether CG practice has any impact on the working capital
management efficiency of Nigerian organizations, and if so, to know the nature and
importance of such effects. I conceived that a sound knowledge of this relationship
might empower Nigerian organizations with the vital information they require for their
resource allocation decisions.
In the study, I developed four research questions to examine whether there were
positive statistical relationships between CEO tenure, CEO duality, BS, size of AC, and
WCM of Nigerian firms. The working capital performance indicators included: CAs,
CLs, CR, and CCC. I adopted descriptive statistical analysis to produce the frequency and
central distribution and to show the effectiveness of the methods used to define, arrange,
summarize, and quantitatively depict the data utilized in the study. To present the
frequency distribution and central tendencies, I tabulated and plotted the minimum,
maximum, M, medium and SD of working capital performance related to CEO tenure,
CEO duality, BS, and AC size of the sampled Nigerian firms. I adopted the general least
square model with intersection weights of 11 sectors (financial services, consumer goods,
oil and gas, agriculture, conglomerates, construction/real estate, ICT, industrial goods,
natural resources, healthcare, and services). This model helped me to examine the
hypotheses of the study and generalize from the sampled Nigerian companies to the
84
entire population of Nigerian organizations. I also adopted inferential statistics to
examine the hypotheses of the study and to generalize from the sampled companies to the
population of the Nigerian organizations. The generated results of this model and of the
inferential statistics indicated an assessment of the relationship between CEO tenure,
CEO duality, BS, and AC size of the sampled Nigerian firms.
In this chapter, I will focus on my analysis and review of the results of the
statistical analyses I conducted on the collected data. I will assess the study findings and
give insight into the impact of CG on WCM. There will be two main sections in this
chapter. In the first, I will provide insights into the descriptive statistics of the sampled
Nigerian companies. In the second section, I will present an analysis of the inferential
statistics will also explain the findings regarding the associations between CEO tenure,
CEO duality, BS, AC size, and the four working capital indicators.
Data Collection
Institutional Review Board (IRB) Approval for Data Collection
The IRB approval number of this doctoral capstone is 03-22-17-0368645. I
obtained the approval contingent on my acceptance of the guidelines in the application
request. The procedure emphasized a strict compliance with Walden University’s ethical
requirements for the doctoral capstone. The IRB procedural process guided the process
of data collection for this study. The data collection commenced after obtaining approval
from the IRB and concluded within 4 weeks of receiving approval.
85
Sources of Collected Data
As I presented in Chapter 3, 89 firms were determined to represent an optimal
sample size for this study. However, NSE data ratings were available for only 84
companies. Further evaluations showed that complete financial data were not available
for five of the firms listed on the Nigerian stock exchange database. The lack of adequate
data necessitated my removal of these five companies from the sampling population. The
NSE stored and administered the reported financial data of the other organizations. I
conducted this research study employing secondary data of varying types from two
sources. I retrieved the financial and governance data as presented for the period from
January 2013 to December 2014 from the respective websites of the sampled firms. The
dependent variables (CR, CAs, CLs, and CCC) were obtained from the NSE website to
aid in the computation of various working capital ratios adopted in testing the study
hypotheses.
Data Analysis: Descriptive Statistics
In this section, I will report the descriptive statistics of the sampled Nigerian
organizations based on the mean, median, and standard deviation of CAs, CLs, CR, CCC,
and SG. In this study, I based the descriptive statistical tests on central tendency and
dispersion measures that are appropriate for categorical and continuous variables. I
concluded with linear relationship analysis and the results of regression for CEO tenure,
CEO duality, BS, and the AC size of the sampled Nigerian firms.
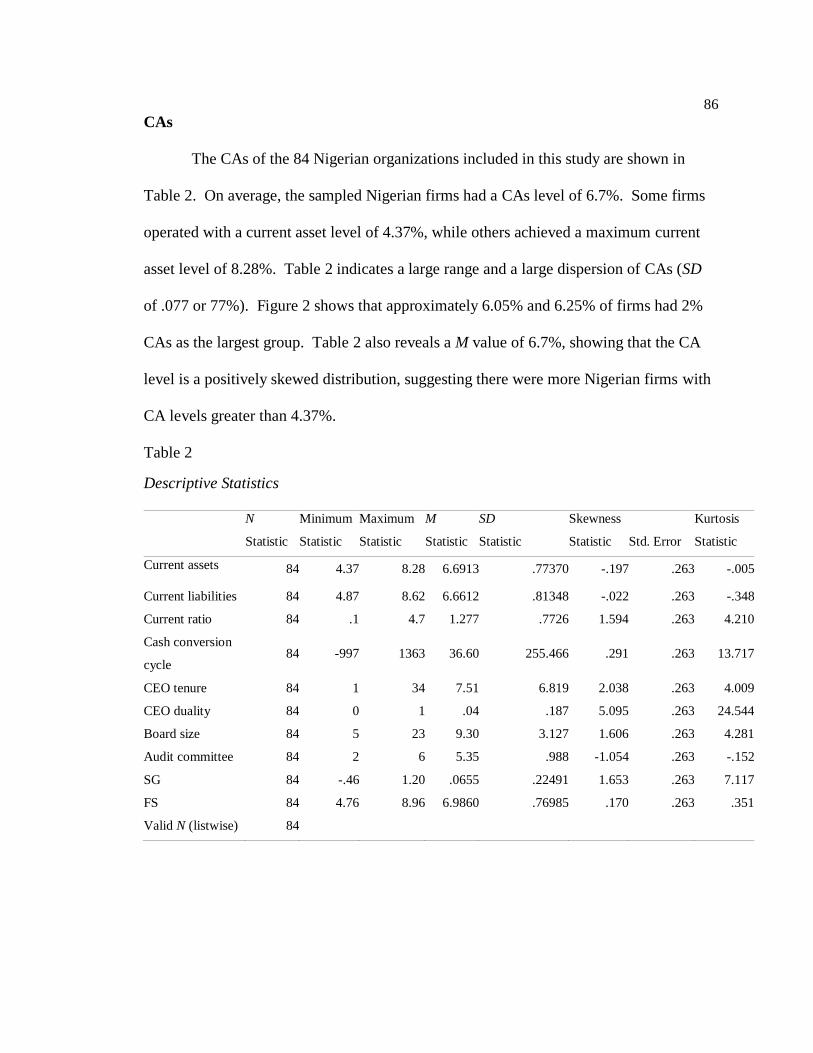
86
CAs
The CAs of the 84 Nigerian organizations included in this study are shown in
Table 2. On average, the sampled Nigerian firms had a CAs level of 6.7%. Some firms
operated with a current asset level of 4.37%, while others achieved a maximum current
asset level of 8.28%. Table 2 indicates a large range and a large dispersion of CAs (SD
of .077 or 77%). Figure 2 shows that approximately 6.05% and 6.25% of firms had 2%
CAs as the largest group. Table 2 also reveals a M value of 6.7%, showing that the CA
level is a positively skewed distribution, suggesting there were more Nigerian firms with
CA levels greater than 4.37%.
Table 2
Descriptive Statistics
N Minimum Maximum M SD Skewness Kurtosis
Statistic Statistic Statistic Statistic Statistic Statistic Std. Error Statistic
Current assets 84 4.37 8.28 6.6913 .77370 -.197 .263 -.005
Current liabilities 84 4.87 8.62 6.6612 .81348 -.022 .263 -.348
Current ratio 84 .1 4.7 1.277 .7726 1.594 .263 4.210
Cash conversion
cycle 84 -997 1363 36.60 255.466 .291 .263 13.717
CEO tenure 84 1 34 7.51 6.819 2.038 .263 4.009
CEO duality 84 0 1 .04 .187 5.095 .263 24.544
Board size 84 5 23 9.30 3.127 1.606 .263 4.281
Audit committee 84 2 6 5.35 .988 -1.054 .263 -.152
SG 84 -.46 1.20 .0655 .22491 1.653 .263 7.117
FS 84 4.76 8.96 6.9860 .76985 .170 .263 .351
Valid N (listwise) 84
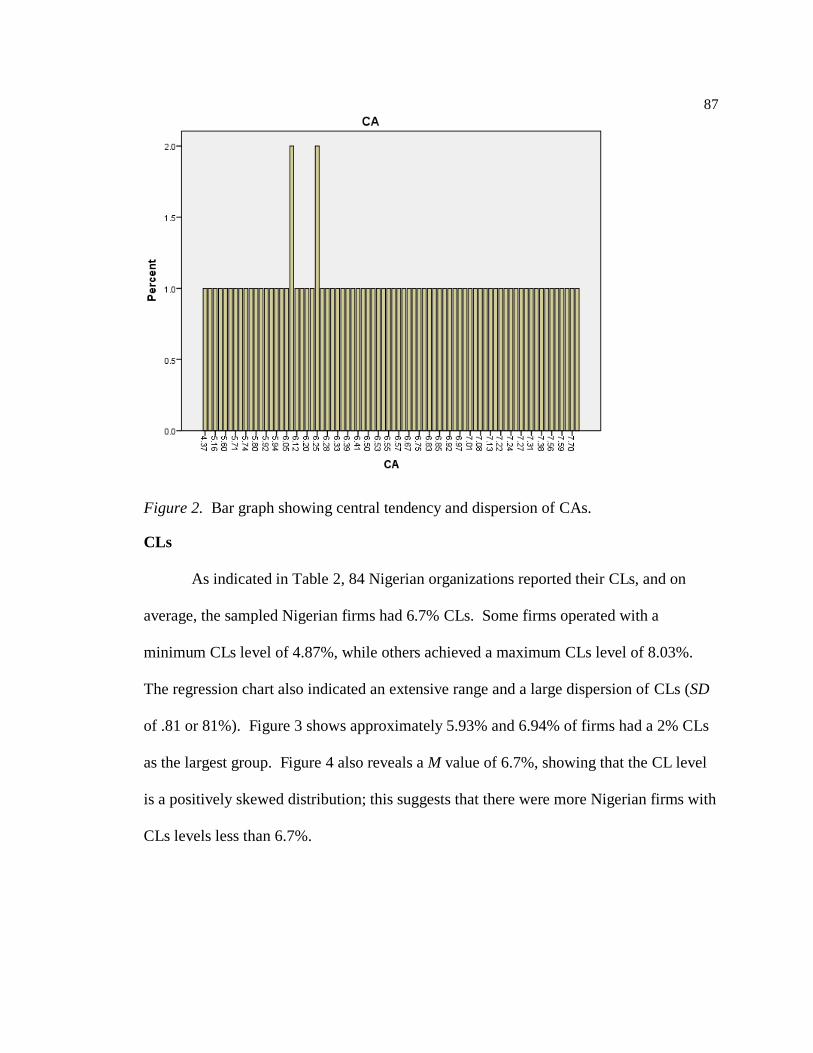
87
Figure 2. Bar graph showing central tendency and dispersion of CAs.
CLs
As indicated in Table 2, 84 Nigerian organizations reported their CLs, and on
average, the sampled Nigerian firms had 6.7% CLs. Some firms operated with a
minimum CLs level of 4.87%, while others achieved a maximum CLs level of 8.03%.
The regression chart also indicated an extensive range and a large dispersion of CLs (SD
of .81 or 81%). Figure 3 shows approximately 5.93% and 6.94% of firms had a 2% CLs
as the largest group. Figure 4 also reveals a M value of 6.7%, showing that the CL level
is a positively skewed distribution; this suggests that there were more Nigerian firms with
CLs levels less than 6.7%.
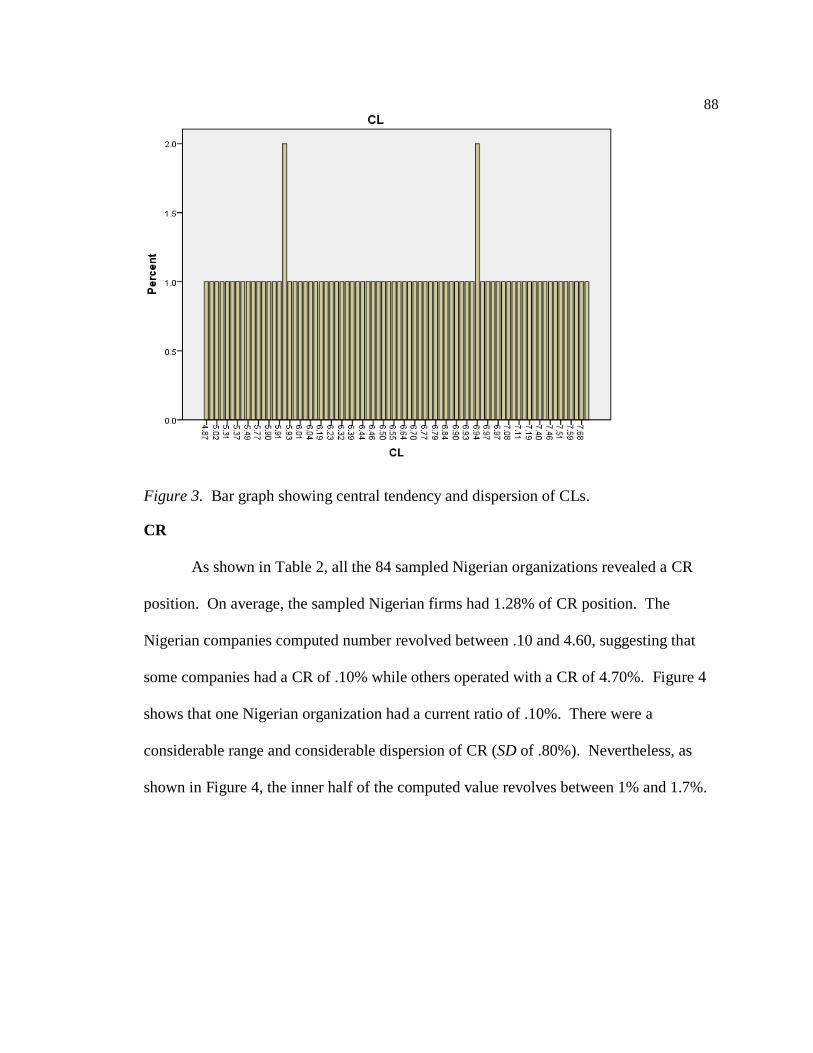
88
Figure 3. Bar graph showing central tendency and dispersion of CLs.
CR
As shown in Table 2, all the 84 sampled Nigerian organizations revealed a CR
position. On average, the sampled Nigerian firms had 1.28% of CR position. The
Nigerian companies computed number revolved between .10 and 4.60, suggesting that
some companies had a CR of .10% while others operated with a CR of 4.70%. Figure 4
shows that one Nigerian organization had a current ratio of .10%. There were a
considerable range and considerable dispersion of CR (SD of .80%). Nevertheless, as
shown in Figure 4, the inner half of the computed value revolves between 1% and 1.7%.
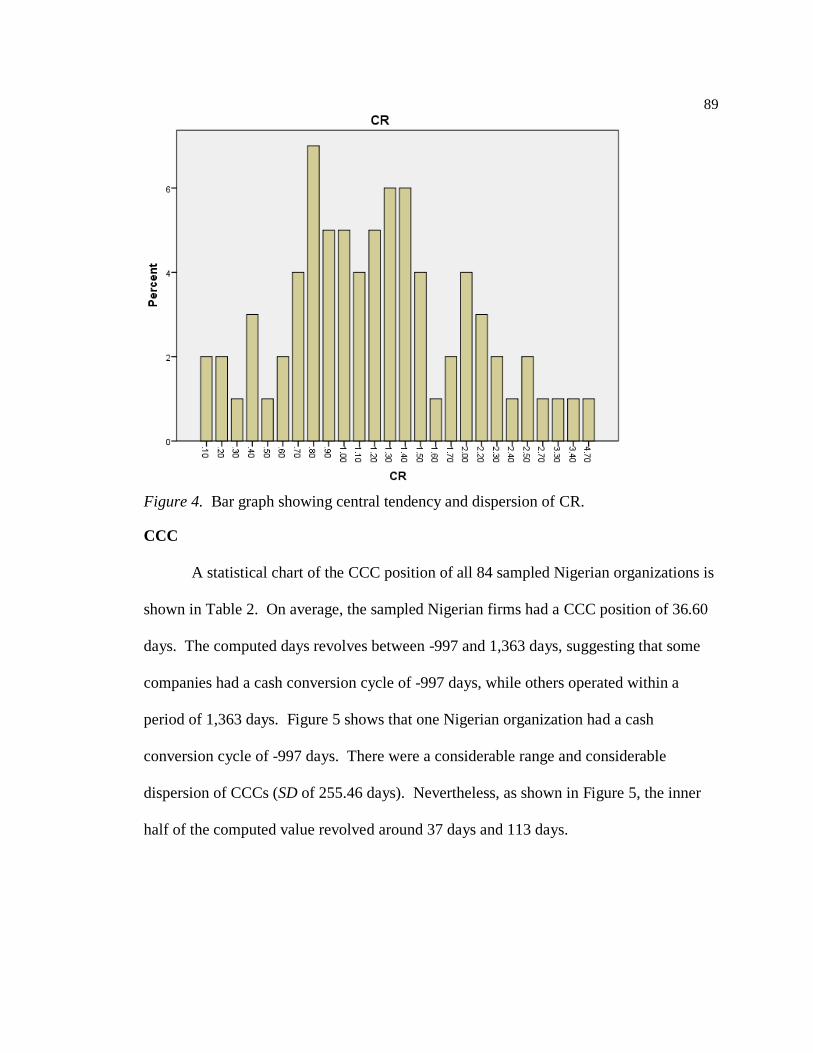
89
Figure 4. Bar graph showing central tendency and dispersion of CR.
CCC
A statistical chart of the CCC position of all 84 sampled Nigerian organizations is
shown in Table 2. On average, the sampled Nigerian firms had a CCC position of 36.60
days. The computed days revolves between -997 and 1,363 days, suggesting that some
companies had a cash conversion cycle of -997 days, while others operated within a
period of 1,363 days. Figure 5 shows that one Nigerian organization had a cash
conversion cycle of -997 days. There were a considerable range and considerable
dispersion of CCCs (SD of 255.46 days). Nevertheless, as shown in Figure 5, the inner
half of the computed value revolved around 37 days and 113 days.
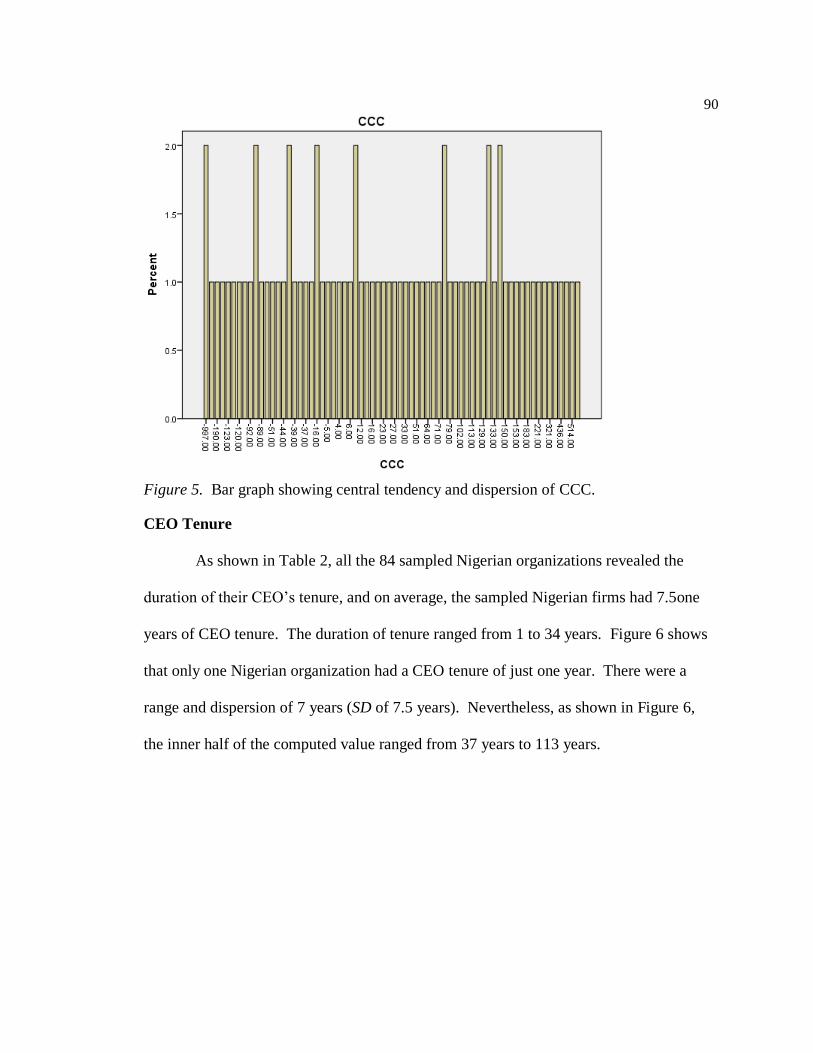
90
Figure 5. Bar graph showing central tendency and dispersion of CCC.
CEO Tenure
As shown in Table 2, all the 84 sampled Nigerian organizations revealed the
duration of their CEO’s tenure, and on average, the sampled Nigerian firms had 7.5one
years of CEO tenure. The duration of tenure ranged from 1 to 34 years. Figure 6 shows
that only one Nigerian organization had a CEO tenure of just one year. There were a
range and dispersion of 7 years (SD of 7.5 years). Nevertheless, as shown in Figure 6,
the inner half of the computed value ranged from 37 years to 113 years.
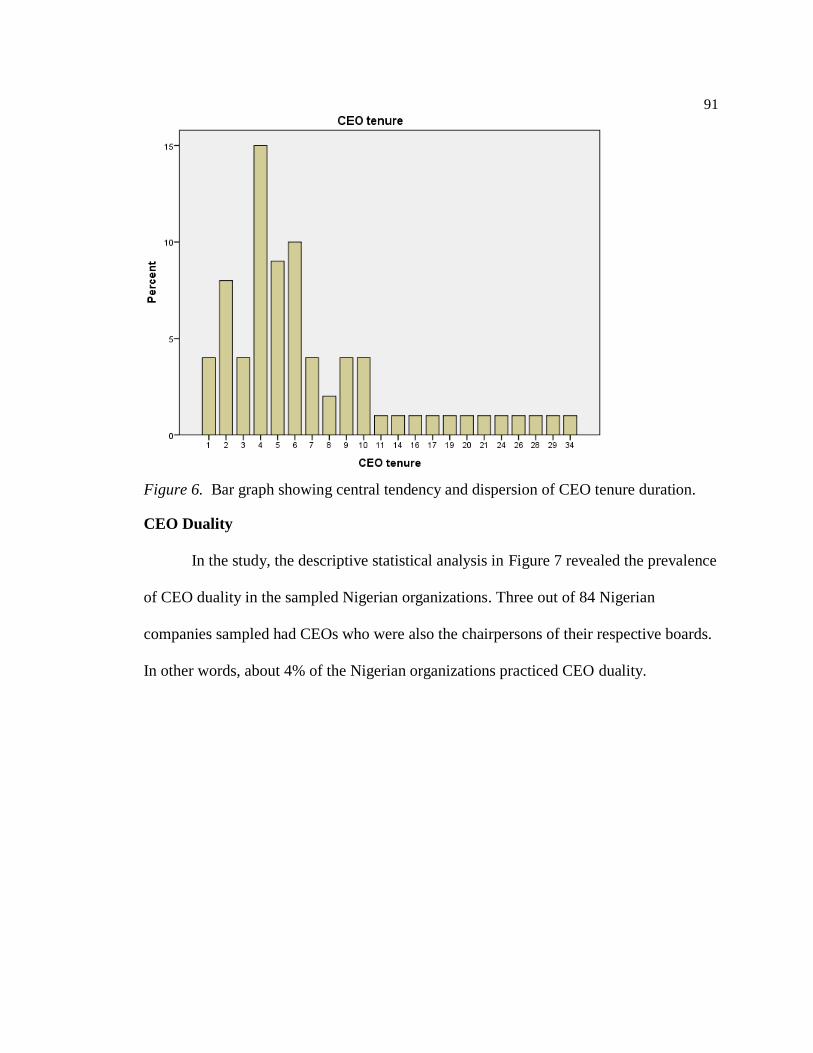
91
Figure 6. Bar graph showing central tendency and dispersion of CEO tenure duration.
CEO Duality
In the study, the descriptive statistical analysis in Figure 7 revealed the prevalence
of CEO duality in the sampled Nigerian organizations. Three out of 84 Nigerian
companies sampled had CEOs who were also the chairpersons of their respective boards.
In other words, about 4% of the Nigerian organizations practiced CEO duality.
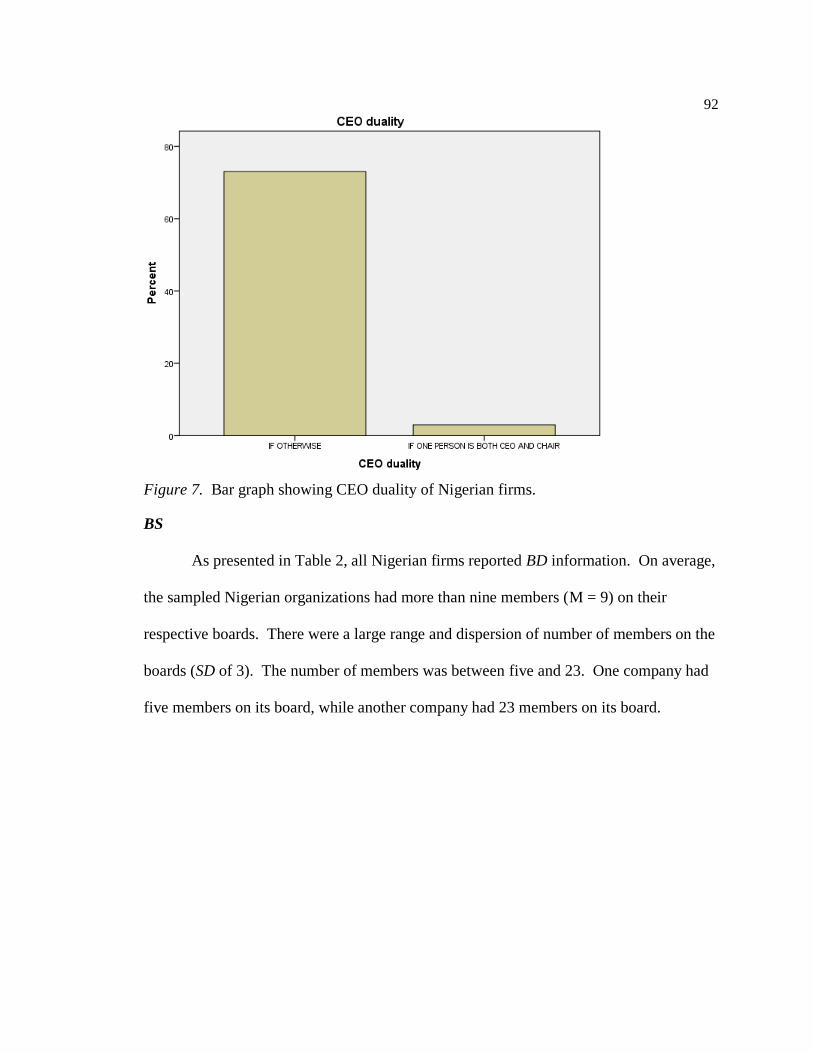
92
Figure 7. Bar graph showing CEO duality of Nigerian firms.
BS
As presented in Table 2, all Nigerian firms reported BD information. On average,
the sampled Nigerian organizations had more than nine members (M = 9) on their
respective boards. There were a large range and dispersion of number of members on the
boards (SD of 3). The number of members was between five and 23. One company had
five members on its board, while another company had 23 members on its board.
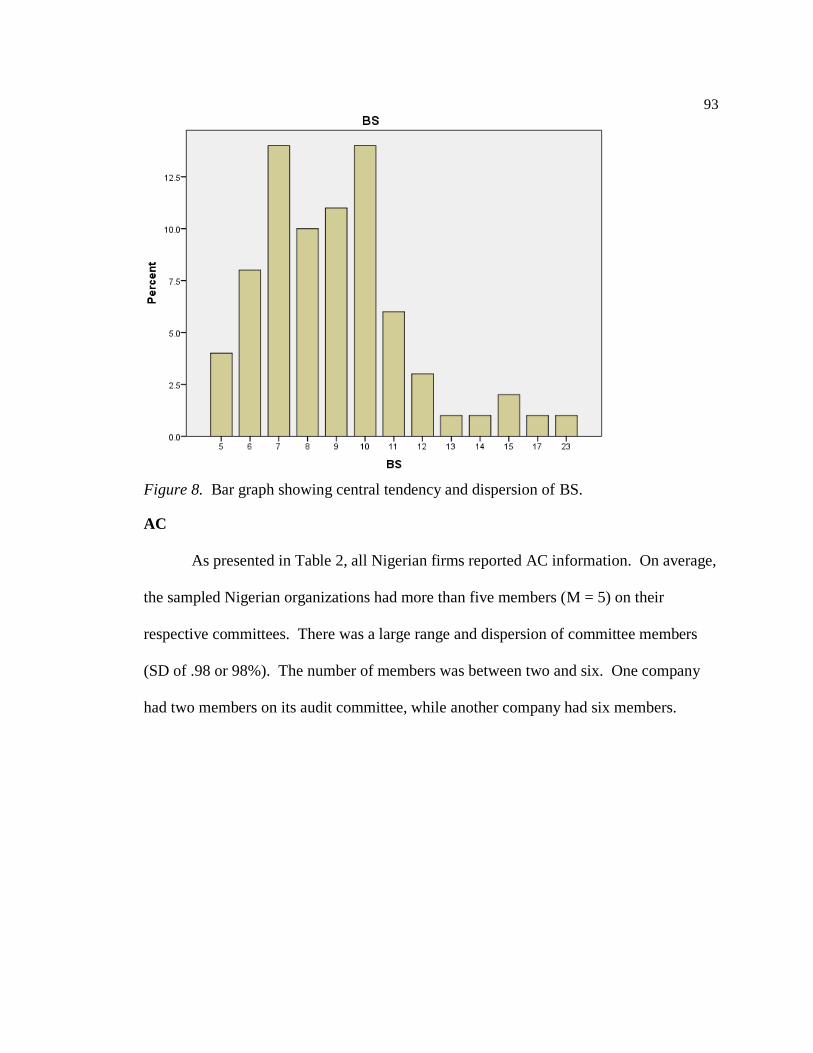
93
Figure 8. Bar graph showing central tendency and dispersion of BS.
AC
As presented in Table 2, all Nigerian firms reported AC information. On average,
the sampled Nigerian organizations had more than five members (M = 5) on their
respective committees. There was a large range and dispersion of committee members
(SD of .98 or 98%). The number of members was between two and six. One company
had two members on its audit committee, while another company had six members.
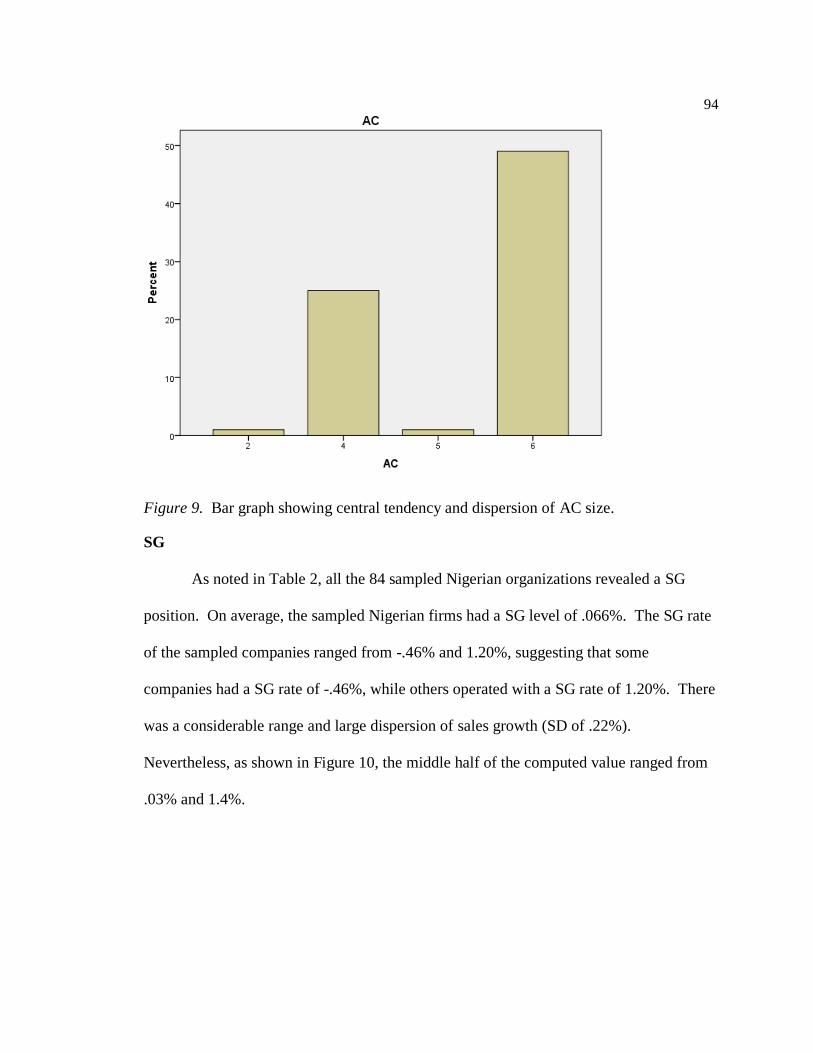
94
Figure 9. Bar graph showing central tendency and dispersion of AC size.
SG
As noted in Table 2, all the 84 sampled Nigerian organizations revealed a SG
position. On average, the sampled Nigerian firms had a SG level of .066%. The SG rate
of the sampled companies ranged from -.46% and 1.20%, suggesting that some
companies had a SG rate of -.46%, while others operated with a SG rate of 1.20%. There
was a considerable range and large dispersion of sales growth (SD of .22%).
Nevertheless, as shown in Figure 10, the middle half of the computed value ranged from
.03% and 1.4%.
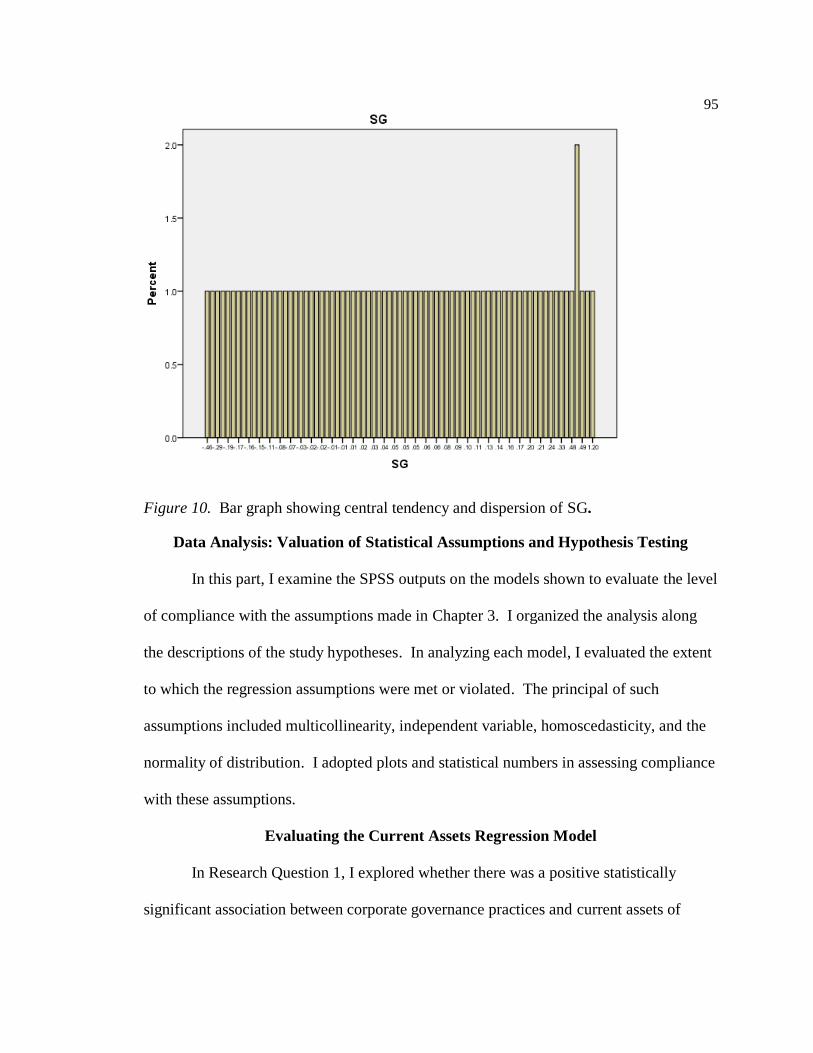
95
Figure 10. Bar graph showing central tendency and dispersion of SG.
Data Analysis: Valuation of Statistical Assumptions and Hypothesis Testing
In this part, I examine the SPSS outputs on the models shown to evaluate the level
of compliance with the assumptions made in Chapter 3. I organized the analysis along
the descriptions of the study hypotheses. In analyzing each model, I evaluated the extent
to which the regression assumptions were met or violated. The principal of such
assumptions included multicollinearity, independent variable, homoscedasticity, and the
normality of distribution. I adopted plots and statistical numbers in assessing compliance
with these assumptions.
Evaluating the Current Assets Regression Model
In Research Question 1, I explored whether there was a positive statistically
significant association between corporate governance practices and current assets of
96
Nigerian organizations. The multiple regression model used CA as the dependent
variable and CEO tenure, CEO duality, BS, and AC size as the independent variables, as
well as other control variables. The model is below:
CA= α + βıTNit+β2CDit+ β3BSit+ β4ACit +eit …………………………………… (12)
Where
α = Alfa,
TNit = CEO tenure,
CDit = CEO duality,
BSit = Board,
ACit = Audit committee,
β = Beta,
µit = the error
CA = Current Assets
The prediction of the outcome of current assets by the weighted combination for
CEO tenure, CEO duality, BS and AC size was tested using an f distribution test and
ANOVA, using a confidence interval alpha level of 5%. The null hypothesis stated that
there was no significant statistical association between CEO tenure, CEO duality, BS, AC
size, and CAs of the sampled Nigerian organizations, indicating that all the stated
coefficients are zero and that,
H1ₒ: βı=β2=β3=β4= 0
The alternative hypothesis predicted that there was a significant positive
association between CEO tenure, CEO duality, BS, AC size, and current assets of the
97
sampled Nigerian organizations, signifying that at least one of the variables belonged in
the regression model. So,
H1ₒ: βı is not zero
The multiple regression analysis was conducted to evaluate whether CEO tenure,
CEO duality, BS, and AC size predict the CAs of the sampled Nigerian organizations.
The multiple regression results are shown below. The multiple regression equation with
CAs as the dependent variable is presented as follows:
CA = 4.476-.016*TN+ .042*CD +.053* BS +.345*AC+ ɛ ……………………… (13)
The correlation emanating from the multiple regression analysis indicated that the
independent variables were highly correlated (F (4, 79) = 8.753, p < .001). Thus, I
included all the independent variables in the analysis. Table 4 shows that the p-value for
CEO tenure, CEO duality, BS, and AC size was <.001. Therefore, I rejected the null
hypotheses that bı=b2=b3=b4= 0. Thus, CEO tenure, CEO duality, BS, and AC size
were statistically significant and could explain 27% of the variance in the dependent
variable CAs (adjusted R square = .272). Only two of the variables significantly
contributed to the regression model: BS (β = .214, p <. 05) and AC size (β = .440, p <.
001). The constant, standardized errors, standardized betas, and their significance value
are compiled in Table 5 below:
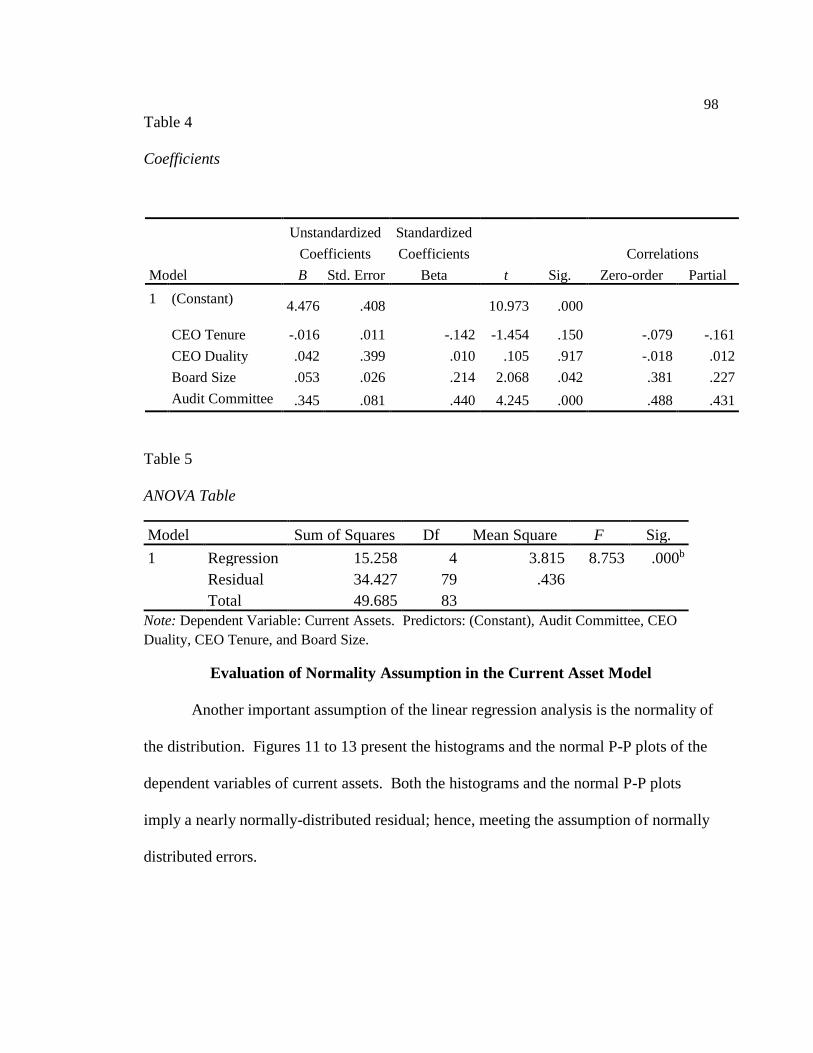
98
Table 4
Coefficients
Model
Unstandardized
Coefficients
Standardized
Coefficients
t Sig.
Correlations
B Std. Error Beta Zero-order Partial
1 (Constant) 4.476 .408
10.973 .000
CEO Tenure -.016 .011 -.142 -1.454 .150 -.079 -.161
CEO Duality .042 .399 .010 .105 .917 -.018 .012
Board Size .053 .026 .214 2.068 .042 .381 .227
Audit Committee .345 .081 .440 4.245 .000 .488 .431
Table 5
ANOVA Table
Model Sum of Squares Df Mean Square F Sig.
1 Regression 15.258 4 3.815 8.753 .000b
Residual 34.427 79 .436
Total 49.685 83
Note: Dependent Variable: Current Assets. Predictors: (Constant), Audit Committee, CEO
Duality, CEO Tenure, and Board Size.
Evaluation of Normality Assumption in the Current Asset Model
Another important assumption of the linear regression analysis is the normality of
the distribution. Figures 11 to 13 present the histograms and the normal P-P plots of the
dependent variables of current assets. Both the histograms and the normal P-P plots
imply a nearly normally-distributed residual; hence, meeting the assumption of normally
distributed errors.
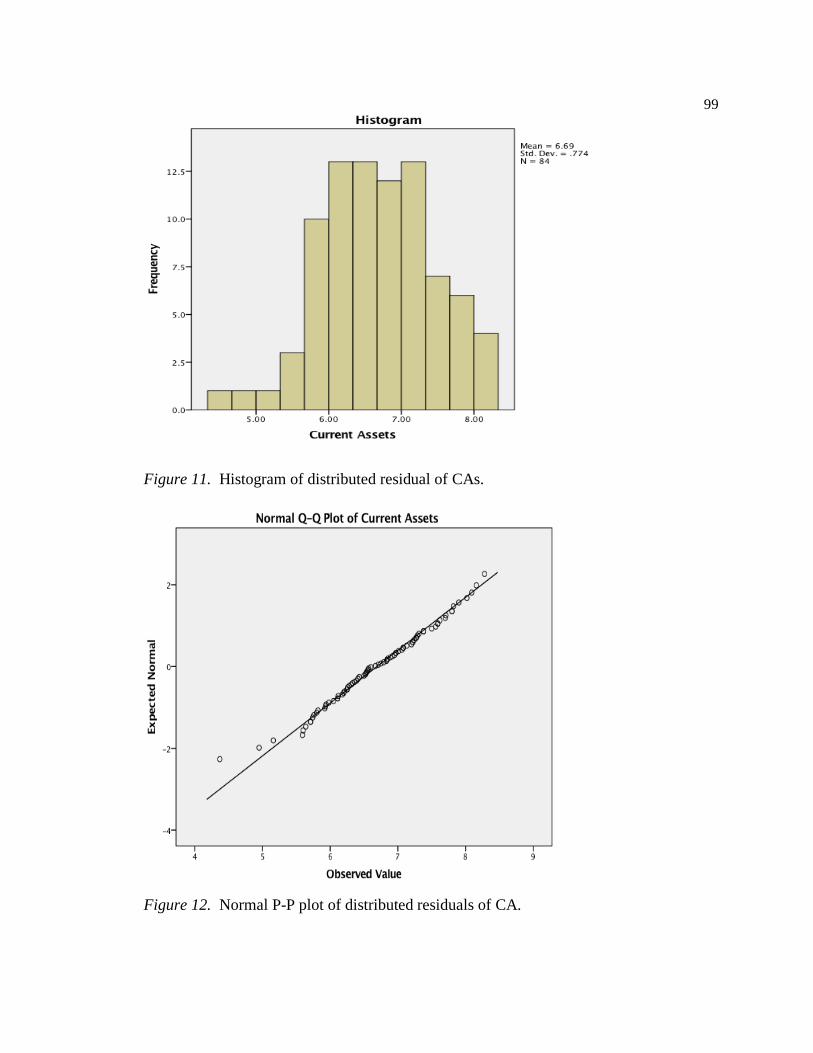
99
Figure 11. Histogram of distributed residual of CAs.
Figure 12. Normal P-P plot of distributed residuals of CA.
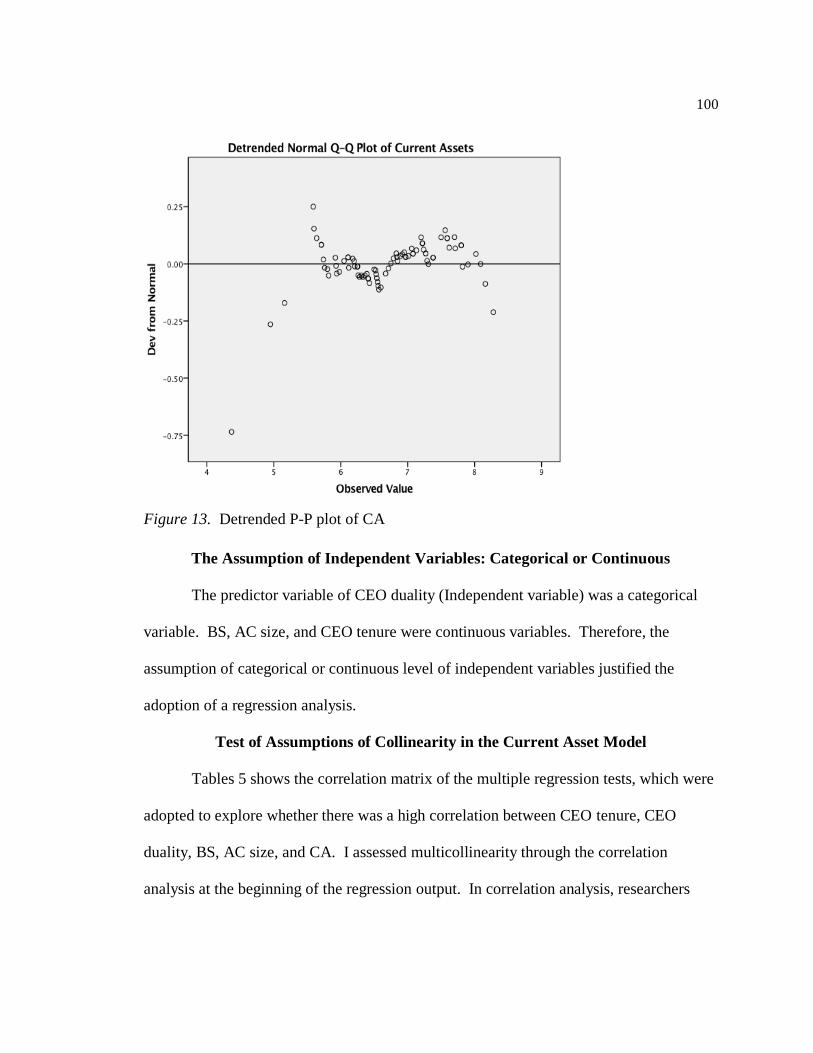
100
Figure 13. Detrended P-P plot of CA
The Assumption of Independent Variables: Categorical or Continuous
The predictor variable of CEO duality (Independent variable) was a categorical
variable. BS, AC size, and CEO tenure were continuous variables. Therefore, the
assumption of categorical or continuous level of independent variables justified the
adoption of a regression analysis.
Test of Assumptions of Collinearity in the Current Asset Model
Tables 5 shows the correlation matrix of the multiple regression tests, which were
adopted to explore whether there was a high correlation between CEO tenure, CEO
duality, BS, AC size, and CA. I assessed multicollinearity through the correlation
analysis at the beginning of the regression output. In correlation analysis, researchers
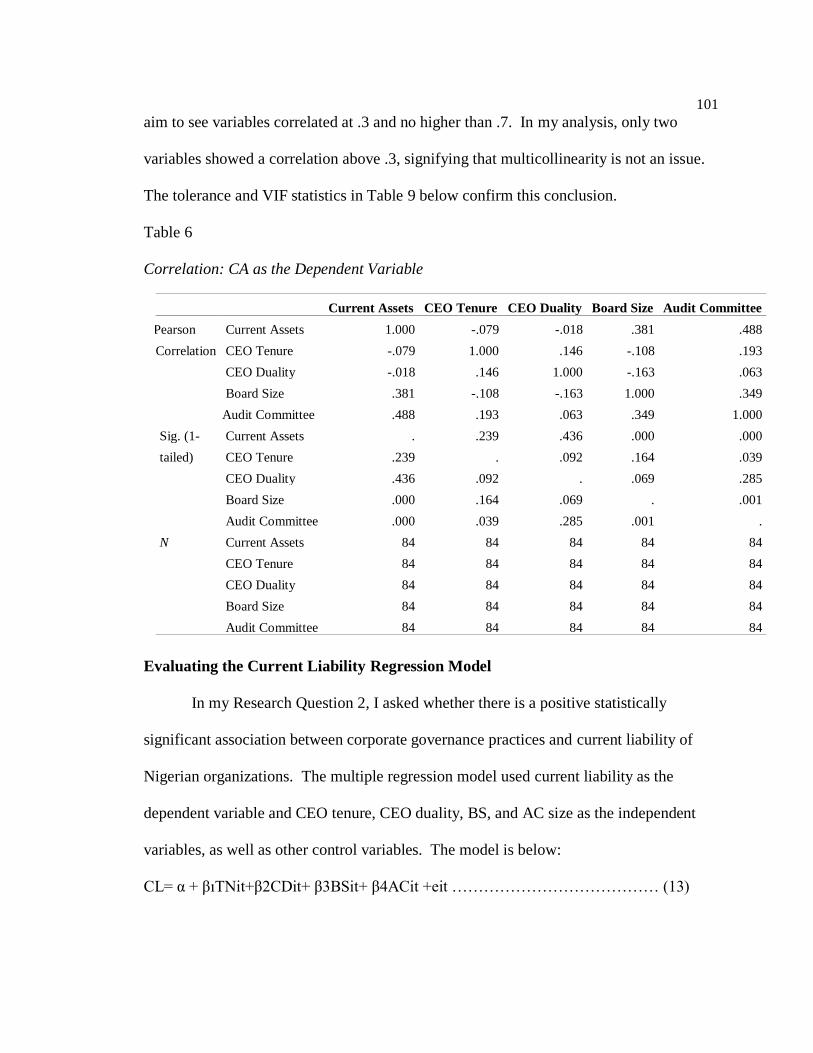
101
aim to see variables correlated at .3 and no higher than .7. In my analysis, only two
variables showed a correlation above .3, signifying that multicollinearity is not an issue.
The tolerance and VIF statistics in Table 9 below confirm this conclusion.
Table 6
Correlation: CA as the Dependent Variable
Current Assets CEO Tenure CEO Duality Board Size Audit Committee
Pearson
Correlation
Current Assets 1.000 -.079 -.018 .381 .488
CEO Tenure -.079 1.000 .146 -.108 .193
CEO Duality -.018 .146 1.000 -.163 .063
Board Size .381 -.108 -.163 1.000 .349
Audit Committee .488 .193 .063 .349 1.000
Sig. (1-
tailed)
Current Assets . .239 .436 .000 .000
CEO Tenure .239 . .092 .164 .039
CEO Duality .436 .092 . .069 .285
Board Size .000 .164 .069 . .001
Audit Committee .000 .039 .285 .001 .
N Current Assets 84 84 84 84 84
CEO Tenure 84 84 84 84 84
CEO Duality 84 84 84 84 84
Board Size 84 84 84 84 84
Audit Committee 84 84 84 84 84
Evaluating the Current Liability Regression Model
In my Research Question 2, I asked whether there is a positive statistically
significant association between corporate governance practices and current liability of
Nigerian organizations. The multiple regression model used current liability as the
dependent variable and CEO tenure, CEO duality, BS, and AC size as the independent
variables, as well as other control variables. The model is below:
CL= α + βıTNit+β2CDit+ β3BSit+ β4ACit +eit ………………………………… (13)
102
Where
α = Alfa,
TNit = CEO tenure,
CDit = CEO duality,
BSit = Board,
ACit = Audit committee,
β = Beta,
µit = the error
CL = Current Liability
The prediction of the outcome of CL by the weighted combination for CEO
tenure, CEO duality, BS, and AC size was tested using an f distribution test and ANOVA
at a confidence interval of the alpha level of 5%. My null hypothesis stated that there
was no significant statistical association between CEO tenure, CEO duality, BS, AC size,
and CL of the sampled Nigerian organizations, indicating that all the stated coefficients
are zero and that,
H2ₒ: βı=β2=β3=β4= 0
My alternative hypothesis predicted that there was a significant positive
association between CEO tenure, CEO duality, BS, AC size, and CL of the sampled
Nigerian organizations, signifying that at least one of the variables belongs in the
regression model. So,
H2ₒ: βı is not zero
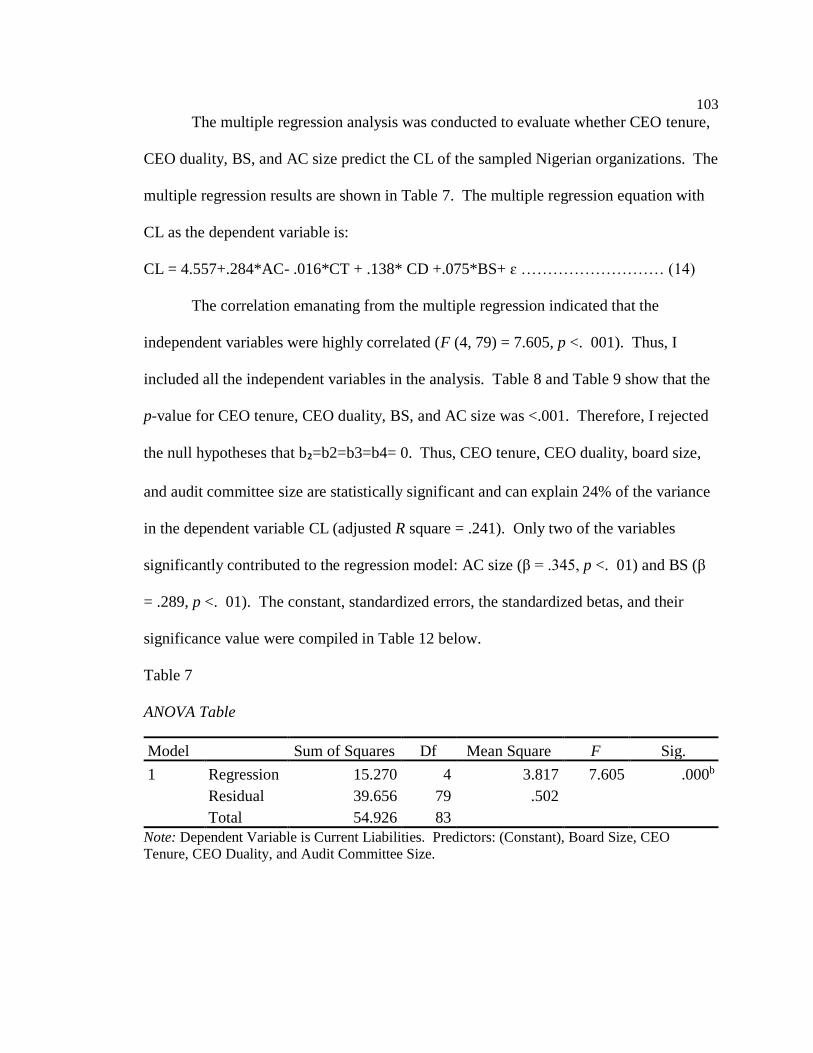
103
The multiple regression analysis was conducted to evaluate whether CEO tenure,
CEO duality, BS, and AC size predict the CL of the sampled Nigerian organizations. The
multiple regression results are shown in Table 7. The multiple regression equation with
CL as the dependent variable is:
CL = 4.557+.284*AC- .016*CT + .138* CD +.075*BS+ ɛ ……………………… (14)
The correlation emanating from the multiple regression indicated that the
independent variables were highly correlated (F (4, 79) = 7.605, p <. 001). Thus, I
included all the independent variables in the analysis. Table 8 and Table 9 show that the
p-value for CEO tenure, CEO duality, BS, and AC size was <.001. Therefore, I rejected
the null hypotheses that b₂=b2=b3=b4= 0. Thus, CEO tenure, CEO duality, board size,
and audit committee size are statistically significant and can explain 24% of the variance
in the dependent variable CL (adjusted R square = .241). Only two of the variables
significantly contributed to the regression model: AC size (β = .345, p <. 01) and BS (β
= .289, p <. 01). The constant, standardized errors, the standardized betas, and their
significance value were compiled in Table 12 below.
Table 7
ANOVA Table
Model Sum of Squares Df Mean Square F Sig.
1 Regression 15.270 4 3.817 7.605 .000b
Residual 39.656 79 .502
Total 54.926 83
Note: Dependent Variable is Current Liabilities. Predictors: (Constant), Board Size, CEO
Tenure, CEO Duality, and Audit Committee Size.
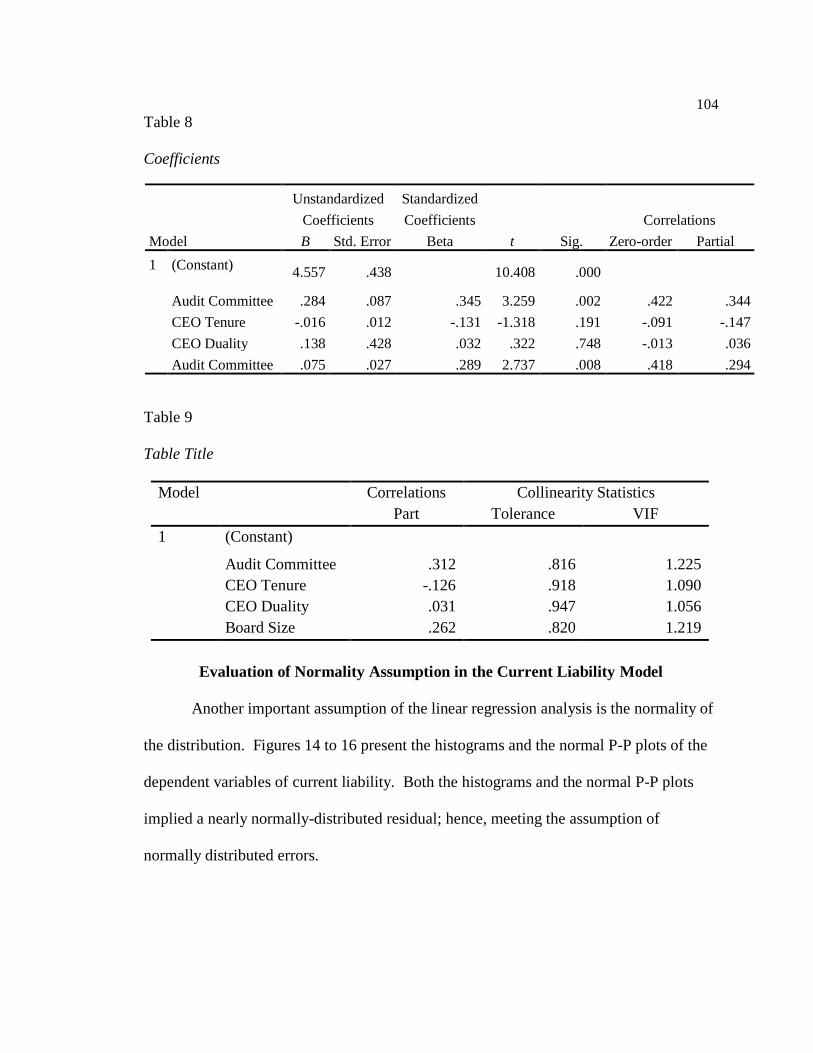
104
Table 8
Coefficients
Model
Unstandardized
Coefficients
Standardized
Coefficients
t Sig.
Correlations
B Std. Error Beta Zero-order Partial
1 (Constant) 4.557 .438
10.408 .000
Audit Committee .284 .087 .345 3.259 .002 .422 .344
CEO Tenure -.016 .012 -.131 -1.318 .191 -.091 -.147
CEO Duality .138 .428 .032 .322 .748 -.013 .036
Audit Committee .075 .027 .289 2.737 .008 .418 .294
Table 9
Table Title
Model Correlations Collinearity Statistics
Part Tolerance VIF
1 (Constant)
Audit Committee .312 .816 1.225
CEO Tenure -.126 .918 1.090
CEO Duality .031 .947 1.056
Board Size .262 .820 1.219
Evaluation of Normality Assumption in the Current Liability Model
Another important assumption of the linear regression analysis is the normality of
the distribution. Figures 14 to 16 present the histograms and the normal P-P plots of the
dependent variables of current liability. Both the histograms and the normal P-P plots
implied a nearly normally-distributed residual; hence, meeting the assumption of
normally distributed errors.
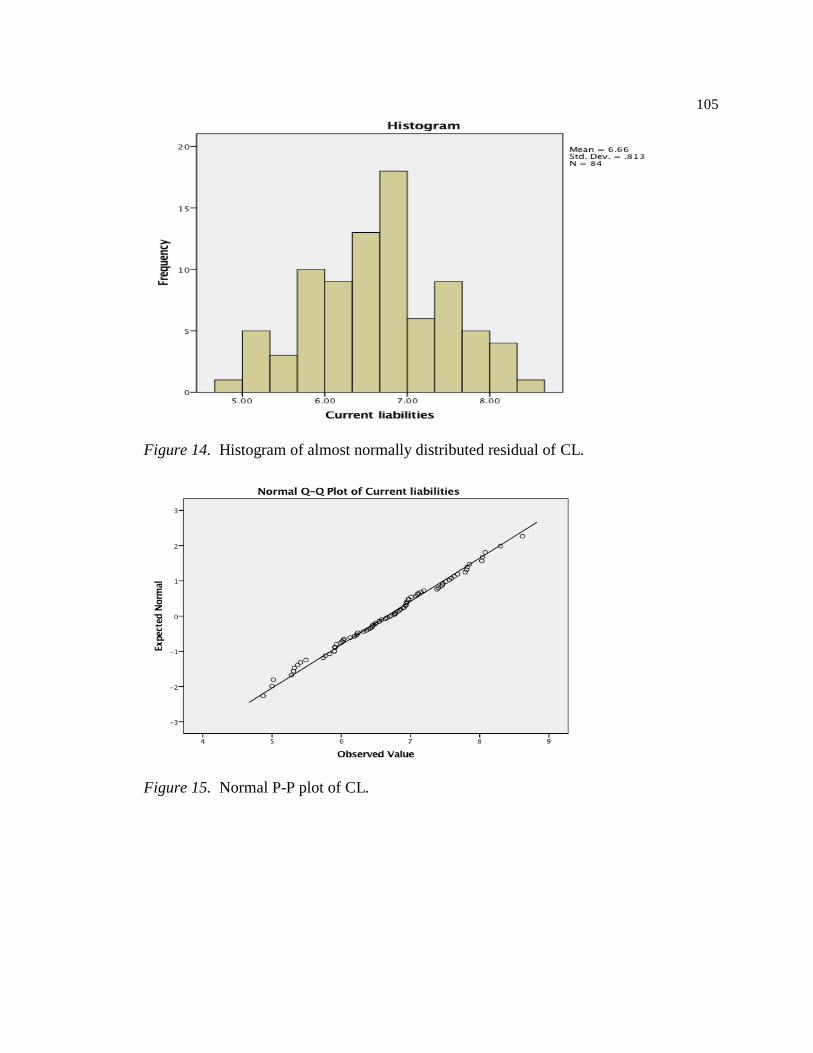
105
Figure 14. Histogram of almost normally distributed residual of CL.
Figure 15. Normal P-P plot of CL.
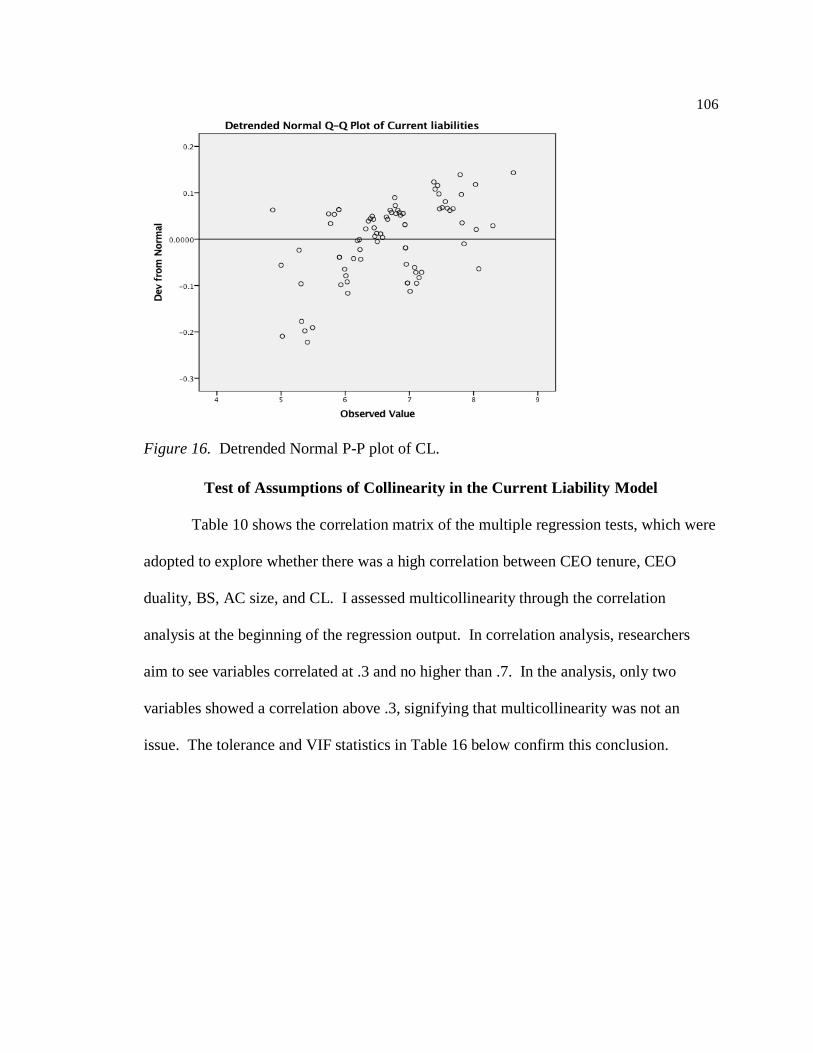
106
Figure 16. Detrended Normal P-P plot of CL.
Test of Assumptions of Collinearity in the Current Liability Model
Table 10 shows the correlation matrix of the multiple regression tests, which were
adopted to explore whether there was a high correlation between CEO tenure, CEO
duality, BS, AC size, and CL. I assessed multicollinearity through the correlation
analysis at the beginning of the regression output. In correlation analysis, researchers
aim to see variables correlated at .3 and no higher than .7. In the analysis, only two
variables showed a correlation above .3, signifying that multicollinearity was not an
issue. The tolerance and VIF statistics in Table 16 below confirm this conclusion.
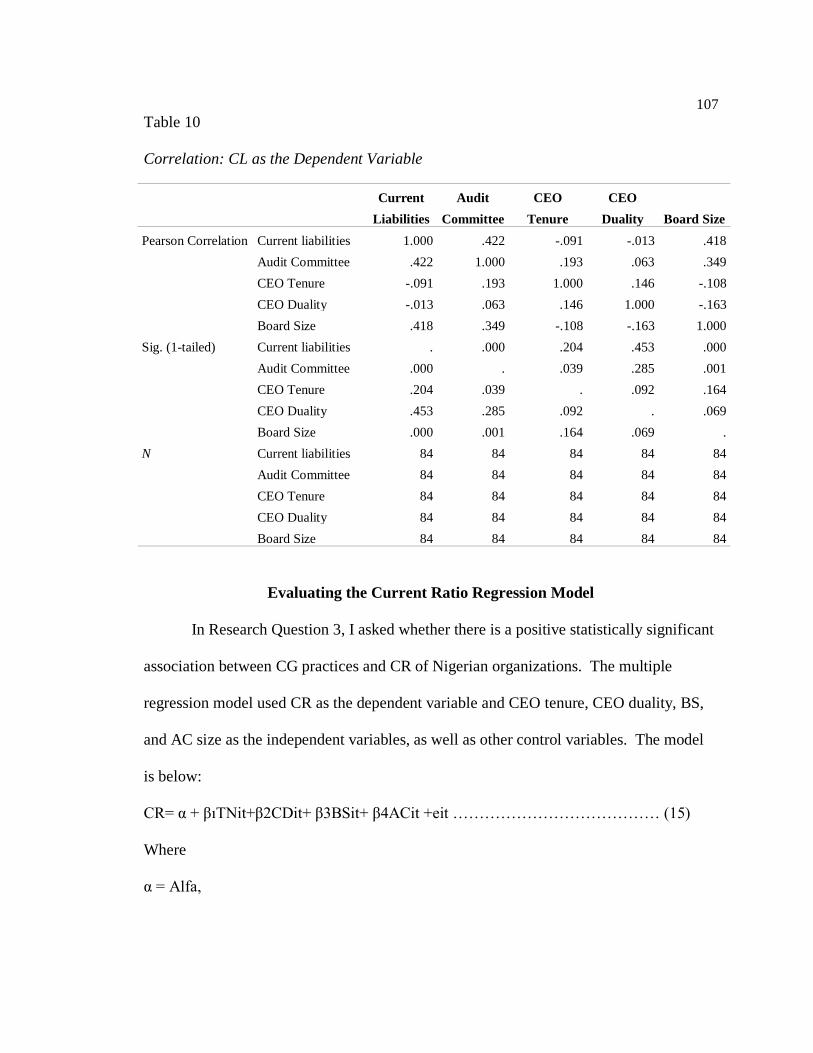
107
Table 10
Correlation: CL as the Dependent Variable
Current
Liabilities
Audit
Committee
CEO
Tenure
CEO
Duality Board Size
Pearson Correlation Current liabilities 1.000 .422 -.091 -.013 .418
Audit Committee .422 1.000 .193 .063 .349
CEO Tenure -.091 .193 1.000 .146 -.108
CEO Duality -.013 .063 .146 1.000 -.163
Board Size .418 .349 -.108 -.163 1.000
Sig. (1-tailed) Current liabilities . .000 .204 .453 .000
Audit Committee .000 . .039 .285 .001
CEO Tenure .204 .039 . .092 .164
CEO Duality .453 .285 .092 . .069
Board Size .000 .001 .164 .069 .
N Current liabilities 84 84 84 84 84
Audit Committee 84 84 84 84 84
CEO Tenure 84 84 84 84 84
CEO Duality 84 84 84 84 84
Board Size 84 84 84 84 84
Evaluating the Current Ratio Regression Model
In Research Question 3, I asked whether there is a positive statistically significant
association between CG practices and CR of Nigerian organizations. The multiple
regression model used CR as the dependent variable and CEO tenure, CEO duality, BS,
and AC size as the independent variables, as well as other control variables. The model
is below:
CR= α + βıTNit+β2CDit+ β3BSit+ β4ACit +eit ………………………………… (15)
Where
α = Alfa,
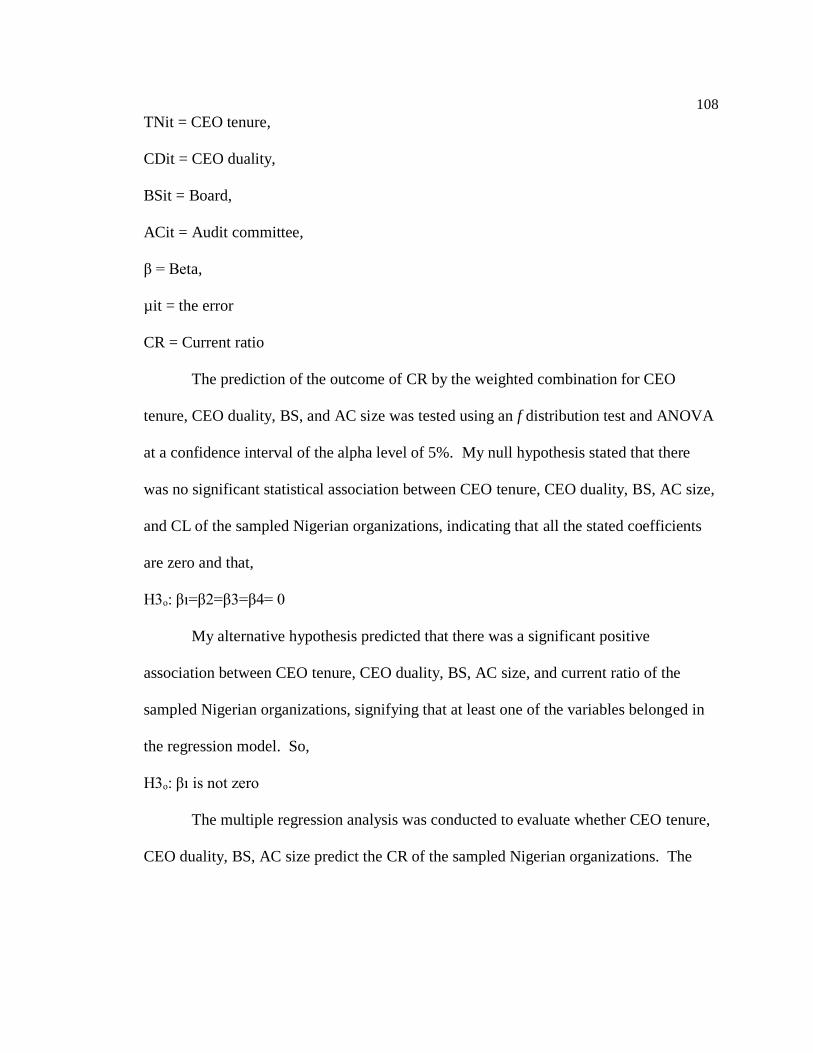
108
TNit = CEO tenure,
CDit = CEO duality,
BSit = Board,
ACit = Audit committee,
β = Beta,
µit = the error
CR = Current ratio
The prediction of the outcome of CR by the weighted combination for CEO
tenure, CEO duality, BS, and AC size was tested using an f distribution test and ANOVA
at a confidence interval of the alpha level of 5%. My null hypothesis stated that there
was no significant statistical association between CEO tenure, CEO duality, BS, AC size,
and CL of the sampled Nigerian organizations, indicating that all the stated coefficients
are zero and that,
H3ₒ: βı=β2=β3=β4= 0
My alternative hypothesis predicted that there was a significant positive
association between CEO tenure, CEO duality, BS, AC size, and current ratio of the
sampled Nigerian organizations, signifying that at least one of the variables belonged in
the regression model. So,
H3ₒ: βı is not zero
The multiple regression analysis was conducted to evaluate whether CEO tenure,
CEO duality, BS, AC size predict the CR of the sampled Nigerian organizations. The
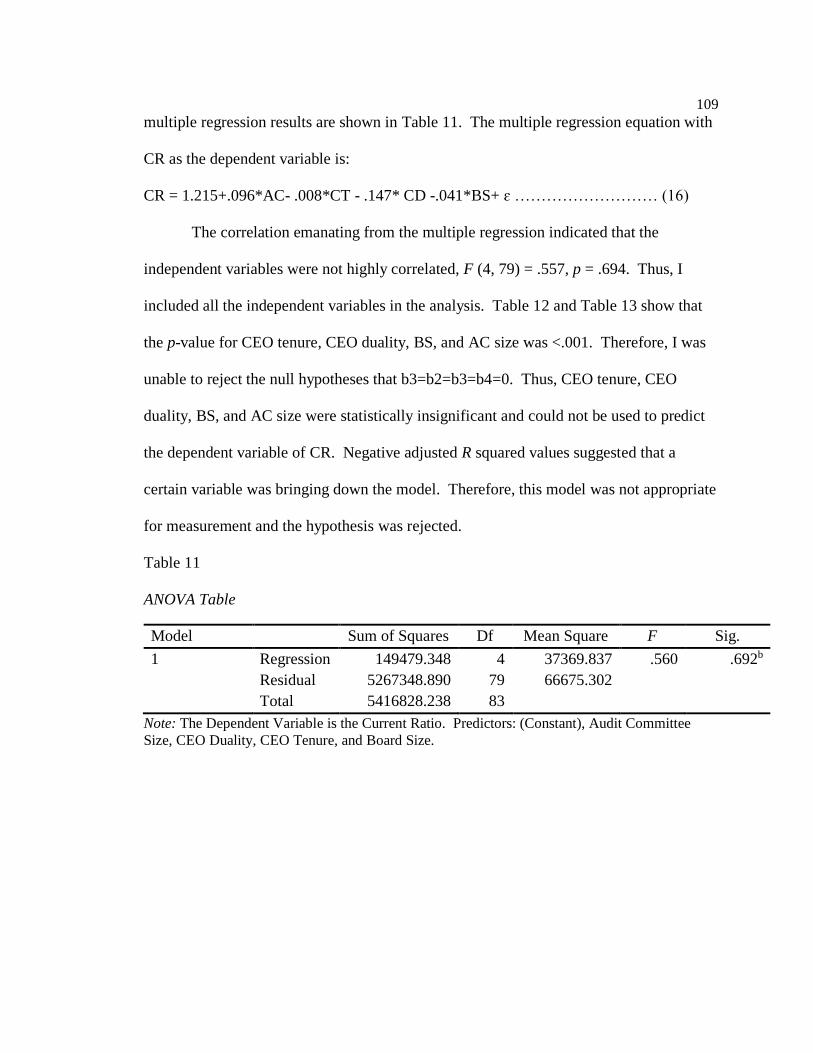
109
multiple regression results are shown in Table 11. The multiple regression equation with
CR as the dependent variable is:
CR = 1.215+.096*AC- .008*CT - .147* CD -.041*BS+ ɛ ……………………… (16)
The correlation emanating from the multiple regression indicated that the
independent variables were not highly correlated, F (4, 79) = .557, p = .694. Thus, I
included all the independent variables in the analysis. Table 12 and Table 13 show that
the p-value for CEO tenure, CEO duality, BS, and AC size was <.001. Therefore, I was
unable to reject the null hypotheses that b3=b2=b3=b4=0. Thus, CEO tenure, CEO
duality, BS, and AC size were statistically insignificant and could not be used to predict
the dependent variable of CR. Negative adjusted R squared values suggested that a
certain variable was bringing down the model. Therefore, this model was not appropriate
for measurement and the hypothesis was rejected.
Table 11
ANOVA Table
Model Sum of Squares Df Mean Square F Sig.
1 Regression 149479.348 4 37369.837 .560 .692b
Residual 5267348.890 79 66675.302
Total 5416828.238 83
Note: The Dependent Variable is the Current Ratio. Predictors: (Constant), Audit Committee
Size, CEO Duality, CEO Tenure, and Board Size.
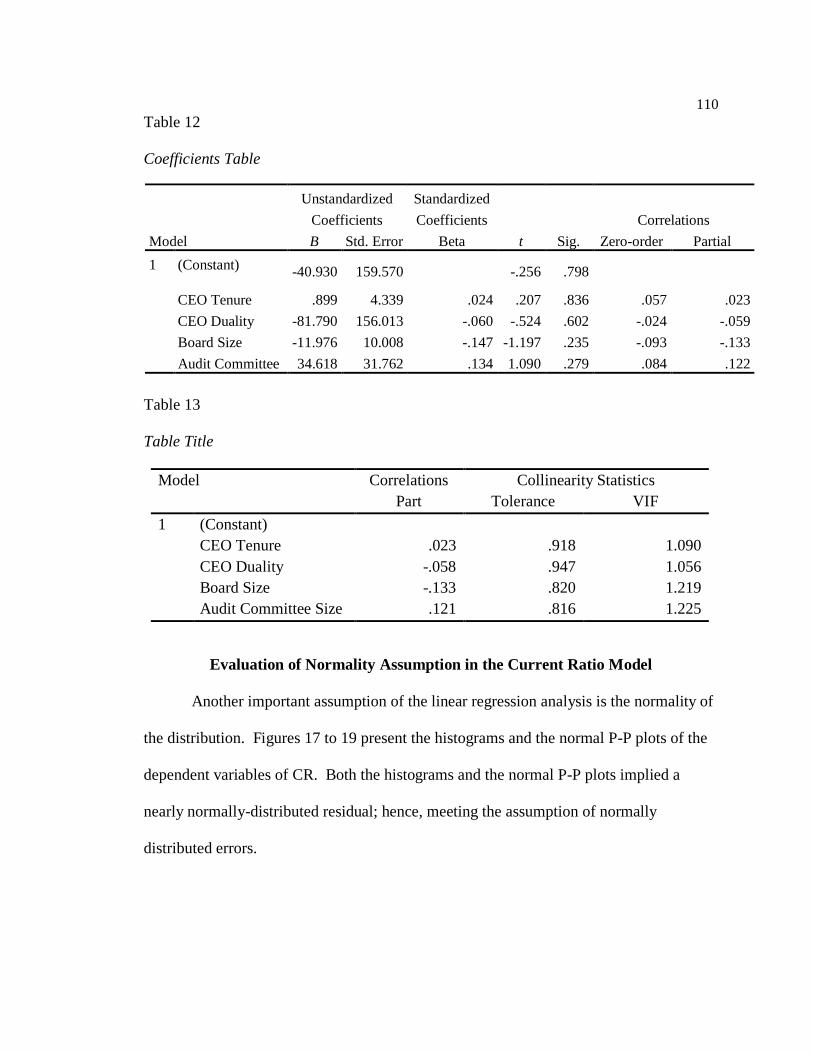
110
Table 12
Coefficients Table
Model
Unstandardized
Coefficients
Standardized
Coefficients
t Sig.
Correlations
B Std. Error Beta Zero-order Partial
1 (Constant) -40.930 159.570 -.256 .798
CEO Tenure .899 4.339 .024 .207 .836 .057 .023
CEO Duality -81.790 156.013 -.060 -.524 .602 -.024 -.059
Board Size -11.976 10.008 -.147 -1.197 .235 -.093 -.133
Audit Committee 34.618 31.762 .134 1.090 .279 .084 .122
Table 13
Table Title
Model Correlations Collinearity Statistics
Part Tolerance VIF
1 (Constant)
CEO Tenure .023 .918 1.090
CEO Duality -.058 .947 1.056
Board Size -.133 .820 1.219
Audit Committee Size .121 .816 1.225
Evaluation of Normality Assumption in the Current Ratio Model
Another important assumption of the linear regression analysis is the normality of
the distribution. Figures 17 to 19 present the histograms and the normal P-P plots of the
dependent variables of CR. Both the histograms and the normal P-P plots implied a
nearly normally-distributed residual; hence, meeting the assumption of normally
distributed errors.
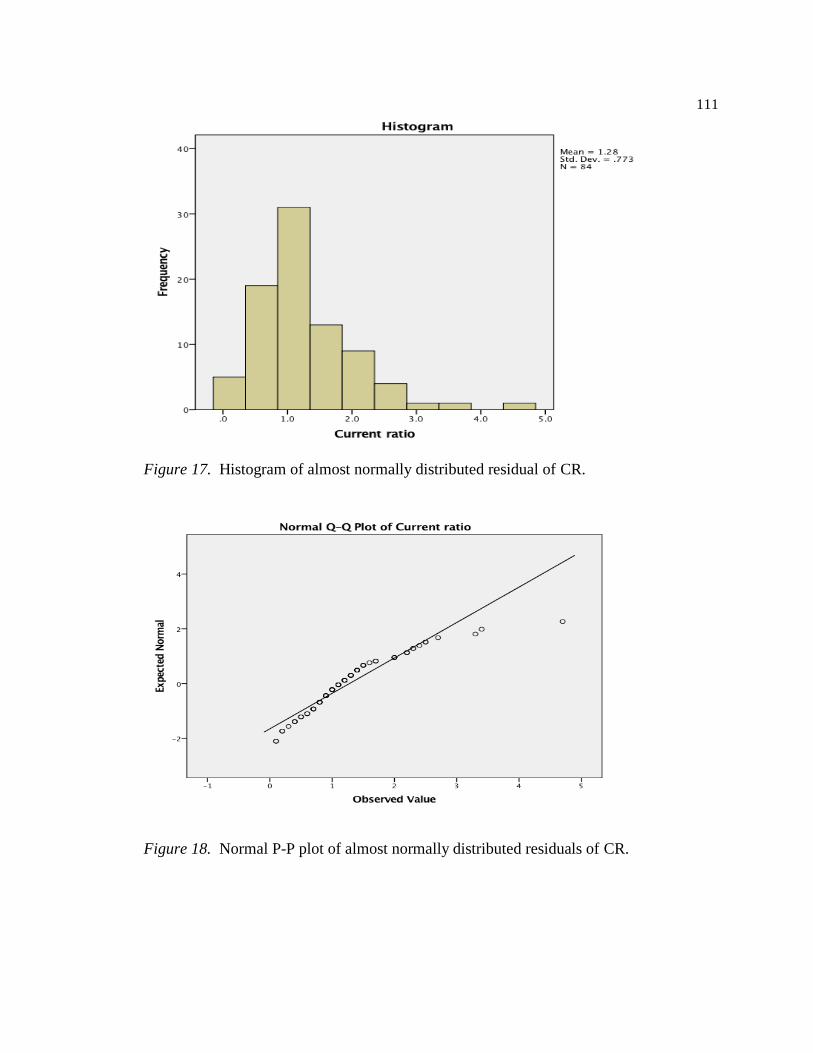
111
Figure 17. Histogram of almost normally distributed residual of CR.
Figure 18. Normal P-P plot of almost normally distributed residuals of CR.
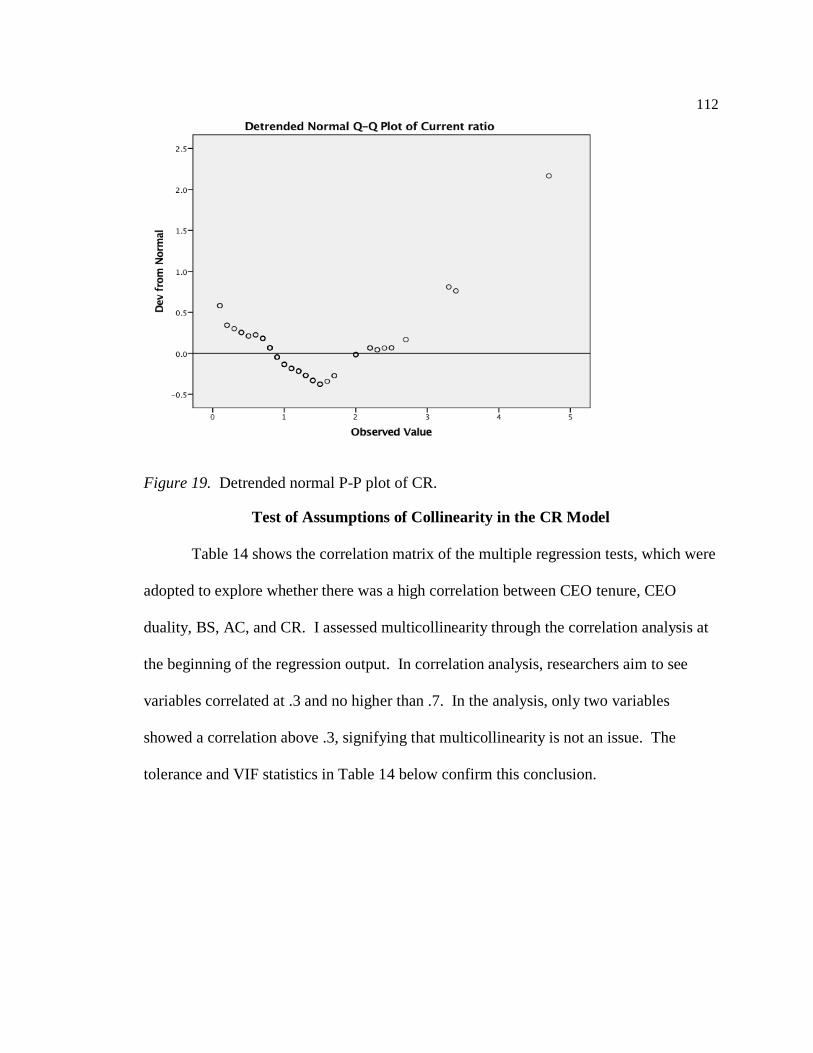
112
Figure 19. Detrended normal P-P plot of CR.
Test of Assumptions of Collinearity in the CR Model
Table 14 shows the correlation matrix of the multiple regression tests, which were
adopted to explore whether there was a high correlation between CEO tenure, CEO
duality, BS, AC, and CR. I assessed multicollinearity through the correlation analysis at
the beginning of the regression output. In correlation analysis, researchers aim to see
variables correlated at .3 and no higher than .7. In the analysis, only two variables
showed a correlation above .3, signifying that multicollinearity is not an issue. The
tolerance and VIF statistics in Table 14 below confirm this conclusion.
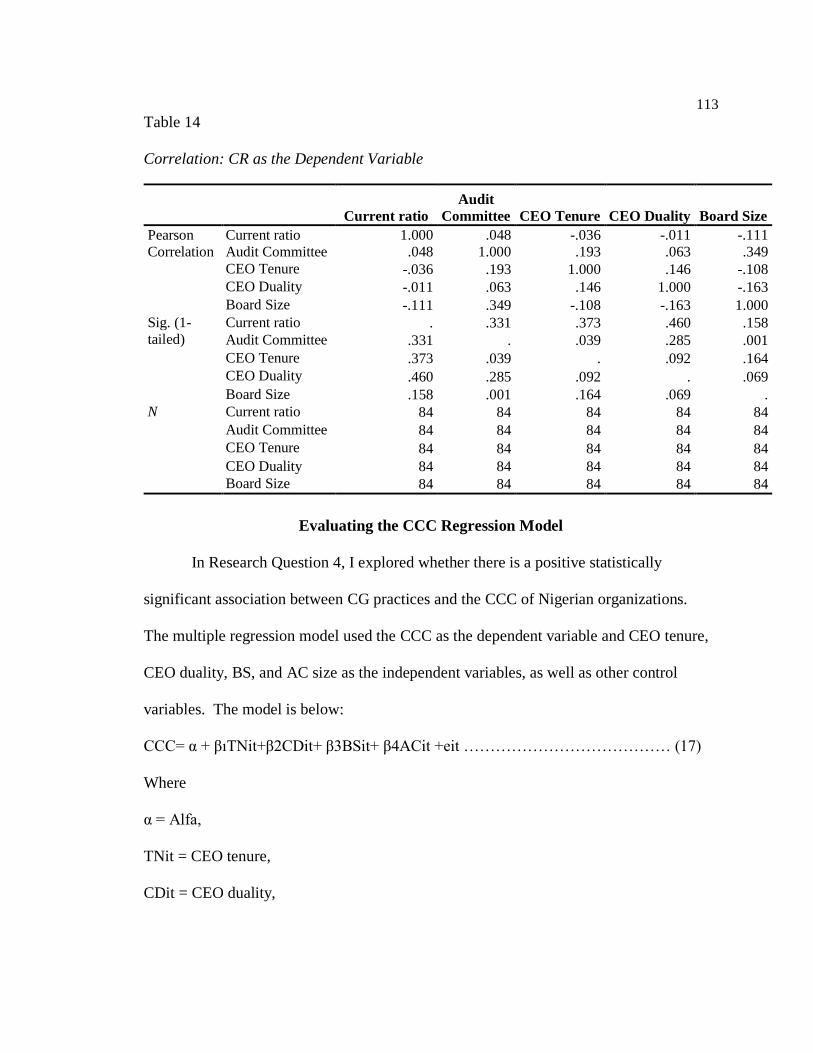
113
Table 14
Correlation: CR as the Dependent Variable
Current ratio
Audit
Committee CEO Tenure CEO Duality Board Size
Pearson
Correlation
Current ratio 1.000 .048 -.036 -.011 -.111
Audit Committee .048 1.000 .193 .063 .349
CEO Tenure -.036 .193 1.000 .146 -.108
CEO Duality -.011 .063 .146 1.000 -.163
Board Size -.111 .349 -.108 -.163 1.000
Sig. (1-
tailed)
Current ratio . .331 .373 .460 .158
Audit Committee .331 . .039 .285 .001
CEO Tenure .373 .039 . .092 .164
CEO Duality .460 .285 .092 . .069
Board Size .158 .001 .164 .069 .
N Current ratio 84 84 84 84 84
Audit Committee 84 84 84 84 84
CEO Tenure 84 84 84 84 84
CEO Duality 84 84 84 84 84
Board Size 84 84 84 84 84
Evaluating the CCC Regression Model
In Research Question 4, I explored whether there is a positive statistically
significant association between CG practices and the CCC of Nigerian organizations.
The multiple regression model used the CCC as the dependent variable and CEO tenure,
CEO duality, BS, and AC size as the independent variables, as well as other control
variables. The model is below:
CCC= α + βıTNit+β2CDit+ β3BSit+ β4ACit +eit ………………………………… (17)
Where
α = Alfa,
TNit = CEO tenure,
CDit = CEO duality,
114
BSit = Board,
ACit = Audit committee,
β = Beta,
µit = the error
CCC = Cash conversion cycle
The prediction of the outcome of CCC by the weighted combination for CEO
tenure, CEO duality, BS, and AC size was tested using an f distribution test and ANOVA
at a confidence interval of the alpha level of 5%. My null hypothesis stated that there
was no significant statistical association between CEO tenure, CEO duality, BS, AC size,
and CCC of the sampled Nigerian organizations, indicating that all the stated coefficients
are zero and that,
H4ₒ: βı=β2=β3=β4= 0
My alternative hypothesis predicted that there was a significant positive
association between CEO tenure, CEO duality, BS, AC size, and CCC of the sampled
Nigerian organizations, signifying that at least one of the variables belonged in the
regression model. So,
H4ₒ: βı is not zero
The multiple regression analysis was conducted to evaluate whether CEO tenure,
CEO duality, BS, and AC size predicted the CCC of the sampled Nigerian organizations.
The multiple regression results are shown in Table 15. The multiple regression equation
with cash conversion cycle as the dependent variable is:
CCC = -040.930+.899*TN- 81.790*CD - 11.976* BS +34.618 *AC+ ɛ …………… (18)
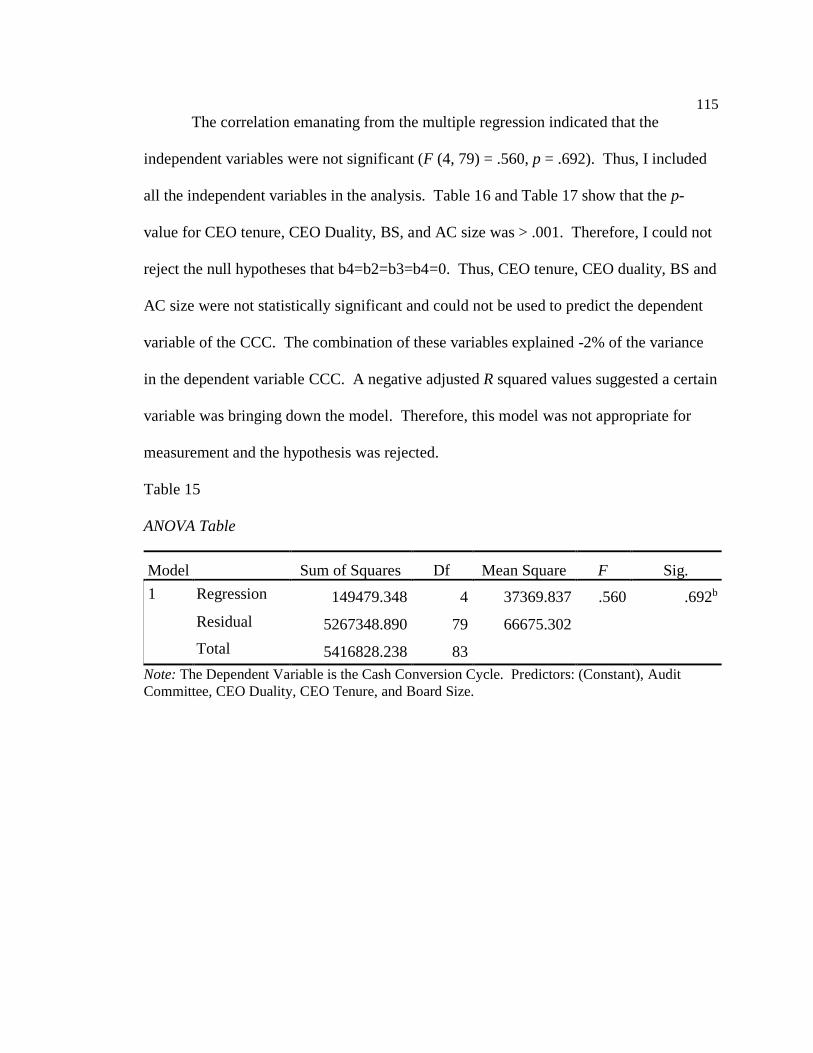
115
The correlation emanating from the multiple regression indicated that the
independent variables were not significant (F (4, 79) = .560, p = .692). Thus, I included
all the independent variables in the analysis. Table 16 and Table 17 show that the p-
value for CEO tenure, CEO Duality, BS, and AC size was > .001. Therefore, I could not
reject the null hypotheses that b4=b2=b3=b4=0. Thus, CEO tenure, CEO duality, BS and
AC size were not statistically significant and could not be used to predict the dependent
variable of the CCC. The combination of these variables explained -2% of the variance
in the dependent variable CCC. A negative adjusted R squared values suggested a certain
variable was bringing down the model. Therefore, this model was not appropriate for
measurement and the hypothesis was rejected.
Table 15
ANOVA Table
Model Sum of Squares Df Mean Square F Sig.
1 Regression 149479.348 4 37369.837 .560 .692b
Residual 5267348.890 79 66675.302
Total 5416828.238 83
Note: The Dependent Variable is the Cash Conversion Cycle. Predictors: (Constant), Audit
Committee, CEO Duality, CEO Tenure, and Board Size.
116
Table 16
Coefficients Table
Model
Unstandardized
Coefficients
Standardized
Coefficients
t Sig.
Correlations
B
Std.
Error Beta
Zero-
order Partial
1 (Constant) -40.930 159.570 -.256 .798
CEO Tenure .899 4.339 .024 .207 .836 .057 .023
CEO Duality -81.790 156.013 -.060 -.524 .602 -.024 -.059
Board Size -11.976 10.008 -.147 -1.197 .235 -.093 -.133
Audit Committee 34.618 31.762 .134 1.090 .279 .084 .122
Table 17
Table Title
Model Correlations Collinearity Statistics
Part Tolerance VIF
1 (Constant)
CEO Tenure .023 .918 1.090
CEO Duality -.058 .947 1.056
Board Size -.133 .820 1.219
Audit Committee Size .121 .816 1.225
Evaluation of Normality Assumption in the CCC
Another important assumption of the linear regression analysis is the normality of
the distribution. Figures 20 to 22 present the histograms and the normal P-P plots of the
dependent variables of cash conversion cycle. Both the histograms and the normal P-P
plots implied a nearly normally-distributed residual; hence, meeting the assumption of
normally distributed errors.
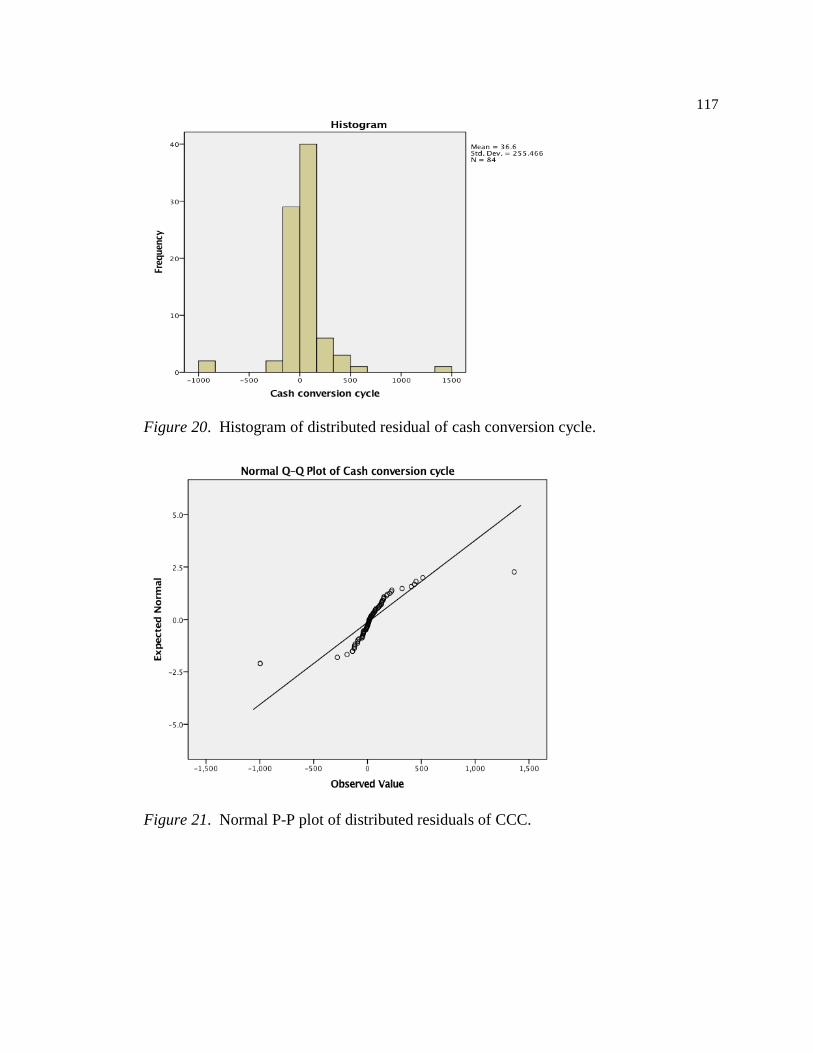
117
Figure 20. Histogram of distributed residual of cash conversion cycle.
Figure 21. Normal P-P plot of distributed residuals of CCC.
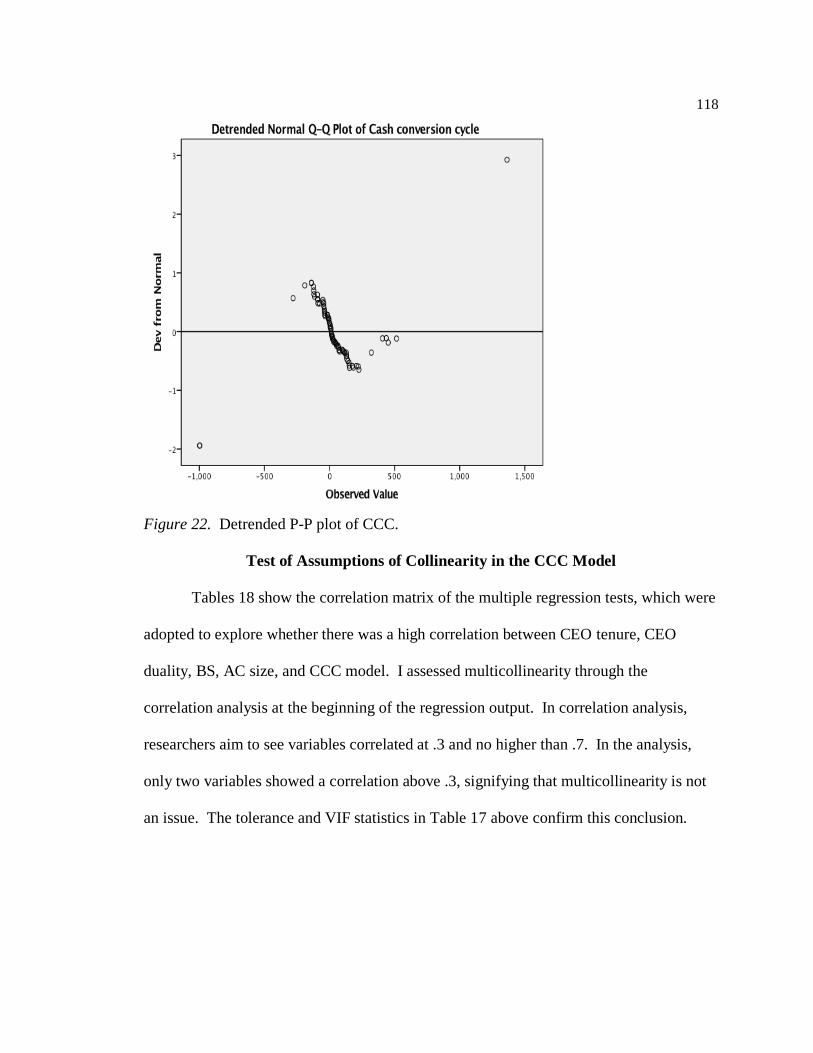
118
Figure 22. Detrended P-P plot of CCC.
Test of Assumptions of Collinearity in the CCC Model
Tables 18 show the correlation matrix of the multiple regression tests, which were
adopted to explore whether there was a high correlation between CEO tenure, CEO
duality, BS, AC size, and CCC model. I assessed multicollinearity through the
correlation analysis at the beginning of the regression output. In correlation analysis,
researchers aim to see variables correlated at .3 and no higher than .7. In the analysis,
only two variables showed a correlation above .3, signifying that multicollinearity is not
an issue. The tolerance and VIF statistics in Table 17 above confirm this conclusion.
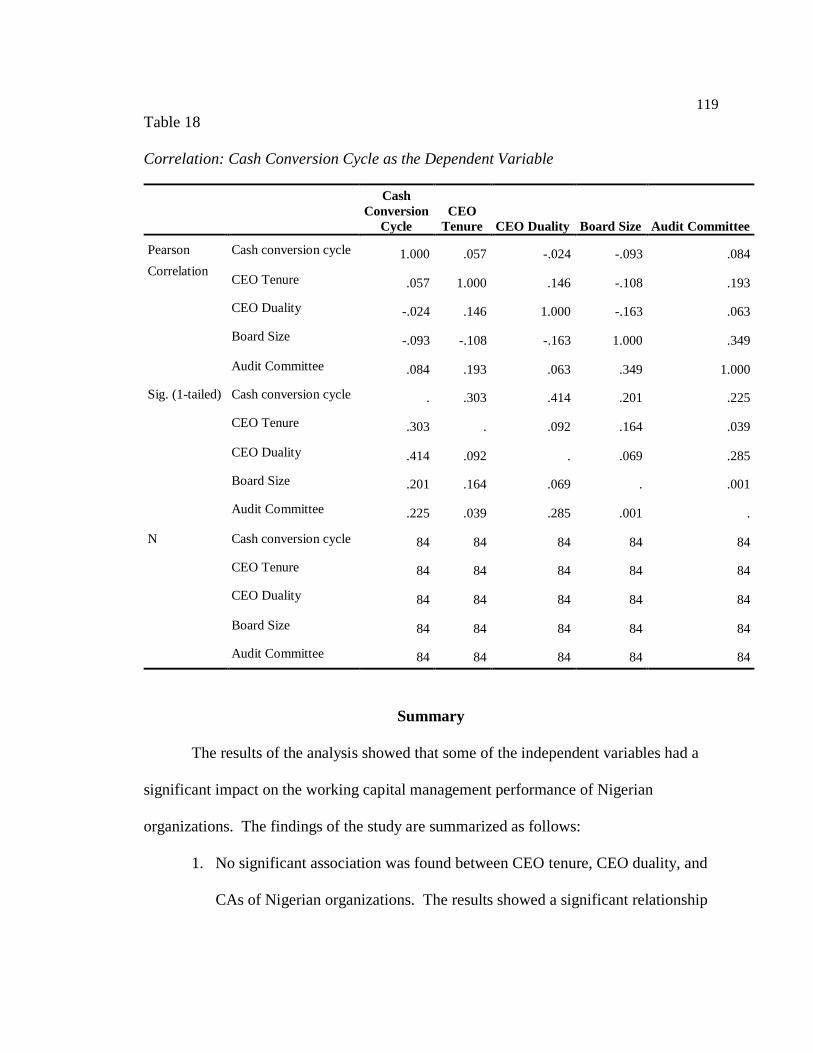
119
Table 18
Correlation: Cash Conversion Cycle as the Dependent Variable
Cash
Conversion
Cycle
CEO
Tenure CEO Duality Board Size Audit Committee
Pearson
Correlation
Cash conversion cycle 1.000 .057 -.024 -.093 .084
CEO Tenure .057 1.000 .146 -.108 .193
CEO Duality -.024 .146 1.000 -.163 .063
Board Size -.093 -.108 -.163 1.000 .349
Audit Committee .084 .193 .063 .349 1.000
Sig. (1-tailed) Cash conversion cycle . .303 .414 .201 .225
CEO Tenure .303 . .092 .164 .039
CEO Duality .414 .092 . .069 .285
Board Size .201 .164 .069 . .001
Audit Committee .225 .039 .285 .001 .
N Cash conversion cycle 84 84 84 84 84
CEO Tenure 84 84 84 84 84
CEO Duality 84 84 84 84 84
Board Size 84 84 84 84 84
Audit Committee 84 84 84 84 84
Summary
The results of the analysis showed that some of the independent variables had a
significant impact on the working capital management performance of Nigerian
organizations. The findings of the study are summarized as follows:
1. No significant association was found between CEO tenure, CEO duality, and
CAs of Nigerian organizations. The results showed a significant relationship
120
between BS, AC size, and CA of Nigerian organizations, although it was a
positive relationship.
2. No significant association was found between CEO tenure, CEO duality, and
the CL of Nigerian organizations. The results showed a significant
association between AC size, BS, and the CL of Nigerian organizations.
3. No significant relationships were found between CEO tenure, CEO duality,
BS, AC size, and the CR of Nigerian organizations. The results showed that
this model is not appropriate for measurement and thus, the hypothesis was
not accepted.
4. No significant relationships were found between CEO tenure, CEO duality,
BS, AC size, and the CCC of Nigerian organizations.
The results showed that this model is not appropriate for measurement and thus,
the hypothesis was not accepted. The results of the study revealed that board size and
audit committee size have an impact on the CA and CL of Nigerian organizations. In
Chapter 5, I will present an overview of the study, its findings, implications, and
recommendations for future investigators in the field to further pursue other factors that
could influence the working capital management efficiency of Nigerian organizations.
121
Chapter 5: Discussion, Conclusions, and Recommendations
Summary of Findings
In this quantitative research study, I examined the association between CG and
WCM of Nigerian organizations, through analysis of data from 2013–2014. The
objective of the study was to examine the impact of CG on WCM, assessing the extent to
which CG could gauge WCM efficiency. The value of sound CG introduced the platform
for effective financial management decisions. In their study, Gill and Biger (2013)
examined the effects of CG on the management of working capital efficiency. Their
results showed that CG plays a vital role in enhancing working capital efficiency. CG
suggests that plans should be carried out in line with short, medium, and long-term goals
of the company with shareholder’s interest (Achchuthan & Rajendran, 2013). WCM is a
short-term mechanism of firms that is vital for financial management decisions. Working
capital influences liquidity and profitability, contributing to a firm’s value (Bagchi &
Khamrui, 2012). Raheman et al. (2010) viewed working capital as a fundamental
determinant for sustaining liquidity, survival, and profitability. Through CG practices,
Nigerian firms can find a strong framework for the management of working capital. To
conclude, this study on CG practices among Nigerian firms added to the existing
empirical work.
In this study, I investigated the impact of CG on WCM efficiency in organizations
listed on the NSE, while devoting particular attention to the BS, CEO tenure, CEO
duality, and AC size using data from 2013 to 2014. The challenges of working capital
variance facing companies in Nigeria remained a source of concern following the 2007–
122
2008 financial crisis that led to the global economic meltdown as stated by Gbadamosi
study. However, the question of whether sound policies of CG could stimulate the
administration of working capital assets was an issue that had yet to be resolved by
researchers. Moreover, scholar practitioners had not conducted empirical studies to
understand the impact of CG on WCM efficiency, particularly in Nigerian organizations.
Taking into consideration the economic size, the potential impacts of liquidity on
people and society, and the nature of Nigerian organizations, an effective CG strategy on
WCM is paramount to survival and growth. In this study, I concentrated on the effects of
CG on WCMs of Nigerian organizations, as measured by CAs, CL, CR, and CCC. The
measurement was carried out by comparing the results of prior research studies grounded
in the different views of the tradeoff theory, pecking order theory, free cash flow theory,
agency theory, and stewardship theory. I reconciled these various theories with the
notion that these approaches could work complementarily, and this notion served as the
theoretical framework. In addition, I hypothesized that CEO tenure, CEO duality, BS,
and AC size are inherent characteristics of the effective CG mechanism that would
improve the WCM efficiency of Nigerian organizations.
I adopted a simple random sampling process to choose companies from the NSE
database and website. The NSE administers the financial and stock market proceedings
of organizations in Nigeria, comprising financial services, consumer goods, oil and gas,
agriculture, conglomerates, construction, ICT, industrial goods, natural resources,
healthcare, and services. My focus, however, necessitated the adoption of a correlational
approach. To fulfill the purpose of the research, I developed four research questions.
123
With the research questions, I sought to establish whether there was linear relationship
between:
1. CG practices and CAs,
2. CG practices and CLs,
3. CG practices and CR, and
4. CG practices and the CCC.
To broaden the scope of the research, I took a broader view of the measurement in
all the research questions. For CEO duality, I assigned a value of 1 if the same person
occupied the position of the chairman of the board and the CEO and a value of 0 if one
person did not hold the position of the chairman of the board and the CEO. While the
CEO tenure was the number of years the individuals concerned served as CEO. For BS, I
counted the number of executives on the board; AC size consisted of the number of AC
members.
The results of the study revealed a significant relationship between BS, AC size,
and CAs and CL (positive correlation); no significant association was found between
CAs, CL, and CEO tenure and CEO duality. The results of the study revealed that there
was no relationship between CR and CCC and BS, AC size, CEO tenure and CEO
duality.
CEO Tenure, CEO Duality, BS, AC Size, and CAs
The economic literature on the influence of CG on WCM is still very scant and
inconclusive. Taking into consideration that WCM efficiency is contextually exclusive to
each type of organization, I sought to explore the impact of CG on WCM of Nigerian
124
organizations. Based on the literature review presented in Chapter 2, I argued that BS,
AC size, CEO tenure, and CEO duality are sound governance practices for the
management of working capital assets. CG structures detail how the management of
working capital policy is monitored and controlled (Fiador & Fiador, 2016). The
monitoring and oversight of CG processes clearly relates to issues of CEO duality, CEO
tenure, AC size, and the size of the board. However, in Chapter 4, with the multiple
regression analyses I evaluated whether CEO tenure, CEO duality, BS, and AC size
predicted the CAs of the sampled Nigerian organizations.
The model was significant (F (4, 79) = 8.753, p < .001); the combination of the
variables explained 27% of the variance in the dependent variable of CAs. Only two of
the variables significantly contributed to the regression model: BS (β = .214, p <. 05) and
AC size (β = .440, p <. 001). The results as measured by CAs were consistent with
conclusions of some past studies that CEO duality and CEO tenure had no relationship to
the management of working capital (Gill & Shah, 2012; Krause et al., 2013; Lawal, 2013;
Shuker, 2012; Valipour et al., 2012). BS and AC size did have a relationship to the
management of working capital, which was also consistent with conclusions of some past
studies (Gill & Shah, 2012; Krause et al., 2013; Lawal, 2013& Shuker, 2012).
Since I reached a conclusion consistent with my hypothesized prediction, the
finding that CG impacts WCM efficiency serves as additional justification for the field
since there are currently few studies on the impact of CG on WCM. Previous research
studies revealed that the size of an organization and the size of its AC could have a
positive influence on organizational performance (Gill & Shah, 2012; Krause et al.,
125
2013& Lawal, 2013). Bansal and Sharma (2016) asserted that committee members also
act as an integral constituent of the company’s board of directors, responsible for rolling
out policies for improving the reporting health of the business. A small board could not
fulfill diverse responsibilities, yet large boards accede to inefficiency due to differences
in option when attempting to make effective decisions for the company; hence, BS
improves the efficiency of WCM (Dittmar et al., 2003).
Al-Mamun et al. (2014) argued that regular meetings of the AC could help to
minimize agency problems and ensure fair and up-to-date information to investors.
Yunos (2014) then noted that if the AC is independent and their work honest, that the
possibility of fraud is reduced. Therefore, I expected there would be a positive
significant relationship between the AC size and BS in the management of working
capital efficiency. The results of this study regarding the effects of board size and audit
committee size confirmed the preceding conclusions. Based on the results of the
statistical tests, I did find a significant relationship between BS, AC size, and WCM
efficiency, as measured by the CAs.
CEO Tenure, CEO Duality, BS, AC Size, and CL
Based on the literature review presented in Chapter 2 and taking into
consideration what past studies have done to research on the impact of CG on WCM, I
argued that BS, AC size, CEO tenure, and CEO duality are sound governance practices
for the management of working capital assets. Also, considering that WCM efficiency is
contextually exclusive to each type of organization, I sought to explore the impact of CG
on WCM of Nigerian organizations as measured by CL. Based the literature review
126
presented in Chapter 2, I hypothesized that there would be a positive relationship between
BS, AC size, CEO tenure, CEO duality, and WCM. Predictably, the statistical test results
that I presented in Chapter 4 revealed that BS, AC size, CEO tenure, and CEO duality
were significantly related to WCM as measured by CL. The conclusion matched my
hypothesized outcomes, and the results were also consistent with the conclusions of some
past studies (Deloof, 2003; Gill & Shah, 2012; Krause et al., 2013; Lawal, 2013; Shuker,
2012; Valipour et al., 2012).
Furthermore, my results showed that having sound CG principles in organizations
may always affect WCM efficiency. As measured by CL, the results of this study
confirmed the predicted outcomes that BS, AC size, CEO tenure, and CEO duality have
positive effects on WCM. However, the results of the study suggested that CL is
significantly positively associated with WCM, which was the predicted conclusion that
BS, AC size, CEO tenure, and CEO duality would have positive effects on WCM
efficiency when measuring CL.
Since CL is measured using debt due within one year, it is possible that
organizations in business for a long time can increase liquidity by taking out a CA to
defray the cost of their CL and eventually incur little expenditures, causing small WCM
assets. This positive situation explains the relationship between WCM efficiency as
measured by current debt.
CEO Tenure, CEO Duality, BS, AC Size, and CR
Based on the literature review presented in Chapter 2 and taking into account
what past studies have found on the impact of CG on WCM, I hypothesized that BS, AC
127
size, CEO tenure, and CEO duality are sound CG practices to manage working capital
assets. Also, considering that WCM efficiency is contextually exclusive to each type of
organization, I sought to explore the impact of CG on WCM of Nigerian organizations as
measured by the CR. The reason for this assumption was that BS, AC size, CEO tenure,
and CEO duality may promote an effective WCM efficiency of Nigerian organizations.
However, as the statistical test results in Chapter 4 indicated, BS, AC size, CEO
tenure, and CEO duality were not significantly related to CR. Although this finding
differs from the hypothesized claim, this finding was consistent with the conclusions of
previous studies (Deloof, 2003; Gill & Shah, 2012; Krause et al., 2013; Lawal, 2013;
Shuker, 2012; Valipour et al., 2012). Similarly, the results also suggested that adopting
CG practices may not have any impact on the CR of Nigerian organizations.
Because I calculated CR by dividing CAs from CL, I expected that Nigerian firms
might have different ways of measuring CRs, adopted for liquidity reasons. However,
the results suggested that CRs were not related to CG tendencies. Importantly, the
finding that there was no association between BS, AC size, CEO tenure, CEO duality,
and CR of Nigerian organizations was consistent with the fact that larger and more
experienced firms have a more significant CR that is often used to calculate liquidity.
CEO Tenure, CEO Duality, BS, AC Size, and CCC
Based on the literature review presented in Chapter 2, and considering what past
studies have done to research the impact of CG on WCM, I hypothesized that BS, AC
size, CEO tenure, and CEO duality are sound CG practices to manage working capital
assets. Also, considering that WCM efficiency is exclusive to each type of organization,
128
I sought to explore the impact of CG on WCM of Nigerian organizations as measured by
the CCC. The reason for this assumption is that BS, AC size, CEO tenure, and CEO
duality may promote an effective WCM efficiency of Nigerian organizations.
However, as the statistical test results in Chapter 4 indicated, BS, AC size, CEO
tenure, and CEO duality were not significantly related to the CCC. Although this finding
differs from the hypothesized claim, the results were consistent with the conclusions of
previous studies (Deloof, 2003; Gill & Shah, 2012; Krause et al., 2013; Lawal, 2013;
Shuker, 2012; Valipour et al., 2012). Similarly, the results also suggested that adopting
CG practices may not have any impact on the CCC of Nigerian organizations. There was
evidence in the literature that an inefficient board, or a board with divergent views, may
not have any impact on WCM efficiency of organizations. Because I measured CCC as
the length of time required to sell inventory, receive goods from customers, and to pay
bills without incurring late penalties, I expected that Nigerian firms might have different
ways of measuring the CCC to take advantage of the small number in comparison to
industrial average. However, the results suggested that the CCC was not related to CG
tendencies. Importantly, the finding that there was no association between BS, AC size,
CEO tenure, CEO duality, and the CCC of Nigerian organizations was consistent with the
fact that increases in the CCC were provoked by poor CG policies regarding the
management's working capital assets.
Additional Interpretations
Amarjit and Biger (2013) noted that corporate governance plays a dominant role
in the management of working capital through the formulation of sound policies. The
129
important role that CEO duality, CEO tenure, BS, and AC size plays cannot be
overemphasized. Gill and Shah (2012) echo this assertion that these different CG arms
play a significant role in promoting the efficiency of WCM. In Chapter 4 of this study,
4% of the Nigerian organizations practiced CEO duality. On average, these firms had
nine members (M = 9) on their boards, and between five and 23 members on their AC. I
concluded that BS and AC size had a positive impact on WCM, as measured by CA and
CL. However, CEO duality and CEO tenure did not have a positive influence on WCM
due to the under-developed nature of Nigeria and the constraints of acquiring or sharing
financial information. I therefore estimate that the number of Nigerian organizations
adopting CG practices in making decisions concerning WCM will likely increase in the
future. The average number of members on the board in the study is consistent with the
initial hypothesis that companies in Nigeria would tend to have four to five members on
their board. The results of this study indicated that 83 out of the 84 sampled Nigerian
organizations had more than five members serving on their board. In addition, only 4%
of organizations had the CEO serving on their boards. Previous studies indicated that CG
boards normally constitute about 17 members; most Nigerian organizations had between
five and 23 members. The results confirm that an effective BS should be between eight
and twenty members to promote efficiency (Moody’s Investor Service, 2014; Chubb
Group of Insurance Companies, 2014).
Limitations of the Study
I limited my study to organizations operating in Nigeria for two reasons: (a)
Nigeria is an emerging nation that lacks a comprehensive CG framework; and (b) I am
130
from Nigeria, and so it was suitable for me to conduct the study in my country of origin.
I further confined the study to companies listed on the NSE, and limited my data to the
period from 2013 to 2014. Hence, it would not be appropriate to generalize the findings
and conclusion of this investigation to companies operating elsewhere. There were
limitations regarding the adoption and use of secondary data not meant originally for this
study. The use of data not related to this research was an inherent problem, since
publicly reported information approximates the kind of data meant for testing a
hypothesis. The use of secondary data that is not consistent with Nigerian organizations
can possibly present errors to the conclusions of the study. For instance, Nigerian
organizations are not used to the practice of CEO duality. The conclusions and
generalizations of this study will apply to the Nigerian organizations alone. Also,
because of the scope of the study, focusing on the relationship between BS, CEO tenure,
CEO duality, and working capital efficiency, some variables such as organizational
leverage and the identification of the CEO may not be present in the analysis model.
From inception, the plan was to randomize the sample, but this was not feasible
because of an incomplete sampling frame. The sampling frame—i.e., the NSE—required
that the sample be drawn from the list of companies that were on the NSE database.
However, I discovered that many firms did not have complete financial information on
the NSE database. Moreover, the outcomes of this study cannot be globally generalized
since the researcher only sampled firms within the list of companies carrying out business
in Nigeria. Conceivably, prospective researchers can add to the field of study by
researching organizations based in other countries.
131
Recommendations for Further Research
As mentioned in the literature review in Chapter 2, there are few research studies
on the impact of corporate governance on working capital management that concentrated
on all sectors of the Nigerian economy. In fact, this was one of the gaps that led to the
present study. Prior research studies explored the impact of CG on WCM of individual
sectors of the Nigerian economy, making it difficult to address the distinctiveness of each
firm and industry.
The results of the current research are unique to the Nigerian organizations. It
was found that CG had a significant effect on the WCM efficiency of the Nigerian
organizations. However, before the field reaches its final conclusions on these findings,
further research is recommended to expand the scope of the study. The duration of 2
years covered in this study is hardly enough to reach a sound conclusion. Aside from
increasing the extent of the research, other future researchers might seek to perform
qualitative research to explore the specific purposes organizational practitioners attach to
CG policies in the management of working capital activities. This understanding of
WCM activities would help to triangulate the research with the existing results to produce
a more reliable and complete finding. Finally, future researchers may want to replicate
the study in other countries, using multidimensional ratings to measure the effect of CG
on WCM (as was carried out in this study), or adopting other methodological approaches
to measure the independent variable.
132
Implications for Social Change
It is evident that previous studies have not focused on the impact of CG on WCM
(Nickerson, Yen & Mahoney, 2012). An oversight function on WCM is essential and
significant to the continuation of the working capital process. I sought to contribute to
the body of knowledge on Nigerian organizations. My study proceeded from the
assumption that the successful management of working capital assets depends on the
effectiveness of CG (Gill & Shah, 2012, p. 71). Further, the results of previous studies
on CEO tenure, CEO duality, BS, and AC size have been ambiguous and unique to
certain industries. This study generated findings as applied to Nigerian organizations in
several industries.
Ademola (2014) noted that the challenges of working capital inconsistency facing
Nigerian firms had remained a source of tremendous concern in the face of high
competition. Ademola’s assertion highlighted the importance of Nigerian organizations
having effective governance practices. Walden University (2013) has defined social
change as a commitment to improve the human and social situation to promote the worth,
dignity, and the ultimate transformation of society. The results of this study may assist
Nigerian organizations and practitioners alike to put in place appropriate governance
mechanisms that would promote their corporate performance and satisfy oversight
regulations.
The Sarbanes- Oxley Act of 2002 in the United States, the Australian Treasury
report of 2002, and the United Kingdom review report by Higgs (2003) have all affected
the external regulatory structures and conduct of various Nigerian organizations. The
133
developments of these oversight bodies have demonstrated the importance of effective
governance. Walden University noted that social change is the commitment to improve
the human and social situation, resulting in the ultimate transformation of the society
(Walden University, 2013). Walden based their premise on the belief that knowledge is
fundamental in promoting human rights. By examining governance practices on working
capital management, my results may assist Nigerian organizations and their
administrators to implement effective governance structures that would enhance
oversight regulations and in turn contribute to the doctrine of corporate social
responsibility (ASQ & Manpower Professional, 2010).
Therefore, my results may help Nigerian organizations adopt and operate an
appropriate CG structure that will enhance their organizational effectiveness, aid business
managers in their resource allocations, and allow them to continue their corporate social
responsibility missions of providing services to the community and transforming the
entire society. My results can assist Nigerian organizations or their administrators to
justify and explain why they opt to operate with current CG structures. The results of this
study, as shown in Chapter 4, suggest that Nigerian organizations could choose to operate
with or without CEO duality and CEO tenure serving as members of the board. It is also
important for managers of Nigerian organizations to realize that while CEO duality and
CEO tenure do not affect CAs, CL, CR, or the CCC, BS and AC size do affect WCM
efficiency.
134
Conclusions
Understanding the mechanism of the impact of CG will be critical to growth and
sustainability of Nigerian organizations. Companies adopt and operate different CG
structure (Mulili & Wong, 2011). Several approaches to CG exist, but the two methods
adopted in this paper are agency theory and stewardship theory. Kiel and Nicholson
(2003) described agency theory as the separation of ownership from control; the
stewardship approach implies that professional managers must run a firm on behalf of the
company owners. Top management is ascribed a significant ownership in the business to
secure a positive correlation between governance practices and the volume of stock
owned by senior management (Mulini & Wong, 2011). While the stewardship approach
suggests that the board of directors and the CEO are inspired to act in the greatest interest
of the business (Mulini & Wong, 2011), there are both positive and negative views of this
argument. For instance, some structures believe that a CEO should occupy both the
position of the CEO and the chairperson of the board while other structures argue that the
CEO holding both positions might bestow immense power on the CEO to influence
operational flow of the board and management. Pham (2015) concluded that CEO
duality could interfere with the effectiveness of the board and distort the performance of
the executive team. As per Krause (2013), researchers have concentrated their efforts on
the influences of BS, AC size, CEO tenure and CEO duality on CG and still came up
with inconclusive results. No researcher has taken the time to review the circumstances
broadly in a developing world like Nigeria. Accordingly, my focus was to fill this gap in
135
the literature. This research study was unique in that it included all the CG practices in
the determination of the WCM efficiency.
The results of this study are consistent with previous studies suggesting that CG
has a relationship with WCM I found specifically that BS and AC size was significantly
related to WCM, while CEO tenure and CEO duality were not related to WCM. Nigerian
organizations are an integral part of the entire system that will aid business managers in
allocating resources and continuing with their corporate social responsibility missions of
providing services to their community and customers. The results of this study suggest
that Nigerian organizations can decide to operate without having to concentrate their
governance structure on CEO duality and CEO tenure but should give adequate attention
to the implementation of BS and AC size in their management process.
136
References
Adair, P., & Adaskou, M. (2015). Trade-off-theory vs. pecking order theory and the
determinants of corporate leverage: Evidence from a panel data analysis upon
French SMEs (2002–2010). Cogent Economics & Finance, 3(1), 1006477.
doi:10.1080/23322039.2015.1006477
Ademola, O. J. (2014). Working capital management and profitability of selected quoted
food and beverages manufacturing firms in Nigeria. Eur. J. Acc. Audit. Finance.
Res, 2(3), 10-21. Retrieved from http://eajournals.org/wp-
content/uploads/Working-Capital-Management-And-Profitability-Of-Selected-
Quoted-Food-And-Beverages-Manufacturing-Firms-In-Nigeria1.pdf
Afrifa, G. A. (2016). Net working capital, cash flow and performance of UK SMEs.
Review of Accounting and Finance, 15(1), 21-44. doi:10.1108/RAF-02-2015-
0031
Afza, T., & Nazir, M. S. (2008). Working capital management practices of firms:
Empirical evidence from Pakistan. Proceedings from 9th South Asian
Management Forum (SAMF). Dhaka, Bangladesh: North South University.
Ali, C. B. (2014). Corporate governance, principal-principal agency conflicts, and
disclosure. Journal of Applied Business Research, 30(2), 419. Retrieved from
http://www.ipag.fr/fr/accueil/la-recherche/publications-WP.html
Aktas, N., Croci, E., & Petmezas, D. (2015). Is working capital management value-
enhancing? Evidence from firm performance and investments. Journal of
Corporate Finance, 30, 98-113. doi.org/10.1016/j.jcorpfin.2014.12.008
137
Akshita A., & Chandan, S. (2016). Corporate governance and firm performance in
developing countries: Evidence from India. Corporate Governance, 16(2), 420-
436. doi:10.1108/CG-01-2016-0018
Al-Mamun, A., Yasser, Q. R., Rahman, M. A., Wickramasinghe, A., & Nathan, T. M.
(2014). Relationship between audit committee characteristics, external auditors
and economic value added (EVA) of public listed firms in Malaysia. Corporate
Ownership & Control, 12(1), 899-910. Retrieved from
http://www.virtusinterpress.org/IMG/pdf/Abdullah_Al_Mamun_paper_2014.pdf
Al-
Amba, S. M. (2013). Does CEO duality enhance firm’s business performance? Empirical
evidence from Bahrain. International Journal of Business and Social Science,
4(6), 88-91.
Anderson, J. P., Prause, J., & Silver, R. C. (2011). A step-by-step guide to using
secondary data for psychological research. Social and Personality Psychology
Compass, 5(1), 56 -75. doi:10.1111/j.1751-9004.2010. 00329.x
Anderson, R. C., Mansi, S. A., & Reeb, D. M. (2003). Founding family ownership and
the agency cost of debt. Journal of Financial Economics, 68(2), 263-285.
Bana, A. (2012). Working capital management and firms’ performance in emerging
markets: The case of Jordan. International Journal of Managerial Finance, 8(2),
155-179. doi:10.1108/17439131211216620
Bansal, N., & Sharma, A. K. (2016). Audit committee, corporate governance and firm
138
performance: Empirical evidence from India. International Journal of Economics
and Finance, 8(3), 103. doi:10.5539/ijef.v8n3p103
Bedue, A. (1997). Choix financiers des entreprises et comportement bancaire [The
financial choices of companies and bank behavior] (PhD thesis). Université Paris
10, Nanterre.
Bibi, N., & Amjad, S. (2017). The relationship between liquidity and firms’ profitability:
A case study of Karachi Stock Exchange. Asian Journal of Finance &
Accounting, 9(1), 54-67. doi:10.5296/ajfa. v9i1.10600
Binti Mohamad, N. E. A., & Elias, S. B. (2013). An assessment on determinant of
working capital management from Malaysian public listed companies.
International Journal of Academic Research in Accounting Finance and
Management Sciences, 3(4), 224-228. doi:10.6007/IJARAFMS/v3-i4/403
Boldina, I., & Beninger, P. G. (2016). Strengthening statistical usage in marine ecology:
Linear regression. Journal of Experimental Marine Biology and Ecology, 474, 81-
91. doi:10.1016/j.jembe.2015.09.010
Bond, T., & Fox, C. M. (2015). Applying the Rasch model: Fundamental measurement in
the human sciences. New York, NY: Routledge.
Boyd, B. K. (1995). CEO duality and firm performance: A contingency model. Strategic
Management Journal, 16(4), 301-312. doi:10.1002/smj.4250160404
Brenes, E. R., Madrigal, K., & Requena, B. (2011). Corporate governance and family
business performance. Journal of Business Research, 64(3), 280-285.
doi:10.1016/j.jbusres.2009.11.013
139
Carpenter, M. D, & Johnson, K. H. (1983). The association between working capital
policy and operating risk. Financial Review, 18(3), 106. doi:10.1111/j.1540-6288.
1983.tb01941.x
Carty, R., & Weiss, G. (2012). Does CEO duality affect corporate performance?
Evidence from the U.S. banking crisis. Journal of Financial Regulation and
Compliance, 20(1), 26-40.
Cohen, J. R., Gaynor, L. M., Krishnamoorthy, G., & Wright, A. M. (2011). The impact
on auditor judgments of CEO influence on audit committee independence.
Auditing: A Journal of Practice & Theory, 30(4), 129-147. doi:10.2308/ajpt-
10146
Coleman, P. T., Hacking, A., Stover, M., Fisher-Yoshida, B., & Nowak, A. (2008). Reconstructing
ripeness: A study of constructive engagement in protracted social conflicts. Conflict Resolution
Quarterly, 26(1), 3-42.
Cuomo, F., Mallin, C., & Zattoni, A. (2015). Corporate governance codes: A review and
research agenda. Corporate Governance: An International Review, 24(3), 222-
241. doi:10.1111/corg.12148
Damar, H. E., Meh, C. A., & Terajima, Y. (2013). Leverage, balance-sheet size and
wholesale funding. Journal of Financial Intermediation, 22(4), 639-662.
doi:10.1.1.357.3999
Das, S. (2016). Impact of cash conversion cycle for measuring the efficiency of cash
management: A study on pharmaceutical sector. Accounting, 2(4), 143-150.
doi:10.5267/j.ac.2016.4.003
140
De, A., & Banerjee, A. (2017). Capital structure and its determinants during the pre-and
post period of recession: Pecking order vs. trade off theory. Indian Journal of
Finance, 11(1), 44-58. doi:10.17010/ijf/2017/v11i1/108961
Deegan, C. (2012). Australian financial accounting. City, Australia: McGraw-Hill
Education.
Delen, D., Kuzey, C., & Uyar, A. (2013). Measuring firm performance using financial
ratios: A decision tree approach. Expert Systems with Applications, 40(10), 3970-
3983. doi.org/10.1016/j.eswa.2013.01.012
Desai, M. A., Foley, C. F., & Hines Jr., J. R. (2016). Trade credit and taxes. Review of
Economics and Statistics, 98(1), 132-139. doi:10.1162/REST_a_00534
Desender, K. A., Aguilera, R. V., Crespi, R., & García-Cestona, M. (2013). When does
ownership matter? Board characteristics and behavior. Strategic Management
Journal, 34(7), 823-842. doi:10.1002/smj.2046
Ding, S., Guariglia, A., & Knight, J. (2013). Investment and financing constraints in
China: Does working capital management make a difference? Journal of Banking
& Finance, 37(5), 1490-1507. doi:10.1016/j.jbankfin.2012.03.025
Dinh Pham Anh, T. (2013). Determinants of corporate cash holdings: A study of listed
manufacturing companies in Vietnam (Doctoral dissertation). Retrieved from
International University HCMC, Vietnam.
Fiador, V., & Fiador, V. (2016). Does corporate governance influence the efficiency of
141
working capital management of listed firms: Evidence from Ghana. African
Journal of Economic and Management Studies, 7(4), 482-496.
doi:10.1108/AJEMS-08-2015-0096
Flannelly, L. T., Flannelly, K. J., & Jankowski, K. R. (2014). Independent, dependent,
and other variables in healthcare and chaplaincy research. Journal of health care
chaplaincy, 20(4), 161-170.doi:10.1080/08854726.2014.959374
Frankfort-Nachmias, C., & Nachmias, D. (2008). Research methods in the social sciences
(7th ed.). New York, NY: Worth Publisher.
Gandhi, S., Thomas, L., & Desai, G. (2017). Effect of VAPE about mother and infant
health on knowledge among primary caregivers of patients with postpartum
psychiatric illness: -A pre-experimental study. Asian Journal of Psychiatry, 28,
21-25. doi:10.1016/j.ajp.2017.03.021
Gbadamosi, W. A. (2016). Corporate social responsibility and financial performance of
banks in the United States (Doctoral dissertation, Walden University).
Gill, A. S., & Biger, N. (2013). The impact of corporate governance on working capital
management efficiency of American manufacturing firms. Managerial Finance,
39(2), 116-132. doi:10.1108/03077435131129398
Gill, A., & Shah, C. (2012). Determinants of corporate cash holdings: Evidence from
Canada. International Journal of Economics and Finance, 4(1), 70-79.
doi:10.5539/ijef.v4n1p70
Gerber, S. B., & Finn, K. V. (2013). Using SPSS for Windows: Data analysis and
graphics. New York, NY: Springer.
142
Grosse-Ruyken, P. T., Wagner, S. M., & Jönke, R. (2011). What is the right cash
conversion cycle for your supply chain? International Journal of Services and
Operations Management, 10(1), 13-29.
Guariglia, A., & Mateut, S. (2016). External finance and trade credit extension in China:
Does political affiliation makes a difference? European Journal of Finance, 22(4-
6), 319-344. doi:10.1080/1351847X.2012.762030
Harris, M., & Raviv, A. (2017). Why do firms sit on cash? An asymmetric information
approach. Retrieved from https://ssrn.com/abstract=2984276
Haslindar, I., Fazilah, M., & Abdul, S. (2011). Corporate governance and agency
costs. In K. J. Anil & K. Makhija (Eds.), International corporate governance
(Advances in financial economics, 14, 109-130. City, State: Emerald Group
Publishing Limited. doi:10.1108/S1569-3732(2011)0000014008
Hayajneh, O. S., & Yassine, F. L. A. (2011). The impact of working capital efficiency on
profitability ‐ An empirical analysis on Jordanian manufacturing firms. International
Research Journal of Finance and Economics, 66, 67‐76.Higgs, D. (2003). Review
of the role and effectiveness of non-executive directors. London, England:
Department of Trade and Industry.
Hillman, A. J., & Dalziel, T. (2003). Boards of directors and firm performance:
Integrating agency and resource dependence perspectives. Academy of
Management Review, 28(3), 383-396
Hilscher, J., Pollet, J. M., & Wilson, M. (2015). Are credit default swaps a sideshow?
143
Evidence that information flows from equity to CDS markets. Journal of
Financial and Quantitative Analysis, 50(3), 543-567. doi:10.2469/dig. v46.n2.17
Hilscher, J., & Wilson, M. (2016). Credit ratings and credit risk: Is one measure
enough? Management Science. https://doi.org/10.1287/mnsc.2016.2514
Hofmann, E., & Kotzab, H. (2010). A supply chain oriented approach of working capital
management. Journal of Business and Logistics, 31(2), 305–330.
Hoskin, R. E., Fizzell, M. R., & Cherry, D. C. (2014). Financial accounting: A user
perspective. Wiley Global Education.
Huang, Y. S., & Wang, C. J. (2015). Corporate governance and risk-taking of Chinese
firms: The role of board size. International Review of Economics & Finance, 37,
96-113. doi:10.1016/j.iref.2014.11.016
Jain, P. K., Singh, S., & Yadav, S. S. (2013). Financial management practices: An
empirical study of Indian corporates. New Delhi, India: Springer.
Joshi, K., & Rajarshi, M. B. (2016). Modified probability proportional to size sampling.
Communications in Statistics-Theory and Methods, (just-accepted).
Juhmani, O. I. (2017). Audit committee characteristics and earnings management: The
case of Bahrain. International Journal of Accounting and Financial
Reporting, 7(1), 11-31. doi:10.5296/ijafr. v7i1.10447
Kahl, M., Shivdasani, A., & Wang, Y. (2015). Short‐term debt as bridge financing:
Evidence from the commercial paper market. Journal of Finance, 70(1), 211-255.
doi:10.1111/jofi.12216
Karaduman, H. A., Akbas, H. E., Caliskan, A. O., & Durer, S. (2011). The relationship
144
between working capital management and profitability: Evidence from an
emerging market. International Research Journal of Finance and Economics, 62,
61‐67.
Kalcheva, I., & Lins, K. V. (2007). International evidence on cash holdings and expected
managerial agency problems. The Review of Financial Studies, 20(4), 1087-1112.
doi.org/10.2139/ssrn.477241
Kalcheva, I. D., & Lins, K. V. (2007). International evidence on cash holdings and
expected managerial agency problems. Review of Financial Studies, 20(4), 1087-
1112.
Karminsky, A., & Polozov, A. (2016). Credit ratings as a financial risk measure.
In Handbook of Ratings (pp. 27-61). doi:10.1007/978-3-319-39261-5
Kim, J., Kim, H., & Woods, D. (2011). Determinants of corporate cash-holding levels:
An empirical examination of the restaurant industry. International Journal of
Hospitality management, 30(3), 568-574. doi:10.1016/j.ijhm.2010.10.004
Kirkham, R. (2012). Liquidity analysis using cash flow ratios and traditional ratios: The
telecommunications sector in Australia. Journal of New Business Ideas & Trends,
10(1), 1-13.
Khan, R. H., & Haque, M. Z. (2017). Compliance with corporate governance guidelines:
A comparative study of high-performing private commercial banks and state-
owned commercial banks in Bangladesh, 5(4), 93-107. doi:10.20431/2349-
0349.0504013
Knauer, T., & Wöhrmann, A. (2013). Working capital management and firm profitability.
145
Journal of Management Control, 24(1), 77-87.
Konak, F., & Güner, E. N. (2016). The impact of working capital management on firm
performance: An empirical evidence from the BIST SME industrial
index. International Journal of Trade, Economics and Finance, 7(2), 38.
doi:10.18178/ijtef.2016.7.2.496
König, P. J., & Pothier, D. (2016). Too much of a good thing? A theory of short-term
debt as a sorting device. Journal of Financial Intermediation, 26, 100-114.
doi:10.1016/j.jfi.2015.12.001
Kroes, J. R., & Manikas, A. S. (2014). Cash flow management and manufacturing firm
financial performance: A longitudinal perspective. International Journal of
Production Economics, 148, 37-50. doi: 10.1016/j.ijpe.2013.11.008
Kuan, T. H., Li, C. S., & Chu, S. H. (2011). Cash holdings and corporate governance in
family-controlled firms. Journal of Business Research, 64(7), 757-764.
doi:10.1016/j.jbusres.2010.07.004
Li, J. Y., & Tang, D. Y. (2016). The leverage externalities of credit default
swaps. Journal of Financial Economics, 120(3), 491-513.
doi:10.1016/j.jfineco.2016.02.005
Liang, D., Lu, C. C., Tsai, C. F., & Shih, G. A. (2016). Financial ratios and corporate
governance indicators in bankruptcy prediction: A comprehensive
study. European Journal of Operational Research, 252(2), 561-572.
doi:10.1016/j.ejor.2016.01.012
146
Lwanga, S. K., & Lemeshow, S. (2015). Sample size determination in health studies: A
practical manual. Geneva: World Health Organization Google Scholar. Retrieved
from http://catalogue.nla.gov.au/Record/2638422
Lyngstadaas, H., & Berg, T. (2016). Working capital management: Evidence from
Norway. International Journal of Managerial Finance, 12(3). doi:10.1108/IJMF-
01-2016-0012
Marttonen, S., Viskari, S., & Kärri, T. (2013). Appeasing company owners through
effective working capital management. International Journal of Managerial and
Financial Accounting, 5(1), 64-78.
Megginson, W. L., & Wei, Z. (2010). Determinants and value of cash holdings: Evidence
from China's privatized firms. SSRN Working Paper Series, 1-37.
McConnell, J. J., & Servaes, H. (1995). Equity ownership and the two faces of debt.
Journal of Financial Economics, 39, 131- 157.
Milfont, T. L., & Fischer, R. (2015). Testing measurement invariance across groups:
Applications in cross-cultural research. International Journal of Psychological
Research, 3(1), 111-130.
Mnif Sellami, Y., Mnif Sellami, Y., Borgi Fendri, H., & Borgi Fendri, H. (2017). The
effect of audit committee characteristics on compliance with IFRS for related
party disclosures: Evidence from South Africa. Managerial Auditing
Journal, 32(6), 603-626. doi:10.1108/MAJ-06-2016-1395
Moodley, T., Ward, M., & Muller, C. (2017). The relationship between the management
147
of payables and the return to investors. South African Journal of Accounting
Research, 31(1), 35-43. doi:10.1080/10291954.2015.1105555
Muhammad, S., Rabi, U. S. J., Ibrahim, F. B., & Ahmad, T. H. (2015). The effect of
working capital management on corporate profitability: Evidence from Nigerian
food product firms. Applied Finance and Accounting, 1(2), 55-63.
doi:10.11114/afa. v1i2.842
Nehf, J. P. (2017). Consumer credit regulation and international financial markets:
Lessons from the mortgage meltdown. In Consumer Law and Socioeconomic
Development (pp. 147-157). doi:10.1007/978-3-319-55624-6_11
Nigerian Stock Exchange. (2016). Equities price list. Retrieved from
http://www.nse.com.ng/market-data/trading-statistics/equities
Nobanee, H., & Abraham, J. (2015). Current assets management of small enterprises.
Journal of Economic Studies, 42(4), 549-560. doi:10.1108/JES-02-2013-0028
Nuryanah, S., & Islam, S. (2011). Corporate governance and performance: Evidence
from an emerging market. Malaysian Accounting Review, 10(1), 17-42.
Nwankwo, O., & Oso (2010). An empirical analysis off corporate survival and growth:
Evidence from efficient working capital management. International Journal of
Scholarly Academic Intellectual Diversity, 12(1).
Okike, E., Adegbite, E., Nakpodia, F., & Adegbite, S. (2015). A review of internal and
external influences on corporate governance and financial accountability in
Nigeria. International Journal of Business Governance and Ethics, 10(2), 165-
185. doi/pdf/10.1504/IJBGE.2015.070933
148
O'Mara, P. (2015). Ratios that lift the lid on liquidity. NZ Business + Management, 29(9),
55.
Ostlund, U., Kidd, L., Wengström, Y., & Rowa-Dewar, N. (2011). Combining qualitative
and quantitative research within mixed method research designs: A
methodological review. International journal of nursing studies, 48(3), 369-383.
doi:10.1016/j.ijnurstu.2010.10.005
Ozkan, A., & Ozkan, D. N. (2004). Corporate cash holdings: An empirical investigation
of UK companies. Journal of Banking and Finance, 28(9), 2103-2134.
Pham, A. N. (2015). CEO duality and performance of not-for-profit hospitals (Doctoral
dissertation). Retrieved from http://scholarworks.waldenu/dissertations/525/
Petersen, C. V., & Plenborg, T. (2012). Financial statement analysis: Valuation, credit
analysis and executive compensation. Harlow, England: Pearson Education.
Pirttilä, M. (2014). The cycle times of working capital: Financial value chain analysis
method (Doctoral dissertation). Retrieved from Lappeenranta University of
Technology, Lappeenranta.
Portney, L. G., & Watkins, M. P. (2015). Foundations of clinical research: Applications
to practice. City, State/Country: FA Davis.
Raheman, A., Afza, T., Qayyum, A., & Bodla, M. A. (2010). Working capital
management and corporate performance of manufacturing sector in Pakistan.
International Research Journal of Finance and Economics, 47, 151‐163.
149
Ramiah, V., Zhao, Y., Moosa, I., & Graham, M. (2016). A behavioural finance approach
to working capital management. The European Journal of Finance, 22(8-9), 662-
687. http://dx.doi.org/10.1080/1351847X.2014.883549
Rezaei, M., & Jafari, S. M. (2015). The relationship between current ratio and financial
leverage of the companies listed in Tehran stock exchange. International Journal
of Advanced and Applied Sciences, 2(12), 1-5.
Rezende, F. (2015). Demand for financial assets and monetary policy: A restatement of
the liquidity preference theory and the speculative demand for money. Journal of
Post Keynesian Economics, 38(1), 64-92.
Sagner, J. S. (2014). Working capital management: Applications and cases. Hoboken,
NJ: John Wiley & Sons.
Salam, Z. A., Quoquab, F., Jamil, R., Rizal, A. M., Mahadi, N., & Hussin, N. (2016).
Does liquidity affects profitability? Advanced Science Letters, 22(12), 4506-4508.
doi:10.1166/asl.2016.8204
Sharperis, C. (2010). G*Power Demonstration [Course handout]. Retrieved from
https://class.waldenu.edu/bbcswebdav/institution/USW1/201370_01/XX_RSCH/
RSCH_8250/Week%2010/Resources/Resources/embedded/G_Power_Demonstrat
ion.doc
Shin, H., Wood, C. C., & Jun, M. (2016). Does effective inventory management improve
profitability? Empirical evidence from US manufacturing industries. International
Journal of Information Systems and Supply Chain Management (IJISSCM), 9(3),
26-45. doi:10.4018/IJISSCM.2016070102
150
Shin, S., Ennis, K. L., & Spurlin, W. P. (2015). Effect of inventory management
efficiency on profitability: Current evidence from the U.S. manufacturing
industry. Journal of Economics and Economic Education Research, 16(1), 98.
Singh, H. P., Singh, H. P., Kumar, S., Kumar, S., Colombage, S., & Colombage, S.
(2017). Working capital management and firm profitability: a meta-
analysis. Qualitative Research in Financial Markets, 9(1), 34-47.
doi:10.1108/QRFM-06-2016-0018
Singhania, M., Sharma, N., & Rohit, J. Y. (2014). Working capital management and
profitability: Evidence from Indian manufacturing companies. Decision, 41(3),
313-326. doi:10.1007/s40622-014-0043-3
Singleton, R. A., & Straits, B. C. (2005). Approaches to social research (4th ed.).
Oxford, England: Oxford University Press, Inc.
Sivashanmugam, C., & Krishnakumar, S. (2016). Working capital management and
corporate profitability: Empirical evidences from Indian cement companies. Asian
Journal of Research in Social Sciences and Humanities, 6(7), 1471-1486.
doi:10.5958/2249-7315.2016.00523.2
Smallman, C. (2004). Exploring theoretical paradigm in corporate
governance. International Journal of Business Governance and Ethics,1(1),78-94.
Stephen, M., & Elvis, K. (2011). Influence of working capital management on firms
profitability: A case study of SMEs in Kenya. International Business
Management, 5, 279‐286.
151
Talonpoika, A. M., Kärri, T., Pirttilä, M., & Monto, S. (2016). Defined strategies for
financial working capital management. International Journal of Managerial
Finance, 12(3), 277-294. doi.org/10.1108/IJMF-11-2014-0178
Tang, J. (2017). CEO duality and firm performance: The moderating roles of other
executives and block holding outside directors. European Management
Journal, 35(3), 362-372. doi:10.1016/j.emj.2016.05.003
Tily, G. (2016). Keynes's General Theory, the Rate of Interest and Keynesian'Economics.
Springer.
Thorne, L. (2017). Discussion of “A theoretical framework of professional accountants’
identity formation and directions for future research.” Journal of Business Ethics,
142(2), 239. doi:10.1007/s10551-016-3145-3
Tran, H., Abbott, M., & Jin Yap, C. (2017). How does working capital management
affect the profitability of Vietnamese small-and medium-sized enterprises?
Journal of Small Business and Enterprise Development, 24(1), 2-
11.doi:10.1108/JSBED-05-2016-0070
Ugwoke, O., Onyeanu, E. O., & Obodoekwe, C. N. (2014). Duality role of chief
executive officer (CEO) in corporate governance and performance of quoted
companies in the Nigerian stock exchange: An appraisal of the perception of
managers and accountants. Global Journal of Management and Business
Research, 13(5), 2222-2847.
Venancio, T., & Godfred, A. A. (2013). The relative importance of working
capital management and its components to SMEs' profitability. Journal of Small
152
Business and Enterprise Development, 20(3), 453-469. doi:10.1108/JSBED-12-
2011-0029
Yasser, Q. R., Entebang, H. A., & Mansor, S. A. (2011). Corporate governance and firm
performance in Pakistan: The case of Karachi Stock Exchange (KSE)-30. Journal
of Economics and International Finance, 3(8), 482-491.
Yazdanfar, D., & Öhman, P. (2014). The impact of cash conversion cycle on firm
profitability: An empirical study based on Swedish data. International Journal of
Managerial Finance, 10(4), 442-452. doi.org/10.1108/IJMF-12-2013-0137
Yusoff, W. F. W., & Alhaji, I. A. (2012). Insight of corporate governance theories.
Journal of Business and Management, 1(1), 52-63.


