Embed Size (px)
Citation preview
Bellarmine University Bellarmine University
ScholarWorks@Bellarmine ScholarWorks@Bellarmine
Graduate Theses, Dissertations, and Capstones Graduate Research
11-30-2016
The Impact of Expertise and After-School Program Dosage on At-The Impact of Expertise and After-School Program Dosage on At-
Risk Student Achievement Risk Student Achievement
Heather E. Orman Bellarmine University, [email protected]
Follow this and additional works at: https://scholarworks.bellarmine.edu/tdc
Part of the Educational Assessment, Evaluation, and Research Commons, Educational Methods
Commons, and the Urban Education Commons
Recommended Citation Recommended Citation Orman, Heather E., "The Impact of Expertise and After-School Program Dosage on At-Risk Student Achievement" (2016). Graduate Theses, Dissertations, and Capstones. 32. https://scholarworks.bellarmine.edu/tdc/32
This Dissertation is brought to you for free and open access by the Graduate Research at ScholarWorks@Bellarmine. It has been accepted for inclusion in Graduate Theses, Dissertations, and Capstones by an authorized administrator of ScholarWorks@Bellarmine. For more information, please contact [email protected], [email protected].
The Impact of Expertise and After-School Program Dosage on At-Risk Student Achievement
A Dissertation
Submitted to the Graduate Faculty of Bellarmine University
in partial fulfillment of the requirements for the degree of
Doctor of Philosophy in
Education and Social Change
by
Heather Edwards Orman
B.A. Midway College, 1996 M.S. Indiana University, 2001
December, 2016

ii
Copyright © 2016
by
Heather Edwards Orman
iii
BELLARMINE UNIVERSITY
The Annsley Frazier Thornton School of Education of Bellarmine University certifies that Heather Edwards Orman has successfully defended her dissertation for the degree of Doctor of Philosophy in Education and Social Change as of November 30, 2016. This is the final and approved form of the dissertation.
The Impact of Expertise and After-School Program Dosage on At-Risk Student Achievement
Heather Edwards Orman
Dissertation Research Committee:
Dr. Grant Smith, Assistant Professor Doctorate Program, Annsley Frazier Thornton School of Education of Bellarmine University Dissertation Chair
Dr. Corrie Block, Professor of Education, Annsley Frazier Thornton School of Education of Bellarmine University Committee Member
Dr. Stephen Daeschner, Professor of Education Graduate Program, Annsley Frazier Thornton School of Education of Bellarmine University Committee Member
Dr. Jim Jury, Professor of Education Graduate Program, Annsley Frazier Thornton School of Education of Bellarmine University Committee Member
iv
Acknowledgements
First, I would like to thank my dissertation committee. Thank you to Dr. Daeschner and
Dr. Jury for providing examples of effective school leadership, insightful discussions, and
willingness to always argue a point. I appreciate Dr. Block and her tireless efforts to argue for
what is right for students. Also, I would like to thank Dr. Smith for his leadership as the
committee chair, his enthusiasm for data, and mostly for his wisdom and guidance.
Second, I would like to thank the School of Education at Bellarmine University. Thank
you to Dr. Kathleen Cooter and Dr. Robert Cooter for your inception of the PhD program at
Bellarmine University and for including me in the first cohort of candidates. Although I prefer
quantitative statistics, I would also like to thank Dr. Elizabeth Dinkins for the invaluable
experiences and learning she provided in her qualitative courses and through the cultural
immersion experience. I must also give a nod to my cohort mates, Sarah Nash Bumpas and
Patrick Englert for the shared laughter and tears.
Finally, I would like to thank my parents, Tom and Susie Edwards, and my sister, Jen
Daniels, for all the birthdays and holidays you have spent without me so I could do this well. I
absolutely could not have done without my husband, Dee Orman. His patience and
encouragement were boundless. I can never repay any of you for the time lost, although I will
try. The spiritual strength given by God and prayers by family were imperative to my success.
v
Abstract of the Dissertation
After-school programs (ASPS) aimed at improving at-risk student achievement abound
and receive considerable funding. Research provides some evidence that ASPs can improve
reading and math achievement for at-risk students, although rigorous evaluation of the programs
and outcomes is minimal. Specifically absent from current ASP literature is examination of
dosage, in the form of hours of program attendance, and its impact on at-risk student
achievement. ASP research; research on learning and time; and expertise theory indicate dosage
rates that are too low and too high will not impact student achievement.
This study investigates the impact of after-school program dosage and expertise on
achievement. This study took place in a mid-sized, urban school district in Kentucky. ESS
monies are provided by the state for ASPs targeting at-risk student achievement. The district
studied provided ESS funding to all low-performing schools to implement an ASP to improve
student achievement. Data was gathered for all 10th and 11th grade students from the low-
performing high schools in the district (n=1346). Dosage levels were calculated for each
participant: none, low, mid, high, in English/Language Arts and Math. English, reading, and
math ACT PLAN and ACT test scores were included for each participant.
An ANCOVA test was performed to investigate the impact of risk status (SES), dosage
(number of hours) and expertise (PLAN) on student achievement (ACT test). Expertise was the
covariate. ASP dosage did not have a significant effect on student achievement. Risk status,
after controlling for expertise, did not have a significant effect on achievement. This study
indicates expertise is a more powerful predictor of achievement than risk status.
vi
Table of Contents
Page
Acknowledgements .......................................................................................................... iv
Abstract of the Dissertation ..............................................................................................v
List of Tables ................................................................................................................... vii
List of Figures ................................................................................................................. viii
CHAPTER 1: INTRODUCTION .....................................................................................1
Statement of the Problem .........................................................................................1
Significance of the Study .........................................................................................3
Purpose of the Study ................................................................................................7
Research Questions ..................................................................................................8
Organization of Dissertation Chapters .....................................................................8
CHAPTER 2: REVIEW OF THE LITERATURE ........................................................9
Theoretical Framework ..........................................................................................10
Learning and Time ........................................................................................10
Expert Performance Theory ..........................................................................12
ASPs and Achievement ..........................................................................................15
Academic ASPs ............................................................................................16
ASPs and Rigor of Analysis .........................................................................17
ASPs and Dosage ..........................................................................................18
ASPs and Low SES .......................................................................................20
ASPs in Context ............................................................................................21
Summary ................................................................................................................22
vii
CHAPTER 3: METHODOLOGY .................................................................................24
Introduction ............................................................................................................24
Sample ....................................................................................................................24
Variables Defined ..................................................................................................27
Measurement ..........................................................................................................28
Data Collection ......................................................................................................29
Experimental Design ..............................................................................................31
Data Analysis .........................................................................................................32
Threats to Validity .................................................................................................36
Summary ................................................................................................................38
CHAPTER 4: RESULTS ................................................................................................40
RQ1 Achievement and Dosage ..............................................................................45
RQ2 Achievement and Risk Status ........................................................................47
RQ3 Achievement and Expertise ...........................................................................48
CHAPTER 5: DISCUSSION ..........................................................................................53
RQ1 Achievement and Dosage ..............................................................................54
RQ2 Achievement and Risk Status ........................................................................55
RQ3 Achievement and Expertise ...........................................................................59
Limitations and Implications .................................................................................63
Conclusion .............................................................................................................65
REFERENCES .................................................................................................................69
viii
List of Figures
Page
Figure 1: Initial Data Request Document ..........................................................................30
Figure 2: Data Request Overview Document ....................................................................31
Figure 3: Lines of Best Fit for Interaction Effect of Expertise by Risk Status ..................49
Figure 4: Line of Best Fit for Relationship of Reading Expertise and Reading ................50
Figure 5: Lines of Best Fit for Interaction Effect of Expertise by Risk Status ..................51
ix
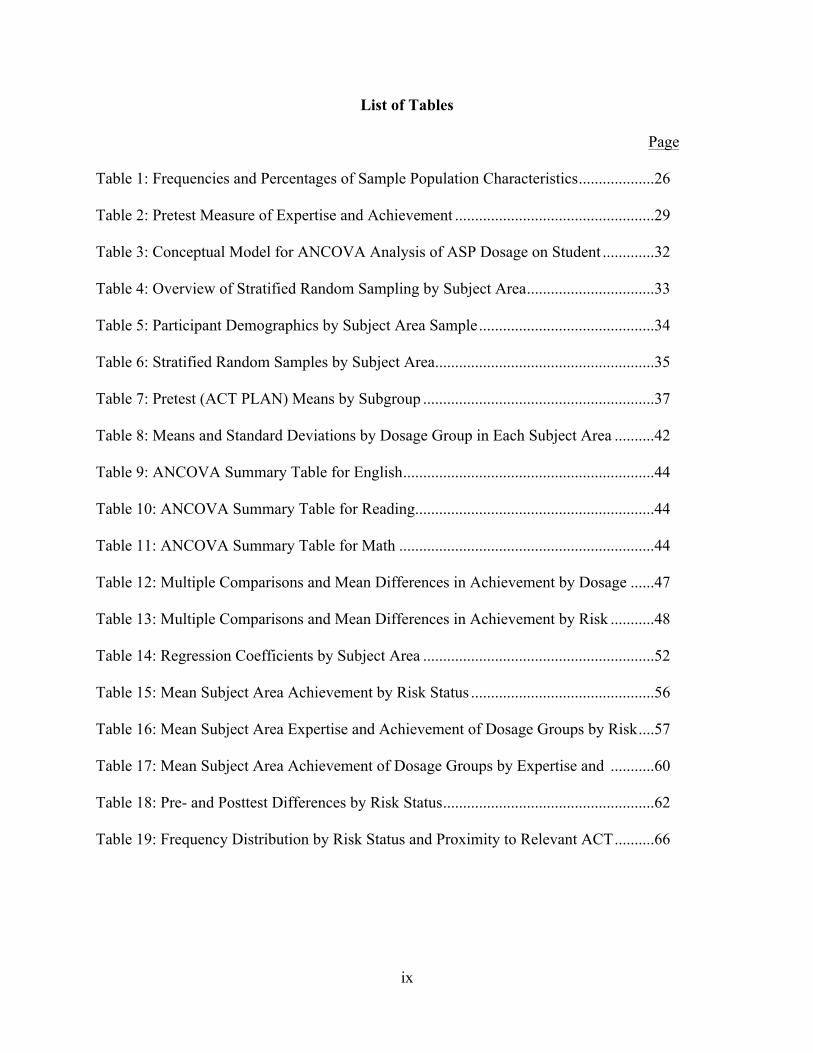
List of Tables
Page
Table 1: Frequencies and Percentages of Sample Population Characteristics ...................26
Table 2: Pretest Measure of Expertise and Achievement ..................................................29
Table 3: Conceptual Model for ANCOVA Analysis of ASP Dosage on Student .............32
Table 4: Overview of Stratified Random Sampling by Subject Area ................................33
Table 5: Participant Demographics by Subject Area Sample ............................................34
Table 6: Stratified Random Samples by Subject Area .......................................................35
Table 7: Pretest (ACT PLAN) Means by Subgroup ..........................................................37
Table 8: Means and Standard Deviations by Dosage Group in Each Subject Area ..........42
Table 9: ANCOVA Summary Table for English ...............................................................44
Table 10: ANCOVA Summary Table for Reading ............................................................44
Table 11: ANCOVA Summary Table for Math ................................................................44
Table 12: Multiple Comparisons and Mean Differences in Achievement by Dosage ......47
Table 13: Multiple Comparisons and Mean Differences in Achievement by Risk ...........48
Table 14: Regression Coefficients by Subject Area ..........................................................52
Table 15: Mean Subject Area Achievement by Risk Status ..............................................56
Table 16: Mean Subject Area Expertise and Achievement of Dosage Groups by Risk ....57
Table 17: Mean Subject Area Achievement of Dosage Groups by Expertise and ...........60
Table 18: Pre- and Posttest Differences by Risk Status .....................................................62
Table 19: Frequency Distribution by Risk Status and Proximity to Relevant ACT ..........66
1
Chapter 1
Introduction
Educators have long touted the potential achievement benefits associated with after-
school program attendance despite a lack of substantive, research-based evidence. Public and
private funds have been funneled to state-, district-, and school-level entities, in the climate of
high stakes accountability, for after-school programs targeting the achievement gap (Cross,
Gottredson, Wilson, Rorie, & Connell, 2010; Durlak, Mahoney, Bohnert, & Parente, 2010;
Granger, 2010; Lauer et al., 2006; Pierce, Bolt, & Vandell, 2010; Seiler et al., 2007; Seiler et al.,
2008). The impact of time on learning has been a focus of education research for decades. Most
research indicates a positive impact on learning with increased instructional time; however, an
achievement gap still exists and is reportedly widening, particularly in low-performing schools
(March & Kleitman, 2002; Pierce et al., 2010). This study contends that different levels of
program dosage, in the form of hours of attendance, among students at different levels of
expertise will result in varying degrees of achievement. Examination of the achievement levels
attained by students at different dosages would help educators strategically fund and plan
academic after-school programs. Schools and districts could use student data to ascertain
pretreatment expertise levels in conjunction with predicted subgroup dosages that result in
positive achievement gains.
Statement of the Problem
Since the early 1900s, school age children have increasingly come from homes in which
both parents work or single parent homes with little or no after school supervision (Apsler, 2009;
Lauer et al., 2006; Pierce et al., 2010). Coupled with societal concerns for a potential increase in
the prevalence of crime and neighborhood safety, there is a greater demand for after-school
2
programs (ASPs) (Apsler, 2009; Cross et al., 2010; Durlak et al., 2010a; Kidron &
Lindsay, 2014; Lauer et al., 2006; Pierce et al., 2010). Although there are different types of
ASPs for adolescents that provide a variety of activities, including sports, arts, study hall, games,
etc. (Shernoff & Vandell, 2007), education reform shifted the focus of ASPs to academics
instead of primarily supervision (Apsler, 2009; Lauer et al., 2006; Pierce et al., 2010).
Under the No Child Left Behind (NCLB) Act of 2001, schools, districts and states
became accountable for failure to meet targeted goals for gap groups identified using assessment
scores. A gap group consists of a group that has historically been subjugated by a comparative
group and for whom public educational institutions are legally obligated to provide equal access
and opportunity. Gap groups can be categorized by race or ethnicity, socioeconomics, gender,
and/or disability. Focus on gap group achievement has continued under current federal
guidelines for education and accountability, Race to the Top, and impacts how states receive
federal monies (U.S. Department of Education [USDE], 2009).
In response to greater societal demand for ASP opportunities and political influences on
school, district and state accountability, Kentucky legislated funding for a specific, academic-
based ASP with the intention of targeting gap students, Extended School Services (ESS) (Seiler
et al., 2008). Kentucky Regulation 704 KAR 3:390 specifies use of ESS monies to provide
additional academic intervention for the highest-need students (Seiler et al., 2008). In particular,
achievement gaps have remained stagnant or widened for low socioeconomic status (SES)
students based on standardized test scores (Kentucky Department of Education [KDE], 2015;
Weston & Sexton, 2009). According to the 2014 State Report Card for Kentucky, 68.7% of
students overall have achieved proficiency on the state accountability model, a combination of
state and national assessments; among all gap groups, 35.1% have reached proficiency at the
3
high school level (KDE, 2015). Only 27.4% of low SES, high school students are proficient in
Math, and 45.4% of low SES, high school students in Kentucky scored novice, the lowest level,
in Reading (KDE, 2015).
Studies of the impact of ASPs on achievement are rife with confounds as programs
inherently involve students who volunteer to participate or research methodology does not
account for attrition. The inconsistency among studies in reporting attendance data, including the
evaluation of students who are referred to but do not attend ASPs or students who dropout of the
program, “may explain why many after-school evaluations have found only small or no effects
on… outcomes” (Dietel, 2009). A 2008 Review of ESS programs in Kentucky indicates that
schools coded students as participants in the program if they attended at least one session (Seiler
et al., 2008). Although attendance is linked with positive academic outcomes, it is often reported
inaccurately (Seiler et al., 2008; Lauer et al. 2006) or indicates positive outcomes with smaller
effect sizes (Dietel, 2009; Hanlon, Simon, Grady & Carswell, 2009).
One factor contributing to positive outcomes among older youth is that the out-of-school-
time (OST) program is “well-attended” (Harvard Family Research Project [HFRP], 2011).
Program attendance is inherently linked to outcome effect. Within current ASP research, study of
outcome effects and dosage requirements are nonexistent or negligible (Apsler, 2009; Cross et
al., 2010; Dietel, 2009; Durlak et al., 2010a; Durlak et al., 2010b; Hanlon et al., 2009; Lauer et
al., 2006; Seiler et al., 2008). Examination of the varying degrees to which levels of dosage
impact achievement will contribute to the body of after-school program research.
Significance of the Study
The framework for the proposed study exists within the most current research available
on out-of-school time (OST) programs, ASPs, and ESS (Apsler, 2009; Cross et al., 2010; Durlak
4
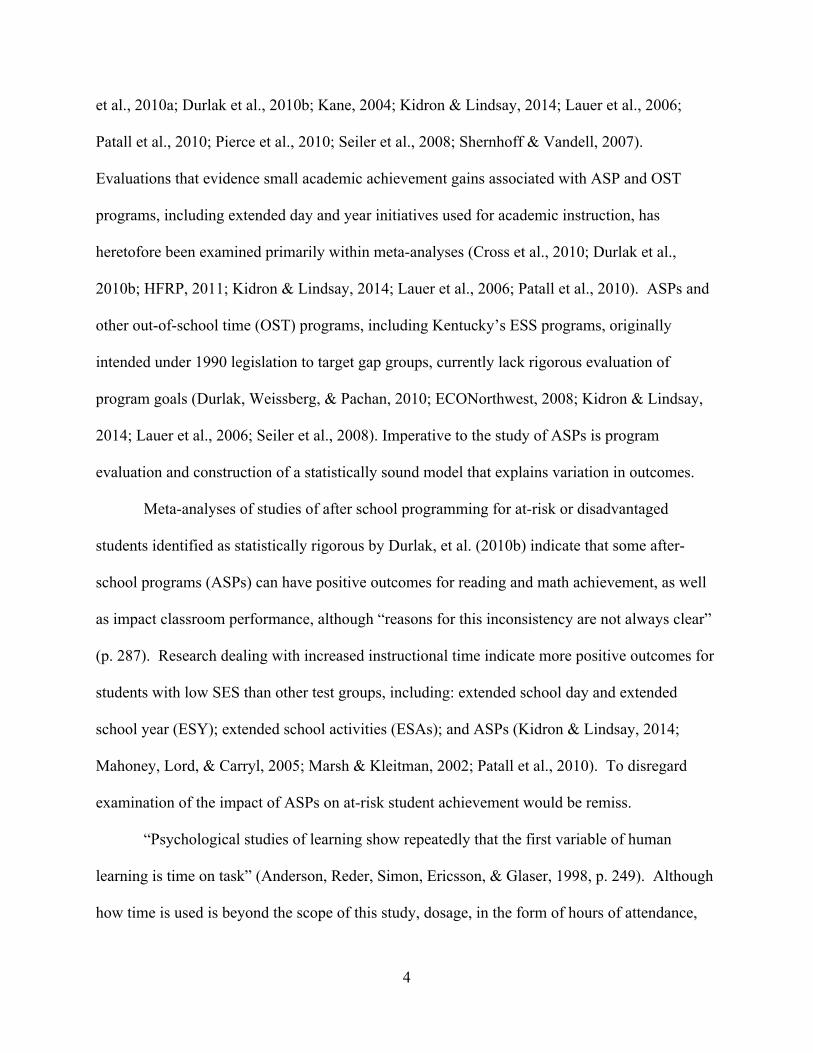
et al., 2010a; Durlak et al., 2010b; Kane, 2004; Kidron & Lindsay, 2014; Lauer et al., 2006;
Patall et al., 2010; Pierce et al., 2010; Seiler et al., 2008; Shernhoff & Vandell, 2007).
Evaluations that evidence small academic achievement gains associated with ASP and OST
programs, including extended day and year initiatives used for academic instruction, has
heretofore been examined primarily within meta-analyses (Cross et al., 2010; Durlak et al.,
2010b; HFRP, 2011; Kidron & Lindsay, 2014; Lauer et al., 2006; Patall et al., 2010). ASPs and
other out-of-school time (OST) programs, including Kentucky’s ESS programs, originally
intended under 1990 legislation to target gap groups, currently lack rigorous evaluation of
program goals (Durlak, Weissberg, & Pachan, 2010; ECONorthwest, 2008; Kidron & Lindsay,
2014; Lauer et al., 2006; Seiler et al., 2008). Imperative to the study of ASPs is program
evaluation and construction of a statistically sound model that explains variation in outcomes.
Meta-analyses of studies of after school programming for at-risk or disadvantaged
students identified as statistically rigorous by Durlak, et al. (2010b) indicate that some after-
school programs (ASPs) can have positive outcomes for reading and math achievement, as well
as impact classroom performance, although “reasons for this inconsistency are not always clear”
(p. 287). Research dealing with increased instructional time indicate more positive outcomes for
students with low SES than other test groups, including: extended school day and extended
school year (ESY); extended school activities (ESAs); and ASPs (Kidron & Lindsay, 2014;
Mahoney, Lord, & Carryl, 2005; Marsh & Kleitman, 2002; Patall et al., 2010). To disregard
examination of the impact of ASPs on at-risk student achievement would be remiss.
“Psychological studies of learning show repeatedly that the first variable of human
learning is time on task” (Anderson, Reder, Simon, Ericsson, & Glaser, 1998, p. 249). Although
how time is used is beyond the scope of this study, dosage, in the form of hours of attendance,
5
has been evidenced within the research as contributing to after-school program effects (Apsler,
2009; Dietel, 2009; Durlak et al., 2010b; HFRP, 2011); however, statistical examination of the
relationship between ASP dosage and achievement is heretofore nonexistent in relevant research
literature. The nature of the relationship between levels of ASP dosage and the impact on
achievement is worthy of examination.
The theoretical tenets of this study are two-fold and were derived initially intuitively: 1)
increased dosage will increase achievement and 2) achievement will vary by dosage based on the
level at which the ASP participant is performing at the onset of dosage. Dosage as it relates to
learning will be examined through research on time and learning. Dosage, achievement and
expertise will be examined through the lens of Expert Performance theory. The underlying
philosophical tenet that all students can learn at high levels is fundamental to this study and
relevant to current legislative agendas.
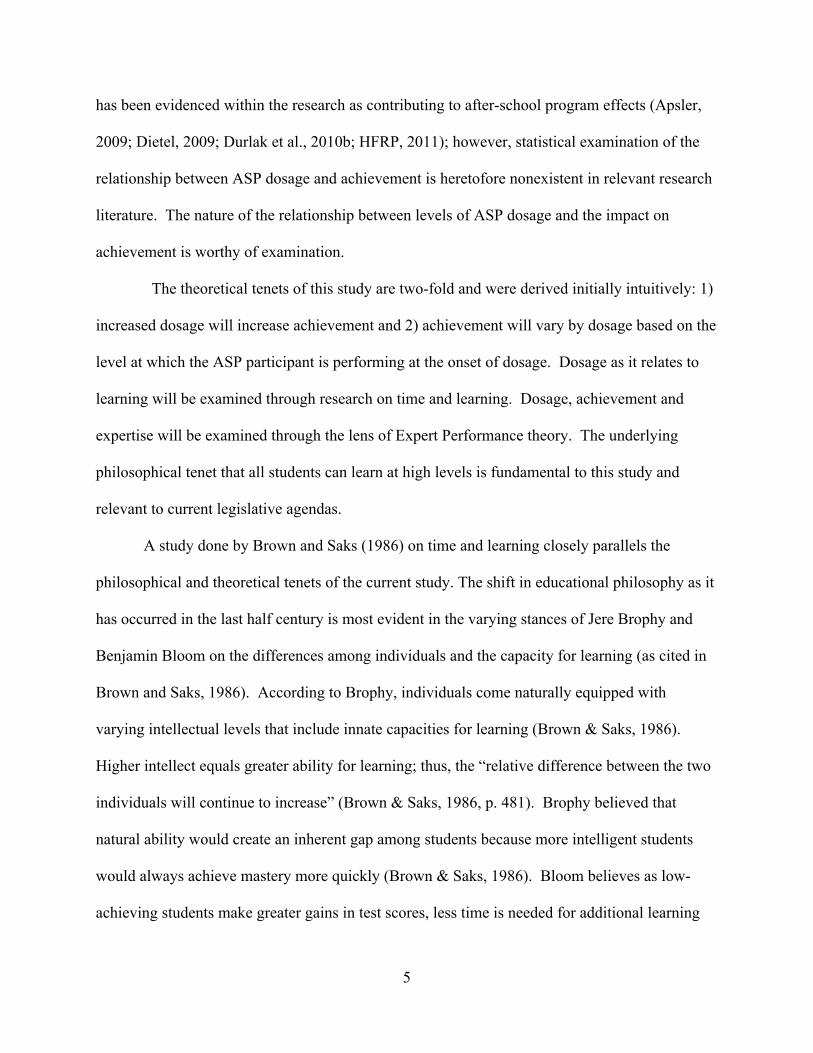
A study done by Brown and Saks (1986) on time and learning closely parallels the
philosophical and theoretical tenets of the current study. The shift in educational philosophy as it
has occurred in the last half century is most evident in the varying stances of Jere Brophy and
Benjamin Bloom on the differences among individuals and the capacity for learning (as cited in
Brown and Saks, 1986). According to Brophy, individuals come naturally equipped with
varying intellectual levels that include innate capacities for learning (Brown & Saks, 1986).
Higher intellect equals greater ability for learning; thus, the “relative difference between the two
individuals will continue to increase” (Brown & Saks, 1986, p. 481). Brophy believed that
natural ability would create an inherent gap among students because more intelligent students
would always achieve mastery more quickly (Brown & Saks, 1986). Bloom believes as low-
achieving students make greater gains in test scores, less time is needed for additional learning
6
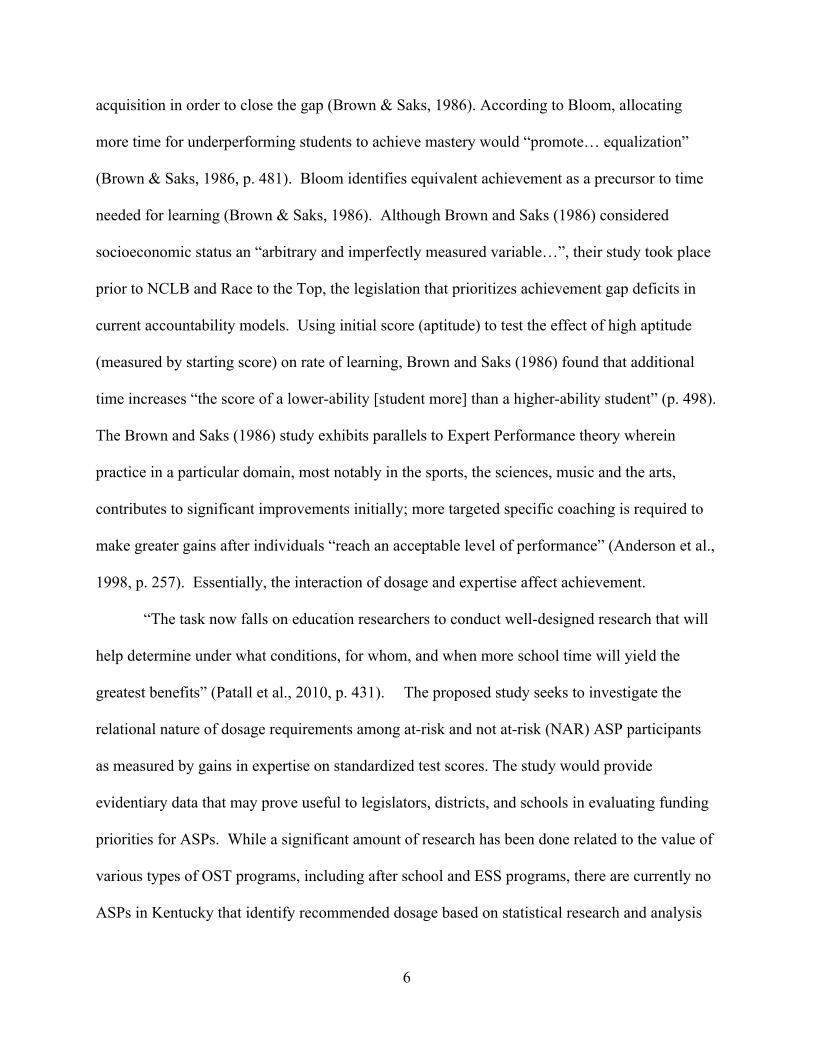
acquisition in order to close the gap (Brown & Saks, 1986). According to Bloom, allocating
more time for underperforming students to achieve mastery would “promote… equalization”
(Brown & Saks, 1986, p. 481). Bloom identifies equivalent achievement as a precursor to time
needed for learning (Brown & Saks, 1986). Although Brown and Saks (1986) considered
socioeconomic status an “arbitrary and imperfectly measured variable…”, their study took place
prior to NCLB and Race to the Top, the legislation that prioritizes achievement gap deficits in
current accountability models. Using initial score (aptitude) to test the effect of high aptitude
(measured by starting score) on rate of learning, Brown and Saks (1986) found that additional
time increases “the score of a lower-ability [student more] than a higher-ability student” (p. 498).
The Brown and Saks (1986) study exhibits parallels to Expert Performance theory wherein
practice in a particular domain, most notably in the sports, the sciences, music and the arts,
contributes to significant improvements initially; more targeted specific coaching is required to
make greater gains after individuals “reach an acceptable level of performance” (Anderson et al.,
1998, p. 257). Essentially, the interaction of dosage and expertise affect achievement.
“The task now falls on education researchers to conduct well-designed research that will
help determine under what conditions, for whom, and when more school time will yield the
greatest benefits” (Patall et al., 2010, p. 431). The proposed study seeks to investigate the
relational nature of dosage requirements among at-risk and not at-risk (NAR) ASP participants
as measured by gains in expertise on standardized test scores. The study would provide
evidentiary data that may prove useful to legislators, districts, and schools in evaluating funding
priorities for ASPs. While a significant amount of research has been done related to the value of
various types of OST programs, including after school and ESS programs, there are currently no
ASPs in Kentucky that identify recommended dosage based on statistical research and analysis
7
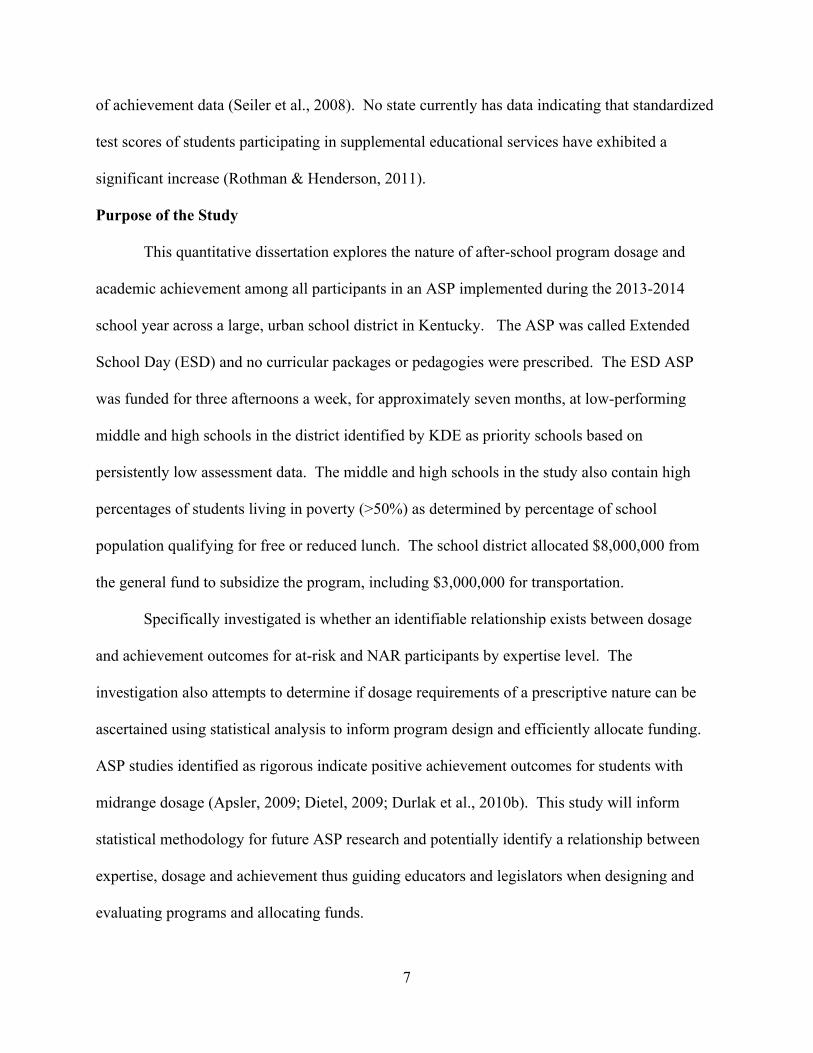
of achievement data (Seiler et al., 2008). No state currently has data indicating that standardized
test scores of students participating in supplemental educational services have exhibited a
significant increase (Rothman & Henderson, 2011).
Purpose of the Study
This quantitative dissertation explores the nature of after-school program dosage and
academic achievement among all participants in an ASP implemented during the 2013-2014
school year across a large, urban school district in Kentucky. The ASP was called Extended
School Day (ESD) and no curricular packages or pedagogies were prescribed. The ESD ASP
was funded for three afternoons a week, for approximately seven months, at low-performing
middle and high schools in the district identified by KDE as priority schools based on
persistently low assessment data. The middle and high schools in the study also contain high
percentages of students living in poverty (>50%) as determined by percentage of school
population qualifying for free or reduced lunch. The school district allocated $8,000,000 from
the general fund to subsidize the program, including $3,000,000 for transportation.
Specifically investigated is whether an identifiable relationship exists between dosage
and achievement outcomes for at-risk and NAR participants by expertise level. The
investigation also attempts to determine if dosage requirements of a prescriptive nature can be
ascertained using statistical analysis to inform program design and efficiently allocate funding.
ASP studies identified as rigorous indicate positive achievement outcomes for students with
midrange dosage (Apsler, 2009; Dietel, 2009; Durlak et al., 2010b). This study will inform
statistical methodology for future ASP research and potentially identify a relationship between
expertise, dosage and achievement thus guiding educators and legislators when designing and
evaluating programs and allocating funds.
8
Research Questions
After school programs (ASPs), out-of-school time programs (OSTs) and Extended
School Day programs (ESDs) have been attributed with potential for increasing student
achievement. Schools, districts, and government agencies fund ASPs although statistical study
of the ASP impact on achievement is minimally evident in relevant literature (Apsler, 2009;
Cross et al., 2010; Durlak et al., 2010a; Durlak et al., 2010b; Kane, 2004; Kidron & Lindsay,
2014; Lauer et al., 2006; Patall et al., 2010; Pierce et al., 2010; Seiler et al., 2008; Shernhoff &
Vandell, 2007).
This study addresses the following research questions:
R1: How does dosage impact math and/or ELA achievement among ASP participants?
R2: How does risk impact math and/or ELA achievement among ASP participants?
R3: How does expertise impact math and/or ELA achievement among ASP participants?
Organization of Dissertation Chapters
Chapter 1 has presented the introduction, statement of the problem, significance of the
study, research questions, hypotheses, definition of terms, and assumptions. Chapter 2 contains
the theoretical framework and a review of literature and research related to after-school
programming, dosage, and rigor of existent ASP research. The strategy and methodology used
for data analysis are presented in Chapter 3. The results of analyses and findings to emerge from
the study are contained in Chapter 4. Chapter 5 contains a summary of the study and findings,
conclusions drawn from the findings, a discussion, and recommendations for further study.
9
Chapter 2
Literature Review
Political agendas, public policy and societal demands influence youth (Granger, 2010).
With the increase of families with two working parents, single parent homes, and demands for
education reform, the demand for after-school programs (ASPs) has increased (Apsler, 2009;
Cross et al., 2010; Durlak et al., 2010a; Kidron & Lindsay, 2014; Lauer et al., 2006; Pierce et al.,
2010). The prevalence of after-school programs includes myriad activities that keep youth
occupied: academics, sports, school-sponsored clubs and activities, and community service
programs (Marsh & Kleitman, 2002; Vandell et al., 2005).
Currently at the federal level, one of the strategies touted by politicians as having
potential to increase student achievement is extending the school day (Patall et al., 2010; Pierce
et al., 2010) and “the specific type of care requested by many parents reflects growing emphasis
on academic performance and accountability, due in part to the No Child Left Behind Act of
2001 (Dynarski, et al., 2004; Lauer et al., 2004)” (as cited in Apsler, 2009, p. 2). Generally,
federal and state funding directed at after-school programs continues to increase (Cross et al.,
2010; Durlak et al., 2010a; Granger, 2010; Kane, 2004; Lauer et al., 2006; Shernoff & Vandell,
2007) as “[e]stimates of total annual federal investment in out-of-school time have reached as
high as $3.6 billion (financeproject.org, 2007)” (as cited in Cross et al., 2010). However, “[t]he
improvements in student performance are too slow, falling short of our own timetable and
continuing to include disturbing gaps for students from minority backgrounds and low-income
families” (Weston & Sexton, 2009, p. 32). Studying the impact of after-school programs
contributes to research aimed at substantiating the allocation of billions of dollars of educational
funding (Durlak et al., 2010a; Kane, 2004; Mahoney et al., 2005; Shernoff & Vandell, 2007).
10
Investment in after-school programs is costly; however, results from rigorous study of ASPs and
outcomes are minimal (Gottfredson, Cross, Wilson, Connell, & Rorie, 2008).
Theoretical Framework
Existent ASP research confounds variables and lacks sound quantitative methodology
(Kidron & Lindsay, 2014; Patall, Cooper, & Allen, 2010). In the Brown and Saks (1986) study
of instructional time and student learning, they acknowledged the complexity of measuring time
in educational settings due to the sheer number of potentially disparate elements that often
confound the element of time. Quantitative analysis includes strictly defined parameters. The
ASP data used for analyses in this study comes from different schools and includes effects and
interactions of variables that have confounded previous attempts to identify causal relationships
in ASP research. In order to apply a quantitative model to multiple educational settings, existent
research on learning and time and expert performance theory, with particular emphasis on
instructional time as it equates to practice, are examined.
Learning and time. Mastery learning theory as it was originally conceptualized by
Bloom implied that all students can be brought to similar levels of achievement within
comparable time frames (Arlin, 1984). Much educational debate in the subsequent half century
has been fraught with the impact of additional time on learning. Examination of cumulative time
spent learning is considered a reliable method for measuring an academic intervention’s
effectiveness (Poncy et al., 2015). Lavy (2015) found that increased instructional time positively
impacts student achievement (1 hour = .025 of a standard deviation), although the impact was
greater for low SES students. Data examined in a Progress in International Reading Literacy
Study (PIRLS), evidenced an average increase of 47 hours of instructional time in U.S.
classrooms between 2006 and 2011 (Sandoval-Hernandez et al., 2013). When increase in
11
achievement was examined, average reading scores among U.S. fourth graders increased by 16
points (Sandoval-Hernandez et al., 2013). In studies that examine time and achievement, impact
is evidenced primarily in mathematics and ELA (Stallings, 1980). ECONorthwest’s (2010)
[R]eview of research on extended learning time in K-12 schools, “found a statistically significant
correlation between total classroom time and student performance for grades seven and 10 in
both math and English” (p. 2). “…amount learned is roughly proportional to amount of time
spent learning” (Anderson et al., 1998, p. 250).
Intuitively, increased instruction should equate to increased achievement; however, the
aforementioned research includes caveats that must be addressed in order to ascertain limits of
the time and learning interaction as “…there is a point at which more time does not produce
more learning” (Stallings, 1980, p. 12). Study of the impact of additional instructional time on
achievement evidences diminishing returns (Schiman & Rivkin, 2015). The PIRLS study of the
relationship between time and achievement “did not show a clear relationship to achievement”,
because the data from some countries showed a negative correlation between time and
achievement (Sandoval-Hernandez et al., 2013, p. 5). Gettinger (1984) investigated the
relationship of time needed for each learner and student achievement. Gettinger (1984) found
“the consequences of additional instructional time may not be the same for all students because
there are individual differences in how much exposure or instruction is actually needed for
mastery” (p. 626).
One tenet of mastery learning is the impact of prerequisite knowledge on subsequent
achievement (Arlin, 1984). Acquired domain knowledge versus genetic superiority as a
precursor to skilled performance has extensive support in research literature (Hambrick &
Meinz, 2011). In a 2010 study done using 500 undergraduate students by Hambrick, Meinz,
12
Pink, Pettibone, & Oswald (as cited in Hambrick & Meinz, 2011), preexisting germane topic
knowledge was the strongest predictor of knowledge acquired. “For tasks in which initially
successful (though slow and error prone) performance is within the ability of most individuals,
consistent practice makes the most difference in terms of performance speed and accuracy”
(Ackerman, 2007, p. 236). Research on deliberate practice identifies the need for longer practice
sessions with novice students (Pachman et al., 2013). That additional practice time would be
needed for low SES students is a logical conclusion as they are more often less successful in
school (Dougherty, Hiserote, & Shaw, 2014; Mahoney et al., 2005; Patall et al., 2010).
Expert performance theory. Expert performance theory counteracts the notion that “a
higher dosage of teaching should obviously produce more learning” (Hanushek, 2015, p. F394).
Ericsson found that with a few hours of memory practice per week, college students were able to
improve their performance on a test of short-term memory (Ericsson, Roring, & Nondagopal,
2007). Expert performance is defined as “reproducibly superior performance” on “standardized
representative tasks, which can capture this superior performance” (Ericsson et al., 2007, p. 9).
Ericsson et al. (2007) contend that with practice in a domain individuals are able to rival or
surpass individuals identified as experts in the domain and there is limited evidence that innate
ability is a necessity for expertise; alternatively, experience in a particular domain is not reliably
indicative of expertise. Ericsson et al. (2007) argue that experts participate in deliberate
“practice activities designed to change and refine particular mediating mechanisms, requiring
problem-solving and successive refinement in feedback”; thus, examination of dosage in the
form of “mindless drill” combined with “mere experience” would not yield the same result
relative to expertise without the mediating factor of deliberate practice (pp. 18-19). Novices will
improve with practice, but once expertise is attained, the practice must be deliberate to continue
13
skill refinement.
According to Ericsson and Lehman (1996), performance level and amount of deliberate
practice are related, and studying the practice habits of experts can inform educational research
and learning theory. In Instructional Design for Advanced Learners: Establishing Connections
Between the Theoretical Frameworks of Cognitive Load and Deliberate Practice, van Gog,
Ericsson, Rikers, and Paas (2005) initially conceptualize Cognitive Load Theory (CLT) and
Expert Performance Theory (EPT) as applicable on a spectrum of learning. CLT postulates the
necessity of certain instructional strategies applicable to “initial skill acquisition”; whereas, EPT
identifies the necessity of deliberate practice, honing particular skills relevant to individual needs
in conjunction with intentional, specific coaching feedback in order to advance expertise in a
particular domain (van Gog et al., 2005). Brown and Saks (1986) incorporated the impact of
initial score (aptitude) to test the premise of high aptitude (measured by starting score) equals
higher rate of learning and found that increased time increases “the score of a lower-ability
[student more] than a higher-ability student” (p. 498).
As cognitive load theory evolved in the late 1990s, the ways instructional techniques
were altered to adjust for the progression from novice to expert resulted in the expert reversal
effect (Paas, Renkl, & Sweller, 2003). Essentially, the expert reversal effect “indicat[es] that
instructional techniques that are effective with novices can lose their effectiveness and even
become ineffective when used with more experienced learners” (Paas et al., 2003, p. 3).
Ackerman (2007) discusses the differences in performance level dependent on task type: open or
closed. Closed tasks are those that include limited knowledge, like Ericsson’s (2007) memory
tasks; whereas, open tasks require a subset of knowledge, including closed tasks, applied to
increasingly complex tasks (Ackerman, 2007). “When this happens, there might be an
14
increasing difference between the levels of the highest- and lowest performing learners”
(Ackerman, 2007, p. 237). Duration of practice correlates positively with achievement when
other factors, such as quality of practice and prior knowledge, are taken into account (Pachman,
Sweller, & Kalyuga, 2013). Novice learners will benefit from repeated skill practice; whereas,
experts need practice designed with intentionality for more specific subsets of skills or practice
will evidence diminishing returns.
“By targeting the performance on the specific forms of skill developed in school,” “by
adopting its measurement (e.g., performance on scholastic achievement tests)” “and past
engagement in various practices”, “it is possible to study how performance on these tests is
influenced by different developmental histories” (Ericsson et al., 2007, p. 13). In this study, the
relationship of SES and achievement constitute developmental history; engagement in practice is
ASP dosage; and performance of skill is expertise. Although there are many methods for
determining expertise in a particular domain, “some kind of measure of performance” is often
used (Chi, 2006, p. 22). One method for determining expertise is to “study experts in
comparison to novices,” or the relative approach (Chi, 2006, p. 22). The underlying premise of
the relative approach is that all can achieve proficiency, a premise similar to all children can
learn (Chi, 2006).
Novices attain expertise through experience and practice. For the purpose of this ASP
study, Chi’s (2006) relative approach will be used to examine how experts perform compared to
novices on ACT tests; essentially, higher pretest scores comprise “the more knowledgeable
group [who will be] considered the “ ‘experts’” and lower pretest scores comprise the less
knowledgeable group the “ ‘novices’” (p. 22). Participants in this ASP study all took the ACT
PLAN during the Fall of 10th grade and the ACT in the Spring of 11th grade. Experience levels
15
of participants are relatively equivalent, excluding students who may have repeated a grade.
Dosage, in this study, is equated with practice in the domain.
It can be reasonably inferred then that dosage among groups, novice and expert, when
equated with instructional practice, as measured by number of hours of program attendance, will
be related to achievement level, as measured by gains in expertise on standardized test scores.
Although examination of optimal ASP dosage on math and English achievement among low SES
students is not pervasive in research literature, one study (Wheeler, 1987, as cited in Patall et al.,
2010) indicates a potential “curvilinear relationship in which at some point increasing school
time is no longer associated with gains in achievement” (p. 429). Theoretically, examination of
expertise levels on pre- and post-test data in conjunction with dosage provides a wider range of
potential outcome effects as minimal and maximal dosages are examined based on level of
expertise.
ASPs and Achievement
New accountability models in education rely on standardized test scores, as they are
equated with instructional efficacy, to measure performance levels of classrooms, schools and
districts. Kentucky has a five-pronged system of accountability for high schools that includes:
achievement, gap, growth, college and career readiness, and graduation rate. If gap group scores
do not evidence increasing proximity to non-gap group scores, then schools and districts receive
fewer gap points. If growth scores in reading and math are not comparable to cohort growth
scores across the state, then schools and districts receive fewer growth points. If achievement
scores overall do not continue to increase then schools and districts receive fewer achievement
points. ASPs are one strategy that schools and districts in Kentucky have used to gain
instructional time with students in need and potentially bolster test scores and address
16
accountability. ASP research from the widespread implementation of programs in Kentucky is
negligible; however ASP research literature shows promise that the additional after-school
instructional time provided to low SES students can result in small gains in reading and math
achievement (Lauer et al., 2006; Stallings, 1980).
Academic ASPs. Although ASPs have historically included club, athletic, and social
components, increased accountability has pressured educational institutions to use the time for
extended content instruction, a shift that is upheld in research (Apsler, 2009; Cross et al., 2010;
Durlak et al., 2010a; Kidron & Lindsay, 2014; Lauer et al., 2006; Pierce et al., 2010). Students
participating in programs with educational goals exhibited characteristics associated with
increased academic achievement including decreased problem behaviors, lower levels of
substance abuse, and increased self-efficacy in adulthood (Durlak et al., 2010a; Hanlon et al.,
2009; Marsh & Kleitman, 2002). In a Lauer et al. (2010) study of OST programs, while the
effect size was small due to confounding variables, the academic programs were the “only…
OST programs that had an effect size greater than zero[.]” Lauer et al. (2006), in their final
analysis of qualified ASP research, cite studies that indicate positive effects for at-risk students
in both mathematics and reading. Patall et al.’s (2010) synthesis of research on the impact of
extending the school day and/or school year concludes that all studies examined indicate some
positive impact on achievement particularly for at-risk students, including those identified as
low-SES.
Academic ASP programs appear to benefit at-risk students, including low-SES students,
the most, particularly in reading and math; however, most ASP research indicates a need to
prioritize attendance and measure ASP impact with valid instruments (Durlak et al., 2010a;
Lauer et al., 2006). The research delineated as statistically rigorous evidenced positive effects
17
for at-risk students related to academic outcomes in programs that included improved attendance
(Apsler, 2009; Durlak et al., 2010a; Seiler et al., 2008). Increasing efficacy in OST programs
with an academic focus advocates use of assessment data to target specific groups of students for
inclusion as well as to analyze program effectiveness (Granger, 2010; Seiler et al., 2008).
ASPs and Rigor of Analysis. Although the preponderance of ASPs is evident in schools
around the United States, and there are multiple studies related to OST and ASP programs, most
lack the fidelity and rigor to evaluate program quality and outcomes (Apsler, 2009; Cross et al.,
2010; Durlak et al., 2010a; ECONorthwest, 2008; Kidron & Lindsay, 2014; Lauer et al., 2006;
Pierce et al., 2010). A meta-analysis of ASPs by Durlak et al. (2010a) found that such studies
generally lack explicitly specified program goals and objectives and lack methodologically
sound evaluative measures. Durlak et al. (2010a) identify disparate analytical rigor among the
studies as further complicating a body of research that inherently includes a wide variety in types
of programs and types of participants. Studies of ASP research indicate a plethora of literature
wrought with poor study design and resultant faulty premises (Apsler, 2009; Durlak et al., 2010a;
Durlak et al., 2010b; Kidron & Lindsay, 2014; Lauer et al., 2006; Patall et al., 2010).
Patall et al. (2010), in their review of schools that have extended the school day and/or
school year to increase allocated instructional time, identify several factors that limit the
potential implications of extended school time on positive academic achievement: multiple
interventions were implemented creating confounding variables; comparison groups were not
comparable; and “there was a great deal of variability in the effect of extended time across
various grade levels” (p. 424). Of 7,000 studies initially identified as relevant to their review of
existent ASP research, Kidron and Lindsay (2014) found 30 that they identified as scientifically
rigorous. Of the subsequent 30 programs, some found positive student outcomes and some found
18
no positive effects (Kidron & Lindsay, 2014). The Lauer et al. (2006) meta-analysis rated most
of the studies surpassing the initial selection criteria as low or medium quality based on
inaccurate or ineffective research methods, such as including only posttest scores or only gain
and posttest scores. Of 335 studies initially reviewed for a meta-analysis of OST programs
designed for at-risk students, Lauer et al. (2006) chose 35 to further analyze, because many of
the studies lacked statistical rigor. The studies chosen for analysis were placed in two content
categories: reading and math (Lauer et al., 2006). Of the reading studies analyzed, only three
were categorized as “high quality,” and only one of the math studies was categorized as “high
quality” based on construct validity, internal validity, external validity, and statistical validity
(Lauer et al., 2006). The findings of the Seiler et al. (2008) report are consistent with other
research in the area of after-school programs (ASPs) (Cross et al., 2010; Durlak et al., 2010a;
Lauer et al., 2006). While several studies of ASPs indicate positive effect outcomes, most have
been disqualified due to lack of rigor in study design (Apsler, 2009; Lauer et al., 2006; Seiler et
al., 2008).
ASPs and Dosage. “Most scholars argue that the relationship between time and
achievement is strengthened as the time variable is refined to more closely reflect the amount of
learning time devoted to the achievement outcome” (Patall et al., 2010, p.414). Most research of
the impact of ASPs and ESS programs on academic achievement includes confounding or
minimal data relevant to dosage requirements (Durlak et al., 2010a; Seiler et al., 2008). Urban
middle school students who attended at least half of an ASP’s sessions exhibited a greater
tendency for increased GPAs in the intervention group versus the comparison group (Hanlon et
al., 2009). Additionally, programs with midrange dosages relative to program duration exhibited
19
larger effect sizes in math and reading outcomes in comparison to minimal or extensive dosages
(Apsler, 2009; Lauer et al., 2010).
ASP research studied evidences poor attendance and turnover among students
participating in the programs (Apsler, 2009; Dietel, 2009; Durlak et al., 2010b). Typically, ASPs
included all students at any level of attendance as receiving treatment, thus undervaluing the
program’s potential impact (Apsler, 2009; Durlak et al., 2010a). “…Harvard Family Research
Project found that nearly 70% of after-school evaluations counted any attendance as full
participation in the program (Chaput, Little, and Weiss 2004)” (as cited in Dietel, 2009, p. 63).
Additionally, some evaluations of ASPs included only the few students remaining after
accounting for dropouts, which would lend itself to selection bias, in that the remaining students
would be those more motivated to achieve academically (Apsler, 2009). “It is important that
future research systematically examine the effect of extending the school year or day to various
lengths to identify optimal amount of time” (Patall et al., 2010, p. 429).
Kane (2004) posits using number of hours of instruction as a delineating variable among
students to identify the impact of gains made due to ASP participation. Program participation
exhibited academic benefits in the areas of reading and math for students who attended more
than 45 hours per school year and less than 100 hours (Apsler, 2009; Lauer et al., 2006).
Offering an ASP, for example, twice weekly for two hours per session in a traditional school
year equates to 72 hours; at a 65% attendance rate, students would meet the minimal requirement
shown in studies to impact academic achievement (Apsler, 2009; Dietel, 2009; Hanlon et al.,
2009). Length of program duration is also an important factor (Dietel, 2009). Research indicates
that duration of one to two years is minimal to achieve impact (Dietel, 2009). “Whether it is
20
medicine, clinical treatment, or involvement in an ASP, a sufficient dosage of active ingredients
is necessary to produce the intended results” (Durlak et al., 2010a, p. 290).
ASPs and Low SES. Closing the achievement gap among low-SES and high-SES
students is critical (Huang, 2015). Children identified as economically disadvantaged are less
likely to perform well in school (Dougherty et al., 2014; Mahoney et al., 2005; Patall et al.,
2010), and “[r]esearch studies generally have shown that children from low socio-economic
backgrounds have the most to gain from extended learning time in any of its forms”
(ECONorthwest, 2008, p. 6). Theorists propose that disadvantaged, low SES, students will
benefit more from ASPs, including those with an academic focus, than advantaged students
(Marsh & Kleitman, 2002; Lauer et al., 2006). Effective ASPs are an opportunity for students to
form positive associations with school, a trait more often found among advantaged children
(Marsh & Kleitman, 2002; Shernoff & Vandell, 2007). Analyses of studies of after school
programming for at-risk or disadvantaged students identified as statistically rigorous indicate that
ASPs can have positive outcomes for reading and math achievement, as well as impact
classroom performance including positive behavioral outcomes (Durlak et al., 2010ba; Durlak et
al., 2010b; ECONorthwest, 2008; Kidron & Lindsay, 2014; Lauer et al., 2006; Marsh &
Kleitman, 2002; Patall et al., 2010). Marsh and Kleitman (2002) reported that extended school
activities (ESAs) resulted in more positive outcomes for students with low SES than other test
groups on standardized test scores. Money for after-school programs targeted at at-risk or
disadvantaged youth has increased significantly in the last three decades (Mahoney et al., 2005);
although, most ASP programs, including those implemented in Kentucky, lack rigorous
examination of outcomes.
21
ASPs in Context. ESS was Kentucky’s response to demand for ASPs under KERA, and
in 2007 Kentucky school districts received $31,859,500 in funding for ESS (Seiler et al., 2008).
Although initially optimistic, districts have become more hesitant to fund ESS ASPs and funding
has evidenced a decline since its original inception in 1992 (Weston & Sexton, 2009). Monies
for ESS programs in Kentucky fall under the Flexible Focus Funds program established by the
Kentucky legislation in 2003, which allows districts to shift allocated funding among five grant
areas: ESS, preschool, professional development, textbooks, and safe schools (Seiler et al., 2007;
Seiler et al., 2008). A 2007 report detailing district use of flexible focus funds for the 2003 –
2007 fiscal years, indicates that districts have shifted approximately $5 million dollars out of
their ESS funding, the most of any negative allocation shift within the focus groups (Seiler et al.,
2008). “Currently insufficient evidence exists to know for certain if extended learning time is a
cost-effective use of scarce educational resources” (ECONorthwest, 2008, p. 8).
ASPs represented in current literature target various goals and objectives including
academics, behavior interventions, substance abuse programs, etc.; however, the specific intent
of ESS according to relevant legislation is to focus on academic interventions (Seiler et al.,
2008). The 2008 Review of ESS Programs in Kentucky evidenced widely varying
interpretations of academic interventions with minimal direct instruction at the middle and high
school levels (Seiler et al.). The majority of secondary programs studied in Kentucky used ESS
time for homework assistance (Seiler et al., 2008). A 2007 study by Shernoff and Vandell using
middle school students involved in an ASP, showed that among a variety of after school
activities including sports, arts enrichment, socializing, sit-down games, academic enrichment
and homework assistance, students rated homework assistance lowest in intrinsic motivation,
positive affect and overall engagement. Shernoff and Vandell (2007) also found that middle
22
school students rated academic enrichment higher in positive affect than sports as identified with
ratings of three factors: proud, excited and happy.
Kentucky Regulation 704 KAR 3:390 specifies use of ESS monies to provide additional
academic intervention for the highest-need students (Seiler et al., 2008). The 2008 study of ESS
programs found only one example of content related instruction in the 15 programs randomly
selected for observation (Seiler et al., 2007). Most of the programs for middle and high school
students used ESS staff for homework assistance with minimal student-teacher interaction (Seiler
et al., 2008). The 2008 review of Kentucky’s ESS programs indicated over 50% of students
enrolled in ESS programs attend between one and 15 hours per year, and 62% of middle school
students involved in ESS programs attend one to 15 hours per year with middle school students
averaging 0.9 days per week (Seiler et al.).
The Review of ESS Programs offered in Kentucky indicates that few schools collect and
analyze data from ESS to evaluate effectiveness of programs or measure student outcomes
(Seiler et al., 2008). Of the 173 districts in Kentucky, only six provided evidence of district level
evaluations, and most of the evidence submitted did not include student outcome data (Seiler et
al., 2008). The Review recommends that schools identify specific program goals as only two of
the schools provided a detailed program plan (Seiler et al., 2008). The inference is that analysis
of outcome data would provide relevant and informative intervention data. Extended School
Services (ESS) is only one of a number of ASPs lacking any substantial and informative
outcome data (Apsler, 2009; Durlak et al., 2010a; ECONorthwest, 2008; Kidron & Lindsay,
2014; Lauer et al., 2006; Patall et al., 2010; Seiler et al., 2008).
23
Summary
ASPs receive substantial funding to help reduce achievement gaps in the current climate
of accountability in education. Districts and schools have minimal rigorous research to direct
funding in a manner that would maximize impact. Additionally, measuring the impact of ASPs
on student achievement is complicated considering attrition, selection bias, instructional
pedagogies, and the myriad confounds that impact potential outcomes. Viewing dosage through
the theoretical lenses of learning and time as they relate to expertise and examining impact using
rigorous, randomized analyses may yield practical results. Districts, schools and students might
benefit from prescriptive dosage requirements.
Chapter 3 includes an overview of the method of procedure for analysis of the study,
including philosophical underpinnings derived from the literature review and the theoretical
framework. Analysis involves using the pre- and post- test data gathered from an existing ESS
program in Kentucky to determine if number of practice hours, expertise level, and dosage in
reading and/or math impacted student achievement.
24
Chapter 3
Introduction
This study involves using rigorous quantitative techniques to determine the relationship
among dosage in the form of total program hours attended; outcome in the form of achievement
gains; and expertise levels on pre- and post-standardized test scores. The research questions are
as follows:
R1: How does dosage impact math and/or ELA achievement among ASP participants?
R2: How does risk impact math and/or ELA achievement among ASP participants?
R3: How does expertise impact math and/or ELA achievement among ASP participants?
Sample
The district from which the data for this study was acquired included ten priority high
schools and eight priority middle schools during the 2013-2014 school year. The district
allocated $5,000,000 of ESS funding for priority schools to implement an ASP program,
including transportation and an afternoon meal. School level support staff provided by KDE for
support in priority schools in conjunction with the assistant superintendents assigned to the
priority schools created individualized ASP proposals for each school. The proposals were
formally submitted to the district’s Board of Education in August 2013. All students at each
school were allowed to participation in that school’s ASP. The district required each school
participating in the program to submit attendance data for each participant who chose to attend.
In addition to ASP attendance data for all students at all schools who participated in the program,
there are requisite standardized test scores that are part of schools’ accountability indices
available for each of the participants. All data for the entire population of 2013-2014 ASP
participants and schools was gathered for this study. After combining number of hours of
25
participation for each student, originally delineated by monthly participation, to gather total
dosage, N≈14,000. Achievement measures for middle schools in Kentucky consist of state-
designed tests; whereas, the high school measures include ACT PLAN and ACT data, national
tests considered highly valid and reliable (ACT, 2014). In order to complete a more rigorous
analysis, data from middle school participants was eliminated. Upon elimination of middle
school data, N=5,865. Total dosage was tabulated for each participant in ELA and Math and
participants without math and/or ELA dosage were eliminated from the data set. Upon
elimination of participants without math and/or ELA dosage, N=1346. Descriptive statistics
were conducted to describe demographic data for the sample population. Frequencies and
percentages for descriptive data are presented in Table 1.
26
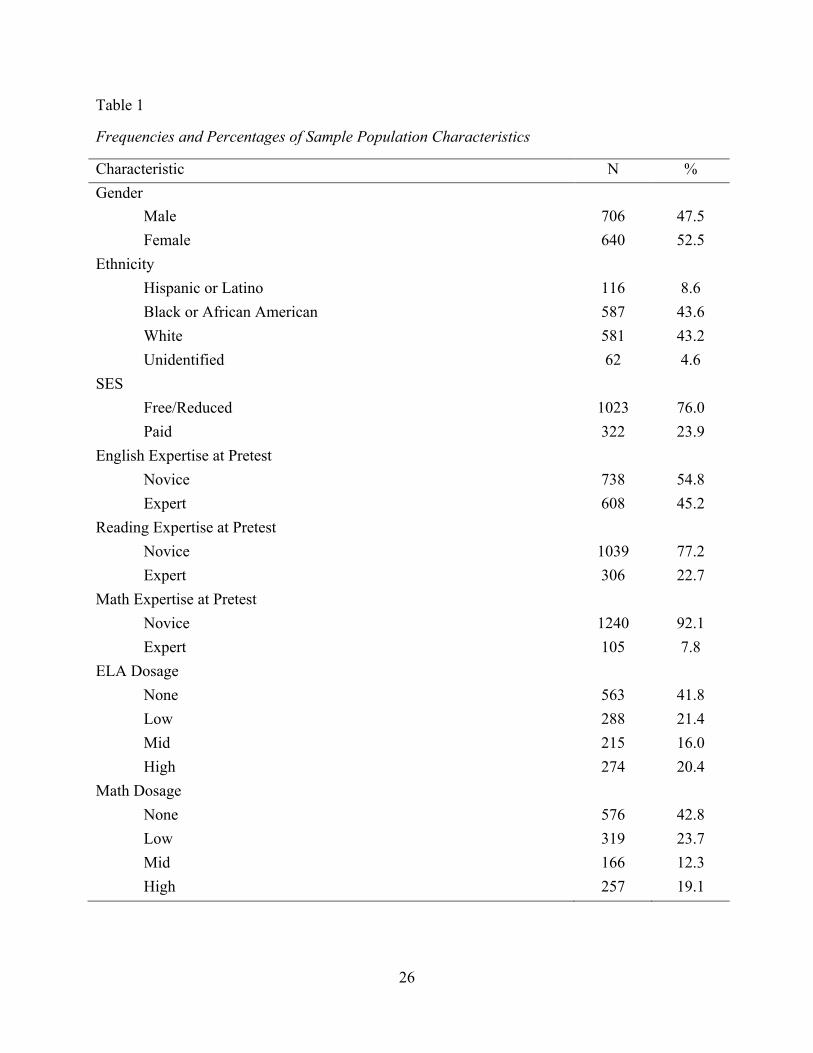
Table 1
Frequencies and Percentages of Sample Population Characteristics
Characteristic N % Gender
Male 706 47.5 Female 640 52.5
Ethnicity Hispanic or Latino 116 8.6 Black or African American 587 43.6 White 581 43.2 Unidentified 62 4.6
SES Free/Reduced 1023 76.0 Paid 322 23.9
English Expertise at Pretest Novice 738 54.8 Expert 608 45.2
Reading Expertise at Pretest Novice 1039 77.2 Expert 306 22.7
Math Expertise at Pretest Novice 1240 92.1 Expert 105 7.8
ELA Dosage None 563 41.8 Low 288 21.4 Mid 215 16.0 High 274 20.4
Math Dosage None 576 42.8 Low 319 23.7 Mid 166 12.3 High 257 19.1
27
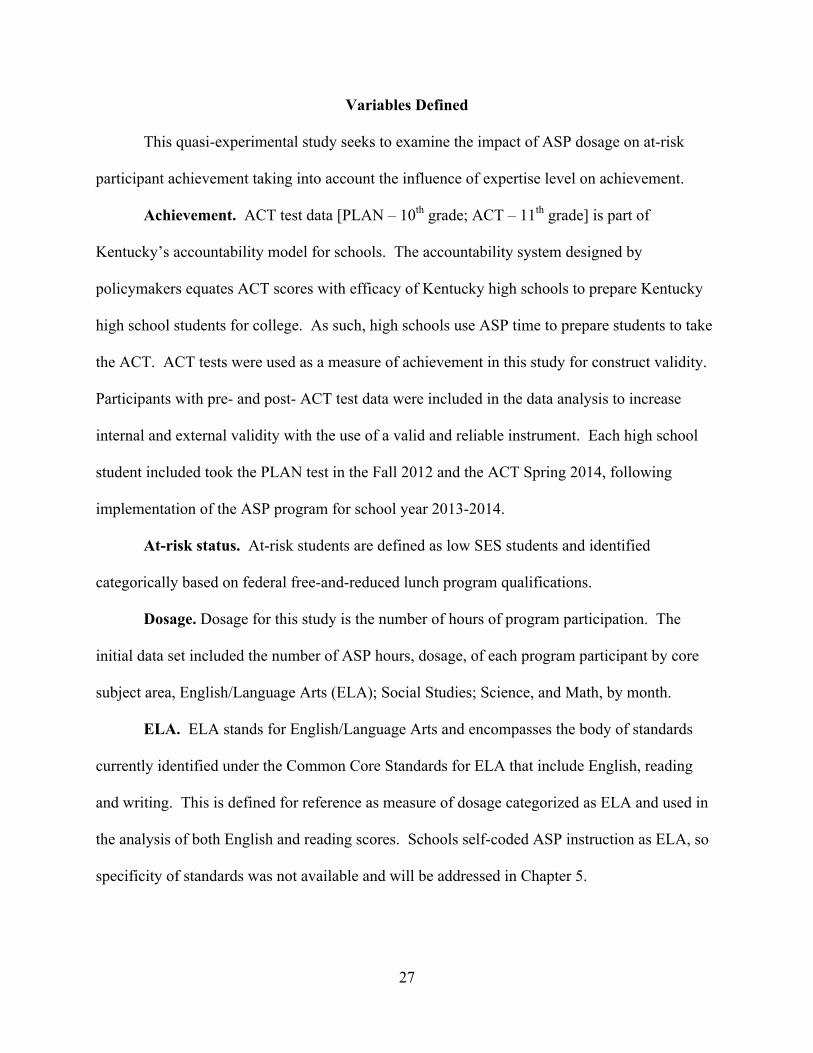
Variables Defined
This quasi-experimental study seeks to examine the impact of ASP dosage on at-risk
participant achievement taking into account the influence of expertise level on achievement.
Achievement. ACT test data [PLAN – 10th grade; ACT – 11th grade] is part of
Kentucky’s accountability model for schools. The accountability system designed by
policymakers equates ACT scores with efficacy of Kentucky high schools to prepare Kentucky
high school students for college. As such, high schools use ASP time to prepare students to take
the ACT. ACT tests were used as a measure of achievement in this study for construct validity.
Participants with pre- and post- ACT test data were included in the data analysis to increase
internal and external validity with the use of a valid and reliable instrument. Each high school
student included took the PLAN test in the Fall 2012 and the ACT Spring 2014, following
implementation of the ASP program for school year 2013-2014.
At-risk status. At-risk students are defined as low SES students and identified
categorically based on federal free-and-reduced lunch program qualifications.
Dosage. Dosage for this study is the number of hours of program participation. The
initial data set included the number of ASP hours, dosage, of each program participant by core
subject area, English/Language Arts (ELA); Social Studies; Science, and Math, by month.
ELA. ELA stands for English/Language Arts and encompasses the body of standards
currently identified under the Common Core Standards for ELA that include English, reading
and writing. This is defined for reference as measure of dosage categorized as ELA and used in
the analysis of both English and reading scores. Schools self-coded ASP instruction as ELA, so
specificity of standards was not available and will be addressed in Chapter 5.
28
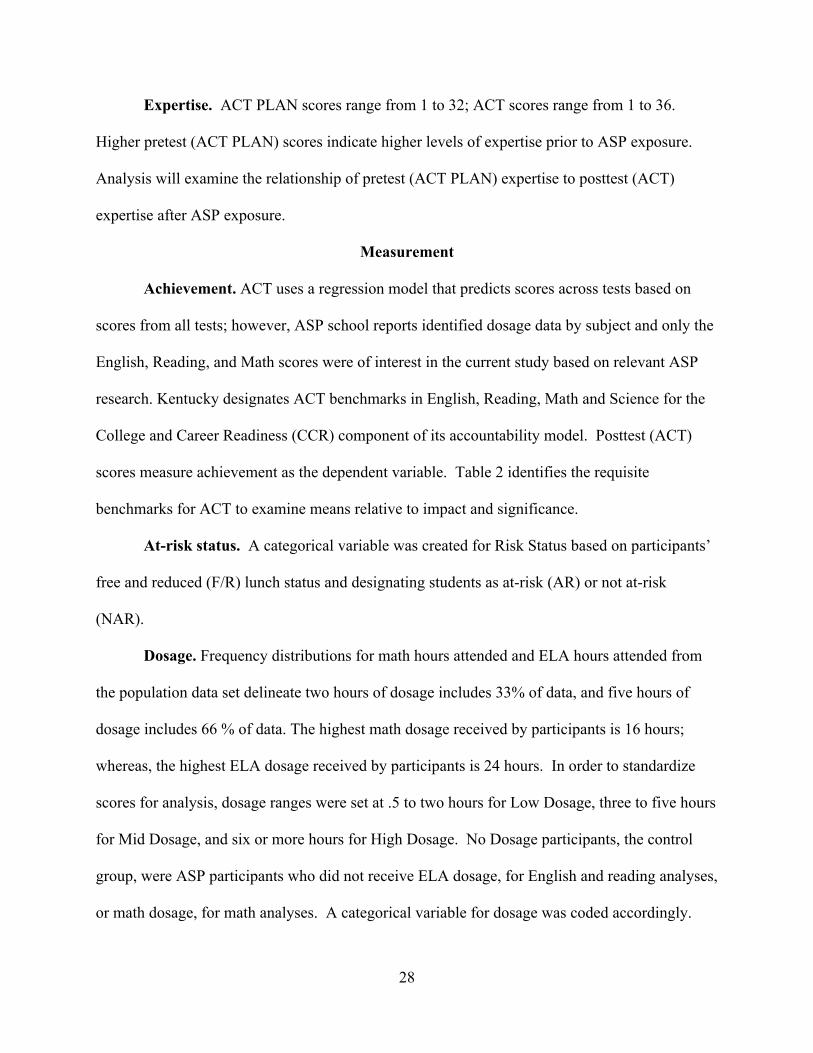
Expertise. ACT PLAN scores range from 1 to 32; ACT scores range from 1 to 36.
Higher pretest (ACT PLAN) scores indicate higher levels of expertise prior to ASP exposure.
Analysis will examine the relationship of pretest (ACT PLAN) expertise to posttest (ACT)
expertise after ASP exposure.
Measurement
Achievement. ACT uses a regression model that predicts scores across tests based on
scores from all tests; however, ASP school reports identified dosage data by subject and only the
English, Reading, and Math scores were of interest in the current study based on relevant ASP
research. Kentucky designates ACT benchmarks in English, Reading, Math and Science for the
College and Career Readiness (CCR) component of its accountability model. Posttest (ACT)
scores measure achievement as the dependent variable. Table 2 identifies the requisite
benchmarks for ACT to examine means relative to impact and significance.
At-risk status. A categorical variable was created for Risk Status based on participants’
free and reduced (F/R) lunch status and designating students as at-risk (AR) or not at-risk
(NAR).
Dosage. Frequency distributions for math hours attended and ELA hours attended from
the population data set delineate two hours of dosage includes 33% of data, and five hours of
dosage includes 66 % of data. The highest math dosage received by participants is 16 hours;
whereas, the highest ELA dosage received by participants is 24 hours. In order to standardize
scores for analysis, dosage ranges were set at .5 to two hours for Low Dosage, three to five hours
for Mid Dosage, and six or more hours for High Dosage. No Dosage participants, the control
group, were ASP participants who did not receive ELA dosage, for English and reading analyses,
or math dosage, for math analyses. A categorical variable for dosage was coded accordingly.
29
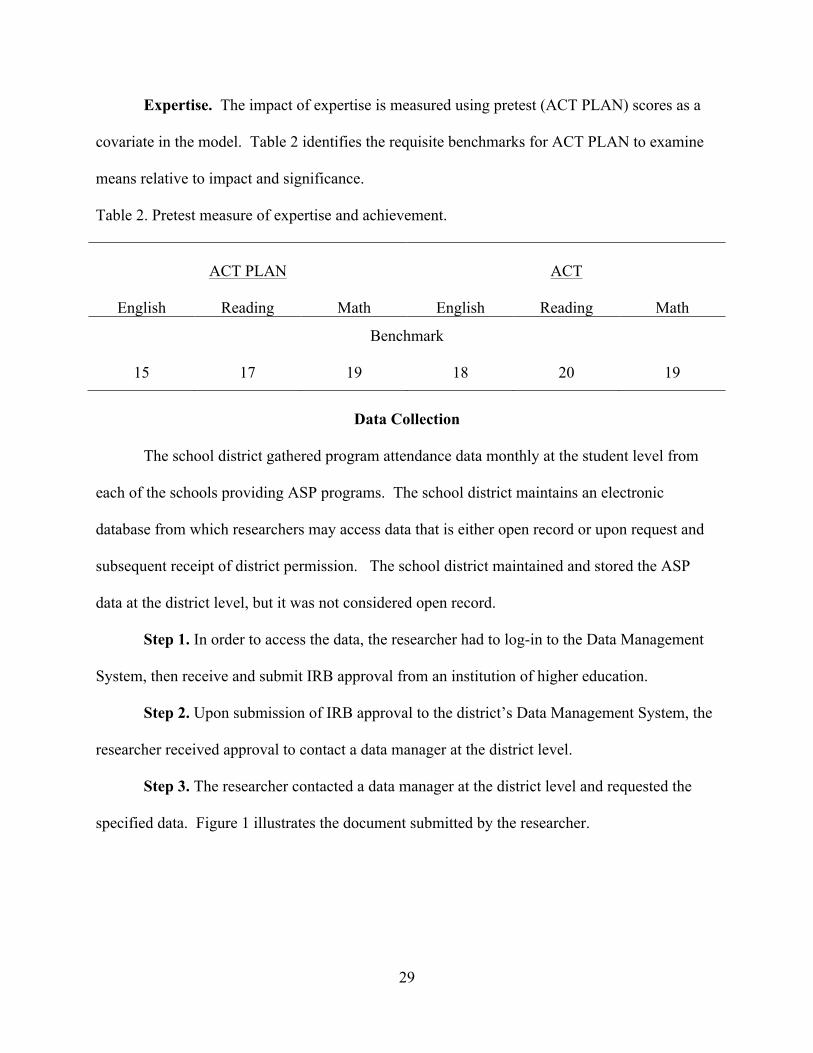
Expertise. The impact of expertise is measured using pretest (ACT PLAN) scores as a
covariate in the model. Table 2 identifies the requisite benchmarks for ACT PLAN to examine
means relative to impact and significance.
Table 2. Pretest measure of expertise and achievement.
ACT PLAN ACT
English Reading Math English Reading Math
Benchmark
15 17 19 18 20 19
Data Collection
The school district gathered program attendance data monthly at the student level from
each of the schools providing ASP programs. The school district maintains an electronic
database from which researchers may access data that is either open record or upon request and
subsequent receipt of district permission. The school district maintained and stored the ASP
data at the district level, but it was not considered open record.
Step 1. In order to access the data, the researcher had to log-in to the Data Management
System, then receive and submit IRB approval from an institution of higher education.
Step 2. Upon submission of IRB approval to the district’s Data Management System, the
researcher received approval to contact a data manager at the district level.
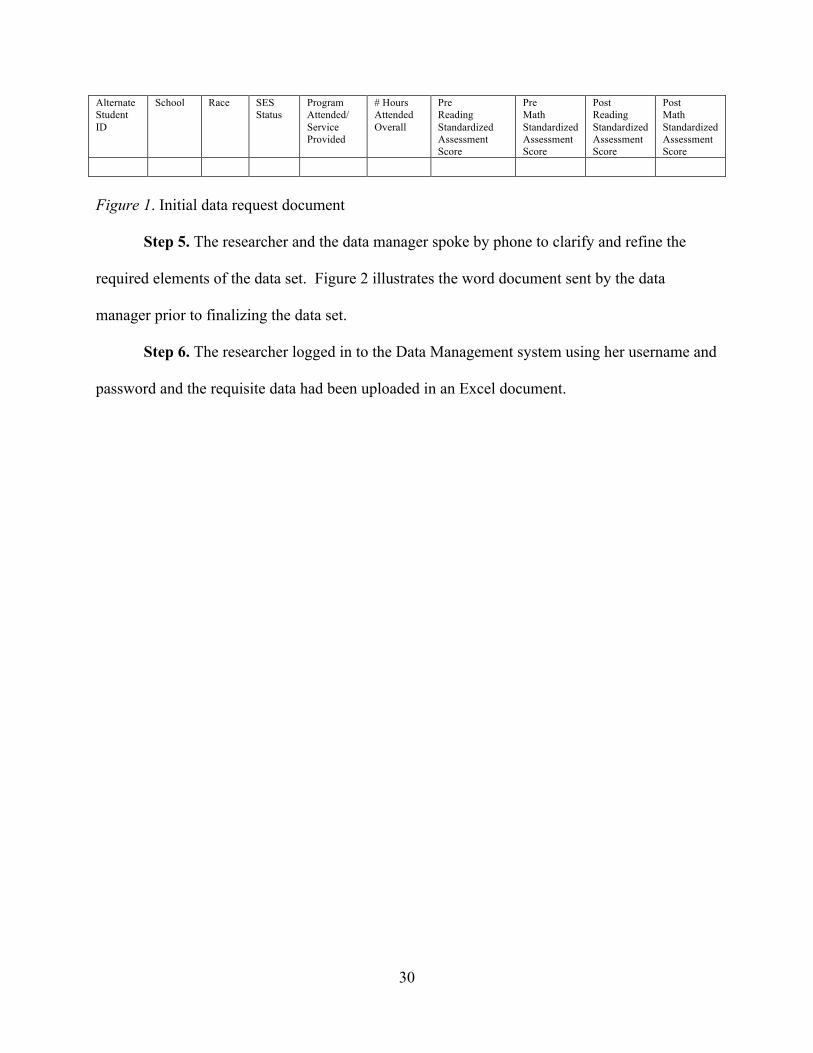
Step 3. The researcher contacted a data manager at the district level and requested the
specified data. Figure 1 illustrates the document submitted by the researcher.
30
Alternate Student ID
School Race SES Status
Program Attended/ Service Provided
# Hours Attended Overall
Pre Reading Standardized Assessment Score
Pre Math Standardized Assessment Score
Post Reading Standardized Assessment Score
Post Math Standardized Assessment Score
Figure 1. Initial data request document
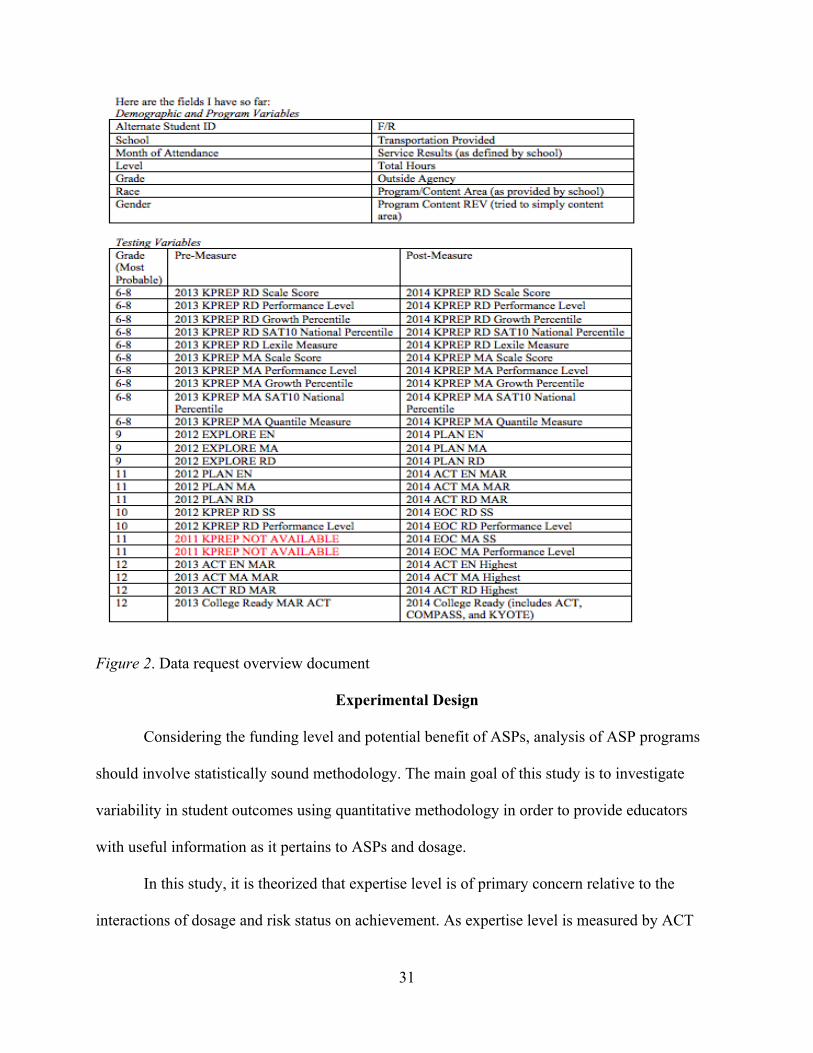
Step 5. The researcher and the data manager spoke by phone to clarify and refine the
required elements of the data set. Figure 2 illustrates the word document sent by the data
manager prior to finalizing the data set.
Step 6. The researcher logged in to the Data Management system using her username and
password and the requisite data had been uploaded in an Excel document.
31
Figure 2. Data request overview document
Experimental Design
Considering the funding level and potential benefit of ASPs, analysis of ASP programs
should involve statistically sound methodology. The main goal of this study is to investigate
variability in student outcomes using quantitative methodology in order to provide educators
with useful information as it pertains to ASPs and dosage.
In this study, it is theorized that expertise level is of primary concern relative to the
interactions of dosage and risk status on achievement. As expertise level is measured by ACT
32
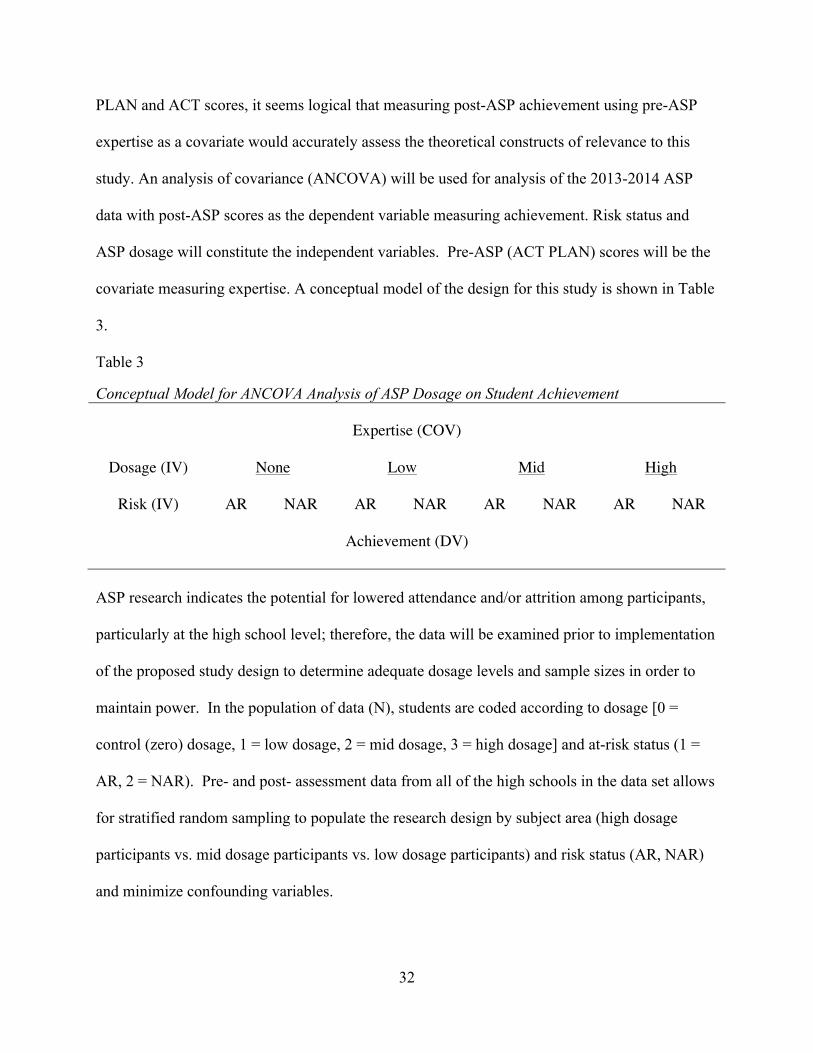
PLAN and ACT scores, it seems logical that measuring post-ASP achievement using pre-ASP
expertise as a covariate would accurately assess the theoretical constructs of relevance to this
study. An analysis of covariance (ANCOVA) will be used for analysis of the 2013-2014 ASP
data with post-ASP scores as the dependent variable measuring achievement. Risk status and
ASP dosage will constitute the independent variables. Pre-ASP (ACT PLAN) scores will be the
covariate measuring expertise. A conceptual model of the design for this study is shown in Table
3.
Table 3
Conceptual Model for ANCOVA Analysis of ASP Dosage on Student Achievement
Expertise (COV)
Dosage (IV)
None Low Mid High
Risk (IV) AR NAR AR NAR AR NAR AR NAR
Achievement (DV)
ASP research indicates the potential for lowered attendance and/or attrition among participants,
particularly at the high school level; therefore, the data will be examined prior to implementation
of the proposed study design to determine adequate dosage levels and sample sizes in order to
maintain power. In the population of data (N), students are coded according to dosage [0 =
control (zero) dosage, 1 = low dosage, 2 = mid dosage, 3 = high dosage] and at-risk status (1 =
AR, 2 = NAR). Pre- and post- assessment data from all of the high schools in the data set allows
for stratified random sampling to populate the research design by subject area (high dosage
participants vs. mid dosage participants vs. low dosage participants) and risk status (AR, NAR)
and minimize confounding variables.
33
Data Analysis
The population sample for this study is n=1346. A statistical power analysis was
performed based on results from the Lauer et al. (2006) study of ASPs. ASPs examined by Lauer
et al. (2006) evidenced effect sizes of .07 among reading programs and .16 for math programs.
Lauer et al. (2006) concluded that “effect sizes of .10 to .20 are not trivial” and “the finding of a
positive effect size that is statistically greater than zero is an encouraging result” (pp. 303-304).
As the current study is related to ASPs and English, reading and math achievement, it is posited
that the results will evidence a small effect size, .20, which is statistically significant. With an α
= .05 and 1 – β = .80 for four groups (control, low, mid, high) and one covariate (expertise), the
projected sample size needed for this effect size is n = 277 for an ANCOVA analysis (Faul,
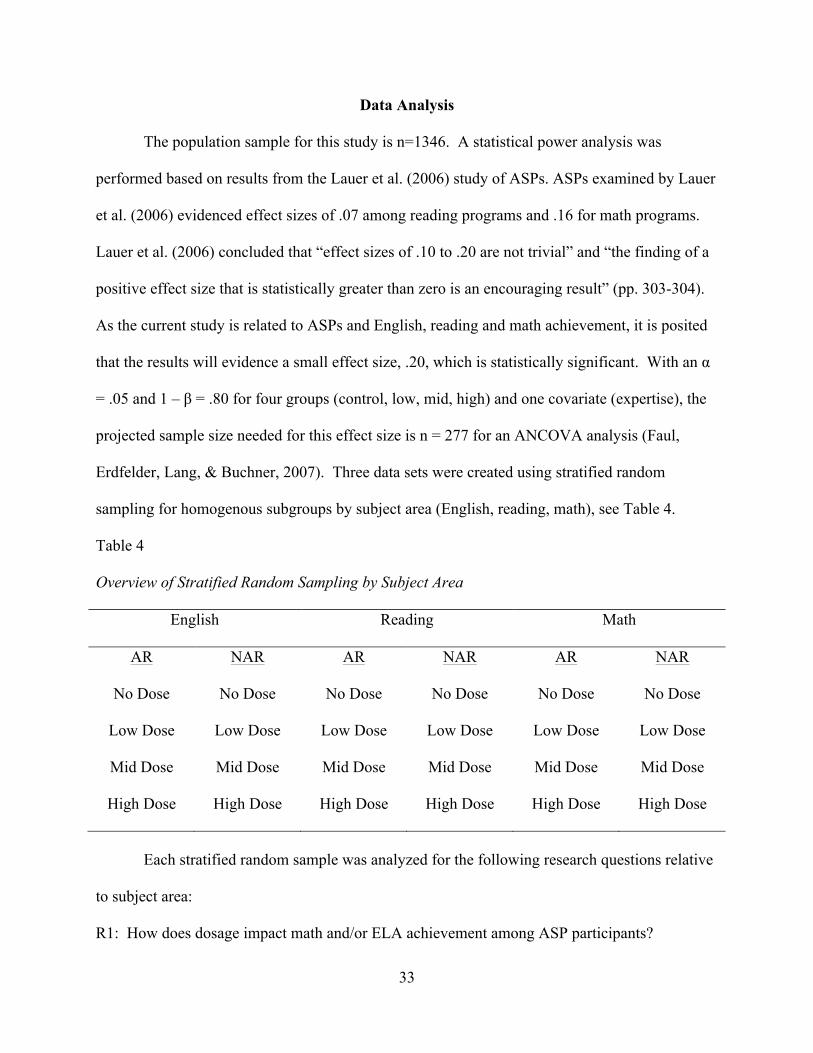
Erdfelder, Lang, & Buchner, 2007). Three data sets were created using stratified random
sampling for homogenous subgroups by subject area (English, reading, math), see Table 4.
Table 4
Overview of Stratified Random Sampling by Subject Area
English Reading Math
AR NAR AR NAR AR NAR
No Dose No Dose No Dose No Dose No Dose No Dose
Low Dose Low Dose Low Dose Low Dose Low Dose Low Dose
Mid Dose Mid Dose Mid Dose Mid Dose Mid Dose Mid Dose
High Dose High Dose High Dose High Dose High Dose High Dose
Each stratified random sample was analyzed for the following research questions relative
to subject area:
R1: How does dosage impact math and/or ELA achievement among ASP participants?
34
R2: How does risk impact math and/or ELA achievement among ASP participants?
R3: How does expertise impact math and/or ELA achievement among ASP participants?
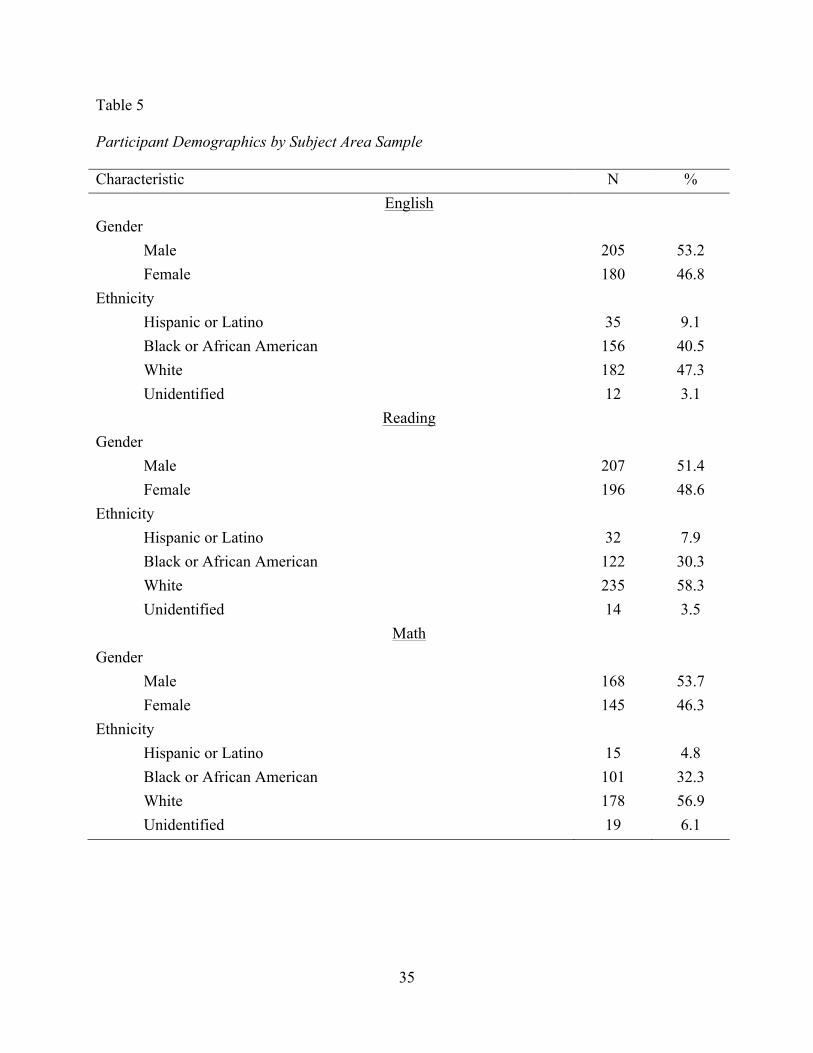
Subsumed within each research question are multiple content areas. Table 5 shows the
participant demographic data after sampling procedures for each subject area.
35
Table 5
Participant Demographics by Subject Area Sample
Characteristic N % English
Gender Male 205 53.2 Female 180 46.8
Ethnicity Hispanic or Latino 35 9.1 Black or African American 156 40.5 White 182 47.3 Unidentified 12 3.1
Reading Gender
Male 207 51.4 Female 196 48.6
Ethnicity Hispanic or Latino 32 7.9 Black or African American 122 30.3 White 235 58.3 Unidentified 14 3.5
Math Gender
Male 168 53.7 Female 145 46.3
Ethnicity Hispanic or Latino 15 4.8 Black or African American 101 32.3 White 178 56.9 Unidentified 19 6.1
36
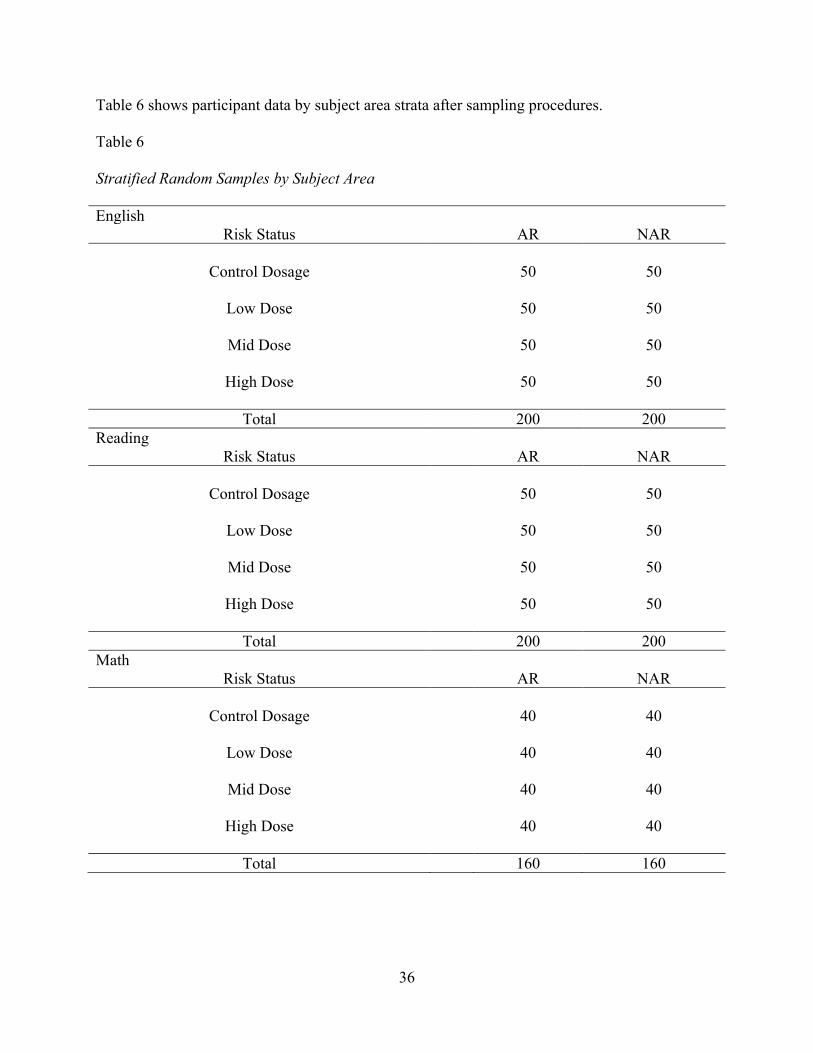
Table 6 shows participant data by subject area strata after sampling procedures.
Table 6
Stratified Random Samples by Subject Area
English Risk Status AR NAR
Control Dosage 50 50
Low Dose 50 50
Mid Dose 50 50
High Dose
50 50
Total 200 200 Reading
Risk Status AR NAR
Control Dosage 50 50
Low Dose 50 50
Mid Dose 50 50
High Dose
50 50
Total 200 200 Math
Risk Status AR NAR
Control Dosage 40 40
Low Dose 40 40
Mid Dose 40 40
High Dose
40 40
Total 160 160
37
Threats to Validity
Shadish et al. (2002) maintain that no amount of adherence to protocols in form or
substance guarantees absolute results in experimentation; nonetheless, properly identifying and
attempting to address possible threats to validity contribute to the perceived rigor of a study,
which in this case is of paramount concern. Three types of validity will be addressed here:
internal validity, construct validity, and external validity; whereas, statistical conclusion validity
will be addressed in greater detail in Chapter 4 (Shadish et al., 2002).
Internal validity. With regard to internal validity in this study are selection bias, history
and maturation. Pretest scores were obtained for this study, a factor attributed to increased rigor
and notably missing in most ASP literature. The most significant threat to internal validity in a
multi-group study, according to Trochim (2005), is the threat that groups are not equivalent prior
to treatment, in this case ASP program dosage. Examination of sample subsets in Table 6
indicates that random stratification resulted in unequal group sizes, although SPSS syntax called
for equivalent groups, in Reading and Math samples. In order to account for the multi-group
threat, control groups were included for each block and pretest means were examined to
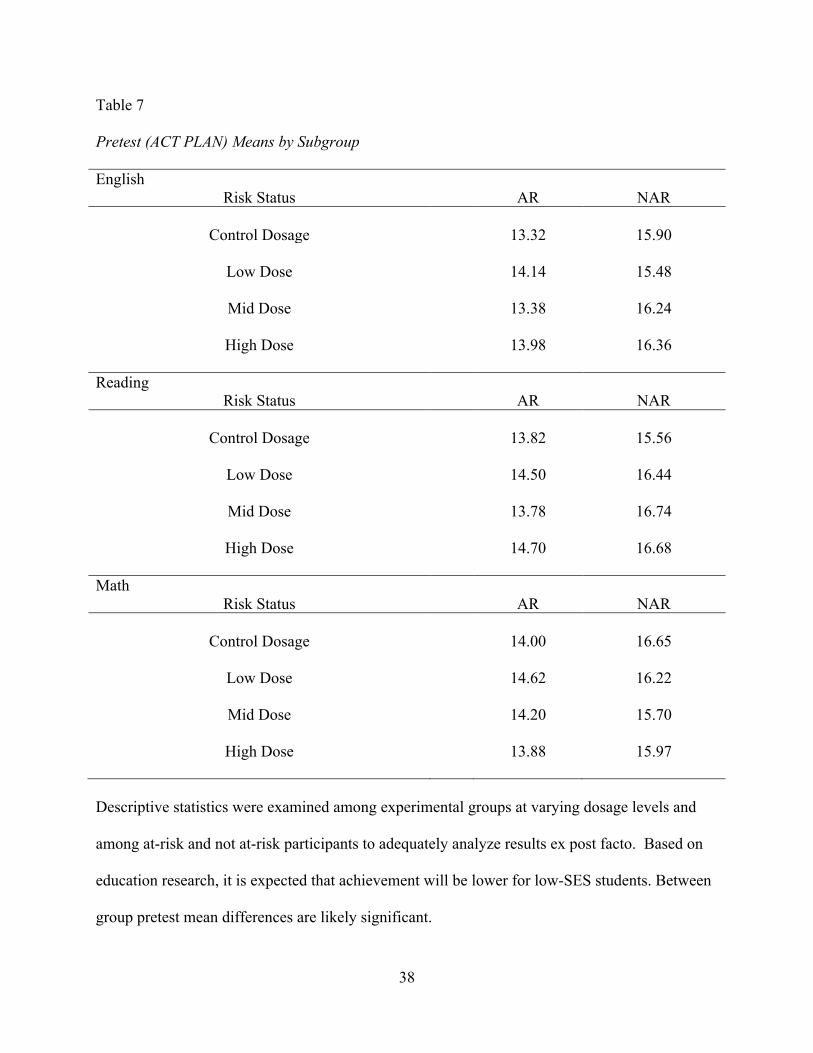
determine equivalency. Table 7 shows pretest (ACT PLAN benchmark) means for all subgroups
by subject area.
38
Table 7
Pretest (ACT PLAN) Means by Subgroup
English Risk Status AR NAR
Control Dosage 13.32 15.90
Low Dose 14.14 15.48
Mid Dose 13.38 16.24
High Dose
13.98 16.36
Reading Risk Status AR NAR
Control Dosage 13.82 15.56
Low Dose 14.50 16.44
Mid Dose 13.78 16.74
High Dose
14.70 16.68
Math Risk Status AR NAR
Control Dosage 14.00 16.65
Low Dose 14.62 16.22
Mid Dose 14.20 15.70
High Dose
13.88 15.97
Descriptive statistics were examined among experimental groups at varying dosage levels and
among at-risk and not at-risk participants to adequately analyze results ex post facto. Based on
education research, it is expected that achievement will be lower for low-SES students. Between
group pretest mean differences are likely significant.
39
Historical threats are also potentially confounding. Although difficult to eliminate
entirely in a school setting, historical threats are controlled in this study with the inclusion of all
participants from the same school district. The ASP programs were implemented and dosage
results reported to district offices within the same time frame. Test results, pre- and post-, were
obtained in the same school years, pre- before ASP program implementation and post- after ASP
program implementation as assessment windows for testing are determined by the state for all
schools in Kentucky.
Construct validity. There are two constructs that are operationalized in this study:
expertise and dosage. Pre-determining expertise as proximity to benchmark on pretest (ACT
PLAN) to accurately sample and use of pretest (ACT PLAN) scores as a covariate that impacts
posttest (ACT) scores, or achievement, are objective measures of face validity. Colleges and
universities across the United States use varying degrees of ACT score attainment to measure
expertise. Use of the benchmark as a measure of expertise for high school juniors is aligned with
Kentucky’s College and Career Readiness measure for high school students; schools receive
points for students who hit the benchmarks, implying that the benchmark is indicative of
expertise in a subject area. The construct of dosage was more difficult to operationalize as ASP
attendance evidences an historical decline as students progress from elementary to high school.
Although dosage levels were standardized by subject area and specifically delineated using
frequency tables in order to increase internal validity with stratified random sampling, the impact
of dosage between low and mid, for example, may be less pronounced as even mid-range dosage
rates are low compared to dosages recommended in relevant research literature.
40
Summary
The research questions address the impact of ASP dosage, specifically midrange dosage,
on at-risk student achievement as measured by standardized assessment. The effect of dosage as
it relates to after-school programming is important to understand not only for its implications on
funding but also as it relates to instruction. Examining at-risk student achievement at varying
degrees of dosage through the lens of expertise provides insight into the degrees of ASP benefit
obtained by students at different achievement levels. In this study, instruction is equated to
practice and the data analysis was subsequently designed around this theoretical premise. Should
dosage, regardless of school as students are randomized by ASP dosage by topic, expertise in
topic and SES status, prove to be statistically significant (p<.05), the instructional implications
will also require further examination. Chapter 4 includes presentation data from this study.
41
Chapter 4
Educators use ASPs to improve student achievement, particularly for students below
grade level and/or at-risk students, although the relationship between ASPs and student
achievement is not clearly defined. The purpose of this study is to investigate the effects of ASP
dosage, risk status and expertise on student achievement.
The data initially gathered for this study constitutes all student attendance and test score
data for students who attended an ASP program in one of the priority middle or high schools in a
mid-sized, urban school district in Kentucky. The initial data set consisted of N≈14,000. The
initial data set included the number of hours, dosage, of each program participant by core subject
area, English/Language Arts (ELA); Social Studies; Science, and Math, by month. Total dosage
was tabulated for each participant in ELA and Math and participants without math or English
dosage were eliminated from the data set. Middle school data was eliminated because the
assessments used in Kentucky to measure student achievement were created by the state
potentially confounding test validity and reliability with the impact of dosage, and scores on
middle school assessments use nominal designations vs. scale scores.
After eliminating middle school data, the database of available measures was reduced to
N=5,685. Participants with missing dosage, pre- or posttest data were eliminated from the
remaining set of high school participant data, leaving N=1346 in the population sample.
Categorical variables of interest: dosage and risk status, were examined using frequency
distributions and equivalent stratified random samples were created using SPSS syntax.
ANCOVA analyses were completed in SPSS for each of the three samples, English,
reading, and math, to answer the following research questions:
R1: How does dosage impact math and/or ELA achievement among ASP participants?
42
R2: How does risk impact math and/or ELA achievement among ASP participants?
R3: How does expertise impact math and/or ELA achievement among ASP participants?
Table 8 shows means and standard deviations by dosage group in each subject area.
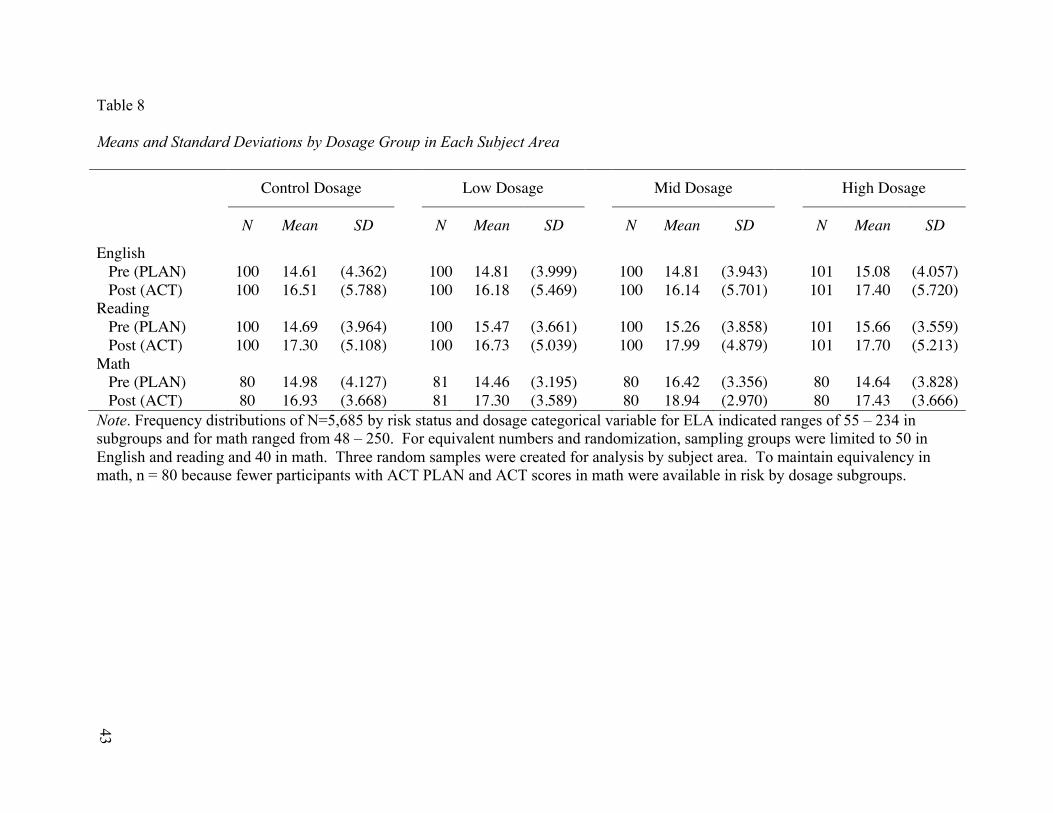
43
Table 8
Means and Standard Deviations by Dosage Group in Each Subject Area
Control Dosage Low Dosage Mid Dosage High Dosage
N Mean SD N Mean SD N Mean SD N Mean SD
English Pre (PLAN) 100 14.61 (4.362) 100 14.81 (3.999) 100 14.81 (3.943) 101 15.08 (4.057) Post (ACT) 100 16.51 (5.788) 100 16.18 (5.469) 100 16.14 (5.701) 101 17.40 (5.720)
Reading Pre (PLAN) 100 14.69 (3.964) 100 15.47 (3.661) 100 15.26 (3.858) 101 15.66 (3.559) Post (ACT) 100 17.30 (5.108) 100 16.73 (5.039) 100 17.99 (4.879) 101 17.70 (5.213)
Math Pre (PLAN) 80 14.98 (4.127) 81 14.46 (3.195) 80 16.42 (3.356) 80 14.64 (3.828) Post (ACT) 80 16.93 (3.668) 81 17.30 (3.589) 80 18.94 (2.970) 80 17.43 (3.666)
Note. Frequency distributions of N=5,685 by risk status and dosage categorical variable for ELA indicated ranges of 55 – 234 in subgroups and for math ranged from 48 – 250. For equivalent numbers and randomization, sampling groups were limited to 50 in English and reading and 40 in math. Three random samples were created for analysis by subject area. To maintain equivalency in math, n = 80 because fewer participants with ACT PLAN and ACT scores in math were available in risk by dosage subgroups.
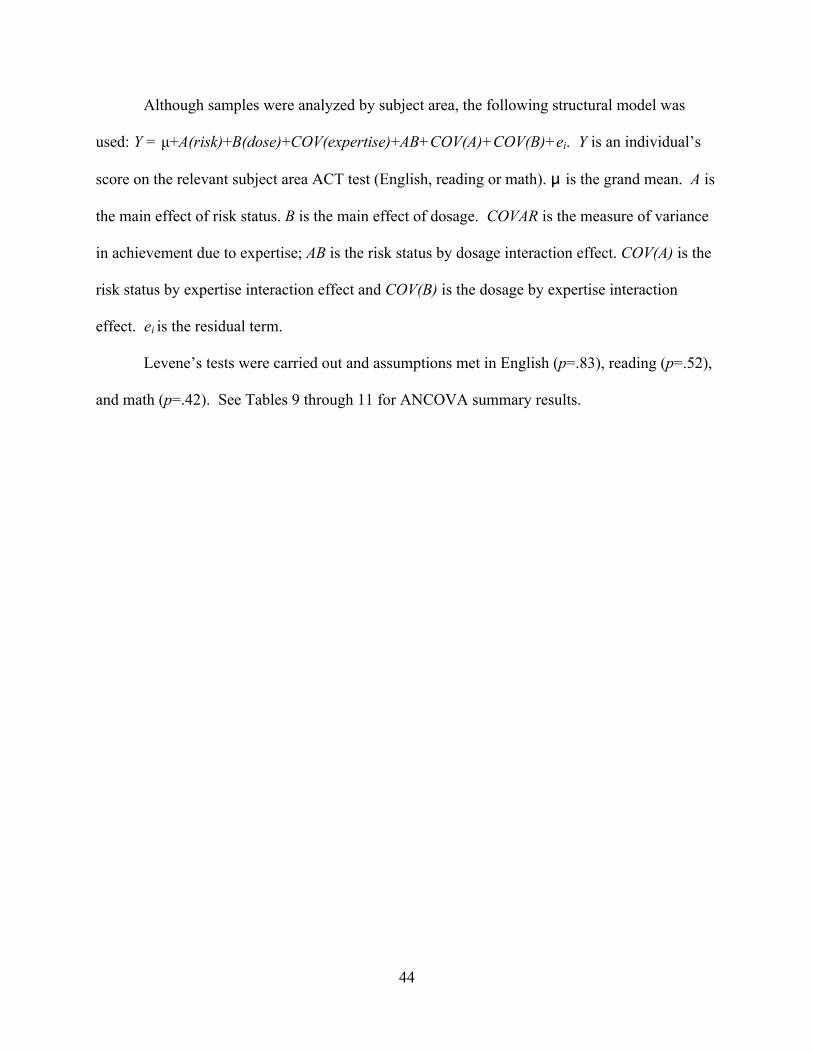
44
Although samples were analyzed by subject area, the following structural model was
used: Y = µ+A(risk)+B(dose)+COV(expertise)+AB+COV(A)+COV(B)+ei. Y is an individual’s
score on the relevant subject area ACT test (English, reading or math). μ is the grand mean. A is
the main effect of risk status. B is the main effect of dosage. COVAR is the measure of variance
in achievement due to expertise; AB is the risk status by dosage interaction effect. COV(A) is the
risk status by expertise interaction effect and COV(B) is the dosage by expertise interaction
effect. ei is the residual term.
Levene’s tests were carried out and assumptions met in English (p=.83), reading (p=.52),
and math (p=.42). See Tables 9 through 11 for ANCOVA summary results.
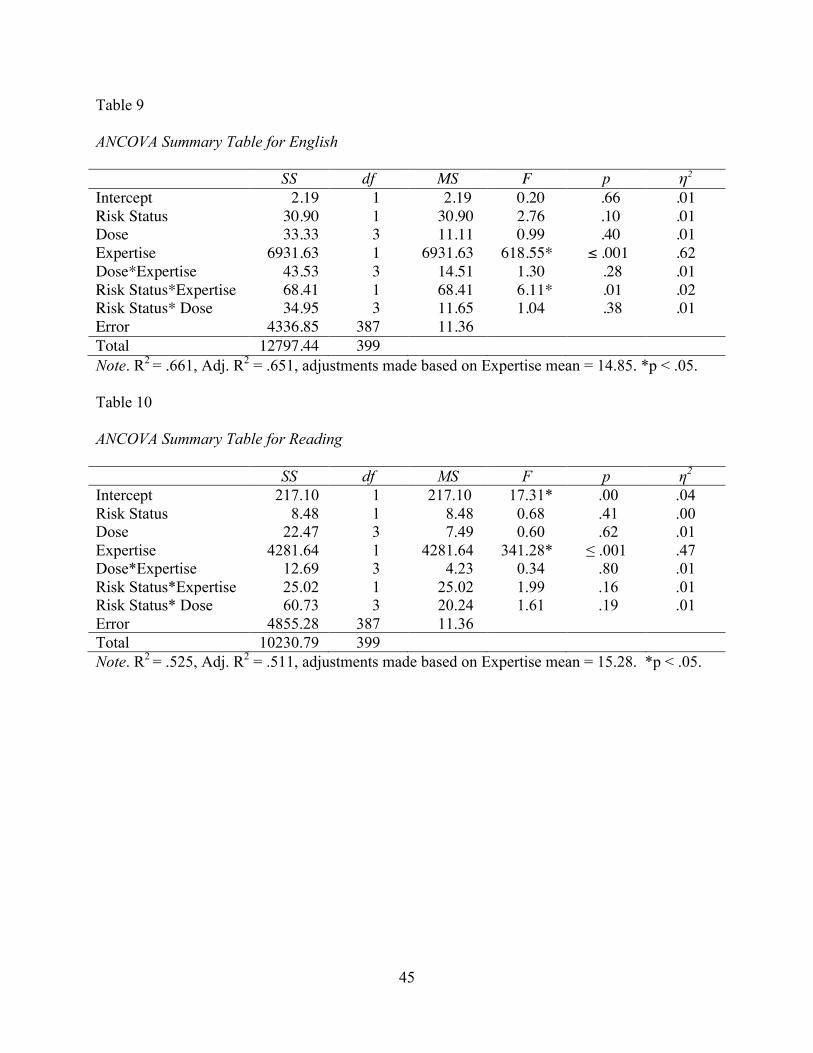
45
Table 9
ANCOVA Summary Table for English
SS df MS F p η2
Intercept 2.19 1 2.19 0.20 .66 .01 Risk Status 30.90 1 30.90 2.76 .10 .01 Dose 33.33 3 11.11 0.99 .40 .01 Expertise 6931.63 1 6931.63 618.55* ≤ .001 .62 Dose*Expertise 43.53 3 14.51 1.30 .28 .01 Risk Status*Expertise 68.41 1 68.41 6.11* .01 .02 Risk Status* Dose 34.95 3 11.65 1.04 .38 .01 Error 4336.85 387 11.36 Total 12797.44 399 Note. R2 = .661, Adj. R2 = .651, adjustments made based on Expertise mean = 14.85. *p < .05. Table 10
ANCOVA Summary Table for Reading
SS df MS F p η2 Intercept 217.10 1 217.10 17.31* .00 .04 Risk Status 8.48 1 8.48 0.68 .41 .00 Dose 22.47 3 7.49 0.60 .62 .01 Expertise 4281.64 1 4281.64 341.28* ≤ .001 .47 Dose*Expertise 12.69 3 4.23 0.34 .80 .01 Risk Status*Expertise 25.02 1 25.02 1.99 .16 .01 Risk Status* Dose 60.73 3 20.24 1.61 .19 .01 Error 4855.28 387 11.36 Total 10230.79 399 Note. R2 = .525, Adj. R2 = .511, adjustments made based on Expertise mean = 15.28. *p < .05.
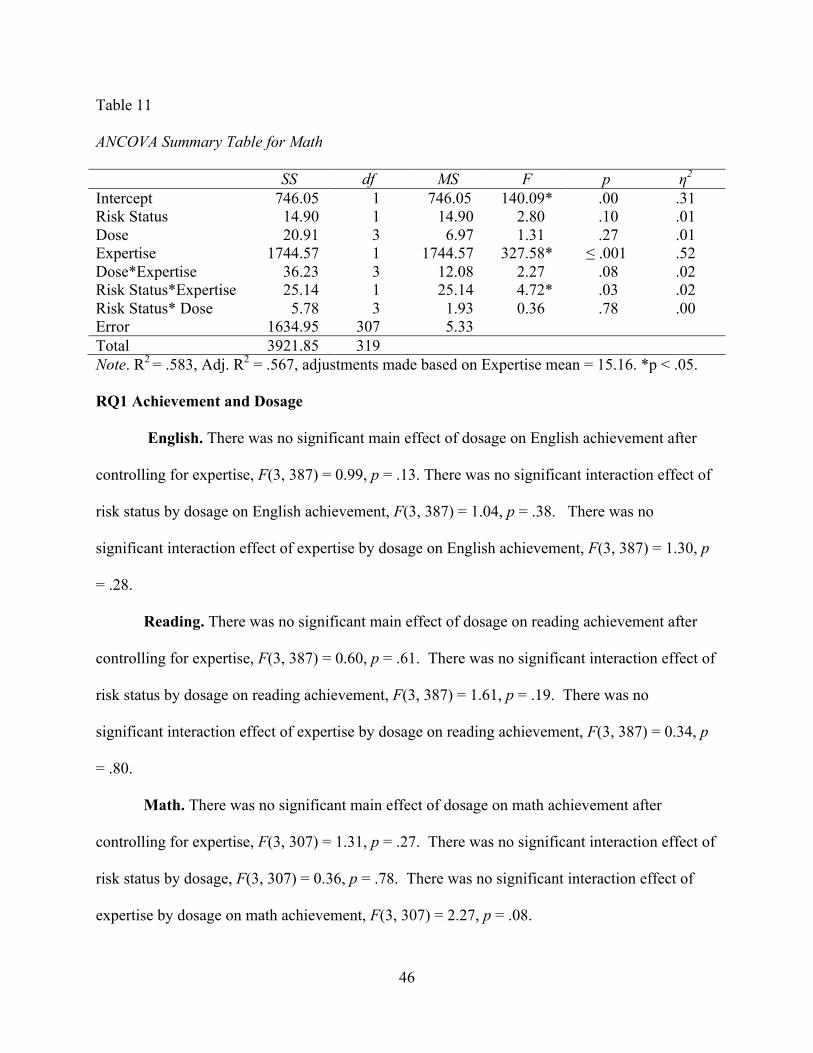
46
Table 11
ANCOVA Summary Table for Math
SS df MS F p η2 Intercept 746.05 1 746.05 140.09* .00 .31 Risk Status 14.90 1 14.90 2.80 .10 .01 Dose 20.91 3 6.97 1.31 .27 .01 Expertise 1744.57 1 1744.57 327.58* ≤ .001 .52 Dose*Expertise 36.23 3 12.08 2.27 .08 .02 Risk Status*Expertise 25.14 1 25.14 4.72* .03 .02 Risk Status* Dose 5.78 3 1.93 0.36 .78 .00 Error 1634.95 307 5.33 Total 3921.85 319 Note. R2 = .583, Adj. R2 = .567, adjustments made based on Expertise mean = 15.16. *p < .05. RQ1 Achievement and Dosage
English. There was no significant main effect of dosage on English achievement after
controlling for expertise, F(3, 387) = 0.99, p = .13. There was no significant interaction effect of
risk status by dosage on English achievement, F(3, 387) = 1.04, p = .38. There was no
significant interaction effect of expertise by dosage on English achievement, F(3, 387) = 1.30, p
= .28.
Reading. There was no significant main effect of dosage on reading achievement after
controlling for expertise, F(3, 387) = 0.60, p = .61. There was no significant interaction effect of
risk status by dosage on reading achievement, F(3, 387) = 1.61, p = .19. There was no
significant interaction effect of expertise by dosage on reading achievement, F(3, 387) = 0.34, p
= .80.
Math. There was no significant main effect of dosage on math achievement after
controlling for expertise, F(3, 307) = 1.31, p = .27. There was no significant interaction effect of
risk status by dosage, F(3, 307) = 0.36, p = .78. There was no significant interaction effect of
expertise by dosage on math achievement, F(3, 307) = 2.27, p = .08.

47
Multiple comparisons show that groups differ by dosage in all subject areas, see Table
12.
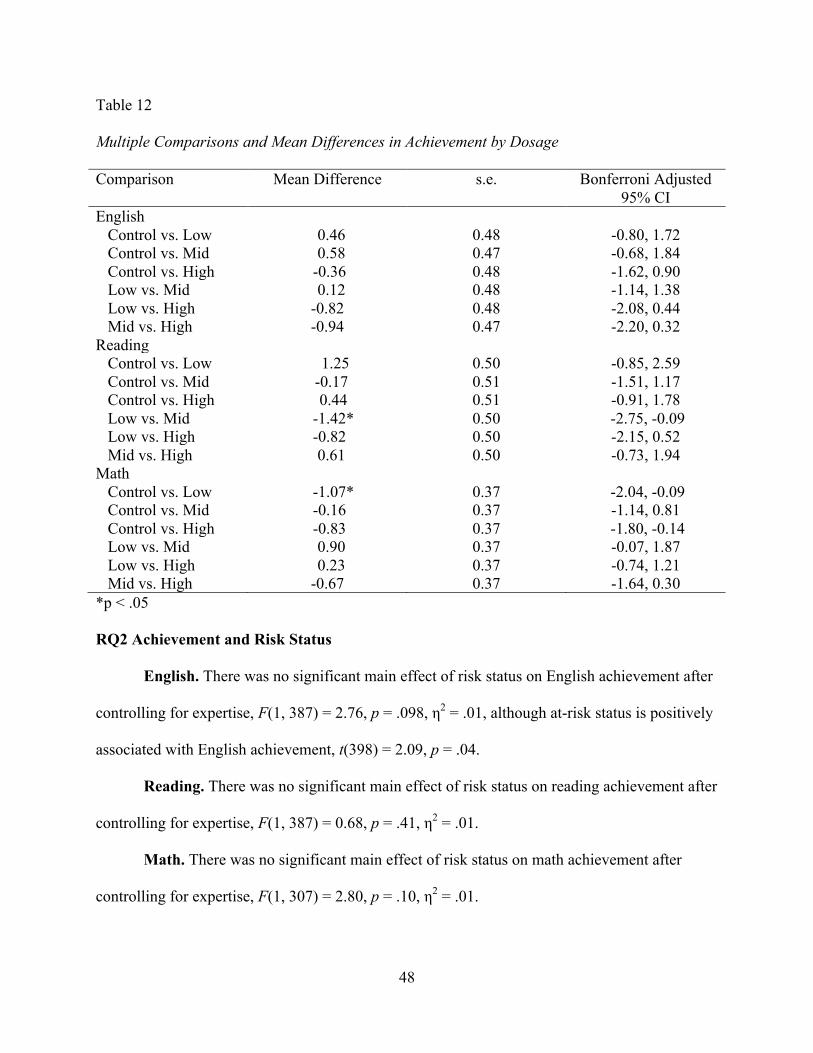
48
Table 12
Multiple Comparisons and Mean Differences in Achievement by Dosage Comparison Mean Difference s.e. Bonferroni Adjusted
95% CI English
Control vs. Low 0.46 0.48 -0.80, 1.72 Control vs. Mid 0.58 0.47 -0.68, 1.84 Control vs. High -0.36 0.48 -1.62, 0.90 Low vs. Mid 0.12 0.48 -1.14, 1.38 Low vs. High -0.82 0.48 -2.08, 0.44 Mid vs. High -0.94 0.47 -2.20, 0.32
Reading Control vs. Low 1.25 0.50 -0.85, 2.59 Control vs. Mid -0.17 0.51 -1.51, 1.17 Control vs. High 0.44 0.51 -0.91, 1.78 Low vs. Mid -1.42* 0.50 -2.75, -0.09 Low vs. High -0.82 0.50 -2.15, 0.52 Mid vs. High 0.61 0.50 -0.73, 1.94
Math Control vs. Low -1.07* 0.37 -2.04, -0.09 Control vs. Mid -0.16 0.37 -1.14, 0.81 Control vs. High -0.83 0.37 -1.80, -0.14 Low vs. Mid 0.90 0.37 -0.07, 1.87 Low vs. High 0.23 0.37 -0.74, 1.21 Mid vs. High -0.67 0.37 -1.64, 0.30
*p < .05 RQ2 Achievement and Risk Status
English. There was no significant main effect of risk status on English achievement after
controlling for expertise, F(1, 387) = 2.76, p = .098, η2 = .01, although at-risk status is positively
associated with English achievement, t(398) = 2.09, p = .04.
Reading. There was no significant main effect of risk status on reading achievement after
controlling for expertise, F(1, 387) = 0.68, p = .41, η2 = .01.
Math. There was no significant main effect of risk status on math achievement after
controlling for expertise, F(1, 307) = 2.80, p = .10, η2 = .01.
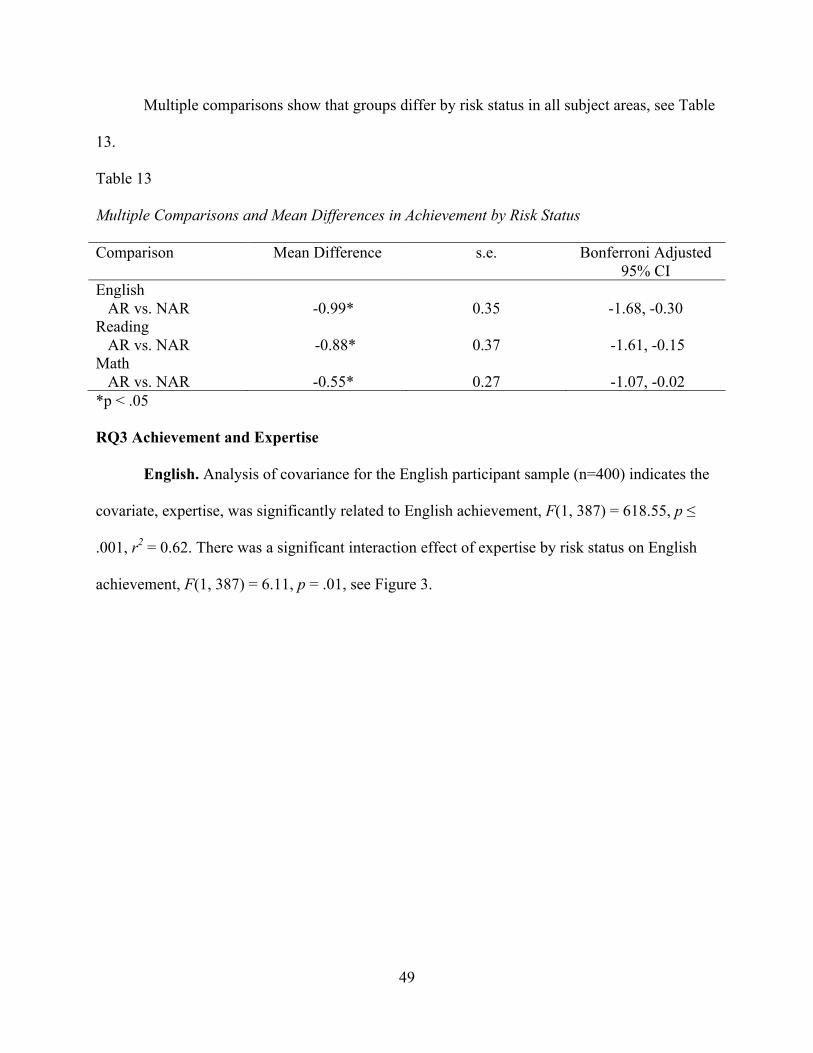
49
Multiple comparisons show that groups differ by risk status in all subject areas, see Table
13.
Table 13
Multiple Comparisons and Mean Differences in Achievement by Risk Status Comparison Mean Difference s.e. Bonferroni Adjusted
95% CI English
AR vs. NAR -0.99* 0.35 -1.68, -0.30 Reading
AR vs. NAR -0.88* 0.37 -1.61, -0.15 Math
AR vs. NAR -0.55* 0.27 -1.07, -0.02 *p < .05 RQ3 Achievement and Expertise
English. Analysis of covariance for the English participant sample (n=400) indicates the
covariate, expertise, was significantly related to English achievement, F(1, 387) = 618.55, p ≤
.001, r2 = 0.62. There was a significant interaction effect of expertise by risk status on English
achievement, F(1, 387) = 6.11, p = .01, see Figure 3.
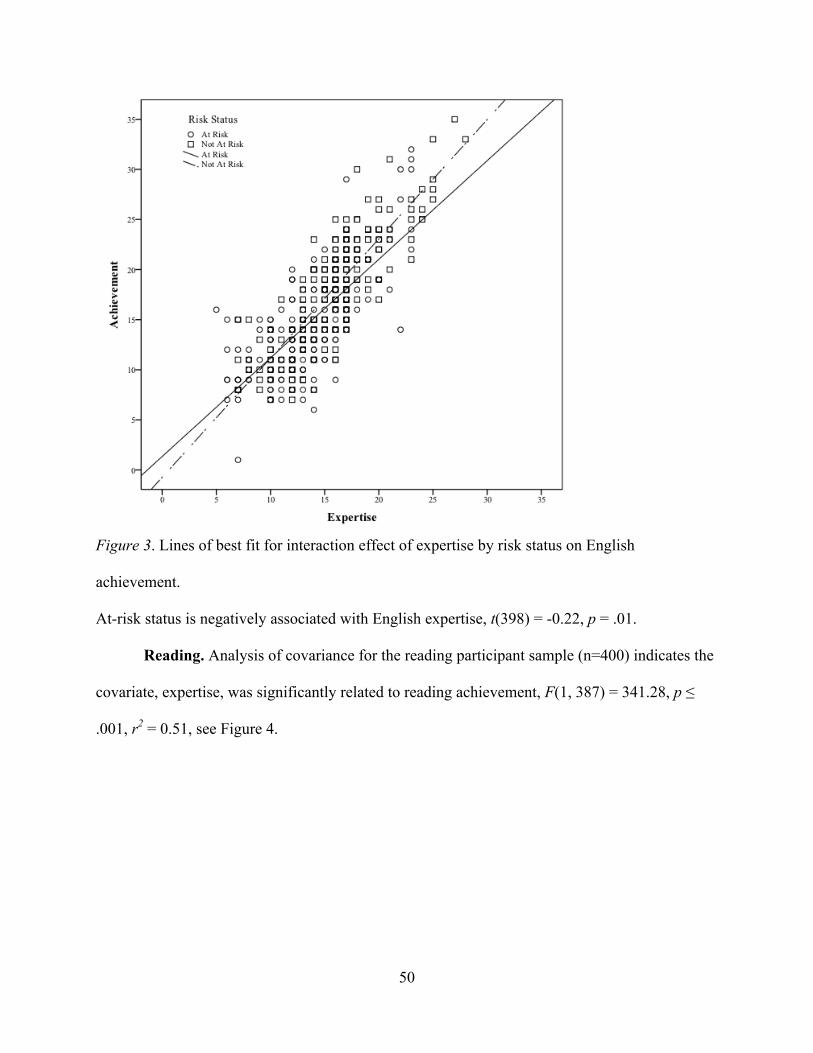
50
Figure 3. Lines of best fit for interaction effect of expertise by risk status on English
achievement.
At-risk status is negatively associated with English expertise, t(398) = -0.22, p = .01.
Reading. Analysis of covariance for the reading participant sample (n=400) indicates the
covariate, expertise, was significantly related to reading achievement, F(1, 387) = 341.28, p ≤
.001, r2 = 0.51, see Figure 4.
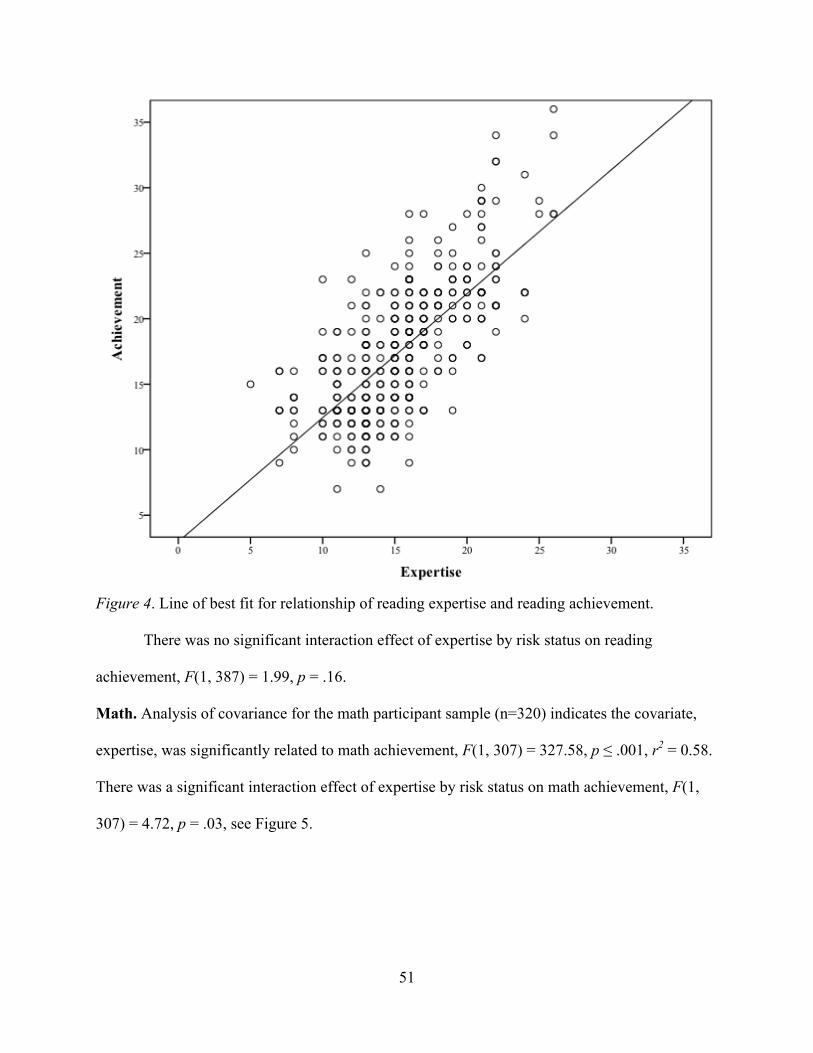
51
Figure 4. Line of best fit for relationship of reading expertise and reading achievement.
There was no significant interaction effect of expertise by risk status on reading
achievement, F(1, 387) = 1.99, p = .16.
Math. Analysis of covariance for the math participant sample (n=320) indicates the covariate,
expertise, was significantly related to math achievement, F(1, 307) = 327.58, p ≤ .001, r2 = 0.58.
There was a significant interaction effect of expertise by risk status on math achievement, F(1,
307) = 4.72, p = .03, see Figure 5.
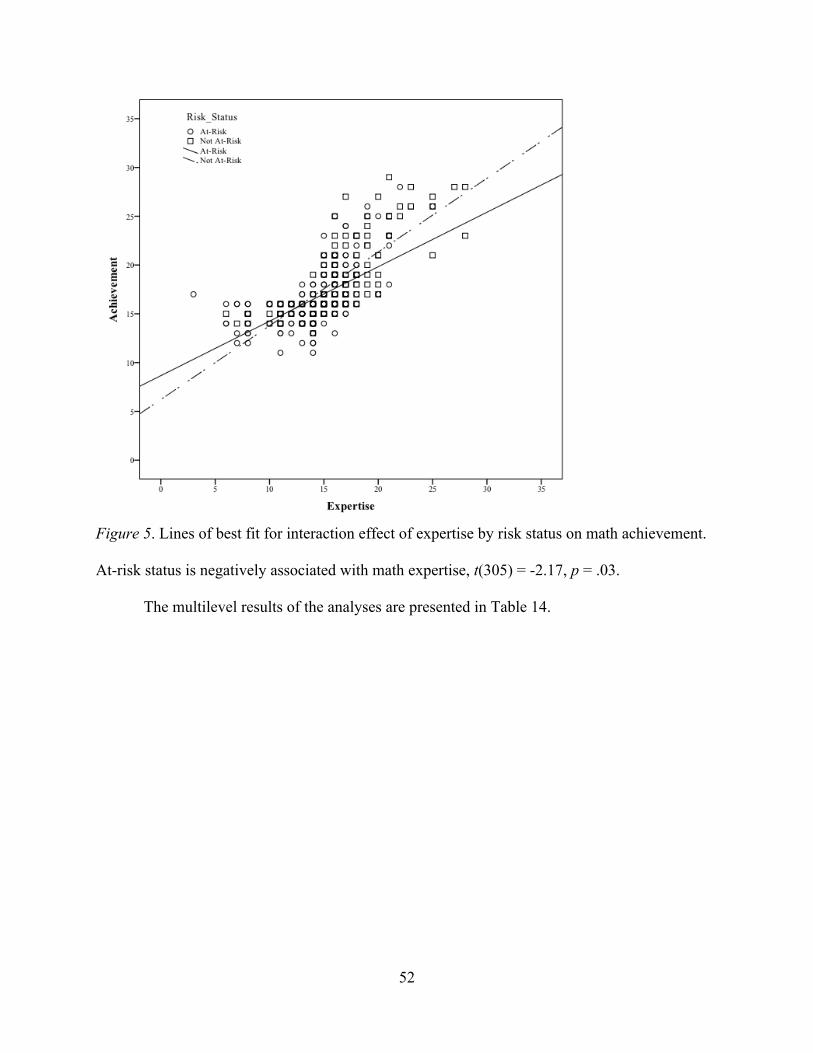
52
Figure 5. Lines of best fit for interaction effect of expertise by risk status on math achievement.
At-risk status is negatively associated with math expertise, t(305) = -2.17, p = .03.
The multilevel results of the analyses are presented in Table 14.
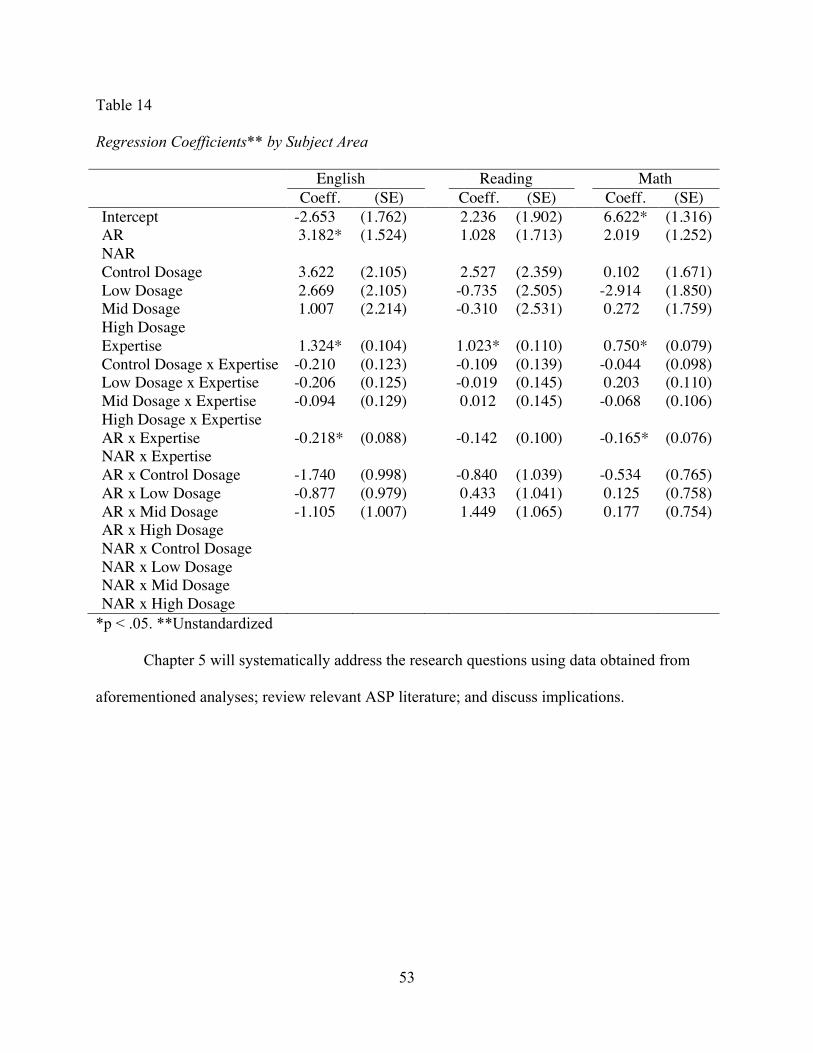
53
Table 14
Regression Coefficients** by Subject Area
English Reading Math Coeff. (SE) Coeff. (SE) Coeff. (SE)
Intercept -2.653 (1.762) 2.236 (1.902) 6.622* (1.316) AR 3.182* (1.524) 1.028 (1.713) 2.019 (1.252) NAR Control Dosage 3.622 (2.105) 2.527 (2.359) 0.102 (1.671) Low Dosage 2.669 (2.105) -0.735 (2.505) -2.914 (1.850) Mid Dosage 1.007 (2.214) -0.310 (2.531) 0.272 (1.759) High Dosage Expertise 1.324* (0.104) 1.023* (0.110) 0.750* (0.079) Control Dosage x Expertise -0.210 (0.123) -0.109 (0.139) -0.044 (0.098) Low Dosage x Expertise -0.206 (0.125) -0.019 (0.145) 0.203 (0.110) Mid Dosage x Expertise -0.094 (0.129) 0.012 (0.145) -0.068 (0.106) High Dosage x Expertise AR x Expertise -0.218* (0.088) -0.142 (0.100) -0.165* (0.076) NAR x Expertise AR x Control Dosage -1.740 (0.998) -0.840 (1.039) -0.534 (0.765) AR x Low Dosage -0.877 (0.979) 0.433 (1.041) 0.125 (0.758) AR x Mid Dosage -1.105 (1.007) 1.449 (1.065) 0.177 (0.754) AR x High Dosage NAR x Control Dosage NAR x Low Dosage NAR x Mid Dosage NAR x High Dosage
*p < .05. **Unstandardized
Chapter 5 will systematically address the research questions using data obtained from
aforementioned analyses; review relevant ASP literature; and discuss implications.
54
Chapter 5
The last half-century has seen more scrutable educational accountability. With increased
accountability comes awareness of gaps in learning, particularly among low-SES students. One
response from educators is increasing instructional time using ASPs. After school time has been
used for athletics, social activities, and clubs (Lauer et al., 2006; Kolberg, 2013; Pierce et al.,
2010). High stakes educational accountability, in the form of state and national-testing
regulations, have shifted the focus of after-school programming to academics (Apsler, 2009;
Kolberg, 2013; Lauer et al., 2006; Pierce et al., 2010). Millions of dollars are spent by districts
around the United States on ASPs targeting at-risk, including low-SES, populations.
Research on the effectiveness of ASP programs and decreasing the achievement gap is
scant. The research garnered on ASPs in current literature is seldom considered rigorous
(Apsler, 2009; Cross et al., 2010; Durlak et al., 2010a; ECONorthwest, 2008; Kidron & Lindsay,
2014; Lauer et al., 2006; Pierce et al., 2010). Within existent quality studies, research that
indicates achievement benefits for at-risk youth is minimal (Lauer et al., 2006). Quality research
on ASP outcomes is needed to support future funding.
Study of time and learning indicates increased time will increase learning (Arlin, 1984;
Stallings, 1980). Increased time is theoretically equated to skill practice. Practice, in time and
learning studies and according to expert performance theory, is shown to improve skill
acquisition (Ericsson et al., 2007; Lavy, 2015; Poncy et al., 2015). As learning relates to
practice, examination of dosage, or ASP time spent learning, can benefit both novice and expert
learners. Dosage prescription may also provide more fastidious ASP funding. Although
educational pedagogy lends itself to effective use of increased time, instructional methodology is
currently beyond the scope of this study.
55
In order to study the impact of ASP dosage on achievement, data was gathered from an
ASP program implemented in a mid-sized, urban school district in Kentucky. The data was used
to answer the following research questions:
R1: How does dosage impact math and/or ELA achievement among ASP participants?
R2: How does risk impact math and/or ELA achievement among ASP participants?
R3: How does expertise impact math and/or ELA achievement among ASP participants?
Discussion
This discussion merges previous study of time and learning, expert performance theory,
ASPs and achievement with quantitative analysis of dosage and achievement data from an ASP
to answer the aforementioned research questions. Relevant data results from Chapter 4 will be
reviewed.
RQ1 Achievement and Dosage
The first research question examined whether there is a difference in achievement among
control group versus low dosage, mid dosage, and high dosage ASP participants. The null
hypothesis is there is no difference in achievement between students who received relevant
subject area ASP dosage and students in the control group. There was no significant main effect
of dosage on achievement, after controlling for expertise, in any subject area. Table 12 displayed
mean comparisons and differences among dosage groups comparing achievement (posttest ACT)
and ASP dosage rates (control, low, mid, high). The control group exhibited higher posttest
scores in English versus low and mid dosage participants. The control group exhibited higher
posttest scores in reading versus low and high dosage participants. Math was the only subject
area where the control group exhibited lower posttest scores compared to dosage groups and the
difference was not statistically significant.
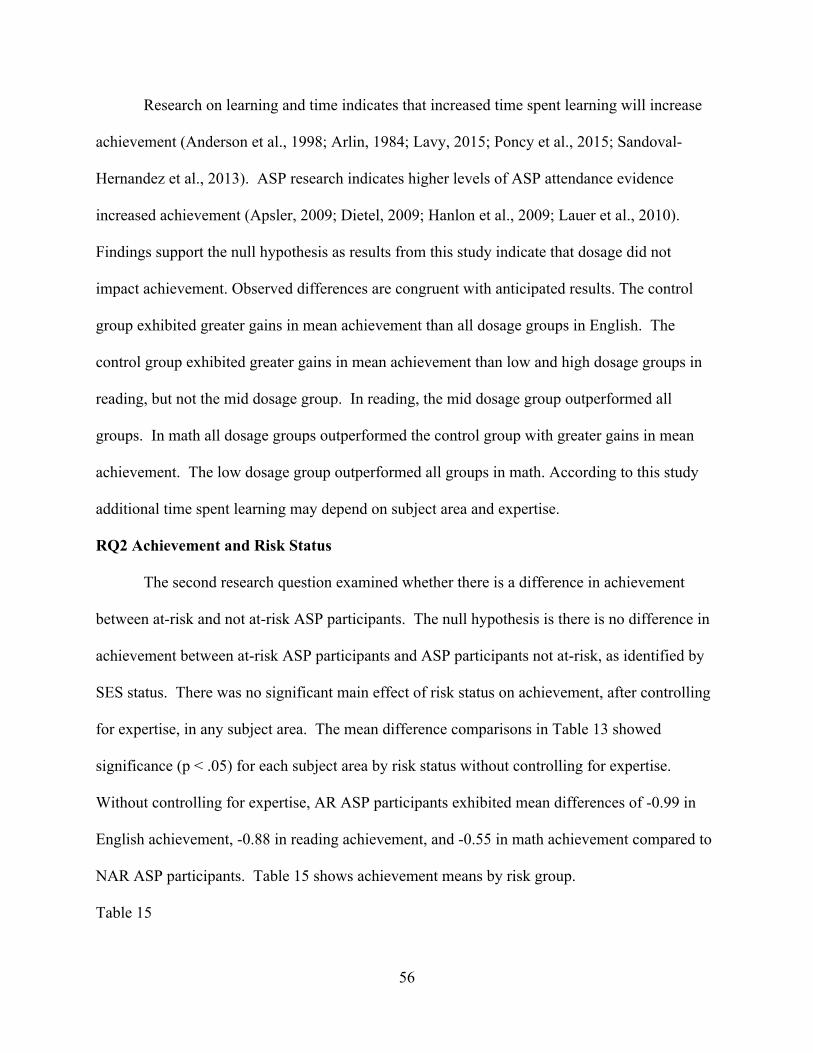
56
Research on learning and time indicates that increased time spent learning will increase
achievement (Anderson et al., 1998; Arlin, 1984; Lavy, 2015; Poncy et al., 2015; Sandoval-
Hernandez et al., 2013). ASP research indicates higher levels of ASP attendance evidence
increased achievement (Apsler, 2009; Dietel, 2009; Hanlon et al., 2009; Lauer et al., 2010).
Findings support the null hypothesis as results from this study indicate that dosage did not
impact achievement. Observed differences are congruent with anticipated results. The control
group exhibited greater gains in mean achievement than all dosage groups in English. The
control group exhibited greater gains in mean achievement than low and high dosage groups in
reading, but not the mid dosage group. In reading, the mid dosage group outperformed all
groups. In math all dosage groups outperformed the control group with greater gains in mean
achievement. The low dosage group outperformed all groups in math. According to this study
additional time spent learning may depend on subject area and expertise.
RQ2 Achievement and Risk Status
The second research question examined whether there is a difference in achievement
between at-risk and not at-risk ASP participants. The null hypothesis is there is no difference in
achievement between at-risk ASP participants and ASP participants not at-risk, as identified by
SES status. There was no significant main effect of risk status on achievement, after controlling
for expertise, in any subject area. The mean difference comparisons in Table 13 showed
significance (p < .05) for each subject area by risk status without controlling for expertise.
Without controlling for expertise, AR ASP participants exhibited mean differences of -0.99 in
English achievement, -0.88 in reading achievement, and -0.55 in math achievement compared to
NAR ASP participants. Table 15 shows achievement means by risk group.
Table 15
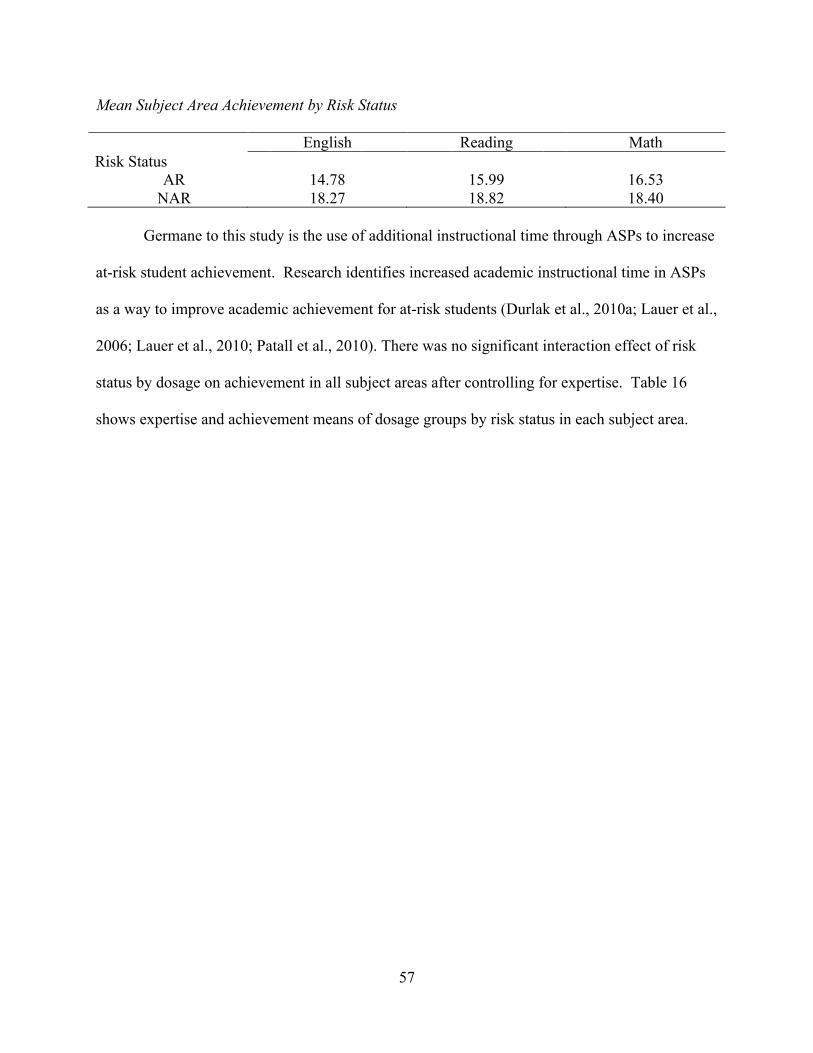
57
Mean Subject Area Achievement by Risk Status
English Reading Math Risk Status
AR 14.78 15.99 16.53 NAR 18.27 18.82 18.40
Germane to this study is the use of additional instructional time through ASPs to increase
at-risk student achievement. Research identifies increased academic instructional time in ASPs
as a way to improve academic achievement for at-risk students (Durlak et al., 2010a; Lauer et al.,
2006; Lauer et al., 2010; Patall et al., 2010). There was no significant interaction effect of risk
status by dosage on achievement in all subject areas after controlling for expertise. Table 16
shows expertise and achievement means of dosage groups by risk status in each subject area.
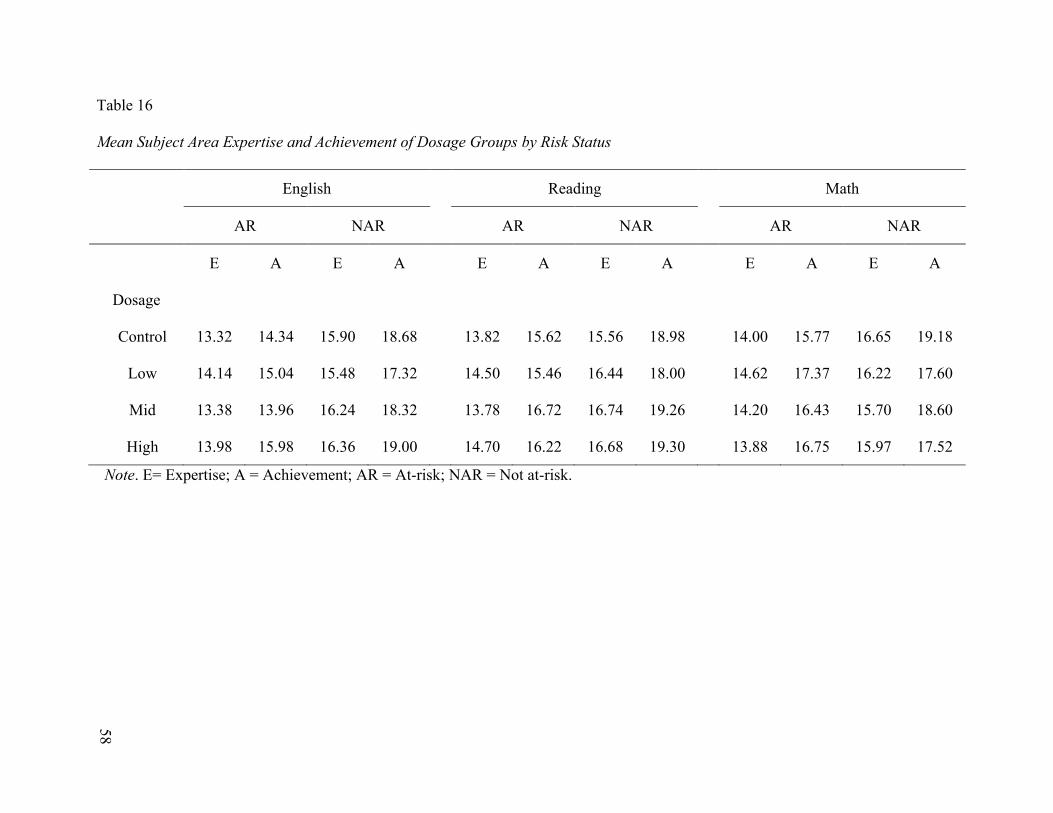
58
Table 16
Mean Subject Area Expertise and Achievement of Dosage Groups by Risk Status
English Reading Math
AR NAR AR NAR AR NAR
E A E A E A E A E A E A
Dosage
Control 13.32 14.34 15.90 18.68 13.82 15.62 15.56 18.98 14.00 15.77 16.65 19.18
Low 14.14 15.04 15.48 17.32 14.50 15.46 16.44 18.00 14.62 17.37 16.22 17.60
Mid 13.38 13.96 16.24 18.32 13.78 16.72 16.74 19.26 14.20 16.43 15.70 18.60
High 13.98 15.98 16.36 19.00 14.70 16.22 16.68 19.30 13.88 16.75 15.97 17.52
Note. E= Expertise; A = Achievement; AR = At-risk; NAR = Not at-risk.
59
Findings support the null hypothesis, although observed differences are congruent with
anticipated results. Without controlling for expertise, risk status significantly impacts
achievement. Differences in expertise levels between AR and NAR participants is evident in this
study and substantiated in research on the underperformance of at-risk students (Dougherty et al.,
2014; Mahoney et al., 2005; Patall et al., 2010). After controlling for expertise, however, results
from this study indicate that risk status does not significantly impact achievement.
English achievement. High dosage AR participants are the only AR group that
outgained the AR control group. The NAR control group outgained all NAR dosage groups. All
NAR dosage groups outgained AR dosage groups.
Reading achievement. Mid dosage AR participants are the only AR group that
outgained the AR control group. The NAR control group outgained all NAR dosage groups. The
mid dosage AR group outgained all but the NAR control group.
Math achievement. AR ASP participants in all dosage groups outgained the AR control
group; no NAR dosage groups outgained the NAR control group. Low and high dosage AR
groups outgained low and high dosage NAR groups.
Results indicate that the ASP studied evidenced increased achievement for NAR
participants vs. AR participants in English, although there is some indication that AR ASP
participants benefitted from ASP participation in reading and math. Research identifies potential
benefits in reading and math achievement for at-risk, high school students who attend out-of-
school time programs (Lauer et al., 2006). At-risk, high school students attending out-of-school
time programs evidenced the largest effect size (.44) in mathematics compared to other grade
levels (Lauer et al., 2006). According to this study, use of additional time in an ASP does not
necessarily increase AR student achievement and programs should take into account expertise
60
level. Results indicate that while risk status, without controlling for expertise, did impact
achievement, a more impactful factor is expertise level.
RQ3 Achievement and Expertise
The third research question examined whether there is a difference in achievement
between ASP participants by expertise level. The alternative hypothesis is there is no difference
in achievement by expertise level. ANCOVA results indicate significance in all three subject
areas: English expertise (p < .001), reading expertise (p < .001), and math expertise (p < .001).
English expertise accounts for 53% (ω2 = 0.53) of the variance in English achievement. Reading
expertise accounts for 40% (ω2 = 0.40) of the variance in reading achievement. Math expertise
accounts for 43% (ω2 = 0.43) of the variance in math achievement. Table 12 displayed
unstandardized regression coefficients by subject area for expertise. The value for English
expertise (b = 1.324) indicates that as English expertise (ACT PLAN score) increases by one
point, English achievement (ACT) increases by 1.324 points. The value for reading expertise (b
= 1.023) indicates that as reading expertise (ACT PLAN score) increases by one point, reading
achievement (ACT) increases by 1.023 points. The value for math expertise (b = 0.750)
indicates that as math expertise (ACT PLAN score) increases by one point, math achievement
(ACT) increases by 0.750 points.
The interaction of expertise and dosage is also examined in answering the research
question. Results indicate there was no significant interaction effect of expertise by dosage on
achievement in any subject area. Table 17 shows expertise and achievement means by dosage
group.
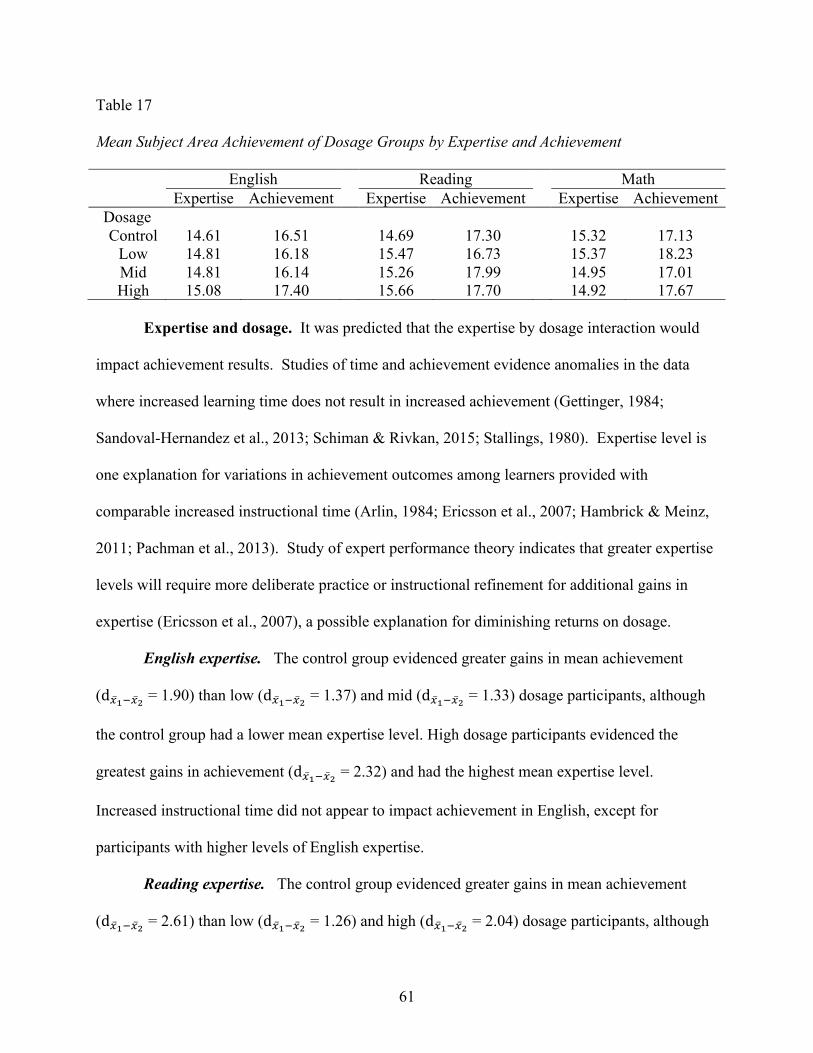
61
Table 17
Mean Subject Area Achievement of Dosage Groups by Expertise and Achievement
English Reading Math Expertise Achievement Expertise Achievement Expertise Achievement
Dosage Control 14.61 16.51 14.69 17.30 15.32 17.13
Low 14.81 16.18 15.47 16.73 15.37 18.23 Mid 14.81 16.14 15.26 17.99 14.95 17.01 High 15.08 17.40 15.66 17.70 14.92 17.67
Expertise and dosage. It was predicted that the expertise by dosage interaction would
impact achievement results. Studies of time and achievement evidence anomalies in the data
where increased learning time does not result in increased achievement (Gettinger, 1984;
Sandoval-Hernandez et al., 2013; Schiman & Rivkan, 2015; Stallings, 1980). Expertise level is
one explanation for variations in achievement outcomes among learners provided with
comparable increased instructional time (Arlin, 1984; Ericsson et al., 2007; Hambrick & Meinz,
2011; Pachman et al., 2013). Study of expert performance theory indicates that greater expertise
levels will require more deliberate practice or instructional refinement for additional gains in
expertise (Ericsson et al., 2007), a possible explanation for diminishing returns on dosage.
English expertise. The control group evidenced greater gains in mean achievement
(d!!!!! = 1.90) than low (d!!!!! = 1.37) and mid (d!!!!! = 1.33) dosage participants, although
the control group had a lower mean expertise level. High dosage participants evidenced the
greatest gains in achievement (d!!!!! = 2.32) and had the highest mean expertise level.
Increased instructional time did not appear to impact achievement in English, except for
participants with higher levels of English expertise.
Reading expertise. The control group evidenced greater gains in mean achievement
(d!!!!! = 2.61) than low (d!!!!! = 1.26) and high (d!!!!! = 2.04) dosage participants, although
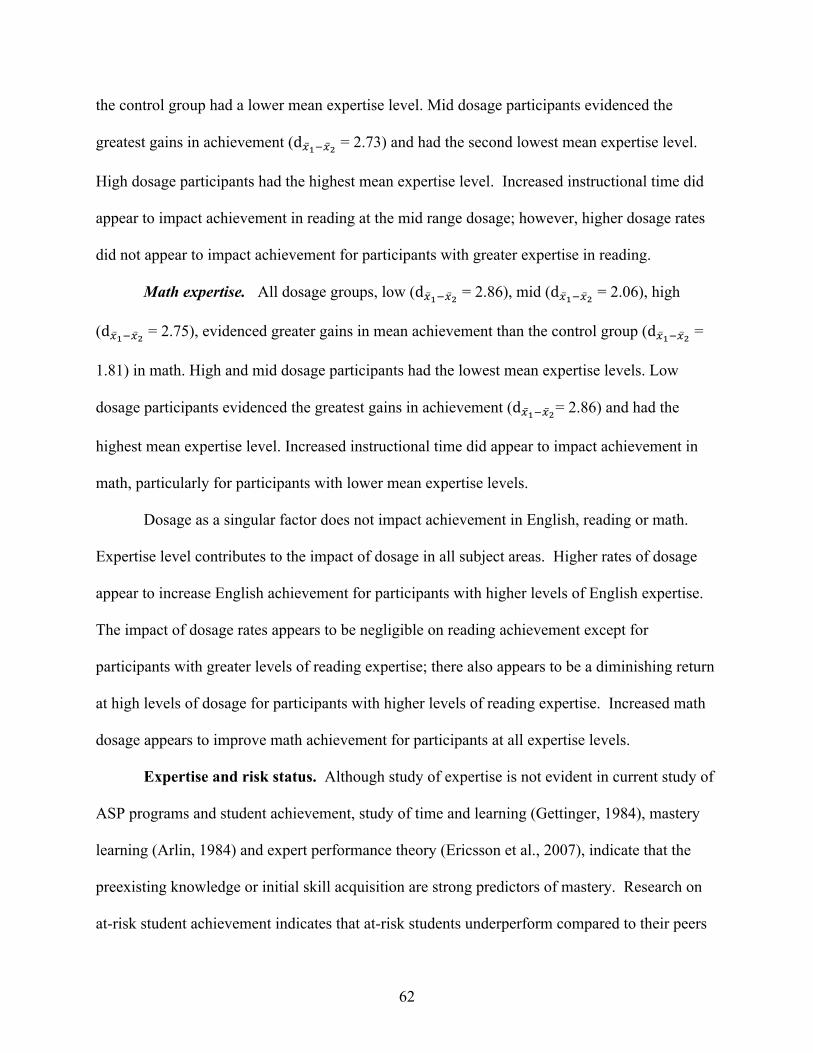
62
the control group had a lower mean expertise level. Mid dosage participants evidenced the
greatest gains in achievement (d!!!!! = 2.73) and had the second lowest mean expertise level.
High dosage participants had the highest mean expertise level. Increased instructional time did
appear to impact achievement in reading at the mid range dosage; however, higher dosage rates
did not appear to impact achievement for participants with greater expertise in reading.
Math expertise. All dosage groups, low (d!!!!! = 2.86), mid (d!!!!! = 2.06), high
(d!!!!! = 2.75), evidenced greater gains in mean achievement than the control group (d!!!!! =
1.81) in math. High and mid dosage participants had the lowest mean expertise levels. Low
dosage participants evidenced the greatest gains in achievement (d!!!!!= 2.86) and had the
highest mean expertise level. Increased instructional time did appear to impact achievement in
math, particularly for participants with lower mean expertise levels.
Dosage as a singular factor does not impact achievement in English, reading or math.
Expertise level contributes to the impact of dosage in all subject areas. Higher rates of dosage
appear to increase English achievement for participants with higher levels of English expertise.
The impact of dosage rates appears to be negligible on reading achievement except for
participants with greater levels of reading expertise; there also appears to be a diminishing return
at high levels of dosage for participants with higher levels of reading expertise. Increased math
dosage appears to improve math achievement for participants at all expertise levels.
Expertise and risk status. Although study of expertise is not evident in current study of
ASP programs and student achievement, study of time and learning (Gettinger, 1984), mastery
learning (Arlin, 1984) and expert performance theory (Ericsson et al., 2007), indicate that the
preexisting knowledge or initial skill acquisition are strong predictors of mastery. Research on
at-risk student achievement indicates that at-risk students underperform compared to their peers
63
who are not at-risk (Dougherty et al., 2014; Mahoney et al., 2005; Patall et al., 2010). Therefore
it is logical to conclude that at-risk students will likely evidence lower levels of expertise
compared to not at-risk peers. It was predicted that the main effect of risk status would impact
student achievement, and although this is evidenced in the analysis, inclusion of the covariate
expertise indicated that between expertise and risk status, expertise is a more significant variable
impacting student achievement.
There was a significant interaction effect of risk status and expertise in English (p=.01)
and math (p = .03), but not in reading (p = .16). Table 18 shows pre- and posttest differences by
risk status in each dosage group.
Table 18
Pre- and Posttest Differences by Risk Status*
English Reading Math Risk Status AR NAR AR NAR AR NAR
Dosage Control 1.02 2.78 1.80 3.42 1.77 2.53
Low 0.90 1.84 0.96 1.56 2.75 1.38 Mid 0.58 2.08 2.94 2.52 2.23 2.38 High 2.00 2.64 1.52 2.62 2.87 1.55
Note. *As shown in Table 19, mean levels of expertise are lower in all groups and subject areas for AR vs. NAR. Risk status impacts achievement in English, reading and math; however, expertise level
contributes to the impact of risk status in English and math. Among subject areas that evidenced
significant risk status by expertise interactions, NAR ASP participants, with greater levels of
expertise, outgain AR ASP participants in English, and low and high dosage AR ASP
participants outgain NAR ASP participants in Math. Although not significant, mid dosage AR
ASP participants outgained NAR ASP participants in reading. There also appears to be a
diminishing return at high levels of dosage for NAR participants in math. No NAR participants
64
outgained control groups in any subject area; whereas, all AR ASP participants outgained the
control group in math, at high dosage rates in English and mid dosage rates in reading.
Limitations and Implications
This study has several limitations. ASP attendance is problematic in ASP research,
particularly with older students (Cross et al., 2010; Dietel, 2009; Durlak et al., 2010a; Granger,
2010). Low attendance rates were also evidenced in this study. Dosage rates were determined
using frequency distributions; and, dosage levels were well below those recommended in
relevant ASP literature (Apsler, 2009; Dietel, 2009; Hanlon et al., 2009; Lauer et al., 2006). All
ASP participants, including control group participants, attend low-performing schools. Also, this
study did not control for variability associated with instructional pedagogy.
First, ASP studies indicate midrange dosage rates will increase student achievement
(Apsler, 2009; Hanlon et al., 2009; Lauer et al., 2010). Relevant literature discusses 50 – 65%
attendance rates or between 45 and 100 hours over the course of one to two years (Apsler, 2009;
Dietel, 2009; Hanlon et al., 2009; Lauer et al., 2010). Based on Kane’s (2004) work that
recommends using actual hours of attendance, frequency distributions revealed that 33% of ASP
participants only attended two hours or less of the program; 66% attended five hours or less; and
100% attended 24 hours or less. Although transportation was provided by the schools, ASP
program participation overall was significantly less than attendance or dosage recommendations
in relevant research literature. ASP attendance is notoriously scant, particularly in high school,
among ASP studies (Apsler, 2009; Dietel, 2009; Durlak et al., 2010b). One implication is that
improving achievement requires greater ASP dosage. Future research is needed on strategies for
improving ASP attendance in high schools, and whether or not increased dosage rates for AR
students may improve achievement.
65
Second, all data for this study includes students who attend low-performing schools. The
ASP program was funded to improve student achievement at schools where the majority of
students were already underperforming based on Kentucky’s accountability model. Low-
performing high schools have lower graduation rates, higher poverty rates, higher suspension
rates, and higher dropout rates. Instructional efficacy is often questioned at low-performing
schools considering the myriad social, emotional, and physical barriers associated with high
poverty that attenuate classroom instruction. A second implication is that results from this study
should be contextualized. Future research is needed on how ASP dosage impacts students from
higher performing high schools.
Third, although this study attempted to mitigate the impact of instructional strategies by
using the entire population of data from the ASP program and random sampling, students came
from different schools, different classrooms, and different methods of ASP program
implementation. Meta-analyses of ASP programs around the United States enumerate many
flaws among ASP studies, primarily poor study design and lack of statistical rigor (Apsler, 2009;
Cross et al., 2010; Durlak et al., 2010a; ECONorthwest, 2008; Kidron & Lindsay, 2014; Lauer et
al., 2006; Pierce et al., 2010). In this study, construct validity was of primary concern.
Measurement of achievement, expertise, risk status and dosage, as they were operationalized for
this study, provided more rigorous constructs than use of instructional strategies. Although
Brown and Saks found that “[i]n no case” was “a variable measuring how time is used…
significantly related to achievement,” they discuss the complexity of measuring instructional
variations (1986, p. 497). Although attempts were made to limit confounding variables,
instructional strategies used at the different high schools may also have impacted student
achievement. Future research is needed on school level variations that may impact ASP program
66
implementation across schools and subsequent evaluation of the impact of dosage and student
achievement.
Conclusion
Findings indicate that at times control group participants, those who did not participate in
the ASP program, outperformed ASP participants. Although not consistent among subject areas,
all of the research questions were partially supported.
It was demonstrated in the current study that ASP dosage did not impact student
achievement. Other ASP studies have shown increased achievement that may have been
attributable to selection bias: low attendance, attrition, and self-selection for ASP participation
(Apsler, 2009; Kane, 2004) or high levels of ASP program dosage (Apsler, 2009; Dietel, 2009;
Hanlon et al., 2009; Lauer et al., 2010). Results from this study indicate ASP participation did
not significantly improve achievement in any subject area, although observed differences
indicate ASP participation improved math achievement more for ASP participants than the
control group. Future research is needed to determine if ASP participation significantly
improves math achievement.
It was demonstrated that risk status, after controlling for expertise, did not impact student
achievement. Although research on low-income students and achievement indicates a correlation
between poverty and low achievement, ASP study has yet to indicate ASP achievement
outcomes of significance for low-SES participants with effect sizes proportional to funding
(Dietel, 2009; Lauer et al., 2006). Kane (2004) posits “we may discover that the sample sizes
required to identify the expected impacts on academic achievement would be prohibitively
expensive” (p. 4).
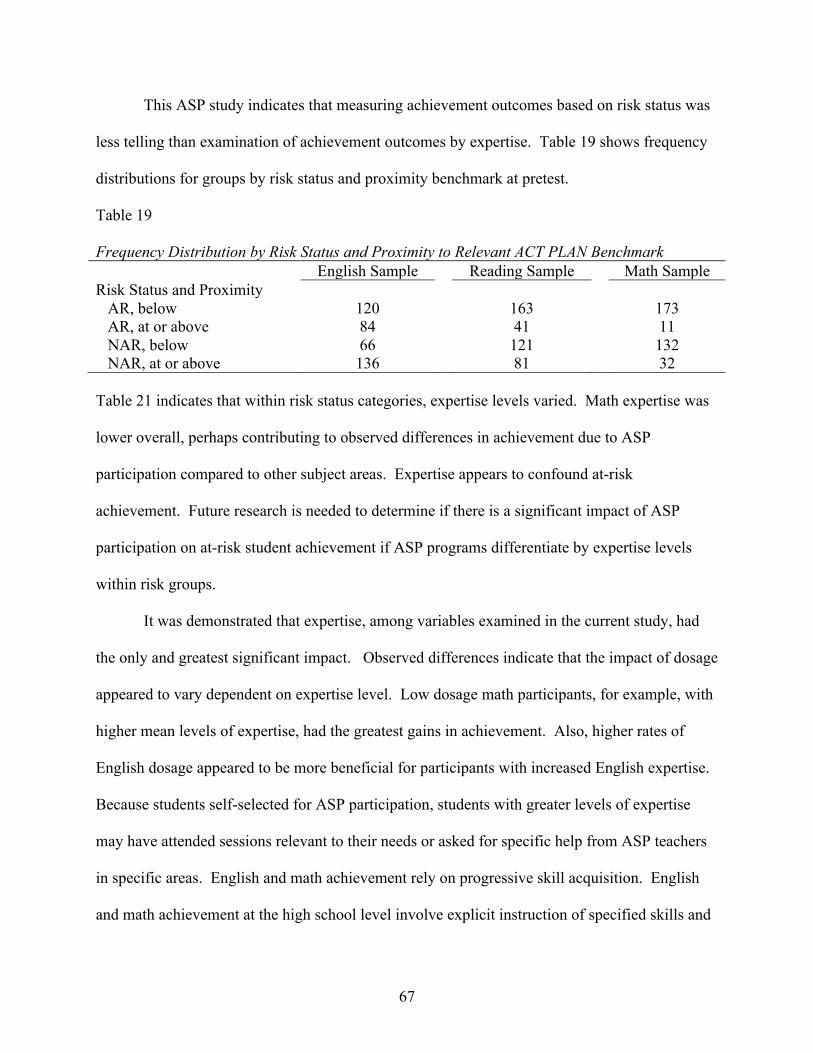
67
This ASP study indicates that measuring achievement outcomes based on risk status was
less telling than examination of achievement outcomes by expertise. Table 19 shows frequency
distributions for groups by risk status and proximity benchmark at pretest.
Table 19
Frequency Distribution by Risk Status and Proximity to Relevant ACT PLAN Benchmark English Sample Reading Sample Math Sample
Risk Status and Proximity AR, below 120 163 173 AR, at or above 84 41 11 NAR, below 66 121 132 NAR, at or above 136 81 32
Table 21 indicates that within risk status categories, expertise levels varied. Math expertise was
lower overall, perhaps contributing to observed differences in achievement due to ASP
participation compared to other subject areas. Expertise appears to confound at-risk
achievement. Future research is needed to determine if there is a significant impact of ASP
participation on at-risk student achievement if ASP programs differentiate by expertise levels
within risk groups.
It was demonstrated that expertise, among variables examined in the current study, had
the only and greatest significant impact. Observed differences indicate that the impact of dosage
appeared to vary dependent on expertise level. Low dosage math participants, for example, with
higher mean levels of expertise, had the greatest gains in achievement. Also, higher rates of
English dosage appeared to be more beneficial for participants with increased English expertise.
Because students self-selected for ASP participation, students with greater levels of expertise
may have attended sessions relevant to their needs or asked for specific help from ASP teachers
in specific areas. English and math achievement rely on progressive skill acquisition. English
and math achievement at the high school level involve explicit instruction of specified skills and
68
deliberate practice. Although effect sizes indicate expertise accounts for approximately half the
variance in achievement, this study indicates neither ASP program dosage nor at-risk status
accounted for the additional variance. One “problem [in current ASP research] is the failure to
describe program details and to assess treatment fidelity” (Lauer et al., 2006, p. 307). Factors to
consider in future research include: instructional pedagogy used in ASPs, ASP teacher
qualifications, and school-level variations.
The main goal of this study was to apply statistically rigorous methodology to study of an
ASP program. The literature review discusses studies of ASP programs that are not considered
statistically rigorous primarily due to inconsistent data collection and data reporting; poorly
defined operational constructs; and missing, invalid or unreliable outcome measures. ASP data
was used in this study because data reporting was required of each school in the district,
including hours of attendance. The scope of the current study posits that subject area equivalent
dosage will impact subject area relevant achievement; in other words, it is not expected that
participants with high dosages of math programming participation will exhibit significant
changes in Reading or English scores. Although dosage rates were low, use of dosage as an
operational construct was an attempt at increased accuracy. Use of ACT tests increased validity
and reliability of results. This study attempted to increase statistical rigor compared to ASP
literature heretofore reviewed (Apsler, 2009; Cross et al., 2010; Durlak et al., 2010a;
ECONorthwest, 2008; Kidron & Lindsay, 2014; Lauer et al., 2006; Pierce et al., 2010).
Millions of dollars are spent on ASPs, including the program examined in this study
costing $8,000,000. Overall, data supports the use of dosage, risk status and expertise along with
rigorous statistical analysis, to measure ASP impact on student achievement. One potential
constraint to examination of the dosage by risk status and/or expertise interaction is low dosage
69
rates. Future study needs to include methods for increasing dosage rate in addition to continued
study of the effects of varied dosage rates by expertise level and risk status on achievement.
However, “[h]igh attendance at a poorly implemented program may do more harm than good”
(Cross et al., 2010, p. 377). Of primary relevance, based on outcomes from this study, is the
importance of expertise in the design, implementation, and evaluation of ASP programs.
Although accountability and funding currently prioritize SES status, this study identified that risk
status does not significantly impact achievement after controlling for expertise. It would be
remiss, then, to qualify, select, or evaluate students based solely on risk status without taking into
account their subject area expertise. Although research indicates that low SES students are less
likely to have attained subject area expertise, this study showed that additional ASP dosage does
not significantly benefit low SES students more than control group participants. Ideally,
strategic identification of ASP participants based on expertise, including specific
recommendations for instruction and dosage, could inform ASP funding.
70
REFERENCES
ACT. (2014). Technical manual. Retrieved from
http://www.act.org/aap/pdf/ACT_Technical_Manual.pdf
ACT. (2015). ACT growth modeling resources. [Data file]. Retrieved from act.org
Ackerman, P.L. (2007). New developments in understanding skilled performance. Current
Directions in Psychological Science, 16(5), 235-239.
Anderson, J.R., Reder, L.M., Simon, H.A., Ericsson, A., & Glaser, R. (1998). Radical
constructivism and cognitive psychology. Brookings Papers on Education Policy, 1, 227-
278.
Apsler, R. (2009) After-school programs for adolescents: A review of evaluation research.
Adolescence, 44(173), 1-19.
Arlin, M. (1984). Time variability in mastery learning. American Educational Research Journal,
21(1), pp. 103-120.
Bereiter, C. (1990). Aspects of an educational learning theory. Review of Educational Research,
60(4), 603-624.
Brown, B.W, & Saks, D.H. (1986). Measuring the effectiveness of instructional time on student
learning: Evidence from the beginning teacher evaluation study. American Journal of
Education, 94(4), 480-500.
Brownell, W.A. (1948). Learning theory and educational practice. The Journal of Educational
Research, 41(7), 481-497.
Chi, M.T.H. (2006). Two approaches to the study of experts’ characteristics. In K.A. Ericsson,
N. Charness, P.J. Feltovich & R.R. Hoffman (Eds.), The Cambridge handbook of
71
expertise and expert performance (pp. 21-30). New York, NY: Cambridge University
Press.
Cross, A., Gottfredson, D. C., Wilson, D. M., Rorie, M., & Connell, N. (2010). Implementation
quality and positive experiences in after-school programs. American Journal of
Community Psychology, 45(3/4), 370-380. doi: 10.1007/s10464-010-9295-z
Dietel, R. (2009). After-school programs: Finding the right dose. Phi Delta Kappan, 91(3), 62-
64.
Dougherty, C., Hiserote, L., & Shaw, T. (2014). Catching up to college and career readiness in
Kentucky. (Research Report No. 4). Retrieved from
http://www.act.org/research/researchers/reports/pdf/ACT_RR2014-4.pdf
Durlak, J. A., Mahoney, J. L., Bohnert, A. M., & Parente, M. E. (2010). Developing and
improving after-school programs to enhance youth’s personal growth and adjustment:
A special issue of AJCP, Editorial, American Journal of Community Psychology, pp.
285-293.
Durlak, J. A., Weissberg, R. P., & Pachan, M. (2010). A meta-analysis of after-school
programs that seek to promote personal and social skills in children and adolescents.
American Journal of Community Psychology, 45(3/4), 294-309. doi:
10.1007/s10464-010-9300-6
ECONorthwest. (2008, August). A review of research on extended learning time in K-12
schools. Portland, OR: The Chalkboard Project.
ECONorthwest. (2010, December). A review of research on extended learning time in K-12
schools. Portland, OR: The Chalkboard Project.

72
Ericsson, K.A., & Lehmann, A.C. (1996). Expert and exceptional performance. Annual Review
of Psychology, 47, 273-305.
Ericsson, K.A., & Ward, P. (2007). Capturing the naturally occurring superior performance of
experts in the laboratory: Toward a science of expert and expert performance. Current
Directions in Psychological Science, 16(6), 346-350.
Ericsson, K.A., Roring, R.W., & Nandagopal, K. (2007). Giftedness and evidence for
reproducibly superior performance: An account based on the expert performance
framework. High Ability Studies, 18(1), 3-56.
Fashola, O.S. (2013) Evaluation of an extended day program for African American males in the
context of single gender schooling and schoolwide reform: A case for extending the
school day for African American males. Peabody Journal of Education, 88(4), 488 – 517.
Faul, F., Erdfelder, E., Buchner, A., & Lang, A.-G. (2009). Statistical power analyses using
G*Power 3.1: Tests for correlation and regression analyses. Behavior Research Methods,
41, 1149-1160.
Gettinger, M. (1984). Achievement as a function of time spent in learning and time needed for
learning. American Education Research Journal, 21(3), pp. 617-628.
Gottfredson, D.C., Cross, A.B., Wilson, D.M., Connell, N., & Rorie, M. (2010, June). A
randomized trial of the effects of an enhanced after-school program for middle school
students. Retrieved from
http://www.ccjs.umd.edu/sites/ccjs.umd.edu/files/pubs/GottfredsonFinalReport.sub_.pdf
Granger, R. C. (2010). Understanding and improving the effectiveness of after-school practice.
American Journal of Community Psychology, 45(3/4), 441-446. doi:
10.1007/s10464-010-9301-5
73
Hambrick, D.Z., & Meinz, E.J. (2011). Limits on predictive power of domain-specific
experience and knowledge in skilled performance. Current Directions in Psychological
Science, 20(5), 275-279.
Hanlon, T. E., Simon, B. D., O'Grady, K. E., Carswell, S. B., & Callaman, J. M. (2009). The
effectiveness of an after-school program targeting urban African American youth.
Education & Urban Society, 42(1), 96-118.
Hanushek, E. A. (2015). Time in Education: Introduction. Economic Journal, 125(588), F394-
F396.
Harvard Family Research Project. (2011, May). Out-of-school time programs for older youth
(Research Update No. 7). Cambridge, MA: HGSE
Hill, C. J., Bloom, H. S., Black, A. R., & Lipsey, M. W. (2008). Empirical Benchmarks for
Interpreting Effect Sizes in Research. Child Development Perspectives, 2(3), 172-177.
Howell, D.C. (2009). Statistical methods for psychology (7th ed.). United States: Wadsworth
Publishing Co Inc.
Huang, H. (2015). Can students themselves narrow the socioeconomic-status-based achievement
gap through their own persistence and learning time? Education Policy Analysis
Archives, 23(108), http://dx.doi.org/10.14507/epaa.v23.1977
Jones, B., & Nachtsheim, C.J. (2009). Split-plot designs: What, why, and how. Journal of
Quality Technology, 41(4), 340-361.
Kane, T. J. (2004, January 16). The Impact of After-School Programs: Interpreting the Results of
Four Recent Evaluations. William T. Grant Foundation Working Paper. New York:
William T. Grant Foundation.
74
Kentucky Department of Education. (2014, August 14). Kentucky ESEA flexibility request
revised submission with amendments to principles 1, 2, and 3. Retrieved from
http://education.ky.gov/school/prischedrecov/Documents/Revised%20Final%20Kentucky
%20ESEA%20waiver%20extension%20aug%2014%20with%20links
Kentucky Department of Education. (2015). Kentucky State Report Card. Retrieved from
http://education.ky.gov
Kentucky Department of Education. (2012, October). FAQs on Kentucky’s New Assessment and
Accountability System for Public Schools. Retrieved from
education.ky.gov/comm/UL/Documents/FAQs%20on%20Kentucky.pdf
Kidron, Y., & Lindsay, J., 2014, The effects of increased learning time on student academic and
nonacademic outcomes: Findings from a meta-analytic review (REL 2014– 015),
Washington, DC: U.S. Department of Education, Institute of Education Sciences,
National Center for Education Evaluation and Regional Assistance, Regional Educational
Laboratory Appalachia.
Kolberg, T. M. (2013). An evaluation of urban compass after-school program (Order No.
3598261). Available from ProQuest Dissertations & Theses Global. (1458634151).
Kowalski, S.M., & Potcner, K.J. (2003, November). How to recognize a split-plot experiment.
Quality Progress, 60-66.
Lauer, P. A., Akiba, M., Wilkerson, S. B., Apthorp, H. S., Snow, D., & Martin-Glenn, M. L.
(2006). Out-of-school-time programs: A meta-analysis of effects for at-risk students.
Review of Educational Research, 76(2), 275-313.
Lavy, V. (2015). Do Differences in Schools' Instruction Time Explain International Achievement Gaps? Evidence from Developed and Developing Countries. Economic Journal,
75
125(588), F397-F424. Mahoney, J.L., Lord, H., & Carryl, E. (2005). An ecological analysis of after-school program
participation and the development of academic performance and motivational attributes
for disadvantaged children. Child Development, 76(4), 811-825.
Marsh, H. W., & Kleitman, S. (2002). Extracurricular school activities: The good, the bad, and
the nonlinear. Harvard Educational Review, 72(4), 464.
Odden, A., Borman, G., & Fermanich, M. (2004). Assessing teacher, classroom, and school
effects, including fiscal effects. Peabody Journal of Education, 79(4), 4-32.
Paas, F., Renkl, A., & Sweller, J. (2003). Cognitive load theory and instructional design: Recent
developments. Educational Psychologist, 38(1), 1-4.
Pachman, M., Sweller, J., & Kalyuga, S. (2013). Levels of knowledge and deliberate practice.
Journal of Experimental Psychology, 19(2), 108-119.
Patall, E.A., Cooper, H., & Allen, A.B. (2010). Extending the school day or school year: A
systematic review of research. Review of Educational Research, 80(3), 401-436.
Pierce, K. M., Bolt, D. M., & Vandell, D. L. (2010). Specific features of after-school program
quality: Associations with children’s functioning in middle childhood. American
Journal of Community Psychology, 45(3/4), 381-393. doi: 10.1007/s10464-010-9304-2
Poncy, B.C., Solomon, B., Duhon, G., Skinner, C., Moore, K., & Simons, S. (2015). An analysis
of learning rate and curricular scope: Caution when choosing academic interventions
based on aggregated outcomes. School Psychology Review, 44(3), 289-305.
Rothman, T., & Henderson, M. (2011). Do school-based tutoring programs significantly improve
student performance on standardized tests?. Research in Middle Level Education Online,
34(6), 1-10.
76
Sandoval-Hernandez, A., Aghakasiri, P., Wild, J., Rutkowski, D., International Association for
the Evaluation of Educational, A., & Indiana Univ., B. E. (2013). Does increasing hours
of schooling lead to improvements in student learning? Policy Brief No. 1. International
Association For The Evaluation Of Educational Achievement.
Schiman, J. C., & Rivkin, S. G. (2015). Instruction Time, Classroom Quality, and Academic
Achievement. Economic Journal, 125(588), F425-F448.
Seiler, M. F., Chilton, K., Nelson, D., Alexander, A., Landy, B., Olds, S., . . . Terr, D. (2008). A
review of the extended school services program (O. o. E. Accountability, Trans.) (pp.
152). Frankfort.
Seiler, M. F., Ewalt, J. G., Olds, S., Alexander, A., Young, P., & Landy, B. (2007). A review of
the flexible focus fund program (O. o. E. Accountability, Trans.) (pp. 66). Frankfort.
Shadish, W. R., Cook, T. D., & Campbell, D. T. (2002). Experimental and quasi-experimental
designs for generalized causal inference. New York: Houghton Mifflin Company.
Shernoff, D. J., & Vandell, D. L. (2007). Engagement in after-school program activities: quality
of experience from the perspective of participants. Journal of Youth & Adolescence,
36(7), 891-903. doi: 10.1007/s10964-007-9183-5.
Slavin, R.E. (1987). Mastery learning reconsidered. Review of Educational Research, 57(2),
175-213.
Stallings, J. (1980). Allocated learning time revisited, or beyond time on task. Educational
Researcher, 9(11), p. 11-16.
Stevens, J.P. (2007). Intermediate statistics: A modern approach. New York, NY: Routledge.
Trochim, W. (2005). The Research Methods Knowledge Base, 2nd Edition. Cornell Custom
Publishing, Cornell University, Ithaca, New York.
77
U. S. Department of Education. (2009). Race to the top program executive summary. Retrieved
from https://www2.ed.gov/programs/racetothetop/executive-summary.pdf.
Vandell, D. L., Shernoff, D. J., Pierce, K. M., Bolt, D. M., Dadisman, K., & Brown, B. B.
(2005). Activities, engagement, and emotion in after-school programs (and elsewhere).
New Directions For Youth Development, 2005(105), 121-129.
van Gog, T., Ericsson, K.A., Rikers, R. M. J. P., and Paas, F. (2005). Instructional design for
advanced learners: Establishing connections between the theoretical frameworks of
cognitive load and deliberate practice. Educational Technology Research and
Development, 53(3), 73-81.
Weston, S. P., Sexton, R. F., & Columbia University, C. f. E. E. (2009). Substantial and yet not
sufficient: Kentucky's effort to build proficiency for each and every child. Education,
Equity, and the Law. No. 2: Campaign for Educational Equity, Teachers College,
Columbia University.


