Embed Size (px)
Citation preview
The impact of interest rateliberalization on the corporatefinancing strategies of quoted
companies in Nigeria
By
Davidson A. Omole,
and
Gabriel O. Falokun,Economic Development Department
Nigerian Institute of Social and Economic Research(NISER), Ibadan, Nigeria
AERC Research Paper 88African Economic Research Consortium, Nairobi
March 1999
© 1999, African Economic Research Consortium.
Published by: The African Economic Research ConsortiumP.O. Box 62882Nairobi, Kenya
Printed by: The Regal Press Kenya, Ltd.P.O. Box 46116Nairobi, Kenya
ISBN 9966-900-94-2
Contents
List of tablesList of figuresAcknowledgementsAbstract
I. Introduction 1II. Literature review 5III Theoretical framework 9IV. Methodology 11V. Empirical results 14VI. Conclusion 37
References 39Appendixes 45
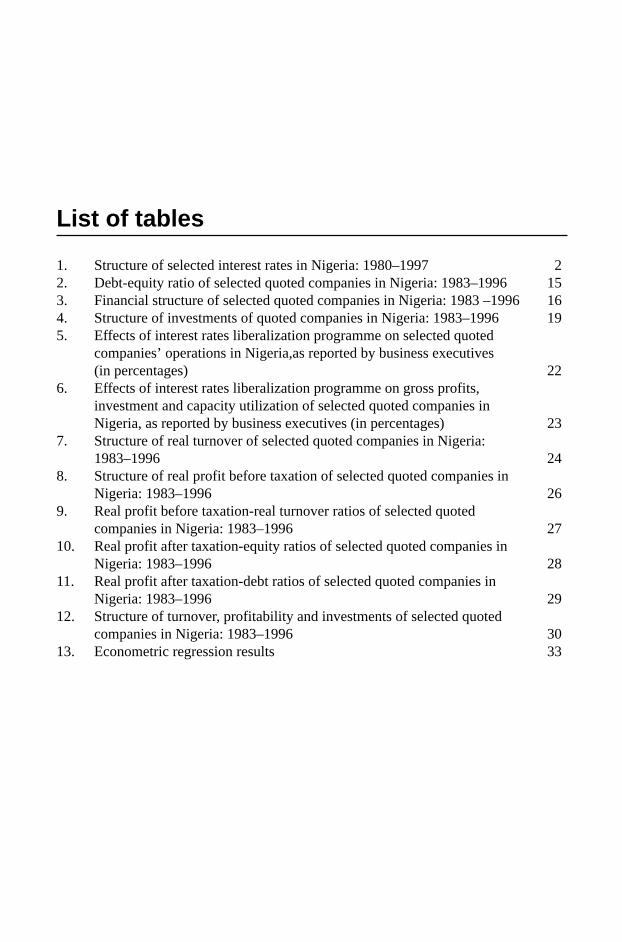
1. Structure of selected interest rates in Nigeria: 1980–1997 22. Debt-equity ratio of selected quoted companies in Nigeria: 1983–1996 153. Financial structure of selected quoted companies in Nigeria: 1983 –1996 164. Structure of investments of quoted companies in Nigeria: 1983–1996 195. Effects of interest rates liberalization programme on selected quoted
companies’ operations in Nigeria,as reported by business executives(in percentages) 22
6. Effects of interest rates liberalization programme on gross profits,investment and capacity utilization of selected quoted companies inNigeria, as reported by business executives (in percentages) 23
7. Structure of real turnover of selected quoted companies in Nigeria:1983–1996 24
8. Structure of real profit before taxation of selected quoted companies inNigeria: 1983–1996 26
9. Real profit before taxation-real turnover ratios of selected quotedcompanies in Nigeria: 1983–1996 27
10. Real profit after taxation-equity ratios of selected quoted companies inNigeria: 1983–1996 28
11. Real profit after taxation-debt ratios of selected quoted companies inNigeria: 1983–1996 29
12. Structure of turnover, profitability and investments of selected quotedcompanies in Nigeria: 1983–1996 30
13. Econometric regression results 33
List of tables
List of figures
1. Debt-equity ratios of selected quoted companies in Nigeria 182. Financial structure of selected quoted companies in Nigeria 183. Average investment of selected quoted companies in Nigeria 214. Structure of investment of selected quoted companies in Nigeria 215. Structure of real turnover of selected quoted companies in Nigeria 256. Structure of real profit before taxation of selected quoted companies
in Nigeria 327. Sources of funds for selected quoted companies in Nigeria 358. Sources of funds most preferred by quoted companies 359. Perception of quoted firms about the prevailing interest rates 3610. Whether financial strategy of quoted companies altered during liberalization 36
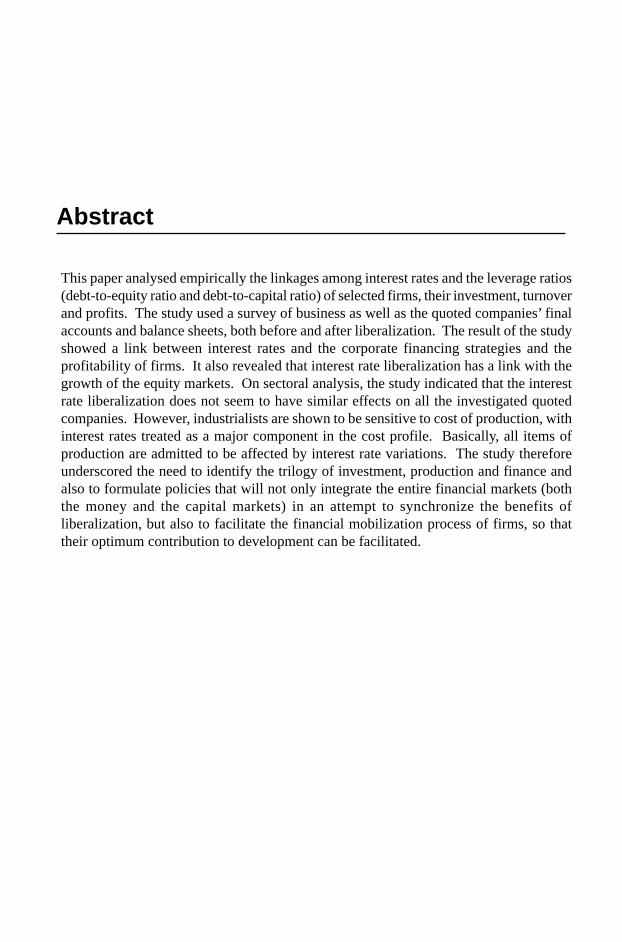
This paper analysed empirically the linkages among interest rates and the leverage ratios(debt-to-equity ratio and debt-to-capital ratio) of selected firms, their investment, turnoverand profits. The study used a survey of business as well as the quoted companies’ finalaccounts and balance sheets, both before and after liberalization. The result of the studyshowed a link between interest rates and the corporate financing strategies and theprofitability of firms. It also revealed that interest rate liberalization has a link with thegrowth of the equity markets. On sectoral analysis, the study indicated that the interestrate liberalization does not seem to have similar effects on all the investigated quotedcompanies. However, industrialists are shown to be sensitive to cost of production, withinterest rates treated as a major component in the cost profile. Basically, all items ofproduction are admitted to be affected by interest rate variations. The study thereforeunderscored the need to identify the trilogy of investment, production and finance andalso to formulate policies that will not only integrate the entire financial markets (boththe money and the capital markets) in an attempt to synchronize the benefits ofliberalization, but also to facilitate the financial mobilization process of firms, so thattheir optimum contribution to development can be facilitated.
Abstract
Acknowledgements
We are grateful to the African Economic Research Consortium (AERC) for financingthis study. We also appreciate the helpful comments, suggestions and study materialsreceived from Lemma Senbet, Francis Mwega, Chris Adams, Machicko Nissanke, M.O.Kayode, O. Teriba, Ernest Aryeetey, Doyin Soyibo, Olu Ajakaiye and others. Manythanks are also due to the entire staff of AERC for their conscentious effort.
However, the result of the study reflects the views of the authors and not necessarilythose of the AERC or the aforementioned personalities.
THE IMPACT OF INTEREST RATES LIBERALIZATION ON THE CORPOATE FINANCING STRATEGIES OF QUOTED
COMPANIES IN NIGERIA 1
I. Introduction
The problem
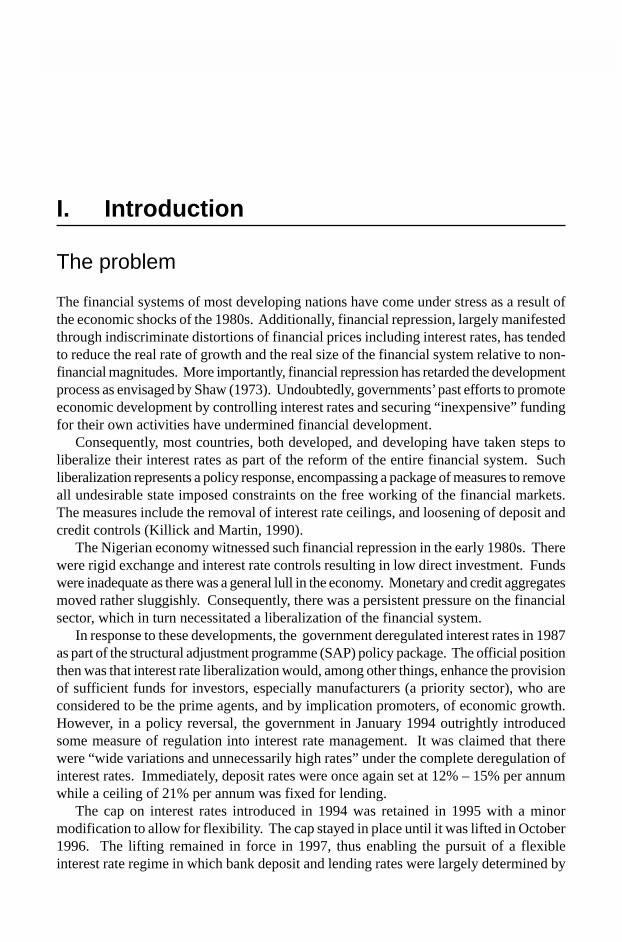
The financial systems of most developing nations have come under stress as a result ofthe economic shocks of the 1980s. Additionally, financial repression, largely manifestedthrough indiscriminate distortions of financial prices including interest rates, has tendedto reduce the real rate of growth and the real size of the financial system relative to non-financial magnitudes. More importantly, financial repression has retarded the developmentprocess as envisaged by Shaw (1973). Undoubtedly, governments’ past efforts to promoteeconomic development by controlling interest rates and securing “inexpensive” fundingfor their own activities have undermined financial development.
Consequently, most countries, both developed, and developing have taken steps toliberalize their interest rates as part of the reform of the entire financial system. Suchliberalization represents a policy response, encompassing a package of measures to removeall undesirable state imposed constraints on the free working of the financial markets.The measures include the removal of interest rate ceilings, and loosening of deposit andcredit controls (Killick and Martin, 1990).
The Nigerian economy witnessed such financial repression in the early 1980s. Therewere rigid exchange and interest rate controls resulting in low direct investment. Fundswere inadequate as there was a general lull in the economy. Monetary and credit aggregatesmoved rather sluggishly. Consequently, there was a persistent pressure on the financialsector, which in turn necessitated a liberalization of the financial system.
In response to these developments, the government deregulated interest rates in 1987as part of the structural adjustment programme (SAP) policy package. The official positionthen was that interest rate liberalization would, among other things, enhance the provisionof sufficient funds for investors, especially manufacturers (a priority sector), who areconsidered to be the prime agents, and by implication promoters, of economic growth.However, in a policy reversal, the government in January 1994 outrightly introducedsome measure of regulation into interest rate management. It was claimed that therewere “wide variations and unnecessarily high rates” under the complete deregulation ofinterest rates. Immediately, deposit rates were once again set at 12% – 15% per annumwhile a ceiling of 21% per annum was fixed for lending.
The cap on interest rates introduced in 1994 was retained in 1995 with a minormodification to allow for flexibility. The cap stayed in place until it was lifted in October1996. The lifting remained in force in 1997, thus enabling the pursuit of a flexibleinterest rate regime in which bank deposit and lending rates were largely determined by
2 RESEARCH PAPER 88
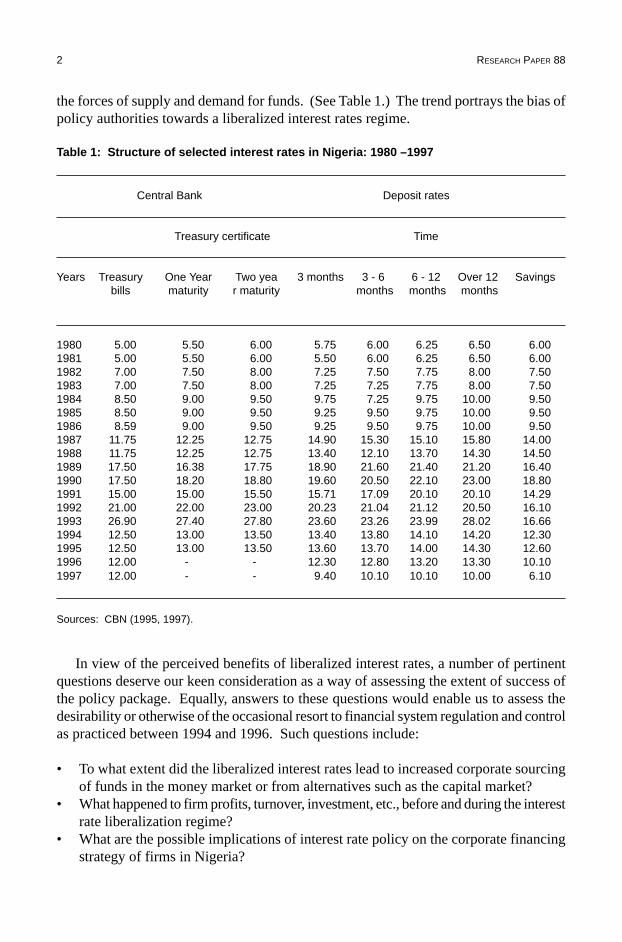
the forces of supply and demand for funds. (See Table 1.) The trend portrays the bias ofpolicy authorities towards a liberalized interest rates regime.
Table 1: Structure of selected interest rates in Nigeria: 1980 –1997
Central Bank Deposit rates
Treasury certificate Time
Years Treasury One Year Two yea 3 months 3 - 6 6 - 12 Over 12 Savingsbills maturity r maturity months months months
1980 5.00 5.50 6.00 5.75 6.00 6.25 6.50 6.001981 5.00 5.50 6.00 5.50 6.00 6.25 6.50 6.001982 7.00 7.50 8.00 7.25 7.50 7.75 8.00 7.501983 7.00 7.50 8.00 7.25 7.25 7.75 8.00 7.501984 8.50 9.00 9.50 9.75 7.25 9.75 10.00 9.501985 8.50 9.00 9.50 9.25 9.50 9.75 10.00 9.501986 8.59 9.00 9.50 9.25 9.50 9.75 10.00 9.501987 11.75 12.25 12.75 14.90 15.30 15.10 15.80 14.001988 11.75 12.25 12.75 13.40 12.10 13.70 14.30 14.501989 17.50 16.38 17.75 18.90 21.60 21.40 21.20 16.401990 17.50 18.20 18.80 19.60 20.50 22.10 23.00 18.801991 15.00 15.00 15.50 15.71 17.09 20.10 20.10 14.291992 21.00 22.00 23.00 20.23 21.04 21.12 20.50 16.101993 26.90 27.40 27.80 23.60 23.26 23.99 28.02 16.661994 12.50 13.00 13.50 13.40 13.80 14.10 14.20 12.301995 12.50 13.00 13.50 13.60 13.70 14.00 14.30 12.601996 12.00 - - 12.30 12.80 13.20 13.30 10.101997 12.00 - - 9.40 10.10 10.10 10.00 6.10
Sources: CBN (1995, 1997).
In view of the perceived benefits of liberalized interest rates, a number of pertinentquestions deserve our keen consideration as a way of assessing the extent of success ofthe policy package. Equally, answers to these questions would enable us to assess thedesirability or otherwise of the occasional resort to financial system regulation and controlas practiced between 1994 and 1996. Such questions include:
• To what extent did the liberalized interest rates lead to increased corporate sourcingof funds in the money market or from alternatives such as the capital market?
• What happened to firm profits, turnover, investment, etc., before and during the interestrate liberalization regime?
• What are the possible implications of interest rate policy on the corporate financingstrategy of firms in Nigeria?
THE IMPACT OF INTEREST RATES LIBERALIZATION ON THE CORPOATE FINANCING STRATEGIES OF QUOTED
COMPANIES IN NIGERIA 3
These issues are addressed in this study as a way of assessing the impact of the interestrate liberalization policy, as well as the relationship between the occasional ceiling oninterest rates and the mobilization of domestic resources.
Objectives of the study
The study sets out to examine empirically the pattern and direction of influence of interestrate liberalization on the corporate financing strategies of selected quoted companies inNigeria, and the implications this will have for the effectiveness of interest rate policies.In the process, the effects of interest rate liberalization on firm profits, turnover, investment,etc., are also examined.
The specific objectives of this study are to:
• trace the impact of interest rate liberalization on the leverage mix of quoted companiesin Nigeria and the financing strategy adopted by them;
• examine the direct impact of interest rate liberalization on stock market activities;• highlight the possible problems faced by quoted companies as well as the probable
benefits to them of financial sector is liberalization; and• draw policy conclusions for enhancing and synchronizing the probable benefits of
interest rates liberalization.
Research hypotheses
The objectives listed above are based on the following research hypotheses:
• That the debt-equity ratio (financing options) of quoted companies in Nigeria is notrelated to interest rate liberalization.
• That there is no link between stock market activities in Nigeria and interest ratesliberalization.
The theoretical underpinnings of these hypotheses are presented in Section II of thisreport. The analysis of the link between interest rates and financing strategies is rootedin the contending hypotheses of Modigliani and Miller (1958, 1963); Sundararajan (1987);Bhattacharya (1988); Dammon and Senbet (1988); and Lyon (1992).
We examined the empirical link between interest rates and the corporate financingstrategy of quoted companies in Nigeria, as portrayed by their leverage mix.
The basic questions we attempted to answer are:
• How did the leverage mix of quoted companies in Nigeria respond to interest rateliberalization?
• Are there intersectoral differences in the leverage mix of quoted companies in Nigeriaconsequent upon interest rate liberalization?

4 RESEARCH PAPER 88
• What are the possible implications of interest rates liberalization and the quotedcompanies financing strategy for the Nigerian stock market?
Plan of the report
The rest of the report is organized as follows. In Section II, we review briefly the existingliterature relating to corporate finance issues and the link with interest rates. Section IIIreviews the theoretical framework, while Section IV presents an overview of themethodology adopted. The results are presented in Section V and we conclude in SectionVI.
THE IMPACT OF INTEREST RATES LIBERALIZATION ON THE CORPOATE FINANCING STRATEGIES OF QUOTED
COMPANIES IN NIGERIA 5
II. Literature review
Issues in corporate financing
Corporate financing strategy incorporates the decisions a firm makes about its capitalstructure, that is, choices of the best debt-equity mix to use to finance its operations.There is an ongoing debate in the literature about the effects of gearing on the weightedaverage cost of capital. Indeed, the empirical evidence so far is inconclusive and theargument continues unabated.
Contrary to the traditional view of corporate finance, Modigliani and Miller (1958)argued that there was no optimal capital structure. The Modigliani-Miller (M-M) theoremstates that the cost of capital is independent of the financing mix (the debt–equity ratio)in a world with rational investors, perfect capital market, no taxes and no default orbankruptcy risks (Modigliani and Miller, 1958). In the M-M framework, a unique optimaldebt–equity ratio does not exist in a firm’s investment decision.
The Modigliani and Miller theorem is based on three key propositions:
• That the firm, acting rationally, will tend to push investment to the point where themarginal yield on physical assets is equal to the market rate of interest.
• That the expected rate of return on yield, i on the stock of any company i, belongingto Kth class is a linear function of leverage. Notationally, this is given as:
S=Pk + (P
k-r)D
i/S
i(1)
where: S = expected rate of return or yieldP
k= capitalization rate
r = interest chargedD
i= market value of debt for company
Si
= market value of common share in the company
• That if a firm, in class k, is acting in the best interest of the stockholders at the timeof the decision, it will exploit an investment opportunity if and only if the rate ofreturn on the investment, say “P”, is as large as or larger than P
k and will be completely
unaltered by the type of security used to finance the investment (Modigliani, 1988;Miller, 1988).
6 RESEARCH PAPER 88
Indeed, the third M–M proposition has given rise to a large body of theoretical workfocusing on the determination of the financing mix used by firms (Donaldson, 1961;Mayers, 1977, 1984, 1985; Molho, 1986; Fazzari et al., 1988; Ross, 1988; Bhattacharya,1988; Harris et al., 1992; Lyon, 1992; Jaramillo et al., 1993). The initial propositions ofthe M-M theorem were also extended to incorporate a tax hypothesis (Modigliani andMiller, 1963; Modigliani, 1988; Miller, 1988).
However, since the celebrated M–M theorem in 1958 and its subsequent extension in1963, there has been an enormous amount of work to either support or refute the taxadjusted valuation model of the M-M theorem (King, 1977; Hite, 1977; Auerbach, 1979;DeAngelo and Masulia, 1980; Grossman and Stiglitz, 1980; Taggart, 1980; Auerbachand King, 1983; Barnea et al., 1985; Sundararajan, 1987; Dammon and Senbet, 1988;Stiglitz, 1988; Givoly et al., 1992; Lyon, 1992). In some of these studies, the possibilityof taxation, bankruptcy and financial distress were introduced to produce an optimalcapital structure for the firm and therefore invalidate the M-M irrelevance theorems(Hite, 1977; DeAngelo and Masulis, 1980; Barnea et al., 1985; Dammon and Senbet,1988; Sundararajan, 1987; Singh and Hamid, 1992; Lyon, 1992). The general conclusionof many of these studies is that even in the absence of the confounding effects of taxation,one should expect the existence of an optimal ratio of debt and equity for a firm. Forexample, Hite (1977) shows that an increase in financial leverage of a firm will reducethe “user cost of capital” and therefore, lead to an increase in the optimal output level ofthat firm. Although the conclusion of Hite’s model implicitly limits the amount of debtfinancing a given firm can obtain, it nevertheless indirectly reveals that there is adivergence in the cost of internal and external sources of finance to firms; this divergencemay therefore affect the efficiency with which investment is allocated.
Sundararajan (1987) examined the linkages among interest rates, the debt–equityratio of firms, the overall cost of capital, savings, investment and growth in the Koreaneconomy during 1963–81. He used a dynamic framework that recognizes the complexinteractions among these variables. According to him, a change in the administeredinterest rate affects the unregulated rate, the overall cost of capital, the real interest ratesand the debt-equity choice of firms. This thereby sets in motion a chain of responsesinfluencing the desired level of the capital stock and its profitability, as well as theavailability of savings and the consequent speed of adjustment of the actual capital stockto the desired level.
Further, Sundararajan (1987) asserts that the debt-equity ratio is important becausethe overall cost of capital to investors –which influences fixed investment, its efficiencyand profits –can be expressed as a weighted sum of the opportunity cost of bank debt andthat of equity, with the weights depending on the debt-equity ratio. Therefore, themultiplier effects of changes in the cost of bank debt (i.e., the interest rate) on the overallcost of capital, and hence on investment incentives and the productivity of capital, depend,among other things, on the share of debt in investment financing and on the inducedadjustments in this share, and in the cost of equity. By implication, there exists an optimumdebt-equity mix for firms. Consequently, the cost of capital depends on the debt-equitymix first falling and then rising as the debt ratio rises. As a result, the financing and realdecisions are no longer independent.
THE IMPACT OF INTEREST RATES LIBERALIZATION ON THE CORPOATE FINANCING STRATEGIES OF QUOTED
COMPANIES IN NIGERIA 7
In a model developed for this purpose Sundararajan (1987) derived a precise expressionof the desired average debt ratio by postulating that firms strive to obtain the debt-equitymix that minimizes the cost of capital. According to him, the optimal debt-equity ratiocan be expressed as:
DE* = d*(iu-i,II) (2)
where:DE* = desired debt-equity ratiod* = nonlinear function of the interest rate subsidy and the rate of inflationiu
= nominal interest rate in the unregulated marketi = weighted average of domestic and foreign interest rates
(adjusted for exchange rate change)II = rate of inflation
In other words, the larger the interest rate subsidy, the higher the desired debt-equityratio. Further, the desired ratio will rise or fall with inflation, depending on whether themarginal risk premium falls or rises with inflation (Sundararajan, 1987). The underlyingassumption of this specification is that in general the desired debt equity ratio will bepositively related to the implicit interest rate subsidy from the regulated financial markets.
The study by Dammon and Senbet (1988), which examines the effect of taxes anddepreciation on corporate investment and financial leverage under uncertainty, hingedon DeAngelo and Masulia’s (1980) extended model, shows that increases in investment-related tax shields due to changes in the corporate tax code are not necessarily associatedwith reductions in leverage at the individual firm level. Moreover, the cross-sectionalanalysis of firms with higher investment related tax shields indicates that they need nothave lower investment related tax shields unless these firms use the same productiontechnology. Actually, this study emphasizes that there are other factors apart from theSundararajan’s (1987) interest subsidy and the inflation rate that can bring about a changein the financial leverage of a firm. This is also corroborated by Lyon (1992), whoemphasized that under a classical corporate income tax, dividends, retained earnings anddebt are all treated differently. However, firms are expected to adopt the form of financewith the lowest tax costs.
Bhattacharya (1988), Harris et al. (1992), and Lyon (1992; provided a set of models,alternatives to M-M theories, grounded in asymmetric information between corporateinsiders and outsiders (shareholders or creditors) in which they establish a link amonginterest rates, financing and investment decisions. They assert that corporate financialbehaviour adjusts discretely to changes in earnings as predicted by signaling models(Lintner, 1956; Kumar, 1987; Jaramillo et al., 1993).
With that, our proposition rests on the assumption that there exists an optimum debt-equity mix for firms in less developed countries (LDCs), especially in view of variousmarket distortions. In the next subsection, we highlight further the theoretical link betweeninterest rates and corporate financing options as a basis for understanding the focus ofthis study.
8 RESEARCH PAPER 88
Interest rates and corporate finance link
There is no doubt a theoretical link exists between interest rates and the financial structureof firms. Interest rates operate through their influence on the cost of capital to the investor,as well as on returns to various groups of savers. A change in the interest rates affects thedebt-equity choice of a firm, the overall cost of capital and real interest rates, and therebysets in motion a chain of responses influencing the desired level of the capital stock andits productivity as well as the availability of savings and consequent speed of adjustmentof the actual capital stock to its desired level.
The debt-equity ratio is important because the overall cost of capital to investors,which influences fixed investments, their efficiency, and profits can be expressed as aweighted sum of the opportunity cost of bank debt and of equity, with the weightsdepending upon the debt-equity ratio. Therefore, the multiplier effects of changes in thecost of bank debt, on the overall cost of capital, depend among other things on the shareof debt in investment financing and on the induced adjustment in this share and in thecost of equity. Further, the cost of equity is said to incorporate a risk premium that firstfalls and then rises as the debt-equity ratio rises. The resulting U-shaped cost of capitalhas been proved to have far-reaching implications for the effectiveness of interest ratepolicy (Sundararajan, 1987).
In general, the desired debt-equity ratio will be positively related to the implicit interestsubsidy on credit from the regulated financial markets. Therefore, the direct effects ofinterest rates on savings and investment can be reinforced or offset by the substantialindirect effects arising from the optimal adjustments in the implicit interest subsidy, andhence induce a fall in the debt-equity ratio.
Other channels through which the interest rates influence the financial structure offirms include the neoclassical rental-wage ratio by which higher interest rates raise therelative price of capital and thereby encourage more intensive use of capital and capital-labour substitution. Another is the project evaluation mechanism by which higher realinterest rates may improve the quality and efficiency of bank credit rationing, therebyweeding out projects that were profitable only with lower interest rates and encouragingthose with higher yields. The financial deepening that directly influences factorproductivity through higher real rates of interest is another channel, and finally there isthe portfolio choice that diverts savings from low-yielding, self-financed investments tothe acquisition of financial assets, through higher yields (McKinnon, 1973; Shaw, 1973;Fry, 1982; Sundararajan, 1987). From all indications, however, the link between theinterest rates and corporate capital structures as well as the pattern of influence of corporatefinancing strategies on the effectiveness of interest rate policies, warrant attention becauseof its implication for resource mobilization, production and growth.
THE IMPACT OF INTEREST RATES LIBERALIZATION ON THE CORPOATE FINANCING STRATEGIES OF QUOTED
COMPANIES IN NIGERIA 9
III. Theoretical framework
Our analysis of the debt-equity mix of firms in this study is rested on the new theoreticaldevelopments that invalidate some of the restrictive assumptions of the M-M propositionson corporate finance. That is, the finance of firms in less developed countries (LDCs)under the problems of taxation and asymmetric information.
The choice of this analytical framework is informed by the recent conclusions ofmany of the studies that are directed to the analysis of firms’ capital structure andinvestment decisions in LDCs including Nigeria. Of interest, it has been identified thatproblems of agency costs, asymmetric information between insiders (managers) andoutsiders (creditors, or shareholders), problems of adverse selection, moral hazard,taxation, signaling, and transaction costs result in a divergence in the cost of internal andexternal sources of finance, with adverse effects on the allocation of investible funds.Moreover, many of these studies have confirmed that the problems of agency costs in thepresence of asymmetric information in LDCs are militating against the use of debt financeby corporate firms. In addition, these identified market distortions, coupled with thehigher tax costs on equity finance, have resulted in general underinvestment in LDCs soas to maintain a lower cost of corporate finance (Sundararajan, 1987; Harris et al., 1992;Jaramillo et al., 1993).
In fact, the identified market distortions in the corporate finance of firms in LDCshave often influenced the financing options chosen by many entrepreneurs, with attendanteffects on firm operations. In particular, the behaviours of many of these corporatemanagers in LDCs have negated the prediction of the traditional economic models thatrequires funds for investment to flow to projects with the highest expected return.Therefore, the higher tax costs, agency costs, transaction costs, etc., have constitutedsome barriers to the efficient allocation of capital across firms in LDCs (Sundararajan,1987; Morisset, 1991; Harris et al, 1992; and Jaramillo et al., 1993). In addition, theasymmetric information in LDCs has presented a different type of barrier to the efficientallocation of capital in that it has resulted in either overinvestment or underinvestment inthe economies. To be precise, there are occasions when funds are applied to projectswith low expected returns (see Lyon, 1992; Jaramillo et al., 1993).
Therefore, contrary to the M-M theorem, which suggested a dichotomy betweenfinance and the real economy, the behaviours of corporate management in LDCs suggestthat finance is not simply a veil, but that there are very important interactions betweencorporate finance and the real economy. That is, corporate growth and investmentdecisions in LDCs are dictated by both financial and real variables.
10 RESEARCH PAPER 88
Our tentative conclusions, then, are that the financing and real decisions of firm(s) inLDCs are no longer independent. In other words, due to the agency cost arguments inthe presence of asymmetric information in LDCs, certain types of projects are morelikely to obtain financing at a lower cost using equity finance rather than debt finance.However, if the tax costs of equity are higher than those of debt, these projects may berelatively under financed (see Barnea et al., 1985; Dammon and Senbet, 1988; Lyon,1992).
In a nutshell, our proposition in this study follows Sundararajan’s (1987) hypothesis,which assumes the existence of an optimum debt-equity mix for firms. Empirically, thecost of capital depends on the debt-equity mix first falling and then rising as the debtratio rises. Notably, the findings of Sundararajan (1987) corroborate the existing peculiarnature of LDCs’ financial markets, which are full of imperfections in spite of theliberalization programmes. Apart from the interest rates subsidy or the rate of inflation,which is the driving force in the model, this study also takes into consideration otherdistortions such as agency costs, differential taxation, bankruptcy, moral hazard,transaction costs and asymmetric information in the analysis of the debt-equity mix ofquoted companies in Nigeria. The methodology for tracking this relationship is presentedin the next section.
THE IMPACT OF INTEREST RATES LIBERALIZATION ON THE CORPOATE FINANCING STRATEGIES OF QUOTED
COMPANIES IN NIGERIA 11
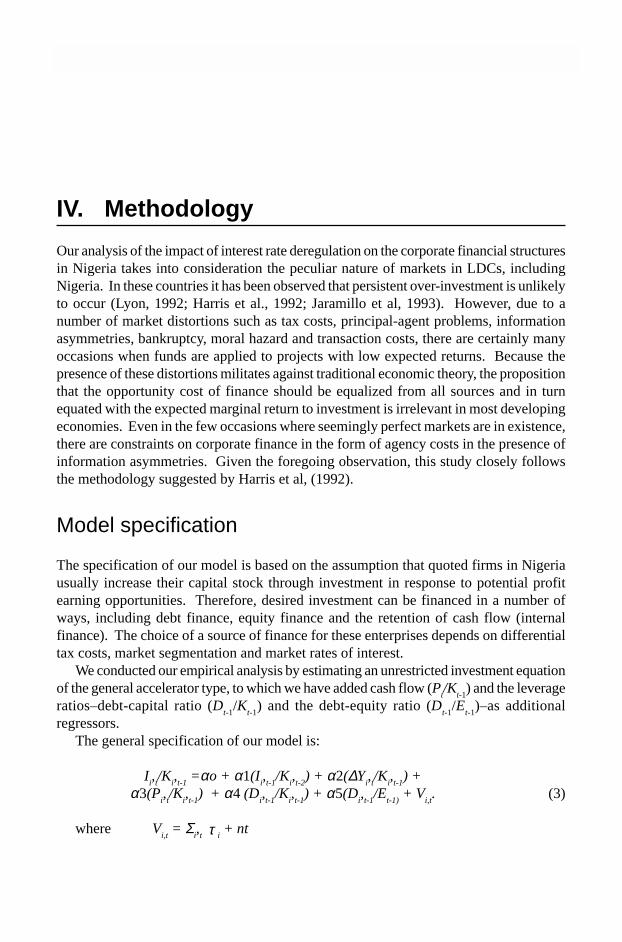
IV. Methodology
Our analysis of the impact of interest rate deregulation on the corporate financial structuresin Nigeria takes into consideration the peculiar nature of markets in LDCs, includingNigeria. In these countries it has been observed that persistent over-investment is unlikelyto occur (Lyon, 1992; Harris et al., 1992; Jaramillo et al, 1993). However, due to anumber of market distortions such as tax costs, principal-agent problems, informationasymmetries, bankruptcy, moral hazard and transaction costs, there are certainly manyoccasions when funds are applied to projects with low expected returns. Because thepresence of these distortions militates against traditional economic theory, the propositionthat the opportunity cost of finance should be equalized from all sources and in turnequated with the expected marginal return to investment is irrelevant in most developingeconomies. Even in the few occasions where seemingly perfect markets are in existence,there are constraints on corporate finance in the form of agency costs in the presence ofinformation asymmetries. Given the foregoing observation, this study closely followsthe methodology suggested by Harris et al, (1992).
Model specification
The specification of our model is based on the assumption that quoted firms in Nigeriausually increase their capital stock through investment in response to potential profitearning opportunities. Therefore, desired investment can be financed in a number ofways, including debt finance, equity finance and the retention of cash flow (internalfinance). The choice of a source of finance for these enterprises depends on differentialtax costs, market segmentation and market rates of interest.
We conducted our empirical analysis by estimating an unrestricted investment equationof the general accelerator type, to which we have added cash flow (P
t/K
t-1) and the leverage
ratios–debt-capital ratio (Dt-1
/Kt-1
) and the debt-equity ratio (Dt-1
/Et-1
)–as additionalregressors.
The general specification of our model is:
Ii,t/K
i,t-1
=αo + α1(Ii,t-1
/Ki,t-2
) + α2(∆Yi,t/K
i,t-1
) +α3(P
i,t/K
i,t-1
) + α4 (Di,t-1
/Ki,t-1
) + α5(Di,t-1
/Et-1)
+ Vi,t. (3)
where Vi,t = Σ
i,t τ i
+ nt
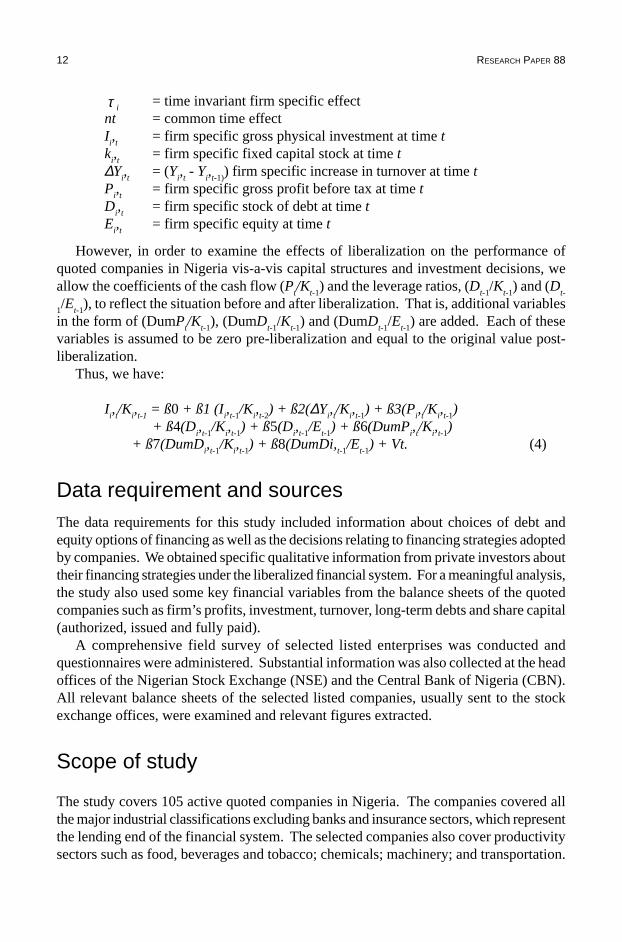
12 RESEARCH PAPER 88
τ i= time invariant firm specific effect
nt = common time effectI
i,t
= firm specific gross physical investment at time tk
i,t
= firm specific fixed capital stock at time t∆Y
i,t
= (Yi,t - Y
i,t-1)
) firm specific increase in turnover at time tP
i,t
= firm specific gross profit before tax at time tD
i,t
= firm specific stock of debt at time tE
i,t
= firm specific equity at time t
However, in order to examine the effects of liberalization on the performance ofquoted companies in Nigeria vis-a-vis capital structures and investment decisions, weallow the coefficients of the cash flow (P
t/K
t-1) and the leverage ratios, (D
t-1/K
t-1) and (D
t-
1/E
t-1), to reflect the situation before and after liberalization. That is, additional variables
in the form of (DumPt/K
t-1), (DumD
t-1/K
t-1) and (DumD
t-1/E
t-1) are added. Each of these
variables is assumed to be zero pre-liberalization and equal to the original value post-liberalization.
Thus, we have:
Ii,t/K
i,t-1
= ß0 + ß1 (Ii,t-1
/Ki,t-2
) + ß2(∆Yi,t/K
i,t-1
) + ß3(Pi,t/K
i,t-1
)+ ß4(D
i,t-1
/Ki,t-1
) + ß5(Di,t-1
/Et-1
) + ß6(DumPi,t/K
i,t-1
)+ ß7(DumD
i,t-1
/Ki,t-1
) + ß8(DumDi,t-1
/Et-1
) + Vt. (4)
Data requirement and sourcesThe data requirements for this study included information about choices of debt andequity options of financing as well as the decisions relating to financing strategies adoptedby companies. We obtained specific qualitative information from private investors abouttheir financing strategies under the liberalized financial system. For a meaningful analysis,the study also used some key financial variables from the balance sheets of the quotedcompanies such as firm’s profits, investment, turnover, long-term debts and share capital(authorized, issued and fully paid).
A comprehensive field survey of selected listed enterprises was conducted andquestionnaires were administered. Substantial information was also collected at the headoffices of the Nigerian Stock Exchange (NSE) and the Central Bank of Nigeria (CBN).All relevant balance sheets of the selected listed companies, usually sent to the stockexchange offices, were examined and relevant figures extracted.
Scope of study
The study covers 105 active quoted companies in Nigeria. The companies covered allthe major industrial classifications excluding banks and insurance sectors, which representthe lending end of the financial system. The selected companies also cover productivitysectors such as food, beverages and tobacco; chemicals; machinery; and transportation.

THE IMPACT OF INTEREST RATES LIBERALIZATION ON THE CORPOATE FINANCING STRATEGIES OF QUOTED
COMPANIES IN NIGERIA 13
Survey procedures
The study team visited all the establishments and met with officials of the companies toacquaint them with the focus and objectives of the study. The discussions centred aroundtheir experiences and opinions about the impact of liberalization on their operations.
Following the discussions, the team administered questionnaires to all 105 companiesto obtain additional information. About 62% responded fully.
To complement the information from the survey, the study team visited the offices ofthe NSE, CBN and the Federal Office of Statistics (FOS). Discussions were held withthe respective officers, and relevant data were collected from the books. A comprehensiveanalysis of the results is provided next.
14 RESEARCH PAPER 88
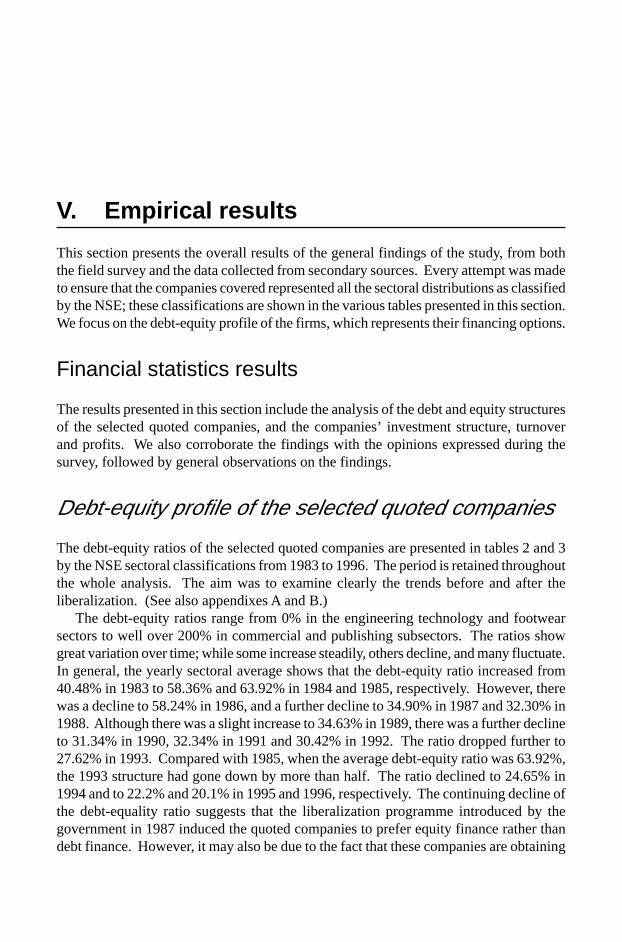
V. Empirical results
This section presents the overall results of the general findings of the study, from boththe field survey and the data collected from secondary sources. Every attempt was madeto ensure that the companies covered represented all the sectoral distributions as classifiedby the NSE; these classifications are shown in the various tables presented in this section.We focus on the debt-equity profile of the firms, which represents their financing options.
Financial statistics results
The results presented in this section include the analysis of the debt and equity structuresof the selected quoted companies, and the companies’ investment structure, turnoverand profits. We also corroborate the findings with the opinions expressed during thesurvey, followed by general observations on the findings.
Debt-equity profile of the selected quoted companies
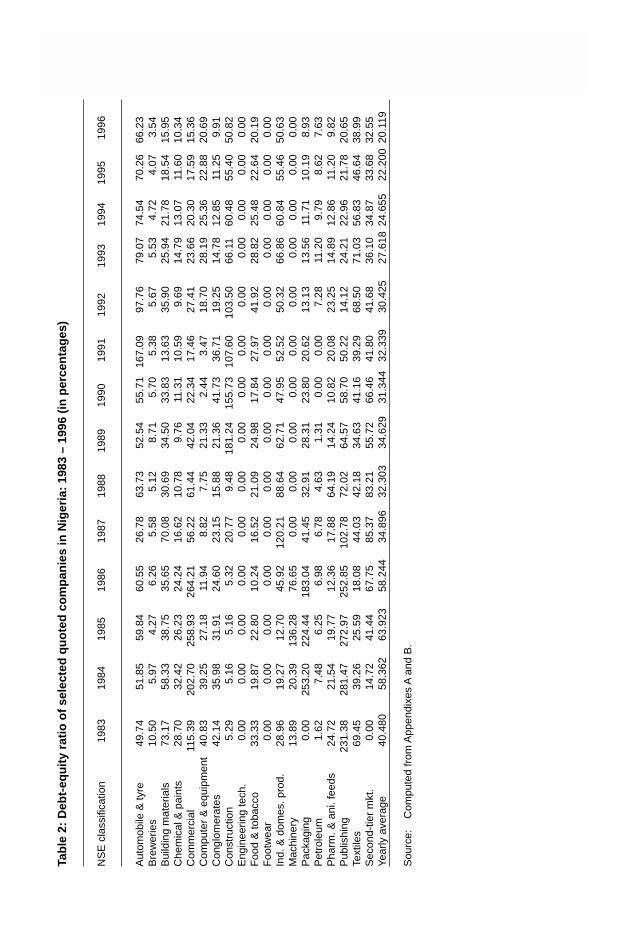
The debt-equity ratios of the selected quoted companies are presented in tables 2 and 3by the NSE sectoral classifications from 1983 to 1996. The period is retained throughoutthe whole analysis. The aim was to examine clearly the trends before and after theliberalization. (See also appendixes A and B.)
The debt-equity ratios range from 0% in the engineering technology and footwearsectors to well over 200% in commercial and publishing subsectors. The ratios showgreat variation over time; while some increase steadily, others decline, and many fluctuate.In general, the yearly sectoral average shows that the debt-equity ratio increased from40.48% in 1983 to 58.36% and 63.92% in 1984 and 1985, respectively. However, therewas a decline to 58.24% in 1986, and a further decline to 34.90% in 1987 and 32.30% in1988. Although there was a slight increase to 34.63% in 1989, there was a further declineto 31.34% in 1990, 32.34% in 1991 and 30.42% in 1992. The ratio dropped further to27.62% in 1993. Compared with 1985, when the average debt-equity ratio was 63.92%,the 1993 structure had gone down by more than half. The ratio declined to 24.65% in1994 and to 22.2% and 20.1% in 1995 and 1996, respectively. The continuing decline ofthe debt-equality ratio suggests that the liberalization programme introduced by thegovernment in 1987 induced the quoted companies to prefer equity finance rather thandebt finance. However, it may also be due to the fact that these companies are obtaining
THE IMPACT OF INTEREST RATES LIBERALIZATION ON THE CORPOATE FINANCING STRATEGIES OF QUOTED
COMPANIES IN NIGERIA 15Ta
ble
2:
Deb
t-eq
uit
y ra
tio
of
sele
cted
qu
ote
d c
om
pan
ies
in N
iger
ia:
1983
– 1
996
(in
per
cen
tag
es)
NS
E c
lass
ifica
tion
1983
1984
1985
1986
1987
1988
1989
1990
1991
1992
1993
1994
1995
1996
Aut
omob
ile &
tyre
49.7
451
.85
59.8
460
.55
26.7
863
.73
52.5
455
.71
167.
0997
.76
79.0
774
.54
70.2
666
.23
Bre
wer
ies
10.5
05.
974.
276.
265.
585.
128.
715.
705.
385.
675.
534.
724.
073.
54B
uild
ing
mat
eria
ls73
.17
58.3
338
.75
35.6
570
.08
30.6
934
.50
33.8
313
.63
35.9
025
.94
21.7
818
.54
15.9
5C
hem
ical
& p
aint
s28
.70
32.4
226
.23
24.2
416
.62
10.7
89.
7611
.31
10.5
99.
6914
.79
13.0
711
.60
10.3
4C
omm
erci
al11
5.39
202.
7025
8.93
264.
2156
.22
61.4
442
.04
22.3
417
.46
27.4
123
.66
20.3
017
.59
15.3
6C
ompu
ter
& e
quip
men
t40
.83
39.2
527
.18
11.9
48.
827.
7521
.33
2.44
3.47
18.7
028
.19
25.3
622
.88
20.6
9C
ongl
omer
ates
42.1
435
.98
31.9
124
.60
23.1
515
.88
21.3
641
.73
36.7
119
.25
14.7
812
.85
11.2
59.
91C
onst
ruct
ion
5.29
5.16
5.16
5.32
20.7
79.
4818
1.24
155.
7310
7.60
103.
5066
.11
60.4
855
.40
50.8
2E
ngin
eerin
g te
ch.
0.00
0.00
0.00
0.00
0.00
0.00
0.00
0.00
0.00
0.00
0.00
0.00
0.00
0.00
Foo
d &
toba
cco
33.3
319
.87
22.8
010
.24
16.5
221
.09
24.9
817
.84
27.9
741
.92
28.8
225
.48
22.6
420
.19
Foo
twea
r0.
000.
000.
000.
000.
000.
000.
000.
000.
000.
000.
000.
000.
000.
00In
d. &
dom
es. p
rod.
28.9
619
.27
12.7
045
.92
120.
2188
.64
62.7
147
.95
52.5
250
.32
66.8
660
.84
55.4
650
.63
Mac
hine
ry13
.89
20.3
913
6.28
76.6
50.
000.
000.
000.
000.
000.
000.
000.
000.
000.
00P
acka
ging
0.00
253.
2022
4.44
183.
0441
.45
32.9
128
.31
23.8
020
.62
13.1
313
.56
11.7
110
.19
8.93
Pet
role
um1.
627.
486.
256.
986.
784.
631.
310.
000.
007.
2811
.20
9.79
8.62
7.63
Pha
rm. &
ani
. fee
ds24
.72
21.5
419
.77
12.3
617
.88
64.1
914
.24
10.8
220
.08
23.2
514
.89
12.8
611
.20
9.82
Pub
lishi
ng23
1.38
281.
4727
2.97
252.
8510
2.78
72.0
264
.57
58.7
050
.22
14.1
224
.21
22.9
621
.78
20.6
5Te
xtile
s69
.45
39.2
625
.59
18.0
844
.03
42.1
834
.63
41.1
639
.29
68.5
071
.03
56.8
346
.64
38.9
9S
econ
d-tie
r m
kt.
0.00
14.7
241
.44
67.7
585
.37
83.2
155
.72
66.4
641
.80
41.6
836
.10
34.8
733
.68
32.5
5Ye
arly
ave
rage
40.4
8058
.362
63.9
2358
.244
34.8
9632
.303
34.6
2931
.344
32.3
3930
.425
27.6
1824
.655
22.2
0020
.119
Sou
rce:
Com
pute
d fr
om A
ppen
dixe
s A
and
B.
16 RESEARCH PAPER 88
finance at the capital market at a lower cost, resulting from both the tax subsidy and thehigh interest rates at the money market.
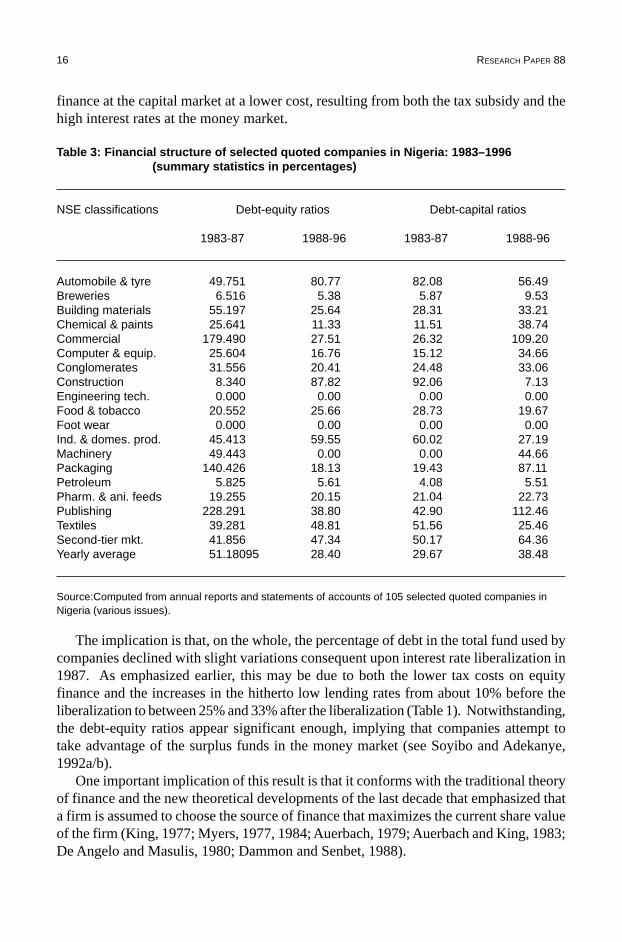
Table 3: Financial structure of selected quoted companies in Nigeria: 1983–1996(summary statistics in percentages)
NSE classifications Debt-equity ratios Debt-capital ratios
1983-87 1988-96 1983-87 1988-96
Automobile & tyre 49.751 80.77 82.08 56.49Breweries 6.516 5.38 5.87 9.53Building materials 55.197 25.64 28.31 33.21Chemical & paints 25.641 11.33 11.51 38.74Commercial 179.490 27.51 26.32 109.20Computer & equip. 25.604 16.76 15.12 34.66Conglomerates 31.556 20.41 24.48 33.06Construction 8.340 87.82 92.06 7.13Engineering tech. 0.000 0.00 0.00 0.00Food & tobacco 20.552 25.66 28.73 19.67Foot wear 0.000 0.00 0.00 0.00Ind. & domes. prod. 45.413 59.55 60.02 27.19Machinery 49.443 0.00 0.00 44.66Packaging 140.426 18.13 19.43 87.11Petroleum 5.825 5.61 4.08 5.51Pharm. & ani. feeds 19.255 20.15 21.04 22.73Publishing 228.291 38.80 42.90 112.46Textiles 39.281 48.81 51.56 25.46Second-tier mkt. 41.856 47.34 50.17 64.36Yearly average 51.18095 28.40 29.67 38.48
Source:Computed from annual reports and statements of accounts of 105 selected quoted companies inNigeria (various issues).
The implication is that, on the whole, the percentage of debt in the total fund used bycompanies declined with slight variations consequent upon interest rate liberalization in1987. As emphasized earlier, this may be due to both the lower tax costs on equityfinance and the increases in the hitherto low lending rates from about 10% before theliberalization to between 25% and 33% after the liberalization (Table 1). Notwithstanding,the debt-equity ratios appear significant enough, implying that companies attempt totake advantage of the surplus funds in the money market (see Soyibo and Adekanye,1992a/b).
One important implication of this result is that it conforms with the traditional theoryof finance and the new theoretical developments of the last decade that emphasized thata firm is assumed to choose the source of finance that maximizes the current share valueof the firm (King, 1977; Myers, 1977, 1984; Auerbach, 1979; Auerbach and King, 1983;De Angelo and Masulis, 1980; Dammon and Senbet, 1988).
THE IMPACT OF INTEREST RATES LIBERALIZATION ON THE CORPOATE FINANCING STRATEGIES OF QUOTED
COMPANIES IN NIGERIA 17
Also, if we take a look at Table 3, which summarizes the financial structure of thequoted companies for the periods of pre-liberalization (1983–1987) and post-liberalization(1988–1996), we will observe that a lot of dramatic changes occurred during theliberalization programme. Notably, the degrees of leverage (ie., debt-equity ratios anddebt-capital stock ratio) vary across sectors during the period. While these financialratios declined in 10 sectors (breweries, building materials, chemicals and paints,commercial, computer and office equipment, conglomerates, machinery, packaging,petroleum, and publishing) during the post-liberalization period, they went up in theother sectors. Specifically, during the post-liberalization period the debt-equity ratio offirms declined significantly in publishing, commercial, packaging, and machinery, byabout 199, 152, 122 and 49 percentage points, respectively. In the same vein, the debt-capital stock ratio declined in these four sectors by about 69, 23, 68 and 45 percentagepoints, respectively. The debt-equity ratio increased significantly in two sectors,automobile and tyres, and construction, by about 3 and 8 percentage points, respectively,in the period of 1988–1996. The increase in the debt-equity ratios of these two companiesis not unconnected with the federal government’s mass transit programme and the housingpolicy, which made them targets of subsidized credit from the government.
On the periodic average, the debt-equity ratio declined by about 23 percentage pointsin 1988–1996 from about 51.2% in 1983–1987. The debt-capital stock ratio also increasedby about 9 percentage points during the post-liberalization period. Another importantimplication of the result is that the development in the money market has given a boostto the stock market activities through increased patronage, which has tended to boost theoverall market capitalization from about N8.9 billion in 1987 to about N285.6 billion in1996. No doubt, the liberalization of the money market has given great impetus to thedevelopment of capital market (see Ogwumike and Omole, 1990; Omole, 1993; NSE,1997). Figure 1 shows the debt equity-ratio trend between 1983 and 1996, while Figure2 presents the pictorial representation of the financial structure of selected quoted firmsin the study.
Investment structure of the selected quoted companies
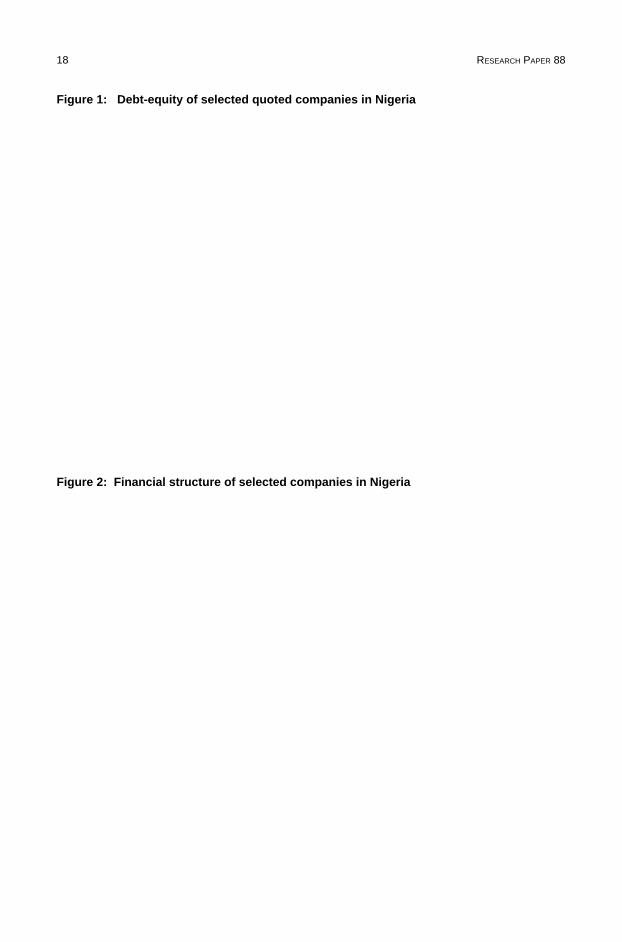
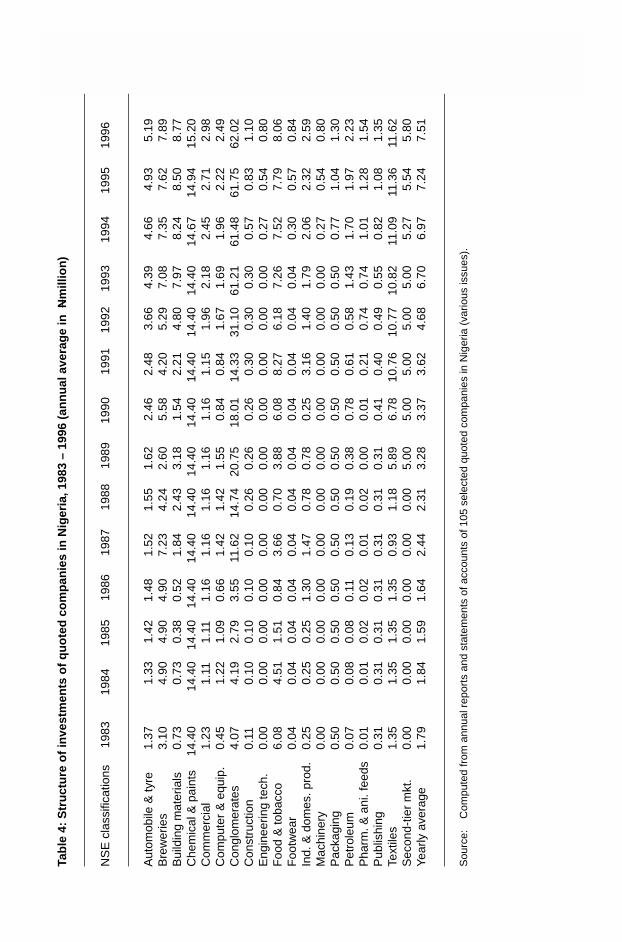
Table 4 shows the investment structure of the selected firms by sectors from 1983 to1996. (See also Appendix C). Across sectors, the investment by firms varies, rangingfrom zero in engineering technology and machinery subsectors to well over N14 millionin the chemical and paints subsectors and about N62 million in conglomerates. Investmentlevels in the breweries, commercial and textiles subsectors also vary from about N1million to N11 million.
In general, the investment structure shows a progressive pattern from 1983 to 1996with the exceptions of chemical and paints, packaging, and footwear, where the investmentlevels appear to have been fixed at N14 million, N0.5 million and N0.04 million,respectively. Others, except the machinery and engineering subsectors, exhibit aprogressive level of investment.
18 RESEARCH PAPER 88
Figure 1: Debt-equity of selected quoted companies in Nigeria
Figure 2: Financial structure of selected companies in Nigeria
THE IMPACT OF INTEREST RATES LIBERALIZATION ON THE CORPOATE FINANCING STRATEGIES OF QUOTED
COMPANIES IN NIGERIA 19Ta
ble
4:
Str
uct
ure
of
inve
stm
ents
of
qu
ote
d c
om
pan
ies
in N
iger
ia, 1
983
– 19
96 (
ann
ual
ave
rag
e in
Nm
illio
n)
NS
E c
lass
ifica
tions
1983
1984
1985
1986
1987
1988
1989
1990
1991
1992
1993
1994
1995
1996
Aut
omob
ile &
tyre
1.37
1.33
1.42
1.48
1.52
1.55
1.62
2.46
2.48
3.66
4.39
4.66
4.93
5.19
Bre
wer
ies
3.10
4.90
4.90
4.90
7.23
4.24
2.60
5.58
4.20
5.29
7.08
7.35
7.62
7.89
Bui
ldin
g m
ater
ials
0.73
0.73
0.38
0.52
1.84
2.43
3.18
1.54
2.21
4.80
7.97
8.24
8.50
8.77
Che
mic
al &
pai
nts
14.4
014
.40
14.4
014
.40
14.4
014
.40
14.4
014
.40
14.4
014
.40
14.4
014
.67
14.9
415
.20
Com
mer
cial
1.23
1.11
1.11
1.16
1.16
1.16
1.16
1.16
1.15
1.96
2.18
2.45
2.71
2.98
Com
pute
r &
equ
ip.
0.45
1.22
1.09
0.66
1.42
1.42
1.55
0.84
0.84
1.67
1.69
1.96
2.22
2.49
Con
glom
erat
es4.
074.
192.
793.
5511
.62
14.7
420
.75
18.0
114
.33
31.1
061
.21
61.4
861
.75
62.0
2C
onst
ruct
ion
0.11
0.10
0.10
0.10
0.10
0.26
0.26
0.26
0.30
0.30
0.30
0.57
0.83
1.10
Eng
inee
ring
tech
.0.
000.
000.
000.
000.
000.
000.
000.
000.
000.
000.
000.
270.
540.
80F
ood
& to
bacc
o6.
084.
511.
510.
843.
660.
703.
886.
088.
276.
187.
267.
527.
798.
06F
ootw
ear
0.04
0.04
0.04
0.04
0.04
0.04
0.04
0.04
0.04
0.04
0.04
0.30
0.57
0.84
Ind.
& d
omes
. pro
d.0.
250.
250.
251.
301.
470.
780.
780.
253.
161.
401.
792.
062.
322.
59M
achi
nery
0.00
0.00
0.00
0.00
0.00
0.00
0.00
0.00
0.00
0.00
0.00
0.27
0.54
0.80
Pac
kagi
ng0.
500.
500.
500.
500.
500.
500.
500.
500.
500.
500.
500.
771.
041.
30P
etro
leum
0.07
0.08
0.08
0.11
0.13
0.19
0.38
0.78
0.61
0.58
1.43
1.70
1.97
2.23
Pha
rm. &
ani
. fee
ds0.
010.
010.
020.
020.
010.
020.
000.
010.
210.
740.
741.
011.
281.
54P
ublis
hing
0.31
0.31
0.31
0.31
0.31
0.31
0.31
0.41
0.40
0.49
0.55
0.82
1.08
1.35
Text
iles
1.35
1.35
1.35
1.35
0.93
1.18
5.89
6.78
10.7
610
.77
10.8
211
.09
11.3
611
.62
Sec
ond-
tier
mkt
.0.
000.
000.
000.
000.
000.
005.
005.
005.
005.
005.
005.
275.
545.
80Ye
arly
ave
rage
1.79
1.84
1.59
1.64
2.44
2.31
3.28
3.37
3.62
4.68
6.70
6.97
7.24
7.51
Sou
rce:
Com
pute
d fr
om a
nnua
l rep
orts
and
sta
tem
ents
of a
ccou
nts
of 1
05 s
elec
ted
quot
ed c
ompa
nies
in N
iger
ia (
vario
us is
sues
).
20 RESEARCH PAPER 88
On the average, investment rose from N1.79 million in 1983 to N1.84 million in1985, declined to N1.64 million in 1986, but then jumped to N2.44 billion in 1987. Withthe exception of a slight decline to N2.31 million in 1988, investment has been on asteady rise to N3.28 million in 1989, N3.37 million in 1990, N3.62 million in 1991,N4.68 million in 1992, N6.70 million in 1993 and N7.51 in 1996.
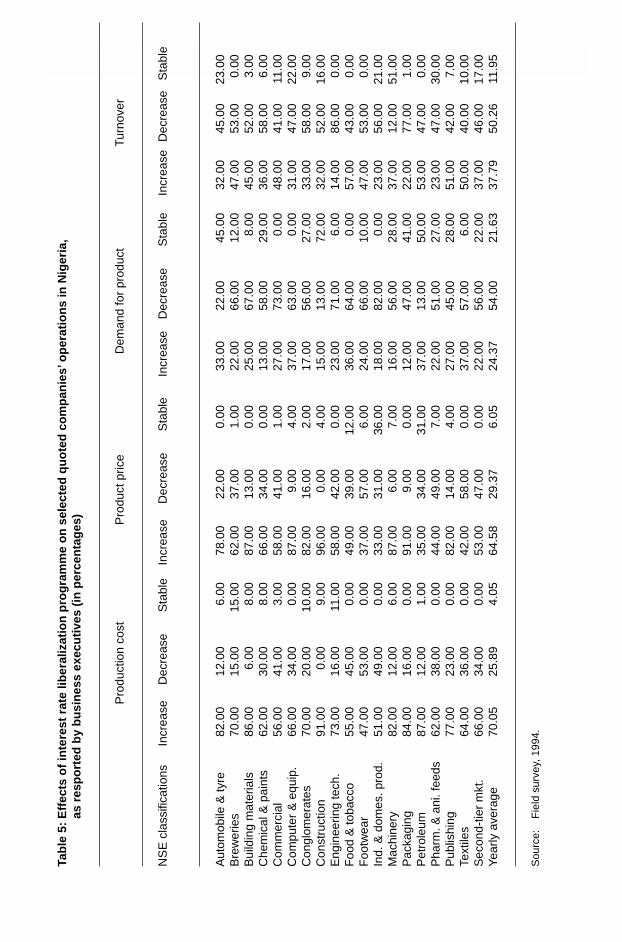
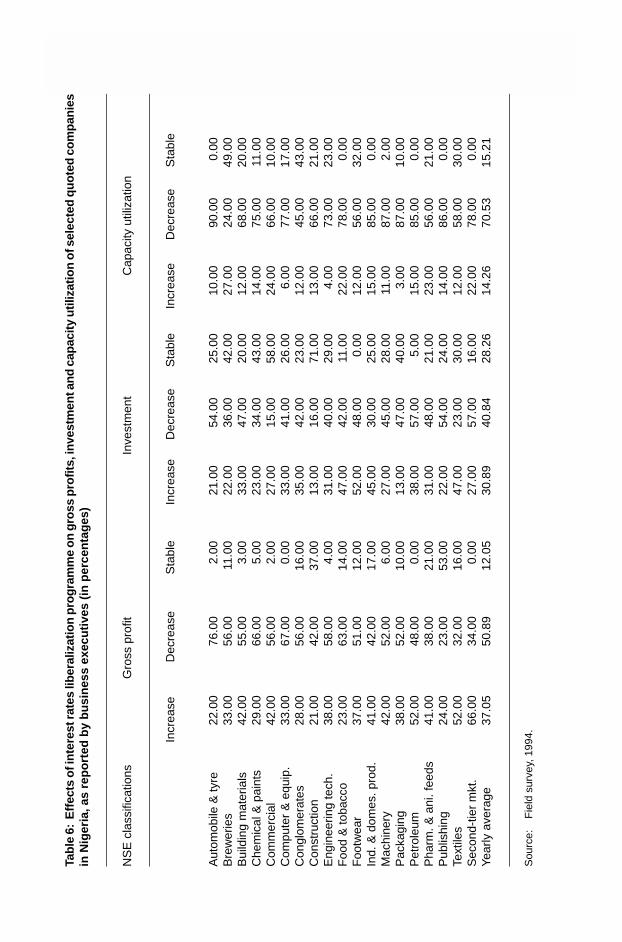
This phenomenon can be explained by the increase in level of savings consequentupon deregulation as confirmed by Ndekwu (1988) and Soyibo and Adekanye (1992a).Most firms plough back a reasonable proportion of their annual profits as a strategy forreducing their cost of capital, especially for investment purposes (Soyode 1978; Oyejide,1972, 1976). The trend, in a sense, confirms the opinion expressed by 31% of the businessexecutives across sectors that liberalization has caused their investments to increase (Table5). It should also be noted that about 37% of the executives admitted that their grossprofits have increased since the liberalization (Table 6). Across sectors, the claims thatprofits have increased vary from 21% in construction to about 66% in second-tier securitiescompanies. A corresponding 14% on the average have also concluded that their capacityutilization has increased, from 3% in packaging subsector to about 27% in the breweriessubsector. Figures 3 and 4 show the structure of investment of selected quoted companiesbetween 1983 and 1996. In the next section, we highlight the real turnover profiles ofthe companies in this study.
Real turnover profiles of the selected quoted companies
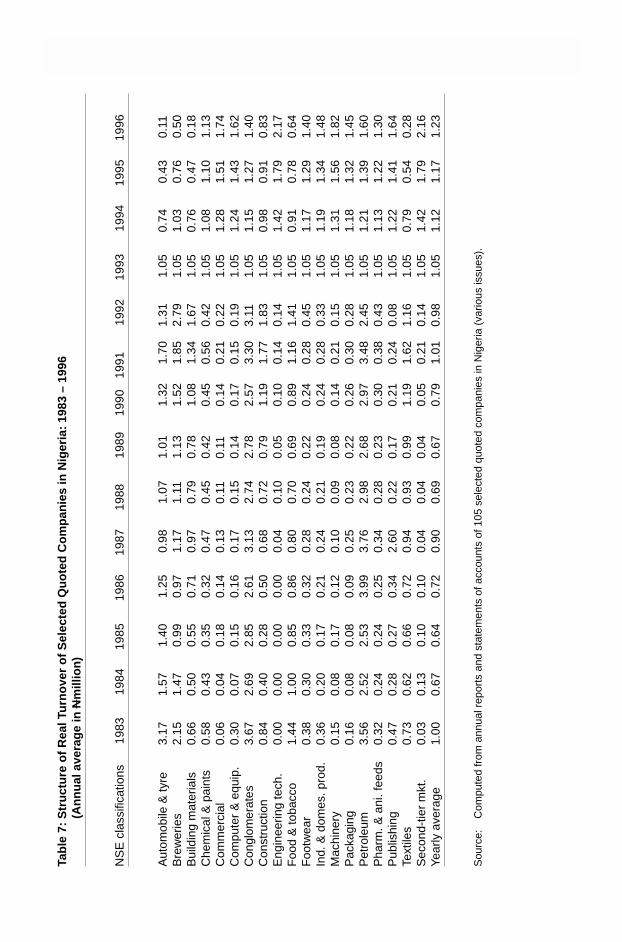
On the whole, it can be seen that the real turnover of companies as mirrored by theselected quoted companies has been on the increase, (Table 7). Available evidence showsthat on the average, real turnover declined from N1.0 million in 1983 to N0.67 million in1984, but rose to N0.72 million in 1986 and to N0.90 million in 1987. It declined againto N0.69 million in 1988 and further to N0.67 million in 1989, but started increasing in1990 from N0.79 million to about N1.2 million and N1.23 million in 1995 and 1996,respectively. (See also Appendix D).
It will be noted that this trend was confirmed by about 38% of the business peopleinterviewed across the sectors, who admitted that their annual business turnovers haveincreased in response to interest rate liberalization (Table 5). The increase in unit pricesconfirmed by about 65% of the business executives (Table 5) accounts for the remarkablegrowth in the quoted companies’ turnovers. In turn, the high turnovers both nominal andreal have yielded increased profits, resulting also from more efficient strategies ofcorporate financing. As a matter of fact, about 33% of the business executives havereported that they have no problem increasing their capital base owing to the remarkableincrease in turnover. Figure 5 presents the trend in the real turnover ratio of firms.
THE IMPACT OF INTEREST RATES LIBERALIZATION ON THE CORPOATE FINANCING STRATEGIES OF QUOTED
COMPANIES IN NIGERIA 21
Figure 3: Average investment of selected quoted companies in Nigeria
Figure 4: Structure of investment of selected quoted companies in Nigeria
22 RESEARCH PAPER 88Ta
ble
5:
Eff
ects
of
inte
rest
rat
e lib
eral
izat
ion
pro
gra
mm
e o
n s
elec
ted
qu
ote
d c
om
pan
ies’
op
erat
ion
s in
Nig
eria
,as
res
po
rted
by
bu
sin
ess
exec
uti
ves
(in
per
cen
tag
es)
Pro
duct
ion
cost
Pro
duct
pric
eD
eman
d fo
r pr
oduc
tTu
rnov
er
NS
E c
lass
ifica
tions
Incr
ease
Dec
reas
eS
tabl
eIn
crea
seD
ecre
ase
Sta
ble
Incr
ease
Dec
reas
eS
tabl
eIn
crea
seD
ecre
ase
Sta
ble
Aut
omob
ile &
tyre
82.0
012
.00
6.00
78.0
022
.00
0.00
33.0
022
.00
45.0
032
.00
45.0
023
.00
Bre
wer
ies
70.0
015
.00
15.0
062
.00
37.0
01.
0022
.00
66.0
012
.00
47.0
053
.00
0.00
Bui
ldin
g m
ater
ials
86.0
06.
008.
0087
.00
13.0
00.
0025
.00
67.0
08.
0045
.00
52.0
03.
00C
hem
ical
& p
aint
s62
.00
30.0
08.
0066
.00
34.0
00.
0013
.00
58.0
029
.00
36.0
058
.00
6.00
Com
mer
cial
56.0
041
.00
3.00
58.0
041
.00
1.00
27.0
073
.00
0.00
48.0
041
.00
11.0
0C
ompu
ter
& e
quip
.66
.00
34.0
00.
0087
.00
9.00
4.00
37.0
063
.00
0.00
31.0
047
.00
22.0
0C
ongl
omer
ates
70.0
020
.00
10.0
082
.00
16.0
02.
0017
.00
56.0
027
.00
33.0
058
.00
9.00
Con
stru
ctio
n91
.00
0.00
9.00
96.0
00.
004.
0015
.00
13.0
072
.00
32.0
052
.00
16.0
0E
ngin
eerin
g te
ch.
73.0
016
.00
11.0
058
.00
42.0
00.
0023
.00
71.0
06.
0014
.00
86.0
00.
00F
ood
& to
bacc
o55
.00
45.0
00.
0049
.00
39.0
012
.00
36.0
064
.00
0.00
57.0
043
.00
0.00
Foo
twea
r47
.00
53.0
00.
0037
.00
57.0
06.
0024
.00
66.0
010
.00
47.0
053
.00
0.00
Ind.
& d
omes
. pro
d.51
.00
49.0
00.
0033
.00
31.0
036
.00
18.0
082
.00
0.00
23.0
056
.00
21.0
0M
achi
nery
82.0
012
.00
6.00
87.0
06.
007.
0016
.00
56.0
028
.00
37.0
012
.00
51.0
0P
acka
ging
84.0
016
.00
0.00
91.0
09.
000.
0012
.00
47.0
041
.00
22.0
077
.00
1.00
Pet
role
um87
.00
12.0
01.
0035
.00
34.0
031
.00
37.0
013
.00
50.0
053
.00
47.0
00.
00P
harm
. & a
ni. f
eeds
62.0
038
.00
0.00
44.0
049
.00
7.00
22.0
051
.00
27.0
023
.00
47.0
030
.00
Pub
lishi
ng77
.00
23.0
00.
0082
.00
14.0
04.
0027
.00
45.0
028
.00
51.0
042
.00
7.00
Text
iles
64.0
036
.00
0.00
42.0
058
.00
0.00
37.0
057
.00
6.00
50.0
040
.00
10.0
0S
econ
d-tie
r m
kt.
66.0
034
.00
0.00
53.0
047
.00
0.00
22.0
056
.00
22.0
037
.00
46.0
017
.00
Yea
rly a
vera
ge70
.05
25.8
94.
0564
.58
29.3
76.
0524
.37
54.0
021
.63
37.7
950
.26
11.9
5
Sou
rce:
Fie
ld s
urve
y, 1
994.
THE IMPACT OF INTEREST RATES LIBERALIZATION ON THE CORPOATE FINANCING STRATEGIES OF QUOTED
COMPANIES IN NIGERIA 23Ta
ble
6:
Eff
ects
of i
nte
rest
rate
s lib
eral
izat
ion
pro
gra
mm
e o
n g
ross
pro
fits,
inve
stm
ent a
nd
cap
acity
util
izat
ion
of s
elec
ted
qu
ote
d c
om
pan
ies
in N
iger
ia, a
s re
po
rted
by
bu
sin
ess
exec
uti
ves
(in
per
cen
tag
es)
NS
E c
lass
ifica
tions
Gro
ss p
rofit
Inve
stm
ent
Cap
acity
util
izat
ion
Incr
ease
Dec
reas
eS
tabl
eIn
crea
seD
ecre
ase
Sta
ble
Incr
ease
Dec
reas
eS
tabl
e
Aut
omob
ile &
tyre
22.0
076
.00
2.00
21.0
054
.00
25.0
010
.00
90.0
00.
00B
rew
erie
s33
.00
56.0
011
.00
22.0
036
.00
42.0
027
.00
24.0
049
.00
Bui
ldin
g m
ater
ials
42.0
055
.00
3.00
33.0
047
.00
20.0
012
.00
68.0
020
.00
Che
mic
al &
pai
nts
29.0
066
.00
5.00
23.0
034
.00
43.0
014
.00
75.0
011
.00
Com
mer
cial
42.0
056
.00
2.00
27.0
015
.00
58.0
024
.00
66.0
010
.00
Com
pute
r &
equ
ip.
33.0
067
.00
0.00
33.0
041
.00
26.0
06.
0077
.00
17.0
0C
ongl
omer
ates
28.0
056
.00
16.0
035
.00
42.0
023
.00
12.0
045
.00
43.0
0C
onst
ruct
ion
21.0
042
.00
37.0
013
.00
16.0
071
.00
13.0
066
.00
21.0
0E
ngin
eerin
g te
ch.
38.0
058
.00
4.00
31.0
040
.00
29.0
04.
0073
.00
23.0
0F
ood
& to
bacc
o23
.00
63.0
014
.00
47.0
042
.00
11.0
022
.00
78.0
00.
00F
ootw
ear
37.0
051
.00
12.0
052
.00
48.0
00.
0012
.00
56.0
032
.00
Ind.
& d
omes
. pro
d.41
.00
42.0
017
.00
45.0
030
.00
25.0
015
.00
85.0
00.
00M
achi
nery
42.0
052
.00
6.00
27.0
045
.00
28.0
011
.00
87.0
02.
00P
acka
ging
38.0
052
.00
10.0
013
.00
47.0
040
.00
3.00
87.0
010
.00
Pet
role
um52
.00
48.0
00.
0038
.00
57.0
05.
0015
.00
85.0
00.
00P
harm
. & a
ni. f
eeds
41.0
038
.00
21.0
031
.00
48.0
021
.00
23.0
056
.00
21.0
0P
ublis
hing
24.0
023
.00
53.0
022
.00
54.0
024
.00
14.0
086
.00
0.00
Text
iles
52.0
032
.00
16.0
047
.00
23.0
030
.00
12.0
058
.00
30.0
0S
econ
d-tie
r m
kt.
66.0
034
.00
0.00
27.0
057
.00
16.0
022
.00
78.0
00.
00Ye
arly
ave
rage
37.0
550
.89
12.0
530
.89
40.8
428
.26
14.2
670
.53
15.2
1
Sou
rce:
Fie
ld s
urve
y, 1
994.
24 RESEARCH PAPER 88Ta
ble
7:
Str
uct
ure
of
Rea
l Tu
rno
ver
of
Sel
ecte
d Q
uo
ted
Co
mp
anie
s in
Nig
eria
: 19
83 –
199
6(A
nn
ual
ave
rag
e in
Nm
illio
n)
NS
E c
lass
ifica
tions
1983
1984
1985
1986
1987
1988
1989
1990
1991
1992
1993
1994
1995
1996
Aut
omob
ile &
tyre
3.17
1.57
1.40
1.25
0.98
1.07
1.01
1.32
1.70
1.31
1.05
0.74
0.43
0.11
Bre
wer
ies
2.15
1.47
0.99
0.97
1.17
1.11
1.13
1.52
1.85
2.79
1.05
1.03
0.76
0.50
Bui
ldin
g m
ater
ials
0.66
0.50
0.55
0.71
0.97
0.79
0.78
1.08
1.34
1.67
1.05
0.76
0.47
0.18
Che
mic
al &
pai
nts
0.58
0.43
0.35
0.32
0.47
0.45
0.42
0.45
0.56
0.42
1.05
1.08
1.10
1.13
Com
mer
cial
0.06
0.04
0.18
0.14
0.13
0.11
0.11
0.14
0.21
0.22
1.05
1.28
1.51
1.74
Com
pute
r &
equ
ip.
0.30
0.07
0.15
0.16
0.17
0.15
0.14
0.17
0.15
0.19
1.05
1.24
1.43
1.62
Con
glom
erat
es3.
672.
692.
852.
613.
132.
742.
782.
573.
303.
111.
051.
151.
271.
40C
onst
ruct
ion
0.84
0.40
0.28
0.50
0.68
0.72
0.79
1.19
1.77
1.83
1.05
0.98
0.91
0.83
Eng
inee
ring
tech
.0.
000.
000.
000.
000.
040.
100.
050.
100.
140.
141.
051.
421.
792.
17F
ood
& to
bacc
o1.
441.
000.
850.
860.
800.
700.
690.
891.
161.
411.
050.
910.
780.
64F
ootw
ear
0.38
0.30
0.33
0.32
0.28
0.24
0.22
0.24
0.28
0.45
1.05
1.17
1.29
1.40
Ind.
& d
omes
. pro
d.0.
360.
200.
170.
210.
240.
210.
190.
240.
280.
331.
051.
191.
341.
48M
achi
nery
0.15
0.08
0.17
0.12
0.10
0.09
0.08
0.14
0.21
0.15
1.05
1.31
1.56
1.82
Pac
kagi
ng0.
160.
080.
080.
090.
250.
230.
220.
260.
300.
281.
051.
181.
321.
45P
etro
leum
3.56
2.52
2.53
3.99
3.76
2.98
2.68
2.97
3.48
2.45
1.05
1.21
1.39
1.60
Pha
rm. &
ani
. fee
ds0.
320.
240.
240.
250.
340.
280.
230.
300.
380.
431.
051.
131.
221.
30P
ublis
hing
0.47
0.28
0.27
0.34
2.60
0.22
0.17
0.21
0.24
0.08
1.05
1.22
1.41
1.64
Text
iles
0.73
0.62
0.66
0.72
0.94
0.93
0.99
1.19
1.62
1.16
1.05
0.79
0.54
0.28
Sec
ond-
tier
mkt
.0.
030.
130.
100.
100.
040.
040.
040.
050.
210.
141.
051.
421.
792.
16Ye
arly
ave
rage
1.00
0.67
0.64
0.72
0.90
0.69
0.67
0.79
1.01
0.98
1.05
1.12
1.17
1.23
Sou
rce:
Com
pute
d fr
om a
nnua
l rep
orts
and
sta
tem
ents
of a
ccou
nts
of 1
05 s
elec
ted
quot
ed c
ompa
nies
in N
iger
ia (
vario
us is
sues
).
THE IMPACT OF INTEREST RATES LIBERALIZATION ON THE CORPOATE FINANCING STRATEGIES OF QUOTED
COMPANIES IN NIGERIA 25
Figure 5: Structure of real turnover of selected quoted companies in Nigeria
Profitability profile of the quoted companies
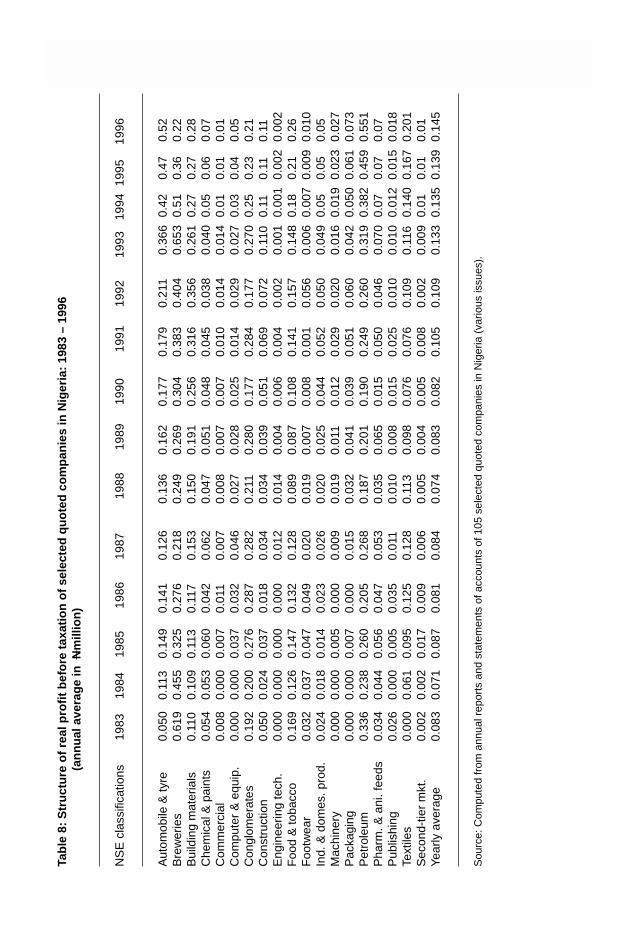
Two analytical measurements are reported in this subsection. First, we identified theratios of profit before taxation in relation to both the real turnover and the capital stockreflecting the profitability of quoted companies as percentage of sales and fixed assets(tables 8 and 9). Next, we computed the ratios of profit after taxation to equity, capitalstock and debt indicating the profitability of equity, capital stock and debt holdings,respectively (tables 10, 11 and 12). It will be recalled that in an effort to liberalize thenation’s financial sector, the policy authority in 1987 deregulated the interest rates andrelaxed all controls and administrative allocations of credits.
In a way, the results obtained in tables 8 to 12 corroborate the efforts of the governmentin this direction. For example, the annual ratios of real profit before taxation to realturnover (on the average) increased by about 10.6 percentage points, from about 3.78%in 1983 to about 12.42% in 1987 (Table 9). It further increased to about 13.07% in 1989,but went down to about 12.68% in 1993.
If we consider the average, annual sectoral growth rates of real profit to real salebetween the period before the deregulation of interest rates (1983 – 1987) and the periodof interest rates liberalization (1988 – 1996), there was greater improvement in industrialperformance in the latter period vis-a-vis quoted companies’ returns to sales. For example,the rate increased by about 1.27 percentage points, from about 9.45% in 1983 – 1987 toabout 10.72% in 1988 – 1996. In actual fact, if the growth rate of profit to sales ratios for
26 RESEARCH PAPER 88Ta
ble
8:
Str
uct
ure
of
real
pro
fit
bef
ore
tax
atio
n o
f se
lect
ed q
uo
ted
co
mp
anie
s in
Nig
eria
: 19
83 –
199
6(a
nn
ual
ave
rag
e in
Nm
illio
n)
NS
E c
lass
ifica
tions
1983
1984
1985
1986
1987
1988
1989
1990
1991
1992
1993
1994
1995
1996
Aut
omob
ile &
tyre
0.05
00.
113
0.14
90.
141
0.12
60.
136
0.16
20.
177
0.17
90.
211
0.36
60.
420.
470.
52B
rew
erie
s0.
619
0.45
50.
325
0.27
60.
218
0.24
90.
269
0.30
40.
383
0.40
40.
653
0.51
0.36
0.22
Bui
ldin
g m
ater
ials
0.11
00.
109
0.11
30.
117
0.15
30.
150
0.19
10.
256
0.31
60.
356
0.26
10.
270.
270.
28C
hem
ical
& p
aint
s0.
054
0.05
30.
060
0.04
20.
062
0.04
70.
051
0.04
80.
045
0.03
80.
040
0.05
0.06
0.07
Com
mer
cial
0.00
80.
000
0.00
70.
011
0.00
70.
008
0.00
70.
007
0.01
00.
014
0.01
40.
010.
010.
01C
ompu
ter
& e
quip
.0.
000
0.00
00.
037
0.03
20.
046
0.02
70.
028
0.02
50.
014
0.02
90.
027
0.03
0.04
0.05
Con
glom
erat
es0.
192
0.20
00.
276
0.28
70.
282
0.21
10.
280
0.17
70.
284
0.17
70.
270
0.25
0.23
0.21
Con
stru
ctio
n0.
050
0.02
40.
037
0.01
80.
034
0.03
40.
039
0.05
10.
069
0.07
20.
110
0.11
0.11
0.11
Eng
inee
ring
tech
.0.
000
0.00
00.
000
0.00
00.
012
0.01
40.
004
0.00
60.
004
0.00
20.
001
0.00
10.
002
0.00
2F
ood
& to
bacc
o0.
169
0.12
60.
147
0.13
20.
128
0.08
90.
087
0.10
80.
141
0.15
70.
148
0.18
0.21
0.26
Foo
twea
r0.
032
0.03
70.
047
0.04
90.
020
0.01
90.
007
0.00
80.
001
0.05
60.
006
0.00
70.
009
0.01
0In
d. &
dom
es. p
rod.
0.02
40.
018
0.01
40.
023
0.02
60.
020
0.02
50.
044
0.05
20.
050
0.04
90.
050.
050.
05M
achi
nery
0.00
00.
000
0.00
50.
000
0.00
90.
019
0.01
10.
012
0.02
90.
020
0.01
60.
019
0.02
30.
027
Pac
kagi
ng0.
000
0.00
00.
007
0.00
00.
015
0.03
20.
041
0.03
90.
051
0.06
00.
042
0.05
00.
061
0.07
3P
etro
leum
0.33
60.
238
0.26
00.
205
0.26
80.
187
0.20
10.
190
0.24
90.
260
0.31
90.
382
0.45
90.
551
Pha
rm. &
ani
. fee
ds0.
034
0.04
40.
056
0.04
70.
053
0.03
50.
065
0.01
50.
050
0.04
60.
070
0.07
0.07
0.07
Pub
lishi
ng0.
026
0.00
00.
005
0.03
50.
011
0.01
00.
008
0.01
50.
025
0.01
00.
010
0.01
20.
015
0.01
8Te
xtile
s0.
000
0.06
10.
095
0.12
50.
128
0.11
30.
098
0.07
60.
076
0.10
90.
116
0.14
00.
167
0.20
1S
econ
d-tie
r m
kt.
0.00
20.
002
0.01
70.
009
0.00
60.
005
0.00
40.
005
0.00
80.
002
0.00
90.
010.
010.
01Ye
arly
ave
rage
0.08
30.
071
0.08
70.
081
0.08
40.
074
0.08
30.
082
0.10
50.
109
0.13
30.
135
0.13
90.
145
Sou
rce:
Com
pute
d fr
om a
nnua
l rep
orts
and
sta
tem
ents
of a
ccou
nts
of 1
05 s
elec
ted
quot
ed c
ompa
nies
in N
iger
ia (
vario
us is
sues
).
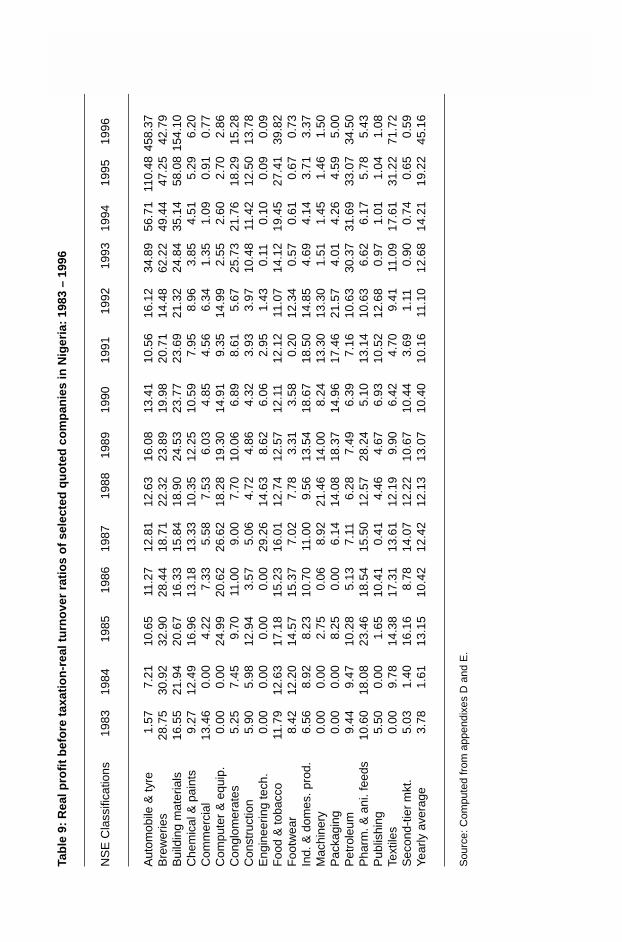
THE IMPACT OF INTEREST RATES LIBERALIZATION ON THE CORPOATE FINANCING STRATEGIES OF QUOTED
COMPANIES IN NIGERIA 27Ta
ble
9:
Rea
l pro
fit
bef
ore
tax
atio
n-r
eal t
urn
ove
r ra
tio
s o
f se
lect
ed q
uo
ted
co
mp
anie
s in
Nig
eria
: 19
83 –
199
6
NS
E C
lass
ifica
tions
1983
1984
1985
1986
1987
1988
1989
1990
1991
1992
1993
1994
1995
1996
Aut
omob
ile &
tyre
1.57
7.21
10.6
511
.27
12.8
112
.63
16.0
813
.41
10.5
616
.12
34.8
956
.71
110.
4845
8.37
Bre
wer
ies
28.7
530
.92
32.9
028
.44
18.7
122
.32
23.8
919
.98
20.7
114
.48
62.2
249
.44
47.2
542
.79
Bui
ldin
g m
ater
ials
16.5
521
.94
20.6
716
.33
15.8
418
.90
24.5
323
.77
23.6
921
.32
24.8
435
.14
58.0
815
4.10
Che
mic
al &
pai
nts
9.27
12.4
916
.96
13.1
813
.33
10.3
512
.25
10.5
97.
958.
963.
854.
515.
296.
20C
omm
erci
al13
.46
0.00
4.22
7.33
5.58
7.53
6.03
4.85
4.56
6.34
1.35
1.09
0.91
0.77
Com
pute
r &
equ
ip.
0.00
0.00
24.9
920
.62
26.6
218
.28
19.3
014
.91
9.35
14.9
92.
552.
602.
702.
86C
ongl
omer
ates
5.25
7.45
9.70
11.0
09.
007.
7010
.06
6.89
8.61
5.67
25.7
321
.76
18.2
915
.28
Con
stru
ctio
n5.
905.
9812
.94
3.57
5.06
4.72
4.86
4.32
3.93
3.97
10.4
811
.42
12.5
013
.78
Eng
inee
ring
tech
.0.
000.
000.
000.
0029
.26
14.6
38.
626.
062.
951.
430.
110.
100.
090.
09F
ood
& to
bacc
o11
.79
12.6
317
.18
15.2
316
.01
12.7
412
.57
12.1
112
.12
11.0
714
.12
19.4
527
.41
39.8
2F
ootw
ear
8.42
12.2
014
.57
15.3
77.
027.
783.
313.
580.
2012
.34
0.57
0.61
0.67
0.73
Ind.
& d
omes
. pro
d.6.
568.
928.
2310
.70
11.0
09.
5613
.54
18.6
718
.50
14.8
54.
694.
143.
713.
37M
achi
nery
0.00
0.00
2.75
0.06
8.92
21.4
614
.00
8.24
13.3
013
.30
1.51
1.45
1.46
1.50
Pac
kagi
ng0.
000.
008.
250.
006.
1414
.08
18.3
714
.96
17.4
621
.57
4.01
4.26
4.59
5.00
Pet
role
um9.
449.
4710
.28
5.13
7.11
6.28
7.49
6.39
7.16
10.6
330
.37
31.6
933
.07
34.5
0P
harm
. & a
ni. f
eeds
10.6
018
.08
23.4
618
.54
15.5
012
.57
28.2
45.
1013
.14
10.6
36.
626.
175.
785.
43P
ublis
hing
5.50
0.00
1.65
10.4
10.
414.
464.
676.
9310
.52
12.6
80.
971.
011.
041.
08Te
xtile
s0.
009.
7814
.38
17.3
113
.61
12.1
99.
906.
424.
709.
4111
.09
17.6
131
.22
71.7
2S
econ
d-tie
r m
kt.
5.03
1.40
16.1
68.
7814
.07
12.2
210
.67
10.4
43.
691.
110.
900.
740.
650.
59Ye
arly
ave
rage
3.78
1.61
13.1
510
.42
12.4
212
.13
13.0
710
.40
10.1
611
.10
12.6
814
.21
19.2
245
.16
Sou
rce:
Com
pute
d fr
om a
ppen
dixe
s D
and
E.
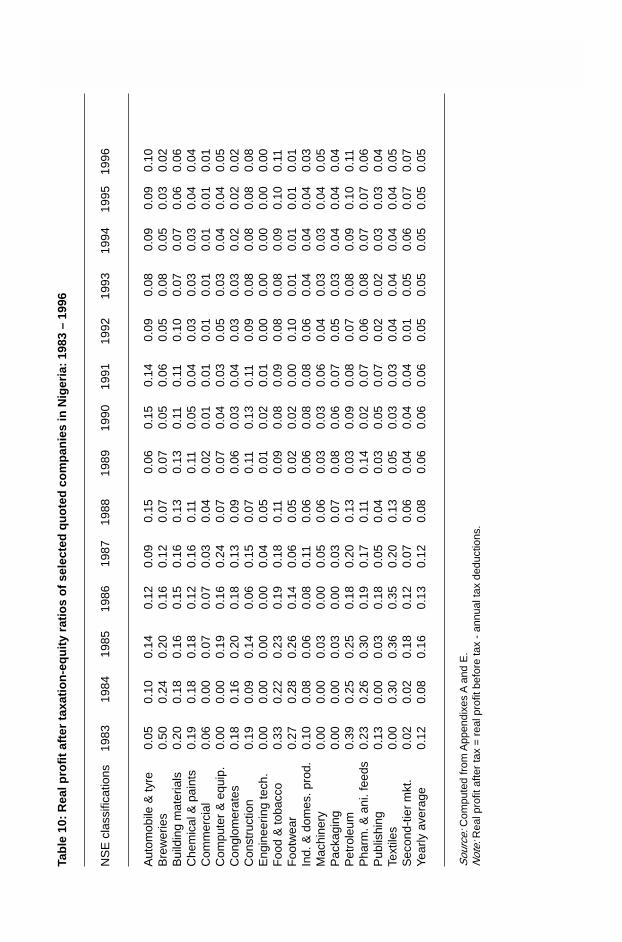
28 RESEARCH PAPER 88Ta
ble
10:
Rea
l pro
fit
afte
r ta
xati
on
-eq
uit
y ra
tio
s o
f se
lect
ed q
uo
ted
co
mp
anie
s in
Nig
eria
: 19
83 –
199
6
NS
E c
lass
ifica
tions
1983
1984
1985
1986
1987
1988
1989
1990
1991
1992
1993
1994
1995
1996
Aut
omob
ile &
tyre
0.05
0.10
0.14
0.12
0.09
0.15
0.06
0.15
0.14
0.09
0.08
0.09
0.09
0.10
Bre
wer
ies
0.50
0.24
0.20
0.16
0.12
0.07
0.07
0.05
0.06
0.05
0.08
0.05
0.03
0.02
Bui
ldin
g m
ater
ials
0.20
0.18
0.16
0.15
0.16
0.13
0.13
0.11
0.11
0.10
0.07
0.07
0.06
0.06
Che
mic
al &
pai
nts
0.19
0.18
0.18
0.12
0.16
0.11
0.11
0.05
0.04
0.03
0.03
0.03
0.04
0.04
Com
mer
cial
0.06
0.00
0.07
0.07
0.03
0.04
0.02
0.01
0.01
0.01
0.01
0.01
0.01
0.01
Com
pute
r &
equ
ip.
0.00
0.00
0.19
0.16
0.24
0.07
0.07
0.04
0.03
0.05
0.03
0.04
0.04
0.05
Con
glom
erat
es0.
180.
160.
200.
180.
130.
090.
060.
030.
040.
030.
030.
020.
020.
02C
onst
ruct
ion
0.19
0.09
0.14
0.06
0.15
0.07
0.11
0.13
0.11
0.09
0.08
0.08
0.08
0.08
Eng
inee
ring
tech
.0.
000.
000.
000.
000.
040.
050.
010.
020.
010.
000.
000.
000.
000.
00F
ood
& to
bacc
o0.
330.
220.
230.
190.
180.
110.
090.
080.
090.
080.
080.
090.
100.
11F
ootw
ear
0.27
0.28
0.26
0.14
0.06
0.05
0.02
0.02
0.00
0.10
0.01
0.01
0.01
0.01
Ind.
& d
omes
. pro
d.0.
100.
080.
060.
080.
110.
060.
060.
080.
080.
060.
040.
040.
040.
03M
achi
nery
0.00
0.00
0.03
0.00
0.05
0.06
0.03
0.03
0.06
0.04
0.03
0.03
0.04
0.05
Pac
kagi
ng0.
000.
000.
030.
000.
030.
070.
080.
060.
070.
050.
030.
040.
040.
04P
etro
leum
0.39
0.25
0.25
0.18
0.20
0.13
0.03
0.09
0.08
0.07
0.08
0.09
0.10
0.11
Pha
rm. &
ani
. fee
ds0.
230.
260.
300.
190.
170.
110.
140.
020.
070.
060.
080.
070.
070.
06P
ublis
hing
0.13
0.00
0.03
0.18
0.05
0.04
0.03
0.05
0.07
0.02
0.02
0.03
0.03
0.04
Text
iles
0.00
0.30
0.36
0.35
0.20
0.13
0.05
0.03
0.03
0.04
0.04
0.04
0.04
0.05
Sec
ond-
tier
mkt
.0.
020.
020.
180.
120.
070.
060.
040.
040.
040.
010.
050.
060.
070.
07Ye
arly
ave
rage
0.12
0.08
0.16
0.13
0.12
0.08
0.06
0.06
0.06
0.05
0.05
0.05
0.05
0.05
Sou
rce:
Com
pute
d fr
om A
ppen
dixe
s A
and
E.
Not
e: R
eal p
rofit
afte
r ta
x =
rea
l pro
fit b
efor
e ta
x -
annu
al ta
x de
duct
ions
.
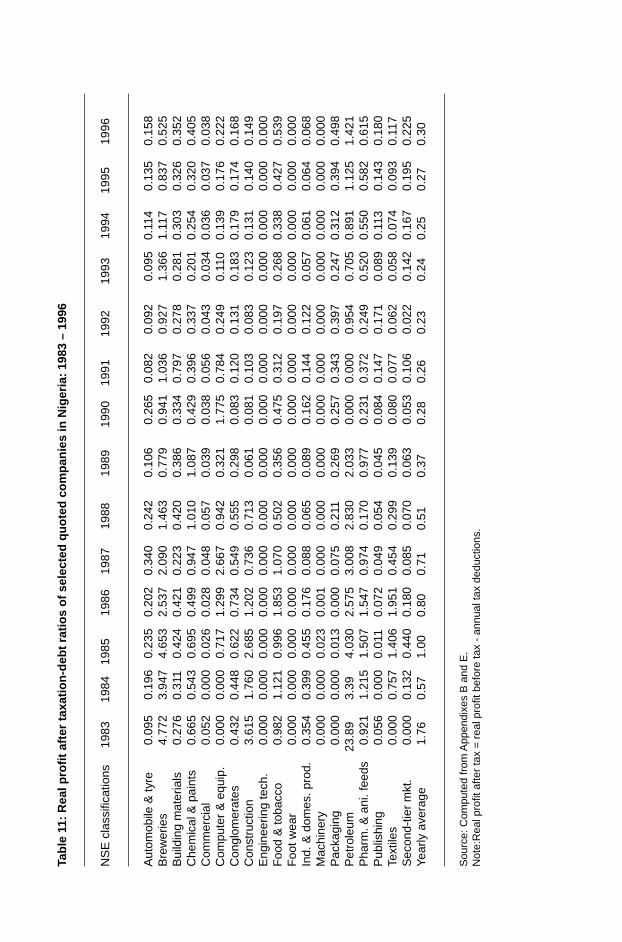
THE IMPACT OF INTEREST RATES LIBERALIZATION ON THE CORPOATE FINANCING STRATEGIES OF QUOTED
COMPANIES IN NIGERIA 29Ta
ble
11:
Rea
l pro
fit
afte
r ta
xati
on
-deb
t ra
tio
s o
f se
lect
ed q
uo
ted
co
mp
anie
s in
Nig
eria
: 19
83 –
199
6
NS
E c
lass
ifica
tions
1983
1984
1985
1986
1987
1988
1989
1990
1991
1992
1993
1994
1995
1996
Aut
omob
ile &
tyre
0.09
50.
196
0.23
50.
202
0.34
00.
242
0.10
60.
265
0.08
20.
092
0.09
50.
114
0.13
50.
158
Bre
wer
ies
4.77
23.
947
4.65
32.
537
2.09
01.
463
0.77
90.
941
1.03
60.
927
1.36
61.
117
0.83
70.
525
Bui
ldin
g m
ater
ials
0.27
60.
311
0.42
40.
421
0.22
30.
420
0.38
60.
334
0.79
70.
278
0.28
10.
303
0.32
60.
352
Che
mic
al &
pai
nts
0.66
50.
543
0.69
50.
499
0.94
71.
010
1.08
70.
429
0.39
60.
337
0.20
10.
254
0.32
00.
405
Com
mer
cial
0.05
20.
000
0.02
60.
028
0.04
80.
057
0.03
90.
038
0.05
60.
043
0.03
40.
036
0.03
70.
038
Com
pute
r &
equ
ip.
0.00
00.
000
0.71
71.
299
2.66
70.
942
0.32
11.
775
0.78
40.
249
0.11
00.
139
0.17
60.
222
Con
glom
erat
es0.
432
0.44
80.
622
0.73
40.
549
0.55
50.
298
0.08
30.
120
0.13
10.
183
0.17
90.
174
0.16
8C
onst
ruct
ion
3.61
51.
760
2.68
51.
202
0.73
60.
713
0.06
10.
081
0.10
30.
083
0.12
30.
131
0.14
00.
149
Eng
inee
ring
tech
.0.
000
0.00
00.
000
0.00
00.
000
0.00
00.
000
0.00
00.
000
0.00
00.
000
0.00
00.
000
0.00
0F
ood
& to
bacc
o0.
982
1.12
10.
996
1.85
31.
070
0.50
20.
356
0.47
50.
312
0.19
70.
268
0.33
80.
427
0.53
9F
oot w
ear
0.00
00.
000
0.00
00.
000
0.00
00.
000
0.00
00.
000
0.00
00.
000
0.00
00.
000
0.00
00.
000
Ind.
& d
omes
. pro
d.0.
354
0.39
90.
455
0.17
60.
088
0.06
50.
089
0.16
20.
144
0.12
20.
057
0.06
10.
064
0.06
8M
achi
nery
0.00
00.
000
0.02
30.
001
0.00
00.
000
0.00
00.
000
0.00
00.
000
0.00
00.
000
0.00
00.
000
Pac
kagi
ng0.
000
0.00
00.
013
0.00
00.
075
0.21
10.
269
0.25
70.
343
0.39
70.
247
0.31
20.
394
0.49
8P
etro
leum
23.8
93.
394.
030
2.57
53.
008
2.83
02.
033
0.00
00.
000
0.95
40.
705
0.89
11.
125
1.42
1P
harm
. & a
ni. f
eeds
0.92
11.
215
1.50
71.
547
0.97
40.
170
0.97
70.
231
0.37
20.
249
0.52
00.
550
0.58
20.
615
Pub
lishi
ng0.
056
0.00
00.
011
0.07
20.
049
0.05
40.
045
0.08
40.
147
0.17
10.
089
0.11
30.
143
0.18
0Te
xtile
s0.
000
0.75
71.
406
1.95
10.
454
0.29
90.
139
0.08
00.
077
0.06
20.
058
0.07
40.
093
0.11
7S
econ
d-tie
r m
kt.
0.00
00.
132
0.44
00.
180
0.08
50.
070
0.06
30.
053
0.10
60.
022
0.14
20.
167
0.19
50.
225
Year
ly a
vera
ge1.
760.
571.
000.
800.
710.
510.
370.
280.
260.
230.
240.
250.
270.
30
Sou
rce:
Com
pute
d fr
om A
ppen
dixe
s B
and
E.
Not
e:R
eal p
rofit
afte
r ta
x =
rea
l pro
fit b
efor
e ta
x -
annu
al ta
x de
duct
ions
.
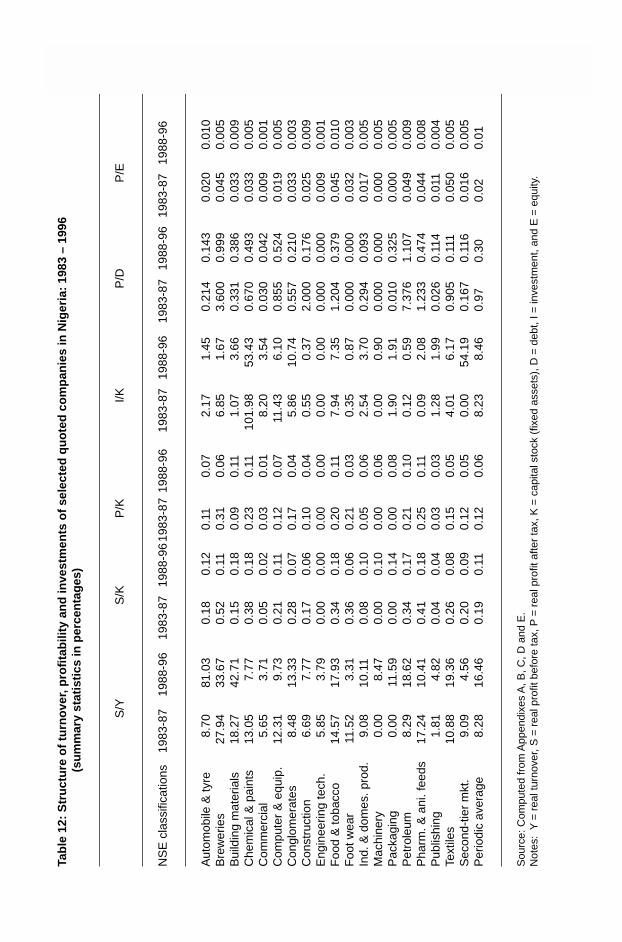
30 RESEARCH PAPER 88Ta
ble
12:
Str
uct
ure
of
turn
ove
r, p
rofi
tab
ility
an
d in
vest
men
ts o
f se
lect
ed q
uo
ted
co
mp
anie
s in
Nig
eria
: 19
83 –
199
6(s
um
mar
y st
atis
tics
in p
erce
nta
ges
)
S/Y
S/K
P/K
I/KP
/DP
/E
NS
E c
lass
ifica
tions
1983
-87
1988
-96
1983
-87
1988
-96
1983
-87
1988
-96
1983
-87
1988
-96
1983
-87
1988
-96
1983
-87
1988
-96
Aut
omob
ile &
tyre
8.70
81.0
30.
180.
120.
110.
072.
171.
450.
214
0.14
30.
020
0.01
0B
rew
erie
s27
.94
33.6
70.
520.
110.
310.
066.
851.
673.
600
0.99
90.
045
0.00
5B
uild
ing
mat
eria
ls18
.27
42.7
10.
150.
180.
090.
111.
073.
660.
331
0.38
60.
033
0.00
9C
hem
ical
& p
aint
s13
.05
7.77
0.38
0.18
0.23
0.11
101.
9853
.43
0.67
00.
493
0.03
30.
005
Com
mer
cial
5.65
3.71
0.05
0.02
0.03
0.01
8.20
3.54
0.03
00.
042
0.00
90.
001
Com
pute
r &
equ
ip.
12.3
19.
730.
210.
110.
120.
0711
.43
6.10
0.85
50.
524
0.01
90.
005
Con
glom
erat
es8.
4813
.33
0.28
0.07
0.17
0.04
5.86
10.7
40.
557
0.21
00.
033
0.00
3C
onst
ruct
ion
6.69
7.77
0.17
0.06
0.10
0.04
0.55
0.37
2.00
00.
176
0.02
50.
009
Eng
inee
ring
tech
.5.
853.
790.
000.
000.
000.
000.
000.
000.
000
0.00
00.
009
0.00
1F
ood
& to
bacc
o14
.57
17.9
30.
340.
180.
200.
117.
947.
351.
204
0.37
90.
045
0.01
0F
oot w
ear
11.5
23.
310.
360.
060.
210.
030.
350.
870.
000
0.00
00.
032
0.00
3In
d. &
dom
es. p
rod.
9.08
10.1
10.
080.
100.
050.
062.
543.
700.
294
0.09
30.
017
0.00
5M
achi
nery
0.00
8.47
0.00
0.10
0.00
0.06
0.00
0.90
0.00
00.
000
0.00
00.
005
Pac
kagi
ng0.
0011
.59
0.00
0.14
0.00
0.08
1.90
1.91
0.01
00.
325
0.00
00.
005
Pet
role
um8.
2918
.62
0.34
0.17
0.21
0.10
0.12
0.59
7.37
61.
107
0.04
90.
009
Pha
rm. &
ani
. fee
ds17
.24
10.4
10.
410.
180.
250.
110.
092.
081.
233
0.47
40.
044
0.00
8P
ublis
hing
1.81
4.82
0.04
0.04
0.03
0.03
1.28
1.99
0.02
60.
114
0.01
10.
004
Text
iles
10.8
819
.36
0.26
0.08
0.15
0.05
4.01
6.17
0.90
50.
111
0.05
00.
005
Sec
ond-
tier
mkt
.9.
094.
560.
200.
090.
120.
050.
0054
.19
0.16
70.
116
0.01
60.
005
Per
iodi
c av
erag
e8.
2816
.46
0.19
0.11
0.12
0.06
8.23
8.46
0.97
0.30
0.02
0.01
Sou
rce:
Com
pute
d fr
om A
ppen
dixe
s A
, B, C
, D a
nd E
.N
otes
: Y
= r
eal t
urno
ver,
S =
rea
l pro
fit b
efor
e ta
x, P
= r
eal p
rofit
afte
r ta
x, K
= c
apita
l sto
ck (
fixed
ass
ets)
, D =
deb
t, I =
inve
stm
ent,
and
E =
equ
ity.
THE IMPACT OF INTEREST RATES LIBERALIZATION ON THE CORPOATE FINANCING STRATEGIES OF QUOTED
COMPANIES IN NIGERIA 31
the period 1988 – 1996 is compared with that of all the years under investigation (1983– 1996), it is greater by about 0.80 percentage points (on the periodic average) fromabout 9.92% to about 10.72% (tables 8 and 9).
This impressive performance is further corroborated as shown in Table 8, which depictsthe real profit before taxation structure of quoted companies. From this table, the sectoralreal profit (on the average) increased by 1.20%, from N0.083 million in 1983 to N0.084million in 1987 (i.e., the starting period of interest rate deregulation). It increasedastronomically by 58.33% in 1993 from about N0.084 million in 1987 to about N0.145million in 1996. On micro analysis, in 9 of the 19 sectors the annual sectoral real growthrates increased from 1987 to 1996. These sectors are automobile and tyre; breweries;building materials; commercial; conglomerates; construction; food, beverages andtobacco; packaging; and petroleum (See also Appendix E.)
The information in Table 10 shows that sectoral real profit-equity ratios were mixed.On the average, the yearly sectoral percentage, which was about 0.12% in 1983, declinedto about 0.08% in 1984. It moved up to 0.16% in 1985, however, and since then hasdeclined annually. It went down to about 0.05% from 1992 to 1996. If we compare therate during the pre-liberalization period (1983–1987) with the rate during the post-liberalization period, we see a decline by about 0.07 percentage points. In the same vein,the real profit after tax-capital stock declined by about 0.05 percentage points (Table12).
Actually, our statistical summaries in percentages in tables 2 and 10 show that (on theaverage) the periodic sectoral debt-equity ratio during the pre-liberalization period islarger than the periodic sectoral real profit after tax-equity ratio during the period. Also,during the post-liberalization era, the sectoral debt-equity ratio is larger than the sectoralreal profit after tax-equity ratio during the period. The two indicators (debt-equity ratioand profit-equity ratio) show a declining trend, however. The implication of these resultsis that while the quoted companies tend to shy away from debt finance, they also tend touse a declining rate of internal sources of finance. In actual fact, if we examine thefirms’ real profit after taxation debt ratios in Table 11, we will discover a declining trend.For example, the ratio, which was about 1.76% in 1983, fell to 0.57% in 1984. It movedup to 1.0% in 1985, but started declining then until it reached the minimum of 0.23% in1992. It went up slightly in 1993 to 0.24%, to 0.27% in 1995 and to 0.30% in 1996.Table 11 shows that the real profit after tax-debt ratio, which was about 0.76% during thepre-liberalization era, declined to about 0.29% during the post-liberalization period.
The general observation one can make in relation to these findings is that quotedcompanies relied much more on equity finance than on debt finance during the post-liberalization period (Table 2). Equally, some of the companies have resorted to internalfinance in the presence of agency costs, bankruptcy, transaction costs, asymmetricinformation, etc. Thus, the trend after the liberalization of interest rates indicates thatfirms are using their internal sources of equity, probably due to the increased cost offinance in the money market as well as a trade-off mechanism to avoid too high a level ofdebt, which might increase their risks of bankruptcy or financial distress in an economicdownturn. Moreover, the choice of internal sources as well as equity finance may beconnected with the lower tax costs on equity finance, if compared with debt finance. Ina nutshell, the behaviour of these companies in Nigeria was perfectly in line with thenew theoretical arguments that assumed that firms usually choose the source of finance
32 RESEARCH PAPER 88
that maximizes their current share value. Therefore, this behaviour usually leads to anoptimal debt-equity ratio for these firms (Auerbach, 1979; Auerbach and King, 1983;Miller, 1988; Lyon, 1992).
Econometric results
In this section, two analytical measurements are done. First, we examine the relationshipbetween the investment structure and five explanatory variables that encompass the debtfinance, equity finance and internal finance of the selected 105 quoted companies inNigeria during the pre-liberalization programme. Second, we examine whether theadopted liberalization programme of 1987 has some impact on the capital structure andinvestment decisions of the selected companies using eight explanatory variables.
The results presented in the first column of Table 13 show that out of the fiveexplanatory variables only three have significant effects on the dependent variable duringthe pre- liberalization programme. The three variables are the lagged investment-capitalratio, the leverage ratio (debt-capital ratio) and the change in turnover-capital ratio.Although the coefficients of the leverage ratio (debt-capital ratio) and the laggedinvestment-capital ratio have some positive as well as some strong significant effects oninvestment, the coefficient of the change in turnover-capital ratio is not only negativelyrelated to investment but with less significant effects during the pre-liberalizationprogramme. Also, the effects of cash flow (profit before tax-capital ratio) and the leverageratio (debt-equity ratio) are negative and not significant. The implication of these resultsis that before the introduction of the liberalization programme in 1987 (i.e., 1983–1987),the majority of these quoted companies relied mainly on debt finance.
Figure 6: Structure of real profit before taxation of selected quoted companies in Nigeria
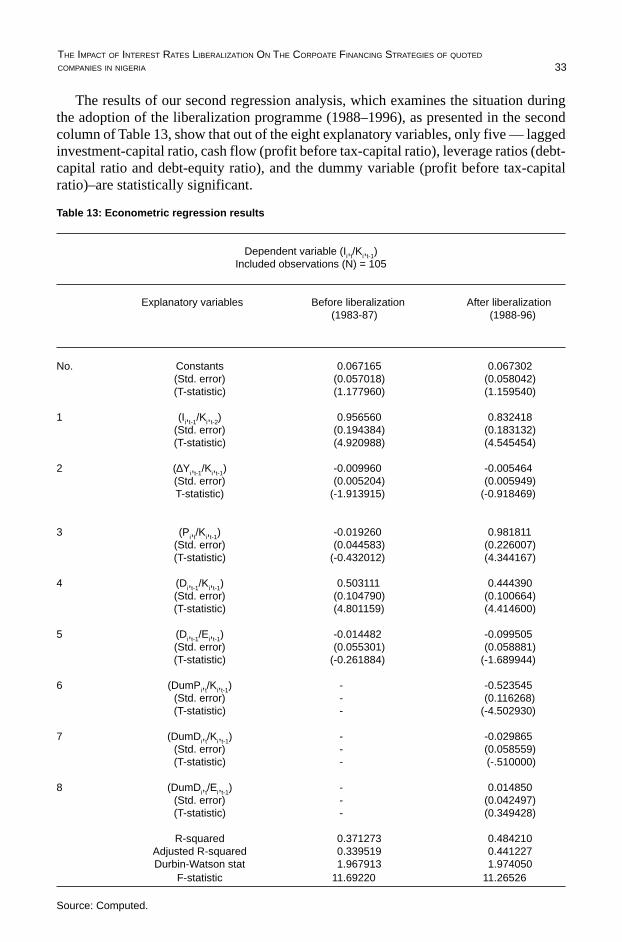
THE IMPACT OF INTEREST RATES LIBERALIZATION ON THE CORPOATE FINANCING STRATEGIES OF QUOTED
COMPANIES IN NIGERIA 33
The results of our second regression analysis, which examines the situation duringthe adoption of the liberalization programme (1988–1996), as presented in the secondcolumn of Table 13, show that out of the eight explanatory variables, only five — laggedinvestment-capital ratio, cash flow (profit before tax-capital ratio), leverage ratios (debt-capital ratio and debt-equity ratio), and the dummy variable (profit before tax-capitalratio)–are statistically significant.
Table 13: Econometric regression results
Dependent variable (Ii,t/Ki,t-1)Included observations (N) = 105
Explanatory variables Before liberalization After liberalization(1983-87) (1988-96)
No. Constants 0.067165 0.067302(Std. error) (0.057018) (0.058042)(T-statistic) (1.177960) (1.159540)
1 (Ii,t-1/Ki,t-2) 0.956560 0.832418(Std. error) (0.194384) (0.183132)(T-statistic) (4.920988) (4.545454)
2 (∆Yi,t-1/Ki,t-1) -0.009960 -0.005464(Std. error) (0.005204) (0.005949)T-statistic) (-1.913915) (-0.918469)
3 (Pi,t/Ki,t-1) -0.019260 0.981811(Std. error) (0.044583) (0.226007)(T-statistic) (-0.432012) (4.344167)
4 (Di,t-1/Ki,t-1) 0.503111 0.444390(Std. error) (0.104790) (0.100664)(T-statistic) (4.801159) (4.414600)
5 (Di,t-1/Ei,t-1) -0.014482 -0.099505(Std. error) (0.055301) (0.058881)(T-statistic) (-0.261884) (-1.689944)
6 (DumPi,t/Ki,t-1) - -0.523545(Std. error) - (0.116268)(T-statistic) - (-4.502930)
7 (DumDi,t/Ki,t-1) - -0.029865(Std. error) - (0.058559)(T-statistic) - (-.510000)
8 (DumDi,t/Ei,t-1) - 0.014850(Std. error) - (0.042497)(T-statistic) - (0.349428)
R-squared 0.371273 0.484210Adjusted R-squared 0.339519 0.441227Durbin-Watson stat 1.967913 1.974050
F-statistic 11.69220 11.26526
Source: Computed.
34 RESEARCH PAPER 88
Three of the five variables — the lagged investment-capital ratio, the leverage ratio (thedebt-capital ratio) and the cash flow (profit before tax-capital) — have some strongpositive effects on investment structure and are also statistically significant. The tworemaining statistically significant variables — debt-equity ratio and dummy variable(profit before tax-capital ratio) — exhibit a negative relationship with the dependentvariable. Out of the three variables with strong positive relationships, the coefficient ofthe lagged investment-capital ratio is the most significant, followed by the coefficient ofthe debt-capital ratio. However, the coefficients of all three variables (investment-capitalratio, debt-capital ratio and profit before tax-capital ratio) exhibit a declining rate in1988–1996; the coefficient of cash flow (profit before tax-capital ratio) became positiveand strongly significant in 1988–1996 in spite of its negative position in 1983–1987.Also, the coefficient of the debt-equity ratio, which was not significant during the pre-liberalization period (1983–1987), was significant with negative relationship. Ourregression analysis results thus further corroborated the statistical investigationsconfirming the predominant role of equity finance supported by internal sources of financeespecially during the post-liberalization period (1988–1996).
Interview results
Tables 5 and 6 summarized the opinions expressed by the business executives during theinterviews. Issues discussed centre mainly on the perceived effects of liberalized interestrates on critical variables such as production cost, product prices, demand for product,turnover, gross profits, investment and capacity utilization. The summary of thediscussions is also shown graphically in figures 7 to 10. In a nutshell, the survey revealedthat companies combined bank loans, credit purchase, debentures and private loans assources of funds. Of all the sources mentioned new equity is the most frequently used,followed by credit purchase. Bank loans are also viable alternatives.
Further, most respondents said the prevailing interest rates were high, and as a resultthey have had to alter their financial mobilization strategies (Figure 10). Similarly, amajority of the business executives claimed that production costs increased tremendouslyafter liberalization, sparking increased product prices, especially under the prevailingmarkup pricing regime. As a result, according to most respondents demand for productshad declined. Turnover also declined as a consequence because of the suppressed demandfor goods and services. Next in the line to be affected was gross profits, which about50% of the respondents reported had also decreased.
Under this situation, investment also declined. Combined, these forces reduced thecapacity utilization of most firms. The report of the central bank as well as that of theManufacturer Association of Nigeria (MAN) confirmed that capacity utilization of mostfirms is still about 30%. This trend warrants attention (Figures 7 to 10), but a look at theresults from the account shows that the situation is not as absolutely gloomy as theyclaim.
THE IMPACT OF INTEREST RATES LIBERALIZATION ON THE CORPOATE FINANCING STRATEGIES OF QUOTED
COMPANIES IN NIGERIA 35
Figure 7: Sources of funds for selected quoted companies in Nigeria
Figure 8: Sources of funds most preferred by selected quoted companies in Nigeria
36 RESEARCH PAPER 88
Figure 9: Perception of selected quoted companies on prevailing interest rates in Nigeria
Figure 10: Whether financial strategy altered during liberalisation
THE IMPACT OF INTEREST RATES LIBERALIZATION ON THE CORPOATE FINANCING STRATEGIES OF QUOTED
COMPANIES IN NIGERIA 37
VI. Conclusion
Summary of findings
This study has revealed in detail the varying impact of interest rate liberalization on thecorporate financing strategies of selected quoted companies in Nigeria. The studyidentified various indicators influenced by the liberalized interest rates, including thefinancing mix adopted by the companies. In the process, it highlighted the link betweeninterest rates and corporate financing, based on the opinions expressed by the businessexecutives and the data collected from the final accounts and balance sheets of thecompanies.
The effects of liberalization on the financing strategies are significant. Moreimportantly, the effect of liberalization on corporate performance is more revealing asindicated by the firms’ turnover, gross profits and investments, all of which decreasedmarginally in a few cases but increased considerably in many others, after the liberalizationof the money market. The significant effect of the liberalization on the growth andresilience of the capital market was also highlighted. The decline in the debt-equityratios implies that firms rely on and use the capital market for raising additional fundsthereby giving some impetus to the activities of the stock market, which in itself isundergoing a form of market liberalization. The direct effect of interest rates on corporateinvestment is indeed considerable.
Notably, investment is mainly determined by the availability of savings and the levelof output expected. Investment has been affected as a consequence. However, the effectshave been mixed. Overall, the direct and indirect impact of interest rate liberalizationhas been substantial. The main policy implication arising from our findings is that interestrate policy can be used to influence both the corporate performance of industries and thegrowth of the capital market.
From all indications, our findings support the position expressed by Sundararajan(1987), who contends that there exists an optimal debt equity mix for firms and thatfirms strive to obtain a debt equity mix that minimizes costs. By implication, the studyrefutes the Modigliani and Miller (1958) postulates that a unique optimal debt-equityratio does not exist. Equally, this finding agrees with signaling models (Spence, 1973),which state that corporate financial behaviour adjusts discretely to changes in earningsas dictated by cost of capital (interest rates in this case).
38 RESEARCH PAPER 88
Policy recommendations
Given the foregoing, liberalizing the interest rates, though desirable for its influence onincreased financial mobilization, would not be enough in itself. Effort is also required inthe area of developing the capital market to absorb the likely increased demand forinvestible funds. Other policies, such as measures to promote equity markets, raisecorporate savings or even encourage inflow of foreign capital, are needed as complementsto interest rate liberalization. Reforms to fully integrate the financial markets (both themoney and capital markets) are necessary conditions not only to improve the effectivenessof interest rate policy, but also to synchronize the revealed benefits of liberalization.
Moreover, complementary policies, such as industrial incentives (that is tax reliefs,reduction in tariffs and provision of basic infrastructural facilities) to cushion the effectsof interest rate liberalization on industrial operations and investment returns, are desirable,given the prominent roles played by such industries in development. Such assistance iscapable of fostering not only industrial development, but economic development in general–a central objective of economic liberalization.
THE IMPACT OF INTEREST RATES LIBERALIZATION ON THE CORPOATE FINANCING STRATEGIES OF QUOTED
COMPANIES IN NIGERIA 39
References
Adam, C.S., Cavendish, W.P. Mistry, P.S. 1990. “Issue in privatization and capital marketdevelopment”. Paper presented to Conference on Capital Market Developmentand Privatization Bombay (14-16 November).
Ahmed, A. 1987. “The structural adjustment programme: The journey so far”, Economicand Financial Review, The Central Bank of Nigeria, vol. 25, no. 4: 25–28.
Ajakaiye, D.O. and Omole, D.A. 1994 “Impact of commercial bank lending rates oninflations in Nigeria, 1987–90” in Achi Atsain, Samuel Wange and Anne G.Drabek.(eds) Economic Policy Experience in Africa: What Have we Learned?African Economic Research Consortium, KENYA.
Ajayi, S.I., and Ojo, O. 1980. International Macroeconomics. University of Ife Press,Ile-Ife, Nigeria.
Ajifs, S. and Hamid, J. 1992 “Corporation financial structures in developing countries”Technical Paper Number 1 International Finance Corporation. The World Bank.Washington, DC.
Alan, R.R. 1982 “High interest rates: A new conventional wisdom for development policy?Some conclusions from Sri Lankan experience”. World Development, vol. 10, no.3: 211–222.
Arellano, M. and Bond, S.R. 1988. “Dynamic panel data estimation using DPD - Aguide for users”, IFS Working paper no. 88/15.
Arellano, M. and Bond, S.R. 1991. “Some tests of specification for panel data: MonteCarlo evidence and an application to employment equations” Review of EconomicStudies, vol. 58: 277–297.
Atiya, I. 1980. “The private sector’s response to financial liberalization in Turkey: 1980-82". Working Paper WP 147 (Washington: World Bank).
Auerbach, A.J. 1979. “Wealth maximization and the cost of capital”. Quarterly Journalof Economics, vol. 93.
Auerbach, A.J. and M.A. King. 1983. “Taxation, portfolio choice and debt-equity ratios:A general equilibrium model.” Quarterly Journal of Economics, vol. 587–609.
Barnea, A., R.A. Haugen and L.W. Senbet. 1985. Agency Problems and FinancialContracting. Englewood Cliffs, New Jersey: Prentice-Hall, Inc.
Bealey, Richard. A. and Myers, Steward C. 1988. Principles of Corporate FinanceSingapore McGraw-Hill Boom Company.
Blaug. 1973. Economic Theory in Retrospect, London: Heineman Educational Books.Bhattacharya, S. 1988. “Corporate finance and the legacy of Miller and Modigliani”.
Journal of Economic Perspectives, vol. 2, no. 4 (Fall): 135–147.
40 RESEARCH PAPER 88
Central Bank of Nigeria. 1995. Statistical Bulletin, vol. 6, nos 1 (June): p.32.Central Bank of Nigeria. 1997. Annual Report and Statement of Accounts. p. 31.Cho, Y.J. and D. Khathkate.1989. “Lessons of financial liberalization in Asia: A
comparative study”. Discussion Paper No. 50 (Washington: World Bank).Collier, P. and C. Mayer. 1989. The sssessment: financial liberalization, financial system,
and economic growth”. Oxford Review of Economic Policy vol. 5., no. 4.Corbo, V. and J. De Melo. 1985. “Overview and summary”. World Development no.
113: 836-66.Dammon F.M. and L.W Senbet. 1988. “The effect of taxes and depreciation on corporate
investment and financial leverage”. The Journal of Finance, vol. XLIII, no. 2:357–373.
Davis, and Mayer, Callier, P. 1991. “Corporate finance in the euromarkets and theeconomic of intermediation”. Discussion Paper No. 570, Centre for EconomicPolicy Research, London.
DeAngelo, H. and R. Masulia, 1980. “Optimal capital structure lender: Corporate andpersonal taxation”. Journal of Financial Economics, 3–29.
Delano, V. and M. Abbas. 1990 “Tragedies for financial reforms: Interest rate policies,stabilization, and bank supervision in developing cCountries” IMF Staff Papers,vol. 37, no. 3: 509-36.
Donaldson, G. 1961. Corporate Debt Capacity, Graduate School of Business Research,Harvard University, Boston.
Fazzari, S.M., R.G. Hubbard and B.C. Peterson. 1988. “Financing constraints andcorporate investment”. Brookings Paper on Economic Activity.
Fry, M.J. 1982. “Models of financially repressed developing economies”. WorldDevelopment (Oxford), vol. 10: 111–67.
Galbis, V. 1977. “Financial intermediation and economic growth in less developed crosssection relationship”. Background Paper to the World Bank Development Report.
Gelb, A. 1989. “Financial liberalization and the internal structure of capital markets” inFinancial Liberalization and Internal Structure of Capital Markets in Asia andLatin America, edited by Miguel Urrutia. The United Nation University, HongKong, pp. 201-267.
Givoly, D., C. Hayn, A.R. Ofer and O. Sarig. 1992. “Taxes and capital structure: Evidencefrom firms’ response to the Tax Reform Act 1986". The Review of Financial Studies,vol. 5, no. 2: 331–355.
Greenwald, B., Stiglitz, J.E. and Weiss, A. 1984. “Information imperfections in the capitalmarket and macroeconomic fluctuations” American Economic Review vol. 74.
Grossman, S.J. and Stiglitz, J.E. 1980. “On the impossibility of informationally efficientmarkets”. American Economic Review, vol. 70: 393-408.
Harris, J.R., F. Schiantarelli and G.M. Siregar. 1992. “The effect of financial liberalizationon the capital structure and investment decisions of Indonesian manufacturingestablishments”. The World Bank Economic Review, vol. 8 no. 1, January 1994.
Hendry, D.F. 1989. PC-Give: An Interactive Econometric Modelling System BiddlesLtd., Guildford and King’s Lynn.
THE IMPACT OF INTEREST RATES LIBERALIZATION ON THE CORPOATE FINANCING STRATEGIES OF QUOTED
COMPANIES IN NIGERIA 41
Hite, G. 1977. “Leverage, output effects, and the M-M theorems”. Journal of FinancialEconomics, vol. 4: 177–202.
Jaramillo, F., F. Schiantarelli and A. Weiss. 1993. “Capital market imperfections beforeand after financial liberalization: A Euler equation approach to panel data forEcuadorian firms”. World Bank Working Paper WPS 1091. The World Bank.
King, M.A. 1977. Public Policy and the Corporation. London: Chapman and Hall.Kumar, P. 1987. “Shareholder - manager conflict and the information content of
dividends”. Mimeo. Carnegie-Mellon University.Lamberte, M.B. 1989. “Financial policies, efficiency and growth: An analysis of broad
cross-section relationship”. Background Paper to the World Bank DevelopmentReport.
Leland, H.E. and Pyle. 1976. “Informational asymmetries, financial structure andintermediation”. Working paper (University of California, Berkeley C.A.).
Lintner, J. 1956. “Distributions of incomes of corporations among dividends, retainedearnings and taxes”. American Economic Review, vol. 46: 97–113.
Leite, S.P. and Sundararajan. 1991. “Issues on interest rate management and liberalization”in Financial System and Development in Africa. Edited by Philippe Callier. EDISeminar Series.
Leite, S.P. 1982. “Interest rates policies in West Africa” IMF Staff Papers vol. 29 1March: 48-76.
Levy, H. and S. Marshall. 1978. Capital, Investment and Financial Decisions LondonPrentice Hall International, Inc.
Lyon, A. 1992. “Taxation, information asymmetries, and a firm’s financing choices”.World Bank Working Paper WPS 936. The World Bank.
Mayer, C. P. and I. Alexander. 1991. “Stock markets and corporate performance: Acomparison of quoted and unquoted companies” Discussion Paper. no. 571. Centrefor Economic Policy Research, London.
McKinnon, R.I. 1973. Money and Capital in Economic Development. Washington, D.C.:Brookings Institution.
McKinnon, R.I. 1976. Money and Finance in Economic Growth and Development: Essaysin Honour of Edward Shaw New York: Marcel Dekker.
McKinnon, R.I. 1986. "Domestic interest rate and foreign capital flows in a liberalizedeconomy”, Paper presented at the Annual Meeting of the American EconomicAssociation, New Orleans, (Unpublished).
McKinnon, R.I. 1988. “Financial liberalization retrospect: Interest rate policies in LDCs”,in The State of Development Economics: Progress and Perspectives. (ed.) by GustarRaniss and J. Paul Schiltz (New York: Basil Blackwell Inc).
Miller, M.H. 1988. “The Modigliani-Miller proposition after thirty years”. Journal ofEconomic Perspectives, vol. 2, no. 4 (fall): 99–120.
Miller, M.H. and K. Rock. 1985. “Dividend, policy under asymmetric information”.Journal of Finance, 40: 1031-1051.
Modigliani, F. and M.H. Miller. 1958. “The cost of capital corporation finance and thetheory of investment.” The American Economic Review, vol. XVIII, no. 3 (June):
42 RESEARCH PAPER 88
261–297.Modigliani, F. 1988. “M-M - Past, present, future”. Journal of Economic Perspectives,
vol. 2, no. 4 (Fall): 149–158.Modigliani, F. and M.H. Miller. 1963. “Corporate income taxes and the cost of capital: A
Correction”. American Economic Review, vol. 53, 433–443.Molho, S.C. 1986. “Interest Rates, Saving, and Investment in Developing Countries”,
IMF Staff Papers vol. 33, no. 1: 90-116.Morisset, J. 1991. “Does financial liberalization really improve private investment in
countries?”. World Bank Working Papers WPS 717. The World Bank, InternationalEconomics Dept.
Myers, S.C. 1977. “Determinants of corporate borrowing”. Journal of FinancialEconomic. vol. 5.
Myers, S.C. 1984. “The capital structure puzzle”, Journal of Finance, vol. 39.Myers, S.C. 1985. “Comments on investment patterns and financial leverage” in B.
Friedman, (ed), Corporate Capital Structure in the United States, University ofChicago Press, Chicago.
Myers, C.P. 1987. “Financial systems and corporate investment”, Oxford Review ofEconomic Policy, p. 3.
Myers, S.C. and N.S. Maijluf. 1984. “Corporate Financing and Investment decisionswhen firms have information that investors do not have”, Journal of FinancialEconomics, vol. 13.
Ndekwu, E.C. 1988. “Interest rates, bank deposits and growth of the Nigerian economy”.NISER Monograph Series. Ibadan, Nigeria: Nigerian Institute for Social andEconomic Research.
Meyer, R. and E. Kuh. 1957. The investment decision: An empirical study. HarvardUniversity Press.
Meyer, J.R. and R.R. Glauber. 1964. Investment decisions: Economic forecasting andpublic policy. Graduate School of Business Administration, Harvard University.
Nnanna, O.J. 1987. “A general survey of the experiences of some less-developed countriesunder structural adjustment programme”, Economic and Financial Review. TheCentral Bank of Nigeria, vol. 25, no. 39-47.
Nigerian Stock Exchange. 1997. Factbook. Lagos, Nigeria.Nissanke, M. 1990. “Mobilizing domestic resources for african development and
diversification: Structural impediments to financial intermediation”. PaperPresented at the World Bank. Conference on Africa Economic Issues. Nairobi(June).
Nissanke, M. 1991. Mobilizing Domestic Savings for Africa Development andDiversification: Overview International Development Centre, University of Oxford.
Odizi, V.A. 1988 “The Nigeria experience of structural adjustment programme:- A centralbank perspective”, Economic Financial Review. The Central Bank of Nigeria.vol. 26 No. 3: 27-35.
Okereke-Onyiuke N. 1984. “Cost of capital: The Nigerian experience”, Nigerian StockExchange Handbook, vol. 2: 25-28.
THE IMPACT OF INTEREST RATES LIBERALIZATION ON THE CORPOATE FINANCING STRATEGIES OF QUOTED
COMPANIES IN NIGERIA 43
Ogwumike, F.O. and D.A Omole. 1997. “Mobilizing domestic resources for economicdevelopment in Nigeria - The role of capital market”. AERC Research Paper No56. Nairobi: African Economic Research Consortium.
Omole, D.A. & G.O. Falokun. 1992. ”Privatization policy in Nigeria (1988-1991): Impacton equity and growth” in Economic Management in Sub-Saharan Africa. (eds)Francis Mwega and V. Seshamani. East African Educational Publishers. Nairobi,Kenya.
Omole, D.A. 1993. “Impact of financial reform on the Nigeria Stock Exchange”. NISERMonograph Series, no. 7. Ibadan: NISER.
Omoruyi, S.E. 1987. “A review of the structural adjustment programme, the foreignexchange market and trade policies in Nigeria”. Economic and Financial Review.The Central Bank of Nigeria, vol. 25, no. 4: 29-38.
Oyejide, T.A. 1972. “Deficit financing, inflation and capital formation: An analysis ofthe Nigerian experience, 1957–1970”. The Nigerian Journal of Economics andSocial Studies, vol. 14: 27–43.
Oyejide, T.A. 1976. “Company dividend policy in Nigeria: An empirical analysis”.Nigerian Journal of Economic and Social Studies, vol. 18, no. 2 (July).
Ramos, J. 1988. “The rise and fall of capital markets in the southern cone” in FinancialLiberalization and Internal Structure of Capital Markets (ed) by Miguel Urrutia.The United Nations University Hong Kong: 43-81.
Rose, S.A. 1977. “The determination of financial structure: The incentive - signallingapproach”, Bell Journal of Economics, 1977 8, 23-40.
Rose, S.A. 1988. “Comment on the Modigliani-Miller propositions”, Journal of EconomicPerspectives, vol. 2, no. 4 (Fall): 127-133.
Sanusi, J.O. 1988. “Deregulating the Nigerian economy: Achievements and prospects”,Economic and Financial Review. The Central Bank of Nigeria, vol. 26, no. 4: 32-40.
Shaw, E.S. 1973. Financial Deepening in Economic Development. New York. OxfordUniversity Press.
Singh, A. and J. Hamid. 1992. “Corporate financial structures in developing countries”.Technical Paper, International Finance Corporation.
Soyode, A. 1978. “Financing industrial growth in Nigeria: A study of the place of debtand retained earnings”. The Journal of Management Studies, vol. 10, no. 1: 26–35.
Soyode, A. 1991. “Structural adjustment programme and its impact on the Nigerian StockMarket”, Research in Third World Accounting, vol. 2.
Soyode, A. 1992. “Economic restructuring and the impact on the Nigerian Stock Market”A Seminar Paper, University of Ibadan.
Soyibo, A. and F. Adekanye. 1992a. “Financial system regulation, deregulation and savingsmobilization in Nigeria”. AERC Research Paper No 11. Nairobi; AERC.
Soyibo, A. and F. Adekanye. 1992b. “The Nigerian banking system in the context ofpolicies of financial regulation and deregulation”. AERC Research Paper No 17.Nairobi: AERC.
Soyibo, A. 1994. “The savings-investment process in Nigeria: An empirical study of the
44 RESEARCH PAPER 88
supply side” AERC Research Paper No 12. African Economic ResearchConsortium, Nairobi, Kenya.
Spence, A.M. 1973. “Job market signalling”, Quarterly Journal of Economics, 87: 355-379.
Sundararajan, V. 1987. “The debt-equity ratio of firms and the effectiveness of interestrate policy”. IMF Staff Papers, vol. 34, no. 2 (June): 260–310.
Stiglitz, J.E. 1988. “Why financial structure matters”. Journal of Economic Perspectives,vol. 2, no. 4: 121–126.
Taggart, R.C. 1980. “Taxes and corporate capital structure in an incomplete market”.Journal of Finance, 35: 645–59.
Killick T. and M. Martin. 1990. “Financial policies in the adaptive economy” ODI WorkingPaper no. 35 May.
Weston, F. and T.E. Copeland. 1983. Financial Theory and Corporate Policy Addison-Wesley Publishing Company Inc. Canada.

THE IMPACT OF INTEREST RATES LIBERALIZATION ON THE CORPOATE FINANCING STRATEGIES OF QUOTED
COMPANIES IN NIGERIA 45
Appendices
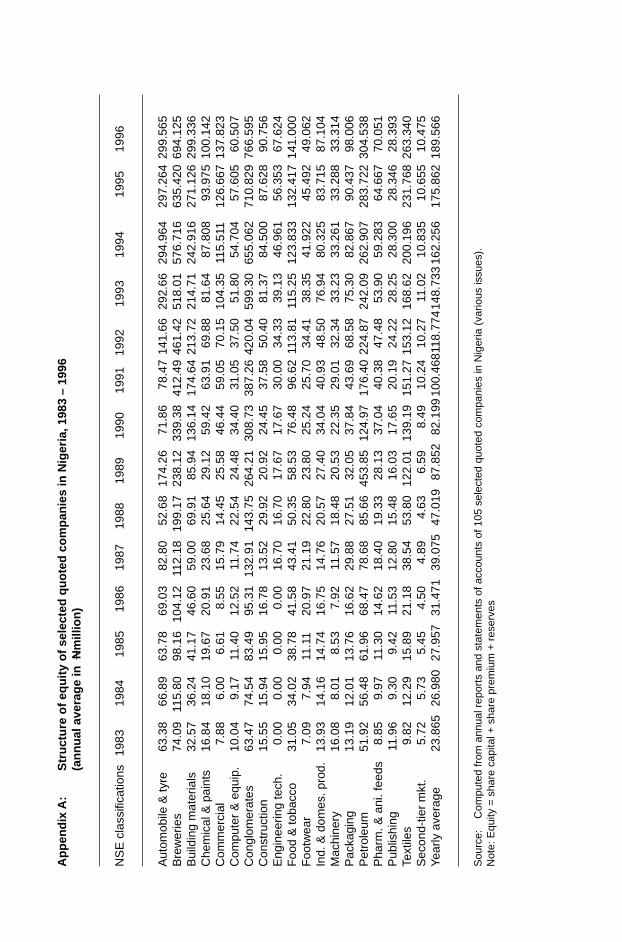
46 RESEARCH PAPER 88A
pp
end
ix A
:S
tru
ctu
re o
f eq
uit
y o
f se
lect
ed q
uo
ted
co
mp
anie
s in
Nig
eria
, 198
3 –
1996
(an
nu
al a
vera
ge
in N
mill
ion
)
NS
E c
lass
ifica
tions
1983
1984
1985
1986
1987
1988
1989
1990
1991
1992
1993
1994
1995
1996
Aut
omob
ile &
tyre
63.3
866
.89
63.7
869
.03
82.8
052
.68
174.
2671
.86
78.4
714
1.66
292.
6629
4.96
429
7.26
429
9.56
5B
rew
erie
s74
.09
115.
8098
.16
104.
1211
2.18
199.
1723
8.12
339.
3841
2.49
461.
4251
8.01
576.
716
635.
420
694.
125
Bui
ldin
g m
ater
ials
32.5
736
.24
41.1
746
.60
59.0
069
.91
85.9
413
6.14
174.
6421
3.72
214.
7124
2.91
627
1.12
629
9.33
6C
hem
ical
& p
aint
s16
.84
18.1
019
.67
20.9
123
.68
25.6
429
.12
59.4
263
.91
69.8
881
.64
87.8
0893
.975
100.
142
Com
mer
cial
7.88
6.00
6.61
8.55
15.7
914
.45
25.5
846
.44
59.0
570
.15
104.
3511
5.51
112
6.66
713
7.82
3C
ompu
ter
& e
quip
.10
.04
9.17
11.4
012
.52
11.7
422
.54
24.4
834
.40
31.0
537
.50
51.8
054
.704
57.6
0560
.507
Con
glom
erat
es63
.47
74.5
483
.49
95.3
113
2.91
143.
7526
4.21
308.
7338
7.26
420.
0459
9.30
655.
062
710.
829
766.
595
Con
stru
ctio
n15
.55
15.9
415
.95
16.7
813
.52
29.9
220
.92
24.4
537
.58
50.4
081
.37
84.5
0087
.628
90.7
56E
ngin
eerin
g te
ch.
0.00
0.00
0.00
0.00
16.7
016
.70
17.6
717
.67
30.0
034
.33
39.1
346
.961
56.3
5367
.624
Foo
d &
toba
cco
31.0
534
.02
38.7
841
.58
43.4
150
.35
58.5
376
.48
96.6
211
3.81
115.
2512
3.83
313
2.41
714
1.00
0F
ootw
ear
7.09
7.94
11.1
120
.97
21.1
922
.80
23.8
025
.24
25.7
034
.41
38.3
541
.922
45.4
9249
.062
Ind.
& d
omes
. pro
d.13
.93
14.1
614
.74
16.7
514
.76
20.5
727
.40
34.0
440
.93
48.5
076
.94
80.3
2583
.715
87.1
04M
achi
nery
16.0
88.
018.
537.
9211
.57
18.4
820
.53
22.3
529
.01
32.3
433
.23
33.2
6133
.288
33.3
14P
acka
ging
13.1
912
.01
13.7
616
.62
29.8
827
.51
32.0
537
.84
43.6
968
.58
75.3
082
.867
90.4
3798
.006
Pet
role
um51
.92
56.4
861
.96
68.4
778
.68
85.6
645
3.85
124.
9717
6.40
224.
8724
2.09
262.
907
283.
722
304.
538
Pha
rm. &
ani
. fee
ds8.
859.
9711
.30
14.6
218
.40
19.3
328
.13
37.0
440
.38
47.4
853
.90
59.2
8364
.667
70.0
51P
ublis
hing
11.9
69.
309.
4211
.53
12.8
015
.48
16.0
317
.65
20.1
924
.22
28.2
528
.300
28.3
4628
.393
Text
iles
9.82
12.2
915
.89
21.1
838
.54
53.8
012
2.01
139.
1915
1.27
153.
1216
8.62
200.
196
231.
768
263.
340
Sec
ond-
tier
mkt
.5.
725.
735.
454.
504.
894.
636.
598.
4910
.24
10.2
711
.02
10.8
3510
.655
10.4
75Y
early
ave
rage
23.8
6526
.980
27.9
5731
.471
39.0
7547
.019
87.8
5282
.199
100.
4681
18.7
7414
8.73
316
2.25
617
5.86
218
9.56
6
Sou
rce:
Com
pute
d fr
om a
nnua
l rep
orts
and
sta
tem
ents
of a
ccou
nts
of 1
05 s
elec
ted
quot
ed c
ompa
nies
in N
iger
ia (
vario
us is
sues
).N
ote:
Equ
ity =
sha
re c
apita
l + s
hare
pre
miu
m +
res
erve
s
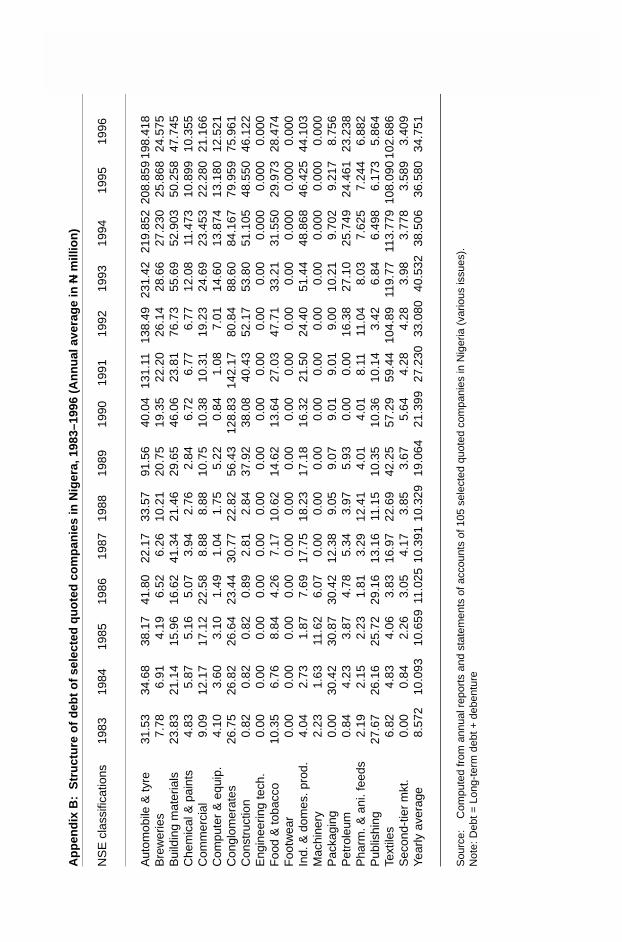
THE IMPACT OF INTEREST RATES LIBERALIZATION ON THE CORPOATE FINANCING STRATEGIES OF QUOTED
COMPANIES IN NIGERIA 47A
pp
end
ix B
: S
tru
ctu
re o
f d
ebt
of
sele
cted
qu
ote
d c
om
pan
ies
in N
iger
a, 1
983–
1996
(A
nn
ual
ave
rag
e in
N m
illio
n)
NS
E c
lass
ifica
tions
1983
1984
1985
1986
1987
1988
1989
1990
1991
1992
1993
1994
1995
1996
Aut
omob
ile &
tyre
31.5
334
.68
38.1
741
.80
22.1
733
.57
91.5
640
.04
131.
1113
8.49
231.
4221
9.85
220
8.85
919
8.41
8B
rew
erie
s7.
786.
914.
196.
526.
2610
.21
20.7
519
.35
22.2
026
.14
28.6
627
.230
25.8
6824
.575
Bui
ldin
g m
ater
ials
23.8
321
.14
15.9
616
.62
41.3
421
.46
29.6
546
.06
23.8
176
.73
55.6
952
.903
50.2
5847
.745
Che
mic
al &
pai
nts
4.83
5.87
5.16
5.07
3.94
2.76
2.84
6.72
6.77
6.77
12.0
811
.473
10.8
9910
.355
Com
mer
cial
9.09
12.1
717
.12
22.5
88.
888.
8810
.75
10.3
810
.31
19.2
324
.69
23.4
5322
.280
21.1
66C
ompu
ter
& e
quip
.4.
103.
603.
101.
491.
041.
755.
220.
841.
087.
0114
.60
13.8
7413
.180
12.5
21C
ongl
omer
ates
26.7
526
.82
26.6
423
.44
30.7
722
.82
56.4
312
8.83
142.
1780
.84
88.6
084
.167
79.9
5975
.961
Con
stru
ctio
n0.
820.
820.
820.
892.
812.
8437
.92
38.0
840
.43
52.1
753
.80
51.1
0548
.550
46.1
22E
ngin
eerin
g te
ch.
0.00
0.00
0.00
0.00
0.00
0.00
0.00
0.00
0.00
0.00
0.00
0.00
00.
000
0.00
0F
ood
& to
bacc
o10
.35
6.76
8.84
4.26
7.17
10.6
214
.62
13.6
427
.03
47.7
133
.21
31.5
5029
.973
28.4
74F
ootw
ear
0.00
0.00
0.00
0.00
0.00
0.00
0.00
0.00
0.00
0.00
0.00
0.00
00.
000
0.00
0In
d. &
dom
es. p
rod.
4.04
2.73
1.87
7.69
17.7
518
.23
17.1
816
.32
21.5
024
.40
51.4
448
.868
46.4
2544
.103
Mac
hine
ry2.
231.
6311
.62
6.07
0.00
0.00
0.00
0.00
0.00
0.00
0.00
0.00
00.
000
0.00
0P
acka
ging
0.00
30.4
230
.87
30.4
212
.38
9.05
9.07
9.01
9.01
9.00
10.2
19.
702
9.21
78.
756
Pet
role
um0.
844.
233.
874.
785.
343.
975.
930.
000.
0016
.38
27.1
025
.749
24.4
6123
.238
Pha
rm. &
ani
. fee
ds2.
192.
152.
231.
813.
2912
.41
4.01
4.01
8.11
11.0
48.
037.
625
7.24
46.
882
Pub
lishi
ng27
.67
26.1
625
.72
29.1
613
.16
11.1
510
.35
10.3
610
.14
3.42
6.84
6.49
86.
173
5.86
4Te
xtile
s6.
824.
834.
063.
8316
.97
22.6
942
.25
57.2
959
.44
104.
8911
9.77
113.
779
108.
090
102.
686
Sec
ond-
tier
mkt
.0.
000.
842.
263.
054.
173.
853.
675.
644.
284.
283.
983.
778
3.58
93.
409
Year
ly a
vera
ge8.
572
10.0
9310
.659
11.0
2510
.391
10.3
2919
.064
21.3
9927
.230
33.0
8040
.532
38.5
0636
.580
34.7
51
Sou
rce:
Com
pute
d fr
om a
nnua
l rep
orts
and
sta
tem
ents
of a
ccou
nts
of 1
05 s
elec
ted
quot
ed c
ompa
nies
in N
iger
ia (
vario
us is
sues
).N
ote:
Deb
t = L
ong-
term
deb
t + d
eben
ture
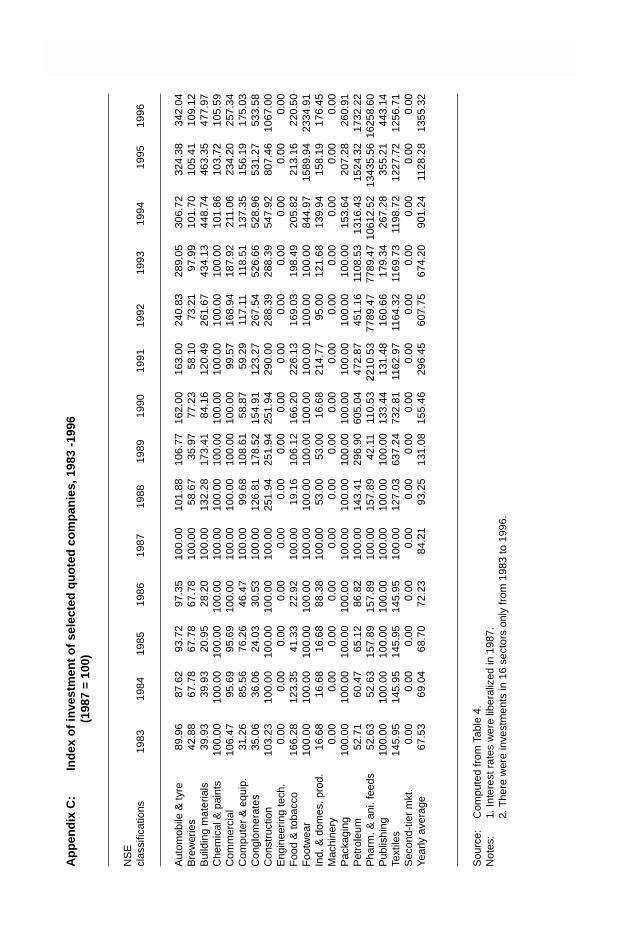
48 RESEARCH PAPER 88A
pp
end
ix C
:In
dex
of
inve
stm
ent
of
sele
cted
qu
ote
d c
om
pan
ies,
198
3 -1
996
(198
7 =
100)
NS
Ecl
assi
ficat
ions
1983
1984
1985
1986
1987
1988
1989
1990
1991
1992
1993
1994
1995
1996
Aut
omob
ile &
tyre
89.9
687
.62
93.7
297
.35
100.
0010
1.88
106.
7716
2.00
163.
0024
0.83
289.
0530
6.72
324.
3834
2.04
Bre
wer
ies
42.8
867
.78
67.7
867
.78
100.
0058
.67
35.9
777
.23
58.1
073
.21
97.9
910
1.70
105.
4110
9.12
Bui
ldin
g m
ater
ials
39.9
339
.93
20.9
528
.20
100.
0013
2.28
173.
4184
.16
120.
4926
1.67
434.
1344
8.74
463.
3547
7.97
Che
mic
al &
pai
nts
100.
0010
0.00
100.
0010
0.00
100.
0010
0.00
100.
0010
0.00
100.
0010
0.00
100.
0010
1.86
103.
7210
5.59
Com
mer
cial
106.
4795
.69
95.6
910
0.00
100.
0010
0.00
100.
0010
0.00
99.5
716
8.94
187.
9221
1.06
234.
2025
7.34
Com
pute
r &
equ
ip.
31.2
685
.56
76.2
646
.47
100.
0099
.68
108.
6158
.87
59.2
911
7.11
118.
5113
7.35
156.
1917
5.03
Con
glom
erat
es35
.06
36.0
624
.03
30.5
310
0.00
126.
8117
8.52
154.
9112
3.27
267.
5452
6.66
528.
9653
1.27
533.
58C
onst
ruct
ion
103.
2310
0.00
100.
0010
0.00
100.
0025
1.94
251.
9425
1.94
290.
0028
8.39
288.
3954
7.92
807.
4610
67.0
0E
ngin
eerin
g te
ch.
0.00
0.00
0.00
0.00
0.00
0.00
0.00
0.00
0.00
0.00
0.00
0.00
0.00
0.00
Foo
d &
toba
cco
166.
2812
3.35
41.3
322
.92
100.
0019
.16
106.
1216
6.20
226.
1316
9.03
198.
4920
5.82
213.
1622
0.50
Foo
twea
r10
0.00
100.
0010
0.00
100.
0010
0.00
100.
0010
0.00
100.
0010
0.00
100.
0010
0.00
844.
9715
89.9
423
34.9
1In
d. &
dom
es. p
rod.
16.6
816
.68
16.6
888
.38
100.
0053
.00
53.0
016
.68
214.
7795
.00
121.
6813
9.94
158.
1917
6.45
Mac
hine
ry0.
000.
000.
000.
000.
000.
000.
000.
000.
000.
000.
000.
000.
000.
00P
acka
ging
100.
0010
0.00
100.
0010
0.00
100.
0010
0.00
100.
0010
0.00
100.
0010
0.00
100.
0015
3.64
207.
2826
0.91
Pet
role
um52
.71
60.4
765
.12
86.8
210
0.00
143.
4129
6.90
605.
0447
2.87
451.
1611
08.5
313
16.4
315
24.3
217
32.2
2P
harm
. & a
ni. f
eeds
52.6
352
.63
157.
8915
7.89
100.
0015
7.89
42.1
111
0.53
2210
.53
7789
.47
7789
.47
1061
2.52
1343
5.56
1625
8.60
Pub
lishi
ng10
0.00
100.
0010
0.00
100.
0010
0.00
100.
0010
0.00
133.
4413
1.48
160.
6617
9.34
267.
2835
5.21
443.
14Te
xtile
s14
5.95
145.
9514
5.95
145.
9510
0.00
127.
0363
7.24
732.
8111
62.9
711
64.3
211
69.7
311
98.7
212
27.7
212
56.7
1S
econ
d-tie
r m
kt.
0.00
0.00
0.00
0.00
0.00
0.00
0.00
0.00
0.00
0.00
0.00
0.00
0.00
0.00
Year
ly a
vera
ge67
.53
69.0
468
.70
72.2
384
.21
93.2
513
1.08
155.
4629
6.45
607.
7567
4.20
901.
2411
28.2
813
55.3
2
Sou
rce:
Com
pute
d fr
om T
able
4.
Not
es:
1. In
tere
st r
ates
wer
e lib
eral
ized
in 1
987.
2. T
here
wer
e in
vest
men
ts in
16
sect
ors
only
from
198
3 to
199
6.
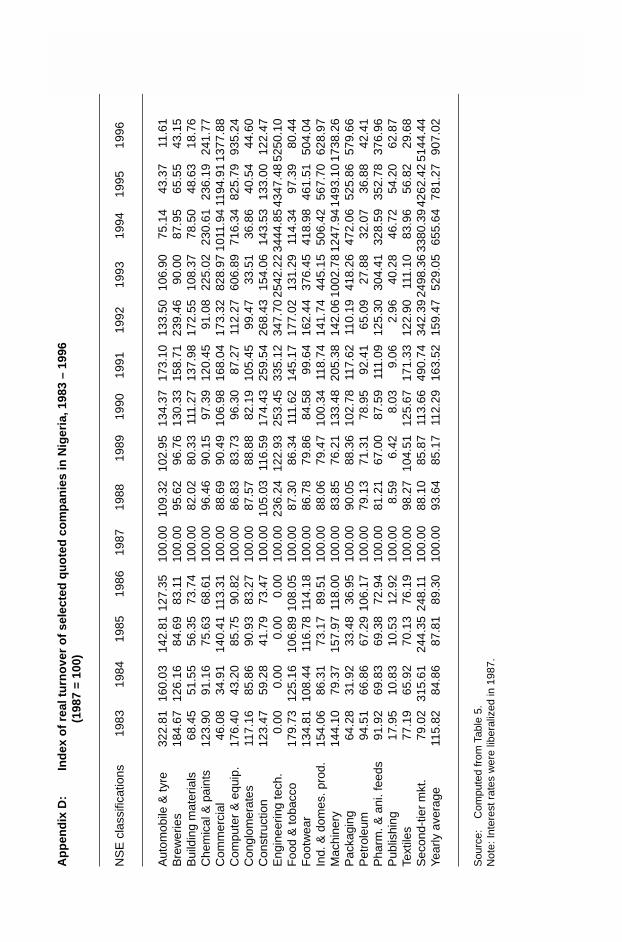
THE IMPACT OF INTEREST RATES LIBERALIZATION ON THE CORPOATE FINANCING STRATEGIES OF QUOTED
COMPANIES IN NIGERIA 49A
pp
end
ix D
:In
dex
of
real
tu
rno
ver
of
sele
cted
qu
ote
d c
om
pan
ies
in N
iger
ia, 1
983
– 19
96(1
987
= 10
0)
NS
E c
lass
ifica
tions
1983
1984
1985
1986
1987
1988
1989
1990
1991
1992
1993
1994
1995
1996
Aut
omob
ile &
tyre
322.
8116
0.03
142.
8112
7.35
100.
0010
9.32
102.
9513
4.37
173.
1013
3.50
106.
9075
.14
43.3
711
.61
Bre
wer
ies
184.
6712
6.16
84.6
983
.11
100.
0095
.62
96.7
613
0.33
158.
7123
9.46
90.0
087
.95
65.5
543
.15
Bui
ldin
g m
ater
ials
68.4
551
.55
56.3
573
.74
100.
0082
.02
80.3
311
1.27
137.
9817
2.55
108.
3778
.50
48.6
318
.76
Che
mic
al &
pai
nts
123.
9091
.16
75.6
368
.61
100.
0096
.46
90.1
597
.39
120.
4591
.08
225.
0223
0.61
236.
1924
1.77
Com
mer
cial
46.0
834
.91
140.
4111
3.31
100.
0088
.69
90.4
910
6.98
168.
0417
3.32
828.
9710
11.9
411
94.9
113
77.8
8C
ompu
ter
& e
quip
.17
6.40
43.2
085
.75
90.8
210
0.00
86.8
383
.73
96.3
087
.27
112.
2760
6.89
716.
3482
5.79
935.
24C
ongl
omer
ates
117.
1685
.86
90.9
383
.27
100.
0087
.57
88.8
882
.19
105.
4599
.47
33.5
136
.86
40.5
444
.60
Con
stru
ctio
n12
3.47
59.2
841
.79
73.4
710
0.00
105.
0311
6.59
174.
4325
9.54
268.
4315
4.06
143.
5313
3.00
122.
47E
ngin
eerin
g te
ch.
0.00
0.00
0.00
0.00
100.
0023
6.24
122.
9325
3.45
335.
1234
7.70
2542
.22
3444
.85
4347
.48
5250
.10
Foo
d &
toba
cco
179.
7312
5.16
106.
8910
8.05
100.
0087
.30
86.3
411
1.62
145.
1717
7.02
131.
2911
4.34
97.3
980
.44
Foo
twea
r13
4.81
108.
4411
6.78
114.
1810
0.00
86.7
879
.86
84.5
899
.64
162.
4437
6.45
418.
9846
1.51
504.
04In
d. &
dom
es. p
rod.
154.
0686
.31
73.1
789
.51
100.
0088
.06
79.4
710
0.34
118.
7414
1.74
445.
1550
6.42
567.
7062
8.97
Mac
hine
ry14
4.10
79.3
715
7.97
118.
0010
0.00
83.8
576
.21
133.
4820
5.38
142.
0610
02.7
812
47.9
414
93.1
017
38.2
6P
acka
ging
64.2
831
.92
33.4
836
.95
100.
0090
.05
88.3
610
2.78
117.
6211
0.19
418.
2647
2.06
525.
8657
9.66
Pet
role
um94
.51
66.8
667
.29
106.
1710
0.00
79.1
371
.31
78.9
592
.41
65.0
927
.88
32.0
736
.88
42.4
1P
harm
. & a
ni. f
eeds
91.9
269
.83
69.3
872
.94
100.
0081
.21
67.0
087
.59
111.
0912
5.30
304.
4132
8.59
352.
7837
6.96
Pub
lishi
ng17
.95
10.8
310
.53
12.9
210
0.00
8.59
6.42
8.03
9.06
2.96
40.2
846
.72
54.2
062
.87
Text
iles
77.1
965
.92
70.1
376
.19
100.
0098
.27
104.
5112
5.67
171.
3312
2.90
111.
1083
.96
56.8
229
.68
Sec
ond-
tier
mkt
.79
.02
315.
6124
4.35
248.
1110
0.00
88.1
085
.87
113.
6649
0.74
342.
3924
98.3
633
80.3
942
62.4
251
44.4
4Ye
arly
ave
rage
115.
8284
.86
87.8
189
.30
100.
0093
.64
85.1
711
2.29
163.
5215
9.47
529.
0565
5.64
781.
2790
7.02
Sou
rce:
Com
pute
d fr
om T
able
5.
Not
e: In
tere
st r
ates
wer
e lib
eral
ized
in 1
987.
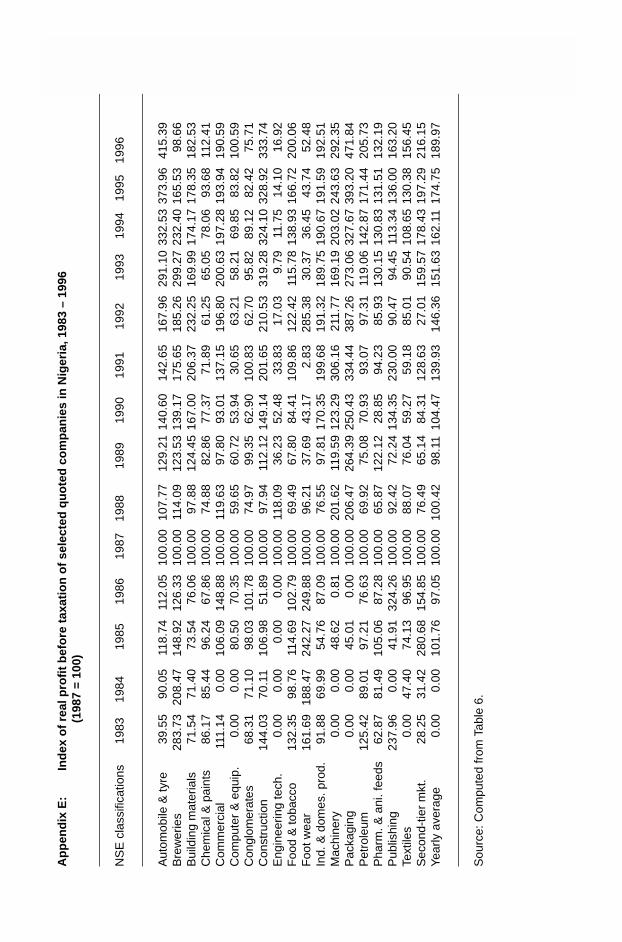
50 RESEARCH PAPER 88A
pp
end
ix E
:In
dex
of
real
pro
fit
bef
ore
tax
atio
n o
f se
lect
ed q
uo
ted
co
mp
anie
s in
Nig
eria
, 198
3 –
1996
(198
7 =
100)
NS
E c
lass
ifica
tions
1983
1984
1985
1986
1987
1988
1989
1990
1991
1992
1993
1994
1995
1996
Aut
omob
ile &
tyre
39.5
590
.05
118.
7411
2.05
100.
0010
7.77
129.
2114
0.60
142.
6516
7.96
291.
1033
2.53
373.
9641
5.39
Bre
wer
ies
283.
7320
8.47
148.
9212
6.33
100.
0011
4.09
123.
5313
9.17
175.
6518
5.26
299.
2723
2.40
165.
5398
.66
Bui
ldin
g m
ater
ials
71.5
471
.40
73.5
476
.06
100.
0097
.88
124.
4516
7.00
206.
3723
2.25
169.
9917
4.17
178.
3518
2.53
Che
mic
al &
pai
nts
86.1
785
.44
96.2
467
.86
100.
0074
.88
82.8
677
.37
71.8
961
.25
65.0
578
.06
93.6
811
2.41
Com
mer
cial
111.
140.
0010
6.09
148.
8810
0.00
119.
6397
.80
93.0
113
7.15
196.
8020
0.63
197.
2819
3.94
190.
59C
ompu
ter
& e
quip
.0.
000.
0080
.50
70.3
510
0.00
59.6
560
.72
53.9
430
.65
63.2
158
.21
69.8
583
.82
100.
59C
ongl
omer
ates
68.3
171
.10
98.0
310
1.78
100.
0074
.97
99.3
562
.90
100.
8362
.70
95.8
289
.12
82.4
275
.71
Con
stru
ctio
n14
4.03
70.1
110
6.98
51.8
910
0.00
97.9
411
2.12
149.
1420
1.65
210.
5331
9.28
324.
1032
8.92
333.
74E
ngin
eerin
g te
ch.
0.00
0.00
0.00
0.00
100.
0011
8.09
36.2
352
.48
33.8
317
.03
9.79
11.7
514
.10
16.9
2F
ood
& to
bacc
o13
2.35
98.7
611
4.69
102.
7910
0.00
69.4
967
.80
84.4
110
9.86
122.
4211
5.78
138.
9316
6.72
200.
06F
oot w
ear
161.
6918
8.47
242.
2724
9.88
100.
0096
.21
37.6
943
.17
2.83
285.
3830
.37
36.4
543
.74
52.4
8In
d. &
dom
es. p
rod.
91.8
869
.99
54.7
687
.09
100.
0076
.55
97.8
117
0.35
199.
6819
1.32
189.
7519
0.67
191.
5919
2.51
Mac
hine
ry0.
000.
0048
.62
0.81
100.
0020
1.62
119.
5912
3.29
306.
1621
1.77
169.
1920
3.02
243.
6329
2.35
Pac
kagi
ng0.
000.
0045
.01
0.00
100.
0020
6.47
264.
3925
0.43
334.
4438
7.26
273.
0632
7.67
393.
2047
1.84
Pet
role
um12
5.42
89.0
197
.21
76.6
310
0.00
69.9
275
.08
70.9
393
.07
97.3
111
9.06
142.
8717
1.44
205.
73P
harm
. & a
ni. f
eeds
62.8
781
.49
105.
0687
.28
100.
0065
.87
122.
1228
.85
94.2
385
.93
130.
1513
0.83
131.
5113
2.19
Pub
lishi
ng23
7.96
0.00
41.9
132
4.26
100.
0092
.42
72.2
413
4.35
230.
0090
.47
94.4
511
3.34
136.
0016
3.20
Text
iles
0.00
47.4
074
.13
96.9
510
0.00
88.0
776
.04
59.2
759
.18
85.0
190
.54
108.
6513
0.38
156.
45S
econ
d-tie
r m
kt.
28.2
531
.42
280.
6815
4.85
100.
0076
.49
65.1
484
.31
128.
6327
.01
159.
5717
8.43
197.
2921
6.15
Year
ly a
vera
ge0.
000.
0010
1.76
97.0
510
0.00
100.
4298
.11
104.
4713
9.93
146.
3615
1.63
162.
1117
4.75
189.
97
Sou
rce:
Com
pute
d fr
om T
able
6.


