Embed Size (px)
Citation preview

www.elsevier.com/locate/foreco
Forest Ecology and Management 203 (2004) 345–360
The impact of land use on soil carbon in Miombo
Woodlands of Malawi
Sarah M. Walkera,*, Paul V. Desankerb,1
aDepartment of Environmental Sciences, University of Virginia, Clark Hall,
291 McCormick Road, Charlottesville, VA 22904, USAbPenn State University/Geography, 202 Walker Building, University Park, PA 16802, USA
Received 16 February 2004; received in revised form 13 August 2004; accepted 13 August 2004
Abstract
In the Miombo Woodlands Region of south-central Africa, it is estimated 50–80% of the total system’s carbon stock is found
in the top 1.5 m belowground. Deforestation and rapid population growth rates have led to reduced fallow periods and
widespread land degradation in the south-central Africa area of the Miombo Woodlands. The impact of this land use conversion
on belowground carbon and nitrogen stocks within the Miombo Woodlands has not been examined extensively in the past. We
addressed how the soil carbon profile reacts to conversion to agriculture, the continuation of agriculture, and the ability of the soil
carbon budget to recover following abandonment within the Chimaliro Forest Reserve and surrounding villages in Kasungu,
Malawi. Protected natural Miombo Woodlands sites, agricultural fields of increasing ages, and fallow fields of increasing ages
were sampled. Surface carbon levels in Miombo soils varied from 1.2 to 3.7%. Agricultural soil carbon was significantly
depressed with surface layers ranging from 0.35 to 1.2% carbon. Unexpectedly, fallow carbon and nitrogen levels continued to
be significantly repressed (surface soils 0.65–2.3% C), pointing out the possible unsustainability of the current agricultural
management cycle dominant in the area. On average, agricultural soils contain 40% less soil carbon than the natural Miombo
Woodlands. Soil carbon declined logarithmically with depth within all land use types. Clay content was significantly positively
correlated with soil carbon in the top 40 cm and therefore areas of higher clay content contained elevated carbon levels.
Although a common attribute to many agricultural systems, bulk densities were not significantly altered by land use changes.
# 2004 Elsevier B.V. All rights reserved.
Keywords: Miombo; Dry tropical forest; Soil carbon; Shifting-cultivation; Agriculture; Land use change
* Corresponding author. Tel.: +1 434 924 4303;
fax: +1 434 982 2137.
E-mail address: [email protected] (S.M. Walker),
[email protected] (P.V. Desanker).1 Tel.: +1 814 865 1748; fax +1 814 863 7943.
0378-1127/$ – see front matter # 2004 Elsevier B.V. All rights reserved
doi:10.1016/j.foreco.2004.08.004
1. Introduction
Recently there has been a growing interest in
understanding the carbon stocks of each ecosystem
worldwide. As negotiations of the Kyoto Protocol
progress, knowing the size of these carbon stocks and
the factors that impact them is becoming economically
.

S.M. Walker, P.V. Desanker / Forest Ecology and Management 203 (2004) 345–360346
important to countries. Estimates of aboveground
biomass stocks exist for most ecosystems, however
carbon belowground in roots and soil is less well
characterized. The ancient soils of the Basement
Complex in south-central Africa covered by the
Miombo Woodlands present local farmers with
nutrient poor soils and crop yields in this part of
Africa are some of the lowest worldwide. Currently
this region is enduring extensive deforestation and
land degradation owing to population increases,
escalating agricultural production, and woodfuel
demands. Much of the newly cropped land is
unsuitable for agriculture and degrades quickly,
thereby forcing the farmer to convert even more land
to agriculture. The impacts of agricultural conversion
and shifting-cultivation on nutrient cycling and
ecological health, however, have not been studied
extensively in the Miombo Woodlands Region.
Owing to slow soil organic matter turnover rates, as
compared to aboveground vegetation, soil carbon
levels do not react as quickly to changes in land use.
Due to this property, soil carbon levels measured
through time can establish the long-term productivity
and possible sustainability of that land use system. In a
nutrient poor system, soil organic matter (SOM) can
play an important role in the stability, quality, and
Scheme 1. Location of study site, Chimaliro Forest Reserve in Malaw
fertility of the soil. Farmers and land use planners are
therefore interested in land use management that will
enhance soil carbon levels.
In most ecosystems worldwide the conversion of
land to agriculture will drastically change natural
internal nutrient cycling and nutrient loss will exceed
nutrient gain. Under agriculture, biomass litter inputs
become minimal and tillage will split up soil
aggregates, increasing decomposition (Allen, 1985;
Tate, 1987). Soil carbon is reduced most drastically in
the plow layers of the soil. Generally, as the labile
carbon from the previous land use is decomposed,
agricultural conversion results in soil carbon loss that
tends to be rapid in the years immediately after
conversion. The rate of loss then diminishes over time
and Soil Organic Carbon (SOC) may reach a new
equilibrium (Houghton et al., 1983; Schlesinger, 1986;
Davidson and Ackerman, 1993).
As is common in drier systems (Woomer et al.,
1997), in the Miombo Woodlands ecosystem of south-
central Africa roughly 60% the total carbon stock is
found belowground (Campbell et al., 1998a,b). The
range of soil carbon levels across the Miombo region
and the main environmental regulators are somewhat
known, however there has been little research on how
land use conversion will alter these carbon stocks. This
i, and the distribution of the Miombo Woodlands (White, 1983).
S.M. Walker, P.V. Desanker / Forest Ecology and Management 203 (2004) 345–360 347
study builds on our understanding of how the
dominant land use pattern impacts soil carbon levels
and the soil carbon vertical structure by comparing soil
carbon stocks within the dominant land cover types:
Miombo Woodland, agricultural fields, and fallow
fields. Differences in soil carbon stocks as agricultural
fields increased in age are explored by sampling fields
of differing ages. Likewise, the possible recovery of
soil carbon stocks within abandoned fields reverting to
woodlands is estimated in fallow fields of increasing
age.
2. Methods
2.1. Study area
The Miombo region spans 2.8 million km2 of
south-central Africa (Scheme 1). Precipitation ranges
from 650 to 1500 mm and 95% of annual precipitation
occurs during the hot wet season (Campbell, 1996;
Desanker et al., 1997). The natural ecosystem is an
open woodland (20–60% canopy cover) with a grass
understory (Trapnell, 1959; Rodgers, 1996). The
aboveground biomass of the Miombo Woodlands
ranges from 37,000 to 95,000 kg/ha (Malaisse et al.,
1975; Chidumayo, 1990; Tietema, 1993; Chidumayo,
1995; Campbell et al., 1998a,b). On average, fires burn
the understory every 3 years across the Miombo and
savannas and therefore greatly impact the vegetation
dynamics of the system and biomass litter levels
reaching the soil (Boaler, 1966). Most trees are able to
resprout if cut or burned and this allows trees to persist
within agricultural fields for many years and regrow
from rootstocks if a field is left fallow (Chidumayo,
1997).
The current study took place within the Chimaliro
Forest Reserve (12.5S, 33.55E) near Kasungu in
Malawi and surrounding villages in coordination with
the Forestry Research Institute of Malawi (FRIM) and
the Department of Forestry of Malawi (Scheme 1).
The area receives roughly 1000 mm of precipitation a
year (Steve Makungwa, personal communication, July
1999). The tall grass understory within the reserve is
collected for thatching during the dry season followed
by controlled burning by the forest reserve guards.
Village chiefs control public land and field allocation
is relatively stable. Although varying between farm-
ers, many farmers keep a section of allocated land
unplowed for use as a firewood and pole resource.
Some farmers rotate this fallow area more frequently
than others. This fallow/degraded woodland is the
most common form of Miombo Woodlands now
occurring in Malawi.
2.2. Field methods
The dominant land use types were identified in the
area in coordination with FRIM, Malawi Department
of Forestry employees, and local farmers. Sites were
selected randomly within each land use type
stratification. Sampling occurred at 5 sites within
the Chimaliro Forest Reserve, 11 agricultural fields,
and 6 fallow fields. General site characteristics were
recorded. The land use history of each site was
documented by interviewing either the forest guard or
the owner of the field. At each site, a random number
was generated for the number of steps into a site and
the direction to be walked. Once at this point, four
1 m2 plots were laid out 20 m away east, west, north
and south from the central point. All vegetation within
the 1 m2 plot was cut off at its base and weighed.
Surface litter was also removed and weighed. Soil and
roots samples were collected in a 1 m2 pit. Soil
samples were taken at the following depths: 0–10 cm,
10–20 cm, 20–40 cm, 40–60 cm, 60–100 cm, 100–
150 cm.
At all depths, soil was taken from each section of
the pit and placed in a large basin, thoroughly mixed,
and a 500 g subsample of soil collected. At sites in
which no roots were found four auger cores were taken
within the pit to collect a sample for the 60–100 and
100–150 cm. Bulk density samples were taken at each
depth using a known volume metal container. Only
one set of bulk density samples were taken per site. All
samples were air dried.
2.3. Laboratory methods
Soil texture measurements were performed on soil
from one pit per site, on depths 0–10, 20–40, and 60–
100 cm. Bulk density measurements were performed
at the University of Virginia by drying the soil at
105 8C for 2 days and then reweighing the samples.
Bulk density samples for five sites were lost in
shipping samples to the USA, therefore at these sites

S.M. Walker, P.V. Desanker / Forest Ecology and Management 203 (2004) 345–360348
bulk density measurements from a site with similar
land use were used as estimations in data analysis. Soil
samples were sieved to 2 mm, soaked in 10% HCl to
remove any carbonates from the soil and then put in a
45 8C oven until dry. Soils were then ground and
analyzed for carbon and nitrogen using a Carlo Erba
elemental analyzer. For each sample, the elemental
analysis was repeated three times and the average C
and N values used in the analysis. Carbon and nitrogen
densities were calculated by multiplying the soil
concentrations by the bulk density (% C � BD).
Stocks of carbon and nitrogen were calculated by
multiplying the carbon or nitrogen density by the
depth of soil sampled (% C � BD � depth).
2.4. Statistical analysis performed
All statistical measures were completed using SAS
(SAS Institute, 1989). Carbon and nitrogen values
were log transformed for all future statistical tests in
order to meet normality assumptions of statistical
tests. The variables included in the analysis were: log
carbon, log nitrogen, field age, bulk density, % clay, %
silt, and % clay + % silt.
Comparisons of data across land uses were
completed using PROC GLM, an analysis of variance
procedure in SAS (SAS Institute, 1989). Site was
nested within land use (LU) type and depth was nested
within site and LU type. Where appropriate, % clay, %
silt, % clay + % silt, and/or BD were added as
covariates. Within the agricultural sites, the ages of the
fields were categorized into three groups: four young
(1–5 years), four medium (10–20 years), and three old
(30–40 years).
A suite of equation types was fitted to the carbon
and depth measurements. A log carbon–log cm
regression best represented the relationship. A
regression was then performed on all the data and
one overall representative equation was developed by
including land use type dummy variables and (land use
type dummy variable) � (log cm) variables. Regres-
sion equations were also performed for each land use
type and for each individual site. The regression
equations for each type and for each of the sites were
then compared to the overall equation by comparing
the intercept, slope, and both, of each equation to the
overall equation. This was also done between the site
equation and the type equation and the overall
equation determined for this study. Additionally,
stepwise multiple regressions on both log % carbon
and log carbon density were completed for each land
use type. Soil texture, bulk density, depth, and age of
agricultural field were included in the stepwise
regressions.
Because of differences in bulk density, the mass of
soil within a particular depth range will not be the
same across all areas. Therefore, a number of
researchers have suggested recalculating carbon
volume estimates based on the mass of soil to a
depth within the natural land use type to correct for
this difference (Mann, 1986; Brown and Lugo, 1990b;
Neill et al., 1997). A Miombo Woodlands average bulk
density was found for each depth and this was
multiplied by the width of each sampling depth. This
Miombo mass of soil for each depth was then
multiplied by the % carbon found at each depth for
each site. This then produced a ‘mass corrected’
volume of carbon for each site. A t-test was performed
to compare this volume with the observed volumes
and an ANOVA was completed to examine differences
between land use types using this carbon volume
estimate.
3. Results
3.1. Explanation of sites
The five Miombo woodland sites measured
contained mixed aged trees that did not show signs
of coppicing or firewood collection. Grass grows to
about 1 m in height and is often collected for thatch at
the end of the dry season. Maize is the dominant crop
sown at the agricultural sites but other crops included
tobacco, millet and groundnuts. Fertilizers were only
used when tobacco was planted and would be applied
at very small levels due to the substantial cost for the
farmer. Age of agricultural field in 11 sites measured
ranged from 1 to 30 years of continuous agriculture.
Within the four young fields (less than 5 years),
coppicing trees less than 0.5 m in height were in
abundance around the field. In the three fields
cultivated for more than 30 years, there were very
few trees still coppicing. The six fallow sites contained
a mix of both coppicing trees and trees growing from
seed. These are areas within the farmer’s allocated

S.M. Walker, P.V. Desanker / Forest Ecology and Management 203 (2004) 345–360 349
land that the farmer has stopped farming in the past
and uses as an area for firewood and pole collection
and possibly for grazing. Therefore, the areas are not
recovering naturally but are instead being impacted at
a relatively constant low level.
3.2. Changes in soil texture and bulk density within
a profile and differences across land use types
Across the sites, clay content ranges 12–45% clay
at the surface (Table 1). On average, the clay content is
30% lower in the top 10 cm than the depths below
20 cm. This downward eluviation of clay to the
subsurface and surface kaolinate decomposition fits
well with the ferrasol soil type FAO map classification
(FAO–UNESCO, 1988). Although the sites span a
range of soil textures, soil texture did not differ
significantly between land use types for each depth.
Clay content is significantly correlated with bulk
density measurements. However, the correlation is
only strong in the top layers of the agriculture and
fallow land uses. The bulk density of the agricul-
tural sites were not significantly different from the
Miombo sites, however fallow sites have signifi-
cantly higher BD levels than Miombo in the top 20 cm
(Table 1).
3.3. Changes in soil nutrients within a profile
After exploring a large number of equation types, a
log carbon–log cm equation was found to best
represent soil carbon and soil nitrogen with depth
(Fig. 1). At all sites soil carbon is greatest at the
surface and then declines rapidly with depth. Below
60 cm, carbon and nitrogen values change only
slightly with depth. The variance between sites of
the same land use and within a site is also highest at the
surface and values become very similar by 40 cm
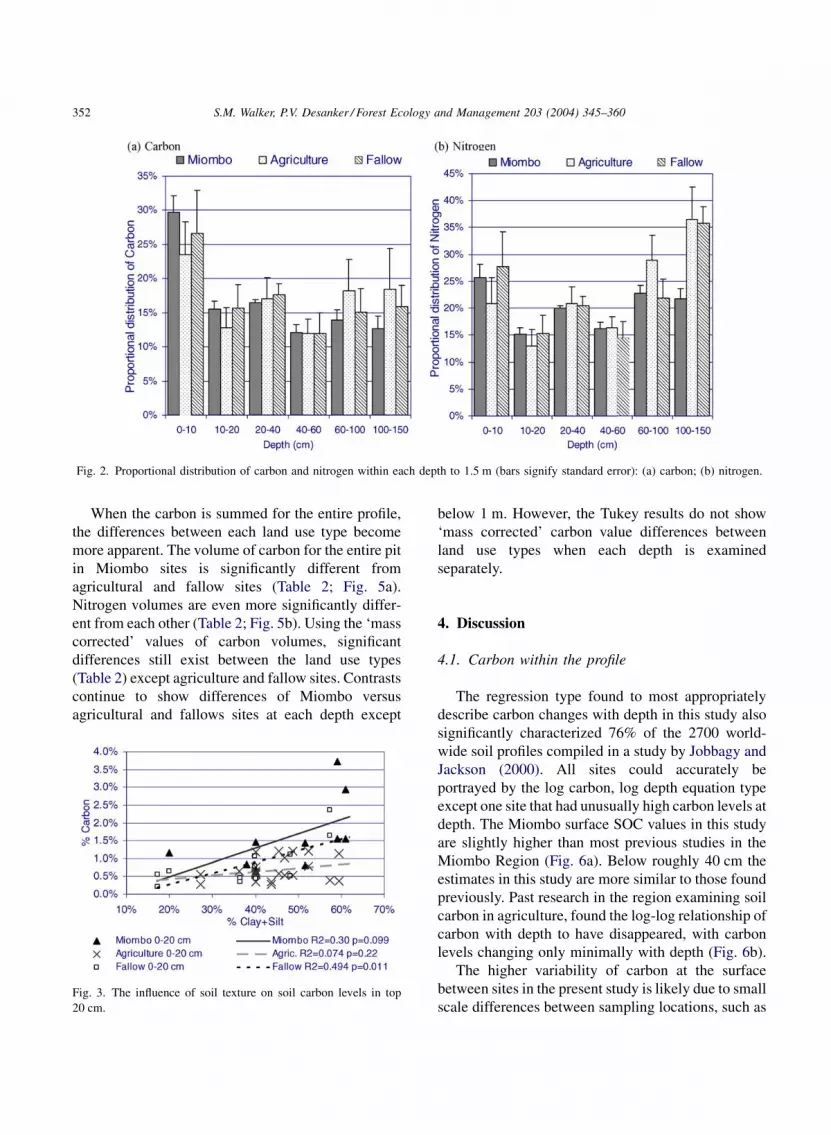
(Table 1; Fig. 1) Within the top 1.5 m, roughly 25% of
the soil carbon is stored in the surface layer (Fig. 2a).
The top 30 cm contains about 50% of all the carbon
found to a depth of 1.5 m. Nitrogen is not as dominant
at the surface, nonetheless about 20% of nitrogen is
found above 10 cm and about 10% between 10 and
20 cm (Fig. 2b).
The carbon to nitrogen ratio of the soil generally
declines slightly with depth. On average the C:N ratio
is about 16 at the surface and declines to 10 at depth
(Table 1). The 10–20-year-old agricultural fields have
the lowest C:N ratios. In agricultural fields, the oldest
fields have the highest C:N ratio, evidencing the
reduction in nitrogen through the years. These oldest
fields have had no chemical fertilizer additions.
3.4. Factors influencing carbon and nitrogen
content levels
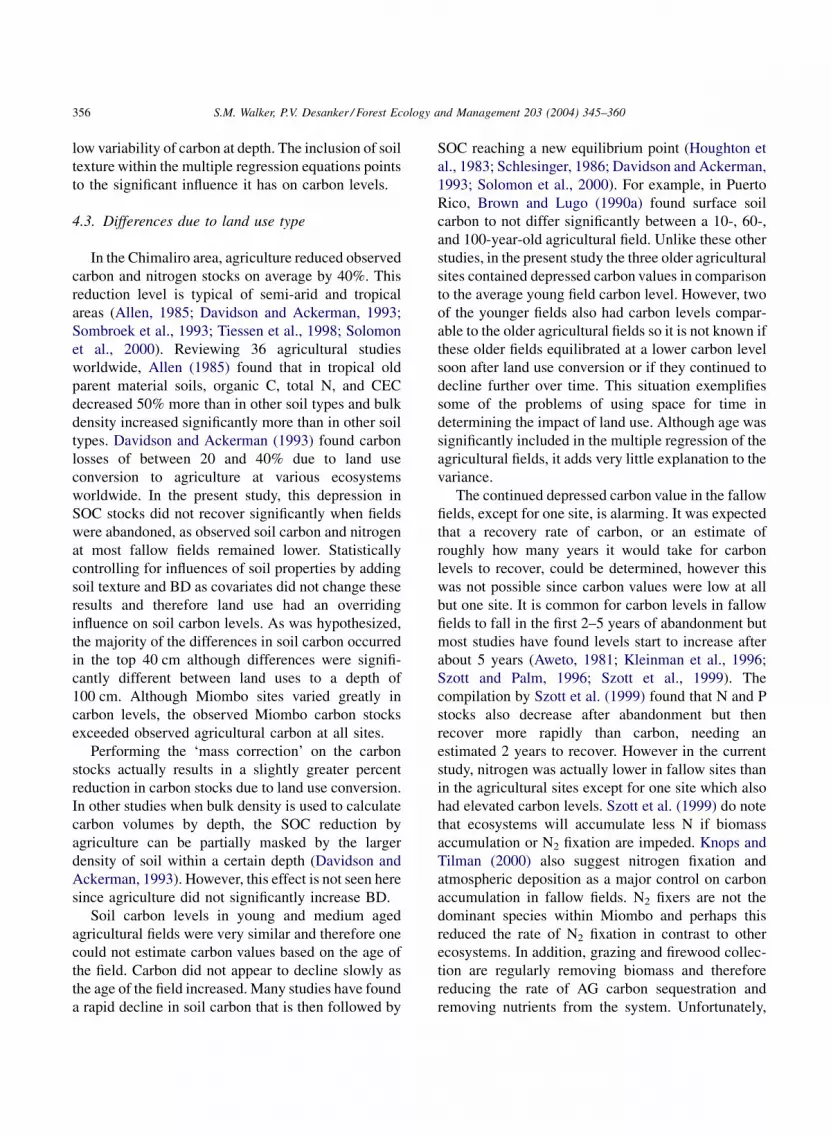
Clay, silt, and BD are all correlated with % carbon
of the soil. Clay content impacts carbon levels most
strongly in the surface layers and significantly to
40 cm (Fig. 3). Clay dominated soils and soils with
lower bulk densities have the highest carbon levels.
Age of the agricultural field is correlated with carbon
as well as nitrogen density above 40 cm. Medium and
young aged fields are not significantly different from
each other. Young fields differ significantly from the
older fields to a depth of 60 cm. However there is not a
gradual decline in carbon levels through time, with
some younger fields having the same level of carbon as
older fields (Fig. 4).
The stepwise multiple regression constructed using
all data points was able to explain a substantial amount
of the variation in carbon levels (R2 = 0.778). Of
course, depth explained the majority of the variation
(R2 = 0.613) and was the only substantial contributor.
% Clay, % silt, and BD were all included as significant
contributions however the partial R2 was very small
for BD. Within the Miombo land use multiple
regression, depth accounted for a much higher
proportion of the variation than other land use type
equations. In contrast, clay accounted for 19% of the
variation in the fallow sites. For the agricultural sites,
age was included as a variable in the multiple
regression although it only explained 2% of the
variation.
3.5. Differences in carbon and nitrogen content
between different land use types
Because of the correlation of clay, silt, and BD with
carbon and BD and clay with each other, these
variables were added to the analysis as covariates.
However, the inclusion of the covariates did not alter
the statistical results. The observed carbon and
nitrogen levels of Miombo sites are significantly
different from all other land use types to a depth of

S.M. Walker, P.V. Desanker / Forest Ecology and Management 203 (2004) 345–360350
Table 1
Average values for each land use type
Land use type Depth
(cm)
% C % N C:N C density
(g/cm3)
N density
(g/cm3)
BD
(g/cm3)
% Clay + silt
Miombo ave. 0–10 2.31 0.138 16.40 0.0266 0.00160 1.19 s 46 bb
(S.D.) 1.052 0.055 1.62 0.0111 0.00058 0.111 16.8
Miombo ave. 10–20 1.16 0.078 14.58 h 0.0134 0.00091 1.22 t u
(S.D.) 0.416 0.021 2.40 0.0049 0.00024 0.089
Miombo ave. 20–40 0.62 0.050 12.47 i 0.0073 0.00058 1.20 v 67 cc
(S.D.) 0.207 0.009 2.95 0.0026 0.00011 0.062 18.2
Miombo ave. 40–60 0.43 0.037 11.66 j 0.0054 0.00046 1.29 x
(S.D.) 0.167 0.008 3.79 0.0024 0.00011 0.119
Miombo ave. 60–100 0.24 0.026 9.57 k 0.0029 0.00031 1.24 y 59 ee
(S.D.) 0.068 0.005 3.28 0.0008 0.00006 0.088 18.4
Miombo ave. 100–150 0.15 a 0.020 f 8.22 l 0.0019 m 0.00024 q 1.32 z aa
(S.D.) 0.051 0.006 2.71 0.0006 0.00007 0.168
Agric. ave. 0–10 0.87 b 0.058 g 14.62 0.0109 n 0.00075 r 1.31 s 44 bb
(S.D.) 0.349 0.022 2.71 0.0042 0.00024 0.127 8.5
Agric. ave. 10–20 0.50 c 0.038 12.89 h 0.0061 0.00047 1.23 t
(S.D.) 0.198 0.011 3.37 0.0024 0.00014 0.106
Agric. ave. 20–40 0.34 d 0.033 11.13 i 0.0041 o 0.00039 1.20 v 54 cc dd
(S.D.) 0.146 0.014 3.82 0.0018 0.00016 0.089 9.7
Agric. ave. 40–60 0.24 e 0.026 9.96 j 0.0028 p 0.00031 1.19
(S.D.) 0.075 0.012 2.83 0.0010 0.00014 0.059
Agric. ave. 60–100 0.18 0.022 8.76 k 0.0023 0.00027 1.25 y 57
(S.D.) 0.113 0.010 3.47 0.0014 0.00012 0.043 13.8
Agric. ave. 100–150 0.13 a 0.022 f 6.83 l 0.0014 m 0.00026 q 1.22 z
(S.D.) 0.088 0.011 3.62 0.0011 0.00013 0.059
Fallow ave. 0–10 1.03 b 0.058 g 17.72 0.0133 n 0.00074 r 1.37 s 37 bb
(S.D.) 0.69 0.036 2.72 0.0078 0.00040 0.106 15.7
Fallow ave. 10–20 0.66 c 0.035 20.57 0.0085 0.00046 1.38 u
(S.D.) 0.495 0.025 10.11 0.0059 0.00030 0.111
Fallow ave. 20–40 0.38 d 0.024 16.54 0.0045 0.00029 1.29 v 47 dd
(S.D.) 0.205 0.013 5.41 0.0022 0.00014 0.121 17.2
Fallow ave. 40–60 0.25 e 0.017 16.61 0.0032 o 0.00021 1.27 x
(S.D.) 0.237 0.015 6.47 0.0031 0.00020 0.021
Fallow ave. 60–100 0.14 0.012 18.62 0.0019 p 0.00015 1.30 y 44 ee
(S.D.) 0.059 0.007 16.19 0.0008 0.00009 0.055 16.8
Fallow ave. 100–150 0.10 0.012 11.73 l 0.0012 0.00016 1.33 aa
(S.D.) 0.070 0.011 34.91 0.0010 0.00015 0.055
Like letters signify no significant differences between land uses for that depth.
100 cm. Using observed values, if each depth is
analyzed separately, observed % C and carbon density
of agriculture and fallow sites are not significantly
different at most depths (Table 1).
If the slope and intercept of the fitted logarithmic
regression equations are compared to each other, about
half of the agricultural site regression equations were
not significantly different from the overall equation.
The slopes of the regression equations for most sites
were similar but the intercepts were not.
Although the amount of carbon in the soil is
different between land uses, the proportional distribu-
tion of carbon throughout the profile is not sig-
nificantly different (Fig. 2a). However, the proportion
of carbon in the top 10 cm is significantly different
between Miombo and agriculture at a 0.09 p-value,
displaying the lower proportion of carbon found in
surface agricultural soil. Nitrogen in agriculture is
lower proportionally at the surface compared to fallow
at a p-value of 0.07 (Fig. 2b).

S.M. Walker, P.V. Desanker / Forest Ecology and Management 203 (2004) 345–360 351
Fig. 1. Land use type regression of carbon and nitrogen density with depth (bars signify standard error).
S.M. Walker, P.V. Desanker / Forest Ecology and Management 203 (2004) 345–360352
Fig. 2. Proportional distribution of carbon and nitrogen within each depth to 1.5 m (bars signify standard error): (a) carbon; (b) nitrogen.
When the carbon is summed for the entire profile,
the differences between each land use type become
more apparent. The volume of carbon for the entire pit
in Miombo sites is significantly different from
agricultural and fallow sites (Table 2; Fig. 5a).
Nitrogen volumes are even more significantly differ-
ent from each other (Table 2; Fig. 5b). Using the ‘mass
corrected’ values of carbon volumes, significant
differences still exist between the land use types
(Table 2) except agriculture and fallow sites. Contrasts
continue to show differences of Miombo versus
agricultural and fallows sites at each depth except
Fig. 3. The influence of soil texture on soil carbon levels in top
20 cm.
below 1 m. However, the Tukey results do not show
‘mass corrected’ carbon value differences between
land use types when each depth is examined
separately.
4. Discussion
4.1. Carbon within the profile
The regression type found to most appropriately
describe carbon changes with depth in this study also
significantly characterized 76% of the 2700 world-
wide soil profiles compiled in a study by Jobbagy and
Jackson (2000). All sites could accurately be
portrayed by the log carbon, log depth equation type
except one site that had unusually high carbon levels at
depth. The Miombo surface SOC values in this study
are slightly higher than most previous studies in the
Miombo Region (Fig. 6a). Below roughly 40 cm the
estimates in this study are more similar to those found
previously. Past research in the region examining soil
carbon in agriculture, found the log-log relationship of
carbon with depth to have disappeared, with carbon
levels changing only minimally with depth (Fig. 6b).
The higher variability of carbon at the surface
between sites in the present study is likely due to small
scale differences between sampling locations, such as

S.M. Walker, P.V. Desanker / Forest Ecology and Management 203 (2004) 345–360 353
Fig. 4. Correlation between age of land use and surface soil carbon density.
position in comparison to trees, past fire history at site,
proximity of termite mounds, slope position, and
grazing intensity. Carbon deeper in the profile will
represent the integration of many years of biological
inputs. Because of the logarithmic nature of carbon
with depth, the majority (�60% on average) of carbon
is found above 40 cm and more than 40% in the top
20 cm. The higher in the profile, the greater influence
land use change will have on the carbon levels. The
surface layers will contain the most labile carbon
sources, i.e., those most readily decomposed by soil
microbes Therefore, if carbon inputs are reduced, the
Table 2
Average total volume of carbon and nitrogen to a depth of 1.5 m
Average (kg/ha) S.D. (kg/ha)
Carbon
Miombo 82517 32684
Agriculture 49031 10799
Fallow 52201 23882
Average 57952 23268
Carbon: mass corrected
Miombo 79623 35981
Agriculture 42440 11833
Fallow 44857 22328
Average 51550 22368
Nitrogen
Miombo 6838 845
Agriculture 5021 1557
Fallow 3877 1349
Average 4997 1654
microbes will continue to decompose the existing
organic matter until the majority of the carbon will
exist as stable, inert complexes. Soil at depth will
generally be relatively old and will not be easily
influenced by land practices happening at the surface
(unless deep rooted plants begin to grow), hence the
low variability of SOC at depth. In comparison with
Jobbagy and Jackson (2000), this study found
proportionally more carbon at the surface than was
seen in other tropical deciduous forests or savannas.
Conversely, the average agricultural fields in Jobbagy
and Jackson (2000) contained proportionally more
S.E. (kg/ha) Percent reduction from Miombo
Top 10 cm Top 1.5 m
23111
7636 �55 �41
16887 �43 �37
16453
25443
8367 �61 �47
15788 �47 �44
15817
598
1101 �50 �26
954 �48 �46
1169

S.M. Walker, P.V. Desanker / Forest Ecology and Management 203 (2004) 345–360354
Fig. 5. Carbon and nitrogen stock within one ha of each land use
(with standard error of entire depth, different letters signify sig-
nificant differences between LU).
surface carbon than this study found. In comparison to
other studies within Miombo, this study also found
proportionally greater levels of carbon at the surface in
agricultural fields (Fig. 6b).
The surface soils of the agricultural fields are
expected to have a lower C:N ratio than the Miombo
Woodlands, as the amount of new inputs into the soil
has been reduced and therefore the majority of SOM is
expected to be older, highly decomposed material
(Waksman, 1924). Additionally there could be a build
up of fertilizer through time. However, this reduced
C:N ratio was found only in some of the older
agricultural sites (at which no fertilizer had ever been
used) and some fallow sites. King and Campbell
(1994) found similar C:N ratios at Miombo sites,
averaging 15 at the surface and 7 at 20 cm and only
slightly lower C:N ratios in the agricultural sites,
averaging 12 at the surface. Other studies in Miombo
Woodlands areas also had surface C:N ratios similar to
those found in the present study, ranging from a low of
8 to a high of 15 (Stromgaard, 1991, 1992; Murwira
and Kirchmann, 1993).
4.2. Soil texture and bulk density
The range of agricultural soil texture was not
significantly different from the Miombo sites, there-
fore it does not seem that soil texture is a factor for
farmers in choosing the location of agricultural fields.
It is difficult to tell if the same is true for all fallow
sites. It is possible that the farmers holding the two
sandier fallow sites that also have low carbon levels
have retained the areas as woodlots because they
believe the areas will not be productive farmland.
Unfortunately, the farmers were not questioned about
their views on the ability of that land to recover in
comparison to other plots.
Due to the break up of soil aggregates by plowing
(Davidson and Ackerman, 1993), increases in bulk
density when land is converted to agriculture are
extremely common worldwide, however no significant
changes were seen in the current study. This may be
due to the naturally lower perturbation level of hand
plowing. King and Campbell (1994) in Zimbabwe
found BD levels very comparable to those in this
study, with Miombo sites having BD of 1.3 g/cm3 and
the arable plots having a higher BD of 1.5 g/cm3. A
bulk density of �1.2–1.4 g/cm3 is very common
worldwide for native vegetation without a thick
organic horizon and agricultural conversion raises
that to �1.5 g/cm3 (Brown and Lugo, 1990b;
Davidson and Ackerman, 1993; Rosell and Galantini,
1997; Batjes and Dijkshoorn, 1999; Feller et al.,
2001). The increased bulk density in fallow fields may
be due to the hoof traffic of grazing animals or from
the higher sand content at some sites.
As in this study, many researchers have also found
some correlation between BD and % clay to exist,
although an adequate predictive relationship between
them has not been found (Curtis and Post, 1964;
Barahona and Santos, 1981; Rodriguez-Murillo,
2001). The higher sand levels in two of the fallow
sites probably contributed to the higher BD levels
found at those sites. This interaction was accounted for
in the analysis of land use impacts on carbon levels,
but its inclusion did not alter the statistical results.

S.M. Walker, P.V. Desanker / Forest Ecology and Management 203 (2004) 345–360 355
Fig. 6. Soil carbon in vertical profile within various published Miombo studies in comparison to the current study: (a) Miombo Woodlands
(Astle, 1969; Brocklington, 1956; Campbell et al., 1995; Campbell et al., 1988; Mapiki, 1988; Nyamapfene, 1991; Robertson, 1984; Stromgaard,
1984; Trapnell et al., 1976; Watson, 1964; Young, 1976), (i = taken from Campbell, 1996); (b) agricultural fields (Mugwira and Nyamangara,
1998; Kirchmann and Eklund, 1994; Chivaura-Mususa and Campbell, 1998).
In many ecosystem types, soil carbon is commonly
seen to be positively correlated with clay and/or clay +
silt including the Jobbagy and Jackson (2000) study
which examined a large number of profiles worldwide,
and Birch and Friend (1956), Foster (1981), and Bird
et al. (2000) in east and southern African soils. Feller
et al. (2001) maintains that within latitudinal
gradients, SOC stocks will be very dependent on
the soil mineralogy and soil texture. Carbon levels
tend to increase with increasing clay content because
carbon is often captured within small pores of clay
particles that are then not physically accessible to
microbes or bound in the interlayers of silicate clays
(Paul, 1984; Lepsch et al., 1994; Lilienfein et al.,
1998). In the current study, a significant but low R2
regression exists between carbon and % clay + silt in
the top 40 cm of observed soils. Clay content does not
influence SOC below 40 cm, perhaps due simply to the
S.M. Walker, P.V. Desanker / Forest Ecology and Management 203 (2004) 345–360356
low variability of carbon at depth. The inclusion of soil
texture within the multiple regression equations points
to the significant influence it has on carbon levels.
4.3. Differences due to land use type
In the Chimaliro area, agriculture reduced observed
carbon and nitrogen stocks on average by 40%. This
reduction level is typical of semi-arid and tropical
areas (Allen, 1985; Davidson and Ackerman, 1993;
Sombroek et al., 1993; Tiessen et al., 1998; Solomon
et al., 2000). Reviewing 36 agricultural studies
worldwide, Allen (1985) found that in tropical old
parent material soils, organic C, total N, and CEC
decreased 50% more than in other soil types and bulk
density increased significantly more than in other soil
types. Davidson and Ackerman (1993) found carbon
losses of between 20 and 40% due to land use
conversion to agriculture at various ecosystems
worldwide. In the present study, this depression in
SOC stocks did not recover significantly when fields
were abandoned, as observed soil carbon and nitrogen
at most fallow fields remained lower. Statistically
controlling for influences of soil properties by adding
soil texture and BD as covariates did not change these
results and therefore land use had an overriding
influence on soil carbon levels. As was hypothesized,
the majority of the differences in soil carbon occurred
in the top 40 cm although differences were signifi-
cantly different between land uses to a depth of
100 cm. Although Miombo sites varied greatly in
carbon levels, the observed Miombo carbon stocks
exceeded observed agricultural carbon at all sites.
Performing the ‘mass correction’ on the carbon
stocks actually results in a slightly greater percent
reduction in carbon stocks due to land use conversion.
In other studies when bulk density is used to calculate
carbon volumes by depth, the SOC reduction by
agriculture can be partially masked by the larger
density of soil within a certain depth (Davidson and
Ackerman, 1993). However, this effect is not seen here
since agriculture did not significantly increase BD.
Soil carbon levels in young and medium aged
agricultural fields were very similar and therefore one
could not estimate carbon values based on the age of
the field. Carbon did not appear to decline slowly as
the age of the field increased. Many studies have found
a rapid decline in soil carbon that is then followed by
SOC reaching a new equilibrium point (Houghton et
al., 1983; Schlesinger, 1986; Davidson and Ackerman,
1993; Solomon et al., 2000). For example, in Puerto
Rico, Brown and Lugo (1990a) found surface soil
carbon to not differ significantly between a 10-, 60-,
and 100-year-old agricultural field. Unlike these other
studies, in the present study the three older agricultural
sites contained depressed carbon values in comparison
to the average young field carbon level. However, two
of the younger fields also had carbon levels compar-
able to the older agricultural fields so it is not known if
these older fields equilibrated at a lower carbon level
soon after land use conversion or if they continued to
decline further over time. This situation exemplifies
some of the problems of using space for time in
determining the impact of land use. Although age was
significantly included in the multiple regression of the
agricultural fields, it adds very little explanation to the
variance.
The continued depressed carbon value in the fallow
fields, except for one site, is alarming. It was expected
that a recovery rate of carbon, or an estimate of
roughly how many years it would take for carbon
levels to recover, could be determined, however this
was not possible since carbon values were low at all
but one site. It is common for carbon levels in fallow
fields to fall in the first 2–5 years of abandonment but
most studies have found levels start to increase after
about 5 years (Aweto, 1981; Kleinman et al., 1996;
Szott and Palm, 1996; Szott et al., 1999). The
compilation by Szott et al. (1999) found that N and P
stocks also decrease after abandonment but then
recover more rapidly than carbon, needing an
estimated 2 years to recover. However in the current
study, nitrogen was actually lower in fallow sites than
in the agricultural sites except for one site which also
had elevated carbon levels. Szott et al. (1999) do note
that ecosystems will accumulate less N if biomass
accumulation or N2 fixation are impeded. Knops and
Tilman (2000) also suggest nitrogen fixation and
atmospheric deposition as a major control on carbon
accumulation in fallow fields. N2 fixers are not the
dominant species within Miombo and perhaps this
reduced the rate of N2 fixation in contrast to other
ecosystems. In addition, grazing and firewood collec-
tion are regularly removing biomass and therefore
reducing the rate of AG carbon sequestration and
removing nutrients from the system. Unfortunately,

S.M. Walker, P.V. Desanker / Forest Ecology and Management 203 (2004) 345–360 357
farmers were not questioned about the initial fertility
of the soil when the land was first deforested, and
therefore it is not known if these sites inherently
contained less C and N. All of the Chimaliro fallow
sites had a tall layer of C4 grass and in Zambia it has
been found that grass fallows can immobilize N
(Barrios et al., 1997). In an acacia woodland in
Tanzania, degradation through selective logging for
charcoal production reduced the labile portions of soil
carbon and nitrogen but only slightly increased the
C:N ratio (Solomon et al., 2000).
Observed soil carbon values in the Miombo
vegetation land use type vary more greatly than
expected. More measurements within this land use
type need to be collected along with other variables
that will influence SOC such as: AG Biomass, annual
litter levels, fire frequency, termite density, and slope
position. Agricultural fields are more similar to each
other and one generalized regression equation could
be used to estimate SOC at an acceptable error level.
The greatest variance in soil carbon occurs in the
surface layers and the standard error of carbon levels
below 60 cm is relatively small (Table 1; Fig. 1).
5. Conclusions
The rapid changes taking place in the populations
of south-central Africa are resulting in a greater area of
land under human control and more intense use of the
land than ever before. Processes or management
practices that alter the inputs of organic matter into the
soil carbon pool or the decomposition rate of SOM
will affect soil carbon levels.
This study examined a number of both natural and
human driven factors influencing soil carbon levels in
the Miombo Woodland Region. By removing the
majority of aboveground biomass, conversion to
agriculture breaks the cycle of carbon movement in
the ecosystem. Carbon in the soil is not replenished at
a rate to keep up with decomposition and carbon
declines. Even in an agricultural system using hand
plowing, SOC levels cannot be maintained. Nitrogen
generally follows the same trend as carbon. Field
experiments and modeling studies should be initiated
to examine potential sustainability improvements
using different agricultural management techniques
such as reduced tillage, application of manure, the
rotation of cover and N-fixing crops, and improved
fallows (Lal et al., 1995; Anderson, 1998; Lal, 1998;
Six et al., 1998).
From the study conducted it appears that the
dominant fallow field land management technique is
not allowing for nutrient recovery. The nutrient
dynamics of these abandoned fallow fields are in
great need of further study. A SOC recovery rate could
not be determined because only one fallow site had
made any type of carbon gain. The extremely low
levels of carbon and especially nitrogen in these
regrowing Miombo sites need to be addressed by
agricultural extension officers. As the area of land
converted to agriculture across the Miombo Region
increases, land in this regrowth state will most likely
become the dominant form of Miombo Woodlands.
Therefore studies of the nutrient dynamics in this type
of land cover will be essential. Land cover estimates of
the area of regrowth have not been estimated for the
region. When preparing land cover maps, these
regrowing areas are often classified as wooded
grassland, bushland, or shrubland depending on the
country, making it impossible to distinguish natural
wooded grassland areas (or at least those not formed
by agricultural abandonment) from regrowth areas on
the current land cover maps. Reevaluation of labeling
methods should be completed to address this issue.
Clay content increased the amount of carbon able
to be stored in the soil within all land use types due to
the protective nature of clay particles. Because of its
positive influence, clay content is an essential site
attribute that must be collected alongside carbon
measurements. Soil texture will need to be considered
in understanding the degree of carbon loss expected
from conversion to agriculture or the possibility of
carbon sequestration. Using a ‘mass corrected’ carbon
estimate was not useful in this study because
conversion to agriculture did not significantly alter
the bulk density of the soils, although some increase
did exist in the older agricultural fields. However, bulk
density was higher in a number of fallow fields, most
likely due to the soil texture and animal traffic.
The current research exhibited the reduced SOC
pool resulting from the dominant agricultural manage-
ment method. If current conditions continue, the
fertility of this land will continue to decline. This will
result in even lower crop yield, leading to increased
poverty and economic instability. Initiation of

S.M. Walker, P.V. Desanker / Forest Ecology and Management 203 (2004) 345–360358
improved agricultural management techniques may
allow for greater soil fertility sustainability.
Acknowledgements
This work has taken place as part of the ‘Coupling
Land Use and Land Cover Changes, and Ecosystem
Processes in Miombo Woodlands’ project funded by
NASA’s LCLUC (Land-Cover and Land-Use Change)
program (NAG5-6384). This work was conducted in
association with Steve Makungwa and Alex Mangu-
lana at the Forestry Research Institute of Malawi and
Richard Chatchuka of the Kasungu District Forestry
Office. We owe much gratitude to the farmers
surrounding the Chimaliro forest reserve for their
warm hospitality and especially to Edward Sambo,
Felix Zimba and Andrea Phiri for their excellent field
assistance. We thank Hank Shugart and Stephen
Macko for their scientific and editorial advice,
Howard Epstein and Margot Miller for assistance
with laboratory work and David Richardson for
assistance with the statistical analysis.
References
Allen, J.C., 1985. Soil response to forest clearing in the United
States and the tropics: geological and biological factors. Bio-
tropica 17, 15–27.
Anderson, G.D., 1998. Grow the soils to grow the crops in Africa. In:
Lal, R. (Ed.), Soil Quality and Agricultural Sustainability.. Ann
Arbor Press, Chelsea, MI.
Astle, W.L., 1969. The vegetation and soils of Chishinga Ranch,
Luapula Province, Zambia. Kirkia 7, 73–102.
Aweto, A.O., 1981. Secondary succession and soil fertility restora-
tion in south-western Nigeria. I. Succession. II. Soil fertility
restoration. J. Ecol. 69, 601–614.
Barahona, E., Santos, E., 1981. Estudios de correlacion y regresion
de diversos parametros analiticos de 52 perfiles de suelos del
sector Montiel–Alcaraz–Bienservida. An Edafol Abrobiol. 40,
761–773.
Barrios, E., Kwesiga, F., Buresh, R.J., Sprent, J.I., 1997. Light
fraction soil organic matter and available nitrogen following
trees and maize. Soil Sci. Soc. Am. J. 61, 826–831.
Batjes, N.H., Dijkshoorn, J.A., 1999. Carbon nitrogen stocks in the
soils of Amazon Region. Geoderma 89, 273–286.
Birch, H.F., Friend, M.T., 1956. The organic matter and nitrogen
status of east African soils. J. Soil Sci. 7, 156–167.
Bird, M.I., Veenendaal, E.M., Moyo, C., Lloyd, J.W., Frost, P.G.W.,
2000. Effect of fire and soil texture on soil carbon in a sub-humid
savanna (Matopos Zimbabwe). Geoderma 94, 71–90.
Boaler, S.B., 1966. Ecology of a Miombo site, Lupa North Forest
Reserve, Tanzania. II. Plant communities and seasonal variation
in the vegetation. J. Ecol. 54, 465–479.
Brocklington, N.R., 1956. Report of a soil and land use survey,
Copperbelt, Northern Rhodesia. Lusaka, Government Printer.
Brown, S., Lugo, A.E., 1990a. Effects of forest clearing and
succession on the carbon and nitrogen content of soils in Puerto
Rico and US Virgin Islands. Plant Soil 124, 53–64.
Brown, S., Lugo, A.E., 1990b. Tropical secondary forests. J. Tro-
pical Ecol. 6, 1–32.
Campbell, B.M., Cunliffe, R.N., Gambiza, J., 1995. Vegetation
structure and small-scale pattern in Miombo Woodland, Mar-
ondera, Zimbabwe. Bothalia 25 (1), 121–126.
Campbell, B.M. (Ed.), 1996. Miombo Woodlands in Transition:
Woodlands and Welfare in Africa. Centre for International
Forestry Research, Bogor, Indonesia, 266 pp.
Campbell, B.M., Frost, P.G.W., Kirchmann, G., Swift, M., 1998a. A
survey of soil fertility management in small-scale farming sys-
tems in north east Zimbabwe. J. Sustainable Agric. 11, 19–39.
Campbell, B.M., Swift, M.J., Frost, P.G.H., Kirchmann, H., 1998b.
Comparative ecosystem characteristics of a Miombo woodland
and an adjacent agricultural field. In: Bergstrom, L., Kirchmann,
H. (Eds.), Carbon and Nutrient Dynamics in Natural and Agri-
cultural Tropical Ecosystems. CAB International, New York, pp.
201–225.
Campbell, B.M., Swift, M.J., Hatton, J., Frost, P.G.H., 1988. Small-
scale vegetation pattern and nutrient cycling in Miombo Wood-
land. In: Verhoevn, J.T.A., Heil, G.W., Werger, M.J.A. (Eds.),
Vegetation Structure in Relation to Carbon and Nutrient Econ-
omy. SPB Academic Publishing, The Hague, The Netherlands,
pp. 69–85.
Chidumayo, E.N., 1990. Above-ground woody biomass structure
and productivity in a Zambezian woodland. Forest Ecol. Man-
age. 36, 33–46.
Chidumayo, E.N., 1995. Handbook of Miombo Ecology and Man-
agement. Stockholm Environment Institute, Stockholm.
Chidumayo, E.N., 1997. Annual and spatial variation in herbaceous
biomass production in a Zambian dry Miombo woodland. S. Afr.
J. Bot. 63, 74–81.
Chivaura-Mususa, C.C., Campbell, B.M., 1998. The influence of
scattered Parinari curatellifolia and Acacia sieberana trees
on soil nutrients in a grassland pasture and in arable fields.
In: Bergstrom, L., Kirchmann, H. (Eds.), CAB International,
pp. 191–200.
Curtis, R.O., Post, B.W., 1964. Estimating bulk densities from
organic matter content in some Vermont forest soils. In:
Proceedings of Soil Science Society of America. pp. 285–288.
Davidson, E.A., Ackerman, I.L., 1993. Changes in soil carbon
inventories following cultivation of previously untilled soils.
Biogeochemistry 20, 161–193.
Desanker, P.V., Frost, P.G.H., Justice, C., Scholes, R.J., 1997. The
Miombo network: framework for a terrestrial transect study of
land-use and land-cover change in the Miombo ecosystems of
central Africa. IGBP Report 41. IGBP, Stockholm, Sweden.
FAO–UNESCO, 1988. FAO–UNESCO soil map of the world-
revised legend. International Soil Reference and Information
Centre, Wageningen.

S.M. Walker, P.V. Desanker / Forest Ecology and Management 203 (2004) 345–360 359
Feller, C., Albrecht, A., Blanchart, E., Cabidoche, Y.M., Chevallier,
T., Hartmann, C., Eschenbrenner, V., LarreLarrouy, M.C., Ndan-
dou, J.F., 2001. Soil organic carbon sequestration in tropical
areas. General considerations and analysis of some edaphic
determinants for lesser antilles soils. Nutr. Cycl. Agroecosyst.
61, 19–32.
Foster, H.L., 1981. The basic factors which determine inherent soil
fertility in Uganda. J. Soil Sci. 32, 149–160.
Houghton, R.A., Hobbie, J.E., Melillo, J.M., 1983. Changes in the
carbon content of terrestrial biota and soils between 1860–1980:
a net release of CO2 to the atmosphere. Ecol. Monogr. 53, 235–
262.
Jobbagy, E.G., Jackson, R.B., 2000. The vertical distribution of soil
organic carbon and its relation to climate and vegetation. Ecol.
Appl. 10, 423–436.
King, J.A., Campbell, B.M., 1994. Soil organic matter relations in
five land cover types in the Miombo region (Zimbabwe). Forest
Ecol. Manage. 67, 225–239.
Kirchmann, H., Eklund, M., 1994. Microbial biomass in a savanna-
woodland and an adjacent arable soil profile in Zimbabwe. Soil
Biol. Biochem. 26 (9), 1281–1283.
Kleinman, P.J.A., Bryant, R.B., Pimental, D., 1996. Assessing
ecological sustainability of slash-and-burn agriculture through
soil fertility indicators. Agron. J. 88, 122–127.
Knops, J.M.H., Tilman, D., 2000. Dynamics of soil nitrogen and
carbon accumulation for 61 years after agricultural abandon-
ment. Ecology 81, 88–98.
Lal, R., 1998. No till and mulching effects on soil physical quality of
a tropical Alfisol in western Nigeria. In: Lal, R. (Ed.), Soil
Quality and Agricultural Sustainability. Ann Arbor Press, Chel-
sea, MI, pp. 251–265.
Lal, R., Kimble, J., Levine, E., Stewart, B.A., 1995. Soil Manage-
ment and Greenhouse Effect. Lewis Publishers, Boca Raton, p.
385.
Lepsch, I.F., Menk, J.R.F., Oliveira, J.B., 1994. Carbon storage and
other properties of soils under agriculture and natural vegetation
in Sao Paulo State, Brazil. Soil Use Manage. 10, 34–42.
Lilienfein, J., Wilcke, W., Neufeldt, H., Ayarz, M.A., Zech, W.,
1998. Land-use effects on organic carbon, nitrogen, and sulphur
concentrations in macroaggregates of differently textured Bra-
zilian oxisols. Zeitschrift-fuer-Pflanzenernaehrung-und-Boden-
kunde. 161 (2), 165–171.
Malaisse, F.P., Freson, R., Goffinet, G., Malaisse-Mousset, 1975.
Litter fall and litter breakdown in Miombo. In: Golley, F.B.,
Medina, E. (Eds.), Tropical Ecological Systems: Trends in
Terrestrial and Aquatic Research. Springer-Verlag, New York,
pp. 137–152.
Mann, L.K., 1986. Changes in soil carbon storage after cultivation.
Soil Sci. 142, 279–288.
Mapiki, A., 1988. Some special features of red soils of the high
rainfall area of Zambia with reference to their fertility and
management problems. In: Nyamapfene, K., Hussein, J., Asu-
madu, K. (Eds.), The Red Soils of East and Southern Africa.
International Development Research Centre, Ottawa, Canada,
pp. 368–378.
Mugwira, L.M., Nyamangara, J., 1998. Organic carbon and plant
nutrients in soils under maize in Chinamhora Communal Area,
Zimbabwe. In: Bergstrom, L., Kirchmann, H. (Eds.), Carbon
and Nutrient Dynamics in Natural Agricultural Tropical Eco-
systems. CAB International, New York, (Chapter 2), pp. 15–21.
Murwira, H.K., Kirchmann, H., 1993. Nitrogen dynamics and maize
growth in a Zimbabwean sandy soil under manure fertilization.
Commu. Soil Sci. Plant Anal. 24, 2343–2359.
Neill, C., Melillo, J.M., Steudler, P.A., Cerri, C.C., De Moraes,
J.F.L., Piccolo, M.C., Brito, M., 1997. Soil carbon and nitrogen
stocks following forest clearing for pasture in the southwestern
Brazilian Amazon. Ecol. Appl. 7, 1216–1225.
Nyamapfene, K., 1991. Soils of Zimbabwe. Nehanda Press, Harare,
Zimbabwe.
Paul, E.A., 1984. Dynamics of soil organic matter. Plant Soil 76,
275–285.
Robertson, E.F., 1984. Regrowth of two African woodland types
after shifting cultivation. Ph.D. thesis, University of Aberdeen.
Rodgers, W.A., 1996. The Miombo Woodlands. In: McClanahan,
T.R., Young, T.P. (Eds.), East African Ecosystems and Their
Conservation. Oxford University Press, New York (Chapter 12).
Rodriguez-Murillo, J.C., 2001. Organic carbon content under dif-
ferent types of land use and soil in peninsular Spain. Biol.
Fertility Soils 33, 53–61.
Rosell, R.A., Galantini, J.A., 1997. Soil organic carbon dynamics in
native and cultivated ecosystems of South America. In: Lal, R.,
Kimble, J.M., Follett, R.F., Stewart, B.A. (Eds.), Management
of Carbon Sequestration in Soil. CRC Press, Boca Raton,
pp. 11–33.
SAS Institute, 1989. SAS/STAT User’s Guide, Version 6, fourth ed.
SAS Institute Inc., Cary, North Carolina.
Schlesinger, W.H., 1986. Changes in soil carbon storage and
associated properties with disturbance and recovery. In:
Trabalka, J.R., Reichle, D.E. (Eds.), The Changing Carbon
Cycle. A Global Analysis. Springer-Verlag, New York, pp.
194–220.
Six, J., Elliot, E.T., Paustain, K., Doran, J.W., 1998. Aggregation and
soil organic matter accumulation in cultivated and native grass-
land soils. Soil Sci. Soc. Am. J. 62, 1367–1377.
Solomon, D., Lehmann, J., Zech, W., 2000. Land use effects on soil
organic matter properties of chromic luvisols in semi-arid north-
ern Tanzania: carbon, nitrogen, lignin and carbohydrates. Agric.
Ecosyst. Environ. 78, 203.
Sombroek, W.G., Nachtergale, F.O., Hebel, A., 1993. Amount,
dynamics and sequestering of carbon in tropical and subtropical
soils. Ambio 22, 417–426.
Stromgaard, P., 1984. Field studies of land use under chitemene
shifting cultivation, Zambia. Geografisk Tidsskrift 84, 78–85.
Stromgaard, P., 1991. Soil nutrient accumulation under traditional
African agriculture in the Miombo woodland of Zambia. Tro-
pical Agric. 68, 74–80.
Stromgaard, P., 1992. Immediate and long-term effects of fire and
ash-fertilization on a Zambian Miombo woodland soil. Agric.
Ecosyst. Environ. 41, 19–37.
Szott, L.T., Palm, C.A., 1996. Nutrient stocks in managed and
natural humid tropical fallows. Plant Soil 186, 293–309.
Szott, L.T., Palm, C.A., Buresh, R.J., 1999. Ecosystem fertility and
fallow function in the humid and subhumid tropics. Agroforestry
Syst. 47, 163.

S.M. Walker, P.V. Desanker / Forest Ecology and Management 203 (2004) 345–360360
Tate, R.L., 1987. Soil Organic Matter: Biological and Ecological
Effects. Wiley, New York.
Tiessen, H., Feller, C., Sampaio, E.V.S.B., Garin, P., 1998. Carbon
sequestration and turnover in semiarid savannas and dry forest.
Climatic-Change 40, 105–117.
Trapnell, C.G., 1959. Ecological results of woodland burning
experiments in Northern Rhodesia. J. Ecol. 47, 129–168.
Trapnell, C.G., Friend, M.T., Chamberlain, G.T., Birch, H.F., 1976.
The effect of fire and termites on a Zambian woodland soil. J.
Ecol. 64, 577–588.
Waksman, S.A., 1924. Influence of microorganisms upon the car-
bon:nitrogen ratio in the soil. J. Agric. Sci. 14, 555–562.
Watson, J.P., 1964. A soil catena on granite in southern Rhodesia. J.
Soil Sci. 15, 238–257.
White, F., 1983. The Vegetation of Africa. Natural Resources
Research, UNESCO, pp. 86–101.
Woomer, P.L., Palm, C.A., Qureshi, J.N., Kotto-Same, J., 1997.
Carbon sequestration and organic resource management in
African smallholder agriculture. In: Lal, R., Kimble, J.M.,
Follett, R.F., Stewart, B.A. (Eds.), Management of Carbon
Sequestration in Soil. CRC Press, New York, (Chapter 12),
pp. 153–173.
Young, A., 1976. Tropical Soils and Soil Survey. Cambridge Uni-
versity Press, Cambridge.