Embed Size (px)
Citation preview

minerals
Article
The Inadvertent Activation of Silicate Minerals Flotationand Their Depression in Molybdenite Beneficiation
Yu Miao 1, Tao Long 2, Jingjun Wang 1, Fu Lai 1, Weiran Zuo 3 and Bao Guo 3,*
�����������������
Citation: Miao, Y.; Long, T.; Wang, J.;
Lai, F.; Zuo, W.; Guo, B. The Inadvertent
Activation of Silicate Minerals Flotation
and Their Depression in Molybdenite
Beneficiation. Minerals 2021, 11, 1296.
https://doi.org/10.3390/min11111296
Academic Editors: Siyuan Yang,
Yangge Zhu, Cheng Liu, Yanhong
Wang and Przemyslaw B. Kowalczuk
Received: 9 October 2021
Accepted: 17 November 2021
Published: 22 November 2021
Publisher’s Note: MDPI stays neutral
with regard to jurisdictional claims in
published maps and institutional affil-
iations.
Copyright: © 2021 by the authors.
Licensee MDPI, Basel, Switzerland.
This article is an open access article
distributed under the terms and
conditions of the Creative Commons
Attribution (CC BY) license (https://
creativecommons.org/licenses/by/
4.0/).
1 China Gold Inner Mongolia Mining Co., Ltd., Manzhouli 021400, China; [email protected] (Y.M.);[email protected] (J.W.); [email protected] (F.L.)
2 China National Gold Group Co., Ltd., Beijing 100020, China; [email protected] School of Zijin Geology and Mining Engineering, Fuzhou University, Fuzhou 350108, China;
[email protected]* Correspondence: [email protected]
Abstract: The Wushan Operation has been studied as a case study, particularly relevant to thecopper-molybdenum separation circuit, in which efforts have been made to improve the quality ofthe molybdenum concentrate through diagnostic analysis. A key finding has been the appearanceof coarser silicate minerals in the molybdenum concentrate due to their inadvertent activation inflotation. The suitable silicate minerals flotation conditions occurs, most likely, due to upstreambulk flotation regarding the usage of novel collectors and metal cations bearing process water. Theflotation of silicate minerals can be diminished by the implementation of water glass and regrinding.The mechanisms underlying flotation behaviors have been revealed by using advanced in-situ surfaceanalysis and particle size analysis techniques.
Keywords: molybdenite; flotation; silicate minerals; activation; regrinding
1. Introduction
Porphyry Cu-Mo ores are important resources for the extraction of molybdenum. Inporphyry Cu-Mo ores, copper and molybdenum mainly exist in the form of chalcopyriteand molybdenite. As a valuable mineral, it is of great significance to efficiently separatemolybdenite from chalcopyrite. Commonly, the molybdenite beneficiation is accomplishedby means of Cu-Mo bulk flotation, followed by separative flotation of molybdenite fromchalcopyrite by using depressants, conventionally sodium sulfide or sodium hydrosulfideto depress the flotation of copper sulfide [1–5]. The undesirable presence of copper inthe molybdenum concentrate was a central focus for researchers and attracted plenty ofthe investigators’ attentions with some successful operational applications [6,7]. Recov-ery of gangue minerals also deteriorated the grade of molybdenum concentrate. Apartfrom mineralogically associated gangue, the liberated pyrite and silicate minerals are alsofloatable to some extent under certain flotation conditions. In particular, the flotation ofquartz can usually be activated by metal cations as shown in a lot of investigations [8–10].However, there is little research on the flotation behaviors of silicate minerals in molybden-ite beneficiation. As gangue minerals, the flotation of silicate minerals might be activatedinadvertently, which needs to be investigated by revealing the surface properties.
The copper-molybdenum operation of Wushan, located in Manzhouli, Inner MongoliaAutonomous Region, Northeast China, was selected as a case study in this study. Overthe past period, the Mo grade has been continuously lower than 45% with Cu gradebeing controlled to less than 1.5%. Therefore, the product quality cannot be guaranteedresulting in the economic loss of the operation. This paper presents solutions from differentaspects, including surface property and particle size, to address the problem. Significantimprovement of the product quality was achieved based on experimental studies and
Minerals 2021, 11, 1296. https://doi.org/10.3390/min11111296 https://www.mdpi.com/journal/minerals

Minerals 2021, 11, 1296 2 of 16
plant practices. The mechanisms underlying the inadvertent activation of silicate mineralsflotation was recognized and depressed in molybdenite beneficiation.
2. Problem Statement of Wushan Operation2.1. Flowsheet of Wushan Processing Operation
The Wushan copper-molybdenum operation was put into commission in 2009. Atypical copper-molybdenum flowsheet has been applied to the plant to produce separatecopper and molybdenum concentrates through bulk flotation and separation flotation, ina stepwise fashion. The flotation at the Cu-Mo separation stage consists of one stage ofrougher flotation, six stages of cleaner flotation and three stages of scavenger flotation, asshown in Figure 1. A kerosene dosage of 0.35 kg/t and a NaHS dosage of 17 kg/t were“stepwisely” added at different stage of Cu-Mo separation flotation.
Minerals 2021, 11, x FOR PEER REVIEW 2 of 17
nificant improvement of the product quality was achieved based on experimental studies
and plant practices. The mechanisms underlying the inadvertent activation of silicate
minerals flotation was recognized and depressed in molybdenite beneficiation.
2. Problem Statement of Wushan Operation
2.1. Flowsheet of Wushan Processing Operation
The Wushan copper‐molybdenum operation was put into commission in 2009. A
typical copper‐molybdenum flowsheet has been applied to the plant to produce separate
copper and molybdenum concentrates through bulk flotation and separation flotation, in
a stepwise fashion. The flotation at the Cu‐Mo separation stage consists of one stage of
rougher flotation, six stages of cleaner flotation and three stages of scavenger flotation, as
shown in Figure 1. A kerosene dosage of 0.35 kg/t and a NaHS dosage of 17 kg/t were
“stepwisely” added at different stage of Cu‐Mo separation flotation.
Bulk Concentrate
Rougher Flotation
Cleaner 1
Cleaner 4
Scavenger 1
Scavenger2
Cleaner 6
Cleaner 5
Cleaner 3
Cleaner 2
Cu Concentrate
Mo Concentrate
Fitrate
Filter
Scavenger 3
Agitation Tank Φ9.0×9.5m
Figure 1. Flow sheet of the Cu‐Mo separation flotation circuit at Wushan Operation.
Currently, the feed input at the bulk flotation stage is 84,500 ton/day, 30% higher
than its designed value, producing 6000 ton of Mo per year in the form of molybdenum
concentrate. Recently, novel copper flotation collectors have been introduced into the
bulk flotation to improve production efficiency and eco‐friendly of the operation.
2.2. Product Quality Analysis
Product quality analysis has been regularly applied to molybdenum concentrate
with Cu, Mo, Fe, S, SiO2 being the major considerable. The selected results of 10 different
samples over a period of production are shown in Table 1. It is seen that only the second
samples meet the criteria (GB3200‐89: Mo ≥45%, Cu ≤1 .5%). Though Cu ≤2 .5% is ac‐
ceptable, excessive SiO2 should be the main problem for product quality. Table 1 indi‐
cates that significant amounts of SiO2 (≥20%) have been transferred into the concentrate.
Since molybdenite (MoS2) and silicate (assayed in the form of SiO2) jointly contributed to
Figure 1. Flow sheet of the Cu-Mo separation flotation circuit at Wushan Operation.
Currently, the feed input at the bulk flotation stage is 84,500 ton/day, 30% higherthan its designed value, producing 6000 ton of Mo per year in the form of molybdenumconcentrate. Recently, novel copper flotation collectors have been introduced into the bulkflotation to improve production efficiency and eco-friendly of the operation.
2.2. Product Quality Analysis
Product quality analysis has been regularly applied to molybdenum concentrate withCu, Mo, Fe, S, SiO2 being the major considerable. The selected results of 10 different samplesover a period of production are shown in Table 1. It is seen that only the second samplesmeet the criteria (GB3200-89: Mo ≥ 45%, Cu ≤ 1.5%). Though Cu ≤ 2.5% is acceptable,excessive SiO2 should be the main problem for product quality. Table 1 indicates thatsignificant amounts of SiO2 (≥20%) have been transferred into the concentrate. Sincemolybdenite (MoS2) and silicate (assayed in the form of SiO2) jointly contributed to morethan 95% mass content for all concentrate samples, the higher grade of SiO2 present in

Minerals 2021, 11, 1296 3 of 16
the concentrate, the lower grade of Mo. Therefore, the depression of molybdenite can bespecifically due to the inadvertent flotation of the silicates.
Table 1. The grade of Mo concentrate from various samples.
Sample No.Grade, %
Cu Mo SiO2
1 1.76 53.01 9.232 1.14 45.41 26.013 1.25 44.30 27.144 2.44 43.78 35.165 2.47 43.72 19.666 1.37 43.37 31.027 1.38 40.23 37.768 2.08 38.64 31.699 1.68 38.12 43.9210 1.63 36.95 40.55
Size by size analysis was carried out for both Cu-Mo separation feed and Mo concen-trate after screening and subsequent assaying. It can be seen from Table 2 that the Cu-Moseparation feed during the unqualified period is obviously coarser. The mass fraction of−600 mesh is 29.06% during the unqualified period, while it is 44.18% during the qualifiedperiod. During unqualified period, 72.18% of SiO2 is distributed in +325 mesh fraction,while this value decreases to 59.44% during the qualified period. On the other hand, thegrades of SiO2 in both feeds are basically the same as 20.04% and 20.15%, respectively.
Table 2. Size-by-size analysis of Cu-Mo separation feed.
Size, µm Mesh
Unqualified Period Qualified Period
Mass, %SiO2
Mass, %SiO2
Grade, % Distribution, % Grade, % Distribution, %
≥74 +200 30.51 36.44 55.48 17.1 48.23 40.9374~43 200~325 22.14 15.12 16.7 17.22 21.66 18.5143~20 325~600 18.29 12.68 11.57 21.5 11.81 12.6≤20 −600 29.06 11.2 16.24 44.18 12.76 27.97Sum 100 20.04 100 100 20.15 100
In respect of the Mo concentrate, 76.88% of SiO2 is distributed in the +325 meshfraction, while this value is only 36.34% during the qualified period (Table 3). Such adifference is of greater significance than it behaves in the feed, which means the coarsersilicate minerals are more likely transferred into concentrate. This leads to SiO2 grade of26.3% during the qualified period, but 42.2% during the unqualified period.
Table 3. Size-by-size analysis of Mo concentrate.
Size, µm Mesh
Unqualified Period Qualified Period
Mass, %Grade% Distribution, %
Mass, %Grade, % Distribution, %
Mo SiO2 Mo SiO2 Mo SiO2 Mo SiO2
43 +325 53.17 25.96 61.04 37.55 76.88 39.76 47.77 30.66 38.7 46.3443~20 325~600 26.18 46.2 26.57 32.9 16.48 31.76 49.15 28.45 31.81 34.35≤20 −600 20.65 52.58 13.57 29.54 6.64 28.48 50.83 17.83 29.49 19.3Sum 100 36.8 42.2 100 100 100 49.1 26.3 100 100

Minerals 2021, 11, 1296 4 of 16
Therefore, it can be deduced that coarse and floatable silicate minerals are presentin the Cu-Mo separation flotation, and the enrichment of these coarse-grained gangueparticles is the major reason for the low-quality production.
2.3. Process Mineralogical Analysis
The Wushan Operation carries out quantitative mineralogy routinely for bulk, copperand molybdenum concentrate, respectively. Concentrates are examined to determine theabundance of each type of minerals in each size fraction as well as the liberation of theinteresting minerals. Combining the mineralogical information with the plant operatingconditions is helpful to optimize the process performance.
Table 4 shows the mineralogical composition of the Cu-Mo separation feed. It containschalcopyrite as the main copper-bearing mineral, molybdenite as the main molybdeum-bearing mineral and pyrite as the most abundant alternative sulfide mineral. The maingangue minerals in the feed are quartz and feldspar.
Table 4. Mineralogical composition of Cu-Mo separation feed, %.
Minerals Volume, %
Molybdenite 5.67Chalcopyrite 39.83
Covellite 5.96Chalcocite 1.12
Bornite 5.36Tennantite 3.41
Pyrite 15.83Sphalerite 2.21
Iron oxide mineral 1.43Quartz 9.11
Potash feldspar, Plagioclase 6.46Muscovite, Biotite 1.82
Others 1.77Sum 100.00
Most copper minerals in the feed are liberated, accounting for 86.26% (Table 5). Itsassociation with molybdenite is very minor, accounting for only 1.17%, making Cu-Moseparation easily accomplished. Regrinding of the feed seems therefore unnecessary toavoid copper minerals in Mo concentrate. Most of molybdenite is also liberated, accountingfor 82.17% of the total feed (Table 5). According to the microscopic images in Figure 2,molybdenite particles in the feed have no significant interlocking with other mineralsand their blade-shaped grains have reached the desired degree of liberation. In general,most sulfide minerals are liberated and barely associated with silicate minerals. A certainamount of pyrite and sphalerite (15.83% and 2.21%, respectively, see Table 4) are presentin Cu-Mo separation feed. Although the interlocking of silicate minerals with pyrite andsphalerite might exist at a small extent, it is not the major cause of silicate minerals’ accessto molybdenum concentrate. Attempts at increasing the NaHS dosage have been doneby the authors to depress sulfide minerals as much as possible, however, the recovery ofsilicate minerals seemed to not be affected. Therefore, minerals association can hardlydevote to the occurrence of silicate minerals in flotation concentrate.
Table 5. Copper and molybdenum minerals dissemination of Cu-Mo separation feed, %.
Minerals Liberated Mo/Cu Minerals Sulfide Oxide Gangue Interlocked
Copper 86.26 1.17 5.98 0.32 3.77 2.50Molybdenum 82.17 7.11 4.86 0.15 3.64 2.07

Minerals 2021, 11, 1296 5 of 16
Figure 2. The presence of molybdenite (Mo) and other minerals (cv for covellite, cc for chalcocite) inMo concentrate.
3. Experimental Methods3.1. Grinding and Flotation
The samples for flotation tests were taken from the froth product in the form of slurry atthe 4th cleaner stage of molybdenite flotation circuit at the processing operation of Wushan.A complete test procedure consisted of grinding followed by conditioning and flotation ofthe ground product were conducted immediately after sampling at plant laboratory.
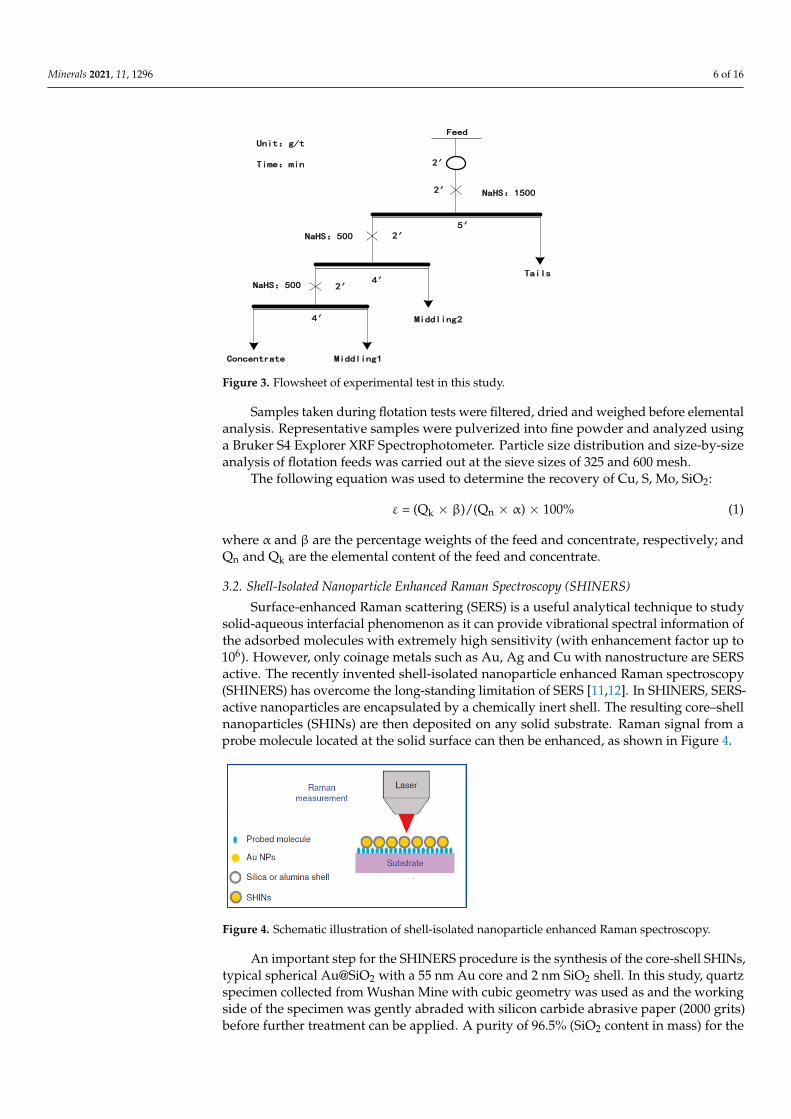
Grinding was carried out in a Φ250 mm × 100 mm laboratory ball mill. For eachgrinding test, a slurry sample was added to the ball mill, together with 20 kg grindingmedia made up of mild-steel balls. The ground slurry was transferred into a 3 litre volumeflotation cell with subsequent conditioning and flotation. The time of this transfer was keptwithin 30 min. The flowsheet and flotation reagent suite used in the tests are illustrated inFigure 3, where collector and frother are not added because the sampled slurry containedthese residue reagents. Copper depressant sodium hydrosulfide (NaHS) was added inaccordance with the plant flowsheet and reagent regime. During flotation, the agitationspeed was set at 1500 rpm, the air flow rate at 15 L/min. The froth products were collectedfor 20 min by scraping into a pan. Plant process water was used in all wet grinding andbatch flotation tests carried out in this study. In the study of the depression effect by waterglass, middlings are not included for simplification.
Minerals 2021, 11, 1296 6 of 16Minerals 2021, 11, x FOR PEER REVIEW 6 of 17
5′
2′
4′
Feed
2′
NaHS:1500
2′NaHS:500
Middling2
Tails
Middling1 Concentrate
4′
NaHS:500 2′
Unit:g/t
Time:min
Figure 3. Flowsheet of experimental test in this study.
Samples taken during flotation tests were filtered, dried and weighed before ele‐
mental analysis. Representative samples were pulverized into fine powder and analyzed
using a Bruker S4 Explorer XRF Spectrophotometer. Particle size distribution and
size‐by‐size analysis of flotation feeds was carried out at the sieve sizes of 325 and 600
mesh.
The following equation was used to determine the recovery of Cu, S, Mo, SiO2:
ε = (Qk × β)/(Qn × α) × 100% (1)
where α and β are the percentage weights of the feed and concentrate, respectively; and
Qn and Qk are the elemental content of the feed and concentrate.
3.2. Shell‐Isolated Nanoparticle Enhanced Raman Spectroscopy (SHINERS)
Surface‐enhanced Raman scattering (SERS) is a useful analytical technique to study
solid‐aqueous interfacial phenomenon as it can provide vibrational spectral information
of the adsorbed molecules with extremely high sensitivity (with enhancement factor up
to 106). However, only coinage metals such as Au, Ag and Cu with nanostructure are
SERS active. The recently invented shell‐isolated nanoparticle enhanced Raman spec‐
troscopy (SHINERS) has overcome the long‐standing limitation of SERS [11,12]. In
SHINERS, SERS‐active nanoparticles are encapsulated by a chemically inert shell. The
resulting core–shell nanoparticles (SHINs) are then deposited on any solid substrate.
Raman signal from a probe molecule located at the solid surface can then be enhanced,
as shown in Figure 4.
Figure 4. Schematic illustration of shell‐isolated nanoparticle enhanced Raman spectroscopy.
An important step for the SHINERS procedure is the synthesis of the core‐shell
SHINs, typical spherical Au@SiO2 with a 55 nm Au core and 2 nm SiO2 shell. In this
Figure 3. Flowsheet of experimental test in this study.
Samples taken during flotation tests were filtered, dried and weighed before elementalanalysis. Representative samples were pulverized into fine powder and analyzed usinga Bruker S4 Explorer XRF Spectrophotometer. Particle size distribution and size-by-sizeanalysis of flotation feeds was carried out at the sieve sizes of 325 and 600 mesh.
The following equation was used to determine the recovery of Cu, S, Mo, SiO2:
ε = (Qk × β)/(Qn × α) × 100% (1)
where α and β are the percentage weights of the feed and concentrate, respectively; andQn and Qk are the elemental content of the feed and concentrate.
3.2. Shell-Isolated Nanoparticle Enhanced Raman Spectroscopy (SHINERS)
Surface-enhanced Raman scattering (SERS) is a useful analytical technique to studysolid-aqueous interfacial phenomenon as it can provide vibrational spectral information ofthe adsorbed molecules with extremely high sensitivity (with enhancement factor up to106). However, only coinage metals such as Au, Ag and Cu with nanostructure are SERSactive. The recently invented shell-isolated nanoparticle enhanced Raman spectroscopy(SHINERS) has overcome the long-standing limitation of SERS [11,12]. In SHINERS, SERS-active nanoparticles are encapsulated by a chemically inert shell. The resulting core–shellnanoparticles (SHINs) are then deposited on any solid substrate. Raman signal from aprobe molecule located at the solid surface can then be enhanced, as shown in Figure 4.
Minerals 2021, 11, x FOR PEER REVIEW 6 of 17
5′
2′
4′
Feed
2′
NaHS:1500
2′NaHS:500
Middling2
Tails
Middling1 Concentrate
4′
NaHS:500 2′
Unit:g/t
Time:min
Figure 3. Flowsheet of experimental test in this study.
Samples taken during flotation tests were filtered, dried and weighed before ele‐
mental analysis. Representative samples were pulverized into fine powder and analyzed
using a Bruker S4 Explorer XRF Spectrophotometer. Particle size distribution and
size‐by‐size analysis of flotation feeds was carried out at the sieve sizes of 325 and 600
mesh.
The following equation was used to determine the recovery of Cu, S, Mo, SiO2:
ε = (Qk × β)/(Qn × α) × 100% (1)
where α and β are the percentage weights of the feed and concentrate, respectively; and
Qn and Qk are the elemental content of the feed and concentrate.
3.2. Shell‐Isolated Nanoparticle Enhanced Raman Spectroscopy (SHINERS)
Surface‐enhanced Raman scattering (SERS) is a useful analytical technique to study
solid‐aqueous interfacial phenomenon as it can provide vibrational spectral information
of the adsorbed molecules with extremely high sensitivity (with enhancement factor up
to 106). However, only coinage metals such as Au, Ag and Cu with nanostructure are
SERS active. The recently invented shell‐isolated nanoparticle enhanced Raman spec‐
troscopy (SHINERS) has overcome the long‐standing limitation of SERS [11,12]. In
SHINERS, SERS‐active nanoparticles are encapsulated by a chemically inert shell. The
resulting core–shell nanoparticles (SHINs) are then deposited on any solid substrate.
Raman signal from a probe molecule located at the solid surface can then be enhanced,
as shown in Figure 4.
Figure 4. Schematic illustration of shell‐isolated nanoparticle enhanced Raman spectroscopy.
An important step for the SHINERS procedure is the synthesis of the core‐shell
SHINs, typical spherical Au@SiO2 with a 55 nm Au core and 2 nm SiO2 shell. In this
Figure 4. Schematic illustration of shell-isolated nanoparticle enhanced Raman spectroscopy.
An important step for the SHINERS procedure is the synthesis of the core-shell SHINs,typical spherical Au@SiO2 with a 55 nm Au core and 2 nm SiO2 shell. In this study, quartzspecimen collected from Wushan Mine with cubic geometry was used as and the workingside of the specimen was gently abraded with silicon carbide abrasive paper (2000 grits)before further treatment can be applied. A purity of 96.5% (SiO2 content in mass) for the

Minerals 2021, 11, 1296 7 of 16
specimen was obtained by X-ray florescence (XRF) analysis. The specimen was then rinsedwith copious amounts of Milli-Q water, dried in air, deposited with SHINs and rinsedwith copious Milli-Q water again. The deposited SHINs particle was very stable withoutobvious spalling by water rinsing or immersing in analyte. Any probe molecule adsorbedonto silica shell is equivalent to its interaction with quartz minerals as similar surfacecharacteristics between these two materials.
Raman data was collected on a Invia Reflex Raman Microscope (manufactured byRenishaw, Wotton-under-Edge, UK) using a 785 nm wavelength laser and 1200 line/mmgrating. The SERS spectra were collected using a 50× long working distance objectivelens at a laser power of 25 mW. The exposure time for each spectrum collection was 1 swith 3 accumulations. The in-situ SHINERS measurements were conducted with a thinreagent-bearing solution covering the surface. The spectrometer was calibrated to thevibrational Raman band of silicon ca. 520 cm−1 prior to the experiment. Normal Ramanspectra of pure chemicals were collected with 250 mW laser power using a 10 s exposurewith one accumulation.
3.3. Focused Beam Reflectance Measurement (FBRM)
In this investigation, molybdenite specimen and quartz specimen were collected fromWushan Mine, ground to fine particles using mortar pestle. Pre-required volume of slurrywas transferred into a 250 mL glass beaker, giving the targeted solids concentration of10%. The FBRM instrument (G400, manufactured by Mettler-Toledo, Columbus, OH, USA)consists of a processing unit and a probe with a 19 mm diameter tip that has a 14 mmdiameter sapphire window at the end. The FBRM probe was placed into the stirred slurryin a vertical position near the inner wall of the beaker. The slurry was stirred by a four-bladeturbine impeller equipped in a dedicated FBRM stand. Stirring rate was set at 400 rpm,with the capture of FBRM data recorded in primary mode at 2 s intervals for total capturetime of 10 min. The distributions are presented as curve graphs for ease of comparisonbut should actually be column graphs. A volume-weighting was achieved by applying asquare-weighting to the chord length distribution [13].
According to the mineralogy study, quartz is the most abundant silicate mineralsin molybdenum concentrate at Wushan Operation, majorly accounting for the high SiO2grade of concentrate. Feldspar is the second most abundant silicate minerals at WushanOperation, and it exhibit similar characteristics in terms of surface properties. Therefore,quartz single mineral specimens were collected from the mine for surface analysis andparticle size analysis.
4. Results and Discussion4.1. Water Quality Analysis
Flotation is a water-intensive process, in order to minimize the use of freshwater,most mining operations in the world use recycled water, underground water, saline water,or seawater, which contain various inorganic and organic species. The content of theseprocess water from different sites at Wushan plant are routinely measured on a daily basis.Table 6 gives representative analysis data of water quality at Wushan. It is seen that thewater recycled to flotation circuit contain quite amount of Ca (more than 300 mg/L), Fe(1~3 mg/L), Cu (5~6 mg/L). Calcium might partially come from the flotation units wherealkaline pH has to be maintained using cost-effective lime (CaO or Ca(OH)2) in orderto depress pyrite. Iron is a result of inorganic flocculant added at water treatment plant,supplied by municipal sewage. Acid mine drainage occurs, especially at open pit andtailings dam where iron and copper can be increasingly present. Wushan is located at ahigh latitude and in a cold region, making the use of sewage water and drainage waternecessary in winter and summer, respectively. In general, the water quality at the plant ispoor, which may negatively affect the flotation at Cu-Mo separation circuit.

Minerals 2021, 11, 1296 8 of 16
Table 6. Analysis of water quality at Wushan operation.
Samples pH Cu, mg/L Fe, mg/L Ca, mg/L
Tap water 1 7.40 0.479 0.89 30.8Tap water 2 7.35 0.007 0.4 28.2
Recycle water 1 5.54 4.27 1.11 321Recycle water 2 6.55 5.92 1.52 356Recycle water 3 6.56 5.88 2.9 370Recycle water 4 7.09 3.75 1.03 292
4.2. Activation of Silicate Minerals Flotation
It is obvious from process mineralogical data that silicate minerals are mostly liber-ated with minor interlocking with other sulfides. The access of silicate particles into themolybdenum concentrate could be due to probable flotation processes such as entrainment,slime coating, and most importantly, activation, which are not related to interlocking anddegree of liberation. Fine particle entrainment in the froth is a common phenomenon ina lot of flotation situations. However, it does not necessarily imply that they are majorlyresponsible for the recovery of silicate minerals at Wushan operation, since their massfraction of −600 mesh is only 16.24% (Table 2). Overall, the surface properties shouldbe responsible for their inadvertent activation in both bulk flotation circuit and Cu-Moseparation flotation circuit.
It is necessary to review the published research where a number of competing factorscan be contributing to the flotation behavior of silicate minerals, especially their activationand depression mechanisms. Calcium ions can form colloidal hydroxides, carbonates,and sulfates, depressing the flotation of sulfide minerals using xanthate as collector at arelatively lower pH [14]. The flotation of molybdenite can also be negatively affected bysignificantly high concentration of Ca2+ and Mg2+ ions that existing in sea water [15,16].Hirajima et al. [17] and Wisnu-Suyantara et al. [18] reported the depressing effect of Ca2+
ions on the flotation of molybdenite at pH > 9, which is possibly due to the adsorption ofCaCO3 precipitates on the molybdenite surface. A similar detrimental effect of Ca2+ onmolybdenite floatability was reported by Lucay et al. [19] in the presence of sulfate ions. Incontrast, the flotation of quartz can usually be activated by calcium ions when sodium oleateis used as collector [8–10]. Moreover, Fe(III) and Cu(II) ions preferably activate the flotationof feldspar and quartz when NaOL is used as collector around pH 7 [20]. These cationsadsorb onto mineral surfaces, leading to an expected increase in NaOL collector adsorptionwith a subsequent enhancement of flotation recoveries. It has also been reported that quartzcan be activated by Cu(II) and Ni(II) and floated with xanthate in the pH 7~10 [21]. Inthis region, copper hydroxide and nickel hydroxide are stable species precipitating onthe surface of silicate minerals, promoting xanthate adsorption. These results indicate thecomplexity of metal cations effect on the floatability of different minerals in a Cu-Mo ore.
Wushan’s bulk flotation circuit involves a combination of collectors which cannot bedisclosed. The flotation collectors of copper sulfide minerals becomes more and more novelnowadays, with the main focus being on the application of non-thiol collectors [22]. In thisway, the molybdenite concentrate can easily be cleaned to yield a high Mo recovery with alow consumption of NaHS during Cu-Mo separation circuit. The adsorbed molecules canthen be easily removed by NaHS from the chalcopyrite surface uncontaminated with thiolcollectors, but this may not be easy for Ca2+ activated silicate minerals because the Ca2+ ionsare not significantly affected by hydrosulfide ions. Thus, the activated silicate minerals retaintheir floatability when tranferring from bulk flotation circuit to Cu-Mo separation flotationcircuit. The recovery of silicate minerals are generally lower than the recovery of copper andmolybdenum in the bulk flotation circuit, but silicate recovery can be high at the beginningof Cu-Mo separation flotation circuit (see Table 7). There is a probability distribution ofparticle-bubble collision and adhesion depending on many affecting factors, of which surfacehydrophobicity definitely contributes. The activated and hydrophobic silicate particles areconcentrated in bulk circuit and these particles can behave highly probable of collision and

Minerals 2021, 11, 1296 9 of 16
adhesion at the beginning of molybdenum circuit. In most cases of copper-molybdenumbeneficiation plants, the recovery of silicate minerals is low, less than 20% by using freshwater [23]. The inadvertent activation of silicate minerals in Wushan’s case should be a dueto the presence of cations in processed water and the recent use of novel copper collectors.
Table 7. Summary of flotation using water glass.
Water Glass, g/t Product Mass, %Grade, % Recovery, %
Cu Mo SiO2 Cu Mo SiO2
0Concentrate 86.95 1.100 28.140 52.39 74.79 92.55 83.72
Tail 13.05 2.470 15.080 67.88 25.21 7.45 16.28Feed 100.00 1.279 26.435 54.41 100.00 100.00 100.00
500Concentrate 82.63 0.970 30.760 41.53 66.74 90.70 75.01
Tail 17.37 2.300 15.000 65.81 33.26 9.30 24.99Feed 100.00 1.201 28.023 45.75 100.00 100.00 100.00
1000Concentrate 81.75 1.140 28.780 35.12 70.28 90.76 68.11
Tail 18.25 2.160 13.120 69.16 29.72 9.24 31.89Feed 100.00 1.326 25.923 55.93 100.00 100.00 100.00
Moreover, flocculants are also used at Wushan’s flotation circuit due to the increasingnumber of fine particles released by grinding. It is seen from Figure 5 that Wushan’sflotation feed contains quite amount of fine chalcopyrite particles less than 10 µm. Min-eralogy shows the mass fraction of ≤10 µm accounts for 27.58% of copper minerals andas high as 36.45% of molybdenum minerals. Low flotation efficiency has been suffered inthe beneficiation of low-grade molybdenum ores due to finer size liberation and crystalanisotropy [24,25]. Finer sizes for a high degree of liberation were required for finelydisseminated low-grade ores, which reduced the collision and adhesion probabilities ofparticles to bubbles. As reported, polyethylene oxide (PEO) has been proved to improveflotation efficiency of micro-fine molybdenite particles visibly [23,26,27]. Such flocculantsadsorbed onto the mineral surface while bridging particles by the hydrophobic long hydro-carbon chain. Thus, flocculants not only induce the flocculation of fine particles but alsoimprove the surface hydrophobicity, both of which improve the flotation performancesof molybdenite and chalcopyrite fine particles. However, the selectivity of flocculants isnormally poor, anchoring on silicate and other minerals as well [27,28]. These mineralscan then be activated in the floc-flotation. Moreover, molybdenite and quartz fine particlesmay induce heterogeneous flocculation, contaminating the concentrate.
Figure 5. The presence of chalcopyrite (cpy) in bulk concentrate.
Minerals 2021, 11, 1296 10 of 16
4.3. Surface Analysis
In order to prove the proposed hypothesis regarding the inadvertent activation ofsilicate minerals in flotation, surface properties of typical quartz mineral were analyzed inresponse to CaCl2 and collectors by using in-situ SHINERS technique.
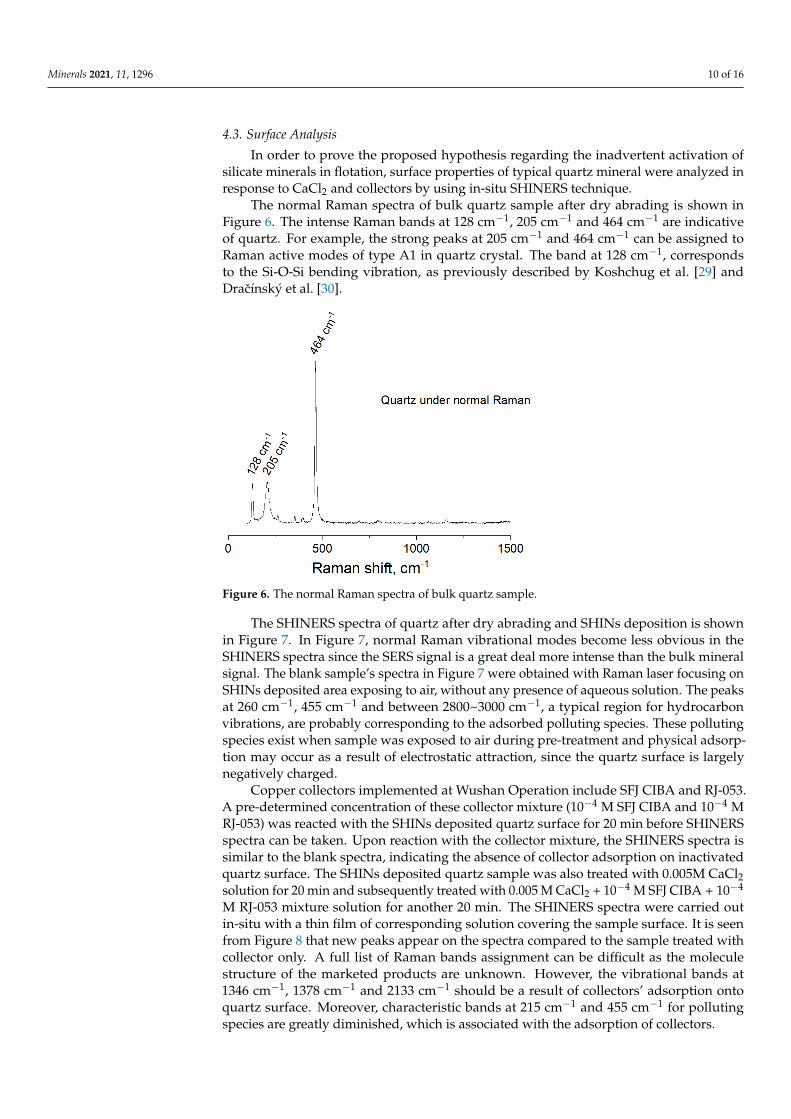
The normal Raman spectra of bulk quartz sample after dry abrading is shown inFigure 6. The intense Raman bands at 128 cm−1, 205 cm−1 and 464 cm−1 are indicativeof quartz. For example, the strong peaks at 205 cm−1 and 464 cm−1 can be assigned toRaman active modes of type A1 in quartz crystal. The band at 128 cm−1, correspondsto the Si-O-Si bending vibration, as previously described by Koshchug et al. [29] andDracínský et al. [30].
Minerals 2021, 11, x FOR PEER REVIEW 10 of 17
Figure 5. The presence of chalcopyrite (cpy) in bulk concentrate.
4.3. Surface Analysis
In order to prove the proposed hypothesis regarding the inadvertent activation of
silicate minerals in flotation, surface properties of typical quartz mineral were analyzed
in response to CaCl2 and collectors by using in‐situ SHINERS technique.
The normal Raman spectra of bulk quartz sample after dry abrading is shown in
Figure 6. The intense Raman bands at 128 cm−1, 205 cm−1 and 464 cm−1 are indicative of
quartz. For example, the strong peaks at 205 cm−1 and 464 cm−1 can be assigned to Raman
active modes of type A1 in quartz crystal. The band at 128 cm−1, corresponds to the
Si‐O‐Si bending vibration, as previously described by Koshchug et al. [29] and Dračínský
et al. [30].
Figure 6. The normal Raman spectra of bulk quartz sample.
The SHINERS spectra of quartz after dry abrading and SHINs deposition is shown
in Figure 7. In Figure 7, normal Raman vibrational modes become less obvious in the
SHINERS spectra since the SERS signal is a great deal more intense than the bulk mineral
signal. The blank sample’s spectra in Figure 7 were obtained with Raman laser focusing
on SHINs deposited area exposing to air, without any presence of aqueous solution. The
peaks at 260 cm−1, 455 cm−1 and between 2800~3000 cm−1, a typical region for hydrocarbon
Figure 6. The normal Raman spectra of bulk quartz sample.
The SHINERS spectra of quartz after dry abrading and SHINs deposition is shownin Figure 7. In Figure 7, normal Raman vibrational modes become less obvious in theSHINERS spectra since the SERS signal is a great deal more intense than the bulk mineralsignal. The blank sample’s spectra in Figure 7 were obtained with Raman laser focusing onSHINs deposited area exposing to air, without any presence of aqueous solution. The peaksat 260 cm−1, 455 cm−1 and between 2800~3000 cm−1, a typical region for hydrocarbonvibrations, are probably corresponding to the adsorbed polluting species. These pollutingspecies exist when sample was exposed to air during pre-treatment and physical adsorp-tion may occur as a result of electrostatic attraction, since the quartz surface is largelynegatively charged.
Copper collectors implemented at Wushan Operation include SFJ CIBA and RJ-053.A pre-determined concentration of these collector mixture (10−4 M SFJ CIBA and 10−4 MRJ-053) was reacted with the SHINs deposited quartz surface for 20 min before SHINERSspectra can be taken. Upon reaction with the collector mixture, the SHINERS spectra issimilar to the blank spectra, indicating the absence of collector adsorption on inactivatedquartz surface. The SHINs deposited quartz sample was also treated with 0.005M CaCl2solution for 20 min and subsequently treated with 0.005 M CaCl2 + 10−4 M SFJ CIBA + 10−4
M RJ-053 mixture solution for another 20 min. The SHINERS spectra were carried outin-situ with a thin film of corresponding solution covering the sample surface. It is seenfrom Figure 8 that new peaks appear on the spectra compared to the sample treated withcollector only. A full list of Raman bands assignment can be difficult as the moleculestructure of the marketed products are unknown. However, the vibrational bands at1346 cm−1, 1378 cm−1 and 2133 cm−1 should be a result of collectors’ adsorption ontoquartz surface. Moreover, characteristic bands at 215 cm−1 and 455 cm−1 for pollutingspecies are greatly diminished, which is associated with the adsorption of collectors.

Minerals 2021, 11, 1296 11 of 16
Minerals 2021, 11, x FOR PEER REVIEW 11 of 17
vibrations, are probably corresponding to the adsorbed polluting species. These pollut‐
ing species exist when sample was exposed to air during pre‐treatment and physical
adsorption may occur as a result of electrostatic attraction, since the quartz surface is
largely negatively charged.
(a) (b)
Figure 7. The SHINERS spectra of bulk quartz sample subjecting to CaCl2 and collector mixture, normal Raman spectra is
also included for comparison. (a) spectra at low wavenumbers; (b) spectra at high wavenumbers
Copper collectors implemented at Wushan Operation include SFJ CIBA and RJ‐053.
A pre‐determined concentration of these collector mixture (10−4 M SFJ CIBA and 10−4 M
RJ‐053) was reacted with the SHINs deposited quartz surface for 20 min before SHINERS
spectra can be taken. Upon reaction with the collector mixture, the SHINERS spectra is
similar to the blank spectra, indicating the absence of collector adsorption on inactivated
quartz surface. The SHINs deposited quartz sample was also treated with 0.005M CaCl2
solution for 20 min and subsequently treated with 0.005M CaCl2 + 10−4 M SFJ CIBA + 10−4
M RJ‐053 mixture solution for another 20 min. The SHINERS spectra were carried out
in‐situ with a thin film of corresponding solution covering the sample surface. It is seen
from Figure 8 that new peaks appear on the spectra compared to the sample treated with
collector only. A full list of Raman bands assignment can be difficult as the molecule
structure of the marketed products are unknown. However, the vibrational bands at 1346
cm−1, 1378 cm−1 and 2133 cm−1 should be a result of collectors’ adsorption onto quartz
surface. Moreover, characteristic bands at 215 cm−1 and 455 cm−1 for polluting species are
greatly diminished, which is associated with the adsorption of collectors.
Figure 8. Schematic diagram of Ca2+ and collector jointly activating quartz with subsequent response to NaHS depression
and regrinding.
Figure 7. The SHINERS spectra of bulk quartz sample subjecting to CaCl2 and collector mixture,normal Raman spectra is also included for comparison. (a) spectra at low wavenumbers; (b) spectraat high wavenumbers.
Minerals 2021, 11, x FOR PEER REVIEW 11 of 17
vibrations, are probably corresponding to the adsorbed polluting species. These pollut‐
ing species exist when sample was exposed to air during pre‐treatment and physical
adsorption may occur as a result of electrostatic attraction, since the quartz surface is
largely negatively charged.
(a) (b)
Figure 7. The SHINERS spectra of bulk quartz sample subjecting to CaCl2 and collector mixture, normal Raman spectra is
also included for comparison. (a) spectra at low wavenumbers; (b) spectra at high wavenumbers
Copper collectors implemented at Wushan Operation include SFJ CIBA and RJ‐053.
A pre‐determined concentration of these collector mixture (10−4 M SFJ CIBA and 10−4 M
RJ‐053) was reacted with the SHINs deposited quartz surface for 20 min before SHINERS
spectra can be taken. Upon reaction with the collector mixture, the SHINERS spectra is
similar to the blank spectra, indicating the absence of collector adsorption on inactivated
quartz surface. The SHINs deposited quartz sample was also treated with 0.005M CaCl2
solution for 20 min and subsequently treated with 0.005M CaCl2 + 10−4 M SFJ CIBA + 10−4
M RJ‐053 mixture solution for another 20 min. The SHINERS spectra were carried out
in‐situ with a thin film of corresponding solution covering the sample surface. It is seen
from Figure 8 that new peaks appear on the spectra compared to the sample treated with
collector only. A full list of Raman bands assignment can be difficult as the molecule
structure of the marketed products are unknown. However, the vibrational bands at 1346
cm−1, 1378 cm−1 and 2133 cm−1 should be a result of collectors’ adsorption onto quartz
surface. Moreover, characteristic bands at 215 cm−1 and 455 cm−1 for polluting species are
greatly diminished, which is associated with the adsorption of collectors.
Figure 8. Schematic diagram of Ca2+ and collector jointly activating quartz with subsequent response to NaHS depression
and regrinding. Figure 8. Schematic diagram of Ca2+ and collector jointly activating quartz with subsequent response to NaHS depressionand regrinding.
It is implicated that the novel copper collectors at Wushan Operation can also adsorbonto Ca2+-activated quartz, rendering its surface hydrophobic. As HS− does not complexwith Ca2+ or quartz, the activated surface can retain its surface hydrophobicity duringthe process of NaHS depression. According to the water analysis in Table 6, calcium ionsconcentration was largely higher than iron and copper ions, reasonaly accounting for theactivation of silicate minerals. Mechanical damage during regrinding may remove thesurface layer, in addition to particle size reduction. The proposed mechanism of quartzactivation and depression is schematically illustrated in Figure 8.
4.4. Depression by Water Glass
Sodium silicate solution (commonly known as water glass) is a typical depressant forsilicate minerals’ flotation [31–33]. Molecular dynamics simulations and density functionaltheory calculations demonstrated that water glass formed a dense adsorption layer onquartz, with both strong hydrogen bond and covalent bond being the main driving forcesfor adsorption [34]. The stable adsorption layer prevents Ca2+, Mg2+, and collectors fromcontacting quartz. Meanwhile, adsorption increases the electronegativity of quartz particlesand enhances their dispersion. The aggregation between valuable minerals and fine gangueminerals can then be greatly reduced, avoiding the deterioration of concentrate grade.
The rougher flotation tests carried out are summarized in Table 7. Adding appropriateamount of water glass is beneficial to reduce silica in the concentrate without compromising

Minerals 2021, 11, 1296 12 of 16
molybdenum recovery too much. The silica grade of molybdenum concentrate is reducedfrom 52.39% to 35.12% by merely using rougher flotation and the quality of molybdenumconcentrate could be further improved if cleaner stage is included.
4.5. Depression by Regrinding
As presented in the process flowsheet, the regrind mill is operating in open circuit.Open circuit grinding is very well-known for producing a flat size distribution with a lot ofunnecessary ultra-fines. It is seen from Table 8 that regrinding for 2 min only makes a massfraction of −325 mesh increasing from 34% to 50%, while the silica content in molybdenumconcentrate has been effectively reduced. Molybdenum grade in the concentrate afterone stage of rougher and two stages of cleaner operation has been increased to 41.96%,which is 3.79% higher than that without regrinding. It is also seen that the recovery ofmolybdenite and the mass recovery slightly decreased to some extent, compromising theseparation efficiency. Therefore, great caution needs to be taken for the use of regrinding inmolybdenum circuit.
Table 8. Data sheet of cleaner flotation using regrinding.
Product Mass, %Grade, % Recovery, %
Cu Mo SiO2 S Cu Mo SiO2 S
Withoutregrinding
(−325 =34%)
Concentrate 53.46 0.46 38.17 49.08 22.77 25.74 67.34 45.78 64.79Middling1 8.84 1.15 27.06 58.97 18.60 10.64 7.89 9.09 8.75Middling2 13.37 1.18 25.53 64.76 15.50 16.51 11.26 15.10 11.03
Tail 24.33 1.85 16.83 70.73 11.92 47.11 13.51 30.02 15.43Feed 100.00 0.96 30.31 57.32 18.79 100.00 100.00 100.00 100.00
Withregrinding
(−325 =50%)
Concentrate 46.14 0.48 41.96 43.69 26.48 18.65 63.34 37.50 63.00Middling1 5.66 1.32 30.56 51.82 21.78 6.29 5.66 5.45 6.35Middling2 12.97 1.33 30.91 50.48 18.42 14.53 13.12 12.18 12.32
Tail 35.23 2.04 15.51 68.46 10.09 60.53 17.88 44.87 18.33Feed 100.00 1.19 30.56 53.76 19.39 100.00 100.00 100.00 100.00
In the grinding process, both abrasion/attrition and breakage could be the mecha-nisms of comminution actions taking place. Attrition may be helpful to obtain freshlyfractured surface without reducing particle size too much [35]. The contaminated silicatemineral particles surface can then be cleaned, exhibiting their naturally owned hydrophiliccharacteristics. Size-by-size analysis of the feed in Table 9 indicates molybdenite particlesize is slightly reduced as +325 mesh mass fraction decreasing from 43.00% to 36.96%,while its mass fraction of −600 mesh remains unchanged. However, silicate particle sizesignificantly reduced as +325 mesh mass fraction decreasing from 84.10% to 62.98%. Inparticular, the mass fraction of −600 mesh increased from 4.64% to 14.18%. The size-by-sizeanalysis implicates that silicate minerals are easier to grind compared to molybdenite. Theblade-shaped grains of molybdenite are largely restored in grinding.
Table 9. Size by size analysis of feed using regrinding.
Mesh Mass, %Grade, % Metal Distribution, %
Cu Mo SiO2 S Cu Mo SiO2 S
Withoutregrinding
+325 65.06 0.63 18.07 73.47 44.28 42.54 43 84.1 44.28325~600 16.27 1.05 39.09 39.33 22.93 17.73 23.25 11.26 22.93−600 18.67 2.05 49.41 14.13 32.78 39.73 33.75 4.64 32.78Sum 100.00 0.96 27.34 56.84 100.00 100 100 100 100
Withregrinding
+325 49.80 0.49 21.42 70.89 35.80 23.81 36.96 62.98 35.8325~600 24.77 0.74 34.68 51.70 29.02 17.89 29.76 22.84 29.02−600 25.43 2.35 37.77 31.27 35.18 58.3 33.27 14.18 35.18Sum 100.00 1.02 28.86 56.06 100.00 100 100 100 100

Minerals 2021, 11, 1296 13 of 16
Most minerals exhibit the typical size dependent recovery as illustrated by Trahar [36]with the maximum recovery being achieved in the intermediate size fractions and thecoarse and fine particles being recovered at a lower rate. For both molybdenum and copper,their recoveries are highest in the range of 20~150 µm [36]. In the case of molybdenum,the finer than 20 µm fraction recovers 10% lower than the optimum size range. The morefine silicate mineral particles that grinding produces, the more difficult their flotation. Incontrast, the effects of grinding on molybdenite particle size and the subsequent flotationperformance are insignificant.
Flocculants has a prominent effect in the microfine molybdenite flotation. In addition,kerosene not only acts at collector, but also induce the formation of large flocs due to thehydrophobic force attraction between molybdenite fine particles. The advanced FBRMinstrument can give an online measurement of particle size, rendering flocculation studyeasier. As seen in Figure 9, molybdenite fine particles exhibited a mean chord length of26 µm before the addition of any reagent, but it increased to 75 µm shortly after the additionof 0.35 g/L kerosene. Figure 10 shows that, in square weighted mode, large flocs aboveaverage chord length are commonly seen. These molybdenite flocs are easily floated ontothe surface of slurry even without the presence of dedicated bubbling. The high pointsof chord length in Figure 9 were obtained when FBRM probe was lifted adjacent to thesurface of slurry, where large flocs are concentrated. Flocs of quartz particles were hardlyseen with the addition of kerosene, in accordance with the unchanged mean chord lengthand its distribution as shown in Figures 9 and 10, respectively.
Minerals 2021, 11, x FOR PEER REVIEW 14 of 17
Figure 9. Flocculation kinetics of molybdenite (a) and quartz (b) particles in response to kerosene addition (0.35 g/L).
Figure 10. Chord length distribution of molybdenite (a) and quartz (b) particles in response to kerosene addition (0.35
g/L).
Hydrophilic silicate mineral particles are not prone to be attractive to each other,
therefore flocculation can hardly occur between these particles. The flocs size is condu‐
cive to the flotation of microfine molybdenite, leading to enhanced selectivity against
silicate minerals. In conclusion, slightly regrinding is beneficial for improving the quality
of molybdenum concentrate for two main reasons: firstly, the exposure of nature hy‐
drophilic silicate particle surface upon attrition. Secondly, relatively finer silicate parti‐
cles lead to poorer recovery. The different particle size was due to differences of grinda‐
bility between molybdenite and quartz, in addition to flocculation between molybdenite
and silicate minerals. The different performances of quartz and molybdenite particles
subjecting to regrinding and kerosene are schematically illustrated in Figure 11 for better
understanding.
Figure 9. Flocculation kinetics of molybdenite (a) and quartz (b) particles in response to kerosene addition (0.35 g/L).
Minerals 2021, 11, x FOR PEER REVIEW 14 of 17
Figure 9. Flocculation kinetics of molybdenite (a) and quartz (b) particles in response to kerosene addition (0.35 g/L).
Figure 10. Chord length distribution of molybdenite (a) and quartz (b) particles in response to kerosene addition (0.35
g/L).
Hydrophilic silicate mineral particles are not prone to be attractive to each other,
therefore flocculation can hardly occur between these particles. The flocs size is condu‐
cive to the flotation of microfine molybdenite, leading to enhanced selectivity against
silicate minerals. In conclusion, slightly regrinding is beneficial for improving the quality
of molybdenum concentrate for two main reasons: firstly, the exposure of nature hy‐
drophilic silicate particle surface upon attrition. Secondly, relatively finer silicate parti‐
cles lead to poorer recovery. The different particle size was due to differences of grinda‐
bility between molybdenite and quartz, in addition to flocculation between molybdenite
and silicate minerals. The different performances of quartz and molybdenite particles
subjecting to regrinding and kerosene are schematically illustrated in Figure 11 for better
understanding.
Figure 10. Chord length distribution of molybdenite (a) and quartz (b) particles in response to kerosene addition (0.35 g/L).
Minerals 2021, 11, 1296 14 of 16
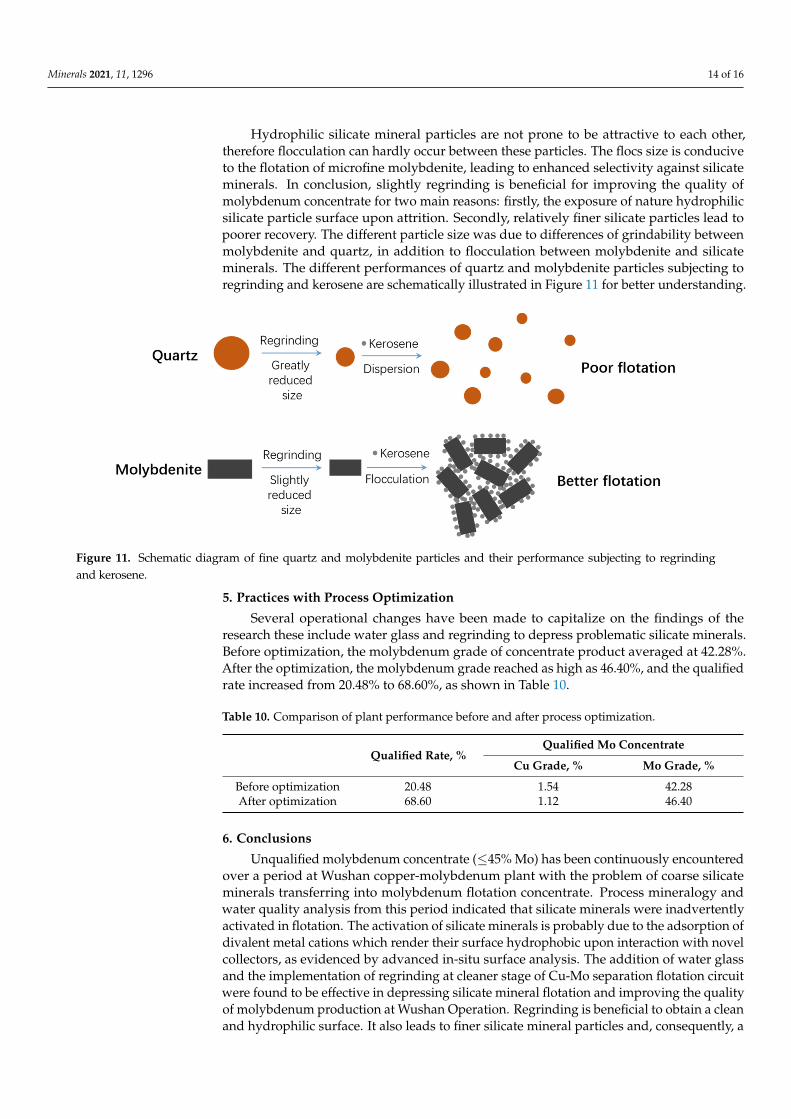
Hydrophilic silicate mineral particles are not prone to be attractive to each other,therefore flocculation can hardly occur between these particles. The flocs size is conduciveto the flotation of microfine molybdenite, leading to enhanced selectivity against silicateminerals. In conclusion, slightly regrinding is beneficial for improving the quality ofmolybdenum concentrate for two main reasons: firstly, the exposure of nature hydrophilicsilicate particle surface upon attrition. Secondly, relatively finer silicate particles lead topoorer recovery. The different particle size was due to differences of grindability betweenmolybdenite and quartz, in addition to flocculation between molybdenite and silicateminerals. The different performances of quartz and molybdenite particles subjecting toregrinding and kerosene are schematically illustrated in Figure 11 for better understanding.
Minerals 2021, 11, x FOR PEER REVIEW 15 of 17
Figure 11. Schematic diagram of fine quartz and molybdenite particles and their performance subjecting to regrinding
and kerosene.
5. Practices with Process Optimization
Several operational changes have been made to capitalize on the findings of the re‐
search these include water glass and regrinding to depress problematic silicate minerals.
Before optimization, the molybdenum grade of concentrate product averaged at 42.28%.
After the optimization, the molybdenum grade reached as high as 46.40%, and the quali‐
fied rate increased from 20.48% to 68.60%, as shown in Table 10.
Table 10. Comparison of plant performance before and after process optimization.
Qualified Rate, % Qualified Mo Concentrate
Cu Grade, % Mo Grade, %
Before optimization 20.48 1.54 42.28
After optimization 68.60 1.12 46.40
6. Conclusions
Unqualified molybdenum concentrate (≤45% Mo) has been continuously encoun‐
tered over a period at Wushan copper‐molybdenum plant with the problem of coarse
silicate minerals transferring into molybdenum flotation concentrate. Process mineralogy
and water quality analysis from this period indicated that silicate minerals were inad‐
vertently activated in flotation. The activation of silicate minerals is probably due to the
adsorption of divalent metal cations which render their surface hydrophobic upon in‐
teraction with novel collectors, as evidenced by advanced in‐situ surface analysis. The
addition of water glass and the implementation of regrinding at cleaner stage of Cu‐Mo
separation flotation circuit were found to be effective in depressing silicate mineral flo‐
tation and improving the quality of molybdenum production at Wushan Operation. Re‐
grinding is beneficial to obtain a clean and hydrophilic surface. It also leads to finer sili‐
cate mineral particles and, consequently, a poorer recovery compared to molybdenite.
The presence of kerosene induces flocculation of molybdenite particles, enhancing their
tolerance in fine particle flotation.
Author Contributions: Conceptualization, Y.M., T.L. and B.G.; methodology, Y.M. and B.G.;
formal analysis, Y.M., W.Z. and B.G.; investigation, F.L. and J.W.; data curation, Y.M. and W.Z.;
writing—original draft preparation, Y.M.; writing—review and editing, W.Z. and B.G.; visualiza‐
tion, X.X.; supervision, J.W. All authors have read and agreed to the published version of the
manuscript.
Funding: This research received no external funding
Institutional Review Board Statement: Not applicable.
Figure 11. Schematic diagram of fine quartz and molybdenite particles and their performance subjecting to regrindingand kerosene.
5. Practices with Process Optimization
Several operational changes have been made to capitalize on the findings of theresearch these include water glass and regrinding to depress problematic silicate minerals.Before optimization, the molybdenum grade of concentrate product averaged at 42.28%.After the optimization, the molybdenum grade reached as high as 46.40%, and the qualifiedrate increased from 20.48% to 68.60%, as shown in Table 10.
Table 10. Comparison of plant performance before and after process optimization.
Qualified Rate, %Qualified Mo Concentrate
Cu Grade, % Mo Grade, %
Before optimization 20.48 1.54 42.28After optimization 68.60 1.12 46.40
6. Conclusions
Unqualified molybdenum concentrate (≤45% Mo) has been continuously encounteredover a period at Wushan copper-molybdenum plant with the problem of coarse silicateminerals transferring into molybdenum flotation concentrate. Process mineralogy andwater quality analysis from this period indicated that silicate minerals were inadvertentlyactivated in flotation. The activation of silicate minerals is probably due to the adsorption ofdivalent metal cations which render their surface hydrophobic upon interaction with novelcollectors, as evidenced by advanced in-situ surface analysis. The addition of water glassand the implementation of regrinding at cleaner stage of Cu-Mo separation flotation circuitwere found to be effective in depressing silicate mineral flotation and improving the qualityof molybdenum production at Wushan Operation. Regrinding is beneficial to obtain a cleanand hydrophilic surface. It also leads to finer silicate mineral particles and, consequently, a

Minerals 2021, 11, 1296 15 of 16
poorer recovery compared to molybdenite. The presence of kerosene induces flocculationof molybdenite particles, enhancing their tolerance in fine particle flotation.
Author Contributions: Conceptualization, Y.M., T.L. and B.G.; methodology, Y.M. and B.G.; formalanalysis, Y.M., W.Z. and B.G.; investigation, F.L. and J.W.; data curation, Y.M. and W.Z.; writing—original draft preparation, Y.M.; writing—review and editing, W.Z. and B.G.; visualization, Y.M. andB.G.; supervision, J.W. All authors have read and agreed to the published version of the manuscript.
Funding: This research received no external funding.
Institutional Review Board Statement: Not applicable.
Informed Consent Statement: Not applicable.
Acknowledgments: This research is supported by the Department of Production and Technology,China National Gold Group Inner Mongolia Mining Co., Ltd. Fuzhou University Testing Fund ofprecious apparatus (project No. 2020T039) is also appreciated.
Conflicts of Interest: The authors declare no conflict of interest.
References1. Chen, Y.; Chen, X.; Peng, Y. The effect of sodium hydrosulfide on molybdenite flotation as a depressant of copper sulfides. Miner.
Eng. 2020, 148, 106203. [CrossRef]2. Pearse, M.J. An overview of the use of chemical reagents in mineral processing. Miner. Eng. 2005, 18, 139–149. [CrossRef]3. Yan, H.; Yang, B.; Zhu, H.; Huang, P.; Hu, Y. Selective flotation of Cu-Mo sulfides using dithiothreitol as an environmental-friendly
depressant. Miner. Eng. 2021, 168, 106929. [CrossRef]4. Yi, G.; Macha, E.; Dyke, J.V.; Macha, R.E.; McKay, T.; Free, M.L. Recent progress on research of molybdenite flotation: A review.
Adv. Colloid. Interface Sci. 2021, 295, 102466. [CrossRef] [PubMed]5. Yin, Z.; Sun, W.; Hu, Y.; Zhai, J.; Guan, Q. Evaluation of the replacement of NaCN with depressant mixtures in the separation of
copper-molybdenum sulphide ore by flotation. Sep. Purif. Technol. 2017, 173, 9–16. [CrossRef]6. Abdollahi, M.; Bahrami, A.; Mirmohammadi, M.S.; Kazemi, F.; Danesh, A.; Ghorbani, Y. A process mineralogy approach to
optimize molybdenite flotation in copper–molybdenum processing plants. Miner. Eng. 2020, 157, 106557. [CrossRef]7. Triffett, B.; Veloo, C.; Adair, B.J.I.; Bradshaw, D. An investigation of the factors affecting the recovery of molybdenite in the
Kennecott Utah Copper bulk flotation circuit. Miner. Eng. 2008, 21, 832–840. [CrossRef]8. Gao, Z.; Jiang, Z.; Sun, W.; Gao, Y. Typical roles of metal ions in mineral flotation: A review. Trans. Nonferr. Metal. Soc. 2021, 31,
2081–2101. [CrossRef]9. Wang, Y.; Khoso, S.; Luo, X.; Tian, M. Understanding the depression mechanism of citric acid in sodium oleate flotation of
Ca2+-activated quartz: Experimental and DFT study. Miner. Eng. 2019, 140, 105878. [CrossRef]10. Xie, R.; Zhu, Y.; Liu, J.; Li, Y. Effects of metal ions on the flotation separation of spodumene from feldspar and quartz. Miner. Eng.
2021, 168, 106–931. [CrossRef]11. Anema, J.R.; Li, J.; Yang, Z.; Ren, B.; Tian, Z. Shell-isolated nanoparticle-enhanced Raman spectroscopy: Expanding the versatility
of surface-enhanced Raman scattering. Rev. Anal. Chem. 2011, 4, 129–150. [CrossRef] [PubMed]12. Li, J.; Huang, Y.; Ding, Y.; Zhang, Z.; Zhou, Z.; Wu, D.; Ren, B.; Wang, Z.; Tian, Z. Shell-isolated nanoparticle-enhanced Raman
Spectroscopy. Nature 2010, 464, 392. [CrossRef]13. Grabsch, A.F.; Yahyaei, M.; Fawell, P.D. Number-sensitive particle size measurements for monitoring flocculation responses to
different grinding conditions. Miner. Eng. 2020, 145, 06088. [CrossRef]14. Zanina, M.; Lambertc, H.; du Plessis, C.A. Lime use and functionality in sulphide mineral flotation: A review. Miner. Eng. 2019,
143, 105922. [CrossRef]15. Chen, Y.; Chen, X.; Peng, Y. The effect of sodium hydrosulfide on molybdenite flotation in seawater and diluted seawater. Miner.
Eng. 2020, 158, 106589. [CrossRef]16. Qiu, Z.; Liu, G.; Liu, Q.; Zhong, H. Understanding the roles of high salinity in inhibiting the molybdenite flotation. Colloids Surf.
2016, 509, 123–129. [CrossRef]17. Hirajima, T.; Wisnu-Suyantara, G.P.; Ichikawa, O.; Elmahdy, A.M. Mg2+ and Ca2+ as divalent seawater cations on the floatability
of molybdenite and chalcopyrite. Miner. Eng. 2016, 96–97, 83–93. [CrossRef]18. Wisnu-Suyantara, G.P.; Hirajima, T.; Miki, H.; Sasaki, K. Floatability of molybdenite and chalcopyrite in artificial seawater. Miner.
Eng. 2018, 115, 117–130. [CrossRef]19. Lucay, F.; Cisternas, L.A.; Gálvez, E.; López-Valdivieso, A. Study of the natural floatability of molybdenite fines in saline solutions
and effect of gypsum precipitation. Miner. Metall. Explor. 2015, 32, 203–208. [CrossRef]20. Zhang, J.; Wang, W.; Liu, J.; Huang, Y.; Feng, Q.; Zhao, H. Fe(III) as an activator for the flotation of spodumene, albite, and quartz
minerals. Miner. Eng. 2014, 61, 16–22.

Minerals 2021, 11, 1296 16 of 16
21. Fornasiero, D.; Ralston, J. Cu(II) and Ni(II) activation in the flotation of quartz, lizardite and chlorite. Int. J. Miner. Process. 2005,76, 75–81. [CrossRef]
22. Liu, G.; Lu, Y.; Zhong, H.; Cao, Z.; Xu, Z. A novel approach for preferential flotation recovery of molybdenite from a porphyrycopper–molybdenum ore. Miner. Eng. 2012, 36–38, 37–44. [CrossRef]
23. Li, S.; Ma, X.; Wang, J.; Xing, Y.; Gui, X.; Cao, Y. Effect of polyethylene oxide on flotation of molybdenite fines. Miner. Eng. 2020,146, 106146. [CrossRef]
24. Castro, S.; Lopez-Valdivieso, A.; Laskowski, J.S. Review of the flotation of molybdenite. Part I: Surface properties and floatability.Int. J. Miner. Process. 2016, 148, 48–58. [CrossRef]
25. Zanina, M.; Ametov, I.; Grano, S.; Zhou, L.; Skinner, W. A study of mechanisms affecting molybdenite recovery in a bulkcopper/molybdenum flotation circuit. Int. J. Miner. Process. 2009, 93, 256–266. [CrossRef]
26. Alvarez, A.; Gutierrez, L.; Laskowski, J.S. Use of polyethylene oxide to improve flotation of fine molybdenite. Miner. Eng. 2018,127, 232–237. [CrossRef]
27. Li, S.; Gao, L.; Wang, J.; Zhou, H.; Liao, Y.; Xing, Y.; Gui, X.; Gao, Y. Polyethylene oxide assisted separation of molybdenite fromquartz by flotation. Miner. Eng. 2021, 162, 106765. [CrossRef]
28. Tian, J.; Gao, H.; Guan, J.; Ren, Z. Modified floc-flotation in fine sericite flotation using polymethylhydrosiloxane. Sep. Purif.Technol. 2017, 174, 439–444. [CrossRef]
29. Koshchug, D.G.; Koshlyakova, A.N.; Balitsky, V.S.; Vyatkin, S.V. Infrared and Raman spectroscopy study of Si1−xGexO2 solidsolutions with α-quartz structures. Spectrochim. Acta A 2020, 233, 118168. [CrossRef]
30. Dracínský, M.; Benda, L.; Bour, P. Ab initio modeling of fused silica, crystal quartz, and water Raman spectra. Chem. Phys. Lett.2011, 215, 54–59. [CrossRef]
31. Abaka-Wood, G.B.; Addai-Mensah, J.; Skinner, W. Selective flotation of rare earth oxides from hematite and quartz mixturesusing oleic acid as a collector. Int. J. Miner. Process. 2017, 169, 60–69. [CrossRef]
32. Rao, D.S.; VijayaKumar, T.V.; Rao, S.S.; Prabhakar, S.; Raju, G.B. Effectiveness of sodium silicate as gangue depressants in iron oreslimes flotation. Int. J. Miner. Metall. Mater. 2011, 18, 515–522. [CrossRef]
33. Tohry, A.; Dehghani, A. Effect of sodium silicate on the reverse anionic flotation of a siliceous–phosphorus iron ore. Sep. Purif.Technol. 2016, 164, 28–33. [CrossRef]
34. Hao, H.; Cao, Y.; Li, L.; Fan, G.; Liu, J. Dispersion and depression mechanism of sodium silicate on quartz: Combined moleculardynamics simulations and density functional theory calculations. Appl. Surf. Sci. 2021, 537, 147926. [CrossRef]
35. Chen, X.; Peng, Y.; Bradshaw, D. The effect of particle breakage mechanisms during regrinding on the subsequent cleaner flotation.Miner. Eng. 2014, 66–68, 157–164. [CrossRef]
36. Trahar, W.J. A rational interpretation of the role of particle size in flotation. Int. J. Miner. Process. 1981, 8, 289–327. [CrossRef]


