Embed Size (px)
Citation preview
THE INFLUENCE OF HYDROTHERMAL
ALTERATION AND LITHOLOGY ON ROCK
PROPERTIES FROM DIFFERENT GEOTHERMAL
FIELDS WITH RELATION TO DRILLING
Latasha Deborah Wyering
A thesis submitted to the University of Canterbury
in fulfilment of the requirements for the degree of
Doctor of Philosophy in Engineering Geology
Department of Geological Sciences
Christchurch, New Zealand
2014
ii
“No Geologist worth anything is permanently bound to a desk or laboratory, but the charming
notion that true science can only be based on unbiased observation of nature in the raw is
mythology. Creative work, in geology and anywhere else, is interaction and synthesis: half-
baked ideas from a bar room, rocks in the field, chains of thought from lonely walks, numbers
squeezed from rocks in a laboratory, numbers from a calculator riveted to a desk, fancy
equipment usually malfunctioning on expensive ships, cheap equipment in the human cranium,
arguments before a road cut.”
Stephen Jay Gould
(September 10, 1941 – May 20, 2002)
iii
DEDICATION
To Mum, Dad and Sean
…Countless sleepless nights and phone calls, with endless support…
iv
TABLE OF CONTENTS
AKNOWLEDGEMENTS ......................................................................................................... xiii
ABSTRACT ................................................................................................................................. xv
PUBLICATIONS ARISING FROM THIS THESIS ........................................................... xviii
CO-AUTHORSHIP FORMS ..................................................................................................... xx
CHAPTER 1: THESIS OUTLINE ................................................................................................ 1
1.1. Thesis Content ..................................................................................................................... 2
1.2. Thesis Framework ............................................................................................................... 4
1.2.1. Research Objectives ..................................................................................................... 4
1.2.2. Research Questions ...................................................................................................... 5
CHAPTER 2: BACKGROUND INFORMATION ....................................................................... 9
2.1. Introduction ....................................................................................................................... 10
2.2. Taupo Volcanic Zone, New Zealand ................................................................................. 11
2.3. Structural Setting of Volcanism in the TVZ ...................................................................... 14
2.4. Geothermal Systems in TVZ ............................................................................................. 14
2.5. Geothermal Field Study Areas .......................................................................................... 15
2.5.1. Ngatamariki ............................................................................................................... 15
2.5.2. Rotokawa ................................................................................................................... 18
2.5.3. Kawerau ..................................................................................................................... 20
2.6. Hydrothermal Alteration ................................................................................................... 22
2.6.1. Impacts of Hydrothermal Alteration on Rock Properties .......................................... 24
2.7. Empirical correlations of Mechanical Properties .............................................................. 26
2.8. History of Drilling Optimisation ....................................................................................... 30
CHAPTER 3: MECHANICAL AND PHYSICAL PROPERTIES OF HYDROTHERMALLY
ALTERED ROCKS, TAUPO VOLCANIC ZONE, NEW ZEALAND. ................................. 35
3.1. Introduction ....................................................................................................................... 36
3.2. Geological Setting ............................................................................................................. 37
v
3.3. Characterisation of samples ............................................................................................... 41
3.3.1. Thin section Mineralogy ............................................................................................ 43
3.3.1.1 Ngatamariki Thin section Mineralogy ................................................................ 43
3.3.1.2 Rotokawa Thin section Mineralogy .................................................................... 46
3.3.1.3 Kawerau Thin section Mineralogy ...................................................................... 48
3.4. Physical and Mechanical Properties .................................................................................. 52
3.4.1. Porosity and Density Testing ..................................................................................... 52
3.4.2. Ultrasonic pulse Velocities ........................................................................................ 54
3.4.3. Uniaxial Compressive Strength Testing .................................................................... 56
3.5. Discussion .......................................................................................................................... 57
3.5.1. Porosity and density ................................................................................................... 57
3.5.2. Ultrasonic Wave Velocities ....................................................................................... 61
3.5.3. Compressive Strength ................................................................................................ 63
3.6. Conclusion ......................................................................................................................... 67
CHAPTER 4: THE DEVELOPMENT OF THE ALTERATION STRENGTH INDEX ........... 70
4.1. Introduction ....................................................................................................................... 71
4.2. Geological Setting ............................................................................................................. 72
4.3. Data Collection .................................................................................................................. 73
4.4. Proposed Method – Alteration Strength Index (ASI) ........................................................ 74
4.5. Alteration Strength Index (ASI) development .................................................................. 75
4.5.1. Mineralogy (Pm and Sm) and Alteration Index (AI) ................................................. 75
4.5.2 Porosity (ŋe) ................................................................................................................ 77
4.5.3 Fractures (Snf) ............................................................................................................ 79
4.6. Discussion .......................................................................................................................... 82
4.6.1. Modified Alteration Strength Index (mASI) ............................................................. 84
4.6.2. Predictive Capabilities ............................................................................................... 89
4.7. Conclusions ....................................................................................................................... 91
vi
CHAPTER 5: USING DRILLING AND GEOLOGICAL PARAMETERS TO ESTIMATE
ROCK STRENGTH IN HYDROTHERMALLY ALTERED ROCK – A COMPARISON OF
MECHANICAL SPECIFIC ENERGY, R/N-W/D CHART AND ALTERATION
STRENGTH INDEX ................................................................................................................ 93
5.1. Introduction ....................................................................................................................... 94
5.2. Geological Setting of the Ngatamariki Geothermal Field ................................................. 95
5.3. Drilling Data used in this Study ........................................................................................ 99
5.4. Methods to Estimate Rock Strength .................................................................................. 99
5.4.1. Specific Energy .......................................................................................................... 99
5.4.2. R/N-W/D Chart ........................................................................................................ 100
5.4.3. Alteration Strength Index (ASI) .............................................................................. 102
5.4.4. Modified Alteration Strength Index (ASI)............................................................... 103
5.5. Results ............................................................................................................................. 105
5.6. Discussion ........................................................................................................................ 109
5.6.1. Drilling Efficiency Dependence of Rock Strength Estimates ................................. 110
5.6.2. Estimated Rock Strength Values ............................................................................. 113
5.6.3. Strength Database and Drill Bit Selection ............................................................... 114
5.7. Conclusion ....................................................................................................................... 115
CHAPTER 6: FAILURE MODES OF HYDROTHERMALLY ALTERED ROCKS UNDER
UNIAXIAL COMPRESSION AND HOW THEY RELATE TO ROCK PROPERTIES .... 117
6.1. Introduction ..................................................................................................................... 118
6.2. Failure in Uniaxial Compression ..................................................................................... 119
6.3. Laboratory Testing .......................................................................................................... 120
6.4. Sample Preparation and descriptions ............................................................................... 119
6.5. Rock Property Results ..................................................................................................... 121
6.5. Discussion ........................................................................................................................ 125
6.5.1. Failure modes, and their relationship to rock properties ......................................... 125
6.5.2. Failure modes, and their relationship to lithology ................................................... 127
6.6. Conclusions ..................................................................................................................... 129
vii
CHAPTER 7: SUMMARY AND FURTHER RESEARCH QUESTIONS.............................. 131
7.1. Summary of Results obtained in this Research ............................................................... 132
7.2. Further Questions and Further Work ............................................................................... 135
7.2.1. Research incorporating Rock Properties and Hydrothermal Alteration .................. 135
7.2.2. Continued Research on Alteration Strength Index (ASI) ........................................ 135
7.2.3. Failure Modes and Expanding Research ................................................................. 137
CHAPTER 8: REFERENCES ................................................................................................... 138
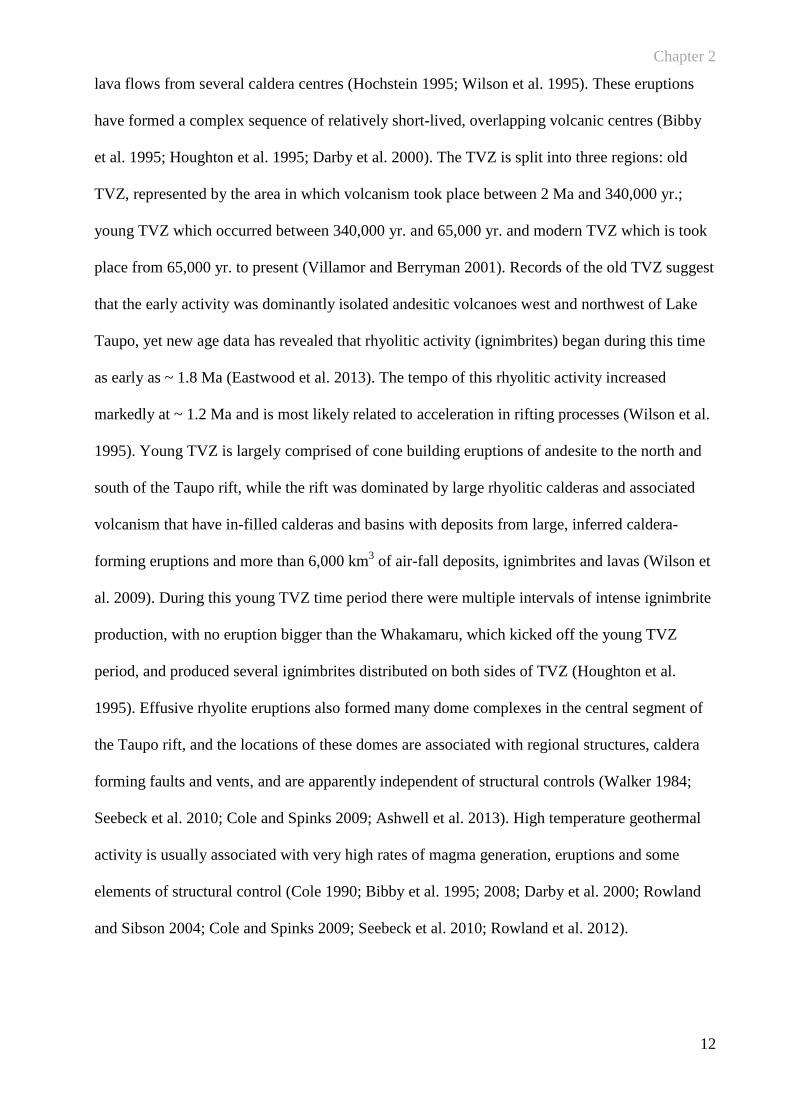
Figure 2.1. Digital elevation map with the geologic setting of geothermal activity in the Taupo
Volcanic Zone (TVZ), showing the positions of geothermal systems (red, purple, orange), the
active and inferred caldera boundaries and the Taupo Rift ...................................................... 13
Figure 2.2. Generalised stratigraphy of the units found at the Ngatamariki Geothermal Field,
New Zealand, with the estimated thickness of each of the units .............................................. 17
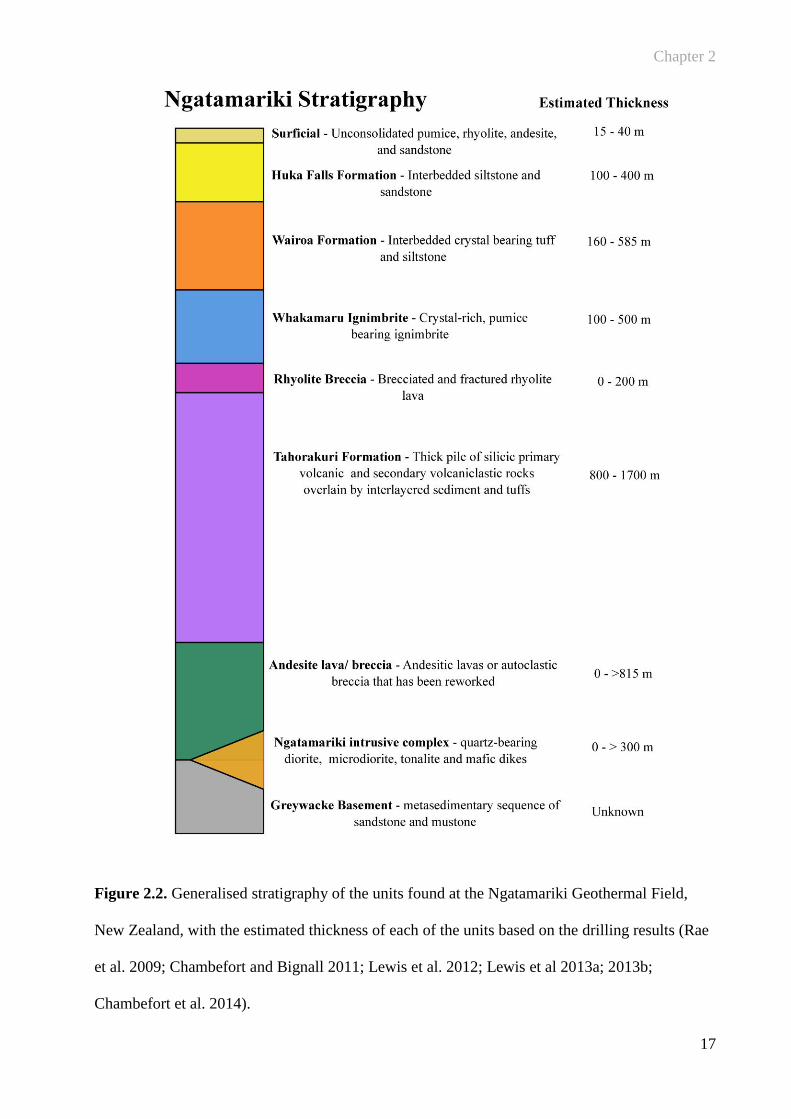
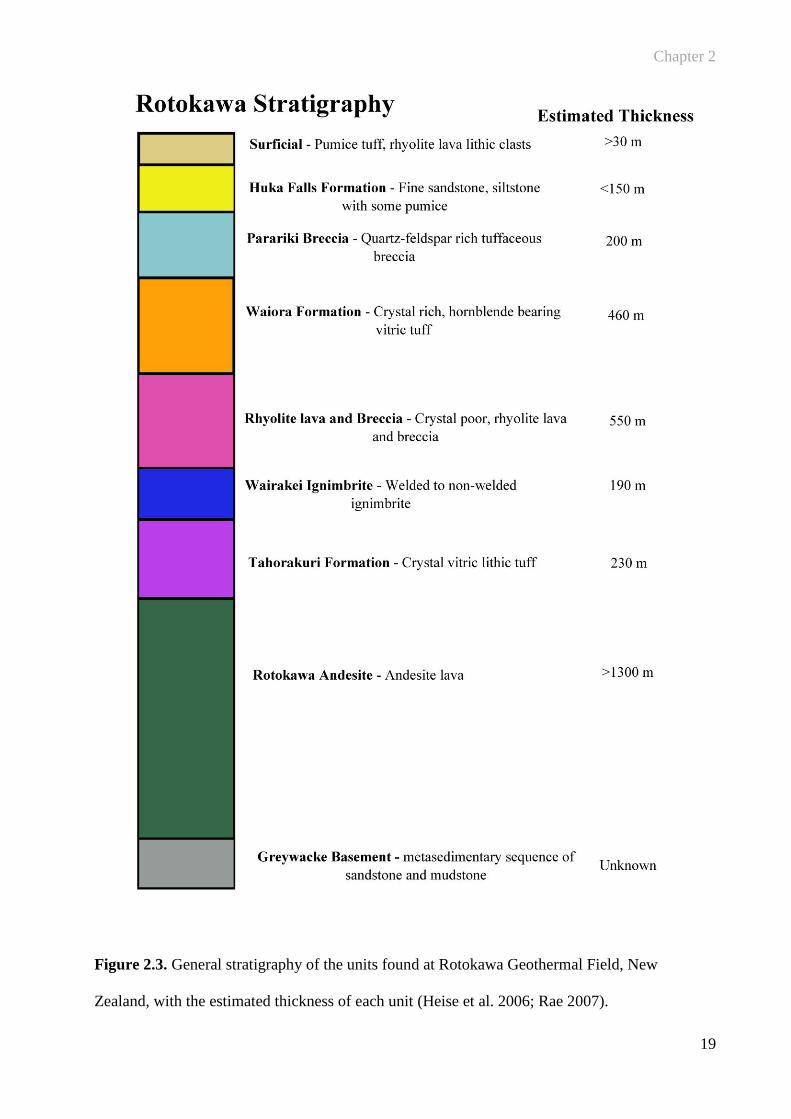
Figure 2.3. General stratigraphy of the units found at the Rotokawa Geothermal Field, New
Zealand, with the estimated thickness of each unit .................................................................. 19
Figure 2.4. General stratigraphy of the units found at the Kawerau Geothermal Field, New
Zealand, with the estimated thicknesses of the units ................................................................ 21
Figure 2.5. Generalised table of alteration minerals that are typically found in geothermal fields
in New Zealand. The minerals show the typical temperature ranges that is possible and the
associated alteration zone that would be located ...................................................................... 24
Figure 3.1. Digital elevation map with the geologic setting of geothermal activity in the Taupo
Volcanic Zone (TVZ), showing the positions of geothermal systems (red, purple, orange), the
active and inferred caldera boundaries and the Taupo Rift ...................................................... 38
Figure 3.2. Generalised stratigraphy of the three geothermal fields, approximate thickness of
each unit and generalised alteration zones (argillic – blue and propylitic - green); the
highlighted units are tested in this study .................................................................................. 40
Figure 3.3. Conceptual model of a conventional, hot, liquid dominated geothermal field. The
model has been split into the alteration zones typical for a geothermal field, with temperature
profiles and surface expressions ............................................................................................... 42
Figure 3.4. Photomicrographs of Andesite Breccia ..................................................................... 44
Figure 3.5. Photomicrographs of the Tahorakuri Formation. ....................................................... 45
viii
Figure 3.6. Photomicrographs of Tonalite .................................................................................... 46
Figure 3.7. Photomicrographs of Rotokawa Andesite Lava ........................................................ 47
Figure 3.8. Photomicrographs of the Matahina Ignimbrite .......................................................... 48
Figure 3.9. Photomicrographs of the Caxton Formation .............................................................. 49
Figure 3.10. Photomicrograph of Kawerau Andesite lava. .......................................................... 50
Figure 3.11. Photomicrographs of the Tahuna Formation ........................................................... 51
Figure 3.12. Photomicrographs of the Te Teko Formation .......................................................... 52
Figure 3.13. Relationship between effective porosity and density from the three geothermal
fields. The graph has been split into shallow and deep lithologies .......................................... 54
Figure 3.14. Relationship between compressional wave velocities and shear wave velocities
(ultrasonic wave velocities) from the three geothermal fields. The graph has been split into
shallow and deep lithologies..................................................................................................... 56
Figure 3.15. Relationship between the Ngatamariki, Rotokawa and Kawerau effective porosity
(%) and measured depth (mD). ................................................................................................ 61
Figure 3.16. Relationship between compressional wave velocities vs. effective porosity .......... 62
Figure 3.17. Box plot of uniaxial compressive strength of the shallow and deep lithologies ...... 64
Figure 3.18. Relationship between dynamic Young’s modulus (Ed) and effective porosity (n). 66
Figure 3.19. Relationship between dynamic Young’s modulus (Ed) and UCS. .......................... 67
Figure 4.1. Relationship between uniaxial compressive strength (UCS) and effective porosity for
the Rotokawa andesite samples. ............................................................................................... 79
Figure 4.2. Relationship between uniaxial compressive strength (UCS) and fracture values for
the Ngatamariki andesite samples. ........................................................................................... 81
Figure 4.3. Relationship between Alteration Strength Index (ASI) and uniaxial compressive
strength (UCS) showing a power relationship .......................................................................... 83
Figure 4.4. Relationship between the calculated UCS derived from ASI and measured uniaxial
compressive strength (UCS) with the absolute error ranges - 50th (dark grey lines) and 90th
percentile (light grey lines). ...................................................................................................... 84
Figure 4.5. Relationship between uniaxial compressive strength (UCS) and the mineralogy
parameter from the three geothermal fields showing a power relationship ............................. 85
ix
Figure 4.6. Relationship between uniaxial compressive strength (UCS) and the mineralogy and
fracture parameters from the three geothermal fields showing a power relationship .............. 87
Figure 4.7. Relationship between uniaxial compressive strength (UCS) and the mineralogy and
porosity parameters combined from the three geothermal fields showing a power relationship
.................................................................................................................................................. 88
Figure 4.8. Conceptual model of a conventional, hot, liquid dominated geothermal field. The
model has been split into the alteration zones typical for a geothermal field, with temperature
profiles, surface expressions with the addition of strength profiles ......................................... 91
Figure 5.1. A map with the geologic setting of geothermal activity in the Taupo Volcanic Zone
(TVZ), showing the positions of geothermal systems, the active and inferred caldera
boundaries and the Taupo Rift ................................................................................................. 96
Figure 5.2. The general stratigraphy of the units found at the Ngatamariki Geothermal Field,
New Zealand, with the estimated thickness of each of the units based on the drilling results
and reports. The located on the unit used on this study is located in red. ................................ 98
Figure 5.3. The general features of the R/N – W/D chart with the efficient drilling regions (red –
efficient drilling, blue – less efficient drilling) ....................................................................... 101
Figure 5.4. Relationship between modified ASI and measured UCS (MPa) of the laboratory data
collected in Chapter 4 to determine Equation 5.7. ................................................................. 104
Figure 5.5. The relationship between mean ROP (m/hr) and R/N-W/D and mASI estimated rock
strength values (left axis) and MSE estimated rock strength values (right axis). .................. 107
Figure 5.6. Relationship of rock strength estimated with MSE and depth (mTVD) with ROP and
depth (mTVD). ....................................................................................................................... 108
Figure 5.7. Relationship of rock strength estimated with mASI (converted to UCS (MPa) and
depth (mTVD) with ROP and depth (mTVD). ....................................................................... 109
Figure 5.8. The R/N – W/D chart for the tuff breccia (1200 – 1425 mTVD) and the welded
ignimbrite (1425 – 1560 mTVD) ........................................................................................... 111
Figure 5.9. The R/N – W/D chart of the tuff and volcaniclastic breccia (1560 – 1675 mTVD)
and the veined tuff breccia (1675 – 1800 mTVD).................................................................. 112
Figure 5.10. The R/N – W/D charts for the crystal poor tuff (1800 – 1925 mTVD) and andesite
bearing lithic tuff (1925 – 1995 mTVD) ................................................................................ 112
Figure 6.1. Schematic representation of the different failure modes identified in this study under
uniaxial compressive stress. ................................................................................................... 120
x
Figure 6.2. Photomicrographs of thin sections that represent (A) andesite lava/breccia, (B)
rhyolitic ignimbrite, (C) intrusive tonalite, and (D) sedimentary samples, in this case a
sandstone. .............................................................................................................................. 122
Figure 6.2. A plot of the proportion of samples that failed by a certain failure mode against their
respective measured rock properties – UCS (MPa), effective porosity (%), fracture value
(Snf), primary minerals (Pm), secondary minerals (Sm), density (kg/m3), ultrasonic wave
velocities (compressional and shear). ..................................................................................... 124
Figure 6.4. A plot of the percentage of samples that failed by a certain failure mode against
lithology. ................................................................................................................................. 128
Table 3.1. Geology from the three geothermal fields split into their respective sections of the
field with the type of alteration present in each sample. .......................................................... 43
Table 3.2. Mean and standard deviation of effective porosity and density, ratio for all lithologies
from the Ngatamariki, Rotokawa and Kawerau geothermal fields. Results for each sample are
in Appendix B.4, Table B.4.1. .................................................................................................. 53
Table 3.3. Mean and standard deviation of compressional and shear wave velocities, dynamic
Young’s moduli and dynamic Poisson’s ratio for all lithologies from the Ngatamariki,
Rotokawa and Kawerau geothermal fields. Results for each sample are in Appendix B.4,
Table B.4.1. .............................................................................................................................. 55
Table 3.4. Mean and standard deviation of uniaxial compressive strength (MPa) for shallow and
deep lithologies from Ngatamariki, Rotokawa and Kawerau. Results for each sample are in
Appendix B.4, Table B.4.2. ...................................................................................................... 57
Table 4.1. The semi-quantitative categories for the primary minerals and the percentages
representing the categories. ...................................................................................................... 75
Table 4.2. The semi-quantitative categories for the secondary minerals and the percentages
representing the categories. ...................................................................................................... 76
Table 4.3. Hardness index values assigned to Moh’s hardness. ................................................... 76
Table 4.4. An example of how to determine the primary and secondary values of the mineralogy
parameter that is multiplied to the alteration index (AI). The assigned percentage is multiplied
to the hardness index and added together to produce the resulting Pm and Sm values. .......... 77
Table 4.5. Values assigned to the samples based on the fractures seen in thin section and on the
bulk rocks. ................................................................................................................................ 80
xi
Table 4.6. Fracture parameter substitute for the drill cuttings. ..................................................... 80
Table 4.7. The top three minerals, alteration intensity, mean mineralogy parameter and UCS
(MPa) of the andesite lithology from the Rotokawa Andesite and Kawerau andesite. ............ 86
Table 5.1. Fracture parameter substitute for the drill cuttings. ................................................... 104
Table 5.2. The minimum, maximum and mean rate of penetration for the lithologies encountered
in the 17inch section of NM8 in order of depth. .................................................................... 105
Table 5.3. Rock strength values derived from MSE, R/N-W/D chart and mASI, along with the
mean ROP, for the lithologies encountered in the 17inch section of NM8 in order of depth 106
Table 5.4. Mean ROP converted to ranking with 1 being the fastest drilled/weakest rock and the
associated order the rock strength methods predicted the rock strengths to occur. The
lithologies are listed in increasing strength (decreasing ROP). .............................................. 106
Table 6.1. Mean and standard deviation of the laboratory results for the four failure modes. Full
rock property and failure mode results in Appendix E.2, Table E.2.1. If more than one failure
mode occurred in a sample the dominant failure mode was reported. ................................... 123
Table 6.2. Mean and standard deviation of the laboratory results for the four lithologies. Full
rock property and failure mode results in Appendix E.2, Table E.2.1. .................................. 128
APPENDIX A: CONFERENCE PAPERS ................................................................................ 162
A.1. New Zealand Geothermal Workshop Conference Paper – November 2012 .................. 163
A.2. New Zealand Geothermal Workshop Conference Paper – November 2013 .................. 172
A.3. New Zealand Geotechnical Society – November 2013 .................................................. 181
A.4. Geological Society of America – October 2014 ............................................................ 190
APPENDIX B: THIN SECTION ANALYSIS AND LABORATORY RESULTS .................. 192
B.1. Ngatamariki Thin Section Analysis ................................................................................ 193
B.2. Rotokawa Thin Section Analysis .................................................................................... 252
B.3. Kawerau Thin Section Analysis...................................................................................... 269
B.4. Laboratory Results for the Porosity, density, Ultrasonic Wave Velocities and Uniaxial
Compressive Strength ........................................................................................................ 331
B.5 Examples of UCS Testing Failures .............................................................. Video appendix
xii
APPENDIX C: TECHNICAL NOTE ON EDS AND THIN SECTION ANALYSIS AND
ALTERATION STRENGTH INDEX (ASI) ANALYSIS ..................................................... 339
C.1. Technical Note: Energy Dispersive spectrometry (EDS) and Thin Section Petrography on
Hydrothermally Altered Rocks .......................................................................................... 340
C.2. Ngatamariki ASI analysis ............................................................................................... 354
C.3. Rotokawa ASI analysis ................................................................................................... 356
C.4. Kawerau ASI analysis ..................................................................................................... 358
APPENDIX D: DRILL CUTTINGS ANALYSIS ..................................................................... 360
D.1. Ngatamariki NM8 17 inch section thin section analysis ................................................ 361
D.2. Ngatamariki NM8 17 inch section mASI analysis ......................................................... 376
APPENDIX E: FAILURE MODES LABORATORY RESULTS ............................................ 379
E.1. Photos of failure modes ................................................................................................... 380
E.2. Failure modes and rock properties results ....................................................................... 387
xiii
ACKNOWLEDGEMENTS
Firstly, I would like to recognize my supervisors for all your guidance and extensive discussions.
Dr. Marlene Villeneuve, thank you for all the guidance you have given me over the last three
years. I appreciate that no matter what was going on in your day you always made time to meet
with me or answer the phone. Thank you for all the pep talks, which always helped me re-focus
my attention on the things that mattered. Dr. Darren Gravley and Dr. Ben Kennedy, thank you
for co-supervising this thesis. You both expressed a lot of interest in my research, which lead on
to lengthy discussions about the significance of this work in global applications. Even though
you both spent a lot of time overseas conducting research of your own, your commitment to late
night/early morning Skype sessions was greatly appreciated. Thank you Irene Wallis for all your
assistance with my thesis and for working at your end to make sure I received all the information
I needed in the form of core, drill cuttings, data etc. Thank you for your time spent reviewing
these chapters and helping me to apply this research to an industry application. Also a very large
thank you to my co-authors for your time, expertise, advice and reviews: Dr. Paul Siratovich,
and Joe Cant.
A huge thank you to Mighty River Power Ltd., Rotokawa Joint Venture Limited; a joint venture
between the Tauhara North No.2 trust and Mighty River Power Company Limited, and Ngati
Tuwharetoa Geothermal Assets Limited, for the use of core, from Ngatamariki, Rotokawa and
Kawerau and drill cuttings from the 17 inch section of NM8, supplied for this study.
I am very grateful for all the sources of funding I have received over the years during my PhD,
which has included the Callaghan Innovation (contract number: MRPR1201/32965) scholarship
which was sponsored by Mighty River Power Ltd., as well as the Source to Surface programme -
a multi-year research incentive between the University of Canterbury and Mighty River Power
Ltd., the Mason Trust Fund, the Canterbury Federation of Graduate Women, the Geoscience
Society of New Zealand.
xiv
A big thank you to the technical staff and students in the Department of Geological Sciences at
the University of Canterbury, thank you for providing an excellent atmosphere – a special thank
you to the other students involved in the Source to Surface programme who provided an ear
when times were getting tough and always supported me through conferences. Thank you to the
technical staff in the department for your various assistances - Rob Spiers for thin section
preparation (even if some were very last minute orders), Cathy Higgins, Sacha Baldwin-
Cunningham, Janet Brehaut for teaching me how to use the equipment in the rock mechanics
room and Chris Grimshaw and Kerry Swanson for all questions microscope related. I could
never forget of course Pat Roberts and Janet Warburton for all your help and also providing time
to organize my time and travels. Thanks also to Mike Flaws from the Engineering department for
your help on the EDS machine.
And where would I be without my friends? You guys have provided numerous good times that
have pulled me through. So now that I am free, how about some yarns over drinks and a sneaky
shoe shopping session?
Last, but definitely not least, my family, thank you for pushing me to achieve my goals; you
have shaped me into the person I am today. Mum and Dad, thank you for being fantastic parents
and trying your very best to understand what I do; but even though you do not understand you
have always made me feel as though I have made you proud. To my brothers, Brynley and Shae,
you two made life difficult for the middle child at the best of times, but I would never change
any of it. Where else would I have learnt to stick up for myself?
Finally, to my husband Sean, no one understands me as much as you do. The late night
discussions (till early morning sometimes) about my work (even when you had work in the
mornings) makes me believe this thesis is as much your baby as mine. I love you all.
xv
ABSTRACT
Deep drilling is required to reach the geothermal fluids extracted for generation of electricity;
therefore, the different rock properties and the hydrothermal alteration of the lithologies being
drilled become an important factor to a conventional geothermal industry. If the correct
equipment required to complete drilling is not selected, the rate of penetration (ROP) can be
suboptimal, potentially increasing the cost of the project. Mechanical characterisation of
hydrothermally altered rocks from geothermal reservoirs will lead to an improved understanding
of rock mechanics in a geothermal environment. Core samples obtained from the Ngatamariki,
Rotokawa and Kawerau Geothermal Fields covered a wide range of lithologies (ignimbrite,
rhyolite lava, sandstone, mudstone, andesite lava/breccia and tonalite) encountered during
drilling. A suite of non-destructive and destructive laboratory tests along with petrographical
analysis were conducted on the samples. Some key findings are that samples that originated from
the shallow and low temperature section of the Kawerau geothermal field had higher porosity
(15 – 56%), lower density (1222 – 2114 kg/m3) and slower ultrasonic wave velocities (1925 –
3512 m/s (vp) and 818 – 1980 m/s (vs)), than the samples from a deeper and higher temperature
section of the field (1.5 – 20%, 2072 – 2837 kg/m3, 2639 – 4593 m/s (vp) and 1476 – 2752 m/s
(vs), respectively). The shallow lithologies had uniaxial compressive strengths (UCS) of 2 – 75
MPa, and the deep lithologies had strengths of 23 – 211 MPa. Typically samples of the same
lithologies that originate from multiple wells across a field have variable rock properties because
of the different alteration zones from which each sample originates.
To obtain a way to relate this rock property data back to the geomechanical model, we developed
a method - Alteration Strength Index (ASI) - to address the effect of hydrothermal alteration on
mechanical rock properties. The index constitutes three components; the mineralogy parameter,
derived from petrological analysis, alteration index (degree of alteration) and an assessment of
mineral hardness; the fracture parameter, assigned based on an assessment of structural damage;
xvi
and the porosity parameter, which accounts for the effect of voids. This method can be used to
estimate a range of rock strengths comparable to UCS, and the ASI calibrated against measured
UCS for the samples produced a strong correlation (R2 of 0.86). From this correlation an
equation was derived to convert ASI to UCS. Because the ASI–UCS relationship is based on an
empirical fit, the UCS value that is obtained from conversion of the ASI includes an error of 7
MPa for the 50th
percentile and 25 MPa for the 90th
percentile with a mean error of 11 MPa. A
sensitivity analysis showed that the mineralogy parameter is the dominant characteristic in this
equation, and the ASI equation using only mineralogy can be used to provide an estimated UCS
range, although the uncertainty becomes greater. This provides the ability to estimate strength
even when either fracture or porosity information are not available, for example in the case of
logging drill cuttings.
To determine the usefulness of the ASI method with drill cuttings and drilling data we compared
it to two methods; mechanical specific energy (MSE) and R/N-W/D chart, both developed for
the oil and gas industry, in a geothermal context. We demonstrated how they can be used to
estimate a range of rock strengths for hydrothermally altered lithologies for the 800 metre long
17 inch (432 mm) diameter section of well NM8 in the Ngatamariki Geothermal Field, New
Zealand. We found that MSE and the R/N-W/D charts correctly ranked relative strength to ROP
for three of six lithologies, while ASI correctly ranked all six lithologies. We also show that the
strength values predicted by ASI correlate to ROP better than those based on MSE or R/N-W/D.
We argue that ASI is more comprehensive than these methods because it provides a range of
rock strength indices for a given hydrothermally altered lithology, is based on the geology, and
does not require drilling parameters (ROP, WOB, RPM, and Torque) to estimate rock strength.
This is particularly important in geothermal systems where lithologies can exhibit high
variability in their physical characteristics and geothermal fields tend to have widely spaced
wells. Using ASI we show how hydrothermal alteration affects drilling, and when used in
xvii
conjunction with a predictive geologic model, how it will aid with optimisation of drilling
practices through drill bit selection.
Rock failure modes are difficult to predict, and are important to rock engineering environments,
which include drilling. By using rock property and mineralogy information, four modes of
failure were identified – axial splitting, single plane shearing, y shaped failure and multiple
fracturing - in this research. The results of this study indicate that these easily measured rock
properties can be inferred to have some control over the failure mode of a sample under uniaxial
loading; however it would be useful to examine these samples further at the microstructural level
to determine the role of microfracturing in the occurrence of failure modes. Further research in
this field has the potential to aid in drilling optimisation through the utilisation of drill bits
designed to fracture rocks in the ways that they are predisposed to fail.
xviii
PUBLICATIONS ARISING FROM THIS THESIS
Journal publications
Wyering LD, Villeneuve MC, Wallis IC, Siratovich PA, Kennedy BM, Gravley DM, Cant JL
2014. Mechanical and physical properties of hydrothermally altered rocks, Taupo Volcanic
Zone, New Zealand. Journal of Volcanology and Geothermal Research 288: 76-93.
Presented in Chapter 3.
Wyering LD, Villeneuve MC, Wallis IC, Siratovich PA, Kennedy BM, Gravley DM 201X. The
development of the Alteration Strength Index. Submitted to Engineering Geology.
Presented in Chapter 4.
Wyering LD, Villeneuve MC, Wallis IC, PA, Kennedy BM, Gravley DM 201X. Using Drilling
and Geological Parameters to Estimate Rock Strength in Hydrothermally Altered Rock – A
comparison of Mechanical Specific Energy, R/N-W/D chart and Alteration Strength Index.
Submitted to Rock Mechanics and Rock Engineering. Presented in Chapter 5.
Conference Papers (*indicates oral presentations)
*Wyering LD, Villeneuve MC, Wallis IC 2012. The effects of hydrothermal alteration on
mechanical rock properties of the Andesite Breccia and Tahorakuri Formation from the
Ngatamariki Geothermal Field, New Zealand and empirical relations between rock
strength and physical properties. In: Proceedings of the 34th
New Zealand Geothermal
Workshop, Auckland, New Zealand, 19th
– 21st November 2012. Presented in Appendix
A.1.
*Wyering LD, Villeneuve MC, Wallis IC 2013. The effect of hydrothermal alteration on the
mechanical and physical rock properties. In: Proceedings of the 35th
New Zealand
xix
Geothermal Workshop, Rotorua, New Zealand, 17th
– 20th
November 2013. Presented in
Appendix A.2.
*Wyering LD, Villeneuve MC, Wallis IC 2013. The effect of hydrothermal alteration on
mechanical and physical rock properties of lithologies from the Ngatamariki, Rotokawa
and Kawerau geothermal fields, Taupo Volcanic Zone, New Zealand. In: Proceedings of
the 19th
New Zealand Geotechnical Symposium. 21st-23
rd December 2013. Presented in
Appendix A.3.
Conference Abstracts (*indicates oral presentations)
*Wyering LD, Villeneuve MC, Wallis IC 2014. The effect of hydrothermal alteration on
Drillability – A study looking at Mechanical Specific Energy, Bingham Index and
Alteration Strength Index. In: Proceedings of the Geological Society of America. Vol. 46,
No.6, Vancouver, British Columbia, Canada, 19th
-22nd
October 2014. Presented in
Appendix A.4.


Chapter 1
CHAPTER 1:
THESIS OUTLINE
Chapter 1
2
1.1. Thesis Contents
Chapter 1 introduces the questions and aims of the thesis with brief statements on the questions
answered, and why this thesis is important to the intended field of research.
Chapter 2 summarises the Taupo Volcanic Zone (TVZ), its location, structure, volcanic history,
volcanic systems and associated rock types. It includes geological explanations and a brief
history of the geothermal fields used in this study (Ngatamariki, Rotokawa and Kawerau), and
introduces the concept of drilling optimisation/drillability with outlines of the research
completed to date.
Chapter 3 addresses the laboratory testing and results from the selected formations, divided into
shallow and deep lithologies from the Ngatamariki, Rotokawa and Kawerau Geothermal Fields.
The non-destructive and destructive testing includes thin section analysis, porosity, density,
ultrasonic wave velocities and uniaxial compressive strength testing.
Chapter 4 provides a detailed description of the development of the Alteration Strength Index
(ASI) equation which addresses the effect that hydrothermal alteration has on mechanical rock
properties, and estimates a range of rock strengths based on readily available geologic data. The
method and overall relationship were optimised by analysing and weighting some of the factors
that affect rock strength, including secondary mineralisation, rock defects (fractures) and
effective porosity.
In Chapter 5 ASI was compared to mechanical specific energy (MSE), and R/N-W/D charts to
evaluate its usefulness as a resource in estimating a range of rock strength from data obtained
while drilling. The section of well used was from the Ngatamariki geothermal field in the 800
metre long 17 inch (432 mm) diameter section, where the drilling parameters were held near
constant.
Chapter 1
3
Chapter 6 focuses on the failure modes of the samples during strength testing, and correlates the
results to the rock properties of the lithologies, with discussion around rock properties that may
lead to predisposition to a certain failure mode or modes.
Chapter 7 concludes the thesis by providing a summary of the current findings regarding the
information collected from the core and drill cuttings from the geothermal fields. It assimilates
the key results from each chapter, and highlights the direction that future research should pursue
to develop the understanding of drillability in geothermal fields.
Several appendices are included in this thesis:
Appendix A includes the papers presented at conferences attended during my research.
Appendix B contains full descriptions of thin section analysis for the samples retrieved from the
Ngatamariki, Rotokawa and Kawerau geothermal fields, along with laboratory results.
Appendix C contains the completed spreadsheets for the data collected for the Alteration
Strength Index (ASI), and includes a technical note for the EDS analysis.
Appendix D contains the completed spreadsheets for the data collected for the ASI/mASI used
with the drill cuttings from NM8, and the petrographic analysis for thin sections supplied for the
same well.
Appendix E contains the full set of photos taken of the failure modes determined in this
research, along with the rock property data for each lithology.
Chapter 1
4
1.2. Thesis framework
1.2.1. Research Objectives
Produce a detailed description of the hydrothermal alteration that has occurred within the
samples used in this research.
Describe the relationships found between physical and mechanical rock properties of
selected lithologies that have undergone differing degrees of alteration. This objective
will include completing porosity, density, ultrasonic wave velocity and uniaxial
compressive strength testing, including collecting stress/strain data and acoustic
emissions data.
Develop an method that can be used as a tool for estimating ranges of theoretical uniaxial
compressive strengths of hydrothermally altered rocks from geological parameters. This
will include looking at the alteration assemblages and evaluating the alteration zone that
the materials fall under, and determining the associated uniaxial compressive strength
expected for the alteration zone.
Assess the effect of alteration on drillability by providing information that enables better
bit selection. This will involve analysing drill cuttings from a section of a geothermal
well where the drilling parameters were held constant and thereby effectively isolated
from impacting the rate of penetration.
Compare the developed method to existing methods that are used to address drilling
optimisation from the oil and gas industry, and discuss the results for a drilled geothermal
well. The two methods used will be mechanical specific energy and the R/N-W/D charts.
Evaluate the parameters of the developed index along with the laboratory results to
determine if one or several parameters impact the failure modes of the rocks during
uniaxial compressive strength testing.
Chapter 1
5
1.2.2. Research Questions
This PhD thesis was developed to determine a method of improving drilling performance
through a detailed understanding of what physical and mechanical changes have occurred to
lithologies that are hydrothermally altered. The questions are focused on systematically
determining how a geothermal system works, and how it changes the physical and mechanical
properties of these rocks. We use this knowledge to address factors that impact the strength of
the material, and design a method to estimate the strength of the altered rocks. It is then tested
against other methods that complete the same analysis, but in a geothermal context. The
questions answered in this thesis are outlined below:
How have geothermal fluids changed the primary mineralogy of hydrothermally altered
rocks? – Chapter 3
In the samples obtained from the Ngatamariki, Rotokawa and Kawerau geothermal fields we
have observed a variety of secondary mineralogy derived from hydrothermal fluids. The
hydrothermal fluids dissolve the primary minerals, which typically consist of feldspars,
pyroxene and quartz, and the relicts become partially or completely replaced with the
secondary minerals. These secondary minerals vary in abundance and distribution based on
the parameters (temperature, pressure, primary mineralogy) that support their nucleation and
growth. The mineralogy we see in the lithologies from these three geothermal fields is
typically found in smectite, argillic and propylitic alteration, and the mineral assemblage
observed in the lithology varies depending on their location in the geothermal system.
Lithologies from deep, high temperature regions of the fields have argillic to propylitic
alteration, and contain secondary minerals characteristic of these types of alteration - quartz,
epidote, chlorite etc. Lithologies from shallow, low temperature regions of the field have
smectite to argillic alteration, which contain clays, calcite, albite etc.
Chapter 1
6
Do the typical relationships that exist between mechanical and physical rock properties
change due to the presence of hydrothermal alteration in rocks from the Taupo Volcanic
Zone? – Chapter 3
A suite of laboratory experiments was conducted on the different lithologies derived from the
Ngatamariki, Rotokawa and Kawerau geothermal fields. These tests included porosity,
density, ultrasonic wave velocity, and uniaxial compressive strength with strain gauges.
There typically exists a negative relationship between porosity and density, and for ultrasonic
wave velocities a positive linear relationship. In this dataset there is no systematic deviation
from these relationships according to either original composition or alteration type. However,
the alteration does impact the results that would be normally expected between two rocks of
the same lithology. The uniaxial compressive strength found that the samples in our study
from the shallow, low temperature regions of the geothermal fields have lower UCS (27.7 ±
10.3 MPa) when compared to samples from deep, high temperature regions (84.8 ± 30.6
MPa). However, the relationships between Young’s modulus, porosity, and UCS still show
the expected inverse trend that fresh and unaltered samples follow.
What parameters have been found to impact the mechanical properties of rocks? –
Chapter 2 and 4.
Research has found that several properties (mineral hardness, secondary minerals,
microstructural damage that includes microfractures and high porosity) of rock can influence
the predicted rock strength of a material (Tuğrul & Zarif, 1999; Ameen et al., 2009;
Rigopoulos et al., 2010; Coggan et al., 2013). Several petrographic and weathering indices
related to chemical, petrological and mechanical properties, have been suggested to identify
the impact of alteration on rock properties in different lithologies, and how this leads to
predicting rock strength based on individual scenarios (Ulusay et al. 1994; Tamrakar et al.
2007; Yildiz et al. 2009; Ceryan et al., 2008).
Chapter 1
7
Is it possible to estimate the strength of hydrothermally altered rocks from their
mineralogy? – Chapter 4
We have developed a method to estimate rock strength, the alteration strength index (ASI), to
facilitate comparison between observed alteration mineralogy and measured rock strength.
The equation uses primary and secondary mineralogy, mineral hardness, alteration index,
porosity and fractures to estimate a range of rock strengths based on differing conditions. It
was created using ideas from research into factors that affect physical and mechanical
properties of both hydrothermally altered and unaltered rocks.
How has the developed method compared to the measured mechanical properties of the
material tested? – Chapter 4
By plotting ASI against the measured uniaxial compressive strength (UCS) of all the samples
from Ngatamariki, Rotokawa and Kawerau we show a clear trend – such that the ASI can be
used to estimate UCS, as the correlation between the two factors produces an R2 of 0.86,
indicating a strong relationship. The UCS value obtained from conversion of the ASI for our
data set has a mean error of 11 MPa, with a 50th
percentile error range of 7 MPa and 90th
percentile range of 25 MPa.
Does the developed method estimate the strength of the material being drilled better than
other method that have been tested? – Chapter 5
As all the information needed to complete the ASI equation cannot be obtained from drill
cuttings (core samples are needed, which are expensive to obtain), the modified Alteration
Strength Index (mASI) was used to compare against mechanical specific energy (MSE) and
R/N-W/D charts. Both MSE and R/N-W/D chart are derived for the oil and gas drilling
industry and are calculated using drilling parameters to obtain estimated rock strength values.
The 17 inch section of NM8 from Ngatamariki was drilled with the drilling parameters held
near constant, providing us with a section of well where the rate of penetration (ROP) is
Chapter 1
8
predominately influenced by the geology of the well. In this case the ROP could be used as
an analogue for rock strength. We found that MSE and the R/N-W/D charts correctly ranked
relative strength to ROP for three out of six lithologies, while ASI correctly ranked all six
lithologies.
What can be done to improve drilling from the research conducted? – Chapter 4 and 5
Conceptual models used to predict temperature profiles and geology can be up dated with
rock strengths based on the data collected from laboratory testing and empirical equations.
As drilling is conducted and the drill cuttings or thin sections are analysed, ranges of
estimated rock strengths can be derived by using ASI or mASI for differing rock conditions.
These rock strength values can be used to help select drill bits for sections of the geothermal
fields that have similar conditions as other parts of the field, potentially leading to improved
rates of penetration, and an understanding of how these differing rock conditions change the
behaviour of the material.

Chapter 2
CHAPTER 2:
BACKGROUND INFORMATION
Chapter 2
10
2.1. Introduction
This thesis is aimed to address the impact that hydrothermal alteration has on physical and
mechanical rock properties, and relating this to drilling in geothermal fields. The work for this
thesis has been completed in the Taupo Volcanic Zone (TVZ), New Zealand with reference to
the Ngatamariki, Rotokawa and Kawerau geothermal fields. The TVZ’s volcanic setting
comprises young igneous geothermal systems with very high heat flows (Kissing and Weir 2005;
Wilson et al. 1995; Bibby et al. 1995; Giggenbach 1995; Rowland and Sibson 2004), which
causes the rocks in the field to become hydrothermally altered due to the presence of geothermal
fluids (Pola et al. 2012). The amount of alteration is variable from field to field depending on
numerous factors – temperature, pressure, rock type, permeability and duration (Browne 1978,
1989; Mehegan et al. 1982; Cox and Browne 1998; Robb 2005; Pola et al. 2012). As these
factors occur within a geothermal system they change the mineralogy in the rocks through mass
transfer; as the hydrothermal fluids dissolve the primary minerals (feldspar, pyroxene, quartz),
they become composed of the available free ions and replace the rock with secondary minerals
(albite, calcite, chlorite, epidote, clays, secondary quartz etc.) (Ferry, 1979; Mehegan et al. 1982;
Giggenbach 1984; Henneberger and Browne 1988; Moore and Gunderson 1995; Simmons and
Browne 2000; Pochee 2010; Esmaeily et al. 2012). The effects of alteration, in the form of
hydrothermal or weathering, on rock properties have been considered by many researchers, with
results showing that as the degree of alteration increases, the ultrasonic wave velocities, porosity,
density and strength are all affected (Frolova et al. 2005; Ladygin et al. 2000; Yildiz et al. 2009;
Frolova et al. 2010; Pola et al. 2012).
An important part of the applied field of rock engineering is the determination of rock properties
of the material being analysed (Tamrakar et al. 2007; Singh et al. 2012; Karakul and Ulusay
2013), in particular rock strength measurements, which are considered necessary for design
using rock materials. Scientists have developed empirical correlations between physical and /or
mechanical rock properties and uniaxial compressive strength, so that rock strength can be
Chapter 2
11
predicted through the use of these cheaper and easier alternatives to destructive testing (Arel and
Tuğrul 2001; Chang et al. 2006; Çobanoğlu and Çelik 2008; Ameen et al. 2009; Binal 2009).
This work has also lead research into developing indices that use parameters such as mineralogy,
fractures, textures, along with physical rock properties to predict rock strength for certain
lithologies (Lumb 1962; Rigopoulos et al. 2010).
The ability to drill quickly and efficiently is particularly important to drilling companies because
it saves money and increases productivity (Bharadwaj and Vinayaka 2013). Therefore, an
understanding of what can improve rate of penetration (ROP) is of significant use to them.
Several studies, mainly in the oil and gas industry, have focused around improving the ROP
using drilling data and/or rock properties to produce mathematical predictive equations to
address the drillability of rocks, with varying success (Galle and Woods 1963; Wilson and
Bentsen 1972; Gstalder and Raynal 1966; Fear 1996; Prasad 2009).
This chapter provides a variety of background knowledge to obtain the answers to the aims
outlined for this thesis, with strong links between hydrothermal alteration, secondary mineralogy
and drillability/drilling optimization for the suite of rocks used in this research.
2.2. Taupo Volcanic Zone, New Zealand
The Taupo Volcanic Zone (TVZ) is located in the central North Island of New Zealand in a 300
km long (200 km on land) and 60 km wide belt, defined by caldera structural boundaries and
vent positions (Fig. 2.1; Wilson et al. 1995). It has formed on a Mesozoic basement assemblage
of metasedimentary rocks (Torlesse Greywacke), identified by drillholes in the Kawerau,
Ohaaki, Rotokawa and Ngatamariki geothermal fields over the last 2 Ma (Browne 1989), and in
its modern form coincides with a structurally and magmatically segmented rift system (Taupo
rift) (Bibby et al. 1995; Rowland and Sibson 2004; Seebeck et al. 2010). Since volcanic activity
started there have been at least 31 caldera-forming rhyolitic eruptions, which have erupted over
20,000 km3 of volcanic rocks, with greater than 90% being rhyolitic pyroclastic and subordinate
Chapter 2
12
lava flows from several caldera centres (Hochstein 1995; Wilson et al. 1995). These eruptions
have formed a complex sequence of relatively short-lived, overlapping volcanic centres (Bibby
et al. 1995; Houghton et al. 1995; Darby et al. 2000). The TVZ is split into three regions: old
TVZ, represented by the area in which volcanism took place between 2 Ma and 340,000 yr.;
young TVZ which occurred between 340,000 yr. and 65,000 yr. and modern TVZ which is took
place from 65,000 yr. to present (Villamor and Berryman 2001). Records of the old TVZ suggest
that the early activity was dominantly isolated andesitic volcanoes west and northwest of Lake
Taupo, yet new age data has revealed that rhyolitic activity (ignimbrites) began during this time
as early as ~ 1.8 Ma (Eastwood et al. 2013). The tempo of this rhyolitic activity increased
markedly at ~ 1.2 Ma and is most likely related to acceleration in rifting processes (Wilson et al.
1995). Young TVZ is largely comprised of cone building eruptions of andesite to the north and
south of the Taupo rift, while the rift was dominated by large rhyolitic calderas and associated
volcanism that have in-filled calderas and basins with deposits from large, inferred caldera-
forming eruptions and more than 6,000 km3 of air-fall deposits, ignimbrites and lavas (Wilson et
al. 2009). During this young TVZ time period there were multiple intervals of intense ignimbrite
production, with no eruption bigger than the Whakamaru, which kicked off the young TVZ
period, and produced several ignimbrites distributed on both sides of TVZ (Houghton et al.
1995). Effusive rhyolite eruptions also formed many dome complexes in the central segment of
the Taupo rift, and the locations of these domes are associated with regional structures, caldera
forming faults and vents, and are apparently independent of structural controls (Walker 1984;
Seebeck et al. 2010; Cole and Spinks 2009; Ashwell et al. 2013). High temperature geothermal
activity is usually associated with very high rates of magma generation, eruptions and some
elements of structural control (Cole 1990; Bibby et al. 1995; 2008; Darby et al. 2000; Rowland
and Sibson 2004; Cole and Spinks 2009; Seebeck et al. 2010; Rowland et al. 2012).
Chapter 2
13
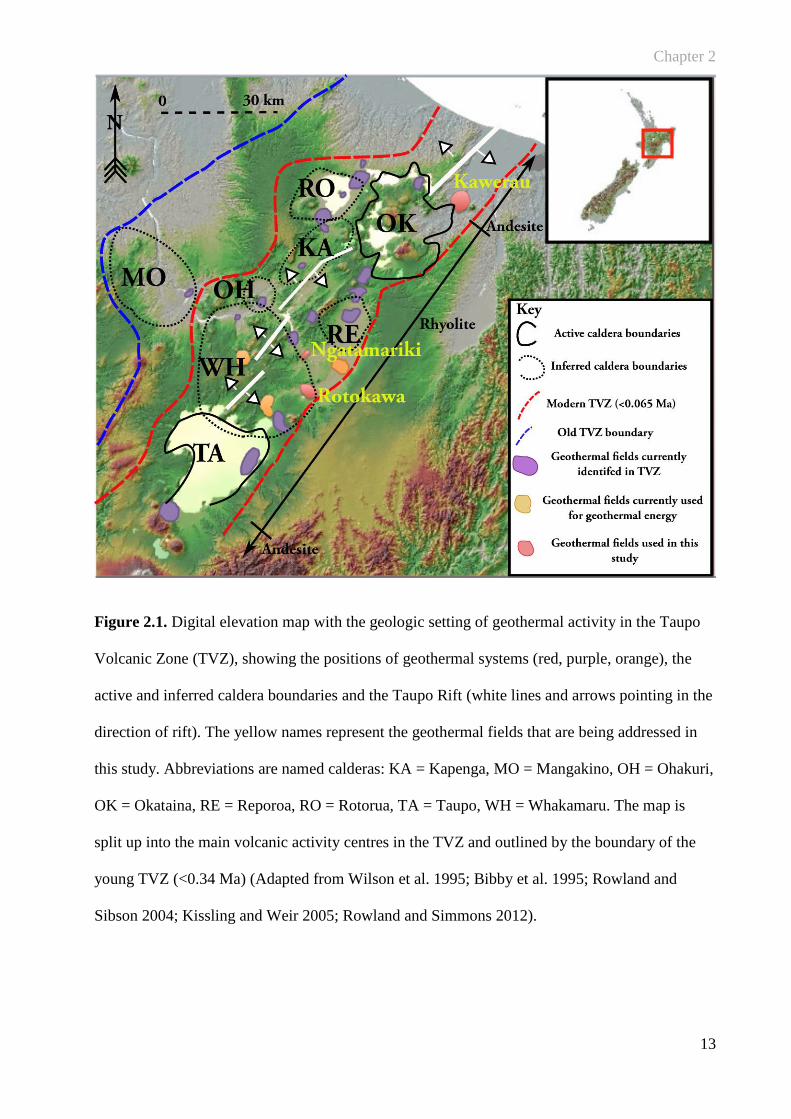
Figure 2.1. Digital elevation map with the geologic setting of geothermal activity in the Taupo
Volcanic Zone (TVZ), showing the positions of geothermal systems (red, purple, orange), the
active and inferred caldera boundaries and the Taupo Rift (white lines and arrows pointing in the
direction of rift). The yellow names represent the geothermal fields that are being addressed in
this study. Abbreviations are named calderas: KA = Kapenga, MO = Mangakino, OH = Ohakuri,
OK = Okataina, RE = Reporoa, RO = Rotorua, TA = Taupo, WH = Whakamaru. The map is
split up into the main volcanic activity centres in the TVZ and outlined by the boundary of the
young TVZ (<0.34 Ma) (Adapted from Wilson et al. 1995; Bibby et al. 1995; Rowland and
Sibson 2004; Kissling and Weir 2005; Rowland and Simmons 2012).
Chapter 2
14
2.3. Structural Setting of Volcanism in the TVZ
Structurally, the volcanism in TVZ is located above the westward subduction zone where the
Pacific plate descends beneath the Australian (Indian) plate (Peacock 1990; Cole 1990; Wilson
et al. 1995; Wood et al. 2001; Villamor and Berryman 2011; Rowland et al. 2012) at a rate of 42-
48mm/yr. (Bibby et al. 1995; Davy and Caldwell 1998; Seebeck et al. 2010). This subduction is
causing a zone of back-arc crustal extension that is part of the continental continuation of active
offshore extension in the Taupo-Hikurangi arc trench to onshore extension in the TVZ (Rowland
and Sibson 2001). This extension is occurring at a rate of 8 ± 4 mm/yr., causing the continental
crust to be thinned (Darby et al. 2000). This 15-40 km wide zone of extension coincides with
several young caldera structures which have been the location of multiple caldera forming events
in Taupo, Whakamaru and Okataina as the extension produces shallow regions where magmatic
bodies can reside (Cole 1990; Bibby et al. 1995; Wilson et al. 1995; Darby et al. 2000; Villamor
and Berryman 2001; Seebeck et al. 2010). Volcanoes at convergent plate boundaries are diverse
in their types and in their distribution as the continental lithosphere is the magma source, which
causes the magma to be heavily modified (Francis and Oppenheimer 2004; Van Der Pluijm and
Marshak 2004). The principal type of volcano is the composite cone composed of blocky lava
and pyroclastics, although most other volcano types can also be found. Explosive volcanism is
typically more evident than effusive basaltic eruptions, therefore a wide range of pyroclastic
deposits and accompanying lava flows that are basaltic through to rhyolitic in composition can
be found in a convergent tectonic zone (Perfit and Davidson 2000; Simkin and Siebert 2000).
Explosive eruptions at volcanic arcs discharge large-scale siliceous eruptions that generate
voluminous pyroclastic flows (ignimbrites deposits) with individual eruptions that may discharge
up to several thousand cubic kilometers of magma during a single event (Sigurdsson 2000).
2.4. Geothermal Systems in TVZ
Any rock type can be host to a geothermal system that is comprised of three things, (1)
permeable reservoir rock, (2) water to carry the heat from the reservoir to the surface, (3) a heat
Chapter 2
15
source (Hochstein and Browne 2000). The geothermal activity in TVZ is related to the
subduction zone and it resides in an area of crustal extension known as the Taupo Rift. As crustal
rock is melted, the newly formed molten material rises to the surface due to buoyancy. This
molten material (magma) and older cooling igneous bodies supply the heat for the geothermal
and volcanic systems (Kissing and Weir 2005), which then interact with groundwater, causing it
to become ion rich, in the upper few kilometers of the Earth’s crust. As the fluids rise they alter
the reservoir rocks, which results in hydrothermal alteration and secondary mineralisation (Cole
1990; Hochstein 1995; Villamor and Berryman 2001; Harrison and White 2004; Kissing and
Weir 2005). These geothermal systems are known as young igneous systems and are hot
compared to other varieties of geothermal systems, with heat flows that can reach 370° C at
depth, and are located all over TVZ (Kissing and Weir 2005; Wilson et al. 1995). TVZ is quite
unique on Earth in the fact that it has a very high heat flow per unit length when compared to
other volcanic settings (Hochstein 1995; Harrison and White 2004; Kissing and Weir 2005).
Hochstein (1995) gives an average figure around 2600MW/100 km for the TVZ while northern
Japan, southern Japan, Sumatra and Oregon have average heat flows of 1400MW/100 km,
800MW/100 km, 600MW/100 km and 300MW/100 km, respectively. Hochstein (1995) claims
that the high heat flow for TVZ is related to its rhyolitic volcanism, and this is only beaten by
Yellowstone which produces a heat flow of 5300MW/100 km (Giggenbach 1995). In TVZ there
are approximately 23 active and two extinct geothermal fields, which transport a total of
4200±500 MW of heat to the surface by convection. Of these geothermal fields heat flow ranges
from <1MW to 540MW (Bibby et al. 1995; Giggenbach 1995; Rowland and Sibson 2004).
2.5. Geothermal Field Study Areas
2.5.1. Ngatamariki
The Ngatamariki geothermal field is located 25 km north-northeast of Taupo in the TVZ (Fig.
2.1). Exploration for the geothermal resource started in the 1980’s with the government drilling
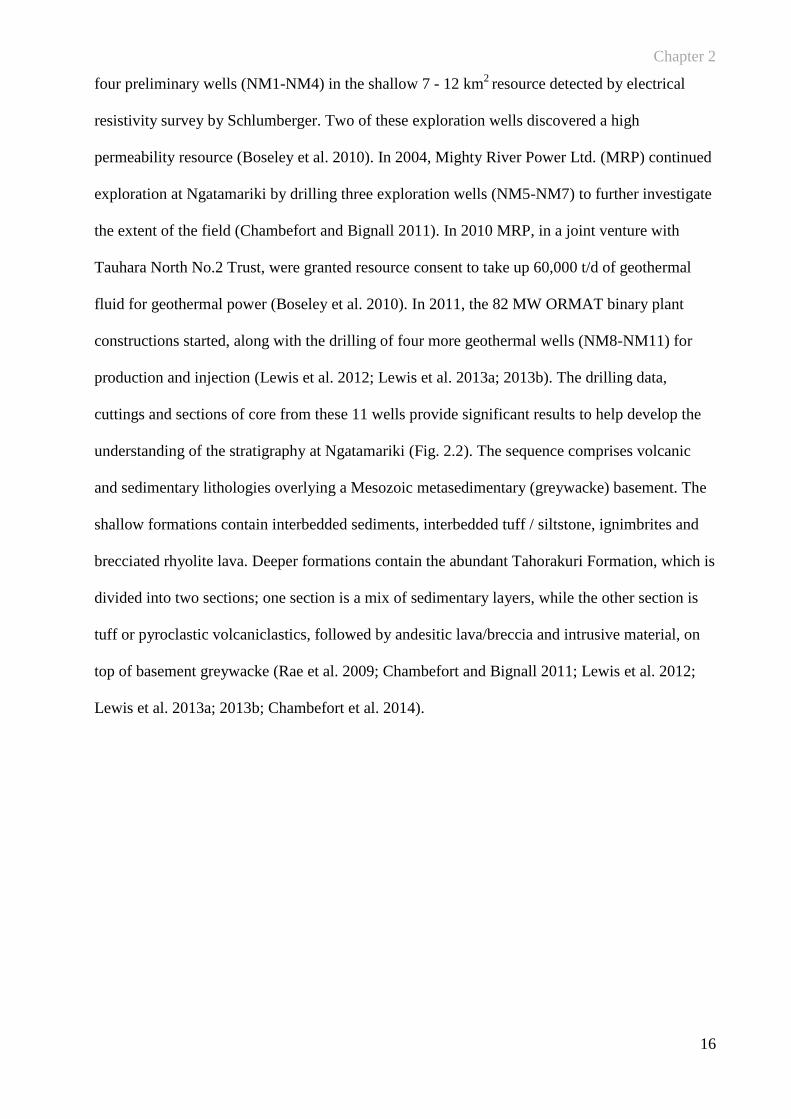
Chapter 2
16
four preliminary wells (NM1-NM4) in the shallow 7 - 12 km2
resource detected by electrical
resistivity survey by Schlumberger. Two of these exploration wells discovered a high
permeability resource (Boseley et al. 2010). In 2004, Mighty River Power Ltd. (MRP) continued
exploration at Ngatamariki by drilling three exploration wells (NM5-NM7) to further investigate
the extent of the field (Chambefort and Bignall 2011). In 2010 MRP, in a joint venture with
Tauhara North No.2 Trust, were granted resource consent to take up 60,000 t/d of geothermal
fluid for geothermal power (Boseley et al. 2010). In 2011, the 82 MW ORMAT binary plant
constructions started, along with the drilling of four more geothermal wells (NM8-NM11) for
production and injection (Lewis et al. 2012; Lewis et al. 2013a; 2013b). The drilling data,
cuttings and sections of core from these 11 wells provide significant results to help develop the
understanding of the stratigraphy at Ngatamariki (Fig. 2.2). The sequence comprises volcanic
and sedimentary lithologies overlying a Mesozoic metasedimentary (greywacke) basement. The
shallow formations contain interbedded sediments, interbedded tuff / siltstone, ignimbrites and
brecciated rhyolite lava. Deeper formations contain the abundant Tahorakuri Formation, which is
divided into two sections; one section is a mix of sedimentary layers, while the other section is
tuff or pyroclastic volcaniclastics, followed by andesitic lava/breccia and intrusive material, on
top of basement greywacke (Rae et al. 2009; Chambefort and Bignall 2011; Lewis et al. 2012;
Lewis et al. 2013a; 2013b; Chambefort et al. 2014).
Chapter 2
17
Figure 2.2. Generalised stratigraphy of the units found at the Ngatamariki Geothermal Field,
New Zealand, with the estimated thickness of each of the units based on the drilling results (Rae
et al. 2009; Chambefort and Bignall 2011; Lewis et al. 2012; Lewis et al 2013a; 2013b;
Chambefort et al. 2014).
Chapter 2
18
2.5.2. Rotokawa
The Rotokawa geothermal field is located in the TVZ, about 12 km northeast of Taupo (Fig.
2.1). Schlumberger first identified the resource potential of the Rotokawa field from resistivity
surveys and numerous surface thermal features, including acid sulphate fumaroles, steaming
ground and bi-carbonate springs. In the mid 1960s - 80s the government drilled seven
exploration wells (RK1-6, RK8) and confirmed the presence of a large, high temperature
geothermal resource (Bannister et al. 2010; Bowyer and Holt 2010; Sewell et al. 2012).
Electricity generation of 24 MW began on the field in 1997 with the installation of the binary
Rotokawa plant. MRP obtained interest in the field through the Rotokawa Joint venture, a joint
venture with the Tauhara North No.2 in 2000. From 1997 to 2005 nine further wells (RK9,
RK11-18) were drilled and power generation was subsequently expanded to 34 MW (Winick et
al. 2009). In 2007, further development occurred at Rotokawa with the drilling of RK19-30 and
the construction of the Nga Awa Purua power station, which is a 140 MW triple-flash plant that
was commissioned in early 2010; and since RK32 - 33 have been drilled (Hunt and Bowyer
2007; Bannister et al. 2010; Bowyer and Holt 2010; Bloomberg et al. 2010). The geology in
Rotokawa is similar to Ngatamariki with shallow formations containing sediments, tuffaceous
breccia, tuffs rhyolitic lavas and ignimbrites, while the deeper formations contain the Tahorakuri
Formation and andesitic lavas that overlie the greywacke basement (Fig. 2.3: Heise et al. 2006;
Rae 2007; Siratovich et al. 2014).
Chapter 2
19
Figure 2.3. General stratigraphy of the units found at Rotokawa Geothermal Field, New
Zealand, with the estimated thickness of each unit (Heise et al. 2006; Rae 2007).
Chapter 2
20
2.5.3. Kawerau
The Kawerau geothermal field is located in northern TVZ, near the eastern boundary in the
township of Kawerau (Fig. 2.1). Over 60 wells have been drilled for production, injection and
monitoring since the first scientific surveys. Shallow drilling to investigate the geothermal
potential of Kawerau began in the early 1950’s by the Department of Scientific and Industrial
Research and the Ministry of Works (Milicich et al. 2010; Wallis et al. 2012; Milicich et al.
2013).
Kawerau currently supplies raw geothermal steam to the adjacent pulp, paper, timber and tissue
mills, which have been operational since 1957 (Bloomer 2011). The Kawerau geothermal system
is hosted in a sequence of volcanic lithologies (tuffs, lavas and intrusive bodies) and sediments
that overlie faulted greywacke basement (Fig. 2.4: Milicich et al. 2013). The shallow formations
consist of a mix of extrusive rhyodacite, ignimbrites, sedimentary lithologies mixed with breccia
tuffs and rhyolite lava. The deep formations consist of welded tuffs, sedimentary tuffacious
breccia, andesite lavas, and sedimentary tuffs overlying a greywacke basement (Milicich et al.
2013).
Chapter 2
21
Figure 2.4. General stratigraphy of the units found at the Kawerau Geothermal Field, New
Zealand, with the estimated thicknesses of the units (modified from Milicich et al. 2013).
Chapter 2
22
2.6. Hydrothermal Alteration
All types of rocks are found in altered and/or weathered conditions due to the elevated
temperatures of highly active volcanic environments and the circulation of hydrothermal fluids
rich in dissolved ions (Cassiaux et al. 2006; Ceryan et al. 2008; Yildiz et al. 2010; Pola et al.
2012). The interaction between geothermal fluids and reservoir rocks usually results in addition
and/or removal of major rock forming components through dissolution, mineral deposition, and
clay mineral formation producing secondary mineralisation (Frank 1995; Finizola et al. 2002;
Hurwitz et al. 2002; Hase et al. 2005; Pola et al. 2012; Pola et al. 2014). Several factors affect
the formation of alteration minerals in reservoir rocks; and these minerals vary in relative
abundance both within a system and between systems depending on pressure, permeability, rock
type, temperature and duration (Browne 1978, 1989; Mehegan et al. 1982; Cox and Browne
1998; Robb 2005; Cassiaux et al. 2006; Pola et al. 2012). Pressure is an important variable
because it controls the distribution of two-phase boiling zones, which are often characterised by
deposition of quartz, K-feldspar and bladed calcite as vein minerals (Browne and Ellis 1970;
Browne 1978; Moore and Gunderson 1995). Permeability and reservoir rock type influence the
distribution and type of hydrothermal alteration, both by their extent and nature. Permeability
controls the magnitude of interaction between fluid and rock, as well as the speed and intensity
of the interaction. Reservoir rock type influences the alteration by it mineralogy; glass in the
reservoir rock is highly susceptible to alteration; therefore, rocks containing large quantities of
glass will undergo higher degrees of alteration compared to crystalline rocks (Mehegan et al.
1982; Barton and Zoback 1992; Moore and Gunderson 1995; Cox and Browne 1998; Lagat
2009; Frolova et al. 2010). Factors in reservoir rock that favour hydrothermal alteration are high
porosity and permeability, microcracks, clastic structure, weak cementation and glass (Lagat
2009; Frolova et al. 2010). Therefore, it follows, that reservoir rocks with these characteristics
are more exposed to thermal fluids and therefore are altered more intensively (Mehegan et al.
1982; Frolova et al. 2010). Browne (1978) and Cox and Browne (1998) found that the initial
Chapter 2
23
mineralogy of the reservoir rock had little effect on alteration minerals that formed at higher
temperatures (i.e. >280°C). In these high temperatures they found that a typical stable
assemblage (K-feldspar, chlorite, epidote, calcite, quartz, illite and pyrite) was present regardless
of rock type; whether it was basalt from Iceland, sandstone from Imperial Valley, rhyolites in
New Zealand or andesite from Indonesia (Henley and Ellis 1983; Goff and Janik 2000).
However, at lower temperatures, the nature of the reservoir rock may have a stronger influence
on the alteration mineralogy, as contrasting alteration mineralogy formed in rhyolitic rocks from
Yellowstone and New Zealand (high-silica zeolites) when compared with the andesites and
basalts from Kamchatka (lower silica zeolites). During the evolution of a geothermal system,
changes in temperature, fluid composition and transitions from liquid to vapour dominated
conditions can occur, resulting in overprinting of alteration and the existence of minerals that are
in disequilibrium with the present system (Browne 1978; Moore and Gunderson 1995; Moore et
al. 2001; Moore et al. 2002).
A wide variety of hydrothermal minerals have been recognized in active geothermal systems
(Fig. 2.5). Establishment of a particular mineral is highly dependent on temperature, meaning
that some minerals are only stable within a specific temperature range, and will only precipitate
if specific ionic concentrations are sufficiently high (Browne 1978; Cox and Browne 1998). In a
given geothermal system, minerals may be approximately correlated to specific depth ranges via
correlations between expected temperatures at different depths. There are three zones of
alteration expected in a conventional geothermal system: smectite, argillic and propylitic. For the
propose of this research propylitic includes potassic and phyllic alteration assemblages (Robb
2005; Stimac et al. 2008; Cumming 2009; Esmaeily et al. 2012). Smectite alteration typically
occurs in geothermal systems at shallow depths with low temperatures, while argillic alteration
usually occurs at moderate depths and warmer temperatures (Robb 2005; Lutz et al. 2010; Lutz
et al. 2011; Pola et al. 2012), and finally propylitic alteration normally occurs at higher
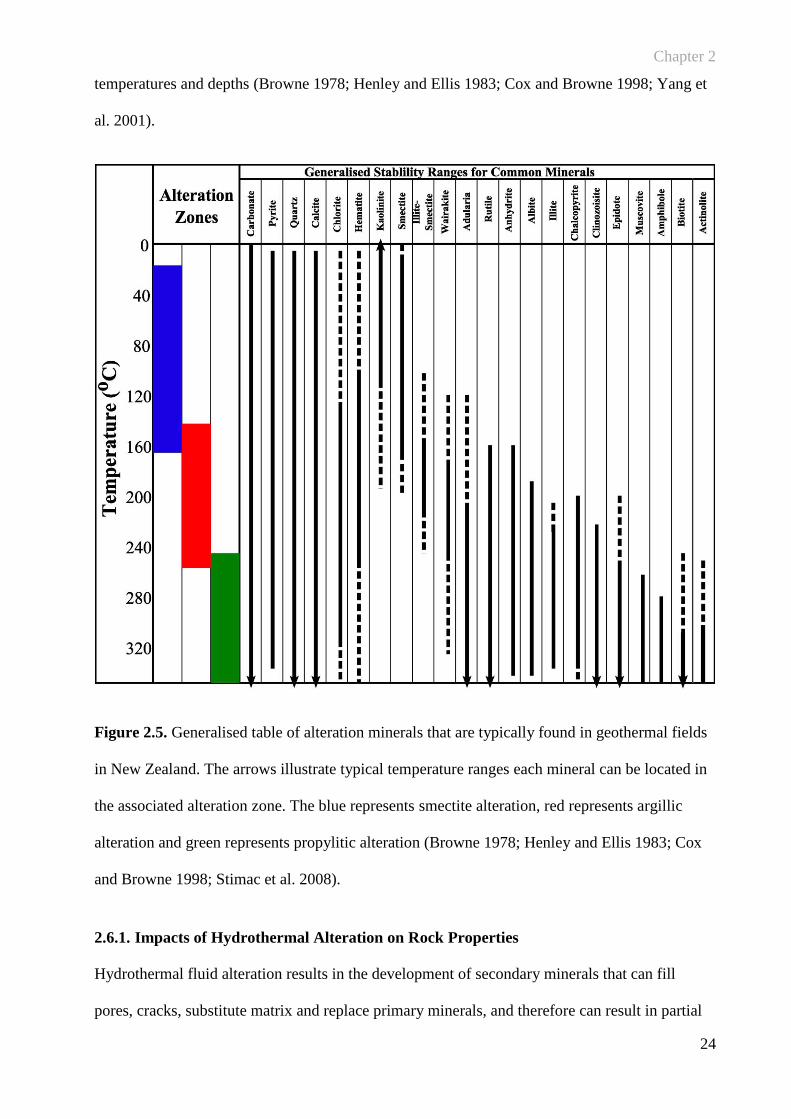
Chapter 2
24
temperatures and depths (Browne 1978; Henley and Ellis 1983; Cox and Browne 1998; Yang et
al. 2001).
Figure 2.5. Generalised table of alteration minerals that are typically found in geothermal fields
in New Zealand. The arrows illustrate typical temperature ranges each mineral can be located in
the associated alteration zone. The blue represents smectite alteration, red represents argillic
alteration and green represents propylitic alteration (Browne 1978; Henley and Ellis 1983; Cox
and Browne 1998; Stimac et al. 2008).
2.6.1. Impacts of Hydrothermal Alteration on Rock Properties
Hydrothermal fluid alteration results in the development of secondary minerals that can fill
pores, cracks, substitute matrix and replace primary minerals, and therefore can result in partial
Chapter 2
25
or wholesale changes in the rock composition and subsequent mechanical behaviour (Robb
2005; Yildiz et al. 2009). Studies that focused on mass transfer of elements during hydrothermal
alteration found that the mobility of major rock forming elements during alteration resulted
primarily from dissolution of minerals containing those elements and precipitation of alteration
products not containing those elements, thus, changing the bulk geochemistry and mineralogy of
the reservoir rocks and differing its primary rock properties (Ferry 1979; Giggenbach 1984;
Henneberger and Browne 1988; Reyes 1990; Simmons and Browne 2000; Pochee 2010;
Esmaeily et al. 2012).
Several authors have studied the influence of hydrothermal alteration on the physical and
mechanical properties of many rock types with the aims of the research varying based on the
information needed (Reid et al. 2001; Moon et al. 2005; Cassiaux et al. 2006; Rigopoulos et al.
2010; Lutz et al. 2011; Tao et al. 2014; Siratovich et al. 2014). Other authors have looked
especially into the changes in physical and mechanical properties based on degree of alteration to
see how these properties can vary due to secondary minerals forming (Sousa et al. 2005; Ceryan
et al. 2008; Pola et al. 2012; Pola et al. 2014). A study by Yildiz et al. (2009) investigated the
effect of hydrothermal alteration on physical and mechanical properties in volcanic rocks from
Köprülü, Afyonkarahisar, West Turkey, and found that altered volcanic rocks had an average
density of 2.7 g/cm3, porosity of roughly 21% and a uniaxial compressive strength of around 24
MPa. In contrast the unaltered volcanic samples had a higher density, lower porosity and much
higher rock strength (2.8 g/cm3, 10% and 45 MPa, respectively). Pola et al. (2012) found that the
shallow, low temperature volcanic rocks used in the study had a gradual decay in the strength of
the material based on the increase in the degree of alteration. However, a decrease in the strength
of the material was affected more by the changes in the rock structures. Consequently, samples
with a high quantity of microfractures and higher porosity tended to fail at lower peak strengths
with limited influence from degree of alteration. Further research, by other scientists, has also
addressed hydrothermal alteration over depth, by looking at the physical and mechanical
Chapter 2
26
properties of rocks found at high temperatures and comparing to similar lithologies found at low
temperatures. A study looking at the Kuril-Kamchatka Island Arc System, Russia, showed a
difference in physical rock properties between tuffs exposed to low and high temperature
systems, where the high temperature system tuffs had higher density (>2.3 g.cm3), strength (>70
MPa), faster ultrasonic wave velocities (>4000 m/s) and lower porosity (<15%) than the low
temperature systems, 1-2 gm3, <50 MPa, <4000 m/s, >20% (Frolova et al. 2010). Frolova et al.
(2010) found that deep, high temperature fluids (>200°C) will typically cause a decrease in
porosity and permeability, and an increase in strength, density and ultrasonic wave velocities.
This is caused by minerals being deposited and infilling the intercrystal and intergranular
micropore space, causing consolidation and hardening of the lithology. The connections between
grains become stronger and denser, reinforcing the cementation of the rock, while the
intergranular pores are almost completely infilled, reducing the total porosity and permeability
(Frolova et al. 2010; Nasimov et al. 2005). They furthermore established that hydrothermal
alteration at low temperatures (<150°C) is complex and diverse, as it can cause an increase or
decrease in physical and mechanical properties depending on the initial primary lithology,
pressure, and fluid interaction (Frolova et al. 2005; Ladygin et al. 2000).
Hydrothermal alteration, and the resulting secondary mineralisation, which has been proven to
alter rock properties, is of particular interest to the conventional geothermal industry because few
rocks in a hot, dynamic, liquid and/or steam filled reservoir are unaltered.
2.7. Empirical correlations of Mechanical Properties
One of the fundamental parts of rock engineering applications is the determination of physical
and mechanical properties of the material being analyzed (Tamrakar et al. 2007; Singh et al.
2012; Karakul and Ulusay 2013), particularly rock strength measurements, which are considered
necessary of design using rock materials. Predictive tools for rock mechanical parameters are
essential for oil and gas or geothermal development, management and prospect evaluation
Chapter 2
27
because very sparse or no borehole-based rock mechanical data is available (Bieniawski 1974;
Ameen et al. 2009). Rock strength determination is completed by either the American Society
for Testing and Materials (ASTM) or International Society of Rock Mechanics (ISRM)
standards; however, core samples are not always readily available making the completion of
testing difficult (Koncagül and Santi 1999; Karakul and Ulusay 2013). Hence, research has been
completed on some sedimentary (Chang et al. 2006; Çobanoğlu and Çelik 2008; Ameen et al.
2009), and igneous (Arel and Tuğrul 2001; Binal 2009; Rigopoulos et al. 2010) rocks in order to
develop or define empirical relationships that can be used to derive mechanical properties
without direct measurement of intact core samples.
Empirical correlations have been used to establish rock mechanical data since the 1950’s.
Typically, research on empirical correlations has been determined by selecting a certain
lithology or rock type and completing several laboratory experiments to determine the
relationship between one parameter and another. Results using this method have determined that
point load values and Schmidt Hammer Value (SHV) (Cargill and Shakoor 1990; Kahraman
2001;Yilmaz and Sendir 2002; Çobanoğlu and Çelik 2008; Yagiz 2008; Binal 2009; Singh et al.
2012; Kohno and Maeda 2012), Young’s Modulus (Dinçer et al. 2004), porosity (Sarda et al.
1993; Farquhar et al. 1994; Edlmann et al. 1998; Jeng et al. 2004; Entwisle et al. 2005; Ameen et
al. 2009), grain area ratio (Jeng et al. 2004), compressional and shear wave velocities (Wyllie et
al. 1956, 1958; Gardner et al. 1974; Sharma and Singh 2008; Karakul and Ulusay 2013), grain
hardness (Yaşar and Erdoğan 2004; Shalabi et al. 2007), and mineralogy (quartz and feldspar
contents) (Tuğrul and Zarif 1999), show good relationships to mechanical properties, especially
uniaxial compressive strength (UCS). Studies into empirical correlations has also included the
use of statistical methods, regression analysis, artificial neural networks (ANNs) (Singh et al.
2001; Dehghan et al. 2010), fuzzy charts and models (Alvarez Grima and Babuška 1999;
Gokceoglu and Zorlu 2004) with results determining that these statistical methods could be used
to determine UCS, as long as the input datasets are available for the lithology being analysed.
Chapter 2
28
Researchers have used the correlations between rock properties and UCS to determine strength
prediction equations, as the strength of the material is an important parameter in engineering
designs. Several studies have shown that mineral hardness, secondary minerals, microstructural
damage, which includes the presence of microfractures and pores can influence the predicted
rock strength (Ameen et al. 2009; Coggan et al. 2013; Heap et al. 2014; Siratovich et al. 2014;
Wyering et al. 2014). Tuğrul and Zarif (1999) and Rigopoulos et al. (2010) found that
mineralogy influenced the strength of rocks, the variation in abundance of hard and soft minerals
significantly influenced the resulting rock strength. Rocks with predominately soft minerals lead
to a lower strength compared to rocks containing predominantly hard minerals (Vutukuri et al.
1974; Rigopoulos et al. 2010; Li et al. 2012). Porosity and fractures was also found to be an
important factor in rock strength, in that voids reduce the integrity of the sample and, as
indicated by the ISRM (Ulusay & Hudson 2007), even a small volume of pores can have a
noticeable mechanical effect (Sammis and Ashby 1986; Fakhimi and Gharahbagh 2011; Heap et
al. 2014a). An increase in porosity reduces stiffness and strength due to stress concentration on
the boundary of the pores. Additionally, the pores may be filled with fluids, which may help in
crack propagation under compression due to the incompressibility of the fluids, leading to an
increase in stress concentrations at pore boundaries as the fluid is trying to escape (Price 1960;
Lama & Vutukuri 1978; Luping 1986). Samples that contain pre-existing fractures require less
energy to initiate further propagation of the pre-existing fractures, resulting in lower peak
strength values (Walsh 1961; Martin 1997; Siratovich et al. 2014). Micro and macrofractures,
whether pre-existing or induced during testing, coalesce during uniaxial compression ultimately
leading to failure of the sample (Bieniawski 1967; Bieniawski et al, 1969).
Weathering is an essential process that affects the mechanical properties of rock material at
shallow depths and on the surface through chemical and physical weathering (Arikan et al. 2007;
Ceryan et al. 2008; Arikan and Aydin 2012). Therefore, scientists have looked at the impact
weathering has on mechanical properties and found that various properties can affect the
Chapter 2
29
resulting strength. Arikan and Aydin (2012) discovered that the changing mineralogy from un-
weathered to high weathering of dacites decreased the studied rocks properties (density, strength
and sonic wave velocities) due to the breakdown of plagioclase phenocrysts and microlites.
Another researcher established that changes in the mineralogy due to the weathering of granites
impacted the uniaxial compressive rock strength as the feldspars begun to change to clays
(Coggan et al. 2013). Arel and Tugrul (2001) looked at how weathering affects the
geomechanical properties of granodiorite, granites and quartz diorites in northwest Turkey and
found that textural and fabric characteristics of igneous rocks provide the most direct control on
the strength. Therefore, as the original texture and fabrics of the igneous rocks got replaced the
uniaxial compressive strength decreased. Ceryan et al. (2008) developed correlations between
the weathering levels of volcanic rocks and their mechanical and physical properties using a
micro-petrographic index. He produced statistically significant results with the uniaxial
compressive strength, tensile strength, elasticity and dynamic elasticity modulus, showing a
decreasing trend in the mentioned properties and the measured micro-petrographic index.
Weathering classification methods have been developed to classify weathered rocks in field with
the use of Schmidt hammer rebound values (SHV) as a correlation to strength (Arkian et al.
2007; Ceryan et al. 2008). Changes in mineralogy, textures, porosity and other rock properties is
important to any research directed towards the effect of changes in physical and mechanical rock
properties; the actually weathering process is not directly relevant to this research as the samples
in our research are located at depths where the effects of alteration due to weathering is not
important.
Several scientists have attempted to devise specific micropetrographic indices for quantifying
changes in the intrinsic properties of rocks. In general, an index should include the parameters
that are most important for the engineering behaviour of rocks. Lumb (1962) proposed a
quantitative index Xd, for working out the degree of decomposition by taking into account the
ratio by weight of quartz and feldspar in a decomposed granite. Weinert (1965) classified
Chapter 2
30
igneous rocks according to the percentage of secondary minerals, considering degree of
alteration. Mendes et al. (1966) introduced the micropetrographic index k, which takes into
account the proportions of the sound (positive influence on the mechanical behaviour of rock)
and unsound (altered minerals) minerals, while Irfan and Dearman (1978) had the same idea, but
used sound minerals as primary minerals and unsound being secondary/alteration minerals.
Onodera et al. (1974) proposed the index Pcr in order to quantify the density of microcracks, and
again Irfana and Dearman (1978) suggested the microfracture index, which is based on the
number of microcracks in a 10 mm area of the thin section. Cole and Sandy (1980) proposed a
secondary mineral rating in order to quantify mineralogy and texture in relation to the durability
of basaltic rocks. A textural coefficient, developed by Howarth and Rowlands (1987), is based
on numerous textural parameters of rocks as a predictive tool for the assessment of drillability
and rock strength properties. Rigopoulos et al. 2010 introduced two indices, the
micropetrographic strength index (Ips) and the replacement index (Irep) to quantify the degree of
alteration of dolerites. Ips uses secondary minerals, primary minerals and the volume of soft and
hard minerals, while the Irep uses alteration products of primary mafic minerals (in volume
percentage) and primary mafic minerals (in volume percentage).
Whilst the equations presented in the papers referenced above may be useful to a practitioner in
the geothermal industry as a first order approximation, this review made clear that while a few of
the empirical correlations appeared to work fairly well for some subsets of the rocks studied,
they were only useful for the lithologies from which the empirical correlations were drawn.
2.8. History of Drilling Optimisation
Drilling optimisation is commonly approached in one of two ways: by attempting to understand
the properties of the lithology being drilled and how those properties control the drillability of
the material; or by using mathematical and simulative methods involving drilling parameters to
find the best rate of penetration (ROP). Drilling companies have compelling reasons to optimise
Chapter 2
31
drilling, with the main reason being that more efficient drilling takes less time to complete and
therefore costs less. The drilling industry is unlikely to improve drilling without a means of
relating it to some rock criteria, and it has been noted by many researchers that this correlation
would assist in evaluating and improving real-time drilling when combined with a consistent
method for evaluating the conditions under which drilling operates. As we begin to understand
more about the parameters that impact drilling, we can evaluate with some certainty the relative
benefit of various approaches to improvement (Bingham 1965a). Drilling optimisation can be
defined as the establishment of real time data to accelerate decision-making based on
information transmitted from downhole. Typically, analysts will look at trends in the drilling
data to derive accurate conclusions about drilling status and use it to develop ways to improve
drilling times and if possible predict rock strengths. With a lack of accurate, timely and
incorporated information, companies cannot control and optimize well production or monitor
and enhance field production, which leads to suboptimal drilling performance (Bharadwaj and
Vinayaka 2013). Drillability is a concept that looks at the resistance of rock to drilling and
depends to a large extent upon the means used for rock destruction (Gstalder and Raynal 1966;
Prasad 2009).
There have been many attempts at analytical methods for optimizing drilling since the 1950’s;
with one of the first attempts using an analytical approach presented in the study of Graham and
Muench (1959). They evaluated weight-on-bit (WOB) and rotary speed combinations to derive
empirical mathematical expressions for bit life expectancy and for drilling rate as a function of
depth, rotary speed and bit weight. Galle and Woods (1963) produced an approach to drilling
optimisation by looking at the effect of constant WOB and rotations per minute (RPM) on the
rate of penetration (ROP). Using their equation, Galle and Woods (1963) were able to produce
graphs and procedures for use in field operations, as these graphs outlined the optimal
combinations of WOB and RPM for different scenarios. Their work produced an average cost
reduction of 25.3%, but had a limitation that did not allow for lithology changes or other
Chapter 2
32
uncontrollable parameters while drilling is undertaken, which is a large factor associated with
drilling in a geothermal field. Exploration has been undertaken to improve Galle and Woods
(1963) research, through dealing with the above limitation by using ‘interval optimisation’ and
‘multiple interval optimisation’ (Wilson and Bentsen 1972). Wilson and Bensten’s (1972)
method divides the well into lithological sections where the drilling conditions are constant and
optimises for each section. Maurer (1962) developed equations for drilling optimisation, where
the drilling rate is a function of RPM, WOB, bit diameter and rock drillability. However, this
research assumed that the drill hole was perfectly clean, with all rock cuttings removed off the
cutting surface. Bingham (1964b) does state that any drilling method that relies upon fluid
circulation to remove cuttings is controlled by the capacity of the system to fulfil this function; if
Maurer’s system is not cleaning the bottom of the hole, the equation does not work.
As an alternative to analytical approaches, various researchers have attempted to optimize
drilling using statistical methods, especially the development of the ROP models by multiple
regressions. Bourgoyne and Young (1974) used multiple regression analysis of drilling data to
find coefficients for their proposed exponential ROP model. This formula achieves drilling
optimization through mathematical manipulation resulting in a means to optimise WOB, RPM
and bit hydraulics. They used minimum cost formula, showing that maximum ROP may
coincide with minimum cost approach if the technical limitations were ignored. Another
approach that was used was an exploratory type of approach by Tansev (1975), which utilises the
interaction of raw data, regression and an optimisation technique. Fear (1999) developed
recommendations for maximizing ROP, by producing correlations between ROP and several
drilling parameters.
Methods to attain an improved understanding of drilling to achieve optimisation also include
drill-off tests. This test is simple, but practical, and attempts to determine the relationship
between optimum operating parameters for a given formation, bit, bottomhole assembly and
Chapter 2
33
hydraulics etc. However, they are specific to the interval in which the test was conducted
(Koederitz and Weis 2005). The method involves fixing the rotary speed and changing the WOB
to see how it impacts ROP (Bourdon et al. 1989). The main downfall of this method is that it is
trial and error based, and that approach is inefficient. This leads to a higher cost for the wells as
the drilling is less than optimal (Frenzel 2006). Reed (1972) formulated a Monte Carlo technique
to solve variable weight-speed problems set out by Galle and Woods (1963). However, Reed
(1972) made only a 3% improvement over Galle and Woods’ method, and when the
computational time was taken into consideration it provided no advantage over the simpler
method laid out by Galle and Woods. The use of simulation software has been explored, and is
becoming recognized as one of the most effective ways to increase ROP. Kelessidis and
Dalamarinis (2009) found that simulators monitoring real-time drilling parameters along with
drillability models allow companies to calculate optimum WOB, pump pressure, and rotary
speed, which can decrease drilling time by 35-50% depending on the lithology being drilled.
Many researches have also found porosity, density, hardness, textures, ultrasonic wave
velocities, and strength impact the drillability of a rock (Howards and Rowlands 1987; Spaar et
al. 1995; Thuro 1997; Altindag 2002; Tanaino 2005; Hoseinie et al. 2008; Bilim 2011;
Kelessidis 2011; Yaşar et al. 2011; Yarali and Kahraman 2011), with some developing indices,
from these physical properties, to predict rock drillability that are widely used in drillability
analysis (Protodyakonov 1962; Deere and Miller 1966; Gstalder and Raynal 1966; Howards and
Rowlands 1987; Wijk 1989; Thuro 1997; Kahraman et al. 2000; Hoseinie et al. 2008; Saeidi et
al. 2013). Prasad (2009) looked at eight rock properties (porosity, density, compressional and
shear wave velocities, strength, Mohr’s friction angle, quartz percentage, and grain size) for six
rock types, and developed a way to predict the drillability of certain lithologies based on the
eight properties. It is displayed as a spider diagram from 0 – 8 (0 representing soft rock and 8
representing hard rock) where you put the easily measured properties on the diagram, which then
allows the user to estimate UCS. Bingham (1964a) believed that industry was unlikely to

Chapter 2
34
accurately predict drilling rates without a means of relating it to rock property measurements.
These rock property measurements would assist in improving drilling performance as it would
give a basis for addressing the conditions which optimal drilling operates.
Chapter 3
CHAPTER 3:
MECHANICAL AND PHYSICAL PROPERTIES OF
HYDROTHERMALLY ALTERED ROCKS, TAUPO VOLCANIC ZONE,
NEW ZEALAND.
Latasha D. Wyering, Marlene C. Villeneuve, Irene C. Wallis, Paul A. Siratovich, Ben M.
Kennedy, Darren M. Gravley, Joseph L. Cant
Published by Journal of Volcanology and Geothermal Research
Manuscript http://dx.doi.org/10.1016/j.jvolgeores.2014.10.008
Chapter 3
36
3.1. Introduction
Alteration produces significant changes in almost all the mineralogical, chemical and physical
properties of rocks (Lumb 1983; Arel and Tugrul 2001; Begonha and Sequeria Braga 2002;
Arikan et al. 2007). Two types of alteration are observed in volcanic environments: weathering
and hydrothermal (Ceryan et al. 2008; Yildiz et al. 2010; Pola et al. 2012). Weathering occurs
when the Earth’s atmosphere and waters interact with the rock system; while in a hydrothermal
context alteration is caused by the movement of hot, dissolved-ion rich fluids through reservoir
rocks causing dissolution, mineral deposition and clay mineral formation producing secondary
mineralisation (Frank 1995; Finizola et al. 2002; Hurwitz et al. 2002; Hase et al. 2005; Pola et al.
2012; Pola et al. 2014). Several factors, in a geothermal field, affect the formation of alteration
minerals; pressure, permeability, rock type, temperature, duration, and these minerals vary in
relative abundance both within a system and between systems (Browne 1978, 1989; Mehegan et
al. 1982; Cox and Browne 1998; Robb 2005; Pola et al. 2012).
Relationships between strength and porosity, density or mineralogy for a specific rock formation
(Chang et al. 2006), and the influence of secondary mineralisation on the physical and
mechanical properties of rock has been studied by many authors (Ulusay et al. 1994; Kahraman
et al. 2005; Chang et al. 2006; Sousa et al. 2005; Tamrakar et al. 2007; Ceryan et al. 2008; Yildiz
et al. 2009; Rajesh Kumar et al. 2011; Pola et al. 2012; Pola et al. 2014). Studies to this extent
are of limited interest to the conventional geothermal industry because few rocks in a hot,
dynamic, liquid and/or steam filled reservoirs are unaltered or exposed at the surface. However,
the results/relationships developed are mainly for sedimentary, granitic and metamorphic rocks
and cannot be applied ubiquitously to all lithologies, especially hydrothermally altered volcanic
rocks at depth. Only recently have studies investigated the physical and mechanical properties of
volcanic rocks (Vinciguerra et al. 2005; Smith et al. 2009; Nara et al. 2011; Heap et al. 2014;
Pola et al. 2012; Pola et al; 2014). However, these studies are focused on site-specific lithologies
and on rock properties that are not directly relevant to the sub-surface reservoir rocks of the
Chapter 3
37
Taupo Volcanic Zone (TVZ) geothermal fields, which are examined in this study. Mass transfer
resulting primarily from dissolution of reservoir rocks minerals and precipitation of alteration
products (Ferry 1979; Giggenbach 1984; Henneberger and Browne 1988; Reyes 1990; Simmons
and Browne 2000; Pochee 2010; Esmaeily et al. 2012) cause the bulk geochemistry and
mineralogy of the reservoir rocks to differ from its initial primary rock mineralogy, leading to a
partial or wholesale changes in the rock composition and subsequent physical and mechanical
behaviour (Lumb 1983; Arel and Tugrul 2001; Begonha and Sequeria Braga 2002; Robb 2005;
Arikan et al. 2007; Yildiz et al. 2009).
The objectives of this chapter are: to produce a detailed description of the altered lithologies
used in this study and to physically and mechanically characterise hydrothermally altered
volcanic rocks. We then examine the relationships between physical and mechanical properties
and lithology to quantify the effect of hydrothermal alteration on these lithologies. The purpose
of this analysis is to support on-going research into the development of a new geotechnical
model to aid in the understanding of the primary controls of rock properties in a young igneous
geothermal system, and how these properties may be utilised for bit selection in drilling (Chapter
5; Wyering et al. – in prep).
3.2. Geological Setting
The rocks in this study originate from the TVZ, which is located at the southern end of the
Tonga-Kermadec arc in the central North Island of New Zealand, in a 300 km long (200 km on
land) and 60 km wide belt, defined by caldera structural boundaries, vent positions and
geothermal fields (Fig. 3.1: Wilson et al. 1995; Rowland and Sibson 2001), and in its modern
form coincides with a structurally and magmatically segmented rift system (Taupo rift). The
oblique subduction of oceanic crust from the Pacific plate beneath the Indian-Australian plate
caused the back arc/arc basin producing the TVZ (Cole 1990; Bibby et al. 1995; 2008; Darby et
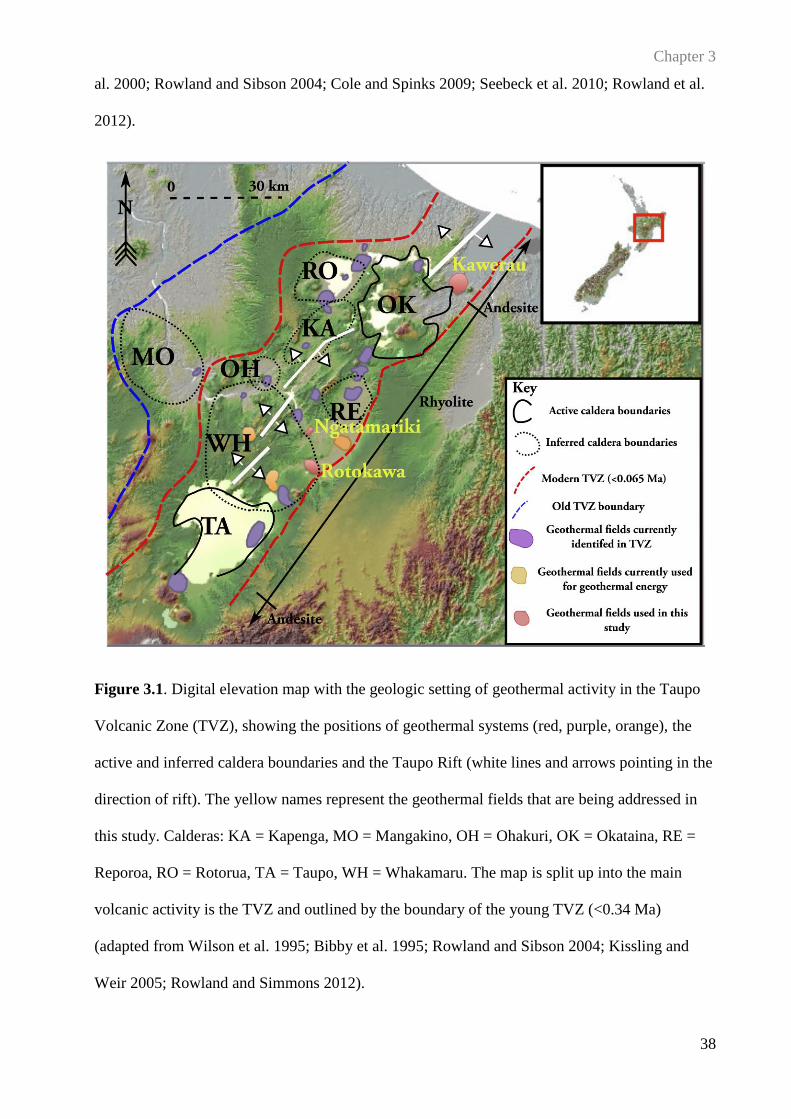
Chapter 3
38
al. 2000; Rowland and Sibson 2004; Cole and Spinks 2009; Seebeck et al. 2010; Rowland et al.
2012).
Figure 3.1. Digital elevation map with the geologic setting of geothermal activity in the Taupo
Volcanic Zone (TVZ), showing the positions of geothermal systems (red, purple, orange), the
active and inferred caldera boundaries and the Taupo Rift (white lines and arrows pointing in the
direction of rift). The yellow names represent the geothermal fields that are being addressed in
this study. Calderas: KA = Kapenga, MO = Mangakino, OH = Ohakuri, OK = Okataina, RE =
Reporoa, RO = Rotorua, TA = Taupo, WH = Whakamaru. The map is split up into the main
volcanic activity is the TVZ and outlined by the boundary of the young TVZ (<0.34 Ma)
(adapted from Wilson et al. 1995; Bibby et al. 1995; Rowland and Sibson 2004; Kissling and
Weir 2005; Rowland and Simmons 2012).
Chapter 3
39
The geothermal systems in the TVZ are developed by the transportation of meteoric waters,
which percolate down through fractures, faults and textures in lithologies, and then rise when
heated by deep magma or intrusive bodies (Henneberger and Browne 1988; Hochstein 1995;
Rowland and Sibson 2004; Rowland and Simmons 2012). These circulating geothermal fluids
become rich in dissolved minerals, as they percolate through the stratigraphy (Henneberger and
Browne, 1988) and precipitate minerals in the reservoir rocks (Goff and Janik 2000).
The samples used in this study were taken from core sourced from the Ngatamariki, Rotokawa
and Kawerau geothermal fields. Ngatamariki and Rotokawa comprise volcanic and sedimentary
lithologies overlying a Mesozoic metasedimentary (greywacke) basement. The shallow
formations contain sediments, tuffs and tuffaceous breccias, siltstones, ignimbrites, and
brecciated/tuffaceous rhyolite lava. Deeper formations contain the Tahorakuri Formation, which
is divided into two sections: a mix of sedimentary layers, and tuff or pyroclastic volcaniclastics
with andesitic lava or breccia on top of the basement rock. Ngatamariki also contains an
intrusive material in the northern end of the field (Fig. 3.2: Krupp and Seward 1987; Browne et
al. 1989; Brown et al. 1992; Brotheridge et al. 1995; Arehart et al. 2002; Rae 2007; Chambefort
et al. 2014). At Kawerau the shallow formations consist of a mix of extrusive rhyodacite,
ignimbrites, sedimentary lithologies mixed with breccia tuffs and rhyolite lava. The deep
formations comprise of welded tuffs, sedimentary tuffacious breccia, andesite lavas, and
sedimentary tuffs overlying the basement rock (Fig. 3.2: Milicich et al. 2011; Milicich et al.
2013).
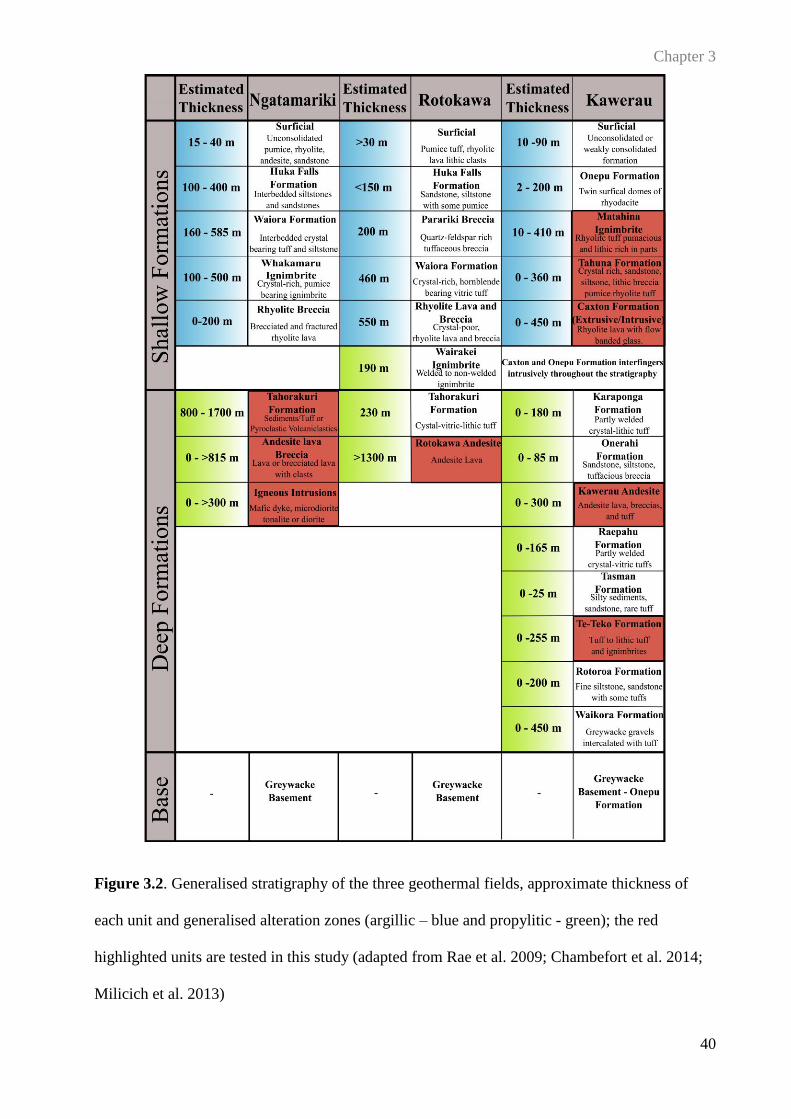
Chapter 3
40
Figure 3.2. Generalised stratigraphy of the three geothermal fields, approximate thickness of
each unit and generalised alteration zones (argillic – blue and propylitic - green); the red
highlighted units are tested in this study (adapted from Rae et al. 2009; Chambefort et al. 2014;
Milicich et al. 2013)
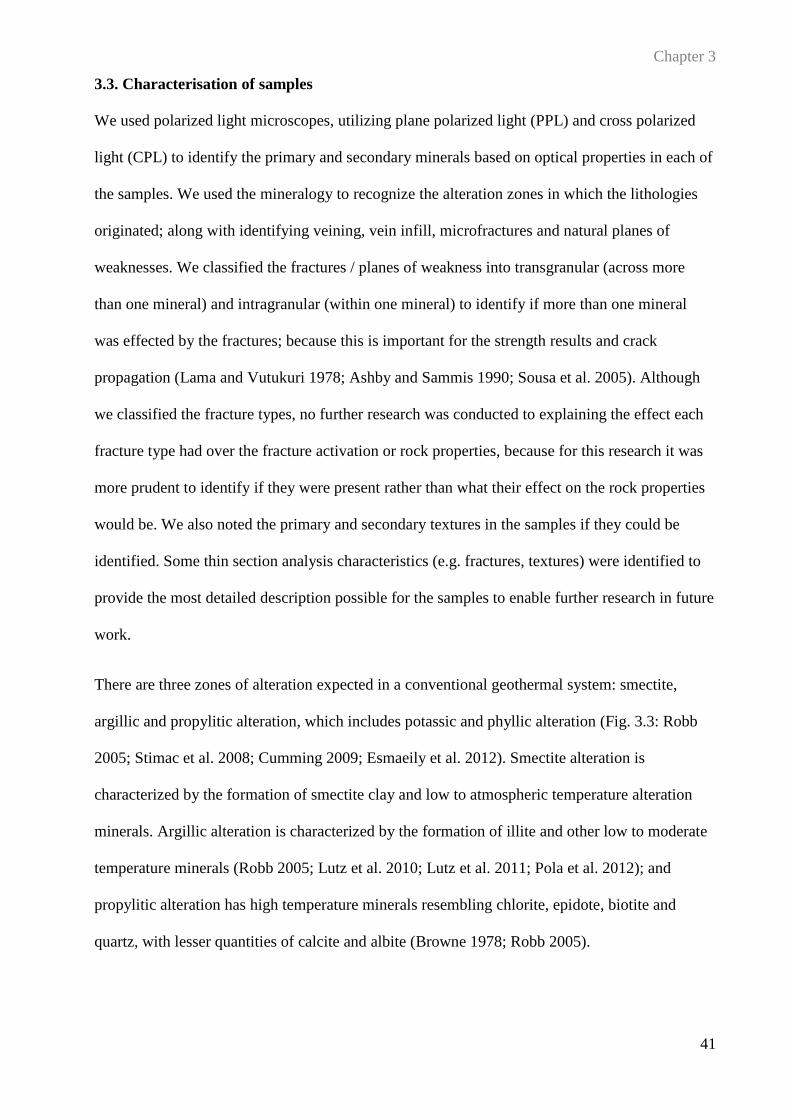
Chapter 3
41
3.3. Characterisation of samples
We used polarized light microscopes, utilizing plane polarized light (PPL) and cross polarized
light (CPL) to identify the primary and secondary minerals based on optical properties in each of
the samples. We used the mineralogy to recognize the alteration zones in which the lithologies
originated; along with identifying veining, vein infill, microfractures and natural planes of
weaknesses. We classified the fractures / planes of weakness into transgranular (across more
than one mineral) and intragranular (within one mineral) to identify if more than one mineral
was effected by the fractures; because this is important for the strength results and crack
propagation (Lama and Vutukuri 1978; Ashby and Sammis 1990; Sousa et al. 2005). Although
we classified the fracture types, no further research was conducted to explaining the effect each
fracture type had over the fracture activation or rock properties, because for this research it was
more prudent to identify if they were present rather than what their effect on the rock properties
would be. We also noted the primary and secondary textures in the samples if they could be
identified. Some thin section analysis characteristics (e.g. fractures, textures) were identified to
provide the most detailed description possible for the samples to enable further research in future
work.
There are three zones of alteration expected in a conventional geothermal system: smectite,
argillic and propylitic alteration, which includes potassic and phyllic alteration (Fig. 3.3: Robb
2005; Stimac et al. 2008; Cumming 2009; Esmaeily et al. 2012). Smectite alteration is
characterized by the formation of smectite clay and low to atmospheric temperature alteration
minerals. Argillic alteration is characterized by the formation of illite and other low to moderate
temperature minerals (Robb 2005; Lutz et al. 2010; Lutz et al. 2011; Pola et al. 2012); and
propylitic alteration has high temperature minerals resembling chlorite, epidote, biotite and
quartz, with lesser quantities of calcite and albite (Browne 1978; Robb 2005).
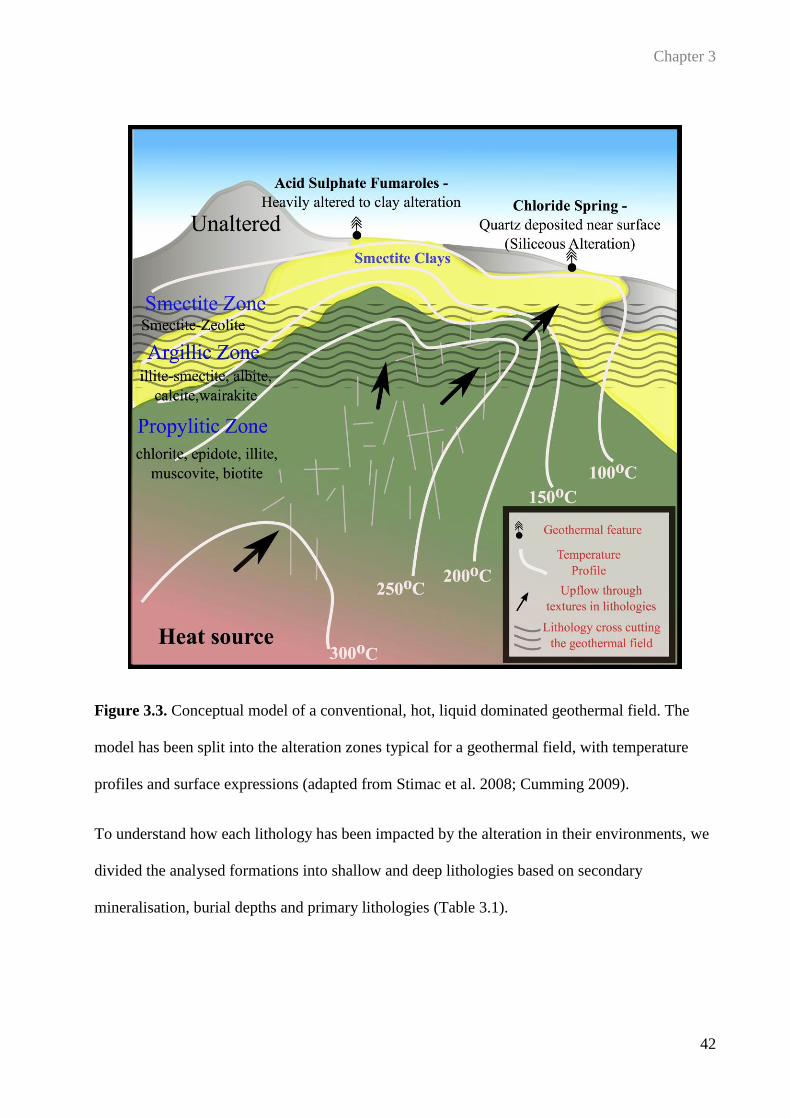
Chapter 3
42
Figure 3.3. Conceptual model of a conventional, hot, liquid dominated geothermal field. The
model has been split into the alteration zones typical for a geothermal field, with temperature
profiles and surface expressions (adapted from Stimac et al. 2008; Cumming 2009).
To understand how each lithology has been impacted by the alteration in their environments, we
divided the analysed formations into shallow and deep lithologies based on secondary
mineralisation, burial depths and primary lithologies (Table 3.1).
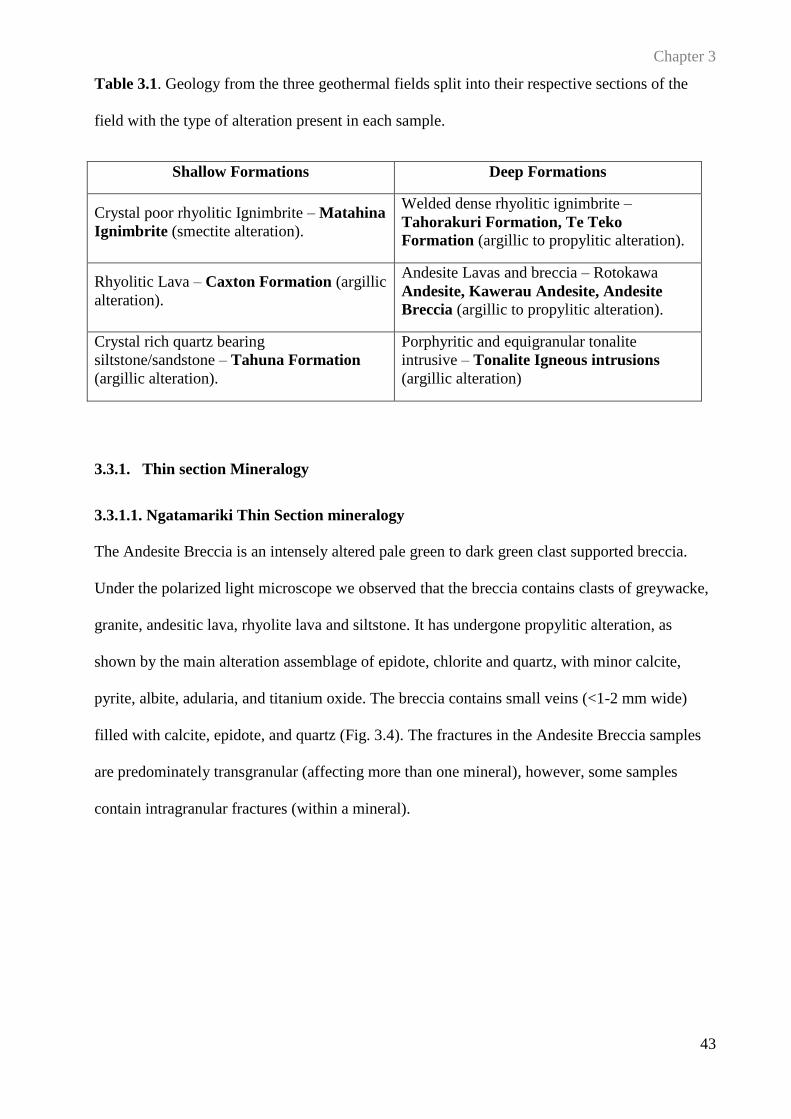
Chapter 3
43
Table 3.1. Geology from the three geothermal fields split into their respective sections of the
field with the type of alteration present in each sample.
Shallow Formations Deep Formations
Crystal poor rhyolitic Ignimbrite – Matahina
Ignimbrite (smectite alteration).
Welded dense rhyolitic ignimbrite –
Tahorakuri Formation, Te Teko
Formation (argillic to propylitic alteration).
Rhyolitic Lava – Caxton Formation (argillic
alteration).
Andesite Lavas and breccia – Rotokawa
Andesite, Kawerau Andesite, Andesite
Breccia (argillic to propylitic alteration).
Crystal rich quartz bearing
siltstone/sandstone – Tahuna Formation
(argillic alteration).
Porphyritic and equigranular tonalite
intrusive – Tonalite Igneous intrusions
(argillic alteration)
3.3.1. Thin section Mineralogy
3.3.1.1. Ngatamariki Thin Section mineralogy
The Andesite Breccia is an intensely altered pale green to dark green clast supported breccia.
Under the polarized light microscope we observed that the breccia contains clasts of greywacke,
granite, andesitic lava, rhyolite lava and siltstone. It has undergone propylitic alteration, as
shown by the main alteration assemblage of epidote, chlorite and quartz, with minor calcite,
pyrite, albite, adularia, and titanium oxide. The breccia contains small veins (<1-2 mm wide)
filled with calcite, epidote, and quartz (Fig. 3.4). The fractures in the Andesite Breccia samples
are predominately transgranular (affecting more than one mineral), however, some samples
contain intragranular fractures (within a mineral).
Chapter 3
44
Figure 3.4. Photomicrographs of Andesite Breccia thin sections. A (PPL) and B (CPL) =
Porphyritic andesite containing epidote (Epi), titanium oxide (TiO), quartz (Qtz), chlorite (Chl),
albite (Alb) and clay. The right hand image is a vug that has been infilled with first chlorite, then
epidote and finally quartz.
The Tahorakuri Formation contains strongly altered light greenish/greyish grey-white
ignimbrites, although one core is an intensely altered, light grey breccia with abundant clay. All
of the Tahorakuri Formation samples are predominately altered to clay and microcrystalline
quartz. However, one core only contains these two minerals along with quartz – pyrite veins. The
alteration products in the samples are quartz, calcite, chlorite, albite, adularia, wairakite, pyrite,
epidote, muscovite, and titanium oxide. The abundance of each of these minerals varies between
samples with the top three minerals typically being quartz, clay and a split between calcite and
epidote. The veins in the samples mainly contain quartz, pyrite and some rare smaller calcite or
illite veins (<0.2-0.3 mm wide) (Fig. 3.5). The Tahorakuri Formation has undergone argillic to
propylitic alteration, which is evident in the high percentages of illite and chlorite in the samples.
The fractures in the Tahorakuri Formation are transgranular.
Chapter 3
45
Figure 3.5. Photomicrographs of different samples from the Tahorakuri Formation. A = Crystal
lithic bearing volcaniclastic rock that has been altered by clay (illite), calcite, chlorite, titanium
oxide and quartz. B = Pumiceous lithic tuff that has been altered by secondary epidote, quartz,
clay, chlorite and albite. The groundmass of the sample contains microcrystalline quartz, clay
and chlorite. The fracture in the samples has been infilled by chlorite and the albite has altered
primary plagioclase. C= Intense clay-altered volcanic rock with pervasive clay and quartz
replacement (Mic Qtz, microcrystalline quartz). The sample has intense silicification, with
disseminated pyrite, quartz and clay. D= Clay altered ignimbrite with sections of wairakite
(Wai) and a pyrite (Py) crystal, which is overgrown by radial clinozoisite (Clin). The thin section
has illite alteration in the groundmass on the right and fine-grained quartz on the left.
The intrusive body at Ngatamariki is a moderately altered light and/or dark coloured porphyritic
and equigranular tonalite. In the polarized light microscope studies the light/white tonalite
contains primary plagioclase and quartz phenocrysts in a fine-grained matrix. The secondary
Chapter 3
46
mineralisation consists of common calcite, muscovite, minor albite and rare titanium oxide,
pyrite and quartz. The dark/grey tonalite has the same primary mineralogy and contains minor
secondary pyrite, albite, calcite, chlorite, muscovite, anhydrite and rare titanium oxide (Fig. 3.6).
The tonalite samples have experienced argillic alteration, as shown by the presence of illite
alteration in large abundance, with transgranular fractures throughout the samples.
Full descriptions of the samples from Ngatamariki are in Appendix B.1.
Figure 3.6. Photomicrographs of Tonalite (porphyritic and equigranular). A= Embayed quartz
with local calcite, muscovite and illite and pyrite (opaque). The black arrows are pointing out
prominent mymekitic textures. The red arrow is pointing out relict plagioclase altered by illite
and calcite. B= Tonalite altered by anhydrite (anh), calcite and pyrite. Primary quartz is seen in
the top right hand corner.
3.3.1.2. Rotokawa Thin Section Mineralogy
The Rotokawa Andesite is a moderately to intensely altered lava/breccia. The matrix and
primary minerals (pyroxene and plagioclase) have been altered predominately to calcite, chlorite,
quartz and minor to common epidote or hematite with minor to rare albite, adularia, titanium
oxide and pyrite (Fig. 3.7). Due to the depth of burial and resulting high temperatures, the
Rotokawa Andesite appears to have experienced intense propylitic alteration as shown by the
presence of illite, chlorite, albite and calcite. Additionally, due to brittle behaviour of the
Chapter 3
47
Rotokawa Andesites the fractures found in the thin sections are both intragranular and
transgranular. Full descriptions of the samples from Rotokawa are in Appendix B.2.
Figure 3.7. Photomicrographs of porphyritic andesite lava with phenocrysts of plagioclase (plag)
and pyroxene (pyr). A and B (CPL/PPL) = A vug in the centre of the thin section has been
infilled with chlorite. The plagioclase minerals have been replaced by secondary chlorite, calcite
and quartz. The pyroxene minerals have been replaced by calcite. The groundmass consists of
fine-grained quartz and illite. C = A CPL image of plagioclase minerals replaced by albite,
calcite and chlorite, with a majority of the samples being replaced by quartz, illite, calcite,
chlorite, titanium oxide and minor epidote. D = A PPL image of what looks like a illite vein (red
box) around the bottom end of a vug that has been infilled by quartz and chlorite.
Chapter 3
48
3.3.1.3. Kawerau Thin Section Mineralogy
The Matahina Ignimbrite is a moderately altered light brown to light greyish cream ignimbrite.
The primary minerals of plagioclase and quartz have been altered to abundant clay, secondary
quartz, titanium oxide, calcite, albite and pyrite, showing that the samples have undergone
smectite to argillic alteration. Glass shards are still evident in some of the welded ignimbrite
samples meaning that the samples are not fully altered, as glass is highly susceptible to alteration
(Fig. 3.8). Samples in the Matahina Ignimbrite appear to have intragranular fractures.
Figure 3.8. Photomicrographs of the Matahina Ignimbrite. All images show that the ignimbrites
groundmass is derived of clay (smectite), microcrystalline quartz and same of the samples (A)
have relict glass shards. The primary minerals, plagioclase and quartz and been replaced by
albite, calcite, clay and quartz.
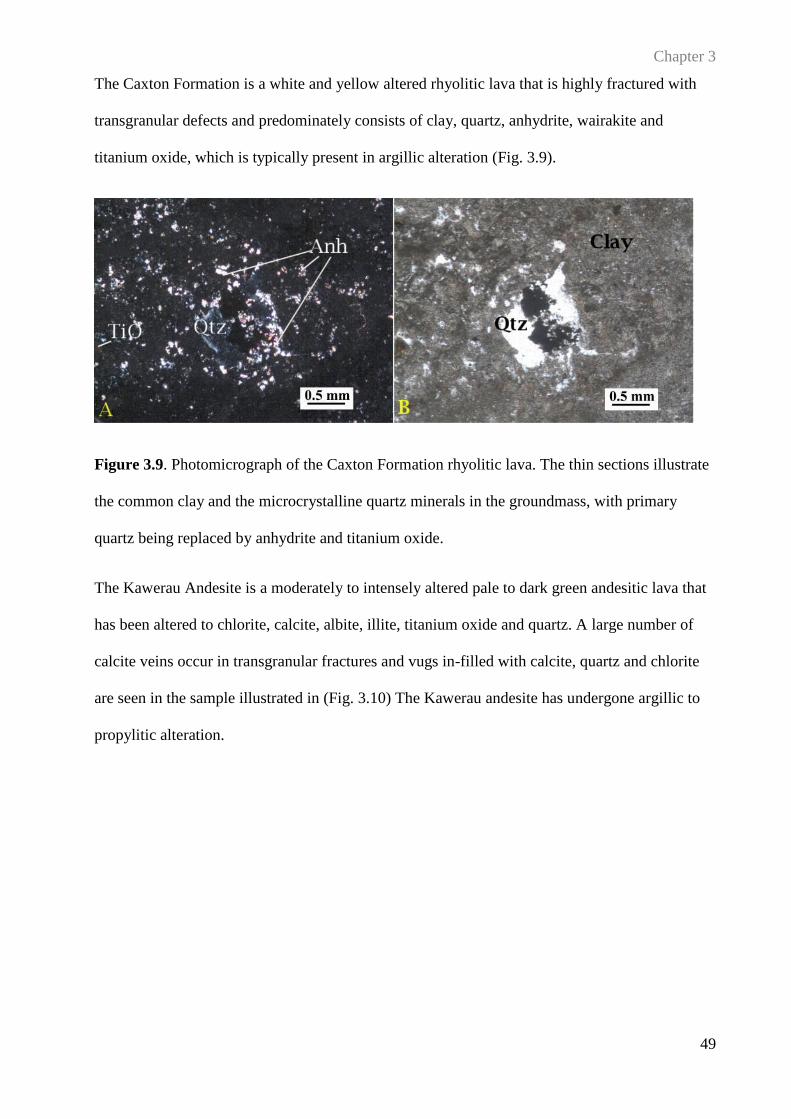
Chapter 3
49
The Caxton Formation is a white and yellow altered rhyolitic lava that is highly fractured with
transgranular defects and predominately consists of clay, quartz, anhydrite, wairakite and
titanium oxide, which is typically present in argillic alteration (Fig. 3.9).
Figure 3.9. Photomicrograph of the Caxton Formation rhyolitic lava. The thin sections illustrate
the common clay and the microcrystalline quartz minerals in the groundmass, with primary
quartz being replaced by anhydrite and titanium oxide.
The Kawerau Andesite is a moderately to intensely altered pale to dark green andesitic lava that
has been altered to chlorite, calcite, albite, illite, titanium oxide and quartz. A large number of
calcite veins occur in transgranular fractures and vugs in-filled with calcite, quartz and chlorite
are seen in the sample illustrated in (Fig. 3.10) The Kawerau andesite has undergone argillic to
propylitic alteration.
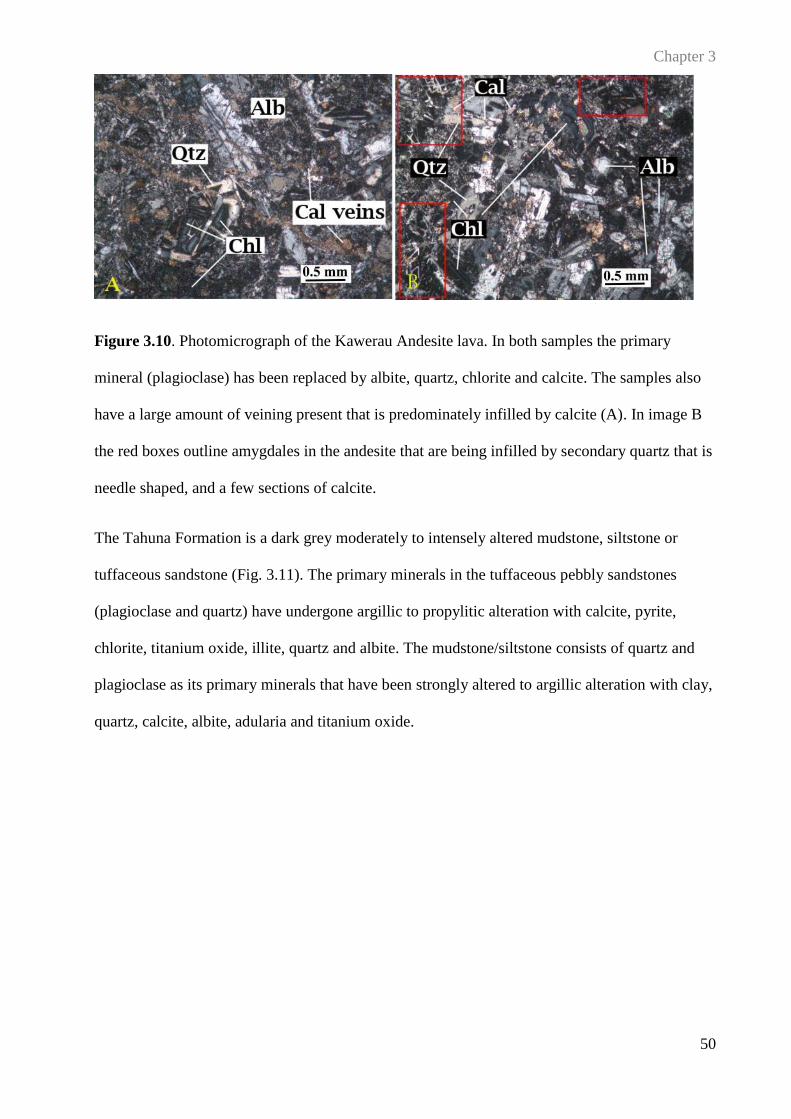
Chapter 3
50
Figure 3.10. Photomicrograph of the Kawerau Andesite lava. In both samples the primary
mineral (plagioclase) has been replaced by albite, quartz, chlorite and calcite. The samples also
have a large amount of veining present that is predominately infilled by calcite (A). In image B
the red boxes outline amygdales in the andesite that are being infilled by secondary quartz that is
needle shaped, and a few sections of calcite.
The Tahuna Formation is a dark grey moderately to intensely altered mudstone, siltstone or
tuffaceous sandstone (Fig. 3.11). The primary minerals in the tuffaceous pebbly sandstones
(plagioclase and quartz) have undergone argillic to propylitic alteration with calcite, pyrite,
chlorite, titanium oxide, illite, quartz and albite. The mudstone/siltstone consists of quartz and
plagioclase as its primary minerals that have been strongly altered to argillic alteration with clay,
quartz, calcite, albite, adularia and titanium oxide.
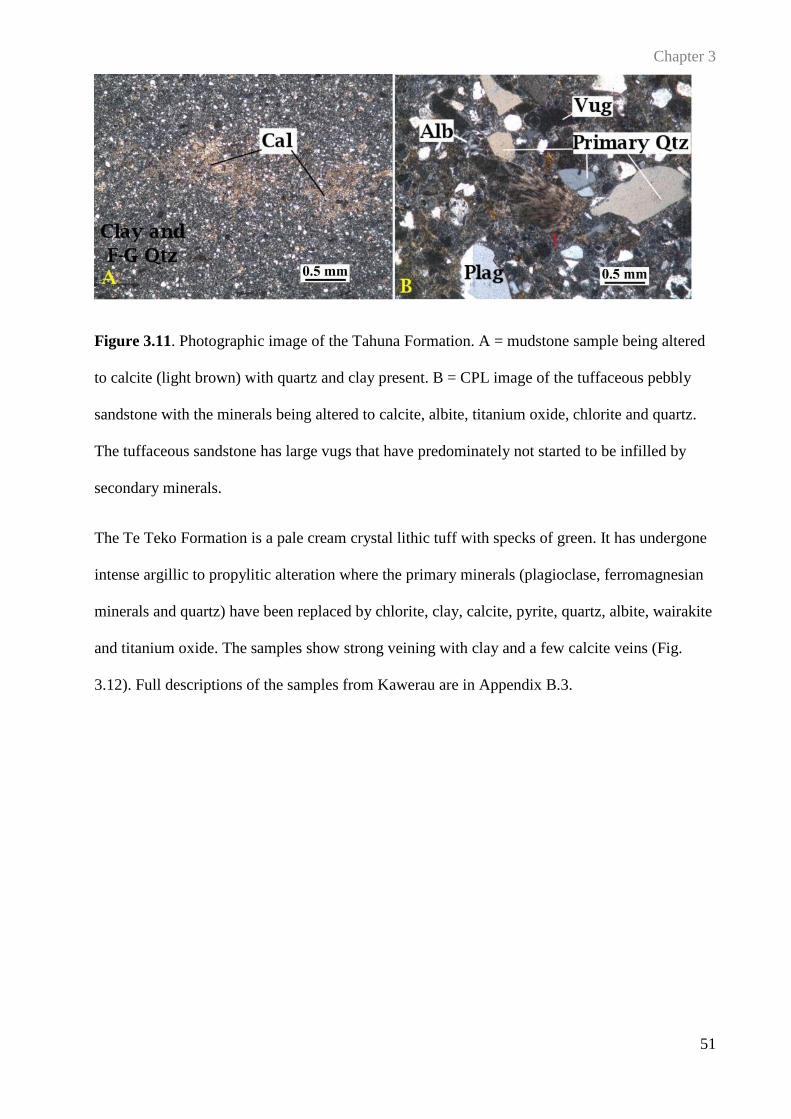
Chapter 3
51
Figure 3.11. Photographic image of the Tahuna Formation. A = mudstone sample being altered
to calcite (light brown) with quartz and clay present. B = CPL image of the tuffaceous pebbly
sandstone with the minerals being altered to calcite, albite, titanium oxide, chlorite and quartz.
The tuffaceous sandstone has large vugs that have predominately not started to be infilled by
secondary minerals.
The Te Teko Formation is a pale cream crystal lithic tuff with specks of green. It has undergone
intense argillic to propylitic alteration where the primary minerals (plagioclase, ferromagnesian
minerals and quartz) have been replaced by chlorite, clay, calcite, pyrite, quartz, albite, wairakite
and titanium oxide. The samples show strong veining with clay and a few calcite veins (Fig.
3.12). Full descriptions of the samples from Kawerau are in Appendix B.3.
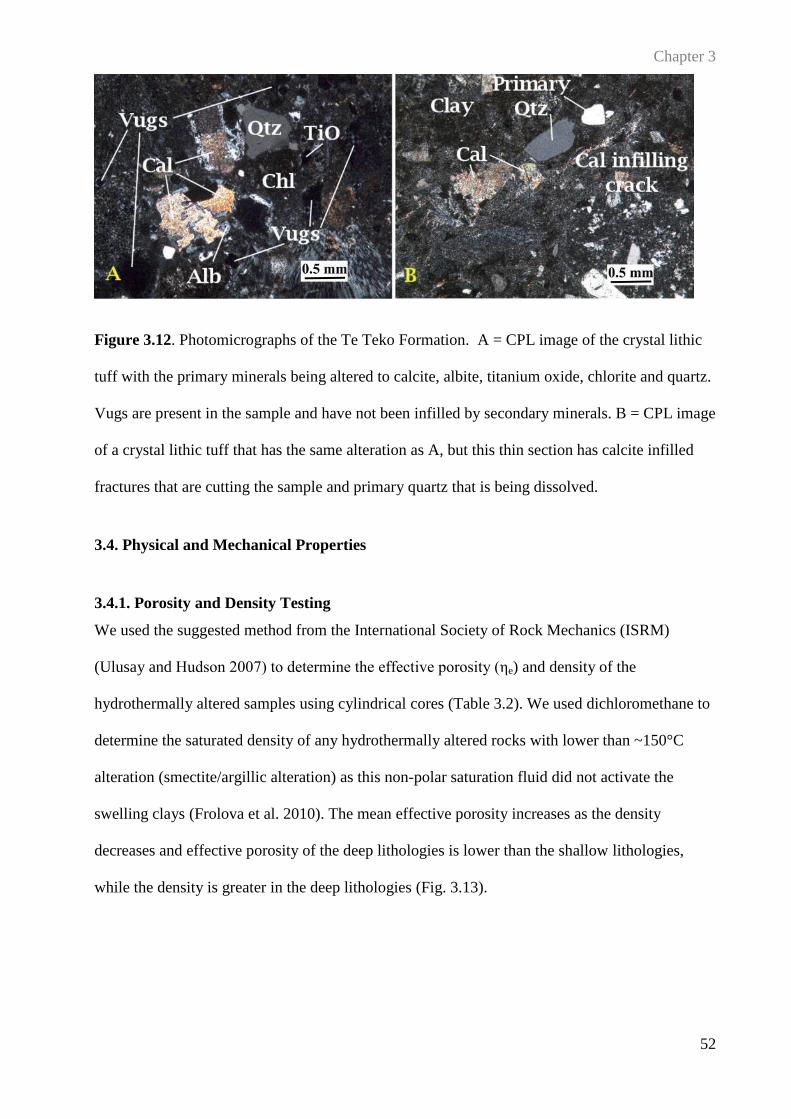
Chapter 3
52
Figure 3.12. Photomicrographs of the Te Teko Formation. A = CPL image of the crystal lithic
tuff with the primary minerals being altered to calcite, albite, titanium oxide, chlorite and quartz.
Vugs are present in the sample and have not been infilled by secondary minerals. B = CPL image
of a crystal lithic tuff that has the same alteration as A, but this thin section has calcite infilled
fractures that are cutting the sample and primary quartz that is being dissolved.
3.4. Physical and Mechanical Properties
3.4.1. Porosity and Density Testing
We used the suggested method from the International Society of Rock Mechanics (ISRM)
(Ulusay and Hudson 2007) to determine the effective porosity (ηe) and density of the
hydrothermally altered samples using cylindrical cores (Table 3.2). We used dichloromethane to
determine the saturated density of any hydrothermally altered rocks with lower than ~150°C
alteration (smectite/argillic alteration) as this non-polar saturation fluid did not activate the
swelling clays (Frolova et al. 2010). The mean effective porosity increases as the density
decreases and effective porosity of the deep lithologies is lower than the shallow lithologies,
while the density is greater in the deep lithologies (Fig. 3.13).
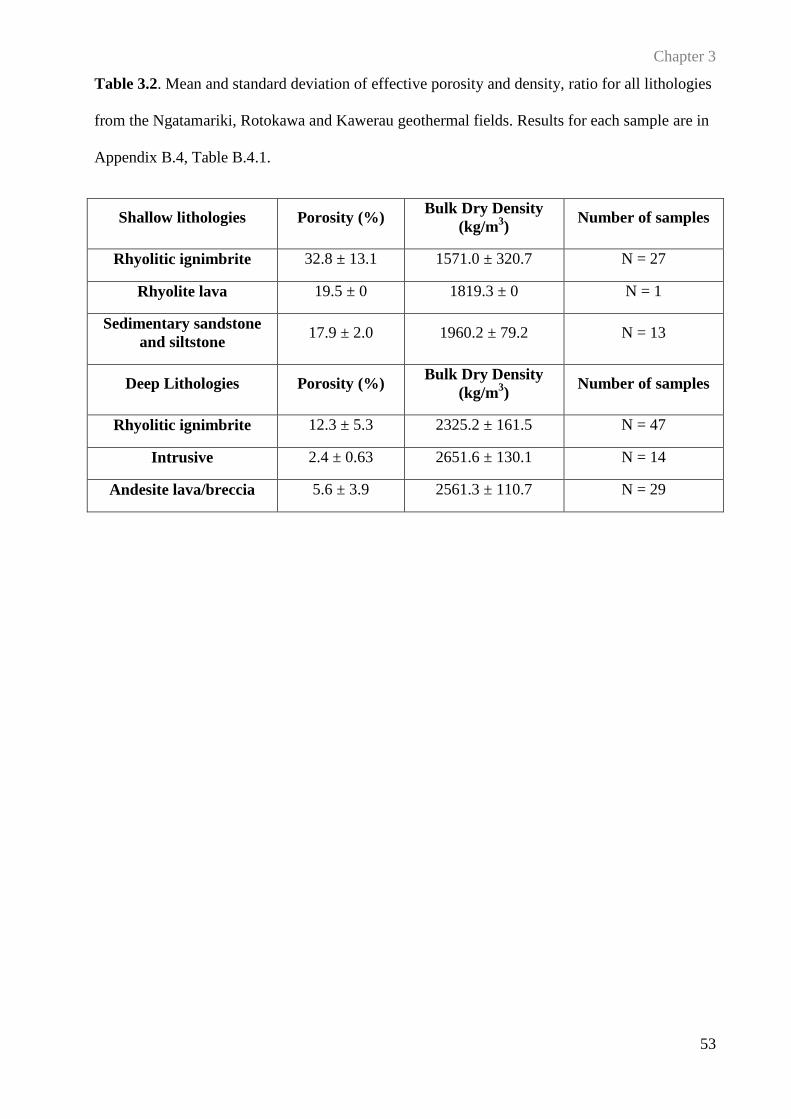
Chapter 3
53
Table 3.2. Mean and standard deviation of effective porosity and density, ratio for all lithologies
from the Ngatamariki, Rotokawa and Kawerau geothermal fields. Results for each sample are in
Appendix B.4, Table B.4.1.
Shallow lithologies Porosity (%) Bulk Dry Density
(kg/m3)
Number of samples
Rhyolitic ignimbrite 32.8 ± 13.1 1571.0 ± 320.7 N = 27
Rhyolite lava 19.5 ± 0 1819.3 ± 0 N = 1
Sedimentary sandstone
and siltstone 17.9 ± 2.0 1960.2 ± 79.2 N = 13
Deep Lithologies Porosity (%) Bulk Dry Density
(kg/m3)
Number of samples
Rhyolitic ignimbrite 12.3 ± 5.3 2325.2 ± 161.5 N = 47
Intrusive 2.4 ± 0.63 2651.6 ± 130.1 N = 14
Andesite lava/breccia 5.6 ± 3.9 2561.3 ± 110.7 N = 29
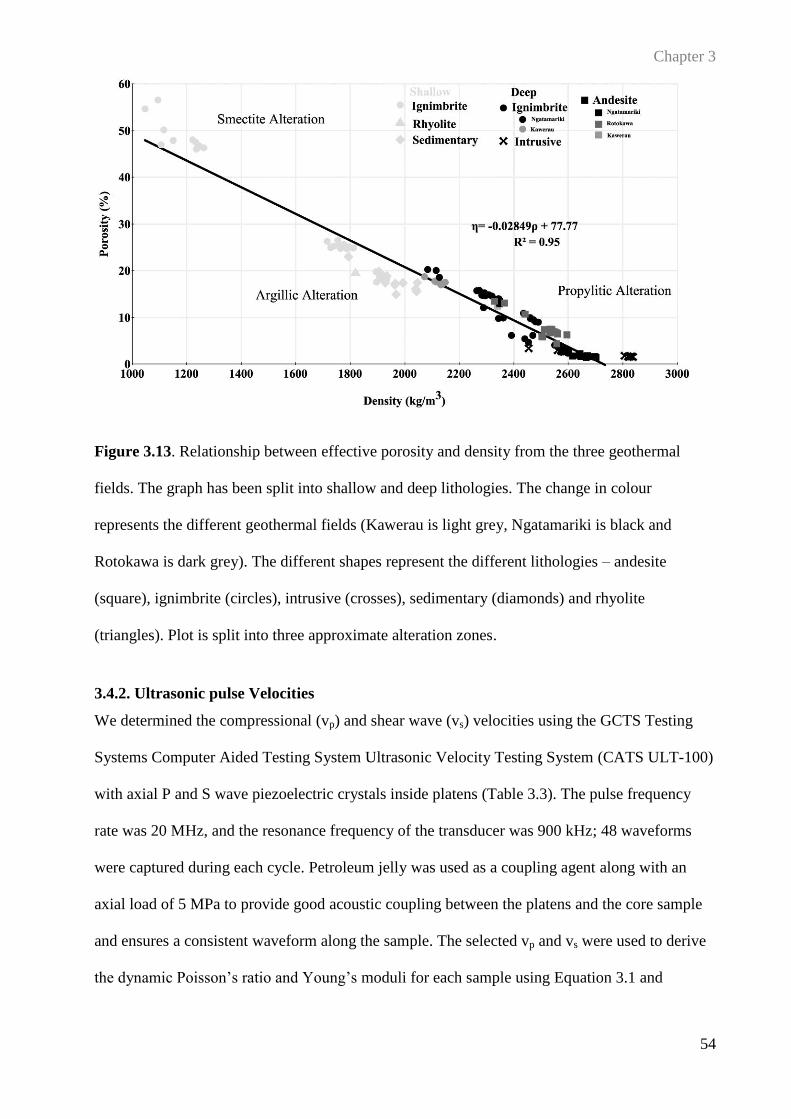
Chapter 3
54
Figure 3.13. Relationship between effective porosity and density from the three geothermal
fields. The graph has been split into shallow and deep lithologies. The change in colour
represents the different geothermal fields (Kawerau is light grey, Ngatamariki is black and
Rotokawa is dark grey). The different shapes represent the different lithologies – andesite
(square), ignimbrite (circles), intrusive (crosses), sedimentary (diamonds) and rhyolite
(triangles). Plot is split into three approximate alteration zones.
3.4.2. Ultrasonic pulse Velocities
We determined the compressional (vp) and shear wave (vs) velocities using the GCTS Testing
Systems Computer Aided Testing System Ultrasonic Velocity Testing System (CATS ULT-100)
with axial P and S wave piezoelectric crystals inside platens (Table 3.3). The pulse frequency
rate was 20 MHz, and the resonance frequency of the transducer was 900 kHz; 48 waveforms
were captured during each cycle. Petroleum jelly was used as a coupling agent along with an
axial load of 5 MPa to provide good acoustic coupling between the platens and the core sample
and ensures a consistent waveform along the sample. The selected vp and vs were used to derive
the dynamic Poisson’s ratio and Young’s moduli for each sample using Equation 3.1 and
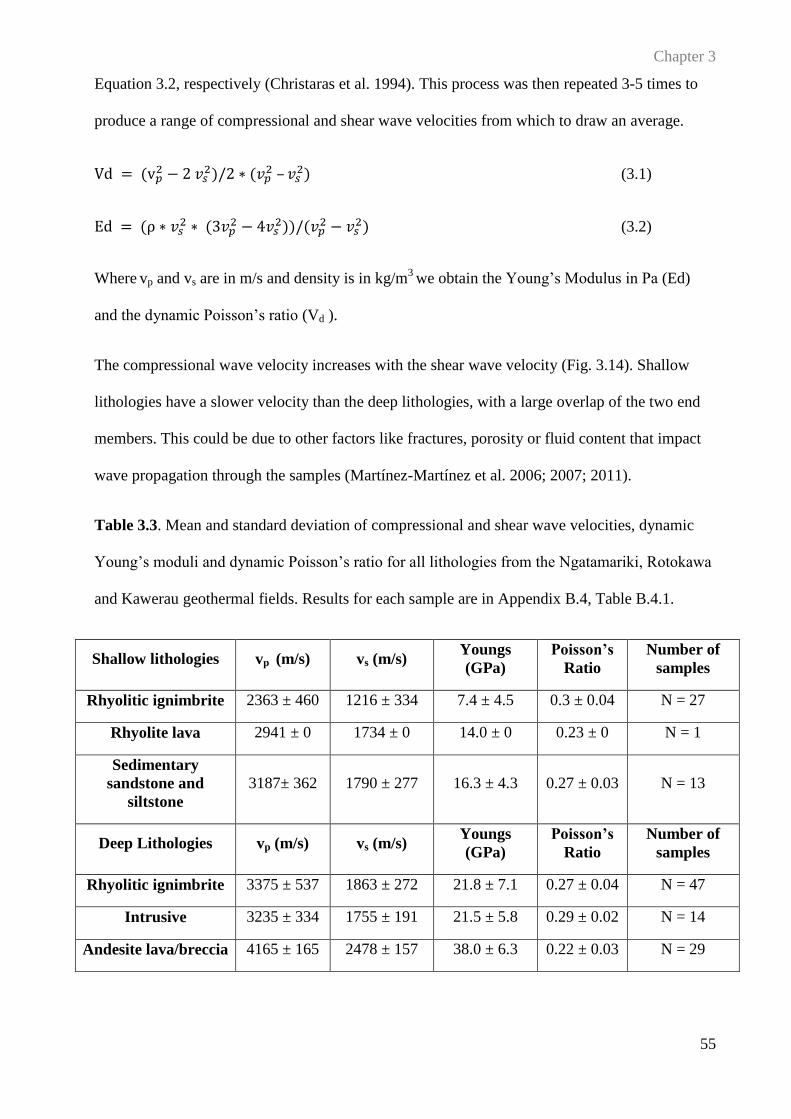
Chapter 3
55
Equation 3.2, respectively (Christaras et al. 1994). This process was then repeated 3-5 times to
produce a range of compressional and shear wave velocities from which to draw an average.
Vd = (v𝑝2 − 2 𝑣𝑠
2)/2 ∗ (𝑣𝑝2 – 𝑣𝑠
2) (3.1)
Ed = (ρ ∗ 𝑣𝑠2 ∗ (3𝑣𝑝
2 − 4𝑣𝑠2))/(𝑣𝑝
2 − 𝑣𝑠2) (3.2)
Where vp and vs are in m/s and density is in kg/m3 we obtain the Young’s Modulus in Pa (Ed)
and the dynamic Poisson’s ratio (Vd ).
The compressional wave velocity increases with the shear wave velocity (Fig. 3.14). Shallow
lithologies have a slower velocity than the deep lithologies, with a large overlap of the two end
members. This could be due to other factors like fractures, porosity or fluid content that impact
wave propagation through the samples (Martínez-Martínez et al. 2006; 2007; 2011).
Table 3.3. Mean and standard deviation of compressional and shear wave velocities, dynamic
Young’s moduli and dynamic Poisson’s ratio for all lithologies from the Ngatamariki, Rotokawa
and Kawerau geothermal fields. Results for each sample are in Appendix B.4, Table B.4.1.
Shallow lithologies vp (m/s) vs (m/s) Youngs
(GPa)
Poisson’s
Ratio
Number of
samples
Rhyolitic ignimbrite 2363 ± 460 1216 ± 334 7.4 ± 4.5 0.3 ± 0.04 N = 27
Rhyolite lava 2941 ± 0 1734 ± 0 14.0 ± 0 0.23 ± 0 N = 1
Sedimentary
sandstone and
siltstone
3187± 362 1790 ± 277 16.3 ± 4.3 0.27 ± 0.03 N = 13
Deep Lithologies vp (m/s) vs (m/s) Youngs
(GPa)
Poisson’s
Ratio
Number of
samples
Rhyolitic ignimbrite 3375 ± 537 1863 ± 272 21.8 ± 7.1 0.27 ± 0.04 N = 47
Intrusive 3235 ± 334 1755 ± 191 21.5 ± 5.8 0.29 ± 0.02 N = 14
Andesite lava/breccia 4165 ± 165 2478 ± 157 38.0 ± 6.3 0.22 ± 0.03 N = 29
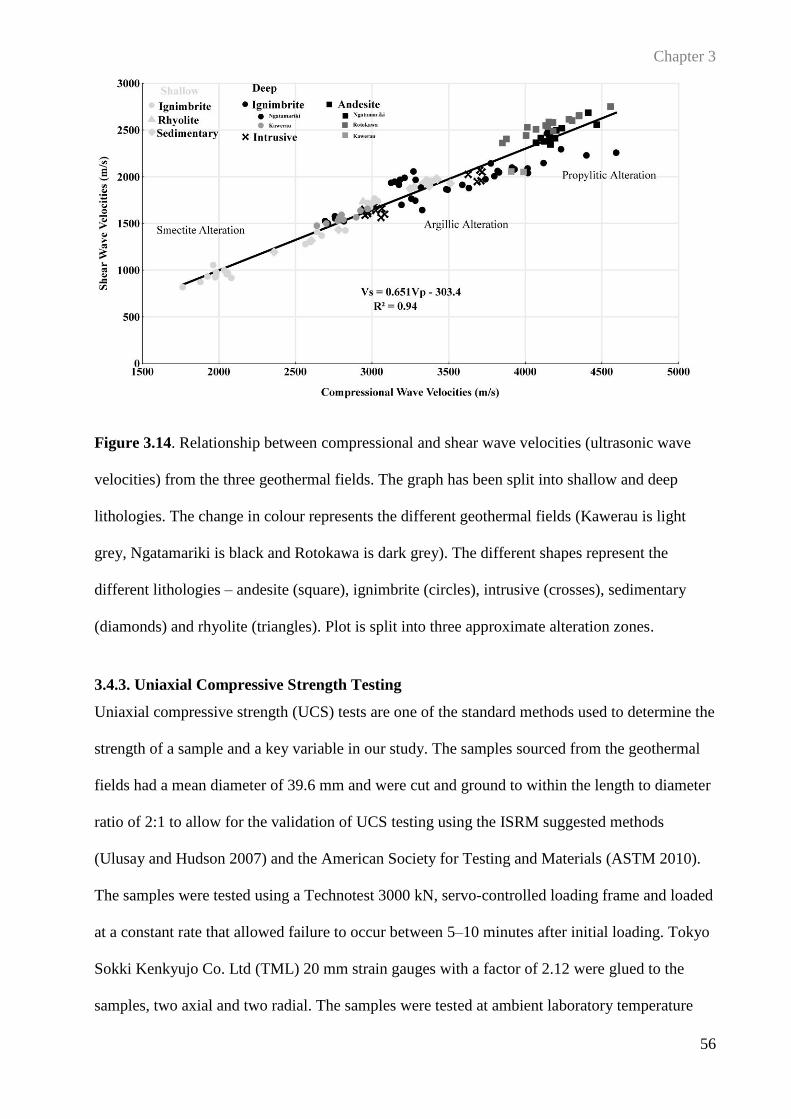
Chapter 3
56
Figure 3.14. Relationship between compressional and shear wave velocities (ultrasonic wave
velocities) from the three geothermal fields. The graph has been split into shallow and deep
lithologies. The change in colour represents the different geothermal fields (Kawerau is light
grey, Ngatamariki is black and Rotokawa is dark grey). The different shapes represent the
different lithologies – andesite (square), ignimbrite (circles), intrusive (crosses), sedimentary
(diamonds) and rhyolite (triangles). Plot is split into three approximate alteration zones.
3.4.3. Uniaxial Compressive Strength Testing
Uniaxial compressive strength (UCS) tests are one of the standard methods used to determine the
strength of a sample and a key variable in our study. The samples sourced from the geothermal
fields had a mean diameter of 39.6 mm and were cut and ground to within the length to diameter
ratio of 2:1 to allow for the validation of UCS testing using the ISRM suggested methods
(Ulusay and Hudson 2007) and the American Society for Testing and Materials (ASTM 2010).
The samples were tested using a Technotest 3000 kN, servo-controlled loading frame and loaded
at a constant rate that allowed failure to occur between 5–10 minutes after initial loading. Tokyo
Sokki Kenkyujo Co. Ltd (TML) 20 mm strain gauges with a factor of 2.12 were glued to the
samples, two axial and two radial. The samples were tested at ambient laboratory temperature
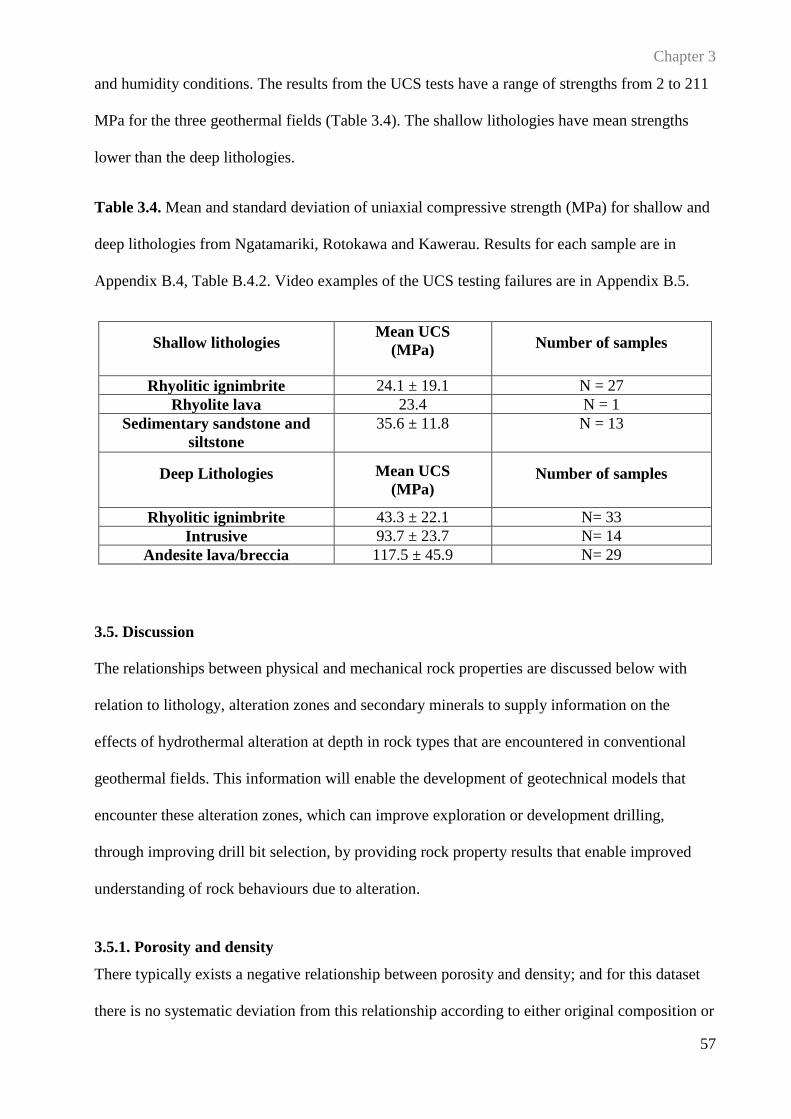
Chapter 3
57
and humidity conditions. The results from the UCS tests have a range of strengths from 2 to 211
MPa for the three geothermal fields (Table 3.4). The shallow lithologies have mean strengths
lower than the deep lithologies.
Table 3.4. Mean and standard deviation of uniaxial compressive strength (MPa) for shallow and
deep lithologies from Ngatamariki, Rotokawa and Kawerau. Results for each sample are in
Appendix B.4, Table B.4.2. Video examples of the UCS testing failures are in Appendix B.5.
Shallow lithologies Mean UCS
(MPa)
Number of samples
Rhyolitic ignimbrite 24.1 ± 19.1
N = 27
Rhyolite lava 23.4
N = 1
Sedimentary sandstone and
siltstone
35.6 ± 11.8
N = 13
Deep Lithologies Mean UCS
(MPa) Number of samples
Rhyolitic ignimbrite 43.3 ± 22.1 N= 33
Intrusive 93.7 ± 23.7 N= 14
Andesite lava/breccia 117.5 ± 45.9 N= 29
3.5. Discussion
The relationships between physical and mechanical rock properties are discussed below with
relation to lithology, alteration zones and secondary minerals to supply information on the
effects of hydrothermal alteration at depth in rock types that are encountered in conventional
geothermal fields. This information will enable the development of geotechnical models that
encounter these alteration zones, which can improve exploration or development drilling,
through improving drill bit selection, by providing rock property results that enable improved
understanding of rock behaviours due to alteration.
3.5.1. Porosity and density
There typically exists a negative relationship between porosity and density; and for this dataset
there is no systematic deviation from this relationship according to either original composition or
Chapter 3
58
alteration type (Fig. 3.13). Frolova et al. (2010) found that lithologies exposed to high
temperature systems have higher density (>2.3 g/cm3), and lower porosity (<15%) than the low
temperature systems (density <1.2 g/cm3, and porosity >20%). These results agree with our
study where the deep lithologies exposed to high temperatures have a higher density and lower
porosity (mean 2.5 g/cm3 and 7%, respectively) than shallow lithologies exposed to low
temperature (mean 1.8 g/cm3 and 24%, respectively). Volcanic rocks typically have a wide range
of primary matrix porosity, due to the wide variety of depositional processes, producing
variations in the original rock textures, grain size distribution, and this initial porosity can be
enhanced or reduced by alteration (Ferry 1979; Giggenbach, 1984; Moon 1993; Rejeki et al.
2005; Frolova et al. 2010; Esmaeily et al. 2012; Pola et al. 2012; Pola et al. 2014;). Our porosity
and density results vary widely within the shallow ignimbrites, even though they all originate
from one field and unit (Fig. 3.13). This variability could be due to some of the samples sourced
from the welded section of ignimbrite and others sourced from the semi-welded sections of the
same ignimbrite, indicating that the depositional processes have caused a natural variation in the
effective porosity and have also caused the large standard deviation in the dataset (Moon, 1993).
Variability in the porosity and density could also be caused by mass transfer. Hydrothermal
alteration at high temperatures (>200°C) can typically cause a decrease in porosity, and an
increase in density (Frolova et al. 2010), through minerals being deposited and infilling the
intercrystal and intergranular micropore space, causing consolidation and hardening of the
lithology (Nasimov et al. 2005; Frolova et al. 2010); which could be the case for the deep
ignimbrites and explains the small standard deviation. Hydrothermal alteration at low
temperatures (<150°C) is complex and diverse as it can cause an increase or decrease in the
porosity or density depending on the initial primary lithology, pressure, and fluid interaction
(Frolova et al. 2010). These results would produce a wider range of data and a high standard
deviation, as seen with the shallow ignimbrites. The deep ignimbrites have a lower porosity and
higher density than the shallow ignimbrites. The depositional history of both the shallow and
Chapter 3
59
deep ignimbrites would have been similar; producing welded and unwelded material with a
wide, but comparable, range of porosities and densities (Moon 1993) but as the ignimbrites
became buried and exposed to hydrothermal alteration they started to be altered, causing their
properties to become less comparable. This shows that although the lithologies started out
similar, differing alteration histories and burial depth impacted the resulting porosity and density
(Table 3.2 and Fig. 3.13).
The porosity and density plot (Fig. 3.13) has been subdivided into smectite, argillic and
propylitic alteration based on mineralogy. In a given geothermal system, minerals may be
approximately correlated to specific depth ranges due to the temperatures at depth. Frolova et al.
(2010) found that deep, high temperature fluids (>200°C) will typically cause a decrease in
porosity and permeability, and an increase in strength, density and ultrasonic wave velocities.
We see that lithologies containing smectite or argillic alteration tend to have a higher porosity
and lower density than lithologies that have propylitic alteration, which matches results from
Frovola et al. (2010). Rejeki et al. (2005) also showed that alteration mineral assemblage and
clay type play a significant role in enhancing or reducing primary porosity; such that the samples
that contain argillic alteration should have a lower porosity and higher density than smectite
samples. The andesite samples from the three geothermal fields experienced moderate to high
temperature alteration, leading to argillic to propylitic alteration being present, with the samples
from Kawerau having more argillic alteration present, while those from Ngatamariki and
Rotokawa have propylitic alteration. Andesites are likely to have had a wide range of primary
porosities depending on clast arrangement and depositional history (Dobson et al. 2003);
however, in our data, the samples with an overall high temperature alteration (Ngatamariki and
Rotokawa andesites) have similar porosities and densities, while the Kawerau andesites have
porosities around 60% higher and densities around 10% lower. This indicates that the alteration
and burial depth matched the trends seen in Nasimov et al. (2005) and Frolova et al. (2010),
Chapter 3
60
where the porosities of the samples increased and the densities decreased from high temperature
alteration to low temperature alteration.
Compaction by grain rotation/crushing (which can occur during faulting) and infilling of large
primary voids by early alteration minerals both work to reduce porosities. When looking at the
Rotokawa Andesite data in Figure 3.15 there may be a trend occurring with a small porosity
change with depth, as in Stimac et al. (2004). However, it is important to note that typically the
deep lithologies in our dataset have low primary porosities when deposited, compared to the
shallow lithologies. A clear compaction/diagenesis trend cannot be applied across lithologies,
and trends should only be assigned to individual lithologies. Therefore, no correlations were
drawn for similar lithologies over different burial depths this is research.
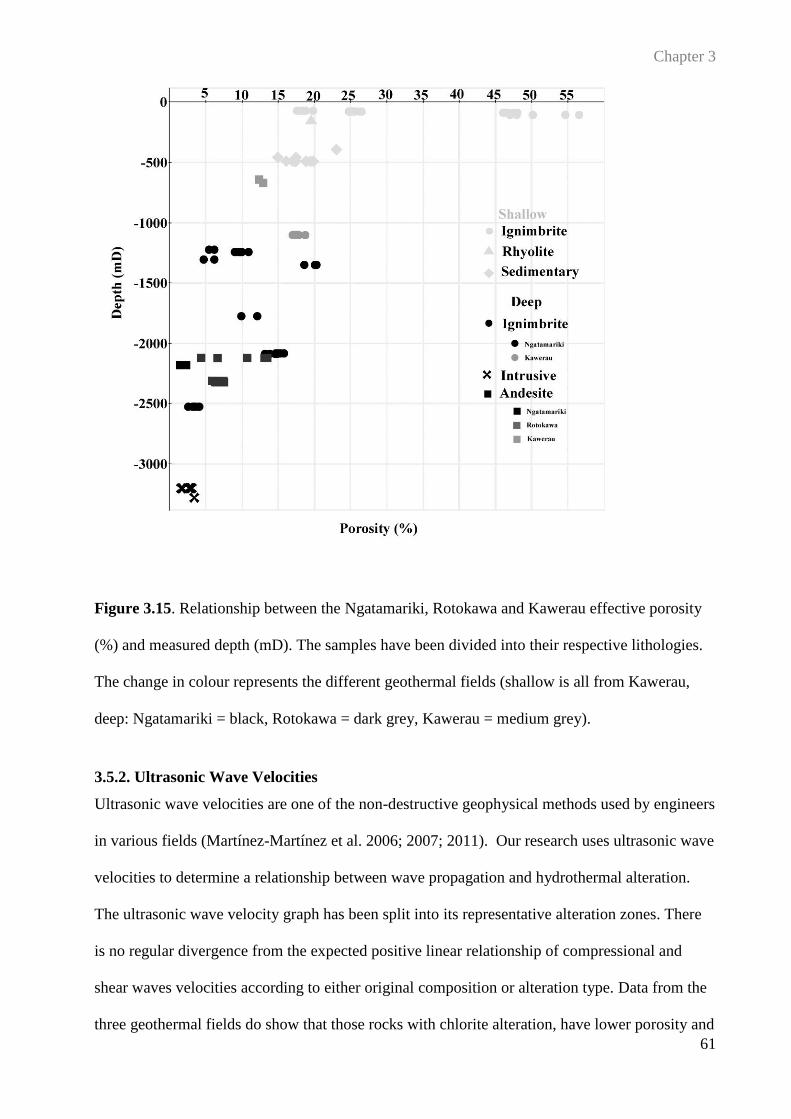
Chapter 3
61
Figure 3.15. Relationship between the Ngatamariki, Rotokawa and Kawerau effective porosity
(%) and measured depth (mD). The samples have been divided into their respective lithologies.
The change in colour represents the different geothermal fields (shallow is all from Kawerau,
deep: Ngatamariki = black, Rotokawa = dark grey, Kawerau = medium grey).
3.5.2. Ultrasonic Wave Velocities
Ultrasonic wave velocities are one of the non-destructive geophysical methods used by engineers
in various fields (Martínez-Martínez et al. 2006; 2007; 2011). Our research uses ultrasonic wave
velocities to determine a relationship between wave propagation and hydrothermal alteration.
The ultrasonic wave velocity graph has been split into its representative alteration zones. There
is no regular divergence from the expected positive linear relationship of compressional and
shear waves velocities according to either original composition or alteration type. Data from the
three geothermal fields do show that those rocks with chlorite alteration, have lower porosity and
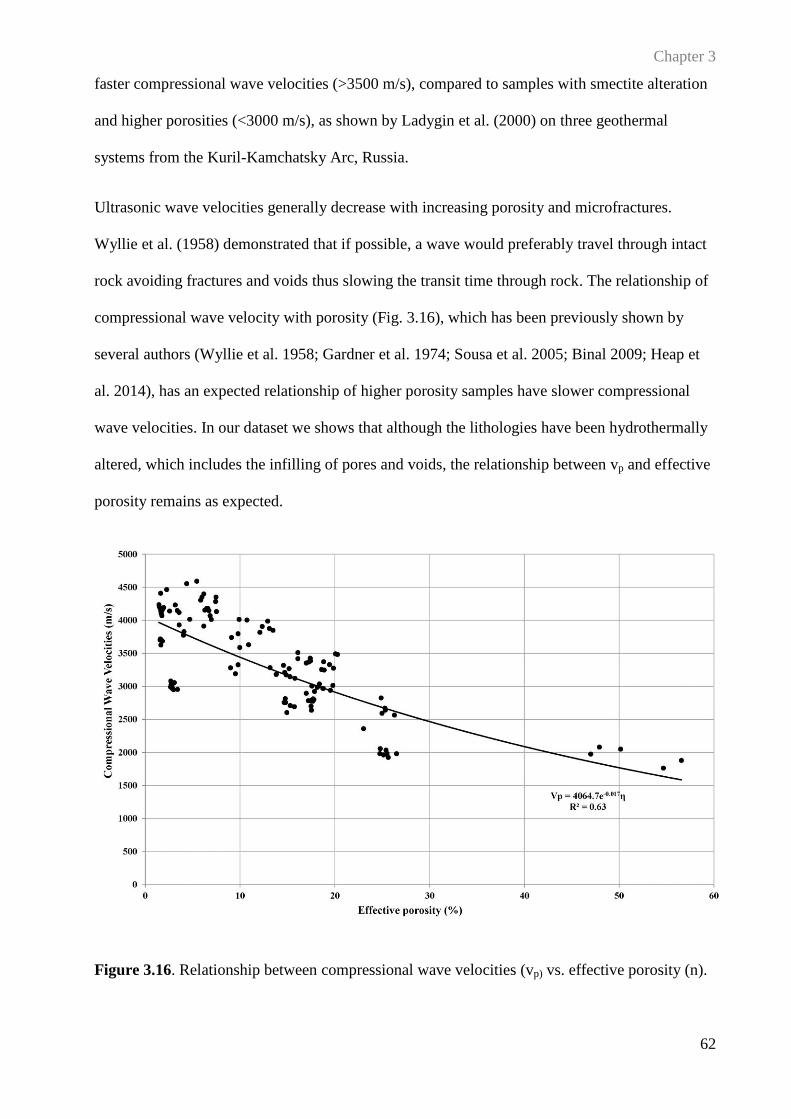
Chapter 3
62
faster compressional wave velocities (>3500 m/s), compared to samples with smectite alteration
and higher porosities (<3000 m/s), as shown by Ladygin et al. (2000) on three geothermal
systems from the Kuril-Kamchatsky Arc, Russia.
Ultrasonic wave velocities generally decrease with increasing porosity and microfractures.
Wyllie et al. (1958) demonstrated that if possible, a wave would preferably travel through intact
rock avoiding fractures and voids thus slowing the transit time through rock. The relationship of
compressional wave velocity with porosity (Fig. 3.16), which has been previously shown by
several authors (Wyllie et al. 1958; Gardner et al. 1974; Sousa et al. 2005; Binal 2009; Heap et
al. 2014), has an expected relationship of higher porosity samples have slower compressional
wave velocities. In our dataset we shows that although the lithologies have been hydrothermally
altered, which includes the infilling of pores and voids, the relationship between vp and effective
porosity remains as expected.
Figure 3.16. Relationship between compressional wave velocities (vp) vs. effective porosity (n).
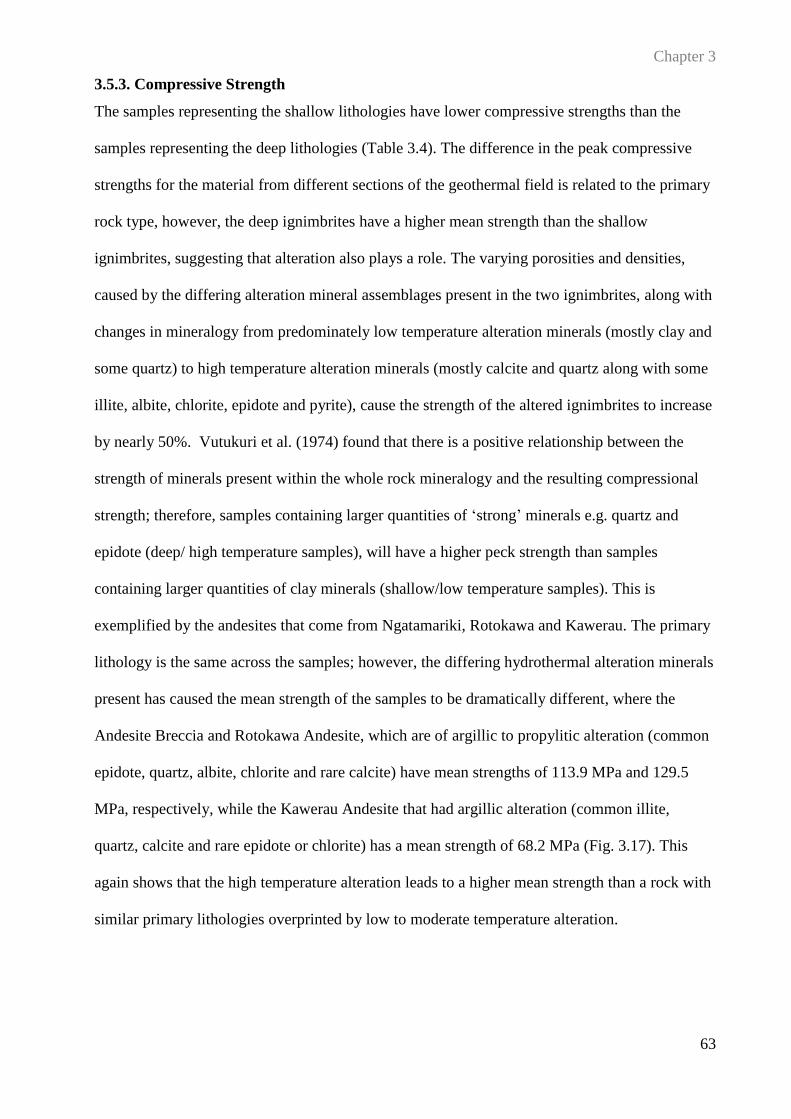
Chapter 3
63
3.5.3. Compressive Strength
The samples representing the shallow lithologies have lower compressive strengths than the
samples representing the deep lithologies (Table 3.4). The difference in the peak compressive
strengths for the material from different sections of the geothermal field is related to the primary
rock type, however, the deep ignimbrites have a higher mean strength than the shallow
ignimbrites, suggesting that alteration also plays a role. The varying porosities and densities,
caused by the differing alteration mineral assemblages present in the two ignimbrites, along with
changes in mineralogy from predominately low temperature alteration minerals (mostly clay and
some quartz) to high temperature alteration minerals (mostly calcite and quartz along with some
illite, albite, chlorite, epidote and pyrite), cause the strength of the altered ignimbrites to increase
by nearly 50%. Vutukuri et al. (1974) found that there is a positive relationship between the
strength of minerals present within the whole rock mineralogy and the resulting compressional
strength; therefore, samples containing larger quantities of ‘strong’ minerals e.g. quartz and
epidote (deep/ high temperature samples), will have a higher peck strength than samples
containing larger quantities of clay minerals (shallow/low temperature samples). This is
exemplified by the andesites that come from Ngatamariki, Rotokawa and Kawerau. The primary
lithology is the same across the samples; however, the differing hydrothermal alteration minerals
present has caused the mean strength of the samples to be dramatically different, where the
Andesite Breccia and Rotokawa Andesite, which are of argillic to propylitic alteration (common
epidote, quartz, albite, chlorite and rare calcite) have mean strengths of 113.9 MPa and 129.5
MPa, respectively, while the Kawerau Andesite that had argillic alteration (common illite,
quartz, calcite and rare epidote or chlorite) has a mean strength of 68.2 MPa (Fig. 3.17). This
again shows that the high temperature alteration leads to a higher mean strength than a rock with
similar primary lithologies overprinted by low to moderate temperature alteration.
Chapter 3
64
Figure 3.17. Box plot of uniaxial compressive strength of the shallow and deep lithologies. The
Andesite represents the Ngatamariki and Rotokawa andesite and the Kawerau label is the
Kawerau andesite. The top whisker = Max, bottom whisker = min, upper box = upper quartile,
middle line = median, lower box = lower quartile.
In our study samples with low porosity (andesite and intrusive samples) tended to fail along a
fracture or fractures that coalesced from pre-existing fractures or failed explosively as fractures
nucleated and propagated from inclusions, microcracks (intragranular or intergranular) and other
defects during compression. The samples that have high porosity tended to fail from compaction
of the pore space leading the sample to crumble, instead of failing along a failure surface. In
strong, indurated, low porosity rocks, compressive failure is preceded by the growth of cracks
from the border of existing inclusions, microcracks and other defects. These cracks coalesce into
growing cracks finally extending to the sample edges after which failure occurs (Romana and
Vásárhelyi 2007). In a sample that has pre-existing macrofractures the resulting compressive
strength tends to be lower than an unfractured sample as the fracture tends to propagate or slide
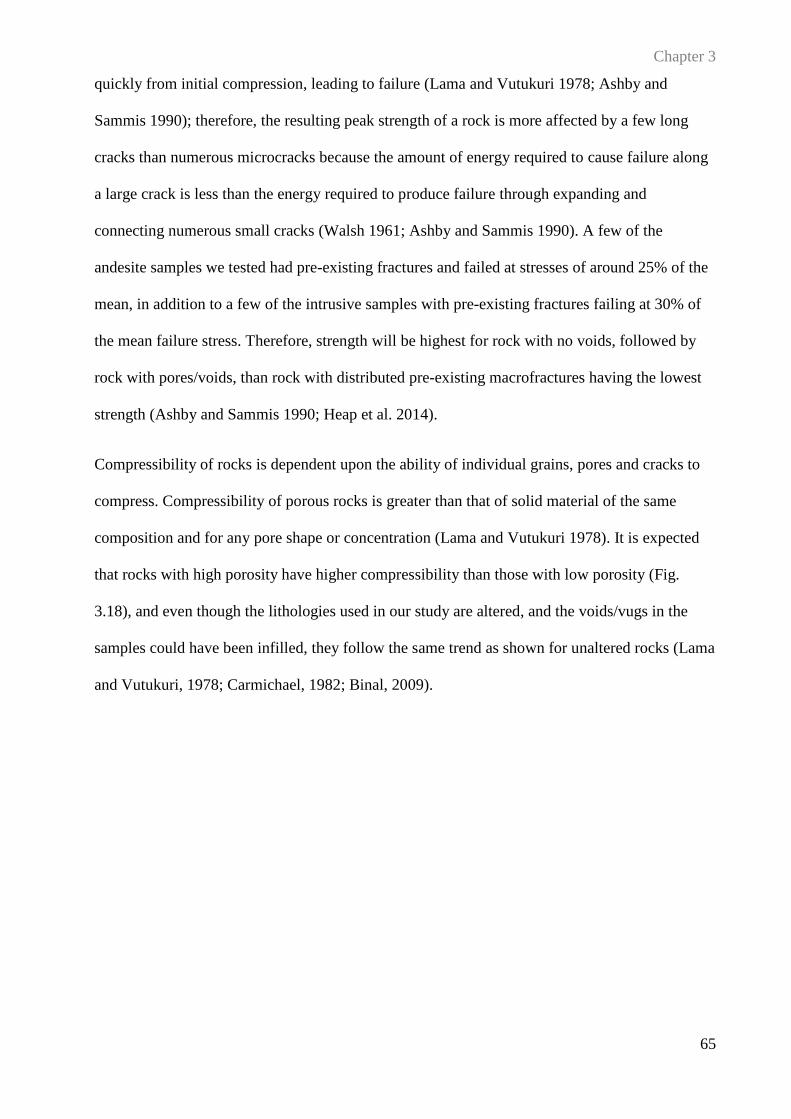
Chapter 3
65
quickly from initial compression, leading to failure (Lama and Vutukuri 1978; Ashby and
Sammis 1990); therefore, the resulting peak strength of a rock is more affected by a few long
cracks than numerous microcracks because the amount of energy required to cause failure along
a large crack is less than the energy required to produce failure through expanding and
connecting numerous small cracks (Walsh 1961; Ashby and Sammis 1990). A few of the
andesite samples we tested had pre-existing fractures and failed at stresses of around 25% of the
mean, in addition to a few of the intrusive samples with pre-existing fractures failing at 30% of
the mean failure stress. Therefore, strength will be highest for rock with no voids, followed by
rock with pores/voids, than rock with distributed pre-existing macrofractures having the lowest
strength (Ashby and Sammis 1990; Heap et al. 2014).
Compressibility of rocks is dependent upon the ability of individual grains, pores and cracks to
compress. Compressibility of porous rocks is greater than that of solid material of the same
composition and for any pore shape or concentration (Lama and Vutukuri 1978). It is expected
that rocks with high porosity have higher compressibility than those with low porosity (Fig.
3.18), and even though the lithologies used in our study are altered, and the voids/vugs in the
samples could have been infilled, they follow the same trend as shown for unaltered rocks (Lama
and Vutukuri, 1978; Carmichael, 1982; Binal, 2009).
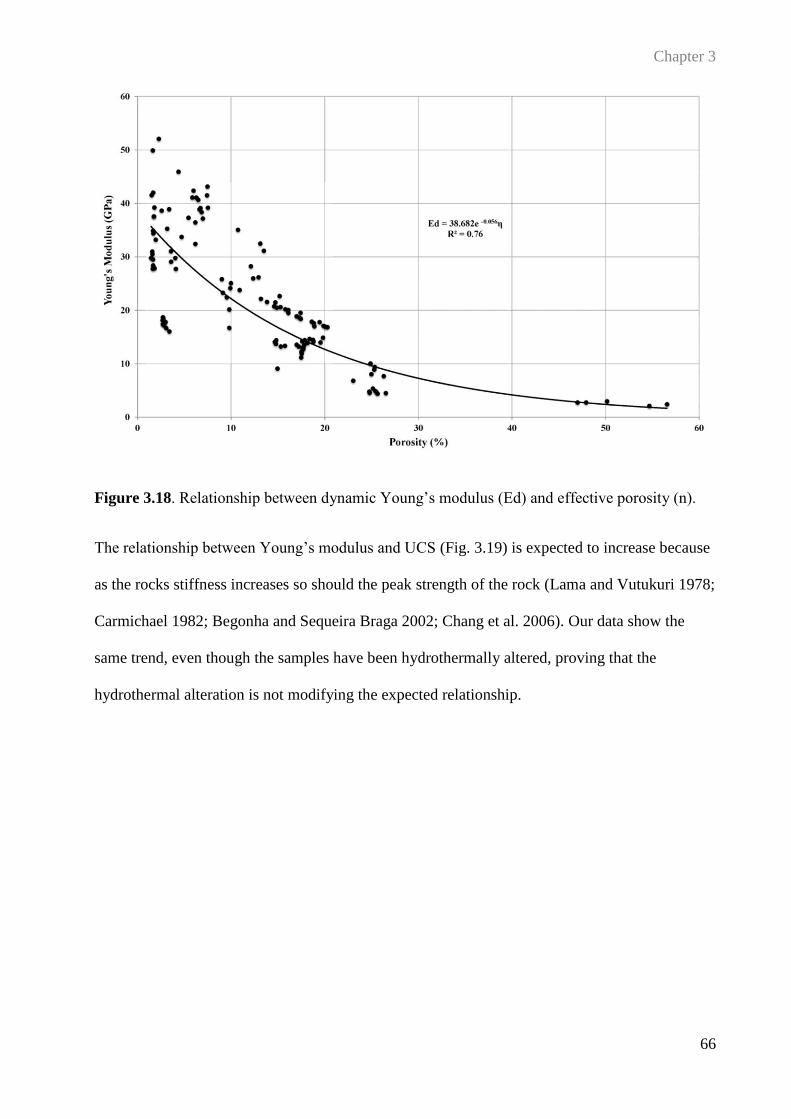
Chapter 3
66
Figure 3.18. Relationship between dynamic Young’s modulus (Ed) and effective porosity (n).
The relationship between Young’s modulus and UCS (Fig. 3.19) is expected to increase because
as the rocks stiffness increases so should the peak strength of the rock (Lama and Vutukuri 1978;
Carmichael 1982; Begonha and Sequeira Braga 2002; Chang et al. 2006). Our data show the
same trend, even though the samples have been hydrothermally altered, proving that the
hydrothermal alteration is not modifying the expected relationship.
Chapter 3
67
Figure 3.19. Relationship between dynamic Young’s modulus (Ed) and UCS.
3.6. Conclusions
We tested samples of a variety of lithologies that are typical in New Zealand geothermal fields
from the Ngatamariki, Rotokawa and Kawerau geothermal fields for physical and mechanical
rock properties. Summary of our key findings are as follows:
1. Through thin section analysis we identified a wide variety of minerals that occur across
the smectite, argillic and propylitic alteration zones. The shallow lithologies: ignimbrite,
rhyolite, and sedimentary samples in our study contain low temperature (smectite to
argillic alteration) alteration minerals like smectite/illite, calcite, and quartz. The deep
lithologies: ignimbrite, andesite and intrusive material contain higher temperature
(argillic to propylitic alteration) alteration minerals like epidote, chlorite, albite, pyrite
and quartz. This shows that the samples obtained cover the range of typical alteration
found in a conventional liquid/gas geothermal field.
Chapter 3
68
2. The type of alteration impacts the porosity and density of the rocks in this dataset. The
shallow lithologies in the low to moderate temperature section of the field have a higher
porosity (23.5%) and lower density (1783 kg/m3) than lithologies from deep higher
temperature sections of the field (6.8% and 2512 kg/m3, respectively), which is evident in
the two ignimbrites. Changes in primary mineralogy, due to alteration, leads to
distinctive porosities and densities depending on the alteration mineral assemblage. No
deviation from the systematic trend was observed in this dataset.
3. There exists a relationship between porosity and burial depth in these rocks. However,
the effect of burial itself cannot be isolated in these rocks because the alteration type and
primary lithologies also have a major influence on porosity; therefore, no correlations
were drawn from samples that had a similar lithology but varying burial depths; for
example, we did not compare the shallow ignimbrites from Kawerau with the deep
ignimbrites from Ngatamariki. The shallow lithologies in these geothermal systems are
typically ignimbrites and sedimentary material, which naturally have higher porosities,
while the deep lithologies are typically extrusive or intrusive volcanic rock, which
naturally have lower porosities.
4. Hydrothermal alteration through secondary mineralisation impacts ultrasonic wave
propagation by changing the mineralogy of the rock. Rocks with chlorite alteration have
lower porosity and faster compressional wave propagation (3500 – 5000 m/s), compared
to rocks with smectite alteration (1700 - 3000 m/s). Rock type, texture, density, porosity,
water content, temperature, pore structure, pore frequency and fracturing will also affect
the velocity of the ultrasonic waves.
5. Hydrothermal alteration through the development of secondary minerals and changes in
physical properties leads to differing mechanical behaviour. The samples in our study
from the shallow, low temperature regions of the geothermal fields have lower UCS
(27.7 ± 10.3 MPa) compared to samples from deep, high temperature regions (84.8 ±
Chapter 3
69
30.6 MPa). However, the relationships between Young’s modulus, porosity, and UCS
show the expected inverse trend that fresh and unaltered samples follow.
6. With respect to conclusions 2, 4 and 5, it is clear that hydrothermal alteration does not
cause a significant deviation from the relationships that would be expected between
physical and mechanical properties. This was previously an unconfirmed hypothesis in a
geothermal field with relation to drilling.
7. The research presented in this paper and on-going research provides a framework to
make informed estimates of the key physical and mechanical parameters that are used for
bit selection where samples have not yet been physically extracted and tested, through
development of a geotechnical model of the geothermal field.
Chapter 4
CHAPTER 4:
THE DEVELOPMENT OF THE ALTERATION STRENGTH INDEX
Latasha D. Wyering, Marlene C. Villeneuve, Irene C. Wallis, Paul A. Siratovich, Ben M.
Kennedy, Darren M. Gravley
Submitted Engineering Geology
Chapter 4
71
4.1. Introduction
Tools that predict rock properties are critical for reservoir development, management and
prospect evaluation during exploration because there is usually limited or no borehole-based
rock property data (Gunsallus & Kulhawy 1984; Edlmann et al. 1998; Ameen et al. 2009).
Relationships between strength and porosity, density or mineralogy for a specific rock formation
have been widely developed based on laboratory tests with rock core from a given field or
lithology (Chang et al. 2006; Tamrakar et al. 2007; Rigopoulos et al. 2010; Singh et al. 2012;
Karakul & Ulusay 2013). These relationships, however, were developed using mainly
sedimentary, granitic and metamorphic rock samples and cannot be applied ubiquitously to all
lithologies, especially hydrothermally altered volcanic rocks. Only recently have studies
investigated the physical and mechanical properties of volcanic rocks (Vinciguerra et al. 2005;
Smith et al. 2009; Nara et al. 2011; Pola et al. 2012; Heap et al. 2014; Pola et al. 2014; Wyering
et al. 2014) with reference to how different rock properties impact the strength of the material.
Recovering core to test is expensive and, owing to the fractures in the rocks, recovery can be
poor leading to only a limited number of samples tested in a given field. Therefore, many
researchers and industry practitioners commonly apply empirical strength relations to borehole
geophysics data or limited laboratory data (Edlmann et al. 1998; Koncagül & Santi 1999; Dinçer
et al. 2004; Entwisle et al. 2005; Çobanoğlu & Çelik 2008; Binal 2009). Chang et al. (2006)
reviewed thirty-two empirical relationships for sedimentary rocks where physical rock properties
were derived from borehole geophysics. Their review made clear that a few of the empirical
relationships appeared to work fairly well for some subsets of the rocks studied. We previously
assessed the applicability of selected equations that were developed for predicting uniaxial
compressive strength (UCS) to our researches lithologies and found that the correlations between
predicted UCS and measured UCS did a poor job fitting the data used (Wyering et al. 2012). The
downfall of these empirical relationships is that they are only applicable to the particular
lithologies being studied, and do not necessarily correlate for all rock types, especially silicic
Chapter 4
72
volcanic rocks affected by secondary mineralisation. Whilst the equations presented in Chang et
al. (2006) may be useful to a practitioner in the geothermal industry as a first order
approximation, they are focused on sedimentary rocks with no high-temperature secondary
mineralisation and therefore have limited utility (Yagiz 2009).
Research has shown that several rock properties (mineral hardness, secondary minerals,
microstructural damage that includes the presence of microfractures and pores) can influence the
predicted rock strength of material (Tuğrul & Zarif 1999; Ameen et al. 2009; Rigopoulos et al.
2010; Coggan et al. 2013; Heap et al. 2014). Several petrographic and weathering indices related
to chemical, petrological and mechanical properties, have been suggested to identify the impact
of alteration on rock properties in different lithologies (Ulusay et al. 1994; Tamrakar et al. 2007;
Ceryan et al. 2008; Yildiz et al. 2010).
This paper describes the development of an empirical relationship that can be used to associate
hydrothermal alteration, secondary mineralisation, and bulk rock structural damage to the
uniaxial compressive strength of selected lithologies from the Ngatamariki, Rotokawa and
Kawerau Geothermal Fields from the Taupo Volcanic Zone, New Zealand. This empirical
relationship should facilitate understanding of how alteration mineralogy and physical properties
control rock strength and its application could be used to optimise drilling of geothermal
reservoirs through improved drill bit selection.
4.2. Geological setting
The Taupo Volcanic Zone (TVZ) is located at the southern end of the Tonga Kermadec arc in
the central North Island of New Zealand, in a 300 km long (200 km on land) and 60 km wide
belt, defined by caldera structural boundaries, vent positions and geothermal fields (Wilson et al.
1995; Rowland & Sibson 2001), and in its modern form coincides with a structurally and
magmatically segmented rift system (Taupo rift). The oblique subduction of oceanic crust from
the Pacific plate beneath the Indian-Australian plate caused the back arc/arc basin producing the
Chapter 4
73
TVZ (Cole 1990; Bibby et al. 1995; 2008; Darby et al. 2000; Rowland & Sibson 2004; Cole &
Spinks 2009; Seebeck et al. 2010; Rowland et al. 2012). The TVZ is comprised of geothermal
systems known as young igneous systems, which are associated with Quaternary volcanism
(Goff & Janik 2000). These circulating geothermal fluids become rich in dissolved minerals, as
they percolate through the stratigraphy (Henneberger & Browne 1988) and precipitate minerals
in the reservoir rocks producing the secondary mineralisation that we see when the rocks are
drilled and brought to the surface (Goff & Janik 2000).
4.3. Data Collection
A study completed by Wyering et al. (2014) (refer to chapter 3) characterised the physical and
mechanical properties of lithologies in the Ngatamariki, Rotokawa and Kawerau Geothermal
field, using non-destructive and destructive methods to determine porosity, density, ultrasonic
wave velocities and uniaxial compressive strength (UCS). The samples sourced from the three
geothermal fields were prepared to have a mean diameter of 39.6 mm and were cut and ground
to within the length to diameter ratio of 2:1. The rocks used in this study included shallow
lithologies of rhyolitic ignimbrite, sandstone and mudstone sedimentary rocks and rhyolite lava,
along with deep lithologies of rhyolitic ignimbrite, andesite breccia/lava and intrusive tonalite.
The study also examined thin sections of the lithologies identifying primary and secondary
minerals, microfractures and bulk rock fractures. For this study we will use their porosity, UCS
data and thin section analysis of the lithologies. Wyering et al. (2014) used the suggested method
from the International Society of Rock Mechanics (ISRM) (Ulusay & Hudson 2007) to
determine the effective porosity (ηe) and density of the hydrothermally altered samples using
cylindrical cores. UCS testing was completed using the ISRM suggested methods (Ulusay &
Hudson 2007) and the American Society for Testing and Materials (ASTM 2010). The samples
were tested using a Technotest 3000 kN, servo-controlled loading frame and loaded at a constant
rate to ensure failure occurred within 5–10 minutes. Tokyo Sokki Kenkyujo Co. Ltd (TML) 20
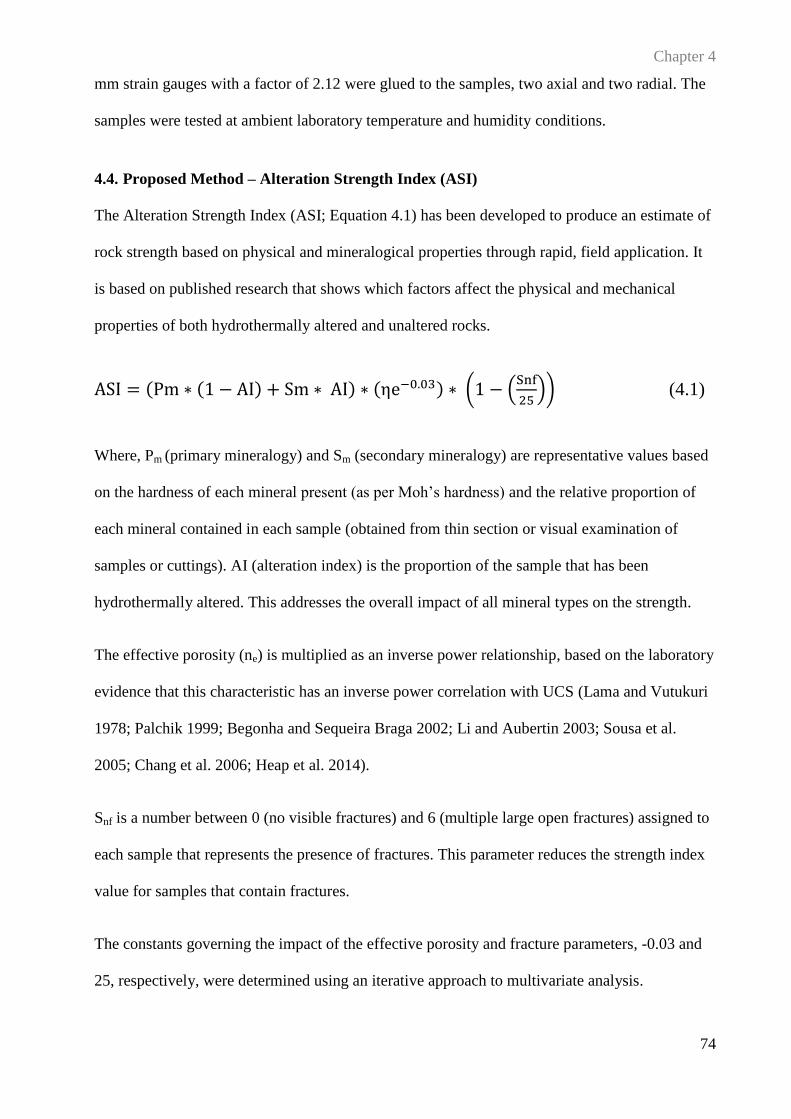
Chapter 4
74
mm strain gauges with a factor of 2.12 were glued to the samples, two axial and two radial. The
samples were tested at ambient laboratory temperature and humidity conditions.
4.4. Proposed Method – Alteration Strength Index (ASI)
The Alteration Strength Index (ASI; Equation 4.1) has been developed to produce an estimate of
rock strength based on physical and mineralogical properties through rapid, field application. It
is based on published research that shows which factors affect the physical and mechanical
properties of both hydrothermally altered and unaltered rocks.
ASI = (Pm ∗ (1 − AI) + Sm ∗ AI) ∗ (ηe−0.03) ∗ (1 − (Snf
25)) (4.1)
Where, Pm (primary mineralogy) and Sm (secondary mineralogy) are representative values based
on the hardness of each mineral present (as per Moh’s hardness) and the relative proportion of
each mineral contained in each sample (obtained from thin section or visual examination of
samples or cuttings). AI (alteration index) is the proportion of the sample that has been
hydrothermally altered. This addresses the overall impact of all mineral types on the strength.
The effective porosity (ne) is multiplied as an inverse power relationship, based on the laboratory
evidence that this characteristic has an inverse power correlation with UCS (Lama and Vutukuri
1978; Palchik 1999; Begonha and Sequeira Braga 2002; Li and Aubertin 2003; Sousa et al.
2005; Chang et al. 2006; Heap et al. 2014).
Snf is a number between 0 (no visible fractures) and 6 (multiple large open fractures) assigned to
each sample that represents the presence of fractures. This parameter reduces the strength index
value for samples that contain fractures.
The constants governing the impact of the effective porosity and fracture parameters, -0.03 and
25, respectively, were determined using an iterative approach to multivariate analysis.
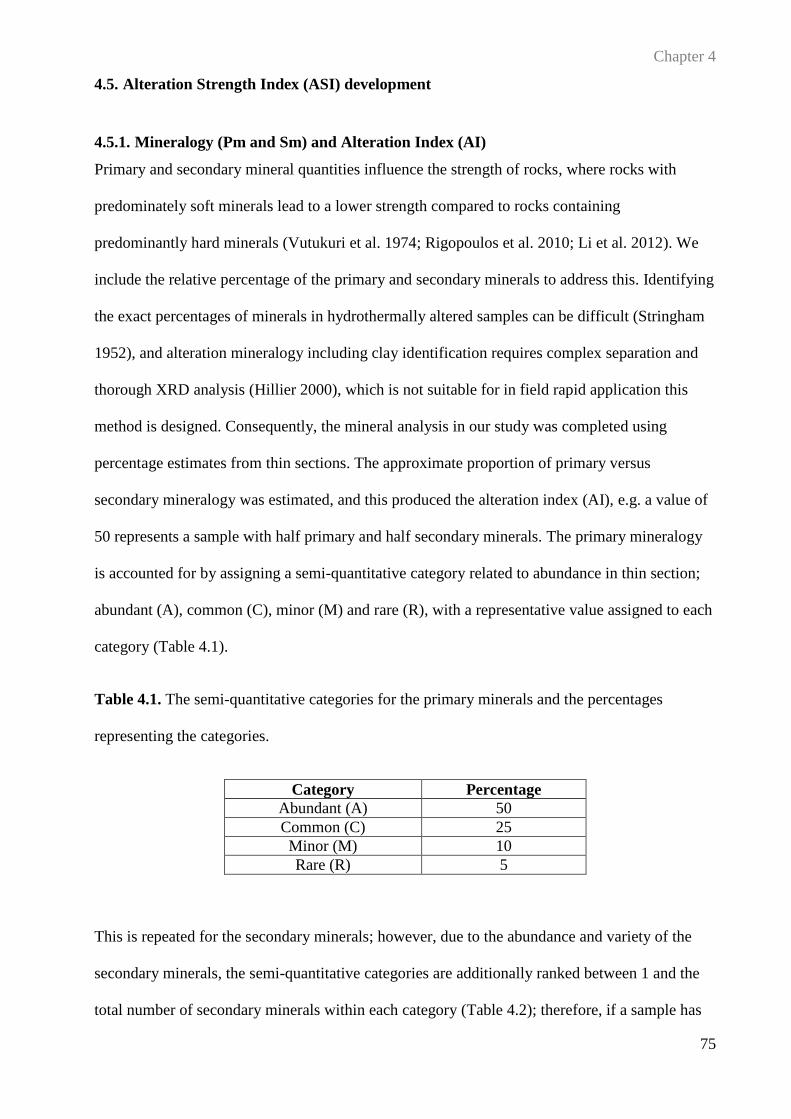
Chapter 4
75
4.5. Alteration Strength Index (ASI) development
4.5.1. Mineralogy (Pm and Sm) and Alteration Index (AI)
Primary and secondary mineral quantities influence the strength of rocks, where rocks with
predominately soft minerals lead to a lower strength compared to rocks containing
predominantly hard minerals (Vutukuri et al. 1974; Rigopoulos et al. 2010; Li et al. 2012). We
include the relative percentage of the primary and secondary minerals to address this. Identifying
the exact percentages of minerals in hydrothermally altered samples can be difficult (Stringham
1952), and alteration mineralogy including clay identification requires complex separation and
thorough XRD analysis (Hillier 2000), which is not suitable for in field rapid application this
method is designed. Consequently, the mineral analysis in our study was completed using
percentage estimates from thin sections. The approximate proportion of primary versus
secondary mineralogy was estimated, and this produced the alteration index (AI), e.g. a value of
50 represents a sample with half primary and half secondary minerals. The primary mineralogy
is accounted for by assigning a semi-quantitative category related to abundance in thin section;
abundant (A), common (C), minor (M) and rare (R), with a representative value assigned to each
category (Table 4.1).
Table 4.1. The semi-quantitative categories for the primary minerals and the percentages
representing the categories.
Category Percentage
Abundant (A)
50
Common (C)
25
Minor (M)
10
Rare (R)
5
This is repeated for the secondary minerals; however, due to the abundance and variety of the
secondary minerals, the semi-quantitative categories are additionally ranked between 1 and the
total number of secondary minerals within each category (Table 4.2); therefore, if a sample has
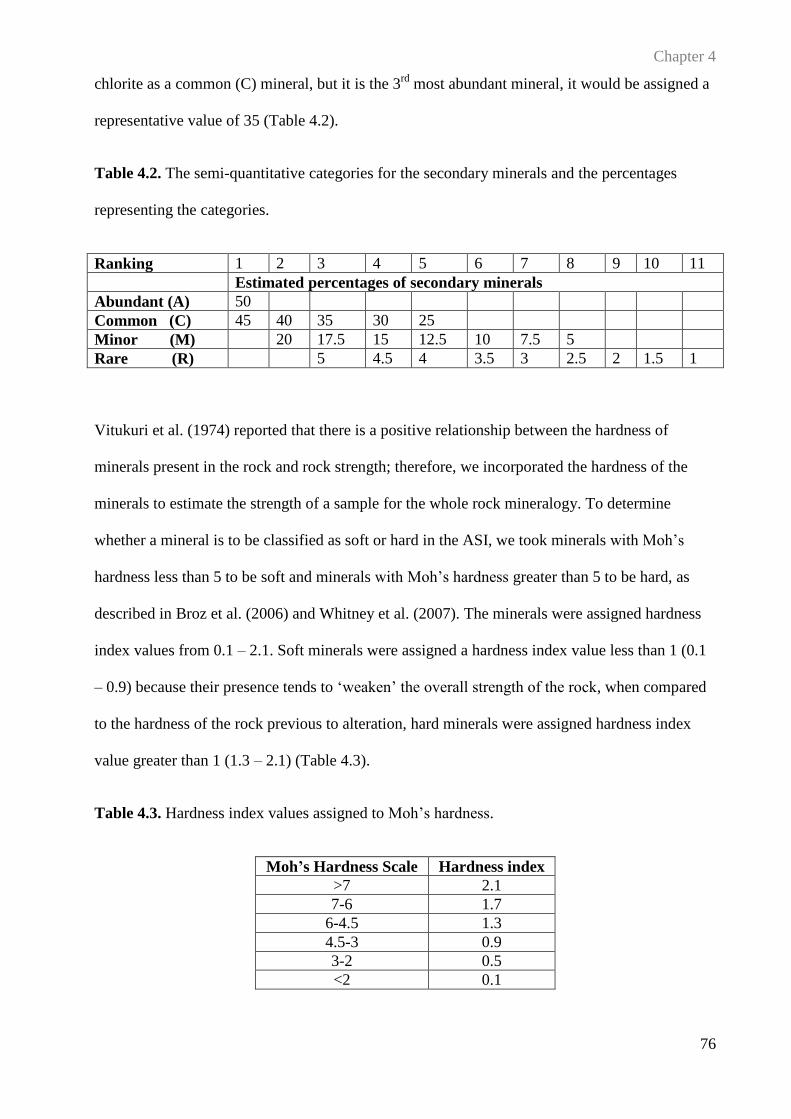
Chapter 4
76
chlorite as a common (C) mineral, but it is the 3rd
most abundant mineral, it would be assigned a
representative value of 35 (Table 4.2).
Table 4.2. The semi-quantitative categories for the secondary minerals and the percentages
representing the categories.
Ranking 1 2 3 4 5 6 7 8 9 10 11
Estimated percentages of secondary minerals
Abundant (A) 50
Common (C) 45 40 35 30 25
Minor (M) 20 17.5 15 12.5 10 7.5 5
Rare (R) 5 4.5 4 3.5 3 2.5 2 1.5 1
Vitukuri et al. (1974) reported that there is a positive relationship between the hardness of
minerals present in the rock and rock strength; therefore, we incorporated the hardness of the
minerals to estimate the strength of a sample for the whole rock mineralogy. To determine
whether a mineral is to be classified as soft or hard in the ASI, we took minerals with Moh’s
hardness less than 5 to be soft and minerals with Moh’s hardness greater than 5 to be hard, as
described in Broz et al. (2006) and Whitney et al. (2007). The minerals were assigned hardness
index values from 0.1 – 2.1. Soft minerals were assigned a hardness index value less than 1 (0.1
– 0.9) because their presence tends to ‘weaken’ the overall strength of the rock, when compared
to the hardness of the rock previous to alteration, hard minerals were assigned hardness index
value greater than 1 (1.3 – 2.1) (Table 4.3).
Table 4.3. Hardness index values assigned to Moh’s hardness.
Moh’s Hardness Scale
Hardness index
>7
2.1
7-6
1.7
6-4.5
1.3
4.5-3
0.9
3-2
0.5
<2
0.1
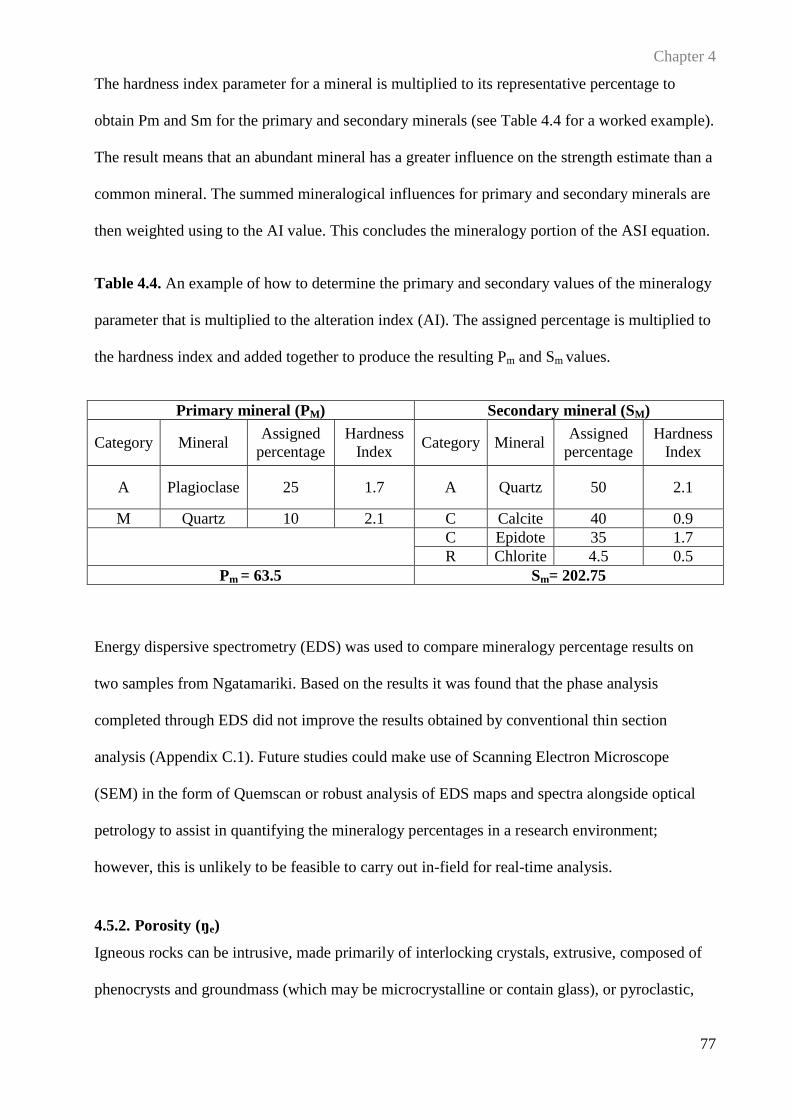
Chapter 4
77
The hardness index parameter for a mineral is multiplied to its representative percentage to
obtain Pm and Sm for the primary and secondary minerals (see Table 4.4 for a worked example).
The result means that an abundant mineral has a greater influence on the strength estimate than a
common mineral. The summed mineralogical influences for primary and secondary minerals are
then weighted using to the AI value. This concludes the mineralogy portion of the ASI equation.
Table 4.4. An example of how to determine the primary and secondary values of the mineralogy
parameter that is multiplied to the alteration index (AI). The assigned percentage is multiplied to
the hardness index and added together to produce the resulting Pm and Sm values.
Primary mineral (PM) Secondary mineral (SM)
Category Mineral Assigned
percentage
Hardness
Index Category Mineral
Assigned
percentage
Hardness
Index
A Plagioclase 25 1.7 A Quartz 50 2.1
M Quartz 10 2.1 C Calcite 40 0.9
C Epidote 35 1.7
R Chlorite 4.5 0.5
Pm = 63.5 Sm= 202.75
Energy dispersive spectrometry (EDS) was used to compare mineralogy percentage results on
two samples from Ngatamariki. Based on the results it was found that the phase analysis
completed through EDS did not improve the results obtained by conventional thin section
analysis (Appendix C.1). Future studies could make use of Scanning Electron Microscope
(SEM) in the form of Quemscan or robust analysis of EDS maps and spectra alongside optical
petrology to assist in quantifying the mineralogy percentages in a research environment;
however, this is unlikely to be feasible to carry out in-field for real-time analysis.
4.5.2. Porosity (ŋe)
Igneous rocks can be intrusive, made primarily of interlocking crystals, extrusive, composed of
phenocrysts and groundmass (which may be microcrystalline or contain glass), or pyroclastic,
Chapter 4
78
composed of grains that are cemented or welded together. Typically, in volcanic rocks, porosity
is microscopic and created by space between minerals, individual grains, vesicles or cracks
(Dobson et al. 2003). The pore structure is usually interconnected and randomly distributed
(Hudyma et al. 2004). Porosity is an important factor in rock strength, because voids reduce the
integrity of the material and, as indicated by the ISRM (Ulusay & Hudson 2007), even a small
volume of pores can have a noticeable mechanical effect (Sammis and Ashby 1986; Fakhimi and
Gharahbagh 2011; Heap et al. 2014a, b). An increase in porosity reduces stiffness and strength
due to stress concentration on the boundary of the pores. Additionally, the pores may be filled
with fluids, which may help in crack propagation under compression due to the incompressibility
of the fluids, leading to an increase in stress concentrations at pore boundaries as the fluid is
trying to escape (Price 1960; Lama & Vutukuri 1978; Luping 1986). It is understood that the
measurement of porosity can take into consideration the presence of established open fractures,
as the saturation fluid is able to infiltrate through into the rock, however the fracture parameter
(Snf) accounts separately for the high potential for failure along pre-existing macrofractures, that
have less proportional influence on porosity than pores due to their smaller volume (Mueller et
al. 2005).
To isolate the impact of porosity on UCS we used the Rotokawa andesite samples, which have
similar mineralogy and fracture characteristics with each other. We found that gaps in the data
made the decision between power, log or linear trends between the effective porosity and UCS in
our data difficult; therefore, we decided on an inverse power relationship because many authors
have reported an inverse power correlation for a variety of rock types (Lama and Vutukuri 1978;
Palchik 1999; Begonha and Sequeira Braga 2002; Li and Aubertin 2003; Sousa et al. 2005;
Chang et al. 2006; Heap et al. 2014). We have used the resulting inverse power correlation
(Fig.4.1) in the ASI equation.
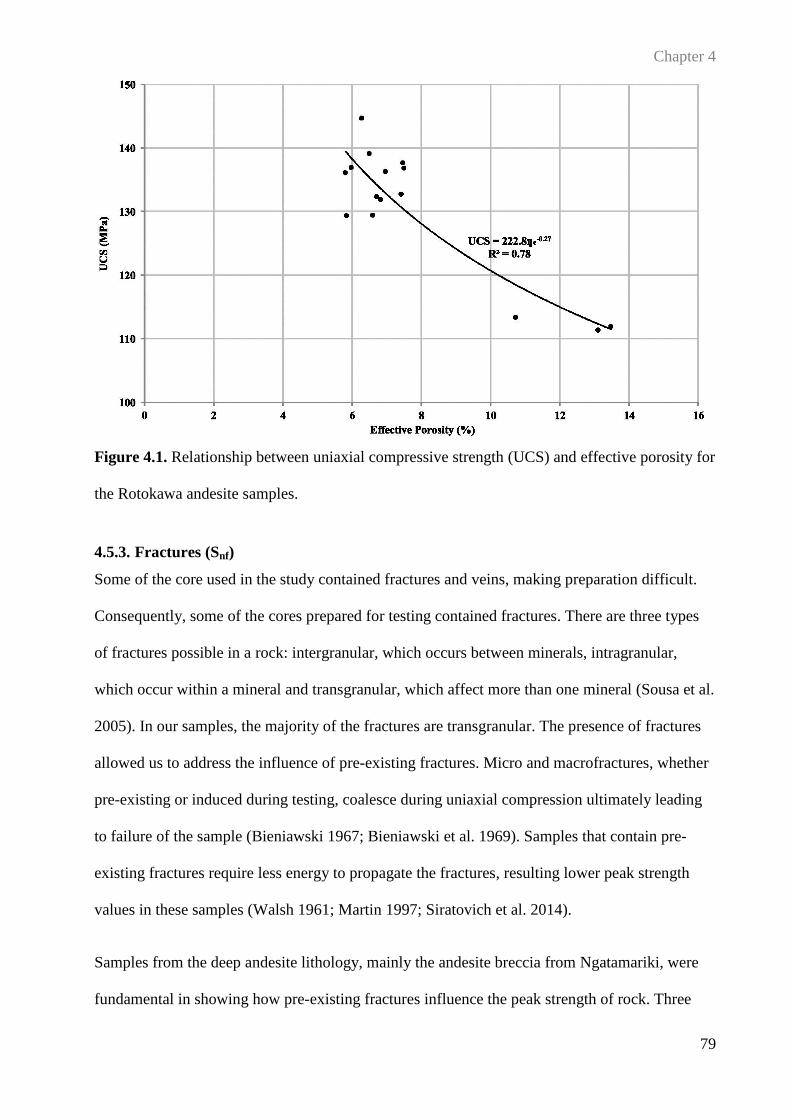
Chapter 4
79
Figure 4.1. Relationship between uniaxial compressive strength (UCS) and effective porosity for
the Rotokawa andesite samples.
4.5.3. Fractures (Snf)
Some of the core used in the study contained fractures and veins, making preparation difficult.
Consequently, some of the cores prepared for testing contained fractures. There are three types
of fractures possible in a rock: intergranular, which occurs between minerals, intragranular,
which occur within a mineral and transgranular, which affect more than one mineral (Sousa et al.
2005). In our samples, the majority of the fractures are transgranular. The presence of fractures
allowed us to address the influence of pre-existing fractures. Micro and macrofractures, whether
pre-existing or induced during testing, coalesce during uniaxial compression ultimately leading
to failure of the sample (Bieniawski 1967; Bieniawski et al. 1969). Samples that contain pre-
existing fractures require less energy to propagate the fractures, resulting lower peak strength
values in these samples (Walsh 1961; Martin 1997; Siratovich et al. 2014).
Samples from the deep andesite lithology, mainly the andesite breccia from Ngatamariki, were
fundamental in showing how pre-existing fractures influence the peak strength of rock. Three
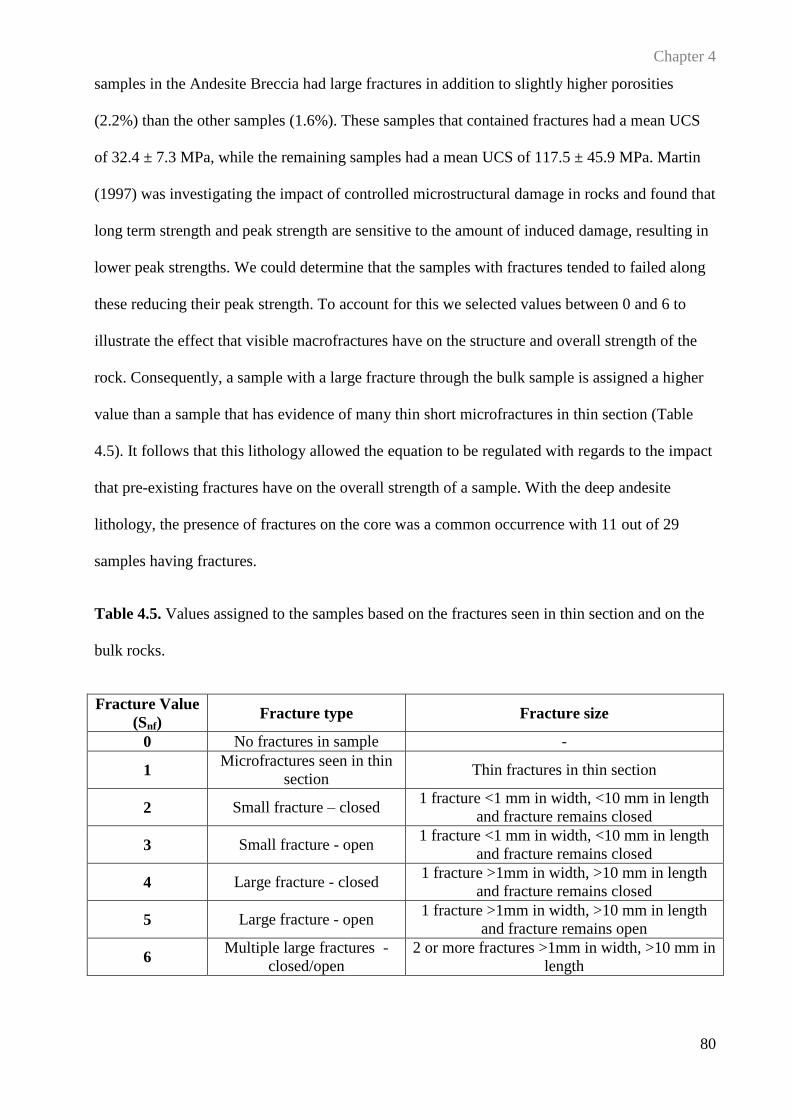
Chapter 4
80
samples in the Andesite Breccia had large fractures in addition to slightly higher porosities
(2.2%) than the other samples (1.6%). These samples that contained fractures had a mean UCS
of 32.4 ± 7.3 MPa, while the remaining samples had a mean UCS of 117.5 ± 45.9 MPa. Martin
(1997) was investigating the impact of controlled microstructural damage in rocks and found that
long term strength and peak strength are sensitive to the amount of induced damage, resulting in
lower peak strengths. We could determine that the samples with fractures tended to failed along
these reducing their peak strength. To account for this we selected values between 0 and 6 to
illustrate the effect that visible macrofractures have on the structure and overall strength of the
rock. Consequently, a sample with a large fracture through the bulk sample is assigned a higher
value than a sample that has evidence of many thin short microfractures in thin section (Table
4.5). It follows that this lithology allowed the equation to be regulated with regards to the impact
that pre-existing fractures have on the overall strength of a sample. With the deep andesite
lithology, the presence of fractures on the core was a common occurrence with 11 out of 29
samples having fractures.
Table 4.5. Values assigned to the samples based on the fractures seen in thin section and on the
bulk rocks.
Fracture Value
(Snf) Fracture type Fracture size
0 No fractures in sample -
1 Microfractures seen in thin
section Thin fractures in thin section
2 Small fracture – closed 1 fracture <1 mm in width, <10 mm in length
and fracture remains closed
3 Small fracture - open 1 fracture <1 mm in width, <10 mm in length
and fracture remains closed
4 Large fracture - closed 1 fracture >1mm in width, >10 mm in length
and fracture remains closed
5 Large fracture - open 1 fracture >1mm in width, >10 mm in length
and fracture remains open
6 Multiple large fractures -
closed/open
2 or more fractures >1mm in width, >10 mm in
length
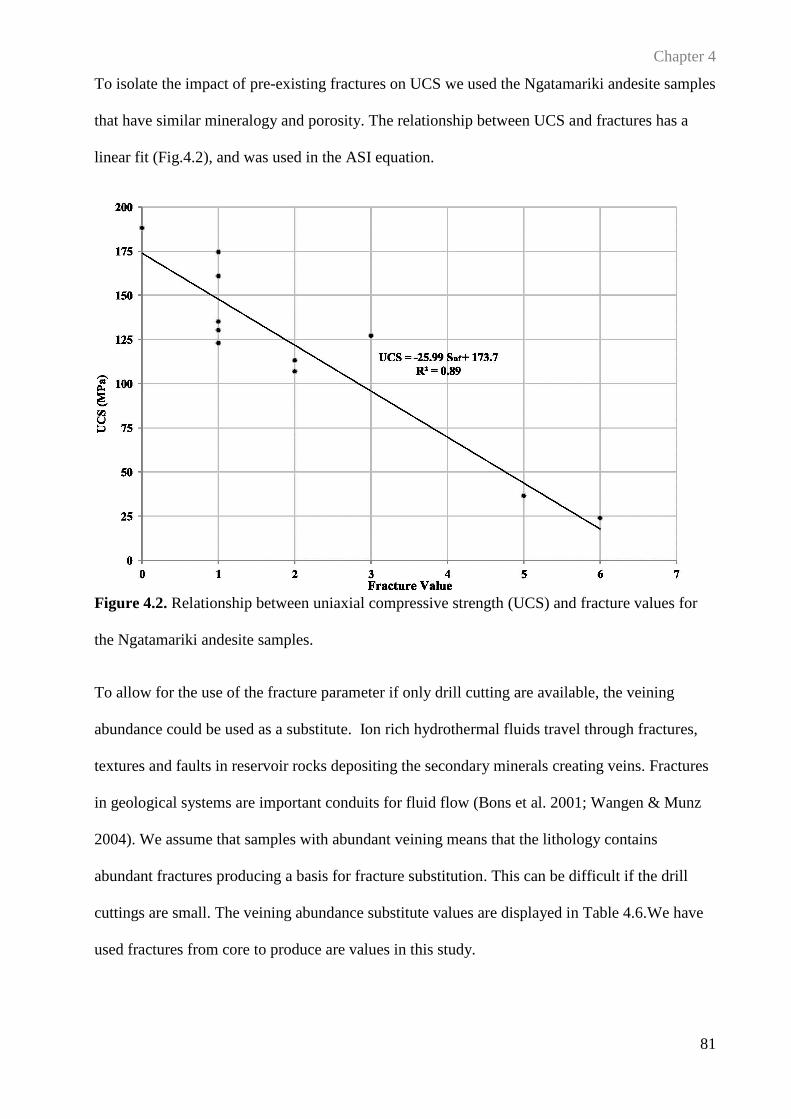
Chapter 4
81
To isolate the impact of pre-existing fractures on UCS we used the Ngatamariki andesite samples
that have similar mineralogy and porosity. The relationship between UCS and fractures has a
linear fit (Fig.4.2), and was used in the ASI equation.
Figure 4.2. Relationship between uniaxial compressive strength (UCS) and fracture values for
the Ngatamariki andesite samples.
To allow for the use of the fracture parameter if only drill cutting are available, the veining
abundance could be used as a substitute. Ion rich hydrothermal fluids travel through fractures,
textures and faults in reservoir rocks depositing the secondary minerals creating veins. Fractures
in geological systems are important conduits for fluid flow (Bons et al. 2001; Wangen & Munz
2004). We assume that samples with abundant veining means that the lithology contains
abundant fractures producing a basis for fracture substitution. This can be difficult if the drill
cuttings are small. The veining abundance substitute values are displayed in Table 4.6.We have
used fractures from core to produce are values in this study.
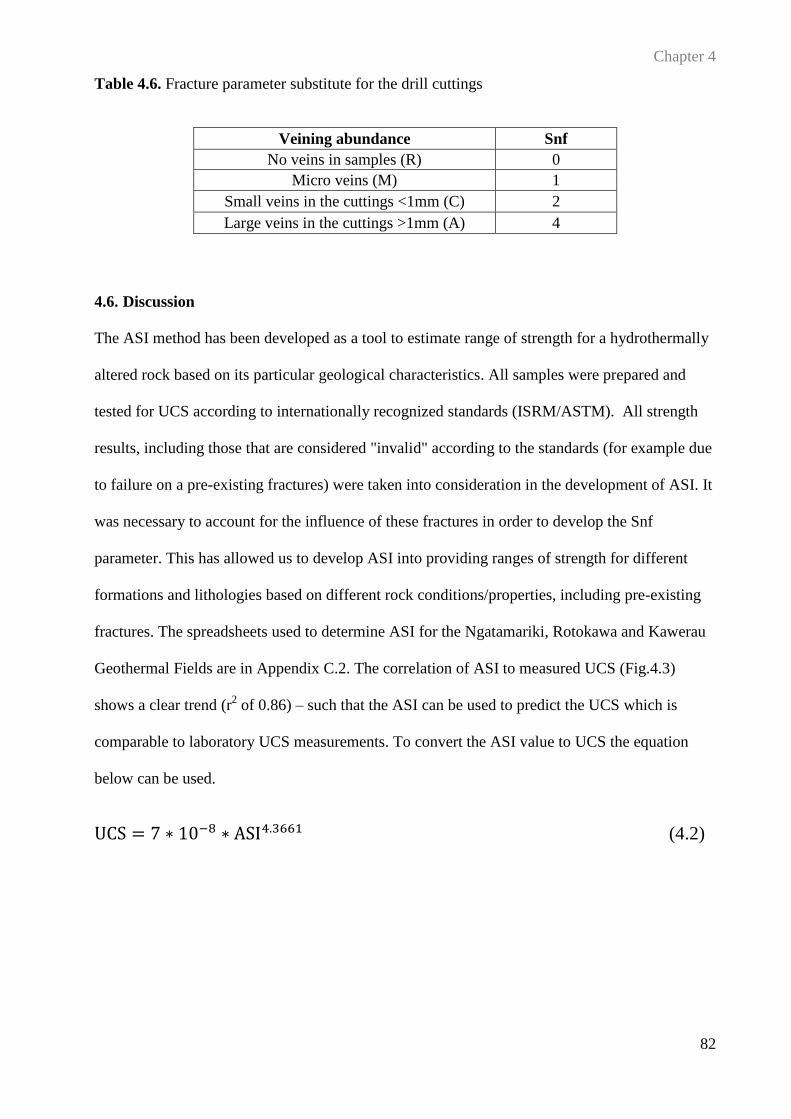
Chapter 4
82
Table 4.6. Fracture parameter substitute for the drill cuttings
Veining abundance Snf
No veins in samples (R) 0
Micro veins (M) 1
Small veins in the cuttings <1mm (C) 2
Large veins in the cuttings >1mm (A) 4
4.6. Discussion
The ASI method has been developed as a tool to estimate range of strength for a hydrothermally
altered rock based on its particular geological characteristics. All samples were prepared and
tested for UCS according to internationally recognized standards (ISRM/ASTM). All strength
results, including those that are considered "invalid" according to the standards (for example due
to failure on a pre-existing fractures) were taken into consideration in the development of ASI. It
was necessary to account for the influence of these fractures in order to develop the Snf
parameter. This has allowed us to develop ASI into providing ranges of strength for different
formations and lithologies based on different rock conditions/properties, including pre-existing
fractures. The spreadsheets used to determine ASI for the Ngatamariki, Rotokawa and Kawerau
Geothermal Fields are in Appendix C.2. The correlation of ASI to measured UCS (Fig.4.3)
shows a clear trend (r2 of 0.86) – such that the ASI can be used to predict the UCS which is
comparable to laboratory UCS measurements. To convert the ASI value to UCS the equation
below can be used.
UCS = 7 ∗ 10−8 ∗ ASI4.3661 (4.2)
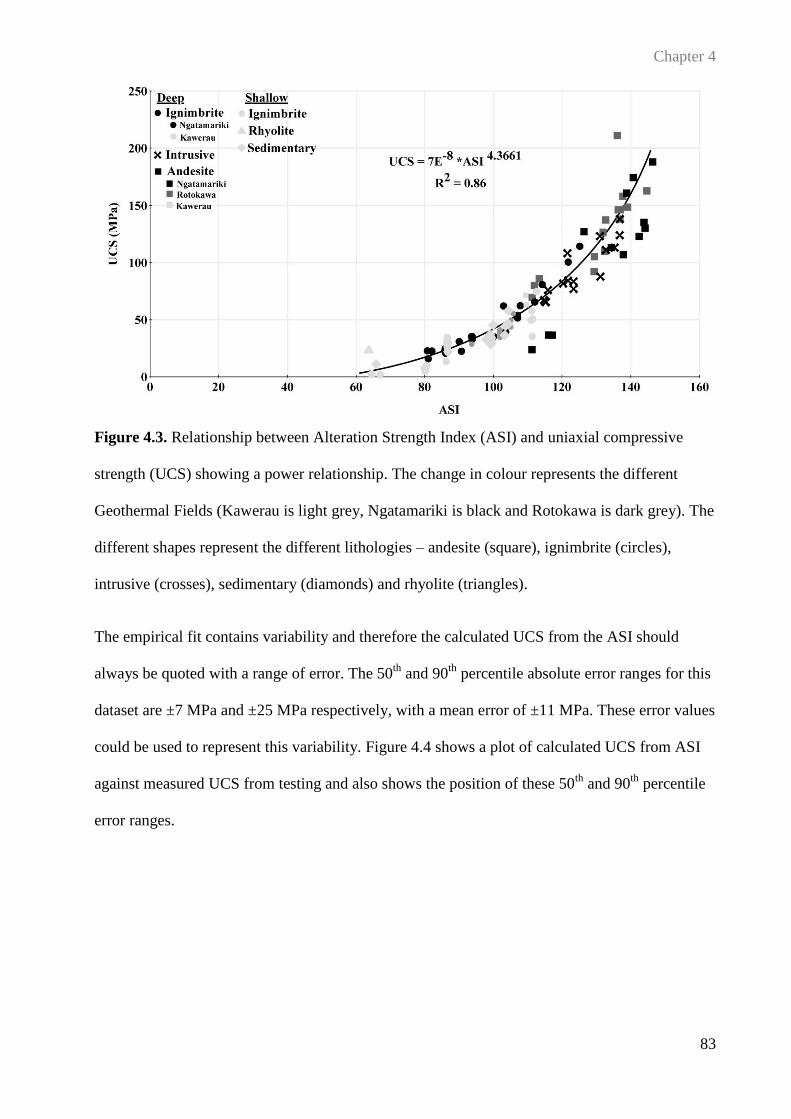
Chapter 4
83
Figure 4.3. Relationship between Alteration Strength Index (ASI) and uniaxial compressive
strength (UCS) showing a power relationship. The change in colour represents the different
Geothermal Fields (Kawerau is light grey, Ngatamariki is black and Rotokawa is dark grey). The
different shapes represent the different lithologies – andesite (square), ignimbrite (circles),
intrusive (crosses), sedimentary (diamonds) and rhyolite (triangles).
The empirical fit contains variability and therefore the calculated UCS from the ASI should
always be quoted with a range of error. The 50th
and 90th
percentile absolute error ranges for this
dataset are ±7 MPa and ±25 MPa respectively, with a mean error of ±11 MPa. These error values
could be used to represent this variability. Figure 4.4 shows a plot of calculated UCS from ASI
against measured UCS from testing and also shows the position of these 50th
and 90th
percentile
error ranges.
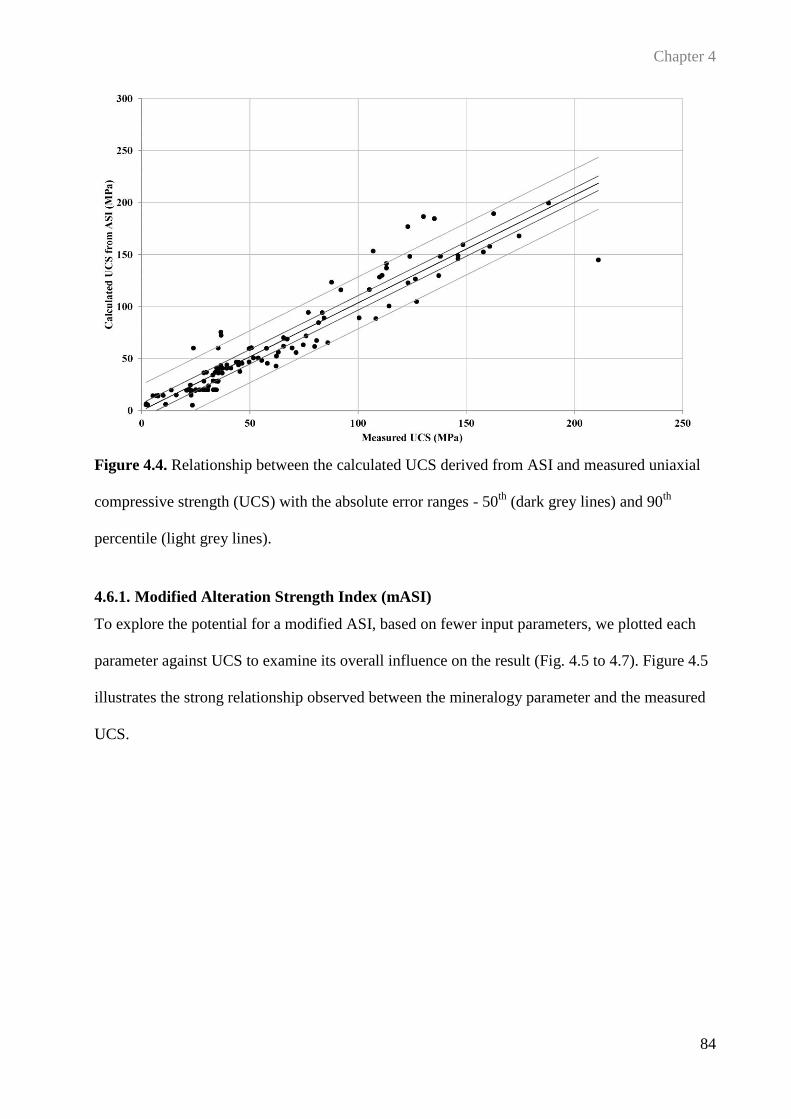
Chapter 4
84
Figure 4.4. Relationship between the calculated UCS derived from ASI and measured uniaxial
compressive strength (UCS) with the absolute error ranges - 50th
(dark grey lines) and 90th
percentile (light grey lines).
4.6.1. Modified Alteration Strength Index (mASI)
To explore the potential for a modified ASI, based on fewer input parameters, we plotted each
parameter against UCS to examine its overall influence on the result (Fig. 4.5 to 4.7). Figure 4.5
illustrates the strong relationship observed between the mineralogy parameter and the measured
UCS.
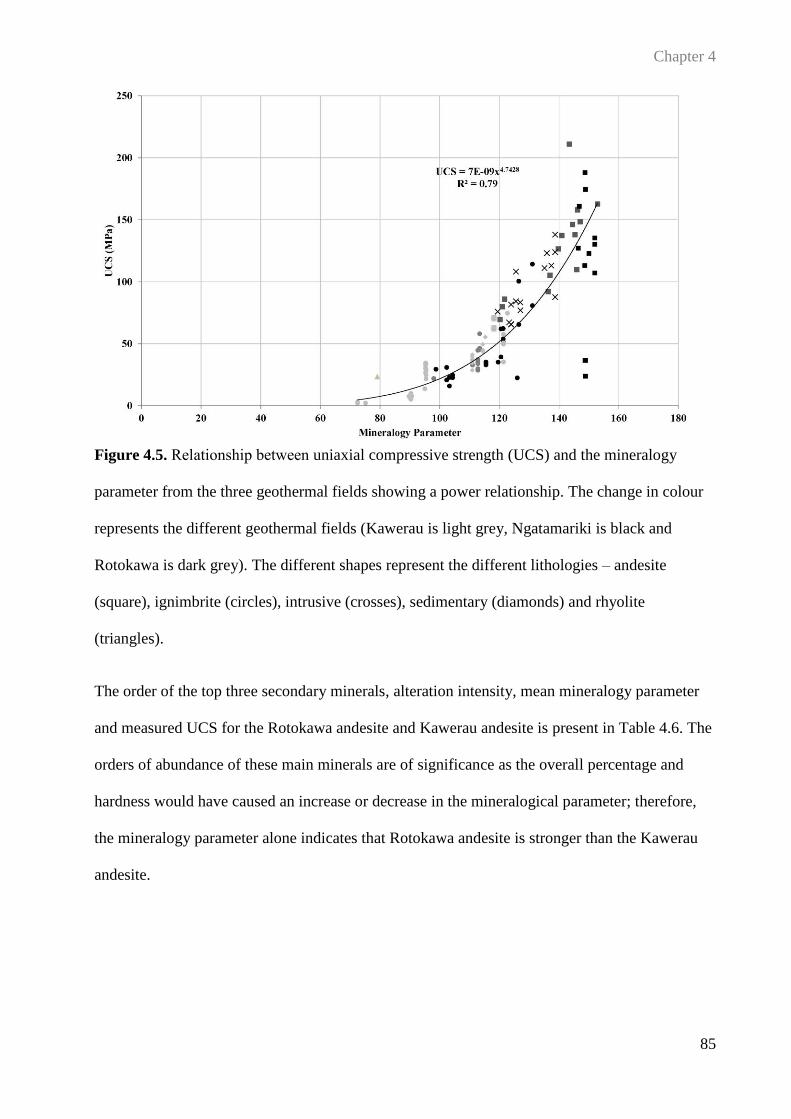
Chapter 4
85
Figure 4.5. Relationship between uniaxial compressive strength (UCS) and the mineralogy
parameter from the three geothermal fields showing a power relationship. The change in colour
represents the different geothermal fields (Kawerau is light grey, Ngatamariki is black and
Rotokawa is dark grey). The different shapes represent the different lithologies – andesite
(square), ignimbrite (circles), intrusive (crosses), sedimentary (diamonds) and rhyolite
(triangles).
The order of the top three secondary minerals, alteration intensity, mean mineralogy parameter
and measured UCS for the Rotokawa andesite and Kawerau andesite is present in Table 4.6. The
orders of abundance of these main minerals are of significance as the overall percentage and
hardness would have caused an increase or decrease in the mineralogical parameter; therefore,
the mineralogy parameter alone indicates that Rotokawa andesite is stronger than the Kawerau
andesite.
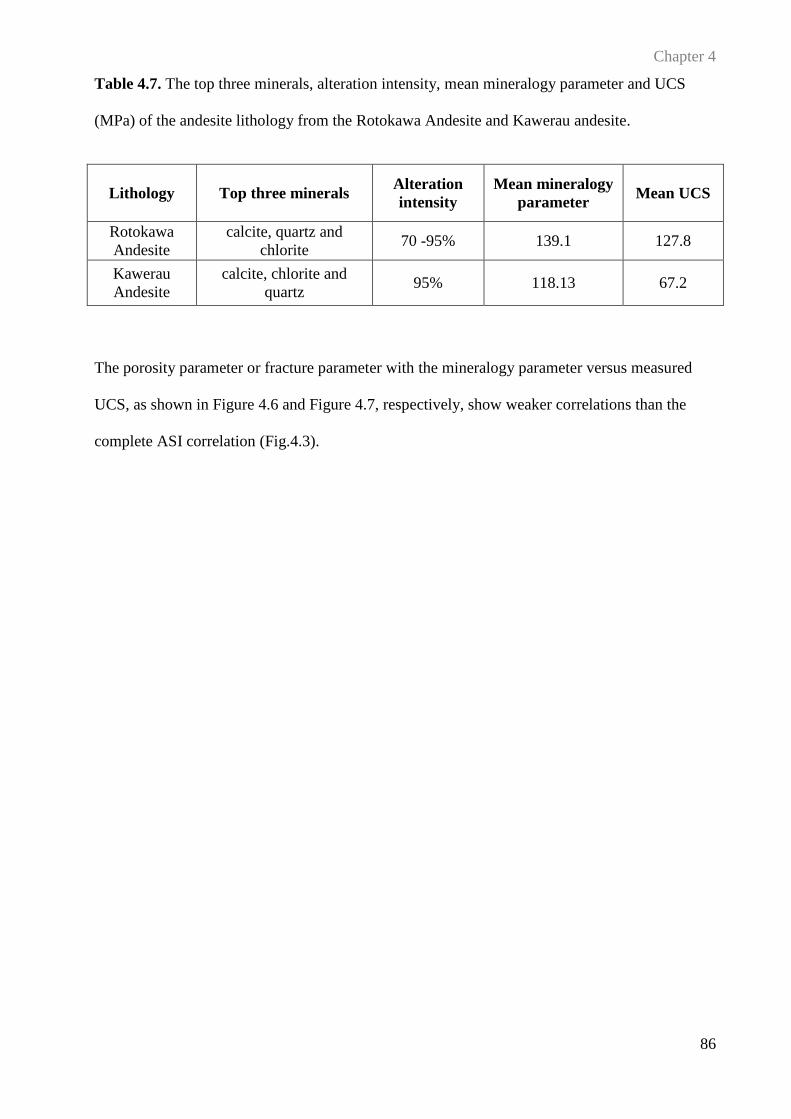
Chapter 4
86
Table 4.7. The top three minerals, alteration intensity, mean mineralogy parameter and UCS
(MPa) of the andesite lithology from the Rotokawa Andesite and Kawerau andesite.
Lithology Top three minerals Alteration
intensity
Mean mineralogy
parameter Mean UCS
Rotokawa
Andesite
calcite, quartz and
chlorite 70 -95% 139.1 127.8
Kawerau
Andesite
calcite, chlorite and
quartz 95% 118.13 67.2
The porosity parameter or fracture parameter with the mineralogy parameter versus measured
UCS, as shown in Figure 4.6 and Figure 4.7, respectively, show weaker correlations than the
complete ASI correlation (Fig.4.3).
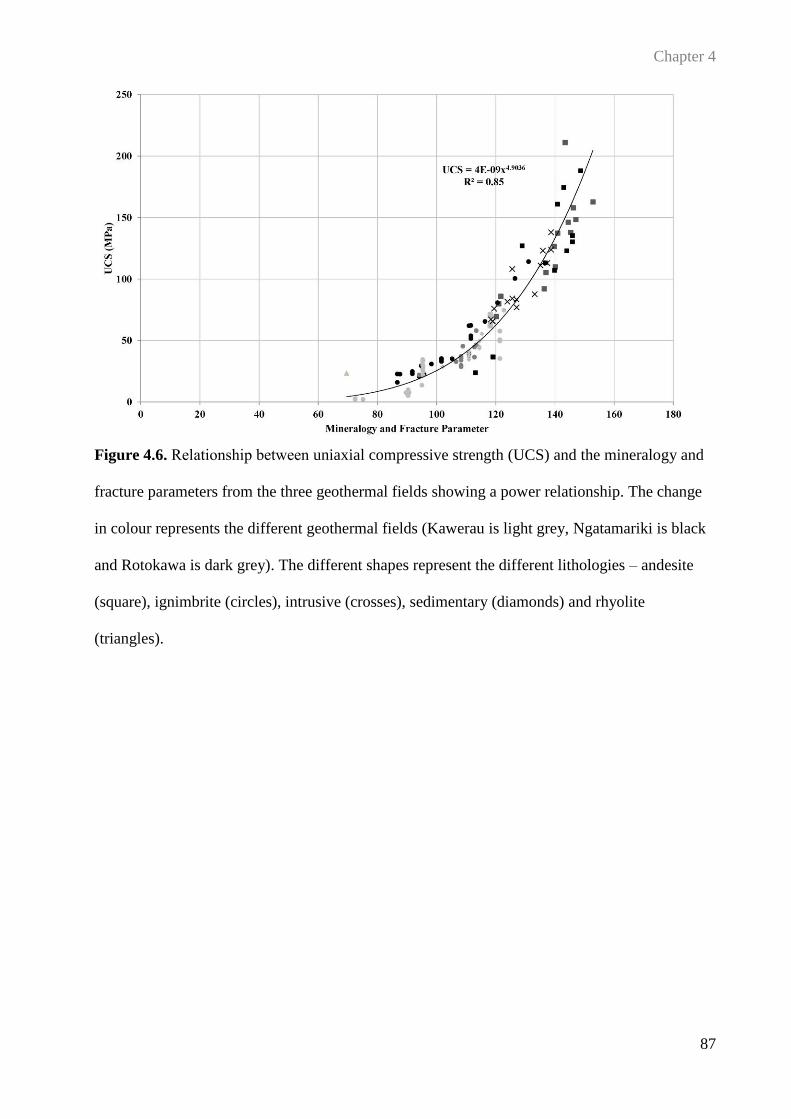
Chapter 4
87
Figure 4.6. Relationship between uniaxial compressive strength (UCS) and the mineralogy and
fracture parameters from the three geothermal fields showing a power relationship. The change
in colour represents the different geothermal fields (Kawerau is light grey, Ngatamariki is black
and Rotokawa is dark grey). The different shapes represent the different lithologies – andesite
(square), ignimbrite (circles), intrusive (crosses), sedimentary (diamonds) and rhyolite
(triangles).
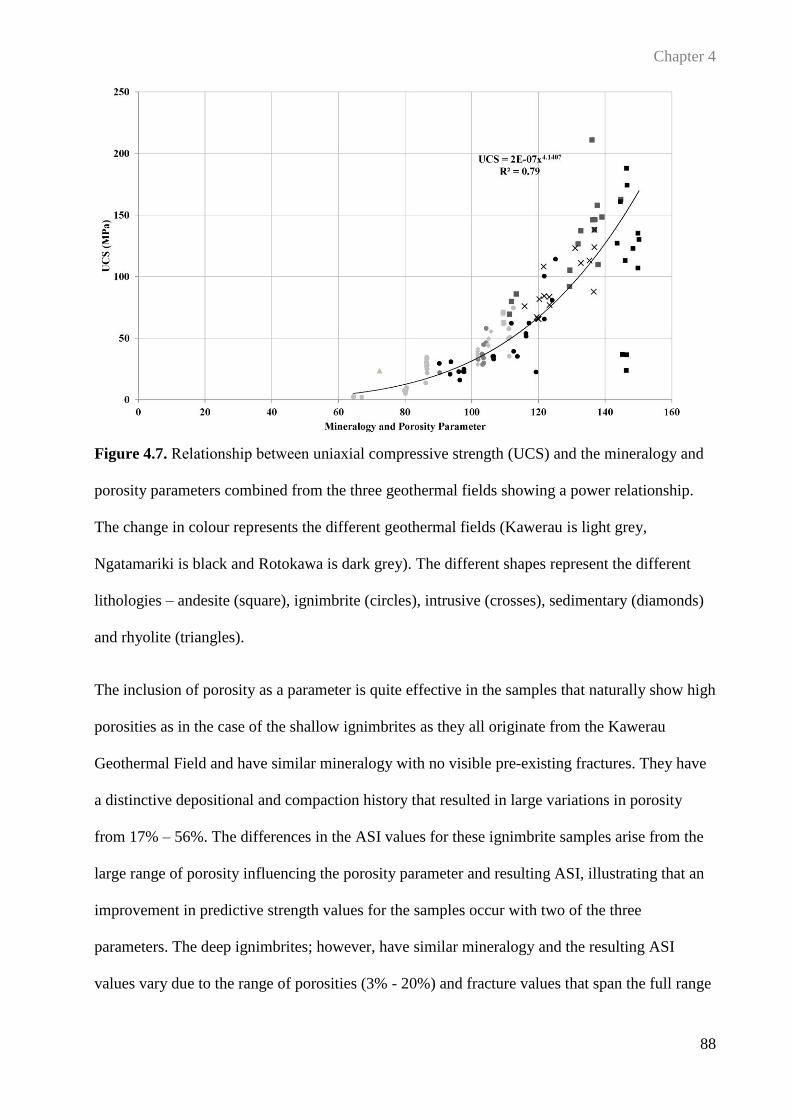
Chapter 4
88
Figure 4.7. Relationship between uniaxial compressive strength (UCS) and the mineralogy and
porosity parameters combined from the three geothermal fields showing a power relationship.
The change in colour represents the different geothermal fields (Kawerau is light grey,
Ngatamariki is black and Rotokawa is dark grey). The different shapes represent the different
lithologies – andesite (square), ignimbrite (circles), intrusive (crosses), sedimentary (diamonds)
and rhyolite (triangles).
The inclusion of porosity as a parameter is quite effective in the samples that naturally show high
porosities as in the case of the shallow ignimbrites as they all originate from the Kawerau
Geothermal Field and have similar mineralogy with no visible pre-existing fractures. They have
a distinctive depositional and compaction history that resulted in large variations in porosity
from 17% – 56%. The differences in the ASI values for these ignimbrite samples arise from the
large range of porosity influencing the porosity parameter and resulting ASI, illustrating that an
improvement in predictive strength values for the samples occur with two of the three
parameters. The deep ignimbrites; however, have similar mineralogy and the resulting ASI
values vary due to the range of porosities (3% - 20%) and fracture values that span the full range
Chapter 4
89
(0 – 6). The resulting ASI for the deep ignimbrites with high porosities and fracture values were
lower than those with low porosity and facture values.
These observations show that the mineralogy parameter is the dominant characteristic in ASI;
however, the inclusion of the effects of porosity and fractures leads to a stronger relationship
with UCS (Fig.4.3). The use of ASI is in its final form provides the best predictions, however if
porosity or pre-existing fracture data are unavailable, good predictions of UCS are still possible.
For example when using drill cuttings, if porosity and/or fracture data are not available the mASI
equation using mineralogy alone still gives a strong relationship (R2 of 0.79) (Fig. 4.5) and the
fracture parameter shows a much greater improvement of the fit of the ASI (R2 of 0.85) (Fig.
4.6) than the porosity data. By including the porosity and mineralogy without the fracture data, a
small improvement is seen in the correlation from when mineralogy is considered alone (R2 of
0.79) (Fig. 4.5 and 4.7). Although the difference between mineralogy and the inclusion of
porosity is small it is worth noting that the addition of the porosity parameter increases the
correlation between measured UCS and ASI to an R2 of 0.86 as compared to the above use of
mineralogy and fracture data without porosity. When using the mASI it is prudent to be aware of
the reduction in accuracy of the prediction of UCS.
4.6.2. Predictive Capabilities
It is important to understand how hydrothermal alteration has influenced the rock properties of a
lithology in order to make strength-based decisions for engineering works in geothermal settings.
For example, predicting strength changes can improve drilling efficiency and help guide drill bit
selection. ASI can be used in the lab or in the field to predict a range of strength, and is
calibrated with hydrothermally altered rocks from three different geothermal fields with diverse
primary lithologies from both shallow and deep alteration zones typical of the TVZ. ASI is
suitable for any hydrothermally altered rocks in this area. The samples tested represent a
majority of lithologies found in a variety of geothermal fields that are exposed to differing
Chapter 4
90
hydrothermal environments. Because the ASI provides ranges of rock strengths it can be used to
provide a first-pass estimate for strength for hydrothermally altered rocks in similar
environments, although further testing is necessary to determine if the constants require
calibration in different geological environments. This research has also allowed us to provide
ranges of rock strengths based solely on the alteration zones, mineralogy, and depth of
lithologies found in a typical geothermal field that can be used to update conceptual models of
geothermal fields (Fig. 4.8). This does not include rock softening due to increased temperature
from the geothermal gradient (Kusznir and Park 1987; Karfakis 1985; Weinberg and
Podladchikov 1994). This conceptual model adds an important element to understanding how
rock mechanics plays a part in a geothermal system, and can be a fundamental addition to the
geothermal industry to support drilling, wellbore stability studies and mechanical modeling.
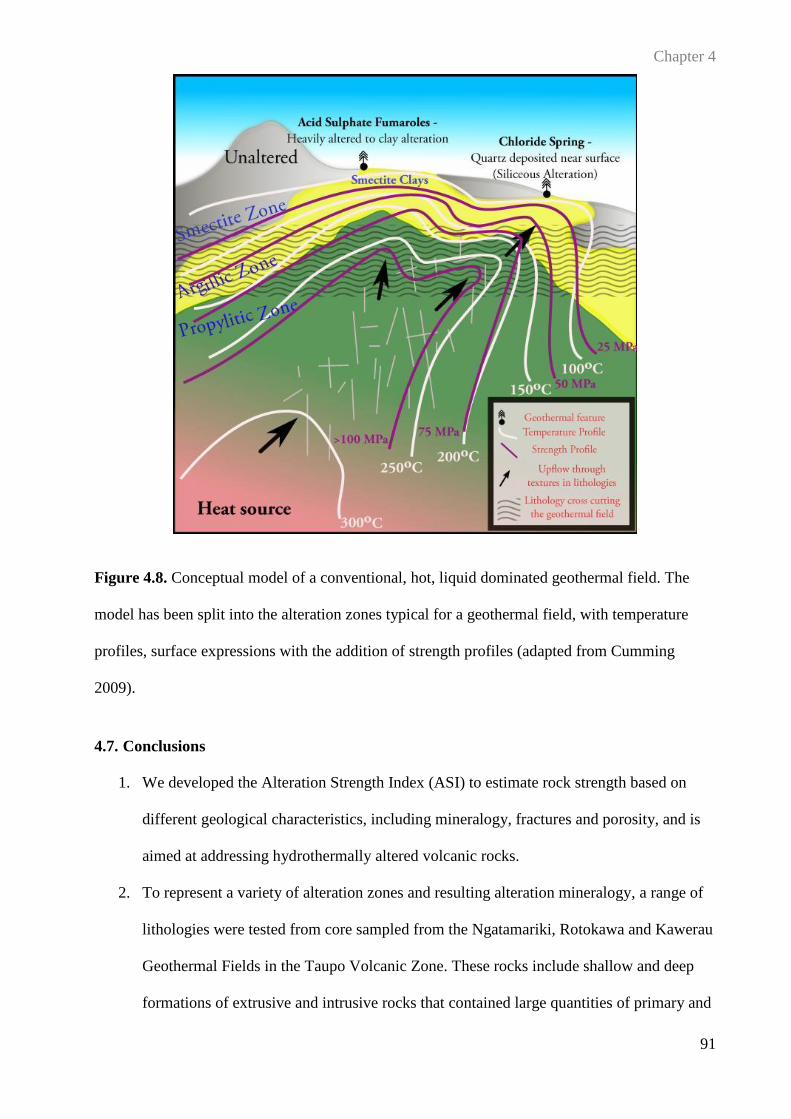
Chapter 4
91
Figure 4.8. Conceptual model of a conventional, hot, liquid dominated geothermal field. The
model has been split into the alteration zones typical for a geothermal field, with temperature
profiles, surface expressions with the addition of strength profiles (adapted from Cumming
2009).
4.7. Conclusions
1. We developed the Alteration Strength Index (ASI) to estimate rock strength based on
different geological characteristics, including mineralogy, fractures and porosity, and is
aimed at addressing hydrothermally altered volcanic rocks.
2. To represent a variety of alteration zones and resulting alteration mineralogy, a range of
lithologies were tested from core sampled from the Ngatamariki, Rotokawa and Kawerau
Geothermal Fields in the Taupo Volcanic Zone. These rocks include shallow and deep
formations of extrusive and intrusive rocks that contained large quantities of primary and
Chapter 4
92
secondary minerals including but not limited to clays, quartz, calcite, chlorite, albite,
pyrite and epidote.
3. Our results show a strong relationship between ASI and measured uniaxial compressive
strength (UCS) (R2 of 0.86), and was used to derive an equation to convert ASI to UCS
results comparable to lab measurements. The 50th
and 90th
percentile absolute error
ranges of this relationship are ±7 MPa and ±25 MPa respectively, with a mean error of
±11 MPa. These can be used to define the ranges of estimated rock strength.
4. The mineralogy is the dominant characteristic in this equation; however, the inclusion of
pre-existing fractures makes the comparable relationship to UCS stronger. The inclusion
of the porosity data shows little improvement in correlation; however, the best way to use
ASI is in its final form. This makes our approach functional in a field setting to provide
real-time strength estimates during engineering works, such as drilling or excavation.
5. A conceptual model of geothermal systems with alteration zones, temperature profiles
and fluid path migration (Fig. 4.8) overlaid with rock strength profiles based on the ASI
adds an important element to understanding how rock mechanics plays a part in a
geothermal system. This can be a fundamental addition to the information needed by the
geothermal industry to support drilling optimization through bit selection, wellbore
stability studies and mechanical modeling.
Chapter 5
CHAPTER 5:
USING DRILLING AND GEOLOGICAL PARAMETERS TO
ESTIMATE ROCK STRENGTH IN HYDROTHERMALLY
ALTERED ROCK – A COMPARISON OF MECHANICAL
SPECIFIC ENERGY, R/N-W/D CHART AND ALTERATION
STRENGTH INDEX
Latasha D. Wyering, Marlene C. Villeneuve, Irene C. Wallis, Ben M. Kennedy, Darren M.
Gravley
Submitted to Rock Mechanic and Rock Engineering
Chapter 5
94
5.1. Introduction
Drilling optimisation is accomplished through real time downhole data capture and analysis that
allows drilling operators to adapt to the geologic conditions being drilled. To further control,
optimise, monitor and enhance field production it is necessary to incorporate accurate and timely
data on rock properties. Modeling and optimisation of drilling processes are extremely important
to increase productivity and decrease costs (Bharadwaj and Vinayaka 2013). There have been
many attempts at analytical (Maurer 1962; Galle and Woods 1963; Reed 1972) and statistical
(Bourgoyne and Young 1974; Tansev 1975; Fear 1999) methods for drilling optimisation with
alternative methods including drill-off tests and the use of simulators monitoring real time
drilling parameters (Bourdon et al. 1989; Koederitz & Weis 2005; Frenzel 2006; Kelessidis and
Dalamarinis 2009); however, these methods are only effective in the interval over which the test
was conducted (Koederitz and Weis 2005).
A fundamental task of drilling engineers is the selection, operation and evaluation of drill bits
(Azar and Samuel 2007) to optimise rate of penetration (ROP) because time spent drilling is
usually a significant portion of total well cost (Fear 1999). Each drill bit is designed to function
best under particular conditions. At present, there is no exact scientific approach to drill bit
selection; evaluation of bit records from nearby wells and mechanical rock properties are
typically used to select the best bit for the given material (Azar and Robello Samuel 2007). ROP
responds to changes in drilling approach; for example, changing the weight on bit (WOB) can
cause the ROP to increase or decrease; and depends strongly on rock properties including
mineralogy, strength, density, porosity and permeability (Onyia 1988; Fear 1999; Yarali and
Kahraman 2011).
Bingham (1964a) believed that the drilling industry was unlikely to accurately predict drilling
rates without a means of relating it to rock property measurements. These rock property
measurements would assist in improving drilling performance as it would give a basis for
Chapter 5
95
addressing the operating conditions for optimal drilling. As a result, many researchers have
assessed the drillability of rock from physical rock properties using porosity, density, hardness,
textures, ultrasonic wave velocities, and compared it to the strength of the rock (Gstalder &
Raynal 1966; Howards & Rowlands 1987; Spaar et al. 1995; Thuro 1997; Altindag 2002;
Tanaino 2005; Hoseinie et al. 2008; Bilim 2011; Kelessidis 2011; Yaşar et al. 2011; Yarali and
Kahraman, 2011). Some researchers have developed indices from these physical properties to
predict rock drillability, which are widely used in drillability analysis (Protodyakonov 1962;
Deere and Miller 1966; Gstalder and Raynal 1966; Howards & Rowlands 1987; Wijk 1989;
Thuro 1997; Kahraman et al. 2000; Hoseinie et al. 2008; Saeidi et al. 2013).
Drilling optimisation or studies related to drillability are often focused on the oil and gas
industry and not conventional geothermal fields. The geothermal industry needs an equation to
assess ROP and drillability in geothermal reservoirs because existing empirical equations
developed in non-geothermally altered rocks (Chang et al. 2006; Tamrakar et al. 2007;
Rigopoulos et al. 2010; Singh et al. 2012; Karakul & Ulusay 2013) are only useful as a first
order approximation. Existing empirical equations do not consider the secondary mineralisation
that exists in hydrothermally altered rocks.
This research compares three methods used to estimate rock strength from drilling and
geological data: specific energy (Teale, 1965), mainly its variation known as mechanical
specific energy (MSE), the work by Bingham (1964b) on the R/N-W/D chart, and a modified
version of ASI explained in chapter 4; and assesses how these methods work in a geothermally
altered field with semi-constant energy input using data from the Ngatamariki Geothermal Field,
New Zealand.
5.2. Geological Setting of the Ngatamariki Geothermal Field
The Taupo Volcanic Zone (TVZ) is located in the central North Island, New Zealand, in a 300
km long (200 km on land) and 60 km wide belt, defined by caldera structural boundaries and
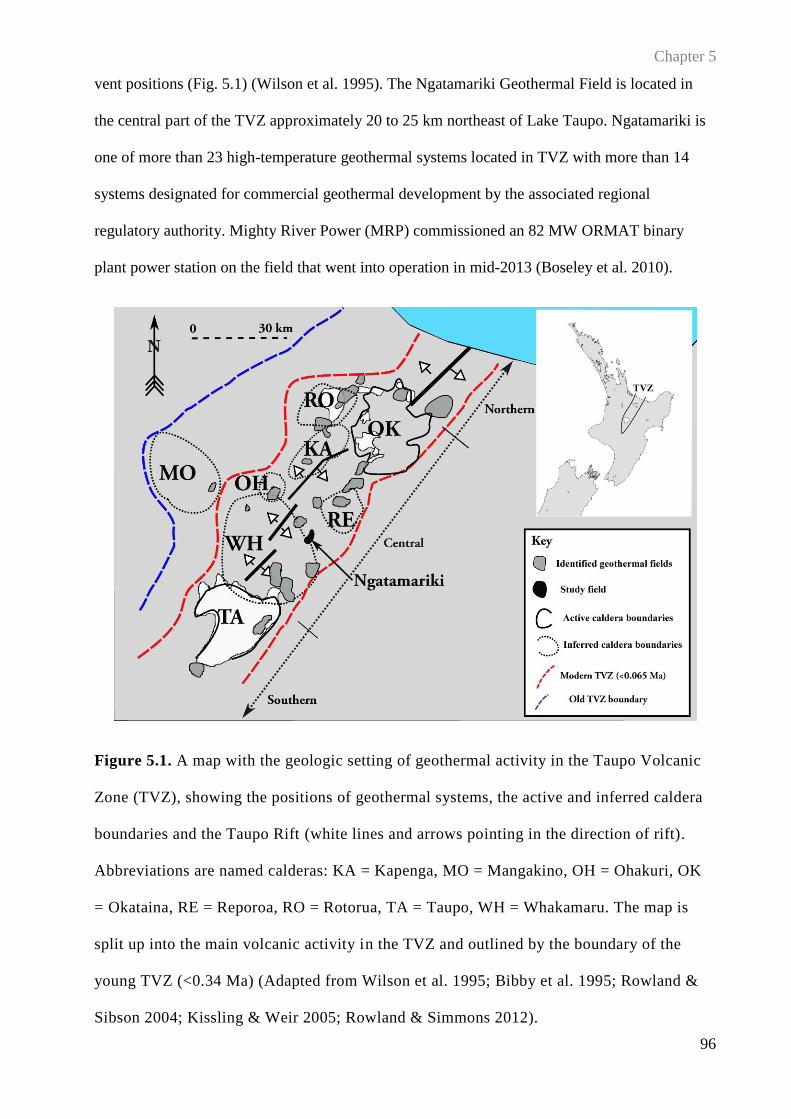
Chapter 5
96
vent positions (Fig. 5.1) (Wilson et al. 1995). The Ngatamariki Geothermal Field is located in
the central part of the TVZ approximately 20 to 25 km northeast of Lake Taupo. Ngatamariki is
one of more than 23 high-temperature geothermal systems located in TVZ with more than 14
systems designated for commercial geothermal development by the associated regional
regulatory authority. Mighty River Power (MRP) commissioned an 82 MW ORMAT binary
plant power station on the field that went into operation in mid-2013 (Boseley et al. 2010).
Figure 5.1. A map with the geologic setting of geothermal activity in the Taupo Volcanic
Zone (TVZ), showing the positions of geothermal systems, the active and inferred caldera
boundaries and the Taupo Rift (white lines and arrows pointing in the direction of rift).
Abbreviations are named calderas: KA = Kapenga, MO = Mangakino, OH = Ohakuri, OK
= Okataina, RE = Reporoa, RO = Rotorua, TA = Taupo, WH = Whakamaru. The map is
split up into the main volcanic activity in the TVZ and outlined by the boundary of the
young TVZ (<0.34 Ma) (Adapted from Wilson et al. 1995; Bibby et al. 1995; Rowland &
Sibson 2004; Kissling & Weir 2005; Rowland & Simmons 2012).
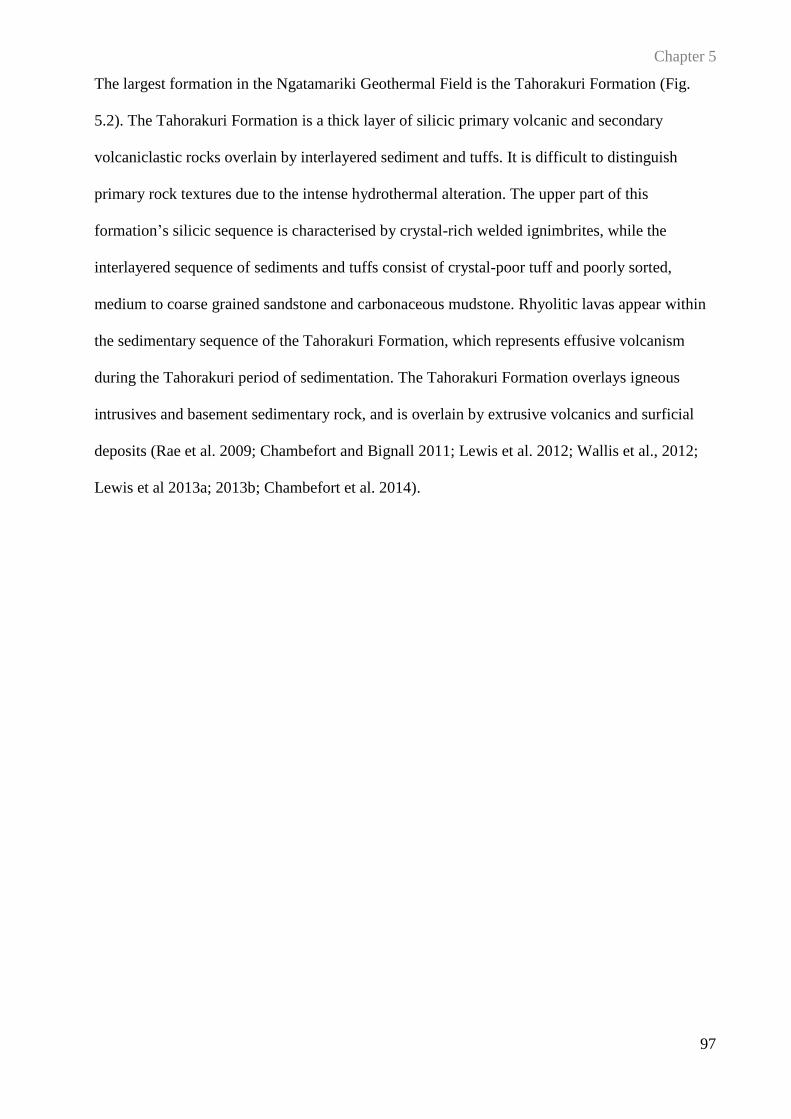
Chapter 5
97
The largest formation in the Ngatamariki Geothermal Field is the Tahorakuri Formation (Fig.
5.2). The Tahorakuri Formation is a thick layer of silicic primary volcanic and secondary
volcaniclastic rocks overlain by interlayered sediment and tuffs. It is difficult to distinguish
primary rock textures due to the intense hydrothermal alteration. The upper part of this
formation’s silicic sequence is characterised by crystal-rich welded ignimbrites, while the
interlayered sequence of sediments and tuffs consist of crystal-poor tuff and poorly sorted,
medium to coarse grained sandstone and carbonaceous mudstone. Rhyolitic lavas appear within
the sedimentary sequence of the Tahorakuri Formation, which represents effusive volcanism
during the Tahorakuri period of sedimentation. The Tahorakuri Formation overlays igneous
intrusives and basement sedimentary rock, and is overlain by extrusive volcanics and surficial
deposits (Rae et al. 2009; Chambefort and Bignall 2011; Lewis et al. 2012; Wallis et al., 2012;
Lewis et al 2013a; 2013b; Chambefort et al. 2014).
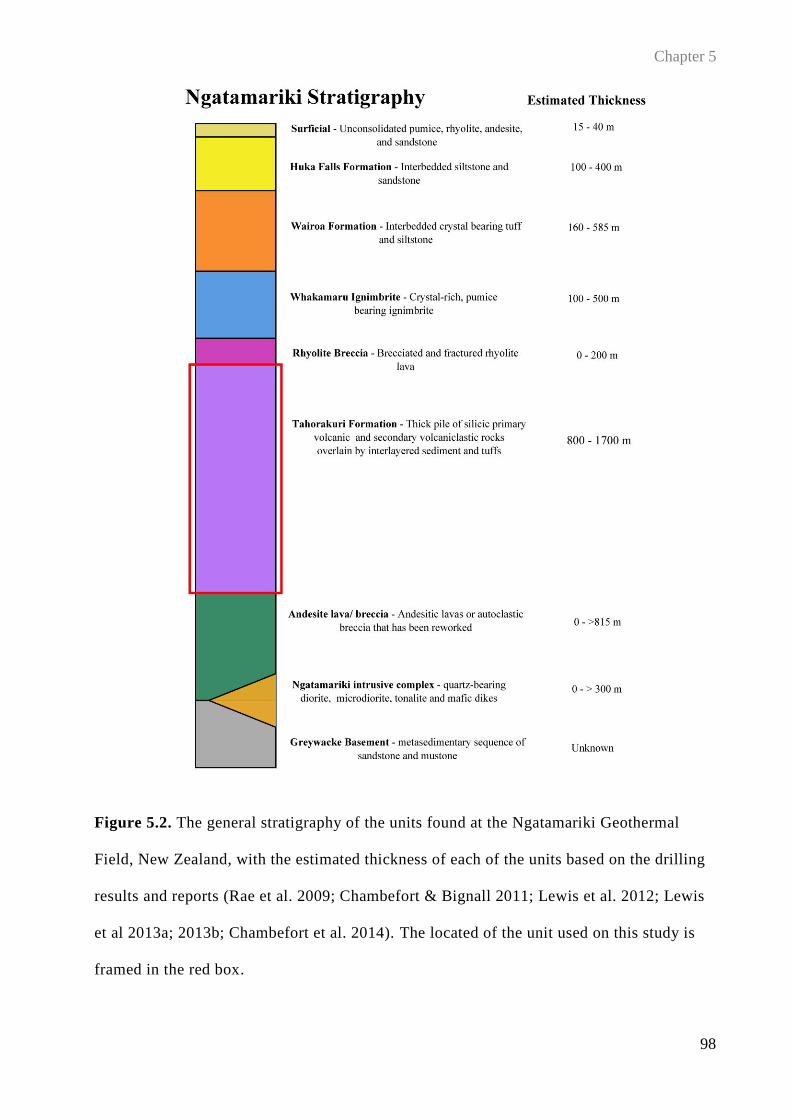
Chapter 5
98
Figure 5.2. The general stratigraphy of the units found at the Ngatamariki Geothermal
Field, New Zealand, with the estimated thickness of each of the units based on the drilling
results and reports (Rae et al. 2009; Chambefort & Bignall 2011; Lewis et al. 2012; Lewis
et al 2013a; 2013b; Chambefort et al. 2014). The located of the unit used on this study is
framed in the red box.
Chapter 5
99
5.3. Drilling Data used in this Study
The 800 m long 17 inch (432 mm) diameter section of well NM8 located in the Tahorakuri
Formation from 1207 – 2002 m Total Vertical Depth (TVD) was used for our study because the
drilling parameters in this section of the well were held near constant, with only small
fluctuations. Two drill bits were used through this section of well (switched at 1479 mTVD).
The first bit was pulled due to the total hours on bit and the second bit was pulled due to total
depth achieved. The first bit was used previously, and was recorded to be in the same condition
after use from when it had been tripped into the well. The second drill bit was new when tripped
into the well and the wear recorded at total depth was minimal. Fluctuations in the ROP is
assumed to be caused by variations in rock strength while drilling; causing the geology to be the
key influence on ROP in this section of well (Cunningham and Eenink 1959). We examine six
primary lithologies consisting of tuff breccia, welded ignimbrite, tuff and volcaniclastic breccia,
veined tuff breccia, crystal poor tuff and andesite bearing lithic tuff; refer to Appendix D.1 for
thin section descriptions.
5.4. Methods to Estimate Rock Strength
5.4.1. Specific Energy
A certain quantity of energy is required to excavate a given volume of rock which depends
entirely on the nature of the rock. The concept of specific energy (SE) (Teale 1965) addresses
rock drillability by calculating the torsional and axial work (energy required) performed by a
drilling bit and dividing this by the volume of rock drilled (output obtained). Mechanical
efficiency is at a maximum when SE is at a minimum. This concept evolved into mechanical
specific energy (MSE; Equation 5.1) (Dupriest and Koederitz 2005 and Dupriest et al. 2005).
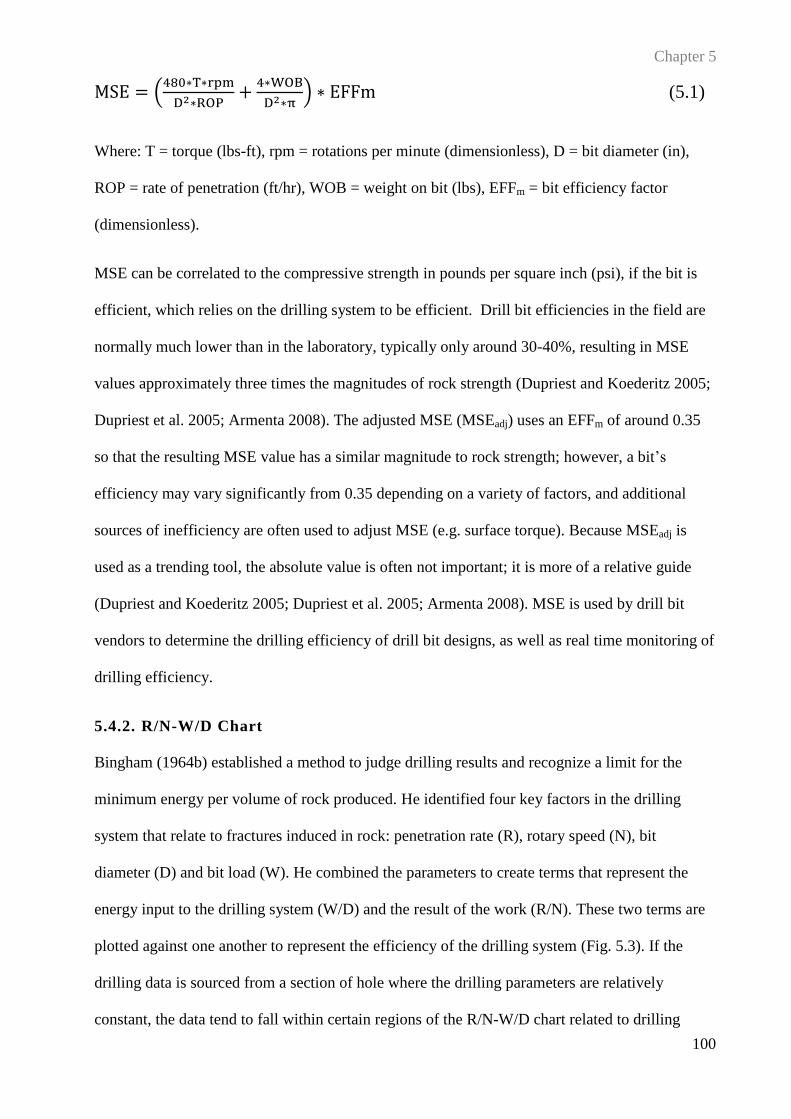
Chapter 5
100
MSE = (480∗T∗rpm
D2∗ROP+
4∗WOB
D2∗π) ∗ EFFm (5.1)
Where: T = torque (lbs-ft), rpm = rotations per minute (dimensionless), D = bit diameter (in),
ROP = rate of penetration (ft/hr), WOB = weight on bit (lbs), EFFm = bit efficiency factor
(dimensionless).
MSE can be correlated to the compressive strength in pounds per square inch (psi), if the bit is
efficient, which relies on the drilling system to be efficient. Drill bit efficiencies in the field are
normally much lower than in the laboratory, typically only around 30-40%, resulting in MSE
values approximately three times the magnitudes of rock strength (Dupriest and Koederitz 2005;
Dupriest et al. 2005; Armenta 2008). The adjusted MSE (MSEadj) uses an EFFm of around 0.35
so that the resulting MSE value has a similar magnitude to rock strength; however, a bit’s
efficiency may vary significantly from 0.35 depending on a variety of factors, and additional
sources of inefficiency are often used to adjust MSE (e.g. surface torque). Because MSEadj is
used as a trending tool, the absolute value is often not important; it is more of a relative guide
(Dupriest and Koederitz 2005; Dupriest et al. 2005; Armenta 2008). MSE is used by drill bit
vendors to determine the drilling efficiency of drill bit designs, as well as real time monitoring of
drilling efficiency.
5.4.2. R/N-W/D Chart
Bingham (1964b) established a method to judge drilling results and recognize a limit for the
minimum energy per volume of rock produced. He identified four key factors in the drilling
system that relate to fractures induced in rock: penetration rate (R), rotary speed (N), bit
diameter (D) and bit load (W). He combined the parameters to create terms that represent the
energy input to the drilling system (W/D) and the result of the work (R/N). These two terms are
plotted against one another to represent the efficiency of the drilling system (Fig. 5.3). If the
drilling data is sourced from a section of hole where the drilling parameters are relatively
constant, the data tend to fall within certain regions of the R/N-W/D chart related to drilling
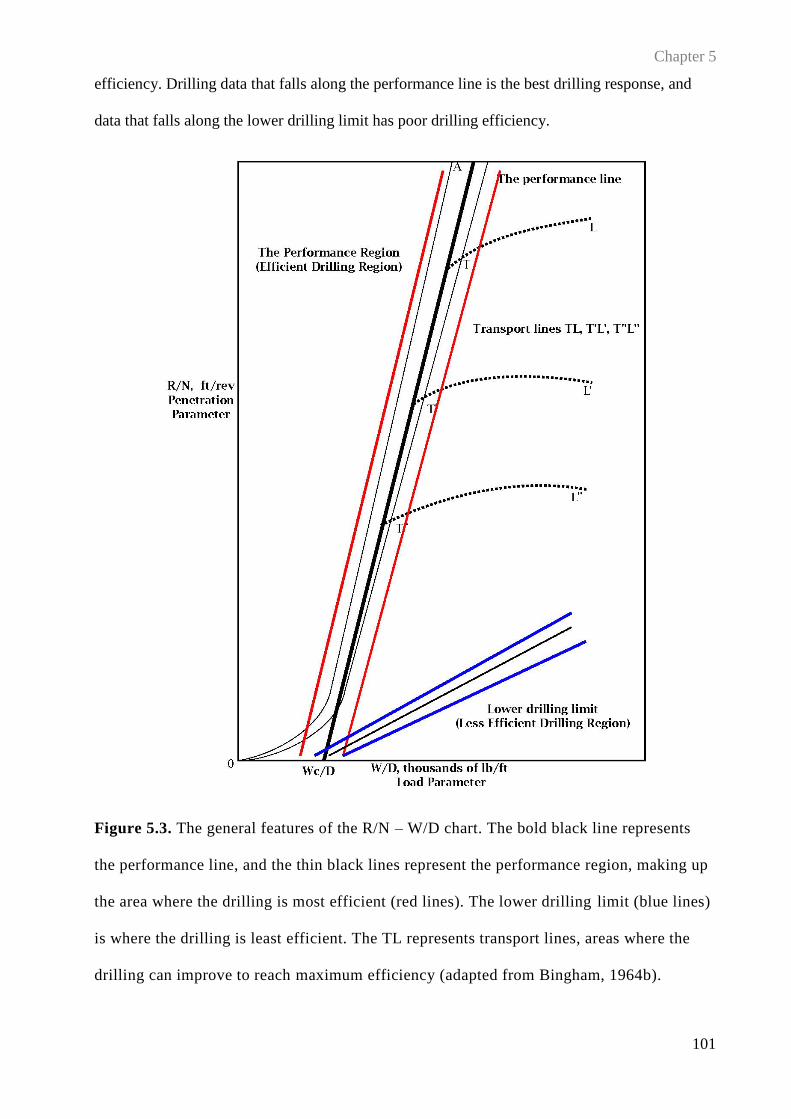
Chapter 5
101
efficiency. Drilling data that falls along the performance line is the best drilling response, and
data that falls along the lower drilling limit has poor drilling efficiency.
Figure 5.3. The general features of the R/N – W/D chart. The bold black line represents
the performance line, and the thin black lines represent the performance region, making up
the area where the drilling is most efficient (red lines). The lower drilling limit (blue lines)
is where the drilling is least efficient. The TL represents transport lines, areas where the
drilling can improve to reach maximum efficiency (adapted from Bingham, 1964b).
Chapter 5
102
In order to obtain rock strength the drilling data is separated into intervals which represent a
certain lithology. The R/N-W/D chart is plotted for each lithology using the drilling parameters.
The drill bit condition, whether it is worn or new, has to be known prior to drilling so the drill bit
can be assigned a drill bit capability constant, which is obtained from Bingham (1964c) (Kew;
Equation 5.2).
Kew = M ∗ (Wc
D)1/2 (5.2)
Where: Kew = the drill bit capability constant (√ft3/lb), M = slope of general performance line
(ft2/lb), and Wc/D = worn-bit intercept (lb/ft).
Kew is constant for a type of drill bit (soft, medium or hard) and the drill bit’s state of wear
(sharp, ¾ worn, ½ worn, ¼ worn or bald). The performance line slope (M) and the Wc/D
intercept (from Fig 5.3) are back calculated through a trial and error approach as the drill bit
capability constant is the only value known; from this method the performance line can be drawn
on the R/N-W/D chart, along with the other characteristic lines (Fig 5.3).
Using Equation 5.3 the rock strength can be converted to shear strength, which can be converted
to compressive strength using Equation 5.4.
τpKew = (Wc
D)1/2 (5.3)
Where, τp= rock shear strength at any pressure, lb/ft2, and Wc/D = worn-bit intercept (lb/ft).
σp = 2τp
144 cos θ (5.4)
Where, σp = compressive strength (psi), and θ = angle of internal friction (assumed to be 35°).
5.4.3. Alteration Strength Index (ASI)
ASI (Equation 5.5) has been proven in chapter 4 to provide a range of rock strengths based on a
rapid analysis of sample mineralogy and microstructure in hydrothermally altered rocks. The
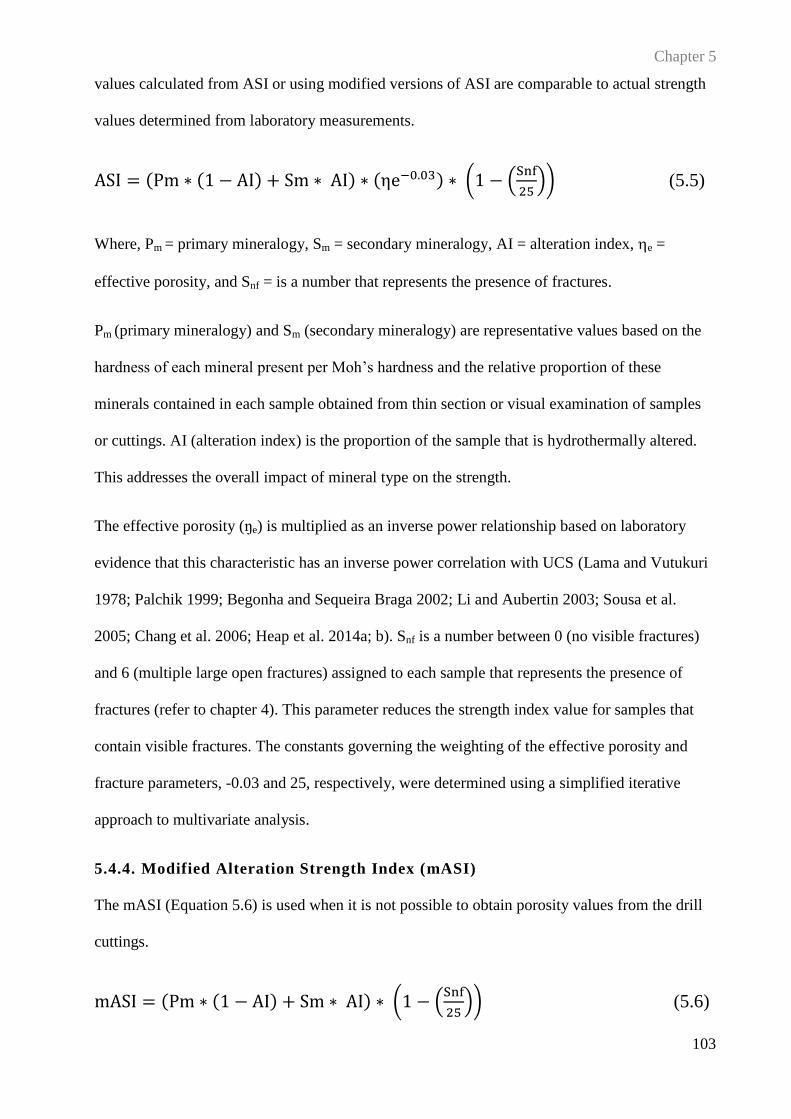
Chapter 5
103
values calculated from ASI or using modified versions of ASI are comparable to actual strength
values determined from laboratory measurements.
ASI = (Pm ∗ (1 − AI) + Sm ∗ AI) ∗ (ηe−0.03) ∗ (1 − (Snf
25)) (5.5)
Where, Pm = primary mineralogy, Sm = secondary mineralogy, AI = alteration index, e =
effective porosity, and Snf = is a number that represents the presence of fractures.
Pm (primary mineralogy) and Sm (secondary mineralogy) are representative values based on the
hardness of each mineral present per Moh’s hardness and the relative proportion of these
minerals contained in each sample obtained from thin section or visual examination of samples
or cuttings. AI (alteration index) is the proportion of the sample that is hydrothermally altered.
This addresses the overall impact of mineral type on the strength.
The effective porosity (ŋe) is multiplied as an inverse power relationship based on laboratory
evidence that this characteristic has an inverse power correlation with UCS (Lama and Vutukuri
1978; Palchik 1999; Begonha and Sequeira Braga 2002; Li and Aubertin 2003; Sousa et al.
2005; Chang et al. 2006; Heap et al. 2014a; b). Snf is a number between 0 (no visible fractures)
and 6 (multiple large open fractures) assigned to each sample that represents the presence of
fractures (refer to chapter 4). This parameter reduces the strength index value for samples that
contain visible fractures. The constants governing the weighting of the effective porosity and
fracture parameters, -0.03 and 25, respectively, were determined using a simplified iterative
approach to multivariate analysis.
5.4.4. Modified Alteration Strength Index (mASI)
The mASI (Equation 5.6) is used when it is not possible to obtain porosity values from the drill
cuttings.
mASI = (Pm ∗ (1 − AI) + Sm ∗ AI) ∗ (1 − (Snf
25)) (5.6)
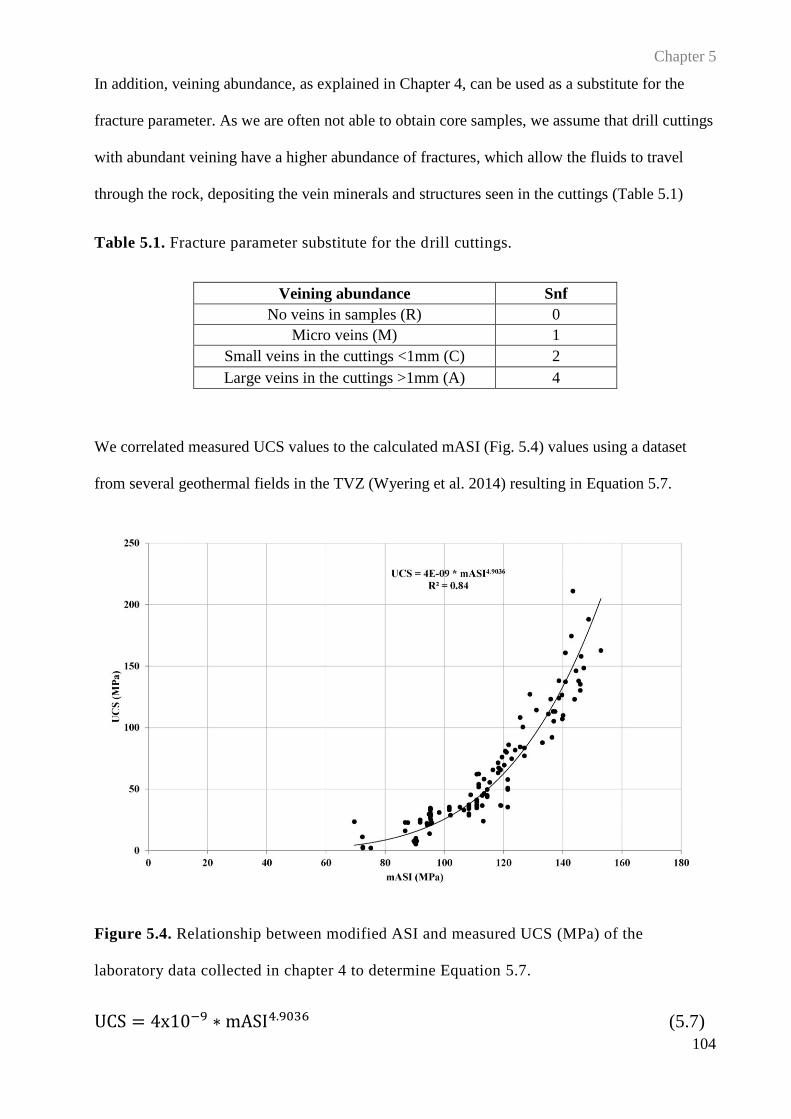
Chapter 5
104
In addition, veining abundance, as explained in Chapter 4, can be used as a substitute for the
fracture parameter. As we are often not able to obtain core samples, we assume that drill cuttings
with abundant veining have a higher abundance of fractures, which allow the fluids to travel
through the rock, depositing the vein minerals and structures seen in the cuttings (Table 5.1)
Table 5.1. Fracture parameter substitute for the drill cuttings.
Veining abundance Snf
No veins in samples (R) 0
Micro veins (M) 1
Small veins in the cuttings <1mm (C) 2
Large veins in the cuttings >1mm (A) 4
We correlated measured UCS values to the calculated mASI (Fig. 5.4) values using a dataset
from several geothermal fields in the TVZ (Wyering et al. 2014) resulting in Equation 5.7.
Figure 5.4. Relationship between modified ASI and measured UCS (MPa) of the
laboratory data collected in chapter 4 to determine Equation 5.7.
UCS = 4x10⁻⁹ ∗ mASI4.9036 (5.7)
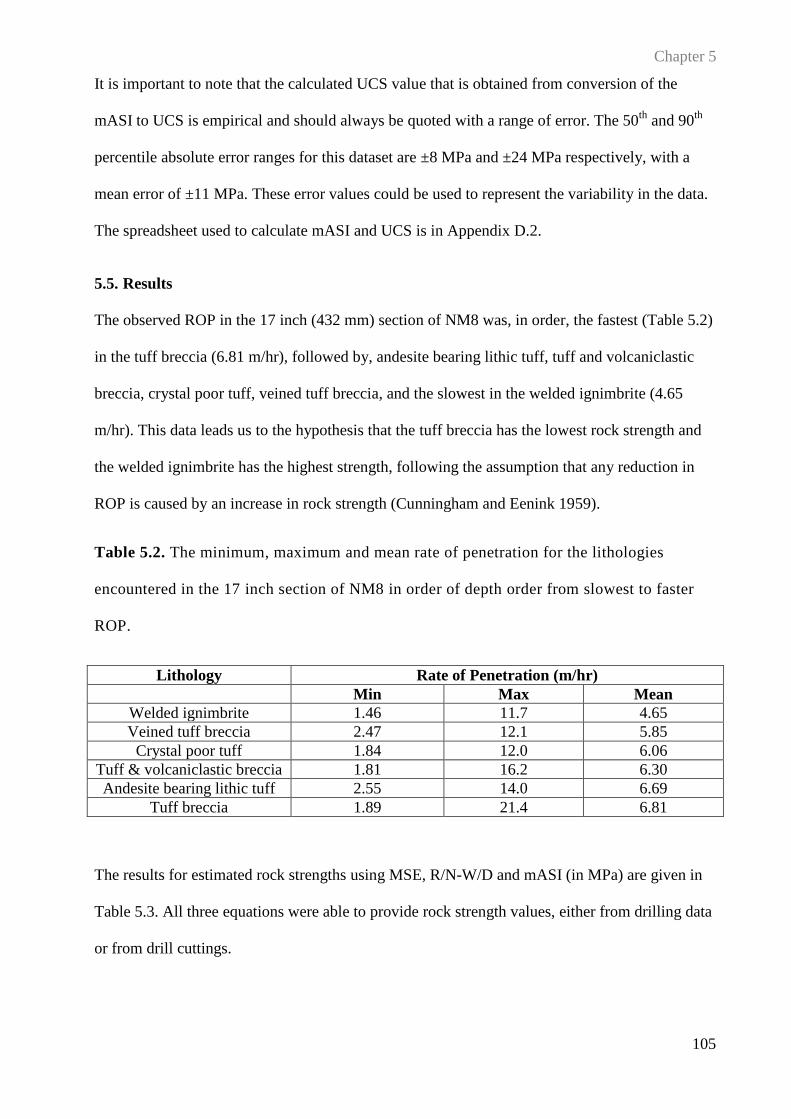
Chapter 5
105
It is important to note that the calculated UCS value that is obtained from conversion of the
mASI to UCS is empirical and should always be quoted with a range of error. The 50th
and 90th
percentile absolute error ranges for this dataset are ±8 MPa and ±24 MPa respectively, with a
mean error of ±11 MPa. These error values could be used to represent the variability in the data.
The spreadsheet used to calculate mASI and UCS is in Appendix D.2.
5.5. Results
The observed ROP in the 17 inch (432 mm) section of NM8 was, in order, the fastest (Table 5.2)
in the tuff breccia (6.81 m/hr), followed by, andesite bearing lithic tuff, tuff and volcaniclastic
breccia, crystal poor tuff, veined tuff breccia, and the slowest in the welded ignimbrite (4.65
m/hr). This data leads us to the hypothesis that the tuff breccia has the lowest rock strength and
the welded ignimbrite has the highest strength, following the assumption that any reduction in
ROP is caused by an increase in rock strength (Cunningham and Eenink 1959).
Table 5.2. The minimum, maximum and mean rate of penetration for the lithologies
encountered in the 17 inch section of NM8 in order of depth order from slowest to faster
ROP.
Lithology Rate of Penetration (m/hr)
Min Max Mean
Welded ignimbrite 1.46 11.7 4.65
Veined tuff breccia 2.47 12.1 5.85
Crystal poor tuff 1.84 12.0 6.06
Tuff & volcaniclastic breccia 1.81 16.2 6.30
Andesite bearing lithic tuff 2.55 14.0 6.69
Tuff breccia 1.89 21.4 6.81
The results for estimated rock strengths using MSE, R/N-W/D and mASI (in MPa) are given in
Table 5.3. All three equations were able to provide rock strength values, either from drilling data
or from drill cuttings.
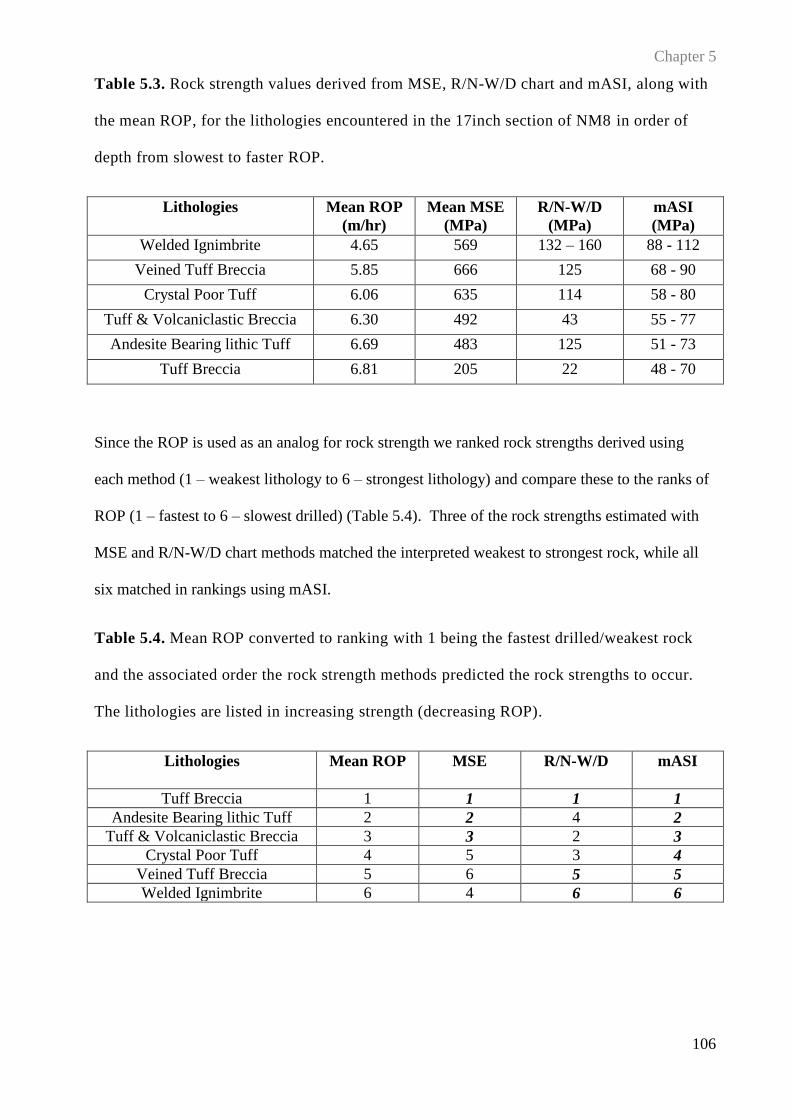
Chapter 5
106
Table 5.3. Rock strength values derived from MSE, R/N-W/D chart and mASI, along with
the mean ROP, for the lithologies encountered in the 17inch section of NM8 in order of
depth from slowest to faster ROP.
Lithologies Mean ROP
(m/hr)
Mean MSE
(MPa)
R/N-W/D
(MPa)
mASI
(MPa)
Welded Ignimbrite 4.65 569 132 – 160 88 - 112
Veined Tuff Breccia 5.85 666 125 68 - 90
Crystal Poor Tuff 6.06 635 114 58 - 80
Tuff & Volcaniclastic Breccia 6.30 492 43 55 - 77
Andesite Bearing lithic Tuff 6.69 483 125 51 - 73
Tuff Breccia 6.81 205 22
48 - 70
Since the ROP is used as an analog for rock strength we ranked rock strengths derived using
each method (1 – weakest lithology to 6 – strongest lithology) and compare these to the ranks of
ROP (1 – fastest to 6 – slowest drilled) (Table 5.4). Three of the rock strengths estimated with
MSE and R/N-W/D chart methods matched the interpreted weakest to strongest rock, while all
six matched in rankings using mASI.
Table 5.4. Mean ROP converted to ranking with 1 being the fastest drilled/weakest rock
and the associated order the rock strength methods predicted the rock strengths to occur.
The lithologies are listed in increasing strength (decreasing ROP).
Lithologies Mean ROP
(m/hr)
MSE R/N-W/D
mASI
Tuff Breccia 1 1 1 1
Andesite Bearing lithic Tuff 2 2 4 2
Tuff & Volcaniclastic Breccia 3 3 2 3
Crystal Poor Tuff 4 5 3 4
Veined Tuff Breccia 5 6 5 5
Welded Ignimbrite 6 4 6 6
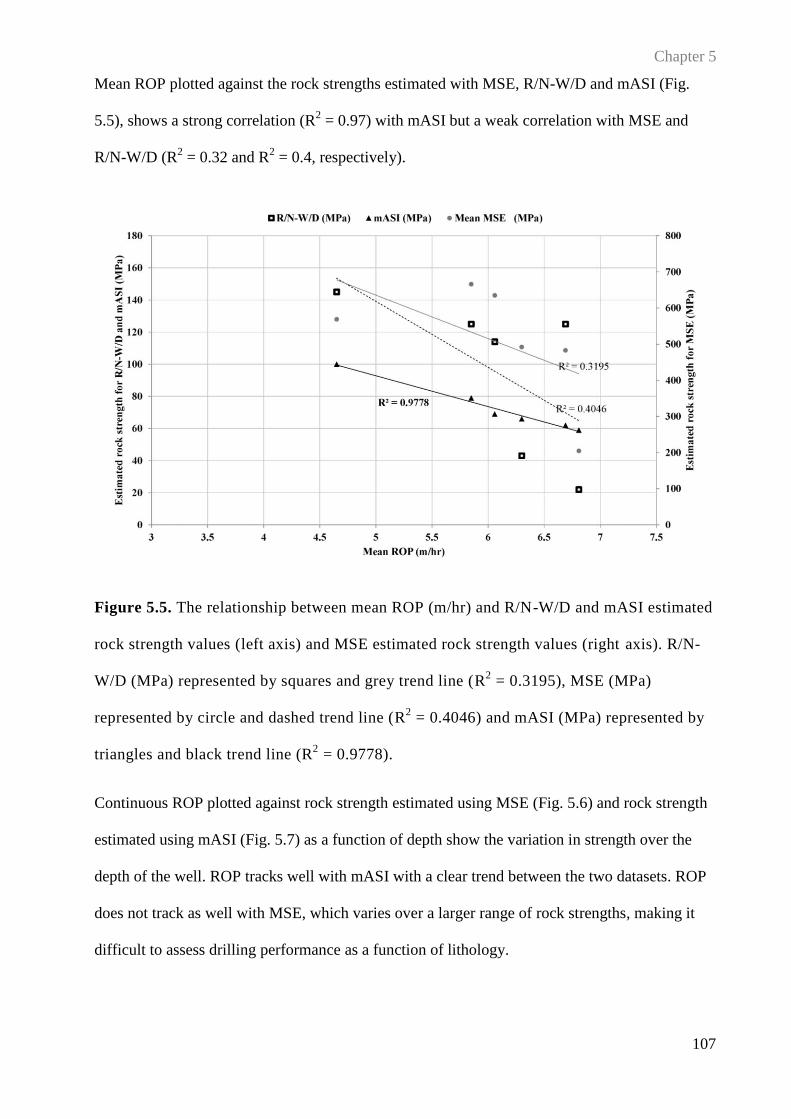
Chapter 5
107
Mean ROP plotted against the rock strengths estimated with MSE, R/N-W/D and mASI (Fig.
5.5), shows a strong correlation (R2 = 0.97) with mASI but a weak correlation with MSE and
R/N-W/D (R2 = 0.32 and R
2 = 0.4, respectively).
Figure 5.5. The relationship between mean ROP (m/hr) and R/N-W/D and mASI estimated
rock strength values (left axis) and MSE estimated rock strength values (right axis). R/N-
W/D (MPa) represented by squares and grey trend line (R2 = 0.3195), MSE (MPa)
represented by circle and dashed trend line (R2 = 0.4046) and mASI (MPa) represented by
triangles and black trend line (R2 = 0.9778).
Continuous ROP plotted against rock strength estimated using MSE (Fig. 5.6) and rock strength
estimated using mASI (Fig. 5.7) as a function of depth show the variation in strength over the
depth of the well. ROP tracks well with mASI with a clear trend between the two datasets. ROP
does not track as well with MSE, which varies over a larger range of rock strengths, making it
difficult to assess drilling performance as a function of lithology.
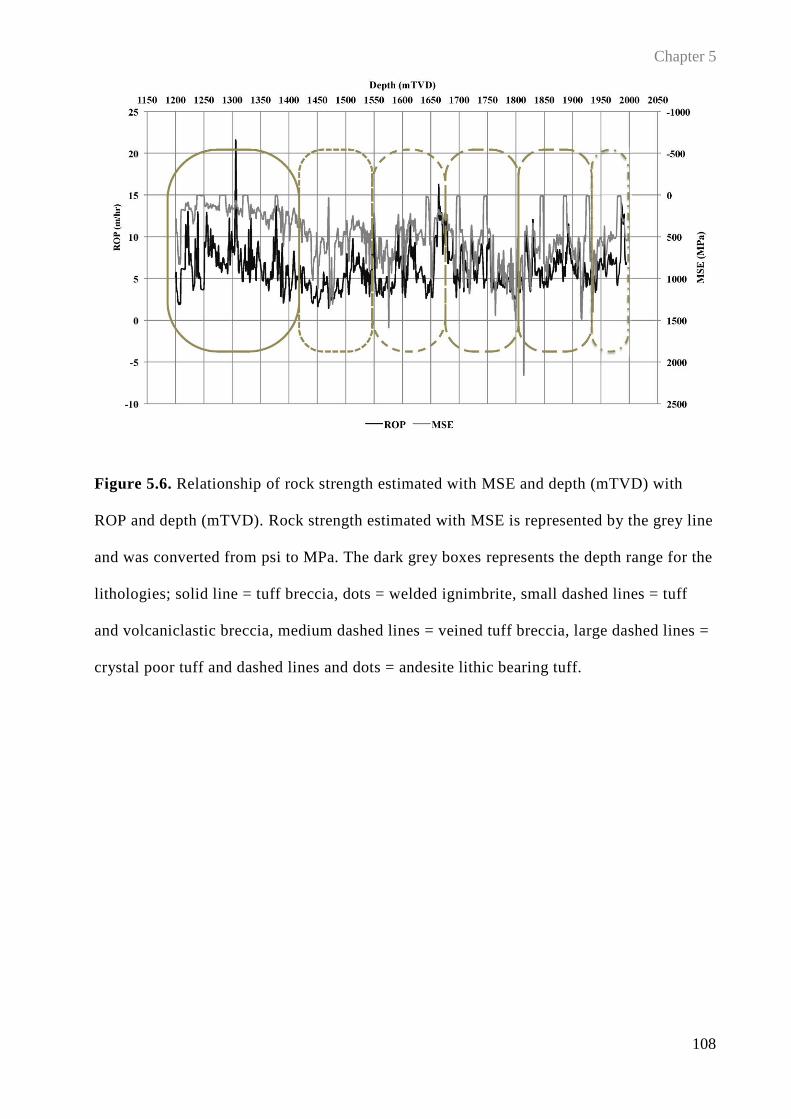
Chapter 5
108
Figure 5.6. Relationship of rock strength estimated with MSE and depth (mTVD) with
ROP and depth (mTVD). Rock strength estimated with MSE is represented by the grey line
and was converted from psi to MPa. The dark grey boxes represents the depth range for the
lithologies; solid line = tuff breccia, dots = welded ignimbrite, small dashed lines = tuff
and volcaniclastic breccia, medium dashed lines = veined tuff breccia, large dashed lines =
crystal poor tuff and dashed lines and dots = andesite lithic bearing tuff.
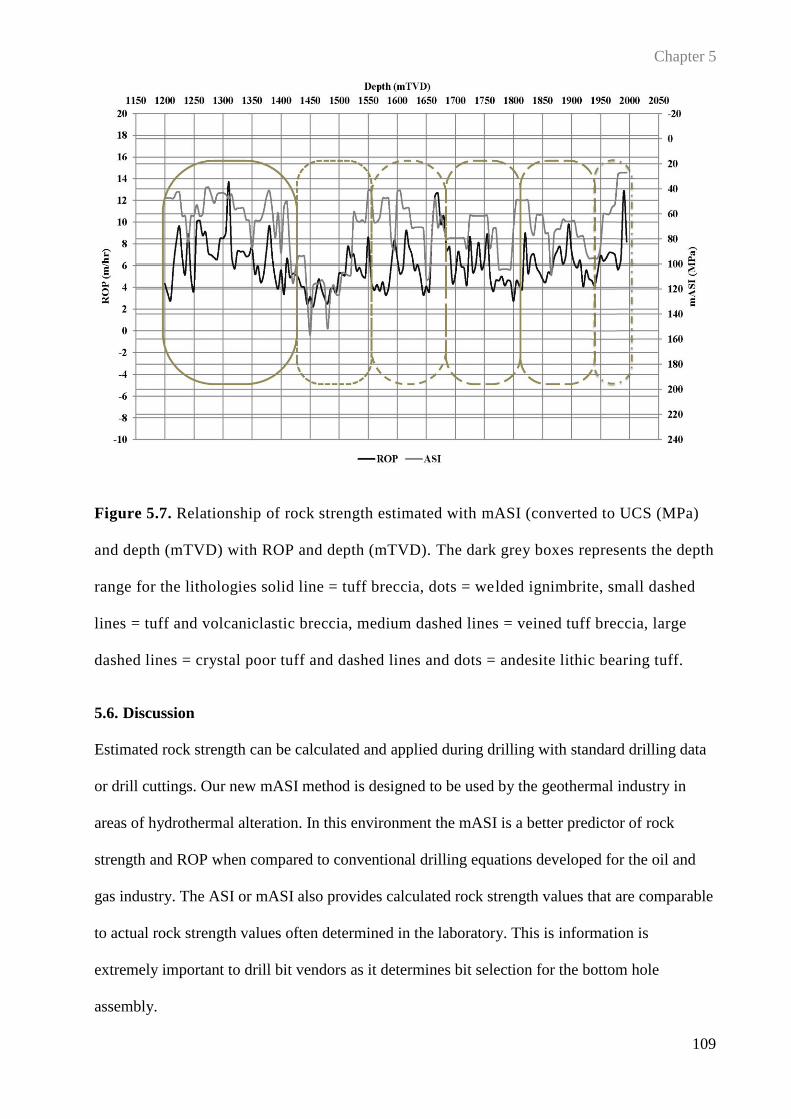
Chapter 5
109
Figure 5.7. Relationship of rock strength estimated with mASI (converted to UCS (MPa)
and depth (mTVD) with ROP and depth (mTVD). The dark grey boxes represents the depth
range for the lithologies solid line = tuff breccia, dots = welded ignimbrite, small dashed
lines = tuff and volcaniclastic breccia, medium dashed lines = veined tuff breccia, large
dashed lines = crystal poor tuff and dashed lines and dots = andesite lithic bearing tuff.
5.6. Discussion
Estimated rock strength can be calculated and applied during drilling with standard drilling data
or drill cuttings. Our new mASI method is designed to be used by the geothermal industry in
areas of hydrothermal alteration. In this environment the mASI is a better predictor of rock
strength and ROP when compared to conventional drilling equations developed for the oil and
gas industry. The ASI or mASI also provides calculated rock strength values that are comparable
to actual rock strength values often determined in the laboratory. This is information is
extremely important to drill bit vendors as it determines bit selection for the bottom hole
assembly.
Chapter 5
110
5.6.1. Drilling Efficiency Dependence of Rock Strength Estimates
Efficient drilling in a geothermal field can be difficult to achieve because the lithology can vary
significantly in rock properties due to a number of factors. For example, the primary lithologies
often vary from extrusive lavas or ignimbrites to sedimentary deposits or intrusive plutons. In oil
and gas fields, drilling occurs through largely indistinct sedimentary lithologies, with little
variation across field (Halbouty et al. 1970). The lithologies in the geothermal field undergo
hydrothermal alteration that causes changes in the primary lithologies due to the presence of
hydrothermal fluids. The fluids modify the primary lithologies through silicification, clay
alterations etc. causing changes in rock strength (Ladygin et al. 2000; Frolova et al. 2005;
Frolova et al. 2010; Lutz et al. 2011; Pola et al. 2014; Wyering et al. 2014). The geothermal
environment exacerbates fluctuations in ROP that the drill team cannot predict and this results in
onsite adjustment and optimization while drilling which is costly; or continued drilling under
non optimal conditions which can also be costly.
The MSE approach was a possible solution to this problem, whereby the drilling team can keep
track of the MSE and ROP side by side and manipulate drilling parameters to improve the ROP;
however, correlating MSE with rock strength is not an easy task because rock strength estimates
using MSE are usually higher and have a poor correlation to UCS measured strength, even when
the bit is drilling at 30-40% efficiency (Dupriest and Koederitz 2005; Dupriest et al. 2005;
Armenta 2008). In many instances, the efficiency of the drilling system is not known, resulting
in the inaccurate calculation of EFFm and estimates of rock strength with high uncertainty. This
is exemplified by the section drilled at Ngatamariki (studied here) where MSE derived estimated
UCS values were far higher than tested rock strength. Drillers in oil and gas fields often know
the rock strength from bit vendor analysis or geologic studies, and can adjust the display value so
it is close to rock strength when the bit is at peak efficiency (Dupriest et al. 2005). This provides
a tangible frame of reference to give the driller a sense that the bit is performing well and that the
ROP will increase reliably simply by raising the WOB or RPM (Dupriest et al. 2005). A lack of
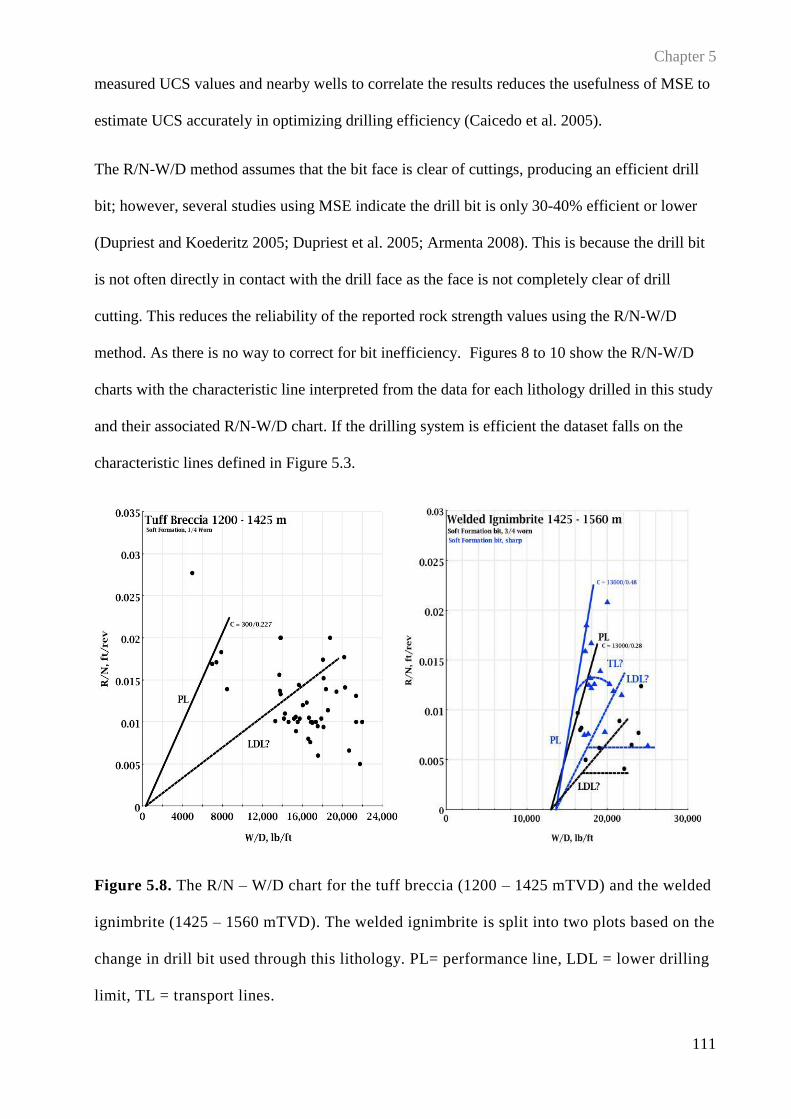
Chapter 5
111
measured UCS values and nearby wells to correlate the results reduces the usefulness of MSE to
estimate UCS accurately in optimizing drilling efficiency (Caicedo et al. 2005).
The R/N-W/D method assumes that the bit face is clear of cuttings, producing an efficient drill
bit; however, several studies using MSE indicate the drill bit is only 30-40% efficient or lower
(Dupriest and Koederitz 2005; Dupriest et al. 2005; Armenta 2008). This is because the drill bit
is not often directly in contact with the drill face as the face is not completely clear of drill
cutting. This reduces the reliability of the reported rock strength values using the R/N-W/D
method. As there is no way to correct for bit inefficiency. Figures 8 to 10 show the R/N-W/D
charts with the characteristic line interpreted from the data for each lithology drilled in this study
and their associated R/N-W/D chart. If the drilling system is efficient the dataset falls on the
characteristic lines defined in Figure 5.3.
Figure 5.8. The R/N – W/D chart for the tuff breccia (1200 – 1425 mTVD) and the welded
ignimbrite (1425 – 1560 mTVD). The welded ignimbrite is split into two plots based on the
change in drill bit used through this lithology. PL= performance line, LDL = lower drilling
limit, TL = transport lines.
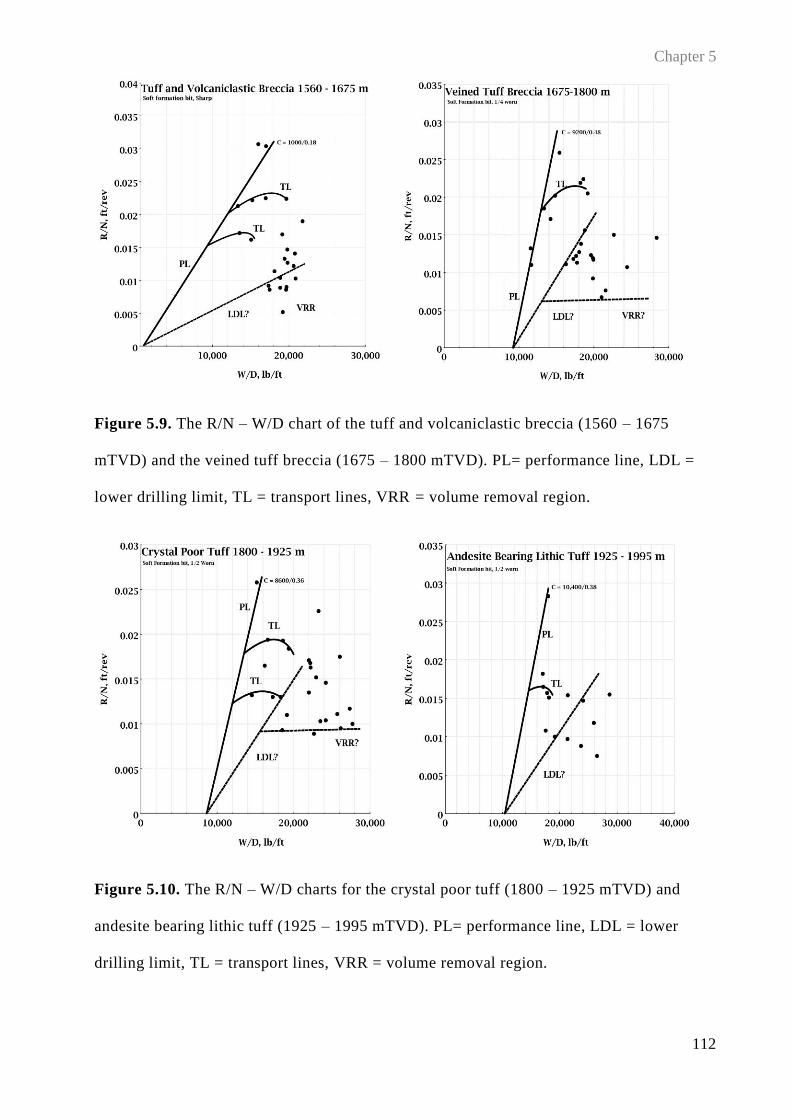
Chapter 5
112
Figure 5.9. The R/N – W/D chart of the tuff and volcaniclastic breccia (1560 – 1675
mTVD) and the veined tuff breccia (1675 – 1800 mTVD). PL= performance line, LDL =
lower drilling limit, TL = transport lines, VRR = volume removal region.
Figure 5.10. The R/N – W/D charts for the crystal poor tuff (1800 – 1925 mTVD) and
andesite bearing lithic tuff (1925 – 1995 mTVD). PL= performance line, LDL = lower
drilling limit, TL = transport lines, VRR = volume removal region.
Chapter 5
113
The drilling data does not fall on the characteristic lines, in these figures, that would be expected
for efficient drilling. Rock strength calculations with this data are not reliable as there is a lack of
data falling around the performance region. The charts represent how efficient the drilling
system was during drilling; the less efficient the system, the more data falls around the lower
drilling limit. In this case the rock strength values estimated by this methodology become
uncertain.
The mASI or ASI methods are based on geological parameters mainly mineralogy, to determine
rock strength and are not influenced by drilling parameters, and do not rely on the drill team
working optimally to provide the information that is necessary for improving drilling systems.
Therefore, use of the ASI in conjunction with geologic models prior to drilling, or by analysis of
the drill cuttings during drilling can help with optimizing drilling parameters.
5.6.2. Estimated Rock Strength Values
The estimated rock strength values calculated using the three methods provide first
approximations for the rock strengths expected in a geothermal field. The estimated rock
strength provided by the mASI and R/N-W/D chart methods provided rock strength values or
ranges that are realistic for hydrothermally altered volcanic material (Calcaterra et al. 2004;
Kohno & Maeda 2012; Pola et al. 2014; Siratovich et al. 2014; Wyering et al. 2014). The mean
rock strength estimated using MSE, with the bit efficiently factor set at 0.35, estimated mean
rock strength values from roughly 205 – 666 MPa across all lithologies (refer to Table 5.2);
however, the absolute range of values for the lithologies varied from 1.3 – 2100 MPa. The rock
strengths estimated using the MSE method are unrealistic and do not appear to reliably represent
the strength of the material being drilled.
Although the R/N-W/D chart provided realistic rock strength values, limitations exist when
using this method. The method assumes the drilling was efficient, which we have proven is not
the case as much of the drilling data falls near the lower drilling limit (refer to Fig. 5.8 to Fig.
Chapter 5
114
10). The method also provides a single rock strength value for a given lithology, unless a bit
change occurred within the lithology, which is important because a single value does not
represent the range of rock strengths usually present in a lithology. Knowledge of the bit wear
during drilling (or at least detailed descriptions of the bit condition) is required so the correct
drill bit capability constant (Kew) can be selected for the rock strength equations (Equations 5.2
to 5.4). If the incorrect value is selected, the resulting performance line and Wc/D intercept lead
to the wrong estimated rock strength value. In this dataset we can only assume the correct Kew
was selected for each lithology, however, small miscalculations could lead to differing results.
The mASI or ASI method is not dependent on drilling efficiency or quantification of drilling
parameters, as it is based on geological parameters. It is only limited by the ability to collect the
required information through thin sections or drill cuttings. Chapter 4, Figure 4.6 demonstrated
the strong relationship between mASI and UCS, which is even stronger with ASI, if porosity
information is available.
5.6.3. Strength Database and Drill Bit Selection
The benefit of having an equation that can estimate rock strengths is the ability to develop a
database system that contains estimated UCS values of the material encountered during drilling
to help optimize drill bit selection. Such a database can be developed (using ASI or mASI) on
site when the geologist logs the drill cuttings. This provides a range of estimated rock strength
for every interval over which cuttings are collected. These estimated values are comparable to
actual values determined from UCS laboratory testing, which is extremely valuable to drilling
engineers and drill bit vendors.
The MSE method could provide the same information; however, unless each well is correlated to
existing rock strengths values, or a nearby well, the values become unreliable and provide more
of a trend towards drilling efficiency/bit performance than estimated rock strength values
(Caicedo et al. 2005; Dupriest et al. 2005). MSE is a useful measure for predicting the power
Chapter 5
115
requirements for a particular bit type to drill at a given ROP in a given lithology, and the ROP
that a particular bit might be expected to achieve in a given rock type (Caicedo et al. 2005);
however; even minor over estimations of strength values can lead to the wrong drill bit choice,
which, in turn, would negatively impact drilling and could result in large financial consequences
to the cost of drilling and viability of the project.
ASI and mASI can be also used for cross well correlations, by plotting the ROP against the
estimated rock strength (Fig. 5.7). The trends in the data can be determined, and as the number
of wells increase and several lithologies are drilled multiple times, correlations from one well to
another can be developed, improving the dataset and understanding of the mechanical behaviour
of the lithologies in the reservoir.
5.7. Conclusion
1. Three methods for estimating rock strength, MSE, R/N-W/D chart and mASI, were used
to estimate a range of rock strengths for the 800m section of the 17 inch (432 mm)
diameter NM8 well from the Ngatamariki geothermal field. The MSE and R/N-W/D
methods were designed for drilling optimization in the oil and gas industry and are
derived from drilling parameters. The mASI method is designed for the geothermal
industry and is based on geological parameters including mineralogy, mineral hardness,
alteration intensity and fracture/veining.
2. Rock strengths estimated using the three methods were plotted against mean ROP (m/hr)
for the 17 inch (432 mm) section of NM8. The drilling parameters were held near
constant for this section of the well; therefore, we were able to use the mean ROP as an
analog to rock strength. Three of the six rock strength estimates based on MSE or the
R/N-W/D chart method matched the lithologies ranked by interpreted strength from ROP,
while all six matched for the mASI method.
Chapter 5
116
3. When mean ROP and the associated mean estimated rock strengths for each lithology
were plotted against one another (Fig. 5.5) we were able to show a clear trend between
the rock strengths estimated using mASI method and ROP, but not between rock
strengths estimated using MSE or R/N-W/D methods and ROP. When ROP and rock
strengths estimated using MSE and mASI were plotted with depth (Fig. 5.6 and 5.7), the
trend was clearer between rock strengths estimated using mASI and ROP than between
rock strengths estimated using MSE and ROP.
4. Dependence on drilling efficiency becomes an issue for rock strength estimated using the
MSE and R/N-W/D methods. Both methods require the drilling to be efficient to obtain
the correct rock strength estimates. For drilling to be completed efficiently UCS
measurements and correlations to nearby wells are required, but in the case studied we
have neither. The rock strength estimated using mASI does not rely on the drilling
system to be efficient because it is based on geological parameters, and will provide a
consistently representative estimate of strength as long as drill cuttings are available.
5. A database of estimated rock strengths for reservoir lithologies, wells or fields is
important for a drill team or bit vendor because the rock strength is a key parameter for
drill bit selection. The mASI or ASI method can be used to build such a database on site
when the geologist logs the drill cuttings. This would provide a range of estimated rock
strength for the material for every interval over which cuttings are collected because the
predicted strength values are able to be compared to actual UCS values measured in
laboratories providing important information for the drilling engineers or drill bit
vendors.
Chapter 6
CHAPTER 6 :
FAILURE MODES OF HYDROTHERMALLY ALTERED ROCKS UNDER
UNIAXIAL COMPRESSION AND HOW THEY RELATE TO ROCK
PROPERTIES
Chapter 6
118
6.1. Introduction
Rock failure is a serious problem in rock engineering environments, which includes drilling and
has been a subject of extensive research for many years (Bieniawski et al. 1969; Peng and
Johnson 1972; Lajtai and Lajtai 1975). The mechanical properties of rocks are affected by
discontinuities and defects, such as planes of weakness, mineralogical variations, bedding
planes, cracks and voids. On a macroscopic scale the discontinuities are characterised by
distinctive joints, while on a microscopic scale, samples can contain initial structural damage in
the form of microcracks/voids (Lajtai and Lajtai 1975; Santarelli and Brown 1989; Eberhardt et
al. 1998; Li et al. 2004; Åkesson et al. 2004; Szwedzicki 2007; Basu et al. 2013). Laboratory
testing has shown that fractures initiated on discontinuities lead to rock failure. The location,
orientation, size, density and extent of microscopic discontinuities contribute to different failure
modes (Szwedzicki 2007). During compression, a complex sequential process of crack closure,
crack initiation, stable and unstable crack growth occur until the critical cracks coalesce to form
one or several macroscopic cracks, resulting in sample failure (Scholz 1968; Sammis and Ashby
1986; Basu et al. 2013); however, the ultimate type of failure modes for the sample is difficult to
predict (Peng and Johnson 1972; Santarelli and Brown 1989). We need to consider why rocks
fail in engineering structures and gain an understanding of how they fail in the circumstances
they face (Hudson 1989). Hudyma et al. (2004) suggested testing samples in uniaxial
compression to help comprehend the failure modes of rock masses. Several studies have been
conducted to observe the failure patterns in a variety of rocks in compression. Sammis and
Ashby (1986) state that confining pressure influences the failure mode; samples that are
unconfined tend to fail through axial splitting; whereas low and moderate confinement results in
shear failure and high confining pressure results in failure through the development of multiple
fractures. Santarelli and Brown (1989) found through triaxial testing that failure manifests itself
in different ways depending on the microstructure of the rock. Maji (2011) indicated that the
type of failure mode under uniaxial compression affects the final strength of the sample, when
Chapter 6
119
two samples of seemingly identical origin but differing failure modes are compared. The ability
to determine the mode in which a rock is most likely to fail can provide information on that
rock’s compressive strength.
Limited research has been conducted into determining whether there is a relationship between
failure modes and particular rock properties; therefore, the aim of this study is to determine
whether certain rock properties influence rock failure modes under uniaxial compression, and
whether they can be used to understand how a rock that displays these properties may fail in the
field.
6.2. Failure in Uniaxial Compression
Under increasing uniaxial compression, stress redistributes within a rock, resulting in
microfracturing; the nucleation of cracks occurs where stress is most concentrated. These cracks
propagate as the load continues to increase, forming either one large crack, or several small
cracks, which ultimately lead to sample failure (Horii and Nemat-Nasser 1985; Szwedzicki
2006).
A total of 114 samples were tested for UCS in this investigation and four failure modes were
observed (Fig. 6.1):
1. Axial splitting: Failure along the plane parallel to the direction of compression
2. Single Shear: One major shearing plane situated at an oblique angle to the direction of
maximum compression
3. Y Shaped failure: A mix of single shear and axial failure modes where the sample shears at
the top and axial splits through the bottom
4. Multiple Fracturing: Sample disintegration along a number of planes at various angles
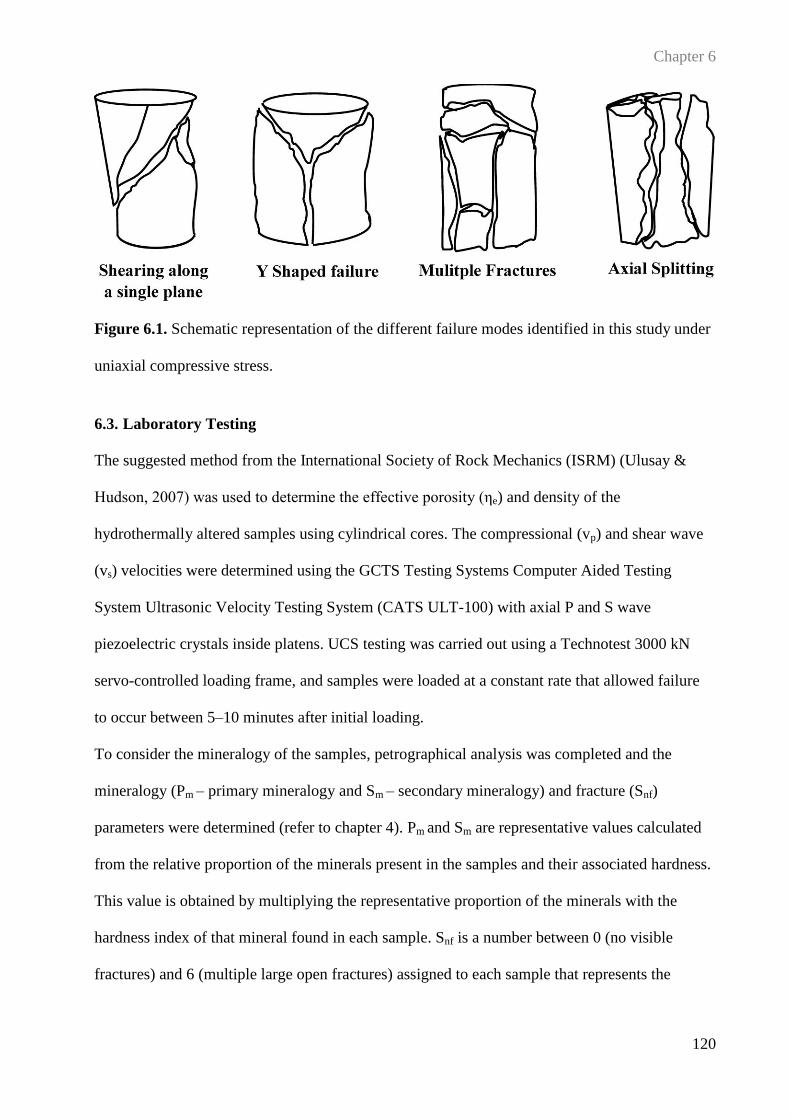
Chapter 6
120
Figure 6.1. Schematic representation of the different failure modes identified in this study under
uniaxial compressive stress.
6.3. Laboratory Testing
The suggested method from the International Society of Rock Mechanics (ISRM) (Ulusay &
Hudson, 2007) was used to determine the effective porosity (ηe) and density of the
hydrothermally altered samples using cylindrical cores. The compressional (vp) and shear wave
(vs) velocities were determined using the GCTS Testing Systems Computer Aided Testing
System Ultrasonic Velocity Testing System (CATS ULT-100) with axial P and S wave
piezoelectric crystals inside platens. UCS testing was carried out using a Technotest 3000 kN
servo-controlled loading frame, and samples were loaded at a constant rate that allowed failure
to occur between 5–10 minutes after initial loading.
To consider the mineralogy of the samples, petrographical analysis was completed and the
mineralogy (Pm – primary mineralogy and Sm – secondary mineralogy) and fracture (Snf)
parameters were determined (refer to chapter 4). Pm and Sm are representative values calculated
from the relative proportion of the minerals present in the samples and their associated hardness.
This value is obtained by multiplying the representative proportion of the minerals with the
hardness index of that mineral found in each sample. Snf is a number between 0 (no visible
fractures) and 6 (multiple large open fractures) assigned to each sample that represents the
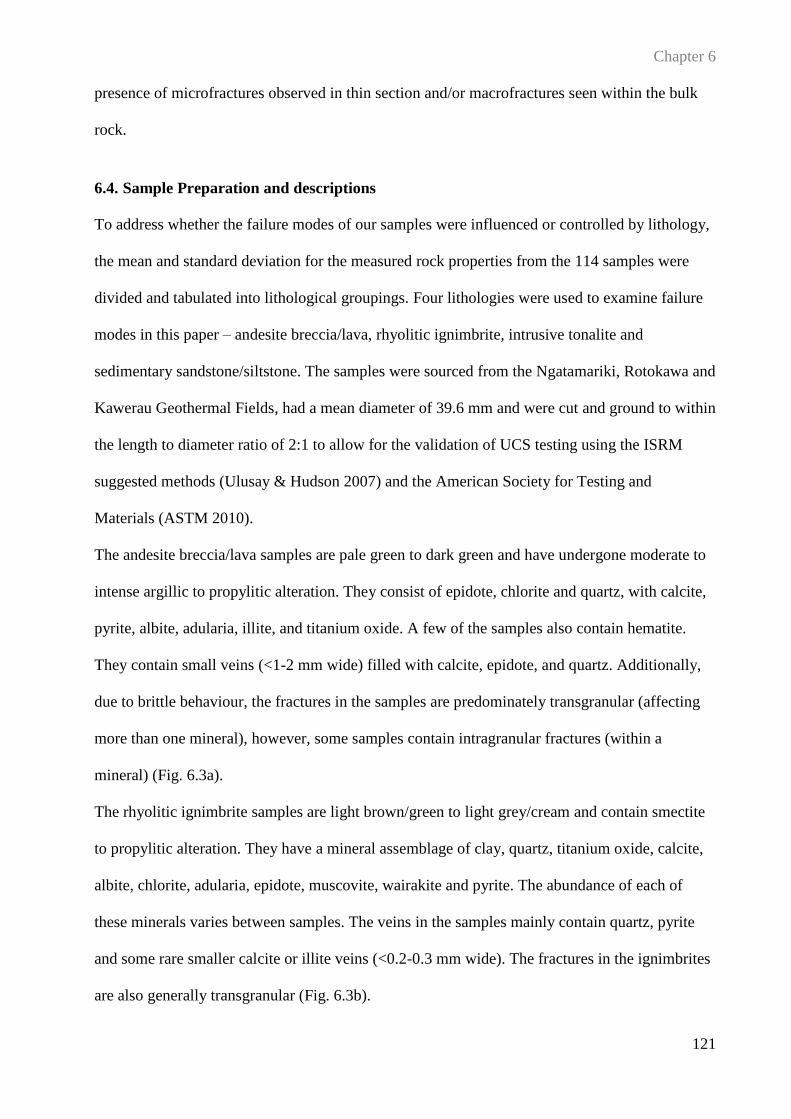
Chapter 6
121
presence of microfractures observed in thin section and/or macrofractures seen within the bulk
rock.
6.4. Sample Preparation and descriptions
To address whether the failure modes of our samples were influenced or controlled by lithology,
the mean and standard deviation for the measured rock properties from the 114 samples were
divided and tabulated into lithological groupings. Four lithologies were used to examine failure
modes in this paper – andesite breccia/lava, rhyolitic ignimbrite, intrusive tonalite and
sedimentary sandstone/siltstone. The samples were sourced from the Ngatamariki, Rotokawa and
Kawerau Geothermal Fields, had a mean diameter of 39.6 mm and were cut and ground to within
the length to diameter ratio of 2:1 to allow for the validation of UCS testing using the ISRM
suggested methods (Ulusay & Hudson 2007) and the American Society for Testing and
Materials (ASTM 2010).
The andesite breccia/lava samples are pale green to dark green and have undergone moderate to
intense argillic to propylitic alteration. They consist of epidote, chlorite and quartz, with calcite,
pyrite, albite, adularia, illite, and titanium oxide. A few of the samples also contain hematite.
They contain small veins (<1-2 mm wide) filled with calcite, epidote, and quartz. Additionally,
due to brittle behaviour, the fractures in the samples are predominately transgranular (affecting
more than one mineral), however, some samples contain intragranular fractures (within a
mineral) (Fig. 6.3a).
The rhyolitic ignimbrite samples are light brown/green to light grey/cream and contain smectite
to propylitic alteration. They have a mineral assemblage of clay, quartz, titanium oxide, calcite,
albite, chlorite, adularia, epidote, muscovite, wairakite and pyrite. The abundance of each of
these minerals varies between samples. The veins in the samples mainly contain quartz, pyrite
and some rare smaller calcite or illite veins (<0.2-0.3 mm wide). The fractures in the ignimbrites
are also generally transgranular (Fig. 6.3b).
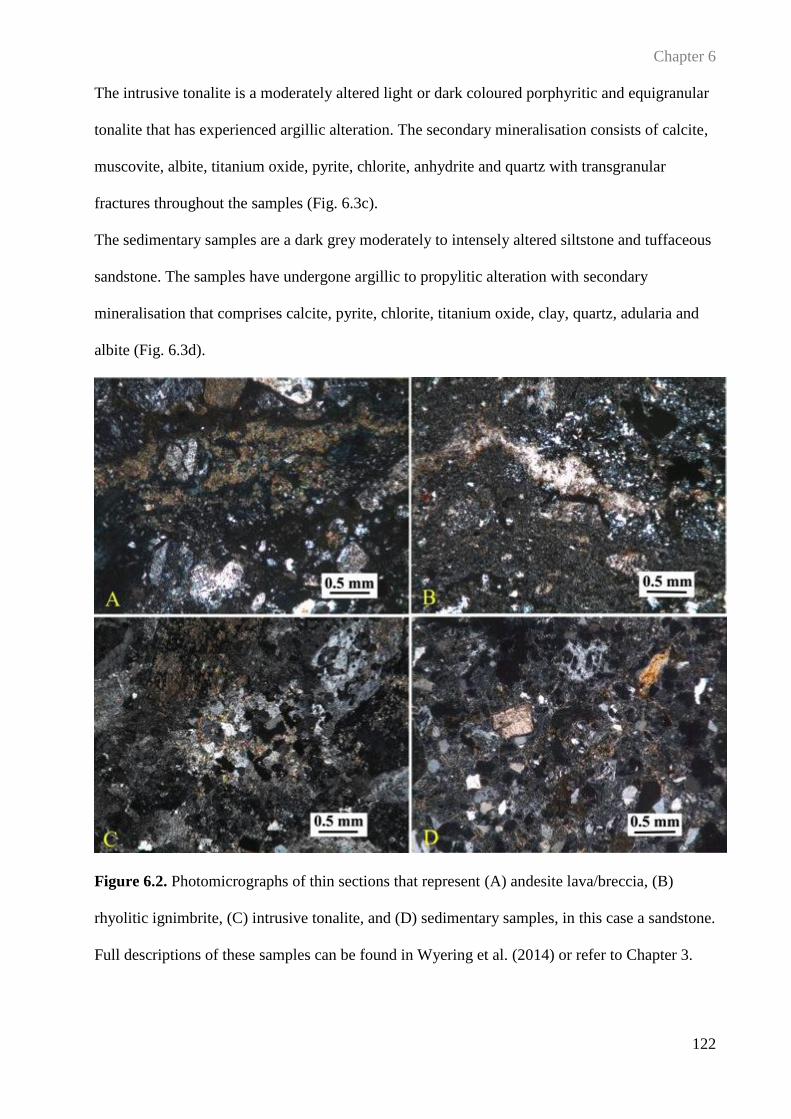
Chapter 6
122
The intrusive tonalite is a moderately altered light or dark coloured porphyritic and equigranular
tonalite that has experienced argillic alteration. The secondary mineralisation consists of calcite,
muscovite, albite, titanium oxide, pyrite, chlorite, anhydrite and quartz with transgranular
fractures throughout the samples (Fig. 6.3c).
The sedimentary samples are a dark grey moderately to intensely altered siltstone and tuffaceous
sandstone. The samples have undergone argillic to propylitic alteration with secondary
mineralisation that comprises calcite, pyrite, chlorite, titanium oxide, clay, quartz, adularia and
albite (Fig. 6.3d).
Figure 6.2. Photomicrographs of thin sections that represent (A) andesite lava/breccia, (B)
rhyolitic ignimbrite, (C) intrusive tonalite, and (D) sedimentary samples, in this case a sandstone.
Full descriptions of these samples can be found in Wyering et al. (2014) or refer to Chapter 3.
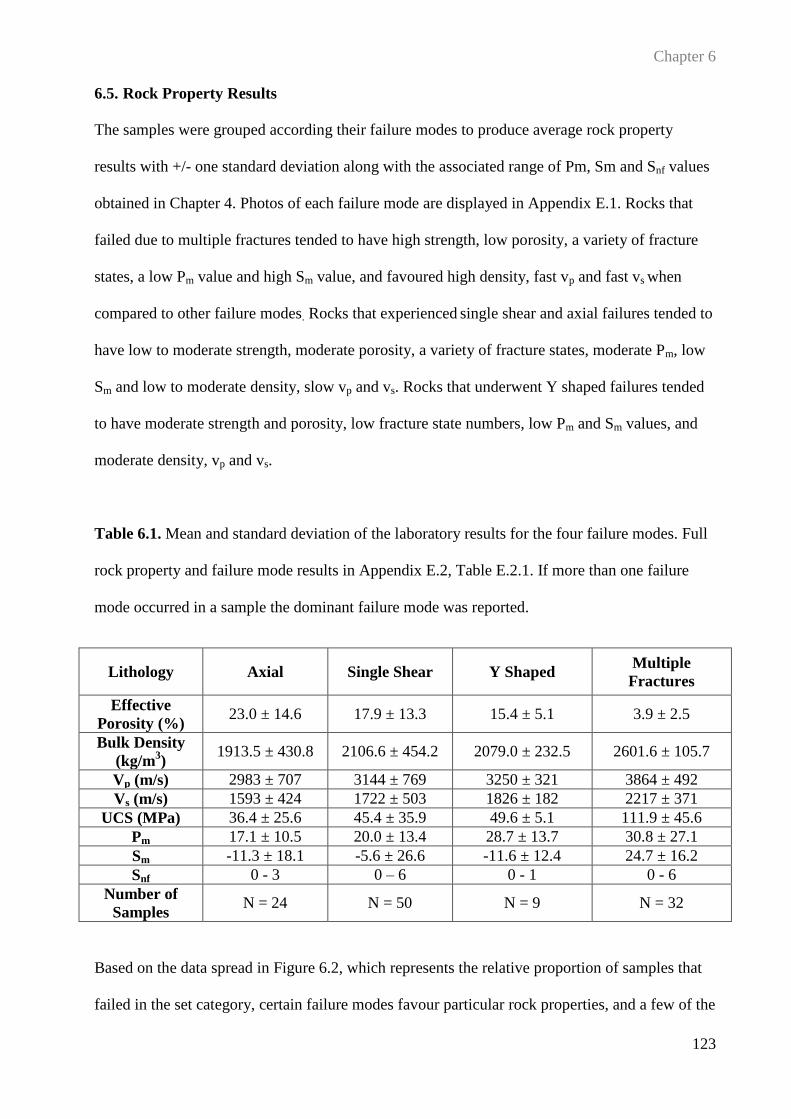
Chapter 6
123
6.5. Rock Property Results
The samples were grouped according their failure modes to produce average rock property
results with +/- one standard deviation along with the associated range of Pm, Sm and Snf values
obtained in Chapter 4. Photos of each failure mode are displayed in Appendix E.1. Rocks that
failed due to multiple fractures tended to have high strength, low porosity, a variety of fracture
states, a low Pm value and high Sm value, and favoured high density, fast vp and fast vs when
compared to other failure modes. Rocks that experienced single shear and axial failures tended to
have low to moderate strength, moderate porosity, a variety of fracture states, moderate Pm, low
Sm and low to moderate density, slow vp and vs. Rocks that underwent Y shaped failures tended
to have moderate strength and porosity, low fracture state numbers, low Pm and Sm values, and
moderate density, vp and vs.
Table 6.1. Mean and standard deviation of the laboratory results for the four failure modes. Full
rock property and failure mode results in Appendix E.2, Table E.2.1. If more than one failure
mode occurred in a sample the dominant failure mode was reported.
Lithology Axial Single Shear Y Shaped Multiple
Fractures
Effective
Porosity (%) 23.0 ± 14.6 17.9 ± 13.3 15.4 ± 5.1 3.9 ± 2.5
Bulk Density
(kg/m3)
1913.5 ± 430.8 2106.6 ± 454.2 2079.0 ± 232.5 2601.6 ± 105.7
Vp (m/s) 2983 ± 707 3144 ± 769 3250 ± 321 3864 ± 492
Vs (m/s) 1593 ± 424 1722 ± 503 1826 ± 182 2217 ± 371
UCS (MPa) 36.4 ± 25.6 45.4 ± 35.9 49.6 ± 5.1 111.9 ± 45.6
Pm 17.1 ± 10.5 20.0 ± 13.4 28.7 ± 13.7 30.8 ± 27.1
Sm -11.3 ± 18.1 -5.6 ± 26.6 -11.6 ± 12.4 24.7 ± 16.2
Snf 0 - 3 0 – 6 0 - 1 0 - 6
Number of
Samples N = 24 N = 50 N = 9 N = 32
Based on the data spread in Figure 6.2, which represents the relative proportion of samples that
failed in the set category, certain failure modes favour particular rock properties, and a few of the
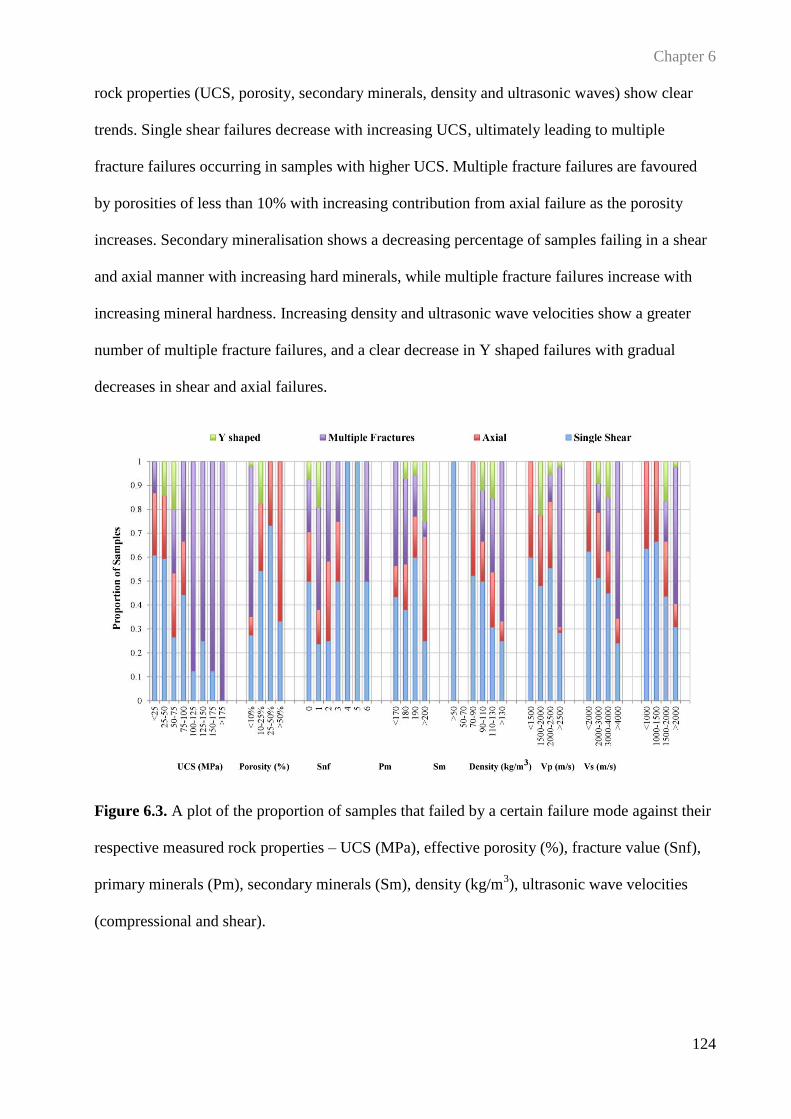
Chapter 6
124
rock properties (UCS, porosity, secondary minerals, density and ultrasonic waves) show clear
trends. Single shear failures decrease with increasing UCS, ultimately leading to multiple
fracture failures occurring in samples with higher UCS. Multiple fracture failures are favoured
by porosities of less than 10% with increasing contribution from axial failure as the porosity
increases. Secondary mineralisation shows a decreasing percentage of samples failing in a shear
and axial manner with increasing hard minerals, while multiple fracture failures increase with
increasing mineral hardness. Increasing density and ultrasonic wave velocities show a greater
number of multiple fracture failures, and a clear decrease in Y shaped failures with gradual
decreases in shear and axial failures.
Figure 6.3. A plot of the proportion of samples that failed by a certain failure mode against their
respective measured rock properties – UCS (MPa), effective porosity (%), fracture value (Snf),
primary minerals (Pm), secondary minerals (Sm), density (kg/m3), ultrasonic wave velocities
(compressional and shear).
Chapter 6
125
6.6. Discussion
6.6.1. Failure modes, and their relationship to rock properties
The failure modes observed in this study can be explained in terms of damage evolution of the
rocks under uniaxial compressive stress (Lajtai and Lajtai 1975; Santarelli and Brown 1989;
Eberhardt et al. 1998; Li et al. 2004; Akesson et al. 2004; Szwedzicki 2007; Basu et al. 2013).
However, these explanations have only been hypothesised with rocks under compression
(Bieniawski 1967; Martin and Chandler 1994; Eberhardt et al. 1998; Li et al. 2004; Basu et al.
2009).
Axial failure occurred in samples that tended to have the weakest UCS (<100 MPa), low density
(<2500 kg/m3), abundant soft minerals (clays), high porosity (>10%) and slow ultrasonic wave
velocities. Pre-existing cracks in the samples tend to propagate parallel to the applied direction
of compression and are not hindered by microstructures or restrictive minerals in the sample
Bieniawski 1967; Martin and Chandler 1994; Eberhardt et al. 1998; Li et al. 2004; Basu et al.
2009). Single shear failure is caused by the connection of pre-existing cracks, which then
coalesce with adjacent cracks whose tips are suitably orientated to favour failure in a shearing
manner (Bieniawski 1967; Martin and Chandler 1994; Eberhardt et al. 1998; Li et al. 2004; Basu
et al. 2009). Shear failure, which was the most common failure mode of the samples tested,
usually occurred in samples that contained laboratory values higher than those that failed axially;
however, even though axial and single shear failures do have slightly differing mean rock
property results (refer Table 6.1) the standard deviations overlap for these two data sets, and
therefore these failure types will occur in rocks that show similar rock properties (low to
moderate strengths, high porosities, low densities, and compressional and shear waves that are
the slowest). The mineralogy associated with these samples generally has a mixture of hard
minerals (e.g. quartz, epidote) and soft minerals (e.g. calcite, clays, etc.), which give low Pm and
Sm values. The soft minerals in the samples allow for crack propagation at lower compressional
stress than samples that contain hard minerals, which limit the connection of cracks. Y shaped
Chapter 6
126
failures represent samples that have two distinct shear planes that were joined by a simple axial
plane from the middle of the sample. Y shaped failures are a combination of axial and single
shear failures, therefore, the associated rock properties should be a contribution of the two end
members. The result of this is that rocks that fail in this manner are similar, in terms of easily
measurable rock properties, to the rocks that fail in axial and single shear manners.
Multiple fracturing is essentially an irregular breakage or crumbling of the sample in order to
release the stored elastic energy dynamically when the cracks within the sample become
constrained (Bieniawski 1967; Martin and Chandler 1994; Eberhardt et al. 1998; Li et al. 2004;
Basu et al. 2009). From our dataset, samples which failed through multiple fracturing had UCS
values above 100 MPa, low porosity (<10%), density above 2500 kg/m3 and compressional and
shear wave velocity above 3000 m/s and 2000 m/s, respectively. From this we would expect the
samples that failed with multiple fractures to be consolidated, well-cemented, brittle samples e.g.
low porosities, high densities, high UCS, fast vp and vs and Snf of 0-2, as shown in Figure 6.3 and
Table 6.1. The mineralogy and associated hardness of the minerals (Pm and Sm) was also
observed to affect the resulting failure mode, as multiple fracture failure occurred in samples that
had high abundances of hard minerals e.g. quartz, epidote, albite etc. This demonstrates that
samples with an abundance of high hardness minerals tend to fail in an explosive manner, and
supports the hypothesis that the hard minerals provide a strong block that cracks cannot
propagate through easily. This leads to the accumulation of elastic energy during the nucleation
of multiple microfractures, which then results in multiple fracturing behaviour as the elastic
energy is converted to kinematic energy when sample failure occurs.
When examined at a microscopic level, the samples that failed with multiple fracture behaviour
tended to have less microstructural damage prior to testing; however, several of the multiple
fracture samples displayed rock properties that were uncommon for this failure mode i.e. high
porosity, low UCS, low Pm and Sm. These samples displayed evidence of high pre-existing
fracture states (3-6) meaning that they had large fractures through the bulk rock prior to strength
Chapter 6
127
testing. The samples did fail along multiple fracture paths, but they are paths that were pre-
existing, which resulted in low compressive strength and a failure mode uncommon to these
results.
6.6.2. Failure modes, and their relationship to lithology
Based solely on the mean and standard deviation of the rock properties in Table 6.1 and Table
6.2 we can see that the andesite breccia/lava and intrusive tonalite samples should favour
multiple fracture behaviour under uniaxial compressive stress. 63% of the andesite samples and
65% of the tonalite samples failed in this manner. The next most common behaviour for both
lithologies was single shear failure with 33% and 36%, respectively (Fig. 6.4).
The physical and mechanical properties of the rhyolitic ignimbrite should favour axial failure,
but single shear failure (53%) was the dominant failure mode with 32% of the samples failing in
an axial manner; however, the standard deviation of the ignimbrite samples still fell within the
rock property range of single shear failure. The sedimentary samples showed an even split
between single shear (38%), axial (31%) and Y shaped (31%), which was expected as the rock
properties spread across the ranges for these failure modes (Fig. 6.4).
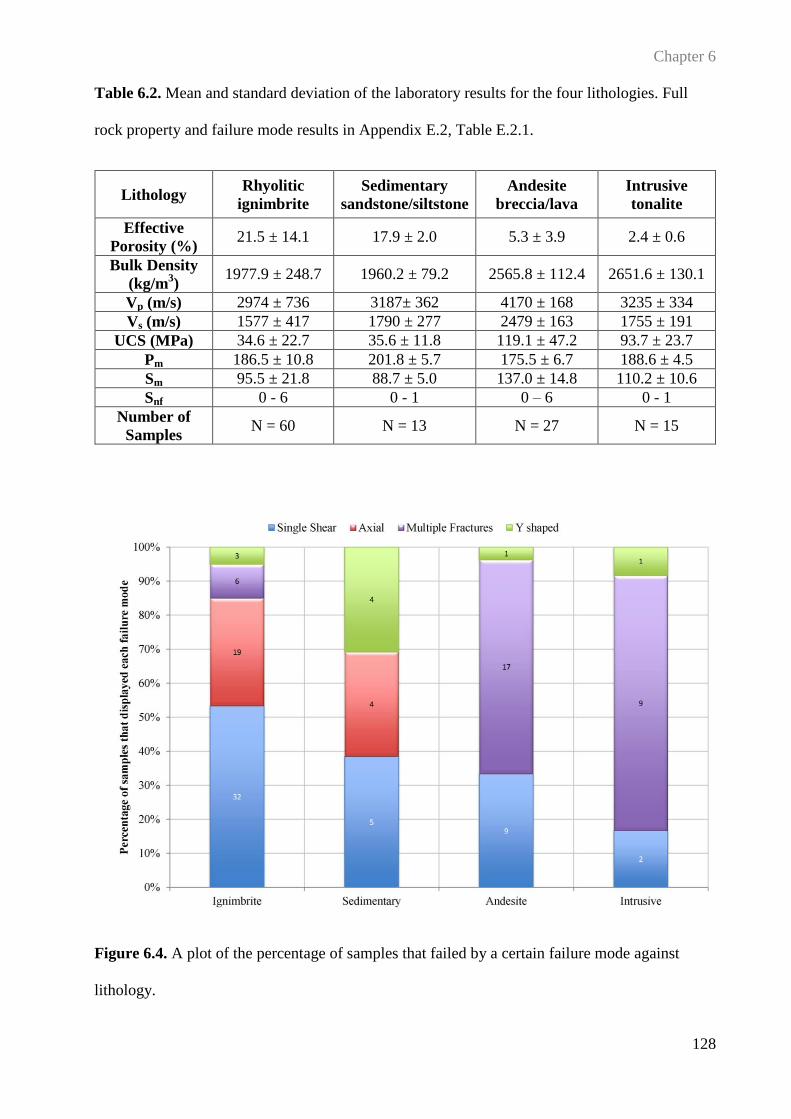
Chapter 6
128
Table 6.2. Mean and standard deviation of the laboratory results for the four lithologies. Full
rock property and failure mode results in Appendix E.2, Table E.2.1.
Lithology Rhyolitic
ignimbrite
Sedimentary
sandstone/siltstone
Andesite
breccia/lava
Intrusive
tonalite
Effective
Porosity (%) 21.5 ± 14.1 17.9 ± 2.0 5.3 ± 3.9 2.4 ± 0.6
Bulk Density
(kg/m3)
1977.9 ± 248.7 1960.2 ± 79.2 2565.8 ± 112.4 2651.6 ± 130.1
Vp (m/s) 2974 ± 736 3187± 362 4170 ± 168 3235 ± 334
Vs (m/s) 1577 ± 417 1790 ± 277 2479 ± 163 1755 ± 191
UCS (MPa) 34.6 ± 22.7 35.6 ± 11.8 119.1 ± 47.2 93.7 ± 23.7
Pm 186.5 ± 10.8 201.8 ± 5.7 175.5 ± 6.7 188.6 ± 4.5
Sm 95.5 ± 21.8 88.7 ± 5.0 137.0 ± 14.8 110.2 ± 10.6
Snf 0 - 6 0 - 1 0 – 6 0 - 1
Number of
Samples N = 60 N = 13 N = 27 N = 15
Figure 6.4. A plot of the percentage of samples that failed by a certain failure mode against
lithology.
Chapter 6
129
Based on the level of alteration observed in the samples we see that the high temperature altered
samples (andesite and intrusive tonalite) typically fail by forming multiple fracture failures,
while the samples that have low temperature alteration fail in single shear or axial mode (Fig.
6.4). This may occur because samples that were altered at high temperature become more
cemented (lower porosity) and brittle, resulting in rock properties such as low porosity, high
density and high uniaxial compressive strength that typically result in multiple fracture failure.
Conversely, samples altered at low temperature have rock properties that commonly lead to
shear or axial failure.
6.7. Conclusions
A full suite of laboratory and mineralogical analysis was completed on 114 samples from three
geothermal fields. We have used the reported results to categorise failure modes and to
determine if rock properties control the failure mode of rocks. The following conclusions can be
drawn:
1. Four failure modes have been identified in the 114 samples – axial splitting,
single shear failure, Y shaped failure and multiple fracture failure. The nature of
the failure mode has been reported to change from axial, single shear to multiple
fracture behaviour as the nature of the pre-existing damage to the microstructure
changes.
2. The mean and standard deviation of the rock properties associated with each
failure mode was reported and from this we identified that the all rock properties
generally increased, (expect porosity which decreased) in order from axial to
single shear, Y shaped and multiple fractures. Samples with rock properties that
indicate low microstructural damage e.g. low porosity, high density, fast
compressional and shear wave velocity, low Snf, are more likely to fail with
multiple fracture behaviour.
Chapter 6
130
3. The samples tested were grouped into lithologies and the mean and standard
deviation of the rock properties for each lithology were reported. Although
grouping the samples in this way produced a wide standard deviation for some of
the lithologies, we observed a trend that indicated that the lithologies which had
undergone high temperature alteration were more likely to fail with multiple
fracture behaviour.
4. From these results it may be possible to predict the mode of failure of a rock,
when parameters such as those measured in this study are known. However, these
rock property results for failure mode may not be extrapolated to different rock
types without further study.
5. Further research in this field has the potential to aid in drilling optimisation
through the utilisation of drill bits designed to fracture rocks in the ways that they
are theoretically predisposed to fail.
Chapter 7
CHAPTER 7:
SUMMARY AND FURTHER RESEARCH
Chapter 7
132
7.1. Summary of Results obtained in this Research
The physical and mechanical properties of the hydrothermally altered rocks from the Ngatamariki,
Rotokawa and Kawerau geothermal fields were measured through both destructive and non-
destructive laboratory testing. Based on petrological analysis and geological reports we identified
six lithologies in the samples obtained from the three geothermal fields – shallow ignimbrite,
rhyolitic lava, sedimentary material, deep ignimbrite, intrusive tonalite and andesite lava/breccia.
Through petrographical analysis, we identified a wide variety of minerals that occurred across the
smectite, argillic and propylitic alteration zones typically found in a conventional liquid/gas
geothermal field. These zones displayed typical mineral assemblages that allowed us to determine
the temperature conditions to which these minerals were exposed. The shallow lithologies
(ignimbrite, rhyolite, and sedimentary samples in our study) contained low temperature (smectite
to argillic) alteration minerals like smectite/illite, calcite, and quartz. The deep lithologies
(ignimbrite, andesite and intrusive material) contained higher temperature (argillic to propylitic)
alteration minerals like epidote, chlorite, albite, pyrite and quartz.
To determine whether hydrothermal alteration, through secondary mineralisation, caused
variations in the rock properties, we compared porosity, density and ultrasonic wave velocities of
the samples used in this dataset, and observed no systematic deviation from the expected trends.
We did observed samples that had a particular type of alteration, i.e. argillic, typically displayed
similar physical properties (porosity, density, Vs/Vp) regardless of the primary mineralogy; e.g.
the rhyolite lava had a mean porosity of 19.5 % and the sedimentary sandstone and siltstone had a
mean porosity of 17.9 %.
Differing mechanical behaviour, due to changes in physical properties through secondary
mineralisation, is evident in strength testing results. The samples in our study from the shallow,
low temperature regions of the geothermal fields have lower UCS when compared to samples
from deep, high temperature regions. These results provide evidence that hydrothermal alteration

Chapter 7
133
can cause changes to the strength of the rocks, which is important information for the drilling
engineer when designing a geomechanical model of the field.
It was important to relate the findings from the laboratory data to their use in a geothermal field,
and the most effective tool was to develop a basis for a geomechanical layer that could be added to
a geothermal conceptual model. A critical factor required for optimisation of the drilling processes
is estimated rock strength values. Previous research found that mineralogy, microstructural
damage; including porosity and fractures, along with alteration intensity, influenced the strength of
rocks. Using the laboratory data and previous research, the Alteration Strength Index (ASI) was
developed to provide a range of estimate rock strengths based on different geological conditions.
By assigning numerical values to the primary and secondary mineralogy, mineral hardness,
alteration intensity, porosity and fractures collected in the laboratory, an index value was
produced. This value was then compared to measured uniaxial compressive strength (UCS) values,
from which we were able to draw a strong correlation (R2 of 0.86). This correlation was used to
convert the ASI “index” values to an estimated rock strength value based on differing geological
conditions. The mean error for the fit in terms of estimated UCS is ±11 MPa, with 50th
and 90th
percentile absolute error ranges of ±7 MPa and ±25 MPa respectively. These estimated rock
strength values have an important application to drilling as the compressive strength of the
material is taken into consideration when selecting drill bits. Therefore, adding this information to
a conceptual model, which can be provided to the drill bit vendors, will prove a significant asset in
optimisation of drilling operations through drill bit selection.
To determine the usefulness of the ASI method in estimating rock strengths, it was compared to
two established methods used for rock strength estimation and drilling optimisation in the
conventional oil and gas industry. The two methods from the oil and gas industry were: specific
energy, better known in the form of mechanical specific energy; and the R/N-W/D charts. In most
drilling scenarios core samples are not obtained due to cost limitations, so a modified version of
Chapter 7
134
ASI was developed for use with drill cuttings. The section of well used for this study was the 800
m long 17 inch (432 mm) diameter section of NM8 in the Ngatamariki Geothermal Field. The
controllable drilling parameters (RPM, WOB and torque) were held near constant, allowing the
ROP to be influenced by the geology being drilled. By plotting the ROP against the resulting rock
strength estimated provided by the three methods we found that three out of six rock strength
estimates, based on either MSE or the R/N-W/D chart method, matched the lithologies ranked by
interpreted strength from ROP, while all six lithologies were matched correctly by the modified
ASI (mASI) method. Issues identified when using MSE or the R/N-W/D charts was their
dependency on drilling efficiency. Both of these methods required the drilling system to be
efficient in order to provide realistic estimated rock strength values. The ASI/mASI method does
not place any requirements on the drilling system, it is derived from geological parameters, and
will provide a consistently representative estimate of strength so long as drill cuttings are
available. The development of a database that provides estimated rock strength of the material
being drilled would be quick and easy to achieve with ASI/mASi, as the mineralogy and veining
abundance are already recorded by the onsite geologist. This would provide a range of estimated
rock strengths for the material for every interval over which the cuttings are collected.
The types of failure modes have been compared to rock properties to see if a relationship existed.
Addressing the way in which a particular rock fails is important to engineering environments such
as drilling, as it enables an understanding of how failure will occur in that rock. Through the
research conducted as part of this thesis we identified that it may be possible to predict a typical
mode of failure of a rock, when parameters such as those measured in this study are known (UCS,
porosity, density, ultrasonic wave velocities, mineralogy etc.). However, the results observed in
this study were not statistically significant, and should not be extrapolated to different rock types
without further study.
Chapter 7
135
7.2. Further Questions and Further Work
During this research many questions have been answered, as outlined in Chapter 1; however,
several other research questions (and thereby potential for future research work) have arisen
during the course of this thesis, which either addresses ongoing research that could support the
findings of this thesis, or new questions that have been of interest; but, have not been explored to
date. The ideas are as follows:
7.2.1. Research incorporating Rock Properties and Hydrothermal Alteration
Due to the findings in Chapter 3 on the physical and mechanical properties of
hydrothermally altered rock, it would be of interest to complete further laboratory testing
on more samples from the same geothermal fields, which should include samples from the
same lithologies used in this study as well as different lithologies. This will allow for a
larger dataset to draw conclusions. To further this research, samples from different
geothermal fields in TVZ should be included, which have similar lithologies of differing
alteration intensity and assemblages; or even new lithologies to study.
Another way to address the effects of changes on the physical and mechanical rock
properties due to hydrothermal alteration is to obtain samples that range in alteration
intensity from fresh to completely altered. A suite of rocks would be needed that cover this
range, which would include determining places where extinct geothermal “paleosystems”
are exposed from the heart of the system to the surface. Road cutting exposures or large
civil projects; e.g. dams, have large rock exposures that could provide the rock samples
needed.
7.2.2. Continued Research on Alteration Strength Index (ASI)
The alteration strength index (ASI) has been developed for hydrothermally altered rock,
and Chapter 5 proves that it works in a geothermal context. Further work into expanding
Chapter 7
136
the dataset from which these uniaxial compressive strength (UCS) values are obtained
would benefit the equation used to convert ASI to UCS as it could decrease the error
ranges. This dataset can be expanded by collecting any core samples that have undergone
hydrothermal alteration and completing porosity testing, microstructural analysis, strength
testing and petrographical analysis.
With an expanding dataset ASI could be refined by reducing the amount of data needed to
estimate rock strength values. Further work, which includes other lithologies that have
been altered could find that certain parameters become obsolete, thereby refining the
method and producing better or easier results.
A query about ASI is – does it work on samples that are not in a geothermal system?
A new dataset could be developed from samples that are drilled or blasted in mining
environments, or even oil and gas fields. By completing a full suite of laboratory testing on
new samples from a different environment, a different ASI to UCS relationship might
originate, thus illustrating the need to develop a different conversion for different drilling
environments. It might alternatively be found that the method is refined by the inclusion of
different datasets, and therefore a single unified conversion of ASI to UCS would be
appropriate for estimation of strength in all environments.
The utilization of the ASI and mASI methods outside of the real-time drilling will be in
numerical and conceptual modeling of geothermal fields. This would to help understand
the geomechanical influences on the reservoir and for planning future drilling and
simulation operations.
The ASI method has been developed to work with the three parameters (mineralogy,
fractures and porosity); however, it has also been proven to work in a modified version
(mASI) with only a slightly larger error range. Each of the parameters has been worked
into the equation in a way that allows them to control the equation output independently,
which is why a modified version is possible. It is theoretically feasible that certain
Chapter 7
137
parameters could be interchanged with a different parameter chosen to represent natural
bedding, flow banding or textures which could be more suited to the lithology being
analysed. The new parameter would just need to be weighted to represent the influence it
has on the strength on the samples by comparing against actual tested UCS. The type of
relationship (logarithmic/power/exponential) would need to be determined in a way similar
to each of the ASI parameters. Completing this research would allow the equation to
produce calculated UCS results favorable to the lithology studied, which is important as
previous research has identified other rock properties can influence predicted strength
results.
7.2.3. Failure Modes and expanding Research
Further strength testing should be conducted on homogeneous rock with the intention of
examining microstructures within the rocks prior to testing, during testing and after testing.
This should include examining the failure planes in thin section and analysing the
development of microstructural damage within the minerals during failure. By analysing
the microstructure in the sample from the beginning to end of test we could identify
particular microstructures correlated with particular modes of failure.
Obtain multiple samples of the same rock and simulate drilling conditions in the
laboratory, and examine the failure that occurs in the sample. If it is not possible to recreate
drilling conditions in the laboratory this might be achieved through computer simulation.
How a sample fails is important in relation to drilling, so conducting strength testing on
samples that are homogeneous in the form of triaxial vs. uniaxial would be of interest. This
research would be comparing drilling conditions (triaxial) vs. unconfined conditions
(uniaxial). This research would be able to identify if failure types identified during uniaxial
strength testing produced the same results during triaxial. It could illustrate the effect
changing confining pressure had on the way a sample will failed.

Chapter 8
CHAPTER 8:
REFERENCES
Chapter 8
139
Åkesson U, Hansson J, Stigh J 2004. Characterisation of microcracks in the Bohus granite,
western Sweden, caused by uniaxial cyclic loading. Engineering Geology. 72:131-142.
Allis RG, Christenson BW, Nairn IA, Risk GF, Sheppard DS, White SP 1995. Kawerau
geothermal field: its natural state and response to development. GNS Science client report
72436C.10.
Altindag R 2002. The evaluation of rock brittleness concept on rotary blast hole drills. The
Journal of The South African Institute of Mining and Metallurgy 61-6.
Alvarez Grima M, Babuška R 1999. Fuzzy model for the prediction of unconfined compressive
strength of rock samples. International Journal of Rock Mechanics and Mining Science 36:
339-349.
Ameen M, Smart BGD, Somerville JMc, Hamilton S, Naji NA 2009. Predicting rock mechanical
properties of carbonate from wireline logs (A case study: Arab-D reservoir, Ghawar field,
Saudi Arabia). Marine and Petroleum Geology 4: 430-444.
Arehart G, Christenson BW, Wood CP, Foland KA, Browne PRL 2002. Timing of volcanic,
plutonic and geothermal activity at Ngatamariki, New Zealand. J. Volcanol. Geotherm. Res.
116: 201-214.
Arel E, Tugrul A 2001. Weathering and its relation to geomechanical properties of Cavusbasi
Granitic rocks in northwestern Turkey. Bulletin of Engineering Geology Environment 2: 123-
133.
Arikan F, Aydin N 2012. Influence of weathering on the Engineering properties of Dacites in
Northeastern Turkey. International Scholarly Research Network Soil Science 12: 1-15.
Arikan F, Ulusay R, Aydin N 2007. Characterization of weathered acidic volcanic rocks and a
weathering classification based on a rating system. Bulletin of Engineering Geology
Environment 66: 415-430.
Armenta M 2008. Identifying inefficient drilling conditions using drilling specific energy. In:
AADE National technical conference and exhibition, Denver (Colorado).
Ashby MF, Sammis CG 1990. The damage mechanics of brittle solids in compression. Pure
Applied Geophysics 133: 489–521.
Chapter 8
140
Ashwell PA, Kennedy BM, Gravley DM, von Aulock FW, Cole JW 2013. Insights into caldera
and regional structures and magma body distribution from lava domes at the Rotorua Caldera,
New Zealand. Journal of Volcanology and Geothermal Research 258: 187-202.
ATSM International 2010. D 7012-10 Standard Test Method for Compressive Strength and
Elastic Moduli of Intact Rock Core Specimens under Varying States of Stress and
Temperatures. In: Annual book of ATSM standards.
Azar JJ, Samuel GR 2007. Drill bit mechanic. In: Azar JJ and Samuel GR eds. Drilling
Engineering. PennWell Books, Tulsa, Oklahoma. Pp. 277-317
Bannister S, Sherburn S, Bourguignon S, Parolai S, Bowyner D 2010. Preprocessing for
reservoir seismicity location: Rotokawa Geothermal Field, New Zealand. In: Proceedings
World Geothermal Congress, Bali (Indonesia).
Barton CA, Zoback MD 1992. Self-similar distribution and properties of macroscopic fractures
at depth in crystalline rocks in the Cajon Pass scientific drill hole. Journal of Geophysical
Research 97: 5181-5200.
Basu A, Celestino TB, Bortolucci AA 2009. Evaluation of rock mechanical behaviour under
uniaxial compression with reference to assessed weathering grades. Rock Mechanics and
Rock Engineering. 42:73-93.
Basu A, Mishra DA, Roychowdhury K 2013. Rock failure modes under uniaxial compression,
Brazilian and point load tests. Bulletin of Engineering Geology and the environment. 72:457-
475.
Begonha A, Sequeira Braga MA 2002. Weathering of the Oporta Granite; geotechnical and
physical properties. Catena 49:57-76.
Bertin E P 1978. Introduction to X-Ray Spectrometric Analysis. Plenum Press, New York. Pp.
83-115.
Bharadwaj AG, Vinayaka S 2013 Drilling Optimization: A Review. International Journal on
Theoretical and Applied Research in Mechanical Engineering 2: 31-5.
Bibby HM, Caldwell TG, Davey FJ, Webb TH 1995. Geophysical evidence on the structure of
the Taupo Volcanic Zone and its hydrothermal circulation. Journal of Volcanology and
Geothermal Research 68:29-58.
Chapter 8
141
Bibby HM, Rick, GF, Caldwell TG, Heise W, Bennie SL 2008. Resistivity structure of western
Taupo Volcanic Zone, New Zealand. New Zealand Journal of Geology and Geophysics 51:
231-244.
Bieniawski ZT 1967. Mechanisms of brittle fracture of rock part II – experimental studies.
International Journal of Rock Mechanics and Mining Science 4:407-423.
Bieniawski ZT 1974. Estimating the strength of rock materials. The Journal of The South
African Institute of Mining and Metallurgy 313-320.
Bieniawski ZT, Denkhaus HG, Vogler UW 1969. Failure of fractured rock. International Journal
of Rock Mechanics and Mining Science. 6:323-341.
Bilim N 2011. Determination of drillability of some natural stones and their association with
rock properties. Scientific Research and Essays 6: 382-387.
Binal A 2009. Prediction of mechanical properties of non-welded and moderately welded
ignimbrite using physical properties, ultrasonic pulse velocity, and point load index tests.
Quarterly Journal of Engineering Geology and Hydrogeology 42: 107-122.
Bingham MG 1964a. How rock properties are related to drilling. Oil and Gas Journal 50: 94-101.
Bingham MG 1964b. How to make the R/N-W/D chart and what it means. Oil and Gas Journal
45: 212-17.
Bingham MG 1964c. What you should know about bit design and performance. Oil and Gas
Journal 47:77-89.
Bingham MG 1964d. How to find rock strength in typical field drilling. Oil and Gas Journal 100-
111.
Bloomberg S, Rissmann C, Mazot A, Oze, C, Horton T, Gravley D, Kennedy B, Werner C,
Christenson B, Pawson J 2012. Soil gas flux exploration at the Rotokawa Geothermal field
and white Island, New Zealand. In: Proceedings 36th
Workshop on Geothermal Reservoir
Engineering Stanford (California).
Bloomer A 2011. Kawerau Direct Heat Use: Historical patterns and recent developments. In:
Proceedings the 34th
New Zealand Geothermal Workshop, 21-23 November, Auckland (New
Zealand).
Boseley C, Grant M A, Burnell J, Ricketts B 2010. Ngatamariki Project Update. In: Proceedings
GRC annual meeting, Sacramento (California).
Chapter 8
142
Bourdon JC, Cooper GA, Curry DA, McCann D, Peltier B 1989. Comparison of field and
laboratory-simulated drill off tests. Society of Petroleum Engineers Drilling Engineering 329-
334.
Bourgoyne AT, Young FS 1974. A multiple regression approach to optimal drilling and
abnormal pressure detection. Society of Petroleum Engineers Journal 257: 371-384.
Bowyner D, Holt R 2010. Case study: Development of a numerical model by a multi-
disciplinary approach, Rotokawa Geothermal Field, New Zealand. In: Proceedings World
Geothermal Congress, Bali (Indonesia).
Brotheridge JMA, Browne PRL, Hochstein MP 1995. The Ngatamariki Geothermal field, NZ:
Surface Manifestations – Past and Present. In: Proceedings, New Zealand Geothermal
Workshop.
Browne PRL 1978. Hydrothermal alteration in active geothermal fields. Earth and Planetary
Science Letters. 6: 229-250.
Browne PRL 1989. Contrasting alteration styles of Andesitic and Rhyolitic rocks in geothermal
fields of the Taupo Volcanic Zone, New Zealand. In: Proceedings, 11th
New Zealand
Geothermal Workshop.
Browne PRL, Ellis AJ 1970. The Ohaaki-Broadlands hydrothermal area, New Zealand:
Mineralogy and related geochemistry. American Journal of Science 269: 97-131.
Browne PRL, Graham IJ, Parker RJ, Wood CP 1992. Subsurface andesite lavas and plutonic
rocks in the Rotokawa, and Ngatamariki geothermal systems, Taupo Volcanic Zone, New
Zealand. J. Volcanol. geotherm. Res. 51: 199-215.
Broz ME, Cook RF, Whitney DL 2006. Microhardness, toughness and modulus of Mohs scale
minerals. American Mineralogy 91:135-142.
Caicedo HU, Calhoun WM, Ewy RT 2005. Unique ROP predictor using bit-specific coefficient
of sliding friction and mechanical efficiency as a function of confined compressive strength
impacts drilling performance In: SPE/IADC Drilling Conference, Amsterdam, (Netherlands).
Calcaterra D, Cappelletti P, Langella A, Colella A, Gennaro M 2004. The ornamental stones of
Caserta province: the Campanian Ignimbrite in the medieval architecture of Casertavecchia.
Journal of Cultural Heritage 5:137-148.
Chapter 8
143
Cargill JS, Shakoor A 1990. Evaluation of empirical methods for measuring the uniaxial
compressive strength of rock. International Journal of Rock Mechanics and Mining Science &
Geomechanical Abstracts 27: 495-503.
Carmichael RS 1982. Handbook of Physical Properties of Rocks, volume II. CRC Press, Boca
Raton.
Cassiaux M, Prout D, Shtari-Kauppi M, Sardini P, Leutsch Y 2006. Clay minerals formed during
propylitic alteration of a granite and their influence on primary porosity: A multi-scale
approach. Clays and Clay Minerals 54: 541-554.
Ceryan S, Tudes S, Ceryan N 2008. A new quantitative weathering classification for igneous
rocks. Environmental Geology 6: 1319-1336.
Chambefort I, Bignall G 2011. Petrographic Review of Stratigraphic units of the Ngatamariki
Geothermal Field. GNS Sciences consultancy report 2011/298.
Chambefort I, Lewis B, Wilson CJN, Rae A, Coutts C, Bignall G, Ireland T (2014) Stratigraphic
and structure of the Ngatamariki geothermal system from New zircon U-Pb geochronology:
Implications for Taupo Volcanic Zone evolution. Jorural of Volcanology and Geothermal
Research 274:51-70.
Chambefort I, Lewis B, Wilson CJN, Rae A, Coutts C, Bignall G, Ireland T 2014. Stratigraphic
and structure of the Ngatamariki geothermal system from New zircon U-Pb geochronology:
Implications for Taupo Volcanic Zone evolution. Journal of Volcanology and Geothermal
Research 274: 51-70.
Chang C, Zoback MD, Khaksar A 2006. Empirical relations between rock strength and physical
properties in sedimentary rock. Journal of Petroleum Science and Engineering 51: 223-237.
Christaras B, Auger F, Mosse E 1994. Determination of the moduli of elasticity of rocks.
Comparison of the ultrasonic velocity and mechanical resonance frequency methods with
direct static methods. Materials and structures. 27: 222-228.
Chunhui T, Tao W, Xiaobing J, Bingjun D, Huaiming L, Jianping Z 2014. Petrophysical
characteristics of rocks and sulfides from the SWIR hydrothermal field. Acta Oceanology Sin
32: 118-125.
Chapter 8
144
Çobanoğlu I, Çelik SB 2008. Estimation of uniaxial compressive strength from point load
strength, Schmidt hardness and P-Wave velocity. Bulletin of Engineering Geology and the
Environment 4:491-498.
Coggan JS, Stead D, Howe JH, Faulks 2013. Mineralogical controls on the engineering
behaviour of hydrothermally altered granites under uniaxial compression. Engineering
Geology 160:89-102.
Cole JW 1990. Structural control and origin of the volcanism in the Taupo volcanic zone, New
Zealand. Bulletin of Volcanology 52: 445-459.
Cole JW, Spinks K 2009. Caldera volcanism and rift structure in the Taupo Volcanic Zone, New
Zealand. IN: Murphy JB, Keppie JD, Hynes AJ (eds) Ancient Orogens and Modern
Analouges. Special publications, Geological Society of London 327:9-29.
Cole WF, Sandy MJ 1980. A proposed secondary mineral rating for basalt road aggregate
durability. Proc. Australian Road Research Board 10: 27-37.
Cox M, Browne P 1998. Hydrothermal alteration mineralogy as an indicator of hydrology at the
Ngawha geothermal field, New Zealand. Geothermics 97: 259-270.
Cumming W 2009. Geothermal resource conceptual models using surface exploration data. In:
Proceedings, Thirty-Fourth Workshop on Geothermal Reservoir Engineering, Stanford
University, California.
Cunningham RA, Eenink JG 1959. Laboratory study of effect of overburden, formation and mud
column pressures of drilling rate of permeable formations. Petroleum Transactions, AIME
217: 9-17.
Darby DJ, Hogkinson KM, Blick GH 2000. Geodetic measurement of deformation in the Taupo
Volcanic Zone, New Zealand. New Zealand Journal of Geology and Geophysics 43: 157-170.
Davy BW, Caldwell TG 1998. Gravity, magnetic and seismic surveys of the caldera complex,
Lake Taupo, North Island, New Zealand. Journal of Volcanology and Geothermal Research
81: 69-89.
Deere DU, Miller RP 1966. Engineering classification and index properties for intact rock.
Technical report no. AFWL-TR-65-116. Air Force Weapons Laboratory.
Chapter 8
145
Dehgan S, Sattari GH, Chehreh Chelgani S, Aliabadi MA 2010. Prediction of uniaxial
compressive strength and modulus of elasticity for Travertine samples using regression and
artificial neural networks. Mining Science and Technology 20: 41-46.
Dinçer I, Acar A, Çobanoğlu I, Uras Y 2004. Correlation between Schmidt hardness, uniaxial
compressive strength and young’s modulus for andesite, basalts and tuffs. Bulletin of
Engineering Geology and the Environment 2: 141-148.
Dobson PF, Kneafsey TJ, Hulen J, Simmons A 2003. Porosity, permeability, and fluid flow in
the Yellowstone geothermal system, Wyoming. Journal of Volcanology and Geothermal
Research 123:313-324.
Dupriest FE, Koederitz WL 2005. Maximizing drill rates with real-time surveillance of
mechanical specific energy. In: SPE/IADC Drilling conference, Amsterdam (Netherlands).
Pp. 1-10.
Dupriest FE, Witt JW, Remmert SM 2005. Maximizing ROP with real-time analysis of digital
data and MSE. IN: International Petroleum Technology Conference, Doha (Qatar). Pp.1-8.
Eastwood A 2013. The Tahorakuri Formation: Investigating the early evolution of the Taupo
Volcanic Zone in buried volcanic rocks at Ngatamariki and Rotokawa geothermal fields. MSc
thesis, University of Canterbury, Christchurch, New Zealand.
Eberhardt E, Stead D, Stimpson B, Read RS 1998. Identifying crack initiation and propagation
threshold in brittle rock. Canadian Geotechnical Journal. 35:222-233.
Edlmann K, Somervill JM, Smart BGD, Hamilton SA, Crawford BR 1998. Predicting rock
mechanical properties from wireline porosities. In: Proceedings SPE/ISRM Eurock,
Trondheim (Norway).
Ehlers E G 1987a. Optical Mineralogy – Volume 1: Theory and Techniques. Blackwell
Scientific Publication. Pp. 1-5.
Ehlers E G 1987b. Optical Mineralogy – Volume 2: Mineral Descriptions. Blackwell Scientific
Publication. Pp. 1-5.
Entwisle D, Hobbs P, Jones L, Gunn D, Raines MG 2005. The relationship between effective
porosity, uniaxial compressive strength and sonic velocity of intact Borrowdale volcanic
group core samples from Sellafield. Geotechnical and Geological Engineering 23: 793-809.
Chapter 8
146
Esmaeily D, Afshooni SZ, Mirnejad H, Rashidnejad-e-Omran N 2012. Mass changes during
hydrothermal alteration associated with gold mineralization in the Astaneh granitoid rocks,
Western Iran. Geochemistry: Exploration, Environment, Analysis 12: 161-175.
Fakhimi A, Gharahbagh EA 2011. Discrete element analysis of the effect of pore size and pore
distribution on the mechanical behaviour of rock. International Journal of Rock Mechanics
and Mining Science 48:77-85.
Farquhar RA, Somerville JM, Smart BGD 1994. Porosity as a Geomechanical indictor: An
Application of core and Log Data and Rock Mechanics. In: Proceedings Society of Petroleum
Engineers, European Petroleum Conference, London (U.K).
Fear MJ 1999. How to improve rate of penetration in field operations. Society of Petroleum
Engineers Drilling & Completion 14: 42-49.
Ferry J 1979. Reaction mechanisms, physical conditions, and mass transfer during hydrothermal
alteration of mica and feldspar in granitic rocks from south-central Maine, USA.
Contributions to Mineralogy and Petrology 139: 125-139.
Finizola A, Sortino F, Lenat JF, Valenza M 2002. Fluid circulation at Stomboli volcano (Aeolian
Islands, Ilaly) from self-potential and soil gas survey. Journal of Volcanology and Geothermal
Research 116: 1-18.
Francis P, Oppenheimer, C 2004. Volcanoes. 2nd
ed. Oxford University Press inc, New York.
Frank D 1995. Surficial extent and conceptual model of hydrothermal system at Mount Rainer.
Journal Volcanology and Geothermal Research 65: 51-80.
Frenzel M 2006. Faster drilling optimization process from trail-and-error to integrated dynamic
analysis. Offshore 48-49.
Frolova J, Ladygin V, Franzson H, Sigurdsson O, Stefansson V, Shustrov V 2005. Petrophysical
properties of fresh to mildly altered hyaloclasitie tuffs. In: Proceedings World Geothermal
Congress, Antalya (Turkey).
Frolova JV, Ladygin VM, Rychagov SN 2010. Petrophysical alteration of volcanic rocks in
hydrothermal systems of the Kuril-Kamchatka Island Arc. In: Proceedings World Geothermal
Congress. Bali (Indonesia).
Galle EM, Woods HB 1963. Best constant weight and rotary speed for rotary rock bits. In:
Spring meeting of the Pacific Coast District API division of Production, May 48-73.
Chapter 8
147
Gardner GHF, Gardner LW, Gregory AR 1974. Formation velocity and density – The diagnostic
basic for stratigraphic traps. Geophysics 39: 770-780.
Giggenbach WF 1984. Mass transfer in hydrothermal alteration systems – a conceptual
approach. Geochimica et Cosmochimica Acta 48: 2693-2711.
Goff F, Janik CJ 2000. Geothermal Systems. In Sigurdsson H, Houghton B, McNutt SR, Rymer
H, Stix J eds. Encyclopedia of Volcanoes. Academic Press. Pp. 817 -834.
Gokceoglu C, Zorlu K 2004. A fuzzy model to predict the uniaxial compressive strength and the
modulus of elasticity of a problematic rock. Engineering Application of Artificial Intelligence
17: 61-72.
Goodall WR, Scales PJ, Butcher AR 2005. The use of QUEMSCAN and diagnostic leaching in
the characterisation of visbale gold in complex ores. Minerals Engineering 18: 877-886.
Graham JW, Muench NL 1959. Analytical determination of optimum bit weight and rotary speed
combinations. In: SPE 1349-G Fall Meeting of the society of Petroleum Engineers, Dallas
(Texas).
Gstalder S, Raynal J 1966. Measurement of some mechanical properties of rocks and their
relationship to rock drillability. Journal of Petroleum Technology 991-996.
Gunsallus KL, Kulhawy FH 1984 A comparative Evaluation of rock strength measures.
International Journal of Rock Mechanics and Mining Science and Geomechanical Abstracts
21:233-248.
Halbouty MT, Meyerhoff AA, King RE, Dott RH; Klemme HD, Shabad T 1970. Worlds giant
oil and gas fields, geologic factors affecting their formation, and basin classification: Part 1:
Giant oil and gas fields. Geology of Giant Petroleum Fields. 502-528.
Harrison AJ, White RS 2004. Crustal structure of the Taupo Volcanic Zone, New Zealand:
Stretching and igneous intrusion. Geophysical Research Letters 31: 2-5.
Hase H, Hashimoto T, Sakanaka S, Kanda W, Tanaka Y 2005 Hydrothermal system beneath Aso
Volcano as inferred from self-potential mapping and resistivity structure. Journal of
Volcanology and Geothermal Research 143: 259-277.
Chapter 8
148
Heap MJ, Lavallée Y, Petrakova L, Baud P, Reuschlé T, Varley NR, Dingwell DB 2014a.
Microstructural controls on the physical and mechanical properties of edifice-forming
andesites at Volcan de Colima, Mexico. Journal of Geophysical Research 1-39.
Heap MJ, Xu T, Chen CF 2014b. The influence of porosity and vesicle size on the brittle
strength of volcanic rocks and magma. Bulletin of Volcanology 76:1-15.
Heise W, Caldwell TG, Bibby HM, Bannister SC 2006. 3D Inversion of magnetotelluric data
from the Rotokawa geothermal field, Taupo Volcanic Zone, New Zealand. In: Proceedings
New Zealand Geothermal Workshop.
Henley RW, Ellis AJ 1983. Geothermal systems ancient and modern: A geochemical review.
Earth-Science Reviews 19: 1-50.
Henneberger RC, Browne PRL 1988. Hydrothermal alteration and evolution of the Ohakuri
Hydrothermal system, Taupo Volcanic Zone, New Zealand. Journal of Volcanology and
Geothermal Research 34: 211-231.
Hillier S 2000. Accurate quantitative analysis of clay and other minreals in sandstone by XRD:
comparison of a Rietveld and a reference intensity ratio (RIR) method and the importance of
sample preparation. Clay minerals 35:291-302.
Hochstein MP 1995. Crustal heat transfer in the Taupo Volcanic Zone New Zealand:
Comparison with other volcanic arcs and explanatory heat source models. Journal of
Volcanology and Geothermal Research 68: 117-151.
Hochstein MP, Browne PRL 2000. Surface manifestations of geothermal systems with volcanic
heat sources. In: Sigurdsson H, Houghton B, McNutt SR, Rymer H, Stix J eds. Encyclopedia
of Volcanoes. Academia Press. Pp. 835-855.
Horii H, Nemat-Nasser S 1985. Compression-induced microcrack growth in brittle solids: Axail
splitting and shear failure. Journal of Geophysical Research. 90:3105-3125.
Hoseinie SH, Aghababaei H, Pourrahimian Y 2008. Development of a new classification system
for assessing of rock mass drillability index (Rdi). International Journal of Rock Mechanics
and Mining Science 45: 1-10.
Houghton BF, Wilson CJN, McWilliams MO, Lanphere MA, Weaver SD, Briggs RM, Pringle
MS 1995. Chronology and dynamics of a large silicic magmatic system: Central Taupo
Volcanic Zone, New Zealand. Geology 23: 13-16.
Chapter 8
149
Howarth DF, Rowlands JC 1987. Quantitative assessment of rock texture and correlation with
drillability and strength properties. Rock Mechanics and Rock Engineering 20:57-85.
Hudson JA 1989. Rock mechanics principles in engineering practice. CIRIA Report,
Butterworth, London.
Hudyma N, Burçin Avar B, Karakouzian M 2004. Compressive strength and failure modes of
lithophysae-rich Topopah Spring Tuff specimens and analog models containing cavities.
Engineering Geology. 73:179-190.
Hunt T, Bowyer D 2007. Reinjection and gravity changes at Rotokawa Geothermal Field, New
Zealand. Geothermics 36: 421-435.
Hurwitz S, Ingebritsen SE, Sorey ML 2002. Episodic thermal perturbations associated with
groundwater flow: an example from Kilauea Volcano, Hawaii. Journal of Geophysical
Research 107.
Irfan TY, Dearman WR 1978. The engineering petrography of a weathered granite in Cornwall,
England. Quarterly Journal of Engineering Geology 11: 233-244.
Jeng FS, Weng MC, Lin ML, Huang TH 2004. Influence of petrographic parameters on
geotechnical properties of tertiary sandstones from Taiwan. Engineering Geology 73: 71-91.
Kahraman S 2001. Evaluation of simple methods for assessing the uniaxial compressive strength
of rock. International Journal of Rock Mechanics and Mining Science 38: 981-994.
Kahraman S, Balci C, Yazici S, Bilgin 2000. Prediction of the penetration rate of rotary blast
hole drills using a new drillability index. International Journal of Rock Mechanics and Mining
Science 37: 729-43.
Kahraman S, Gunaydin O, Fener M 2005. The effect of porosity on the relation between uniaxial
compressive strength and point load index. Rock. Mech. Min. Sci. 42: 584-589.
Karakul H, Ulusay R 2013. Empirical correlations for predicting strength properties of rocks
from p-wave velocity under different degrees of saturation. Rock Mechanics and Rock.
Engineering 46: 981-999.
Karfakis MG 1985. Drilling mechanisms at elevated rock temperatures. International Journal of
Rock Mechanics and Mining Science and Abstracts 22: 407-417.
Chapter 8
150
Keil K 1973. Microprobe Analysis – Chapter 5: Applications of the Electron Microprobe in
Geology. A Wiley-Interscience Publication. Pp. 189-222.
Kelessidis VC 2011. Rock drillability prediction from in situ determined unconfined
compressive strength of rock. The Journal of the Southern African of Mining and Metallurgy
111: 429-436.
Kelessidis VC, Dalamarinis P 2009. Monitoring drilling bit parameters allows optimization of
drilling rates. In: International multidisciplinary scientific geo-conference and expo. Albena,
(Bulgaria). Pp. 1-8.
Kissling WM, Weir GJ 2005. The spatial distribution of the geothermal fields in the Taupo
Volcanic Zone, New Zealand. Journal of Volcanology and Geothermal Research 145: 136-
150.
Knappett C, Pirrie D, Power MR, Nikolakopoulou I, Hilditch J, Rollinson GK 2011.
Mineralogical analysis and provenancing of ancient ceramics using automated SEM-EDS
analysis (QUEMSCAN): a pilot study of LBI pottery from Akrotiri, Thera. Journal of
Archaeological Science. 38: 219-232.
Knight R D, Klassen R A, Hunt P 2002. Mineralogy of fine-grained sediment by energy-
dispersive spectrometry (EDS) image analysis – a methodology. Environmental Geology
42:32-40.
Koederitz WL, Weis J 2005. A real-time implementation of MSE. In: American Association of
Drilling Engineers National Technical Conference and Exhibition, Houston (Texas). Pp 1-8.
Kohno M, Maeda H 2012. Relationship between point load index and uniaxial compressive
strength of hydrothermally altered soft rocks. International Journal of Rock Mechanics and
Mining Science 50: 147-157.
Koncagül EC, Santi PM 1999. Predicting the unconfined strength of the Breathitt shale using
slake durability, Shore hardness and rock structural properties. International Journal of Rock
Mechanics and Mining Science 36: 139-153.
Krupp RE, Seward TM 1987. The Rotokawa geothermal system, New Zealand: An active
epithermal gold-depositing environment. Economic Geology 82: 1109-1129.
Chapter 8
151
Kusznir NJ, Park RG 1987. The extensional strength of the continental lithosphere; its
dependence on geothermal gradient, and crustal composition and thickness. Geological
Society, London, Special Publications 28: 35-52.
Ladygin V, Frolova J, Rychagov S 2000. Formation of composition and petrophysical properties
of hydrothermally altered rocks in geothermal reservoir. In: Proceedings. World Geothermal
Congress, Kyushu-Tokoku (Japan).
Lagat J 2009. Hydrothermal alteration mineralogy in geothermal fields with case examples from
Olkaria Domes Geothermal field, Kenya. Short Course IV on Exploration for Geothermal
Resources. Kenya.
Lajtai EZ, Lajtai VN 1974. The evolution of brittle fracture in rocks. Journal of Geological
Society. 130:1-18.
Lama RD, Vutukuri VS 1978. Handbook on Mechanical Properties of rocks, Vol. 2. Editor Trans
Tech Publications. Clausthal, Germany.
Legmann H, Sullivan P 2003. The 30 MW Rotokawa I geothermal project five years of
operation. In: Proceedings of the International Geothermal Conference, Reykjavik (Iceland).
Lewis B, Chambefort I, Rae AJ 2012. Geology of Injection Well NM8-NM8A Ngatamariki
Geothermal Field. GNS science consultancy report 2012/188.
Lewis B, Chambefort I, Rae AJ, Sanders F 2013a. Geology of Well NM9, Ngatamariki
Geothermal Field. GNS science consultancy report 2012/330.
Lewis B, Chambefort I, Rae AJ, Sanders F, Massiot C 2013b. Geology of Well NM11,
Ngatamariki Geothermal Field. GNS science consultancy report 2013/33.
Li L, Aubertin M 2003. A general relationship between porosity and uniaxial strength of
engineering material. Canada Journal of Civil Engineering 30:644-658.
Li L, Lee PKK, Tsui Y, Tham, LG, Tang CA 2004. Failure process of granite. International
Journal of Geomechanics. 3:84-98.
Li Y, Wang J, Jung, W, Ghassemi A 2012. Mechanical properties of intact rock and fractures in
welded tuff from Newberry Volcano. In: Proceedings. Thirty-Seventh Workshop on
Geothermal Reservoir Engineering, Stanford, California.
Chapter 8
152
Liu Y, Gupta R, Sharma A, Wall T, Butcher A, Miller G, Gottlieb P, French D 2005. Mineral
matter-organic matter association characterisation by QUEMSCAN and application to coal
utilisation. Fuel 84: 1259-1267.
Lumb P 1962. The properties of decomposed granite. Geotechnique 12: 226-243.
Lumb P 1983. Engineering properties of fresh and decomposed igneous rocks from Hong Kong.
Eng. Geol. 19: 81-94.
Luping T 1986. A study of the quantitative relationship between strength and pore size
distribution of porous materials. Cement and Concrete Research 16:87-96.
Lutz S, Zutshi A, Robertson-Tait A, Drakos P, Zemach E 2011. Lithologies, hydrothermal
alteration and rock mechanical properties in wells 15-12 and BCH-3, Bradys Hot Springs
Geothermal field, Nevada. GRC Transaction 35: 469-476.
Lutz SJ, Hickman S, Davatzes N, Zemach E, Drakos P, Robertson-Tait A 2010. Rock
mechanical testing and petrological analysis in support of well stimulation activities at the
desert peak geothermal field, Nevada. In: Proceedings, 37th
Workshop on Geothermal
Reservoir Engineering. Stanford, California (USA).
Maji VB 2011. Understanding failure mode in uniaxial and triaxial compression for a hard brittle
rock. In: Proceedings of the 12th
IRSM international congress on rock mechanics. CRC
Press/Balkema, Leiden. 723-726.
Martin CD 1997. Seventeenth Canadian Geotechnical colloquium: The effect of cohesion loss
and stress path on brittle rock strength. Canada Geotechnical Journal 34:698-725.
Martin CD, Chandler NA 1994. The progressive fracture of Lac du Bonnet Granite. International
Journal of Rock Mechanics and Mining Science and Geomechanical abstracts. 31:643-659.
Martínez-Martínez J, Benavente D, García del Cura MA 2007. Petrographic quantification of
brecciated rocks by image analysis. Application to the interpretation of elastic wave
velocities. Eng. Geol. 90: 41-54.
Martínez-Martínez J, Benavente D, García del Cura MA 2011. Spatial attenuation: The most
sensitive ultrasonic parameter for detecting petrographic features and decay processes in
carbonate. Eng. Geol. 3-4: 84-95.
Chapter 8
153
Martínez-Martínez J, Benavente D, García Del Cura MA, Canaveras, JC 2006. Ultrasonic to
brecciated dolostones for assessing the mechanical properties. IAEG. 243: 1-11.
Maurer WC 1962. The “Perfect-Cleaning” Theory of Rotary Drilling. Journal of Petroleum
Technology 14: 1270-74.
Mehegan JM, Robinson PT, Delaney JR 1982 Secondary mineralisation and hydrothermal
alteration in the Reydarfjordur drill core, Eastern Iceland. Journal of Geophysical Research
87: 6511-6524.
Mendes FM, Aires-Barros L, Rodrigues FP 1966. The use of modal analysis in the mechanical
characterization of rock masses. In: Proceedings of first congress, International Society for
Rock Mechanics, Lisbon. Pp. 217–33.
Milicich S, Wilson CJN, Bignall G, Pezaro B 2011. Buried rhyolite in the Kawerau geothermal
field, Taupo Volcanic Zone, New Zealand: Source of a rejuvenated geothermal system. In:
Proceedings, New Zealand Geothermal Workshop.
Milicich SD, Fruetsch F, Ramirez LE, Rae AJ, Alcaraz SA, Kallenberg B, McCoy-west AJ,
Bignall G 2010. Stratigraphic correlation study of the Kawerau Geothermal Field. GNS
Science Consultancy Report 2101/23.
Milicich SD, Wilson CJN, Bignall G, Pezaro B, Bardsley C 2013. Reconstructing the geological
and structural history of an active geothermal field: A case study from New Zealand. Journal
of Volcanology and Geothermal Research 262: 7-24.
Moon VG 1993. Microstructural controls on the geomechanical behaviour of ignimbrite. Eng.
Geol. 35: 19-31.
Moore DE, Hickman S, Lockner DA, Dobson PF 2001. Hydrothermal minerals and
microstructures in the Silangkitang geothermal field along the Great Sumatran fault zone,
Sumatra, Indonesia. Geological Society of America Bulletin 113: 1179-1192.
Moore JN, Allis R, Renner JL, Mildenhall D, McCulloch J 2002. Petrological evidence for
boiling to dryness in the Karaha-Telaga Bodas Geothermal system, Indonesia. In: Proceedings
27th
Workshop on Geothermal Reservoir Engineering, Stanford, California.
Moore JN, Gunderson RP 1995. Fluid inclusion and isotropic systematics of an evolving
magmatic hydrothermal system. Geochimica et Cosmochimica Acta 59: 3887-3907.
Chapter 8
154
Mueller S, Melnik O, Spieler O, Scheu B, Dingwell DB 2005. Permeability and degassing of
dome lavas undergoing rapid decompression: An experimental determination. Bulletin of
Volcanology 67:526-538.
Nara Y, Meredith PG, Yoneda T, Kaneko K 2011. Influence of macro-fractures and micro-
fractures on permeability and elastic wave velocities in basalt at elevated pressure.
Tectonophysics. 503: 52-29.
Nasimov RM, Diaur NI, Genshaft YS, Saltykovsky AF, Frolova J, Ladygin VM 2005. High PT
experimental studies of hydrothermally altered tuffs, Kuril Islands, Russia. In: Proceedings
World Geothermal Congress, Antalya (Turkey).
Nesse W D 2004. Introduction to Optical Mineralogy 3rd
ed. Oxford University Press. Pp. 134-
151.
Onodera TF, Yoshinaka R, Oda M 1974. Weathering and its relation to mechanical properties of
granite. In: Proceedings of 3rd
congress, International Society of Rock Mechanics, Denver,
2A:71-78.
Onyia EC 1988. Relationship between formation strength, drilling strength and electric log
properties. In: Proceedings SPE Annual Technical Conference and Exhibition, Houston
(Texas).
Palchik V 1999. Inflence of porosity and elastic modulus on uniaxial compressive strength in
soft brittle porous sandstone. Rock Mechanics and Rock Engineering 32:303-309.
Peacock SM 1990. Fluid Processes in Subduction zones. Science 248: 329-337.
Peng S, Johnson AM 1972. Crack growth and faulting in cylindrical specimens of Chelmsford
granite. International journal of Rock Mechanics and Mining Science. 9:37-86.
Perfit MR, Davidson JP 2000. Plate Tectonics and Volcanism. In: Sigurdsson H, Houghton B,
McNutt SR, Rymer H, Stix J eds. Encyclopedia of Volcanoes. Academic Press. Pp. 89-114.
Pochee A 2010. Mass transfer and hydrothermal alteration in the Rotokawa Andesite, Rotokawa
geothermal field, New Zealand. MSc thesis, University of Auckland, Auckland, New
Zealand.
Pola A, Crosta G, Fusi N, Barberini V, Norini G 2012. Influence of alteration on physical
properties of volcanic rocks. Tectonophysics 566-567: 67-86.
Chapter 8
155
Pola A, Crosta GB, Fusi N, Castellanza R 2014. General characterization of the mechanical
behaviour of different volcanic rocks with respect to alteration. Engineering Geology 169: 1-
13.
Prasad U 2009 Drillability of a rock in terms of its physic-mechanical and micro-structural
properties. In: Proceedings 43rd
US Rock Mechanics Symposium, Asheville (NC).
Price NJ 1960. The compressive strength of coal measure rocks. Coll. Engineering 37:283-292.
Protodyakonov MM 1962. Mechanical properties and drillability of rocks. In: Proceedings 5th
Symposium on Rock Mechanics, University Minnesota, 103-118.
Rae A 2007. Rotokawa Geology and Geophysics. GNS science consultancy report 2007/83.
Rae AJ, Ramirez LE, Boseley 2009. Geology of Geothermal Well NM7. Ngatamriki Geothermal
Field. GNS Science consultancy report 2009/289.
Rajesh Kumar B, Vardhan H, Govindaraj M 2011. Prediction of uniaxial compressive strength,
tensile strength and porosity of sedimentary rocks using sound level produced during rotary
drilling. Rock Mechanics and Rock Engneering 44: 613-620.
Reed RL 1972. A Monte Carlo Approach to optimal drilling. Society of Petroleum Engineers
Journal 12: 423-438.
Reyes AG 1990. Petrology of Philippine geothermal systems and the application of alteration
mineralogy to their assessment. Jounral of Volcanology and Geothermal Research 43: 279-
309.
Reid ME, Sisson TW, Brien DL 2001. Volcano collapse promoted by hydrothermal alteration
and edifice shape, Mount Rainier, Washington. Geology 29: 779-782.
Rejeki S, Hadi J, Suhayati I 2005. Porosity study for detail reservoir characterization in Darajat
Geothermal Field, West Java, Indonesia. In: Proceedings, World Geothermal Congress,
Antalya (Turkey)
Rigopoulos I, Tsikouras B, Pomonis P, Hatzipanagiotou K 2010. The influence of alteration on
the engineering properties of dolerites: The examples from the Pindos and Vourinos
ophiolites (Northern Greece). Rock Mechanics and Mining Science 47: 69-80.
Chapter 8
156
Risk GF, Caldwell TG, Bibby HM 2003. Tensor time domain electromagnetic resistivity
measurements at Ngatamariki geothermal field, New Zealand. Journal of Volcanology and
Geothermal Research 127: 33-54.
Robb L 2005. Introduction to ore-forming processes - Part 2: Hydrothermal processes. Blackwell
Science Ltd.
Romana M, Vásárhelyi B 2007. A discussion on the decrease of unconfined compressive
strength between saturated and dry rock samples. In: Proceedings of 11th
congress of the
International society for rock mechanics vol. 1, Taylor and Francis Lisbon. Pp.139-142.
Rowland J, Bardsley C, Downs D, Sepulveda F, Simmons S, Scholz C 2012. Tectonic controls
on hydrothermal fluid flow in a rifting and migrating arc, Taupo Volcanic Zone, New
Zealand. In: Proceedings 35th
New Zealand Geothermal Workshop. Auckland (New Zealand).
Rowland JV, Sibson RH 2001. Extensional fault kinematics within the Taupo Volcanic Zone,
New Zealand: Soft-linked segmentation of a continental rift system. New Zealand Journal of
Geology and Geophysics 2: 271-283.
Rowland JV, Sibson RH 2001. Extensional fault kinematics within the Taupo Volcanic Zone,
New Zealand: Soft-linked segmentation of a continental rift system. New Zealand Journal of
Geology and Geophysics 2:271-283.
Rowland JV, Sibson RH 2004. Structural controls on hydrothermal flow in a segmented rift
system, Taupo Volcanic Zone, New Zealand. Geofluids 4: 259-283.
Rowland JV, Simmons S 2012. Hydrologic, magmatic and tectonic controls on hydrothermal
flow, Taupo Volcanic Zone, New Zealand: Implications for the formation of epithermal vein
deposits. Economic Geology 107: 427-457.
Russ JC 1984. Fundamentals of Energy Dispersive X-Ray Analysis. Butterworths monographs in
materials. Pp. 17-41.
Saeidi O, Torabi SR, Ataei M 2013. Development of a new index to assess the rock mass
drillability. Geotechnical Geology Engineering 31: 1477-1495.
Sammis CG, Ashby MF 1986. The failure of brittle porous solids under compressive stress
states. Acta. Mell. 34: 511-526.
Chapter 8
157
Santarelli FJ, Brown ET 1989. Failure of three sedimentary rocks in Triaxial and hollow cylinder
compression tests. International journal of Rock Mechanics and Mining Science and
Geomechanical abstracts. 26:401-413.
Sarda JP, Kessler N, Wicquart E, Hannaford K, Deflandre JP 1993. Use of porosity as a strength
indictor for sand production evaluation. In: Proceedings Society of Petroleum Engineers
Annual Technical Conference and Exhibition, Houston, Texas.
Scholz CH 1968. Experimental study of the fracturing process in brittle rock. Journal of
Geophyiscal research. 73:1447-1454.
Seeback H, Nicol A, Stern TA, Bibby HM, Stagpoole V 2010. Fault controls on the geometry
and location of the Okataina Caldera, Taupo Volcanic Zone, New Zealand. Journal of
Volcanology and Geothermal Research 190: 136-151.
Sewell S, Cumming W B, Azwar L, Bardsley C 2012. Integrated MT and natural state
temperature interpretation for a conceptual model supporting reservoir numerical modeling
and well targeting at the Rotokawa Geothermal Field, New Zealand. In: Proceedings 37th
Workshop on Geothermal Reservoir Engineering Standford, California.
Shalabi FI, Cording EJ, Al-Hattamleh OH 2007. Estimation of rock engineering properties using
hardness tests. Engineering Geology 90: 138-147.
Sharma PK, Singh TN 2008. A correlation between p-wave velocity, impact strength index,
slake durability index and uniaxial compressive strength. Bulletin Engineering Geology and
the Environment 67: 17-22.
Shelley D 1985. Optical Mineralogy 2nd
ed. Elsevier, New York. Pp. 247 - 266 .
Sigurdsson H 2000. Volcanic Episodes and rates of volcanism. In Sigurdsson H, Houghton B,
McNutt SR, Rymer H, Stix J eds. Encyclopedia of Volcanoes. Academia Press. Pp. 271-279.
Simkin T, Siebert L 2000. Earth’s volcanoes and eruptions: an overview. In Sigurdsson H,
Houghton B, McNutt SR, Rymer H, Stix J eds. Encyclopedia of Volcanoes. Academic Press.
Pp. 249-261.
Simmons SF, Browne PRL 2000. Hydrothermal minerals and precious metals in the Broadlands-
Ohaaki Geothermal systems: Implications for understanding low-sulfidation epithermal
environments. Economic Geology 95: 971-999.
Chapter 8
158
Singh TN, Kainthola A, Venkatesh A 2012. Correlation between point load index and uniaxial
compressive strength for different rock types. Rock Mechanics and Rock Engineering 45:
259-264.
Singh VK, Singh D, Singh TN 2001. Prediction of strength properties of some schistose rocks
from petrographic properties using artificial neural networks. International Journal of Rock
Mechanics and Mining Science 38: 269-284.
Siratovich PA, Heap MJ, Villenueve MC, Cole JW, Reuschle T 2014. Physical property
relationship of the Rotokawa Andesite, a significant geothermal reservoir rock in the Taupo
Volcanic Zone, New Zealand. Geothermal Energy 2:1-31.
Smith R, Sammonds PR, Kilburn CRJ 2009. Fracturing of volcanic systems: Experimental
insights into pre-eruptive conditions. Earth and Planetary Science Letters 1-4: 211-219.
Sousa LMO, Suarez del Rio LM, Calleja L, Ruiz de Argandona R, Rodriguez Rey A 2005.
Influence of microfractures and porosity on the physic-mechanical properties and weathering
of ornamental granites. Engineering Geology 77:153-168.
Spaar JR, Ledgerwood LW, Christensen H, Goodman H, Graff RL, Moo TJ 1995. Formation
compressive strength estimates for predicting drillability and PDC bit selection. In:
SPE/IADC Drilling Conference, Amsterdam. Pp. 569 - 578
Stimac J, Nordquist G, Suminar A, Sirad-Azwar L 2008. An overview of the Awibengkok
geothermal system, Indonesia. Geothermics 37: 300-331.
Stimac J, Powell T, Golla G 2004. Porosity and permeability of the Tiwi geothermal fields,
Philippines, based on continuous and spot core measurement. Geothermics. 33: 87-107.
Stringham B 1952. Fields of formation of some common hydrothermal alteration minerals.
Society of Economic Geology 47:661-664.
Szwedzicki T 2007. Technical Note – A hypothesis on modes of failure of rock samples tested in
uniaxial compression. Rock Mechanics and Rock Engineering. 40: 97-104.
Tamrakar N, Yokota S, Sherestha S 2007. Relationship among mechanical, physical and
petrological properties of Siwalik sandstones, Central Nepal Sub-Himalayas. Engineering
Geology 3-4: 105-123.
Tanaino AS 2005. Rock classification by drillability. Part 1: Analysis of the available
classifications. Journal of Mining Science 41:541-549.
Chapter 8
159
Tansev E 1975. A heuristic approach to drilling optimization. In: Proceedings SPE annual Fall
meeting, Dallas, TX.
Teale R 1965. The concept of specific energy in rock drilling. International Journal of Rock
Mechanics and Mining Science 2: 57-73.
Thuro K 1997. Drillability prediction: geological influences in hard rock drill and blast
tunneling. Geologische Rundschau 86:426-438.
Tuğrul A, Zarif IH 1999. Correlation of mineralogical and textural characteristics with
engineering properties of selected granitic rocks from Turkey. Engineering Geology 51: 303-
317.
Ulusay R, Hudson JA 2007. Standard method for determining the uniaxial compressive strength
and deformability of rock materials. In: The complete ISRM suggested methods for rock
characterization, testing and monitoring: 1974-2006. Turkish National group 1979. Pp. 121-
132.
Ulusay R, Hudson JA 2007. Standard Method for determining water content, porosity, density,
absorption and related properties. In: The complete ISRM suggested methods for rock
characterization, testing and monitoring: 1974-2006. Turkish National group 1978. Pp. 85-92.
Ulusay R, Tureli K, Ider MH 1994. Prediction of engineering properties of a selected litharenite
sandstone from its petrographic characteristics using correlation and multivariate statistical
techniques. Engineering Geology 37:135-157.
Van Der Pluijm BA, Marshak S 2004. Earth Structure Second edition – Chapter 17:
Convergence and Collision. W.W. Norton & Company inc., USA. Pp. 412-443.
Villamor P, Berryman K 2001. A late Quaternary extension rate in the Taupo Volcanic Zone,
New Zealand, derived from Fault slip data. NZ Journal of Geology and Geophysics 44: 243-
269.
Vinciquerra S, Trovato C, Meredith PG, Benson PM 2005. Relating seismic velocities, thermal
cracking and permeability in Mt. Etna and Iceland basalts. International Journal of Rock
Mechanics and Mining Science 7-8: 900-910.
Vutukuri VS, Lama RD, Saluja SS 1974. Handbook on mechanical properties of Rocks – Testing
techniques and results, Vol. 1. Trans Tech Publications. Clausthal, Germany.
Chapter 8
160
Walker G P L 1984. Downsag calderas, ring faults, caldera sizes, and incremental caldera
growth. Journal of Geophysical Research 89: 8407-8416.
Wallis I C, McNamara D, Rowland J V, Massiot C 2012. The nature of fracture permeability in
the basement greywacke at Kawerau geothermal field, New Zealand. In: Proceedings
Workshop of geothermal reservoir engineering, Stanford University, Stanford, California.
Wallis I, McCormick S, Sewell S, Boseley C 2012. Formation assessment in geothermal using
wireline tools – Application and early results from the Ngatamariki geothermal field, New
Zealand. In: Proceedings New Zealand Geothermal workshop, Auckland (New Zealand).
Walsh J 1961. The effects of cracks on the compressibility of rocks. Journal of Geophysical
Research 70:381-389.
Weinberg RB, Podladchikov Y 1994. Diapiric ascent of magmas through power law crust and
mantle. Journal of Geophysical Research 99: 9543-9559.
Weinert HH 1965. Climatic factors affecting the weathering of igneous rocks. Agricultural
Meteorology 2: 27-42.
Whitney DL, Broz M, Cook RF 2007. Hardness, toughness and modulus of some common
metamorphic minerals. American Mineralogy 92:281-288.
Wijk G 1989. The stamp test for rock drillability classification. International Journal of Rock
Mechanics and Mining Science 26: 37-44.
Wilson CJN, Gravley DM, Leonard GS, Rowland JV 2009. Volcanism in the central Taupo
Volcanic Zone, New Zealand: tempo, styles and controls. Studies in Volcanology: The
Legacy of George Walker. Special Publication of IAVCEI 2: 225-247.
Wilson CJN, Houghton BF, McWilliam MO, Lanphere MA, Weaver SD, Briggs RM 1995.
Volcanic and structural evolution of Taupo Volcanic Zone, New Zealand: a review. Journal of
Volcanology and Geothermal Research 68: 1-28.
Wilson DC, Bentsen RG 1972. Optimization techniques for minimizing drilling costs. In: SPE
3983 47th
SPE Annual Fall Meeting, San Antonio.
Winick J, Powell T, Mroczek Ed 2009. The natural state geochemistry of the Rotokawa
Reservoir. In: Proceedings New Zealand Geothermal Workshop, Rotorua (New Zealand).
Chapter 8
161
Wood CP, Brathwaite RL, Rosenberg MD 2001. Basement structure, lithology and permeability
at Kawerau and Ohaaki geothermal fields, New Zealand. Geothermics 30: 461-481.
Wyering LD, Villeneuve MC, Wallis IC 2012. The effects of hydrothermal alteration on the
physical and mechanical rock properties of the Andesite Breccia and Tahorakuri Formation
from the Ngatamariki Geothermal field, New Zealand and empirical relations between rock
strength and physical properties. In: Proceedings, New Zealand geothermal Workshop,
Auckland, (New Zealand) – In appendix A.1
Wyering LD, Villeneuve MC, Wallis IC, Kennedy BM, Gravley DM 201X. Using drilling and
geological parameters to estimate rock strength in hydrothermally altered rock – A study
looking at Mechanical Specific Energy, R/N-W/D Chart and Alteration Strength Index. In
Preparation.
Wyering LD, Villeneuve MC, Wallis IC, Siratovich PA, Kennedy BM, Gravley DM 2014n.
Development of the alteration strength index. In Preparation.
Wyering LD, Villeneuve MC, Wallis IC, Siratovich PA, Kennedy BM, Gravley DM 2014n. The
development of the Alteration Strength Index Equation. In Preparation.
Wyering LD, Villeneuve MC, Wallis IC, Siratovich PA, Kennedy BM, Gravley DM, Cant JL
2014. Mechanical and physical properties of hydrothermally altered rocks, Taupo Volcanic
Zone, New Zealand. Journal of Volcanology and Geothermal Research 288: 76-93.
Wyllie MRJ, Gregory AR, Gardner LW 1956. Elastic wave velocities in heterogeneous and
porous media. Geophysics 21: 41-70.
Wyllie MRJ, Gregory AR, Gardner LW 1958. An experimental investigation of factors affecting
elastic wave velocities in porous media. Geophysics. 3: 459-493.
Yagiz S 2009. Predicting uniaxial compressive strength, modulus of elasticity and index
properties of rocks using the Schmidt hammer. Bulletin of Engineering Geology and the
Environment 68:55-63.
Yang K, Browne PRL, Huntington JF, Walshe JL 2001. Characterising the hydrothermal
alteration of the Broadlands-Ohaaki geothermal system, New Zealand, using short-wave
infrared spectroscopy. Journal of Volcanology and Geothermal Research 106: 53-65.
Yarali O, Kahraman S 2011. The drillability assessment of rocks using the different brittleness
values. Tunnelling and Underground Space Technology 26: 406-414.
Chapter 8
162
Yaşar E, Erdoğan Y 2004. Estimation of rock physicomechanical properties using hardness
methods. Engineering Geology 71:281-288.
Yaşar E, Ranjith PG, Viete DR 2011. An experimental investigation into the drilling and physic-
mechancal properties of a rock-like brittle material. Journal of Petroleum Science and
Engineering 76: 185-193.
Yıldız A, Kuşcu M, Dumlupunar I, Krrem Aritan A, Begci M 2010. The determination of the
mineralogical alteration index and the investigation of the efficiency of the hydrothermal
alteration on physic-mechanical properties in volcanic rocks from Koprulu, Afyonkarahisar,
West Turkey. Bulletin of Engineering Geology and the Environment 69: 51-61.
Yilmaz I, Sendir H 2002 Correlation of Schmidt hardness with unconfined compressive strength
and young’s modulus in gypsum from Sivas (Turkey). Engineering Geology 6: 211-219.


