Embed Size (px)
Citation preview
The Kingdom of Cambodia A Study on Special Economic Zones
for SMEs
Final Report
March 2013
Japan International Cooperation Agency (JICA)
Japan Development Institute (JDI)

3
SUMMARY 1. BACKGROUND
Of the eight SEZs currently running in Cambodia, three SEZs are popular among Japanese compa-
nies, which are located in Bavet in Svay Rieng, near the Vietnam border, A strong willingness of
Japanese companies has been observed to expand further there, leading to the idea that the area
could be an area of industrial clusters. However, all necessary infrastructure systems - transporta-
tionelectric power supply, water, solid waste disposal, drainage, and sewerage networks, which are
just as much the basis of production activity as the housing inventory in the entire area surrounding
the production facilities, commercial facilities, transportation, and district facilities, education and
health institutions, culture and entertainment activities, have not been fully developed. Also, the
government of Cambodia shows a strong interest in the study of urban development plans aroundthe
production base, and consider measures to promote future industrial diversification and development
clusters, that will lead towards the continuous business expansion of Japanese companies active in
Svay Rieng Province.
2. 2. ANALYSIS OF THE CURRENT STATE OF CAMBODIA'S INDUSTRIES AND
MANUFACTURING BUSINESSES AND THEIR PROJECTIONS
2.1 THE CURRENT STATE OF CAMBODIA'S INDUSTRIES
Cambodia's industries are characterized by labor-intensive ones that involve simple assembly, com-
prising sewing, shoe-making, motorcycle repair, and plastic products (daily necessities), and reveals
that these businesses operate mostly in Phnom Penh and Siem Reap. Cambodia's industries mainly
comprise sewing, shoe-making, and motorcycle repair, businesses that also identify those of Myan-
mar and Laos as the last entrants of ASEAN. To promote the improvement of existing industries and
the development of new ones, technological transfer by foreign capital is vital.
2-2. The Characteristics and Projections of Cambodia's Manufacturing Businesses, Which
Rely Largely on Foreign Capital
The following summarizes Cambodia's major manufacturing businesses (sewing, electrical and elec-
tronics, and machinery) and their projections.
(1) Sewing Industry
① Characteristics
4
The trade surplus posted by sewing businesses provides the resources to import other consum-
ables and industrial goods. In this regard, sewing is Cambodia's biggest industry that possesses
export competitiveness.
In Cambodia, there are no nationally run sewing companies. Moreover, local sewing companies
are weak, and the approval of wholly-owned foreign companies to enter the country's market
since 1994 has led to the dominance of foreign capital in the production and export of sewn
products.
The products are first characterized by the fact that they are largely knit. Knitting requires small
investment, and transportation costs are cheap as the raw materials are not bulky.
The second characteristic of Cambodian products is that they first focus on the production of
undergarments, which are easy to produce and for which the quality standards are lax among
outer garments (e.g., uniforms, training wear, jackets, short jackets, pants, and skirts), interme-
diate garments (e.g., pajamas, T-shirts, dress shirts, and sweaters), and undergarments (under-
wear).
② Projections
In the past, nightwear and pajamas made with cotton and synthetic fibers were Cambodia's
strongest products in terms of international competitiveness. Gradually, these undergarments
are being replaced by intermediate and outer garments, such as cotton skirts, men's shirts made
with fabric and men's clothing, which emphasize the silhouette of the body.
These trends are already apparent with the entry of Nisshin Clothing, known for overalls (en-
tered Cambodia in 2011), Towa, known for men's clothing (2011), ROCKS, known for
women's and men's casuals, and Ronchesuta (2012), known for women's clothing.
However, while the Bavet region offers the advantage of its location with access to Ho Chi
Minh's port(s), it has encountered the bottlenecks of [poor] infrastructure and labor. As such,
unless these bottlenecks are resolved, it is impossible to manufacture products that maintain
quality. It is therefore not easy to operate large sewing factories.
(2) Electrical and Electronics Industry
① Characteristics
Cambodia's electrical and electronics industry demonstrates potential for future growth, though
it has only embarked on the beginning phase of the development backed by the entry of foreign
companies. Some Japanese companies that are running businesses in neighboring countries
such as Thailand and Malaysia have shown a strong interest in production in Cambodia by lev-
eraging the country's cheap labor.
5
② Projections
In terms of the potential for Japanese companies to enter Cambodia, the following three patterns can
be projected based on an analysis of the basic locational requirements for the electrical and electron-
ics industry, policies on the division of production within ASEAN among Japanese companies in
Thailand, and the current trends in the entry to Vietnam among electrical and electronics companies,
etc.
(i) Assembly process of wire harnesses
(ii) Assembly process of coils and transformers
(iii) Assembly of small electrical products
(3) Machinery
① Characteristics
In terms of machinery, Cambodia has relied on imports. In turn, galvanized steel plates and
motorcycles have been substituted by Japanese companies.
Japanese companies in Thailand, which focus on transportation equipment, designated Thailand
as the center of production. At the same time, they are pushing ahead to build a horizontal divi-
sion of production wherein they seek to cut production costs by allowing its factories and parts
manufacturers in ASEAN to complement each other. Therefore, to cut costs, etc. against the
backdrop of the rise in wages in Thailand and the appreciation of its currency, and so as to re-
inforce competitiveness against China, the companies are considering transferring their more
labor-intensive processes to Cambodia.
② Projections
The fields that show promise in machinery include surface treatments in post-processing
(plating, painting, and high-frequency), and assembly and wiring (print circuit processing, parts
assembly, and mounting), all in the category of precision machinery. Moreover, in automobile
parts, the promising fields include chassis and automobile body parts (e.g., fuel tanks, exhaust
pipes, mufflers, window frames, seats, and air bags) and electrical parts and others (e.g.,
switches, meters, wipers, alarms, and heaters) However, [the success] all depends on securing
electricity, waterworks and other industrial infrastructure, as well as labor. Therefore, in today's
Bavet region, operation of machinery factories is not necessarily easy unless the bottlenecks are
resolved.
2-3. Characteristics of Companies Entering Cambodia (Investing Country, Business Type, and
Location)
6
Although comprehensive statistics have not been disclosed, according to CSEZB sources (from 2006
to the end of 2012), the characteristics of the tenant companies in each SEZ can be summarized as
follows.
Increased rapidly from 2008. In 2012, there were 43 companies, reaching $320 million.
Companies include those from Japan, Thailand, South Korea, Malaysia, and Singapore.
The business include not just the traditional industries of shoes and pouches, but also electrical
and electronic parts, motorcycle parts, and labor-intensive electrical and electronic parts such as
automobiles and plastics. They are diverse, including labor-intensive machine parts. In the
Bavet region under review, there is a trend among foreign companies [specializing in] bolt nuts,
plastics, coils and transformers, electrical locks, and clock parts.
As for the SEZs, Phnom Penh, fully equipped with infrastructure, boasts the largest scale in
terms of both the number of tenant companies and the investment amount. This is followed by
Manhattan SEZ in the Bavet region by the Vietnam border (eastern region), Tai Seng SEZ, and
Dragon King SEZ. These feature good access to the port(s) in southern Vietnam. Combined,
these three SEZs rival Phnom Penh SEZ in terms of the number of tenant companies. The total
of the three SEZs in the Sihanouk region in Southern Cambodia is commensurate with ap-
proximately half of the number of tenant companies at Phnom Penh SEZ. The two around the
border of Thailand (western region), or Poipet SEZ and Koh Kong SEZ, do not hold enough
number of tenant companies from Thailand at this time.
2-4. Characteristics of Japanese Companies
The following characteristics can be derived regarding the entry of Japanese manufacturers.
The entry of Japanese companies is remarkable. The investment amounted to $320 million in
2012, surpassing the $310 million in cumulative terms up to 2011.
From 1994 to 2009, export products focused on sewn goods, shoes, and stationery, while mo-
torcycles, galvanized steel plates, and processed foods catered to the domestic demand. On the
other hand, from 2010 to January 2013, while sewn goods still accounted for a large portion of
exports, business types were diversifying, encompassing electrical and electronic parts (small
motors, wire harnesses, aluminum TV frames, coils and transformers, and mold plastics),
automobile parts (air conditioner parts, wire harnesses, emblems, and aluminum die casts), and
precision machinery (parts for clocks and eyeglasses).
In terms of the locations of the companies, electrical and electronic parts manufacturers, auto-
mobile manufacturers, and those specializing in medium-priced sewn products, shoes, and bags,
preferred Phnom Penh SEZ, which commands rents at relatively higher prices. Meanwhile,
those specializing in low-priced sewn products, shoes, and bags tended to prefer Tai Seng SEZ
and Manhattan SEZ because their rents are low, even though their infrastructure is subpar and
7
not enough labor is available. Moreover, Koh Kong SEZ and Poipet SEZ were preferred among
Thai automobile parts manufacturers, while Dragon King SEZ at the Vietnamese border (also
facing such problems as subpar infrastructure and lack of labor) was preferred by Vietnamese
precision machinery manufacturers.
3. DEVELOPMENT CONDITIONS OF EXISTING SPECIAL ECONOMIC ZONES AND
FACTORIES IN BAVET REGION
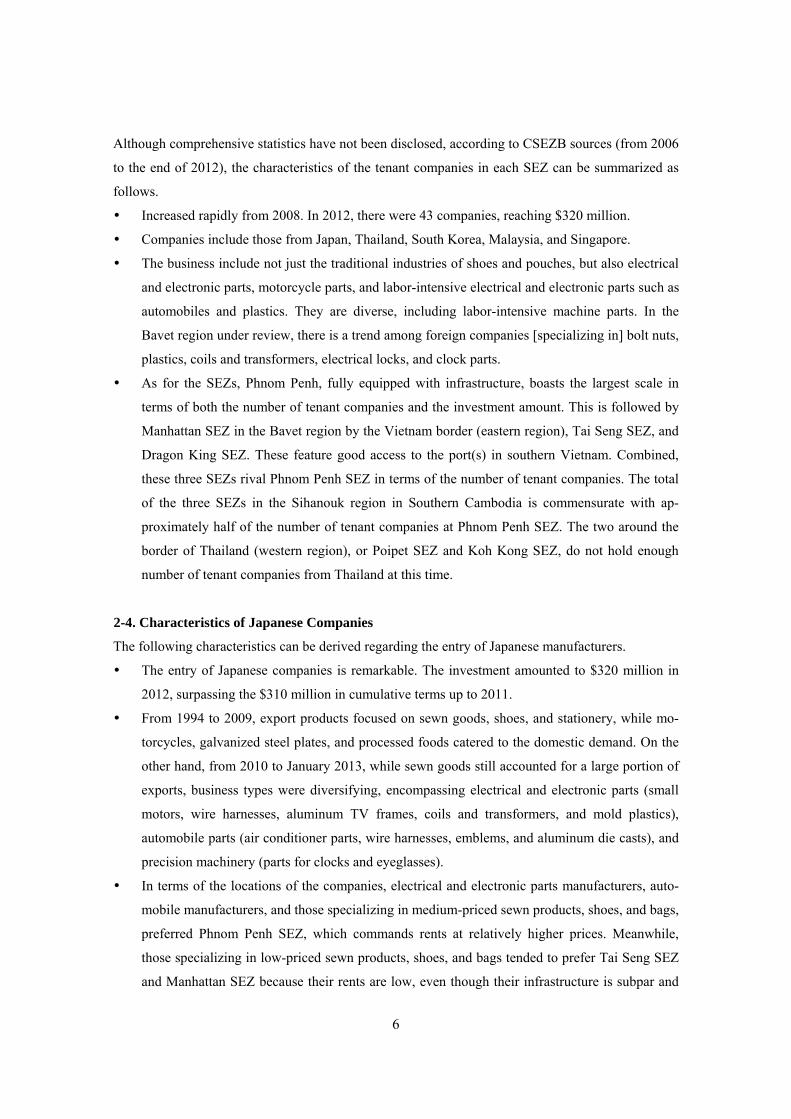
3-1. LAYOUT OF SPECIAL ECONOMIC ZONES AND FACTORIES IN BAVET REGION
From the country border, the following special economic zones and factories were built or planned;
Manhattan SEZ 、 Tai Seng Bavet SEZ 、 Tai Seng Bavet SEZ Sub 、 Dragon King SEZ 、
Nissin(Factory)、Shandong Industrial Park. Some factories are under operation, under preparation
for operation, under construction.
Figure 1:Layout of SEZs and Factories in Bavet
Source: Study team
3-2. Infrastructure Conditions of Special Economic Zones in Bavet Region
The following table shows infrastructure conditions of SEZs in Bavet region.

8
Table 1: Basic Infrastructure Conditions of SEZs SEZ Planned
Develop-ment Area
Electricity Water Supply
Waste Water
Drainage Road Dormitory
Manhattan SEZ 180ha by SEZ map, but 208ha by drawing
Present Capacity 6MW
Water source: Under ground water Supply by pipe in front of factory
Discharg-ing to bor-row pit excavated during land earth work
Discharg-ing to rice field through u-channel along road
Asphalt road with-out white lines
Under planning Developer:
Manhattan In-ternational Co., Ltd
Tai Seng Bavet SEZ
125ha by sez map, but 205ha by drawing
Total ca-pacity: 4MW
Water source: Under ground water Factory must have supply facility
Discharg-ing to bor-row pit by the same pipe for rain and waste wa-ter Flowing out to rice field
Concrete road was made last year
Develop-ment drawing indicates dormitory, not yet built
Tai Seng Bavet SEZ Sub Developer: Tai Seng Bavet SEZ Co., Ltd
Dragon King SEZ
108ha by drawing
Plan to use lines along No. 1 road
Drawing indicated the places for treatment plants
Under construction, Under planning
Developer: Dragon King Co., Ltd Shandong In-dustrial Park
116ha by drawing
Same above
The same system as Manhattan SEZ
Developer: Manhattan In-ternational Co., Ltd Hi Park SEZ 300ha by
CDC in-formation
Under planning
Under planning Not confirmed
Source: Study team
It is clear that the existing SEZs do not satisfy the condition prescribed by SEZ sub decree that says
“SEZ must have full infrastructure.” Manhattan SEZ seems to satisfy preliminary conditions of in-
frastructure. Water is supplied up to the underground pipe in front of factories. Waste water is dis-
charging to the borrow pit which expects natural treatment. However, there are no treatment facili-
ties offering a suitable cleaning process for factories to achieve the internationally satisfactory water
quality level. It is also clear that waste water is unable to be cleaned only through borrow pit pond.
9
Tai Seng Bavet SEZ does not have both a water treatment plant and a waste water treatment plant.
Specifically, the waste water pipe is co-used for rain water drainage that will make it impossible to
discharge the waste water during the rainy season when the water flow volume becomes high.
3-3. DETAILED INVESTIGATION OF FACTORY OPERATING CONDITIONS INSIDE/OUTSIDE SEZS
In order to investigate factory operating conditions, the following categories are used for investiga-
tion.
Factory under operation;
Factory - already built, but not yet operating, preparing for operation;
Factory - with signed Land lease agreement, but not yet built;
Factory - expected to make contract with presently vacant lot
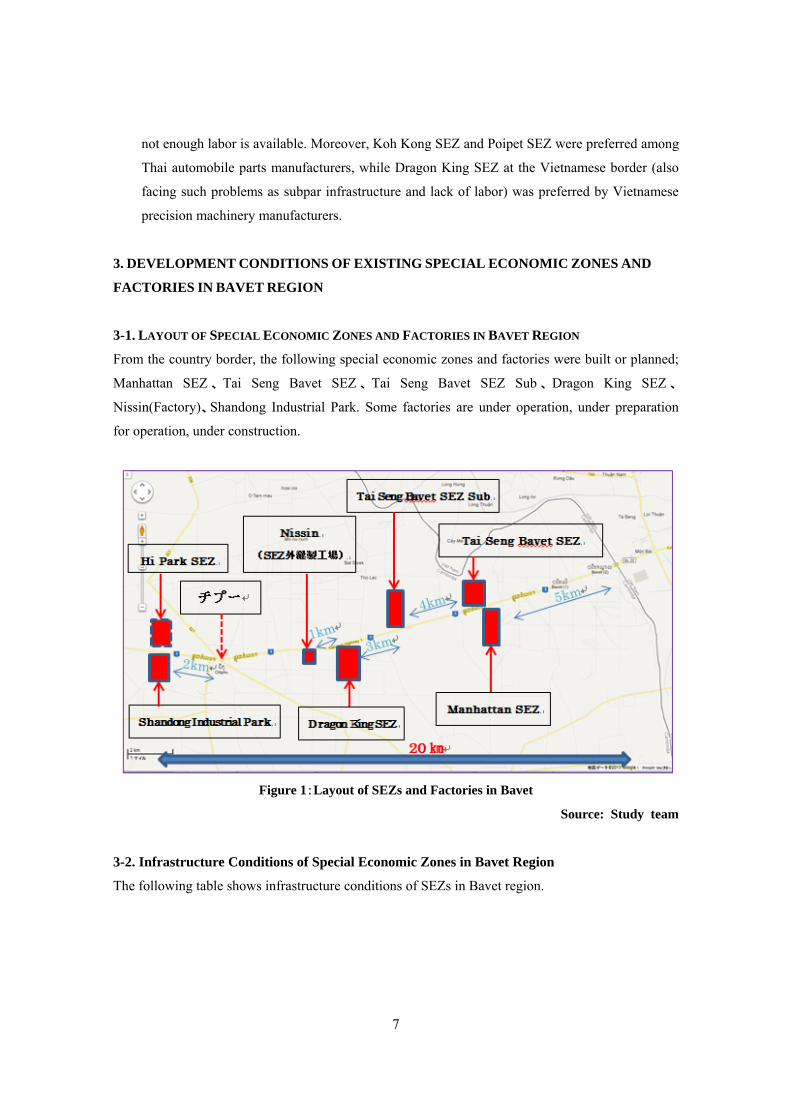
The following table summarizes the previous tables. It shows present agglomerating and operating
factories inside and outside SEZs.
Table 2:Present Operating Conditions of Factories in Bavet Region Operating Conditions Time(End of 2012~
January 2013) Note
Total Developed Land Area (ha)
145.57 Assumed: Operating Factory Lot Area×100/70. (Difficult to measure the pre-sent developed area due to the ongoing con-struction.)
Land lot area of operating factories(ha)
101.90
Nos. of operating factories (EA)
31 Inside SEZ:6 (Japan) Outside SEZ:1 (Japan)
Nos. of Workers(people) 18,382 Water(㎥/day) 1,838.20 Assumed: 100l/people/day Waste Water(㎥/day) 1,470.56 80% of Water Volume Electrical demand capac-ity(MW)
10.53 Manhattan and Tai Seng: 10MW
Source: Study team
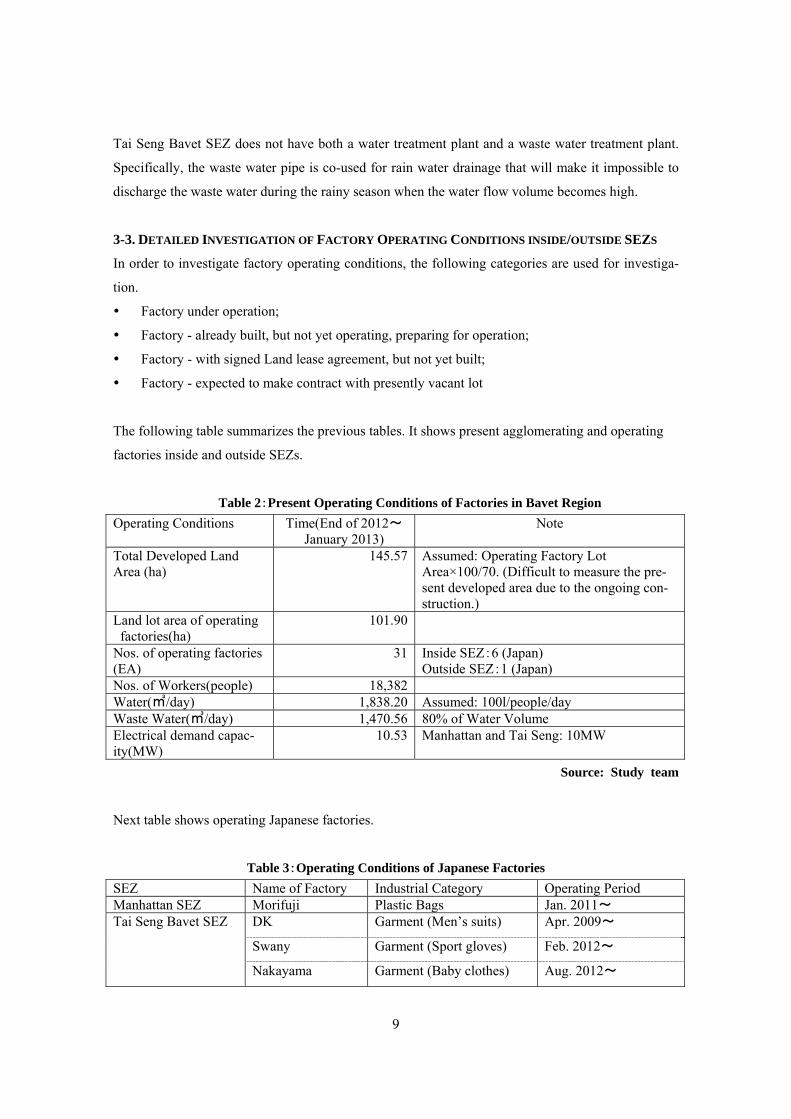
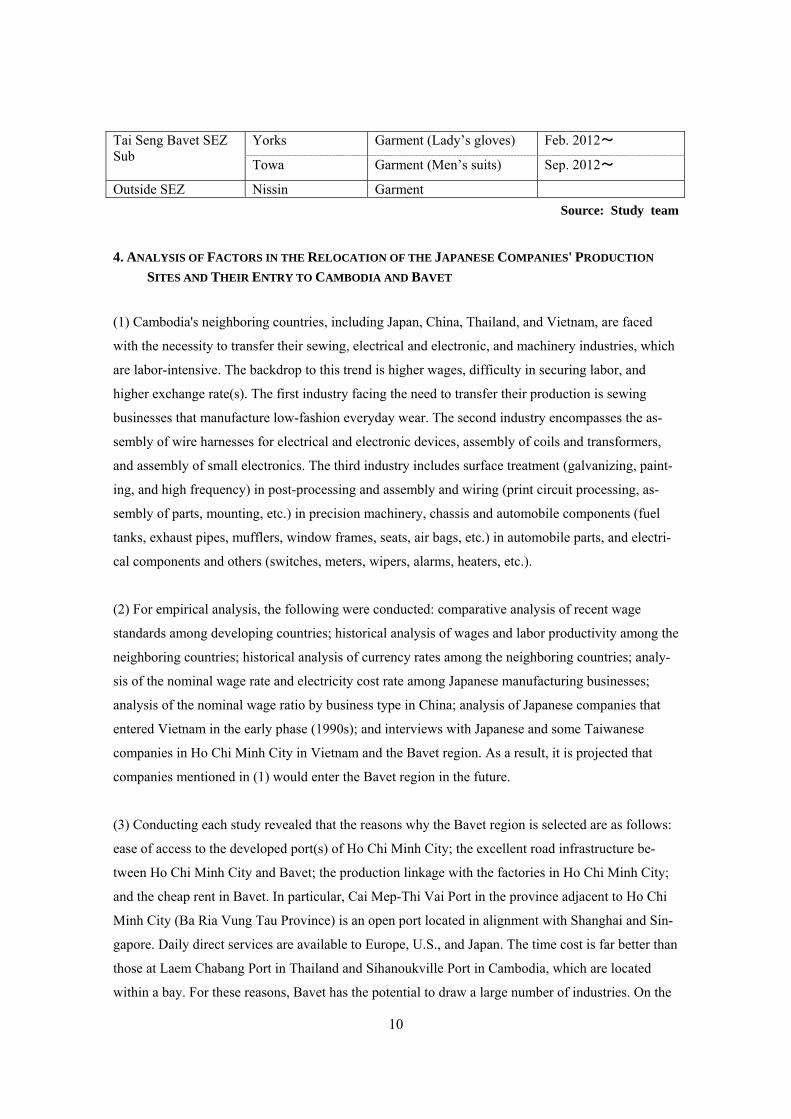
Next table shows operating Japanese factories.
Table 3:Operating Conditions of Japanese Factories SEZ Name of Factory Industrial Category Operating Period Manhattan SEZ Morifuji Plastic Bags Jan. 2011~ Tai Seng Bavet SEZ DK Garment (Men’s suits) Apr. 2009~
Swany Garment (Sport gloves) Feb. 2012~
Nakayama Garment (Baby clothes) Aug. 2012~
10
Tai Seng Bavet SEZ Sub
Yorks Garment (Lady’s gloves) Feb. 2012~
Towa Garment (Men’s suits) Sep. 2012~
Outside SEZ Nissin Garment Source: Study team
4. ANALYSIS OF FACTORS IN THE RELOCATION OF THE JAPANESE COMPANIES' PRODUCTION
SITES AND THEIR ENTRY TO CAMBODIA AND BAVET
(1) Cambodia's neighboring countries, including Japan, China, Thailand, and Vietnam, are faced
with the necessity to transfer their sewing, electrical and electronic, and machinery industries, which
are labor-intensive. The backdrop to this trend is higher wages, difficulty in securing labor, and
higher exchange rate(s). The first industry facing the need to transfer their production is sewing
businesses that manufacture low-fashion everyday wear. The second industry encompasses the as-
sembly of wire harnesses for electrical and electronic devices, assembly of coils and transformers,
and assembly of small electronics. The third industry includes surface treatment (galvanizing, paint-
ing, and high frequency) in post-processing and assembly and wiring (print circuit processing, as-
sembly of parts, mounting, etc.) in precision machinery, chassis and automobile components (fuel
tanks, exhaust pipes, mufflers, window frames, seats, air bags, etc.) in automobile parts, and electri-
cal components and others (switches, meters, wipers, alarms, heaters, etc.).
(2) For empirical analysis, the following were conducted: comparative analysis of recent wage
standards among developing countries; historical analysis of wages and labor productivity among the
neighboring countries; historical analysis of currency rates among the neighboring countries; analy-
sis of the nominal wage rate and electricity cost rate among Japanese manufacturing businesses;
analysis of the nominal wage ratio by business type in China; analysis of Japanese companies that
entered Vietnam in the early phase (1990s); and interviews with Japanese and some Taiwanese
companies in Ho Chi Minh City in Vietnam and the Bavet region. As a result, it is projected that
companies mentioned in (1) would enter the Bavet region in the future.
(3) Conducting each study revealed that the reasons why the Bavet region is selected are as follows:
ease of access to the developed port(s) of Ho Chi Minh City; the excellent road infrastructure be-
tween Ho Chi Minh City and Bavet; the production linkage with the factories in Ho Chi Minh City;
and the cheap rent in Bavet. In particular, Cai Mep-Thi Vai Port in the province adjacent to Ho Chi
Minh City (Ba Ria Vung Tau Province) is an open port located in alignment with Shanghai and Sin-
gapore. Daily direct services are available to Europe, U.S., and Japan. The time cost is far better than
those at Laem Chabang Port in Thailand and Sihanoukville Port in Cambodia, which are located
within a bay. For these reasons, Bavet has the potential to draw a large number of industries. On the
11
other hand, there are issues of labor shortage, inadequate electric power and water systems at indus-
trial complexes named "SEZ," and activities by consultant(s) that were identified to have solicited
investment without disclosing these problems. The interviews in Bavet, combined with these issues,
also showed that, undeniably, companies may have been misinformed in selecting the locations for
investment.
(4) These issues can be categorized into two: those that ought to be resolved by companies who en-
tered Bavet, and those that require public aid. The companies, implementing bodies of SEZs, and
third-party developers must take commercial initiatives to build dormitories and commercial facili-
ties to secure labor and install power generators and water systems. In Vietnam, industrial park(s)
developed by VSIP (Singapore) are accompanied by dormitories and commercial facilities in the
neighboring area(s). While [they] have not received any public aid, at Thang Long Industrial Park,
demand is being made to the Japanese government to provide public aid for such facilities. As long
as there is VSIP's precedent, it would not be easy to receive public aid that breaks the balance. In this
regard, the same applies to Cambodia. In any case, in terms of the infrastructure, the start is to care-
fully inspect the agreements concluded between the Cambodian government and the implementing
bodies of SEZs, as well as those between the implementing bodies of SEZs and the tenant compa-
nies.
(5)“The Survey of Japanese-Affiliated Companies in Asia and Oceania” conducted by JETRO in
2012 shows the directions for business development in the next one-two years by country/region.
According to the survey result for 3,805 Japanese companies, the high ratio of business expansion
needs in the invested countries are put in order as (i) Lao PDR (94%), (ii) India (84%), (iii) Bangla-
desh (82%), (iv) Indonesia (77%) and Cambodia (77%). Incidentally, Vietnam (66%), China (52%)
are dropped from the previous survey in 2011. On the contrary, the ratio of needs for downsizing and
relocating to a third country/region or withdrawal is gone up for China (5.8%), Vietnam (2.0%) from
the previous survey in 2011. Additionally, Cambodia is shown as nothing (0%) in the year 2012
survey.
When we apply the latter ratio to accumulated numbers of Japanese companies invested in China
(total 23,000 firms) and Vietnam (total 1,500 firms) until the end of 2012, we can get the numbers of
companies which have intentions of downsizing and relocating to a third country/region or with-
drawal as 1,330 firms from China and 30 firms from Vietnam. If the existing shortage of labor
force and lack of infrastructure in Bavet will be solved in the future, the investment for relocation
will be stimulated from China and Vietnam to there, though the converse is also true in case of no
improvement in Bavet.
12
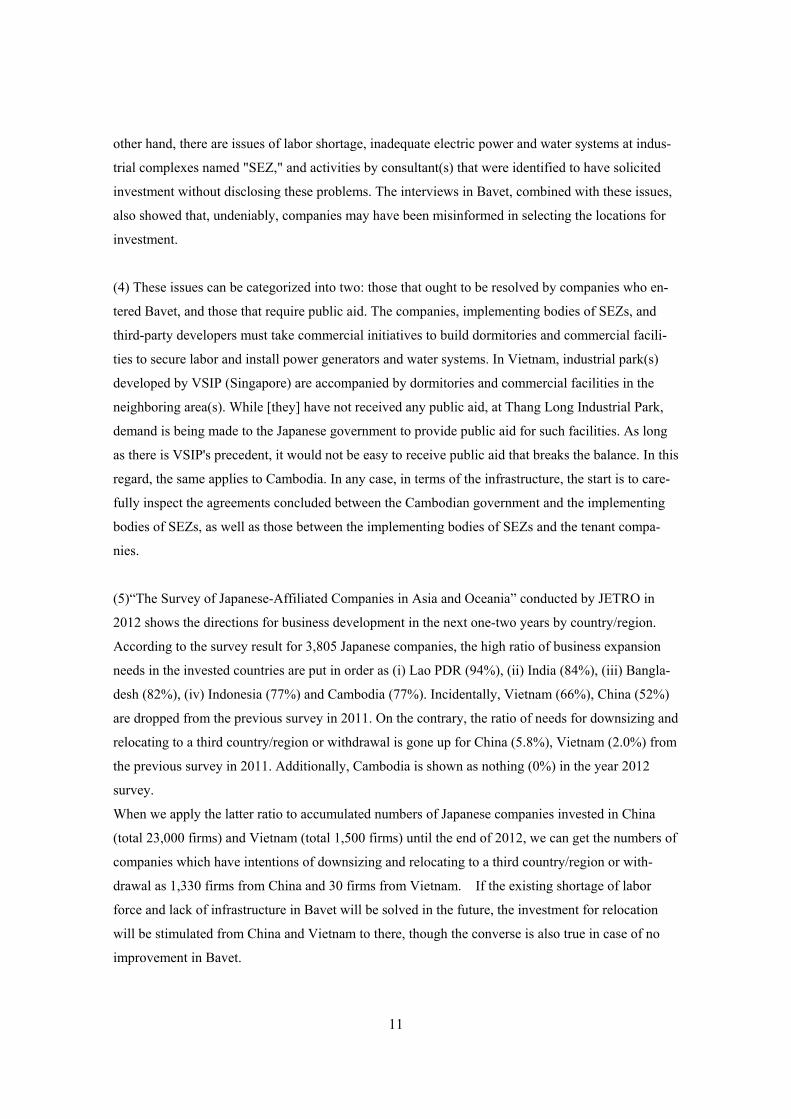
5. PROBLEMS WITH INFRASTRUCTURE CONDITIONS OF EXISTING SEZS AND FACTORIES 5-1. Special Conditions of Infrastructures in Bavet Region
In terms of world economic situations, due to changes in Chinese labor cost, China cannot be the
only one major industrial base, anymore. Many of them tend to move toward south-east Asia. Spe-
cifically Cambodia has a tax advantage as a least developed country. In this respect, country borders
such as Bavet have a great advantage to form a joint production process between Cambodia, where
small parts can be made, and Vietnam, where whole products are assembled. Foreign investors pay
attention to Bavet because of the relatively low labor cost with plenty of workers and the closest dis-
tance to Vietnam. Manhattan SEZ and Tai Seng Bavet SEZ started operation in 2006 in Bavet region.
Following them, a few more SEZs were authorized by CDC.
Table 4: SEZs and Factories in Bavet Region
SEZ Operation Condition Remarks or Problems with Infra-
structure
Manhattan SEZ 19 Factories are operating. Electric power shortage, Poor
transportation for workers, Fre-
quent strikes
Tai Seng SE 8 Factories are operating. Above + improper waste water
system
Tai Seng Sub 3 Factories are operating. Same above
Dragon King SEZ Under land developing.
1 Factory is under construction.
Shandong Industrial
Park
Under land developing.
A few factories are under construction.
Hi Park SEZ Jan. 2013, SEZ development plan was
authorized.
Total development area is 300ha.
Nissin Factory Factory was built in 2012. Under op-
eration.
Land area is 5ha. Self- infrastruc-
ture.
Rocks Factory 5ha land is under construction. To be self-infrastructure
Source: Study team
However, in 2012, infrastructure problems started coming out; shortage of electricity, improper
waste water system, poor transportation system for workers, insufficient dormitory and strikes. The
main cause of those problems is from agglomerating effect of several SEZs and factories. The loca-
tion of SEZs and the time of development were coincidently near and close. Agglomerating SEZs,
which are composed from independent SEZ, creates huge infrastructure demand suddenly and un-
13
expectedly. With the situation as it is, some factories have been experiencing a hard time to continue
the operation. Urgent remedies are strongly required.
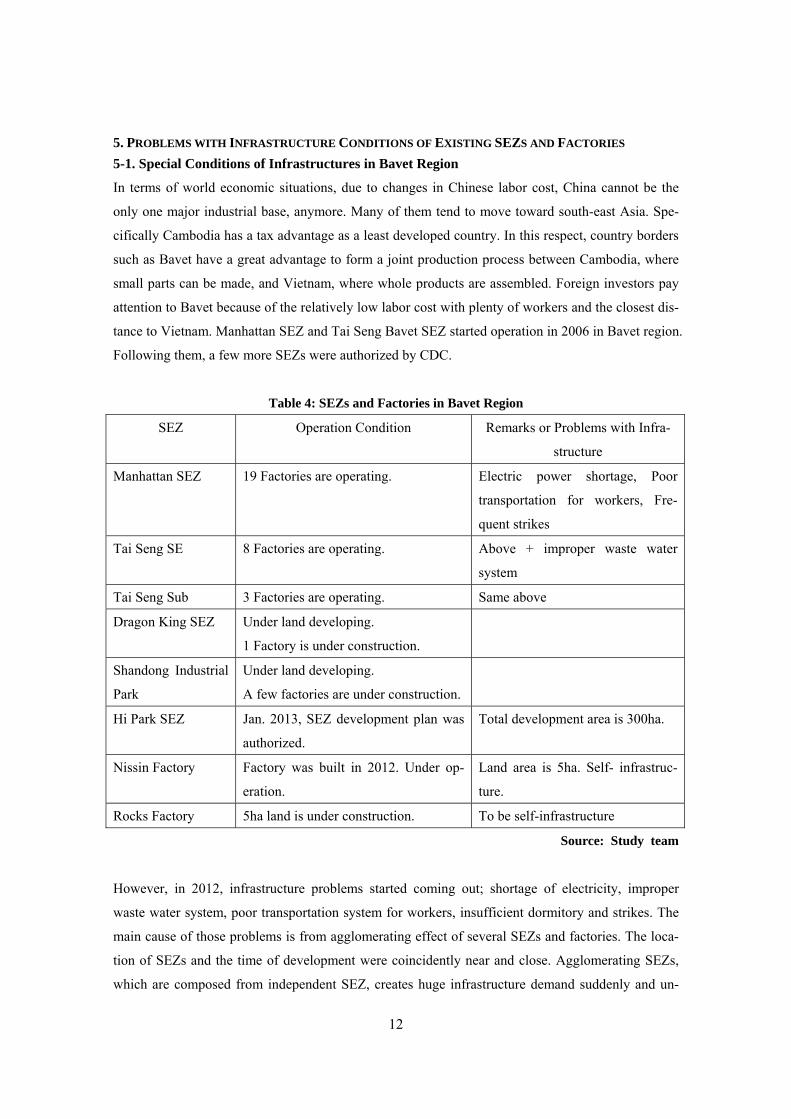
5.2 Unit for Forecasting Future Development The unit is necessary for forecasting future infrastructure demand. The unit is calculated using exist-
ing actual data of electrical consumption (metering monitoring data), numbers of workers, and num-
bers of factories. In the following tables, the units for forecasting infrastructure demand are summa-
rized.
①Unit for forecasting Electric Power Capacity
Table 5: Coefficient (MW/ha) Based on Current Contract with EDC)
Taisen SEZ Factory Lot Area (ha) Contract with EDC: 4MW
Factory Area under
Operation (Taisen 1 +
2)
24.46 ha Rate (Electricity /
Factory Area)
0.164 MW/ha
Manhattan SEZ Factory Lot Area (ha) Contract with EDC: 6MW
Factory Area under
Operation (Manhattan)
72.44 ha Rate (Electricity /
Factory Area)
0.083 MW/ha
Coefficient (MW/ha) for Forecasting Future Factory Development
Factory Area under
Operation (Taisen 1+2,
Manhattan)
Factory Lot Area (ha) Contract with EDC: 10MW
96.90ha Rate (Electricity /
Factory Area)
0.103 MW/ha
Source: Study team
②Unit for forecasting Numbers of Workers
Table 6: Coefficient (Nos. of Workers /ha) Based on Present Working Numbers
Taisen SEZ Factory Lot Area (ha) Nos. of Workers Unit (Workers/ha)
Factory Area under
Operation (Taisen 1 +
2)
24.46 ha 5,777 236
Manhattan SEZ Factory Lot Area (ha) Nos. of Workers Unit (Workers/ha)
Factory Area under 72.44 ha 12,525 162
14
Operation (Manhattan)
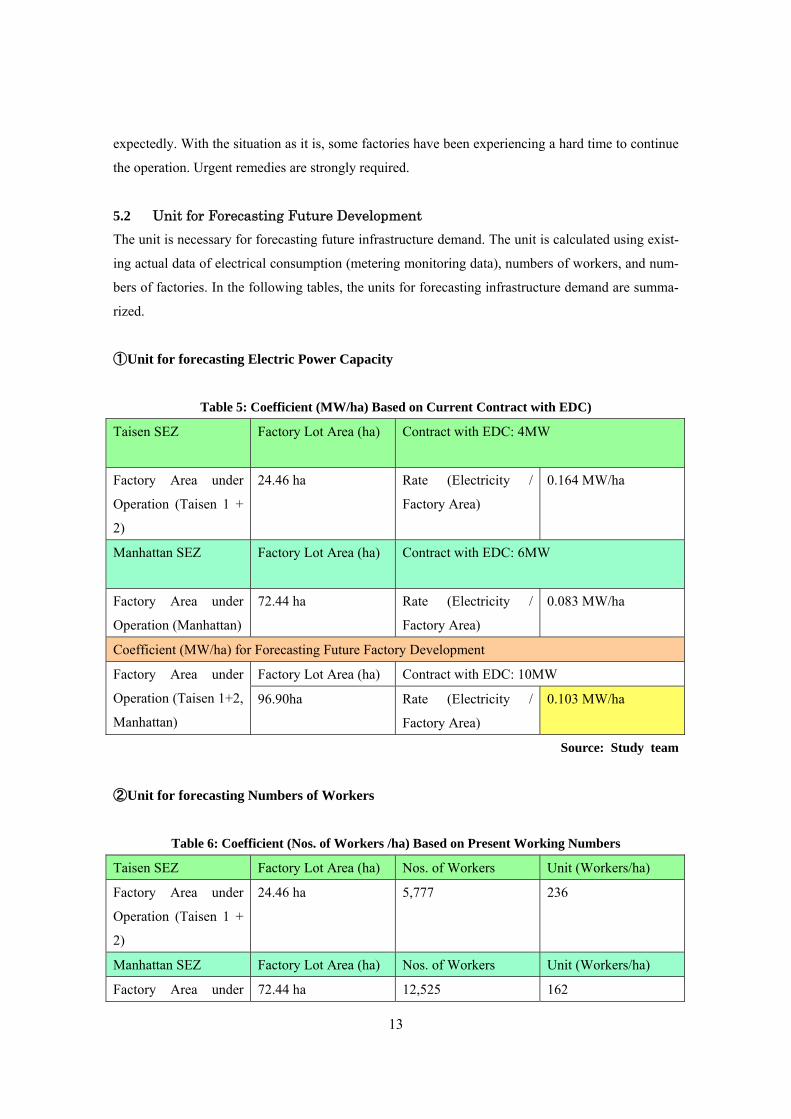
Coefficient (Workers/ha) for Forecasting Future Factory Development
Factory Area under
Operation (Taisen 1+2,
Manhattan)
Factory Lot Area (ha) Nos. of Workers Unit (Workers/ha)
96.90ha 18,302 189
Source: Study team
③Unit for Forecasting Numbers of Factories
Table 7: Coefficient (Nos. of Factories /ha) Based on Present Factory Numbers
Taisen SEZ Factory Lot Area (ha) Nos. of Factories Unit (Factories/ha)
Factory Area under
Operation (Taisen 1 +
2)
24.46 ha 11 0.450
Manhattan SEZ Factory Lot Area (ha) Nos. of Factories Unit (Factories/ha)
Factory Area under
Operation (Manhattan)
72.44 ha 19 0.262
Coefficient (Factories/ha) for Forecasting Future Factory Development
Factory Area under
Operation (Taisen 1+2,
Manhattan)
Factory Lot Area (ha) Nos. of Factories Unit (Factories/ha)
96.90ha 30 0.310
Source: Study team
5.3 Forecasting Based on the Development Plan (Original Development Drawing)
Presently, the special economic zones are developing land following the original drawing of devel-
opment plan. For the purpose of forecasting future infrastructure demand of SEZs, in terms of fac-
tory lot areas, the land area is categorized by the following 4 conditions of factories on land lots;
1) Factory - under operation
2) Factory - under preparation for operation, building construction nearly completed
3) Factory - with land leasing agreement but building construction not yet completed
4) Expected Factory - having no contract yet, and land still vacant
Using the factory lot area data of condition (1), the unit for forecasting the numbers of workers, fac-
tories, and electric power capacity are calculated.
15
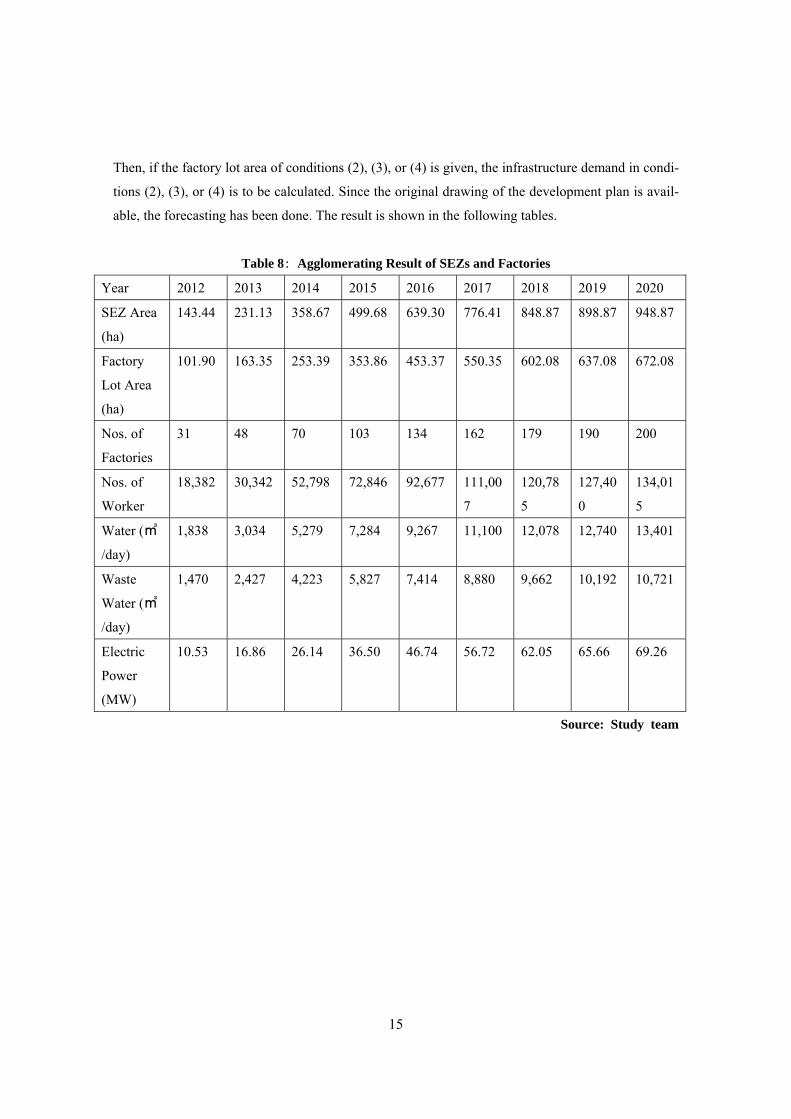
Then, if the factory lot area of conditions (2), (3), or (4) is given, the infrastructure demand in condi-
tions (2), (3), or (4) is to be calculated. Since the original drawing of the development plan is avail-
able, the forecasting has been done. The result is shown in the following tables.
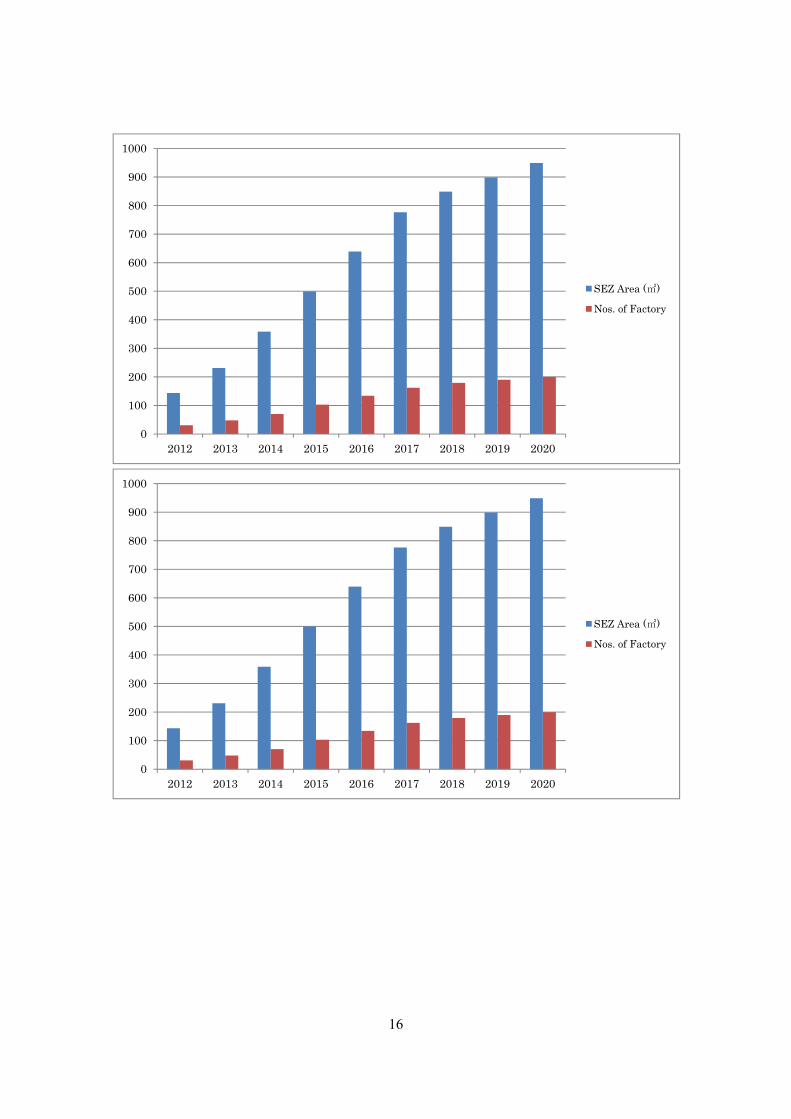
Table 8: Agglomerating Result of SEZs and Factories
Year 2012 2013 2014 2015 2016 2017 2018 2019 2020
SEZ Area
(ha)
143.44 231.13 358.67 499.68 639.30 776.41 848.87 898.87 948.87
Factory
Lot Area
(ha)
101.90 163.35 253.39 353.86 453.37 550.35 602.08 637.08 672.08
Nos. of
Factories
31 48 70 103 134 162 179 190 200
Nos. of
Worker
18,382 30,342 52,798 72,846 92,677 111,00
7
120,78
5
127,40
0
134,01
5
Water (㎥
/day)
1,838 3,034 5,279 7,284 9,267 11,100 12,078 12,740 13,401
Waste
Water (㎥
/day)
1,470 2,427 4,223 5,827 7,414 8,880 9,662 10,192 10,721
Electric
Power
(MW)
10.53 16.86 26.14 36.50 46.74 56.72 62.05 65.66 69.26
Source: Study team
16
0
100
200
300
400
500
600
700
800
900
1000
2012 2013 2014 2015 2016 2017 2018 2019 2020
SEZ Area (㎡)
Nos. of Factory
0
100
200
300
400
500
600
700
800
900
1000
2012 2013 2014 2015 2016 2017 2018 2019 2020
SEZ Area (㎡)
Nos. of Factory
17
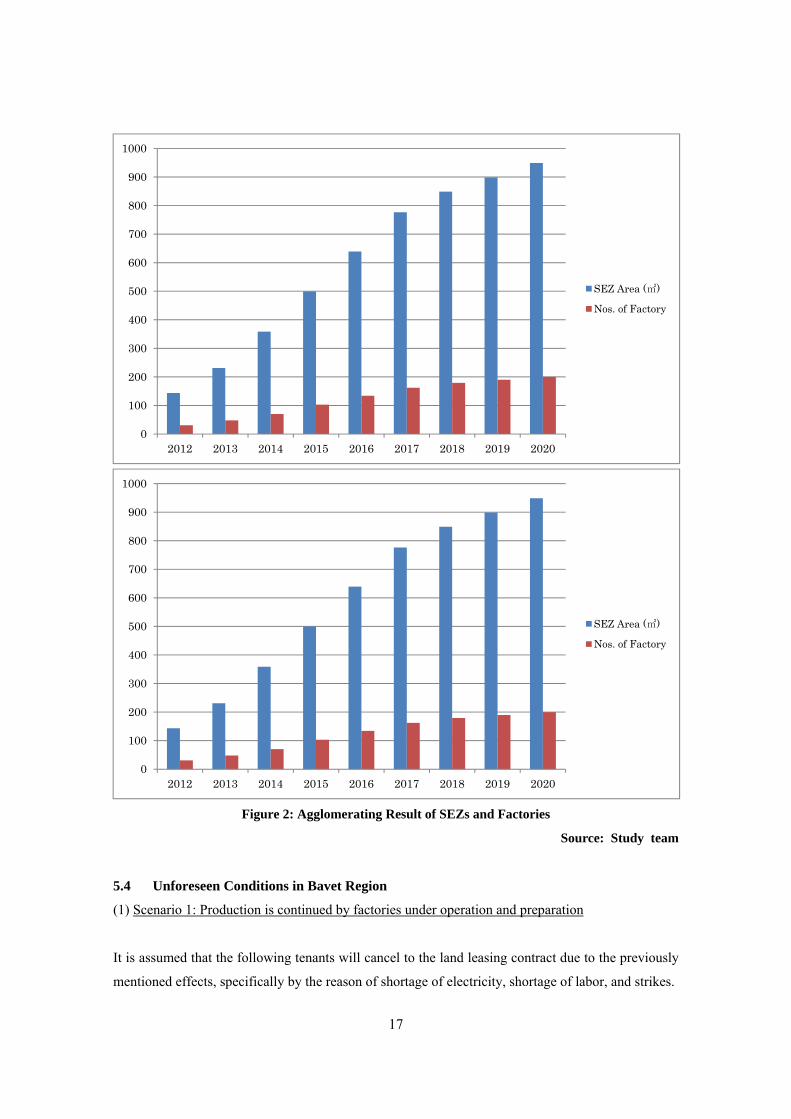
Figure 2: Agglomerating Result of SEZs and Factories
Source: Study team
5.4 Unforeseen Conditions in Bavet Region
(1) Scenario 1: Production is continued by factories under operation and preparation
It is assumed that the following tenants will cancel to the land leasing contract due to the previously
mentioned effects, specifically by the reason of shortage of electricity, shortage of labor, and strikes.
0
100
200
300
400
500
600
700
800
900
1000
2012 2013 2014 2015 2016 2017 2018 2019 2020
SEZ Area (㎡)
Nos. of Factory
0
100
200
300
400
500
600
700
800
900
1000
2012 2013 2014 2015 2016 2017 2018 2019 2020
SEZ Area (㎡)
Nos. of Factory
18
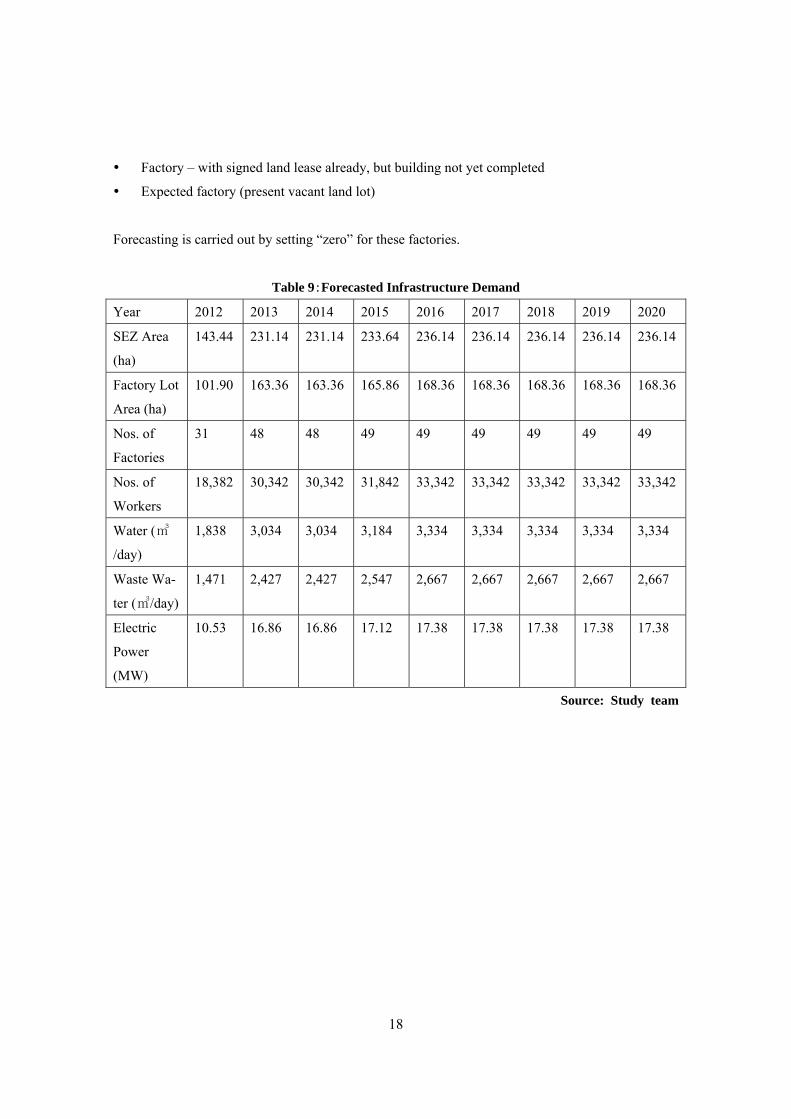
Factory – with signed land lease already, but building not yet completed
Expected factory (present vacant land lot)
Forecasting is carried out by setting “zero” for these factories.
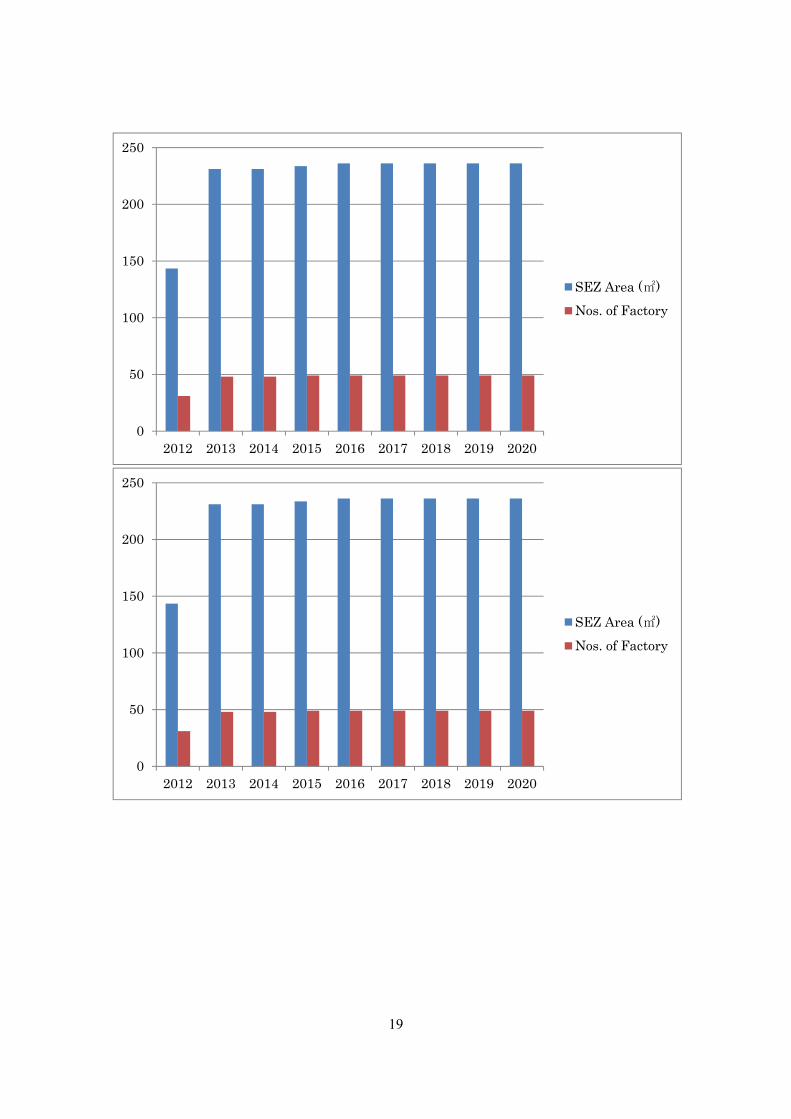
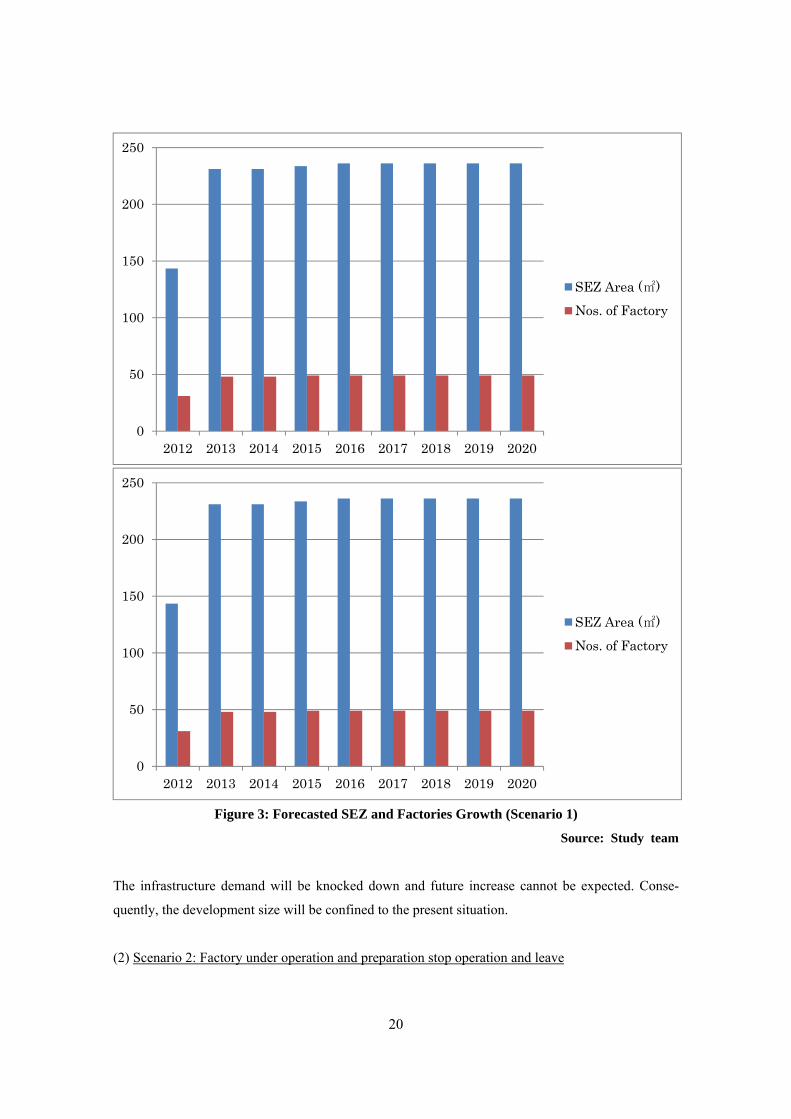
Table 9:Forecasted Infrastructure Demand
Year 2012 2013 2014 2015 2016 2017 2018 2019 2020
SEZ Area
(ha)
143.44 231.14 231.14 233.64 236.14 236.14 236.14 236.14 236.14
Factory Lot
Area (ha)
101.90 163.36 163.36 165.86 168.36 168.36 168.36 168.36 168.36
Nos. of
Factories
31 48 48 49 49 49 49 49 49
Nos. of
Workers
18,382 30,342 30,342 31,842 33,342 33,342 33,342 33,342 33,342
Water (㎥
/day)
1,838 3,034 3,034 3,184 3,334 3,334 3,334 3,334 3,334
Waste Wa-
ter (㎥/day)
1,471 2,427 2,427 2,547 2,667 2,667 2,667 2,667 2,667
Electric
Power
(MW)
10.53 16.86 16.86 17.12 17.38 17.38 17.38 17.38 17.38
Source: Study team
19
0
50
100
150
200
250
2012 2013 2014 2015 2016 2017 2018 2019 2020
SEZ Area (㎡)Nos. of Factory
0
50
100
150
200
250
2012 2013 2014 2015 2016 2017 2018 2019 2020
SEZ Area (㎡)Nos. of Factory
20
Figure 3: Forecasted SEZ and Factories Growth (Scenario 1)
Source: Study team
The infrastructure demand will be knocked down and future increase cannot be expected. Conse-
quently, the development size will be confined to the present situation.
(2) Scenario 2: Factory under operation and preparation stop operation and leave
0
50
100
150
200
250
2012 2013 2014 2015 2016 2017 2018 2019 2020
SEZ Area (㎡)Nos. of Factory
0
50
100
150
200
250
2012 2013 2014 2015 2016 2017 2018 2019 2020
SEZ Area (㎡)Nos. of Factory
21
It is assumed that the following tenants will give up and stop operation to leave due to the previously
mentioned all effects relating to electric power, labor, water, waste water, etc. Here, simple 10% of
the following tenants will leave. (No data of leaving ratio, therefore 10% is simple assumed for one
case.)
Factory - under operation
Factory - under preparation
Forecasting is carried out assuming that these factories will leave from 2014. For the result, see the
main part of this Report.
6. LAWS AND INSTITUTIONS RELATED TO INVESTMENT AND BUSINESS ACTIVITIES 6.1 SEZ Legal System and Institution
①SEZ Sub-degree
SEZ SUB-DECREE (NO. 148 ON THE ESTABLISHMENT AND MANAGEMENT OF THE
SPECIAL ECONOMIC ZONE) was established in 2005 and since then sseven years has passed.
Originally the subdecree was meant to be reviewd after a couple of years in order to solve problem
and upgrade it to a law. However the subdecree has remain as a subdecree and has not yet been im-
proved, resuling in practical problem on the ground in SEZ development in Cambodia.
②Problems of SEZ Sub decree
According to the interview result conducted in Svay Rieng province, the major problems of the
subdecree are as follows:
(ⅰ) Lack of Supervision: CSEZA of CDC, the authority who is in charge of supervising SEZs, does
not seem to fully manage and supervise SEZ developers so that the SEZ developers comply with the
SEZ subdecree.
(ⅱ) Sub-standard SEZs: Because some SEZs have been developed without proper infrastructure,
which are required by the SEZ subdecree. If tenant companies invest in factories in such SEZs un-
knowingly, these companies may face serious problems undermining their businesses.
(ⅲ) Lack of Planning: SEZs have been developed without considering the long term development
plan of the region. As a result, such problems as lack of infrastructure and labor have come up.
(ⅳ) There are unclear requirements from OSS.
③Proposal for Solutions
22
1) Capacity building should be carried put for CSEZA/CDC in order to inprove the supervision abil-
ity and information provision.
2) An information providing system shold be created, where comprehensive, objective and accurate
information will be disseminated for investors.
3) CSEZA/CDC should take counter measures for quickly solving problems and preventive
measures in consultation with other ministries.
4) Legal and mindset reforms should be addressed.
6-2 Labor Law
Under the current labor law, it is allowed to employ persons over the age of 15 and under the age of
18 according to the excerpts of the law presented. The Article 177 of the Labor law prohibits com-
panies from employing persons under the age of 15. Actually, most of the Japanese companies in
Bavet manily employ persons over the age of 18. According to the department of labor of Svay
Rieng province, if companies employ persons under the age of 18, it will be difficult to sell their
products to the US and EU markets. Therefore companies exporting to the US and EU normally do
not employ persons under the age of 18. Since the constitution of Cambodia stipulates compulsory
eduction of 9 years (up to lower secondary high school) and if students complete lower secondary
schools as scheduled, there would not be a problem to employ persons over 15 years. As we will see
in Chapter 8 of this report, there are a number students who can not complete lower secondary
schoolds by the age of 15. However, the education leve in Sva Rieng has been improving year by
year and especially more and more young people now complete lower secondary than before. The
labor market may soon be improved for employing persons below the age of 18.
7. FUTURE DEVELOPMENT DIRECTION OF BAVET REGION 7.1 Electricity
Hearing Report is shown here (EDC HQ in Phnom Penh, and Svay Rieng Office)
Present power to the Bavet region is supplied from Vietnam through National Road No.1, and
total capacity is 16MW. The contracted capacity of Manhattan is 6MW and that of Tai Seng
Bavet SEZ (Main/Sub) is 4MW. There is one more line (7MW) from Vietnam running in a
southerly direction through towards Svay Rieng. However, this transmission line does not reach
Bavet. The demand of Manhattan SEZ and Tai Seng Bavet SEZ (Main/Sub) has already
reached maximum.
In Cambodia, in 2013, two hydro power plants in Stung Atay and one coal power plant in Si-
hanoukville will start supplying power to meet load demand. The total capacity is supposed to
be 466MW.
23
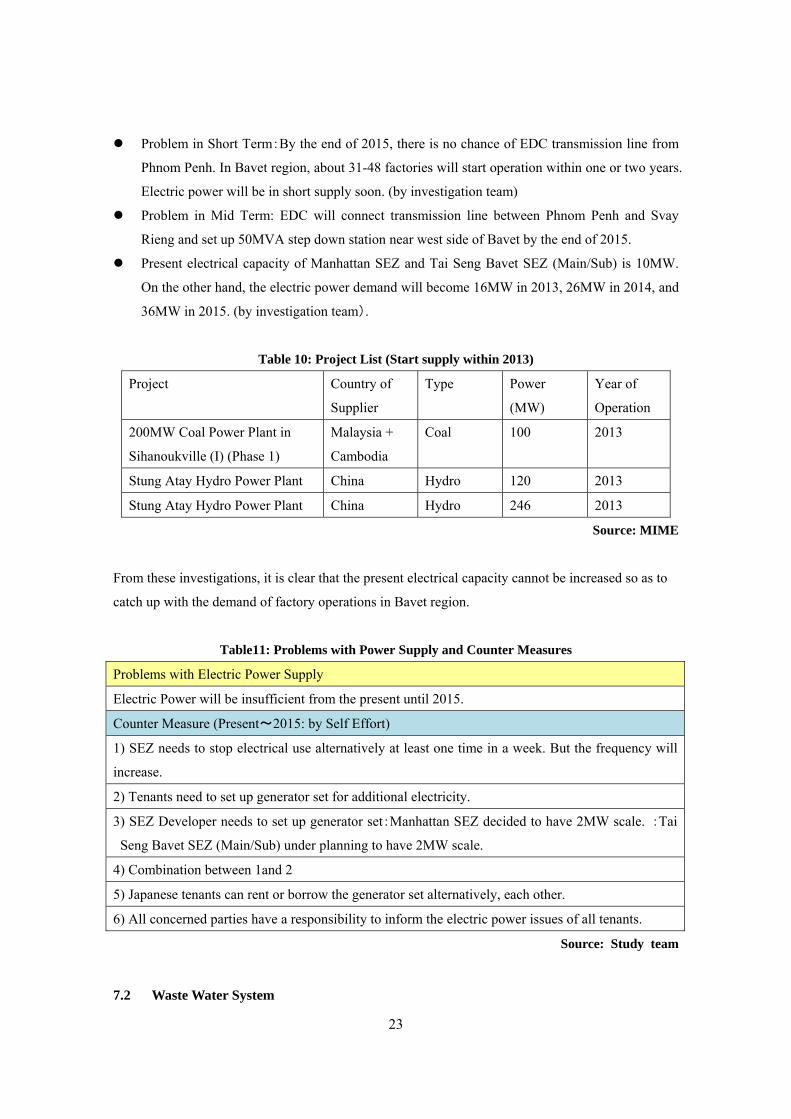
Problem in Short Term:By the end of 2015, there is no chance of EDC transmission line from
Phnom Penh. In Bavet region, about 31-48 factories will start operation within one or two years.
Electric power will be in short supply soon. (by investigation team)
Problem in Mid Term: EDC will connect transmission line between Phnom Penh and Svay
Rieng and set up 50MVA step down station near west side of Bavet by the end of 2015.
Present electrical capacity of Manhattan SEZ and Tai Seng Bavet SEZ (Main/Sub) is 10MW.
On the other hand, the electric power demand will become 16MW in 2013, 26MW in 2014, and
36MW in 2015. (by investigation team).
Table 10: Project List (Start supply within 2013)
Project Country of
Supplier
Type Power
(MW)
Year of
Operation
200MW Coal Power Plant in
Sihanoukville (I) (Phase 1)
Malaysia +
Cambodia
Coal 100 2013
Stung Atay Hydro Power Plant China Hydro 120 2013
Stung Atay Hydro Power Plant China Hydro 246 2013
Source: MIME
From these investigations, it is clear that the present electrical capacity cannot be increased so as to
catch up with the demand of factory operations in Bavet region.
Table11: Problems with Power Supply and Counter Measures
Problems with Electric Power Supply
Electric Power will be insufficient from the present until 2015.
Counter Measure (Present~2015: by Self Effort)
1) SEZ needs to stop electrical use alternatively at least one time in a week. But the frequency will
increase.
2) Tenants need to set up generator set for additional electricity.
3) SEZ Developer needs to set up generator set:Manhattan SEZ decided to have 2MW scale. :Tai
Seng Bavet SEZ (Main/Sub) under planning to have 2MW scale.
4) Combination between 1and 2
5) Japanese tenants can rent or borrow the generator set alternatively, each other.
6) All concerned parties have a responsibility to inform the electric power issues of all tenants.
Source: Study team
7.2 Waste Water System
24
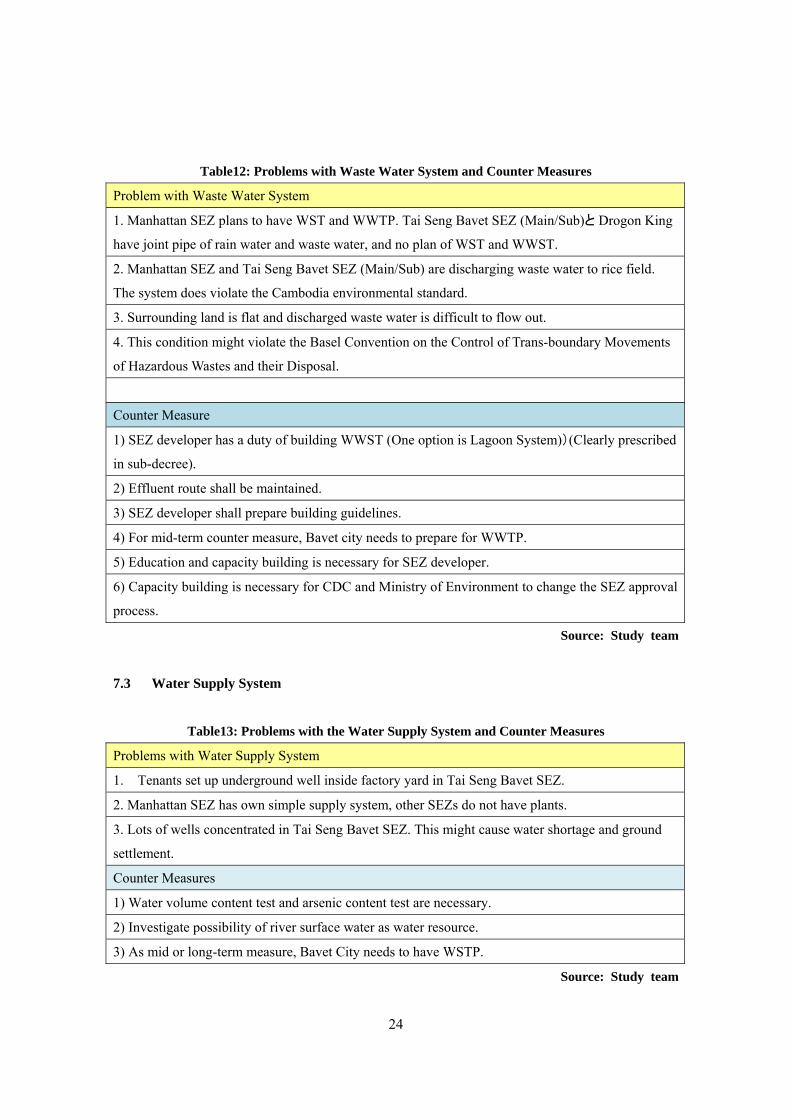
Table12: Problems with Waste Water System and Counter Measures
Problem with Waste Water System
1. Manhattan SEZ plans to have WST and WWTP. Tai Seng Bavet SEZ (Main/Sub)と Drogon King
have joint pipe of rain water and waste water, and no plan of WST and WWST.
2. Manhattan SEZ and Tai Seng Bavet SEZ (Main/Sub) are discharging waste water to rice field.
The system does violate the Cambodia environmental standard.
3. Surrounding land is flat and discharged waste water is difficult to flow out.
4. This condition might violate the Basel Convention on the Control of Trans-boundary Movements
of Hazardous Wastes and their Disposal.
Counter Measure
1) SEZ developer has a duty of building WWST (One option is Lagoon System))(Clearly prescribed
in sub-decree).
2) Effluent route shall be maintained.
3) SEZ developer shall prepare building guidelines.
4) For mid-term counter measure, Bavet city needs to prepare for WWTP.
5) Education and capacity building is necessary for SEZ developer.
6) Capacity building is necessary for CDC and Ministry of Environment to change the SEZ approval
process.
Source: Study team
7.3 Water Supply System
Table13: Problems with the Water Supply System and Counter Measures
Problems with Water Supply System
1. Tenants set up underground well inside factory yard in Tai Seng Bavet SEZ.
2. Manhattan SEZ has own simple supply system, other SEZs do not have plants.
3. Lots of wells concentrated in Tai Seng Bavet SEZ. This might cause water shortage and ground
settlement.
Counter Measures
1) Water volume content test and arsenic content test are necessary.
2) Investigate possibility of river surface water as water resource.
3) As mid or long-term measure, Bavet City needs to have WSTP.
Source: Study team
25
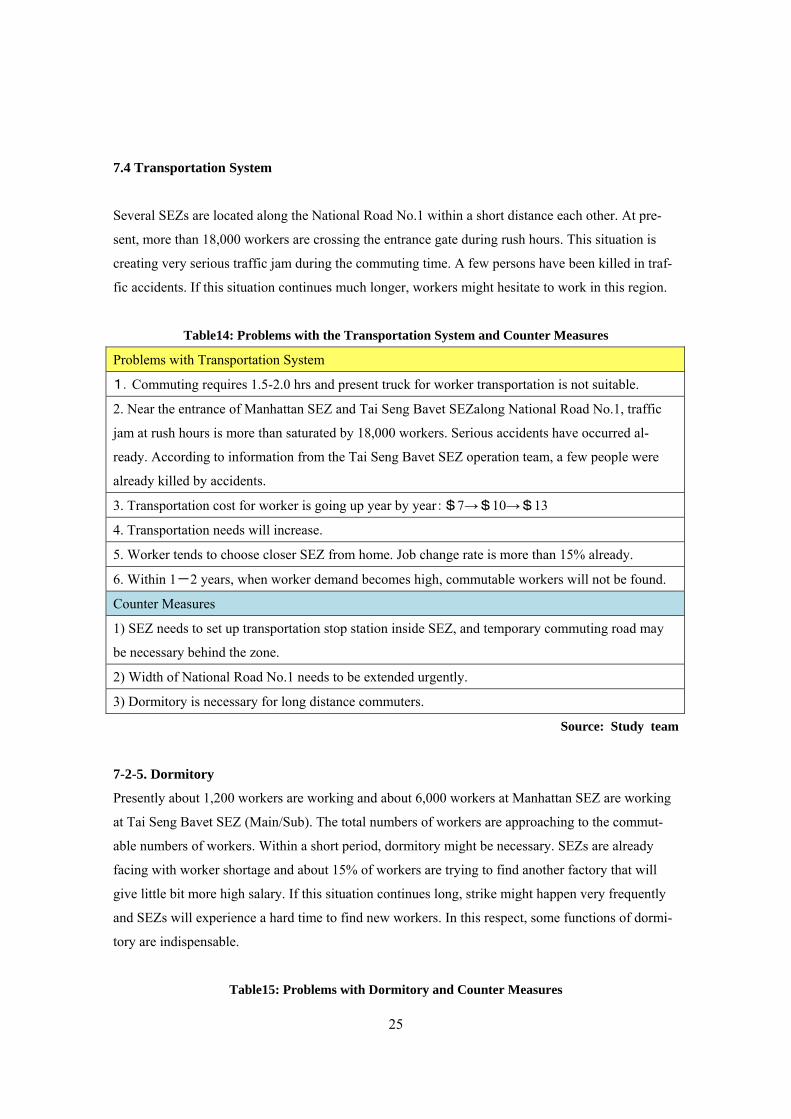
7.4 Transportation System
Several SEZs are located along the National Road No.1 within a short distance each other. At pre-
sent, more than 18,000 workers are crossing the entrance gate during rush hours. This situation is
creating very serious traffic jam during the commuting time. A few persons have been killed in traf-
fic accidents. If this situation continues much longer, workers might hesitate to work in this region.
Table14: Problems with the Transportation System and Counter Measures
Problems with Transportation System
1.Commuting requires 1.5-2.0 hrs and present truck for worker transportation is not suitable.
2. Near the entrance of Manhattan SEZ and Tai Seng Bavet SEZalong National Road No.1, traffic
jam at rush hours is more than saturated by 18,000 workers. Serious accidents have occurred al-
ready. According to information from the Tai Seng Bavet SEZ operation team, a few people were
already killed by accidents.
3. Transportation cost for worker is going up year by year:$7→$10→$13
4. Transportation needs will increase.
5. Worker tends to choose closer SEZ from home. Job change rate is more than 15% already.
6. Within 1-2 years, when worker demand becomes high, commutable workers will not be found.
Counter Measures
1) SEZ needs to set up transportation stop station inside SEZ, and temporary commuting road may
be necessary behind the zone.
2) Width of National Road No.1 needs to be extended urgently.
3) Dormitory is necessary for long distance commuters.
Source: Study team
7-2-5. Dormitory
Presently about 1,200 workers are working and about 6,000 workers at Manhattan SEZ are working
at Tai Seng Bavet SEZ (Main/Sub). The total numbers of workers are approaching to the commut-
able numbers of workers. Within a short period, dormitory might be necessary. SEZs are already
facing with worker shortage and about 15% of workers are trying to find another factory that will
give little bit more high salary. If this situation continues long, strike might happen very frequently
and SEZs will experience a hard time to find new workers. In this respect, some functions of dormi-
tory are indispensable.
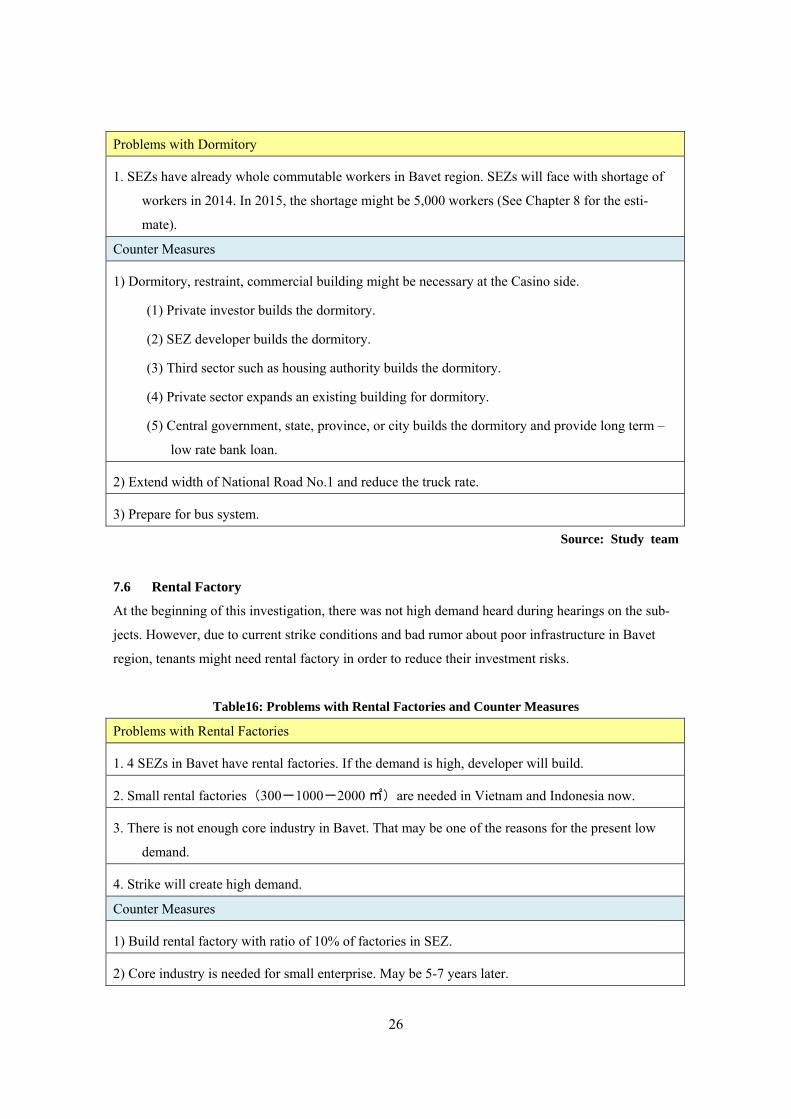
Table15: Problems with Dormitory and Counter Measures
26
Problems with Dormitory
1. SEZs have already whole commutable workers in Bavet region. SEZs will face with shortage of
workers in 2014. In 2015, the shortage might be 5,000 workers (See Chapter 8 for the esti-
mate).
Counter Measures
1) Dormitory, restraint, commercial building might be necessary at the Casino side.
(1) Private investor builds the dormitory.
(2) SEZ developer builds the dormitory.
(3) Third sector such as housing authority builds the dormitory.
(4) Private sector expands an existing building for dormitory.
(5) Central government, state, province, or city builds the dormitory and provide long term –
low rate bank loan.
2) Extend width of National Road No.1 and reduce the truck rate.
3) Prepare for bus system.
Source: Study team
7.6 Rental Factory
At the beginning of this investigation, there was not high demand heard during hearings on the sub-
jects. However, due to current strike conditions and bad rumor about poor infrastructure in Bavet
region, tenants might need rental factory in order to reduce their investment risks.
Table16: Problems with Rental Factories and Counter Measures
Problems with Rental Factories
1. 4 SEZs in Bavet have rental factories. If the demand is high, developer will build.
2. Small rental factories (300-1000-2000 ㎡) are needed in Vietnam and Indonesia now.
3. There is not enough core industry in Bavet. That may be one of the reasons for the present low
demand.
4. Strike will create high demand.
Counter Measures
1) Build rental factory with ratio of 10% of factories in SEZ.
2) Core industry is needed for small enterprise. May be 5-7 years later.
27
3) If the urgent needs happen, the combined rental factory such as PPSEZ type can be applied.
Source: Study team
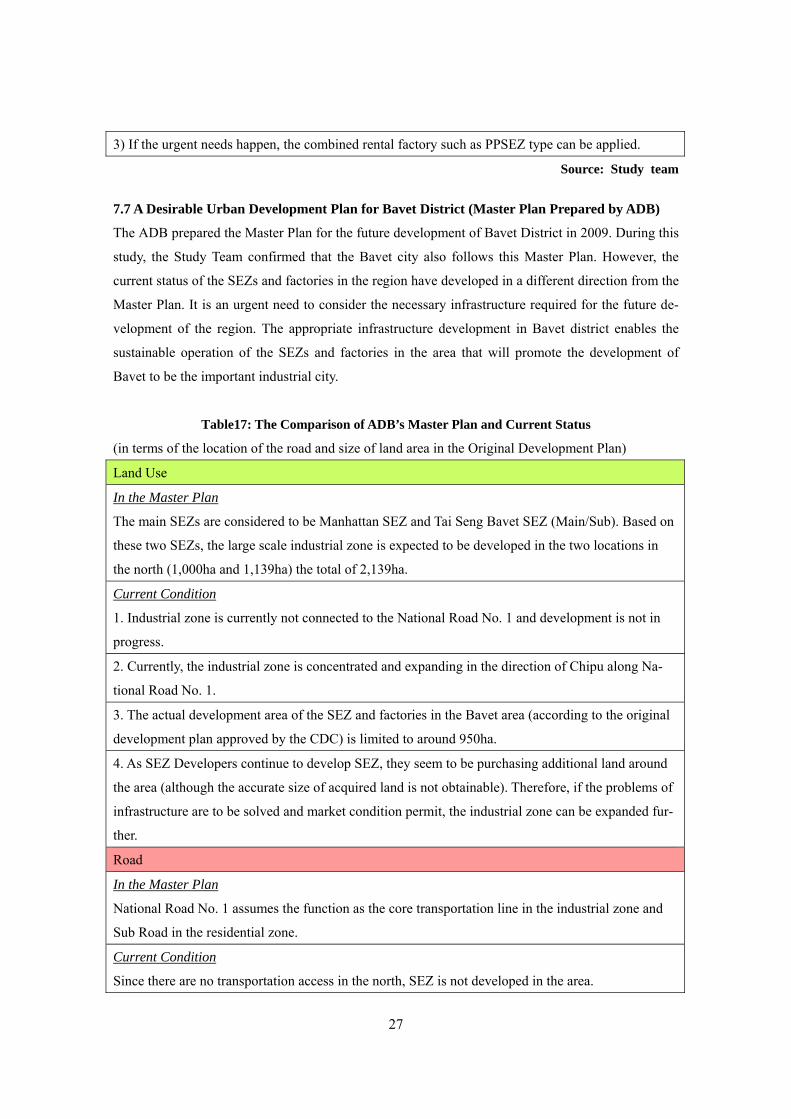
7.7 A Desirable Urban Development Plan for Bavet District (Master Plan Prepared by ADB)
The ADB prepared the Master Plan for the future development of Bavet District in 2009. During this
study, the Study Team confirmed that the Bavet city also follows this Master Plan. However, the
current status of the SEZs and factories in the region have developed in a different direction from the
Master Plan. It is an urgent need to consider the necessary infrastructure required for the future de-
velopment of the region. The appropriate infrastructure development in Bavet district enables the
sustainable operation of the SEZs and factories in the area that will promote the development of
Bavet to be the important industrial city.
Table17: The Comparison of ADB’s Master Plan and Current Status
(in terms of the location of the road and size of land area in the Original Development Plan)
Land Use
In the Master Plan
The main SEZs are considered to be Manhattan SEZ and Tai Seng Bavet SEZ (Main/Sub). Based on
these two SEZs, the large scale industrial zone is expected to be developed in the two locations in
the north (1,000ha and 1,139ha) the total of 2,139ha.
Current Condition
1. Industrial zone is currently not connected to the National Road No. 1 and development is not in
progress.
2. Currently, the industrial zone is concentrated and expanding in the direction of Chipu along Na-
tional Road No. 1.
3. The actual development area of the SEZ and factories in the Bavet area (according to the original
development plan approved by the CDC) is limited to around 950ha.
4. As SEZ Developers continue to develop SEZ, they seem to be purchasing additional land around
the area (although the accurate size of acquired land is not obtainable). Therefore, if the problems of
infrastructure are to be solved and market condition permit, the industrial zone can be expanded fur-
ther.
Road
In the Master Plan
National Road No. 1 assumes the function as the core transportation line in the industrial zone and
Sub Road in the residential zone.
Current Condition
Since there are no transportation access in the north, SEZ is not developed in the area.
28
Source:ADB Master Plan
7.8 SEZ Based Urban Development in the Bavet Area
If the Bavet area is able to solve the electric power shortage, establish dormitories, and perform road
maintenance by 2015, there will be no basic infrastructure problem in Bavet area. As described in
Chapter 5, based on the original development plan approved by CDC, it is estimated that all the fac-
tory lots will be fully occupied and the companies starting their operations from 2020. In addition, if
the industrial accumulation is favorable, Bavet area will have a potential to further develop as an
SEZ-based industrial city. Usually, SEZ will be financial viable with certain development scale and
in many cases, size of the SEZ are 200ha to 500ha. This additional expansion requires around 10
years. Based on this assumption, below section discusses the necessary infrastructure development
under the condition that each SEZs in the Bavet area expand their sizes to 200 to 500ha during 2020
to 2030.
7.9 Demand Forecast of Infrastructure
In case of the SEZ Developers continue to operate and the market is stabilized due to the industrial
accumulation, each SEZs will gradually expand their development area. As a result, further accumu-
lation of SEZs and factories will be expected in the whole Bavet area. Based on this assumption, the
infrastructure demand in the whole region is estimated below. For the projection, basic unit indicated
in the previous chapter is used.
Table18: Infrastructure Demand in Bavet
Year 2020 2030
Development Area (ha) 948.88 1,738.57
Factory Lot Area (ha) 672.08 1,200.00
Nos. of Factories 200 359
Nos. of Workers 134,015 228,436
Water (㎥/day) 13,401.55 22,843.62
Waste Water (㎥/day) 10,721.24 18,274.89
Electric Power (MW) 69.26 122.15
Source: Study team
7.10 Necessary Infrastructure in Bavet Region in the Future
The this section describes the necessary infrastructure development based on the combination of the
ADB’s Master Plan, and the current status and future development prospects analyzed by the Study
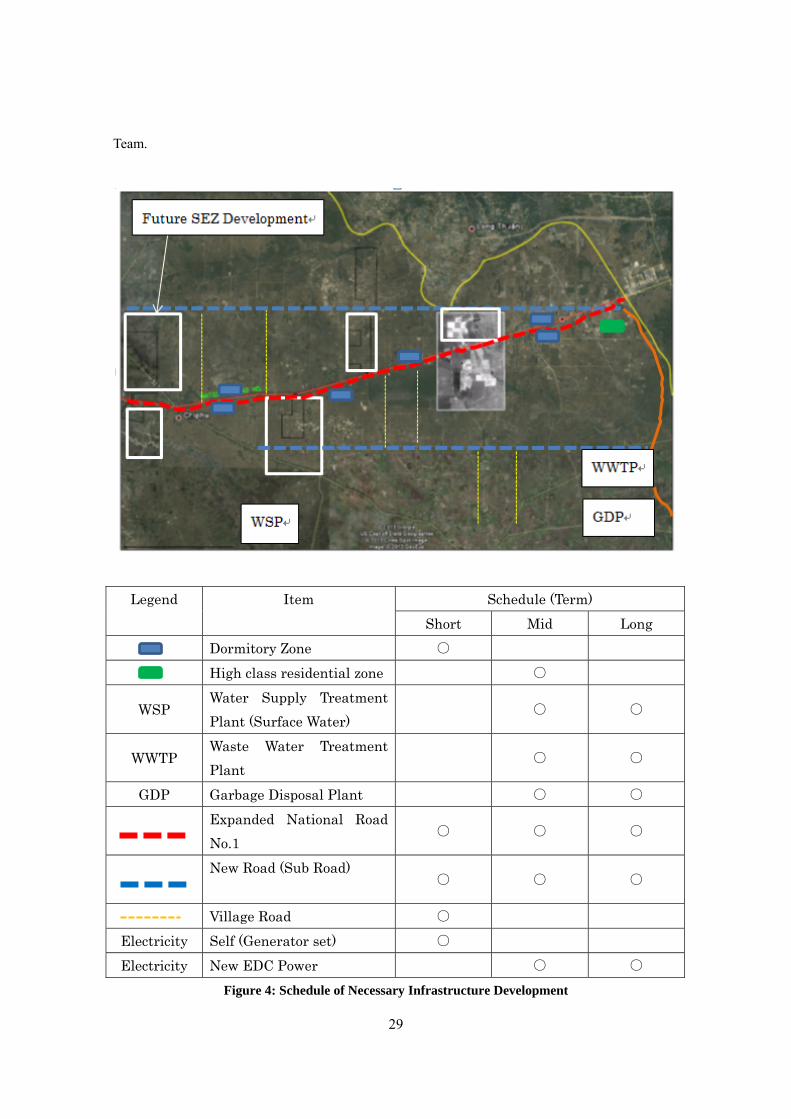
29
Team.
Legend Item Schedule (Term) Short Mid Long
Dormitory Zone ○ High class residential zone ○
WSP Water Supply Treatment Plant (Surface Water)
○ ○
WWTP Waste Water Treatment Plant
○ ○
GDP Garbage Disposal Plant ○ ○
Expanded National Road No.1
○ ○ ○
New Road (Sub Road)
○ ○ ○
Village Road ○ Electricity Self (Generator set) ○ Electricity New EDC Power ○ ○
Figure 4: Schedule of Necessary Infrastructure Development
30
Source: Study team
(1) Necessary Infrastructure Development in the Short Term
Village Road indicated in Yellow
Village roads development is in urgent need to expand the commuter belt. During the rainy season,
because the drainage is poor, the route connecting village and National Road No. 1 is difficult to
commute in many cases. In order to solve this problem, a self road development scheme by the vil-
lagers is recommended. Firstly, asphalt cement shall be provided to the villagers and the road devel-
opment shall be done by the villagers themselves. As an incentive, once the village roads are devel-
oped, motor bike and tuk tuk shall be granted. In this case, the grassroots support of JICA may be
applicable.
Dormitory Development
There is a limitation of commuting workers that is rapidly being reached at this moment. Therefore,
a dormitory shall be developed in a timely manner. A more upscale residential facility for the man-
ager class worker is also required, especially for the foreign tenants. In this case, the application of
the currently closed casino as a residential use may be an option.
Electricity (Generator Set)
No additional EDC power will available until 2015. Until that time, self power supply is necessary.
(2) Desirable Infrastructure Development in the Mid Term
Widening of National Road No. .1 and New Road Development by ADB (Red dashed line and Blue
dashed line)
Local traffic condition is imminent. There is a need for the road maintenance as soon as possible. In
ADB’s development plan, new road development is expected to proceed in the south. However the
road in the north is also important to disperse the communal traffic. It may serve as the bypass road
to Vietnam.
(3) Desirable Infrastructure Development in the Long Term
Water Supply Plant
Excessive water intake by the increasing factories in SEZs may result in land settlement. Utilization
of the river water as the water source is recommended with building pipes along the new road net-
work.
Waste Water Treatment Plant
31
Wastewater treatment plant has to be developed in the SEZ by the SEZ Developer. As the urbaniza-
tion progresses, naturally the population increases. Therefore, sewage plant for the urban population
in the city is also required. As the same as water supply, sewage pipe shall be equipped along the
new road network as the Figure shows. Only after the purification, the treated wastewater shall be
discharged into the river.
Waste Disposal and Treatment Facilities
As the urbanization progresses by attracting investment and labors in SEZ, large amount of waste
will be generated. Thus, the establishment of the waste treatment facility at the site indicated in the
Figure is expected. In addition, it is desired to utilize the heat generated by the incineration of
wastes.
8. LABOR MARKET SITUATION
8.1 Potential Labor Supply to Taiseng and Manhattan SEZs
In this section, we consider the potential labor supply to particular SEZs, namely Taiseng SEZ (main
and sub) and Manhattan SEZ. Taiseng and Manhattan SEZs are located at a place which is near the
Vietnam border and in the easternmost among the existing SEZs in Bavet area. Therefore, the labor
supply from the east of the SEZs are rather limited and the majority of the labor supply have to come
from the west of the SEZs. Since the majority of the population is concentrated in the western part of
the province, the southwest in particular, SEZs are in more advantageous positions in terms of labor
if located more close to the population concentration. This may well explain the reason why new
SEZs are located to further and further to the east.
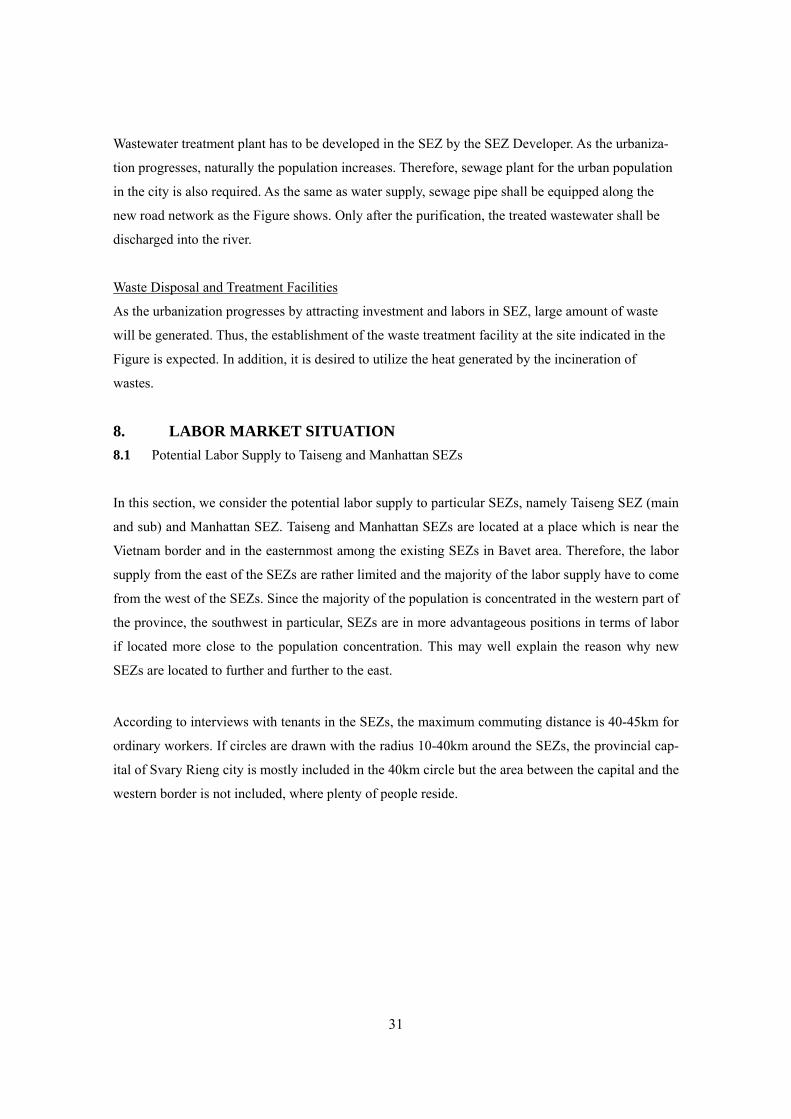
According to interviews with tenants in the SEZs, the maximum commuting distance is 40-45km for
ordinary workers. If circles are drawn with the radius 10-40km around the SEZs, the provincial cap-
ital of Svary Rieng city is mostly included in the 40km circle but the area between the capital and the
western border is not included, where plenty of people reside.
32
Figure5: 0-40km area from Taiseng and Manhattan SEZs
Source: Study team
This 40km circle incdules 6 districts with 270,000 people, accouting for 57% of the land area of
Svay Rieng province.
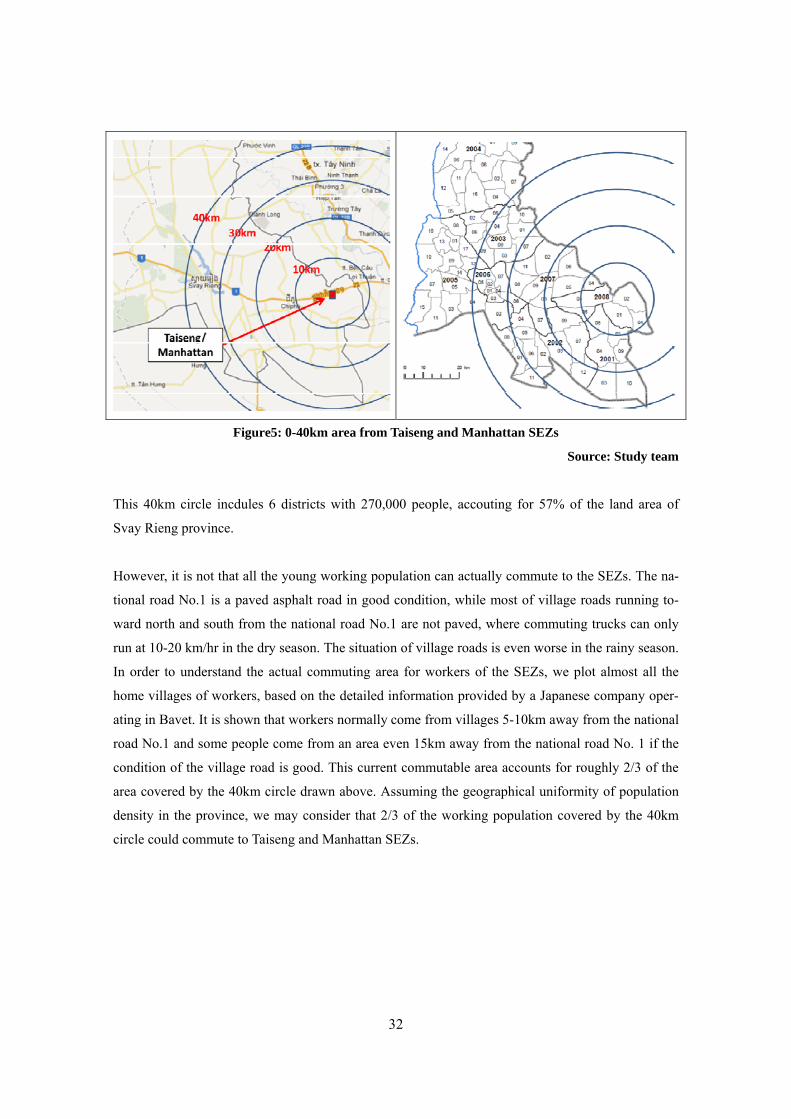
However, it is not that all the young working population can actually commute to the SEZs. The na-
tional road No.1 is a paved asphalt road in good condition, while most of village roads running to-
ward north and south from the national road No.1 are not paved, where commuting trucks can only
run at 10-20 km/hr in the dry season. The situation of village roads is even worse in the rainy season.
In order to understand the actual commuting area for workers of the SEZs, we plot almost all the
home villages of workers, based on the detailed information provided by a Japanese company oper-
ating in Bavet. It is shown that workers normally come from villages 5-10km away from the national
road No.1 and some people come from an area even 15km away from the national road No. 1 if the
condition of the village road is good. This current commutable area accounts for roughly 2/3 of the
area covered by the 40km circle drawn above. Assuming the geographical uniformity of population
density in the province, we may consider that 2/3 of the working population covered by the 40km
circle could commute to Taiseng and Manhattan SEZs.
33
Figure 6:Map of Current Commutable Area
*ArcGIS was used for calculating the yellow area.
Source: Google map modified by Study team
Besides, we also assume that 80% of the commuting young women and 50 % of the commuting
young men may enter the labor market for factories in Bavet. Under these assumptions, an estimate
of potential labor supply to Taiseng and Manhattan SEZs is presented below.
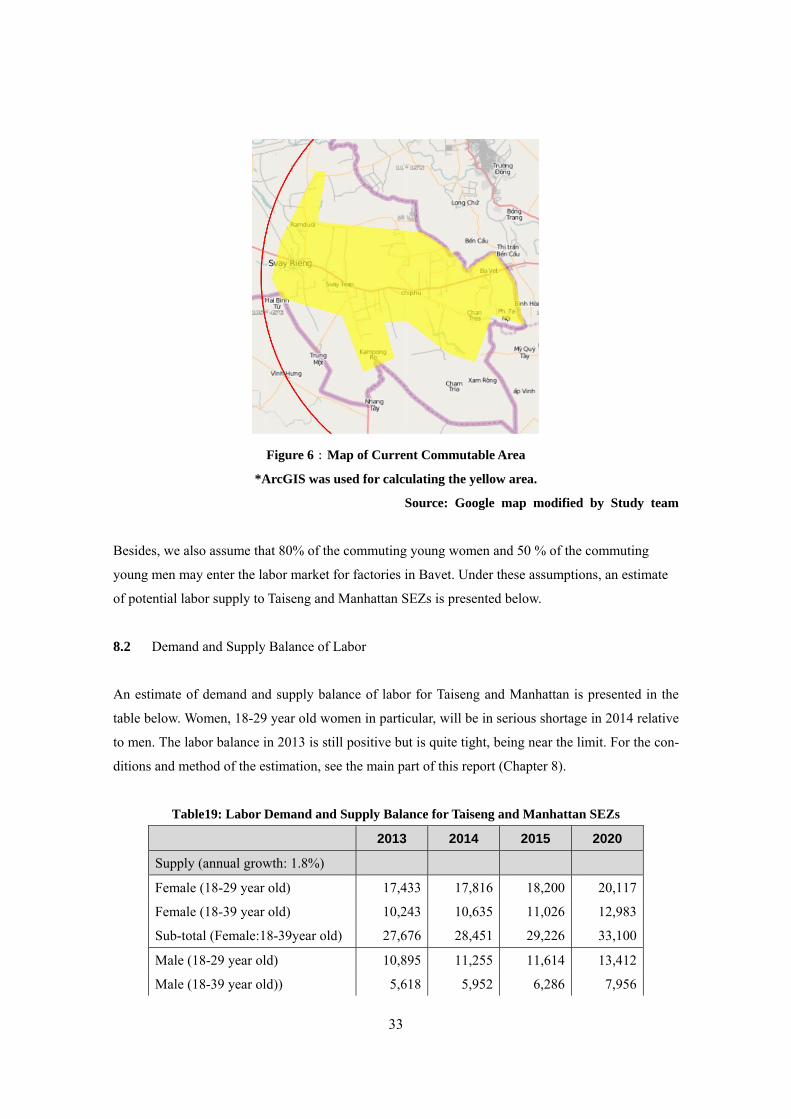
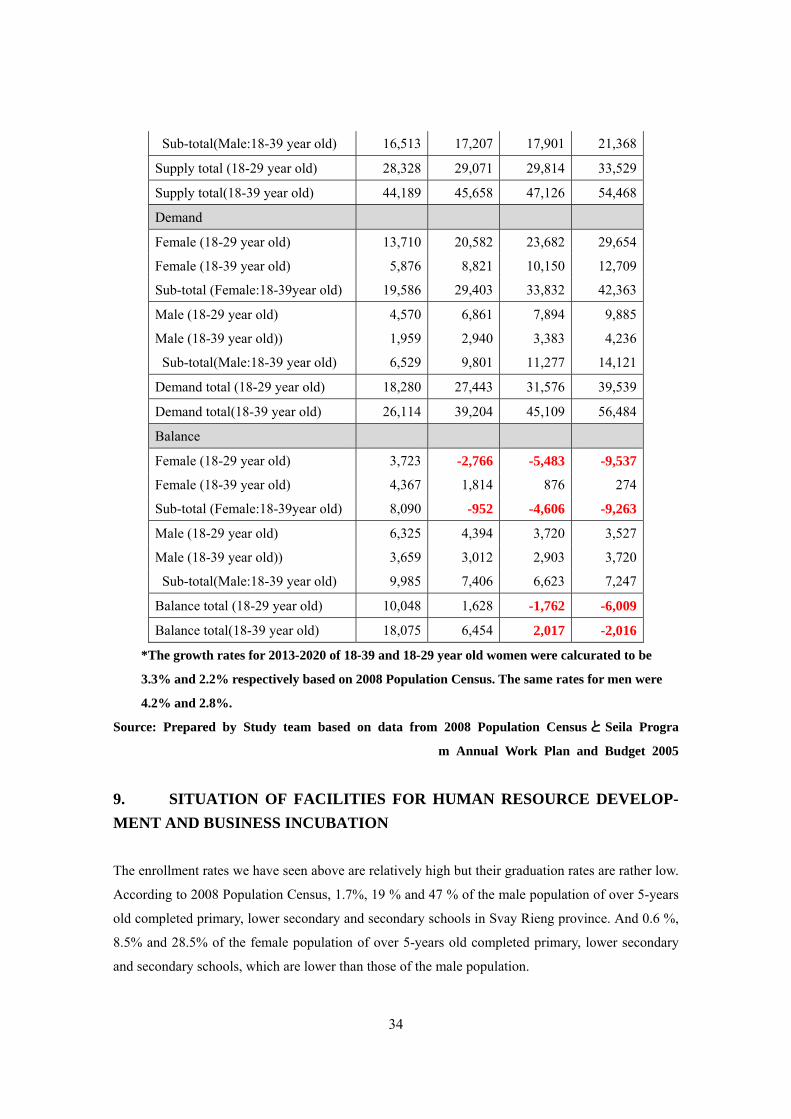
8.2 Demand and Supply Balance of Labor
An estimate of demand and supply balance of labor for Taiseng and Manhattan is presented in the
table below. Women, 18-29 year old women in particular, will be in serious shortage in 2014 relative
to men. The labor balance in 2013 is still positive but is quite tight, being near the limit. For the con-
ditions and method of the estimation, see the main part of this report (Chapter 8).
Table19: Labor Demand and Supply Balance for Taiseng and Manhattan SEZs
2013 2014 2015 2020
Supply (annual growth: 1.8%)
Female (18-29 year old) 17,433 17,816 18,200 20,117
Female (18-39 year old) 10,243 10,635 11,026 12,983
Sub-total (Female:18-39year old) 27,676 28,451 29,226 33,100
Male (18-29 year old) 10,895 11,255 11,614 13,412
Male (18-39 year old)) 5,618 5,952 6,286 7,956
34
Sub-total(Male:18-39 year old) 16,513 17,207 17,901 21,368
Supply total (18-29 year old) 28,328 29,071 29,814 33,529
Supply total(18-39 year old) 44,189 45,658 47,126 54,468
Demand
Female (18-29 year old) 13,710 20,582 23,682 29,654
Female (18-39 year old) 5,876 8,821 10,150 12,709
Sub-total (Female:18-39year old) 19,586 29,403 33,832 42,363
Male (18-29 year old) 4,570 6,861 7,894 9,885
Male (18-39 year old)) 1,959 2,940 3,383 4,236
Sub-total(Male:18-39 year old) 6,529 9,801 11,277 14,121
Demand total (18-29 year old) 18,280 27,443 31,576 39,539
Demand total(18-39 year old) 26,114 39,204 45,109 56,484
Balance
Female (18-29 year old) 3,723 -2,766 -5,483 -9,537
Female (18-39 year old) 4,367 1,814 876 274
Sub-total (Female:18-39year old) 8,090 -952 -4,606 -9,263
Male (18-29 year old) 6,325 4,394 3,720 3,527
Male (18-39 year old)) 3,659 3,012 2,903 3,720
Sub-total(Male:18-39 year old) 9,985 7,406 6,623 7,247
Balance total (18-29 year old) 10,048 1,628 -1,762 -6,009
Balance total(18-39 year old) 18,075 6,454 2,017 -2,016
*The growth rates for 2013-2020 of 18-39 and 18-29 year old women were calcurated to be
3.3% and 2.2% respectively based on 2008 Population Census. The same rates for men were
4.2% and 2.8%.
Source: Prepared by Study team based on data from 2008 Population Censusと Seila Progra
m Annual Work Plan and Budget 2005
9. SITUATION OF FACILITIES FOR HUMAN RESOURCE DEVELOP-MENT AND BUSINESS INCUBATION
The enrollment rates we have seen above are relatively high but their graduation rates are rather low.
According to 2008 Population Census, 1.7%, 19 % and 47 % of the male population of over 5-years
old completed primary, lower secondary and secondary schools in Svay Rieng province. And 0.6 %,
8.5% and 28.5% of the female population of over 5-years old completed primary, lower secondary
and secondary schools, which are lower than those of the male population.
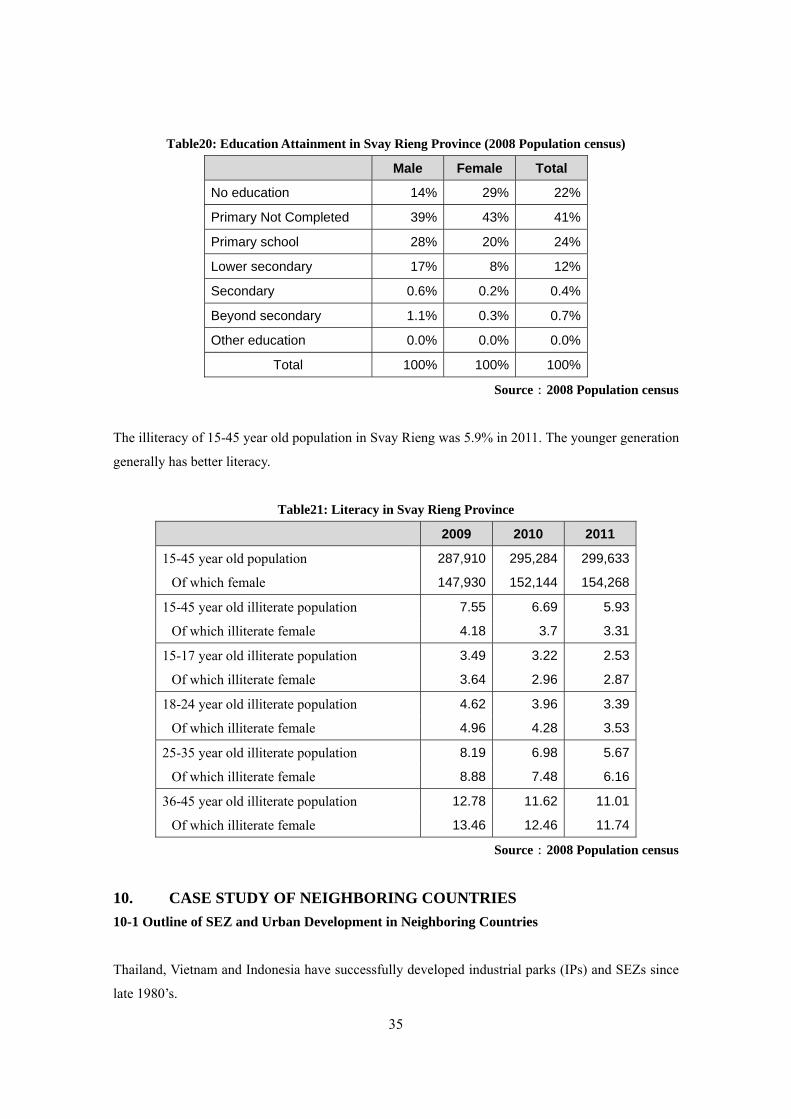
35
Table20: Education Attainment in Svay Rieng Province (2008 Population census)
Male Female Total
No education 14% 29% 22%
Primary Not Completed 39% 43% 41%
Primary school 28% 20% 24%
Lower secondary 17% 8% 12%
Secondary 0.6% 0.2% 0.4%
Beyond secondary 1.1% 0.3% 0.7%
Other education 0.0% 0.0% 0.0%
Total 100% 100% 100%
Source:2008 Population census
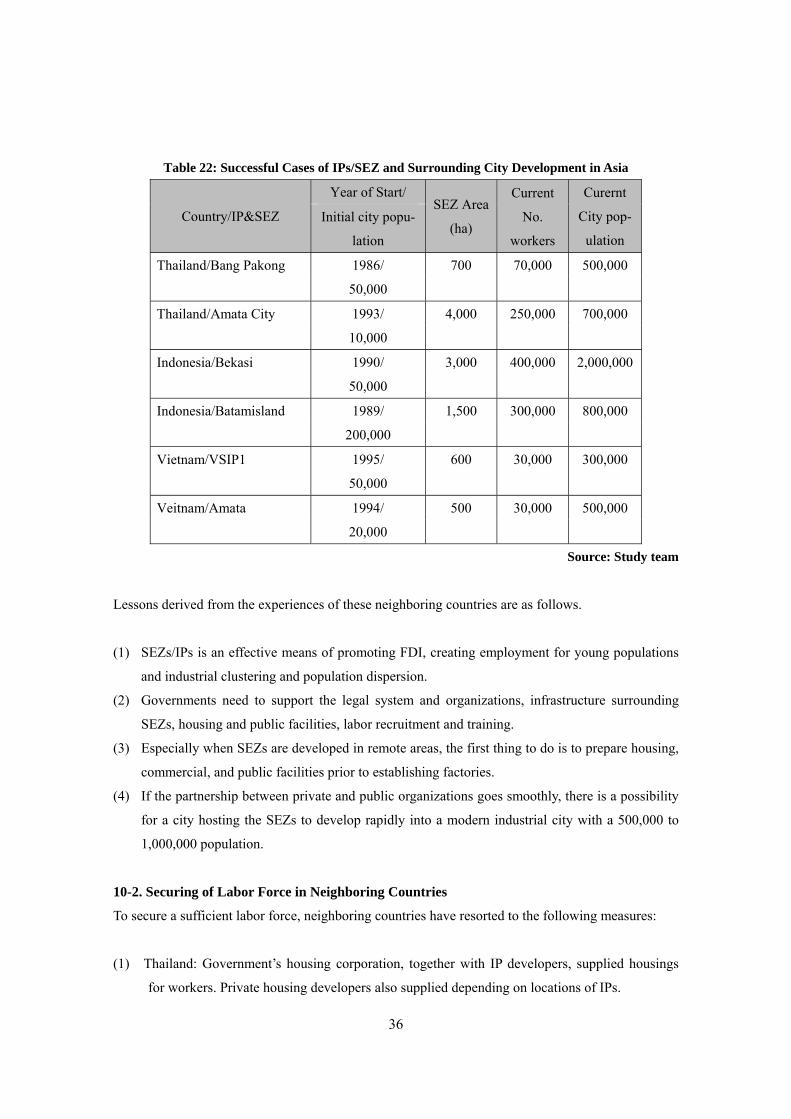
The illiteracy of 15-45 year old population in Svay Rieng was 5.9% in 2011. The younger generation
generally has better literacy.
Table21: Literacy in Svay Rieng Province
2009 2010 2011
15-45 year old population 287,910 295,284 299,633
Of which female 147,930 152,144 154,268
15-45 year old illiterate population 7.55 6.69 5.93
Of which illiterate female 4.18 3.7 3.31
15-17 year old illiterate population 3.49 3.22 2.53
Of which illiterate female 3.64 2.96 2.87
18-24 year old illiterate population 4.62 3.96 3.39
Of which illiterate female 4.96 4.28 3.53
25-35 year old illiterate population 8.19 6.98 5.67
Of which illiterate female 8.88 7.48 6.16
36-45 year old illiterate population 12.78 11.62 11.01
Of which illiterate female 13.46 12.46 11.74
Source:2008 Population census
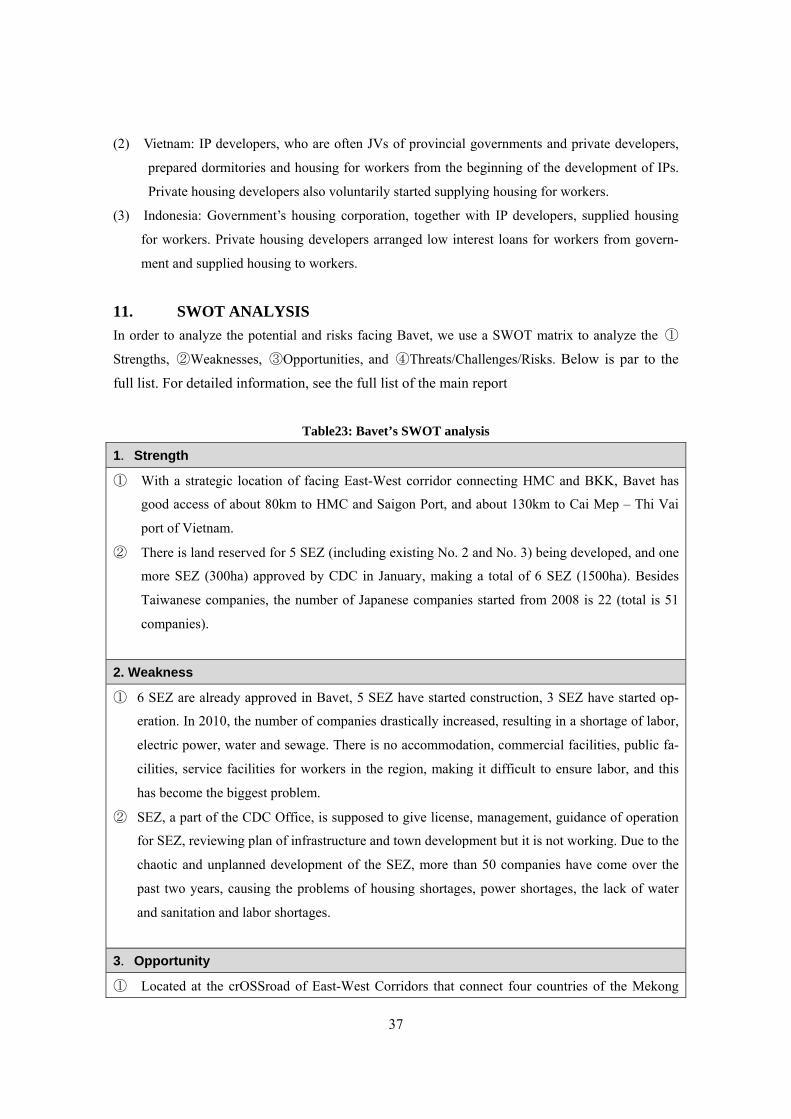
10. CASE STUDY OF NEIGHBORING COUNTRIES 10-1 Outline of SEZ and Urban Development in Neighboring Countries
Thailand, Vietnam and Indonesia have successfully developed industrial parks (IPs) and SEZs since
late 1980’s.
36
Table 22: Successful Cases of IPs/SEZ and Surrounding City Development in Asia
Country/IP&SEZ
Year of Start/ SEZ Area
(ha)
Current
No.
workers
Curernt
City pop-
ulation
Initial city popu-
lation
Thailand/Bang Pakong 1986/ 700 70,000 500,000
50,000
Thailand/Amata City 1993/ 4,000 250,000 700,000
10,000
Indonesia/Bekasi 1990/ 3,000 400,000 2,000,000
50,000
Indonesia/Batamisland 1989/ 1,500 300,000 800,000
200,000
Vietnam/VSIP1 1995/ 600 30,000 300,000
50,000
Veitnam/Amata 1994/ 500 30,000 500,000
20,000
Source: Study team
Lessons derived from the experiences of these neighboring countries are as follows.
(1) SEZs/IPs is an effective means of promoting FDI, creating employment for young populations
and industrial clustering and population dispersion.
(2) Governments need to support the legal system and organizations, infrastructure surrounding
SEZs, housing and public facilities, labor recruitment and training.
(3) Especially when SEZs are developed in remote areas, the first thing to do is to prepare housing,
commercial, and public facilities prior to establishing factories.
(4) If the partnership between private and public organizations goes smoothly, there is a possibility
for a city hosting the SEZs to develop rapidly into a modern industrial city with a 500,000 to
1,000,000 population.
10-2. Securing of Labor Force in Neighboring Countries
To secure a sufficient labor force, neighboring countries have resorted to the following measures:
(1) Thailand: Government’s housing corporation, together with IP developers, supplied housings
for workers. Private housing developers also supplied depending on locations of IPs.
37
(2) Vietnam: IP developers, who are often JVs of provincial governments and private developers,
prepared dormitories and housing for workers from the beginning of the development of IPs.
Private housing developers also voluntarily started supplying housing for workers.
(3) Indonesia: Government’s housing corporation, together with IP developers, supplied housing
for workers. Private housing developers arranged low interest loans for workers from govern-
ment and supplied housing to workers.
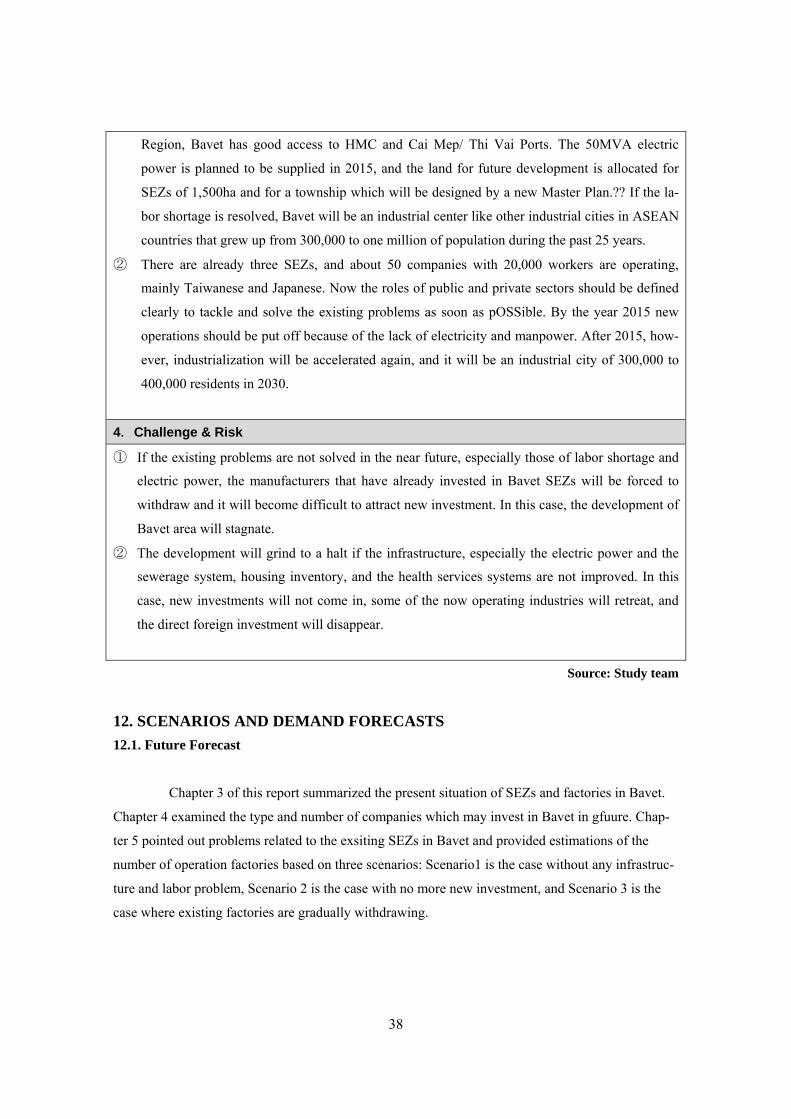
11. SWOT ANALYSIS
In order to analyze the potential and risks facing Bavet, we use a SWOT matrix to analyze the ①
Strengths, ②Weaknesses, ③Opportunities, and ④Threats/Challenges/Risks. Below is par to the
full list. For detailed information, see the full list of the main report
Table23: Bavet’s SWOT analysis
1.Strength
① With a strategic location of facing East-West corridor connecting HMC and BKK, Bavet has
good access of about 80km to HMC and Saigon Port, and about 130km to Cai Mep – Thi Vai
port of Vietnam.
② There is land reserved for 5 SEZ (including existing No. 2 and No. 3) being developed, and one
more SEZ (300ha) approved by CDC in January, making a total of 6 SEZ (1500ha). Besides
Taiwanese companies, the number of Japanese companies started from 2008 is 22 (total is 51
companies).
2. Weakness
① 6 SEZ are already approved in Bavet, 5 SEZ have started construction, 3 SEZ have started op-
eration. In 2010, the number of companies drastically increased, resulting in a shortage of labor,
electric power, water and sewage. There is no accommodation, commercial facilities, public fa-
cilities, service facilities for workers in the region, making it difficult to ensure labor, and this
has become the biggest problem.
② SEZ, a part of the CDC Office, is supposed to give license, management, guidance of operation
for SEZ, reviewing plan of infrastructure and town development but it is not working. Due to the
chaotic and unplanned development of the SEZ, more than 50 companies have come over the
past two years, causing the problems of housing shortages, power shortages, the lack of water
and sanitation and labor shortages.
3.Opportunity
① Located at the crOSSroad of East-West Corridors that connect four countries of the Mekong
38
Region, Bavet has good access to HMC and Cai Mep/ Thi Vai Ports. The 50MVA electric
power is planned to be supplied in 2015, and the land for future development is allocated for
SEZs of 1,500ha and for a township which will be designed by a new Master Plan.?? If the la-
bor shortage is resolved, Bavet will be an industrial center like other industrial cities in ASEAN
countries that grew up from 300,000 to one million of population during the past 25 years.
② There are already three SEZs, and about 50 companies with 20,000 workers are operating,
mainly Taiwanese and Japanese. Now the roles of public and private sectors should be defined
clearly to tackle and solve the existing problems as soon as pOSSible. By the year 2015 new
operations should be put off because of the lack of electricity and manpower. After 2015, how-
ever, industrialization will be accelerated again, and it will be an industrial city of 300,000 to
400,000 residents in 2030.
4.Challenge & Risk
① If the existing problems are not solved in the near future, especially those of labor shortage and
electric power, the manufacturers that have already invested in Bavet SEZs will be forced to
withdraw and it will become difficult to attract new investment. In this case, the development of
Bavet area will stagnate.
② The development will grind to a halt if the infrastructure, especially the electric power and the
sewerage system, housing inventory, and the health services systems are not improved. In this
case, new investments will not come in, some of the now operating industries will retreat, and
the direct foreign investment will disappear.
Source: Study team
12. SCENARIOS AND DEMAND FORECASTS 12.1. Future Forecast
Chapter 3 of this report summarized the present situation of SEZs and factories in Bavet.
Chapter 4 examined the type and number of companies which may invest in Bavet in gfuure. Chap-
ter 5 pointed out problems related to the exsiting SEZs in Bavet and provided estimations of the
number of operation factories based on three scenarios: Scenario1 is the case without any infrastruc-
ture and labor problem, Scenario 2 is the case with no more new investment, and Scenario 3 is the
case where existing factories are gradually withdrawing.
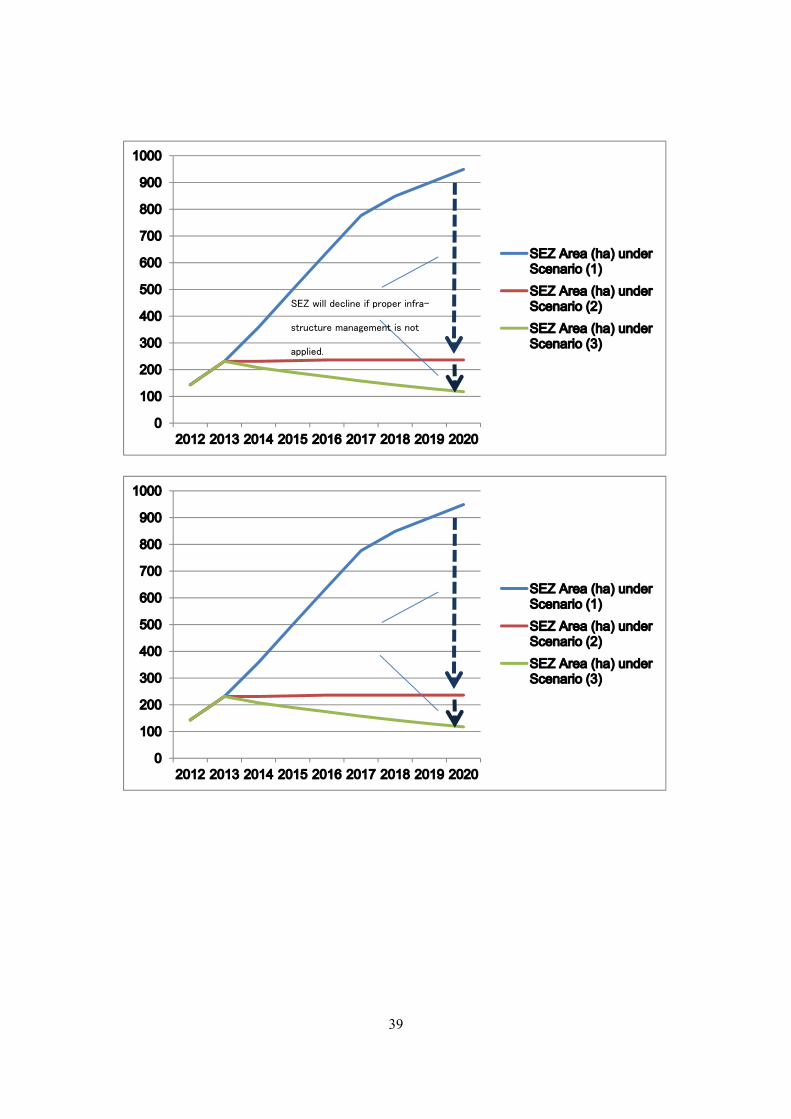
39
SEZ will decline if proper infra-
structure management is not
applied.
40
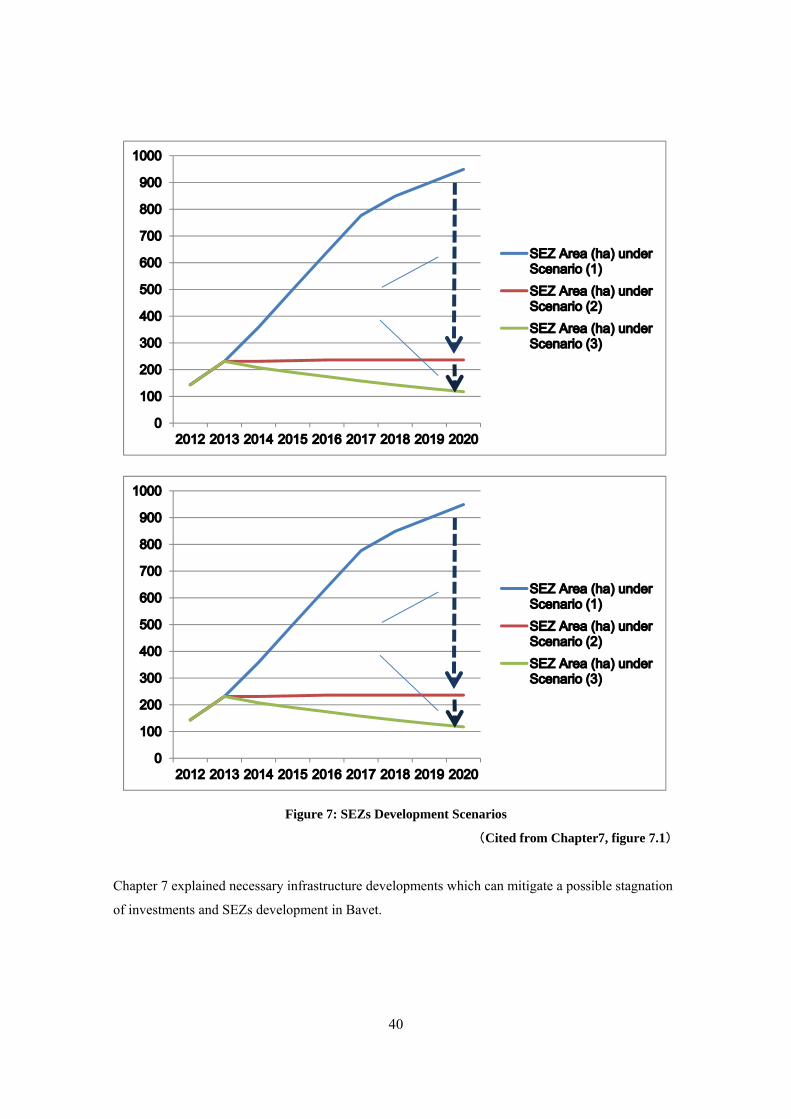
Figure 7: SEZs Development Scenarios
(Cited from Chapter7, figure 7.1)
Chapter 7 explained necessary infrastructure developments which can mitigate a possible stagnation
of investments and SEZs development in Bavet.
41
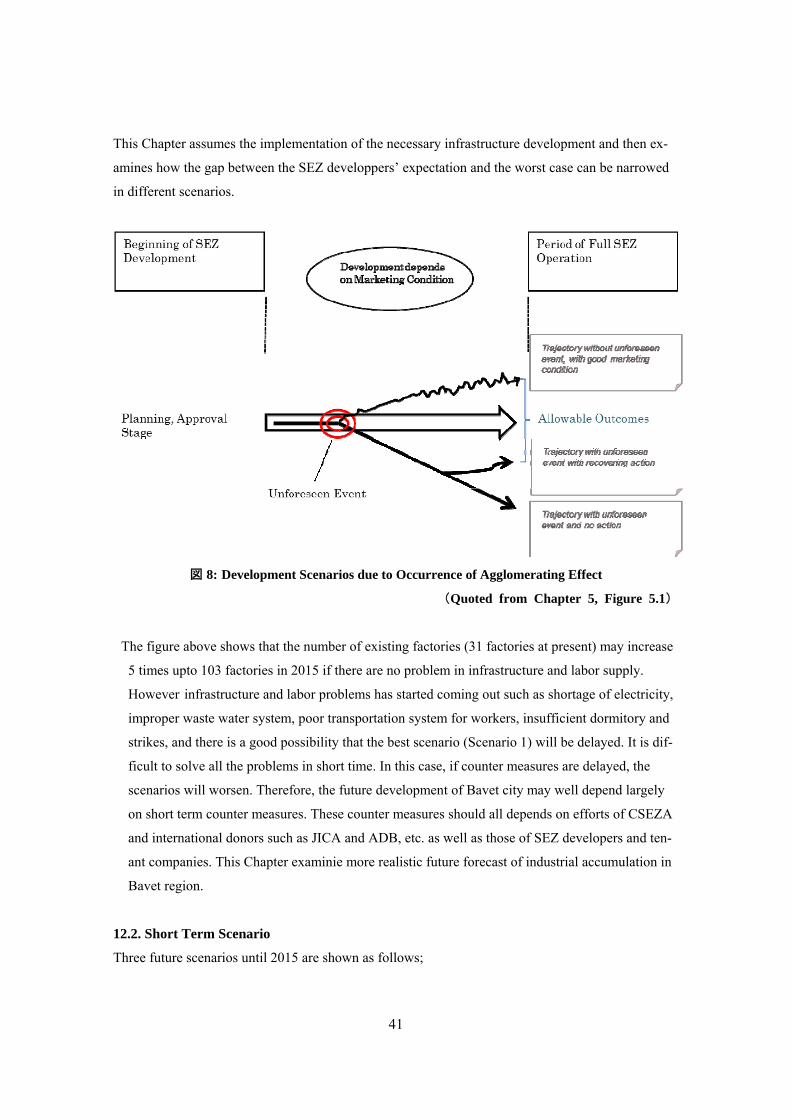
This Chapter assumes the implementation of the necessary infrastructure development and then ex-
amines how the gap between the SEZ developpers’ expectation and the worst case can be narrowed
in different scenarios.
図 8: Development Scenarios due to Occurrence of Agglomerating Effect
(Quoted from Chapter 5, Figure 5.1)
The figure above shows that the number of existing factories (31 factories at present) may increase
5 times upto 103 factories in 2015 if there are no problem in infrastructure and labor supply.
However infrastructure and labor problems has started coming out such as shortage of electricity,
improper waste water system, poor transportation system for workers, insufficient dormitory and
strikes, and there is a good possibility that the best scenario (Scenario 1) will be delayed. It is dif-
ficult to solve all the problems in short time. In this case, if counter measures are delayed, the
scenarios will worsen. Therefore, the future development of Bavet city may well depend largely
on short term counter measures. These counter measures should all depends on efforts of CSEZA
and international donors such as JICA and ADB, etc. as well as those of SEZ developers and ten-
ant companies. This Chapter examinie more realistic future forecast of industrial accumulation in
Bavet region.
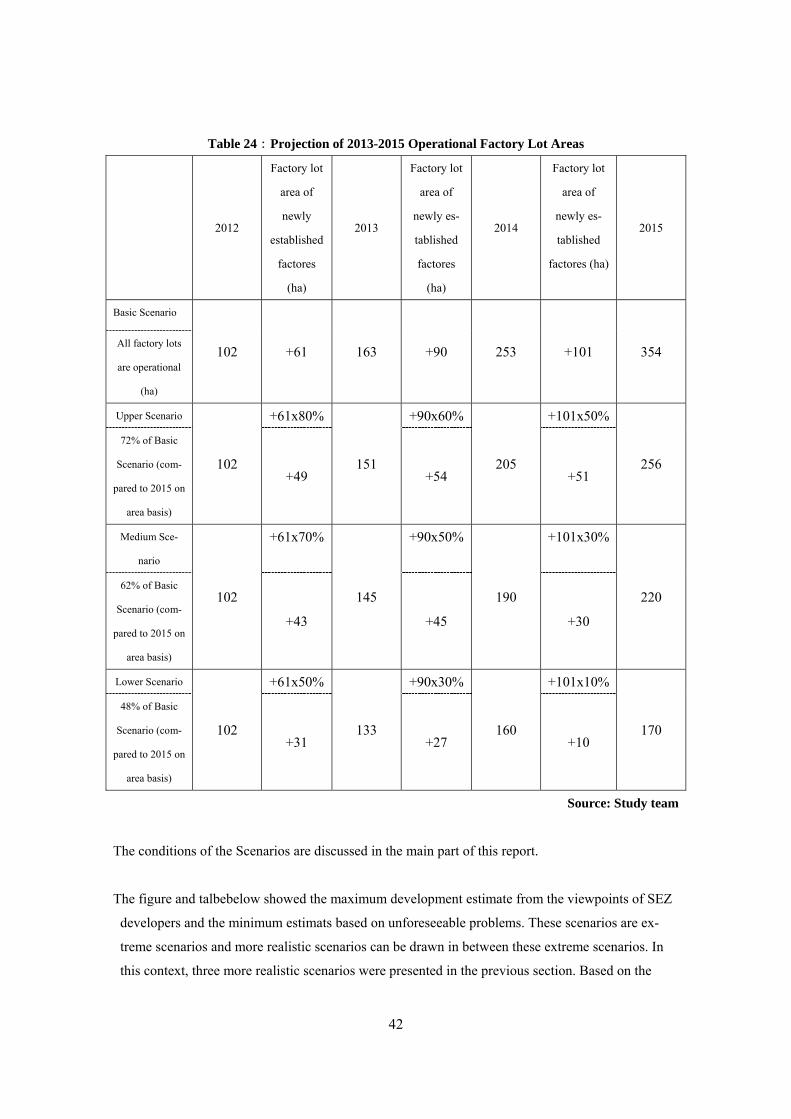
12.2. Short Term Scenario
Three future scenarios until 2015 are shown as follows;
42
Table 24:Projection of 2013-2015 Operational Factory Lot Areas
2012
Factory lot
area of
newly
established
factores
(ha)
2013
Factory lot
area of
newly es-
tablished
factores
(ha)
2014
Factory lot
area of
newly es-
tablished
factores (ha)
2015
Basic Scenario
102 +61 163 +90 253 +101 354 All factory lots
are operational
(ha)
Upper Scenario
102
+61x80%
151
+90x60%
205
+101x50%
256
72% of Basic
Scenario (com-
pared to 2015 on
area basis)
+49 +54 +51
Medium Sce-
nario
102
+61x70%
145
+90x50%
190
+101x30%
220 62% of Basic
Scenario (com-
pared to 2015 on
area basis)
+43 +45 +30
Lower Scenario
102
+61x50%
133
+90x30%
160
+101x10%
170
48% of Basic
Scenario (com-
pared to 2015 on
area basis)
+31 +27 +10
Source: Study team
The conditions of the Scenarios are discussed in the main part of this report.
The figure and talbebelow showed the maximum development estimate from the viewpoints of SEZ
developers and the minimum estimats based on unforeseeable problems. These scenarios are ex-
treme scenarios and more realistic scenarios can be drawn in between these extreme scenarios. In
this context, three more realistic scenarios were presented in the previous section. Based on the
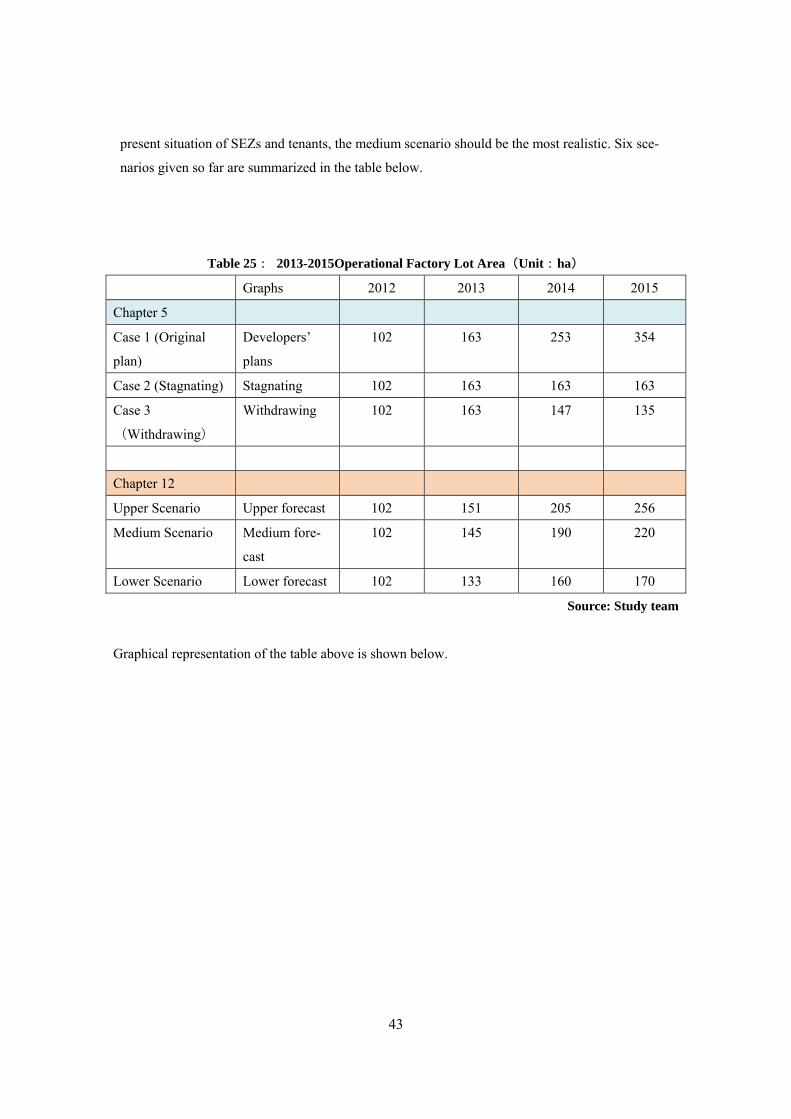
43
present situation of SEZs and tenants, the medium scenario should be the most realistic. Six sce-
narios given so far are summarized in the table below.
Table 25: 2013-2015Operational Factory Lot Area(Unit:ha)
Graphs 2012 2013 2014 2015
Chapter 5
Case 1 (Original
plan)
Developers’
plans
102 163 253 354
Case 2 (Stagnating) Stagnating 102 163 163 163
Case 3
(Withdrawing)
Withdrawing 102 163 147 135
Chapter 12
Upper Scenario Upper forecast 102 151 205 256
Medium Scenario Medium fore-
cast
102 145 190 220
Lower Scenario Lower forecast 102 133 160 170
Source: Study team
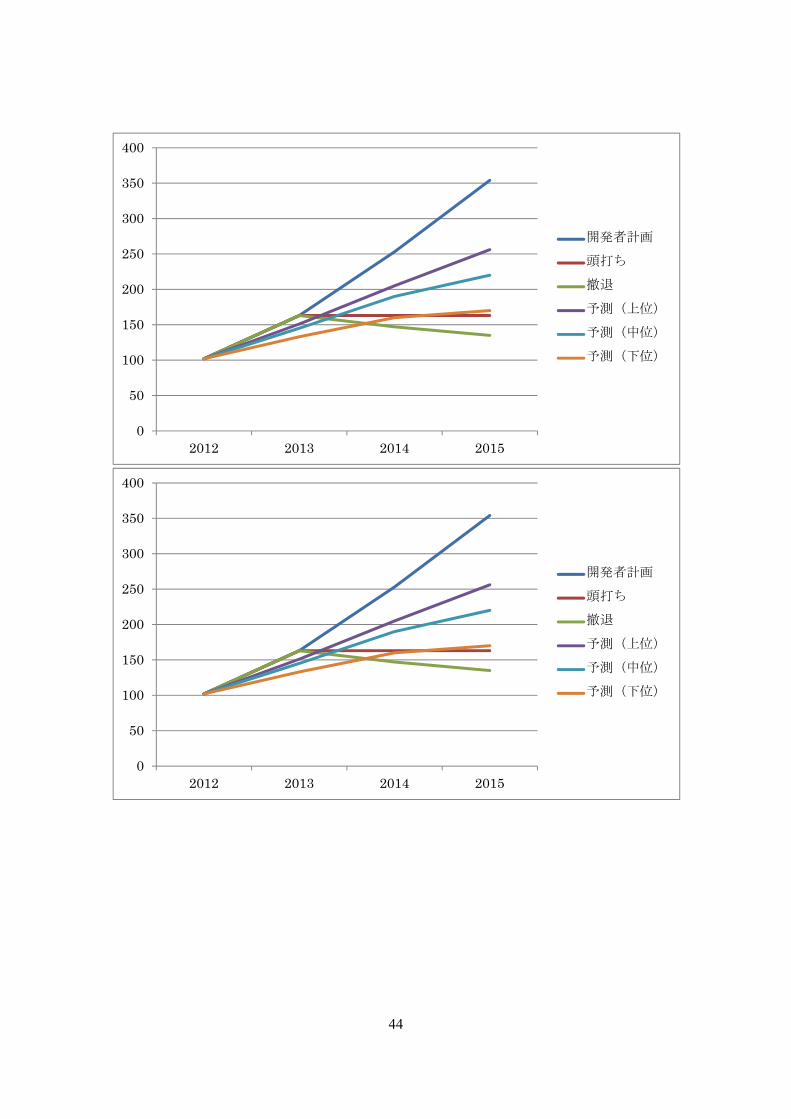
Graphical representation of the table above is shown below.
44
0
50
100
150
200
250
300
350
400
2012 2013 2014 2015
開発者計画
頭打ち
撤退
予測(上位)
予測(中位)
予測(下位)
0
50
100
150
200
250
300
350
400
2012 2013 2014 2015
開発者計画
頭打ち
撤退
予測(上位)
予測(中位)
予測(下位)
45
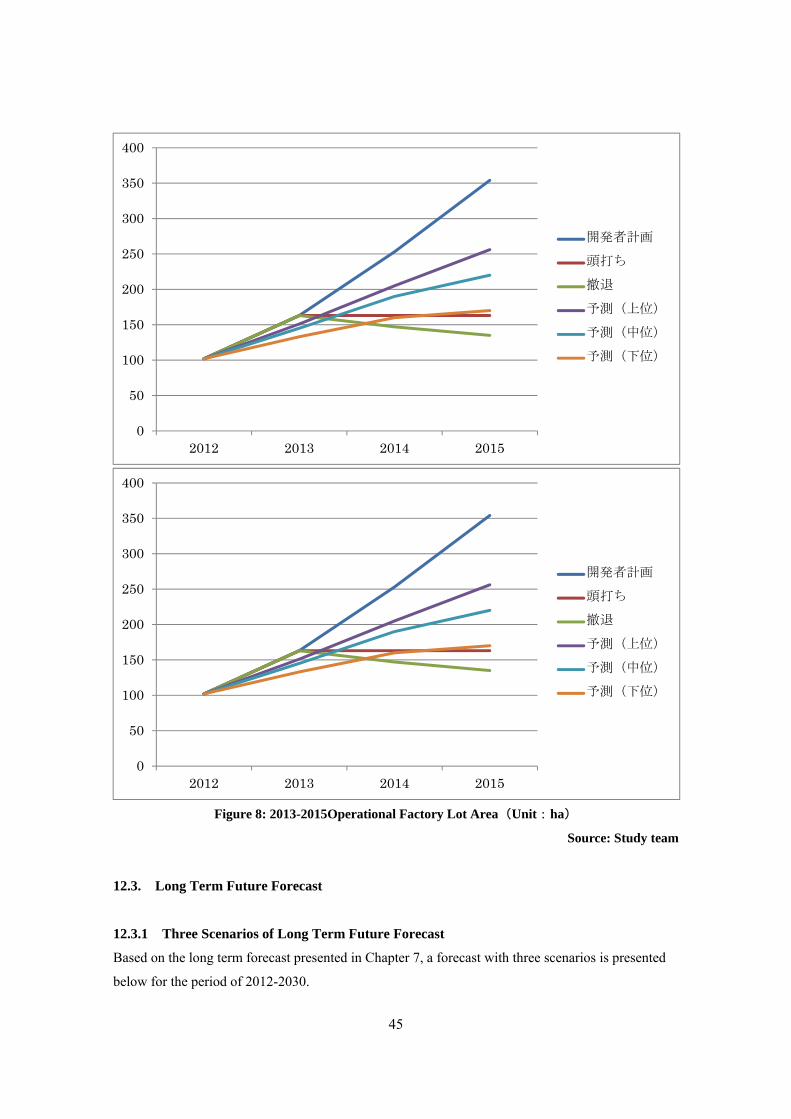
Figure 8: 2013-2015Operational Factory Lot Area(Unit:ha)
Source: Study team
12.3. Long Term Future Forecast
12.3.1 Three Scenarios of Long Term Future Forecast
Based on the long term forecast presented in Chapter 7, a forecast with three scenarios is presented
below for the period of 2012-2030.
0
50
100
150
200
250
300
350
400
2012 2013 2014 2015
開発者計画
頭打ち
撤退
予測(上位)
予測(中位)
予測(下位)
0
50
100
150
200
250
300
350
400
2012 2013 2014 2015
開発者計画
頭打ち
撤退
予測(上位)
予測(中位)
予測(下位)
46
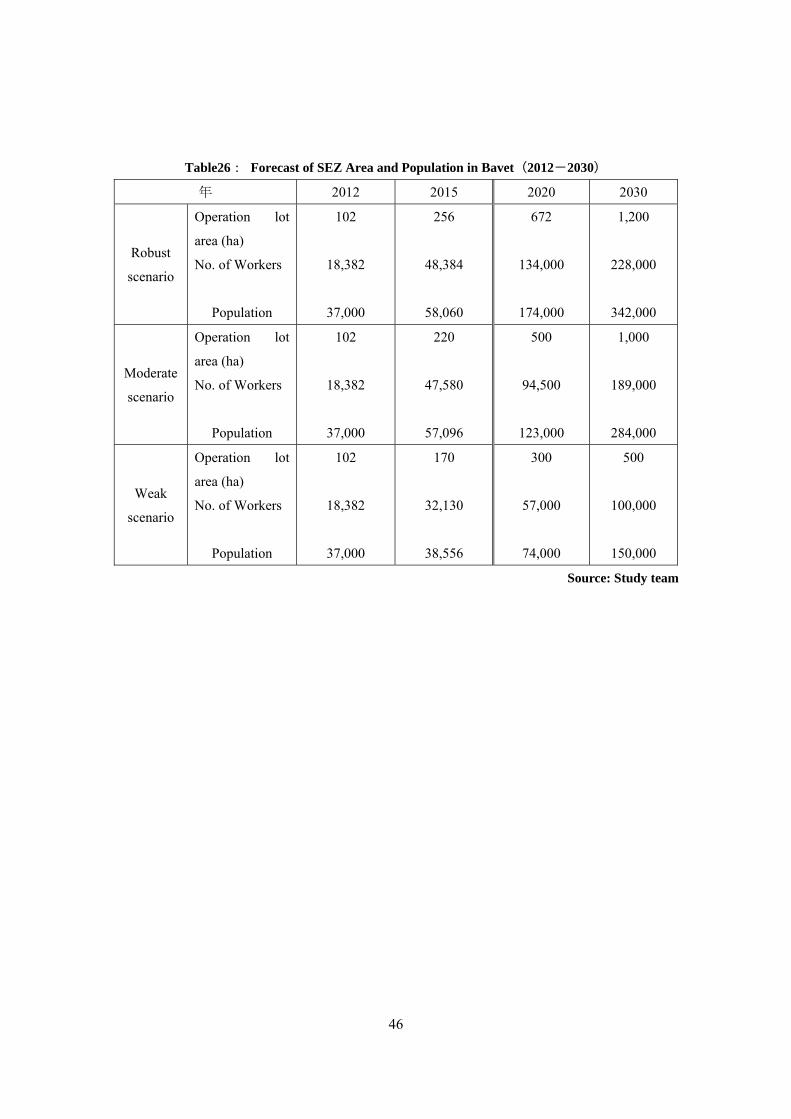
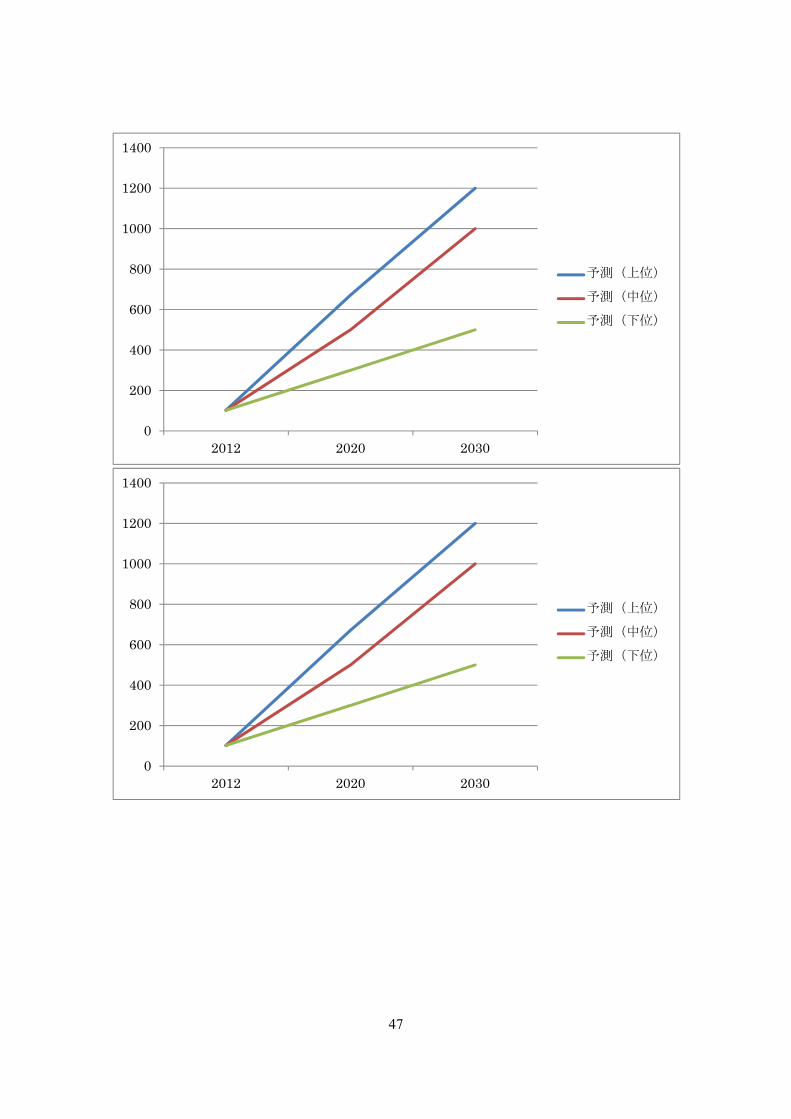
Table26: Forecast of SEZ Area and Population in Bavet(2012-2030)
年 2012 2015 2020 2030
Robust
scenario
Operation lot
area (ha)
No. of Workers
Population
102
18,382
37,000
256
48,384
58,060
672
134,000
174,000
1,200
228,000
342,000
Moderate
scenario
Operation lot
area (ha)
No. of Workers
Population
102
18,382
37,000
220
47,580
57,096
500
94,500
123,000
1,000
189,000
284,000
Weak
scenario
Operation lot
area (ha)
No. of Workers
Population
102
18,382
37,000
170
32,130
38,556
300
57,000
74,000
500
100,000
150,000
Source: Study team
47
0
200
400
600
800
1000
1200
1400
2012 2020 2030
予測(上位)
予測(中位)
予測(下位)
0
200
400
600
800
1000
1200
1400
2012 2020 2030
予測(上位)
予測(中位)
予測(下位)
48
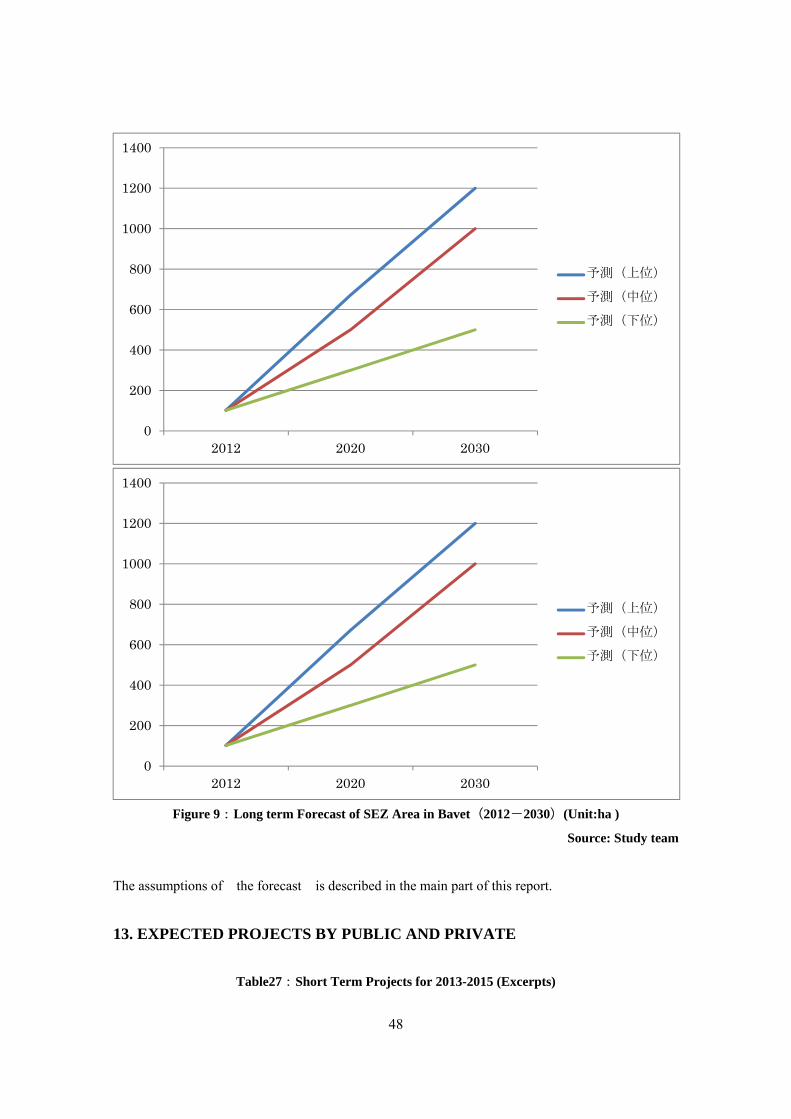
Figure 9:Long term Forecast of SEZ Area in Bavet(2012-2030)(Unit:ha )
Source: Study team
The assumptions of the forecast is described in the main part of this report.
13. EXPECTED PROJECTS BY PUBLIC AND PRIVATE
Table27:Short Term Projects for 2013-2015 (Excerpts)
0
200
400
600
800
1000
1200
1400
2012 2020 2030
予測(上位)
予測(中位)
予測(下位)
0
200
400
600
800
1000
1200
1400
2012 2020 2030
予測(上位)
予測(中位)
予測(下位)
49
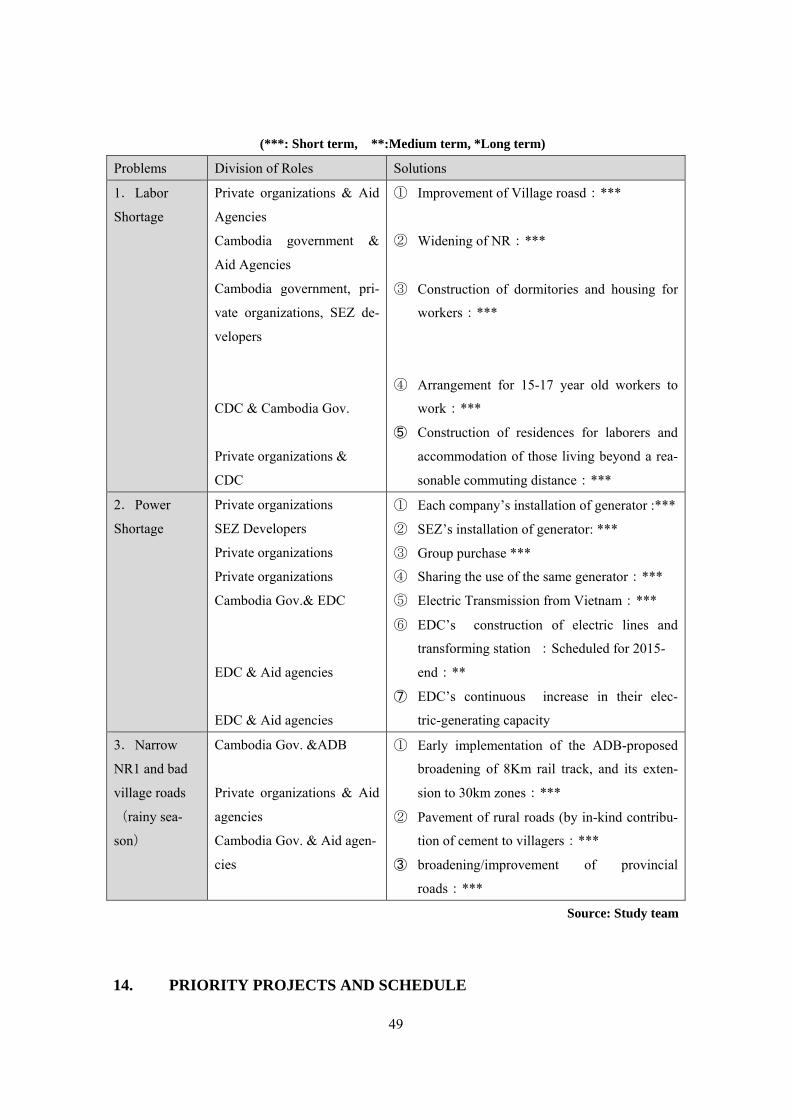
(***: Short term, **:Medium term, *Long term)
Problems Division of Roles Solutions
1.Labor
Shortage
Private organizations & Aid
Agencies
Cambodia government &
Aid Agencies
Cambodia government, pri-
vate organizations, SEZ de-
velopers
CDC & Cambodia Gov.
Private organizations &
CDC
① Improvement of Village roasd:***
② Widening of NR:***
③ Construction of dormitories and housing for
workers:***
④ Arrangement for 15-17 year old workers to
work:***
⑤ Construction of residences for laborers and
accommodation of those living beyond a rea-
sonable commuting distance:***
2.Power
Shortage
Private organizations
SEZ Developers
Private organizations
Private organizations
Cambodia Gov.& EDC
EDC & Aid agencies
EDC & Aid agencies
① Each company’s installation of generator :***
② SEZ’s installation of generator: ***
③ Group purchase ***
④ Sharing the use of the same generator:***
⑤ Electric Transmission from Vietnam:***
⑥ EDC’s construction of electric lines and
transforming station :Scheduled for 2015-
end:**
⑦ EDC’s continuous increase in their elec-
tric-generating capacity
3.Narrow
NR1 and bad
village roads
(rainy sea-
son)
Cambodia Gov. &ADB
Private organizations & Aid
agencies
Cambodia Gov. & Aid agen-
cies
① Early implementation of the ADB-proposed
broadening of 8Km rail track, and its exten-
sion to 30km zones:***
② Pavement of rural roads (by in-kind contribu-
tion of cement to villagers:***
③ broadening/improvement of provincial
roads:***
Source: Study team
14. PRIORITY PROJECTS AND SCHEDULE
50
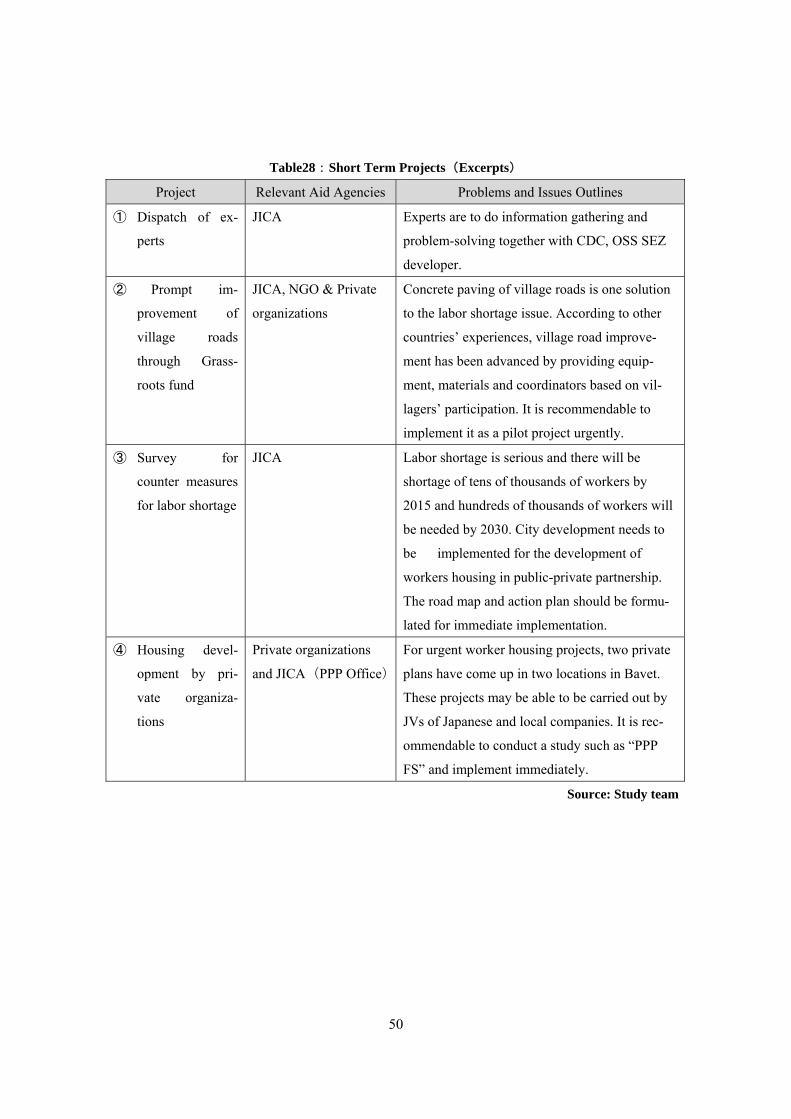
Table28:Short Term Projects(Excerpts)
Project Relevant Aid Agencies Problems and Issues Outlines
① Dispatch of ex-
perts
JICA Experts are to do information gathering and
problem-solving together with CDC, OSS SEZ
developer.
② Prompt im-
provement of
village roads
through Grass-
roots fund
JICA, NGO & Private
organizations
Concrete paving of village roads is one solution
to the labor shortage issue. According to other
countries’ experiences, village road improve-
ment has been advanced by providing equip-
ment, materials and coordinators based on vil-
lagers’ participation. It is recommendable to
implement it as a pilot project urgently.
③ Survey for
counter measures
for labor shortage
JICA Labor shortage is serious and there will be
shortage of tens of thousands of workers by
2015 and hundreds of thousands of workers will
be needed by 2030. City development needs to
be implemented for the development of
workers housing in public-private partnership.
The road map and action plan should be formu-
lated for immediate implementation.
④ Housing devel-
opment by pri-
vate organiza-
tions
Private organizations
and JICA(PPP Office)
For urgent worker housing projects, two private
plans have come up in two locations in Bavet.
These projects may be able to be carried out by
JVs of Japanese and local companies. It is rec-
ommendable to conduct a study such as “PPP
FS” and implement immediately.
Source: Study team
51
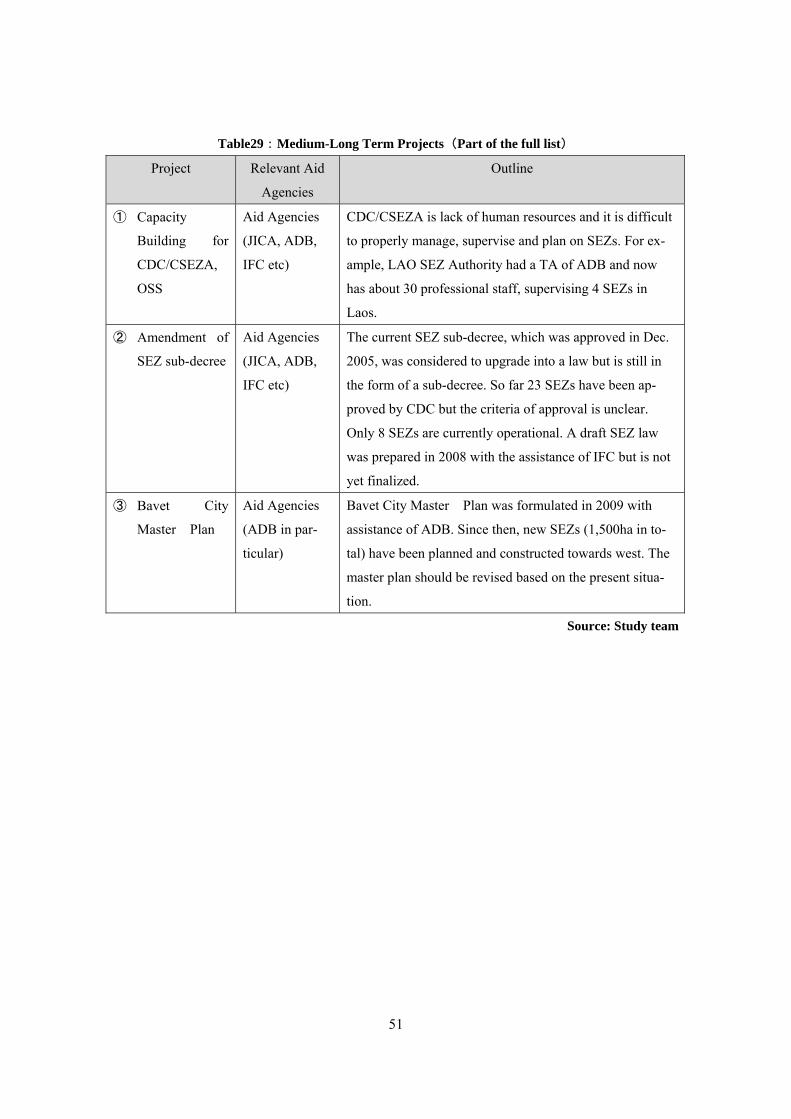
Table29:Medium-Long Term Projects(Part of the full list)
Project Relevant Aid
Agencies
Outline
① Capacity
Building for
CDC/CSEZA,
OSS
Aid Agencies
(JICA, ADB,
IFC etc)
CDC/CSEZA is lack of human resources and it is difficult
to properly manage, supervise and plan on SEZs. For ex-
ample, LAO SEZ Authority had a TA of ADB and now
has about 30 professional staff, supervising 4 SEZs in
Laos.
② Amendment of
SEZ sub-decree
Aid Agencies
(JICA, ADB,
IFC etc)
The current SEZ sub-decree, which was approved in Dec.
2005, was considered to upgrade into a law but is still in
the form of a sub-decree. So far 23 SEZs have been ap-
proved by CDC but the criteria of approval is unclear.
Only 8 SEZs are currently operational. A draft SEZ law
was prepared in 2008 with the assistance of IFC but is not
yet finalized.
③ Bavet City
Master Plan
Aid Agencies
(ADB in par-
ticular)
Bavet City Master Plan was formulated in 2009 with
assistance of ADB. Since then, new SEZs (1,500ha in to-
tal) have been planned and constructed towards west. The
master plan should be revised based on the present situa-
tion.
Source: Study team
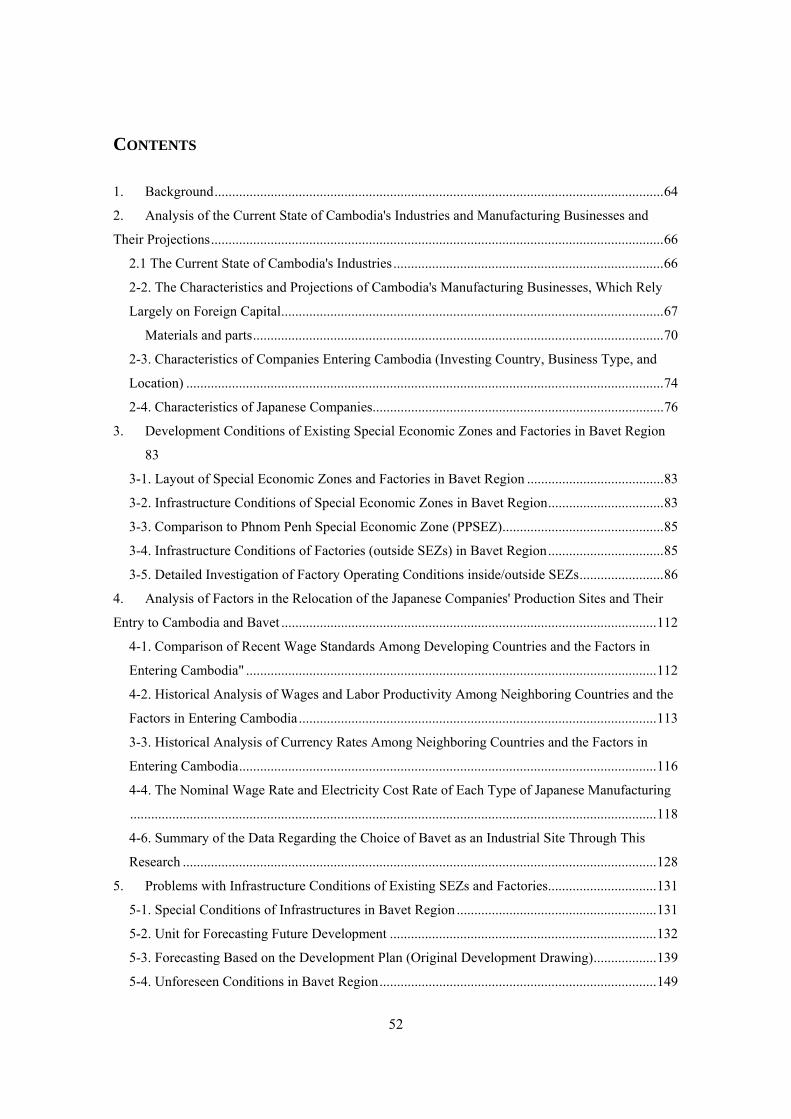
52
CONTENTS
1. Background ................................................................................................................................ 64
2. Analysis of the Current State of Cambodia's Industries and Manufacturing Businesses and
Their Projections ................................................................................................................................. 66
2.1 The Current State of Cambodia's Industries ............................................................................. 66
2-2. The Characteristics and Projections of Cambodia's Manufacturing Businesses, Which Rely
Largely on Foreign Capital ............................................................................................................. 67
Materials and parts ..................................................................................................................... 70
2-3. Characteristics of Companies Entering Cambodia (Investing Country, Business Type, and
Location) ........................................................................................................................................ 74
2-4. Characteristics of Japanese Companies................................................................................... 76
3. Development Conditions of Existing Special Economic Zones and Factories in Bavet Region
83
3-1. Layout of Special Economic Zones and Factories in Bavet Region ....................................... 83
3-2. Infrastructure Conditions of Special Economic Zones in Bavet Region ................................. 83
3-3. Comparison to Phnom Penh Special Economic Zone (PPSEZ) .............................................. 85
3-4. Infrastructure Conditions of Factories (outside SEZs) in Bavet Region ................................. 85
3-5. Detailed Investigation of Factory Operating Conditions inside/outside SEZs ........................ 86
4. Analysis of Factors in the Relocation of the Japanese Companies' Production Sites and Their
Entry to Cambodia and Bavet ........................................................................................................... 112
4-1. Comparison of Recent Wage Standards Among Developing Countries and the Factors in
Entering Cambodia" ..................................................................................................................... 112
4-2. Historical Analysis of Wages and Labor Productivity Among Neighboring Countries and the
Factors in Entering Cambodia ...................................................................................................... 113
3-3. Historical Analysis of Currency Rates Among Neighboring Countries and the Factors in
Entering Cambodia ....................................................................................................................... 116
4-4. The Nominal Wage Rate and Electricity Cost Rate of Each Type of Japanese Manufacturing
...................................................................................................................................................... 118
4-6. Summary of the Data Regarding the Choice of Bavet as an Industrial Site Through This
Research ....................................................................................................................................... 128
5. Problems with Infrastructure Conditions of Existing SEZs and Factories ............................... 131
5-1. Special Conditions of Infrastructures in Bavet Region ......................................................... 131
5-2. Unit for Forecasting Future Development ............................................................................ 132
5-3. Forecasting Based on the Development Plan (Original Development Drawing) .................. 139
5-4. Unforeseen Conditions in Bavet Region ............................................................................... 149
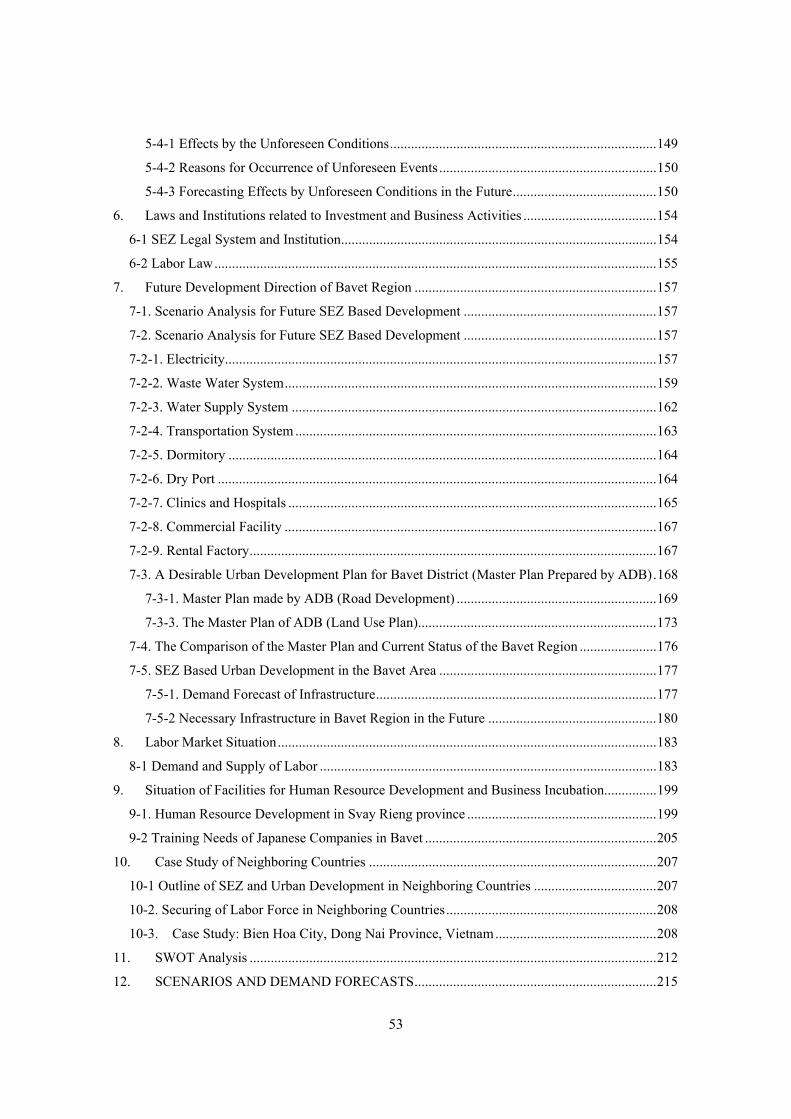
53
5-4-1 Effects by the Unforeseen Conditions ............................................................................ 149
5-4-2 Reasons for Occurrence of Unforeseen Events .............................................................. 150
5-4-3 Forecasting Effects by Unforeseen Conditions in the Future ......................................... 150
6. Laws and Institutions related to Investment and Business Activities ...................................... 154
6-1 SEZ Legal System and Institution .......................................................................................... 154
6-2 Labor Law .............................................................................................................................. 155
7. Future Development Direction of Bavet Region ..................................................................... 157
7-1. Scenario Analysis for Future SEZ Based Development ....................................................... 157
7-2. Scenario Analysis for Future SEZ Based Development ....................................................... 157
7-2-1. Electricity ........................................................................................................................... 157
7-2-2. Waste Water System .......................................................................................................... 159
7-2-3. Water Supply System ........................................................................................................ 162
7-2-4. Transportation System ....................................................................................................... 163
7-2-5. Dormitory .......................................................................................................................... 164
7-2-6. Dry Port ............................................................................................................................. 164
7-2-7. Clinics and Hospitals ......................................................................................................... 165
7-2-8. Commercial Facility .......................................................................................................... 167
7-2-9. Rental Factory .................................................................................................................... 167
7-3. A Desirable Urban Development Plan for Bavet District (Master Plan Prepared by ADB) . 168
7-3-1. Master Plan made by ADB (Road Development) ......................................................... 169
7-3-3. The Master Plan of ADB (Land Use Plan) .................................................................... 173
7-4. The Comparison of the Master Plan and Current Status of the Bavet Region ...................... 176
7-5. SEZ Based Urban Development in the Bavet Area .............................................................. 177
7-5-1. Demand Forecast of Infrastructure ................................................................................ 177
7-5-2 Necessary Infrastructure in Bavet Region in the Future ................................................ 180
8. Labor Market Situation ............................................................................................................ 183
8-1 Demand and Supply of Labor ................................................................................................ 183
9. Situation of Facilities for Human Resource Development and Business Incubation............... 199
9-1. Human Resource Development in Svay Rieng province ...................................................... 199
9-2 Training Needs of Japanese Companies in Bavet .................................................................. 205
10. Case Study of Neighboring Countries .................................................................................. 207
10-1 Outline of SEZ and Urban Development in Neighboring Countries ................................... 207
10-2. Securing of Labor Force in Neighboring Countries ............................................................ 208
10-3. Case Study: Bien Hoa City, Dong Nai Province, Vietnam .............................................. 208
11. SWOT Analysis .................................................................................................................... 212
12. SCENARIOS AND DEMAND FORECASTS ..................................................................... 215

54
13. EXPECTED PROJECTS BY PUBLIC AND PRIVATE ..................................................... 227
14. PRIORITY PROJECTS AND SCHEDULE ......................................................................... 230
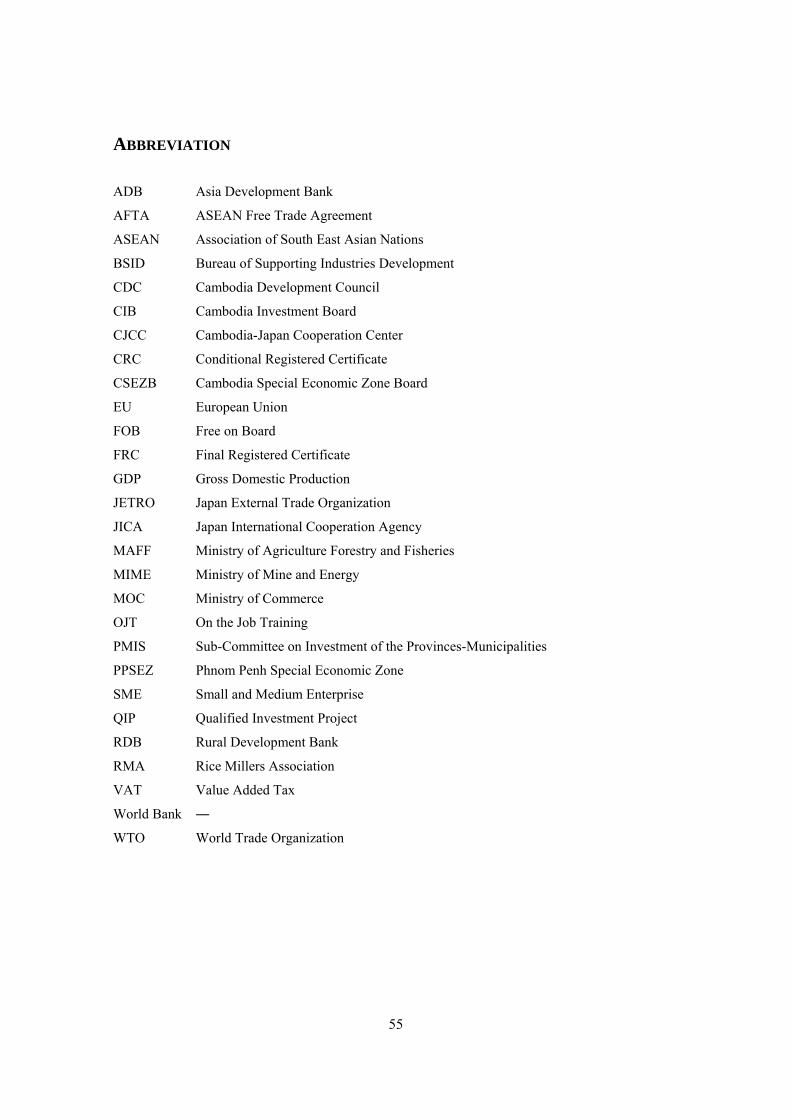
55
ABBREVIATION ADB Asia Development Bank
AFTA ASEAN Free Trade Agreement
ASEAN Association of South East Asian Nations
BSID Bureau of Supporting Industries Development
CDC Cambodia Development Council
CIB Cambodia Investment Board
CJCC Cambodia-Japan Cooperation Center
CRC Conditional Registered Certificate
CSEZB Cambodia Special Economic Zone Board
EU European Union
FOB Free on Board
FRC Final Registered Certificate
GDP Gross Domestic Production
JETRO Japan External Trade Organization
JICA Japan International Cooperation Agency
MAFF Ministry of Agriculture Forestry and Fisheries
MIME Ministry of Mine and Energy
MOC Ministry of Commerce
OJT On the Job Training
PMIS Sub-Committee on Investment of the Provinces-Municipalities
PPSEZ Phnom Penh Special Economic Zone
SME Small and Medium Enterprise
QIP Qualified Investment Project
RDB Rural Development Bank
RMA Rice Millers Association
VAT Value Added Tax
World Bank ―
WTO World Trade Organization
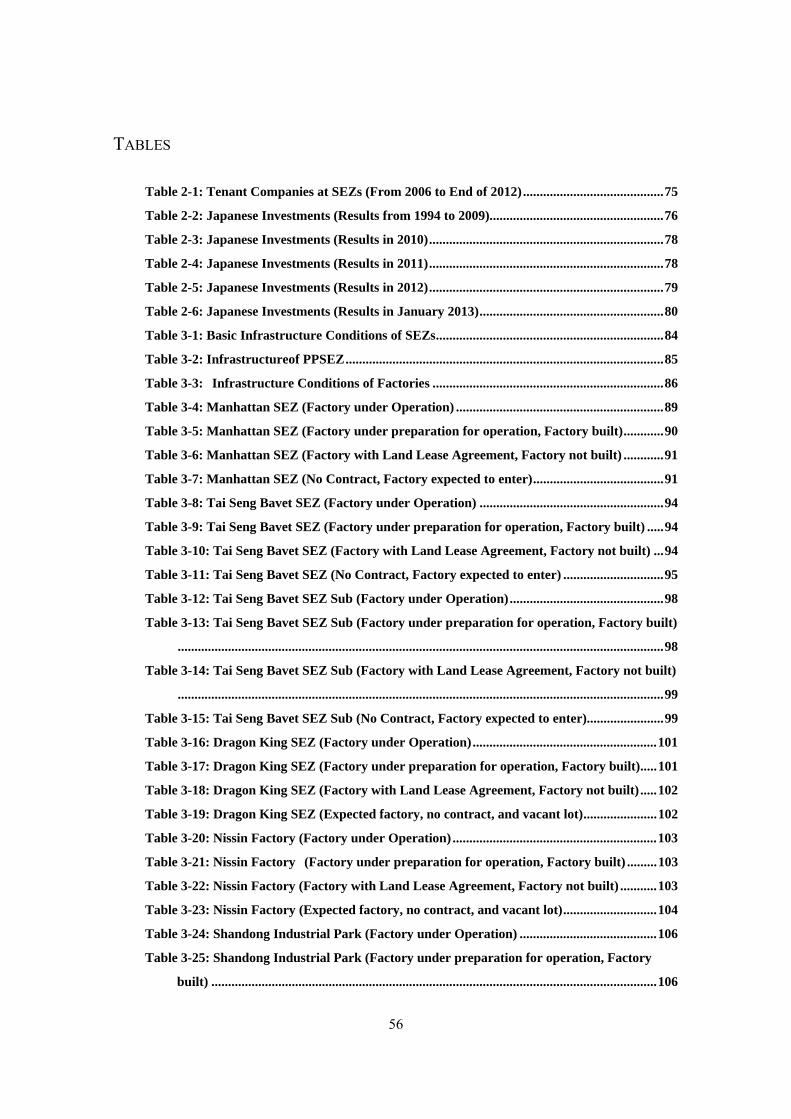
56
TABLES
Table 2-1: Tenant Companies at SEZs (From 2006 to End of 2012) .......................................... 75
Table 2-2: Japanese Investments (Results from 1994 to 2009).................................................... 76
Table 2-3: Japanese Investments (Results in 2010) ...................................................................... 78
Table 2-4: Japanese Investments (Results in 2011) ...................................................................... 78
Table 2-5: Japanese Investments (Results in 2012) ...................................................................... 79
Table 2-6: Japanese Investments (Results in January 2013) ....................................................... 80
Table 3-1: Basic Infrastructure Conditions of SEZs .................................................................... 84
Table 3-2: Infrastructureof PPSEZ ............................................................................................... 85
Table 3-3: Infrastructure Conditions of Factories ..................................................................... 86
Table 3-4: Manhattan SEZ (Factory under Operation) .............................................................. 89
Table 3-5: Manhattan SEZ (Factory under preparation for operation, Factory built) ............ 90
Table 3-6: Manhattan SEZ (Factory with Land Lease Agreement, Factory not built) ............ 91
Table 3-7: Manhattan SEZ (No Contract, Factory expected to enter) ....................................... 91
Table 3-8: Tai Seng Bavet SEZ (Factory under Operation) ....................................................... 94
Table 3-9: Tai Seng Bavet SEZ (Factory under preparation for operation, Factory built) ..... 94
Table 3-10: Tai Seng Bavet SEZ (Factory with Land Lease Agreement, Factory not built) ... 94
Table 3-11: Tai Seng Bavet SEZ (No Contract, Factory expected to enter) .............................. 95
Table 3-12: Tai Seng Bavet SEZ Sub (Factory under Operation) .............................................. 98
Table 3-13: Tai Seng Bavet SEZ Sub (Factory under preparation for operation, Factory built)
................................................................................................................................................. 98
Table 3-14: Tai Seng Bavet SEZ Sub (Factory with Land Lease Agreement, Factory not built)
................................................................................................................................................. 99
Table 3-15: Tai Seng Bavet SEZ Sub (No Contract, Factory expected to enter)....................... 99
Table 3-16: Dragon King SEZ (Factory under Operation) ....................................................... 101
Table 3-17: Dragon King SEZ (Factory under preparation for operation, Factory built) ..... 101
Table 3-18: Dragon King SEZ (Factory with Land Lease Agreement, Factory not built) ..... 102
Table 3-19: Dragon King SEZ (Expected factory, no contract, and vacant lot) ...................... 102
Table 3-20: Nissin Factory (Factory under Operation) ............................................................. 103
Table 3-21: Nissin Factory (Factory under preparation for operation, Factory built) ......... 103
Table 3-22: Nissin Factory (Factory with Land Lease Agreement, Factory not built) ........... 103
Table 3-23: Nissin Factory (Expected factory, no contract, and vacant lot) ............................ 104
Table 3-24: Shandong Industrial Park (Factory under Operation) ......................................... 106
Table 3-25: Shandong Industrial Park (Factory under preparation for operation, Factory
built) ..................................................................................................................................... 106
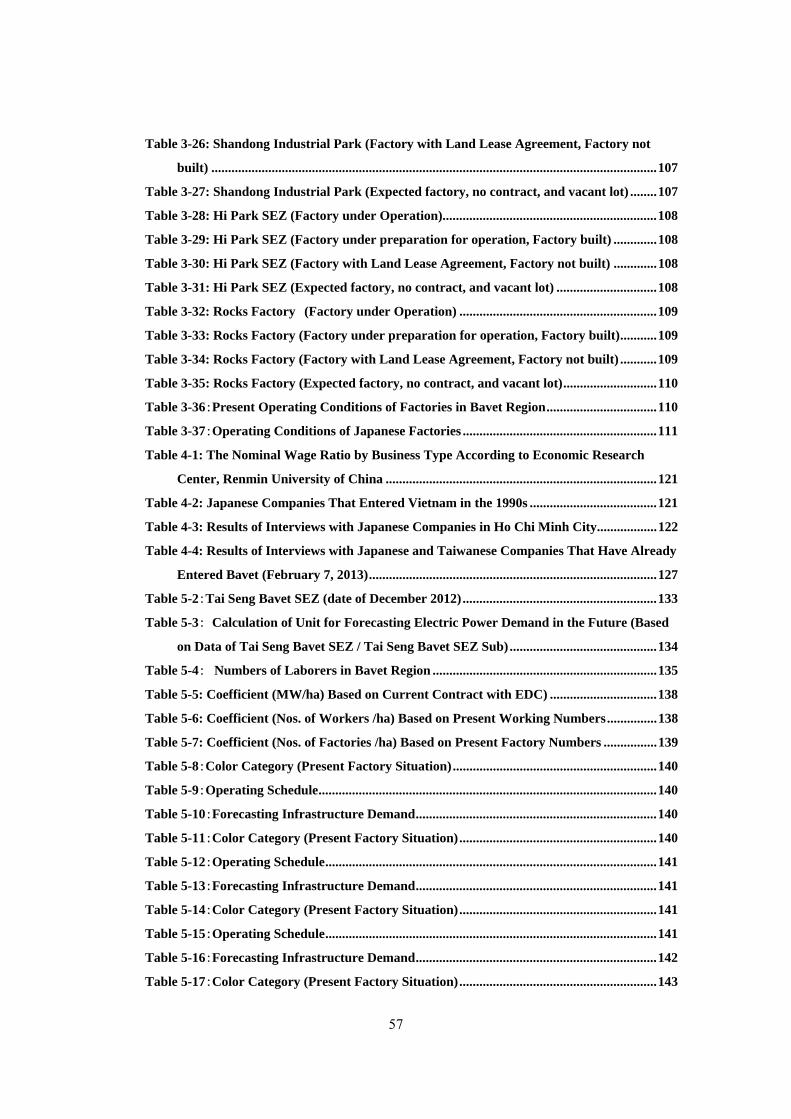
57
Table 3-26: Shandong Industrial Park (Factory with Land Lease Agreement, Factory not
built) ..................................................................................................................................... 107
Table 3-27: Shandong Industrial Park (Expected factory, no contract, and vacant lot) ........ 107
Table 3-28: Hi Park SEZ (Factory under Operation)................................................................ 108
Table 3-29: Hi Park SEZ (Factory under preparation for operation, Factory built) ............. 108
Table 3-30: Hi Park SEZ (Factory with Land Lease Agreement, Factory not built) ............. 108
Table 3-31: Hi Park SEZ (Expected factory, no contract, and vacant lot) .............................. 108
Table 3-32: Rocks Factory (Factory under Operation) ........................................................... 109
Table 3-33: Rocks Factory (Factory under preparation for operation, Factory built) ........... 109
Table 3-34: Rocks Factory (Factory with Land Lease Agreement, Factory not built) ........... 109
Table 3-35: Rocks Factory (Expected factory, no contract, and vacant lot) ............................ 110
Table 3-36:Present Operating Conditions of Factories in Bavet Region ................................. 110
Table 3-37:Operating Conditions of Japanese Factories .......................................................... 111
Table 4-1: The Nominal Wage Ratio by Business Type According to Economic Research
Center, Renmin University of China ................................................................................. 121
Table 4-2: Japanese Companies That Entered Vietnam in the 1990s ...................................... 121
Table 4-3: Results of Interviews with Japanese Companies in Ho Chi Minh City.................. 122
Table 4-4: Results of Interviews with Japanese and Taiwanese Companies That Have Already
Entered Bavet (February 7, 2013) ...................................................................................... 127
Table 5-2:Tai Seng Bavet SEZ (date of December 2012) .......................................................... 133
Table 5-3: Calculation of Unit for Forecasting Electric Power Demand in the Future (Based
on Data of Tai Seng Bavet SEZ / Tai Seng Bavet SEZ Sub) ............................................ 134
Table 5-4: Numbers of Laborers in Bavet Region ................................................................... 135
Table 5-5: Coefficient (MW/ha) Based on Current Contract with EDC) ................................ 138
Table 5-6: Coefficient (Nos. of Workers /ha) Based on Present Working Numbers ............... 138
Table 5-7: Coefficient (Nos. of Factories /ha) Based on Present Factory Numbers ................ 139
Table 5-8:Color Category (Present Factory Situation) ............................................................. 140
Table 5-9:Operating Schedule ..................................................................................................... 140
Table 5-10:Forecasting Infrastructure Demand ........................................................................ 140
Table 5-11:Color Category (Present Factory Situation) ........................................................... 140
Table 5-12:Operating Schedule ................................................................................................... 141
Table 5-13:Forecasting Infrastructure Demand ........................................................................ 141
Table 5-14:Color Category (Present Factory Situation) ........................................................... 141
Table 5-15:Operating Schedule ................................................................................................... 141
Table 5-16:Forecasting Infrastructure Demand ........................................................................ 142
Table 5-17:Color Category (Present Factory Situation) ........................................................... 143
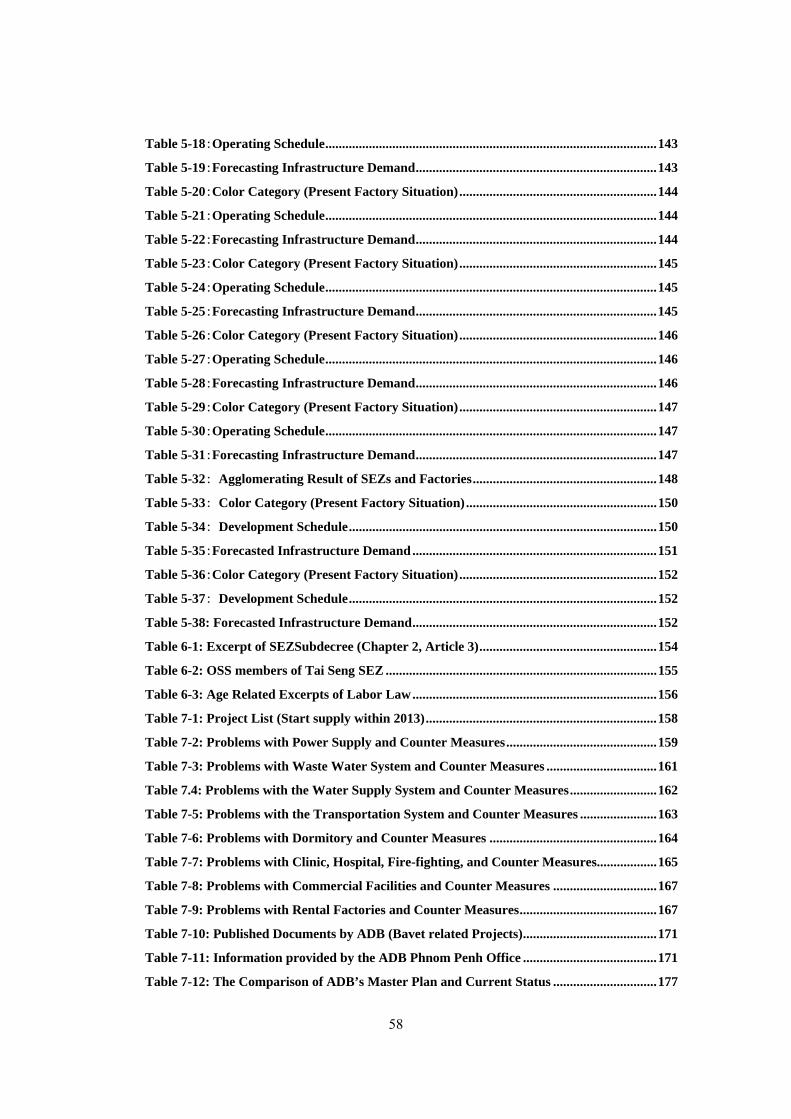
58
Table 5-18:Operating Schedule ................................................................................................... 143
Table 5-19:Forecasting Infrastructure Demand ........................................................................ 143
Table 5-20:Color Category (Present Factory Situation) ........................................................... 144
Table 5-21:Operating Schedule ................................................................................................... 144
Table 5-22:Forecasting Infrastructure Demand ........................................................................ 144
Table 5-23:Color Category (Present Factory Situation) ........................................................... 145
Table 5-24:Operating Schedule ................................................................................................... 145
Table 5-25:Forecasting Infrastructure Demand ........................................................................ 145
Table 5-26:Color Category (Present Factory Situation) ........................................................... 146
Table 5-27:Operating Schedule ................................................................................................... 146
Table 5-28:Forecasting Infrastructure Demand ........................................................................ 146
Table 5-29:Color Category (Present Factory Situation) ........................................................... 147
Table 5-30:Operating Schedule ................................................................................................... 147
Table 5-31:Forecasting Infrastructure Demand ........................................................................ 147
Table 5-32: Agglomerating Result of SEZs and Factories ....................................................... 148
Table 5-33: Color Category (Present Factory Situation) ......................................................... 150
Table 5-34: Development Schedule ............................................................................................ 150
Table 5-35:Forecasted Infrastructure Demand ......................................................................... 151
Table 5-36:Color Category (Present Factory Situation) ........................................................... 152
Table 5-37: Development Schedule ............................................................................................ 152
Table 5-38: Forecasted Infrastructure Demand ......................................................................... 152
Table 6-1: Excerpt of SEZSubdecree (Chapter 2, Article 3) ..................................................... 154
Table 6-2: OSS members of Tai Seng SEZ ................................................................................. 155
Table 6-3: Age Related Excerpts of Labor Law ......................................................................... 156
Table 7-1: Project List (Start supply within 2013) ..................................................................... 158
Table 7-2: Problems with Power Supply and Counter Measures ............................................. 159
Table 7-3: Problems with Waste Water System and Counter Measures ................................. 161
Table 7.4: Problems with the Water Supply System and Counter Measures .......................... 162
Table 7-5: Problems with the Transportation System and Counter Measures ....................... 163
Table 7-6: Problems with Dormitory and Counter Measures .................................................. 164
Table 7-7: Problems with Clinic, Hospital, Fire-fighting, and Counter Measures.................. 165
Table 7-8: Problems with Commercial Facilities and Counter Measures ............................... 167
Table 7-9: Problems with Rental Factories and Counter Measures ......................................... 167
Table 7-10: Published Documents by ADB (Bavet related Projects) ........................................ 171
Table 7-11: Information provided by the ADB Phnom Penh Office ........................................ 171
Table 7-12: The Comparison of ADB’s Master Plan and Current Status ............................... 177
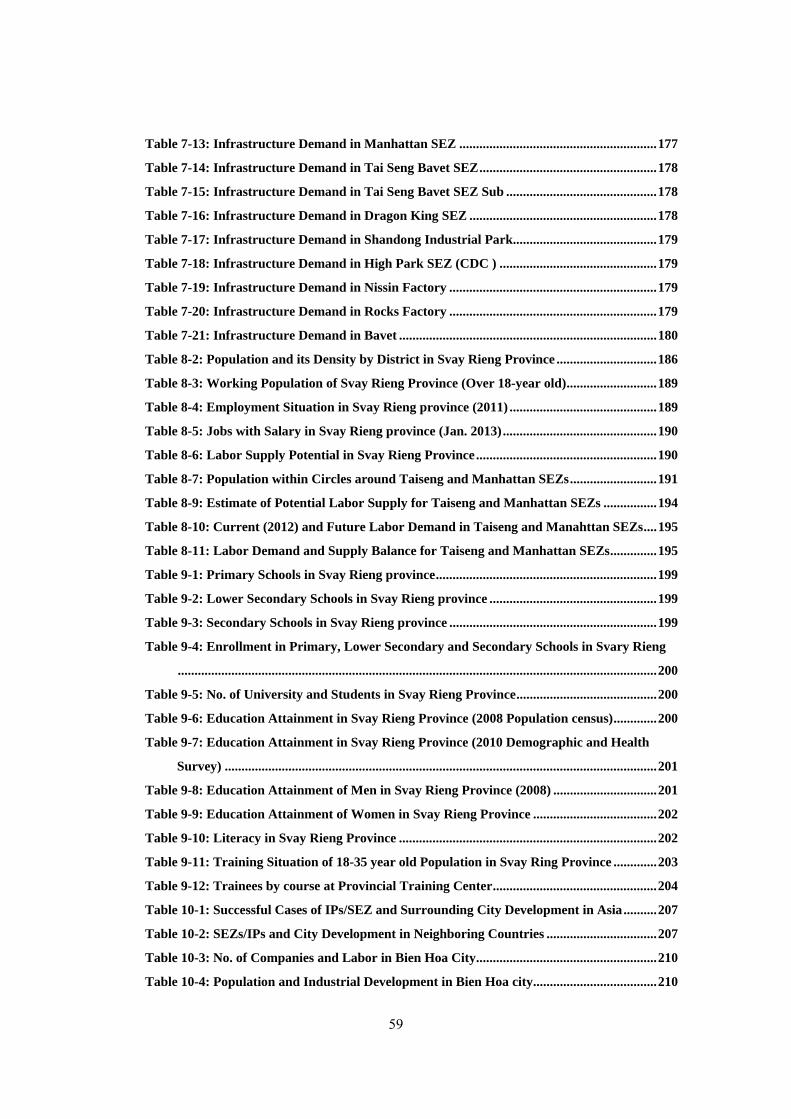
59
Table 7-13: Infrastructure Demand in Manhattan SEZ ........................................................... 177
Table 7-14: Infrastructure Demand in Tai Seng Bavet SEZ ..................................................... 178
Table 7-15: Infrastructure Demand in Tai Seng Bavet SEZ Sub ............................................. 178
Table 7-16: Infrastructure Demand in Dragon King SEZ ........................................................ 178
Table 7-17: Infrastructure Demand in Shandong Industrial Park........................................... 179
Table 7-18: Infrastructure Demand in High Park SEZ (CDC ) ............................................... 179
Table 7-19: Infrastructure Demand in Nissin Factory .............................................................. 179
Table 7-20: Infrastructure Demand in Rocks Factory .............................................................. 179
Table 7-21: Infrastructure Demand in Bavet ............................................................................. 180
Table 8-2: Population and its Density by District in Svay Rieng Province .............................. 186
Table 8-3: Working Population of Svay Rieng Province (Over 18-year old) ........................... 189
Table 8-4: Employment Situation in Svay Rieng province (2011) ............................................ 189
Table 8-5: Jobs with Salary in Svay Rieng province (Jan. 2013) .............................................. 190
Table 8-6: Labor Supply Potential in Svay Rieng Province ...................................................... 190
Table 8-7: Population within Circles around Taiseng and Manhattan SEZs .......................... 191
Table 8-9: Estimate of Potential Labor Supply for Taiseng and Manhattan SEZs ................ 194
Table 8-10: Current (2012) and Future Labor Demand in Taiseng and Manahttan SEZs .... 195
Table 8-11: Labor Demand and Supply Balance for Taiseng and Manhattan SEZs .............. 195
Table 9-1: Primary Schools in Svay Rieng province .................................................................. 199
Table 9-2: Lower Secondary Schools in Svay Rieng province .................................................. 199
Table 9-3: Secondary Schools in Svay Rieng province .............................................................. 199
Table 9-4: Enrollment in Primary, Lower Secondary and Secondary Schools in Svary Rieng
............................................................................................................................................... 200
Table 9-5: No. of University and Students in Svay Rieng Province .......................................... 200
Table 9-6: Education Attainment in Svay Rieng Province (2008 Population census) ............. 200
Table 9-7: Education Attainment in Svay Rieng Province (2010 Demographic and Health
Survey) ................................................................................................................................. 201
Table 9-8: Education Attainment of Men in Svay Rieng Province (2008) ............................... 201
Table 9-9: Education Attainment of Women in Svay Rieng Province ..................................... 202
Table 9-10: Literacy in Svay Rieng Province ............................................................................. 202
Table 9-11: Training Situation of 18-35 year old Population in Svay Ring Province ............. 203
Table 9-12: Trainees by course at Provincial Training Center ................................................. 204
Table 10-1: Successful Cases of IPs/SEZ and Surrounding City Development in Asia .......... 207
Table 10-2: SEZs/IPs and City Development in Neighboring Countries ................................. 207
Table 10-3: No. of Companies and Labor in Bien Hoa City ...................................................... 210
Table 10-4: Population and Industrial Development in Bien Hoa city ..................................... 210
60
Table 11-1: SWOT analysis .......................................................................................................... 212
Table 12-1: Projection of 2013-2015 Operational Factory Lot Areas ...................................... 217
Table 12-2: All the factory lots are put into operation .............................................................. 218
Table 12-3: Upper Scenario ......................................................................................................... 218
Table 12-4: Medium Scenario ...................................................................................................... 219
Table 12-5: Lower Scenario ......................................................................................................... 220
Table 12-6: 2013-2015Operational Factory Lot Area(Unit:ha) ........................................ 220
Table 12-7: Forecast of SEZ Area and Population in Bavet(2012-2030).......................... 222
Table 12-8: Forecast based on Medium scenario for Bavet(2012-2030) ........................... 225
61
FIGURES
Figure 1:Layout of SEZs and Factories in Bavet........................................................................... 7
Figure 2: Agglomerating Result of SEZs and Factories .............................................................. 16
Figure 3: Forecasted SEZ and Factories Growth (Scenario 1) ................................................... 19
Figure 2-1: Stages of Entry by Electrical and Electronics Companies by Technological and
Investment Levels .................................................................................................................. 70
Figure 2-2: Transportation Equipment Industry (Automobiles and Bicycles) in Thailand ..... 73
Figure 3-1:Layout of SEZs and Factories in Bavet ..................................................................... 83
Figure 3-2: Drawing of Development Plan (Manhattan SEZ) .................................................... 87
Figure 3-3: Present Development Condition (Manhattan SEZ) ................................................. 88
Figure 3-4: Drawing of Development Plan (Tai Seng Bavet SEZ) .............................................. 92
Figure 3-5: Present Operating Situation (Tai Seng Bavet SEZ) ................................................. 93
Figure 3-6: Drawing of Development Plan (Tai Seng Bavet SEZ Sub) ...................................... 96
Figure 3-7: Factory Operating Conditions (Tai Seng Bavet SEZ Sub) ...................................... 97
Figure 3-8: Drawing of Development Plan and Operating Condition (Dragon King SEZ) ... 100
Figure 3-9: Drawing of Development Plan (Shandong Industrial Park) ................................. 105
Figure 3-10: Factory Operating Conditions(Shandong Industrial Park) ............................... 105
Figure 4-1: Basic Monthly Wages of Workers (General Insutrial Labors) ............................. 112
Figure 4-2: Basic Monthly Wages of Workers (Key Technicians) ............................................ 113
Figure 4-3: Philips Curve (China) ............................................................................................... 114
Figure 4-4: Philips Curve (China) ............................................................................................... 115
Figure 4-5: Philips Curve (Thailand) .......................................................................................... 115
Figure 4-6: Impact Factors of the Chinese Yuan ....................................................................... 117
Figure 4-7: Impact Factors of the Vietnamese Dong ................................................................. 117
Figure 4-9: Nominal Wage Rate and Electricity Cost Rate Among Japanese Manufacturing
Sectors .................................................................................................................................. 120
Figure 5-1: Development Scenarios due to Occurrence of Agglomerating Effect ................... 132
Figure 5-2: Agglomerating Result of SEZs and Factories ......................................................... 148
Figure 5-3: Urban Growth (Scenario 1) ...................................................................................... 151
Figure 5-4: Urban Growth (Scenario 2) ...................................................................................... 153
Figure 7-1: Scenario Analysis for Future SEZ Based Development ......................................... 157
Figure 7-2: Transmission Line Plan ............................................................................................ 158
Figure 7-3: Transmission Line Plan(Phnom Penh -> Svy Reing, Vietnam -> Svy Reing) . 159
Figure 7-4: Medical facilities in Svay Rieng ............................................................................... 166
Figure 7-5: Joint Use of Dry port and Rental Factory ............................................................... 168
62
Figure 7-6: Joint Use of Dry port and Rental Factory ............................................................... 169
Figure 7-7: Master Plan (Road Cross Section Type) ................................................................. 170
Figure 7-8: Master Plan (Road Cross Section Type) ................................................................. 171
Figure 7-9: Bavet Road Master Plan ........................................................................................... 172
Figure 7-10: National Road No.1 Cross-Sectional View of Road Widening (Width 24.8m) .. 173
Figure 7-11: Land Use Plan of Bavet City .................................................................................. 173
Figure 7-12: Land Use Plan of Bavet City .................................................................................. 174
Figure 7-13: Master Plan of Bavet prepared by ADB ............................................................... 174
Figure 7-14: Land Use Zoning Plan ............................................................................................ 175
Figure 7-15: Land Use Zoning Plan ............................................................................................ 175
Figure 7-16: Master Plan of the Bavet Region Prepared by ADB ............................................ 176
Figure 7-17: SEZ Locations According to the Original Development Plan ............................. 176
Figure 7-18:Necessary Infrastructure Development in the Future .......................................... 181
Figure 8-1: Population Trend in Svay Rieng Province .............................................................. 185
Figure 8-2: Populaion Pyramid of Svay Rieng Province (2008) ................................................ 185
Figure 8-3: Administrative Map of Svay Rieng Province .......................................................... 186
Figure 8-4: Population Density Map of Svay Rieng Province ................................................... 187
Figure 8-5: Population of Bavet District ..................................................................................... 188
Figure 8-6: Employment Situation in Svay Rieng province (Total: 82.3%) ............................ 189
Figure 8-7: 0-40km area from Taiseng and Manhattan SEZs .................................................. 191
Figure 8-8: Map of Current Commutable Area (Yellow area: about 85,000ha) ..................... 194
Figure 8-9: Map of Current Commutable Area ......................................................................... 195
Figure 10-1: Map of Dong Nai Province ..................................................................................... 209
Figure 10-2: IPs concentrated in Bien Hoa City ......................................................................... 209
Figure 10-3: Amata Vietnam IP and Surrounding Area ........................................................... 211
Figure 12-1: SEZs Development Scenarios ................................................................................. 215
Figure 12-2: Development Scenarios due to Occurrence of Agglomerating Effect ................. 217
Figure 12-3: 2013-2015Operational Factory Lot Area(Unit:ha)Source: Study team ..... 221
Figure 12-4: Long term Forecast of SEZ Area in Bavet(2012-2030)(Unit:ha ) ............... 224
Figure 13-1:Project List ............................................................................................................... 227
Figure 14-1:Project List ............................................................................................................... 230
Appendix

63
64
1. BACKGROUND Since the end of the civil war, Cambodia has promoted reforms that would lead the nation towards
democracy and a market economy, achieving a steady economic growth over the past 10 years. Ag-
riculture, tourism, and a robust garment industry have been driving growth, but after the collapse of
Lehman Brothers in 2008, the Cambodian economy has been damaged by consumer demand down-
turn in Europe and the U.S., a decrease in tourist arrivals and garment exports, and the stagnation of
foreign direct investment (FDI).
In order to move away from an industrial structure dependent on the demand of specific foreign
markets, Cambodia has been aiming at the diversification of its industrial structure while activating
FDI, easing lack of domestic funds, increasing domestic productivity, promoting the transfer of
technology, and creating employment.
In addition to the internal conditions mentioned above, external conditions have become factors in
accelerating FDI in recent years. With the increase in labor costs in China, Thailand, and Vietnam,
labor shortages, the 2011 floods in Thailand, Cambodia has enhanced its presence as a candidate
country for secondary production of labor-intensive manufacturing industry.
On the other hand, an increasing number of Japanese SMEs consider overseas transfer of production
base and business expansion to capture the demand of emerging countries, particularly in Asia, due
to such recent conditions as the yen appreciation and high production costs. In particular, the
ASEAN countries as host countries are becoming a leading target as "China plus one".
From the standpoint of both the Japanese and Cambodian sides, Japanese companies are expected to
invest in Cambodia. However there are also challenges. Challenges for Cambodia are the fact that
the strategy of the Cambodian government to attract investment is not always clear. Cambodia has
not been able to boost the expansion of FDI by Japanese companies because industrial policy
(manufacturing in particular) which takes into consideration infrastructure, human resources, and
supply chain, and the direction of attracting FDI are unclear while there has been delays in develop-
ment of hard and soft infrastructure based on planning urban and regional development and indus-
trial location.
In addition, as the challenges of the Japanese side, small businesses do not have enough knowledge,
finance, human resources and know-how of international business, facing many problems in invest-
65
ing overseas, in Cambodia in particular. From this point of view, it should be necessary to assist
small and medium-sized businesses that seek overseas investments in order to do business with for-
eign countries. This need has been pointed out in the" Outline of support for overseas SMEs, " com-
piled by the Small Business Administration in June 2011.
The use of the “rental factory” has been popular among Japanese companies looking to expand into
the ASEAN countries, in order to reduce the initial cost in terms of risk mitigation. There is also in-
formation suggesting a supply shortage of rental facotries in Indonesia, Vietnam etc. In Cambodia,
the needs of factories (especially rental factories) and Special Economic Zones (SEZ) are expected
to increase, in order to expand business opportunities for small and medium-sized enterprises.
Furthermore, it is important to keep in mind the development infrastructure for power to promote the
production activities, water, waste disposal, drainage and the development of a city surrounding the
SEZ where companies are located, as well as the rental factories and SEZs. In particular, in order to
ensure a stable labor force and the development of comfortable living environment for expatriates
from Japan, who stay a long period of time, it is necessary to consider the development of commer-
cial facilities, transportation, education, medical care in the city, while keeping in mind a compre-
hensive development plan based on SEZ facility requirements.
Of the eight SEZs currently running in Cambodia, three SEZs are popular among Japanese compa-
nies, which are located in Bavet in Svay Rieng, near the Vietnam border, a strong willingness of
Japanese companies has been observed to expand further there, leading to the idea that the area
could be an area of industrial clusters. However, all necessary infrastructure systems - transporta-
tionelectric power supply, water, solid waste disposal, drainage, and sewerage networks, which are
just as much the basis of production activity as the housing inventory in the entire area surrounding
the production facilities, commercial facilities, transportation, and district facilities, education and
health institutions, culture and entertainment activities, have not been fully developed. Also, the
government of Cambodia shows a strong interest in the study of urban development plans aroundthe
production base, and consider measures to promote future industrial diversification and development
clusters, that will lead towards the continuous business expansion of Japanese companies active in
Svay Rieng Province.
66
2. ANALYSIS OF THE CURRENT STATE OF CAMBODIA'S IN-DUSTRIES AND MANUFACTURING BUSINESSES AND THEIR PROJECTIONS
2.1 The Current State of Cambodia's Industries
The economic census disclosed in 2011 describes the current state of Cambodia's industries, albeit in
simple terms. The main points can be summarized as follows.
In terms of the number of companies, retailers, wholesalers, and motorcycle repair shops account for
approximately 57%, manufacturing for approximately 15%, and hotels and restaurants for approxi-
mately 14%. Rice milling and sewing are the major players in manufacturing. In terms of the number
of companies newly established, retailers, wholesalers, and motorcycle repair shops account for ap-
proximately 58%, hotels and restaurants for approximately 17%, and manufacturing for approxi-
mately 12%. These are followed by information and communications, real estate and development,
hotels and restaurants, and entertainment, which are also showing growth.
In terms of the number of persons employed, retailers, wholesalers, and motorcycle repair shops ac-
count for approximately 33%, manufacturing for approximately 32%, and hotels and restaurants for
approximately 12%. In manufacturing, rice milling, sewing, shoe-making, sugar refining, and struc-
tural metal production account for a large portion.
In terms of location, approximately 20% of the companies and approximately 33% of all persons
employed are located in the capital of Phnom Penh. However, in terms of the number of companies
newly established, the northern region and the eastern border region show a striking growth.
In terms of annual sales, manufacturing accounts for approximately 48%, out of which sewing,
shoe-making, and plastic products (daily necessities) account for a large portion.
In terms of annual sales by region, Phnom Penh accounts for approximately 67% and Siem Reap for
approximately 23%. Combined, these two locations account for approximately 90% of the total.
The above information from the census shows that Cambodia's industries are characterized by la-
bor-intensive ones that involve simple assembly, comprising sewing, shoe-making, motorcycle re-
pair, and plastic products (daily necessities), and reveals that these businesses operate mostly in
Phnom Penh and Siem Reap. The trajectory of the country's industrial development can be deline-
ated with future censuses conducted on a regular basis. However, to promote the improvement of
existing industries and the development of new ones, subclassification using such [tools] as HS
67
codes will be even more helpful. For example, we cannot analyze the trends in the development of
parts supply industries using the current categorization that combines retailers, wholesalers, and
motorcycle repairs. This is because motorcycle repair businesses possess parts inventories. In the
future, it is possible that supporting industries would develop through in-house manufacturing of
parts.
To supplement the 2011 economic census, industrial products among exports show that the mainstay
sewn products account for approximately 60%, while shoes account for approximately 20%. Aside
from industrial products, the exports [include] rice, rubber, and marine products.
As you can see, Cambodia's industries mainly comprise sewing, shoe-making, and motorcycle repair,
businesses that also identify those of Myanmar and Laos as the last entrants of ASEAN. To promote
the improvement of existing industries and the development of new ones, technological transfer by
foreign capital is vital. This is true just by looking at the case of sewing businesses. In 2011, the av-
erage unit price for exports to the U.S. was $2.40/㎡ in Cambodia, while it was $10.50/㎡ in Mo-
rocco, more than four times greater. This is because while the former receives orders from the U.S.
for mainstay export products, the latter receives highly sophisticated orders that are based on dress
patterns for the Paris Collection. Moreover, in terms of shoes, in 2011, the average unit price for ex-
ports to the U.S. was $11.70/pair in Cambodia, while it was $78.80/pair in France, which is over six
times greater. To improve these existing industries, foreign companies that make orders to Cambo-
dian companies must realize that improvements are being made to the quality and quantity of the
products.
2-2. The Characteristics and Projections of Cambodia's Manufacturing Businesses, Which
Rely Largely on Foreign Capital
The following summarizes Cambodia's major manufacturing businesses (sewing, electrical and elec-
tronics, and machinery) and their projections.
(1) Sewing Industry
① Characteristics
The trade surplus posted by sewing businesses provides the resources to import other consum-
ables and industrial goods. In this regard, sewing is Cambodia's biggest industry that possesses
export competitiveness.
In Cambodia, there are no nationally run sewing companies. Moreover, local sewing companies
are weak, and the approval of wholly-owned foreign companies to enter the country's market
68
since 1994 has led to the dominance of foreign capital in the production and export of sewn
products.
The products are first characterized by the fact that they are largely knit. Knitting requires small
investment, and transportation costs are cheap as the raw materials are not bulky. Moreover,
knitting does not require a high level of skills as the laborers can catch up quickly to attain im-
provements in productivity. Usually, knit products (e.g., underwear, pajamas, nightwear, knit
shirts, children's socks, and babies' clothing) post approximately 10% higher productivity than
fabrics (e.g., work uniforms, business shirts, and suits). Similar to the situation in Cambodia is
Bangladesh, which boasts a large production scale. As in Cambodia, sewn products account for
a large portion of exports in Bangladesh. They are also similar in that they are mainstay
low-priced products. However, because Bangladesh has built its expertise in sewing businesses
for over a decade longer than Cambodia, the country is making a transition from knit products
to fabrics, which offer a high added value. As a result, the average unit price for exports to the
U.S. is KHR3.00/㎡, which is slightly higher than that of Cambodia.
Currently, approximately 80% and 15% of Cambodia's sewn products are exported to the U.S.
and the E.U., respectively. In recent years, Japanese companies have been entering the market
for fabrics in response to the rising labor costs in the neighboring countries.
The second characteristic of Cambodian products is that they first focus on the production of
undergarments, which are easy to produce and for which the quality standards are lax among
outer garments (e.g., uniforms, training wear, jackets, short jackets, pants, and skirts), interme-
diate garments (e.g., pajamas, T-shirts, dress shirts, and sweaters), and undergarments (under-
wear). They are followed in the order of intermediate garments and outer garments.
Exports comply with the ILO standards, making it possible to receive orders for large lots cov-
ering a small variety from the U.S. Exports to the E.U. are small lots covering a large variety.
Thus, they account for a small portion of total exports. In particular, exports to Japan can be
expanded, despite the stringent quality standards, in addition to orders for small lots covering a
large variety. This is because Japanese companies are accelerating their entry from such places
as China and Vietnam to Cambodia, where the labor cost is cheaper. The companies are also
making efforts to improve workers' sewing skills. In Cambodia, production for Japan has al-
ready begun for products that do not require a high level of skills, that maintain a steady level
of demand, and that do not vary in their patterns, such as overalls, uniforms, semi-business
shirts, business shirts, casual shirts, polo shirts, T-shirts, pants, and easy-order men's clothing.
Only a few short jackets and thick jeans are produced. This sets China and Vietnam apart from
Cambodia in terms of sewing technology.
② Projections
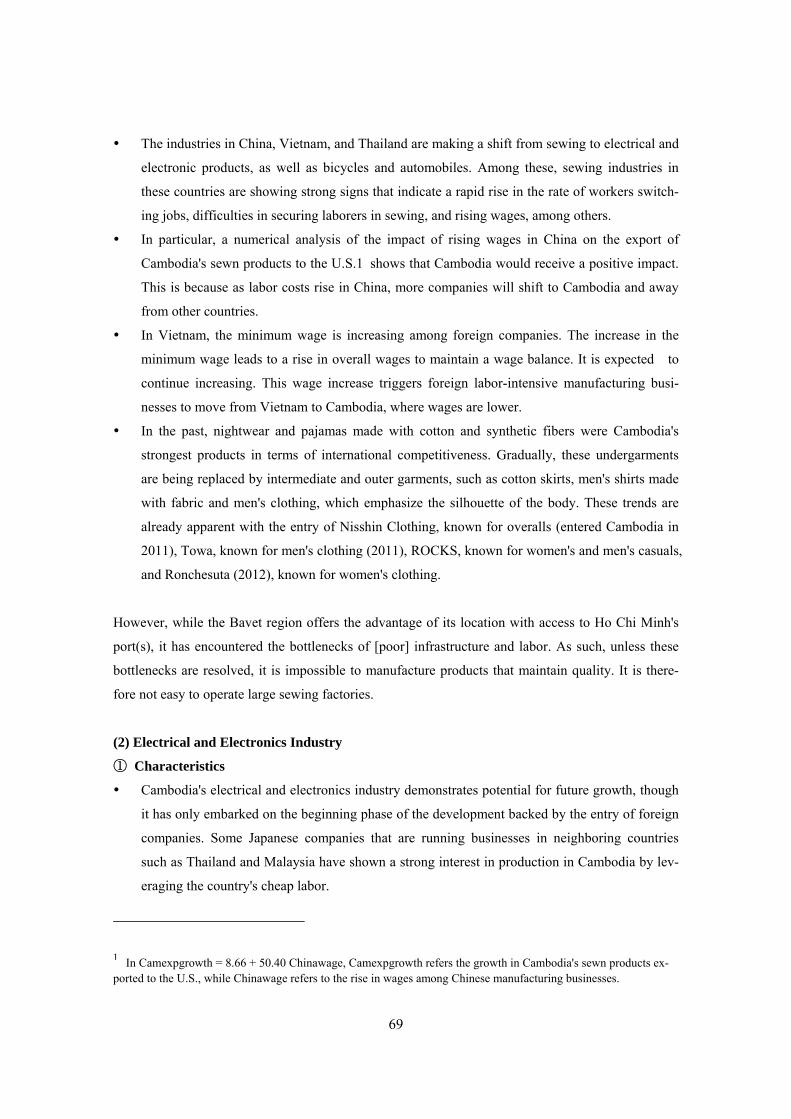
69
The industries in China, Vietnam, and Thailand are making a shift from sewing to electrical and
electronic products, as well as bicycles and automobiles. Among these, sewing industries in
these countries are showing strong signs that indicate a rapid rise in the rate of workers switch-
ing jobs, difficulties in securing laborers in sewing, and rising wages, among others.
In particular, a numerical analysis of the impact of rising wages in China on the export of
Cambodia's sewn products to the U.S.1 shows that Cambodia would receive a positive impact.
This is because as labor costs rise in China, more companies will shift to Cambodia and away
from other countries.
In Vietnam, the minimum wage is increasing among foreign companies. The increase in the
minimum wage leads to a rise in overall wages to maintain a wage balance. It is expected to
continue increasing. This wage increase triggers foreign labor-intensive manufacturing busi-
nesses to move from Vietnam to Cambodia, where wages are lower.
In the past, nightwear and pajamas made with cotton and synthetic fibers were Cambodia's
strongest products in terms of international competitiveness. Gradually, these undergarments
are being replaced by intermediate and outer garments, such as cotton skirts, men's shirts made
with fabric and men's clothing, which emphasize the silhouette of the body. These trends are
already apparent with the entry of Nisshin Clothing, known for overalls (entered Cambodia in
2011), Towa, known for men's clothing (2011), ROCKS, known for women's and men's casuals,
and Ronchesuta (2012), known for women's clothing.
However, while the Bavet region offers the advantage of its location with access to Ho Chi Minh's
port(s), it has encountered the bottlenecks of [poor] infrastructure and labor. As such, unless these
bottlenecks are resolved, it is impossible to manufacture products that maintain quality. It is there-
fore not easy to operate large sewing factories.
(2) Electrical and Electronics Industry
① Characteristics
Cambodia's electrical and electronics industry demonstrates potential for future growth, though
it has only embarked on the beginning phase of the development backed by the entry of foreign
companies. Some Japanese companies that are running businesses in neighboring countries
such as Thailand and Malaysia have shown a strong interest in production in Cambodia by lev-
eraging the country's cheap labor.
1 In Camexpgrowth = 8.66 + 50.40 Chinawage, Camexpgrowth refers the growth in Cambodia's sewn products ex-ported to the U.S., while Chinawage refers to the rise in wages among Chinese manufacturing businesses.
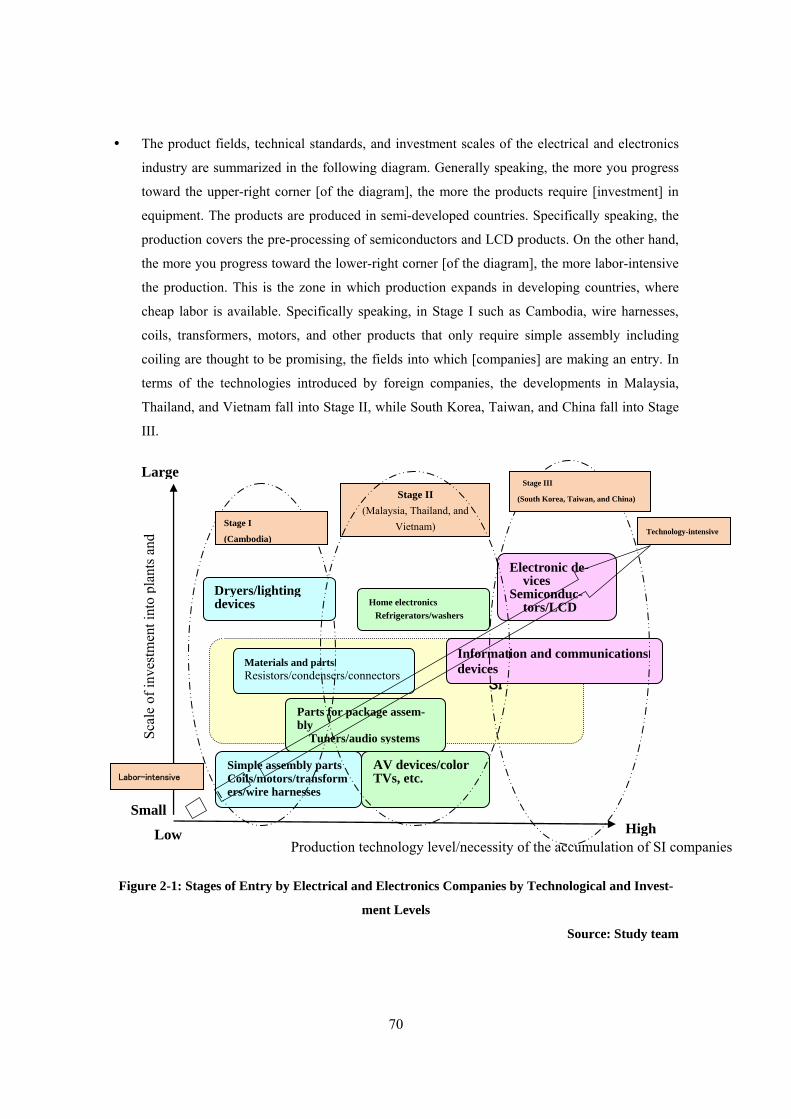
70
The product fields, technical standards, and investment scales of the electrical and electronics
industry are summarized in the following diagram. Generally speaking, the more you progress
toward the upper-right corner [of the diagram], the more the products require [investment] in
equipment. The products are produced in semi-developed countries. Specifically speaking, the
production covers the pre-processing of semiconductors and LCD products. On the other hand,
the more you progress toward the lower-right corner [of the diagram], the more labor-intensive
the production. This is the zone in which production expands in developing countries, where
cheap labor is available. Specifically speaking, in Stage I such as Cambodia, wire harnesses,
coils, transformers, motors, and other products that only require simple assembly including
coiling are thought to be promising, the fields into which [companies] are making an entry. In
terms of the technologies introduced by foreign companies, the developments in Malaysia,
Thailand, and Vietnam fall into Stage II, while South Korea, Taiwan, and China fall into Stage
III.
Figure 2-1: Stages of Entry by Electrical and Electronics Companies by Technological and Invest-
ment Levels
Source: Study team
AV devices/color TVs, etc.
Home electronics Refrigerators/washers
SI
Electronic de-vices
Semiconduc-tors/LCD
Simple assembly partsCoils/motors/transformers/wire harnesses
Materials and parts Resistors/condensers/connectors
Low High
Large
Small
Scal
e of
inve
stm
ent i
nto
plan
ts a
nd
Parts for package assem-bly
Tuners/audio systems
Information and communications devices
Production technology level/necessity of the accumulation of SI companies
Stage II (Malaysia, Thailand, and
Vietnam) Stage I
(Cambodia)
Stage III
(South Korea, Taiwan, and China)
Technology-intensive
Labor-intensive
Dryers/lighting devices
71
Cambodia's strengths lie in its location, as the parts produced in Cambodia can be supplied to
any destination hub of its neighboring countries. Meeting the delivery dates is important in re-
maining competitive in the electrical and electronics industry. Because Cambodia is adjacent to
Malaysia, which boasts a highly developed electrical and electronics industry, it has the poten-
tial to supply products in a shorter time frame than China once the logistics system is in place in
Cambodia.
Catalyzed by the entry of Minebea (small motors, entered in 2010), the Japanese electrical and
electronics companies that branched out into Cambodia include AsleElectronics (wire harnesses
for home electronics, 2011), MARUNIX (wire harnesses for home electronics, 2011),
DAIWA-ONKYO (mobile speakers, 2011), IZUMI DENSHI (aluminum frames for flat televi-
sions, 2011), and Tokyo Parts (coils and transformers, 2012). These industries have entered
Stage I of the above diagram.
② Projections
In terms of the potential for Japanese companies to enter Cambodia, the following three patterns can
be projected based on an analysis of the basic locational requirements for the electrical and electron-
ics industry, policies on the division of production within ASEAN among Japanese companies in
Thailand, and the current trends in the entry to Vietnam among electrical and electronics companies,
etc.
(i) Assembly process of wire harnesses: Wire harnesses are electrical wire parts that connect electri-
cal components in automobiles and circuits and parts within electrical and electronic devices. As
such, they require small production runs of a large variety of items. The process is extremely labor
intensive, as it is difficult to automate the process of bundling various types (e.g., length, thickness)
of cables. A shortage of production capabilities for harnesses is projected to occur in the ASEAN
region. For this reason, Japanese companies, while focusing on Thailand and Vietnam, are looking to
expand their production bases to Cambodia and the neighboring countries. In addition to Japanese
companies, Thai companies are also looking to enter the industrial complexes within the borders of
Cambodia.
(ii) Assembly process of coils and transformers: Electrical and electronic products use many parts
produced in various coiling processes, such as coils, transformers, filters, converters, and vibrating
motors. Their demand is expanding further. The coiling process could possibly be automated. How-
ever, if low-wage workers with dexterity can be secured, it would be most advantageous cost-wise to
conduct an assembly that places coiling machines side by side with operators. As such, among Japa-
72
nese companies in ASEAN and China, there are those that are entering Cambodia based on the as-
sumption that there is a stable supply of electricity.
(iii) Assembly of small electrical products: As for relatively small electrical products such as hair-
dryers and other personal products and lighting equipment, Japanese and local companies in Thai-
land are looking to make products in countries with the cheapest possible labor. As this requires
processing of metal and plastic parts, investment in manufacturing equipment such as presses and
mold injectors is necessary. Moreover, a stable and reliable supply of electricity is necessary for a
stable operation. Therefore, the entry of foreign companies to this field is contingent upon the
preparation of industrial complexes with export processing capabilities that come with electrical fa-
cilities, etc., and container transportation capabilities. Over the long term, it is also contingent upon
whether SI companies can be opened in the surrounding areas. As such, eyes are set on Cambodia as
potential site for investment over the medium term once the infrastructure is in place in the country.
However, while the Bavet region offers the advantage of its location with access to Ho Chi Minh
City's port(s), it has encountered the bottlenecks of [poor] infrastructure and labor. As such, unless
these bottlenecks are resolved, it is impossible to manufacture products that maintain quality. It is
therefore not easy to operate electrical and electronics factories.
(3) Machinery
① Characteristics
In terms of machinery, Cambodia has relied on imports. In turn, galvanized steel plates and motor-
cycles have been substituted by Japanese companies. According to Thailand Automotive Institute, as
shown in the diagram below, sixteen automobile manufacturers and five motorcycle manufacturers
currently have production bases in Thailand. All of these are foreign companies. Beneath these as-
semblers are 800 parts manufacturers as primary subcontractors (Tier 1). Moreover, there are 1,500
or fewer local Thai companies as secondary and tertiary subcontractors (Tier 2 and 3)2.
2 Revision of JETRO, "East Asia Economic Integration and the Roles of JETRO," June 2006 (original source: Thai
Automotive Institute)to reflect the conditions in 2010.
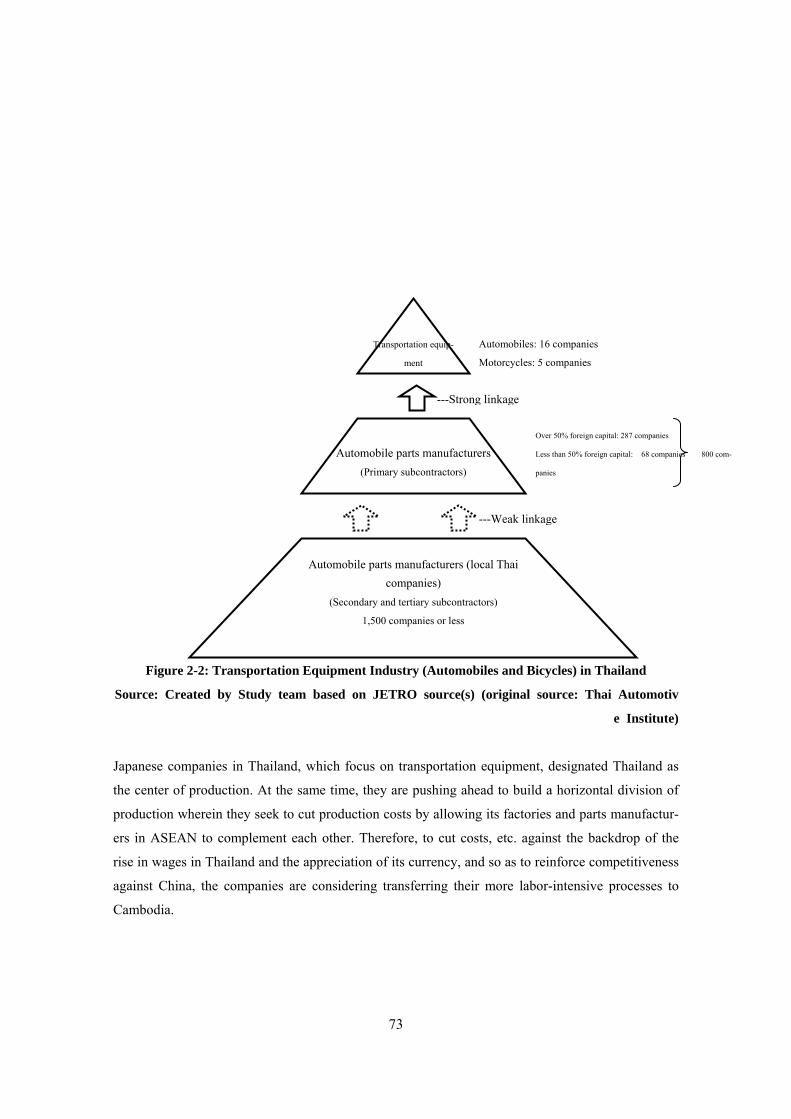
73
Figure 2-2: Transportation Equipment Industry (Automobiles and Bicycles) in Thailand
Source: Created by Study team based on JETRO source(s) (original source: Thai Automotiv
e Institute)
Japanese companies in Thailand, which focus on transportation equipment, designated Thailand as
the center of production. At the same time, they are pushing ahead to build a horizontal division of
production wherein they seek to cut production costs by allowing its factories and parts manufactur-
ers in ASEAN to complement each other. Therefore, to cut costs, etc. against the backdrop of the
rise in wages in Thailand and the appreciation of its currency, and so as to reinforce competitiveness
against China, the companies are considering transferring their more labor-intensive processes to
Cambodia.
Automobiles: 16 companies
Motorcycles: 5 companies
Transportation equip-
ment
Automobile parts manufacturers
(Primary subcontractors)
Over 50% foreign capital: 287 companies
Less than 50% foreign capital: 68 companies 800 com-
panies
Automobile parts manufacturers (local Thai companies)
(Secondary and tertiary subcontractors)
1,500 companies or less
---Strong linkage
---Weak linkage
74
In response to the development of AFTA, Thailand's automobile industry is implementing a phased
tariff reduction within ASEAN. By 2014, tariff on all products will be eliminated. Thus, trade within
the region is expected to rise sharply.
Against this backdrop, labor-intensive parts for automobile manufacturers in Thailand, such as
automobile wire harnesses (Sumitomo Wiring Systems in 2011 and G.S. Eletech in 2012), automo-
bile emblems (Marusan Plastic in 2012), and automobile air conditioner parts (Denso in 2013) [are
now being manufactured] in Cambodia.
② Projections
The fields that show promise in machinery include surface treatments in post-processing (plating,
painting, and high-frequency), and assembly and wiring (print circuit processing, parts assembly,
and mounting), all in the category of precision machinery. Moreover, in automobile parts, the prom-
ising fields include chassis and automobile body parts (e.g., fuel tanks, exhaust pipes, mufflers,
window frames, seats, and air bags) and electrical parts and others (e.g., switches, meters, wipers,
alarms, and heaters) However, [the success] all depends on securing electricity, waterworks and
other industrial infrastructure, as well as labor. Therefore, in today's Bavet region, operation of ma-
chinery factories is not necessarily easy unless the bottlenecks are resolved.
2-3. Characteristics of Companies Entering Cambodia (Investing Country, Business Type, and
Location)
Although comprehensive statistics have not been disclosed, according to CSEZB sources (from 2006
to the end of 2012), the characteristics of the tenant companies in each SEZ can be summarized as
follows.
Increased rapidly from 2008. In 2012, there were 43 companies, reaching $320 million.
Companies include those from Japan, Thailand, South Korea, Malaysia, and Singapore.
The business include not just the traditional industries of shoes and pouches, but also electrical
and electronic parts, motorcycle parts, and labor-intensive electrical and electronic parts such as
automobiles and plastics. They are diverse, including labor-intensive machine parts. In the
Bavet region under review, there is a trend among foreign companies [specializing in] bolt nuts,
plastics, coils and transformers, electrical locks, and clock parts.
As for the SEZs, Phnom Penh, fully equipped with infrastructure, boasts the largest scale in
terms of both the number of tenant companies and the investment amount. This is followed by
Manhattan SEZ in the Bavet region by the Vietnam border (eastern region), Tai Seng SEZ, and
Dragon King SEZ. These feature good access to the port(s) in southern Vietnam. Combined,
these three SEZs rival Phnom Penh SEZ in terms of the number of tenant companies. The total
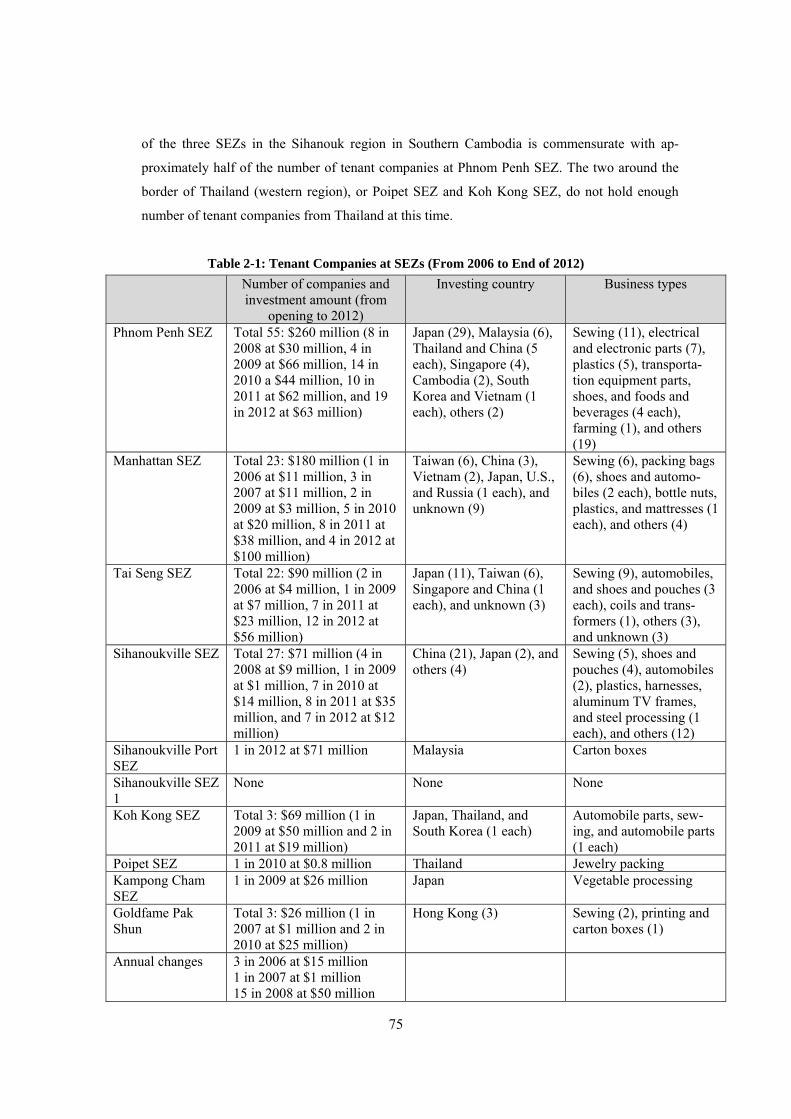
75
of the three SEZs in the Sihanouk region in Southern Cambodia is commensurate with ap-
proximately half of the number of tenant companies at Phnom Penh SEZ. The two around the
border of Thailand (western region), or Poipet SEZ and Koh Kong SEZ, do not hold enough
number of tenant companies from Thailand at this time.
Table 2-1: Tenant Companies at SEZs (From 2006 to End of 2012) Number of companies and
investment amount (from opening to 2012)
Investing country Business types
Phnom Penh SEZ Total 55: $260 million (8 in 2008 at $30 million, 4 in 2009 at $66 million, 14 in 2010 a $44 million, 10 in 2011 at $62 million, and 19 in 2012 at $63 million)
Japan (29), Malaysia (6), Thailand and China (5 each), Singapore (4), Cambodia (2), South Korea and Vietnam (1 each), others (2)
Sewing (11), electrical and electronic parts (7), plastics (5), transporta-tion equipment parts, shoes, and foods and beverages (4 each), farming (1), and others (19)
Manhattan SEZ Total 23: $180 million (1 in 2006 at $11 million, 3 in 2007 at $11 million, 2 in 2009 at $3 million, 5 in 2010 at $20 million, 8 in 2011 at $38 million, and 4 in 2012 at $100 million)
Taiwan (6), China (3), Vietnam (2), Japan, U.S., and Russia (1 each), and unknown (9)
Sewing (6), packing bags (6), shoes and automo-biles (2 each), bottle nuts, plastics, and mattresses (1 each), and others (4)
Tai Seng SEZ Total 22: $90 million (2 in 2006 at $4 million, 1 in 2009 at $7 million, 7 in 2011 at $23 million, 12 in 2012 at $56 million)
Japan (11), Taiwan (6), Singapore and China (1 each), and unknown (3)
Sewing (9), automobiles, and shoes and pouches (3 each), coils and trans-formers (1), others (3), and unknown (3)
Sihanoukville SEZ Total 27: $71 million (4 in 2008 at $9 million, 1 in 2009 at $1 million, 7 in 2010 at $14 million, 8 in 2011 at $35 million, and 7 in 2012 at $12 million)
China (21), Japan (2), and others (4)
Sewing (5), shoes and pouches (4), automobiles (2), plastics, harnesses, aluminum TV frames, and steel processing (1 each), and others (12)
Sihanoukville Port SEZ
1 in 2012 at $71 million
Malaysia Carton boxes
Sihanoukville SEZ 1
None None None
Koh Kong SEZ Total 3: $69 million (1 in 2009 at $50 million and 2 in 2011 at $19 million)
Japan, Thailand, and South Korea (1 each)
Automobile parts, sew-ing, and automobile parts (1 each)
Poipet SEZ 1 in 2010 at $0.8 million Thailand Jewelry packing Kampong Cham SEZ
1 in 2009 at $26 million Japan Vegetable processing
Goldfame Pak Shun
Total 3: $26 million (1 in 2007 at $1 million and 2 in 2010 at $25 million)
Hong Kong (3) Sewing (2), printing and carton boxes (1)
Annual changes 3 in 2006 at $15 million 1 in 2007 at $1 million 15 in 2008 at $50 million
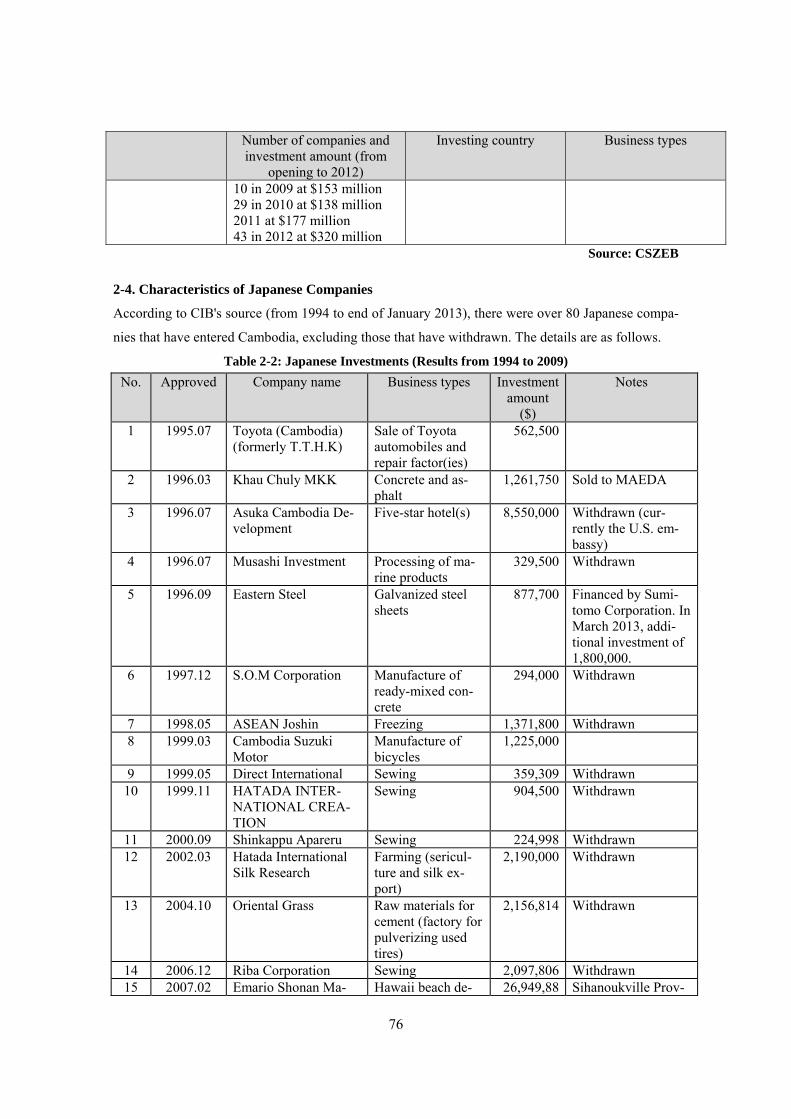
76
Number of companies and investment amount (from
opening to 2012)
Investing country Business types
10 in 2009 at $153 million 29 in 2010 at $138 million 2011 at $177 million 43 in 2012 at $320 million
Source: CSZEB 2-4. Characteristics of Japanese Companies
According to CIB's source (from 1994 to end of January 2013), there were over 80 Japanese compa-
nies that have entered Cambodia, excluding those that have withdrawn. The details are as follows.
Table 2-2: Japanese Investments (Results from 1994 to 2009) No. Approved Company name Business types Investment
amount ($)
Notes
1 1995.07 Toyota (Cambodia) (formerly T.T.H.K)
Sale of Toyota automobiles and repair factor(ies)
562,500
2 1996.03 Khau Chuly MKK Concrete and as-phalt
1,261,750 Sold to MAEDA
3 1996.07 Asuka Cambodia De-velopment
Five-star hotel(s) 8,550,000 Withdrawn (cur-rently the U.S. em-bassy)
4 1996.07 Musashi Investment Processing of ma-rine products
329,500 Withdrawn
5 1996.09 Eastern Steel Galvanized steel sheets
877,700 Financed by Sumi-tomo Corporation. In March 2013, addi-tional investment of 1,800,000.
6 1997.12 S.O.M Corporation Manufacture of ready-mixed con-crete
294,000 Withdrawn
7 1998.05 ASEAN Joshin Freezing 1,371,800 Withdrawn 8 1999.03 Cambodia Suzuki
Motor Manufacture of bicycles
1,225,000
9 1999.05 Direct International Sewing 359,309 Withdrawn 10 1999.11 HATADA INTER-
NATIONAL CREA-TION
Sewing 904,500 Withdrawn
11 2000.09 Shinkappu Apareru Sewing 224,998 Withdrawn 12 2002.03 Hatada International
Silk Research Farming (sericul-ture and silk ex-port)
2,190,000 Withdrawn
13 2004.10 Oriental Grass Raw materials for cement (factory for pulverizing used tires)
2,156,814 Withdrawn
14 2006.12 Riba Corporation Sewing 2,097,806 Withdrawn 15 2007.02 Emario Shonan Ma- Hawaii beach de- 26,949,88 Sihanoukville Prov-
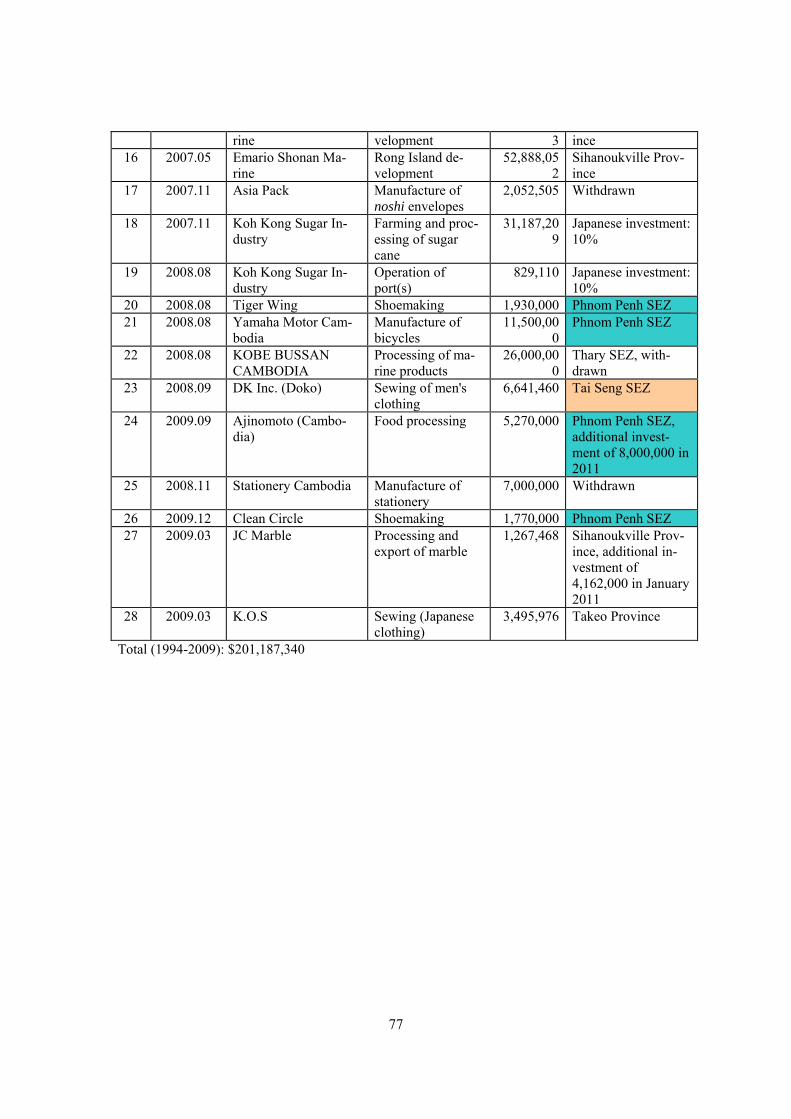
77
rine velopment 3 ince 16 2007.05 Emario Shonan Ma-
rine Rong Island de-velopment
52,888,052
Sihanoukville Prov-ince
17 2007.11 Asia Pack Manufacture of noshi envelopes
2,052,505 Withdrawn
18 2007.11 Koh Kong Sugar In-dustry
Farming and proc-essing of sugar cane
31,187,209
Japanese investment: 10%
19 2008.08 Koh Kong Sugar In-dustry
Operation of port(s)
829,110 Japanese investment: 10%
20 2008.08 Tiger Wing Shoemaking 1,930,000 Phnom Penh SEZ 21 2008.08 Yamaha Motor Cam-
bodia Manufacture of bicycles
11,500,000
Phnom Penh SEZ
22 2008.08 KOBE BUSSAN CAMBODIA
Processing of ma-rine products
26,000,000
Thary SEZ, with-drawn
23 2008.09 DK Inc. (Doko) Sewing of men's clothing
6,641,460 Tai Seng SEZ
24 2009.09 Ajinomoto (Cambo-dia)
Food processing 5,270,000 Phnom Penh SEZ, additional invest-ment of 8,000,000 in 2011
25 2008.11 Stationery Cambodia Manufacture of stationery
7,000,000 Withdrawn
26 2009.12 Clean Circle Shoemaking 1,770,000 Phnom Penh SEZ 27 2009.03 JC Marble Processing and
export of marble 1,267,468 Sihanoukville Prov-
ince, additional in-vestment of 4,162,000 in January 2011
28 2009.03 K.O.S Sewing (Japanese clothing)
3,495,976 Takeo Province
Total (1994-2009): $201,187,340
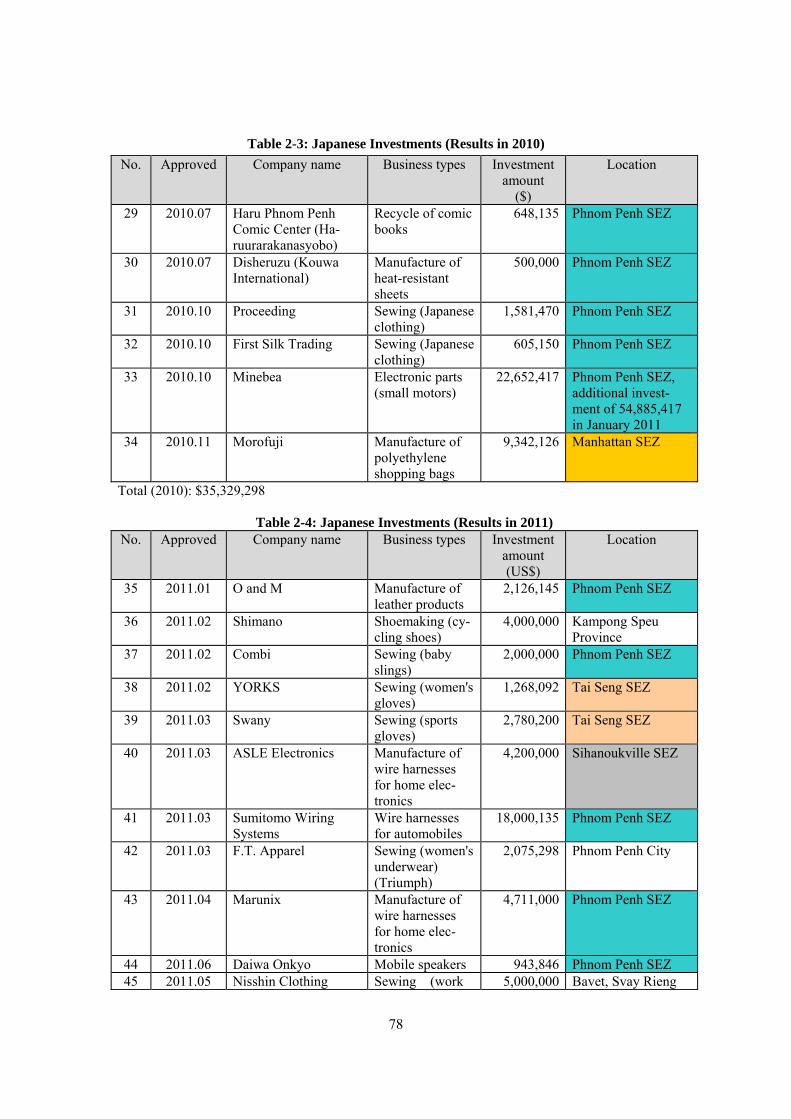
78
Table 2-3: Japanese Investments (Results in 2010) No. Approved Company name Business types Investment
amount ($)
Location
29 2010.07 Haru Phnom Penh Comic Center (Ha-ruurarakanasyobo)
Recycle of comic books
648,135 Phnom Penh SEZ
30 2010.07 Disheruzu (Kouwa International)
Manufacture of heat-resistant sheets
500,000 Phnom Penh SEZ
31 2010.10 Proceeding Sewing (Japanese clothing)
1,581,470 Phnom Penh SEZ
32 2010.10 First Silk Trading Sewing (Japanese clothing)
605,150 Phnom Penh SEZ
33 2010.10 Minebea Electronic parts (small motors)
22,652,417 Phnom Penh SEZ, additional invest-ment of 54,885,417 in January 2011
34 2010.11 Morofuji Manufacture of polyethylene shopping bags
9,342,126 Manhattan SEZ
Total (2010): $35,329,298
Table 2-4: Japanese Investments (Results in 2011) No. Approved Company name Business types Investment
amount (US$)
Location
35 2011.01 O and M Manufacture of leather products
2,126,145 Phnom Penh SEZ
36 2011.02 Shimano Shoemaking (cy-cling shoes)
4,000,000 Kampong Speu Province
37 2011.02 Combi Sewing (baby slings)
2,000,000 Phnom Penh SEZ
38 2011.02 YORKS Sewing (women's gloves)
1,268,092 Tai Seng SEZ
39 2011.03 Swany Sewing (sports gloves)
2,780,200 Tai Seng SEZ
40 2011.03 ASLE Electronics Manufacture of wire harnesses for home elec-tronics
4,200,000 Sihanoukville SEZ
41 2011.03 Sumitomo Wiring Systems
Wire harnesses for automobiles
18,000,135 Phnom Penh SEZ
42 2011.03 F.T. Apparel Sewing (women's underwear) (Triumph)
2,075,298 Phnom Penh City
43 2011.04 Marunix Manufacture of wire harnesses for home elec-tronics
4,711,000 Phnom Penh SEZ
44 2011.06 Daiwa Onkyo Mobile speakers 943,846 Phnom Penh SEZ 45 2011.05 Nisshin Clothing Sewing (work 5,000,000 Bavet, Svay Rieng
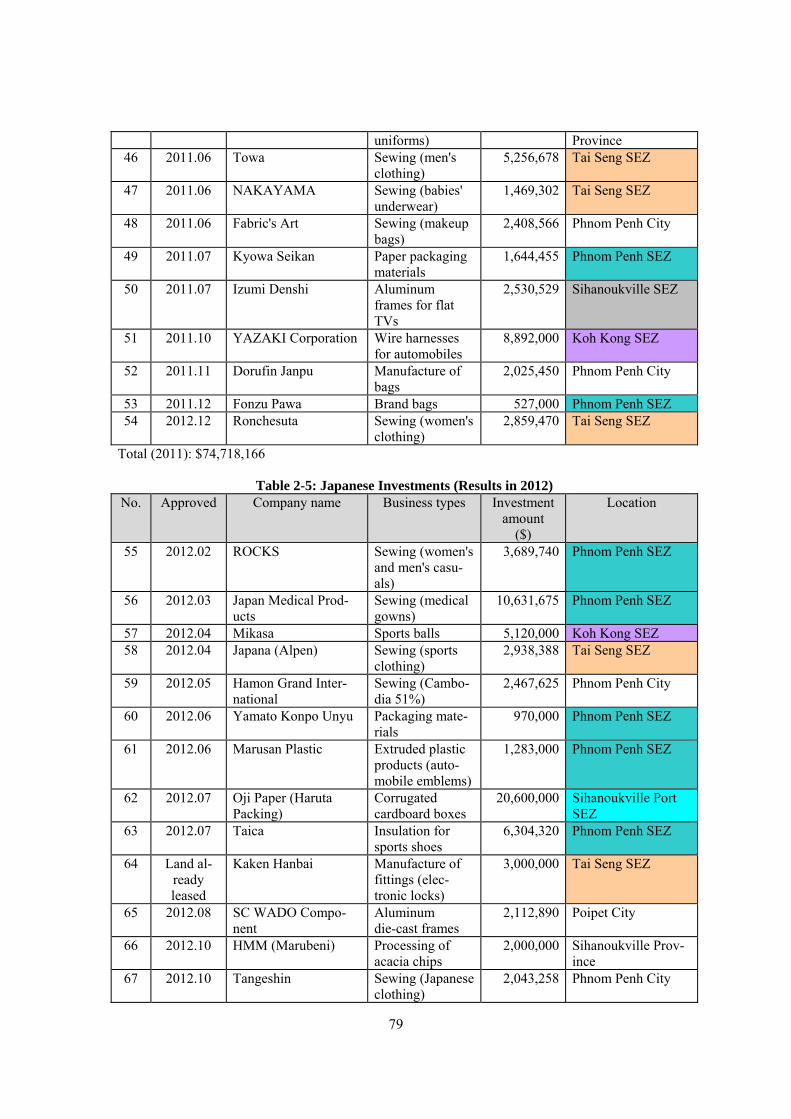
79
uniforms) Province 46 2011.06 Towa Sewing (men's
clothing) 5,256,678 Tai Seng SEZ
47 2011.06 NAKAYAMA Sewing (babies' underwear)
1,469,302 Tai Seng SEZ
48 2011.06 Fabric's Art Sewing (makeup bags)
2,408,566 Phnom Penh City
49 2011.07 Kyowa Seikan Paper packaging materials
1,644,455 Phnom Penh SEZ
50 2011.07 Izumi Denshi Aluminum frames for flat TVs
2,530,529 Sihanoukville SEZ
51 2011.10 YAZAKI Corporation Wire harnesses for automobiles
8,892,000 Koh Kong SEZ
52 2011.11 Dorufin Janpu Manufacture of bags
2,025,450 Phnom Penh City
53 2011.12 Fonzu Pawa Brand bags 527,000 Phnom Penh SEZ 54 2012.12 Ronchesuta Sewing (women's
clothing) 2,859,470 Tai Seng SEZ
Total (2011): $74,718,166
Table 2-5: Japanese Investments (Results in 2012) No. Approved Company name Business types Investment
amount ($)
Location
55 2012.02 ROCKS Sewing (women's and men's casu-als)
3,689,740 Phnom Penh SEZ
56 2012.03 Japan Medical Prod-ucts
Sewing (medical gowns)
10,631,675 Phnom Penh SEZ
57 2012.04 Mikasa Sports balls 5,120,000 Koh Kong SEZ 58 2012.04 Japana (Alpen) Sewing (sports
clothing) 2,938,388 Tai Seng SEZ
59 2012.05 Hamon Grand Inter-national
Sewing (Cambo-dia 51%)
2,467,625 Phnom Penh City
60 2012.06 Yamato Konpo Unyu Packaging mate-rials
970,000 Phnom Penh SEZ
61 2012.06 Marusan Plastic Extruded plastic products (auto-mobile emblems)
1,283,000 Phnom Penh SEZ
62 2012.07 Oji Paper (Haruta Packing)
Corrugated cardboard boxes
20,600,000 Sihanoukville Port SEZ
63 2012.07 Taica Insulation for sports shoes
6,304,320 Phnom Penh SEZ
64 Land al-ready leased
Kaken Hanbai Manufacture of fittings (elec-tronic locks)
3,000,000 Tai Seng SEZ
65 2012.08 SC WADO Compo-nent
Aluminum die-cast frames
2,112,890 Poipet City
66 2012.10 HMM (Marubeni) Processing of acacia chips
2,000,000 Sihanoukville Prov-ince
67 2012.10 Tangeshin Sewing (Japanese clothing)
2,043,258 Phnom Penh City
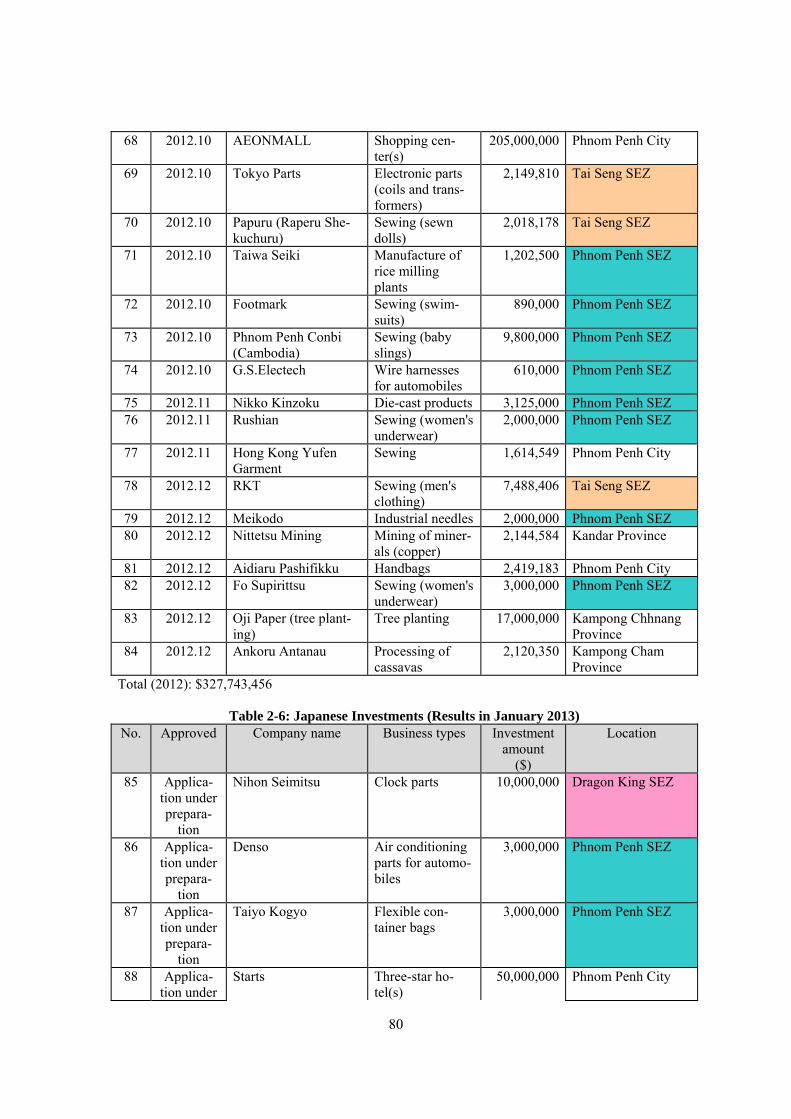
80
68 2012.10 AEONMALL Shopping cen-ter(s)
205,000,000 Phnom Penh City
69 2012.10 Tokyo Parts Electronic parts (coils and trans-formers)
2,149,810 Tai Seng SEZ
70 2012.10 Papuru (Raperu She-kuchuru)
Sewing (sewn dolls)
2,018,178 Tai Seng SEZ
71 2012.10 Taiwa Seiki Manufacture of rice milling plants
1,202,500 Phnom Penh SEZ
72 2012.10 Footmark Sewing (swim-suits)
890,000 Phnom Penh SEZ
73 2012.10 Phnom Penh Conbi (Cambodia)
Sewing (baby slings)
9,800,000 Phnom Penh SEZ
74 2012.10 G.S.Electech Wire harnesses for automobiles
610,000 Phnom Penh SEZ
75 2012.11 Nikko Kinzoku Die-cast products 3,125,000 Phnom Penh SEZ 76 2012.11 Rushian Sewing (women's
underwear) 2,000,000 Phnom Penh SEZ
77 2012.11 Hong Kong Yufen Garment
Sewing 1,614,549 Phnom Penh City
78 2012.12 RKT Sewing (men's clothing)
7,488,406 Tai Seng SEZ
79 2012.12 Meikodo Industrial needles 2,000,000 Phnom Penh SEZ 80 2012.12 Nittetsu Mining Mining of miner-
als (copper) 2,144,584 Kandar Province
81 2012.12 Aidiaru Pashifikku Handbags 2,419,183 Phnom Penh City 82 2012.12 Fo Supirittsu Sewing (women's
underwear) 3,000,000 Phnom Penh SEZ
83 2012.12 Oji Paper (tree plant-ing)
Tree planting 17,000,000 Kampong Chhnang Province
84 2012.12 Ankoru Antanau Processing of cassavas
2,120,350 Kampong Cham Province
Total (2012): $327,743,456
Table 2-6: Japanese Investments (Results in January 2013) No. Approved Company name Business types Investment
amount ($)
Location
85 Applica-tion under prepara-
tion
Nihon Seimitsu Clock parts 10,000,000 Dragon King SEZ
86 Applica-tion under prepara-
tion
Denso Air conditioning parts for automo-biles
3,000,000 Phnom Penh SEZ
87 Applica-tion under prepara-
tion
Taiyo Kogyo Flexible con-tainer bags
3,000,000 Phnom Penh SEZ
88 Applica-tion under
Starts Three-star ho-tel(s)
50,000,000 Phnom Penh City
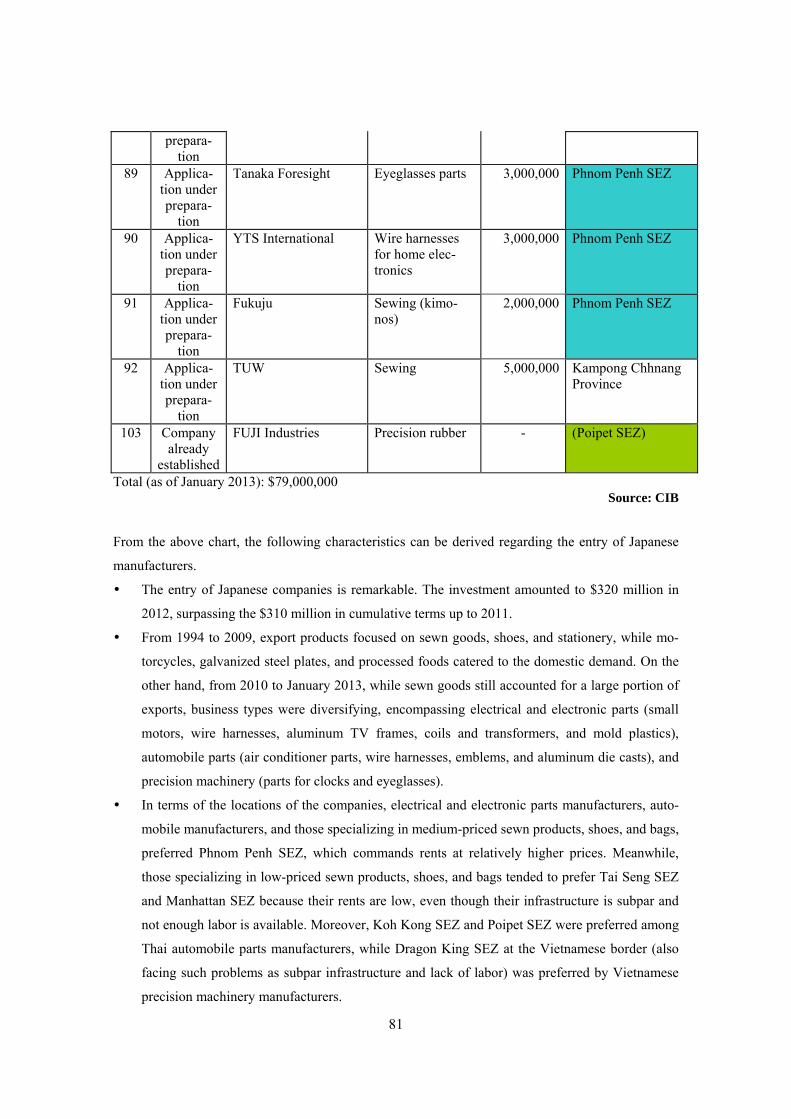
81
prepara-tion
89 Applica-tion under prepara-
tion
Tanaka Foresight Eyeglasses parts 3,000,000 Phnom Penh SEZ
90 Applica-tion under prepara-
tion
YTS International Wire harnesses for home elec-tronics
3,000,000 Phnom Penh SEZ
91 Applica-tion under prepara-
tion
Fukuju Sewing (kimo-nos)
2,000,000 Phnom Penh SEZ
92 Applica-tion under prepara-
tion
TUW Sewing 5,000,000 Kampong Chhnang Province
103 Company already
established
FUJI Industries Precision rubber - (Poipet SEZ)
Total (as of January 2013): $79,000,000 Source: CIB
From the above chart, the following characteristics can be derived regarding the entry of Japanese
manufacturers.
The entry of Japanese companies is remarkable. The investment amounted to $320 million in
2012, surpassing the $310 million in cumulative terms up to 2011.
From 1994 to 2009, export products focused on sewn goods, shoes, and stationery, while mo-
torcycles, galvanized steel plates, and processed foods catered to the domestic demand. On the
other hand, from 2010 to January 2013, while sewn goods still accounted for a large portion of
exports, business types were diversifying, encompassing electrical and electronic parts (small
motors, wire harnesses, aluminum TV frames, coils and transformers, and mold plastics),
automobile parts (air conditioner parts, wire harnesses, emblems, and aluminum die casts), and
precision machinery (parts for clocks and eyeglasses).
In terms of the locations of the companies, electrical and electronic parts manufacturers, auto-
mobile manufacturers, and those specializing in medium-priced sewn products, shoes, and bags,
preferred Phnom Penh SEZ, which commands rents at relatively higher prices. Meanwhile,
those specializing in low-priced sewn products, shoes, and bags tended to prefer Tai Seng SEZ
and Manhattan SEZ because their rents are low, even though their infrastructure is subpar and
not enough labor is available. Moreover, Koh Kong SEZ and Poipet SEZ were preferred among
Thai automobile parts manufacturers, while Dragon King SEZ at the Vietnamese border (also
facing such problems as subpar infrastructure and lack of labor) was preferred by Vietnamese
precision machinery manufacturers.

82
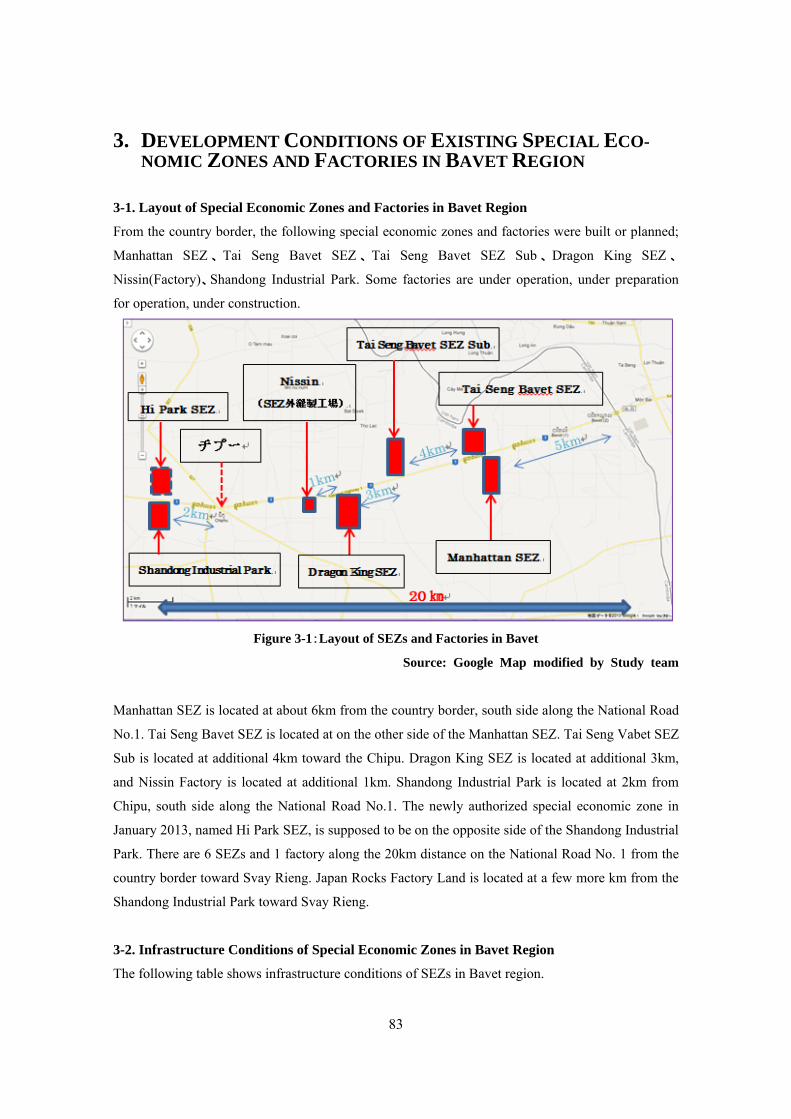
83
3. DEVELOPMENT CONDITIONS OF EXISTING SPECIAL ECO-NOMIC ZONES AND FACTORIES IN BAVET REGION
3-1. Layout of Special Economic Zones and Factories in Bavet Region
From the country border, the following special economic zones and factories were built or planned;
Manhattan SEZ 、 Tai Seng Bavet SEZ 、 Tai Seng Bavet SEZ Sub 、 Dragon King SEZ 、
Nissin(Factory)、Shandong Industrial Park. Some factories are under operation, under preparation
for operation, under construction.
Figure 3-1:Layout of SEZs and Factories in Bavet
Source: Google Map modified by Study team
Manhattan SEZ is located at about 6km from the country border, south side along the National Road
No.1. Tai Seng Bavet SEZ is located at on the other side of the Manhattan SEZ. Tai Seng Vabet SEZ
Sub is located at additional 4km toward the Chipu. Dragon King SEZ is located at additional 3km,
and Nissin Factory is located at additional 1km. Shandong Industrial Park is located at 2km from
Chipu, south side along the National Road No.1. The newly authorized special economic zone in
January 2013, named Hi Park SEZ, is supposed to be on the opposite side of the Shandong Industrial
Park. There are 6 SEZs and 1 factory along the 20km distance on the National Road No. 1 from the
country border toward Svay Rieng. Japan Rocks Factory Land is located at a few more km from the
Shandong Industrial Park toward Svay Rieng.
3-2. Infrastructure Conditions of Special Economic Zones in Bavet Region
The following table shows infrastructure conditions of SEZs in Bavet region.
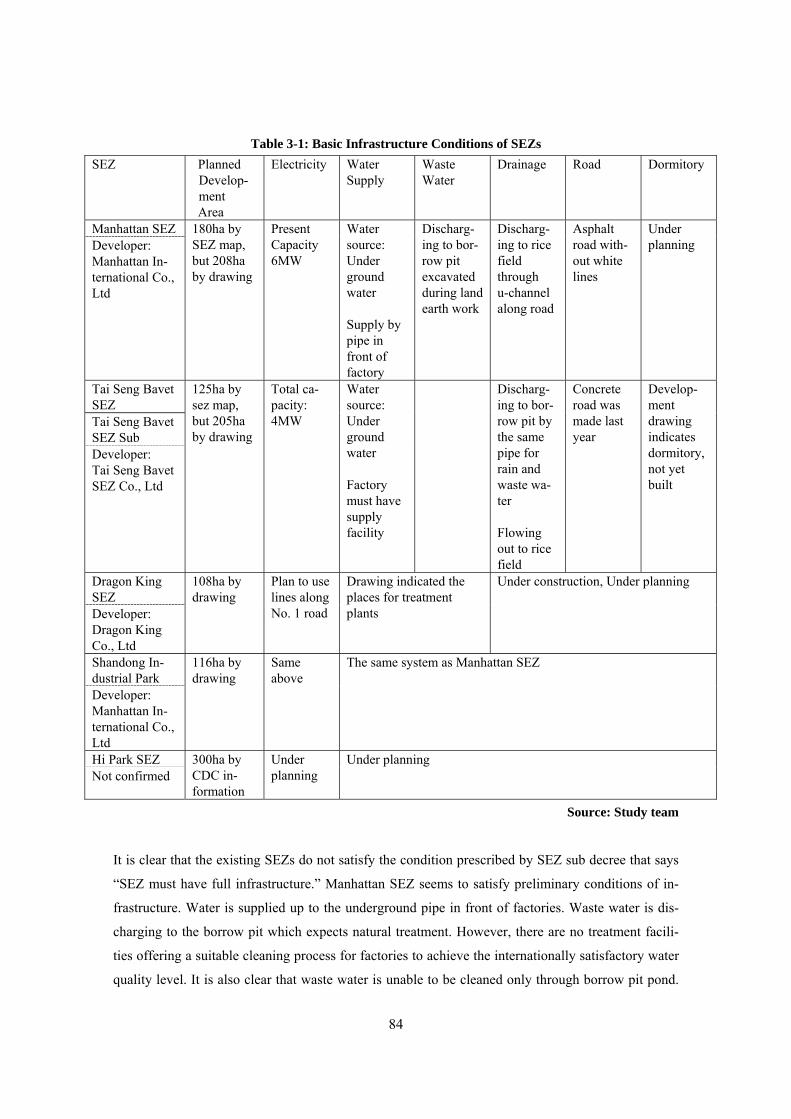
84
Table 3-1: Basic Infrastructure Conditions of SEZs SEZ Planned
Develop-ment Area
Electricity Water Supply
Waste Water
Drainage Road Dormitory
Manhattan SEZ 180ha by SEZ map, but 208ha by drawing
Present Capacity 6MW
Water source: Under ground water Supply by pipe in front of factory
Discharg-ing to bor-row pit excavated during land earth work
Discharg-ing to rice field through u-channel along road
Asphalt road with-out white lines
Under planning Developer:
Manhattan In-ternational Co., Ltd
Tai Seng Bavet SEZ
125ha by sez map, but 205ha by drawing
Total ca-pacity: 4MW
Water source: Under ground water Factory must have supply facility
Discharg-ing to bor-row pit by the same pipe for rain and waste wa-ter Flowing out to rice field
Concrete road was made last year
Develop-ment drawing indicates dormitory, not yet built
Tai Seng Bavet SEZ Sub Developer: Tai Seng Bavet SEZ Co., Ltd
Dragon King SEZ
108ha by drawing
Plan to use lines along No. 1 road
Drawing indicated the places for treatment plants
Under construction, Under planning
Developer: Dragon King Co., Ltd Shandong In-dustrial Park
116ha by drawing
Same above
The same system as Manhattan SEZ
Developer: Manhattan In-ternational Co., Ltd Hi Park SEZ 300ha by
CDC in-formation
Under planning
Under planning Not confirmed
Source: Study team
It is clear that the existing SEZs do not satisfy the condition prescribed by SEZ sub decree that says
“SEZ must have full infrastructure.” Manhattan SEZ seems to satisfy preliminary conditions of in-
frastructure. Water is supplied up to the underground pipe in front of factories. Waste water is dis-
charging to the borrow pit which expects natural treatment. However, there are no treatment facili-
ties offering a suitable cleaning process for factories to achieve the internationally satisfactory water
quality level. It is also clear that waste water is unable to be cleaned only through borrow pit pond.
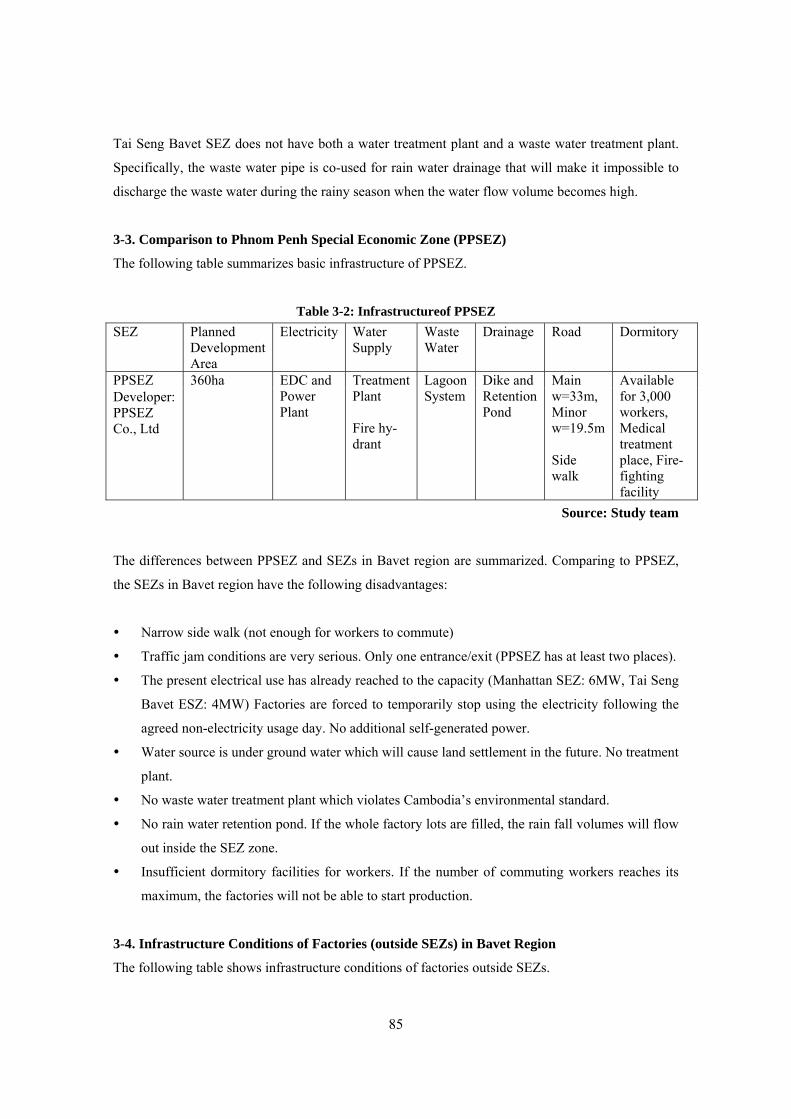
85
Tai Seng Bavet SEZ does not have both a water treatment plant and a waste water treatment plant.
Specifically, the waste water pipe is co-used for rain water drainage that will make it impossible to
discharge the waste water during the rainy season when the water flow volume becomes high.
3-3. Comparison to Phnom Penh Special Economic Zone (PPSEZ)
The following table summarizes basic infrastructure of PPSEZ.
Table 3-2: Infrastructureof PPSEZ SEZ Planned
Development Area
Electricity Water Supply
Waste Water
Drainage Road Dormitory
PPSEZ 360ha EDC and Power Plant
Treatment Plant Fire hy-drant
Lagoon System
Dike and Retention Pond
Main w=33m, Minor w=19.5m Side walk
Available for 3,000 workers, Medical treatment place, Fire- fighting facility
Developer: PPSEZ Co., Ltd
Source: Study team
The differences between PPSEZ and SEZs in Bavet region are summarized. Comparing to PPSEZ,
the SEZs in Bavet region have the following disadvantages:
Narrow side walk (not enough for workers to commute)
Traffic jam conditions are very serious. Only one entrance/exit (PPSEZ has at least two places).
The present electrical use has already reached to the capacity (Manhattan SEZ: 6MW, Tai Seng
Bavet ESZ: 4MW) Factories are forced to temporarily stop using the electricity following the
agreed non-electricity usage day. No additional self-generated power.
Water source is under ground water which will cause land settlement in the future. No treatment
plant.
No waste water treatment plant which violates Cambodia’s environmental standard.
No rain water retention pond. If the whole factory lots are filled, the rain fall volumes will flow
out inside the SEZ zone.
Insufficient dormitory facilities for workers. If the number of commuting workers reaches its
maximum, the factories will not be able to start production.
3-4. Infrastructure Conditions of Factories (outside SEZs) in Bavet Region
The following table shows infrastructure conditions of factories outside SEZs.
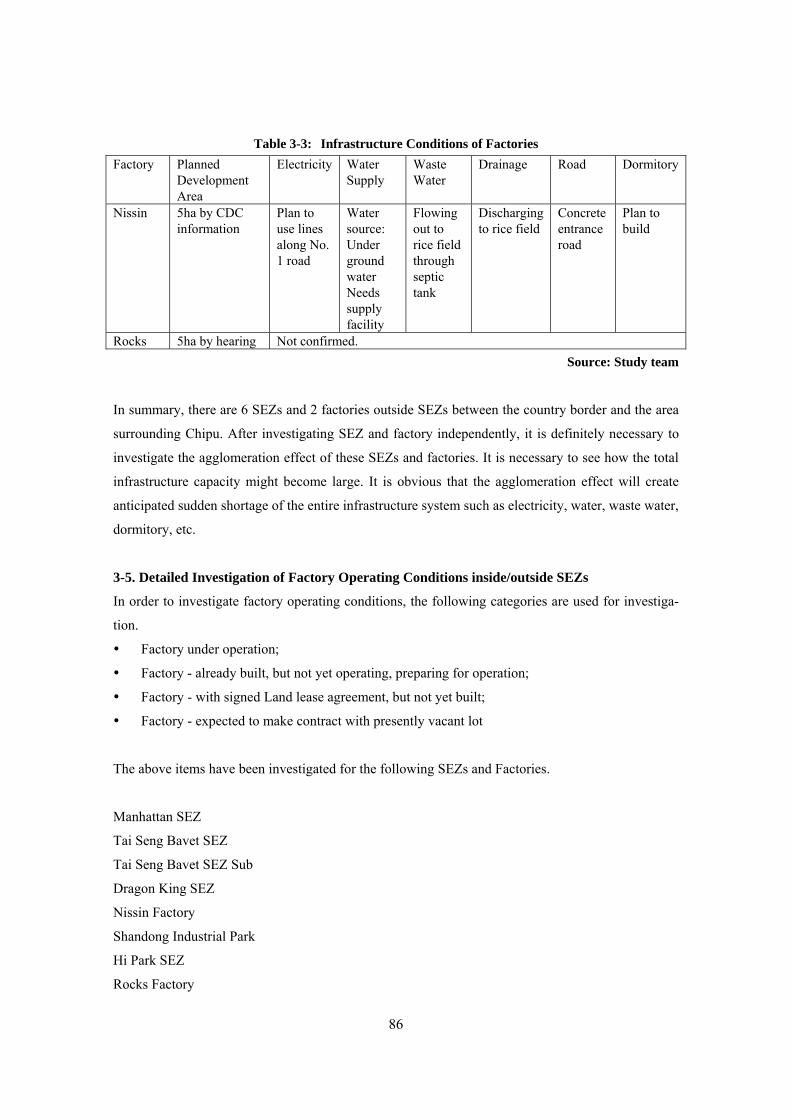
86
Table 3-3: Infrastructure Conditions of Factories Factory Planned
Development Area
Electricity Water Supply
Waste Water
Drainage Road Dormitory
Nissin 5ha by CDC information
Plan to use lines along No. 1 road
Water source: Under ground water Needs supply facility
Flowing out to rice field through septic tank
Discharging to rice field
Concrete entrance road
Plan to build
Rocks 5ha by hearing Not confirmed. Source: Study team
In summary, there are 6 SEZs and 2 factories outside SEZs between the country border and the area
surrounding Chipu. After investigating SEZ and factory independently, it is definitely necessary to
investigate the agglomeration effect of these SEZs and factories. It is necessary to see how the total
infrastructure capacity might become large. It is obvious that the agglomeration effect will create
anticipated sudden shortage of the entire infrastructure system such as electricity, water, waste water,
dormitory, etc.
3-5. Detailed Investigation of Factory Operating Conditions inside/outside SEZs
In order to investigate factory operating conditions, the following categories are used for investiga-
tion.
Factory under operation;
Factory - already built, but not yet operating, preparing for operation;
Factory - with signed Land lease agreement, but not yet built;
Factory - expected to make contract with presently vacant lot
The above items have been investigated for the following SEZs and Factories.
Manhattan SEZ
Tai Seng Bavet SEZ
Tai Seng Bavet SEZ Sub
Dragon King SEZ
Nissin Factory
Shandong Industrial Park
Hi Park SEZ
Rocks Factory
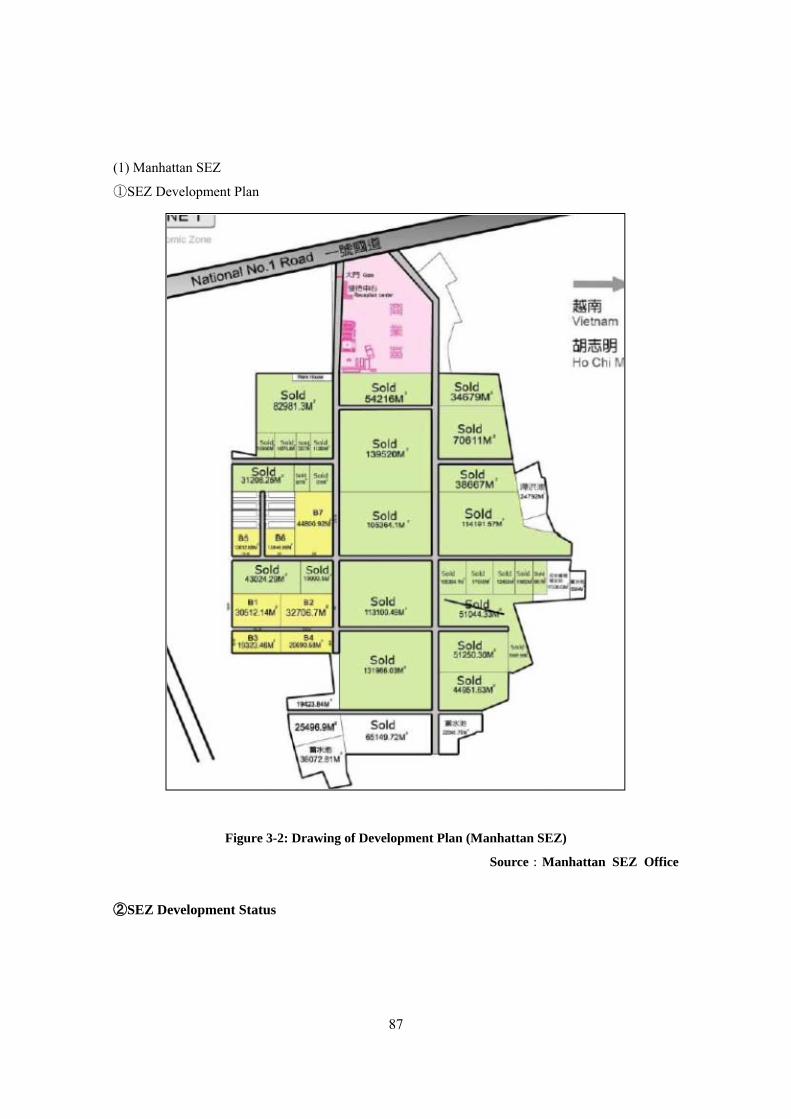
87
(1) Manhattan SEZ
①SEZ Development Plan
Figure 3-2: Drawing of Development Plan (Manhattan SEZ)
Source:Manhattan SEZ Office
②SEZ Development Status
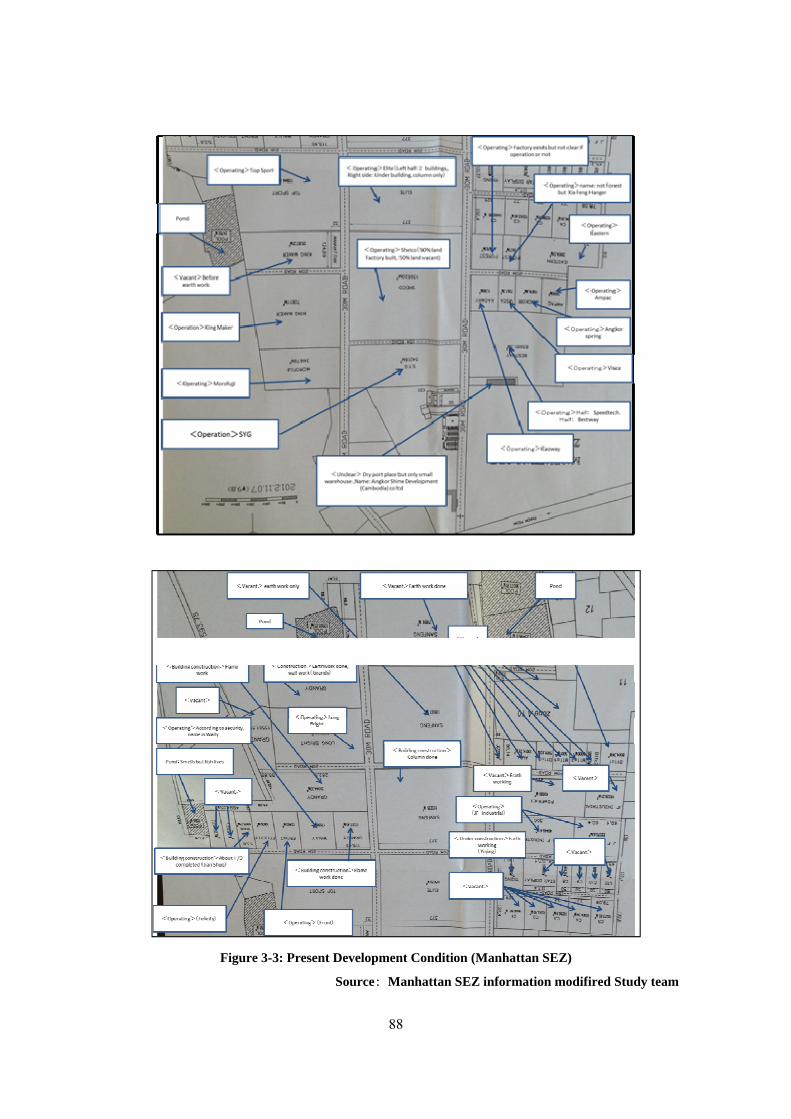
88
Figure 3-3: Present Development Condition (Manhattan SEZ)
Source: Manhattan SEZ information modifired Study team
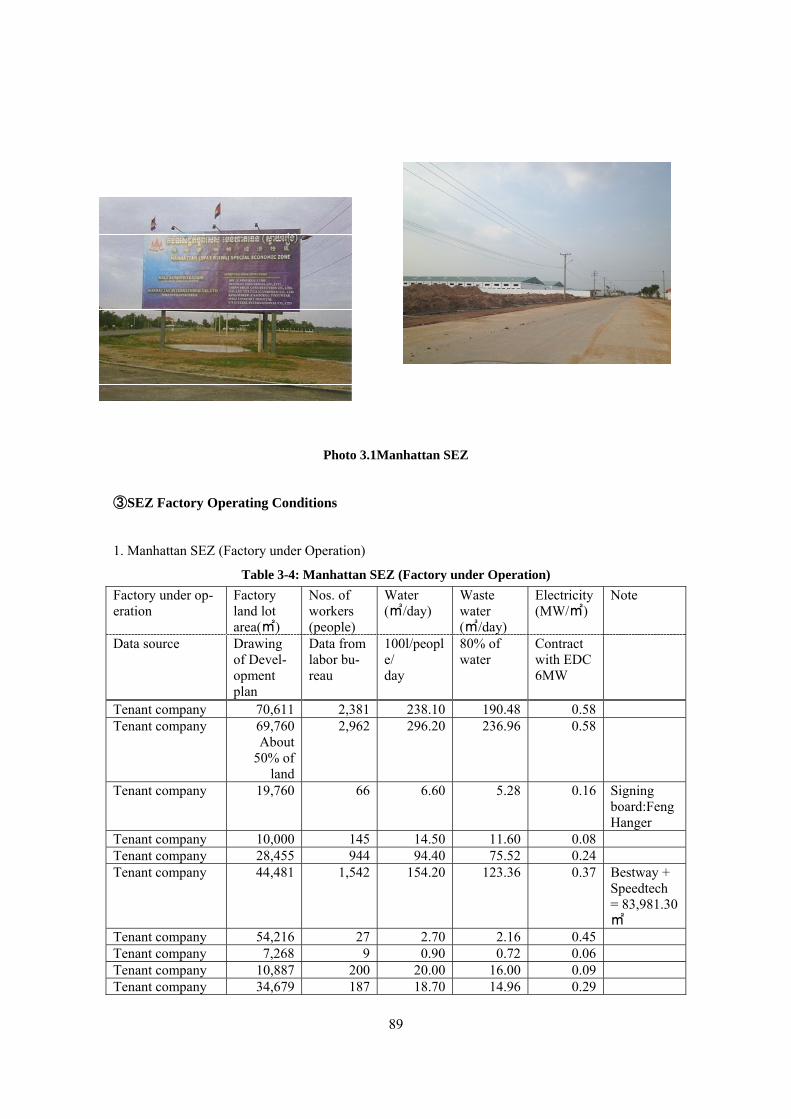
89
Photo 3.1Manhattan SEZ
③SEZ Factory Operating Conditions
1. Manhattan SEZ (Factory under Operation)
Table 3-4: Manhattan SEZ (Factory under Operation) Factory under op-eration
Factory land lot area(㎡)
Nos. of workers (people)
Water (㎥/day)
Waste water (㎥/day)
Electricity (MW/㎡)
Note
Data source Drawing of Devel-opment plan
Data from labor bu-reau
100l/people/ day
80% of water
Contract with EDC 6MW
Tenant company 70,611 2,381 238.10 190.48 0.58 Tenant company 69,760
About 50% of
land
2,962 296.20 236.96 0.58
Tenant company 19,760 66 6.60 5.28 0.16 Signing board:Feng Hanger
Tenant company 10,000 145 14.50 11.60 0.08 Tenant company 28,455 944 94.40 75.52 0.24 Tenant company 44,481 1,542 154.20 123.36 0.37 Bestway +
Speedtech = 83,981.30㎡
Tenant company 54,216 27 2.70 2.16 0.45 Tenant company 7,268 9 0.90 0.72 0.06 Tenant company 10,887 200 20.00 16.00 0.09 Tenant company 34,679 187 18.70 14.96 0.29
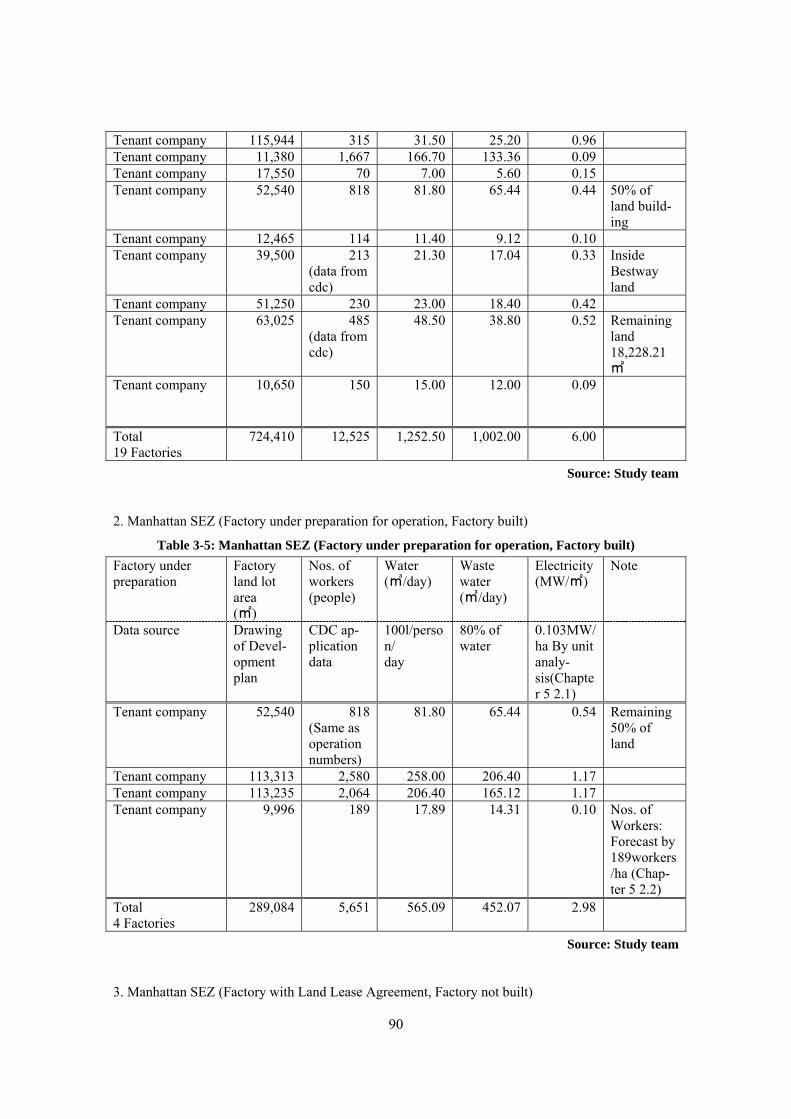
90
Tenant company 115,944 315 31.50 25.20 0.96 Tenant company 11,380 1,667 166.70 133.36 0.09 Tenant company 17,550 70 7.00 5.60 0.15 Tenant company 52,540 818 81.80 65.44 0.44 50% of
land build-ing
Tenant company 12,465 114 11.40 9.12 0.10 Tenant company 39,500 213
(data from cdc)
21.30 17.04 0.33 Inside Bestway land
Tenant company 51,250 230 23.00 18.40 0.42 Tenant company 63,025 485
(data from cdc)
48.50 38.80 0.52 Remaining land 18,228.21㎡
Tenant company 10,650 150 15.00 12.00 0.09
Total 19 Factories
724,410 12,525 1,252.50 1,002.00 6.00
Source: Study team
2. Manhattan SEZ (Factory under preparation for operation, Factory built)
Table 3-5: Manhattan SEZ (Factory under preparation for operation, Factory built) Factory under preparation
Factory land lot area (㎡)
Nos. of workers (people)
Water (㎥/day)
Waste water (㎥/day)
Electricity (MW/㎡)
Note
Data source Drawing of Devel-opment plan
CDC ap-plication data
100l/person/ day
80% of water
0.103MW/ha By unit analy-sis(Chapter 5 2.1)
Tenant company 52,540 818(Same as operation numbers)
81.80 65.44 0.54 Remaining 50% of land
Tenant company 113,313 2,580 258.00 206.40 1.17 Tenant company 113,235 2,064 206.40 165.12 1.17 Tenant company 9,996 189 17.89 14.31 0.10 Nos. of
Workers: Forecast by 189workers/ha (Chap-ter 5 2.2)
Total 4 Factories
289,084 5,651 565.09 452.07 2.98
Source: Study team
3. Manhattan SEZ (Factory with Land Lease Agreement, Factory not built)
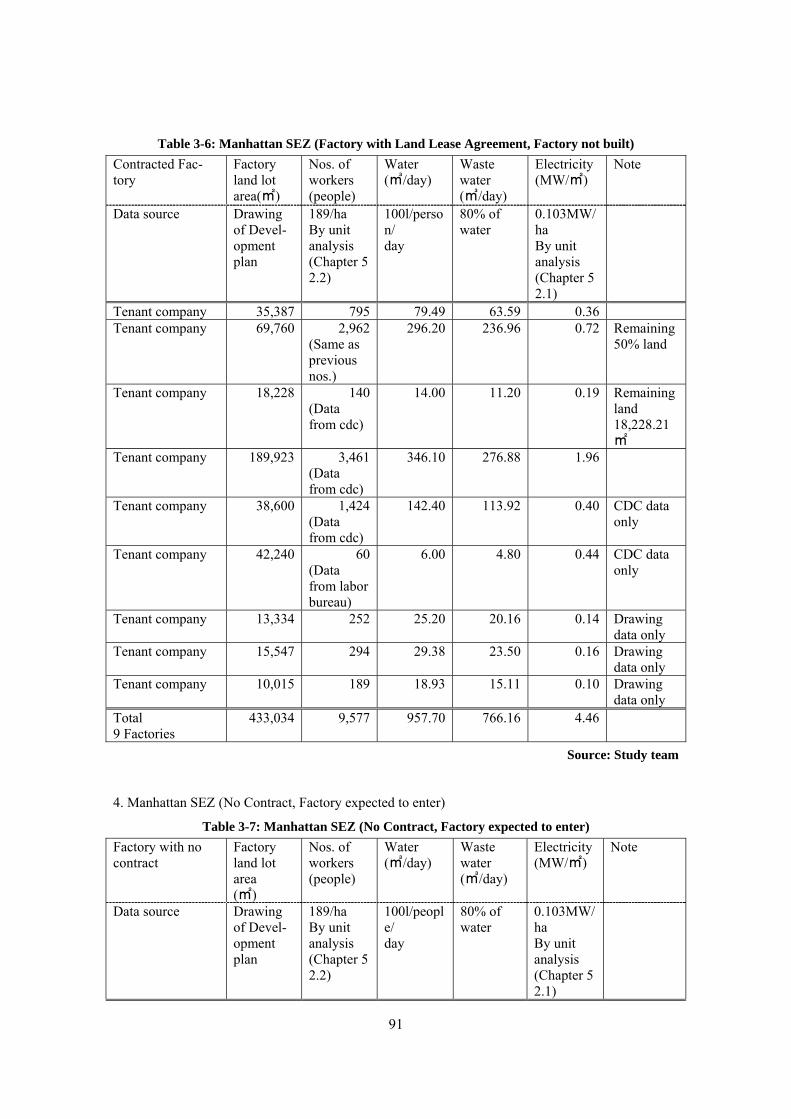
91
Table 3-6: Manhattan SEZ (Factory with Land Lease Agreement, Factory not built) Contracted Fac-tory
Factory land lot area(㎡)
Nos. of workers (people)
Water (㎥/day)
Waste water (㎥/day)
Electricity (MW/㎡)
Note
Data source Drawing of Devel-opment plan
189/ha By unit analysis (Chapter 5 2.2)
100l/person/ day
80% of water
0.103MW/ha By unit analysis (Chapter 5 2.1)
Tenant company 35,387 795 79.49 63.59 0.36 Tenant company 69,760 2,962
(Same as previous nos.)
296.20 236.96 0.72 Remaining 50% land
Tenant company 18,228 140(Data from cdc)
14.00 11.20 0.19 Remaining land 18,228.21㎡
Tenant company 189,923 3,461(Data from cdc)
346.10 276.88 1.96
Tenant company 38,600
1,424(Data from cdc)
142.40 113.92 0.40 CDC data only
Tenant company 42,240 60(Data from labor bureau)
6.00 4.80 0.44 CDC data only
Tenant company 13,334 252 25.20 20.16 0.14 Drawing data only
Tenant company 15,547 294 29.38 23.50 0.16 Drawing data only
Tenant company 10,015 189 18.93 15.11 0.10 Drawing data only
Total 9 Factories
433,034 9,577 957.70 766.16 4.46
Source: Study team
4. Manhattan SEZ (No Contract, Factory expected to enter)
Table 3-7: Manhattan SEZ (No Contract, Factory expected to enter) Factory with no contract
Factory land lot area (㎡)
Nos. of workers (people)
Water (㎥/day)
Waste water (㎥/day)
Electricity (MW/㎡)
Note
Data source Drawing of Devel-opment plan
189/ha By unit analysis (Chapter 5 2.2)
100l/people/ day
80% of water
0.103MW/ha By unit analysis (Chapter 5 2.1)

92
Vacant factory land lot
9,761 217 21.74 17.39 0.10
Source: Study team
5.2 Tai Seng Bavet SEZ
①SEZ Development Plan
Figure 3-4: Drawing of Development Plan (Tai Seng Bavet SEZ)
Source: Tai Seng Bavet SEZ Co., Ltd. information modified by Study team
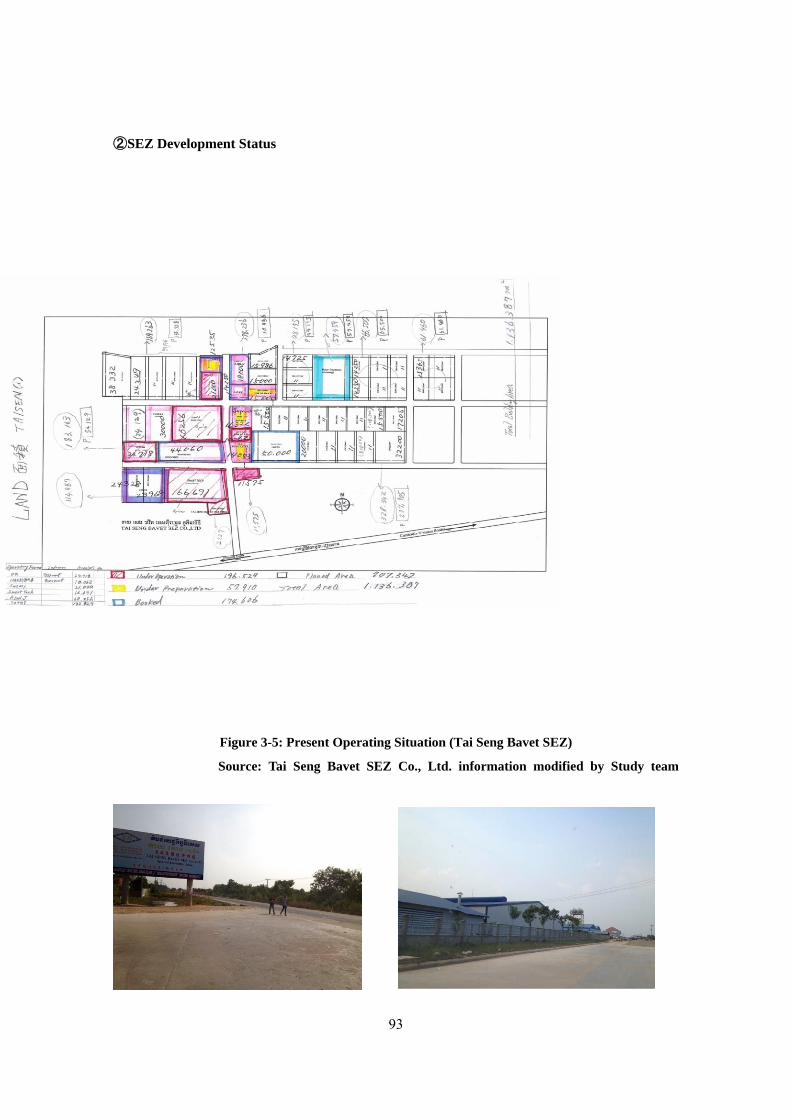
93
②SEZ Development Status
Figure 3-5: Present Operating Situation (Tai Seng Bavet SEZ)
Source: Tai Seng Bavet SEZ Co., Ltd. information modified by Study team
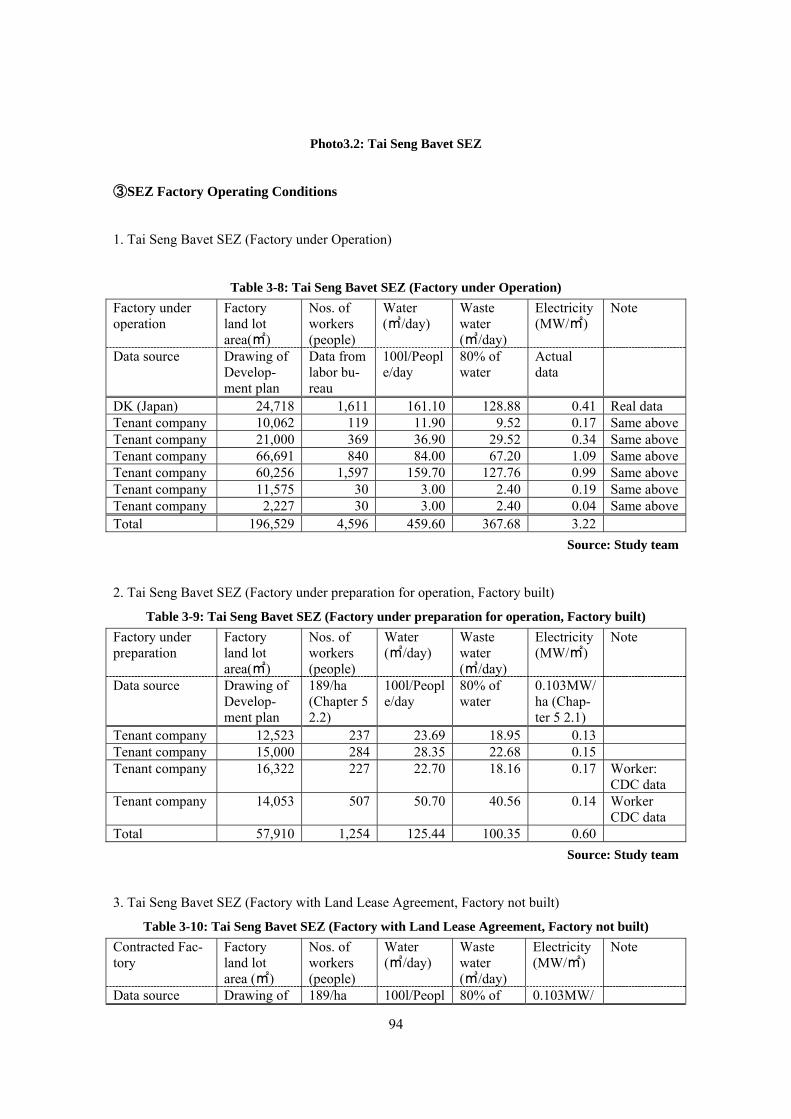
94
Photo3.2: Tai Seng Bavet SEZ
③SEZ Factory Operating Conditions
1. Tai Seng Bavet SEZ (Factory under Operation)
Table 3-8: Tai Seng Bavet SEZ (Factory under Operation) Factory under operation
Factory land lot area(㎡)
Nos. of workers (people)
Water (㎥/day)
Waste water (㎥/day)
Electricity (MW/㎡)
Note
Data source Drawing of Develop-ment plan
Data from labor bu-reau
100l/People/day
80% of water
Actual data
DK (Japan) 24,718 1,611 161.10 128.88 0.41 Real data Tenant company 10,062 119 11.90 9.52 0.17 Same aboveTenant company 21,000 369 36.90 29.52 0.34 Same aboveTenant company 66,691 840 84.00 67.20 1.09 Same aboveTenant company 60,256 1,597 159.70 127.76 0.99 Same aboveTenant company 11,575 30 3.00 2.40 0.19 Same aboveTenant company 2,227 30 3.00 2.40 0.04 Same aboveTotal 196,529 4,596 459.60 367.68 3.22
Source: Study team
2. Tai Seng Bavet SEZ (Factory under preparation for operation, Factory built)
Table 3-9: Tai Seng Bavet SEZ (Factory under preparation for operation, Factory built) Factory under preparation
Factory land lot area(㎡)
Nos. of workers (people)
Water (㎥/day)
Waste water (㎥/day)
Electricity (MW/㎡)
Note
Data source Drawing of Develop-ment plan
189/ha (Chapter 5 2.2)
100l/People/day
80% of water
0.103MW/ha (Chap-ter 5 2.1)
Tenant company 12,523 237 23.69 18.95 0.13 Tenant company 15,000 284 28.35 22.68 0.15 Tenant company 16,322 227 22.70 18.16 0.17 Worker:
CDC data Tenant company 14,053 507 50.70 40.56 0.14 Worker
CDC data Total 57,910 1,254 125.44 100.35 0.60
Source: Study team
3. Tai Seng Bavet SEZ (Factory with Land Lease Agreement, Factory not built)
Table 3-10: Tai Seng Bavet SEZ (Factory with Land Lease Agreement, Factory not built) Contracted Fac-tory
Factory land lot area (㎡)
Nos. of workers (people)
Water (㎥/day)
Waste water (㎥/day)
Electricity (MW/㎡)
Note
Data source Drawing of 189/ha 100l/Peopl 80% of 0.103MW/
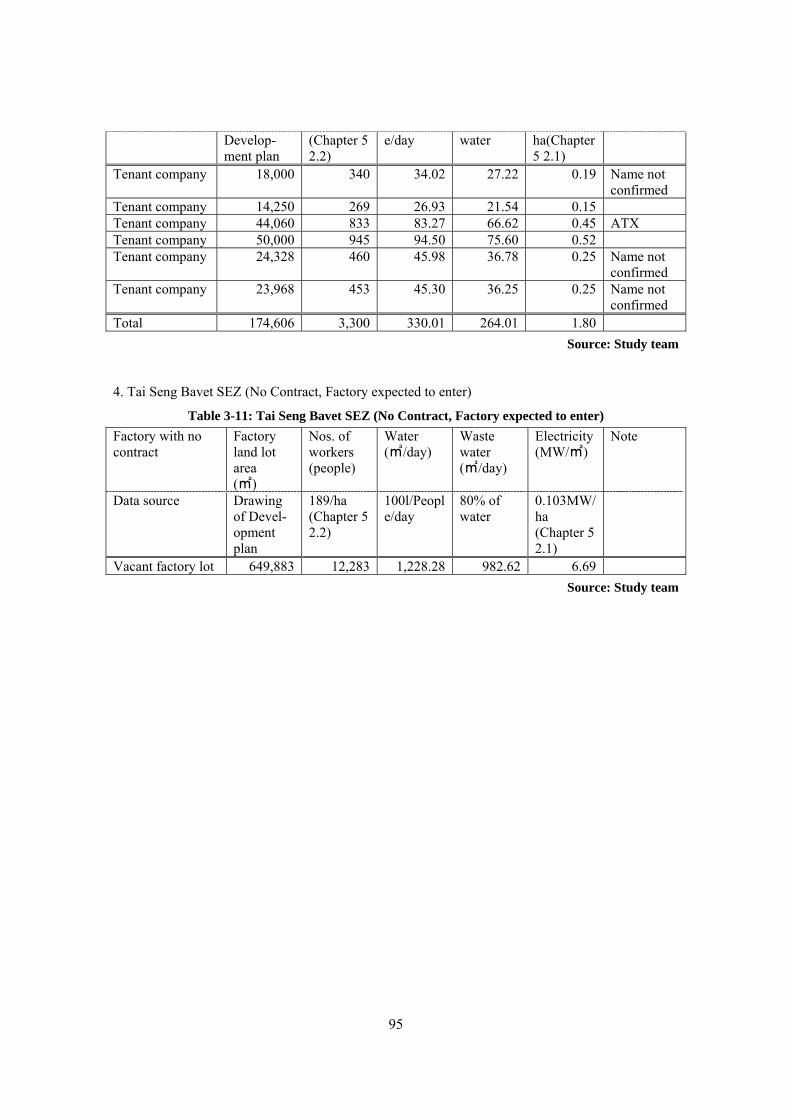
95
Develop-ment plan
(Chapter 5 2.2)
e/day water ha(Chapter 5 2.1)
Tenant company 18,000 340 34.02 27.22 0.19 Name not confirmed
Tenant company 14,250 269 26.93 21.54 0.15 Tenant company 44,060 833 83.27 66.62 0.45 ATX Tenant company 50,000 945 94.50 75.60 0.52 Tenant company 24,328 460 45.98 36.78 0.25 Name not
confirmed Tenant company 23,968 453 45.30 36.25 0.25 Name not
confirmed Total 174,606 3,300 330.01 264.01 1.80
Source: Study team
4. Tai Seng Bavet SEZ (No Contract, Factory expected to enter)
Table 3-11: Tai Seng Bavet SEZ (No Contract, Factory expected to enter) Factory with no contract
Factory land lot area (㎡)
Nos. of workers (people)
Water (㎥/day)
Waste water (㎥/day)
Electricity (MW/㎡)
Note
Data source Drawing of Devel-opment plan
189/ha (Chapter 5 2.2)
100l/People/day
80% of water
0.103MW/ha (Chapter 5 2.1)
Vacant factory lot 649,883 12,283 1,228.28 982.62 6.69 Source: Study team
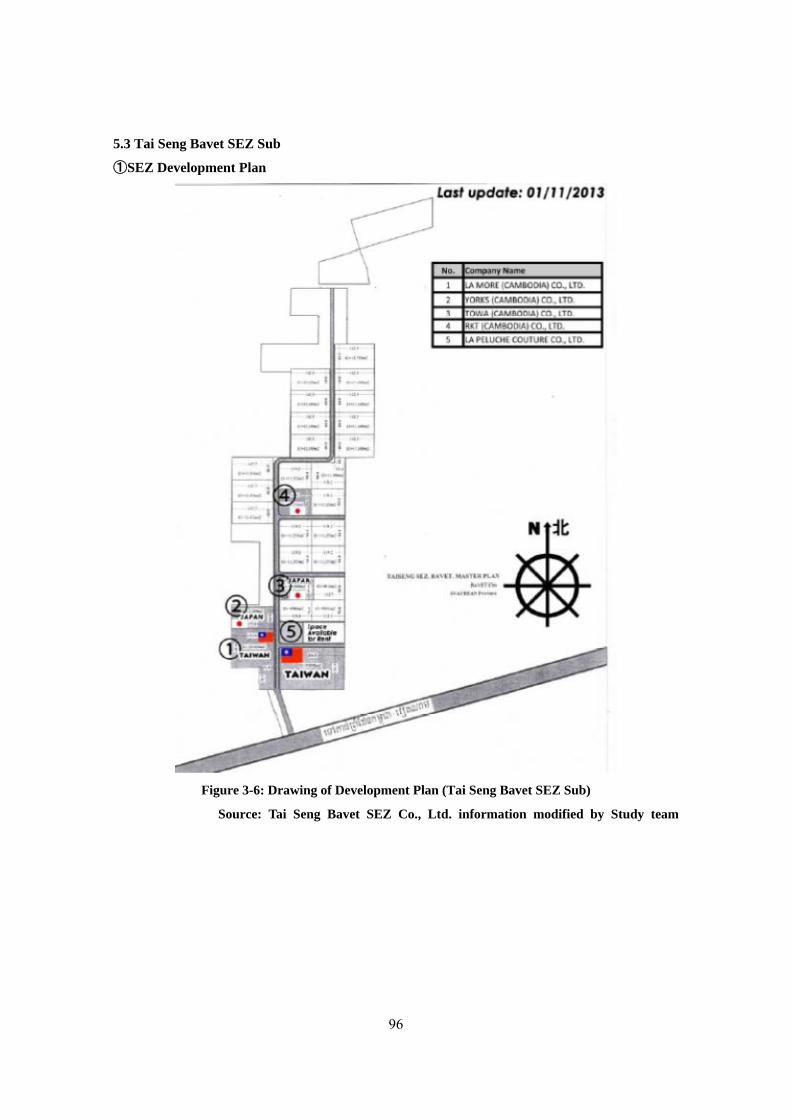
96
5.3 Tai Seng Bavet SEZ Sub
①SEZ Development Plan
Figure 3-6: Drawing of Development Plan (Tai Seng Bavet SEZ Sub)
Source: Tai Seng Bavet SEZ Co., Ltd. information modified by Study team
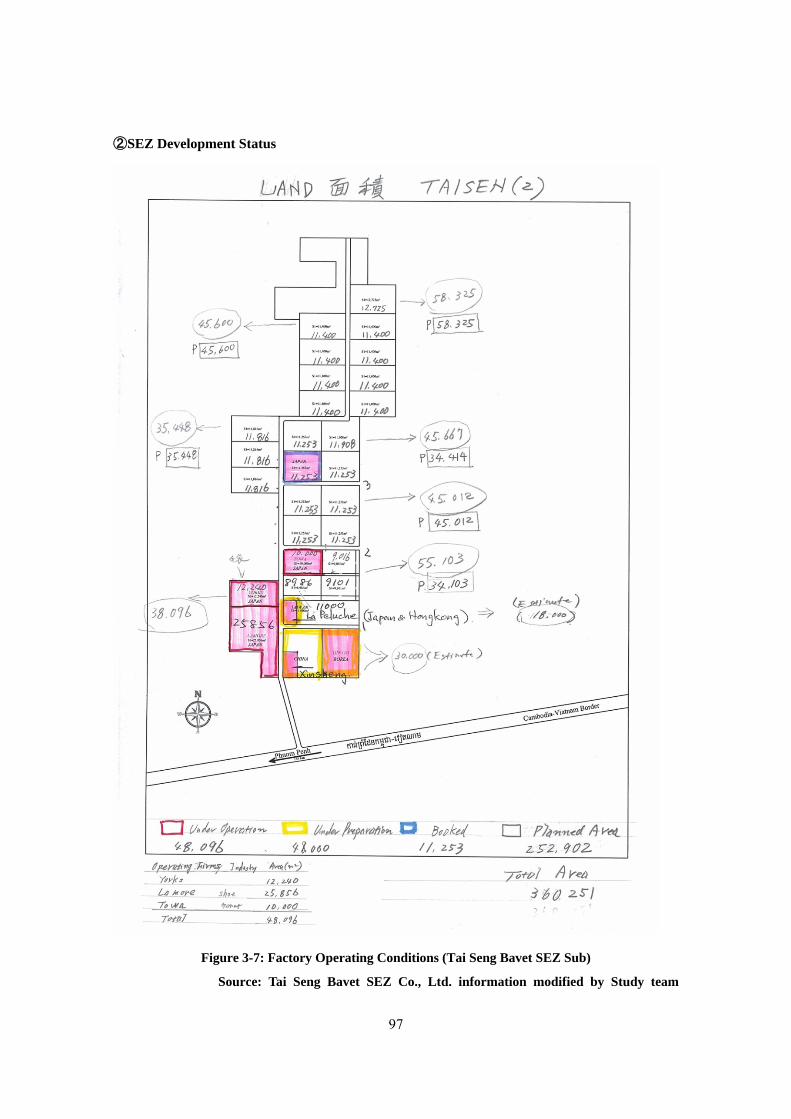
97
②SEZ Development Status
Figure 3-7: Factory Operating Conditions (Tai Seng Bavet SEZ Sub)
Source: Tai Seng Bavet SEZ Co., Ltd. information modified by Study team
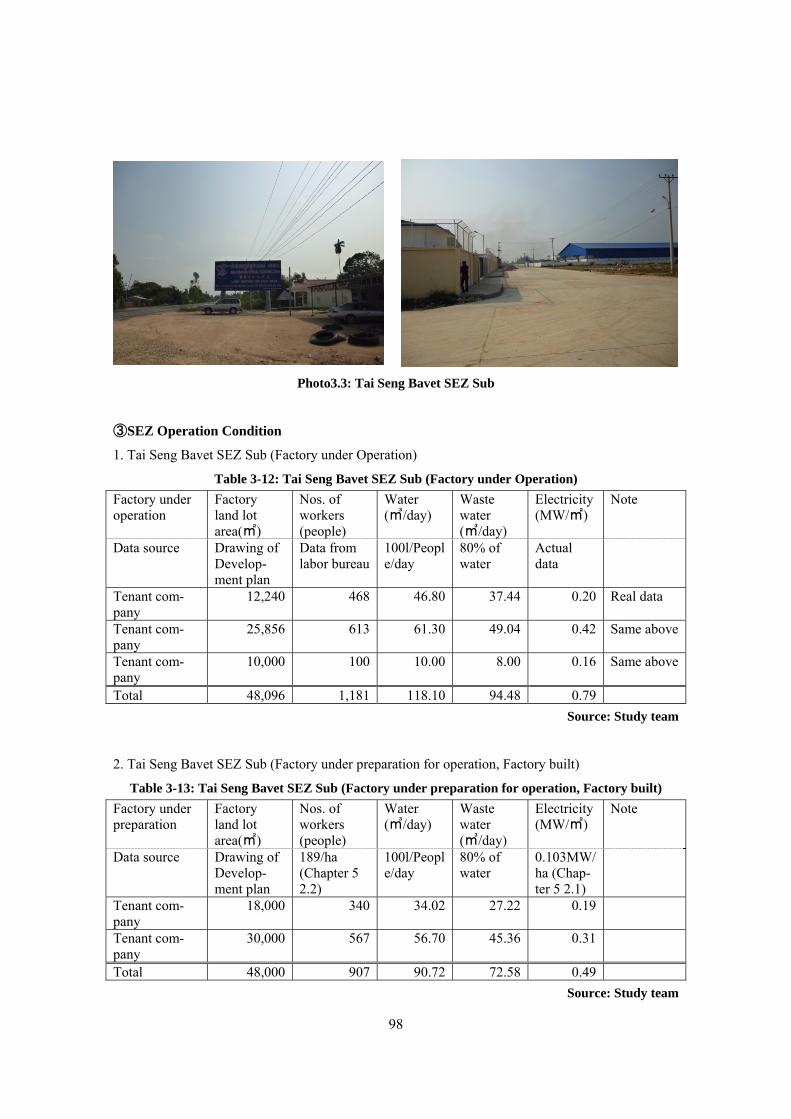
98
Photo3.3: Tai Seng Bavet SEZ Sub
③SEZ Operation Condition
1. Tai Seng Bavet SEZ Sub (Factory under Operation)
Table 3-12: Tai Seng Bavet SEZ Sub (Factory under Operation) Factory under operation
Factory land lot area(㎡)
Nos. of workers (people)
Water (㎥/day)
Waste water (㎥/day)
Electricity (MW/㎡)
Note
Data source Drawing of Develop-ment plan
Data from labor bureau
100l/People/day
80% of water
Actual data
Tenant com-pany
12,240 468 46.80 37.44 0.20 Real data
Tenant com-pany
25,856 613 61.30 49.04 0.42 Same above
Tenant com-pany
10,000 100 10.00 8.00 0.16 Same above
Total 48,096 1,181 118.10 94.48 0.79 Source: Study team
2. Tai Seng Bavet SEZ Sub (Factory under preparation for operation, Factory built)
Table 3-13: Tai Seng Bavet SEZ Sub (Factory under preparation for operation, Factory built) Factory under preparation
Factory land lot area(㎡)
Nos. of workers (people)
Water (㎥/day)
Waste water (㎥/day)
Electricity (MW/㎡)
Note
Data source Drawing of Develop-ment plan
189/ha (Chapter 5 2.2)
100l/People/day
80% of water
0.103MW/ha (Chap-ter 5 2.1)
Tenant com-pany
18,000 340 34.02 27.22 0.19
Tenant com-pany
30,000 567 56.70 45.36 0.31
Total 48,000 907 90.72 72.58 0.49 Source: Study team
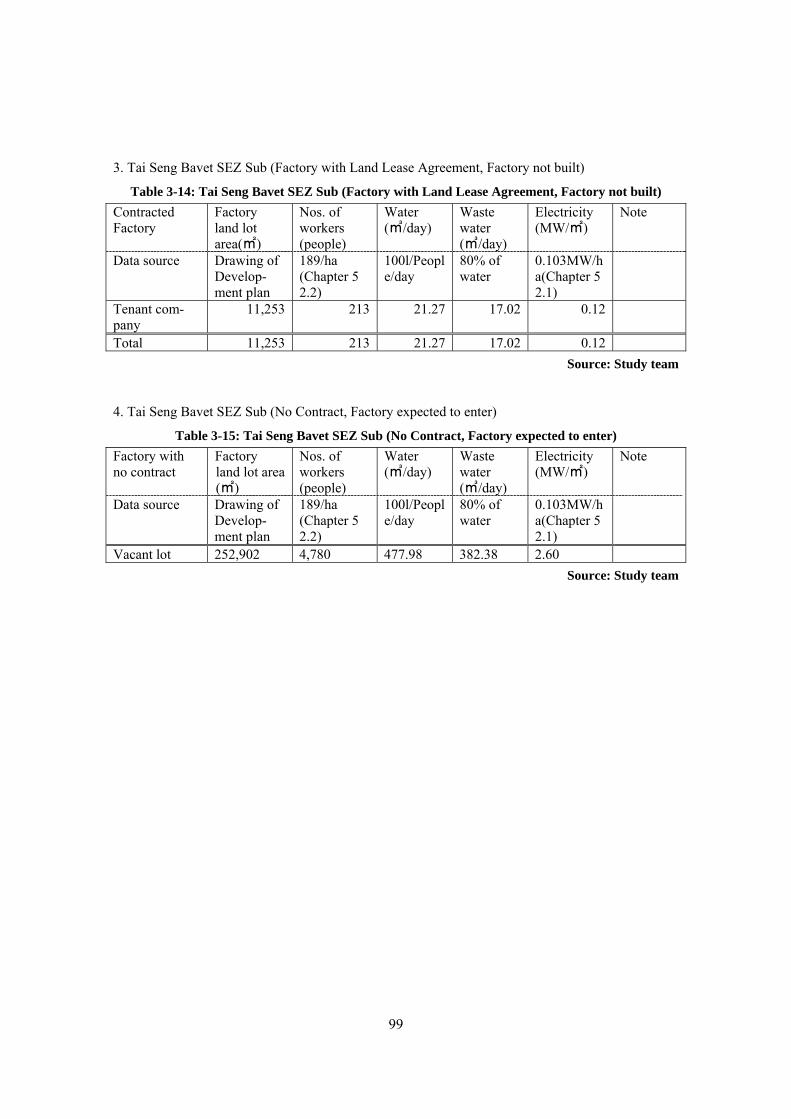
99
3. Tai Seng Bavet SEZ Sub (Factory with Land Lease Agreement, Factory not built)
Table 3-14: Tai Seng Bavet SEZ Sub (Factory with Land Lease Agreement, Factory not built) Contracted Factory
Factory land lot area(㎡)
Nos. of workers (people)
Water (㎥/day)
Waste water (㎥/day)
Electricity (MW/㎡)
Note
Data source Drawing of Develop-ment plan
189/ha (Chapter 5 2.2)
100l/People/day
80% of water
0.103MW/ha(Chapter 5 2.1)
Tenant com-pany
11,253 213 21.27 17.02 0.12
Total 11,253 213 21.27 17.02 0.12 Source: Study team
4. Tai Seng Bavet SEZ Sub (No Contract, Factory expected to enter)
Table 3-15: Tai Seng Bavet SEZ Sub (No Contract, Factory expected to enter) Factory with no contract
Factory land lot area (㎡)
Nos. of workers (people)
Water (㎥/day)
Waste water (㎥/day)
Electricity (MW/㎡)
Note
Data source Drawing of Develop-ment plan
189/ha (Chapter 5 2.2)
100l/People/day
80% of water
0.103MW/ha(Chapter 5 2.1)
Vacant lot 252,902 4,780 477.98 382.38 2.60 Source: Study team
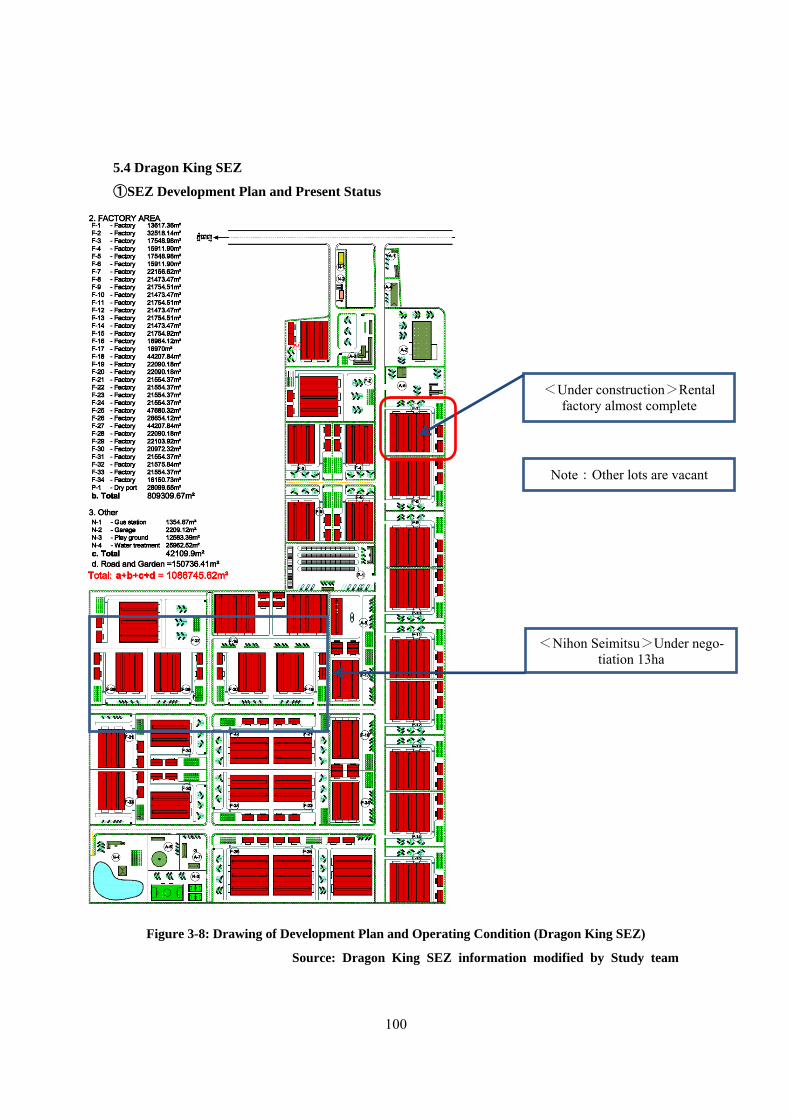
100
5.4 Dragon King SEZ
①SEZ Development Plan and Present Status
Figure 3-8: Drawing of Development Plan and Operating Condition (Dragon King SEZ)
Source: Dragon King SEZ information modified by Study team
Note:Other lots are vacant
<Under construction>Rental factory almost complete
<Nihon Seimitsu>Under nego-tiation 13ha
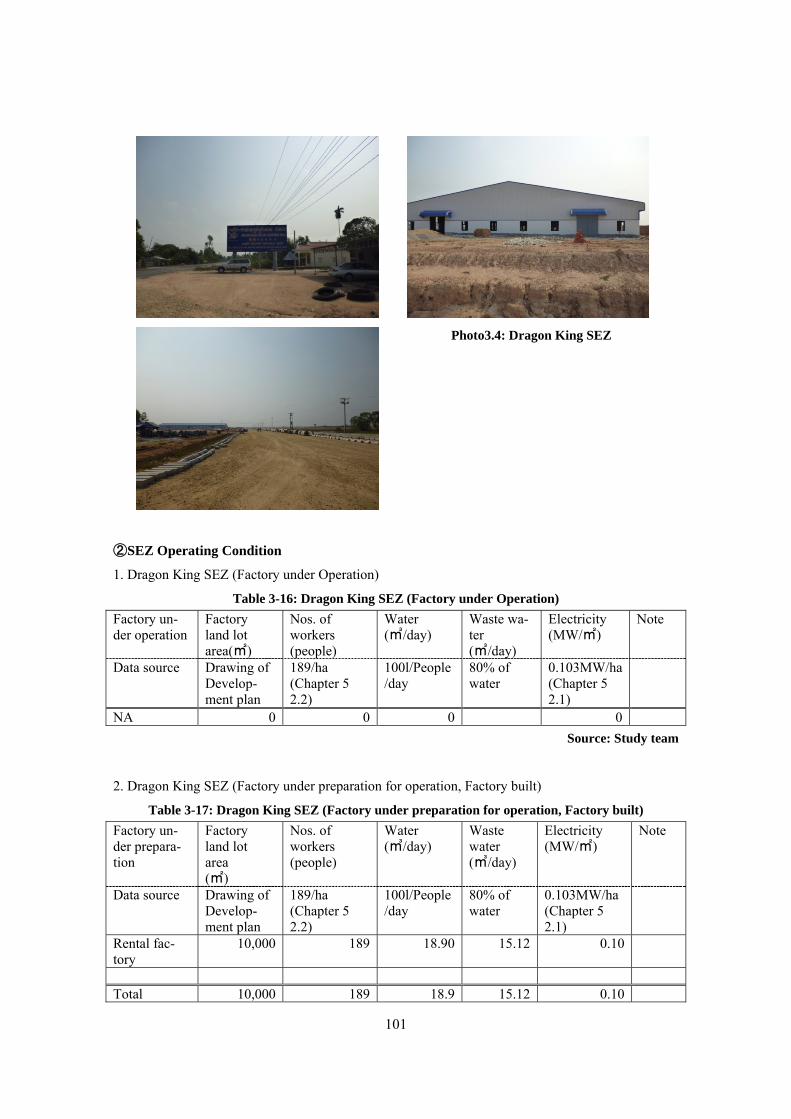
101
Photo3.4: Dragon King SEZ
②SEZ Operating Condition
1. Dragon King SEZ (Factory under Operation)
Table 3-16: Dragon King SEZ (Factory under Operation) Factory un-der operation
Factory land lot area(㎡)
Nos. of workers (people)
Water (㎥/day)
Waste wa-ter (㎥/day)
Electricity (MW/㎡)
Note
Data source Drawing of Develop-ment plan
189/ha (Chapter 5 2.2)
100l/People/day
80% of water
0.103MW/ha (Chapter 5 2.1)
NA 0 0 0 0 Source: Study team
2. Dragon King SEZ (Factory under preparation for operation, Factory built)
Table 3-17: Dragon King SEZ (Factory under preparation for operation, Factory built) Factory un-der prepara-tion
Factory land lot area (㎡)
Nos. of workers (people)
Water (㎥/day)
Waste water (㎥/day)
Electricity (MW/㎡)
Note
Data source Drawing of Develop-ment plan
189/ha (Chapter 5 2.2)
100l/People/day
80% of water
0.103MW/ha (Chapter 5 2.1)
Rental fac-tory
10,000 189 18.90 15.12 0.10
Total 10,000 189 18.9 15.12 0.10
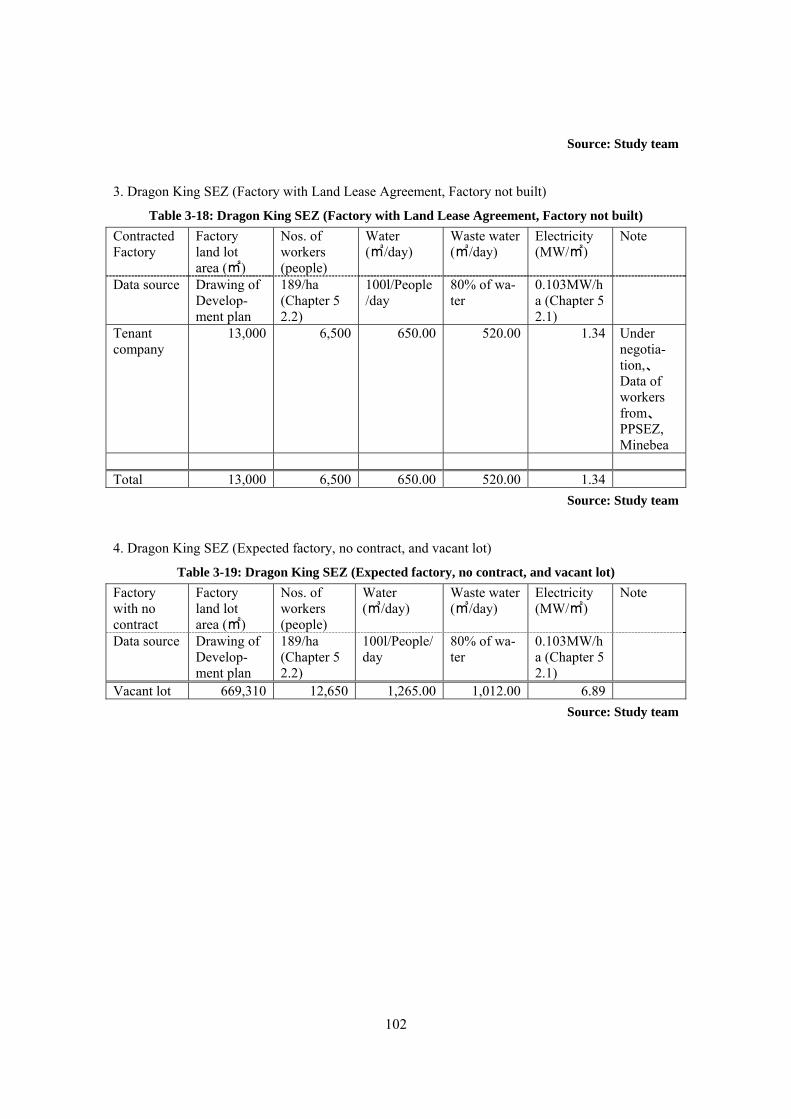
102
Source: Study team
3. Dragon King SEZ (Factory with Land Lease Agreement, Factory not built)
Table 3-18: Dragon King SEZ (Factory with Land Lease Agreement, Factory not built) Contracted Factory
Factory land lot area (㎡)
Nos. of workers (people)
Water (㎥/day)
Waste water(㎥/day)
Electricity (MW/㎡)
Note
Data source Drawing of Develop-ment plan
189/ha (Chapter 5 2.2)
100l/People/day
80% of wa-ter
0.103MW/ha (Chapter 5 2.1)
Tenant company
13,000 6,500 650.00 520.00 1.34 Under negotia-tion,、Data of workers from、PPSEZ, Minebea
Total 13,000 6,500 650.00 520.00 1.34
Source: Study team
4. Dragon King SEZ (Expected factory, no contract, and vacant lot)
Table 3-19: Dragon King SEZ (Expected factory, no contract, and vacant lot) Factory with no contract
Factory land lot area (㎡)
Nos. of workers (people)
Water (㎥/day)
Waste water(㎥/day)
Electricity (MW/㎡)
Note
Data source Drawing of Develop-ment plan
189/ha (Chapter 5 2.2)
100l/People/day
80% of wa-ter
0.103MW/ha (Chapter 5 2.1)
Vacant lot 669,310 12,650 1,265.00 1,012.00 6.89 Source: Study team
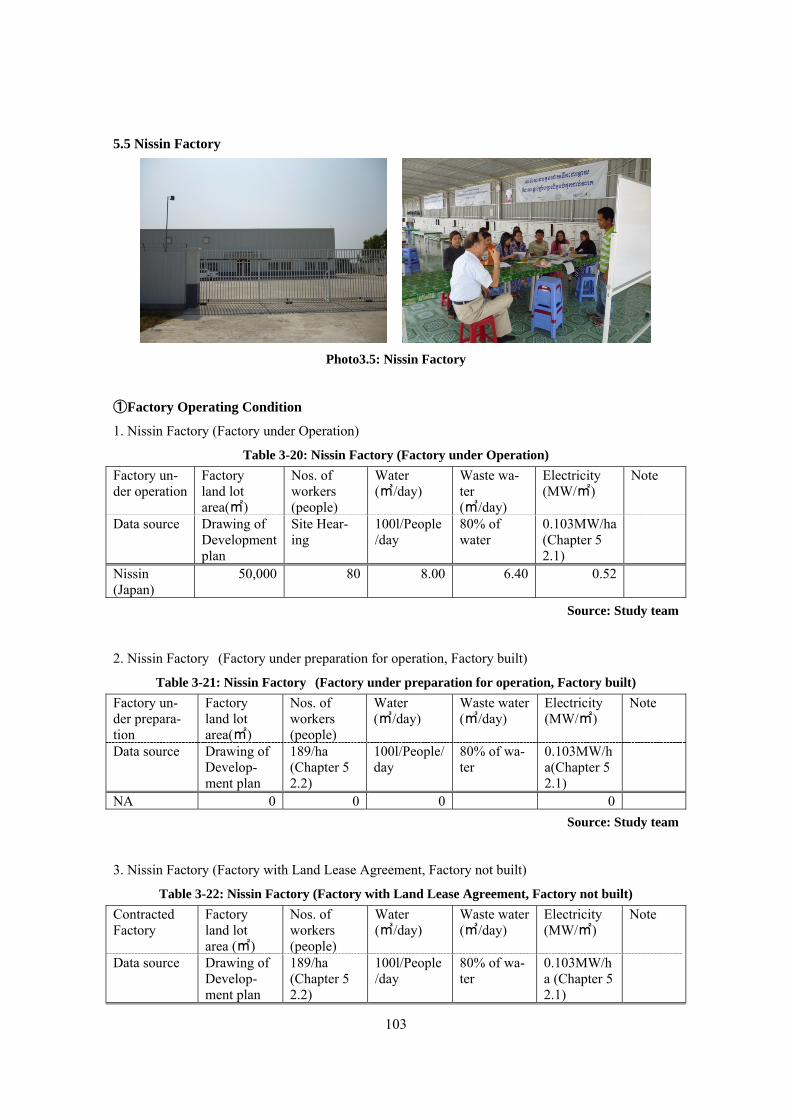
103
5.5 Nissin Factory
Photo3.5: Nissin Factory
①Factory Operating Condition
1. Nissin Factory (Factory under Operation)
Table 3-20: Nissin Factory (Factory under Operation) Factory un-der operation
Factory land lot area(㎡)
Nos. of workers (people)
Water (㎥/day)
Waste wa-ter (㎥/day)
Electricity (MW/㎡)
Note
Data source Drawing of Development plan
Site Hear-ing
100l/People/day
80% of water
0.103MW/ha (Chapter 5 2.1)
Nissin (Japan)
50,000 80 8.00 6.40 0.52
Source: Study team
2. Nissin Factory (Factory under preparation for operation, Factory built)
Table 3-21: Nissin Factory (Factory under preparation for operation, Factory built) Factory un-der prepara-tion
Factory land lot area(㎡)
Nos. of workers (people)
Water (㎥/day)
Waste water(㎥/day)
Electricity (MW/㎡)
Note
Data source Drawing of Develop-ment plan
189/ha (Chapter 5 2.2)
100l/People/day
80% of wa-ter
0.103MW/ha(Chapter 5 2.1)
NA 0 0 0 0 Source: Study team
3. Nissin Factory (Factory with Land Lease Agreement, Factory not built)
Table 3-22: Nissin Factory (Factory with Land Lease Agreement, Factory not built) Contracted Factory
Factory land lot area (㎡)
Nos. of workers (people)
Water (㎥/day)
Waste water(㎥/day)
Electricity (MW/㎡)
Note
Data source Drawing of Develop-ment plan
189/ha (Chapter 5 2.2)
100l/People/day
80% of wa-ter
0.103MW/ha (Chapter 5 2.1)
104
NA 0 0 0 0 Source: Study team
4. Nissin Factory (Expected factory, no contract, and vacant lot)
Table 3-23: Nissin Factory (Expected factory, no contract, and vacant lot) Factory with no contract
Factory land lot area (㎡)
Nos. of workers (people)
Water (㎥/day)
Waste water(㎥/day)
Electricity (MW/㎡)
Note
Data source Drawing of Develop-ment plan
189/ha (Chapter 5 2.2)
100l/People/day
80% of wa-ter
0.103MW/ha (Chapter 5 2.1)
Vacant lot 0 0 0 0 Source: Study team
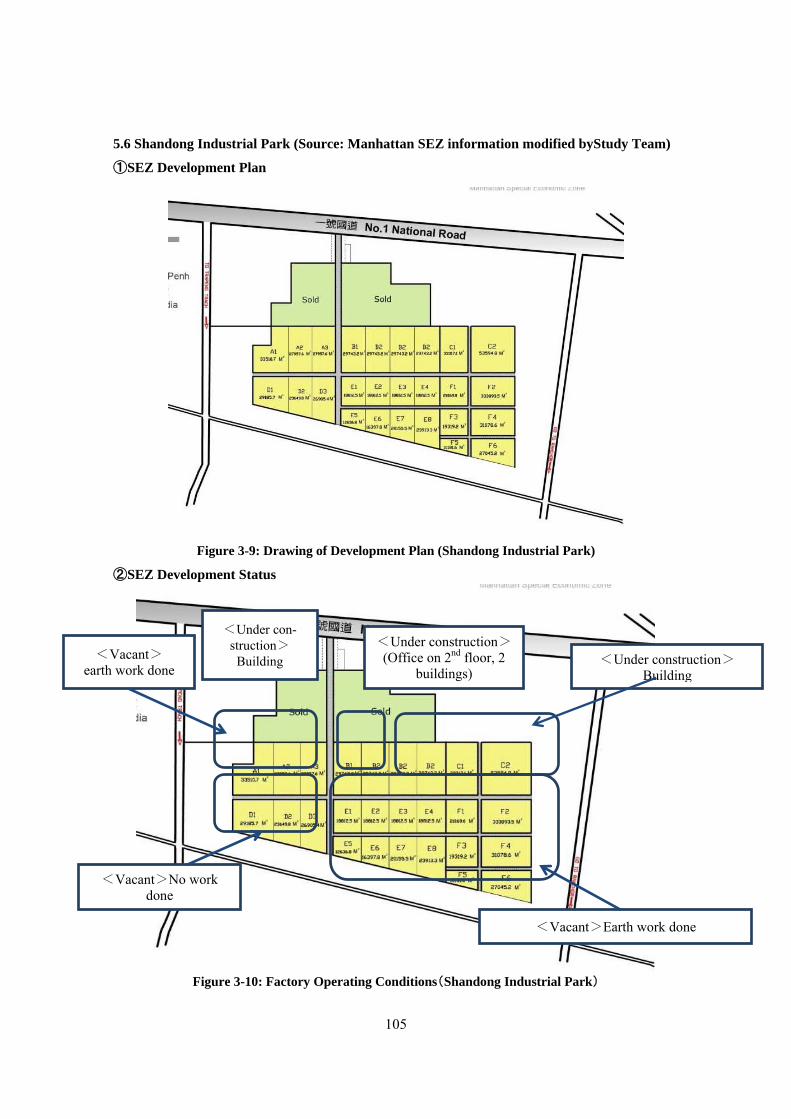
105
5.6 Shandong Industrial Park (Source: Manhattan SEZ information modified byStudy Team)
①SEZ Development Plan
Figure 3-9: Drawing of Development Plan (Shandong Industrial Park)
②SEZ Development Status
Figure 3-10: Factory Operating Conditions(Shandong Industrial Park)
<Vacant>No work done
<Vacant> earth work done
<Vacant>Earth work done
<Under construction>Building
<Under construction>(Office on 2nd floor, 2
buildings)
<Under con-struction>
Building
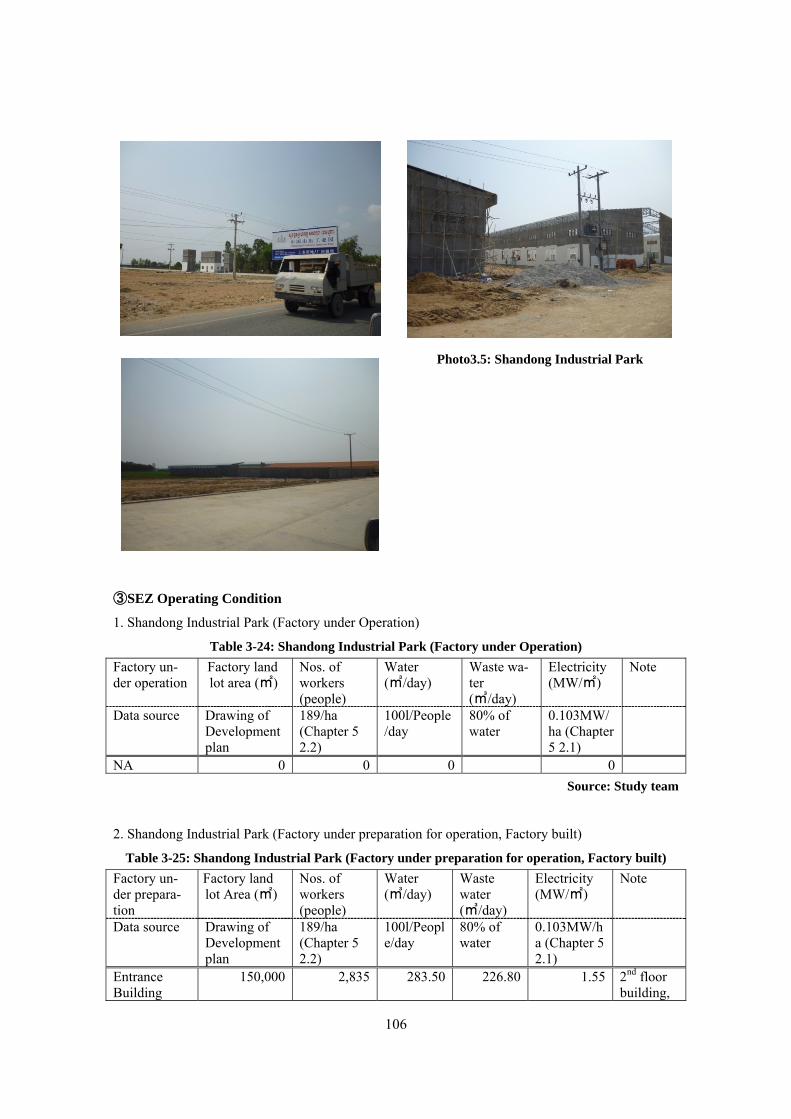
106
Photo3.5: Shandong Industrial Park
③SEZ Operating Condition
1. Shandong Industrial Park (Factory under Operation)
Table 3-24: Shandong Industrial Park (Factory under Operation) Factory un-der operation
Factory land lot area (㎡)
Nos. of workers (people)
Water (㎥/day)
Waste wa-ter (㎥/day)
Electricity (MW/㎡)
Note
Data source Drawing of Development plan
189/ha (Chapter 5 2.2)
100l/People/day
80% of water
0.103MW/ha (Chapter 5 2.1)
NA 0 0 0 0 Source: Study team
2. Shandong Industrial Park (Factory under preparation for operation, Factory built)
Table 3-25: Shandong Industrial Park (Factory under preparation for operation, Factory built) Factory un-der prepara-tion
Factory land lot Area (㎡)
Nos. of workers (people)
Water (㎥/day)
Waste water (㎥/day)
Electricity (MW/㎡)
Note
Data source Drawing of Development plan
189/ha (Chapter 5 2.2)
100l/People/day
80% of water
0.103MW/ha (Chapter 5 2.1)
Entrance Building
150,000 2,835 283.50 226.80 1.55 2nd floor building,
107
ground floor is for rental factory
Building 29,743.20 562 56.21 44.97 0.31 Lot B1 Building 29,743.20 562 56.21 44.97 0.31 Lot B2 Total 209,486.40 3,959 395.92 316.74 2.17
Source: Study team
3. Shandong Industrial Park (Factory with Land Lease Agreement, Factory not built)
Table 3-26: Shandong Industrial Park (Factory with Land Lease Agreement, Factory not built) Contracted Factory
Factory land lot area (㎡)
Nos. of workers (people)
Water (㎥/day)
Waste water (㎥/day)
Electricity (MW/㎡)
Note
Data source Drawing of Development plan
189/ha (Chapter 5 2.2)
100l/People/day
80% of water
0.103MW/ha (Chapter 5 2.1)
NA 0 0 0 0 Source: Study team
4. Shandong Industrial Park (Expected factory, no contract, and vacant lot)
Table 3-27: Shandong Industrial Park (Expected factory, no contract, and vacant lot) Factory with no contract
Factory land lot area (㎡)
Nos. of workers (people)
Water (㎥/day)
Waste water (㎥/day)
Electricity (MW/㎡)
Note
Data source Drawing of Development plan
189/ha (Chapter 5 2.2)
100l/Peopleday
80% of water
0.103MW/ha (Chapter 5 2.1)
Vacant lot 606,505.60 15,422 1,542.22 1,233.78 6.25 Source: Study team
108
5.7 Hi Park SEZ
①SEZ Operating Condition
1. Hi Park SEZ (Factory under Operation)
Table 3-28: Hi Park SEZ (Factory under Operation) Factory un-der opera-tion
Factory land lot area(㎡)
Nos. of workers (people)
Water (㎥/day)
Waste water (㎥/day)
Electricity (MW/㎡)
Note
Data source Drawing of Development plan
189/ha (Chapter 5 2.2)
100l/People/day
80% of water
0.103MW/ha (Chapter 5 2.1)
NA 0 0 0 0 Source: Study team
2. Hi Park SEZ (Factory under preparation for operation, Factory built)
Table 3-29: Hi Park SEZ (Factory under preparation for operation, Factory built) Factory un-der prepara-tion
Factory land lot area(㎡)
Nos. of workers (people)
Water (㎥/day)
Waste water (㎥/day)
Electricity (MW/㎡)
Note
Data source Drawing of Development plan
189/ha (Chapter 5 2.2)
100l/People/day
80% of water
0.103MW/ha (Chapter 5 2.1)
NA 0 0 0 0 Source: Study team
3. Hi Park SEZ (Factory with Land Lease Agreement, Factory not built)
Table 3-30: Hi Park SEZ (Factory with Land Lease Agreement, Factory not built) Contracted Factory
Factory land lot area (㎡)
Nos. of workers (people)
Water (㎥/day)
Waste water (㎥/day)
Electricity (MW/㎡)
Note
Data source Drawing of Development plan
189/ha (Chapter 5 2.2)
100l/People/day
80% of water
0.103MW/ha (Chapter 5 2.1)
NA 0 0 0 0 Source: Study team
4. Hi Park SEZ (Expected factory, no contract, and vacant lot)
Table 3-31: Hi Park SEZ (Expected factory, no contract, and vacant lot) Factory with no contract
Factory land lot area (㎡)
Nos. of workers (people)
Water (㎥/day)
Waste water (㎥/day)
Electricity (MW/㎡)
Note
Data source Drawing of Development plan
189/ha (Chapter 5 2.2)
100l/People/day
80% of water
0.103MW/ha (Chapter 5 2.1)
Vacant lot 2,100,000 39,690 3,969.00 3,175.20 21.63 Source: Study team
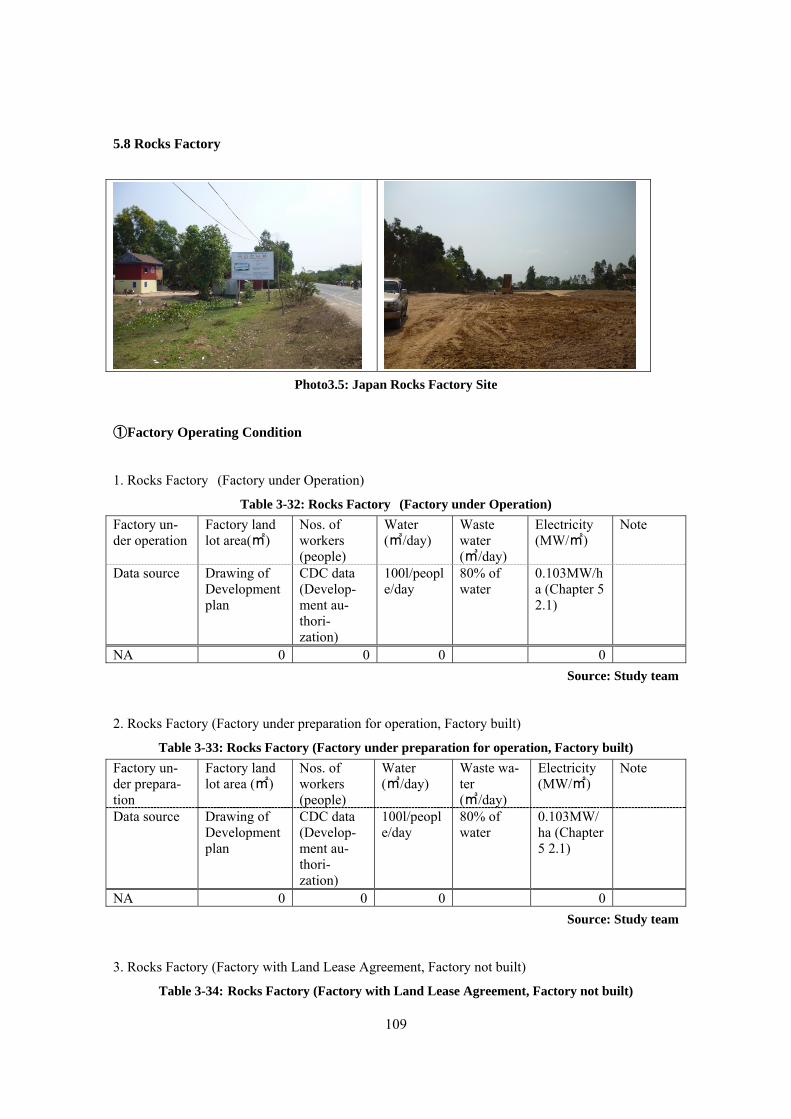
109
5.8 Rocks Factory
Photo3.5: Japan Rocks Factory Site
①Factory Operating Condition
1. Rocks Factory (Factory under Operation)
Table 3-32: Rocks Factory (Factory under Operation) Factory un-der operation
Factory land lot area(㎡)
Nos. of workers (people)
Water (㎥/day)
Waste water (㎥/day)
Electricity (MW/㎡)
Note
Data source Drawing of Development plan
CDC data (Develop-ment au-thori- zation)
100l/people/day
80% of water
0.103MW/ha (Chapter 5 2.1)
NA 0 0 0 0 Source: Study team
2. Rocks Factory (Factory under preparation for operation, Factory built)
Table 3-33: Rocks Factory (Factory under preparation for operation, Factory built) Factory un-der prepara-tion
Factory land lot area (㎡)
Nos. of workers (people)
Water (㎥/day)
Waste wa-ter (㎥/day)
Electricity (MW/㎡)
Note
Data source Drawing of Development plan
CDC data (Develop-ment au-thori- zation)
100l/people/day
80% of water
0.103MW/ha (Chapter 5 2.1)
NA 0 0 0 0 Source: Study team
3. Rocks Factory (Factory with Land Lease Agreement, Factory not built)
Table 3-34: Rocks Factory (Factory with Land Lease Agreement, Factory not built)
110
Contracted Factory
Factory land lot area (㎡)
Nos. of workers (people)
Water (㎥/day)
Waste water (㎥/day)
Electricity (MW/㎡)
Note
Data source Drawing of Development plan
Site Hearing 100l/people/day
80% of water
0.103MW/ha (Chapter 5 2.1)
Japan Rocks (Japan) Under earth works
50,000 3,000 300.00 240.00 0.52 Nos. of worker: Hearing
Source: Study team
4. Rocks Factory (Expected factory, no contract, and vacant lot)
Table 3-35: Rocks Factory (Expected factory, no contract, and vacant lot) Factory with no contract
Factory land lot area (㎡)
Nos. of workers (people)
Water (㎥/day)
Waste water (㎥/day)
Electricity (MW/㎡)
Note
Data source Drawing of Development plan
CDC data (Develop-ment appli-cation)
100l/people/day
80% of water
0.103MW/ha (Chapter 5 2.1)
NA 0 0 0 0 Source: Study team
6. Present Operating Conditions of Factories in Bavet Region
The following table summarizes the previous tables. It shows present agglomerating and operating
factories inside and outside SEZs.
Table 3-36:Present Operating Conditions of Factories in Bavet Region Operating Conditions Time(End of 2012~
January 2013) Note
Total Developed Land Area (ha)
145.57 Assumed: Operating Factory Lot Area×100/70. (Difficult to measure the pre-sent developed area due to the ongoing con-struction.)
Land lot area of operating factories(ha)
101.90
Nos. of operating factories (EA)
31 Inside SEZ:6 (Japan) Outside SEZ:1 (Japan)
Nos. of Workers(people) 18,382 Water(㎥/day) 1,838.20 Assumed: 100l/people/day Waste Water(㎥/day) 1,470.56 80% of Water Volume Electrical demand capac-ity(MW)
10.53 Manhattan and Tai Seng: 10MW
Source: Study team
Next table shows operating Japanese factories.
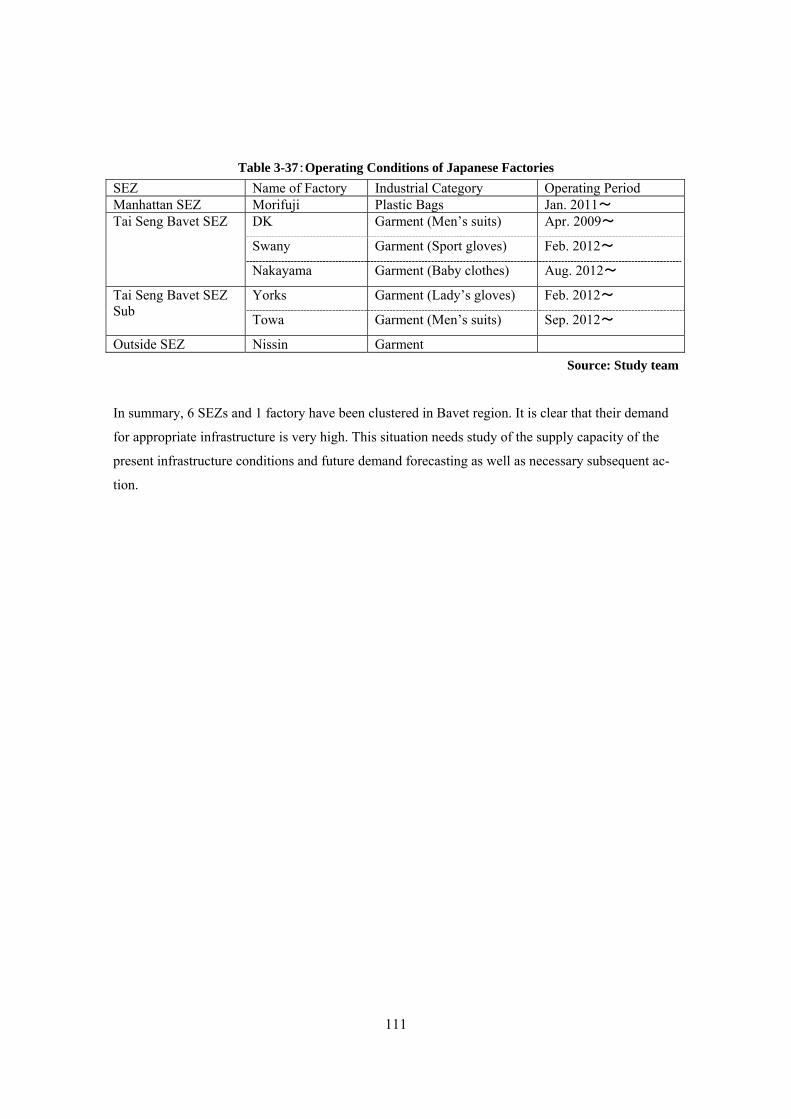
111
Table 3-37:Operating Conditions of Japanese Factories SEZ Name of Factory Industrial Category Operating Period Manhattan SEZ Morifuji Plastic Bags Jan. 2011~ Tai Seng Bavet SEZ DK Garment (Men’s suits) Apr. 2009~
Swany Garment (Sport gloves) Feb. 2012~
Nakayama Garment (Baby clothes) Aug. 2012~
Tai Seng Bavet SEZ Sub
Yorks Garment (Lady’s gloves) Feb. 2012~
Towa Garment (Men’s suits) Sep. 2012~
Outside SEZ Nissin Garment Source: Study team
In summary, 6 SEZs and 1 factory have been clustered in Bavet region. It is clear that their demand
for appropriate infrastructure is very high. This situation needs study of the supply capacity of the
present infrastructure conditions and future demand forecasting as well as necessary subsequent ac-
tion.
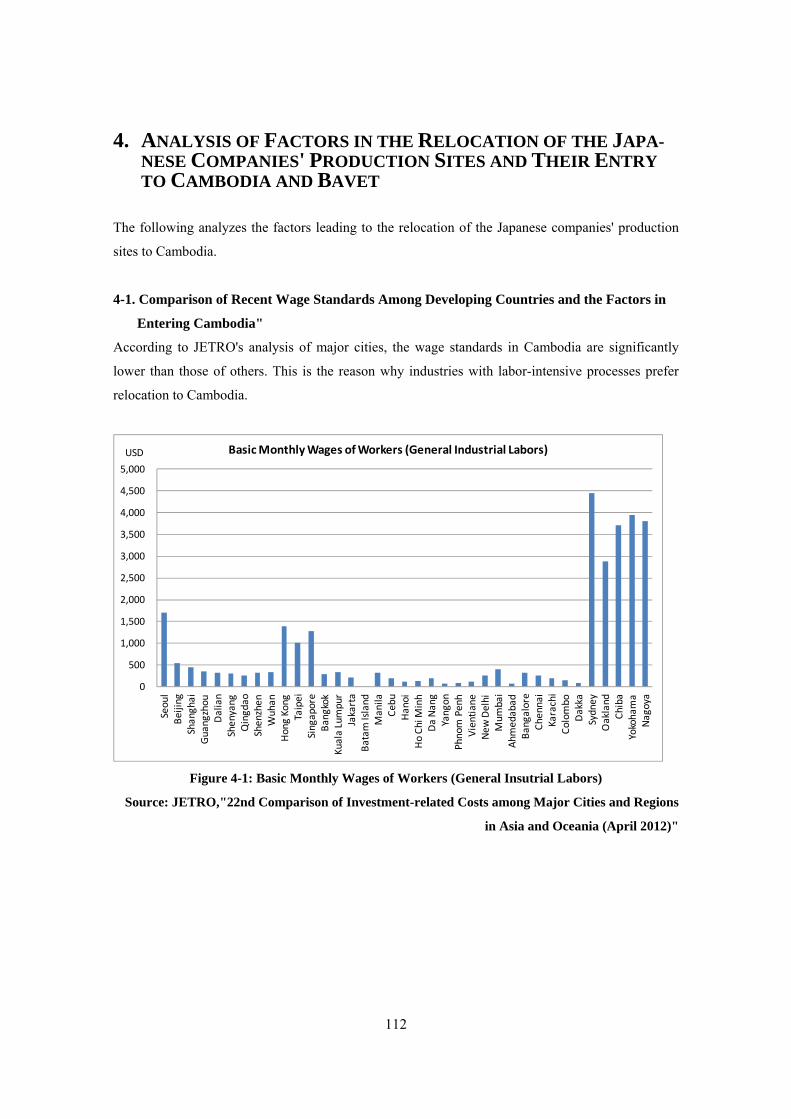
112
4. ANALYSIS OF FACTORS IN THE RELOCATION OF THE JAPA-NESE COMPANIES' PRODUCTION SITES AND THEIR ENTRY TO CAMBODIA AND BAVET
The following analyzes the factors leading to the relocation of the Japanese companies' production
sites to Cambodia.
4-1. Comparison of Recent Wage Standards Among Developing Countries and the Factors in
Entering Cambodia"
According to JETRO's analysis of major cities, the wage standards in Cambodia are significantly
lower than those of others. This is the reason why industries with labor-intensive processes prefer
relocation to Cambodia.
Figure 4-1: Basic Monthly Wages of Workers (General Insutrial Labors)
Source: JETRO,"22nd Comparison of Investment-related Costs among Major Cities and Regions
in Asia and Oceania (April 2012)"
0
500
1,000
1,500
2,000
2,500
3,000
3,500
4,000
4,500
5,000
Seoul
Beijing
Shanghai
Guangzhou
Dalian
Shenyang
Qingdao
Shenzhen
Wuhan
Hong Kong
Taipei
Singapore
Bangkok
Kuala Lumpur
Jakarta
Batam Island
Manila
Cebu
Hanoi
Ho Ch
i Minh
Da Nang
Yangon
Phnom Penh
Vientia
neNew
Delhi
Mum
bai
Ahmedabad
Bangalore
Chennai
Karachi
Colombo
Dakka
Sydney
Oakland
Chiba
Yokohama
Nagoya
Basic Monthly Wages of Workers (General Industrial Labors)USD
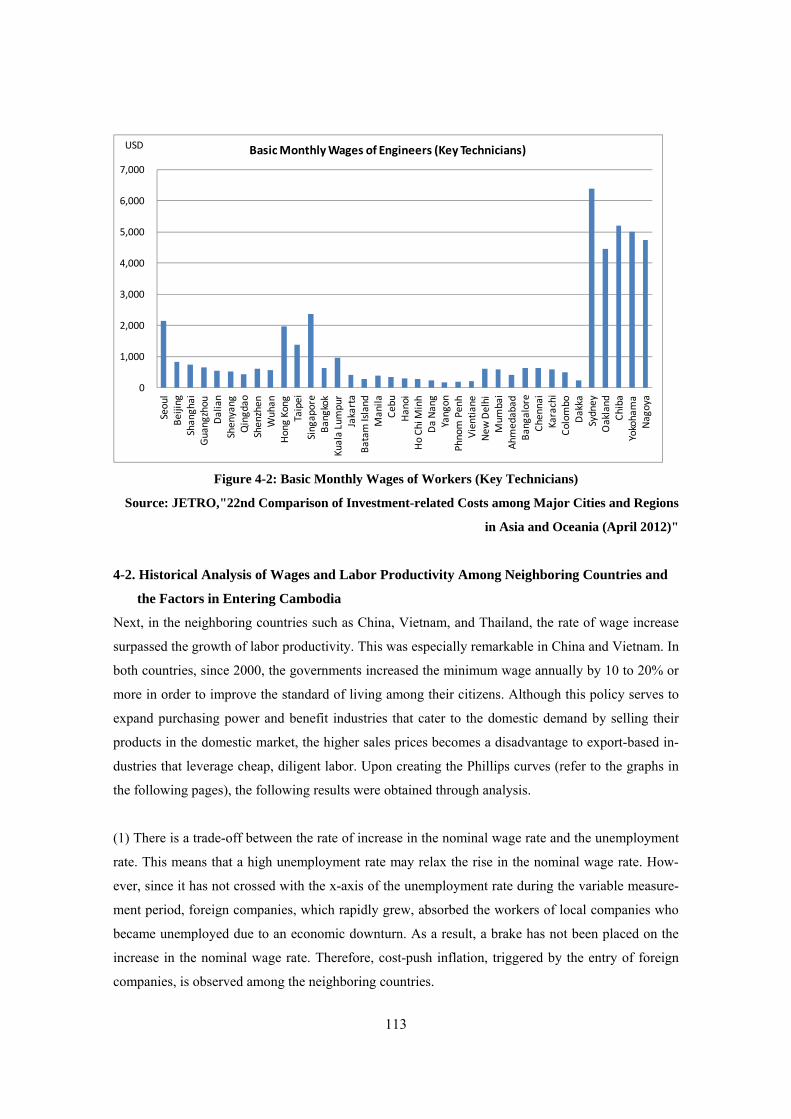
113
Figure 4-2: Basic Monthly Wages of Workers (Key Technicians)
Source: JETRO,"22nd Comparison of Investment-related Costs among Major Cities and Regions
in Asia and Oceania (April 2012)"
4-2. Historical Analysis of Wages and Labor Productivity Among Neighboring Countries and
the Factors in Entering Cambodia
Next, in the neighboring countries such as China, Vietnam, and Thailand, the rate of wage increase
surpassed the growth of labor productivity. This was especially remarkable in China and Vietnam. In
both countries, since 2000, the governments increased the minimum wage annually by 10 to 20% or
more in order to improve the standard of living among their citizens. Although this policy serves to
expand purchasing power and benefit industries that cater to the domestic demand by selling their
products in the domestic market, the higher sales prices becomes a disadvantage to export-based in-
dustries that leverage cheap, diligent labor. Upon creating the Phillips curves (refer to the graphs in
the following pages), the following results were obtained through analysis.
(1) There is a trade-off between the rate of increase in the nominal wage rate and the unemployment
rate. This means that a high unemployment rate may relax the rise in the nominal wage rate. How-
ever, since it has not crossed with the x-axis of the unemployment rate during the variable measure-
ment period, foreign companies, which rapidly grew, absorbed the workers of local companies who
became unemployed due to an economic downturn. As a result, a brake has not been placed on the
increase in the nominal wage rate. Therefore, cost-push inflation, triggered by the entry of foreign
companies, is observed among the neighboring countries.
0
1,000
2,000
3,000
4,000
5,000
6,000
7,000 Seoul
Beijing
Shanghai
Guangzhou
Dalian
Shenyang
Qingdao
Shenzhen
Wuhan
Hong Kong
Taipei
Singapore
Bangkok
Kuala Lumpur
Jakarta
Batam Island
Manila
Cebu
Hanoi
Ho Ch
i Minh
Da Nang
Yangon
Phnom Penh
Vientia
neNew
Delhi
Mum
bai
Ahmedabad
Bangalore
Chennai
Karachi
Colombo
Dakka
Sydney
Oakland
Chiba
Yokohama
Nagoya
Basic Monthly Wages of Engineers (Key Technicians)USD
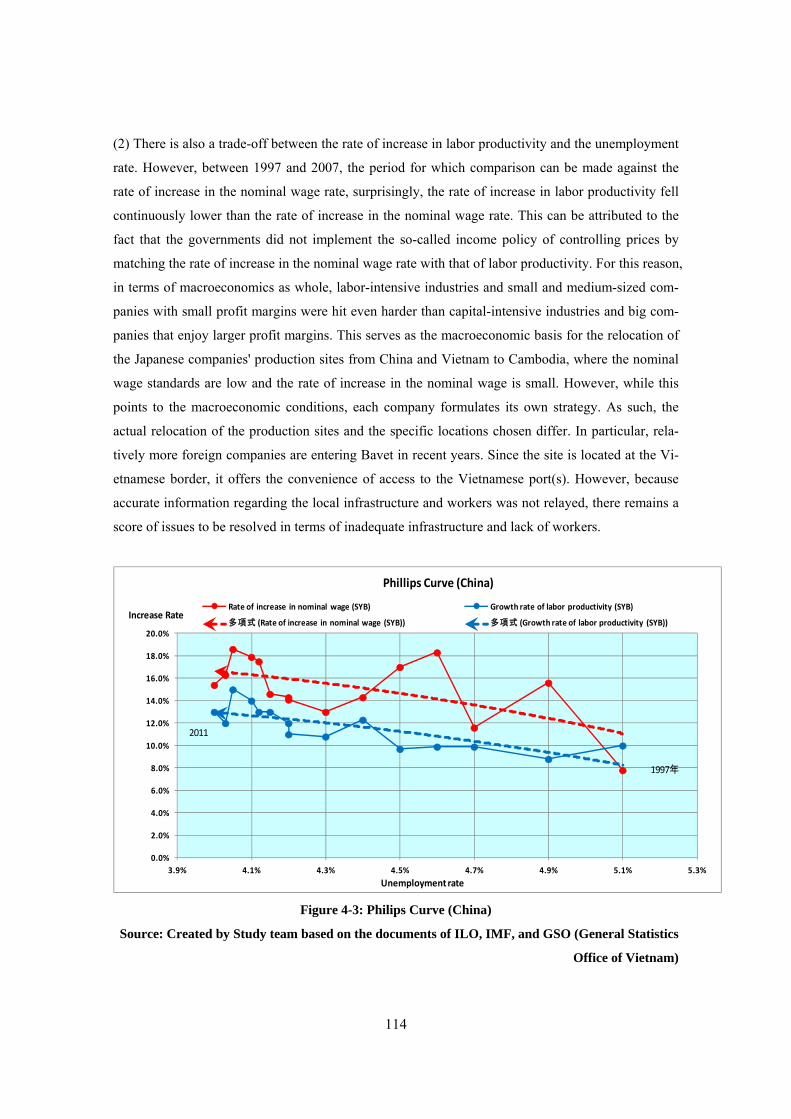
114
(2) There is also a trade-off between the rate of increase in labor productivity and the unemployment
rate. However, between 1997 and 2007, the period for which comparison can be made against the
rate of increase in the nominal wage rate, surprisingly, the rate of increase in labor productivity fell
continuously lower than the rate of increase in the nominal wage rate. This can be attributed to the
fact that the governments did not implement the so-called income policy of controlling prices by
matching the rate of increase in the nominal wage rate with that of labor productivity. For this reason,
in terms of macroeconomics as whole, labor-intensive industries and small and medium-sized com-
panies with small profit margins were hit even harder than capital-intensive industries and big com-
panies that enjoy larger profit margins. This serves as the macroeconomic basis for the relocation of
the Japanese companies' production sites from China and Vietnam to Cambodia, where the nominal
wage standards are low and the rate of increase in the nominal wage is small. However, while this
points to the macroeconomic conditions, each company formulates its own strategy. As such, the
actual relocation of the production sites and the specific locations chosen differ. In particular, rela-
tively more foreign companies are entering Bavet in recent years. Since the site is located at the Vi-
etnamese border, it offers the convenience of access to the Vietnamese port(s). However, because
accurate information regarding the local infrastructure and workers was not relayed, there remains a
score of issues to be resolved in terms of inadequate infrastructure and lack of workers.
Figure 4-3: Philips Curve (China)
Source: Created by Study team based on the documents of ILO, IMF, and GSO (General Statistics
Office of Vietnam)
0.0%
2.0%
4.0%
6.0%
8.0%
10.0%
12.0%
14.0%
16.0%
18.0%
20.0%
3.9% 4.1% 4.3% 4.5% 4.7% 4.9% 5.1% 5.3%
Rate of increase in nominal wage (SYB) Growth rate of labor productivity (SYB)
多項式 (Rate of increase in nominal wage (SYB)) 多項式 (Growth rate of labor productivity (SYB))
Phillips Curve (China)
Unemployment rate
2011
1997年
Increase Rate
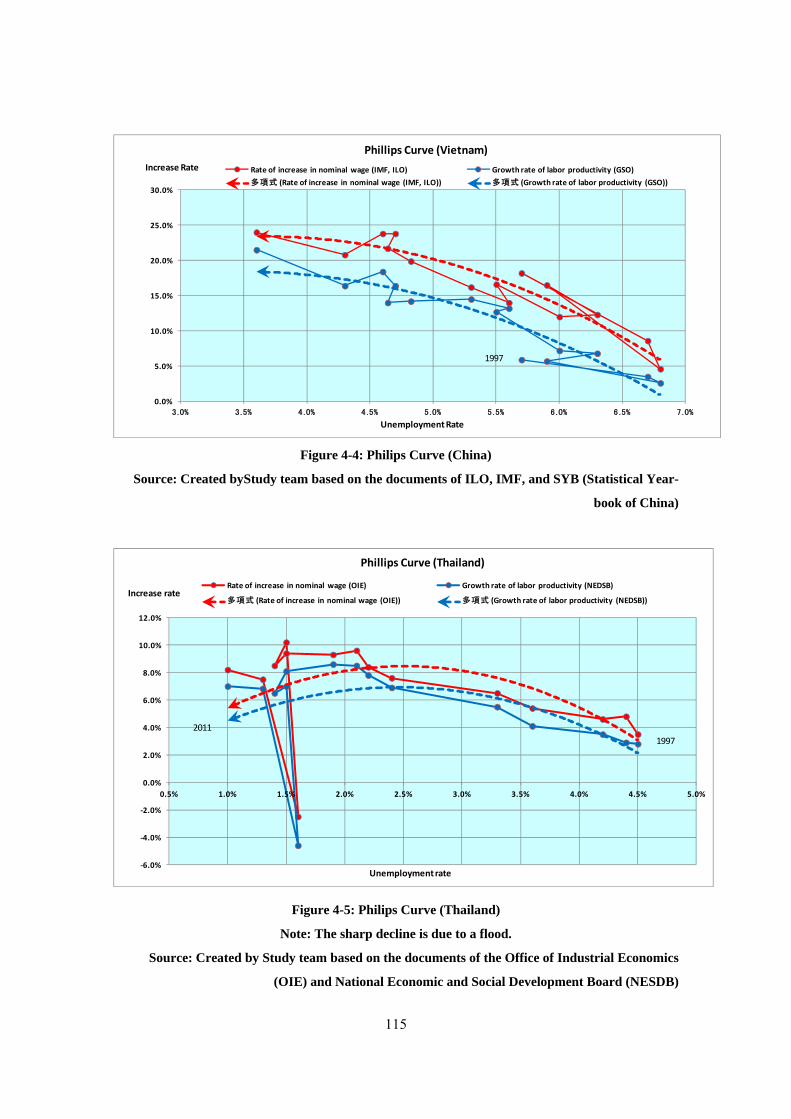
115
Figure 4-4: Philips Curve (China)
Source: Created byStudy team based on the documents of ILO, IMF, and SYB (Statistical Year-
book of China)
Figure 4-5: Philips Curve (Thailand)
Note: The sharp decline is due to a flood.
Source: Created by Study team based on the documents of the Office of Industrial Economics
(OIE) and National Economic and Social Development Board (NESDB)
0.0%
5.0%
10.0%
15.0%
20.0%
25.0%
30.0%
3 .0% 3 .5% 4 .0% 4 .5% 5 .0% 5 .5% 6 .0% 6 .5% 7 .0%
Rate of increase in nominal wage (IMF, ILO) Growth rate of labor productivity (GSO)
多項式 (Rate of increase in nominal wage (IMF, ILO)) 多項式 (Growth rate of labor productivity (GSO))
Unemployment Rate
Phillips Curve (Vietnam)
1997
Increase Rate
‐6.0%
‐4.0%
‐2.0%
0.0%
2.0%
4.0%
6.0%
8.0%
10.0%
12.0%
0.5% 1.0% 1.5% 2.0% 2.5% 3.0% 3.5% 4.0% 4.5% 5.0%
Rate of increase in nominal wage (OIE) Growth rate of labor productivity (NEDSB)
多項式 (Rate of increase in nominal wage (OIE)) 多項式 (Growth rate of labor productivity (NEDSB))
Phillips Curve (Thailand)
Unemployment rate
19972011
Increase rate
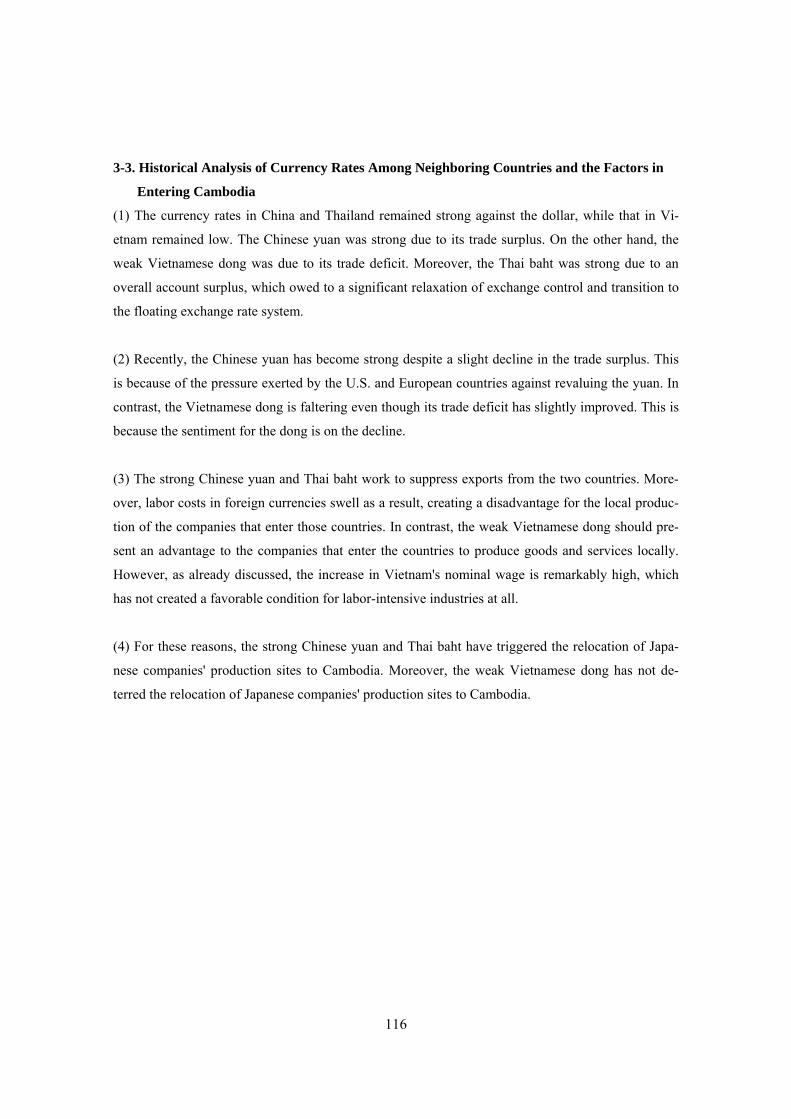
116
3-3. Historical Analysis of Currency Rates Among Neighboring Countries and the Factors in
Entering Cambodia
(1) The currency rates in China and Thailand remained strong against the dollar, while that in Vi-
etnam remained low. The Chinese yuan was strong due to its trade surplus. On the other hand, the
weak Vietnamese dong was due to its trade deficit. Moreover, the Thai baht was strong due to an
overall account surplus, which owed to a significant relaxation of exchange control and transition to
the floating exchange rate system.
(2) Recently, the Chinese yuan has become strong despite a slight decline in the trade surplus. This
is because of the pressure exerted by the U.S. and European countries against revaluing the yuan. In
contrast, the Vietnamese dong is faltering even though its trade deficit has slightly improved. This is
because the sentiment for the dong is on the decline.
(3) The strong Chinese yuan and Thai baht work to suppress exports from the two countries. More-
over, labor costs in foreign currencies swell as a result, creating a disadvantage for the local produc-
tion of the companies that enter those countries. In contrast, the weak Vietnamese dong should pre-
sent an advantage to the companies that enter the countries to produce goods and services locally.
However, as already discussed, the increase in Vietnam's nominal wage is remarkably high, which
has not created a favorable condition for labor-intensive industries at all.
(4) For these reasons, the strong Chinese yuan and Thai baht have triggered the relocation of Japa-
nese companies' production sites to Cambodia. Moreover, the weak Vietnamese dong has not de-
terred the relocation of Japanese companies' production sites to Cambodia.
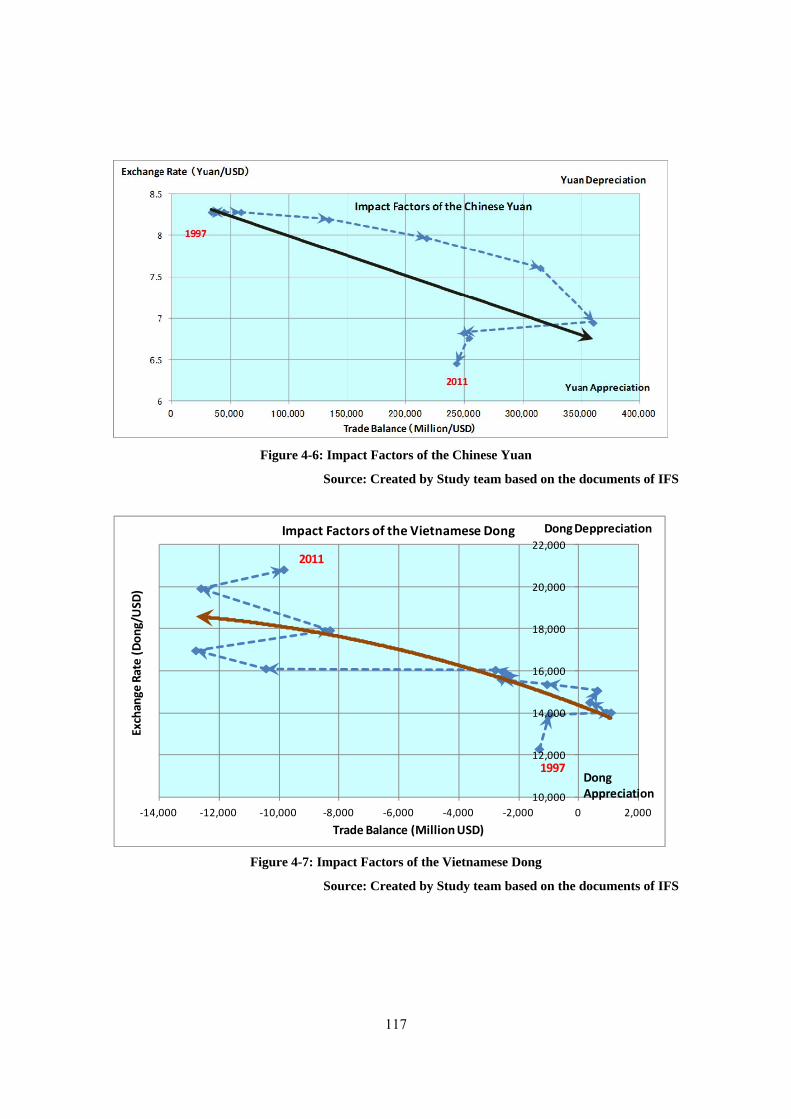
117
Figure 4-6: Impact Factors of the Chinese Yuan
Source: Created by Study team based on the documents of IFS
Figure 4-7: Impact Factors of the Vietnamese Dong
Source: Created by Study team based on the documents of IFS
10,000
12,000
14,000
16,000
18,000
20,000
22,000
‐14,000 ‐12,000 ‐10,000 ‐8,000 ‐6,000 ‐4,000 ‐2,000 0 2,000
Impact Factors of the Vietnamese Dong
Trade Balance (Million USD)
1997
2011
Dong Deppreciation
Dong Appreciation
Exchange
Rate (D
ong/USD
)
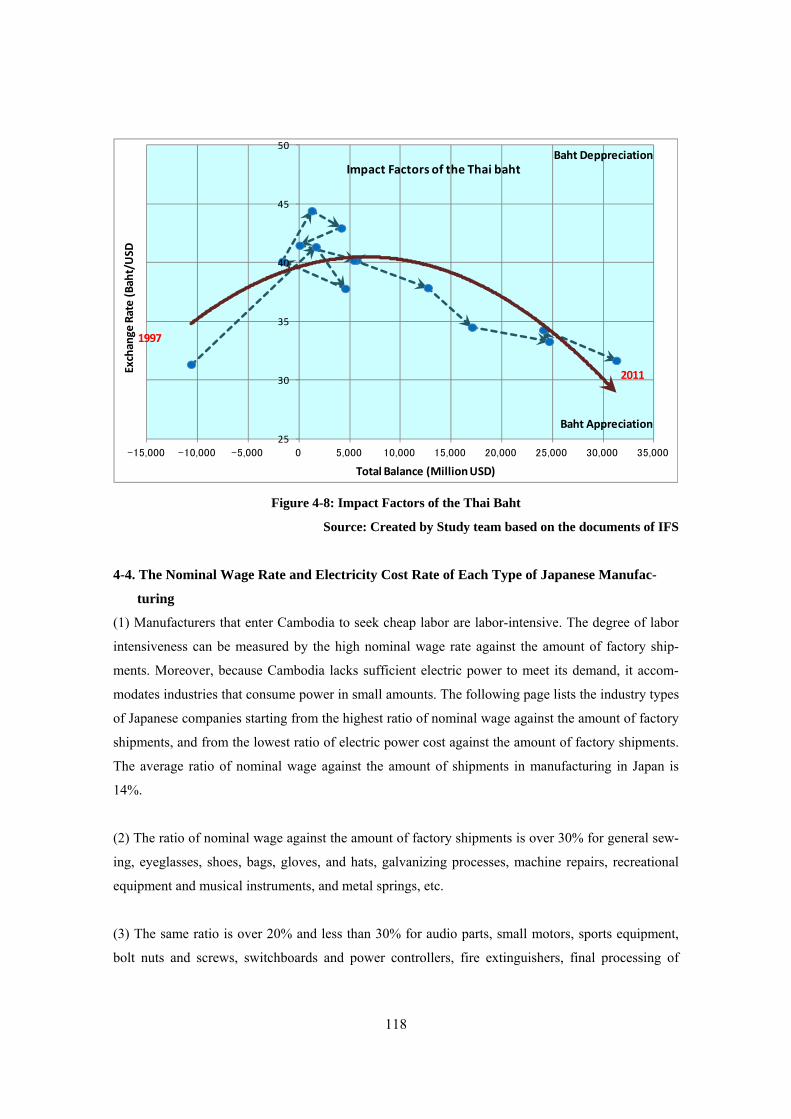
118
Figure 4-8: Impact Factors of the Thai Baht
Source: Created by Study team based on the documents of IFS
4-4. The Nominal Wage Rate and Electricity Cost Rate of Each Type of Japanese Manufac-
turing
(1) Manufacturers that enter Cambodia to seek cheap labor are labor-intensive. The degree of labor
intensiveness can be measured by the high nominal wage rate against the amount of factory ship-
ments. Moreover, because Cambodia lacks sufficient electric power to meet its demand, it accom-
modates industries that consume power in small amounts. The following page lists the industry types
of Japanese companies starting from the highest ratio of nominal wage against the amount of factory
shipments, and from the lowest ratio of electric power cost against the amount of factory shipments.
The average ratio of nominal wage against the amount of shipments in manufacturing in Japan is
14%.
(2) The ratio of nominal wage against the amount of factory shipments is over 30% for general sew-
ing, eyeglasses, shoes, bags, gloves, and hats, galvanizing processes, machine repairs, recreational
equipment and musical instruments, and metal springs, etc.
(3) The same ratio is over 20% and less than 30% for audio parts, small motors, sports equipment,
bolt nuts and screws, switchboards and power controllers, fire extinguishers, final processing of
25
30
35
40
45
50
-15,000 -10,000 -5,000 0 5,000 10,000 15,000 20,000 25,000 30,000 35,000
Baht Appreciation
Impact Factors of the Thai baht
Total Balance (Million USD)
Exchange
Rate (B
aht/USD
Baht Deppreciation
1997
2011

119
metal products for construction, wire harnesses, mold plastics, clock and clock parts, corrugated
cardboard boxes, stationery, etc.
(4) In contrast, in capital-intensive industries (process industries), those with a ratio that falls below
10% include CDs and DVDs, LCD and flat panels, cement, pharmaceuticals, mobile phones, iron-
works, steelworks and rolling, etc.
(5) In fact, the companies that have entered Cambodia specialize in fields that demonstrate a high
ratio of nominal wage against the amount of factory shipments, such as general sewing, eyeglasses,
shoes, bags, gloves, and hats, galvanizing processes, metal springs, audio parts, small motors, coils
and transformers, bolt nuts and screws, wire harnesses, mold plastics, clocks and clock parts, corru-
gated cardboard boxes, stationery, bicycles, construction materials, etc. These industries will priori-
tize Phnom Penh as long as they require that infrastructure is in place and labor can be secured.
However, there are quite a few companies who have entered the Bavet region, which offers cheap
rent, despite lacking these requirements. This is based on corporate strategy and does not rely on the
government's policy on the choice of industrial locations.
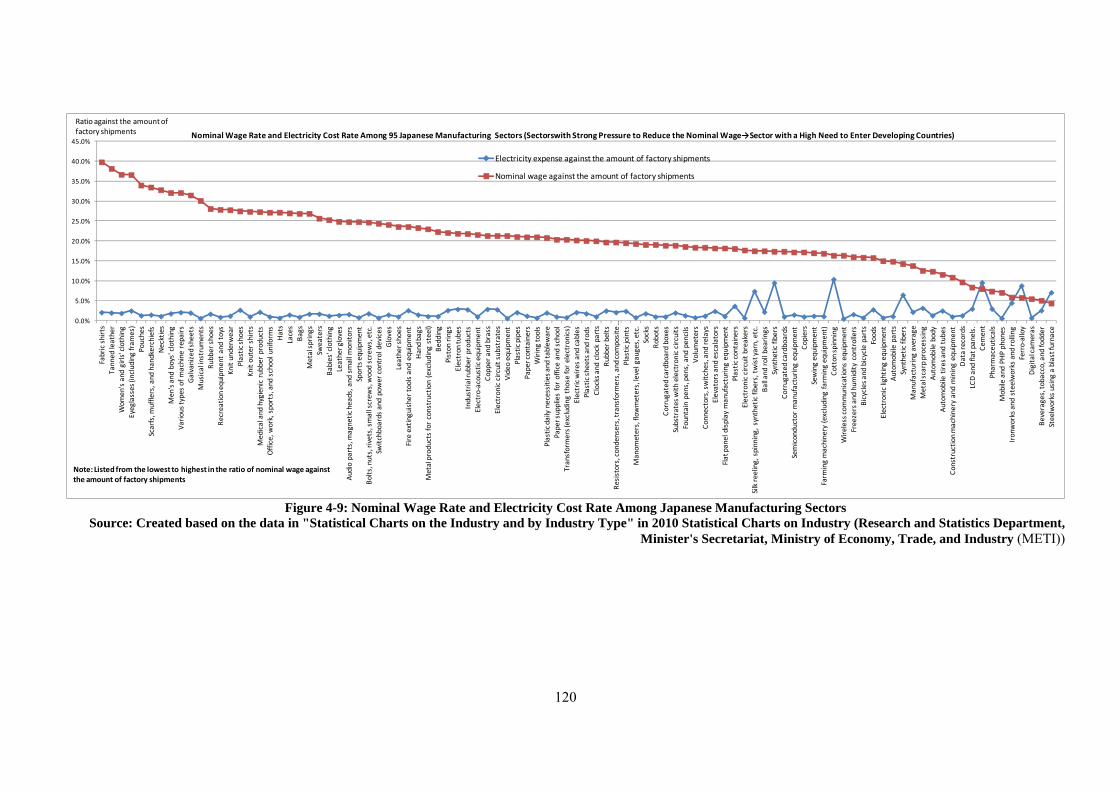
120
Figure 4-9: Nominal Wage Rate and Electricity Cost Rate Among Japanese Manufacturing Sectors
Source: Created based on the data in "Statistical Charts on the Industry and by Industry Type" in 2010 Statistical Charts on Industry (Research and Statistics Department, Minister's Secretariat, Ministry of Economy, Trade, and Industry (METI))
0.0%
5.0%
10.0%
15.0%
20.0%
25.0%
30.0%
35.0%
40.0%
45.0%
Fabric shirts
Tanned
leather
Wom
en's and
girls' clothing
Eyeglasses (including
fram
es)
Pouches
Scarfs, m
ufflers, and
handkerchiefs
Neckties
Men's and
boys' clothing
Vario
us types of m
achine
repairs
Galvanized sheets
Musical instruments
Rubber shoes
Recreatio
n equipm
ent and toys
Knit underw
ear
Plastic
shoes
Knit outer shirts
Medical and
hygienic rubber products
Office, work, sports, and
school uniform
sHats
Laces
Bags
Metal sp
rings
Sweaters
Babies' clothing
Leather gloves
Audio parts, magnetic h
eads, and
small m
onito
rsSports equipment
Bolts, nuts, rivets, small screw
s, wood screws, etc.
Switchboards and power control devices
Gloves
Leather shoes
Fire extinguisher tools and equipm
ent
Hand bags
Metal products for constructio
n (excluding
steel)
Bedding
Piston
rings
Electron
tubes
Industria
l rubber products
Electro‐acoustic equipment
Copper and
brass
Electronic circuit substrates
Video equipm
ent
Plastic
pipes
Paper containers
Wiring
tools
Plastic
daily necessitie
s and
tablew
are
Paper supplies for office and school
Transformers (excluding
those for electronics)
Electric wire
s and cables
Plastic
sheets and
rods
Clocks and
clock parts
Rubber belts
Resistors, co
ndensers, transform
ers, and
composite …
Plastic
joints
Manom
eters, flow
meters, level gauges, etc.
Socks
Robots
Corrugated
cardboard boxes
Substrates with
electronic circuits
Fountain pens, pens, and
pencils
Volum
eters
Connectors, switches, and
relays
Elevators a
nd escalators
Flat panel display m
anufacturin
g equipm
ent
Plastic
containers
Electronic circuit b
reakers
Silk re
eling, spinning, synthetic fibers, twist yarn, etc.
Ball a
nd ro
ll bearings
Synthetic
fibers
Corrugated
cardboards
Semiconductor m
anufacturin
g equipm
ent
Copiers
Sewing equipm
ent
Farm
ing machinery (e
xcluding
farm
ing equipm
ent)
Cotton
spinning
Wire
less co
mmunications equipment
Freezers and
hum
idity
controllers
Bicycles and
bicycle parts
Foods
Electronic lightin
g equipm
ent
Automobile parts
Synthetic
fibers
Manufacturin
g average
Metal scarp processing
Automobile body
Automobile tire
s and
tubes
Constructio
n machinery and
mining equipm
ent
Data records
LCD and
flat panels.
Cement
Pharmaceuticals
Mobile and
PHP phones
Ironworks and
steelworks and
rolling
Ferro‐alloy
Digita
l cam
eras
Beverages, tobacco, and
fodder
Steelworks using
a blast furnace
Electricity expense against the amount of factory shipments
Nominal wage against the amount of factory shipments
Nominal Wage Rate and Electricity Cost Rate Among 95 Japanese Manufacturing Sectors (Sectorswith Strong Pressure to Reduce the Nominal Wage→Sector with a High Need to Enter Developing Countries)
Ratio against the amount of factory shipments
Note: Listed from the lowest to highest in the ratio of nominal wage against the amount of factory shipments
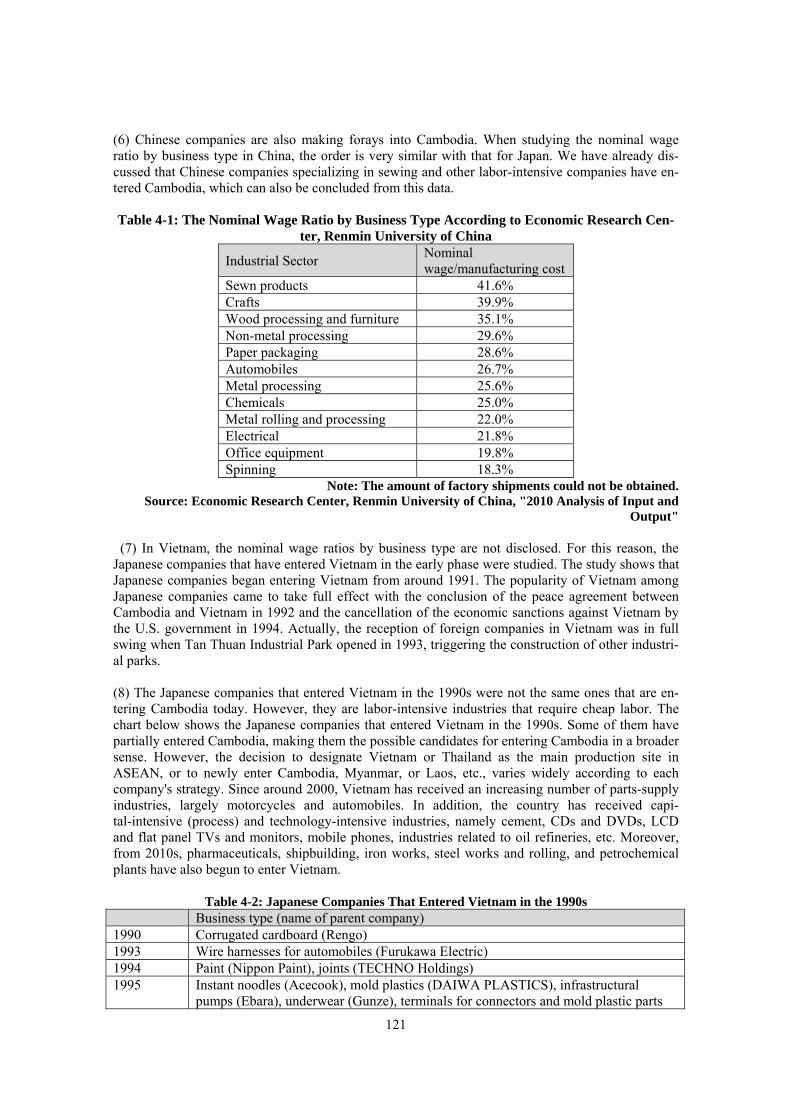
121
(6) Chinese companies are also making forays into Cambodia. When studying the nominal wage ratio by business type in China, the order is very similar with that for Japan. We have already dis-cussed that Chinese companies specializing in sewing and other labor-intensive companies have en-tered Cambodia, which can also be concluded from this data. Table 4-1: The Nominal Wage Ratio by Business Type According to Economic Research Cen-
ter, Renmin University of China
Industrial Sector Nominal wage/manufacturing cost
Sewn products 41.6% Crafts 39.9% Wood processing and furniture 35.1% Non-metal processing 29.6% Paper packaging 28.6% Automobiles 26.7% Metal processing 25.6% Chemicals 25.0% Metal rolling and processing 22.0% Electrical 21.8% Office equipment 19.8% Spinning 18.3%
Note: The amount of factory shipments could not be obtained. Source: Economic Research Center, Renmin University of China, "2010 Analysis of Input and
Output"
(7) In Vietnam, the nominal wage ratios by business type are not disclosed. For this reason, the Japanese companies that have entered Vietnam in the early phase were studied. The study shows that Japanese companies began entering Vietnam from around 1991. The popularity of Vietnam among Japanese companies came to take full effect with the conclusion of the peace agreement between Cambodia and Vietnam in 1992 and the cancellation of the economic sanctions against Vietnam by the U.S. government in 1994. Actually, the reception of foreign companies in Vietnam was in full swing when Tan Thuan Industrial Park opened in 1993, triggering the construction of other industri-al parks. (8) The Japanese companies that entered Vietnam in the 1990s were not the same ones that are en-tering Cambodia today. However, they are labor-intensive industries that require cheap labor. The chart below shows the Japanese companies that entered Vietnam in the 1990s. Some of them have partially entered Cambodia, making them the possible candidates for entering Cambodia in a broader sense. However, the decision to designate Vietnam or Thailand as the main production site in ASEAN, or to newly enter Cambodia, Myanmar, or Laos, etc., varies widely according to each company's strategy. Since around 2000, Vietnam has received an increasing number of parts-supply industries, largely motorcycles and automobiles. In addition, the country has received capi-tal-intensive (process) and technology-intensive industries, namely cement, CDs and DVDs, LCD and flat panel TVs and monitors, mobile phones, industries related to oil refineries, etc. Moreover, from 2010s, pharmaceuticals, shipbuilding, iron works, steel works and rolling, and petrochemical plants have also begun to enter Vietnam.
Table 4-2: Japanese Companies That Entered Vietnam in the 1990s Business type (name of parent company) 1990 Corrugated cardboard (Rengo) 1993 Wire harnesses for automobiles (Furukawa Electric) 1994 Paint (Nippon Paint), joints (TECHNO Holdings) 1995 Instant noodles (Acecook), mold plastics (DAIWA PLASTICS), infrastructural
pumps (Ebara), underwear (Gunze), terminals for connectors and mold plastic parts
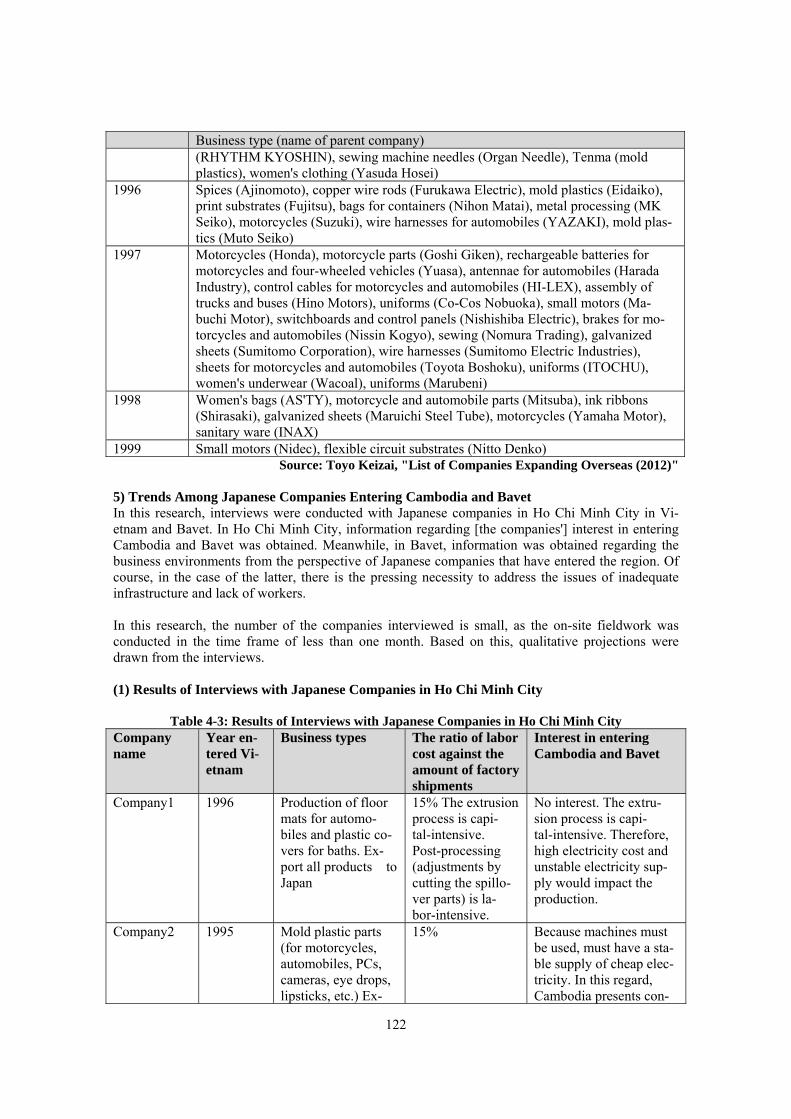
122
Business type (name of parent company) (RHYTHM KYOSHIN), sewing machine needles (Organ Needle), Tenma (mold plastics), women's clothing (Yasuda Hosei)
1996 Spices (Ajinomoto), copper wire rods (Furukawa Electric), mold plastics (Eidaiko), print substrates (Fujitsu), bags for containers (Nihon Matai), metal processing (MK Seiko), motorcycles (Suzuki), wire harnesses for automobiles (YAZAKI), mold plas-tics (Muto Seiko)
1997 Motorcycles (Honda), motorcycle parts (Goshi Giken), rechargeable batteries for motorcycles and four-wheeled vehicles (Yuasa), antennae for automobiles (Harada Industry), control cables for motorcycles and automobiles (HI-LEX), assembly of trucks and buses (Hino Motors), uniforms (Co-Cos Nobuoka), small motors (Ma-buchi Motor), switchboards and control panels (Nishishiba Electric), brakes for mo-torcycles and automobiles (Nissin Kogyo), sewing (Nomura Trading), galvanized sheets (Sumitomo Corporation), wire harnesses (Sumitomo Electric Industries), sheets for motorcycles and automobiles (Toyota Boshoku), uniforms (ITOCHU), women's underwear (Wacoal), uniforms (Marubeni)
1998 Women's bags (AS'TY), motorcycle and automobile parts (Mitsuba), ink ribbons (Shirasaki), galvanized sheets (Maruichi Steel Tube), motorcycles (Yamaha Motor), sanitary ware (INAX)
1999 Small motors (Nidec), flexible circuit substrates (Nitto Denko) Source: Toyo Keizai, "List of Companies Expanding Overseas (2012)"
5) Trends Among Japanese Companies Entering Cambodia and Bavet In this research, interviews were conducted with Japanese companies in Ho Chi Minh City in Vi-etnam and Bavet. In Ho Chi Minh City, information regarding [the companies'] interest in entering Cambodia and Bavet was obtained. Meanwhile, in Bavet, information was obtained regarding the business environments from the perspective of Japanese companies that have entered the region. Of course, in the case of the latter, there is the pressing necessity to address the issues of inadequate infrastructure and lack of workers. In this research, the number of the companies interviewed is small, as the on-site fieldwork was conducted in the time frame of less than one month. Based on this, qualitative projections were drawn from the interviews. (1) Results of Interviews with Japanese Companies in Ho Chi Minh City
Table 4-3: Results of Interviews with Japanese Companies in Ho Chi Minh City Company name
Year en-tered Vi-etnam
Business types The ratio of labor cost against the amount of factory shipments
Interest in entering Cambodia and Bavet
Company1 1996 Production of floor mats for automo-biles and plastic co-vers for baths. Ex-port all products to Japan
15% The extrusion process is capi-tal-intensive. Post-processing (adjustments by cutting the spillo-ver parts) is la-bor-intensive.
No interest. The extru-sion process is capi-tal-intensive. Therefore, high electricity cost and unstable electricity sup-ply would impact the production.
Company2 1995 Mold plastic parts (for motorcycles, automobiles, PCs, cameras, eye drops, lipsticks, etc.) Ex-
15% Because machines must be used, must have a sta-ble supply of cheap elec-tricity. In this regard, Cambodia presents con-
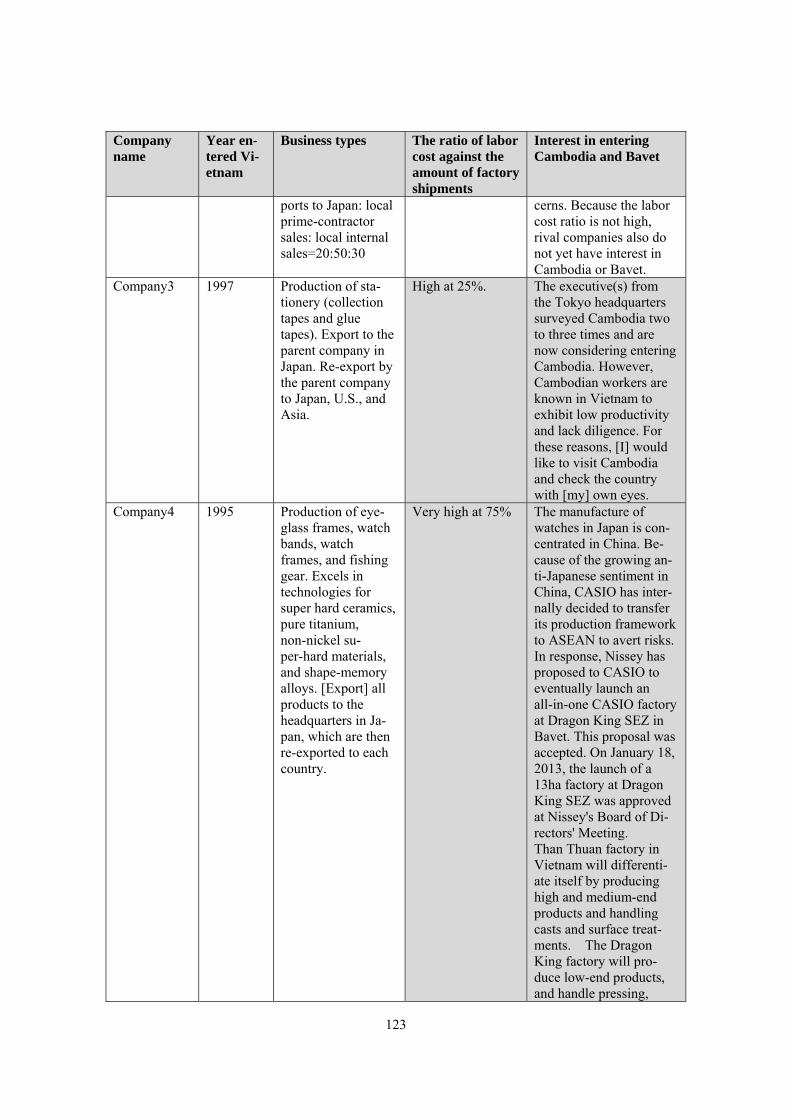
123
Company name
Year en-tered Vi-etnam
Business types The ratio of labor cost against the amount of factory shipments
Interest in entering Cambodia and Bavet
ports to Japan: local prime-contractor sales: local internal sales=20:50:30
cerns. Because the labor cost ratio is not high, rival companies also do not yet have interest in Cambodia or Bavet.
Company3 1997 Production of sta-tionery (collection tapes and glue tapes). Export to the parent company in Japan. Re-export by the parent company to Japan, U.S., and Asia.
High at 25%. The executive(s) from the Tokyo headquarters surveyed Cambodia two to three times and are now considering entering Cambodia. However, Cambodian workers are known in Vietnam to exhibit low productivity and lack diligence. For these reasons, [I] would like to visit Cambodia and check the country with [my] own eyes.
Company4 1995 Production of eye-glass frames, watch bands, watch frames, and fishing gear. Excels in technologies for super hard ceramics, pure titanium, non-nickel su-per-hard materials, and shape-memory alloys. [Export] all products to the headquarters in Ja-pan, which are then re-exported to each country.
Very high at 75% The manufacture of watches in Japan is con-centrated in China. Be-cause of the growing an-ti-Japanese sentiment in China, CASIO has inter-nally decided to transfer its production framework to ASEAN to avert risks. In response, Nissey has proposed to CASIO to eventually launch an all-in-one CASIO factory at Dragon King SEZ in Bavet. This proposal was accepted. On January 18, 2013, the launch of a 13ha factory at Dragon King SEZ was approved at Nissey's Board of Di-rectors' Meeting. Than Thuan factory in Vietnam will differenti-ate itself by producing high and medium-end products and handling casts and surface treat-ments. The Dragon King factory will pro-duce low-end products, and handle pressing,
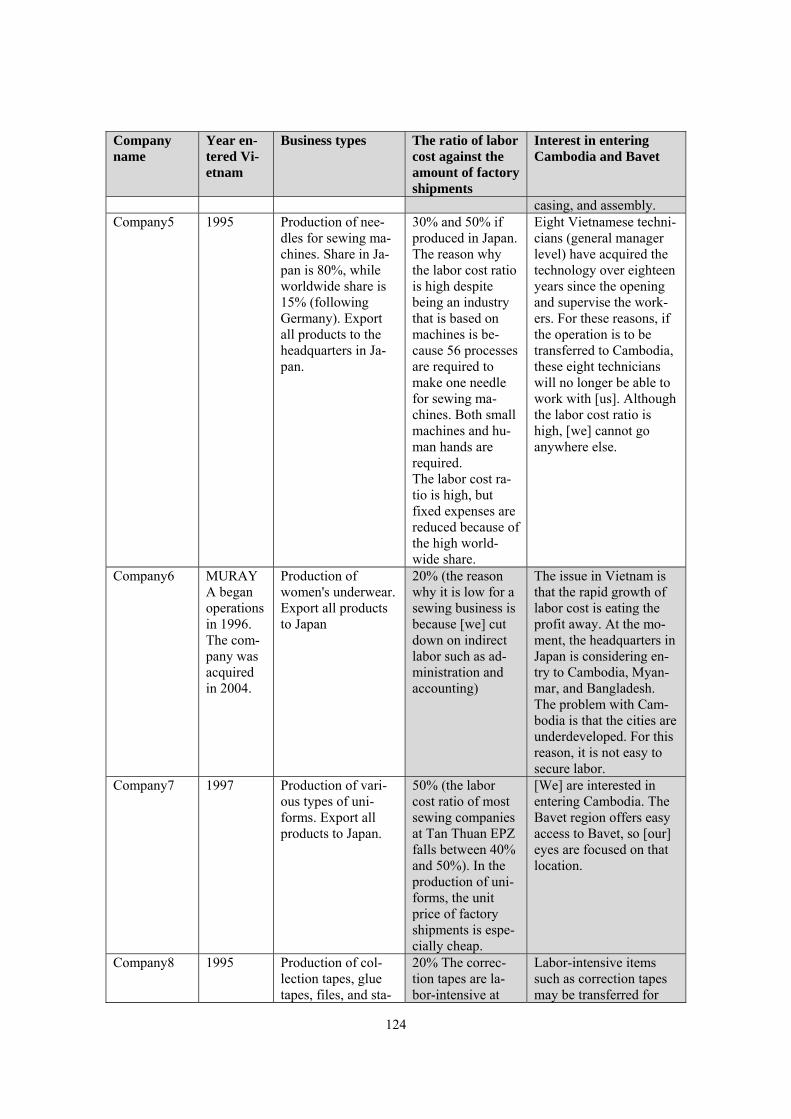
124
Company name
Year en-tered Vi-etnam
Business types The ratio of labor cost against the amount of factory shipments
Interest in entering Cambodia and Bavet
casing, and assembly. Company5 1995 Production of nee-
dles for sewing ma-chines. Share in Ja-pan is 80%, while worldwide share is 15% (following Germany). Export all products to the headquarters in Ja-pan.
30% and 50% if produced in Japan. The reason why the labor cost ratio is high despite being an industry that is based on machines is be-cause 56 processes are required to make one needle for sewing ma-chines. Both small machines and hu-man hands are required. The labor cost ra-tio is high, but fixed expenses are reduced because of the high world-wide share.
Eight Vietnamese techni-cians (general manager level) have acquired the technology over eighteen years since the opening and supervise the work-ers. For these reasons, if the operation is to be transferred to Cambodia, these eight technicians will no longer be able to work with [us]. Although the labor cost ratio is high, [we] cannot go anywhere else.
Company6 MURAYA began operations in 1996. The com-pany was acquired in 2004.
Production of women's underwear. Export all products to Japan
20% (the reason why it is low for a sewing business is because [we] cut down on indirect labor such as ad-ministration and accounting)
The issue in Vietnam is that the rapid growth of labor cost is eating the profit away. At the mo-ment, the headquarters in Japan is considering en-try to Cambodia, Myan-mar, and Bangladesh. The problem with Cam-bodia is that the cities are underdeveloped. For this reason, it is not easy to secure labor.
Company7 1997 Production of vari-ous types of uni-forms. Export all products to Japan.
50% (the labor cost ratio of most sewing companies at Tan Thuan EPZ falls between 40% and 50%). In the production of uni-forms, the unit price of factory shipments is espe-cially cheap.
[We] are interested in entering Cambodia. The Bavet region offers easy access to Bavet, so [our] eyes are focused on that location.
Company8 1995 Production of col-lection tapes, glue tapes, files, and sta-
20% The correc-tion tapes are la-bor-intensive at
Labor-intensive items such as correction tapes may be transferred for
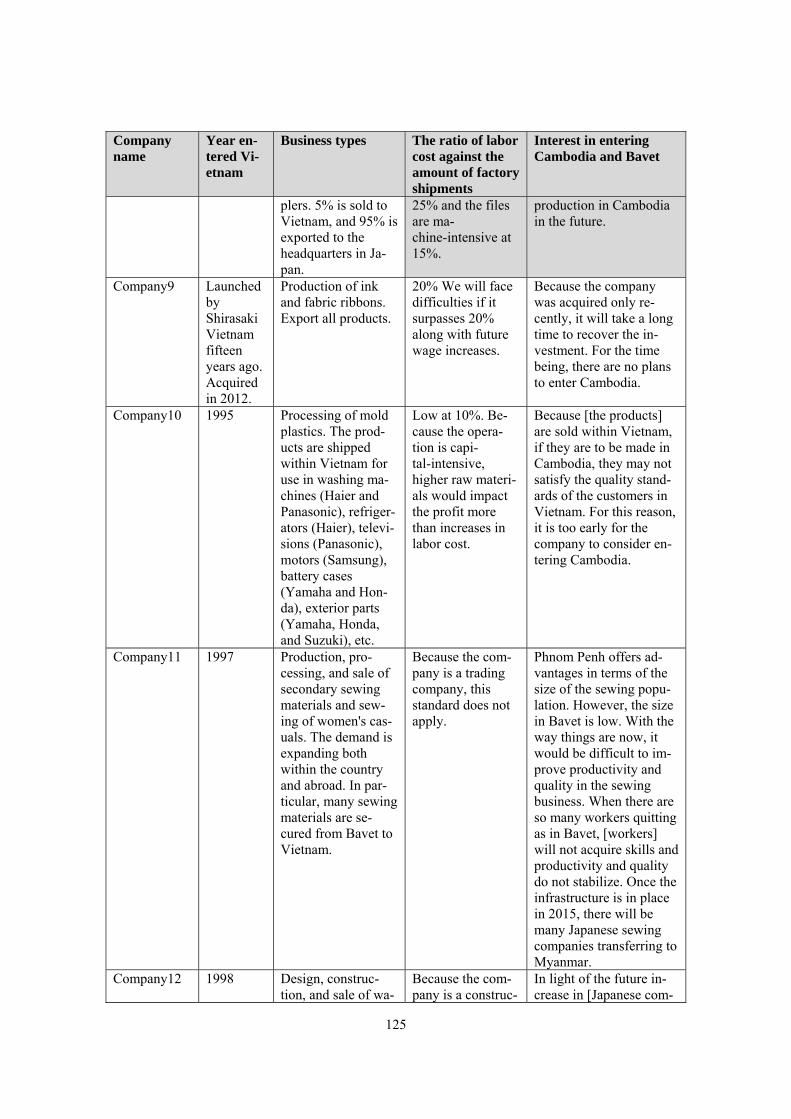
125
Company name
Year en-tered Vi-etnam
Business types The ratio of labor cost against the amount of factory shipments
Interest in entering Cambodia and Bavet
plers. 5% is sold to Vietnam, and 95% is exported to the headquarters in Ja-pan.
25% and the files are ma-chine-intensive at 15%.
production in Cambodia in the future.
Company9 Launched by Shirasaki Vietnam fifteen years ago. Acquired in 2012.
Production of ink and fabric ribbons. Export all products.
20% We will face difficulties if it surpasses 20% along with future wage increases.
Because the company was acquired only re-cently, it will take a long time to recover the in-vestment. For the time being, there are no plans to enter Cambodia.
Company10 1995 Processing of mold plastics. The prod-ucts are shipped within Vietnam for use in washing ma-chines (Haier and Panasonic), refriger-ators (Haier), televi-sions (Panasonic), motors (Samsung), battery cases (Yamaha and Hon-da), exterior parts (Yamaha, Honda, and Suzuki), etc.
Low at 10%. Be-cause the opera-tion is capi-tal-intensive, higher raw materi-als would impact the profit more than increases in labor cost.
Because [the products] are sold within Vietnam, if they are to be made in Cambodia, they may not satisfy the quality stand-ards of the customers in Vietnam. For this reason, it is too early for the company to consider en-tering Cambodia.
Company11 1997 Production, pro-cessing, and sale of secondary sewing materials and sew-ing of women's cas-uals. The demand is expanding both within the country and abroad. In par-ticular, many sewing materials are se-cured from Bavet to Vietnam.
Because the com-pany is a trading company, this standard does not apply.
Phnom Penh offers ad-vantages in terms of the size of the sewing popu-lation. However, the size in Bavet is low. With the way things are now, it would be difficult to im-prove productivity and quality in the sewing business. When there are so many workers quitting as in Bavet, [workers] will not acquire skills and productivity and quality do not stabilize. Once the infrastructure is in place in 2015, there will be many Japanese sewing companies transferring to Myanmar.
Company12 1998 Design, construc-tion, and sale of wa-
Because the com-pany is a construc-
In light of the future in-crease in [Japanese com-
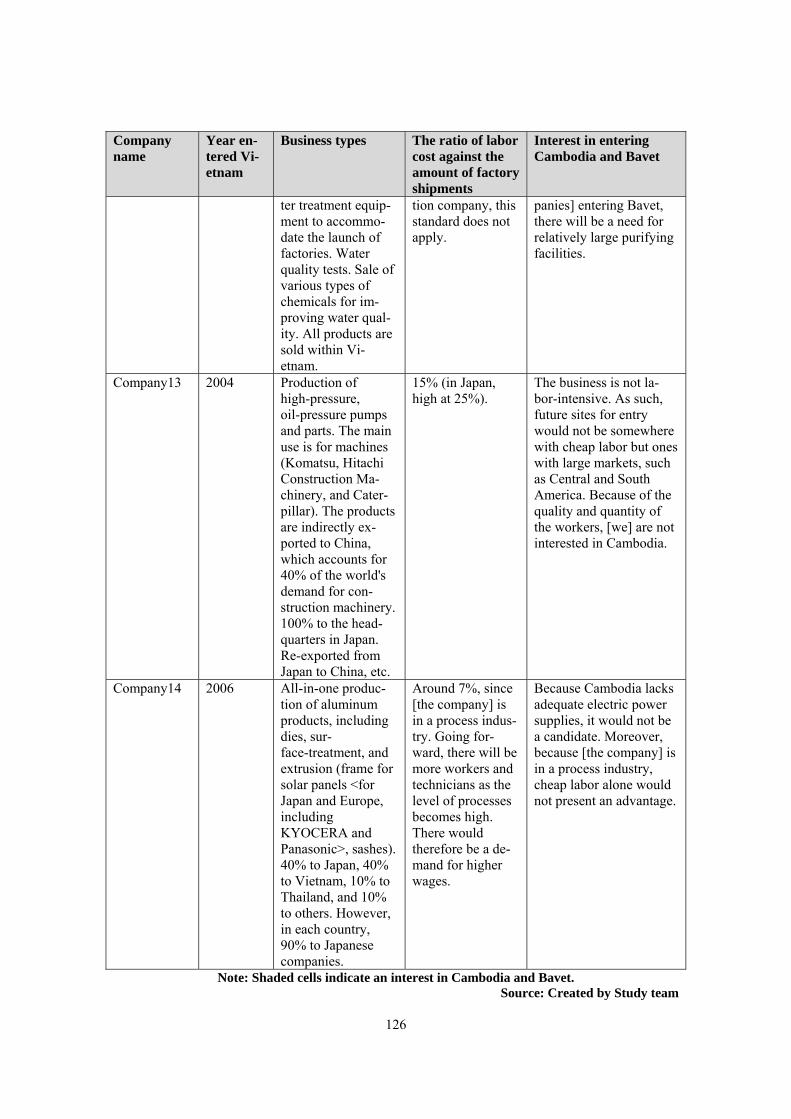
126
Company name
Year en-tered Vi-etnam
Business types The ratio of labor cost against the amount of factory shipments
Interest in entering Cambodia and Bavet
ter treatment equip-ment to accommo-date the launch of factories. Water quality tests. Sale of various types of chemicals for im-proving water qual-ity. All products are sold within Vi-etnam.
tion company, this standard does not apply.
panies] entering Bavet, there will be a need for relatively large purifying facilities.
Company13 2004 Production of high-pressure, oil-pressure pumps and parts. The main use is for machines (Komatsu, Hitachi Construction Ma-chinery, and Cater-pillar). The products are indirectly ex-ported to China, which accounts for 40% of the world's demand for con-struction machinery. 100% to the head-quarters in Japan. Re-exported from Japan to China, etc.
15% (in Japan, high at 25%).
The business is not la-bor-intensive. As such, future sites for entry would not be somewhere with cheap labor but ones with large markets, such as Central and South America. Because of the quality and quantity of the workers, [we] are not interested in Cambodia.
Company14 2006 All-in-one produc-tion of aluminum products, including dies, sur-face-treatment, and extrusion (frame for solar panels <for Japan and Europe, including KYOCERA and Panasonic>, sashes). 40% to Japan, 40% to Vietnam, 10% to Thailand, and 10% to others. However, in each country, 90% to Japanese companies.
Around 7%, since [the company] is in a process indus-try. Going for-ward, there will be more workers and technicians as the level of processes becomes high. There would therefore be a de-mand for higher wages.
Because Cambodia lacks adequate electric power supplies, it would not be a candidate. Moreover, because [the company] is in a process industry, cheap labor alone would not present an advantage.
Note: Shaded cells indicate an interest in Cambodia and Bavet. Source: Created by Study team
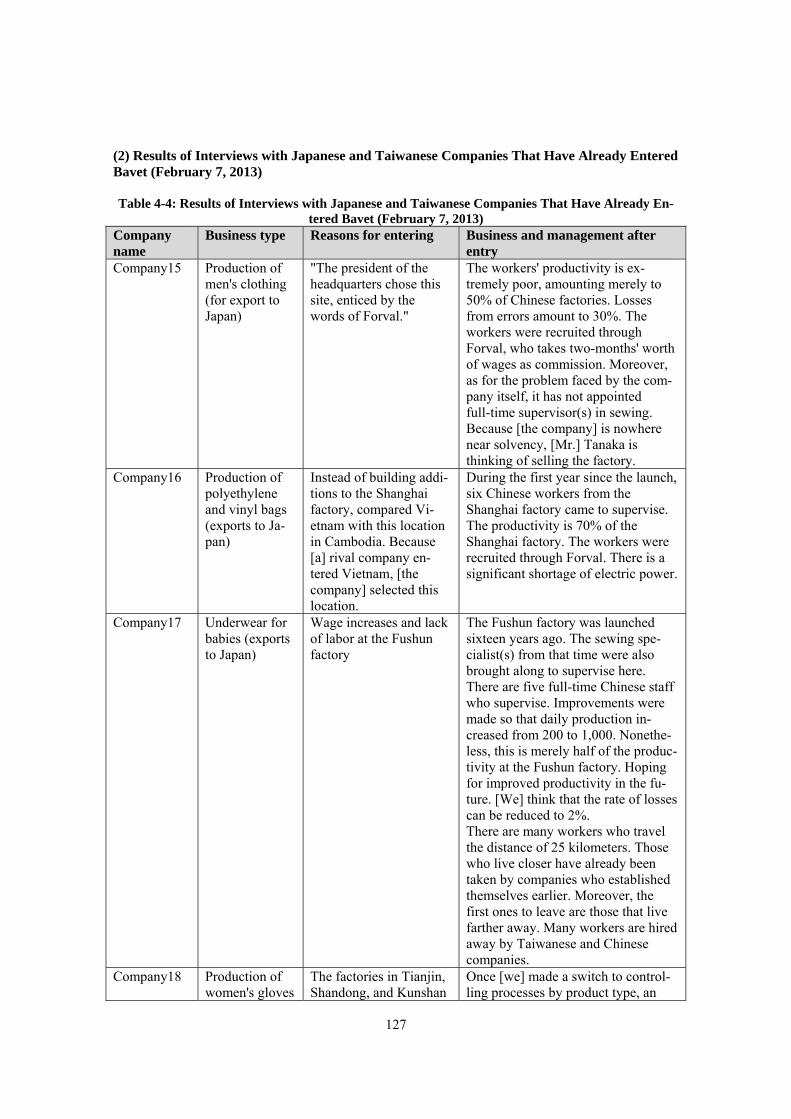
127
(2) Results of Interviews with Japanese and Taiwanese Companies That Have Already Entered Bavet (February 7, 2013) Table 4-4: Results of Interviews with Japanese and Taiwanese Companies That Have Already En-
tered Bavet (February 7, 2013) Company name
Business type Reasons for entering Business and management after entry
Company15 Production of men's clothing (for export to Japan)
"The president of the headquarters chose this site, enticed by the words of Forval."
The workers' productivity is ex-tremely poor, amounting merely to 50% of Chinese factories. Losses from errors amount to 30%. The workers were recruited through Forval, who takes two-months' worth of wages as commission. Moreover, as for the problem faced by the com-pany itself, it has not appointed full-time supervisor(s) in sewing. Because [the company] is nowhere near solvency, [Mr.] Tanaka is thinking of selling the factory.
Company16 Production of polyethylene and vinyl bags (exports to Ja-pan)
Instead of building addi-tions to the Shanghai factory, compared Vi-etnam with this location in Cambodia. Because [a] rival company en-tered Vietnam, [the company] selected this location.
During the first year since the launch, six Chinese workers from the Shanghai factory came to supervise. The productivity is 70% of the Shanghai factory. The workers were recruited through Forval. There is a significant shortage of electric power.
Company17 Underwear for babies (exports to Japan)
Wage increases and lack of labor at the Fushun factory
The Fushun factory was launched sixteen years ago. The sewing spe-cialist(s) from that time were also brought along to supervise here. There are five full-time Chinese staff who supervise. Improvements were made so that daily production in-creased from 200 to 1,000. Nonethe-less, this is merely half of the produc-tivity at the Fushun factory. Hoping for improved productivity in the fu-ture. [We] think that the rate of losses can be reduced to 2%. There are many workers who travel the distance of 25 kilometers. Those who live closer have already been taken by companies who established themselves earlier. Moreover, the first ones to leave are those that live farther away. Many workers are hired away by Taiwanese and Chinese companies.
Company18 Production of women's gloves
The factories in Tianjin, Shandong, and Kunshan
Once [we] made a switch to control-ling processes by product type, an
128
Company name
Business type Reasons for entering Business and management after entry
(for export to Japan)
are being scaled down due to wage increases and labor issues. In Chi-na, [companies] cannot withdraw without the government's approval. Therefore, operations continue against [our] will through balanced contraction. Commis-sion-based processing is also done in Bangladesh and the Philippines.
improvement was successfully made from 50% to 70% that of Chinese factories in a year. Right now, [we] plan to set the standard work time, calculate the standard cost, and ana-lyze the standard cost. 90% of the workers travel to work by trucks. There are workers who spend around two hours to travel to work, with one hour or more plus walking. Traveling 30 kilometers takes an hour. The attrition rate is between 10% and 15%. At Bavet, [the company] seeks to recover in five years, so the land is leased for five years. After that, be-cause wage increase is thought to be inevitable also in Myanmar, [we] are thinking of entering Ethiopia, a Cath-olic country. [I] actually went to sur-vey the site. In general, it looked good.
Company19 Dying of cotton fabric (indirect export)
Sewing companies have transferred from China to Cambodia. [We] can benefit from GSP in Cambodia and Myan-mar. The site is 14ha. [The company] supplies died fabric to brand sewing companies in Phnom Penh and Ho Chi Minh City. Through these locations, [the company] indirectly ex-ports to major compa-nies, including Puma (U.S.), Benesen (U.S.), Mizuno (Japan), and UNIQLO (Japan). In terms of products di-rectly delivered, 45% are to Phnom Penh and 45% are to Ho Chi Minh City.
The dying machine(s) are controlled by computer(s). As such, for electric-ity, power generator(s) using heavy oil have been installed. The genera-tion cost is 29%, double the EDC. Because the operation is capi-tal-intensive, Cambodians are in-volved only during the final pro-cess(es). Machine processing is done by foreigners. The quality of workers is poor. The attrition rate is 7%. The core workers are Chinese, Taiwanese, and Malaysian, who account for 25% of all workers (300 persons). The company is fully equipped with water and sewage system(s), as well as water treatment facilities.
Source: Created by Study team 4-6. Summary of the Data Regarding the Choice of Bavet as an Industrial Site Through This
Research (1) Cambodia's neighboring countries, including Japan, China, Thailand, and Vietnam, are faced with the necessity to transfer their sewing, electrical and electronic, and machinery industries, which are labor-intensive. The backdrop to this trend is higher wages, difficulty in securing labor, and higher exchange rate(s). The first industry facing the need to transfer their production is sewing
129
businesses that manufacture low-fashion everyday wear. The second industry encompasses the as-sembly of wire harnesses for electrical and electronic devices, assembly of coils and transformers, and assembly of small electronics. The third industry includes surface treatment (galvanizing, paint-ing, and high frequency) in post-processing and assembly and wiring (print circuit processing, as-sembly of parts, mounting, etc.) in precision machinery, chassis and automobile components (fuel tanks, exhaust pipes, mufflers, window frames, seats, air bags, etc.) in automobile parts, and electri-cal components and others (switches, meters, wipers, alarms, heaters, etc.). (2) For empirical analysis, the following were conducted: comparative analysis of recent wage standards among developing countries; historical analysis of wages and labor productivity among the neighboring countries; historical analysis of currency rates among the neighboring countries; analy-sis of the nominal wage rate and electricity cost rate among Japanese manufacturing businesses; analysis of the nominal wage ratio by business type in China; analysis of Japanese companies that entered Vietnam in the early phase (1990s); and interviews with Japanese and some Taiwanese companies in Ho Chi Minh City in Vietnam and the Bavet region. As a result, it is projected that companies mentioned in (1) would enter the Bavet region in the future. (3) Conducting each study revealed that the reasons why the Bavet region is selected are as follows: ease of access to the developed port(s) of Ho Chi Minh City; the excellent road infrastructure be-tween Ho Chi Minh City and Bavet; the production linkage with the factories in Ho Chi Minh City; and the cheap rent in Bavet. In particular, Cai Mep-Thi Vai Port in the province adjacent to Ho Chi Minh City (Ba Ria Vung Tau Province) is an open port located in alignment with Shanghai and Sin-gapore. Daily direct services are available to Europe, U.S., and Japan. The time cost is far better than those at Laem Chabang Port in Thailand and Sihanoukville Port in Cambodia, which are located within a bay. For these reasons, Bavet has the potential to draw a large number of industries. On the other hand, there are issues of labor shortage, inadequate electric power and water systems at indus-trial complexes named "SEZ," and activities by consultant(s) that were identified to have solicited investment without disclosing these problems. The interviews in Bavet, combined with these issues, also showed that, undeniably, companies may have been misinformed in selecting the locations for investment. (4) These issues can be categorized into two: those that ought to be resolved by companies who en-tered Bavet, and those that require public aid. The companies, implementing bodies of SEZs, and third-party developers must take commercial initiatives to build dormitories and commercial facili-ties to secure labor and install power generators and water systems. In Vietnam, industrial park(s) developed by VSIP (Singapore) are accompanied by dormitories and commercial facilities in the neighboring area(s). While [they] have not received any public aid, at Thang Long Industrial Park, demand is being made to the Japanese government to provide public aid for such facilities. As long as there is VSIP's precedent, it would not be easy to receive public aid that breaks the balance. In this regard, the same applies to Cambodia. In any case, in terms of the infrastructure, the start is to care-fully inspect the agreements concluded between the Cambodian government and the implementing bodies of SEZs, as well as those between the implementing bodies of SEZs and the tenant compa-nies. “The Survey of Japanese-Affiliated Companies in Asia and Oceania” conducted by JETRO in 2012 shows the directions for business development in the next one-two years by country/region. Ac-cording to the survey result for 3,805 Japanese companies, the high ratio of business expansion needs in the invested countries are put in order as (i) Lao PDR (94%), (ii) India (84%), (iii) Bangla-desh (82%), (iv) Indonesia (77%) and Cambodia (77%). Incidentally, Vietnam (66%), China (52%) are dropped from the previous survey in 2011. On the contrary, the ratio of needs for downsizing and relocating to a third country/region or withdrawal is gone up for China (5.8%), Vietnam (2.0%) from the previous survey in 2011. Additionally, Cambodia is shown as nothing (0%) in the year 2012 survey. When we apply the latter ratio to accumulated numbers of Japanese companies invested in China (total 23,000 firms) and Vietnam (total 1,500 firms) until the end of 2012, we can get the numbers of

130
companies which have intentions of downsizing and relocating to a third country/region or with-drawal as 1,330 firms from China and 30 firms from Vietnam. If the existing shortage of labor force and lack of infrastructure in Bavet will be solved in the future, the investment for relocation will be stimulated from China and Vietnam to there, though the converse is also true in case of no improvement in Bavet.
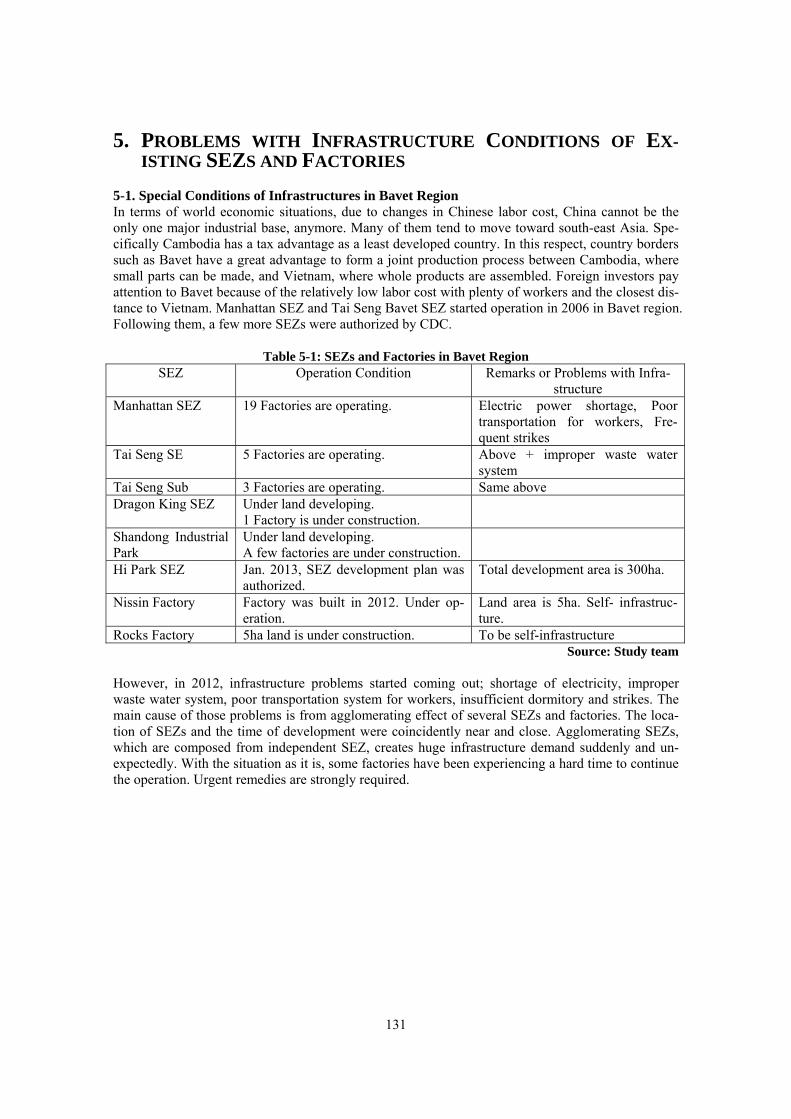
131
5. PROBLEMS WITH INFRASTRUCTURE CONDITIONS OF EX-ISTING SEZS AND FACTORIES
5-1. Special Conditions of Infrastructures in Bavet Region In terms of world economic situations, due to changes in Chinese labor cost, China cannot be the only one major industrial base, anymore. Many of them tend to move toward south-east Asia. Spe-cifically Cambodia has a tax advantage as a least developed country. In this respect, country borders such as Bavet have a great advantage to form a joint production process between Cambodia, where small parts can be made, and Vietnam, where whole products are assembled. Foreign investors pay attention to Bavet because of the relatively low labor cost with plenty of workers and the closest dis-tance to Vietnam. Manhattan SEZ and Tai Seng Bavet SEZ started operation in 2006 in Bavet region. Following them, a few more SEZs were authorized by CDC.
Table 5-1: SEZs and Factories in Bavet Region SEZ Operation Condition Remarks or Problems with Infra-
structure Manhattan SEZ 19 Factories are operating. Electric power shortage, Poor
transportation for workers, Fre-quent strikes
Tai Seng SE 5 Factories are operating. Above + improper waste water system
Tai Seng Sub 3 Factories are operating. Same above Dragon King SEZ Under land developing.
1 Factory is under construction.
Shandong Industrial Park
Under land developing. A few factories are under construction.
Hi Park SEZ Jan. 2013, SEZ development plan was authorized.
Total development area is 300ha.
Nissin Factory Factory was built in 2012. Under op-eration.
Land area is 5ha. Self- infrastruc-ture.
Rocks Factory 5ha land is under construction. To be self-infrastructure Source: Study team
However, in 2012, infrastructure problems started coming out; shortage of electricity, improper waste water system, poor transportation system for workers, insufficient dormitory and strikes. The main cause of those problems is from agglomerating effect of several SEZs and factories. The loca-tion of SEZs and the time of development were coincidently near and close. Agglomerating SEZs, which are composed from independent SEZ, creates huge infrastructure demand suddenly and un-expectedly. With the situation as it is, some factories have been experiencing a hard time to continue the operation. Urgent remedies are strongly required.
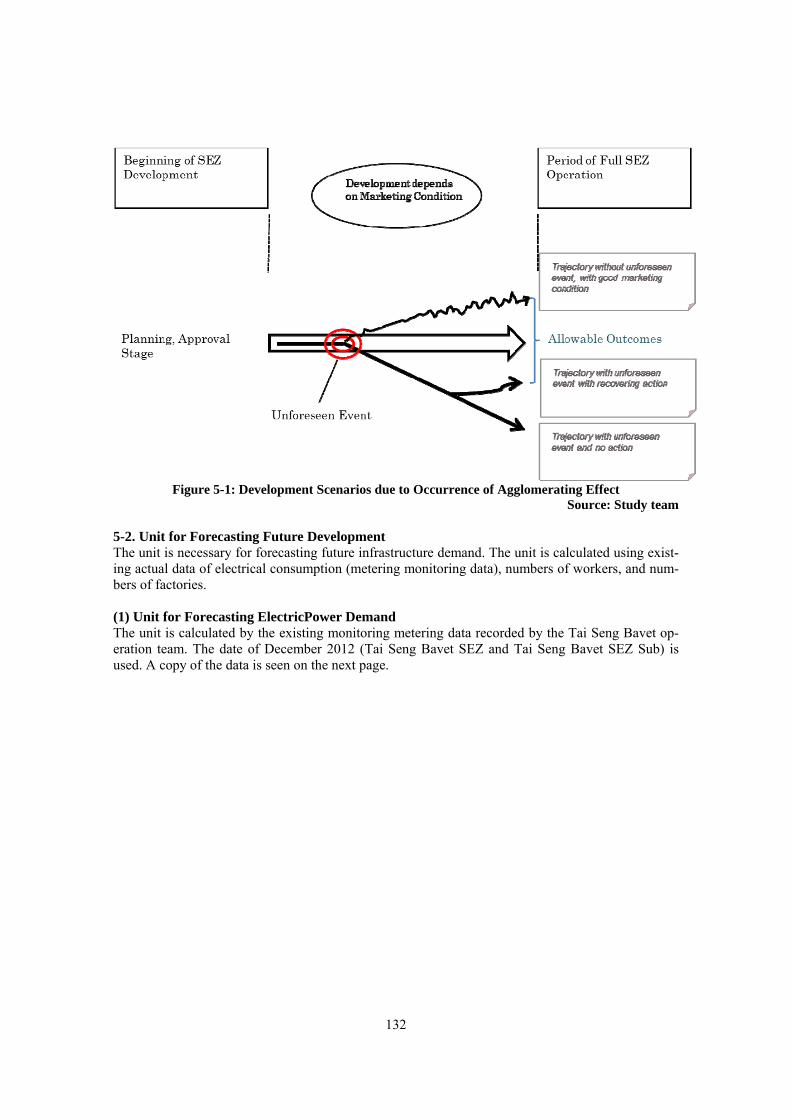
132
Figure 5-1: Development Scenarios due to Occurrence of Agglomerating Effect
Source: Study team 5-2. Unit for Forecasting Future Development The unit is necessary for forecasting future infrastructure demand. The unit is calculated using exist-ing actual data of electrical consumption (metering monitoring data), numbers of workers, and num-bers of factories. (1) Unit for Forecasting ElectricPower Demand The unit is calculated by the existing monitoring metering data recorded by the Tai Seng Bavet op-eration team. The date of December 2012 (Tai Seng Bavet SEZ and Tai Seng Bavet SEZ Sub) is used. A copy of the data is seen on the next page.
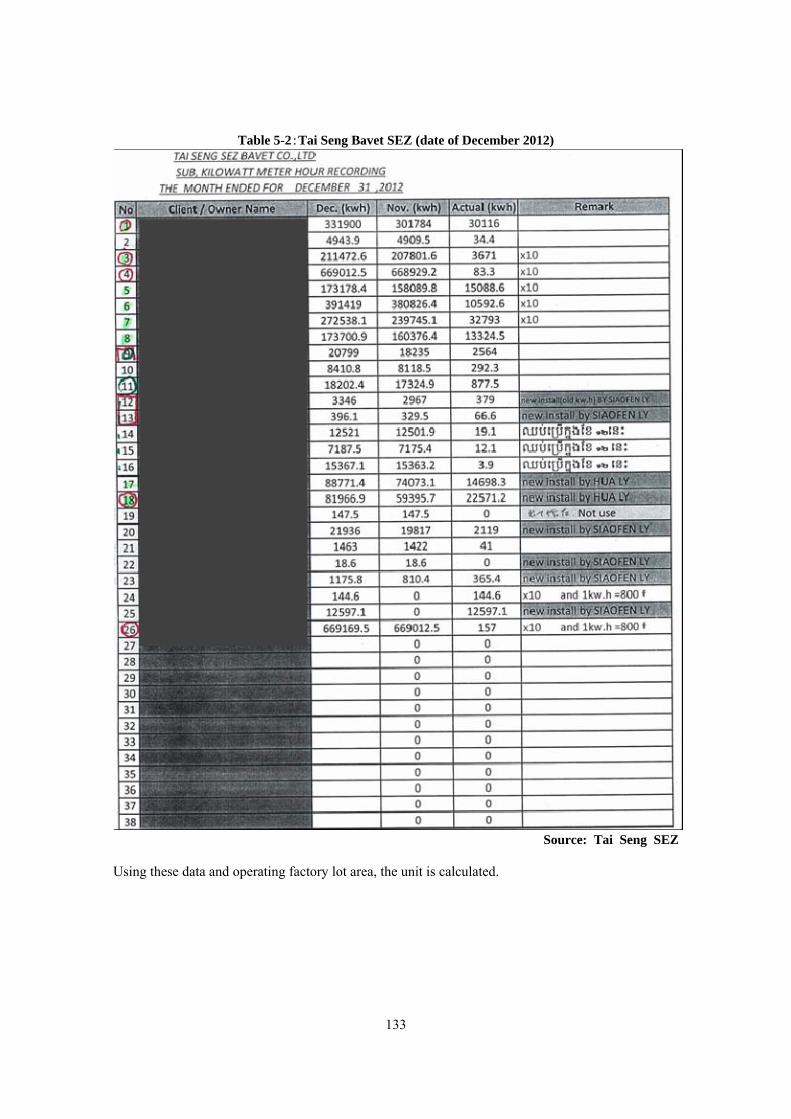
133
Table 5-2:Tai Seng Bavet SEZ (date of December 2012)
Source: Tai Seng SEZ
Using these data and operating factory lot area, the unit is calculated.
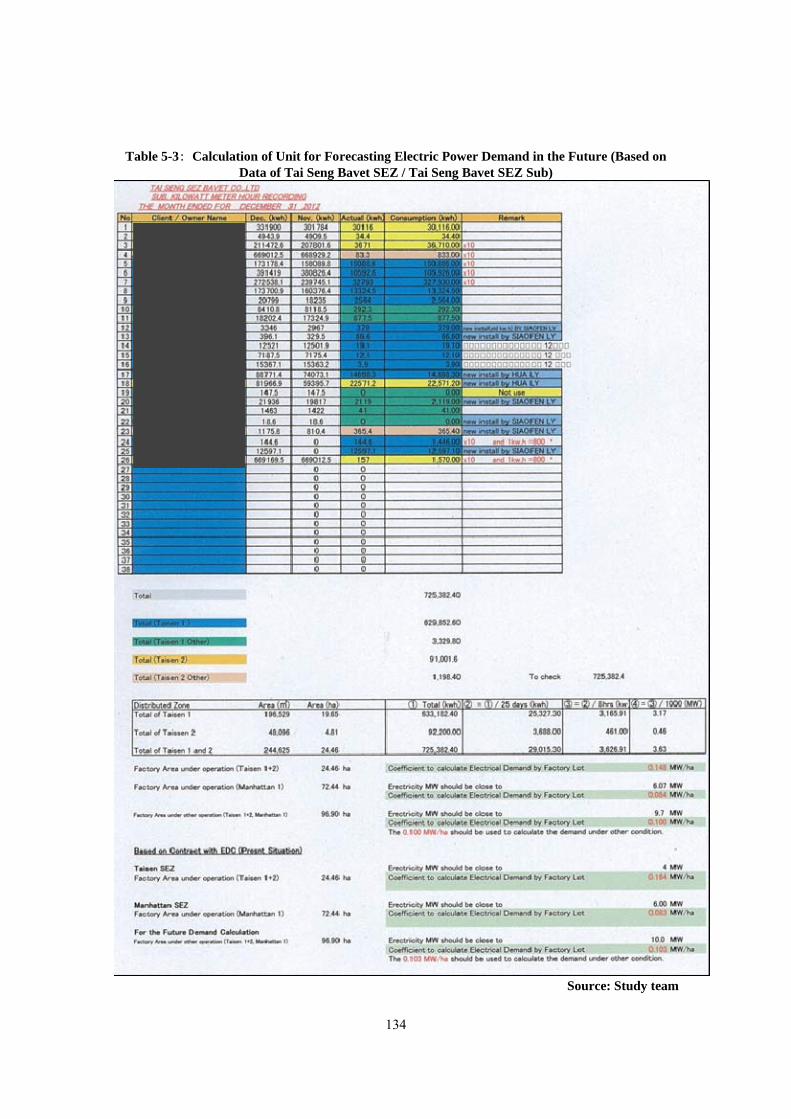
134
Table 5-3: Calculation of Unit for Forecasting Electric Power Demand in the Future (Based on
Data of Tai Seng Bavet SEZ / Tai Seng Bavet SEZ Sub)
Source: Study team
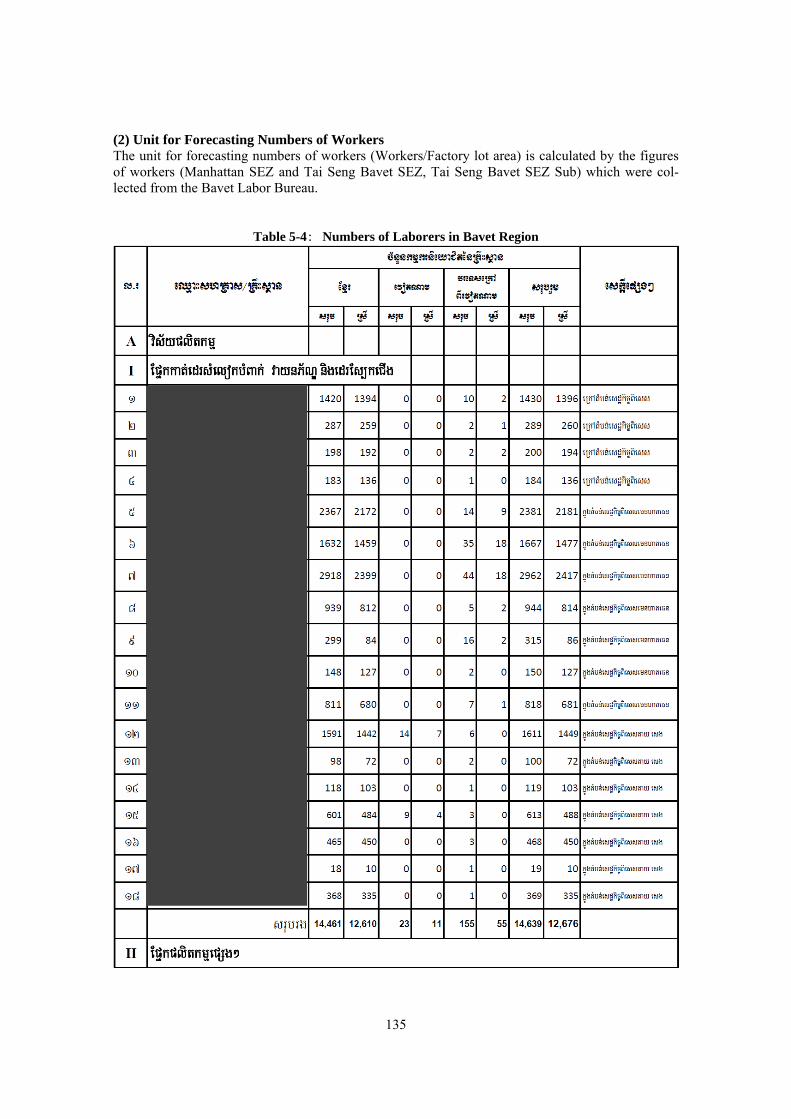
135
(2) Unit for Forecasting Numbers of Workers The unit for forecasting numbers of workers (Workers/Factory lot area) is calculated by the figures of workers (Manhattan SEZ and Tai Seng Bavet SEZ, Tai Seng Bavet SEZ Sub) which were col-lected from the Bavet Labor Bureau.
Table 5-4: Numbers of Laborers in Bavet Region
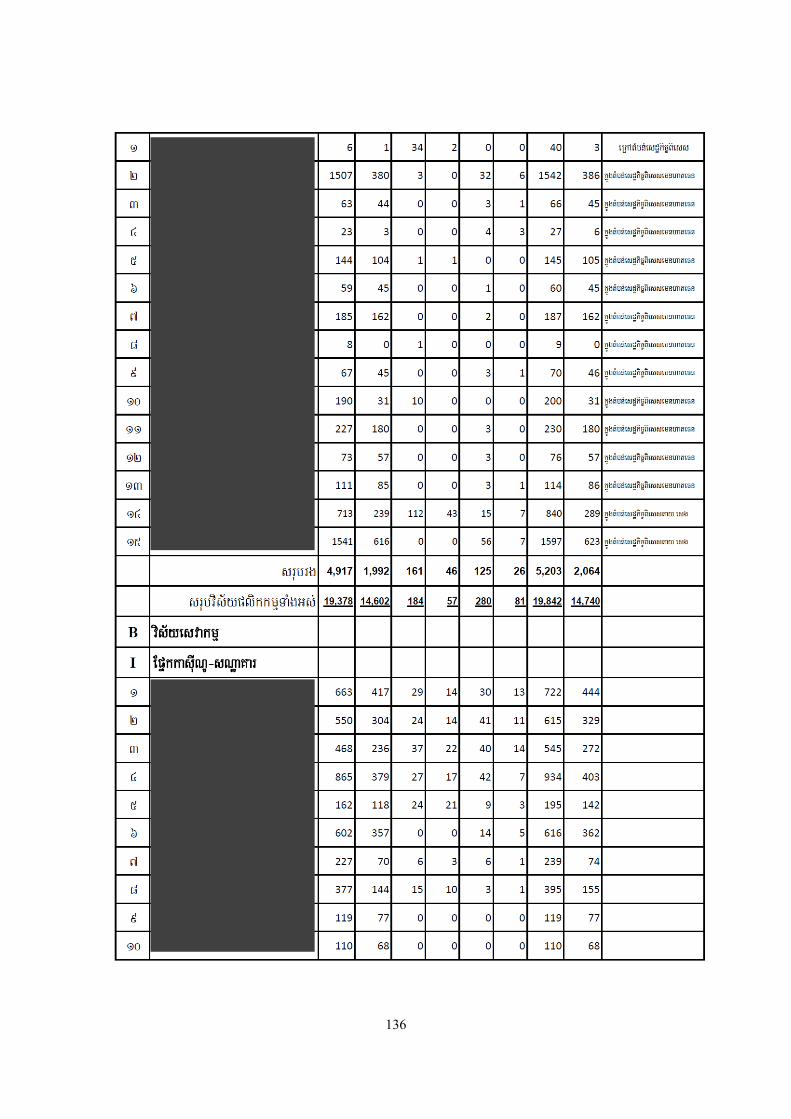
136
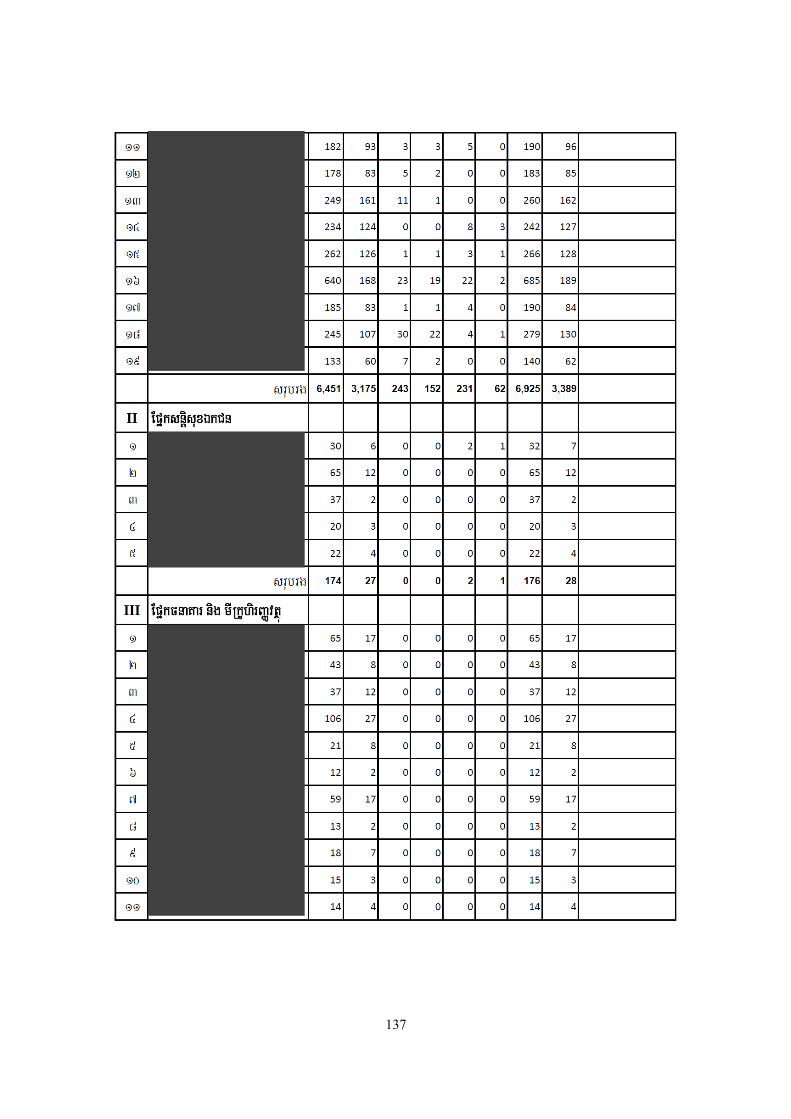
137
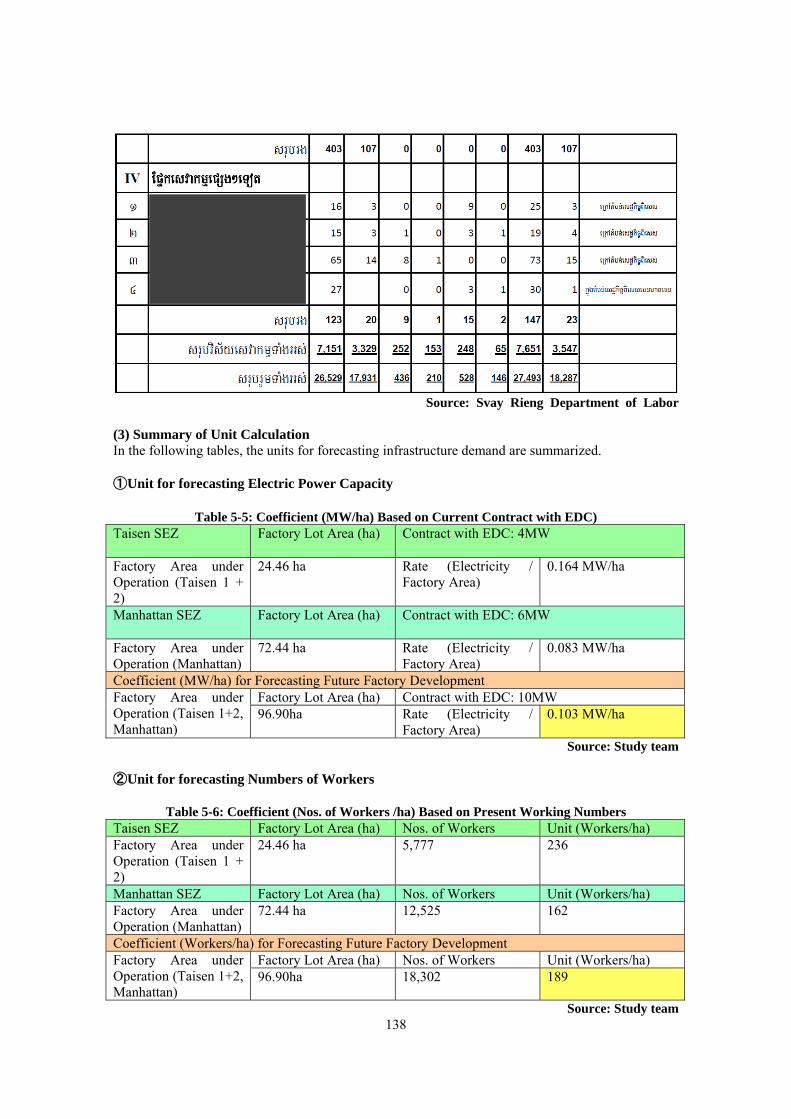
138
Source: Svay Rieng Department of Labor
(3) Summary of Unit Calculation In the following tables, the units for forecasting infrastructure demand are summarized. ①Unit for forecasting Electric Power Capacity
Table 5-5: Coefficient (MW/ha) Based on Current Contract with EDC) Taisen SEZ Factory Lot Area (ha) Contract with EDC: 4MW
Factory Area under Operation (Taisen 1 + 2)
24.46 ha Rate (Electricity / Factory Area)
0.164 MW/ha
Manhattan SEZ Factory Lot Area (ha) Contract with EDC: 6MW
Factory Area under Operation (Manhattan)
72.44 ha Rate (Electricity / Factory Area)
0.083 MW/ha
Coefficient (MW/ha) for Forecasting Future Factory Development Factory Area under Operation (Taisen 1+2, Manhattan)
Factory Lot Area (ha) Contract with EDC: 10MW 96.90ha Rate (Electricity /
Factory Area) 0.103 MW/ha
Source: Study team ②Unit for forecasting Numbers of Workers
Table 5-6: Coefficient (Nos. of Workers /ha) Based on Present Working Numbers Taisen SEZ Factory Lot Area (ha) Nos. of Workers Unit (Workers/ha) Factory Area under Operation (Taisen 1 + 2)
24.46 ha 5,777 236
Manhattan SEZ Factory Lot Area (ha) Nos. of Workers Unit (Workers/ha) Factory Area under Operation (Manhattan)
72.44 ha 12,525 162
Coefficient (Workers/ha) for Forecasting Future Factory Development Factory Area under Operation (Taisen 1+2, Manhattan)
Factory Lot Area (ha) Nos. of Workers Unit (Workers/ha) 96.90ha 18,302 189
Source: Study team
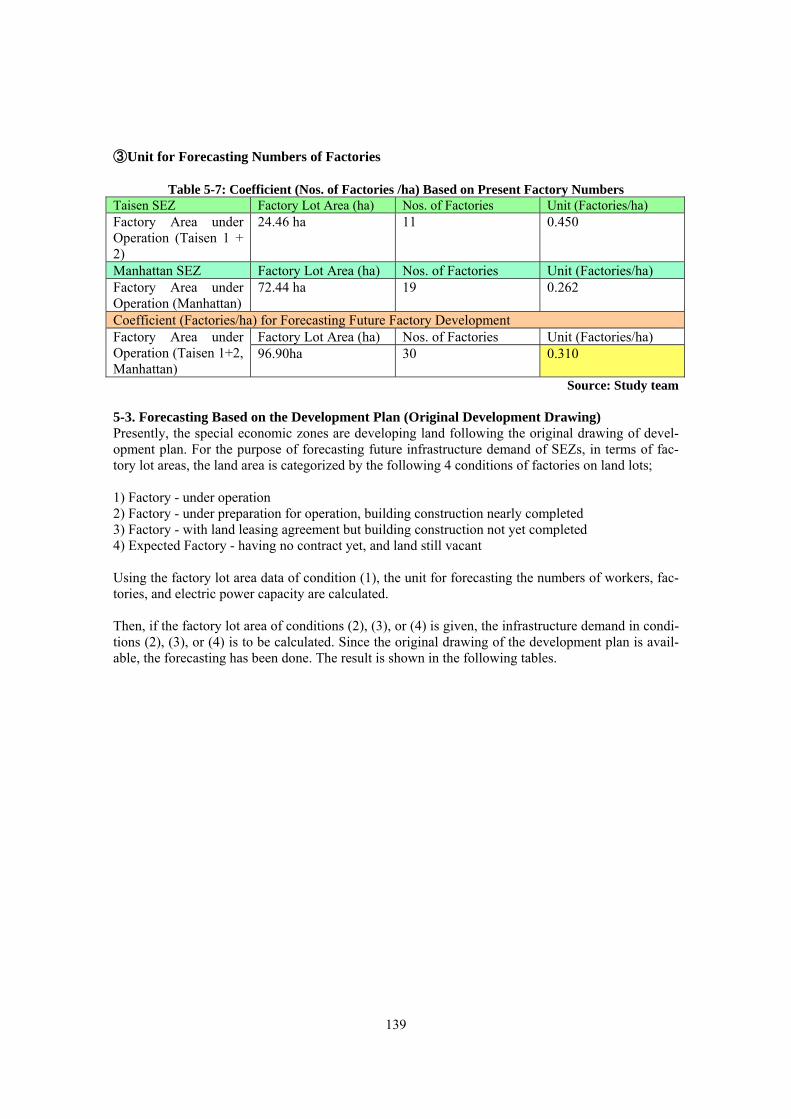
139
③Unit for Forecasting Numbers of Factories
Table 5-7: Coefficient (Nos. of Factories /ha) Based on Present Factory Numbers Taisen SEZ Factory Lot Area (ha) Nos. of Factories Unit (Factories/ha) Factory Area under Operation (Taisen 1 + 2)
24.46 ha 11 0.450
Manhattan SEZ Factory Lot Area (ha) Nos. of Factories Unit (Factories/ha) Factory Area under Operation (Manhattan)
72.44 ha 19 0.262
Coefficient (Factories/ha) for Forecasting Future Factory Development Factory Area under Operation (Taisen 1+2, Manhattan)
Factory Lot Area (ha) Nos. of Factories Unit (Factories/ha) 96.90ha 30 0.310
Source: Study team 5-3. Forecasting Based on the Development Plan (Original Development Drawing) Presently, the special economic zones are developing land following the original drawing of devel-opment plan. For the purpose of forecasting future infrastructure demand of SEZs, in terms of fac-tory lot areas, the land area is categorized by the following 4 conditions of factories on land lots; 1) Factory - under operation 2) Factory - under preparation for operation, building construction nearly completed 3) Factory - with land leasing agreement but building construction not yet completed 4) Expected Factory - having no contract yet, and land still vacant Using the factory lot area data of condition (1), the unit for forecasting the numbers of workers, fac-tories, and electric power capacity are calculated. Then, if the factory lot area of conditions (2), (3), or (4) is given, the infrastructure demand in condi-tions (2), (3), or (4) is to be calculated. Since the original drawing of the development plan is avail-able, the forecasting has been done. The result is shown in the following tables.
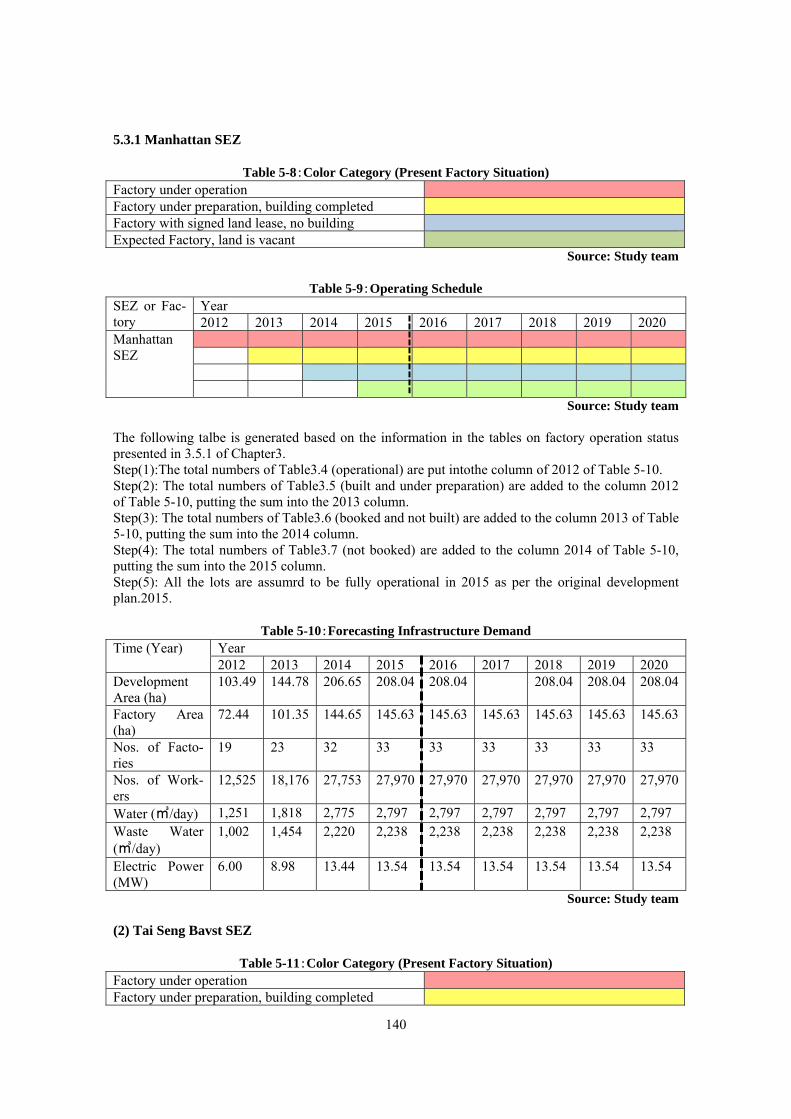
140
5.3.1 Manhattan SEZ
Table 5-8:Color Category (Present Factory Situation) Factory under operation Factory under preparation, building completed Factory with signed land lease, no building Expected Factory, land is vacant
Source: Study team
Table 5-9:Operating Schedule SEZ or Fac-tory
Year 2012 2013 2014 2015 2016 2017 2018 2019 2020
Manhattan SEZ
Source: Study team The following talbe is generated based on the information in the tables on factory operation status presented in 3.5.1 of Chapter3. Step(1):The total numbers of Table3.4 (operational) are put intothe column of 2012 of Table 5-10. Step(2): The total numbers of Table3.5 (built and under preparation) are added to the column 2012 of Table 5-10, putting the sum into the 2013 column. Step(3): The total numbers of Table3.6 (booked and not built) are added to the column 2013 of Table 5-10, putting the sum into the 2014 column. Step(4): The total numbers of Table3.7 (not booked) are added to the column 2014 of Table 5-10, putting the sum into the 2015 column. Step(5): All the lots are assumrd to be fully operational in 2015 as per the original development plan.2015.
Table 5-10:Forecasting Infrastructure Demand Time (Year) Year
2012 2013 2014 2015 2016 2017 2018 2019 2020 Development Area (ha)
103.49 144.78 206.65 208.04 208.04 208.04 208.04 208.04
Factory Area (ha)
72.44 101.35 144.65 145.63 145.63 145.63 145.63 145.63 145.63
Nos. of Facto-ries
19 23 32 33 33 33 33 33 33
Nos. of Work-ers
12,525 18,176 27,753 27,970 27,970 27,970 27,970 27,970 27,970
Water (㎥/day) 1,251 1,818 2,775 2,797 2,797 2,797 2,797 2,797 2,797 Waste Water (㎥/day)
1,002 1,454 2,220 2,238 2,238 2,238 2,238 2,238 2,238
Electric Power (MW)
6.00 8.98 13.44 13.54 13.54 13.54 13.54 13.54 13.54
Source: Study team (2) Tai Seng Bavst SEZ
Table 5-11:Color Category (Present Factory Situation) Factory under operation Factory under preparation, building completed
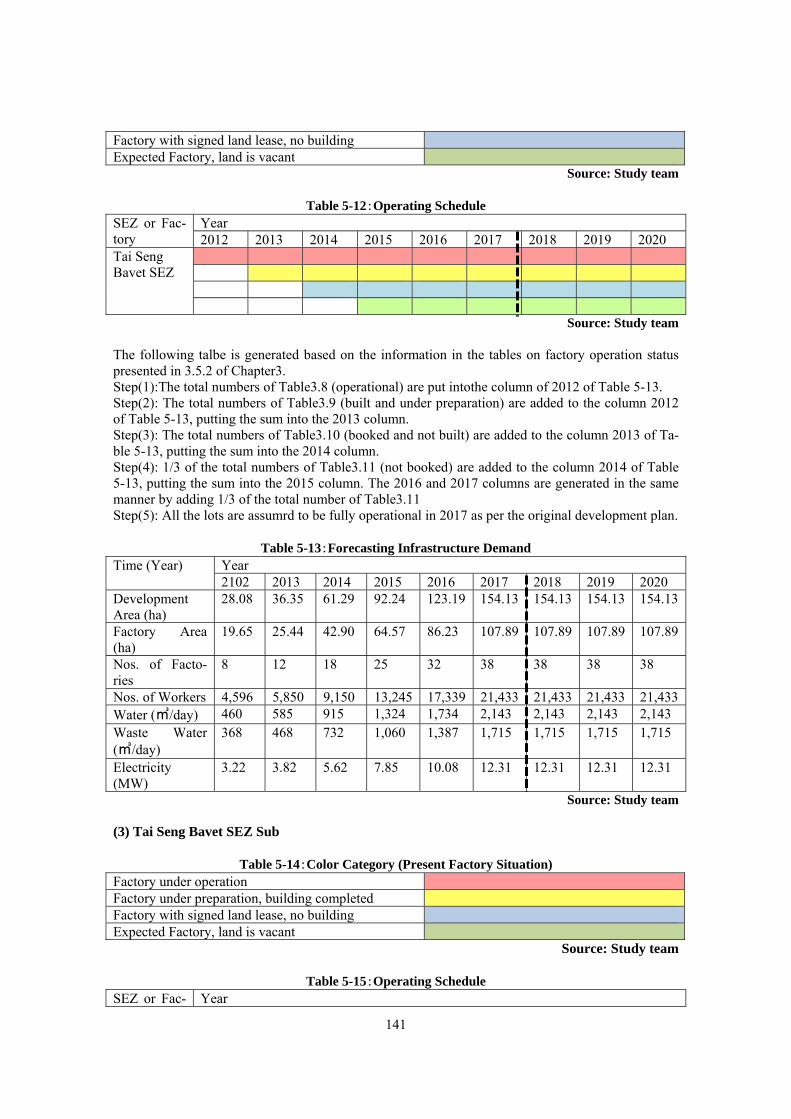
141
Factory with signed land lease, no building Expected Factory, land is vacant
Source: Study team
Table 5-12:Operating Schedule SEZ or Fac-tory
Year 2012 2013 2014 2015 2016 2017 2018 2019 2020
Tai Seng Bavet SEZ
Source: Study team The following talbe is generated based on the information in the tables on factory operation status presented in 3.5.2 of Chapter3. Step(1):The total numbers of Table3.8 (operational) are put intothe column of 2012 of Table 5-13. Step(2): The total numbers of Table3.9 (built and under preparation) are added to the column 2012 of Table 5-13, putting the sum into the 2013 column. Step(3): The total numbers of Table3.10 (booked and not built) are added to the column 2013 of Ta-ble 5-13, putting the sum into the 2014 column. Step(4): 1/3 of the total numbers of Table3.11 (not booked) are added to the column 2014 of Table 5-13, putting the sum into the 2015 column. The 2016 and 2017 columns are generated in the same manner by adding 1/3 of the total number of Table3.11 Step(5): All the lots are assumrd to be fully operational in 2017 as per the original development plan.
Table 5-13:Forecasting Infrastructure Demand Time (Year) Year
2102 2013 2014 2015 2016 2017 2018 2019 2020 Development Area (ha)
28.08 36.35 61.29 92.24 123.19 154.13 154.13 154.13 154.13
Factory Area (ha)
19.65 25.44 42.90 64.57 86.23 107.89 107.89 107.89 107.89
Nos. of Facto-ries
8 12 18 25 32 38 38 38 38
Nos. of Workers 4,596 5,850 9,150 13,245 17,339 21,433 21,433 21,433 21,433Water (㎥/day) 460 585 915 1,324 1,734 2,143 2,143 2,143 2,143 Waste Water (㎥/day)
368 468 732 1,060 1,387 1,715 1,715 1,715 1,715
Electricity (MW)
3.22 3.82 5.62 7.85 10.08 12.31 12.31 12.31 12.31
Source: Study team (3) Tai Seng Bavet SEZ Sub
Table 5-14:Color Category (Present Factory Situation) Factory under operation Factory under preparation, building completed Factory with signed land lease, no building Expected Factory, land is vacant
Source: Study team
Table 5-15:Operating Schedule SEZ or Fac- Year
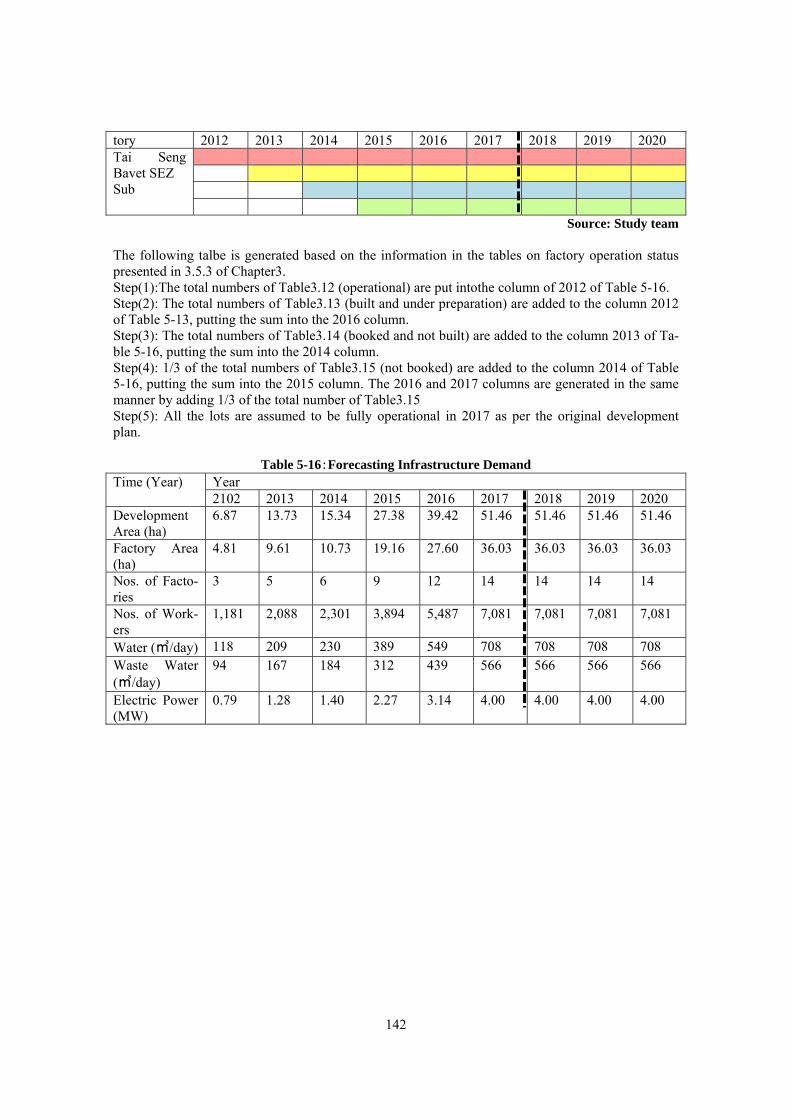
142
tory 2012 2013 2014 2015 2016 2017 2018 2019 2020 Tai Seng Bavet SEZ Sub
Source: Study team The following talbe is generated based on the information in the tables on factory operation status presented in 3.5.3 of Chapter3. Step(1):The total numbers of Table3.12 (operational) are put intothe column of 2012 of Table 5-16. Step(2): The total numbers of Table3.13 (built and under preparation) are added to the column 2012 of Table 5-13, putting the sum into the 2016 column. Step(3): The total numbers of Table3.14 (booked and not built) are added to the column 2013 of Ta-ble 5-16, putting the sum into the 2014 column. Step(4): 1/3 of the total numbers of Table3.15 (not booked) are added to the column 2014 of Table 5-16, putting the sum into the 2015 column. The 2016 and 2017 columns are generated in the same manner by adding 1/3 of the total number of Table3.15 Step(5): All the lots are assumed to be fully operational in 2017 as per the original development plan.
Table 5-16:Forecasting Infrastructure Demand Time (Year) Year
2102 2013 2014 2015 2016 2017 2018 2019 2020 Development Area (ha)
6.87 13.73 15.34 27.38 39.42 51.46 51.46 51.46 51.46
Factory Area (ha)
4.81 9.61 10.73 19.16 27.60 36.03 36.03 36.03 36.03
Nos. of Facto-ries
3 5 6 9 12 14 14 14 14
Nos. of Work-ers
1,181 2,088 2,301 3,894 5,487 7,081 7,081 7,081 7,081
Water (㎥/day) 118 209 230 389 549 708 708 708 708 Waste Water (㎥/day)
94 167 184 312 439 566 566 566 566
Electric Power (MW)
0.79 1.28 1.40 2.27 3.14 4.00 4.00 4.00 4.00
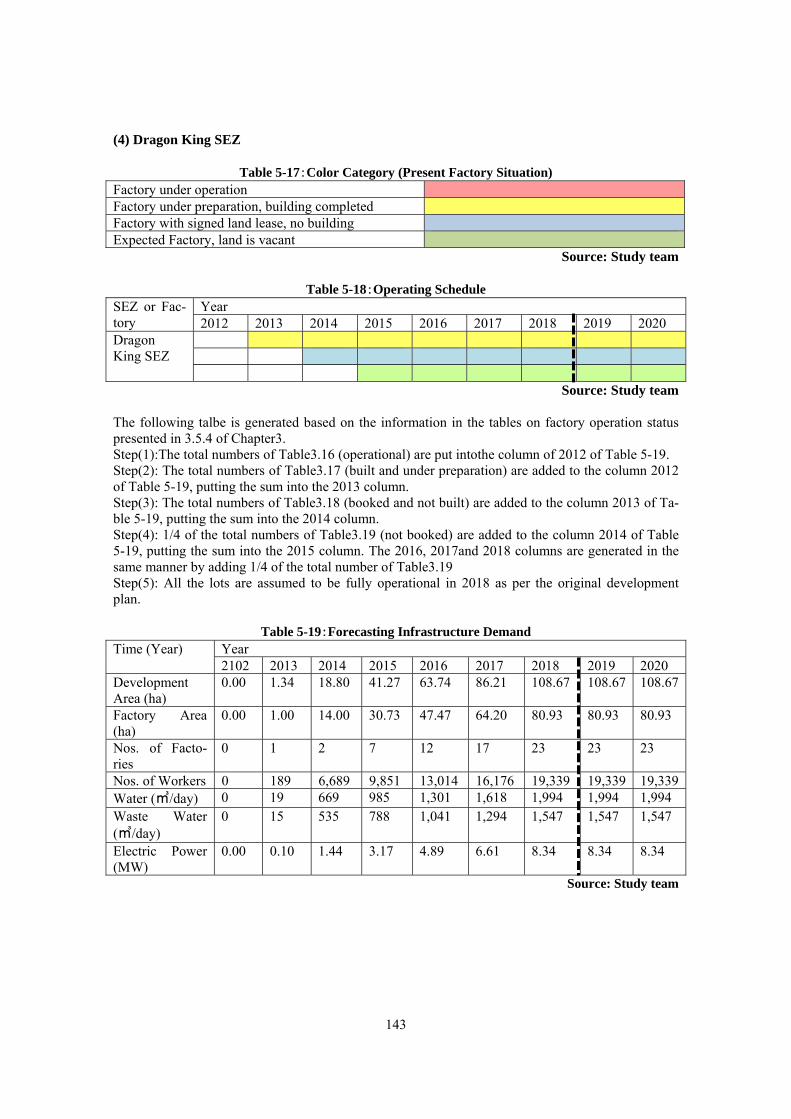
143
(4) Dragon King SEZ
Table 5-17:Color Category (Present Factory Situation) Factory under operation Factory under preparation, building completed Factory with signed land lease, no building Expected Factory, land is vacant
Source: Study team
Table 5-18:Operating Schedule SEZ or Fac-tory
Year 2012 2013 2014 2015 2016 2017 2018 2019 2020
Dragon King SEZ
Source: Study team The following talbe is generated based on the information in the tables on factory operation status presented in 3.5.4 of Chapter3. Step(1):The total numbers of Table3.16 (operational) are put intothe column of 2012 of Table 5-19. Step(2): The total numbers of Table3.17 (built and under preparation) are added to the column 2012 of Table 5-19, putting the sum into the 2013 column. Step(3): The total numbers of Table3.18 (booked and not built) are added to the column 2013 of Ta-ble 5-19, putting the sum into the 2014 column. Step(4): 1/4 of the total numbers of Table3.19 (not booked) are added to the column 2014 of Table 5-19, putting the sum into the 2015 column. The 2016, 2017and 2018 columns are generated in the same manner by adding 1/4 of the total number of Table3.19 Step(5): All the lots are assumed to be fully operational in 2018 as per the original development plan.
Table 5-19:Forecasting Infrastructure Demand Time (Year) Year
2102 2013 2014 2015 2016 2017 2018 2019 2020 Development Area (ha)
0.00 1.34 18.80 41.27 63.74 86.21 108.67 108.67 108.67
Factory Area (ha)
0.00 1.00 14.00 30.73 47.47 64.20 80.93 80.93 80.93
Nos. of Facto-ries
0 1 2 7 12 17 23 23 23
Nos. of Workers 0 189 6,689 9,851 13,014 16,176 19,339 19,339 19,339Water (㎥/day) 0 19 669 985 1,301 1,618 1,994 1,994 1,994 Waste Water (㎥/day)
0 15 535 788 1,041 1,294 1,547 1,547 1,547
Electric Power (MW)
0.00 0.10 1.44 3.17 4.89 6.61 8.34 8.34 8.34
Source: Study team
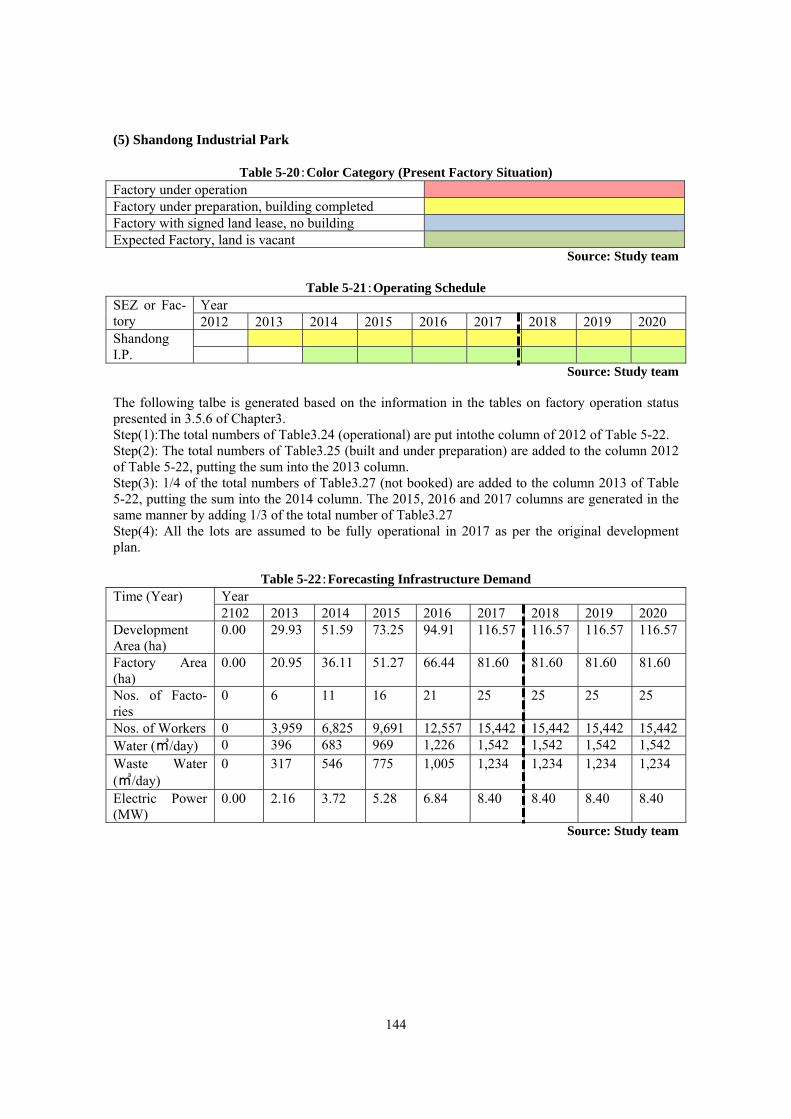
144
(5) Shandong Industrial Park
Table 5-20:Color Category (Present Factory Situation) Factory under operation Factory under preparation, building completed Factory with signed land lease, no building Expected Factory, land is vacant
Source: Study team
Table 5-21:Operating Schedule SEZ or Fac-tory
Year 2012 2013 2014 2015 2016 2017 2018 2019 2020
Shandong I.P.
Source: Study team The following talbe is generated based on the information in the tables on factory operation status presented in 3.5.6 of Chapter3. Step(1):The total numbers of Table3.24 (operational) are put intothe column of 2012 of Table 5-22. Step(2): The total numbers of Table3.25 (built and under preparation) are added to the column 2012 of Table 5-22, putting the sum into the 2013 column. Step(3): 1/4 of the total numbers of Table3.27 (not booked) are added to the column 2013 of Table 5-22, putting the sum into the 2014 column. The 2015, 2016 and 2017 columns are generated in the same manner by adding 1/3 of the total number of Table3.27 Step(4): All the lots are assumed to be fully operational in 2017 as per the original development plan.
Table 5-22:Forecasting Infrastructure Demand Time (Year) Year
2102 2013 2014 2015 2016 2017 2018 2019 2020 Development Area (ha)
0.00 29.93 51.59 73.25 94.91 116.57 116.57 116.57 116.57
Factory Area (ha)
0.00 20.95 36.11 51.27 66.44 81.60 81.60 81.60 81.60
Nos. of Facto-ries
0 6 11 16 21 25 25 25 25
Nos. of Workers 0 3,959 6,825 9,691 12,557 15,442 15,442 15,442 15,442Water (㎥/day) 0 396 683 969 1,226 1,542 1,542 1,542 1,542 Waste Water (㎥/day)
0 317 546 775 1,005 1,234 1,234 1,234 1,234
Electric Power (MW)
0.00 2.16 3.72 5.28 6.84 8.40 8.40 8.40 8.40
Source: Study team
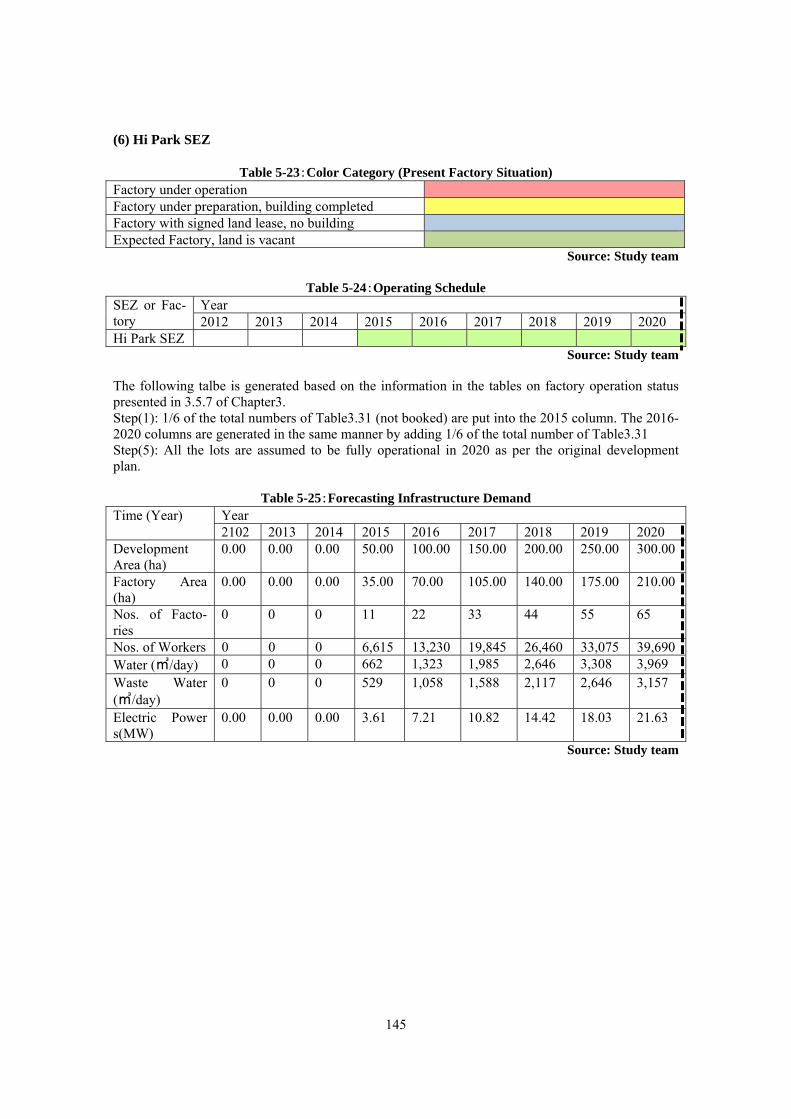
145
(6) Hi Park SEZ
Table 5-23:Color Category (Present Factory Situation) Factory under operation Factory under preparation, building completed Factory with signed land lease, no building Expected Factory, land is vacant
Source: Study team
Table 5-24:Operating Schedule SEZ or Fac-tory
Year 2012 2013 2014 2015 2016 2017 2018 2019 2020
Hi Park SEZ Source: Study team
The following talbe is generated based on the information in the tables on factory operation status presented in 3.5.7 of Chapter3. Step(1): 1/6 of the total numbers of Table3.31 (not booked) are put into the 2015 column. The 2016- 2020 columns are generated in the same manner by adding 1/6 of the total number of Table3.31 Step(5): All the lots are assumed to be fully operational in 2020 as per the original development plan.
Table 5-25:Forecasting Infrastructure Demand Time (Year) Year
2102 2013 2014 2015 2016 2017 2018 2019 2020 Development Area (ha)
0.00 0.00 0.00 50.00 100.00 150.00 200.00 250.00 300.00
Factory Area (ha)
0.00 0.00 0.00 35.00 70.00 105.00 140.00 175.00 210.00
Nos. of Facto-ries
0 0 0 11 22 33 44 55 65
Nos. of Workers 0 0 0 6,615 13,230 19,845 26,460 33,075 39,690Water (㎥/day) 0 0 0 662 1,323 1,985 2,646 3,308 3,969 Waste Water (㎥/day)
0 0 0 529 1,058 1,588 2,117 2,646 3,157
Electric Power s(MW)
0.00 0.00 0.00 3.61 7.21 10.82 14.42 18.03 21.63
Source: Study team
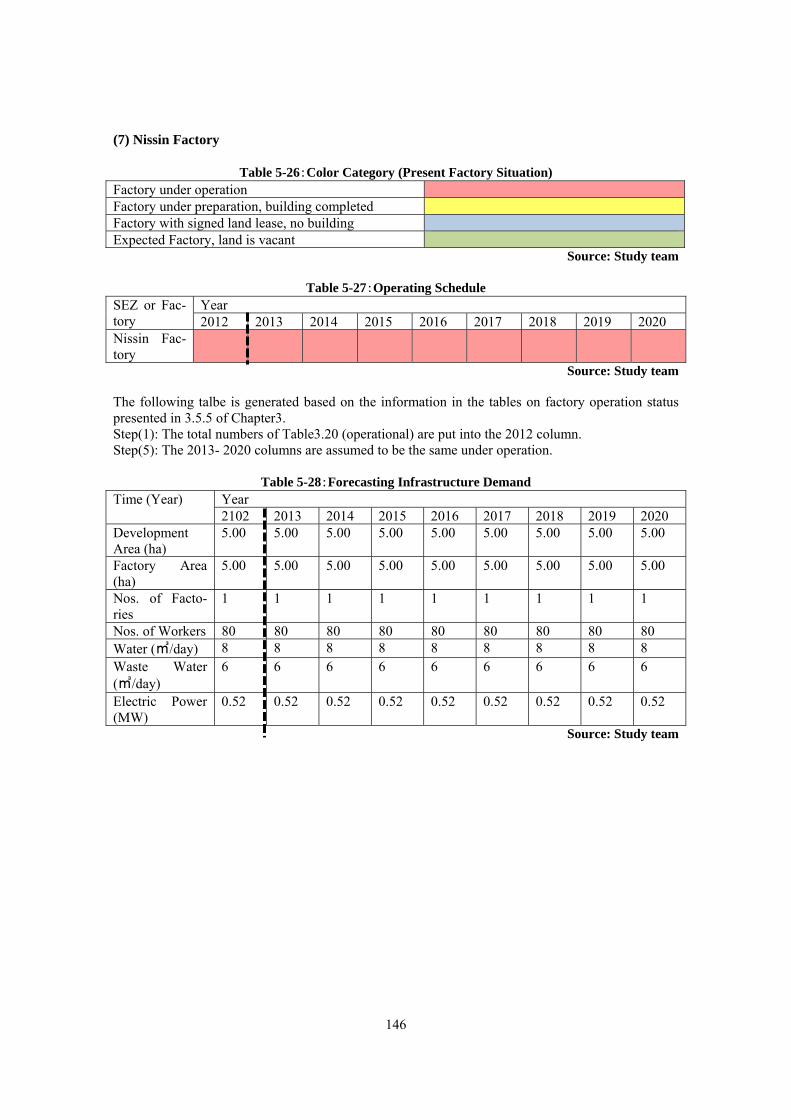
146
(7) Nissin Factory
Table 5-26:Color Category (Present Factory Situation) Factory under operation Factory under preparation, building completed Factory with signed land lease, no building Expected Factory, land is vacant
Source: Study team
Table 5-27:Operating Schedule SEZ or Fac-tory
Year 2012 2013 2014 2015 2016 2017 2018 2019 2020
Nissin Fac-tory
Source: Study team The following talbe is generated based on the information in the tables on factory operation status presented in 3.5.5 of Chapter3. Step(1): The total numbers of Table3.20 (operational) are put into the 2012 column. Step(5): The 2013- 2020 columns are assumed to be the same under operation.
Table 5-28:Forecasting Infrastructure Demand Time (Year) Year
2102 2013 2014 2015 2016 2017 2018 2019 2020 Development Area (ha)
5.00 5.00 5.00 5.00 5.00 5.00 5.00 5.00 5.00
Factory Area (ha)
5.00 5.00 5.00 5.00 5.00 5.00 5.00 5.00 5.00
Nos. of Facto-ries
1 1 1 1 1 1 1 1 1
Nos. of Workers 80 80 80 80 80 80 80 80 80 Water (㎥/day) 8 8 8 8 8 8 8 8 8 Waste Water (㎥/day)
6 6 6 6 6 6 6 6 6
Electric Power (MW)
0.52 0.52 0.52 0.52 0.52 0.52 0.52 0.52 0.52
Source: Study team
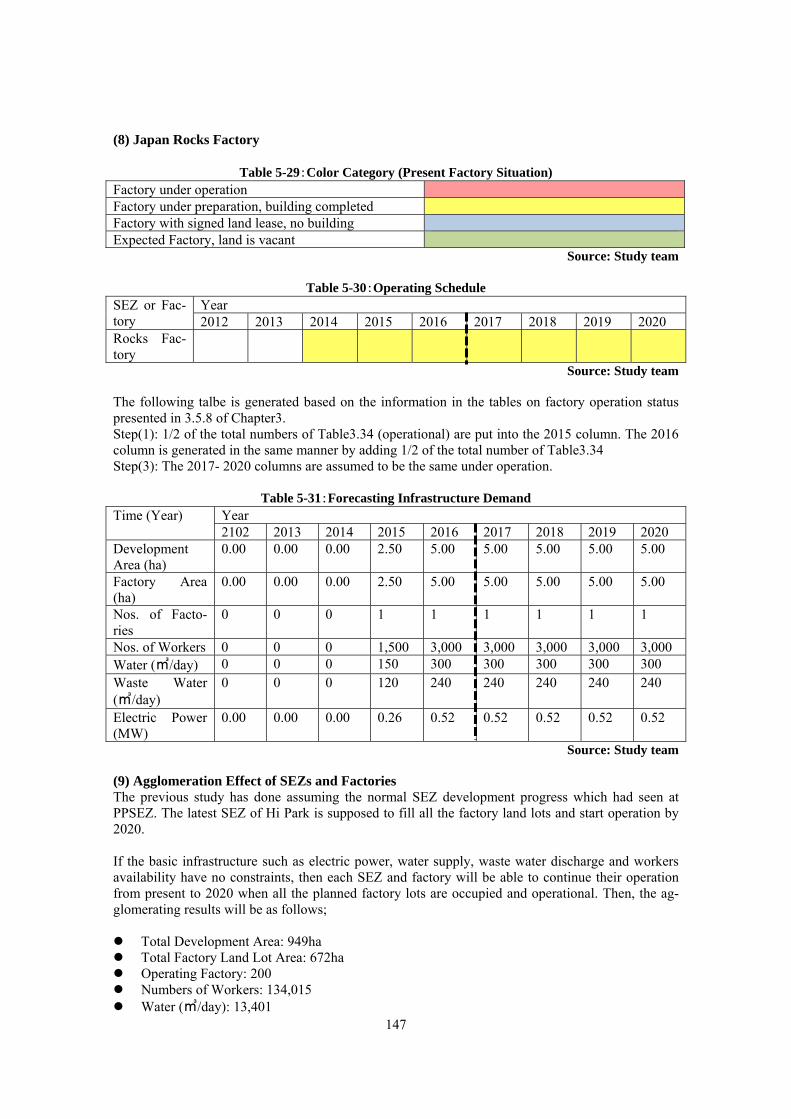
147
(8) Japan Rocks Factory
Table 5-29:Color Category (Present Factory Situation) Factory under operation Factory under preparation, building completed Factory with signed land lease, no building Expected Factory, land is vacant
Source: Study team
Table 5-30:Operating Schedule SEZ or Fac-tory
Year 2012 2013 2014 2015 2016 2017 2018 2019 2020
Rocks Fac-tory
Source: Study team The following talbe is generated based on the information in the tables on factory operation status presented in 3.5.8 of Chapter3. Step(1): 1/2 of the total numbers of Table3.34 (operational) are put into the 2015 column. The 2016 column is generated in the same manner by adding 1/2 of the total number of Table3.34 Step(3): The 2017- 2020 columns are assumed to be the same under operation.
Table 5-31:Forecasting Infrastructure Demand Time (Year) Year
2102 2013 2014 2015 2016 2017 2018 2019 2020 Development Area (ha)
0.00 0.00 0.00 2.50 5.00 5.00 5.00 5.00 5.00
Factory Area (ha)
0.00 0.00 0.00 2.50 5.00 5.00 5.00 5.00 5.00
Nos. of Facto-ries
0 0 0 1 1 1 1 1 1
Nos. of Workers 0 0 0 1,500 3,000 3,000 3,000 3,000 3,000 Water (㎥/day) 0 0 0 150 300 300 300 300 300 Waste Water (㎥/day)
0 0 0 120 240 240 240 240 240
Electric Power (MW)
0.00 0.00 0.00 0.26 0.52 0.52 0.52 0.52 0.52
Source: Study team (9) Agglomeration Effect of SEZs and Factories The previous study has done assuming the normal SEZ development progress which had seen at PPSEZ. The latest SEZ of Hi Park is supposed to fill all the factory land lots and start operation by 2020. If the basic infrastructure such as electric power, water supply, waste water discharge and workers availability have no constraints, then each SEZ and factory will be able to continue their operation from present to 2020 when all the planned factory lots are occupied and operational. Then, the ag-glomerating results will be as follows;
Total Development Area: 949ha Total Factory Land Lot Area: 672ha Operating Factory: 200 Numbers of Workers: 134,015 Water (㎥/day): 13,401
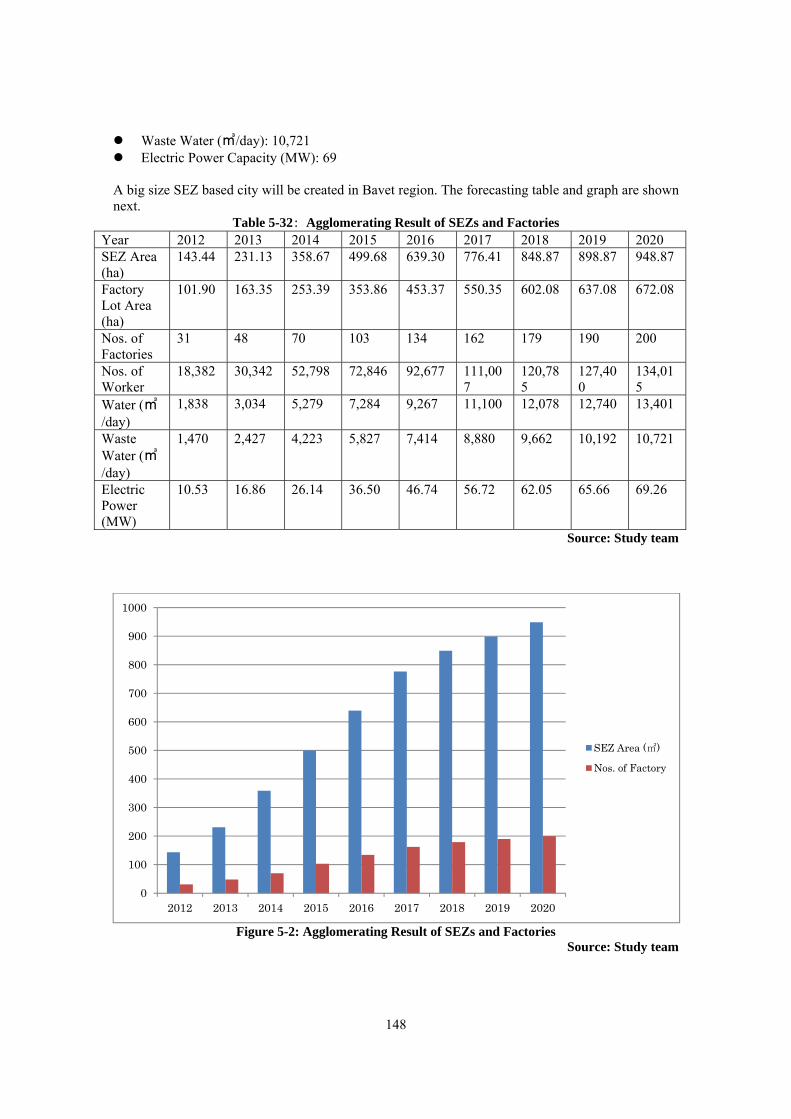
148
Waste Water (㎥/day): 10,721 Electric Power Capacity (MW): 69
A big size SEZ based city will be created in Bavet region. The forecasting table and graph are shown next.
Table 5-32: Agglomerating Result of SEZs and Factories Year 2012 2013 2014 2015 2016 2017 2018 2019 2020 SEZ Area (ha)
143.44 231.13 358.67 499.68 639.30 776.41 848.87 898.87 948.87
Factory Lot Area (ha)
101.90 163.35 253.39 353.86 453.37 550.35 602.08 637.08 672.08
Nos. of Factories
31 48 70 103 134 162 179 190 200
Nos. of Worker
18,382 30,342 52,798 72,846 92,677 111,007
120,785
127,400
134,015
Water (㎥/day)
1,838 3,034 5,279 7,284 9,267 11,100 12,078 12,740 13,401
Waste Water (㎥/day)
1,470 2,427 4,223 5,827 7,414 8,880 9,662 10,192 10,721
Electric Power (MW)
10.53 16.86 26.14 36.50 46.74 56.72 62.05 65.66 69.26
Source: Study team
Figure 5-2: Agglomerating Result of SEZs and Factories Source: Study team
0
100
200
300
400
500
600
700
800
900
1000
2012 2013 2014 2015 2016 2017 2018 2019 2020
SEZ Area (㎡)
Nos. of Factory
149
5-4. Unforeseen Conditions in Bavet Region Special economic zones and factories are facing with lots of problems. The serious matters are picked up and details are reported 5-4-1 Effects by the Unforeseen Conditions There are several effects which has been causing very big trouble to the tenants. (1) Effects by Electrical Shortage Since Manhattan SEZ and Tai Seng SEZ (Main/Sub) completed the land development as SEZ, lots of international tenants have begun operations within a short period. Consequently the electrical consumption increased drastically and power cuts have been occurring these days. According to hearing at EDC (Phnom Penh and Svay Rieng), this region depends on the electrical power supply from Vietnam. The total capacity for Manhattan SEZ is 6MW and for Tai Seng BAvet SEZ (Main/Sub) is 4MW, respectively. Judging from monthly electric power consumption monitoring data, it is obvious that the capacity for these SEZs is already full. This is the reason why the power cut has been occurring so frequently. Among the factories inside the SEZs, there are plastic product makers that cannot cope with the sudden power cuts during their production process. With the situa-tion as it is, the tenants inside the SEZs have set up a working time sharing (schedule of spontaneous work or non-work time schedule) with each other. If these situations continue long, some factories might be forced to give up their production in the region. (2) Effects by Waste Water Treatment System Manhattan SEZ has installed waste water discharging pipes under the internal roads. They have a pond to collect the discharged waste water. So far it seems no problems have emerged with this sys-tem. However if all the factories were to operate at once, the natural pond would not be enough to clear the waste water effluent standard of Cambodia. Tai Seng SEZ (Main/Sub) does not have a waste water discharging pipe and the waste water from factories are flowing into the rain water col-lecting pipe. Both the rain water and waste water are flowing into the borrow pit which was exca-vated during the infrastructure construction. It is clear that this waste water system does not satisfy the aforementioned standard. If this situation continues long, the waste water might seriously dam-age the surrounding rice field. (3) Effects by Water Supply Treatment System (3) Effects by Water Supply Treatment Facility Manhattan SEZ has installed water supply pipe underground along the internal road. Tenants are taking the water from the pipe in front. Tai Seng Bavet SEZ has not installed the water supply pipe and tenants are taking the water by setting up makeshift underground wells by themselves. Specifi-cally in the case of Tai Seng Bavet SEZ (Main/Sub), by taking the underground water from the nar-row space, water shortage and ground settlement might occur. (4) Effects by Transportation System for Workers Several SEZs are located along the National Road No.1 within a short distance of each other. This situation is creating very serious congestion during the commuting time. A few people have been killed by the traffic accidents. If this situation continues long, workers might hesitate to work in this region. (5) Effects by Commuting Workers The population of the entire Svay Rieng Province is about 600,000 and that of Bavet is about 40,000. Presently about 1,200 workers are working and about 6,000 workers at Manhattan SEZ are working at Tai Seng Bavet SEZ (Main/Sub). The total numbers of workers are approaching to the total num-bers of workers commuting. Within a short period, a dormitory might be necessary. SEZs are already facing worker shortages and about 15% of workers are looking for a factory that will pay a higher salary. If this situation continues long, strikes might happen more frequently and SEZs will experi-ence difficulties in finding new workers. In this respect, some functions of a dormitory is indispen-sable.
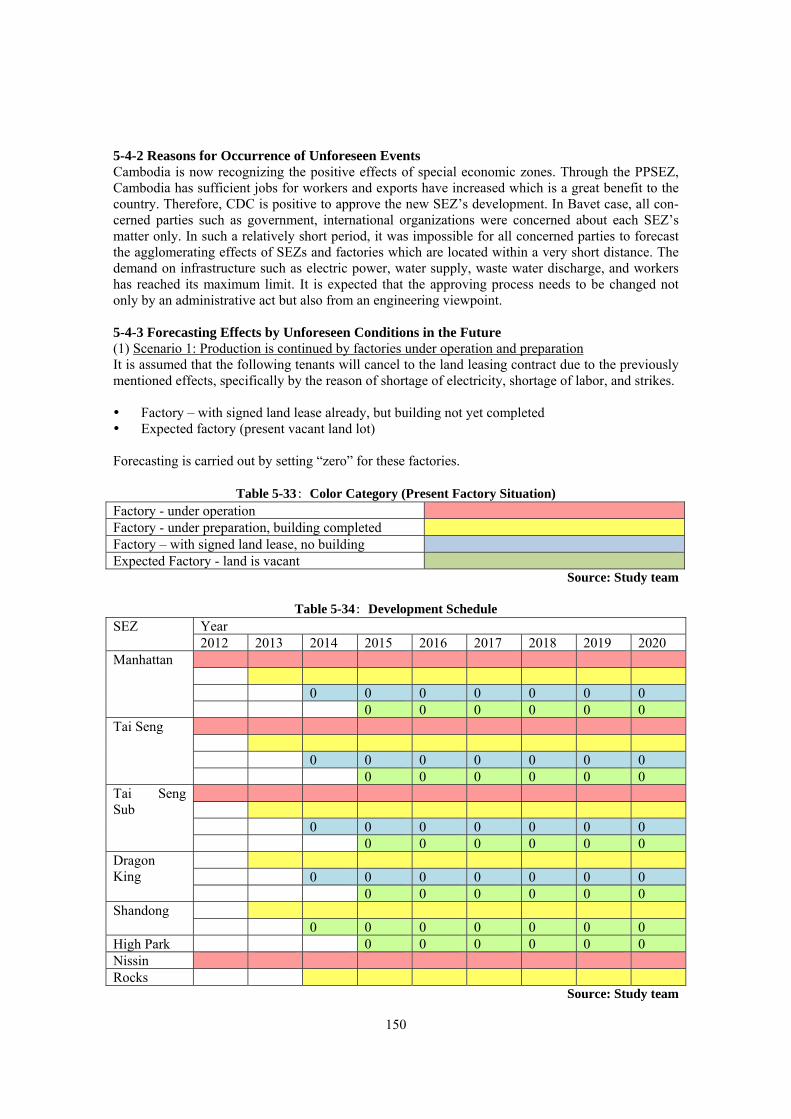
150
5-4-2 Reasons for Occurrence of Unforeseen Events Cambodia is now recognizing the positive effects of special economic zones. Through the PPSEZ, Cambodia has sufficient jobs for workers and exports have increased which is a great benefit to the country. Therefore, CDC is positive to approve the new SEZ’s development. In Bavet case, all con-cerned parties such as government, international organizations were concerned about each SEZ’s matter only. In such a relatively short period, it was impossible for all concerned parties to forecast the agglomerating effects of SEZs and factories which are located within a very short distance. The demand on infrastructure such as electric power, water supply, waste water discharge, and workers has reached its maximum limit. It is expected that the approving process needs to be changed not only by an administrative act but also from an engineering viewpoint. 5-4-3 Forecasting Effects by Unforeseen Conditions in the Future (1) Scenario 1: Production is continued by factories under operation and preparation It is assumed that the following tenants will cancel to the land leasing contract due to the previously mentioned effects, specifically by the reason of shortage of electricity, shortage of labor, and strikes. Factory – with signed land lease already, but building not yet completed Expected factory (present vacant land lot)
Forecasting is carried out by setting “zero” for these factories.
Table 5-33: Color Category (Present Factory Situation) Factory - under operation Factory - under preparation, building completed Factory – with signed land lease, no building Expected Factory - land is vacant
Source: Study team
Table 5-34: Development Schedule SEZ Year
2012 2013 2014 2015 2016 2017 2018 2019 2020 Manhattan
0 0 0 0 0 0 0 0 0 0 0 0 0
Tai Seng 0 0 0 0 0 0 0 0 0 0 0 0 0
Tai Seng Sub
0 0 0 0 0 0 0 0 0 0 0 0 0
Dragon King
0 0 0 0 0 0 0 0 0 0 0 0 0
Shandong 0 0 0 0 0 0 0
High Park 0 0 0 0 0 0 Nissin Rocks
Source: Study team
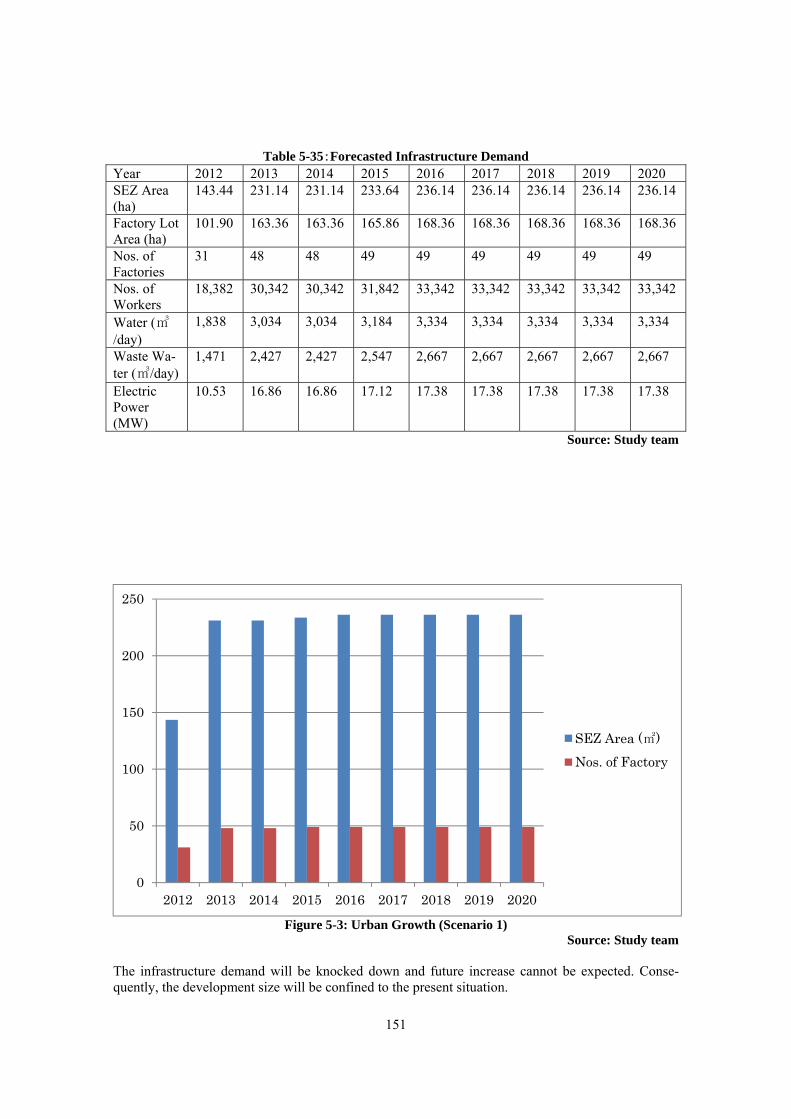
151
Table 5-35:Forecasted Infrastructure Demand
Year 2012 2013 2014 2015 2016 2017 2018 2019 2020 SEZ Area (ha)
143.44 231.14 231.14 233.64 236.14 236.14 236.14 236.14 236.14
Factory Lot Area (ha)
101.90 163.36 163.36 165.86 168.36 168.36 168.36 168.36 168.36
Nos. of Factories
31 48 48 49 49 49 49 49 49
Nos. of Workers
18,382 30,342 30,342 31,842 33,342 33,342 33,342 33,342 33,342
Water (㎥/day)
1,838 3,034 3,034 3,184 3,334 3,334 3,334 3,334 3,334
Waste Wa-ter (㎥/day)
1,471 2,427 2,427 2,547 2,667 2,667 2,667 2,667 2,667
Electric Power (MW)
10.53 16.86 16.86 17.12 17.38 17.38 17.38 17.38 17.38
Source: Study team
Figure 5-3: Urban Growth (Scenario 1) Source: Study team
The infrastructure demand will be knocked down and future increase cannot be expected. Conse-quently, the development size will be confined to the present situation.
0
50
100
150
200
250
2012 2013 2014 2015 2016 2017 2018 2019 2020
SEZ Area (㎡)Nos. of Factory
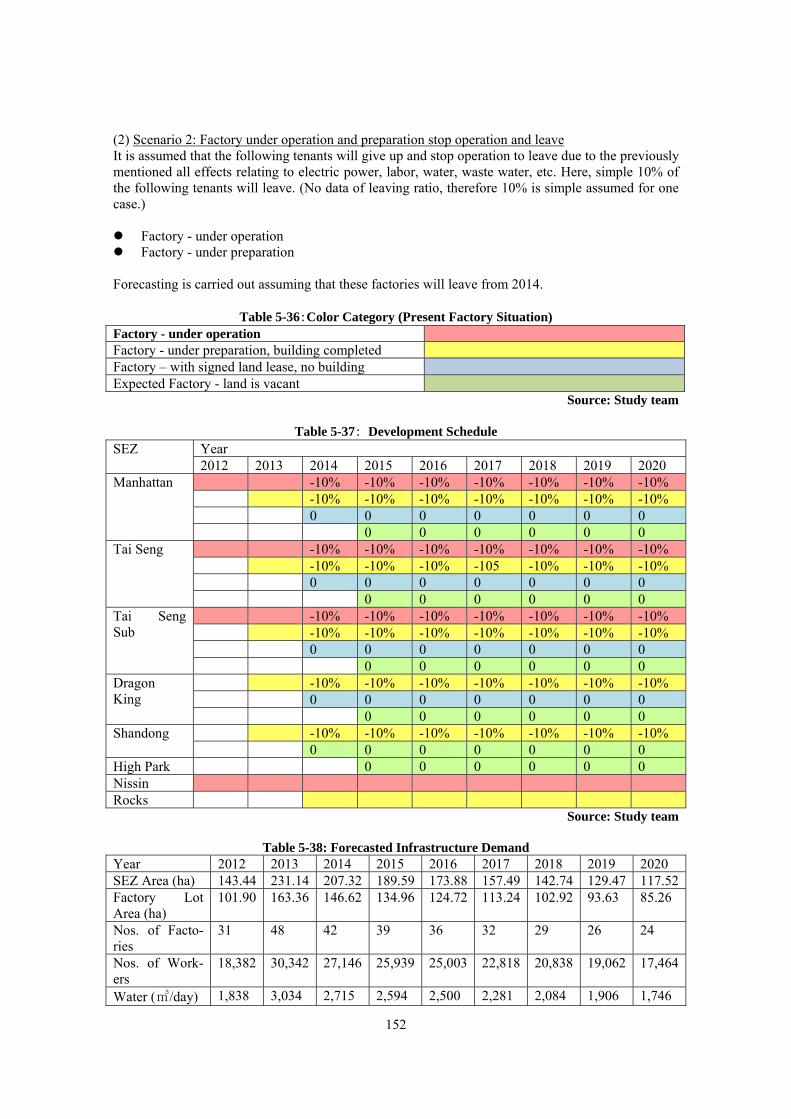
152
(2) Scenario 2: Factory under operation and preparation stop operation and leave It is assumed that the following tenants will give up and stop operation to leave due to the previously mentioned all effects relating to electric power, labor, water, waste water, etc. Here, simple 10% of the following tenants will leave. (No data of leaving ratio, therefore 10% is simple assumed for one case.)
Factory - under operation Factory - under preparation
Forecasting is carried out assuming that these factories will leave from 2014.
Table 5-36:Color Category (Present Factory Situation) Factory - under operation Factory - under preparation, building completed Factory – with signed land lease, no building Expected Factory - land is vacant
Source: Study team
Table 5-37: Development Schedule SEZ Year
2012 2013 2014 2015 2016 2017 2018 2019 2020 Manhattan -10% -10% -10% -10% -10% -10% -10%
-10% -10% -10% -10% -10% -10% -10% 0 0 0 0 0 0 0 0 0 0 0 0 0
Tai Seng -10% -10% -10% -10% -10% -10% -10% -10% -10% -10% -105 -10% -10% -10% 0 0 0 0 0 0 0 0 0 0 0 0 0
Tai Seng Sub
-10% -10% -10% -10% -10% -10% -10% -10% -10% -10% -10% -10% -10% -10% 0 0 0 0 0 0 0 0 0 0 0 0 0
Dragon King
-10% -10% -10% -10% -10% -10% -10% 0 0 0 0 0 0 0 0 0 0 0 0 0
Shandong -10% -10% -10% -10% -10% -10% -10% 0 0 0 0 0 0 0
High Park 0 0 0 0 0 0 Nissin Rocks
Source: Study team
Table 5-38: Forecasted Infrastructure Demand Year 2012 2013 2014 2015 2016 2017 2018 2019 2020 SEZ Area (ha) 143.44 231.14 207.32 189.59 173.88 157.49 142.74 129.47 117.52Factory Lot Area (ha)
101.90 163.36 146.62 134.96 124.72 113.24 102.92 93.63 85.26
Nos. of Facto-ries
31 48 42 39 36 32 29 26 24
Nos. of Work-ers
18,382 30,342 27,146 25,939 25,003 22,818 20,838 19,062 17,464
Water (㎥/day) 1,838 3,034 2,715 2,594 2,500 2,281 2,084 1,906 1,746
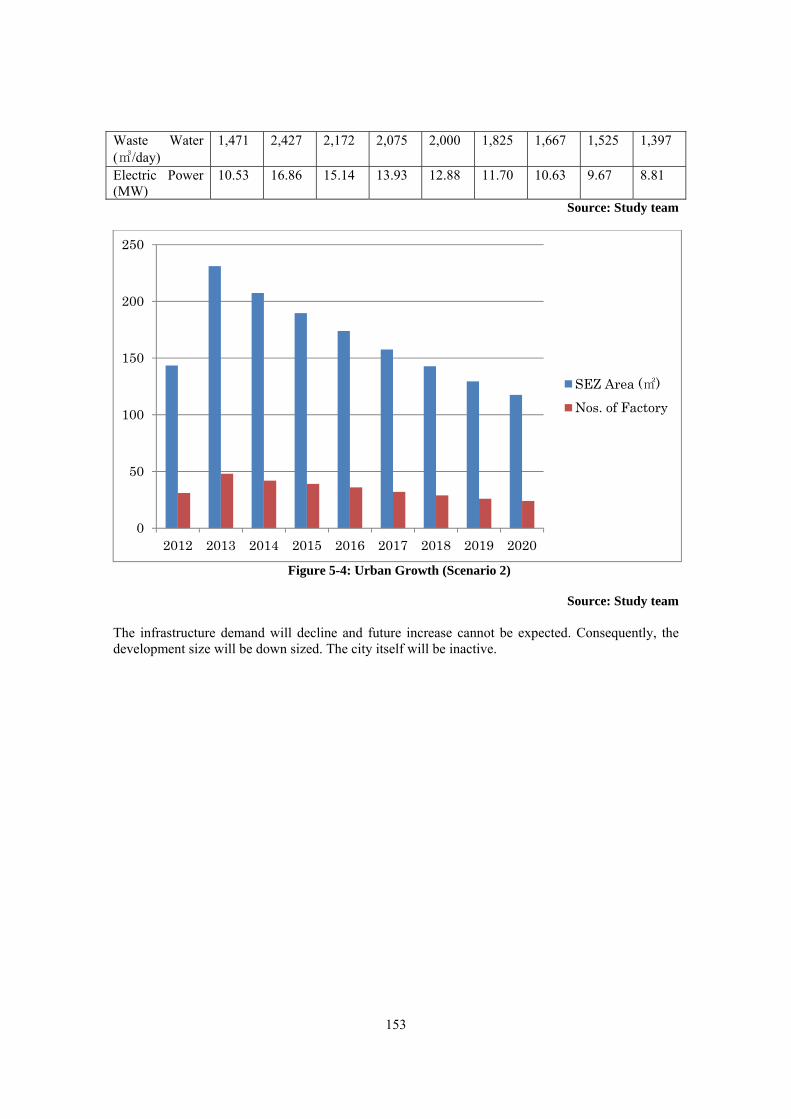
153
Waste Water (㎥/day)
1,471 2,427 2,172 2,075 2,000 1,825 1,667 1,525 1,397
Electric Power (MW)
10.53 16.86 15.14 13.93 12.88 11.70 10.63 9.67 8.81
Source: Study team
Figure 5-4: Urban Growth (Scenario 2)
Source: Study team The infrastructure demand will decline and future increase cannot be expected. Consequently, the development size will be down sized. The city itself will be inactive.
0
50
100
150
200
250
2012 2013 2014 2015 2016 2017 2018 2019 2020
SEZ Area (㎡)Nos. of Factory
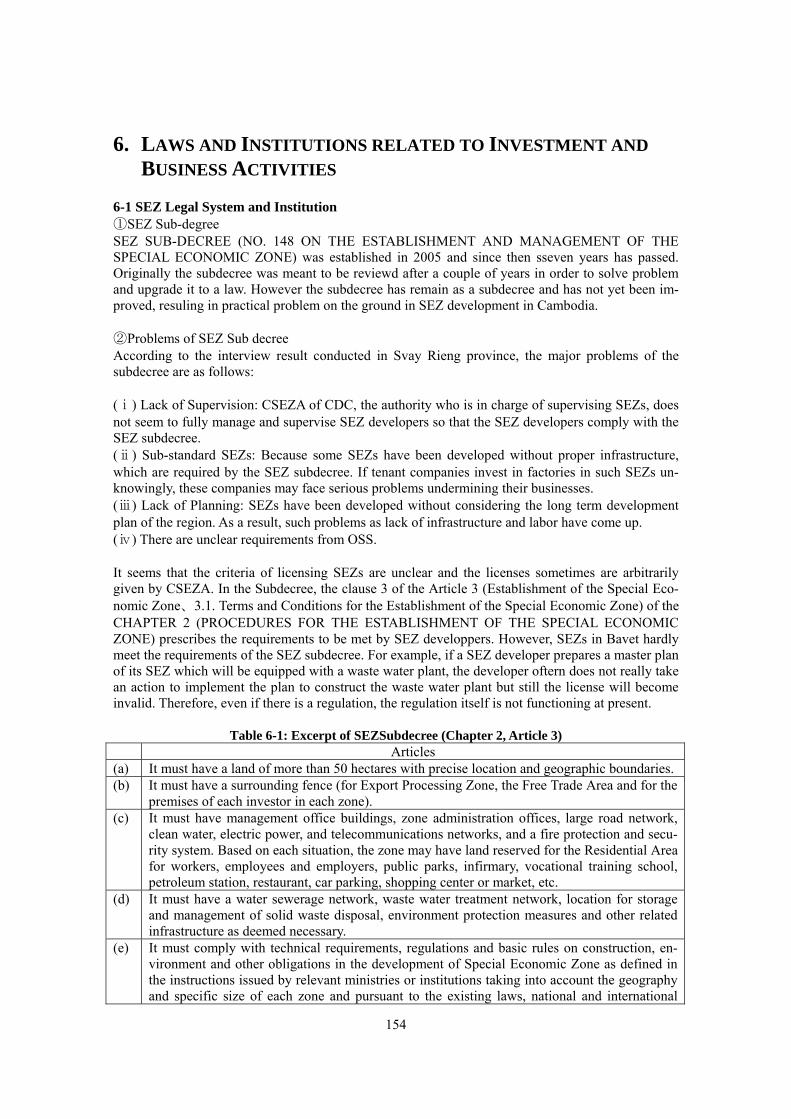
154
6. LAWS AND INSTITUTIONS RELATED TO INVESTMENT AND BUSINESS ACTIVITIES
6-1 SEZ Legal System and Institution ①SEZ Sub-degree SEZ SUB-DECREE (NO. 148 ON THE ESTABLISHMENT AND MANAGEMENT OF THE SPECIAL ECONOMIC ZONE) was established in 2005 and since then sseven years has passed. Originally the subdecree was meant to be reviewd after a couple of years in order to solve problem and upgrade it to a law. However the subdecree has remain as a subdecree and has not yet been im-proved, resuling in practical problem on the ground in SEZ development in Cambodia. ②Problems of SEZ Sub decree According to the interview result conducted in Svay Rieng province, the major problems of the subdecree are as follows: (ⅰ) Lack of Supervision: CSEZA of CDC, the authority who is in charge of supervising SEZs, does not seem to fully manage and supervise SEZ developers so that the SEZ developers comply with the SEZ subdecree. (ⅱ) Sub-standard SEZs: Because some SEZs have been developed without proper infrastructure, which are required by the SEZ subdecree. If tenant companies invest in factories in such SEZs un-knowingly, these companies may face serious problems undermining their businesses. (ⅲ) Lack of Planning: SEZs have been developed without considering the long term development plan of the region. As a result, such problems as lack of infrastructure and labor have come up. (ⅳ) There are unclear requirements from OSS. It seems that the criteria of licensing SEZs are unclear and the licenses sometimes are arbitrarily given by CSEZA. In the Subdecree, the clause 3 of the Article 3 (Establishment of the Special Eco-nomic Zone、3.1. Terms and Conditions for the Establishment of the Special Economic Zone) of the CHAPTER 2 (PROCEDURES FOR THE ESTABLISHMENT OF THE SPECIAL ECONOMIC ZONE) prescribes the requirements to be met by SEZ developpers. However, SEZs in Bavet hardly meet the requirements of the SEZ subdecree. For example, if a SEZ developer prepares a master plan of its SEZ which will be equipped with a waste water plant, the developer oftern does not really take an action to implement the plan to construct the waste water plant but still the license will become invalid. Therefore, even if there is a regulation, the regulation itself is not functioning at present.
Table 6-1: Excerpt of SEZSubdecree (Chapter 2, Article 3) Articles (a) It must have a land of more than 50 hectares with precise location and geographic boundaries.(b) It must have a surrounding fence (for Export Processing Zone, the Free Trade Area and for the
premises of each investor in each zone). (c) It must have management office buildings, zone administration offices, large road network,
clean water, electric power, and telecommunications networks, and a fire protection and secu-rity system. Based on each situation, the zone may have land reserved for the Residential Area for workers, employees and employers, public parks, infirmary, vocational training school, petroleum station, restaurant, car parking, shopping center or market, etc.
(d) It must have a water sewerage network, waste water treatment network, location for storage and management of solid waste disposal, environment protection measures and other related infrastructure as deemed necessary.
(e) It must comply with technical requirements, regulations and basic rules on construction, en-vironment and other obligations in the development of Special Economic Zone as defined in the instructions issued by relevant ministries or institutions taking into account the geography and specific size of each zone and pursuant to the existing laws, national and international
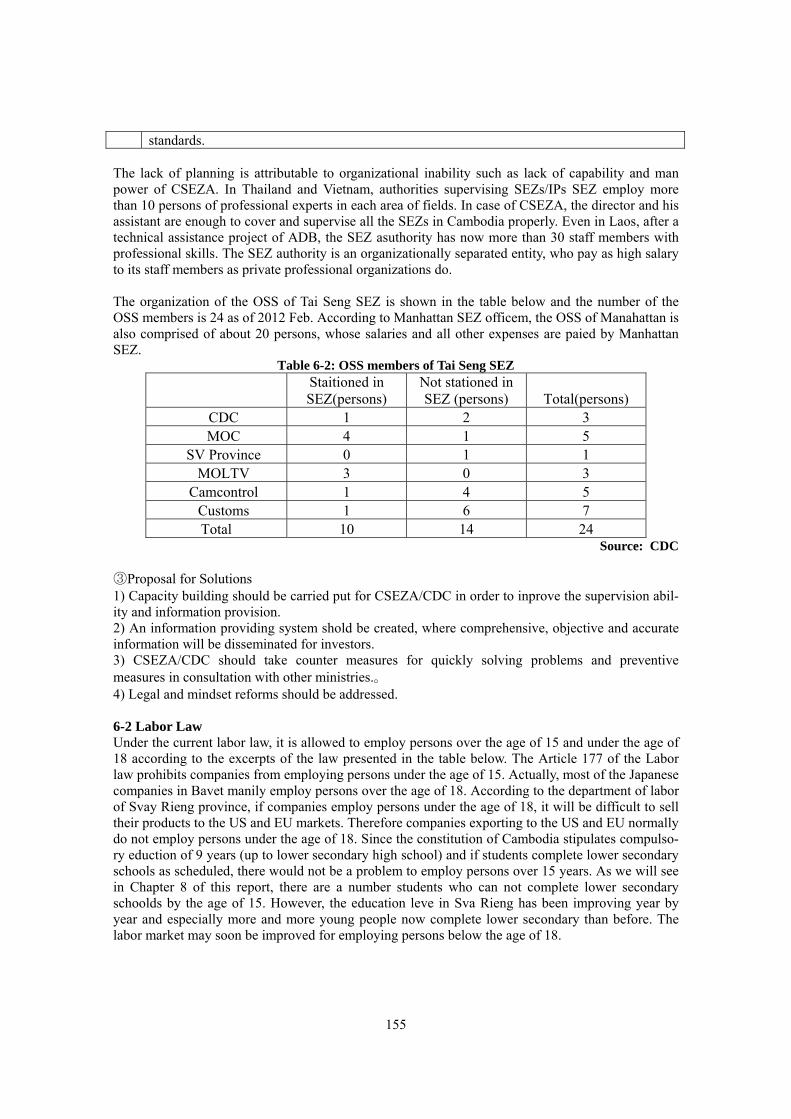
155
standards. The lack of planning is attributable to organizational inability such as lack of capability and man power of CSEZA. In Thailand and Vietnam, authorities supervising SEZs/IPs SEZ employ more than 10 persons of professional experts in each area of fields. In case of CSEZA, the director and his assistant are enough to cover and supervise all the SEZs in Cambodia properly. Even in Laos, after a technical assistance project of ADB, the SEZ asuthority has now more than 30 staff members with professional skills. The SEZ authority is an organizationally separated entity, who pay as high salary to its staff members as private professional organizations do. The organization of the OSS of Tai Seng SEZ is shown in the table below and the number of the OSS members is 24 as of 2012 Feb. According to Manhattan SEZ officem, the OSS of Manahattan is also comprised of about 20 persons, whose salaries and all other expenses are paied by Manhattan SEZ.
Table 6-2: OSS members of Tai Seng SEZ Staitioned in SEZ(persons)
Not stationed in SEZ (persons) Total(persons)
CDC 1 2 3 MOC 4 1 5
SV Province 0 1 1 MOLTV 3 0 3
Camcontrol 1 4 5 Customs 1 6 7 Total 10 14 24
Source: CDC
③Proposal for Solutions 1) Capacity building should be carried put for CSEZA/CDC in order to inprove the supervision abil-ity and information provision. 2) An information providing system shold be created, where comprehensive, objective and accurate information will be disseminated for investors. 3) CSEZA/CDC should take counter measures for quickly solving problems and preventive measures in consultation with other ministries.。 4) Legal and mindset reforms should be addressed. 6-2 Labor Law Under the current labor law, it is allowed to employ persons over the age of 15 and under the age of 18 according to the excerpts of the law presented in the table below. The Article 177 of the Labor law prohibits companies from employing persons under the age of 15. Actually, most of the Japanese companies in Bavet manily employ persons over the age of 18. According to the department of labor of Svay Rieng province, if companies employ persons under the age of 18, it will be difficult to sell their products to the US and EU markets. Therefore companies exporting to the US and EU normally do not employ persons under the age of 18. Since the constitution of Cambodia stipulates compulso-ry eduction of 9 years (up to lower secondary high school) and if students complete lower secondary schools as scheduled, there would not be a problem to employ persons over 15 years. As we will see in Chapter 8 of this report, there are a number students who can not complete lower secondary schoolds by the age of 15. However, the education leve in Sva Rieng has been improving year by year and especially more and more young people now complete lower secondary than before. The labor market may soon be improved for employing persons below the age of 18.
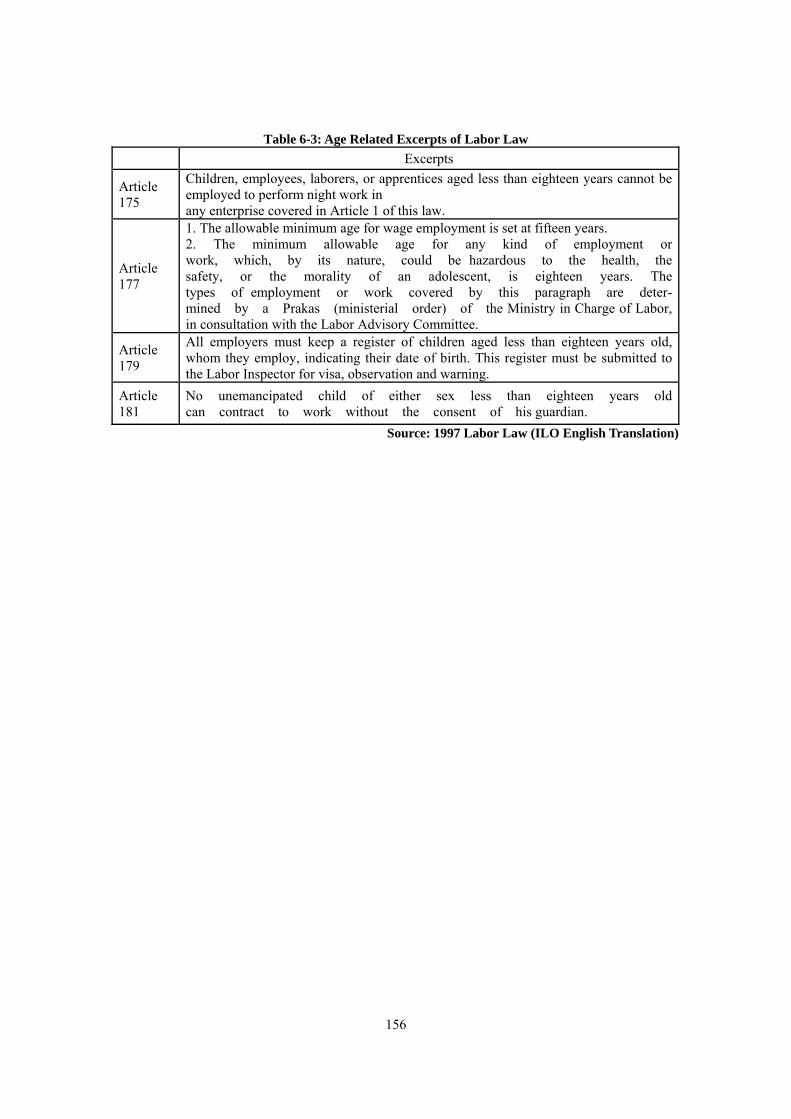
156
Table 6-3: Age Related Excerpts of Labor Law Excerpts
Article 175
Children, employees, laborers, or apprentices aged less than eighteen years cannot be employed to perform night work in any enterprise covered in Article 1 of this law.
Article 177
1. The allowable minimum age for wage employment is set at fifteen years. 2. The minimum allowable age for any kind of employment or work, which, by its nature, could be hazardous to the health, the safety, or the morality of an adolescent, is eighteen years. The types of employment or work covered by this paragraph are deter-mined by a Prakas (ministerial order) of the Ministry in Charge of Labor, in consultation with the Labor Advisory Committee.
Article 179
All employers must keep a register of children aged less than eighteen years old, whom they employ, indicating their date of birth. This register must be submitted to the Labor Inspector for visa, observation and warning.
Article 181
No unemancipated child of either sex less than eighteen years old can contract to work without the consent of his guardian.
Source: 1997 Labor Law (ILO English Translation)
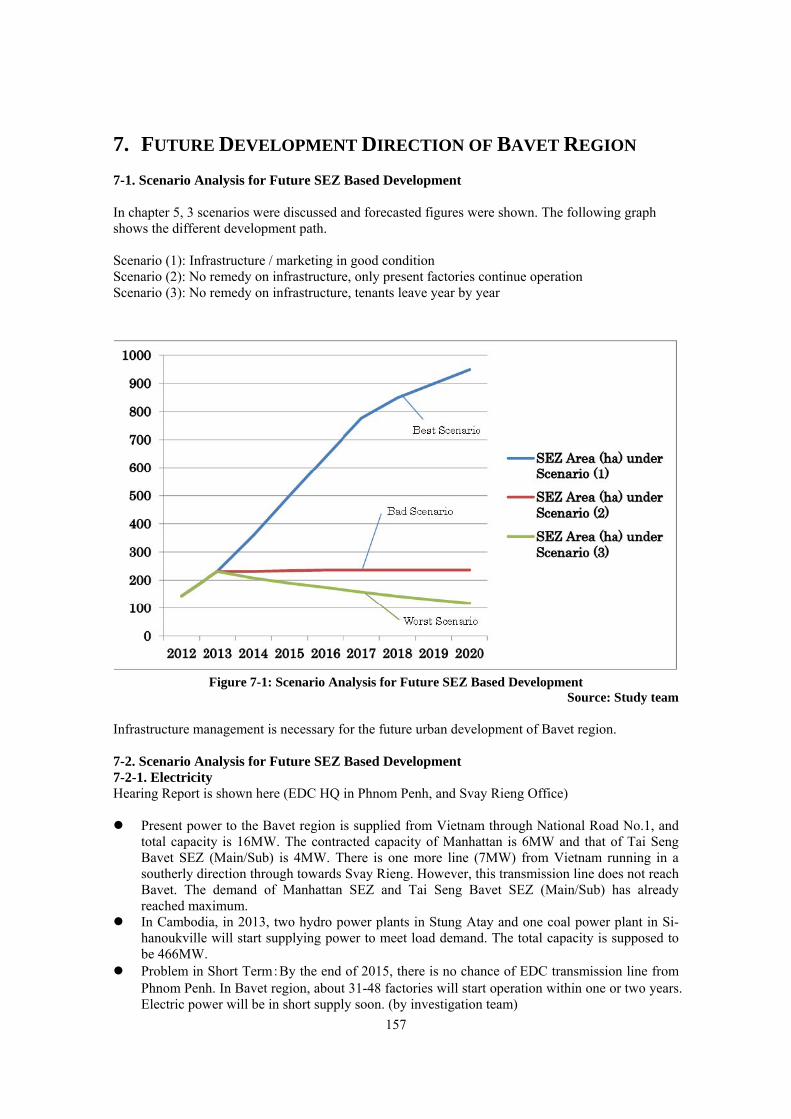
157
7. FUTURE DEVELOPMENT DIRECTION OF BAVET REGION 7-1. Scenario Analysis for Future SEZ Based Development In chapter 5, 3 scenarios were discussed and forecasted figures were shown. The following graph shows the different development path. Scenario (1): Infrastructure / marketing in good condition Scenario (2): No remedy on infrastructure, only present factories continue operation Scenario (3): No remedy on infrastructure, tenants leave year by year
Figure 7-1: Scenario Analysis for Future SEZ Based Development
Source: Study team Infrastructure management is necessary for the future urban development of Bavet region. 7-2. Scenario Analysis for Future SEZ Based Development 7-2-1. Electricity Hearing Report is shown here (EDC HQ in Phnom Penh, and Svay Rieng Office)
Present power to the Bavet region is supplied from Vietnam through National Road No.1, and total capacity is 16MW. The contracted capacity of Manhattan is 6MW and that of Tai Seng Bavet SEZ (Main/Sub) is 4MW. There is one more line (7MW) from Vietnam running in a southerly direction through towards Svay Rieng. However, this transmission line does not reach Bavet. The demand of Manhattan SEZ and Tai Seng Bavet SEZ (Main/Sub) has already reached maximum.
In Cambodia, in 2013, two hydro power plants in Stung Atay and one coal power plant in Si-hanoukville will start supplying power to meet load demand. The total capacity is supposed to be 466MW.
Problem in Short Term:By the end of 2015, there is no chance of EDC transmission line from Phnom Penh. In Bavet region, about 31-48 factories will start operation within one or two years. Electric power will be in short supply soon. (by investigation team)
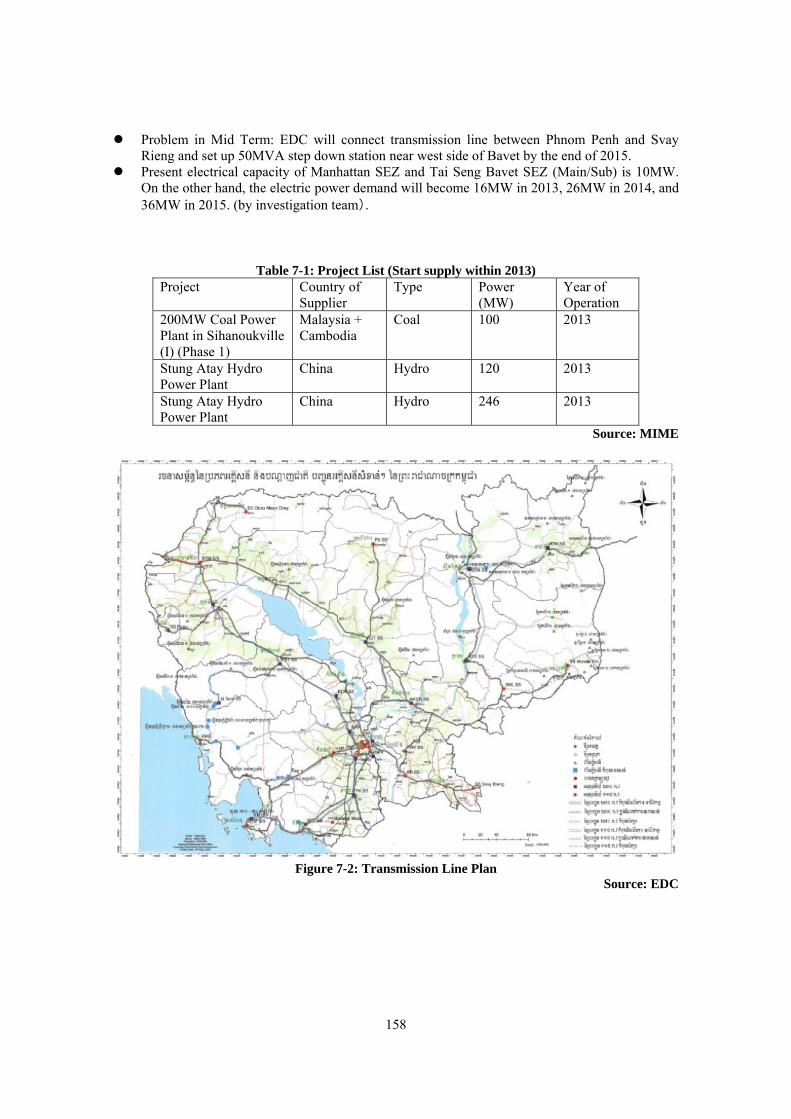
158
Problem in Mid Term: EDC will connect transmission line between Phnom Penh and Svay Rieng and set up 50MVA step down station near west side of Bavet by the end of 2015.
Present electrical capacity of Manhattan SEZ and Tai Seng Bavet SEZ (Main/Sub) is 10MW. On the other hand, the electric power demand will become 16MW in 2013, 26MW in 2014, and 36MW in 2015. (by investigation team).
Table 7-1: Project List (Start supply within 2013) Project Country of
Supplier Type Power
(MW) Year of Operation
200MW Coal Power Plant in Sihanoukville (I) (Phase 1)
Malaysia + Cambodia
Coal 100 2013
Stung Atay Hydro Power Plant
China Hydro 120 2013
Stung Atay Hydro Power Plant
China Hydro 246 2013
Source: MIME
Figure 7-2: Transmission Line Plan
Source: EDC
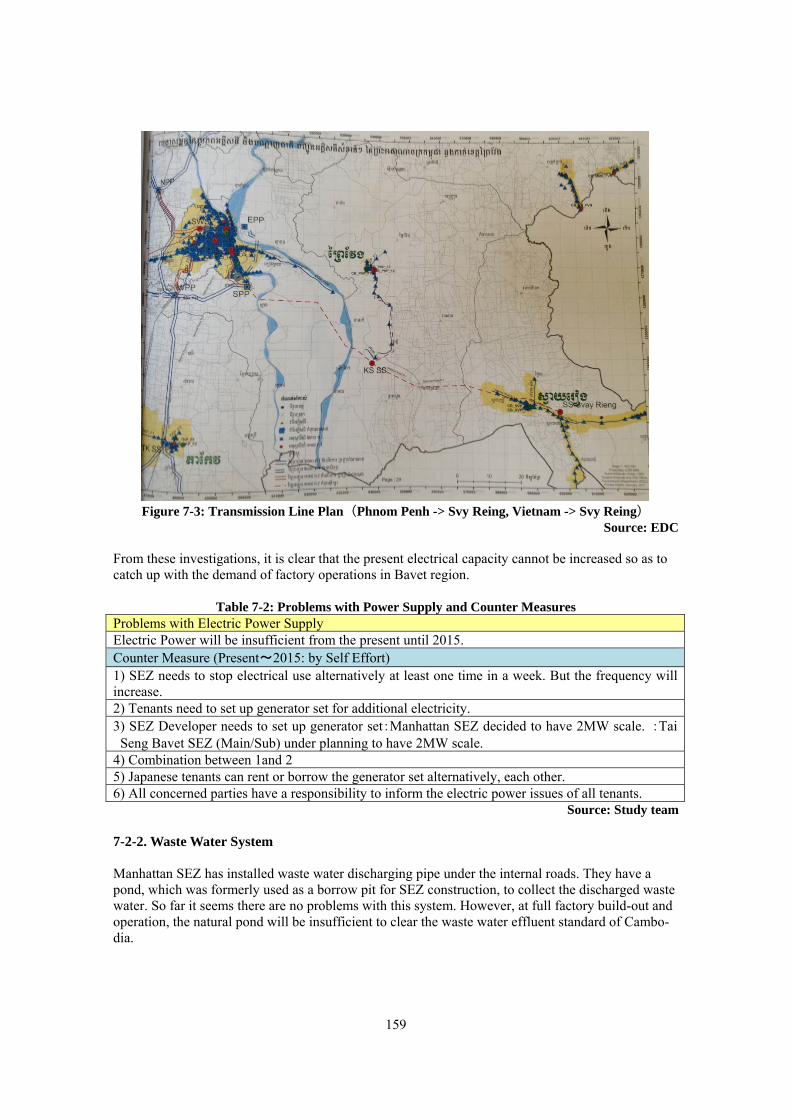
159
Figure 7-3: Transmission Line Plan(Phnom Penh -> Svy Reing, Vietnam -> Svy Reing)
Source: EDC From these investigations, it is clear that the present electrical capacity cannot be increased so as to catch up with the demand of factory operations in Bavet region.
Table 7-2: Problems with Power Supply and Counter Measures Problems with Electric Power Supply Electric Power will be insufficient from the present until 2015. Counter Measure (Present~2015: by Self Effort) 1) SEZ needs to stop electrical use alternatively at least one time in a week. But the frequency will increase. 2) Tenants need to set up generator set for additional electricity. 3) SEZ Developer needs to set up generator set:Manhattan SEZ decided to have 2MW scale. :Tai
Seng Bavet SEZ (Main/Sub) under planning to have 2MW scale. 4) Combination between 1and 2 5) Japanese tenants can rent or borrow the generator set alternatively, each other. 6) All concerned parties have a responsibility to inform the electric power issues of all tenants.
Source: Study team 7-2-2. Waste Water System Manhattan SEZ has installed waste water discharging pipe under the internal roads. They have a pond, which was formerly used as a borrow pit for SEZ construction, to collect the discharged waste water. So far it seems there are no problems with this system. However, at full factory build-out and operation, the natural pond will be insufficient to clear the waste water effluent standard of Cambo-dia.
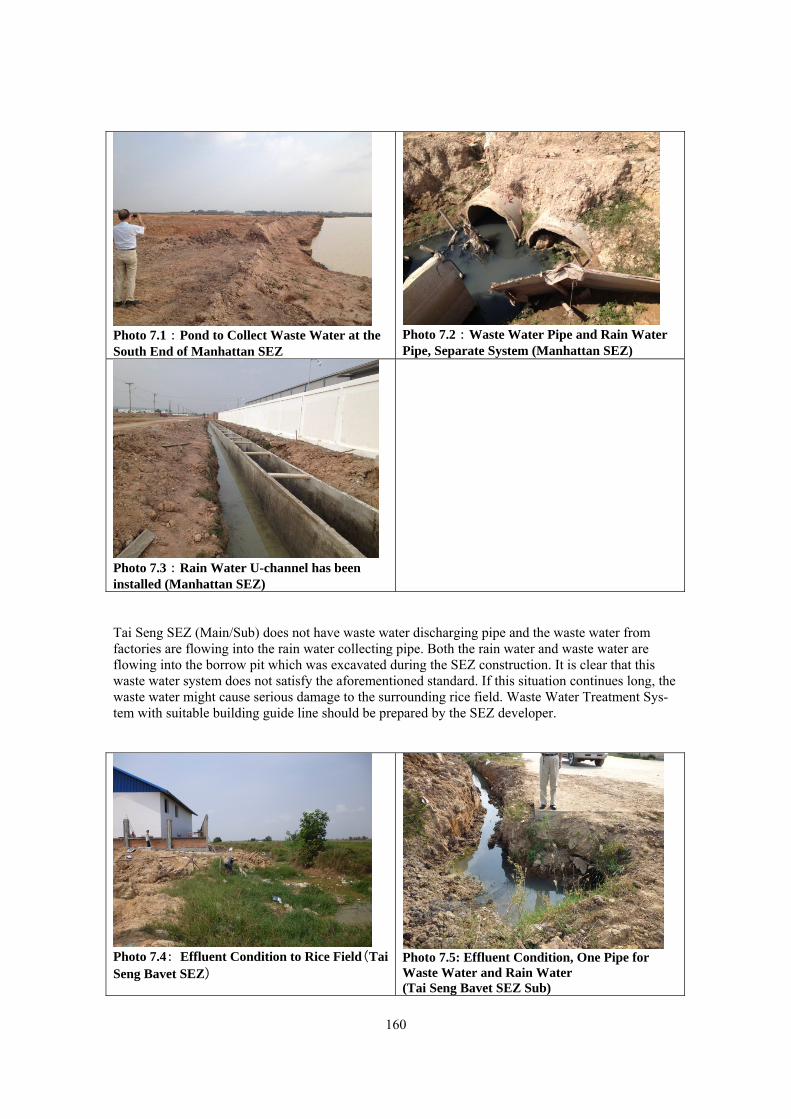
160
Photo 7.1:Pond to Collect Waste Water at the South End of Manhattan SEZ
Photo 7.2:Waste Water Pipe and Rain Water Pipe, Separate System (Manhattan SEZ)
Photo 7.3:Rain Water U-channel has been installed (Manhattan SEZ)
Tai Seng SEZ (Main/Sub) does not have waste water discharging pipe and the waste water from factories are flowing into the rain water collecting pipe. Both the rain water and waste water are flowing into the borrow pit which was excavated during the SEZ construction. It is clear that this waste water system does not satisfy the aforementioned standard. If this situation continues long, the waste water might cause serious damage to the surrounding rice field. Waste Water Treatment Sys-tem with suitable building guide line should be prepared by the SEZ developer.
Photo 7.4: Effluent Condition to Rice Field(Tai Seng Bavet SEZ)
Photo 7.5: Effluent Condition, One Pipe for Waste Water and Rain Water (Tai Seng Bavet SEZ Sub)
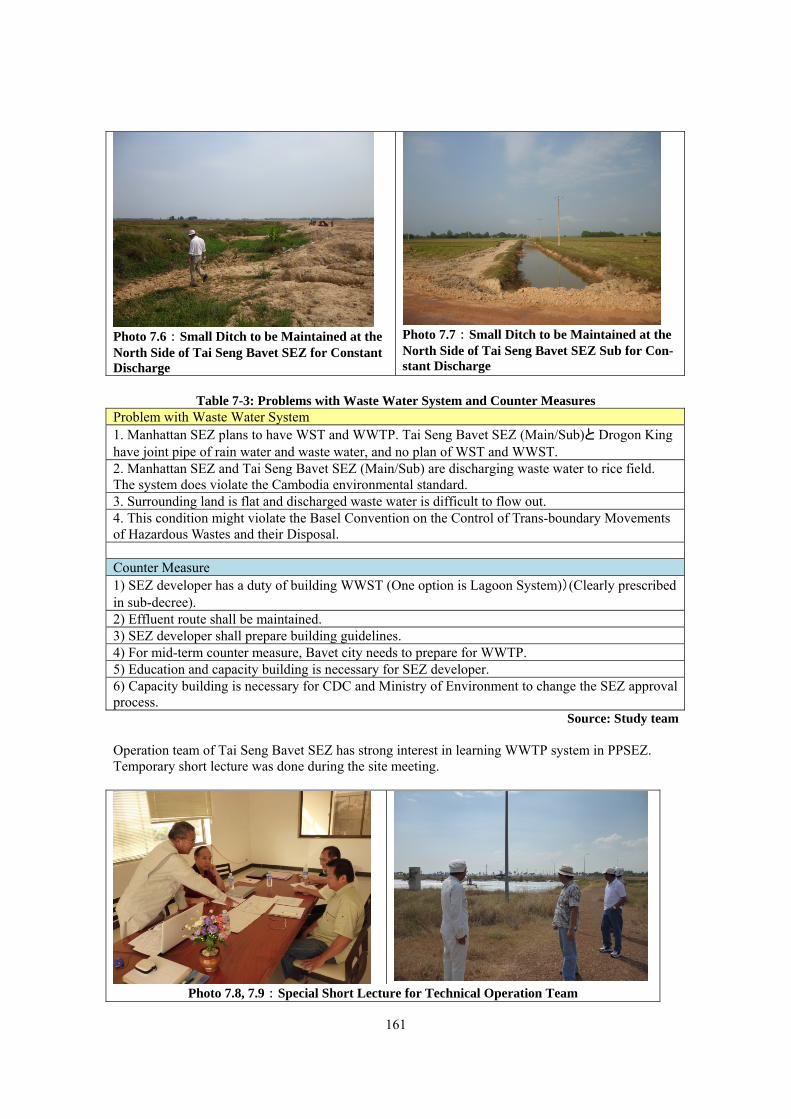
161
Photo 7.6:Small Ditch to be Maintained at the North Side of Tai Seng Bavet SEZ for Constant Discharge
Photo 7.7:Small Ditch to be Maintained at the North Side of Tai Seng Bavet SEZ Sub for Con-stant Discharge
Table 7-3: Problems with Waste Water System and Counter Measures
Problem with Waste Water System 1. Manhattan SEZ plans to have WST and WWTP. Tai Seng Bavet SEZ (Main/Sub)と Drogon King have joint pipe of rain water and waste water, and no plan of WST and WWST. 2. Manhattan SEZ and Tai Seng Bavet SEZ (Main/Sub) are discharging waste water to rice field. The system does violate the Cambodia environmental standard. 3. Surrounding land is flat and discharged waste water is difficult to flow out. 4. This condition might violate the Basel Convention on the Control of Trans-boundary Movements of Hazardous Wastes and their Disposal. Counter Measure 1) SEZ developer has a duty of building WWST (One option is Lagoon System))(Clearly prescribed in sub-decree). 2) Effluent route shall be maintained. 3) SEZ developer shall prepare building guidelines. 4) For mid-term counter measure, Bavet city needs to prepare for WWTP. 5) Education and capacity building is necessary for SEZ developer. 6) Capacity building is necessary for CDC and Ministry of Environment to change the SEZ approval process.
Source: Study team Operation team of Tai Seng Bavet SEZ has strong interest in learning WWTP system in PPSEZ. Temporary short lecture was done during the site meeting.
Photo 7.8, 7.9:Special Short Lecture for Technical Operation Team
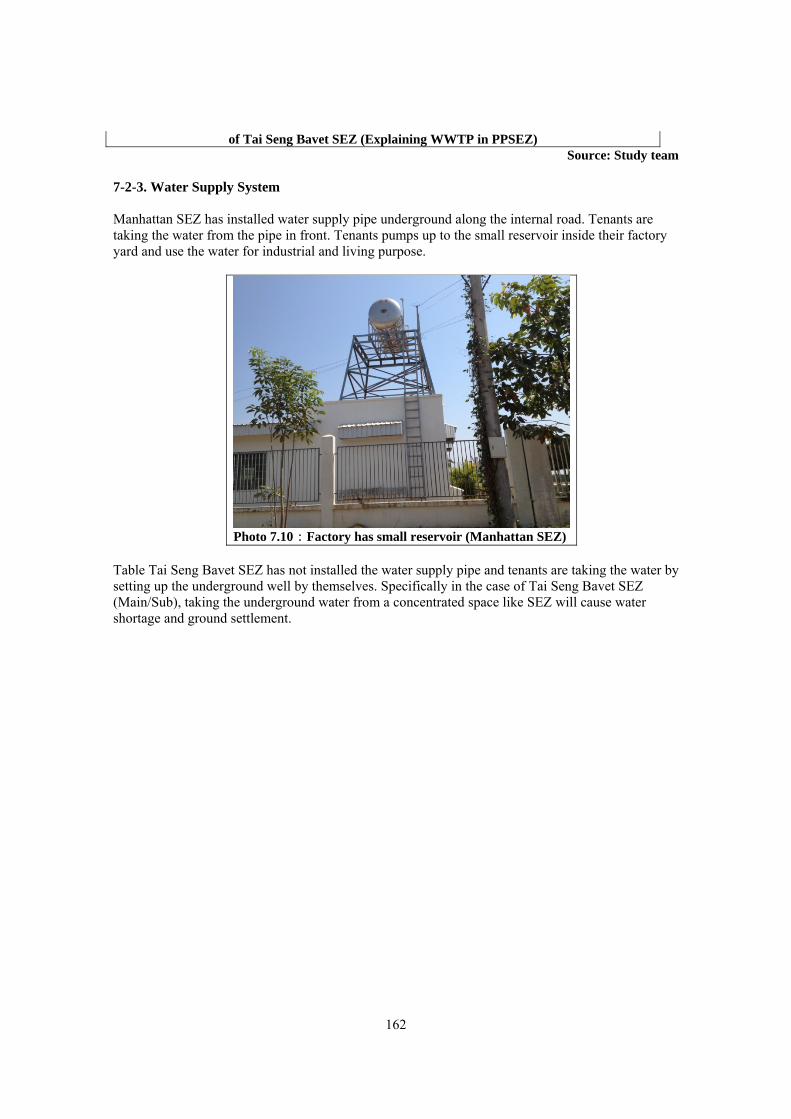
162
of Tai Seng Bavet SEZ (Explaining WWTP in PPSEZ)Source: Study team
7-2-3. Water Supply System Manhattan SEZ has installed water supply pipe underground along the internal road. Tenants are taking the water from the pipe in front. Tenants pumps up to the small reservoir inside their factory yard and use the water for industrial and living purpose.
Photo 7.10:Factory has small reservoir (Manhattan SEZ)
Table Tai Seng Bavet SEZ has not installed the water supply pipe and tenants are taking the water by setting up the underground well by themselves. Specifically in the case of Tai Seng Bavet SEZ (Main/Sub), taking the underground water from a concentrated space like SEZ will cause water shortage and ground settlement.
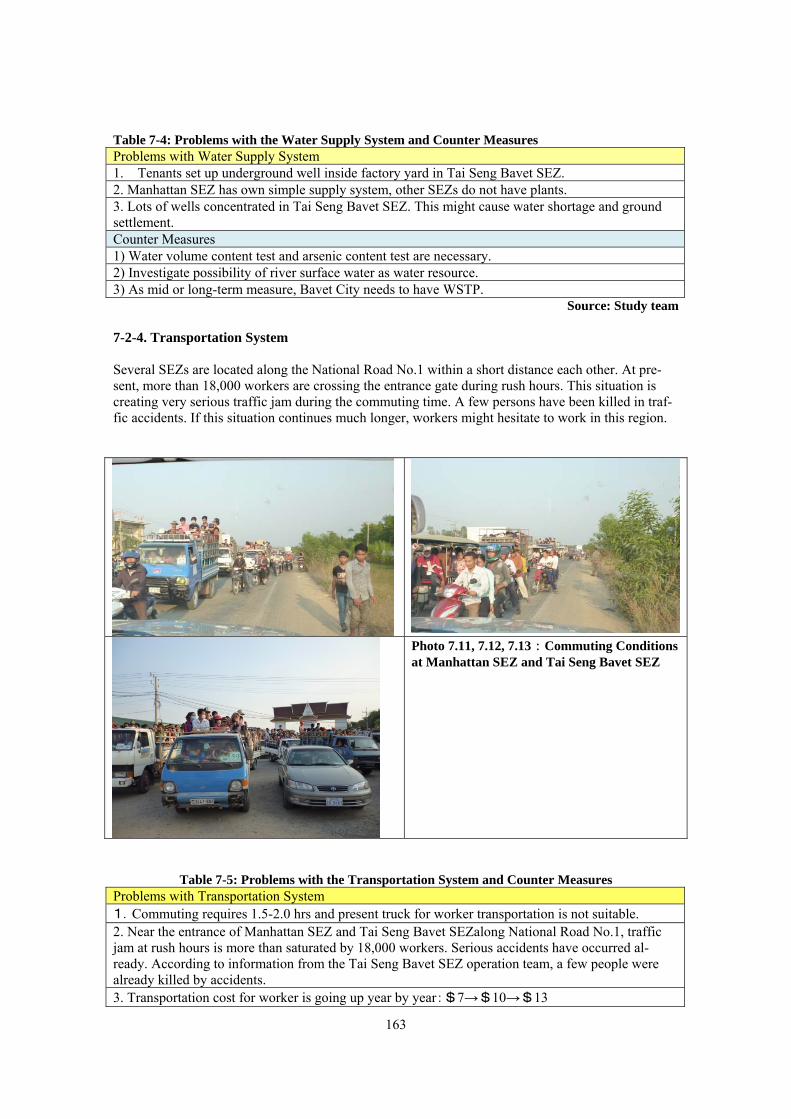
163
Table 7-4: Problems with the Water Supply System and Counter Measures Problems with Water Supply System 1. Tenants set up underground well inside factory yard in Tai Seng Bavet SEZ. 2. Manhattan SEZ has own simple supply system, other SEZs do not have plants. 3. Lots of wells concentrated in Tai Seng Bavet SEZ. This might cause water shortage and ground settlement. Counter Measures 1) Water volume content test and arsenic content test are necessary. 2) Investigate possibility of river surface water as water resource. 3) As mid or long-term measure, Bavet City needs to have WSTP.
Source: Study team 7-2-4. Transportation System Several SEZs are located along the National Road No.1 within a short distance each other. At pre-sent, more than 18,000 workers are crossing the entrance gate during rush hours. This situation is creating very serious traffic jam during the commuting time. A few persons have been killed in traf-fic accidents. If this situation continues much longer, workers might hesitate to work in this region.
Photo 7.11, 7.12, 7.13:Commuting Conditions at Manhattan SEZ and Tai Seng Bavet SEZ
Table 7-5: Problems with the Transportation System and Counter Measures Problems with Transportation System 1.Commuting requires 1.5-2.0 hrs and present truck for worker transportation is not suitable. 2. Near the entrance of Manhattan SEZ and Tai Seng Bavet SEZalong National Road No.1, traffic jam at rush hours is more than saturated by 18,000 workers. Serious accidents have occurred al-ready. According to information from the Tai Seng Bavet SEZ operation team, a few people were already killed by accidents. 3. Transportation cost for worker is going up year by year:$7→$10→$13

164
4. Transportation needs will increase. 5. Worker tends to choose closer SEZ from home. Job change rate is more than 15% already. 6. Within 1-2 years, when worker demand becomes high, commutable workers will not be found. Counter Measures 1) SEZ needs to set up transportation stop station inside SEZ, and temporary commuting road may be necessary behind the zone. 2) Width of National Road No.1 needs to be extended urgently. 3) Dormitory is necessary for long distance commuters.
Source: Study team 7-2-5. Dormitory Presently about 1,200 workers are working and about 6,000 workers at Manhattan SEZ are working at Tai Seng Bavet SEZ (Main/Sub). The total numbers of workers are approaching to the commut-able numbers of workers. Within a short period, dormitory might be necessary. SEZs are already facing with worker shortage and about 15% of workers are trying to find another factory that will give little bit more high salary. If this situation continues long, strike might happen very frequently and SEZs will experience a hard time to find new workers. In this respect, some functions of dormi-tory are indispensable.
Table 7-6: Problems with Dormitory and Counter Measures Problems with Dormitory
1. SEZs have already whole commutable workers in Bavet region. SEZs will face with shortage of workers in 2014. In 2015, the shortage might be 5,000 workers (See Chapter 8 for the esti-mate).
Counter Measures
1) Dormitory, restraint, commercial building might be necessary at the Casino side. (1) Private investor builds the dormitory. (2) SEZ developer builds the dormitory. (3) Third sector such as housing authority builds the dormitory. (4) Private sector expands an existing building for dormitory. (5) Central government, state, province, or city builds the dormitory and provide long term –
low rate bank loan.
2) Extend width of National Road No.1 and reduce the truck rate.
3) Prepare for bus system. Source: Study team
7-2-6. Dry Port Manhattan SEZ and Tai Seng Bavet SEZ have own dry port inside the SEZ. Dragon King SEZ、Shandong Industrial Park has a dry port plan on their development drawing. One private dry port is located between Manhattan SEZ and country border. So far, problems with dry port availability were not found during the investigation.
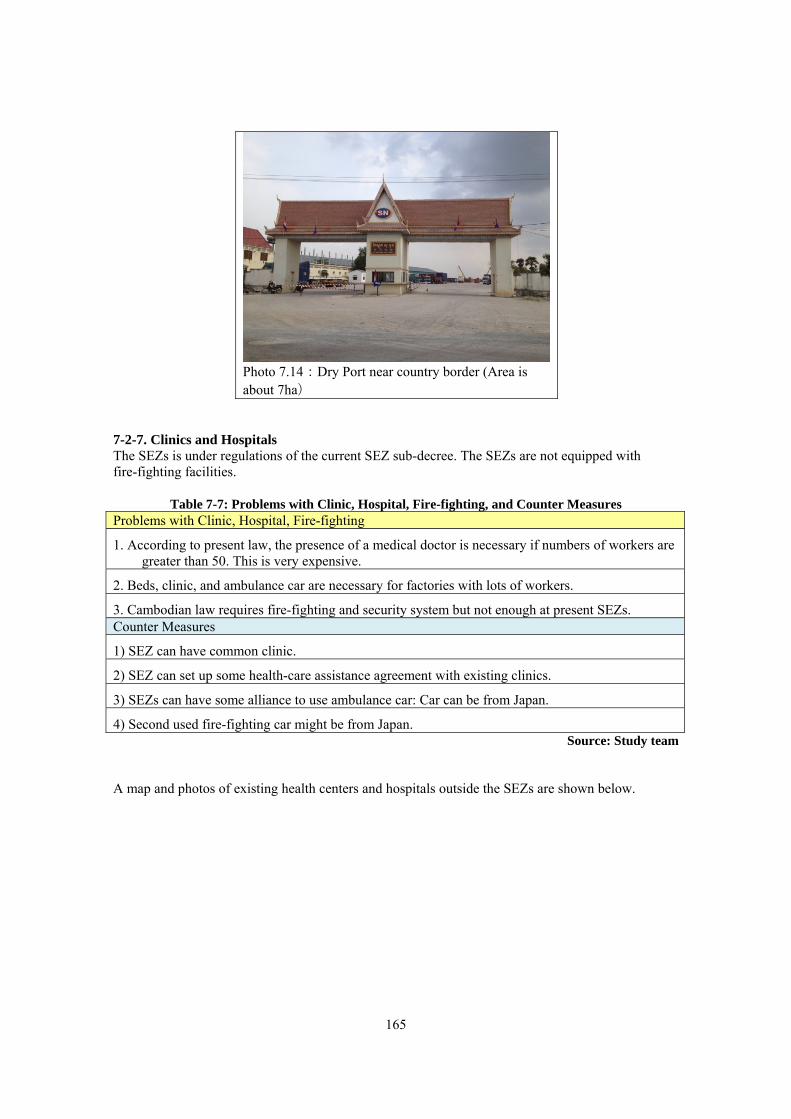
165
Photo 7.14:Dry Port near country border (Area is about 7ha)
7-2-7. Clinics and Hospitals The SEZs is under regulations of the current SEZ sub-decree. The SEZs are not equipped with fire-fighting facilities.
Table 7-7: Problems with Clinic, Hospital, Fire-fighting, and Counter Measures Problems with Clinic, Hospital, Fire-fighting
1. According to present law, the presence of a medical doctor is necessary if numbers of workers are greater than 50. This is very expensive.
2. Beds, clinic, and ambulance car are necessary for factories with lots of workers.
3. Cambodian law requires fire-fighting and security system but not enough at present SEZs. Counter Measures
1) SEZ can have common clinic.
2) SEZ can set up some health-care assistance agreement with existing clinics.
3) SEZs can have some alliance to use ambulance car: Car can be from Japan.
4) Second used fire-fighting car might be from Japan. Source: Study team
A map and photos of existing health centers and hospitals outside the SEZs are shown below.
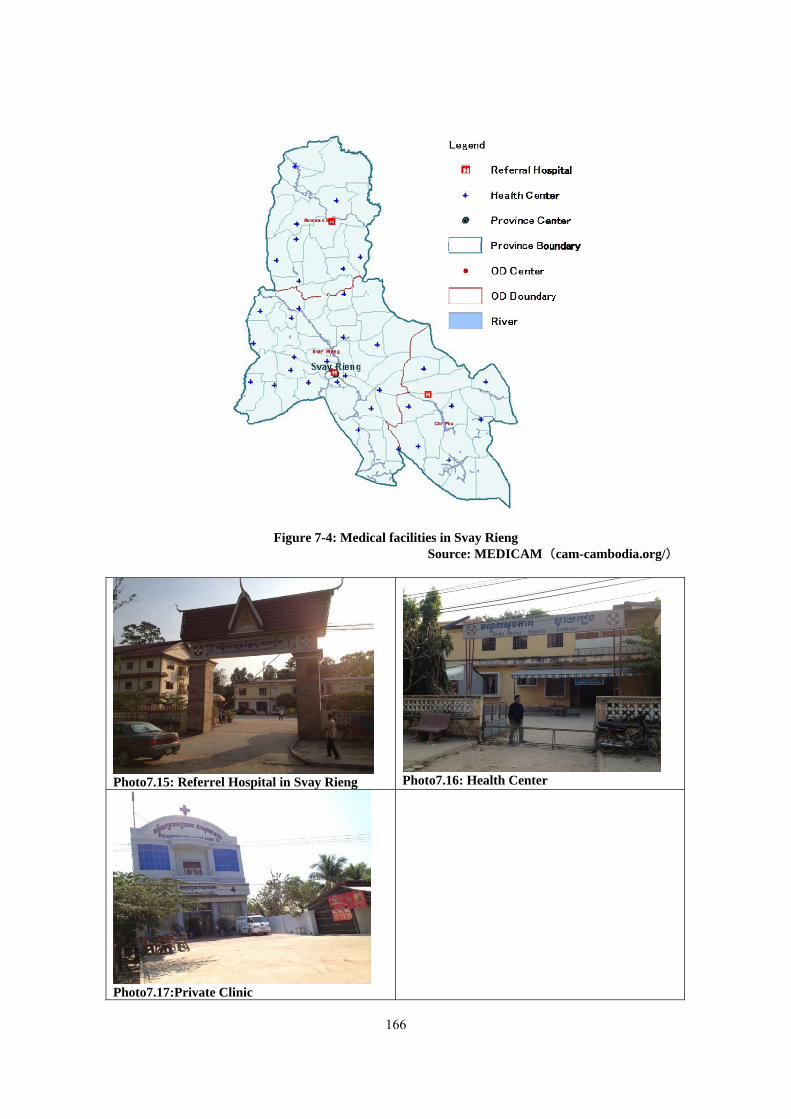
166
Figure 7-4: Medical facilities in Svay Rieng Source: MEDICAM(cam-cambodia.org/)
Photo7.15: Referrel Hospital in Svay Rieng
Photo7.16: Health Center
Photo7.17:Private Clinic
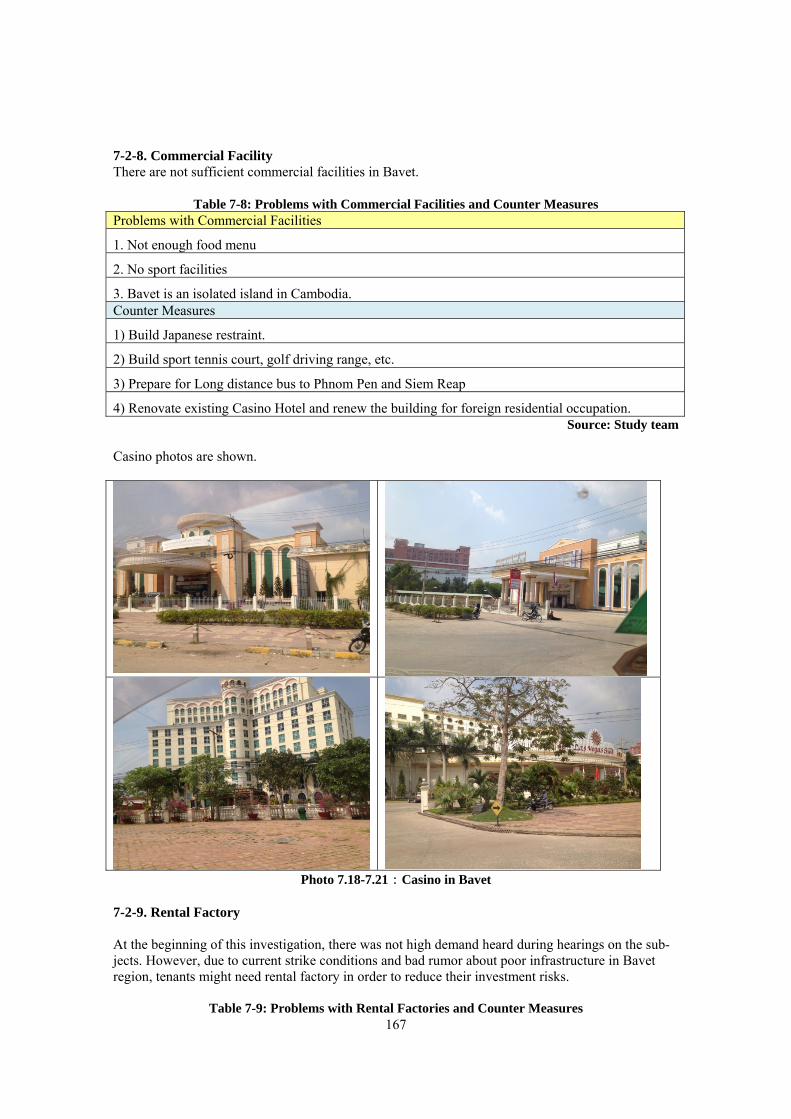
167
7-2-8. Commercial Facility There are not sufficient commercial facilities in Bavet.
Table 7-8: Problems with Commercial Facilities and Counter Measures Problems with Commercial Facilities
1. Not enough food menu
2. No sport facilities
3. Bavet is an isolated island in Cambodia. Counter Measures
1) Build Japanese restraint.
2) Build sport tennis court, golf driving range, etc.
3) Prepare for Long distance bus to Phnom Pen and Siem Reap
4) Renovate existing Casino Hotel and renew the building for foreign residential occupation. Source: Study team
Casino photos are shown.
Photo 7.18-7.21:Casino in Bavet
7-2-9. Rental Factory At the beginning of this investigation, there was not high demand heard during hearings on the sub-jects. However, due to current strike conditions and bad rumor about poor infrastructure in Bavet region, tenants might need rental factory in order to reduce their investment risks.
Table 7-9: Problems with Rental Factories and Counter Measures
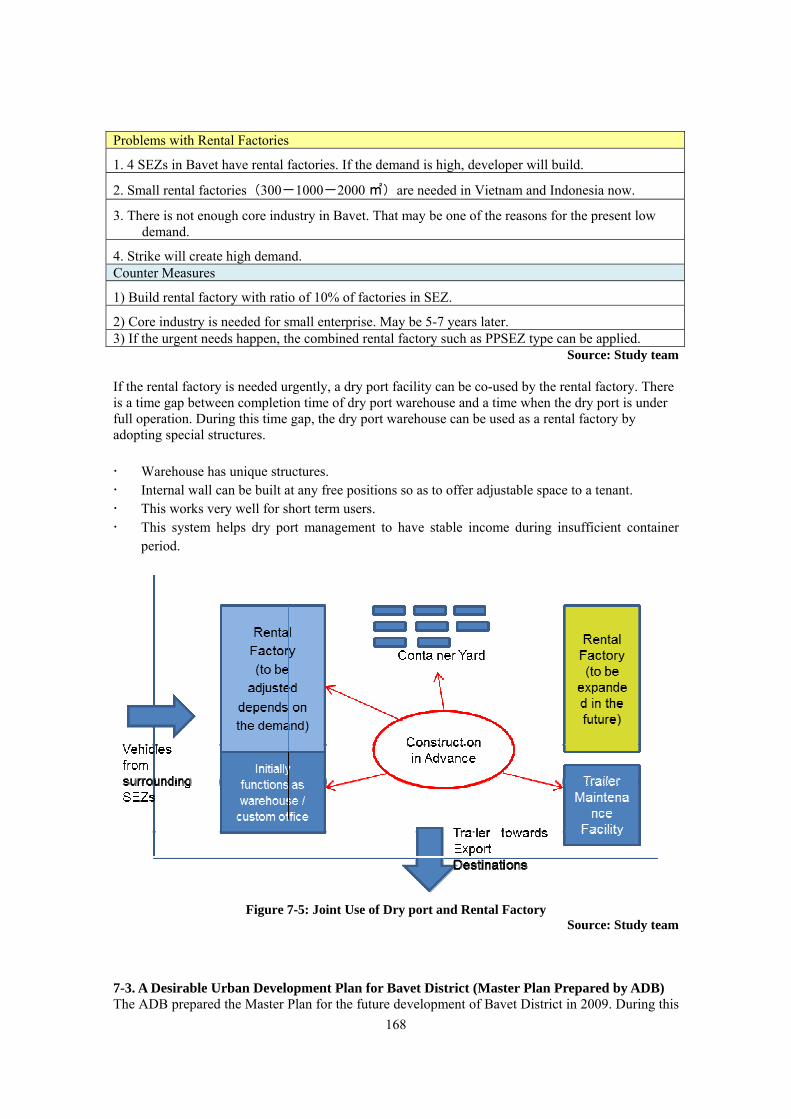
168
Problems with Rental Factories
1. 4 SEZs in Bavet have rental factories. If the demand is high, developer will build.
2. Small rental factories (300-1000-2000 ㎡) are needed in Vietnam and Indonesia now.
3. There is not enough core industry in Bavet. That may be one of the reasons for the present low demand.
4. Strike will create high demand. Counter Measures
1) Build rental factory with ratio of 10% of factories in SEZ.
2) Core industry is needed for small enterprise. May be 5-7 years later. 3) If the urgent needs happen, the combined rental factory such as PPSEZ type can be applied.
Source: Study team If the rental factory is needed urgently, a dry port facility can be co-used by the rental factory. There is a time gap between completion time of dry port warehouse and a time when the dry port is under full operation. During this time gap, the dry port warehouse can be used as a rental factory by adopting special structures. Warehouse has unique structures. Internal wall can be built at any free positions so as to offer adjustable space to a tenant. This works very well for short term users. This system helps dry port management to have stable income during insufficient container
period.
Figure 7-5: Joint Use of Dry port and Rental Factory
Source: Study team
7-3. A Desirable Urban Development Plan for Bavet District (Master Plan Prepared by ADB) The ADB prepared the Master Plan for the future development of Bavet District in 2009. During this
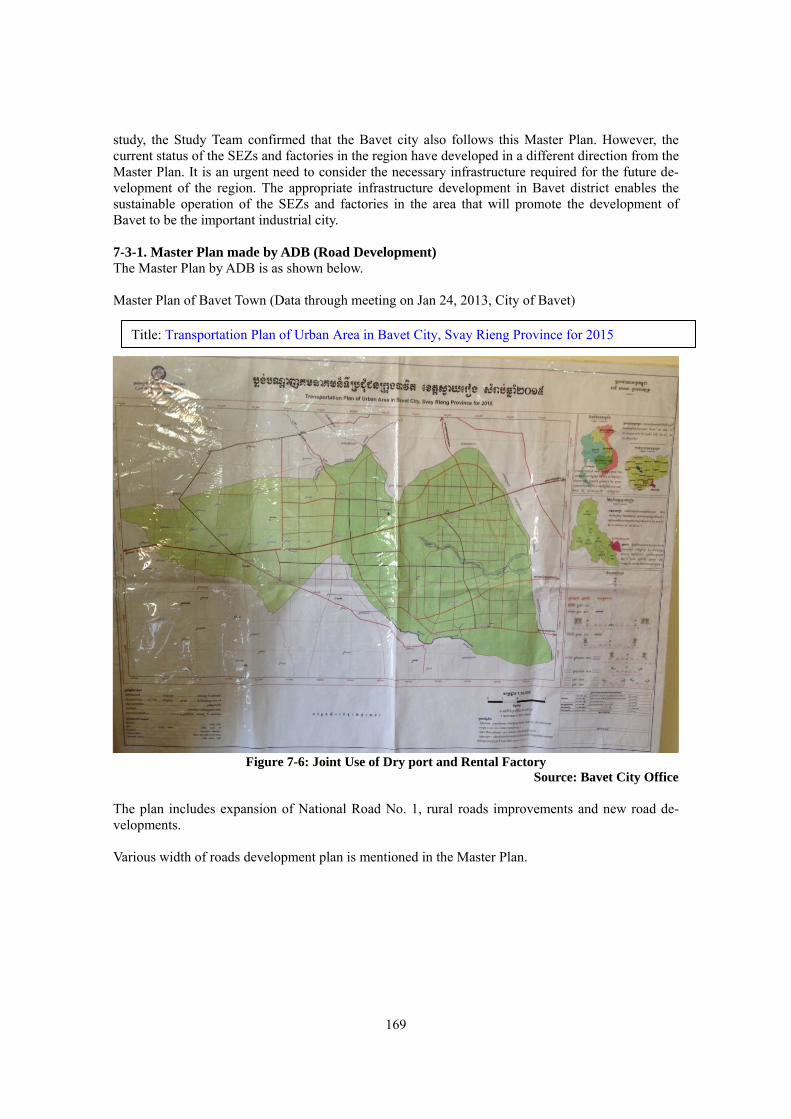
169
study, the Study Team confirmed that the Bavet city also follows this Master Plan. However, the current status of the SEZs and factories in the region have developed in a different direction from the Master Plan. It is an urgent need to consider the necessary infrastructure required for the future de-velopment of the region. The appropriate infrastructure development in Bavet district enables the sustainable operation of the SEZs and factories in the area that will promote the development of Bavet to be the important industrial city. 7-3-1. Master Plan made by ADB (Road Development) The Master Plan by ADB is as shown below. Master Plan of Bavet Town (Data through meeting on Jan 24, 2013, City of Bavet)
Figure 7-6: Joint Use of Dry port and Rental Factory
Source: Bavet City Office The plan includes expansion of National Road No. 1, rural roads improvements and new road de-velopments. Various width of roads development plan is mentioned in the Master Plan.
Title: Transportation Plan of Urban Area in Bavet City, Svay Rieng Province for 2015
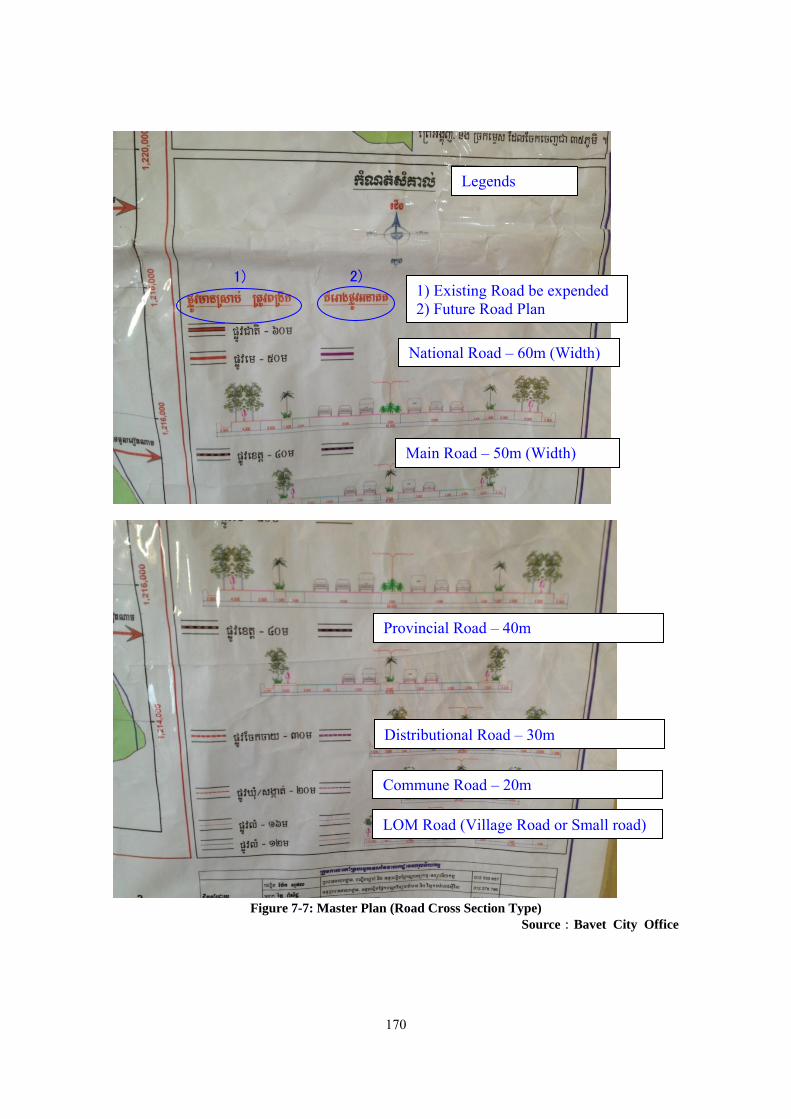
170
Figure 7-7: Master Plan (Road Cross Section Type)
Source:Bavet City Office
Legends
1) Existing Road be expended 2) Future Road Plan
National Road – 60m (Width)
Main Road – 50m (Width)
1) 2)
Provincial Road – 40m
Distributional Road – 30m
Commune Road – 20m
LOM Road (Village Road or Small road)
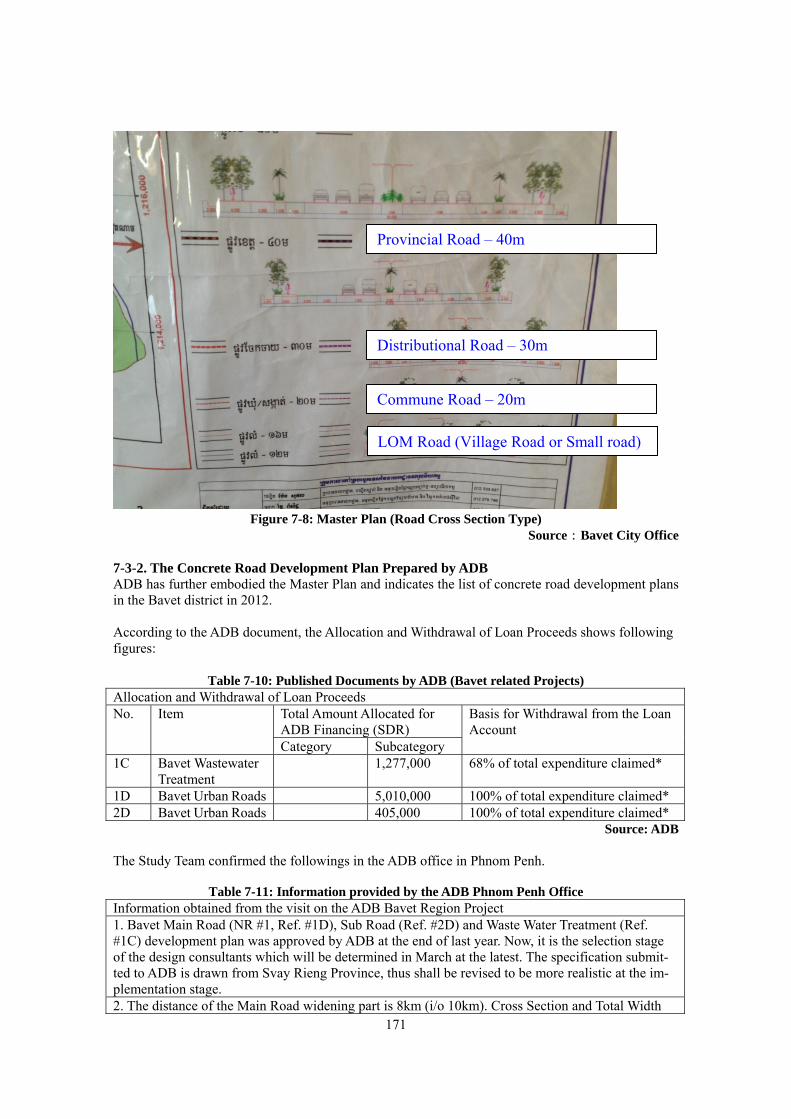
171
Figure 7-8: Master Plan (Road Cross Section Type)
Source:Bavet City Office 7-3-2. The Concrete Road Development Plan Prepared by ADB ADB has further embodied the Master Plan and indicates the list of concrete road development plans in the Bavet district in 2012. According to the ADB document, the Allocation and Withdrawal of Loan Proceeds shows following figures:
Table 7-10: Published Documents by ADB (Bavet related Projects) Allocation and Withdrawal of Loan Proceeds No. Item Total Amount Allocated for
ADB Financing (SDR) Basis for Withdrawal from the Loan Account
Category Subcategory 1C Bavet Wastewater
Treatment 1,277,000 68% of total expenditure claimed*
1D Bavet Urban Roads 5,010,000 100% of total expenditure claimed* 2D Bavet Urban Roads 405,000 100% of total expenditure claimed*
Source: ADB The Study Team confirmed the followings in the ADB office in Phnom Penh.
Table 7-11: Information provided by the ADB Phnom Penh Office Information obtained from the visit on the ADB Bavet Region Project 1. Bavet Main Road (NR #1, Ref. #1D), Sub Road (Ref. #2D) and Waste Water Treatment (Ref. #1C) development plan was approved by ADB at the end of last year. Now, it is the selection stage of the design consultants which will be determined in March at the latest. The specification submit-ted to ADB is drawn from Svay Rieng Province, thus shall be revised to be more realistic at the im-plementation stage. 2. The distance of the Main Road widening part is 8km (i/o 10km). Cross Section and Total Width
Provincial Road – 40m
Distributional Road – 30m
Commune Road – 20m
LOM Road (Village Road or Small road)
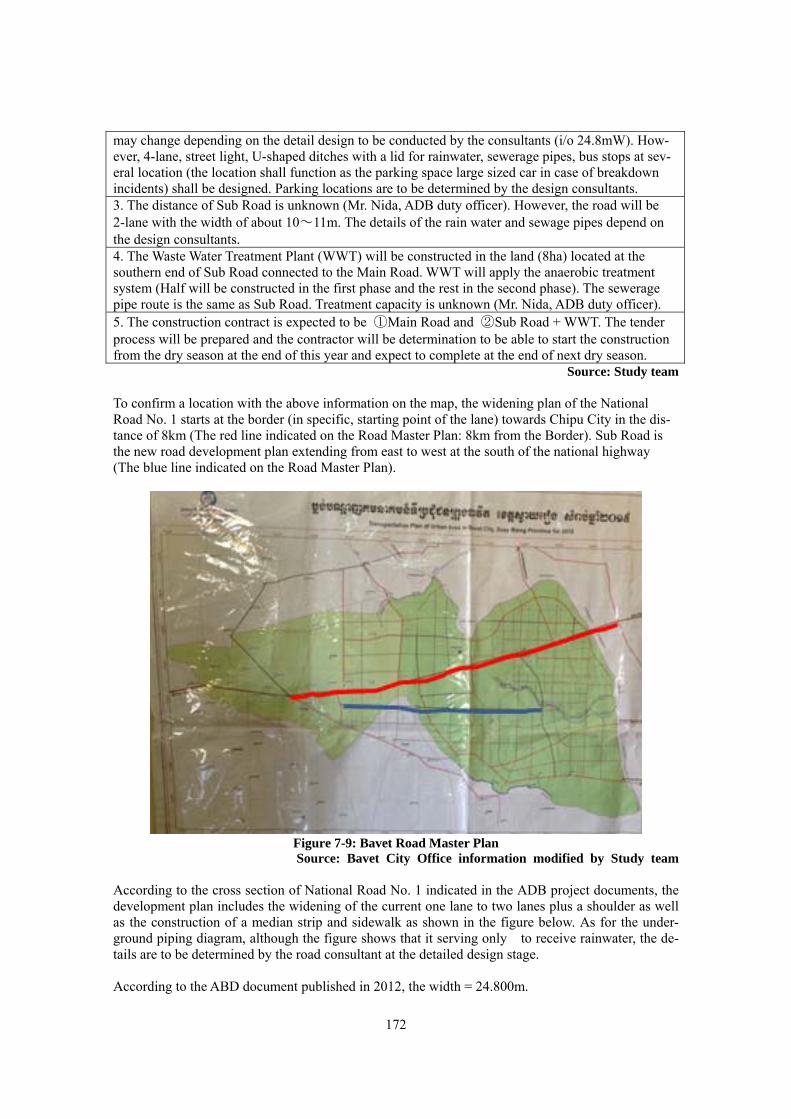
172
may change depending on the detail design to be conducted by the consultants (i/o 24.8mW). How-ever, 4-lane, street light, U-shaped ditches with a lid for rainwater, sewerage pipes, bus stops at sev-eral location (the location shall function as the parking space large sized car in case of breakdown incidents) shall be designed. Parking locations are to be determined by the design consultants. 3. The distance of Sub Road is unknown (Mr. Nida, ADB duty officer). However, the road will be 2-lane with the width of about 10~11m. The details of the rain water and sewage pipes depend on the design consultants. 4. The Waste Water Treatment Plant (WWT) will be constructed in the land (8ha) located at the southern end of Sub Road connected to the Main Road. WWT will apply the anaerobic treatment system (Half will be constructed in the first phase and the rest in the second phase). The sewerage pipe route is the same as Sub Road. Treatment capacity is unknown (Mr. Nida, ADB duty officer). 5. The construction contract is expected to be ①Main Road and ②Sub Road + WWT. The tender process will be prepared and the contractor will be determination to be able to start the construction from the dry season at the end of this year and expect to complete at the end of next dry season.
Source: Study team To confirm a location with the above information on the map, the widening plan of the National Road No. 1 starts at the border (in specific, starting point of the lane) towards Chipu City in the dis-tance of 8km (The red line indicated on the Road Master Plan: 8km from the Border). Sub Road is the new road development plan extending from east to west at the south of the national highway (The blue line indicated on the Road Master Plan).
Figure 7-9: Bavet Road Master Plan Source: Bavet City Office information modified by Study team
According to the cross section of National Road No. 1 indicated in the ADB project documents, the development plan includes the widening of the current one lane to two lanes plus a shoulder as well as the construction of a median strip and sidewalk as shown in the figure below. As for the under-ground piping diagram, although the figure shows that it serving only to receive rainwater, the de-tails are to be determined by the road consultant at the detailed design stage. According to the ABD document published in 2012, the width = 24.800m.
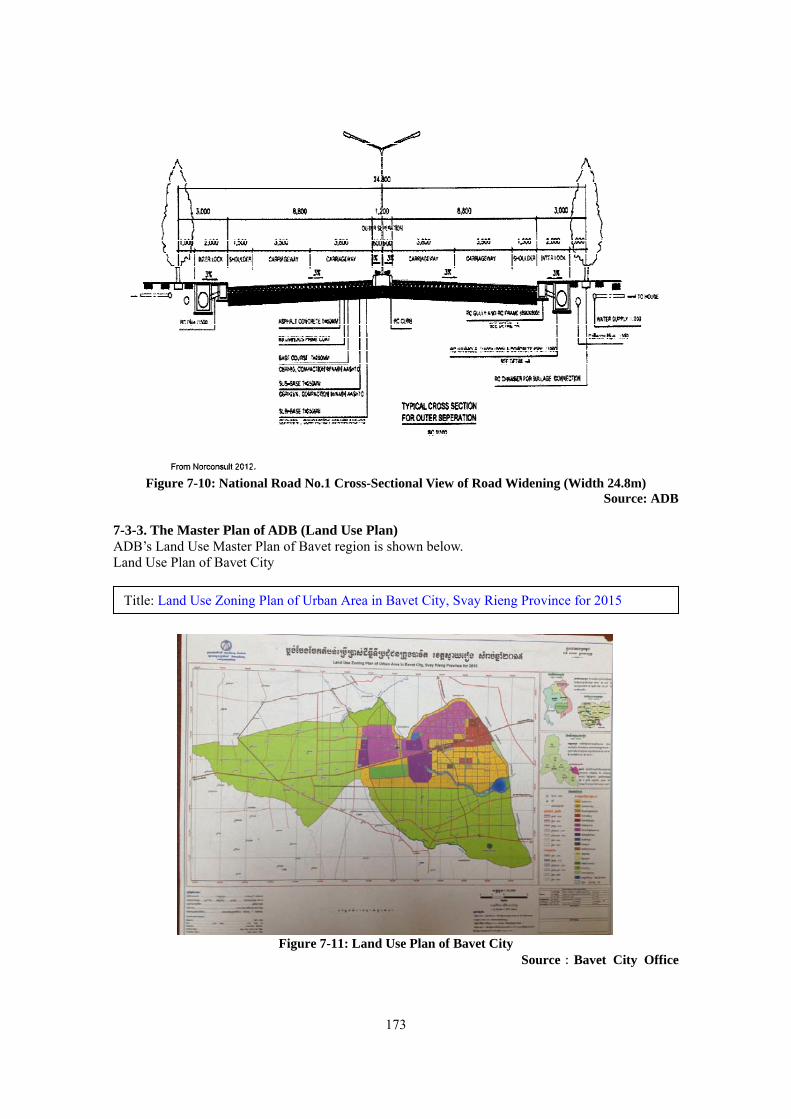
173
Figure 7-10: National Road No.1 Cross-Sectional View of Road Widening (Width 24.8m)
Source: ADB 7-3-3. The Master Plan of ADB (Land Use Plan) ADB’s Land Use Master Plan of Bavet region is shown below. Land Use Plan of Bavet City
Figure 7-11: Land Use Plan of Bavet City
Source:Bavet City Office
Title: Land Use Zoning Plan of Urban Area in Bavet City, Svay Rieng Province for 2015
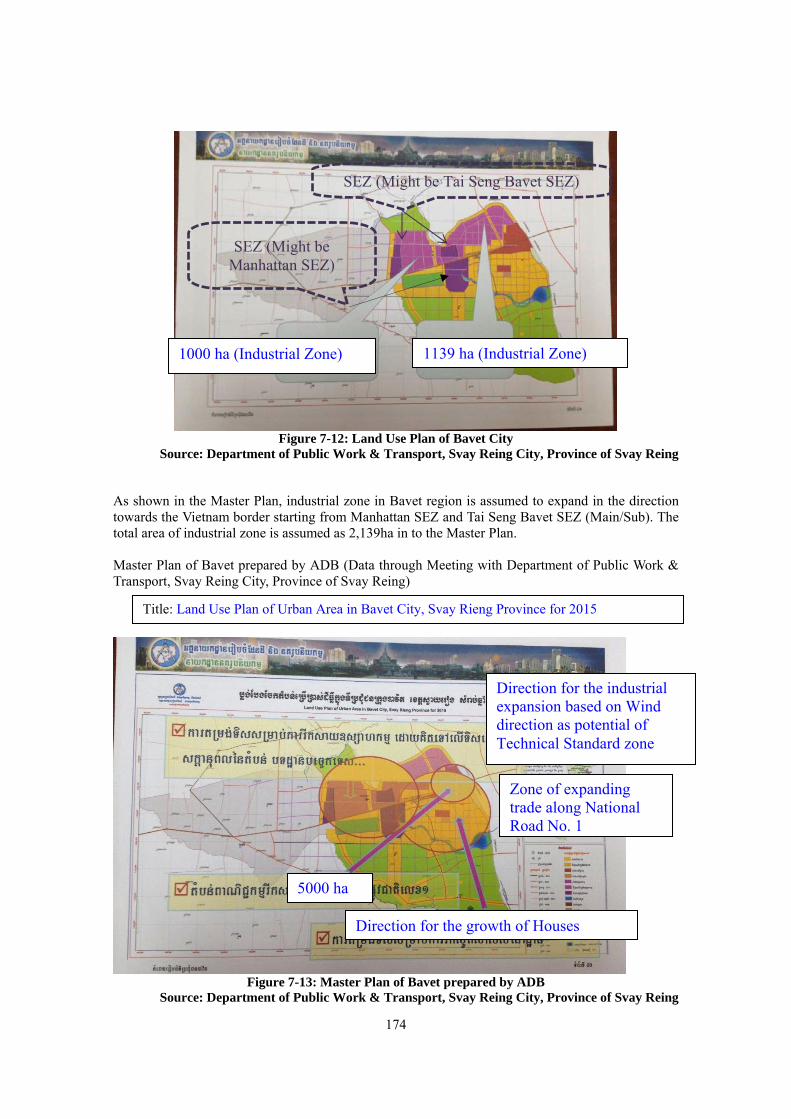
174
Figure 7-12: Land Use Plan of Bavet City
Source: Department of Public Work & Transport, Svay Reing City, Province of Svay Reing As shown in the Master Plan, industrial zone in Bavet region is assumed to expand in the direction towards the Vietnam border starting from Manhattan SEZ and Tai Seng Bavet SEZ (Main/Sub). The total area of industrial zone is assumed as 2,139ha in to the Master Plan. Master Plan of Bavet prepared by ADB (Data through Meeting with Department of Public Work & Transport, Svay Reing City, Province of Svay Reing)
Figure 7-13: Master Plan of Bavet prepared by ADB
Source: Department of Public Work & Transport, Svay Reing City, Province of Svay Reing
Title: Land Use Plan of Urban Area in Bavet City, Svay Rieng Province for 2015
5000 ha
Zone of expanding trade along National Road No. 1
Direction for the industrial expansion based on Wind direction as potential of Technical Standard zone
Direction for the growth of Houses
1000 ha (Industrial Zone) 1139 ha (Industrial Zone)
SEZ (Might be Tai Seng Bavet SEZ)
SEZ (Might be Manhattan SEZ)

175
In the ADB’s Master Plan, an industrial zone is assumed to be developed taking into account the di-rection of the wind. It is planned that the zone of expanding trade is around 5,000ha near the border and the residential zone is to be located at the south of the industrial zone.
Figure 7-14: Land Use Zoning Plan Source: Department of Public Work & Transport, Svay Reing City, Province of Svay Reing
ADB’s Master Plan considers the river water at the south east as the source of water supply and plans to establish a rainwater drainage facility in the vicinity of SEZ. The Master Plan recommends installation of a waste disposal and treatment plant at the south east end of the region.
Figure 7-15: Land Use Zoning Plan Source: Department of Public Work & Transport, Svay Reing City, Province of Svay Reing
Title: Land Use Zoning Plan of Urban Area in Bavet, Svay Rieng Province for 2015
424 ha
Garbage Disposal Plant
Water drainage
Fresh Water
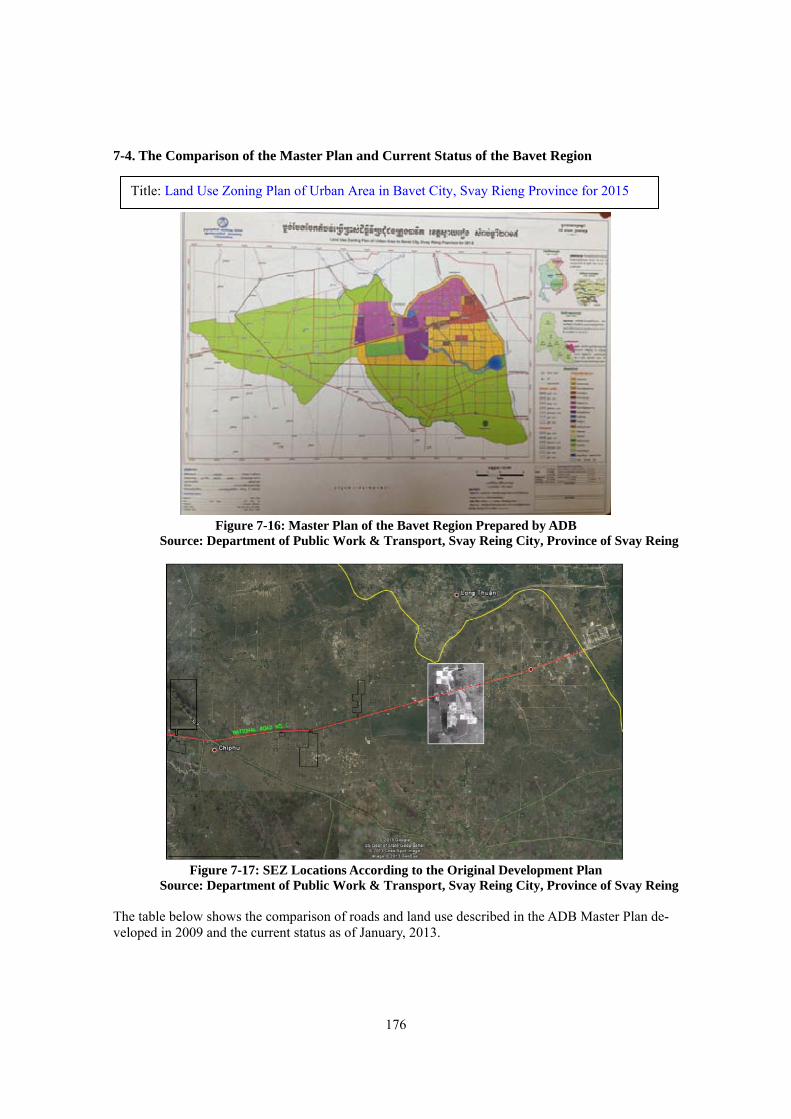
176
7-4. The Comparison of the Master Plan and Current Status of the Bavet Region
Figure 7-16: Master Plan of the Bavet Region Prepared by ADB
Source: Department of Public Work & Transport, Svay Reing City, Province of Svay Reing
Figure 7-17: SEZ Locations According to the Original Development Plan
Source: Department of Public Work & Transport, Svay Reing City, Province of Svay Reing The table below shows the comparison of roads and land use described in the ADB Master Plan de-veloped in 2009 and the current status as of January, 2013.
Title: Land Use Zoning Plan of Urban Area in Bavet City, Svay Rieng Province for 2015
177
Table 7-12: The Comparison of ADB’s Master Plan and Current Status (in terms of the location of the road and size of land area in the Original Development Plan) Land Use In the Master Plan The main SEZs are considered to be Manhattan SEZ and Tai Seng Bavet SEZ (Main/Sub). Based on these two SEZs, the large scale industrial zone is expected to be developed in the two locations in the north (1,000ha and 1,139ha) the total of 2,139ha. Current Condition 1. Industrial zone is currently not connected to the National Road No. 1 and development is not in progress. 2. Currently, the industrial zone is concentrated and expanding in the direction of Chipu along Na-tional Road No. 1. 3. The actual development area of the SEZ and factories in the Bavet area (according to the original development plan approved by the CDC) is limited to around 950ha. 4. As SEZ Developers continue to develop SEZ, they seem to be purchasing additional land around the area (although the accurate size of acquired land is not obtainable). Therefore, if the problems of infrastructure are to be solved and market condition permit, the industrial zone can be expanded fur-ther. Road In the Master Plan National Road No. 1 assumes the function as the core transportation line in the industrial zone and Sub Road in the residential zone. Current Condition Since there are no transportation access in the north, SEZ is not developed in the area.
Source: Study team
7-5. SEZ Based Urban Development in the Bavet Area If the Bavet area is able to solve the electric power shortage, establish dormitories, and perform road maintenance by 2015, there will be no basic infrastructure problem in Bavet area. As described in Chapter 5, based on the original development plan approved by CDC, it is estimated that all the fac-tory lots will be fully occupied and the companies starting their operations from 2020. In addition, if the industrial accumulation is favorable, Bavet area will have a potential to further develop as an SEZ-based industrial city. Usually, SEZ will be financial viable with certain development scale and in many cases, size of the SEZ are 200ha to 500ha. This additional expansion requires around 10 years. Based on this assumption, below section discusses the necessary infrastructure development under the condition that each SEZs in the Bavet area expand their sizes to 200 to 500ha during 2020 to 2030. 7-5-1. Demand Forecast of Infrastructure In case of the SEZ Developers continue to operate and the market is stabilized due to the industrial accumulation, each SEZs will gradually expand their development area. As a result, further accumu-lation of SEZs and factories will be expected in the whole Bavet area. Based on this assumption, the infrastructure demand in the whole region is estimated below. For the projection, basic unit indicated in the previous chapter is used. (1) Manhattan SEZ (According to the interviews, the development of the zone is the same as the original)
Table 7-13: Infrastructure Demand in Manhattan SEZ Year 2020 2030 Development Area (ha) 208.84 208.84 Factory Lot Area (ha) 145.63 145.63 Nos. of Factories 33 33 Nos. of Workers 27,970 27,970
178
Water (㎥/day) 2,797.03 2,797.03 Waste Water (㎥/day) 2,237.62 2,237.62 Electric Power (MW) 13.54 13.54
Source: Study team (2) Tai Seng Bavet SEZ (SEZ Developer is possibly acquiring the surrounding land. Additional 70ha may be expandable to-wards the border)
Table 7-14: Infrastructure Demand in Tai Seng Bavet SEZ Year 2020 2030 Development Area (ha) 154.13 220.53 Factory Lot Area (ha) 107.89 154.37 Nos. of Factories 38 48 Nos. of Workers 21,433 29,176 Water (㎥/day) 2,143.33 2,917.59 Waste Water (㎥/day) 1,714.66 2,334.07 Electricity (MW) 12.31 15.90
Source: Study team (3) Tai Seng Bavet SEZ Sub (SEZ Developer is possibly acquiring the surrounding land. Additional 50ha may be expandable to-wards the border)
Table 7-15: Infrastructure Demand in Tai Seng Bavet SEZ Sub Year 2020 2030 Development Area (ha) 51.46 100.00 Factory Lot Area (ha) 36.03 50.00 Nos. of Factories 14 16 Nos. of Workers 7,081 9,450 Water (㎥/day) 708.07 945.00 Waste Water (㎥/day) 566.46 756.00 Electric Power (MW) 4.00 5.15
Source: Study team (4) Dragon King SEZ (According to the interview, the SEZ Developer has the willingness to expand to a large scale SEZ. The total SEZ area of 500ha is assumed in the future)
Table 7-16: Infrastructure Demand in Dragon King SEZ Year 2020 2030 Development Area (ha) 108.67 500.00 Factory Lot Area (ha) 80.93 350.00 Nos. of Factories 23 109 Nos. of Workers 19,339 66,150 Water (㎥/day) 1,933.90 6,615.00 Waste Water (㎥/day) 1,547.12 5,292.00 Electricity (MW) 8.34 36.05
Source: Study team (5) Shandong Industrial Park (The same management company of Manhattan SEZ. Additional 80ha may be developed judging from the land shape)
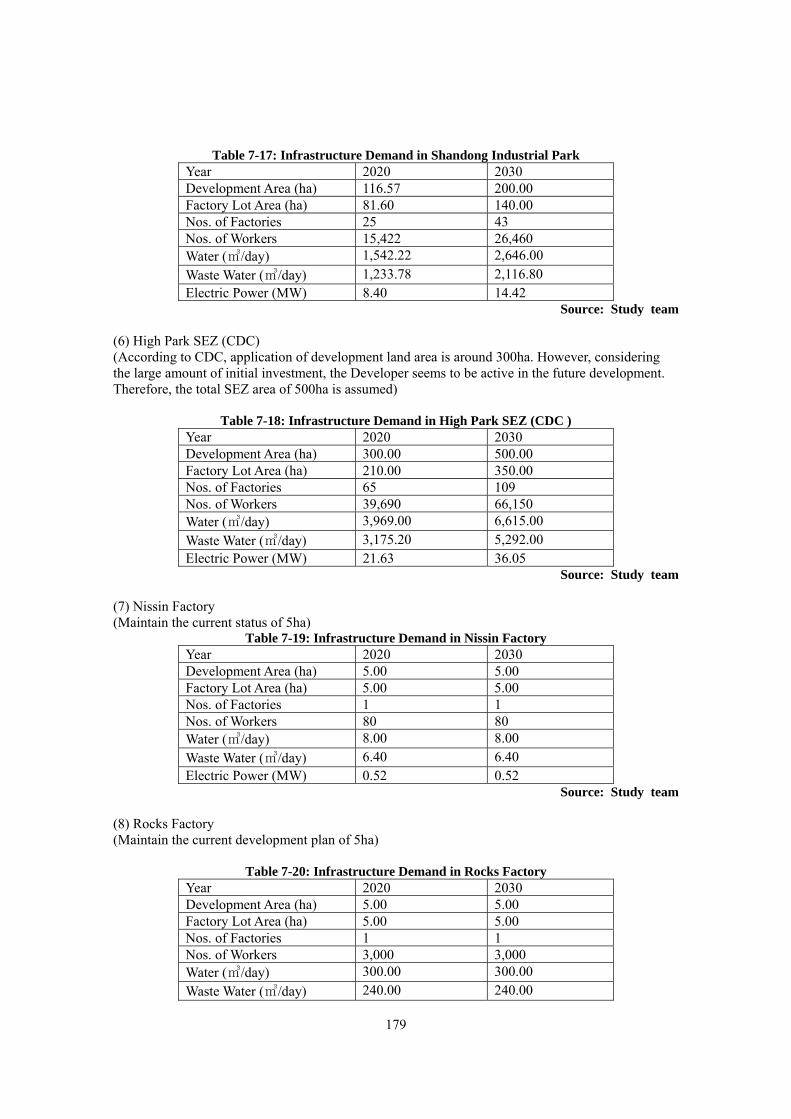
179
Table 7-17: Infrastructure Demand in Shandong Industrial Park
Year 2020 2030 Development Area (ha) 116.57 200.00 Factory Lot Area (ha) 81.60 140.00 Nos. of Factories 25 43 Nos. of Workers 15,422 26,460 Water (㎥/day) 1,542.22 2,646.00 Waste Water (㎥/day) 1,233.78 2,116.80 Electric Power (MW) 8.40 14.42
Source: Study team (6) High Park SEZ (CDC) (According to CDC, application of development land area is around 300ha. However, considering the large amount of initial investment, the Developer seems to be active in the future development. Therefore, the total SEZ area of 500ha is assumed)
Table 7-18: Infrastructure Demand in High Park SEZ (CDC ) Year 2020 2030 Development Area (ha) 300.00 500.00 Factory Lot Area (ha) 210.00 350.00 Nos. of Factories 65 109 Nos. of Workers 39,690 66,150 Water (㎥/day) 3,969.00 6,615.00 Waste Water (㎥/day) 3,175.20 5,292.00 Electric Power (MW) 21.63 36.05
Source: Study team (7) Nissin Factory (Maintain the current status of 5ha)
Table 7-19: Infrastructure Demand in Nissin Factory Year 2020 2030 Development Area (ha) 5.00 5.00 Factory Lot Area (ha) 5.00 5.00 Nos. of Factories 1 1 Nos. of Workers 80 80 Water (㎥/day) 8.00 8.00 Waste Water (㎥/day) 6.40 6.40 Electric Power (MW) 0.52 0.52
Source: Study team (8) Rocks Factory (Maintain the current development plan of 5ha)
Table 7-20: Infrastructure Demand in Rocks Factory Year 2020 2030 Development Area (ha) 5.00 5.00 Factory Lot Area (ha) 5.00 5.00 Nos. of Factories 1 1 Nos. of Workers 3,000 3,000 Water (㎥/day) 300.00 300.00 Waste Water (㎥/day) 240.00 240.00
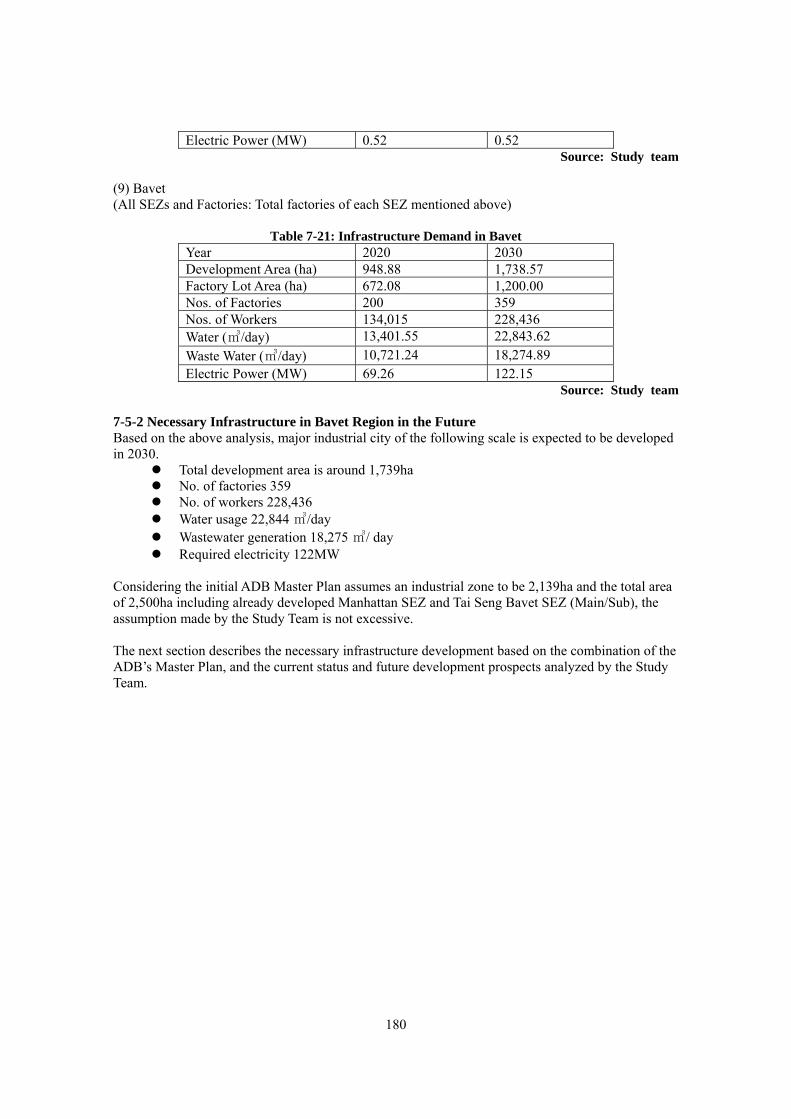
180
Electric Power (MW) 0.52 0.52 Source: Study team
(9) Bavet (All SEZs and Factories: Total factories of each SEZ mentioned above)
Table 7-21: Infrastructure Demand in Bavet Year 2020 2030 Development Area (ha) 948.88 1,738.57 Factory Lot Area (ha) 672.08 1,200.00 Nos. of Factories 200 359 Nos. of Workers 134,015 228,436 Water (㎥/day) 13,401.55 22,843.62 Waste Water (㎥/day) 10,721.24 18,274.89 Electric Power (MW) 69.26 122.15
Source: Study team 7-5-2 Necessary Infrastructure in Bavet Region in the Future Based on the above analysis, major industrial city of the following scale is expected to be developed in 2030.
Total development area is around 1,739ha No. of factories 359 No. of workers 228,436 Water usage 22,844 ㎥/day Wastewater generation 18,275 ㎥/ day Required electricity 122MW
Considering the initial ADB Master Plan assumes an industrial zone to be 2,139ha and the total area of 2,500ha including already developed Manhattan SEZ and Tai Seng Bavet SEZ (Main/Sub), the assumption made by the Study Team is not excessive. The next section describes the necessary infrastructure development based on the combination of the ADB’s Master Plan, and the current status and future development prospects analyzed by the Study Team.
181
Figure 7-18:Necessary Infrastructure Development in the Future
Source: Study team
Legend Item Schedule (Term) Short Mid Long
Dormitory Zone ○ High class residential zone ○
WSTP Water Supply Treatment Plant (Surface Water)
○ ○
WWTP Waste Water Treatment Plant ○ ○a GDP Garbage Disposal Plant ○ ○
Expanded National Road No.1 ○ ○ ○ New Road (Sub Road)
○ ○ ○
Village Road ○ Electricity Self (Generator set) ○ Electricity New EDC Power ○ ○
Table 7.14: Schedule of Necessary Infrastructure Development Source: Study team
(1) Necessary Infrastructure Development in the Short Term Village Road indicated in Yellow Village roads development is in urgent need to expand the commuter belt. During the rainy season, because the drainage is poor, the route connecting village and National Road No. 1 is difficult to commute in many cases. In order to solve this problem, a self road development scheme by the vil-lagers is recommended. Firstly, asphalt cement shall be provided to the villagers and the road devel-opment shall be done by the villagers themselves. As an incentive, once the village roads are devel-oped, motor bike and tuk tuk shall be granted. In this case, the grassroots support of JICA may be applicable.
182
Dormitory Development There is a limitation of commuting workers that is rapidly being reached at this moment. Therefore, a dormitory shall be developed in a timely manner. A more upscale residential facility for the man-ager class worker is also required, especially for the foreign tenants. In this case, the application of the currently closed casino as a residential use may be an option. Electricity (Generator Set) No additional EDC power will available until 2015. Until that time, self power supply is necessary. (2) Desirable Infrastructure Development in the Mid Term Widening of National Road No. .1 and New Road Development by ADB (Red dashed line and Blue dashed line) Local traffic condition is imminent. There is a need for the road maintenance as soon as possible. In ADB’s development plan, new road development is expected to proceed in the south. However the road in the north is also important to disperse the communal traffic. It may serve as the bypass road to Vietnam. (3) Desirable Infrastructure Development in the Long Term Water Supply Plant Excessive water intake by the increasing factories in SEZs may result in land settlement. Utilization of the river water as the water source is recommended with building pipes along the new road net-work. Waste Water Treatment Plant Wastewater treatment plant has to be developed in the SEZ by the SEZ Developer. As the urbaniza-tion progresses, naturally the population increases. Therefore, sewage plant for the urban population in the city is also required. As the same as water supply, sewage pipe shall be equipped along the new road network as the Figure shows. Only after the purification, the treated wastewater shall be discharged into the river. Waste Disposal and Treatment Facilities As the urbanization progresses by attracting investment and labors in SEZ, large amount of waste will be generated. Thus, the establishment of the waste treatment facility at the site indicated in the Figure is expected. In addition, it is desired to utilize the heat generated by the incineration of wastes.
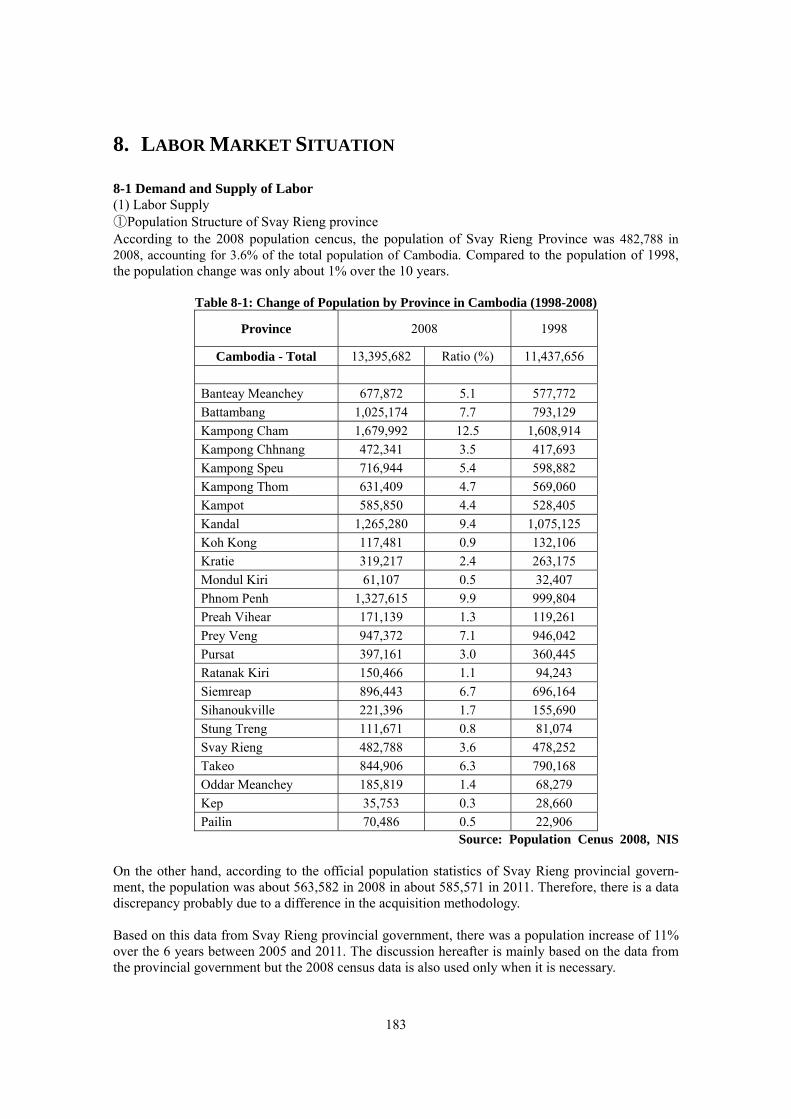
183
8. LABOR MARKET SITUATION 8-1 Demand and Supply of Labor (1) Labor Supply ①Population Structure of Svay Rieng province According to the 2008 population cencus, the population of Svay Rieng Province was 482,788 in 2008, accounting for 3.6% of the total population of Cambodia. Compared to the population of 1998, the population change was only about 1% over the 10 years.
Table 8-1: Change of Population by Province in Cambodia (1998-2008)
Province 2008 1998
Cambodia - Total 13,395,682 Ratio (%) 11,437,656
Banteay Meanchey 677,872 5.1 577,772 Battambang 1,025,174 7.7 793,129 Kampong Cham 1,679,992 12.5 1,608,914 Kampong Chhnang 472,341 3.5 417,693 Kampong Speu 716,944 5.4 598,882 Kampong Thom 631,409 4.7 569,060 Kampot 585,850 4.4 528,405 Kandal 1,265,280 9.4 1,075,125 Koh Kong 117,481 0.9 132,106 Kratie 319,217 2.4 263,175 Mondul Kiri 61,107 0.5 32,407 Phnom Penh 1,327,615 9.9 999,804 Preah Vihear 171,139 1.3 119,261 Prey Veng 947,372 7.1 946,042 Pursat 397,161 3.0 360,445 Ratanak Kiri 150,466 1.1 94,243 Siemreap 896,443 6.7 696,164 Sihanoukville 221,396 1.7 155,690 Stung Treng 111,671 0.8 81,074 Svay Rieng 482,788 3.6 478,252 Takeo 844,906 6.3 790,168 Oddar Meanchey 185,819 1.4 68,279 Kep 35,753 0.3 28,660 Pailin 70,486 0.5 22,906
Source: Population Cenus 2008, NIS On the other hand, according to the official population statistics of Svay Rieng provincial govern-ment, the population was about 563,582 in 2008 in about 585,571 in 2011. Therefore, there is a data discrepancy probably due to a difference in the acquisition methodology. Based on this data from Svay Rieng provincial government, there was a population increase of 11% over the 6 years between 2005 and 2011. The discussion hereafter is mainly based on the data from the provincial government but the 2008 census data is also used only when it is necessary.
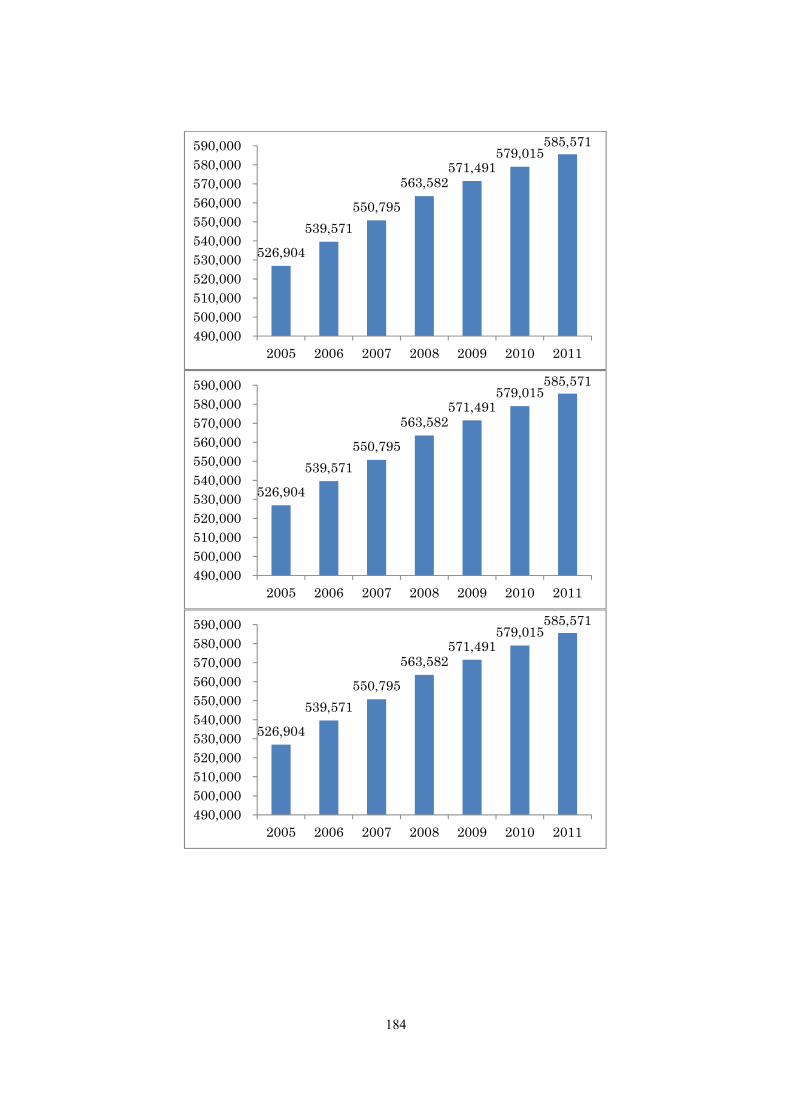
184
526,904
539,571 550,795
563,582 571,491
579,015 585,571
490,000 500,000 510,000 520,000 530,000 540,000 550,000 560,000 570,000 580,000 590,000
2005 2006 2007 2008 2009 2010 2011
526,904
539,571 550,795
563,582 571,491
579,015 585,571
490,000 500,000 510,000 520,000 530,000 540,000 550,000 560,000 570,000 580,000 590,000
2005 2006 2007 2008 2009 2010 2011
526,904
539,571 550,795
563,582 571,491
579,015 585,571
490,000 500,000 510,000 520,000 530,000 540,000 550,000 560,000 570,000 580,000 590,000
2005 2006 2007 2008 2009 2010 2011
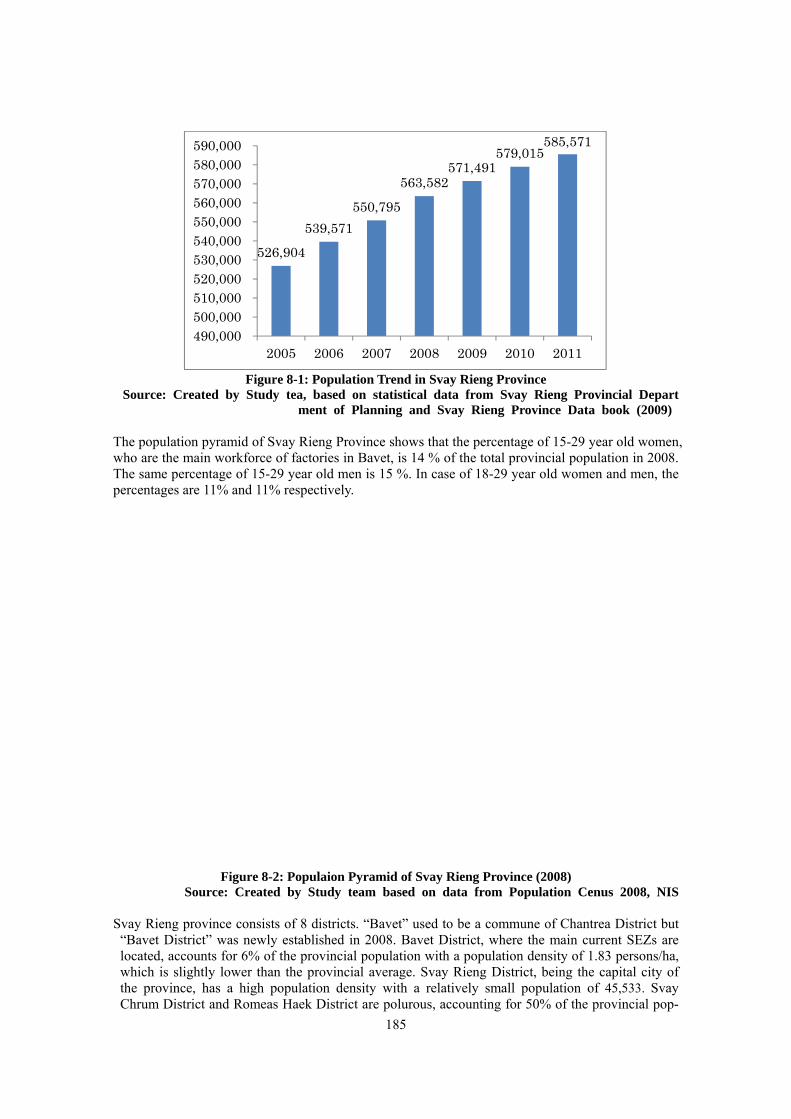
185
Figure 8-1: Population Trend in Svay Rieng Province
Source: Created by Study tea, based on statistical data from Svay Rieng Provincial Department of Planning and Svay Rieng Province Data book (2009)
The population pyramid of Svay Rieng Province shows that the percentage of 15-29 year old women, who are the main workforce of factories in Bavet, is 14 % of the total provincial population in 2008. The same percentage of 15-29 year old men is 15 %. In case of 18-29 year old women and men, the percentages are 11% and 11% respectively.
Figure 8-2: Populaion Pyramid of Svay Rieng Province (2008)
Source: Created by Study team based on data from Population Cenus 2008, NIS Svay Rieng province consists of 8 districts. “Bavet” used to be a commune of Chantrea District but
“Bavet District” was newly established in 2008. Bavet District, where the main current SEZs are located, accounts for 6% of the provincial population with a population density of 1.83 persons/ha, which is slightly lower than the provincial average. Svay Rieng District, being the capital city of the province, has a high population density with a relatively small population of 45,533. Svay Chrum District and Romeas Haek District are polurous, accounting for 50% of the provincial pop-
526,904
539,571 550,795
563,582 571,491
579,015 585,571
490,000 500,000 510,000 520,000 530,000 540,000 550,000 560,000 570,000 580,000 590,000
2005 2006 2007 2008 2009 2010 2011
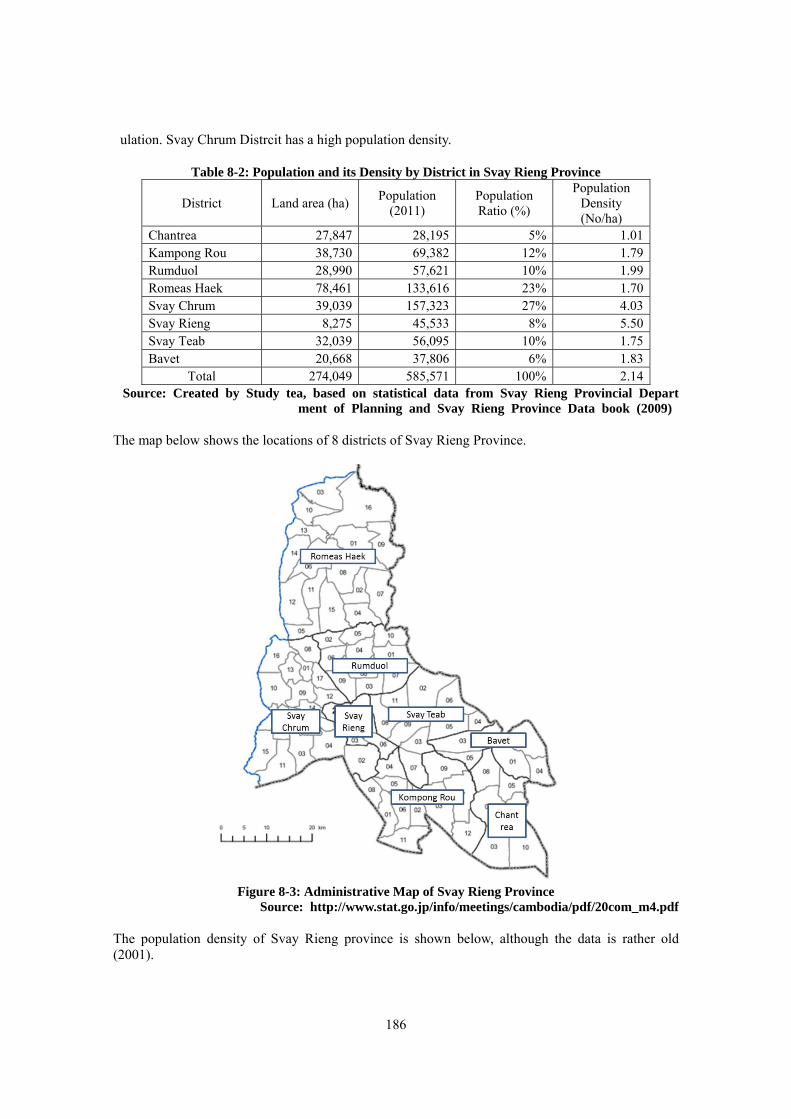
186
ulation. Svay Chrum Distrcit has a high population density.
Table 8-2: Population and its Density by District in Svay Rieng Province
District Land area (ha) Population (2011)
Population Ratio (%)
Population Density (No/ha)
Chantrea 27,847 28,195 5% 1.01 Kampong Rou 38,730 69,382 12% 1.79 Rumduol 28,990 57,621 10% 1.99 Romeas Haek 78,461 133,616 23% 1.70 Svay Chrum 39,039 157,323 27% 4.03 Svay Rieng 8,275 45,533 8% 5.50 Svay Teab 32,039 56,095 10% 1.75 Bavet 20,668 37,806 6% 1.83
Total 274,049 585,571 100% 2.14 Source: Created by Study tea, based on statistical data from Svay Rieng Provincial Depart
ment of Planning and Svay Rieng Province Data book (2009) The map below shows the locations of 8 districts of Svay Rieng Province.
Figure 8-3: Administrative Map of Svay Rieng Province
Source: http://www.stat.go.jp/info/meetings/cambodia/pdf/20com_m4.pdf The population density of Svay Rieng province is shown below, although the data is rather old (2001).
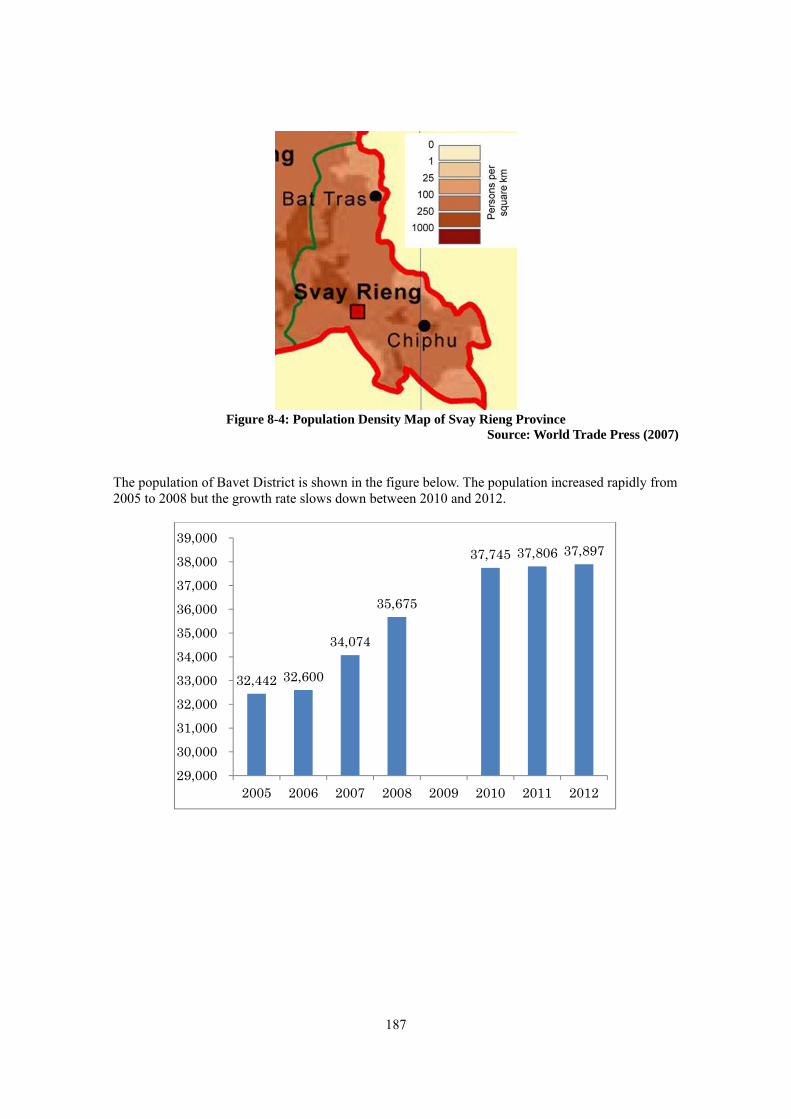
187
Figure 8-4: Population Density Map of Svay Rieng Province
Source: World Trade Press (2007) The population of Bavet District is shown in the figure below. The population increased rapidly from 2005 to 2008 but the growth rate slows down between 2010 and 2012.
32,442 32,600
34,074
35,675
37,745 37,806 37,897
29,000 30,000 31,000 32,000 33,000 34,000 35,000 36,000 37,000 38,000 39,000
2005 2006 2007 2008 2009 2010 2011 2012
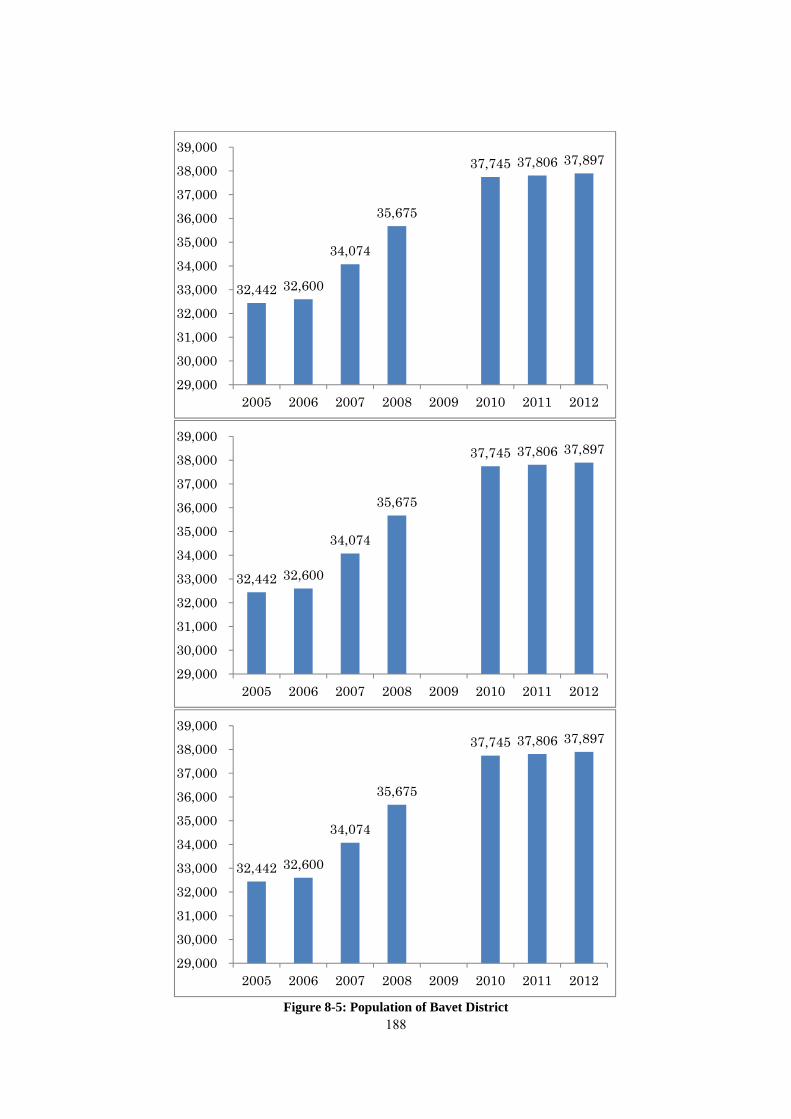
188
Figure 8-5: Population of Bavet District
32,442 32,600
34,074
35,675
37,745 37,806 37,897
29,000 30,000 31,000 32,000 33,000 34,000 35,000 36,000 37,000 38,000 39,000
2005 2006 2007 2008 2009 2010 2011 2012
32,442 32,600
34,074
35,675
37,745 37,806 37,897
29,000 30,000 31,000 32,000 33,000 34,000 35,000 36,000 37,000 38,000 39,000
2005 2006 2007 2008 2009 2010 2011 2012
32,442 32,600
34,074
35,675
37,745 37,806 37,897
29,000 30,000 31,000 32,000 33,000 34,000 35,000 36,000 37,000 38,000 39,000
2005 2006 2007 2008 2009 2010 2011 2012
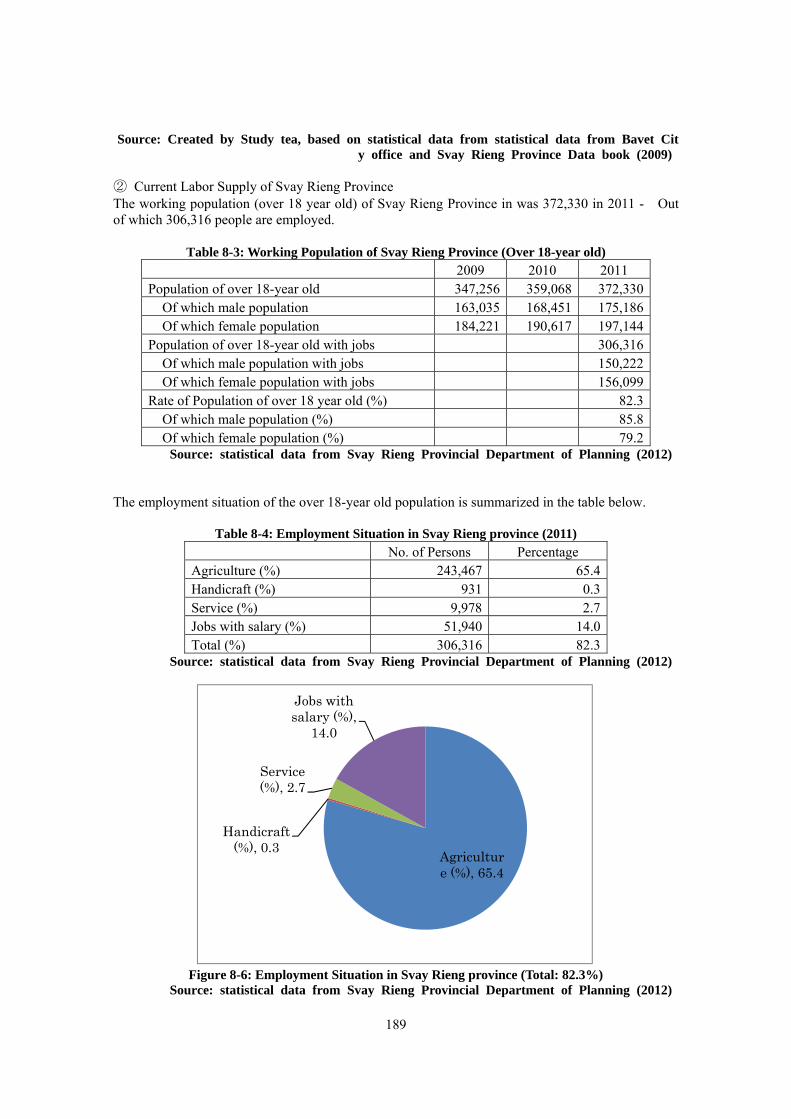
189
Source: Created by Study tea, based on statistical data from statistical data from Bavet City office and Svay Rieng Province Data book (2009)
② Current Labor Supply of Svay Rieng Province The working population (over 18 year old) of Svay Rieng Province in was 372,330 in 2011 - Out of which 306,316 people are employed.
Table 8-3: Working Population of Svay Rieng Province (Over 18-year old)
2009 2010 2011 Population of over 18-year old 347,256 359,068 372,330 Of which male population 163,035 168,451 175,186 Of which female population 184,221 190,617 197,144 Population of over 18-year old with jobs 306,316 Of which male population with jobs 150,222 Of which female population with jobs 156,099 Rate of Population of over 18 year old (%) 82.3 Of which male population (%) 85.8 Of which female population (%) 79.2
Source: statistical data from Svay Rieng Provincial Department of Planning (2012)
The employment situation of the over 18-year old population is summarized in the table below.
Table 8-4: Employment Situation in Svay Rieng province (2011) No. of Persons Percentage Agriculture (%) 243,467 65.4 Handicraft (%) 931 0.3 Service (%) 9,978 2.7 Jobs with salary (%) 51,940 14.0 Total (%) 306,316 82.3
Source: statistical data from Svay Rieng Provincial Department of Planning (2012)
Figure 8-6: Employment Situation in Svay Rieng province (Total: 82.3%)
Source: statistical data from Svay Rieng Provincial Department of Planning (2012)
Agriculture (%), 65.4
Handicraft (%), 0.3
Service (%), 2.7
Jobs with salary (%),
14.0
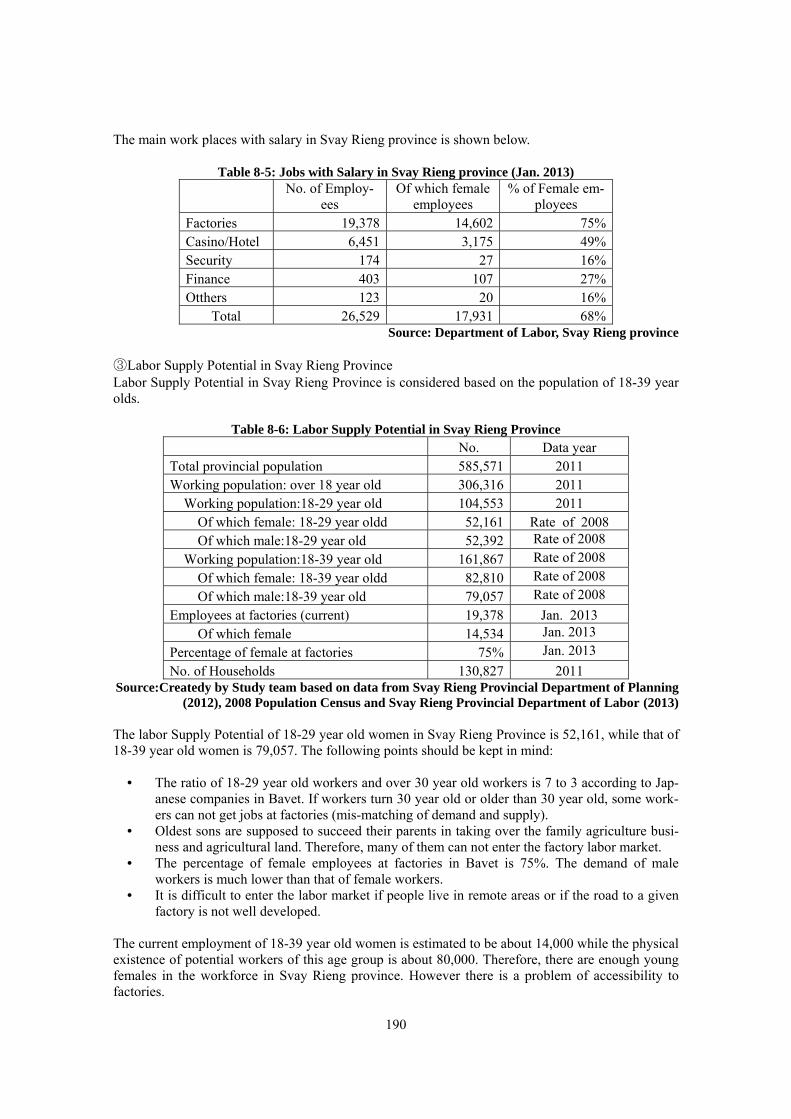
190
The main work places with salary in Svay Rieng province is shown below.
Table 8-5: Jobs with Salary in Svay Rieng province (Jan. 2013)
No. of Employ-
ees Of which female
employees % of Female em-
ployees Factories 19,378 14,602 75% Casino/Hotel 6,451 3,175 49% Security 174 27 16% Finance 403 107 27% Otthers 123 20 16%
Total 26,529 17,931 68% Source: Department of Labor, Svay Rieng province
③Labor Supply Potential in Svay Rieng Province Labor Supply Potential in Svay Rieng Province is considered based on the population of 18-39 year olds.
Table 8-6: Labor Supply Potential in Svay Rieng Province No. Data year Total provincial population 585,571 2011 Working population: over 18 year old 306,316 2011
Working population:18-29 year old 104,553 2011 Of which female: 18-29 year oldd 52,161 Rate of 2008 Of which male:18-29 year old 52,392 Rate of 2008
Working population:18-39 year old 161,867 Rate of 2008 Of which female: 18-39 year oldd 82,810 Rate of 2008 Of which male:18-39 year old 79,057 Rate of 2008
Employees at factories (current) 19,378 Jan. 2013 Of which female 14,534 Jan. 2013 Percentage of female at factories 75% Jan. 2013 No. of Households 130,827 2011
Source:Createdy by Study team based on data from Svay Rieng Provincial Department of Planning (2012), 2008 Population Census and Svay Rieng Provincial Department of Labor (2013)
The labor Supply Potential of 18-29 year old women in Svay Rieng Province is 52,161, while that of 18-39 year old women is 79,057. The following points should be kept in mind:
• The ratio of 18-29 year old workers and over 30 year old workers is 7 to 3 according to Jap-anese companies in Bavet. If workers turn 30 year old or older than 30 year old, some work-ers can not get jobs at factories (mis-matching of demand and supply).
• Oldest sons are supposed to succeed their parents in taking over the family agriculture busi-ness and agricultural land. Therefore, many of them can not enter the factory labor market.
• The percentage of female employees at factories in Bavet is 75%. The demand of male workers is much lower than that of female workers.
• It is difficult to enter the labor market if people live in remote areas or if the road to a given factory is not well developed.
The current employment of 18-39 year old women is estimated to be about 14,000 while the physical existence of potential workers of this age group is about 80,000. Therefore, there are enough young females in the workforce in Svay Rieng province. However there is a problem of accessibility to factories.
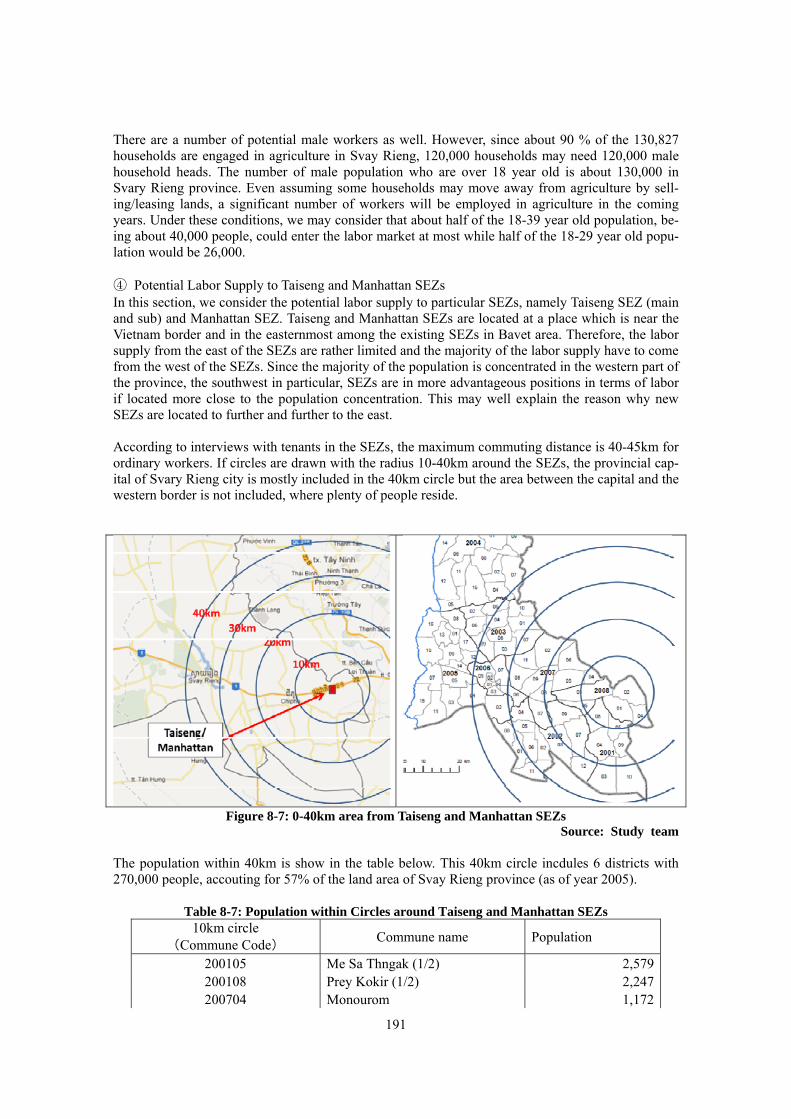
191
There are a number of potential male workers as well. However, since about 90 % of the 130,827 households are engaged in agriculture in Svay Rieng, 120,000 households may need 120,000 male household heads. The number of male population who are over 18 year old is about 130,000 in Svary Rieng province. Even assuming some households may move away from agriculture by sell-ing/leasing lands, a significant number of workers will be employed in agriculture in the coming years. Under these conditions, we may consider that about half of the 18-39 year old population, be-ing about 40,000 people, could enter the labor market at most while half of the 18-29 year old popu-lation would be 26,000. ④ Potential Labor Supply to Taiseng and Manhattan SEZs In this section, we consider the potential labor supply to particular SEZs, namely Taiseng SEZ (main and sub) and Manhattan SEZ. Taiseng and Manhattan SEZs are located at a place which is near the Vietnam border and in the easternmost among the existing SEZs in Bavet area. Therefore, the labor supply from the east of the SEZs are rather limited and the majority of the labor supply have to come from the west of the SEZs. Since the majority of the population is concentrated in the western part of the province, the southwest in particular, SEZs are in more advantageous positions in terms of labor if located more close to the population concentration. This may well explain the reason why new SEZs are located to further and further to the east. According to interviews with tenants in the SEZs, the maximum commuting distance is 40-45km for ordinary workers. If circles are drawn with the radius 10-40km around the SEZs, the provincial cap-ital of Svary Rieng city is mostly included in the 40km circle but the area between the capital and the western border is not included, where plenty of people reside.
Figure 8-7: 0-40km area from Taiseng and Manhattan SEZs Source: Study team
The population within 40km is show in the table below. This 40km circle incdules 6 districts with 270,000 people, accouting for 57% of the land area of Svay Rieng province (as of year 2005).
Table 8-7: Population within Circles around Taiseng and Manhattan SEZs 10km circle
(Commune Code) Commune name Population
200105 Me Sa Thngak (1/2) 2,579200108 Prey Kokir (1/2) 2,247200704 Monourom 1,172
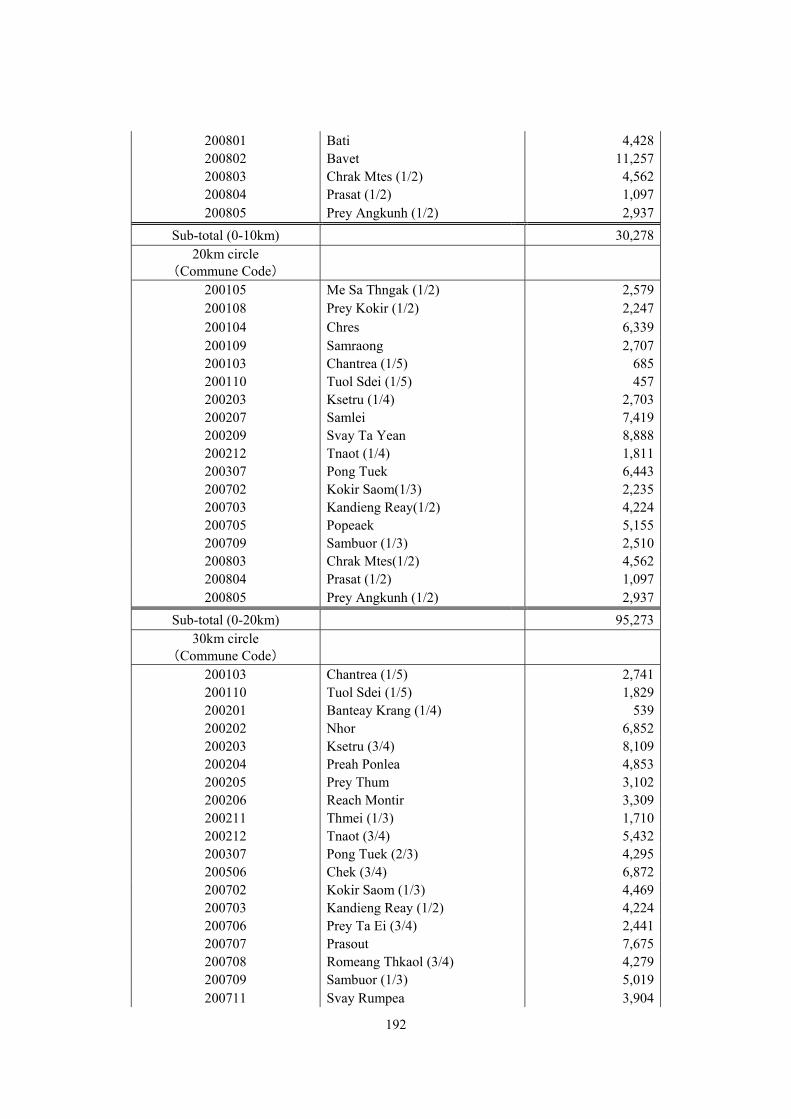
192
200801 Bati 4,428200802 Bavet 11,257200803 Chrak Mtes (1/2) 4,562200804 Prasat (1/2) 1,097200805 Prey Angkunh (1/2) 2,937
Sub-total (0-10km) 30,27820km circle
(Commune Code)
200105 Me Sa Thngak (1/2) 2,579200108 Prey Kokir (1/2) 2,247200104 Chres 6,339200109 Samraong 2,707200103 Chantrea (1/5) 685200110 Tuol Sdei (1/5) 457200203 Ksetru (1/4) 2,703200207 Samlei 7,419200209 Svay Ta Yean 8,888200212 Tnaot (1/4) 1,811200307 Pong Tuek 6,443200702 Kokir Saom(1/3) 2,235200703 Kandieng Reay(1/2) 4,224200705 Popeaek 5,155200709 Sambuor (1/3) 2,510200803 Chrak Mtes(1/2) 4,562200804 Prasat (1/2) 1,097200805 Prey Angkunh (1/2) 2,937
Sub-total (0-20km) 95,27330km circle
(Commune Code)
200103 Chantrea (1/5) 2,741200110 Tuol Sdei (1/5) 1,829200201 Banteay Krang (1/4) 539200202 Nhor 6,852200203 Ksetru (3/4) 8,109200204 Preah Ponlea 4,853200205 Prey Thum 3,102200206 Reach Montir 3,309200211 Thmei (1/3) 1,710200212 Tnaot (3/4) 5,432200307 Pong Tuek (2/3) 4,295200506 Chek (3/4) 6,872200702 Kokir Saom (1/3) 4,469200703 Kandieng Reay (1/2) 4,224200706 Prey Ta Ei (3/4) 2,441200707 Prasout 7,675200708 Romeang Thkaol (3/4) 4,279200709 Sambuor (1/3) 5,019200711 Svay Rumpea 3,904
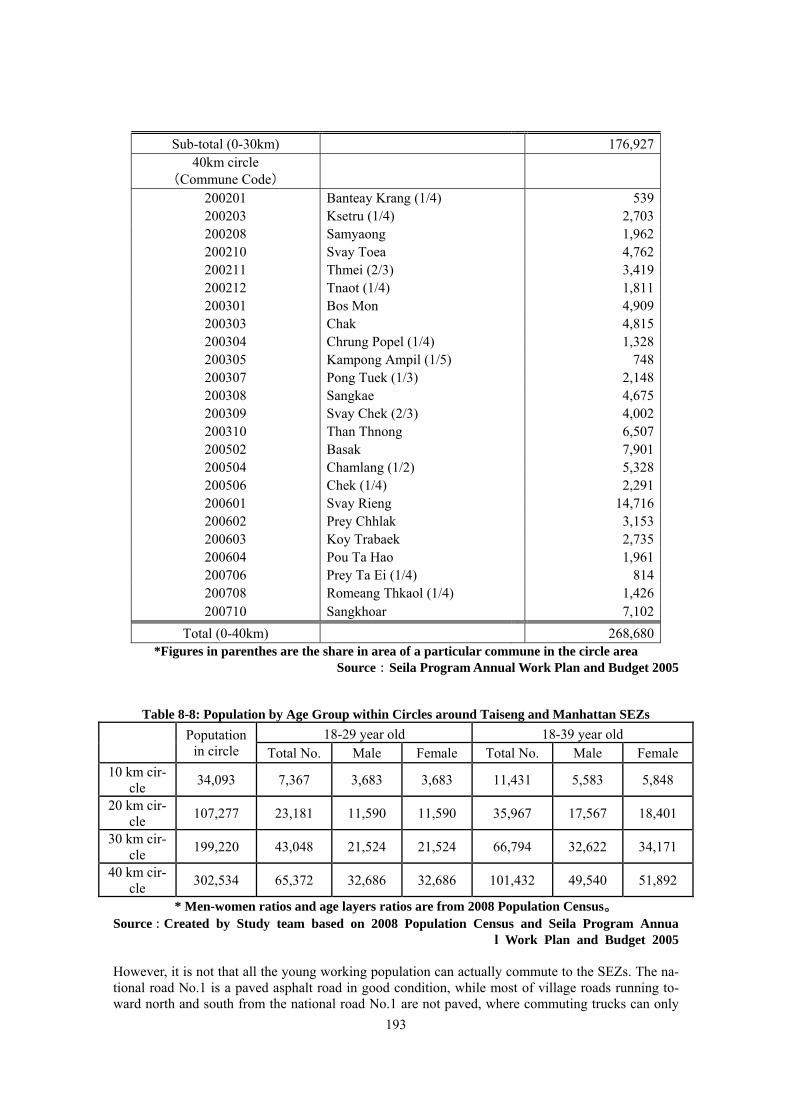
193
Sub-total (0-30km) 176,92740km circle
(Commune Code)
200201 Banteay Krang (1/4) 539200203 Ksetru (1/4) 2,703200208 Samyaong 1,962200210 Svay Toea 4,762200211 Thmei (2/3) 3,419200212 Tnaot (1/4) 1,811200301 Bos Mon 4,909200303 Chak 4,815200304 Chrung Popel (1/4) 1,328200305 Kampong Ampil (1/5) 748200307 Pong Tuek (1/3) 2,148200308 Sangkae 4,675200309 Svay Chek (2/3) 4,002200310 Than Thnong 6,507200502 Basak 7,901200504 Chamlang (1/2) 5,328200506 Chek (1/4) 2,291200601 Svay Rieng 14,716200602 Prey Chhlak 3,153200603 Koy Trabaek 2,735200604 Pou Ta Hao 1,961200706 Prey Ta Ei (1/4) 814200708 Romeang Thkaol (1/4) 1,426200710 Sangkhoar 7,102
Total (0-40km) 268,680*Figures in parenthes are the share in area of a particular commune in the circle area
Source:Seila Program Annual Work Plan and Budget 2005
Table 8-8: Population by Age Group within Circles around Taiseng and Manhattan SEZs
Poputation
in circle 18-29 year old 18-39 year old
Total No. Male Female Total No. Male Female 10 km cir-
cle 34,093 7,367 3,683 3,683 11,431 5,583 5,848
20 km cir-cle 107,277 23,181 11,590 11,590 35,967 17,567 18,401
30 km cir-cle 199,220 43,048 21,524 21,524 66,794 32,622 34,171
40 km cir-cle 302,534 65,372 32,686 32,686 101,432 49,540 51,892
* Men-women ratios and age layers ratios are from 2008 Population Census。 Source:Created by Study team based on 2008 Population Census and Seila Program Annua
l Work Plan and Budget 2005 However, it is not that all the young working population can actually commute to the SEZs. The na-tional road No.1 is a paved asphalt road in good condition, while most of village roads running to-ward north and south from the national road No.1 are not paved, where commuting trucks can only
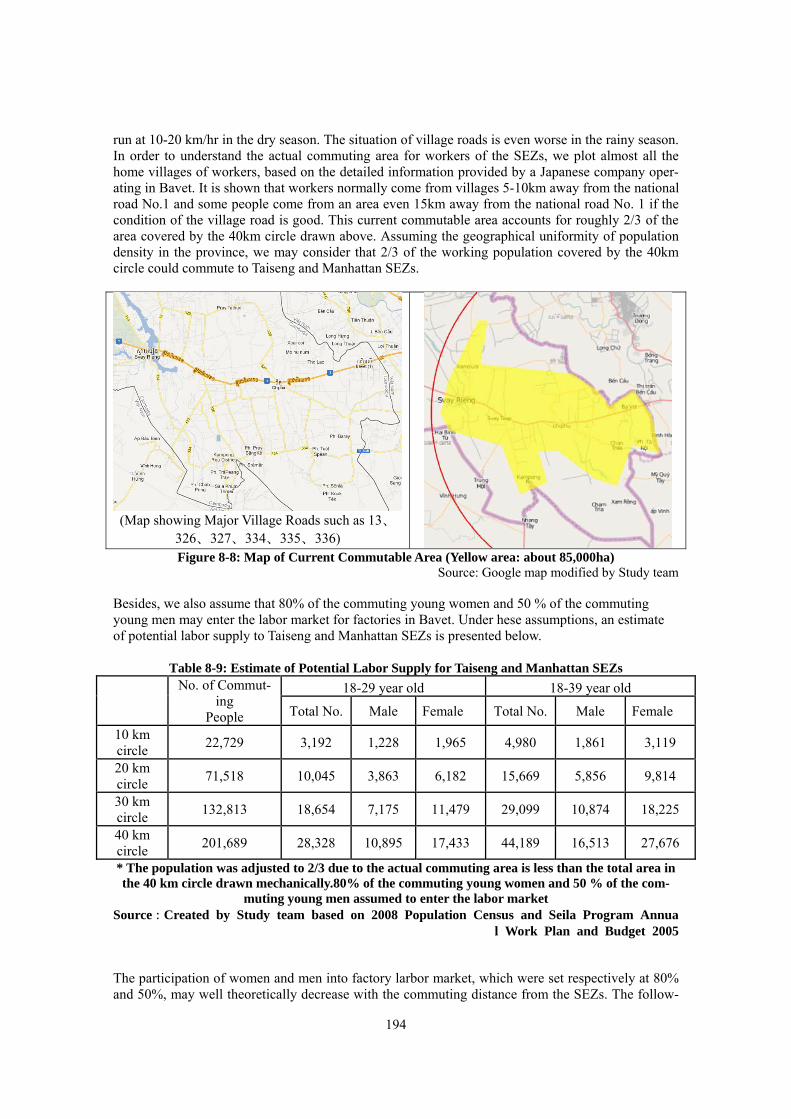
194
run at 10-20 km/hr in the dry season. The situation of village roads is even worse in the rainy season. In order to understand the actual commuting area for workers of the SEZs, we plot almost all the home villages of workers, based on the detailed information provided by a Japanese company oper-ating in Bavet. It is shown that workers normally come from villages 5-10km away from the national road No.1 and some people come from an area even 15km away from the national road No. 1 if the condition of the village road is good. This current commutable area accounts for roughly 2/3 of the area covered by the 40km circle drawn above. Assuming the geographical uniformity of population density in the province, we may consider that 2/3 of the working population covered by the 40km circle could commute to Taiseng and Manhattan SEZs.
(Map showing Major Village Roads such as 13、326、327、334、335、336) Figure 8-8: Map of Current Commutable Area (Yellow area: about 85,000ha)
Source: Google map modified by Study team Besides, we also assume that 80% of the commuting young women and 50 % of the commuting young men may enter the labor market for factories in Bavet. Under hese assumptions, an estimate of potential labor supply to Taiseng and Manhattan SEZs is presented below.
Table 8-9: Estimate of Potential Labor Supply for Taiseng and Manhattan SEZs
No. of Commut-ing
People
18-29 year old 18-39 year old
Total No. Male Female Total No. Male Female
10 km circle 22,729 3,192 1,228 1,965 4,980 1,861 3,119
20 km circle 71,518 10,045 3,863 6,182 15,669 5,856 9,814
30 km circle 132,813 18,654 7,175 11,479 29,099 10,874 18,225
40 km circle 201,689 28,328 10,895 17,433 44,189 16,513 27,676
* The population was adjusted to 2/3 due to the actual commuting area is less than the total area in the 40 km circle drawn mechanically.80% of the commuting young women and 50 % of the com-
muting young men assumed to enter the labor market Source:Created by Study team based on 2008 Population Census and Seila Program Annua
l Work Plan and Budget 2005 The participation of women and men into factory larbor market, which were set respectively at 80% and 50%, may well theoretically decrease with the commuting distance from the SEZs. The follow-
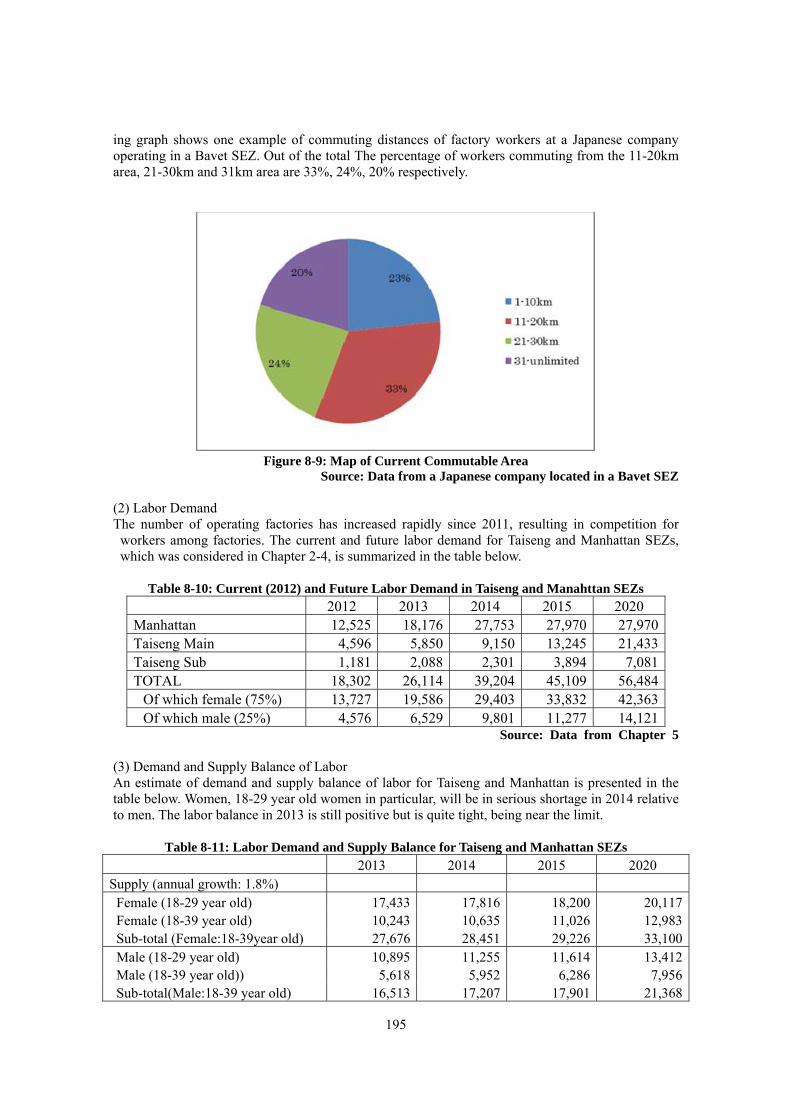
195
ing graph shows one example of commuting distances of factory workers at a Japanese company operating in a Bavet SEZ. Out of the total The percentage of workers commuting from the 11-20km area, 21-30km and 31km area are 33%, 24%, 20% respectively.
Figure 8-9: Map of Current Commutable Area
Source: Data from a Japanese company located in a Bavet SEZ (2) Labor Demand The number of operating factories has increased rapidly since 2011, resulting in competition for
workers among factories. The current and future labor demand for Taiseng and Manhattan SEZs, which was considered in Chapter 2-4, is summarized in the table below.
Table 8-10: Current (2012) and Future Labor Demand in Taiseng and Manahttan SEZs
2012 2013 2014 2015 2020 Manhattan 12,525 18,176 27,753 27,970 27,970Taiseng Main 4,596 5,850 9,150 13,245 21,433Taiseng Sub 1,181 2,088 2,301 3,894 7,081TOTAL 18,302 26,114 39,204 45,109 56,484 Of which female (75%) 13,727 19,586 29,403 33,832 42,363 Of which male (25%) 4,576 6,529 9,801 11,277 14,121
Source: Data from Chapter 5 (3) Demand and Supply Balance of Labor An estimate of demand and supply balance of labor for Taiseng and Manhattan is presented in the table below. Women, 18-29 year old women in particular, will be in serious shortage in 2014 relative to men. The labor balance in 2013 is still positive but is quite tight, being near the limit.
Table 8-11: Labor Demand and Supply Balance for Taiseng and Manhattan SEZs 2013 2014 2015 2020 Supply (annual growth: 1.8%)
Female (18-29 year old) 17,433 17,816 18,200 20,117Female (18-39 year old) 10,243 10,635 11,026 12,983Sub-total (Female:18-39year old) 27,676 28,451 29,226 33,100Male (18-29 year old) 10,895 11,255 11,614 13,412Male (18-39 year old)) 5,618 5,952 6,286 7,956
Sub-total(Male:18-39 year old) 16,513 17,207 17,901 21,368
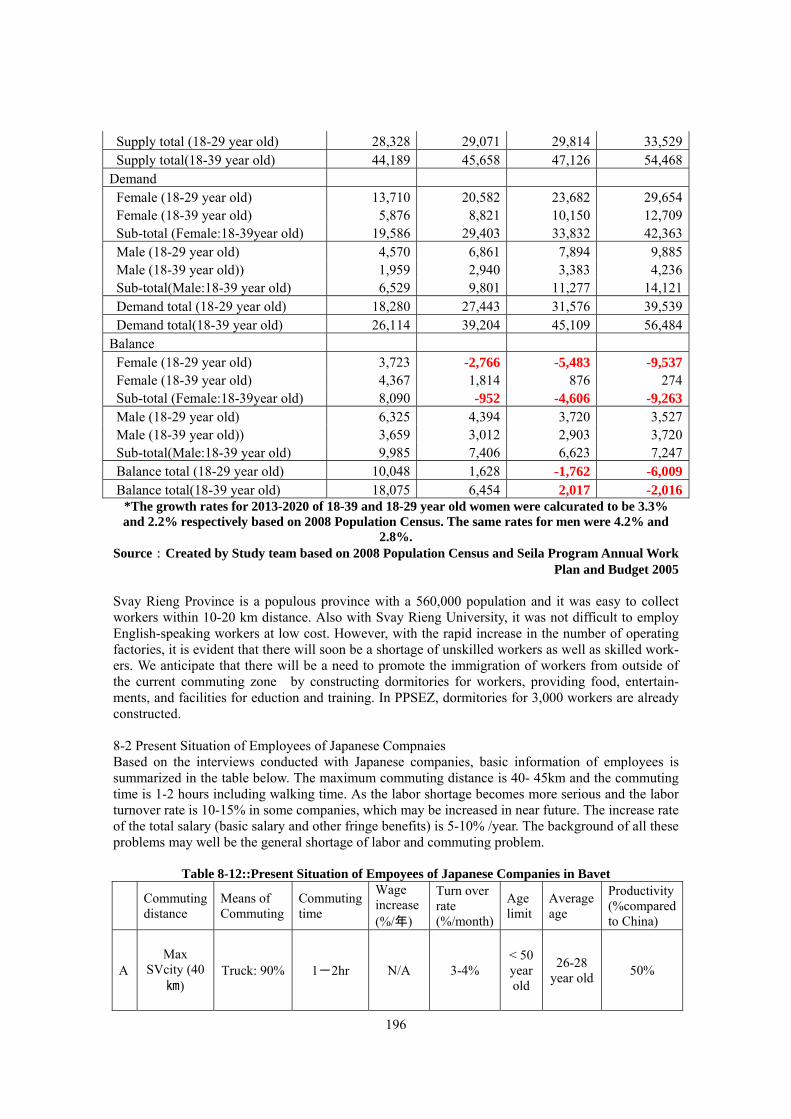
196
Supply total (18-29 year old) 28,328 29,071 29,814 33,529Supply total(18-39 year old) 44,189 45,658 47,126 54,468
Demand Female (18-29 year old) 13,710 20,582 23,682 29,654Female (18-39 year old) 5,876 8,821 10,150 12,709Sub-total (Female:18-39year old) 19,586 29,403 33,832 42,363Male (18-29 year old) 4,570 6,861 7,894 9,885Male (18-39 year old)) 1,959 2,940 3,383 4,236
Sub-total(Male:18-39 year old) 6,529 9,801 11,277 14,121Demand total (18-29 year old) 18,280 27,443 31,576 39,539Demand total(18-39 year old) 26,114 39,204 45,109 56,484
Balance Female (18-29 year old) 3,723 -2,766 -5,483 -9,537Female (18-39 year old) 4,367 1,814 876 274Sub-total (Female:18-39year old) 8,090 -952 -4,606 -9,263Male (18-29 year old) 6,325 4,394 3,720 3,527Male (18-39 year old)) 3,659 3,012 2,903 3,720
Sub-total(Male:18-39 year old) 9,985 7,406 6,623 7,247Balance total (18-29 year old) 10,048 1,628 -1,762 -6,009Balance total(18-39 year old) 18,075 6,454 2,017 -2,016
*The growth rates for 2013-2020 of 18-39 and 18-29 year old women were calcurated to be 3.3% and 2.2% respectively based on 2008 Population Census. The same rates for men were 4.2% and
2.8%. Source:Created by Study team based on 2008 Population Census and Seila Program Annual Work
Plan and Budget 2005
Svay Rieng Province is a populous province with a 560,000 population and it was easy to collect workers within 10-20 km distance. Also with Svay Rieng University, it was not difficult to employ English-speaking workers at low cost. However, with the rapid increase in the number of operating factories, it is evident that there will soon be a shortage of unskilled workers as well as skilled work-ers. We anticipate that there will be a need to promote the immigration of workers from outside of the current commuting zone by constructing dormitories for workers, providing food, entertain-ments, and facilities for eduction and training. In PPSEZ, dormitories for 3,000 workers are already constructed. 8-2 Present Situation of Employees of Japanese Compnaies Based on the interviews conducted with Japanese companies, basic information of employees is summarized in the table below. The maximum commuting distance is 40- 45km and the commuting time is 1-2 hours including walking time. As the labor shortage becomes more serious and the labor turnover rate is 10-15% in some companies, which may be increased in near future. The increase rate of the total salary (basic salary and other fringe benefits) is 5-10% /year. The background of all these problems may well be the general shortage of labor and commuting problem.
Table 8-12::Present Situation of Empoyees of Japanese Companies in Bavet
Commuting distance
Means of Commuting
Commuting time
Wage increase (%/年)
Turn over rate (%/month)
Age limit
Average age
Productivity (%compared to China)
A Max
SVcity (40㎞)
Truck: 90% 1-2hr N/A 3-4% < 50 year old
26-28 year old 50%
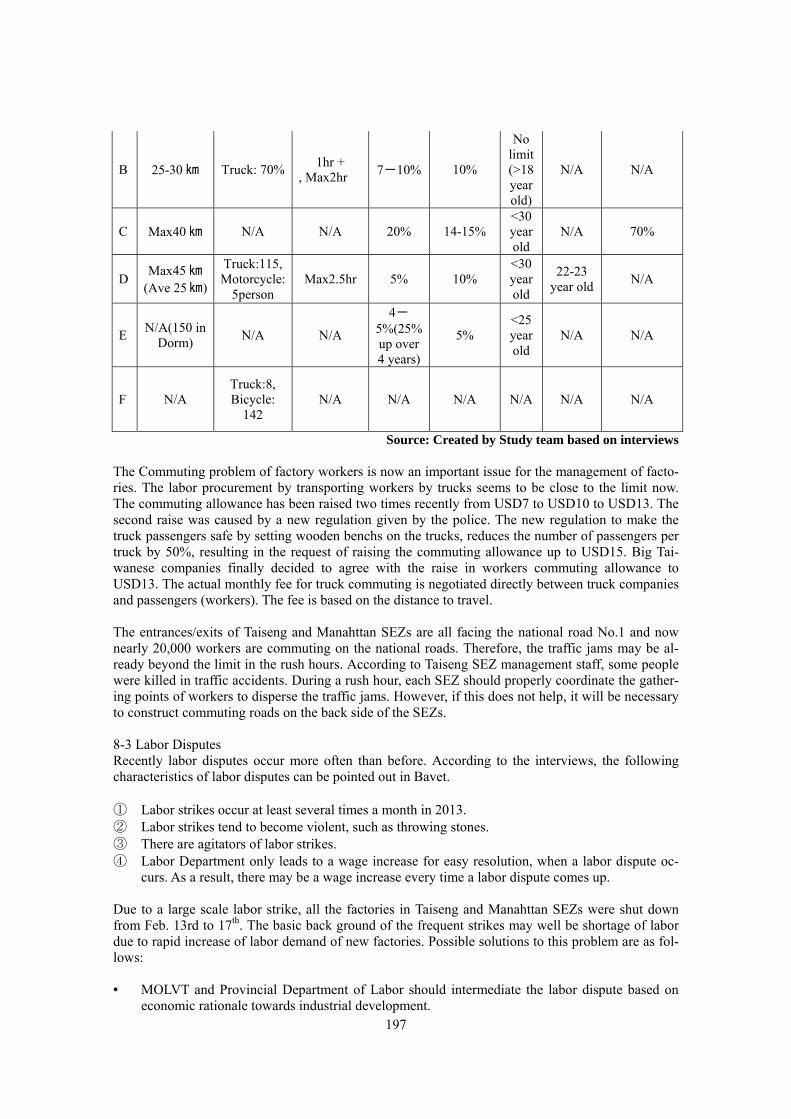
197
B 25-30 ㎞ Truck: 70% 1hr + , Max2hr 7-10% 10%
No limit (>18 year old)
N/A N/A
C Max40 ㎞ N/A N/A 20% 14-15% <30 year old
N/A 70%
D Max45 ㎞
(Ave 25 ㎞)
Truck:115, Motorcycle:
5person Max2.5hr 5% 10%
<30 year old
22-23 year old N/A
E N/A(150 in Dorm) N/A N/A
4-5%(25% up over 4 years)
5% <25 year old
N/A N/A
F N/A Truck:8, Bicycle:
142 N/A N/A N/A N/A N/A N/A
Source: Created by Study team based on interviews The Commuting problem of factory workers is now an important issue for the management of facto-ries. The labor procurement by transporting workers by trucks seems to be close to the limit now. The commuting allowance has been raised two times recently from USD7 to USD10 to USD13. The second raise was caused by a new regulation given by the police. The new regulation to make the truck passengers safe by setting wooden benchs on the trucks, reduces the number of passengers per truck by 50%, resulting in the request of raising the commuting allowance up to USD15. Big Tai-wanese companies finally decided to agree with the raise in workers commuting allowance to USD13. The actual monthly fee for truck commuting is negotiated directly between truck companies and passengers (workers). The fee is based on the distance to travel. The entrances/exits of Taiseng and Manahttan SEZs are all facing the national road No.1 and now nearly 20,000 workers are commuting on the national roads. Therefore, the traffic jams may be al-ready beyond the limit in the rush hours. According to Taiseng SEZ management staff, some people were killed in traffic accidents. During a rush hour, each SEZ should properly coordinate the gather-ing points of workers to disperse the traffic jams. However, if this does not help, it will be necessary to construct commuting roads on the back side of the SEZs. 8-3 Labor Disputes Recently labor disputes occur more often than before. According to the interviews, the following characteristics of labor disputes can be pointed out in Bavet. ① Labor strikes occur at least several times a month in 2013. ② Labor strikes tend to become violent, such as throwing stones. ③ There are agitators of labor strikes. ④ Labor Department only leads to a wage increase for easy resolution, when a labor dispute oc-
curs. As a result, there may be a wage increase every time a labor dispute comes up. Due to a large scale labor strike, all the factories in Taiseng and Manahttan SEZs were shut down from Feb. 13rd to 17th. The basic back ground of the frequent strikes may well be shortage of labor due to rapid increase of labor demand of new factories. Possible solutions to this problem are as fol-lows: • MOLVT and Provincial Department of Labor should intermediate the labor dispute based on
economic rationale towards industrial development.
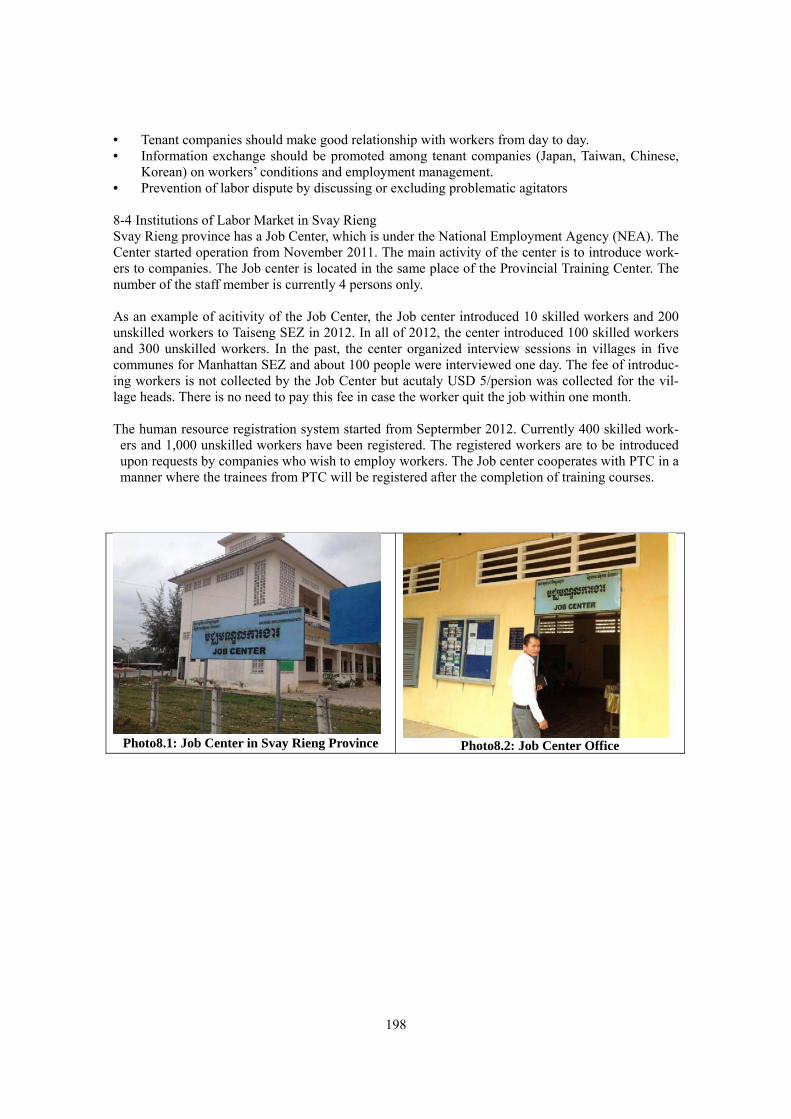
198
• Tenant companies should make good relationship with workers from day to day. • Information exchange should be promoted among tenant companies (Japan, Taiwan, Chinese,
Korean) on workers’ conditions and employment management. • Prevention of labor dispute by discussing or excluding problematic agitators 8-4 Institutions of Labor Market in Svay Rieng Svay Rieng province has a Job Center, which is under the National Employment Agency (NEA). The Center started operation from November 2011. The main activity of the center is to introduce work-ers to companies. The Job center is located in the same place of the Provincial Training Center. The number of the staff member is currently 4 persons only. As an example of acitivity of the Job Center, the Job center introduced 10 skilled workers and 200 unskilled workers to Taiseng SEZ in 2012. In all of 2012, the center introduced 100 skilled workers and 300 unskilled workers. In the past, the center organized interview sessions in villages in five communes for Manhattan SEZ and about 100 people were interviewed one day. The fee of introduc-ing workers is not collected by the Job Center but acutaly USD 5/persion was collected for the vil-lage heads. There is no need to pay this fee in case the worker quit the job within one month. The human resource registration system started from Septermber 2012. Currently 400 skilled work-
ers and 1,000 unskilled workers have been registered. The registered workers are to be introduced upon requests by companies who wish to employ workers. The Job center cooperates with PTC in a manner where the trainees from PTC will be registered after the completion of training courses.
Photo8.1: Job Center in Svay Rieng Province Photo8.2: Job Center Office
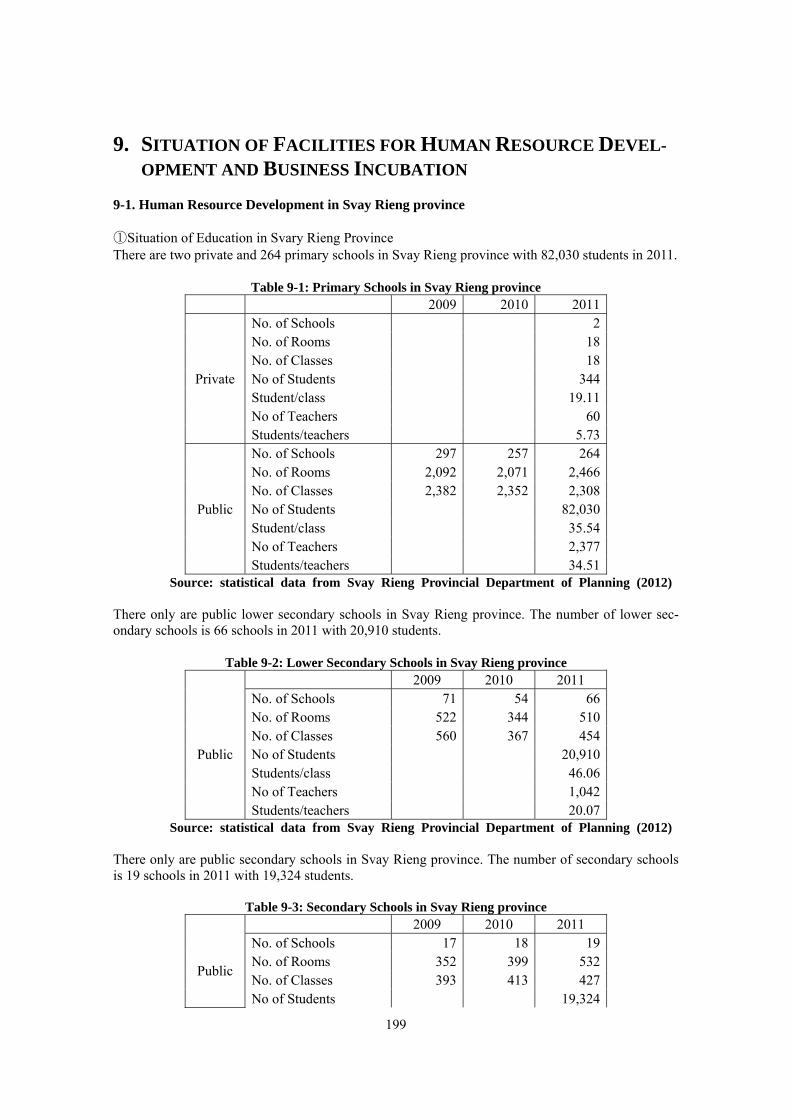
199
9. SITUATION OF FACILITIES FOR HUMAN RESOURCE DEVEL-OPMENT AND BUSINESS INCUBATION
9-1. Human Resource Development in Svay Rieng province ①Situation of Education in Svary Rieng Province There are two private and 264 primary schools in Svay Rieng province with 82,030 students in 2011.
Table 9-1: Primary Schools in Svay Rieng province 2009 2010 2011
Private
No. of Schools 2 No. of Rooms 18 No. of Classes 18 No of Students 344 Student/class 19.11 No of Teachers 60 Students/teachers 5.73
Public
No. of Schools 297 257 264 No. of Rooms 2,092 2,071 2,466 No. of Classes 2,382 2,352 2,308 No of Students 82,030 Student/class 35.54 No of Teachers 2,377 Students/teachers 34.51
Source: statistical data from Svay Rieng Provincial Department of Planning (2012) There only are public lower secondary schools in Svay Rieng province. The number of lower sec-ondary schools is 66 schools in 2011 with 20,910 students.
Table 9-2: Lower Secondary Schools in Svay Rieng province 2009 2010 2011
Public
No. of Schools 71 54 66 No. of Rooms 522 344 510 No. of Classes 560 367 454 No of Students 20,910 Students/class 46.06 No of Teachers 1,042 Students/teachers 20.07
Source: statistical data from Svay Rieng Provincial Department of Planning (2012) There only are public secondary schools in Svay Rieng province. The number of secondary schools is 19 schools in 2011 with 19,324 students.
Table 9-3: Secondary Schools in Svay Rieng province 2009 2010 2011
Public
No. of Schools 17 18 19 No. of Rooms 352 399 532 No. of Classes 393 413 427 No of Students 19,324
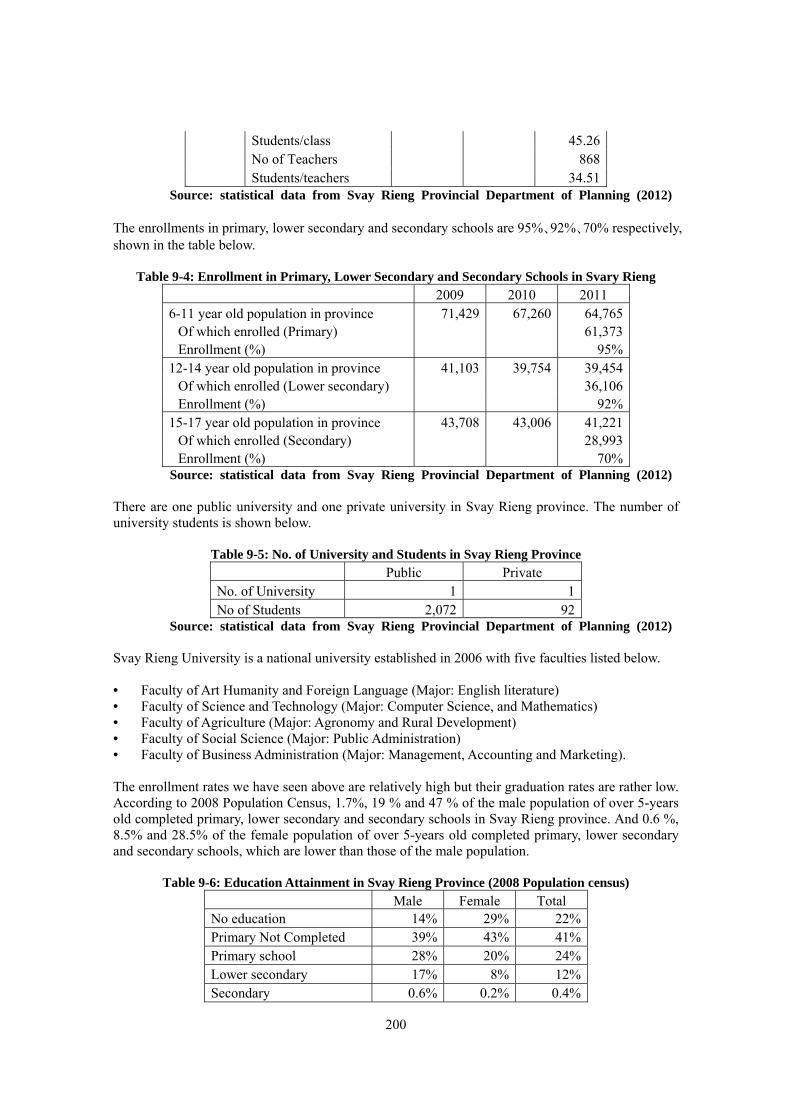
200
Students/class 45.26 No of Teachers 868 Students/teachers 34.51
Source: statistical data from Svay Rieng Provincial Department of Planning (2012) The enrollments in primary, lower secondary and secondary schools are 95%、92%、70% respectively, shown in the table below.
Table 9-4: Enrollment in Primary, Lower Secondary and Secondary Schools in Svary Rieng 2009 2010 2011 6-11 year old population in province 71,429 67,260 64,765 Of which enrolled (Primary) 61,373 Enrollment (%) 95% 12-14 year old population in province 41,103 39,754 39,454 Of which enrolled (Lower secondary) 36,106 Enrollment (%) 92% 15-17 year old population in province 43,708 43,006 41,221 Of which enrolled (Secondary) 28,993 Enrollment (%) 70% Source: statistical data from Svay Rieng Provincial Department of Planning (2012)
There are one public university and one private university in Svay Rieng province. The number of university students is shown below.
Table 9-5: No. of University and Students in Svay Rieng Province Public Private No. of University 1 1 No of Students 2,072 92
Source: statistical data from Svay Rieng Provincial Department of Planning (2012) Svay Rieng University is a national university established in 2006 with five faculties listed below. • Faculty of Art Humanity and Foreign Language (Major: English literature) • Faculty of Science and Technology (Major: Computer Science, and Mathematics) • Faculty of Agriculture (Major: Agronomy and Rural Development) • Faculty of Social Science (Major: Public Administration) • Faculty of Business Administration (Major: Management, Accounting and Marketing). The enrollment rates we have seen above are relatively high but their graduation rates are rather low. According to 2008 Population Census, 1.7%, 19 % and 47 % of the male population of over 5-years old completed primary, lower secondary and secondary schools in Svay Rieng province. And 0.6 %, 8.5% and 28.5% of the female population of over 5-years old completed primary, lower secondary and secondary schools, which are lower than those of the male population.
Table 9-6: Education Attainment in Svay Rieng Province (2008 Population census) Male Female Total No education 14% 29% 22% Primary Not Completed 39% 43% 41% Primary school 28% 20% 24% Lower secondary 17% 8% 12% Secondary 0.6% 0.2% 0.4%
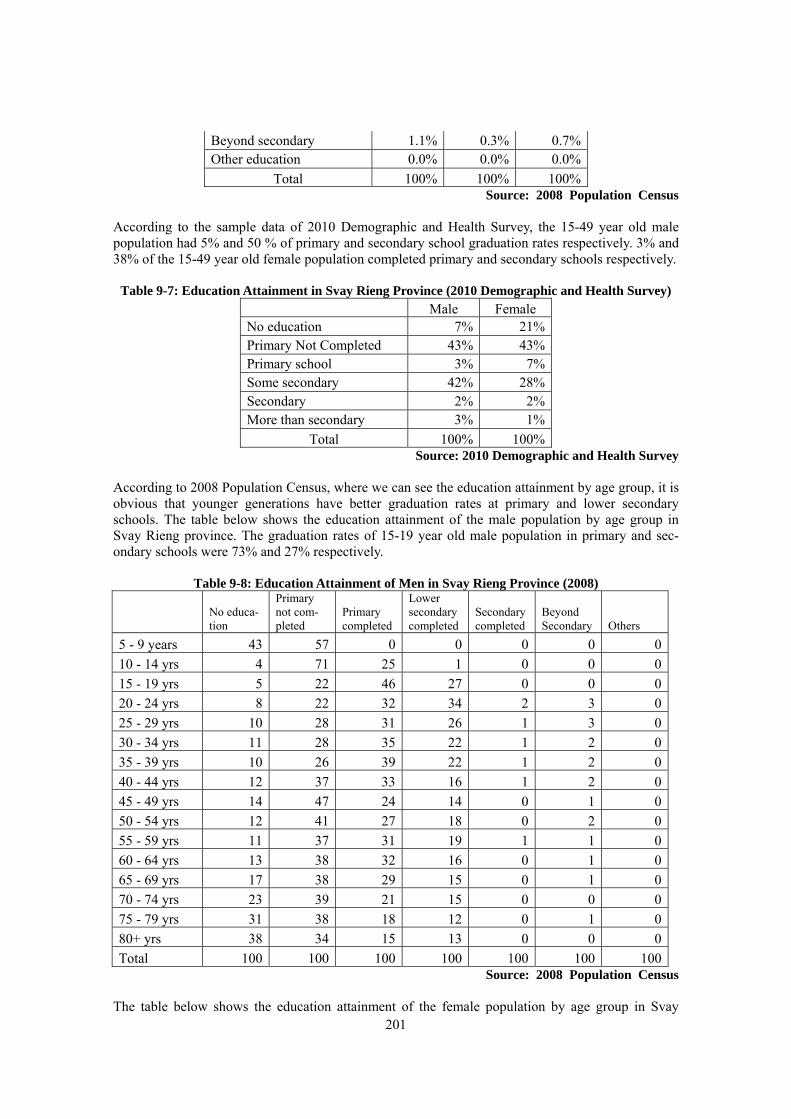
201
Beyond secondary 1.1% 0.3% 0.7% Other education 0.0% 0.0% 0.0%
Total 100% 100% 100% Source: 2008 Population Census
According to the sample data of 2010 Demographic and Health Survey, the 15-49 year old male population had 5% and 50 % of primary and secondary school graduation rates respectively. 3% and 38% of the 15-49 year old female population completed primary and secondary schools respectively.
Table 9-7: Education Attainment in Svay Rieng Province (2010 Demographic and Health Survey) Male Female No education 7% 21%Primary Not Completed 43% 43%Primary school 3% 7%Some secondary 42% 28%Secondary 2% 2%More than secondary 3% 1%
Total 100% 100%Source: 2010 Demographic and Health Survey
According to 2008 Population Census, where we can see the education attainment by age group, it is obvious that younger generations have better graduation rates at primary and lower secondary schools. The table below shows the education attainment of the male population by age group in Svay Rieng province. The graduation rates of 15-19 year old male population in primary and sec-ondary schools were 73% and 27% respectively.
Table 9-8: Education Attainment of Men in Svay Rieng Province (2008)
No educa-tion
Primary not com-pleted
Primary completed
Lower secondary completed
Secondary completed
Beyond Secondary Others
5 - 9 years 43 57 0 0 0 0 010 - 14 yrs 4 71 25 1 0 0 015 - 19 yrs 5 22 46 27 0 0 020 - 24 yrs 8 22 32 34 2 3 025 - 29 yrs 10 28 31 26 1 3 030 - 34 yrs 11 28 35 22 1 2 035 - 39 yrs 10 26 39 22 1 2 040 - 44 yrs 12 37 33 16 1 2 045 - 49 yrs 14 47 24 14 0 1 050 - 54 yrs 12 41 27 18 0 2 055 - 59 yrs 11 37 31 19 1 1 060 - 64 yrs 13 38 32 16 0 1 065 - 69 yrs 17 38 29 15 0 1 070 - 74 yrs 23 39 21 15 0 0 075 - 79 yrs 31 38 18 12 0 1 080+ yrs 38 34 15 13 0 0 0Total 100 100 100 100 100 100 100
Source: 2008 Population Census The table below shows the education attainment of the female population by age group in Svay
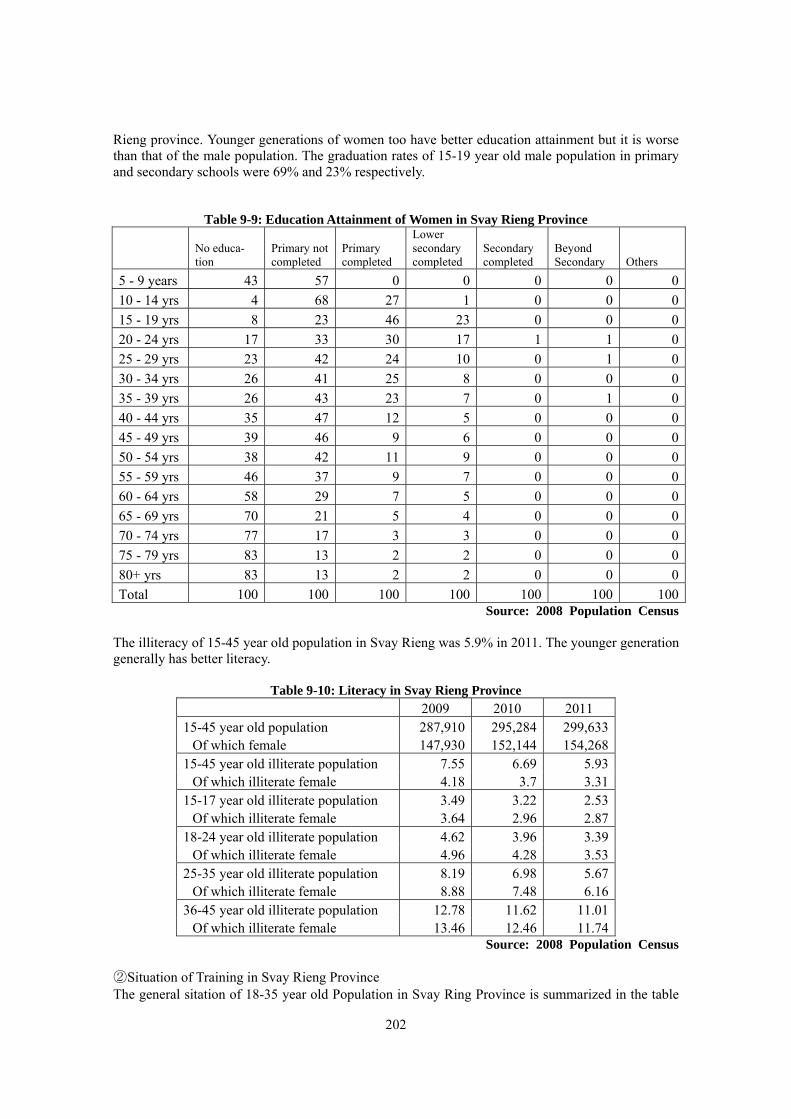
202
Rieng province. Younger generations of women too have better education attainment but it is worse than that of the male population. The graduation rates of 15-19 year old male population in primary and secondary schools were 69% and 23% respectively.
Table 9-9: Education Attainment of Women in Svay Rieng Province
No educa-tion
Primary not completed
Primary completed
Lower secondary completed
Secondary completed
Beyond Secondary Others
5 - 9 years 43 57 0 0 0 0 010 - 14 yrs 4 68 27 1 0 0 015 - 19 yrs 8 23 46 23 0 0 020 - 24 yrs 17 33 30 17 1 1 025 - 29 yrs 23 42 24 10 0 1 030 - 34 yrs 26 41 25 8 0 0 035 - 39 yrs 26 43 23 7 0 1 040 - 44 yrs 35 47 12 5 0 0 045 - 49 yrs 39 46 9 6 0 0 050 - 54 yrs 38 42 11 9 0 0 055 - 59 yrs 46 37 9 7 0 0 060 - 64 yrs 58 29 7 5 0 0 065 - 69 yrs 70 21 5 4 0 0 070 - 74 yrs 77 17 3 3 0 0 075 - 79 yrs 83 13 2 2 0 0 080+ yrs 83 13 2 2 0 0 0Total 100 100 100 100 100 100 100
Source: 2008 Population Census The illiteracy of 15-45 year old population in Svay Rieng was 5.9% in 2011. The younger generation generally has better literacy.
Table 9-10: Literacy in Svay Rieng Province 2009 2010 2011 15-45 year old population 287,910 295,284 299,633 Of which female 147,930 152,144 154,268 15-45 year old illiterate population 7.55 6.69 5.93 Of which illiterate female 4.18 3.7 3.31 15-17 year old illiterate population 3.49 3.22 2.53 Of which illiterate female 3.64 2.96 2.87 18-24 year old illiterate population 4.62 3.96 3.39 Of which illiterate female 4.96 4.28 3.53 25-35 year old illiterate population 8.19 6.98 5.67 Of which illiterate female 8.88 7.48 6.16 36-45 year old illiterate population 12.78 11.62 11.01 Of which illiterate female 13.46 12.46 11.74
Source: 2008 Population Census ②Situation of Training in Svay Rieng Province The general sitation of 18-35 year old Population in Svay Ring Province is summarized in the table
203
below.
Table 9-11: Training Situation of 18-35 year old Population in Svay Ring Province 2011 Total Female 18-24 year old population in province 85,155 43,118 Of which go to secondary school 14,298 6,935 Rate of which going to secondary school (%) 16.8 8.1 Of which go to university and training center 5,205 2,226 Rate of which going to university and training center (%) 6.1 2.6 Of which going to university (%) 4.2 1.6 Of which going to training center (%) 1.9 1.0 25-35 year old population in province 98,015 51,163 Of which go to universtiy and training center 3,689 1,760 Rate of which going to university and training center (%) 3.8 1.8 Of which going to university (%) 1.7 0.8 Of which going to training center (%) 2.1 1.0
Source: statistical data from Svay Rieng Provincial Department of Planning (2012) Svay Rieng province has a Provincial Training Center, which was established in 2001 under the de-partment of labor. It has 47 staff members with one director and two vice directors and 16 admin-istration staff and about 28 trainers and teacher. The budget of the center is provided by MOLVT. It received technical and financial support from ADB between 2007 and 2012 under the “Voucher skill training program”. The provincial training center provides the training of the following subjects.
• Electricity • Electronics repair • Sewing • Welding • Air con • Basic Computer skill • Motor repair • Small engine repair • House wiring • Make up • Veterinary • Animal husbandry (such as pig raising)
Training is provided in short term course and long term course. A typical example of a short term course training is a training of agricultural techniques in villages for 1-4 weeks. A typical example of a long-term course training is a training of sewing for 4 months. According to the interview with the center staff, the students who complete the sewing course often start their own sewing busineses in home villages, instead of going to garment factories.
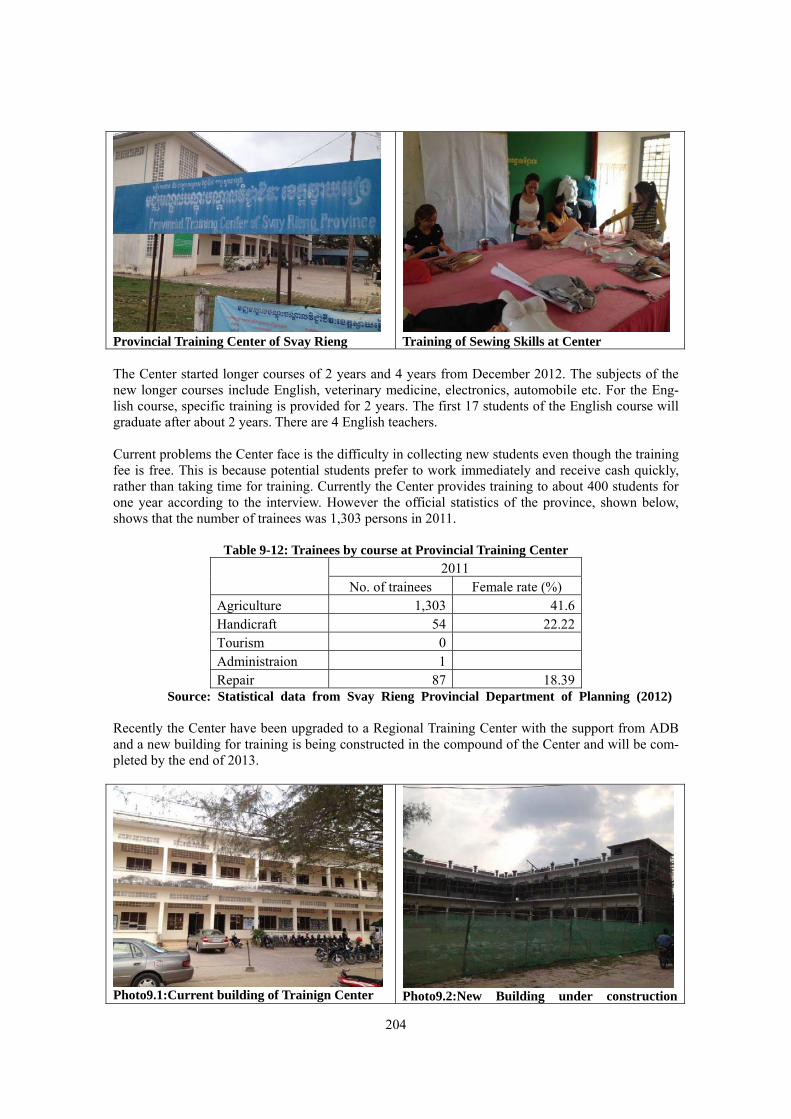
204
Provincial Training Center of Svay Rieng
Training of Sewing Skills at Center
The Center started longer courses of 2 years and 4 years from December 2012. The subjects of the new longer courses include English, veterinary medicine, electronics, automobile etc. For the Eng-lish course, specific training is provided for 2 years. The first 17 students of the English course will graduate after about 2 years. There are 4 English teachers. Current problems the Center face is the difficulty in collecting new students even though the training fee is free. This is because potential students prefer to work immediately and receive cash quickly, rather than taking time for training. Currently the Center provides training to about 400 students for one year according to the interview. However the official statistics of the province, shown below, shows that the number of trainees was 1,303 persons in 2011.
Table 9-12: Trainees by course at Provincial Training Center
2011
No. of trainees Female rate (%) Agriculture 1,303 41.6 Handicraft 54 22.22 Tourism 0 Administraion 1 Repair 87 18.39
Source: Statistical data from Svay Rieng Provincial Department of Planning (2012) Recently the Center have been upgraded to a Regional Training Center with the support from ADB and a new building for training is being constructed in the compound of the Center and will be com-pleted by the end of 2013.
Photo9.1:Current building of Trainign Center Photo9.2:New Building under construction
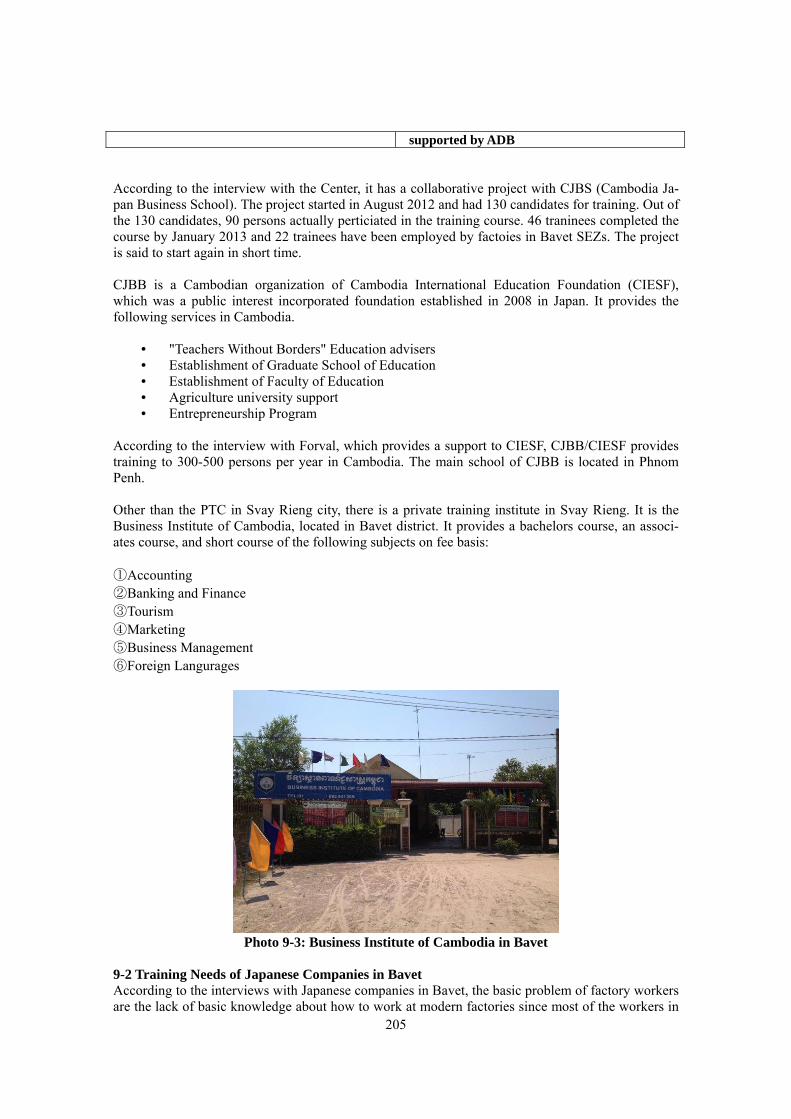
205
supported by ADB According to the interview with the Center, it has a collaborative project with CJBS (Cambodia Ja-pan Business School). The project started in August 2012 and had 130 candidates for training. Out of the 130 candidates, 90 persons actually perticiated in the training course. 46 traninees completed the course by January 2013 and 22 trainees have been employed by factoies in Bavet SEZs. The project is said to start again in short time. CJBB is a Cambodian organization of Cambodia International Education Foundation (CIESF), which was a public interest incorporated foundation established in 2008 in Japan. It provides the following services in Cambodia.
• "Teachers Without Borders" Education advisers • Establishment of Graduate School of Education • Establishment of Faculty of Education • Agriculture university support • Entrepreneurship Program
According to the interview with Forval, which provides a support to CIESF, CJBB/CIESF provides training to 300-500 persons per year in Cambodia. The main school of CJBB is located in Phnom Penh. Other than the PTC in Svay Rieng city, there is a private training institute in Svay Rieng. It is the Business Institute of Cambodia, located in Bavet district. It provides a bachelors course, an associ-ates course, and short course of the following subjects on fee basis: ①Accounting ②Banking and Finance ③Tourism ④Marketing ⑤Business Management ⑥Foreign Langurages
Photo 9-3: Business Institute of Cambodia in Bavet
9-2 Training Needs of Japanese Companies in Bavet According to the interviews with Japanese companies in Bavet, the basic problem of factory workers are the lack of basic knowledge about how to work at modern factories since most of the workers in

206
Svay Rieng province used to engage in agriculture and did not have any experience of working in factories. Another problem is the lack of basic education such as counting, calculation, writing and reading due to a lack of exposure to public education. The lack of skilled worker is all mentioned by some companies but is less serious at this moment than the shortage of unskilled workers.
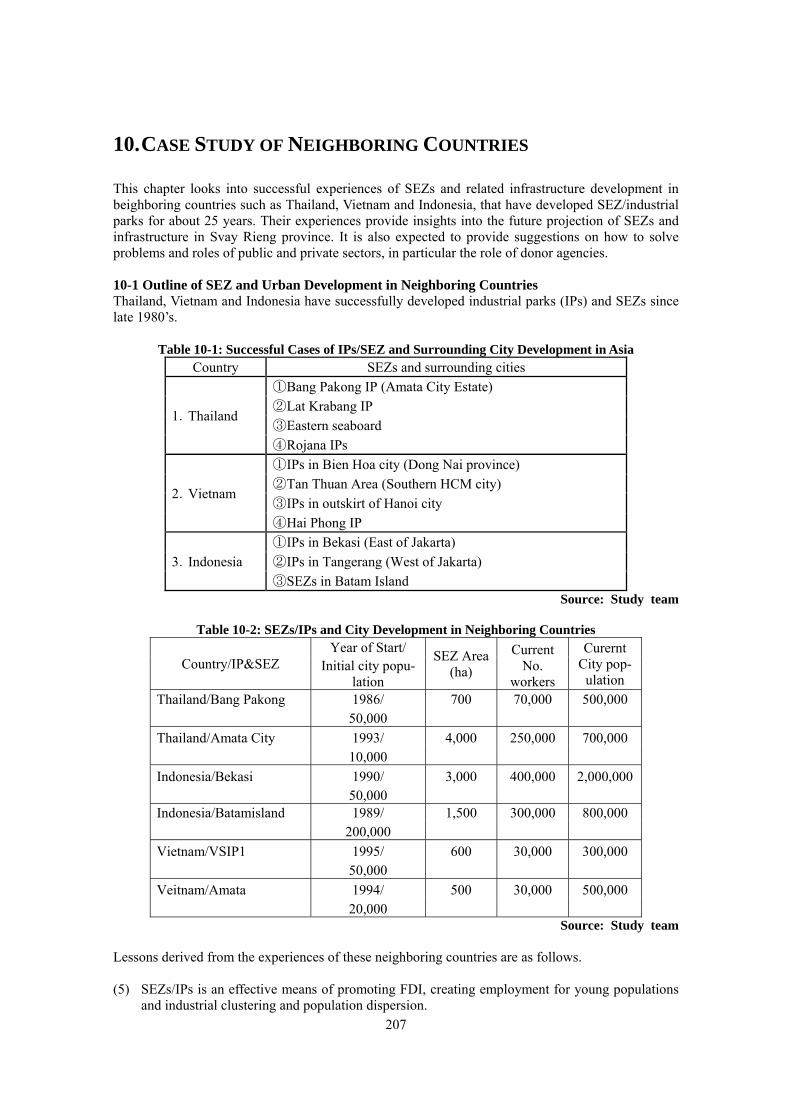
207
10. CASE STUDY OF NEIGHBORING COUNTRIES This chapter looks into successful experiences of SEZs and related infrastructure development in beighboring countries such as Thailand, Vietnam and Indonesia, that have developed SEZ/industrial parks for about 25 years. Their experiences provide insights into the future projection of SEZs and infrastructure in Svay Rieng province. It is also expected to provide suggestions on how to solve problems and roles of public and private sectors, in particular the role of donor agencies. 10-1 Outline of SEZ and Urban Development in Neighboring Countries Thailand, Vietnam and Indonesia have successfully developed industrial parks (IPs) and SEZs since late 1980’s.
Table 10-1: Successful Cases of IPs/SEZ and Surrounding City Development in Asia Country SEZs and surrounding cities
1.Thailand
①Bang Pakong IP (Amata City Estate) ②Lat Krabang IP ③Eastern seaboard ④Rojana IPs
2.Vietnam
①IPs in Bien Hoa city (Dong Nai province) ②Tan Thuan Area (Southern HCM city) ③IPs in outskirt of Hanoi city ④Hai Phong IP
3.Indonesia ①IPs in Bekasi (East of Jakarta) ②IPs in Tangerang (West of Jakarta) ③SEZs in Batam Island
Source: Study team
Table 10-2: SEZs/IPs and City Development in Neighboring Countries
Country/IP&SEZ Year of Start/ SEZ Area
(ha) Current
No. workers
Curernt City pop-
ulation Initial city popu-
lation Thailand/Bang Pakong 1986/ 700 70,000 500,000 50,000 Thailand/Amata City 1993/ 4,000 250,000 700,000 10,000 Indonesia/Bekasi 1990/ 3,000 400,000 2,000,000 50,000 Indonesia/Batamisland 1989/ 1,500 300,000 800,000 200,000 Vietnam/VSIP1 1995/ 600 30,000 300,000 50,000 Veitnam/Amata 1994/ 500 30,000 500,000 20,000
Source: Study team Lessons derived from the experiences of these neighboring countries are as follows. (5) SEZs/IPs is an effective means of promoting FDI, creating employment for young populations
and industrial clustering and population dispersion.
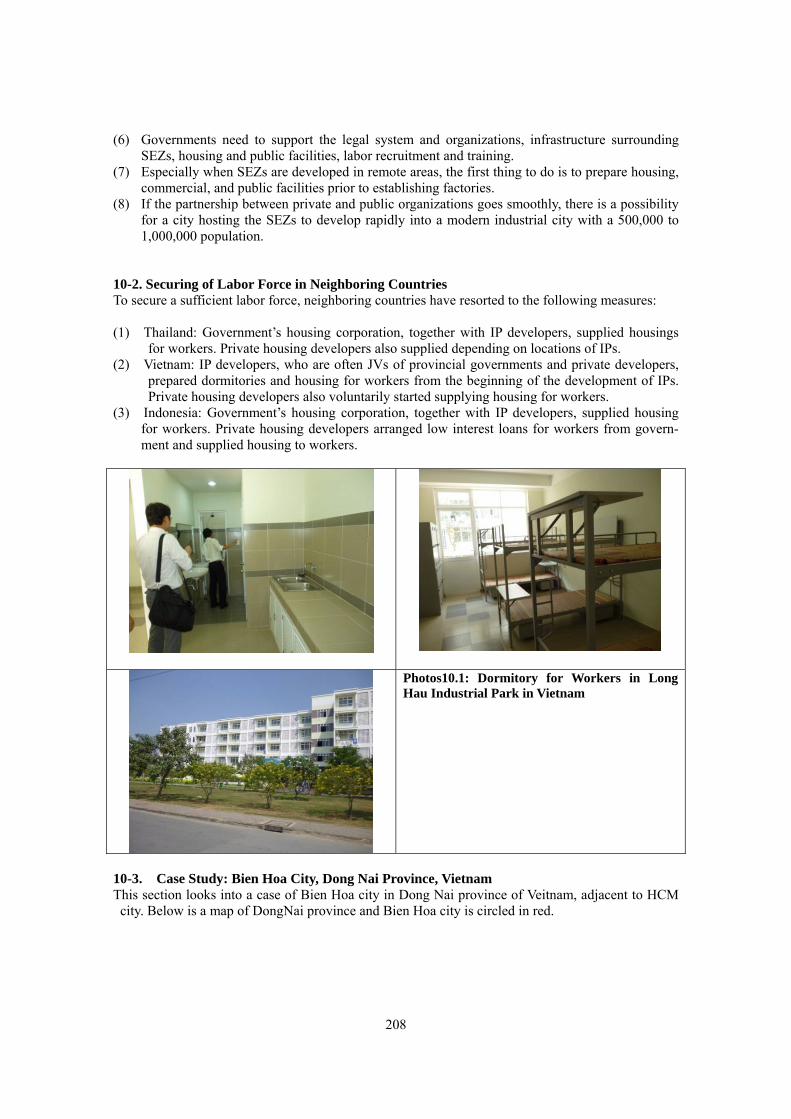
208
(6) Governments need to support the legal system and organizations, infrastructure surrounding SEZs, housing and public facilities, labor recruitment and training.
(7) Especially when SEZs are developed in remote areas, the first thing to do is to prepare housing, commercial, and public facilities prior to establishing factories.
(8) If the partnership between private and public organizations goes smoothly, there is a possibility for a city hosting the SEZs to develop rapidly into a modern industrial city with a 500,000 to 1,000,000 population.
10-2. Securing of Labor Force in Neighboring Countries To secure a sufficient labor force, neighboring countries have resorted to the following measures: (1) Thailand: Government’s housing corporation, together with IP developers, supplied housings
for workers. Private housing developers also supplied depending on locations of IPs. (2) Vietnam: IP developers, who are often JVs of provincial governments and private developers,
prepared dormitories and housing for workers from the beginning of the development of IPs. Private housing developers also voluntarily started supplying housing for workers.
(3) Indonesia: Government’s housing corporation, together with IP developers, supplied housing for workers. Private housing developers arranged low interest loans for workers from govern-ment and supplied housing to workers.
Photos10.1: Dormitory for Workers in Long Hau Industrial Park in Vietnam
10-3. Case Study: Bien Hoa City, Dong Nai Province, Vietnam This section looks into a case of Bien Hoa city in Dong Nai province of Veitnam, adjacent to HCM
city. Below is a map of DongNai province and Bien Hoa city is circled in red.

209
Figure 10-1: Map of Dong Nai Province
Source: Amata Vietnam HP
During the Vietnam War, the city of Bien Hoa was a military city with an air base and military base. However, after the war, the city changed dramatically into a modern industrial city, with a current population of 800,000. In this process, the previous military base was changed into IPs. The map of Bien Hoa city is presented below.
Figure 10-2: IPs concentrated in Bien Hoa City
Source: Google Map The tables below presents the basic data on demography and 8 IPs located in Bien Hoa city, includ-ing no. of tenants, no. of Vietnamese employees in IPs, no. of foreign expatriates, no. of Japanese tenants in IPs, and Japanese expatriates.
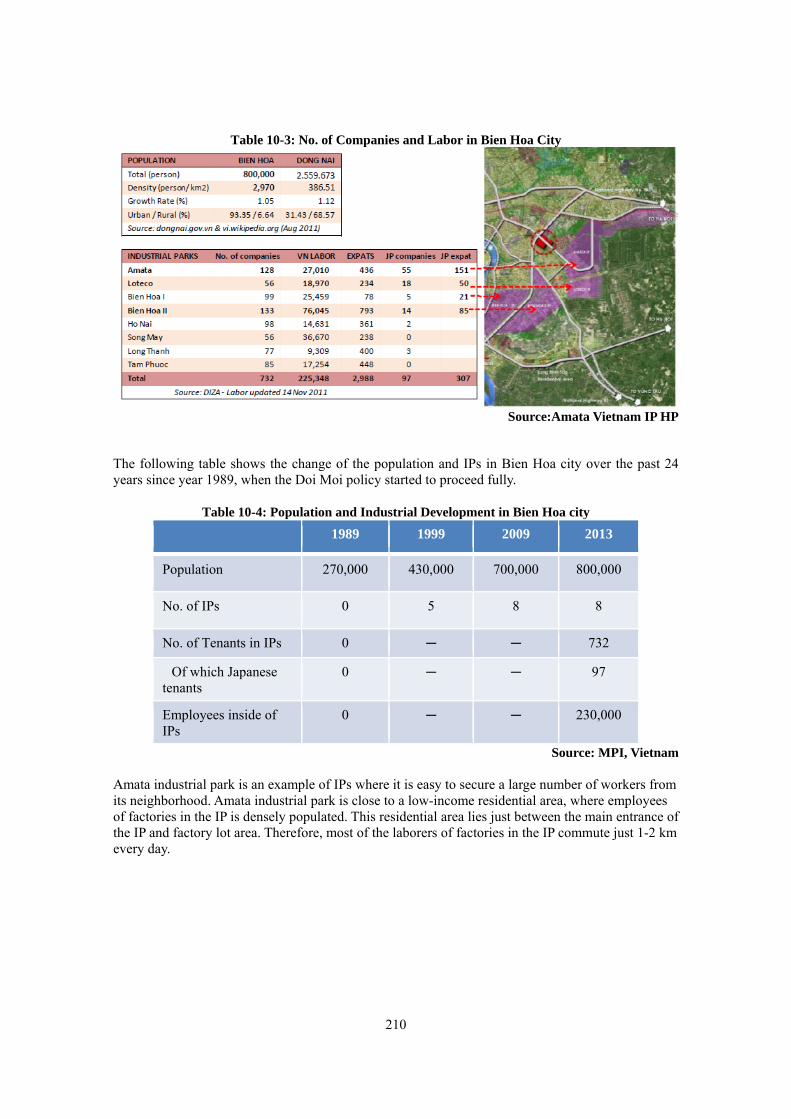
210
Table 10-3: No. of Companies and Labor in Bien Hoa City
Source:Amata Vietnam IP HP
The following table shows the change of the population and IPs in Bien Hoa city over the past 24 years since year 1989, when the Doi Moi policy started to proceed fully.
Table 10-4: Population and Industrial Development in Bien Hoa city
1989 1999 2009 2013
Population 270,000 430,000 700,000 800,000
No. of IPs 0 5 8 8
No. of Tenants in IPs 0 - - 732
Of which Japanese tenants
0 - - 97
Employees inside of IPs
0 - - 230,000
Source: MPI, Vietnam Amata industrial park is an example of IPs where it is easy to secure a large number of workers from its neighborhood. Amata industrial park is close to a low-income residential area, where employees of factories in the IP is densely populated. This residential area lies just between the main entrance of the IP and factory lot area. Therefore, most of the laborers of factories in the IP commute just 1-2 km every day.
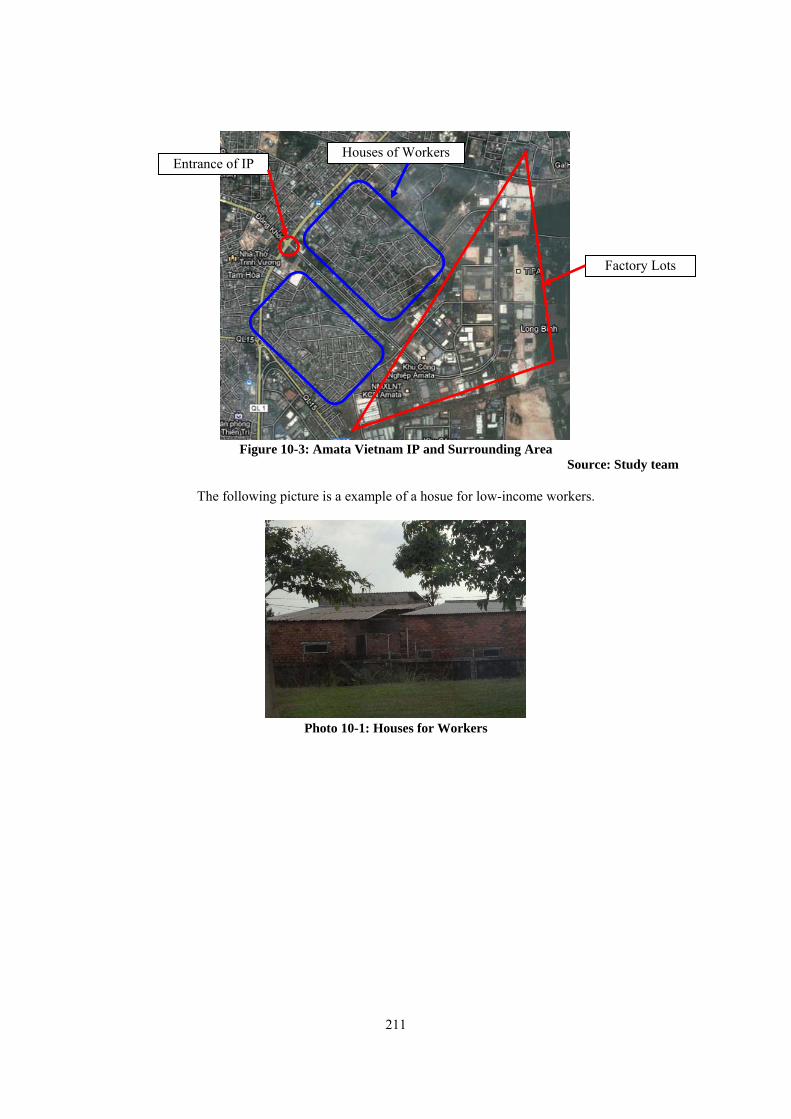
211
Figure 10-3: Amata Vietnam IP and Surrounding Area
Source: Study team
The following picture is a example of a hosue for low-income workers.
Photo 10-1: Houses for Workers
Factory Lots
Entrance of IP Houses of Workers
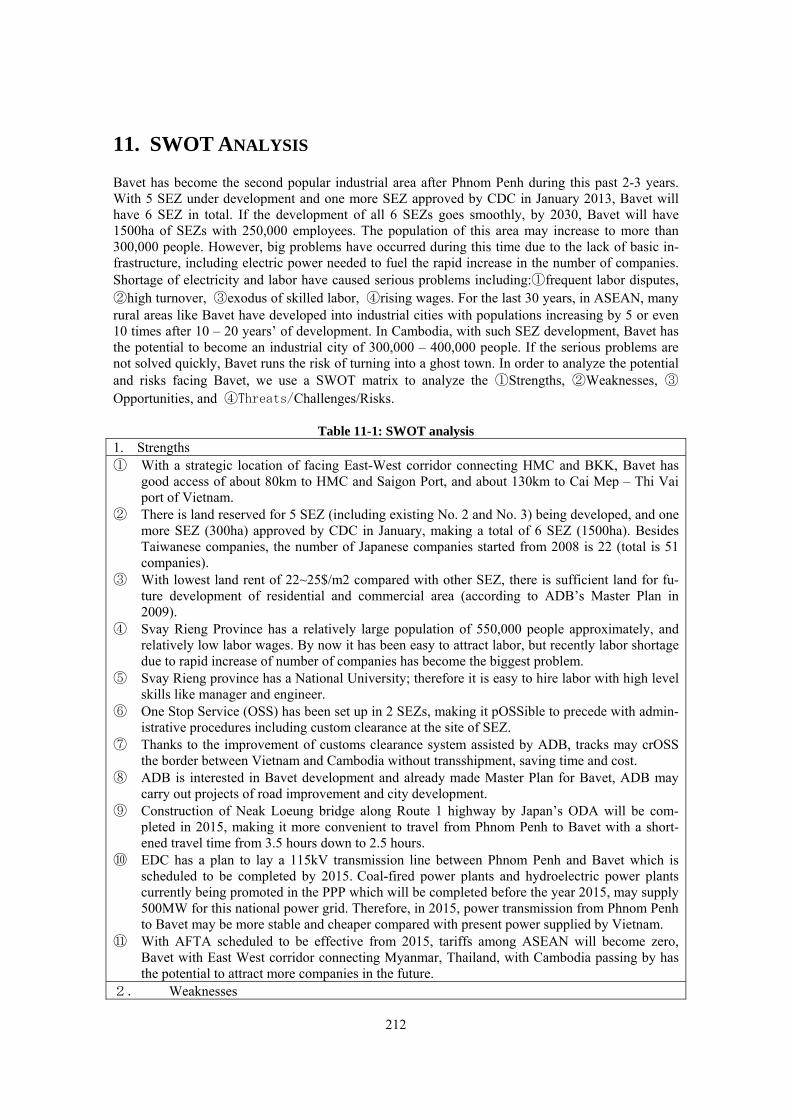
212
11. SWOT ANALYSIS Bavet has become the second popular industrial area after Phnom Penh during this past 2-3 years. With 5 SEZ under development and one more SEZ approved by CDC in January 2013, Bavet will have 6 SEZ in total. If the development of all 6 SEZs goes smoothly, by 2030, Bavet will have 1500ha of SEZs with 250,000 employees. The population of this area may increase to more than 300,000 people. However, big problems have occurred during this time due to the lack of basic in-frastructure, including electric power needed to fuel the rapid increase in the number of companies. Shortage of electricity and labor have caused serious problems including:①frequent labor disputes, ②high turnover, ③exodus of skilled labor, ④rising wages. For the last 30 years, in ASEAN, many rural areas like Bavet have developed into industrial cities with populations increasing by 5 or even 10 times after 10 – 20 years’ of development. In Cambodia, with such SEZ development, Bavet has the potential to become an industrial city of 300,000 – 400,000 people. If the serious problems are not solved quickly, Bavet runs the risk of turning into a ghost town. In order to analyze the potential and risks facing Bavet, we use a SWOT matrix to analyze the ①Strengths, ②Weaknesses, ③Opportunities, and ④Threats/Challenges/Risks.
Table 11-1: SWOT analysis 1. Strengths ① With a strategic location of facing East-West corridor connecting HMC and BKK, Bavet has
good access of about 80km to HMC and Saigon Port, and about 130km to Cai Mep – Thi Vai port of Vietnam.
② There is land reserved for 5 SEZ (including existing No. 2 and No. 3) being developed, and one more SEZ (300ha) approved by CDC in January, making a total of 6 SEZ (1500ha). Besides Taiwanese companies, the number of Japanese companies started from 2008 is 22 (total is 51 companies).
③ With lowest land rent of 22~25$/m2 compared with other SEZ, there is sufficient land for fu-ture development of residential and commercial area (according to ADB’s Master Plan in 2009).
④ Svay Rieng Province has a relatively large population of 550,000 people approximately, and relatively low labor wages. By now it has been easy to attract labor, but recently labor shortage due to rapid increase of number of companies has become the biggest problem.
⑤ Svay Rieng province has a National University; therefore it is easy to hire labor with high level skills like manager and engineer.
⑥ One Stop Service (OSS) has been set up in 2 SEZs, making it pOSSible to precede with admin-istrative procedures including custom clearance at the site of SEZ.
⑦ Thanks to the improvement of customs clearance system assisted by ADB, tracks may crOSS the border between Vietnam and Cambodia without transshipment, saving time and cost.
⑧ ADB is interested in Bavet development and already made Master Plan for Bavet, ADB may carry out projects of road improvement and city development.
⑨ Construction of Neak Loeung bridge along Route 1 highway by Japan’s ODA will be com-pleted in 2015, making it more convenient to travel from Phnom Penh to Bavet with a short-ened travel time from 3.5 hours down to 2.5 hours.
⑩ EDC has a plan to lay a 115kV transmission line between Phnom Penh and Bavet which is scheduled to be completed by 2015. Coal-fired power plants and hydroelectric power plants currently being promoted in the PPP which will be completed before the year 2015, may supply 500MW for this national power grid. Therefore, in 2015, power transmission from Phnom Penh to Bavet may be more stable and cheaper compared with present power supplied by Vietnam.
⑪ With AFTA scheduled to be effective from 2015, tariffs among ASEAN will become zero, Bavet with East West corridor connecting Myanmar, Thailand, with Cambodia passing by has the potential to attract more companies in the future.
2. Weaknesses
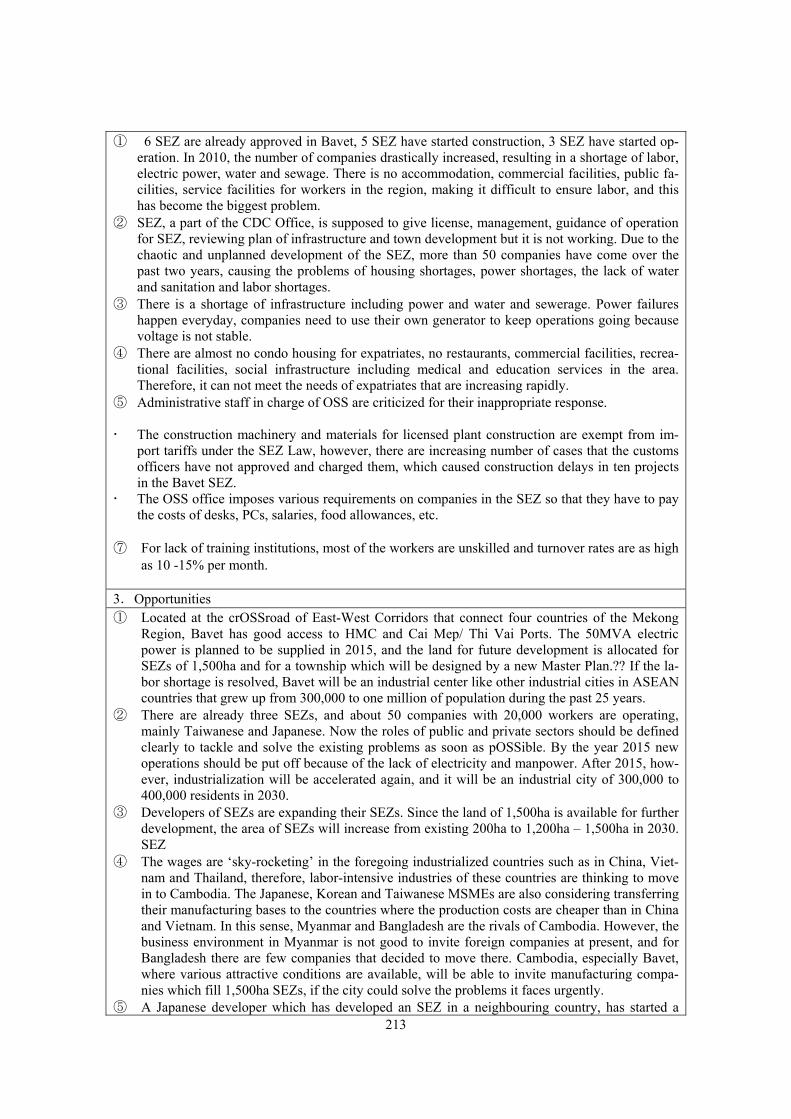
213
① 6 SEZ are already approved in Bavet, 5 SEZ have started construction, 3 SEZ have started op-eration. In 2010, the number of companies drastically increased, resulting in a shortage of labor, electric power, water and sewage. There is no accommodation, commercial facilities, public fa-cilities, service facilities for workers in the region, making it difficult to ensure labor, and this has become the biggest problem.
② SEZ, a part of the CDC Office, is supposed to give license, management, guidance of operation for SEZ, reviewing plan of infrastructure and town development but it is not working. Due to the chaotic and unplanned development of the SEZ, more than 50 companies have come over the past two years, causing the problems of housing shortages, power shortages, the lack of water and sanitation and labor shortages.
③ There is a shortage of infrastructure including power and water and sewerage. Power failures happen everyday, companies need to use their own generator to keep operations going because voltage is not stable.
④ There are almost no condo housing for expatriates, no restaurants, commercial facilities, recrea-tional facilities, social infrastructure including medical and education services in the area. Therefore, it can not meet the needs of expatriates that are increasing rapidly.
⑤ Administrative staff in charge of OSS are criticized for their inappropriate response. The construction machinery and materials for licensed plant construction are exempt from im-
port tariffs under the SEZ Law, however, there are increasing number of cases that the customs officers have not approved and charged them, which caused construction delays in ten projects in the Bavet SEZ.
The OSS office imposes various requirements on companies in the SEZ so that they have to pay the costs of desks, PCs, salaries, food allowances, etc.
⑦ For lack of training institutions, most of the workers are unskilled and turnover rates are as high as 10 -15% per month.
3.Opportunities ① Located at the crOSSroad of East-West Corridors that connect four countries of the Mekong
Region, Bavet has good access to HMC and Cai Mep/ Thi Vai Ports. The 50MVA electric power is planned to be supplied in 2015, and the land for future development is allocated for SEZs of 1,500ha and for a township which will be designed by a new Master Plan.?? If the la-bor shortage is resolved, Bavet will be an industrial center like other industrial cities in ASEAN countries that grew up from 300,000 to one million of population during the past 25 years.
② There are already three SEZs, and about 50 companies with 20,000 workers are operating, mainly Taiwanese and Japanese. Now the roles of public and private sectors should be defined clearly to tackle and solve the existing problems as soon as pOSSible. By the year 2015 new operations should be put off because of the lack of electricity and manpower. After 2015, how-ever, industrialization will be accelerated again, and it will be an industrial city of 300,000 to 400,000 residents in 2030.
③ Developers of SEZs are expanding their SEZs. Since the land of 1,500ha is available for further development, the area of SEZs will increase from existing 200ha to 1,200ha – 1,500ha in 2030. SEZ
④ The wages are ‘sky-rocketing’ in the foregoing industrialized countries such as in China, Viet-nam and Thailand, therefore, labor-intensive industries of these countries are thinking to move in to Cambodia. The Japanese, Korean and Taiwanese MSMEs are also considering transferring their manufacturing bases to the countries where the production costs are cheaper than in China and Vietnam. In this sense, Myanmar and Bangladesh are the rivals of Cambodia. However, the business environment in Myanmar is not good to invite foreign companies at present, and for Bangladesh there are few companies that decided to move there. Cambodia, especially Bavet, where various attractive conditions are available, will be able to invite manufacturing compa-nies which fill 1,500ha SEZs, if the city could solve the problems it faces urgently.
⑤ A Japanese developer which has developed an SEZ in a neighbouring country, has started a
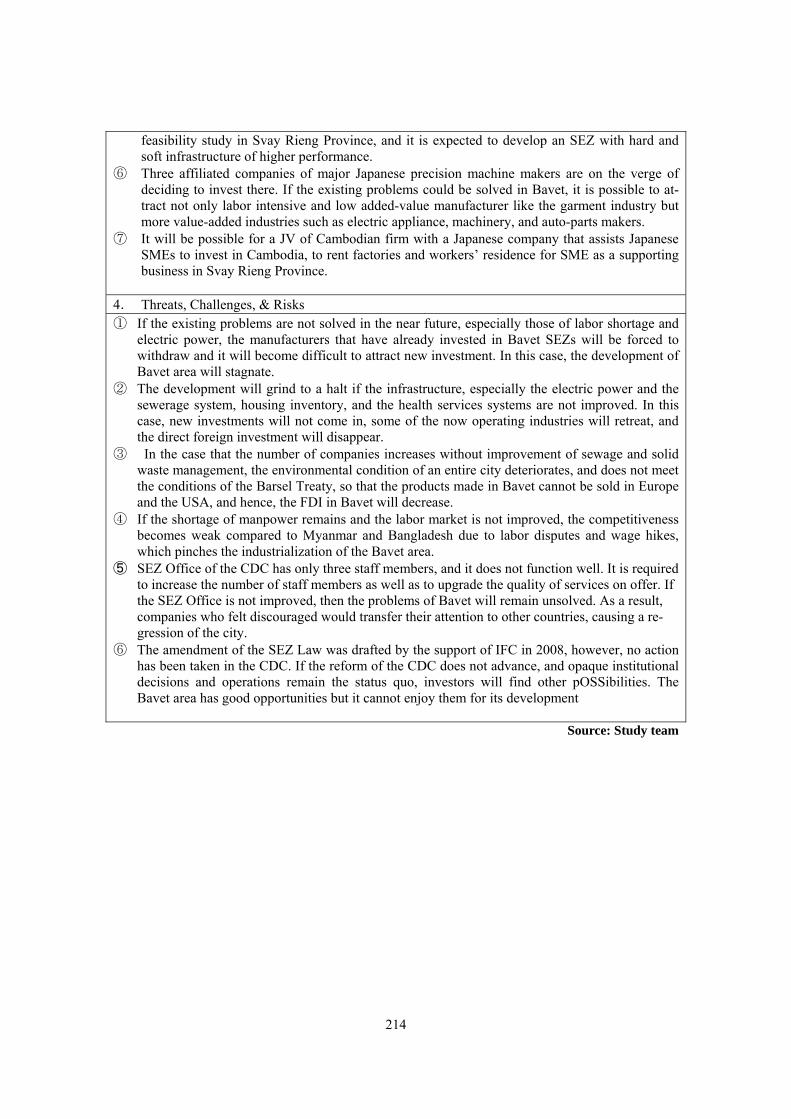
214
feasibility study in Svay Rieng Province, and it is expected to develop an SEZ with hard and soft infrastructure of higher performance.
⑥ Three affiliated companies of major Japanese precision machine makers are on the verge of deciding to invest there. If the existing problems could be solved in Bavet, it is possible to at-tract not only labor intensive and low added-value manufacturer like the garment industry but more value-added industries such as electric appliance, machinery, and auto-parts makers.
⑦ It will be possible for a JV of Cambodian firm with a Japanese company that assists Japanese SMEs to invest in Cambodia, to rent factories and workers’ residence for SME as a supporting business in Svay Rieng Province.
4. Threats, Challenges, & Risks ① If the existing problems are not solved in the near future, especially those of labor shortage and
electric power, the manufacturers that have already invested in Bavet SEZs will be forced to withdraw and it will become difficult to attract new investment. In this case, the development of Bavet area will stagnate.
② The development will grind to a halt if the infrastructure, especially the electric power and the sewerage system, housing inventory, and the health services systems are not improved. In this case, new investments will not come in, some of the now operating industries will retreat, and the direct foreign investment will disappear.
③ In the case that the number of companies increases without improvement of sewage and solid waste management, the environmental condition of an entire city deteriorates, and does not meet the conditions of the Barsel Treaty, so that the products made in Bavet cannot be sold in Europe and the USA, and hence, the FDI in Bavet will decrease.
④ If the shortage of manpower remains and the labor market is not improved, the competitiveness becomes weak compared to Myanmar and Bangladesh due to labor disputes and wage hikes, which pinches the industrialization of the Bavet area.
⑤ SEZ Office of the CDC has only three staff members, and it does not function well. It is required to increase the number of staff members as well as to upgrade the quality of services on offer. If the SEZ Office is not improved, then the problems of Bavet will remain unsolved. As a result, companies who felt discouraged would transfer their attention to other countries, causing a re-gression of the city.
⑥ The amendment of the SEZ Law was drafted by the support of IFC in 2008, however, no action has been taken in the CDC. If the reform of the CDC does not advance, and opaque institutional decisions and operations remain the status quo, investors will find other pOSSibilities. The Bavet area has good opportunities but it cannot enjoy them for its development
Source: Study team
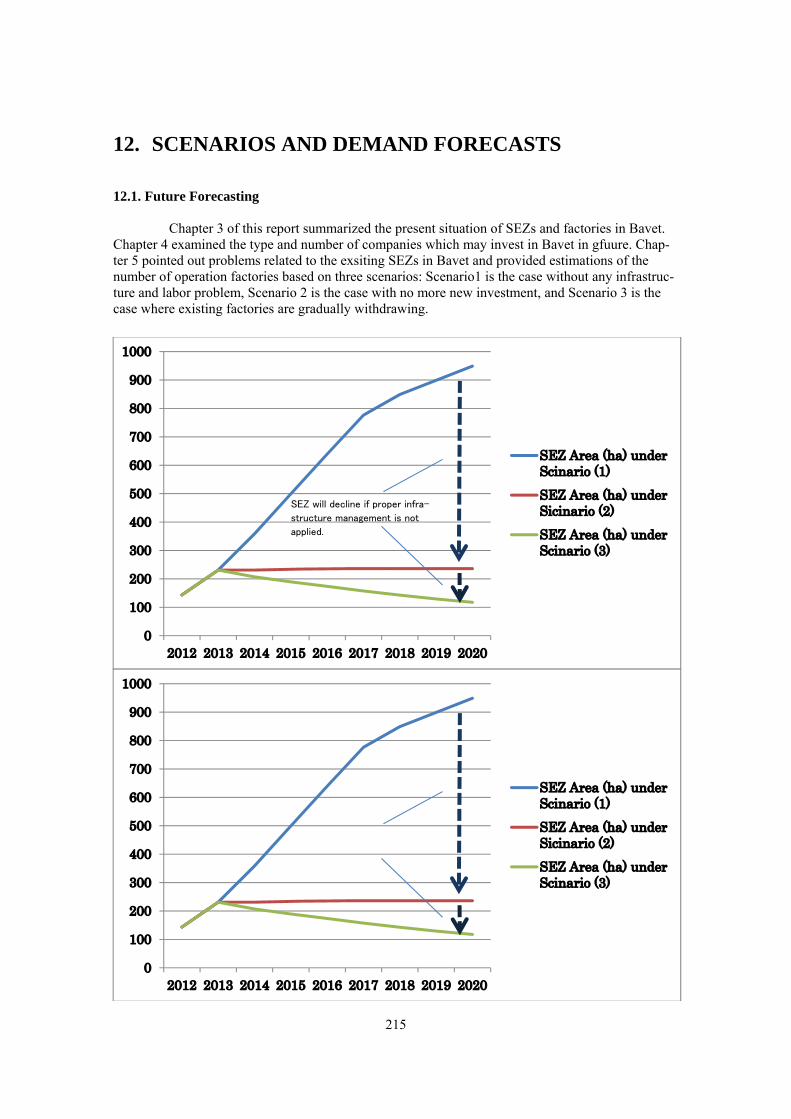
215
12. SCENARIOS AND DEMAND FORECASTS 12.1. Future Forecasting Chapter 3 of this report summarized the present situation of SEZs and factories in Bavet. Chapter 4 examined the type and number of companies which may invest in Bavet in gfuure. Chap-ter 5 pointed out problems related to the exsiting SEZs in Bavet and provided estimations of the number of operation factories based on three scenarios: Scenario1 is the case without any infrastruc-ture and labor problem, Scenario 2 is the case with no more new investment, and Scenario 3 is the case where existing factories are gradually withdrawing.
SEZ will decline if proper infra-
structure management is not
applied.
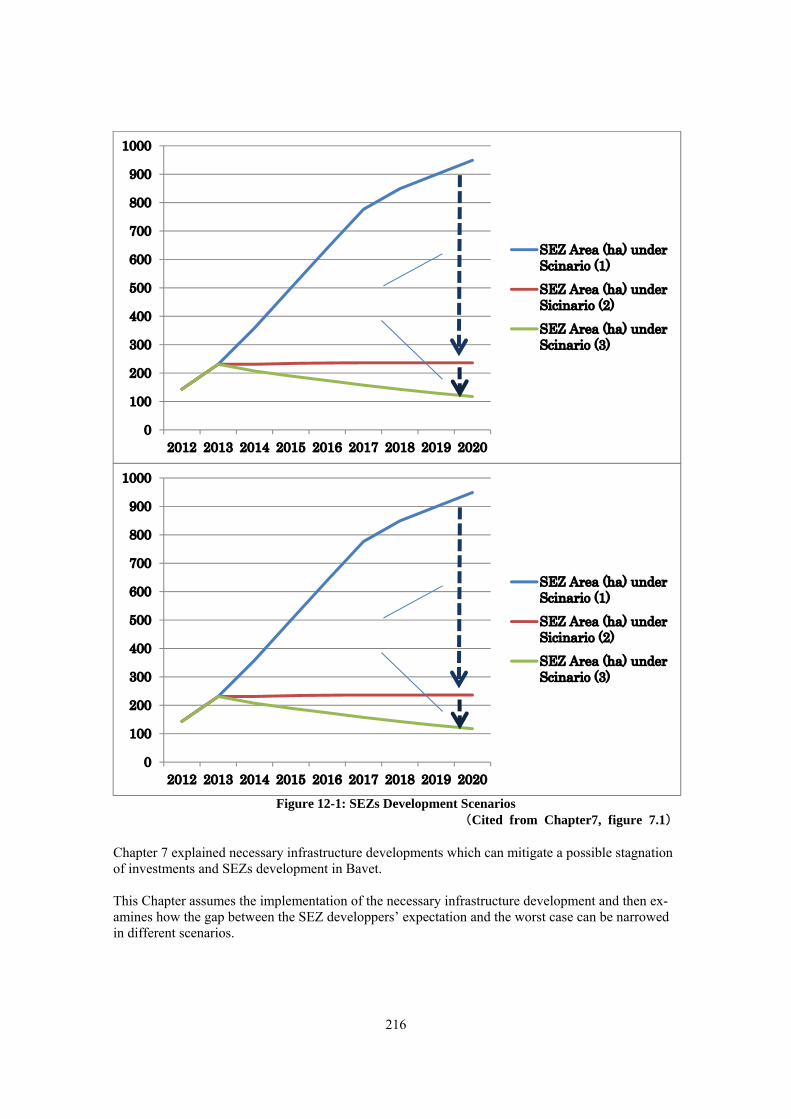
216
Figure 12-1: SEZs Development Scenarios (Cited from Chapter7, figure 7.1)
Chapter 7 explained necessary infrastructure developments which can mitigate a possible stagnation of investments and SEZs development in Bavet. This Chapter assumes the implementation of the necessary infrastructure development and then ex-amines how the gap between the SEZ developpers’ expectation and the worst case can be narrowed in different scenarios.
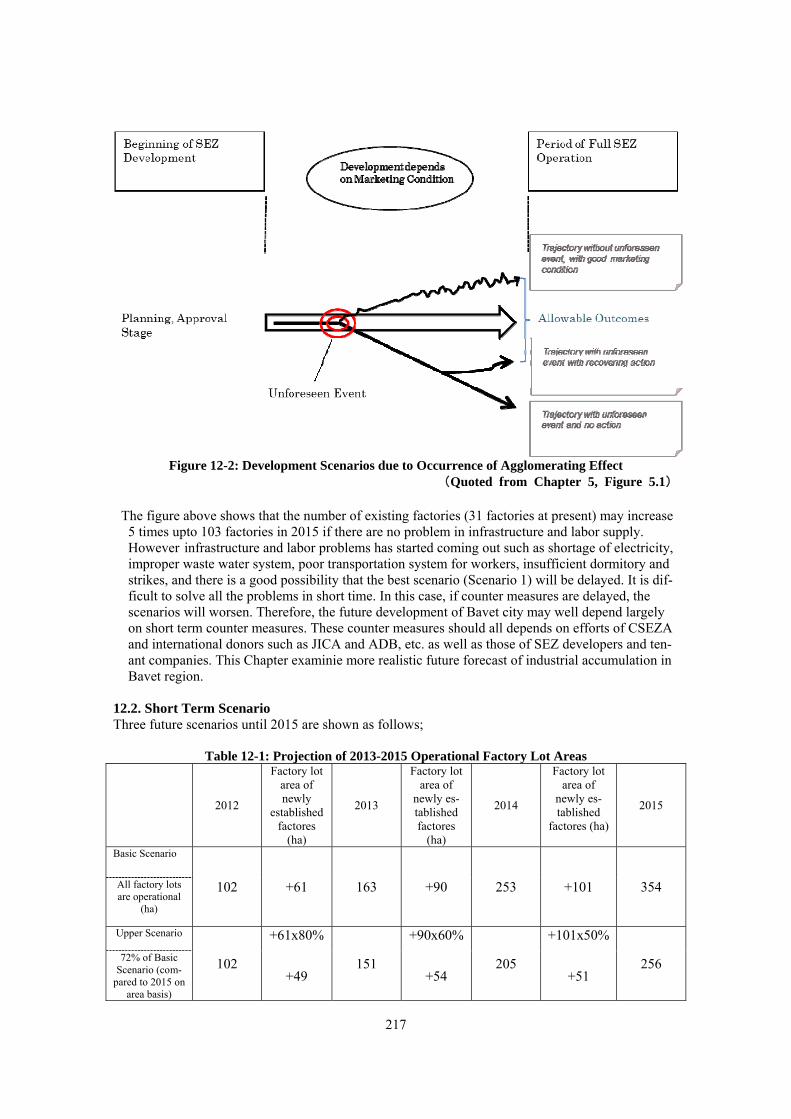
217
Figure 12-2: Development Scenarios due to Occurrence of Agglomerating Effect
(Quoted from Chapter 5, Figure 5.1)
The figure above shows that the number of existing factories (31 factories at present) may increase 5 times upto 103 factories in 2015 if there are no problem in infrastructure and labor supply. However infrastructure and labor problems has started coming out such as shortage of electricity, improper waste water system, poor transportation system for workers, insufficient dormitory and strikes, and there is a good possibility that the best scenario (Scenario 1) will be delayed. It is dif-ficult to solve all the problems in short time. In this case, if counter measures are delayed, the scenarios will worsen. Therefore, the future development of Bavet city may well depend largely on short term counter measures. These counter measures should all depends on efforts of CSEZA and international donors such as JICA and ADB, etc. as well as those of SEZ developers and ten-ant companies. This Chapter examinie more realistic future forecast of industrial accumulation in Bavet region.
12.2. Short Term Scenario Three future scenarios until 2015 are shown as follows;
Table 12-1: Projection of 2013-2015 Operational Factory Lot Areas
2012
Factory lot area of newly
established factores
(ha)
2013
Factory lot area of
newly es-tablished factores
(ha)
2014
Factory lot area of
newly es-tablished
factores (ha)
2015
Basic Scenario
102 +61 163 +90 253 +101 354 All factory lots are operational
(ha)
Upper Scenario
102
+61x80%
151
+90x60%
205
+101x50%
256 72% of Basic Scenario (com-
pared to 2015 on area basis)
+49 +54 +51
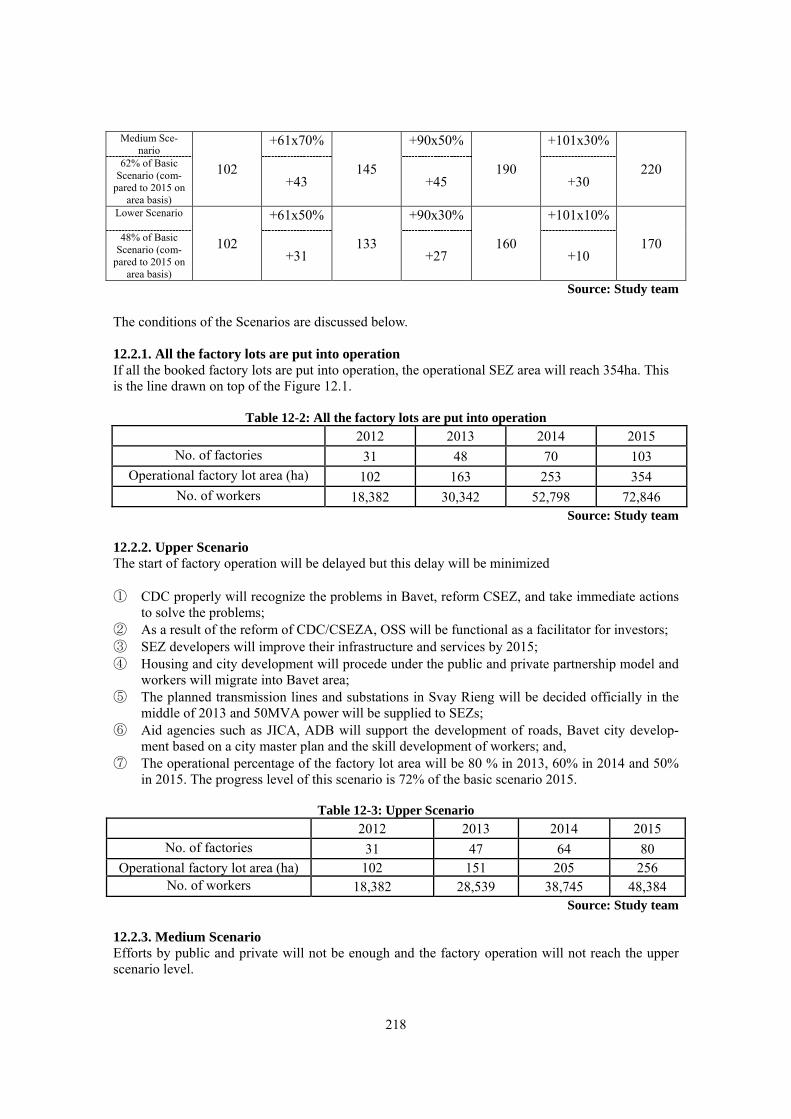
218
Medium Sce-nario
102
+61x70%
145
+90x50%
190
+101x30%
220 62% of Basic Scenario (com-
pared to 2015 on area basis)
+43 +45 +30
Lower Scenario
102
+61x50%
133
+90x30%
160
+101x10%
170 48% of Basic Scenario (com-
pared to 2015 on area basis)
+31 +27 +10
Source: Study team
The conditions of the Scenarios are discussed below. 12.2.1. All the factory lots are put into operation If all the booked factory lots are put into operation, the operational SEZ area will reach 354ha. This is the line drawn on top of the Figure 12.1.
Table 12-2: All the factory lots are put into operation
2012 2013 2014 2015 No. of factories 31 48 70 103
Operational factory lot area (ha) 102 163 253 354 No. of workers 18,382 30,342 52,798 72,846
Source: Study team 12.2.2. Upper Scenario The start of factory operation will be delayed but this delay will be minimized ① CDC properly will recognize the problems in Bavet, reform CSEZ, and take immediate actions
to solve the problems; ② As a result of the reform of CDC/CSEZA, OSS will be functional as a facilitator for investors; ③ SEZ developers will improve their infrastructure and services by 2015; ④ Housing and city development will procede under the public and private partnership model and
workers will migrate into Bavet area; ⑤ The planned transmission lines and substations in Svay Rieng will be decided officially in the
middle of 2013 and 50MVA power will be supplied to SEZs; ⑥ Aid agencies such as JICA, ADB will support the development of roads, Bavet city develop-
ment based on a city master plan and the skill development of workers; and, ⑦ The operational percentage of the factory lot area will be 80 % in 2013, 60% in 2014 and 50%
in 2015. The progress level of this scenario is 72% of the basic scenario 2015.
Table 12-3: Upper Scenario 2012 2013 2014 2015
No. of factories 31 47 64 80 Operational factory lot area (ha) 102 151 205 256
No. of workers 18,382 28,539 38,745 48,384 Source: Study team
12.2.3. Medium Scenario Efforts by public and private will not be enough and the factory operation will not reach the upper scenario level.
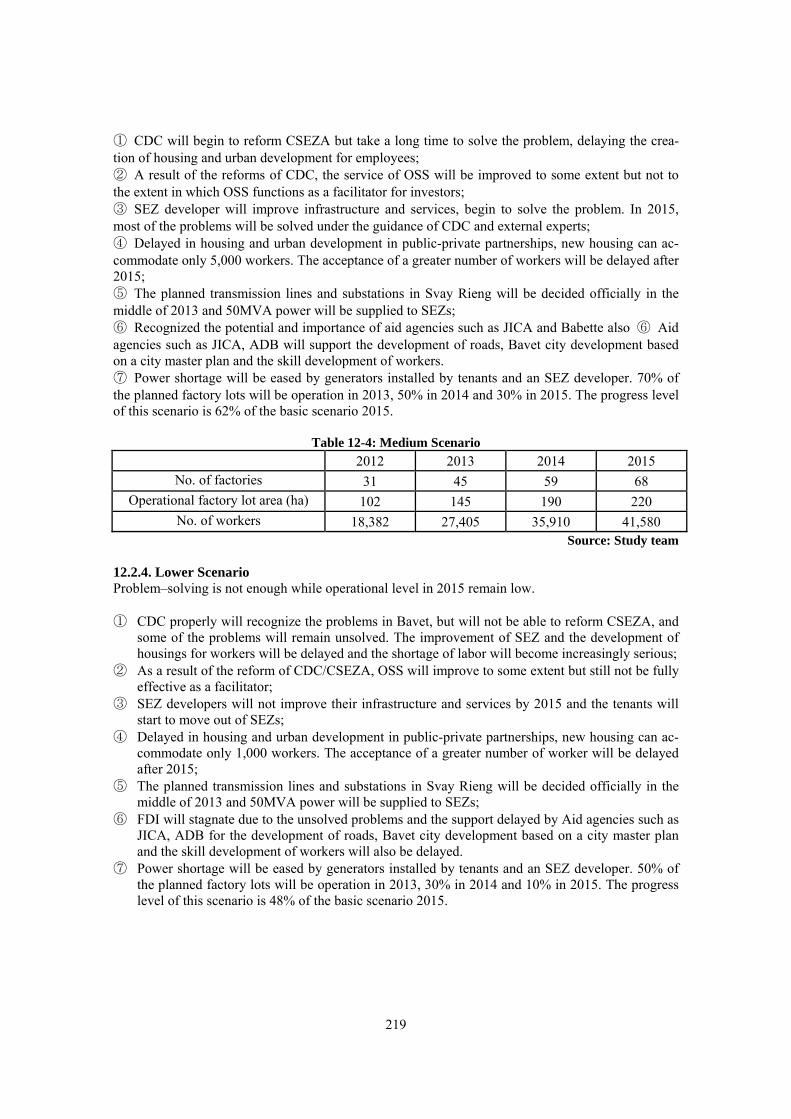
219
① CDC will begin to reform CSEZA but take a long time to solve the problem, delaying the crea-tion of housing and urban development for employees; ② A result of the reforms of CDC, the service of OSS will be improved to some extent but not to the extent in which OSS functions as a facilitator for investors; ③ SEZ developer will improve infrastructure and services, begin to solve the problem. In 2015, most of the problems will be solved under the guidance of CDC and external experts; ④ Delayed in housing and urban development in public-private partnerships, new housing can ac-commodate only 5,000 workers. The acceptance of a greater number of workers will be delayed after 2015; ⑤ The planned transmission lines and substations in Svay Rieng will be decided officially in the middle of 2013 and 50MVA power will be supplied to SEZs; ⑥ Recognized the potential and importance of aid agencies such as JICA and Babette also ⑥ Aid agencies such as JICA, ADB will support the development of roads, Bavet city development based on a city master plan and the skill development of workers. ⑦ Power shortage will be eased by generators installed by tenants and an SEZ developer. 70% of the planned factory lots will be operation in 2013, 50% in 2014 and 30% in 2015. The progress level of this scenario is 62% of the basic scenario 2015.
Table 12-4: Medium Scenario 2012 2013 2014 2015
No. of factories 31 45 59 68 Operational factory lot area (ha) 102 145 190 220
No. of workers 18,382 27,405 35,910 41,580 Source: Study team
12.2.4. Lower Scenario Problem–solving is not enough while operational level in 2015 remain low. ① CDC properly will recognize the problems in Bavet, but will not be able to reform CSEZA, and
some of the problems will remain unsolved. The improvement of SEZ and the development of housings for workers will be delayed and the shortage of labor will become increasingly serious;
② As a result of the reform of CDC/CSEZA, OSS will improve to some extent but still not be fully effective as a facilitator;
③ SEZ developers will not improve their infrastructure and services by 2015 and the tenants will start to move out of SEZs;
④ Delayed in housing and urban development in public-private partnerships, new housing can ac-commodate only 1,000 workers. The acceptance of a greater number of worker will be delayed after 2015;
⑤ The planned transmission lines and substations in Svay Rieng will be decided officially in the middle of 2013 and 50MVA power will be supplied to SEZs;
⑥ FDI will stagnate due to the unsolved problems and the support delayed by Aid agencies such as JICA, ADB for the development of roads, Bavet city development based on a city master plan and the skill development of workers will also be delayed.
⑦ Power shortage will be eased by generators installed by tenants and an SEZ developer. 50% of the planned factory lots will be operation in 2013, 30% in 2014 and 10% in 2015. The progress level of this scenario is 48% of the basic scenario 2015.
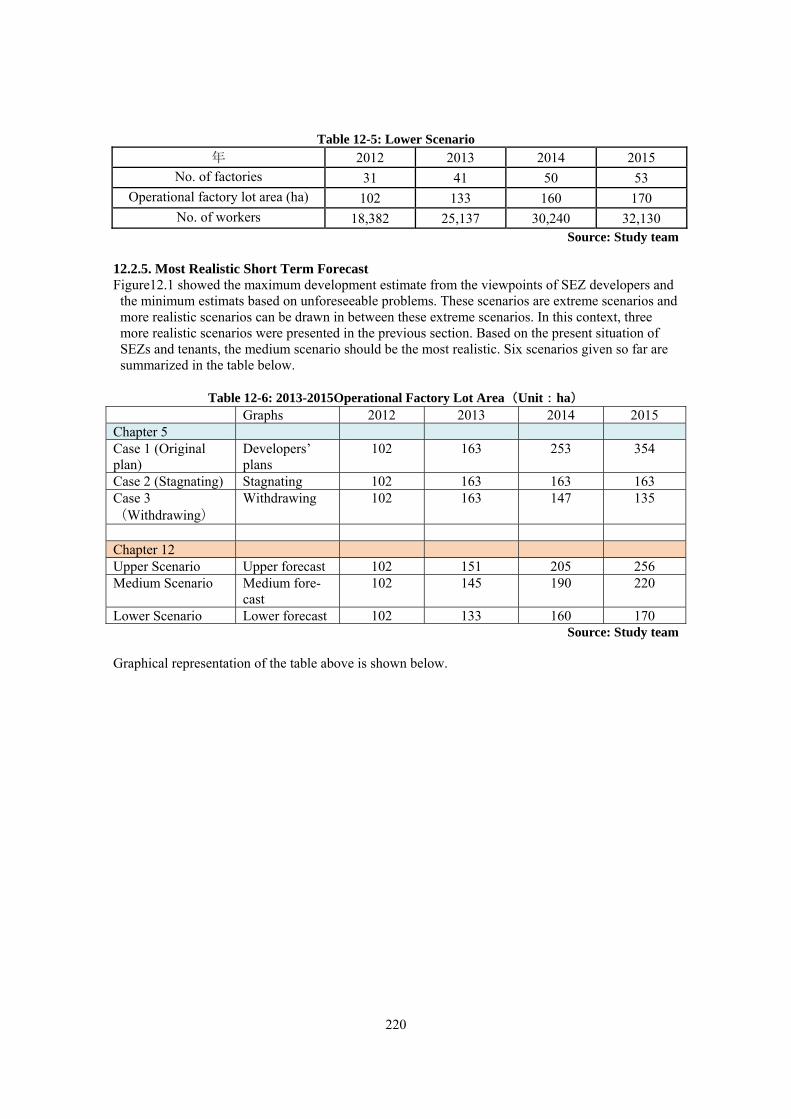
220
Table 12-5: Lower Scenario 年 2012 2013 2014 2015
No. of factories 31 41 50 53 Operational factory lot area (ha) 102 133 160 170
No. of workers 18,382 25,137 30,240 32,130 Source: Study team
12.2.5. Most Realistic Short Term Forecast Figure12.1 showed the maximum development estimate from the viewpoints of SEZ developers and
the minimum estimats based on unforeseeable problems. These scenarios are extreme scenarios and more realistic scenarios can be drawn in between these extreme scenarios. In this context, three more realistic scenarios were presented in the previous section. Based on the present situation of SEZs and tenants, the medium scenario should be the most realistic. Six scenarios given so far are summarized in the table below.
Table 12-6: 2013-2015Operational Factory Lot Area(Unit:ha)
Graphs 2012 2013 2014 2015 Chapter 5 Case 1 (Original plan)
Developers’ plans
102 163 253 354
Case 2 (Stagnating) Stagnating 102 163 163 163 Case 3 (Withdrawing)
Withdrawing 102 163 147 135
Chapter 12 Upper Scenario Upper forecast 102 151 205 256 Medium Scenario Medium fore-
cast 102 145 190 220
Lower Scenario Lower forecast 102 133 160 170 Source: Study team
Graphical representation of the table above is shown below.
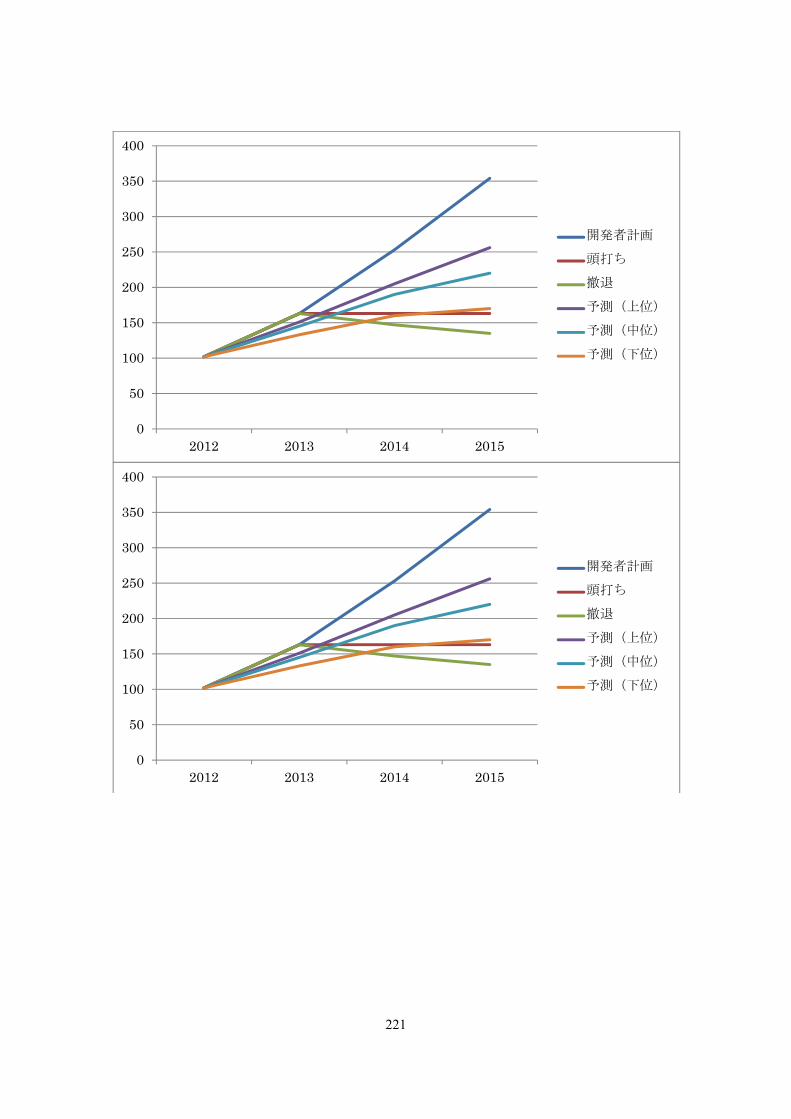
221
0
50
100
150
200
250
300
350
400
2012 2013 2014 2015
開発者計画
頭打ち
撤退
予測(上位)
予測(中位)
予測(下位)
0
50
100
150
200
250
300
350
400
2012 2013 2014 2015
開発者計画
頭打ち
撤退
予測(上位)
予測(中位)
予測(下位)
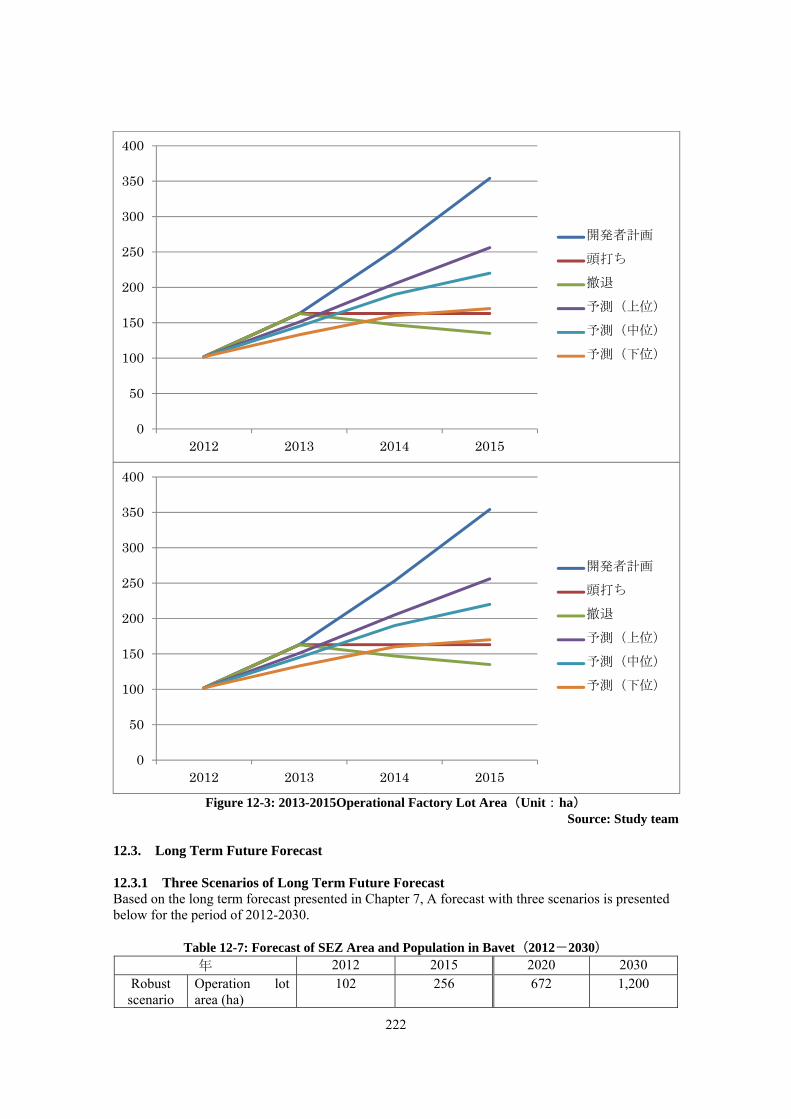
222
Figure 12-3: 2013-2015Operational Factory Lot Area(Unit:ha) Source: Study team
12.3. Long Term Future Forecast 12.3.1 Three Scenarios of Long Term Future Forecast Based on the long term forecast presented in Chapter 7, A forecast with three scenarios is presented below for the period of 2012-2030.
Table 12-7: Forecast of SEZ Area and Population in Bavet(2012-2030) 年 2012 2015 2020 2030
Robust scenario
Operation lot area (ha)
102
256
672
1,200
0
50
100
150
200
250
300
350
400
2012 2013 2014 2015
開発者計画
頭打ち
撤退
予測(上位)
予測(中位)
予測(下位)
0
50
100
150
200
250
300
350
400
2012 2013 2014 2015
開発者計画
頭打ち
撤退
予測(上位)
予測(中位)
予測(下位)
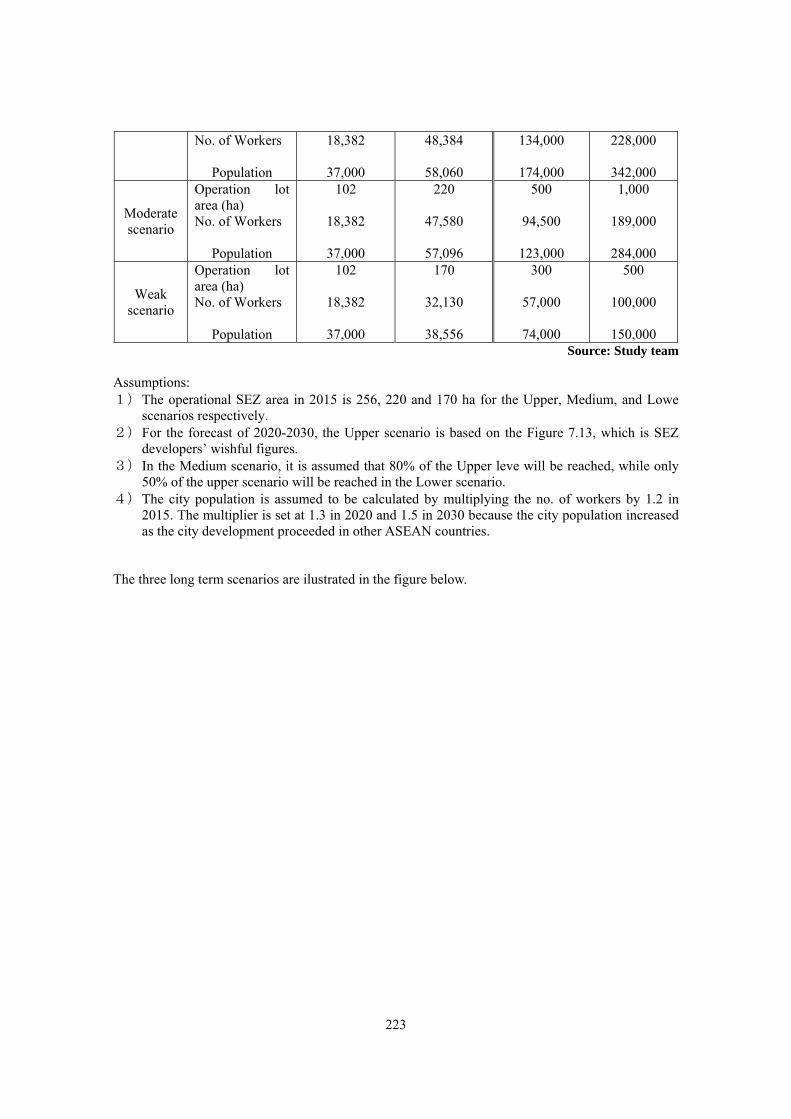
223
No. of Workers
Population
18,382
37,000
48,384
58,060
134,000
174,000
228,000
342,000
Moderate scenario
Operation lot area (ha) No. of Workers
Population
102
18,382
37,000
220
47,580
57,096
500
94,500
123,000
1,000
189,000
284,000
Weak scenario
Operation lot area (ha) No. of Workers
Population
102
18,382
37,000
170
32,130
38,556
300
57,000
74,000
500
100,000
150,000 Source: Study team
Assumptions: 1) The operational SEZ area in 2015 is 256, 220 and 170 ha for the Upper, Medium, and Lowe
scenarios respectively. 2) For the forecast of 2020-2030, the Upper scenario is based on the Figure 7.13, which is SEZ
developers’ wishful figures. 3) In the Medium scenario, it is assumed that 80% of the Upper leve will be reached, while only
50% of the upper scenario will be reached in the Lower scenario. 4) The city population is assumed to be calculated by multiplying the no. of workers by 1.2 in
2015. The multiplier is set at 1.3 in 2020 and 1.5 in 2030 because the city population increased as the city development proceeded in other ASEAN countries.
The three long term scenarios are ilustrated in the figure below.
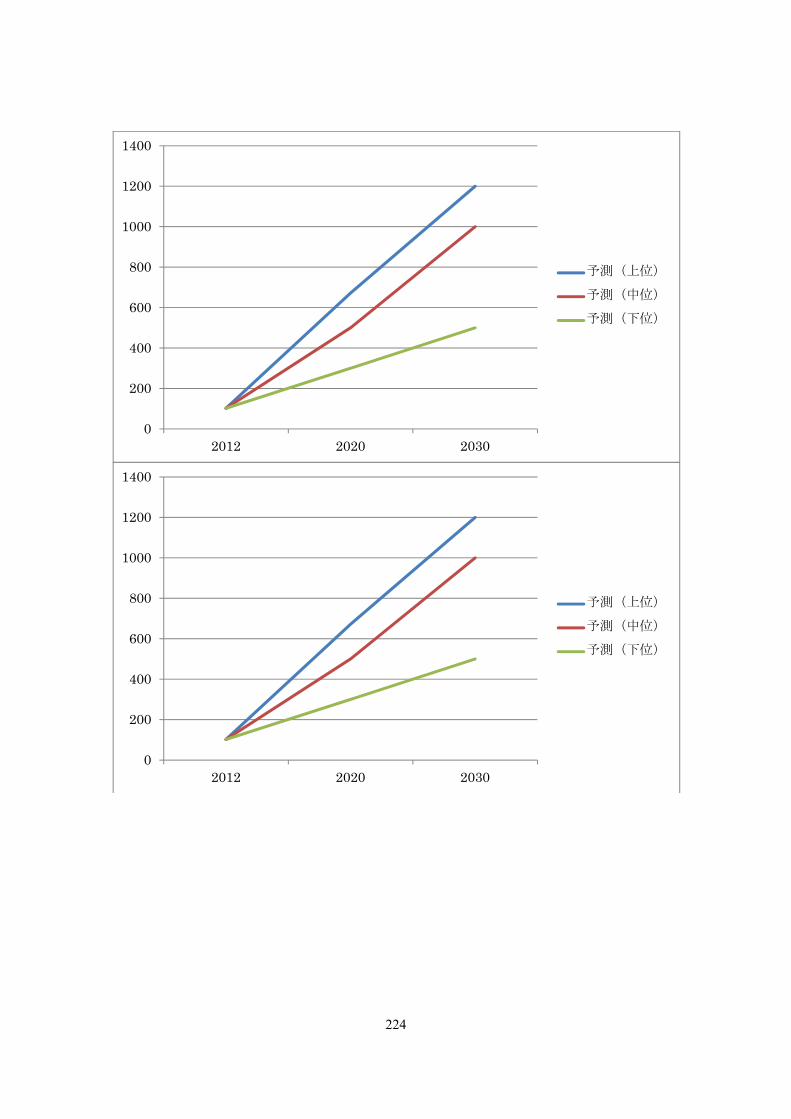
224
0
200
400
600
800
1000
1200
1400
2012 2020 2030
予測(上位)
予測(中位)
予測(下位)
0
200
400
600
800
1000
1200
1400
2012 2020 2030
予測(上位)
予測(中位)
予測(下位)
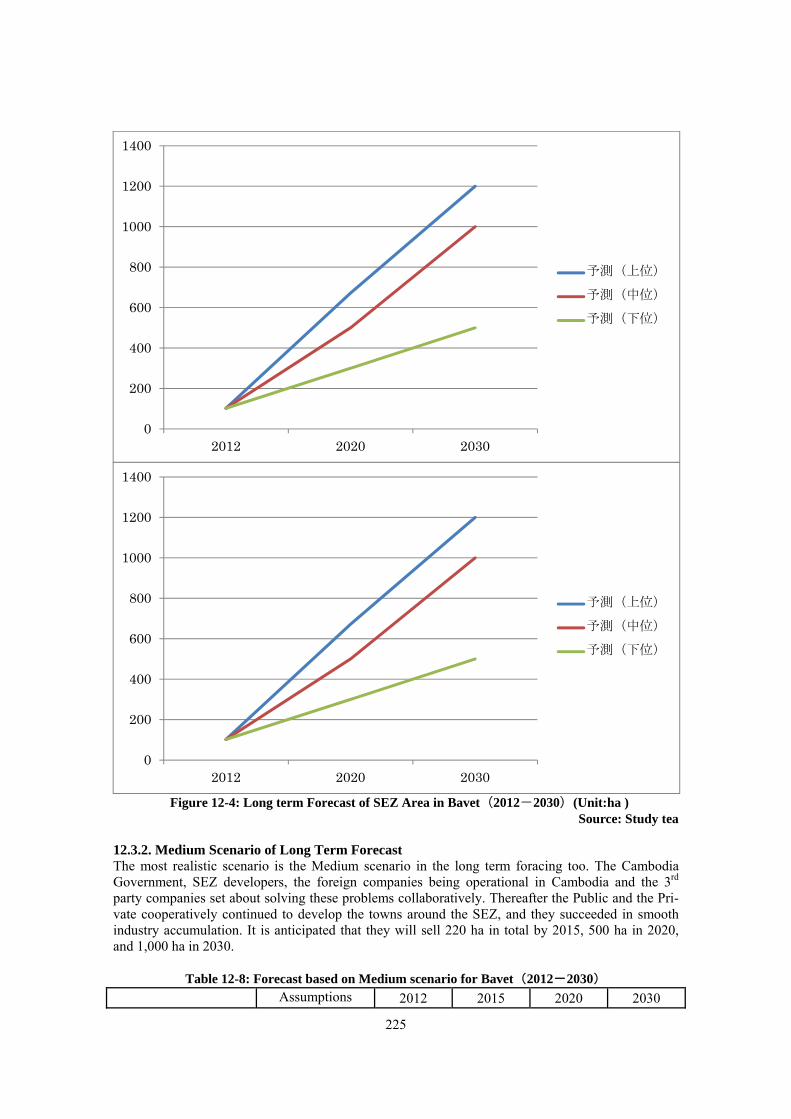
225
Figure 12-4: Long term Forecast of SEZ Area in Bavet(2012-2030)(Unit:ha ) Source: Study tea
12.3.2. Medium Scenario of Long Term Forecast The most realistic scenario is the Medium scenario in the long term foracing too. The Cambodia Government, SEZ developers, the foreign companies being operational in Cambodia and the 3rd party companies set about solving these problems collaboratively. Thereafter the Public and the Pri-vate cooperatively continued to develop the towns around the SEZ, and they succeeded in smooth industry accumulation. It is anticipated that they will sell 220 ha in total by 2015, 500 ha in 2020, and 1,000 ha in 2030.
Table 12-8: Forecast based on Medium scenario for Bavet(2012-2030) Assumptions 2012 2015 2020 2030
0
200
400
600
800
1000
1200
1400
2012 2020 2030
予測(上位)
予測(中位)
予測(下位)
0
200
400
600
800
1000
1200
1400
2012 2020 2030
予測(上位)
予測(中位)
予測(下位)
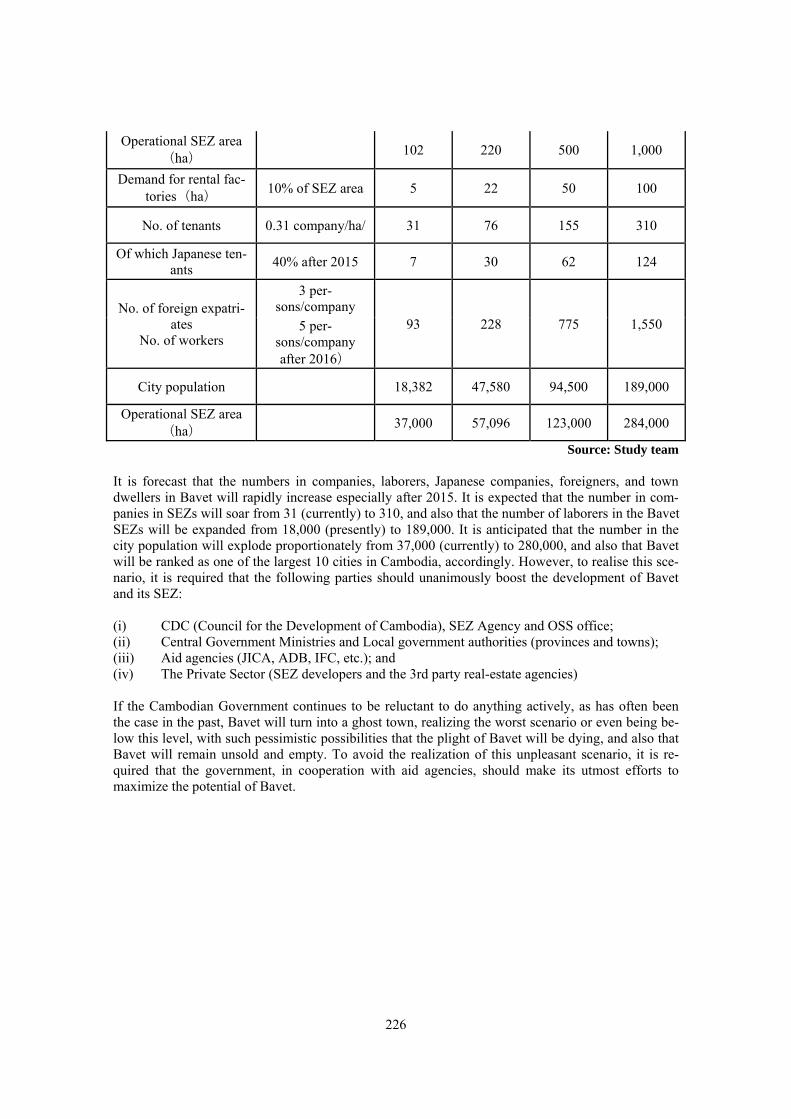
226
Operational SEZ area(ha) 102 220 500 1,000
Demand for rental fac-tories(ha)
10% of SEZ area 5 22 50 100
No. of tenants 0.31 company/ha/ 31 76 155 310
Of which Japanese ten-ants 40% after 2015 7 30 62 124
No. of foreign expatri-ates
No. of workers
3 per-sons/company
93 228 775 1,550 5 per-sons/company after 2016)
City population 18,382 47,580 94,500 189,000
Operational SEZ area(ha)
37,000 57,096 123,000 284,000
Source: Study team It is forecast that the numbers in companies, laborers, Japanese companies, foreigners, and town dwellers in Bavet will rapidly increase especially after 2015. It is expected that the number in com-panies in SEZs will soar from 31 (currently) to 310, and also that the number of laborers in the Bavet SEZs will be expanded from 18,000 (presently) to 189,000. It is anticipated that the number in the city population will explode proportionately from 37,000 (currently) to 280,000, and also that Bavet will be ranked as one of the largest 10 cities in Cambodia, accordingly. However, to realise this sce-nario, it is required that the following parties should unanimously boost the development of Bavet and its SEZ: (i) CDC (Council for the Development of Cambodia), SEZ Agency and OSS office; (ii) Central Government Ministries and Local government authorities (provinces and towns); (iii) Aid agencies (JICA, ADB, IFC, etc.); and (iv) The Private Sector (SEZ developers and the 3rd party real-estate agencies) If the Cambodian Government continues to be reluctant to do anything actively, as has often been the case in the past, Bavet will turn into a ghost town, realizing the worst scenario or even being be-low this level, with such pessimistic possibilities that the plight of Bavet will be dying, and also that Bavet will remain unsold and empty. To avoid the realization of this unpleasant scenario, it is re-quired that the government, in cooperation with aid agencies, should make its utmost efforts to maximize the potential of Bavet.
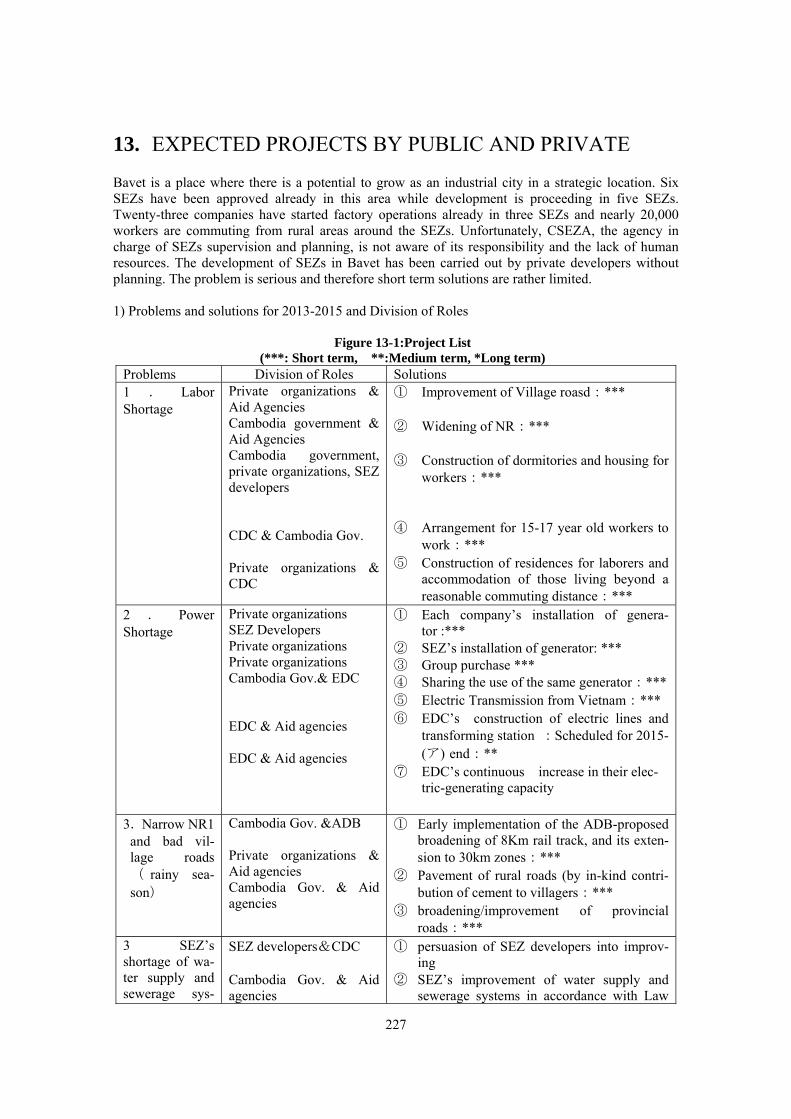
227
13. EXPECTED PROJECTS BY PUBLIC AND PRIVATE Bavet is a place where there is a potential to grow as an industrial city in a strategic location. Six SEZs have been approved already in this area while development is proceeding in five SEZs. Twenty-three companies have started factory operations already in three SEZs and nearly 20,000 workers are commuting from rural areas around the SEZs. Unfortunately, CSEZA, the agency in charge of SEZs supervision and planning, is not aware of its responsibility and the lack of human resources. The development of SEZs in Bavet has been carried out by private developers without planning. The problem is serious and therefore short term solutions are rather limited.
1) Problems and solutions for 2013-2015 and Division of Roles
Figure 13-1:Project List
(***: Short term, **:Medium term, *Long term) Problems Division of Roles Solutions 1 . Labor Shortage
Private organizations & Aid Agencies Cambodia government & Aid Agencies Cambodia government, private organizations, SEZ developers CDC & Cambodia Gov. Private organizations & CDC
① Improvement of Village roasd:***
② Widening of NR:***
③ Construction of dormitories and housing for workers:***
④ Arrangement for 15-17 year old workers to work:***
⑤ Construction of residences for laborers and accommodation of those living beyond a reasonable commuting distance:***
2 . Power Shortage
Private organizations SEZ Developers Private organizations Private organizations Cambodia Gov.& EDC EDC & Aid agencies EDC & Aid agencies
① Each company’s installation of genera-tor :***
② SEZ’s installation of generator: *** ③ Group purchase *** ④ Sharing the use of the same generator:***⑤ Electric Transmission from Vietnam:*** ⑥ EDC’s construction of electric lines and
transforming station :Scheduled for 2015-(ア) end:**
⑦ EDC’s continuous increase in their elec-tric-generating capacity
3.Narrow NR1 and bad vil-lage roads( rainy sea-son)
Cambodia Gov. &ADB Private organizations & Aid agencies Cambodia Gov. & Aid agencies
① Early implementation of the ADB-proposed broadening of 8Km rail track, and its exten-sion to 30km zones:***
② Pavement of rural roads (by in-kind contri-bution of cement to villagers:***
③ broadening/improvement of provincial roads:***
3 SEZ’s shortage of wa-ter supply and sewerage sys-
SEZ developers&CDC Cambodia Gov. & Aid agencies
① persuasion of SEZ developers into improv-ing
② SEZ’s improvement of water supply and sewerage systems in accordance with Law
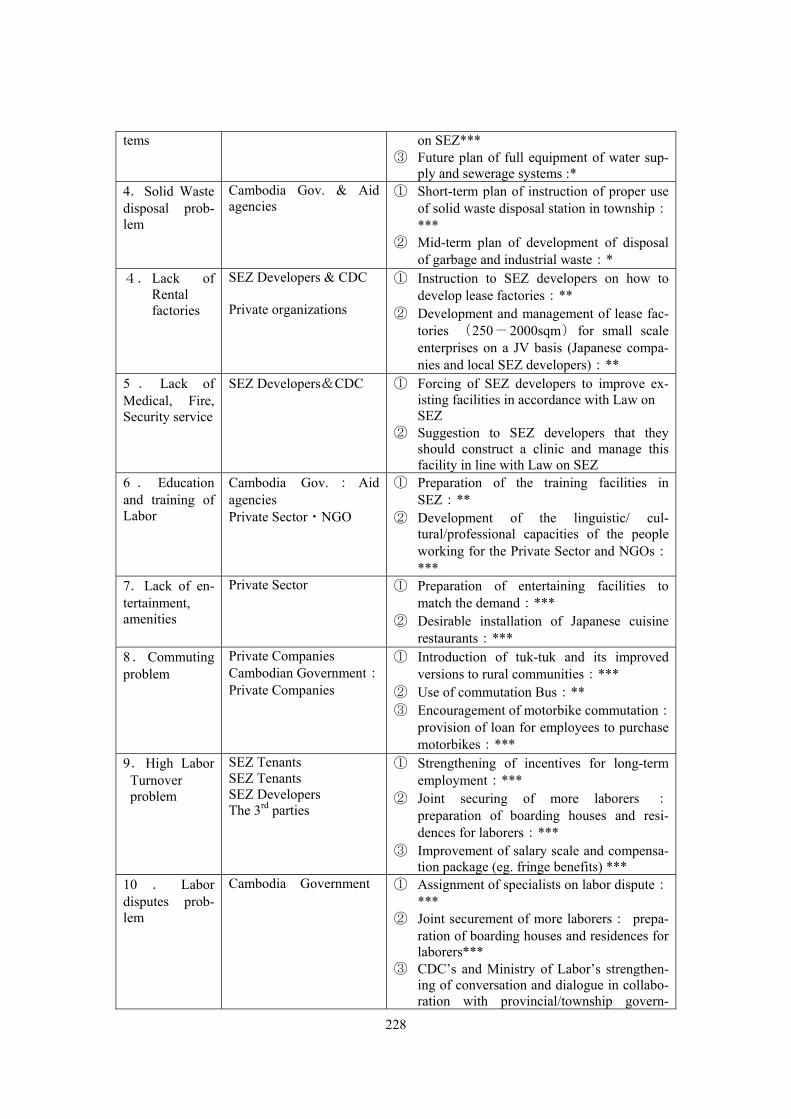
228
tems
on SEZ*** ③ Future plan of full equipment of water sup-
ply and sewerage systems :* 4.Solid Waste disposal prob-lem
Cambodia Gov. & Aid agencies
① Short-term plan of instruction of proper use of solid waste disposal station in township:***
② Mid-term plan of development of disposal of garbage and industrial waste:*
4. Lack of Rental factories
SEZ Developers & CDC Private organizations
① Instruction to SEZ developers on how to develop lease factories:**
② Development and management of lease fac-tories (250-2000sqm) for small scale enterprises on a JV basis (Japanese compa-nies and local SEZ developers):**
5 . Lack of Medical, Fire, Security service
SEZ Developers&CDC ① Forcing of SEZ developers to improve ex-isting facilities in accordance with Law on SEZ
② Suggestion to SEZ developers that they should construct a clinic and manage this facility in line with Law on SEZ
6 . Education and training of Labor
Cambodia Gov. : Aid agencies Private Sector・NGO
① Preparation of the training facilities in SEZ:**
② Development of the linguistic/ cul-tural/professional capacities of the people working for the Private Sector and NGOs:***
7.Lack of en-tertainment, amenities
Private Sector ① Preparation of entertaining facilities to match the demand:***
② Desirable installation of Japanese cuisine restaurants:***
8.Commuting problem
Private Companies Cambodian Government:Private Companies
① Introduction of tuk-tuk and its improved versions to rural communities:***
② Use of commutation Bus:** ③ Encouragement of motorbike commutation:
provision of loan for employees to purchase motorbikes:***
9.High Labor Turnover problem
SEZ Tenants SEZ Tenants SEZ Developers The 3rd parties
① Strengthening of incentives for long-term employment:***
② Joint securing of more laborers :preparation of boarding houses and resi-dences for laborers:***
③ Improvement of salary scale and compensa-tion package (eg. fringe benefits) ***
10 . Labor disputes prob-lem
Cambodia Government ① Assignment of specialists on labor dispute:***
② Joint securement of more laborers: prepa-ration of boarding houses and residences for laborers***
③ CDC’s and Ministry of Labor’s strengthen-ing of conversation and dialogue in collabo-ration with provincial/township govern-
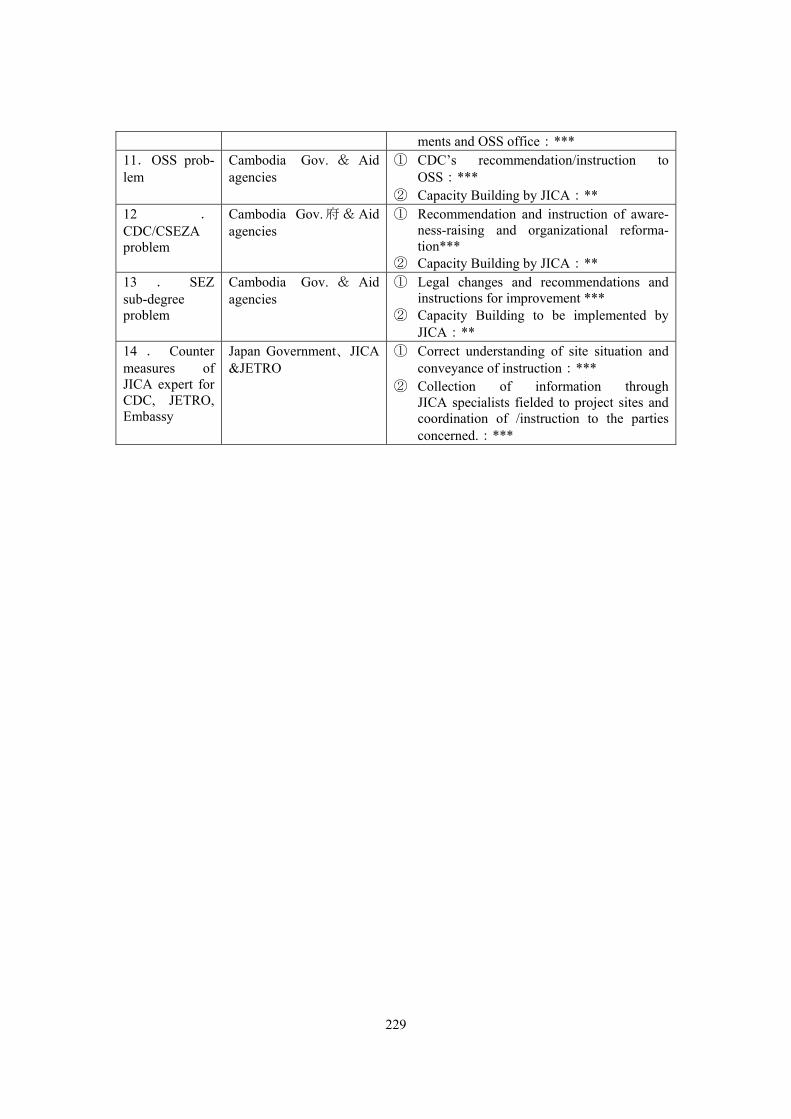
229
ments and OSS office:*** 11.OSS prob-lem
Cambodia Gov. & Aid agencies
① CDC’s recommendation/instruction to OSS:***
② Capacity Building by JICA:** 12 .CDC/CSEZA problem
Cambodia Gov.府&Aid agencies
① Recommendation and instruction of aware-ness-raising and organizational reforma-tion***
② Capacity Building by JICA:** 13 . SEZ sub-degree problem
Cambodia Gov. & Aid agencies
① Legal changes and recommendations and instructions for improvement ***
② Capacity Building to be implemented by JICA:**
14 . Counter measures of JICA expert for CDC, JETRO, Embassy
Japan Government、JICA&JETRO
① Correct understanding of site situation and conveyance of instruction:***
② Collection of information through JICA specialists fielded to project sites and coordination of /instruction to the parties concerned.:***
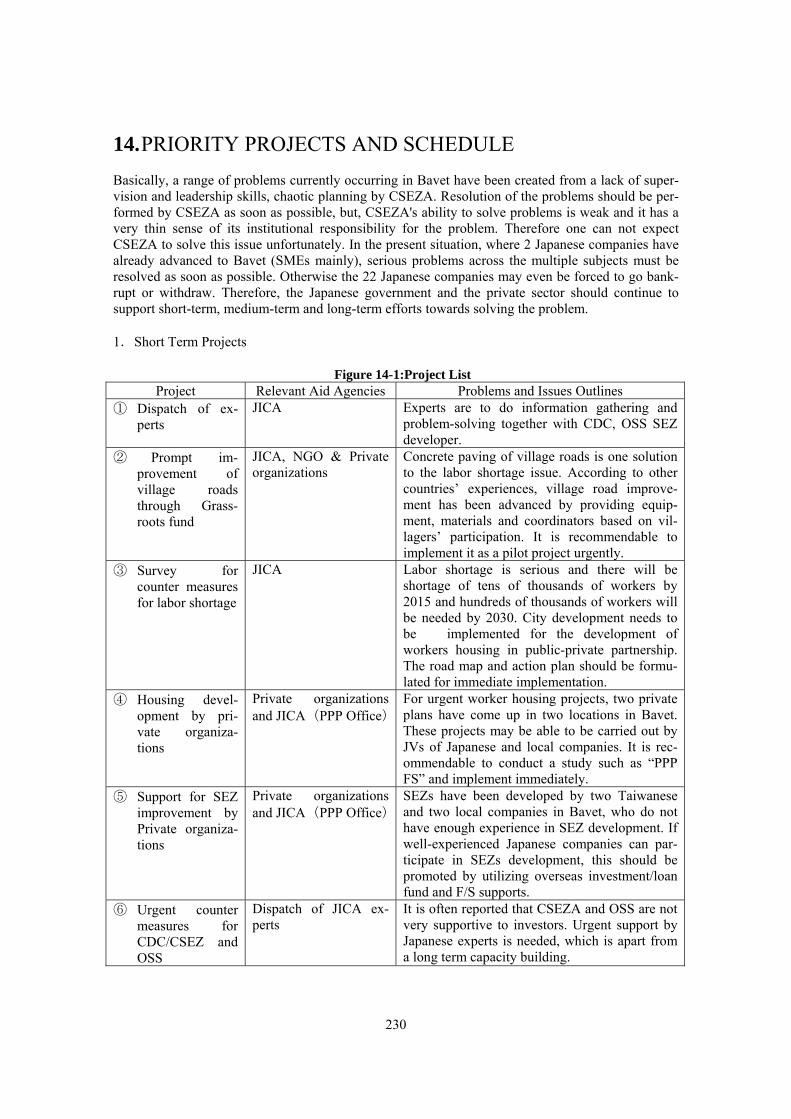
230
14. PRIORITY PROJECTS AND SCHEDULE Basically, a range of problems currently occurring in Bavet have been created from a lack of super-vision and leadership skills, chaotic planning by CSEZA. Resolution of the problems should be per-formed by CSEZA as soon as possible, but, CSEZA's ability to solve problems is weak and it has a very thin sense of its institutional responsibility for the problem. Therefore one can not expect CSEZA to solve this issue unfortunately. In the present situation, where 2 Japanese companies have already advanced to Bavet (SMEs mainly), serious problems across the multiple subjects must be resolved as soon as possible. Otherwise the 22 Japanese companies may even be forced to go bank-rupt or withdraw. Therefore, the Japanese government and the private sector should continue to support short-term, medium-term and long-term efforts towards solving the problem. 1.Short Term Projects
Figure 14-1:Project List Project Relevant Aid Agencies Problems and Issues Outlines
① Dispatch of ex-perts
JICA Experts are to do information gathering and problem-solving together with CDC, OSS SEZ developer.
② Prompt im-provement of village roads through Grass-roots fund
JICA, NGO & Private organizations
Concrete paving of village roads is one solution to the labor shortage issue. According to other countries’ experiences, village road improve-ment has been advanced by providing equip-ment, materials and coordinators based on vil-lagers’ participation. It is recommendable to implement it as a pilot project urgently.
③ Survey for counter measures for labor shortage
JICA Labor shortage is serious and there will be shortage of tens of thousands of workers by 2015 and hundreds of thousands of workers will be needed by 2030. City development needs to be implemented for the development of workers housing in public-private partnership. The road map and action plan should be formu-lated for immediate implementation.
④ Housing devel-opment by pri-vate organiza-tions
Private organizations and JICA(PPP Office)
For urgent worker housing projects, two private plans have come up in two locations in Bavet. These projects may be able to be carried out by JVs of Japanese and local companies. It is rec-ommendable to conduct a study such as “PPP FS” and implement immediately.
⑤ Support for SEZ improvement by Private organiza-tions
Private organizations and JICA(PPP Office)
SEZs have been developed by two Taiwanese and two local companies in Bavet, who do not have enough experience in SEZ development. If well-experienced Japanese companies can par-ticipate in SEZs development, this should be promoted by utilizing overseas investment/loan fund and F/S supports.
⑥ Urgent counter measures for CDC/CSEZ and OSS
Dispatch of JICA ex-perts
It is often reported that CSEZA and OSS are not very supportive to investors. Urgent support by Japanese experts is needed, which is apart from a long term capacity building.
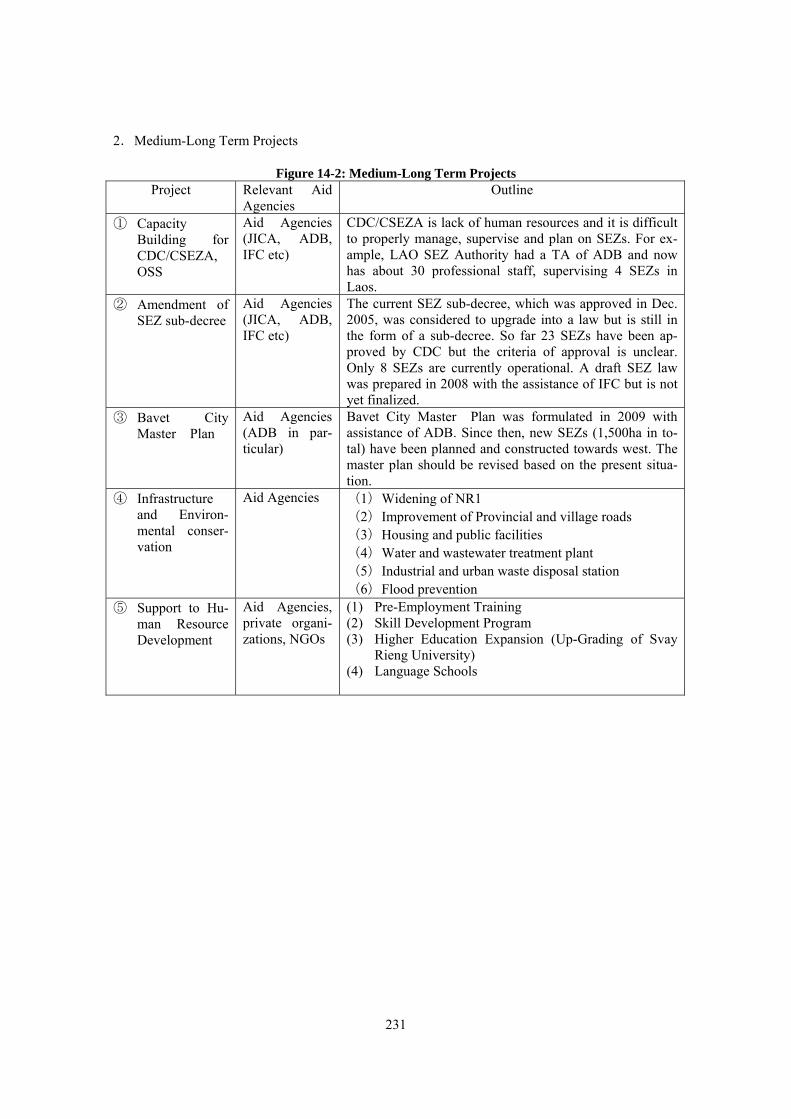
231
2.Medium-Long Term Projects
Figure 14-2: Medium-Long Term Projects Project Relevant Aid
Agencies Outline
① Capacity Building for CDC/CSEZA, OSS
Aid Agencies (JICA, ADB, IFC etc)
CDC/CSEZA is lack of human resources and it is difficult to properly manage, supervise and plan on SEZs. For ex-ample, LAO SEZ Authority had a TA of ADB and now has about 30 professional staff, supervising 4 SEZs in Laos.
② Amendment of SEZ sub-decree
Aid Agencies (JICA, ADB, IFC etc)
The current SEZ sub-decree, which was approved in Dec. 2005, was considered to upgrade into a law but is still in the form of a sub-decree. So far 23 SEZs have been ap-proved by CDC but the criteria of approval is unclear. Only 8 SEZs are currently operational. A draft SEZ law was prepared in 2008 with the assistance of IFC but is not yet finalized.
③ Bavet City Master Plan
Aid Agencies (ADB in par-ticular)
Bavet City Master Plan was formulated in 2009 with assistance of ADB. Since then, new SEZs (1,500ha in to-tal) have been planned and constructed towards west. The master plan should be revised based on the present situa-tion.
④ Infrastructure and Environ-mental conser-vation
Aid Agencies (1)Widening of NR1 (2)Improvement of Provincial and village roads (3)Housing and public facilities (4)Water and wastewater treatment plant (5)Industrial and urban waste disposal station (6)Flood prevention
⑤ Support to Hu-man Resource Development
Aid Agencies, private organi-zations, NGOs
(1) Pre-Employment Training (2) Skill Development Program (3) Higher Education Expansion (Up-Grading of Svay
Rieng University) (4) Language Schools

Appendix
(1) 3-Year Gradual Investment Program in Svay Rieng Province (2) 3-Year Gradual Investment Program in Bavet City
3-Year Gradual Investment Program in Svay Rieng
Province
2012-2014
Kingdom of Cambodia
Nation-Religion-King
Decision
On
Council of Svay Rieng Province
- Having seen the constitution of Kingdom of Cambodia
- Having seen Royal Kram No. NS/RKM/0508/017, dated 22 May 2008, promulgating the
Law of Administrative Management in Capital, Province, City, District, and Sangkat
- Having seen Royal Kram No. NS/RKM/0508/018, dated 24 May 2008, promulgating the
Law on Election and Selection of Capital, Provincial, City, District and Communal
Sangkat
- Having seen Sub Decree No. 219 ANKr.BK, dated 14 December 2009, on the
Establishment of the Development Plan and 3-Year Gradual Investment Program in
Capital, Province, City, District and Sangkat
- Inter-Ministry Prakas No. 2417, dated 27 December 2010, on the Establishment of
Development Plan and 3-Year Gradual Investment Program in Capital, Province, City,
District and Sangkat
- Referring to the Minute of meeting of provincial council on 27 December 2011
Decide
Article 1: Agree with the 3-Year Gradual Investment Program in Svay Rieng province in 2012-
2014 as stated in the attachment.
Article 2: Board of Provincial governor must continue all legal acts to practice the 3-year
moving investment program in Svay Rieng province in 2012-2014.
Article 3: This decision is promulgated from signing date forward.
Copy to:
- Ministry of Interior
- Ministry of Planning
- Ministry of Economy and Finance
- Secretariat of K.J.A.B
(To inform)
- Head of Svay Rieng provincial
officer
(For occupation)
- Chronology
Svay Rieng, 3 January 2012
Head of Svay Rieng province council
(Seal and Signature)
Kim Thea
Svay Rieng administration
No. 01 SSR.KB
CONTENT
Decision on enforcement of 3-Year Gradual Investment Program of Svay Rieng
Province in 2012-2014 ....................................................................................................
Preface ...........................................................................................................................1
Introduction ..................................................................................................................3
Svay Rieng Provincial Administrative Map ..............................................................4
Chapter 1 Economic and Social Situation in 2011
1.1.Summary data of Economy and Society ..............................................................................5
1.2.Current Situation and Problems ...........................................................................................6
1.2.1.Economic Situation .....................................................................................................6
1.2.2.Social Situation ...........................................................................................................7
1.2.3.Situation of Land Use, Natural Resource and Environment Management .................8
1.2.4.Situation of Disaster management and Climate Change .............................................8
1.2.5.Situation of Administration, Security and Public Order Management .......................9
Chapter 2 Project of 3-Year Gradual Investment Program of Svay Rieng Province 2012-2014
2.1. Project of 3-Year Gradual Investment Program of Svay Rieng Province 2012-2014...11
2.1.1. Ongoing Projects (Table 2.1, Part i) ..............................................................................11
2.1.2. Promised Projects (Table 2.1, Part ii) ............................................................................11
2.1.3. Not Promised Projects (Table 2.1, Part iii) ....................................................................12
2.2. Intermediate-term Expenditure Framework (waiting for guidance) ..........................14
2.3. Action Planning for implementing projects of Svay Rieng Provincial Investment
Program 2012 .........................................................................................................................14
Appendix Table 2.1. 3-Year Gradual Investment Program in Svay Rieng province 2012-2014 ........21
Table 2.2. Supporting fund from outside ............................................................................70
Table 2.3. Intermediate-term expenditure framework (Waiting for guidance) .......................
Table 2.4. Action Planning for implementing projects of provincial investment program in
2012 .....................................................................................................................................71
3-Year Gradual Investment Program in Svay Rieng Province in 2012-2014 Page 1
PREFACE
According to the Law of administrative management in Capital, Province, City, District,
and Sangkat, each council must have a 5-Year Development Plan and 3-Year Gradual
Investment Program for the councils to control and investigate all implementations of investment
program and development of all sectors under its administrated territory.
In first mandate, Svay Rieng provincial council, created by the local election in 2009,
have already adopted a 5-Year Development Plan (2011-2015) and 3-Year Gradual Investment
Program in 2011-2013 for investment aids needs as capital and technic to implement provincial
development strategies so as to succeed targets and objectives of provincial development in
2015.
In the process of preparing the Svay Rieng Provincial 3-Year Gradual Investment
Program in 2012-2014, working group who established Development Plan and Provincial
Investment Program reformed and updated 2011 Investment Plan and also prepared new project
proposal which is a priority project proposal of sector department of city and district, and
managed the priority, calculated mean point of provincial level, determined technical point,
calculated beneficial point and effective rate of price of new 381 projects (46 projects failed in
technical point). There are 41 projects which are not promised in 2011, gradually moved into the
investment program in 2012. Meanwhile, working group who established Development Plan and
Provincial Investment Program have drafted a list of provincial project proposal to give chance
to all related people to check, discuss, give ideas and agree with the drafted list of provincial
project proposal. After showing Table 1.3 “drafted list of provincial project proposal”1, working
group who established plan and Provincial Investment Program made decision to select priority
project which responded to development framework and fitted the provincial council’s policy
guidance. Those projects were selected and included in Table 1.4 “list of provincial priority
project”2.
After having selected the provincial priority project (Table 1.4), working group who
established Development Plan and Provincial Investment Program has also prepared draft for 3-
Year Gradual Investment Program in order to submit to the provincial council to check and
adopt. This draft for 3-Year Gradual Investment Program is formed into many important parts
such as economic and social situation in 2011, list of Svay Rieng provincial 3-Year Gradual
Investment Project in 2012-1014, supporting fund from outside, 3-Year intermediate-term
expenditure framework (have not been calculated due to waiting for guidance), and action plan
for implementing first year investment program project (2012).
1 There are 376 projects 2 There are 351 projects
After checking and recommending on the draft of Provincial 3-Year Gradual Investment
Program by provincial board of governor and Provincial Technical Facilitation Committee,
working group who established Development Plan and Provincial Investment Program
announced the integration seminar of Provincial Investment Program so as to find development
partners, both national and international organizations, to support those provincial priority
projects which are the priority projects being not promised yet (Table 2.1 Part iii)3.
3-Year Gradual Investment Program in Svay Rieng Province in 2012-2014 Page 2
After the seminar finished, working group have checked, reformed in accordance with
many recommendations, and also finished the draft of provincial investment program. This
provincial investment program in 2012-2014 consists of 486 projects.
The provincial council made a remark on 3-Year Gradual Investment Program of Svay
Rieng province in 2012-2014 and the use of provincial council, board of governors, department,
organizations, institutions and other development partners. The council also reconfirmed and
inspired all development partners, who would sponsor and support Svay Rieng province and
should have foundation to check high priority projects of the list of 3-Year Gradual Investment
Program of Svay Rieng province in 2012-2014. This could reach the goal and priority which
were included in 5-Year Development Plan of Svay Rieng province (2011-2015) in order to
contribute to poverty reduction in Cambodia with the Royal Government and promote welfare of
people in accordance with Cambodia Millennium Development Goal.
I would like to express profound thanks to His and Her Excellency, ladies and
gentlemen who attentively participated in the process of preparing the 3-Year Gradual
Investment Program of Svay Rieng province in 2012-2014. I would like to appeal to all
development partners, departments, organizations, institutions, aid-providing communities,
social civil organizations, civil servants, all levels of local authorities and all citizens to continue
supporting the implementation of all priority investment projects proposed to succeed; and
respond to Royal Government of Cambodia’s policies for the fourth parliamentary session
especially, the implementation of the second round of Rectangular Strategies to increase of jobs,
equity and effectiveness in Cambodia.
3 There are 3 projects
Svay Rieng, 3 January 2012
Head of Svay Rieng provincial council
(Seal and Signature)
Kim Thea
3-Year Gradual Investment Program in Svay Rieng Province in 2012-2014 Page 3
INTRODUCTION
The preparation of the 3-Year Gradual Investment Program of Svay Rieng province in
2012-2014 is to prioritize all priorities of the projects in provincial development planning
framework in 2011-2015 to be under a good condition which is easy to implement effectively.
The priority projects proposed by departments, organizations, institutions, city and districts in
2011 are also carefully combined and calculated for the effectiveness rate of price with high
responsibilities. Under the recommendation of the board of governors and Provincial Technical
Facilitation Committee, the working group who established Provincial Investment Project and
plan elaborated content of economic, social, situation of land Use, natural resources and
environment management, situation of disasters management and climate change, situation of
administrative management, security and public order in order to show the potential of the
priority projects which are supported and meet the local needs.
The 3-Year Gradual Investment Program of Svay Rieng province in 2012-2014,
described in the following pages reflects the projects and activities implemented in each sector
and 3-Year Gradual Investment Programs for the following years. The investigation, control and
evaluation of the progress of priority projects implementation are very important for provincial
council, board of governors and other related people to ensure that Development Plan and
Provincial Investment Program will be achieved following targets and objectives set. This
Investment Program has the following forms:
Decision on enforcement of the 3-Year Gradual Investment Program of Svay Rieng
province in 2012-2014
Preface
Introduction
Provincial Map
Chapter 1: Economic and Social Situation in 2011
Chapter 2: Project of 3-Year Gradual Investment Program in 2012-2014
Annex
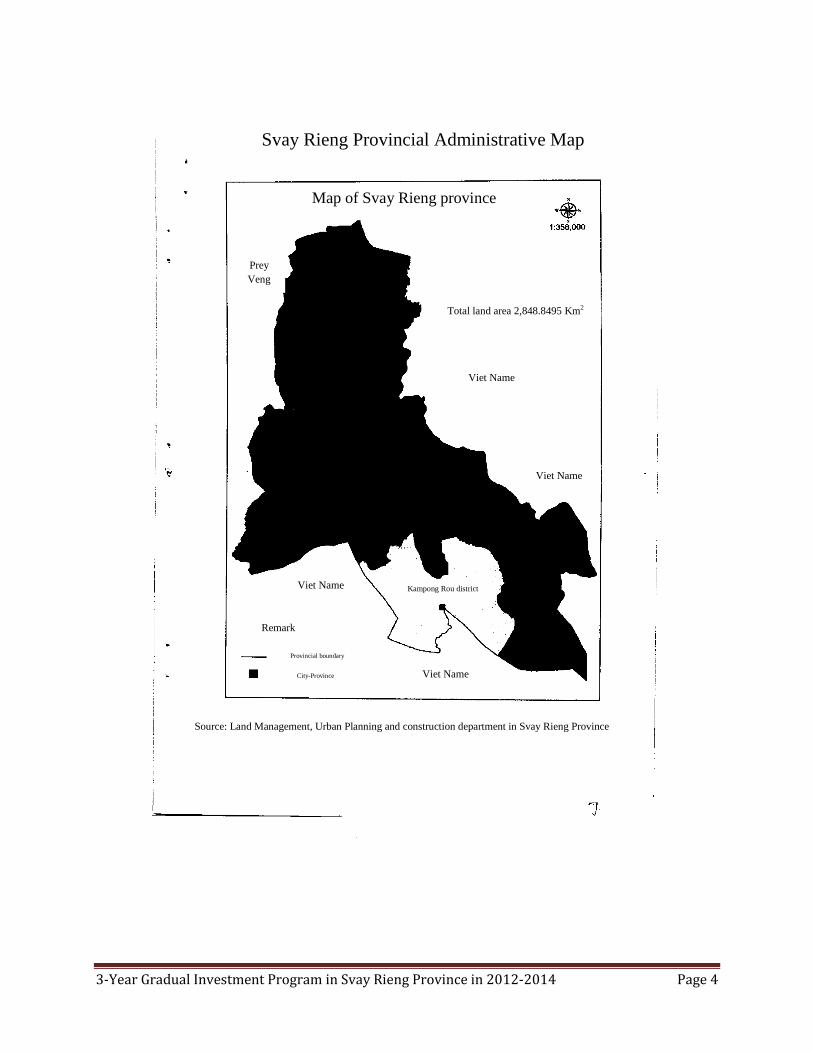
3-Year Gradual Investment Program in Svay Rieng Province in 2012-2014 Page 4
Svay Rieng Provincial Administrative Map
Source: Land Management, Urban Planning and construction department in Svay Rieng Province
Map of Svay Rieng province
Total land area 2,848.8495 Km2
Viet Name
Viet Name
Viet Name
Viet Name
Kampong Rou district
Prey
Veng
Remark
Provincial boundary
City-Province
3-Year Gradual Investment Program in Svay Rieng Province in 2012-2014 Page 5
Chapter 1 Economic and Social Situation in 2011
1.1. Summary Data of Economic and Social Situation
Key information in Svay Rieng Province in 2011
No. Description Unit Year 2011
1 Provincial land area (after compromising)4
Km2
2,848.85
2 Number of cities and districts (2 cities, 6 districts) City-district 8
3 Number of commune and sangkat (12 Sangkats, 68
communes)
commune-sangkat 80
4 Number of villages Village 690
5 Total population Person 579,015
6 Total number of women Person 299,887
7 Yearly population growth % 1
8 Total number of families Family 127,872
9 Rate of women being the head of the family % 17.18
10 Rate of poor families % 20.93
11 Rate of families employing in agriculture as a main
job
% 90.15
12 Rate of children aging between 6-11years old who not
going to school
% 9.66
13 Rate of illiterates aging between 15-60 years old % 8.15
14 Rate of illiterate women aging between 15-60years old % 4.58
15 Total number of women giving birth of babies Person 8,905
16 Rate of women giving birth of babies at health center
rate
% 88.45
17 Rate of women giving birth of babies with traditional
midwife
% 11.55
18 Maternal death among 100,000 births after giving
birth from 0-1 month
Person 66
19 Rate of using running water (urban) % 46.1
20 Rate of families using clean well % 96.38
21 Proportion of Families having hygiene toilets % 29.8
4 Royal decree No. NS/RKT/1110/862, dated 08 November 2010
3-Year Gradual Investment Program in Svay Rieng Province in 2012-2014 Page 6
Svay Rieng province is situated duck beak-like area, along the National road #1, at
eastern of Kingdom of Cambodia and totaling 125 km away from Phnom Penh City. It is
bordered to the North and West by Prey Veng province, to the South and East by Long An
province and Tay Ninh province, approximately 258 km away (Tay Ninh 130 km and Long An
128 km) of Socialist Republic of Vietnam.
Svay Rieng province is located in flat area, having total land area of 2,848.85 km2, after
compromising administrative border between Prey Veng province and Svay Rieng provinces by
dividing a part of land area of Tros commune, Romeas Haek district, Svay Rieng province into
Kraboa commune, Kamchay Mea district, Prey Veng province (Royal decree NS/RKT/1110/862,
dated 08 November 2010). Its geographic feature is pan-like. There are Kampong Trach river in
Romeas Haek district and VaiKo river flows through from the North to South, and down to
Cambodia-Vietnam border situated at the border between Kampong Chamlong commune and
Basac commune, Svay Chrum district, Svay Rieng Province of Kingdom of Cambodia and
Heong Deang Ar Commune, Vinh Hong district, Long An province of Socialist Republic of
Vietnam; in which the provincial land area seems to be divided into one half each.
Svay Rieng provincial administrative management consists of two cities (Svay Rieng
City and Bavet City), in which there are 6 districts (Chantrea District, Kompong Rou District,
Romdoul District, Romeas Haek District, Svay Chrum District and Svay Teap District), in which
there are 12 Sangkats, 68 communes, and 690 villages. Provincial administrative area is in Svay
Rieng City. Total population is 579,015, of which 299,887 are women, and 127,872 families
which have 4.52 per family on average, in density of 195 people per square kilometer. There are
336,842 people (199,850 people are women) whose names are listed in election list in 2010.
Climate and rain volume in Svay Rieng province located in tropical area, being wet and
dry, which the hottest is 38.5 degree Celsius and the coldest is 19 degree Celsius. The average of
rain volume given by monsoon is 1,995.8 mm in rainy season.
There are two main sources of rivers in dry season to meet people’s needs: VaiKo River
linking from Mekong river bank and flowing through Kampong Trabaek district, Prey Veng
province and Kampong Trach River. VaiKo River has two overflow dams, in which one situates
at Ta Hor Bridge in Sangkat Por Ta Hor of Svay Rieng City and another one is at Doun Sar
Bridge in Doun Sar commune of Svay Chrum district. Wells can be dug or drilled for usage in
accordance with each local geographical situation. The water from the wells in some communes
of Chantrea district contains lime and rust and arsenic from 10% to 30% in all cities and districts
in provinces.
3-Year Gradual Investment Program in Svay Rieng Province in 2012-2014 Page 7
1.2. Current Situation and Problems
1.2.1. Economic Situation
Economic Situation in province almost depends on agriculture, especially rice crop. 91%
of population being equal to 116,065 families employs in agriculture as their main job.
Land areas for farming production in Svay Rieng province are: 181,500 hectares of rice
growing land, in which 165,000 hectares of raining-season rice giving 2.4 ton per hectare of rice
yield and 16,500 hectares of dry-season rice giving 4.1 ton per hectare of rice yield. There are 17,
525 hectares of land for growing diverse crop: cassava, sugarcane and rubber plant (Source:
Svay Rieng Provincial Department of Agriculture in 2011). The total length of canal is 410,731
meters, in which main canal has 191,028 meters, and it can water 53,768 hectares of rice field,
including 38,436 hectares of raining-season rice. There are 902 tractors, 3,562 plowing tractors
and 6,564 pumping machines.
There are 4 special economic zones in Bavet City but only two zones are working:
Manhattan Special Economic Zone and Tai Seng Special Economic Zone. There are totally 14
working factories, including 7 garment and shoe factories, 1 screw factory, 2 bike factories, 3
package factories and 1 Kova brand painting factory. Beside from these, there are 2,662 small
rice mills, 2,041 handicraft and service providers, 10 banks, 4 private security companies and 18
casinos, in which there are 10 casinos in Bavet City, 4 in Prey Vor, Thmey commune, Kampong
Rou district, 3 in Samroung commune, Chantrea district and 1 in Bos Morn commune, Romdoul
district (Source: Provincial Department of Labor and Vocational Training in Svay Rieng
province).
Svay Rieng province has electricity link, which has 7 MW, linking from Vietnam through
border of Prey Vor in Kampong Rou district and another link, which has10 MW, connected
through Bavet international border, Sangkat Bavet, Bavet City, and electricity link will be
expended 16MW in 2012 (Sourec: Electricity of Cambodia in Svay Rieng province).
1.2.2. Social Situation
There are 3 higher education institutions: Svay Rieng University (5 faculties) is under the
control of Ministry of Education Youth and Sports, Institute of Sociology and Technology, and
University of Business controlled by private sector. There are 19 high schools, 53 secondary
schools, 260 primary school controlled by state and there are also some private schools. The total
number of students is 115,545, in which 53,552 students being equal to 46% are female and
university students are 2,271, in which 34% are female. Children who completed compulsory
foundation of education are accounted for 53.77%. Children who study at secondary school are
accounted for 94% (female 93%).

3-Year Gradual Investment Program in Svay Rieng Province in 2012-2014 Page 8
Public health bases cover 1 provincial hospital, 2 referral hospitals, 38 health centers and
1 health post controlled by Svay Rieng provincial Department of Health, employed totally 503
employees and workers such as doctors, pharmacists, dentists, male and female nurses,
midwives, experimenters and physiotherapists; till 2011, one health staff must serve about 2,000
citizens and 90% of women delivering their babies with clinical midwife. The baby mortality
rate is 10 per 1,000 and rate of maternal death is 66 per 100,000. There will be 5 more
constructions of health centers, 2 reformations of health centers to referral hospitals, and more
delivery rooms for each health center. (Source: Svay Rieng provincial Department of Health in
2011).
Rate of families having hygiene toilet is 29.80%. There are 5 clean running water systems
(urban area of Svay Rieng City, Bavet City, urban are of Svay Teap district, Roumdoul district
and Chiphu market) and 91,288 pumping and other diverse wells, accounted for 71% of all
families. On the other hand, violence in families has decreased from 0.91% (2010) to 0.70%
(2011).
Poverty rate decreases from 30.90% in 2009 to 20.93% in 2011 (temporary source:
poverty family identification 2011, Svay Rieng provincial Department of Plan); the district
having the highest poverty rate is Rormeas Haek district (24.97%). People who live in the
highest standard are living in Svay Rieng City (11.60%) and Bavet City. Rate of families using
iodized salt is 39% in 2011 (first semester report of Svay Rieng provincial Department of
Planning in 2010). According to the census in 2008, there are 7,101 disable people (3,144
female). 99.75% of all people are Buddhist, besides from this, 0.05% is Muslim, 0.19 % is
Christian and 0.01% believes in other religions.
1.2.3. Situation of Land Use, Natural Resources and Environment Management
90% of people use their land mainly for growing rice. There are not any families living
by finding forest by-product. Rate of families having rice field less than 1 hectare is 31% and
families not having their own rice field is 4%. Provincial administration has announced the
impact of using chemical fertilizer and pesticide, and encourages people to use organic fertilizer
with their rice and other diverse crops.
To respond to the Royal Government’s strategy in enhancing increase of rice yield to 4
million tons per year and encouraging the export of rice product to reach 1 million tons per year
by 2015 (Prime Minister Hun Sen’s speech in the 13th
Forum of Private Sector), provincial
administration committed to make a strategy in increasing land area for growing dry-season rice
crop to 30,000 hectares by 2014 and expected to get yield of raining-season rice crop for
3t/hectare on average and that of dry-season rice for 5t/hectare on average by 2014.

3-Year Gradual Investment Program in Svay Rieng Province in 2012-2014 Page 9
Trash collecting service activities is very low for only 1%. On the other hand, land area of Svay
Rieng province decrease from 2,966.40 square kilometer to only 2,848.85 square kilometer, after
compromising border of Svay Rieng and Prey Veng provincial administration, by dividing some
part of land area of Tros commune in Rormeas Haek district of Svay Rieng province into Krar
Boa commune, Kamchay Mea district in Prey Veng province, according to the royal decree
NS/RKT/1110/862, dated 08 November 2010.
1.2.4. Situation of Disaster Management and Climate Change
In the last decades, climate changes very often which causes disasters such as storm,
lightning strike, fire which impact directly and indirectly on economic and social sector,
especially people’s living and destroyed many human lives and properties. For instance, in 2010,
fire destroyed 49 houses, storm destroyed 165 houses and 17 people were struck by lightning.
In 2011, Svay Reing province has been affected by flood and caused many damages as
following:
- Flood affected 7 Cities-districts: Svay Rieng City, Svay Chrum, Kampong Rou,
Roemeas Haek, Chantrea, Svay Teap, and Romdoul district, totaling 39 sangkat-
communes, 161 villages. Cities-districts which are severely affected are: Svay Rieng
City, Svay Chrum, Kampong Rou, Rormeas Haek and Chantrea district
- There are 6,140 houses flooded (equal to 17,076 families)
- 4,160 families were evacuated to safe places
- Affected 13,350 hectares of rice field, totally damaged 7,761 hectares, and 444
hectare of diverse crops
- Affected 17 schools, most of them are primary schools.
- Affected 16 pagodas
- Affected 58 km of unsealed roads, 2.2 km of sealed road and 66 km of canal
- Affected 5 bridges
- Affected 9,973 animals
The restoration after flooding:
To respond to the priority needs and enhancement of the living standard of the citizens
after flooding, Head of Svay Rieng provincial board of governors has prepared and announced
many strategies as following:
- Help and encourage people to replant their crops (sow, transplant seedling) with
co-sowing or giving seed, especially encourage them to practice recession rice and
dry-season on time
- Encourage replanting other diverse crops
- Strive to restore all damaged constructions and infrastructures such as roads, bridges,
canals
- Maintain public order, hygiene along the road, public places and citizens’ residences
in order to ensure good environment and welfare of people

3-Year Gradual Investment Program in Svay Rieng Province in 2012-2014 Page 10
1.2.5. Situation of Administrative, Security and Public Order Management
15% of population migrated to find jobs. Because of the economic and living condition,
0.45 % of total families moved in and 0.38 moved out of the province. Robberies, murders, and
conflicts usually occur almost in every city and district. However, according to the data analysis,
those cases become less and less than the previous years. 12% of babies have not been registered
for birth certificate yet.
Along with the strong points mentioned above, some problems still occur in Svay Rieng
province such as production factor, innovation, improvement of agricultural output quality, use
of potential land and other resources, irrigation system capacity and the existing water resource
still being limited, especially irrigation system.
Though there have encouraged and gathered investors to invest in the province to create
more job opportunities for people so as to cut down the number of immigrants, Svay Rieng
province has still faced problems which people immigrate to find jobs. In 2010, there are 46,674
immigrants. There are 6,039 immigrants, who do not have an actual job (Source: provincial
statistic document in 2011, Svay Rieng provincial Department of Plan). Moreover, the province
still lacks of resources to support the process of development, providing high quality of public
services, visible and invisible infrastructures and low quality procurement. On the other hand,
traffic accidents still continue to happen, and natural disasters usually occur; that is reason why
the province lost a lot of benefits which take a part of building the national economy.

3-Year Gradual Investment Program in SvayRieng province 2012-2014 Page 11
Chapter 2
Project of 3-Year Gradual Investment Program of Svay Rieng province 2012-2014
The 3-Year Gradual Investment Program of Svay Rieng province 2012-2014 plays a
key factor in contributing to the continuous of development. This program is held for Svay
Rieng province development plan 2011-2015, especially for successful and timely
implementation of all strategies, and for targets and objects achievement of all the province
development plans which is responsive to the priority needs of departments, organizations,
institutions, cities and districts in order to urgently supply the basic needs. This program also
covers expenses of sectors during the 3 years (2012-2014).
2.1 Project of 3-Year Gradual Investment Program of Svay Rieng province 2012-2014
2.1.1 Ongoing Projects (Table 2.1, Part i)
In 2011, the province has 21 ongoing projects, all of which mainly focus on only the
support of social section.
2.1.2 Promised Projects (Table 2.1, Part ii)
There are 146 promised projects, which need 2,411,682.67 million Riel of total budget
(2,300,049.71 million Riel for 71 internal projects, and 111,632.96 million Riel for 75
external projects). These projects are listed as follow:
2.1.2.1 Economic Sector
- 7 projects for Agriculture
- 5 projects for Water Resource
- 4 projects for Public Work
- 4 projects for Rural Development
- 1 project for Industry
2.1.2.2 Social Sector
- 2 projects for Economic and Society
- 10 projects for Rural Development
- 3 projects for Health
- 15 projects for Education
- 3 project for Plan
2.1.2.3 Land, Natural Resources, Environment, Disaster, and Climate
Change Management
- 1 project for Environment
- 3 projects for Rural Development
- 7 projects for Public Work
- 1 project for Health
- 1 project for Land
2.1.2.4 Administration, Security and Public Order
- 4 projects for Administration

3-Year Gradual Investment Program in SvayRieng province 2012-2014 Page 12
2.1.3 Not Promised Projects (Table 2.1, Part iii)
Not Promised Projects have been finding supports, totaling 319 projects which are in
need 5,964,331.96 million Riel of total budget for duration of 3-Years Gradual Investment
Program (2012-2014), and all projects are listed as follow:
2.1.3.1 Economic Sector
- 9 projects for Agriculture
- 15 projects for Water Resource
- 1 project for Plan
- 11 projects for Public Work
- 11 projects for Industry and Service
- 3 projects for Rural Development
2.1.3.2 Social Sector
- 6 projects for Agriculture
- 26 projects for Education
- 12 projects for Health
- 9 projects for Employment
- 4 projects for Plan
- 1 project for Public Work
- 3 projects for Culture and Religion
- 45 projects for Women Affair
- 5 projects for Economy, Social Affair
- 1 project for Commerce
- 1 project for Information
- 1 project for Land
- 56 projects for Rural Development
- 4 projects for Service and Poverty
2.1.3.3 Land, Natural Resources, Environment, Disaster, and Climate
Change Management
- 15 projects for Environment
- 2 projects for Agriculture
- 3 projects for Water Resource
- 9 projects for Land
- 3 projects for Administration
- 3 projects for Culture and Religion
- 5 projects for Social Affair
- 6 projects for Public Work
- 1 projects for Service
2.1.3.4 Administration, Security and Public Order
- 11 projects for Women Affair
- 4 projects for Plan
- 1 project for Land
- 12 projects for Administration

3-Year Gradual Investment Program in SvayRieng province 2012-2014 Page 13
- 4 projects for Social Affair
- 1 project for Public Work
- 1 project for Health
- 21 project for Education
2.2 Intermediate-Term Expenditure Framework
(Waiting for guidance)
2.3 Action Plan for Implementing Projects of Svay Rieng Provincial Investment
Program 2012
A. Promised Projects (Internal project)
1. Economic Sector
1.1 Public Work
1. To maintain road #314D paved with mountain sand, by plowing and rolling
2. To maintain national road in Svay Rieng City, Romeas Haek district, Prey Koki
Commune, from Bro Sot Downtown to Kampong Rou district
3. Repair drainages along the roads in Svay Reing City
4. Repair, asphalt, and install water pipes and drainages across the roads, and repair
rectangle drainages along the roads in Kampong Trach commune, Chantrea district,
Dos district, Sangkat Chek, Prey Koki commune, Mes Tgok commune, Samroung
commune, from Bro Sot Downtown to Kampong Rou district
1.2 Water Resources
1. Construct and repair DaunToy Irrigation System in Chantrea district
2. Construct and repair Kampong Chrey Irrigation System in Svay Chrum district
3. Construct and repair Veal Tnach Irrigations System in Svay Chrum district
4. Construct and repair Batu Irrigation System in Chantrea district
5. Reconstruct Neal Creek in Svay Chrum district
1.3 Rural Development
1. Construct DBST type of sealed road, road of Kory Trobaek Bridge to Basac
commune in Svay Chrum district
2. Construct DBST type of sealed road, and entrance road of Bavet City Hall
3. Construct MACADAM type of sealed road on the dam preventing flood at the
western of Svay Rieng City
4. Repair and refill in hole of the roads and to maintain all drainages in provinces.
1.4 Industry
1. Construct public power poles in Svay Reing City
1.5 Agriculture
1. Provide rice seeds, which can produce high yields, to all farmers in Svay Chrum
district and Svay Rieng City
2. Promote the System of Rice Intensification (SRI) in accordance with Natural
Principle and Field Demonstration in Kampong Rou district and Svay Reing City
3. Six technical training courses about raising animals in Bavet City
3-Year Gradual Investment Program in SvayRieng province 2012-2014 Page 14
4. Strengthen qualification of village veterinary in the Bavet City
5. Provide technical uses of chemistry fertilizer and poisonous chemical in
Agriculture in Bavet City
6. Vaccinate and treat illness of cattle in all districts
7. Construct biogas kilns in Kampong Rou, Svay Chrum district and Svay Rieng City
2. Social Affair Sector
2.1 Economy and Social Affair
1. Organize slaughterhouse in all districts
2. Organize and repair market stalls in front of Veal Yon Market
2.2 Rural Development
1. Enhance infrastructure of clean water supply system and rural sanitation in
Chantrea, Romdoul, Romeas Haek and Svay Chrum district
2. Construct structure and cover of toilets amount 870 places for families and 2,610
drainages in Chantrea, Romdoul, Romeas Haek and Svay Chrum district
3. Educate the importance of maintenance and using hygiene toilets, and build toilets
for schools
4. Publicize Community-Led Total Sanitation (CLTS) to 25 communes in Chantrea,
Romdoul, Svay Chrum and Svay Teap district
5. Educate the importance of using soap to wash hand (PHAST) to 22 communes in
Chantrea, Kampong Rou, Romdoul, Svay Chrum and Svay Teap district
6. Clean Water Program and sanitation in 30 schools and communities in Chantrea,
Kampong Rou, Romdoul, Svay Chrum and Svay Teap district
7. Propose toilet construction to families and instruct them to use the toilets
8. Educate sanitation to clean up houses
9. Eliminate infection of AIDS and Bird Flu (h5n1)
10. Propose parents to take their children to get 9-type illness vaccination
2.3 Health
1. Celebrate the International AIDS Day in Bavet City
2. Celebrate Tuberculosis Day in the province, Bavet City and Romeas Haek district
3. Control and eliminate counterfeit medicines and illegal healthcare services in Bavet
City
2.4 Education
1. Announce and educate parents to understand about the importance of their
children’s education in Bavet City
2. Educate in each house (Mother Group) in Bavet City
3. Train and support kindergarten teachers, and supply facilities to kindergarten
classes in Sangkat Prey Angkunh and Sangkat Chrok Mtes
4. Survey the number of children between 0-5 years old in villages
5. Construct kindergarten classes at elementary schools
6. Support community’s kindergarten classes
7. Sketch the map to study at each house
8. Construct 7 classroom buildings in Chantrea district, Romdoul district, Romeas
Haek district, Svay Chrum district and Svay Rieng City
9. Train elementary teachers in Sangkat Svay Rieng and Svay Rieng province

3-Year Gradual Investment Program in SvayRieng province 2012-2014 Page 15
10. Train community’s kindergarten teachers newly selected at Education Institute
11. Reinforce teaching tasks for community’s kindergarten teachers at Education
Institute
12. Provide scholarship to poor elementary students in Kampong Rou district, Romeas
Haek district, Svay Chrum district and Svay Teap district
13. Provide nourishment to poor secondary school students
14. Open training classes for existing literacy teachers at Education Institute
15. Strengthen qualification of literacy teachers at Education Institute
2.5 Plan
1. Prepare and create documents supporting PIW and DIW process in all districts and
cities
2. Collect, key in and create documents of basic data for villages, commune/Sangkat,
city/district and province
3. Qualification training course for organizing 3-Year Gradual Investment Program
in all districts and Cities
3. Land, Natural Resources, Environment, Disaster, and Climate Change Management
3.1 Environment
1. Celebrate 05th
March National-International Environment Day in all districts and
Cities
3.2 Rural Development
1. Install 0.60m diameter of drainages on the both sides of road to the south of
Chiphu Market and 60 manholes
2. Install 0.60m diameter of drainages along the road #212 and 16 manholes in Svay
Rieng City
3. Install 1m diameter of drainages on the both sides of National Road #1 and 320
manholes in Bavet City
3.3 Health
1. Build referral hospital of level 1 in Bavet Health Center
3.4 Public Work
1. Build 1,000m of dike along eastern bank of Veiko River in Svay Rieng City
2. Announce 10 courses of traffic law in the whole province
3. Teach and offer 120 courses of motor driving tests in the whole province
4. Install new traffic signs in the whole province
5. Repair traffic signs in the whole province
6. Enhance garages in the whole province
7. Enhance driving schools in the whole province
3.5 Land
1. Register in list of land ownership with system in Svay Chrum district

3-Year Gradual Investment Program in SvayRieng province 2012-2014 Page 16
4. Administration, Security and Public Order
4.1 Administration
1. To maintain parks and lay carpet tiles in line of parks in Svay Rieng City
2. To maintain provincial offices, district offices and city hall
3. Construct meeting building and sitting room of Eo+E1 at provincial offices
4. Build health centers and provincial hospitals
B. Promised Project (External project)
1. Control and eliminate counterfeit medicines and illegal healthcare services in Romeas
Haek district
2. Celebrate World Breastfeeding Week in Romeas Haek district
3. Promote Children Education Program and increase number of school children between
3-5 years old at the education institute
4. Take action in recording the number of disable children at 257 schools
5. Educate vulnerable orphans in 7 districts and Cities
6. Gather people living with AIDS to meditate in 7 districts and Cities
7. Sponsor all patient’s families in 7 districts and Cities
8. Provide education about AIDS and reproductive health to women working at the
entertainment places in Svay Rieng City and Bavet City
9. Take care of people living with AIDS in communities of Svay Rieng City and Bavet
City
10. Bird Flu Prevention Program in all districts and Cities
11. Build leisure booths in Prey Basak Resort
12. Build restaurants in Prey Basak Resort
13. Construct entrance and exit in Prey Basak Resort
14. Find labor market for people in all companies in the province
15. Carry out work inspection in all companies in the province
16. Carry out work, health and safety inspection in all companies in the province
17. Broadcast and educate about the safety migration in all districts and cities
18. Carry out child labour inspection in all companies in the province
19. Inspect on operations of companies dispatching workers to foreign counties in all
districts and cities
20. Examine health of workers and employees in all companies in the province
21. Create work books for Khmer employees in all companies in the province
22. Create work books for foreign employees in all companies in the province
23. Inspect on apprentices training work in all companies in the province
24. Train apprentices in all companies in the province
25. Collect information from all private training institutes and organizations
26. Train teaching methodologies to teachers in-training at Provincial Professional
Training Center
27. Train work inspection and settlement procedure of labor dispute at Department of
Labor
28. Research jobs and training requirement in all districts and cities
29. Train tailor skills at Provincial Professional Training Center
30. Train wedding salon skill at Provincial Professional Training Center
31. Train utility skill at Provincial Professional Training Center
32. Train motor repairing skill at Provincial Professional Training Center
33. Train automobile repairing skill at Provincial Professional Training Center
34. Train electronic skill at Provincial Professional Training Center
35. Train Air conditioner repairing skill at Provincial Professional Training Center
3-Year Gradual Investment Program in SvayRieng province 2012-2014 Page 17
36. Train hairdresser skill at Provincial Professional Training Center
37. Train computer skill at Provincial Professional Training Center
38. Train veterinarian skill at Provincial Professional Training Center
39. Train building skill at Provincial Professional Training Center
40. Train welding and soldering skill at Provincial Professional Training Center
41. Train pigs raising skill and vaccination in 6 districts
42. Train fish hatchery skill in 6 districts
43. Train poultry raising skill in 6 districts
44. Train vegetable planting skill in 6 districts
45. Train rice intensification (Transplant 1 rice seed) in 6 districts
46. Train composing fertilizer producing skill in 6 districts
47. Train mushrooms planting skill in 6 districts
48. Train in local communities in 6 districts
49. Train all enterprises in 6 districts
50. Organize and establish Village Development Committee in all districts and Cities
51. Strengthen capability of Village Development Committee in all districts and Cities
52. To Maintain roads in cycle time from Mok Da to Ta Menh in Romeas Haek district
53. To Maintain roads in cycle time in Kraol kou commune in Svay Chrum district
54. To Maintain roads in cycle time from Mok Da to Kampong Trach in Romeas Haek
district
55. To Maintain roads in cycle time in Bavet City
56. To Maintain roads daily in Kampong Trach commune, Romeas Haek district
57. To Maintain roads daily in Preah Ponlea commune, Kampong Rou district
58. To Maintain roads daily from Svay Chrum to Boeung Rai in Svay Chrum district
59. To Maintain roads daily from Prey Pdao to Chres commune, Chantrea district
60. To Maintain roads daily from Svay Ta Yean commune to Ksae To commune in
Kampong Rou district
61. Establish committee of banking in cash, animals and rice in Romeas Haek district
62. Establish Committee of Cash Credit in Kampong Rou district, Romeas Haek district
and Svay Chrum district
63. Stimulate rural economic development ideas in Romeas Haek district
64. Evaluate Credit Action in Kampong Rou, Romeas Haek, and Svay Chrum district
65. Train motor-repairing skill at Provincial Professional Training Center
66. Train agriculture machinery skill at Provincial Professional Training Center
67. Train electronic skill at Provincial Professional Training Center
68. Train tailor skill at Provincial Professional Training Center
69. Train hairdressing and beauty surgery skill at Provincial Professional Training Center
70. Train bamboo furniture manufacturing skill at Provincial Professional Training Center
71. Train English language using skill at Provincial Professional Training Center
72. Repair and enlarge DBST of Kampong Spean road separating from boundary poles
#171 at Sangkat Bavet, Bavet City
73. Repair and seal road #314C with DBST and Reseal DBST type in Svay Rieng City
74. Repair and seal road #119-206 in Svay Rieng City
75. Repair and seal road #208 with DBST type in Svay Rieng City

Annex

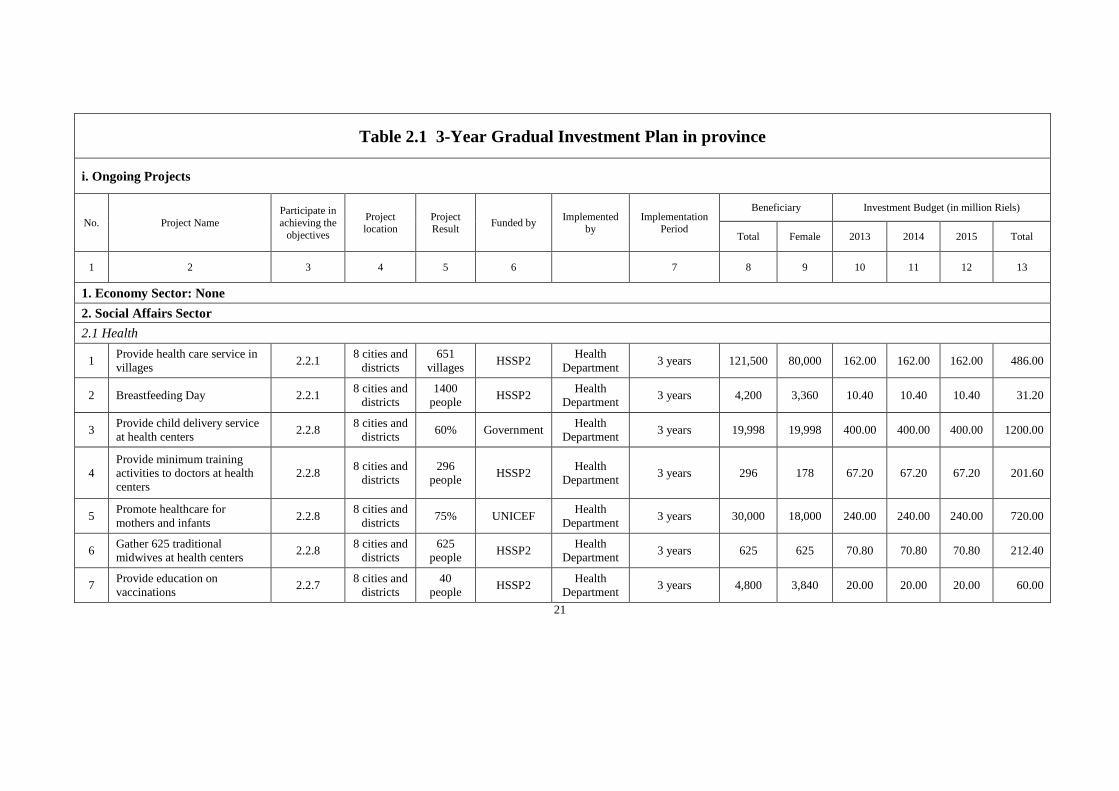
Table 2.1 3-Year Gradual Investment Plan in province
i. Ongoing Projects
No. Project Name
Participate in
achieving the
objectives
Project location
Project Result
Funded by Implemented
by Implementation
Period
Beneficiary Investment Budget (in million Riels)
Total Female 2013 2014 2015 Total
1 2 3 4 5 6 7 8 9 10 11 12 13
1. Economy Sector: None
2. Social Affairs Sector
2.1 Health
1 Provide health care service in
villages 2.2.1
8 cities and
districts
651
villages HSSP2
Health
Department 3 years 121,500 80,000 162.00 162.00 162.00 486.00
2 Breastfeeding Day 2.2.1 8 cities and
districts
1400
people HSSP2
Health
Department 3 years 4,200 3,360 10.40 10.40 10.40 31.20
3 Provide child delivery service
at health centers 2.2.8
8 cities and
districts 60% Government
Health
Department 3 years 19,998 19,998 400.00 400.00 400.00 1200.00
4
Provide minimum training
activities to doctors at health
centers
2.2.8 8 cities and
districts
296
people HSSP2
Health
Department 3 years 296 178 67.20 67.20 67.20 201.60
5 Promote healthcare for
mothers and infants 2.2.8
8 cities and
districts 75% UNICEF
Health
Department 3 years 30,000 18,000 240.00 240.00 240.00 720.00
6 Gather 625 traditional
midwives at health centers 2.2.8
8 cities and
districts
625
people HSSP2
Health
Department 3 years 625 625 70.80 70.80 70.80 212.40
7 Provide education on
vaccinations 2.2.7
8 cities and
districts
40
people HSSP2
Health
Department 3 years 4,800 3,840 20.00 20.00 20.00 60.00
21
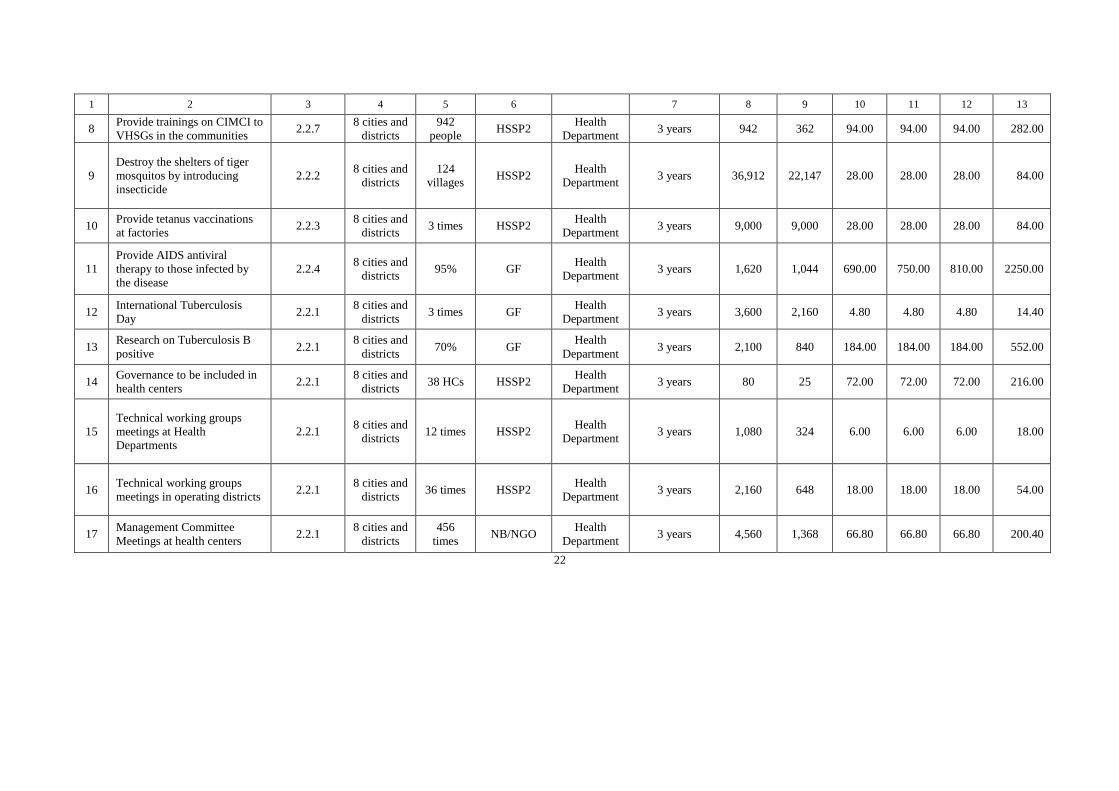
1 2 3 4 5 6 7 8 9 10 11 12 13
8 Provide trainings on CIMCI to
VHSGs in the communities 2.2.7
8 cities and
districts
942
people HSSP2
Health
Department 3 years 942 362 94.00 94.00 94.00 282.00
9
Destroy the shelters of tiger
mosquitos by introducing
insecticide
2.2.2 8 cities and
districts
124
villages HSSP2
Health
Department 3 years 36,912 22,147 28.00 28.00 28.00 84.00
10 Provide tetanus vaccinations
at factories 2.2.3
8 cities and
districts 3 times HSSP2
Health
Department 3 years 9,000 9,000 28.00 28.00 28.00 84.00
11
Provide AIDS antiviral
therapy to those infected by
the disease
2.2.4 8 cities and
districts 95% GF
Health
Department 3 years 1,620 1,044 690.00 750.00 810.00 2250.00
12 International Tuberculosis
Day 2.2.1
8 cities and
districts 3 times GF
Health
Department 3 years 3,600 2,160 4.80 4.80 4.80 14.40
13 Research on Tuberculosis B
positive 2.2.1
8 cities and
districts 70% GF
Health
Department 3 years 2,100 840 184.00 184.00 184.00 552.00
14 Governance to be included in
health centers 2.2.1
8 cities and
districts 38 HCs HSSP2
Health
Department 3 years 80 25 72.00 72.00 72.00 216.00
15
Technical working groups
meetings at Health
Departments
2.2.1 8 cities and
districts 12 times HSSP2
Health
Department 3 years 1,080 324 6.00 6.00 6.00 18.00
16 Technical working groups
meetings in operating districts 2.2.1
8 cities and
districts 36 times HSSP2
Health
Department 3 years 2,160 648 18.00 18.00 18.00 54.00
17 Management Committee
Meetings at health centers 2.2.1
8 cities and
districts
456
times NB/NGO
Health
Department 3 years 4,560 1,368 66.80 66.80 66.80 200.40
22
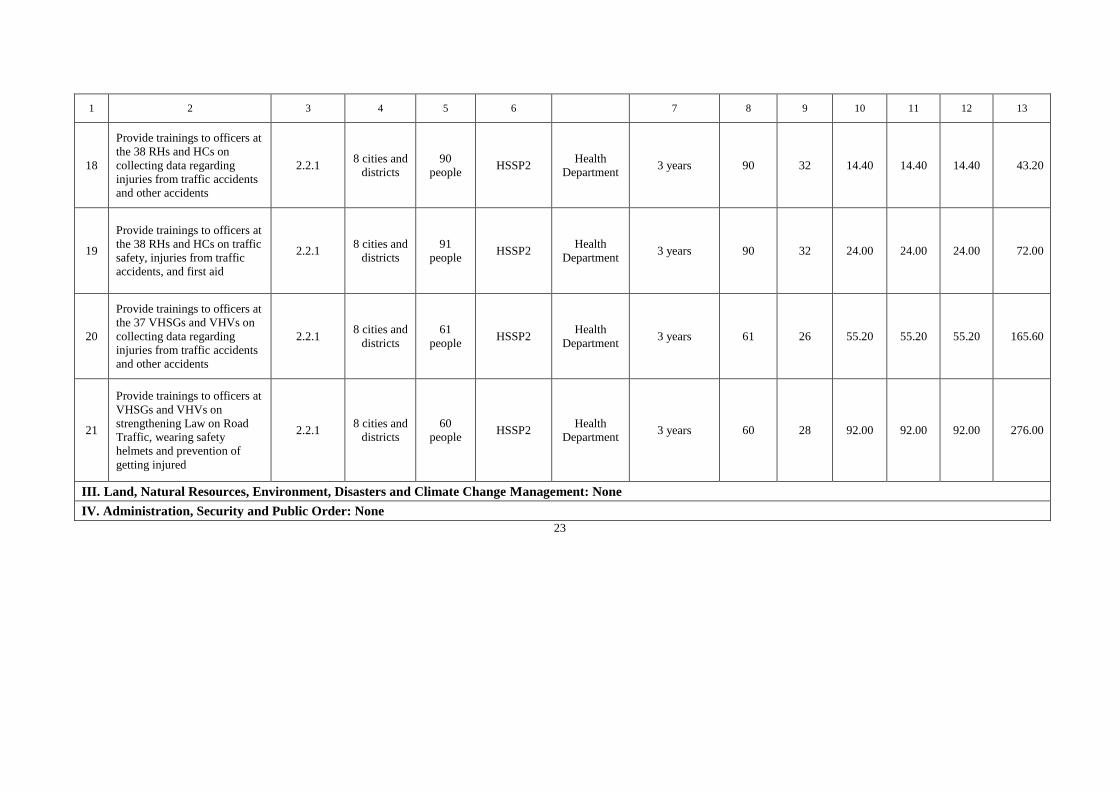
1 2 3 4 5 6 7 8 9 10 11 12 13
18
Provide trainings to officers at
the 38 RHs and HCs on
collecting data regarding
injuries from traffic accidents
and other accidents
2.2.1 8 cities and
districts
90
people HSSP2
Health
Department 3 years 90 32 14.40 14.40 14.40 43.20
19
Provide trainings to officers at
the 38 RHs and HCs on traffic
safety, injuries from traffic
accidents, and first aid
2.2.1 8 cities and
districts
91
people HSSP2
Health
Department 3 years 90 32 24.00 24.00 24.00 72.00
20
Provide trainings to officers at
the 37 VHSGs and VHVs on
collecting data regarding
injuries from traffic accidents
and other accidents
2.2.1 8 cities and
districts
61
people HSSP2
Health
Department 3 years 61 26 55.20 55.20 55.20 165.60
21
Provide trainings to officers at
VHSGs and VHVs on
strengthening Law on Road
Traffic, wearing safety
helmets and prevention of
getting injured
2.2.1 8 cities and
districts
60
people HSSP2
Health
Department 3 years 60 28 92.00 92.00 92.00 276.00
III. Land, Natural Resources, Environment, Disasters and Climate Change Management: None
IV. Administration, Security and Public Order: None
23
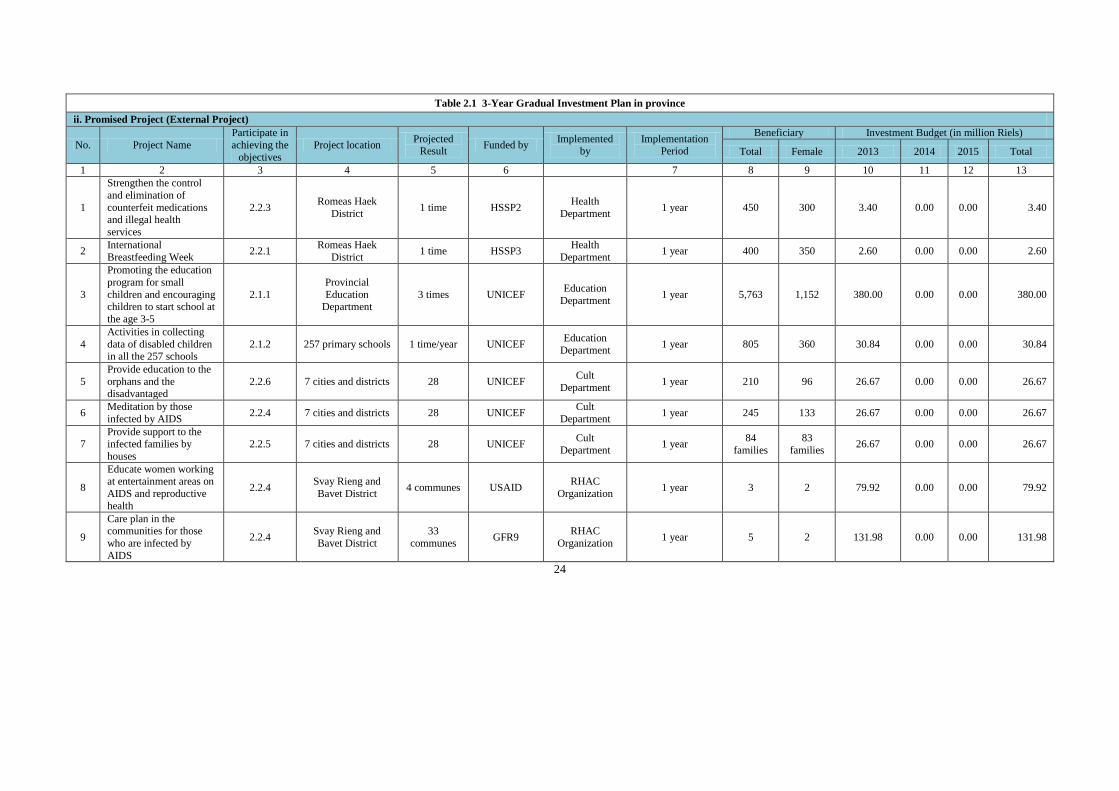
Table 2.1 3-Year Gradual Investment Plan in province
ii. Promised Project (External Project)
No. Project Name
Participate in
achieving the
objectives
Project location Projected
Result Funded by
Implemented by
Implementation Period
Beneficiary Investment Budget (in million Riels)
Total Female 2013 2014 2015 Total
1 2 3 4 5 6 7 8 9 10 11 12 13
1
Strengthen the control
and elimination of
counterfeit medications and illegal health
services
2.2.3 Romeas Haek
District 1 time HSSP2
Health
Department 1 year 450 300 3.40 0.00 0.00 3.40
2 International
Breastfeeding Week 2.2.1
Romeas Haek
District 1 time HSSP3
Health
Department 1 year 400 350 2.60 0.00 0.00 2.60
3
Promoting the education
program for small
children and encouraging children to start school at
the age 3-5
2.1.1
Provincial
Education Department
3 times UNICEF Education
Department 1 year 5,763 1,152 380.00 0.00 0.00 380.00
4
Activities in collecting
data of disabled children in all the 257 schools
2.1.2 257 primary schools 1 time/year UNICEF Education
Department 1 year 805 360 30.84 0.00 0.00 30.84
5
Provide education to the
orphans and the disadvantaged
2.2.6 7 cities and districts 28 UNICEF Cult
Department 1 year 210 96 26.67 0.00 0.00 26.67
6 Meditation by those
infected by AIDS 2.2.4 7 cities and districts 28 UNICEF
Cult
Department 1 year 245 133 26.67 0.00 0.00 26.67
7 Provide support to the infected families by
houses
2.2.5 7 cities and districts 28 UNICEF Cult
Department 1 year
84
families
83
families 26.67 0.00 0.00 26.67
8
Educate women working at entertainment areas on
AIDS and reproductive
health
2.2.4 Svay Rieng and
Bavet District 4 communes USAID
RHAC
Organization 1 year 3 2 79.92 0.00 0.00 79.92
9
Care plan in the communities for those
who are infected by
AIDS
2.2.4 Svay Rieng and
Bavet District
33
communes GFR9
RHAC
Organization 1 year 5 2 131.98 0.00 0.00 131.98
24
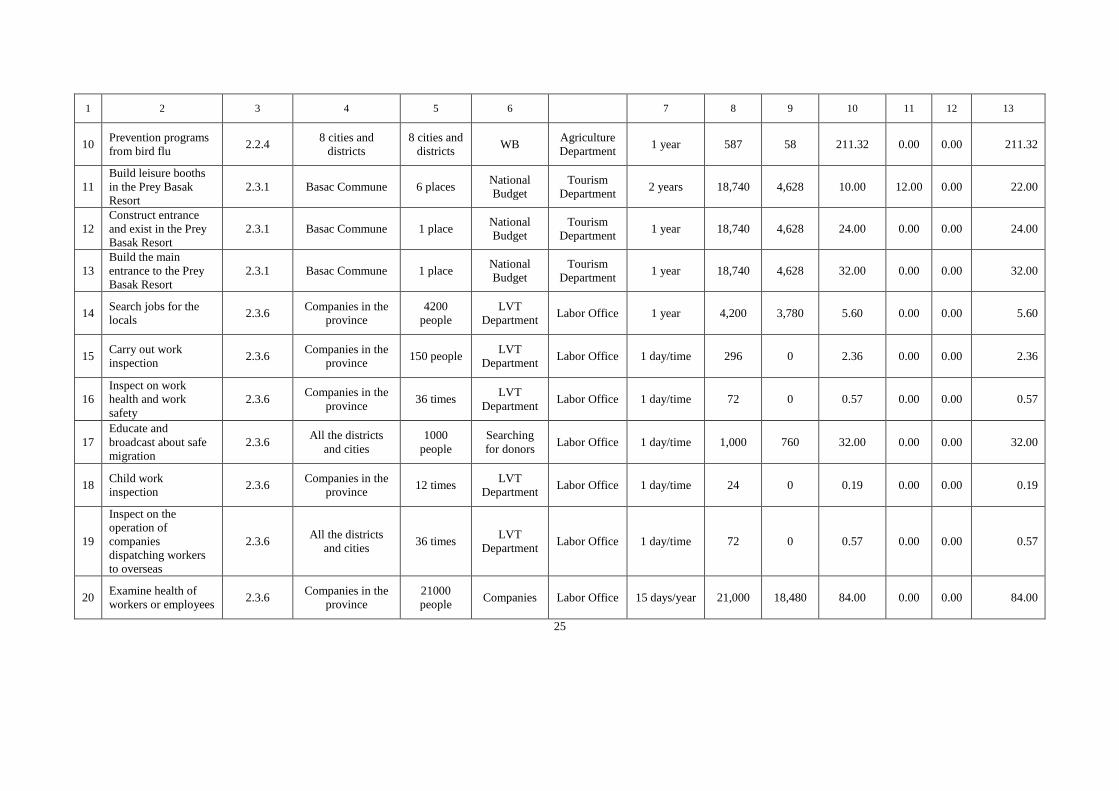
1 2 3 4 5 6 7 8 9 10 11 12 13
10 Prevention programs
from bird flu 2.2.4
8 cities and
districts
8 cities and
districts WB
Agriculture
Department 1 year 587 58 211.32 0.00 0.00 211.32
11
Build leisure booths
in the Prey Basak
Resort
2.3.1 Basac Commune 6 places National
Budget
Tourism
Department 2 years 18,740 4,628 10.00 12.00 0.00 22.00
12
Construct entrance
and exist in the Prey
Basak Resort
2.3.1 Basac Commune 1 place National
Budget
Tourism
Department 1 year 18,740 4,628 24.00 0.00 0.00 24.00
13
Build the main
entrance to the Prey
Basak Resort
2.3.1 Basac Commune 1 place National
Budget
Tourism
Department 1 year 18,740 4,628 32.00 0.00 0.00 32.00
14 Search jobs for the
locals 2.3.6
Companies in the
province
4200
people
LVT
Department Labor Office 1 year 4,200 3,780 5.60 0.00 0.00 5.60
15 Carry out work
inspection 2.3.6
Companies in the
province 150 people
LVT
Department Labor Office 1 day/time 296 0 2.36 0.00 0.00 2.36
16
Inspect on work
health and work
safety
2.3.6 Companies in the
province 36 times
LVT
Department Labor Office 1 day/time 72 0 0.57 0.00 0.00 0.57
17
Educate and
broadcast about safe
migration
2.3.6 All the districts
and cities
1000
people
Searching
for donors Labor Office 1 day/time 1,000 760 32.00 0.00 0.00 32.00
18 Child work
inspection 2.3.6
Companies in the
province 12 times
LVT
Department Labor Office 1 day/time 24 0 0.19 0.00 0.00 0.19
19
Inspect on the
operation of
companies
dispatching workers
to overseas
2.3.6 All the districts
and cities 36 times
LVT
Department Labor Office 1 day/time 72 0 0.57 0.00 0.00 0.57
20 Examine health of
workers or employees 2.3.6
Companies in the
province
21000
people Companies Labor Office 15 days/year 21,000 18,480 84.00 0.00 0.00 84.00
25
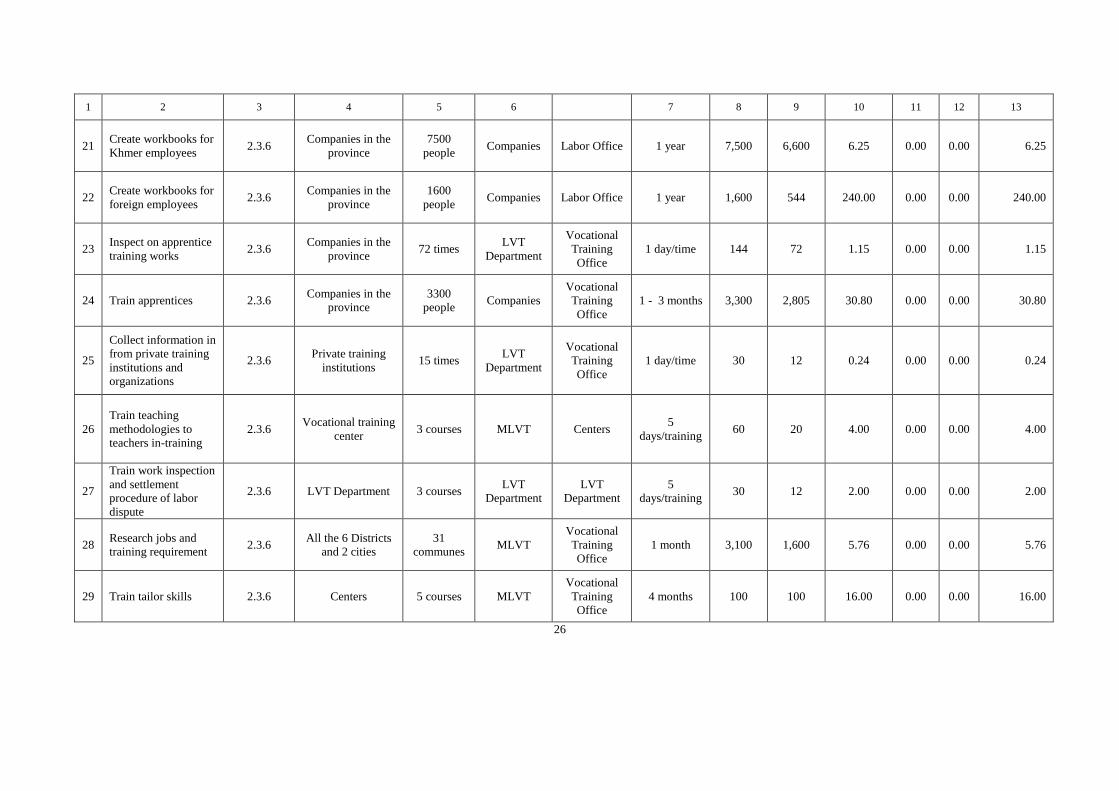
1 2 3 4 5 6 7 8 9 10 11 12 13
21 Create workbooks for
Khmer employees 2.3.6
Companies in the
province
7500
people Companies Labor Office 1 year 7,500 6,600 6.25 0.00 0.00 6.25
22 Create workbooks for
foreign employees 2.3.6
Companies in the
province
1600
people Companies Labor Office 1 year 1,600 544 240.00 0.00 0.00 240.00
23 Inspect on apprentice
training works 2.3.6
Companies in the
province 72 times
LVT
Department
Vocational
Training
Office
1 day/time 144 72 1.15 0.00 0.00 1.15
24 Train apprentices 2.3.6 Companies in the
province
3300
people Companies
Vocational
Training
Office
1 - 3 months 3,300 2,805 30.80 0.00 0.00 30.80
25
Collect information in
from private training
institutions and
organizations
2.3.6 Private training
institutions 15 times
LVT
Department
Vocational
Training
Office
1 day/time 30 12 0.24 0.00 0.00 0.24
26
Train teaching
methodologies to
teachers in-training
2.3.6 Vocational training
center 3 courses MLVT Centers
5
days/training 60 20 4.00 0.00 0.00 4.00
27
Train work inspection
and settlement
procedure of labor
dispute
2.3.6 LVT Department 3 courses LVT
Department
LVT
Department
5
days/training 30 12 2.00 0.00 0.00 2.00
28 Research jobs and
training requirement 2.3.6
All the 6 Districts
and 2 cities
31
communes MLVT
Vocational
Training
Office
1 month 3,100 1,600 5.76 0.00 0.00 5.76
29 Train tailor skills 2.3.6 Centers 5 courses MLVT
Vocational
Training
Office
4 months 100 100 16.00 0.00 0.00 16.00
26
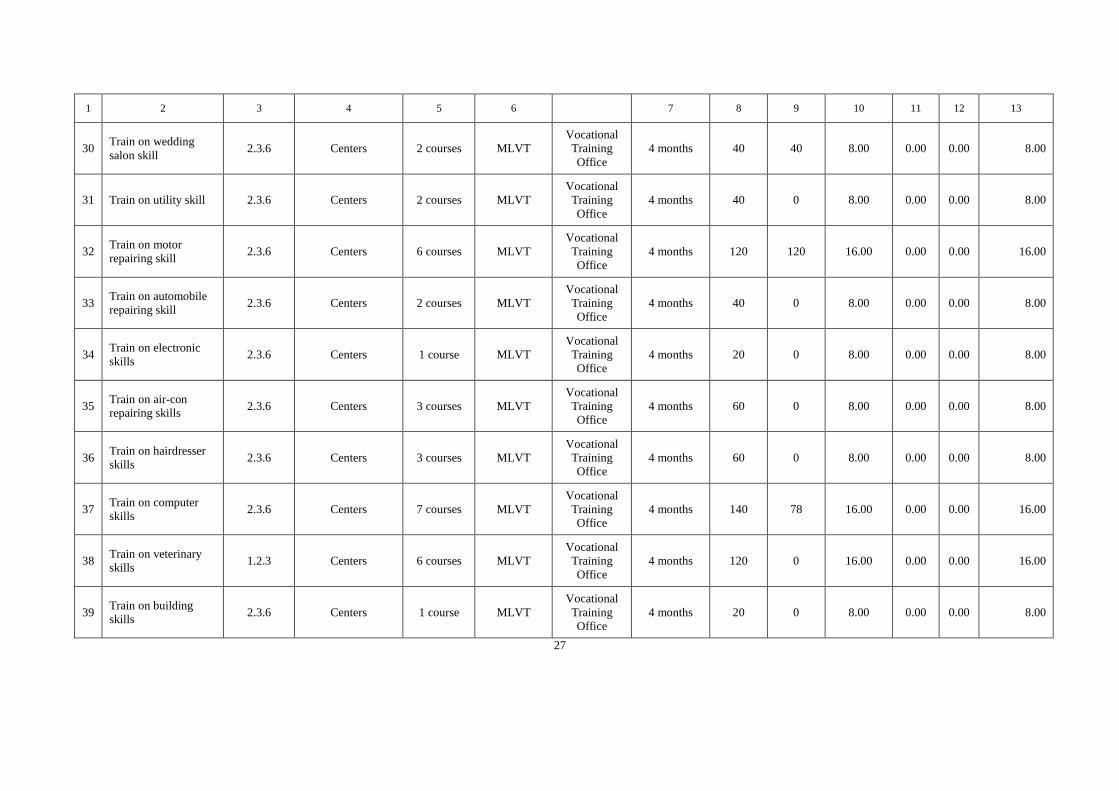
1 2 3 4 5 6 7 8 9 10 11 12 13
30 Train on wedding
salon skill 2.3.6 Centers 2 courses MLVT
Vocational
Training
Office
4 months 40 40 8.00 0.00 0.00 8.00
31 Train on utility skill 2.3.6 Centers 2 courses MLVT
Vocational
Training
Office
4 months 40 0 8.00 0.00 0.00 8.00
32 Train on motor
repairing skill 2.3.6 Centers 6 courses MLVT
Vocational
Training
Office
4 months 120 120 16.00 0.00 0.00 16.00
33 Train on automobile
repairing skill 2.3.6 Centers 2 courses MLVT
Vocational
Training
Office
4 months 40 0 8.00 0.00 0.00 8.00
34 Train on electronic
skills 2.3.6 Centers 1 course MLVT
Vocational
Training
Office
4 months 20 0 8.00 0.00 0.00 8.00
35 Train on air-con
repairing skills 2.3.6 Centers 3 courses MLVT
Vocational
Training
Office
4 months 60 0 8.00 0.00 0.00 8.00
36 Train on hairdresser
skills 2.3.6 Centers 3 courses MLVT
Vocational
Training
Office
4 months 60 0 8.00 0.00 0.00 8.00
37 Train on computer
skills 2.3.6 Centers 7 courses MLVT
Vocational
Training
Office
4 months 140 78 16.00 0.00 0.00 16.00
38 Train on veterinary
skills 1.2.3 Centers 6 courses MLVT
Vocational
Training
Office
4 months 120 0 16.00 0.00 0.00 16.00
39 Train on building
skills 2.3.6 Centers 1 course MLVT
Vocational
Training
Office
4 months 20 0 8.00 0.00 0.00 8.00
27
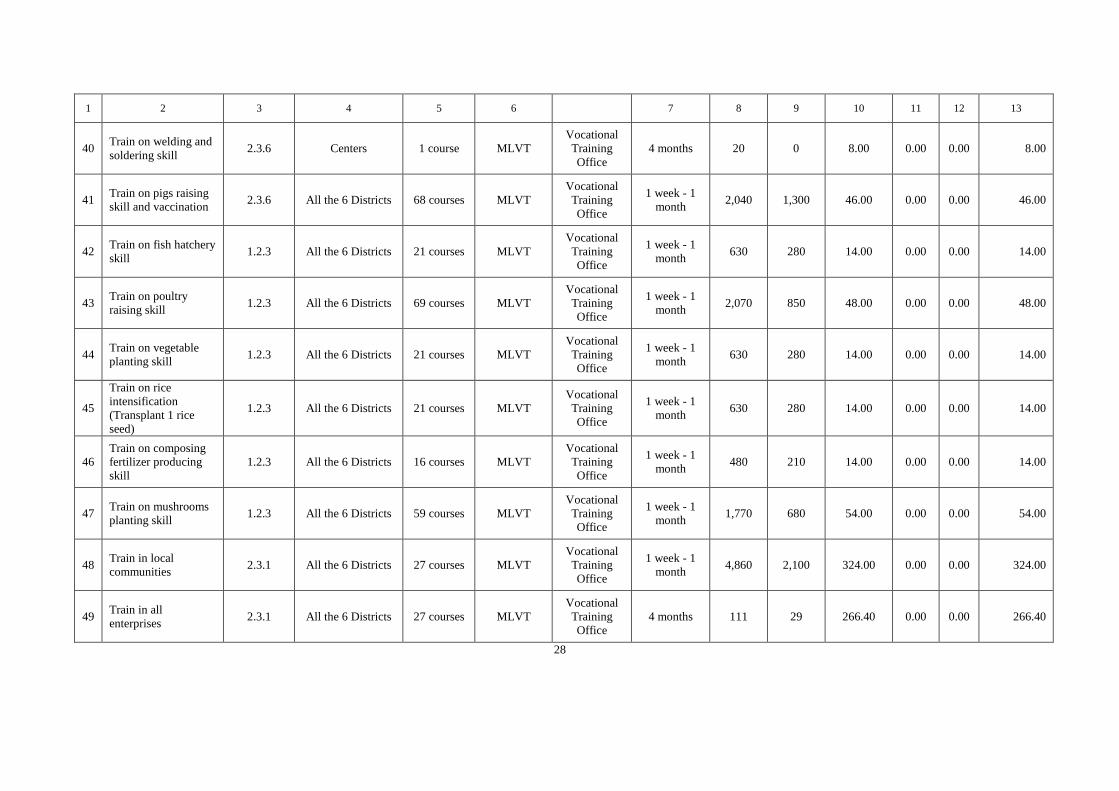
1 2 3 4 5 6 7 8 9 10 11 12 13
40 Train on welding and
soldering skill 2.3.6 Centers 1 course MLVT
Vocational
Training
Office
4 months 20 0 8.00 0.00 0.00 8.00
41 Train on pigs raising
skill and vaccination 2.3.6 All the 6 Districts 68 courses MLVT
Vocational
Training
Office
1 week - 1
month 2,040 1,300 46.00 0.00 0.00 46.00
42 Train on fish hatchery
skill 1.2.3 All the 6 Districts 21 courses MLVT
Vocational
Training
Office
1 week - 1
month 630 280 14.00 0.00 0.00 14.00
43 Train on poultry
raising skill 1.2.3 All the 6 Districts 69 courses MLVT
Vocational
Training
Office
1 week - 1
month 2,070 850 48.00 0.00 0.00 48.00
44 Train on vegetable
planting skill 1.2.3 All the 6 Districts 21 courses MLVT
Vocational
Training
Office
1 week - 1
month 630 280 14.00 0.00 0.00 14.00
45
Train on rice
intensification
(Transplant 1 rice
seed)
1.2.3 All the 6 Districts 21 courses MLVT
Vocational
Training
Office
1 week - 1
month 630 280 14.00 0.00 0.00 14.00
46
Train on composing
fertilizer producing
skill
1.2.3 All the 6 Districts 16 courses MLVT
Vocational
Training
Office
1 week - 1
month 480 210 14.00 0.00 0.00 14.00
47 Train on mushrooms
planting skill 1.2.3 All the 6 Districts 59 courses MLVT
Vocational
Training
Office
1 week - 1
month 1,770 680 54.00 0.00 0.00 54.00
48 Train in local
communities 2.3.1 All the 6 Districts 27 courses MLVT
Vocational
Training
Office
1 week - 1
month 4,860 2,100 324.00 0.00 0.00 324.00
49 Train in all
enterprises 2.3.1 All the 6 Districts 27 courses MLVT
Vocational
Training
Office
4 months 111 29 266.40 0.00 0.00 266.40
28
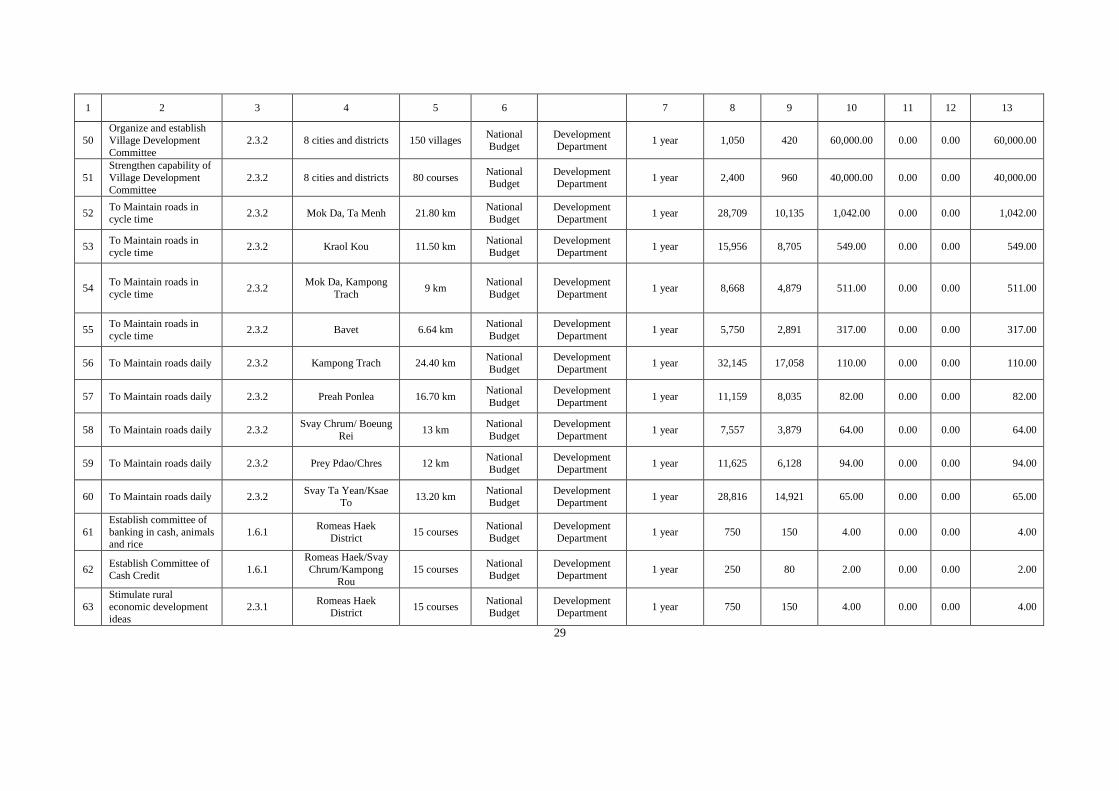
1 2 3 4 5 6 7 8 9 10 11 12 13
50
Organize and establish
Village Development
Committee
2.3.2 8 cities and districts 150 villages National Budget
Development Department
1 year 1,050 420 60,000.00 0.00 0.00 60,000.00
51
Strengthen capability of
Village Development
Committee
2.3.2 8 cities and districts 80 courses National Budget
Development Department
1 year 2,400 960 40,000.00 0.00 0.00 40,000.00
52 To Maintain roads in
cycle time 2.3.2 Mok Da, Ta Menh 21.80 km
National
Budget
Development
Department 1 year 28,709 10,135 1,042.00 0.00 0.00 1,042.00
53 To Maintain roads in
cycle time 2.3.2 Kraol Kou 11.50 km
National
Budget
Development
Department 1 year 15,956 8,705 549.00 0.00 0.00 549.00
54 To Maintain roads in
cycle time 2.3.2
Mok Da, Kampong
Trach 9 km
National
Budget
Development
Department 1 year 8,668 4,879 511.00 0.00 0.00 511.00
55 To Maintain roads in
cycle time 2.3.2 Bavet 6.64 km
National
Budget
Development
Department 1 year 5,750 2,891 317.00 0.00 0.00 317.00
56 To Maintain roads daily 2.3.2 Kampong Trach 24.40 km National
Budget
Development
Department 1 year 32,145 17,058 110.00 0.00 0.00 110.00
57 To Maintain roads daily 2.3.2 Preah Ponlea 16.70 km National
Budget
Development
Department 1 year 11,159 8,035 82.00 0.00 0.00 82.00
58 To Maintain roads daily 2.3.2 Svay Chrum/ Boeung
Rei 13 km
National
Budget
Development
Department 1 year 7,557 3,879 64.00 0.00 0.00 64.00
59 To Maintain roads daily 2.3.2 Prey Pdao/Chres 12 km National Budget
Development Department
1 year 11,625 6,128 94.00 0.00 0.00 94.00
60 To Maintain roads daily 2.3.2 Svay Ta Yean/Ksae
To 13.20 km
National Budget
Development Department
1 year 28,816 14,921 65.00 0.00 0.00 65.00
61
Establish committee of
banking in cash, animals and rice
1.6.1 Romeas Haek
District 15 courses
National
Budget
Development
Department 1 year 750 150 4.00 0.00 0.00 4.00
62 Establish Committee of Cash Credit
1.6.1
Romeas Haek/Svay
Chrum/Kampong
Rou
15 courses National Budget
Development Department
1 year 250 80 2.00 0.00 0.00 2.00
63
Stimulate rural
economic development
ideas
2.3.1 Romeas Haek
District 15 courses
National Budget
Development Department
1 year 750 150 4.00 0.00 0.00 4.00
29
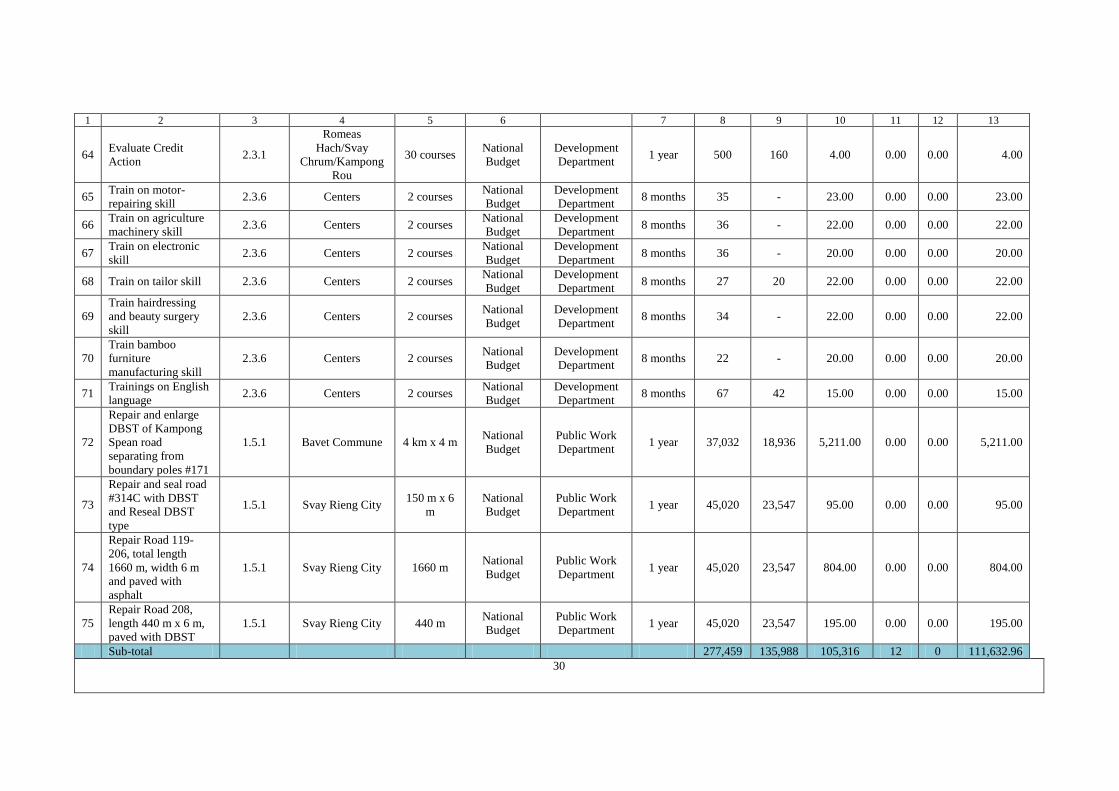
1 2 3 4 5 6 7 8 9 10 11 12 13
64 Evaluate Credit
Action 2.3.1
Romeas
Hach/Svay
Chrum/Kampong
Rou
30 courses National
Budget
Development
Department 1 year 500 160 4.00 0.00 0.00 4.00
65 Train on motor-
repairing skill 2.3.6 Centers 2 courses
National
Budget
Development
Department 8 months 35 - 23.00 0.00 0.00 23.00
66 Train on agriculture
machinery skill 2.3.6 Centers 2 courses
National
Budget
Development
Department 8 months 36 - 22.00 0.00 0.00 22.00
67 Train on electronic
skill 2.3.6 Centers 2 courses
National
Budget
Development
Department 8 months 36 - 20.00 0.00 0.00 20.00
68 Train on tailor skill 2.3.6 Centers 2 courses National
Budget
Development
Department 8 months 27 20 22.00 0.00 0.00 22.00
69
Train hairdressing
and beauty surgery
skill
2.3.6 Centers 2 courses National
Budget
Development
Department 8 months 34 - 22.00 0.00 0.00 22.00
70
Train bamboo
furniture
manufacturing skill
2.3.6 Centers 2 courses National
Budget
Development
Department 8 months 22 - 20.00 0.00 0.00 20.00
71 Trainings on English
language 2.3.6 Centers 2 courses
National
Budget
Development
Department 8 months 67 42 15.00 0.00 0.00 15.00
72
Repair and enlarge
DBST of Kampong
Spean road
separating from
boundary poles #171
1.5.1 Bavet Commune 4 km x 4 m National
Budget
Public Work
Department 1 year 37,032 18,936 5,211.00 0.00 0.00 5,211.00
73
Repair and seal road
#314C with DBST
and Reseal DBST
type
1.5.1 Svay Rieng City 150 m x 6
m
National
Budget
Public Work
Department 1 year 45,020 23,547 95.00 0.00 0.00 95.00
74
Repair Road 119-
206, total length
1660 m, width 6 m
and paved with
asphalt
1.5.1 Svay Rieng City 1660 m National
Budget
Public Work
Department 1 year 45,020 23,547 804.00 0.00 0.00 804.00
75
Repair Road 208,
length 440 m x 6 m,
paved with DBST
1.5.1 Svay Rieng City 440 m National
Budget
Public Work
Department 1 year 45,020 23,547 195.00 0.00 0.00 195.00
Sub-total 277,459 135,988 105,316 12 0 111,632.96
30
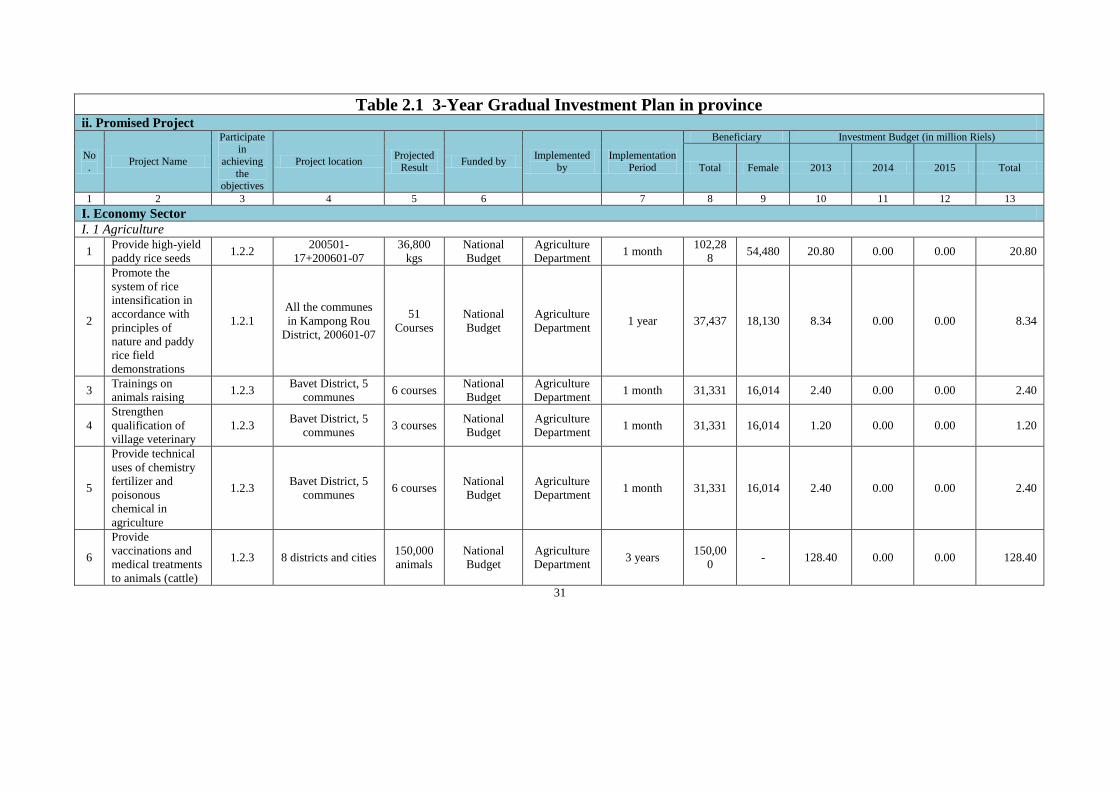
Table 2.1 3-Year Gradual Investment Plan in province ii. Promised Project
No.
Project Name
Participate in
achieving
the objectives
Project location Projected
Result Funded by
Implemented by
Implementation Period
Beneficiary Investment Budget (in million Riels)
Total Female 2013 2014 2015 Total
1 2 3 4 5 6 7 8 9 10 11 12 13
I. Economy Sector
I. 1 Agriculture
1 Provide high-yield
paddy rice seeds 1.2.2
200501-
17+200601-07
36,800
kgs
National
Budget
Agriculture
Department 1 month
102,28
8 54,480 20.80 0.00 0.00 20.80
2
Promote the
system of rice
intensification in
accordance with
principles of
nature and paddy
rice field
demonstrations
1.2.1
All the communes
in Kampong Rou
District, 200601-07
51
Courses
National
Budget
Agriculture
Department 1 year 37,437 18,130 8.34 0.00 0.00 8.34
3 Trainings on
animals raising 1.2.3
Bavet District, 5
communes 6 courses
National
Budget
Agriculture
Department 1 month 31,331 16,014 2.40 0.00 0.00 2.40
4
Strengthen
qualification of
village veterinary
1.2.3 Bavet District, 5
communes 3 courses
National
Budget
Agriculture
Department 1 month 31,331 16,014 1.20 0.00 0.00 1.20
5
Provide technical
uses of chemistry
fertilizer and
poisonous
chemical in
agriculture
1.2.3 Bavet District, 5
communes 6 courses
National
Budget
Agriculture
Department 1 month 31,331 16,014 2.40 0.00 0.00 2.40
6
Provide
vaccinations and
medical treatments
to animals (cattle)
1.2.3 8 districts and cities 150,000
animals
National
Budget
Agriculture
Department 3 years
150,00
0 - 128.40 0.00 0.00 128.40
31
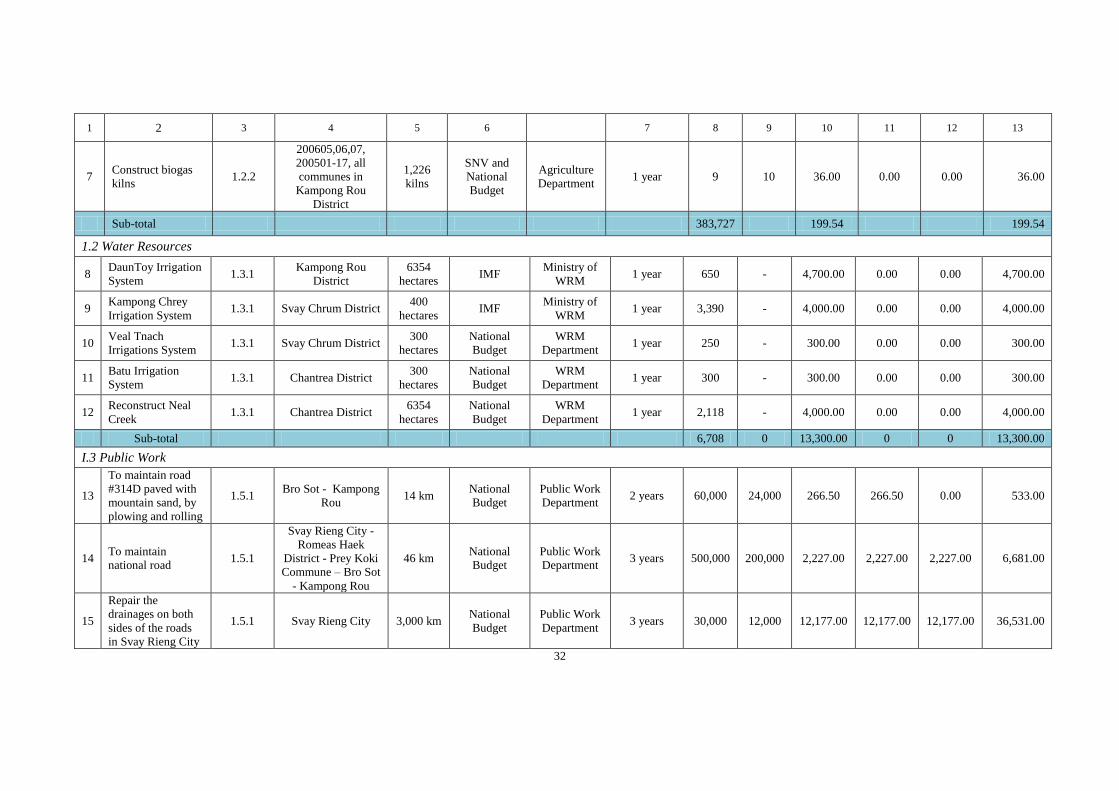
1 2 3 4 5 6 7 8 9 10 11 12 13
7 Construct biogas
kilns 1.2.2
200605,06,07,
200501-17, all
communes in
Kampong Rou
District
1,226
kilns
SNV and
National
Budget
Agriculture
Department 1 year 9 10 36.00 0.00 0.00 36.00
Sub-total 383,727 199.54 199.54
1.2 Water Resources
8 DaunToy Irrigation
System 1.3.1
Kampong Rou
District
6354
hectares IMF
Ministry of
WRM 1 year 650 - 4,700.00 0.00 0.00 4,700.00
9 Kampong Chrey
Irrigation System 1.3.1 Svay Chrum District
400
hectares IMF
Ministry of
WRM 1 year 3,390 - 4,000.00 0.00 0.00 4,000.00
10 Veal Tnach
Irrigations System 1.3.1 Svay Chrum District
300
hectares
National
Budget
WRM
Department 1 year 250 - 300.00 0.00 0.00 300.00
11 Batu Irrigation
System 1.3.1 Chantrea District
300
hectares
National
Budget
WRM
Department 1 year 300 - 300.00 0.00 0.00 300.00
12 Reconstruct Neal
Creek 1.3.1 Chantrea District
6354
hectares
National
Budget
WRM
Department 1 year 2,118 - 4,000.00 0.00 0.00 4,000.00
Sub-total 6,708 0 13,300.00 0 0 13,300.00
I.3 Public Work
13
To maintain road
#314D paved with
mountain sand, by
plowing and rolling
1.5.1 Bro Sot - Kampong
Rou 14 km
National
Budget
Public Work
Department 2 years 60,000 24,000 266.50 266.50 0.00 533.00
14 To maintain
national road 1.5.1
Svay Rieng City -
Romeas Haek
District - Prey Koki
Commune – Bro Sot
- Kampong Rou
46 km National
Budget
Public Work
Department 3 years 500,000 200,000 2,227.00 2,227.00 2,227.00 6,681.00
15
Repair the
drainages on both
sides of the roads
in Svay Rieng City
1.5.1 Svay Rieng City 3,000 km National
Budget
Public Work
Department 3 years 30,000 12,000 12,177.00 12,177.00 12,177.00 36,531.00
32
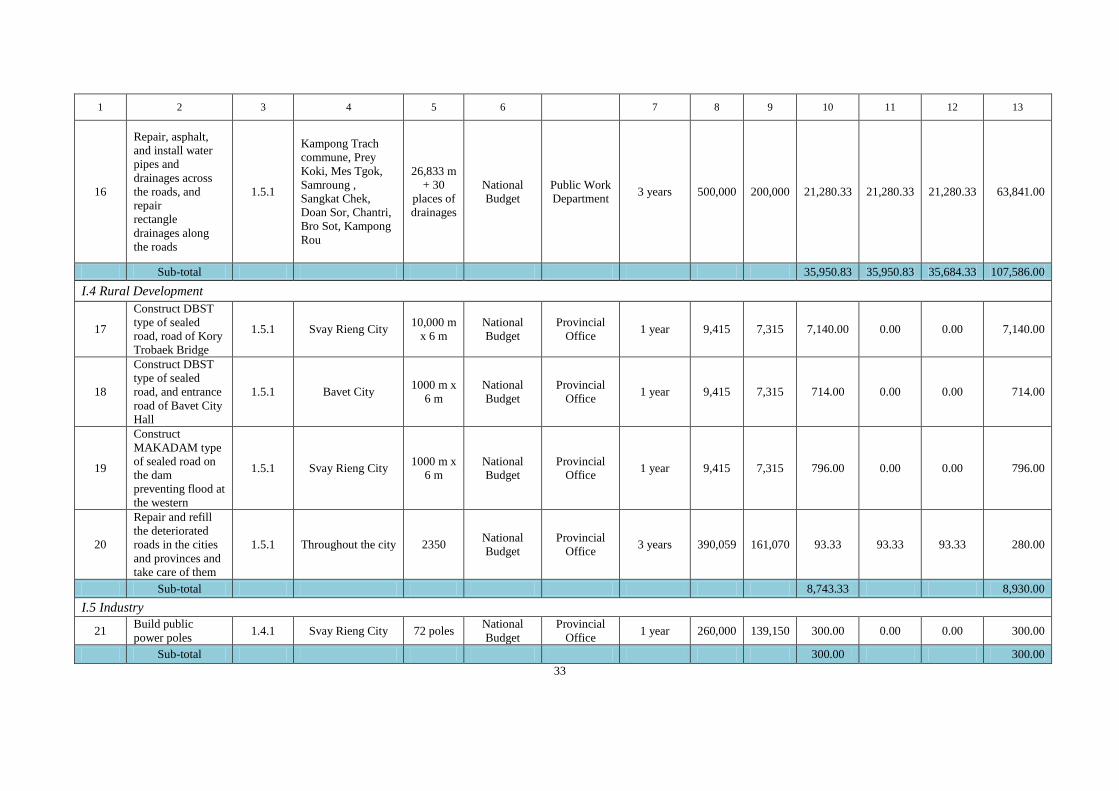
1 2 3 4 5 6 7 8 9 10 11 12 13
16
Repair, asphalt,
and install water
pipes and
drainages across
the roads, and
repair
rectangle
drainages along
the roads
1.5.1
Kampong Trach
commune, Prey
Koki, Mes Tgok,
Samroung ,
Sangkat Chek,
Doan Sor, Chantri,
Bro Sot, Kampong
Rou
26,833 m
+ 30
places of
drainages
National
Budget
Public Work
Department 3 years 500,000 200,000 21,280.33 21,280.33 21,280.33 63,841.00
Sub-total 35,950.83 35,950.83 35,684.33 107,586.00
I.4 Rural Development
17
Construct DBST
type of sealed
road, road of Kory
Trobaek Bridge
1.5.1 Svay Rieng City 10,000 m
x 6 m
National
Budget
Provincial
Office 1 year 9,415 7,315 7,140.00 0.00 0.00 7,140.00
18
Construct DBST
type of sealed
road, and entrance
road of Bavet City
Hall
1.5.1 Bavet City 1000 m x
6 m
National
Budget
Provincial
Office 1 year 9,415 7,315 714.00 0.00 0.00 714.00
19
Construct
MAKADAM type
of sealed road on
the dam
preventing flood at
the western
1.5.1 Svay Rieng City 1000 m x
6 m
National
Budget
Provincial
Office 1 year 9,415 7,315 796.00 0.00 0.00 796.00
20
Repair and refill
the deteriorated
roads in the cities
and provinces and
take care of them
1.5.1 Throughout the city 2350 National
Budget
Provincial
Office 3 years 390,059 161,070 93.33 93.33 93.33 280.00
Sub-total 8,743.33 8,930.00
I.5 Industry
21 Build public
power poles 1.4.1 Svay Rieng City 72 poles
National
Budget
Provincial
Office 1 year 260,000 139,150 300.00 0.00 0.00 300.00
Sub-total 300.00 300.00
33
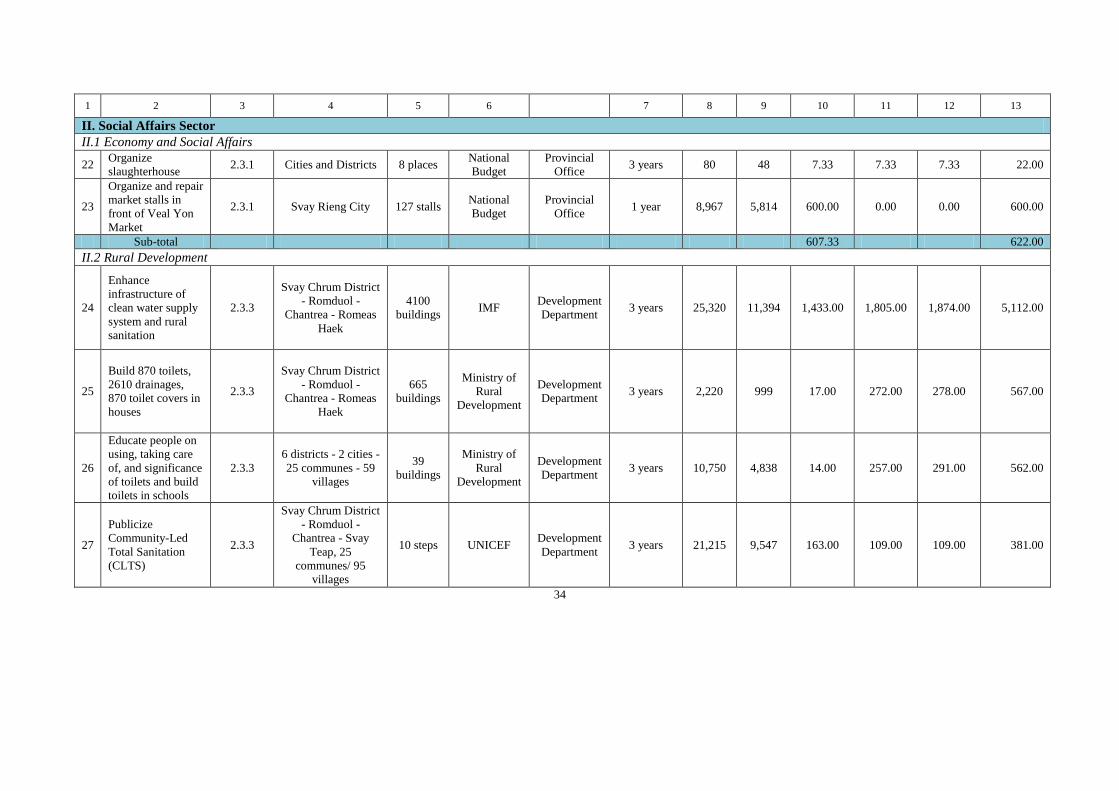
1 2 3 4 5 6 7 8 9 10 11 12 13
II. Social Affairs Sector
II.1 Economy and Social Affairs
22 Organize
slaughterhouse 2.3.1 Cities and Districts 8 places
National
Budget
Provincial
Office 3 years 80 48 7.33 7.33 7.33 22.00
23
Organize and repair
market stalls in
front of Veal Yon
Market
2.3.1 Svay Rieng City 127 stalls National
Budget
Provincial
Office 1 year 8,967 5,814 600.00 0.00 0.00 600.00
Sub-total 607.33 622.00
II.2 Rural Development
24
Enhance
infrastructure of
clean water supply
system and rural
sanitation
2.3.3
Svay Chrum District
- Romduol -
Chantrea - Romeas
Haek
4100
buildings IMF
Development
Department 3 years 25,320 11,394 1,433.00 1,805.00 1,874.00 5,112.00
25
Build 870 toilets,
2610 drainages,
870 toilet covers in
houses
2.3.3
Svay Chrum District
- Romduol -
Chantrea - Romeas
Haek
665
buildings
Ministry of
Rural
Development
Development
Department 3 years 2,220 999 17.00 272.00 278.00 567.00
26
Educate people on
using, taking care
of, and significance
of toilets and build
toilets in schools
2.3.3
6 districts - 2 cities -
25 communes - 59
villages
39
buildings
Ministry of
Rural
Development
Development
Department 3 years 10,750 4,838 14.00 257.00 291.00 562.00
27
Publicize
Community-Led
Total Sanitation
(CLTS)
2.3.3
Svay Chrum District
- Romduol -
Chantrea - Svay
Teap, 25
communes/ 95
villages
10 steps UNICEF Development
Department 3 years 21,215 9,547 163.00 109.00 109.00 381.00
34
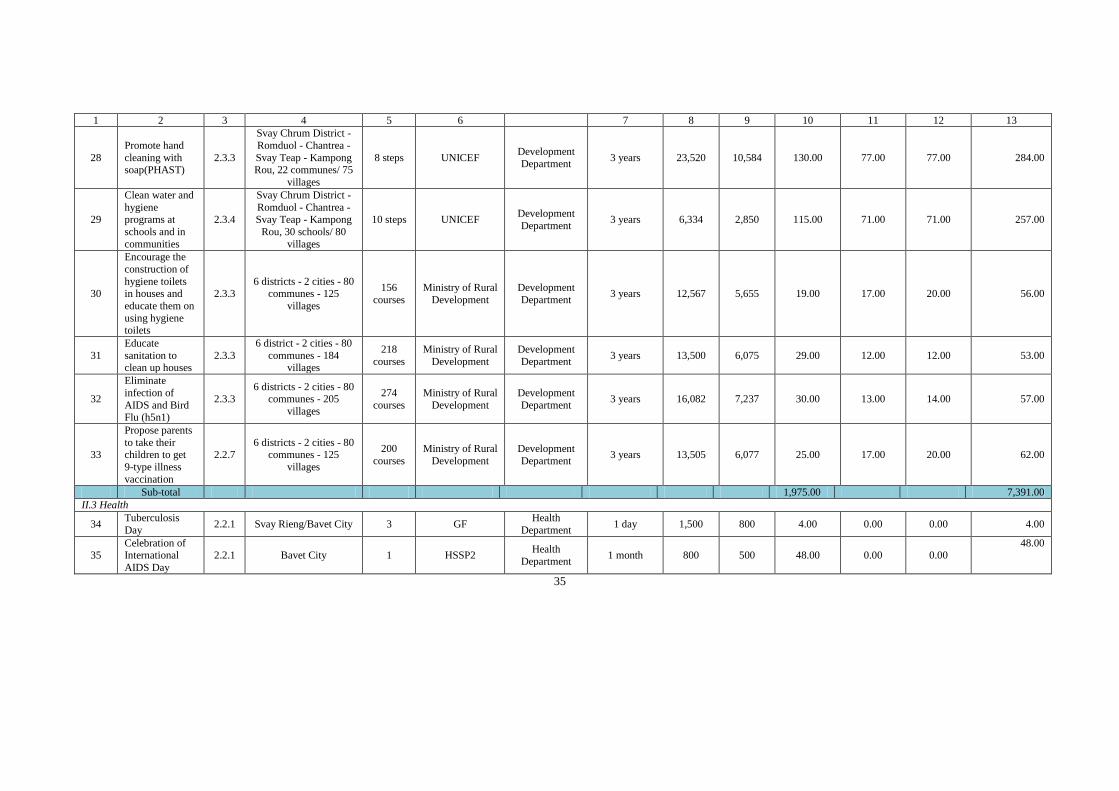
1 2 3 4 5 6 7 8 9 10 11 12 13
28
Promote hand
cleaning with soap(PHAST)
2.3.3
Svay Chrum District -
Romduol - Chantrea -
Svay Teap - Kampong Rou, 22 communes/ 75
villages
8 steps UNICEF Development
Department 3 years 23,520 10,584 130.00 77.00 77.00 284.00
29
Clean water and
hygiene programs at
schools and in
communities
2.3.4
Svay Chrum District -
Romduol - Chantrea - Svay Teap - Kampong
Rou, 30 schools/ 80
villages
10 steps UNICEF Development
Department 3 years 6,334 2,850 115.00 71.00 71.00 257.00
30
Encourage the
construction of
hygiene toilets in houses and
educate them on
using hygiene toilets
2.3.3 6 districts - 2 cities - 80
communes - 125
villages
156
courses
Ministry of Rural
Development
Development
Department 3 years 12,567 5,655 19.00 17.00 20.00 56.00
31
Educate
sanitation to clean up houses
2.3.3
6 district - 2 cities - 80
communes - 184 villages
218
courses
Ministry of Rural
Development
Development
Department 3 years 13,500 6,075 29.00 12.00 12.00 53.00
32
Eliminate
infection of
AIDS and Bird Flu (h5n1)
2.3.3 6 districts - 2 cities - 80
communes - 205
villages
274
courses
Ministry of Rural
Development
Development
Department 3 years 16,082 7,237 30.00 13.00 14.00 57.00
33
Propose parents
to take their children to get
9-type illness
vaccination
2.2.7 6 districts - 2 cities - 80
communes - 125
villages
200
courses
Ministry of Rural
Development
Development
Department 3 years 13,505 6,077 25.00 17.00 20.00 62.00
Sub-total 1,975.00 7,391.00
II.3 Health
34 Tuberculosis
Day 2.2.1 Svay Rieng/Bavet City 3 GF
Health
Department 1 day 1,500 800 4.00 0.00 0.00 4.00
35 Celebration of International
AIDS Day
2.2.1 Bavet City 1 HSSP2 Health
Department 1 month 800 500 48.00 0.00 0.00
48.00
35
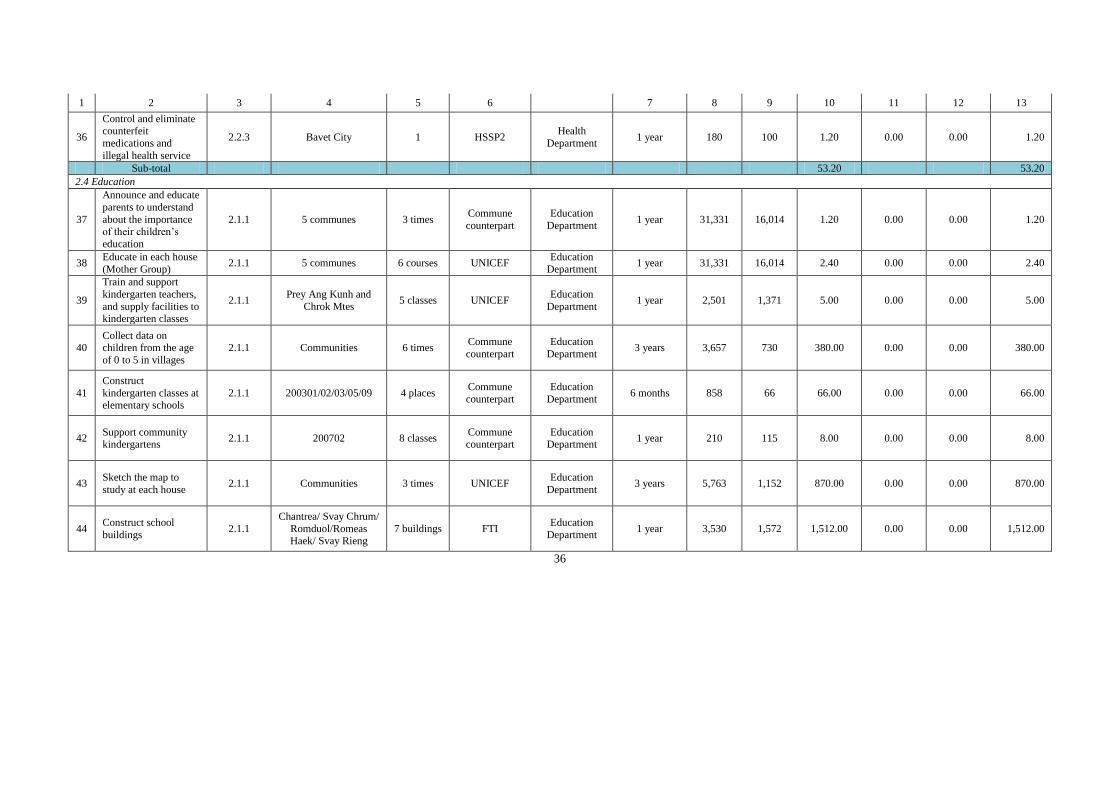
1 2 3 4 5 6 7 8 9 10 11 12 13
36
Control and eliminate counterfeit
medications and
illegal health service
2.2.3 Bavet City 1 HSSP2 Health
Department 1 year 180 100 1.20 0.00 0.00 1.20
Sub-total 53.20 53.20
2.4 Education
37
Announce and educate
parents to understand
about the importance of their children’s
education
2.1.1 5 communes 3 times Commune
counterpart
Education
Department 1 year 31,331 16,014 1.20 0.00 0.00 1.20
38 Educate in each house
(Mother Group) 2.1.1 5 communes 6 courses UNICEF
Education
Department 1 year 31,331 16,014 2.40 0.00 0.00 2.40
39
Train and support
kindergarten teachers,
and supply facilities to kindergarten classes
2.1.1 Prey Ang Kunh and
Chrok Mtes 5 classes UNICEF
Education
Department 1 year 2,501 1,371 5.00 0.00 0.00 5.00
40 Collect data on children from the age
of 0 to 5 in villages
2.1.1 Communities 6 times Commune
counterpart
Education
Department 3 years 3,657 730 380.00 0.00 0.00 380.00
41
Construct
kindergarten classes at elementary schools
2.1.1 200301/02/03/05/09 4 places Commune
counterpart
Education
Department 6 months 858 66 66.00 0.00 0.00 66.00
42 Support community kindergartens
2.1.1 200702 8 classes Commune counterpart
Education Department
1 year 210 115 8.00 0.00 0.00 8.00
43 Sketch the map to
study at each house 2.1.1 Communities 3 times UNICEF
Education
Department 3 years 5,763 1,152 870.00 0.00 0.00 870.00
44 Construct school
buildings 2.1.1
Chantrea/ Svay Chrum/
Romduol/Romeas Haek/ Svay Rieng
7 buildings FTI Education
Department 1 year 3,530 1,572 1,512.00 0.00 0.00 1,512.00
36
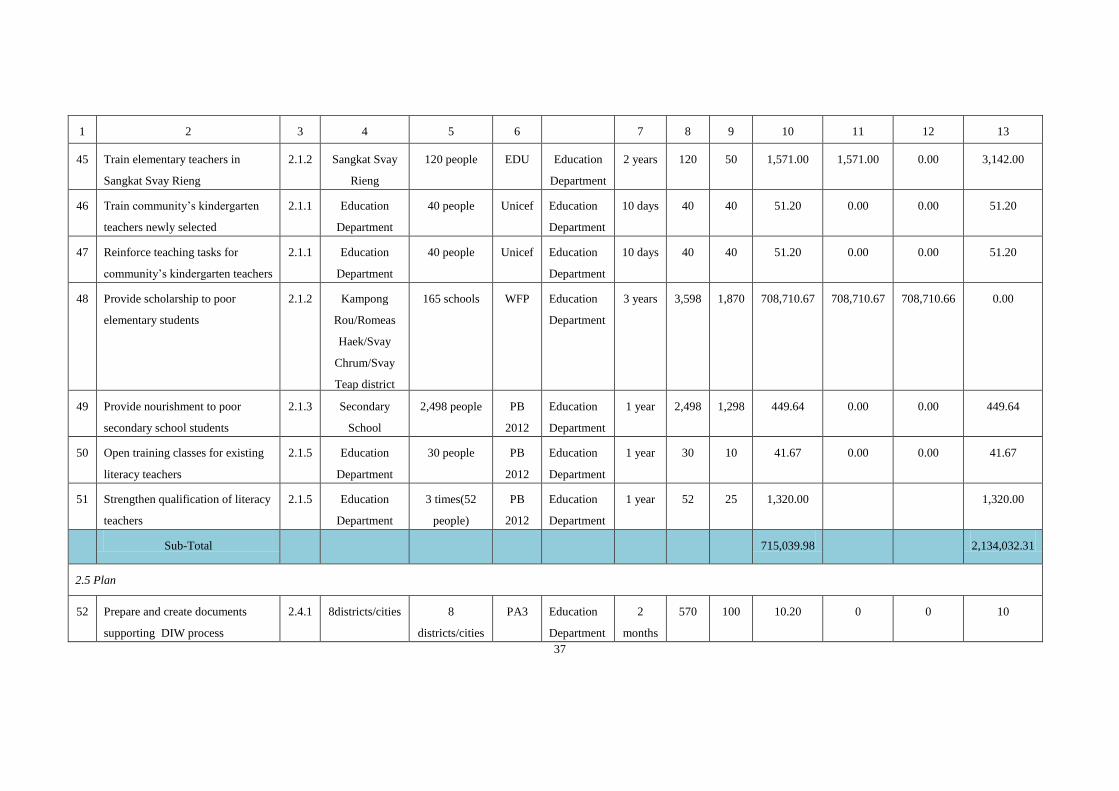
1 2 3 4 5 6 7 8 9 10 11 12 13
45 Train elementary teachers in
Sangkat Svay Rieng
2.1.2 Sangkat Svay
Rieng
120 people EDU Education
Department
2 years 120 50 1,571.00 1,571.00 0.00 3,142.00
46 Train community’s kindergarten
teachers newly selected
2.1.1 Education
Department
40 people Unicef Education
Department
10 days 40 40 51.20 0.00 0.00 51.20
47 Reinforce teaching tasks for
community’s kindergarten teachers
2.1.1 Education
Department
40 people Unicef Education
Department
10 days 40 40 51.20 0.00 0.00 51.20
48 Provide scholarship to poor
elementary students
2.1.2 Kampong
Rou/Romeas
Haek/Svay
Chrum/Svay
Teap district
165 schools WFP Education
Department
3 years 3,598 1,870 708,710.67 708,710.67 708,710.66 0.00
49 Provide nourishment to poor
secondary school students
2.1.3 Secondary
School
2,498 people PB
2012
Education
Department
1 year 2,498 1,298 449.64 0.00 0.00 449.64
50 Open training classes for existing
literacy teachers
2.1.5 Education
Department
30 people PB
2012
Education
Department
1 year 30 10 41.67 0.00 0.00 41.67
51 Strengthen qualification of literacy
teachers
2.1.5 Education
Department
3 times(52
people)
PB
2012
Education
Department
1 year 52 25 1,320.00 1,320.00
Sub-Total 715,039.98 2,134,032.31
2.5 Plan
52 Prepare and create documents
supporting DIW process
2.4.1 8districts/cities 8
districts/cities
PA3 Education
Department
2
months
570 100 10.20 0 0 10
37
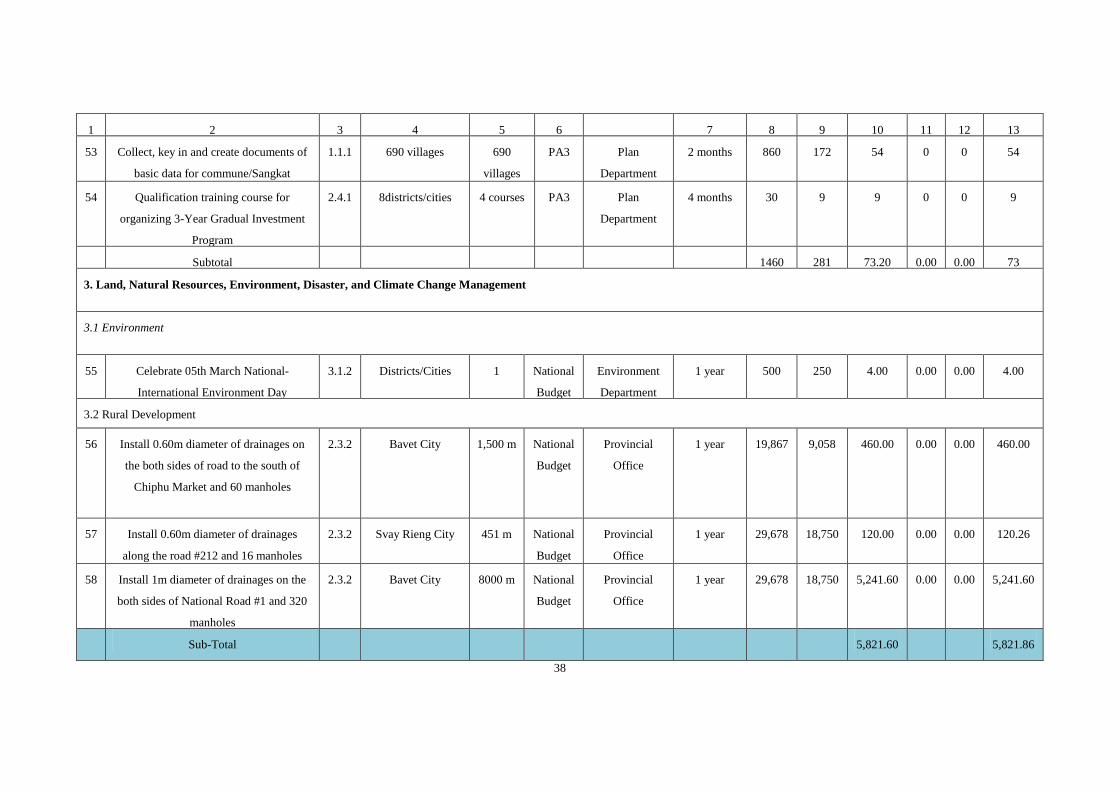
1 2 3 4 5 6 7 8 9 10 11 12 13
53 Collect, key in and create documents of
basic data for commune/Sangkat
1.1.1 690 villages 690
villages
PA3 Plan
Department
2 months 860 172 54 0 0 54
54 Qualification training course for
organizing 3-Year Gradual Investment
Program
2.4.1 8districts/cities 4 courses PA3 Plan
Department
4 months 30 9 9 0 0 9
Subtotal 1460 281 73.20 0.00 0.00 73
3. Land, Natural Resources, Environment, Disaster, and Climate Change Management
3.1 Environment
55 Celebrate 05th March National-
International Environment Day
3.1.2 Districts/Cities 1 National
Budget
Environment
Department
1 year 500 250 4.00 0.00 0.00 4.00
3.2 Rural Development
56 Install 0.60m diameter of drainages on
the both sides of road to the south of
Chiphu Market and 60 manholes
2.3.2 Bavet City 1,500 m National
Budget
Provincial
Office
1 year 19,867 9,058 460.00 0.00 0.00 460.00
57 Install 0.60m diameter of drainages
along the road #212 and 16 manholes
2.3.2 Svay Rieng City 451 m National
Budget
Provincial
Office
1 year 29,678 18,750 120.00 0.00 0.00 120.26
58 Install 1m diameter of drainages on the
both sides of National Road #1 and 320
manholes
2.3.2 Bavet City 8000 m National
Budget
Provincial
Office
1 year 29,678 18,750 5,241.60 0.00 0.00 5,241.60
Sub-Total 5,821.60 5,821.86
38
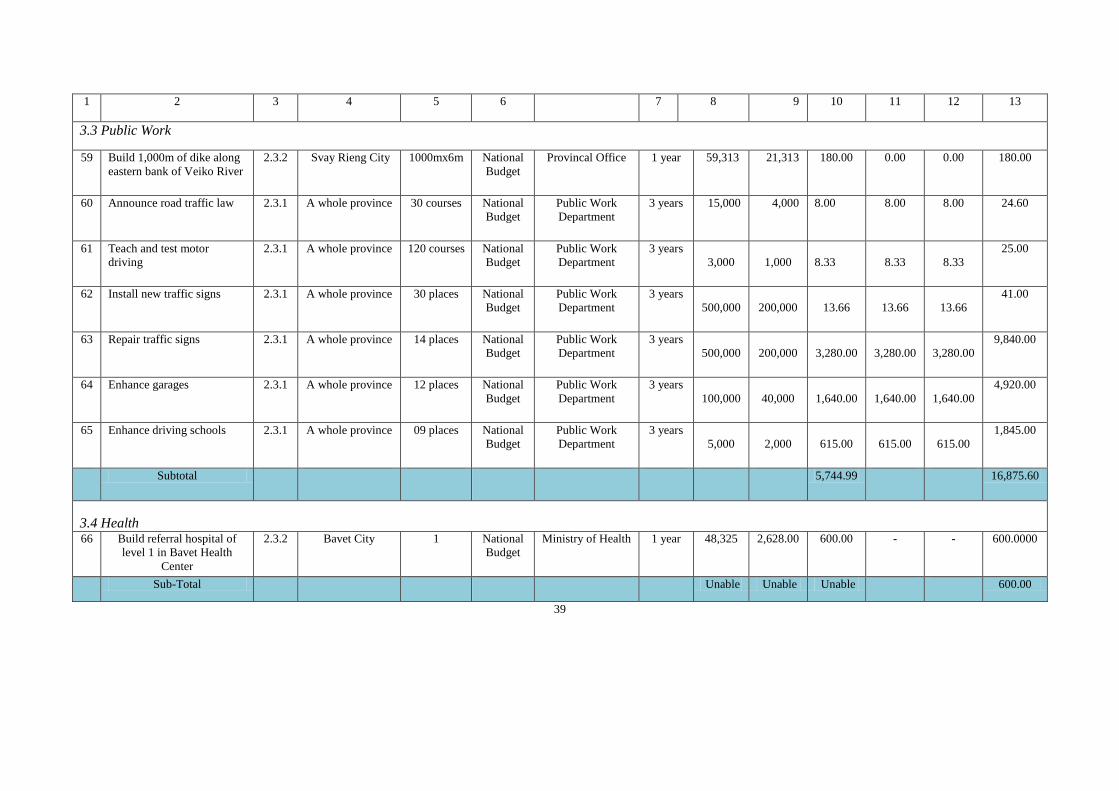
1 2 3 4 5 6 7 8 9 10 11 12 13
3.3 Public Work
59 Build 1,000m of dike along
eastern bank of Veiko River
2.3.2 Svay Rieng City 1000mx6m National
Budget
Provincal Office 1 year 59,313 21,313 180.00 0.00 0.00 180.00
60 Announce road traffic law 2.3.1 A whole province 30 courses National
Budget
Public Work
Department
3 years 15,000 4,000 8.00 8.00 8.00 24.60
61 Teach and test motor
driving
2.3.1 A whole province 120 courses National
Budget
Public Work
Department 3 years
3,000
1,000
8.33
8.33
8.33
25.00
62 Install new traffic signs 2.3.1 A whole province 30 places National
Budget
Public Work
Department 3 years
500,000
200,000
13.66
13.66
13.66
41.00
63 Repair traffic signs 2.3.1 A whole province 14 places National
Budget
Public Work
Department 3 years
500,000
200,000
3,280.00
3,280.00
3,280.00
9,840.00
64 Enhance garages 2.3.1 A whole province 12 places National
Budget
Public Work
Department 3 years
100,000
40,000
1,640.00
1,640.00
1,640.00
4,920.00
65 Enhance driving schools 2.3.1 A whole province 09 places National
Budget
Public Work
Department 3 years
5,000
2,000
615.00
615.00
615.00
1,845.00
Subtotal 5,744.99 16,875.60
3.4 Health
66 Build referral hospital of
level 1 in Bavet Health
Center
2.3.2 Bavet City 1 National
Budget
Ministry of Health 1 year 48,325 2,628.00 600.00 - - 600.0000
Sub-Total Unable Unable Unable 600.00
39
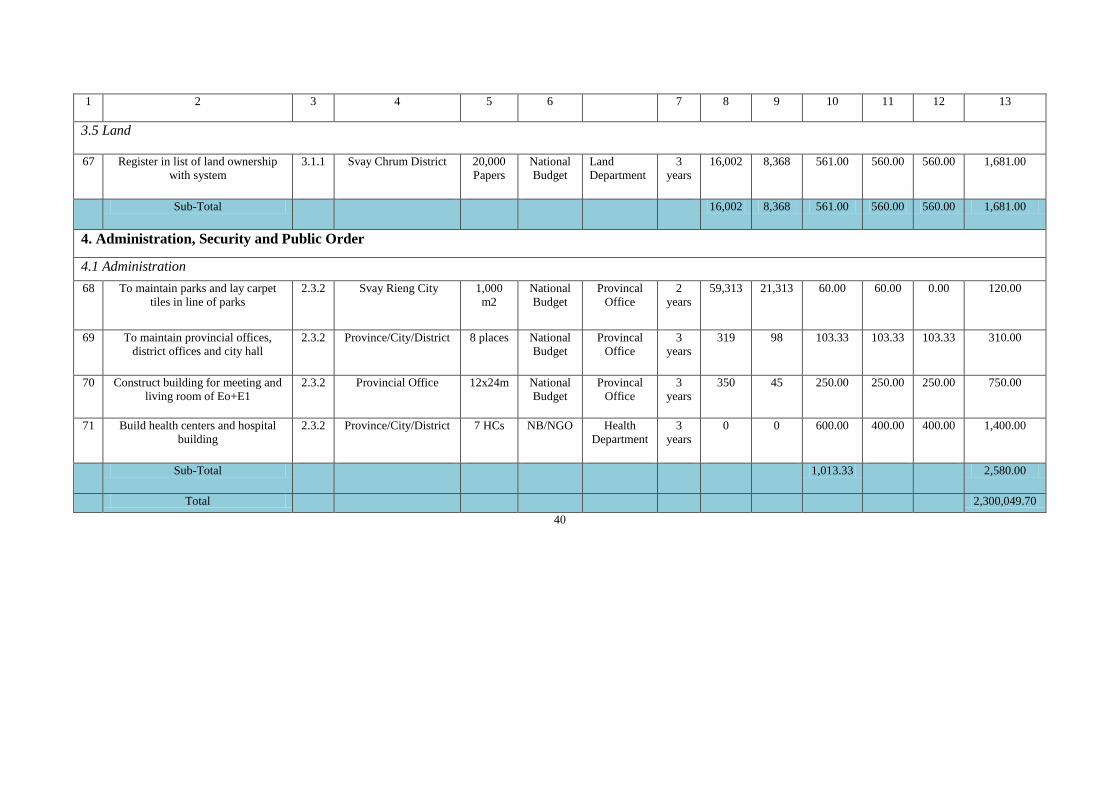
1 2 3 4 5 6 7 8 9 10 11 12 13
3.5 Land
67 Register in list of land ownership
with system
3.1.1 Svay Chrum District 20,000
Papers
National
Budget
Land
Department
3
years
16,002 8,368 561.00 560.00 560.00 1,681.00
Sub-Total 16,002 8,368 561.00 560.00 560.00 1,681.00
4. Administration, Security and Public Order
4.1 Administration
68 To maintain parks and lay carpet
tiles in line of parks
2.3.2 Svay Rieng City 1,000
m2
National
Budget
Provincal
Office
2
years
59,313 21,313 60.00 60.00 0.00 120.00
69 To maintain provincial offices,
district offices and city hall
2.3.2 Province/City/District 8 places National
Budget
Provincal
Office
3
years
319 98 103.33 103.33 103.33 310.00
70 Construct building for meeting and
living room of Eo+E1
2.3.2 Provincial Office 12x24m National
Budget
Provincal
Office
3
years
350 45 250.00 250.00 250.00 750.00
71 Build health centers and hospital
building
2.3.2 Province/City/District 7 HCs NB/NGO Health
Department
3
years
0 0 600.00 400.00 400.00 1,400.00
Sub-Total 1,013.33 2,580.00
Total 2,300,049.70
40
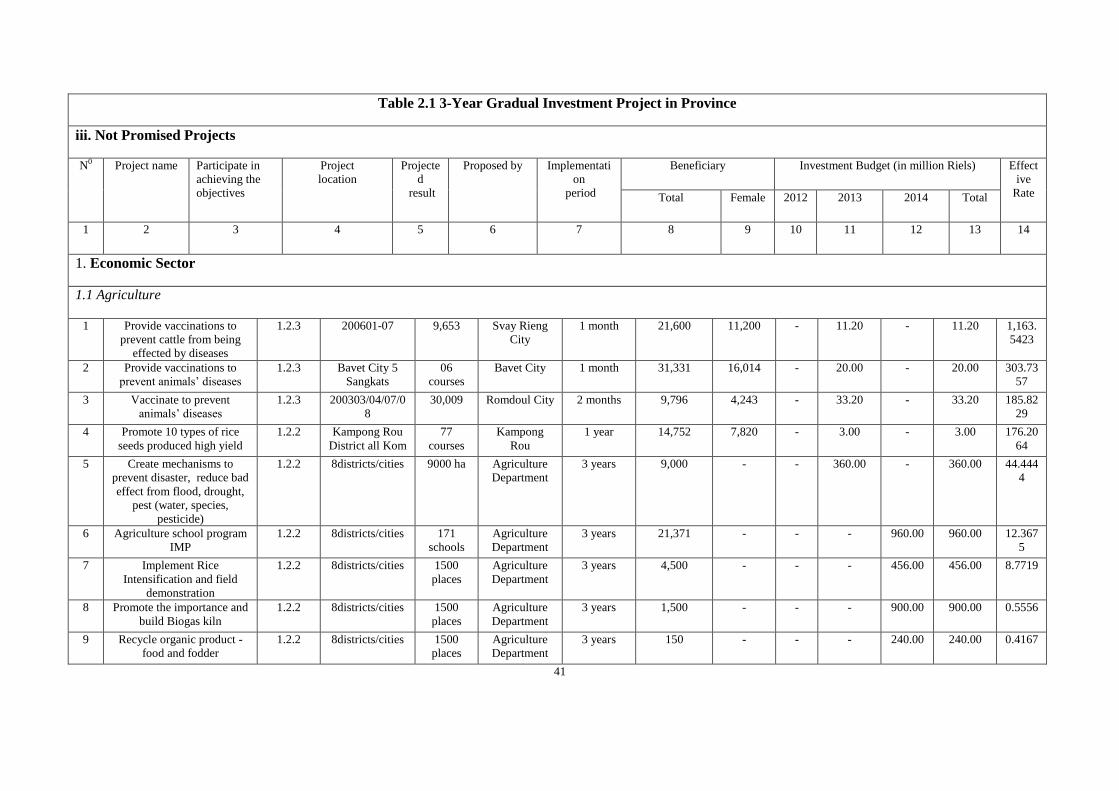
Table 2.1 3-Year Gradual Investment Project in Province
iii. Not Promised Projects
N0 Project name Participate in
achieving the
objectives
Project
location
Projecte
d
result
Proposed by Implementati
on
period
Beneficiary Investment Budget (in million Riels) Effect
ive
Rate Total Female 2012 2013 2014 Total
1 2 3 4 5 6 7 8 9 10 11 12 13 14
1. Economic Sector
1.1 Agriculture
1 Provide vaccinations to
prevent cattle from being
effected by diseases
1.2.3 200601-07 9,653 Svay Rieng
City
1 month 21,600 11,200 - 11.20 - 11.20 1,163.
5423
2 Provide vaccinations to
prevent animals’ diseases
1.2.3 Bavet City 5
Sangkats
06
courses
Bavet City 1 month 31,331 16,014 - 20.00 - 20.00 303.73
57
3 Vaccinate to prevent
animals’ diseases
1.2.3 200303/04/07/0
8
30,009 Romdoul City 2 months 9,796 4,243 - 33.20 - 33.20 185.82
29
4 Promote 10 types of rice
seeds produced high yield
1.2.2 Kampong Rou
District all Kom
77
courses
Kampong
Rou
1 year 14,752 7,820 - 3.00 - 3.00 176.20
64
5 Create mechanisms to
prevent disaster, reduce bad
effect from flood, drought,
pest (water, species,
pesticide)
1.2.2 8districts/cities 9000 ha Agriculture
Department
3 years 9,000 - - 360.00 - 360.00 44.444
4
6 Agriculture school program
IMP
1.2.2 8districts/cities 171
schools
Agriculture
Department
3 years 21,371 - - - 960.00 960.00 12.367
5
7 Implement Rice
Intensification and field
demonstration
1.2.2 8districts/cities 1500
places
Agriculture
Department
3 years 4,500 - - - 456.00 456.00 8.7719
8 Promote the importance and
build Biogas kiln
1.2.2 8districts/cities 1500
places
Agriculture
Department
3 years 1,500 - - - 900.00 900.00 0.5556
9 Recycle organic product -
food and fodder
1.2.2 8districts/cities 1500
places
Agriculture
Department
3 years 150 - - - 240.00 240.00 0.4167
41
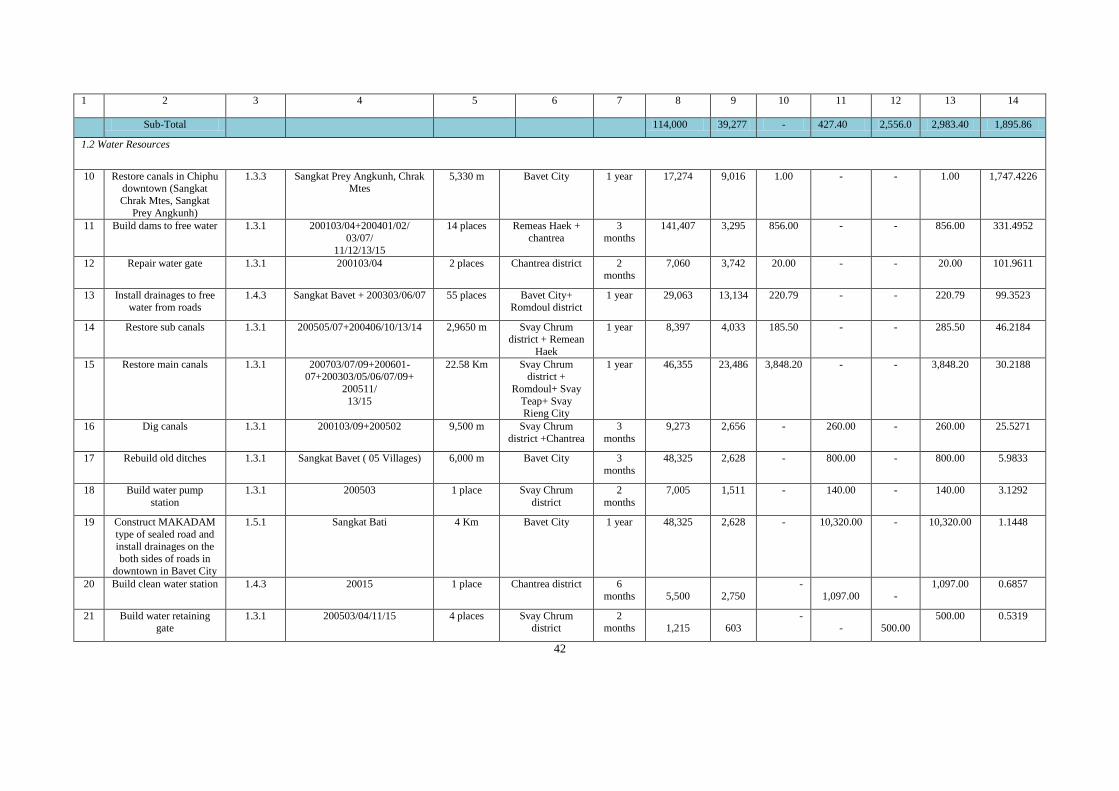
1 2 3 4 5 6 7 8 9 10 11 12 13 14
Sub-Total 114,000 39,277 - 427.40 2,556.0 2,983.40 1,895.86
1.2 Water Resources
10 Restore canals in Chiphu downtown (Sangkat
Chrak Mtes, Sangkat
Prey Angkunh)
1.3.3 Sangkat Prey Angkunh, Chrak Mtes
5,330 m Bavet City 1 year 17,274 9,016 1.00 - - 1.00 1,747.4226
11 Build dams to free water 1.3.1 200103/04+200401/02/
03/07/
11/12/13/15
14 places Remeas Haek +
chantrea
3
months
141,407 3,295 856.00 - - 856.00 331.4952
12 Repair water gate 1.3.1 200103/04 2 places Chantrea district 2 months
7,060 3,742 20.00 - - 20.00 101.9611
13 Install drainages to free water from roads
1.4.3 Sangkat Bavet + 200303/06/07 55 places Bavet City+ Romdoul district
1 year 29,063 13,134 220.79 - - 220.79 99.3523
14 Restore sub canals 1.3.1 200505/07+200406/10/13/14 2,9650 m Svay Chrum district + Remean
Haek
1 year 8,397 4,033 185.50 - - 285.50 46.2184
15 Restore main canals 1.3.1 200703/07/09+200601- 07+200303/05/06/07/09+
200511/
13/15
22.58 Km Svay Chrum district +
Romdoul+ Svay
Teap+ Svay Rieng City
1 year 46,355 23,486 3,848.20 - - 3,848.20 30.2188
16 Dig canals 1.3.1 200103/09+200502 9,500 m Svay Chrum
district +Chantrea
3
months
9,273 2,656 - 260.00 - 260.00 25.5271
17 Rebuild old ditches 1.3.1 Sangkat Bavet ( 05 Villages) 6,000 m Bavet City 3
months
48,325 2,628 - 800.00 - 800.00 5.9833
18 Build water pump
station
1.3.1 200503 1 place Svay Chrum
district
2
months
7,005 1,511 - 140.00 - 140.00 3.1292
19 Construct MAKADAM
type of sealed road and install drainages on the
both sides of roads in
downtown in Bavet City
1.5.1 Sangkat Bati 4 Km Bavet City 1 year 48,325 2,628 - 10,320.00 - 10,320.00 1.1448
20 Build clean water station 1.4.3 20015 1 place Chantrea district 6
months
5,500
2,750
-
1,097.00
-
1,097.00 0.6857
21 Build water retaining gate
1.3.1 200503/04/11/15 4 places Svay Chrum district
2 months
1,215
603
- -
500.00
500.00 0.5319
42
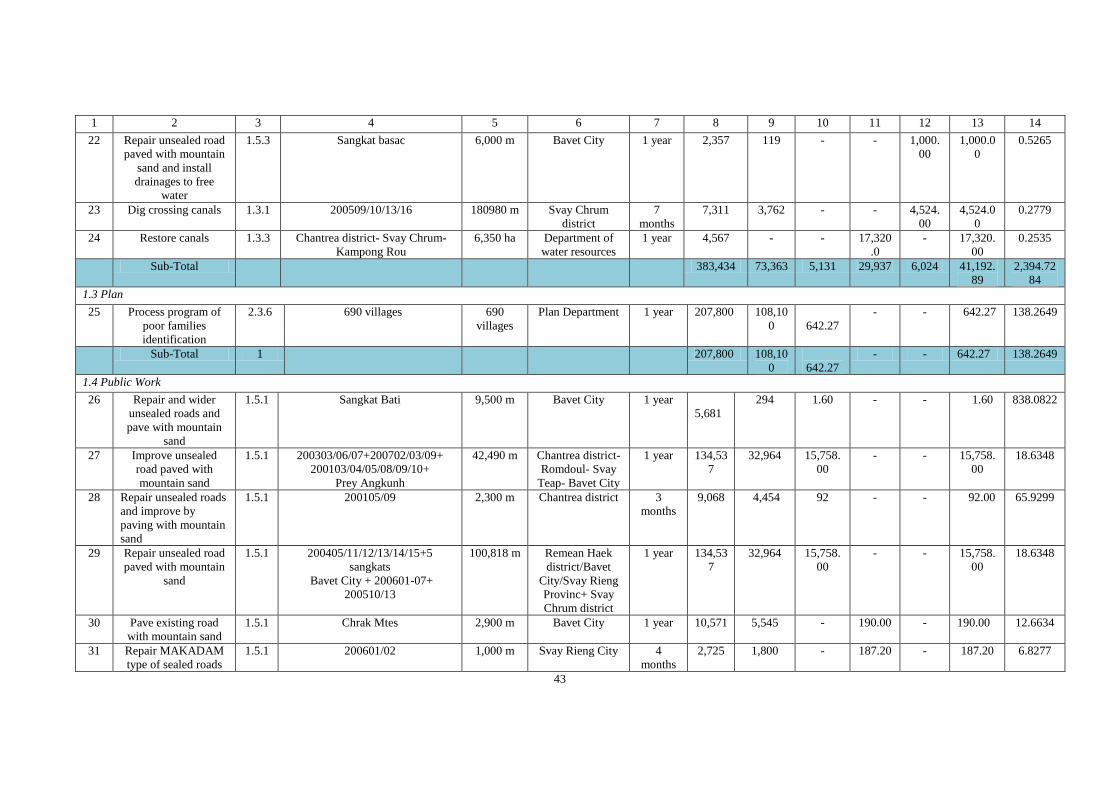
1 2 3 4 5 6 7 8 9 10 11 12 13 14
22 Repair unsealed road
paved with mountain
sand and install
drainages to free
water
1.5.3 Sangkat basac 6,000 m Bavet City 1 year 2,357 119 - - 1,000.
00
1,000.0
0
0.5265
23 Dig crossing canals 1.3.1 200509/10/13/16 180980 m Svay Chrum
district
7
months
7,311 3,762 - - 4,524.
00
4,524.0
0
0.2779
24 Restore canals 1.3.3 Chantrea district- Svay Chrum-
Kampong Rou
6,350 ha Department of
water resources
1 year 4,567 - - 17,320
.0
- 17,320.
00
0.2535
Sub-Total 383,434 73,363 5,131 29,937 6,024 41,192.
89
2,394.72
84
1.3 Plan
25 Process program of
poor families
identification
2.3.6 690 villages 690
villages
Plan Department 1 year 207,800 108,10
0
642.27
- - 642.27 138.2649
Sub-Total 1 207,800 108,10
0
642.27
- - 642.27 138.2649
1.4 Public Work
26 Repair and wider
unsealed roads and
pave with mountain
sand
1.5.1 Sangkat Bati 9,500 m Bavet City 1 year
5,681
294 1.60 - - 1.60 838.0822
27 Improve unsealed
road paved with
mountain sand
1.5.1 200303/06/07+200702/03/09+
200103/04/05/08/09/10+
Prey Angkunh
42,490 m Chantrea district-
Romdoul- Svay
Teap- Bavet City
1 year 134,53
7
32,964 15,758.
00
- - 15,758.
00
18.6348
28 Repair unsealed roads
and improve by
paving with mountain
sand
1.5.1 200105/09 2,300 m Chantrea district 3
months
9,068 4,454 92 - - 92.00 65.9299
29 Repair unsealed road
paved with mountain
sand
1.5.1 200405/11/12/13/14/15+5
sangkats
Bavet City + 200601-07+
200510/13
100,818 m Remean Haek
district/Bavet
City/Svay Rieng
Provinc+ Svay
Chrum district
1 year 134,53
7
32,964 15,758.
00
- - 15,758.
00
18.6348
30 Pave existing road
with mountain sand
1.5.1 Chrak Mtes 2,900 m Bavet City 1 year 10,571 5,545 - 190.00 - 190.00 12.6634
31 Repair MAKADAM
type of sealed roads
1.5.1 200601/02 1,000 m Svay Rieng City 4
months
2,725 1,800 - 187.20 - 187.20 6.8277
43
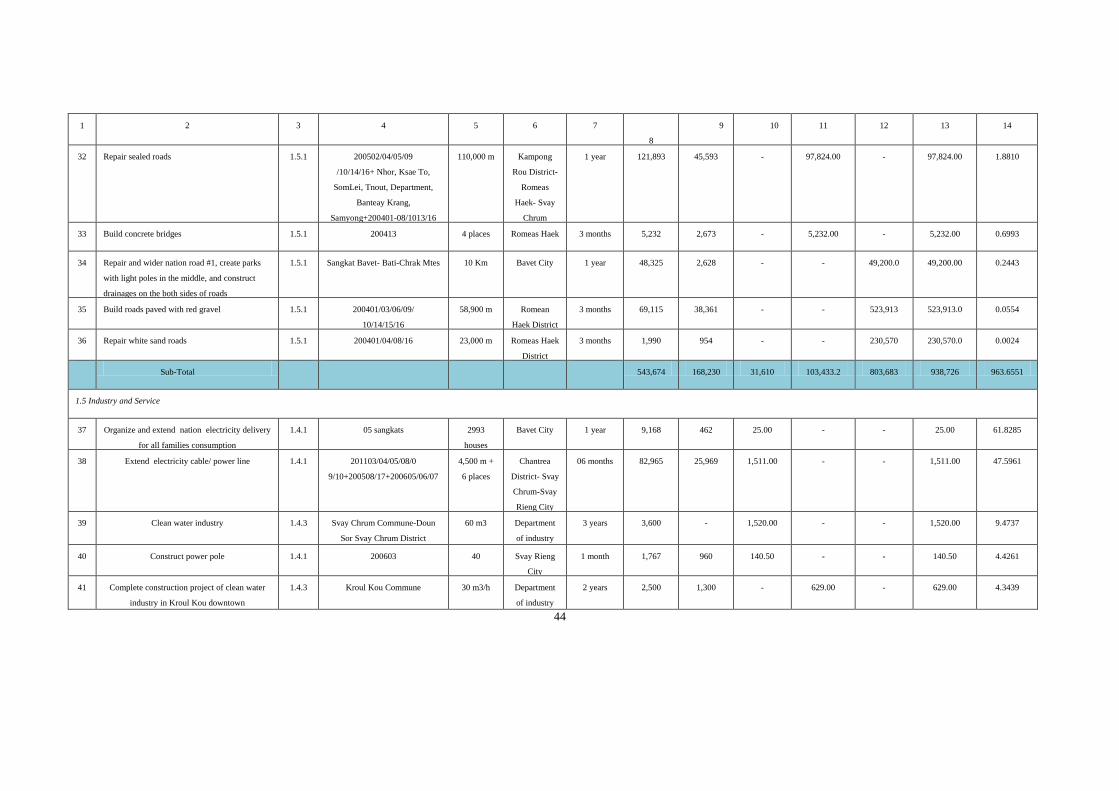
1 2 3 4 5 6 7
8
9 10 11 12 13 14
32 Repair sealed roads 1.5.1 200502/04/05/09
/10/14/16+ Nhor, Ksae To,
SomLei, Tnout, Department,
Banteay Krang,
Samyong+200401-08/1013/16
110,000 m Kampong
Rou District-
Romeas
Haek- Svay
Chrum
1 year 121,893 45,593 - 97,824.00 - 97,824.00 1.8810
33 Build concrete bridges 1.5.1 200413 4 places Romeas Haek 3 months 5,232 2,673 - 5,232.00 - 5,232.00 0.6993
34 Repair and wider nation road #1, create parks
with light poles in the middle, and construct
drainages on the both sides of roads
1.5.1 Sangkat Bavet- Bati-Chrak Mtes 10 Km Bavet City 1 year 48,325 2,628 - - 49,200.0 49,200.00 0.2443
35 Build roads paved with red gravel 1.5.1 200401/03/06/09/
10/14/15/16
58,900 m Romean
Haek District
3 months 69,115 38,361 - - 523,913 523,913.0 0.0554
36 Repair white sand roads 1.5.1 200401/04/08/16 23,000 m Romeas Haek
District
3 months 1,990 954 - - 230,570 230,570.0 0.0024
Sub-Total 543,674 168,230 31,610 103,433.2 803,683 938,726 963.6551
1.5 Industry and Service
37 Organize and extend nation electricity delivery
for all families consumption
1.4.1 05 sangkats 2993
houses
Bavet City 1 year 9,168 462 25.00 - - 25.00 61.8285
38 Extend electricity cable/ power line 1.4.1 201103/04/05/08/0
9/10+200508/17+200605/06/07
4,500 m +
6 places
Chantrea
District- Svay
Chrum-Svay
Rieng City
06 months 82,965 25,969 1,511.00 - - 1,511.00 47.5961
39 Clean water industry 1.4.3 Svay Chrum Commune-Doun
Sor Svay Chrum District
60 m3 Department
of industry
3 years 3,600 - 1,520.00 - - 1,520.00 9.4737
40 Construct power pole 1.4.1 200603 40 Svay Rieng
City
1 month 1,767 960 140.50 - - 140.50 4.4261
41 Complete construction project of clean water
industry in Kroul Kou downtown
1.4.3 Kroul Kou Commune 30 m3/h Department
of industry
2 years 2,500 1,300 - 629.00 - 629.00 4.3439
44
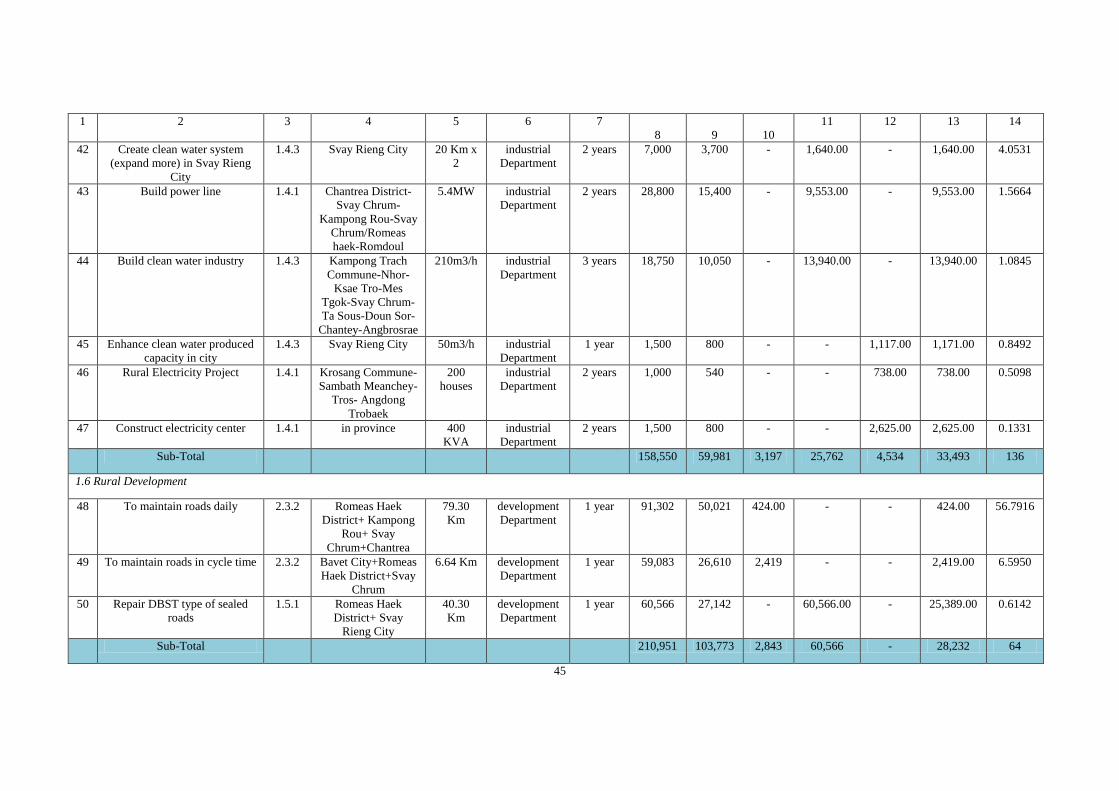
1 2 3 4 5 6 7
8
9
10
11 12 13 14
42 Create clean water system
(expand more) in Svay Rieng
City
1.4.3 Svay Rieng City 20 Km x
2
industrial
Department
2 years 7,000 3,700 - 1,640.00 - 1,640.00 4.0531
43 Build power line 1.4.1 Chantrea District-
Svay Chrum-
Kampong Rou-Svay
Chrum/Romeas
haek-Romdoul
5.4MW industrial
Department
2 years 28,800 15,400 - 9,553.00 - 9,553.00 1.5664
44 Build clean water industry 1.4.3 Kampong Trach
Commune-Nhor-
Ksae Tro-Mes
Tgok-Svay Chrum-
Ta Sous-Doun Sor-
Chantey-Angbrosrae
210m3/h industrial
Department
3 years 18,750 10,050 - 13,940.00 - 13,940.00 1.0845
45 Enhance clean water produced
capacity in city
1.4.3 Svay Rieng City 50m3/h industrial
Department
1 year 1,500 800 - - 1,117.00 1,171.00 0.8492
46 Rural Electricity Project 1.4.1 Krosang Commune-
Sambath Meanchey-
Tros- Angdong
Trobaek
200
houses
industrial
Department
2 years 1,000 540 - - 738.00 738.00 0.5098
47 Construct electricity center 1.4.1 in province 400
KVA
industrial
Department
2 years 1,500 800 - - 2,625.00 2,625.00 0.1331
Sub-Total 158,550 59,981 3,197 25,762 4,534 33,493 136
1.6 Rural Development
48 To maintain roads daily 2.3.2 Romeas Haek
District+ Kampong
Rou+ Svay
Chrum+Chantrea
79.30
Km
development
Department
1 year 91,302 50,021 424.00 - - 424.00 56.7916
49 To maintain roads in cycle time 2.3.2 Bavet City+Romeas
Haek District+Svay
Chrum
6.64 Km development
Department
1 year 59,083 26,610 2,419 - - 2,419.00 6.5950
50 Repair DBST type of sealed
roads
1.5.1 Romeas Haek
District+ Svay
Rieng City
40.30
Km
development
Department
1 year 60,566 27,142 - 60,566.00 - 25,389.00 0.6142
Sub-Total 210,951 103,773 2,843 60,566 - 28,232 64
45
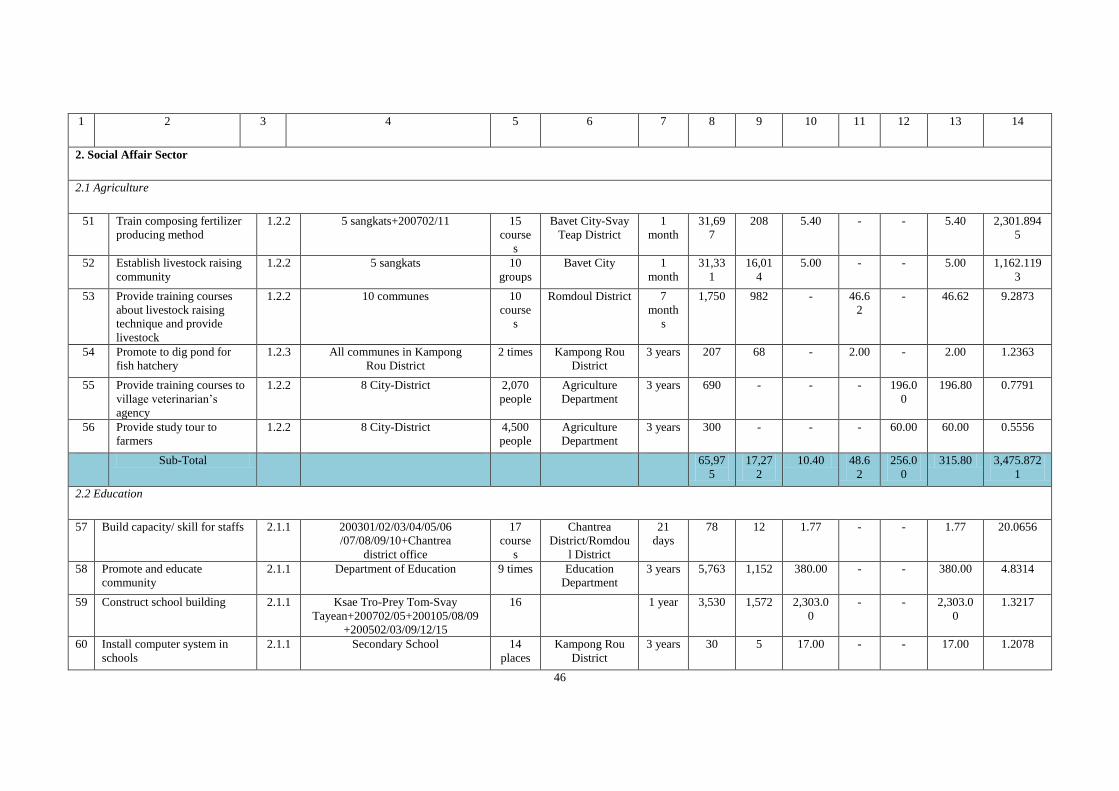
1 2 3 4 5 6 7 8 9 10 11 12 13 14
2. Social Affair Sector
2.1 Agriculture
51 Train composing fertilizer
producing method
1.2.2 5 sangkats+200702/11 15
course
s
Bavet City-Svay
Teap District
1
month
31,69
7
208 5.40 - - 5.40 2,301.894
5
52 Establish livestock raising
community
1.2.2 5 sangkats 10
groups
Bavet City 1
month
31,33
1
16,01
4
5.00 - - 5.00 1,162.119
3
53 Provide training courses
about livestock raising
technique and provide
livestock
1.2.2 10 communes 10
course
s
Romdoul District 7
month
s
1,750 982 - 46.6
2
- 46.62 9.2873
54 Promote to dig pond for
fish hatchery
1.2.3 All communes in Kampong
Rou District
2 times Kampong Rou
District
3 years 207 68 - 2.00 - 2.00 1.2363
55 Provide training courses to
village veterinarian’s
agency
1.2.2 8 City-District 2,070
people
Agriculture
Department
3 years 690 - - - 196.0
0
196.80 0.7791
56 Provide study tour to
farmers
1.2.2 8 City-District 4,500
people
Agriculture
Department
3 years 300 - - - 60.00 60.00 0.5556
Sub-Total 65,97
5
17,27
2
10.40 48.6
2
256.0
0
315.80 3,475.872
1
2.2 Education
57 Build capacity/ skill for staffs 2.1.1 200301/02/03/04/05/06
/07/08/09/10+Chantrea
district office
17
course
s
Chantrea
District/Romdou
l District
21
days
78 12 1.77 - - 1.77 20.0656
58 Promote and educate
community
2.1.1 Department of Education 9 times Education
Department
3 years 5,763 1,152 380.00 - - 380.00 4.8314
59 Construct school building 2.1.1 Ksae Tro-Prey Tom-Svay
Tayean+200702/05+200105/08/09
+200502/03/09/12/15
16 1 year 3,530 1,572 2,303.0
0
- - 2,303.0
0
1.3217
60 Install computer system in
schools
2.1.1 Secondary School 14
places
Kampong Rou
District
3 years 30 5 17.00 - - 17.00 1.2078
46
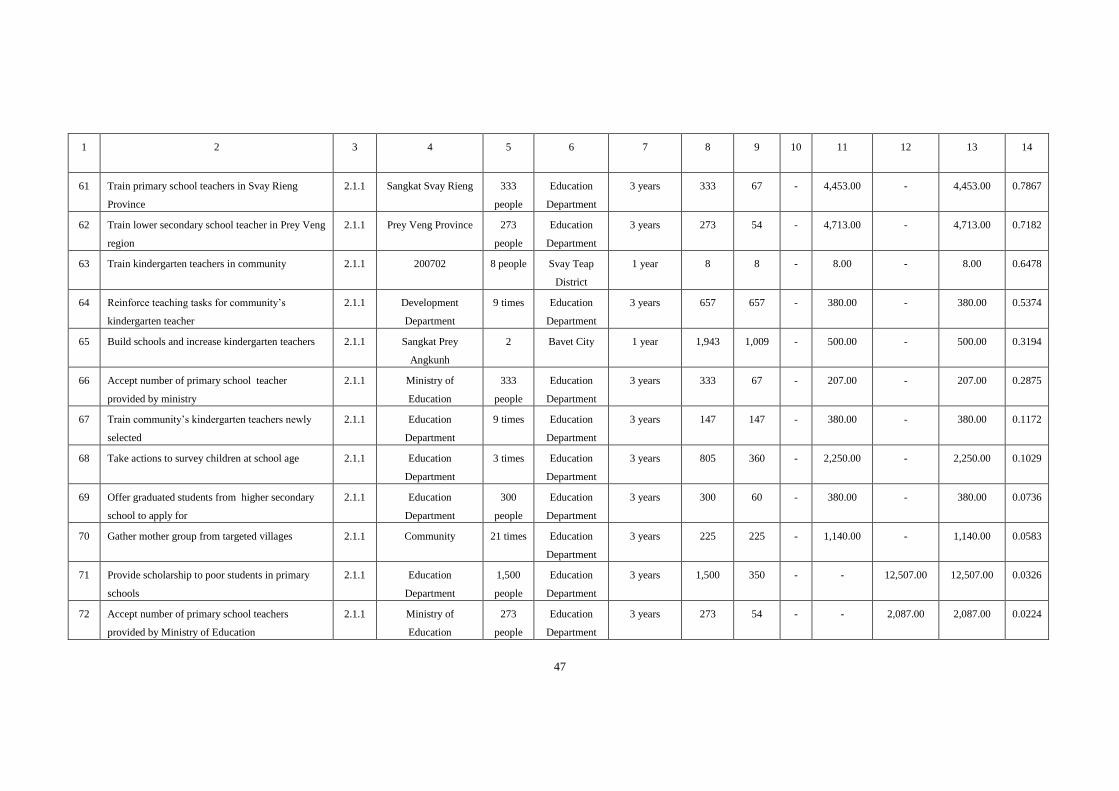
1 2 3 4 5 6 7 8 9 10 11 12 13 14
61 Train primary school teachers in Svay Rieng
Province
2.1.1 Sangkat Svay Rieng 333
people
Education
Department
3 years 333 67 - 4,453.00 - 4,453.00 0.7867
62 Train lower secondary school teacher in Prey Veng
region
2.1.1 Prey Veng Province 273
people
Education
Department
3 years 273 54 - 4,713.00 - 4,713.00 0.7182
63 Train kindergarten teachers in community 2.1.1 200702 8 people Svay Teap
District
1 year 8 8 - 8.00 - 8.00 0.6478
64 Reinforce teaching tasks for community’s
kindergarten teacher
2.1.1 Development
Department
9 times Education
Department
3 years 657 657 - 380.00 - 380.00 0.5374
65 Build schools and increase kindergarten teachers 2.1.1 Sangkat Prey
Angkunh
2 Bavet City 1 year 1,943 1,009 - 500.00 - 500.00 0.3194
66 Accept number of primary school teacher
provided by ministry
2.1.1 Ministry of
Education
333
people
Education
Department
3 years 333 67 - 207.00 - 207.00 0.2875
67 Train community’s kindergarten teachers newly
selected
2.1.1 Education
Department
9 times Education
Department
3 years 147 147 - 380.00 - 380.00 0.1172
68 Take actions to survey children at school age 2.1.1 Education
Department
3 times Education
Department
3 years 805 360 - 2,250.00 - 2,250.00 0.1029
69 Offer graduated students from higher secondary
school to apply for
2.1.1 Education
Department
300
people
Education
Department
3 years 300 60 - 380.00 - 380.00 0.0736
70 Gather mother group from targeted villages 2.1.1 Community 21 times Education
Department
3 years 225 225 - 1,140.00 - 1,140.00 0.0583
71 Provide scholarship to poor students in primary
schools
2.1.1 Education
Department
1,500
people
Education
Department
3 years 1,500 350 - - 12,507.00 12,507.00 0.0326
72 Accept number of primary school teachers
provided by Ministry of Education
2.1.1 Ministry of
Education
273
people
Education
Department
3 years 273 54 - - 2,087.00 2,087.00 0.0224
47
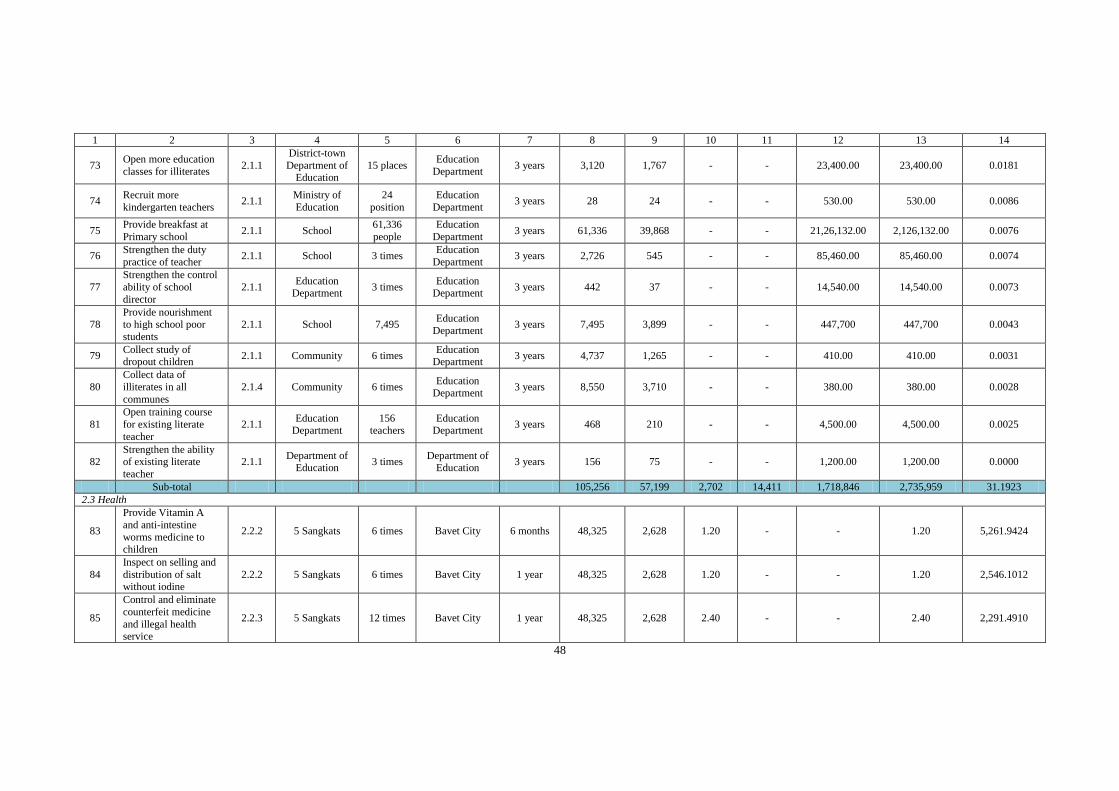
1 2 3 4 5 6 7 8 9 10 11 12 13 14
73 Open more education
classes for illiterates 2.1.1
District-town
Department of Education
15 places Education
Department 3 years 3,120 1,767 - - 23,400.00 23,400.00 0.0181
74 Recruit more
kindergarten teachers 2.1.1
Ministry of
Education
24
position
Education
Department 3 years 28 24 - - 530.00 530.00 0.0086
75 Provide breakfast at
Primary school 2.1.1 School
61,336
people
Education
Department 3 years 61,336 39,868 - - 21,26,132.00 2,126,132.00 0.0076
76 Strengthen the duty
practice of teacher 2.1.1 School 3 times
Education
Department 3 years 2,726 545 - - 85,460.00 85,460.00 0.0074
77
Strengthen the control
ability of school
director
2.1.1 Education
Department 3 times
Education Department
3 years 442 37 - - 14,540.00 14,540.00 0.0073
78 Provide nourishment to high school poor
students
2.1.1 School 7,495 Education
Department 3 years 7,495 3,899 - - 447,700 447,700 0.0043
79 Collect study of dropout children
2.1.1 Community 6 times Education
Department 3 years 4,737 1,265 - - 410.00 410.00 0.0031
80
Collect data of
illiterates in all
communes
2.1.4 Community 6 times Education
Department 3 years 8,550 3,710 - - 380.00 380.00 0.0028
81
Open training course
for existing literate
teacher
2.1.1 Education
Department 156
teachers Education
Department 3 years 468 210 - - 4,500.00 4,500.00 0.0025
82 Strengthen the ability of existing literate
teacher
2.1.1 Department of
Education 3 times
Department of Education
3 years 156 75 - - 1,200.00 1,200.00 0.0000
Sub-total 105,256 57,199 2,702 14,411 1,718,846 2,735,959 31.1923
2.3 Health
83
Provide Vitamin A
and anti-intestine
worms medicine to children
2.2.2 5 Sangkats 6 times Bavet City 6 months 48,325 2,628 1.20 - - 1.20 5,261.9424
84
Inspect on selling and
distribution of salt
without iodine
2.2.2 5 Sangkats 6 times Bavet City 1 year 48,325 2,628 1.20 - - 1.20 2,546.1012
85
Control and eliminate
counterfeit medicine
and illegal health service
2.2.3 5 Sangkats 12 times Bavet City 1 year 48,325 2,628 2.40 - - 2.40 2,291.4910
48
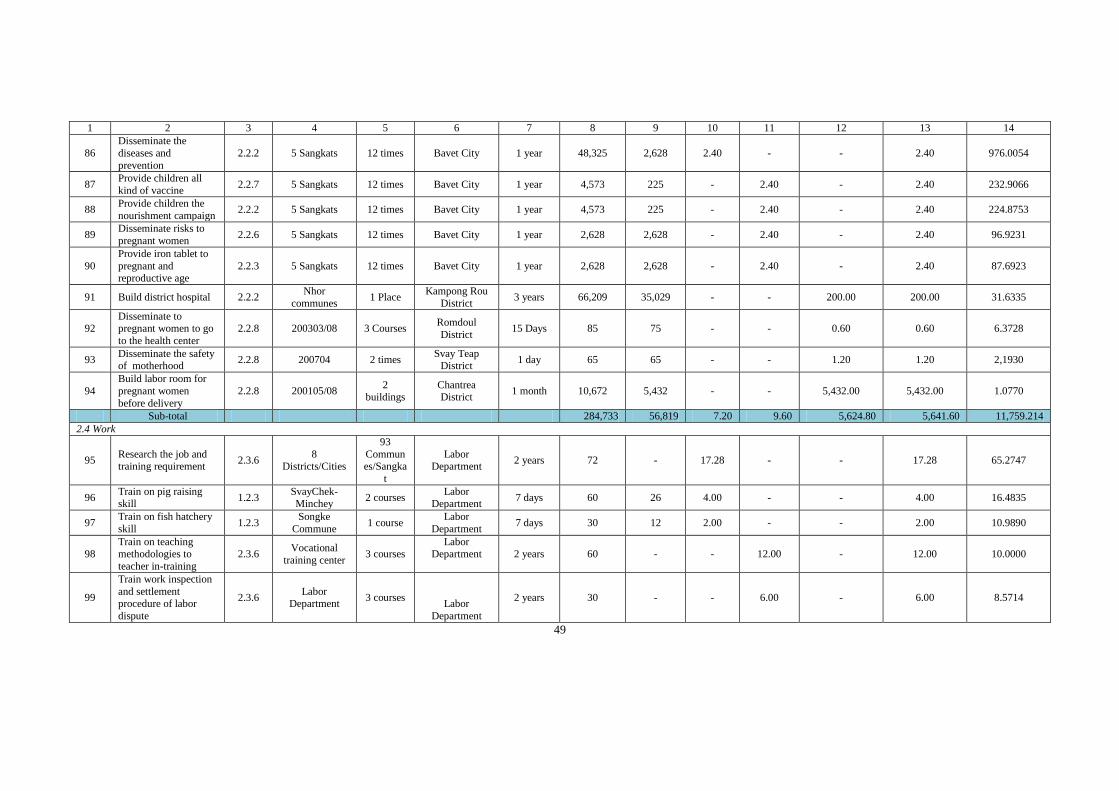
1 2 3 4 5 6 7 8 9 10 11 12 13 14
86
Disseminate the
diseases and
prevention
2.2.2 5 Sangkats 12 times Bavet City 1 year 48,325 2,628 2.40 - - 2.40 976.0054
87 Provide children all
kind of vaccine 2.2.7 5 Sangkats 12 times Bavet City 1 year 4,573 225 - 2.40 - 2.40 232.9066
88 Provide children the
nourishment campaign 2.2.2 5 Sangkats 12 times Bavet City 1 year 4,573 225 - 2.40 - 2.40 224.8753
89 Disseminate risks to
pregnant women 2.2.6 5 Sangkats 12 times Bavet City 1 year 2,628 2,628 - 2.40 - 2.40 96.9231
90
Provide iron tablet to
pregnant and reproductive age
2.2.3 5 Sangkats 12 times Bavet City 1 year 2,628 2,628 - 2.40 - 2.40 87.6923
91 Build district hospital 2.2.2 Nhor
communes 1 Place
Kampong Rou
District 3 years 66,209 35,029 - - 200.00 200.00 31.6335
92 Disseminate to pregnant women to go
to the health center
2.2.8 200303/08 3 Courses Romdoul
District 15 Days 85 75 - - 0.60 0.60 6.3728
93 Disseminate the safety of motherhood
2.2.8 200704 2 times Svay Teap
District 1 day 65 65 - - 1.20 1.20 2,1930
94
Build labor room for
pregnant women
before delivery
2.2.8 200105/08 2
buildings Chantrea District
1 month 10,672 5,432 - - 5,432.00 5,432.00 1.0770
Sub-total 284,733 56,819 7.20 9.60 5,624.80 5,641.60 11,759.214
2.4 Work
95 Research the job and training requirement
2.3.6 8
Districts/Cities
93
Communes/Sangka
t
Labor Department
2 years 72 - 17.28 - - 17.28 65.2747
96 Train on pig raising skill
1.2.3 SvayChek-Minchey
2 courses Labor
Department 7 days 60 26 4.00 - - 4.00 16.4835
97 Train on fish hatchery
skill 1.2.3
Songke
Commune 1 course
Labor
Department 7 days 30 12 2.00 - - 2.00 10.9890
98 Train on teaching methodologies to
teacher in-training
2.3.6 Vocational
training center 3 courses
Labor Department 2 years 60 - - 12.00 - 12.00 10.0000
99
Train work inspection
and settlement procedure of labor
dispute
2.3.6 Labor
Department 3 courses
Labor
Department
2 years 30 - - 6.00 - 6.00 8.5714
49
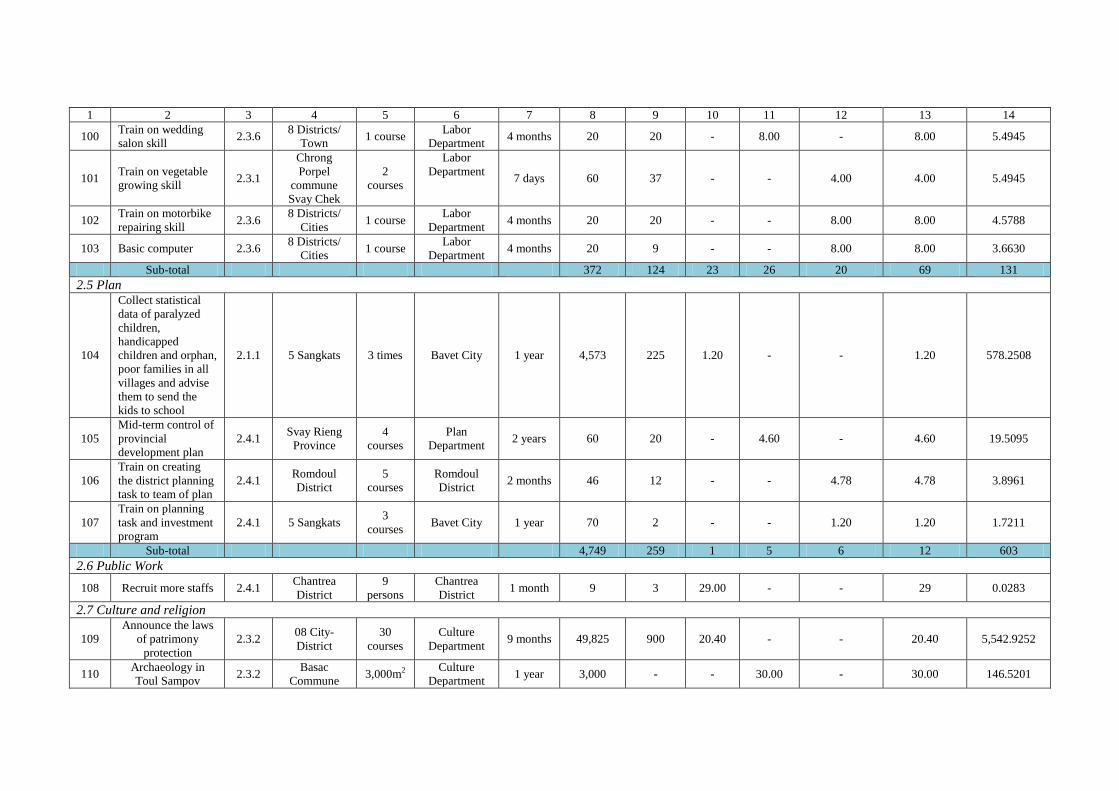
1 2 3 4 5 6 7 8 9 10 11 12 13 14
100 Train on wedding
salon skill 2.3.6
8 Districts/
Town 1 course
Labor
Department 4 months 20 20 - 8.00 - 8.00 5.4945
101 Train on vegetable
growing skill 2.3.1
Chrong
Porpel
commune
Svay Chek
2
courses
Labor
Department 7 days 60 37 - - 4.00 4.00 5.4945
102 Train on motorbike
repairing skill 2.3.6
8 Districts/
Cities 1 course
Labor
Department 4 months 20 20 - - 8.00 8.00 4.5788
103 Basic computer 2.3.6 8 Districts/
Cities 1 course
Labor
Department 4 months 20 9 - - 8.00 8.00 3.6630
Sub-total 372 124 23 26 20 69 131
2.5 Plan
104
Collect statistical
data of paralyzed
children,
handicapped
children and orphan,
poor families in all
villages and advise
them to send the
kids to school
2.1.1 5 Sangkats 3 times Bavet City 1 year 4,573 225 1.20 - - 1.20 578.2508
105
Mid-term control of
provincial
development plan
2.4.1 Svay Rieng
Province
4
courses
Plan
Department 2 years 60 20 - 4.60 - 4.60 19.5095
106
Train on creating
the district planning
task to team of plan
2.4.1 Romdoul
District
5
courses
Romdoul
District 2 months 46 12 - - 4.78 4.78 3.8961
107
Train on planning
task and investment
program
2.4.1 5 Sangkats 3
courses Bavet City 1 year 70 2 - - 1.20 1.20 1.7211
Sub-total 4,749 259 1 5 6 12 603
2.6 Public Work
108 Recruit more staffs 2.4.1 Chantrea
District
9
persons
Chantrea
District 1 month 9 3 29.00 - - 29 0.0283
2.7 Culture and religion
109
Announce the laws
of patrimony
protection
2.3.2 08 City-
District
30
courses
Culture
Department 9 months 49,825 900 20.40 - - 20.40 5,542.9252
110 Archaeology in
Toul Sampov 2.3.2
Basac
Commune 3,000m2 Culture
Department 1 year 3,000 - - 30.00 - 30.00 146.5201
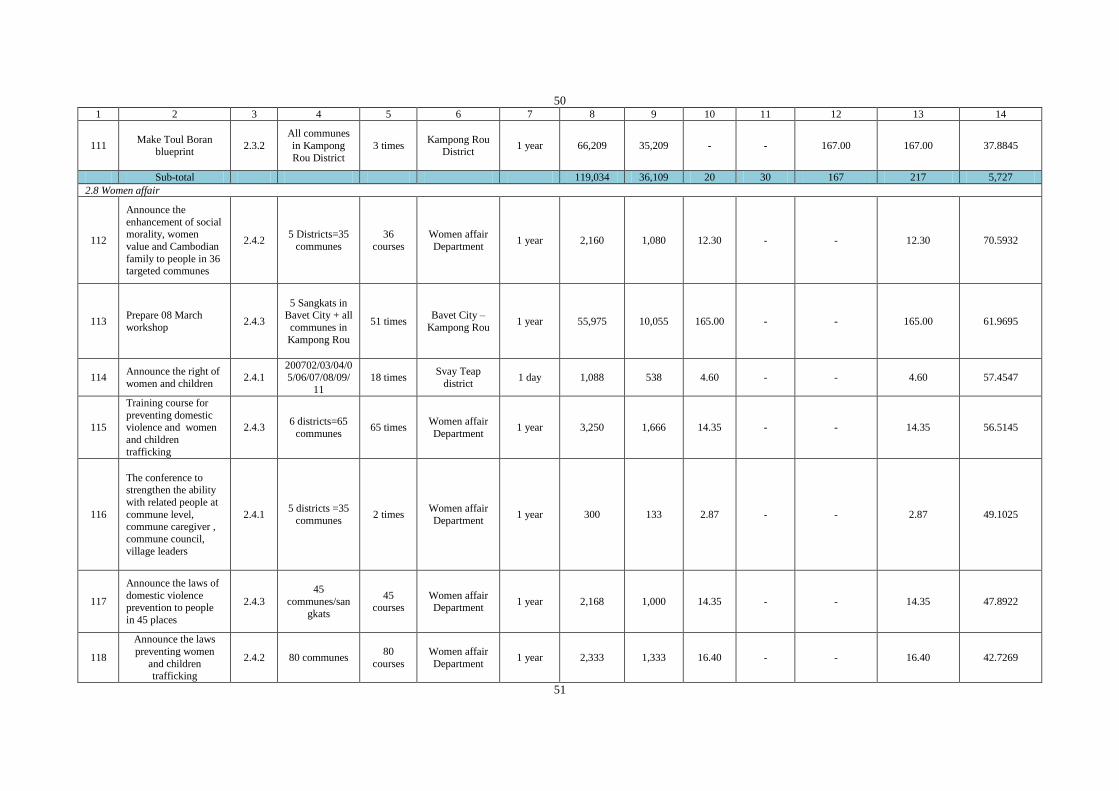
50 1 2 3 4 5 6 7 8 9 10 11 12 13 14
111 Make Toul Boran
blueprint 2.3.2
All communes
in Kampong
Rou District
3 times Kampong Rou
District 1 year 66,209 35,209 - - 167.00 167.00 37.8845
Sub-total 119,034 36,109 20 30 167 217 5,727
2.8 Women affair
112
Announce the
enhancement of social morality, women
value and Cambodian
family to people in 36 targeted communes
2.4.2 5 Districts=35
communes
36
courses
Women affair
Department 1 year 2,160 1,080 12.30 - - 12.30 70.5932
113 Prepare 08 March
workshop 2.4.3
5 Sangkats in Bavet City + all
communes in
Kampong Rou
51 times Bavet City –
Kampong Rou 1 year 55,975 10,055 165.00 - - 165.00 61.9695
114 Announce the right of
women and children 2.4.1
200702/03/04/05/06/07/08/09/
11
18 times Svay Teap
district 1 day 1,088 538 4.60 - - 4.60 57.4547
115
Training course for
preventing domestic
violence and women
and children
trafficking
2.4.3 6 districts=65
communes 65 times
Women affair
Department 1 year 3,250 1,666 14.35 - - 14.35 56.5145
116
The conference to strengthen the ability
with related people at
commune level, commune caregiver ,
commune council,
village leaders
2.4.1 5 districts =35
communes 2 times
Women affair
Department 1 year 300 133 2.87 - - 2.87 49.1025
117
Announce the laws of
domestic violence prevention to people
in 45 places
2.4.3
45
communes/san
gkats
45 courses
Women affair Department
1 year 2,168 1,000 14.35 - - 14.35 47.8922
118
Announce the laws
preventing women
and children trafficking
2.4.2 80 communes 80
courses
Women affair
Department 1 year 2,333 1,333 16.40 - - 16.40 42.7269
51
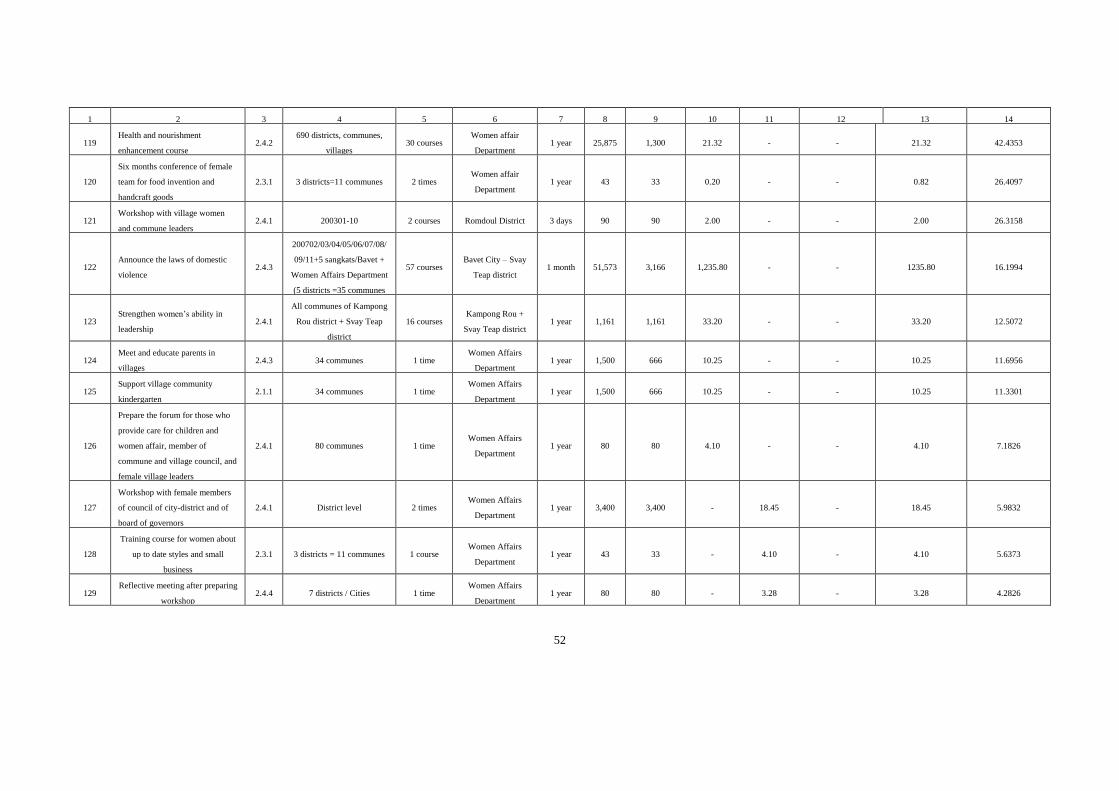
1 2 3 4 5 6 7 8 9 10 11 12 13 14
119 Health and nourishment
enhancement course 2.4.2
690 districts, communes,
villages 30 courses
Women affair
Department 1 year 25,875 1,300 21.32 - - 21.32 42.4353
120
Six months conference of female
team for food invention and
handcraft goods
2.3.1 3 districts=11 communes 2 times Women affair
Department 1 year 43 33 0.20 - - 0.82 26.4097
121 Workshop with village women
and commune leaders 2.4.1 200301-10 2 courses Romdoul District 3 days 90 90 2.00 - - 2.00 26.3158
122 Announce the laws of domestic
violence 2.4.3
200702/03/04/05/06/07/08/
09/11+5 sangkats/Bavet +
Women Affairs Department
(5 districts =35 communes
57 courses Bavet City – Svay
Teap district 1 month 51,573 3,166 1,235.80 - - 1235.80 16.1994
123 Strengthen women’s ability in
leadership 2.4.1
All communes of Kampong
Rou district + Svay Teap
district
16 courses Kampong Rou +
Svay Teap district 1 year 1,161 1,161 33.20 - - 33.20 12.5072
124 Meet and educate parents in
villages 2.4.3 34 communes 1 time
Women Affairs
Department 1 year 1,500 666 10.25 - - 10.25 11.6956
125 Support village community
kindergarten 2.1.1 34 communes 1 time
Women Affairs
Department 1 year 1,500 666 10.25 - - 10.25 11.3301
126
Prepare the forum for those who
provide care for children and
women affair, member of
commune and village council, and
female village leaders
2.4.1 80 communes 1 time Women Affairs
Department 1 year 80 80 4.10 - - 4.10 7.1826
127
Workshop with female members
of council of city-district and of
board of governors
2.4.1 District level 2 times Women Affairs
Department 1 year 3,400 3,400 - 18.45 - 18.45 5.9832
128
Training course for women about
up to date styles and small
business
2.3.1 3 districts = 11 communes 1 course Women Affairs
Department 1 year 43 33 - 4.10 - 4.10 5.6373
129 Reflective meeting after preparing
workshop 2.4.4 7 districts / Cities 1 time
Women Affairs
Department 1 year 80 80 - 3.28 - 3.28 4.2826
52
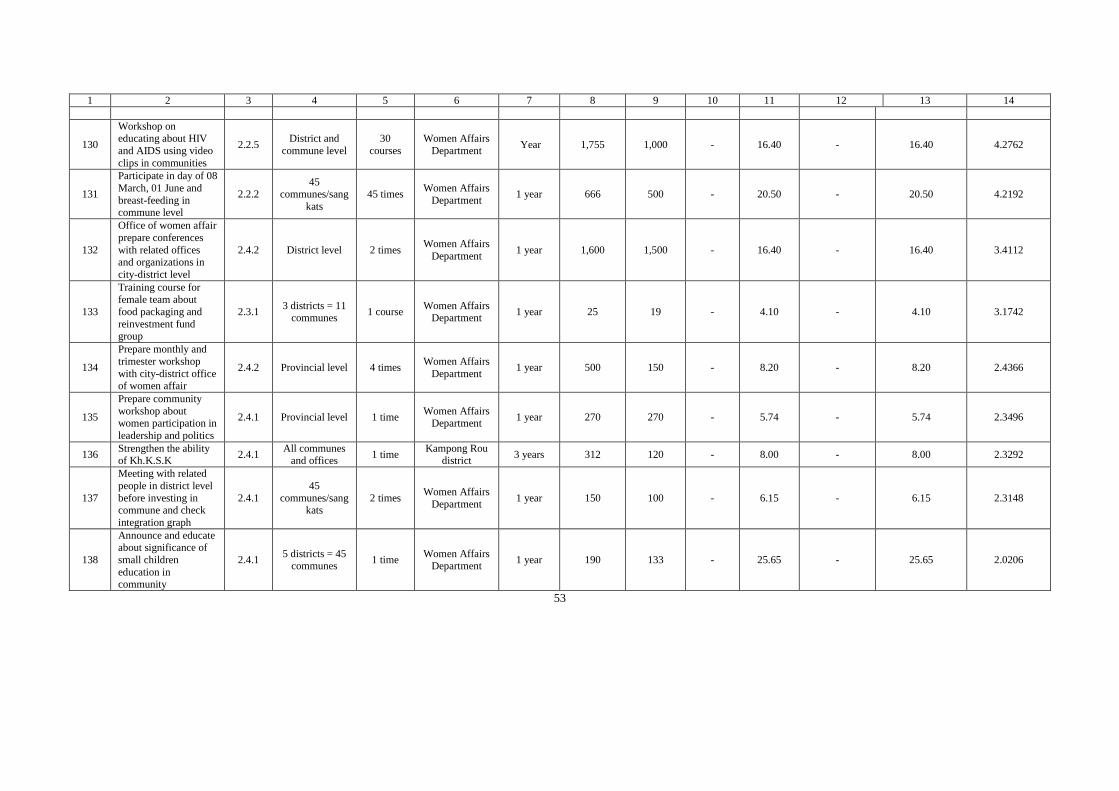
1 2 3 4 5 6 7 8 9 10 11 12 13 14
130
Workshop on educating about HIV
and AIDS using video
clips in communities
2.2.5 District and
commune level
30
courses
Women Affairs
Department Year 1,755 1,000 - 16.40 - 16.40 4.2762
131
Participate in day of 08
March, 01 June and
breast-feeding in commune level
2.2.2 45
communes/sang
kats
45 times Women Affairs
Department 1 year 666 500 - 20.50 - 20.50 4.2192
132
Office of women affair
prepare conferences
with related offices and organizations in
city-district level
2.4.2 District level 2 times Women Affairs
Department 1 year 1,600 1,500 - 16.40 - 16.40 3.4112
133
Training course for female team about
food packaging and
reinvestment fund group
2.3.1 3 districts = 11
communes 1 course
Women Affairs Department
1 year 25 19 - 4.10 - 4.10 3.1742
134
Prepare monthly and
trimester workshop
with city-district office of women affair
2.4.2 Provincial level 4 times Women Affairs
Department 1 year 500 150 - 8.20 - 8.20 2.4366
135
Prepare community
workshop about
women participation in
leadership and politics
2.4.1 Provincial level 1 time Women Affairs
Department 1 year 270 270 - 5.74 - 5.74 2.3496
136 Strengthen the ability of Kh.K.S.K
2.4.1 All communes
and offices 1 time
Kampong Rou district
3 years 312 120 - 8.00 - 8.00 2.3292
137
Meeting with related
people in district level
before investing in commune and check
integration graph
2.4.1
45
communes/sangkats
2 times Women Affairs
Department 1 year 150 100 - 6.15 - 6.15 2.3148
138
Announce and educate about significance of
small children
education in community
2.4.1 5 districts = 45
communes 1 time
Women Affairs Department
1 year 190 133 - 25.65 - 25.65 2.0206
53
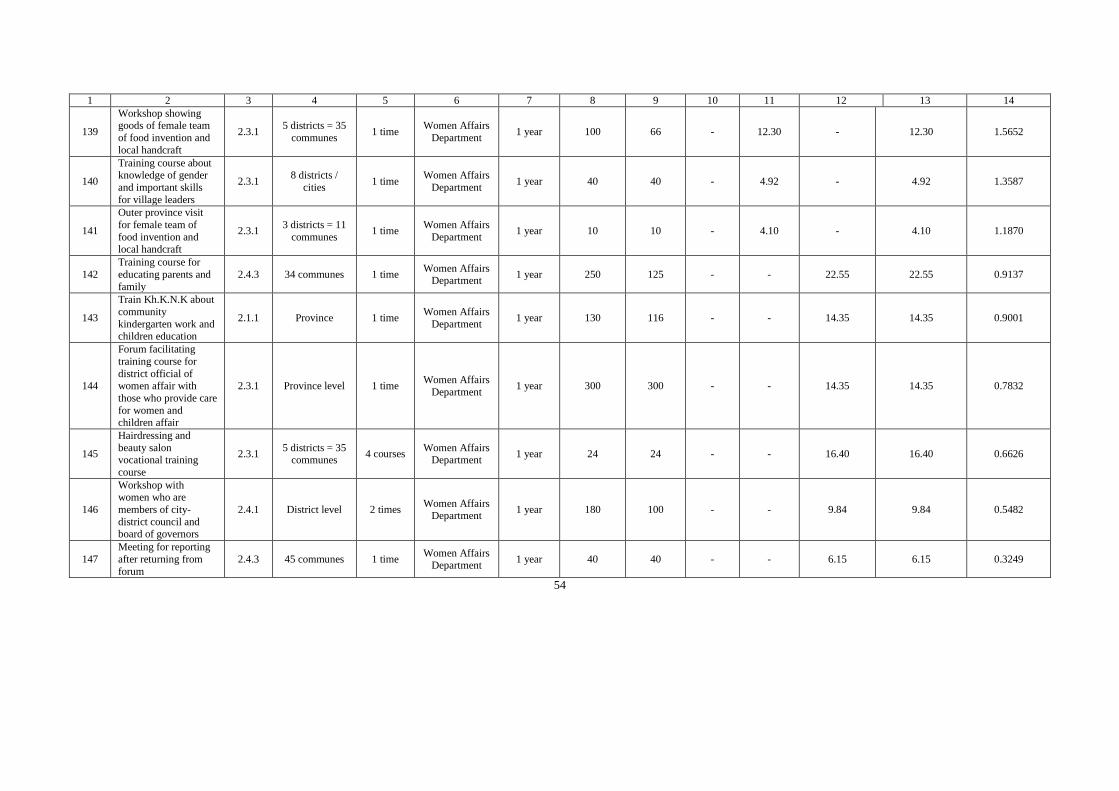
1 2 3 4 5 6 7 8 9 10 11 12 13 14
139
Workshop showing goods of female team
of food invention and
local handcraft
2.3.1 5 districts = 35
communes 1 time
Women Affairs
Department 1 year 100 66 - 12.30 - 12.30 1.5652
140
Training course about knowledge of gender
and important skills
for village leaders
2.3.1 8 districts /
cities 1 time
Women Affairs
Department 1 year 40 40 - 4.92 - 4.92 1.3587
141
Outer province visit
for female team of
food invention and
local handcraft
2.3.1 3 districts = 11
communes 1 time
Women Affairs
Department 1 year 10 10 - 4.10 - 4.10 1.1870
142
Training course for
educating parents and
family
2.4.3 34 communes 1 time Women Affairs
Department 1 year 250 125 - - 22.55 22.55 0.9137
143
Train Kh.K.N.K about
community
kindergarten work and children education
2.1.1 Province 1 time Women Affairs
Department 1 year 130 116 - - 14.35 14.35 0.9001
144
Forum facilitating
training course for
district official of women affair with
those who provide care
for women and
children affair
2.3.1 Province level 1 time Women Affairs
Department 1 year 300 300 - - 14.35 14.35 0.7832
145
Hairdressing and
beauty salon vocational training
course
2.3.1 5 districts = 35
communes 4 courses
Women Affairs Department
1 year 24 24 - - 16.40 16.40 0.6626
146
Workshop with women who are
members of city-
district council and board of governors
2.4.1 District level 2 times Women Affairs
Department 1 year 180 100 - - 9.84 9.84 0.5482
147
Meeting for reporting
after returning from
forum
2.4.3 45 communes 1 time Women Affairs
Department 1 year 40 40 - - 6.15 6.15 0.3249
54
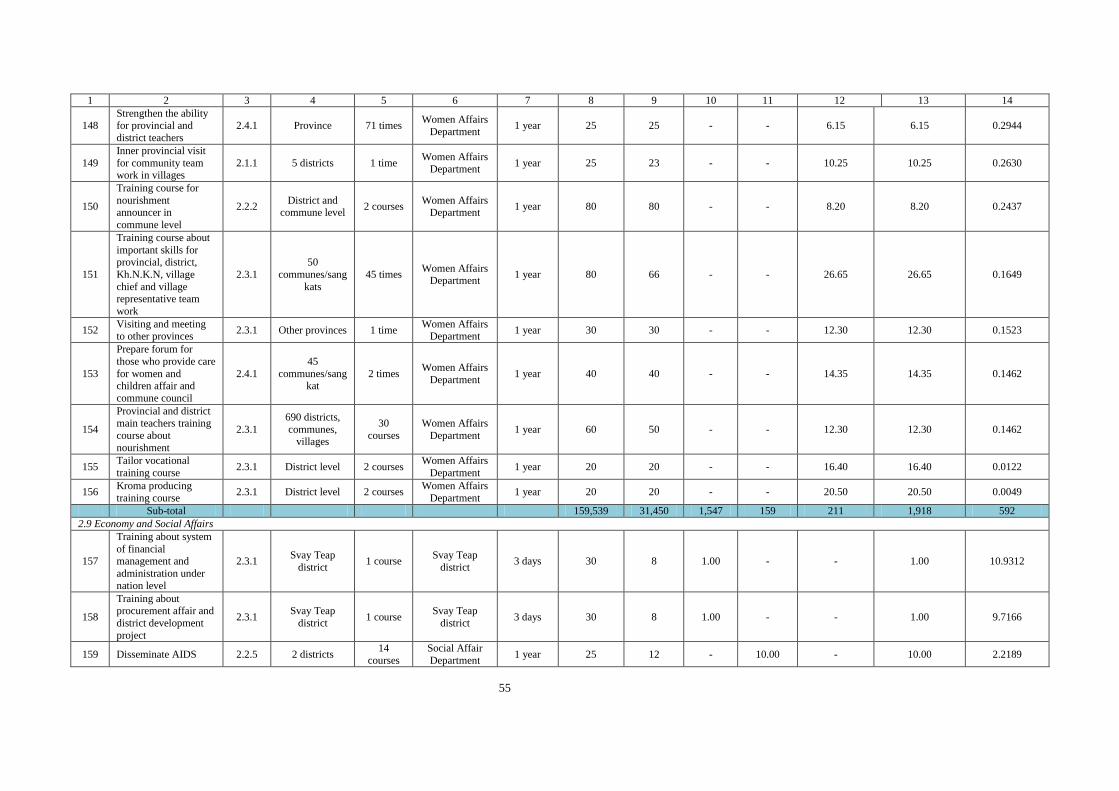
1 2 3 4 5 6 7 8 9 10 11 12 13 14
148 Strengthen the ability for provincial and
district teachers
2.4.1 Province 71 times Women Affairs
Department 1 year 25 25 - - 6.15 6.15 0.2944
149
Inner provincial visit
for community team work in villages
2.1.1 5 districts 1 time Women Affairs
Department 1 year 25 23 - - 10.25 10.25 0.2630
150
Training course for
nourishment announcer in
commune level
2.2.2 District and
commune level 2 courses
Women Affairs Department
1 year 80 80 - - 8.20 8.20 0.2437
151
Training course about
important skills for provincial, district,
Kh.N.K.N, village
chief and village representative team
work
2.3.1
50
communes/sang
kats
45 times Women Affairs
Department 1 year 80 66 - - 26.65 26.65 0.1649
152 Visiting and meeting to other provinces
2.3.1 Other provinces 1 time Women Affairs
Department 1 year 30 30 - - 12.30 12.30 0.1523
153
Prepare forum for
those who provide care
for women and children affair and
commune council
2.4.1
45
communes/sangkat
2 times Women Affairs
Department 1 year 40 40 - - 14.35 14.35 0.1462
154
Provincial and district
main teachers training
course about
nourishment
2.3.1
690 districts,
communes, villages
30
courses
Women Affairs
Department 1 year 60 50 - - 12.30 12.30 0.1462
155 Tailor vocational
training course 2.3.1 District level 2 courses
Women Affairs
Department 1 year 20 20 - - 16.40 16.40 0.0122
156 Kroma producing
training course 2.3.1 District level 2 courses
Women Affairs
Department 1 year 20 20 - - 20.50 20.50 0.0049
Sub-total 159,539 31,450 1,547 159 211 1,918 592
2.9 Economy and Social Affairs
157
Training about system
of financial management and
administration under
nation level
2.3.1 Svay Teap
district 1 course
Svay Teap
district 3 days 30 8 1.00 - - 1.00 10.9312
158
Training about procurement affair and
district development
project
2.3.1 Svay Teap
district 1 course
Svay Teap
district 3 days 30 8 1.00 - - 1.00 9.7166
159 Disseminate AIDS 2.2.5 2 districts 14
courses
Social Affair
Department 1 year 25 12 - 10.00 - 10.00 2.2189
55
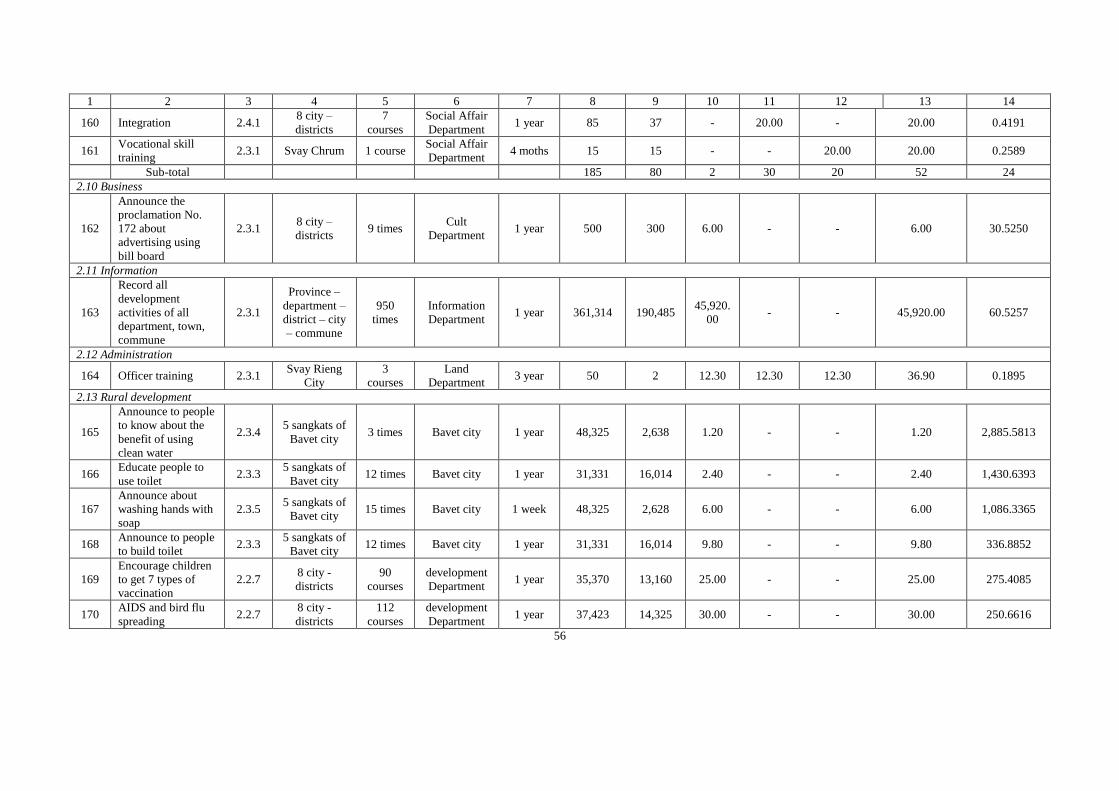
1 2 3 4 5 6 7 8 9 10 11 12 13 14
160 Integration 2.4.1 8 city –
districts
7
courses
Social Affair
Department 1 year 85 37 - 20.00 - 20.00 0.4191
161 Vocational skill
training 2.3.1 Svay Chrum 1 course
Social Affair
Department 4 moths 15 15 - - 20.00 20.00 0.2589
Sub-total 185 80 2 30 20 52 24
2.10 Business
162
Announce the
proclamation No.
172 about
advertising using
bill board
2.3.1 8 city –
districts 9 times
Cult
Department 1 year 500 300 6.00 - - 6.00 30.5250
2.11 Information
163
Record all
development
activities of all
department, town,
commune
2.3.1
Province –
department –
district – city
– commune
950
times
Information
Department 1 year 361,314 190,485
45,920.
00 - - 45,920.00 60.5257
2.12 Administration
164 Officer training 2.3.1 Svay Rieng
City
3
courses
Land
Department 3 year 50 2 12.30 12.30 12.30 36.90 0.1895
2.13 Rural development
165
Announce to people
to know about the
benefit of using
clean water
2.3.4 5 sangkats of
Bavet city 3 times Bavet city 1 year 48,325 2,638 1.20 - - 1.20 2,885.5813
166 Educate people to
use toilet 2.3.3
5 sangkats of
Bavet city 12 times Bavet city 1 year 31,331 16,014 2.40 - - 2.40 1,430.6393
167
Announce about
washing hands with
soap
2.3.5 5 sangkats of
Bavet city 15 times Bavet city 1 week 48,325 2,628 6.00 - - 6.00 1,086.3365
168 Announce to people
to build toilet 2.3.3
5 sangkats of
Bavet city 12 times Bavet city 1 year 31,331 16,014 9.80 - - 9.80 336.8852
169
Encourage children
to get 7 types of
vaccination
2.2.7 8 city -
districts
90
courses
development
Department 1 year 35,370 13,160 25.00 - - 25.00 275.4085
170 AIDS and bird flu
spreading 2.2.7
8 city -
districts
112
courses
development
Department 1 year 37,423 14,325 30.00 - - 30.00 250.6616
56
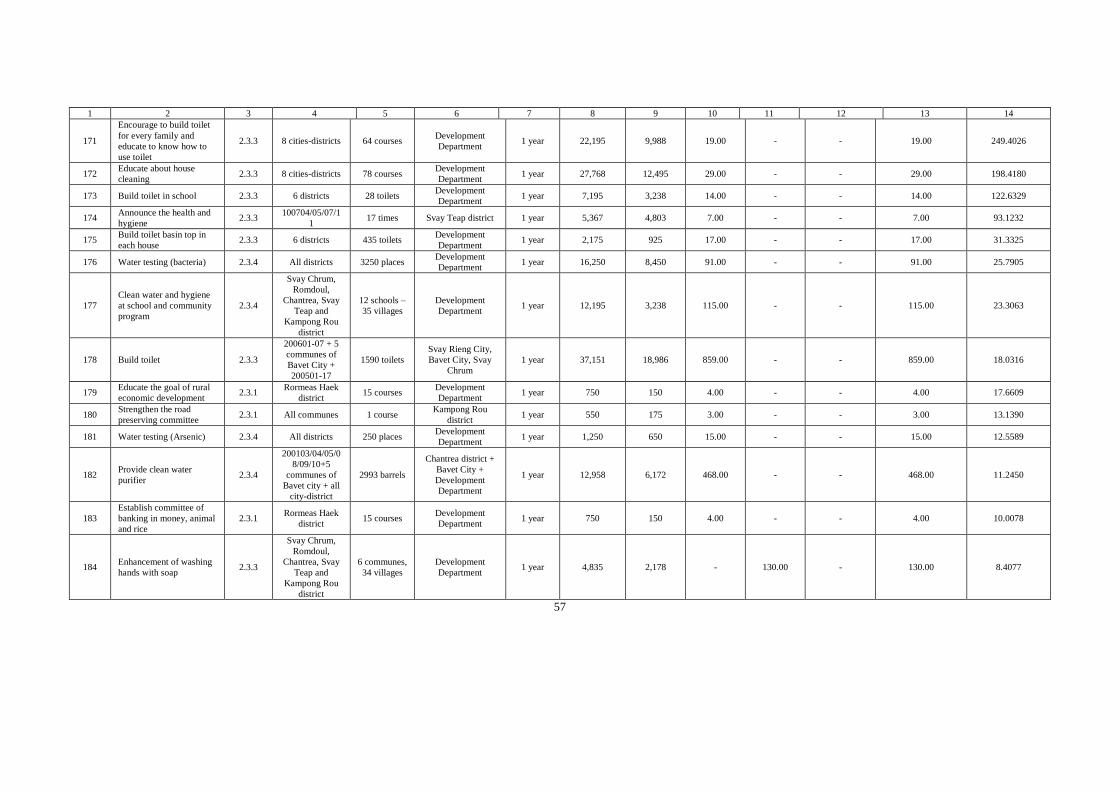
1 2 3 4 5 6 7 8 9 10 11 12 13 14
171
Encourage to build toilet
for every family and
educate to know how to
use toilet
2.3.3 8 cities-districts 64 courses Development
Department 1 year 22,195 9,988 19.00 - - 19.00 249.4026
172 Educate about house
cleaning 2.3.3 8 cities-districts 78 courses
Development
Department 1 year 27,768 12,495 29.00 - - 29.00 198.4180
173 Build toilet in school 2.3.3 6 districts 28 toilets Development
Department 1 year 7,195 3,238 14.00 - - 14.00 122.6329
174 Announce the health and
hygiene 2.3.3
100704/05/07/1
1 17 times Svay Teap district 1 year 5,367 4,803 7.00 - - 7.00 93.1232
175 Build toilet basin top in
each house 2.3.3 6 districts 435 toilets
Development
Department 1 year 2,175 925 17.00 - - 17.00 31.3325
176 Water testing (bacteria) 2.3.4 All districts 3250 places Development
Department 1 year 16,250 8,450 91.00 - - 91.00 25.7905
177
Clean water and hygiene
at school and community
program
2.3.4
Svay Chrum,
Romdoul,
Chantrea, Svay
Teap and
Kampong Rou
district
12 schools –
35 villages
Development
Department 1 year 12,195 3,238 115.00 - - 115.00 23.3063
178 Build toilet 2.3.3
200601-07 + 5
communes of
Bavet City +
200501-17
1590 toilets
Svay Rieng City,
Bavet City, Svay
Chrum
1 year 37,151 18,986 859.00 - - 859.00 18.0316
179 Educate the goal of rural
economic development 2.3.1
Rormeas Haek
district 15 courses
Development
Department 1 year 750 150 4.00 - - 4.00 17.6609
180 Strengthen the road
preserving committee 2.3.1 All communes 1 course
Kampong Rou
district 1 year 550 175 3.00 - - 3.00 13.1390
181 Water testing (Arsenic) 2.3.4 All districts 250 places Development
Department 1 year 1,250 650 15.00 - - 15.00 12.5589
182 Provide clean water
purifier 2.3.4
200103/04/05/0
8/09/10+5
communes of
Bavet city + all
city-district
2993 barrels
Chantrea district +
Bavet City +
Development
Department
1 year 12,958 6,172 468.00 - - 468.00 11.2450
183
Establish committee of
banking in money, animal
and rice
2.3.1 Rormeas Haek
district 15 courses
Development
Department 1 year 750 150 4.00 - - 4.00 10.0078
184 Enhancement of washing
hands with soap 2.3.3
Svay Chrum,
Romdoul,
Chantrea, Svay
Teap and
Kampong Rou
district
6 communes,
34 villages
Development
Department 1 year 4,835 2,178 - 130.00 - 130.00 8.4077
57
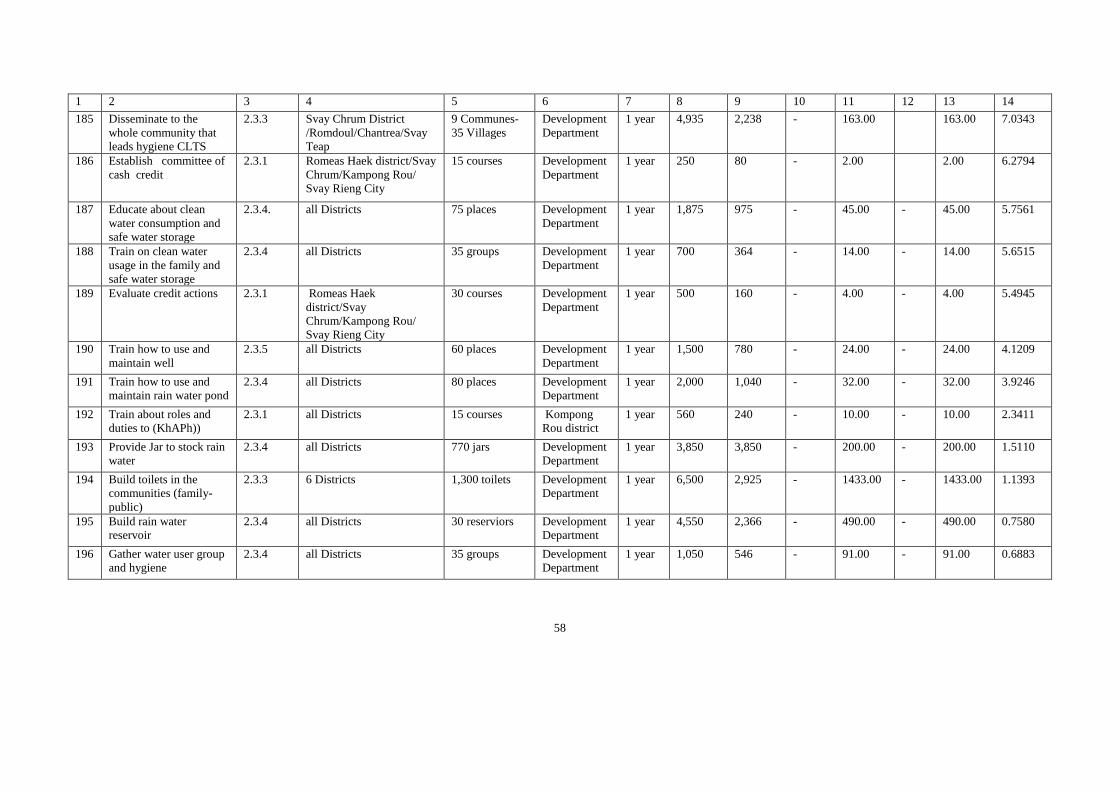
1 2 3 4 5 6 7 8 9 10 11 12 13 14
185 Disseminate to the
whole community that
leads hygiene CLTS
2.3.3 Svay Chrum District
/Romdoul/Chantrea/Svay
Teap
9 Communes-
35 Villages
Development
Department
1 year 4,935 2,238 - 163.00 163.00 7.0343
186 Establish committee of
cash credit
2.3.1 Romeas Haek district/Svay
Chrum/Kampong Rou/
Svay Rieng City
15 courses Development
Department
1 year 250 80 - 2.00 2.00 6.2794
187 Educate about clean
water consumption and
safe water storage
2.3.4. all Districts 75 places Development
Department
1 year 1,875 975 - 45.00 - 45.00 5.7561
188 Train on clean water
usage in the family and
safe water storage
2.3.4 all Districts 35 groups Development
Department
1 year 700 364 - 14.00 - 14.00 5.6515
189 Evaluate credit actions 2.3.1 Romeas Haek
district/Svay
Chrum/Kampong Rou/
Svay Rieng City
30 courses Development
Department
1 year 500 160 - 4.00 - 4.00 5.4945
190 Train how to use and
maintain well
2.3.5 all Districts 60 places Development
Department
1 year 1,500 780 - 24.00 - 24.00 4.1209
191 Train how to use and
maintain rain water pond
2.3.4 all Districts 80 places Development
Department
1 year 2,000 1,040 - 32.00 - 32.00 3.9246
192 Train about roles and
duties to (KhAPh))
2.3.1 all Districts 15 courses Kompong
Rou district
1 year 560 240 - 10.00 - 10.00 2.3411
193 Provide Jar to stock rain
water
2.3.4 all Districts 770 jars Development
Department
1 year 3,850 3,850 - 200.00 - 200.00 1.5110
194 Build toilets in the
communities (family-
public)
2.3.3 6 Districts 1,300 toilets Development
Department
1 year 6,500 2,925 - 1433.00 - 1433.00 1.1393
195 Build rain water
reservoir
2.3.4 all Districts 30 reserviors Development
Department
1 year 4,550 2,366 - 490.00 - 490.00 0.7580
196 Gather water user group
and hygiene
2.3.4 all Districts 35 groups Development
Department
1 year 1,050 546 - 91.00 - 91.00 0.6883
58
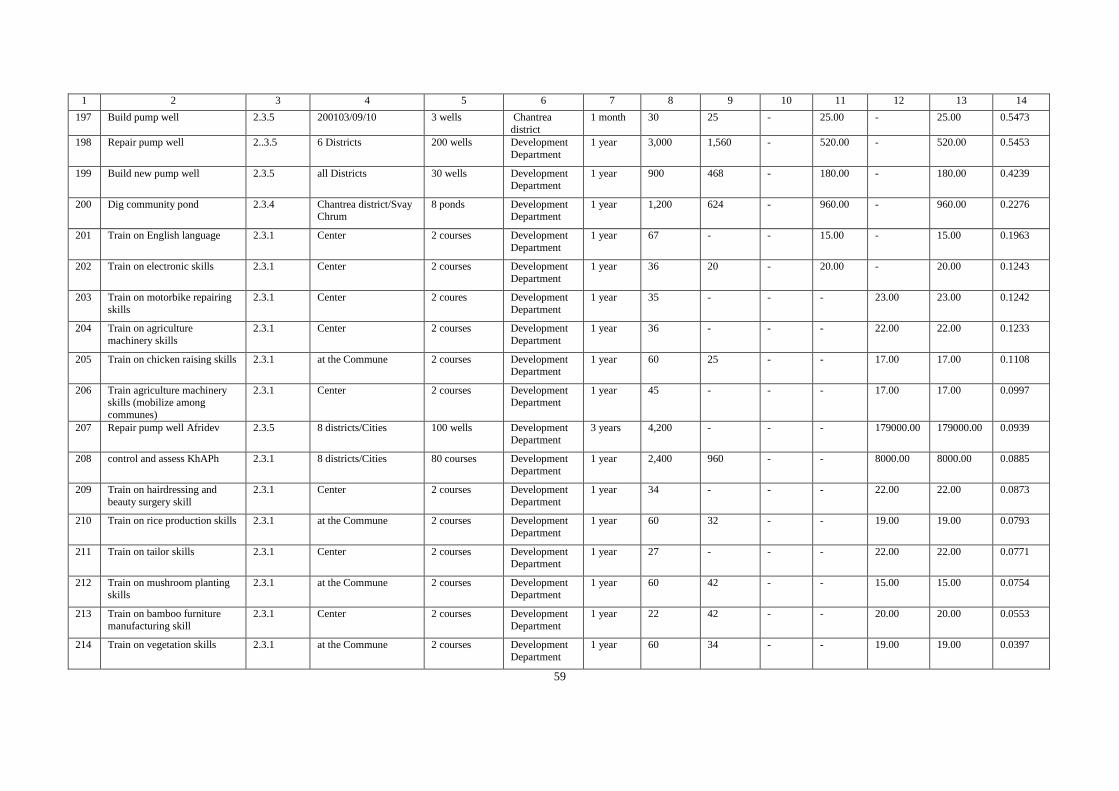
1 2 3 4 5 6 7 8 9 10 11 12 13 14
197 Build pump well 2.3.5 200103/09/10 3 wells Chantrea
district
1 month 30 25 - 25.00 - 25.00 0.5473
198 Repair pump well 2..3.5 6 Districts 200 wells Development
Department
1 year 3,000 1,560 - 520.00 - 520.00 0.5453
199 Build new pump well 2.3.5 all Districts 30 wells Development Department
1 year 900 468 - 180.00 - 180.00 0.4239
200 Dig community pond 2.3.4 Chantrea district/Svay Chrum
8 ponds Development Department
1 year 1,200 624 - 960.00 - 960.00 0.2276
201 Train on English language 2.3.1 Center 2 courses Development
Department
1 year 67 - - 15.00 - 15.00 0.1963
202 Train on electronic skills 2.3.1 Center 2 courses Development
Department
1 year 36 20 - 20.00 - 20.00 0.1243
203 Train on motorbike repairing
skills
2.3.1 Center 2 coures Development
Department
1 year 35 - - - 23.00 23.00 0.1242
204 Train on agriculture
machinery skills
2.3.1 Center 2 courses Development
Department
1 year 36 - - - 22.00 22.00 0.1233
205 Train on chicken raising skills 2.3.1 at the Commune 2 courses Development Department
1 year 60 25 - - 17.00 17.00 0.1108
206 Train agriculture machinery skills (mobilize among
communes)
2.3.1 Center 2 courses Development Department
1 year 45 - - - 17.00 17.00 0.0997
207 Repair pump well Afridev 2.3.5 8 districts/Cities 100 wells Development
Department
3 years 4,200 - - - 179000.00 179000.00 0.0939
208 control and assess KhAPh 2.3.1 8 districts/Cities 80 courses Development
Department
1 year 2,400 960 - - 8000.00 8000.00 0.0885
209 Train on hairdressing and
beauty surgery skill
2.3.1 Center 2 courses Development
Department
1 year 34 - - - 22.00 22.00 0.0873
210 Train on rice production skills 2.3.1 at the Commune 2 courses Development
Department
1 year 60 32 - - 19.00 19.00 0.0793
211 Train on tailor skills 2.3.1 Center 2 courses Development Department
1 year 27 - - - 22.00 22.00 0.0771
212 Train on mushroom planting
skills
2.3.1 at the Commune 2 courses Development
Department
1 year 60 42 - - 15.00 15.00 0.0754
213 Train on bamboo furniture
manufacturing skill
2.3.1 Center 2 courses Development
Department
1 year 22 42 - - 20.00 20.00 0.0553
214 Train on vegetation skills 2.3.1 at the Commune 2 courses Development
Department
1 year 60 34 - - 19.00 19.00 0.0397
59
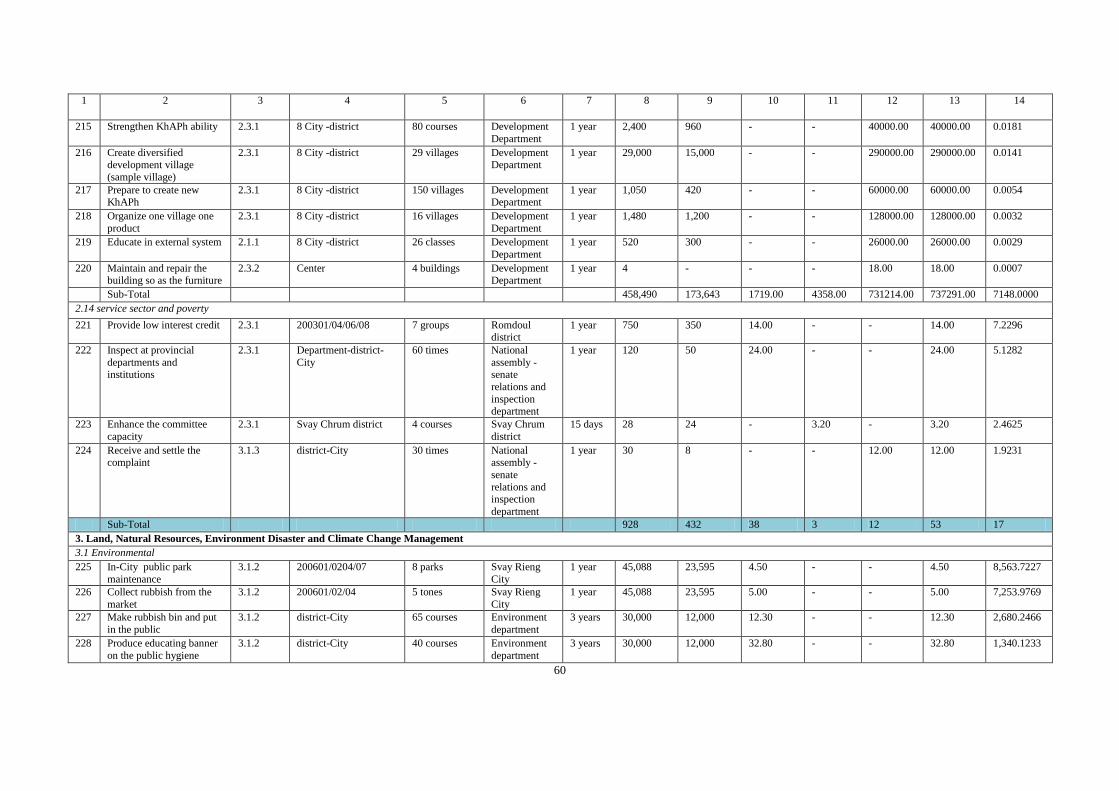
1 2 3 4 5 6 7 8 9 10 11 12 13 14
215 Strengthen KhAPh ability 2.3.1 8 City -district 80 courses Development
Department
1 year 2,400 960 - - 40000.00 40000.00 0.0181
216 Create diversified development village
(sample village)
2.3.1 8 City -district 29 villages Development Department
1 year 29,000 15,000 - - 290000.00 290000.00 0.0141
217 Prepare to create new KhAPh
2.3.1 8 City -district 150 villages Development Department
1 year 1,050 420 - - 60000.00 60000.00 0.0054
218 Organize one village one
product
2.3.1 8 City -district 16 villages Development
Department
1 year 1,480 1,200 - - 128000.00 128000.00 0.0032
219 Educate in external system 2.1.1 8 City -district 26 classes Development
Department
1 year 520 300 - - 26000.00 26000.00 0.0029
220 Maintain and repair the building so as the furniture
2.3.2 Center 4 buildings Development Department
1 year 4 - - - 18.00 18.00 0.0007
Sub-Total 458,490 173,643 1719.00 4358.00 731214.00 737291.00 7148.0000
2.14 service sector and poverty
221 Provide low interest credit 2.3.1 200301/04/06/08 7 groups Romdoul district
1 year 750 350 14.00 - - 14.00 7.2296
222 Inspect at provincial
departments and institutions
2.3.1 Department-district-
City
60 times National
assembly -senate
relations and
inspection department
1 year 120 50 24.00 - - 24.00 5.1282
223 Enhance the committee
capacity
2.3.1 Svay Chrum district 4 courses Svay Chrum
district
15 days 28 24 - 3.20 - 3.20 2.4625
224 Receive and settle the complaint
3.1.3 district-City 30 times National assembly -
senate
relations and inspection
department
1 year 30 8 - - 12.00 12.00 1.9231
Sub-Total 928 432 38 3 12 53 17
3. Land, Natural Resources, Environment Disaster and Climate Change Management
3.1 Environmental
225 In-City public park
maintenance
3.1.2 200601/0204/07 8 parks Svay Rieng
City
1 year 45,088 23,595 4.50 - - 4.50 8,563.7227
226 Collect rubbish from the
market
3.1.2 200601/02/04 5 tones Svay Rieng
City
1 year 45,088 23,595 5.00 - - 5.00 7,253.9769
227 Make rubbish bin and put
in the public
3.1.2 district-City 65 courses Environment
department
3 years 30,000 12,000 12.30 - - 12.30 2,680.2466
228 Produce educating banner
on the public hygiene
3.1.2 district-City 40 courses Environment
department
3 years 30,000 12,000 32.80 - - 32.80 1,340.1233
60
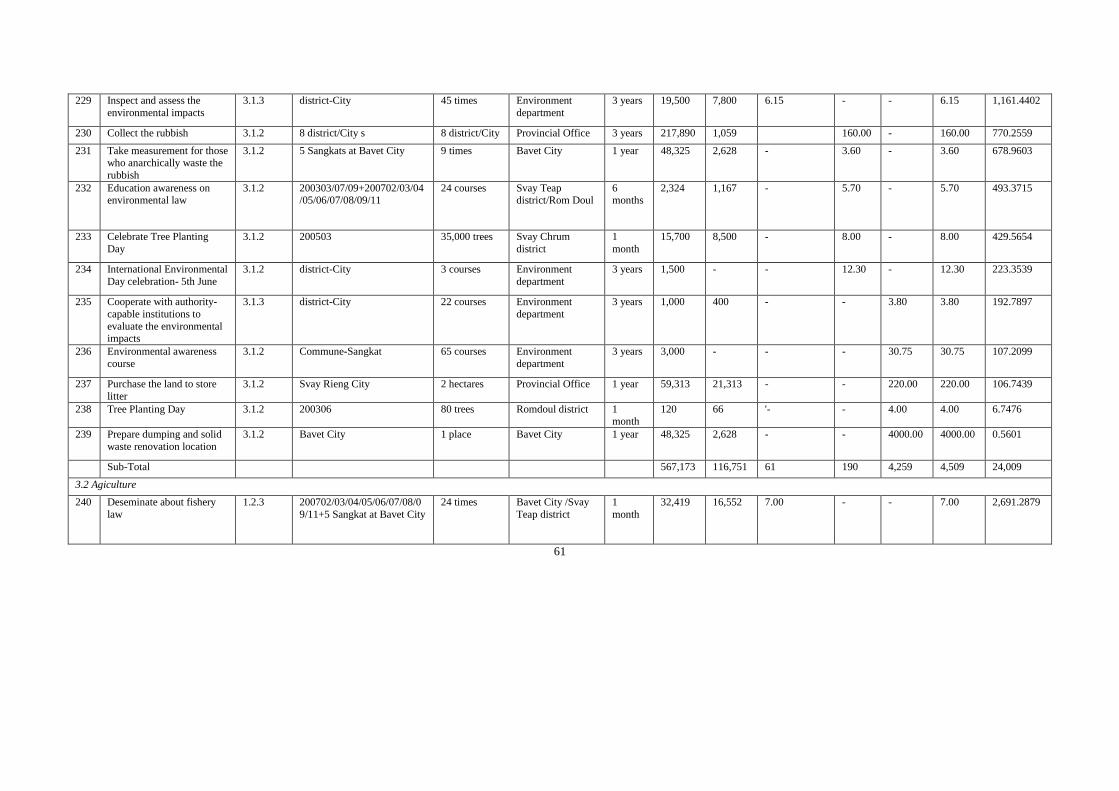
229 Inspect and assess the
environmental impacts
3.1.3 district-City 45 times Environment
department
3 years 19,500 7,800 6.15 - - 6.15 1,161.4402
230 Collect the rubbish 3.1.2 8 district/City s 8 district/City Provincial Office 3 years 217,890 1,059 160.00 - 160.00 770.2559
231 Take measurement for those who anarchically waste the
rubbish
3.1.2 5 Sangkats at Bavet City 9 times Bavet City 1 year 48,325 2,628 - 3.60 - 3.60 678.9603
232 Education awareness on environmental law
3.1.2 200303/07/09+200702/03/04 /05/06/07/08/09/11
24 courses Svay Teap district/Rom Doul
6 months
2,324 1,167 - 5.70 - 5.70 493.3715
233 Celebrate Tree Planting
Day
3.1.2 200503 35,000 trees Svay Chrum
district
1
month
15,700 8,500 - 8.00 - 8.00 429.5654
234 International Environmental
Day celebration- 5th June
3.1.2 district-City 3 courses Environment
department
3 years 1,500 - - 12.30 - 12.30 223.3539
235 Cooperate with authority-
capable institutions to
evaluate the environmental impacts
3.1.3 district-City 22 courses Environment
department
3 years 1,000 400 - - 3.80 3.80 192.7897
236 Environmental awareness
course
3.1.2 Commune-Sangkat 65 courses Environment
department
3 years 3,000 - - - 30.75 30.75 107.2099
237 Purchase the land to store
litter
3.1.2 Svay Rieng City 2 hectares Provincial Office 1 year 59,313 21,313 - - 220.00 220.00 106.7439
238 Tree Planting Day 3.1.2 200306 80 trees Romdoul district 1
month
120 66 '- - 4.00 4.00 6.7476
239 Prepare dumping and solid
waste renovation location
3.1.2 Bavet City 1 place Bavet City 1 year 48,325 2,628 - - 4000.00 4000.00 0.5601
Sub-Total 567,173 116,751 61 190 4,259 4,509 24,009
3.2 Agiculture
240 Deseminate about fishery
law
1.2.3 200702/03/04/05/06/07/08/0
9/11+5 Sangkat at Bavet City
24 times Bavet City /Svay
Teap district
1
month
32,419 16,552 7.00 - - 7.00 2,691.2879
61
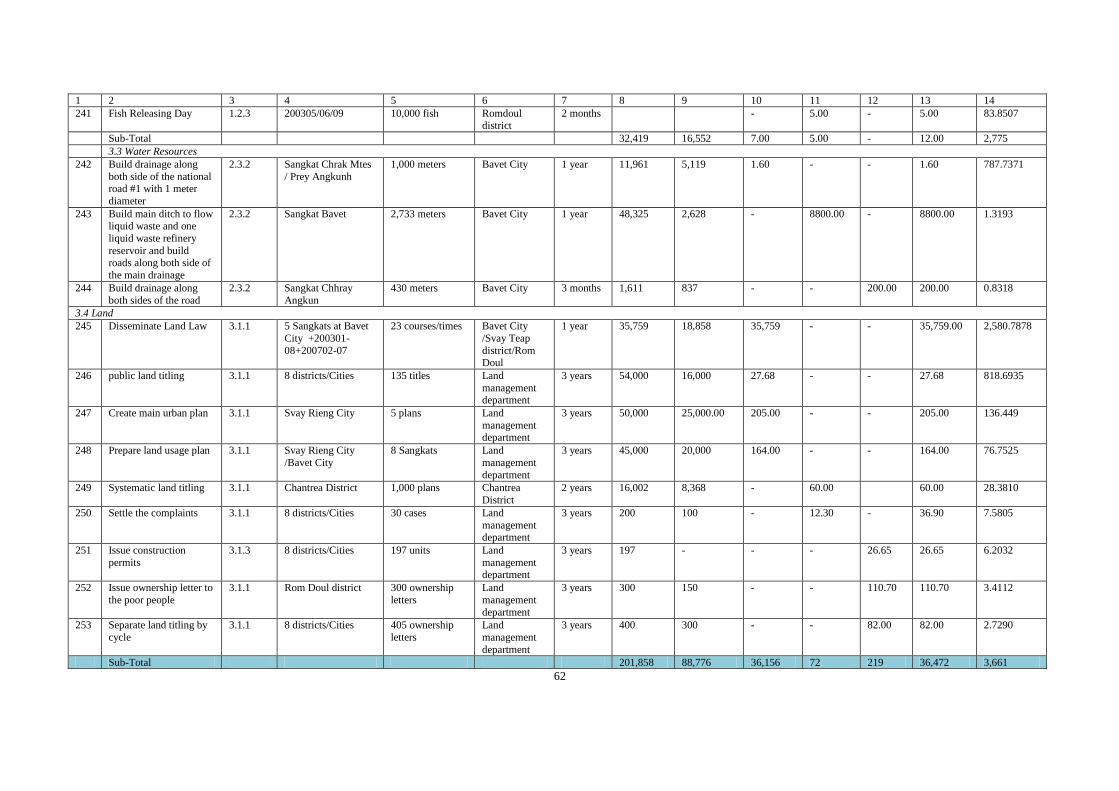
1 2 3 4 5 6 7 8 9 10 11 12 13 14
241 Fish Releasing Day 1.2.3 200305/06/09 10,000 fish Romdoul district
2 months - 5.00 - 5.00 83.8507
Sub-Total 32,419 16,552 7.00 5.00 - 12.00 2,775
3.3 Water Resources
242 Build drainage along
both side of the national road #1 with 1 meter
diameter
2.3.2 Sangkat Chrak Mtes
/ Prey Angkunh
1,000 meters Bavet City 1 year 11,961 5,119 1.60 - - 1.60 787.7371
243 Build main ditch to flow liquid waste and one
liquid waste refinery
reservoir and build roads along both side of
the main drainage
2.3.2 Sangkat Bavet 2,733 meters Bavet City 1 year 48,325 2,628 - 8800.00 - 8800.00 1.3193
244 Build drainage along
both sides of the road
2.3.2 Sangkat Chhray
Angkun
430 meters Bavet City 3 months 1,611 837 - - 200.00 200.00 0.8318
3.4 Land
245 Disseminate Land Law 3.1.1 5 Sangkats at Bavet
City +200301-
08+200702-07
23 courses/times Bavet City
/Svay Teap
district/Rom Doul
1 year 35,759 18,858 35,759 - - 35,759.00 2,580.7878
246 public land titling 3.1.1 8 districts/Cities 135 titles Land
management department
3 years 54,000 16,000 27.68 - - 27.68 818.6935
247 Create main urban plan 3.1.1 Svay Rieng City 5 plans Land
management department
3 years 50,000 25,000.00 205.00 - - 205.00 136.449
248 Prepare land usage plan 3.1.1 Svay Rieng City
/Bavet City
8 Sangkats Land
management
department
3 years 45,000 20,000 164.00 - - 164.00 76.7525
249 Systematic land titling 3.1.1 Chantrea District 1,000 plans Chantrea
District
2 years 16,002 8,368 - 60.00 60.00 28.3810
250 Settle the complaints 3.1.1 8 districts/Cities 30 cases Land
management department
3 years 200 100 - 12.30 - 36.90 7.5805
251 Issue construction
permits
3.1.3 8 districts/Cities 197 units Land
management department
3 years 197 - - - 26.65 26.65 6.2032
252 Issue ownership letter to
the poor people
3.1.1 Rom Doul district 300 ownership
letters
Land
management
department
3 years 300 150 - - 110.70 110.70 3.4112
253 Separate land titling by
cycle
3.1.1 8 districts/Cities 405 ownership
letters
Land
management
department
3 years 400 300 - - 82.00 82.00 2.7290
Sub-Total 201,858 88,776 36,156 72 219 36,472 3,661
62
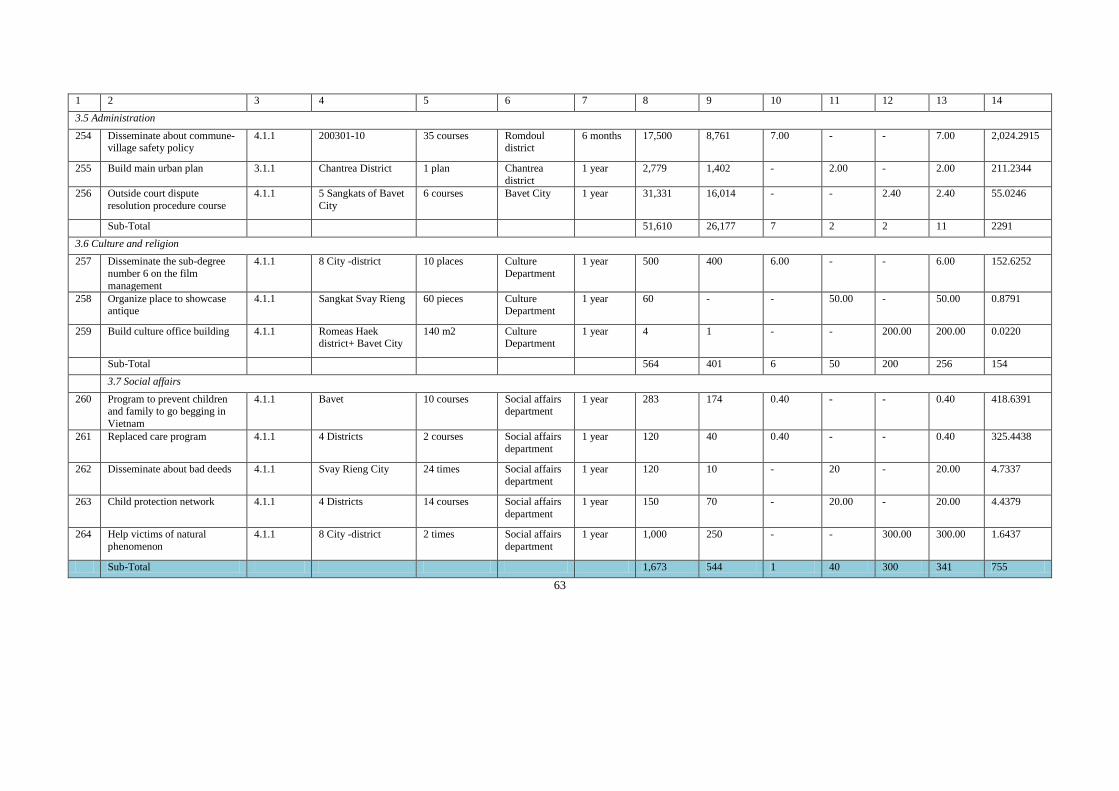
1 2 3 4 5 6 7 8 9 10 11 12 13 14
3.5 Administration
254 Disseminate about commune-village safety policy
4.1.1 200301-10 35 courses Romdoul district
6 months 17,500 8,761 7.00 - - 7.00 2,024.2915
255 Build main urban plan 3.1.1 Chantrea District 1 plan Chantrea
district
1 year 2,779 1,402 - 2.00 - 2.00 211.2344
256 Outside court dispute
resolution procedure course
4.1.1 5 Sangkats of Bavet
City
6 courses Bavet City 1 year 31,331 16,014 - - 2.40 2.40 55.0246
Sub-Total 51,610 26,177 7 2 2 11 2291
3.6 Culture and religion
257 Disseminate the sub-degree
number 6 on the film
management
4.1.1 8 City -district 10 places Culture
Department
1 year 500 400 6.00 - - 6.00 152.6252
258 Organize place to showcase antique
4.1.1 Sangkat Svay Rieng 60 pieces Culture Department
1 year 60 - - 50.00 - 50.00 0.8791
259 Build culture office building 4.1.1 Romeas Haek district+ Bavet City
140 m2 Culture Department
1 year 4 1 - - 200.00 200.00 0.0220
Sub-Total 564 401 6 50 200 256 154
3.7 Social affairs
260 Program to prevent children and family to go begging in
Vietnam
4.1.1 Bavet 10 courses Social affairs department
1 year 283 174 0.40 - - 0.40 418.6391
261 Replaced care program 4.1.1 4 Districts 2 courses Social affairs
department
1 year 120 40 0.40 - - 0.40 325.4438
262 Disseminate about bad deeds 4.1.1 Svay Rieng City 24 times Social affairs
department
1 year 120 10 - 20 - 20.00 4.7337
263 Child protection network 4.1.1 4 Districts 14 courses Social affairs
department
1 year 150 70 - 20.00 - 20.00 4.4379
264 Help victims of natural
phenomenon
4.1.1 8 City -district 2 times Social affairs
department
1 year 1,000 250 - - 300.00 300.00 1.6437
Sub-Total 1,673 544 1 40 300 341 755
63
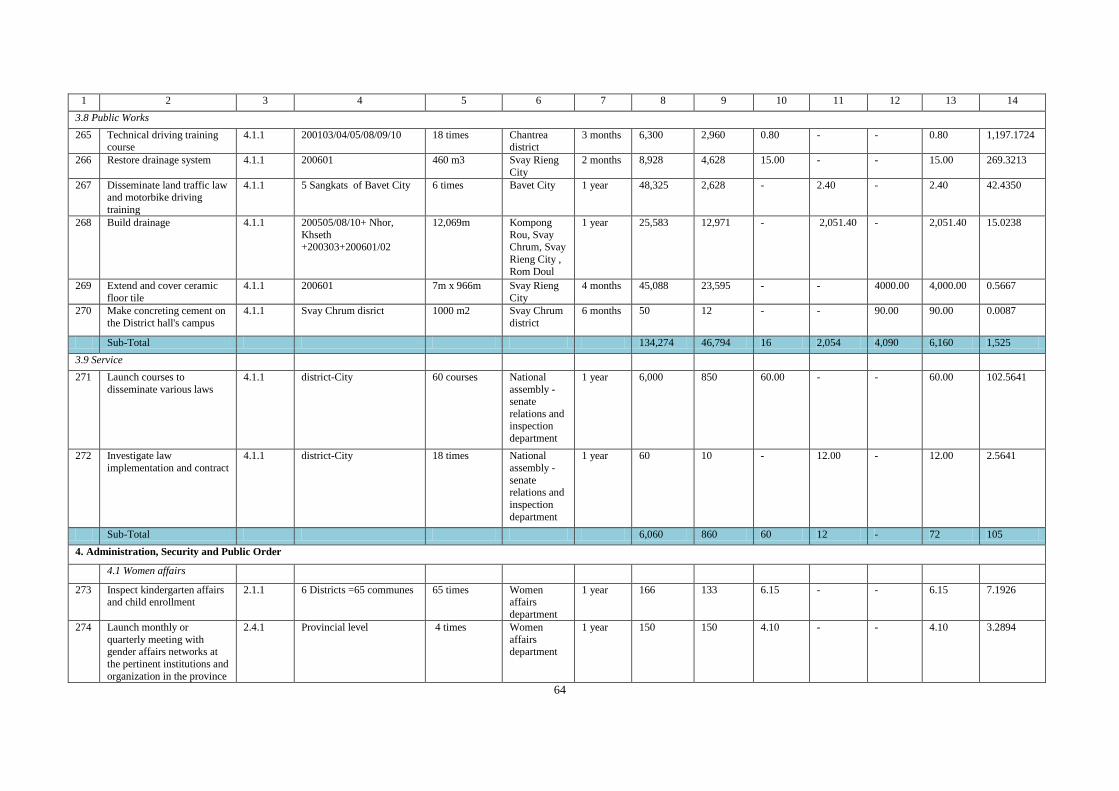
1 2 3 4 5 6 7 8 9 10 11 12 13 14
3.8 Public Works
265 Technical driving training course
4.1.1 200103/04/05/08/09/10 18 times Chantrea district
3 months 6,300 2,960 0.80 - - 0.80 1,197.1724
266 Restore drainage system 4.1.1 200601 460 m3 Svay Rieng
City
2 months 8,928 4,628 15.00 - - 15.00 269.3213
267 Disseminate land traffic law and motorbike driving
training
4.1.1 5 Sangkats of Bavet City 6 times Bavet City 1 year 48,325 2,628 - 2.40 - 2.40 42.4350
268 Build drainage 4.1.1 200505/08/10+ Nhor,
Khseth +200303+200601/02
12,069m Kompong
Rou, Svay Chrum, Svay
Rieng City ,
Rom Doul
1 year 25,583 12,971 - 2,051.40 - 2,051.40 15.0238
269 Extend and cover ceramic
floor tile
4.1.1 200601 7m x 966m Svay Rieng
City
4 months 45,088 23,595 - - 4000.00 4,000.00 0.5667
270 Make concreting cement on
the District hall's campus
4.1.1 Svay Chrum disrict 1000 m2 Svay Chrum
district
6 months 50 12 - - 90.00 90.00 0.0087
Sub-Total 134,274 46,794 16 2,054 4,090 6,160 1,525
3.9 Service
271 Launch courses to
disseminate various laws
4.1.1 district-City 60 courses National
assembly -senate
relations and
inspection
department
1 year 6,000 850 60.00 - - 60.00 102.5641
272 Investigate law
implementation and contract
4.1.1 district-City 18 times National
assembly -
senate relations and
inspection
department
1 year 60 10 - 12.00 - 12.00 2.5641
Sub-Total 6,060 860 60 12 - 72 105
4. Administration, Security and Public Order
4.1 Women affairs
273 Inspect kindergarten affairs and child enrollment
2.1.1 6 Districts =65 communes 65 times Women affairs
department
1 year 166 133 6.15 - - 6.15 7.1926
274 Launch monthly or
quarterly meeting with gender affairs networks at
the pertinent institutions and
organization in the province
2.4.1 Provincial level 4 times Women
affairs department
1 year 150 150 4.10 - - 4.10 3.2894
64
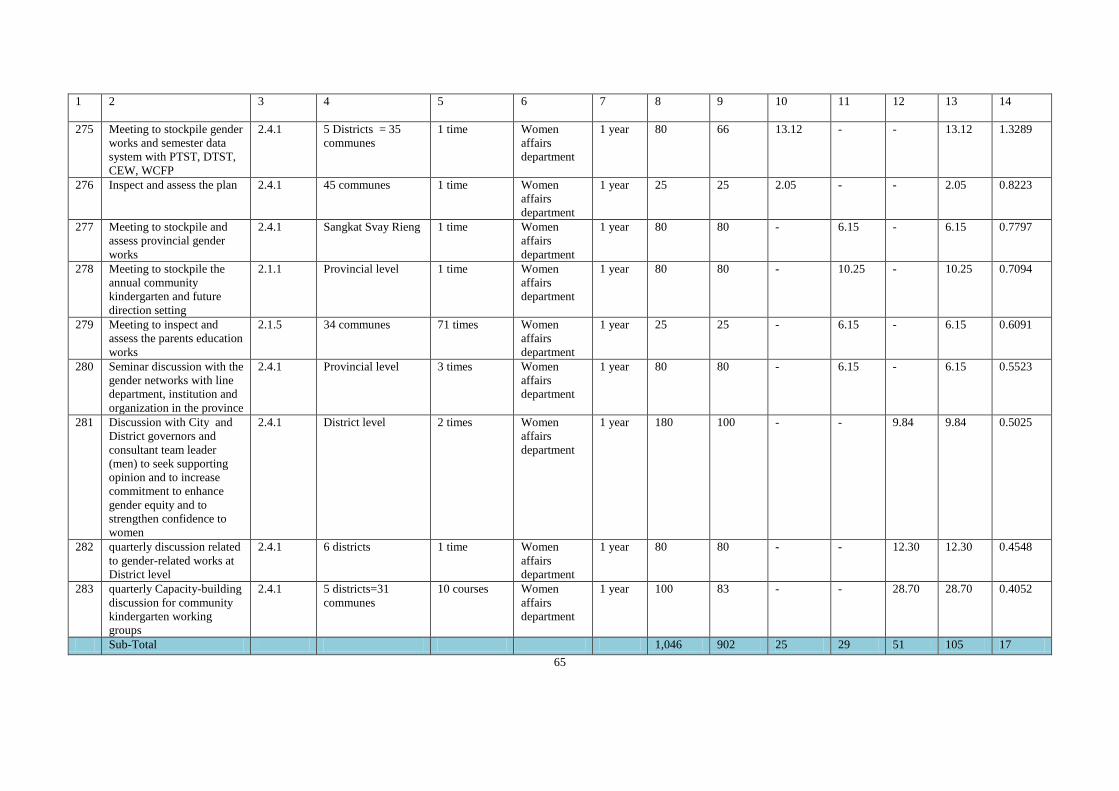
1 2 3 4 5 6 7 8 9 10 11 12 13 14
275 Meeting to stockpile gender
works and semester data
system with PTST, DTST,
CEW, WCFP
2.4.1 5 Districts = 35
communes
1 time Women
affairs
department
1 year 80 66 13.12 - - 13.12 1.3289
276 Inspect and assess the plan 2.4.1 45 communes 1 time Women
affairs
department
1 year 25 25 2.05 - - 2.05 0.8223
277 Meeting to stockpile and
assess provincial gender
works
2.4.1 Sangkat Svay Rieng 1 time Women
affairs
department
1 year 80 80 - 6.15 - 6.15 0.7797
278 Meeting to stockpile the
annual community
kindergarten and future
direction setting
2.1.1 Provincial level 1 time Women
affairs
department
1 year 80 80 - 10.25 - 10.25 0.7094
279 Meeting to inspect and
assess the parents education
works
2.1.5 34 communes 71 times Women
affairs
department
1 year 25 25 - 6.15 - 6.15 0.6091
280 Seminar discussion with the
gender networks with line
department, institution and
organization in the province
2.4.1 Provincial level 3 times Women
affairs
department
1 year 80 80 - 6.15 - 6.15 0.5523
281 Discussion with City and
District governors and
consultant team leader
(men) to seek supporting
opinion and to increase
commitment to enhance
gender equity and to
strengthen confidence to
women
2.4.1 District level 2 times Women
affairs
department
1 year 180 100 - - 9.84 9.84 0.5025
282 quarterly discussion related
to gender-related works at
District level
2.4.1 6 districts 1 time Women
affairs
department
1 year 80 80 - - 12.30 12.30 0.4548
283 quarterly Capacity-building
discussion for community
kindergarten working
groups
2.4.1 5 districts=31
communes
10 courses Women
affairs
department
1 year 100 83 - - 28.70 28.70 0.4052
Sub-Total 1,046 902 25 29 51 105 17
65
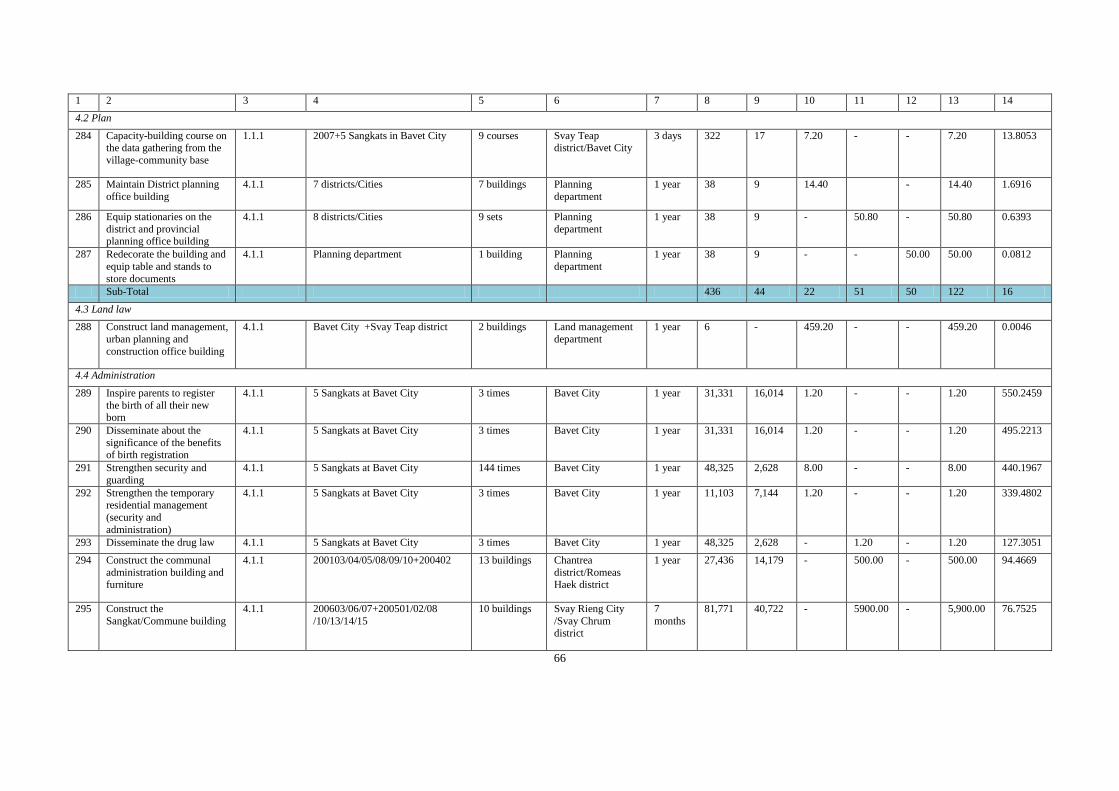
1 2 3 4 5 6 7 8 9 10 11 12 13 14
4.2 Plan
284 Capacity-building course on the data gathering from the
village-community base
1.1.1 2007+5 Sangkats in Bavet City 9 courses Svay Teap district/Bavet City
3 days 322 17 7.20 - - 7.20 13.8053
285 Maintain District planning
office building
4.1.1 7 districts/Cities 7 buildings Planning
department
1 year 38 9 14.40 - 14.40 1.6916
286 Equip stationaries on the
district and provincial planning office building
4.1.1 8 districts/Cities 9 sets Planning
department
1 year 38 9 - 50.80 - 50.80 0.6393
287 Redecorate the building and
equip table and stands to
store documents
4.1.1 Planning department 1 building Planning
department
1 year 38 9 - - 50.00 50.00 0.0812
Sub-Total 436 44 22 51 50 122 16
4.3 Land law
288 Construct land management,
urban planning and
construction office building
4.1.1 Bavet City +Svay Teap district 2 buildings Land management
department
1 year 6 - 459.20 - - 459.20 0.0046
4.4 Administration
289 Inspire parents to register
the birth of all their new
born
4.1.1 5 Sangkats at Bavet City 3 times Bavet City 1 year 31,331 16,014 1.20 - - 1.20 550.2459
290 Disseminate about the
significance of the benefits of birth registration
4.1.1 5 Sangkats at Bavet City 3 times Bavet City 1 year 31,331 16,014 1.20 - - 1.20 495.2213
291 Strengthen security and
guarding
4.1.1 5 Sangkats at Bavet City 144 times Bavet City 1 year 48,325 2,628 8.00 - - 8.00 440.1967
292 Strengthen the temporary residential management
(security and
administration)
4.1.1 5 Sangkats at Bavet City 3 times Bavet City 1 year 11,103 7,144 1.20 - - 1.20 339.4802
293 Disseminate the drug law 4.1.1 5 Sangkats at Bavet City 3 times Bavet City 1 year 48,325 2,628 - 1.20 - 1.20 127.3051
294 Construct the communal
administration building and furniture
4.1.1 200103/04/05/08/09/10+200402 13 buildings Chantrea
district/Romeas Haek district
1 year 27,436 14,179 - 500.00 - 500.00 94.4669
295 Construct the
Sangkat/Commune building
4.1.1 200603/06/07+200501/02/08
/10/13/14/15
10 buildings Svay Rieng City
/Svay Chrum district
7
months
81,771 40,722 - 5900.00 - 5,900.00 76.7525
66

1 2 3 4 5 6 7 8 9 10 11 12 13 14
296 Construct police and village administration
station building
4.1.1 200103/05/10 3 buildings Chantrea district
3 months
11,941 6,647 - 42.00 - 42.00 58.4984
297 Promote safe
migration (2011)
4.1.1 8 districts/Cities 1500 people Labor
department
3 years 1,500 - - - 48.00 48.00 35.7143
298 Strengthen registration
works
4.1.1 5 Sangkats of Bavet City 3 times Bavet City 1 year 31,331 16,014 - - 1.20 1.20 15.5156
299 Disseminate the registration works
4.1.1 200702/03/04/05/06/07/08/09/10 9 courses Svay Teap district
1 day 450 200 - - 2.70 2.70 5.4810
300 Make/distribute ID
card to people for uses
4.1.1 200103/04/05/08/09/10 3 times Chantrea
district
3
months
5,562 2,915 - - 17.00 17.00 4.9738
Sub-Total 330,406 125,105 12 6,443 69 6,524 2,244
4.5 Social affairs
301 Construct district
office building
4.1.1 Rom Doul district 54 m2 Social affairs
department
6
months
289 70 50.00 - - 50.00 1.1400
302 Repair department 4.1.1 Social affairs department 100 m2 Social affairs
department
3
months
45 22 22.00 - - 22.00 0.5043
303 National Council for
Children
4.1.1 8 City -district 6 courses Social affairs
department
1 year 350 170 - 20.00 - 200.00 0.3452
304 Construct veteran residences
4.1.1 Svay Chrum district 30 m2 Social affairs department
3 months
7 3 - - 30.00 30.00 0.0345
Sub-Total 691 265 72 20 30 302 2
4.6 Public works
305 Equip stationeries and vehicles to implement
the works
4.1.1 Chantrea district 8 kinds Chantrea district
6 months
23 3 6.00 - - 6.00 0.1166
4.7 Health
306 Construct health
center
4.1.1 Som Lei, Royal department, new+
2002/03/07/09/12+200413/14/15+200103/04/10
14
buildings
Chantrea
district/Romeas
Haek/Kampong Rou/Svay
Chrum
1 year 92,071 61,458 7,270.00 - 7,270.00 9.5916
67
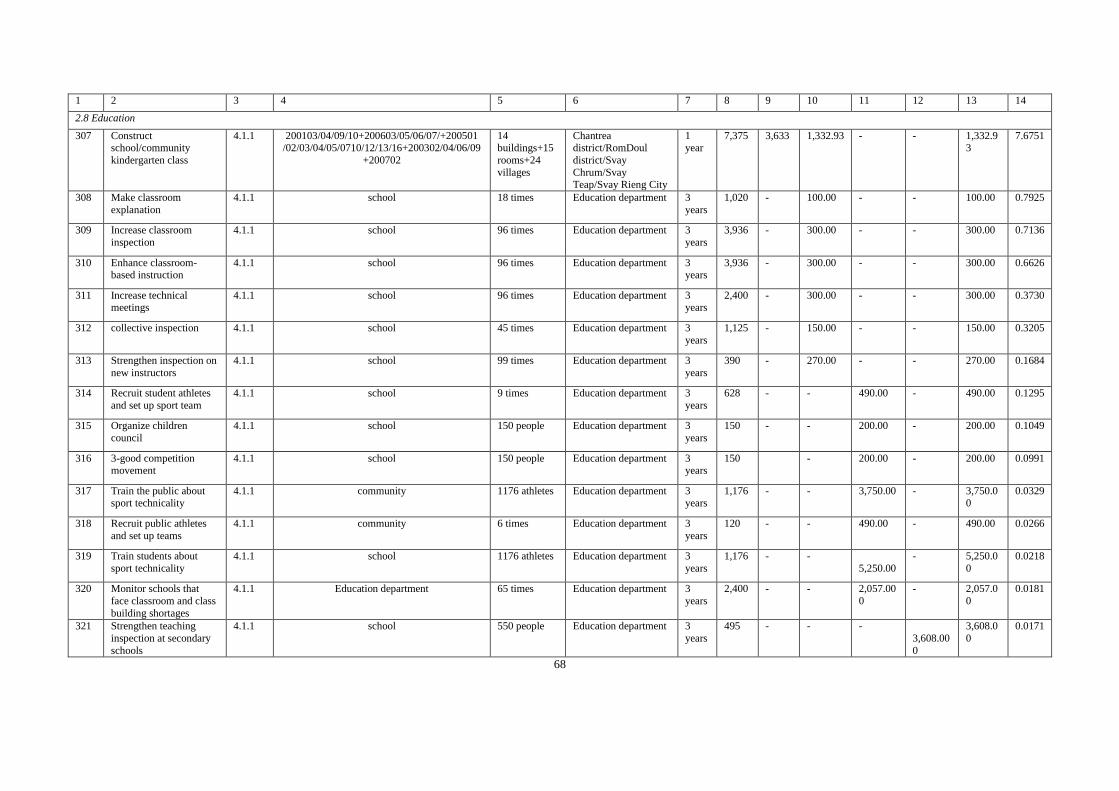
1 2 3 4 5 6 7 8 9 10 11 12 13 14
2.8 Education
307 Construct school/community
kindergarten class
4.1.1 200103/04/09/10+200603/05/06/07/+200501 /02/03/04/05/0710/12/13/16+200302/04/06/09
+200702
14 buildings+15
rooms+24
villages
Chantrea district/RomDoul
district/Svay
Chrum/Svay Teap/Svay Rieng City
1 year
7,375 3,633 1,332.93 - - 1,332.93
7.6751
308 Make classroom
explanation
4.1.1 school 18 times Education department 3
years
1,020 - 100.00 - - 100.00 0.7925
309 Increase classroom
inspection
4.1.1 school 96 times Education department 3
years
3,936 - 300.00 - - 300.00 0.7136
310 Enhance classroom-based instruction
4.1.1 school 96 times Education department 3 years
3,936 - 300.00 - - 300.00 0.6626
311 Increase technical meetings
4.1.1 school 96 times Education department 3 years
2,400 - 300.00 - - 300.00 0.3730
312 collective inspection 4.1.1 school 45 times Education department 3
years
1,125 - 150.00 - - 150.00 0.3205
313 Strengthen inspection on
new instructors
4.1.1 school 99 times Education department 3
years
390 - 270.00 - - 270.00 0.1684
314 Recruit student athletes
and set up sport team
4.1.1 school 9 times Education department 3
years
628 - - 490.00 - 490.00 0.1295
315 Organize children
council
4.1.1 school 150 people Education department 3
years
150 - - 200.00 - 200.00 0.1049
316 3-good competition movement
4.1.1 school 150 people Education department 3 years
150 - 200.00 - 200.00 0.0991
317 Train the public about sport technicality
4.1.1 community 1176 athletes Education department 3 years
1,176 - - 3,750.00 - 3,750.00
0.0329
318 Recruit public athletes
and set up teams
4.1.1 community 6 times Education department 3
years
120 - - 490.00 - 490.00 0.0266
319 Train students about
sport technicality
4.1.1 school 1176 athletes Education department 3
years
1,176 - -
5,250.00
- 5,250.0
0
0.0218
320 Monitor schools that
face classroom and class
building shortages
4.1.1 Education department 65 times Education department 3
years
2,400 - - 2,057.00
0
- 2,057.0
0
0.0181
321 Strengthen teaching
inspection at secondary
schools
4.1.1 school 550 people Education department 3
years
495 - - -
3,608.00
0
3,608.0
0
0.0171
68
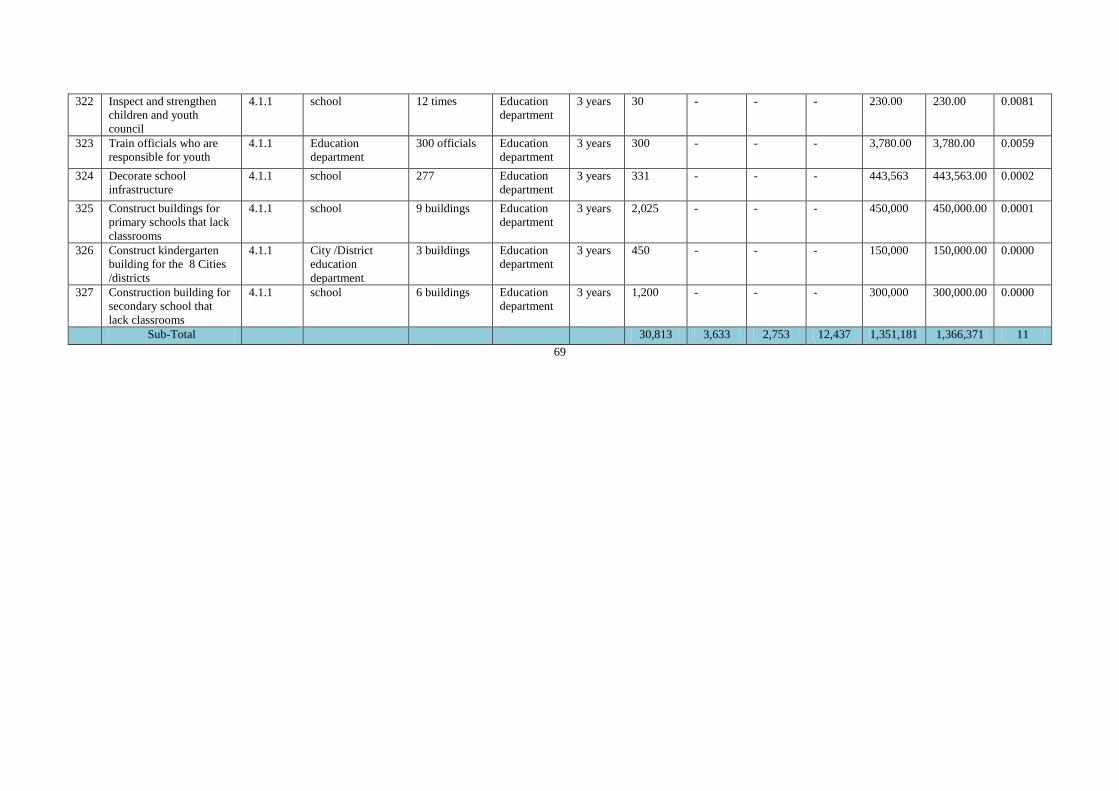
322 Inspect and strengthen
children and youth
council
4.1.1 school 12 times Education
department
3 years 30 - - - 230.00 230.00 0.0081
323 Train officials who are
responsible for youth
4.1.1 Education
department
300 officials Education
department
3 years 300 - - - 3,780.00 3,780.00 0.0059
324 Decorate school
infrastructure
4.1.1 school 277 Education
department
3 years 331 - - - 443,563 443,563.00 0.0002
325 Construct buildings for
primary schools that lack
classrooms
4.1.1 school 9 buildings Education
department
3 years 2,025 - - - 450,000 450,000.00 0.0001
326 Construct kindergarten
building for the 8 Cities
/districts
4.1.1 City /District
education
department
3 buildings Education
department
3 years 450 - - - 150,000 150,000.00 0.0000
327 Construction building for
secondary school that
lack classrooms
4.1.1 school 6 buildings Education
department
3 years 1,200 - - - 300,000 300,000.00 0.0000
Sub-Total 30,813 3,633 2,753 12,437 1,351,181 1,366,371 11
69
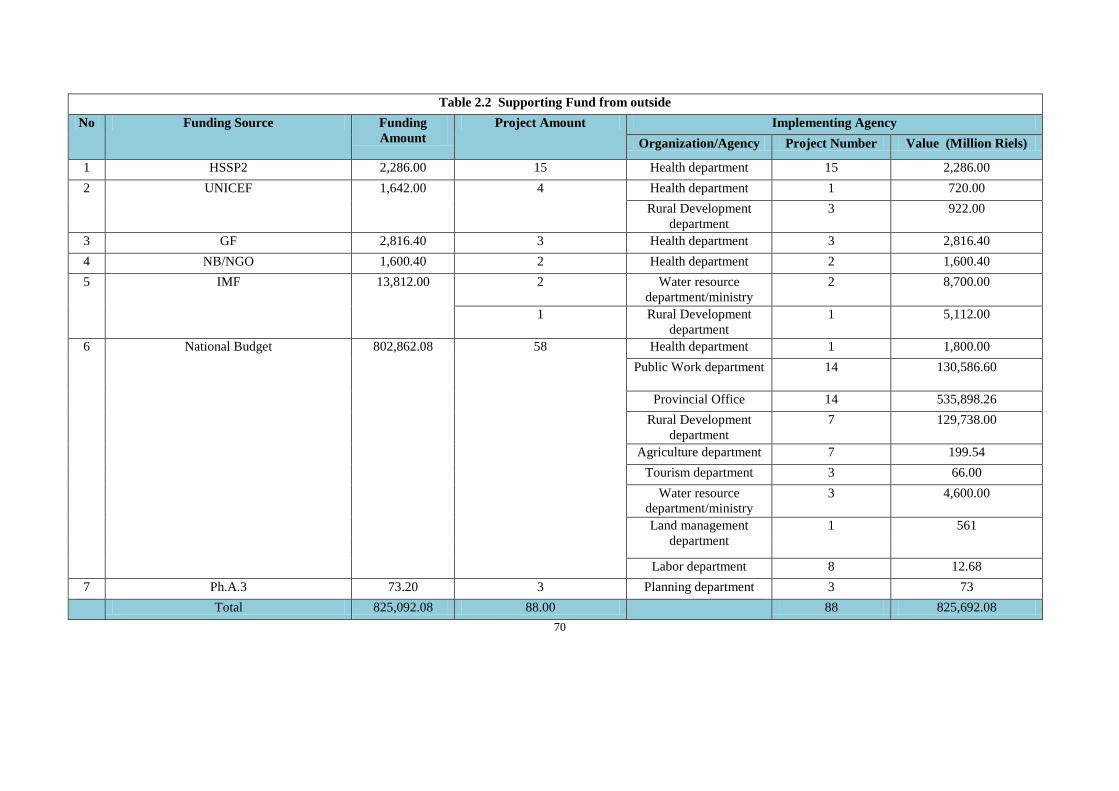
Table 2.2 Supporting Fund from outside
No Funding Source Funding
Amount
Project Amount Implementing Agency
Organization/Agency Project Number Value (Million Riels)
1 HSSP2 2,286.00 15 Health department 15 2,286.00
2 UNICEF 1,642.00 4 Health department 1 720.00
Rural Development
department
3 922.00
3 GF 2,816.40 3 Health department 3 2,816.40
4 NB/NGO 1,600.40 2 Health department 2 1,600.40
5 IMF 13,812.00 2 Water resource
department/ministry
2 8,700.00
1 Rural Development
department
1 5,112.00
6 National Budget 802,862.08 58 Health department 1 1,800.00
Public Work department 14 130,586.60
Provincial Office 14 535,898.26
Rural Development
department
7 129,738.00
Agriculture department 7 199.54
Tourism department 3 66.00
Water resource
department/ministry
3 4,600.00
Land management
department
1 561
Labor department 8 12.68
7 Ph.A.3 73.20 3 Planning department 3 73
Total 825,092.08 88.00 88 825,692.08
70
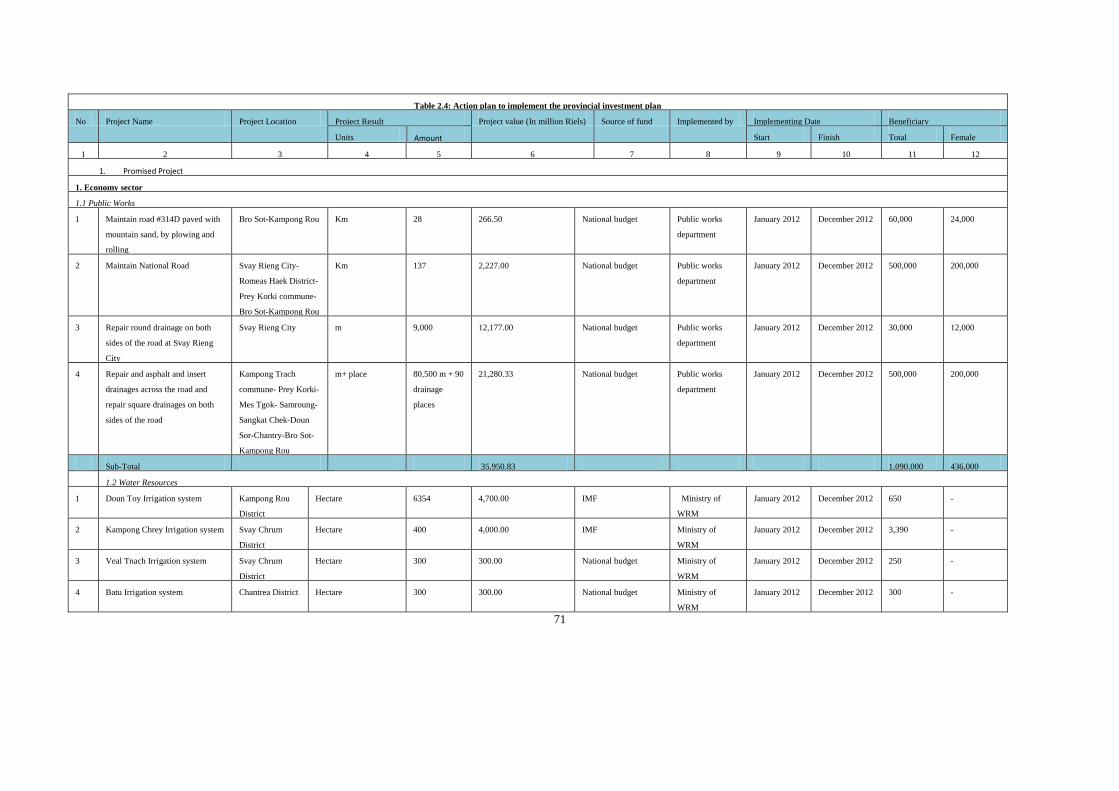
Table 2.4: Action plan to implement the provincial investment plan
No Project Name Project Location Project Result Project value (In million Riels) Source of fund Implemented by Implementing Date Beneficiary
Units Amount Start Finish Total Female
1 2 3 4 5 6 7 8 9 10 11 12
1. Promised Project
1. Economy sector
1.1 Public Works
1 Maintain road #314D paved with
mountain sand, by plowing and
rolling
Bro Sot-Kampong Rou Km 28 266.50 National budget Public works
department
January 2012 December 2012 60,000 24,000
2 Maintain National Road Svay Rieng City-
Romeas Haek District-
Prey Korki commune-
Bro Sot-Kampong Rou
Km 137 2,227.00 National budget Public works
department
January 2012 December 2012 500,000 200,000
3 Repair round drainage on both
sides of the road at Svay Rieng
City
Svay Rieng City m 9,000 12,177.00 National budget Public works
department
January 2012 December 2012 30,000 12,000
4 Repair and asphalt and insert
drainages across the road and
repair square drainages on both
sides of the road
Kampong Trach
commune- Prey Korki-
Mes Tgok- Samroung-
Sangkat Chek-Doun
Sor-Chantry-Bro Sot-
Kampong Rou
m+ place 80,500 m + 90
drainage
places
21,280.33 National budget Public works
department
January 2012 December 2012 500,000 200,000
Sub-Total 35,950.83 1,090,000 436,000
1.2 Water Resources
1 Doun Toy Irrigation system Kampong Rou
District
Hectare 6354 4,700.00 IMF Ministry of
WRM
January 2012 December 2012 650 -
2 Kampong Chrey Irrigation system Svay Chrum
District
Hectare 400 4,000.00 IMF Ministry of
WRM
January 2012 December 2012 3,390 -
3 Veal Tnach Irrigation system Svay Chrum
District
Hectare 300 300.00 National budget Ministry of
WRM
January 2012 December 2012 250 -
4 Batu Irrigation system Chantrea District Hectare 300 300.00 National budget Ministry of
WRM
January 2012 December 2012 300 -
71
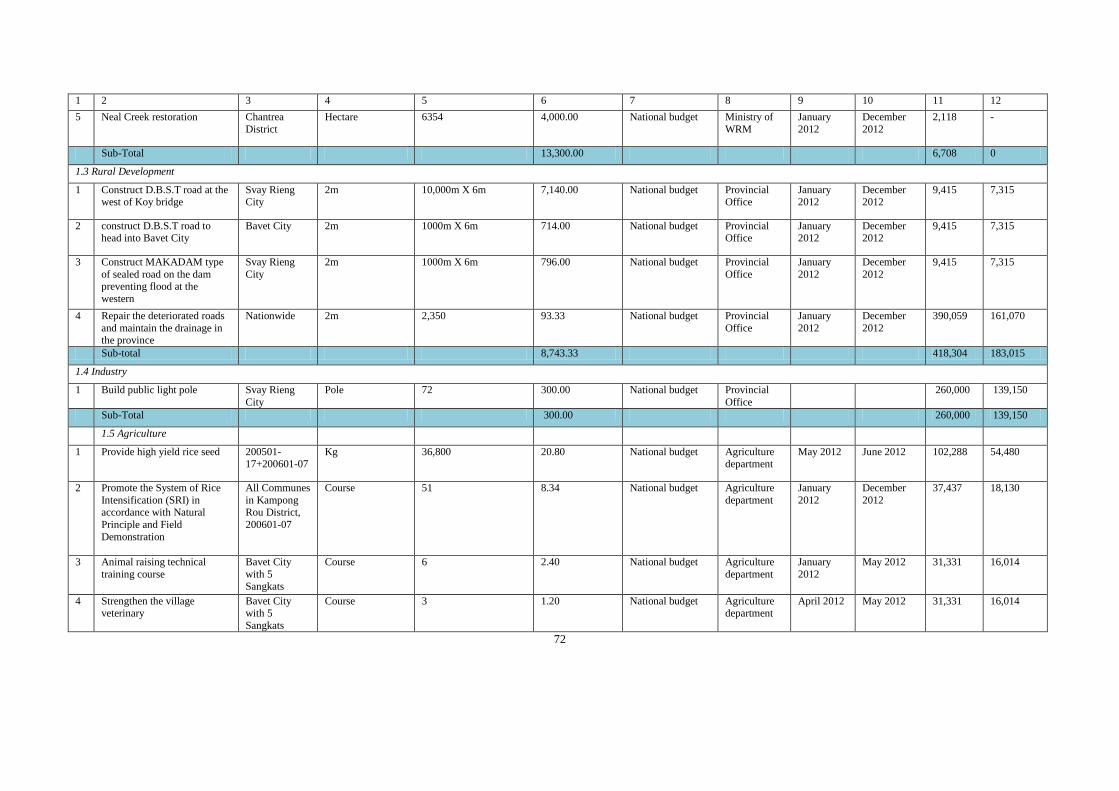
1 2 3 4 5 6 7 8 9 10 11 12
5 Neal Creek restoration Chantrea
District
Hectare 6354 4,000.00 National budget Ministry of
WRM
January
2012
December
2012
2,118 -
Sub-Total 13,300.00 6,708 0
1.3 Rural Development
1 Construct D.B.S.T road at the west of Koy bridge
Svay Rieng City
2m 10,000m X 6m 7,140.00 National budget Provincial Office
January 2012
December 2012
9,415 7,315
2 construct D.B.S.T road to head into Bavet City
Bavet City 2m 1000m X 6m 714.00 National budget Provincial Office
January 2012
December 2012
9,415 7,315
3 Construct MAKADAM type
of sealed road on the dam preventing flood at the
western
Svay Rieng
City
2m 1000m X 6m 796.00 National budget Provincial
Office
January
2012
December
2012
9,415 7,315
4 Repair the deteriorated roads
and maintain the drainage in the province
Nationwide 2m 2,350 93.33 National budget Provincial
Office
January
2012
December
2012
390,059 161,070
Sub-total 8,743.33 418,304 183,015
1.4 Industry
1 Build public light pole Svay Rieng
City
Pole 72 300.00 National budget Provincial
Office
260,000 139,150
Sub-Total 300.00 260,000 139,150
1.5 Agriculture
1 Provide high yield rice seed 200501-17+200601-07
Kg 36,800 20.80 National budget Agriculture department
May 2012 June 2012 102,288 54,480
2 Promote the System of Rice
Intensification (SRI) in accordance with Natural
Principle and Field
Demonstration
All Communes
in Kampong Rou District,
200601-07
Course 51 8.34 National budget Agriculture
department
January
2012
December
2012
37,437 18,130
3 Animal raising technical
training course
Bavet City
with 5
Sangkats
Course 6 2.40 National budget Agriculture
department
January
2012
May 2012 31,331 16,014
4 Strengthen the village veterinary
Bavet City with 5
Sangkats
Course 3 1.20 National budget Agriculture department
April 2012 May 2012 31,331 16,014
72
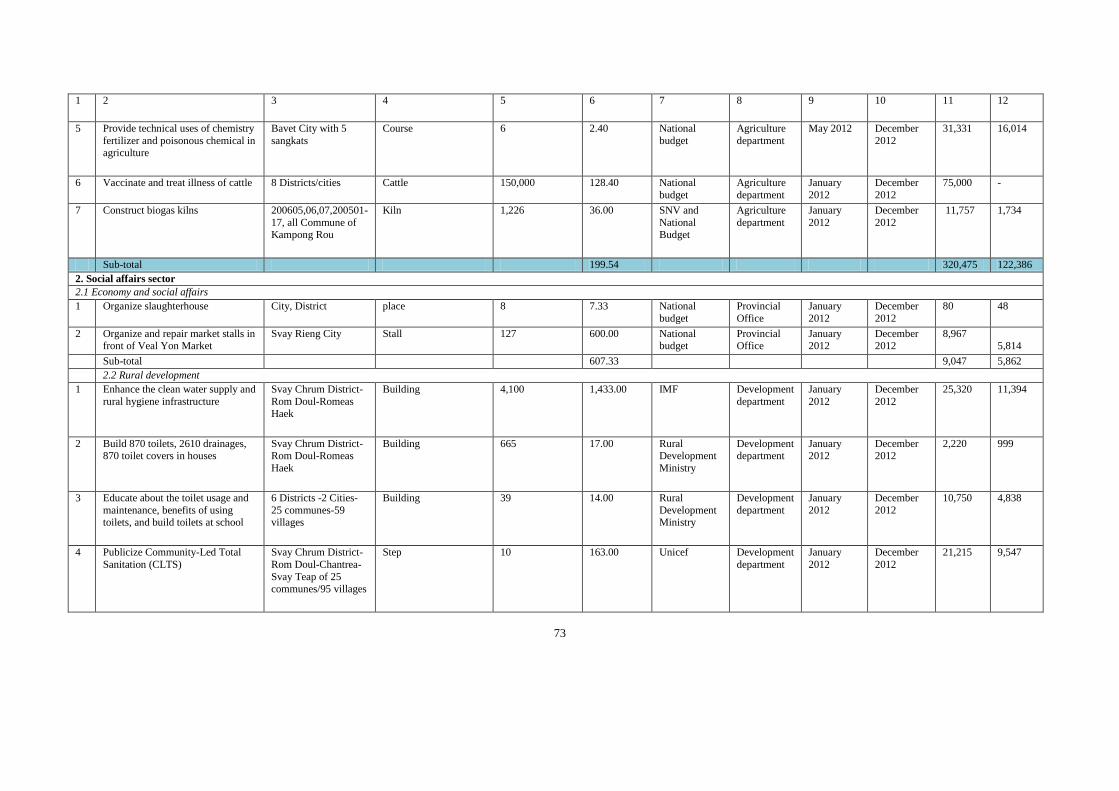
1 2 3 4 5 6 7 8 9 10 11 12
5 Provide technical uses of chemistry
fertilizer and poisonous chemical in agriculture
Bavet City with 5
sangkats
Course 6 2.40 National
budget
Agriculture
department
May 2012 December
2012
31,331 16,014
6 Vaccinate and treat illness of cattle 8 Districts/cities Cattle 150,000 128.40 National
budget
Agriculture
department
January
2012
December
2012
75,000 -
7 Construct biogas kilns 200605,06,07,200501-
17, all Commune of Kampong Rou
Kiln 1,226 36.00 SNV and
National Budget
Agriculture
department
January
2012
December
2012
11,757 1,734
Sub-total 199.54 320,475 122,386
2. Social affairs sector
2.1 Economy and social affairs
1 Organize slaughterhouse City, District place 8 7.33 National
budget
Provincial
Office
January
2012
December
2012
80 48
2 Organize and repair market stalls in front of Veal Yon Market
Svay Rieng City Stall 127 600.00 National budget
Provincial Office
January 2012
December 2012
8,967 5,814
Sub-total 607.33 9,047 5,862
2.2 Rural development
1 Enhance the clean water supply and
rural hygiene infrastructure
Svay Chrum District-
Rom Doul-Romeas Haek
Building 4,100 1,433.00 IMF Development
department
January
2012
December
2012
25,320 11,394
2 Build 870 toilets, 2610 drainages, 870 toilet covers in houses
Svay Chrum District-Rom Doul-Romeas
Haek
Building 665 17.00 Rural Development
Ministry
Development department
January 2012
December 2012
2,220 999
3 Educate about the toilet usage and
maintenance, benefits of using toilets, and build toilets at school
6 Districts -2 Cities-
25 communes-59 villages
Building 39 14.00 Rural
Development Ministry
Development
department
January
2012
December
2012
10,750 4,838
4 Publicize Community-Led Total
Sanitation (CLTS)
Svay Chrum District-
Rom Doul-Chantrea-
Svay Teap of 25
communes/95 villages
Step 10 163.00 Unicef Development
department
January
2012
December
2012
21,215 9,547
73
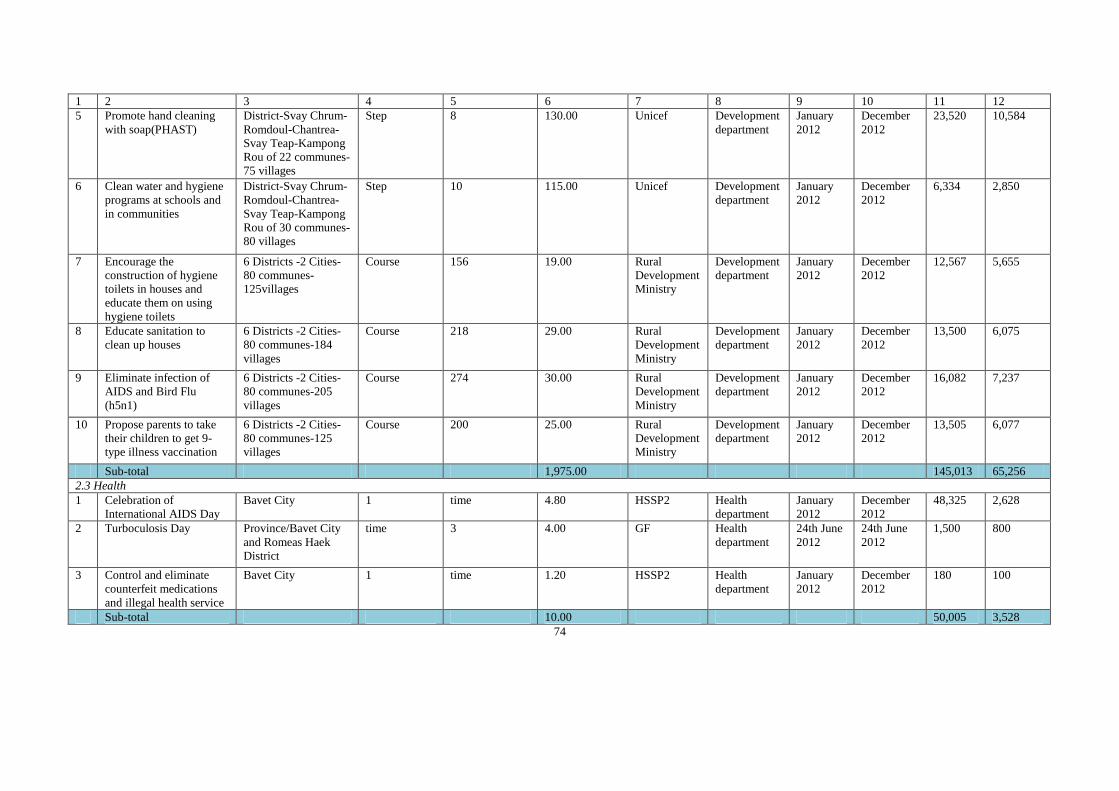
1 2 3 4 5 6 7 8 9 10 11 12
5 Promote hand cleaning
with soap(PHAST)
District-Svay Chrum-
Romdoul-Chantrea-
Svay Teap-Kampong
Rou of 22 communes-
75 villages
Step 8 130.00 Unicef Development
department
January
2012
December
2012
23,520 10,584
6 Clean water and hygiene
programs at schools and
in communities
District-Svay Chrum-
Romdoul-Chantrea-
Svay Teap-Kampong
Rou of 30 communes-
80 villages
Step 10 115.00 Unicef Development
department
January
2012
December
2012
6,334 2,850
7 Encourage the
construction of hygiene
toilets in houses and
educate them on using
hygiene toilets
6 Districts -2 Cities-
80 communes-
125villages
Course 156 19.00 Rural
Development
Ministry
Development
department
January
2012
December
2012
12,567 5,655
8 Educate sanitation to
clean up houses
6 Districts -2 Cities-
80 communes-184
villages
Course 218 29.00 Rural
Development
Ministry
Development
department
January
2012
December
2012
13,500 6,075
9 Eliminate infection of
AIDS and Bird Flu
(h5n1)
6 Districts -2 Cities-
80 communes-205
villages
Course 274 30.00 Rural
Development
Ministry
Development
department
January
2012
December
2012
16,082 7,237
10 Propose parents to take
their children to get 9-
type illness vaccination
6 Districts -2 Cities-
80 communes-125
villages
Course 200 25.00 Rural
Development
Ministry
Development
department
January
2012
December
2012
13,505 6,077
Sub-total 1,975.00 145,013 65,256
2.3 Health
1 Celebration of
International AIDS Day
Bavet City 1 time 4.80 HSSP2 Health
department
January
2012
December
2012
48,325 2,628
2 Turboculosis Day Province/Bavet City
and Romeas Haek
District
time 3 4.00 GF Health
department
24th June
2012
24th June
2012
1,500 800
3 Control and eliminate
counterfeit medications
and illegal health service
Bavet City 1 time 1.20 HSSP2 Health
department
January
2012
December
2012
180 100
Sub-total 10.00 50,005 3,528
74
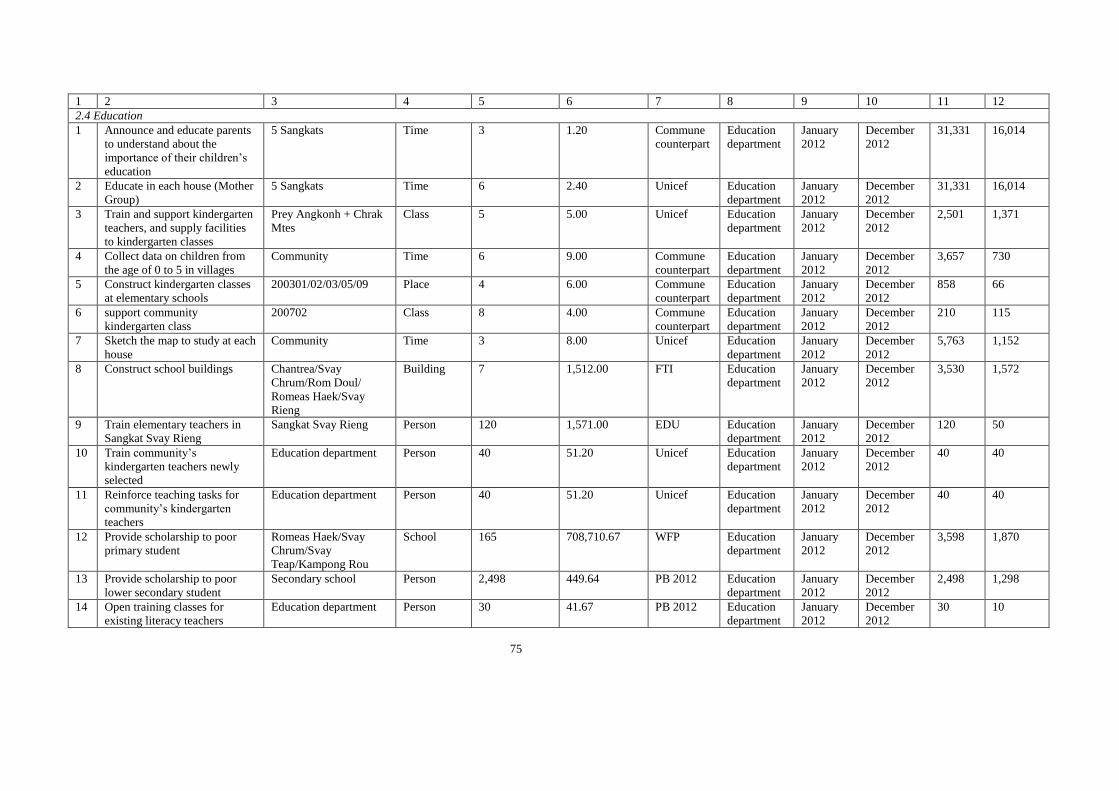
1 2 3 4 5 6 7 8 9 10 11 12
2.4 Education
1 Announce and educate parents
to understand about the
importance of their children’s
education
5 Sangkats Time 3 1.20 Commune
counterpart
Education
department
January
2012
December
2012
31,331 16,014
2 Educate in each house (Mother
Group)
5 Sangkats Time 6 2.40 Unicef Education
department
January
2012
December
2012
31,331 16,014
3 Train and support kindergarten
teachers, and supply facilities
to kindergarten classes
Prey Angkonh + Chrak
Mtes
Class 5 5.00 Unicef Education
department
January
2012
December
2012
2,501 1,371
4 Collect data on children from
the age of 0 to 5 in villages
Community Time 6 9.00 Commune
counterpart
Education
department
January
2012
December
2012
3,657 730
5 Construct kindergarten classes
at elementary schools
200301/02/03/05/09 Place 4 6.00 Commune
counterpart
Education
department
January
2012
December
2012
858 66
6 support community
kindergarten class
200702 Class 8 4.00 Commune
counterpart
Education
department
January
2012
December
2012
210 115
7 Sketch the map to study at each
house
Community Time 3 8.00 Unicef Education
department
January
2012
December
2012
5,763 1,152
8 Construct school buildings Chantrea/Svay
Chrum/Rom Doul/
Romeas Haek/Svay
Rieng
Building 7 1,512.00 FTI Education
department
January
2012
December
2012
3,530 1,572
9 Train elementary teachers in
Sangkat Svay Rieng
Sangkat Svay Rieng Person 120 1,571.00 EDU Education
department
January
2012
December
2012
120 50
10 Train community’s
kindergarten teachers newly
selected
Education department Person 40 51.20 Unicef Education
department
January
2012
December
2012
40 40
11 Reinforce teaching tasks for
community’s kindergarten
teachers
Education department Person 40 51.20 Unicef Education
department
January
2012
December
2012
40 40
12 Provide scholarship to poor
primary student
Romeas Haek/Svay
Chrum/Svay
Teap/Kampong Rou
School 165 708,710.67 WFP Education
department
January
2012
December
2012
3,598 1,870
13 Provide scholarship to poor
lower secondary student
Secondary school Person 2,498 449.64 PB 2012 Education
department
January
2012
December
2012
2,498 1,298
14 Open training classes for
existing literacy teachers
Education department Person 30 41.67 PB 2012 Education
department
January
2012
December
2012
30 10
75
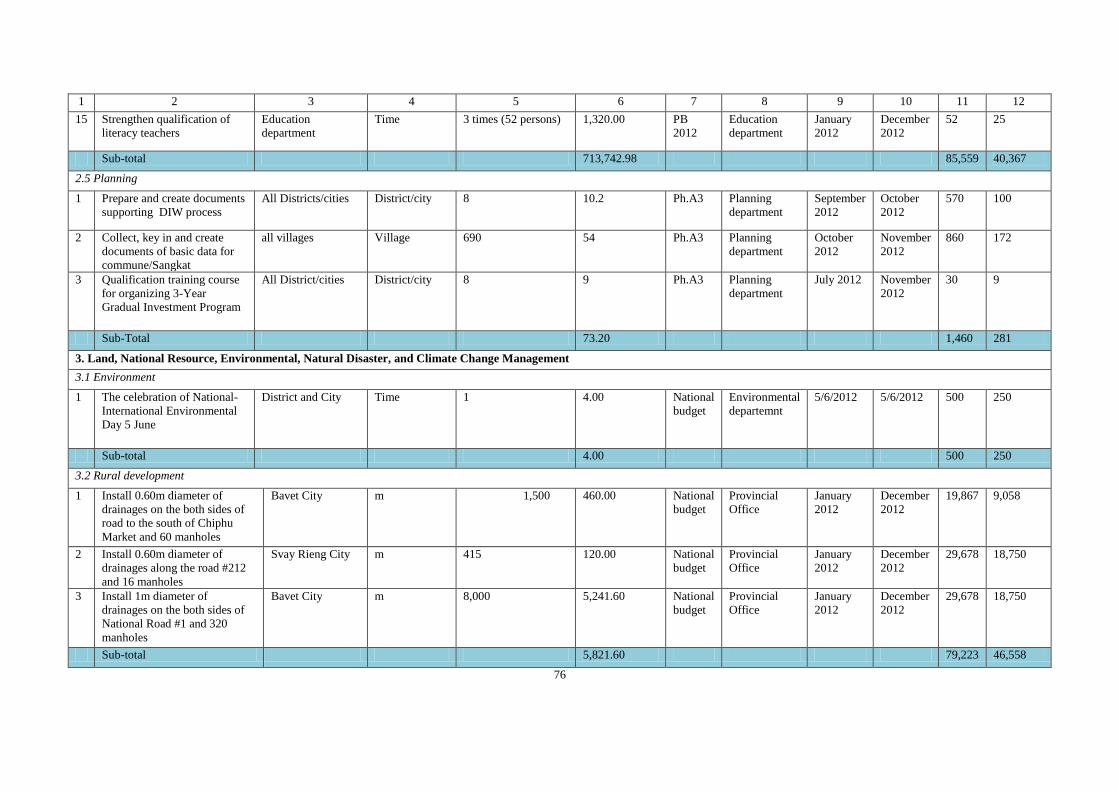
1 2 3 4 5 6 7 8 9 10 11 12
15 Strengthen qualification of
literacy teachers
Education
department
Time 3 times (52 persons) 1,320.00 PB
2012
Education
department
January
2012
December
2012
52 25
Sub-total 713,742.98 85,559 40,367
2.5 Planning
1 Prepare and create documents
supporting DIW process
All Districts/cities District/city 8 10.2 Ph.A3 Planning
department
September
2012
October
2012
570 100
2 Collect, key in and create
documents of basic data for
commune/Sangkat
all villages Village 690 54 Ph.A3 Planning
department
October
2012
November
2012
860 172
3 Qualification training course
for organizing 3-Year
Gradual Investment Program
All District/cities District/city 8 9 Ph.A3 Planning
department
July 2012 November
2012
30 9
Sub-Total 73.20 1,460 281
3. Land, National Resource, Environmental, Natural Disaster, and Climate Change Management
3.1 Environment
1 The celebration of National-
International Environmental
Day 5 June
District and City Time 1 4.00 National
budget
Environmental
departemnt
5/6/2012 5/6/2012 500 250
Sub-total 4.00 500 250
3.2 Rural development
1 Install 0.60m diameter of
drainages on the both sides of
road to the south of Chiphu
Market and 60 manholes
Bavet City m 1,500 460.00 National
budget
Provincial
Office
January
2012
December
2012
19,867 9,058
2 Install 0.60m diameter of
drainages along the road #212
and 16 manholes
Svay Rieng City m 415 120.00 National
budget
Provincial
Office
January
2012
December
2012
29,678 18,750
3 Install 1m diameter of
drainages on the both sides of
National Road #1 and 320
manholes
Bavet City m 8,000 5,241.60 National
budget
Provincial
Office
January
2012
December
2012
29,678 18,750
Sub-total 5,821.60 79,223 46,558
76
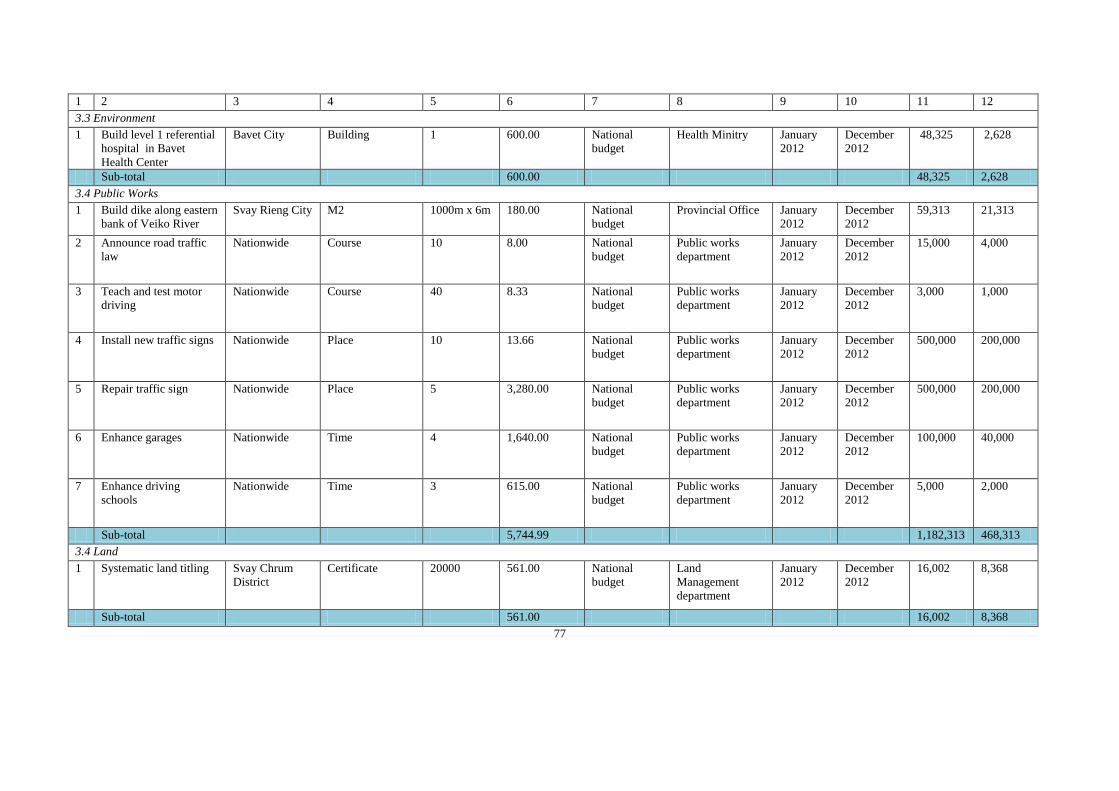
1 2 3 4 5 6 7 8 9 10 11 12
3.3 Environment
1 Build level 1 referential
hospital in Bavet
Health Center
Bavet City Building 1 600.00 National
budget
Health Minitry January
2012
December
2012
48,325 2,628
Sub-total 600.00 48,325 2,628
3.4 Public Works
1 Build dike along eastern
bank of Veiko River
Svay Rieng City M2 1000m x 6m 180.00 National
budget
Provincial Office January
2012
December
2012
59,313 21,313
2 Announce road traffic
law
Nationwide Course 10 8.00 National
budget
Public works
department
January
2012
December
2012
15,000 4,000
3 Teach and test motor
driving
Nationwide Course 40 8.33 National
budget
Public works
department
January
2012
December
2012
3,000 1,000
4 Install new traffic signs Nationwide Place 10 13.66 National
budget
Public works
department
January
2012
December
2012
500,000 200,000
5 Repair traffic sign Nationwide Place 5 3,280.00 National
budget
Public works
department
January
2012
December
2012
500,000 200,000
6 Enhance garages Nationwide Time 4 1,640.00 National
budget
Public works
department
January
2012
December
2012
100,000 40,000
7 Enhance driving
schools
Nationwide Time 3 615.00 National
budget
Public works
department
January
2012
December
2012
5,000 2,000
Sub-total 5,744.99 1,182,313 468,313
3.4 Land
1 Systematic land titling Svay Chrum
District
Certificate 20000 561.00 National
budget
Land
Management
department
January
2012
December
2012
16,002 8,368
Sub-total 561.00 16,002 8,368
77
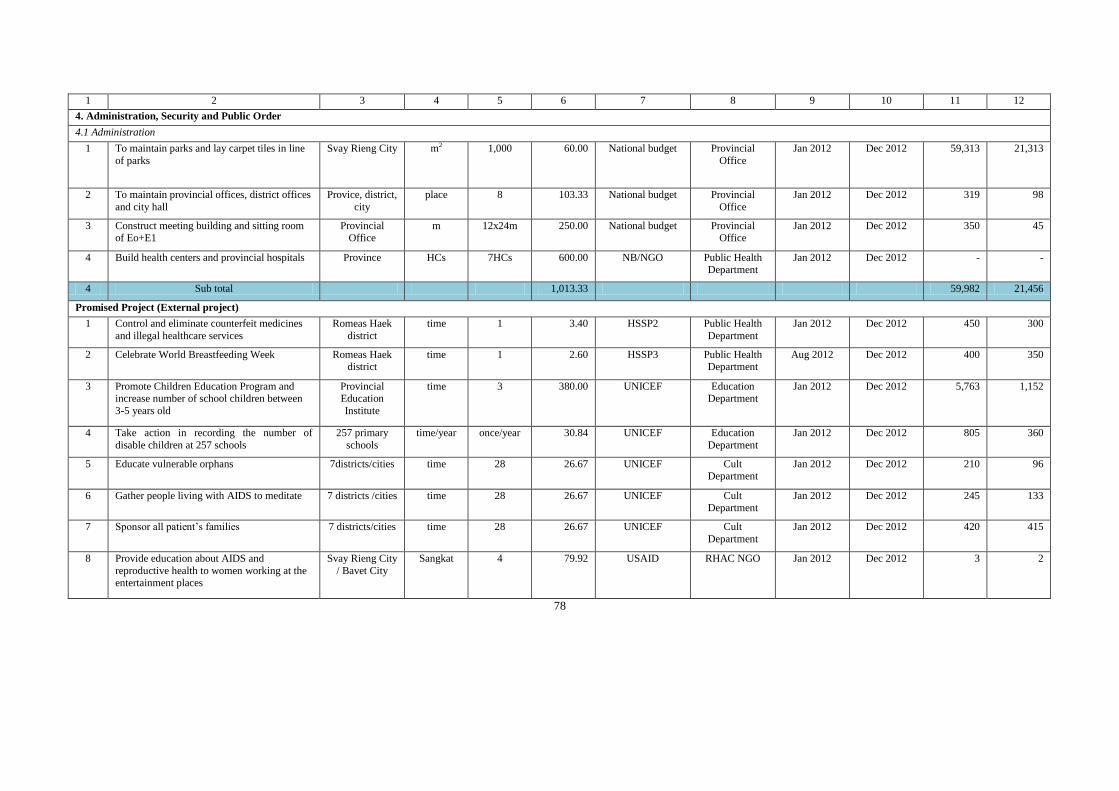
1 2 3 4 5 6 7 8 9 10 11 12
4. Administration, Security and Public Order
4.1 Administration
1 To maintain parks and lay carpet tiles in line
of parks
Svay Rieng City m2 1,000 60.00 National budget Provincial
Office
Jan 2012 Dec 2012 59,313 21,313
2 To maintain provincial offices, district offices
and city hall
Provice, district,
city
place 8 103.33 National budget Provincial
Office
Jan 2012 Dec 2012 319 98
3 Construct meeting building and sitting room of Eo+E1
Provincial Office
m 12x24m 250.00 National budget Provincial Office
Jan 2012 Dec 2012 350 45
4 Build health centers and provincial hospitals Province HCs 7HCs 600.00 NB/NGO Public Health Department
Jan 2012 Dec 2012 - -
4 Sub total 1,013.33 59,982 21,456
Promised Project (External project)
1 Control and eliminate counterfeit medicines
and illegal healthcare services
Romeas Haek
district
time 1 3.40 HSSP2 Public Health
Department
Jan 2012 Dec 2012 450 300
2 Celebrate World Breastfeeding Week Romeas Haek district
time 1 2.60 HSSP3 Public Health Department
Aug 2012 Dec 2012 400 350
3 Promote Children Education Program and increase number of school children between
3-5 years old
Provincial Education
Institute
time 3 380.00 UNICEF Education Department
Jan 2012 Dec 2012 5,763 1,152
4 Take action in recording the number of
disable children at 257 schools
257 primary
schools
time/year once/year 30.84 UNICEF Education
Department
Jan 2012 Dec 2012 805 360
5 Educate vulnerable orphans 7districts/cities time 28 26.67 UNICEF Cult Department
Jan 2012 Dec 2012 210 96
6 Gather people living with AIDS to meditate 7 districts /cities time 28 26.67 UNICEF Cult Department
Jan 2012 Dec 2012 245 133
7 Sponsor all patient’s families 7 districts/cities time 28 26.67 UNICEF Cult
Department
Jan 2012 Dec 2012 420 415
8 Provide education about AIDS and
reproductive health to women working at the entertainment places
Svay Rieng City
/ Bavet City
Sangkat 4 79.92 USAID RHAC NGO Jan 2012 Dec 2012 3 2
78
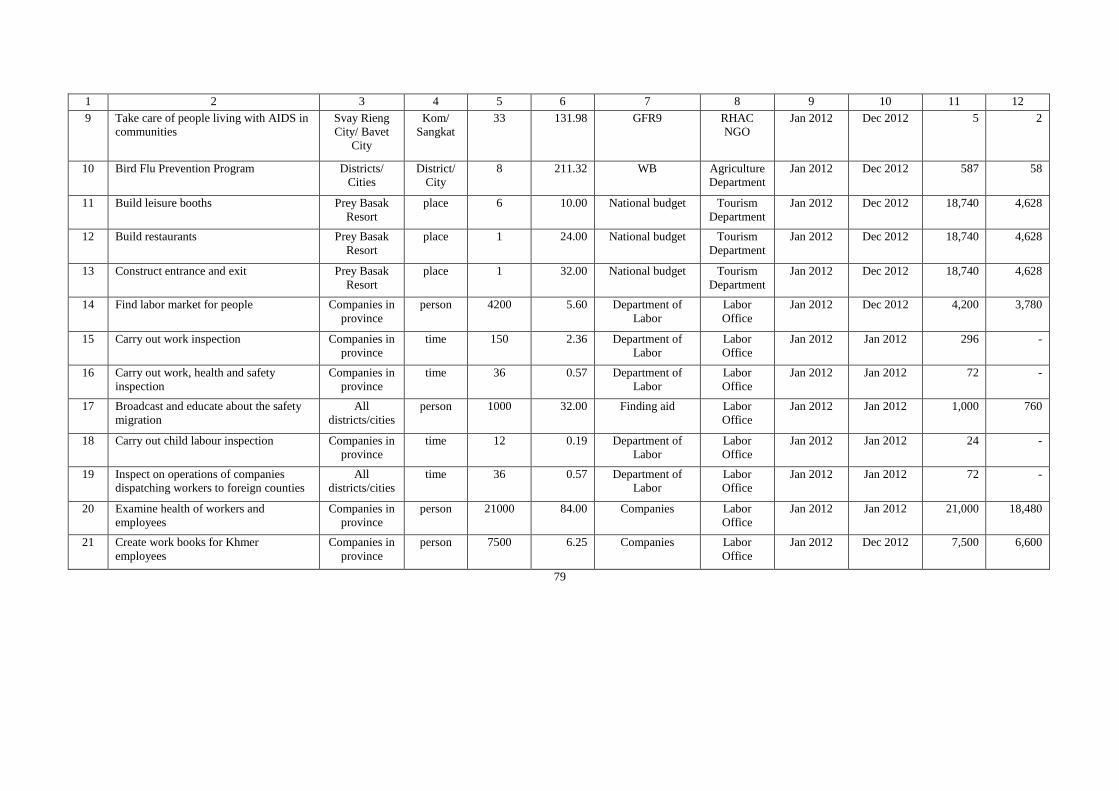
1 2 3 4 5 6 7 8 9 10 11 12
9 Take care of people living with AIDS in
communities
Svay Rieng
City/ Bavet
City
Kom/
Sangkat
33 131.98 GFR9 RHAC
NGO
Jan 2012 Dec 2012 5 2
10 Bird Flu Prevention Program Districts/
Cities
District/
City
8 211.32 WB Agriculture
Department
Jan 2012 Dec 2012 587 58
11 Build leisure booths Prey Basak
Resort
place 6 10.00 National budget Tourism
Department
Jan 2012 Dec 2012 18,740 4,628
12 Build restaurants Prey Basak
Resort
place 1 24.00 National budget Tourism
Department
Jan 2012 Dec 2012 18,740 4,628
13 Construct entrance and exit Prey Basak
Resort
place 1 32.00 National budget Tourism
Department
Jan 2012 Dec 2012 18,740 4,628
14 Find labor market for people Companies in
province
person 4200 5.60 Department of
Labor
Labor
Office
Jan 2012 Dec 2012 4,200 3,780
15 Carry out work inspection Companies in
province
time 150 2.36 Department of
Labor
Labor
Office
Jan 2012 Jan 2012 296 -
16 Carry out work, health and safety
inspection
Companies in
province
time 36 0.57 Department of
Labor
Labor
Office
Jan 2012 Jan 2012 72 -
17 Broadcast and educate about the safety
migration
All
districts/cities
person 1000 32.00 Finding aid Labor
Office
Jan 2012 Jan 2012 1,000 760
18 Carry out child labour inspection Companies in
province
time 12 0.19 Department of
Labor
Labor
Office
Jan 2012 Jan 2012 24 -
19 Inspect on operations of companies
dispatching workers to foreign counties
All
districts/cities
time 36 0.57 Department of
Labor
Labor
Office
Jan 2012 Jan 2012 72 -
20 Examine health of workers and
employees
Companies in
province
person 21000 84.00 Companies Labor
Office
Jan 2012 Jan 2012 21,000 18,480
21 Create work books for Khmer
employees
Companies in
province
person 7500 6.25 Companies Labor
Office
Jan 2012 Dec 2012 7,500 6,600
79
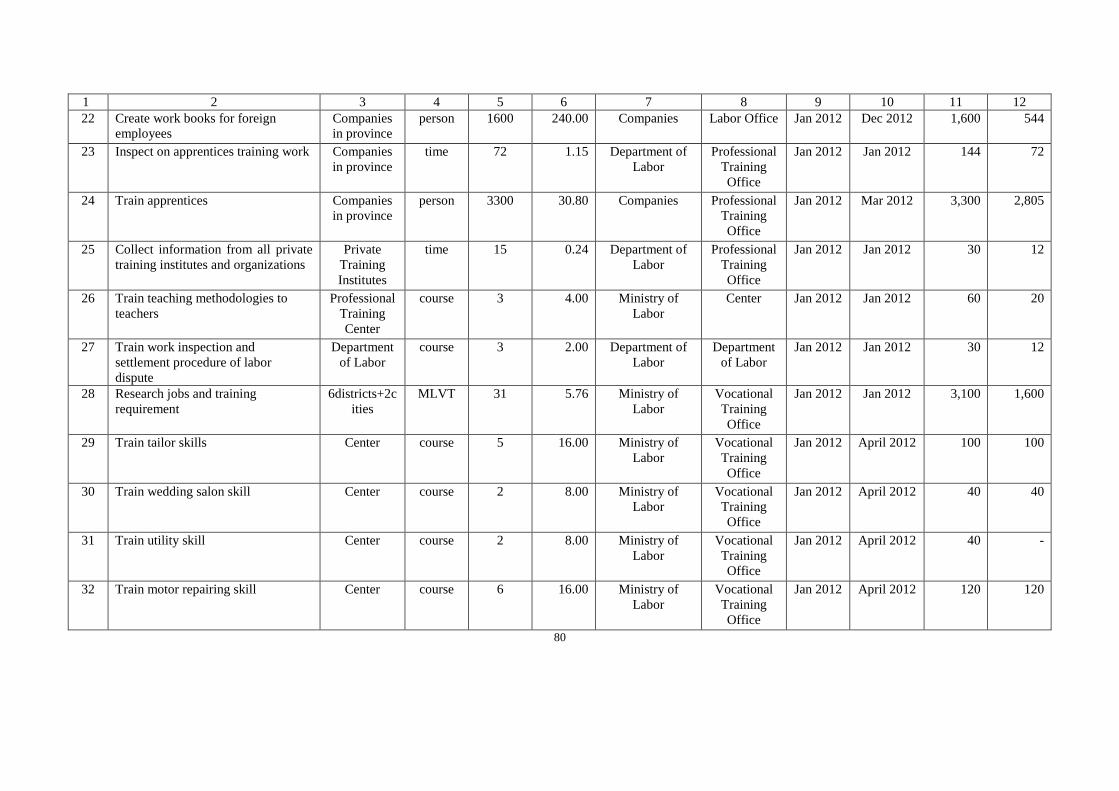
1 2 3 4 5 6 7 8 9 10 11 12
22 Create work books for foreign
employees
Companies
in province
person 1600 240.00 Companies Labor Office Jan 2012 Dec 2012 1,600 544
23 Inspect on apprentices training work Companies
in province
time 72 1.15 Department of
Labor
Professional
Training
Office
Jan 2012 Jan 2012 144 72
24 Train apprentices Companies
in province
person 3300 30.80 Companies Professional
Training
Office
Jan 2012 Mar 2012 3,300 2,805
25 Collect information from all private
training institutes and organizations
Private
Training
Institutes
time 15 0.24 Department of
Labor
Professional
Training
Office
Jan 2012 Jan 2012 30 12
26 Train teaching methodologies to
teachers
Professional
Training
Center
course 3 4.00 Ministry of
Labor
Center Jan 2012 Jan 2012 60 20
27 Train work inspection and
settlement procedure of labor
dispute
Department
of Labor
course 3 2.00 Department of
Labor
Department
of Labor
Jan 2012 Jan 2012 30 12
28 Research jobs and training
requirement
6districts+2c
ities
MLVT 31 5.76 Ministry of
Labor
Vocational
Training
Office
Jan 2012 Jan 2012 3,100 1,600
29 Train tailor skills Center course 5 16.00 Ministry of
Labor
Vocational
Training
Office
Jan 2012 April 2012 100 100
30 Train wedding salon skill Center course 2 8.00 Ministry of
Labor
Vocational
Training
Office
Jan 2012 April 2012 40 40
31 Train utility skill Center course 2 8.00 Ministry of
Labor
Vocational
Training
Office
Jan 2012 April 2012 40 -
32 Train motor repairing skill Center course 6 16.00 Ministry of
Labor
Vocational
Training
Office
Jan 2012 April 2012 120 120
80
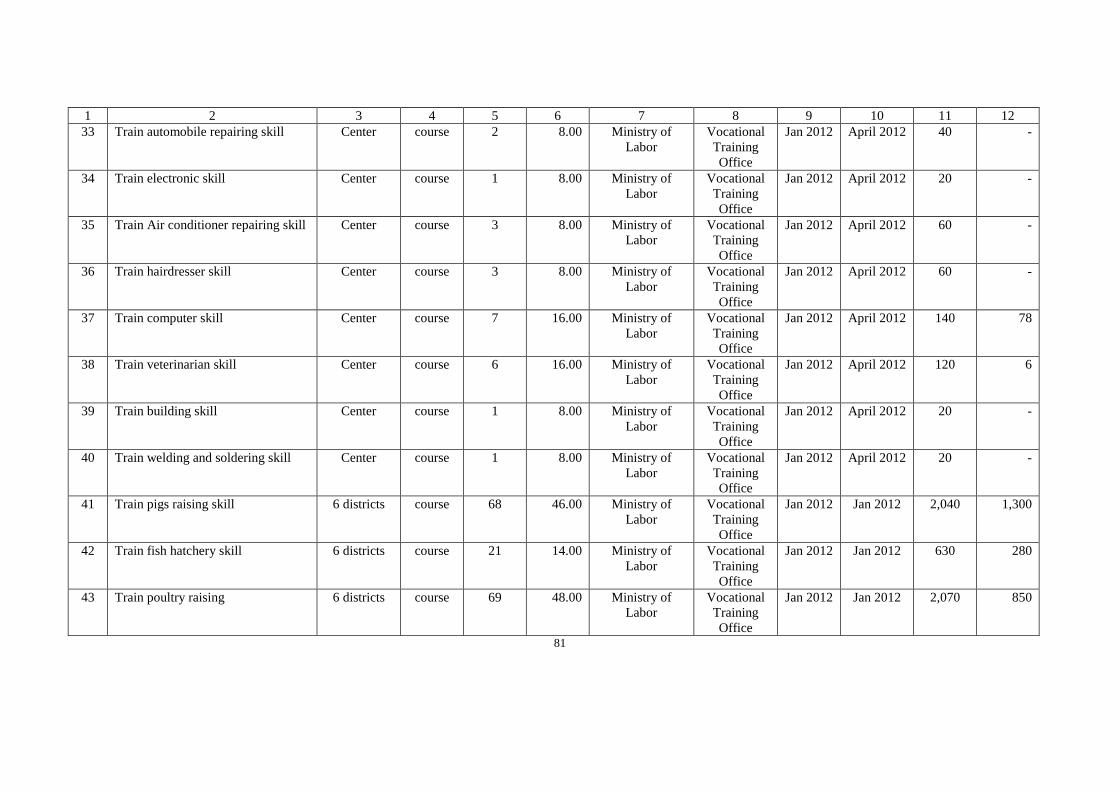
1 2 3 4 5 6 7 8 9 10 11 12
33 Train automobile repairing skill Center course 2 8.00 Ministry of
Labor
Vocational
Training
Office
Jan 2012 April 2012 40 -
34 Train electronic skill Center course 1 8.00 Ministry of
Labor
Vocational
Training
Office
Jan 2012 April 2012 20 -
35 Train Air conditioner repairing skill Center course 3 8.00 Ministry of
Labor
Vocational
Training
Office
Jan 2012 April 2012 60 -
36 Train hairdresser skill Center course 3 8.00 Ministry of
Labor
Vocational
Training
Office
Jan 2012 April 2012 60 -
37 Train computer skill Center course 7 16.00 Ministry of
Labor
Vocational
Training
Office
Jan 2012 April 2012 140 78
38 Train veterinarian skill Center course 6 16.00 Ministry of
Labor
Vocational
Training
Office
Jan 2012 April 2012 120 6
39 Train building skill Center course 1 8.00 Ministry of
Labor
Vocational
Training
Office
Jan 2012 April 2012 20 -
40 Train welding and soldering skill Center course 1 8.00 Ministry of
Labor
Vocational
Training
Office
Jan 2012 April 2012 20 -
41 Train pigs raising skill 6 districts course 68 46.00 Ministry of
Labor
Vocational
Training
Office
Jan 2012 Jan 2012 2,040 1,300
42 Train fish hatchery skill 6 districts course 21 14.00 Ministry of
Labor
Vocational
Training
Office
Jan 2012 Jan 2012 630 280
43 Train poultry raising 6 districts course 69 48.00 Ministry of
Labor
Vocational
Training
Office
Jan 2012 Jan 2012 2,070 850
81
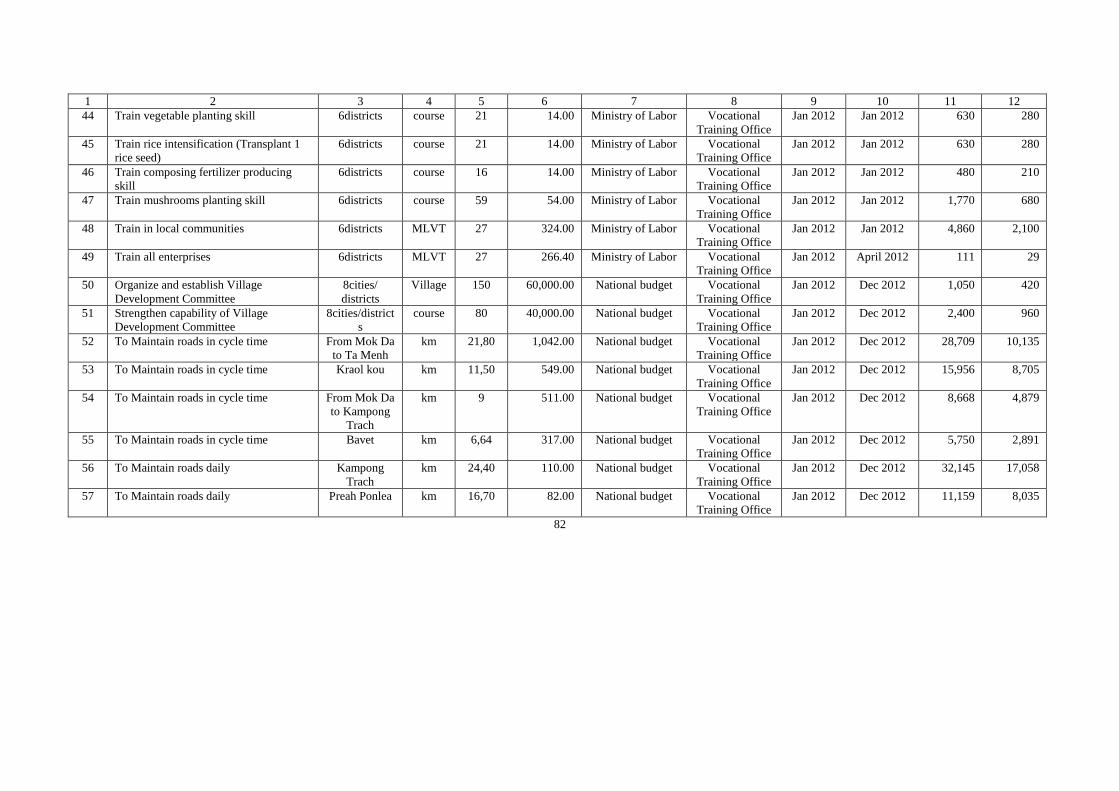
1 2 3 4 5 6 7 8 9 10 11 12
44 Train vegetable planting skill 6districts course 21 14.00 Ministry of Labor Vocational
Training Office
Jan 2012 Jan 2012 630 280
45 Train rice intensification (Transplant 1
rice seed)
6districts course 21 14.00 Ministry of Labor Vocational
Training Office
Jan 2012 Jan 2012 630 280
46 Train composing fertilizer producing
skill
6districts course 16 14.00 Ministry of Labor Vocational
Training Office
Jan 2012 Jan 2012 480 210
47 Train mushrooms planting skill 6districts course 59 54.00 Ministry of Labor Vocational
Training Office
Jan 2012 Jan 2012 1,770 680
48 Train in local communities 6districts MLVT 27 324.00 Ministry of Labor Vocational
Training Office
Jan 2012 Jan 2012 4,860 2,100
49 Train all enterprises 6districts MLVT 27 266.40 Ministry of Labor Vocational
Training Office
Jan 2012 April 2012 111 29
50 Organize and establish Village
Development Committee
8cities/
districts
Village 150 60,000.00 National budget Vocational
Training Office
Jan 2012 Dec 2012 1,050 420
51 Strengthen capability of Village
Development Committee
8cities/district
s
course 80 40,000.00 National budget Vocational
Training Office
Jan 2012 Dec 2012 2,400 960
52 To Maintain roads in cycle time From Mok Da
to Ta Menh
km 21,80 1,042.00 National budget Vocational
Training Office
Jan 2012 Dec 2012 28,709 10,135
53 To Maintain roads in cycle time Kraol kou km 11,50 549.00 National budget Vocational
Training Office
Jan 2012 Dec 2012 15,956 8,705
54 To Maintain roads in cycle time From Mok Da
to Kampong
Trach
km 9 511.00 National budget Vocational
Training Office
Jan 2012 Dec 2012 8,668 4,879
55 To Maintain roads in cycle time Bavet km 6,64 317.00 National budget Vocational
Training Office
Jan 2012 Dec 2012 5,750 2,891
56 To Maintain roads daily Kampong
Trach
km 24,40 110.00 National budget Vocational
Training Office
Jan 2012 Dec 2012 32,145 17,058
57 To Maintain roads daily Preah Ponlea km 16,70 82.00 National budget Vocational
Training Office
Jan 2012 Dec 2012 11,159 8,035
82
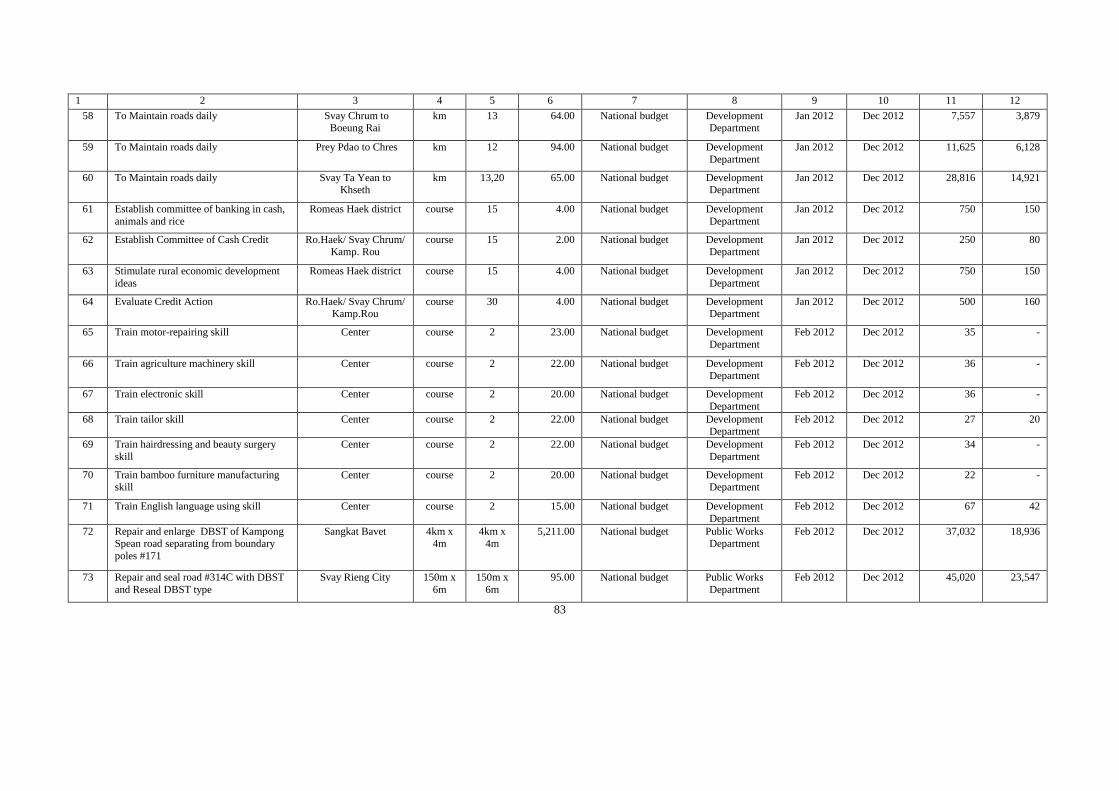
1 2 3 4 5 6 7 8 9 10 11 12
58 To Maintain roads daily Svay Chrum to Boeung Rai
km 13 64.00 National budget Development Department
Jan 2012 Dec 2012 7,557 3,879
59 To Maintain roads daily Prey Pdao to Chres km 12 94.00 National budget Development
Department
Jan 2012 Dec 2012 11,625 6,128
60 To Maintain roads daily Svay Ta Yean to Khseth
km 13,20 65.00 National budget Development Department
Jan 2012 Dec 2012 28,816 14,921
61 Establish committee of banking in cash,
animals and rice
Romeas Haek district course 15 4.00 National budget Development
Department
Jan 2012 Dec 2012 750 150
62 Establish Committee of Cash Credit Ro.Haek/ Svay Chrum/
Kamp. Rou
course 15 2.00 National budget Development
Department
Jan 2012 Dec 2012 250 80
63 Stimulate rural economic development
ideas
Romeas Haek district course 15 4.00 National budget Development
Department
Jan 2012 Dec 2012 750 150
64 Evaluate Credit Action Ro.Haek/ Svay Chrum/ Kamp.Rou
course 30 4.00 National budget Development Department
Jan 2012 Dec 2012 500 160
65 Train motor-repairing skill Center course 2 23.00 National budget Development
Department
Feb 2012 Dec 2012 35 -
66 Train agriculture machinery skill Center course 2 22.00 National budget Development Department
Feb 2012 Dec 2012 36 -
67 Train electronic skill Center course 2 20.00 National budget Development
Department
Feb 2012 Dec 2012 36 -
68 Train tailor skill Center course 2 22.00 National budget Development Department
Feb 2012 Dec 2012 27 20
69 Train hairdressing and beauty surgery
skill
Center course 2 22.00 National budget Development
Department
Feb 2012 Dec 2012 34 -
70 Train bamboo furniture manufacturing skill
Center course 2 20.00 National budget Development Department
Feb 2012 Dec 2012 22 -
71 Train English language using skill Center course 2 15.00 National budget Development
Department
Feb 2012 Dec 2012 67 42
72 Repair and enlarge DBST of Kampong Spean road separating from boundary
poles #171
Sangkat Bavet 4km x 4m
4km x 4m
5,211.00 National budget Public Works Department
Feb 2012 Dec 2012 37,032 18,936
73 Repair and seal road #314C with DBST
and Reseal DBST type
Svay Rieng City
150m x
6m
150m x
6m
95.00 National budget Public Works
Department
Feb 2012 Dec 2012 45,020 23,547
83
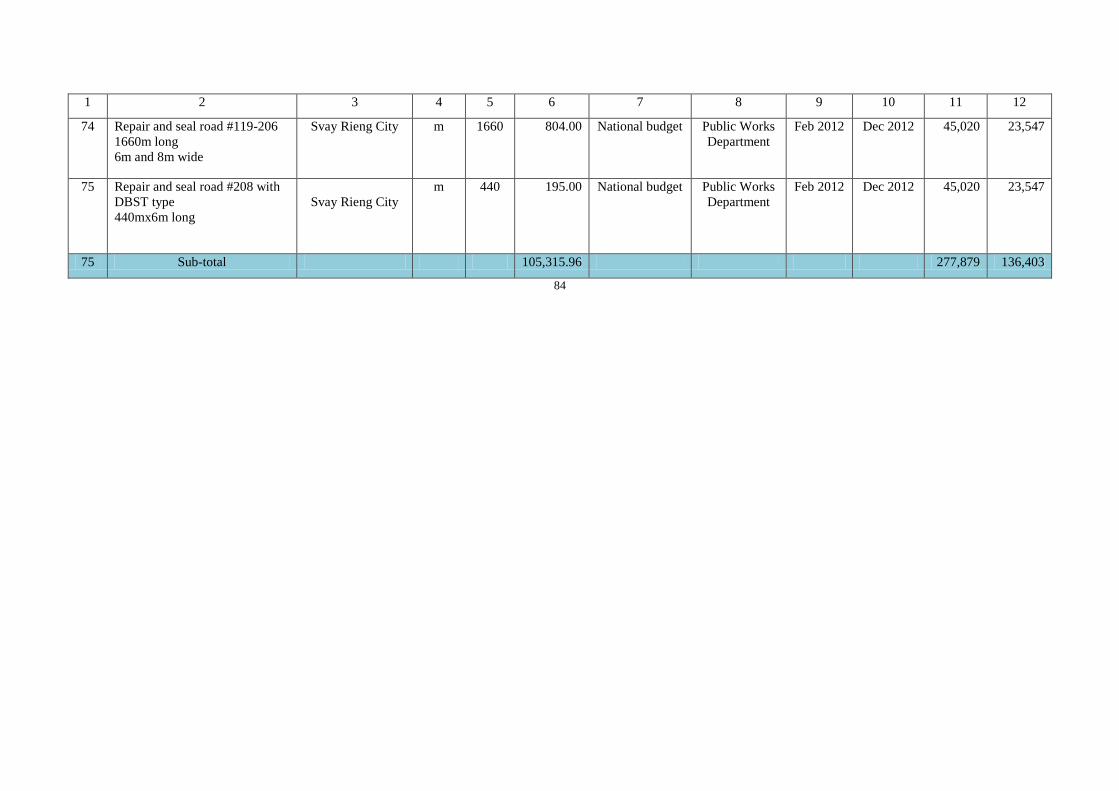
1 2 3 4 5 6 7 8 9 10 11 12
74 Repair and seal road #119-206
1660m long
6m and 8m wide
Svay Rieng City
m 1660 804.00 National budget Public Works
Department
Feb 2012 Dec 2012 45,020 23,547
75 Repair and seal road #208 with
DBST type
440mx6m long
Svay Rieng City
m 440 195.00 National budget Public Works
Department
Feb 2012 Dec 2012 45,020 23,547
75 Sub-total 105,315.96 277,879 136,403
84
Appendix (2)
3-Year Gradual Investment Program
in Bavet City
2012-2014
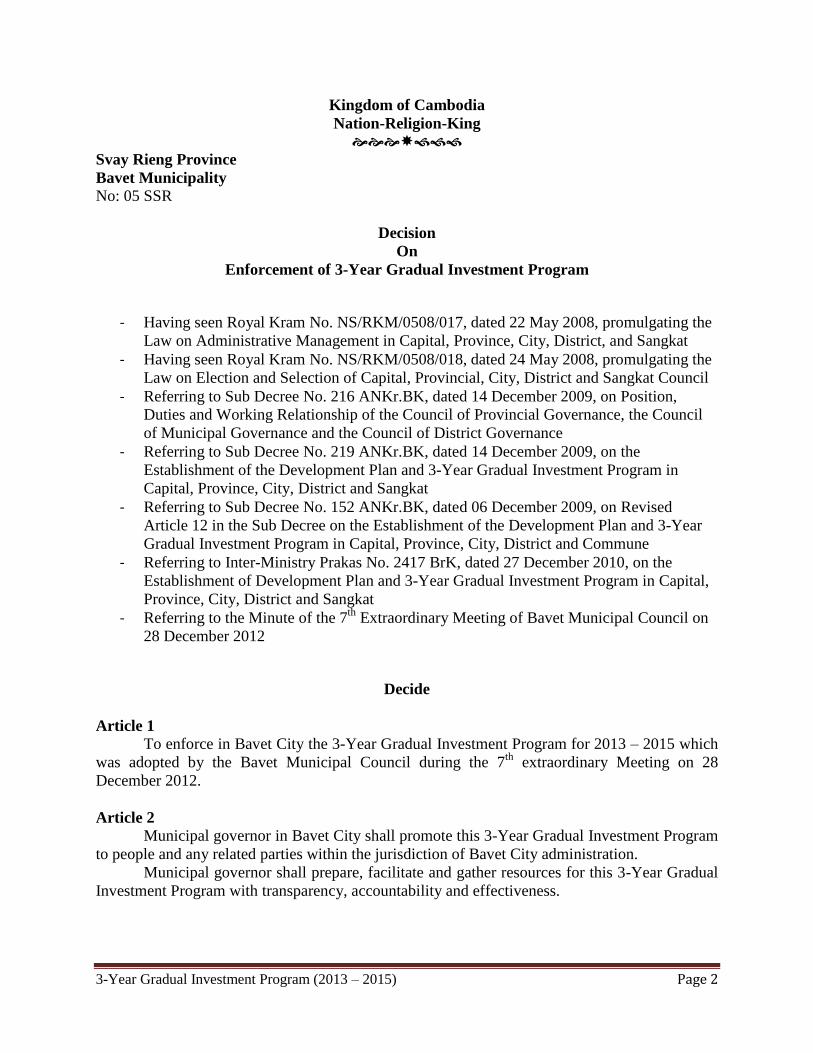
3-Year Gradual Investment Program (2013 – 2015) Page 2
Kingdom of Cambodia
Nation-Religion-King
Svay Rieng Province
Bavet Municipality
No: 05 SSR
Decision
On
Enforcement of 3-Year Gradual Investment Program
- Having seen Royal Kram No. NS/RKM/0508/017, dated 22 May 2008, promulgating the
Law on Administrative Management in Capital, Province, City, District, and Sangkat
- Having seen Royal Kram No. NS/RKM/0508/018, dated 24 May 2008, promulgating the
Law on Election and Selection of Capital, Provincial, City, District and Sangkat Council
- Referring to Sub Decree No. 216 ANKr.BK, dated 14 December 2009, on Position,
Duties and Working Relationship of the Council of Provincial Governance, the Council
of Municipal Governance and the Council of District Governance
- Referring to Sub Decree No. 219 ANKr.BK, dated 14 December 2009, on the
Establishment of the Development Plan and 3-Year Gradual Investment Program in
Capital, Province, City, District and Sangkat
- Referring to Sub Decree No. 152 ANKr.BK, dated 06 December 2009, on Revised
Article 12 in the Sub Decree on the Establishment of the Development Plan and 3-Year
Gradual Investment Program in Capital, Province, City, District and Commune
- Referring to Inter-Ministry Prakas No. 2417 BrK, dated 27 December 2010, on the
Establishment of Development Plan and 3-Year Gradual Investment Program in Capital,
Province, City, District and Sangkat
- Referring to the Minute of the 7th
Extraordinary Meeting of Bavet Municipal Council on
28 December 2012
Decide
Article 1
To enforce in Bavet City the 3-Year Gradual Investment Program for 2013 – 2015 which
was adopted by the Bavet Municipal Council during the 7th
extraordinary Meeting on 28
December 2012.
Article 2
Municipal governor in Bavet City shall promote this 3-Year Gradual Investment Program
to people and any related parties within the jurisdiction of Bavet City administration.
Municipal governor shall prepare, facilitate and gather resources for this 3-Year Gradual
Investment Program with transparency, accountability and effectiveness.
3-Year Gradual Investment Program (2013 – 2015) Page 3
Article 3
Municipal governor shall formulate mechanisms and systems to control and evaluate the
implementation of this 3-Year Gradual Investment Program with participation from any related
parties so as to increase the effectiveness of the implementation of the 3-Year Gradual
Investment Program.
Municipal governor shall prepare reports on the outcome of the control and evaluation of
the implementation of this 3-Year Gradual Investment Program and report this to the meeting of
Bavet Municipal Council on the progress of the implementation of this 3-Year Gradual
Investment Program at specified date.
Municipal governor shall prepare and send the annual report on the implementation of
this 3-Year Gradual Investment Program to the Municipal Council.
Article 4
Municipal governor shall evaluate the implementation of this 3-Year Gradual Investment
Program at the mid of their mandate and the end of Municipal Council’s mandate so as to
evaluate the achieved outcome in comparison with the target and objectives set in the 3-Year
Gradual Investment Program.
Article 5
The Board of Governor, office and all related institutions in Bavet City shall follow this
Decision effective from the signing date.
Bavet, 31 December 2012
Head of Bavet City Council
(Signature)
Copy to:
- Svay Rieng Provincial Hall
- Provincial Planning Department
- Same to Article 4
Chronology

3-Year Gradual Investment Program (2013 – 2015) Page 4
PREFACE
This is the third year that Bavet Municipal Council has prepared this 3-Year Gradual
Investment Program, which provides opportunities to specialized offices around the City, offices
under the Municipality, Sangkat Council, social civil organizations, private sector, citizen,
representative group of interests, especially to youth groups and children, and to any related
parties for participating directly in the process of preparing this 3-Year Gradual Investment
Program. This 3-Year Gradual Investment Program has been established to provide guidelines in
relation to policies and city development frameworks in order to direct the Municipal
administration toward economic development for the local and to promote service quality which
contribute to poverty reduction and promote living standard and welfare of people in the City.
This 3-Year Gradual Investment Program has also been established to be used as an essential
base to make decision on city development and establishment of the 3-Year Gradual Investment
Program, intermediate-term expenditures framework (3 years) and Municipal annual budget.
On behalf of the first mandate of the Bavet Municipal Council, I would like to give my
appreciation to Municipal governor, Municipal Technical Facilitation Committee, Municipal
Women and Children Consultation Committee, other Committees of Municipal Council,
specialized Offices around the city, Offices under the Municipality, social civil organization,
private sector, Sangkat Council, citizen, representative group of interests, especially youth
groups and children, and any other related parties which have actively participated in the process
of establishing the 3-Year Gradual Investment Program. Meanwhile, I would also like to express
my profound thanks to the Municipal Governance and the working group who established the
development plan and the 3-Year Gradual Investment Program by heading and facilitating the
process of preparing the 3-Year Gradual Investment Program until it is now achieved.
On behalf of the Municipal Council, I would like to appeal to and expect that provincial
administration, specialized organizations, private sector, social civil organization, development
partners and other generous donors support activity frameworks and any privileged services
which respond to the Municipal intermediate-term (3 years) of expenditure framework which is
set within this 3-Year Gradual Investment Program.
Bavet, 31 December 2012
Head of the Bavet Municipal Council
(Signature)

3-Year Gradual Investment Program (2013 – 2015) Page 5
INTRODUCTION
Bavet City is one of the 8 cities and districts in Svay Rieng Province and bordered:
- to the North by Svay Teab District, Svay Rieng Province, Cambodia, and BenKov
District, Tay Ninh Province, Viet Nam
- to the South by Chantrea District and Kompong Rou District
- to the West by Svay Teab District and Kompong Rou District
- to the East by BenKov District, Tra Pang District, Tay Ninh Province and Doeuk Vey
District, Long An Province, Viet Nam
Bavet City is divided into 5 sangkats and 35 villages with total land area of 206.69 km2
and with a population of 37,897, of which 19,125 are women and has density of 183people/km2.
Approximately 66.12% of the population is farmers who live by depending on agriculture which
is a main sector in supporting people’s living in Bavet City. Aside from agricultural sector which
is the core and the main sector, there are also other sectors such as industrial sector and private
investment companies which basically create jobs for people.
In May 2009, the election for Capital, Provincial, Municipal, District and Sangkat
Council was successfully carried out under the Law on Administrative Management in the
Capital, Province, City, District and Sangkat. Municipal Council together with Municipal
Governor has performed their duties for good governance and basic economic development in
accordance with the decentralization and deconcentralization policies, and any rules and
regulations.
The first mandate of Bavet Municipal Council has established the 3-Year Gradual
Investment Program for 2013 – 2015 in accordance with Article 38 and Article 39 of Law on
Administrative Management in the Capital, Province, Municipality, District and Commune; Sub
Decree No.219 ANKr.BK, dated 14 December 2009, on the Establishment of Development Plan
and 3-Year Gradual Investment Program for Capital, Province, City, District and Sangkat; and
Sub Decree No.152 ANKr.BK, dated 06 December 2009, on the Revised Article 12 of Sub
Decree on the Establishment of Development Plan and 3-Year Gradual Investment Program for
Capital, Province, City, District and Sangkat.
The 3-Year Gradual Investment Program of Bavet City has been established according
to guidelines by participating and discussing with people, local communities, representative
group of interests, especially youth groups and children, Sangkat Councils, specialized offices
around the City, offices under the Municipality, social civil organizations, private sector and any
related parties within the jurisdiction of the City in analyzing the situation, potentiality, facing
problems and any requirements.
The 3-Year Gradual Investment Program of Bavet City has been set with specific
visions, targets, objectives, indicators and strategies based on which decisions are made to
employ the resources and other potentiality to develop the economy and promote service quality
so as to respond to people’s needs and to contribute to poverty reduction.
3-Year Gradual Investment Program (2013 – 2015) Page 6
The 3-Year Gradual Investment Program of Bavet City consists of two chapters;
Chapter 1 describes the economic and social situation, Chapter 2 the plan for the next three years
of the 3-Year Gradual Investment Program.
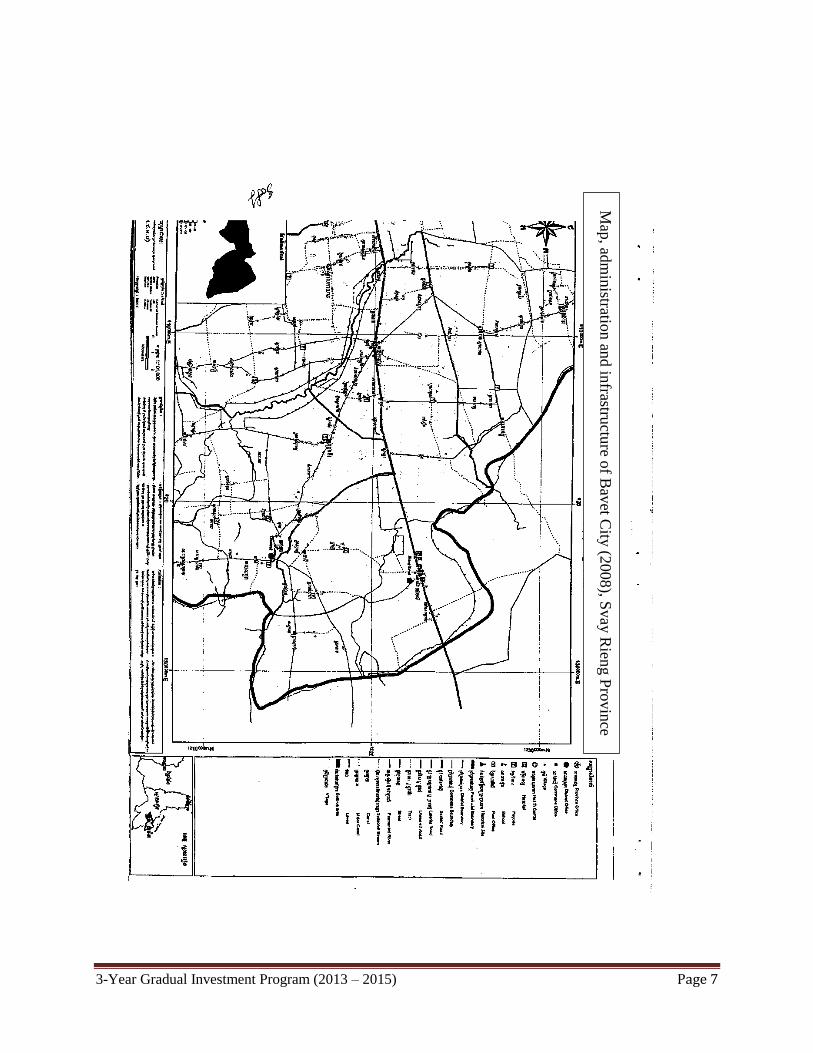
3-Year Gradual Investment Program (2013 – 2015) Page 7
Map
, adm
inistratio
n an
d in
frastructu
re of B
avet C
ity (2
008), S
vay R
ieng P
rovin
ce
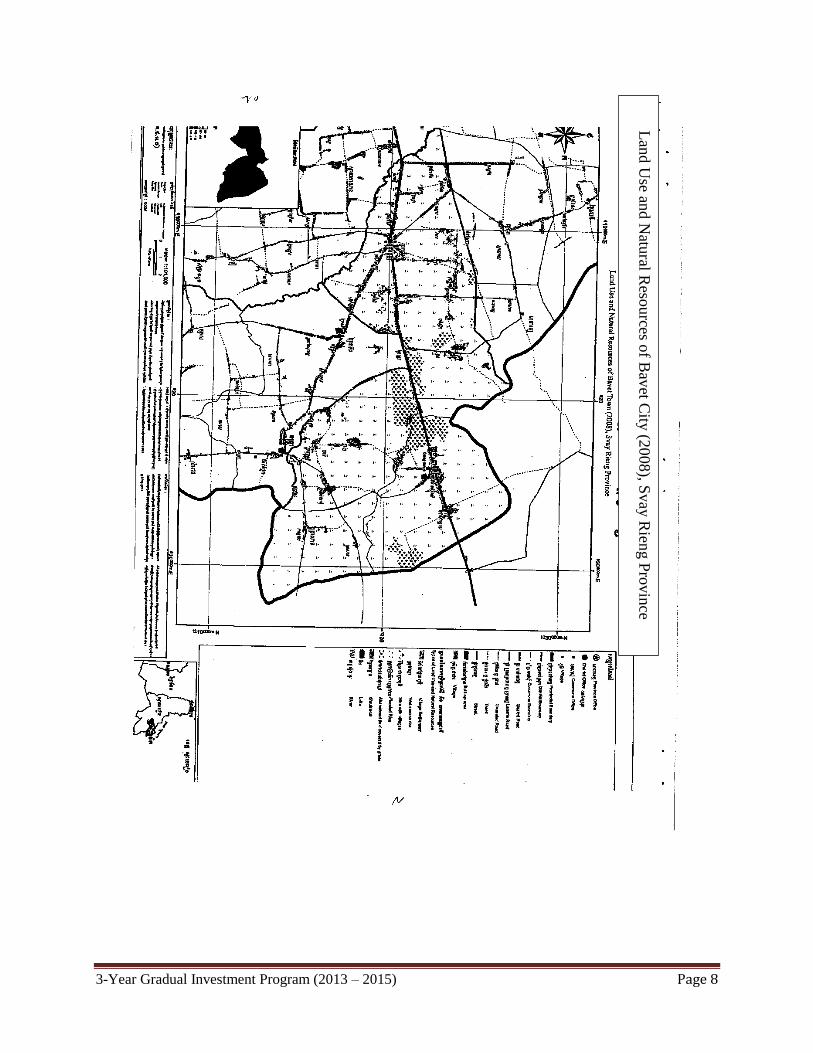
3-Year Gradual Investment Program (2013 – 2015) Page 8
Lan
d U
se and N
atural R
esources o
f Bav
et City
(20
08), S
vay
Rien
g P
rovin
ce
Chapter 1
Economic and Social Situation
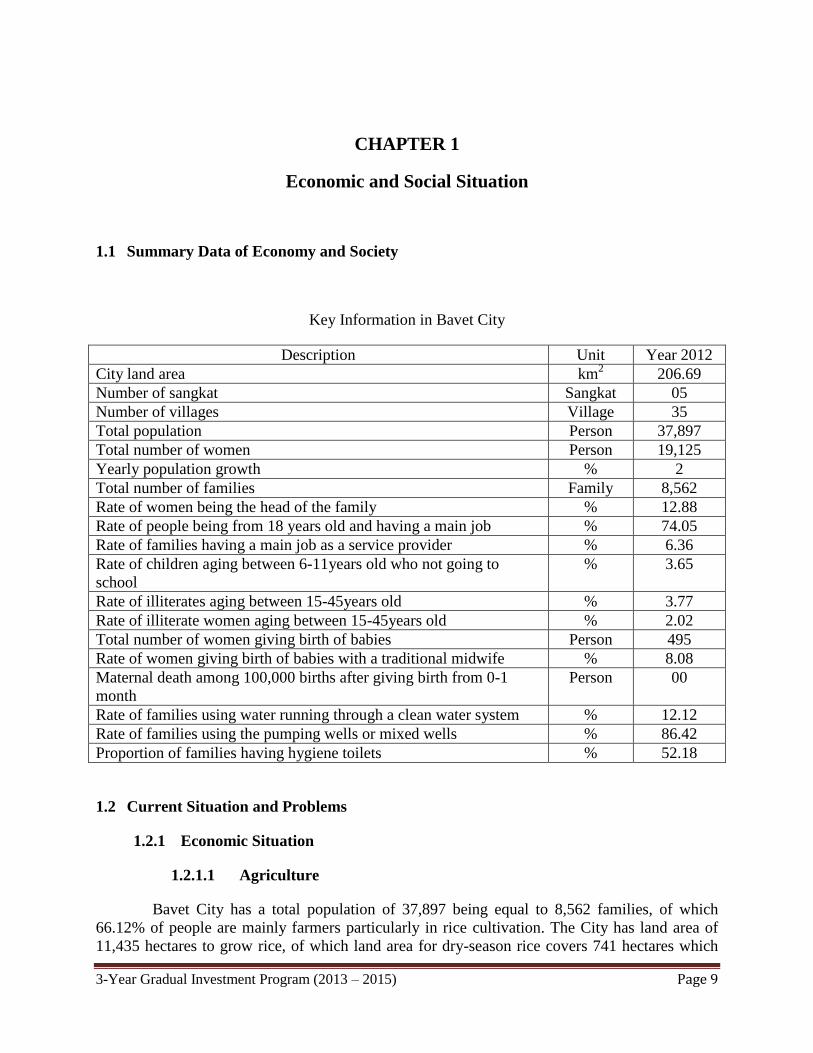
3-Year Gradual Investment Program (2013 – 2015) Page 9
CHAPTER 1
Economic and Social Situation
1.1 Summary Data of Economy and Society
Key Information in Bavet City
Description Unit Year 2012
City land area km2 206.69
Number of sangkat Sangkat 05
Number of villages Village 35
Total population Person 37,897
Total number of women Person 19,125
Yearly population growth % 2
Total number of families Family 8,562
Rate of women being the head of the family % 12.88
Rate of people being from 18 years old and having a main job % 74.05
Rate of families having a main job as a service provider % 6.36
Rate of children aging between 6-11years old who not going to
school
% 3.65
Rate of illiterates aging between 15-45years old % 3.77
Rate of illiterate women aging between 15-45years old % 2.02
Total number of women giving birth of babies Person 495
Rate of women giving birth of babies with a traditional midwife % 8.08
Maternal death among 100,000 births after giving birth from 0-1
month
Person 00
Rate of families using water running through a clean water system % 12.12
Rate of families using the pumping wells or mixed wells % 86.42
Proportion of families having hygiene toilets % 52.18
1.2 Current Situation and Problems
1.2.1 Economic Situation
1.2.1.1 Agriculture
Bavet City has a total population of 37,897 being equal to 8,562 families, of which
66.12% of people are mainly farmers particularly in rice cultivation. The City has land area of
11,435 hectares to grow rice, of which land area for dry-season rice covers 741 hectares which
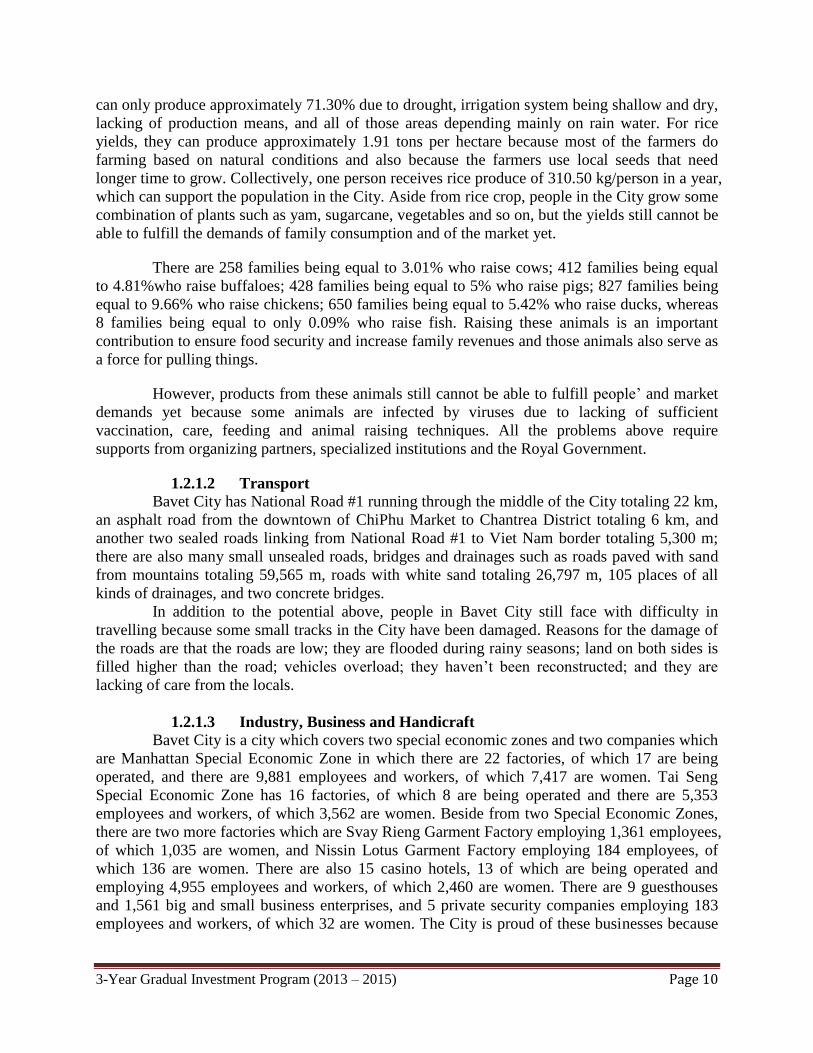
3-Year Gradual Investment Program (2013 – 2015) Page 10
can only produce approximately 71.30% due to drought, irrigation system being shallow and dry,
lacking of production means, and all of those areas depending mainly on rain water. For rice
yields, they can produce approximately 1.91 tons per hectare because most of the farmers do
farming based on natural conditions and also because the farmers use local seeds that need
longer time to grow. Collectively, one person receives rice produce of 310.50 kg/person in a year,
which can support the population in the City. Aside from rice crop, people in the City grow some
combination of plants such as yam, sugarcane, vegetables and so on, but the yields still cannot be
able to fulfill the demands of family consumption and of the market yet.
There are 258 families being equal to 3.01% who raise cows; 412 families being equal
to 4.81%who raise buffaloes; 428 families being equal to 5% who raise pigs; 827 families being
equal to 9.66% who raise chickens; 650 families being equal to 5.42% who raise ducks, whereas
8 families being equal to only 0.09% who raise fish. Raising these animals is an important
contribution to ensure food security and increase family revenues and those animals also serve as
a force for pulling things.
However, products from these animals still cannot be able to fulfill people’ and market
demands yet because some animals are infected by viruses due to lacking of sufficient
vaccination, care, feeding and animal raising techniques. All the problems above require
supports from organizing partners, specialized institutions and the Royal Government.
1.2.1.2 Transport
Bavet City has National Road #1 running through the middle of the City totaling 22 km,
an asphalt road from the downtown of ChiPhu Market to Chantrea District totaling 6 km, and
another two sealed roads linking from National Road #1 to Viet Nam border totaling 5,300 m;
there are also many small unsealed roads, bridges and drainages such as roads paved with sand
from mountains totaling 59,565 m, roads with white sand totaling 26,797 m, 105 places of all
kinds of drainages, and two concrete bridges.
In addition to the potential above, people in Bavet City still face with difficulty in
travelling because some small tracks in the City have been damaged. Reasons for the damage of
the roads are that the roads are low; they are flooded during rainy seasons; land on both sides is
filled higher than the road; vehicles overload; they haven’t been reconstructed; and they are
lacking of care from the locals.
1.2.1.3 Industry, Business and Handicraft
Bavet City is a city which covers two special economic zones and two companies which
are Manhattan Special Economic Zone in which there are 22 factories, of which 17 are being
operated, and there are 9,881 employees and workers, of which 7,417 are women. Tai Seng
Special Economic Zone has 16 factories, of which 8 are being operated and there are 5,353
employees and workers, of which 3,562 are women. Beside from two Special Economic Zones,
there are two more factories which are Svay Rieng Garment Factory employing 1,361 employees,
of which 1,035 are women, and Nissin Lotus Garment Factory employing 184 employees, of
which 136 are women. There are also 15 casino hotels, 13 of which are being operated and
employing 4,955 employees and workers, of which 2,460 are women. There are 9 guesthouses
and 1,561 big and small business enterprises, and 5 private security companies employing 183
employees and workers, of which 32 are women. The City is proud of these businesses because
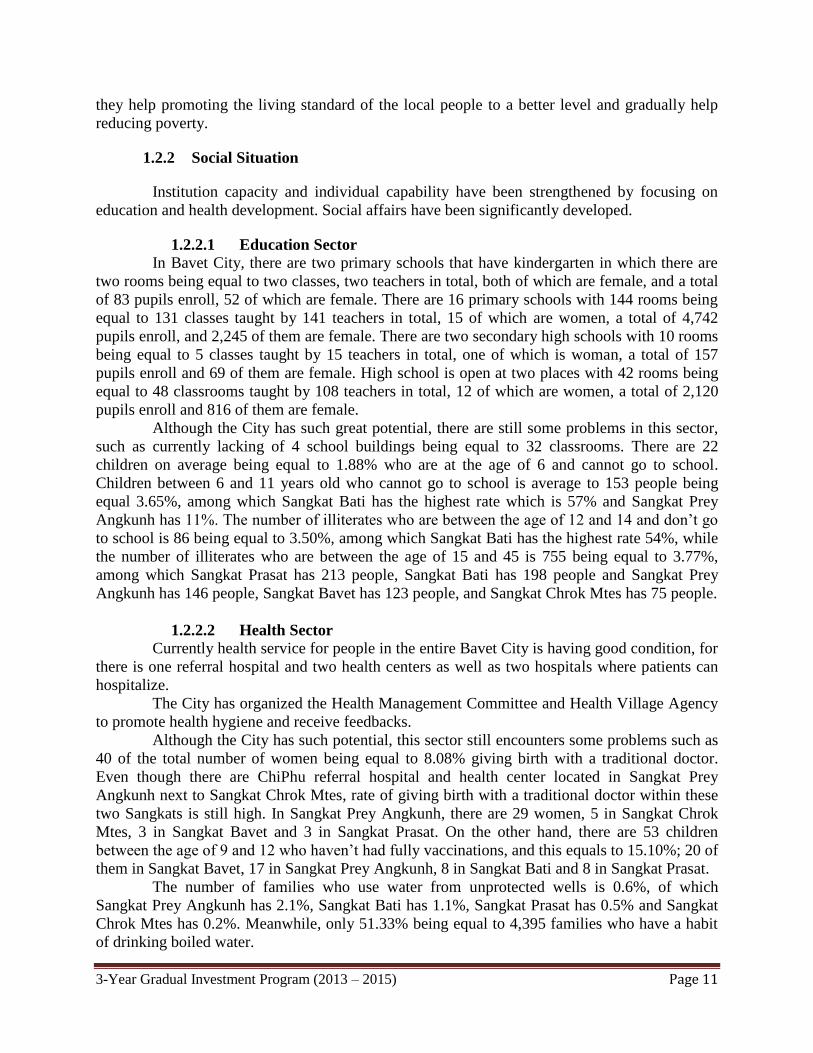
3-Year Gradual Investment Program (2013 – 2015) Page 11
they help promoting the living standard of the local people to a better level and gradually help
reducing poverty.
1.2.2 Social Situation
Institution capacity and individual capability have been strengthened by focusing on
education and health development. Social affairs have been significantly developed.
1.2.2.1 Education Sector
In Bavet City, there are two primary schools that have kindergarten in which there are
two rooms being equal to two classes, two teachers in total, both of which are female, and a total
of 83 pupils enroll, 52 of which are female. There are 16 primary schools with 144 rooms being
equal to 131 classes taught by 141 teachers in total, 15 of which are women, a total of 4,742
pupils enroll, and 2,245 of them are female. There are two secondary high schools with 10 rooms
being equal to 5 classes taught by 15 teachers in total, one of which is woman, a total of 157
pupils enroll and 69 of them are female. High school is open at two places with 42 rooms being
equal to 48 classrooms taught by 108 teachers in total, 12 of which are women, a total of 2,120
pupils enroll and 816 of them are female.
Although the City has such great potential, there are still some problems in this sector,
such as currently lacking of 4 school buildings being equal to 32 classrooms. There are 22
children on average being equal to 1.88% who are at the age of 6 and cannot go to school.
Children between 6 and 11 years old who cannot go to school is average to 153 people being
equal 3.65%, among which Sangkat Bati has the highest rate which is 57% and Sangkat Prey
Angkunh has 11%. The number of illiterates who are between the age of 12 and 14 and don’t go
to school is 86 being equal to 3.50%, among which Sangkat Bati has the highest rate 54%, while
the number of illiterates who are between the age of 15 and 45 is 755 being equal to 3.77%,
among which Sangkat Prasat has 213 people, Sangkat Bati has 198 people and Sangkat Prey
Angkunh has 146 people, Sangkat Bavet has 123 people, and Sangkat Chrok Mtes has 75 people.
1.2.2.2 Health Sector
Currently health service for people in the entire Bavet City is having good condition, for
there is one referral hospital and two health centers as well as two hospitals where patients can
hospitalize.
The City has organized the Health Management Committee and Health Village Agency
to promote health hygiene and receive feedbacks.
Although the City has such potential, this sector still encounters some problems such as
40 of the total number of women being equal to 8.08% giving birth with a traditional doctor.
Even though there are ChiPhu referral hospital and health center located in Sangkat Prey
Angkunh next to Sangkat Chrok Mtes, rate of giving birth with a traditional doctor within these
two Sangkats is still high. In Sangkat Prey Angkunh, there are 29 women, 5 in Sangkat Chrok
Mtes, 3 in Sangkat Bavet and 3 in Sangkat Prasat. On the other hand, there are 53 children
between the age of 9 and 12 who haven’t had fully vaccinations, and this equals to 15.10%; 20 of
them in Sangkat Bavet, 17 in Sangkat Prey Angkunh, 8 in Sangkat Bati and 8 in Sangkat Prasat.
The number of families who use water from unprotected wells is 0.6%, of which
Sangkat Prey Angkunh has 2.1%, Sangkat Bati has 1.1%, Sangkat Prasat has 0.5% and Sangkat
Chrok Mtes has 0.2%. Meanwhile, only 51.33% being equal to 4,395 families who have a habit
of drinking boiled water.

3-Year Gradual Investment Program (2013 – 2015) Page 12
The number of families who are carrying or have been infected by AIDS is 27, of which
Sangkat Bati has 9 families, Sangkat Prey Angkunh has 8 families, Sangkat Bavet has 7 families,
Sangkat Chrok Mtes has 2 families and Sangkat Prasat has 1 family. There are 22 orphans under
18 years old who don’t have parents or whose parents have died due to infection of AIDS. There
are 44 disabled people who cannot earn their own living, of which Sangkat Prey Angkunh has 17
people, Sangkat Bavet has 17 people, Sangkat Chrok Mtes has 7 people, and Sangkat Prasat has
3 people. Regarding the elderly people without family support, there are 13 people, of whom
Sangkat Bavet has 10 people, Sangkat Bati has 2 people, and Sangkat Chrok Mtes has one.
1.2.2.3 Cult and Religion Sector
There are 18 pagodas throughout the City and 133 monks, of whom 58 are venerable
and 75 are novices. 99% of the citizens believe in Buddha and there are 5 Buddhist primary
schools. There are 8 pagodas where Seima for Preah Vihear have already been built and another
10 Preah Vihears are in the process. Some pagodas don’t have protection fence, monk’s
residence is not sufficient, and there are increasing constructions being carried out within the
pagoda area.
1.2.2.4 Gender Sector
To achieve Cambodia’s Millennium Development Goals, the City has increased the
number of women to serve decision-making and leadership positions in institutions,
organizations, social civil organizations, companies and factories. Developing women to be
leaders is to increase education for women and girls, and to promote health care for women and
girls, and to organize integrate gender into the process of preparing, controlling and evaluating
policies regarding social activities. Because some women still don’t have enough capabilities to
take their responsibility or duties responding to institutions’ needs yet. There are lacking of
education and advertisement for preventing violent activities in families, women and children
trafficking, which are obstacles to women can using their potentialities fully in order to
contribute to economic and social development.
1.2.3 Situation of Land Use, Natural Resource and Environment Management
1.2.3.1 Land Use
Bavet City has a total land area of 20,669 hectares. Land area for building houses is
8,413.85 hectares, 11,435 hectares for growing plantations, 404 hectares for natural forest and
416.15 hectares for other uses. These pieces of land area allow people in the City to build houses
and to grow plants in good conditions; nevertheless, due to high increase in population every
year, some people in the City face problems such as lacking of land to grow plants and to build
houses. Because of lacking of land to grow plants and to build houses, some people have invaded
public land such as lakes, creeks, canals, roads, hills and forest land and use them as individual’s
possession.
1.2.3.1 Natural Resources Currently, the City has total land area of approximately 819.15 hectares covering forest,
lakes, creeks, canals and hills from which people in the City can obtain produce and by-products
to support their living. However, until today, 85% of those lakes, creeks, canals and streams are

3-Year Gradual Investment Program (2013 – 2015) Page 13
gradually becoming narrower and shallower. Meanwhile, a small number of people have invaded
some area of these lakes and creeks to use as their own possession. Today some of the natural
resources are going down which is concerning. This decrease has been caused by many factors
such as continuous growth of population every year, deforestation and the act of anarchically
obtaining produce and by-products from natural resources. Lakes, creeks and canals have
become narrower and shallower, and illegal fishing has resulted with decreasing fish yields from
year to year.
1.2.3.2 Environment
Currently, the City’s environment is in good condition, but according to population
growth, economic boom and technology advancement are factors to increase use of materials and
disposal of waste disorderly which damage the beauty of the City. Waste collection service is
still slow both public and private companies while the City is having increasing multi-economic
activities especially casinos, factories, enterprises and handicraft works that produce incredible
amount of waste.
57.58% of the families grow plants by using chemical fertilizers. There are three
communes whose rate is higher than 80%; Sangkat Prey Angkunh has 57.7% and Sangkat Bati
has 11.1%. Meanwhile, 46.53% of the families use pesticides. The Sangkat that has the highest
rate is Sangkat Prasat which is 97.4%, Sangkat Bati has 72.8%, Sangkat Chrok Mtes has 61.5%
and Sangkat Prey Angkunh has 60.2%.
1.2.4 Situation of Disaster Management and Climate Change
1.2.4.3 Disaster Management
Within the last five years, there have been 2 cases of typhoon which destroyed houses of
five families. There were 35 people severely affected by the typhoons; 11 hectares of rice fields
were ruined; and 3,100 metres of the roads were damaged by the flood.
1.2.4.4 Climate Change
Global climate change results some effects on Bavet City such as raining in the wrong
season and climate change from temperature of 35 to 40oC. All these changes affect people’s
living in Bavet; for example, lakes, creeks, and canals are dry during the dry season, and some
paddies and other plants are also facing with the problem of insufficient watering during the dry
season.
1.2.5 Situation of Administration, Security and Public Order
1.2.5.1 Good Governance
Good governance in accordance with national reform specifically administration reform,
public, legal reform, and arm force reform are strengthened to ensure that every process is
transparent and accountable to the Board of Governors and Council, and the council is
accountable to the Royal Government and the citizen. After election of the first mandate of
District/Municipal Council, the Municipality has organized a new administrative management
structure and has already allocated employees to this new structure. The Council, the Board of
Governors and all Municipal officials have actively performed their duties and responsibilities in

3-Year Gradual Investment Program (2013 – 2015) Page 14
providing service and solving problems for people in the City. Regarding this matter, the City is
still facing with some problems such that officials have limited capability which requires training
developments; working office and supplies necessary to carry out work duties are still not
appropriate and sufficient; and some officials are still not able to perform the current workloads.
1.2.5.2 Land Management
Bavet City consists of 5 Sangkats and 35 villages. It is bordered to the North by Svay
Teab District, Svay Rieng Province, Cambodia, and Ben Kov District, Tay Ninh Province; to the
South by Chantrea District and Kompong Rou District; to the West by Svay Teab District and
Kompong Rou District; to the East by Ben Kov District, Tra Pang District, Tay Ninh Province,
and Doeuk Vey District, Long An Province, Viet Nam. In land management, the City has
encountered some problems; for example, some people have built small houses to sell things on
public land; land dispute has always been an issue due to unclear land boundary and the people’s
unawareness of Law on Land.
1.2.5.3 Statistic Management
The City has put together statistics of people of the entire city and updates them every
year. Regarding population registration, after circulating the importance of all kinds of the
population registration letters, most of the locals have been aware of it and came to register in
due course. However, a small number of people are late to register for birth certificates;
according to data in 2012, of the entire City, only 89.78% of newly born babies have been
registered for birth certificates and only 28.76% of couples have registered for marriage
certificates. These numbers are not yet sufficient and satisfied by the local authority because
some parents still have less consideration of registering birth certificate for their children and
don’t understand the significance of population registration letters.
1.2.5.4 Security Work and Public Order
Regarding security and public order, Municipal administration guarantees good security
control within the City by putting police stations in 18 locations within the 35 villages, 209
creating citizen protection groups which have 965 members and having guarding shifts in 3 big
groups and 6 small groups totaling 67 members which patrol around every night. To implement
the Safety Village/Commune Policy, the three arm forces have to cooperate well particularly in
monitoring all targets, people who go in and out and temporary stay so that security and public
order can be maintained satisfactorily.
In addition to the strengths above, there have also been some issues such as one case of
murder and kidnapping, 5 cases of stealing, and 34 cases of other conflicts. There have been 22
cases of traffic accidents caused by drivers not obeying the law, drunk driving, many deteriorated
roads and some of the roads not having clear traffic signs and some vehicles being not
technically acceptable.

Chapter 2
The Projects of the 3-Year Gradual Investment
Program
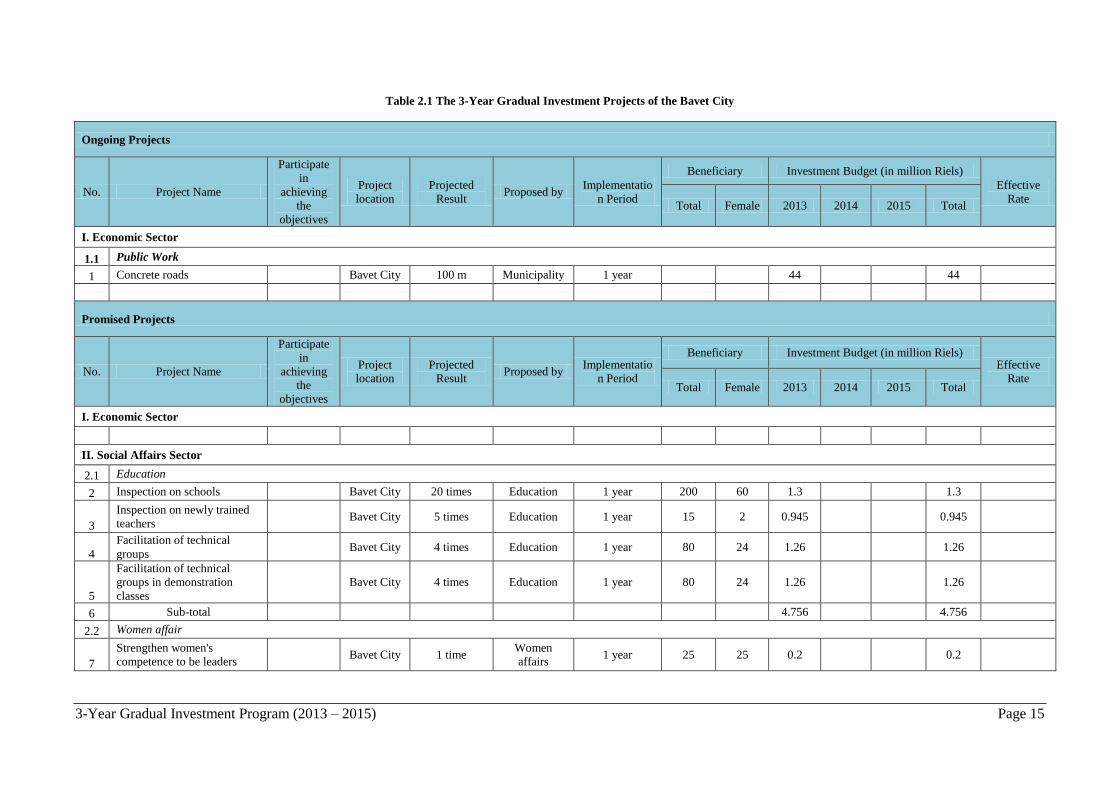
3-Year Gradual Investment Program (2013 – 2015) Page 15
Table 2.1 The 3-Year Gradual Investment Projects of the Bavet City
Ongoing Projects
No. Project Name
Participate
in
achieving
the
objectives
Project
location
Projected
Result Proposed by
Implementatio
n Period
Beneficiary Investment Budget (in million Riels)
Effective
Rate Total Female 2013 2014 2015 Total
I. Economic Sector
1.1 Public Work
1 Concrete roads Bavet City 100 m Municipality 1 year 44 44
Promised Projects
No. Project Name
Participate
in
achieving
the
objectives
Project
location
Projected
Result Proposed by
Implementatio
n Period
Beneficiary Investment Budget (in million Riels) Effective
Rate Total Female 2013 2014 2015 Total
I. Economic Sector
II. Social Affairs Sector
2.1 Education
2 Inspection on schools Bavet City 20 times Education 1 year 200 60 1.3 1.3
3
Inspection on newly trained
teachers Bavet City 5 times Education 1 year 15 2 0.945 0.945
4
Facilitation of technical
groups Bavet City 4 times Education 1 year 80 24 1.26 1.26
5
Facilitation of technical
groups in demonstration
classes
Bavet City 4 times Education 1 year 80 24 1.26 1.26
6 Sub-total 4.756 4.756
2.2 Women affair
7
Strengthen women's
competence to be leaders Bavet City 1 time
Women
affairs 1 year 25 25 0.2 0.2
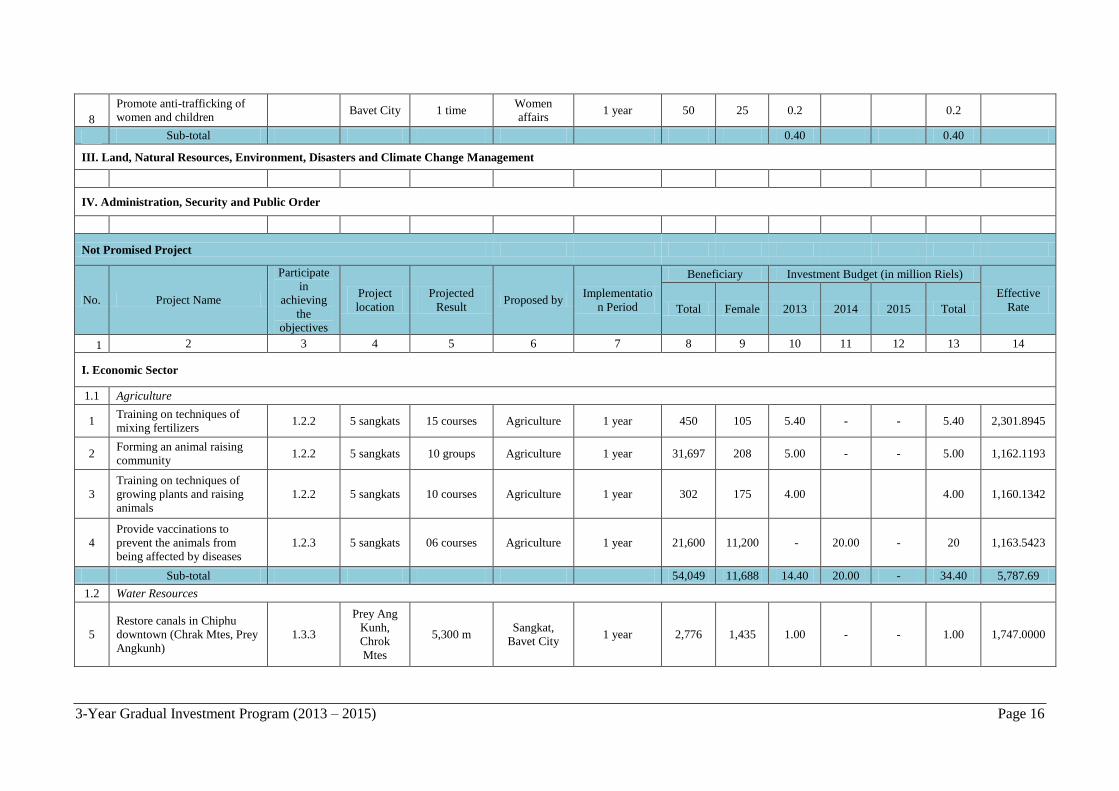
3-Year Gradual Investment Program (2013 – 2015) Page 16
8
Promote anti-trafficking of
women and children Bavet City 1 time
Women
affairs 1 year 50 25 0.2 0.2
Sub-total 0.40 0.40
III. Land, Natural Resources, Environment, Disasters and Climate Change Management
IV. Administration, Security and Public Order
Not Promised Project
No. Project Name
Participate
in
achieving
the
objectives
Project
location
Projected
Result Proposed by
Implementatio
n Period
Beneficiary Investment Budget (in million Riels)
Effective
Rate Total Female 2013 2014 2015 Total
1 2 3 4 5 6 7 8 9 10 11 12 13 14
I. Economic Sector
1.1 Agriculture
1 Training on techniques of
mixing fertilizers 1.2.2 5 sangkats 15 courses Agriculture 1 year 450 105 5.40 - - 5.40 2,301.8945
2 Forming an animal raising
community 1.2.2 5 sangkats 10 groups Agriculture 1 year 31,697 208 5.00 - - 5.00 1,162.1193
3
Training on techniques of
growing plants and raising
animals
1.2.2 5 sangkats 10 courses Agriculture 1 year 302 175 4.00 4.00 1,160.1342
4
Provide vaccinations to
prevent the animals from
being affected by diseases
1.2.3 5 sangkats 06 courses Agriculture 1 year 21,600 11,200 - 20.00 - 20 1,163.5423
Sub-total 54,049 11,688 14.40 20.00 - 34.40 5,787.69
1.2 Water Resources
5
Restore canals in Chiphu
downtown (Chrak Mtes, Prey
Angkunh)
1.3.3
Prey Ang
Kunh,
Chrok
Mtes
5,300 m Sangkat,
Bavet City 1 year 2,776 1,435 1.00 - - 1.00 1,747.0000
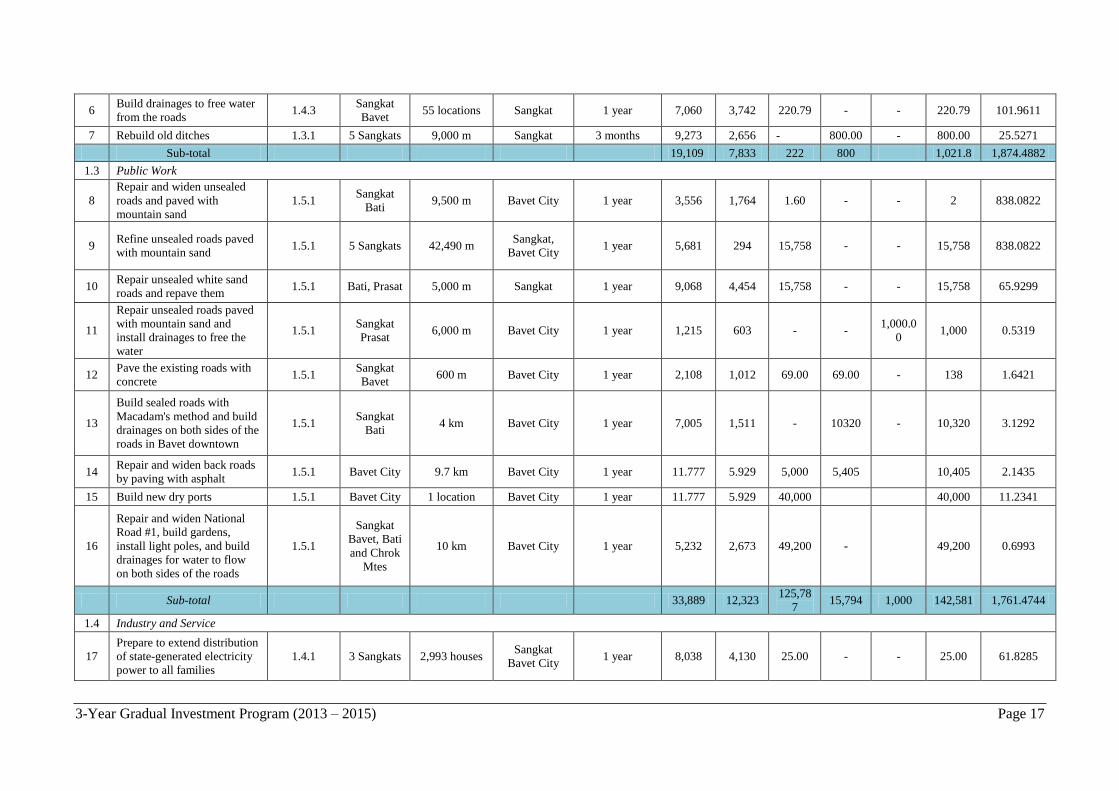
3-Year Gradual Investment Program (2013 – 2015) Page 17
6 Build drainages to free water
from the roads 1.4.3
Sangkat
Bavet 55 locations Sangkat 1 year 7,060 3,742 220.79 - - 220.79 101.9611
7 Rebuild old ditches 1.3.1 5 Sangkats 9,000 m Sangkat 3 months 9,273 2,656 - 800.00 - 800.00 25.5271
Sub-total 19,109 7,833 222 800 1,021.8 1,874.4882
1.3 Public Work
8
Repair and widen unsealed
roads and paved with
mountain sand
1.5.1 Sangkat
Bati 9,500 m Bavet City 1 year 3,556 1,764 1.60 - - 2 838.0822
9 Refine unsealed roads paved
with mountain sand 1.5.1 5 Sangkats 42,490 m
Sangkat,
Bavet City 1 year 5,681 294 15,758 - - 15,758 838.0822
10 Repair unsealed white sand
roads and repave them 1.5.1 Bati, Prasat 5,000 m Sangkat 1 year 9,068 4,454 15,758 - - 15,758 65.9299
11
Repair unsealed roads paved
with mountain sand and
install drainages to free the
water
1.5.1 Sangkat
Prasat 6,000 m Bavet City 1 year 1,215 603 - -
1,000.0
0 1,000 0.5319
12 Pave the existing roads with
concrete 1.5.1
Sangkat
Bavet 600 m Bavet City 1 year 2,108 1,012 69.00 69.00 - 138 1.6421
13
Build sealed roads with
Macadam's method and build
drainages on both sides of the
roads in Bavet downtown
1.5.1 Sangkat
Bati 4 km Bavet City 1 year 7,005 1,511 - 10320 - 10,320 3.1292
14 Repair and widen back roads
by paving with asphalt 1.5.1 Bavet City 9.7 km Bavet City 1 year 11.777 5.929 5,000 5,405 10,405 2.1435
15 Build new dry ports 1.5.1 Bavet City 1 location Bavet City 1 year 11.777 5.929 40,000 40,000 11.2341
16
Repair and widen National
Road #1, build gardens,
install light poles, and build
drainages for water to flow
on both sides of the roads
1.5.1
Sangkat
Bavet, Bati
and Chrok
Mtes
10 km Bavet City 1 year 5,232 2,673 49,200 - 49,200 0.6993
Sub-total 33,889 12,323 125,78
7 15,794 1,000 142,581 1,761.4744
1.4 Industry and Service
17
Prepare to extend distribution
of state-generated electricity
power to all families
1.4.1 3 Sangkats 2,993 houses Sangkat
Bavet City 1 year 8,038 4,130 25.00 - - 25.00 61.8285
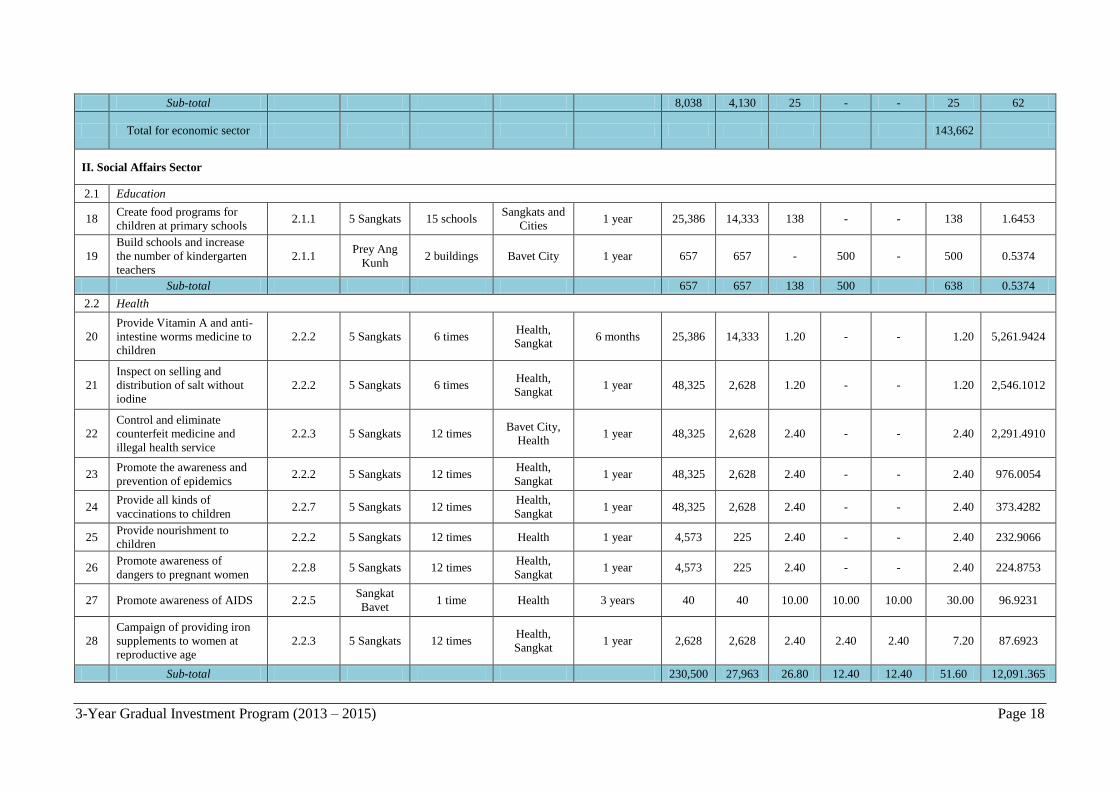
3-Year Gradual Investment Program (2013 – 2015) Page 18
Sub-total 8,038 4,130 25 - - 25 62
Total for economic sector 143,662
II. Social Affairs Sector
2.1 Education
18 Create food programs for
children at primary schools 2.1.1 5 Sangkats 15 schools
Sangkats and
Cities 1 year 25,386 14,333 138 - - 138 1.6453
19
Build schools and increase
the number of kindergarten
teachers
2.1.1 Prey Ang
Kunh 2 buildings Bavet City 1 year 657 657 - 500 - 500 0.5374
Sub-total 657 657 138 500 638 0.5374
2.2 Health
20
Provide Vitamin A and anti-
intestine worms medicine to
children
2.2.2 5 Sangkats 6 times Health,
Sangkat 6 months 25,386 14,333 1.20 - - 1.20 5,261.9424
21
Inspect on selling and
distribution of salt without
iodine
2.2.2 5 Sangkats 6 times Health,
Sangkat 1 year 48,325 2,628 1.20 - - 1.20 2,546.1012
22
Control and eliminate
counterfeit medicine and
illegal health service
2.2.3 5 Sangkats 12 times Bavet City,
Health 1 year 48,325 2,628 2.40 - - 2.40 2,291.4910
23 Promote the awareness and
prevention of epidemics 2.2.2 5 Sangkats 12 times
Health,
Sangkat 1 year 48,325 2,628 2.40 - - 2.40 976.0054
24 Provide all kinds of
vaccinations to children 2.2.7 5 Sangkats 12 times
Health,
Sangkat 1 year 48,325 2,628 2.40 - - 2.40 373.4282
25 Provide nourishment to
children 2.2.2 5 Sangkats 12 times Health 1 year 4,573 225 2.40 - - 2.40 232.9066
26 Promote awareness of
dangers to pregnant women 2.2.8 5 Sangkats 12 times
Health,
Sangkat 1 year 4,573 225 2.40 - - 2.40 224.8753
27 Promote awareness of AIDS 2.2.5 Sangkat
Bavet 1 time Health 3 years 40 40 10.00 10.00 10.00 30.00 96.9231
28
Campaign of providing iron
supplements to women at
reproductive age
2.2.3 5 Sangkats 12 times Health,
Sangkat 1 year 2,628 2,628 2.40 2.40 2.40 7.20 87.6923
Sub-total 230,500 27,963 26.80 12.40 12.40 51.60 12,091.365
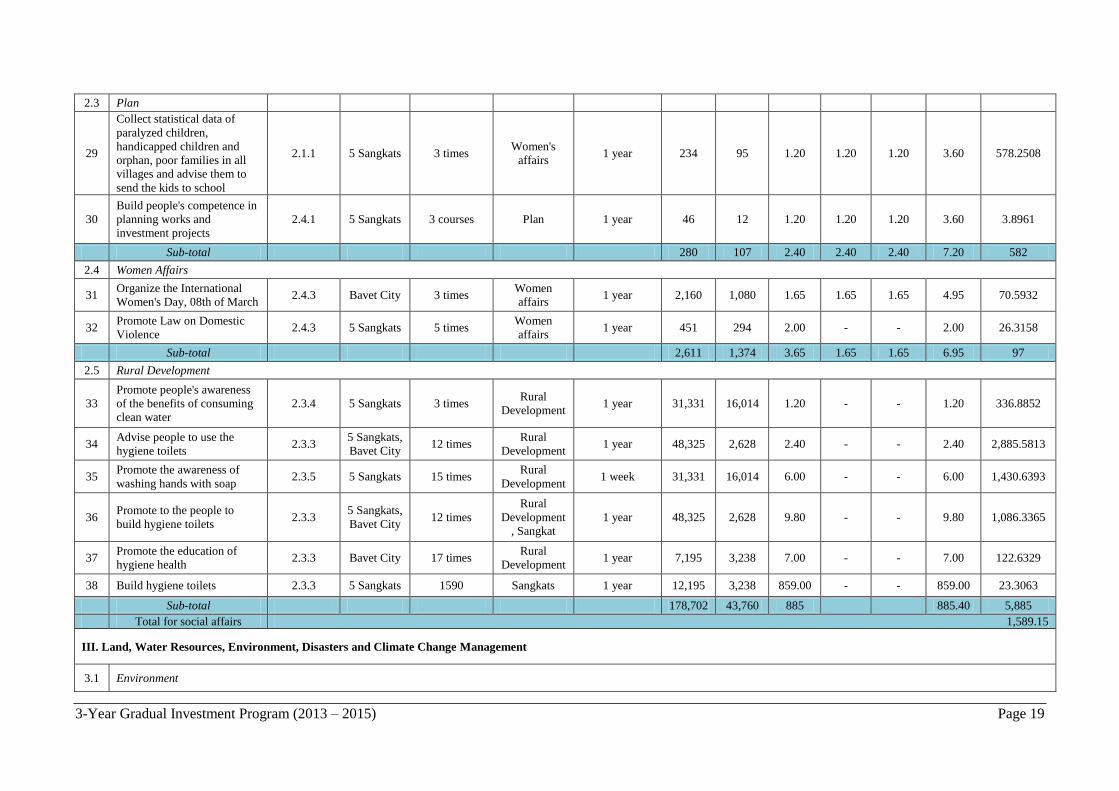
3-Year Gradual Investment Program (2013 – 2015) Page 19
2.3 Plan
29
Collect statistical data of
paralyzed children,
handicapped children and
orphan, poor families in all
villages and advise them to
send the kids to school
2.1.1 5 Sangkats 3 times Women's
affairs 1 year 234 95 1.20 1.20 1.20 3.60 578.2508
30
Build people's competence in
planning works and
investment projects
2.4.1 5 Sangkats 3 courses Plan 1 year 46 12 1.20 1.20 1.20 3.60 3.8961
Sub-total 280 107 2.40 2.40 2.40 7.20 582
2.4 Women Affairs
31 Organize the International
Women's Day, 08th of March 2.4.3 Bavet City 3 times
Women
affairs 1 year 2,160 1,080 1.65 1.65 1.65 4.95 70.5932
32 Promote Law on Domestic
Violence 2.4.3 5 Sangkats 5 times
Women
affairs 1 year 451 294 2.00 - - 2.00 26.3158
Sub-total 2,611 1,374 3.65 1.65 1.65 6.95 97
2.5 Rural Development
33
Promote people's awareness
of the benefits of consuming
clean water
2.3.4 5 Sangkats 3 times Rural
Development 1 year 31,331 16,014 1.20 - - 1.20 336.8852
34 Advise people to use the
hygiene toilets 2.3.3
5 Sangkats,
Bavet City 12 times
Rural
Development 1 year 48,325 2,628 2.40 - - 2.40 2,885.5813
35 Promote the awareness of
washing hands with soap 2.3.5 5 Sangkats 15 times
Rural
Development 1 week 31,331 16,014 6.00 - - 6.00 1,430.6393
36 Promote to the people to
build hygiene toilets 2.3.3
5 Sangkats,
Bavet City 12 times
Rural
Development
, Sangkat
1 year 48,325 2,628 9.80 - - 9.80 1,086.3365
37 Promote the education of
hygiene health 2.3.3 Bavet City 17 times
Rural
Development 1 year 7,195 3,238 7.00 - - 7.00 122.6329
38 Build hygiene toilets 2.3.3 5 Sangkats 1590 Sangkats 1 year 12,195 3,238 859.00 - - 859.00 23.3063
Sub-total 178,702 43,760 885
885.40 5,885
Total for social affairs 1,589.15
III. Land, Water Resources, Environment, Disasters and Climate Change Management
3.1 Environment
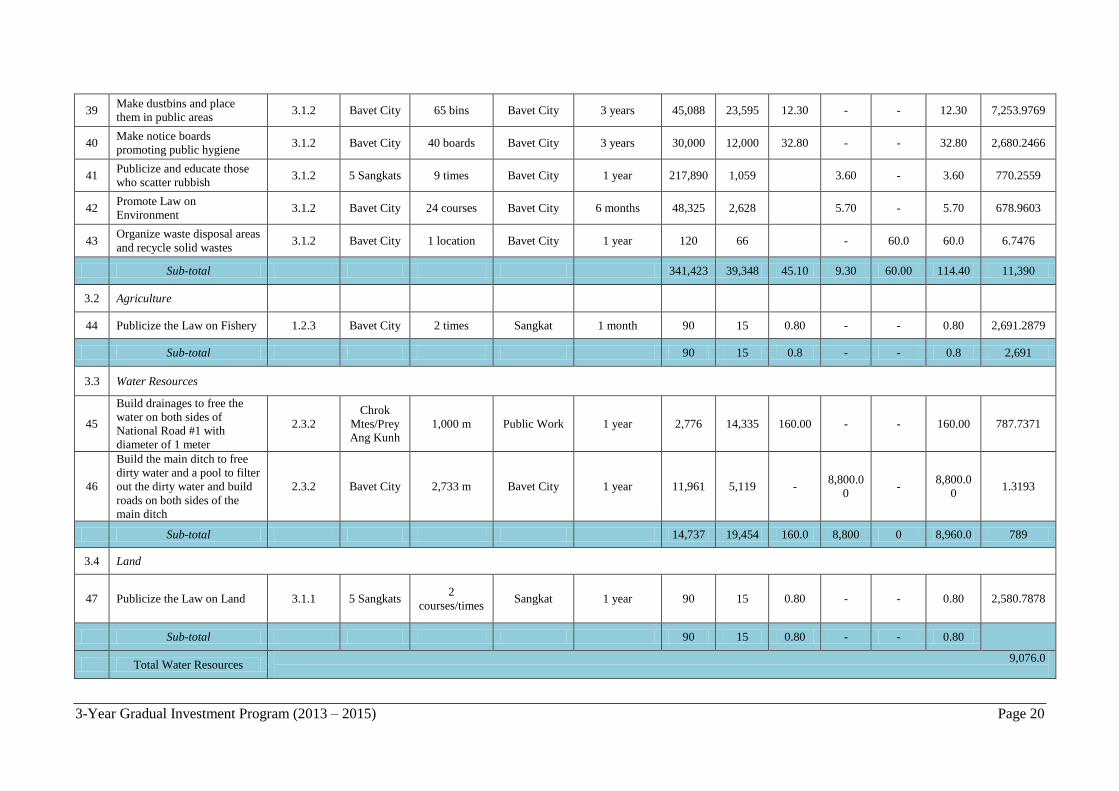
3-Year Gradual Investment Program (2013 – 2015) Page 20
39 Make dustbins and place
them in public areas 3.1.2 Bavet City 65 bins Bavet City 3 years 45,088 23,595 12.30 - - 12.30 7,253.9769
40 Make notice boards
promoting public hygiene 3.1.2 Bavet City 40 boards Bavet City 3 years 30,000 12,000 32.80 - - 32.80 2,680.2466
41 Publicize and educate those
who scatter rubbish 3.1.2 5 Sangkats 9 times Bavet City 1 year 217,890 1,059 3.60 - 3.60 770.2559
42 Promote Law on
Environment 3.1.2 Bavet City 24 courses Bavet City 6 months 48,325 2,628 5.70 - 5.70 678.9603
43 Organize waste disposal areas
and recycle solid wastes 3.1.2 Bavet City 1 location Bavet City 1 year 120 66 - 60.0 60.0 6.7476
Sub-total 341,423 39,348 45.10 9.30 60.00 114.40 11,390
3.2 Agriculture
44 Publicize the Law on Fishery 1.2.3 Bavet City 2 times Sangkat 1 month 90 15 0.80 - - 0.80 2,691.2879
Sub-total 90 15 0.8 - - 0.8 2,691
3.3 Water Resources
45
Build drainages to free the
water on both sides of
National Road #1 with
diameter of 1 meter
2.3.2
Chrok
Mtes/Prey
Ang Kunh
1,000 m Public Work 1 year 2,776 14,335 160.00 - - 160.00 787.7371
46
Build the main ditch to free
dirty water and a pool to filter
out the dirty water and build
roads on both sides of the
main ditch
2.3.2 Bavet City 2,733 m Bavet City 1 year 11,961 5,119 - 8,800.0
0 -
8,800.0
0 1.3193
Sub-total 14,737 19,454 160.0 8,800 0 8,960.0 789
3.4 Land
47 Publicize the Law on Land 3.1.1 5 Sangkats 2
courses/times Sangkat 1 year 90 15 0.80 - - 0.80 2,580.7878
Sub-total 90 15 0.80 - - 0.80
Total Water Resources 9,076.0
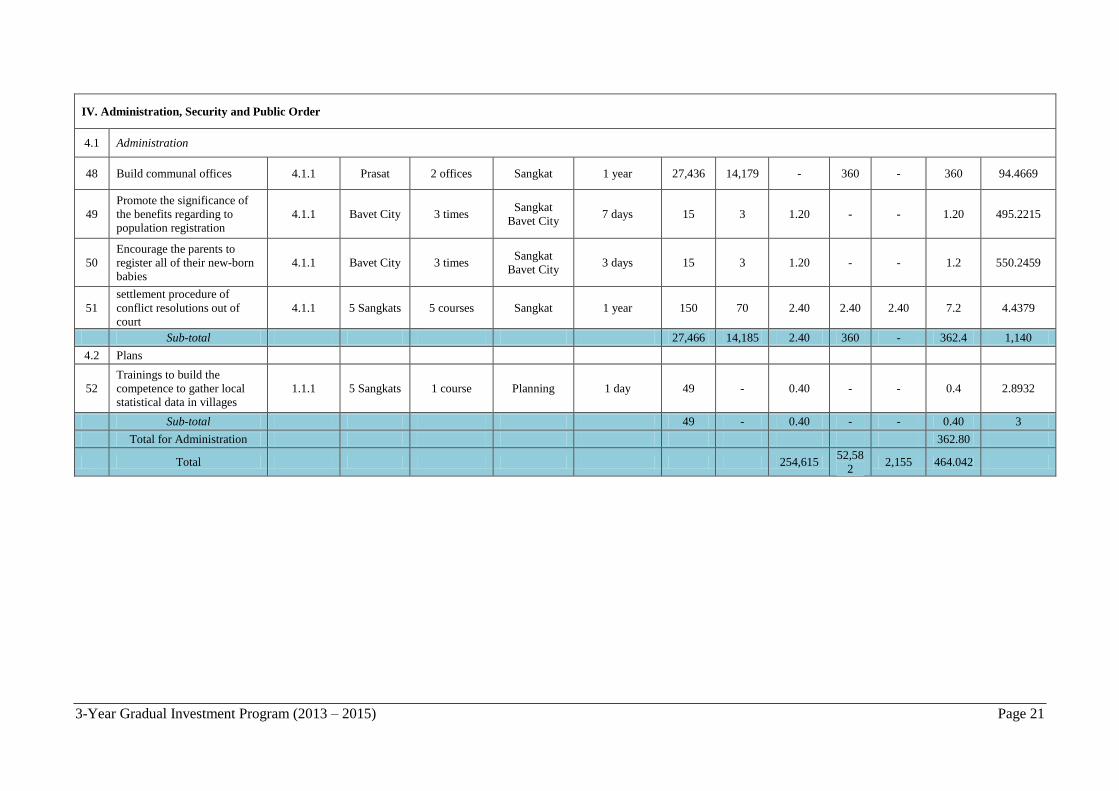
3-Year Gradual Investment Program (2013 – 2015) Page 21
IV. Administration, Security and Public Order
4.1 Administration
48 Build communal offices 4.1.1 Prasat 2 offices Sangkat 1 year 27,436 14,179 - 360 - 360 94.4669
49
Promote the significance of
the benefits regarding to
population registration
4.1.1 Bavet City 3 times Sangkat
Bavet City 7 days 15 3 1.20 - - 1.20 495.2215
50
Encourage the parents to
register all of their new-born
babies
4.1.1 Bavet City 3 times Sangkat
Bavet City 3 days 15 3 1.20 - - 1.2 550.2459
51
settlement procedure of
conflict resolutions out of
court
4.1.1 5 Sangkats 5 courses Sangkat 1 year 150 70 2.40 2.40 2.40 7.2 4.4379
Sub-total 27,466 14,185 2.40 360 - 362.4 1,140
4.2 Plans
52
Trainings to build the
competence to gather local
statistical data in villages
1.1.1 5 Sangkats 1 course Planning 1 day 49 - 0.40 - - 0.4 2.8932
Sub-total 49 - 0.40 - - 0.40 3
Total for Administration 362.80
Total 254,615 52,58
2 2,155 464.042
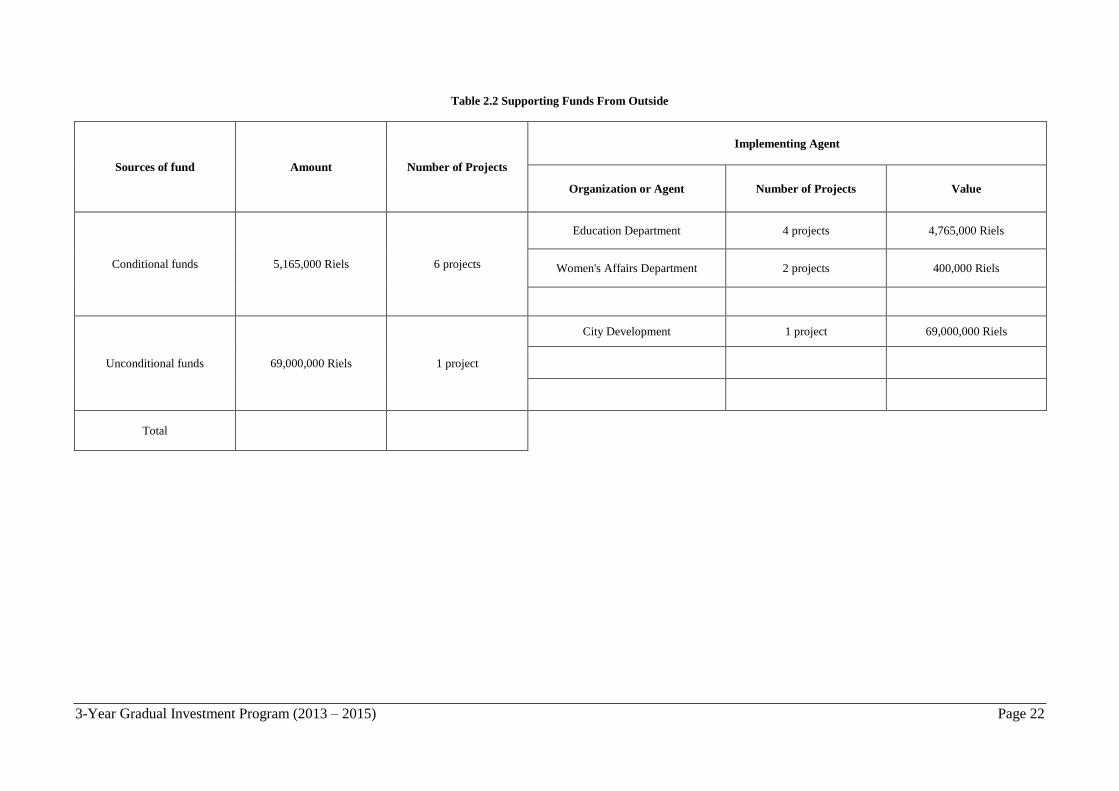
3-Year Gradual Investment Program (2013 – 2015) Page 22
Table 2.2 Supporting Funds From Outside
Sources of fund Amount Number of Projects
Implementing Agent
Organization or Agent Number of Projects Value
Conditional funds 5,165,000 Riels 6 projects
Education Department 4 projects 4,765,000 Riels
Women's Affairs Department 2 projects 400,000 Riels
Unconditional funds 69,000,000 Riels 1 project
City Development 1 project 69,000,000 Riels
Total
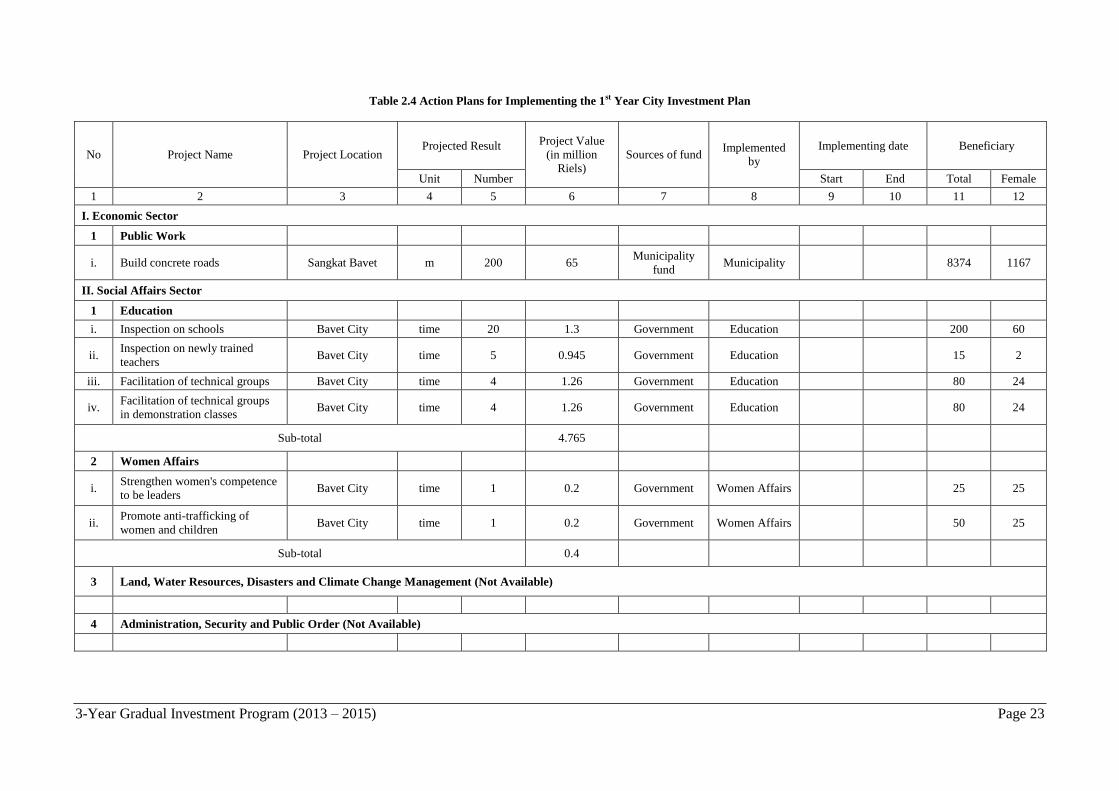
3-Year Gradual Investment Program (2013 – 2015) Page 23
Table 2.4 Action Plans for Implementing the 1st Year City Investment Plan
No Project Name Project Location Projected Result Project Value
(in million
Riels)
Sources of fund Implemented
by
Implementing date Beneficiary
Unit Number Start End Total Female
1 2 3 4 5 6 7 8 9 10 11 12
I. Economic Sector
1 Public Work
i. Build concrete roads Sangkat Bavet m 200 65 Municipality
fund Municipality 8374 1167
II. Social Affairs Sector
1 Education
i. Inspection on schools Bavet City time 20 1.3 Government Education 200 60
ii. Inspection on newly trained
teachers Bavet City time 5 0.945 Government Education 15 2
iii. Facilitation of technical groups Bavet City time 4 1.26 Government Education 80 24
iv. Facilitation of technical groups
in demonstration classes Bavet City time 4 1.26 Government Education 80 24
Sub-total 4.765
2 Women Affairs
i. Strengthen women's competence
to be leaders Bavet City time 1 0.2 Government Women Affairs 25 25
ii. Promote anti-trafficking of
women and children Bavet City time 1 0.2 Government Women Affairs 50 25
Sub-total 0.4
3 Land, Water Resources, Disasters and Climate Change Management (Not Available)
4 Administration, Security and Public Order (Not Available)
3-Year Gradual Investment Program (2013-2015)
Annex

3-Year Gradual Investment Program (2013-2015)
Kingdom of Cambodia
Nation-Religion-King
Svay Rieng Province
Bavet Municipality
No: ………SSR
Decision
On
Political Guideline for Creating Development Plan and 3-Year Gradual Investment Program
Council of Bavet City
- Having seen the Royal Kram No. N.S/RKM/0508/017, dated 22 May 2008, promulgating the
Law on Administrative Management in Capital, Province, City, District, and Sangkat
- Having seen Royal Kram No. N.S/RKM/0508/018, dated 24 May 2008, promulgating the Law on
Election and Selection of Capital, Provincial, City, District and Sangkat Council
- Sub decree No. 218 ANKr.BK, dated 14 December 2009, on creating, organizing and progressing
of the Technical Facilitating Committee of Provincial Council, Technical Facilitating Committee
of City Council and Technical Facilitating Committee of District Council
- Declaration No. 4275 Br.K, dated 30 December 2009, on organizing and progressing of the
Women and Children Consultation Committee in the Capital, Province, City, District and Sangkat
Council
- Guidance No. 036 SNhN, dated 28 December 2010, by the Ministry of Interior on the practice of
positional duties and the disciplines of the Technical Facilitating Committee of the Provincial and
District Council
- Inter-Ministries declaration No. 2417 Br.K, dated 27 December 2010, on creating development
plan and 3-Year Gradual Investment Program of the Capital, Province, City, District, and Sangkat
of the Ministry of Interior and the Ministry of Planning
- Having seen Guidance No. 003 SNhN/KkChAB, on making up working group who established
development plan and 3-Year Gradual Investment Program for Capital, Province, City, District,
and Sangkat
- Referring to the Minute of the 7th Extraordinary Meeting of Bavet Municipal Council on 28
December 2012
Decide
Article 1:
In order to obtain brotherliness with prior goal of the Royal Government determined in the
second phase of the rectangular strategy, the first mandate of city council is interested in:
1. Reassurance of the forever peace, political stability, security and social order so as to enhance the
state of laws, protect human right and dignity, and pluralistic democracy
2. Strengthen and increase the agricultural productivity
3. Strengthen and increase the development of visual infrastructure

3-Year Gradual Investment Program (2013-2015)
4. Be mindful of human resource development
5. Enhance the electricity supply, handcraft development, and small and medium business
6. Be mindful of enhancing clean water and hygiene
7. Promote and encourage private investment
8. Female’s power strengthen and decision making
9. Reassure to reduce the poverty rate for more than 2% per year and rehabilitate key indicators in
social affairs sector especially, education, health and gender equality
10. Reassurance of increase effectiveness and quality of public services, reform it according to the
good governance policy especially, strengthen law enforcement
11. Natural resources conservation, reassures the forever good environment, prevent and save all bad
impacts of disasters.
Article 2:
Political Guidelines of Bavet city council in the first mandate for the 5-Year City Development
Goal 2010-2015 are considered the Intermediate-Term Vision in accordance with the strategic plan of
Cambodia Millennium Development Plan, Nation Development, laws of administrative management of
Capital, Province, City, District, and Sangkat, certificates of standard justice, and ways leading to forever
development and effectiveness.
Article 3:
Working group who established development plan and annual 3-Year Gradual Investment
Program must create municipal planning in accordance with Political Guidelines determined and
practiced with talent and accountability.
Article 4:
Municipal board of governors, chief of administration, offices under the control municipal hall,
related organizations must fully cooperate and practice with brotherliness of this Political Guideline after
the signing date afterward.
Copy for:
- Svay Rieng Municipal Hall
- Provincial Department of Plan
- Same to article 4
Chronicle document
Bavet, 31 December 2012
Head of Bavet City Council
(Signature)
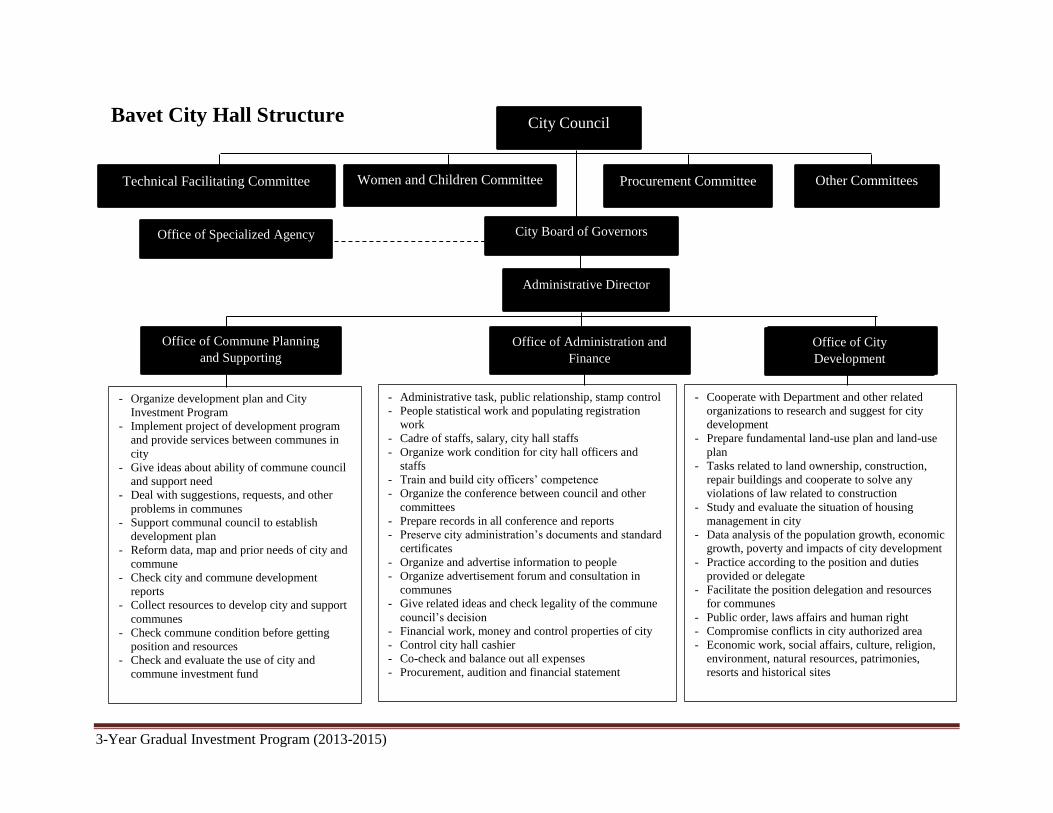
3-Year Gradual Investment Program (2013-2015)
Bavet City Hall Structure City Council
Technical Facilitating Committee Women and Children Committee Procurement Committee Other Committees
Office of Specialized Agency City Board of Governors
Administrative Director
Office of Commune Planning
and Supporting
Office of Administration and
Finance
Office of City
Development
- Administrative task, public relationship, stamp control
- People statistical work and populating registration
work
- Cadre of staffs, salary, city hall staffs
- Organize work condition for city hall officers and
staffs
- Train and build city officers’ competence
- Organize the conference between council and other
committees
- Prepare records in all conference and reports
- Preserve city administration’s documents and standard
certificates
- Organize and advertise information to people
- Organize advertisement forum and consultation in
communes
- Give related ideas and check legality of the commune
council’s decision
- Financial work, money and control properties of city
- Control city hall cashier
- Co-check and balance out all expenses
- Procurement, audition and financial statement
- Organize development plan and City
Investment Program
- Implement project of development program
and provide services between communes in
city
- Give ideas about ability of commune council
and support need
- Deal with suggestions, requests, and other
problems in communes
- Support communal council to establish
development plan
- Reform data, map and prior needs of city and
commune
- Check city and commune development
reports
- Collect resources to develop city and support
communes
- Check commune condition before getting
position and resources
- Check and evaluate the use of city and
commune investment fund
- Cooperate with Department and other related
organizations to research and suggest for city
development
- Prepare fundamental land-use plan and land-use
plan
- Tasks related to land ownership, construction,
repair buildings and cooperate to solve any
violations of law related to construction
- Study and evaluate the situation of housing
management in city
- Data analysis of the population growth, economic
growth, poverty and impacts of city development
- Practice according to the position and duties
provided or delegate
- Facilitate the position delegation and resources
for communes
- Public order, laws affairs and human right
- Compromise conflicts in city authorized area
- Economic work, social affairs, culture, religion,
environment, natural resources, patrimonies,
resorts and historical sites
Office of City
Development
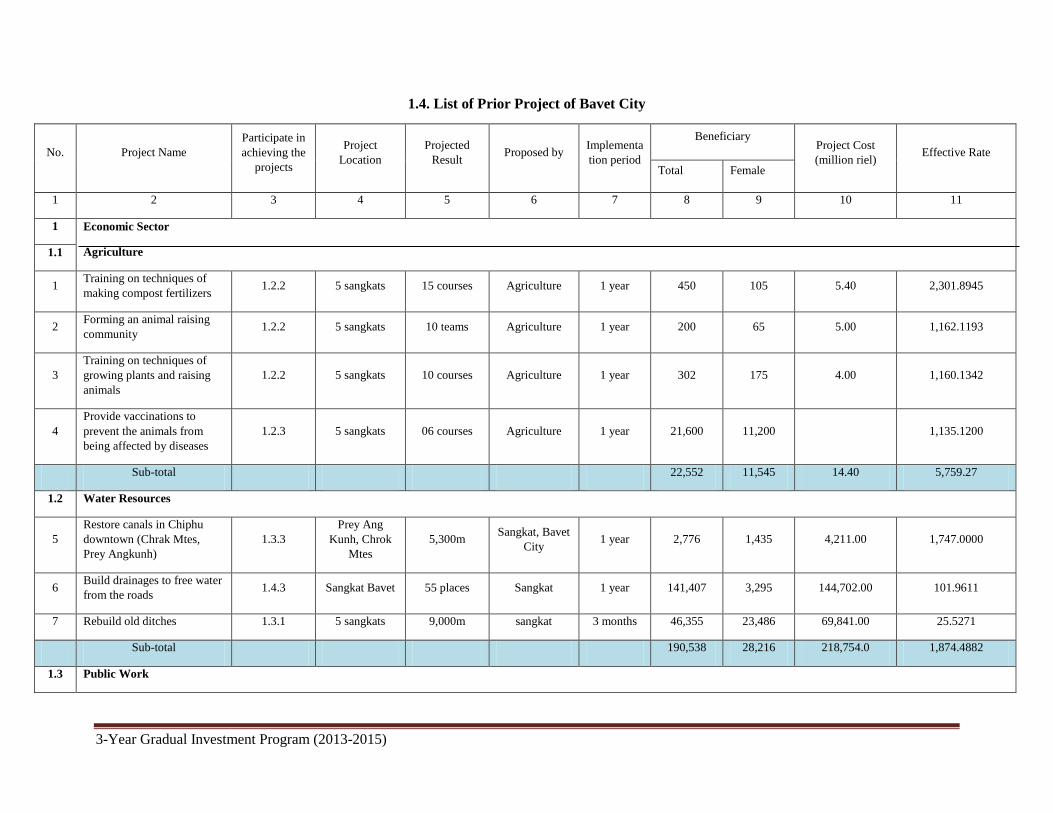
3-Year Gradual Investment Program (2013-2015)
1.4. List of Prior Project of Bavet City
No. Project Name
Participate in
achieving the
projects
Project
Location
Projected
Result Proposed by
Implementa
tion period
Beneficiary Project Cost
(million riel) Effective Rate
Total Female
1 2 3 4 5 6 7 8 9 10 11
1 Economic Sector
Agriculture 1.1
1 Training on techniques of
making compost fertilizers 1.2.2 5 sangkats 15 courses Agriculture 1 year 450 105 5.40 2,301.8945
2 Forming an animal raising
community 1.2.2 5 sangkats 10 teams Agriculture 1 year 200 65 5.00 1,162.1193
3
Training on techniques of
growing plants and raising
animals
1.2.2 5 sangkats 10 courses Agriculture 1 year 302 175 4.00 1,160.1342
4
Provide vaccinations to
prevent the animals from
being affected by diseases
1.2.3 5 sangkats 06 courses Agriculture 1 year 21,600 11,200 1,135.1200
Sub-total 22,552 11,545 14.40 5,759.27
1.2 Water Resources
5
Restore canals in Chiphu
downtown (Chrak Mtes,
Prey Angkunh)
1.3.3
Prey Ang
Kunh, Chrok
Mtes
5,300m Sangkat, Bavet
City 1 year 2,776 1,435 4,211.00 1,747.0000
6 Build drainages to free water
from the roads 1.4.3 Sangkat Bavet 55 places Sangkat 1 year 141,407 3,295 144,702.00 101.9611
7 Rebuild old ditches 1.3.1 5 sangkats 9,000m sangkat 3 months 46,355 23,486 69,841.00 25.5271
Sub-total 190,538 28,216 218,754.0 1,874.4882
1.3 Public Work
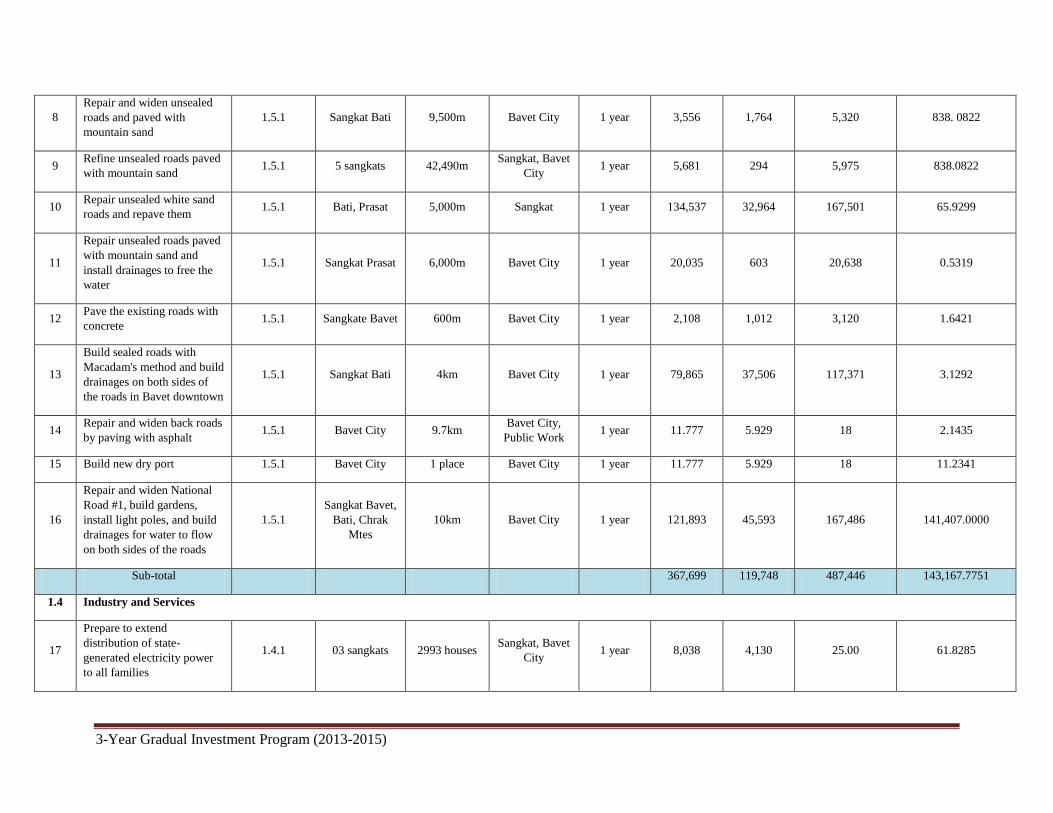
3-Year Gradual Investment Program (2013-2015)
8
Repair and widen unsealed
roads and paved with
mountain sand
1.5.1 Sangkat Bati 9,500m Bavet City 1 year 3,556 1,764 5,320 838. 0822
9 Refine unsealed roads paved
with mountain sand 1.5.1 5 sangkats 42,490m
Sangkat, Bavet
City 1 year 5,681 294 5,975 838.0822
10 Repair unsealed white sand
roads and repave them 1.5.1 Bati, Prasat 5,000m Sangkat 1 year 134,537 32,964 167,501 65.9299
11
Repair unsealed roads paved
with mountain sand and
install drainages to free the
water
1.5.1 Sangkat Prasat 6,000m Bavet City 1 year 20,035 603 20,638 0.5319
12 Pave the existing roads with
concrete 1.5.1 Sangkate Bavet 600m Bavet City 1 year 2,108 1,012 3,120 1.6421
13
Build sealed roads with
Macadam's method and build
drainages on both sides of
the roads in Bavet downtown
1.5.1 Sangkat Bati 4km Bavet City 1 year 79,865 37,506 117,371 3.1292
14 Repair and widen back roads
by paving with asphalt 1.5.1 Bavet City 9.7km
Bavet City,
Public Work 1 year 11.777 5.929 18 2.1435
15 Build new dry port 1.5.1 Bavet City 1 place Bavet City 1 year 11.777 5.929 18 11.2341
16
Repair and widen National
Road #1, build gardens,
install light poles, and build
drainages for water to flow
on both sides of the roads
1.5.1
Sangkat Bavet,
Bati, Chrak
Mtes
10km Bavet City 1 year 121,893 45,593 167,486 141,407.0000
Sub-total 367,699 119,748 487,446 143,167.7751
1.4 Industry and Services
17
Prepare to extend
distribution of state-
generated electricity power
to all families
1.4.1 03 sangkats 2993 houses Sangkat, Bavet
City 1 year 8,038 4,130 25.00 61.8285
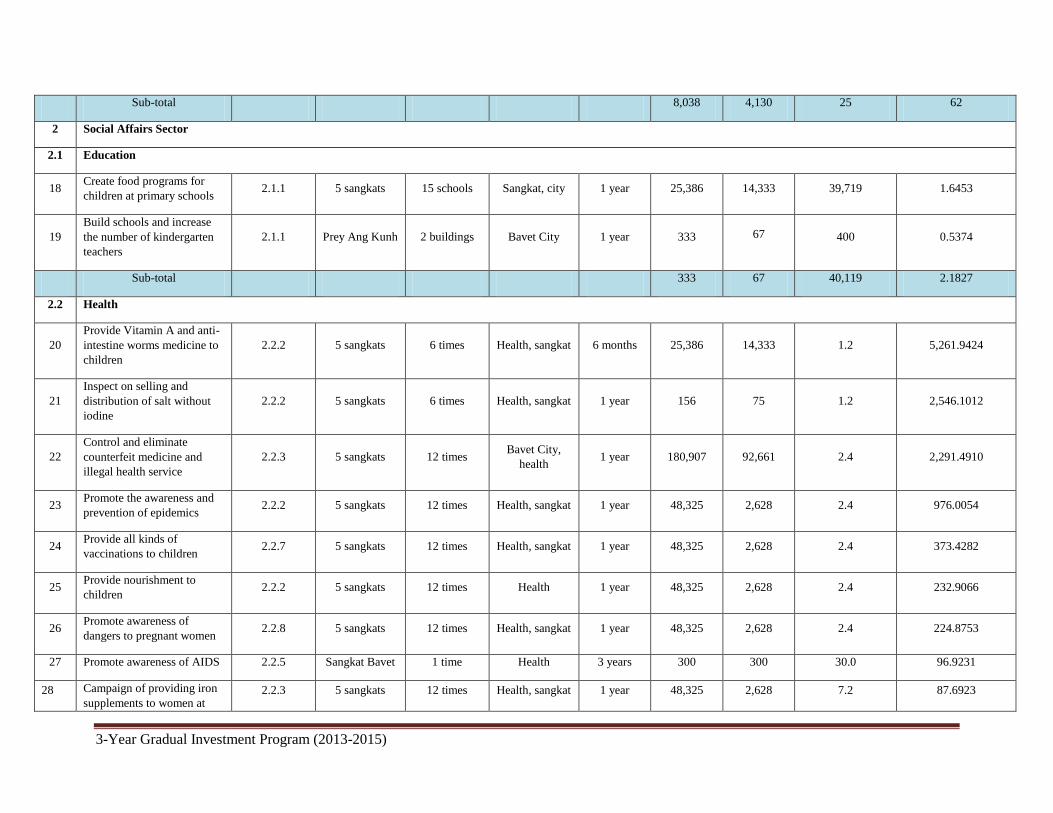
3-Year Gradual Investment Program (2013-2015)
Sub-total 8,038 4,130 25 62
2 Social Affairs Sector
2.1 Education
18 Create food programs for
children at primary schools 2.1.1 5 sangkats 15 schools Sangkat, city 1 year 25,386 14,333 39,719 1.6453
19
Build schools and increase
the number of kindergarten
teachers
2.1.1 Prey Ang Kunh 2 buildings Bavet City 1 year 333 67 400 0.5374
Sub-total 333 67 40,119 2.1827
2.2 Health
20
Provide Vitamin A and anti-
intestine worms medicine to
children
2.2.2 5 sangkats 6 times Health, sangkat 6 months 25,386 14,333 1.2 5,261.9424
21
Inspect on selling and
distribution of salt without
iodine
2.2.2 5 sangkats 6 times Health, sangkat 1 year 156 75 1.2 2,546.1012
22
Control and eliminate
counterfeit medicine and
illegal health service
2.2.3 5 sangkats 12 times Bavet City,
health 1 year 180,907 92,661 2.4 2,291.4910
23 Promote the awareness and
prevention of epidemics 2.2.2 5 sangkats 12 times Health, sangkat 1 year 48,325 2,628 2.4 976.0054
24 Provide all kinds of
vaccinations to children 2.2.7 5 sangkats 12 times Health, sangkat 1 year 48,325 2,628 2.4 373.4282
25 Provide nourishment to
children 2.2.2 5 sangkats 12 times Health 1 year 48,325 2,628 2.4 232.9066
26 Promote awareness of
dangers to pregnant women 2.2.8 5 sangkats 12 times Health, sangkat 1 year 48,325 2,628 2.4 224.8753
27 Promote awareness of AIDS 2.2.5 Sangkat Bavet 1 time Health 3 years 300 300 30.0 96.9231
28 Campaign of providing iron
supplements to women at 2.2.3 5 sangkats 12 times Health, sangkat 1 year 48,325 2,628 7.2 87.6923
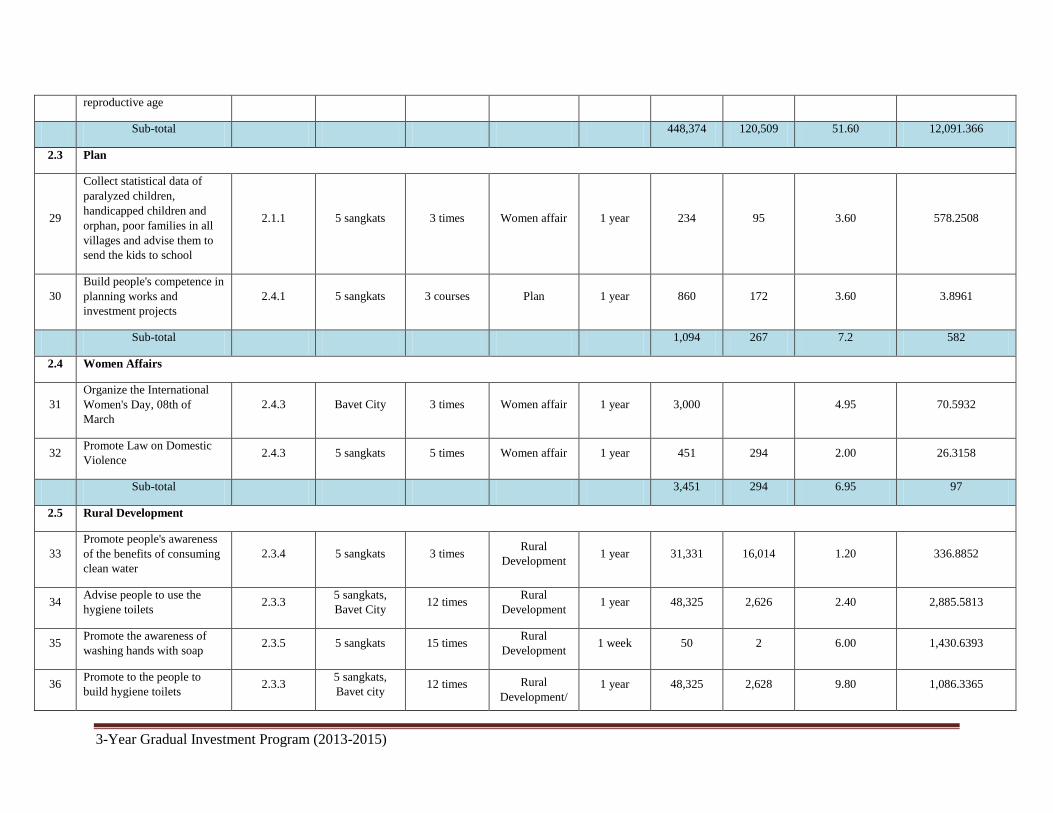
3-Year Gradual Investment Program (2013-2015)
reproductive age
Sub-total 448,374 120,509 51.60 12,091.366
2.3 Plan
29
Collect statistical data of
paralyzed children,
handicapped children and
orphan, poor families in all
villages and advise them to
send the kids to school
2.1.1 5 sangkats 3 times Women affair 1 year 234 95 3.60 578.2508
30
Build people's competence in
planning works and
investment projects
2.4.1 5 sangkats 3 courses Plan 1 year 860 172 3.60 3.8961
Sub-total 1,094 267 7.2 582
2.4 Women Affairs
31
Organize the International
Women's Day, 08th of
March
2.4.3 Bavet City 3 times Women affair 1 year 3,000 4.95 70.5932
32 Promote Law on Domestic
Violence 2.4.3 5 sangkats 5 times Women affair 1 year 451 294 2.00 26.3158
Sub-total 3,451 294 6.95 97
2.5 Rural Development
33
Promote people's awareness
of the benefits of consuming
clean water
2.3.4 5 sangkats 3 times Rural
Development 1 year 31,331 16,014 1.20 336.8852
34 Advise people to use the
hygiene toilets 2.3.3
5 sangkats,
Bavet City 12 times
Rural
Development 1 year 48,325 2,626 2.40 2,885.5813
35 Promote the awareness of
washing hands with soap 2.3.5 5 sangkats 15 times
Rural
Development 1 week 50 2 6.00 1,430.6393
36 Promote to the people to
build hygiene toilets 2.3.3
5 sangkats,
Bavet city 12 times Rural
Development/ 1 year 48,325 2,628 9.80 1,086.3365
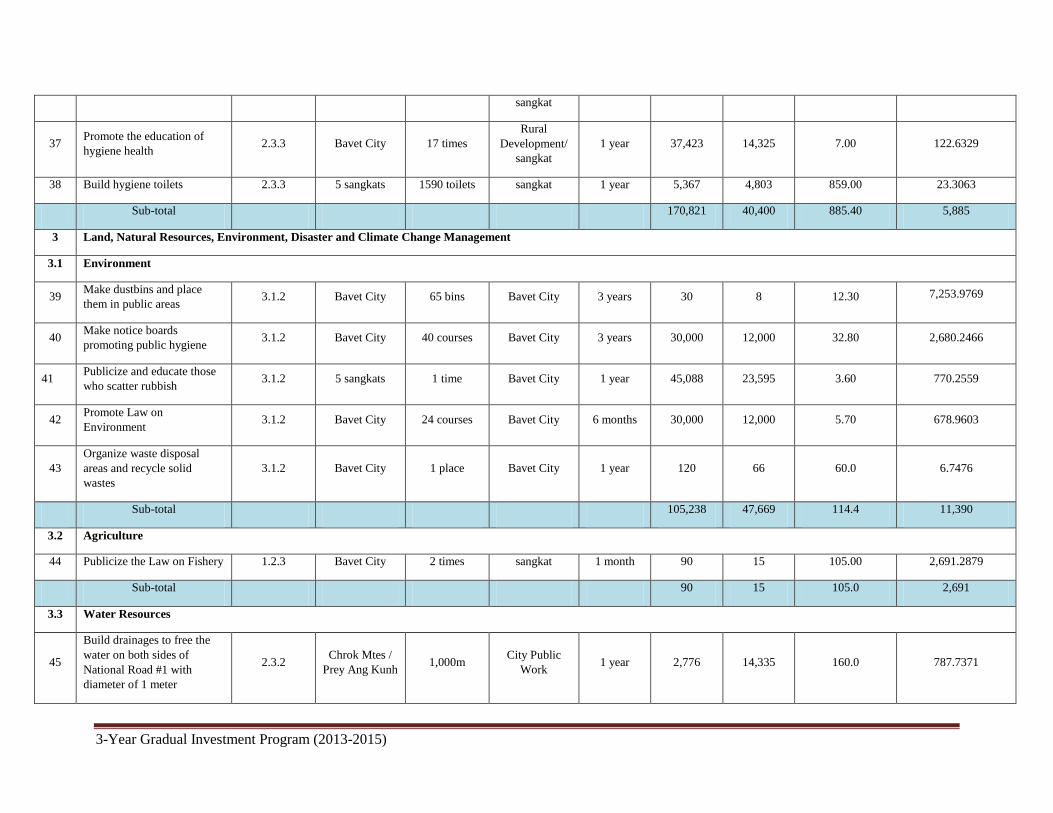
3-Year Gradual Investment Program (2013-2015)
sangkat
37 Promote the education of
hygiene health 2.3.3 Bavet City 17 times
Rural
Development/
sangkat
1 year 37,423 14,325 7.00 122.6329
38 Build hygiene toilets 2.3.3 5 sangkats 1590 toilets sangkat 1 year 5,367 4,803 859.00 23.3063
Sub-total 170,821 40,400 885.40 5,885
3 Land, Natural Resources, Environment, Disaster and Climate Change Management
3.1 Environment
39 Make dustbins and place
them in public areas 3.1.2 Bavet City 65 bins Bavet City 3 years 30 8 12.30 7,253.9769
40 Make notice boards
promoting public hygiene 3.1.2 Bavet City 40 courses Bavet City 3 years 30,000 12,000 32.80 2,680.2466
41 Publicize and educate those
who scatter rubbish 3.1.2 5 sangkats 1 time Bavet City 1 year 45,088 23,595 3.60 770.2559
42 Promote Law on
Environment 3.1.2 Bavet City 24 courses Bavet City 6 months 30,000 12,000 5.70 678.9603
43
Organize waste disposal
areas and recycle solid
wastes
3.1.2 Bavet City 1 place Bavet City 1 year 120 66 60.0 6.7476
Sub-total 105,238 47,669 114.4 11,390
3.2 Agriculture
44 Publicize the Law on Fishery 1.2.3 Bavet City 2 times sangkat 1 month 90 15 105.00 2,691.2879
Sub-total 90 15 105.0 2,691
3.3 Water Resources
45
Build drainages to free the
water on both sides of
National Road #1 with
diameter of 1 meter
2.3.2 Chrok Mtes /
Prey Ang Kunh 1,000m
City Public
Work 1 year 2,776 14,335 160.0 787.7371
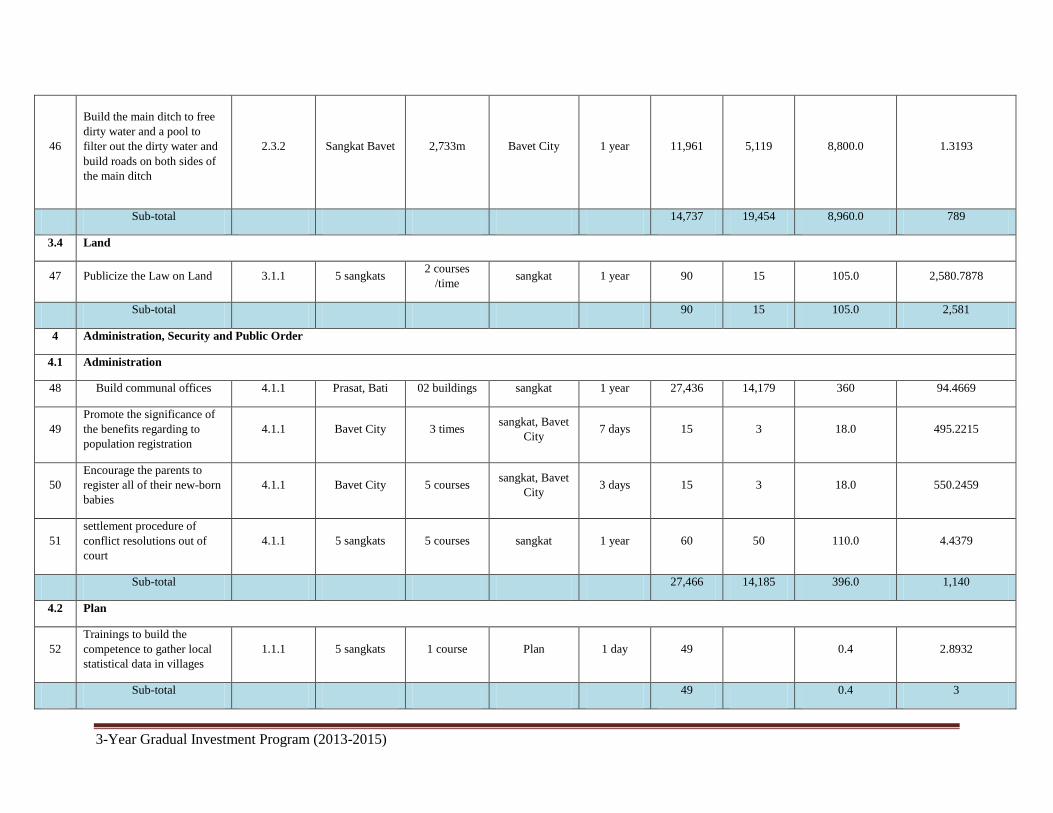
3-Year Gradual Investment Program (2013-2015)
46
Build the main ditch to free
dirty water and a pool to
filter out the dirty water and
build roads on both sides of
the main ditch
2.3.2 Sangkat Bavet 2,733m Bavet City 1 year 11,961 5,119 8,800.0 1.3193
Sub-total 14,737 19,454 8,960.0 789
3.4 Land
47 Publicize the Law on Land 3.1.1 5 sangkats 2 courses
/time sangkat 1 year 90 15 105.0 2,580.7878
Sub-total 90 15 105.0 2,581
4 Administration, Security and Public Order
4.1 Administration
48 Build communal offices 4.1.1 Prasat, Bati 02 buildings sangkat 1 year 27,436 14,179 360 94.4669
49
Promote the significance of
the benefits regarding to
population registration
4.1.1 Bavet City 3 times sangkat, Bavet
City 7 days 15 3 18.0 495.2215
50
Encourage the parents to
register all of their new-born
babies
4.1.1 Bavet City 5 courses sangkat, Bavet
City 3 days 15 3 18.0 550.2459
51
settlement procedure of
conflict resolutions out of
court
4.1.1 5 sangkats 5 courses sangkat 1 year 60 50 110.0 4.4379
Sub-total 27,466 14,185 396.0 1,140
4.2 Plan
52
Trainings to build the
competence to gather local
statistical data in villages
1.1.1 5 sangkats 1 course Plan 1 day 49 0.4 2.8932
Sub-total 49 0.4 3
3-Year Gradual Investment Program (2013-2015)
Conclusion
The previous implementing of the City 3-Year Gradual Investment Program (2012-2014)
favorably resulted as shown in the book of this investment program. Even though the program was not
succeeded and perfectly responded to people’s needs and suggestions, but it showed the improvement and
lead to the poverty reduction.
The continuance of peace enhancement, political and social stability, improvement of laws and
social order enforcement, and good governance are the dynamic forces which lead to social prosperity.
However, many actions with brotherliness and harmonization are required in many sectors. City council
expect to get fully cooperation from those who are related, state, private and social civil so as to achieve
strategic goal of the second phase of government rectangular especially, in order to reduce poverty
quicker, and reassure peace, happiness and prosperity for every citizen.


![Cambodia Demographic and Health Survey 2014 [FR312]](https://img.pdfslide.net/doc/110x75/631b20d2209fbf85b505ab04/cambodia-demographic-and-health-survey-2014-fr312.jpg)


