Embed Size (px)
Citation preview

astr
o-ph
/950
8127
27
Aug
95
To Appear in The Astrophysical Journal (Letters)The Near-Infrared Fundamental Plane of Elliptical GalaxiesMichael A. Pahre1;2, S. G. Djorgovski1;3, and R. R. de Carvalho1;4ABSTRACTWe present results from a near-infrared K-band imaging survey of 59 ellipticalgalaxies in �ve nearby clusters. We measure photometric parameters for each galaxyusing surface photometry and draw velocity dispersions from the literature. Threeobservables de�ne a near-infrared Fundamental Plane (FP) of elliptical galaxies withRe / �1:44�0:04��0:79�0:04e . The scatter in the near-infrared relation is small at 16:5%in distance, which is equivalent to, or less than, the scatter of the optical FP. Wesuggest that the small deviation of the near-infrared FP relation from the optical FPis due to the reduction of metallicity e�ects in the near-infrared bandpass. While thesmall scatter of the optical FP could be consistent with compensating e�ects of age andmetallicity, the similarly small scatter of the near-infrared FP is nearly independent ofmetallicity and hence places a strong constraint on possible age spreads among ellipticalgalaxies at every point along the FP. We suggest that the departure of the near-infraredFP from the pure virial form Re / �2��1e , and the corresponding observed relation(M=L) /M0:16�0:01, may be explained by slight systematic departures of the structureand dynamics of elliptical galaxies from a homology.Subject headings: galaxies: clusters: general | galaxies: elliptical and lenticular, cD| galaxies: fundamental parameters | infrared: galaxies1Palomar Observatory, California Institute of Technology, Pasadena, CA 91125; Email: [email protected],[email protected], [email protected] Observer, Las Campanas Observatory.3Presidential Young Investigator.4On Leave of absence from Observat�orio Nacional - CNPq - DAF.

{ 2 {1. IntroductionElliptical galaxies form a two-parameter family, a two-dimensional Fundamental Plane (FP)within the multi-dimensional parameter space of several observables (Djorgovski & Davis 1987;Dressler et al. 1987; see also Kormendy & Djorgovski 1989, Djorgovski 1992, and referencestherein). Typically, one considers a parameter space of the half-light radius re, the mean surfacebrightness enclosed within that radius h�ie, and the central velocity dispersion �. The FPcorrelations have a small scatter (of order 0:1 dex in log re), which makes them potentially usefulboth as distance indicators and as a strong constraint on galaxy formation models. Explanationhas been o�ered as to the origin of the FP, in particular its apparent deviation from the purevirial relation, primarily by invoking stellar populations variations among galaxies along the FP(Djorgovski 1988; Djorgovski & Santiago 1993, hereafter DS93; Renzini & Ciotti 1993). Substantial�ne-tuning of variations in the IMF or mass-to-light ratio are required to remain consistent withthe thinness at every location along the FP. Furthermore, the allowed range of mass-to-light ratiofrom one end of the FP to the other is small (Djorgovski & Davis 1987; Faber et al. 1987).Variations in metallicity along the FP could give rise to the tilt of the FP in opticalwavelengths, as line-blanketing e�ects in the metal-rich giant ellipticals would make their h�iefainter. Observations of the FP in the near-infrared could shed light on the origin of theFP by probing a wavelength region with a di�erent sensitivity to stellar populations e�ects.Observations in the K-band window (� = 2:2�m) will trace old stellar populations and thebolometric luminosity, as this bandpass is far less metallicity-sensitive than optical wavelengths.Early results on the near-infrared FP (Recillas-Cruz et al. 1990, 1991; DS93) have all reliedon photoelectric aperture photometry, whereas the optical FP comparison data utilized detailedsurface photometry. The rapid development in near-infrared imaging detectors has only recentlymade a near-infrared imaging survey of this scale feasible.The observations described in this Letter are preliminary results for part of an ongoingprogram to observe more than 250 early-type galaxies in eleven clusters. The complete detailsof the observational methods, reductions, calibrations, and comparisons with photometry fromthe literature will be given in a subsequent paper (Pahre et al. 1995b). These results followpreliminary results presented for the Virgo (Pahre et al. 1995a) and Perseus (Pahre et al. 1994)clusters individually, and for the entire �ve cluster sample (Djorgovski, Pahre, & de Carvalho1995) which includes the Virgo, Perseus, Coma, Abell 194, and Abell 2634 clusters.2. ObservationsNine galaxies in the Virgo cluster were observed in the Ks-band (2:16�m) at the 2:5 m du PontTelescope at the Las Campanas Observatory in 1993 March, and are described elsewhere (Pahre &Mould 1994). The observations of the other four clusters were taken in the Ks-band between 1994October and 1995 March using a new near-infrared camera (Murphy et al. 1995) on the 1:52 m

{ 3 {telescope at Palomar Observatory. This instrument is based on a NICMOS{3, 256 � 256 pixelarray reimaged at 1:1 at the f/8.75 cassegrain focus, producing a 0:62000 projected pixel size anda 15900 �eld-of-view. The galaxy lists were mostly chosen from those of Lucey & Carter (1988)and Lucey et al. (1991a,b), except for the Perseus cluster, which was selected to include all 19galaxies in Faber et al. (1989). Each galaxy was observed for 15� 60 s on-source, separated into�ve di�erent telescope pointings, and the sky was estimated from a similar total number of framestaken before and after each galaxy. All observations were taken during photometric conditions,with a mixture of the UKIRT faint standards (Casali & Hawarden 1992) and the new HST faintstandards (S. E. Persson, private communication) being used for calibration. Usually between5 and 15 standards were observed on each photometric night, which have a typical rms scatterless than 0:02 mag. The typical seeing was � 1:500, with some observations having signi�cantlybetter seeing than could be fully-sampled. We have compared aperture magnitudes measured forthe Virgo and Coma galaxies with Persson, Frogel, & Aaronson (1979), and �nd mean o�sets ofKour �KPFA = 0:00� 0:01 mag (Virgo) and +0:02� 0:02 mag (Coma), with an rms scatter of0:05 and 0:04 mag, respectively.We have constructed surface brightness pro�les for each galaxy by �nding the best-�ttingelliptical isophote � in integer pixel steps in the semimajor axis a using the ELLIPSE task in theSTSDAS package of the IRAF image reduction software. Pro�les at a > 10 pixels were rebinnedto improve the SNR as described in Djorgovski (1985), and then corrections to the photometry forsurface brightness (SB) dimming as (1 + z)�4, galactic extinction (taking AK = 0:085AB and themedian AB estimate from Faber et al. 1989 for each cluster), and the k-correction of +3:3z forthe K-band (Persson et al. 1979). The mean SB internal to each isophote h�i was calculated byintegrating the pro�le at each semimajor axis length. Half-light e�ective radii re and the mean SBinterior to that radius h�ie were measured using �ts of � against a1=4 under the assumption thatall pro�les followed a de Vaucouleur form. The apparent half-light radii re were then transformedto metric size Re by assuming H0 = 75 km s�1. We have drawn velocity dispersion � data fromthe literature, giving equal weights to the work by Lucey & Carter (1988) or Lucey et al. (1991a,b)and a mean of all other measurements from the literature (as compiled by McElroy 1994, privatecommunication). We note that using the Faber et al. (1989) velocity dispersions for the Comacluster causes no signi�cant change in the FP parameters described in x3. We have excluded allgalaxies with � < 100 km s�1 or re < 200, thereby avoiding issues of dwarf galaxies and seeingcorrections. The galaxy sample is thus 59 galaxies out of the initial list of 83.3. Constructing the Near-Infrared Fundamental PlaneUsing the measurements of re, h�ie, and � described in x2, we have used bivariate least-squaresanalysis to �nd the optimal correlation between these FP variables. The methodology is as foundin previous studies (Djorgovski & Davis 1987; de Carvalho & Djorgovski 1989; de Carvalho &Djorgovski 1992). In order to construct the FP itself, we �rst �nd the \mixing" value b in the
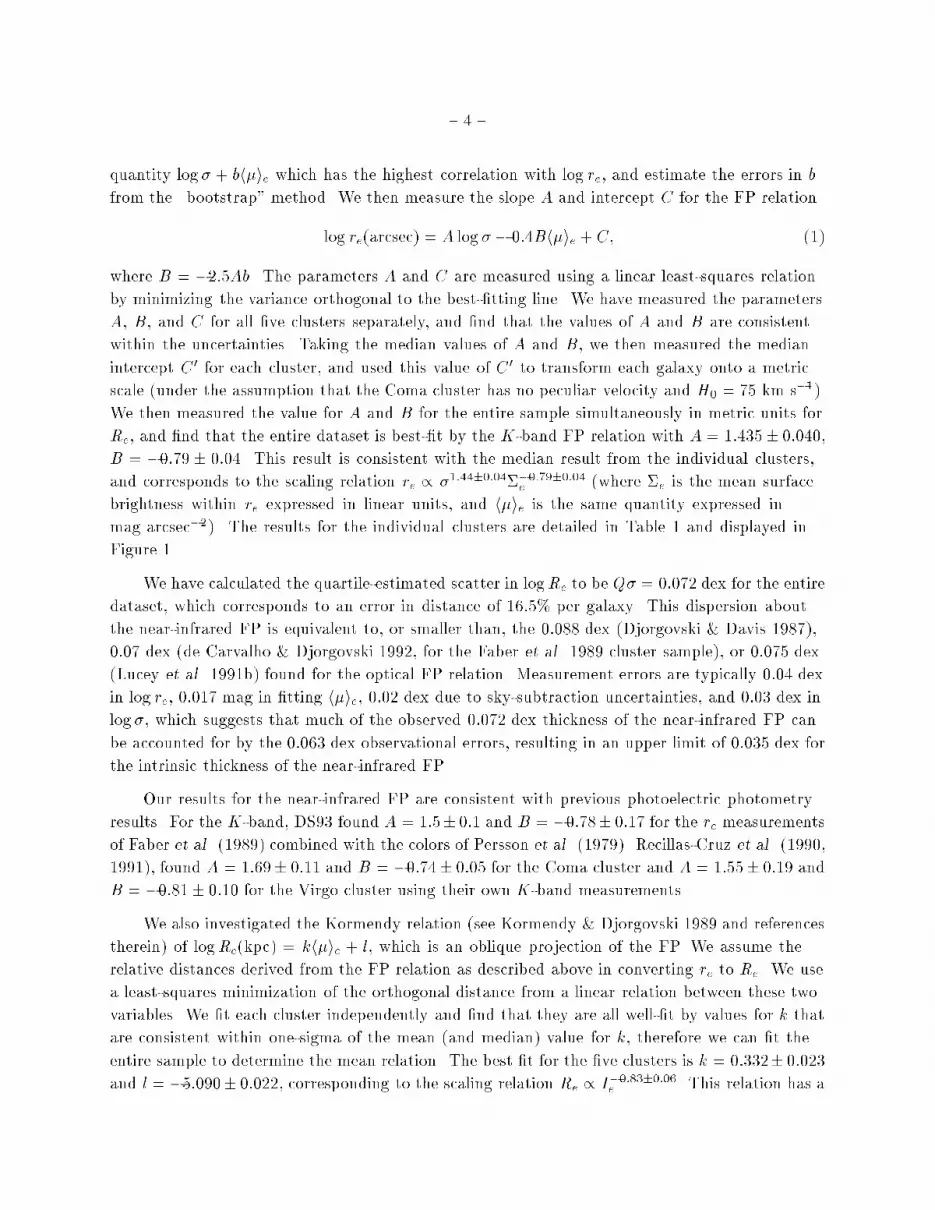
{ 4 {quantity log � + bh�ie which has the highest correlation with log re, and estimate the errors in bfrom the \bootstrap" method. We then measure the slope A and intercept C for the FP relationlog re(arcsec) = A log � � 0:4Bh�ie + C; (1)where B = �2:5Ab. The parameters A and C are measured using a linear least-squares relationby minimizing the variance orthogonal to the best-�tting line. We have measured the parametersA, B, and C for all �ve clusters separately, and �nd that the values of A and B are consistentwithin the uncertainties. Taking the median values of A and B, we then measured the medianintercept C 0 for each cluster, and used this value of C 0 to transform each galaxy onto a metricscale (under the assumption that the Coma cluster has no peculiar velocity and H0 = 75 km s�1).We then measured the value for A and B for the entire sample simultaneously in metric units forRe, and �nd that the entire dataset is best-�t by the K-band FP relation with A = 1:435� 0:040,B = �0:79� 0:04. This result is consistent with the median result from the individual clusters,and corresponds to the scaling relation re / �1:44�0:04��0:79�0:04e (where �e is the mean surfacebrightness within re expressed in linear units, and h�ie is the same quantity expressed inmag arcsec�2). The results for the individual clusters are detailed in Table 1 and displayed inFigure 1.We have calculated the quartile-estimated scatter in logRe to be Q� = 0:072 dex for the entiredataset, which corresponds to an error in distance of 16:5% per galaxy. This dispersion aboutthe near-infrared FP is equivalent to, or smaller than, the 0:088 dex (Djorgovski & Davis 1987),0:07 dex (de Carvalho & Djorgovski 1992, for the Faber et al. 1989 cluster sample), or 0:075 dex(Lucey et al. 1991b) found for the optical FP relation. Measurement errors are typically 0:04 dexin log re, 0:017 mag in �tting h�ie, 0:02 dex due to sky-subtraction uncertainties, and 0:03 dex inlog �, which suggests that much of the observed 0:072 dex thickness of the near-infrared FP canbe accounted for by the 0:063 dex observational errors, resulting in an upper limit of 0:035 dex forthe intrinsic thickness of the near-infrared FP.Our results for the near-infrared FP are consistent with previous photoelectric photometryresults. For the K-band, DS93 found A = 1:5� 0:1 and B = �0:78� 0:17 for the re measurementsof Faber et al. (1989) combined with the colors of Persson et al. (1979). Recillas-Cruz et al. (1990,1991), found A = 1:69� 0:11 and B = �0:74� 0:05 for the Coma cluster and A = 1:55� 0:19 andB = �0:81� 0:10 for the Virgo cluster using their own K-band measurements.We also investigated the Kormendy relation (see Kormendy & Djorgovski 1989 and referencestherein) of logRe(kpc) = kh�ie + l, which is an oblique projection of the FP. We assume therelative distances derived from the FP relation as described above in converting re to Re. We usea least-squares minimization of the orthogonal distance from a linear relation between these twovariables. We �t each cluster independently and �nd that they are all well-�t by values for k thatare consistent within one-sigma of the mean (and median) value for k, therefore we can �t theentire sample to determine the mean relation. The best �t for the �ve clusters is k = 0:332� 0:023and l = �5:090� 0:022, corresponding to the scaling relation Re / I�0:83�0:06e . This relation has a

{ 5 {quartile-estimated dispersion of Q� = 0:173, corresponding to an uncertainty of 40% in distanceper galaxy. This best-�tting Kormendy relation is also plotted in Figure 1. The near-infraredrelation can be compared to the optical r-band relation of Re / I�0:85e (Kormendy & Djorgovski1989). The near-infrared FP thus shows a 60% reduction in scatter over the near-infraredKormendy relation. 4. Discussion and ConclusionsThe best-�t to Eq. (1) of the near-infrared FP relation can be compared with its opticalcounterpart. The V -band relation is A = 1:24 � 0:08 and B = �0:9 � 0:1 (Lucey, Bower, &Ellis 1991, taking the mean of the Coma and Virgo cluster results) or A = 1:25 � 0:07 andB = �0:80 � 0:03 (the cluster sample of Faber et al. 1989, in the analysis of de Carvalho &Djorgovski 1992). The variation in the exponent of the FP (i.e. the Re / �A term) with bandpasswas described by DS93, with the slope of the FP becoming steeper (A increases) with increasingwavelength. We �nd that A has changed by +0:19� 0:06 dex from the V -band to the K-band,consistent with the DS93 result of +0:29� 0:11.The relationship in Eq. (1) departs, however, from that expected for a pure virial theorem,if light directly traces mass. The virial form of the FP is Re / �2��1e , so the near-infrared FPformally di�ers from the virial relation at high con�dence for the A parameter. Faber et al.(1987) and Djorgovski (1988) argue that if elliptical galaxies form a homologous family, then themass-to-light ratio enclosed by Re is a function of luminosity according to the scaling relation(M=L)e / M�, where � = (2�A) = (2 +A). [We note that the alternate form found in somestudies is (M=L)e / L�e , where � = (2� A)=2A and � = �=(1 + �).] The optical studies listedabove result in � = 0:23� 0:02 in the V -band. The near-infrared result is � = 0:16� 0:01, whichis inconsistent with zero to high signi�cance. Since the near-infrared sample described in thisLetter spans � 4 mag in luminosity, the least luminous galaxies have a mass-to-light ratio only50% less than that of the largest galaxies. Our near-infrared result is also consistent with DS93and Recillas-Cruz et al. (1990, 1991) who found � = 0:14� 0:03 and 0:13� 0:05, respectively.This dependence of mass-to-light ratio on mass is plotted in terms of observables in Figure 2,although we note (as does Djorgovski 1988) that this �gure shows an oblique projection of the FP,prone to large cumulative and correlated errors. Nonetheless, the FP-derived value of � = 0:16 isconsistent with the data of Figure 2.Explanations of the departure of the optical relation from zero often focused on line-blanketinge�ects (Faber et al. 1987) as there is a mass-metallicity relation along the elliptical galaxysequence. But while the slope A of the near-infrared FP could be explained by stellar populations,the small scatter of the relation would be more challenging. For example, by assuming auniform mapping between the color-magnitude relation and the FP, we �nd that the (V � K)color-magnitude relation for ellipticals (Bower, Lucey, & Ellis 1992) predicts a change in (V �K)of � 0:32 mag for the 4 mag range in KT of our observations. In the Worthey (1994) stellar

{ 6 {populations models for solar metallicity and a 12 Gyr age, the color-magnitude relation wouldrequire only a change of 0.02{0.04 dex in (M=L)Bol between the two extremes of the FP, whichis less than the 0.3 dex required in the K-band, thus the tilt of the FP cannot be explained bymetallicity e�ects alone. A variation in age between 8 Gyr and 17 Gyr along the sequence wouldproduce a 0.25 dex variation in (M=L)Bol, but this would require a synchronicity in all clustersin the formation of elliptical galaxies of a given mass, since the thickness of the FP at any pointis only < 5% of its span in age. Another explanation for the variation in (M=L) along the FPcould be the velocity anisotropy, but DS93 have used correlations utilizing velocity anisotropyand showed that they follow similar scaling relations to those described above; they concludethat velocity anisotropy could not explain all of the (M=L) dependence on mass. IMF variationsmay be partly responsible (DS93), but they require a �ne-tuning which appears unlikely (Renzini& Ciotti 1993); the same may be said for a systematic variation in the dark matter content ofelliptical galaxies.Under the assumption that elliptical galaxies form a homology (in both their spatial andkinematic distributions), there is a unique mapping between the observed central velocitydispersion and the mean kinetic energy per unit mass, and between the de Vaucouleur radius andthe mean harmonic radius (Djorgovski, de Carvalho, & Han 1988). It is well known, however,that more luminous ellipticals tend to be more anisotropic (Davies et al. 1983) and to haveshallower surface brightness pro�les (Schombert 1986; Caon, Capaccioli, & D'Onofrio 1993). Inaddition, in N -body simulations there appear to be velocity dispersion aperture e�ects whichentail a nonhomologous velocity distribution at any �ducial radius for galaxies of the same mass(Capelato, de Carvalho, & Carlberg 1995). Simple analytical models of elliptical galaxies can beconstructed (Hjorth & Madsen 1995), which would reproduce the necessary surface brightnesspro�le departures from the homology (Burkert 1993). The observations in this Letter that � 6= 0 inthe K-band, suggests that the origin of much of the tilt of the FP (relative to constant (M=L) andthe pure virial theorem) can be explained by systematic deviations of the structure and dynamicsof ellipticals from a homology. In other words, the mappings described above may be changingalong the sequence of elliptical galaxies. It is thus possible that the slope of the near-infrared FPcan be explained primarily by dynamical arguments. In such a scenario in which slight departuresfrom a homology are present within the family of elliptical galaxies, the small thickness of the FPmight place strong constraints on galaxy formation (Capelato et al. 1995). More clues about thiscould be a�orded by simulations spanning a wider range of galaxy properties, or by observationsof the FP at higher redshifts.This work was supported in part by the NSF PYI award AST-9157412 to S. G. D., andGreenstein and Kingsley Fellowships to M. A. P. Many thanks are due to the builders of the newnear-infrared camera, in particular David Murphy, Eric Persson, and Anand Sivaramakrishnan.The construction of the camera was supported in part by generous donations from the PerkinFund, the Jeanne Rich Foundation, and the North American Rockwell Corporation. We wouldlike to thank Jeremy Mould for use of the Virgo cluster data, and the director of Las Campanas

{ 7 {Observatory for allocating time for infrared imaging of elliptical galaxies. We also thank J.Kenne�ck, C. Fassnacht, and J. Larkin for doing some of the observing for this project.
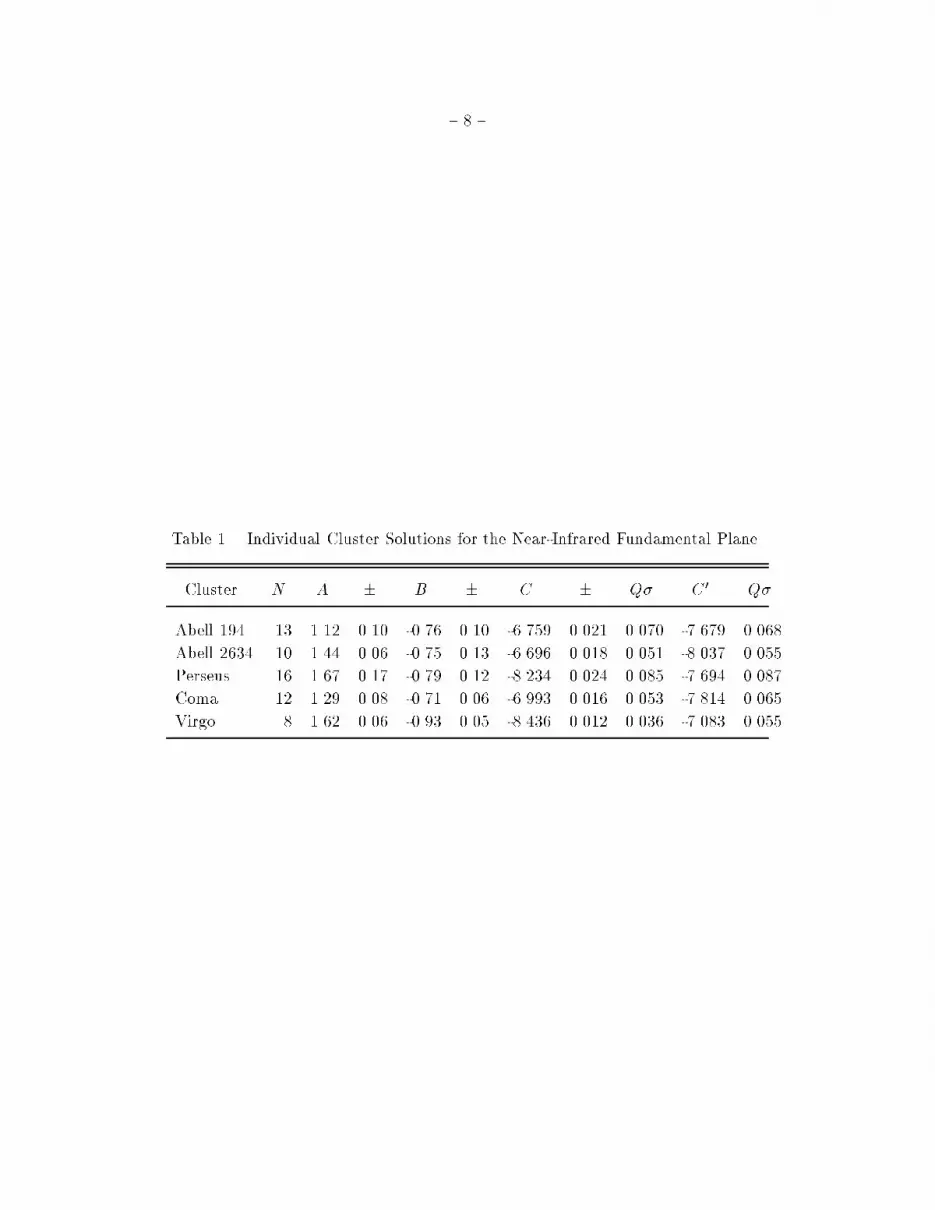
{ 8 {Table 1. Individual Cluster Solutions for the Near-Infrared Fundamental PlaneCluster N A � B � C � Q� C0 Q�Abell 194 13 1.12 0.10 -0.76 0.10 -6.759 0.021 0.070 -7.679 0.068Abell 2634 10 1.44 0.06 -0.75 0.13 -6.696 0.018 0.051 -8.037 0.055Perseus 16 1.67 0.17 -0.79 0.12 -8.234 0.024 0.085 -7.694 0.087Coma 12 1.29 0.08 -0.71 0.06 -6.993 0.016 0.053 -7.814 0.065Virgo 8 1.62 0.06 -0.93 0.05 -8.436 0.012 0.036 -7.083 0.055

{ 9 {REFERENCESBower, R. B., Lucey, J. R., & Ellis, R. S. 1992, MNRAS, 254, 601Burkert, A. 1993, A&A, 278, 23Caon, N., Capaccioli, M., & D'Onofrio, M. 1993, MNRAS, 265, 1013Capelato, H. V., de Carvalho, R. R., & Carlberg, R. G. 1995, ApJ, in pressde Carvalho, R. R., & Djorgovski, S. 1989, ApJ, 341, L37de Carvalho, R. R., & Djorgovski, S. 1992, ApJ, 389, L49Casali, M. M., & Hawarden, T. G. 1992, JCMT-UKIRT Newsletter, 3, 33Davies, R., Efstathiou, G., Fall, S. M., Illingworth, G., & Schechter, P. 1983, ApJ, 266, 41Djorgovski, S. 1985, Ph.D. thesis, University of California (Berkeley)Djorgovski, S. 1988, in Starbursts and Galaxy Evolution, proceedings of the Moriond AstrophysicsWorkshop, ed. T. X. Thuan (Gif sur Yvette: Editions Fronti�eres), 549Djorgovski, S. 1992, in ASP Conf. Ser. 24, ed. R. R. de Carvalho (San Francisco: ASP), 73Djorgovski, S. G., Pahre, M. A., & de Carvalho, R. R. 1995, in ASP Conf. Ser., Fresh Views onElliptical Galaxies, ed. A. Buzzoni (San Francisco: ASP), in pressDjorgovski, S., de Carvalho, R., and Han, M.-S. 1988, in ASP Conf. Ser. 4, The ExtragalacticDistance Scale, ed S. van den Bergh, S. & Pritchet, C. (San Francisco: ASP), 329Djorgovski, S., & Davis, M. 1987, ApJ, 313, 59Djorgovski, S., & Santiago, B. X. 1993, in proceedings of the ESO/EIPC Workshop on Structure,Dynamics, and Chemical Evolution of Early-Type Galaxies, ed. J. Danziger, et al. , ESOpublication No. 45, 59 (DS93)Dressler, A., Lynden-Bell, D., Burstein, D., Davies, R. L., Faber, S. M., Terlevich, R. J., &Wegner, G. 1987, ApJ, 313, 42Faber, S. M., Dressler, A., Davies, R. L., Burstein, D., Lynden-Bell, D., Terlevich, R., & Wegner,G. 1987, in Nearly Normal Galaxies, ed. S. M. Faber (New York: Springer Verlag), 175Faber, S. M., Wegner, G., Burstein, D., Davies, R. L., Dressler, A., Lynden-Bell, D., & Terlevich,R. J. 1989, ApJS, 69, 763Hjorth, J., & Madsen, J. 1995, ApJ, 445, 55Kormendy, J., & Djorgovski, S. 1989, ARA&A, 27, 235

{ 10 {Lucey, J. R., Bower, R. B., & Ellis, R. S. 1991, MNRAS, 249, 755Lucey, J. R., & Carter, D. 1988, MNRAS, 235, 1177Lucey, J. R., Gray, P. M., Carter, D., & Terlevich, R. J. 1991a, MNRAS, 248, 804Lucey, J. R., Guzm�an, R., Carter, D., & Terlevich, R. J. 1991b, MNRAS, 253, 584Murphy, D., Persson, S. E., Pahre, M. A., Sivaramakrishna, A., & Djorgovski, S. G. 1995, PASP,submittedPahre, M. A., Djorgovski, S. G., de Carvalho, R. R., & Mould, J. R. 1994, BAAS, 26, 1497Pahre, M. A., & Mould, J. R. 1994, ApJ, 433, 567Pahre, M. A., et al. 1995b, in preparationPahre, M. A., Djorgovski, S., Matthews, K., Shupe, D., de Carvalho, R., & Mould, J. R. 1995a, inStellar Populations, proceedings of IAU Symp. 164, ed. G. Gilmore, in pressPersson, S. E., Frogel, J. A., & Aaronson, M. 1979, ApJS, 39, 61Recillas-Cruz, E., Carrasco, L., Serrano, P. G., & Cruz-Gonz�alez, I. 1990, A&A, 229, 64Recillas-Cruz, E., Carrasco, L., Serrano, P. G., & Cruz-Gonz�alez, I. 1991, A&A, 249, 312Renzini, A., & Ciotti, L. 1993, ApJ, 416, L49Schombert, J. 1986, ApJS, 60, 603Worthey, G. 1994, ApJS, 95, 107This preprint was prepared with the AAS LATEX macros v4.0.

{ 11 {
5.5 6 6.5
0
1(a)
18 16
Abell 194Abell 2634ComaPerseusVirgo
(b)
Fig. 1.| (a) The near-infrared FP of elliptical galaxies and (b) the Kormendy relation (an obliqueprojection of the FP) for the sample of 59 galaxies. The scatter is clearly reduced by the introductionof the central velocity dispersion term. The total scatter from the FP relation in units of logRe isgiven as Q� = 0:072, corresponding to a 16:5% uncertainty in distance per galaxy. Median errorbars are also shown in each panel.

{ 12 {
4 5 610
10.5
11
11.5
Fig. 2.| The variation of mass-to-light ratio (ordinate plus a constant) with mass (abscissa plus aconstant) for the 59 galaxies in the sample. This diagram by itself is of limited utility in constraining�, as the errors in both axes are both cumulative and correlated. The data are well-represented,however, by the FP-derived � = 0:16, with a residual scatter of Q� = 0:11 dex about this line.