Embed Size (px)
Citation preview
ARTICLE
The negative cofactor 2 complex is a key regulatorof drug resistance in Aspergillus fumigatusTakanori Furukawa 1,2,7, Norman van Rhijn 1,2,7, Marcin Fraczek1, Fabio Gsaller1, Emma Davies1, Paul Carr1,
Sara Gago 1,2, Rachael Fortune-Grant1,2, Sayema Rahman1,2, Jane Mabey Gilsenan1, Emma Houlder 2,
Caitlin H. Kowalski3, Shriya Raj 4, Sanjoy Paul5, Peter Cook 2, Josie E. Parker 6, Steve Kelly 6,
Robert A. Cramer3, Jean-Paul Latgé4, Scott Moye-Rowley5, Elaine Bignell1,2, Paul Bowyer1,2,8* &
Michael J. Bromley 1,2,8*
The frequency of antifungal resistance, particularly to the azole class of ergosterol biosyn-
thetic inhibitors, is a growing global health problem. Survival rates for those infected with
resistant isolates are exceptionally low. Beyond modification of the drug target, our under-
standing of the molecular basis of azole resistance in the fungal pathogen Aspergillus fumi-
gatus is limited. We reasoned that clinically relevant antifungal resistance could derive from
transcriptional rewiring, promoting drug resistance without concomitant reductions in
pathogenicity. Here we report a genome-wide annotation of transcriptional regulators in
A. fumigatus and construction of a library of 484 transcription factor null mutants. We identify
12 regulators that have a demonstrable role in itraconazole susceptibility and show that
loss of the negative cofactor 2 complex leads to resistance, not only to the azoles but also
the salvage therapeutics amphotericin B and terbinafine without significantly affecting
pathogenicity.
https://doi.org/10.1038/s41467-019-14191-1 OPEN
1Manchester Fungal Infection Group, Division of Infection, Immunity and Respiratory Medicine, Faculty of Biology, Medicine and Health, University ofManchester, CTF Building, 46 Grafton Street, Manchester M13 9NT, UK. 2 Lydia Becker Institute of Immunology and Inflammation, Manchester CollaborativeCentre for Inflammation Research, Division of Infection, Immunity and Respiratory Medicine, Faculty of Biology, Medicine and Health, University ofManchester, Manchester Academic Health Science Centre, Manchester, UK. 3 Department of Microbiology and Immunology, Geisel School of Medicine atDartmouth, Hanover, NH 03766, USA. 4Unité des Aspergillus, Institut Pasteur, 25 rue du Docteur Roux, 75724 Cedex 15 Paris, France. 5 Department ofMolecular Physiology and Biophysics, Carver College of Medicine, University of Iowa, Iowa City, IA 52242, USA. 6 Institute of Life Science, SwanseaUniversity Medical School, Swansea University, Swansea, Wales SA2 8PP, UK. 7These authors contributed equally: Takanori Furukawa, Norman van Rhijn.8These authors jointly supervised this work: Paul Bowyer, Michael J. Bromley. *email: [email protected]; [email protected]
NATURE COMMUNICATIONS | (2020) 11:427 | https://doi.org/10.1038/s41467-019-14191-1 | www.nature.com/naturecommunications 1
1234
5678
90():,;
A spergillus fumigatus is the most important airbornemould pathogen and allergen worldwide. Estimates sug-gest that over 3 million people have invasive or chronic
infections that lead to in excess of 600,000 deaths every year1.Only three classes of drugs are currently recommended for thetreatment of aspergillosis with the azole class being recommendedfor primary therapeutic purposes, and amphotericin B and theechinocandins (caspofungin and micafungin) for salvage therapy.With effective treatment, mortality rates for invasive diseaseremain ~50%2. It is of great concern, however, that drug resistanceto the azoles is rapidly emerging. For individuals that are infectedwith a resistant isolate the mortality rate exceeds 80%3,4. As dis-ease progression is so rapid in invasive aspergillosis (IA)5, therapyfailure is attributable to delays in administering alternative agents.Methods to rapidly detect resistance are critical to ensure effectivetransition to alternative appropriate therapies.Our understanding of the factors governing azole resistance in
A. fumigatus is not fully defined. The azoles act by inhibiting thehemoprotein lanosterol demethylase (Cyp51A) resulting in areduction of the key sterol, ergosterol, in the fungal membraneand an accumulation of toxic sterol intermediates6. Azole resis-tance is frequently associated with an allelic variant of cyp51Athat incorporates a tandem repeat in the promoter, typically TR34
or TR46, with a secondary non-synonymous mutation within itscoding sequence7. These modifications appear to have no sub-stantial impact on pathogenicity in murine models of invasiveaspergillosis8. The mechanism of resistance in a significant pro-portion of other isolates remains unclear7. This hinders thedevelopment of rapid molecular diagnostics to detect drugresistance in the clinic. Our limited understanding of themechanisms of azole resistance also prevents the development ofcombination therapeutic strategies that specifically target drug-resistance mechanisms9.
We and others have recently reported on the role played byvarious A. fumigatus transcriptional regulators in response toazole antifungal drugs10–12. The sterol regulatory element-binding protein (SREBP), SrbA is a basic helix–loop–helix(bHLH) transcriptional activator which directly regulates at leastseven genes in the ergosterol biosynthetic pathway, includingcyp51A10. Loss of srbA through gene replacement results in asignificant increase in susceptibility to azoles13 in part due tosignificant reductions in cyp51A mRNA levels14. The binding sitefor SrbA in the cyp51A promoter falls within the 34 and 46 mersduplicated in TR34/46 pandemic azole-resistant isolates12. Therepeat duplicates the DNA-binding site leading to SrbA-mediatedupregulation of cyp51A and a concomitant increase in azoleresistance. AtrR, a Zn2-Cys6 transcription factor, also positivelyregulates sterol biosynthesis and directly binds the cyp51A pro-moter at the TR site, and additionally the promoter of an azoleexporter, cdr1B11,15. The CCAAT-binding domain complex CBC,a heterotrimer comprising HapB, HapC and HapE, is a negativeregulator of sterol biosynthesis directly binding the promoters of14 ergosterol biosynthetic genes, including cyp51A12. Loss of CBCfunction leads to pan-azole resistance. Notably, a clinical azole-resistant isolate with a defect in HapE that results in perturbedDNA binding at the cyp51A promoter has been described12,16.Binding of the CBC at the cyp51A promoter is facilitated byanother transcriptional regulator, HapX12. HapX is an iron-responsive basic region leucine zipper (bZIP) transcription factorthat regulates the expression of genes linked to iron acquisition,storage and metabolism and facilitates binding of the CBC17. It isalso notable that loss of SrbA, the CBC, HapX or AtrR is asso-ciated with significant reductions in virulence in murine modelsof invasive pulmonary aspergillosis11–13,17.
The transcriptional network governing azole resistance istherefore highly complex and involves multiple regulators, some
of which remain to be identified as our current models of thisnetwork are not able to explain all of the existing clinically sig-nificant mechanisms of azole resistance. We therefore postulatedthat other perturbations of the transcriptional network wouldlead to alterations in azole resistance without affectingpathogenicity.In this study, we have generated and screened a library of 484
A. fumigatus transcription factor null mutant strains and iden-tified a cohort of 12 factors that govern azole resistance andsensitivity. Here, we describe in detail the role of two CBF/NF-Yfamily transcription regulators, AFUB_029870 (NctA) andAFUB_045980 (NctB) where loss of function leads to azoleresistance. We show that the A. fumigatus NctA and NctB(Negative cofactor two A and B) are part of the same transcrip-tional regulatory complex and demonstrate that the NCT com-plex is a key regulator of ergosterol biosynthesis and the azoleexporter CDR1B. We also report that loss of the NCT complexleads to a multi-drug-resistance phenotype, including the azoles(itraconazole, voriconazole and posaconazole) as well as the sal-vage therapeutic amphotericin B18 and terbinafine, an agent usedin the treatment of chronic and allergic disease19. Furthermore,loss of this complex results in a notable increase in the immu-nogenic properties of A. fumigatus, but does not result in loss ofvirulence. The results of our study highlight that loss of functionof a single gene can give rise to cross-resistance to many of theprimary drugs used to treat aspergillosis and should promptclinical centres to look for these mechanisms of resistance. As wealso show that strains lacking a functional NCT complex arehypersensitive to the echinocandins, switching patients har-bouring strains with these mutations to caspofungin could be apreferred course of action.
ResultsGeneration of a library of transcription factor null mutants. Asystematic review of the genes previously annotated as tran-scription factors (TFs) in the databases at ENSEMBL fungi,ASPGD and DBD20 resulted in the identification of 495 putativeTFs (Supplementary Data 1). To further characterise this cohort,we classified each TF according to its Pfam domains, identifiedusing Hidden Markov Model profiling (hmmscan). The majorityof TFs were shown to have either one (n= 245) or two (n= 158)functional domains associated with transcriptional regulation(Supplementary Fig. 1). The most common domains identifiedwere binuclear zinc cluster (n= 192 (PFAM00172) and fungal-specific transcription domains (n= 195 (PFAM04052 and11951); Supplementary Fig. 1). This is consistent with previousreports that describe domains of transcription factors in asco-mycetes21. Sixty-two proteins lacked any Pfam domains asso-ciated with transcription factor function. However, followingcross-referencing of these to orthologues in the AF293 genome(whose genome annotation has been enhanced by comparison toRNA-seq data) to reconcile annotation differences, and additionalevaluation to identify PROSITE, SUPERFAMILY, SMART andCDD domains, we were able to identify transcription factor-associated domains for all, but six proteins (SupplementaryData. 1). For two of these proteins, MedA and LaeA, a functionalrole in transcriptional regulation has been defined experimen-tally22–24. We were unable to identify any functional domains inthe orthologue of the TFIIIC subunit tfc6 or three proteinsannotated as RfeD, F and G.Unlike in the model yeast, Saccharomyces cerevisiae, gene
replacement strategies in A. fumigatus are complicated byrelatively low levels of homologous recombination. This problemcan be mitigated by the use of strains lacking components of thenon-homologous end joining machinery25, such as Ku7026,
ARTICLE NATURE COMMUNICATIONS | https://doi.org/10.1038/s41467-019-14191-1
2 NATURE COMMUNICATIONS | (2020) 11:427 | https://doi.org/10.1038/s41467-019-14191-1 | www.nature.com/naturecommunications
Ku8027 and Lig428, however, even in strains lacking these factors,gene replacement cassettes require around 1 kb of homologoussequence flanking each side of a target gene27. To facilitate thedisruption of all of the TFs identified, we chose to employ a fusionPCR approach similar to that described by Szewczyk et al.29 (seeschematic Supplementary Fig. 2) and used custom developedscripts to design the primers for amplification of the genereplacement cassettes (see the Methods section). Cassettes weresuccessfully amplified for all 495 of the TFs, and were used totransform MFIG001, a Δku80, pyrG+ strain derived from FGSCstrain A116030. We isolated null homokaryons for 97.7% (484)transcription factor genes as defined by our ability to isolatestrains, in which we could amplify from the hygromycinresistance cassette to a region beyond the gene replacementcassette in addition to a lack of a PCR product corresponding tothe target gene (see schematic Supplementary Fig. 2). Precisereplacement was further confirmed for a randomly selected subsetof 12 mutants by Southern blot analysis (Supplementary Data 1).Despite several attempts (minimum n= 3), we were unable toisolate null mutants for 11 genes (Supplementary Data 1). Themajority of these genes encode components of the RNApolymerase I/II/III transcription factor complexes, or aretranscription factors, which locate at a higher-level of a regulatoryhierarchy31 whose deletion would likely to cause a lethalphenotype.
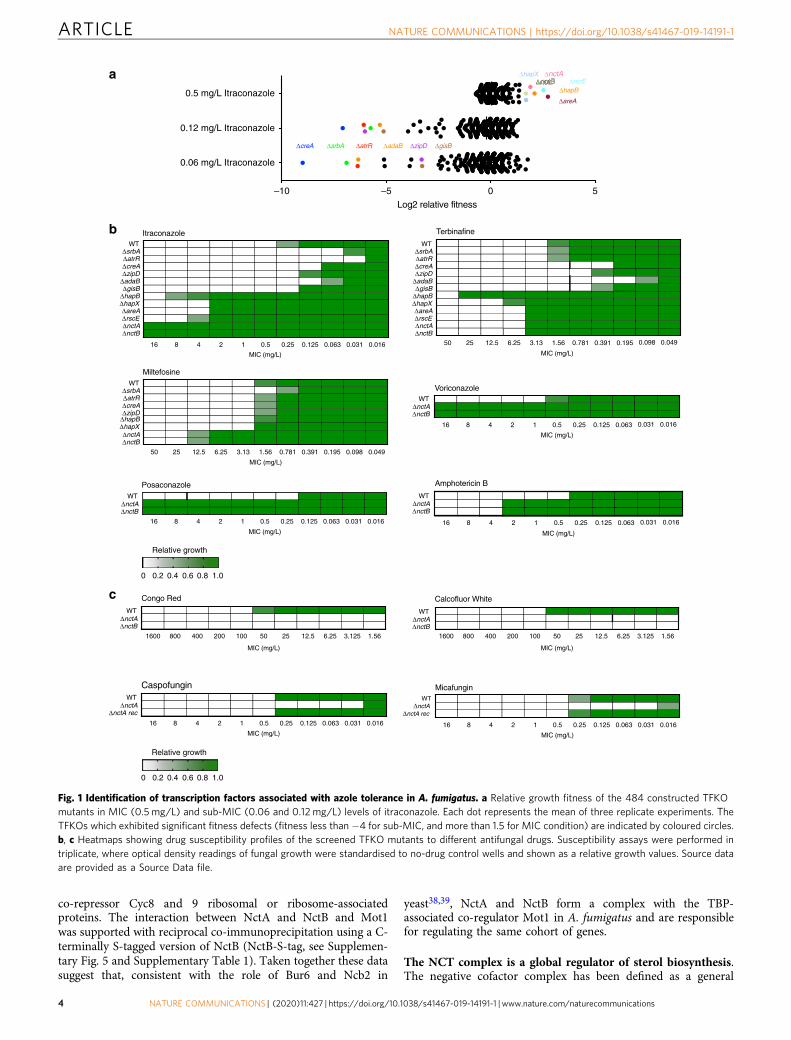
An azole susceptibility screen of the transcription factormutant library. The minimum inhibitory concentrations (MIC)of itraconazole for the isogenic strain (MFIG001) was deter-mined to be 0.5 mg/L in the RPMI-1640 media, followingprocedures outlined by EUCAST32. To identify novel tran-scriptional regulators associated with azole sensitivity andresistance, we screened the transcription factor null library atitraconazole concentrations representing sub-minimum inhibi-tory concentrations (MIC) (0.06 and 0.12 mg/L) and at the MIC(0.5 mg/L).Six transcription factor null mutants exhibited clear and
reproducible fitness defects in sub-MIC levels of itraconazolewhen compared with the cohort of mutants in the collection(Fig. 1a). The transcription factors knocked out in two of thesemutants have previously been defined as activators of theergosterol biosynthetic pathway, including cyp51A, namely SrbAand AtrR. The other null mutants identified in the screen lackedthe carbon catabolite repressor CreA33, the calcium-responsiveregulator ZipD34, the SAGA complex subunit AdaB35 and theorthologue of the S. cerevisiae stress-responsive regulator GIS2herein described as GisB36. When the library was screened atitraconazole levels at the MIC, we identified six transcriptionfactor mutants, two of which we have previously described(ΔhapX and ΔhapB)12 and four of which we associate with azoleresistance in A. fumigatus for the first time (ΔnctA, ΔnctB, ΔareAand ΔrscE).We extended our phenotypic profiling of these isolates to assess
their general growth fitness (Supplementary Fig. 3) and sensitivityprofiles to additional antifungal drugs (Fig. 1b, c). The identifiedtranscription factor null mutants showed variable growth fitnessprofiles, depending on the culture conditions tested. However, wedid not see a clear correlation between their growth fitness andazole-sensitivity phenotypes. In comparison with the isogenicwild-type control, ΔcreA and ΔzipD showed increased sensitivityto the ergosterol biosynthetic inhibitor terbinafine. Interestingly,the nctA and nctB null mutants phenocopied each other(Supplementary Fig. 3) and were resistant to the triazolesvoriconazole (>32-fold increase in MIC) and posaconazole(>128-fold increase), terbinafine (twofold increase in MIC),
miltefosine (eightfold increase in MIC) and amphotericin B(eightfold increase in MIC). Conversely, the nctA and nctB nullmutants showed hypersensitivity to the cell wall perturbing agentsCongo Red, Calcofluor White, caspofungin and micafungin.
NctA and NctB are members of the CBF/NF-Y family of reg-ulators. Pfam domain searches indicate that NctA and NctB aremembers of the evolutionarily conserved CBF/NF-Y family oftranscription factors, which include the CBC transcription reg-ulator complex (Supplementary Fig. 4)37. NctA (AFUB_029870)encodes a 247 aa protein, and is a reciprocal BLAST match of theS. cerevisiae negative cofactor 2 (NC2) complex α-subunit Bur6.NctA and Bur6, however, show little sequence similarity with theexception of the CBF/NFYB domain where they share 49%identity over 75 contiguous amino acids. NctA has two para-logues in A. fumigatus, HapE and an as yet un-named regulatorencoded by AFUB_058240. Consistent with the similar pheno-types of the nctA and nctB null mutants, nctB (AFUB_045980)encodes a 142 aa protein that is the reciprocal BLAST match ofthe S. cerevisiae NC2 complex β-subunit (Ncb2) sharing 49%sequence identity over 86% of the protein. NctB has one readilyidentifiable paralogue in A. fumigatus, HapC.
Loss of NctA leads to a reduction in growth rate. To determineif the effects of nctA loss were due solely to the gene replacementand not other mutagenic events from transformation, an nctAreconstituted strain was generated. The growth rate of thenctA null alongside the parent strain MFIG001 (WT) and thenctA reconstituted strain (nctA rec) was assessed on Aspergilluscomplete media (ACM), Aspergillus minimal media (AMM),RPMI-1640 and DMEM. In all conditions, the nctA null mutanthad a significantly reduced growth rate (36–44% reduction)compared with MFIG001 (Fig. 2a, b). Importantly, the recon-stituted strain was indistinguishable in these assays fromMFIG001. This reduction in growth rate is associated with adecrease in the initial rate of germination (5–6 h) and hyphalextension (Fig. 2c, d).
NctA and NctB co-operatively regulate the same network ofgenes. To assess the role of NctA and NctB on global regulationof gene expression in A. fumigatus, we carried out transcriptomicanalysis (RNA-seq) using RNA extracted from cultures grown inthe RPMI-1640 media. In the absence of itraconazole, 1244 geneswere upregulated (>2-fold; FDR < 0.05) and 1049 (>2-fold; FDR< 0.05) genes were downregulated in the nctA null when com-pared with the isogenic parent strain (Supplementary Data 2).Similarly, 1183 genes were upregulated and 1104 genes weredownregulated in the nctB null mutant. In the presence of itra-conazole, 735 genes were upregulated and 736 genes weredownregulated in the nctA null mutant, and 865 genes wereupregulated and 852 genes were downregulated in the nctB nullmutant. Direct comparison of the two data sets shows that theregulons of both transcription factors have a very high degree ofsimilarity in both conditions (Fig. 3a, b), suggesting that bothtranscription factors work co-operatively.To assess if NctA physically interacts with NctB, and to
determine if any other proteins are found complexed with NctA,we generated a strain which encoded a functional C-terminally S-tagged derivative of NctA (as shown by the fact that the strain thatwas indistinguishable from the wild-type isolate) (NctA-S-tag, seeSupplementary Fig. 5), and performed co-immunoprecipitationfollowed by LC/MS identification of interacting proteins. Inaddition to NctA, 20 unique proteins were identified (Supple-mentary Table 1; >2 matched peptides), including NctB, the TBP-associated transcriptional regulator Mot1, the transcriptional
NATURE COMMUNICATIONS | https://doi.org/10.1038/s41467-019-14191-1 ARTICLE
NATURE COMMUNICATIONS | (2020) 11:427 | https://doi.org/10.1038/s41467-019-14191-1 | www.nature.com/naturecommunications 3
co-repressor Cyc8 and 9 ribosomal or ribosome-associatedproteins. The interaction between NctA and NctB and Mot1was supported with reciprocal co-immunoprecipitation using a C-terminally S-tagged version of NctB (NctB-S-tag, see Supplemen-tary Fig. 5 and Supplementary Table 1). Taken together these datasuggest that, consistent with the role of Bur6 and Ncb2 in
yeast38,39, NctA and NctB form a complex with the TBP-associated co-regulator Mot1 in A. fumigatus and are responsiblefor regulating the same cohort of genes.
The NCT complex is a global regulator of sterol biosynthesis.The negative cofactor complex has been defined as a general
a
0.06 mg/L Itraconazole
–10 –5 0 5
0.12 mg/L Itraconazole
0.5 mg/L Itraconazole
Log2 relative fitness
ΔatrRΔsrbAΔcreA ΔzipD
ΔhapB
ΔnctAΔnctnctBΔnctB
ΔhapX
ΔadaB ΔgisB
ΔareA
ΔrscE
b
16 8 4 2 1 0.5 0.25 0.125 0.063 0.031 0.016
WTΔsrbAΔatrRΔcreAΔzipD
WTΔsrbAΔatrRΔcreAΔzipD
ΔadaBΔgisB
ΔhapBΔhapXΔareAΔrscEΔnctAΔnctB
ΔhapBΔhapXΔnctAΔnctB
ΔnctAΔnctB
WTΔsrbAΔatrRΔcreAΔzipD
ΔadaBΔgisB
ΔhapBΔhapXΔareAΔrscEΔnctAΔnctB
ΔnctAΔnctB
Itraconazole
MIC (mg/L)
50 25 12.5 6.25 3.13 1.56 0.781 0.391 0.195 0.098 0.049
Miltefosine
MIC (mg/L)
16
0 0.2 0.4 0.6 0.8 1.0
0 0.2 0.4 0.6 0.8 1.0
8 4 2 1 0.5 0.25 0.125 0.063 0.031 0.016
WT
ΔnctAΔnctB
WT
ΔnctAΔnctA rec
WT
Posaconazole
MIC (mg/L)
50 25 12.5 6.25 3.13 1.56 0.781 0.391 0.195 0.098 0.049
Terbinafine
MIC (mg/L)
16 8 4 2 1 0.5 0.25 0.125 0.063 0.031 0.016
Amphotericin B
MIC (mg/L)
16 8 4 2 1 0.5 0.25 0.125 0.063 0.031 0.016
WT
ΔnctAΔnctB
WT
ΔnctAΔnctB
WT
Voriconazole
MIC (mg/L)
Relative growth
c
Relative growth
1600 800 400 200 100 50 25 12.5 6.25 3.125 1.56
Congo Red
MIC (mg/L)
16 8 4 2 1 0.5 0.25 0.125 0.063 0.031 0.016
Caspofungin
MIC (mg/L)
1600 800 400 200 100 50 25 12.5 6.25 3.125 1.56
Calcofluor White
MIC (mg/L)
16 8 4 2 1 0.5 0.25 0.125 0.063 0.031 0.016
WTΔnctA
ΔnctA rec
Micafungin
MIC (mg/L)
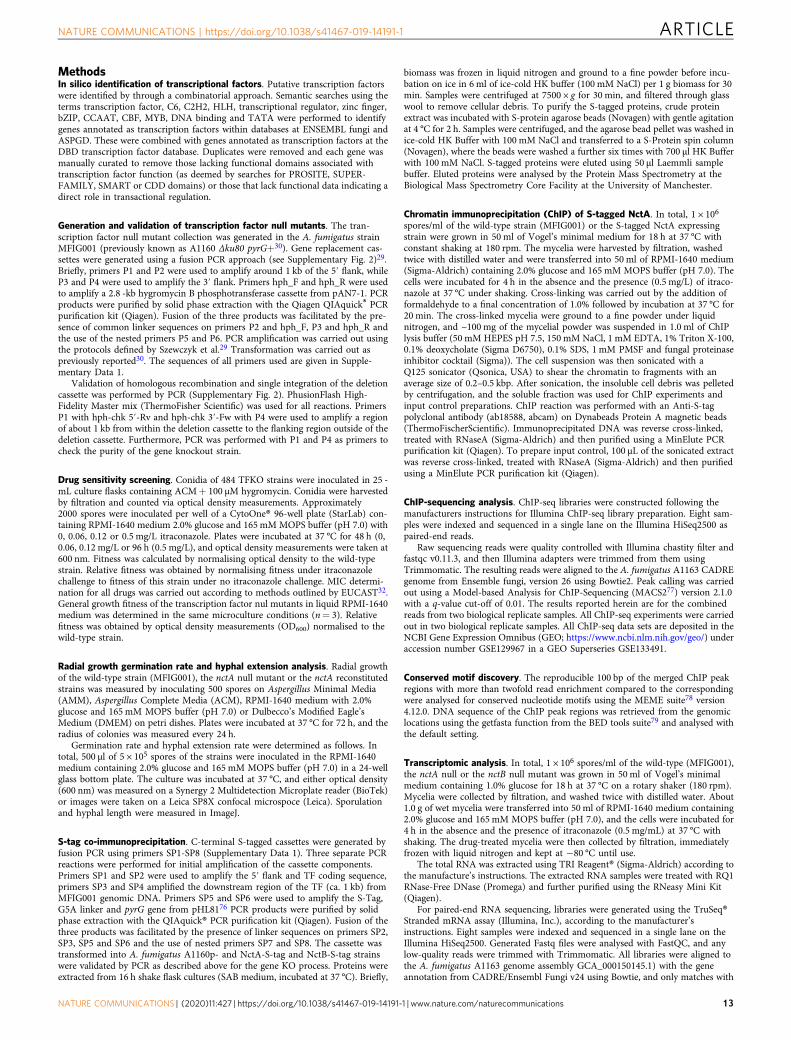
Fig. 1 Identification of transcription factors associated with azole tolerance in A. fumigatus. a Relative growth fitness of the 484 constructed TFKOmutants in MIC (0.5 mg/L) and sub-MIC (0.06 and 0.12 mg/L) levels of itraconazole. Each dot represents the mean of three replicate experiments. TheTFKOs which exhibited significant fitness defects (fitness less than −4 for sub-MIC, and more than 1.5 for MIC condition) are indicated by coloured circles.b, c Heatmaps showing drug susceptibility profiles of the screened TFKO mutants to different antifungal drugs. Susceptibility assays were performed intriplicate, where optical density readings of fungal growth were standardised to no-drug control wells and shown as a relative growth values. Source dataare provided as a Source Data file.
ARTICLE NATURE COMMUNICATIONS | https://doi.org/10.1038/s41467-019-14191-1
4 NATURE COMMUNICATIONS | (2020) 11:427 | https://doi.org/10.1038/s41467-019-14191-1 | www.nature.com/naturecommunications
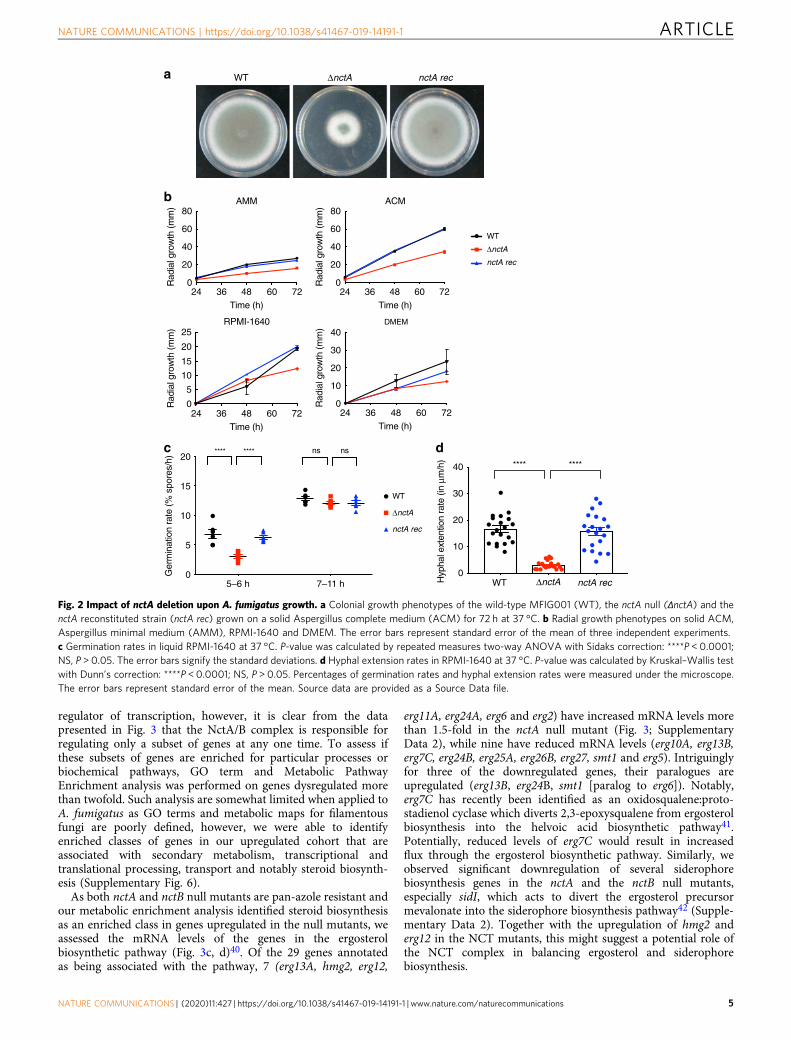
regulator of transcription, however, it is clear from the datapresented in Fig. 3 that the NctA/B complex is responsible forregulating only a subset of genes at any one time. To assess ifthese subsets of genes are enriched for particular processes orbiochemical pathways, GO term and Metabolic PathwayEnrichment analysis was performed on genes dysregulated morethan twofold. Such analysis are somewhat limited when applied toA. fumigatus as GO terms and metabolic maps for filamentousfungi are poorly defined, however, we were able to identifyenriched classes of genes in our upregulated cohort that areassociated with secondary metabolism, transcriptional andtranslational processing, transport and notably steroid biosynth-esis (Supplementary Fig. 6).As both nctA and nctB null mutants are pan-azole resistant and
our metabolic enrichment analysis identified steroid biosynthesisas an enriched class in genes upregulated in the null mutants, weassessed the mRNA levels of the genes in the ergosterolbiosynthetic pathway (Fig. 3c, d)40. Of the 29 genes annotatedas being associated with the pathway, 7 (erg13A, hmg2, erg12,
erg11A, erg24A, erg6 and erg2) have increased mRNA levels morethan 1.5-fold in the nctA null mutant (Fig. 3; SupplementaryData 2), while nine have reduced mRNA levels (erg10A, erg13B,erg7C, erg24B, erg25A, erg26B, erg27, smt1 and erg5). Intriguinglyfor three of the downregulated genes, their paralogues areupregulated (erg13B, erg24B, smt1 [paralog to erg6]). Notably,erg7C has recently been identified as an oxidosqualene:proto-stadienol cyclase which diverts 2,3-epoxysqualene from ergosterolbiosynthesis into the helvoic acid biosynthetic pathway41.Potentially, reduced levels of erg7C would result in increasedflux through the ergosterol biosynthetic pathway. Similarly, weobserved significant downregulation of several siderophorebiosynthesis genes in the nctA and the nctB null mutants,especially sidI, which acts to divert the ergosterol precursormevalonate into the siderophore biosynthesis pathway42 (Supple-mentary Data 2). Together with the upregulation of hmg2 anderg12 in the NCT mutants, this might suggest a potential role ofthe NCT complex in balancing ergosterol and siderophorebiosynthesis.
a
c
b
WT ΔnctA
ΔnctA
d
nctA rec
WT ΔnctA nctA rec
nctA rec
ACM
024 36 48 60 72
20
40
60
80
Time (h)
24 36 48 60 72Time (h)
Rad
ial g
row
th (
mm
)R
adia
l gro
wth
(m
m)
024 36 48 60 72
20
40
60
80
Time (h)
24 36 48 60 72Time (h)
Rad
ial g
row
th (
mm
)R
adia
l gro
wth
(m
m)
AMM
0
5
10
15
20
25RPMI-1640
0
10
20
30
40DMEM
WT
ΔnctA
nctA rec
WT
5–6 h 7–11 h0
5
10
15
20
Ger
min
atio
n ra
te (
% s
pore
s/h)
**** **** ns ns
0
10
20
30
40
Hyp
hal e
xten
tion
rate
(in
μm
/h) **** ****
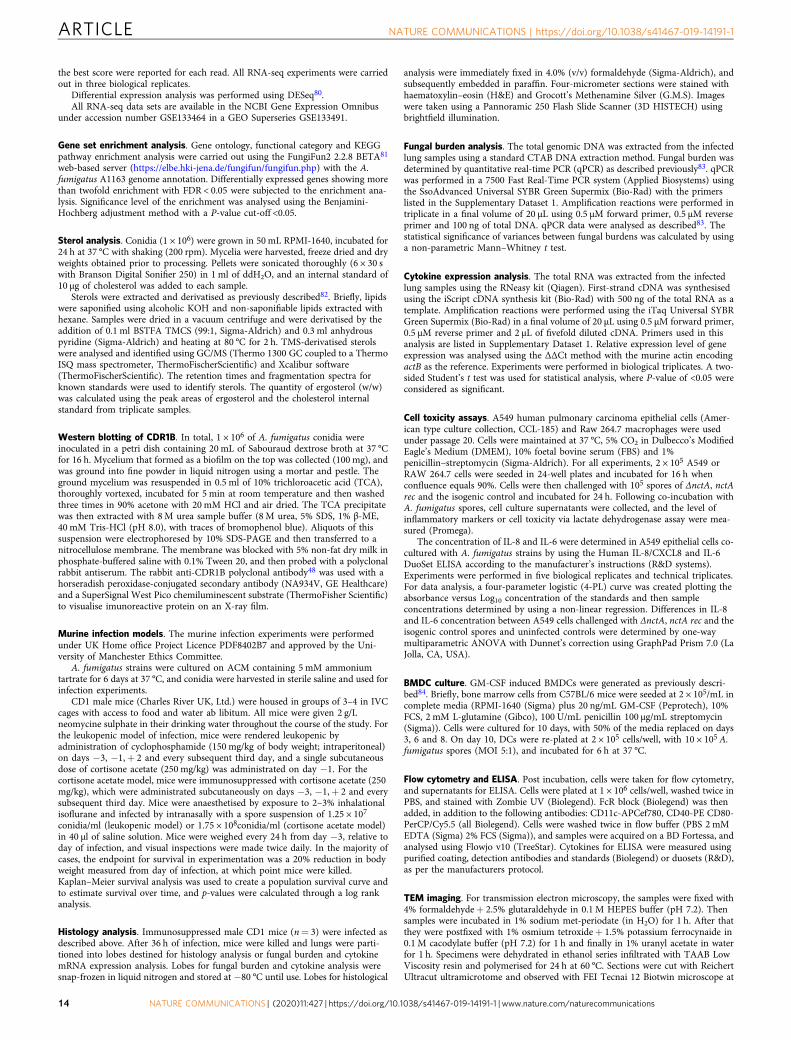
Fig. 2 Impact of nctA deletion upon A. fumigatus growth. a Colonial growth phenotypes of the wild-type MFIG001 (WT), the nctA null (ΔnctA) and thenctA reconstituted strain (nctA rec) grown on a solid Aspergillus complete medium (ACM) for 72 h at 37 °C. b Radial growth phenotypes on solid ACM,Aspergillus minimal medium (AMM), RPMI-1640 and DMEM. The error bars represent standard error of the mean of three independent experiments.c Germination rates in liquid RPMI-1640 at 37 °C. P-value was calculated by repeated measures two-way ANOVA with Sidaks correction: ****P < 0.0001;NS, P > 0.05. The error bars signify the standard deviations. d Hyphal extension rates in RPMI-1640 at 37 °C. P-value was calculated by Kruskal–Wallis testwith Dunn’s correction: ****P < 0.0001; NS, P > 0.05. Percentages of germination rates and hyphal extension rates were measured under the microscope.The error bars represent standard error of the mean. Source data are provided as a Source Data file.
NATURE COMMUNICATIONS | https://doi.org/10.1038/s41467-019-14191-1 ARTICLE
NATURE COMMUNICATIONS | (2020) 11:427 | https://doi.org/10.1038/s41467-019-14191-1 | www.nature.com/naturecommunications 5
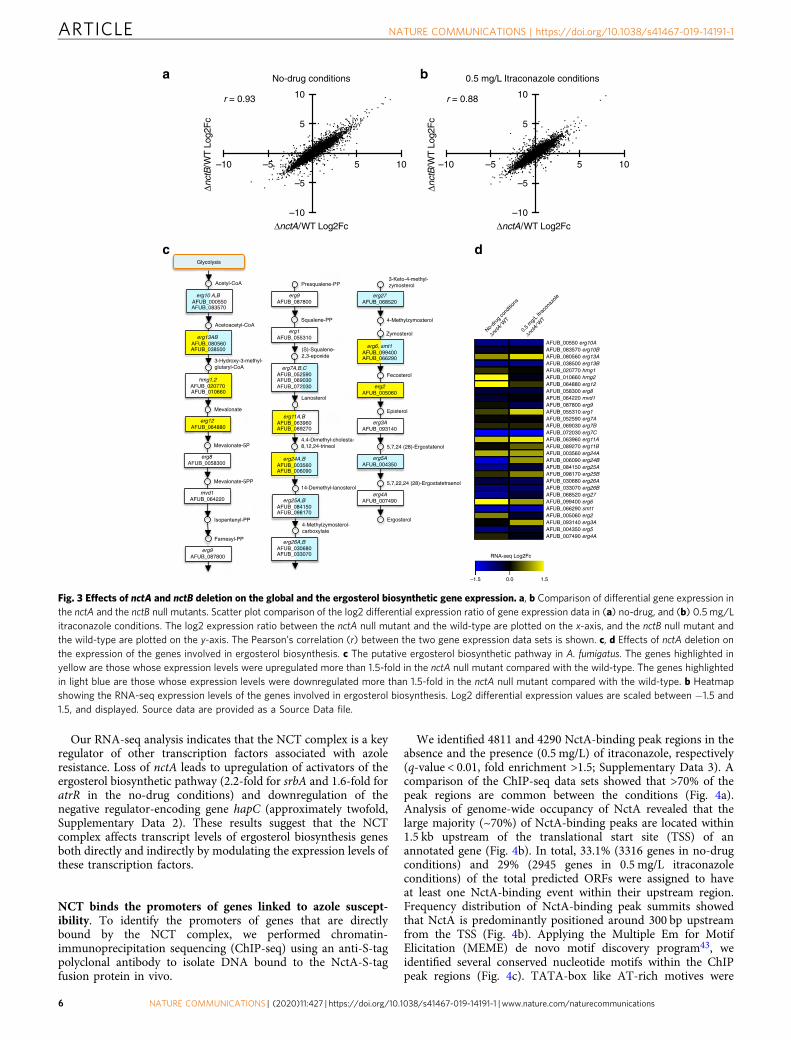
Our RNA-seq analysis indicates that the NCT complex is a keyregulator of other transcription factors associated with azoleresistance. Loss of nctA leads to upregulation of activators of theergosterol biosynthetic pathway (2.2-fold for srbA and 1.6-fold foratrR in the no-drug conditions) and downregulation of thenegative regulator-encoding gene hapC (approximately twofold,Supplementary Data 2). These results suggest that the NCTcomplex affects transcript levels of ergosterol biosynthesis genesboth directly and indirectly by modulating the expression levels ofthese transcription factors.
NCT binds the promoters of genes linked to azole suscept-ibility. To identify the promoters of genes that are directlybound by the NCT complex, we performed chromatin-immunoprecipitation sequencing (ChIP-seq) using an anti-S-tagpolyclonal antibody to isolate DNA bound to the NctA-S-tagfusion protein in vivo.
We identified 4811 and 4290 NctA-binding peak regions in theabsence and the presence (0.5 mg/L) of itraconazole, respectively(q-value < 0.01, fold enrichment >1.5; Supplementary Data 3). Acomparison of the ChIP-seq data sets showed that >70% of thepeak regions are common between the conditions (Fig. 4a).Analysis of genome-wide occupancy of NctA revealed that thelarge majority (~70%) of NctA-binding peaks are located within1.5 kb upstream of the translational start site (TSS) of anannotated gene (Fig. 4b). In total, 33.1% (3316 genes in no-drugconditions) and 29% (2945 genes in 0.5 mg/L itraconazoleconditions) of the total predicted ORFs were assigned to haveat least one NctA-binding event within their upstream region.Frequency distribution of NctA-binding peak summits showedthat NctA is predominantly positioned around 300 bp upstreamfrom the TSS (Fig. 4b). Applying the Multiple Em for MotifElicitation (MEME) de novo motif discovery program43, weidentified several conserved nucleotide motifs within the ChIPpeak regions (Fig. 4c). TATA-box like AT-rich motives were
–10 –5 5 10
–10
–5
5
10
–10
–5
5
10
ΔnctA/WT Log2Fc
Δnct
B/W
T L
og2F
c
Δnct
B/W
T L
og2F
c
ΔnctA/WT Log2Fc
No-drug conditions
r = 0.93
–10 –5 5 10
0.5 mg/L Itraconazole conditions
r = 0.88
a
c d
b
RNA-seq Log2Fc
–1.5 0.0 1.5
3-Hydroxy-3-methyl- glutaryl-CoA
Acetyl-CoA
Glycolysis
Mevalonate
erg12 AFUB_064880
Mevalonate-5PP
mvd1 AFUB_064220
Acetoacetyl-CoA
Mevalonate-5P
erg8 AFUB_0058300
erg9 AFUB_087800
Farnesyl-PP
Isopentenyl-PP
erg10 A,B AFUB_000550 AFUB_083570
hmg1,2 AFUB_020770 AFUB_010660
Squalene-PP
erg1 AFUB_055310
Presqualene-PP
erg9 AFUB_087800
(S)-Squalene- 2,3-epoxide
erg11A,B AFUB_063960 AFUB_089270
Lanosterol
4.4-Dimethyl-cholesta- 8,12,24-trineol
14-Demethyl-lanosterol
erg26A,B AFUB_030680 AFUB_033070
4-Methylzymosterol- carboxylate
erg24A,B AFUB_003560 AFUB_006090
erg7A,B,C AFUB_052590 AFUB_069030 AFUB_072030
3-Keto-4-methyl- zymosterol
erg27 AFUB_068520
4-Methylzymosterol
Fecosterol
erg2 AFUB_005060
Episterol
erg3A AFUB_093140
5,7,24 (28)-Ergostatenol
erg5A AFUB_004350
5,7,22,24 (28)-Ergostatetraenol
erg4A AFUB_007490
Ergosterol
Zymosterol
erg6, smt1 AFUB_099400 AFUB_066290
erg13AB AFUB_080560 AFUB_038500
erg25A,B AFUB_084150 AFUB_098170
No-dr
ug co
nditio
ns
ΔnctA
/ WT
0.5
mg/
L Itra
cona
zole
ΔnctA
/ WT
AFUB_00550 erg10A AFUB_083570 erg10B AFUB_080560 erg13A AFUB_038500 erg13B AFUB_020770 hmg1 AFUB_010660 hmg2 AFUB_064880 erg12 AFUB_058300 erg8 AFUB_064220 mvd1 AFUB_087800 erg9 AFUB_055310 erg1 AFUB_052590 erg7A AFUB_069030 erg7B AFUB_072030 erg7C AFUB_063960 erg11A AFUB_089270 erg11B AFUB_003560 erg24A AFUB_006090 erg24B AFUB_084150 erg25A AFUB_098170 erg25B AFUB_030680 erg26A AFUB_033070 erg26B AFUB_068520 erg27 AFUB_099400 erg6 AFUB_066290 smt1 AFUB_005060 erg2 AFUB_093140 erg3A AFUB_004350 erg5 AFUB_007490 erg4A
Fig. 3 Effects of nctA and nctB deletion on the global and the ergosterol biosynthetic gene expression. a, b Comparison of differential gene expression inthe nctA and the nctB null mutants. Scatter plot comparison of the log2 differential expression ratio of gene expression data in (a) no-drug, and (b) 0.5mg/Litraconazole conditions. The log2 expression ratio between the nctA null mutant and the wild-type are plotted on the x-axis, and the nctB null mutant andthe wild-type are plotted on the y-axis. The Pearson’s correlation (r) between the two gene expression data sets is shown. c, d Effects of nctA deletion onthe expression of the genes involved in ergosterol biosynthesis. c The putative ergosterol biosynthetic pathway in A. fumigatus. The genes highlighted inyellow are those whose expression levels were upregulated more than 1.5-fold in the nctA null mutant compared with the wild-type. The genes highlightedin light blue are those whose expression levels were downregulated more than 1.5-fold in the nctA null mutant compared with the wild-type. b Heatmapshowing the RNA-seq expression levels of the genes involved in ergosterol biosynthesis. Log2 differential expression values are scaled between −1.5 and1.5, and displayed. Source data are provided as a Source Data file.
ARTICLE NATURE COMMUNICATIONS | https://doi.org/10.1038/s41467-019-14191-1
6 NATURE COMMUNICATIONS | (2020) 11:427 | https://doi.org/10.1038/s41467-019-14191-1 | www.nature.com/naturecommunications
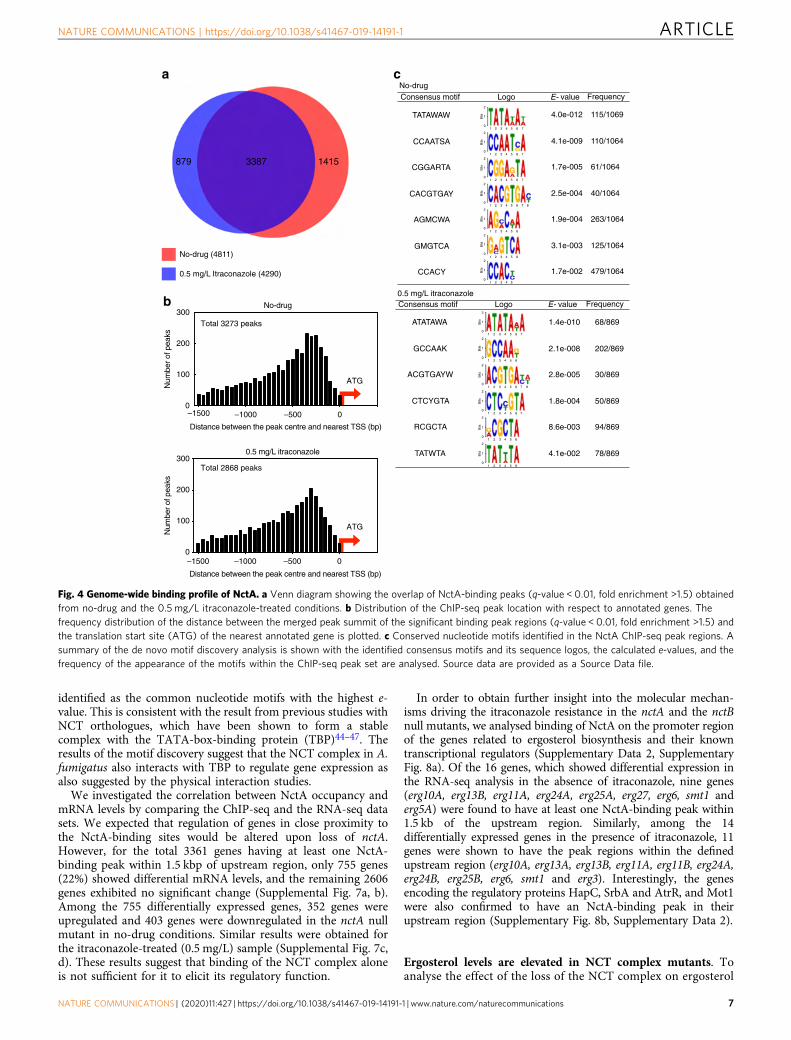
identified as the common nucleotide motifs with the highest e-value. This is consistent with the result from previous studies withNCT orthologues, which have been shown to form a stablecomplex with the TATA-box-binding protein (TBP)44–47. Theresults of the motif discovery suggest that the NCT complex in A.fumigatus also interacts with TBP to regulate gene expression asalso suggested by the physical interaction studies.We investigated the correlation between NctA occupancy and
mRNA levels by comparing the ChIP-seq and the RNA-seq datasets. We expected that regulation of genes in close proximity tothe NctA-binding sites would be altered upon loss of nctA.However, for the total 3361 genes having at least one NctA-binding peak within 1.5 kbp of upstream region, only 755 genes(22%) showed differential mRNA levels, and the remaining 2606genes exhibited no significant change (Supplemental Fig. 7a, b).Among the 755 differentially expressed genes, 352 genes wereupregulated and 403 genes were downregulated in the nctA nullmutant in no-drug conditions. Similar results were obtained forthe itraconazole-treated (0.5 mg/L) sample (Supplemental Fig. 7c,d). These results suggest that binding of the NCT complex aloneis not sufficient for it to elicit its regulatory function.
In order to obtain further insight into the molecular mechan-isms driving the itraconazole resistance in the nctA and the nctBnull mutants, we analysed binding of NctA on the promoter regionof the genes related to ergosterol biosynthesis and their knowntranscriptional regulators (Supplementary Data 2, SupplementaryFig. 8a). Of the 16 genes, which showed differential expression inthe RNA-seq analysis in the absence of itraconazole, nine genes(erg10A, erg13B, erg11A, erg24A, erg25A, erg27, erg6, smt1 anderg5A) were found to have at least one NctA-binding peak within1.5 kb of the upstream region. Similarly, among the 14differentially expressed genes in the presence of itraconazole, 11genes were shown to have the peak regions within the definedupstream region (erg10A, erg13A, erg13B, erg11A, erg11B, erg24A,erg24B, erg25B, erg6, smt1 and erg3). Interestingly, the genesencoding the regulatory proteins HapC, SrbA and AtrR, and Mot1were also confirmed to have an NctA-binding peak in theirupstream region (Supplementary Fig. 8b, Supplementary Data 2).
Ergosterol levels are elevated in NCT complex mutants. Toanalyse the effect of the loss of the NCT complex on ergosterol
No-drug (4811)
0.5 mg/L Itraconazole (4290)
3387 1415 879
ATG
ATG
Total 3273 peaks
Total 2868 peaks
a
b
No-drugConsensus motif E- value Frequency
TATAWAW 4.0e-012 115/1069
CCAATSA 4.1e-009 110/1064
CGGARTA 1.7e-005 61/1064
CACGTGAY 2.5e-004 40/1064
AGMCWA 1.9e-004 263/1064
GMGTCA 3.1e-003 125/1064
CCACY 1.7e-002 479/1064
c
0.5 mg/L itraconazoleConsensus motif E- value Frequency
ATATAWA 1.4e-010 68/869
GCCAAK 2.1e-008 202/869
ACGTGAYW 2.8e-005 30/869
CTCYGTA 1.8e-004 50/869
RCGCTA 8.6e-003 94/869
TATWTA 4.1e-002 78/869
–1500 –1000 –500 0
–1500 –1000 –500 0
0
100
200
300
Distance between the peak centre and nearest TSS (bp)
Num
ber
of p
eaks
0
100
200
300
Num
ber
of p
eaks
No-drug
Distance between the peak centre and nearest TSS (bp)
0.5 mg/L itraconazole
Logo
Logo
1 2
2
1Bits
0
2
1Bits
0
2
1Bits
0
2
1Bits
0
2
1Bits
0
2
1Bits
0
2
1Bits
0
3 4 5 6 7
1 2 3 4 5 6 7
1 2 3 4 5 6 7
1 2 3 4 5 6
1 2 3 4 5 6
1 2 3 4 5
1 2 3 4 5
6
7
2
1Bits
0
2
1Bits
0
2
1Bits
0
2
1Bits
0
2
1Bits
0
2
1Bits
0
1 2 3 4 5 6
1 2 3 4 5 6
1 2 3 4 5 6 7
1 2 3 4 5 6
1 2 3 4 5 6
1 2 3 4 5 6
7
8
7
8
Fig. 4 Genome-wide binding profile of NctA. a Venn diagram showing the overlap of NctA-binding peaks (q-value < 0.01, fold enrichment >1.5) obtainedfrom no-drug and the 0.5 mg/L itraconazole-treated conditions. b Distribution of the ChIP-seq peak location with respect to annotated genes. Thefrequency distribution of the distance between the merged peak summit of the significant binding peak regions (q-value < 0.01, fold enrichment >1.5) andthe translation start site (ATG) of the nearest annotated gene is plotted. c Conserved nucleotide motifs identified in the NctA ChIP-seq peak regions. Asummary of the de novo motif discovery analysis is shown with the identified consensus motifs and its sequence logos, the calculated e-values, and thefrequency of the appearance of the motifs within the ChIP-seq peak set are analysed. Source data are provided as a Source Data file.
NATURE COMMUNICATIONS | https://doi.org/10.1038/s41467-019-14191-1 ARTICLE
NATURE COMMUNICATIONS | (2020) 11:427 | https://doi.org/10.1038/s41467-019-14191-1 | www.nature.com/naturecommunications 7
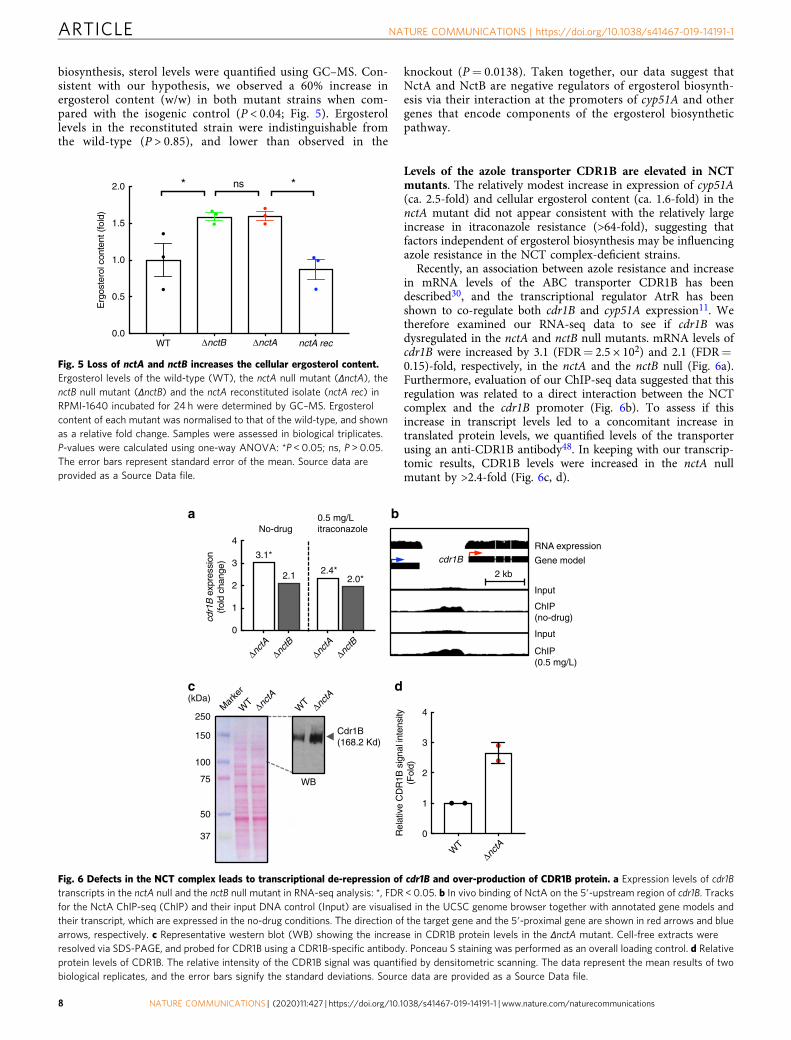
biosynthesis, sterol levels were quantified using GC–MS. Con-sistent with our hypothesis, we observed a 60% increase inergosterol content (w/w) in both mutant strains when com-pared with the isogenic control (P < 0.04; Fig. 5). Ergosterollevels in the reconstituted strain were indistinguishable fromthe wild-type (P > 0.85), and lower than observed in the
knockout (P= 0.0138). Taken together, our data suggest thatNctA and NctB are negative regulators of ergosterol biosynth-esis via their interaction at the promoters of cyp51A and othergenes that encode components of the ergosterol biosyntheticpathway.
Levels of the azole transporter CDR1B are elevated in NCTmutants. The relatively modest increase in expression of cyp51A(ca. 2.5-fold) and cellular ergosterol content (ca. 1.6-fold) in thenctA mutant did not appear consistent with the relatively largeincrease in itraconazole resistance (>64-fold), suggesting thatfactors independent of ergosterol biosynthesis may be influencingazole resistance in the NCT complex-deficient strains.Recently, an association between azole resistance and increase
in mRNA levels of the ABC transporter CDR1B has beendescribed30, and the transcriptional regulator AtrR has beenshown to co-regulate both cdr1B and cyp51A expression11. Wetherefore examined our RNA-seq data to see if cdr1B wasdysregulated in the nctA and nctB null mutants. mRNA levels ofcdr1B were increased by 3.1 (FDR= 2.5 × 10²) and 2.1 (FDR=0.15)-fold, respectively, in the nctA and the nctB null (Fig. 6a).Furthermore, evaluation of our ChIP-seq data suggested that thisregulation was related to a direct interaction between the NCTcomplex and the cdr1B promoter (Fig. 6b). To assess if thisincrease in transcript levels led to a concomitant increase intranslated protein levels, we quantified levels of the transporterusing an anti-CDR1B antibody48. In keeping with our transcrip-tomic results, CDR1B levels were increased in the nctA nullmutant by >2.4-fold (Fig. 6c, d).
WT ΔnctB ΔnctA nctA rec0.0
0.5
1.0
1.5
2.0
Erg
oste
rol c
onte
nt (
fold
)
* *ns
Fig. 5 Loss of nctA and nctB increases the cellular ergosterol content.Ergosterol levels of the wild-type (WT), the nctA null mutant (ΔnctA), thenctB null mutant (ΔnctB) and the nctA reconstituted isolate (nctA rec) inRPMI-1640 incubated for 24 h were determined by GC–MS. Ergosterolcontent of each mutant was normalised to that of the wild-type, and shownas a relative fold change. Samples were assessed in biological triplicates.P-values were calculated using one-way ANOVA: *P < 0.05; ns, P > 0.05.The error bars represent standard error of the mean. Source data areprovided as a Source Data file.
dc
a b
250
150
100
Cdr1B (168.2 Kd)
WB
(kDa)
75
50
37
2 kb
Input
ChIP(no-drug)
Input
ChIP(0.5 mg/L)
Gene model
RNA expression cdr1B
0
1
2
3
4
Rel
ativ
e C
DR
1B s
igna
l int
ensi
ty(F
old)
ΔnctA
ΔnctA
WT
WTM
arke
r
ΔnctA
WT
ΔnctA
ΔnctB
ΔnctA
ΔnctB
0
1
2
3
4
cdr1
B e
xpre
ssio
n(f
old
chan
ge)
3.1*
2.1 2.4*2.0*
No-drug0.5 mg/Litraconazole
Fig. 6 Defects in the NCT complex leads to transcriptional de-repression of cdr1B and over-production of CDR1B protein. a Expression levels of cdr1Btranscripts in the nctA null and the nctB null mutant in RNA-seq analysis: *, FDR < 0.05. b In vivo binding of NctA on the 5′-upstream region of cdr1B. Tracksfor the NctA ChIP-seq (ChIP) and their input DNA control (Input) are visualised in the UCSC genome browser together with annotated gene models andtheir transcript, which are expressed in the no-drug conditions. The direction of the target gene and the 5′-proximal gene are shown in red arrows and bluearrows, respectively. c Representative western blot (WB) showing the increase in CDR1B protein levels in the ΔnctA mutant. Cell-free extracts wereresolved via SDS-PAGE, and probed for CDR1B using a CDR1B-specific antibody. Ponceau S staining was performed as an overall loading control. d Relativeprotein levels of CDR1B. The relative intensity of the CDR1B signal was quantified by densitometric scanning. The data represent the mean results of twobiological replicates, and the error bars signify the standard deviations. Source data are provided as a Source Data file.
ARTICLE NATURE COMMUNICATIONS | https://doi.org/10.1038/s41467-019-14191-1
8 NATURE COMMUNICATIONS | (2020) 11:427 | https://doi.org/10.1038/s41467-019-14191-1 | www.nature.com/naturecommunications
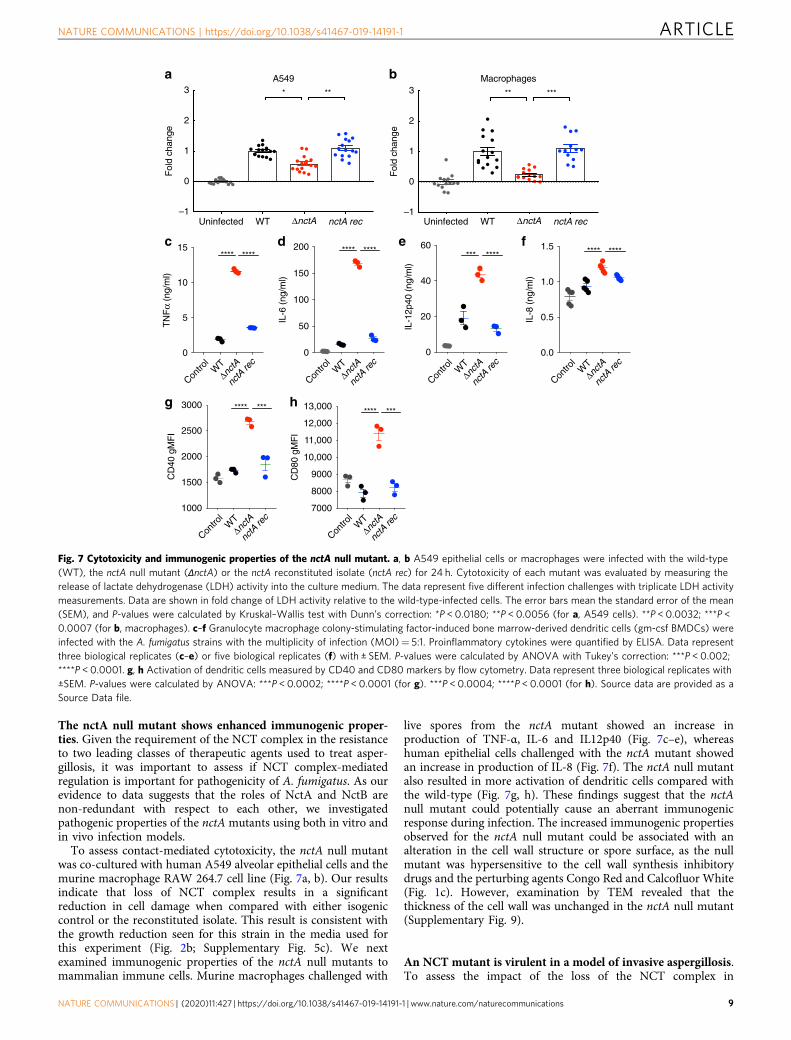
The nctA null mutant shows enhanced immunogenic proper-ties. Given the requirement of the NCT complex in the resistanceto two leading classes of therapeutic agents used to treat asper-gillosis, it was important to assess if NCT complex-mediatedregulation is important for pathogenicity of A. fumigatus. As ourevidence to data suggests that the roles of NctA and NctB arenon-redundant with respect to each other, we investigatedpathogenic properties of the nctA mutants using both in vitro andin vivo infection models.To assess contact-mediated cytotoxicity, the nctA null mutant
was co-cultured with human A549 alveolar epithelial cells and themurine macrophage RAW 264.7 cell line (Fig. 7a, b). Our resultsindicate that loss of NCT complex results in a significantreduction in cell damage when compared with either isogeniccontrol or the reconstituted isolate. This result is consistent withthe growth reduction seen for this strain in the media used forthis experiment (Fig. 2b; Supplementary Fig. 5c). We nextexamined immunogenic properties of the nctA null mutants tomammalian immune cells. Murine macrophages challenged with
live spores from the nctA mutant showed an increase inproduction of TNF-α, IL-6 and IL12p40 (Fig. 7c–e), whereashuman epithelial cells challenged with the nctA mutant showedan increase in production of IL-8 (Fig. 7f). The nctA null mutantalso resulted in more activation of dendritic cells compared withthe wild-type (Fig. 7g, h). These findings suggest that the nctAnull mutant could potentially cause an aberrant immunogenicresponse during infection. The increased immunogenic propertiesobserved for the nctA null mutant could be associated with analteration in the cell wall structure or spore surface, as the nullmutant was hypersensitive to the cell wall synthesis inhibitorydrugs and the perturbing agents Congo Red and Calcofluor White(Fig. 1c). However, examination by TEM revealed that thethickness of the cell wall was unchanged in the nctA null mutant(Supplementary Fig. 9).
An NCT mutant is virulent in a model of invasive aspergillosis.To assess the impact of the loss of the NCT complex in
Uninfected WT ΔnctA nctA rec Uninfected WT ΔnctA nctA rec–1
0
1
2
3
Fol
d ch
ange
–1
0
1
2
3
Fol
d ch
ange
A549
* **
Macrophages
** ***
a
c
g h
d e f
b
Contro
lW
TΔnc
tA
nctA
rec
Contro
lW
TΔnc
tA
nctA
rec
Contro
lW
TΔnc
tA
nctA
rec
Contro
lW
TΔnc
tA
nctA
rec
Contro
lW
TΔnc
tA
nctA
rec
Contro
lW
TΔnc
tA
nctA
rec
0
5
10
15
TN
Fα
(ng/
ml)
**** ****
0
50
100
150
200
IL-6
(ng
/ml)
**** ****
0
20
40
60
IL-1
2p40
(ng
/ml)
*** ****
0.0
0.5
1.0
1.5
IL-8
(ng
/ml)
**** ****
1000
1500
2000
2500
3000
CD
40 g
MF
I
**** ***
7000
8000
9000
10,000
11,000
12,000
13,000
CD
80 g
MF
I
**** ***
Fig. 7 Cytotoxicity and immunogenic properties of the nctA null mutant. a, b A549 epithelial cells or macrophages were infected with the wild-type(WT), the nctA null mutant (ΔnctA) or the nctA reconstituted isolate (nctA rec) for 24 h. Cytotoxicity of each mutant was evaluated by measuring therelease of lactate dehydrogenase (LDH) activity into the culture medium. The data represent five different infection challenges with triplicate LDH activitymeasurements. Data are shown in fold change of LDH activity relative to the wild-type-infected cells. The error bars mean the standard error of the mean(SEM), and P-values were calculated by Kruskal–Wallis test with Dunn’s correction: *P < 0.0180; **P < 0.0056 (for a, A549 cells). **P < 0.0032; ***P <0.0007 (for b, macrophages). c–f Granulocyte macrophage colony-stimulating factor-induced bone marrow-derived dendritic cells (gm-csf BMDCs) wereinfected with the A. fumigatus strains with the multiplicity of infection (MOI)= 5:1. Proinflammatory cytokines were quantified by ELISA. Data representthree biological replicates (c–e) or five biological replicates (f) with ± SEM. P-values were calculated by ANOVA with Tukey’s correction: ***P < 0.002;****P < 0.0001. g, h Activation of dendritic cells measured by CD40 and CD80 markers by flow cytometry. Data represent three biological replicates with±SEM. P-values were calculated by ANOVA: ***P < 0.0002; ****P < 0.0001 (for g). ***P < 0.0004; ****P < 0.0001 (for h). Source data are provided as aSource Data file.
NATURE COMMUNICATIONS | https://doi.org/10.1038/s41467-019-14191-1 ARTICLE
NATURE COMMUNICATIONS | (2020) 11:427 | https://doi.org/10.1038/s41467-019-14191-1 | www.nature.com/naturecommunications 9
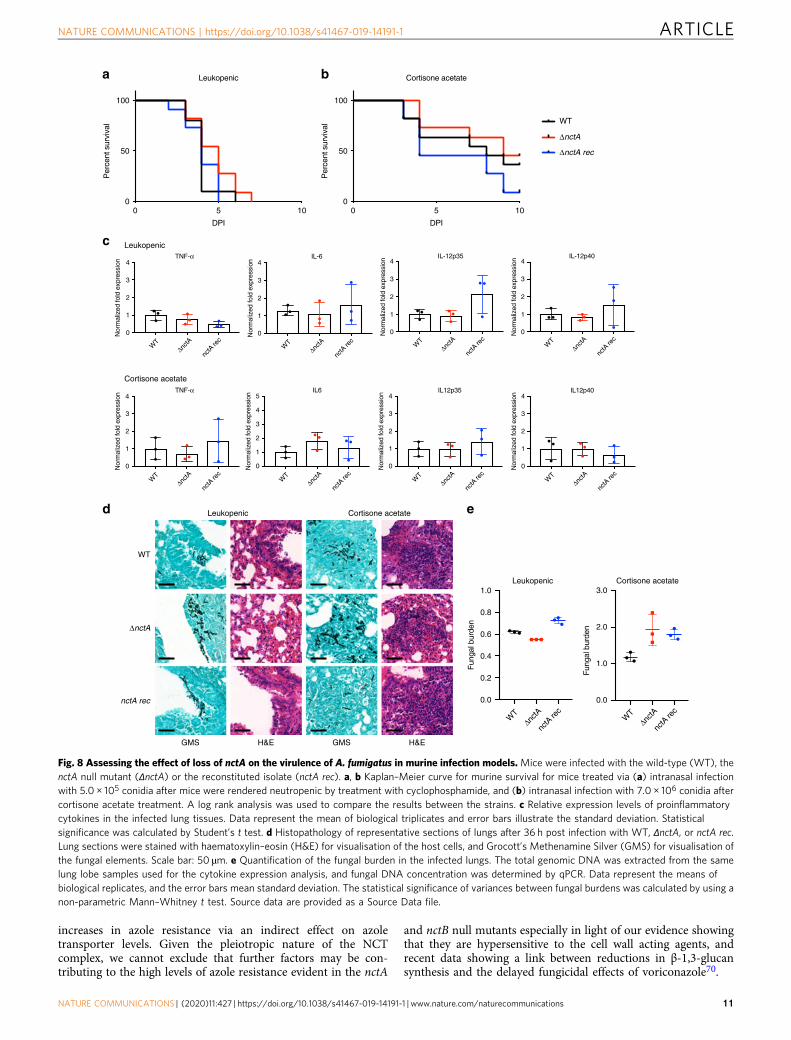
pathogenicity, we compared the virulence of the nctA null mutantwith that of the isogenic isolate MFIG001 in a leukopenic modelof invasive aspergillosis. All mice challenged with theMFIG001 strain succumbed to infection (100% mortality) within7 days post infection. Despite the significant growth defect(Fig. 2b) and the reduced cytotoxicity (Fig. 7a, b) observed inNCT mutants, the virulence of the nctA null mutant was statis-tically indistinguishable from the isogenic isolate (Fig. 8a).In the leukopenic aspergillosis model, the host cellular innate
response is quantitatively attenuated particularly during theinitiation of infection allowing the microbe to proliferate andcause host damage. Thus, we investigated the role of the NCTcomplex in virulence in a murine model that uses cortisoneacetate as an immunosuppressive agent resulting in qualitativedefects in innate immunity. This model has been shown to betterreflect the host’s immune response in relation to detection offungal-specific PAMPs. In this model, overall murine mortalitywith the isogenic strain was 45% at day 10 post infection.Similarly, the nctA null mutant also showed 50% mortality at theend of the infection time course. Although the nctA rec strainshowed a slightly increased mortality compared with the otherstrains, no significant differences were observed in virulencebetween the all tested strains (Fig. 8b).One potential hypothesis that could explain the retention of
virulence of the nctA null mutant is the aberrant immunogenicproperties observed in the mutant in vitro. However, nosignificant differences were observed in the expression levels ofcytokine-encoding genes (TNF-α, IL12 and IL-6) between thestrains at 36 h post inoculation (p.i.) (Fig. 8c). Furthermore, noobvious difference in the inflammatory response was observedbetween the strains in histopathology (Fig. 8d). Contrary to ourexpectation from the in vitro studies, the nctA null mutantshowed an indistinguishable level of fungal burden with theisogenic control at 36 h p.i. (Fig. 8e). These results suggest thatpathogenicity is maintained in this strain as its growth is notsignificantly altered in vivo, and our results add to the growingbody of evidence that poor in vitro growth is not an absoluteindicator of virulence defects49,50.
DiscussionIn this study, we have constructed a 484 members transcriptionfactor null mutant library with the aim of providing a systematicevaluation of regulators that contribute to azole resistance inA. fumigatus. This library now provides an opportunity for thefungal community to further explore regulatory mechanisms andfactors in the pathobiology of this important human fungalpathogen. To date, much of our understanding of azole tolerancehas been driven by hypotheses derived from model organismsthat have significantly superior functional genomic resources.Functional screens of transcription factor null mutant librarieshave been performed in the model yeasts S. cerevisiae51 andSchizosaccharomyces pombe52, the model filamentous fungusNeurospora crassa53 and the pathogenic yeasts Cryptococcusneoformans54 and Candida albicans55. Although these studieshave proven to be effective in uncovering a number key regulatorsof drug resistance, the roles of transcription factors can varysignificantly from species to species and large-scale transcrip-tional rewiring is frequently observed (for a review see ref. 56). Forexample, loss of the A. fumigatus pH-responsive transcriptionalregulator PacC, results in a >20-fold increase in flucytosine sen-sitivity in A. fumigatus57, however, loss of the orthologue in yeast(RIM101) leads to an increase in flucytosine resistance54,55. Ourscreen of azole resistance in A. fumigatus highlights significantdifferences in the transcriptional regulation of azole tolerance infilamentous fungi compared with yeasts. Of the 12 transcription
factors identified in our screen as having altered susceptibility toitraconazole, only half HapB, SreA (SrbA)54, AdaB35,58, GisB59
CreA and HapX60 may have been predicted from previousscreening efforts. Of the remaining regulators, functional ortho-logues of AreA exist in yeast (eg. Gat1p and Gln3p in S. cerevi-siae), however, they have not been associated with changes inazole resistance while orthologues of three (NctA, NctB andRscE) are essential for viability, and two (ZipD and AtrR) areabsent in yeasts.We have explored, in detail, the role of the two CBF/NF-Y
family transcription regulators, AFUB_029870 (NctA) andAFUB_045980 (NctB) in azole resistance. The orthologues of theseregulators in S. cerevisiae, known, respectively, as Bur6 and Ncb2,are subunits of a heterotrimeric transcriptional regulator calledNegative Cofactor 2 (NC2). The NC2 complex, originally identifiedas a TBP (TATA-box-binding protein)-associated factor, acts asa negative regulator of RNA polymerase II transcription by inhi-biting formation of the pre-initiation complex (PIC)61,62. Assemblyof the heteromeric PIC is required for transcription from RNA polII-dependent promoters, and its assembly is contingent uponrecruitment of the TBP and the general transcription factors TFIIAand TFIIB. NC2 inhibits PIC formation by preventing theinteraction of TBP with TFIIA and TFIIB [ref. 63 and referencestherein]. The interaction between NCT and the TBP is regulated bythe Swi2/Snf2-type ATPase transcriptional modulator Mot164.Consistent with a role for Mot1 in regulating NCT–TBP complexbinding, we have shown a direct physical interaction between Mot1and NctA in A. fumigatus. Interestingly, it appears that the NCTcomplex also has a direct role in negatively regulating Mot1 activityas expression of mot1 is upregulated in the nctA null mutants andbinding sites for the NCT are found in the mot1 promoter (Sup-plementary Data 2). In keeping with the role of the NCT as ageneral transcriptional cofactor, genome-wide binding studies in S.cerevisiae, C. albicans and H. sapiens have revealed interaction within excess of 20% of all RNA pol II gene promoters63–66. Thesefinding are consistent with our observation that NctA binds thepromoters of over 30% of protein encoding genes of A. fumigatus,however, given this general role, what appears remarkable is thatnctA and nctB are not essential for viability of this fungus as theyare in yeasts44 and loss of function mutants have clear and veryspecific phenotypic traits.We have shown that loss of the NCT complex leads to a large
increase in MIC to the azoles, most notably for posaconazolewhere we observed a shift in MIC from 0.25 mg/L to >16 mg/L.This phenotype is associated with transcriptional dysregulation ofthe ergosterol biosynthetic pathway directly and indirectly viasrbA10, atrR11,15 and hapC12, an increase in cellular ergosterollevels (c. 1.6-fold) and an increase in levels of the Cdr1B azoletransporter (2.4-fold) (see model in Fig. 9). Although the increasein sterol levels in the NCT mutants is rather modest andapparently out of keeping with the large increase in MIC, recentevidence does not support a direct linear relationship betweenergosterol levels and azole tolerance. Rybak et al. describedmutation in the sterol sensing domain of hmg1 (hmg1F262del) thatresults in an apparent de-repression of ergosterol biosynthesisleading to a modest increase (1.6-fold) in ergosterol levels, but amuch higher relative increase in MIC to itraconazole and isavu-conazole (eight-fold)67. The reason for this incongruity is unclear,however, studies in S. cerevisiae have highlighted that changes inthe composition of the plasma membrane affect the function oftransporters. For example, depletion in sterol levels caused by lossof erg4 or erg6 leads to a reduction in the activity of the multi-drug-resistance transporter Pdr568, and ergosterol is required tocorrectly localise the azole exporter Cdr1p in C. albicans69. Thisleads us to speculate that even relatively small increases inergosterol content in the cell membrane may lead to large
ARTICLE NATURE COMMUNICATIONS | https://doi.org/10.1038/s41467-019-14191-1
10 NATURE COMMUNICATIONS | (2020) 11:427 | https://doi.org/10.1038/s41467-019-14191-1 | www.nature.com/naturecommunications
increases in azole resistance via an indirect effect on azoletransporter levels. Given the pleiotropic nature of the NCTcomplex, we cannot exclude that further factors may be con-tributing to the high levels of azole resistance evident in the nctA
and nctB null mutants especially in light of our evidence showingthat they are hypersensitive to the cell wall acting agents, andrecent data showing a link between reductions in β-1,3-glucansynthesis and the delayed fungicidal effects of voriconazole70.
0 5 100
50
100
DPI
0 5 10
DPI
Per
cent
sur
viva
l
0
50
100
Per
cent
sur
viva
l
Leukopenic Cortisone acetate
WT
ΔnctA
ΔnctA rec
a b
0
1
2
3
4
Nor
mal
ized
fold
exp
ress
ion
Nor
mal
ized
fold
exp
ress
ion
WT
ΔnctA
nctA
rec
WT
ΔnctA
nctA
rec
WT
ΔnctA
nctA
rec
WT
ΔnctA
nctA
rec
WT
ΔnctA
nctA
rec
WT
ΔnctA
nctA
rec
WT
ΔnctA
nctA
rec
WT
ΔnctA
nctA
rec
0
1
2
3
4
Nor
mal
ized
fold
exp
ress
ion
0
1
2
3
4
Nor
mal
ized
fold
exp
ress
ion
WT
ΔnctA
nctA
rec
WT
ΔnctA
nctA
rec
0
1
2
3
4
Nor
mal
ized
fold
exp
ress
ion
0
1
2
3
4
Nor
mal
ized
fold
exp
ress
ionTNF-α
TNF-α
0
1
2
3
4
5IL6
IL-6
0
1
2
3
4
Nor
mal
ized
fold
exp
ress
ion IL12p35
IL-12p35
0
1
2
3
4
Nor
mal
ized
fold
exp
ress
ion IL12p40
IL-12p40
c Leukopenic
Cortisone acetate
d e
0.0
0.2
0.4
0.6
0.8
1.0
Fun
gal b
urde
n
Fun
gal b
urde
n
0.0
1.0
2.0
3.0Leukopenic Cortisone acetate
WT
ΔnctA
nctA rec
Leukopenic Cortisone acetate
GMS H&E GMS H&E
Fig. 8 Assessing the effect of loss of nctA on the virulence of A. fumigatus in murine infection models. Mice were infected with the wild-type (WT), thenctA null mutant (ΔnctA) or the reconstituted isolate (nctA rec). a, b Kaplan–Meier curve for murine survival for mice treated via (a) intranasal infectionwith 5.0 × 10⁵ conidia after mice were rendered neutropenic by treatment with cyclophosphamide, and (b) intranasal infection with 7.0 × 10⁶ conidia aftercortisone acetate treatment. A log rank analysis was used to compare the results between the strains. c Relative expression levels of proinflammatorycytokines in the infected lung tissues. Data represent the mean of biological triplicates and error bars illustrate the standard deviation. Statisticalsignificance was calculated by Student’s t test. d Histopathology of representative sections of lungs after 36 h post infection with WT, ΔnctA, or nctA rec.Lung sections were stained with haematoxylin–eosin (H&E) for visualisation of the host cells, and Grocott’s Methenamine Silver (GMS) for visualisation ofthe fungal elements. Scale bar: 50 µm. e Quantification of the fungal burden in the infected lungs. The total genomic DNA was extracted from the samelung lobe samples used for the cytokine expression analysis, and fungal DNA concentration was determined by qPCR. Data represent the means ofbiological replicates, and the error bars mean standard deviation. The statistical significance of variances between fungal burdens was calculated by using anon-parametric Mann–Whitney t test. Source data are provided as a Source Data file.
NATURE COMMUNICATIONS | https://doi.org/10.1038/s41467-019-14191-1 ARTICLE
NATURE COMMUNICATIONS | (2020) 11:427 | https://doi.org/10.1038/s41467-019-14191-1 | www.nature.com/naturecommunications 11
The most striking phenotypes that we have observed for thenctA and the nctB null mutants aside from the resistance to theazole class of antifungals is their resistance to the salvage ther-apeutic amphotericin B and terbinafine, which can be used inthe management of patients with chronic or allergic disease19.Cross-resistance to the azoles and terbinafine is understandable, asboth act on the ergosterol biosynthetic pathway (terbinafine,inhibits the action of squalene epoxidase, an enzyme that catalysesthe conversion of squalene to squalene 2,3-epoxide in the ergos-terol biosynthesis pathway71). Cross-resistance between theseagents and amphotericin B is much harder to explain. Ampho-tericin B acts by selectively binding ergosterol in the fungalmembrane and creating pores resulting in leakage of intracellularcontents72. Theoretically therefore, resistance to the azoles causedby upregulation of ergosterol in the cell membrane should lead toincreased sensitivity to amphotericin B as this would enhance theinteraction between the drug and its binding target. Indeed, thisinverse correlation in resistance profiles has been observed inseveral mutants from C. neoformans54 and in ergosterol biosyn-thetic mutants of S. cerevisiae73. Cross-resistance to the azoles andamphotericin B has previously been reported in artificially con-structed yeast mutants. In C. albicans, laboratory generated strainslacking both copies of ERG11 (Cyp51A orthologue) or ERG3(sterol 5,6, desaturase) are viable and resistant to fluconazole.As ergosterol is replaced in their cell membrane by alternativesterols, these isolates are also resistant to amphotericin B74,75.However, depletion of ergosterol levels is clearly not the key causeof amphotericin B resistance in the NCT mutants, as they exhibitan increase in ergosterol content in line with the observedincreased expression of cyp51A and other genes of the ergosterolbiosynthetic pathway. There is limited information on themechanisms of amphotericin B resistance in A. fumigatus, how-ever, it has been suggested that an increase in the production ofoxidative stress-reducing enzymes such as catalases that confersresistance to the oxidising abilities of amphotericin B may con-tribute to resistance75. It is also possible that changes in thestructure of the cell wall architecture in the nctA/nctB null strainsis contributing to amphotericin B resistance by limiting access to
the ergosterol in the cell membrane. Clearly, additional studies areneeded to further define the mechanism of amphotericin resis-tance in these strains. Our results gain greater significance as wehave observed that, despite significant growth defects in vitro, thenctA mutant retained similar levels of virulence and growth inmurine models of infection. This suggests that resistance observedin the nctA/B null mutants may be clinically relevant, however, asrelatively few sequenced A. fumigatus isolates are in the publicdomain, a genetic association between drug resistance and poly-morphisms in nctA and nctB is currently difficult to prove.Clinical guidelines currently suggest that amphotericin B may beused as a salvage therapeutic when initial therapy with vor-iconazole fails18. This would clearly be contraindicated in aninfection with a strain with NctA/NctB-mediated azole resistance,so rapid detection of such isolates would support appropriatealternative therapeutic treatment such as an echinocandin towhich these mutants are extremely sensitive (Fig. 1c).The relevance of our findings for clinical drug resistance in
pathogenic yeasts is unclear. Downregulation of Bur6 and Ncb2, inC. albicans leads to a modest increase in azole resistance, which hasbeen attributed to a slight (ca. 2-fold) increase in cdr1 expression44.To our knowledge however there have been no reports ofamphotericin B resistance in these strains, and resistant clinicalisolates carrying mutations in Bur6 and Ncb2 have not beenreported. Critically, as both Ncb2 and Bur6 are essential for viabilityin C. albicans, null mutants are unlikely to persist in a host setting44.
In summary, we have generated a library of transcription factornull mutants in the fungal pathogen A. fumigatus. This library ispublically available and can be exploited by the research com-munity to provide comprehensive insights into transcriptionalnetworks governing critical factors associated with the cell biol-ogy, pathogenicity and allergenicity in this understudied aetio-logical agent. Using this resource, we have identified the networkof regulators governing azole resistance and identified a novelmechanism that, through a single genetic mutation, is able todrive both high level pan-azole resistance and cross-resistance tothe salvage therapeutic amphotericin B and terbinafine withoutsignificantly impacting virulence.
NctBNctASecondarymetabolism
ABCtransporters
Siderophorebiosynthesis
Elevated CDR1Bproduction
srbA
atrR
hapC
Elevated ergosterolproduction
Ergosterol
Ergosterol biosyntheticpathway
cyp51A
erg25Ahmg1
cdr1B
Azoles
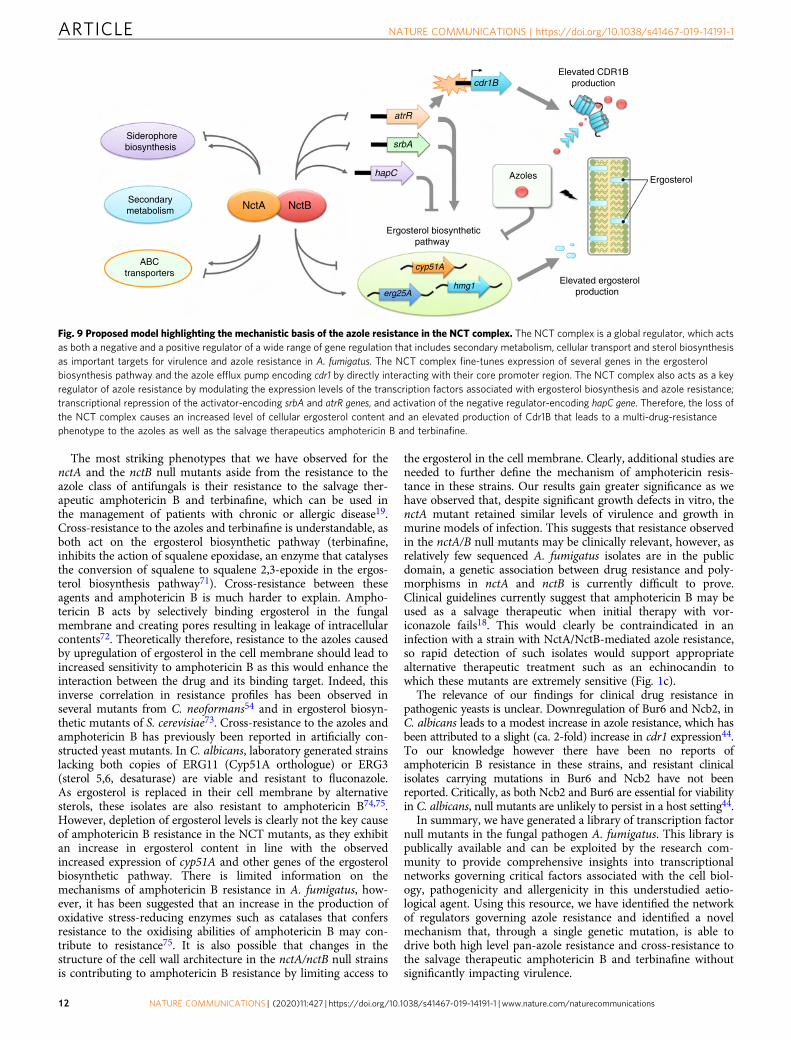
Fig. 9 Proposed model highlighting the mechanistic basis of the azole resistance in the NCT complex. The NCT complex is a global regulator, which actsas both a negative and a positive regulator of a wide range of gene regulation that includes secondary metabolism, cellular transport and sterol biosynthesisas important targets for virulence and azole resistance in A. fumigatus. The NCT complex fine-tunes expression of several genes in the ergosterolbiosynthesis pathway and the azole efflux pump encoding cdr1 by directly interacting with their core promoter region. The NCT complex also acts as a keyregulator of azole resistance by modulating the expression levels of the transcription factors associated with ergosterol biosynthesis and azole resistance;transcriptional repression of the activator-encoding srbA and atrR genes, and activation of the negative regulator-encoding hapC gene. Therefore, the loss ofthe NCT complex causes an increased level of cellular ergosterol content and an elevated production of Cdr1B that leads to a multi-drug-resistancephenotype to the azoles as well as the salvage therapeutics amphotericin B and terbinafine.
ARTICLE NATURE COMMUNICATIONS | https://doi.org/10.1038/s41467-019-14191-1
12 NATURE COMMUNICATIONS | (2020) 11:427 | https://doi.org/10.1038/s41467-019-14191-1 | www.nature.com/naturecommunications
MethodsIn silico identification of transcriptional factors. Putative transcription factorswere identified by through a combinatorial approach. Semantic searches using theterms transcription factor, C6, C2H2, HLH, transcriptional regulator, zinc finger,bZIP, CCAAT, CBF, MYB, DNA binding and TATA were performed to identifygenes annotated as transcription factors within databases at ENSEMBL fungi andASPGD. These were combined with genes annotated as transcription factors at theDBD transcription factor database. Duplicates were removed and each gene wasmanually curated to remove those lacking functional domains associated withtranscription factor function (as deemed by searches for PROSITE, SUPER-FAMILY, SMART or CDD domains) or those that lack functional data indicating adirect role in transactional regulation.
Generation and validation of transcription factor null mutants. The tran-scription factor null mutant collection was generated in the A. fumigatus strainMFIG001 (previously known as A1160 Δku80 pyrG+30). Gene replacement cas-settes were generated using a fusion PCR approach (see Supplementary Fig. 2)29.Briefly, primers P1 and P2 were used to amplify around 1 kb of the 5′ flank, whileP3 and P4 were used to amplify the 3′ flank. Primers hph_F and hph_R were usedto amplify a 2.8 -kb hygromycin B phosphotransferase cassette from pAN7-1. PCRproducts were purified by solid phase extraction with the Qiagen QIAquick® PCRpurification kit (Qiagen). Fusion of the three products was facilitated by the pre-sence of common linker sequences on primers P2 and hph_F, P3 and hph_R andthe use of the nested primers P5 and P6. PCR amplification was carried out usingthe protocols defined by Szewczyk et al.29 Transformation was carried out aspreviously reported30. The sequences of all primers used are given in Supple-mentary Data 1.
Validation of homologous recombination and single integration of the deletioncassette was performed by PCR (Supplementary Fig. 2). PhusionFlash High-Fidelity Master mix (ThermoFisher Scientific) was used for all reactions. PrimersP1 with hph-chk 5′-Rv and hph-chk 3′-Fw with P4 were used to amplify a regionof about 1 kb from within the deletion cassette to the flanking region outside of thedeletion cassette. Furthermore, PCR was performed with P1 and P4 as primers tocheck the purity of the gene knockout strain.
Drug sensitivity screening. Conidia of 484 TFKO strains were inoculated in 25 -mL culture flasks containing ACM+ 100 µM hygromycin. Conidia were harvestedby filtration and counted via optical density measurements. Approximately2000 spores were inoculated per well of a CytoOne® 96-well plate (StarLab) con-taining RPMI-1640 medium 2.0% glucose and 165 mM MOPS buffer (pH 7.0) with0, 0.06, 0.12 or 0.5 mg/L itraconazole. Plates were incubated at 37 °C for 48 h (0,0.06, 0.12 mg/L or 96 h (0.5 mg/L), and optical density measurements were taken at600 nm. Fitness was calculated by normalising optical density to the wild-typestrain. Relative fitness was obtained by normalising fitness under itraconazolechallenge to fitness of this strain under no itraconazole challenge. MIC determi-nation for all drugs was carried out according to methods outlined by EUCAST32.General growth fitness of the transcription factor nul mutants in liquid RPMI-1640medium was determined in the same microculture conditions (n= 3). Relativefitness was obtained by optical density measurements (OD600) normalised to thewild-type strain.
Radial growth germination rate and hyphal extension analysis. Radial growthof the wild-type strain (MFIG001), the nctA null mutant or the nctA reconstitutedstrains was measured by inoculating 500 spores on Aspergillus Minimal Media(AMM), Aspergillus Complete Media (ACM), RPMI-1640 medium with 2.0%glucose and 165 mM MOPS buffer (pH 7.0) or Dulbecco’s Modified Eagle’sMedium (DMEM) on petri dishes. Plates were incubated at 37 °C for 72 h, and theradius of colonies was measured every 24 h.
Germination rate and hyphal extension rate were determined as follows. Intotal, 500 µl of 5 × 10⁵ spores of the strains were inoculated in the RPMI-1640medium containing 2.0% glucose and 165 mM MOPS buffer (pH 7.0) in a 24-wellglass bottom plate. The culture was incubated at 37 °C, and either optical density(600 nm) was measured on a Synergy 2 Multidetection Microplate reader (BioTek)or images were taken on a Leica SP8X confocal microspoce (Leica). Sporulationand hyphal length were measured in ImageJ.
S-tag co-immunoprecipitation. C-terminal S-tagged cassettes were generated byfusion PCR using primers SP1-SP8 (Supplementary Data 1). Three separate PCRreactions were performed for initial amplification of the cassette components.Primers SP1 and SP2 were used to amplify the 5′ flank and TF coding sequence,primers SP3 and SP4 amplified the downstream region of the TF (ca. 1 kb) fromMFIG001 genomic DNA. Primers SP5 and SP6 were used to amplify the S-Tag,G5A linker and pyrG gene from pHL8176 PCR products were purified by solidphase extraction with the QIAquick® PCR purification kit (Qiagen). Fusion of thethree products was facilitated by the presence of linker sequences on primers SP2,SP3, SP5 and SP6 and the use of nested primers SP7 and SP8. The cassette wastransformed into A. fumigatus A1160p- and NctA-S-tag and NctB-S-tag strainswere validated by PCR as described above for the gene KO process. Proteins wereextracted from 16 h shake flask cultures (SAB medium, incubated at 37 °C). Briefly,
biomass was frozen in liquid nitrogen and ground to a fine powder before incu-bation on ice in 6 ml of ice-cold HK buffer (100 mM NaCl) per 1 g biomass for 30min. Samples were centrifuged at 7500 × g for 30 min, and filtered through glasswool to remove cellular debris. To purify the S-tagged proteins, crude proteinextract was incubated with S-protein agarose beads (Novagen) with gentle agitationat 4 °C for 2 h. Samples were centrifuged, and the agarose bead pellet was washed inice-cold HK Buffer with 100 mM NaCl and transferred to a S-Protein spin column(Novagen), where the beads were washed a further six times with 700 µl HK Bufferwith 100 mM NaCl. S-tagged proteins were eluted using 50 µl Laemmli samplebuffer. Eluted proteins were analysed by the Protein Mass Spectrometry at theBiological Mass Spectrometry Core Facility at the University of Manchester.
Chromatin immunoprecipitation (ChIP) of S-tagged NctA. In total, 1 × 10⁶
spores/ml of the wild-type strain (MFIG001) or the S-tagged NctA expressingstrain were grown in 50 ml of Vogel’s minimal medium for 18 h at 37 °C withconstant shaking at 180 rpm. The mycelia were harvested by filtration, washedtwice with distilled water and were transferred into 50 ml of RPMI-1640 medium(Sigma-Aldrich) containing 2.0% glucose and 165 mM MOPS buffer (pH 7.0). Thecells were incubated for 4 h in the absence and the presence (0.5 mg/L) of itraco-nazole at 37 °C under shaking. Cross-linking was carried out by the addition offormaldehyde to a final concentration of 1.0% followed by incubation at 37 °C for20 min. The cross-linked mycelia were ground to a fine powder under liquidnitrogen, and ~100 mg of the mycelial powder was suspended in 1.0 ml of ChIPlysis buffer (50 mM HEPES pH 7.5, 150 mM NaCl, 1 mM EDTA, 1% Triton X-100,0.1% deoxycholate (Sigma D6750), 0.1% SDS, 1 mM PMSF and fungal proteinaseinhibitor cocktail (Sigma)). The cell suspension was then sonicated with aQ125 sonicator (Qsonica, USA) to shear the chromatin to fragments with anaverage size of 0.2–0.5 kbp. After sonication, the insoluble cell debris was pelletedby centrifugation, and the soluble fraction was used for ChIP experiments andinput control preparations. ChIP reaction was performed with an Anti-S-tagpolyclonal antibody (ab18588, abcam) on Dynabeads Protein A magnetic beads(ThermoFischerScientific). Immunoprecipitated DNA was reverse cross-linked,treated with RNaseA (Sigma-Aldrich) and then purified using a MinElute PCRpurification kit (Qiagen). To prepare input control, 100 µL of the sonicated extractwas reverse cross-linked, treated with RNaseA (Sigma-Aldrich) and then purifiedusing a MinElute PCR purification kit (Qiagen).
ChIP-sequencing analysis. ChIP-seq libraries were constructed following themanufacturers instructions for Illumina ChIP-seq library preparation. Eight sam-ples were indexed and sequenced in a single lane on the Illumina HiSeq2500 aspaired-end reads.
Raw sequencing reads were quality controlled with Illumina chastity filter andfastqc v0.11.3, and then Illumina adapters were trimmed from them usingTrimmomatic. The resulting reads were aligned to the A. fumigatus A1163 CADREgenome from Ensemble fungi, version 26 using Bowtie2. Peak calling was carriedout using a Model-based Analysis for ChIP-Sequencing (MACS277) version 2.1.0with a q-value cut-off of 0.01. The results reported herein are for the combinedreads from two biological replicate samples. All ChIP-seq experiments were carriedout in two biological replicate samples. All ChIP-seq data sets are deposited in theNCBI Gene Expression Omnibus (GEO; https://www.ncbi.nlm.nih.gov/geo/) underaccession number GSE129967 in a GEO Superseries GSE133491.
Conserved motif discovery. The reproducible 100 bp of the merged ChIP peakregions with more than twofold read enrichment compared to the correspondingwere analysed for conserved nucleotide motifs using the MEME suite78 version4.12.0. DNA sequence of the ChIP peak regions was retrieved from the genomiclocations using the getfasta function from the BED tools suite79 and analysed withthe default setting.
Transcriptomic analysis. In total, 1 × 10⁶ spores/ml of the wild-type (MFIG001),the nctA null or the nctB null mutant was grown in 50 ml of Vogel’s minimalmedium containing 1.0% glucose for 18 h at 37 °C on a rotary shaker (180 rpm).Mycelia were collected by filtration, and washed twice with distilled water. About1.0 g of wet mycelia were transferred into 50 ml of RPMI-1640 medium containing2.0% glucose and 165 mM MOPS buffer (pH 7.0), and the cells were incubated for4 h in the absence and the presence of itraconazole (0.5 mg/mL) at 37 °C withshaking. The drug-treated mycelia were then collected by filtration, immediatelyfrozen with liquid nitrogen and kept at −80 °C until use.
The total RNA was extracted using TRI Reagent® (Sigma-Aldrich) according tothe manufacture’s instructions. The extracted RNA samples were treated with RQ1RNase-Free DNase (Promega) and further purified using the RNeasy Mini Kit(Qiagen).
For paired-end RNA sequencing, libraries were generated using the TruSeq®Stranded mRNA assay (Illumina, Inc.), according to the manufacturer’sinstructions. Eight samples were indexed and sequenced in a single lane on theIllumina HiSeq2500. Generated Fastq files were analysed with FastQC, and anylow-quality reads were trimmed with Trimmomatic. All libraries were aligned tothe A. fumigatus A1163 genome assembly GCA_000150145.1) with the geneannotation from CADRE/Ensembl Fungi v24 using Bowtie, and only matches with
NATURE COMMUNICATIONS | https://doi.org/10.1038/s41467-019-14191-1 ARTICLE
NATURE COMMUNICATIONS | (2020) 11:427 | https://doi.org/10.1038/s41467-019-14191-1 | www.nature.com/naturecommunications 13
the best score were reported for each read. All RNA-seq experiments were carriedout in three biological replicates.
Differential expression analysis was performed using DESeq80.All RNA-seq data sets are available in the NCBI Gene Expression Omnibus
under accession number GSE133464 in a GEO Superseries GSE133491.
Gene set enrichment analysis. Gene ontology, functional category and KEGGpathway enrichment analysis were carried out using the FungiFun2 2.2.8 BETA81
web-based server (https://elbe.hki-jena.de/fungifun/fungifun.php) with the A.fumigatus A1163 genome annotation. Differentially expressed genes showing morethan twofold enrichment with FDR < 0.05 were subjected to the enrichment ana-lysis. Significance level of the enrichment was analysed using the Benjamini-Hochberg adjustment method with a P-value cut-off <0.05.
Sterol analysis. Conidia (1 × 10⁶) were grown in 50 mL RPMI-1640, incubated for24 h at 37 °C with shaking (200 rpm). Mycelia were harvested, freeze dried and dryweights obtained prior to processing. Pellets were sonicated thoroughly (6 × 30 swith Branson Digital Sonifier 250) in 1 ml of ddH2O, and an internal standard of10 µg of cholesterol was added to each sample.
Sterols were extracted and derivatised as previously described82. Briefly, lipidswere saponified using alcoholic KOH and non-saponifiable lipids extracted withhexane. Samples were dried in a vacuum centrifuge and were derivatised by theaddition of 0.1 ml BSTFA TMCS (99:1, Sigma-Aldrich) and 0.3 ml anhydrouspyridine (Sigma-Aldrich) and heating at 80 °C for 2 h. TMS-derivatised sterolswere analysed and identified using GC/MS (Thermo 1300 GC coupled to a ThermoISQ mass spectrometer, ThermoFischerScientific) and Xcalibur software(ThermoFischerScientific). The retention times and fragmentation spectra forknown standards were used to identify sterols. The quantity of ergosterol (w/w)was calculated using the peak areas of ergosterol and the cholesterol internalstandard from triplicate samples.
Western blotting of CDR1B. In total, 1 × 10⁶ of A. fumigatus conidia wereinoculated in a petri dish containing 20 mL of Sabouraud dextrose broth at 37 °Cfor 16 h. Mycelium that formed as a biofilm on the top was collected (100 mg), andwas ground into fine powder in liquid nitrogen using a mortar and pestle. Theground mycelium was resuspended in 0.5 ml of 10% trichloroacetic acid (TCA),thoroughly vortexed, incubated for 5 min at room temperature and then washedthree times in 90% acetone with 20 mM HCl and air dried. The TCA precipitatewas then extracted with 8M urea sample buffer (8 M urea, 5% SDS, 1% β-ME,40 mM Tris-HCl (pH 8.0), with traces of bromophenol blue). Aliquots of thissuspension were electrophoresed by 10% SDS-PAGE and then transferred to anitrocellulose membrane. The membrane was blocked with 5% non-fat dry milk inphosphate-buffered saline with 0.1% Tween 20, and then probed with a polyclonalrabbit antiserum. The rabbit anti-CDR1B polyclonal antibody48 was used with ahorseradish peroxidase-conjugated secondary antibody (NA934V, GE Healthcare)and a SuperSignal West Pico chemiluminescent substrate (ThermoFisher Scientific)to visualise imunoreactive protein on an X-ray film.
Murine infection models. The murine infection experiments were performedunder UK Home office Project Licence PDF8402B7 and approved by the Uni-versity of Manchester Ethics Committee.
A. fumigatus strains were cultured on ACM containing 5 mM ammoniumtartrate for 6 days at 37 °C, and conidia were harvested in sterile saline and used forinfection experiments.
CD1 male mice (Charles River UK, Ltd.) were housed in groups of 3–4 in IVCcages with access to food and water ab libitum. All mice were given 2 g/Lneomycine sulphate in their drinking water throughout the course of the study. Forthe leukopenic model of infection, mice were rendered leukopenic byadministration of cyclophosphamide (150 mg/kg of body weight; intraperitoneal)on days −3, −1,+ 2 and every subsequent third day, and a single subcutaneousdose of cortisone acetate (250 mg/kg) was administrated on day −1. For thecortisone acetate model, mice were immunosuppressed with cortisone acetate (250mg/kg), which were administrated subcutaneously on days −3, −1,+ 2 and everysubsequent third day. Mice were anaesthetised by exposure to 2–3% inhalationalisoflurane and infected by intranasally with a spore suspension of 1.25 × 10⁷
conidia/ml (leukopenic model) or 1.75 × 10⁸conidia/ml (cortisone acetate model)in 40 µl of saline solution. Mice were weighed every 24 h from day −3, relative today of infection, and visual inspections were made twice daily. In the majority ofcases, the endpoint for survival in experimentation was a 20% reduction in bodyweight measured from day of infection, at which point mice were killed.Kaplan–Meier survival analysis was used to create a population survival curve andto estimate survival over time, and p-values were calculated through a log rankanalysis.
Histology analysis. Immunosuppressed male CD1 mice (n= 3) were infected asdescribed above. After 36 h of infection, mice were killed and lungs were parti-tioned into lobes destined for histology analysis or fungal burden and cytokinemRNA expression analysis. Lobes for fungal burden and cytokine analysis weresnap-frozen in liquid nitrogen and stored at −80 °C until use. Lobes for histological
analysis were immediately fixed in 4.0% (v/v) formaldehyde (Sigma-Aldrich), andsubsequently embedded in paraffin. Four-micrometer sections were stained withhaematoxylin–eosin (H&E) and Grocott’s Methenamine Silver (G.M.S). Imageswere taken using a Pannoramic 250 Flash Slide Scanner (3D HISTECH) usingbrightfield illumination.
Fungal burden analysis. The total genomic DNA was extracted from the infectedlung samples using a standard CTAB DNA extraction method. Fungal burden wasdetermined by quantitative real-time PCR (qPCR) as described previously83. qPCRwas performed in a 7500 Fast Real-Time PCR system (Applied Biosystems) usingthe SsoAdvanced Universal SYBR Green Supermix (Bio-Rad) with the primerslisted in the Supplementary Dataset 1. Amplification reactions were performed intriplicate in a final volume of 20 µL using 0.5 µM forward primer, 0.5 µM reverseprimer and 100 ng of total DNA. qPCR data were analysed as described83. Thestatistical significance of variances between fungal burdens was calculated by usinga non-parametric Mann–Whitney t test.
Cytokine expression analysis. The total RNA was extracted from the infectedlung samples using the RNeasy kit (Qiagen). First-strand cDNA was synthesisedusing the iScript cDNA synthesis kit (Bio-Rad) with 500 ng of the total RNA as atemplate. Amplification reactions were performed using the iTaq Universal SYBRGreen Supermix (Bio-Rad) in a final volume of 20 µL using 0.5 µM forward primer,0.5 µM reverse primer and 2 µL of fivefold diluted cDNA. Primers used in thisanalysis are listed in Supplementary Dataset 1. Relative expression level of geneexpression was analysed using the ΔΔCt method with the murine actin encodingactB as the reference. Experiments were performed in biological triplicates. A two-sided Student’s t test was used for statistical analysis, where P-value of <0.05 wereconsidered as significant.
Cell toxicity assays. A549 human pulmonary carcinoma epithelial cells (Amer-ican type culture collection, CCL-185) and Raw 264.7 macrophages were usedunder passage 20. Cells were maintained at 37 °C, 5% CO2 in Dulbecco’s ModifiedEagle’s Medium (DMEM), 10% foetal bovine serum (FBS) and 1%penicillin–streptomycin (Sigma-Aldrich). For all experiments, 2 × 10⁵ A549 orRAW 264.7 cells were seeded in 24-well plates and incubated for 16 h whenconfluence equals 90%. Cells were then challenged with 105 spores of ΔnctA, nctArec and the isogenic control and incubated for 24 h. Following co-incubation withA. fumigatus spores, cell culture supernatants were collected, and the level ofinflammatory markers or cell toxicity via lactate dehydrogenase assay were mea-sured (Promega).
The concentration of IL-8 and IL-6 were determined in A549 epithelial cells co-cultured with A. fumigatus strains by using the Human IL-8/CXCL8 and IL-6DuoSet ELISA according to the manufacturer’s instructions (R&D systems).Experiments were performed in five biological replicates and technical triplicates.For data analysis, a four-parameter logistic (4-PL) curve was created plotting theabsorbance versus Log10 concentration of the standards and then sampleconcentrations determined by using a non-linear regression. Differences in IL-8and IL-6 concentration between A549 cells challenged with ΔnctA, nctA rec and theisogenic control spores and uninfected controls were determined by one-waymultiparametric ANOVA with Dunnet’s correction using GraphPad Prism 7.0 (LaJolla, CA, USA).
BMDC culture. GM-CSF induced BMDCs were generated as previously descri-bed84. Briefly, bone marrow cells from C57BL/6 mice were seeded at 2 × 10⁵/mL incomplete media (RPMI-1640 (Sigma) plus 20 ng/mL GM-CSF (Peprotech), 10%FCS, 2 mM L-glutamine (Gibco), 100 U/mL penicillin 100 µg/mL streptomycin(Sigma)). Cells were cultured for 10 days, with 50% of the media replaced on days3, 6 and 8. On day 10, DCs were re-plated at 2 × 10⁵ cells/well, with 10 × 105 A.fumigatus spores (MOI 5:1), and incubated for 6 h at 37 °C.
Flow cytometry and ELISA. Post incubation, cells were taken for flow cytometry,and supernatants for ELISA. Cells were plated at 1 × 10⁶ cells/well, washed twice inPBS, and stained with Zombie UV (Biolegend). FcR block (Biolegend) was thenadded, in addition to the following antibodies: CD11c-APCef780, CD40-PE CD80-PerCP/Cy5.5 (all Biolegend). Cells were washed twice in flow buffer (PBS 2 mMEDTA (Sigma) 2% FCS (Sigma)), and samples were acquired on a BD Fortessa, andanalysed using Flowjo v10 (TreeStar). Cytokines for ELISA were measured usingpurified coating, detection antibodies and standards (Biolegend) or duosets (R&D),as per the manufacturers protocol.
TEM imaging. For transmission electron microscopy, the samples were fixed with4% formaldehyde+ 2.5% glutaraldehyde in 0.1 M HEPES buffer (pH 7.2). Thensamples were incubated in 1% sodium met-periodate (in H2O) for 1 h. After thatthey were postfixed with 1% osmium tetroxide+ 1.5% potassium ferrocynaide in0.1 M cacodylate buffer (pH 7.2) for 1 h and finally in 1% uranyl acetate in waterfor 1 h. Specimens were dehydrated in ethanol series infiltrated with TAAB LowViscosity resin and polymerised for 24 h at 60 °C. Sections were cut with ReichertUltracut ultramicrotome and observed with FEI Tecnai 12 Biotwin microscope at
ARTICLE NATURE COMMUNICATIONS | https://doi.org/10.1038/s41467-019-14191-1
14 NATURE COMMUNICATIONS | (2020) 11:427 | https://doi.org/10.1038/s41467-019-14191-1 | www.nature.com/naturecommunications
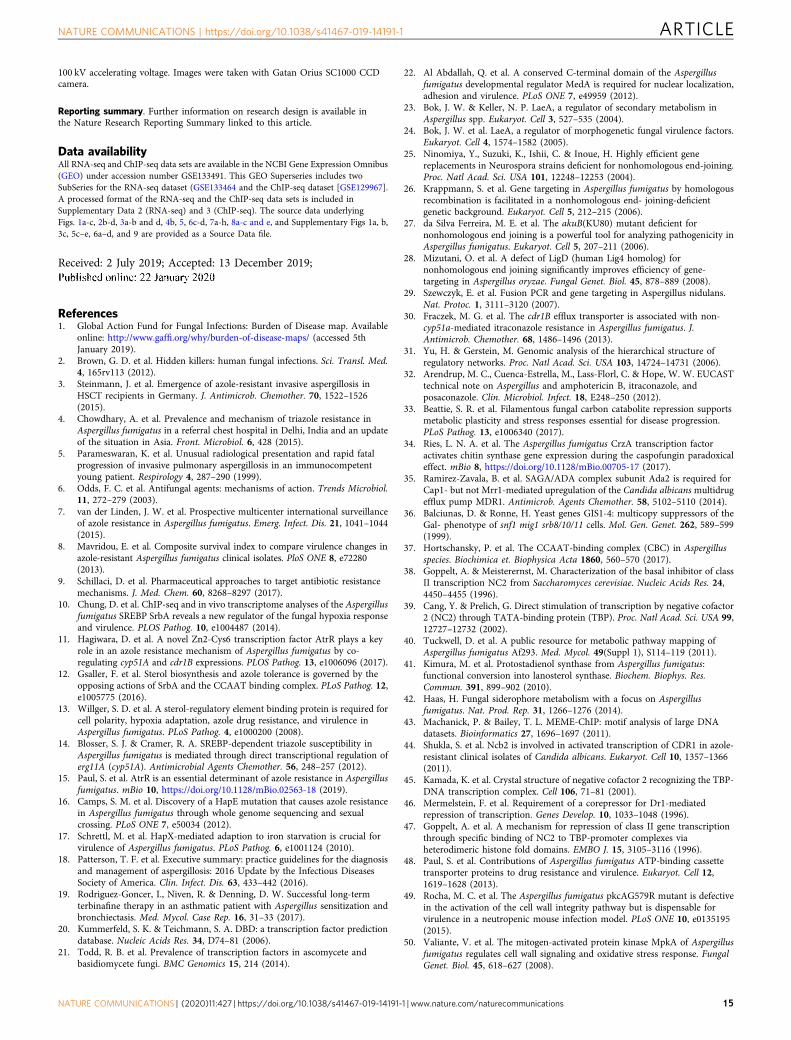
100 kV accelerating voltage. Images were taken with Gatan Orius SC1000 CCDcamera.
Reporting summary. Further information on research design is available inthe Nature Research Reporting Summary linked to this article.
Data availabilityAll RNA-seq and ChIP-seq data sets are available in the NCBI Gene Expression Omnibus(GEO) under accession number GSE133491. This GEO Superseries includes twoSubSeries for the RNA-seq dataset (GSE133464 and the ChIP-seq dataset [GSE129967].A processed format of the RNA-seq and the ChIP-seq data sets is included inSupplementary Data 2 (RNA-seq) and 3 (ChIP-seq). The source data underlyingFigs. 1a-c, 2b-d, 3a-b and d, 4b, 5, 6c-d, 7a-h, 8a-c and e, and Supplementary Figs 1a, b,3c, 5c–e, 6a–d, and 9 are provided as a Source Data file.
Received: 2 July 2019; Accepted: 13 December 2019;
References1. Global Action Fund for Fungal Infections: Burden of Disease map. Available
online: http://www.gaffi.org/why/burden-of-disease-maps/ (accessed 5thJanuary 2019).
2. Brown, G. D. et al. Hidden killers: human fungal infections. Sci. Transl. Med.4, 165rv113 (2012).
3. Steinmann, J. et al. Emergence of azole-resistant invasive aspergillosis inHSCT recipients in Germany. J. Antimicrob. Chemother. 70, 1522–1526(2015).
4. Chowdhary, A. et al. Prevalence and mechanism of triazole resistance inAspergillus fumigatus in a referral chest hospital in Delhi, India and an updateof the situation in Asia. Front. Microbiol. 6, 428 (2015).
5. Parameswaran, K. et al. Unusual radiological presentation and rapid fatalprogression of invasive pulmonary aspergillosis in an immunocompetentyoung patient. Respirology 4, 287–290 (1999).
6. Odds, F. C. et al. Antifungal agents: mechanisms of action. Trends Microbiol.11, 272–279 (2003).
7. van der Linden, J. W. et al. Prospective multicenter international surveillanceof azole resistance in Aspergillus fumigatus. Emerg. Infect. Dis. 21, 1041–1044(2015).
8. Mavridou, E. et al. Composite survival index to compare virulence changes inazole-resistant Aspergillus fumigatus clinical isolates. PloS ONE 8, e72280(2013).
9. Schillaci, D. et al. Pharmaceutical approaches to target antibiotic resistancemechanisms. J. Med. Chem. 60, 8268–8297 (2017).
10. Chung, D. et al. ChIP-seq and in vivo transcriptome analyses of the Aspergillusfumigatus SREBP SrbA reveals a new regulator of the fungal hypoxia responseand virulence. PLOS Pathog. 10, e1004487 (2014).
11. Hagiwara, D. et al. A novel Zn2-Cys6 transcription factor AtrR plays a keyrole in an azole resistance mechanism of Aspergillus fumigatus by co-regulating cyp51A and cdr1B expressions. PLOS Pathog. 13, e1006096 (2017).
12. Gsaller, F. et al. Sterol biosynthesis and azole tolerance is governed by theopposing actions of SrbA and the CCAAT binding complex. PLoS Pathog. 12,e1005775 (2016).
13. Willger, S. D. et al. A sterol-regulatory element binding protein is required forcell polarity, hypoxia adaptation, azole drug resistance, and virulence inAspergillus fumigatus. PLoS Pathog. 4, e1000200 (2008).
14. Blosser, S. J. & Cramer, R. A. SREBP-dependent triazole susceptibility inAspergillus fumigatus is mediated through direct transcriptional regulation oferg11A (cyp51A). Antimicrobial Agents Chemother. 56, 248–257 (2012).
15. Paul, S. et al. AtrR is an essential determinant of azole resistance in Aspergillusfumigatus. mBio 10, https://doi.org/10.1128/mBio.02563-18 (2019).
16. Camps, S. M. et al. Discovery of a HapE mutation that causes azole resistancein Aspergillus fumigatus through whole genome sequencing and sexualcrossing. PLoS ONE 7, e50034 (2012).
17. Schrettl, M. et al. HapX-mediated adaption to iron starvation is crucial forvirulence of Aspergillus fumigatus. PLoS Pathog. 6, e1001124 (2010).
18. Patterson, T. F. et al. Executive summary: practice guidelines for the diagnosisand management of aspergillosis: 2016 Update by the Infectious DiseasesSociety of America. Clin. Infect. Dis. 63, 433–442 (2016).
19. Rodriguez-Goncer, I., Niven, R. & Denning, D. W. Successful long-termterbinafine therapy in an asthmatic patient with Aspergillus sensitization andbronchiectasis. Med. Mycol. Case Rep. 16, 31–33 (2017).
20. Kummerfeld, S. K. & Teichmann, S. A. DBD: a transcription factor predictiondatabase. Nucleic Acids Res. 34, D74–81 (2006).
21. Todd, R. B. et al. Prevalence of transcription factors in ascomycete andbasidiomycete fungi. BMC Genomics 15, 214 (2014).
22. Al Abdallah, Q. et al. A conserved C-terminal domain of the Aspergillusfumigatus developmental regulator MedA is required for nuclear localization,adhesion and virulence. PLoS ONE 7, e49959 (2012).
23. Bok, J. W. & Keller, N. P. LaeA, a regulator of secondary metabolism inAspergillus spp. Eukaryot. Cell 3, 527–535 (2004).
24. Bok, J. W. et al. LaeA, a regulator of morphogenetic fungal virulence factors.Eukaryot. Cell 4, 1574–1582 (2005).
25. Ninomiya, Y., Suzuki, K., Ishii, C. & Inoue, H. Highly efficient genereplacements in Neurospora strains deficient for nonhomologous end-joining.Proc. Natl Acad. Sci. USA 101, 12248–12253 (2004).
26. Krappmann, S. et al. Gene targeting in Aspergillus fumigatus by homologousrecombination is facilitated in a nonhomologous end- joining-deficientgenetic background. Eukaryot. Cell 5, 212–215 (2006).
27. da Silva Ferreira, M. E. et al. The akuB(KU80) mutant deficient fornonhomologous end joining is a powerful tool for analyzing pathogenicity inAspergillus fumigatus. Eukaryot. Cell 5, 207–211 (2006).
28. Mizutani, O. et al. A defect of LigD (human Lig4 homolog) fornonhomologous end joining significantly improves efficiency of gene-targeting in Aspergillus oryzae. Fungal Genet. Biol. 45, 878–889 (2008).
29. Szewczyk, E. et al. Fusion PCR and gene targeting in Aspergillus nidulans.Nat. Protoc. 1, 3111–3120 (2007).
30. Fraczek, M. G. et al. The cdr1B efflux transporter is associated with non-cyp51a-mediated itraconazole resistance in Aspergillus fumigatus. J.Antimicrob. Chemother. 68, 1486–1496 (2013).
31. Yu, H. & Gerstein, M. Genomic analysis of the hierarchical structure ofregulatory networks. Proc. Natl Acad. Sci. USA 103, 14724–14731 (2006).
32. Arendrup, M. C., Cuenca-Estrella, M., Lass-Florl, C. & Hope, W. W. EUCASTtechnical note on Aspergillus and amphotericin B, itraconazole, andposaconazole. Clin. Microbiol. Infect. 18, E248–250 (2012).
33. Beattie, S. R. et al. Filamentous fungal carbon catabolite repression supportsmetabolic plasticity and stress responses essential for disease progression.PLoS Pathog. 13, e1006340 (2017).
34. Ries, L. N. A. et al. The Aspergillus fumigatus CrzA transcription factoractivates chitin synthase gene expression during the caspofungin paradoxicaleffect. mBio 8, https://doi.org/10.1128/mBio.00705-17 (2017).
35. Ramirez-Zavala, B. et al. SAGA/ADA complex subunit Ada2 is required forCap1- but not Mrr1-mediated upregulation of the Candida albicans multidrugefflux pump MDR1. Antimicrob. Agents Chemother. 58, 5102–5110 (2014).
36. Balciunas, D. & Ronne, H. Yeast genes GIS1-4: multicopy suppressors of theGal- phenotype of snf1 mig1 srb8/10/11 cells. Mol. Gen. Genet. 262, 589–599(1999).
37. Hortschansky, P. et al. The CCAAT-binding complex (CBC) in Aspergillusspecies. Biochimica et. Biophysica Acta 1860, 560–570 (2017).
38. Goppelt, A. & Meisterernst, M. Characterization of the basal inhibitor of classII transcription NC2 from Saccharomyces cerevisiae. Nucleic Acids Res. 24,4450–4455 (1996).
39. Cang, Y. & Prelich, G. Direct stimulation of transcription by negative cofactor2 (NC2) through TATA-binding protein (TBP). Proc. Natl Acad. Sci. USA 99,12727–12732 (2002).
40. Tuckwell, D. et al. A public resource for metabolic pathway mapping ofAspergillus fumigatus Af293. Med. Mycol. 49(Suppl 1), S114–119 (2011).
41. Kimura, M. et al. Protostadienol synthase from Aspergillus fumigatus:functional conversion into lanosterol synthase. Biochem. Biophys. Res.Commun. 391, 899–902 (2010).
42. Haas, H. Fungal siderophore metabolism with a focus on Aspergillusfumigatus. Nat. Prod. Rep. 31, 1266–1276 (2014).
43. Machanick, P. & Bailey, T. L. MEME-ChIP: motif analysis of large DNAdatasets. Bioinformatics 27, 1696–1697 (2011).
44. Shukla, S. et al. Ncb2 is involved in activated transcription of CDR1 in azole-resistant clinical isolates of Candida albicans. Eukaryot. Cell 10, 1357–1366(2011).
45. Kamada, K. et al. Crystal structure of negative cofactor 2 recognizing the TBP-DNA transcription complex. Cell 106, 71–81 (2001).
46. Mermelstein, F. et al. Requirement of a corepressor for Dr1-mediatedrepression of transcription. Genes Develop. 10, 1033–1048 (1996).
47. Goppelt, A. et al. A mechanism for repression of class II gene transcriptionthrough specific binding of NC2 to TBP-promoter complexes viaheterodimeric histone fold domains. EMBO J. 15, 3105–3116 (1996).
48. Paul, S. et al. Contributions of Aspergillus fumigatus ATP-binding cassettetransporter proteins to drug resistance and virulence. Eukaryot. Cell 12,1619–1628 (2013).
49. Rocha, M. C. et al. The Aspergillus fumigatus pkcAG579R mutant is defectivein the activation of the cell wall integrity pathway but is dispensable forvirulence in a neutropenic mouse infection model. PLoS ONE 10, e0135195(2015).
50. Valiante, V. et al. The mitogen-activated protein kinase MpkA of Aspergillusfumigatus regulates cell wall signaling and oxidative stress response. FungalGenet. Biol. 45, 618–627 (2008).
NATURE COMMUNICATIONS | https://doi.org/10.1038/s41467-019-14191-1 ARTICLE
NATURE COMMUNICATIONS | (2020) 11:427 | https://doi.org/10.1038/s41467-019-14191-1 | www.nature.com/naturecommunications 15
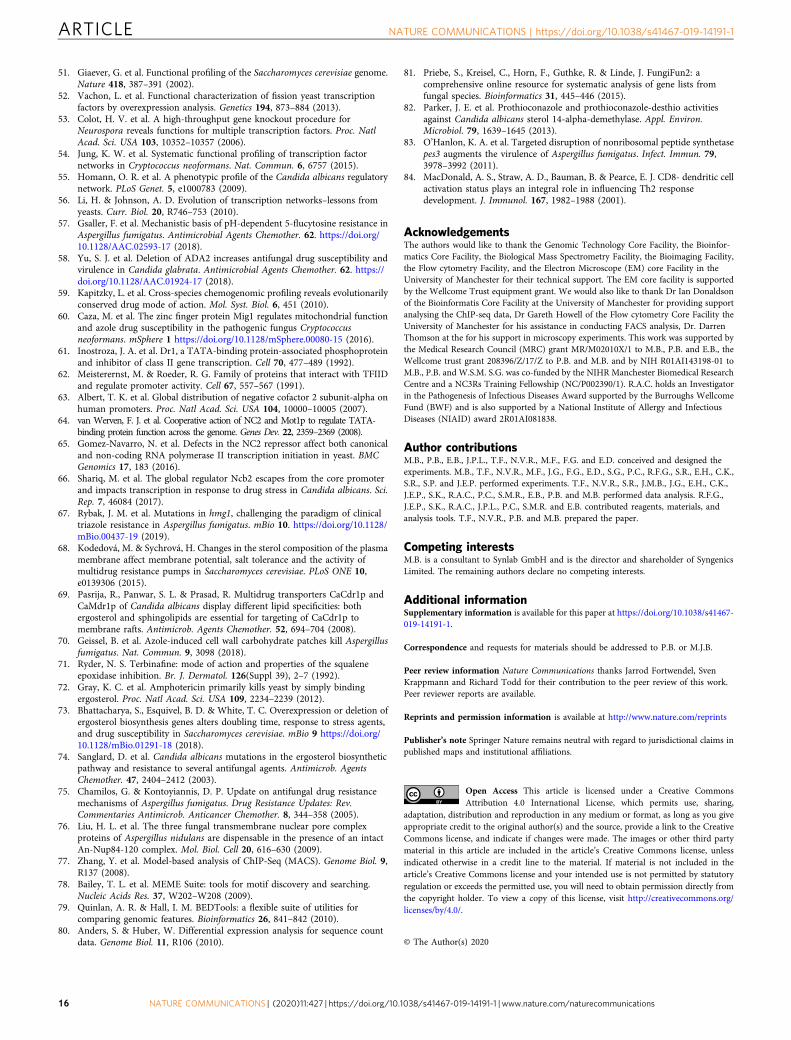
51. Giaever, G. et al. Functional profiling of the Saccharomyces cerevisiae genome.Nature 418, 387–391 (2002).
52. Vachon, L. et al. Functional characterization of fission yeast transcriptionfactors by overexpression analysis. Genetics 194, 873–884 (2013).
53. Colot, H. V. et al. A high-throughput gene knockout procedure forNeurospora reveals functions for multiple transcription factors. Proc. NatlAcad. Sci. USA 103, 10352–10357 (2006).
54. Jung, K. W. et al. Systematic functional profiling of transcription factornetworks in Cryptococcus neoformans. Nat. Commun. 6, 6757 (2015).
55. Homann, O. R. et al. A phenotypic profile of the Candida albicans regulatorynetwork. PLoS Genet. 5, e1000783 (2009).
56. Li, H. & Johnson, A. D. Evolution of transcription networks–lessons fromyeasts. Curr. Biol. 20, R746–753 (2010).
57. Gsaller, F. et al. Mechanistic basis of pH-dependent 5-flucytosine resistance inAspergillus fumigatus. Antimicrobial Agents Chemother. 62. https://doi.org/10.1128/AAC.02593-17 (2018).
58. Yu, S. J. et al. Deletion of ADA2 increases antifungal drug susceptibility andvirulence in Candida glabrata. Antimicrobial Agents Chemother. 62. https://doi.org/10.1128/AAC.01924-17 (2018).
59. Kapitzky, L. et al. Cross-species chemogenomic profiling reveals evolutionarilyconserved drug mode of action. Mol. Syst. Biol. 6, 451 (2010).
60. Caza, M. et al. The zinc finger protein Mig1 regulates mitochondrial functionand azole drug susceptibility in the pathogenic fungus Cryptococcusneoformans. mSphere 1 https://doi.org/10.1128/mSphere.00080-15 (2016).
61. Inostroza, J. A. et al. Dr1, a TATA-binding protein-associated phosphoproteinand inhibitor of class II gene transcription. Cell 70, 477–489 (1992).
62. Meisterernst, M. & Roeder, R. G. Family of proteins that interact with TFIIDand regulate promoter activity. Cell 67, 557–567 (1991).
63. Albert, T. K. et al. Global distribution of negative cofactor 2 subunit-alpha onhuman promoters. Proc. Natl Acad. Sci. USA 104, 10000–10005 (2007).
64. van Werven, F. J. et al. Cooperative action of NC2 and Mot1p to regulate TATA-binding protein function across the genome. Genes Dev. 22, 2359–2369 (2008).
65. Gomez-Navarro, N. et al. Defects in the NC2 repressor affect both canonicaland non-coding RNA polymerase II transcription initiation in yeast. BMCGenomics 17, 183 (2016).
66. Shariq, M. et al. The global regulator Ncb2 escapes from the core promoterand impacts transcription in response to drug stress in Candida albicans. Sci.Rep. 7, 46084 (2017).
67. Rybak, J. M. et al. Mutations in hmg1, challenging the paradigm of clinicaltriazole resistance in Aspergillus fumigatus. mBio 10. https://doi.org/10.1128/mBio.00437-19 (2019).
68. Kodedová, M. & Sychrová, H. Changes in the sterol composition of the plasmamembrane affect membrane potential, salt tolerance and the activity ofmultidrug resistance pumps in Saccharomyces cerevisiae. PLoS ONE 10,e0139306 (2015).
69. Pasrija, R., Panwar, S. L. & Prasad, R. Multidrug transporters CaCdr1p andCaMdr1p of Candida albicans display different lipid specificities: bothergosterol and sphingolipids are essential for targeting of CaCdr1p tomembrane rafts. Antimicrob. Agents Chemother. 52, 694–704 (2008).
70. Geissel, B. et al. Azole-induced cell wall carbohydrate patches kill Aspergillusfumigatus. Nat. Commun. 9, 3098 (2018).
71. Ryder, N. S. Terbinafine: mode of action and properties of the squaleneepoxidase inhibition. Br. J. Dermatol. 126(Suppl 39), 2–7 (1992).
72. Gray, K. C. et al. Amphotericin primarily kills yeast by simply bindingergosterol. Proc. Natl Acad. Sci. USA 109, 2234–2239 (2012).
73. Bhattacharya, S., Esquivel, B. D. & White, T. C. Overexpression or deletion ofergosterol biosynthesis genes alters doubling time, response to stress agents,and drug susceptibility in Saccharomyces cerevisiae. mBio 9 https://doi.org/10.1128/mBio.01291-18 (2018).
74. Sanglard, D. et al. Candida albicans mutations in the ergosterol biosyntheticpathway and resistance to several antifungal agents. Antimicrob. AgentsChemother. 47, 2404–2412 (2003).
75. Chamilos, G. & Kontoyiannis, D. P. Update on antifungal drug resistancemechanisms of Aspergillus fumigatus. Drug Resistance Updates: Rev.Commentaries Antimicrob. Anticancer Chemother. 8, 344–358 (2005).
76. Liu, H. L. et al. The three fungal transmembrane nuclear pore complexproteins of Aspergillus nidulans are dispensable in the presence of an intactAn-Nup84-120 complex. Mol. Biol. Cell 20, 616–630 (2009).
77. Zhang, Y. et al. Model-based analysis of ChIP-Seq (MACS). Genome Biol. 9,R137 (2008).
78. Bailey, T. L. et al. MEME Suite: tools for motif discovery and searching.Nucleic Acids Res. 37, W202–W208 (2009).
79. Quinlan, A. R. & Hall, I. M. BEDTools: a flexible suite of utilities forcomparing genomic features. Bioinformatics 26, 841–842 (2010).
80. Anders, S. & Huber, W. Differential expression analysis for sequence countdata. Genome Biol. 11, R106 (2010).
81. Priebe, S., Kreisel, C., Horn, F., Guthke, R. & Linde, J. FungiFun2: acomprehensive online resource for systematic analysis of gene lists fromfungal species. Bioinformatics 31, 445–446 (2015).
82. Parker, J. E. et al. Prothioconazole and prothioconazole-desthio activitiesagainst Candida albicans sterol 14-alpha-demethylase. Appl. Environ.Microbiol. 79, 1639–1645 (2013).
83. O’Hanlon, K. A. et al. Targeted disruption of nonribosomal peptide synthetasepes3 augments the virulence of Aspergillus fumigatus. Infect. Immun. 79,3978–3992 (2011).
84. MacDonald, A. S., Straw, A. D., Bauman, B. & Pearce, E. J. CD8- dendritic cellactivation status plays an integral role in influencing Th2 responsedevelopment. J. Immunol. 167, 1982–1988 (2001).
AcknowledgementsThe authors would like to thank the Genomic Technology Core Facility, the Bioinfor-matics Core Facility, the Biological Mass Spectrometry Facility, the Bioimaging Facility,the Flow cytometry Facility, and the Electron Microscope (EM) core Facility in theUniversity of Manchester for their technical support. The EM core facility is supportedby the Wellcome Trust equipment grant. We would also like to thank Dr Ian Donaldsonof the Bioinformatis Core Facility at the University of Manchester for providing supportanalysing the ChIP-seq data, Dr Gareth Howell of the Flow cytometry Core Facility theUniversity of Manchester for his assistance in conducting FACS analysis, Dr. DarrenThomson at the for his support in microscopy experiments. This work was supported bythe Medical Research Council (MRC) grant MR/M02010X/1 to M.B., P.B. and E.B., theWellcome trust grant 208396/Z/17/Z to P.B. and M.B. and by NIH R01AI143198-01 toM.B., P.B. and W.S.M. S.G. was co-funded by the NIHR Manchester Biomedical ResearchCentre and a NC3Rs Training Fellowship (NC/P002390/1). R.A.C. holds an Investigatorin the Pathogenesis of Infectious Diseases Award supported by the Burroughs WellcomeFund (BWF) and is also supported by a National Institute of Allergy and InfectiousDiseases (NIAID) award 2R01AI081838.
Author contributionsM.B., P.B., E.B., J.P.L., T.F., N.V.R., M.F., F.G. and E.D. conceived and designed theexperiments. M.B., T.F., N.V.R., M.F., J.G., F.G., E.D., S.G., P.C., R.F.G., S.R., E.H., C.K.,S.R., S.P. and J.E.P. performed experiments. T.F., N.V.R., S.R., J.M.B., J.G., E.H., C.K.,J.E.P., S.K., R.A.C., P.C., S.M.R., E.B., P.B. and M.B. performed data analysis. R.F.G.,J.E.P., S.K., R.A.C., J.P.L., P.C., S.M.R. and E.B. contributed reagents, materials, andanalysis tools. T.F., N.V.R., P.B. and M.B. prepared the paper.
Competing interestsM.B. is a consultant to Synlab GmbH and is the director and shareholder of SyngenicsLimited. The remaining authors declare no competing interests.
Additional informationSupplementary information is available for this paper at https://doi.org/10.1038/s41467-019-14191-1.
Correspondence and requests for materials should be addressed to P.B. or M.J.B.
Peer review information Nature Communications thanks Jarrod Fortwendel, SvenKrappmann and Richard Todd for their contribution to the peer review of this work.Peer reviewer reports are available.
Reprints and permission information is available at http://www.nature.com/reprints
Publisher’s note Springer Nature remains neutral with regard to jurisdictional claims inpublished maps and institutional affiliations.
Open Access This article is licensed under a Creative CommonsAttribution 4.0 International License, which permits use, sharing,
adaptation, distribution and reproduction in any medium or format, as long as you giveappropriate credit to the original author(s) and the source, provide a link to the CreativeCommons license, and indicate if changes were made. The images or other third partymaterial in this article are included in the article’s Creative Commons license, unlessindicated otherwise in a credit line to the material. If material is not included in thearticle’s Creative Commons license and your intended use is not permitted by statutoryregulation or exceeds the permitted use, you will need to obtain permission directly fromthe copyright holder. To view a copy of this license, visit http://creativecommons.org/licenses/by/4.0/.
© The Author(s) 2020
ARTICLE NATURE COMMUNICATIONS | https://doi.org/10.1038/s41467-019-14191-1
16 NATURE COMMUNICATIONS | (2020) 11:427 | https://doi.org/10.1038/s41467-019-14191-1 | www.nature.com/naturecommunications


