Embed Size (px)
Citation preview

THE NORTHERN
TRANSPORTATION
SYSTEMS ASSESSMENT
Phase 1 Report
Northern Transportation
Demand Assessment
June 2010

NORTHERN TRANSPORTATION SYSTEMS ASSESSMENT
PAGE 2 PROLOG/EBA

PHASE 1 REPORT: TRANSPORTATION DEMAND ASSESSMENT
PROLOG/EBA PAGE 3
THE NORTHERN
TRANSPORTATION
SYSTEMS ASSESSMENT
Phase 1 Report
Northern Transportation
Demand Assessment
Submitted to Transport Canada
Submitted by PROLOG Canada Inc.
In Association with EBA Engineering Consultants Ltd.
June 2010

NORTHERN TRANSPORTATION SYSTEMS ASSESSMENT
PAGE 4 PROLOG/EBA

PHASE 1 REPORT: TRANSPORTATION DEMAND ASSESSMENT
PROLOG/EBA PAGE 5
NORTHERN TRANSPORTATION SYSTEMS ASSESSMENT Phase 1 Report
Northern Transportation Demand Assessment
Table of Contents
1. Introduction and Summary .............................................................. 7
2. Contemporary Transportation Systems Demand .................................. 11
2.1 Sealift Systems Demand .......................................................................................................... 13
2.1.1 Eastern Dry Cargo System ............................................................................................ 15
2.1.2 Eastern Fuel Supply System ......................................................................................... 20
2.1.3 Western Sealift System ................................................................................................. 24
2.2 Intermodal Systems Demand ................................................................................................. 31
2.2.1 Mackenzie Intermodal System ..................................................................................... 31
2.2.2 Hudson Bay Intermodal System.................................................................................. 37
2.2.3 Inside Passage Intermodal System.............................................................................. 43
2.3 Trucking Systems Demand ..................................................................................................... 49
2.3.1 Yukon Heavy Haul Highway System ........................................................................... 51
2.3.2 NWT Highway and Winter Road Systems .................................................................. 65
2.4 Airport Systems Demand ....................................................................................................... 77
2.4.1 Northern Air Service Network ..................................................................................... 78
2.4.2 Passenger Traffic .......................................................................................................... 79
2.4.3 Air Cargo Traffic ........................................................................................................... 82
3. Emergent Resource Development Demand ......................................... 89
3.1 Yukon Mining & Energy Overview ......................................................................................... 90
3.1.2 Yukon Producing Mines (Low Scenario) ..................................................................... 92
3.1.3 Yukon Probable Mines (Medium Scenario) ................................................................ 92
3.1.3 Yukon Possible Mines (High Scenario) ....................................................................... 93
3.1.4 Yukon Energy Development......................................................................................... 94
3.2 NWT Mining and Energy ........................................................................................................ 99
3.2.1 NWT Producing Mines (Low Scenario) ..................................................................... 100
NORTHERN TRANSPORTATION SYSTEMS ASSESSMENT
PAGE 6 PROLOG/EBA
3.2.2 NWT Probable Mines (Medium Scenario) ............................................................... 102
3.2.3 NWT Possible Mines (High Scenario) ...................................................................... 104
3.2.4 NWT Energy Development ........................................................................................ 104
3.3 Nunavut Mining and Energy Overview ............................................................................... 108
3.3.1 Nunavut Producing Mines (Low Scenario) ............................................................... 109
3.3.2 Nunavut Probable Mines (Medium Scenario) .......................................................... 109
3.3.3 Nunavut Possible Mines (High Scenario) ...................................................................111
3.3.4 Nunavut Oil and Gas ................................................................................................... 112
3.4 Northern Strategy Developments ......................................................................................... 113
3.4.1 The Canadian Arctic Research Initiative ................................................................... 113
3.4.2 Canadian Forces Army Training Centre .................................................................... 113
3.4.3 Arctic Deep Water Port ............................................................................................... 114
4. Consolidated Commodity Forecasts ................................................ 117
4.1 Community Resupply Traffic Forecasts ................................................................................ 118
4.1.1 Nunavut Community Resupply ................................................................................... 119
4.1.2 NWT Community Resupply ....................................................................................... 120
4.1.3 Yukon Community Resupply ...................................................................................... 121
4.2 Resource Development Traffic Forecasts .............................................................................122
4.2.1 Yukon Resource Development ....................................................................................124
4.2.2 NWT Resource Development .................................................................................... 126
4.3.3 Nunavut Resource Development .............................................................................. 129
5. Future System Performance ......................................................... 131
Appendix .................................................................................... 133
Nunavut Socio-Economic Differences ........................................................................................134
Northern Marine Voyages (2009 Sailings) ................................................................................139
Resource Development Projects Detailed Demand Forecast ....................................................143
Community Resupply Traffic Forecasting Methodology .......................................................... 148
Highway Statistical Development – Yukon & NWT ................................................................. 149
Scheduled Northern Air Service and Representative Aircraft .................................................. 161
Stakeholder Interviews ............................................................................................................... 164

PHASE 1 REPORT: TRANSPORTATION DEMAND ASSESSMENT
PROLOG/EBA PAGE 7
NORTHERN TRANSPORTATION SYSTEMS ASSESSMENT Phase 1 Report
Northern Transportation Demand Assessment
1. Introduction and Summary
This is the Phase 1 Report of the Northern Transportation Systems Assessment. The purpose
of the Phase 1 Report is to profile current and future traffic demand for each modal system in
the North. Subsequently in Phase 2, traffic allocation among modes will be reassessed in
terms of emerging economic, resource development and environmental changes impacting
both transportation system performance and infrastructure requirements.
The scope of Phase 1 work embraces the surface and air transport systems of Nunavut, The
Northwest Territories and Yukon and their extensions into southern Canada and Alaska. This
Phase 1 Demand Report is based upon primary data sources obtained through interviews and
surveys conducted with all major transportation system stakeholders in government and
industry.
The Phase 1 Report has established current traffic demand for the following modal
transportation systems:
Total Freight in 2009 in Tonnes
Transportation
System
Community Resupply
General Freight
Resource Projects
General Freight
Bulk Fuel
Supply
Total
Inbound
Eastern Sealift 54,500 39,100 139,900 233,500
Western Sealift 3,750 3,850 58,900 66,500
Hudson Bay 4,300 27,300 38,500 70,100
Mackenzie River 8,900 3,900 26,200 39,000
Inside Passage * 59,400 24,100 64,000 147,500
Mackenzie Rail * 8,500 1,700 201,300 211,500
NWT Highways 163,000 48,000 300,000 511,000
Yukon Highways 371,000 143,900 121,900 636,800
Total Inbound * 605,350 266,050 685,400 1,556,900
Air Freight 20,000
Mineral Exports 54,000
Total Tonnes 1,630,900
* Mackenzie Rail and Inside Passage Tonnes included in Highway and River Tonnes, and excluded from Total Tonnes.

NORTHERN TRANSPORTATION SYSTEMS ASSESSMENT
PAGE 8 PROLOG/EBA
NWT/Nunavut
Marine
409,100 tonnes
(26%)
Yukon Highways
636,800 tonnes
(41%) NWT Highways
60% Fuel
40% General
NWT
Highways
511,000
tonnes
(33%)
Current Inbound Freight Traffic Split (Tonnes in 2009)
From these current demand statistics the following traffic split shows that:
• Yukon Highways carry the most northern traffic (over 40%);
• Nunavut Sealift and NWT Mackenzie River traffic is about a quarter of the total;
• Northwest Territories Highways carry a third of northern traffic and of that total;
• Fuel is approximately 60% of the Northwest Territories Highways traffic total.
The modal split shifts across the North:
• From exclusively Sealift in the roadless Eastern Arctic;
• To a mix of Highway, Intermodal and Western Sealift in the Northwest Territories;
• To a preponderance of trucking on the extensive Yukon Highway System.
Northern Transport Systems demand development includes traffic generated by resource
projects that are currently active. As well, forecasts extended from current baseline traffic are
augmented with assessment of resource development projects that may take place over the
next 20 years.
Northern Transport Demand Forecast Summary (tonnes)
2010 2015 2020 2025 2030
General Freight 443,557 459,499 474,226 489,032 503,737
Development Freight 94,100 846,100 1,193,000 375,000 322,000
Bulk Fuel 718,986 1,142,164 1,233,712 1,017,954 908,614
Total Inbound 1,256,643 2,447,763 2,900,938 1,881,986 1,734,351
Outbound 112,000 1,381,000 19,556,600 19,320,600 18,820,600
Induced Demand* 18,820 169,220 238,600 75,000 64,400
A 1.20 induced impacts multiplier is applied to development freight to account for the additional traffic demand that can be expected with spin-off economic activity from resource development projects. Induced demand is shown for information only and not included in the totals.
PHASE 1 REPORT: TRANSPORTATION DEMAND ASSESSMENT
PROLOG/EBA PAGE 9
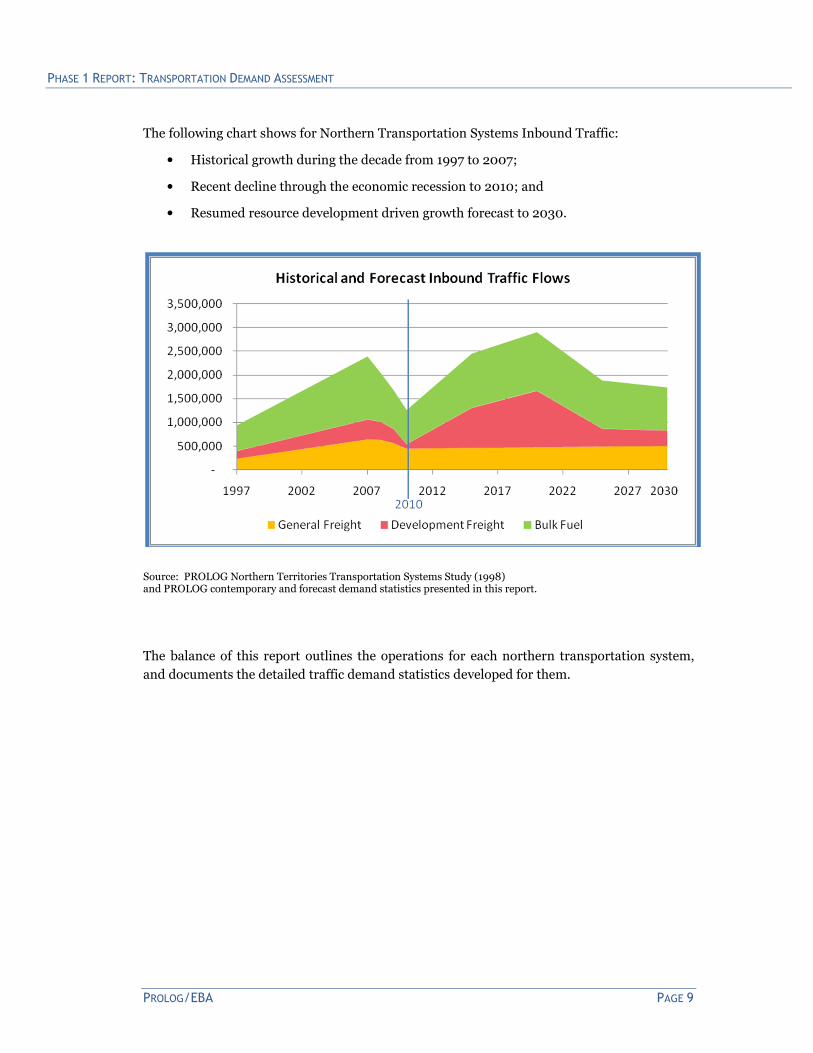
The following chart shows for Northern Transportation Systems Inbound Traffic:
• Historical growth during the decade from 1997 to 2007;
• Recent decline through the economic recession to 2010; and
• Resumed resource development driven growth forecast to 2030.
Source: PROLOG Northern Territories Transportation Systems Study (1998) and PROLOG contemporary and forecast demand statistics presented in this report.
The balance of this report outlines the operations for each northern transportation system,
and documents the detailed traffic demand statistics developed for them.

NORTHERN TRANSPORTATION SYSTEMS ASSESSMENT
PAGE 10 PROLOG/EBA

PHASE 1 REPORT: TRANSPORTATION DEMAND ASSESSMENT
PROLOG/EBA PAGE 11
2. Contemporary Transportation Systems Demand
This chapter of the report documents actual demand imposed on the current configuration of
Northern Transportation Systems as outlined in the map opposite. Current transportation
systems supplying both communities and resource developments in the North are:
• Eastern Sealift Systems – break bulk general cargo ships and bulk fuel product
tankers with sailings from the East originating traffic to the Kivalliq, Qikiqtaaluk and
Kitikmeot regions of Nunavut.
• Western Sealift Systems – combination deck cargo/bulk fuel Mackenzie River barges
or deep draft ocean vessels with sailings from the West originating traffic to the
Nunavut and NWT Western Arctic Coast.
• Inland Intermodal Systems – a combination of intermodal container/trailer services
and integrated marine and rail or road bulk commodity hauls within Hudson Bay, the
Mackenzie Valley and the Alaska/B.C. Inside Passage.
• Truck Transport Systems – a range of roads from the relatively extensive Yukon
heavy haul highway system; to all-weather highways extended by winter/ice roads in
NWT; to no roads at all in Nunavut.
• Air Passenger & Cargo Systems – Northern Regional Airports at Iqaluit, Rankin Inlet,
Yellowknife and Whitehorse linked to Southern Gateway Airports at Montreal,
Ottawa, Winnipeg, Edmonton, Calgary and Vancouver.
These northern transportation systems supply the carrying capacity to meet contemporary
traffic demand summarized in the following table.
Total Surface Systems Demand (Inbound Tonnes)
2007 2008 2009
Eastern & Western Sealift 202,800 250,300 300,000
Intermodal Marine/Truck/Rail 313,300 399,000 256,600
Yukon & NWT Through Truck 2,102,400 1,708,000 1,000,300
Total 2,618,500 2,357,300 1,556,900

NORTHERN TRANSPORTATION SYSTEMS ASSESSMENT
PAGE 12 PROLOG/EBA

PHASE 1 REPORT: TRANSPORTATION DEMAND ASSESSMENT
PROLOG/EBA PAGE 13
2.1 Sealift Systems Demand
Arctic Sealift operations resupply coastal communities in Nunavut and the Northwest
Territories. There are no permanent road connections to Southern Canada1 and the only
surface transportation access is by sealift, both from the East Coast and from the West Coast:
• The Eastern Sealift is a well developed system of tanker and dry cargo ships
historically resupplying Baffin communities - and recently Kivalliq and Kitikmeot
communities as well.
• The Western Sealift has recently begun deep draft barge resupply to Kitikmeot and
coastal NWT communities historically reached by extension of the Mackenzie River
Barge System.
Traffic flows for 2009 and composition for the Eastern and Western Sealift are highlighted on
the map opposite. In the table below current demand is shown for each region served by
sealift.
1 In the Northwest Territories, all-weather Dempster Highway access to the Mackenzie Delta is seasonally extended to the Arctic Coast by the Inuvik-Tuktoyaktuk winter ice road. In Nunavut, the only permanent road construction has been for mine access: 28 km from Arctic Bay to the former Nanisivik Mine, 100 km from Milne Inlet to the Mary River Mine development, and 110 km from Baker Lake to the new Meadowbank Mine.
Total Eastern and Western Sealift (2009 Tonnes)
Sealift Cargo: Bulk Fuel Dry Cargo Total Cargo
From East To:
Kivalliq 66,000 40,700 106,700
Qikiqtaaluk 74,000 29,300 103,300
Kitikmeot 23,500 23,500
Total Eastern Sealift 140,000 93,500 233,500
From West To:
Kitikmeot 44,000 6,600 50,600
NWT Coast 15,000 900 15,900
Total Western Sealift 59,000 7,500 66,500
Total East & West Sealift 199,000 101,000 300,000
NORTHERN TRANSPORTATION SYSTEMS ASSESSMENT
PAGE 14 PROLOG/EBA
There are some 15 sealift sailings each season for Community Resupply and Resource
Development Dry Cargo and Bulk Fuel (see appendix for sailings).
Due to the ice regime, this resupply traffic is constrained by a short summer shipping window
from the third week of July through the first week of October. From the seasonally-manned
Ice Operations Centre at Iqaluit, the Canadian Coast Guard coordinates marine navigation
and ice-breaking services to vessels operating in Canadian waters north of the 60th parallel
and in Hudson Bay. Ice-breakers are deployed in this region from July through November to
insure that the shipping window is maintained within each Shipping Safety Control Zone.
Access to the region was originally controlled under a Zone/Date System [Z/DS] with the
Arctic carved up into regions and access dates according to ships ice capabilities. However,
zones were established based on knowledge of ice conditions at the time (1960-70's) and do
not reflect the changes since then. More recently, the Arctic Ice Regime Shipping System
(AIRSS) has been designed precisely to counteract this limitation by taking into account the
prevailing ice conditions when deciding whether a ship may enter a zone in the Arctic.
The implementation of the AIRSS system now allows greater flexibility in determining
delivery windows since it takes into account the actual ice conditions for a region in the Arctic
in determining access for a particular ice classification of vessel. The Z/DS can still be used
for planning access dates and delivery schedules but if entry is desired outside of the
prescribed dates then the AIRSS system must be used.
Both the original zone date system (Z/DS) and the Arctic Ice Regime Shipping
System (AIRSS) system are running in parallel at this time. However work has been
undertaken to examine the viability of combining or revising the two systems to form a hybrid
system. (See appendix for further information on Z/DS and AIRSS).
The delivery system for Arctic community resupply has evolved over time to match vessel
capabilities with limited port facilities. Where dry cargo used to be shipped as break bulk
[individual pieces] it is increasingly (half) being shipped by container, the advantage being
security, the ability for the individual customer to pack their own container and ease of
handling/less damage for the shipper/consolidator and ship owner.
While Western Arctic communities generally have shallow draft docks, offloading at virtually
all Eastern Arctic resupply sites requires lightering to a designated “sealift” beach. Some
discharge points are open to the sea. Maintenance and improvement of all marine resupply
facilities in the Western NWT and Nunavut, are a program responsibility of Canadian Coast
Guard/Department of Fisheries and Oceans, delivery of which is carried out by the respective
territory.
With more competitive market conditions and a moderating ice regime, resupply sourcing
and routing are evolving. Eastern Arctic Sealift from Quebec has expanded at the expense of:
• Hudson Bay barge service from Churchill, Manitoba and Moosonee, Ontario
• Mackenzie River Western Arctic barge service from Hay River, NWT.

PHASE 1 REPORT: TRANSPORTATION DEMAND ASSESSMENT
PROLOG/EBA PAGE 15
There is now an increasing trend for cargo to be shipped from southern Canada or elsewhere
direct to the communities with penetration from the east coast almost to Tuktoyaktuk and
from the west coast all the way to Taloyoak.
The following sections of this chapter look first at the two Eastern Sealift services for:
• Dry Cargo Resupply; and
• Bulk Fuel Products
Then the Western Sealift, which is in transition, is outlined for:
• The traditional Hay River Gateway; and
• A new West Coast Sealift Gateway.
2.1.1 Eastern Dry Cargo System
The Eastern Dry Cargo Ship System supplies
Nunavut by sealift from the southern Canadian
east coast including both community resupply
and resource development cargo:
• Community Resupply Sealift contracted
by the Nunavut Government, Northwest
Company (Northern Stores), Arctic
Cooperatives or other private shippers.
• Resource Project sealift contracts
privately negotiated by resource
development companies.
For both of these, the following table shows current dry cargo sealift demand in Nunavut.
Current Dry Cargo Sealift Demand (2009 Tonnes)
Government of Nunavut Contract 27,900
Private Shipper Contracts 26,600
Community Resupply Total 54,500
Resource Development Cargo 39,100
Total Dry Cargo Sealift 93,600
MV Umiavut offloading cargo to lighter barges for delivery to a sealift beach. Nunatsiaq News Photo
Source: Nunavut Government, Mining Companies, Arctic Cooperatives and a sampling of Northern Stores.
NORTHERN TRANSPORTATION SYSTEMS ASSESSMENT
PAGE 16 PROLOG/EBA
There are three principal marine transportation companies involved in dry cargo resupply to
Nunavut (see appendix for fleet statistics):
• Nunavut Eastern Arctic Shipping (NEAS), owned by Sakku Investments,
Qikiqtaaluk Corporation, Makivik Corporation and Transport Nanuk (itself a joint
venture between North West Company and Logistec Corporation). NEAS operates a
fleet of ice class container/Roll-On Roll-Off/heavy lift ships carrying dry cargo to
northern Quebec and Nunavut.
• Northern Transportation Co. Ltd. (NTCL) - Owned by Inuvialuit Development
Corporation and Nunasi Corporation, through Norterra a holding company. NTCL
utilizes tugs and barges for bulk fuel and deck cargo deliveries, both on rivers and on
the oceans. For some of the operations they will charter in ice class ships.
• Nunavut Sealink & Supply Inc. (NSSI), a joint venture between Arctic Co-
operatives Limited, the majority shareholder, and Desgagnés Transarctik Inc., the
managing partner. NSSI owns a fleet of container/break bulk ships in service to
northern Quebec and Nunavut.
The aboriginal people of Nunavut and the NWT have taken a strong business interest in their
own resupply. This is reflected in joint ownership of the above transportation companies that
have been structured to obtain preferential treatment provided to Inuit firms under Article 24
of the Nunavut Land Claim Agreement.
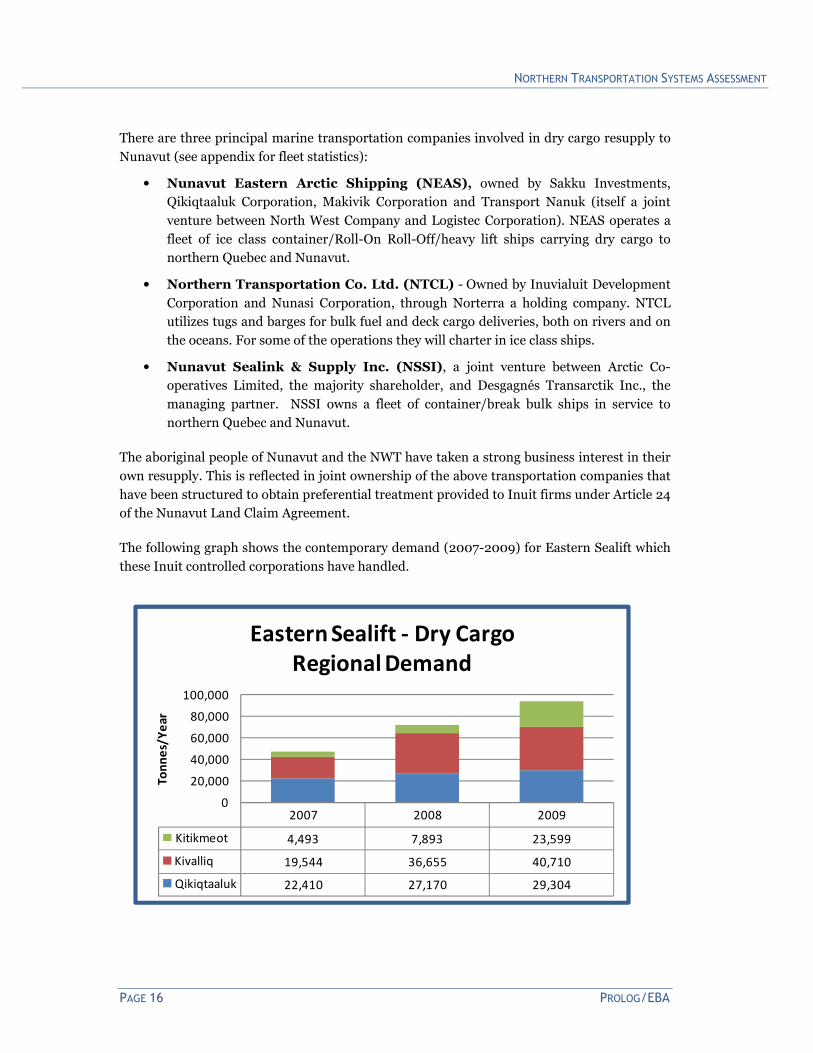
The following graph shows the contemporary demand (2007-2009) for Eastern Sealift which
these Inuit controlled corporations have handled.
2007 2008 2009
Kitikmeot 4,493 7,893 23,599
Kivalliq 19,544 36,655 40,710
Qikiqtaaluk 22,410 27,170 29,304
0
20,000
40,000
60,000
80,000
100,000
To
nn
es/
Ye
ar
Eastern Sealift - Dry Cargo
Regional Demand

PHASE 1 REPORT: TRANSPORTATION DEMAND ASSESSMENT
PROLOG/EBA PAGE 17
While overall traffic to the north has declined with the recession over the 2007-2009 period,
Eastern Sealift traffic to all three regions of Nunavut has increased, pushed up primarily by
resource development projects as can be seen in the graph that follows.
Each region in Nunavut has a major mining project in play that is prompting these large
sealift traffic increases:
• Newmont Mining is developing the Hope Bay Gold Mine on the Coronation Gulf
between Cambridge Bay and Kugluktuk in the Kitikmeot Region
• Baffinland Iron Mines has developed the Mary River mine south of Pond Inlet, and
although currently on hold, shipped 130,000 tonnes to European Steel Mills in 2008
• Agnico-Eagle Mining Ltd has developed the Meadowbank Gold mine north of Baker
Lake for first year production in 2010.
Development Driven Increasing Demand
(2006 to 2009)
Region Development Market Increase
Qikiqtaaluk Mary River Mine 53% increase
Kivalliq Meadowbank Mine 46% increase
Kitikmeot Hope Bay Mine 418% increase
In 2008 the Baffinland Mary River Mine exported three trial cargo shiploads of Nunavut iron
ore to European steel mills. Full production is estimated at 18,000,000 tonnes per year. The
company is partnering with Federal Commerce and Navigation and Teekay Corporation for
its shipping requirements. FedNav has a long history of operating in the Canadian Arctic and
TeeKay is experienced in construction and operation of large ships.
NORTHERN TRANSPORTATION SYSTEMS ASSESSMENT
PAGE 18 PROLOG/EBA
Reportedly a consortium of the shipping companies will construct between 10 and 17
icebreaking Capesize bulk carriers of 170,000 tonnes displacement, with a cargo carrying
capacity of 130,000 tonnes of ore.
A key enabler of Eastern Arctic Sealift expansion into non-traditional markets has been the
opportunity to carry, in addition to regular community resupply cargo, a surge in resource
development project cargos. With development driven increasing dry cargo demand,
shipowners have re-equipped fleets with new, ice class vessels and are competitively seeking
expanded markets:
• beyond the traditional Eastern Arctic Sealift Focus on Baffin (Qikiqtaaluk);
• in both Hudson Bay (Kivalliq) and the Western Arctic (Kitikmeot).
Qikiqtaaluk Dry Cargo Market
While Kivalliq and Kitikmeot Regions have alternative sealift services, the Qikiqtaaluk market
is served almost exclusively by the traditional Eastern Sealift from the St. Lawrence Gateway
in Quebec. This market is dominated by dry cargo demand at Iqaluit which accounts for 90%
of the Qikiqtaaluk Region.
The Eastern Sealift operates along the east coast of Canada and into the Arctic as far west as
Cambridge Bay via a St. Lawrence gateway from the Montreal area. Historically, Eastern
Arctic Sealift operations have evolved over the last fifty years from a combination of
government, military and private sector services.
In the early 1950’s Distant Early Warning (DEW) line construction brought an unprecedented
level of Eastern Arctic Sealift activity. As many as 50 private, mostly Canadian, vessels were
chartere53d by the United States Military Sea Transportation Service (later the Military
Sealift Command) to provide construction logistics support. Subsequently, following
construction completion and through the late 1970’s, primary logistics support to DEW line
sites was provided by U.S. Military Sealift Command vessels from Bayonne, New Jersey.
In parallel with DEW Line logistics support controlled by the U.S. Military, the Canadian
Federal Government time chartered several small ships each year for community resupply. In
the late 1970’s, DEW Line logistics requirements were merged into the Canadian Government
controlled sealift and the marine transportation contract was shifted to full liner terms.
Coincident with transition from U.S. controlled logistics support of military installations
came (a not so coincidental) drastic reduction in those requirements with both base closures
and replacement of manned DEW Line sites by the automated North Warning System in the
late 1980’s. The Canadian Coast Guard coordinated all government sponsored cargo and
residual military requirements in a commercially oriented sealift that was almost exclusively
Canadian origin goods marshalled at Montreal.

PHASE 1 REPORT: TRANSPORTATION DEMAND ASSESSMENT
PROLOG/EBA PAGE 19
Since the formation of Nunavut in 1999 that government has taken responsibility for the
organization and contracting of resupply into its own communities. With devolution of this
responsibility to the territories the system has become much more flexible and innovation has
lowered the cost to deliver goods to the communities.
Community Resupply Sealift to all Nunavut communities is now managed through the
Nunavut Department of Community And Government Services. Competitive contracts are let
for the transportation of all government cargo, including schools, hamlets and the federal
government requirements. The contracts are structured in such a way as to require the ship
owner to provide the same rate for private shippers as for the government.
By pooling cargo and using the leverage of the relatively large volume of government cargo
which it controls, the government has effectively used the tendering process to obtain lower
rates on behalf of all shippers. In this way the government uses their large requirement to
obtain a lower rate than otherwise would be possible for smaller and individual shippers.
Kivalliq Dry Cargo Market
The Kivalliq Region has been served variously by traditional Sealift from the East Coast
(Montreal) - and by Churchill, Manitoba and Moosonee, Ontario based barge operations.
Hudson Bay barge operations from the Churchill, Manitoba railhead (see Hudson Bay Marine
Intermodal Chapter) were initiated by NTCL in 1975. For 25 years this service replaced the
Montreal based sealift for the majority of dry cargo that originates in Winnipeg and moves by
truck and rail to Churchill for marine transportation to Kivalliq communities.
During the last decade, Eastern Sealift Shipowners have re-entered the Hudson Bay
community resupply market and currently carry most dry cargo for the region. A small
amount of cargo (4 – 8,000 tonnes/year) still moves from Churchill via NTCL tug and barge
service. However, both NSSI and NEAS ships call at Churchill as well as providing a through
bill of lading service via Montreal for Kivalliq cargo originating in Winnipeg.
Kitikmeot Dry Cargo Market
The Western Arctic was served almost exclusively by NTCL until 2007, when Eastern Sealift
shipowners began testing the market (and ice conditions) to determine viability of regular
community resupply operations. Since that time, Eastern Sealift sailings have been extended
to Nunavut communities in the Kitikmeot region of the Western Arctic every summer.
Ironically, these communities which are located in one of the most remote regions of the
North now enjoy a more competitive market than many communities further south. Three
marine transportation companies provide alternative southern purchasing and/or northern
delivery options from either eastern or western Canada. In all likelihood Eastern Sealift ship
owners can extend that Western Arctic market competition to include Northwest Territories
community resupply as well.

NORTHERN TRANSPORTATION SYSTEMS ASSESSMENT
PAGE 20 PROLOG/EBA
2.1.2 Eastern Fuel Supply System
The Eastern Bulk Fuel Tanker System supplies petroleum products for power generation,
heating and motor fuel in both the Qikiqtaaluk and Kivalliq Regions:
• Community requirements are contracted by the Petroleum Products Division of the
Nunavut Community and Government Services Department.
• Resource development requirements are privately contracted.
In the following graph, note that bulk fuel demand is moving up with resource
development.
Google Earth Image of fuel product tanker discharge to Inuit Head Pipeline at Iqaluit.
(Tonnes/Year)
PHASE 1 REPORT: TRANSPORTATION DEMAND ASSESSMENT
PROLOG/EBA PAGE 21
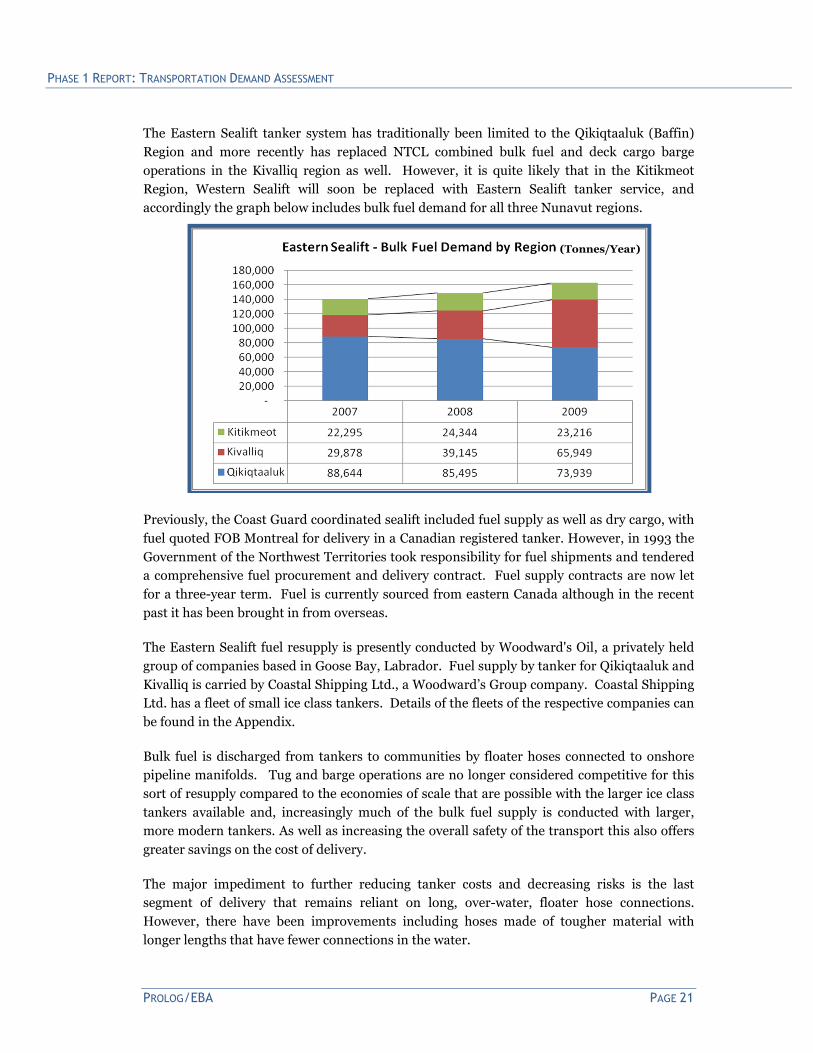
The Eastern Sealift tanker system has traditionally been limited to the Qikiqtaaluk (Baffin)
Region and more recently has replaced NTCL combined bulk fuel and deck cargo barge
operations in the Kivalliq region as well. However, it is quite likely that in the Kitikmeot
Region, Western Sealift will soon be replaced with Eastern Sealift tanker service, and
accordingly the graph below includes bulk fuel demand for all three Nunavut regions.
Previously, the Coast Guard coordinated sealift included fuel supply as well as dry cargo, with
fuel quoted FOB Montreal for delivery in a Canadian registered tanker. However, in 1993 the
Government of the Northwest Territories took responsibility for fuel shipments and tendered
a comprehensive fuel procurement and delivery contract. Fuel supply contracts are now let
for a three-year term. Fuel is currently sourced from eastern Canada although in the recent
past it has been brought in from overseas.
The Eastern Sealift fuel resupply is presently conducted by Woodward's Oil, a privately held
group of companies based in Goose Bay, Labrador. Fuel supply by tanker for Qikiqtaaluk and
Kivalliq is carried by Coastal Shipping Ltd., a Woodward’s Group company. Coastal Shipping
Ltd. has a fleet of small ice class tankers. Details of the fleets of the respective companies can
be found in the Appendix.
Bulk fuel is discharged from tankers to communities by floater hoses connected to onshore
pipeline manifolds. Tug and barge operations are no longer considered competitive for this
sort of resupply compared to the economies of scale that are possible with the larger ice class
tankers available and, increasingly much of the bulk fuel supply is conducted with larger,
more modern tankers. As well as increasing the overall safety of the transport this also offers
greater savings on the cost of delivery.
The major impediment to further reducing tanker costs and decreasing risks is the last
segment of delivery that remains reliant on long, over-water, floater hose connections.
However, there have been improvements including hoses made of tougher material with
longer lengths that have fewer connections in the water.
(Tonnes/Year)

NORTHERN TRANSPORTATION SYSTEMS ASSESSMENT
PAGE 22 PROLOG/EBA
Qikiqtaaluk Fuel Supply Market
At Iqaluit, resupply is accomplished with approximately 300 metres of 20-cm (8-in) floater
hose hauled from the tanker by a workboat. The hose is connected to the pipeline manifold at
Inuit Head. The pipeline extends inland to the Iqaluit tank farm. It takes 4 to 5 days to
discharge the tanker at 600,000 litres/hour using the 20-cm (8-in) hose.
At other Qikiqtaaluk communities 10-cm (4-in) discharge hose in 300-metre lengths is
carried on reels on the tankers and extended to pipeline manifolds on the beach. For
comparison, 5 to 6 million litres delivered to Pond Inlet takes 1.5 to 2 days to discharge using
a 10-cm (4-in) hose.
With the exception of a permanent docking facility at Nanisivik which is used as a refuelling
station by Coast Guard icebreakers, the ability to improve Nunavut sealift logistics with new
infrastructure is limited due to high tides (nine metres at Iqaluit) and inevitable ice damage.
Total Qikiqtaaluk fuel supply demand currently stands at about 74,000 tonnes per year (see
following table). The fuel delivered to Iqaluit is 40-to 45-million litres which is approximately
45% of the Qikiqtaaluk total. An interim decline in resource development demand is due to
temporarily curtailed activity at the Baffinland Mary River Iron Mine.
Qikiqtaaluk Fuel Supply Demand (Tonnes Ex East)
2007 2008 2009
Community Resupply Fuel 81,644 78,995 72,939
Resource Development Fuel 7,000 6,500 1,000
Total Sealift Fuel Supply Demand 88,644 85,495 73,939
Kivalliq Fuel Supply Market
In the late 1990s the government of the Northwest Territories, which until 1999 included
Nunavut, cost-shared with the Canadian Hydrographic Service a program of modern
hydrographic surveys of the approaches to Kivalliq communities. The resulting accurate,
digital hydrographic charts would enable deep or medium draft tankers to deliver oil directly
to all Kivalliq communities except Baker Lake, which requires shallower draft tankers or
barges to transit Chesterfield Inlet.
This allowed the inclusion of Kivalliq communities in the 2002 Eastern Arctic Sealift contract
for foreign sourcing of Nunavut fuel supply. NTCL, the previous fuel transporter from
Churchill, Manitoba, did not win this contract; it was won by Woodward’s, a Goose Bay,

PHASE 1 REPORT: TRANSPORTATION DEMAND ASSESSMENT
PROLOG/EBA PAGE 23
Newfoundland, company which had been in the fuel supply business for some time. Since
2002 fuel for Kivalliq communities has remained part of Woodward’s fuel supply contract.
Kivalliq region resupply with fuel tankers is now similar to Qikiqtaaluk Region except for
Baker Lake. Smaller tankers or barges are required to access Baker Lake via Chesterfield
Inlet. However, for many years while Kivalliq resupply was operated by NTCL from
Churchill, bulk fuel, as well as deck cargo was carried in combination on the same barge.
Kivalliq Region bulk fuel demand is shown for the 2007-2009 period in the following table.
Kivalliq Fuel Supply Demand – (Tonnes Ex East)
2007 2008 2009
Community Resupply Fuel 23,478 28,745 27,449
Resource Development Fuel 6,400 10,400 38,500
Total Sealift Fuel Supply Demand 29,878 39,145 65,949
Resource development demand has jumped to the point where it now exceeds Kivalliq
community demand by 40%. The Meadowbank Mine near Baker Lake received
38,500 tonnes of bulk fuel in 2009. A tanker owned by Woodwards was chartered to
Chesterfield Inlet where fuel was transferred to NTCL barge for final delivery to Baker Lake.
Kitikmeot Fuel Supply Market
While Kitikmeot region fuel has been traditionally supplied by Western Sealift, it is
anticipated that Eastern Sealift tanker service will follow the Dry Cargo Sealift into the
Western Arctic as well. The Kitikmeot Region demand over the last three years is shown in
the following table
Kitikmeot Eastern Fuel Supply Demand
2007 2008 2009
Total Sealift Fuel Supply Demand 22,300 24,350 27,000

NORTHERN TRANSPORTATION SYSTEMS ASSESSMENT
PAGE 24 PROLOG/EBA
2.1.3 Western Sealift System
NTCL shallow draft barging extended into the Western Arctic
The Western Sealift is a system in transition. NTCL is reconfiguring sealift barge operations
to the Western Arctic to meet the multi-carrier market resulting from Eastern Sealift
expansion into the Kitikmeot Region and potentially into the Northwest Territories as well:
• From extension of conventional combination deck/bulk cargo Mackenzie River barge
operations exclusively serving the Western Arctic from the Hay River, NWT railhead;
• To separate deep draft tankers and deck cargo barges originating bulk fuel and
community resupply delivery from the West Coast of the United States and Canada.
The following table shows how Western Arctic Sealift Demand is being met with a mix of
shallow draft river/coastal barges from Hay River and deep draft tankers or ocean barges
from the west coast.
Western Sealift Demand (Tonnes in 2009) Bulk Fuel Deck Cargo Total
Ex Hay River Shallow Draft Barges 5,000 1100 6,100To NWT Coast 3,000 600
To Kitikmeot 2,000 500
Ex West Coast Deep Draft Vessels 54,000 6400 60,400To NWT Coast 15,000 300
To Kitikmeot 27 ,000 2,300
To Mining 12,000 3,800
Total Western Sealift Demand 59,000 7500 66,500

PHASE 1 REPORT: TRANSPORTATION DEMAND ASSESSMENT
PROLOG/EBA PAGE 25
Increasing resource driven Western Sealift traffic to the Kitikmeot Region and simultaneous
shifting from Hay River based operations to West Coast based operations is shown over the
2007-2009 period in the following chart.
Hay River Gateway
Resupply to the Western Arctic was originally provided through a combination of whaling
stations, trading posts, Catholic missions and RCMP detachments. All used the wooden
schooner, powered by both sail and diesel, for resupply. The last of these was not retired until
1957 when NTCL first extended Mackenzie River barge service to the Western Arctic coast in
conjunction with logistics support for the Distant Early Warning line.
Since that time Western Arctic communities in the Northwest Territories and Nunavut have
been resupplied by NTCL shallow draft river barges from the Hay River gateway. Staging and
trans-shipment for Sealift continuation of barge service to western Arctic coastal communities
takes place at Tuktoyaktuk, and with a regional coordination office at Cambridge Bay.
As with the Eastern Arctic, ice and weather are the major operating constraints for sealift
service to the Western Arctic. Vessels must be moved in and back out of the Western Arctic
between the middle of July and the third week of September. Unlike the Eastern Arctic, most
Western Arctic communities have shallow draft floating or fixed docks to which NTCL barges
can discharge cargo directly.
(Tonnes/Year)

NORTHERN TRANSPORTATION SYSTEMS ASSESSMENT
PAGE 26 PROLOG/EBA
Waterways, Alberta was the original terminus of NTCL and the Northern Alberta Railway
(NAR) line from Edmonton. Cargo was transferred to barges for the voyage down the
Athabasca River, across Lake Athabasca and down the Slave River to Fort Fitzgerald, Alberta.
Due to several sets of impassable rapids in the Slave River, cargo was unloaded at Fort
Fitzgerald and moved over a 26 mile portage to Fort Smith, unloaded again to barges for the
journey down the Slave River, across Great Slave Lake and down the Mackenzie River.
In 1961 NTCL opened a terminal in Hay River, N.W.T., handling freight arriving by highway
from Edmonton. Cargo destined for Mackenzie River and Mackenzie Delta communities was
shipped in traditional flat-bottom river tugs and barges from Hay River. The home base for
NTCL there now features a 25-hectare loading terminal, large shipyard, Syncro-lift and fleet
maintenance facility.
In 1964 the Great Slave Lake Railway, a federally-sponsored northern development project
and now a sub-division of CN Rail, was completed to Hay River. In time, Hay River became
the base of all NTCL marine operations for freight movements to Mackenzie River and
Western arctic communities and resource projects.
NTCL was a Federal Crown Corporation until 1985. Since that time, NTCL has been a
100% aboriginal-owned private company, and is the founding member of the NorTerra Inc.
group of companies. NorTerra is owned by the Inuvialuit Development Corporation of the
Western Arctic on behalf of the Inuvialuit of the Western Arctic and Nunasi Corporation, on
behalf of the Inuit of Nunavut.
NTCL has grown to its present fleet of 13 Tug Boats, ranging from 1,100 horsepower to 7,200
horsepower along with 94 combination fuel and deck cargo barges ranging in size from 600
tons to 15,000 tons. 1972 was a record year for cargo movement on the Mackenzie River and
the Arctic region when approximately 400,000 tonnes crossed NTCL docks. From that time
to the present, tonnage from Hay River has gradually declined. The reasons include the
decline of oil exploration in and around Inuvik and the Arctic offshore; the building of the
Dempster Highway through Yukon to Inuvik; and NWT Power's conversion of the power
plant at Inuvik from diesel fuel to natural gas.
In 1982 a modular drilling rig was
transported from Hay River to
Prudhoe Bay, Alaska with the
largest module weighing 1,167
tons. The total of all modules
shipped to this oilfield project was
9,354 tons; the largest sailing ever
to leave Hay River.

PHASE 1 REPORT: TRANSPORTATION DEMAND ASSESSMENT
PROLOG/EBA PAGE 27
In 1993, a contract was received from the Alaska North Slope Regional Corporation to deliver
bulk fuel to the Alaska communities of Kaktovik, Point Barrow, Wainwright, Point Lay and
Point Hope. A total of 20,000 tons was shipped under the contract.
In 1997 NTCL moved a completely modularized production system from Hay River to the BP
Badami oil field site on the North Slope of Alaska.
Badami Oil Field Modules Transferring from Road to Barge at Hay River, N.W.T.
This route for oversized oil field modules may be reversed in future, with “over-the-top”
delivery of production facilities fabricated offshore for Alberta Athabasca Oil Sands projects.
Recently, NTCL and Mammoet Canada, an international heavy lift specialist, formed a joint
venture to pursue “over-the-top” delivery of large process modules fabricated in Asia, shipped
around Alaska and up the Mackenzie River/Great Slave Lake/Slave and Athabasca River
systems to oil sands projects near Fort McMurray, Alberta.
Ocean-going barges carrying modules weighing as much as 2,000 tonnes and transferring to
Mackenzie River tugs and barges at the mouth of the Mackenzie River may be more
economical than shipping much smaller modules over conventional routes from the south.
The current practice is restricted to modules weighing 400 tonnes or less shipped to the Fort
McMurray area by truck or rail.
The marine route requires a 38-km portage between Fort Smith and Fort Fitzgerald to avoid
five sets of rapids between the two communities. The barge and tug would be winched onto
multi-wheeled Mammoet heavy transport trailers, and returned to the river above the rapids
for the balance of the journey. Barge designs will have to contemplate the 3 ½ ft. typical draft
in the Athabasca River.

NORTHERN TRANSPORTATION SYSTEMS ASSESSMENT
PAGE 28 PROLOG/EBA
NTCL generated interest in the proposed program in 2006 when they conducted a successful
trial sailing over the route.
Negotiations with at least one oil sands developer were interrupted when the current
economic recession negatively impacted bitumen prices resulting in oil companies curtailing
capital investments in oil sands projects.
The “over-the-top” route is being re-examined in 2010, after highway permits were
withdrawn for module moves from the head of the Columbia-Snake river system at Lewiston,
Idaho following a public outcry. An option similar to the method described above, but
without the Fort Fitzgerald portage, is being investigated as an alternative to the U.S. route.
At Hay River, depending on weight and dimensions, modules can be transferred to either the
CN Rail system to Ft. McMurray; or to truck using the Alberta "High Load" Corridor system.
West Coast Gateway
In parallel with Western Arctic Sealift traditionally originating at Hay River, NTCL has
recently started the transition to deep draft barging from the West Coast. NTCL will compete
with both NSSI and NEAS now serving Kitikmeot communities from Montreal as an
extension of the Eastern Arctic Sealift into the Western Arctic.
With these new market entrants and a more conducive ice regime around Alaska, NTCL has
set up a similar supply system using deep draft barges for both bulk fuel and deck
cargo from the West Coast into the Western Arctic. The NTCL Western Arctic Sealift
Program includes a west coast freight consolidation and staging facility at Delta, B.C. and the
“NT 12000”, a new 12,000-tonne, deep draft ocean barge purpose built in Korea for NTCL.
MV "Marjory" on Slave River Rapids Portage, carried by Mammoet Canada's Heavy Haul Trailers
PHASE 1 REPORT: TRANSPORTATION DEMAND ASSESSMENT
PROLOG/EBA PAGE 29
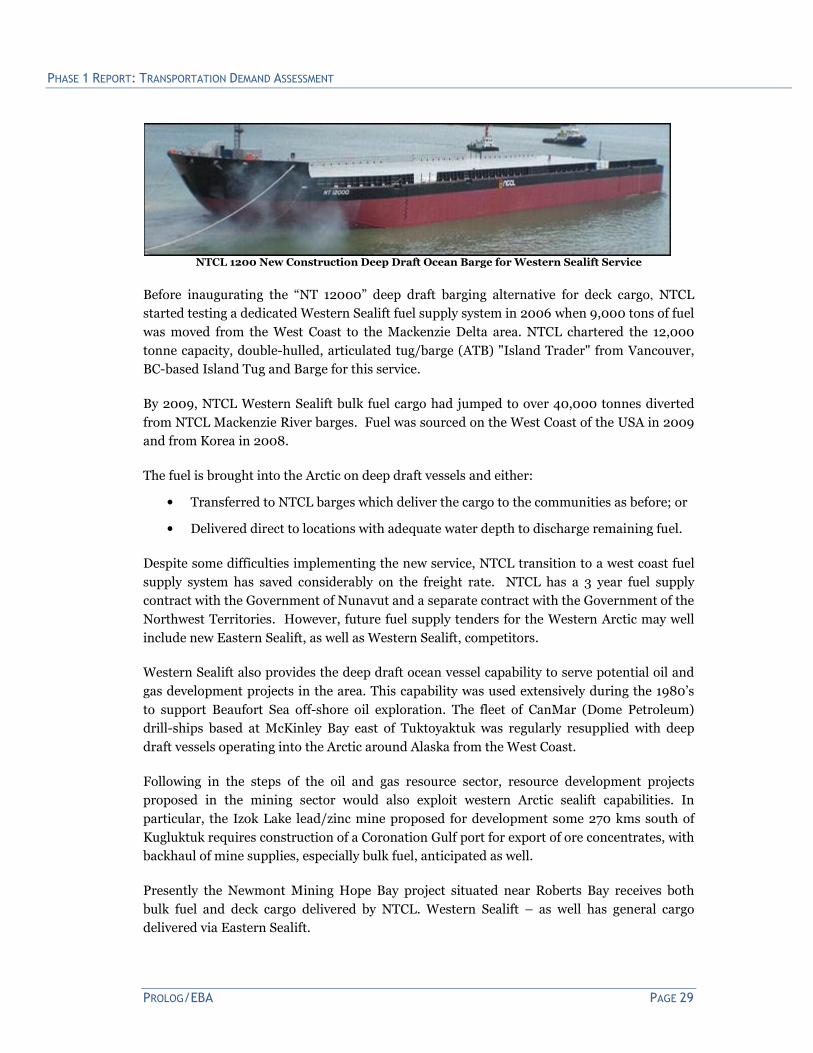
NTCL 1200 New Construction Deep Draft Ocean Barge for Western Sealift Service
Before inaugurating the “NT 12000” deep draft barging alternative for deck cargo, NTCL
started testing a dedicated Western Sealift fuel supply system in 2006 when 9,000 tons of fuel
was moved from the West Coast to the Mackenzie Delta area. NTCL chartered the 12,000
tonne capacity, double-hulled, articulated tug/barge (ATB) "Island Trader" from Vancouver,
BC-based Island Tug and Barge for this service.
By 2009, NTCL Western Sealift bulk fuel cargo had jumped to over 40,000 tonnes diverted
from NTCL Mackenzie River barges. Fuel was sourced on the West Coast of the USA in 2009
and from Korea in 2008.
The fuel is brought into the Arctic on deep draft vessels and either:
• Transferred to NTCL barges which deliver the cargo to the communities as before; or
• Delivered direct to locations with adequate water depth to discharge remaining fuel.
Despite some difficulties implementing the new service, NTCL transition to a west coast fuel
supply system has saved considerably on the freight rate. NTCL has a 3 year fuel supply
contract with the Government of Nunavut and a separate contract with the Government of the
Northwest Territories. However, future fuel supply tenders for the Western Arctic may well
include new Eastern Sealift, as well as Western Sealift, competitors.
Western Sealift also provides the deep draft ocean vessel capability to serve potential oil and
gas development projects in the area. This capability was used extensively during the 1980’s
to support Beaufort Sea off-shore oil exploration. The fleet of CanMar (Dome Petroleum)
drill-ships based at McKinley Bay east of Tuktoyaktuk was regularly resupplied with deep
draft vessels operating into the Arctic around Alaska from the West Coast.
Following in the steps of the oil and gas resource sector, resource development projects
proposed in the mining sector would also exploit western Arctic sealift capabilities. In
particular, the Izok Lake lead/zinc mine proposed for development some 270 kms south of
Kugluktuk requires construction of a Coronation Gulf port for export of ore concentrates, with
backhaul of mine supplies, especially bulk fuel, anticipated as well.
Presently the Newmont Mining Hope Bay project situated near Roberts Bay receives both
bulk fuel and deck cargo delivered by NTCL. Western Sealift – as well has general cargo
delivered via Eastern Sealift.

NORTHERN TRANSPORTATION SYSTEMS ASSESSMENT
PAGE 30 PROLOG/EBA

PHASE 1 REPORT: TRANSPORTATION DEMAND ASSESSMENT
PROLOG/EBA PAGE 31
2.2 Intermodal Systems Demand
There are three northern intermodal systems that combine inland rail, road and marine
transport to access each territory (see map on opposite page):
• Mackenzie Intermodal System – Connects Mackenzie River and road links in the
NWT at Inuvik, Fort Simpson and the Hay River railhead.
• Hudson Bay Intermodal System – Connects Kivalliq communities in Nunavut to the
Port of Churchill railhead and via rail to road links at Gillam or Thompson, Manitoba.
• Inside Passage Intermodal System – Connects Yukon and Mackenzie Delta
Communities with Alaska/BC Inside Passage road, marine and rail links.
Another intermodal system at the Moosonee Rail/Marine Gateway is no longer active for
Nunavut traffic.
These are primarily barge-based intermodal systems with containers or roll-on/roll-off
trailers transferring community general freight among modes. However, there are also inter-
modal bulk cargo transfers for inbound fuel and outbound resource cargos to bulk grain
carriers at Churchill and ore ships at Skagway.
This section outlines operations and demand for each of these inland intermodal
transportation systems.
2.2.1 Mackenzie Intermodal System
Cooper Service 800 Series Barges with Highway Trailers for Norman Wells and Tulita.
Cooper Barging Photo
This intermodal transportation system uses the Mackenzie River for summer seasonal barge
service to communities and resource developments in the Mackenzie Valley and Delta, as well
as along the Western Arctic coast. It integrates CN Rail and southern trucking services with
marine operations of NTCL, Cooper Barging and Horizon North.

NORTHERN TRANSPORTATION SYSTEMS ASSESSMENT
PAGE 32 PROLOG/EBA
Inter-modal transfers complete rail and road connections from Alberta and British Columbia:
• The NTCL Hay River Terminal is a major intermodal hub with barge loading facilities
to transfer marine containers and other deck cargo delivered by truck via Mackenzie
Highway 1 from Alberta;
• The CN Railhead at Hay River/Enterprise is a bulk terminal for Edmonton refinery
sourced fuel transfers to barges or trucks – and a barge or truck transload facility for
other freight;
• The Coopers Barging Terminal at Fort Simpson is a roll-on/roll-off facility for deck
cargo and trailers moved by truck via Mackenzie Highway 1 from Alberta or Liard
Highway 7 from B.C.
• The NTCL and Horizon Terminal at Inuvik is an intermodal transload facility for
truck freight moved over Dempster Highway 8 from the Alaska Highway or Alaska
Inside Passage ports.
2006 2007 2008 2009
Bulk Fuel 32,000 29,000 27,000 26,000
Resource Development 19,000 17,000 18,000 9,000
Community Resupply 9,000 8,000 9,000 4,000
-
10,000
20,000
30,000
40,000
50,000
60,000
70,000
Ton
ne
s/Y
ear
Mackenzie Valley Intermodal Demand - By Commodity Group
2006 2007 2008 2009
Fort Simpson 12,000 10,800 17,000 11,400
Hay River 48,000 42,000 36,000 27,600
-
10,000
20,000
30,000
40,000
50,000
60,000
70,000
Ton
ne
s/Y
ea
r
Mackenzie Valley Intermodal Demand - By Marine Gateway

PHASE 1 REPORT: TRANSPORTATION DEMAND ASSESSMENT
PROLOG/EBA PAGE 33
Hay River Railhead
The CN Rail Slave Subdivision is a 969 km railway
operating in Alberta and the Northwest Territories
and terminating at Hay River, N.W.T. It is the
northernmost trackage of the contiguous North
American railway network.
The rail line originally continued east from Hay
River to the Pine Point mine. This section was
abandoned in 1988 once concentrate shipments
from the closed mine ceased. The total mileage in
the Northwest Territories from the border with
Alberta to Hay River is approximately 80 miles.
Tracks extend into the NTCL terminal and the
barge loading docks alongside the Hay River.
Originally constructed to a minimum standard over muskeg and discontinuous permafrost,
track structure, ties and culverts deteriorated further resulting in trains operating at reduced
capacity during summer. The need to significantly upgrade the system was recognized by CN
and since 2007, $75 million has been invested in the Slave Subdivision. Ongoing budgets are
in place for further investment of $8 to $10 million in 2010, and annually thereafter. The
investment has been in new ties and ballast; bridges and culverts; and siding extensions.
CN Rail reaches southern NWT
communities via the highway
network; and Mackenzie River and
Western Arctic communities via
NTCL barges.
Commodities moved on the Slave
Subdivision include principally
petroleum products and small
amounts of agriculture and forest
products (see adjacent table).
Note the progressive decline since
2007 which is largely accounted for
by the attendant decline in fuel
shipments to the three diamond
mines. Both the impact of a world
economic recession resulting in
periodic mine closures and new
underground vs. open pit mining
substantially reduced fuel demand.
Midnight Sun Bulk Fuel Terminal providing interim storage and rail to barge or truck transload for
Imperial Oil Limited at the CN Railhead in Hay River.
Mark Kimakowich photo.
Source: CN Rail

NORTHERN TRANSPORTATION SYSTEMS ASSESSMENT
PAGE 34 PROLOG/EBA
Hay River Barge Gateway
NTCL Barge Terminal at Hay River, NWT – NTCL Photo.
The Hay River Gateway originated with the opening of a marine terminal at Hay River,
N.W.T. by NTCL in 1962. For three years cargo was transhipped from southern-originating
trucks to barges after freight was consolidated for various Mackenzie River community
destinations. Since 1965 rail service has connected with barges at Hay River. Currently rail
service is mainly for bulk fuel and deck cargo is delivered by truck.
Since 2006 the decline in traffic over the Hay River Gateway has reached the point that it is
less than the cargo now delivered to the Western Arctic over the West Coast Gateway.
However, the Mackenzie River intermodal marine route from Hay River (and Fort Simpson)
still remains an important northern transportation system. Until an all-weather Mackenzie
Valley Highway is constructed, the stranded communities along the river will rely largely on
barge service. Construction of the Mackenzie Valley Pipeline, if it proceeds, will rejuvenate oil
and gas activity, much of which will be served from Hay River as in the past.
The following table shows Mackenzie Valley Intermodal Marine System Demand, including
both Mackenzie Valley traffic and Western Arctic traffic both of which are handled at Hay
River as part of the same transportation system.
Hay River Gateway Intermodal Marine System Demand (Tonnes Estimated in 2010)
To: Deck Cargo Bulk Fuel Total Cargo
Mackenzie Valley 1,800 22,500 24,300
Western Arctic 1,000 4,500 5,500
Gateway Total 2,800 27,000 29,800
Source: NTCL

PHASE 1 REPORT: TRANSPORTATION DEMAND ASSESSMENT
PROLOG/EBA PAGE 35
Fort Simpson Barge Gateway
Cooper Barging Service Fort Simpson terminal near the junction of Mackenzie Highway 1 and Liard Highway 7.
Cooper Barging Photo
In addition to NTCL, Cooper Barging Service transports general freight and construction
materials mainly to central Mackenzie River points north of Wrigley, and the oil and gas
industry in the area, when active. Coopers Barging provides a competitive barging operation
to NTCL on the Mackenzie and Liard Rivers, and Great Slave Lake. Headquartered in Fort
Nelson, BC, Coopers Barging started its marine business on the Liard River in 1942, and
expanded into trucking and construction in the mid 1960s.
The Company is focused on barging deck cargo, equipment, camps and supplies supporting
oil and gas exploration projects in the Mackenzie Valley, and transporting general freight for
communities along the river. Its main marine staging base today is the landing dock and
storage yard located at the confluence of the Liard and Mackenzie Rivers, at Fort Simpson,
N.W.T. Much of the resource development freight arrives at Fort Simpson over the Liard
Highway corridor from Fort Nelson and southern B.C.
Coopers operates four shallow-draft river tugs and a fleet of nine barges (see appendix). The
Company's barges are designed for deck cargo only (no fuel compartments) and its business is
focused on supplies for the oil and gas; minerals; and lumber industries - to which its trucking
and construction services are also offered. It also carries LTL freight and other commodities
in containers and highway trailers to Norman Wells and other communities on the Mackenzie
River not served by road.
Coopers Barging offers regular scheduled services from Fort Simpson annually, generally
eight or nine trips from early June to the end of September. Charter services are available for
trips on the Liard River. General freight and commodity class tariffs are weight-based and set
for destinations along the river, with special rates and tariffs available for highway trailers,
container handling and consolidation, and time charter voyages.
Fort Simpson Gateway Intermodal Marine System Demand (Tonnes Estimated in 2010)
Community Freight Resource Freight Total Deck Cargo
3,000 tonnes 7,000 tonnes 10,000 tonnes
Source: Coopers Barging

NORTHERN TRANSPORTATION SYSTEMS ASSESSMENT
PAGE 36 PROLOG/EBA
Mackenzie Delta Barge Gateway
A Mackenzie Delta Gateway is
provided for truck to barge
transfer between the
Dempster Highway and the
Mackenzie River at Inuvik. In
addition to NTCL barge
terminal facilities at Inuvik
and Tuktoyaktuk, Horizon
North Logistics provides a
broad range of logistics
services in the Mackenzie Delta.
Horizon Northern Logistics Inc. is a Canadian publicly-traded company that offers supply,
management, and catering of camps; stabilized base platforms for work areas on tundra and
permafrost; and marine transportation support services.
The Company, with over 700 employees, has operations in three Western Canadian provinces
and the three northern territories, and has entered into a large number of business
partnerships with aboriginal organizations where it is active.
Horizon currently offers three business segments; camps and catering; matting systems for
surface stabilization; and marine services. The marine services include base camps, off-shore
logistics, remote shoreline staging, self-contained barge camps, mobile sleigh camps, river tug
and barge transportation.
Horizon operates four tugs and various barges for the transportation of fuel and equipment
throughout the Mackenzie Delta. This equipment is made available at daily charter rates
during the navigational season, generally from mid-June to mid-October. Horizon provides
portable camp/work barges that are moved in close proximity to exploration worksites,
mainly in the Mackenzie Delta, with supplies and equipment sufficient to facilitate winter
season work programs.
Horizon also owns or has access to three staging sites in the Delta region that have served the
oil and gas industry for years, Tuktoyaktuk, Lucas Point and Swimming Point. These are
offered to users as field operational bases. The Tuktoyaktuk facility consists of a 280 man
camp, fuel tank farm, barge landing docks, maintenance shops and equipment storage areas.
Lucas and Swimming Point are leased from Arctic Oil and Gas Services Inc., a company 50%
owned by Horizon, and 50% owned by the Inuvialuit Development Corporation. Swimming
Point, located between Inuvik and Tuktoyaktuk, features an 80 man camp, landing strip, fuel
storage, barge dock and maintenance and storage buildings. Lucas Point, south of Swimming
Point, has a landing dock, storage area and a 4.5 acre gravelled storage yard.
NTCL tug wintered over at the Inuvik Barge Terminal and Transload Facility between the Dempster Highway and the Mackenzie River.

PHASE 1 REPORT: TRANSPORTATION DEMAND ASSESSMENT
PROLOG/EBA PAGE 37
2.2.2 Hudson Bay Intermodal System
The Hudson Bay Intermodal System integrates summer seasonal marine transportation to Kivalliq communities in Nunavut with road and/or rail transport from Winnipeg to Churchill, Manitoba. The system comprises roll-on/roll-off trailers, equipment and packaged freight moved:
• By truck over Manitoba Provincial Trunk Highway 6 to the Thompson Roadhead;
• By train over the Hudson Bay Railway to the Port of Churchill Railhead; and
• By barge or ship from Churchill to Kivalliq Region communities.
As well, an integrated rail/marine bulk fuel supply system to Kivalliq communities was active
in the recent past.
Traffic demand for the Hudson Bay Intermodal System is generated by resource
developments and communities in the Kivalliq region of Nunavut. These communities have
until recent years received their annual resupply via the Hudson Bay Railway to the port of
Churchill, Manitoba, and then by tug and barge service from Churchill to the Kivalliq Region.
However, before 1975 and again since the early 2000’s these communities have been
receiving most of their annual resupply as part of the Eastern Sealift system from Montreal.
For this east coast originating traffic as well as the remaining Hudson Bay Intermodal system
traffic via the Port of Churchill, the following table shows total Kivalliq Region demand for
community and resource general freight as well as for bulk fuel.
Hudson Bay Kivalliq Region Total Traffic Demand
Community Resource Fuel Total
4,300 tonnes 27,300 tonnes 38,500 tonnes 70,100 tonnes
Roll-On/Roll-Off and Intermodal Container Traffic en route from Winnipeg via road to rail transload
at Thompson, Manitoba for movement by train – the only surface connection – to Hudson Bay Port of Churchill.

NORTHERN TRANSPORTATION SYSTEMS ASSESSMENT
PAGE 38 PROLOG/EBA
Hudson Bay Railhead
Hudson Bay Railhead at Churchill, Manitoba with Hudson Bay Port of Churchill Grain Terminal in background.
The Hudson Bay Railhead at Churchill, Manitoba is the northern terminus of the closest rail
connection to Nunavut. The length of the entire rail route from Churchill to Winnipeg is
1,697 km. As there is no road connection to Churchill, most highway traffic is transferred to
trains at Thompson 548 km south of Churchill.
OMNITrax is a shortline railway holding company that owns and operates The Hudson Bay
Railway (HBR). HBR runs 920 km between Churchill and The Pas where it connects with the
Canadian National rail system. OMNITrax purchased the rail line from Canadian National in
1997 and acquired the Port of Churchill from the federal government at the same time.
The entire line is rated at 263,000 pounds weight on rail which can accommodate 100 tonne
carloads. Track condition for the last 296 km between Gilliam and Churchill has historically
limited running times to 12 hours.
A $60 million infrastructure upgrade will result in an increase in train speeds on the northern
part of the line from 16 km/h to 40 km/h. The work includes tie installations, siding
extensions, turnout replacement, bridge work, road crossings and engineering work. The
upgrade investment cost is equally shared among OMNITrax, the Federal and Manitoba
Governments.
Railway operations are typically:
• 1-2 grain trains/day in summer for ocean exports;
• 2-3 trains/week with freight and fuel for Churchill and Kivalliq communities;
• 3 passenger trains/week for VIA Rail remote communities service in Manitoba;
Integrated truck/rail/marine intermodal transload service between Winnipeg, Thompson,
Churchill and Kivalliq communities includes the operations of Gardewine North and Harris
Transport.

PHASE 1 REPORT: TRANSPORTATION DEMAND ASSESSMENT
PROLOG/EBA PAGE 39
Hudson Bay Deep Sea Port
The Hudson Bay Port of Churchill is the intermodal interface between rail service from the
South and marine operations to the North. It is owned in parallel with the Hudson Bay
Railway by OmniTRAX.
The port facility embraces a large grain terminal, a 1000 metre wharf, on-dock rail and
warehouse, and a tank farm. The current ice-free shipping season is mid-July through mid-
October.
Port capabilities include:
• Four 250 metre ship berths with, from the channel entrance, the first berth used for
tanker discharges, two berths for grain loading, and the fourth berth for general
cargo/container operations.
• Water depth alongside at mean low water of 12.2 metres at the first three berths and
11.6 metres at the fourth berth.
• A barge loading facility inside the main dock and an on-dock transit warehouse with
inside rail access.
• 50 million litres fuel storage tank farm with rail access in the immediate port area.
The centerpiece of the port is a high capacity grain terminal which has been extensively
upgraded and handled in excess of 700,000 tonnes of grain in 2000. Canadian Wheat Board
grain shipments are reported to account for about 80% of annual shipments through the port.
Port tonnage throughput over the last decade is shown in the following table:
Hudson Bay Port of Churchill Annual Throughput (tonnes)
2000 2001 2002 2003 2004 2005 2006 2007 2008 2009
710,579 478,203 279,270 615,394 400,010 466,785 488,754 620,709 424,388 529,391
Source: OmniTRAX
Hudson Bay Port of Churchill, Manitoba
Churchill Gateway Development Corp. Photo
NORTHERN TRANSPORTATION SYSTEMS ASSESSMENT
PAGE 40 PROLOG/EBA
Hudson Bay Barge Gateway
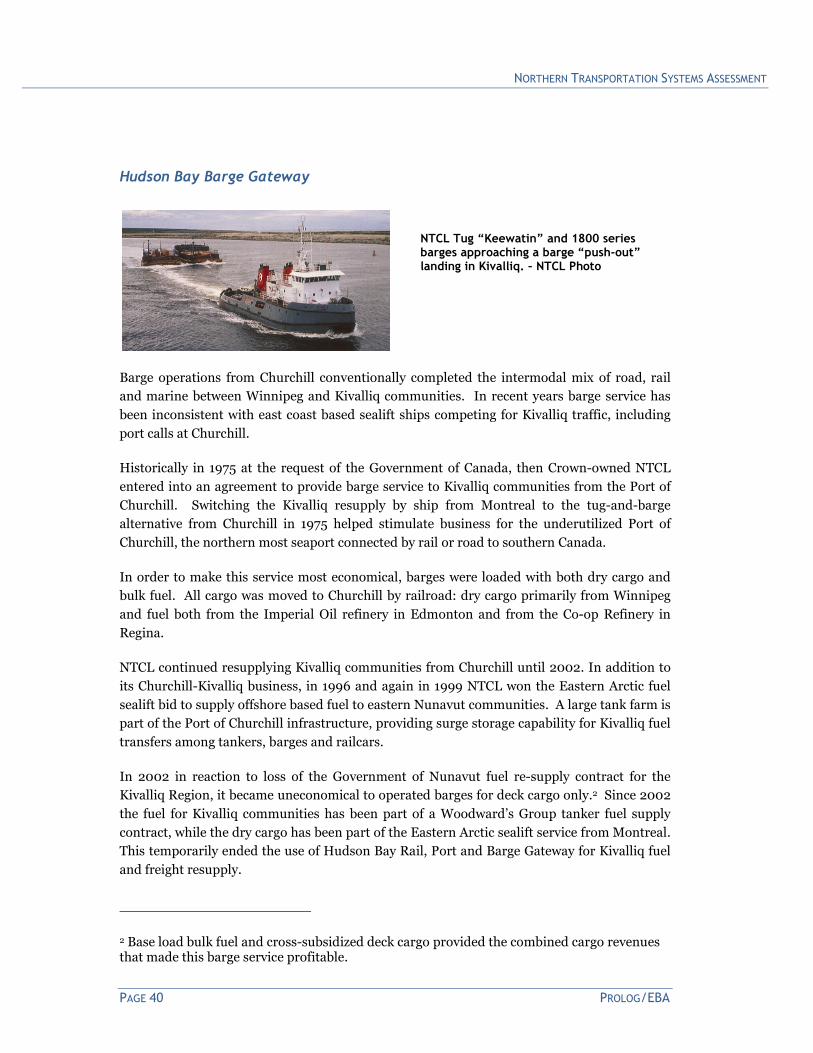
NTCL Tug “Keewatin” and 1800 series barges approaching a barge “push-out” landing in Kivalliq. – NTCL Photo
Barge operations from Churchill conventionally completed the intermodal mix of road, rail
and marine between Winnipeg and Kivalliq communities. In recent years barge service has
been inconsistent with east coast based sealift ships competing for Kivalliq traffic, including
port calls at Churchill.
Historically in 1975 at the request of the Government of Canada, then Crown-owned NTCL
entered into an agreement to provide barge service to Kivalliq communities from the Port of
Churchill. Switching the Kivalliq resupply by ship from Montreal to the tug-and-barge
alternative from Churchill in 1975 helped stimulate business for the underutilized Port of
Churchill, the northern most seaport connected by rail or road to southern Canada.
In order to make this service most economical, barges were loaded with both dry cargo and
bulk fuel. All cargo was moved to Churchill by railroad: dry cargo primarily from Winnipeg
and fuel both from the Imperial Oil refinery in Edmonton and from the Co-op Refinery in
Regina.
NTCL continued resupplying Kivalliq communities from Churchill until 2002. In addition to
its Churchill-Kivalliq business, in 1996 and again in 1999 NTCL won the Eastern Arctic fuel
sealift bid to supply offshore based fuel to eastern Nunavut communities. A large tank farm is
part of the Port of Churchill infrastructure, providing surge storage capability for Kivalliq fuel
transfers among tankers, barges and railcars.
In 2002 in reaction to loss of the Government of Nunavut fuel re-supply contract for the
Kivalliq Region, it became uneconomical to operated barges for deck cargo only.2 Since 2002
the fuel for Kivalliq communities has been part of a Woodward’s Group tanker fuel supply
contract, while the dry cargo has been part of the Eastern Arctic sealift service from Montreal.
This temporarily ended the use of Hudson Bay Rail, Port and Barge Gateway for Kivalliq fuel
and freight resupply.
2 Base load bulk fuel and cross-subsidized deck cargo provided the combined cargo revenues that made this barge service profitable.

PHASE 1 REPORT: TRANSPORTATION DEMAND ASSESSMENT
PROLOG/EBA PAGE 41
In 2006 NTCL re-entered the Hudson Bay market with cargo from Montreal as well as from
the port of Churchill. Plans were to serve all Kivalliq region communities as well as
Sanikiluaq, in the Southeast part of Hudson Bay. However, NTCL’s main involvement in
Kivalliq has recently been in barging between Chesterfield Inlet and Baker Lake the
construction materials and fuel for the Meadowbank gold mine north of Baker Lake.
In 2009 all dry cargo to Kivalliq communities was shipped from Montreal. Of the total, most
was delivered direct to Kivalliq communities by NSSI or NEAS. However 4,320 tonnes was
delivered to Churchill from where it was barged to the communities by NTCL. In 2010 it is
planned that all NTCL community dry cargo for the Kivalliq region will be shipped through
Churchill.
Moosonee Rail/Barge Gateway
Tug and barge service provided by Moosonee Transportation Ltd. (MTL), based at Moosonee
in Northern Ontario on the southern tip of James Bay in southern Hudson Bay, serves James
Bay coastal communities in Ontario and Quebec.
Hudson Bay barge operations from the Moosonee, Ontario railhead were initiated by Arctic
Transportation Ltd. (a Crowley Maritime/FedNav joint venture). Subsequently Moosonee
Transportation Ltd. acquired the operation and until 2005 provided regular community
resupply to Nunavut communities in James Bay (Sanikiluaq/Belcher Islands) and sporadic
charter sailings to Kivalliq communities along the Hudson Bay coast.
All resupply commodities were brought to Moosonee via Ontario Northland Railway from
southern Ontario. However, since 2005 all of Sanikiluaq’s annual resupply has been part of
the Eastern Arctic sealift.

NORTHERN TRANSPORTATION SYSTEMS ASSESSMENT
PAGE 42 PROLOG/EBA

PHASE 1 REPORT: TRANSPORTATION DEMAND ASSESSMENT
PROLOG/EBA PAGE 43
2.2.3 Inside Passage Intermodal System
Alaska Marine Lines offload operations at Skagway, Alaska, including intermodal containers for highway delivery to Yukon.
This Northern Transportation System extends along the Southeast Alaska and B.C. Coastal
Inside Passage. It provides year around ice free port access to Yukon - and through Yukon via
the Alaska Highway to Interior Alaska, or via the Dempster Highway to the Mackenzie Delta.
See current inside Passage traffic flows on the map opposite.
Inside Passage marine accesses rail and/or road infrastructure via the following ports:
• Alaska Highway 1 and Robert Campbell Highway 4 via Cassiar Highway 37 from the
Inside Passage Port of Stewart, B. C (bordering Hyder, Alaska)
• Haines Highway 3 and Alaska Highway 1 via the Inside Passage Port of Haines,
Alaska (40 miles south of the Alaska/Canada border),
• White Pass & Yukon Route railway (passenger only/potentially reactivated freight
service) and parallel Klondike Highway 2 from the Inside Passage Port of Skagway,
Alaska (20 miles south of the Alaska/Canada border).
Inbound marine service to Yukon is currently provided by:
• Delta Western – monthly tanker barge service from Vancouver and/or Puget Sound
to Haines for Totem Oil (delivering to Mackenzie Fuels in Yukon).
• Island Tug & Barge – monthly tanker barge service from Vancouver to Skagway for
PetroMarine (branded North 60 in Yukon).
• Alaska Marine Lines – weekly container/deck cargo barge service from Seattle to both
Haines and Skagway.

NORTHERN TRANSPORTATION SYSTEMS ASSESSMENT
PAGE 44 PROLOG/EBA
Inbound Inside Passage demand has held fairly constant after allowing for a peak mining
exploration and development year in 2007 as shown in the following chart.
Outbound marine traffic from Yukon is mostly mineral concentrates from Skagway and (in
2010) from Stewart. Resumption of Yukon base metal exports began with Minto Mine copper
concentrates in July, 2007. Yukon Zinc production at the Wolverine Mine started in 2010.
Inside Passage Mineral Exports from Yukon (tonnes)
2007 2008 2009 2010 (est)
Skagway 5,000 48,000 54,000 60,000-80,000
Stewart 80,000-100,000
Source: Capstone and Yukon Zinc interviews
In addition to marine cargo traffic there is also a very large Inside Passage Cruise Ship market
totalling 424 port calls at Skagway with 779,000 passengers in 2009.
Inside Passage Cruise Ship Passengers Disembarking at Skagway
2006 2007 2008 2009 2010 (est)
755,314 820,744 765,492 779,043 665,491
The Inside Passage provides marine access from Vancouver and Seattle through Skagway and
Haines, Alaska with short all-weather highway connections into Yukon. The Port of Skagway
has traditionally been the gateway to Yukon since the White Pass and Yukon Railway was
completed to Whitehorse in 1900. Until the late 1970’s, the Inside Passage essentially
provided sole supply access to Yukon.
2007 2008 2009
Bulk Fuel 65,700 63,700 63,900
Resource Development 30,500 28,300 24,200
Community Resupply 64,400 62,300 59,400
-
30,000
60,000
90,000
120,000
150,000
180,000
To
nn
es/
Ye
ar
Inside Passage Inbound Traffic by Commodity

PHASE 1 REPORT: TRANSPORTATION DEMAND ASSESSMENT
PROLOG/EBA PAGE 45
Skagway
90%
Haines
10%
Although the White Pass and Yukon Railway is still in place from Skagway to Whitehorse, it is
presently in use for summer tourist trains from Skagway, only as far into Yukon as Carcross.
In 1979, the South Klondike Highway was completed parallel to the railway. It was initially
intended only as a summer tourist road closed to truck traffic. In 1986 as part of a package of
inducements to re-open the mine at Faro, the Government of Yukon initiated an agreement
with the State of Alaska that now accommodates year-round heavy trucking on the South
Klondike Highway.
The South Klondike Highway was opened to heavy trucking primarily to ensure a viable
transportation corridor to tidewater for Yukon and to enhance the viability of mining
operations in Yukon and nearby B.C. However, its connection to the Mackenzie Delta via the
North Klondike Highway and Dempster Highway (also completed in 1979) now provide a
year-round ice-free port access route to the Western NWT, as well.
The White Pass System continued to provide intermodal container service with its own ships
into the 1990’s. However, much of the traffic traditionally moving through this historical
gateway to Yukon has been diverted to the Alaska Highway from Vancouver and, increasingly,
from Edmonton. In 1996 the last of the White Pass ships was removed from service.
Skagway is the primary tidewater access point for, and historical gateway to, Yukon. It is just
18 miles (29 km) from the Canadian border and 180 km from Whitehorse. Most inbound
cargo is bulk fuel and container traffic for furtherance to Yukon. Virtually all outbound cargo
is Canadian bulk commodity export traffic (mostly ore concentrate and some timber).
Haines is an alternate port for Yukon and the primary port for U.S. traffic connecting through
Yukon and the southeast panhandle of Alaska to the interior of Alaska from the lower 48
United States. Haines is 405 km from Whitehorse or 225 km further than Skagway. Despite
the additional distance, Haines plays an important alternate marine access role for Yukon.
Alaska/BC Marine Container Gateway.
Most community general freight on the Inside Passage moves in marine containers
transferred to trucks at Skagway for highway delivery to Yukon destinations or Haines for
highway delivery through Yukon to Interior Alaska destinations. Current inbound
community general freight flows, via Haines and Skagway both to Yukon communities and
through Yukon to Interior Alaska, consist of:
Inside Passage Community General Freight (tonnes in 2009)
Through Yukon To Yukon Total
Via Haines 5,000 1,000 6,000
Via Skagway 1,000 52,000 53,000
Total 6,000 53,000 59,000
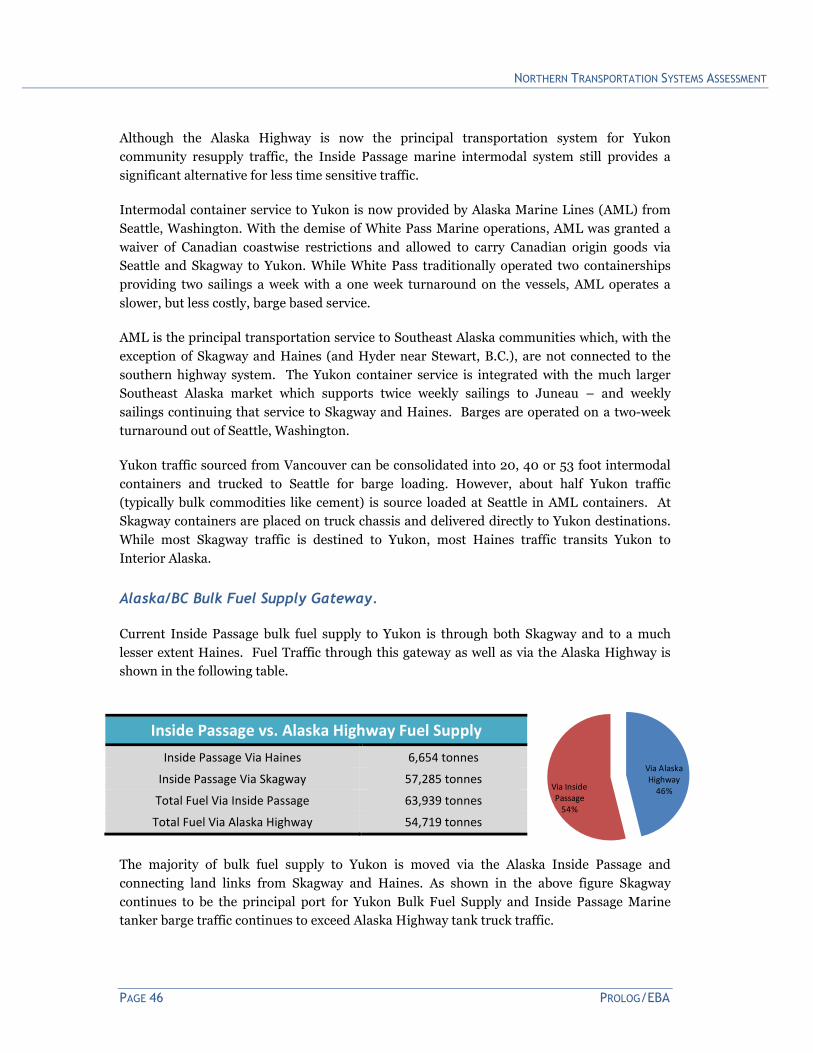
NORTHERN TRANSPORTATION SYSTEMS ASSESSMENT
PAGE 46 PROLOG/EBA
Via Alaska
Highway
46%Via Inside
Passage
54%
Although the Alaska Highway is now the principal transportation system for Yukon
community resupply traffic, the Inside Passage marine intermodal system still provides a
significant alternative for less time sensitive traffic.
Intermodal container service to Yukon is now provided by Alaska Marine Lines (AML) from
Seattle, Washington. With the demise of White Pass Marine operations, AML was granted a
waiver of Canadian coastwise restrictions and allowed to carry Canadian origin goods via
Seattle and Skagway to Yukon. While White Pass traditionally operated two containerships
providing two sailings a week with a one week turnaround on the vessels, AML operates a
slower, but less costly, barge based service.
AML is the principal transportation service to Southeast Alaska communities which, with the
exception of Skagway and Haines (and Hyder near Stewart, B.C.), are not connected to the
southern highway system. The Yukon container service is integrated with the much larger
Southeast Alaska market which supports twice weekly sailings to Juneau – and weekly
sailings continuing that service to Skagway and Haines. Barges are operated on a two-week
turnaround out of Seattle, Washington.
Yukon traffic sourced from Vancouver can be consolidated into 20, 40 or 53 foot intermodal
containers and trucked to Seattle for barge loading. However, about half Yukon traffic
(typically bulk commodities like cement) is source loaded at Seattle in AML containers. At
Skagway containers are placed on truck chassis and delivered directly to Yukon destinations.
While most Skagway traffic is destined to Yukon, most Haines traffic transits Yukon to
Interior Alaska.
Alaska/BC Bulk Fuel Supply Gateway.
Current Inside Passage bulk fuel supply to Yukon is through both Skagway and to a much
lesser extent Haines. Fuel Traffic through this gateway as well as via the Alaska Highway is
shown in the following table.
Inside Passage vs. Alaska Highway Fuel Supply
Inside Passage Via Haines 6,654 tonnes
Inside Passage Via Skagway 57,285 tonnes
Total Fuel Via Inside Passage 63,939 tonnes
Total Fuel Via Alaska Highway 54,719 tonnes
The majority of bulk fuel supply to Yukon is moved via the Alaska Inside Passage and
connecting land links from Skagway and Haines. As shown in the above figure Skagway
continues to be the principal port for Yukon Bulk Fuel Supply and Inside Passage Marine
tanker barge traffic continues to exceed Alaska Highway tank truck traffic.

PHASE 1 REPORT: TRANSPORTATION DEMAND ASSESSMENT
PROLOG/EBA PAGE 47
Historically, Skagway has been the principal port for Yukon fuel supply. Until 1994, the White
Pass pipeline between Skagway and Whitehorse moved the majority of Yukon bulk fuel
delivered from Vancouver refineries via the Alaska Inside Passage. In October of 1994, the
pipeline was shut down and the White Pass fuel distributorship (Chevron) was sold to an
Alaska firm, Petro-Marine which rebranded Yukon fuel distribution operations as North 60.
Petro-Marine has one barge sailing per month into Skagway discharging over a two- to three-
day period approximately six million litres to pipeline headers located at the ore dock. Fuel is
delivered from Vancouver refiners by Canadian contract barge operators. With exception of
some fuel for local requirements and ferry fuelling, the balance of fuel at Skagway is now
trucked to Whitehorse for Yukon distribution.
Haines, Alaska is an alternative Yukon fuel supply gateway. In 1991, to induce a more
competitive market place, the Yukon Government guaranteed financing (subsequently repaid
ahead of schedule) for a new common-user bulk fuel terminal at Haines, Alaska. Delta-
Western currently operates the Haines terminal and provides fuel barge service to it from
Alaska and Washington State refineries. Delta Western uses barges with capacity varying
from three to eight million litres and calling at Haines less than once a month.
Alaska/BC Resource Development Gateway
Current Inbound Resource and Construction Project traffic is:
• via Haines 510 tonnes to Interior Alaska and 142 tonnes to Yukon
• via Skagway119 tonnes to Interior Alaska and 9106 tonnes to Yukon
Yukon Resource and Construction Project traffic has traditionally accessed the Inside Passage
Marine System at Stewart, B.C. as well as at Haines and Skagway Alaska. Before closure of
the Cassiar Asbestos mine, outbound fibre and inbound mine supplies were initially handled
via the White Pass intermodal rail/marine system through Skagway and later shifted to a
similarly coordinated intermodal marine/truck system through Stewart.
A Stewart marine/truck system will start handling lead/zinc ore concentrate and mine
supplies for the Yukon Zinc Wolverine mine in 2010.
Skagway has handled over half a million tonnes of outbound concentrates and corresponding
inbound mine supplies when the lead/zinc mine at Faro was in operation. Since closure of
that mine there has been little outbound traffic from Yukon until the opening of the Minto
copper mine.
Current Minto copper concentrates outbound exceed 54,000 tonnes/year. In 2010 Skagway
mineral exports will be matched by Stewart outbound mineral traffic anticipated to grow from
60,000 tonnes/year to over 100,000 tonnes/year.

NORTHERN TRANSPORTATION SYSTEMS ASSESSMENT
PAGE 48 PROLOG/EBA

PHASE 1 REPORT: TRANSPORTATION DEMAND ASSESSMENT
PROLOG/EBA PAGE 49
2.3 Trucking Systems Demand
Northern truck transport systems are extensions of the Alaska Highway from British
Columbia and the Mackenzie Highway from Alberta:
• In Yukon, an extensive all-weather heavy haul system has expanded from the Alaska
Highway to include the Robert Campbell, Dempster, North and South Klondike
Highways
• In the Northwest Territories, winter roads seasonally extend Mackenzie Highway
trucking operations into the Slave Geologic Province, to Tlicho communities and
along the Mackenzie Valley.
• In Nunavut, no communities are connected by road - either within the territory or
between Nunavut and the southern Provinces.
Traffic flows and composition for Northern Truck Transport systems are highlighted on the
map opposite for current demand exceeding one million tonnes per year by 2010.
Highway systems demand in both Yukon and NWT was derived in large part from weigh scale
data. See appendix for detailed statistical development.

NORTHERN TRANSPORTATION SYSTEMS ASSESSMENT
PAGE 50 PROLOG/EBA
Yukon Highway System

PHASE 1 REPORT: TRANSPORTATION DEMAND ASSESSMENT
PROLOG/EBA PAGE 51
2.3.1 Yukon Heavy Haul Highway System
Crossing Nares River Bridge at Carcross, Yukon, Canadian Lynden Transport bulk haul permitted "Super B" train carrying 53 tonnes of copper concentrate from Minto Mine to the Skagway, Alaska ore terminal.
Building upon Alaska Highway construction completed by the U.S. military during World
War II, Yukon now has the most extensive highway system in the North. Over much of this
system bulk haul permits accommodate heavy haul truck transport not normally allowed
elsewhere in North America.
The Yukon Heavy Haul Highway System has been key to overcoming high cost bulk
transportation that might otherwise preclude remote resource development critical to
sustained economic growth in the territory. This part of the report provides highway system
demand data at three major gateways that funnel truck traffic into Yukon (see highway map
opposite):
• The major gateway for Northbound Traffic is Watson Lake at the Junction of the
Alaska Highway and Cassiar Highway from British Columbia with Robert Campbell
Highway 4 and continuation of Alaska Highway 1 in Yukon.
• The major gateway for North and Southbound truck traffic to and from marine
connections is the Inside Passage at Skagway, Alaska via Klondike Highway 2 or
Haines, Alaska via Haines Highway 3, both connecting to Alaska Highway 1
• The major gateway for Southbound Traffic is Beaver Creek on the Alaska Highway at
the US/Canada border crossing from Interior Alaska.
The current 2009 Yukon Highways traffic survey and PROLOG's results analysis provides
traffic flows over the three main Gateways for the three main commodity groupings, and
historical cargo flows for 2008, and 2007. The chart and table below provide a listing of the
three commodity group traffic flows for the three years, up to and including 2009.

NORTHERN TRANSPORTATION SYSTEMS ASSESSMENT
PAGE 52 PROLOG/EBA
Yukon Highway System Traffic Summary
2007 2008 2009
Trucks Tonnes Trucks Tonnes Trucks Tonnes
Community Resupply 16,000 401,800 15,550 388,700 14,000 371,000
Development Freight 7,500 202,500 7,250 195,900 7,000 143,900
Bulk Fuel 3,200 125,300 3,100 121,300 3,000 121,900
Total 26,700 729,600 25,900 705,900 24,000 636,800
The decline in cargo movements to and through Yukon from 2007 to 2009 clearly reflects the
condition of the overall Canadian and world economies in those years. The drop in total
tonnage in Yukon would have been even more dramatic if the Minto Mine had not come into
production in early 2008.
There are three major gateways to the Yukon Highway System. In addition to the Inside
Passage Marine Intermodal Gateway at Skagway, Alaska, truck traffic from southern Canada
enters Yukon from the Cassiar and Alaska Highways through the Watson Lake Gateway on
the B.C./Yukon border. Southbound Alaska Highway truck traffic enters Yukon through the
Interior Alaska Gateway on the Canada/U.S. border at Beaver Creek, Yukon. In addition, the
Dempster Highway provides truck access between Yukon and Inuvik, N.W.T. and the Top of
the World Highway provides an alternate summer-only connection between Interior Alaska
and Dawson City, Yukon.
2007 2008 2009
Bulk Fuel 125,200 121,400 121,900
Development Freight 202,500 196,000 143,900
General Freight 401,900 388,500 371,000
-
100,000
200,000
300,000
400,000
500,000
600,000
700,000
800,000
Inb
ou
nd
To
nn
es/
Ye
ar
Yukon Highway System Demand - By Comodity Group

PHASE 1 REPORT: TRANSPORTATION DEMAND ASSESSMENT
PROLOG/EBA PAGE 53
Inbound traffic demand at the three major Yukon Highway System gateways is shown on the
following chart for the 2007-2009 period.
Many truck movements over a corridor from a Gateway entry point to a destination are
known to involve a specific commodity. For example, Mackenzie Fuels carries jet fuel from
the Port of Haines to Whitehorse three times per week; and to Dawson City twice per week.
Accordingly, the "Bulk Fuel" commodity group content from that Gateway; in that corridor; to
that destination - accounts for 95% of the commodity groupings in tabulating Haines to South
Yukon traffic flows.
Yukon will have three mines in production by the end of 2010. Capstone Mining's Minto
Copper Mine is currently producing in excess of planned 60,000 tonnes of copper
concentrate/year and will continue to do so through 2018. Concentrates are shipped to the
marine ore terminal at Skagway, AK, for export markets. Yukon Zinc will bring its Wolverine
Mine on stream mid-2010 and is expected to produce 135,000 tonnes of lead, zinc and copper
concentrates annually, to be transported to the port of Stewart, B.C. The Cantung mine owned
by North American Tungsten will re-open on October, 2010 with 9,000 tonnes/year tungsten
compound WO3 production, to 2014.
Yukon Highway Operations
Yukon possesses an extensive road network of some 4700 kilometres, including a highway
trunk system which includes eleven numbered routes, and a number of secondary or seasonal
roads that provide access to resource projects and recreational areas. The primary routes are
generally maintained to typical North American standards with the exception of the Canol
Road (Hwy 6) and the Top of the World Highway (Hwy 9) which are closed in winter. The
Nahanni Range Road is kept open by Yukon Highways year-round when the Cantung Mine is
operating. North American Tungsten Corp. plans to open the mine again in October, 2010.
2007 2008 2009
Interior Alaska Gateway 133,800 129,400 123,200
Inside Passage Gateway 160,600 152,300 147,500
Watson Lake Gateway 395,200 382,200 366,100
-
100,000
200,000
300,000
400,000
500,000
600,000
700,000
800,000
Inb
ou
nd
To
nn
es/
Ye
ar
Yukon Highway System Demand - By Gateway

NORTHERN TRANSPORTATION SYSTEMS ASSESSMENT
PAGE 54 PROLOG/EBA
The following Table 3.1 details the extent of highways and roads in Yukon that are maintained
by Yukon Highways and Public Works.
Highway Network Description
Trunk Highways – Paved 2,136.44 km
Trunk Highways – Gravel
Surface
1,487.22 km
Other Roads – Paved 20.25 km
Other Roads – Gravel 1,037.35 km
Total Maintained Roads 4,681.26 km
There is also a large network of winter roads, exploration trails, and mine access roads that
are, or were constructed and maintained privately. These and other future roads built for
similar purposes vary considerably in their ability to function as future resource corridors.
Their upgrading to all-weather facilities would have to survive geological, engineering,
environmental and socio-economic studies to establish their suitability to be added to the
permanent road system.
All of the bridges on the primary road network are considered adequate to handle
conventional truck axle weights into the foreseeable future. Certain secondary roads are
assessed reduced axle weights or total truck bans during the spring break-up period.
Following are Yukon public highways and distances.
Yukon Public Road System
Highway # Highway Name Length (km)
1 Alaska Highway 943.9
2 Klondike Highway 691.9
3 Haines Road 174.0
4 Campbell Highway 582.3
5 Dempster Highway 465.0
6 North and South Canol* 462.7
7 Atlin Road 41.0
8 Tagish Road 54.0
9 Top Of The World Highway* 105.9
10 Nahanni Range Road 134.0
11 Silver Trail 110.4
*Seasonal Restrictions

PHASE 1 REPORT: TRANSPORTATION DEMAND ASSESSMENT
PROLOG/EBA PAGE 55
The following table lists those segments of the Yukon highway system that permit up to 77,111
kgs. allowable GVW which adds 13.6 tonnes the normal Yukon highway permissible gross
vehicle weight limit of 63,500 kgs.
Yukon Heavy Haul Highways with Bulk Permitting
Highway Name Comments/Description
Hwy 1 (Alaska) Bridges may require strengthening. Permits likely OK. Bulk haul
permitted from Campbell Highway to South Klondike Highway when
Sa Dena Hess Mine was in production.
Hwy 2 (Klondike) Permits issued for ore haul from Carmacks, to Skagway; fuel from
Skagway to Whitehorse. Past haul from Faro to Skagway permitted
Hwy 3 (Haines Rd) No applications to date. Would likely be permitted
Hwy 4 (Campbell) Permitted west of Faro and south from Sa Dena Hess when mines
were in production. Wolverine Mine haul will be permitted.
The current Bulk Haul permit tariff charged by Yukon Highways is one cent per tonne
kilometre applied to the weight over the legal GVW limit, for the portion of the haul on a
public highway.
The Highways Department does not attempt to tie the tariff to the incremental maintenance
cost as might be perceived is inflicted on the highway from the added weight and traffic
increase. Rather, it is a negotiated fee with a historical basis, and likely to prevail in the future
as a precedent and because Highways does not have a scientific basis for determining the
actual cost.
Currently, two bulk haul permits are active. Canadian Lynden Transport carries copper
concentrate from the Minto Mine south to the Skagway ore terminal in Super B Train trucks
carrying 53 tonne payloads. North 60 Transport transports petroleum products from the
Petro Marine Services tank farm at the Port of Skagway (mainly) to its tank farm at
Whitehorse. It averages 43 tonnes with a mixed fleet of trucking equipment types.
Additional bulk haul permits are anticipated as new mines go into production (e.g., Bellekeno
and Wolverine in 2010).

NORTHERN TRANSPORTATION SYSTEMS ASSESSMENT
PAGE 56 PROLOG/EBA

PHASE 1 REPORT: TRANSPORTATION DEMAND ASSESSMENT
PROLOG/EBA PAGE 57
Watson Lake Gateway
Watson Lake located near the British Columbia border, is the major point of entry for
inbound highway freight to Yukon originating in southern Canada and the USA. It is also the
main gateway for through freight destined for the interior of Alaska. The map opposite
graphically displays corridor routings and traffic densities.
At Watson Lake inbound truck traffic enters Yukon:
• Over B.C. Highway 97 (The Alaska Highway) from primarily Edmonton, Alberta and
the railhead at Fort Nelson, B.C.;
• Over B.C. Highway 37 (The Cassiar Highway) from primarily Vancouver and
potentially the ports of Prince Rupert, Kitimat and Stewart, B.C.
From the Watson Lake Gateway, Alaska Highway 1 and Robert Campbell Highway 4 continue
into Yukon.
Alaska Highway
Yukon`s 935 km Alaska Highway No. 1 which originates at Dawson Creek, BC and terminates
at Delta Junction, AK, is constructed and maintained to full North American standards for its
full distance through the territory. It forms part of the continental highway system to the
south.
This primary transportation spine also provides access to year round ice-free Pacific Ocean
ports at Skagway (via the South Klondike Highway 2) and Haines (via the Haines Road,
Highway 3), Alaska. Northward, the highway links the interior of Alaska and the NWT over
the North Klondike Highway 2 and the Dempster Highway No. 5.
Robert Campbell Highway
The 582 km Robert Campbell Highway No. 4 originates at Watson Lake, YT and ends at
Carmacks, YT on the North Klondike Highway. Highway officials describe it as a relatively
narrow gravel road that requires substantial upgrading south of Faro, YT if any significant
further mine development occurs in the area. The Anvil, St. Cyr and Simpson Ranges in the
Selwyn Mountains adjacent to the Campbell highway have been a major host to mining
activity over the years in Yukon.
The following table shows total inbound and outbound cargo flows over the Watson Lake
Gateway, totalling 481,000 tonnes in 2009. During the year, 366,000 tonnes of northbound
cargo passed through the Gateway into Yukon including 135,000 tonnes to the Interior of
Alaska; and 22,000 tonnes to the Northwest Territory's Mackenzie Delta area.
This volume includes Cassiar Highway (B.C. Hwy 37) traffic, most of it originating in
Vancouver and funnelled on to the Alaska Highway from a point a few kms west of Watson
Lake.

NORTHERN TRANSPORTATION SYSTEMS ASSESSMENT
PAGE 58 PROLOG/EBA
190,000 tonnes were delivered to Southern Yukon destinations, mainly Whitehorse, and
19,400 tonnes to Northern Yukon points, mainly the Minto Mine near Carmacks, and Dawson
City. 2009 outbound traffic includes 116,000 tonnes originating in the interior of Alaska
Watson Lake Gateway Traffic (2009)
Route Origin Destination Truckloads Tonnes
Inbound Alaska Hwy 1 AB, BC South Yukon 7,642 190,000
AK Hwy 1, Hwy 2 AB, BC North Yukon 781 19,000
AK Hwy to YT 8,423 209,000
AK Hwy 1, Hwy 5 AB, BC NWT 923 22,000
AK Hwy 1 AB, BC,US Interior Alaska 5,377 135,000
Through YT 6,300 157,000
Total Inbound 14,723 366,000
Outbound Alaska Hwy 1 Int. AK, NWT AB, BC,US 5,060 116,000
Total Outbound 5,060 116,000
TOTAL GATEWAY 19,783 482,000
(Tonnes Northbound)

PHASE 1 REPORT: TRANSPORTATION DEMAND ASSESSMENT
PROLOG/EBA PAGE 59
Inside Passage Gateway
Inside Passage Gateway - South Klondike Hwy 2 joins Alaska Highway 1 South of Whitehorse
The Inside Passage Gateway connects the Yukon Heavy Haul Highway system with tidewater
at the ice-free ports of Skagway and Haines, Alaska (see 2.2.3 Inside Passage Intermodal
System for map of marine traffic flows connecting to the Yukon Highway System.):
• From Skagway, Klondike Highway 2 is the traditional mine haul route connecting
with Alaska Highway 1 at Whitehorse, Robert Campbell Highway 4 at Carmacks - and
Dempster Highway 5 near Dawson City for Mackenzie Delta Traffic.
• From Haines, Haines Highway 3 is the traditional route for Interior Alaska traffic
moving through Yukon to the Haines Junction connection with the Alaska Highway
and continuing to the border crossing at Beaver Creek.
From the Klondike Corridor to Skagway, the Tagish Road and Canol Road diverge toward
mineral developments in the Ross River area. As well, many mineral developments access the
North Klondike Highway and the Dempster Highway diverges at Dawson toward potential oil
and gas developments in Northern Yukon and the Mackenzie Delta.
North Klondike/Dempster Highways
The North Klondike Highway 2 from Carmacks (km 360) to Dawson (km 700) is not
considered adequate to facilitate truck haul frequencies much greater than current traffic
levels. Although this section of the highway has BST classification (bituminous surface
treatment) for suppressing dust, over $100 million would be required to strengthen the road
base to facilitate such projects as the Mackenzie Gas Project (MGP) which could see up to
8,000 heavy truckloads of pipeline construction materials shipped to the northern segments
of the pipeline over this route.
The more recently developed Dempster Highway 5 (junction km 680) to the NWT border, on
the other hand, was constructed to full North American standards and requires very little
upgrading to support new resource development projects north of Dawson.

NORTHERN TRANSPORTATION SYSTEMS ASSESSMENT
PAGE 60 PROLOG/EBA
Tagish Road
The 54 km Highway 8 link between Carcross and Highway 1 (Jake’s Corner) has limited truck
traffic, more likely as the result of local residential influence than technical inadequacy.
Future mine traffic off the lower segment of the Robert Campbell Highway and northern B.C.
on to the Alaska Highway and destined to the Skagway, AK ore terminal over the Tagish Road
could feature lower trucking costs based on the distance saved by avoiding the circuitous
Whitehorse route alternative. The aforementioned mines are all potential candidates for the
Skagway ore terminal, and the presence of the new facility constructed by the Alaska
Industrial Development and Export Authority for the Minto Mine could well be the magnet
required to draw new mine traffic to the closest tidewater port.
Canol Road
The seasonal South Canol Road (Highway 6) is theoretically available for commercial traffic.
However, the road is a winding route that follows topographical contours with minimal cuts
and fills, and has many tight, hairpin curves in and out of valleys.
Some engineering studies have been carried out on improving the North Canol Road, and to a
lesser extent, the South Canol. The entire Hwy 6 route from Johnson's Crossing to the NWT
border represents an important potential mine haul road that can dramatically reduce the
cost of transporting concentrates out, and supplies in - to mines in the area. The Selwyn
Howard Pass, Mactung and Wolverine mineral properties all could benefit from development
of the Canol route as a dedicated mine haul road.
2007 2008 2009
Bulk Fuel 65,700 63,700 63,900
Development Freight 30,500 26,300 24,200
General Freight 64,400 62,300 59,400
-
20,000
40,000
60,000
80,000
100,000
120,000
140,000
160,000
180,000
Inb
ou
nd
To
nn
es/
Ye
ar
Inside Passage Gateway Demand - By Commodity Group

PHASE 1 REPORT: TRANSPORTATION DEMAND ASSESSMENT
PROLOG/EBA PAGE 61
Traffic through the Inside Passage Gateway to Yukon and Alaska (2009)
Route Origin Destination Truckloads Tonnes
Inbound Klondike 2, Hwy 1 Skagway So. Yukon 2,776 84,000
+ No. 60 Haul Skagway Whitehorse 839 36,000
Klondike Hwy 2 Skagway No. Yukon 29 1,000
Haines Hwy 3, Hwy 1 Haines So. Yukon 158 6,000
Hwy 3, Hwy 2 Haines No. Yukon 25 1,000
Total Inside Psg to Yukon 3,827 128,000
Klondike 2, Hwy 1 Skagway Int. Alaska 44 1,000
Haines Hwy 3, Hwy 1 Haines Int. Alaska 189 5,000
Total Inbound 4,060 134,000
Outbound Klondike Hwy 2 Minto Mine Skagway 1,023 54,000
TOTAL 5,083 188,000
Note that in addition to inbound truckloads, since 2007 outbound mineral concentrate
shipments (54,000 tonnes of copper concentrate in 2009) have resumed via Klondike
Highway 2 and the Inside Passage Gateway at Skagway, Alaska.

NORTHERN TRANSPORTATION SYSTEMS ASSESSMENT
PAGE 62 PROLOG/EBA

PHASE 1 REPORT: TRANSPORTATION DEMAND ASSESSMENT
PROLOG/EBA PAGE 63
Interior Alaska Gateway
This gateway is the main point of entry to/from the State of Alaska on Alaska State Highway 2
and is located near the Yukon community of Beaver Creek, located on the Alaska Highway -
Yukon Hwy 1. This route from Interior Alaska brings mainly outbound freight destined for
the USA and southern Canada, plus a relatively small volume of fuel, and construction
equipment and materials into North and South Yukon. Fuel hauls originated at the North
Pole, AK refinery near Fairbanks. This facility is scheduled for closure in the near future.
A relatively small volume of 8,000 tonnes of total cargo was transported from the interior of
Alaska inbound to Yukon destinations, during 2009. A large percentage of this was fuel
sourced at the Flint Hills Refinery at North Pole, AK, near Fairbanks. A large volume of
highway traffic (115,000 tonnes) passed directly from the interior of Alaska southbound over
the Alaska Highway through Yukon to destinations in the USA and southern Canada.
Interior Alaska Gateway Traffic - 2009
Route Origin Destination Truckloads Tonnes
Inbound AK Hwy 1, 2 Int. Alaska North Yukon 26 1,000
Top Of The World Hwy Int. Alaska North Yukon 51 2,000
AK Hwy 1 Int. Alaska South Yukon 204 5,000
Total Int. AK to Yukon 281 8,000
Outbound AK Hwy 1 Int. Alaska USA, Canada 5,040 115,000
TOTAL INTERIOR ALASKA 5,321 123,000
(Southbound Tonnes)

NORTHERN TRANSPORTATION SYSTEMS ASSESSMENT
PAGE 64 PROLOG/EBA

PHASE 1 REPORT: TRANSPORTATION DEMAND ASSESSMENT
PROLOG/EBA PAGE 65
2.3.2 NWT Highway and Winter Road Systems
Fort Providence Ferry crossing of the Mackenzie River on Yellowknife Highway 3 near junction with Mackenzie Highway 1. A new bridge is under construction here.
The Mackenzie Highway from Alberta is the primary truck corridor into the Northwest
Territories. From the Hay River/Enterprise Gateway, a system of all-weather highways with
winter road extensions is still evolving. The Liard and Dempster Highway Corridors also
provide NWT trucking access. See highway system map opposite.
This part of the report provides all-weather highway and winter/ice road demand data for the
following regions and highway corridors to them:
• Hay River/Yellowknife Corridor - Mackenzie Highway 1 from Alberta to Hay
River and Yellowknife corridor communities extended by winter/ice road to Whati
and Gameti as well as to resource developments in the Great Slave Lake area and, via
winter/ice road, in the Slave Geologic Province;
• Mackenzie Valley Corridor – Mackenzie Highway 1 from Alberta and Liard
Highway 7 from British Columbia to Fort Liard, Fort Simpson and from Wrigley
extended by winter road to other communities and resource developments in the
Mackenzie Valley;
• Mackenzie Delta Corridor - Dempster Highway 8 from Yukon to Inuvik, and
extended by ice road to Aklavik, Tuktoyaktuk and offshore development support
activities in the Delta/Beaufort Region.
Although not a separate transport corridor to the Northwest Territories, Highway 5 (Fort
Smith Highway) extends into the northeast corner of Alberta and bridges Mackenzie Highway
traffic from Alberta over a connecting winter road between Fort Smith and Fort Chipewyan,
an otherwise isolated Alberta community on Lake Athabasca.
The total current demand for all three of these NWT Highway corridors in 2009 is 460,000
tonnes per year - equivalent to approximately 14,150 truckloads.

NORTHERN TRANSPORTATION SYSTEMS ASSESSMENT
PAGE 66 PROLOG/EBA

PHASE 1 REPORT: TRANSPORTATION DEMAND ASSESSMENT
PROLOG/EBA PAGE 67
Truck traffic ranges between 86% and 99% concentrated on the southern NWT Highway
System (Mackenzie Valley and Hay River/Yellowknife Corridors) as shown in the following
table and in the traffic density map opposite.
The following figure shows both the predominance of bulk fuel traffic and how it declines in
direct relation to resource development demand.
2007 2008 2009
Bulk Fuel 706,980 457,254 300,000
Development Freight 116,985 85,652 48,000
General Freight 197,649 200,314 163,000
-
200,000
400,000
600,000
800,000
1,000,000
1,200,000
To
nn
es/
Ye
ar
NWT All Weather Highway System Demand - By Commodity Group
2007 2008 2009
Mackenzie Delta Corridor 23,814 23,020 22,050
Mackenzie Valley Corridor 86,700 58,700 42,100
Hay River/Yellowknife Corridor 911,100 661,500 446,850
-
200,000
400,000
600,000
800,000
1,000,000
1,200,000 T
on
ne
s/Y
ea
r
NWT All Weather Highway System Demand - By Corridor

NORTHERN TRANSPORTATION SYSTEMS ASSESSMENT
PAGE 68 PROLOG/EBA
NWT Highway Operations
NWT surface access for communities and resource developments is provided by:
• All-weather roads (year-round availability)
• Ice bridge and ferry crossings (fall and/or spring interruptions)
• Winter roads over land and ice roads on rivers or lakes (limited season)
• Seasonal access roads that prolong winter/ice availability (extended season).
Most all-weather and winter roads are public roads provided by the Department of
Transportation of the Government of Northwest Territories.
The NWT primary highway system6 consists of 2,021 kilometres of all-weather roads, most of
which were constructed between 1960 and 1983. The following table lists the highways
according to the three main transportation corridors.
NWT All Weather Highway System
Highway or Road Length (km)
Alberta to Hay River/Yellowknife Corridor
Highway 1 (Mackenzie Highway to Jct 3) 187.0
Highway 2 (Hay River Highway) 43.7
Highway 3 (Yellowknife Highway) 338.8
Highway 4 (Ingraham Trail) 69.2
Highway 5 (Fort Smith Highway) 266.0
Highway 6 (Fort Resolution Highway) 90.0
B. C. to Mackenzie Valley Corridor
Highway 1 (Jct 3 to Wrigley) 503.0
Highway 7 (Liard Highway) 254.1
Yukon to Mackenzie Delta Corridor
Highway 8 (Dempster Highway) 269.3
Total All-Weather Highway System 2021.1
Historically, the first highway in the Northwest Territories was the CANOL Road from
Norman Wells to the Alaska Highway. It was built by the U.S. Army during World War II
parallel to the CANOL pipeline for which it provided construction and maintenance logistics
support. The CANOL Road and Pipeline were abandoned after less than a year of service.

PHASE 1 REPORT: TRANSPORTATION DEMAND ASSESSMENT
PROLOG/EBA PAGE 69
The first permanent highway access to the Northwest Territories came with completion of the
Mackenzie Highway to Hay River in 1949. Since then, the Mackenzie Highway corridor has
been extended with a regional road network to reach most communities in the Great Slave
Lake Basin and the southern Mackenzie/Liard River watersheds. A counterpart corridor to
the northern Mackenzie Delta is the Dempster Highway completed in 1979.
In general, Highways 1, 2 and 5 in the area between the Alberta/NWT border and Great Slave
Lake are paved surfaces with either hot mix asphalt or chip seal (single asphalt surface
treatment). There are some segments along Highway 5 that have been reverted back to gravel
and for the most part, Highway 6 to Fort Resolution is gravel.
From the Mackenzie River to the Behchoko and Yellowknife area north of Great Slave Lake,
Highway 3 is a chip seal paved surface. North of Yellowknife, Highway 4 is a combination of
paved and gravel surfaces.
Along the south side of the Mackenzie River and through the Mackenzie Valley to Wrigley,
Highway 1 is predominantly gravel with a section south of Fort Simpson that is paved.
Through the Liard area to the British Columbia/NWT border, Highway 7 is gravel.
At the north end of the Mackenzie Valley and into the Mackenzie Delta, Highway 8 from the
Yukon/NWT border to Inuvik is predominantly gravel with very short paved sections entering
the Town of Inuvik.
The Tuktoyaktuk Winter Road is an ice road on frozen Mackenzie River Delta channels and
the frozen Arctic Ocean between the communities of Inuvik and Tuktoyaktuk. It services
natural gas fields and exploration facilities and is a key community resupply route for
Tuktoyaktuk and Aklavik. The ice road season is typically from mid-December to mid-April.
Gravel surfaced highways in the NWT are generally treated each year with Calcium Chloride
or other commonly used dust suppressants.
NWT All-Weather Highways are generally available to truck transport year-round. For the
most part, they are constrained only by the fall freeze-up and spring thaw transition periods
between ferry and ice-bridge crossings:
• The Mackenzie River at Fort Providence, N’Dulee and Tsiigehtchic;
• The Liard River at Fort Simpson; and
• The Peel River at Fort McPherson.
The transition period can be up to two months in the fall before an ice bridge is up to full
truckload weights but is generally only a week or so in the Spring while the ice breaks up and
clears the river crossing.
At the Fort Providence crossing, ferry service continues into the winter until the parallel ice
bridge is up to full truckload limits. Construction of a permanent bridge is replacing the Fort
Providence ferry and ice bridge crossing.
NORTHERN TRANSPORTATION SYSTEMS ASSESSMENT
PAGE 70 PROLOG/EBA
All-Weather Highway System
Three corridors channel highway traffic into the northwest Territories – The Hay
River/Yellowknife Corridor, the Mackenzie Valley Corridor, and the Mackenzie delta
corridor:.
The Hay River/Yellowknife Corridor - From Alberta, the Mackenzie Highway 1 brings
traffic from the Calgary-Edmonton-Peace River corridor into the Great Slave Lake area. It
embraces the portion of the NWT Highway System that is paved, including the Mackenzie
Highway from Alberta and connecting highways to Hay River, Fort Resolution and Fort
Smith. The Mackenzie/Yellowknife Highway route is paved as far as Behchoko.
The Mackenzie Valley Corridor - This trucking corridor extends from the Mackenzie
highway through the Mackenzie Valley and may ultimately lead to the link-up of a continuous
all-weather extension of the Mackenzie Highway. At that point, residual dependence upon the
Mackenzie River barge service will be removed and in all likelihood replaced by competing
truck services – at least for dry freight. It includes Liard Highway 7 from British Columbia
over which BC Highway 97 brings traffic from the Vancouver and the Fort Nelson railhead
into the Mackenzie Valley. It was completed in 1983 to access the Mackenzie/Liard River
basins from British Columbia. Mackenzie Valley resource development never reached
anticipated levels and accordingly the Liard Highway has never attracted much through
traffic. However, currently there is a significant amount of local truck traffic associated with
gas field activity on the Liard Plateau and logging operations in the region, as well as some
mining work primarily associated with the Prairie Creek project.
The Mackenzie Delta Corridor - From Yukon, the Dempster Highway (Yukon Hwy
5/NWT Hwy 8) brings Alaska/Klondike Highway traffic into the Mackenzie Delta. It was
completed in 1979 as a “road to resources” to support Mackenzie Delta/Beaufort Sea oil and
gas development. That development is still pending. However, currently the Dempster
Highway provides year-round highway access to Mackenzie Delta communities that otherwise
would have to await extension of the Mackenzie Highway from Wrigley. A 180 km seasonal
winter (ice) road connects Inuvik and Tuktoyatuk and an initial 20 km of a future all-weather
highway to Inuvik has been completed south from Tuktoyaktuk to Gravel Source 177 in 2010.
Contemporary demand for commodity movements through each of these corridors is shown
in the following three figures3.
3 Tonnages to Southern Northwest Territories are based on tonnages provided for Highway 1, Highway 2 and Highway 3. Tonnages provided in the data for Highway 7 are destined to Highway 1 and/or 3 and are therefore accounted for. Tonnages provided in the data for the TCWR would originate from Highway 3 and are therefore accounted for. Tonnages to the Mackenzie Valley are based on tonnages provided for Highway 1 (Mackenzie Highway Winter Road, Wrigley to Fort Good Hope). Tonnages to the Mackenzie Delta are based on tonnages provided for Highway 8 (Dempster Highway).

PHASE 1 REPORT: TRANSPORTATION DEMAND ASSESSMENT
PROLOG/EBA PAGE 71
2007 2008 2009
Bulk Fuel 645,300 412,500 270,900
Development Freight 103,600 73,000 40,610
General Freight 162,200 176,000 135,340
-
200,000
400,000
600,000
800,000
1,000,000
Alberta to Hay River/Yellowknife Corridor (Tonnes/Year)
2007 2008 2009
Bulk Fuel 57,900 41,100 25,600
Development Freight 9,400 8,800 3,700
General Freight 19,400 8,800 12,800
-
20,000
40,000
60,000
80,000
100,000
Alberta/B.C. to Mackenzie Valley Corridor (Tonnes/Year)
2007 2008 2009
Bulk Fuel 3,780 3,654 3,500
Development Freight 3,985 3,852 3,690
General Freight 16,049 15,514 14,860
-
5,000
10,000
15,000
20,000
25,000
30,000
Yukon to Mackenzie Delta Corridor (Tonnes/Year)

NORTHERN TRANSPORTATION SYSTEMS ASSESSMENT
PAGE 72 PROLOG/EBA
NWT Winter/Ice Road System
Inuvik-Tuktoyaktuk Winter Ice Road on East Channel of Mackenzie River.
A winter road system is constructed each year in the NWT. With 1,277 km of public winter
roads plus another 580 kilometres of privately constructed winter roads, this seasonal system
more than equals the distance covered by the all-weather highway network. Historically, the
program has facilitated resource exploration and development in areas inaccessible during
other seasons; and provided community road access otherwise impossible.
There are four major winter/ice road systems extending all-weather highway corridors in the
NWT:
• The Mackenzie Valley Winter Road from Wrigley to Tulita, Deline, Norman Wells and
Fort Good Hope;
• The Inuvik-Tuktoyaktuk Ice Road along the Mackenzie River East Channel to Aklavik
and Tuktoyaktuk;
• The Gameti Winter/Ice Road from Bechoko to Wha Ti and Gameti.
• The Tibbett Lake to Contwoyto Lake Winter/Ice Road
With the major exception of the privately constructed and operated Tibbett to Contwoyto
Winter Road, most other winter/ice roads are part of the public highway system. The most
extensive of these is the Mackenzie Winter Road which is 480 km distance between Wrigley
and Fort Good Hope and another 106 km between Tulita and Deline.
The public winter/ice road system is supplemented by seasonal winter and ice roads
constructed and operated by private enterprises. The most significant and long standing of
such roads is the Tibbitt to Contwoyto Winter Road. The TCWR is the only current land
based transportation system into the Slave Geologic Province, a mineral rich area of Canada
extending north from Great Slave Lake in the Northwest Territories through Nunavut to the
Arctic Coast. Originally constructed between Yellowknife and the Lupin Gold Mine, which is
located approximately 550 km to the north in Nunavut, the TCWR is currently constructed
and operated on an annual basis to primarily serve the diamond mines located in the
Northwest Territories approximately 375 km north of Yellowknife.

PHASE 1 REPORT: TRANSPORTATION DEMAND ASSESSMENT
PROLOG/EBA PAGE 73
Trucking distance on these principal winter roads, as well as shorter seasonal community
access roads, is shown in the following table:
Seasonal Winter/Ice Road System
Mackenzie Valley
Highway 1 (Mackenzie Highway, Wrigley to Fort Good
Hope)
480.0
Deline Access 106.0
Inuvik-Tuktoyaktuk
Tuktoyaktuk Access 194.0
Aklavik Access 86.0
Gameti
Gameti Road 100.0
Whati Road 145.0
Tibbett Lake to Contwoyto (Private)
Tibbett Lake to Contwoyto 580.0
Other seasonal access roads
Nahanni Butte Access 22.0
Highway 3 Ice Crossing 13.0
Trout Lake Access 126.0
Dettah Access 6.0
Total 1,858
Truck traffic on the principal winter roads is shown in the following tables:
2007 2008 2009
Bulk Fuel 3,600 2,200 1,700
Development Freight 600 500 300
General Freight 1,200 1,100 900
-
1,000
2,000
3,000
4,000
5,000
6,000
To
nn
es/
Ye
ar
Gameti Winter/Ice Road

NORTHERN TRANSPORTATION SYSTEMS ASSESSMENT
PAGE 74 PROLOG/EBA
Winter Road Tonnes/Year

PHASE 1 REPORT: TRANSPORTATION DEMAND ASSESSMENT
PROLOG/EBA PAGE 75
The overland Mackenzie winter road system has been gradually improved with the
installation of bridges and culverts, and upgrading alignments along the permanent right-of-
way for an all-weather extension of the Mackenzie Highway.
The Mackenzie Winter Road System has become a valuable transportation asset in terms of
providing two season resupply capability to complement summer only barge service. Winter
oil and gas exploration continues sporadically in the Norman Wells and Tulita areas, serviced
by the Mackenzie winter road system.
Further north, the Inuvik-Tuktoyaktuk Ice Road is built on the East Channel of the Mackenzie
River over 194 km between Inuvik and the Tuktoyaktuk Peninsula. As well there is an 86 km
spur to Aklavik.
The public winter road system was previously extended with private ice roads along the arctic
coast east to Herschel Island and west to McKinley Bay, in support of offshore exploration
operations.
The other major public system is the Gameti and Wha Ti winter/ice road totalling 225 km
largely constructed over lake surfaces. Until the Colomac mine was shut down in 1997, a
portion of this route (the first 60 km) was heavily used for mine resupply.
The Tibbett to Contwoyto Winter Road Joint Venture is comprised of Diamond Mines in the
Slave Geologic Province and holds an exclusive concession permit (Letter of Occupancy
issued by the Federal Government) for construction of this 580 km winter road. The terms of
occupancy require that the road be open to all users on a shared-cost basis and that all users
pay an equal fee for use.
Unlike the public winter roads, the TCWR system has no potential for serving any community
resupply requirements. It is a true “[winter] road to resources” with links to many mining
prospects, but not to any communities. Nevertheless, the TCWR has become an important
transportation asset for reducing resource development logistics costs − and accordingly
increasing current and potential economic benefits to the NWT.

NORTHERN TRANSPORTATION SYSTEMS ASSESSMENT
PAGE 76 PROLOG/EBA

PHASE 1 REPORT: TRANSPORTATION DEMAND ASSESSMENT
PROLOG/EBA PAGE 77
2.4 Airport Systems Demand
The Northern Airport System with air transport routes and air cargo flows from Southern
Gateway Airports are shown in the map opposite. This section of the report outlines for both
air cargo and passenger demand:
• The air transportation system in Northern Canada; and
• Current baseline traffic and forecasts to 2030.
The need for air service varies dramatically among the territories. In Yukon, where there is a
fairly well developed road system, the need for air transport is not nearly as great as in
Nunuvut, where there is a virtual absence of roads. In the Northwest Territories, the all-
weather road system is confined mainly to the western end of Great Slave Lake (Yellowknife,
Hay River), north along the Mackenzie Valley (to Wrigley) and around Inuvik and the
northern end of the Dempster Highway. During the winter months, the all-weather road
system is augmented with seasonal winter roads and winter ice roads.
Depending on their size, northern communities are served by a variety of aircraft, including
the Boeing 737, the Hawker Siddeley 748, the ATR-42 and the DHC-6 Twin Otter.
Communities are often served by combination (Combi) aircraft (e.g. B737, HS748) where
passengers and cargo are both carried on the main deck, separated by a moveable bulkhead.
Financial viability of many northern air services, particularly at smaller communities, often
relies on revenue from both types of payload. As well, fares on mainline services to northern
gateways, like Yellowknife and Iqaluit, can support service to smaller communities.4
Passenger volumes in the North are dominated by government travel, estimated to account
for up to two-thirds of total traffic. The Government of Nunavut, for example, has
decentralized operations, with departmental functions dispersed to 11 different communities.
While this is assisted by advanced communications, it has nevertheless contributed to the
overall need for government air travel. Air transport also performs an important Medevac
role for patients requiring treatment at regional or southern medical facilities.
While traffic bottlenecks can occur at northern airports, these facilities can generally
accommodate significant surges in traffic. However, future northern projects will likely
require infrastructure improvements at certain airports, including runway upgrades, new
passenger and cargo facilities, expanded parking aprons and improved navigational aids.5
4 In fact, there is concern that new mainline competition from the South will negatively impact the incumbent northern carriers and their ability to support regional passenger and cargo service to smaller northern communities.
5 Southern gateways - like Vancouver, Edmonton, Winnipeg and Ottawa - are already well developed and are less likely to require infrastructure improvements to accommodate the air transportation needs of future northern development.

NORTHERN TRANSPORTATION SYSTEMS ASSESSMENT
PAGE 78 PROLOG/EBA
2.4.1 Northern Air Service Network
Yellowknife Airport with First Air
Yukon, the Northwest Territories and Nunavut offer an extensive network of airports that are
operated by the territorial governments, the federal government and commercial and
industrial interests.
Yukon has 4 airports and 22 aerodromes operated by the territorial government and three of
these have scheduled air service - Whitehorse, Dawson and Old Crow.6 The Government of
Northwest Territories operates 27 airports and almost two-thirds of these have scheduled air
service. There are 26 government operated airports in Nunavut, most of which receive
scheduled air service, again reflecting the virtual absence of roads.
There are a number of other airports, not operated by the territorial governments, that receive
charter or semi-scheduled flights from carriers like Air North, Canadian North, First Air,
Alkan Air, Air Tindi (Tlicho Air), Arctic Sunwest and Northwestern Air Lease for personnel
movements and cargo re-supply. These include:
In Yukon
• Minto operated by Minto Explorations
• La Biche River- operated by Devon Canada Corp. In NWT
• Ekati, Diavik, Gahcho Kue, Snap Lake - operated by BHP, Rio Tinto and DeBeers.
• Snare Lake and Taltson River - operated by Northwest Territories Power Corp.
• Rae/Edzo - operated by the Dogrib Rae Band.
• Prairie Creek - operated by Canadian Zinc Corp.
• Tungsten - operated by North American Tungsten Corp.
• Great Bear Lake and Taltheilei - operated by Plummers Lodge. In Nunavut
• Alert, Eureka, Tanquary Fiord - operated by various federal government departments.
• Hope Bay and Doris Lake - operated by Hope Bay Mining.
Northern Canada receives scheduled jet service from a number of major cities in the South –
Vancouver, Calgary/Edmonton, Winnipeg and Ottawa/Montreal. These services connect to
6 Although its infrastructure is in need of renewal, Watson Lake Airport in southeast Yukon is fairly well developed and up to the early 1990s enjoyed scheduled jet service.
First Air ATR-42 and Canadian North Dash 8 at Yellowknife Air Terminal Building

PHASE 1 REPORT: TRANSPORTATION DEMAND ASSESSMENT
PROLOG/EBA PAGE 79
four northern gateways – Whitehorse, Yellowknife, Rankin Inlet and Iqaluit. Jet service
also extends north from Yellowknife to Norman Wells, Inuvik and Cambridge Bay and east-
west between Yellowknife, Rankin Inlet and Iqaluit. West of Yellowknife, turboprop service
operates to Fort Simpson.
Mainly turboprop service extends beyond the northern gateways and certain regional hubs
(e.g. Norman Wells, Inuvik, Cambridge Bay) to smaller communities throughout the North.
The jet carriers serving the North are Air North, Canadian North, First Air, Air Canada and
WestJet. Air North, Canadian North and First Air are all native birthright corporations.
Canadian North is owned by Inuvialuit Development Corp. and Nunasi Corporation; First Air
is wholly owned by the northern Quebec Makivik Corporation; and Air North is partially
owned by the Gwichin First Nation. Other smaller carriers, like North Wright Airways and
Aklak Air, are also birthright corporations.
Scheduled northern air service is outlined in detail in the appendix.
2.4.2 Passenger Traffic
Enplaned-Deplaned Passengers
The following table shows historical enplaned-deplaned passenger volumes for nine northern
airports. It should be noted that the historical years are 2005 and 2009 for Yukon and
Nunavut airports and 2004 and 2008 for the Northwest Territories.
This table also provides baseline passenger forecasts to the years 2020 and 2030. Once
again, historic traffic growth varies widely between the various airports, from negative growth
at Norman Wells to positive annual growth of 8.3% at Yellowknife. Traffic growth can vary
dramatically from year to year, mainly due to fluctuations in the natural resource industry.
Future baseline growth will be driven by a number of factors, including the comparative
isolation of many northern communities, population growth, government travel, tourism
demand and traffic generated by existing resource production. While the first four should
generate fairly consistent growth, resource production will be driven by fluctuations in world
commodity markets.
Canadian North B737 aircraft at Norman Wells Airport.

NORTHERN TRANSPORTATION SYSTEMS ASSESSMENT
PAGE 80 PROLOG/EBA
Yukon and the western side of the Northwest Territories are reasonably well served by all-
weather roads but Nunavut has virtually no permanent roads and air travel demand is
exacerbated by a de-centralized territorial government. However, Nunavut has less resource
production than the other two territories.
Based on the foregoing, we have projected annual passenger growth at 2.0% for the airports
in all three territories.
Enplaned/Deplaned Passengers at Major Northern Airports
2005 2009 2015 2020 2025 2030
Yukon
Whitehorse 188,275 228,993 257,846 284,638 314,407 247,153
NWT
Yellowknife 373,852 514,489 591,148 652,372 720,285 795,400
Inuvik 58,206 74,322 85,396 94,240 104,051 114,902
Norman Wells 48,048 44,871 51,557 56,896 62,819 69,371
Hay River 26,018 30,402 34,932 38,550 42,563 47,001
Fort Smith 12,734 14,214 16,332 18,023 19,900 21,975
Fort Simpson 9,059 9,722 11,228 12,391 13,861 15,018
Nunavut
Iqaluit 108,000 115,000 129,490 142,945 157,895 174,340
Rankin Inlet 60,000 67,560 74,580 82,380 90,960
Source: Governments of Yukon, Northwest Territories and Nunavut.
Service Segment Passengers
Although origin-destination data was not available, general estimates of service segment
traffic were developed by determining the number of available seats7 offered on major
northern route segments over a 12-month period and applying an assumed load factor.
Service segment statistics indicate the number of two-way passengers travelling over a flight
segment, irrespective of origin or destination. For example, a passenger travelling on a flight
between Edmonton and Yellowknife may have Yellowknife, Norman Wells, Inuvik or some
other northern community as his final destination.
7 Available seat statistics were provided by Transport Canada from airline schedule information published by the Official Airline Guide.

PHASE 1 REPORT: TRANSPORTATION DEMAND ASSESSMENT
PROLOG/EBA PAGE 81
Estimated service segment passenger volumes for 2009 for a number of major northern
routes are shown in the following table.
Service Segment Passengers, 2009
Major Northern Routes
Service Segment Passengers
Calgary/Edmonton – Yellowknife 412,000
Vancouver – Whitehorse 193,000
Ottawa – Iqaluit 98,000
Yellowknife – Inuvik 120,000
Yellowknife – Cambridge Bay 81,000
Yellowknife – Iqaluit 53,000
Calgary/Edmonton – Whitehorse 48,000
Winnipeg – Rankin Inlet 40,000
Yellowknife – Whitehorse 10,000
Industrial Passenger Traffic
Northern mining operations are significant generators of passenger traffic through the
regular rotation of work crews. Some of the workers are northern residents while others
originate from the South. Depending on the availability of all-weather roads, workers are
transported to and from the mines by either air or surface transport. For example, the
diamond mines – Ekati, Diavik and Snap Lake – can only be accessed by air. However,
mining operations in Yukon are accessed by a combination of air and surface transport.
Air transport to the mines is carried out by a combination of scheduled services and private
company charters. Consequently, only part of this traffic, the scheduled portion, will be
captured in the previous tables.

NORTHERN TRANSPORTATION SYSTEMS ASSESSMENT
PAGE 82 PROLOG/EBA
The following table shows two-way passenger traffic – air and surface - at northern mines
operational in 2010.
Operating Mines – Northern Canada
Air and Surface Passenger Traffic8
Mine Point of Origin Annual 2-way Passengers
Diavik (diamonds), NWT Yellowknife 15,000
Snap Lake (diamonds), NWT Yellowknife 14,439
Ekati (diamonds), NWT Yellowknife 14,500
Meadowbank (gold), Nunavut9 Montreal, Val d’Or, Kivalliq 12,376
Cantung (tungsten), NWT10
Wolverine (copper, zinc), Yukon11 Whitehorse 7,800
Minto (copper), Yukon12 Whitehorse, Carmacks 8,200
2.4.3 Air Cargo Traffic
Canadian North B737 Combi via Norman Wells and Air North HS748 Combi via Old Crow converge at Inuvik.
Air cargo in the North can be divided into three separate categories:
• Subsidized perishable food and other essential items moving under the Nutrition North (Former Food Mail) Program;
• General cargo that moves on a regular basis to communities as a co-product of scheduled passenger service.
• air cargo support for major capital projects, mainly related to resource development.
8 This information was sourced from the mine owners and operators.
9 Employees from Baker Lake are bussed to the Meadowbank mine site; employees from other Kivalliq communities are flown directly to the mine by charter aircraft; employees from the South are flown directly to the mine by charter from Montreal and Val d’Or.
10 Mining operations at Cantung were suspended in October 2009 and are expected to re-commence in October 2010.
11 Workers at the Wolverine mine are hired both locally and from the south. About 8% are bussed to and from the mine – the rest are airlifted.
12 The Minto mine employs workers from the territories and the South. Workers are rotated in and out of the mine by air from Whitehorse, with one plane making a stop in Carmacks.

PHASE 1 REPORT: TRANSPORTATION DEMAND ASSESSMENT
PROLOG/EBA PAGE 83
Nutrition North (Food Mail)
In the 2009 fiscal year, Food Mail in the three territories accounted for 11,511 tonnes of air
cargo, more than double the 1998 volume of 5,334 tonnes. The program has been operated
by Canada Post and Indian and North Affairs Canada (INAC) and serves 41 communities in
eight regions over a number of designated entry points. The regions and official entry points
(in brackets) are Baffin (Val d’Or), Kivalliq (Winnipeg, Churchill, Thompson), Kitikmeot
(Yellowknife), Beaufort-Delta (Yellowknife/Inuvik), Sahtu (Yellowknife), Great Slave Lake
(Yellowknife), Deh Cho (Fort Simpson/Hay River) and Yukon (Whitehorse).
The ‘postage rate’ for air transporting perishable food, the biggest category by volume, is a flat
80¢ per kilogram plus 75¢ per package. Non-perishable and non-food items carry a rate of
$2.15 per kilogram and the same package rate. Nunavut is by far the biggest user of the
program because of the relative remoteness of its communities and the virtual absence of
roads. In contrast, Yukon has only one community, Old Crow, that qualifies for the program.
It is noteworthy that Food Mail destined for the Baffin region is mainly airlifted from Val
d’Or, Quebec, to Iqaluit for furtherance to the other communities by air. Similarly, most of
the Food Mail destined for the Kivalliq region is flown directly from Winnipeg to Rankin Inlet
for transhipment by air to the smaller communities. Food Mail destined for the Sahtu and
Kitikmeot regions is trucked to Yellowknife and then airlifted to the smaller communities.
In a similar vein, Food Mail destined for the Beaufort-Delta region is transported by truck to
Inuvik and then distributed by air.
The Food Mail Program has undergone a major review because of escalating demand, rising
costs and a concern about sustainability. As a result, changes were recently announced
under a new name, Nutrition North Canada. Under the new program subsidies will go
directly to the retailers and wholesalers and market forces will determine the most efficient
routing for transporting eligible items. There will no longer be designated entry points.13
General Cargo
General air cargo moves to the northern gateways by the air and surface modes and is then
airlifted to smaller remote communities throughout the North. While some cargo is
transported on freighter aircraft, most of it moves as a co-product of passenger service, often
on combination aircraft like the B-737 and HS-748. Accordingly, it follows much the same
route network as scheduled passenger service.
13 Food Mail Review, Interim Report, INAC, 2009. Changes to the Food Mail Program and the emergence of Nutrition North Canada were formally announced by the Indian and Northern Affairs Minister on May 21, 2010.

NORTHERN TRANSPORTATION SYSTEMS ASSESSMENT
PAGE 84 PROLOG/EBA
Mine Re-supply
Air Tindi Dash 8 at Diavik Diamond Mine Airport.
The air cargo mode is used to support northern mine development and operations -
depending on the availability of all-weather and seasonal roads. In Yukon, most of the
operating mines are accessible by all-weather road.
However, in the Northwest Territories and Nunavut access to current mining operations is
much more limited. The table below provides current air cargo volumes to/from the mine
site for operating mines in the three territories. These tonnages are made up mainly of
perishables and other consumables.
Operating Mines – Northern Canada
Air Cargo Re-supply14
Mine Point of Origin Annual Air Cargo
(tonnes)
Diavik (diamonds), NWT Yellowknife 2,700
Snap Lake (diamonds), NWT Yellowknife 1,900
Ekati (diamonds), NWT15 Yellowknife 3,476
Meadowbank (gold), Nunavut Thompson, Man. 1,264
Cantung (tungsten), NWT16 Nil
Wolverine (copper, zinc), Yukon nil
Minto (copper), Yukon17 Whitehorse 260
14 This information was sourced from the mine owners and operators.
15 The Ekati mine has cut back its reliance on the Winter Ice Road, with only large, bulky items moving via that mode. A small amount of air cargo also originates from Hay River.
16 The Cantung and Wolverine mines have a limited need for air cargo support because of the availability of all-weather road access to the mine sites. For Cantung, which is located just across the territorial border in the NWT, cargo is typically trucked to the mine from Watson Lake. For Wolverine, cargo is trucked to the mine via Watson Lake and/or Whitehorse.

PHASE 1 REPORT: TRANSPORTATION DEMAND ASSESSMENT
PROLOG/EBA PAGE 85
The following table illustrates 2009 cargo flows for Food Mail and general cargo by northern
gateway and region. These figures do not include air cargo volumes for re-supply of mining
operations. Based on industry input, 60/40 split between Food Mail and general cargo is
assumed for Nunavut and the Northwest Territories and 10/90 for Yukon.
Baseline forecasts have been developed for northern air cargo that assume that Food Mail will
continue to be an important component of future growth. Between 1998 and 2009 Food Mail
volumes delivered to Nunavut increased at an annual rate of 7.6%. The corresponding rates
of growth for the Northwest Territories and Yukon were 5.4% and 0.6% respectively.
With rapidly rising Food Mail demand and escalating costs, the Federal Government
undertook an extensive program review in 2006. While the review recognized the value of the
program in supplying nutritious food to northern residents at affordable prices, measures
were recommended that may or may not restrain future growth in Food Mail volumes.
Accordingly, overall air cargo forecasts have been developed assuming a 4.0% annual growth
rate for Nunavut, 3.0% for the Northwest Territories and a nominal 1.0% for Yukon.
Northern Air Cargo Flows (tonnes)
2009 Forecast
Gateway Destination Food Mail Gen Cargo Total 2020 2030
Nunavut
Iqaluit Baffin 6,219 4,146 10,365 15,952 23,622
Rankin Inlet Kivalliq 2,579 1,719 4,298 6,615 9,795
Yellowknife Kitikmeot 1,587 1,058 2,645 4,071 6,028
10,385 6,923 17,308 23,638 39,445
NWT
Yellowknife &
Inuvik
Beaufort-Delta 302
Yellowknife Sahtu 715
Yellowknife Great Slave Lake 3
Fort Simpson &
Hay River
Deh Cho 0
1,020 680 1,700 2,353 3,162
Yukon
Whitehorse Yukon 106 950 1,056 1,178 1,301
17 The Minto mine is accessed by all-weather road via the Klondike Highway and ice-road or barge across the Yukon River. Air support is only used during freeze-up and break-up of the river when the barge or the ice-road are not operational. Otherwise, air cargo is used for emergency situations only.

NORTHERN TRANSPORTATION SYSTEMS ASSESSMENT
PAGE 86 PROLOG/EBA
Northern Airport Activity Forecast
Aircraft movements (landings and takeoffs) are a measure of airport activity against which we
can gauge an airport’s physical capacity to accommodate aircraft volumes and aircraft of
differing specifications and operating characteristics. For example, larger aircraft will
generally require longer runways, more apron space, higher pavement loadings and larger
passenger and cargo facilities to accommodate bigger payloads.
The infrastructure requirements of a northern airport will depend mainly on its elevation and
the dimensions, gross weight and payload capacity of aircraft that regularly serve the facility.
The table following shows historical takeoffs and landings (local and itinerant) at airports in
all three territories.1819 For 2008, it also shows the split in itinerant traffic volumes between
light and heavy aircraft based on gross take-off weight. The heaviest aircraft in the light
category (≤5,670 kgs) includes the Twin Otter; the heavy category (>5,670 kgs) includes
aircraft like the B737, the Lockheed Hercules and the HS-748. It is noteworthy that there
tends to be a predominance of light aircraft activity at the smaller airports and more heavy
aircraft activity at the northern gateways and regional hubs. For our baseline forecast it is
assumed that the two weight categories will maintain the same proportions of total traffic
throughout the forecast period.
This table provides normal or baseline forecasts of aircraft movements to the years 2020 and
2030, assuming no economic development stimulus during the forecast period. Except for
the bigger airports, traffic was projected at an annual growth rate of 1.0%, slightly above the
average growth rate across all the northern airports for the historical period. Historical
growth at the larger airports varied significantly, from 0.1% at Inuvik to 5.6% at Iqaluit.
Recognizing that airport traffic in the North can experience unpredictable swings, we applied
an annual growth rate of 2.0% to Whitehorse, Dawson, Yellowknife, Norman Wells, Inuvik
and Iqaluit, which is well within long-term historical trends but reflects the comparatively
busier nature of northern gateways and regional hubs.
18 Total aircraft movements consist of local and itinerant movements. A local movement refers to an aircraft movement that does not leave the air traffic control circuit or the close proximity of the airport. An itinerant movement is an aircraft landing or taking off that is arriving from or departing to another place or that temporarily leaves the circuit.
19 Although Churchill is located in northern Manitoba, it is an important transportation gateway to the Kivalliq region.
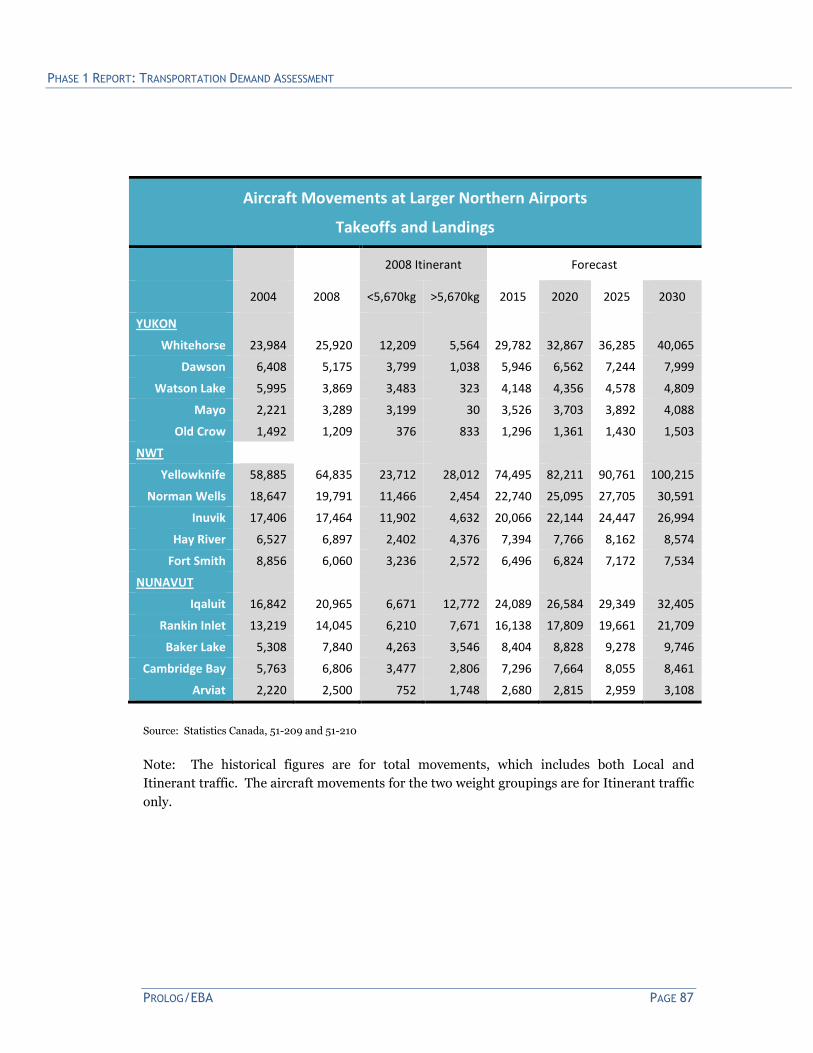
PHASE 1 REPORT: TRANSPORTATION DEMAND ASSESSMENT
PROLOG/EBA PAGE 87
Aircraft Movements at Larger Northern Airports
Takeoffs and Landings
2008 Itinerant Forecast
2004 2008 <5,670kg >5,670kg 2015 2020 2025 2030
YUKON
Whitehorse 23,984 25,920 12,209 5,564 29,782 32,867 36,285 40,065
Dawson 6,408 5,175 3,799 1,038 5,946 6,562 7,244 7,999
Watson Lake 5,995 3,869 3,483 323 4,148 4,356 4,578 4,809
Mayo 2,221 3,289 3,199 30 3,526 3,703 3,892 4,088
Old Crow 1,492 1,209 376 833 1,296 1,361 1,430 1,503
NWT
Yellowknife 58,885 64,835 23,712 28,012 74,495 82,211 90,761 100,215
Norman Wells 18,647 19,791 11,466 2,454 22,740 25,095 27,705 30,591
Inuvik 17,406 17,464 11,902 4,632 20,066 22,144 24,447 26,994
Hay River 6,527 6,897 2,402 4,376 7,394 7,766 8,162 8,574
Fort Smith 8,856 6,060 3,236 2,572 6,496 6,824 7,172 7,534
NUNAVUT
Iqaluit 16,842 20,965 6,671 12,772 24,089 26,584 29,349 32,405
Rankin Inlet 13,219 14,045 6,210 7,671 16,138 17,809 19,661 21,709
Baker Lake 5,308 7,840 4,263 3,546 8,404 8,828 9,278 9,746
Cambridge Bay 5,763 6,806 3,477 2,806 7,296 7,664 8,055 8,461
Arviat 2,220 2,500 752 1,748 2,680 2,815 2,959 3,108
Source: Statistics Canada, 51-209 and 51-210
Note: The historical figures are for total movements, which includes both Local and
Itinerant traffic. The aircraft movements for the two weight groupings are for Itinerant traffic
only.

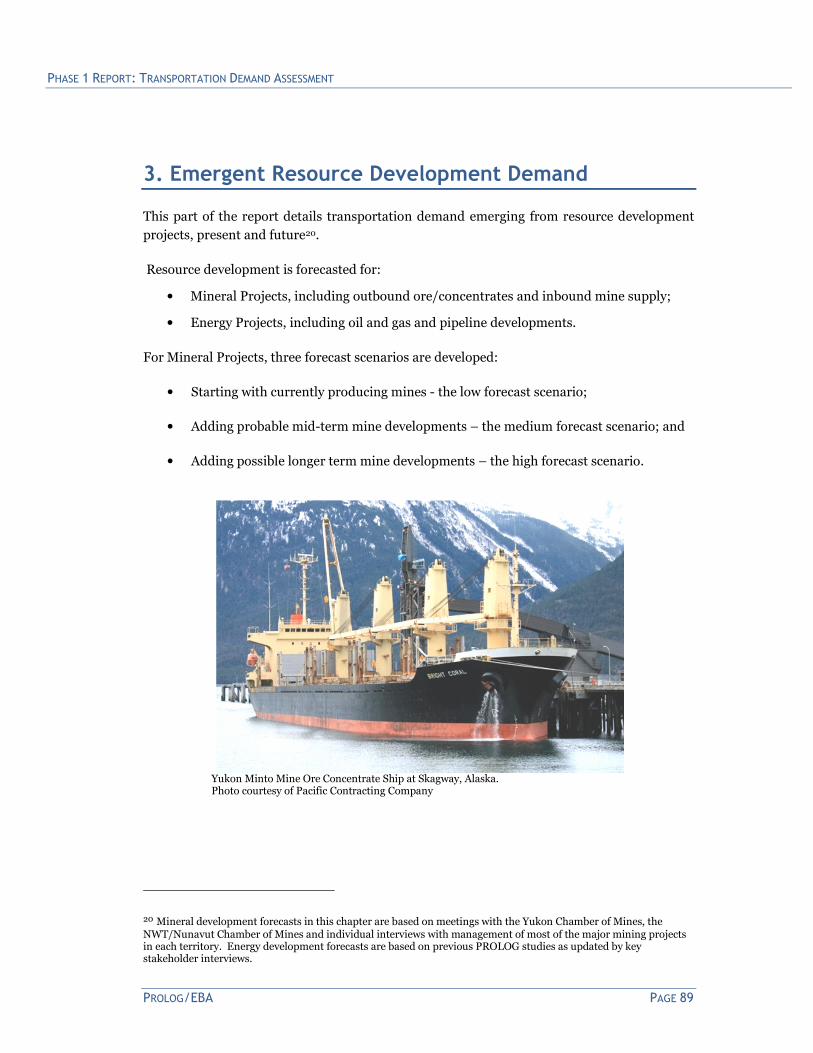
PHASE 1 REPORT: TRANSPORTATION DEMAND ASSESSMENT
PROLOG/EBA PAGE 89
3. Emergent Resource Development Demand
This part of the report details transportation demand emerging from resource development
projects, present and future20.
Resource development is forecasted for:
• Mineral Projects, including outbound ore/concentrates and inbound mine supply;
• Energy Projects, including oil and gas and pipeline developments.
For Mineral Projects, three forecast scenarios are developed:
• Starting with currently producing mines - the low forecast scenario;
• Adding probable mid-term mine developments – the medium forecast scenario; and
• Adding possible longer term mine developments – the high forecast scenario.
Yukon Minto Mine Ore Concentrate Ship at Skagway, Alaska. Photo courtesy of Pacific Contracting Company
20 Mineral development forecasts in this chapter are based on meetings with the Yukon Chamber of Mines, the NWT/Nunavut Chamber of Mines and individual interviews with management of most of the major mining projects in each territory. Energy development forecasts are based on previous PROLOG studies as updated by key stakeholder interviews.

NORTHERN TRANSPORTATION SYSTEMS ASSESSMENT
PAGE 90 PROLOG/EBA
3.1 Yukon Mining & Energy Overview
Yukon's $1.4 billion economy (2008 GDP) grew 4.1% from 2007 to 2008. The Mining and Oil
and Gas sector while representing only some 5.1% of the total GDP is the fastest growing
single sector in the territory having increased 56.3% from 2007 to 2008.
Yukon currently produces and exports 300,000 cubic metres/day (approx. 80,000
tonnes/year) of natural gas from its Kotaneelee field in the southeast corner of the territory;
and 60,000 tonnes per year of copper concentrate at the Minto Mine in Central Yukon,
trucked to the Port of Skagway, AK and exported to Asian refineries.
Mineral exploration in Canada's Yukon in 2009 remained active with exploration
expenditures estimated to be $90 million. Several advanced exploration projects returned
significant drill results, highlighting the under-explored potential of these properties even at
an advanced stage of exploration.
Yukon has a progressive regulatory permitting process, established in 2003 with the passing
of the Yukon Environmental and Socio-Economic Assessment Act (YESAA). YESSA provides
a single, multi-jurisdictional assessment process for projects under federal, territorial or First
Nation jurisdiction that applies to most mining exploration and development activities.
The YESAA process provides mining and energy companies with a timely recommendation or
deficiency list on applications. In 2009, 56 project assessments were completed and decision
documents issued. Of these 48 authorizations and land use approval permits were issued.
Unlike other jurisdictions, First Nations approval processes and benefit agreement rights are
established. Yukon is at the forefront of land claim settlements in Canada, with eleven of
fourteen Yukon First Nations land claims finalized. Mineral rights and land tenure in these
areas provide regulatory certainty to both the Yukon government and industry.

PHASE 1 REPORT: TRANSPORTATION DEMAND ASSESSMENT
PROLOG/EBA PAGE 91
Summary of Yukon Resource Traffic Forecasts (Tonnes/Year)
2010 2015 2020 2025 2030
Mining
Low Scenario
Inbound 41,000 69,000 58,000
Outbound 112,000 209,000 200,000
Medium Scenario
Inbound 49,500 135,000 149,000 75,000
Outbound 112,000 565,000 736,000 500,000
High Scenario
Inbound 54,000 224,000 327,000 253,000 160,000
Outbound 112,000 580,000 1,051,000 815,000 300,000
Energy
Pipeline
Inbound 786,000
Outbound
Resupply 3,000 3,000
Exploration
Inbound 3,000 6,000 6,000
For the three mining scenarios, the following figure shows the maximum traffic demand that
would occur in Yukon with the cumulative impact of all base metal mining projects included
in the High Scenario Forecast.

NORTHERN TRANSPORTATION SYSTEMS ASSESSMENT
PAGE 92 PROLOG/EBA
3.1.2 Yukon Producing Mines (Low Scenario)
Currently there is only one producing mine in Yukon. Capstone Mining Corporation's Minto
Mine is a high-grade copper-gold mine that commenced production operations in October,
2007. The property is located 240 km north of Whitehorse and is accessed by the North
Klondike Hwy 2 to a turnoff near Carmacks, and a private 29 km all-weather but seasonally-
constrained road to the mine from the west side of the Yukon River. Some 60,000 tonnes of
copper concentrate was shipped from the mine in 2009, to Asian smelters over a new
tidewater ore terminal at Skagway, Alaska.
The low scenario developed in the resource project forecast is assumed to be the freight
to/from the currently producing mines in operation in 2010. In Yukon, two more mines will
be in production during 2010 and their in and outbound volumes are therefore included in
the low (currently producing) scenario forming the baseline freight forecast.
The Cantung Mine owned by North American Tungsten Corp. will resume production of
tungsten oxide (WO3) and copper concentrates in the fourth quarter, 2010; and Yukon Zinc
Corporation's Wolverine Mine base and precious metal property is scheduled for start-up
mid-2010. Yukon Zinc is a subsidiary of China's Jinduicheng Molybdenum Group.
From the original start-up of production in 1962, the Cantung Mine went through a number
of owners until purchased by North American Tungsten in 1997. It has also experienced a
number of commodity-price caused closures over the years and has a relatively short
remaining production life, now forecasted to be mined out by 2015.
Actually located in NWT a short distance from the Yukon border, the mine is some 300 km
northeast of Watson Lake, and is accessed through, and draws its staff from labour pools in -
Yukon. As in past operations, commencing October, 2010 it will produce 9,000 tonnes/year
of tungsten oxide (WO3) and copper concentrate, and require 8,000 tonnes of fuel for
electrical generation, heat and equipment; and 3,000 tonnes of mine re-supplies, annually.
Tungsten oxide is trucked directly to the United States.
The Wolverine Mine is located 190 km north west of Watson Lake, YT, and is accessed by a 26
km private all-weather road off the Robert Campbell Hwy 4. Its logistics plan involves hauling
135,000 tonnes of mixed base metal concentrates from the mine to the ore terminal at
Stewart, BC. Eleven megawatts power will be diesel-generated on-site, requiring 21,000
tonnes of fuel for it, heating and the underground mining equipment. The mine has an
anticipated ten year life.
3.1.3 Yukon Probable Mines (Medium Scenario)
Medium Scenario Yukon mines in the "probable" category are three properties with proven
reserves supporting an economically viable business plan; regulatory process underway; and
financing in place.

PHASE 1 REPORT: TRANSPORTATION DEMAND ASSESSMENT
PROLOG/EBA PAGE 93
Alexo Resource Corporation's Bellekeno Mine is a short term operation located near Keno
off Yukon Hwy 11 is scheduled to come on stream in 2011, and be wound up by 2014. Silver
will be produced along with lead and zinc concentrates totalling 20,000 tonnes/year destined
for either Skagway, or optionally trucked directly to the metals refinery at Trail, BC. Power is
expected to be supplied from the Yukon grid and the 5 - 8 megawatt "Mayo B" hydro station
expansion, resulting in relatively small volumes of inbound mine re-supply freight and fuel.
Selwyn Resources Project in the Howard's Pass Base Metal District is a potentially large
mining operation located near the NWT border in southeast Yukon. It is accessed from the
Nahanni Range Road Hwy 10, north of the Cantung Mine. Selwyn recently formed a 50/50
joint venture with the Yunnan Chihong Group of China. Production of lead and zinc
concentrates of up to 500,000 tonnes/year is expected to start in 2014 with a currently
foreseeable mine life of ten years. 60,000 tonnes of fuel/year will be required to service the
mine and 20 megawatt diesel powered generating system, although the Company is
investigating hydro-based options.
Selwyn's current logistics plan involves construction of a slurry pipeline for its concentrate to
a separation facility on the Robert Campbell Highway. The product will then be shipped by
truck to Skagway, AK, if appropriate arrangements can be made. The Company is dealing with
various authorities at Skagway and is promoting a consolidation of these interests to ease the
process of obtaining access to the port, and throughput agreement(s) and permits for use of
the State-owned ore terminal.
Western Copper Corporation's Carmacks Copper Project is a property located on an 13
km access road off the Freegold Road some 33 km north of Carmacks. The open pit mine will
produce 16,000 tonnes of copper cathodes annually for a period of six and one half years, to
be trucked south; and 11,000 tonnes/year of inbound process sulphur, re-supplies and
mobile equipment fuel. Power will be supplied to the mine from the Yukon grid, currently 12
km from the property.
A major upgrade of Freegold Road may be required to support mining operations, even
without the bulk haul incremental loads (see Yukon Heavy Haul Highway System Section)
not currently planned. If studies indicate a need to re-route Freegold Road around Carmacks
requiring a new crossing of the Nordenskiold River, upgrading costs could total $20 million.
Any further highway impacts have not yet been determined.
3.1.3 Yukon Possible Mines (High Scenario)
High Scenario Yukon mines in the "possible" category are two properties with production
further out in the future; proven reserves identified but still in the pre-feasibility stage;
regulatory processes not yet started; and specific project financing not yet in place.
Western Copper Corporation's ambitious Casino Project has been placed in this category.
This property is located on the Casino Trail 120 km west of the current terminus of the
Freegold Road at Big Creek, 84 km northwest of Carmacks. The Company views the 120 km

NORTHERN TRANSPORTATION SYSTEMS ASSESSMENT
PAGE 94 PROLOG/EBA
all-weather extension of the Freegold Road as essential to the success of the venture. It will
also require substantial upgrading of the Freegold Road itself.
This large open pit operation will produce approximately 300,000 tonnes of copper, silver
and molybdenum concentrate annually commencing in 2016, and require 160,000
tonnes/year of inbound fuel and re-supply freight over its 24 year life. A 100 megawatt power
generation facility is planned and a nearby coal deposit is seen by the Company as the best
option for a source of fuel.
Also in the High Scenario "Possible" Case is North American Tungsten's Mactung Mine.
The project is still carrying out exploration and has not begun the final YESAA permitting
activity. Unlike Cantung, the Mactung property is on the Yukon side of the NWT/Yukon
border, some 8 km north of MacMillan Pass. Scheduled for start-up in 2015, the underground
mine has an estimated ten year productive life and the Company plans to gradually re-employ
many of their staff soon to be active again at its Cantung Mine. It will produce 13,000 tonnes
annually of tungsten oxide and copper concentrate when in production and require 5,000
tonnes/year of mine supplies and fuel.
At this point, the Company does not have a logistics plan other than one similar to the current
all-truck Cantung program transporting concentrates from the mine direct to its US
customers. Recently however, a proposal was submitted to North American Tungsten to truck
their concentrate to Skagway in bulk containers. The containers could then be barged to
Seattle and either placed on rail or trucked to the Company's American customers thereby
offering freight cost savings vs. the all-trucking route now used. Year-round operation and
improvements to the North Canol Road, Yukon Hwy 6, would significantly benefit Mactung.
3.1.4 Yukon Energy Development
The Federal Government devolved responsibility for energy resource management to Yukon
in 1998. The Yukon Energy, Mines and Resources Department conducts all oil and gas rights
dispositions (land use permits, water rights, etc.) and along with the First nations, the
common royalty regimes. The Federal Government continues to have responsibility for oil
and gas development in the Beaufort Sea. In 2007 and 2008, nearly $2.5 billion was bid for
offshore rights in the Beaufort, largely by BP and Imperial Oil/Exxon.

PHASE 1 REPORT: TRANSPORTATION DEMAND ASSESSMENT
PROLOG/EBA PAGE 95
Oil & Gas Prospects
Yukon contains eight distinct sedimentary basins, each with its own unique geological history
and character. 73 wells have been drilled in Yukon to date, and the Territory has estimated
the natural gas potential at 17 trillion cubic feet, and oil potential at 790 million barrels.
The territory's single producing natural gas field is Kotaneelee in the Liard plateau in
southeast Yukon, currently producing 300,000 cubic metres/day. Gas is delivered via the 178
km Pointed Mountain Pipeline to the Spectre Energy system at Fort Nelson, BC.
The Eagle Plains and Peel Plateau and Plain are the two basins attracting the greatest
exploration interest in Yukon. However, in February, 2010 the Yukon Government
temporarily suspended the issuance of new oil and gas rights in the Peel Watershed Planning
Region while a land use planning process is carried out. As far back as 1950, surface
exploration work was carried out in both basins. 34 wells were drilled in the Eagle Plain from
1960 to 1985 resulting in 15 petroleum plays (9 gas and 6 oil) yielding proven discoveries. 19
wells have been drilled in the Peel Plateau Basin from 1965 to 1977 resulting in several gas
shows but no economic reserves.
Over the years, permits and Significant Discovery Licenses have been issued to major industry
players such as Devon, Hunt Oil, Chevron Canada, EnCana Corporation, Nexen Inc., BP
Canada Resources, Phillips Petroleum, PetroCanada and Imperial Oil. Several of these are
licenses are for exploration work in the Beaufort Sea, off the Yukon coast. Yukon has an
agreement in place with the federal government to participate in the management of the
offshore drilling and production programs, and in the sharing of revenues.
As costs to explore for oil and gas continue to escalate in the Canadian oil patch, and
dramatically so in frontier areas of northern Canada without infrastructure - Yukon, with its
established road system, will be relatively attractive to explorers in their search for new
reserves.
The best guess at this time is that the Mackenzie Gas Project (MGP) will be completed and on
stream by 2018. The forecast assumes that a drilling rig will be employed in the Peel Plateau
or Eagle Plain Basins at that time, implementing a strategy to prove up a natural gas reservoir
there and produce gas that can be shipped by pipeline to the MGP.
Each drilling rig move, set up and operation is assumed to require about 60 - 80 truckloads to
service the project. 3,000 tonnes is therefore provided in the forecast for this activity
commencing 2020; increasing to two rigs (6,000 tonnes) before 2030. This volume of freight
per rig is typical of the logistics program supporting recent drilling operations in the
Mackenzie Delta.
Yukon’s historical investment in highways and future access to major pipelines will serve this
future mid-term economic development opportunity very well.

NORTHERN TRANSPORTATION SYSTEMS ASSESSMENT
PAGE 96 PROLOG/EBA
The following map, displays the various Oil and Gas Exploration Regions in Yukon, and the
onshore and offshore resource potential in each of the eight oil and gas basins in the
Territory.
Note the Eagle Plains and Peel Plateau Basins proximity to the NWT border, and their total
potential reserves representing 52% of the total for all Yukon oil and gas basins.
Map courtesy of Yukon Energy, Mines and Resources
Alaska Highway Gas Pipeline
In addition to potential development of Yukon oil and gas basins, the Alaska Highway Gas
Pipeline Project is planned for construction through the territory. The AHGPP currently has
two developer/sponsors, Denali - a joint venture between BP and ConocoPhillips; and a
second initiative by Trans Canada Pipeline supported by Exxon/Mobil Corporation. Both
proposals to build and operate the pipeline are entering the "Open Season" period of the
project, where submissions are made to the regulatory authorities identifying potential users

PHASE 1 REPORT: TRANSPORTATION DEMAND ASSESSMENT
PROLOG/EBA PAGE 97
of the system and their financial and participatory commitment to the project. Discussions
between various levels of government on both sides of the border are continuing at this time
on issues of royalties, financing support programs, and construction and ownership rights.
Much detailed engineering work has yet to be completed. Although other concepts such as an
all-Alaska pipeline to an LNG (liquefied natural gas) marine terminal at Valdez are still being
considered, it seems probable that the conventional pipeline and Dalton/Alaska Highway
route to Alberta will persevere, and likely follow the MGP by several years. The accompanying
map shows the pipeline route through Alaska, Yukon and into southern Canada.
With estimated costs to build the Mackenzie Valley pipeline now increased to over $16 billion,
the prospect of a Dempster Highway lateral, originally proposed by producers in the 1970’s,
may again be considered. This option for Mackenzie Delta gas, with connection to the
AHGPP shortens the pipeline distance by some 250 km.

NORTHERN TRANSPORTATION SYSTEMS ASSESSMENT
PAGE 98 PROLOG/EBA
Even with the currently proposed Mackenzie Valley pipeline route, the Mackenzie Gas Project
(MGP) could have a significant impact on Yukon transportation systems demand with respect
to both Alaska Highway and Inside Passage access to the Mackenzie Delta via the Dempster
Highway. However, the proponents of the MGP led by Imperial Oil have not considered this
alternative to date. The producer’s current plans call for all pipeline major commodities to be
delivered to the project stockpile sites by barge or truck from the CN Railhead at Hay River,
NWT, with only Shell Canada planning to use the Beaufort Sea route for modules to be used
for gas treatment at their Niglintgak production site in the Mackenzie Delta. Accordingly, the
MGP freight volumes are not included in the Yukon energy forecast.
The volumes are included in the NWT Resource Project forecast and the inbound pipeline
primary construction materials mobilization volume (400,000 tonnes) is identified in the
2015 forecast figures.
Completion of the MGP will almost certainly encourage Yukon natural gas exploration activity
in the Eagle Plain and Peel Plateau and Plain. Resulting production would then be
transported by pipeline to connect with the MGP. The freight volumes associated with this
drilling is included in the Yukon Energy forecast.

PHASE 1 REPORT: TRANSPORTATION DEMAND ASSESSMENT
PROLOG/EBA PAGE 99
3.2 NWT Mining and Energy
In recent years the NWT mining industry has contributed over $2 billion to the economy of
the Northwest Territory, thanks to four operating mines. Over $10 billion has been invested
by the mines actively in production and in exploration activity. A combination of the recent
downturn in the world economy resulting in reduced metal prices; an attendant inability to
finance projects; and cumbersome regulatory processes and complex political issues has
resulted in a dramatic decline in mineral exploration - from $147 million in 2007 to $30
million in 2009.
The industry contributes about 50% of the NWT's economic base; provides over 2,500
permanent jobs; and offers five or six prospective "probable" additional mines that could be
in production within five years.
NWT Resource Traffic Forecasts (Tonnes/Year)
2010 2015 2020 2025 2030
Mining
Low Scenario
Inbound 121,000 267,000 267,000 192,000 41,000
Outbound
Medium Scenario
Inbound 135,000 515,000 532,000 302,000 151,000
Outbound 386,000 386,000 386,000 386,000
High Scenario
Inbound 138,000 523,000 542,000 312,000 161,000
Outbound 416,000 416,000 416,000 416,000
Energy
Pipeline
Inbound 400,000
Outbound
Resupply 5,000 5,000 5,000
Exploration
Inbound 6,000 69,000 73,000 102,000 142,000

NORTHERN TRANSPORTATION SYSTEMS ASSESSMENT
PAGE 100 PROLOG/EBA
For the three mining scenarios, the following figure shows the maximum mineral
development that would occur in NWT with the cumulative impact of all projects included in
the High Scenario Forecast.
3.2.1 NWT Producing Mines (Low Scenario)
The Low Scenario developed in the resource project forecast is assumed to be the freight
to/from the currently producing mines in 2010. In NWT, the three producing diamond mines
are included in the Low Scenario forming the baseline freight forecast. The three diamond
mines currently in operation are Ekati, owned by BHP-Billiton Plc. expected to operate until
2020; Diavik, controlled by Rio Tinto Plc. will be in production until 2027; and DeBeers
Canada Snap Lake Mine will operate to 2031.
Transport Systems demand for these mines is essentially the traffic on the Tibbett to
Contwoyto Winter Road (TCWR)21. A joint venture of the major mines using this road has
been formed to finance annual construction and operations of the TCWR, monitor all freight
movements over the system, and pro-rate the total program costs each year back to the users
based on their volume of freight and distance to the mines. The TCWR system exists under a
"License of Occupation" issued by DIAND, and does not expire until 2033.
21 Discussion with Erik Madsen, Director of Winter Road Operations for the Tibbett to Contwoyto Winter Road.

PHASE 1 REPORT: TRANSPORTATION DEMAND ASSESSMENT
PROLOG/EBA PAGE 101
Leases on three rest camp sites are also included in the operation. The system commences
operation in early February when 28 inches of ice depth is gained, allowing light loads only
until 41 inches of ice is in place, generally 10 - 14 days later. Truck speeds are closely
controlled in both directions.
The annual cost to construct and operate the TCWR system can be raised or lowered to meet
the anticipated volume of traffic forecasted by each of the users. In 2009, the total cost was
$16 million to facilitate the movement of 173,000 tonnes of freight using 5,377 truckloads.
This resulted in a 53 cent per tonne-km charge-back to the mining companies for the season.
For the 2010 season, which was somewhat shortened by mild weather - 3,937 truckloads
moved 120,000 tonnes, from February 4 to March 21st. 90,000 tonnes (75%) of this was fuel.
During the 2010 ice road supply season, the Diavik Mine received 18,000 tonnes of fuel and
22,000 tonnes of mine resupplies. These relatively low volumes reflect the mine's temporary
closure and depressed diamond market. Between this year and 2012, Diavik will change from
an open pit mine to an all underground operation. This will significantly impact the future
mix and volumes of fuel and supplies to the mine.
Commencing 2013 Diavik is estimating its requirements at 69,000 tonnes of fuel, and
82,000 tonnes of mine supplies, much of this cement for backfilling the mined out sub-
surface caverns. Diavik's mine life is expected to continue to 2017. Much of the fuel demand is
for power generation requirements for the 41 MW system at the mine.
The Diavik Mine located at Lac de Gras, controlled by Rio Tinto Plc., is in its seventh year of
operation and has produced over 50 million carats of rough diamonds to date. The Company
has spent approximately $5 billion so far in construction and operating costs, 73% northern.
BHP-Billiton's Ekati Mine has been in operation since 1998, and produces approximately 3
million carats per year from 9,000 tonnes of ore mined daily. Kimberlite ore production
involves two open pit, and two underground mines. About 800 staff are employed and a
further 700 contractors are on the site at any given time. The mine's life is currently
estimated to last until 2020.
Freight volume estimates provided forecast ongoing demand for 57,000 tonnes of fuel and
18,000 tonnes of mine resupplies. Fuel is used for mining equipment, heating and to self-
generate the 30 MW of power required for all operations.
The future forecast for Ekati estimates annual fuel requirements of 57,000 tonnes; and
18,000 tonnes of mine supplies.
The DeBeers Canada diamond mine at Snap Lake is the first deBeers mine located outside
Africa. It is an all-underground mine located 220 km northeast of Yellowknife and is accessed
over the TCWR and a private winter road to the property. The mine is expected to remain in
production beyond the study period through 2030.

NORTHERN TRANSPORTATION SYSTEMS ASSESSMENT
PAGE 102 PROLOG/EBA
The Company commenced operations in 2008 and to date has invested over $1.5 billion in
construction and operations costs, 70% of which was to NWT-based contractors, suppliers
and Aboriginal businesses.
Snap Lake is forecasting annual fuel requirements of 29,000 tonnes, and a further 12,000
tonnes of mine supplies. Gatcho Kue Mine, also owned by DeBeers, is expected to open in
2016.
3.2.2 NWT Probable Mines (Medium Scenario)
Medium Scenario mines in NWT that fall into the "probable" category are five properties with
proven reserves supporting an economically viable business plan; regulatory process
underway; and financing identified or in place.
The Yellowknife Gold project is a gold mine owned by Tyhee Development, and is located
90 km north of Yellowknife, currently accessed by winter road. The Company is investigating
construction of an all-weather "trail" generally following the TCWR "secondary" route from
the south end of Gordon Lake to Yellowknife.
The trail would be structurally adequate to handle heavy trucks but would not be built to
official highway geometric standards. Tyhee state that the road could also give permanent
access to the territory's Bluefish Hydro facility as well as for TCWR traffic. Tyhee hopes to
access Bluefish hydro power, but would require the station to be upgraded and its capacity
expanded.
An open pit operation, the mine estimates future inbound fuel requirements of 125,000
tonnes/year commencing 2013, and other re-supply freight of 30,000 tonnes/year The
expected mine life is nine years, pending additional discoveries.
The NICO Mine, owned by Fortune Minerals Limited is located 160 km northwest of
Yellowknife. It is a primarily a cobalt and bismuth property with gold and copper by-product
production planned. The mine, which is in the environmental permitting stage, is currently
accessed by a winter road, but is hopeful an all-weather road being studied by the Federal,
N.W.T. and Tlicho governments will eventually be available. The mine life is forecasted to be
17 years, with start-up planned for 2014.
With both underground and open pit mining planned, it will require 10 MW of power and is
hopeful of accessing electricity from an expanded Snare River Hydro facility 22 km east of the
mine, or a new hydro project being studied on the La Martre River, near the community of
Whati.
NICO will produce 66,000 tonnes of outbound concentrates annually, and require 17,000
tonnes of fuel and 5,000 tonnes of mine supplies each year over the life of the mine.

PHASE 1 REPORT: TRANSPORTATION DEMAND ASSESSMENT
PROLOG/EBA PAGE 103
Tamerlane Ventures Inc. plan to re-open the Pine Point Mine in the near future using new
cryogenic technology that will enable it to access lead and zinc ore deposits inaccessible
during the initial Pine Point operations from 1964 to 1988. The plan calls for trucking initially
200,000 tonnes/year of concentrates to a CN Rail transfer terminal near Hay River.
Concentrate production will go to 120,000 tonnes/year after five years of mining operations.
Inbound fuel (4,000 tonnes/year) and mining supplies (1,000 tonnes/year) are small
volumes as the mine will be supplied power from the Taltson River hydro station, and mining
operations will be underground for the planned 20 year mine life.
Canadian Zinc Corporation continues with regulatory and environmental approval activity
through 2010 for its Prairie Creek lead, zinc concentrate and silver underground mine
located in the South Mackenzie Mountains in the southwest corner of NWT. Current access is
by 170 km winter road from the Liard Highway near Nahanni Butte, NT. Originally known as
the Cadillac Silver Mine much of the mine head works is in place including a 1,000 meter air
strip. Approximately $19 million has been invested by the Company recently to upgrade the
facilities and continue exploration work.
120,000 tonnes/year of lead and zinc concentrate is planned to be trucked to the railhead at
Fort Nelson, BC when the mine commences production scheduled for 2012. This outbound
volume is planned to increase to 200,000 tonnes/year in 2020 with expansion of the mine.
Inbound fuel 8,000 tonnes and 15,000 tonnes of mine supplies are required annually,
increasing to 15,000 tonnes and 25,000 tonnes respectively when production increases in
2020. The current logistics plan calls for inbound supplies to be sourced over Hay River, NT.
DeBeers Canada, with 51% controlling interest, plans to start mining its Gaucho Kue
kimberlitic diamond deposit in 2014. The property is located 85 km southeast of DeBeer's
Snap Lake project and 300 km east-northeast of Yellowknife, at Kennedy Lake. Access will be
by a spur off the TCWR, likely extended from the existing ice road spur to Snap Lake.
The mine is scheduled to commence production in 2014, using open pit mining methods and
processing up to 6,000 tonnes of ore per day and over a mine life of 16 years. Inbound fuel
for trucks and on-site diesel 10 MW power generation will total 25,000 tonnes/year, and
dry cargo freight supplies 18,000 tonnes/year

NORTHERN TRANSPORTATION SYSTEMS ASSESSMENT
PAGE 104 PROLOG/EBA
3.2.3 NWT Possible Mines (High Scenario)
High Scenario volume mines in NWT that fall into the "possible" category are a single
property with production further out in the future; proven reserves identified but still in the
pre-feasibility stage; regulatory processes not yet started; and specific project financing not
yet in place.
The Thor Lake property owned by Avalon Rare Earth Metals Inc. is a rare earth element
(REE) mining property located 100 km east southeast of Yellowknife, near the north shore of
Great Slave Lake. Rare earth elements are a group of some 16 elements with unique chemical,
magnetic and luminescent properties that are used in the manufacture of computers, cell
phones, batteries, etc.
Avalon plans to start production in 2015 and ship 65,000 tonnes of REE ore annually by
barge to a concentrator located at the Pine Point Mine. 35,000 tonnes of REE concentrate will
then be trucked to Hay River for trans-shipment to CN Rail. Inbound freight will include
3,000 tonnes/year of chemical re-agents, and 8,000 tonnes/year of fuel will be required at
the mine. 6 MW of electricity from the Taltson hydro grid will be required to power the
concentrator at Pine Point.
3.2.4 NWT Energy Development
The only drilling activity during 2010 in NWT is in the Cameron Hills field which straddles
the Alberta/NWT border, and is being carried out by Paramount Energy. This is basically an
Alberta play as all production and related oilfield services is to/from Alberta.
Some exploration work continues in the Central Mackenzie Basin area. Supplies are moved to
Norman Wells storage yards, generally by Coopers Barging. The company is planning to
transport some 4,500 tonnes of oilfield dry cargo freight and equipment in 2010.
Much of the malaise in the industry is blamed on delays in the regulatory approvals process
and the Joint Review Panel review of the Mackenzie Valley natural gas pipeline project
proposed by the Mackenzie Gas Project (MGP) oil company proponents.
Previous drilling activity by MGM, Devon and PetroCanada in the Coleville Lake area,
Mackenzie Delta and Beaufort Sea has all been shelved pending further studies into the MGP
economic viability by its owners; government and First Nations support; and gas pricing,
fiscal and market issues.
PHASE 1 REPORT: TRANSPORTATION DEMAND ASSESSMENT
PROLOG/EBA PAGE 105
The Mackenzie Gas Project
The Mackenzie Gas Project (MGP) is a proposed 1,196 km natural gas pipeline system along
the Mackenzie River valley which connects onshore Mackenzie River Delta gas fields with the
existing gas pipeline transportation system in northern Alberta and North American markets.
The pipeline, estimated to cost $16 billion, is currently designed to transport an initial 1.2
billion cubic feet of gas to the Alberta pipeline network and to southern markets. The project
is currently being assessed by the National Energy Board as part of the government(s)
regulatory process. A statement of support by the NEB is expected by the end of September,
2010 - likely with conditions attached. How this will impact the economic viability of the
project remains to be seen.
The proponents of the MGP are energy companies Shell Oil, ConocoPhillips/ ExxonMobil and
Imperial Oil along with the Aboriginal Pipeline Group (APG). The three oil companies will
provide their "anchor field" production of some 800 million cubic feet per day as the baseline
volume, and make the additional capacity available to third party producers seeking access to
the system.
The current plan calls for a major gas processing plant at Inuvik where gas liquids will be
separated from the anchor field gathering system's natural gas flow. Gas processing, gas
chilling and compression, and liquids stabilization will occur at the Inuvik area facility. The
dry gas will be transported to Alberta through a 30-inch pipeline.
The natural gas liquids pipeline will be a 10-inch diameter pipeline extending about480
kilometres from the Inuvik area facility to Norman Wells, where it will connect with the
existing Enbridge pipeline. More pumping facilities added along the route in the
future will increase the capacity of natural gas liquids, if necessary.
This assessment assumes that the MGP project will proceed. It has the support of all but one
of the First Nations in the Mackenzie Valley. Indeed a full one third equity interest in the
project is now held by their Aboriginal Pipeline Group. TransCanada Corporation have
provided APG financial support and will likely take on a more prominent planning role
if/when the project proceeds to the next detailed engineering stage.
The forecast provided herein identifies project construction to commence in 2015 when
approximately 46% of the primary construction materials and modules totalling 400,000
tonnes will be mobilized and (mainly) barged (>90%) to stockpile sites at river discharge
points along the pipeline right-of-way.
Barging is being planned for anchor field modules and materials destined for pipeline
construction "spreads" from the Delta to around Fort Simpson, and trucks used for the
remaining distance to the Alberta border.
The map on the following page shows the MGP pipeline route and facilities location.

NORTHERN TRANSPORTATION SYSTEMS ASSESSMENT
PAGE 106 PROLOG/EBA
Mackenzie Gas Project
Mackenzie Valley Pipeline Route
And Associated Facilities

PHASE 1 REPORT: TRANSPORTATION DEMAND ASSESSMENT
PROLOG/EBA PAGE 107
NWT Oil and Gas Exploration
The presence of the Mackenzie Gas Pipeline when certain will generate new exploration
activity throughout NWT. This assessment assumes four active drilling rigs will be employed
in the Central Mackenzie Basin region in 2015, which was the same level experienced in 2005.
This work will require 27,000 tonnes of oilfield equipment, fuel and supplies annually. Six
rigs are assumed to be exploring in 2025, and eight in 2030 generating 40,000 tonnes and
54,000 tonnes/year respectively.
In the Beaufort Sea Basin the assumption is also made that starting in 2015 one drill-ship will
be active similar to the level experienced in 2005. This will require four barge loads of
equipment and supplies totalling 4,000 tonnes for a single drill-ship; increasing to two drill-
ships in 2025 (8,000 tonnes); and three by 2030 (12,000 tonnes).
With the MGP anchor field processing facilities and gathering system in place in the
Mackenzie Delta, by 2015 five drilling rigs will be active in the Basin requiring 38,000 tonnes
of equipment, fuel and supplies. The assessment assumes this will increase to seven rigs by
2025 and ten by 2030 requiring 54,000 tonnes and 76,000 tonnes respectively of inbound
equipment, fuel and support supplies annually.

NORTHERN TRANSPORTATION SYSTEMS ASSESSMENT
PAGE 108 PROLOG/EBA
3.3 Nunavut Mining and Energy Overview
Nunavut, with its large land area and the wealth of its geological provinces, has major
potential for mining. Traces of base metals (copper, iron, nickel, lead, zinc) precious
materials (for example, gold, and diamonds), hydrocarbons (oil and gas) and radioactive
elements (uranium) have been detected in various locations of the territory in recent years.
Nunavut Resource Traffic Forecasts (Tonnes/Year)
2010 2015 2020 2025 2030
Mining
Low Scenario
Inbound 35,000 62,000
Outbound
Medium Scenario
Inbound 73,800 291,300 274,000 274,000 274,000
Outbound 430,000 18,434,600 18,434,600 18,434,600
High Scenario
Inbound 75,300 366,000 432,000 432,000 432,000
Outbound 430,000 18,884,600 18,884,600 18,884,600
Energy
Exploration
Inbound 4,000 8,000 8,000 12,000
The following figure shows the cumulative impact of all projects included in the three scenario
forecasts with the maximum mineral development that could occur in Nunavut.

PHASE 1 REPORT: TRANSPORTATION DEMAND ASSESSMENT
PROLOG/EBA PAGE 109
3.3.1 Nunavut Producing Mines (Low Scenario)
Through 2009, there were no mines in production in Nunavut, with the successful Nanisivik
and Polaris base metal mines mined out and closed a few years ago. However, the
Meadowbank Gold Mine owned by Agnico-Eagle Mining Ltd., in the Kivalliq Region near
Baker Lake, should be in production by mid-2010. Meadowbank is an open pit gold mine
accessed from the community of Baker Lake by a 110 km all-weather road (AWR).
The Low Scenario in the resource project forecast is assumed to be the freight to/from the
Meadowbank mine in operation in 2010. Only the Meadowbank Gold Mine is included in the
Low Scenario for producing mines forming the baseline freight forecast.
The Meadowbank Gold Mine owned by Agnico-Eagle Mining Ltd., is located
approximately 70 km north of Baker Lake in the Kivalliq Region of Nunavut. The mine will be
in production by mid-2010. Meadowbank is an open pit mine accessed from by a 110 km all-
weather road beginning at the staging area on the lake off Chesterfield Inlet. All inbound bulk
commodities and supplies are delivered to the mine dock during the summer marine
navigational season. Fuel for the mine's 28 MW diesel electric system is lightered from small
coastal tankers to barges in Chesterfield Inlet, and off-loaded to a tank farm at Baker Lake.
Inbound mine supplies arrive from the rail head at Churchill, MN and are also brought in by
barges directly to the new landing dock at Baker Lake during the summer navigational
season. An airstrip at the mine facilitates the transport of employees on rotational shifts; and
the supply of consumables, etc.
The open pit mine has a currently scheduled life of nine years. 32 - 35,000 tonnes of fuel will
be required annually, and 25 - 30,000 tonnes of dry cargo supplies to sustain operations.
3.3.2 Nunavut Probable Mines (Medium Scenario)
Medium Scenario mines in Nunavut that fall into the "probable" category are five properties
with proven reserves supporting an economically viable business plan; regulatory process
underway; and financing identified or in place.
The Meliadine Mine developed by Comaplex Minerals Corporation near Rankin Inlet is the
next resource project after Meadowbank likely to come on stream in Nunavut's Kivalliq
region. The property was recently purchased by Agnico-Eagle which is clearly consolidating
its gold mining interests in the area.
The Meliadine West property is located in Nunavut Territory, approximately 28 kilometres
northwest of Rankin Inlet. The goal of exploration on the property is to find an economic
mesothermal lode gold deposit. In excess of CAD $118 million has been spent on exploration
of the property since 1990.

NORTHERN TRANSPORTATION SYSTEMS ASSESSMENT
PAGE 110 PROLOG/EBA
An initial 12 year mine life is predicted for Meliadine with operations commencing in 2014. It
will produce 15 MW power using diesel generators and use both open pit and underground
mine methods. 20,000 tonnes of fuel will be required annually, along with 8,000 tonnes of
mine supplies.
The huge Mary River Mine iron ore deposit, with some 365 million tonnes of proven and
probable reserves, is located about 160 km south of the community of Pond Inlet on North
Baffin Island, in the Qikiktaaluk region of Nunavut.
Mine owner Baffinland Iron Mines Corporation plans to transport (initially) 18 million
tonnes/year of high-grade iron ore from its Mary River open pit mine on North Baffin
Island, 143 km by rail to a new port facility to be constructed at Steensby Inlet. Production is
scheduled to commence in 2016, and the mine has a 21 year life. The initial outbound ore
volume could increase to 30 million tonnes/year with mine expansion. When operational,
inbound freight will consist of 41,000 tonnes of fuel and 10,000 tonnes of dry cargo supplies
which will be transported to the mine over the rail system or alternatively, a winter road from
Milne Inlet on the north side of the Island. Fuel for diesel-powered generation at the mine
will be railed to the property from a permanent marine tank farm at the Steensby Inlet port.
There will also be a diesel-powered plant at the port. Together the plants will produce about
45 MW. Mary River is an open pit mining operation which will employ 275 people at the
mine, and 175 at the port, when in production. During the mine construction period 138,000
tonnes of equipment, materials and supplies will be supplied to the sites along with 35,000
tonnes of fuel.
The deepwater port plan provides for one ore carrier berth and two service ship berths. Ore
will be loaded from a stockpile to ships via a 12,000 tonne/hr. conveyor.
Baffinland has formed a partnership alliance with Edna Limited to complete shipping studies
and eventually coordinate all marine transportation functions. Cape-size ore carriers are
planned - Polar Class 4 vessels with 135,000 DWT capacities. Some 10 ships will be required
and the port should be operational 12 months/year
Newmont Mining Corporation is a large American-owned international mining company that
is actively bringing the Hope Bay Mine in the Kitikmeot region of Nunavut into play. The
Hope Bay gold property is located 90 km south of Cambridge Bay near the Canadian
mainland coast, south of Melville Sound. Some $85 million has been invested by Newmont in
mine preparations and exploration over the last two years.
Access for inbound commodities is by barge over a shallow water jetty in Roberts Bay off
Melville Sound. The decision to proceed with mine development was reached in October,
2009 and will commence with a major sealift of nearly 30,000 tonnes of fuel, equipment and
construction materials in 2010.
Production is planned using both open pit and underground mining methods. Start-up is
currently scheduled for 2014 with an initial predicted mine life of 20 years. Power

PHASE 1 REPORT: TRANSPORTATION DEMAND ASSESSMENT
PROLOG/EBA PAGE 111
requirements will be met by on-site diesel generators. When in production, Hope Bay will
require 34,000 tonnes of fuel and 5,000 tonnes of dry cargo supplies, annually. The mine
supplies will likely be sourced from the East Coast as it is the main source of mine materials
and equipment in North America.
The Izok Lake property owned now by MMG of China is a potentially huge base metal mine
located approximately 300 km north of Yellowknife. The nearest surface access is by winter
road from the Lupin Gold Mine on Contwoyto Lake, the terminus of the TCWR.
The best current estimate of production start-up is 2015. Using both underground and open
pit mining methods, the operation is forecasted to produce 430,000 tonnes/year of lead, zinc
and copper concentrates over a predicted mine life of 12 - 14 years.
Production at Izok Lake is totally dependent on an all-weather road system to an arctic port
facility to store concentrates and load ice-class ships to be located at either Bathurst Inlet or
elsewhere on the Coronation Gulf. From a tank farm located at the port, the Izok lake Mine is
estimated to require 28,000 tonnes of fuel annually, together with 10,000 tonnes of mine
supplies to be shipped over either or both the arctic port or the TCWR. On-site diesel power
generation will be employed under the existing development plan.
The Kiggavik Project is a proposed $1.5 billion uranium mining and milling operation
located in the Kivalliq region of Nunavut approximately 80 km west of the community of
Baker Lake.
AREVA Resources Canada, a subsidiary of the large international French Areva Energy
Group, is proposing to use open pit and underground mining methods at two main sites on
the property. 2,000 tonnes/day of ore will be excavated, trucked to an ore stockpile and
directed to a mill to produce yellowcake, a uranium concentrate. A dock site at Baker Lake
would serve as a transfer and storage facility for materials and supplies. A 90 – 100 km haul
road would be constructed to link the Baker Lake dock site to the main project site. A 27
MW diesel-powered electrical generation plant is planned to service the mine.
About 4,600 tonnes of yellowcake concentrate, sealed in steel drums and stuffed to marine
containers, will be shipped either by air or barge to southern points for processing. 58,000
tonnes of fuel will be required annually to sustain operations, along with 60,000 tonnes of
mine supplies when both sites are in production.
3.3.3 Nunavut Possible Mines (High Scenario)
The High Scenario mine in Nunavut that falls into the "possible" category is a single property
with production further out in the future; proven reserves identified but still in the pre-
feasibility stage; regulatory processes not yet started; and specific project financing not yet in
place.

NORTHERN TRANSPORTATION SYSTEMS ASSESSMENT
PAGE 112 PROLOG/EBA
The Hackett River base and precious metal mine owned by Sabina Gold and Silver
Corporation is located about 480 km northeast of Yellowknife and some 75 km south of the
potential deep-water port being promoted at Bathurst Inlet. Lead, zinc and copper
concentrates along with silver will be mined using open pit mining technology, over the 18-
year predicted mine life scheduled for start-up in 2018.
This is a large mining operation that will require an all-weather access road to a port facility
similar to the one proposed for Bathurst Inlet. If the seaport is developed at Bathurst Inlet it
will also no doubt serve the Izok Lake Mine as well, and likely provide a lower cost fuel and
bulk commodity supply point for other mines in the area, including the diamond mines in
NWT in the Lac de Gras area.
12,000 tonnes of ore will be processed daily at the mine which will produce 450,000 tonnes
of mixed concentrates annually. 58,000 tonnes of fuel will be consumed by mining trucks
and a diesel power generation facility. Inbound mine supply requirements are estimated to
be 100,000 tonnes/year , identified in the pre-feasibility studies.
3.3.4 Nunavut Oil and Gas
Nunavut is believed to have significant oil and natural gas potential. The largest known fossil
fuel reserves lie in a remote area in the Sverdrup Basin in the High Arctic, west of Axel
Heiberg Island. Current estimates place the recoverable reserves in this Basin alone at 17.4
trillion cubic feet of natural gas, and 334 million barrels of oil. This is equal to about 11 per
cent of Canada’s total crude oil resources and 20 per cent of Canada’s natural gas resources,
and represents a potential value far exceeding that of mining in Nunavut.
Nineteen discoveries were made in this Basin between 1969 and 1985, including a major gas
field at Drake Point and the Bent Horn oil field. Bent Horn produced light crude for eleven
years between 1985 and 1996. The record of drilling success in the High Arctic has been
impressive with one discovery for every six wells drilled in the Sverdrup Basin itself. This
offers a high potential for further discoveries of both offshore and onshore oil and gas.
However, oil and gas exploration and development activity has been frustrated for many years
in the eastern Arctic due to complicated ownership structures, high costs of development, and
dated seismic data.
New exploration, production and transportation technologies now available should encourage
re-evaluation of exploration ventures that can lead to Oil and Gas field development in
Nunavut.
The forecast for this report assumes one on-shore exploration drilling rig will be employed in
the High Arctic in Nunavut by 2015 resulting in the mobilization of 4,000 tonnes of
equipment, fuel and oilfield supplies; increasing to two rigs by 2020 (8,000 tonnes of
supplies) and three by 2030 requiring 12,000 tonnes of total freight.

PHASE 1 REPORT: TRANSPORTATION DEMAND ASSESSMENT
PROLOG/EBA PAGE 113
3.4 Northern Strategy Developments
3.4.1 The Canadian High Arctic Research Station (CHARS)
In the October 2007 Speech from the Throne the federal government committed to building
an arctic research station “on the cutting-edge of arctic issues, including environmental
science and resource development”. Indian and Northern Affairs(INAC) is the lead
department.
INAC consulted with various stakeholders to create a Visioning Workshop report entitled
Defining Science Priorities for Canada’s New Arctic Science Station. They then commissioned
the Council of Canadian Academics to come up with a report entitled “Vision for the Canadian
Arctic Research Initiative: Assessing the Opportunities”.
The department has narrowed the site selection to three communities, Resolute Bay,
Cambridge Bay and Pond Inlet. They are in the process of defining the objectives of the
station. This will determine what kind of research will be done and kind of facility that is
required.
Resolute Bay has some advantages since the Polar Continental Shelf Program (PCSP) is
currently located there. PCSP has a number of services for scientists conducting research in
the arctic including twin otter aircraft and helicopters.
There is also field equipment; satellite telephones, etc. All this would have to be duplicated
should another site be chosen. As well the Department of National Defence has chosen
Resolute Bay as their site for an Arctic Training Centre. This could provide synergies that
could assist both departments by reducing costs.
At this point based on the information available it is felt that the station could accommodate
between 20 and 50 researchers and staff. This would include an executive director, a person
in charge of each science team and team members.
To support these people there would need to be 4 tonnes of dry cargo plus 3.5 tonnes of fuel
per person. The range would be between 80 and 200 tonnes of dry cargo annually. For fuel
the range would be between 70 to 175 tonnes.
3.4.2 Canadian Forces Army Training Centre
As part of their Northern Strategy Commitments, the federal government announced the
establishment of a Canadian Forces Army Training Centre in Resolute Bay. The training
facility will provide a permanent staging base in the Arctic for Army capabilities.

NORTHERN TRANSPORTATION SYSTEMS ASSESSMENT
PAGE 114 PROLOG/EBA
The stated goals of this facility are:
• To provide a multi-use facility capable of supporting the Army Advanced Winter
Warfare Course; Army Sovereignty Operations and Canadian Forces Joint Exercises;
Search and Rescue Technician Arctic survival training; Canadian Rangers training;
and a command and control centre for regional military and civilian disaster-
response operations;
• To increase the Canadian Military expertise and knowledge of operating in the Arctic,
and the overall Canadian military’s presence in the North; and
• To provide year-round training facilities and a location for pre-positioning training
equipment and various types of vehicles in the High Arctic. (“The Canadian Forces
and Private Military Companies: A Possible Partnership in the Arctic”; Lt. Colonel
Denis Boucher)
Details of the training centre have not been released. However; it is felt that the site could
include 20 to 40 permanent staff, with an average of 10 persons in training throughout the
year. Major exercises if based at the site would not have a significant impact on the regular re-
supply of the centre. Exercises such as Nanook 2009 which was based out of Iqaluit, had all
equipment and supplies brought in for the operations. Logistics support is a vital part of the
exercise since it demonstrates the military’s ability to support such a mission and sustain it in
the field. For Nanook 2009 numerous C17 and Hercules aircraft flights were used to support
the operation as were navy and Coast Guard vessels. Resolute Bay as the goals indicate would
be used for pre-positioning of equipment.
Re-supply would involve approximately 5 tonnes of dry cargo per person to support the
training throughout the year. The range would be 150 tonnes to 250 tonnes of dry cargo.
Normal requirements plus the use of equipment such as snow machines would result in an
average fuel consumption of 4.5 tonnes per person per year. This creates a range of 135
tonnes to 225 tonnes of fuel.
3.4.3 Arctic Deep Water Port
As part of the Northern Strategy the government also announced the building of a naval
docking and refueling facility in Nanisivik. This site will expand an existing deep water
berthing area which until recently was used by the Coast Guard.
Located in sheltered Strathcona Sound inside the eastern entrance to the Northwest Passage,
the base is expected to serve as a staging area for the new Arctic/Offshore Patrol Vessels
(AOPV), enabling them to resupply, refuel, embark equipment and supplies, and transfer
personnel. Coast Guard are also expected to return to the site once the facilities are
operational. Maintenance and operating costs are projected at approximately $200 million
over 20 years. (Standing Senate Committee on Fisheries and Oceans)

PHASE 1 REPORT: TRANSPORTATION DEMAND ASSESSMENT
PROLOG/EBA PAGE 115
The AOPVs were part of the Northern Strategy announcement and are to include six to eight
new armed, ice-strengthened offshore patrol vessels (“Polar Class 5 Arctic/ Offshore Patrol
Vessels”). The fuel consumption is forecast to be 11 tonnes per day per ship. Of the six ships it
is likely that only two will be in the Arctic at any one time. It is assumed that they travel for
half the time and that they spend three months per year in the Arctic this results in 90 days/2
x 2 ships x 11 tpd = 990 tonnes, or approximately 1,000 tonnes of diesel. This assumes they
leave the south full of bunker and keep topped up via Nanisivik. By adding Coast Guard
requirements it is forecast that annual requirements will be approximately 6,000 tonnes of
fuel.
The refuelling base will be seasonal and will probably operate for 5 months per year with a
staff of 10. Resupply will be 4 tonnes of dry cargo per person and 4.5 tonnes of fuel per
person. Resupply for ships will include fuel and dry goods which will basically be fresh goods
and other essential items estimated at 20 tonnes. Total dry good for Nanisivik would be
approximately 16.5 tonnes for base re-supply and 20 tonnes for ship re-supply or
approximately 36.5 tonnes of dry cargo. Fuel resupply would be 19 tonnes for the base and
6,000 tonnes for vessel refuelling or approximately 6,020 tonnes of fuel.
New Sealift Traffic – Northern Strategy Initiatives
(Tonnes/Year)
LOW
Scenario
HIGH
Scenario
Arctic Research Station
Dry Goods 80.0 200.0
Fuel 70.0 175.0
CF Army Training Centre
Dry Goods 150.0 250.0
Fuel 135.0 225.0
Nanisivik Deep Water Port
Port Dry Goods 16.5 16.5
Port Fuel 19.0 19.0
Ship Dry Goods 20.0 20.0
Ship Fuel 6,000.0 6,000.0
Total
Dry Goods 266.5 486.5
Fuel 6,224.0 6,419.0
Total All Cargo 6,490.5 6,905.5

NORTHERN TRANSPORTATION SYSTEMS ASSESSMENT
PAGE 116 PROLOG/EBA
Nanisivik provides DND with a base of operation to serve the Eastern Arctic. There are
currently no plans to develop a deep water capability in the Western Arctic. However, it is
unlikely that such a facility if developed would be a standalone operation due to the
prohibitive costs of developing such a base.
It is more likely to be a joint venture taking advantage of deep water marine facilities
developed to support resource development. This would provide an opportunity to operate in
the Western Arctic without having to incur the full capital costs of developing a standalone
deep water facility.
An existing site in the Western Arctic is Tuktoyaktuk Harbour. There are currently marine
facilities in place and the harbour has been used to support oil and gas drilling operations in
the Beaufort Sea. The entrance to the harbour is shallow and could be an issue depending of
the size of vessels planned. The site does have advantages that may appeal to DND in the
future.
If a Western Arctic deep water facility is developed it is likely to be similar to the proposed
Nanisivik operation. Re-supply would be approximately 40 tonnes of dry cargo and
approximately 1000 tonnes of fuel.

PHASE 1 REPORT: TRANSPORTATION DEMAND ASSESSMENT
PROLOG/EBA PAGE 117
4. Consolidated Commodity Forecasts
From the current year 2009 baseline, traffic forecasts have been extended forward 20 years
based on Statistics Canada medium growth population projections (see appendix) for
Community Resupply traffic; and on medium scenario forecasts (see previous Chapter 3) for
Resource Development traffic.
The following table provides a major commodity summary forecast for Northern
Transportation Systems Demand through 2030.
Northern Transport Demand Forecast Summary (tonnes)
2010 2015 2020 2025 2030
General Freight 443,557 459,499 474,226 489,032 503,737
Development Freight 94,100 846,100 1,193,000 375,000 322,000
Bulk Fuel 718,986 1,142,164 1,233,712 1,017,954 908,614
Total Inbound 1,256,643 2,447,763 2,900,938 1,881,986 1,734,351
Outbound 112,000 1,381,000 19,556,600 19,320,600 18,820,600
Induced Demand* 18,820 169,220 238,600 75,000 64,400
The balance of this section provides 20 year forecasts with graphical presentations for
Community Resupply and Resource Development Traffic within each territory.
*A 1.20 induced impacts multiplier is applied to development freight to account for the additional traffic demand that can be expected with spin-off economic activity from resource development projects. Induced demand is shown for information only and not included in the totals.

NORTHERN TRANSPORTATION SYSTEMS ASSESSMENT
PAGE 118 PROLOG/EBA
4.1 Community Resupply Traffic Forecasts

PHASE 1 REPORT: TRANSPORTATION DEMAND ASSESSMENT
PROLOG/EBA PAGE 119
4.1.1 Nunavut Community Resupply
Nunavut Community Resupply Forecast (Tonnes/Year)
2010 2015 2020 2025 2030
Qikiqtaaluk
General Freight 15,145 15,985 16,736 17,381 17,951
Bulk Fuel 73,596 77,680 81,327 84,464 87,236
Total 88,741 93,665 98,063 101,845 105,187
Kivalliq
General Freight 14,592 15,403 16,126 16,748 17,292
Bulk Fuel 27,696 29,233 30,606 31,786 32,829
Total 42,288 44,636 46,732 48,534 50,121
Kitikmeot
General Freight 7,815 8,319 8,710 9,046 9,342
Bulk Fuel 23,425 24,726 25,886 26,884 27,766
Total 31,240 33,045 34,596 35,930 37,108
Nunavut Total 162,269 171,346 179,391 186,309 192,416
General
Freight
23%
Bulk Fuel
77%
Nunavut Community Resupply
Average Commodity Split
55%26%
19%
Nunavut Community Resupply
Average Regional Split
Qikiqtaaluk Kivalliq Kitikmeot
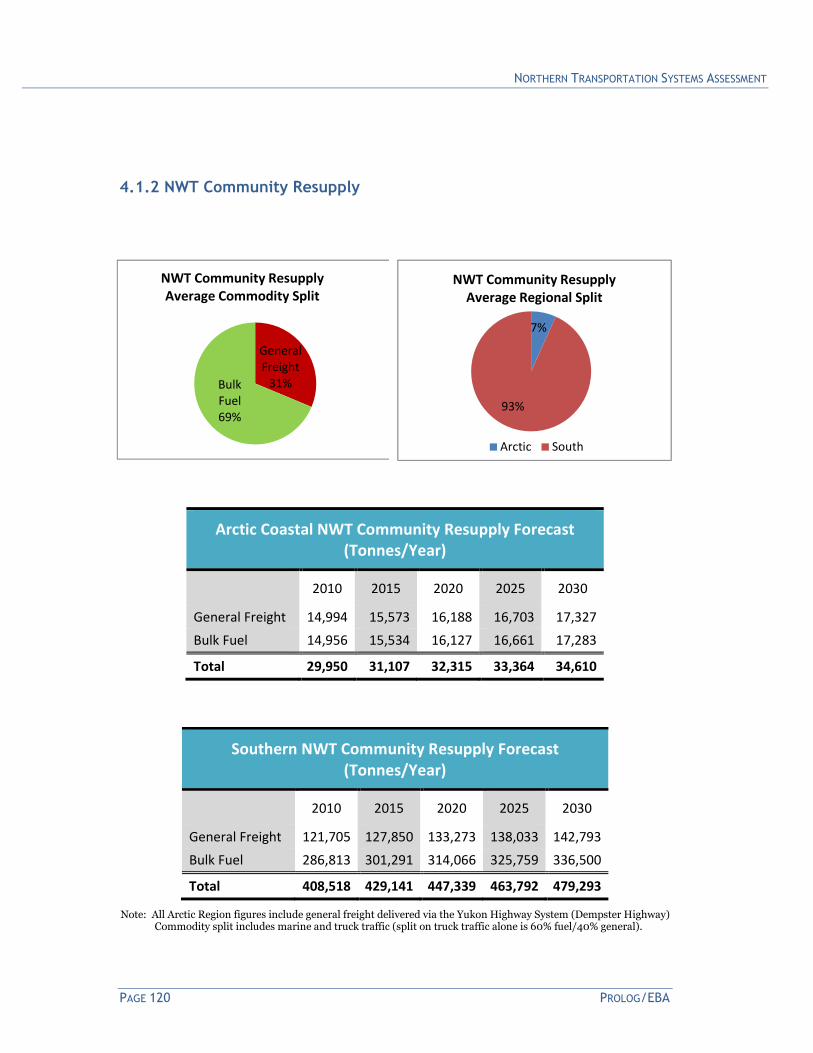
NORTHERN TRANSPORTATION SYSTEMS ASSESSMENT
PAGE 120 PROLOG/EBA
4.1.2 NWT Community Resupply
Arctic Coastal NWT Community Resupply Forecast
(Tonnes/Year)
2010 2015 2020 2025 2030
General Freight 14,994 15,573 16,188 16,703 17,327
Bulk Fuel 14,956 15,534 16,127 16,661 17,283
Total 29,950 31,107 32,315 33,364 34,610
Southern NWT Community Resupply Forecast
(Tonnes/Year)
2010 2015 2020 2025 2030
General Freight 121,705 127,850 133,273 138,033 142,793
Bulk Fuel 286,813 301,291 314,066 325,759 336,500
Total 408,518 429,141 447,339 463,792 479,293
Note: All Arctic Region figures include general freight delivered via the Yukon Highway System (Dempster Highway) Commodity split includes marine and truck traffic (split on truck traffic alone is 60% fuel/40% general).
General
Freight
31%Bulk
Fuel
69%
NWT Community Resupply
Average Commodity Split
7%
93%
NWT Community Resupply
Average Regional Split
Arctic South

PHASE 1 REPORT: TRANSPORTATION DEMAND ASSESSMENT
PROLOG/EBA PAGE 121
4.1.3 Yukon Community Resupply
Yukon Community Resupply Traffic Forecast
(Tonnes/Year)
2010 2015 2020 2025 2030
General Freight 167,406 171,627 175,812 180,703 185,573
Bulk Fuel 122,300 125,500 128,700 132,400 136,000
Total Yukon 289,706 297,127 304,512 313,103 321,573
To Alaska 100,900 103,700 106,300 109,300 112,300
To NWT 14,994 15,573 16,188 16,703 17,327
Total 405,600 416,400 427,000 439,106 451,200
General
Freight
58%
Bulk
Fuel
42%
Yukon Community Resupply
Average Commodity Split
71%
25%
4%
Yukon Community Resupply
Average Regional Split
Yukon To Alaska To NWT
Note: General freight to Alaska and NWT is included to show total demand on Yukon Highways.

NORTHERN TRANSPORTATION SYSTEMS ASSESSMENT
PAGE 122 PROLOG/EBA
4.2 Resource Development Traffic Forecasts
All Resource Traffic Forecasts (Tonnes/Year)
2010 2015 2020 2025 2030
Mining
Medium Scenario
Inbound 258,300 941,300 955,000 651,000 425,000
Outbound 112,000 1,381,000 19,556,600 19,320,600 18,820,600
Energy
Pipeline
Inbound - 400,000 786,000
Resupply 5,000 8,000 8,000
Exploration
Inbound 6,000 73,000 84,000 116,000 160,000
All Resource
Traffic
Inbound 264,300 1,414,300 1,830,000 775,000 593,000
Outbound 112,000 1,381,000 19,556,600 19,320,600 18,820,600
Total Mine Traffic Forecast (Tonnes/Year)
Excludes Baffinland Mary River Iron Mine (18 million tonnes/year)

PHASE 1 REPORT: TRANSPORTATION DEMAND ASSESSMENT
PROLOG/EBA PAGE 123
Territorial Mine Traffic Forecasts (Tonnes/Year)
Excludes Baffinland Mary River Iron Mine (18 million tonnes/year)

NORTHERN TRANSPORTATION SYSTEMS ASSESSMENT
PAGE 124 PROLOG/EBA
4.2.1 Yukon Resource Development
Yukon Resource Traffic Forecast Summary
(Tonnes/Year)
2010 2015 2020 2025 2030
Mining
Medium Scenario
Inbound 49,500 135,000 149,000 75,000
Outbound 112,000 565,000 736,000 500,000
Energy
Pipeline
Inbound 786,000
Resupply 3,000 3,000
Exploration
Inbound 3,000 6,000 6,000
Yukon Mining Forecast (Tonnes/Year)

PHASE 1 REPORT: TRANSPORTATION DEMAND ASSESSMENT
PROLOG/EBA PAGE 125
Yukon Mineral Development by Region – Medium Scenario (Tonnes/Year)
Mine Traffic 2010 2015 2020 2025 2030
Carmacks
Minto Outbound 65,000 65,000 65,000
Fuel 23,000 23,000 23,000
Supplies 4,000 4,000 4,000
Carmacks Copper Outbound 16,000 16,000
Fuel 1,000 8,000 8,000
Supplies 500 3,000 3,000
Bellekeno Outbound 20,000 20,000
Fuel 1,000 3,000 3,000
Supplies 1,000 2,000 2,000
Carmacks Total Outbound 65,000 101,000 101,000 0 0
Fuel 25,000 34,000 34,000 0 0
Supplies 5,500 9,000 9,000 0 0
Canol
Selwyn Outbound 320,000 500,000 500000
Fuel 3,000 40,000 60,000 60000
Supplies 2,000 10,000 15,000 15,000
Wolverine Outbound 45,000 135,000 135,000
Fuel 8,000 21,000 21,000
Supplies 3,000 10,000 10,000
Cantung Outbound 2,000 9,000
Fuel 2,000 8,000
Supplies 1,000 3,000
Canol Total Outbound 47,000 464,000 635,000 500000 0
Fuel 13,000 69,000 81,000 60000 0
Supplies 6,000 23,000 25,000 15,000 0
Yukon Total Outbound 112,000 565,000 736,000 500000 0
Fuel 38,000 103,000 115,000 60000 0
Supplies 11,500 32,000 34,000 15,000 0
Yukon Oil and Gas Development (Tonnes/Year)
Development Traffic 2010 2015 2020 2025 2030
Alaska Gas Pipeline Inbound 0 0 786,500 3,000 3,000
Oil & Gas Exploration Inbound 0 0 3,000 6,000 6,000
Total 0 0 789,500 9,000 9,000
Note: Casino property included in longer term sceanrio would export 300,000 tonnes/year of copper concentrate and require 100,000 tonnes/year of fuel and 60,000 tonnes/year of other mine supplies.

NORTHERN TRANSPORTATION SYSTEMS ASSESSMENT
PAGE 126 PROLOG/EBA
4.2.2 NWT Resource Development
NWT Resource Traffic Forecast Summary
(Tonnes/Year)
2010 2015 2020 2025 2030
Mining
Medium Scenario
Inbound 135,000 515,000 532,000 302,000 151,000
Outbound 386,000 386,000 386,000 386,000
Energy
Pipeline
Inbound 400,000
Resupply 5,000 5,000 5,000
Exploration
Inbound 6,000 69,000 73,000 102,000 142,000
NWT Mining Traffic Forecast (Tonnes/Year)
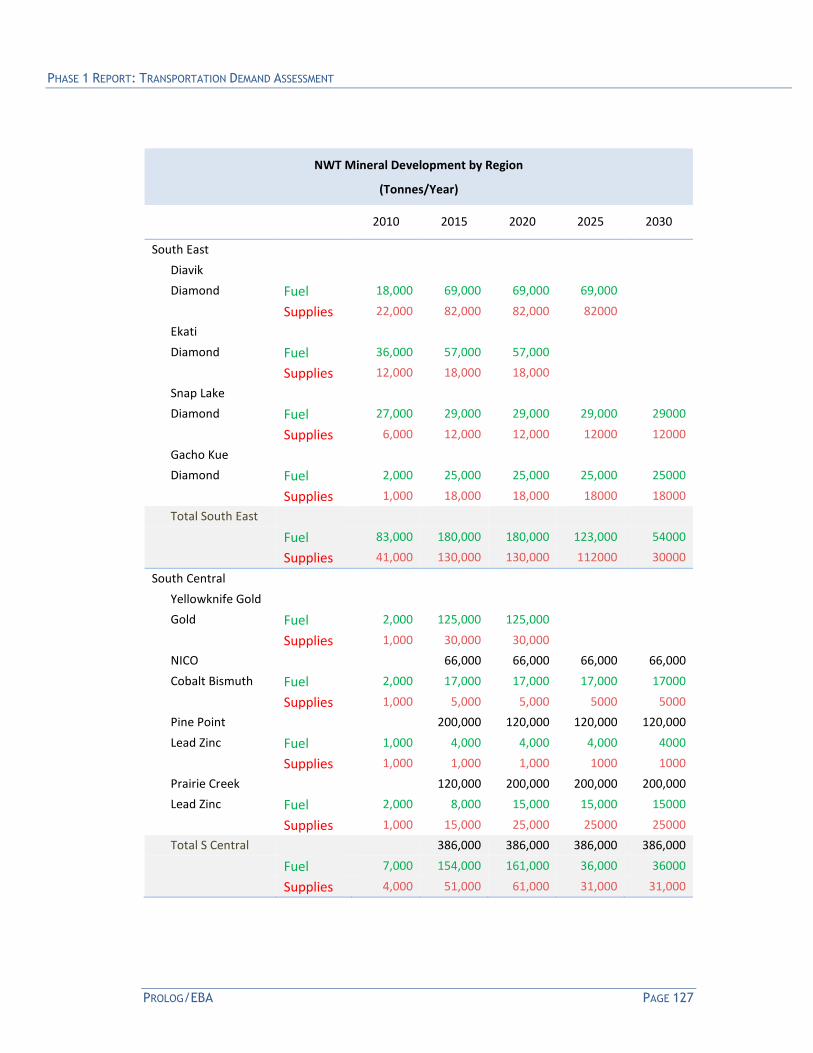
PHASE 1 REPORT: TRANSPORTATION DEMAND ASSESSMENT
PROLOG/EBA PAGE 127
NWT Mineral Development by Region
(Tonnes/Year)
2010 2015 2020 2025 2030
South East
Diavik
Diamond Fuel 18,000 69,000 69,000 69,000
Supplies 22,000 82,000 82,000 82000
Ekati
Diamond Fuel 36,000 57,000 57,000
Supplies 12,000 18,000 18,000
Snap Lake
Diamond Fuel 27,000 29,000 29,000 29,000 29000
Supplies 6,000 12,000 12,000 12000 12000
Gacho Kue
Diamond Fuel 2,000 25,000 25,000 25,000 25000
Supplies 1,000 18,000 18,000 18000 18000
Total South East
Fuel 83,000 180,000 180,000 123,000 54000
Supplies 41,000 130,000 130,000 112000 30000
South Central
Yellowknife Gold
Gold Fuel 2,000 125,000 125,000
Supplies 1,000 30,000 30,000
NICO 66,000 66,000 66,000 66,000
Cobalt Bismuth Fuel 2,000 17,000 17,000 17,000 17000
Supplies 1,000 5,000 5,000 5000 5000
Pine Point 200,000 120,000 120,000 120,000
Lead Zinc Fuel 1,000 4,000 4,000 4,000 4000
Supplies 1,000 1,000 1,000 1000 1000
Prairie Creek 120,000 200,000 200,000 200,000
Lead Zinc Fuel 2,000 8,000 15,000 15,000 15000
Supplies 1,000 15,000 25,000 25000 25000
Total S Central 386,000 386,000 386,000 386,000
Fuel 7,000 154,000 161,000 36,000 36000
Supplies 4,000 51,000 61,000 31,000 31,000

NORTHERN TRANSPORTATION SYSTEMS ASSESSMENT
PAGE 128 PROLOG/EBA
NWT Oil and Gas Development
(Tonnes/Year)
Development Traffic 2010 2015 2020 2025 2030
Mackenzie Gas Pipeline Inbound 0 400,000 5,000 5,000 5,000
Oil & Gas Exploration
Baufort Sea Inbound 4,000 8,000 8,000 12,000
Mackenzie Delta Inbound 38,000 38,000 54,000 76,000
Mackenzie Basin Inbound 6,000 27,000 27,000 40,000 54,000
Total 6,000 469,000 78,000 107,000 147,000

PHASE 1 REPORT: TRANSPORTATION DEMAND ASSESSMENT
PROLOG/EBA PAGE 129
4.3.3 Nunavut Resource Development
Nunavut Resource Traffic Summary
(Tonnes/Year)
2010 2015 2020 2025 2030
Mining
Medium Scenario
Inbound 73,800 291,300 274,000 274,000 274,000
Outbound 430,000 18,434,600 18,434,600 18,434,600
Energy
Exploration
Inbound 4,000 8,000 8,000 12,000
Nunavut Mining Traffic Forecast (Tonnes/Year)
Excludes Baffinland Mary River Iron Mine (18 million tonnes/year)

NORTHERN TRANSPORTATION SYSTEMS ASSESSMENT
PAGE 130 PROLOG/EBA
Nunavut Mineral Development by Region (Tonnes/Year)
2010 2015 2020 2025 2030
Kivalliq
Meadowbank
Gold Fuel 20,000 32,000
Supplies 15,000 30,000
Meliadine
Gold Fuel 3,000 20,000 20,000 20,000 20000
Supplies 2,000 8,000 8,000 8000 8000
Kiggavik Outbound 4,600 4,600 4,600
Yellowcake Fuel 200 200 58,000 58,000 58000
Supplies 100 100 60,000 60000 60000
Kivalliq Total Outbound 0 0 4,600 4,600 4,600
Fuel 23,200 52,200 78,000 78,000 78000
Supplies 17,100 38,100 68,000 68000 68000
Kitikmeot
Hope Bay
Gold Fuel 16,000 34,000 34,000 34,000 34000
Supplies 13,000 5,000 5,000 5000 5000
Izok Lake Outbound 430,000 430,000 430,000 430,000
Pb Zn Cu Fuel 1,000 28,000 28,000 28,000 28000
Supplies 500 10,000 10,000 10000 10000
Kitikmeot Outbound 0 430,000 430,000 430,000 430,000
Fuel 17,000 62,000 62,000 62,000 62000
Supplies 13,500 15,000 15,000 15000 15000
Qikiqtaaluk
Mary River Outbound 18,000,000 18,000,000 18,000,000
Iron Ore Fuel 2,000 17,000 41,000 41,000 41000
Supplies 1,000 107,000 10,000 10000 10000
Nunavut Total Outbound 0 430000 18,434,600 18,434,600 18,434,600
Fuel 42,200 131,200 181,000 181,000 181000
Supplies 31,600 160,100 93,000 93000 93000
Nunavut Oil and Gas Development (Tonnes/Year)
Development Traffic 2010 2015 2020 2025 2030
Oil & Gas Exploration Inbound 0 4,000 8,000 8,000 12,000

PHASE 1 REPORT: TRANSPORTATION DEMAND ASSESSMENT
PROLOG/EBA PAGE 131
5. Future System Performance
Ongoing changes in northern transportation demand are driving systems performance issues
across the North. These include:
• Kivalliq resupply shifting from Churchill based barge operations to Montreal based
Eastern Sealift operations and possibly back again with NTCL re-entering the market,
especially for the Meadowbank mine resupply at Baker Lake.
• Kitikmeot resupply shifting from Hay River based Mackenzie River barging to
Montreal based Eastern Sealift operations with both NSSI and NEAS offering
community resupply and resource development support (Newmont/Hope Bay Mine)
• NWT River resupply for deck cargo and bulk fuel to the Western Arctic shifting to
Western Sealift operations originating in the Vancouver Area as well as fuel sourcing
from the US west coast.
• NWT Seasonal Road constraints due to mild weather precluding sufficient ice
thickness thorough a full operating season (with supplemental air cargo operations
required in 2005 for approximately one third of the mine resupply tonnage).
• NWT, Nunavut and Yukon prospects for increasing mineral developments driving
new port access project proposals to reach remote production areas and to exploit
opportunities for more efficient export transportation.
• Yukon Port of Skagway mineral export facility reconstruction in parallel with Stewart
Bulk Terminal facilities in British Columbia providing competing options for Yukon
mining industry.
These ongoing demand driven performance changes set the requirements for Infrastructure
Assessment in Phase 2 of the Northern Transportation Systems Assessment.


PHASE 1 REPORT: TRANSPORTATION DEMAND ASSESSMENT
PROLOG/EBA PAGE 133
Appendix
1) Nunavut Socio-Economic Differences
2) Marine Fleet and Sailing Statistics
3) Highway Statistics Development
4) Community Resupply Forecast Methodology
5) Scheduled Northern Air Service and Representative Aircraft
6) Resource Development Forecast Detail
7) Stakeholder Interviews Conducted

NORTHERN TRANSPORTATION SYSTEMS ASSESSMENT
PAGE 134 PROLOG/EBA
Nunavut Socio-Economic Differences
In the course of completing the Northern Transportation Systems Assessment Phase 1
Demand Report, it has become apparent that relative to the other territories, Community
Resupply Traffic to Nunavut is much lower. The following points out a number of the socio-
economic differences that can cause that effect.
Transportation Infrastructure
The three Canadian territories may have many similarities but are also very dissimilar. One
major difference lies in transportation infrastructure. Yukon has an extensive all weather
highway system that links all but one of the major communities. The Northwest Territories
(NWT) has an extensive highway system in the south but there are many communities in the
north which are without all weather roads (Inuvik is linked by all weather road to the Yukon
via the Dempster Highway). In stark contrast the Nunavut Territory (NU) has no road system
other than local roads. The highway system in Yukon and NWT not only allows for year round
re-supply but supports businesses that require a reliable transportation system to maintain
their sophisticated logistic chains.
Population Distribution
Another major difference between the territories lies in how populations are distributed
within the three territories. Of Yukon’s 34,000 inhabitants approximately 75 percent live in
the Whitehorse area. In the NWT nearly 45 percent of the 43,000 population live in
Yellowknife. Of Nunavut’s 32,000 population approximately 23 percent of the population
lives in the capital of Iqaluit.
The population densities of communities like Whitehorse and Yellowknife offer economies of
scales that together with reliable transportation and socio-economic conditions contribute
toward economies that benefit from the multiplier effect. There are tertiary businesses such as
a limited manufacturing sector which supports operations like mining and transportation.
Also, service sectors support government, tourism and mining. These businesses contribute to
higher employment, incomes and consumption.
Retail Outlets
Both Whitehorse and Yellowknife have benefited by the introduction of big box stores.
Operations like Wal-Mart, Superstore, Canadian Tire, The Brick, Marks Work Warehouse and
others have allowed Northerners in these communities to benefit from lower prices and enjoy
a selection of merchandise that was previously not known in the North. The availability of
paved all-weather roads has ensured that these large stores can fit into the logistic chains of
their corporations and provide reliability in service and cheaper prices. The increase in
selection also contributes to impulse spending. This together with other factors mentioned

PHASE 1 REPORT: TRANSPORTATION DEMAND ASSESSMENT
PROLOG/EBA PAGE 135
below helps contribute to an increase in consumption which increases consumer spending
and increases the volume of freight moved into the territories.
Food Services
The introduction of fast food outlets in the North also contributes to increased freight
movements. In both Whitehorse and Yellowknife there are food services such as Tim
Horton’s, Starbucks, McDonalds, Boston Pizza, Subway, Kentucky Fried Chicken, A&W, etc
which are based on a steady reliable re-supply of fresh supplies to stay in business. The
success of these operations demonstrates that the transportation system is efficient and able
to meet the needs of both the management of the operations and their customers.
Monthly Receipts for Food Services and Drinking Places (Stats Canada)
March 2009
($000)
February 2010
($000)
Yukon 3,549 4,586
Northwest Territories 6,190 6,912
Nunavut 1,425 1,554
In March of 2009 Yukon receipts were almost 150 percent more than Nunavut’s. Although
Yukon registered almost two hundred percent more receipts in February 2010 than does
Nunavut one reason for this difference is that Whitehorse holds it Rendezvous celebrations
during the month of February. What the chart does demonstrate is that there is a significant
difference in food service and drinking place receipts and this is reflective of a number of
factors including tourism that create greater demand for consumables.
Demographics/Disposable Income
In Yukon less than 25 percent of the population is aboriginal while in the NWT it is 50 percent
and in NU it is 85 percent. Aboriginals tend to be concentrated in the remote communities
where there are limited employment opportunities and where the cost of living tends to be
higher.
The economic situation in Northern communities varies dramatically. Government remains
the major employer in the three territories and is supported by industries such as mining and
tourism. The major communities benefit the most from government activity and
unemployment rates in the capitals is significantly lower than other communities, particularly
isolated ones. In NU mining exploration and the development of new mines are having some
impact but unemployment remains high.

NORTHERN TRANSPORTATION SYSTEMS ASSESSMENT
PAGE 136 PROLOG/EBA
Nunavut Economic Data by Community
Community Pop. Median Household
Income (2005)
Unemployment
Rate
More than one
person per room
Average
Age
Iqaluit 6,184 $89,088 7.8 6.7 28.8
Clyde River 820 $46,464 24.2 35.1 20.8
Igloolik 1,538 $47,744 16.1 27.7 18.9
Pangnirtung 1,325 $44,928 17.1 12.3 21.9
Arviat 2,060 $45,184 13.0 30.8 19.5
Baker Lake 1,728 $41,344 18.9 24.4 22.0
Rankin Inlet 2,358 $73,344 10.2 16.0 23.9
Repulse Bay 748 $40,576 34.5 42.9 18.9
Cambridge Bay 1,477 $71,936 9.7 12.2 26.3
Kugaaruk 688 $58,624 21.3 44.4 18.0
Taloyoak 809 $45,952 28.1 35.1 19.6
Data from “Inventory of Health Services in Nunavut” October 22, 2009. Much of the data is based on the 2006 Census and although the communities have grown. The relationship between unemployment, income, household income and housing conditions is still very much relevant.
As noted above government is the major employer in the three territories. When you subtract
the capital of Iqaluit and the regional centres of Cambridge Bay and Rankin Inlet the
employment rates and household incomes are quite low. Although not all 26 NU communities
are listed here the relationships are the same. When one takes into account that the cost of
food in these communities is extremely high it is obvious that the disposable income of many
of these communities is very low which limits the amount of purchasing that can be done.
The federal government is altering the food mail program to address the need to ensure that
nutritious food is made available to these communities at reasonable prices to help promote
healthy life styles. This will help in the smaller communities where incomes are low and all of
the fresh produce must be flown in.
Average Annual Household Income in Canada (AAHI)
YEAR 2006 2001 1996
CANADA 53,634 52,438 49,142
NORTHWEST TERRITORIES 80,085 71,475 72,448
YUKON TERRITORY 60,105 58,215 60,993
NUNAVUT TERRITORY 60,221 50,971 48,896
Source: Statistics Canada

PHASE 1 REPORT: TRANSPORTATION DEMAND ASSESSMENT
PROLOG/EBA PAGE 137
While the AAHI in Yukon and Nunavut are similar there is a large variation between the
capital cities and other communities. In Whitehorse the AAHI is $66,191while in Iqaluit it is
$89,088 which are significantly above other communities in their territories (in Yukon the
AAHI for Old Crow is $36,352 and in Watson Lake the second largest community it is
$47,232). However; in Yukon Old Crow is connected by scheduled air service to Whitehorse,
six days per week and benefits from Whitehorse’s lower food and retail costs. Other Yukon
communities benefit from their highway connection to Whitehorse since people frequently
travel to the capital for various reasons including medical and business. Nunavut’s other
communities do not benefit from air links to Iqaluit since all fresh food products are flown to
Iqaluit from the south so that no real advantages exist in shopping in the Nunavut capital.
Yukon and the NWT because of their road connections therefore have a significant advantage
in terms of pricing for food stuffs and other retail items. The lower costs are reflected in
higher disposable income.
The NWT communities served by all weather roads also have an advantage over Nunavut
communities. Much of the food mail destined for communities north of Yellowknife is trucked
to Yellowknife then transferred to air for the final leg of the journey. This helps reduce costs
but does not overcome the cost implications of air transportation.
Traditional Foods
Another factor affecting dry goods consumption is that aboriginal peoples tend to rely more
heavily on traditional foods for their sustenance. Although only the NWT has conducted a
survey of reliance on traditional foods it is believed to be representative of aboriginal peoples
in all three territories. The survey conducted in 2008 was to determine the number of
households where more than half of the meat and fish consumed came from hunting and
fishing. In communities with a high proportion of aboriginals, traditional food consumption
was very high as in Tuktoyaktuk (63.3), Holman (62.9), Fort Liard (66.5), Jean Marie River
(90.0), Colville Lake (94.3), and Lutselk’e (91.9). In larger communities where there is a
higher proportion of non-aboriginals results are quite different as in Inuvik (25.2), Fort
Simpson (34.4), Hay River (15.7), and Yellowknife (10.7). In Nunavut where 85% of the
population is aboriginal, it is believed that consumption of fish and meat caught through
hunting and fishing would be very similar to the numbers in the Northwest Territories.
Retail Trade
Retail Trade by Province and Territory
2005 (000) 2006 (000) 2007 (000) 2008 (000) 2009 (000)
Canada 365,994.1 389,459.5 412,565.3 427,895.9 415,413.4
Yukon 434.7 452.5 502.7 534.5 526.7
NWT 574.6 599.1 678.1 705.6 693.0
Nunavut 249.5 260.4 278.1 308.7 324.2
Source: Statistics Canada

NORTHERN TRANSPORTATION SYSTEMS ASSESSMENT
PAGE 138 PROLOG/EBA
Yukon and Nunavut have similar size populations however Yukon has 62 percent more retail
trade than Nunavut. This reflects the socio-economic situation, tourism, and the selection
available to Yukoners through lower costs provided by the variety of shopping options.
Employment
Employment Labour Force
Jurisdiction Total
Canada 16,021,180
Yukon 17,315
NWT 21,350
Nunavut 10,670
Source: Statistics Canada 2006 Census
Despite having similar populations Yukon has 62 percent more people in the labour force.
Part of the explanation for this is that Nunavut has a very young population. The median age
is 23.1 and 33.9 percent are 14 years or younger.
Tourism
Tourism in Yukon accounts for 4.4 percent of the territory’s GDP contributing approximately
$500 million to the economy. Tourism is the largest private sector employer in Yukon, and
roughly 70 percent of Yukon’s employment population work for businesses that report some
level of tourism revenue. Approximately 300,000 travellers cross Yukon’s international
border each year. By contrast tourism in the Northwest Territories generates approximately
$113.6 million in revenue annually and attracts 36,000 visitors per year. Nunavut attracted
approximately 13,000 visitors in 2005 but the increase in cruise ship visits has the potential
to increase this number.
In Yukon the number of tourists has a significant impact on consumption of dry cargo items.
Bus tours stay at local hotels, purchase meals and purchase other retail items.
Driving the Alaska Highway is a major tourist attraction. Motor homes and trailers from all
over North America and from Europe can be seen travelling the highway. These tourists
patronize local stores and are a significant contributor to the local economy.
Although not a significant as tourism there are a large number of trucks that transit Yukon to
and from Alaska. These truckers not only purchase fuel but also purchase food and other
consumables.

PHASE 1 REPORT: TRANSPORTATION DEMAND ASSESSMENT
PROLOG/EBA PAGE 139
Northern Marine Voyages (2009 Sailings)
Northwest Passage Transits (Source: NORDREG Reporting)
3 Coast Guard Sailings
2 Commercial Sailings
8 Pleasure Craft Sailings
4 Cruise Ship Sailings (592 Passengers)
Eastern Sealift (Source: Government of Nunavut)
7 Woodwards Tanker Sailings to Iqaluit
4 Woodwards Tanker Sailings to Rankin Inlet
3 Woodwards Tanker Sailings to Cape Dorset & Baker Lake
1 or 2 Woodwards Tanker Sailings to all other Kivalliq and Qiqitaaluk Communities
1 or 2 NSSI and NEAS Dry Cargo Resupply Ship Sailings to all Nunavut Communities
15 additional NSSI or NEAS Dry Cargo Resupply Ship Sailings to Iqaluit
Western Sealift (Source: NTCL)
2 NTCL Charter Tanker Sailings from West Coast to Western Arctic Communities
3 NTCL Bulk/Deck Cargo Barge Sailings from Hay River to Western Arctic Communities
Mackenzie River Sailings (Source: NTCL and Cooper Services)
14 NTCL Bulk/Deck Cargo Barge Sailings from Hay River to Mackenzie River Communities
9 Coopers Barge Sailings from Fort Nelson to Tulita and Norman Wells
Inside Passage Sailings (Skagway Convention & Visitors Bureau)
52 Scheduled Container Barge Sailings to Skagway and Haines
12 Scheduled Fuel Barge Sailings to Skagway and Haines 424 Cruise Ship Sailings to Skagway or Haines (779,043 passengers)
Churchill Port Calls (Source: OmniTRAX and NTCL)
18 Bulk Ships loading grain for export
1 NTCL Barge Sailing to Kivalliq

NORTHERN TRANSPORTATION SYSTEMS ASSESSMENT
PAGE 140 PROLOG/EBA
No
rth
ern
Ma
rin
e F
lee
t
Sh
ips
Bu
ilt
Ice
Cla
ss
HP
S
pe
ed
LO
A
Bre
ad
th
De
pth
D
raft
D
WT
To
nn
es
Co
nta
ine
r
Nu
na
vu
t E
ast
ern
Arc
tic
Se
ali
ft
MV
Aiv
ik
19
80
B
V I
CE
11
1
52
00
1
4
10
9.9
m
19
.4
12
.95
5
.92
4
86
0
28
0
MV
Um
iavu
t 1
98
8
LR I
ce C
lass
6
00
0
15
1
13
.16
1
8.9
0
11
.28
8
.54
9
58
7
56
7
MV
Ava
taq
1
98
9
LR I
ce C
lass
6
00
0
15
1
13
.16
1
8.9
0
11
.28
8
.54
9
58
7
56
7
MV
Qa
mu
tik
1
99
4
LR I
ce C
lass
7
38
0
16
1
37
.16
1
8.9
0
11
.65
8
.51
5
12
75
4
73
0
Nu
na
vu
t S
ea
lin
k &
Su
pp
ly I
nc.
An
na
De
sga
gn
es
19
86
B
V I
ce C
lass
1
03
30
1
4.5
1
73
.5
23
.05
1
3.7
0
10
1
78
50
5
53
Ca
mill
a D
esg
ag
ne
s 1
98
2
LR?
7
79
7
14
.5
13
3.4
1
20
.93
1
4.1
3
6.8
7
70
00
Ro
sair
e D
esg
ag
ne
s 2
00
7
GL
E3
7
34
4
15
.5
13
8.0
7
21
8
12
74
4
67
3
Sed
na
2
00
9
GL
E3
7
34
4
15
.5
13
9
21
8
12
61
2
66
5
Ze
led
a
20
09
G
L E
3
73
44
1
5.5
1
38
.98
2
1
8
1
26
92
6
65
Co
ast
al
Sh
ipp
ing
Ltd
. (W
oo
dw
ard
s G
rou
p)
Do
rsch
1
98
0
GL
?
6,0
00
1
4.5
0
13
0.7
5
18
.50
1
0.6
2
8.3
10
1
0,5
56
Mo
ka
mi
19
89
R
MR
?
3,5
02
1
3.5
9
7.4
?
6
.51
0
4.5
01
2
,85
3
Tu
vaq
1
97
7
DN
V I
ce 1
A
2x
14
.0
16
4.4
7
21
.51
1
2.0
2
9.5
02
1
5,9
54

PHASE 1 REPORT: TRANSPORTATION DEMAND ASSESSMENT
PROLOG/EBA PAGE 141
No
rth
ern
Ma
rin
e F
lee
t
Tu
gs
Bu
ilt
Ice
H
P
Sp
ee
d
LOA
B
rea
dth
D
ep
th
Dra
ft
Ba
rge
s B
uil
t S
eri
es
Len
gth
B
rea
dth
C
ap
y
No
rth
ern
Tra
nsp
ort
ati
on
Co
mp
an
y L
imit
ed
M.V
. A
lex
Go
rdo
n
19
75
LR
Cla
ss
72
00
1
5.5
kts
2
05
' 4
5'
18
'2"
14
'2"
4
19
74
1
80
0
21
0’
56
’ 2
59
0t
M.V
. Ji
m K
ila
bu
k 1
97
5
LR C
lass
7
20
0
15
.5
20
5'
45
' 1
8'2
" 1
4'2
" 1
2
00
9
15
00
2
50
’ 5
6’
21
90
t
M.V
. N
un
akp
ut
19
69
-
43
00
1
2
16
7'6
" 4
7'9
" 1
0'6
" 6
' 2
0
19
72
1
50
0
25
0’
56
’ 2
19
0t
M.V
. P
isu
raya
k K
oo
too
k
19
69
-
43
00
1
2
16
0'
40
' 1
0'6
" 6
'6"
8
19
69
1
50
0
25
0’
56
’ 2
19
0t
M.V
. P
at
Lya
ll 1
96
9
- 4
30
0
12
1
60
' 4
0'
10
'6"
6'6
" 1
-
10
50
2
16
’ 4
9’
17
30
t
M.V
. V
ic I
ng
rah
am
1
97
0
- 4
50
0
12
1
54
'6"
50
' 9
'6"
3'9
" 3
-
10
30
2
00
’ 4
8’
12
70
t
M.V
. E
dg
ar
Ko
toka
k 1
97
3
- 5
60
0
14
1
53
'3'
52
'1"
9'6
3
'9"
24
1
96
9
10
00
2
00
’ 5
0’
10
05
t
M.V
. H
en
ry
19
73
-
45
00
1
4
15
3'3
' 5
2'1
" 9
'6
3'9
" 2
1
96
5
82
0
17
5’
50
’ 9
00
t
M.V
. K
elly
Ova
yua
k 1
97
3
- 5
60
0
14
1
48
'3'
52
'1"
9'6
3
'9"
11
1
96
2
80
0
16
0’
48
’ 9
30
t
M.V
. Jo
ck M
cNiv
en
1
97
3
- 4
50
0
14
1
48
'3'
52
'1"
9'6
3
'9"
2
19
65
7
00
1
55
’ 4
5’
cam
p
M.V
. K
ee
wa
tin
1
97
4
LR C
lass
3
37
5
12
1
26
'6"
38
'1"
12
'1"
8'1
0"
18
1
95
7
60
0
15
0’
35
’ 6
07
t
M.V
. M
arj
ory
-
- 1
10
0
10
8
1'1
" 2
9'6
" 7
'9"
3'6
"
M.V
. A
rcti
c K
ug
alu
k
- -
22
50
1
2
98
' 3
8'
7'
4'6
"
M.V
. Sa
ns
Sa
ult
-
- 1
50
0
12
7
7'6
" 2
4'
6'8
1/2
3'9
"

NORTHERN TRANSPORTATION SYSTEMS ASSESSMENT
PAGE 142 PROLOG/EBA
No
rth
ern
Ma
rin
e F
lee
t
Tu
gs
Bu
ilt
Ice
H
P
Sp
ee
d
LOA
B
rea
dth
D
ep
th
Dra
ft
Ba
rge
s B
uil
t S
eri
es
Len
gth
B
rea
dth
C
ap
y
Co
op
er
Ba
rgin
g S
erv
ice
s
MV
"M
alt
a"
80
0
3
2
00
1
80
0
16
5’
45
’ 9
00
t
MV
"Sh
eil
a J
"
8
00
5
4
00
1
27
’ 3
2’
27
5t
MV
"H
ug
h A
Yo
un
g"
14
50
1
2
00
MV
"M
ille
r D
elt
a"
22
00
Ho
rizo
n M
ari
ne
MV
"B
ert
Lo
ng
"
2,0
00
•
SBM
T 8
02
Ba
rge
Ca
mp
MV
"R
isco
Re
ag
an
"
1
00
0
•
Will
iam
Bra
dle
y La
nd
ing
Ba
rge
MV
"W
.H.
Ho
rto
n"
1
00
0
•
Arc
tic
Sta
r Se
lf-c
on
tain
ed
Ba
rge
Ca
mp
MV
"D
elt
a E
ag
le"
1
•
Joh
n W
urm
lin
ge
r M
ach
ine
Sh
op
Ba
rge

PHASE 1 REPORT: TRANSPORTATION DEMAND ASSESSMENT
PROLOG/EBA PAGE 143
Resource Development Projects Detailed Demand Forecast
Ma
y 8
/10
SH
EE
T 5
N
OR
TH
ER
N T
RA
NS
PO
RT
AT
ION
SY
ST
EM
S A
SS
ES
SM
EN
T
BA
SE
ME
TA
L M
INE
S -
NO
RT
HE
RN
TE
RR
ITO
RIE
S
(to
nn
es)
Pro
ject
Lif
eM
ax
. Y
ea
r
MIN
EP
rod
uct
sS
tatu
s -1
2/
10
Inb
ou
nd
Ou
tbo
un
dT
ota
lIn
bo
un
dO
utb
ou
nd
T
ota
l
R
em
ark
s
YU
KO
NM
into
Cu
Pro
du
cin
g3
23
,00
07
75
,00
01
,09
8,0
00
27
,00
06
5,0
00
92
,00
0
Tru
ck -
Sk
ag
wa
y
Wo
lve
rin
eP
b,
Zn
, C
uP
rod
uci
ng
35
2,0
00
1,5
30
,00
01
,88
2,0
00
31
,00
01
35
,00
01
66
,00
0
Tru
ck -
Ste
wa
rt,
BC
Ca
ntu
ng
W0
3,
Cu
Pro
du
cin
g5
8,0
00
47
,00
01
05
,00
01
1,0
00
9,0
00
20
,00
0
Re
-op
en
s O
ct.
'10
Ca
rma
cks
Cu
Sh
ort
Te
rm1
32
,00
01
44
,00
02
76
,00
01
1,0
00
16
,00
02
7,0
00
C
op
pe
r ca
tho
de
s
Se
lwy
nZ
n,
Pb
Sh
ort
Te
rm1
,09
7,0
00
2,3
52
,00
03
,44
9,0
00
75
,00
05
00
,00
05
75
,00
0
Co
nce
ntr
ate
slu
rry
pip
eli
ne
Be
lle
ke
no
Zn
, P
b,
Ag
Sh
ort
Te
rm5
2,0
00
20
0,0
00
25
2,0
00
5,0
00
20
,00
02
5,0
00
I
ncl
ud
es
futu
re d
ev
elo
pm
en
t
Ca
sin
oC
u,
Mo
lyLo
ng
Te
rm2
,62
2,0
00
4,5
00
,00
07
,12
2,0
00
16
0,0
00
30
0,0
00
46
0,0
00
C
oa
l-fi
red
po
we
r g
en
era
tio
n
Ma
ctu
ng
W0
3,
Cu
Lon
g T
erm
24
9,5
00
19
5,0
00
44
4,5
00
18
,00
01
5,0
00
33
,00
0
Mo
ve
re
sou
rce
s fr
om
Ca
ntu
ng
To
tal
Yu
ko
n4
,88
5,5
00
9,7
43
,00
01
4,6
28
,50
03
38
,00
01
,06
0,0
00
1,3
98
,00
0
NW
TN
ICO
Co
, B
iS
ho
rt T
erm
43
6,0
00
1,1
22
,00
01
,55
8,0
00
22
,00
06
6,0
00
88
,00
0
Pro
cess
co
ns
in S
ask
ato
on
Pin
e P
oin
tZ
n,
Pb
Sh
ort
Te
rm1
03
,00
02
,51
0,0
00
2,6
13
,00
05
,00
02
00
,00
02
05
,00
0
Re
-op
en
wit
h n
ew
te
chn
olo
gy
Pra
irie
Cr.
Pb
, Z
n,
Cu
, A
gS
ho
rt T
erm
63
0,0
00
3,1
60
,00
03
,79
0,0
00
40
,00
02
00
,00
02
40
,00
0
Old
Ca
dil
lac
Sil
ve
r M
ine
Th
or
Lak
eR
EE
Lon
g T
erm
24
3,6
00
48
0,0
00
72
3,6
00
13
,00
03
0,0
00
43
,00
0
Ra
re E
art
h E
lem
en
ts
To
tal
NW
T1
,41
2,6
00
7,2
72
,00
08
,68
4,6
00
80
,00
04
96
,00
05
76
,00
0
NU
NA
VU
TM
ary
Riv
er
Fe
Ore
Sh
ort
Te
rm1
,37
3,0
00
26
1,0
00
,00
02
62
,37
3,0
00
51
,00
01
8,0
00
,00
01
8,0
51
,00
0
Hu
ge
iro
n o
re p
rod
uct
ion
Izo
k L
ak
eP
b,
Zn
, C
uS
ho
rt T
erm
81
5,0
00
6,8
80
,00
07
,69
5,0
00
38
,00
04
30
,00
04
68
,00
0
Ric
h M
ine
- R
eq
uir
es a
rcti
c p
ort
Kig
ga
vik
U3
O8
Sh
ort
Te
rm1
,68
5,8
00
59
,80
01
,74
5,6
00
11
8,0
00
4,6
00
12
2,6
00
P
rod
uct
- Y
ell
ow
cak
e
Ha
cke
tt R
.P
b,
Zn
, C
uLo
ng
Te
rm2
,28
6,5
00
5,8
50
,00
08
,13
6,5
00
15
8,0
00
45
0,0
00
60
8,0
00
R
ich
Min
e -
Re
qu
ire
s a
rcti
c p
ort
To
tal
Nu
na
vu
t6
,16
0,3
00
27
3,7
89
,80
02
79
,95
0,1
00
36
5,0
00
18
,88
4,6
00
19
,24
9,6
00
To
tals
- A
ll T
err
ito
rie
s1
2,4
58
,40
02
90
,80
4,8
00
30
3,2
63
,20
07
83
,00
02
0,4
40
,60
02
1,2
23
,60
0

NORTHERN TRANSPORTATION SYSTEMS ASSESSMENT
PAGE 144 PROLOG/EBA
Ma
y 8
/10
SH
EE
T 1
N
TS
A
NO
RT
HE
RN
TE
RR
ITO
RIE
S T
OT
AL
RE
SOU
RC
E P
RO
JEC
T F
RE
IGH
T D
EM
AN
D
(T0
NN
ES
)
PIP
ELI
NE
S2
01
02
01
12
01
22
01
32
01
42
01
52
01
62
01
72
01
82
01
92
02
02
02
12
02
22
02
32
02
42
02
52
02
62
02
72
02
82
02
92
03
0
Ma
cke
nzi
e G
as
Pro
ject
Co
nst
ruct
ion
Inb
ou
nd
40
0,0
00
46
6,0
00
Ou
tbo
un
d1
12
,00
0
Re
-su
pp
lie
s5
,00
05
,00
05
,00
05
,00
05
,00
05
,00
05
,00
05
,00
05
,00
05
,00
05,
00
05
,00
05
,00
05
,00
0
Ala
ska
Ga
s P
ipe
lin
e -
Yu
ko
n S
ect
ion
Co
nst
ruct
ion
Inb
ou
nd
78
6,5
00
31
7,7
00
Ou
tbo
un
d8
3,0
00
Re
-su
pp
lie
s3
,00
03
,00
03
,00
03
,00
03
,00
03
,00
03
,00
03
,00
03
,00
0
To
tal
Inb
ou
nd
40
0,0
00
46
6,0
00
5,0
00
5,0
00
5,0
00
79
1,5
00
32
2,7
00
8,0
00
8,0
00
8,0
00
8,0
00
8,0
00
8,0
00
8,0
00
8,0
00
8,0
00
To
tal
Ou
tbo
un
d1
12
,00
08
3,0
00
OIL
& G
AS
EX
PLO
RA
TIO
N
Ma
cke
nzi
e O
&G
Ex
plo
rati
on
Be
au
fort
Se
a O
ffsh
ore
4,0
00
4,0
00
4,0
00
4,0
00
4,0
00
4,0
00
8,0
00
8,0
00
8,0
00
8,0
00
8,0
00
8,0
00
12
,00
01
2,0
00
12
,00
01
2,0
00
12
,00
0
Ma
cke
nzi
e D
elt
a O
nsh
ore
23
,00
03
8,0
00
38
,00
03
8,0
00
38
,00
03
8,0
00
38
,00
05
4,0
00
54
,00
05
4,0
00
54
,00
05
4,0
00
76
,00
07
6,0
00
76
,00
07
6,0
00
76
,00
0
Ce
ntr
al
Ma
cke
nzi
e B
asi
n6
,00
06
,00
06
,00
06
,00
02
7,0
00
27,
00
02
7,0
00
27
,00
02
7,0
00
27
,00
02
7,0
00
40
,00
04
0,0
00
40
,000
40
,00
04
0,0
00
54
,00
05
4,0
00
54
,00
05
4,0
00
54
,00
0
Ea
ste
rn A
rcti
c O
&G
Ex
plo
rati
on
4,0
00
4,0
00
4,0
00
4,0
00
4,0
00
4,0
00
8,0
00
8,0
00
8,0
00
8,0
00
8,0
00
8,0
00
12
,00
01
2,0
00
12
,00
01
2,0
00
12
,00
0
Yu
ko
n O
&G
Ex
plo
rati
on
3,0
00
3,0
00
3,0
00
3,0
00
3,0
00
3,0
00
6,0
00
6,0
00
6,0
00
6,0
00
6,0
00
6,0
00
6,0
00
To
tal
Inb
ou
nd
60
00
60
00
60
00
60
00
58
00
07
30
00
73
00
07
30
00
76
00
07
60
00
84
00
01
13
00
01
13
00
01
13
00
01
16
00
01
16
00
01
60
00
01
60
00
01
60
00
01
600
00
16
00
00
MIN
ING
Yu
ko
nO
utb
ou
nd
11
2,0
00
22
9,0
00
22
9,0
00
24
4,0
00
58
0,0
00
58
0,0
00
871
,00
08
71
,00
01
,05
1,0
00
1,0
51
,00
01
,05
1,0
00
96
6,0
00
83
1,0
00
81
5,0
00
81
5,0
00
81
5,0
00
30
0,0
00
30
0,0
00
30
0,0
00
30
0,0
003
00
,00
0
Inb
ou
nd
54
,00
09
3,5
00
24
0,0
00
32
1,0
00
22
4,0
00
22
4,0
00
30
2,0
00
30
2,0
00
32
7,0
00
32
7,0
00
32
7,0
00
29
5,0
00
26
4,0
00
25
3,0
002
53
,00
02
53
,00
01
60
,00
01
60
,00
01
60
,00
01
60
,00
01
60
,00
0
NW
TO
utb
ou
nd
50
,00
01
00
,00
03
66
,00
04
96
,00
04
96
,00
04
96
,00
04
16
,00
04
16
,00
06
16
,00
06
16
,00
06
16
,00
06
16
,00
06
16
,00
06
16
,00
06
16
,00
06
16
,00
06
16
,00
06
16
,00
06
16
,00
0
Inb
ou
nd
13
8,0
00
27
7,0
00
32
6,0
00
48
9,3
00
51
5,3
00
52
3,0
00
523
,00
05
23
,00
05
23
,00
05
23
,00
05
42
,00
04
67
,00
04
67
,00
03
12
,00
03
12
,00
03
12
,00
03
12
,00
03
12
,00
01
61
,00
01
61
,00
01
61
,000
Nu
na
vu
tO
utb
ou
nd
43
0,0
00
43
0,0
00
43
0,0
00
88
4,6
00
88
4,6
00
88
4,6
00
88
4,6
00
88
4,6
00
88
4,6
00
88
4,6
00
88
4,6
00
88
4,6
00
88
4,6
00
88
4,6
00
88
4,6
00
88
4,6
00
Inb
ou
nd
75
,30
01
37
,30
02
10
,80
0461,8
00
37
7,8
00
366,3
00
421,0
00
364
,000
48
8,0
00
445,0
00
432,0
00
432,0
00
43
2,0
00
432,0
00
432
,000
432,0
00
432,0
00
432,0
00
432,0
00
432,0
00
432,0
00
To
tal
Ou
tbo
un
d1
12
,00
02
29
,00
02
79
,00
03
44
,00
09
46
,00
01
,50
6,0
00
1,7
97
,00
01
,79
7,0
00
2,3
51
,60
02
,35
1,6
00
2,5
51
,60
02
,46
6,6
00
2,3
31,6
00
2,3
15
,60
02
,31
5,6
00
2,3
15
,60
01
,80
0,6
00
1,8
00
,60
01,
80
0,6
00
1,8
00
,60
01
,80
0,6
00
To
tal
Inb
ou
nd
26
7,3
00
50
7,8
00
77
6,8
00
##
##
##
##
##
##
##
##
1,1
13
,30
01
,24
6,0
00
1,1
89
,00
01
,33
8,0
00
1,2
95
,00
01
,30
1,0
00
1,1
94
,00
01
,16
3,0
00
99
7,0
00
99
7,0
00
99
7,0
00
90
4,0
00
90
4,0
00
75
3,0
00
753
,00
07
53
,00
0
Ma
ry R
ive
r O
utb
ou
nd
9,0
00
,00
0#
##
##
##
##
18
,00
0,0
00
##
##
##
##
##
##
##
##
##
##
##
##
##
##
##
##
##
##
18
,00
0,0
00
18
,00
0,0
00
##
##
##
##
#1
8,0
00
,000
##
##
##
##
#1
8,0
00
,00
01
8,0
00
,00
01
8,0
00
,00
0
TO
TA
L R
ES
OU
RC
E P
RO
JEC
T
To
tal
Ou
tbo
un
d1
12
,00
02
29
,00
02
79
,00
03
44
,00
09
46
,00
01
,50
6,0
00
1,7
97
,00
01
,90
9,0
00
2,3
51
,60
02
,35
1,6
00
2,5
51
,60
02
,46
6,6
00
2,4
14,6
00
2,3
15
,60
02
,31
5,6
00
2,3
15
,60
01
,80
0,6
00
1,8
00
,60
01,
80
0,6
00
1,8
00
,60
01
,80
0,6
00
Ma
ry R
ive
r O
re9
,00
0,0
00
##
##
##
##
#1
8,0
00
,00
0#
##
##
##
##
##
##
##
##
##
##
##
##
##
##
##
##
##
#1
8,0
00
,00
01
8,0
00
,00
0#
##
##
##
##
18
,00
0,0
00#
##
##
##
##
18
,00
0,0
00
18
,00
0,0
00
18
,00
0,0
00
To
tal
Inb
ou
nd
27
3,3
00
51
3,8
00
78
2,8
00
##
##
##
##
##
##
##
##
1,5
86
,30
01
,78
5,0
00
1,2
67
,00
01
,41
9,0
00
1,3
76
,00
02
,17
6,5
00
1,6
29
,70
01
,28
4,0
00
1,1
18
,00
01
,12
1,0
00
1,1
21
,00
01
,07
2,0
00
1,0
72
,000
92
1,0
00
92
1,0
00
92
1,0
00
R
ESO
UR
CE
TR
AFF
IC
BY
T
ER
RIT
OR
Y
Yu
ko
nO
utb
ou
nd
11
2,0
00
22
9,0
00
22
9,0
00
24
4,0
00
58
0,0
00
58
0,0
00
87
1,0
00
871
,00
01
,05
1,0
00
1,0
51
,00
01
,05
1,0
00
96
6,0
00
91
4,0
00
81
5,0
00
81
5,0
00
81
5,0
00
30
0,0
00
30
0,0
00
30
0,0
00
30
0,0
00
30
0,0
00
Inb
ou
nd
54
,00
09
3,5
00
24
0,0
00
32
1,0
00
22
4,0
00
22
4,0
00
30
2,0
00
30
2,0
00
33
0,0
00
33
0,0
00
1,1
16
,50
06
15
,70
02
70
,00
02
59
,00
02
62
,00
02
62
,00
01
69
,00
01
69
,00
01
69
,00
01
69
,00
01
69
,00
0
NW
TO
utb
ou
nd
50
,00
01
00
,00
03
66
,00
04
96
,00
04
96
,00
06
08
,00
04
16
,00
04
16,
00
06
16
,00
06
16
,00
06
16
,00
06
16
,00
06
16
,00
06
16
,00
06
16
,00
06
16
,00
06
16
,00
06
16
,00
06
16
,00
0
Inb
ou
nd
14
4,0
00
28
3,0
00
33
2,0
00
49
5,3
00
56
9,3
00
99
2,0
00
1,0
58
,00
05
97
,00
05
97
,00
05
97
,00
06
20
,00
05
74
,00
05
74
,00
04
19
,00
04
19,0
00
41
9,0
00
45
9,0
00
45
9,0
00
30
8,0
00
30
8,0
00
30
8,0
00
Nu
na
vu
tO
utb
ou
nd
43
0,0
00
9,4
30
,00
0#
##
##
##
##
18
,88
4,6
00
##
##
##
##
##
##
##
##
##
##
##
##
##
##
##
##
##
##
18
,88
4,6
00
18
,88
4,6
00
##
##
##
##
#1
8,8
84
,60
0#
##
##
##
##
18
,88
4,6
00
18
,88
4,6
00
18
,88
4,6
00
Inb
ou
nd
75
,30
01
37
,30
02
10
,80
04
61
,80
03
81
,80
03
70
,30
04
25
,00
03
68
,00
04
92
,00
04
49
,00
04
40
,00
04
40
,00
04
40
,00
04
40
,00
04
40
,00
04
40
,00
04
44
,00
04
44
,00
04
44
,00
04
44
,00
04
44
,00
0

PHASE 1 REPORT: TRANSPORTATION DEMAND ASSESSMENT
PROLOG/EBA PAGE 145
Ma
y 8
/10
SH
EE
T 2
N
TS
A
NO
RT
HE
RN
TE
RR
ITO
RIE
S A
NN
UA
L F
RE
IGH
T D
EM
AN
D
YU
KO
N M
INE
S(T
0N
NE
S)
MIN
E
Op
era
tin
g M
ine
s2
00
92
01
02
01
12
01
22
01
32
01
42
01
52
01
62
01
72
01
82
01
92
02
02
021
20
22
20
23
20
24
20
25
20
26
20
27
20
28
20
29
20
30
TO
TA
LS
Min
toO
utb
ou
nd
Pro
du
ctio
n6
0,0
00
65
,00
06
5,0
00
65
,00
06
5,0
00
65
,00
06
5,0
00
65
,00
06
5,0
00
65
,00
06
5,0
00
65
,00
07
75
,00
0
Inb
ou
nd
Fu
el
23,
000
23,
000
23
,000
23
,000
23
,000
23
,000
23
,000
23,
000
23,
000
23,
000
23,
000
23,
000
27
6,0
00
Su
pp
lie
s3,
000
4,0
004,
000
4,0
004
,000
4,0
004
,000
4,00
04,
000
4,00
04,
000
4,00
04
7,0
00
To
tal
Inb
ou
nd
26
,00
02
7,0
00
27
,00
02
7,0
00
27
,00
02
7,0
00
27
,00
02
7,0
00
27
,00
02
7,0
00
27
,00
02
7,0
00
32
3,0
00
Wo
lve
rin
eO
utb
ou
nd
Pro
du
ctio
n4
5,0
00
13
5,0
00
13
5,0
00
13
5,0
00
13
5,0
00
13
5,0
00
13
5,0
00
13
5,0
00
13
5,0
00
13
5,0
00
13
5,0
00
13
5,0
00
1,5
30
,00
0
Inb
ou
nd
Fu
el
8,0
002
1,0
002
1,0
002
1,0
002
1,0
002
1,0
002
1,00
02
1,00
02
1,00
02
1,00
02
1,00
02
1,0
002
39
,00
0
Su
pp
lie
s3,
000
10
,000
10
,000
10
,000
10
,000
10
,000
10,
000
10,
000
10,
000
10,
000
10,
000
10
,000
11
3,0
00
To
tal
Inb
ou
nd
11
,00
03
1,0
00
31
,00
03
1,0
00
31
,00
03
1,0
00
31
,00
03
1,0
00
31
,00
03
1,0
00
31
,00
03
1,0
00
35
2,0
00
Ca
ntu
ng
Ou
tbo
un
d P
rod
uct
ion
2,0
00
9,0
00
9,0
00
9,0
00
9,0
00
9,0
00
47
,00
0
Inb
ou
nd
Fu
el
2,0
008,
000
8,0
008
,000
8,0
008
,000
42
,00
0
Su
pp
lie
s1,
000
3,0
003
,000
3,0
003
,000
3,0
001
6,0
00
To
tal
Inb
ou
nd
3,0
00
11
,00
01
1,0
00
11
,00
01
1,0
00
11
,00
05
8,0
00
To
tal
Ou
tbo
un
d6
0,0
00
11
2,0
00
20
9,0
00
20
9,0
00
20
9,0
00
20
9,0
00
20
9,0
00
20
0,0
00
20
0,0
00
20
0,0
00
20
0,0
00
20
0,0
00
13
5,0
00
2,3
52
,00
0
inb
ou
nd
Fu
el
33
,00
05
2,0
00
44
,00
0
inb
ou
nd
Su
pp
lie
s8
,00
01
7,0
00
14
,00
0
To
tal
Inb
ou
nd
26
,00
04
1,0
00
69
,00
06
9,0
00
69
,00
06
9,0
00
69
,00
05
8,0
00
58
,00
05
8,0
00
58
,00
05
8,0
00
31
,00
07
33
,00
0
To
tal
- O
pe
rati
ng
Min
es
86
,00
01
53
,00
02
78
,00
02
78
,00
02
78
,00
02
78
,00
02
78
,00
02
58
,00
02
58
,00
02
58
,00
02
58
,00
02
58
,00
01
66
,00
03
,08
5,0
00
Pro
ba
ble
Min
es
(sh
ort
te
rm)
Ca
rma
cks
Ou
tbo
un
d P
rod
uct
ion
16
,00
01
6,0
00
16
,00
01
6,0
00
16
,00
01
6,0
00
16
,00
01
6,0
00
16
,00
01
44
,00
0
Co
pp
er
Inb
ou
nd
Fu
el
1,0
001,
000
2,0
003
,000
8,0
008
,000
8,00
08,
000
8,00
08,
000
8,00
08
,000
8,0
007
9,0
00
Su
pp
lie
s5
005
001
2,0
001
3,0
003
,000
3,0
003,
000
3,00
03,
000
3,00
03,
000
3,0
003
,000
53
,00
0
To
tal
Inb
ou
nd
1,5
001,
500
14
,000
16
,000
11
,000
11
,000
11,
000
11,
000
11,
000
11,
000
11,
000
11
,000
11,0
001
32
,00
0
Se
lwy
nO
utb
ou
nd
Pro
du
ctio
n3
20
,00
03
20
,00
03
20
,00
03
20
,00
05
00
,00
05
00
,00
05
00
,00
05
00
,00
05
00
,00
05
00
,00
05
00
,00
05
00
,00
05
,28
0,0
00
Inb
ou
nd
Fu
el
3,0
005,
000
42
,000
42
,000
40
,000
40
,000
40,
000
40,
000
60,
000
60,
000
60,
000
60
,000
60,0
0060
,00
06
0,0
006
0,0
007
32
,00
0
Su
pp
lie
s2,
000
3,0
0010
0,0
0010
0,0
001
0,0
001
0,0
001
0,00
01
0,00
01
5,00
01
5,00
01
5,00
01
5,0
0015
,000
15,0
00
15,
000
15
,000
36
5,0
00
To
tal
Inb
ou
nd
5,0
008,
000
142,
000
142,
000
50
,000
50
,000
50,
000
50,
000
75,
000
75,
000
75,
000
75
,000
75,0
0075
,00
07
5,0
007
5,0
001
,09
7,0
00
Be
lle
ke
no
Ou
tbo
un
d P
rod
uct
ion
20
,00
02
0,0
00
20
,00
02
0,0
00
20
,00
02
0,0
00
20
,00
02
0,0
00
20
,00
02
0,0
00
20
0,0
00
Inb
ou
nd
Fu
el
1,0
003,
000
3,0
003
,000
3,0
003
,000
3,00
03,
000
3,00
03,
000
3,00
03
1,0
00
Su
pp
lie
s1,
000
2,0
002
,000
2,0
002
,000
2,0
002,
000
2,00
02,
000
2,00
02,
000
21
,00
0
To
tal
Inb
ou
nd
2,0
005,
000
5,0
005
,000
5,0
005
,000
5,00
05,
000
5,00
05,
000
5,00
05
2,0
00
To
tal
Ou
tbo
un
d2
0,0
00
20
,00
02
0,0
00
35
6,0
00
35
6,0
00
35
6,0
00
35
6,0
00
53
6,0
00
53
6,0
00
53
6,0
00
51
6,0
00
51
6,0
00
50
0,0
00
50
0,0
00
50
0,0
00
5,6
24
,00
0
inb
ou
nd
Fu
el
5,0
00
51
,00
07
1,0
00
60
,00
0
inb
ou
nd
Su
pp
lie
s3
,50
01
5,0
00
20
,00
01
5,0
00
To
tal
Inb
ou
nd
8,5
00
14
,50
01
61
,00
01
63
,00
06
6,0
00
66
,00
06
6,0
00
66
,00
09
1,0
00
91
,00
09
1,0
00
86
,00
08
6,0
00
75
,00
07
5,0
00
75
,00
01
,28
1,0
00
To
tal
- S
ho
rt T
erm
Min
es
8,5
00
34
,50
01
81
,00
01
83
,00
04
22
,00
04
22
,00
04
22
,00
04
22
,00
06
27
,00
06
27
,00
06
27
,00
06
02
,00
06
02
,00
05
75
,00
05
75
,00
05
75
,00
06
,90
5,0
00
Po
ssib
le M
ine
s (l
on
g t
erm
)
Ca
sin
oO
utb
ou
nd
Pro
du
ctio
n3
00
,00
03
00
,00
03
00
,00
03
00
,00
03
00
,00
03
00
,00
03
00
,00
03
00,0
00
30
0,0
00
30
0,0
00
30
0,0
00
30
0,0
00
30
0,0
00
30
0,0
00
30
0,0
00
4,5
00
,00
0
Inb
ou
nd
Fu
el
2,0
002,
000
2,0
002
1,0
002
1,0
002
1,0
001
00,
000
10
0,00
01
00,
000
100,
000
10
0,00
010
0,0
001
00,0
001
00,0
00
100,
000
100
,000
100
,000
100
,000
100
,000
100
,000
100
,000
1,5
69
,00
0
Su
pp
lie
s1,
000
1,0
001
,000
50
,000
50
,000
50
,000
60,
000
60,
000
60,
000
60,
000
60,
000
60
,000
60,0
0060
,00
06
0,0
006
0,0
006
0,0
006
0,0
006
0,0
006
0,0
006
0,0
001
,05
3,0
00
To
tal
Inb
ou
nd
3,0
003,
000
3,0
007
1,0
007
1,0
007
1,0
001
60,
000
16
0,00
01
60,
000
160,
000
16
0,00
016
0,0
001
60,0
001
60,0
00
160,
000
160
,000
160
,000
160
,000
160
,000
160
,000
160
,000
2,6
22
,00
0
Ma
ctu
ng
Ou
tbo
un
d P
rod
uct
ion
15
,00
01
5,0
00
15
,00
01
5,0
00
15
,00
01
5,0
00
15
,00
01
5,0
00
15
,00
01
5,0
00
15
,00
01
5,0
00
15
,00
01
95
,00
0
Inb
ou
nd
Fu
el
1,0
005,
000
5,0
001
3,0
001
3,0
001
3,0
001
3,00
01
3,00
01
3,00
01
3,00
01
3,00
01
3,0
0013
,000
13,0
00
13,
000
13
,000
18
0,0
00
Su
pp
lie
s5
002,
000
2,0
005
,000
5,0
005
,000
5,00
05,
000
5,00
05,
000
5,00
05
,000
5,0
005
,00
05,
000
5,0
006
9,5
00
To
tal
Inb
ou
nd
1,5
007,
000
7,0
001
8,0
001
8,0
001
8,0
001
8,00
01
8,00
01
8,00
01
8,00
01
8,00
01
8,0
0018
,000
18,0
00
18,
000
18
,000
24
9,5
00
To
tal
Ou
tbo
un
d1
5,0
00
15
,00
01
5,0
00
31
5,0
00
31
5,0
00
31
5,0
00
31
5,0
00
31
5,0
00
31
5,0
00
31
5,0
00
31
5,0
00
31
5,0
00
31
5,0
00
30
0,0
00
30
0,0
00
30
0,0
00
30
0,0
00
30
0,0
00
4,6
95
,00
0
inb
ou
nd
Fu
el
3,0
00
34
,00
01
13
,00
01
13
,00
01
00
,00
0
inb
ou
nd
Su
pp
lie
s1
,50
05
5,0
00
65
,00
06
5,0
00
60
,00
0
To
tal
Inb
ou
nd
4,5
00
10
,00
01
0,0
00
89
,00
08
9,0
00
89
,00
01
78
,00
01
78
,00
01
78
,00
01
78
,00
01
78
,00
01
78
,00
01
78
,00
01
78
,00
01
78
,00
01
78
,00
01
60
,00
01
60
,00
01
60
,00
01
60
,00
01
60
,00
02
,87
1,5
00
To
tal
- Lo
ng
Te
rm M
ine
s4
,50
01
0,0
00
10
,00
01
04
,00
01
04
,00
01
04
,00
04
93
,00
04
93
,00
04
93
,00
04
93
,00
04
93
,00
04
93
,00
04
93
,00
04
93
,00
04
93
,00
049
3,0
00
46
0,0
00
46
0,0
00
46
0,0
00
46
0,0
00
46
0,0
00
7,5
66
,50
0
To
tal
- A
ll m
ine
s O
utb
ou
nd
60
,00
01
12
,00
02
29
,00
02
29
,00
02
44
,00
05
80
,00
05
80
,00
08
71,
00
08
71
,00
01
,05
1,0
00
1,0
51
,00
01
,05
1,0
00
96
6,0
00
83
1,0
008
15
,00
08
15
,00
08
15
,00
03
00
,00
03
00
,00
03
00
,00
03
00
,00
030
0,0
00
12
,67
1,0
00
T
ota
l -
All
min
es
Inb
ou
nd
26
,00
05
4,0
00
93
,50
02
40
,00
03
21
,00
02
24
,00
02
24
,00
03
02
,00
03
02
,00
03
27
,00
03
27
,00
03
27
,00
02
95
,00
02
64
,00
02
53
,00
02
53
,00
02
53
,00
01
60
,00
01
60
,00
01
60
,00
01
60
,00
01
60
,00
04
,88
5,5
00
TO
TA
L -
ALL
MIN
ES
86
,00
01
66
,00
03
22
,50
04
69
,00
05
65
,00
08
04
,00
08
04
,00
01
,17
3,0
00
1,1
73
,00
01
,37
8,0
00
1,3
78
,00
01
,37
8,0
00
1,2
61
,00
01
,09
5,0
00
1,0
68
,00
01
,06
8,0
00
1,0
68
,00
04
60
,00
04
60
,00
04
60
,00
04
60
,00
04
60
,00
01
7,5
56
,50
0

NORTHERN TRANSPORTATION SYSTEMS ASSESSMENT
PAGE 146 PROLOG/EBA
May
8/1
0SH
EET
3
NTS
A
NO
RTH
ERN
TER
RITO
RIES
AN
NU
AL
FREI
GH
T D
EMA
ND
NW
T M
INES
(T0N
NES
)
MIN
E
Ope
rati
ng M
ines
2009
2010
2011
2012
2013
2014
2015
2016
2017
2018
2019
2020
2021
2022
2023
2024
2025
2026
2027
2028
2029
2030
TOTA
LS
Dia
vik
Out
bou
nd
A
ctua
ls
Inb
ound
Fuel
44,0
0018
,000
60,0
0064
,000
69,0
0069
,000
69,0
0069
,000
69,0
0069
,000
69,0
0069
,000
69,0
0069
,000
69,0
0069
,000
69,0
0069
,000
69,0
00
Supp
lies
53,0
0022
,000
72,0
0077
,000
82,0
0082
,000
82,0
0082
,000
82,0
0082
,000
82,0
0082
,000
82,0
0082
,000
82,0
0082
,000
82,0
0082
,000
82,0
00
Tota
lIn
boun
d87
,000
40,0
0013
2,00
014
1,00
015
1,00
015
1,00
015
1,00
015
1,00
015
1,00
015
1,00
015
1,00
015
1,00
015
1,00
015
1,00
015
1,00
015
1,00
015
1,00
015
1,00
015
1,00
02,
665,
000
Ekat
iO
utbo
und
Inb
ound
Fuel
37,0
0036
,000
50,0
0054
,000
57,0
0057
,000
57,0
0057
,000
57,0
0057
,000
57,0
0057
,000
Supp
lies
12,0
0012
,000
16,0
0017
,000
18,0
0018
,000
18,0
0018
,000
18,0
0018
,000
18,0
0018
,000
Tota
lIn
boun
d49
,000
48,0
0066
,000
71,0
0075
,000
75,0
0075
,000
75,0
0075
,000
75,0
0075
,000
75,0
0083
4,00
0
Snap
Lak
eO
utbo
und
Inb
ound
Fuel
18,0
0027
,000
25,0
0027
,000
29,0
0029
,000
29,0
0029
,000
29,0
0029
,000
29,0
0029
,000
29,0
0029
,000
29,0
0029
,000
29,0
0029
,000
29,0
0029
,000
29,0
0029
,000
Supp
lies
8,00
06,
000
10,0
0011
,000
12,0
0012
,000
12,0
0012
,000
12,0
0012
,000
12,0
0012
,000
12,0
0012
,000
12,0
0012
,000
12,0
0012
,000
12,0
0012
,000
12,0
0012
,000
Tota
lIn
boun
d26
,000
33,0
0035
,000
38,0
0041
,000
41,0
0041
,000
41,0
0041
,000
41,0
0041
,000
41,0
0041
,000
41,0
0041
,000
41,0
0041
,000
41,0
0041
,000
41,0
0041
,000
41,0
0087
0,00
0
Tot
al -
Ope
rati
ng M
ines
162,
000
121,
000
233,
000
250,
000
267,
000
267,
000
267,
000
267,
000
267,
000
267,
000
267,
000
267,
000
192,
000
192,
000
192,
000
192,
000
192,
000
192,
000
192,
000
41,0
0041
,000
41,0
004,
369,
000
Tot
al O
utbo
und
Tot
al In
boun
d16
2,00
012
1,00
023
3,00
025
0,00
026
7,00
026
7,00
026
7,00
026
7,00
026
7,00
026
7,00
026
7,00
026
7,00
019
2,00
019
2,00
019
2,00
019
2,00
019
2,00
019
2,00
019
2,00
041
,000
41,0
0041
,000
4,36
9,00
0
Pro
babl
e M
ines
(sh
ort t
erm
)20
0920
1020
1120
1220
1320
1420
1520
1620
1720
1820
1920
2020
2120
2220
2320
2420
2520
2620
2720
2820
2920
30
Y'kn
ife
Au
Out
bou
nd
Inb
ound
Fuel
2,00
016
,000
17,0
0012
5,00
012
5,00
012
5,00
012
5,00
012
5,00
012
5,00
012
5,00
012
5,00
012
5,00
012
5,00
0
Supp
lies
1,00
04,
000
4,00
030
,000
30,0
0030
,000
30,0
0030
,000
30,0
0030
,000
30,0
0030
,000
30,0
00
Tota
lIn
boun
d3,
000
20,0
0021
,000
155,
000
155,
000
155,
000
155,
000
155,
000
155,
000
155,
000
155,
000
155,
000
155,
000
1,59
4,00
0
NIC
OO
utbo
und
66,0
0066
,000
66,0
0066
,000
66,0
0066
,000
66,0
0066
,000
66,0
0066
,000
66,0
0066
,000
66,0
0066
,000
66,0
0066
,000
66,0
001,
122,
000
Inb
ound
Fuel
2,00
02,
000
3,00
03,
000
17,0
0017
,000
17,0
0017
,000
17,0
0017
,000
17,0
0017
,000
17,0
0017
,000
17,0
0017
,000
17,0
0017
,000
17,0
0017
,000
17,0
0029
9,00
0
Supp
lies
1,00
01,
000
25,0
0025
,000
5,00
05,
000
5,00
05,
000
5,00
05,
000
5,00
05,
000
5,00
05,
000
5,00
05,
000
5,00
05,
000
5,00
05,
000
5,00
013
7,00
0
Tota
lIn
boun
d3,
000
3,00
028
,000
28,0
0022
,000
22,0
0022
,000
22,0
0022
,000
22,0
0022
,000
22,0
0022
,000
22,0
0022
,000
22,0
0022
,000
22,0
0022
,000
22,0
0022
,000
436,
000
Pine
Poi
ntO
utbo
und
50,0
0010
0,00
020
0,00
020
0,00
020
0,00
020
0,00
012
0,00
012
0,00
012
0,00
012
0,00
012
0,00
012
0,00
012
0,00
012
0,00
012
0,00
012
0,00
012
0,00
012
0,00
012
0,00
02,
510,
000
Inb
ound
Fuel
1,00
01,
000
1,00
02,
000
4,00
04,
000
4,00
04,
000
4,00
04,
000
4,00
04,
000
4,00
04,
000
4,00
04,
000
4,00
04,
000
4,00
04,
000
4,00
073
,000
Supp
lies
1,00
010
,000
1,00
01,
000
1,00
01,
000
1,00
01,
000
1,00
01,
000
1,00
01,
000
1,00
01,
000
1,00
01,
000
1,00
01,
000
1,00
01,
000
1,00
030
,000
Tota
lIn
boun
d2,
000
11,0
002,
000
3,00
05,
000
5,00
05,
000
5,00
05,
000
5,00
05,
000
5,00
05,
000
5,00
05,
000
5,00
05,
000
5,00
05,
000
5,00
05,
000
103,
000
Prai
rie
Out
bou
nd12
0,00
012
0,00
012
0,00
012
0,00
012
0,00
012
0,00
012
0,00
012
0,00
020
0,00
020
0,00
020
0,00
020
0,00
020
0,00
020
0,00
020
0,00
020
0,00
020
0,00
020
0,00
020
0,00
03,
160,
000
C
reek
Inb
ound
Fuel
2,00
02,
000
8,00
08,
000
8,00
08,
000
8,00
08,
000
8,00
08,
000
15,0
0015
,000
15,0
0015
,000
15,0
0015
,000
15,0
0015
,000
15,0
0015
,000
15,0
0023
3,00
0
Supp
lies
1,00
01,
000
15,0
0015
,000
15,0
0015
,000
15,0
0015
,000
15,0
0015
,000
25,0
0025
,000
25,0
0025
,000
25,0
0025
,000
25,0
0025
,000
25,0
0025
,000
25,0
0039
7,00
0
Tota
lIn
boun
d3,
000
3,00
023
,000
23,0
0023
,000
23,0
0023
,000
23,0
0023
,000
23,0
0040
,000
40,0
0040
,000
40,0
0040
,000
40,0
0040
,000
40,0
0040
,000
40,0
0040
,000
630,
000
Gac
ho K
ueO
utbo
und
Inb
ound
Fuel
2,00
03,
000
4,00
05,
000
25,0
0025
,000
25,0
0025
,000
25,0
0025
,000
25,0
0025
,000
25,0
0025
,000
25,0
0025
,000
25,0
0025
,000
25,0
0025
,000
25,0
0043
9,00
0
Supp
lies
1,00
01,
000
15,0
0015
,000
18,0
0018
,000
18,0
0018
,000
18,0
0018
,000
18,0
0018
,000
18,0
0018
,000
18,0
0018
,000
18,0
0018
,000
18,0
0018
,000
18,0
0033
8,00
0
Tota
lIn
boun
d3,
000
4,00
019
,000
20,0
0043
,000
43,0
0043
,000
43,0
0043
,000
43,0
0043
,000
43,0
0043
,000
43,0
0043
,000
43,0
0043
,000
43,0
0043
,000
43,0
0043
,000
777,
000
Tot
al O
utbo
und
170,
000
220,
000
386,
000
386,
000
386,
000
386,
000
306,
000
306,
000
386,
000
386,
000
386,
000
386,
000
386,
000
386,
000
386,
000
386,
000
386,
000
386,
000
386,
000
6,79
2,00
0
Tot
al In
boun
d14
,000
41,0
0093
,000
229,
000
248,
000
248,
000
248,
000
248,
000
248,
000
248,
000
265,
000
265,
000
265,
000
110,
000
110,
000
110,
000
110,
000
110,
000
110,
000
110,
000
110,
000
3,54
0,00
0
Tot
al -
Shor
t Ter
m M
ines
14,0
0041
,000
263,
000
449,
000
634,
000
634,
000
634,
000
634,
000
554,
000
554,
000
651,
000
651,
000
651,
000
496,
000
496,
000
496,
000
496,
000
496,
000
496,
000
496,
000
496,
000
10,3
32,0
00
Pos
sibl
e M
ines
(lo
ng t
erm
)20
0920
1020
1120
1220
1320
1420
1520
1620
1720
1820
1920
2020
2120
2220
2320
2420
2520
2620
2720
2820
2920
30
Thor
Lak
eO
utbo
und
30,0
0030
,000
30,0
0030
,000
30,0
0030
,000
30,0
0030
,000
30,0
0030
,000
30,0
0030
,000
30,0
0030
,000
30,0
0030
,000
480,
000
Inb
ound
Fuel
2,00
02,
000
2,00
08,
300
8,30
010
,000
10,0
0010
,000
10,0
0010
,000
10,0
0010
,000
10,0
0010
,000
10,0
0010
,000
10,0
0010
,000
10,0
0010
,000
10,0
0018
2,60
0
Supp
lies
1,00
01,
000
1,00
05,
000
5,00
03,
000
3,00
03,
000
3,00
03,
000
3,00
03,
000
3,00
03,
000
3,00
03,
000
3,00
03,
000
3,00
03,
000
3,00
061
,000
Tota
lIn
boun
d3,
000
3,00
03,
000
13,3
0013
,300
13,0
0013
,000
13,0
0013
,000
13,0
0013
,000
13,0
0013
,000
13,0
0013
,000
13,0
0013
,000
13,0
0013
,000
13,0
0013
,000
243,
600
Tot
al -
Long
Ter
m M
ines
3,00
03,
000
3,00
013
,300
13,3
0043
,000
43,0
0043
,000
43,0
0043
,000
43,0
0043
,000
43,0
0043
,000
43,0
0043
,000
43,0
0043
,000
43,0
0043
,000
43,0
0072
3,60
0
Tot
al -
All
min
es O
utbo
und
170,
000
220,
000
386,
000
416,
000
416,
000
416,
000
336,
000
336,
000
416,
000
416,
000
416,
000
416,
000
416,
000
416,
000
416,
000
416,
000
416,
000
416,
000
416,
000
7,27
2,00
0
T
otal
- A
ll m
ines
Inbo
und
162,
000
138,
000
277,
000
346,
000
509,
300
528,
300
528,
000
528,
000
528,
000
528,
000
528,
000
545,
000
470,
000
470,
000
315,
000
315,
000
315,
000
315,
000
315,
000
164,
000
164,
000
164,
000
8,15
2,60
0
TOTA
L - A
LL M
INES
162,
000
138,
000
277,
000
516,
000
729,
300
914,
300
944,
000
944,
000
944,
000
864,
000
864,
000
961,
000
886,
000
886,
000
731,
000
731,
000
731,
000
731,
000
731,
000
580,
000
580,
000
580,
000
15,4
24,6
00

PHASE 1 REPORT: TRANSPORTATION DEMAND ASSESSMENT
PROLOG/EBA PAGE 147
M
ay 8
/10
SHEE
T 4
NTS
A
NO
RTHE
RN T
ERRI
TORI
ES A
NN
UAL
FRE
IGHT
DEM
AND
NU
NAV
UT
MIN
ES(T
0NN
ES)
MIN
E
Ope
rati
ng M
ines
2009
2010
2011
2012
2013
2014
2015
2016
2017
2018
2019
2020
2021
2022
2023
2024
2025
2026
2027
2028
2029
2030
TOTA
LS
Mea
dow
bank
Out
boun
dAc
tual
s
Inbo
und
Fuel
38,5
0020
,000
34,0
0035
,000
34,0
0035
,000
32,0
0032
,000
32,0
0032
,000
8,00
033
2,50
0
Supp
lies
27,3
0015
,000
25,0
0031
,000
29,0
0030
,000
30,0
0028
,000
26,0
0024
,000
5,00
027
0,30
0
Tota
lInb
ound
65,8
0035
,000
59,0
0066
,000
63,0
0065
,000
62,0
0060
,000
58,0
0056
,000
13,0
0060
2,80
0
Prob
able
Min
es (s
hort
ter
m)
2009
2010
2011
2012
2013
2014
2015
2016
2017
2018
2019
2020
2021
2022
2023
2024
2025
2026
2027
2028
2029
2030
Mel
iadi
neO
utbo
und
Inbo
und
Fuel
3,00
021
,000
21,0
0021
,000
20,0
0020
,000
20,0
0020
,000
20,0
0020
,000
20,0
0020
,000
20,0
0020
,000
20,0
0020
,000
20,0
0020
,000
20,0
0020
,000
20,0
0040
6,00
0
Supp
lies
2,00
020
,000
20,0
0020
,000
8,00
08,
000
8,00
08,
000
8,00
08,
000
8,00
08,
000
8,00
08,
000
8,00
08,
000
8,00
08,
000
8,00
08,
000
8,00
019
8,00
0
Tota
lInb
ound
5,00
041
,000
41,0
0041
,000
28,0
0028
,000
28,0
0028
,000
28,0
0028
,000
28,0
0028
,000
28,0
0028
,000
28,0
0028
,000
28,0
0028
,000
28,0
0028
,000
28,0
0060
4,00
0
Mar
y Ri
ver
Out
boun
d9,
000,
000
18,0
00,0
0018
,000
,000
18,0
00,0
0018
,000
,000
18,0
00,0
0018
,000
,000
18,0
00,0
0018
,000
,000
18,0
00,0
0018
,000
,000
18,0
00,0
0018
,000
,000
18,0
00,0
0018
,000
,000
261,
000,
000
Inbo
und
Fuel
2,00
03,
000
5,00
041
,000
33,0
0017
,000
50,0
0041
,000
41,0
0041
,000
41,0
0041
,000
41,0
0041
,000
41,0
0041
,000
41,0
0041
,000
41,0
0041
,000
41,0
0072
5,00
0
Supp
lies
1,00
02,
000
3,00
022
1,00
011
8,00
010
7,00
056
,000
10,0
0010
,000
10,0
0010
,000
10,0
0010
,000
10,0
0010
,000
10,0
0010
,000
10,0
0010
,000
10,0
0010
,000
648,
000
Tota
lInb
ound
3,00
05,
000
8,00
026
2,00
015
1,00
012
4,00
010
6,00
051
,000
51,0
0051
,000
51,0
0051
,000
51,0
0051
,000
51,0
0051
,000
51,0
0051
,000
51,0
0051
,000
51,0
001,
373,
000
Hope
Bay
Out
boun
d
Inbo
und
Fuel
16,0
0016
,000
16,0
0016
,000
34,0
0034
,000
34,0
0034
,000
34,0
0034
,000
34,0
0034
,000
34,0
0034
,000
34,0
0034
,000
34,0
0034
,000
34,0
0034
,000
34,0
0064
2,00
0
Supp
lies
13,0
0013
,000
10,0
0010
,000
30,0
005,
000
5,00
05,
000
5,00
05,
000
5,00
05,
000
5,00
05,
000
5,00
05,
000
5,00
05,
000
5,00
05,
000
5,00
015
6,00
0
Tota
lInb
ound
29,0
0029
,000
26,0
0026
,000
64,0
0039
,000
39,0
0039
,000
39,0
0039
,000
39,0
0039
,000
39,0
0039
,000
39,0
0039
,000
39,0
0039
,000
39,0
0039
,000
39,0
0079
8,00
0
Izok
Lake
Out
boun
d43
0,00
043
0,00
043
0,00
043
0,00
043
0,00
043
0,00
043
0,00
043
0,00
043
0,00
043
0,00
043
0,00
043
0,00
043
0,00
043
0,00
043
0,00
043
0,00
06,
880,
000
Inbo
und
Fuel
1,00
01,
000
28,0
0028
,000
28,0
0028
,000
28,0
0028
,000
28,0
0028
,000
28,0
0028
,000
28,0
0028
,000
28,0
0028
,000
28,0
0028
,000
28,0
0028
,000
28,0
0053
4,00
0
Supp
lies
500
500
40,0
0040
,000
40,0
0010
,000
10,0
0010
,000
10,0
0010
,000
10,0
0010
,000
10,0
0010
,000
10,0
0010
,000
10,0
0010
,000
10,0
0010
,000
10,0
0028
1,00
0
Tota
lInb
ound
1,50
01,
500
68,0
0068
,000
68,0
0038
,000
38,0
0038
,000
38,0
0038
,000
38,0
0038
,000
38,0
0038
,000
38,0
0038
,000
38,0
0038
,000
38,0
0038
,000
38,0
0081
5,00
0
Kigg
avik
Out
boun
d4,
600
4,60
04,
600
4,60
04,
600
4,60
04,
600
4,60
04,
600
4,60
04,
600
4,60
04,
600
59,8
00
Inbo
und
Fuel
200
200
200
200
200
200
50,0
0050
,000
58,0
0058
,000
58,0
0058
,000
58,0
0058
,000
58,0
0058
,000
58,0
0058
,000
58,0
0058
,000
58,0
0085
5,20
0
Supp
lies
100
100
100
100
100
100
25,0
0025
,000
60,0
0060
,000
60,0
0060
,000
60,0
0060
,000
60,0
0060
,000
60,0
0060
,000
60,0
0060
,000
60,0
0083
0,60
0
Tota
lInb
ound
300
300
300
300
300
300
75,0
0075
,000
118,
000
118,
000
118,
000
118,
000
118,
000
118,
000
118,
000
118,
000
118,
000
118,
000
118,
000
118,
000
118,
000
1,68
5,80
0
T
otal
Out
boun
d43
0,00
09,
430,
000
18,4
30,0
0018
,434
,600
18,4
34,6
0018
,434
,600
18,4
34,6
0018
,434
,600
18,4
34,6
0018
,434
,600
18,4
34,6
0018
,434
,600
18,4
34,6
0018
,434
,600
18,4
34,6
0018
,434
,600
267,
939,
800
T
otal
Inbo
und
38,8
0076
,800
143,
300
397,
300
311,
300
229,
300
286,
000
231,
000
274,
000
274,
000
274,
000
274,
000
274,
000
274,
000
274,
000
274,
000
274,
000
274,
000
274,
000
274,
000
274,
000
5,27
5,80
0
Poss
ible
Min
es (l
ong
term
)
Hack
ett R
.O
utbo
und
450,
000
450,
000
450,
000
450,
000
450,
000
450,
000
450,
000
450,
000
450,
000
450,
000
450,
000
450,
000
450,
000
5,85
0,00
0
Inbo
und
Fuel
1,00
01,
000
1,00
01,
000
1,00
030
,000
30,0
0030
,000
58,0
0058
,000
58,0
0058
,000
58,0
0058
,000
58,0
0058
,000
58,0
0058
,000
58,0
0058
,000
58,0
0084
9,00
0
Supp
lies
500
500
500
500
500
45,0
0045
,000
45,0
0010
0,00
010
0,00
010
0,00
010
0,00
010
0,00
010
0,00
010
0,00
010
0,00
010
0,00
010
0,00
010
0,00
010
0,00
010
0,00
01,
437,
500
Tota
lInb
ound
1,50
01,
500
1,50
01,
500
1,50
075
,000
75,0
0075
,000
158,
000
158,
000
158,
000
158,
000
158,
000
158,
000
158,
000
158,
000
158,
000
158,
000
158,
000
158,
000
158,
000
2,28
6,50
0
T
otal
- Al
l min
es O
utbo
und
430,
000
9,43
0,00
018
,430
,000
18,8
84,6
0018
,884
,600
18,8
84,6
0018
,884
,600
18,8
84,6
0018
,884
,600
18,8
84,6
0018
,884
,600
18,8
84,6
0018
,884
,600
18,8
84,6
0018
,884
,600
18,8
84,6
0027
3,78
9,80
0
Tot
al -
All m
ines
Inbo
und
65,8
0075
,300
137,
300
210,
800
461,
800
377,
800
366,
300
421,
000
364,
000
488,
000
445,
000
432,
000
432,
000
432,
000
432,
000
432,
000
432,
000
432,
000
432,
000
432,
000
432,
000
432,
000
8,16
5,10
0
TOTA
L - A
LL M
INES
65,8
0075
,300
137,
300
210,
800
461,
800
377,
800
796,
300
9,85
1,00
018
,794
,000
19,3
72,6
0019
,329
,600
19,3
16,6
0019
,316
,600
19,3
16,6
0019
,316
,600
19,3
16,6
0019
,316
,600
19,3
16,6
0019
,316
,600
19,3
16,6
0019
,316
,600
281,
954,
900

NORTHERN TRANSPORTATION SYSTEMS ASSESSMENT
PAGE 148 PROLOG/EBA
Community Resupply Traffic Forecasting Methodology
Phase 1 of this study has prepared a reasonably complete picture of the historical and current
traffic in the various regions of the three territories. The various sources of the data have
been noted in the respective sections of the report dealing with each of the gateways.
Different forecasting methods were used for different types of traffic. As resource
developments vary in size and type of traffic, it is not possible to use formula or template to
forecast their traffic. The traffic associated with future resource developments, such as mines,
was estimated on the basis of information obtained from mining companies directly or the
territorial Chambers of Mines. .
The forecasting of the regular “community oriented” traffic was done on the basis of projected
population. The following table shows the current (2009) and forecast populations for
Yukon, NWT and Nunavut for the years 2010, 2015, 2020 and 2030 (Note the assumptions
on which the population forecasts are based). Future traffic in each of these years was
estimated by multiplying the 2009 traffic tonnages by the ratio of the future population and
the 2009 population.
It should be noted that the traffic generated by the periodic, one-of-a-kind construction of, for
example, a school may not be fully captured in the per capita tonnage rates.
Source: Statistics Canada
Population Projections Utilized for Traffic Forecasts
2009 2010 2015 2020 2025 2030
Yukon % of 2009 33,700
100.0%
33,800
100.3%
34,700
103.0%
35,600
105.6%
36,600
108.6%
37,600
111.6%
NWT % of 2009 43,400
100.0 %
43,800
100.9%
45,500
104.8%
47,200
108.8%
48,900
112.7%
50,600
116.6%
Nunavut % of 2009 32,200
100.0%
32,500
100.9%
34,300
106.5%
35,900
111.5%
37,200
115.5%
38,500
119.6%
Assumptions:
1. These populations are estimated from the population projections obtained from Statistics Canada on May 26, 2010. The base population for these projections is obtained from the preliminary postcensal estimates of the population on July 1st, 2009 as calculated by Statistics Canada’s Demography Division based on the 2006 Census and are adjusted to take account of net undercoverage by province/territory.
2. These estimates are based on medium-growth scenario which was developed on the basis of assumptions reflecting the medium trends observed in the past.
3. These estimates of population consider interprovincial migration assumption based on the historical trend for the period 1981/1982 to 2007/2008.

PHASE 1 REPORT: TRANSPORTATION DEMAND ASSESSMENT
PROLOG/EBA PAGE 149
Highway Statistical Development – Yukon & NWT
Yukon Commercial Traffic Measurement
Yukon Highways and Public Works operate a weigh scale near Whitehorse that captures the
vast majority of truck traffic serving or passing through, Yukon. This facility is operated 24/7
and each truck stopped provides:
• a sequenced transaction number and date weighed
• commodity carried (14 commodity classifications)
• configuration code (25 axle arrangements from straight trucks to multi-axle trains)
• origin, destination and route direction (north or south)
• total GVW (kgs), number of Axles, and axle and axle grouping weights (kgs)
Monthly reports are prepared that provide the following information:
• Loads - Origin/Destination/Route vs. Truck Configuration. A monthly report that provides the number of loads that can be grouped and aggregated by corridor.
• Loads/Commodity Summary. A monthly report that provides the number of loads measured in each commodity group. Also provides the number of empty trucks counted.
• Bulk Haul Reports. Monthly reports for each of North 60 Transport and Canadian Lynden Transport, truckers currently carrying payloads exceeding the maximum permissible gross vehicle weight (GVW) under special "Bulk Haul Permits" issued by the Department of Highways.
• Dangerous Goods Summary Report. Provides the number of trucks and their GVW, for each dangerous goods classification code.
The Bulk Haul reports are compiled separately to provide a basis for calculating the fees
levelled by the Highways Department on the trucking companies permitted to haul over-sized
loads up to 77,111 kgs. GVW.
Yukon Volume Estimates Calculations
Commodity Groupings
The Whitehorse Weigh Scale reports above, when analyzed, provide sufficient information to
aggregate loads by commodity groups, by corridor. The commodity groupings are consistent
with all other Northern Territories transportation systems measured:
A B C Community Resupply, Construction and Bulk Fuel General Freight Resource Development Supply Agricultural Products Construction Materials Petroleum Products General Merchandise Iron, Pipe & Steel Propane Household Goods Mine Ore Asphalt Livestock Equipment & Flammable Liquids Mobile Homes Machinery, Timber, Logs

NORTHERN TRANSPORTATION SYSTEMS ASSESSMENT
PAGE 150 PROLOG/EBA
Vehicles
The vehicle classification code system provides detailed axle and axle grouping information
which is helpful to identify and segregate commodity flows in the selected corridors. The
dominant truck types providing the bulk of all movements in Yukon are as follows: Classification Vehicle Usual Commodities Typical Code Description Carried Tare (kgs)
A B C 8 Three axle straight truck X X 10,000 12 3 axle tractor, 2 axle semi X X X 17,000 14 3 axle tractor, tridem trailer X X X 19,000 18 7 or 8 axle A or C train X X 21,000 20 7 axle B train double X X X 22,000 21 8 axle B train double X X X 23,000 22 9+ axle multi-unit vehicle X X 24,000 23 10 axle double X 24,000+
Vehicle tare weights in Yukon are easily established as empty trucks must report and be
weighed as well as loaded vehicles, and form part of the daily accounting. By subtracting the
tare weight from the measured gross vehicle weight (GVW), the payload for that truck is
determined.
Knowing the truck type, average GVW and tare of weighed trucks, attendant payloads are
applied to the total monthly movements, resulting in the volume in tonnes for that specific
commodity and corridor for the period.
Truck traffic into Yukon was segregated to two destinations. South Yukon includes all
communities along and south of Alaska Hwy 1; and every destination north of Hwy 1 was
grouped as North Yukon.
Obvious high volume truck hauls with an established origin and destination stand out in
certain Yukon corridors and becomes evident in analyzing the traffic statistics. Much of this
traffic lends itself to "Bulk Haul" permits as mentioned above, issued by YTG which allows
oversized loads on selected highway segments.

PHASE 1 REPORT: TRANSPORTATION DEMAND ASSESSMENT
PROLOG/EBA PAGE 151
Hw
y #
Hw
y N
ame
No
rmal
Lim
itB
ulk
Hau
lC
om
men
ts
kmD
escr
iptio
nkm
(63.
5 t
GV
W)
(77.
1 t G
VW
)
1A
lask
a96
7.6
BC
/YT
bor
der s
outh
of W
atso
n La
ke19
65.7
YT
/AK
bor
der n
orth
of B
eave
r C
reek
yes
yes
Sec
tion
from
Whi
teho
rse
to A
lask
a bo
rder
may
requ
ire b
ridge
stre
ngth
enin
g to
allo
w
bulk
hau
l wei
ghts
. B
ridge
ana
lysi
s ha
sn't
been
don
e be
caus
e no
app
licat
ions
hav
e
been
rec
eive
d to
car
ry o
ut a
bul
k ha
ul o
n th
is s
ectio
n. B
ulk
haul
ing
wou
ld li
kely
be
OK
.
2K
lond
ike
24.1
AK
/BC
bor
der
157.
8Jo
ins
Ala
ska
Hw
y so
uth
of W
hite
hors
eye
sye
s
bulk
hau
l was
allo
wed
in th
e pa
st fo
r con
cent
rate
from
Far
o an
d is
now
allo
wed
for f
uel
haul
from
Ska
gway
to W
hite
hors
e
2K
lond
ike
157.
819
1.8
Leav
es A
lask
a H
wy
north
of W
hite
hors
eye
sye
sS
ectio
n th
at ru
ns c
oncu
rren
tly w
ith A
lask
a H
ighw
ay th
roug
h W
hteh
orse
2K
lond
ike
191.
835
9.0
Join
s C
ampb
ell H
wy
@ C
arm
acks
yes
yes
Whi
teho
rse
to C
arm
acks
. B
ulk
haul
was
allo
wed
in th
e pa
st
2K
lond
ike
359.
038
8.4
End
of f
ully
stru
ctur
ed ro
ad n
orth
of
Car
mac
ksye
sye
s
Mee
ts s
truct
ural
sta
ndar
d fo
r bu
lk h
aul b
ut h
asn'
t bee
n pe
rmitt
ed in
the
past
bec
ause
ensu
ing
sect
ions
are
n't s
truc
tura
lly c
apab
le fo
r bul
k ha
ul
2K
lond
ike
388.
471
6.0
Daw
son
City
yes,
sea
sona
llyno
Abo
ut 2
8 ki
lom
etre
s so
uth
of S
tew
art C
ross
ing
mee
t the
str
uctu
ral s
tand
ard
for b
ulk
haul
, but
the
rem
aind
er o
f the
sec
tion
does
not
.
3H
aine
s R
oad
71.3
AK
/BC
bor
der
246.
1H
aine
s Ju
nctio
nye
sye
sN
o ap
plic
atio
ns fo
r bul
k ha
ul re
ceiv
ed fo
r the
Hai
nes
Roa
d
4C
ampb
ell
0.0
Wat
son
Lake
10.0
Wat
son
Lake
airp
ort a
cces
s ro
adye
sye
sA
spha
lt pa
vem
ent
4C
ampb
ell
10.0
414.
4F
aro
acce
ss ro
ad (M
itche
ll R
d)ye
s, s
easo
nally
no
Bul
k ha
ul w
as a
llow
ed u
p to
km
46.
8 w
hen
Sa
Den
a H
es m
ine
oper
ated
. T
his
sect
ion
is
mos
tly n
arro
w, u
nim
prov
ed g
rave
l with
a fe
w s
hort
sec
tions
of f
ully
stru
ctur
ed ro
ad w
ith
BS
T s
urfa
ce o
n th
e so
uthe
rn e
nd.
4C
ampb
ell
414.
444
8.0
End
of f
ully
str
uctu
red
road
wes
t of F
aro
acce
ss r
oad
yes
yes
Rec
onst
ruct
ed to
full
stru
ctur
al s
tand
ard
with
BS
T s
urfa
ce
4C
ampb
ell
448.
058
2.3
Join
s K
lond
ike
Hw
y @
Car
mac
ksye
sye
s
Par
t of t
he F
aro
bulk
hau
l rou
te.
Has
not
bee
n re
stric
ted
in s
prin
g, b
ut s
houl
d be
as
the
BS
T s
urfa
ces
plac
ed a
fter s
hutd
own
of th
e m
ine
have
no
stru
ctur
e to
sup
port
them
.
BS
T w
ill d
isap
pear
sho
uld
bulk
hau
l res
ume
5D
emps
ter
0.0
Leav
es K
lond
ike
Hw
y ne
ar D
awso
n C
ity46
5.0
YT
/NW
T b
orde
rye
sno
6S
outh
Can
ol R
d0.
0Le
aves
Ala
ska
Hw
y km
129
522
8.0
Ferr
y @
Ros
s R
iver
no
6N
orth
Can
ol R
oad
228.
0F
erry
@ R
oss
Riv
er46
2.7
YT
/NW
T b
orde
rno
7A
tlin
Roa
d0.
0Le
aves
Tag
ish
Rd
km 1
.741
.0Y
T/B
C b
orde
rye
s, s
easo
nally
no
8T
agis
h R
oad
0.0
Leav
es A
lask
a H
wy
km 1
337.
354
.0Jo
ins
Klo
ndik
e H
wy
km 1
06.4
nono
Stra
ight
truc
ks o
nly,
max
imum
GV
W 2
6.4
tonn
es fo
r sta
ndar
d 3
axle
uni
t
9T
op o
f the
Wor
ld H
wy
0.0
Ferr
y @
Daw
son
City
105.
9Y
T/A
K b
orde
rye
s, s
easo
nally
no
10N
ahan
ni R
ange
Roa
d0.
0Le
aves
Cam
pbel
l Hw
y km
107
.813
4.0
End
of Y
G m
aint
enan
ceye
sno
YT
/NW
T b
orde
r km
192
app
rox.
Eas
t sec
tion
mai
ntai
ned
by m
ine
11S
ilver
Tra
il0.
0Le
aves
Klo
ndik
e H
wy
km 5
32.8
110.
4K
eno
yes,
sea
sona
llyno
Not
e: W
here
"se
ason
ally
" is
incl
uded
in th
e no
rmal
lim
it co
lum
n it
mea
ns s
prin
g lo
ad re
stric
tions
are
impo
sed
Sec
tio
n
NORTHERN TRANSPORTATION SYSTEMS ASSESSMENT
PAGE 152 PROLOG/EBA
NWT Commercial Traffic Measurement
The information regarding movements and tonnages presented in the following sections was
provided by Mr. Rob Thom of the Department of Transportation, GNWT and Mr. Eric
Madsen of the TCWR Joint Venture. It should be noted that the tonnages moving by road
public highway system are not directly measured, but have been derived from various sources,
including:
• Weigh Scales located at Enterprise, Inuvik and Fort Liard;
• Vehicle classification and traffic volumes from the 5 highway ferries;
• Total traffic volumes and average daily traffic collected from permanent and temporary traffic counters on the NWT Highway system; and
• Vehicle classification and traffic volumes from the Fort Providence weigh-in-motion scale.
Data Sources Used to Develop Estimates
Sources of data used to calculate the volume of goods on the transportation corridors in the
Northwest Territories include:
• Weigh Scales located at Enterprise, Inuvik and Fort Liard;
• Vehicle classification and traffic volumes from the 5 highway ferries;
• Total traffic volumes and average daily traffic collected from permanent and temporary traffic counters on the NWT Highway system; and
• Vehicle classification and traffic volumes from Fort Providence weigh-in-motion scale.
Commercial Traffic from Weigh Scales
The data base maintained at the Enterprise Weigh Scale contains comprehensive information
on commercial vehicle volumes, classifications, weights and material transported. This
information is the basis for determining the amount of commodities transported on the
different transportation corridors.
The following table shows the classification of material from each commercial vehicle
reporting to the Enterprise Weigh Scale according to the three commodity categories in the
Northern Transportation Systems Assessment Survey.

PHASE 1 REPORT: TRANSPORTATION DEMAND ASSESSMENT
PROLOG/EBA PAGE 153
Material Categories at Enterprise Weigh Scale
A – Community Gen Freight B – Const & Resource Dev C – Bulk Fuel Supply
Asphalt Ammonium Nitrate Aviation Fuel
Building Material Camp Shack Flammable Liquids
Calcium Cement Fuel Oil
Compressed Gases Construction Material Gasoline
Containers Drill Rig Liquified Petrol Gases
Corrosive Materials Equipment
Danger Placard Explosives
General Freight Pipe
Gravel Steel
Hay Bales Tanks
Highway Salt Tires
Household Furniture
Lime, Logs, Lumber
Miscellaneous
Mixed Dangerous Goods
Mobile Homes
Vehicles
The class of each commercial vehicle reporting to the Enterprise Weigh Scale is recorded
under “Unit Type”. Unit Types and assumed tare weights are shown in the following table.
Unit Types and Tare Weights
Unit Type Assumed Tare
Weight (kg)
Single Axle Straight Truck 7,000
Tandem Axle Straight Truck 9,000
4-Axle Semi 15,000
5-Axle Semi 16,000
6-Axle Semi 18,000
A-Train 20,000
B-Train 20,000
C-Train 20,000
Super B-Train 20,000
Logging Truck 15,000

NORTHERN TRANSPORTATION SYSTEMS ASSESSMENT
PAGE 154 PROLOG/EBA
Commercial vehicle data is only collected when the Enterprise Weigh Scale is open. The scale
is normally open until 5:30 pm. Trucks do not report to the scale if it is not open, resulting in
under reporting. Data from the Fort Providence Weigh-in-Motion Scale suggests that 20
percent of all traffic passing through Enterprise do not report to the weigh scale due to it
being closed. A factor of 1.20 is applied to account for under-reporting.
The payload of each commercial vehicle is calculated by subtracting the assumed tare weight
from the vehicle’s total weight. For the Enterprise Weigh Scale, the total number of trucks
reporting, and the quantity of goods in the 3 commodity groups from 2007 to 2009 is shown
in the table below.
Commercial Vehicle Traffic and Commodities Reported at Enterprise Weigh Scale
Year Trucks
Reporting
Trucks Carrying
Dangerous Goods
A–Community
Gen Frt (kg)
B–Const &
Resource Dev (kg)
C – Bulk Fuel
Supply (kg)
2007 21,460 8,947 148,417,352 72,210,877 291,822,247
2008 18,820 6,280 160,010,590 66,558,330 187,893,900
2009 10,861 3,620 97,862,030 28,551,330 116,943,850
Commercial vehicle traffic is also collected at the weigh scales located in Inuvik and Fort
Liard. The Fort Liard Weigh Scale closed to traffic in 2007. While the data available from
these weigh scales is not as comprehensive as at the Enterprise Weigh Scale (i.e. type of
commodities transported), enough information is collected to complete the annual
Transportation of Dangerous Goods Report, including; total number of trucks reporting,
number of trucks transporting dangerous goods, and quantities of bulk fuel. The tables below
show the number of trucks reporting, number of trucks carrying dangerous goods, and
quantity of bulk fuel from 2003 to 2009 for the Inuvik and Fort Liard Weigh Scales,
respectively.
Commercial Vehicle Traffic at Inuvik Weigh Scale
Year Trucks Reporting Trucks Carrying
Dangerous Goods
C – Bulk Fuel
Supply (kg)
2003 4,486 333 8,161,018
2004 5,502 413 10,092,707
2005 1,700 426 10,215,411
2006 3,344 251 11,933,494
2007 3,520 264 13,256,492
2008 3,426 450 14,303,543
2009 2,983 357 14,726,163
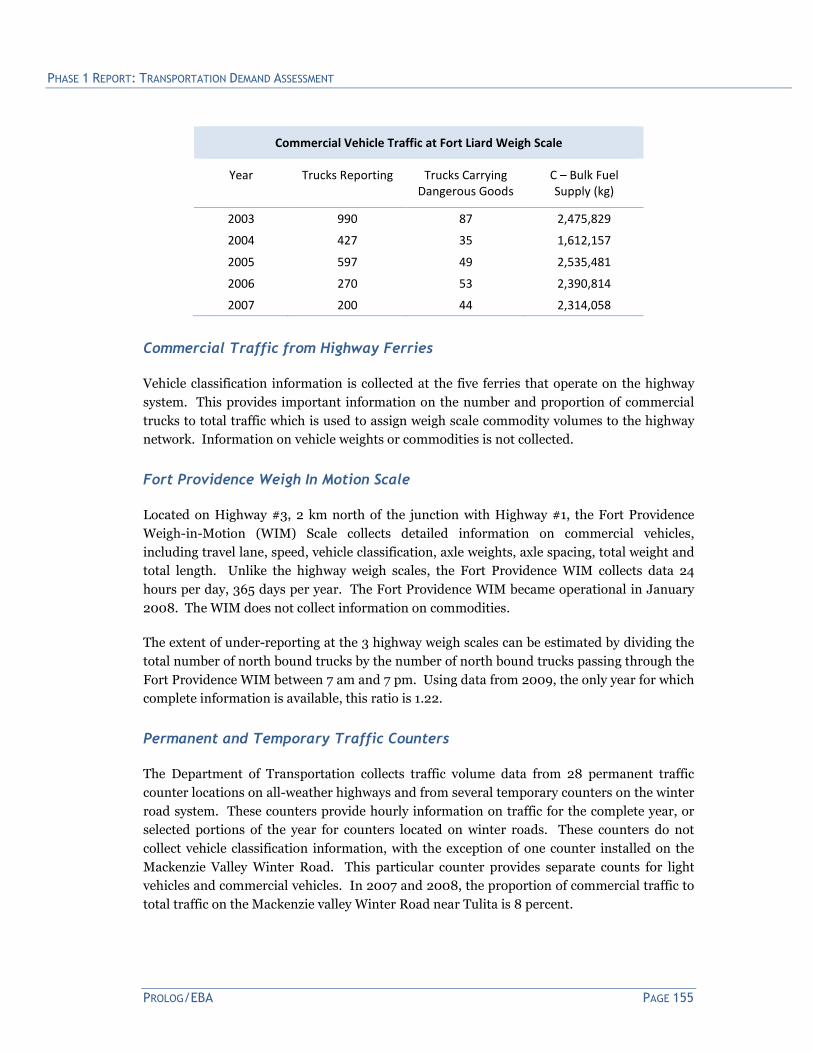
PHASE 1 REPORT: TRANSPORTATION DEMAND ASSESSMENT
PROLOG/EBA PAGE 155
Commercial Vehicle Traffic at Fort Liard Weigh Scale
Year Trucks Reporting Trucks Carrying
Dangerous Goods
C – Bulk Fuel
Supply (kg)
2003 990 87 2,475,829
2004 427 35 1,612,157
2005 597 49 2,535,481
2006 270 53 2,390,814
2007 200 44 2,314,058
Commercial Traffic from Highway Ferries
Vehicle classification information is collected at the five ferries that operate on the highway
system. This provides important information on the number and proportion of commercial
trucks to total traffic which is used to assign weigh scale commodity volumes to the highway
network. Information on vehicle weights or commodities is not collected.
Fort Providence Weigh In Motion Scale
Located on Highway #3, 2 km north of the junction with Highway #1, the Fort Providence
Weigh-in-Motion (WIM) Scale collects detailed information on commercial vehicles,
including travel lane, speed, vehicle classification, axle weights, axle spacing, total weight and
total length. Unlike the highway weigh scales, the Fort Providence WIM collects data 24
hours per day, 365 days per year. The Fort Providence WIM became operational in January
2008. The WIM does not collect information on commodities.
The extent of under-reporting at the 3 highway weigh scales can be estimated by dividing the
total number of north bound trucks by the number of north bound trucks passing through the
Fort Providence WIM between 7 am and 7 pm. Using data from 2009, the only year for which
complete information is available, this ratio is 1.22.
Permanent and Temporary Traffic Counters
The Department of Transportation collects traffic volume data from 28 permanent traffic
counter locations on all-weather highways and from several temporary counters on the winter
road system. These counters provide hourly information on traffic for the complete year, or
selected portions of the year for counters located on winter roads. These counters do not
collect vehicle classification information, with the exception of one counter installed on the
Mackenzie Valley Winter Road. This particular counter provides separate counts for light
vehicles and commercial vehicles. In 2007 and 2008, the proportion of commercial traffic to
total traffic on the Mackenzie valley Winter Road near Tulita is 8 percent.

NORTHERN TRANSPORTATION SYSTEMS ASSESSMENT
PAGE 156 PROLOG/EBA
The traffic counters do not collect any information on vehicle weights, dimensions or
commodities.
Vehicle classification information from the highway ferries and the Fort Providence WIM are
used in conjunction with volume data from the traffic counters to estimate truck volumes or
proportion of truck traffic to total traffic on highway segments.
Volume Estimates Calculations
Estimated Volume of Goods at Enterprise Weigh Scale
Year AEnterprise BEnterprsie CEnterprise
2007 178,100,822 86,653,052 350,186,696
2008 192,012,708 79,869,996 225,472,680
2009 117,434,436 34,261,596 140,332,620
Estimated Volume of Goods at Inuvik Weigh Scale
Year AInuvik BInuvik CInuvik
2007 46,343,505 22,547,937 15,907,790
2008 45,568,566 18,954,793 17,164,252
2009 42,588,431 12,425,211 17,671,396
Estimated Volume of Goods at the Fort Liard Weigh Scale
Year ALiard BLiard CLiard
2007 1,659,840 807,577 2,776,870
2008 4,371,718 1,818,469 2,686,655
2009 2,673,731 780,063 1,672,156
Weigh scale results are assigned to highway segments based on average daily truck traffic
(ADTT) through vehicle classification data collected at the highway ferries and traffic volume
data collected by permanent and temporary traffic counters.
General assumptions:
• All bulk fuel passing through the Enterprise Weigh Scale originate in Hay River and
travels south on Highway #2;
• All community general freight and construction & resource development commodities
passing through the Enterprise Weigh Scale (AEnterprise, BEnterprise)originate in Alberta
and travels north on Highway #1;

PHASE 1 REPORT: TRANSPORTATION DEMAND ASSESSMENT
PROLOG/EBA PAGE 157
• All commodities passing through the Inuvik Weigh Scale (AInuvik, BInuvik, and CInuvik)
originate in the Yukon and travels north on Highway #8;
• All commodities passing through the Fort Liard Weigh Scale (ALiard, BLiard, and CLiard)
originate in British Columbia and travels north on Highway #7;
• The quantity of back haul goods is negligible;
• The volume of north bound traffic is equal to the volume of south bound traffic on any
highway segment;
• No traffic that passes through the Fort Liard Weigh Scale travels on Highway #2 or
Highway #5; and
• Commodity volumes vary in direct proportion to the number of trucks or ADTT on a
highway segment.
Estimated quantities of goods (in kilograms)
Via Fort Simpson Highway #1
The estimated quantities of goods travelling up Highway #1 to Fort Simpson are calculated as
follows:
ADTTLafferty, [1] ADTTMerv Hardie
[1]
% Trucks
Lafferty
Ferry
ADT at
Highway #2,
km 10
ADTTHwy2-10 [2]
2007 16.6 95.3 15.3 380 58.1
2008 19.9 94.1 18.1 450 81.5
2009 19.9 94.1 18.1 450 81.5
[1] Values for 2009 are presently not available for the highway ferries. It is assumed that the ADTT’s and % Trucks are the same as 2008.
[2] The ADTT for Highway #2 is calculated by multiplying the ADT from data obtained from the traffic counter located on Highway #2, km 10 by the % trucks at the Lafferty Ferry. It is assumed that the % trucks at the Lafferty Ferry is representative of traffic on Highway #2, Highway #5, Highway #7 and Highway #1 between Highway #3 and Fort Simpson.
The estimated quantities of goods travelling up Highway #1 to Fort Simpson are:
AHwy1 BHwy1 CHwy1
2007 17,637,253 8,581,217 52,360,994
2008 8,447,424 8,447,424 39,827,814
2009 12,420,414 3,623,666 24,824,824

NORTHERN TRANSPORTATION SYSTEMS ASSESSMENT
PAGE 158 PROLOG/EBA
Via Hay River Highway #2
The estimated quantities of goods travelling along Highway 2 are:
AHwy2 BHwy2 CHwy2
2007 60,868,575 55,142,852 350,186,696
2008 80,046,218 33,296,188 225,472,680
2009 48,956,044 14,282,967 140,332,620
Via Yellowknife Highway #3
The estimated quantities of goods travelling along Highway 3 are:
AHwy3 BHwy3 CHwy3
2007 101,254,834 49,264,458 300,602,572
2008 96,030,047 39,944,853 188,331,521
2009 58,731,709 17,135,026 117,216,223
Via Liard Highway #7
All traffic and goods that travel along Highway 7 pass through the Fort Liard Weigh Scale:
AHwy7 BHwy7 CHwy7
2007 1,659,840 807,577 2,776,870
2008 4,371,718 1,818,469 2,686,655
2009 2,673,731 780,063 1,672,156
Via Mackenzie Winter Road
The estimated quantities of goods travelling Highway 1 to Fort Simpson is used to estimate
goods going up the Mackenzie Valley Winter Road. Quantities are calculated as follows:
AMVWR BMVWR CMVWR
2007 1,838,411 894,459 5,457,823
2008 283,346 283,346 1,335,917
2009 394,680 115,148 788,851
Via Rae Lakes Winter Road
ARLWR BRLWR CRLWR
2007 1,197,734 582,745 3,555,800
2008 1,115,101 463,839 2,186,905
2009 848,832 247,648 1,694,092

PHASE 1 REPORT: TRANSPORTATION DEMAND ASSESSMENT
PROLOG/EBA PAGE 159
Via Dempster Highway 8
In the section of this study report which describes the truck traffic in Yukon, traffic estimates
for the segment of the Dempster Highway south of the Yukon/NWT border are reported to be
much lower than the data provided by the Department of Transportation, GNWT for the
northern portion of the Dempster Highway. For the purposes of this study, the lower traffic
estimates have been considered for the segment of the Dempster Highway north of the
Yukon/NWT border to Inuvik. Traffic estimates for the Inuvik to Tuktoyaktuk Ice Road are
reported by the Department of Transportation, GNWT to be approximately one third of the
reported traffic on the Dempster Highway near Inuvik, and that same proportion has been
considered to estimate the traffic on the Inuvik to Tuktoyaktuk Ice Road for this study.
Via Inuvik-Tuktoyaktuk Winter Road
The Inuvik - Tuktoyaktuk Winter Road is an ice road on frozen Mackenzie River
Delta channels and the frozen Beaufort Sea along the Tuktoyaktuk Peninsula. It
serves natural gas fields and exploration facilities at Mallik, Aput, and Langley. The
winter road also serves Horizon Logistic's ice-locked camp barges, Wurmlinger and
Arctic Star, which act as bases of operations for both winter road crews and
exploration personnel. In addition, the winter road is a key supply line for
Tuktoyaktuk and Aklavik.
The ice road season for the Tuktoyaktuk (Tuk) Ice Road route along the east channel
of the Mackenzie River generally commences mid-December and lasts until mid-
April. The ice is not sufficiently strong enough for first ten days to two weeks to
support the largest of commercial trucks and 17 weeks is the average period for full
heavy haul traffic measurement.
Carriers most active during the Tuk winter ice road shipping season:
• Manitoulin/Northwest Transport
• Matco Transportation Systems
• Northwind Industries
• Klamik Transport
Manitoulin, Matco and Inuvik-based Klamik Transport are the chief motor carriers in
the general freight business. All freight for Tuk and Aklavik arrives over the
Dempster; is off-loaded at Inuvik terminals, and consolidated there for the two
communities. Klamik has the contract for Stanton Stores, and Manitoulin looks after
Northwest Stores.
Gruben, Northwind and Allen Transport are the major truckers serving the resource
and construction industry. Drilling fluids, chemical re-agents, cement, mud
compounds, equipment, water, fuel, lubricants, etc. - all from the south and taken in
for each rig move.

NORTHERN TRANSPORTATION SYSTEMS ASSESSMENT
PAGE 160 PROLOG/EBA
In 2009 there were B Trains on the Ice Road hauling fuel from the south, likely
aviation fuel for helicopters and small aircraft servicing the drilling activity in the
Delta.
Akita drilling had a single rig in operation in the Delta during the 2009 drilling
season and the two preceding years. The rig was moved three times to new drilling
sites. Northwind estimate 50 - 100 truckloads per move excluding the rig and
drilling equipment itself. These loads are combinations of straight trucks, semi-
trailers or combination vehicles. 3,000 tonnes is the average estimated total freight
requirement to service a drilling operation for a season in the arctic (ref: Akita
Drilling).
Truck payloads vary from approximately 8 tonnes for a tandem axle straight truck, to
40 tonnes for an 8-axle B Train. 25 tonnes per load is selected as the average
truckload to service a seasonal drilling program.
For community re-supply shipments to Aklavik and Tuk, the combination of LTL and
TL mixed loads results in a payload of 23.2 tonnes - the typical average used
throughout this assessment for general cargo, dry freight trucking.
The following table formats the information gathered from carriers which in turn
substantiates a rationalized freight analysis for the Inuvik-Tuktoyaktuk Winter Road:
Tuktoyaktuk Ice Road Traffic 2009
Carrier Loads/wk Weeks Payload Volume
Community Resupply
Manitoulin 3 17 23.2 1,183
Matco 1.5 17 23.2 592
Klamik 3 17 23.2 1,183
Others 3 17 23.2 1,183
Total 4,140
Resource Development
Northwind, Gruben, Allen (Oilfield) 7 17 25 3,000
Others 1,000
Total 4,000
Total 8,100

PHASE 1 REPORT: TRANSPORTATION DEMAND ASSESSMENT
PROLOG/EBA PAGE 161
Scheduled Northern Air Service and Representative Aircraft
Scheduled Air Service at Northern Communities – Yukon
Airport Airlines22 Equipment To/From
Whitehorse Air North, Air Canada Jet Calgary/Edmonton/Vancouver
Dawson City Air North Turboprop Whitehorse
Old Crow Air North Turboprop Whitehorse
Scheduled Air Service at Northern Communities – NWT
Airport Airlines23 Equipment To/From
Yellowknife Canadian North,
WestJet, Air Canada,
First Air
Turboprop, Jet Calgary/Edmonton/Vancouver
Iqaluit, Whitehorse
Hay River First Air Turboprop Yellowknife
Buffalo Airways Prop Yellowknife
Northwestern Air Turboprop Edmonton
Fort Smith Northwestern Air Turboprop Edmonton
Fort Simpson First Air
Air Tindi
Turboprop Yellowknife
Whitehorse
Inuvik Canadian North;
First Air
Jet Yellowknife
Norman Wells Canadian North; First Air Jet Yellowknife
Fort Good Hope North Wright Turbo Prop Norman Wells
Tulita North Wright Turbo Prop Norman Wells
Deline North Wright Turbo Prop Norman Wells
Colville Lake North Wright Turbo Prop Norman Wells
Tuktoyaktuk Aklak Air Turbo Prop Inuvik
Aklavik Aklak Air Turbo Prop Inuvik
Fort McPherson Aklak Air Turbo Prop Inuvik
22 Northern mainline carriers sometimes provide service to smaller communities through partner airlines. For example, Canadian North partners with Aklak, Calm Air, Air Tindi, North Wright and Kenn Borek.
23 Northern mainline carriers sometimes provide service to smaller communities through partner airlines. For example, Canadian North partners with Aklak, Calm Air, Air Tindi, North Wright and Kenn Borek.

NORTHERN TRANSPORTATION SYSTEMS ASSESSMENT
PAGE 162 PROLOG/EBA
Paulatuk Aklak Air Turbo Prop Inuvik
Sachs Harbour Aklak Air Turbo Prop Inuvik
Holman/Ulukhaktok First Air; Aklak Air Turbo Prop Yellowknife, Inuvik
Wha Ti Air Tindi Turbo Prop Yellowknife
Gameti/Rae Lakes Air Tindi Turbo Prop Yellowknife
Lutsel K’e Air Tindi Turbo Prop Yellowknife
Wekweeti/Snare Lake Air Tindi Turbo Prop Yellowknife
Scheduled Air Service at Northern Communities – Nunavut
Airport Airlines Equipment To/From
Iqaluit Air Canada; First Air; Jet Montreal, Ottawa
Canadian North Yellowknife
Rankin Inlet Canadian North; First Air; Jet Yellowknife, Iqaluit
Calm Air; Kivalliq Air Turbo Prop Winnipeg; Churchill
Pangnirtung First Air; Canadian North Turbo Prop Iqaluit
Quiqtarjuaq First Air; Canadian North Turbo Prop Iqaluit
Clyde River First Air; Canadian North Turbo Prop Iqaluit
Pond Inlet First Air; Canadian North Turbo Prop Iqaluit
Nanisivik First Air Turbo Prop Iqaluit
Resolute First Air Turbo Prop Iqaluit
Grise Fiord Kenn Borek Turbo Prop Resolute
Igloolik First Air; Canadian North Turbo Prop Iqaluit
Hall Beach First Air; Canadian North Turbo Prop Iqaluit
Cape Dorset First Air; Canadian North Turbo Prop Iqaluit
Coral Harbour Calm Air; Kivalliq Air Turbo Prop Rankin, Winnipeg. Churchill
Chesterfield Inlet Calm Air; Kivalliq Air Turbo Prop Rankin, Winnipeg. Churchill
Kimmirut First Air Turbo Prop Iqaluit
Arviat Calm Air; First Air; Kivalliq Air Turbo Prop Rankin, Winnipeg. Churchill
Whale Cove Calm Air; Kivalliq Air Turbo Prop Rankin, Winnipeg. Churchill
Baker Lake Calm Air; First Air, Kivalliq Air Turbo Prop Rankin, Winnipeg. Churchill
Repulse Bay Calm Air; Kivalliq Air Turbo Prop Rankin, Winnipeg. Churchill
Kugluktuk Canadian North; First Air Turbo Prop Yellowknife
Cambridge Bay Canadian North; First Air Jet; Turbo Prop Yellowknife
Gjoa Haven Canadian North; First Air Turbo Prop Yellowknife
Taloyoak Canadian North; First Air Turbo Prop Yellowknife
Kugaaruk Canadian North; First Air Turbo Prop Yellowknife

PHASE 1 REPORT: TRANSPORTATION DEMAND ASSESSMENT
PROLOG/EBA PAGE 163
Representative aircraft that currently operate in northern Canada
Maximum Payload (lbs) Takeoff Distance (ft) 24
Beech 99 2,900 2,500
Cessna 208 Caravan 3,200 2,500
DHC-6 Twin Otter 3,500 STOL
Dash-8-100 7,400 3,200
ATR-42-300 10,000 3,400
DHC-7 10,500 STOL
HS-748 10,500 4,000
DHC-5 Buffalo 18,000 STOL
B737-200C 31,300 5,000-6,000
L-188 Electra 33,000 5,000-6,000
L-382 Hercules 45,800 5,000-6,000
B767-223SF 98,700 6,000-7,000
24 These are illustrative takeoff distances. Actual takeoff distance will be determined by airport elevation, aircraft payload and aircraft fuel load, the latter being determined by the length of the anticipated flight stage. Elevations of northern airports can vary from sea level to 3,000 feet. The DHC-5, DHC-6 and DHC-7 all have short takeoff and landing (STOL) capability.

NORTHERN TRANSPORTATION SYSTEMS ASSESSMENT
PAGE 164 PROLOG/EBA
Stakeholder Interviews
Government
Wally Hidinger Director of Planning
Yukon Highways and Public Works
Vern Janz Director, Transport Services
Yukon Highways and Public Works
John Warkentin Manager, Carrier Compliance
Highways and Public Works
Harvey Brooks Deputy Minister
Yukon Economic Development
Greg Komaromi Assistant Deputy Minister
Yukon Energy, Mines & Resources
Robert Holmes Director
Yukon Energy, Mines & Resources
Minerals Branch
Ron Sumanik, Manager, Business Development
Yukon Energy, Mines & Resources
Oil & Gas Resources
David Morrison, President & CEO
Yukon Energy Corporation
Jim Stevens Director of Planning
GNWT Transportation
Mark McCulloch Nunavut Community & Govt Services
Community Resupply
Jon Paton Nunavut Community & Govt Services
Community Resupply
Alan Johnson Nunavut Econ Dev & Transportation
Transportation Planning
Todd McKay Community & Govt Services
Petroleum Products Division
Marinka Darling Canada Customs
Allan Nixon Assistant Deputy Minister
Yukon Highways & Public works

PHASE 1 REPORT: TRANSPORTATION DEMAND ASSESSMENT
PROLOG/EBA PAGE 165
Mining
J. Michael Wark Executive Director
Yukon Chamber of Mines
Carl Shultze Geologist
All-Terrane Mineral Exploration Services
President, Yukon Chamber of Mines
Mike Vaydik General Manager,
NWT and Nunavut Chamber of Mines
Lou Covello Consultant
Director, NWT and Nunavut Chamber of Mines,
Member of Infrastructure Committee
Gary Lee Geologist
Past President and Director
Yukon Chamber of Mines
Jonathon Clegg Vice President, Engineering
Western Copper Corporation
Robert L. McIntyre Vice President, Corporate Affairs
Alexco Resource Corp
Robert T. McNight Director, Vice President Corporate Development
Selwyn Resources Ltd.
Lionel Labelle Director, Procurement & Supply Chain Management
Yukon Zinc Corporation
Robin Goad President, Fortune Minerals Limited
Director, NWT and Nunavut Chamber of Mines
Member of Infrastructure Committee
Dave Webb President, Tyhee Development Corporation
Director, NWT and Nunavut Chamber of Mines
Member of Infrastructure Committee
John F. Kearney Chairman and President
Canadian Zinc Corporation
Erik Madsen Director, Winter Road Operations
TCWR Joint Venture
Michael T. Zurowski, Executive Vice President, Baffinland Iron Mines
Stephen Quinn President, Capstone Mining

NORTHERN TRANSPORTATION SYSTEMS ASSESSMENT
PAGE 166 PROLOG/EBA
Transportation
Gary W. Lewis Manager, Whitehorse Branch
Canadian Freightways
Sheldon King, Sales Manager
Pacific Northwest Moving
Lloyd Bjork Manager,
Canadian Lynden Transport
Damen Anderson, Regional Manager
Matco Transportation Services
John Lindsay Vice President & General Manager
Island Tug & Barge Ltd.
Steve Pollock Director of Planning
Island Tug & Barge Ltd.
John Marshall, Martin
Landry and Bill Smith
Marketing Department
Northern Transportation Company Limited
Mark Kimakowich, Assistant Superintendent
CN Rail
Larry Wheaton Vice President of Operations
Robinson Enterprises Ltd
Barry Henkel, Manager, Colomac and Snap Lake Operations
Tlicho Logistics
Suzanne Pacquin President Nunavut Eastern Arctic Shipping
Daniel Desgagnes Managing Director, Nunavut Sealink & Supply Inc.
Dennis Clarke President, Gardewine North
Dennis White General Manger, Woodwards Group of Companies
Bill Drew Executive Director, Churchill Gateway Development Corp.
Shane Hutchins Churchill Port Director, OMNITrax
Michael Brandt Vice President, White Pass & Yukon Route

PHASE 1 REPORT: TRANSPORTATION DEMAND ASSESSMENT
PROLOG/EBA PAGE 167


