Embed Size (px)
Citation preview

- The plant traits that drive ecosystems: Evidence from three continents - 295
Journal of Vegetation Science 15: 295-304, 2004© IAVS; Opulus Press Uppsala.
Abstract.Question: A set of easily-measured (‘soft’) plant traits hasbeen identified as potentially useful predictors of ecosystemfunctioning in previous studies. Here we aimed to discoverwhether the screening techniques remain operational in widelycontrasted circumstances, to test for the existence of axes ofvariation in the particular sets of traits, and to test for theirlinks with ‘harder’ traits of proven importance to ecosystemfunctioning.Location: central-western Argentina, central England, north-ern upland Iran, and north-eastern Spain.Recurrent patterns of ecological specialization: Throughordination of a matrix of 640 vascular plant taxa by 12 stand-ardized traits, we detected similar patterns of specialization inthe four floras. The first PCA axis was identified as an axis ofresource capture, usage and release. PCA axis 2 appeared to bea size-related axis. Individual PCA for each country showedthat the same traits remained valuable as predictors of resourcecapture and utilization in all of them, despite their majordifferences in climate, biogeography and land-use. The resultswere not significantly driven by particular taxa: the main traitsdetermining PCA axis 1 were very similar in eudicotyledonsand monocotyledons and Asteraceae, Fabaceae and Poaceae.Links between recurrent suites of ‘soft’ traits and ‘hard’traits: The validity of PCA axis 1 as a key predictor of resourcecapture and utilization was tested by comparisons between thisaxis and values of more rigorously established predictors (‘hard’traits) for the floras of Argentina and England. PCA axis 1 wascorrelated with variation in relative growth rate, leaf nitrogencontent, and litter decomposition rate. It also coincided withpalatability to model generalist herbivores. Therefore, locationon PCA axis 1 can be linked to major ecosystem processes inthose habitats where the plants are dominant.
Conclusion: We confirm the existence at the global scale of amajor axis of evolutionary specialization, previously recog-nised in several local floras. This axis reflects a fundamentaltrade-off between rapid acquisition of resources and conserva-tion of resources within well-protected tissues. These majortrends of specialization were maintained across different envi-ronmental situations (including differences in the proximatecauses of low productivity, i.e. drought or mineral nutrientdeficiency). The trends were also consistent across floras andmajor phylogenetic groups, and were linked with traits di-rectly relevant to ecosystem processes.
Keywords: Argentina; Comparative ecology; England; Func-tional diversity; Iran; Plant functional types; Recurrent patternsof specialization; Spain; Specific leaf area.
Nomenclature: Bolòs et al. (1990); Flora Iranica (1963 on-wards); Stace (1991); Zuloaga et al. (1994); Zuloaga & Morrone(1996, 1999).
Introduction
The photosynthetic activities of green plants providethe mechanism whereby resources enter ecosystems, andthere has been gradual acceptance that in this processplants are not acting as a simple conduit. It is now widelyaccepted that differences between plants in the way theyacquire, process and invest resources can have very largeeffects on the species composition and functioning ofecosystems (Chapin et al. 2000; Loreau et al. 2001).
The plant traits that drive ecosystems: Evidence from three continents
Díaz, S.1*; Hodgson, J.G.2†; Thompson, K.2; Cabido, M.1; Cornelissen, J.H.C.3; Jalili, A.4;Montserrat-Martí, G.5; Grime, J.P.2; Zarrinkamar, F.4; Asri, Y.4; Band, S.R.2; Basconcelo,S.1; Castro-Díez, P.5; Funes, G.1; Hamzehee, B.4; Khoshnevi, M.4; Pérez-Harguindeguy, N.1;Pérez-Rontomé, M.C.5; Shirvany, F.A.4; Vendramini, F.1; Yazdani, S.4; Abbas-Azimi, R.4;Bogaard, A.6; Boustani, S.4; Charles, M.6; Dehghan, M.4; de Torres-Espuny, L.5; Falczuk,
V.1; Guerrero-Campo, J.5; Hynd, A.6; Jones, G.6; Kowsary, E.4; Kazemi-Saeed, F.4; Maestro-Martínez, M.5; Romo-Díez, A.7; Shaw, S.8; Siavash, B.4; Villar-Salvador, P.5 & Zak, M.R.1
1Instituto Multidisciplinario de Biología Vegetal (CONICET - UNC) and F.C.E.F.y N., Universidad Nacional de Córdoba,Casilla de Correo 495, Vélez Sársfield 299, 5000 Córdoba, Argentina; 2Unit of Comparative Plant Ecology, Departmentof Animal and Plant Sciences, The University, Sheffield S10 2TN, UK; †Current address: Peak Science & Environment,Station House, Leadmill, Hathersage, Hope Valley, S32 1BA, UK; 3Department of Systems Ecology, Faculty Earth and
Life Sciences, Free University, De Boelelaan 1087, 1081 HV Amsterdam, The Netherlands; 4Research Institute of Forestsand Rangelands, P.O. Box 13185-116, Tehran, Iran; 5Departamento de Ecología Funcional y Biodiversidad, Instituto
Pirenaico de Ecología (CSIC), Aptdo. 202, E-50080 Zaragoza, Spain; 6Department of Archaeology and Prehistory, TheUniversity, Sheffield S1 4ET, UK; 7Institut Botànic de Barcelona, Parc Montjuïc, Av. dels Muntanyans s/n, 08038 Barcelona,
Spain; 8Department of Animal and Plant Sciences, The University, Sheffield S10 2TN, UK; *Corresponding author; Fax+543514332104; E-mail [email protected]

296 Díaz, S. et al.
Table 1. A comparison of the study areas in four different countries.
Argentina England Iran Spain
Area (km2) ca. 40 000 ca. 3000 ca. 725 ca. 1000Latitude (range) 31∞25' - 32∞ S 53∞05'-53∞32’ N 38∞41' - 39∞7' N 41∞45'- 41∞70' NLongitude (range) 64∞10' - 68∞37' W 0∞57' - 2∞51' W 46∞42' - 46∞58' E 0∞40' - 1∞40' WAltitude (range; m asl) 350 - 2155 2 - 636 350 - 2840 100 - 400Mean annual rainfall (range; mm) 85 - 912 565 - 1800 316 - 686 300 - 350Rainfall distribution Confined to warm season Throughout year but Throughout year but Mainly in spring and
with winter maximum with winter maximum autumn
Mean annual temperature (range; ∞C) 8.1 - 19.6 9 - 11 5 - 14 6 - 24No. frost-free months (range) 0 - 8 3 - 6 6 3 - 5No. months in which 1 - 12 0 - 2 2 - 4 6
evapotranspiration > precipitation(range)
Dominant vegetation types sampled Halophytic shrubland Arable Broad-leaved woodland ArableMontane grassland Broad-leaved woodland Montane grassland Riverine habitatsMontane woodland Coniferous plantation Montane dwarf scrub Xerophytic shrublandXerophytic woodland Grassland Xerophytic woodlandXerophytic shrubland Heathland
Wetland
Land use in sampled areas Extensive livestock (cattle, Arable agriculture in Extensive livestock in Arable agriculturehorses, goats and sheep) lowland; grazing by summer (sheep and especially inRanching, with sheep and cattle in goats) lowlands; grazing byassociated logging and uplands Sites of cultivation now sheep much reducedburning Some extensive coniferous abandoned and mainly confined
Cultivation scattered and plantations to fallow arable landuncommon Much industrial and urban Some industrial and
development in urban development inlowlands lowlands
Total number vascular plant species ca. 2100 ca. 950 ca. 1020 ca. 1000in the region studied
Human population density ca. 6 ind.km–2 ca. 590 ind.km–2 < 1 ind.km–2; visited by ca. 15 ind.km–2
nomads in summer
At the present time many ecosystems are experi-encing changes in land use and climate that are unprec-edented in scale and rate (Vitousek et al. 1997). There isan urgent need to devise predictors of the impacts of suchevents and often this need arises in circumstances wherethere is no detailed knowledge of ecosystem properties.In recent years this problem has given extra impetus to thesearch for easily-measured, universally-applicable pre-dictors of ecosystem function and responsiveness tochange. Through investigations in various parts of theworld (e.g. Chapin et al. 1996; Díaz & Cabido 1997;Grime et al. 1997; Reich et al. 1997; Wardle et al. 1998;Cunningham et al. 1999; Craine et al. 2001; Wright &Westoby 2002; Ackerly 2003), evidence is growing thatsuch predictors do exist, and can be found in the form ofsingle traits or sets of co-occurring traits of plants.
Why should screening of plant traits on a world basislead to the discovery of universally applicable predictorsof ecosystem properties? Superficial variety in plant lifeis deceptive and tends to obscure the presence of recur-ring constraints on the core functioning and evolutionaryspecialization available to plants. The evidence for thisunderlying constraint in the evolution and ecology ofplants is to be found in a long series of investigations and
reviews (Ramenskii 1938; Grime 1974, 2001; Chapin1980; Lambers & Poorter 1992; Chapin et al. 1993;Westoby 1998; Aerts & Chapin 2000; Westoby et al.2002). For the purposes of this paper, the key finding isthat the core traits and trade-offs consistently identified inthese publications (life history, growth rate, tissue lifespan, mineral nutrient concentrations, defence againstgeneralist herbivores, resistance to decomposition), re-late to aspects of plant functioning with unambiguousrepercussions on ecosystem functioning.
To date, most screening programmes that have sug-gested the existence of useful plant predictors of ecosys-tem properties and susceptibility to local or global changehave concentrated on local floras and vegetation types.The main purpose of this paper is, when restricting atten-tion to a set of easily measured (‘soft’) traits that have beenidentified as potentially useful predictors of ecosystemfunctioning in previous studies, to discover whether thescreening techniques remain operational in widely con-trasted circumstances, and to test for the existence of axesof variation in the particular sets of traits. Secondary objec-tives were to see how far these traits and axes of variationare aligned with phylogeny; and to relate them to ‘harder’traits of proven importance to ecosystem functioning.

- The plant traits that drive ecosystems: Evidence from three continents - 297
Methods
We constructed a data set comprising common vascu-lar plant species from four countries differing greatly inclimate, biogeography and land use: central-westernArgentina, central England, northern upland Iran, andnortheastern Spain (Table 1).
Species selection
The general criteria for species selection included: (1)a species had to be common; and (2) the collection had tocover a wide range of growth forms, families and habi-tats. Our species selection was not clade-based, but ratherlocal assembly-based. This puts our trait selection strat-egy within the category of non-random taxon sampling(Ackerly 2000). This is the most appropriate samplingstrategy considering that one of our major aims was toassess consistency of patterns across clades, species as-semblies and ecosystems, and our questions were muchmore in the field of present-day community and ecosys-tem ecology, than in that of evolutionary ecology (Ackerly2000; Westoby et al. 2002). We restricted our study tocommon species not only for practical reasons (consider-ing all species in the four floras would have beenunfeasible), but mainly because we wished to focus onspecies that (1) appeared well adapted to the local condi-tions; and (2) had a reasonably good chance of impactingupon major ecosystem processes. Only common speciescan ensure these goals (Grime 1998). We tried to coverthe widest possible range of growth forms, families andhabitats in an attempt to provide the strongest possibletest for the patterns detected, and the widest possible
scope for our generalizations.The whole data set comprised 640 taxa belonging to
86 families (App. 1). The Argentine data set comprisedthe 207 most abundant species in 313 vegetation sampleplots described in Díaz & Cabido (1997). The species setrepresented ca. 10% of the total number of species in theregion, and included 51 plant families, numerous growthforms, and plants from pristine and from disturbed habi-tats. The 143 British species represented ca. 15% of thetotal number of species in the region, included 47 plantfamilies, and were selected to ensure that all the majorhabitats and climatic regions (lowland and upland) wereincluded. The 186 species from Iran (43 families, ca. 18%of the flora), and the 104 species from Spain (30 families,ca. 10% of the flora), were similarly representative. In total49 species were common to two or more data sets; theirmeasured trait values were similar in different countries,supporting the consistency and comparability of our meth-ods, but sufficiently different to represent adapted por-tions of the local flora in each region, and thereforegenuine unbiased contributors. The outcomes of the analy-ses were unaffected by whether they were considered ornot; therefore we included them for completeness.
Trait selection and measurement
There is now sufficient published evidence pointingto a relatively short list of morphological and functionaltraits strongly linked to key aspects of both the estab-lished and regenerative phases of the life of plants (seeWeiher et al. 1999; Lavorel & Garnier 2002 and Westobyet al. 2002 for recent reviews). Some of these traits havealso been shown to influence ecosystem processes (Hobbie
Table 2. Traits measured on 640 vascular plant species from Argentina, England, Iran and Spain. See Cornelissen et al. (2003) andreferences therein for details on ecological meaning and measurement procedures. *1trait log10-transformed for analysis; *2categoriesfollow Grime et al. (1988); *3maximum height of well grown individuals, but excluding small leaves above the height of the maincanopy; *4seed size and shape were calculated for the whole dispersal unit (see Thompson et al. 1993 for details).
Trait Type of variable
Leaf size Continuous (mm2)*1
Specific leaf area Continuous (mm2 leaf area / mg leaf mass)*1
Leaf toughness Continuous (= leaf tensile strength; Newton mm leaf width–1)*1
Inrolling of lamina Continuous [1 – (inrolled width/expanded width)]Leaf thickness Continuous (mm)*1
Canopy height Continuous (cm)*1*3
Woodiness Ordinal: 0 = non-woody; 1 = semi-woody; 2 = soft wood (£ 0.6 mg.mm–3); 3 = densewood (> 0.6 mg.mm–3)
Mean distance between ramets Ordinal: 0 = no ramets; 1 = < 10 cm; 2 = 10 - 50; 3 = > 50 connected below ground or at ground levelShoot phenology Ordinal for green biomass peak: 1 = no evident peak; 2 = winter, autumn, early spring
peak; 3 = late spring, spring, spring-summer; 4 = late summer-early autumn; 5 = latespring-summer, summer*2
Life span Ordinal: 1 = annual; 2 = biennial; 3 = perennialSeed mass Continuous (mg air-dry mass)*1*4
Seed shape Continuous (variance among length, width and depth when length = 1; for a sphericalseed, variance = 0)*1*4
298 Díaz, S. et al.
1992; Berendse 1994; Aerts 1995; MacGillivray et al.1995; Aerts & Chapin 2000), but many of these requireprocedures that are too laborious for large-scale screen-ing purposes (i.e., ‘hard’ traits; see below). We aimed toemploy only measurements of known importance to (1)the regenerative and established phases of the plant lifecycle, (2) plant responses to the environment, and/or (3)plant effects on ecosystem processes. Measurementsalso had to be applied rapidly to large numbers ofspecies, i.e. relatively ‘soft’ (Hodgson et al. 1999; Lavorel& Garnier 2002). We selected 12 continuous or ordinaltraits (Table 2). These traits are known not to be triviallycorrelated among themselves, i.e. each trait is measuringa different plant property. All non-seed traits relate tohealthy, sexually mature plants growing in unshadedhabitats, and are the average of at least six replicates perspecies. See Hendry & Grime (1993), Díaz & Cabido(1997), Grime et al. (1997), Westoby (1998) andCornelissen et al. (2003) for details on ecological inter-pretation and measurement of traits.
In order to test the links between these recurrentpatterns of specialization and major ecosystem processes,we conducted additional screening of ‘hard’ traits onsubsets of species from Argentina and England, selectedto represent the whole range of habitats, growth forms,and taxa present in the main data bases (App. 1). Theseadditional traits were relative growth rate, leaf nitro-gen content, rate of litter decomposition, and prefer-ence by generalist invertebrate herbivores, all of provenvalue as predictors of ecosystem processes (Mooney1972; Grime & Hunt 1975; Coley 1980; McNaughtonet al. 1989; Herms & Mattson 1992; Hobbie 1992;Berendse 1994; Aerts 1995; Grime et al. 1996; Aerts &Chapin 2000; Lavorel & Garnier 2002). Relative growthrate was measured on seedlings growing under stand-ard conditions (Grime & Hunt 1975; Hunt &Cornelissen 1997; F. Vendramini unpubl.). Leaf nitro-gen content was measured on young, fully expandedsun leaves (Thompson et al. 1997; Vendramini et al.2000). Potential decomposition rate was expressed aspercentage of dry weight loss of 1 g litter in bagsburied in a standard decomposition bed in an experi-mental garden under natural climatic conditions in thecities of Sheffield (England) and Córdoba (Argentina)(Cornelissen 1996; Pérez-Harguindeguy et al. 2000).Preference by model herbivores was determined aspercentage of leaf area consumed by garden snails(Helix aspersa) in cafeteria experiments, involving ten1-cm2 replicates per species, randomly allocated topositions in a grid (Grime et al. 1996; Cornelissen et al.1999; Pérez-Harguindeguy et al. 2003).
Data analysis
To detect general specialization trends across thefour floras, we organized the data into a single 12 trait ¥640 species matrix. We submitted the matrix to a Princi-pal Component Analysis (PCA) based on the correlationmatrix of variables, in which data are centred and stand-ardized by standard deviation, which is considered ap-propriate for mixed data (Jongman et al. 1987).
In order to assess whether trends detected in thewhole data set were similar in different individualfloras, we ran separate PCAs considering (1) only thespecies from each country; and (2) the species of allpossible combinations of three countries (i.e. Argentina+ England + Iran, Argentina + England + Spain,Argentina + Iran + Spain, and England + Iran + Spain).We then correlated the eigenvector scores of the 12plant traits on PCA axes 1 and 2 obtained from analy-ses of each individual country against the eigenvectorscores of the same traits from joint analyses of thethree other countries.
In order to assess whether the general trends foundin the analysis of the whole data set were consistent indifferent broad taxonomic groups, we ran separatePCAs for eudicotyledons (sensu Soltis et al. 1999),monocotyledons, and three major plant families, eachrepresented by at least 50 species in the whole data setand at least 12 species in each individual country:Asteraceae, Fabaceae and Poaceae. We then correlatedthe eigenvector scores of 12 plant traits along Axis 1 and2 obtained in separate PCAs (eudicotyledons againstmonocotyledons, Asteraceae against Fabaceae,Asteraceae against Poaceae, and Fabaceae againstPoaceae). Only 11 traits (woodiness excluded) wereconsidered in comparisons involving monocotyledons.
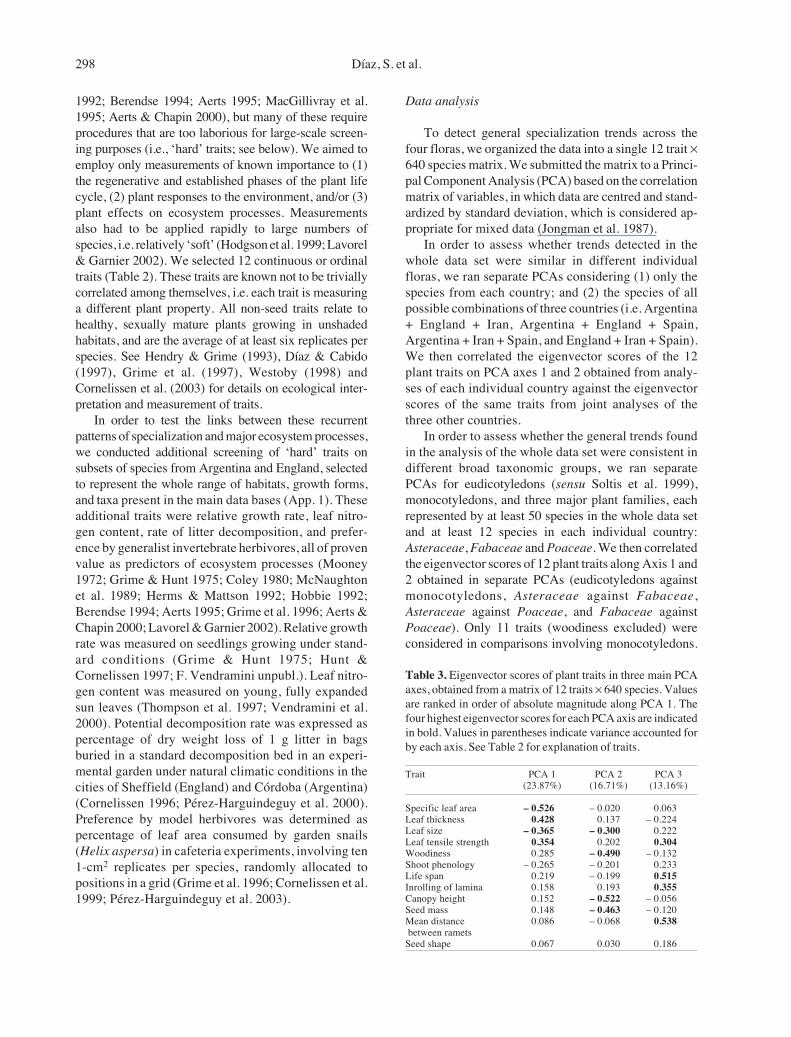
Table 3. Eigenvector scores of plant traits in three main PCAaxes, obtained from a matrix of 12 traits ¥ 640 species. Valuesare ranked in order of absolute magnitude along PCA 1. Thefour highest eigenvector scores for each PCA axis are indicatedin bold. Values in parentheses indicate variance accounted forby each axis. See Table 2 for explanation of traits.
Trait PCA 1 PCA 2 PCA 3(23.87%) (16.71%) (13.16%)
Specific leaf area – 0.526 – 0.020 0.063Leaf thickness 0.428 0.137 – 0.224Leaf size – 0.365 – 0.300 0.222Leaf tensile strength 0.354 0.202 0.304Woodiness 0.285 – 0.490 – 0.132Shoot phenology – 0.265 – 0.201 0.233Life span 0.219 – 0.199 0.515Inrolling of lamina 0.158 0.193 0.355Canopy height 0.152 – 0.522 – 0.056Seed mass 0.148 – 0.463 – 0.120Mean distance 0.086 – 0.068 0.538 between rametsSeed shape 0.067 0.030 0.186

- The plant traits that drive ecosystems: Evidence from three continents - 299
We also compared the range of scores of species belong-ing to the Asteraceae, Fabaceae and Poaceae alongaxes 1 and 2 in the PCA ordination of the whole data set.
To evaluate whether the patterns of specializationdetected on the basis of mostly ‘soft’ traits were con-sistent with traits of proven value as ecosystem predic-tors (‘hard’ traits), we correlated the scores of selectedspecies from Argentina and England along PCA axis 1obtained from the analysis of the whole data set againsttheir relative growth rate, leaf nitrogen content, andrate of litter decomposition. In the case of consump-tion by generalist invertebrate herbivores, data distri-bution was markedly skewed due to the presence ofmany zero values; therefore we ran Mann-Whitneytests to compare the scores along PCA axis 1 (wholedata set) of Argentine and British species that wereeaten vs. those that were not eaten.
Results
Recurrent patterns of ecological specialization
Similar patterns of specialization were detected in thefour floras (Fig. 1). The first PCA axis was identified asan axis of resource capture, usage and release, accountingfor ca. 24% of the total variance, a remarkably high valueconsidering the size and heterogeneity of the database. Atthe lower end of PCA axis 1 were species with large, thin,
Fig. 1. PCA ordination of 640 plant species from Argentina, England, Iran and Spain, on the basis of 12 traits. Labels display traitswith the highest eigenvector scores on PCA axes 1 and 2, with the label with the highest score presented nearest to the axis. Stylizedfigures indicate extreme types, such as aquatics and tender-leaved ephemerals at the lower end of PCA axis 1, Cactaceae at the higherend of PCA axis 1, and large-leaved deciduous trees and shrubs at the lower end of PCA axis 2. Eigenvector scores of all traits alongPCA axes 1-3 are in Table 3. Locations of individual species on the ordination plane are available from the corresponding author.
tender leaves of high specific leaf area, while at the higherend were species with small, thick, tough leaves of lowspecific leaf area. PCA axis 2 accounted for a further ca.17% of the total variance and appeared to be a size-relatedaxis. Tall species with dense wood, large leaves and largeseeds (mainly trees) were found at low values whilesmaller, often herbaceous species with small leaves andseeds occurred at high values of PCA axis 2. Axis 3appeared to be a life history/clonality axis (Table 3). Hereattention is largely confined to the interpretation of axis 1.
The floras of Argentina and England showed thewidest range and the most extreme types along PCA axis1 (Fig. 1), with British aquatic plants and fast-growing,short-lived herbs of fertile soils representing one extreme,and desert succulents from Argentina representing theopposite extreme. Otherwise the four floras overlappedwidely on the PCA ordination plane (scores ca. –1 to 4along axis 1, and –4 to 2 along axis 2; Fig. 1). Britishplants from the most nutrient-deficient habitats, identi-fied as extreme stress tolerators in an earlier functionalcomparison (e.g. Festuca ovina, Koeleria macrantha,Deschampsia flexuosa; Grime et al. 1997), occupied anintermediate position (scores ca. 1 to 2 along axis 1) in theordination of the combined floras, very similar to that ofplants typical of seasonally dry areas of Argentina andSpain. A separate PCA excluding desert succulents pro-duced very similar results, including the same rank ofeigenvector scores along both axes, indicating that theordination was not strongly driven by these extreme plant

300 Díaz, S. et al.
types (also see correlation between PCA of Argentinespecies against PCA of English + Iranian + Spanishspecies; Table 4). These results strongly imply the exist-ence of suites of correlated traits, and consistent positiveand negative associations between plant characteristics.
The patterns of ecological specialization detected alongthe first two PCA axes appear to be largely independentof geographical location. The eigenvector scores of dif-ferent plant traits were very similar in separate PCAs ofthe data sets for individual countries (Table 4). The sametraits remained valuable as predictors of resource captureand utilization despite major differences in the physical,chemical and biotic conditions of the four regions, and inparticular, great variation in the proximate causes of low
productivity (drought or mineral nutrient deficiency).Phylogeny was not the major factor in the expres-
sion of PCA axis 1, in the sense that the results werenot significantly driven by particular taxa. The maintraits determining PCA axis 1 were very similar ineudicotyledons and monocotyledons (Fig. 2a), and inthe major families Asteraceae, Fabaceae and Poaceae(Fig. 2b-d). In all major taxa examined, PCA axis 1differentiated between plants with large leaves, highspecific leaf area, and peak production of new leavesstrongly confined to the growing season, and ever-green plants with small, thick, tough leaves. Further-more, when the full data set was considered (Fig. 1) theranges of scores of Asteraceae, Fabaceae and Poaceaealong PCA axis 1 overlapped to a very large extent(Fig. 3a). Despite differences between families that areapparent to all ecologists, and which have frequentlyled to the assumption that some families (e.g. legumesand grasses) represent distinct functional types in anyecological context, the same overriding trait trade-offsoperate in each of these major taxa.
Phylogeny played a more important role in thedetermination of PCA axis 2 than Axis 1. Although themain traits determining PCA axis 2 were similar ineudicotyledons and monocotyledons (r = – 0.655; P =0.029), there were different trends for Asteraceae,Fabaceae and Poaceae (Asteraceae vs. Fabaceae: r =0.202 and P = 0.527; Asteraceae vs. Poaceae: r = 0.072
Fig. 2. Relationships between the eigenvector scores of 11-12 plant traits along Axis 1 of (A) separate PCA analyses of 150monocotyledons and 490 eudicotyledons belonging to four different local floras (Argentina, England, Iran and Spain); and (B-D)separate PCA analyses of three major plant families with > 50 species in the database (Asteraceae: 87 species; Fabaceae: 51 species;Poaceae: 118 species). Only 11 traits (woodiness excluded) were considered in comparisons involving monocotyledons. r =Spearman Rank Correlation Coefficient.
Table 4. Correlations between the eigenvector scores of 12plant traits (see Table 2) on PCA axes 1 and 2 from separateanalyses of species from each individual country, and eigenvectorscores of the same traits along PCA axes 1 and 2 from jointanalyses of the three other countries. r = Spearman RankCorrelation Coefficient.
PCA 1 PCA 2r P r P
Argentina 0.748 0.005 0.587 0.045England 0.720 0.008 0.923 < 0.001Iran 0.671 0.017 0.748 0.005Spain 0.944 < 0.001 0.683 0.014

- The plant traits that drive ecosystems: Evidence from three continents - 301
and P = 0.831; Fabaceae vs. Poaceae: r = 0.400 and P =0.222), and the ranges of scores of these taxa alongaxis 2 of the PCA ordination of the whole data setoverlapped less than in the case of axis 1 (Fig. 3b). Inparticular, Fabaceae showed lower scores, associatedwith the large canopy height and seed size, and densewood, that are typical of some of its member species.
Links between recurrent suites of ‘soft’ traits and‘hard’ traits
The validity of PCA axis 1 as a key predictor ofresource capture and utilization was confirmed bycomparisons between this axis and values of morerigorously established predictors (‘hard’ traits) for thefloras of Argentina and England (Fig. 4). PCA axis 1was correlated with variation in relative growth rate(Fig. 4a, b), leaf nitrogen content (Fig. 4c, d), and litterdecomposition rate (Fig. 4e, f). It also coincided withpalatability to generalist herbivores in an analysis ofpreference by model herbivores (garden snails), withunpalatable plants being concentrated towards the higherend of PCA axis 1 for both countries (Mann-Whitney
test; for Argentina, N = 51 species, z = – 2.124; P = 0.034;for England, N = 51 species, z = – 3.532; P < 0.001).These four attributes have clear links among themselvesand with major aspects of ecosystem functioning, suchas primary productivity, nutrient cycling and trophictransfers (see Introduction for references). Therefore,location on PCA axis 1 can be linked to major ecosys-tem processes.
Discussion
Recurrent patterns of plant specialization andecosystem processes: a good start for generalizationin ecology?
Our results indicate a fundamental trade-off in plantdesign between a set of plant attributes that allow rapidacquisition of resources (‘acquisitive type’), and another
Fig. 3. Distribution of species belonging to plant families with> 50 species (Asteraceae: 87 species; Fabaceae: 51 species;Poaceae: 118 species) along PCA axes 1 (A) and 2 (B). Valuescorrespond to scores of species on axes 1 and 2 of a PCAordination of 640 plant species from Argentina, England, Iranand Spain (Fig. 1). Box = interquartile range, containing 50%of values; line across box = median; whiskers = highest andlowest values, excluding outliers (i. e. cases with values > 1.5box lengths from the upper or lower edge of the box). Twooutliers were identified in (A), representing less than 0.80% ofthe species considered in this analysis; these were the Argentinehalophytes Cyclolepis genistoides (Asteraceae) and Prosopisstrombulifera (Fabaceae). No outliers were identified in thecase of (B).
Fig. 4. Relationships between PCA axis 1 scores from Fig. 1and relative growth rate (A, B), leaf nitrogen content (C, D),and potential decomposition rate (E, F) of subsets of speciesfrom Argentina and England, selected to represent the wholerange of habitats, growth forms, and taxa present in the maindatabase. dw = dry weight; r = Spearman Rank CorrelationCoefficient. See App. 1 for list of Argentine and Britishspecies involved in this comparison.

302 Díaz, S. et al.
set that permits conservation of resources within wellprotected tissues (‘conservative/retentive types’). Thisconfirms and extends the predictions of previous theoreti-cal and empirical work based on more restricted databases(Mooney 1972; Grime 1974; Chapin 1980; Coley 1980;Lambers & Poorter 1992; Herms & Mattson 1992; Hobbie1992; Chapin et al. 1993; Berendse 1994; Aerts 1995;Díaz & Cabido 1997; Grime et al. 1997; Reich et al. 1997;Aerts & Chapin 2000; Wright & Westoby 2002). On thebasis of the largest and most diverse data set published sofar, our findings suggest that this fundamental trade-offmay be broadly applied to contrasting floras, environ-ments, and growth forms. This trade-off appears to belargely independent of both geographical location andtaxonomic affinity, and there is a close association be-tween position in the trade-off and traits linked to majorecosystem processes.
Our findings suggest that water- and nutrient stresslead to convergent trait syndromes, a finding consistentwith other recent empirical work (Cunningham et al.1999; Lamont et al. 2002), and illustrate how, on the basisof different anatomical structures, plants from very dif-ferent lineages address the same problem: the protectionof photosynthetic tissue from external agents, especiallydesiccation and herbivory. Variation observed along PCAAxis 1, the fact that protection of photosynthetic tissue isachieved through slightly different mechanisms (e.g.,fibrous, inrolling lamina in graminoids; thickened cuticlein succulents), and slight variations in the associationsbetween some traits in different families (e.g. shoot phe-nology and seed mass, Fig. 2b-d) reconcile two differentapproaches in plant ecology, one that searches for generalpatterns of functional specialization, and another thatemphasizes the fine-tuning of species and populations toparticular abiotic and biotic habitat conditions (e.g., Harper1982; Grubb 1985, 1998). Many traits, notably someaspects of the regeneration phase and phenology, withlow association with the first PCA axes (Fig. 1, Table 3),appear to be relatively independent from the generaltrends described in this article, and thus provide amplescope for the exploration of patterns important at the locallevel, or important to certain populations in the face ofparticular sources of stress (e.g. pollution) or disturbance.
Particularly noteworthy was the close similarity intrait variation between Fabaceae and Poaceae (Figs. 2dand 3a), often separated as different functional types inecosystem studies (Hooper & Vitousek 1997; Hector etal. 1999; Lepš et al. 2001; Spehn et al. 2000; Tilman et al.2001). Our findings do not deny the fact that somemembers of these plant families can indeed act as distinctfunctional types in some situations. For example, theinvasion of some nitrogen-poor systems by nitrogen-fixers (often, but not always, members of the Fabaceae),sometimes leads to dramatic increase of nitrogen avail-
ability in the soil (reviewed by Levine et al. 2003), andthus facilitates vegetational shifts from conservative toacquisitive traits. Rather, our results show that these threemajor families do not differ substantially in terms of theconservative-acquisite trade-off and thus in terms of theireffects on major ecosystem processes mediated by thesetraits. This indicates that there is no evidence that justifiesassuming Fabaceae, Asteraceae and Poaceae as differ-ent functional types a priori in every situation.
The existence of consistent links between ‘soft’ and‘hard’ traits has been put forward as a promising way toconnect plant traits with major ecosystem processes(Hodgson et al. 1999; Lavorel & Garnier 2002). Ourresults, based on extensive ‘soft’ and ‘hard’ trait informa-tion, show that those links are indeed present, and they areconsistent across different environmental situations.
Perspectives and applications
The lesson from other sciences, such as physics andchemistry, is that genuine progress in understanding thediversity of the natural world comes from a recognition ofits fundamental unity. In this paper we have shown that amajor axis of evolutionary specialization, previously iden-tified in several floras, can also be detected at the trans-regional scale, across floras exhibiting huge variation inphylogeny, and across areas of contrasting climates, landuse regimes and biogeographical histories. Has this dem-onstration helped in the quest for the fundamental unity ofecology? We think it has, but there is still a long way togo. The strength of science may derive from the question-ing and falsification of attempted generalizations, andfrom the search for exceptions, but this search is onlytruly meaningful against a solid background. For boththeoretical and practical reasons, we need to know howthe axes of ecological specialization identified here aredistributed across heterogeneous landscapes, how theyrespond to global changes in climate and land use, andhow far they predict key aspects of ecosystem function-ing such as productivity, nutrient cycling, carbon storage,and resilience.
Acknowledgements. We thank D. Abal-Solís, A.M. Anton,A.A. Coccuci, L. Galetto and other members of IMBIV, J.M.Menna, M.L. De Wyesiki, P. Riemann and all former membersof UCPE. This manuscript benefited from helpful suggestionsby G.L. Rapson and two anonymous referees. This work wassupported by the Darwin Initiative (DEFRA-UK), NERC, theEuropean Union, The British Council, Research Institute ofForests and Rangelands (Iran), FONCyT, Fundación Antorchas,Agencia Córdoba Ciencia SE, IAI, CONICET, SECyT-UNC,and Universidad Nacional de Córdoba (Argentina), and ComisiónInterministerial de Ciencia y Tecnología (Spain). The J.S.Guggenheim Memorial Foundation, the Andrew W. MellonFoundation and Stanford University provided generous supportto S. Díaz while writing this article.

- The plant traits that drive ecosystems: Evidence from three continents - 303
References
Ackerly, D.D. 2000. Taxon sampling, correlated evolution, andindependent contrasts. Evolution 54: 1480-1492.
Ackerly, D.D. 2004. Functional strategies of chaparral shrubs inrelation to seasonal water deficit and disturbance. Ecology74: 25-44.
Aerts, R. 1995. The advantages of being evergreen. TrendsEcol. Evol. 10: 402-407.
Aerts, R. & Chapin, F.S. III. 2000. The mineral nutrition of wildplants revisited: A re-evaluation of processes and patterns.Adv. Ecol. Res. 30: 1-67.
Berendse, F. 1994. Litter decomposability – a neglected compo-nent of plant fitness. J. Ecol. 82: 187-190.
Bolòs, O., Vigo, J., Masalles, R.M. & Ninot, J. 1990. Floramanual dels països Catalans. Editorial Pòrtic, Barcelona, ES.
Chapin, F.S. III. 1980. The mineral nutrition of wild plants.Annu. Rev. Ecol. Syst. 11: 233-260.
Chapin, F.S. III., Autumn, K. & Pugnaire, F. 1993. Evolution ofsuites of traits in response to environmental stress. Am. Nat.142: S78-S92.
Chapin, F.S. III., Bret-Harte, M.S., Hobbie, S. & Zhong, H.1996. Plant functional types as predictors of the transientresponse of arctic vegetation to global change. J. Veg. Sci. 7:347-357.
Chapin, F.S. III., Zavaleta, E.S., Eviner, V.T., Naylor, R.L.,Vitousek, P.M., Reynolds, H.L., Hooper, D.U., Lavorel, S.,Sala, O.E., Hobbie, S.E., Mack, M.C. & Diaz, S. 2000.Functional and societal consequences of changing bioticdiversity. Nature 405: 234-242.
Coley, P.D. 1980. Effects of leaf age and plant life historypatterns on herbivory. Nature 284: 545-546.
Cornelissen, J.H.C. 1996. An experimental comparison of leafdecomposition rates in a wide range of temperate plantspecies and types. J. Ecol. 84: 573-582.
Cornelissen, J.H.C., Pérez-Harguindeguy, N., Díaz, S., Grime,J.P., Marzano, B., Cabido, M., Vendramini, F. & Cerabolini,B. 1999. Leaf structure and defence control litter decompo-sition rate across species, life forms and continents. NewPhytol. 43: 191-200.
Cornelissen, J.H.C., Lavorel, S., Garnier, E., Díaz, S., Buchmann,N., Gurvich, D.E., Reich, P.B., ter Steege, H., Morgan,H.D., van der Heijden, M.G.A., Pausas, J.G. & Poorter, H.2003. Handbook of protocols for standardised and easymeasuremens of plant functional traits worldwide. Austr. J.Bot. 51: 335-380.
Craine, J.M., Froehle, J., Tilman, D., Wedin, D.A. & Chapin,F.S. III. 2001. The relationships among root and leaf traitsof 76 grassland species and relative abundance along fertil-ity and disturbance gradients. Oikos 93: 274-285.
Cunningham, S.A., Summerhayes, B. & Westoby, M. 1999.Evolutionary divergences in leaf structure and chemistry,comparing rainfall and soil nutrient gradients. Ecol. Monogr.69: 569-588.
Díaz, S. & Cabido, M. 1997. Plant functional types and ecosys-tem function in relation to global change. J. Veg. Sci. 8: 463-474.
Flora Iranica 1963 onwards. Flora des iranischen Hochlandesund der umrahmenden Gebirge von Karl Heinz Rechinger.
Akademische Druck- u. Verlagsanstalt, Graz, AT.Grime, J.P. 1974. Vegetation classification by reference to
strategies. Nature 250: 26-31.Grime, J.P. 1998. Benefits of plant diversity to ecosystems:
immediate, filter and founder effects. J. Ecol. 86: 902-910.Grime, J.P. 2001. Plant strategies, vegetation processes, and
ecosystem properties. John Wiley & Sons, Chichester, UK.Grime, J.P. & Hunt, R. 1975. Relative growth rate: its range and
adaptive significance in a local flora. J. Ecol. 63: 393-422.Grime, J.P., Hodgson, J.G. & Hunt, R. 1988. Comparative plant
ecology. Unwin Hyman, London, UK.Grime, J.P., Cornelissen, J.H.C., Thompson, K. & Hodgson,
J.G. 1996. Evidence of a causal connection between anti-herbivore defence and the decomposition rate of leaves.Oikos 77: 489-494.
Grime, J.P., Thompson, K., Hunt, R., Hodgson, J.G., Cornelissen,J.H.C., Rorison I.H., Hendry, G.A.F., Ashenden, T.W.,Askew, A.P., Band, S.R., Booth, R.E., Bossard, C.C.,Campbell, B.D., Cooper, J.E.L., Davison, A., Gupta, P.L.,Hall, W., Hand, D.W., Hannah, M.A., Hillier, S.H.,Hodkinson, D.J., Jalili, A., Liu, Z., Mackey, J.M.L.,Matthews, N., Mowforth, M.A., Neal, A.M., Reader, R.J.,Reiling, K., Ross-Fraser, W., Spencer, R.E., Sutton, F.,Tasker, D.E., Thorpe, P.C. & Whitehouse, J. 1997. Inte-grated screening validates primary axes of specialisation inplants. Oikos 79: 259-281.
Grubb, P.J. 1985. Plant populations and vegetation in relation tohabitat, disturbance and competition: Problems of generali-sation. In: White, J. (ed.) The population structure of veg-etation, pp. 595-621. Junk Publishers, Dordrecht, NL.
Grubb, P.J. 1998. A reassessment of the strategies of plantswhich cope with shortages of resources. Perspect. PlantEcol. Evolut. Syst. 1: 3-31.
Harper, J.L. 1982. After description, pp. 11-25. In: Newman,E.I. (ed.) The plant community as a working mechanism.Blackwell, London, UK.
Hector, A., Schmid, B., Beierkuhnlein, C., Caldeira M.C.,Diemer, M., Dimitrakopoulos, P.G., Finn, J.A., Freitas, H.,Giller, P.S., Good, J., Harris, R., Hogberg, P., Huss-Danell,K., Joshi, J., Jumpponen, A., Korner, C., Leadley, P., Loreau,M., Minns, A., Mulder, C.P.H., O’Donovan, G., Otway,S.J., Pereira, J.S., Prinz, A., Read, D.J., Scherer-Lorenzen,M., Schulze, E.-D., Siamantziouras, A.S.D., Spehn, E.M.,Terry, A.C., Troumbis, A.Y., Woodward, F.I., Yachi, S. &Lawton, J.H. 1999. Plant diversity and productivity experi-ments in European grasslands. Science 286: 1123-1127.
Hendry, G.A.F. & Grime, J.P. 1993. Methods in comparativeplant ecology. Chapman and Hall, London, UK.
Herms, D.A. & Mattson, W.J. 1992. The dilemma of plants: togrow or defend. Quart. Rev. Biol. 67: 293-335.
Hobbie, S.E. 1992. Effects of plant species on nutrient cycling.Trends Ecol. Evol. 7: 336-339.
Hodgson, J.G., Wilson, P.J., Hunt, R., Grime, J.P. & Thompson,K. 1999. Allocating C-S-R plant functional types: a softapproach to a hard problem. Oikos 85: 282-294.
Hooper, D.U. & Vitousek, P.M. 1997. The effects of plantcomposition and diversity on ecosystem processes. Science277: 1302-1305.
Hunt, R. & Cornelissen, J.H.C. 1997. Components of relative

304 Díaz, S. et al.
growth rate and their interrelations in 59 temperate plantspecies. New Phytol. 135: 395-417.
Jongman, R.H.G., ter Braak, C.J.F. & van Tongeren, O.F.R.1987. Data analysis in community and landscape ecology.Pudoc, Wageningen, NL.
Lambers, H. & Poorter, H. 1992. Inherent variation in growthrate between higher plants: a search for physiological causesand ecological consequences. Adv. Ecol. Res. 23: 187-261.
Lamont, B.B., Groom, P.K. & Cowling, R.M. 2002. High leafmass per area of related species assemblages may reflectlow rainfall and carbon isotope discrimination rather thanlow phosphorus and nitrogen concentrations. Funct. Ecol.16: 403-412.
Lavorel, S. & Garnier, E. 2002. Predicting changes in commu-nity composition and ecosystem functioning from planttraits – revisiting the Holy Grail. Funct. Ecol. 16: 545-556.
Lepš, J., Brown, V.K., Len, T.A.D., Gormsen, D., Hedlund, K.,Kailova, J., Korthals, G.W., Mortimer, S.R., Rodriguez-Barrueco, C., Roy, J., Regina, I.S., van Dijk, C. & van derPutten, W.H. 2001. Separating the chance effect from otherdiversity effects in the functioning of plant communities.Oikos 92: 123-134.
Levine, J., Vilá, M., D’Antonio, C., Dukes, J., Grigulis, K. &Lavorel, S. 2003. Mechanisms underlying the impacts ofexotic plant invasions. Proc. R. Soc. Lond. Ser. B 270: 775-781.
Loreau, M., Naeem, S., Inchausti, P., Bengtsson, J., Grime, J.P.,Hector, A., Hooper, D.U., Huston, M.A., Raffaelli, D.,Schmid, B., Tilman, D. & Wardle, D.A. 2001. Biodiversityand ecosystem functioning: current knowledge and futurechallenges. Science 294: 804-808.
MacGillivray, C.W., Grime, J.P. and the ISP team. 1995. Test-ing predictions of resistance and resilience of vegetationsubjected to extreme events. Funct. Ecol. 9: 640-649.
McNaughton, S.J., Oesterheld, M., Frank, D.A. & Williams,K.J. 1989. Ecosystem-level patterns of primary productiv-ity and herbivory in terrestrial habitats. Nature 341: 142-144.
Mooney, H.A. 1972. The carbon balance of plants. Annu. Rev.Ecol. Syst. 3: 315-346.
Pérez-Harguindeguy, N., Díaz, S., Cornelissen, J.H.C.,Vendramini, F., Cabido, M. & Castellanos, A. 2000. Chem-istry and toughness predict leaf litter decomposition ratesover a wide spectrum of functional types and taxa in centralArgentina. Plant Soil 218: 21-30.
Pérez-Harguindeguy, N., Díaz, S., Vendramini, F., Cornelissen,J.H.C., Gurvich, D.E. & Cabido, M. 2003. Leaf traits andherbivore selection in the field and in cafeteria experiments.Aust. Ecol. 28: 642-650.
Ramenskii, L.G. 1938. Introduction to the geobotanical study ofcomplex vegetations. Selkozgiz, Moscow, RU.
Reich, P.B., Walters, M.B. & Ellsworth, D.S. 1997. Fromtropics to tundra: Global convergence in plant functioning.Proc. Natl. Acad. Sci. U.S.A. 94: 13730-13734.
Soltis, P.S., Soltis., D.E. & Chase, M.W. 1999. Angiospermphylogeny inferred from multiple genes as a tool for com-parative biology. Nature 402: 402-404.
Spehn, E.M., Joshi, J., Schmid, B., Diemer, M. & Körner, C.2000. Above-ground resource use increases with plant
species richness in experimental grassland ecosystems.Funct. Ecol. 14: 326-337.
Stace, C. 1991. The New Flora of the British Isles. Cambridge,University Press, Cambridge, UK.
Thompson, K., Band, S.R. & Hodgson, J.G. 1993. Seed size andshape predict persistence in soil. Funct. Ecol. 7: 236-241.
Thompson, K., Parkinson, J.A., Band, S.R. & Spencer, R.E.1997. A comparative study of leaf nutrient concentrationsin a regional herbaceous flora. New Phytol. 136: 679-689.
Tilman, D., Reich, P.B., Knops, J., Wedin, D.A., Mielke, T. &Lehman, C. 2001. Diversity and productivity in a long-termgrassland experiment. Science 294: 843-845.
Vendramini, F., Díaz, S., Pérez-Harguindeguy, N., Cabido, M.,Llano-Sotelo, J.M. & Castellanos, A. 2000. Composiciónquímica y caracteres foliares de distintos tipos funcionalesde plantas del centro-oeste de Argentina. Kurtziana 28:181-193.
Vitousek, P.M., Mooney H.A., Lubchenko J. & Melillo J.M.1997. Human domination of the earth’s ecosystems. Science277: 494-499.
Wardle, D.A., Barker, G.M., Bonner, K.I. & Nicholson, K.S.1998. Can comparative approaches based on plantecophysiological traits predict the nature of biotic interac-tions and individual plant species effects in ecosystems? J.Ecol. 86: 405-420.
Weiher, E., van der Werf, A., Thompson, K., Roderick, M.,Garnier, E. & Eriksson, O. 1999. Challenging Theophrastus:A common core list of plant traits for functional ecology. J.Veg. Sci. 10: 609-620.
Westoby, M. 1998. A leaf-height-seed (LHS) plant ecologystrategy scheme. Plant Soil 199: 213-227.
Westoby, M., Falster, D.S., Moles, A.T., Vesk, P.A. & Wright,I.J. 2002. Plant ecological strategies: some leading dimensiosof variation between species. Annu. Rev. Ecol. Syst. 33:125-160.
Wright, I.J. & Westoby, M. 2002. Leaves at low versus highrainfall: coordination of structure, lifespan and physiology.New Phytol. 155: 403-416.
Zuloaga, F.O. & Morrone, O. 1996. Catálogo de las PlantasVasculares de la República Argentina I. Monogr. Syst. Bot.Mo. Bot. Gard. 60: 1-323.
Zuloaga, F.O. & Morrone, O. 1999. Catálogo de las PlantasVasculares de la República Argentina II. Monogr. Syst. Bot.Mo. Bot. Gard. 74: 1-1269.
Zuloaga, F.O., Nicora, E.G., Rúgolo de Agrasar, Z.E., Morrone,O., Pensiero, J. & Cialdella, A.M. 1994. Catálogo de laFamilia Poaceae en la República Argentina. Monogr. Syst.Bot. Mo.Bot. Gard. 47: 1-178.
Received 12 March 2003;Accepted 26 December 2003.
Co-ordinating Editor: G. Rapson.
For App. 1, see JVS/AVS Electronic Archives;www.opuluspress.se/pub/archives/index.htm