Embed Size (px)
Citation preview

The realisation of the participation society. Welfare state reform in the Netherlands: 2010-2015
Lei Delsen
Creating knowledge for society
Nijmegen, August 2016NiCE16-02
Working paper

1
The realisation of the participation society. Welfare state reform in the
Netherlands: 2010-2015
Lei Delsen
Radboud University, Institute for Management Research, Department of Economics,
Thomas van Aquinostraat 5, 6525 GD Nijmegen, The Netherlands. [email protected]
Abstract
The main research question that will be answered in this paper is in which direction the
social protection system in the Netherlands is evolving and how this evolution of the Dutch
social protection system is influenced by economic forces and economic reasoning? In
answering this question attention is paid to the impact of the Economic and Monetary Union,
the aging of the Dutch population, and the impact of the recent economic crisis. Facts and
figures for the 2010-2015 period concerning the evolution of the Dutch economy and social
protection, are compared with the previous trends. The major recent reforms in health
insurance, long-term care insurance, social support and social assistance, and the pension
system are reviewed. A policy outlook concludes the paper.
An earlier version of this paper was presented at the fifth conference “The State of the
Welfare State in EU anno 1992 and 20 years later”, organised by the Research Institute for
Work and Society (HIVA) of the Catholic University of Leuven for and in collaboration with
the European Centre for Workers' Questions (Europäisches Zentrum für Arbeitnehmerfragen,
EZA), Leuven, 19-20 October 2015. Helpful comments from Jozef Pacolet are gratefully
acknowledged.

2
1. Introduction
The main research question that will be answered in this paper is in which direction the social
protection system in the Netherlands is evolving and how this evolution of the Dutch social
protection system is influenced by economic forces and economic reasoning? In answering
this question attention is paid to the impact of the Economic and Monetary Union (EMU), the
aging of the Dutch population, and the impact of the recent economic crisis. This paper
updates the report on welfare state reform in the Netherlands (Delsen, 2012) for the fourth
(2010) conference ‘The State of the Welfare State in EU anno 1992 and 15 years later’.
Special attention is paid to the pension system and the curative health care and long-term care
insurances. Facts and figures for the 2010-2015 period concerning the evolution of Dutch
social protection are compared with the previous trends.
The structure of the paper is as follows. In Section 2 the macro-economic trends and its
relation with fiscal policy over the past decade are pictured. Also some macro data on Dutch
social security expenditure and labour market developments are presented and related to fiscal
policy and the crisis. The subsequent sections review the contents of some major reforms in
the Dutch welfare state arrangements over the past years. Section 3 pictures the first steps
towards a participation society taken after the turn of the century, and positions it within the
models developed by Titmuss and Esping-Anderson. Section 4 deals with recent reforms in
curative health care, long-term care, social support and social assistance, implying the
political realisation of the participation society. Pension and early retirement reforms are
addressed in Section 5. A policy outlook concludes the paper.
2. Macro-economic context and public finance
2.1 Economic growth
The growth rates of the Dutch economy show considerable fluctuations: periods of above EU
average economic growth are succeeded by periods of below EU average economic growth
(See Figure 1). Part of these fluctuations is caused by procyclical fiscal policy and pension
policy. In the past decade austerity measures have been taken to secure financial
sustainability, to save the Dutch welfare state and to reduce the public deficit and public debt.
In 2003 the Stability and Growth Pact (SGP) obliged to implement an austerity program,
while the Dutch economy was still weak. In reaction to the public wages and benefit freeze in
2004 and 2005, the increase in pension contributions to restore funding ratios of pension

3
funds, and the uncertainties accompanying the announced reform by the Balkenende II
administration of the health care sector and the pension reform Dutch citizens increased their
private savings to compensate the smaller public safety net. In the report to the third EZA
conference in 2005 (Delsen, 2006) it was concluded that this is part of the explanation why
the Netherlands experienced the longest recession since World War II in 2002 and 2003.
The Dutch economy was hit hard by the 2008 financial and economic crisis; the economy
shrank by 3.8% in 2009 (See Figure 1). To safeguard the stability of the financial system the
banks Fortis Nederland and ABN Amro were nationalised (costs € 16.8 billion) in 2008,
followed by SNS Reaal (costs € 3.7 billion) in 2013. Eventually the shares will be sold
again. In 2009 and 2010, the Balkenende IV cabinet together with the Provinces and
municipalities spend nearly € 7.5 billion to stimulate employment, construction, the housing
market and a sustainable economy.
Figure 1: Growth of the volume of gross domestic product in the Netherlands, 2000-2016
(%)
Source: CPB (2015).
It was also agreed that a start will be made on restoring public finances in 2011 provided there
is sufficient economic growth. The Dutch Government responded to the crisis in line with the
Reinhart and Rogoff (2010) paper stating that a high debt is detrimental to economic growth
and countries seldom grow out of their debt. From 2011, the Rutte I cabinet introduced
significant cuts in expenditure, a wage freeze in the public sector, and tax increases. The total
savings package of the two cabinets-Rutte for the period 2011-2017 amounts to € 54 billion,
to meet the budgetary target imposed by EMU. Calculations by the International Monetary
-4
-3
-2
-1
0
1
2
3
4
5
2000 2001 2002 2003 2004 2005 2006 2007 2008 2009 2010 2011 2012 2013 2014 2015 2016

4
Fund show that the fiscal multipliers of the planned fiscal consolidation during the crisis were
underestimated for both sides of the fiscal balance. Stronger planned fiscal consolidation has
been associated with lower growth rates than expected (Blanchard and Leigh, 2013). The
Dutch economy has been in three recessions (triple dip) over the past years (2009, 2012 and
2013) (See Figure 1). The austerity policy exacerbated the recessions, and partly explains why
Dutch economic growth lagged behind in the euro area in 2012 and 2013, and the poor
performance relative to neighbouring countries. Estimates by the CPB Netherlands Bureau for
Economic Policy Analysis (CPB) show that austerity policies will reduce annual economic
growth by 0.3-0.4%-points between 2011 and 2017. In 2015 the economy is recovering. CPB
estimates the Dutch economy to grow by 2.0% in 2015 and 2.4% in 2016 (See Figure 1). This
GDP growth is mainly caused by domestic expenditures. A procyclical tax reduction of € 5
billion for employed person is planned for 2016, the year before the next national elections.
2.2. Public finance
In 1993 the debt-to-GDP ratio reached its peak (78%). Above EU average economic growth
between 1994 and 1999 reduced it considerably. In 2000 the ratio was 51.4% and 42.4% in
2007 (See Figure 2). In 2000 the Scientific Council for Government Policy (WRR, 2000)
plead for an accelerated repayment of the public debt. In the same year, the purple Kok I
cabinet announced to pay off the public debt in 25 years time. Paying off the full public debt
in one generation was also the aim of the various Balkenende cabinets between 2002 and
2010 to finance the increasing costs accompanying demographic aging (Delsen, 2009). From
the ‘formula of Domar’ (Domar, 1944) it can be derived that the SGP implies that the EMU
norm for the public-debt-to-GDP ratio is set at 0% instead of 60%. It will require long periods
of budget surpluses.
Figure 2: Gross debt general government, 2000-2016 (% of GDP)
40
45
50
55
60
65
70
2000 2001 2002 2003 2004 2005 2006 2007 2008 2009 2010 2011 2012 2013 2014 2015 2016
5
Source: CPB (2015).
Also the Rutte cabinets consider paying off the public debt as a form of saving, necessary for
sustainable public finances in the long run (aging, old age pension, health care costs) and to
prevent a burden on posterity. The Netherlands has significantly improved long-term fiscal
sustainability by mitigating aging-related pressures on public budgets. Pension reforms have
more than halved projected pension-related increases in public expenditure (OECD, 2014).
The policy reaction to address the financial and economic crisis caused a sharp deterioration in
public finances. The public debt passed the upper limit of 60% in 2011, reached its peak in
2014 (67.9%) and is estimated to decrease to 66.4% in 2015 and 64.5% in 2016, partly due to
the business cycle, fiscal policy, and the selling (at a loss) of shares in ABN Amro (See
Figure 2). A public debt of zero is unwise (Delsen, 2009). To emerge stronger from an
economic crisis extra investments are required. When a higher deficit or debt results in more
and improved human and physical capital and basic and fundamental research to acquire new
knowledge, it generates (more) economic growth in the future. Debt financing is no problem,
for interest payments and redemption can be funded from the additional tax revenue. The
currently low interest rates allow the Government to borrow cheaply and render more
investments cost effective.
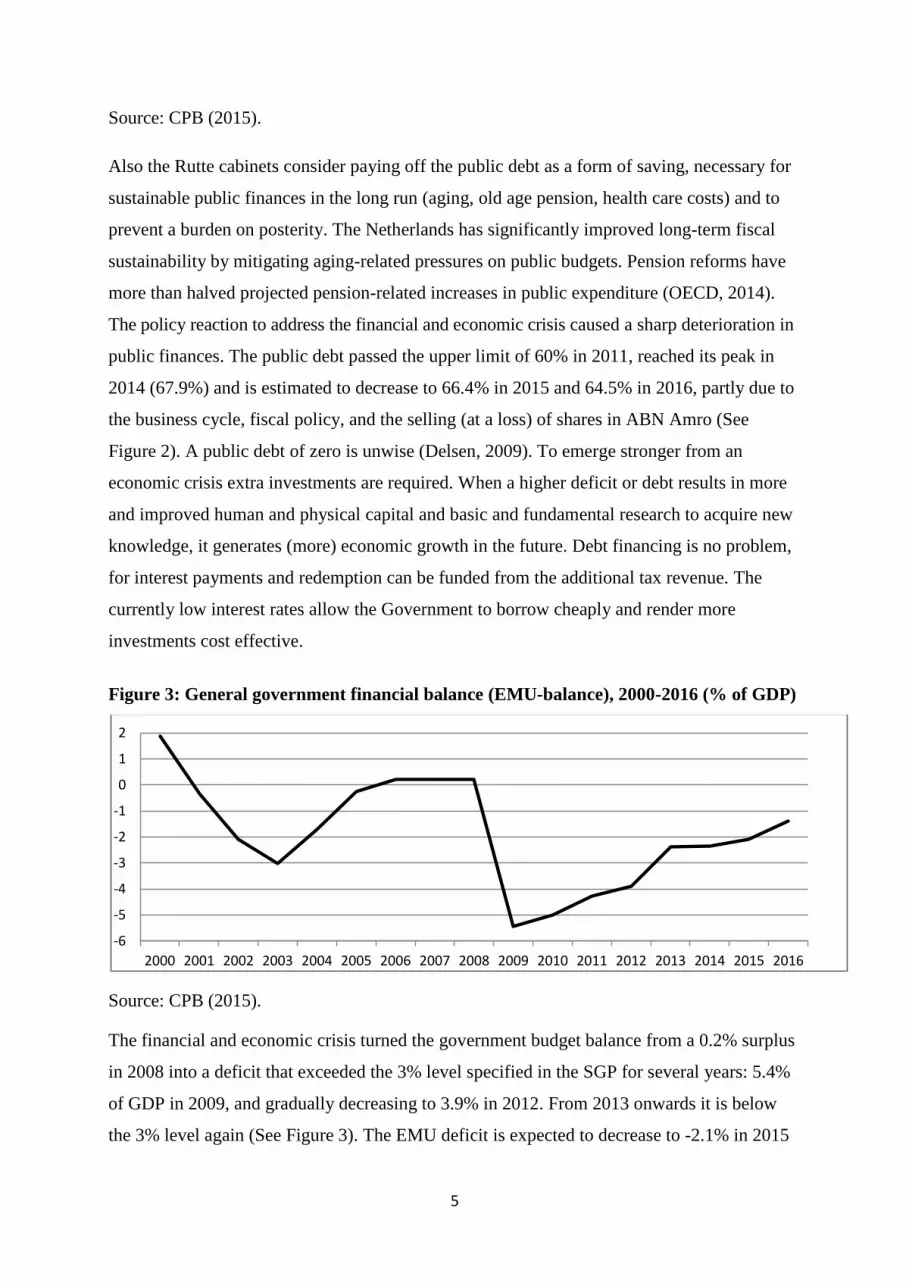
Figure 3: General government financial balance (EMU-balance), 2000-2016 (% of GDP)
Source: CPB (2015).
The financial and economic crisis turned the government budget balance from a 0.2% surplus
in 2008 into a deficit that exceeded the 3% level specified in the SGP for several years: 5.4%
of GDP in 2009, and gradually decreasing to 3.9% in 2012. From 2013 onwards it is below
the 3% level again (See Figure 3). The EMU deficit is expected to decrease to -2.1% in 2015
-6
-5
-4
-3
-2
-1
0
1
2
2000 2001 2002 2003 2004 2005 2006 2007 2008 2009 2010 2011 2012 2013 2014 2015 2016

6
and -1.4% in 2016. The recovering economy, resulting in higher tax income and lower
spending on social benefits, are responsible for the estimated drop of the financial deficit.
2.3 Social security and labour market
Dutch welfare state reform is heavily influenced by periods of growth and stagnation. In 1982
fiscal consolidation and social security reform was started by the first Lubbers administration,
and has continued by the two Kok cabinets, the four Balkenende cabinets and as well until
this day by the Rutte I and II administrations. Dutch Coalition Agreements 1982-2012 show
continuity in policy issues: control of collective expenditure, reduction of budget deficit and
activating labour market and social security policies. Fiscal consolidation was and still is
pursued to create room to manage the expected costs related to the aging of the Dutch
population, as well as for the operation of automatic fiscal stabilisers related to EMU
membership. Cutting taxes and social security contributions to alleviate the collective burden
and bolster employment are part of this. At the beginning of the 1980s social security
expenditure as a percentage of GDP was around 19%. It dropped to 10.7% in 2000 (See
Figure 4). Social security expenditure (excluding health care) is an automatic economic
stabiliser: The level of social security expenditure is the mirror image of the business cycle
situation. Slow GDP growth in 2002 and 2003 (See Figure 1) and after the 2008 crisis is
accompanied by an increase in public social security expenditure. Due to the economic
recovery and the strong decrease in unemployment benefits total expenditure on social
security is estimated to decrease from 12.6% of GDP in 2014 to 12.1% in 2016. The
expenditure on old age pensions and disability benefits, as percentage of GDP, showed minor
decreases, partly due to the aging of the Dutch population.
Figure 4: Government expenditure on social security in the Netherlands, 2000-2016 (%
of GDP)
10.0
10.5
11.0
11.5
12.0
12.5
13.0
2000 2001 2002 2003 2004 2005 2006 2007 2008 2009 2010 2011 2012 2013 2014 2015 2016

7
Source: CPB (2015).
In the report to the fourth EZA conference in 2010 it was concluded that the consequences of
the crisis for the Dutch labour market have been limited. It was partly cushioned by the
temporary and agency workers who withdrew from the labour market, the increase in self-
employed without personnel, short-time work and part-time unemployment insurance
(Delsen, 2012). The unemployment rate still is one of the lowest in the EU. According to
Eurostat the seasonally adjusted unemployment rate in the Netherlands was 5.5% in
September 2012, 7.1% in September 2014, and 6.8% in September 2015. In the years after the
crisis, unemployment is underestimated by 15%. The number of unemployed people looking
for a job increased from 318,000 (3.7% of the workforce) in 2008 to 660,000 (7.4% of the
workforce) in 2014 (CPB, 2015). The number of discouraged workers almost doubled from
just over 50,000 in 2008 to almost 100,000 in 2014 (De Graaf-Zijl et al., 2015). Between
2013 and 2018 the budget of the unemployment benefit agency UWV to assist the
unemployed to find a job will be cut by 25% (De Deken and Maarse, 2013). In 2014 the
number of unemployment benefits increased by 2,000 to 438,000 and the number of social
assistance benefits increased by 18,000 to 377,000. A total of 815,000 beneficiaries in 2014.
The new 2015 Participation Act (Participatiewet) (See Section 4.4) is estimated to increase
the volume of social assistance benefits by 8,000 in 2015. The Netherlands is the only EU
country with a general disability programme that does not separate work-injury from no-
work-related injuries. The number of disability beneficiaries reached its peak of almost one
million people in 2003 (See Delsen, 2012). After a decade of decreases, the number of
disability benefits increased for the first time by 2,000 to 810,100 (9% of the labour force) in
2014, suggesting that disability schemes are used as a dismissal device.
Not only the continuous and increasing policy emphasis on workfare and an activating social
security system, also the crisis had distributional consequences. Over the past decade the
proportion of employed people on precarious employment contracts without a fixed
relationship or specified duration, i.e. flexible employment relations (flexibele arbeidsrelaties)
increased from 15% in 2004 to 22% in 2014; a strong increase occurred after 2011. In the
same period the share of self-employed, especially those without staff, increased from 8% to
12%. It increased continuously from 2009. Moonlighting (multiple job holding) increased
from 5.6% of all employed in 2004 to 7.5% in 2014. About half of them take more than one
job to make ends meet (Chkalova et al., 2015). The number of food banks increased from 46

8
in 2006 to 110 in 2008. Also the number of food bank users more than doubled to around
13,000 in 2008. Notable the number of self-employed people requesting help increased
strongly. December 2014 there were 157 food banks with 94,000 users, of which 37,600
children. Although poverty rates fluctuate with the business cycle, the number of poor people
is rather stable, around 1 million people, i.e. 10% of the Dutch population. The poverty rate
among benefit recipients is high (25-30%) and highest among social assistance recipients (40-
45%). The poverty among immigrants from the new EU member states is higher (around
21%) than among non-western immigrants (18%). The poverty rate of employed people is
lower than average and rather stable at 4-5%. Over the past two decades the composition
changed considerably. Within the group of working poor there was a shift from employees
(3%) towards self-employed people (13%). In 2013 the working poor represented over half
(56%) of all poor people. In 2012 this was 43%. This shift is related to the strong growth in
the number of self-employed without personnel. Despite the increasing labour mobility and
the growing number of ‘flexworkers’ job duration is rather stable, nine to ten years. This
indicates a growing segmentation of both internal and external labour markets.
3. The first steps towards a participation society
A welfare state is a country with a democratic constitution, where production is largely
governed by the price mechanism and where the government tries to guarantee its citizens an
acceptable standard of living through a combination of consultation, regulation and activation
of the budget mechanism. Each welfare state is the product of a very specific national history
and culture. Dutch culture is characterised by solidarity and equality. The Dutch welfare state
is founded on solidarity and fairness. The polder model is deeply rooted in the consensus-
oriented culture of the Dutch. A typical Dutch feature is that the government and the social
partners are involved in the preparation, formulation and implementation of policy (Delsen,
2002). According to the tripartite Social and Economic Council (SER, 2006), the main
advisory body on social-economic policy to the Government, labour market and social
security institutions must enable and encourage people to be economically independent. The
Social and Economic Council saw a broad consensus in Dutch society to reform the reactive
and passive Dutch welfare state into a more proactive and activating welfare state. The
welfare state is to be replaced by a participation society. In such a society involvement is
central. All Dutch citizens have the right to develop their talents and the duty to use those
talents in the service of society. Those involved have a responsibility and must take an active
attitude. An activating participation society requires a labour market that is sufficiently

9
flexible to adapt to changing circumstances. In this approach work security (employability)
rather than job security is central (SER, 2006).
Figure 5: From welfare state to participation society
Welfare state reform in the Netherlands 2003-Lei Delsen
Centralisation
Collective
responsibility
Individual
responsibility
Decentralisation
Social-democratic Liberal
Corporatist Charity
Source: De Mooij, 2006, adapted.
Titmuss (1974) distinguishes three models of social policy: the residual welfare model, the
industrial achievement-performance model, and the institutional redistributive model. These
three models of social policy largely correspond with the three typologies of welfare state
design in Europe by Esping-Andersen (1990): the liberal, the corporatist, and the social-
democratic welfare states (See Figure 5). Esping-Andersen puts the Dutch welfare state in the
corporatist model, while Sapir (2006) considers the Netherlands to be part of the Nordic
model. The Dutch welfare state indeed is a hybrid model. In the middle of the 2000s it may
best be characterised on the left hand side of Figure 5, somewhere between the social-
democratic and the corporatist welfare state. Past reforms, however, also contain elements of
the liberal welfare state, i.e. privatisation of the social security and the introduction of the
market in the provision of social protection as well as reforms that emphasise individual
responsibility (De Mooij, 2006). Since the 1980s allocation has become the core aim in Dutch
economic policy and public finance. Stabilisation and (re)redistribution have received less
policy attention. There has been a shift in Netherlands from a model based on equality and
collective solidarity to a model based on freedom of choice and individual responsibility.
Universal rights remained intact, but access has become increasingly selective and

10
conditional. Reports for previous EZA conferences also show more emphasis being put on
activation (See Delsen, 2006; 2012). The shift from welfare to workfare implies a move to the
right in Figure 5. Workfare was introduced in the social assistance in 1990. The sickness and
disability insurances were privatised in 1996 and 1998. Financial risks have been shifted
towards firms through experience rating. From 2004, employers are fully accountable for
absence due to sickness during the first two years. In 2004 in the social assistance (Wet Werk
en Bijstand, WWB) passive income support was replaced by activating income support and
labour participation; ‘suitable work’ was replaced by ‘general accepted work’. In 2006
disability reform introduced a distinction between partially incapacitated individuals
(workfare) and wholly and permanently incapacitated persons (welfare).
Moreover, decentralisation from the central to the local level took place. In 2004 social
assistance (WWB) and in 2007 social support services (Wet Maatschappelijke Ondersteuning,
WMO) became the responsibility of municipalities. Over the past years the number of
earmarked grants from the central government to the municipalities was reduced substantially,
while the general grants to municipalities (spending autonomy) were considerably increased.
The contrast between decentralisation and centralisation is a classic public administration
problem. The efficiency and effectiveness arguments in favour of decentralisation can also be
used as reasons to centralise. So (de)centralisation will always be based on political
arguments. Decentralisation of responsibility to the local governments allows customising and
tailors made solutions. However, it also implies that each municipality has to invent the wheel
again, and incurs policy development costs. Copying a policy (best practices) from another
municipality avoids these development costs, but also renders it more difficult to tailor to
specific local conditions. Also the decreasing number of Dutch municipalities and its
increasing scale reduce the customisation possibilities. Municipalities have a financial
incentive to discourage participation in schemes and programmes. In addition, there will be
more legal inequality, unequal treatment of equal cases between municipalities.
The fundamental reforms of the various welfare state arrangements, especially in the health
care system (Zorgverzekeringswet, Zvw) in 2006 and in social support (WMO) in 2007 imply
a further shift away from the Rhineland model in the direction of the Anglo-Saxon model.
These reforms put even more emphasis on competition, decentralisation from central
government to municipalities, and on individual responsibility, and imply a further move to
the right and to the bottom of Figure 5. The promotion of civil society by various

11
governments fits in here. Increasingly responsibilities have been put in the hands of the
people to take care of themselves. If they cannot people are entitled by law to income support,
social support and help in finding work for as long as necessary. Also consequences of the
Anglo-Saxon model were ‘imported’: discouraged workers, moonlighting and working poor
became policy issues (See Section 2.3). The first food bank was established in Rotterdam in
2002. Moreover, WMO expects people to take care of others and support others. The lower-
right quadrant reflects societies before welfare states were founded. In this world the state
involvement is absent and solidarity is organised in small communities and via private
charity.
The 2007 WMO, often called the ‘participation act’, represented an important step in the
transition of the Dutch welfare state towards a participation society. Government and
professional support act as a last resort. People must take responsibility for their own future
and create their own social and financial safety nets. The underlying idea of the participation
society is one in which people decrease their dependency on state provision and instead
become self-sufficient or dependent on family and community solidarity. The participation
society is therefore not the same as the abolition of the welfare state, but stands for a different
distribution of collective and individual responsibilities. It resembles Titmuss’s residual
welfare model based on the principle of assistance, i.e. a social security net. Family and the
private market is core. Government is a last and temporary resort, when the private market
and the family fall short. Central aim of the residual welfare model is to teach people how to
do without it (Titmuss, 1974). The Dutch government encourages active citizenship by
appealing to negative feelings and emotions about failure to participate more actively in
society. Participation is a duty, citizens should feel bad if they do not do the ‘normal’ thing,
and feel ashamed for being passive and leaving too much to the already overburdened
government (See Verhoeven and Tonkens, 2013).
King Willem-Alexander’s Speech from the Thrown (17 September 2013) signals the formal
political aim of the Rutte II administration to transform the Dutch welfare state into a
participation society: “It is an undeniable reality that in today's network and information
society people are both more assertive and more independent than in the past. This combined
with the need to reduce the budget deficit, means that the classical welfare state is slowly but
surely evolving into a participation society. Everyone who is able will be asked to take
responsibility for their own lives and immediate surroundings.” The present Dutch welfare

12
state schemes are considered to be unsustainable and outdated. “In today's world, people want
to be able to make their own choices, manage their own lives and take care of one another.”
To achieve this, the government will decentralise public services towards the municipalities.
In that Speech far reaching reforms were announced in among others long-term care, youth
care, welfare, and work. These reforms will be addressed in the following Section 4.
4. Health care system reform
4.1 From three to four compartments
Up to 2007 the Dutch health care system consisted of three separate compartments, each of
which had its own method of financing and regulation (See Table 1). Compartment 1
comprises long-term care regulated by the Exceptional Medical Expenses Act (Algemene Wet
Bijzondere Ziektekosten, AWBZ). Compartment 2 concerns basic curative care regulated by
the universally compulsory Health Insurance Act (Zorgverzekeringswet, Zvw) from 2006. For
the time being compartment 3 only concerns voluntary supplementary private health
insurance additional to Zvw. Voluntary supplementary long-term care insurance is
announced. In 2007 a fourth ‘support’ compartment was added. Parts of the AWBZ (home
help, transport, facilities for the disabled and meals on wheels) were shifted to the new Social
Support Act (Wet Maatschappelijke Ondersteuning, WMO) and became the responsibility of
the local authorities (See Table 1). Not all long-term care was covered by the AWBZ; also
after 2007 the AWBZ still covered some curative and rehabilitative care.
Table 1: Four compartments of the Dutch health care sector AWBZ (care) Wmo (support)
(2007)
ZVW (cure) (2006) Voluntary
supplementary
insurance
Long-term care Assistance, personal
care, nursing care,
treatment, stay in an
institution
Home help Some medical device
Social services in
long-term care
context
Meals on wheels,
home adjustment,
transport
Non-long-term care Maternity care,
rehabilitation in a
nursing home or at
home, temporary
care
Many social
services
Health care Dental care,
physiotherapy,
cosmetic
treatments
Source: Mot (2010), adapted.
The proportion of Dutch people that choose a supplementary health insurance dropped from
93% in 2006 to 83% in 2013. In 2013 in the lowest income group 28% had no supplementary

13
health insurance; in the higher income groups this was 14%. In health care, steps are taken to
rationalise the basic health package, enhance the gate-keeping role of primary-care doctors,
strengthen incentives for health insurers to develop cost-effective purchases of health
services, lower spending on medicines as well as boost savings in the hospital sector (OECD,
2014). Further austerity of the benefit package is called for by the Minister of Health in 2013
(See De Deken and Maarse, 2013). Limiting standard health package will imply that
supplementary health insurance will become more important.
Table 2: Development of the annual compulsory personal excess for basic health
insurance package, Health Insurance Act (Zvw), 2006-2016
2006* 2007* 2008 2009 2010 2011 2012 2013 2014 2015 2016
€ 255 € 255 € 150 € 155 € 165 € 170 € 220 € 350 € 360 € 375 € 385
* No claim rebate.
Over the past decade private contributions to health care and long-term care (compulsory
excess, income and wealth-tested co-payments, coinsurance) have been introduced or
increased. For example, the compulsory personal excess in the Zvw more than doubled to €
385 in 2016 (See Table 2). In 2008 the total amount of compulsory excess was € 1.4 billion,
in 2014 € 3.1 billion (Van Strien and Bagheloe-Datadin, 2015). Total costs of health care
gradually increased from 11.7% of GDP in 2001, 13.1% in 2006 to an estimated 15.6% of
GDP in 2013 (CBS, 2014). These Statistics Netherlands data include private expenditure on
health care, e.g. child care, voluntary excess and supplementary insurance.
Between 1980 and 2000 total public health care expenditure as a percentage of GDP was
rather stable and well under control compared to the EU average. The macro expenditure
ceiling caused waiting lists (Delsen, 2006). Around 2000 an increase in expenditure occurred,
caused by the elimination of the waiting lists. The latter was accomplished around 2005 (See
Figure 6). The total public expenditure increase from 6.6% of GDP in 2005 to 8.0% of GDP
in 2006 was mainly related to the abolishment of the voluntary private health insurance and
the compulsory Sickness Fund Act (Ziekenfondswet, ZFW) that covered medical costs, and
the replacement by the compulsory national Zvw. Zvw contributions are fully seen as part of
the collective tax and premium burden, while the private health contributions are not. In 2000
AWBZ expenditure was 2.9% and Zvw 2.7% of GDP. In 2006 Zvw expenditure (4.3%)
surpassed AWBZ (3.6%) expenditure. Also after 2006, Zvw expenditure continued to rise

14
stronger than AWBZ expenditure. The limited increase in AWBZ expenditure is partly related
to the shift of social support from the AWBZ to the WMO in 2007 (See Figure 6).
Figure 6: Collectively financed expenditure on health care (Zvw), long-term care
(AWBZ) and social support (WMO) in the Netherlands, 2000-2016 (% of GDP)
Source: CPB (2015).
Over the past decade productivity increased strongly in Dutch curative health care. Related to
long-term care evidence for the end of Baumol’s disease is mixed. Productivity increases
mainly resulted in an increase in the volume of care and not in lower care expenditure
(Trienekens et al., 2012).The strong estimated drop in AWBZ expenditure in 2015 and 2016
is related to the 2015 reform of long-term care. On 1 January 2015 the AWBZ disappeared
and was divided into the Long-term care act (Wet Langdurige Zorg, WLZ), the WMO, the
Zvw, and the Youth Act (Jeugdwet). The next sections review these changes in health care
and long-term care in more detail.
4.2 Curative health care
The 2006 Zvw implied that instead of being managed primarily by the government, it is the
private health insurance market which is responsible for providing a legally fixed standard
package of curative health insurance to all Dutch citizens. Everybody older than 18 years has
to pay a nominal health care contribution (€ 1097 in 2014; € 1211 in 2015) to the care
insurance company. The government pays the nominal contribution for children under the age
of 18. In addition to the nominal premium all persons earning an income (wage, social
0
1
2
3
4
5
6
7
8
9
10
20
00
20
01
20
02
20
03
20
04
20
05
20
06
20
07
20
08
20
09
20
10
20
11
20
12
20
13
20
14
20
15
20
16
Total Zvw AWBZ Wmo

15
security benefit, profit or freelance earnings) have to pay an earning dependent contribution
for health insurance to the government. Hence, also younger persons below age 18 with an
income have to pay this income-related contribution levied and collected by the tax collector.
In 2009 the premium was 6.9%; in 2015 6.95%. The income-related contribution is calculated
as a percentage of the so-called ‘contribution income’ up to a maximum. This maximum was
€ 32,369 in 2009 and increased to € 51,414 in 2015. The Government also guarantees access
to health care for undocumented immigrants. In 2006 contributions covered 93% of the Zvw
expenditure and 87% in 2014. The proportion covered by private payments increased from
5% to 7%. The percentage covered by taxes increased from 3% to 6% (Van Strien and
Bagheloe-Datadin, 2015). A health care allowance (zorgtoeslag) ensures affordability for
everyone. It limits the premium to 5% of the total income (De Deken and Maarse, 2013).
Since its introduction in 2006 over 5 million citizens (about two thirds of all insured people)
receive this income dependent subsidy. Total expenditure rose from € 2.5 billion in 2006 to €
5.1 billion in 2013. As a result of the lowering of the earning dependent contribution and the
austerity of the allowance expenditure dropped to € 4 billion in 2014. Also the number of
recipients decreased in 2014 relative to 2013 (Van Strien and Bagheloe-Datadin, 2015). In
2015 the health care allowance was again reduced.
The introduction of more market forces in health care had already been proposed by the
Dekker Commission in its 1987 advice Bereidheid tot verandering and was adopted by the
successive cabinets Lubbers (1988-1994). As a solution to too many rules and bureaucracy,
lack of efficiency and insufficient responsiveness to changes and diverging needs of the
population. Also a national insurance was proposed. In 1998 the Kok II administration
announced – related to population aging – far-reaching long-term changes in the national
health insurance system. The OECD (2000: 105) concluded that introduction of the market
mechanism in health care may conflict with the principle of equity or equality of treatment,
and even their effectiveness is not always proven. In a 2001 document the Kok II cabinet
concluded there is a large consensus for a transformation of the centralised and supply driven
system into a decentralised and demand-driven system (Ministry of VWS, 2001). This is one
of the core elements of the Zvw. The policy report followed the tripartite Social and
Economic Council (SER, 2000) recommendation to replace the existing different types of
health care insurance by one single health care insurance for the entire population. This was
seen as a necessary condition for a proper working of a system of managed health care
competition. In 2003 the Balkenende II administration announced its intention to introduce a

16
compulsory standard insurance policy for everyone. The ultimate aim was to move towards a
system of managed competition by 2006, with the effective degree of regulation and
competition varying among different sectors (OECD, 2002: 110-113).
According to the Euro Health Consumer Index (EHCI) based on surveys among patients the
Dutch health care system is the best in the EU. Explanations for this success are the system of
the private health insurance market (competition), the primary-care doctor as a gatekeeper and
the relatively high degree of patient organisation. Solidarity, universal access, equal treatment
and good quality of health care services are the main goals of Dutch health care. Advocates of
this demand driven managed competition system argued that competition among private
insurers would reduce health care spending, enhance consumer choice, and improve the
quality of care. Dutch experience is different. Competition has not sharply slowed the rate of
growth in health care spending (See Figure 6). It produced high administrative costs for
providers and complexity (Delsen, 2006; 2012; Okma, Marmor and Oberlander, 2011; Schut,
Sorbe and Høj, 2013; De Deken and Maarse, 2013). This does not come as a surprise, for the
new Dutch health care system shows great similarity with the health care system in the United
States. The demand driven system of managed competition incorporates market failures.
OECD Health Statistics show that in 2013, public health spending as a share of GDP in the
Netherlands was the highest in the OECD. Total health care expenditure was the second
highest, after the United States (OECD, 2015). Based on objective measures the quality of the
Dutch health care is slightly above the OECD average.
A condition sine qua non for the health reform to meet its objectives is that Dutch citizens are
critical clients that annually choose the care insurer and put pressure on insurers to deliver
better value services. The expansion of consumer choice has not worked as envisioned. Also
this does not come as a surprise. Behavioural economics predicts that only few participants
will choose another insurance provider. The vast majority remains with the same provider
also when leading to a lower financial result. Furthermore, inequality will increase. The
experience with the Zvw confirms this. Between 2009 and 2014 the mobility of insured
persons has fluctuated between 3.3% and 7.2%. Since the introduction of the Zvw in 2006,
three quarters of the insured persons did not yet switch. Insured persons who have changed
relatively little have high care costs, are relatively old and often live in the more sparsely
populated areas of the country. Young people and healthy persons change more frequently
(KPMG, 2014). The experience with health insurance policies shows that, although risk
selection in the Zvw is prohibited, young people and high-skilled workers through tricks for

17
the same policy get more favourable conditions than older people and low-skilled workers.
The solidarity is undermined (de Volkskrant, 5 December 2014). Moreover, there is a
substantial increase in the number of insured persons failing to pay their insurance premiums.
Around 2000, roughly 1.5% of the Dutch population had no health insurance. Recent data
from Statistics Netherlands show an increase in the number of nonpayers from 1.9% in 2010
to 2.2% in 2014. This may be related to the increase of contributions and the compulsory
excess and the cut of the health care allowance.
Market failures imply that in addition to competition other measures are needed to control
health care costs (Schut, Sorbe and Høj, 2013). This may explain why a further extension of
competition is supplemented with agreements. The scope of free pricing in hospital care was
raised from 33% to 70% in 2011. Another measure to intensify competition was the
abolishment of the ex-post risk equalisation arrangements which had been in place since 2006
to limit the financial risk of insurers. At present insurers are at risk for 91% of their expenses.
Furthermore, the government announced the lifting of the traditional ban on for-profit hospital
care under a set of strict conditions. In 2013 an agreement was concluded between the
Government, the representative national associations of hospitals, medical specialists, family
physicians, mental health workers, insurers and patients e.g. to limit volume growth between
2015 and 2017. The agreement is expected to save about € 1 billion. Instead of removing
health services from the benefit package of health insurance legislation (the initial plan), it
was agreed that providers will be more critical in using these services: health care must be
appropriate. However, in 2013 the Minister of Health also called for suggestions on how to
further improve efficiency and sobering the benefit package (See De Deken and Maarse,
2013).
4.3 Long-term care
The share of long-term care (AWBZ) costs in GDP increased from 2.9% in 2000, 3.6% in
2006, to 4.0% in 2012 and decreased from 2013 onwards to an estimated 2.5% of GDP in
2016 (See Figure 6). Public spending on long-term care is high relative to other OECD
countries (Schut, Sorbe and Høj, 2013). Relative to other EU countries, informal care for the
elderly is unimportant in the Netherlands. Institutional care plays a relative heavy role.
Related to elderly care and long-term care the government policy is aimed at substitution by
informal and community-based care at home (Van Staveren, 2010; Mot, 2010). This is more
efficient and more in line with preferences of care-users. The shift from institutional to home

18
care is a win-win situation. Not only (older) people with disabilities prefer to live
independently, home care also is less expensive than institutional care (Rouwendal and
Thomese, 2010). AWBZ costs as a percentage of GDP kept rising, despite the introduction of
the WMO in 2007. The business cycle has its influence, but the drop in 2015 and 2016 is
mainly caused by the new 2015 act on long-term care. AWBZ is financed on a pay-as-you-go
basis. Contributions levied on income in the first two income brackets of the wage and
income tax covered 61% in 2006 and 75% in 2004. In 2014 the AWBZ contribution was
12.65%. The maximum contribution base was € 33,363. Taxes covered 21% in 2006 and 16%
in 2014. Income and wealth dependent co-payments covered 7.8% of the costs in 2008 and
8.4% in 2014 (Van Strien and Bagheloe-Datadin, 2015).
Per 1 January 2015 the AWBZ disappeared and was divided into the Long-term Care act (Wet
Langdurige Zorg, WLZ), the WMO, the Zvw and the Youth Act (Jeugdwet). This long-term
care reform finishes the reform that was started by the WMO in 2007. Next to a saving of € 5
billion, the WMO also signifies the recalibration of the responsibilities between the central
and local government, between government and citizens and between citizens (Verhoeven and
Tonkens, 2013). The aim of WMO is to enable everybody - old and young, the disabled and
able-bodied, indigenous people and immigrants, with or without problems - to participate in
society to the full extent. Municipalities are tasked with helping people with limitations – by
offering appropriate individual support in housing, employment, communication and transport
- to participate when they are unable to exercise control over their own lives for reasons
beyond their influence (Mot, 2010; Van Staveren, 2010). WMO implies a shift from the
perspective of care and services to the perspective of the client's own strengths. Care and
social support are first and foremost the personal responsibility of citizens. Government and
professional support act as a last resort.
The present Rutte II administration states that citizens have become consumers and clients of
public services. This dependence on the welfare state is considered unsustainable.
Government was expected to solve all problems; creativity, engagement and ability to solve
problems were lost. Citizens must change their irresponsible attitudes (See Verhoeven and
Tonkens, 2013). The 2015 Long-term Care Act (WLZ) is considered the political realisation
of the participation society. Like the WMO, also the WLZ expects people to decrease their
dependency on state care provisions (professionals) and instead become self-sufficient or

19
dependent on family and informal caregivers (relatives, neighbours, friends, volunteers) (Da
Roit and de Klerk, 2013).
The Government expects a permanent savings of approximately € 3.5 billion on long-term
care. The aim of these reforms is to develop a ladder of care and support that starts with the
care being provided within the patient's own environment, then scales up to local support by
municipal services and community nursing, and finally ends with a public safety net for those
who need intensive care provision. Outpatient day care, support and guidance are now the
responsibility of municipalities. This decentralisation was accompanied by a budget cut by
around 25%. The extramural part of the AWBZ stopped from 2015. Components of
extramural care, specifically supervision and the protected residence of mental health care
clients are placed under the WMO. Activities of a curative nature, such as long-term mental
health care (with treatment) (Geestelijke Gezondheidszorg, GGZ), and home care and district
nursing are transferred to the Zvw. The health insurance companies that took over the tasks of
the AWBZ have commercial interests. Already in 2000 the Social and Economic Council
recommended to focus AWBZ more on serious medical risks and long-term care (SER,
2000), to make it more affordable and more effective. This recommendation to bring back
AWBZ to its original purpose was repeated in 2008 (SER, 2008). The Council favours more
freedom of choice for the clients and more individual responsibility for clients, i.e. shifting
from a supply-oriented to a demand-oriented implementation of the AWBZ. The Council also
suggested to transfer short-term recovery related care to Zvw and to separate housing from
care (SER, 2008). The 2015 WLZ only covers long-term care for the most vulnerable elderly
(heavy dementia, severe mental health problems) and multiple and severely disabled people,
including children up till the age of 18. As with the AWBZ, the WLZ contribution is a fixed
percentage (9.65% in 2015) of the income in the first two income brackets of the wage and
income tax. In 2015 the maximum contribution base was € 33,589. So the maximum
contribution was € 3,241 in 2015. Long-term care now is an insured right for people who need
permanently (24/7) intensive care and require close monitoring. The Youth Act (Jeugdwet)
implies that from 2015 on the 393 municipalities also are responsible for all youth (< 18
years) care services and youth assistance, such as caring for young people with intellectual
disability, young people with mental disorders, child protection measures and youth
rehabilitation. The budget is reduced by 17.5%. Children with serious mental or physical
limitations that need intensive care all day are covered by the central government in the Long

20
term Care Act (WLZ). Has the care of the child heavy medical sides, then claims can be made
to the intensive child care under the Health Insurance Act (Zvw).
The municipality, on the basis of the WMO, are responsible for the disabled, the elderly and
people with mental health problems with light care needs that can stay at home. This includes
such things as day care and domestic help. In a conversation at the kitchen table the civil
servant determines which care someone needs, taking into account whether relatives, friends
or acquaintances can render assistance and offers tailor made solutions. Inequality in long-
term care may be the result. Not only because of the decentralisation, i.e. equal cases may be
treated differently by municipalities, also because of differences between people who can
afford to outsource care and those who cannot afford this in the new participation society (Da
Roit and de Klerk, 2013). This conflicts with the Dutch culture characterised by solidarity and
equality.
4.4 Participation Act
On 1 January 2015 the Participation Act (Participatiewet) replaced the Act Work and
Assistance (Wet Werk en Bijstand, WWB), the Sheltered Employment Act (Wet Sociale
Werkvoorziening, WSW) and a large part of the Disability Benefit Act for the Young
Handicapped (Wet werk en Arbeidsondersteuning Jonggehandicapten, Wajong). About
700,000 people who can work but need support falls under the new Participation Act.
Municipalities are responsible for their support. The estimated annual saving will gradually
increase to € 0.4 billion in 2017. In a letter to the government (1 November 2015) aldermen of
Finance of 234 municipalities write to be very worried - limits are reached - due to cumulative
cuts, among other things related to the WMO, youth care, and the participation act.
The Participation Act’s aim is to have as many people with or without a handicap find a paid
job with an ordinary employer. In line with the 2006 disability insurance reform (See Section
3) a distinction is made between workfare and welfare. All 240,000 Wajong benefit recipients
will be re-examined. For Wajongers fully and permanently disabled nothing changes. They
keep their full benefit from UWV. For partially disabled Wajongers the benefit is reduced
from 75% to 70% of the legal minimum wage. Also for current WSWers with permanent
employment, nothing changes. The employers (100,000) and Government (25,000) guarantee
additional jobs for social assistance recipients and occupational disabled by 2026. If that
target is not achieved, employers will be required to ensure that people with an occupational

21
disability make up a certain percentage of their staff. The 2012 reform introduced the civil
duty to do socially useful work (maatschappelijk nuttige werkzaamheden) in returns for
welfare as an option for municipalities. The 2015 Participation Act extended the obligation to
do general acceptable work in the Social Assistance Act with the obligation of a quid pro quo
relative to ability besides, or in addition to regular employment for people, who appeal to the
solidarity of the society, i.e. benefit recipients. The act also requires Dutch welfare recipients
to take available jobs even if they had to move or commute up to three hours per day. The
consequences of a lower benefit may go beyond the loss of income. Dutch experience with
reforming the disability benefit (WAO) shows that detrimental health effect may occur when
the new job does not match the health problems of the individual. The extra costs of hospital
admissions may be substantial and need to taken into account when reforming (cuts) social
security (Gielen and García-Gómez, 2015).
5. Reform of early retirement and pension systems
5.1 Basic pension
The Dutch three pillars pension system is considered to be one of the best pension systems in
the world. It delivers good benefits, is sustainable and has a high level of integrity (Mercer,
2015). Relative to other EU countries the Dutch pension system is better equipped to resist
external shocks and demographic developments, because of the mix of funding and pay-as-
you-go financing. However, the much faster than expected increase in life expectancy, the
financial crisis, the policy responses to them, and the lack of trust have raised concerns on the
sustainability of the pension system. The balance between funded and pay-as-you-go pensions
is questioned (De Deken and Maarse, 2013; Beetsma et al., 2015).
The first pillar, the General Old Age Act (Algemene Ouderdomswet – AOW), provides a flat
rate basic pension - unrelated to the earnings history - for all residents of the Netherlands from
the age of 65 (until 2013). For singles the benefit is 70% of the net minimum wage; for
partners 50%. It is neither possible to draw the old-age pension before the official retirement
age nor to postpone it. Every year lived in the Netherlands between age 15 and the statutory
retirement age entitles one to 2% of the full AOW benefit. Full AOW requires living in the
Netherlands for 50 years. Those with incomplete residence profiles, e.g. immigrants and
Dutch natives who lived abroad for longer periods, are eligible to means-tested social
assistance. The basic old age pension is financed on a pay-as-you-go basis in the first two

22
income brackets of the wage and income tax. In 1997 the contribution rate was fixed at 17.9%
to limit the labour costs. The increasing gap (due to aging) between contribution received and
benefits paid is financed by general tax revenues. In 2015 the minimum contribution was €
508 and the maximum contribution € 5,088. People receiving an old age benefit do not have
to pay this AOW contribution.
Especially the first pillar AOW expenditures are susceptible to aging, because of the pay-as-
you-go financing. Already in March 2009, the cabinet Balkenende IV decided to increase the
AOW age in two steps: in 2020 to 66 years and to 67 in 2025 in an attempt to cut back a
spiralling budget deficit as part of a package of measures to combat the economic crisis. It
was expected to improve public finances by 0.7% of GDP; a saving of € 4.5 billion, and to
increase employment rates considerably (CPB, 2010: 109-110). In the second pension pillar
the maximum fiscally facilitated accrual rate was to be lowered from 2010 onward for
average wage schemes from 2.25% to 2.15% and the final pay schemes from 2% to 1.9%. On
20 February 2010 the cabinet Balkenende IV fell and the bill was put on ice.
Table 3: Statutory retirement age in the Netherlands, 2013-2021
2013 2014 2015 2016 2017 2018 2019 2020 2021
Statutory
retirement
age
65 + 1
month
65 + 2
months
65 + 3
months
65 + 6
months
65 + 9
months 66
66 + 4
months
66 + 8
months 67
Source: Ministry of Social Affairs and Employment.
The Commission Goudswaard (2010) in its advice on the future of the pensions, at the request
of the minister of Social Affairs, called for a new balance between the ambition, the certainty
and the costs of pensions. It was concluded that the contribution rates in the supplementary
pensions were at a historically high level. A further increase was considered to harm the
competitiveness of the Dutch economy, and hence prosperity and employment.
Recommendations include linking the retirement age to the increasing life expectancy and
more conditional retirement benefits. June 2010 the social partners concluded a pension
agreement (Foundation of Labour, 2010). Details were worked out in the June 2011 document
(Foundation of Labour, 2011). The Rutte I cabinet fully supported it. Initially, it intended to
gradually increase the AOW age from 2013 onwards to 66 in 2020 and 67 in 2025 (See Table
3), and then link the age to average life expectancy. Different birth cohorts are confronted
with different statutory pension ages. An increase in pension age is disadvantageous for low
income earners because of their lower life expectancy. The present Rutte II administration

23
opposes the flexibilisation of the AOW age agreed by the social partners. Freedom of choice
will have a negative impact on employment, and increases the costs for the Treasury. AOW
will also become considerably more complex for people and execution more expensive.
Moreover, adverse selection occurs (Klijnsma, 2015a). The Foundation of Labour also agreed
that indexation of supplementary pensions will be made more conditional on the financial
health of the pension fund, measured by the funding ratio. Communication about
supplementary pensions will be improved. Moreover, the social partners agreed to stabilise
contributions, and avoid its harmful economic effects. Stabilisation of contributions implies
less risk sharing between generations.
June 2015, a law was adopted to accelerate the pace of the increase of the AOW pension-age
from 2016. The AOW pension-age will be 66 years already in 2018 and 67 years in 2021 (See
Table 3). Starting from 2022 the AOW age is periodically adapted to the increase of the
average life expectancy. The estimated cumulative saving of this acceleration is about € 2.9
billion in the period 2016-2024; the cumulative tax revenues and contributions increases are €
770 million. There is a bridging benefit for people who already participated on 1 January
2013 in an early retirement or a pre-pension scheme, and have not been able to prepare for the
accelerated AOW-age increase.
5.2 Supplementary pension
The supplementary pension is an important fringe benefit (deferred wage). Around 90% of the
Dutch employees participate in a second pillar pension scheme. For 20% of the employees the
employer concludes pension insurance with an insurer; 80% of the employees take part in an
industry, enterprise, or occupational not-for-profit pension fund. In 2014, the size of the
investments by Dutch pension funds was over 166% of GDP (Bruil et al., 2015). Around 20%
of all employed persons do not participate in a supplementary pension scheme; around 10% of
the employees and more than half (57%) of the self-employed (ING, 2014). Employment in a
specific company or branch determines enrolment in the accompanying pension fund or
insurer. Social partners are responsible for the establishment and control of pension funds.
Admission rules, provisions and benefits are determined in collective bargaining. Currently
employers pay about two thirds of total contributions to occupational pension schemes; one
third is paid by employees. Contributions are tax-deductible and taxes are levied during the
pay-out phase (reversal rule). Benefits are paid in the form of a lifelong annuity. Early or late
retirement is allowed, depending on individual preferences and the retirement plan. Most

24
occupational pensions are defined-benefit provisions, meaning a certain benefit obligation is
predefined. Around 90% of the active members have an average pay schemes and 1% a final
pay schemes. Defined-contribution systems (about 5%) are still rare in the Netherlands,
although its number increased considerably in recent years. The remaining schemes are a
mixture of the different types of arrangements.
Before 2000 high returns on equities paid for the indexation of pension benefits and the
increase of pension liabilities. In 2001 and 2002 due to dropping share prices and negative
returns many Dutch pension funds became underfunded. To restore funding ratios in the
private sector pension contributions increased from 10.5% in 2002 to 14% in 2004 and in the
public sector from 12% to 19% of gross wages. Also benefits were frozen, and pension
schemes of the employed were sobered, including partial indexation, limiting the accrual rate,
and a massive shift from final pay to average pay schemes. Some pension funds even had to
reduce the nominal value of benefits (stamping). Financial risks were shifted towards the
participants (Delsen, 2012). From 2007 onwards, the Financial Assessment Framework
(Financieel Toetsingskader, FTK) requires to discount future benefits (liabilities) with the
risk-free term structure (swap curve) of interest rates (Beetsma et al., 2015). The 2008
pension crisis was broader and deeper than the 2001-2003 crisis. In 2009 the drop in share
values resulted in underfunding of 85% of the pension funds. Also the stronger than expected
rising life-expectancy increased pension costs and put pressure on pension funds. In the years
that followed, as a result of the continuous drop in interest rates funding ratios decreased or
continued to be low despite high asset returns on pension funds. In 2007, at the beginning of
the financial crisis, contributions were slightly over 4% of GDP. In response to the crisis, they
increased to over 5% in 2012 and close to 5.5% of GDP in 2013, but were not enough to
restore the financial health of the pension funds. Moreover, the contribution burden was
shifted from employers (from over 80% in 2004 to 68% in 2010) towards employees (De
Deken and Maarse, 2013; Beetsma et al., 2015). Also Beetsma et al. (2015) concludes that a
further increase of the pension contribution would harm the competitiveness of the Dutch
economy. Moreover, the contribution base was reduced. The crisis forced pension funds to
replace the unconditional indexation, by conditional indexation depending on their financial
health - the funding ratio. The policy response to the second pension crisis shifted the
financial risks further towards the participants (De Deken en Maarse, 2013; Beetsma et al.,
2015). The 2010 pension agreement effectively ended the dominant defined contribution
nature of the earnings-related pensions. Accumulated rights and pension benefits will more

25
explicitly move along with the financial health of the pension funds and hence with the
developments on the financial markets. These developments explain the growth of the third
pension pillar consisting of voluntary savings plans and provisions made individually, such as
life insurance, house ownership, stocks or savings accounts.
The first and second pension pillar plans are related to each. Occupational pensions can only
be built-up on the salary minus the AOW-deductible. The second pillar concerns the
occupational pension payment on top of the AOW-payment. So in case of retirement before
statutory retirement age the AOW benefit is zero and has to be compensated. Now that the
AOW retirement age has been raised, ages in the two pillars have to be kept aligned. The
increase in retirement age also implies a reduction in the accrual rates that may incite to retire
early. The 2013 pension agreement of the cabinet with a selection of the opposition parties
sobered the fiscally facilitation of supplementary pensions according to the pension target age
of 67 years. The maximum fiscally facilitated accrual rates have been lowered. For average
pay plans from 2.25% in 2013, 2.15% in 2014 to 1.875% in 2015. For the final pay schemes
from 2% in 2013, 1.9% in 2014 to 1.657% in 2015. As a consequence, people will have to
contribute more years to arrive at a full pension; or a full pension will offer a substantially
lower replacement rate. The Government motivated this reduction of the accrual rate by the
increase of the retirement age: people can build up pension during a longer period and still
reach a decent pension. It also allows decreasing the pension contribution rates. Moreover,
from 1 January 2015 employees do not build up pension any more on their gross annual salary
above € 100,000,-. It also applies to partner pensions. For part-timers this amount is
calculated pro rata. A supplementary savings scheme will be introduced as an alternative. The
reversal rule does not apply: payments to this savings scheme are to be made out of net salary.
They will still be able to contract a net annuity policy exempt from capital revenue tax. Low
pension contributions are in the interest of the employers (profits), employees (wages), and
the management (policy room). Van Praag (2015) refers to a 'détournement de pouvoir'. The
Government not only supervises pensions, but is also the largest employer. So conditional
indexation, the reductions in benefits and in obligatory contributions suits her well. Taking
this together with the market based discounting rule, not only the trade union movement, also
the big pension funds ABP and PFZW, associations of older people such as KNVG, NVOG,
KBO Brabant, and the ANBO argue that the current Government policy does not lead to the
maintenance of the system but to a breakdown (Van Praag, 2015).

26
Dutch industry pension funds are obliged to charge a uniform contribution rate. Also in
enterprise pension funds it is often applied. All participants, irrespective of age or life
expectancy, pay the same contribution rate. Also the pension accrual rates are uniform
(doorsneesystematiek). The Governments argues that this leads to redistribution from younger
to older workers, for the contributions by the younger workers stay in the fund longer and
yield more capital returns. This affects the support base for the system. It also limits the
introduction of options and limits choices. Two alternatives are considered: a system of
digressive pension accrual (decreasing with age) and uniform contribution rate or a
progressive contribution (increasing with age) and a flat accrual rate. The Cabinet favours the
first option (Klijnsma, 2015b). Abolishment of the uniform contribution and accrual rates will
incite older workers to reduce working hours or retire earlier (Westerhout, 2015).
5.3 Early retirement
Actual average retirement age is below statutory retirement age (65 years until 2013) in the
Netherlands. Effective average retirement age was stable at 61 years between 2000 and 2006
(See Figure 7). In 2007 it increased to 61.7 years and to 64.1 years in 2014. This strong rise in
recent years is related to the fundamental reforms in the early retirement and pension
schemes. In 2006 the fiscal facilitation of the pay-as-you-go voluntary early retirement (VUT)
and funded pre-pension arrangements was abolished. This abolishment aimed to increase the
labour market participation of older employees.
Figure 7: Effective retirement age in the Netherlands, 2000-2014
Source: Statistics Netherlands, Statline.
Dutch employees could still retire early by using the Life Course Savings Scheme (LCSS,
Levensloopregeling) introduced in 2006 to alleviate pressure on informal care and increase
labour market participation. The LCSS offered employees the opportunity to save - tax free -
60
61
62
63
64
20
00
20
01
20
02
20
03
20
04
20
05
20
06
20
07
20
08
20
09
20
10
20
11
20
12
20
13
20
14

27
to finance periods of unpaid leave. In 2010, the cabinet Rutte I announced the abolishment of
the LCSS to be replaced by a new Vitality Scheme (VS, Vitaliteitsregeling). However, in
2012, the Rutte II administration decided not to introduce the VS for budgetary reason (See
Delsen and Smits, 2014). Its impact on the average effective retirement age is limited, for the
participation rate in the LCSS was low. The only remaining early exit route with a social
security benefit is the disability benefit (De Deken and Maarse, 2013). The increase in the
number of disability benefits in 2014 after a decade of decreases seems to confirm this (See
Section 2.3).
Increasing retirement age and labour market participation rates of older workers is
accompanied by distributional consequences. It results in adverse selection in the labour
market. Those who can afford it, probably the more productive people, will still retire early,
while the lower end of the labour market, the less productive, is forced to continue to work.
Moreover, a new structural problem occurred. The unemployment rate among the elderly (60-
65 years) doubled between beginning of 2009 (4%) and beginning of 2015 (10%). Long-term
unemployment (> 1 year) of elderly tripled. In 2014 over half of all long-term unemployed
was between 45 and 65 years old; a quarter between 55 and 65 years old. The impact on
effective retirement age of recent reforms in the first and second pension pillars may be
limited or even negative. The reason is that raising the retirement age and the accompanied
drop in accrual rates may reduce the reward to continue work. For due to offsetting wealth
and accrual effects there are at best modest effects of rising the normal retirement age on
labour supply. Social security plays two roles in the decision whether to retire or to continue
working. The wealth effects, i.e. higher social security wealth will induce individuals to
consume more of all goods, including leisure, and to retire early. The accrual effects, i.e. the
decision to continue to work depends on the increase in retirement consumption resulting from
an additional year of work, relative to the value of an additional year of leisure (Coile and
Gruber, 2000).
6. Policy outlook
In the years to come the Dutch welfare state based on equality and collective solidarity will be
replaced by the participation society based on individual responsibility and freedom of choice.
The final role of the national Government and the relationship between levels of government
and the citizens still have to be established. Decentralisation towards the municipalities
renders pilot testing more desirable and more feasible for the design of effective local

28
policies. The transaction costs for the municipalities related to the quid pro quo approach –
workfare, failure to cooperate or to provide the required information is punished by sanction
such as benefit cuts or complete suspension – in social assistance are considerable, and is
considered ineffective as well as. Using insight from behavioural economics may contribute
to a more efficient and effective redesign of the welfare state (Mullainathan and Shafir, 2013;
Bregman, 2014). The increasing number of Dutch municipalities that plans to run experiments
with a basic income for social assistance recipients fits in here. The 1965 Social Assistance
Act was the crowning piece, the social safety net, of the Dutch welfare state. The basic
income may become the crowning piece of the participation society.
Recently it has been suggested to link housing, mortgages, pensions and health care
(Bovenberg and Van Ewijk, 2012; Asbeek Brusse and Van Montfort, 2012). The 2013
pension agreement of the Rutte II administration with a selection of the opposition parties
includes offering employees the opportunity to use part of their pension contribution for
paying off their home mortgage. The Cabinet examines the feasibility of participants to use
pension contribution to repay their mortgage debt, and the use of part of the accumulated
pension for mortgage payment. The first option will have considerable impact on the pension
rights at retirement age. In the second option part of the lower pension, will be offset by the
lower living expenses after retirement. Care-at-home, provided by relatives or professional
caregivers, is the most important substitute for intramural care. Many elderly prefer to stay in
their homes as long as possible even when their health deteriorates. Rouwendal and Thomese
(2010) conclude, based on Dutch data, that elderly homeowners indeed have a substantial
lower transition rate to institutionalised care than renters. Facilitating this strong preference
among elderly homeowner will have a mitigating effect on the demand for long-term care and
limits the costs of intramural long-term care. A reverse mortgage allows elderly homeowners
to borrow against home equity, and consume home equity while continuing residing in their
homes (Dillingh, Prast, Rossi and Urzì Brancati, 2015). Home equity can be used to
supplement retirement income or to fund large expenditures, for example adjustments to the
home or arrange extra care at home. The home can be sold to finance intramural care
(Bovenberg and Van Ewijk, 2012; Asbeek Brusse and Van Montfort, 2012). In accordance
with the SER-advice (SER, 2015), in the next five years (by 2020), the Government wants to
realise more freedom of choice and more customisation in the second pension pillar. This will
allow a better link with housing and care (Klijnsma, 2015b). People are not fully aware or do
not have a complete picture of the (future) consequences of a choice they make now. Choices

29
related to old age are complex. Additional options increase the risk of making the wrong
choice. Options are not for everyone. From behavioural finance and experience with existing
options in health care (KPMG, 2014) and pension plans (Delsen, 2015; Dellaert and Ponds,
2014) it can be concluded that only a small minority of the participants will use additional
options in the supplementary pension schemes. In addition to distribution problems options
also involve privacy issues and considerable transaction costs for all parties.
Bibliography
Asbeek Brusse, W. and C.J. van Montfort (red.) (2012) Wonen, zorg en pensioenen.
Hervormen en verbinden, Den Haag: Wetenschappelijke Raad voor het
Regeringsbeleid.
Beetsma, R., M. Constandse, F. Cordewener, W. Romp and S. Vos (2015) The Dutch pension
system and the financial crisis, CESifo DICE Report 2 (June).
Blanchard, O. and D. Leigh (2013) Growth Forecast Errors and Fiscal Multipliers, IMF
Working Paper WP/13/1, Washington: International Monetary Fund.
Bovenberg, A.L. and C. van Ewijk (2012) The future of multi-pillar Pension systems, in A.L.
Bovenberg, C. van Ewijk and E. Westerhout (eds.) The Future of Multi-Pillar
Pensions. Cambridge: Cambridge University Press, 373-418.
Bregman, R. (2014) Gratis geld voor iedereen, Amsterdam: De Correspondent.
Bruil, A., C. Schmitz, J. Gebraad and R. Bhageloe-Datadin (2015) Totale
pensioenaanspraken van Nederland in beeld. AOW vergt meer geld dan aanvullend
pensioen, Heerlen/Den Haag: Centraal Bureau voor de Statistiek.
CBS (2014) Gezondheid en zorg in cijfers 2014, Heerlen/Den Haag: Centraal Bureau voor de
Statistiek.
Chkalova, K., A. Goudswaard, J. Sanders and W. Smits (2015) Dynamiek op de Nederlandse
arbeidsmarkt. De focus op flexibilisering, Den Haag: Centraal Bureau voor de
Statistiek.
Coile, C. and J. Gruber (2000) Social security and retirement, NBER Working paper 7830,
Cambridge: National Bureau of Economic Research.
Commissie Goudswaard (2010) Een sterke tweede pijler: Naar een toekomstbestendig stelsel
van aanvullende pensioenen, Den Haag: Commissie Toekomstbestendigheid
Aanvullende Pensioenregelingen.
CPB (2010) Vergrijzing verdeeld; toekomst van de Nederlandse overheidsfinanciën, CPB
Bijzondere Publicatie 86, Den Haag: Centraal Plan Bureau.
CPB (2015) Macro Economische Verkenning 2016, Den Haag: Centraal Plan Bureau.
Da Roit, B. and J. de Klerk (2013) Heaviness, intensity, and intimacy: Dutch elder care in the
context of retrenchment of the welfare state, Medicine Anthropology Theory, 1 (1): 1–
12.
Deken, de J. and H. Maarse (2013) Pensions, health and long-term care. The Netherlands,
asisp country document, Köln: Gesellschaft für Versicherungswissenschaft und -
gestaltung e.V.
Dellaert, B. and E. Ponds (2014) Pensioen op maat: heterogeniteit en individuele
keuzevrijheid in pensioenen. In: L. Bovenberg, C. van Ewijk and T. Nijman (red.),
Toekomst voor aanvullende pensioenen, Preadviezen van de Koninklijke Vereniging
voor de Staathuishoudkunde 2014, Amsterdam, 45-71.
Delsen, L. (2000) Staatsschuld van nul is onverstandig, Economisch Statistische Berichten, 85
(4284): 967.

30
Delsen, L. (2002) Exit Polder Model? Socioeconomic Changes in the Netherlands, Westport:
Preager Publishers.
Delsen, L. (2006) De hervorming van de verzorgingsstaat in Nederland: 1982-2003, Belgisch
Tijdschrift voor Sociale Zekerheid, 48 (4): 633-666.
Delsen, L. (2009) Crisis: overheid moet meer lenen, Aelementair, 8 (4): 12-16.
Delsen, L. (2012) From welfare state to participation society. Welfare state reform in the
Netherlands: 2003-2010, NiCE Working Paper 12-103, Nijmegen Center for
Economics (NiCE), Institute for Management Research, Nijmegen: Radboud
University.
Delsen, L. (2015) Keuzemogelijkheden binnen en tussen pensioenregelingen: niet voor elk
wat wils, Beleid en Maatschappij, 42 (2): 122-143.
Delsen, L. and J. Smits (2014) The rise and fall of the Dutch savings schemes, Netspar
Discussion Paper No. 02/2014-008, Tilburg: Netspar.
Dillingh, R., H. Prast, M. Rossi and C. Urzì Brancati (2015) The psychology and economics
of reverse mortgage attitudes, Design Paper 38, Netspar industry paper series, Tilburg:
Netspar.
Domar, E. D. (1944) The ‘Burden of the Debt’ and the National Income, American Economic
Review, 34 (4): 798-827.
Esping-Andersen, G. (1990) The three worlds of welfare capitalism, Cambridge: Polity Press.
Foundation of Labour (2010) Pensioenakkoord voorjaar 2010, Den Haag: Stichting van de
Arbeid.
Foundation of Labour (2011) Uitwerkingsmemorandum pensioenakkoord 2010 en
beleidsagenda 2020, Den Haag: Stichting van de Arbeid. Gielen, A. and P. García-Gómez (2015) Nadelige gezondheidseffecten van hervorming
arbeidsongeschiktheidsvoorzieningen, ESB Dossier Activerende sociale zekerheid,
47065, maart: 38-42.
Graaf-Zijl, de M., W. Smits, F. Snoek and R. De Vries (2015) Steeds meer ontmoedigde
terugtrekking van arbeidsmarkt sinds crisis, Economisch Statistische Berichten, 100
(4722): 688-689.
ING (2014) Meerderheid zelfstandigen bouwt geen pensioen op, ING Economisch
Bureau/ZZP Barometer.
Klijnsma, J. (2015a) Brief over flexibele AOW, 16 februari, Den Haag: Ministerie van Sociale
Zaken en Werkgelegenheid.
Klijnsma, J. (2015b) Hoofdlijnen van een toekomstbestendig pensioenstelsel. Brief van
staatssecretaris Klijnsma (SZW) aan de Tweede Kamer over de hoofdlijnen voor een
toekomstige inrichting van het stelsel van aanvullende pensioenen in Nederland, 6 juli,
Den Haag: Ministerie van Sociale Zaken en Werkgelegenheid.
KPMG (2014) Evaluatie Zorgverzekeringswet. Eindrapportage, KPMG Plexus. Mercer (2015) Melbourne Mercer Global Pension Index, Melbourne: Australian Centre for
Financial Studies.
Ministry of VWS (2001) Nota Vraag aan bod. Hoofdlijnen van vernieuwing van het
zorgstelsel, vergaderjaar 2000-2001, 27855, nr. 1-2, Den Haag: Tweede Kamer der
Staten Generaal.
Mooij, de R.A. (2006) Reinventing the welfare state, CPB Special Publication no. 60, The
Hague: CPB Netherlands Bureau for Economic Policy Analysis.
Mot, E. (2010) The Dutch system of long-term care, CPB Document No. 204, The Hague:
CPB Netherlands Bureau for Economic Policy Analysis.
Mullainathan, S. and E. Shafir (2013) Scarcity: Why Having Too Little Means So Much, New
York: Times Books.

31
OECD (2000) Economic Survey of the Netherlands 1999-2000, Paris: Organisation for
Economic Co-operation and Development.
OECD (2002) Economic Survey of the Netherlands 2002-2003, Paris: Organisation for
Economic Co-operation and Development.
OECD (2010) Economic Survey of the Netherlands 2010, Paris: Organisation for Economic
Co-operation and Development.
OECD (2012) Economic Survey of the Netherlands 2012, Paris: Organisation for Economic
Co-operation and Development.
OECD (2014) Economic Survey of the Netherlands 2014, Paris: Organisation for Economic
Co-operation and Development.
OECD (2015) How does health spending in the Netherlands compare?, Paris: Organisation
for Economic Co-operation and Development.
Okma, K.G.H., T.R. Marmor and J. Oberlander (2011) Managed competition for Medicare?
Sobering lessons from the Netherlands, The New England Journal of Medicine, 365
(4): 287-289.
Praag, van B. (2015) Desastreus beleid voor pensioenen, NRC Handelsblad, 6 mei.
Reinhart, C. M. and K. S. Rogoff (2010) Growth in a Time of Debt, American Economic
Review, 100 (2): 573-78.
Rouwendal, J. and F. Thomese (2010) Homeownership and demand for long-term care,
Netspar Discussion Paper 11/2010-068, Tilburg: Netspar.
Sapir, A. (2006) Globalization and the Reform of European Social Models, Journal of
Common Market Studies, 44 (2): 369-90.
Schut, E., S. Sorbe and J. Høj (2013) Health Care Reform and Long-Term Care in the
Netherlands, OECD Economics Department Working Papers, No. 1010, OECD
Publishing, Paris.
SER (2000) Naar een gezond stelsel van ziektekostenverzekeringen, Den Haag: Sociaal-
Economische Raad.
SER (2008) Langdurige zorg verzekerd: Over de toekomst van de AWBZ, Advies 0803, Den
Haag: Sociaal-Economische Raad.
SER (2015) Toekomst pensioenstelsel. Advies 15/1, Den Haag: Sociaal-Economisch Raad.
Staveren, I. van (2010) Home Care Reform in the Netherlands: Impacts on Unpaid Care in
Rotterdam, Forum for Social Economics, 39 (1): 13-21.
Strien, van F. and R. Bagheloe-Datadin (2015) Ontwikkeling en financiering van de
zorglasten sinds 2006, De Nederlandse Economie 07, Den Haag: Centraal Bureau voor
de Statistiek.
Titmuss, R.M. (1974) Social policy: an introduction, London: Allen & Unwin.
Trienekens, J., G. van der Vlugt, P., Jeurissen, and M. Germin (2012) Analyse stijging
zorguitgaven, Economisch Statistische Berichten, 97 (4643): 534-537.
Verhoeven, I. and E. Tonkens (2013) Talking active citizenship: framing welfare state reform
in England and the Netherlands, Social Policy and Society, 12 (3): 415-426.
Westerhout, E.W.M.T. (2015) Arbeidsmarkteffecten van de doorsneesystematiek,
Economisch Statistische Berichten, 100 (4722): 674-677.
WRR (2000) Generatiebewust beleid, WRR Rapport 55, Wetenschappelijke Raad voor het
Regeringsbeleid, Den Haag: Sdu Uitgeverij.

More information about the working paper series is available at the website of the Institute for Management Research: www.ru.nl/imr
Contact details
Lei DelsenInstitute for Management ResearchDepartment of EconomicsThomas van Aquinostraat 56525 GD NijmegenThe NetherlandsE-mail: [email protected]