Embed Size (px)
Citation preview

arX
iv:0
807.
3044
v2 [
astr
o-ph
] 1
2 Se
p 20
08Accepted by ApJ, July 15, 2008Preprint typeset using LATEX style emulateapj v. 10/09/06
THE ROTATING NUCLEAR STAR CLUSTER IN NGC 4244
Anil C. Seth1,2, Robert D. Blum3, Nate Bastian 4, Nelson Caldwell1, Victor P. Debattista5, Thomas H. Puzia6
Accepted by ApJ, July 15, 2008
ABSTRACT
We present observations of the nuclear star cluster in the nearby edge-on spiral galaxy NGC 4244using the Gemini Near-Infrared Integral Field Spectrograph (NIFS) with laser guide star adaptiveoptics. From a previous study of edge-on galaxies, this nuclear star cluster was found to be oneof a sample of clusters that appear flattened along the plane of their host galaxies disks. Suchclusters show evidence for multiple morphological components, with younger/bluer disk componentsand older/redder spheroidal components. Our new observations of NGC 4244 show clear rotation of30 kms−1 within the central 10 pc (0.5′′) of the cluster. The central velocity dispersion is found to be28±2 km s−1. The multiple stellar populations inferred from the optical colors and spectra are seenas variations in the CO line strength in the NIFS spectra. The rotation is clearly detected even in theolder, more spheroidal stellar component. We discuss evidence for similar structures and kinematicsin the nuclear star clusters of other galaxies including M33 and the Milky Way. Our observationssupport two possible formation mechanisms: (1) episodic accretion of gas from the disk directly ontothe nuclear star cluster, or (2) episodic accretion of young star clusters formed in the central part ofthe galaxy due to dynamical friction.Subject headings: galaxies:nuclei – galaxies:star clusters – galaxies: spiral – galaxies: kinematics and
dynamics – galaxies:formation – galaxies: individual (NGC 4244)
1. INTRODUCTION
Prominent nuclear star clusters (NSCs) are found in∼75% of late-type spiral galaxies (Boker et al. 2002) andearly-type galaxies (Cote et al. 2006). These NSCs areintrinsically very luminous, with typical MI ∼ −12, andsizes similar to globular clusters (reff ∼ 5pc; Boker et al.2004). Recently, multiple studies (Ferrarese et al. 2006;Wehner & Harris 2006; Rossa et al. 2006) have shownthat NSC masses are coupled to the mass of their hostgalaxy, following a similar M -σ relation as massive blackholes (MBHs) and extending this relation to lower massgalaxies. This result suggests that the formation of bothtypes of objects are linked to the formation of their hostgalaxies. Some galaxies host both NSCs and MBHs, butthe relationship between these two types of objects isunknown (Seth et al. 2008). Unlike black holes, the as-sembly history of NSCs can, in principle, be inferred fromstudies of their stellar populations and kinematics. ThusNSCs provide important tools for studying the history ofgalaxy centers and their connection to the galaxies as awhole.
In spiral galaxies, integrated optical spectra of NSCsshow that they nearly always have multiple stellar pop-ulations (Walcher et al. 2006; Rossa et al. 2006). Morespecifically, NSCs typically have a young stellar popu-lation (<100 Myr) but are dominated in mass by starsolder than >1 Gyr. Further support to this picture comes
1 Harvard-Smithsonian Center for Astrophysics, 60 GardenStreet Cambridge, MA 02138
2 Center for Astrophysics Fellow, [email protected] National Optical Astronomy Observatory, 950 North Cherry
Avenue, Tucson, AZ, 857214 Institute of Astronomy, University of Cambridge5 Centre For Astrophysics, University of Central Lancashire,
Preston PR1 2HE, UK, RCUK Fellow6 Herzberg Institute of Astrophysics, 5071 West Saanich Road,
Victoria, BC V9E 2E7, Canada
from the observations of several distinct populations inthe color-magnitude diagram of the nucleus of the Sgrdwarf spheroidal (M54; Monaco et al. 2005; Siegel et al.2007).
In Seth et al. (2006) (Paper I), we found from a studyof edge-on galaxies that in some NSCs these multiplestellar populations appear to be associated with differentmorphological components. These clusters are flattenedalong the major-axis of the galaxy and have color mapsand morphologies that suggest they consist of youngdisks and older more spheroidal components.
We present here follow-up observations of the NSC inNGC 4244, the nearest galaxy in the Paper I sample(D=4.3 Mpc, 1′′=21 pc; Seth et al. 2005). In Paper I,we presented integrated optical spectra of this clusterthat indicate the presence of multiple stellar populations.Although the detailed star formation history is not well-constrained, populations of 50-100 Myr combined witholder populations are required to provide a good fit tothe spectra. Redshifted emission identified with an HIIregion offset by 19 pc along the major axis of the clustergives a lower-limit to the mass of ∼2.5×10⁶ M⊙. Thismass measurement is consistent with the masses derivedfrom the stellar population fitting of the spectrum aswell.
In §2 we describe the observations and data reduction.Our results on the kinematics, morphology and stellarpopulations of the cluster are presented in §3. We discussthe results in the context of other galaxies and formationmodels in §4.
2. OBSERVATIONS & DATA REDUCTION
K-band spectra of the NGC 4244 nuclear star clus-ter were obtained using the Near-Infrared Integral FieldSpectrograph (NIFS) on Gemini North, an image-slicingintegral field unit spectrograph. The spectrograph wasused in conjunction with the ALTAIR Laser Guide Star

2 Seth et al.
system. The cluster itself was used as a tip/tilt star,but is too faint (r=16.18) to get the highest-Strehl per-formance. The cluster was observed in K-band on thenights of February 9 and April 29 2007. In total 5×900second exposures were obtained on-source and 4×900 secexposures off-source (sky). The airmass of the obser-vations ranged between 1.11 and 1.42, and an A0 star,HIP50459 was observed on both nights at similar air-mass to be used as a telluric calibrator. The exposuresall had similar image quality, with the PSF FWHM vary-ing by <30% between the exposures. We note that H-band spectral observations of the NGC 4244 NSC wereobtained as well, but due to a number of observationalproblems and a significantly lower resolution, these dataare not discussed here.
The data were reduced using the Gemini v. 1.9 IRAFpackage, utilizing pipelines based on the NIFSEXAM-PLES scripts. To obtain a clean telluric absorption spec-tra from the HIP50459 observations, the spectra wereprocessed as described for the science images below, afterwhich 1-D spectra were extracted and the Brγ absorptionline was fit and removed.
For the science exposures, an off-source exposure wassubtracted from each on-source exposure; for the Febru-ary 9 data only one off-source exposure was availableand was thus subtracted from both images. The imageswere then sliced up and rectified based on Ronchi maskand arc lamp images using NFTRANSFORM and spa-tially rebinned into image cubes using NIFCUBE. In thisprocess, the original 0.043×0.1′′ pixels get rebinned into0.05′′ pixels which are block replicated in the long (slice)direction. Each data cube was then corrected for telluricabsorption using the NFTELLURIC program, which al-lows for interactive correction of the small differences inthe wavelength calibration and airmass between the ob-servations of the calibrator and each exposure. The fi-nal data cubes from each individual on-source exposurewere combined using GEMCOMBINE correcting for spa-tial and spectral offsets. The resulting data cube has a∼3′′×3′′ field of view with 0.05′′ spatial pixels and 2.132A spectral pixels from 2.00-2.44 µm. Based on measure-ments of the sky lines, the spectral resolution is ∼4.1A(53 km s−1) FWHM. The spatial resolution in the com-bined image was measured using four compact sourcesafter subtracting the NSC model (§3.1) and found to be0.23′′ FWHM. These four compact sources are shown ascrosses in Fig. 1; three of the four are also detected aspoint-like sources in the higher resolution (0.08′′ FWHM)HST images. The spatial resolution of our data cubeis roughly ∼2× lower than that achieved when using abrighter tip/tilt star (e.g. for our telluric calibrators).
A spectrum from the inner 0.1′′ of the cluster is shownin Fig. 1. The plotted spectrum is the normalized fluxratio of the galaxy spectrum to the Brγ-corrected A0Vtelluric calibrator spectrum. All the spectral analy-sis presented below is done using flux ratioed spectra.In order to achieve a reasonable S/N for analysis ofthe outer parts of the cluster, the data were spatiallybinned using the Voronoi tesselation method describedin (Cappellari & Copin 2003). The S/N of each pixelwas determined empirically using a relatively featurelessportion of the spectra between 22140 and 22866A. Indi-vidual pixels near the center of the image have S/N>50per pixel. We binned pixels together in order to obtain
Fig. 1.— Top – The spectrum within 0.1′′ of the nuclear starcluster center. The plotted spectrum is the normalized flux ratio ofthe galaxy spectrum to the Brγ-corrected A0V telluric calibratorspectrum. The CO bandheads dominate the red part of the spec-trum while Mg I (21080,22830A), Brγ (21676A), Na I (22075A),and Ca I (22644-77A) lines are also seen. Bottom – K-band imagemade from collapsing the final data cube along the spectral direc-tion. Contours are at 16.5,15.5,14.5, 13.5, and 12.5 mag/arcsec2.Crosses show the four compact sources used to determine the spa-tial resolution of the data. The compass in the upper left showsthe rotation of the field (PA=147◦); the x-axis runs roughly alongthe major axis of the galaxy.
a S/N∼25 in each bin, so near the center, the ’bins’ con-sisted of a single pixel. We found that the S/N did notincrease as expected with binning (at least in part dueto spectral rebinning during the initial reduction), thusthe outer bins have S/N of <10.
We also reconstructed a calibrated K-band image of thenuclear star cluster for the morphological analysis pre-sented in §3.1. To do this, we first multiplied the spectraby a 9500K black body to correct for the division by theA0 telluric calibrator, and then multiplied this spectrumby the 2MASS Ks filter response curve before collapsingthe data cube to an image. We then calibrated the zero-point of this image by comparing the flux from the bestfitting model (described below) to the magnitude of thesource in the 2MASS Point Source Catalog (Ks=13.55;Cutri et al. 2003). Based on the variation between mod-els and the uncertainty in the sky-level on our image, thiszeropoint should be good to ∼10%. The image and cali-brated contours are shown in the bottom panel of Fig. 1.
3. RESULTS
In this section, we present results from our Gem-ini/NIFS K-band observations. We first discuss morpho-logical fits to our high resolution K-band image (§3.1).We then present the kinematics of the cluster in §3.2and its stellar populations in §3.3. The most significantfinding is that the NGC 4244 NSC is strongly rotating.
The Rotating Nuclear Star Cluster in NGC 4244 3
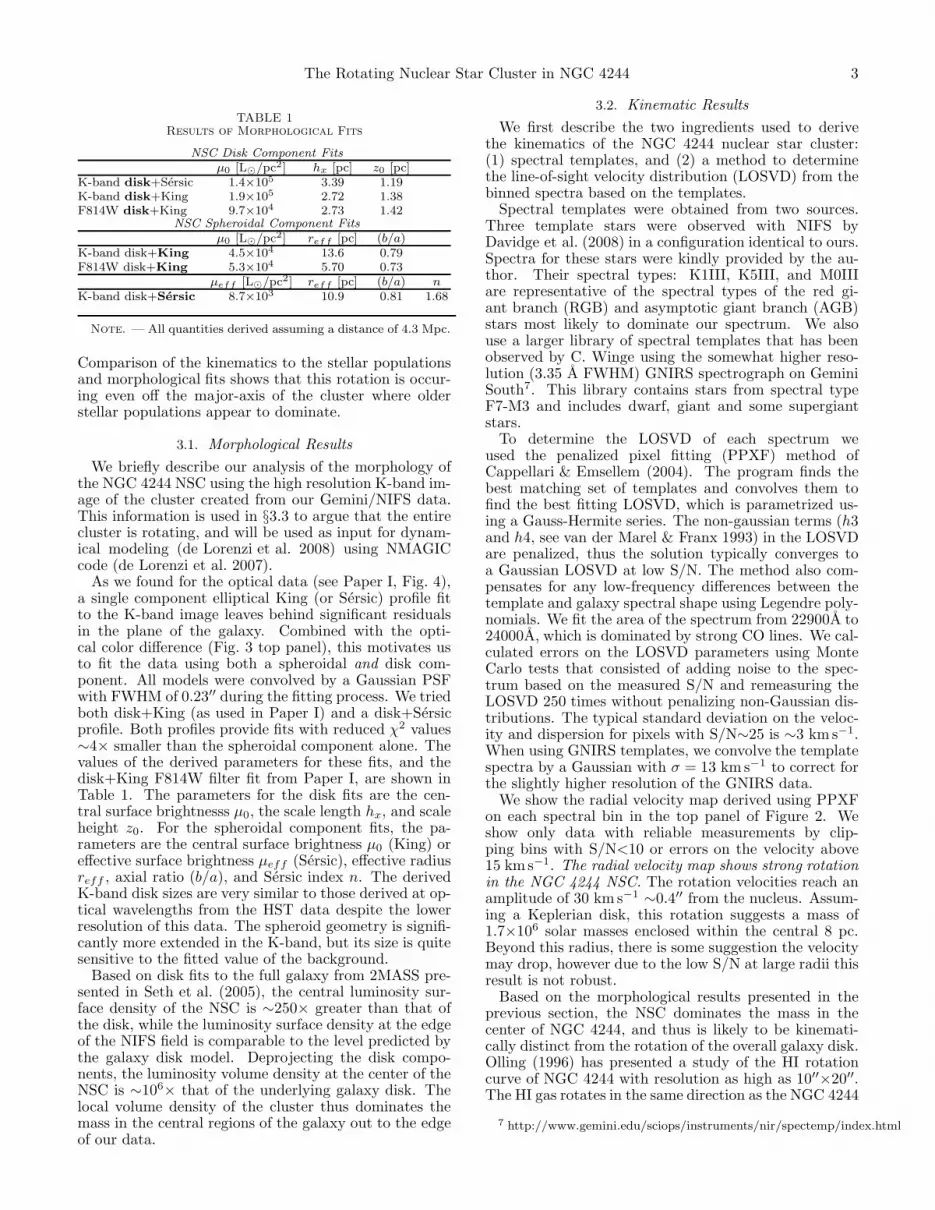
TABLE 1Results of Morphological Fits
NSC Disk Component Fits
µ0 [L⊙/pc2] hx [pc] z0 [pc]K-band disk+Sersic 1.4×10⁵ 3.39 1.19K-band disk+King 1.9×10⁵ 2.72 1.38F814W disk+King 9.7×10⁴ 2.73 1.42
NSC Spheroidal Component Fits
µ0 [L⊙/pc2] reff [pc] (b/a)K-band disk+King 4.5×10⁴ 13.6 0.79F814W disk+King 5.3×10⁴ 5.70 0.73
µeff [L⊙/pc2] reff [pc] (b/a) nK-band disk+Sersic 8.7×10³ 10.9 0.81 1.68
Note. — All quantities derived assuming a distance of 4.3 Mpc.
Comparison of the kinematics to the stellar populationsand morphological fits shows that this rotation is occur-ing even off the major-axis of the cluster where olderstellar populations appear to dominate.
3.1. Morphological Results
We briefly describe our analysis of the morphology ofthe NGC 4244 NSC using the high resolution K-band im-age of the cluster created from our Gemini/NIFS data.This information is used in §3.3 to argue that the entirecluster is rotating, and will be used as input for dynam-ical modeling (de Lorenzi et al. 2008) using NMAGICcode (de Lorenzi et al. 2007).
As we found for the optical data (see Paper I, Fig. 4),a single component elliptical King (or Sersic) profile fitto the K-band image leaves behind significant residualsin the plane of the galaxy. Combined with the opti-cal color difference (Fig. 3 top panel), this motivates usto fit the data using both a spheroidal and disk com-ponent. All models were convolved by a Gaussian PSFwith FWHM of 0.23′′ during the fitting process. We triedboth disk+King (as used in Paper I) and a disk+Sersicprofile. Both profiles provide fits with reduced χ2 values∼4× smaller than the spheroidal component alone. Thevalues of the derived parameters for these fits, and thedisk+King F814W filter fit from Paper I, are shown inTable 1. The parameters for the disk fits are the cen-tral surface brightnesss µ0, the scale length hx, and scaleheight z0. For the spheroidal component fits, the pa-rameters are the central surface brightness µ0 (King) oreffective surface brightness µeff (Sersic), effective radiusreff , axial ratio (b/a), and Sersic index n. The derivedK-band disk sizes are very similar to those derived at op-tical wavelengths from the HST data despite the lowerresolution of this data. The spheroid geometry is signifi-cantly more extended in the K-band, but its size is quitesensitive to the fitted value of the background.
Based on disk fits to the full galaxy from 2MASS pre-sented in Seth et al. (2005), the central luminosity sur-face density of the NSC is ∼250× greater than that ofthe disk, while the luminosity surface density at the edgeof the NIFS field is comparable to the level predicted bythe galaxy disk model. Deprojecting the disk compo-nents, the luminosity volume density at the center of theNSC is ∼106× that of the underlying galaxy disk. Thelocal volume density of the cluster thus dominates themass in the central regions of the galaxy out to the edgeof our data.
3.2. Kinematic Results
We first describe the two ingredients used to derivethe kinematics of the NGC 4244 nuclear star cluster:(1) spectral templates, and (2) a method to determinethe line-of-sight velocity distribution (LOSVD) from thebinned spectra based on the templates.
Spectral templates were obtained from two sources.Three template stars were observed with NIFS byDavidge et al. (2008) in a configuration identical to ours.Spectra for these stars were kindly provided by the au-thor. Their spectral types: K1III, K5III, and M0IIIare representative of the spectral types of the red gi-ant branch (RGB) and asymptotic giant branch (AGB)stars most likely to dominate our spectrum. We alsouse a larger library of spectral templates that has beenobserved by C. Winge using the somewhat higher reso-lution (3.35 A FWHM) GNIRS spectrograph on GeminiSouth7. This library contains stars from spectral typeF7-M3 and includes dwarf, giant and some supergiantstars.
To determine the LOSVD of each spectrum weused the penalized pixel fitting (PPXF) method ofCappellari & Emsellem (2004). The program finds thebest matching set of templates and convolves them tofind the best fitting LOSVD, which is parametrized us-ing a Gauss-Hermite series. The non-gaussian terms (h3and h4, see van der Marel & Franx 1993) in the LOSVDare penalized, thus the solution typically converges toa Gaussian LOSVD at low S/N. The method also com-pensates for any low-frequency differences between thetemplate and galaxy spectral shape using Legendre poly-nomials. We fit the area of the spectrum from 22900A to24000A, which is dominated by strong CO lines. We cal-culated errors on the LOSVD parameters using MonteCarlo tests that consisted of adding noise to the spec-trum based on the measured S/N and remeasuring theLOSVD 250 times without penalizing non-Gaussian dis-tributions. The typical standard deviation on the veloc-ity and dispersion for pixels with S/N∼25 is ∼3 km s−1.When using GNIRS templates, we convolve the templatespectra by a Gaussian with σ = 13 km s−1 to correct forthe slightly higher resolution of the GNIRS data.
We show the radial velocity map derived using PPXFon each spectral bin in the top panel of Figure 2. Weshow only data with reliable measurements by clip-ping bins with S/N<10 or errors on the velocity above15 kms−1. The radial velocity map shows strong rotationin the NGC 4244 NSC. The rotation velocities reach anamplitude of 30 km s−1 ∼0.4′′ from the nucleus. Assum-ing a Keplerian disk, this rotation suggests a mass of1.7×106 solar masses enclosed within the central 8 pc.Beyond this radius, there is some suggestion the velocitymay drop, however due to the low S/N at large radii thisresult is not robust.
Based on the morphological results presented in theprevious section, the NSC dominates the mass in thecenter of NGC 4244, and thus is likely to be kinemati-cally distinct from the rotation of the overall galaxy disk.Olling (1996) has presented a study of the HI rotationcurve of NGC 4244 with resolution as high as 10′′×20′′.The HI gas rotates in the same direction as the NGC 4244
7 http://www.gemini.edu/sciops/instruments/nir/spectemp/index.html

4 Seth et al.
NSC. The innermost point in their derived rotation curveis at 24′′ where the galaxy rotation is 35 km s−1, increas-ing to 60 km s−1 at 47′′. Given that we observe rotationof ∼30 km s−1 within the central half-arcsecond, this sug-gests that the rotation of the NSC is distinct from thegas component of the galaxy disk. It would be interest-ing to compare the NSC rotation to the stellar rotationin the galaxy disk, however, this would require relativelydeep long-slit spectroscopy (e.g. Yoachim & Dalcanton2008) since the surface brightness of the galaxy beyondthe nuclear star cluster is quite low.
The line-of-sight velocity dispersion is a somewhatmore difficult quantity to measure accurately due to thelow dispersion of the cluster as a whole. Our spectrahave 2.1A/28 km s−1 pixels and 4.1A/53 km s−1 reso-lution (FWHM), while the dispersions of NSCs in late-type galaxies are typically ∼25 km s−1 (Walcher et al.2005). Nonetheless, we are able to make an accuratemeasurement of the central dispersion of the cluster,σ = 28 ± 2 kms−1. Convolution of the templates withthis dispersion substantially (by a factor of 2) improvesthe χ2 of their fit to the central spectrum of the cluster,giving a reduced χ2 of 0.9 and 1.1 using the GNIRS andNIFS templates respectively. The bottom panel of Fig. 2shows a map after clipping data with S/N<15 or errorsin the dispersion >10 km s−1. The velocity dispersiondrops along the major axis to to values of 10-20 km s−1
at precisely the area where rotation is seen most stronglyindicating that we are indeed seeing a relatively cold ro-tating disk. This dispersion is close to the limit of whatwe can reliably recover from our relatively low resolu-tion observations, thus these values may represent upperlimits. It is unclear whether the increased dispersion wesee in the center is a result of unresolved rotation or agenuinely hot component.
The use of the templates from NIFS and GNIRS givevery similar results for both the velocities and disper-sions. The GNIRS templates selected for fitting the spec-tra are primarily at spectral types close to those (K-Mgiants) represented by the 3 NIFS spectra. For almostall the spectra, our measured non-Gaussian h3 and h4components of the LOSVD were consistent with zero.However, due to our low S/N and resolution, we wouldnot expect to be able to detect any non-Gaussian signa-tures (Cappellari & Emsellem 2004).
3.3. Stellar Populations and Connection to Kinematics
From the optical data described in Paper I, theNGC 4244 NSC has two distinct stellar populations – abluer population dominates in the midplane with a red-der population dominating above and below the plane.This is clearly seen in the HST based color-map shownin the top panel of Fig. 3. We would expect the NIFSdata to resolve these different populations despite the2× lower resolution. If we make a map of the CO linestrength (bottom panel of Fig. 3), the bluer areas of theHST image clearly have stronger CO absorption than theredder areas above the midplane. The CO line strengthis determined by comparing the average depth of the lineat rest wavelengths of 22957±52A to the continuum mea-sured just to the blue of the CO bandhead (12CO (2, 0);Kleinmann & Hall 1986). We also measured these valuesfor the GNIRS template stars for comparison. The COline strength values for the NSC range from ∼0.10 above
Fig. 2.— Top – Color indicates the measured radial velocityfor the Voronoi binned data using templates observed with NIFS.Gray areas indicate spectra with S/N < 10 and/or errors > 15kms−1. Rotation of ∼30 kms−1 is clearly visible along the ma-jor axis. Contours show the K-band image at 15.5,14.5,13.5, and12.5 mag/arcsec2. The black bar indicates 10 pc (0.47′′). Bot-tom – Velocity dispersion measurements with S/N >15 and errors<10 km s−1. The dispersion drops away from the center indicatinga relatively cold disk population.
and below the major axis typical of late G-type giantstars (Teff ∼ 4800 K), to ∼0.25 along the major axis,typical of K3-K6 giants (Teff ∼ 4100 K). We cautionthat the CO depth depends on the gravity of the stars aswell as their effective temperature. We note that whileMg, Ca, and Brγ absorption are clearly detected in thehighest S/N spectra, these features have lower S/N thanthe CO feature and do not show any obvious variationsacross the NSC. No emission features are detected.
To better understand the relation between the opticalcolors and CO line strengths seen within the cluster, inFig. 4 we model these quantities using Padova isochroneswhich include an updated treatment of the asymptotic gi-ant branch (AGB) (Marigo et al. 2008). We sampled 107
M⊙ of stars from a Kroupa (2001) initial mass functionand then obtained effective temperature, gravities, andthe F606W, F814W, and K-band magnitudes for eachstar from the isochrones at ages from 4 Myr to 14 Gyr.To obtain estimates for the CO line strength, we usedthe relations from Doyon et al. (1994), who fit CO linestrength as a function of effective temperature for dwarfs,giants, and supergiants. The total CO line strength ateach age was calculated as the mean CO line strengthweighted by the K-band luminosity of each star. We notethat the broader Doyon et al. (1994) CO index has val-ues that are 20-50% lower than the one we measure here,nonetheless, the trends of CO depth with age should be

The Rotating Nuclear Star Cluster in NGC 4244 5
Fig. 3.— 2′′×2′′ images of top – the F606W-F814W color mapfrom the HST/ACS data described in Paper I. The image has beenrotated to match the orientation of the NIFS data. The contoursindicate the F814W surface brightness and were chosen to roughlymatch the K-band contours in 2 and in the bottom panel. Theblack bar indicates 10 pc (0.47′′). Bottom – the CO line strengthwith larger values indicating deeper CO lines. The contours showK-band contours as in 2.
robust. We also caution that the models remain veryuncertain, especially given that the CO strength can bedominated by the coolest, thermally pulsing AGB stars,which are very difficult to model (Marigo et al. 2008).The CO line strength shows peaks at two ages; first at10-20 Myr due to the presence of bright red supergiantstars, and second at ∼300 Myr from AGB stars. TheCO evolution of these models is qualitatively similar tothat seen in the models of Maraston (2005), which alsoinclude contributions from thermally pulsing AGB stars,but differs from earlier models that don’t include thisphase and thus are lacking the second peak in CO depth(e.g. Leitherer et al. 1999).
We can use these models to qualitatively analyze thevariations in stellar population seen across the cluster inFigs. 3 and 5. The extinction is not well known, howeverspectroscopic fits suggest an AV ∼ 0.5 corresponding toa reddening of ∼0.2 magnitudes in the F606W-F814Wcolor. For the youngest stars, we expect a metallicityof Z∼0.008 based on the 100 km s−1 circular velocity ofNGC 4244 (Garnett 2002). However, the combination ofthe red color and low CO values above and below themidplane of the cluster suggest an old (&1 Gyr), moremetal-poor population. Along the major axis there is aslight reddening in the optical color along with an in-crease in the CO line strength. One possible explanationfor this is an age gradient within the disk; for instanceif the center had an age of ∼100 Myr years then the
Fig. 4.— Models of the optical color CO line strength usingPadova isochrones Marigo et al. (2008) at Z=0.004, 0.008, and0.019. The top panel shows the CO line strength derived usingrelations from Doyon et al. (1994), while the bottom panel showsthe F606W-F814W optical color.
redder colors and deeper CO could result from slightlyolder or younger populations at 5-10 pc. We cautionthat the stellar populations at any point in the clusterare clearly mixed and thus information determined fromcomparing the observations to single-stellar populationmodels should be viewed with caution. With the ma-turing of NIR stellar models and spectral libraries (e.g.Lancon et al. 2007; Marmol-Queralto et al. 2008), futurepopulation synthesis studies may be able to provide morerobust results on the resolved star formation history fromthis type of data. Lastly, we note that it is possible forthermal emission from warm dust to reduce the strengthof the CO absorption. However, the low star formationactivity in the NSC indicated by the lack of NIR emis-sion lines suggests that dust emission probably does notplay a large role in this cluster.
We now turn to the relation between the stellar pop-ulations and the rotation. Figure 5 shows the derivedvelocity, CO line strength, optical color, and disk frac-tion of the NGC 4244 NSC as function of position inslices along, above, and below the major axis. The slicesare each 0.25′′ in height, and the plotted lines are theresult of averaging the maps (i.e. Fig. 2 and 3) along thevertical direction in each slice at every pixel along the x-direction. The velocity and CO measurements were madeusing the Voronoi binned data; the symbols in these pan-els show the light-weighted positions of the bins coded bywhich slice they fell in.
The top panel of Figure 5 shows that the rotation isnot confined to the midplane, but is present ∼0.25′′ aboveand below the midplane as well. The bottom three panelsshow that the slices above and below the plane are clearlysampling a different component/stellar population fromthe midplane. The CO lines are less deep away from theplane, while the optical color is redder. The disk fractionin the bottom panel is based on the results of our mor-phological descomposition from §3.1. We calculated thefraction of disk light along our slices from the best-fittingSersic+Disk model after convolving each component withthe PSF. For the area above and below the major axis,only 10-20% of the light in our NIFS observations appearto be coming from the disk. Taken together, these plotsshow that the whole cluster is rotating, not just the bluer,younger disk component. This finding places strong con-straints on the formation of this NSC as detailed in the

6 Seth et al.
Fig. 5.— Profiles of (from top-to-bottom) the relative radial ve-locity, CO line strength, optical (F606W-F814W) color, and frac-tion of light expected from the disk based on the morphologicalmodels. Each quantity is plotted for the midplane (black solid lineand symbols) and for slices above and below (red dashed line andsymbols) the major axis. Lines show vertically binned averages ineach slice, while the symbols in the top two panels show the valuesof each bin that fell within our slices.
following section.
4. DISCUSSION & CONCLUSIONS
In NGC 4244, we find a flattened nuclear star clus-ter with multiple components, a younger disk structureand an older spheroidal structure (Paper I). From ourNIFS data, we have shown that the cluster is rotating at±30 km s−1 within the central 10 pc of the cluster. Thisrotation is not confined just to the younger disk compo-nent, but also appears to be present in the older, morespheroidal component.
There are two basic models for NSC formation: (1)globular clusters which collect at the center due to dy-namical friction (Tremaine et al. 1975; Lotz et al. 2001),or (2) episodic accretion of gas onto the center fol-lowed by in situ star formation (Milosavljevic 2004; Bekki2007). A third alternative (3), combining these two sce-narios, has recently been proposed by Milosavljevic &Agarwal (2008, private communication) in which NSCsform from young star clusters in the inner part of thegalaxy disk which are massive enough to accrete ontothe nucleus. These mechanisms are not exclusive; NSCscould form from a combination of these effects, and differ-ent types of galaxies may have different dominant mecha-nisms. However, our observations for NGC 4244 stronglyconflict with the first scenario. If a significant fraction ofthe NSC were formed from globular clusters distributedin a spheroidal distribution no rotation would be ex-pected. Thus the primary formation mechanism must
be through episodic accretion of material from the diskof the galaxy, either gas or young star clusters. Distin-guishing between gas and star cluster accretion may bepossible through comparison of our kinematic data withsimulations. Direct evidence of gas accretion into thecentral∼10 parsecs is seen in a couple nearby nuclear starclusters using CO observations (Schinnerer et al. 2003,2006).
There is substantial evidence that the structure we seein NGC 4244 is not unique, and in fact may be typical forNSCs in spiral galaxies. In Paper I, 5/9 NSCs in edge-onspirals were significantly flattened along the major axisof the galaxy disk, with three showing clear compositemorphologies. NGC 4244 is the nearest of these galax-ies and thus presents the clearest view of these struc-tures. There is also evidence for similar structures inearlier type galaxies; Balcells et al. (2007) find a num-ber of disky “nuclear extended components” with scalelengths as small as 5 pc in a sample of early-type spiralsand elliptical galaxies. Previous studies of nuclei in largesamples of spirals (Boker et al. 2002; Carollo et al. 2002)have focused on face-on galaxies making the structures inthe disk plane difficult to detect. And very few galaxieshave the pc-scale quality of kinematic data that we havehere. However, where this data exists there is evidencefor nuclear structures similar to those presented here.
The Milky Way hosts a nuclear star cluster centeredon Sgr A∗, first noted by Becklin & Neugebauer (1968).The luminosity profile of the inner ∼100 pc of the MilkyWay is distinct from the underlying bulge and disk pro-files (e.g. Serabyn & Morris 1996). This component isclearly flattened along the galactic plane (axial ratio of0.45; Catchpole et al. 1990), but less so in the central 30pc, which led Launhardt et al. (2002) to propose the exis-tence of two components, a 3×10⁷ Msol NSC dominatingthe central 30 pc (with reff ∼ 10 pc) and a more massivenuclear stellar disk extending out to 100-200 pc. Numer-ous young OH/IR stars are found, primarily within thecentral 40 pc and these have a flattened distribution withrotation of >100 kms−1 (Lindqvist et al. 1992). Basedon integrated K-band spectra, McGinn et al. (1989) findthat the central dispersion is ∼125 km s−1 and dropsquickly with increasing radius, while the rotation in-creases outwards equalling the rotation at a radius of∼3 pc, the edge of their study. Compared to theNGC 4244 NSC, the Milky Way appears quite similar,but scaled up by ∼10× in mass and ∼3× in size, ro-tation, and dispersion as would be expected for a moremassive galaxy. The very center (<1 pc) of the MW NSChas been intensively studied and shows complex dynam-ics with striking differences between older stars and veryyoung (<10 Myr) stars. The latter show ordered rotation(and counter rotation!) and provide evidence for pro-cesses 2 (Genzel et al. 2003) and 3 (e.g. Maillard et al.2004; Lu et al. 2005) described above.
There is also evidence for flattening and rotation in theM33 NSC. This cluster is elongated along the major axisof the galaxy with an axial ratio of ∼0.85 (Lauer et al.1998; Matthews & Wood 2001). At a radius of ∼1′′
(4 pc), the rotation is ∼8 km s−1 and dispersion is27 km s−1 (Gebhardt et al. 2001). Even considering thatthe orientation is likely not edge-on, it appears that therotation does not dominate in the M33 NSC to the sameextent as in NGC 4244.
The Rotating Nuclear Star Cluster in NGC 4244 7
In conclusion, we have shown above that the nuclearstar cluster in NGC 4244 is rotating. The rotation is seenin both the young disk and older spheroid components,suggesting that accretion of gas or star clusters from thedisk is the dominant mechanism in the formation of thisNSC. While there is some evidence that other NSCs inspiral galaxies have similar structures (and thus forma-tion histories), a better understanding of NSC formationacross Hubble type will require a detailed study resolv-ing the stellar populations and kinematics of numerousnearby NSCs.
Acknowledgments: The authors thank Tracy Beck,Andre Wong, and Richard McDermid for their help withthe observation planning and analysis. We thank TimDavidge for giving us his spectral templates. This paperwas much improved by the suggestions of the referee,
Torsten Boker. We also acknowledge helpful conversa-tions with Thomas Puzia, Kevin Covey, Dawn Erb, andAndres Jordan. Anil Seth gratefully acknowledges thesupport of the CfA Postdoctoral Fellowship. Based onobservations obtained at the Gemini Observatory, whichis operated by the Association of Universities for Re-search in Astronomy (AURA), Inc., under a cooperativeagreement with the National Science Foundation (NSF)on behalf of the Gemini partnership: the NSF (UnitedStates), the Science and Technology Facilities Coun-cil (United Kingdom), the National Research Council(Canada), CONICYT (Chile), the Australian ResearchCouncil (Australia), the Ministerio da Ciencia e Tecnolo-gia (Brazil), and SECYT (Argentina).
Facilities: Gemini:Gillett (NIFS/ALTAIR), HST(ACS/WFC)
REFERENCES
Balcells, M., Graham, A. W., & Peletier, R. F. 2007, ApJ, 665,1084
Becklin, E. E., & Neugebauer, G. 1968, ApJ, 151, 145Bekki, K. 2007, Publications of the Astronomical Society of
Australia, 24, 77Boker, T., Laine, S., van der Marel, R. P., Sarzi, M., Rix, H.-W.,
Ho, L. C., & Shields, J. C. 2002, AJ, 123, 1389Boker, T., Sarzi, M., McLaughlin, D. E., van der Marel, R. P., Rix,
H.-W., Ho, L. C., & Shields, J. C. 2004, AJ, 127, 105Cappellari, M., & Copin, Y. 2003, MNRAS, 342, 345Cappellari, M., & Emsellem, E. 2004, PASP, 116, 138Carollo, C. M., Stiavelli, M., Seigar, M., de Zeeuw, P. T., &
Dejonghe, H. 2002, AJ, 123, 159Catchpole, R. M., Whitelock, P. A., & Glass, I. S. 1990, MNRAS,
247, 479Cote, P. et al. 2006, ApJS, 165, 57Cutri, R. M. et al. 2003, 2MASS All Sky Catalog
of point sources. (The IRSA 2MASS All-Sky PointSource Catalog, NASA/IPAC Infrared ScienceArchive. http://irsa.ipac.caltech.edu/applications/Gator/)
Davidge, T. J., Beck, T. L., & McGregor, P. J. 2008, ApJ, 677, 238de Lorenzi, F., Debattista, V. P., Gerhard, O., & Sambhus, N. 2007,
MNRAS, 376, 71de Lorenzi, F., Debattista, V. P., & Seth, A. 2008, in prepDoyon, R., Joseph, R. D., & Wright, G. S. 1994, ApJ, 421, 101Ferrarese, L. et al. 2006, ApJ, 644, L21Garnett, D. R. 2002, ApJ, 581, 1019Gebhardt, K. et al. 2001, AJ, 122, 2469Genzel, R. et al. 2003, ApJ, 594, 812Kleinmann, S. G., & Hall, D. N. B. 1986, ApJS, 62, 501Kroupa, P. 2001, MNRAS, 322, 231Lancon, A., Hauschildt, P. H., Ladjal, D., & Mouhcine, M. 2007,
A&A, 468, 205Lauer, T. R., Faber, S. M., Ajhar, E. A., Grillmair, C. J., & Scowen,
P. A. 1998, AJ, 116, 2263Launhardt, R., Zylka, R., & Mezger, P. G. 2002, A&A, 384, 112Leitherer, C. et al. 1999, ApJS, 123, 3Lindqvist, M., Habing, H. J., & Winnberg, A. 1992, A&A, 259, 118Lotz, J. M., Telford, R., Ferguson, H. C., Miller, B. W., Stiavelli,
M., & Mack, J. 2001, ApJ, 552, 572
Lu, J. R., Ghez, A. M., Hornstein, S. D., Morris, M., & Becklin,E. E. 2005, ApJ, 625, L51
Maillard, J. P., Paumard, T., Stolovy, S. R., & Rigaut, F. 2004,A&A, 423, 155
Maraston, C. 2005, MNRAS, 362, 799Marigo, P., Girardi, L., Bressan, A., Groenewegen, M. A. T., Silva,
L., & Granato, G. L. 2008, A&A, 482, 883Marmol-Queralto, E., Cardiel, N., Cenarro, A. J., Vazdekis, A.,
Gorgas, J., Pedraz, S., Peletier, R. F., & Sanchez-Blazquez, P.2008, ArXiv e-prints, 806
Matthews, L. D., & Wood, K. 2001, ApJ, 548, 150McGinn, M. T., Sellgren, K., Becklin, E. E., & Hall, D. N. B. 1989,
ApJ, 338, 824Milosavljevic, M. 2004, ApJ, 605, L13Monaco, L., Bellazzini, M., Ferraro, F. R., & Pancino, E. 2005,
MNRAS, 356, 1396
Olling, R. P. 1996, AJ, 112, 457Rossa, J., van der Marel, R. P., Boker, T., Gerssen, J., Ho, L. C.,
Rix, H.-W., Shields, J. C., & Walcher, C.-J. 2006, AJ, 132, 1074Schinnerer, E., Boker, T., Emsellem, E., & Lisenfeld, U. 2006, ApJ,
649, 181Schinnerer, E., Boker, T., & Meier, D. S. 2003, ApJ, 591, L115Serabyn, E., & Morris, M. 1996, Nature, 382, 602Seth, A., Agueros, M., Lee, D., & Basu-Zych, A. 2008, ApJ, 678,
116Seth, A. C., Dalcanton, J. J., & de Jong, R. S. 2005, AJ, 129, 1331Seth, A. C., Dalcanton, J. J., Hodge, P. W., & Debattista, V. P.
2006, AJ, 132, 2539Siegel, M. H. et al. 2007, ApJ, 667, L57Tremaine, S. D., Ostriker, J. P., & Spitzer, L. 1975, ApJ, 196, 407van der Marel, R. P., & Franx, M. 1993, ApJ, 407, 525Walcher, C. J., Boker, T., Charlot, S., Ho, L. C., Rix, H.-W., Rossa,
J., Shields, J. C., & van der Marel, R. P. 2006, ApJ, 649, 692Walcher, C. J. et al. 2005, ApJ, 618, 237Wehner, E. H., & Harris, W. E. 2006, ApJ, 644, L17Yoachim, P., & Dalcanton, J. J. 2008, arXiv:0804.3966, 804


