Embed Size (px)
Citation preview
3JUL200720235794
THIS DOCUMENT IS IMPORTANT AND REQUIRES YOUR IMMEDIATE ATTENTION
If you are in any doubt as to the action you should take, you are recommended to seek your own personal financial adviceimmediately from your stockbroker, bank, solicitor, accountant, fund manager or other appropriate independent financialadviser, who is authorised under the Financial Services and Markets Act 2000 if you are in the United Kingdom, or, if not,from another appropriately authorised independent financial adviser.
If you have sold or otherwise transferred all of your ABN AMRO Ordinary Shares, you should send this document and theaccompanying documents as soon as possible to the purchaser or transferee or to the stockbroker, bank or other agent throughwhom the sale or transfer was effected for delivery to the purchaser or the transferee. However, the distribution of this documentand any accompanying documents into certain jurisdictions may be restricted by law and therefore persons into whosepossession this document and any accompanying documents come should inform themselves about and observe any suchrestrictions. In particular, such documents should not be distributed, forwarded to or transmitted in or into any RestrictedJurisdiction or any other jurisdiction where the extension or availability of the Offers would breach any applicable law.
NEITHER THE U.S. SECURITIES AND EXCHANGE COMMISSION NOR ANY STATE SECURITIES COMMISSION HASAPPROVED OR DISAPPROVED OF THE NEW RBS ORDINARY SHARES TO BE ISSUED IN CONNECTION WITH THEOFFERS OR HAS PASSED UPON THE ADEQUACY OR ACCURACY OF THE DISCLOSURE IN THIS DOCUMENT. ANYREPRESENTATION TO THE CONTRARY IS A CRIMINAL OFFENCE IN THE UNITED STATES.
This document is not for distribution into the United States. Offers and sales of the New RBS Ordinary Shares outside of theUnited States are being made pursuant to Regulation S under the Securities Act. Offers and sales of the New RBS OrdinaryShares to U.S. Holders are covered by the U.S. Prospectus. Offers and sales of the New RBS Ordinary Shares outside the UnitedStates are not covered by the U.S. Prospectus. No copy of this document may be mailed, communicated or distributed in theUnited States or to U.S. Holders in any manner. Any acceptance of the Offers that would result, directly or indirectly, in a violationof this restriction will be null and void. Each ABN AMRO Shareholder acquiring New RBS Ordinary Shares in the Offer pursuant tothe Offer Document will be deemed to have represented and warranted that it has acquired the New RBS Ordinary Shares in an‘‘Offshore transaction’’ as such term is defined in Regulation S.
A copy of this document, which comprises a supplementary prospectus relating to RBS prepared in accordance with theProspectus Rules made under section 84 of the Financial Services and Markets Act 2000, has been filed with the FSA and hasbeen made available to the public as required by section 3.2 of the Prospectus Rules.
The Royal Bank of Scotland Group plc(incorporated under the Companies Acts 1948 to 1967 and registered with Registered No. SC45551)
Proposed issue of up to 556,143,700 ordinary shares of 25 pence each inThe Royal Bank of Scotland Group plc
and
Proposed admission of up to 556,143,700 ordinary shares inThe Royal Bank of Scotland Group plc to the Official List and to
trading on the market for listed securities of the London Stock Exchange
Sponsor and Financial AdviserMerrill Lynch International
Application will be made to the FSA for the New RBS Ordinary Shares to be admitted to the Official List, and to the London StockExchange for the New RBS Ordinary Shares to be admitted to trading on the London Stock Exchange’s main market for listedsecurities. It is expected that admission to the Official List and the London Stock Exchange will become effective, and thatdealings in the New RBS Ordinary Shares will commence, shortly following the date on which it is announced that all conditions tothe Offers have been satisfied or, to the extent legally permitted, waived.
The whole of this Supplementary Prospectus should be read. This Supplementary Prospectus is supplementary to theProspectus dated 20 July 2007. Accordingly this document should be read in conjunction with the Prospectus.
Investors should rely only on the information contained in the Prospectus, this document and the Offer Document. No person hasbeen authorised to give any information or make any representations other than those contained in the Prospectus and thisdocument and, if given or made, such information or representation must not be relied upon as having been so authorised. RBSwill comply with its obligation to publish a supplementary prospectus containing further updated information required by law orby any regulatory authority but assumes no further obligation to publish additional information.
Subject to certain exceptions, this document and any accompanying documents are not being made available to ABN AMROShareholders with registered addresses in Australia or Japan and may not be treated as an offer of any New RBS Ordinary Sharesto any person resident or located in such jurisdictions or another Restricted Jurisdiction.
Any persons (including, without limitation, custodians, nominees and trustees) who have a contractual or other legal obligation toforward this document or any accompanying documents to any Restricted Jurisdiction should read paragraph 11 entitled‘‘Offering Restrictions’’ in Part XXIV of the Prospectus.
Merrill Lynch International which is authorised and regulated in the United Kingdom by the FSA, is acting as financial adviser toFortis, RBS and Santander and as underwriter for Fortis, RBS and Santander and is acting for no one else in connection with theOffers and will not be responsible to anyone other than Fortis, RBS and Santander for providing the protections afforded tocustomers of Merrill Lynch International or for providing advice to any other person in relation to the Offers.

TABLE OF CONTENTS
PART I SUPPLEMENTAL SUMMARY . . . . . . . . . . . . . . . . . . . . . . . . . . . . . . . . . . . . . 3
PART II OTHER INFORMATION . . . . . . . . . . . . . . . . . . . . . . . . . . . . . . . . . . . . . . . . . 6
PART III UNAUDITED INTERIM FINANCIAL INFORMATION RELATING TO RBS . . . . . . . 9
PART IV UNAUDITED INTERIM FINANCIAL INFORMATION RELATING TO ABN AMRO . 48
PART V ADDITIONAL INFORMATION . . . . . . . . . . . . . . . . . . . . . . . . . . . . . . . . . . . . . 114
DEFINITIONS . . . . . . . . . . . . . . . . . . . . . . . . . . . . . . . . . . . . . . . . . . . . . . . . . . . . . . . . . 117
2
PART I
SUPPLEMENTAL SUMMARY
The following summary information should be read in conjunction with the Summary as set out onpages 6 to 13 of the Prospectus, as an introduction to and in conjunction with, the full text of thisdocument and the Prospectus.
Any investment decision relating to RBS, the Transaction and/or the Offer should be based onconsideration of this document as a whole and the Prospectus as a whole. Investors should alsoconsider, as appropriate, the Offer Document or the RBS Shareholder Circular. Where a claim relating toinformation contained in this document is brought before a court, a plaintiff investor might, under thenational legislation of the EEA States, have to bear the costs of translating this document before legalproceedings are initiated. Civil liability attaches to those persons who are responsible for this summary,including any translation of this summary, but only if this summary is misleading, inaccurate orinconsistent when read together with the other parts of this document.
1 UNAUDITED INTERIM FINANCIAL INFORMATION RELATING TO RBS
On 3 August 2007, RBS published the unaudited interim financial information for RBS for the six monthsended 30 June 2007, in accordance with IFRS, a summary of which follows:
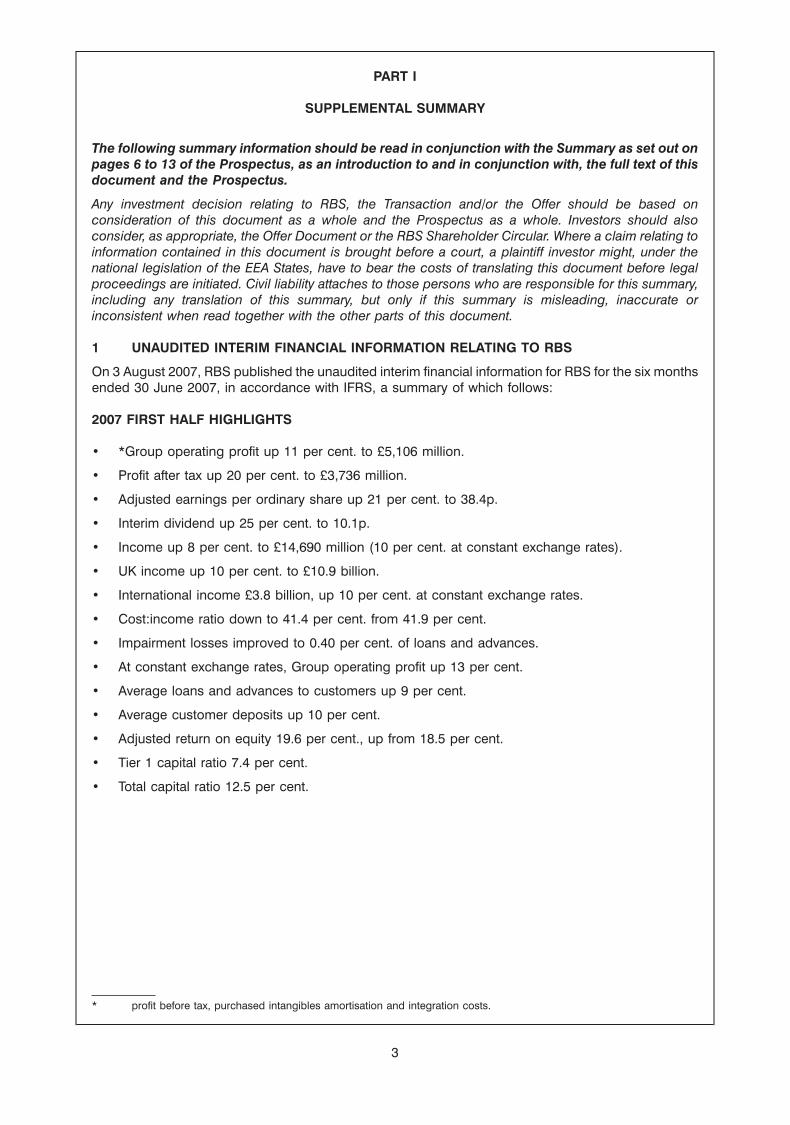
2007 FIRST HALF HIGHLIGHTS
• *Group operating profit up 11 per cent. to £5,106 million.
• Profit after tax up 20 per cent. to £3,736 million.
• Adjusted earnings per ordinary share up 21 per cent. to 38.4p.
• Interim dividend up 25 per cent. to 10.1p.
• Income up 8 per cent. to £14,690 million (10 per cent. at constant exchange rates).
• UK income up 10 per cent. to £10.9 billion.
• International income £3.8 billion, up 10 per cent. at constant exchange rates.
• Cost:income ratio down to 41.4 per cent. from 41.9 per cent.
• Impairment losses improved to 0.40 per cent. of loans and advances.
• At constant exchange rates, Group operating profit up 13 per cent.
• Average loans and advances to customers up 9 per cent.
• Average customer deposits up 10 per cent.
• Adjusted return on equity 19.6 per cent., up from 18.5 per cent.
• Tier 1 capital ratio 7.4 per cent.
• Total capital ratio 12.5 per cent.
* profit before tax, purchased intangibles amortisation and integration costs.
3
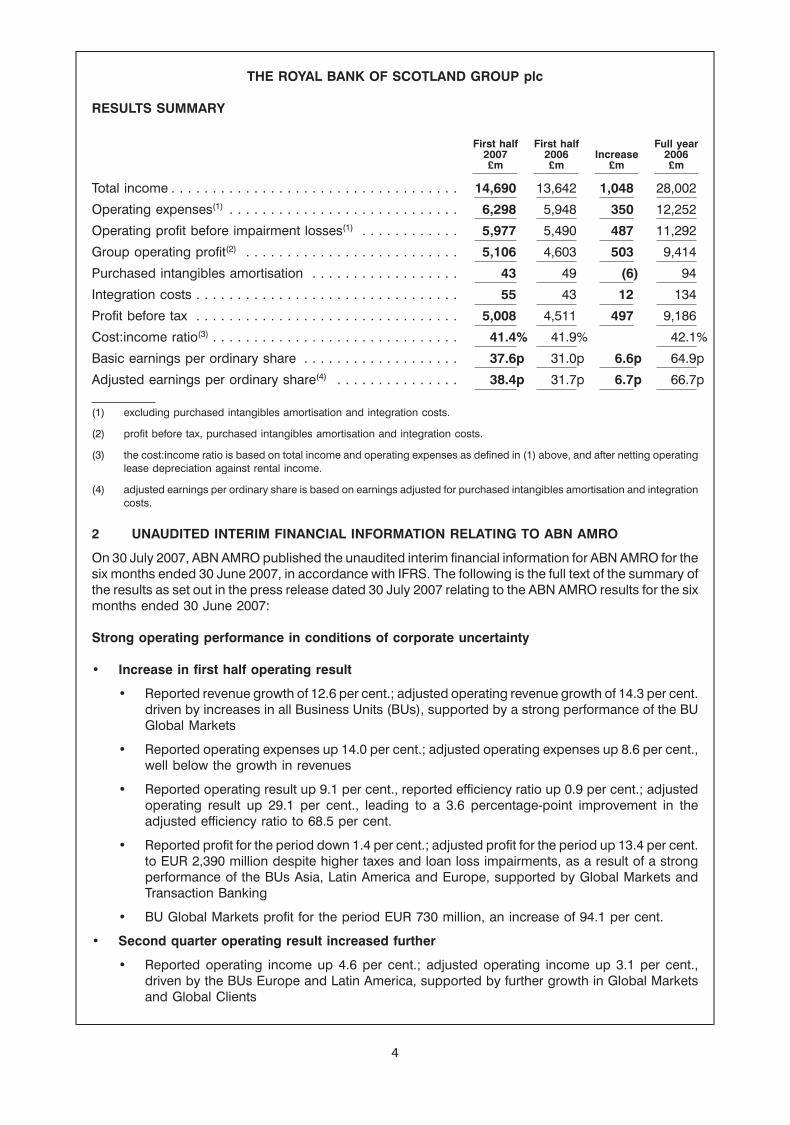
THE ROYAL BANK OF SCOTLAND GROUP plc
RESULTS SUMMARY
First half First half Full year2007 2006 Increase 2006£m £m £m £m
Total income . . . . . . . . . . . . . . . . . . . . . . . . . . . . . . . . . . . 14,690 13,642 1,048 28,002
Operating expenses(1) . . . . . . . . . . . . . . . . . . . . . . . . . . . . 6,298 5,948 350 12,252
Operating profit before impairment losses(1) . . . . . . . . . . . . 5,977 5,490 487 11,292
Group operating profit(2) . . . . . . . . . . . . . . . . . . . . . . . . . . 5,106 4,603 503 9,414
Purchased intangibles amortisation . . . . . . . . . . . . . . . . . . 43 49 (6) 94
Integration costs . . . . . . . . . . . . . . . . . . . . . . . . . . . . . . . . 55 43 12 134
Profit before tax . . . . . . . . . . . . . . . . . . . . . . . . . . . . . . . . 5,008 4,511 497 9,186
Cost:income ratio(3) . . . . . . . . . . . . . . . . . . . . . . . . . . . . . . 41.4% 41.9% 42.1%
Basic earnings per ordinary share . . . . . . . . . . . . . . . . . . . 37.6p 31.0p 6.6p 64.9p
Adjusted earnings per ordinary share(4) . . . . . . . . . . . . . . . 38.4p 31.7p 6.7p 66.7p
(1) excluding purchased intangibles amortisation and integration costs.
(2) profit before tax, purchased intangibles amortisation and integration costs.
(3) the cost:income ratio is based on total income and operating expenses as defined in (1) above, and after netting operatinglease depreciation against rental income.
(4) adjusted earnings per ordinary share is based on earnings adjusted for purchased intangibles amortisation and integrationcosts.
2 UNAUDITED INTERIM FINANCIAL INFORMATION RELATING TO ABN AMRO
On 30 July 2007, ABN AMRO published the unaudited interim financial information for ABN AMRO for thesix months ended 30 June 2007, in accordance with IFRS. The following is the full text of the summary ofthe results as set out in the press release dated 30 July 2007 relating to the ABN AMRO results for the sixmonths ended 30 June 2007:
Strong operating performance in conditions of corporate uncertainty
• Increase in first half operating result
• Reported revenue growth of 12.6 per cent.; adjusted operating revenue growth of 14.3 per cent.driven by increases in all Business Units (BUs), supported by a strong performance of the BUGlobal Markets
• Reported operating expenses up 14.0 per cent.; adjusted operating expenses up 8.6 per cent.,well below the growth in revenues
• Reported operating result up 9.1 per cent., reported efficiency ratio up 0.9 per cent.; adjustedoperating result up 29.1 per cent., leading to a 3.6 percentage-point improvement in theadjusted efficiency ratio to 68.5 per cent.
• Reported profit for the period down 1.4 per cent.; adjusted profit for the period up 13.4 per cent.to EUR 2,390 million despite higher taxes and loan loss impairments, as a result of a strongperformance of the BUs Asia, Latin America and Europe, supported by Global Markets andTransaction Banking
• BU Global Markets profit for the period EUR 730 million, an increase of 94.1 per cent.
• Second quarter operating result increased further
• Reported operating income up 4.6 per cent.; adjusted operating income up 3.1 per cent.,driven by the BUs Europe and Latin America, supported by further growth in Global Marketsand Global Clients
4

• Reported operating expenses down 4.0 per cent.; adjusted operating expenses up3.5 per cent.
• Reported operating result increased 30.9 per cent.; adjusted operating result up 2.2 per cent.following a strong first quarter
• Antonveneta results below expectations; actions and initiatives reinforced to improve revenuegrowth
• Well on track to beat the 2007 EPS target of EUR 2.30 on an adjusted basis
• Core tier 1 ratio 6.12 per cent. and tier 1 ratio 8.17 per cent., well above the year-end targets of6 per cent. and 8 per cent.
• Interim dividend 2007 of EUR 0.58, up 3 cents or 5.5 per cent.
3 ADDITIONAL INFORMATION
3.1 Results of the Banks’ Extraordinary General Meetings
At the respective extraordinary general meetings of the Banks, all resolutions proposed in connectionwith the Transaction were passed.
5
PART II
OTHER INFORMATION
The contents of this document are not to be construed as legal, business or tax advice. Each prospectiveinvestor should consult his, her or its own solicitor, independent financial adviser or tax adviser for legal,financial or tax advice.
FORWARD-LOOKING STATEMENTS
The Prospectus and this document contains or incorporates by reference ‘‘forward-looking statements’’regarding the intent, belief or current expectations of RFS Holdings, Fortis, RBS, Santander, ABN AMROand their respective directors and officers about RFS Holdings, Fortis, RBS, Santander or ABN AMRO,their respective businesses and the transactions described in this document. Generally, words such as‘‘may’’, ‘‘will’’, ‘‘expect’’, ‘‘intend’’, ‘‘estimate’’, ‘‘anticipate’’, ‘‘believe’’, ‘‘plan’’, ‘‘seek’’, ‘‘continue’’ orsimilar expressions identify forward-looking statements.
These forward-looking statements are not guarantees of future performance. Rather, they are based oncurrent views and assumptions and involve known and unknown risks, uncertainties and other factors,many of which are outside the control of RFS Holdings, Fortis, RBS, Santander or ABN AMRO and aredifficult to predict, that may cause actual results or developments to differ materially from any futureresults or developments expressed or implied from the forward-looking statements. Factors that couldcause actual results to differ materially from those contemplated by the forward-looking statementsinclude, among other factors:
• costs (including taxes) or difficulties related to the integration of acquisitions, including theproposed acquisition of ABN AMRO, may be greater than expected;
• the risk of unexpected consequences resulting from acquisitions, including the proposedacquisition of ABN AMRO;
• RBS’s ability to achieve revenue benefits and cost savings from the integration of certain ofABN AMRO’s businesses and assets;
• Fortis’s, RBS’s, Santander’s and RFS Holdings’ ability to obtain regulatory approvals for theproposed acquisition of ABN AMRO without materially onerous conditions;
• any change-of-control provisions in ABN AMRO’s agreements that might be triggered by thetransactions described in this document;
• the potential exposure of RBS and ABN AMRO to various types of market risks, such as interest raterisk, foreign exchange rate risk and commodity and equity price risk. For example, certain of themarket risk disclosures are dependent on choices about key model characteristics andassumptions and are subject to various limitations. By their nature, certain of the market riskdisclosures are only estimates and, as a result, actual future gains and losses could differ materiallyfrom those that have been estimated;
• general economic conditions in the European Union, in particular in the United Kingdom, theNetherlands, Belgium and Spain and in other countries in which RBS or ABN AMRO have businessactivities or investments, including the United States;
• the monetary and interest rate policies of central banks, in particular the Bank of England, the DutchCentral Bank, the Central Bank of Belgium, the Bank of Spain, the European Central Bank, theBoard of Governors of the U.S. Federal Reserve System and other G-7 central banks;
• changes or volatility in interest rates, foreign exchange rates (including the exchange rates betweenSterling, US Dollar and euros), asset prices, equity markets, commodity prices, inflation or deflation;
• the effects of competition and consolidation in the markets in which RBS or ABN AMRO operate,which may be influenced by regulation, deregulation or enforcement policies;
• tax consequences of restructuring;
• changes in consumer spending and savings habits, including changes in government policieswhich may influence investment decisions;
6
• changes in applicable laws, regulations and taxes in jurisdictions in which RBS and ABN AMROoperate, including the laws and regulations governing the structure of the transactions described inthis document, as well as actions or decisions by courts and regulators;
• natural and other disasters;
• the inability of RBS or ABN AMRO to hedge certain risks economically;
• the adequacy of RBS’s or ABN AMRO’s impairment provisions and loss reserves;
• technological changes; and
• the success of RBS and/or ABN AMRO in managing the risks involved in the foregoing.
These statements are further qualified by the risk factors disclosed in or incorporated by reference in theProspectus that could cause actual results to differ materially from those in the forward-lookingstatements. See ‘‘Risk Factors’’ in Part II of the Prospectus.
The statements relating to the revenue benefits, costs savings, adjusted earnings per share, returns oninvestment, internal rates of return, capital ratios and business growth opportunities the Banks expect toachieve following the transactions described in the Prospectus and this document are based onassumptions. However, these expected revenue benefits, cost savings, adjusted earnings per share,returns on investment, internal rates of return, capital ratios and business growth opportunities may notbe achieved. There can be no assurance that the Banks will be able to implement successfully thestrategic and operational initiatives that are intended.
These forward-looking statements speak only as at the date of this document. Except as required by theFSA, the London Stock Exchange, the Part VI Rules or applicable law, RBS does not have any obligationto update or revise publicly any forward-looking statement, whether as a result of new information, futureevents or otherwise. Except as required by the FSA, the London Stock Exchange, the Part VI Rules orapplicable law, RBS expressly disclaims any obligation or undertaking to release publicly any updates orrevisions to any forward-looking statement contained herein to reflect any change in RBS’s expectationswith regard thereto or any change in events, conditions or circumstances on which any such statementis based.
NOTICE
This document does not constitute an offer of, or the solicitation of an offer to subscribe for or buy, anyNew RBS Ordinary Shares to any person in any jurisdiction to whom it is unlawful to make such offer orsolicitation in such jurisdiction and is not for distribution in or into any Restricted Jurisdiction, except asdetermined by the Company in its sole discretion and pursuant to applicable laws.
None of RBS, Merrill Lynch, or their respective representatives is making any representation to anyofferee or purchaser of the New RBS Ordinary Shares offered hereby regarding the legality of aninvestment by such offeree or purchaser under appropriate investment or similar laws. Each investorshould consult with his, her or its own advisers as to the legal, tax, business, financial and relatedaspects of purchase or subscription of the New RBS Ordinary Shares.
PRESENTATION OF INFORMATION ON ABN AMRO
This document contains certain information relating to ABN AMRO and the ABN AMRO Group, includingthe information contained in Part III, headed ‘‘Unaudited interim financial information relating toABN AMRO’’.
This information has been compiled from information published by ABN AMRO and has not beencommented on or verified by ABN AMRO. RBS confirms that such information has been accuratelyreproduced from such sources and, so far as RBS is aware and is able to ascertain from informationpublished by ABN AMRO, no facts have been omitted which would render the reproduced informationinaccurate or misleading. Please also see the risk factor ‘‘The Banks have conducted only a limited duediligence review of ABN AMRO and, therefore, RBS may become subject to unknown liabilities ofABN AMRO, which may have an adverse effect on RBS’s financial condition and results of operations’’on page 15 in Part II of the Prospectus which applies equally to information contained in thisSupplementary Prospectus.
7

NO INTERNET SITE IS PART OF THIS SUPPLEMENTARY PROSPECTUS
Each of Fortis, RBS, Santander and ABN AMRO maintains an internet site. The Fortis internet site is athttp://www.fortis.com. The RBS internet site is at http://www.rbs.com. The Santander internet site is athttp://www.santander.com. The ABN AMRO internet site is at http://www.abnamro.com. In addition, theBanks have established an internet site for the Offers which is accessible through each of the Banks’websites. Information contained in or otherwise accessible through these internet sites is not a part ofthis Supplementary Prospectus. All references in this Supplementary Prospectus to these internet sitesare inactive textual references to these internet addresses and are for your information only.
8
PART III
UNAUDITED INTERIM FINANCIAL INFORMATION RELATING TO RBS
The following is the unaudited interim financial information for RBS for the six months ended 30 June 2007which has been extracted, without material adjustment, from the press release dated 3 August 2007relating to the RBS results for the six months ended 30 June 2007.
GROUP CHIEF EXECUTIVE’S REVIEW
Our Group has consistently demonstrated its ability to deliver organic growth in income, profit andearnings per share and we have done so once again in the first half of 2007, with a strong performancefrom our range of diversified businesses. Total income rose to £14,690 million, up 8 per cent., operatingprofit increased by 11 per cent. to £5,106 million and adjusted earnings per share by 21 per cent. to38.4p.
Income growth has been built on increasing customer activity across our core franchises. Each of ourdivisions faces different market conditions, but across the Group as a whole we have grown averagecustomer deposits by 10 per cent. and lending by 9 per cent., demonstrating the resilience of ouroperating model. Adverse movements in exchange rates have affected not only Citizens but alsoCorporate Markets and Wealth Management. In constant currency terms, we grew income by 10 percent. and operating profit by 13 per cent..
We have also expanded our product capabilities and broadened our geographical footprint, withexcellent results from Corporate Markets, Wealth Management and Ulster Bank. We have madeparticularly good progress in Asia, where we more than doubled income, benefiting from theinvestments we are making in building our franchise.
Income growth has been accompanied by good cost discipline. In the first half the Group cost:incomeratio improved further to 41.4 per cent.. Our customer-facing divisions have directed investment towardsfaster-growth opportunities while tightly managing their direct costs. Our Manufacturing division heldinfrastructure and support cost growth to just 2 per cent. while supporting increased business volumes.
Strong credit metrics highlight our conservative risk profile across the Group, and impairment losses fell2 per cent. to £871 million. The quality of our corporate loan portfolio remains very strong, and webelieve that we have passed the peak of bad debts in the UK unsecured personal credit market. Ourearly action to tighten lending criteria and reduce activity in the direct loan market is now reflected infalling arrears and a 7 per cent. reduction in Retail impairment losses. Our trading book risk remainsmodest.
Many of our customers’ homes have been damaged by the severe flooding the UK has experienced overthe last two months, and we have been working hard to process their claims as quickly as possible andassist them at this difficult time. This has, naturally, affected RBS Insurance’s results, with June floodclaims estimated to have cost a net £125 million. Had it not been for this factor, our Group operatingprofit would have grown by 16 per cent. on a constant currency basis.
Adjusted earnings per share increased by 21 per cent. to 38.4p, driven by our strong operatingperformance, a reduction in the number of shares in issue following last year’s share buyback, and aneffective tax rate of 25.4 per cent. in the first half of 2007. This tax rate includes the full impact on deferredtax of the change in the UK corporation tax rate from April 2008. Excluding this deferred tax reduction,adjusted earnings per share rose by 16 per cent..
Adjusted return on equity improved to 19.6 per cent., or to 18.7 per cent. excluding the deferred taxreduction.
Our businesses
These very good results endorse the strength of our business model and emphasise the importance ofdiversity in our sources of income. They also reflect the measured investments we have made overrecent years to take advantage of growth opportunities across our businesses. In each of our divisionswe have achieved good growth in core customer numbers, underpinning these results andstrengthening our franchise for the future.
9
Our businesses have continued to balance volume growth against profitability, and we have maintaineda more cautious approach towards a number of business segments in which we have not consideredthat the available returns matched the costs and risks entailed. We have, therefore, further reduced ourbusiness volumes in markets such as direct loans, intermediary mortgages and insurance partnerships,with a consequent improvement in profitability.
Global Banking & Markets has produced another strong performance, as its expanding product set andbroadening geographical footprint have yielded a 19 per cent. increase in operating profit, while UKCorporate Banking has maintained its consistently good pace of growth. Ulster Bank and WealthManagement, too, have kept up their momentum, and we are continuing to invest in these high-growthbusinesses.
Retail Markets has continued to build its core current account franchise, providing the platform for stronggrowth in its savings and investments business. Lending growth has been more subdued but ourcautious credit stance has produced a reduction in impairment losses, and this, together with flatunderlying costs, drove a 10 per cent. increase in operating profit.
Citizens has increased its customer numbers by 5 per cent. and made significant progress in its efforts todiversify its income streams away from its traditional deposit products, with good growth in credit cardsand merchant acquiring. That diversification has emphatically not included the sub-prime creditmarkets, and we have no regrets over our decision to avoid this segment. Average corporate lendingincreased by 12 per cent., demonstrating the momentum we are building towards our objective ofdeveloping a significant corporate and commercial banking presence in the US. Operating profit rose by2 per cent. in US dollar terms.
RBS Insurance has also performed well in the first half. Whilst its headline operating profit is lower,reflecting the £125 million net cost of the June floods, its underlying performance shows a meaningfulimprovement. In our own-brand businesses we have increased prices and improved risk selection whileholding volumes steady, with the result that operating profit in this segment rose by 10 per cent.,excluding the flood effect. In our partnership operations, where we provide underwriting and processingservices to third party distributors, we have put profitability ahead of volume, exiting some low-marginpartnership contracts.
Capital
We have managed our balance sheet carefully, generating capital to fund a 9 per cent. increase inrisk-weighted assets since 30 June 2006 while holding our Tier 1 ratio at 7.4 per cent., in the middle ofour target range of 7-8 per cent.. The Financial Services Authority has endorsed our Basel II programmeand we will be among the small group of financial institutions permitted to use the advanced approach tocredit risk management when the new capital adequacy framework comes into effect next year.
In line with our established policy, we will be paying an interim dividend equivalent to one third of theprevious year’s total dividend. Allowing for the bonus share issue in May, that equates to 10.1p pershare, up 25 per cent..
Outlook
Some of the structural headwinds we have experienced in Retail Markets, Citizens and RBS Insurancehave begun to abate. The strength of our franchise coupled with the diversity of our income streamsmeans the Group is well placed to compete as the market evolves. We remain confident of the Group’sability to continue to deliver sustainable organic growth in income, profit and earnings per share.
Sir Fred GoodwinGroup Chief Executive
10
THE ROYAL BANK OF SCOTLAND GROUP plc
Summary Consolidated Income Statement
for the half year ended 30 June 2007 (unaudited)
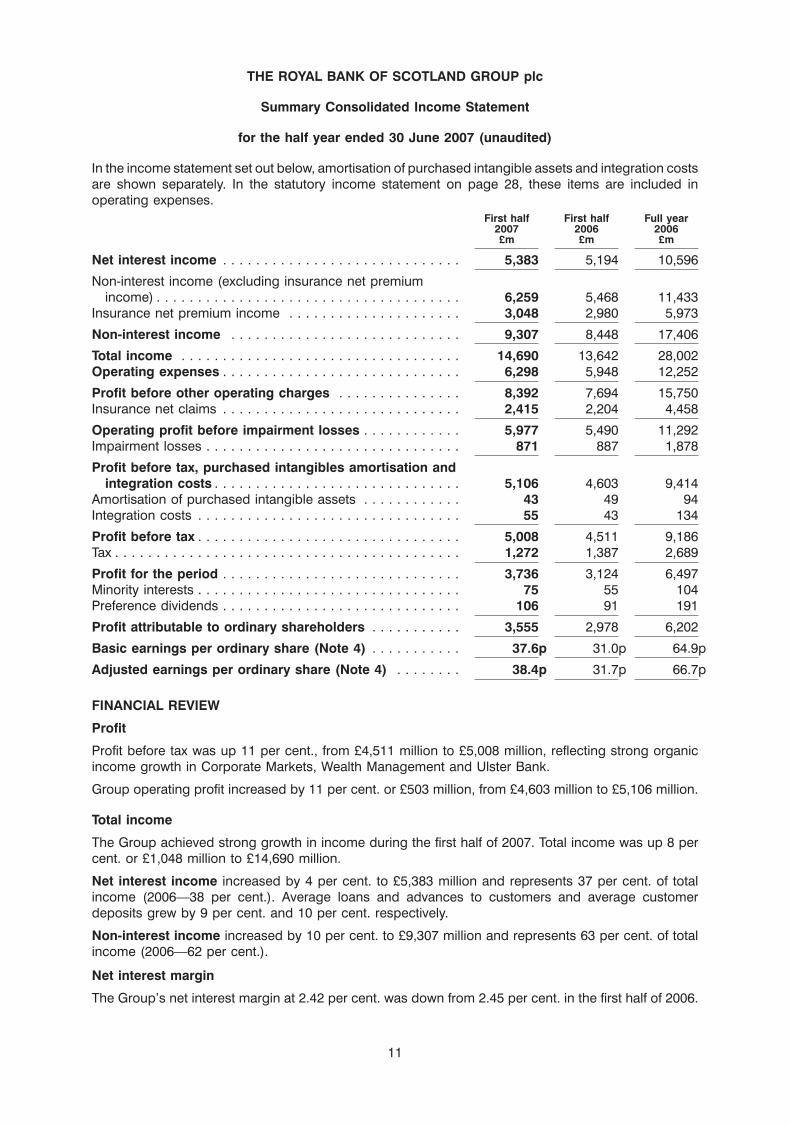
In the income statement set out below, amortisation of purchased intangible assets and integration costsare shown separately. In the statutory income statement on page 28, these items are included inoperating expenses.
First half First half Full year2007 2006 2006£m £m £m
Net interest income . . . . . . . . . . . . . . . . . . . . . . . . . . . . . 5,383 5,194 10,596
Non-interest income (excluding insurance net premiumincome) . . . . . . . . . . . . . . . . . . . . . . . . . . . . . . . . . . . . . 6,259 5,468 11,433
Insurance net premium income . . . . . . . . . . . . . . . . . . . . . 3,048 2,980 5,973
Non-interest income . . . . . . . . . . . . . . . . . . . . . . . . . . . . 9,307 8,448 17,406
Total income . . . . . . . . . . . . . . . . . . . . . . . . . . . . . . . . . . 14,690 13,642 28,002Operating expenses . . . . . . . . . . . . . . . . . . . . . . . . . . . . . 6,298 5,948 12,252
Profit before other operating charges . . . . . . . . . . . . . . . 8,392 7,694 15,750Insurance net claims . . . . . . . . . . . . . . . . . . . . . . . . . . . . . 2,415 2,204 4,458
Operating profit before impairment losses . . . . . . . . . . . . 5,977 5,490 11,292Impairment losses . . . . . . . . . . . . . . . . . . . . . . . . . . . . . . . 871 887 1,878
Profit before tax, purchased intangibles amortisation andintegration costs . . . . . . . . . . . . . . . . . . . . . . . . . . . . . . 5,106 4,603 9,414
Amortisation of purchased intangible assets . . . . . . . . . . . . 43 49 94Integration costs . . . . . . . . . . . . . . . . . . . . . . . . . . . . . . . . 55 43 134
Profit before tax . . . . . . . . . . . . . . . . . . . . . . . . . . . . . . . . 5,008 4,511 9,186Tax . . . . . . . . . . . . . . . . . . . . . . . . . . . . . . . . . . . . . . . . . . 1,272 1,387 2,689
Profit for the period . . . . . . . . . . . . . . . . . . . . . . . . . . . . . 3,736 3,124 6,497Minority interests . . . . . . . . . . . . . . . . . . . . . . . . . . . . . . . . 75 55 104Preference dividends . . . . . . . . . . . . . . . . . . . . . . . . . . . . . 106 91 191
Profit attributable to ordinary shareholders . . . . . . . . . . . 3,555 2,978 6,202
Basic earnings per ordinary share (Note 4) . . . . . . . . . . . 37.6p 31.0p 64.9p
Adjusted earnings per ordinary share (Note 4) . . . . . . . . 38.4p 31.7p 66.7p
FINANCIAL REVIEW
Profit
Profit before tax was up 11 per cent., from £4,511 million to £5,008 million, reflecting strong organicincome growth in Corporate Markets, Wealth Management and Ulster Bank.
Group operating profit increased by 11 per cent. or £503 million, from £4,603 million to £5,106 million.
Total income
The Group achieved strong growth in income during the first half of 2007. Total income was up 8 percent. or £1,048 million to £14,690 million.
Net interest income increased by 4 per cent. to £5,383 million and represents 37 per cent. of totalincome (2006—38 per cent.). Average loans and advances to customers and average customerdeposits grew by 9 per cent. and 10 per cent. respectively.
Non-interest income increased by 10 per cent. to £9,307 million and represents 63 per cent. of totalincome (2006—62 per cent.).
Net interest margin
The Group’s net interest margin at 2.42 per cent. was down from 2.45 per cent. in the first half of 2006.
11
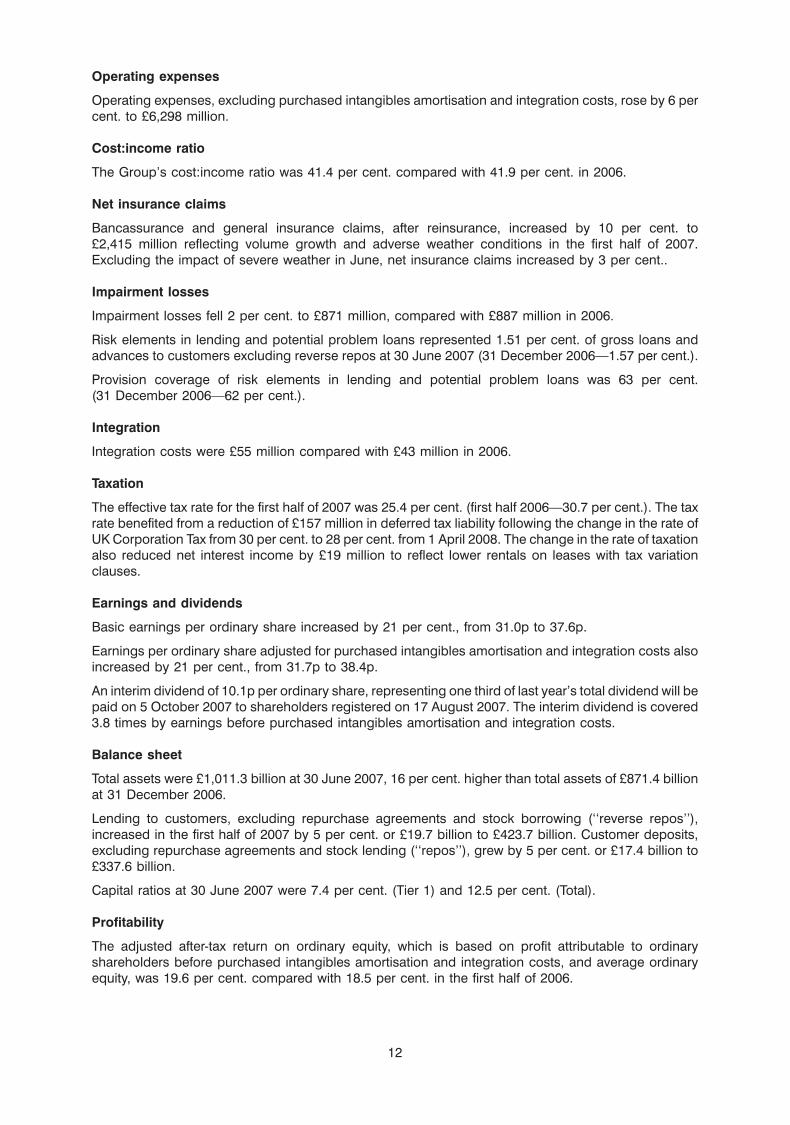
Operating expenses
Operating expenses, excluding purchased intangibles amortisation and integration costs, rose by 6 percent. to £6,298 million.
Cost:income ratio
The Group’s cost:income ratio was 41.4 per cent. compared with 41.9 per cent. in 2006.
Net insurance claims
Bancassurance and general insurance claims, after reinsurance, increased by 10 per cent. to£2,415 million reflecting volume growth and adverse weather conditions in the first half of 2007.Excluding the impact of severe weather in June, net insurance claims increased by 3 per cent..
Impairment losses
Impairment losses fell 2 per cent. to £871 million, compared with £887 million in 2006.
Risk elements in lending and potential problem loans represented 1.51 per cent. of gross loans andadvances to customers excluding reverse repos at 30 June 2007 (31 December 2006—1.57 per cent.).
Provision coverage of risk elements in lending and potential problem loans was 63 per cent.(31 December 2006—62 per cent.).
Integration
Integration costs were £55 million compared with £43 million in 2006.
Taxation
The effective tax rate for the first half of 2007 was 25.4 per cent. (first half 2006—30.7 per cent.). The taxrate benefited from a reduction of £157 million in deferred tax liability following the change in the rate ofUK Corporation Tax from 30 per cent. to 28 per cent. from 1 April 2008. The change in the rate of taxationalso reduced net interest income by £19 million to reflect lower rentals on leases with tax variationclauses.
Earnings and dividends
Basic earnings per ordinary share increased by 21 per cent., from 31.0p to 37.6p.
Earnings per ordinary share adjusted for purchased intangibles amortisation and integration costs alsoincreased by 21 per cent., from 31.7p to 38.4p.
An interim dividend of 10.1p per ordinary share, representing one third of last year’s total dividend will bepaid on 5 October 2007 to shareholders registered on 17 August 2007. The interim dividend is covered3.8 times by earnings before purchased intangibles amortisation and integration costs.
Balance sheet
Total assets were £1,011.3 billion at 30 June 2007, 16 per cent. higher than total assets of £871.4 billionat 31 December 2006.
Lending to customers, excluding repurchase agreements and stock borrowing (‘‘reverse repos’’),increased in the first half of 2007 by 5 per cent. or £19.7 billion to £423.7 billion. Customer deposits,excluding repurchase agreements and stock lending (‘‘repos’’), grew by 5 per cent. or £17.4 billion to£337.6 billion.
Capital ratios at 30 June 2007 were 7.4 per cent. (Tier 1) and 12.5 per cent. (Total).
Profitability
The adjusted after-tax return on ordinary equity, which is based on profit attributable to ordinaryshareholders before purchased intangibles amortisation and integration costs, and average ordinaryequity, was 19.6 per cent. compared with 18.5 per cent. in the first half of 2006.
12
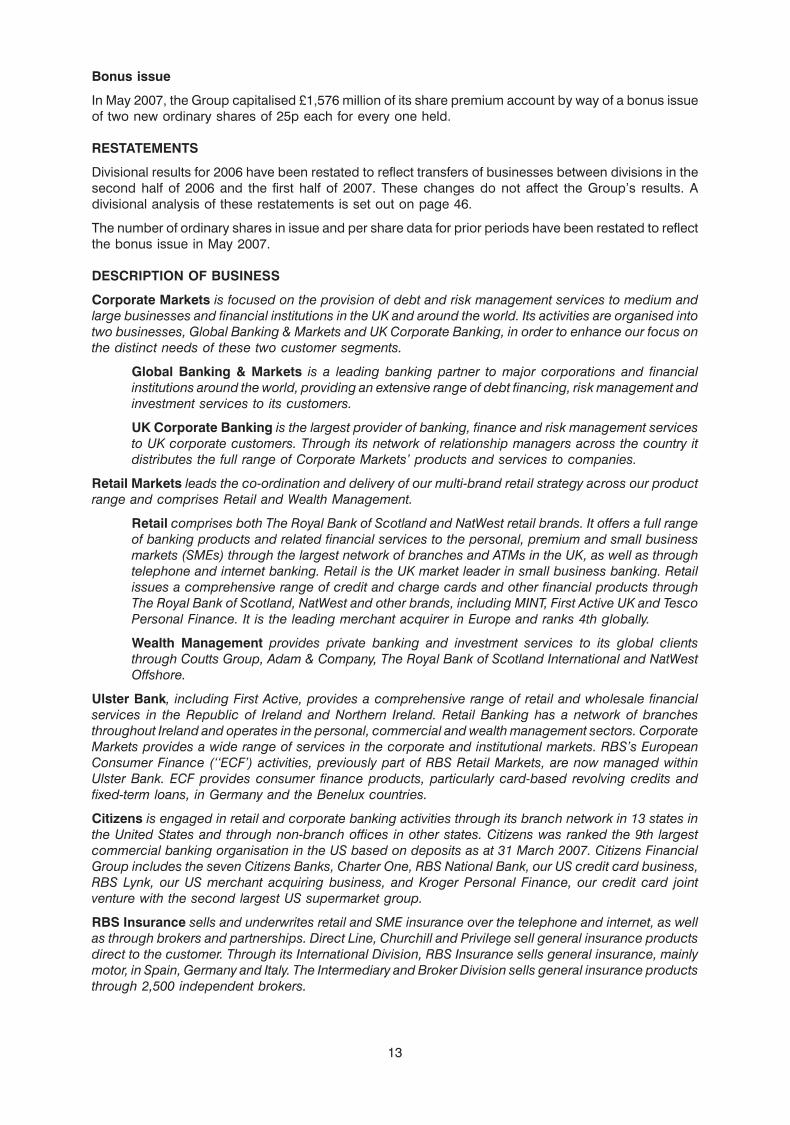
Bonus issue
In May 2007, the Group capitalised £1,576 million of its share premium account by way of a bonus issueof two new ordinary shares of 25p each for every one held.
RESTATEMENTS
Divisional results for 2006 have been restated to reflect transfers of businesses between divisions in thesecond half of 2006 and the first half of 2007. These changes do not affect the Group’s results. Adivisional analysis of these restatements is set out on page 46.
The number of ordinary shares in issue and per share data for prior periods have been restated to reflectthe bonus issue in May 2007.
DESCRIPTION OF BUSINESS
Corporate Markets is focused on the provision of debt and risk management services to medium andlarge businesses and financial institutions in the UK and around the world. Its activities are organised intotwo businesses, Global Banking & Markets and UK Corporate Banking, in order to enhance our focus onthe distinct needs of these two customer segments.
Global Banking & Markets is a leading banking partner to major corporations and financialinstitutions around the world, providing an extensive range of debt financing, risk management andinvestment services to its customers.
UK Corporate Banking is the largest provider of banking, finance and risk management servicesto UK corporate customers. Through its network of relationship managers across the country itdistributes the full range of Corporate Markets’ products and services to companies.
Retail Markets leads the co-ordination and delivery of our multi-brand retail strategy across our productrange and comprises Retail and Wealth Management.
Retail comprises both The Royal Bank of Scotland and NatWest retail brands. It offers a full rangeof banking products and related financial services to the personal, premium and small businessmarkets (SMEs) through the largest network of branches and ATMs in the UK, as well as throughtelephone and internet banking. Retail is the UK market leader in small business banking. Retailissues a comprehensive range of credit and charge cards and other financial products throughThe Royal Bank of Scotland, NatWest and other brands, including MINT, First Active UK and TescoPersonal Finance. It is the leading merchant acquirer in Europe and ranks 4th globally.
Wealth Management provides private banking and investment services to its global clientsthrough Coutts Group, Adam & Company, The Royal Bank of Scotland International and NatWestOffshore.
Ulster Bank, including First Active, provides a comprehensive range of retail and wholesale financialservices in the Republic of Ireland and Northern Ireland. Retail Banking has a network of branchesthroughout Ireland and operates in the personal, commercial and wealth management sectors. CorporateMarkets provides a wide range of services in the corporate and institutional markets. RBS’s EuropeanConsumer Finance (‘‘ECF’) activities, previously part of RBS Retail Markets, are now managed withinUlster Bank. ECF provides consumer finance products, particularly card-based revolving credits andfixed-term loans, in Germany and the Benelux countries.
Citizens is engaged in retail and corporate banking activities through its branch network in 13 states inthe United States and through non-branch offices in other states. Citizens was ranked the 9th largestcommercial banking organisation in the US based on deposits as at 31 March 2007. Citizens FinancialGroup includes the seven Citizens Banks, Charter One, RBS National Bank, our US credit card business,RBS Lynk, our US merchant acquiring business, and Kroger Personal Finance, our credit card jointventure with the second largest US supermarket group.
RBS Insurance sells and underwrites retail and SME insurance over the telephone and internet, as wellas through brokers and partnerships. Direct Line, Churchill and Privilege sell general insurance productsdirect to the customer. Through its International Division, RBS Insurance sells general insurance, mainlymotor, in Spain, Germany and Italy. The Intermediary and Broker Division sells general insurance productsthrough 2,500 independent brokers.
13
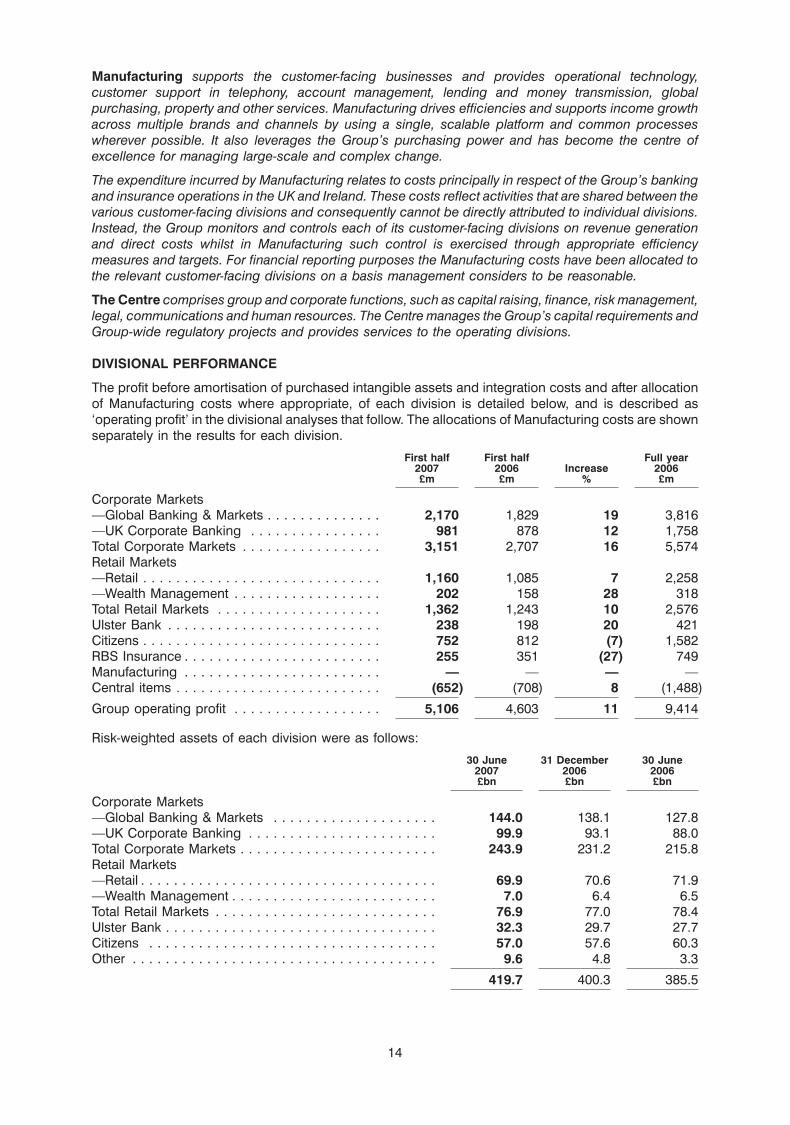
Manufacturing supports the customer-facing businesses and provides operational technology,customer support in telephony, account management, lending and money transmission, globalpurchasing, property and other services. Manufacturing drives efficiencies and supports income growthacross multiple brands and channels by using a single, scalable platform and common processeswherever possible. It also leverages the Group’s purchasing power and has become the centre ofexcellence for managing large-scale and complex change.
The expenditure incurred by Manufacturing relates to costs principally in respect of the Group’s bankingand insurance operations in the UK and Ireland. These costs reflect activities that are shared between thevarious customer-facing divisions and consequently cannot be directly attributed to individual divisions.Instead, the Group monitors and controls each of its customer-facing divisions on revenue generationand direct costs whilst in Manufacturing such control is exercised through appropriate efficiencymeasures and targets. For financial reporting purposes the Manufacturing costs have been allocated tothe relevant customer-facing divisions on a basis management considers to be reasonable.
The Centre comprises group and corporate functions, such as capital raising, finance, risk management,legal, communications and human resources. The Centre manages the Group’s capital requirements andGroup-wide regulatory projects and provides services to the operating divisions.
DIVISIONAL PERFORMANCE
The profit before amortisation of purchased intangible assets and integration costs and after allocationof Manufacturing costs where appropriate, of each division is detailed below, and is described as‘operating profit’ in the divisional analyses that follow. The allocations of Manufacturing costs are shownseparately in the results for each division.
First half First half Full year2007 2006 Increase 2006£m £m % £m
Corporate Markets—Global Banking & Markets . . . . . . . . . . . . . . 2,170 1,829 19 3,816—UK Corporate Banking . . . . . . . . . . . . . . . . 981 878 12 1,758Total Corporate Markets . . . . . . . . . . . . . . . . . 3,151 2,707 16 5,574Retail Markets—Retail . . . . . . . . . . . . . . . . . . . . . . . . . . . . . 1,160 1,085 7 2,258—Wealth Management . . . . . . . . . . . . . . . . . . 202 158 28 318Total Retail Markets . . . . . . . . . . . . . . . . . . . . 1,362 1,243 10 2,576Ulster Bank . . . . . . . . . . . . . . . . . . . . . . . . . . 238 198 20 421Citizens . . . . . . . . . . . . . . . . . . . . . . . . . . . . . 752 812 (7) 1,582RBS Insurance . . . . . . . . . . . . . . . . . . . . . . . . 255 351 (27) 749Manufacturing . . . . . . . . . . . . . . . . . . . . . . . . — — — —Central items . . . . . . . . . . . . . . . . . . . . . . . . . (652) (708) 8 (1,488)
Group operating profit . . . . . . . . . . . . . . . . . . 5,106 4,603 11 9,414
Risk-weighted assets of each division were as follows:
30 June 31 December 30 June2007 2006 2006£bn £bn £bn
Corporate Markets—Global Banking & Markets . . . . . . . . . . . . . . . . . . . . 144.0 138.1 127.8—UK Corporate Banking . . . . . . . . . . . . . . . . . . . . . . . 99.9 93.1 88.0Total Corporate Markets . . . . . . . . . . . . . . . . . . . . . . . . 243.9 231.2 215.8Retail Markets—Retail . . . . . . . . . . . . . . . . . . . . . . . . . . . . . . . . . . . . 69.9 70.6 71.9—Wealth Management . . . . . . . . . . . . . . . . . . . . . . . . . 7.0 6.4 6.5Total Retail Markets . . . . . . . . . . . . . . . . . . . . . . . . . . . 76.9 77.0 78.4Ulster Bank . . . . . . . . . . . . . . . . . . . . . . . . . . . . . . . . . 32.3 29.7 27.7Citizens . . . . . . . . . . . . . . . . . . . . . . . . . . . . . . . . . . . 57.0 57.6 60.3Other . . . . . . . . . . . . . . . . . . . . . . . . . . . . . . . . . . . . . 9.6 4.8 3.3
419.7 400.3 385.5
14
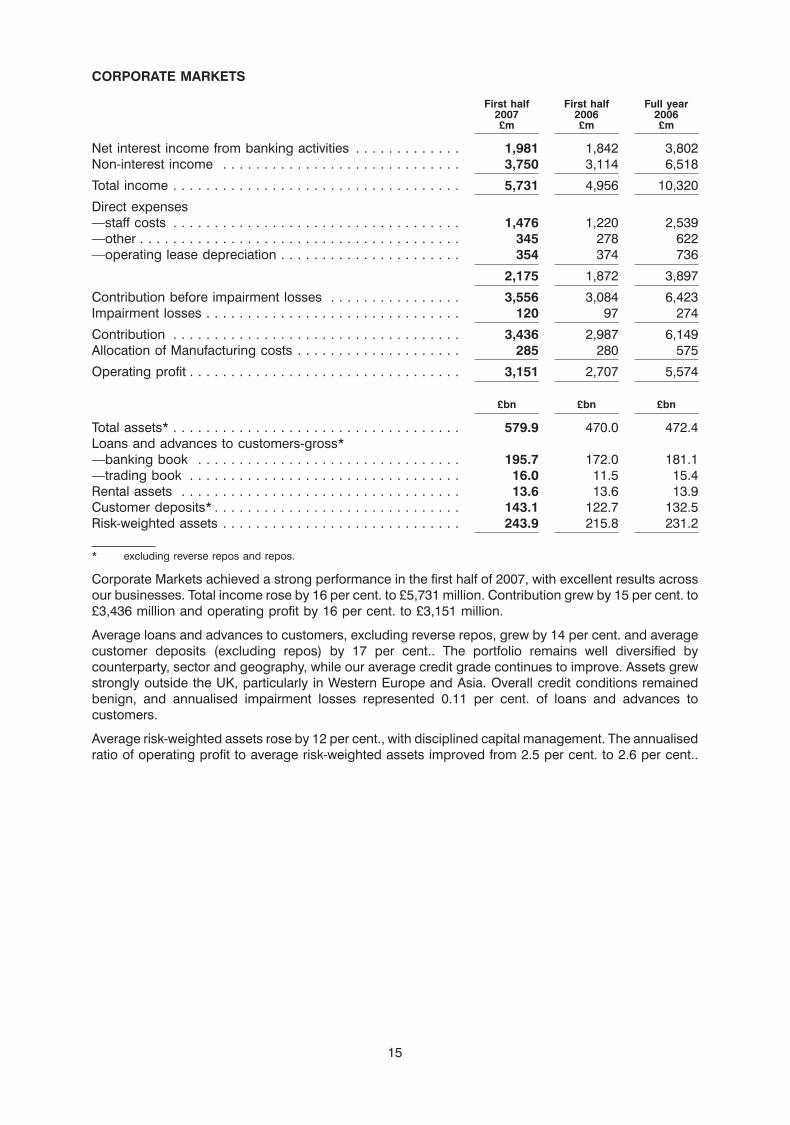
CORPORATE MARKETS
First half First half Full year2007 2006 2006£m £m £m
Net interest income from banking activities . . . . . . . . . . . . . 1,981 1,842 3,802Non-interest income . . . . . . . . . . . . . . . . . . . . . . . . . . . . . 3,750 3,114 6,518
Total income . . . . . . . . . . . . . . . . . . . . . . . . . . . . . . . . . . . 5,731 4,956 10,320
Direct expenses—staff costs . . . . . . . . . . . . . . . . . . . . . . . . . . . . . . . . . . . 1,476 1,220 2,539—other . . . . . . . . . . . . . . . . . . . . . . . . . . . . . . . . . . . . . . . 345 278 622—operating lease depreciation . . . . . . . . . . . . . . . . . . . . . . 354 374 736
2,175 1,872 3,897
Contribution before impairment losses . . . . . . . . . . . . . . . . 3,556 3,084 6,423Impairment losses . . . . . . . . . . . . . . . . . . . . . . . . . . . . . . . 120 97 274
Contribution . . . . . . . . . . . . . . . . . . . . . . . . . . . . . . . . . . . 3,436 2,987 6,149Allocation of Manufacturing costs . . . . . . . . . . . . . . . . . . . . 285 280 575
Operating profit . . . . . . . . . . . . . . . . . . . . . . . . . . . . . . . . . 3,151 2,707 5,574
£bn £bn £bn
Total assets* . . . . . . . . . . . . . . . . . . . . . . . . . . . . . . . . . . . 579.9 470.0 472.4Loans and advances to customers-gross*—banking book . . . . . . . . . . . . . . . . . . . . . . . . . . . . . . . . 195.7 172.0 181.1—trading book . . . . . . . . . . . . . . . . . . . . . . . . . . . . . . . . . 16.0 11.5 15.4Rental assets . . . . . . . . . . . . . . . . . . . . . . . . . . . . . . . . . . 13.6 13.6 13.9Customer deposits* . . . . . . . . . . . . . . . . . . . . . . . . . . . . . . 143.1 122.7 132.5Risk-weighted assets . . . . . . . . . . . . . . . . . . . . . . . . . . . . . 243.9 215.8 231.2
* excluding reverse repos and repos.
Corporate Markets achieved a strong performance in the first half of 2007, with excellent results acrossour businesses. Total income rose by 16 per cent. to £5,731 million. Contribution grew by 15 per cent. to£3,436 million and operating profit by 16 per cent. to £3,151 million.
Average loans and advances to customers, excluding reverse repos, grew by 14 per cent. and averagecustomer deposits (excluding repos) by 17 per cent.. The portfolio remains well diversified bycounterparty, sector and geography, while our average credit grade continues to improve. Assets grewstrongly outside the UK, particularly in Western Europe and Asia. Overall credit conditions remainedbenign, and annualised impairment losses represented 0.11 per cent. of loans and advances tocustomers.
Average risk-weighted assets rose by 12 per cent., with disciplined capital management. The annualisedratio of operating profit to average risk-weighted assets improved from 2.5 per cent. to 2.6 per cent..
15
CORPORATE MARKETS—GLOBAL BANKING & MARKETS
First half First half Full year2007 2006 2006£m £m £m
Net interest income from banking activities . . . . . . . . . . . . . 842 796 1,632
Net fees and commissions receivable . . . . . . . . . . . . . . . . . 627 503 1,032Trading activities . . . . . . . . . . . . . . . . . . . . . . . . . . . . . . . . 1,426 1,210 2,242Income from rental assets (net of related funding costs) . . . . 348 350 677Other operating income (net of related funding costs) . . . . . 630 412 1,279
Non-interest income . . . . . . . . . . . . . . . . . . . . . . . . . . . . . 3,031 2,475 5,230
Total income . . . . . . . . . . . . . . . . . . . . . . . . . . . . . . . . . . . 3,873 3,271 6,862
Direct expenses—staff costs . . . . . . . . . . . . . . . . . . . . . . . . . . . . . . . . . . . 1,173 951 1,975—other . . . . . . . . . . . . . . . . . . . . . . . . . . . . . . . . . . . . . . . 245 195 436—operating lease depreciation . . . . . . . . . . . . . . . . . . . . . . 193 207 406
1,611 1,353 2,817
Contribution before impairment losses . . . . . . . . . . . . . . . . 2,262 1,918 4,045Impairment losses . . . . . . . . . . . . . . . . . . . . . . . . . . . . . . . 21 19 85
Contribution . . . . . . . . . . . . . . . . . . . . . . . . . . . . . . . . . . . 2,241 1,899 3,960Allocation of Manufacturing costs . . . . . . . . . . . . . . . . . . . . 71 70 144
Operating profit . . . . . . . . . . . . . . . . . . . . . . . . . . . . . . . . . 2,170 1,829 3,816
£bn £bn £bn
Total assets* . . . . . . . . . . . . . . . . . . . . . . . . . . . . . . . . . . . 484.9 384.3 383.7Loans and advances to customers—gross*—banking book . . . . . . . . . . . . . . . . . . . . . . . . . . . . . . . . 102.4 87.9 94.3—trading book . . . . . . . . . . . . . . . . . . . . . . . . . . . . . . . . . 16.0 11.5 15.4Rental assets . . . . . . . . . . . . . . . . . . . . . . . . . . . . . . . . . . 11.9 12.0 12.2Customer deposits* . . . . . . . . . . . . . . . . . . . . . . . . . . . . . . 59.4 48.5 54.1Risk-weighted assets . . . . . . . . . . . . . . . . . . . . . . . . . . . . . 144.0 127.8 138.1
* excluding reverse repos and repos.
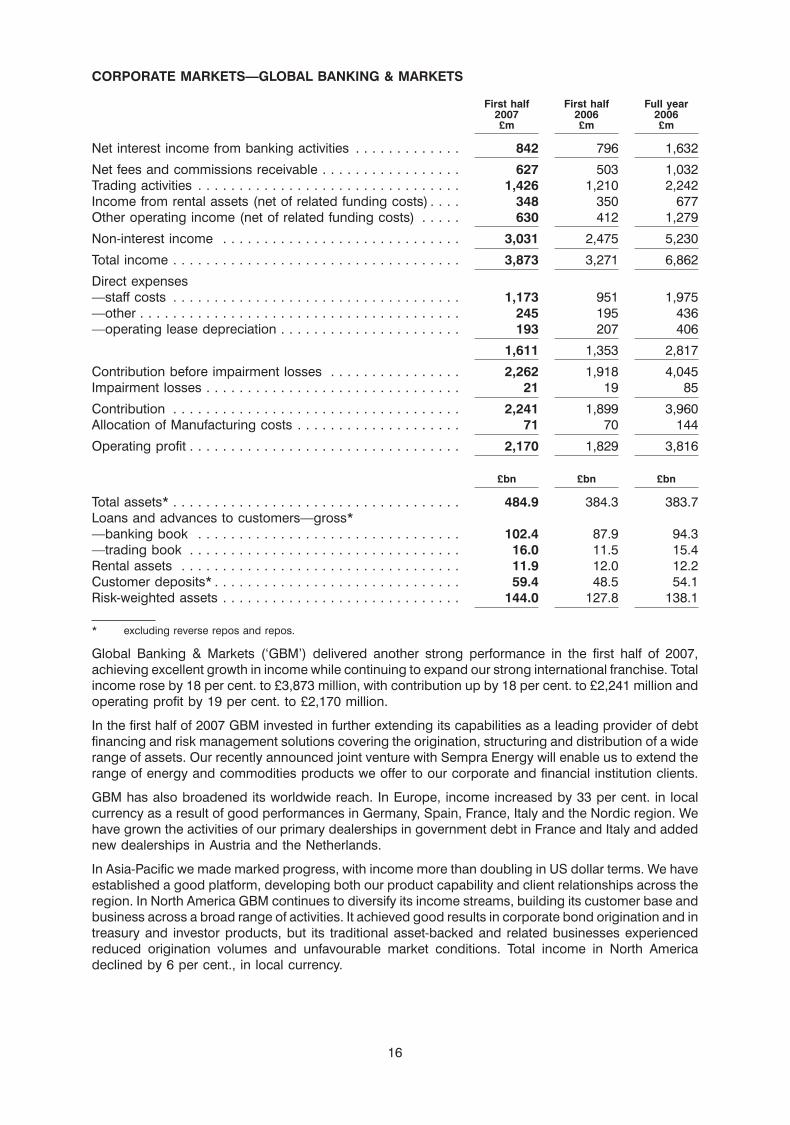
Global Banking & Markets (‘GBM’) delivered another strong performance in the first half of 2007,achieving excellent growth in income while continuing to expand our strong international franchise. Totalincome rose by 18 per cent. to £3,873 million, with contribution up by 18 per cent. to £2,241 million andoperating profit by 19 per cent. to £2,170 million.
In the first half of 2007 GBM invested in further extending its capabilities as a leading provider of debtfinancing and risk management solutions covering the origination, structuring and distribution of a widerange of assets. Our recently announced joint venture with Sempra Energy will enable us to extend therange of energy and commodities products we offer to our corporate and financial institution clients.
GBM has also broadened its worldwide reach. In Europe, income increased by 33 per cent. in localcurrency as a result of good performances in Germany, Spain, France, Italy and the Nordic region. Wehave grown the activities of our primary dealerships in government debt in France and Italy and addednew dealerships in Austria and the Netherlands.
In Asia-Pacific we made marked progress, with income more than doubling in US dollar terms. We haveestablished a good platform, developing both our product capability and client relationships across theregion. In North America GBM continues to diversify its income streams, building its customer base andbusiness across a broad range of activities. It achieved good results in corporate bond origination and intreasury and investor products, but its traditional asset-backed and related businesses experiencedreduced origination volumes and unfavourable market conditions. Total income in North Americadeclined by 6 per cent., in local currency.
16
Net interest income from banking activities rose by 6 per cent. to £842 million, representing 22 per cent.of GBM’s total income. Average loans and advances to customers, excluding reverse repos, increasedby 15 per cent. as we further expanded our customer base outside the UK.
Net fee income rose by 25 per cent. to £627 million, reflecting our top tier position in arranging,structuring and distributing large scale financings, with excellent progress in international bondunderwritings.
Income from trading activities grew by 18 per cent. to £1,426 million, with a particularly strongperformance in our European businesses helping to offset lower revenues in US asset-backed andrelated markets. Good performances in foreign exchange and interest rate derivatives weresupplemented by growth in our broadening product range, including equity derivatives and retailinvestor products. Average trading book value at risk remained modest at £16.1 million.
Our rental and other asset-based activities have achieved continuing success in originating, structuring,financing and managing physical assets such as aircraft, trains, ships and real estate for our customers.Income from rental assets, net of related funding costs and operating lease depreciation, increased by8 per cent. to £155 million. These businesses also generated value through the ownership and activemanagement of our portfolio of assets. Good results from these activities, as well as from principalinvestments arising from our financing activities with corporate customers and financial sponsors, werereflected in other operating income, which increased to £630 million (net of related funding costs).
We have maintained good cost discipline while continuing to invest in extending our geographicalfootprint, our infrastructure and our product range. Total expenses grew by 18 per cent. to £1,682 million.Variable performance-related compensation increased and now accounts for 45 per cent. of total costs.Net of operating lease depreciation our cost:income ratio was 40.5 per cent..
Portfolio risk remained stable and the corporate credit environment remained benign. Impairment lossesof £21 million were in line with the first half of 2006, a period which included significant recoveries.
Average risk-weighted assets grew by 12 per cent. and the annualised ratio of operating profit to averagerisk-weighted assets improved from 2.8 per cent. to 3.0 per cent..
CORPORATE MARKETS—UK CORPORATE BANKING
First half First half Full year2007 2006 2006£m £m £m
Net interest income from banking activities . . . . . . . . . . . . . 1,139 1,046 2,170Non-interest income . . . . . . . . . . . . . . . . . . . . . . . . . . . . . 719 639 1,288
Total income . . . . . . . . . . . . . . . . . . . . . . . . . . . . . . . . . . . 1,858 1,685 3,458
Direct expenses—staff costs . . . . . . . . . . . . . . . . . . . . . . . . . . . . . . . . . . . 303 269 564—other . . . . . . . . . . . . . . . . . . . . . . . . . . . . . . . . . . . . . . . 100 83 186—operating lease depreciation . . . . . . . . . . . . . . . . . . . . . . 161 167 330
564 519 1,080
Contribution before impairment losses . . . . . . . . . . . . . . . . 1,294 1,166 2,378Impairment losses . . . . . . . . . . . . . . . . . . . . . . . . . . . . . . . 99 78 189
Contribution . . . . . . . . . . . . . . . . . . . . . . . . . . . . . . . . . . . 1,195 1,088 2,189Allocation of Manufacturing costs . . . . . . . . . . . . . . . . . . . . 214 210 431
Operating profit . . . . . . . . . . . . . . . . . . . . . . . . . . . . . . . . . 981 878 1,758
£bn £bn £bn
Total assets* . . . . . . . . . . . . . . . . . . . . . . . . . . . . . . . . . . . 95.0 85.7 88.7Loans and advances to customers-gross* . . . . . . . . . . . . . . 93.3 84.1 86.8Customer deposits* . . . . . . . . . . . . . . . . . . . . . . . . . . . . . . 83.7 74.2 78.4Risk-weighted assets . . . . . . . . . . . . . . . . . . . . . . . . . . . . . 99.9 88.0 93.1
* excluding reverse repos and repos.
17
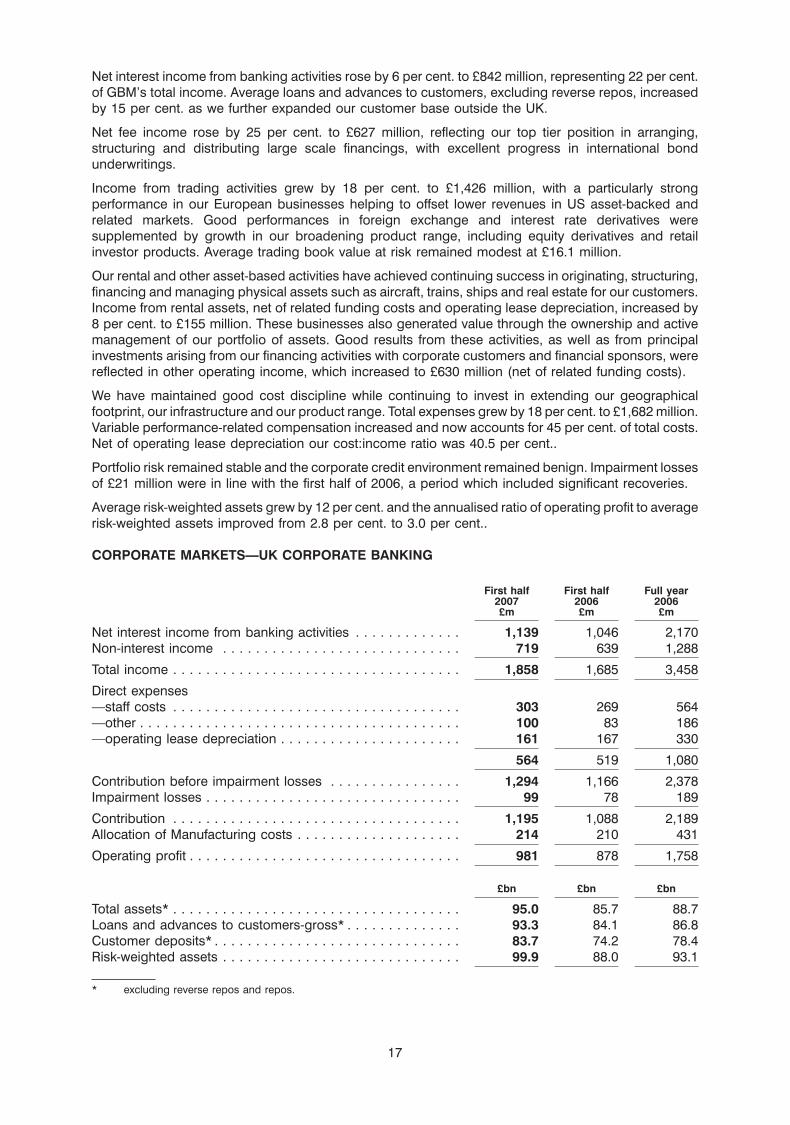
UK Corporate Banking has had a strong start to the year across its businesses, building further on ourmarket-leading positions. Total income rose by 10 per cent. to £1,858 million and contribution by 10 percent. to £1,195 million. Operating profit rose by 12 per cent. to £981 million.
There has been good growth in customer volumes, with average loans and advances up 12 per cent.and average deposits up 18 per cent.. This led to an increase in net interest income from bankingactivities of 9 per cent. to £1,139 million. Although the corporate marketplace remains an area of intensecompetition, the rate of margin decline has eased in the first half of 2007.
Non-interest income rose by 13 per cent. to £719 million, as a result of growth in fees and good progressin the distribution of trade and invoice finance as well as of interest rate and foreign exchange products.
Total expenses rose by 7 per cent. to £778 million. We have continued to extend ‘‘Another Way ofBanking’’, improving our service quality and product capabilities through the addition of 600 front-linestaff. We have made good progress in the rollout of Bankline, our enhanced web-based electronicbanking platform, adding advanced payments functionality.
Impairment losses totalled £99 million, which as a percentage of average loans and advances tocustomers is in line with the full year 2006, reflecting the stable credit quality of the portfolio as well as abenign economic environment.
RETAIL MARKETS
First half First half Full year2007 2006 2006£m £m £m
Net interest income . . . . . . . . . . . . . . . . . . . . . . . . . . . . . . 2,339 2,243 4,607Non-interest income . . . . . . . . . . . . . . . . . . . . . . . . . . . . . 1,965 1,900 3,852
Total income . . . . . . . . . . . . . . . . . . . . . . . . . . . . . . . . . . . 4,304 4,143 8,459
Direct expenses—staff costs . . . . . . . . . . . . . . . . . . . . . . . . . . . . . . . . . . . 828 774 1,615—other . . . . . . . . . . . . . . . . . . . . . . . . . . . . . . . . . . . . . . . 360 386 745
1,188 1,160 2,360
Insurance net claims . . . . . . . . . . . . . . . . . . . . . . . . . . . . . 285 242 488
Contribution before impairment losses . . . . . . . . . . . . . . . . 2,831 2,741 5,611Impairment losses . . . . . . . . . . . . . . . . . . . . . . . . . . . . . . . 612 659 1,311
Contribution . . . . . . . . . . . . . . . . . . . . . . . . . . . . . . . . . . . 2,219 2,082 4,300Allocation of Manufacturing costs . . . . . . . . . . . . . . . . . . . . 857 839 1,724
Operating profit . . . . . . . . . . . . . . . . . . . . . . . . . . . . . . . . . 1,362 1,243 2,576
£bn £bn £bn
Total banking assets . . . . . . . . . . . . . . . . . . . . . . . . . . . . . 120.4 114.9 118.4Loans and advances to customers—gross—mortgages . . . . . . . . . . . . . . . . . . . . . . . . . . . . . . . . . . . 70.4 66.0 69.7—personal . . . . . . . . . . . . . . . . . . . . . . . . . . . . . . . . . . . . 20.5 20.8 20.5—cards . . . . . . . . . . . . . . . . . . . . . . . . . . . . . . . . . . . . . . 7.8 8.4 8.2—business . . . . . . . . . . . . . . . . . . . . . . . . . . . . . . . . . . . . 19.5 17.7 18.1Customer deposits* . . . . . . . . . . . . . . . . . . . . . . . . . . . . . . 122.0 109.6 115.5Investment management assets—excluding deposits . . . . . . 38.2 32.3 34.9Risk-weighted assets . . . . . . . . . . . . . . . . . . . . . . . . . . . . . 76.9 78.4 77.0
* customer deposits exclude bancassurance.
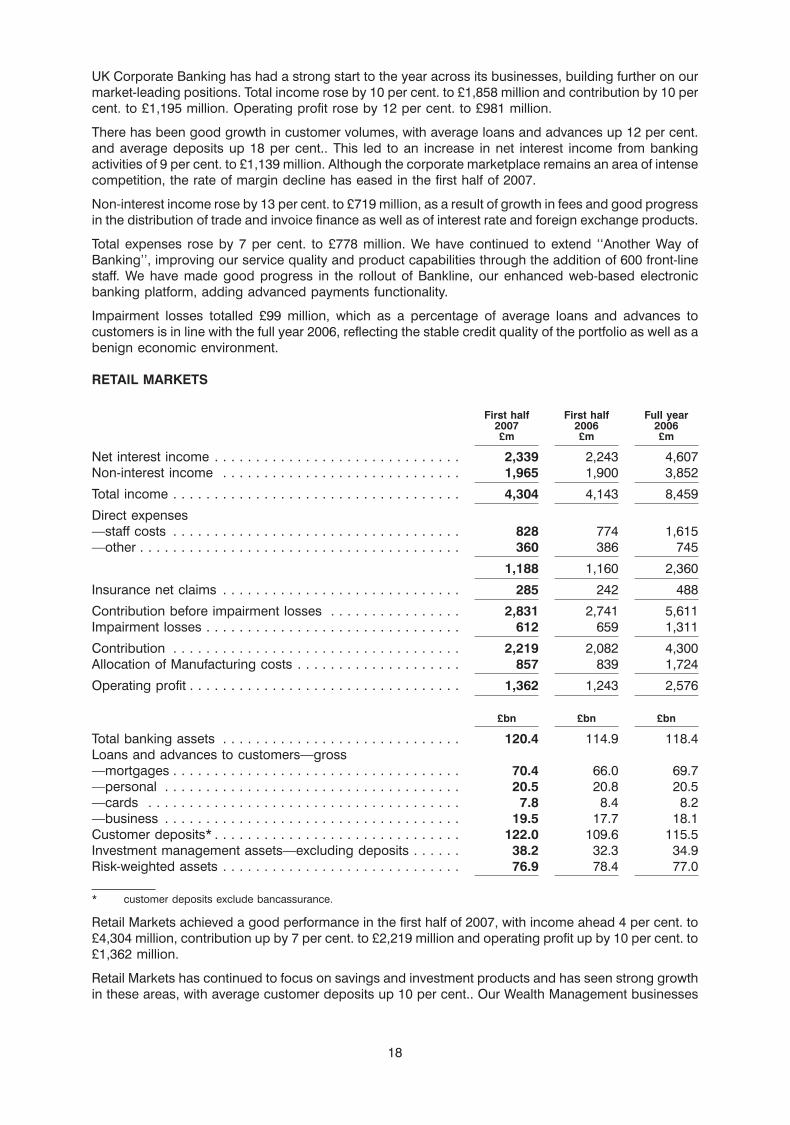
Retail Markets achieved a good performance in the first half of 2007, with income ahead 4 per cent. to£4,304 million, contribution up by 7 per cent. to £2,219 million and operating profit up by 10 per cent. to£1,362 million.
Retail Markets has continued to focus on savings and investment products and has seen strong growthin these areas, with average customer deposits up 10 per cent.. Our Wealth Management businesses
18
have performed strongly, benefiting from the significant investment made in the UK and Asia in recentyears. Lending growth in the personal sector remains subdued as a result of the slowdown in demandfor consumer credit. We have maintained our cautious approach to this sector, reducing lending in anumber of segments where we have not viewed returns as commensurate with the risks and acquisitioncosts involved.
Expenses have been kept under tight control, with continued efficiency gains allowing us to continue toinvest and grow the business. The first half of 2007 marked the turning point in UK unsecured credit, andimpairment losses fell by 7 per cent., with the resultant increase in profitability.
Average risk-weighted assets fell by 2 per cent., reflecting a change in business mix towards mortgagelending as well as careful balance sheet management, including increased use of securitisations.
RETAIL MARKETS—RETAIL
First half First half Full year2007 2006 2006£m £m £m
Net interest income . . . . . . . . . . . . . . . . . . . . . . . . . . . . . . 2,067 2,006 4,111Non-interest income . . . . . . . . . . . . . . . . . . . . . . . . . . . . . 1,740 1,701 3,459
Total income . . . . . . . . . . . . . . . . . . . . . . . . . . . . . . . . . . . 3,807 3,707 7,570
Direct expenses—staff costs . . . . . . . . . . . . . . . . . . . . . . . . . . . . . . . . . . . 670 631 1,316—other . . . . . . . . . . . . . . . . . . . . . . . . . . . . . . . . . . . . . . . 295 323 618
965 954 1,934
Insurance net claims . . . . . . . . . . . . . . . . . . . . . . . . . . . . . 285 242 488
Contribution before impairment losses . . . . . . . . . . . . . . . . 2,557 2,511 5,148Impairment losses . . . . . . . . . . . . . . . . . . . . . . . . . . . . . . . 611 657 1,310
Contribution . . . . . . . . . . . . . . . . . . . . . . . . . . . . . . . . . . . 1,946 1,854 3,838Allocation of Manufacturing costs . . . . . . . . . . . . . . . . . . . . 786 769 1,580
Operating profit . . . . . . . . . . . . . . . . . . . . . . . . . . . . . . . . . 1,160 1,085 2,258
£bn £bn £bn
Total banking assets . . . . . . . . . . . . . . . . . . . . . . . . . . . . . 107.8 103.9 107.4Loans and advances to customers—gross—Mortgages . . . . . . . . . . . . . . . . . . . . . . . . . . . . . . . . . . . 66.2 62.1 65.6—Personal . . . . . . . . . . . . . . . . . . . . . . . . . . . . . . . . . . . . 16.5 17.4 17.1—Cards . . . . . . . . . . . . . . . . . . . . . . . . . . . . . . . . . . . . . . 7.7 8.3 8.1—Business . . . . . . . . . . . . . . . . . . . . . . . . . . . . . . . . . . . . 18.2 16.6 16.9Customer deposits* . . . . . . . . . . . . . . . . . . . . . . . . . . . . . . 91.3 83.2 87.1Risk-weighted assets . . . . . . . . . . . . . . . . . . . . . . . . . . . . . 69.9 71.9 70.6
* customer deposits exclude bancassurance.
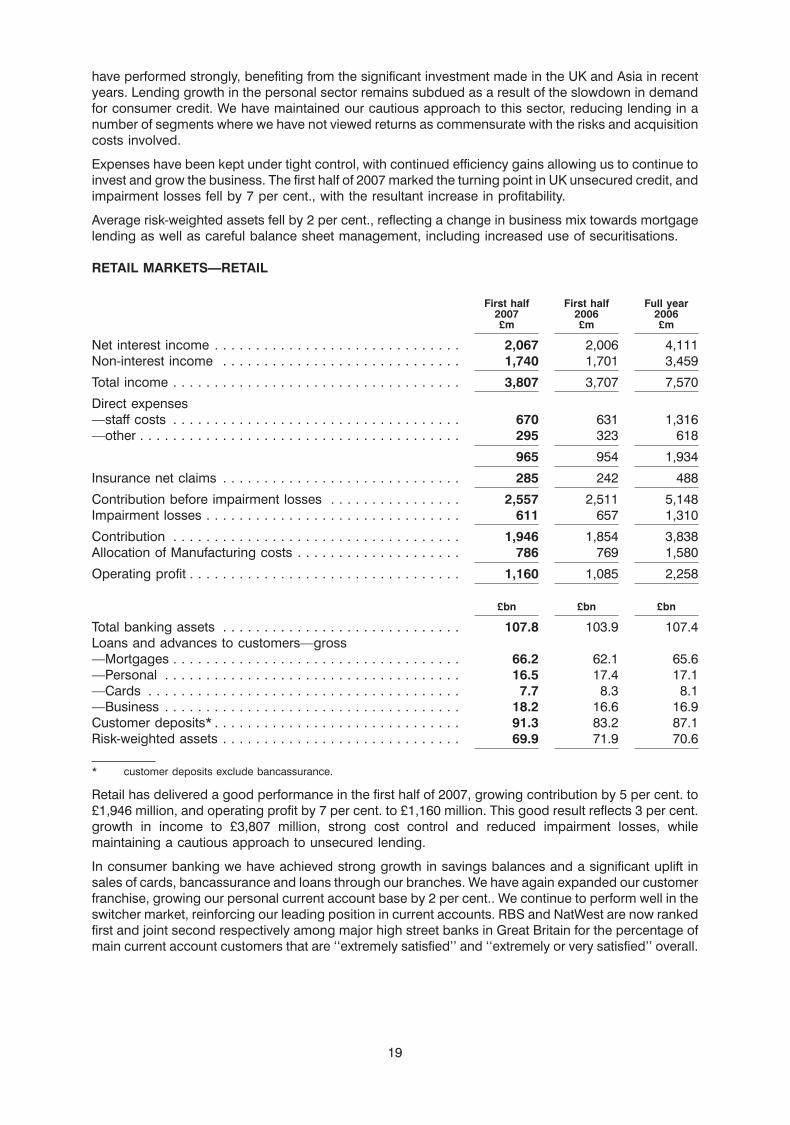
Retail has delivered a good performance in the first half of 2007, growing contribution by 5 per cent. to£1,946 million, and operating profit by 7 per cent. to £1,160 million. This good result reflects 3 per cent.growth in income to £3,807 million, strong cost control and reduced impairment losses, whilemaintaining a cautious approach to unsecured lending.
In consumer banking we have achieved strong growth in savings balances and a significant uplift insales of cards, bancassurance and loans through our branches. We have again expanded our customerfranchise, growing our personal current account base by 2 per cent.. We continue to perform well in theswitcher market, reinforcing our leading position in current accounts. RBS and NatWest are now rankedfirst and joint second respectively among major high street banks in Great Britain for the percentage ofmain current account customers that are ‘‘extremely satisfied’’ and ‘‘extremely or very satisfied’’ overall.
19

In business banking the implementation of a new operating model has produced good results, enablingus to increase our market share. NatWest leads the SME banking market in England and Wales whileRBS remains leader in the Scottish market. We have gained ground in the start-up market and haverecently launched a new market-leading account to target this segment.
Results for our cards and direct finance business reflected our strategy of focusing unsecured personallending on lower risk segments, as well as the market-wide decline in credit card borrowing. Income was5 per cent. lower as a result of declining card and direct loan balances and the impact of the Office of FairTrading’s ruling on credit card fees. Effective cost control and reducing credit losses contributed to a4 per cent. increase in operating profit.
Net interest income increased by 3 per cent. to £2,067 million, with faster growth in deposits helping tomitigate lower unsecured lending volumes and declining card balances. Average customer depositbalances were 8 per cent. higher, driven by very strong growth in personal savings balances, up 12 percent., and accelerating growth in business deposits, up 10 per cent.. Net interest margin was stable.
Average loans and advances to customers increased by 4 per cent., with average mortgage lending up7 per cent. and average business loans up 8 per cent.. Mortgage activity focused on the more profitablebranch channels, where gross lending was 13 per cent. higher, whilst we have continued to take aselective approach to the intermediary channel, where our gross lending was 10 per cent. lower than inthe first half of 2006. We have further reduced our presence in the direct loans market, whilst focusing onquality business with existing customers, resulting in continued growth in lending through the branchchannel. Average credit card balances fell by 10 per cent. as customers repaid debt, but we haveachieved excellent growth in the recruitment of new card accounts through our branches.
Non-interest income was £1,740 million, 2 per cent. ahead of the first half of 2006, with strong incomegrowth in investment and private banking businesses offset by lower credit card late payment fees andlower fee income as a result of reduced direct lending volumes.
Bancassurance continued its excellent progress with sales increasing by 24 per cent. to £171 millionannual premium equivalent. The continuing increase in our sales force has resulted in an increase inmarket share to more than 10 per cent..
Despite investments for future growth, total expenses rose by just 2 per cent. to £1,751 million, whilstdirect expenses were up just 1 per cent. to £965 million. Excluding redundancy costs associated with thedivision’s reorganisation, direct costs were 2 per cent. lower. These redundancy costs resulted in a 5 percent. reduction in headcount and made up most of a 6 per cent. increase in staff costs to £670 million.We sustained investment in customer-facing staff in branches and in our bancassurance and investmentbusinesses. Other costs were reduced by 9 per cent. to £295 million.
Impairment losses decreased by 7 per cent. to £611 million, reflecting the improvement in arrears trendson both credit cards and unsecured personal loans. Mortgage arrears remain very low—the averageloan-to-value ratio of Retail’s mortgages was 47 per cent. overall and 64 per cent. on new mortgageswritten in the first half of 2007. Small business credit quality remains good.
20
RETAIL MARKETS—WEALTH MANAGEMENT
First half First half Full year2007 2006 2006£m £m £m
Net interest income . . . . . . . . . . . . . . . . . . . . . . . . . . . . . . 272 237 496Non-interest income . . . . . . . . . . . . . . . . . . . . . . . . . . . . . 225 199 393
Total income . . . . . . . . . . . . . . . . . . . . . . . . . . . . . . . . . . . 497 436 889
Direct expenses—staff costs . . . . . . . . . . . . . . . . . . . . . . . . . . . . . . . . . . . 158 143 299—other . . . . . . . . . . . . . . . . . . . . . . . . . . . . . . . . . . . . . . . 65 63 127
223 206 426
Contribution before impairment losses . . . . . . . . . . . . . . . . 274 230 463Impairment losses . . . . . . . . . . . . . . . . . . . . . . . . . . . . . . . 1 2 1
Contribution . . . . . . . . . . . . . . . . . . . . . . . . . . . . . . . . . . . 273 228 462Allocation of Manufacturing costs . . . . . . . . . . . . . . . . . . . . 71 70 144
Operating profit . . . . . . . . . . . . . . . . . . . . . . . . . . . . . . . . . 202 158 318
£bn £bn £bn
Loans and advances to customers—gross . . . . . . . . . . . . . 9.6 8.5 8.8Investment management assets—excluding deposits . . . . . . 31.2 26.0 28.2Customer deposits . . . . . . . . . . . . . . . . . . . . . . . . . . . . . . 30.7 26.4 28.4Risk-weighted assets . . . . . . . . . . . . . . . . . . . . . . . . . . . . . 7.0 6.5 6.4
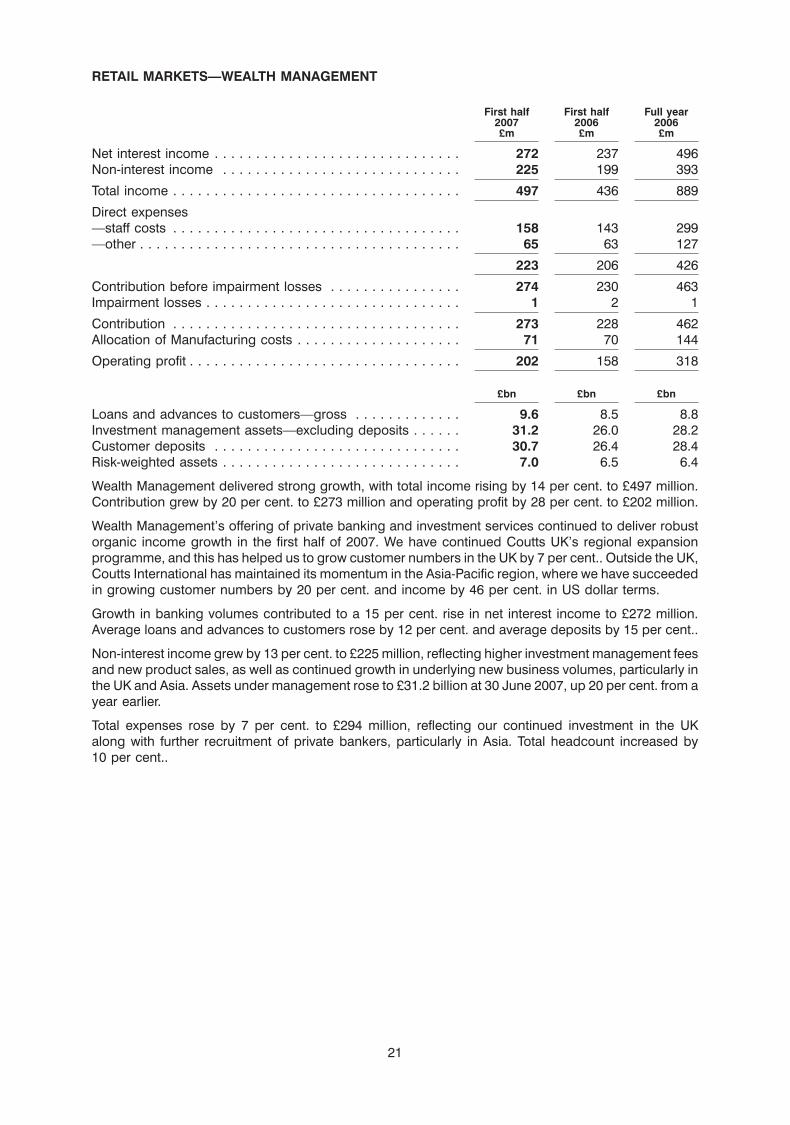
Wealth Management delivered strong growth, with total income rising by 14 per cent. to £497 million.Contribution grew by 20 per cent. to £273 million and operating profit by 28 per cent. to £202 million.
Wealth Management’s offering of private banking and investment services continued to deliver robustorganic income growth in the first half of 2007. We have continued Coutts UK’s regional expansionprogramme, and this has helped us to grow customer numbers in the UK by 7 per cent.. Outside the UK,Coutts International has maintained its momentum in the Asia-Pacific region, where we have succeededin growing customer numbers by 20 per cent. and income by 46 per cent. in US dollar terms.
Growth in banking volumes contributed to a 15 per cent. rise in net interest income to £272 million.Average loans and advances to customers rose by 12 per cent. and average deposits by 15 per cent..
Non-interest income grew by 13 per cent. to £225 million, reflecting higher investment management feesand new product sales, as well as continued growth in underlying new business volumes, particularly inthe UK and Asia. Assets under management rose to £31.2 billion at 30 June 2007, up 20 per cent. from ayear earlier.
Total expenses rose by 7 per cent. to £294 million, reflecting our continued investment in the UKalong with further recruitment of private bankers, particularly in Asia. Total headcount increased by10 per cent..
21
ULSTER BANK
First half First half Full year2007 2006 2006£m £m £m
Net interest income . . . . . . . . . . . . . . . . . . . . . . . . . . . . . . 467 415 873Non-interest income . . . . . . . . . . . . . . . . . . . . . . . . . . . . . 146 128 252
Total income . . . . . . . . . . . . . . . . . . . . . . . . . . . . . . . . . . . 613 543 1,125
Direct expenses—staff costs . . . . . . . . . . . . . . . . . . . . . . . . . . . . . . . . . . . 137 121 254—other . . . . . . . . . . . . . . . . . . . . . . . . . . . . . . . . . . . . . . . 78 62 131
215 183 385
Contribution before impairment losses . . . . . . . . . . . . . . . . 398 360 740Impairment losses . . . . . . . . . . . . . . . . . . . . . . . . . . . . . . . 53 57 104
Contribution . . . . . . . . . . . . . . . . . . . . . . . . . . . . . . . . . . . 345 303 636Allocation of Manufacturing costs . . . . . . . . . . . . . . . . . . . . 107 105 215
Operating profit . . . . . . . . . . . . . . . . . . . . . . . . . . . . . . . . . 238 198 421
Average exchange rate—e/£ . . . . . . . . . . . . . . . . . . . . . . . 1.482 1.456 1.467
£bn £bn £bn
Total assets . . . . . . . . . . . . . . . . . . . . . . . . . . . . . . . . . . . . 49.4 41.8 44.5Loans and advances to customers—gross—mortgages . . . . . . . . . . . . . . . . . . . . . . . . . . . . . . . . . . . 16.2 14.2 15.0—corporate . . . . . . . . . . . . . . . . . . . . . . . . . . . . . . . . . . . 21.7 16.8 19.6—other . . . . . . . . . . . . . . . . . . . . . . . . . . . . . . . . . . . . . . . 3.2 2.9 3.6Customer deposits . . . . . . . . . . . . . . . . . . . . . . . . . . . . . . 20.1 17.6 18.1Risk-weighted assets . . . . . . . . . . . . . . . . . . . . . . . . . . . . . 32.3 27.7 29.7Spot exchange rate—e/£ . . . . . . . . . . . . . . . . . . . . . . . . . . 1.485 1.446 1.490
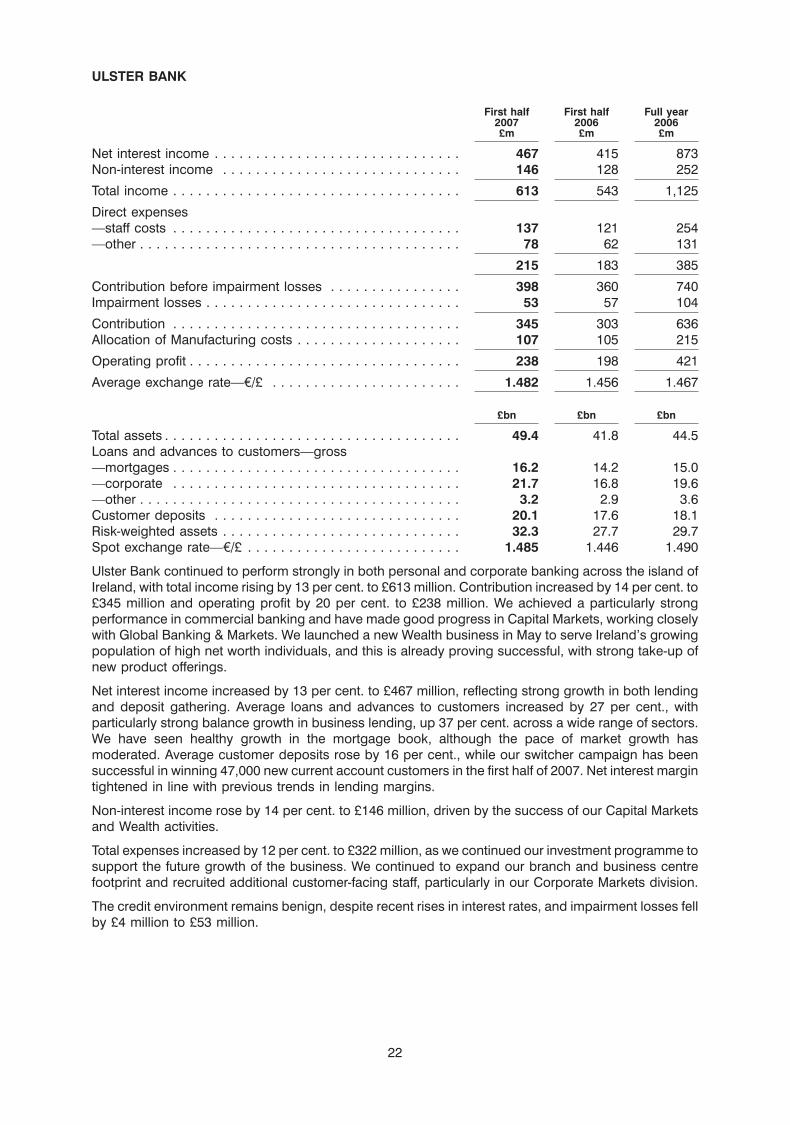
Ulster Bank continued to perform strongly in both personal and corporate banking across the island ofIreland, with total income rising by 13 per cent. to £613 million. Contribution increased by 14 per cent. to£345 million and operating profit by 20 per cent. to £238 million. We achieved a particularly strongperformance in commercial banking and have made good progress in Capital Markets, working closelywith Global Banking & Markets. We launched a new Wealth business in May to serve Ireland’s growingpopulation of high net worth individuals, and this is already proving successful, with strong take-up ofnew product offerings.
Net interest income increased by 13 per cent. to £467 million, reflecting strong growth in both lendingand deposit gathering. Average loans and advances to customers increased by 27 per cent., withparticularly strong balance growth in business lending, up 37 per cent. across a wide range of sectors.We have seen healthy growth in the mortgage book, although the pace of market growth hasmoderated. Average customer deposits rose by 16 per cent., while our switcher campaign has beensuccessful in winning 47,000 new current account customers in the first half of 2007. Net interest margintightened in line with previous trends in lending margins.
Non-interest income rose by 14 per cent. to £146 million, driven by the success of our Capital Marketsand Wealth activities.
Total expenses increased by 12 per cent. to £322 million, as we continued our investment programme tosupport the future growth of the business. We continued to expand our branch and business centrefootprint and recruited additional customer-facing staff, particularly in our Corporate Markets division.
The credit environment remains benign, despite recent rises in interest rates, and impairment losses fellby £4 million to £53 million.
22
CITIZENS
First half First half Full year First half First half Full year2007 2006 2006 2007 2006 2006£m £m £m $m $m $m
Net interest income . . . . . . . . . . . . . 980 1,075 2,085 1,931 1,924 3,844Non-interest income . . . . . . . . . . . . 585 611 1,232 1,153 1,094 2,271
Total income . . . . . . . . . . . . . . . . . . 1,565 1,686 3,317 3,084 3,018 6,115
Direct expenses—staff costs . . . . . . . . . . . . . . . . . . 378 424 803 746 759 1,480—other . . . . . . . . . . . . . . . . . . . . . 352 379 751 693 677 1,385
730 803 1,554 1,439 1,436 2,865
Contribution before impairmentlosses . . . . . . . . . . . . . . . . . . . . . 835 883 1,763 1,645 1,582 3,250
Impairment losses . . . . . . . . . . . . . 83 71 181 163 128 333
Operating profit . . . . . . . . . . . . . . . 752 812 1,582 1,482 1,454 2,917
Average exchange rate—US$/£ . . . . 1.970 1.790 1.844
$bn $bn $bn
Total assets . . . . . . . . . . . . . . . . . . . . . . . . . . . . . . . . . . . . . . . . . 160.3 164.2 162.2Loans and advances to customers—gross—mortgages . . . . . . . . . . . . . . . . . . . . . . . . . . . . . . . . . . . . . . . . 18.5 19.4 18.6—home equity . . . . . . . . . . . . . . . . . . . . . . . . . . . . . . . . . . . . . . . 36.2 33.1 34.5—other consumer . . . . . . . . . . . . . . . . . . . . . . . . . . . . . . . . . . . . . 22.7 24.5 23.2—corporate and commercial . . . . . . . . . . . . . . . . . . . . . . . . . . . . . 34.6 32.2 32.7Customer deposits . . . . . . . . . . . . . . . . . . . . . . . . . . . . . . . . . . . . 106.1 111.8 106.8Customer deposits (excluding wholesale funding) . . . . . . . . . . . . . . 104.0 105.2 103.6Risk-weighted assets . . . . . . . . . . . . . . . . . . . . . . . . . . . . . . . . . . . 114.4 111.5 113.1Spot exchange rate—US$/£ . . . . . . . . . . . . . . . . . . . . . . . . . . . . . . 2.006 1.849 1.965
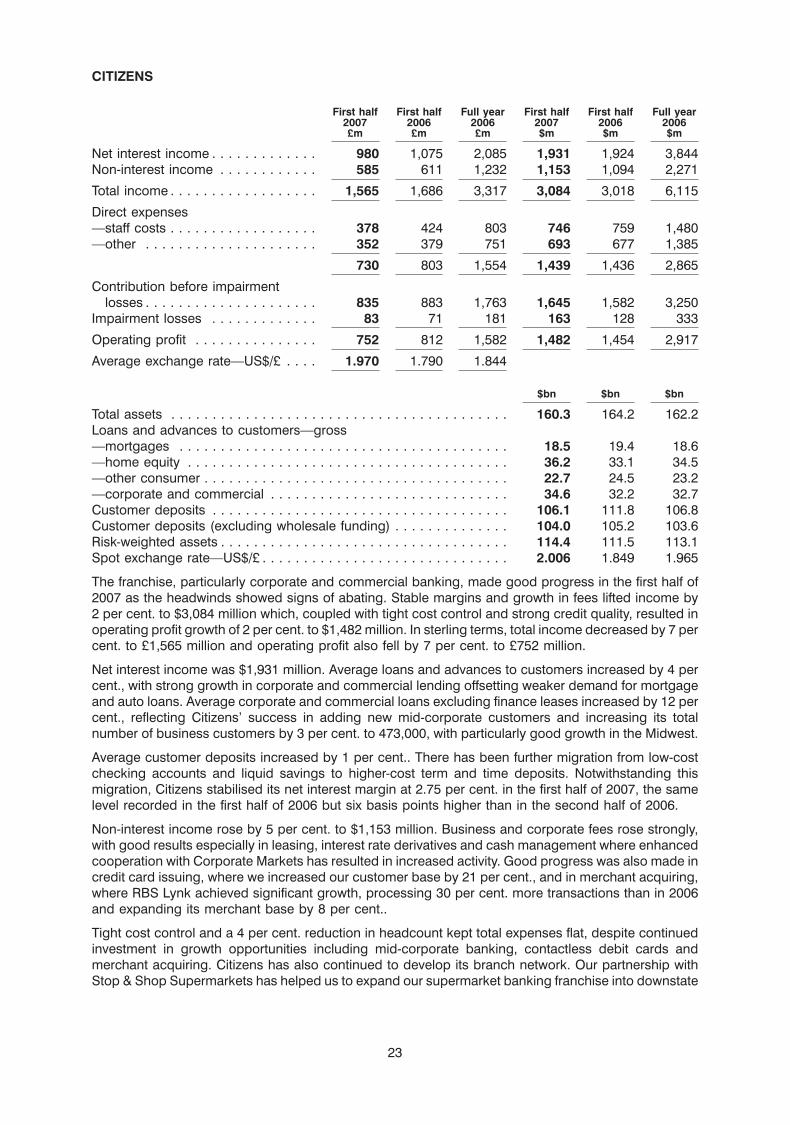
The franchise, particularly corporate and commercial banking, made good progress in the first half of2007 as the headwinds showed signs of abating. Stable margins and growth in fees lifted income by2 per cent. to $3,084 million which, coupled with tight cost control and strong credit quality, resulted inoperating profit growth of 2 per cent. to $1,482 million. In sterling terms, total income decreased by 7 percent. to £1,565 million and operating profit also fell by 7 per cent. to £752 million.
Net interest income was $1,931 million. Average loans and advances to customers increased by 4 percent., with strong growth in corporate and commercial lending offsetting weaker demand for mortgageand auto loans. Average corporate and commercial loans excluding finance leases increased by 12 percent., reflecting Citizens’ success in adding new mid-corporate customers and increasing its totalnumber of business customers by 3 per cent. to 473,000, with particularly good growth in the Midwest.
Average customer deposits increased by 1 per cent.. There has been further migration from low-costchecking accounts and liquid savings to higher-cost term and time deposits. Notwithstanding thismigration, Citizens stabilised its net interest margin at 2.75 per cent. in the first half of 2007, the samelevel recorded in the first half of 2006 but six basis points higher than in the second half of 2006.
Non-interest income rose by 5 per cent. to $1,153 million. Business and corporate fees rose strongly,with good results especially in leasing, interest rate derivatives and cash management where enhancedcooperation with Corporate Markets has resulted in increased activity. Good progress was also made incredit card issuing, where we increased our customer base by 21 per cent., and in merchant acquiring,where RBS Lynk achieved significant growth, processing 30 per cent. more transactions than in 2006and expanding its merchant base by 8 per cent..
Tight cost control and a 4 per cent. reduction in headcount kept total expenses flat, despite continuedinvestment in growth opportunities including mid-corporate banking, contactless debit cards andmerchant acquiring. Citizens has also continued to develop its branch network. Our partnership withStop & Shop Supermarkets has helped us to expand our supermarket banking franchise into downstate
23
New York, while in February we completed the acquisition of GreatBanc, Inc., strengthening our positionin the Chicago market and making us the 5th largest bank in the Chicago area, based on deposits.
The increasing proportion of commercial lending in our portfolio has contributed to an increase inimpairment losses to $163 million. This reflects the growth in the portfolio over the recent past and stillrepresents just 0.29 per cent. of loans and advances to customers, on an annualised basis, illustratingthe quality of our portfolio. Risk elements in lending and problem loans represent 0.35 per cent. of loansand advances, up slightly from 0.32 per cent. in 2006. Citizens is not active in sub-prime lending, andconsumer lending is to prime customers, with average FICO scores on our portfolios, including homeequity lines of credit, in excess of 700 with 96 per cent. of lending secured.
RBS INSURANCEFirst half First half Full year
2007 2006 2006£m £m £m
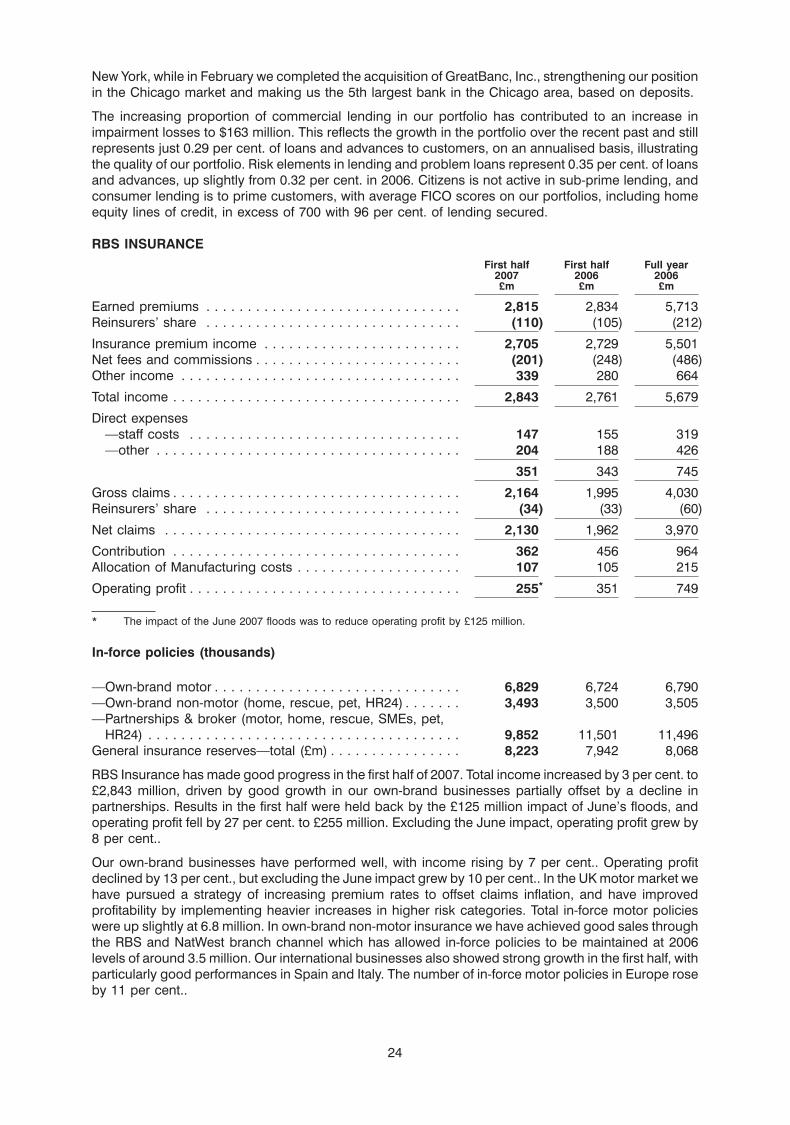
Earned premiums . . . . . . . . . . . . . . . . . . . . . . . . . . . . . . . 2,815 2,834 5,713Reinsurers’ share . . . . . . . . . . . . . . . . . . . . . . . . . . . . . . . (110) (105) (212)
Insurance premium income . . . . . . . . . . . . . . . . . . . . . . . . 2,705 2,729 5,501Net fees and commissions . . . . . . . . . . . . . . . . . . . . . . . . . (201) (248) (486)Other income . . . . . . . . . . . . . . . . . . . . . . . . . . . . . . . . . . 339 280 664
Total income . . . . . . . . . . . . . . . . . . . . . . . . . . . . . . . . . . . 2,843 2,761 5,679
Direct expenses—staff costs . . . . . . . . . . . . . . . . . . . . . . . . . . . . . . . . . 147 155 319—other . . . . . . . . . . . . . . . . . . . . . . . . . . . . . . . . . . . . . 204 188 426
351 343 745
Gross claims . . . . . . . . . . . . . . . . . . . . . . . . . . . . . . . . . . . 2,164 1,995 4,030Reinsurers’ share . . . . . . . . . . . . . . . . . . . . . . . . . . . . . . . (34) (33) (60)
Net claims . . . . . . . . . . . . . . . . . . . . . . . . . . . . . . . . . . . . 2,130 1,962 3,970
Contribution . . . . . . . . . . . . . . . . . . . . . . . . . . . . . . . . . . . 362 456 964Allocation of Manufacturing costs . . . . . . . . . . . . . . . . . . . . 107 105 215
Operating profit . . . . . . . . . . . . . . . . . . . . . . . . . . . . . . . . . 255* 351 749
* The impact of the June 2007 floods was to reduce operating profit by £125 million.
In-force policies (thousands)
—Own-brand motor . . . . . . . . . . . . . . . . . . . . . . . . . . . . . . 6,829 6,724 6,790—Own-brand non-motor (home, rescue, pet, HR24) . . . . . . . 3,493 3,500 3,505—Partnerships & broker (motor, home, rescue, SMEs, pet,
HR24) . . . . . . . . . . . . . . . . . . . . . . . . . . . . . . . . . . . . . . 9,852 11,501 11,496General insurance reserves—total (£m) . . . . . . . . . . . . . . . . 8,223 7,942 8,068
RBS Insurance has made good progress in the first half of 2007. Total income increased by 3 per cent. to£2,843 million, driven by good growth in our own-brand businesses partially offset by a decline inpartnerships. Results in the first half were held back by the £125 million impact of June’s floods, andoperating profit fell by 27 per cent. to £255 million. Excluding the June impact, operating profit grew by8 per cent..
Our own-brand businesses have performed well, with income rising by 7 per cent.. Operating profitdeclined by 13 per cent., but excluding the June impact grew by 10 per cent.. In the UK motor market wehave pursued a strategy of increasing premium rates to offset claims inflation, and have improvedprofitability by implementing heavier increases in higher risk categories. Total in-force motor policieswere up slightly at 6.8 million. In own-brand non-motor insurance we have achieved good sales throughthe RBS and NatWest branch channel which has allowed in-force policies to be maintained at 2006levels of around 3.5 million. Our international businesses also showed strong growth in the first half, withparticularly good performances in Spain and Italy. The number of in-force motor policies in Europe roseby 11 per cent..
24
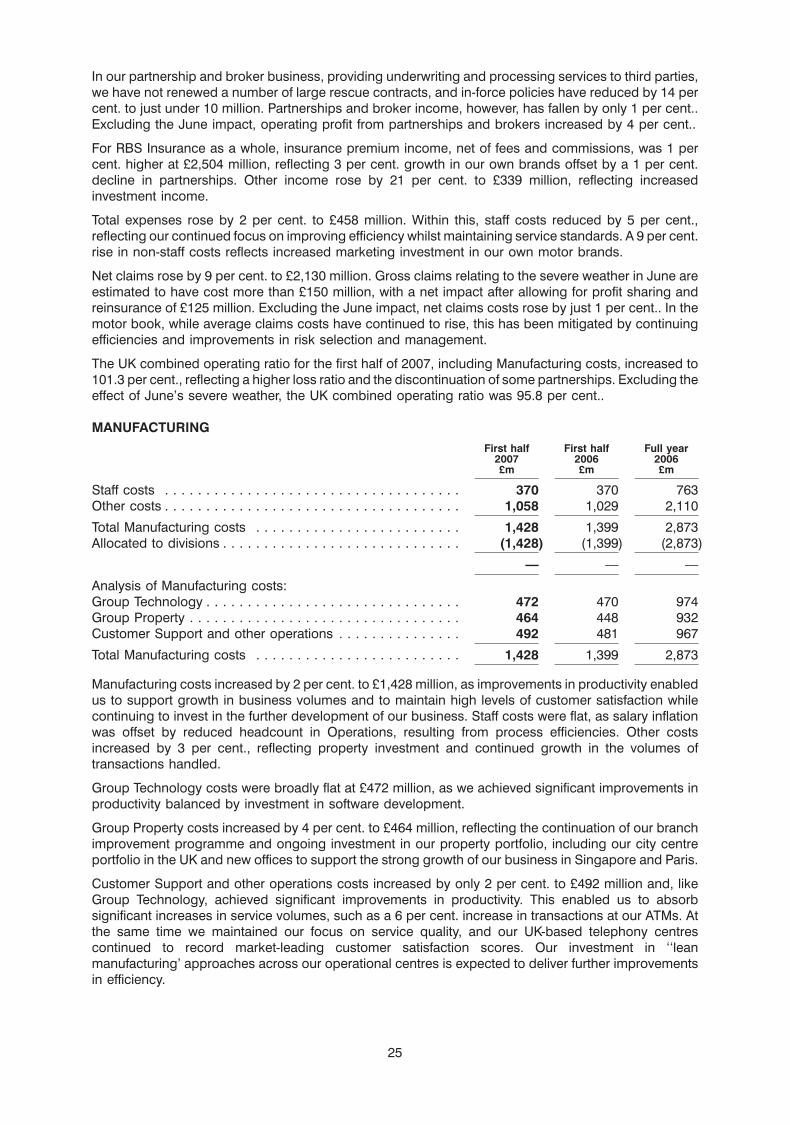
In our partnership and broker business, providing underwriting and processing services to third parties,we have not renewed a number of large rescue contracts, and in-force policies have reduced by 14 percent. to just under 10 million. Partnerships and broker income, however, has fallen by only 1 per cent..Excluding the June impact, operating profit from partnerships and brokers increased by 4 per cent..
For RBS Insurance as a whole, insurance premium income, net of fees and commissions, was 1 percent. higher at £2,504 million, reflecting 3 per cent. growth in our own brands offset by a 1 per cent.decline in partnerships. Other income rose by 21 per cent. to £339 million, reflecting increasedinvestment income.
Total expenses rose by 2 per cent. to £458 million. Within this, staff costs reduced by 5 per cent.,reflecting our continued focus on improving efficiency whilst maintaining service standards. A 9 per cent.rise in non-staff costs reflects increased marketing investment in our own motor brands.
Net claims rose by 9 per cent. to £2,130 million. Gross claims relating to the severe weather in June areestimated to have cost more than £150 million, with a net impact after allowing for profit sharing andreinsurance of £125 million. Excluding the June impact, net claims costs rose by just 1 per cent.. In themotor book, while average claims costs have continued to rise, this has been mitigated by continuingefficiencies and improvements in risk selection and management.
The UK combined operating ratio for the first half of 2007, including Manufacturing costs, increased to101.3 per cent., reflecting a higher loss ratio and the discontinuation of some partnerships. Excluding theeffect of June’s severe weather, the UK combined operating ratio was 95.8 per cent..
MANUFACTURINGFirst half First half Full year
2007 2006 2006£m £m £m
Staff costs . . . . . . . . . . . . . . . . . . . . . . . . . . . . . . . . . . . . 370 370 763Other costs . . . . . . . . . . . . . . . . . . . . . . . . . . . . . . . . . . . . 1,058 1,029 2,110
Total Manufacturing costs . . . . . . . . . . . . . . . . . . . . . . . . . 1,428 1,399 2,873Allocated to divisions . . . . . . . . . . . . . . . . . . . . . . . . . . . . . (1,428) (1,399) (2,873)
— — —
Analysis of Manufacturing costs:Group Technology . . . . . . . . . . . . . . . . . . . . . . . . . . . . . . . 472 470 974Group Property . . . . . . . . . . . . . . . . . . . . . . . . . . . . . . . . . 464 448 932Customer Support and other operations . . . . . . . . . . . . . . . 492 481 967
Total Manufacturing costs . . . . . . . . . . . . . . . . . . . . . . . . . 1,428 1,399 2,873
Manufacturing costs increased by 2 per cent. to £1,428 million, as improvements in productivity enabledus to support growth in business volumes and to maintain high levels of customer satisfaction whilecontinuing to invest in the further development of our business. Staff costs were flat, as salary inflationwas offset by reduced headcount in Operations, resulting from process efficiencies. Other costsincreased by 3 per cent., reflecting property investment and continued growth in the volumes oftransactions handled.
Group Technology costs were broadly flat at £472 million, as we achieved significant improvements inproductivity balanced by investment in software development.
Group Property costs increased by 4 per cent. to £464 million, reflecting the continuation of our branchimprovement programme and ongoing investment in our property portfolio, including our city centreportfolio in the UK and new offices to support the strong growth of our business in Singapore and Paris.
Customer Support and other operations costs increased by only 2 per cent. to £492 million and, likeGroup Technology, achieved significant improvements in productivity. This enabled us to absorbsignificant increases in service volumes, such as a 6 per cent. increase in transactions at our ATMs. Atthe same time we maintained our focus on service quality, and our UK-based telephony centrescontinued to record market-leading customer satisfaction scores. Our investment in ‘‘leanmanufacturing’ approaches across our operational centres is expected to deliver further improvementsin efficiency.
25
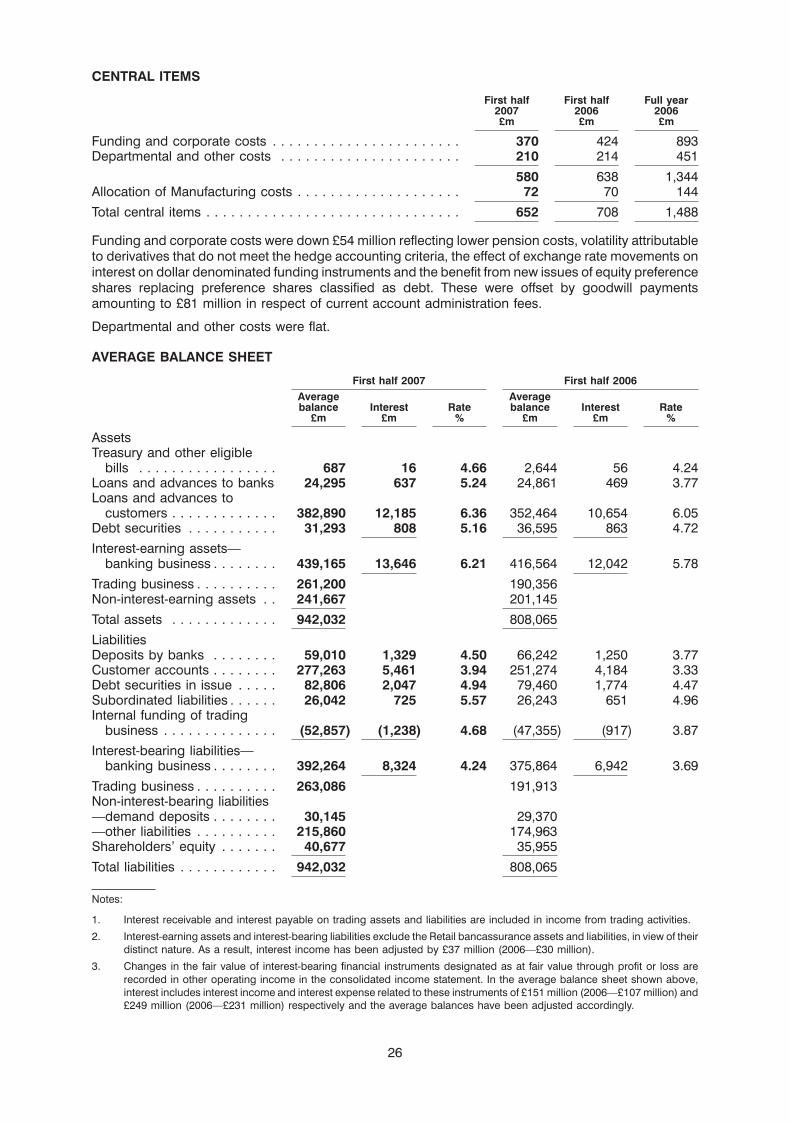
CENTRAL ITEMS
First half First half Full year2007 2006 2006£m £m £m
Funding and corporate costs . . . . . . . . . . . . . . . . . . . . . . . 370 424 893Departmental and other costs . . . . . . . . . . . . . . . . . . . . . . 210 214 451
580 638 1,344Allocation of Manufacturing costs . . . . . . . . . . . . . . . . . . . . 72 70 144
Total central items . . . . . . . . . . . . . . . . . . . . . . . . . . . . . . . 652 708 1,488
Funding and corporate costs were down £54 million reflecting lower pension costs, volatility attributableto derivatives that do not meet the hedge accounting criteria, the effect of exchange rate movements oninterest on dollar denominated funding instruments and the benefit from new issues of equity preferenceshares replacing preference shares classified as debt. These were offset by goodwill paymentsamounting to £81 million in respect of current account administration fees.
Departmental and other costs were flat.
AVERAGE BALANCE SHEET
First half 2007 First half 2006Average Averagebalance Interest Rate balance Interest Rate
£m £m % £m £m %
AssetsTreasury and other eligible
bills . . . . . . . . . . . . . . . . . 687 16 4.66 2,644 56 4.24Loans and advances to banks 24,295 637 5.24 24,861 469 3.77Loans and advances to
customers . . . . . . . . . . . . . 382,890 12,185 6.36 352,464 10,654 6.05Debt securities . . . . . . . . . . . 31,293 808 5.16 36,595 863 4.72
Interest-earning assets—banking business . . . . . . . . 439,165 13,646 6.21 416,564 12,042 5.78
Trading business . . . . . . . . . . 261,200 190,356Non-interest-earning assets . . 241,667 201,145
Total assets . . . . . . . . . . . . . 942,032 808,065
LiabilitiesDeposits by banks . . . . . . . . 59,010 1,329 4.50 66,242 1,250 3.77Customer accounts . . . . . . . . 277,263 5,461 3.94 251,274 4,184 3.33Debt securities in issue . . . . . 82,806 2,047 4.94 79,460 1,774 4.47Subordinated liabilities . . . . . . 26,042 725 5.57 26,243 651 4.96Internal funding of trading
business . . . . . . . . . . . . . . (52,857) (1,238) 4.68 (47,355) (917) 3.87
Interest-bearing liabilities—banking business . . . . . . . . 392,264 8,324 4.24 375,864 6,942 3.69
Trading business . . . . . . . . . . 263,086 191,913Non-interest-bearing liabilities—demand deposits . . . . . . . . 30,145 29,370—other liabilities . . . . . . . . . . 215,860 174,963Shareholders’ equity . . . . . . . 40,677 35,955
Total liabilities . . . . . . . . . . . . 942,032 808,065
Notes:
1. Interest receivable and interest payable on trading assets and liabilities are included in income from trading activities.
2. Interest-earning assets and interest-bearing liabilities exclude the Retail bancassurance assets and liabilities, in view of theirdistinct nature. As a result, interest income has been adjusted by £37 million (2006—£30 million).
3. Changes in the fair value of interest-bearing financial instruments designated as at fair value through profit or loss arerecorded in other operating income in the consolidated income statement. In the average balance sheet shown above,interest includes interest income and interest expense related to these instruments of £151 million (2006—£107 million) and£249 million (2006—£231 million) respectively and the average balances have been adjusted accordingly.
26
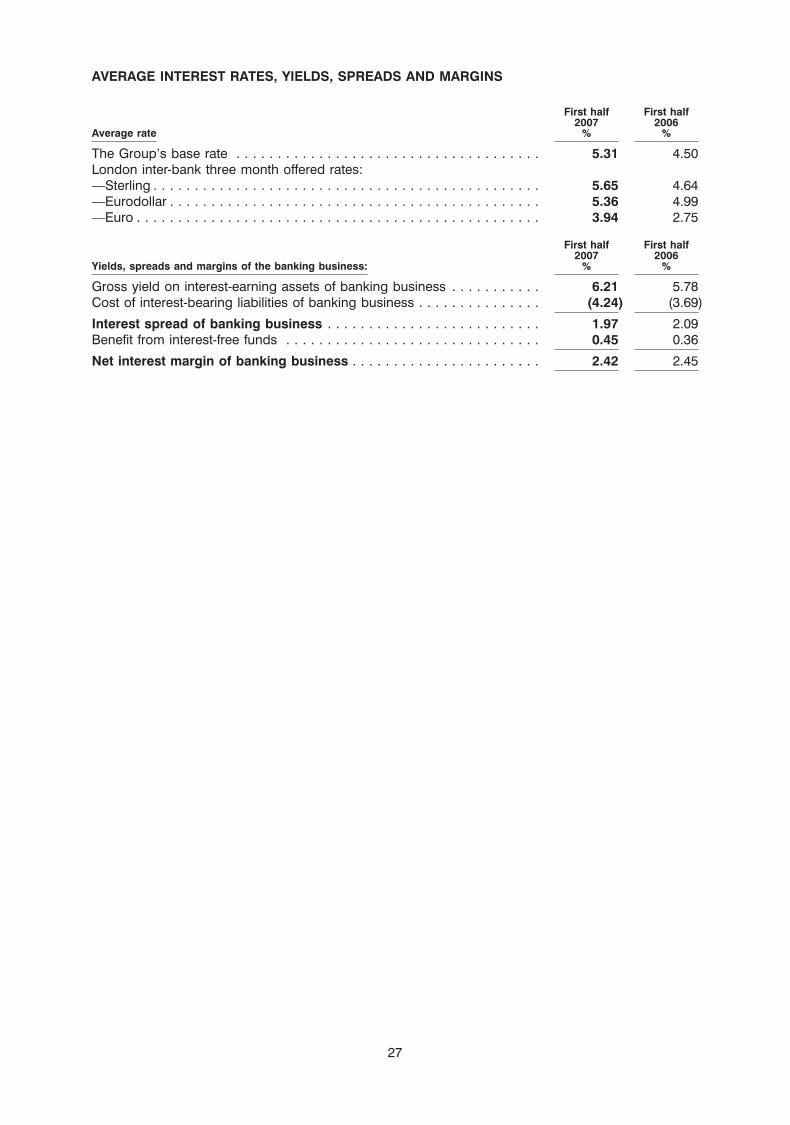
AVERAGE INTEREST RATES, YIELDS, SPREADS AND MARGINS
First half First half2007 2006
Average rate % %
The Group’s base rate . . . . . . . . . . . . . . . . . . . . . . . . . . . . . . . . . . . . . 5.31 4.50London inter-bank three month offered rates:—Sterling . . . . . . . . . . . . . . . . . . . . . . . . . . . . . . . . . . . . . . . . . . . . . . . 5.65 4.64—Eurodollar . . . . . . . . . . . . . . . . . . . . . . . . . . . . . . . . . . . . . . . . . . . . . 5.36 4.99—Euro . . . . . . . . . . . . . . . . . . . . . . . . . . . . . . . . . . . . . . . . . . . . . . . . . 3.94 2.75
First half First half2007 2006
Yields, spreads and margins of the banking business: % %
Gross yield on interest-earning assets of banking business . . . . . . . . . . . 6.21 5.78Cost of interest-bearing liabilities of banking business . . . . . . . . . . . . . . . (4.24) (3.69)
Interest spread of banking business . . . . . . . . . . . . . . . . . . . . . . . . . . 1.97 2.09Benefit from interest-free funds . . . . . . . . . . . . . . . . . . . . . . . . . . . . . . . 0.45 0.36
Net interest margin of banking business . . . . . . . . . . . . . . . . . . . . . . . 2.42 2.45
27
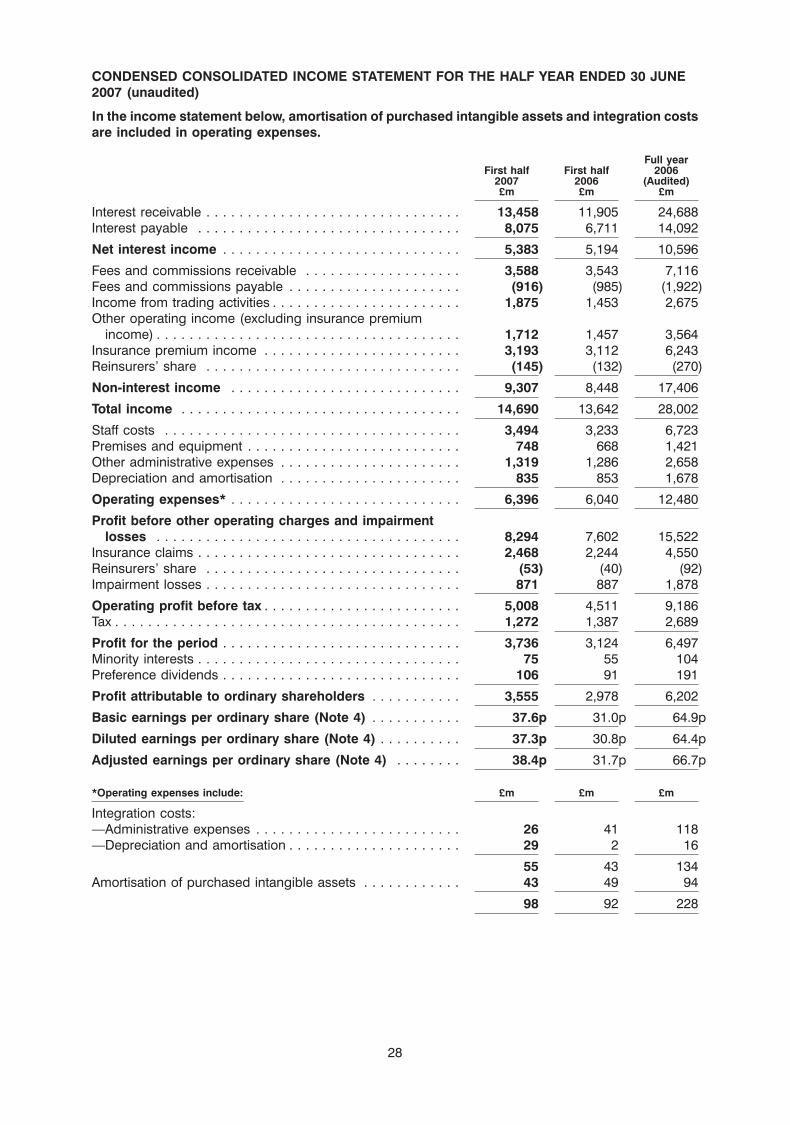
CONDENSED CONSOLIDATED INCOME STATEMENT FOR THE HALF YEAR ENDED 30 JUNE2007 (unaudited)
In the income statement below, amortisation of purchased intangible assets and integration costsare included in operating expenses.
Full yearFirst half First half 2006
2007 2006 (Audited)£m £m £m
Interest receivable . . . . . . . . . . . . . . . . . . . . . . . . . . . . . . . 13,458 11,905 24,688Interest payable . . . . . . . . . . . . . . . . . . . . . . . . . . . . . . . . 8,075 6,711 14,092
Net interest income . . . . . . . . . . . . . . . . . . . . . . . . . . . . . 5,383 5,194 10,596
Fees and commissions receivable . . . . . . . . . . . . . . . . . . . 3,588 3,543 7,116Fees and commissions payable . . . . . . . . . . . . . . . . . . . . . (916) (985) (1,922)Income from trading activities . . . . . . . . . . . . . . . . . . . . . . . 1,875 1,453 2,675Other operating income (excluding insurance premium
income) . . . . . . . . . . . . . . . . . . . . . . . . . . . . . . . . . . . . . 1,712 1,457 3,564Insurance premium income . . . . . . . . . . . . . . . . . . . . . . . . 3,193 3,112 6,243Reinsurers’ share . . . . . . . . . . . . . . . . . . . . . . . . . . . . . . . (145) (132) (270)
Non-interest income . . . . . . . . . . . . . . . . . . . . . . . . . . . . 9,307 8,448 17,406
Total income . . . . . . . . . . . . . . . . . . . . . . . . . . . . . . . . . . 14,690 13,642 28,002
Staff costs . . . . . . . . . . . . . . . . . . . . . . . . . . . . . . . . . . . . 3,494 3,233 6,723Premises and equipment . . . . . . . . . . . . . . . . . . . . . . . . . . 748 668 1,421Other administrative expenses . . . . . . . . . . . . . . . . . . . . . . 1,319 1,286 2,658Depreciation and amortisation . . . . . . . . . . . . . . . . . . . . . . 835 853 1,678
Operating expenses* . . . . . . . . . . . . . . . . . . . . . . . . . . . . 6,396 6,040 12,480
Profit before other operating charges and impairmentlosses . . . . . . . . . . . . . . . . . . . . . . . . . . . . . . . . . . . . . 8,294 7,602 15,522
Insurance claims . . . . . . . . . . . . . . . . . . . . . . . . . . . . . . . . 2,468 2,244 4,550Reinsurers’ share . . . . . . . . . . . . . . . . . . . . . . . . . . . . . . . (53) (40) (92)Impairment losses . . . . . . . . . . . . . . . . . . . . . . . . . . . . . . . 871 887 1,878
Operating profit before tax . . . . . . . . . . . . . . . . . . . . . . . . 5,008 4,511 9,186Tax . . . . . . . . . . . . . . . . . . . . . . . . . . . . . . . . . . . . . . . . . . 1,272 1,387 2,689
Profit for the period . . . . . . . . . . . . . . . . . . . . . . . . . . . . . 3,736 3,124 6,497Minority interests . . . . . . . . . . . . . . . . . . . . . . . . . . . . . . . . 75 55 104Preference dividends . . . . . . . . . . . . . . . . . . . . . . . . . . . . . 106 91 191
Profit attributable to ordinary shareholders . . . . . . . . . . . 3,555 2,978 6,202
Basic earnings per ordinary share (Note 4) . . . . . . . . . . . 37.6p 31.0p 64.9p
Diluted earnings per ordinary share (Note 4) . . . . . . . . . . 37.3p 30.8p 64.4p
Adjusted earnings per ordinary share (Note 4) . . . . . . . . 38.4p 31.7p 66.7p
*Operating expenses include: £m £m £m
Integration costs:—Administrative expenses . . . . . . . . . . . . . . . . . . . . . . . . . 26 41 118—Depreciation and amortisation . . . . . . . . . . . . . . . . . . . . . 29 2 16
55 43 134Amortisation of purchased intangible assets . . . . . . . . . . . . 43 49 94
98 92 228
28
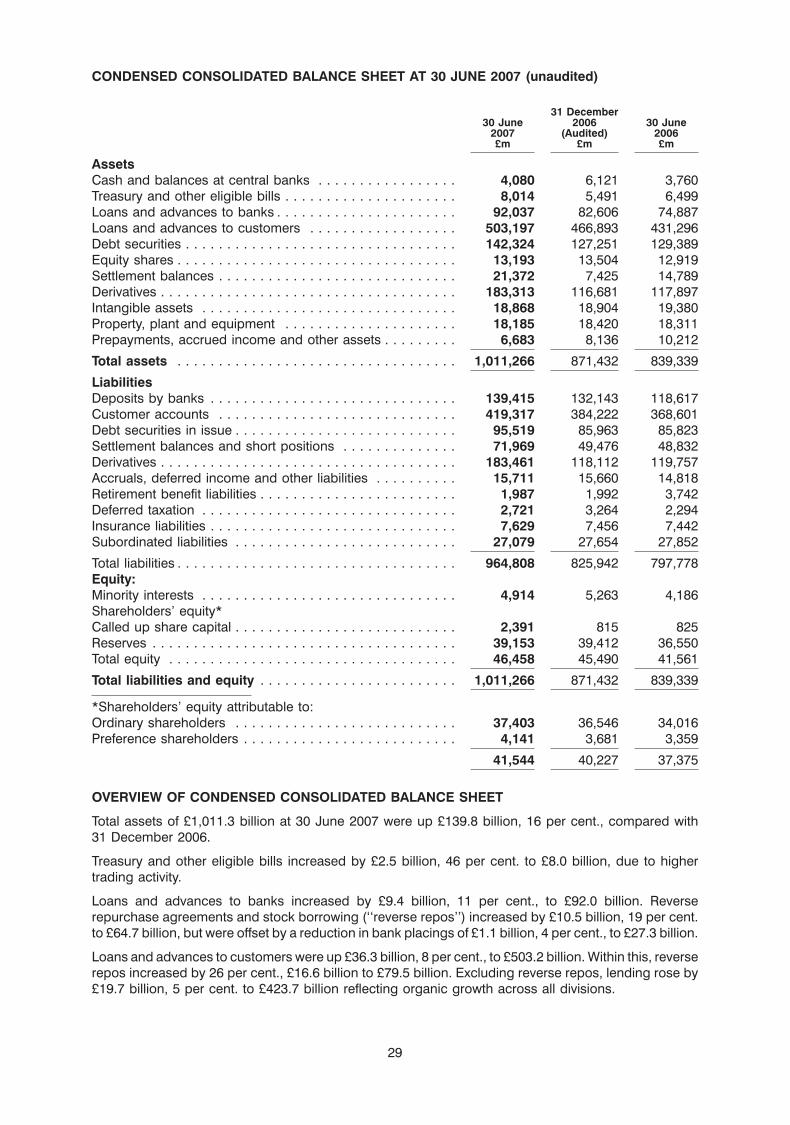
CONDENSED CONSOLIDATED BALANCE SHEET AT 30 JUNE 2007 (unaudited)
31 December30 June 2006 30 June
2007 (Audited) 2006£m £m £m
AssetsCash and balances at central banks . . . . . . . . . . . . . . . . . 4,080 6,121 3,760Treasury and other eligible bills . . . . . . . . . . . . . . . . . . . . . 8,014 5,491 6,499Loans and advances to banks . . . . . . . . . . . . . . . . . . . . . . 92,037 82,606 74,887Loans and advances to customers . . . . . . . . . . . . . . . . . . 503,197 466,893 431,296Debt securities . . . . . . . . . . . . . . . . . . . . . . . . . . . . . . . . . 142,324 127,251 129,389Equity shares . . . . . . . . . . . . . . . . . . . . . . . . . . . . . . . . . . 13,193 13,504 12,919Settlement balances . . . . . . . . . . . . . . . . . . . . . . . . . . . . . 21,372 7,425 14,789Derivatives . . . . . . . . . . . . . . . . . . . . . . . . . . . . . . . . . . . . 183,313 116,681 117,897Intangible assets . . . . . . . . . . . . . . . . . . . . . . . . . . . . . . . 18,868 18,904 19,380Property, plant and equipment . . . . . . . . . . . . . . . . . . . . . 18,185 18,420 18,311Prepayments, accrued income and other assets . . . . . . . . . 6,683 8,136 10,212
Total assets . . . . . . . . . . . . . . . . . . . . . . . . . . . . . . . . . . 1,011,266 871,432 839,339
LiabilitiesDeposits by banks . . . . . . . . . . . . . . . . . . . . . . . . . . . . . . 139,415 132,143 118,617Customer accounts . . . . . . . . . . . . . . . . . . . . . . . . . . . . . 419,317 384,222 368,601Debt securities in issue . . . . . . . . . . . . . . . . . . . . . . . . . . . 95,519 85,963 85,823Settlement balances and short positions . . . . . . . . . . . . . . 71,969 49,476 48,832Derivatives . . . . . . . . . . . . . . . . . . . . . . . . . . . . . . . . . . . . 183,461 118,112 119,757Accruals, deferred income and other liabilities . . . . . . . . . . 15,711 15,660 14,818Retirement benefit liabilities . . . . . . . . . . . . . . . . . . . . . . . . 1,987 1,992 3,742Deferred taxation . . . . . . . . . . . . . . . . . . . . . . . . . . . . . . . 2,721 3,264 2,294Insurance liabilities . . . . . . . . . . . . . . . . . . . . . . . . . . . . . . 7,629 7,456 7,442Subordinated liabilities . . . . . . . . . . . . . . . . . . . . . . . . . . . 27,079 27,654 27,852
Total liabilities . . . . . . . . . . . . . . . . . . . . . . . . . . . . . . . . . . 964,808 825,942 797,778Equity:Minority interests . . . . . . . . . . . . . . . . . . . . . . . . . . . . . . . 4,914 5,263 4,186Shareholders’ equity*Called up share capital . . . . . . . . . . . . . . . . . . . . . . . . . . . 2,391 815 825Reserves . . . . . . . . . . . . . . . . . . . . . . . . . . . . . . . . . . . . . 39,153 39,412 36,550Total equity . . . . . . . . . . . . . . . . . . . . . . . . . . . . . . . . . . . 46,458 45,490 41,561
Total liabilities and equity . . . . . . . . . . . . . . . . . . . . . . . . 1,011,266 871,432 839,339
*Shareholders’ equity attributable to:Ordinary shareholders . . . . . . . . . . . . . . . . . . . . . . . . . . . 37,403 36,546 34,016Preference shareholders . . . . . . . . . . . . . . . . . . . . . . . . . . 4,141 3,681 3,359
41,544 40,227 37,375
OVERVIEW OF CONDENSED CONSOLIDATED BALANCE SHEET
Total assets of £1,011.3 billion at 30 June 2007 were up £139.8 billion, 16 per cent., compared with31 December 2006.
Treasury and other eligible bills increased by £2.5 billion, 46 per cent. to £8.0 billion, due to highertrading activity.
Loans and advances to banks increased by £9.4 billion, 11 per cent., to £92.0 billion. Reverserepurchase agreements and stock borrowing (‘‘reverse repos’’) increased by £10.5 billion, 19 per cent.to £64.7 billion, but were offset by a reduction in bank placings of £1.1 billion, 4 per cent., to £27.3 billion.
Loans and advances to customers were up £36.3 billion, 8 per cent., to £503.2 billion. Within this, reverserepos increased by 26 per cent., £16.6 billion to £79.5 billion. Excluding reverse repos, lending rose by£19.7 billion, 5 per cent. to £423.7 billion reflecting organic growth across all divisions.
29
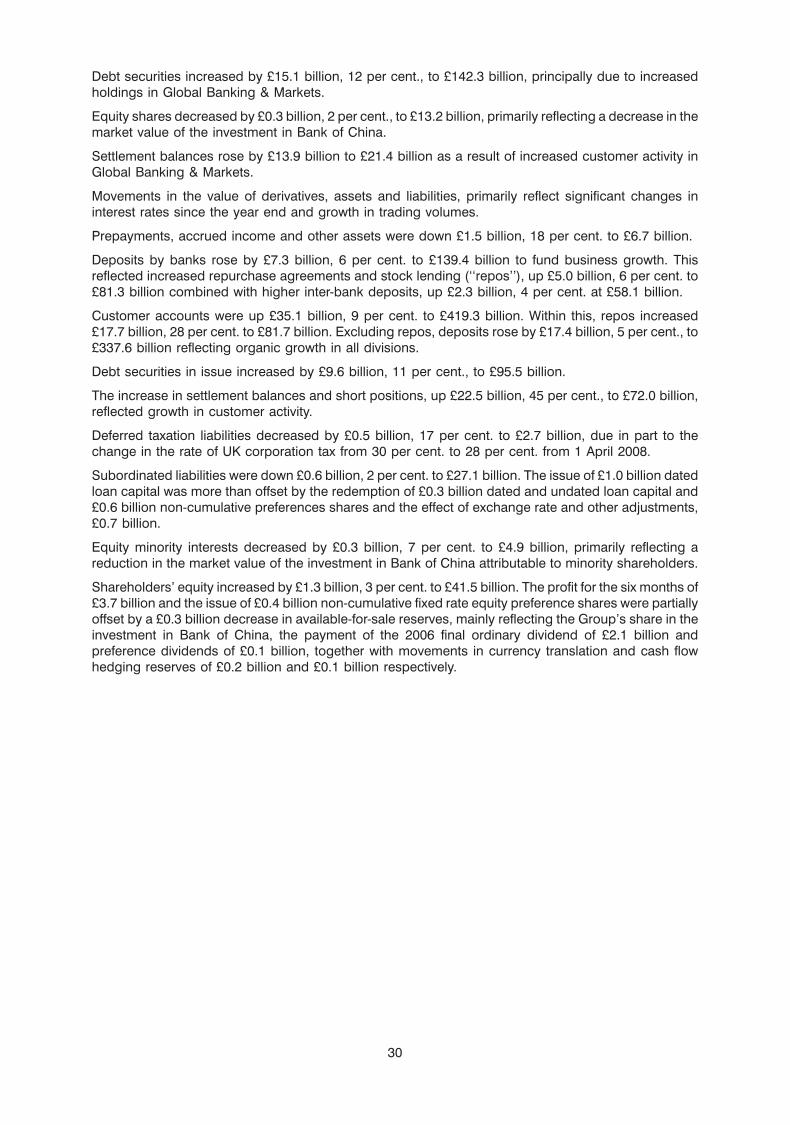
Debt securities increased by £15.1 billion, 12 per cent., to £142.3 billion, principally due to increasedholdings in Global Banking & Markets.
Equity shares decreased by £0.3 billion, 2 per cent., to £13.2 billion, primarily reflecting a decrease in themarket value of the investment in Bank of China.
Settlement balances rose by £13.9 billion to £21.4 billion as a result of increased customer activity inGlobal Banking & Markets.
Movements in the value of derivatives, assets and liabilities, primarily reflect significant changes ininterest rates since the year end and growth in trading volumes.
Prepayments, accrued income and other assets were down £1.5 billion, 18 per cent. to £6.7 billion.
Deposits by banks rose by £7.3 billion, 6 per cent. to £139.4 billion to fund business growth. Thisreflected increased repurchase agreements and stock lending (‘‘repos’’), up £5.0 billion, 6 per cent. to£81.3 billion combined with higher inter-bank deposits, up £2.3 billion, 4 per cent. at £58.1 billion.
Customer accounts were up £35.1 billion, 9 per cent. to £419.3 billion. Within this, repos increased£17.7 billion, 28 per cent. to £81.7 billion. Excluding repos, deposits rose by £17.4 billion, 5 per cent., to£337.6 billion reflecting organic growth in all divisions.
Debt securities in issue increased by £9.6 billion, 11 per cent., to £95.5 billion.
The increase in settlement balances and short positions, up £22.5 billion, 45 per cent., to £72.0 billion,reflected growth in customer activity.
Deferred taxation liabilities decreased by £0.5 billion, 17 per cent. to £2.7 billion, due in part to thechange in the rate of UK corporation tax from 30 per cent. to 28 per cent. from 1 April 2008.
Subordinated liabilities were down £0.6 billion, 2 per cent. to £27.1 billion. The issue of £1.0 billion datedloan capital was more than offset by the redemption of £0.3 billion dated and undated loan capital and£0.6 billion non-cumulative preferences shares and the effect of exchange rate and other adjustments,£0.7 billion.
Equity minority interests decreased by £0.3 billion, 7 per cent. to £4.9 billion, primarily reflecting areduction in the market value of the investment in Bank of China attributable to minority shareholders.
Shareholders’ equity increased by £1.3 billion, 3 per cent. to £41.5 billion. The profit for the six months of£3.7 billion and the issue of £0.4 billion non-cumulative fixed rate equity preference shares were partiallyoffset by a £0.3 billion decrease in available-for-sale reserves, mainly reflecting the Group’s share in theinvestment in Bank of China, the payment of the 2006 final ordinary dividend of £2.1 billion andpreference dividends of £0.1 billion, together with movements in currency translation and cash flowhedging reserves of £0.2 billion and £0.1 billion respectively.
30
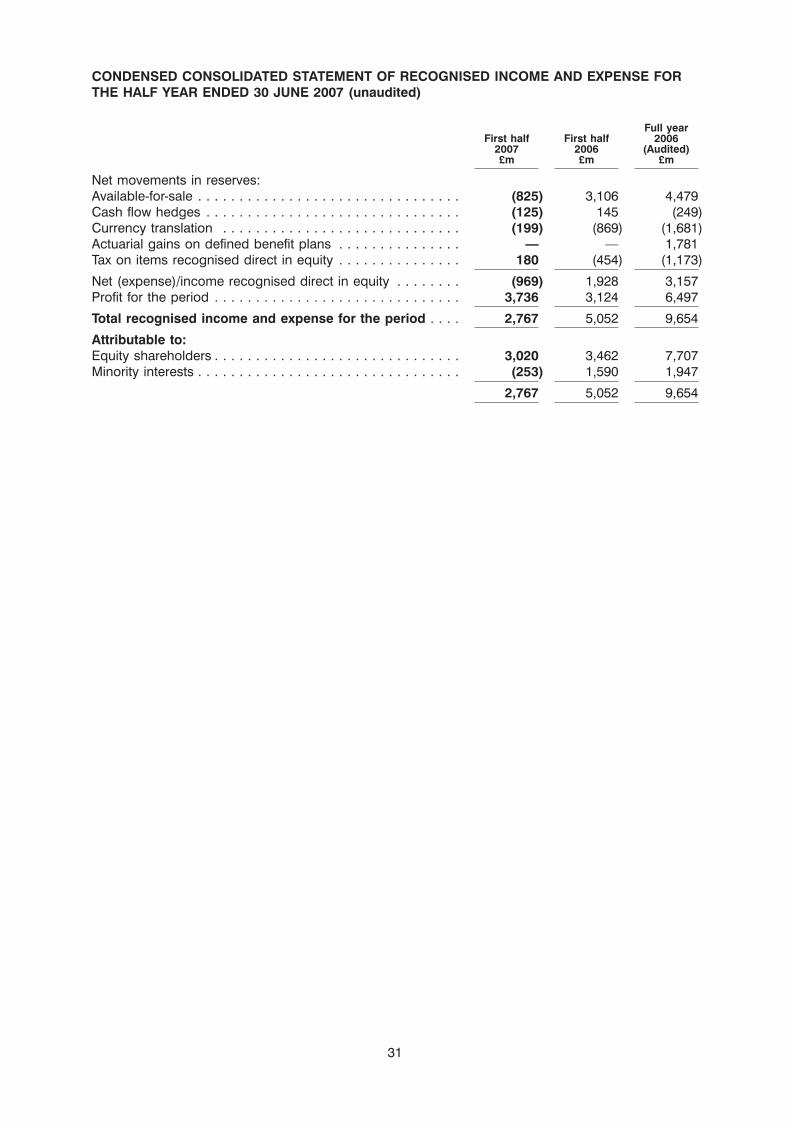
CONDENSED CONSOLIDATED STATEMENT OF RECOGNISED INCOME AND EXPENSE FORTHE HALF YEAR ENDED 30 JUNE 2007 (unaudited)
Full yearFirst half First half 2006
2007 2006 (Audited)£m £m £m
Net movements in reserves:Available-for-sale . . . . . . . . . . . . . . . . . . . . . . . . . . . . . . . . (825) 3,106 4,479Cash flow hedges . . . . . . . . . . . . . . . . . . . . . . . . . . . . . . . (125) 145 (249)Currency translation . . . . . . . . . . . . . . . . . . . . . . . . . . . . . (199) (869) (1,681)Actuarial gains on defined benefit plans . . . . . . . . . . . . . . . — — 1,781Tax on items recognised direct in equity . . . . . . . . . . . . . . . 180 (454) (1,173)
Net (expense)/income recognised direct in equity . . . . . . . . (969) 1,928 3,157Profit for the period . . . . . . . . . . . . . . . . . . . . . . . . . . . . . . 3,736 3,124 6,497
Total recognised income and expense for the period . . . . 2,767 5,052 9,654
Attributable to:Equity shareholders . . . . . . . . . . . . . . . . . . . . . . . . . . . . . . 3,020 3,462 7,707Minority interests . . . . . . . . . . . . . . . . . . . . . . . . . . . . . . . . (253) 1,590 1,947
2,767 5,052 9,654
31
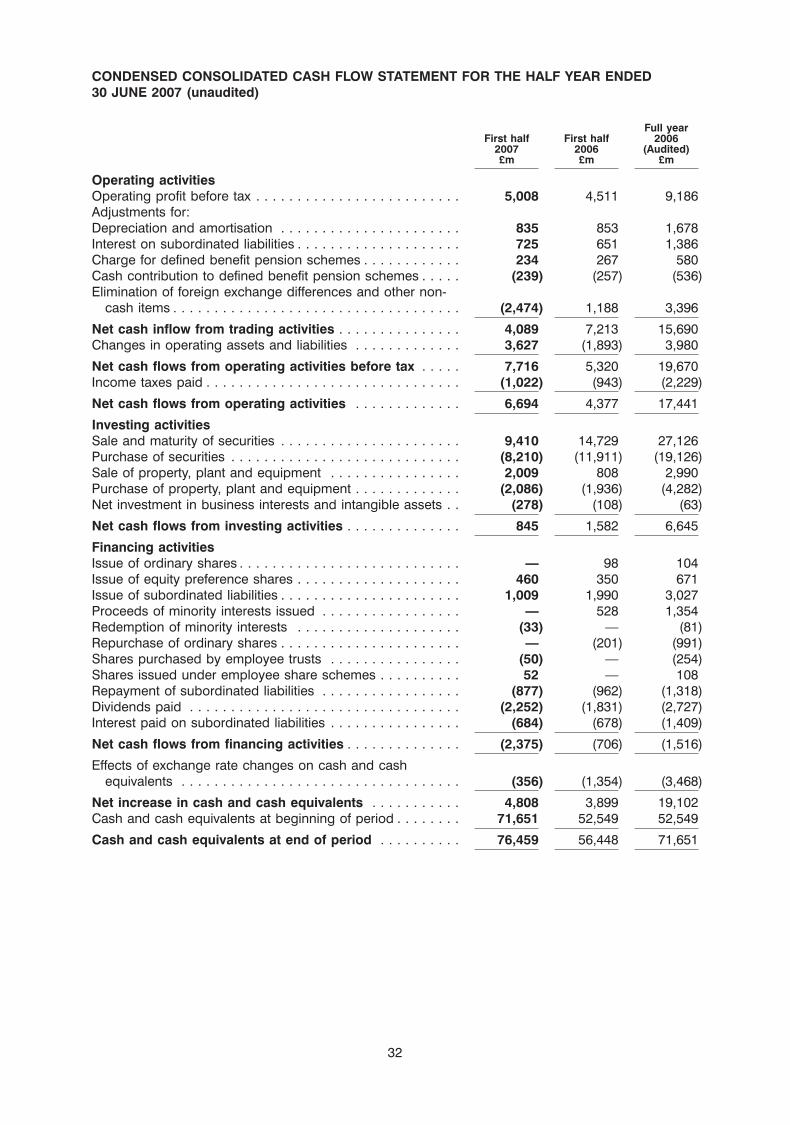
CONDENSED CONSOLIDATED CASH FLOW STATEMENT FOR THE HALF YEAR ENDED30 JUNE 2007 (unaudited)
Full yearFirst half First half 2006
2007 2006 (Audited)£m £m £m
Operating activitiesOperating profit before tax . . . . . . . . . . . . . . . . . . . . . . . . . 5,008 4,511 9,186Adjustments for:Depreciation and amortisation . . . . . . . . . . . . . . . . . . . . . . 835 853 1,678Interest on subordinated liabilities . . . . . . . . . . . . . . . . . . . . 725 651 1,386Charge for defined benefit pension schemes . . . . . . . . . . . . 234 267 580Cash contribution to defined benefit pension schemes . . . . . (239) (257) (536)Elimination of foreign exchange differences and other non-
cash items . . . . . . . . . . . . . . . . . . . . . . . . . . . . . . . . . . . (2,474) 1,188 3,396
Net cash inflow from trading activities . . . . . . . . . . . . . . . 4,089 7,213 15,690Changes in operating assets and liabilities . . . . . . . . . . . . . 3,627 (1,893) 3,980
Net cash flows from operating activities before tax . . . . . 7,716 5,320 19,670Income taxes paid . . . . . . . . . . . . . . . . . . . . . . . . . . . . . . . (1,022) (943) (2,229)
Net cash flows from operating activities . . . . . . . . . . . . . 6,694 4,377 17,441
Investing activitiesSale and maturity of securities . . . . . . . . . . . . . . . . . . . . . . 9,410 14,729 27,126Purchase of securities . . . . . . . . . . . . . . . . . . . . . . . . . . . . (8,210) (11,911) (19,126)Sale of property, plant and equipment . . . . . . . . . . . . . . . . 2,009 808 2,990Purchase of property, plant and equipment . . . . . . . . . . . . . (2,086) (1,936) (4,282)Net investment in business interests and intangible assets . . (278) (108) (63)
Net cash flows from investing activities . . . . . . . . . . . . . . 845 1,582 6,645
Financing activitiesIssue of ordinary shares . . . . . . . . . . . . . . . . . . . . . . . . . . . — 98 104Issue of equity preference shares . . . . . . . . . . . . . . . . . . . . 460 350 671Issue of subordinated liabilities . . . . . . . . . . . . . . . . . . . . . . 1,009 1,990 3,027Proceeds of minority interests issued . . . . . . . . . . . . . . . . . — 528 1,354Redemption of minority interests . . . . . . . . . . . . . . . . . . . . (33) — (81)Repurchase of ordinary shares . . . . . . . . . . . . . . . . . . . . . . — (201) (991)Shares purchased by employee trusts . . . . . . . . . . . . . . . . (50) — (254)Shares issued under employee share schemes . . . . . . . . . . 52 — 108Repayment of subordinated liabilities . . . . . . . . . . . . . . . . . (877) (962) (1,318)Dividends paid . . . . . . . . . . . . . . . . . . . . . . . . . . . . . . . . . (2,252) (1,831) (2,727)Interest paid on subordinated liabilities . . . . . . . . . . . . . . . . (684) (678) (1,409)
Net cash flows from financing activities . . . . . . . . . . . . . . (2,375) (706) (1,516)
Effects of exchange rate changes on cash and cashequivalents . . . . . . . . . . . . . . . . . . . . . . . . . . . . . . . . . . (356) (1,354) (3,468)
Net increase in cash and cash equivalents . . . . . . . . . . . 4,808 3,899 19,102Cash and cash equivalents at beginning of period . . . . . . . . 71,651 52,549 52,549
Cash and cash equivalents at end of period . . . . . . . . . . 76,459 56,448 71,651
32
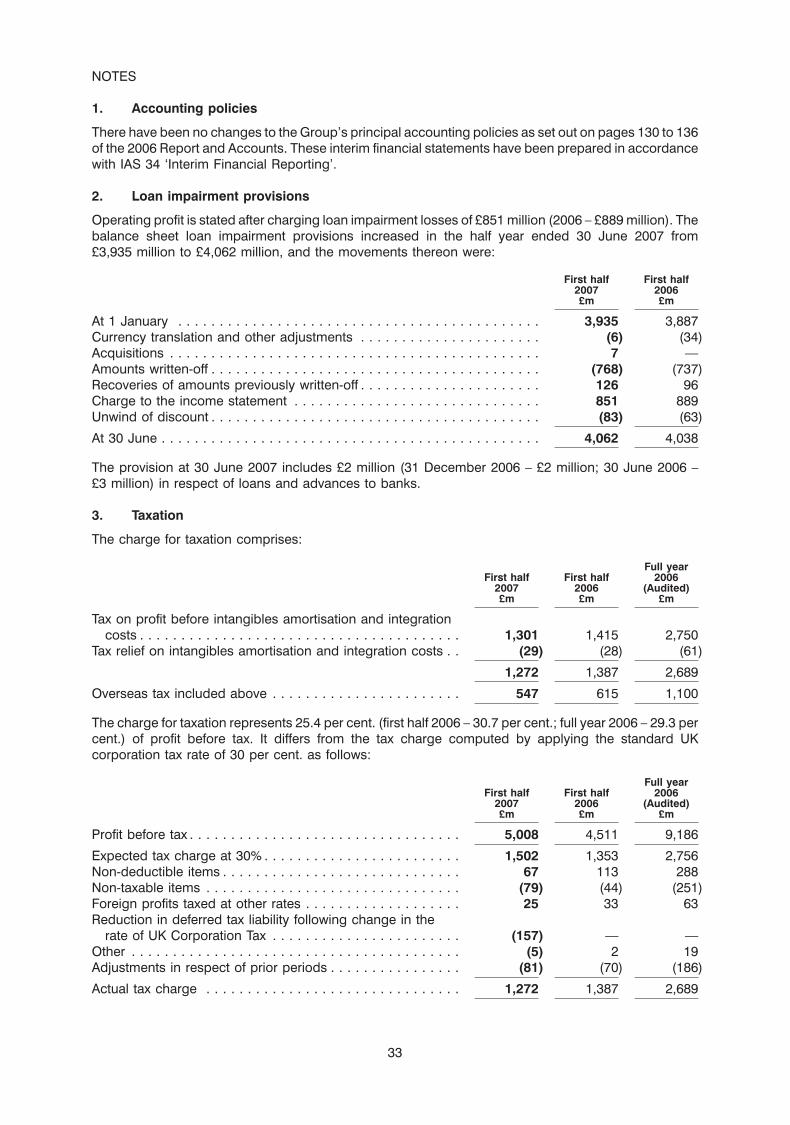
NOTES
1. Accounting policies
There have been no changes to the Group’s principal accounting policies as set out on pages 130 to 136of the 2006 Report and Accounts. These interim financial statements have been prepared in accordancewith IAS 34 ‘Interim Financial Reporting’.
2. Loan impairment provisions
Operating profit is stated after charging loan impairment losses of £851 million (2006 – £889 million). Thebalance sheet loan impairment provisions increased in the half year ended 30 June 2007 from£3,935 million to £4,062 million, and the movements thereon were:
First half First half2007 2006£m £m
At 1 January . . . . . . . . . . . . . . . . . . . . . . . . . . . . . . . . . . . . . . . . . . . . 3,935 3,887Currency translation and other adjustments . . . . . . . . . . . . . . . . . . . . . . (6) (34)Acquisitions . . . . . . . . . . . . . . . . . . . . . . . . . . . . . . . . . . . . . . . . . . . . . 7 —Amounts written-off . . . . . . . . . . . . . . . . . . . . . . . . . . . . . . . . . . . . . . . . (768) (737)Recoveries of amounts previously written-off . . . . . . . . . . . . . . . . . . . . . . 126 96Charge to the income statement . . . . . . . . . . . . . . . . . . . . . . . . . . . . . . 851 889Unwind of discount . . . . . . . . . . . . . . . . . . . . . . . . . . . . . . . . . . . . . . . . (83) (63)
At 30 June . . . . . . . . . . . . . . . . . . . . . . . . . . . . . . . . . . . . . . . . . . . . . . 4,062 4,038
The provision at 30 June 2007 includes £2 million (31 December 2006 – £2 million; 30 June 2006 –£3 million) in respect of loans and advances to banks.
3. Taxation
The charge for taxation comprises:
Full yearFirst half First half 2006
2007 2006 (Audited)£m £m £m
Tax on profit before intangibles amortisation and integrationcosts . . . . . . . . . . . . . . . . . . . . . . . . . . . . . . . . . . . . . . . 1,301 1,415 2,750
Tax relief on intangibles amortisation and integration costs . . (29) (28) (61)
1,272 1,387 2,689
Overseas tax included above . . . . . . . . . . . . . . . . . . . . . . . 547 615 1,100
The charge for taxation represents 25.4 per cent. (first half 2006 – 30.7 per cent.; full year 2006 – 29.3 percent.) of profit before tax. It differs from the tax charge computed by applying the standard UKcorporation tax rate of 30 per cent. as follows:
Full yearFirst half First half 2006
2007 2006 (Audited)£m £m £m
Profit before tax . . . . . . . . . . . . . . . . . . . . . . . . . . . . . . . . . 5,008 4,511 9,186
Expected tax charge at 30% . . . . . . . . . . . . . . . . . . . . . . . . 1,502 1,353 2,756Non-deductible items . . . . . . . . . . . . . . . . . . . . . . . . . . . . . 67 113 288Non-taxable items . . . . . . . . . . . . . . . . . . . . . . . . . . . . . . . (79) (44) (251)Foreign profits taxed at other rates . . . . . . . . . . . . . . . . . . . 25 33 63Reduction in deferred tax liability following change in the
rate of UK Corporation Tax . . . . . . . . . . . . . . . . . . . . . . . (157) — —Other . . . . . . . . . . . . . . . . . . . . . . . . . . . . . . . . . . . . . . . . (5) 2 19Adjustments in respect of prior periods . . . . . . . . . . . . . . . . (81) (70) (186)
Actual tax charge . . . . . . . . . . . . . . . . . . . . . . . . . . . . . . . 1,272 1,387 2,689
33
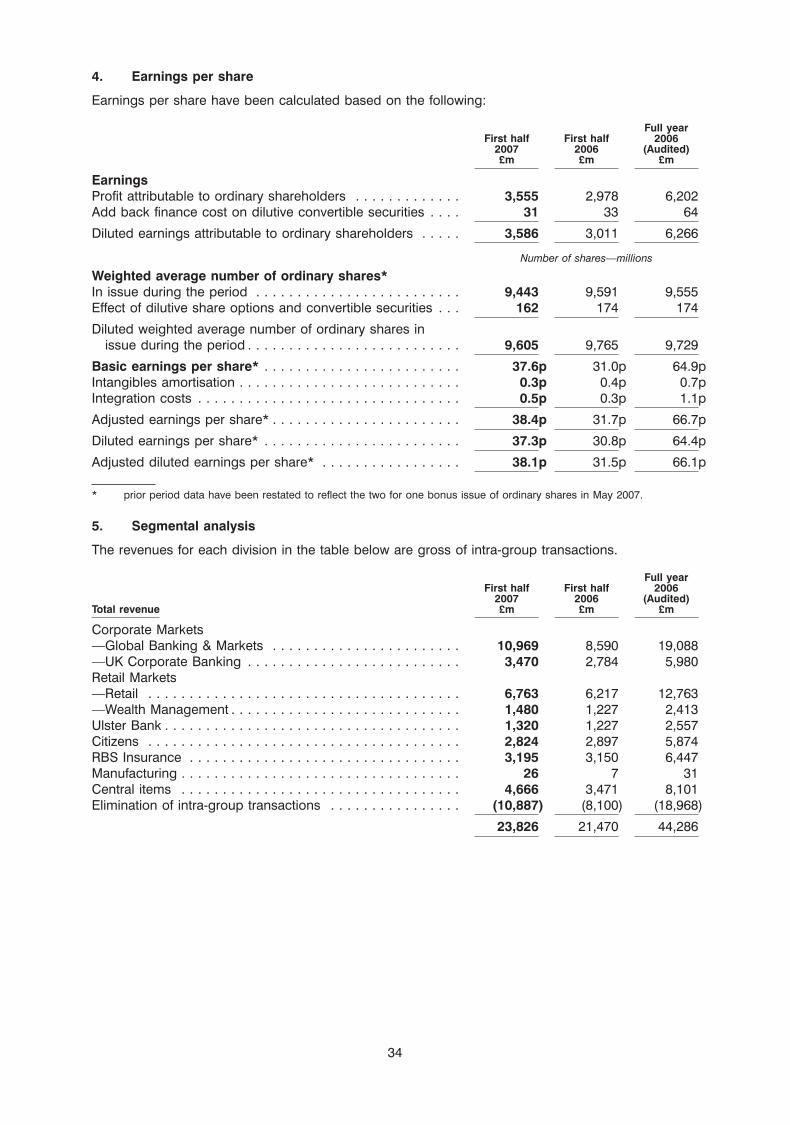
4. Earnings per share
Earnings per share have been calculated based on the following:
Full yearFirst half First half 2006
2007 2006 (Audited)£m £m £m
EarningsProfit attributable to ordinary shareholders . . . . . . . . . . . . . 3,555 2,978 6,202Add back finance cost on dilutive convertible securities . . . . 31 33 64
Diluted earnings attributable to ordinary shareholders . . . . . 3,586 3,011 6,266
Number of shares—millions
Weighted average number of ordinary shares*In issue during the period . . . . . . . . . . . . . . . . . . . . . . . . . 9,443 9,591 9,555Effect of dilutive share options and convertible securities . . . 162 174 174
Diluted weighted average number of ordinary shares inissue during the period . . . . . . . . . . . . . . . . . . . . . . . . . . 9,605 9,765 9,729
Basic earnings per share* . . . . . . . . . . . . . . . . . . . . . . . . 37.6p 31.0p 64.9pIntangibles amortisation . . . . . . . . . . . . . . . . . . . . . . . . . . . 0.3p 0.4p 0.7pIntegration costs . . . . . . . . . . . . . . . . . . . . . . . . . . . . . . . . 0.5p 0.3p 1.1p
Adjusted earnings per share* . . . . . . . . . . . . . . . . . . . . . . . 38.4p 31.7p 66.7p
Diluted earnings per share* . . . . . . . . . . . . . . . . . . . . . . . . 37.3p 30.8p 64.4p
Adjusted diluted earnings per share* . . . . . . . . . . . . . . . . . 38.1p 31.5p 66.1p
* prior period data have been restated to reflect the two for one bonus issue of ordinary shares in May 2007.
5. Segmental analysis
The revenues for each division in the table below are gross of intra-group transactions.
Full yearFirst half First half 2006
2007 2006 (Audited)Total revenue £m £m £m
Corporate Markets—Global Banking & Markets . . . . . . . . . . . . . . . . . . . . . . . 10,969 8,590 19,088—UK Corporate Banking . . . . . . . . . . . . . . . . . . . . . . . . . . 3,470 2,784 5,980Retail Markets—Retail . . . . . . . . . . . . . . . . . . . . . . . . . . . . . . . . . . . . . . 6,763 6,217 12,763—Wealth Management . . . . . . . . . . . . . . . . . . . . . . . . . . . . 1,480 1,227 2,413Ulster Bank . . . . . . . . . . . . . . . . . . . . . . . . . . . . . . . . . . . . 1,320 1,227 2,557Citizens . . . . . . . . . . . . . . . . . . . . . . . . . . . . . . . . . . . . . . 2,824 2,897 5,874RBS Insurance . . . . . . . . . . . . . . . . . . . . . . . . . . . . . . . . . 3,195 3,150 6,447Manufacturing . . . . . . . . . . . . . . . . . . . . . . . . . . . . . . . . . . 26 7 31Central items . . . . . . . . . . . . . . . . . . . . . . . . . . . . . . . . . . 4,666 3,471 8,101Elimination of intra-group transactions . . . . . . . . . . . . . . . . (10,887) (8,100) (18,968)
23,826 21,470 44,286
34
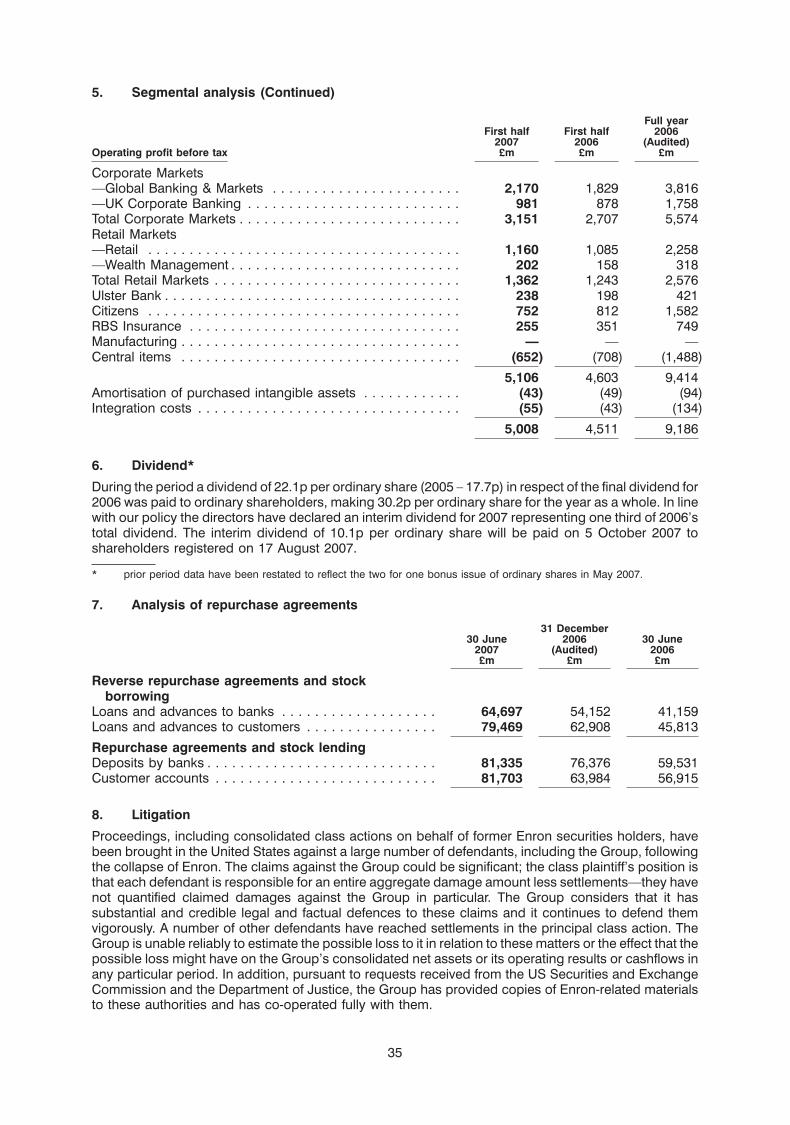
5. Segmental analysis (Continued)
Full yearFirst half First half 2006
2007 2006 (Audited)Operating profit before tax £m £m £m
Corporate Markets—Global Banking & Markets . . . . . . . . . . . . . . . . . . . . . . . 2,170 1,829 3,816—UK Corporate Banking . . . . . . . . . . . . . . . . . . . . . . . . . . 981 878 1,758Total Corporate Markets . . . . . . . . . . . . . . . . . . . . . . . . . . . 3,151 2,707 5,574Retail Markets—Retail . . . . . . . . . . . . . . . . . . . . . . . . . . . . . . . . . . . . . . 1,160 1,085 2,258—Wealth Management . . . . . . . . . . . . . . . . . . . . . . . . . . . . 202 158 318Total Retail Markets . . . . . . . . . . . . . . . . . . . . . . . . . . . . . . 1,362 1,243 2,576Ulster Bank . . . . . . . . . . . . . . . . . . . . . . . . . . . . . . . . . . . . 238 198 421Citizens . . . . . . . . . . . . . . . . . . . . . . . . . . . . . . . . . . . . . . 752 812 1,582RBS Insurance . . . . . . . . . . . . . . . . . . . . . . . . . . . . . . . . . 255 351 749Manufacturing . . . . . . . . . . . . . . . . . . . . . . . . . . . . . . . . . . — — —Central items . . . . . . . . . . . . . . . . . . . . . . . . . . . . . . . . . . (652) (708) (1,488)
5,106 4,603 9,414Amortisation of purchased intangible assets . . . . . . . . . . . . (43) (49) (94)Integration costs . . . . . . . . . . . . . . . . . . . . . . . . . . . . . . . . (55) (43) (134)
5,008 4,511 9,186
6. Dividend*
During the period a dividend of 22.1p per ordinary share (2005 – 17.7p) in respect of the final dividend for2006 was paid to ordinary shareholders, making 30.2p per ordinary share for the year as a whole. In linewith our policy the directors have declared an interim dividend for 2007 representing one third of 2006’stotal dividend. The interim dividend of 10.1p per ordinary share will be paid on 5 October 2007 toshareholders registered on 17 August 2007.
* prior period data have been restated to reflect the two for one bonus issue of ordinary shares in May 2007.
7. Analysis of repurchase agreements
31 December30 June 2006 30 June
2007 (Audited) 2006£m £m £m
Reverse repurchase agreements and stockborrowing
Loans and advances to banks . . . . . . . . . . . . . . . . . . . 64,697 54,152 41,159Loans and advances to customers . . . . . . . . . . . . . . . . 79,469 62,908 45,813
Repurchase agreements and stock lendingDeposits by banks . . . . . . . . . . . . . . . . . . . . . . . . . . . . 81,335 76,376 59,531Customer accounts . . . . . . . . . . . . . . . . . . . . . . . . . . . 81,703 63,984 56,915
8. Litigation
Proceedings, including consolidated class actions on behalf of former Enron securities holders, havebeen brought in the United States against a large number of defendants, including the Group, followingthe collapse of Enron. The claims against the Group could be significant; the class plaintiff’s position isthat each defendant is responsible for an entire aggregate damage amount less settlements—they havenot quantified claimed damages against the Group in particular. The Group considers that it hassubstantial and credible legal and factual defences to these claims and it continues to defend themvigorously. A number of other defendants have reached settlements in the principal class action. TheGroup is unable reliably to estimate the possible loss to it in relation to these matters or the effect that thepossible loss might have on the Group’s consolidated net assets or its operating results or cashflows inany particular period. In addition, pursuant to requests received from the US Securities and ExchangeCommission and the Department of Justice, the Group has provided copies of Enron-related materialsto these authorities and has co-operated fully with them.
35
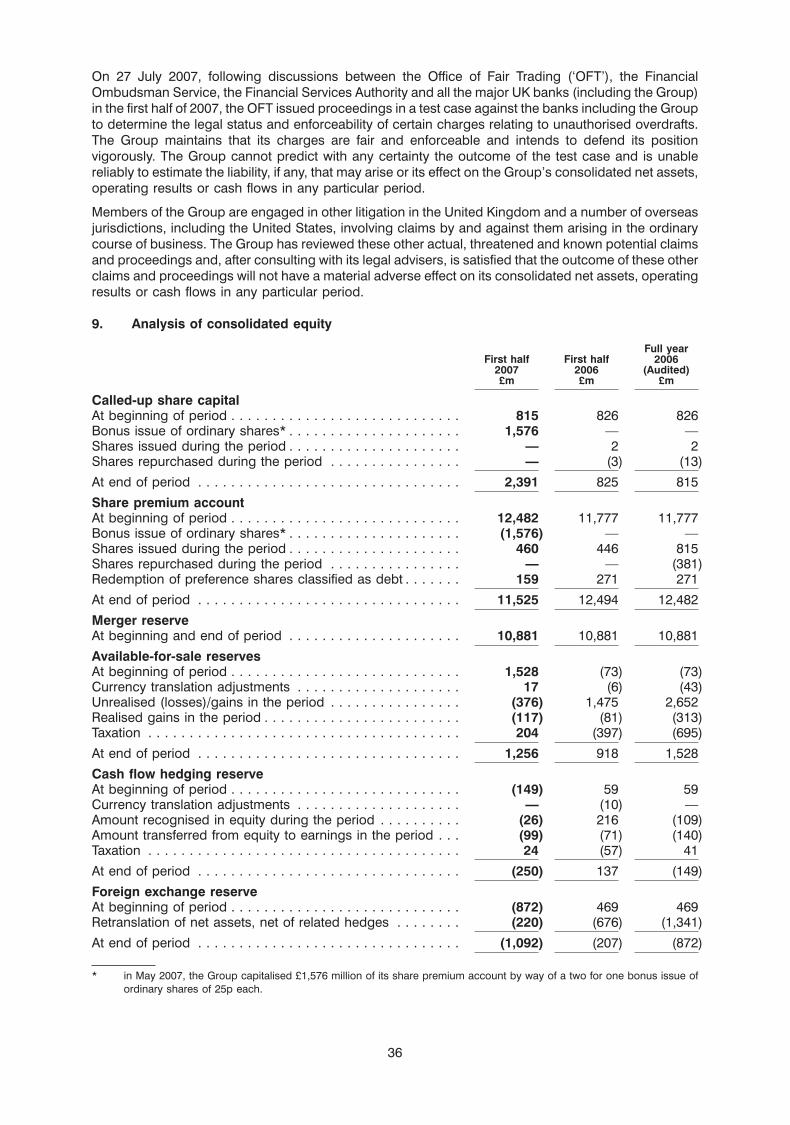
On 27 July 2007, following discussions between the Office of Fair Trading (‘OFT’), the FinancialOmbudsman Service, the Financial Services Authority and all the major UK banks (including the Group)in the first half of 2007, the OFT issued proceedings in a test case against the banks including the Groupto determine the legal status and enforceability of certain charges relating to unauthorised overdrafts.The Group maintains that its charges are fair and enforceable and intends to defend its positionvigorously. The Group cannot predict with any certainty the outcome of the test case and is unablereliably to estimate the liability, if any, that may arise or its effect on the Group’s consolidated net assets,operating results or cash flows in any particular period.
Members of the Group are engaged in other litigation in the United Kingdom and a number of overseasjurisdictions, including the United States, involving claims by and against them arising in the ordinarycourse of business. The Group has reviewed these other actual, threatened and known potential claimsand proceedings and, after consulting with its legal advisers, is satisfied that the outcome of these otherclaims and proceedings will not have a material adverse effect on its consolidated net assets, operatingresults or cash flows in any particular period.
9. Analysis of consolidated equity
Full yearFirst half First half 2006
2007 2006 (Audited)£m £m £m
Called-up share capitalAt beginning of period . . . . . . . . . . . . . . . . . . . . . . . . . . . . 815 826 826Bonus issue of ordinary shares* . . . . . . . . . . . . . . . . . . . . . 1,576 — —Shares issued during the period . . . . . . . . . . . . . . . . . . . . . — 2 2Shares repurchased during the period . . . . . . . . . . . . . . . . — (3) (13)
At end of period . . . . . . . . . . . . . . . . . . . . . . . . . . . . . . . . 2,391 825 815
Share premium accountAt beginning of period . . . . . . . . . . . . . . . . . . . . . . . . . . . . 12,482 11,777 11,777Bonus issue of ordinary shares* . . . . . . . . . . . . . . . . . . . . . (1,576) — —Shares issued during the period . . . . . . . . . . . . . . . . . . . . . 460 446 815Shares repurchased during the period . . . . . . . . . . . . . . . . — — (381)Redemption of preference shares classified as debt . . . . . . . 159 271 271
At end of period . . . . . . . . . . . . . . . . . . . . . . . . . . . . . . . . 11,525 12,494 12,482
Merger reserveAt beginning and end of period . . . . . . . . . . . . . . . . . . . . . 10,881 10,881 10,881
Available-for-sale reservesAt beginning of period . . . . . . . . . . . . . . . . . . . . . . . . . . . . 1,528 (73) (73)Currency translation adjustments . . . . . . . . . . . . . . . . . . . . 17 (6) (43)Unrealised (losses)/gains in the period . . . . . . . . . . . . . . . . (376) 1,475 2,652Realised gains in the period . . . . . . . . . . . . . . . . . . . . . . . . (117) (81) (313)Taxation . . . . . . . . . . . . . . . . . . . . . . . . . . . . . . . . . . . . . . 204 (397) (695)
At end of period . . . . . . . . . . . . . . . . . . . . . . . . . . . . . . . . 1,256 918 1,528
Cash flow hedging reserveAt beginning of period . . . . . . . . . . . . . . . . . . . . . . . . . . . . (149) 59 59Currency translation adjustments . . . . . . . . . . . . . . . . . . . . — (10) —Amount recognised in equity during the period . . . . . . . . . . (26) 216 (109)Amount transferred from equity to earnings in the period . . . (99) (71) (140)Taxation . . . . . . . . . . . . . . . . . . . . . . . . . . . . . . . . . . . . . . 24 (57) 41
At end of period . . . . . . . . . . . . . . . . . . . . . . . . . . . . . . . . (250) 137 (149)
Foreign exchange reserveAt beginning of period . . . . . . . . . . . . . . . . . . . . . . . . . . . . (872) 469 469Retranslation of net assets, net of related hedges . . . . . . . . (220) (676) (1,341)
At end of period . . . . . . . . . . . . . . . . . . . . . . . . . . . . . . . . (1,092) (207) (872)
* in May 2007, the Group capitalised £1,576 million of its share premium account by way of a two for one bonus issue ofordinary shares of 25p each.
36
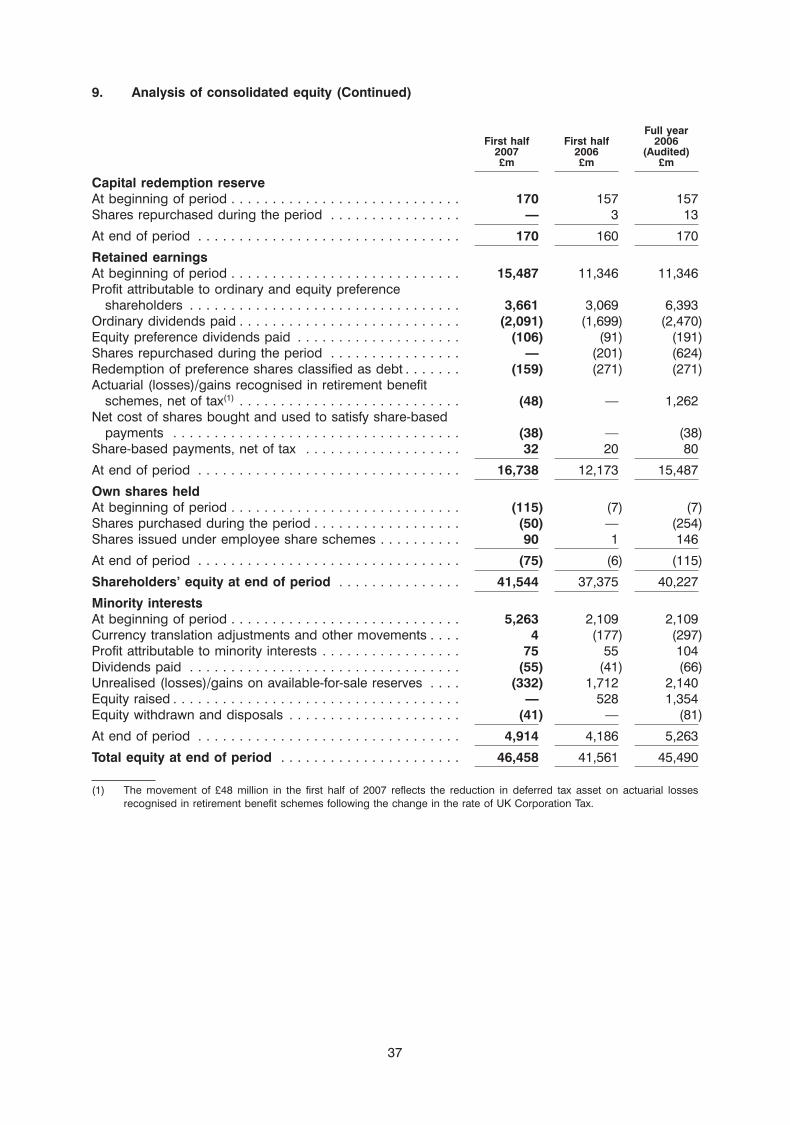
9. Analysis of consolidated equity (Continued)
Full yearFirst half First half 2006
2007 2006 (Audited)£m £m £m
Capital redemption reserveAt beginning of period . . . . . . . . . . . . . . . . . . . . . . . . . . . . 170 157 157Shares repurchased during the period . . . . . . . . . . . . . . . . — 3 13
At end of period . . . . . . . . . . . . . . . . . . . . . . . . . . . . . . . . 170 160 170
Retained earningsAt beginning of period . . . . . . . . . . . . . . . . . . . . . . . . . . . . 15,487 11,346 11,346Profit attributable to ordinary and equity preference
shareholders . . . . . . . . . . . . . . . . . . . . . . . . . . . . . . . . . 3,661 3,069 6,393Ordinary dividends paid . . . . . . . . . . . . . . . . . . . . . . . . . . . (2,091) (1,699) (2,470)Equity preference dividends paid . . . . . . . . . . . . . . . . . . . . (106) (91) (191)Shares repurchased during the period . . . . . . . . . . . . . . . . — (201) (624)Redemption of preference shares classified as debt . . . . . . . (159) (271) (271)Actuarial (losses)/gains recognised in retirement benefit
schemes, net of tax(1) . . . . . . . . . . . . . . . . . . . . . . . . . . . (48) — 1,262Net cost of shares bought and used to satisfy share-based
payments . . . . . . . . . . . . . . . . . . . . . . . . . . . . . . . . . . . (38) — (38)Share-based payments, net of tax . . . . . . . . . . . . . . . . . . . 32 20 80
At end of period . . . . . . . . . . . . . . . . . . . . . . . . . . . . . . . . 16,738 12,173 15,487
Own shares heldAt beginning of period . . . . . . . . . . . . . . . . . . . . . . . . . . . . (115) (7) (7)Shares purchased during the period . . . . . . . . . . . . . . . . . . (50) — (254)Shares issued under employee share schemes . . . . . . . . . . 90 1 146
At end of period . . . . . . . . . . . . . . . . . . . . . . . . . . . . . . . . (75) (6) (115)
Shareholders’ equity at end of period . . . . . . . . . . . . . . . 41,544 37,375 40,227
Minority interestsAt beginning of period . . . . . . . . . . . . . . . . . . . . . . . . . . . . 5,263 2,109 2,109Currency translation adjustments and other movements . . . . 4 (177) (297)Profit attributable to minority interests . . . . . . . . . . . . . . . . . 75 55 104Dividends paid . . . . . . . . . . . . . . . . . . . . . . . . . . . . . . . . . (55) (41) (66)Unrealised (losses)/gains on available-for-sale reserves . . . . (332) 1,712 2,140Equity raised . . . . . . . . . . . . . . . . . . . . . . . . . . . . . . . . . . . — 528 1,354Equity withdrawn and disposals . . . . . . . . . . . . . . . . . . . . . (41) — (81)
At end of period . . . . . . . . . . . . . . . . . . . . . . . . . . . . . . . . 4,914 4,186 5,263
Total equity at end of period . . . . . . . . . . . . . . . . . . . . . . 46,458 41,561 45,490
(1) The movement of £48 million in the first half of 2007 reflects the reduction in deferred tax asset on actuarial lossesrecognised in retirement benefit schemes following the change in the rate of UK Corporation Tax.
37
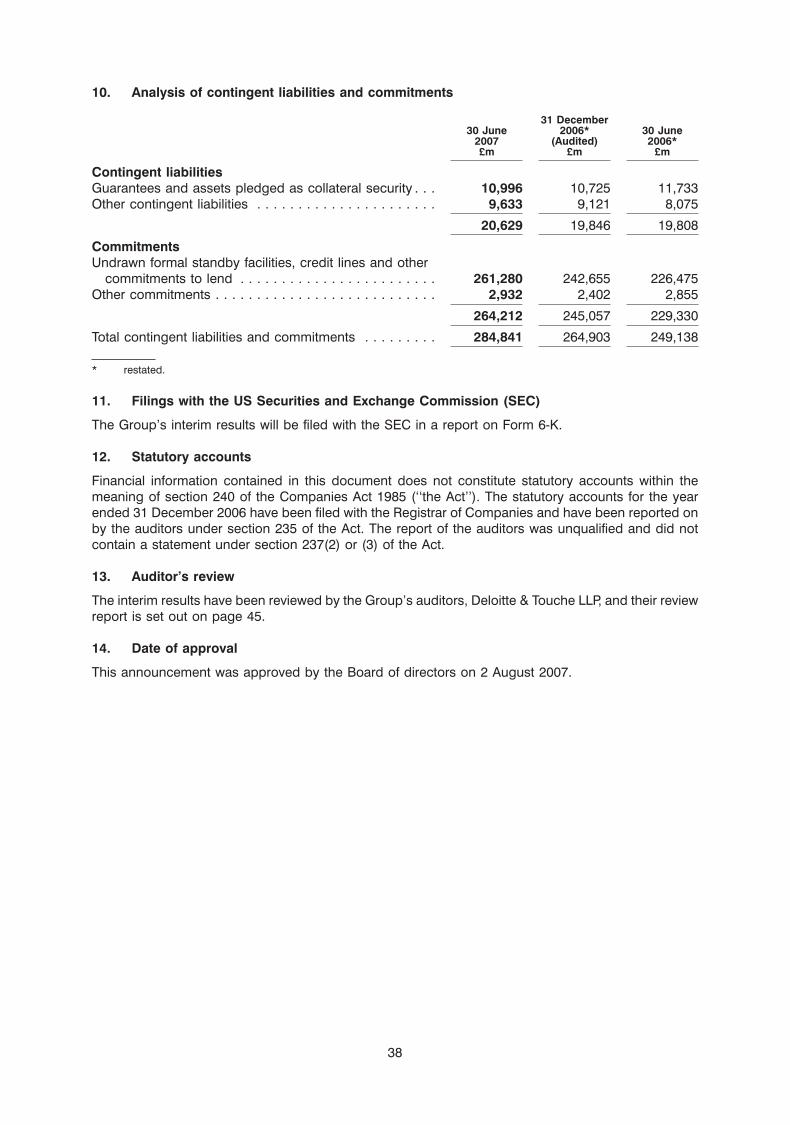
10. Analysis of contingent liabilities and commitments
31 December30 June 2006* 30 June
2007 (Audited) 2006*£m £m £m
Contingent liabilitiesGuarantees and assets pledged as collateral security . . . 10,996 10,725 11,733Other contingent liabilities . . . . . . . . . . . . . . . . . . . . . . 9,633 9,121 8,075
20,629 19,846 19,808
CommitmentsUndrawn formal standby facilities, credit lines and other
commitments to lend . . . . . . . . . . . . . . . . . . . . . . . . 261,280 242,655 226,475Other commitments . . . . . . . . . . . . . . . . . . . . . . . . . . . 2,932 2,402 2,855
264,212 245,057 229,330
Total contingent liabilities and commitments . . . . . . . . . 284,841 264,903 249,138
* restated.
11. Filings with the US Securities and Exchange Commission (SEC)
The Group’s interim results will be filed with the SEC in a report on Form 6-K.
12. Statutory accounts
Financial information contained in this document does not constitute statutory accounts within themeaning of section 240 of the Companies Act 1985 (‘‘the Act’’). The statutory accounts for the yearended 31 December 2006 have been filed with the Registrar of Companies and have been reported onby the auditors under section 235 of the Act. The report of the auditors was unqualified and did notcontain a statement under section 237(2) or (3) of the Act.
13. Auditor’s review
The interim results have been reviewed by the Group’s auditors, Deloitte & Touche LLP, and their reviewreport is set out on page 45.
14. Date of approval
This announcement was approved by the Board of directors on 2 August 2007.
38
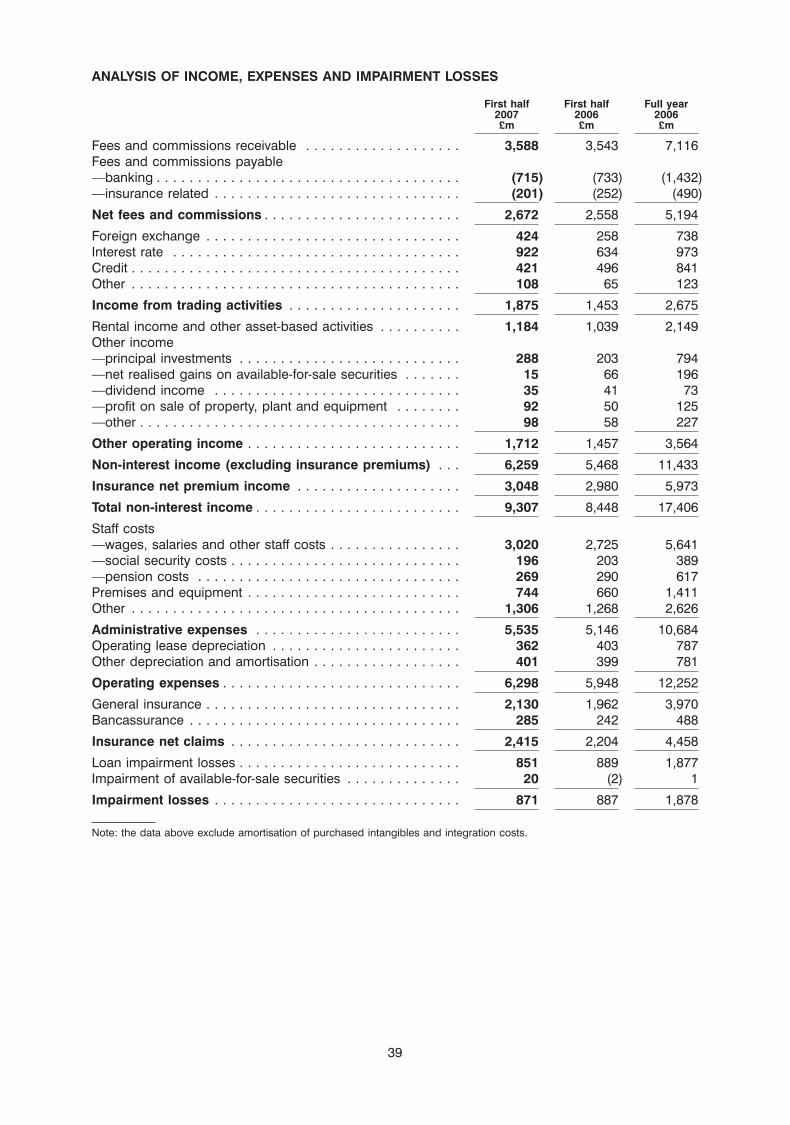
ANALYSIS OF INCOME, EXPENSES AND IMPAIRMENT LOSSES
First half First half Full year2007 2006 2006£m £m £m
Fees and commissions receivable . . . . . . . . . . . . . . . . . . . 3,588 3,543 7,116Fees and commissions payable—banking . . . . . . . . . . . . . . . . . . . . . . . . . . . . . . . . . . . . . (715) (733) (1,432)—insurance related . . . . . . . . . . . . . . . . . . . . . . . . . . . . . . (201) (252) (490)
Net fees and commissions . . . . . . . . . . . . . . . . . . . . . . . . 2,672 2,558 5,194
Foreign exchange . . . . . . . . . . . . . . . . . . . . . . . . . . . . . . . 424 258 738Interest rate . . . . . . . . . . . . . . . . . . . . . . . . . . . . . . . . . . . 922 634 973Credit . . . . . . . . . . . . . . . . . . . . . . . . . . . . . . . . . . . . . . . . 421 496 841Other . . . . . . . . . . . . . . . . . . . . . . . . . . . . . . . . . . . . . . . . 108 65 123
Income from trading activities . . . . . . . . . . . . . . . . . . . . . 1,875 1,453 2,675
Rental income and other asset-based activities . . . . . . . . . . 1,184 1,039 2,149Other income—principal investments . . . . . . . . . . . . . . . . . . . . . . . . . . . 288 203 794—net realised gains on available-for-sale securities . . . . . . . 15 66 196—dividend income . . . . . . . . . . . . . . . . . . . . . . . . . . . . . . 35 41 73—profit on sale of property, plant and equipment . . . . . . . . 92 50 125—other . . . . . . . . . . . . . . . . . . . . . . . . . . . . . . . . . . . . . . . 98 58 227
Other operating income . . . . . . . . . . . . . . . . . . . . . . . . . . 1,712 1,457 3,564
Non-interest income (excluding insurance premiums) . . . 6,259 5,468 11,433
Insurance net premium income . . . . . . . . . . . . . . . . . . . . 3,048 2,980 5,973
Total non-interest income . . . . . . . . . . . . . . . . . . . . . . . . . 9,307 8,448 17,406
Staff costs—wages, salaries and other staff costs . . . . . . . . . . . . . . . . 3,020 2,725 5,641—social security costs . . . . . . . . . . . . . . . . . . . . . . . . . . . . 196 203 389—pension costs . . . . . . . . . . . . . . . . . . . . . . . . . . . . . . . . 269 290 617Premises and equipment . . . . . . . . . . . . . . . . . . . . . . . . . . 744 660 1,411Other . . . . . . . . . . . . . . . . . . . . . . . . . . . . . . . . . . . . . . . . 1,306 1,268 2,626
Administrative expenses . . . . . . . . . . . . . . . . . . . . . . . . . 5,535 5,146 10,684Operating lease depreciation . . . . . . . . . . . . . . . . . . . . . . . 362 403 787Other depreciation and amortisation . . . . . . . . . . . . . . . . . . 401 399 781
Operating expenses . . . . . . . . . . . . . . . . . . . . . . . . . . . . . 6,298 5,948 12,252
General insurance . . . . . . . . . . . . . . . . . . . . . . . . . . . . . . . 2,130 1,962 3,970Bancassurance . . . . . . . . . . . . . . . . . . . . . . . . . . . . . . . . . 285 242 488
Insurance net claims . . . . . . . . . . . . . . . . . . . . . . . . . . . . 2,415 2,204 4,458
Loan impairment losses . . . . . . . . . . . . . . . . . . . . . . . . . . . 851 889 1,877Impairment of available-for-sale securities . . . . . . . . . . . . . . 20 (2) 1
Impairment losses . . . . . . . . . . . . . . . . . . . . . . . . . . . . . . 871 887 1,878
Note: the data above exclude amortisation of purchased intangibles and integration costs.
39
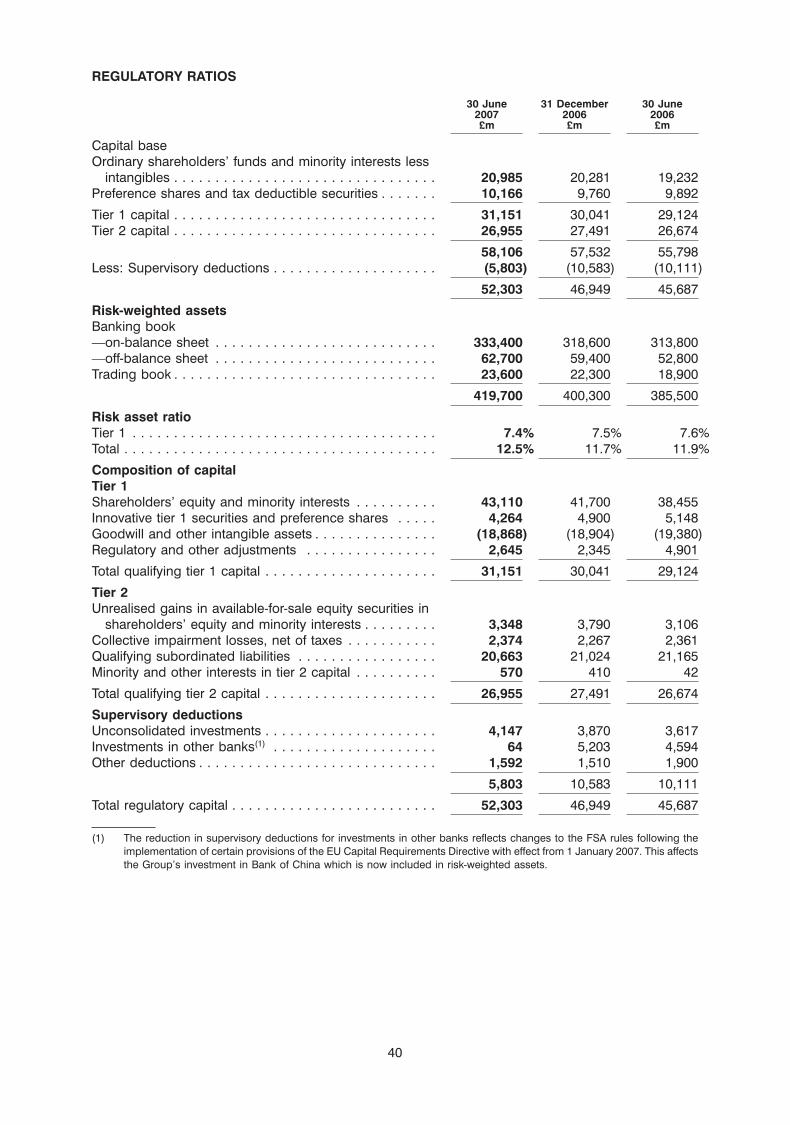
REGULATORY RATIOS
30 June 31 December 30 June2007 2006 2006£m £m £m
Capital baseOrdinary shareholders’ funds and minority interests less
intangibles . . . . . . . . . . . . . . . . . . . . . . . . . . . . . . . . 20,985 20,281 19,232Preference shares and tax deductible securities . . . . . . . 10,166 9,760 9,892
Tier 1 capital . . . . . . . . . . . . . . . . . . . . . . . . . . . . . . . . 31,151 30,041 29,124Tier 2 capital . . . . . . . . . . . . . . . . . . . . . . . . . . . . . . . . 26,955 27,491 26,674
58,106 57,532 55,798Less: Supervisory deductions . . . . . . . . . . . . . . . . . . . . (5,803) (10,583) (10,111)
52,303 46,949 45,687
Risk-weighted assetsBanking book—on-balance sheet . . . . . . . . . . . . . . . . . . . . . . . . . . . 333,400 318,600 313,800—off-balance sheet . . . . . . . . . . . . . . . . . . . . . . . . . . . 62,700 59,400 52,800Trading book . . . . . . . . . . . . . . . . . . . . . . . . . . . . . . . . 23,600 22,300 18,900
419,700 400,300 385,500
Risk asset ratioTier 1 . . . . . . . . . . . . . . . . . . . . . . . . . . . . . . . . . . . . . 7.4% 7.5% 7.6%Total . . . . . . . . . . . . . . . . . . . . . . . . . . . . . . . . . . . . . . 12.5% 11.7% 11.9%
Composition of capitalTier 1Shareholders’ equity and minority interests . . . . . . . . . . 43,110 41,700 38,455Innovative tier 1 securities and preference shares . . . . . 4,264 4,900 5,148Goodwill and other intangible assets . . . . . . . . . . . . . . . (18,868) (18,904) (19,380)Regulatory and other adjustments . . . . . . . . . . . . . . . . 2,645 2,345 4,901
Total qualifying tier 1 capital . . . . . . . . . . . . . . . . . . . . . 31,151 30,041 29,124
Tier 2Unrealised gains in available-for-sale equity securities in
shareholders’ equity and minority interests . . . . . . . . . 3,348 3,790 3,106Collective impairment losses, net of taxes . . . . . . . . . . . 2,374 2,267 2,361Qualifying subordinated liabilities . . . . . . . . . . . . . . . . . 20,663 21,024 21,165Minority and other interests in tier 2 capital . . . . . . . . . . 570 410 42
Total qualifying tier 2 capital . . . . . . . . . . . . . . . . . . . . . 26,955 27,491 26,674
Supervisory deductionsUnconsolidated investments . . . . . . . . . . . . . . . . . . . . . 4,147 3,870 3,617Investments in other banks(1) . . . . . . . . . . . . . . . . . . . . 64 5,203 4,594Other deductions . . . . . . . . . . . . . . . . . . . . . . . . . . . . . 1,592 1,510 1,900
5,803 10,583 10,111
Total regulatory capital . . . . . . . . . . . . . . . . . . . . . . . . . 52,303 46,949 45,687
(1) The reduction in supervisory deductions for investments in other banks reflects changes to the FSA rules following theimplementation of certain provisions of the EU Capital Requirements Directive with effect from 1 January 2007. This affectsthe Group’s investment in Bank of China which is now included in risk-weighted assets.
40
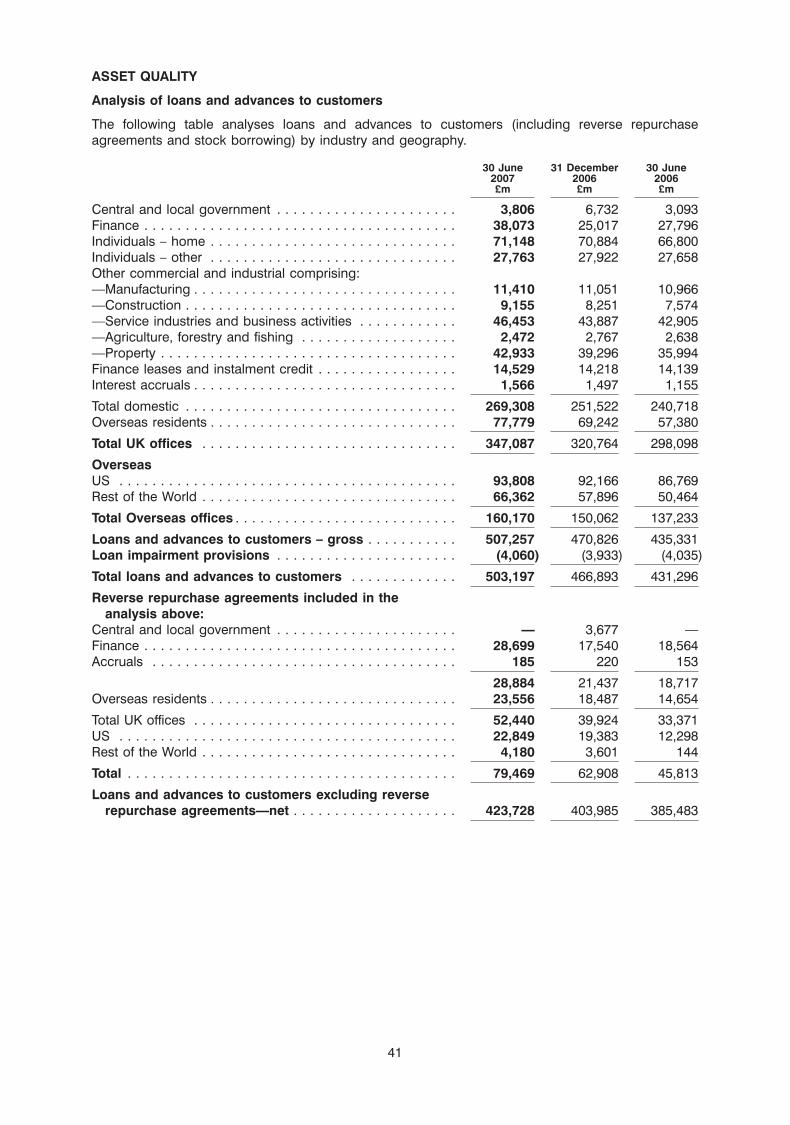
ASSET QUALITY
Analysis of loans and advances to customers
The following table analyses loans and advances to customers (including reverse repurchaseagreements and stock borrowing) by industry and geography.
30 June 31 December 30 June2007 2006 2006£m £m £m
Central and local government . . . . . . . . . . . . . . . . . . . . . . 3,806 6,732 3,093Finance . . . . . . . . . . . . . . . . . . . . . . . . . . . . . . . . . . . . . . 38,073 25,017 27,796Individuals – home . . . . . . . . . . . . . . . . . . . . . . . . . . . . . . 71,148 70,884 66,800Individuals – other . . . . . . . . . . . . . . . . . . . . . . . . . . . . . . 27,763 27,922 27,658Other commercial and industrial comprising:—Manufacturing . . . . . . . . . . . . . . . . . . . . . . . . . . . . . . . . 11,410 11,051 10,966—Construction . . . . . . . . . . . . . . . . . . . . . . . . . . . . . . . . . 9,155 8,251 7,574—Service industries and business activities . . . . . . . . . . . . 46,453 43,887 42,905—Agriculture, forestry and fishing . . . . . . . . . . . . . . . . . . . 2,472 2,767 2,638—Property . . . . . . . . . . . . . . . . . . . . . . . . . . . . . . . . . . . . 42,933 39,296 35,994Finance leases and instalment credit . . . . . . . . . . . . . . . . . 14,529 14,218 14,139Interest accruals . . . . . . . . . . . . . . . . . . . . . . . . . . . . . . . . 1,566 1,497 1,155
Total domestic . . . . . . . . . . . . . . . . . . . . . . . . . . . . . . . . . 269,308 251,522 240,718Overseas residents . . . . . . . . . . . . . . . . . . . . . . . . . . . . . . 77,779 69,242 57,380
Total UK offices . . . . . . . . . . . . . . . . . . . . . . . . . . . . . . . 347,087 320,764 298,098
OverseasUS . . . . . . . . . . . . . . . . . . . . . . . . . . . . . . . . . . . . . . . . . 93,808 92,166 86,769Rest of the World . . . . . . . . . . . . . . . . . . . . . . . . . . . . . . . 66,362 57,896 50,464
Total Overseas offices . . . . . . . . . . . . . . . . . . . . . . . . . . . 160,170 150,062 137,233
Loans and advances to customers – gross . . . . . . . . . . . 507,257 470,826 435,331Loan impairment provisions . . . . . . . . . . . . . . . . . . . . . . (4,060) (3,933) (4,035)
Total loans and advances to customers . . . . . . . . . . . . . 503,197 466,893 431,296
Reverse repurchase agreements included in theanalysis above:
Central and local government . . . . . . . . . . . . . . . . . . . . . . — 3,677 —Finance . . . . . . . . . . . . . . . . . . . . . . . . . . . . . . . . . . . . . . 28,699 17,540 18,564Accruals . . . . . . . . . . . . . . . . . . . . . . . . . . . . . . . . . . . . . 185 220 153
28,884 21,437 18,717Overseas residents . . . . . . . . . . . . . . . . . . . . . . . . . . . . . . 23,556 18,487 14,654
Total UK offices . . . . . . . . . . . . . . . . . . . . . . . . . . . . . . . . 52,440 39,924 33,371US . . . . . . . . . . . . . . . . . . . . . . . . . . . . . . . . . . . . . . . . . 22,849 19,383 12,298Rest of the World . . . . . . . . . . . . . . . . . . . . . . . . . . . . . . . 4,180 3,601 144
Total . . . . . . . . . . . . . . . . . . . . . . . . . . . . . . . . . . . . . . . . 79,469 62,908 45,813
Loans and advances to customers excluding reverserepurchase agreements—net . . . . . . . . . . . . . . . . . . . . 423,728 403,985 385,483
41
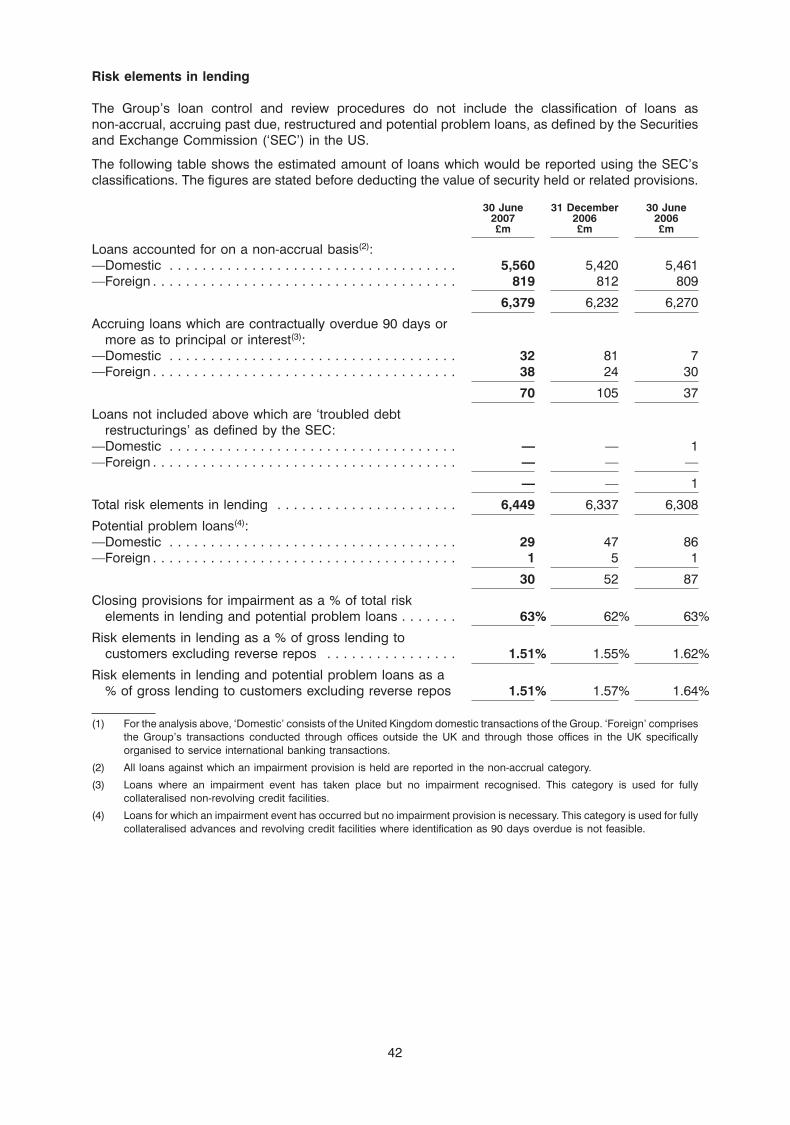
Risk elements in lending
The Group’s loan control and review procedures do not include the classification of loans asnon-accrual, accruing past due, restructured and potential problem loans, as defined by the Securitiesand Exchange Commission (‘SEC’) in the US.
The following table shows the estimated amount of loans which would be reported using the SEC’sclassifications. The figures are stated before deducting the value of security held or related provisions.
30 June 31 December 30 June2007 2006 2006£m £m £m
Loans accounted for on a non-accrual basis(2):—Domestic . . . . . . . . . . . . . . . . . . . . . . . . . . . . . . . . . . . 5,560 5,420 5,461—Foreign . . . . . . . . . . . . . . . . . . . . . . . . . . . . . . . . . . . . . 819 812 809
6,379 6,232 6,270
Accruing loans which are contractually overdue 90 days ormore as to principal or interest(3):
—Domestic . . . . . . . . . . . . . . . . . . . . . . . . . . . . . . . . . . . 32 81 7—Foreign . . . . . . . . . . . . . . . . . . . . . . . . . . . . . . . . . . . . . 38 24 30
70 105 37
Loans not included above which are ‘troubled debtrestructurings’ as defined by the SEC:
—Domestic . . . . . . . . . . . . . . . . . . . . . . . . . . . . . . . . . . . — — 1—Foreign . . . . . . . . . . . . . . . . . . . . . . . . . . . . . . . . . . . . . — — —
— — 1
Total risk elements in lending . . . . . . . . . . . . . . . . . . . . . . 6,449 6,337 6,308
Potential problem loans(4):—Domestic . . . . . . . . . . . . . . . . . . . . . . . . . . . . . . . . . . . 29 47 86—Foreign . . . . . . . . . . . . . . . . . . . . . . . . . . . . . . . . . . . . . 1 5 1
30 52 87
Closing provisions for impairment as a % of total riskelements in lending and potential problem loans . . . . . . . 63% 62% 63%
Risk elements in lending as a % of gross lending tocustomers excluding reverse repos . . . . . . . . . . . . . . . . 1.51% 1.55% 1.62%
Risk elements in lending and potential problem loans as a% of gross lending to customers excluding reverse repos 1.51% 1.57% 1.64%
(1) For the analysis above, ‘Domestic’ consists of the United Kingdom domestic transactions of the Group. ‘Foreign’ comprisesthe Group’s transactions conducted through offices outside the UK and through those offices in the UK specificallyorganised to service international banking transactions.
(2) All loans against which an impairment provision is held are reported in the non-accrual category.
(3) Loans where an impairment event has taken place but no impairment recognised. This category is used for fullycollateralised non-revolving credit facilities.
(4) Loans for which an impairment event has occurred but no impairment provision is necessary. This category is used for fullycollateralised advances and revolving credit facilities where identification as 90 days overdue is not feasible.
42
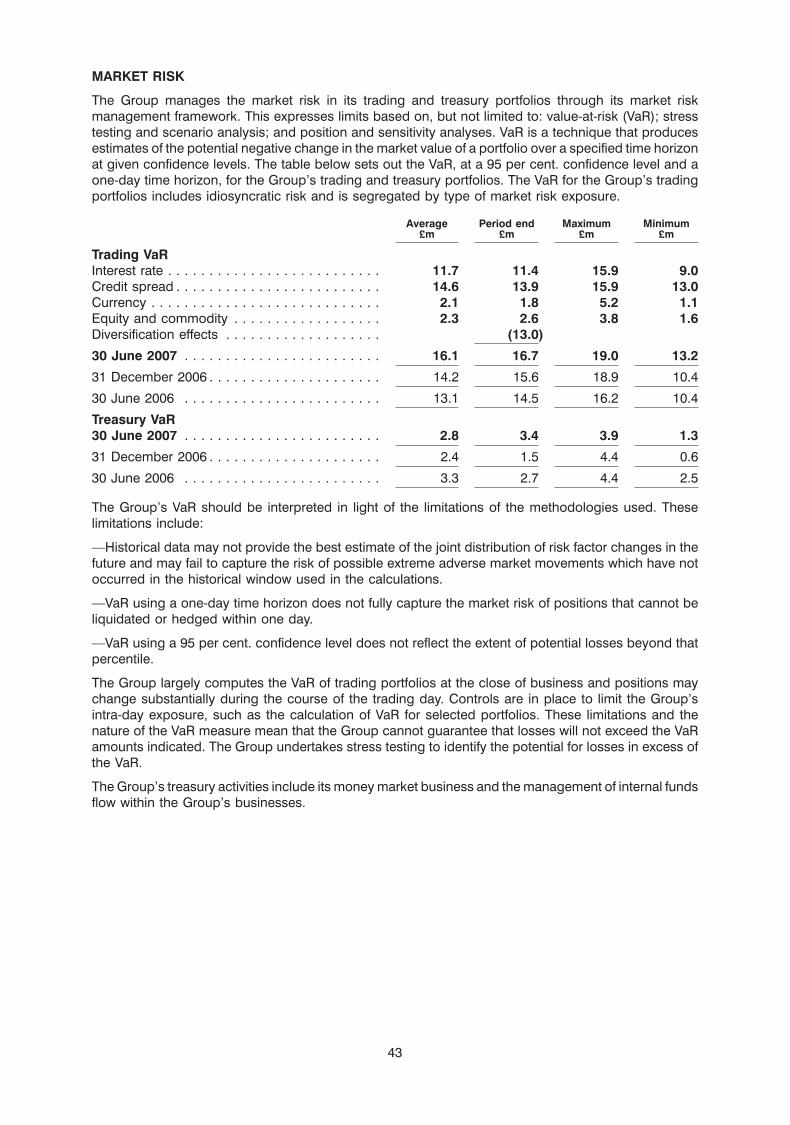
MARKET RISK
The Group manages the market risk in its trading and treasury portfolios through its market riskmanagement framework. This expresses limits based on, but not limited to: value-at-risk (VaR); stresstesting and scenario analysis; and position and sensitivity analyses. VaR is a technique that producesestimates of the potential negative change in the market value of a portfolio over a specified time horizonat given confidence levels. The table below sets out the VaR, at a 95 per cent. confidence level and aone-day time horizon, for the Group’s trading and treasury portfolios. The VaR for the Group’s tradingportfolios includes idiosyncratic risk and is segregated by type of market risk exposure.
Average Period end Maximum Minimum£m £m £m £m
Trading VaRInterest rate . . . . . . . . . . . . . . . . . . . . . . . . . . 11.7 11.4 15.9 9.0Credit spread . . . . . . . . . . . . . . . . . . . . . . . . . 14.6 13.9 15.9 13.0Currency . . . . . . . . . . . . . . . . . . . . . . . . . . . . 2.1 1.8 5.2 1.1Equity and commodity . . . . . . . . . . . . . . . . . . 2.3 2.6 3.8 1.6Diversification effects . . . . . . . . . . . . . . . . . . . (13.0)
30 June 2007 . . . . . . . . . . . . . . . . . . . . . . . . 16.1 16.7 19.0 13.2
31 December 2006 . . . . . . . . . . . . . . . . . . . . . 14.2 15.6 18.9 10.4
30 June 2006 . . . . . . . . . . . . . . . . . . . . . . . . 13.1 14.5 16.2 10.4
Treasury VaR30 June 2007 . . . . . . . . . . . . . . . . . . . . . . . . 2.8 3.4 3.9 1.3
31 December 2006 . . . . . . . . . . . . . . . . . . . . . 2.4 1.5 4.4 0.6
30 June 2006 . . . . . . . . . . . . . . . . . . . . . . . . 3.3 2.7 4.4 2.5
The Group’s VaR should be interpreted in light of the limitations of the methodologies used. Theselimitations include:
—Historical data may not provide the best estimate of the joint distribution of risk factor changes in thefuture and may fail to capture the risk of possible extreme adverse market movements which have notoccurred in the historical window used in the calculations.
—VaR using a one-day time horizon does not fully capture the market risk of positions that cannot beliquidated or hedged within one day.
—VaR using a 95 per cent. confidence level does not reflect the extent of potential losses beyond thatpercentile.
The Group largely computes the VaR of trading portfolios at the close of business and positions maychange substantially during the course of the trading day. Controls are in place to limit the Group’sintra-day exposure, such as the calculation of VaR for selected portfolios. These limitations and thenature of the VaR measure mean that the Group cannot guarantee that losses will not exceed the VaRamounts indicated. The Group undertakes stress testing to identify the potential for losses in excess ofthe VaR.
The Group’s treasury activities include its money market business and the management of internal fundsflow within the Group’s businesses.
43
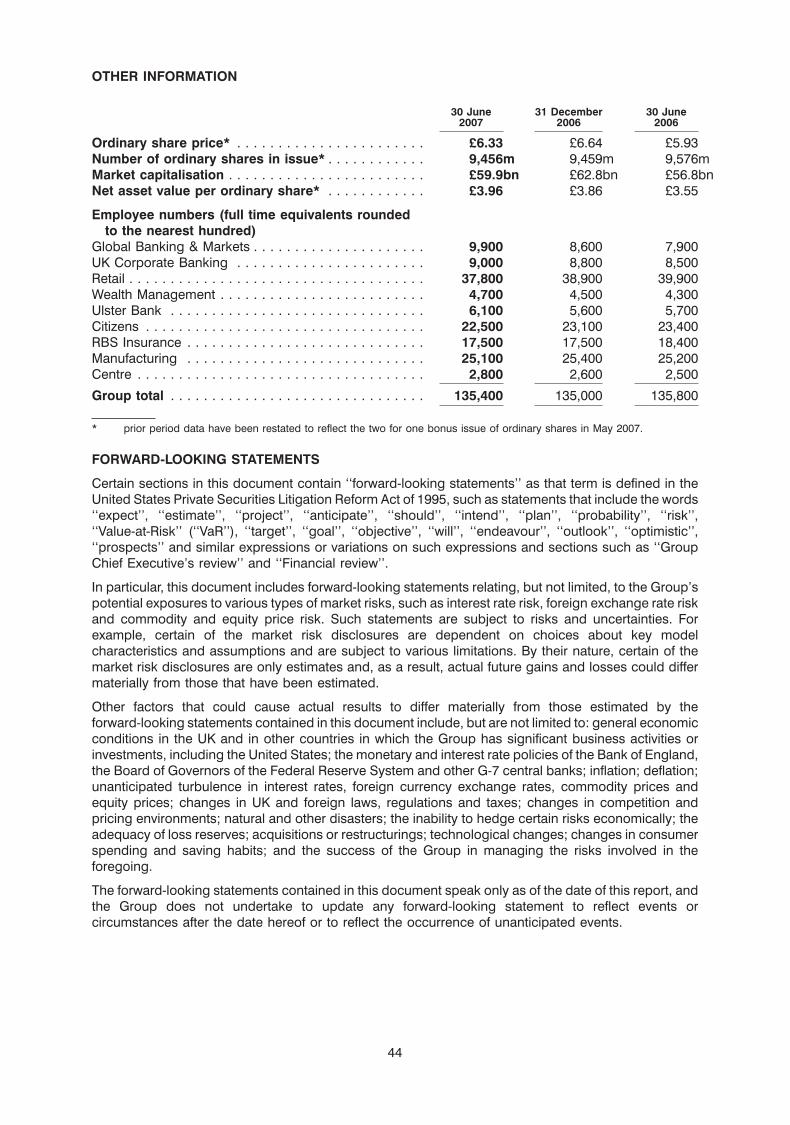
OTHER INFORMATION
30 June 31 December 30 June2007 2006 2006
Ordinary share price* . . . . . . . . . . . . . . . . . . . . . . . £6.33 £6.64 £5.93Number of ordinary shares in issue* . . . . . . . . . . . . 9,456m 9,459m 9,576mMarket capitalisation . . . . . . . . . . . . . . . . . . . . . . . . £59.9bn £62.8bn £56.8bnNet asset value per ordinary share* . . . . . . . . . . . . £3.96 £3.86 £3.55
Employee numbers (full time equivalents roundedto the nearest hundred)
Global Banking & Markets . . . . . . . . . . . . . . . . . . . . . 9,900 8,600 7,900UK Corporate Banking . . . . . . . . . . . . . . . . . . . . . . . 9,000 8,800 8,500Retail . . . . . . . . . . . . . . . . . . . . . . . . . . . . . . . . . . . . 37,800 38,900 39,900Wealth Management . . . . . . . . . . . . . . . . . . . . . . . . . 4,700 4,500 4,300Ulster Bank . . . . . . . . . . . . . . . . . . . . . . . . . . . . . . . 6,100 5,600 5,700Citizens . . . . . . . . . . . . . . . . . . . . . . . . . . . . . . . . . . 22,500 23,100 23,400RBS Insurance . . . . . . . . . . . . . . . . . . . . . . . . . . . . . 17,500 17,500 18,400Manufacturing . . . . . . . . . . . . . . . . . . . . . . . . . . . . . 25,100 25,400 25,200Centre . . . . . . . . . . . . . . . . . . . . . . . . . . . . . . . . . . . 2,800 2,600 2,500
Group total . . . . . . . . . . . . . . . . . . . . . . . . . . . . . . . 135,400 135,000 135,800
* prior period data have been restated to reflect the two for one bonus issue of ordinary shares in May 2007.
FORWARD-LOOKING STATEMENTS
Certain sections in this document contain ‘‘forward-looking statements’’ as that term is defined in theUnited States Private Securities Litigation Reform Act of 1995, such as statements that include the words‘‘expect’’, ‘‘estimate’’, ‘‘project’’, ‘‘anticipate’’, ‘‘should’’, ‘‘intend’’, ‘‘plan’’, ‘‘probability’’, ‘‘risk’’,‘‘Value-at-Risk’’ (‘‘VaR’’), ‘‘target’’, ‘‘goal’’, ‘‘objective’’, ‘‘will’’, ‘‘endeavour’’, ‘‘outlook’’, ‘‘optimistic’’,‘‘prospects’’ and similar expressions or variations on such expressions and sections such as ‘‘GroupChief Executive’s review’’ and ‘‘Financial review’’.
In particular, this document includes forward-looking statements relating, but not limited, to the Group’spotential exposures to various types of market risks, such as interest rate risk, foreign exchange rate riskand commodity and equity price risk. Such statements are subject to risks and uncertainties. Forexample, certain of the market risk disclosures are dependent on choices about key modelcharacteristics and assumptions and are subject to various limitations. By their nature, certain of themarket risk disclosures are only estimates and, as a result, actual future gains and losses could differmaterially from those that have been estimated.
Other factors that could cause actual results to differ materially from those estimated by theforward-looking statements contained in this document include, but are not limited to: general economicconditions in the UK and in other countries in which the Group has significant business activities orinvestments, including the United States; the monetary and interest rate policies of the Bank of England,the Board of Governors of the Federal Reserve System and other G-7 central banks; inflation; deflation;unanticipated turbulence in interest rates, foreign currency exchange rates, commodity prices andequity prices; changes in UK and foreign laws, regulations and taxes; changes in competition andpricing environments; natural and other disasters; the inability to hedge certain risks economically; theadequacy of loss reserves; acquisitions or restructurings; technological changes; changes in consumerspending and saving habits; and the success of the Group in managing the risks involved in theforegoing.
The forward-looking statements contained in this document speak only as of the date of this report, andthe Group does not undertake to update any forward-looking statement to reflect events orcircumstances after the date hereof or to reflect the occurrence of unanticipated events.
44
INDEPENDENT REVIEW REPORT TO THE ROYAL BANK OF SCOTLAND GROUP plc
Introduction
We have been instructed by the company to review the financial information for the six months ended30 June 2007 which comprises the condensed consolidated income statement, the condensedconsolidated balance sheet, the condensed consolidated statement of recognised income andexpense, the condensed consolidated cash flow statement and related notes 1 to 14 (‘‘the financialinformation’’). We have read the other information contained in the interim report and consideredwhether it contains any apparent misstatements or material inconsistencies with the financialinformation.
This report is made solely to the company in accordance with Bulletin 1999/4 issued by the AuditingPractices Board. Our work has been undertaken so that we might state to the company those matters weare required to state to them in an independent review report and for no other purpose. To the fullestextent permitted by law, we do not accept or assume responsibility to anyone other than the company,for our review work, for this report, or for the conclusions we have formed.
Directors’ responsibilities
The interim report, including the financial information, is the responsibility of, and has been approved by,the directors. The directors are responsible for preparing the interim report in accordance with the ListingRules of the Financial Services Authority and the requirements of IAS 34 which require that theaccounting policies and presentation applied to the interim figures are consistent with those applied inpreparing the preceding annual accounts except where any changes, and the reasons for them, aredisclosed.
Review work performed
We conducted our review in accordance with the guidance contained in Bulletin 1999/4 issued by theAuditing Practices Board for use in the United Kingdom. A review consists principally of makingenquiries of Group management and applying analytical procedures to the financial information andunderlying financial data and, based thereon, assessing whether the accounting policies andpresentation have been consistently applied unless otherwise disclosed. A review excludes auditprocedures such as tests of controls and verification of assets, liabilities and transactions. It issubstantially less in scope than an audit performed in accordance with International Standards onAuditing (UK and Ireland) and therefore provides a lower level of assurance than an audit. Accordingly,we do not express an audit opinion on the financial information.
Review conclusion
On the basis of our review we are not aware of any material modifications that should be made to thefinancial information as presented for the six months ended 30 June 2007.
Deloitte & Touche LLPChartered AccountantsEdinburgh
2 August 2007
45
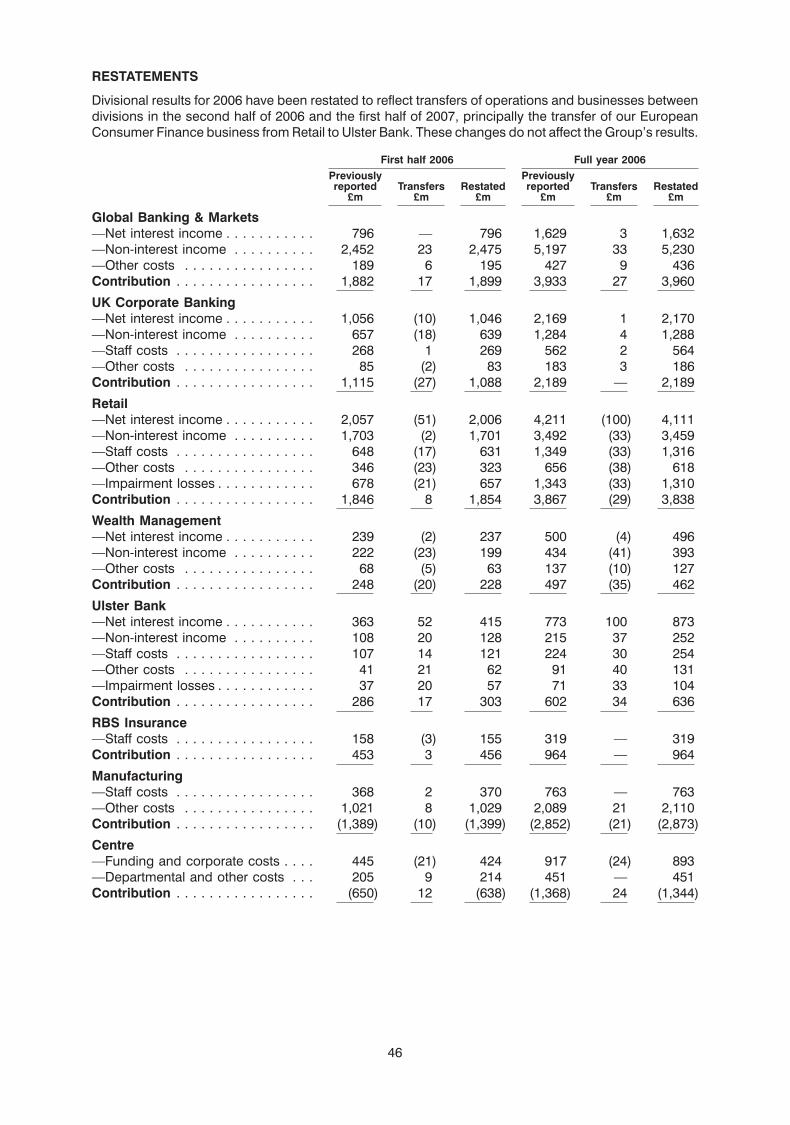
RESTATEMENTS
Divisional results for 2006 have been restated to reflect transfers of operations and businesses betweendivisions in the second half of 2006 and the first half of 2007, principally the transfer of our EuropeanConsumer Finance business from Retail to Ulster Bank. These changes do not affect the Group’s results.
First half 2006 Full year 2006Previously Previouslyreported Transfers Restated reported Transfers Restated
£m £m £m £m £m £m
Global Banking & Markets—Net interest income . . . . . . . . . . . 796 — 796 1,629 3 1,632—Non-interest income . . . . . . . . . . 2,452 23 2,475 5,197 33 5,230—Other costs . . . . . . . . . . . . . . . . 189 6 195 427 9 436Contribution . . . . . . . . . . . . . . . . . 1,882 17 1,899 3,933 27 3,960
UK Corporate Banking—Net interest income . . . . . . . . . . . 1,056 (10) 1,046 2,169 1 2,170—Non-interest income . . . . . . . . . . 657 (18) 639 1,284 4 1,288—Staff costs . . . . . . . . . . . . . . . . . 268 1 269 562 2 564—Other costs . . . . . . . . . . . . . . . . 85 (2) 83 183 3 186Contribution . . . . . . . . . . . . . . . . . 1,115 (27) 1,088 2,189 — 2,189
Retail—Net interest income . . . . . . . . . . . 2,057 (51) 2,006 4,211 (100) 4,111—Non-interest income . . . . . . . . . . 1,703 (2) 1,701 3,492 (33) 3,459—Staff costs . . . . . . . . . . . . . . . . . 648 (17) 631 1,349 (33) 1,316—Other costs . . . . . . . . . . . . . . . . 346 (23) 323 656 (38) 618—Impairment losses . . . . . . . . . . . . 678 (21) 657 1,343 (33) 1,310Contribution . . . . . . . . . . . . . . . . . 1,846 8 1,854 3,867 (29) 3,838
Wealth Management—Net interest income . . . . . . . . . . . 239 (2) 237 500 (4) 496—Non-interest income . . . . . . . . . . 222 (23) 199 434 (41) 393—Other costs . . . . . . . . . . . . . . . . 68 (5) 63 137 (10) 127Contribution . . . . . . . . . . . . . . . . . 248 (20) 228 497 (35) 462
Ulster Bank—Net interest income . . . . . . . . . . . 363 52 415 773 100 873—Non-interest income . . . . . . . . . . 108 20 128 215 37 252—Staff costs . . . . . . . . . . . . . . . . . 107 14 121 224 30 254—Other costs . . . . . . . . . . . . . . . . 41 21 62 91 40 131—Impairment losses . . . . . . . . . . . . 37 20 57 71 33 104Contribution . . . . . . . . . . . . . . . . . 286 17 303 602 34 636
RBS Insurance—Staff costs . . . . . . . . . . . . . . . . . 158 (3) 155 319 — 319Contribution . . . . . . . . . . . . . . . . . 453 3 456 964 — 964
Manufacturing—Staff costs . . . . . . . . . . . . . . . . . 368 2 370 763 — 763—Other costs . . . . . . . . . . . . . . . . 1,021 8 1,029 2,089 21 2,110Contribution . . . . . . . . . . . . . . . . . (1,389) (10) (1,399) (2,852) (21) (2,873)
Centre—Funding and corporate costs . . . . 445 (21) 424 917 (24) 893—Departmental and other costs . . . 205 9 214 451 — 451Contribution . . . . . . . . . . . . . . . . . (650) 12 (638) (1,368) 24 (1,344)
46

FINANCIAL CALENDAR
2007 interim dividend payment . . . . . . . . . . . . . . . . . . . . . . . . . . . . . . . . . . . . 5 October 20072007 annual results announcement . . . . . . . . . . . . . . . . . . . . . . . . . . . . . . . . . 28 February 20082007 final dividend payment . . . . . . . . . . . . . . . . . . . . . . . . . . . . . . . . . . . . . . June 20082008 interim results announcement . . . . . . . . . . . . . . . . . . . . . . . . . . . . . . . . . August 2008
CONTACTS
Sir Fred Goodwin . . . . . . . . . . . . . . . . . . . . . . Group Chief Executive 020 7672 00080131 523 2203
Guy Whittaker . . . . . . . . . . . . . . . . . . . . . . . . Group Finance Director 020 7672 00030131 523 2028
Richard O’Connor . . . . . . . . . . . . . . . . . . . . . Head of Investor Relations 020 7672 1758
For media enquiries:Howard Moody . . . . . . . . . . . . . . . . . . . . . . . Group Director, Communications 020 7672 1923
07768 033562
Carolyn McAdam . . . . . . . . . . . . . . . . . . . . . . Head of Group Communications 020 7672 191407796 274968
47
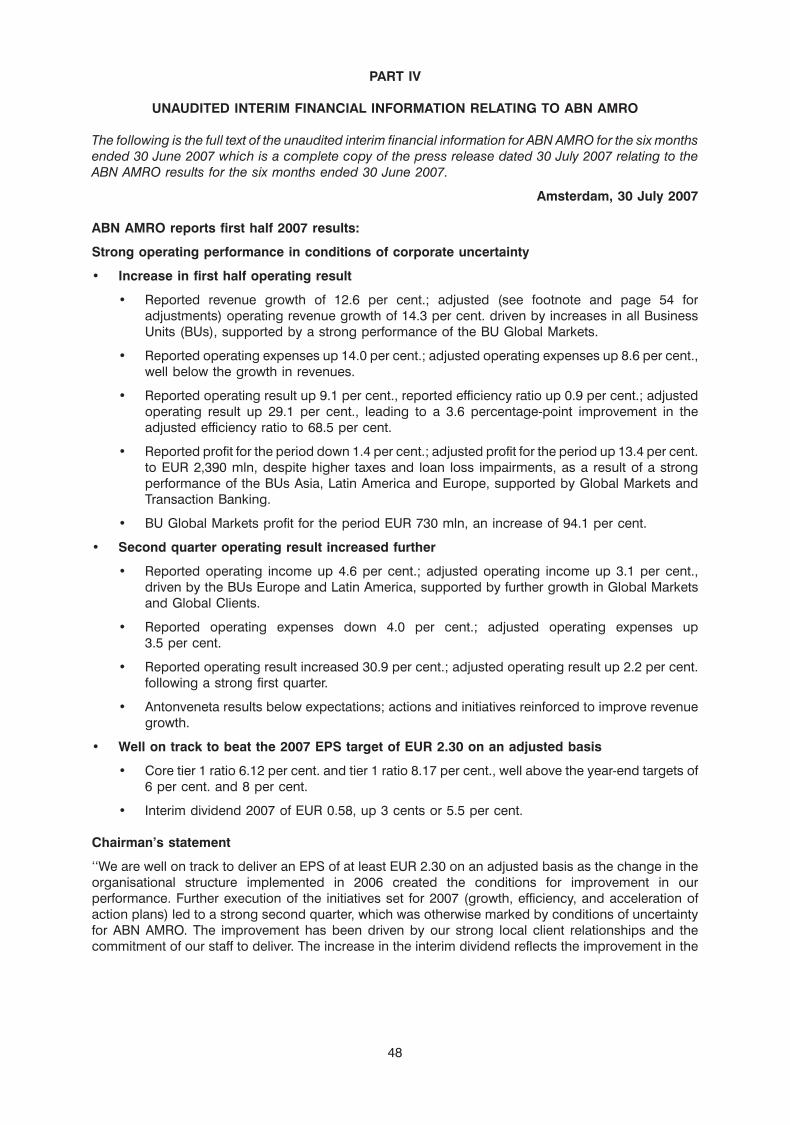
PART IV
UNAUDITED INTERIM FINANCIAL INFORMATION RELATING TO ABN AMRO
The following is the full text of the unaudited interim financial information for ABN AMRO for the six monthsended 30 June 2007 which is a complete copy of the press release dated 30 July 2007 relating to theABN AMRO results for the six months ended 30 June 2007.
Amsterdam, 30 July 2007
ABN AMRO reports first half 2007 results:
Strong operating performance in conditions of corporate uncertainty
• Increase in first half operating result
• Reported revenue growth of 12.6 per cent.; adjusted (see footnote and page 54 foradjustments) operating revenue growth of 14.3 per cent. driven by increases in all BusinessUnits (BUs), supported by a strong performance of the BU Global Markets.
• Reported operating expenses up 14.0 per cent.; adjusted operating expenses up 8.6 per cent.,well below the growth in revenues.
• Reported operating result up 9.1 per cent., reported efficiency ratio up 0.9 per cent.; adjustedoperating result up 29.1 per cent., leading to a 3.6 percentage-point improvement in theadjusted efficiency ratio to 68.5 per cent.
• Reported profit for the period down 1.4 per cent.; adjusted profit for the period up 13.4 per cent.to EUR 2,390 mln, despite higher taxes and loan loss impairments, as a result of a strongperformance of the BUs Asia, Latin America and Europe, supported by Global Markets andTransaction Banking.
• BU Global Markets profit for the period EUR 730 mln, an increase of 94.1 per cent.
• Second quarter operating result increased further
• Reported operating income up 4.6 per cent.; adjusted operating income up 3.1 per cent.,driven by the BUs Europe and Latin America, supported by further growth in Global Marketsand Global Clients.
• Reported operating expenses down 4.0 per cent.; adjusted operating expenses up3.5 per cent.
• Reported operating result increased 30.9 per cent.; adjusted operating result up 2.2 per cent.following a strong first quarter.
• Antonveneta results below expectations; actions and initiatives reinforced to improve revenuegrowth.
• Well on track to beat the 2007 EPS target of EUR 2.30 on an adjusted basis
• Core tier 1 ratio 6.12 per cent. and tier 1 ratio 8.17 per cent., well above the year-end targets of6 per cent. and 8 per cent.
• Interim dividend 2007 of EUR 0.58, up 3 cents or 5.5 per cent.
Chairman’s statement
‘‘We are well on track to deliver an EPS of at least EUR 2.30 on an adjusted basis as the change in theorganisational structure implemented in 2006 created the conditions for improvement in ourperformance. Further execution of the initiatives set for 2007 (growth, efficiency, and acceleration ofaction plans) led to a strong second quarter, which was otherwise marked by conditions of uncertaintyfor ABN AMRO. The improvement has been driven by our strong local client relationships and thecommitment of our staff to deliver. The increase in the interim dividend reflects the improvement in the
48
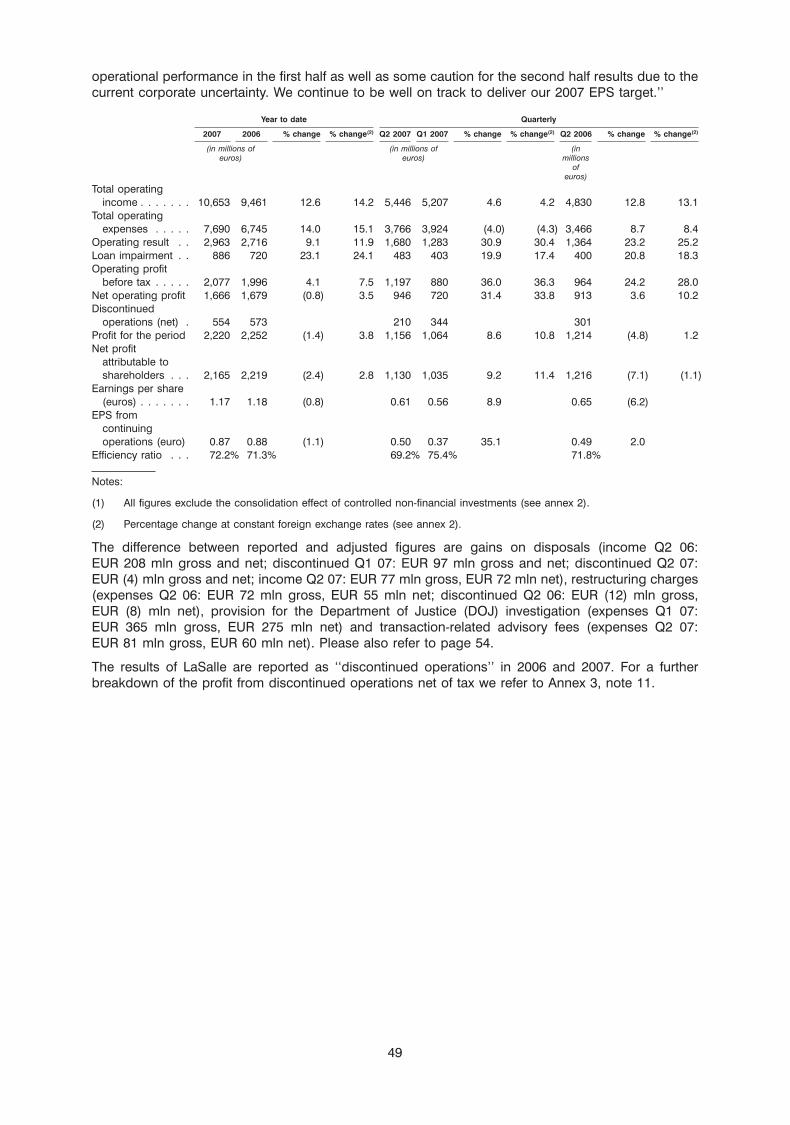
operational performance in the first half as well as some caution for the second half results due to thecurrent corporate uncertainty. We continue to be well on track to deliver our 2007 EPS target.’’
Year to date Quarterly
2007 2006 % change % change(2) Q2 2007 Q1 2007 % change % change(2) Q2 2006 % change % change(2)
(in millions of (in millions of (ineuros) euros) millions
ofeuros)
Total operatingincome . . . . . . . 10,653 9,461 12.6 14.2 5,446 5,207 4.6 4.2 4,830 12.8 13.1
Total operatingexpenses . . . . . 7,690 6,745 14.0 15.1 3,766 3,924 (4.0) (4.3) 3,466 8.7 8.4
Operating result . . 2,963 2,716 9.1 11.9 1,680 1,283 30.9 30.4 1,364 23.2 25.2Loan impairment . . 886 720 23.1 24.1 483 403 19.9 17.4 400 20.8 18.3Operating profit
before tax . . . . . 2,077 1,996 4.1 7.5 1,197 880 36.0 36.3 964 24.2 28.0Net operating profit 1,666 1,679 (0.8) 3.5 946 720 31.4 33.8 913 3.6 10.2Discontinued
operations (net) . 554 573 210 344 301Profit for the period 2,220 2,252 (1.4) 3.8 1,156 1,064 8.6 10.8 1,214 (4.8) 1.2Net profit
attributable toshareholders . . . 2,165 2,219 (2.4) 2.8 1,130 1,035 9.2 11.4 1,216 (7.1) (1.1)
Earnings per share(euros) . . . . . . . 1.17 1.18 (0.8) 0.61 0.56 8.9 0.65 (6.2)
EPS fromcontinuingoperations (euro) 0.87 0.88 (1.1) 0.50 0.37 35.1 0.49 2.0
Efficiency ratio . . . 72.2% 71.3% 69.2% 75.4% 71.8%
Notes:
(1) All figures exclude the consolidation effect of controlled non-financial investments (see annex 2).
(2) Percentage change at constant foreign exchange rates (see annex 2).
The difference between reported and adjusted figures are gains on disposals (income Q2 06:EUR 208 mln gross and net; discontinued Q1 07: EUR 97 mln gross and net; discontinued Q2 07:EUR (4) mln gross and net; income Q2 07: EUR 77 mln gross, EUR 72 mln net), restructuring charges(expenses Q2 06: EUR 72 mln gross, EUR 55 mln net; discontinued Q2 06: EUR (12) mln gross,EUR (8) mln net), provision for the Department of Justice (DOJ) investigation (expenses Q1 07:EUR 365 mln gross, EUR 275 mln net) and transaction-related advisory fees (expenses Q2 07:EUR 81 mln gross, EUR 60 mln net). Please also refer to page 54.
The results of LaSalle are reported as ‘‘discontinued operations’’ in 2006 and 2007. For a furtherbreakdown of the profit from discontinued operations net of tax we refer to Annex 3, note 11.
49
Dear shareholder,
The first half of this year has seen momentous events for ABN AMRO and it is against this backdrop thatI am pleased to report the strong operating performance of the Group. In 2006 we implemented changesto the Group’s organisational structure, and we identified 2007 as ‘‘a year of delivery’’. These changeshave resulted in improved operational performance in 2007, and the delivery of earnings growth.
These results demonstrate the strengths of our strong local client relationships, the dedication andresilience of our staff, and the robustness of our businesses. At the start of this year we called 2007‘‘a year of delivery’’. Delivery is defined as earnings per share of at least EUR 2.30 on an adjusted basis.In the first six months of this year we have delivered reported earnings per share of EUR 1.17 andadjusted earnings per share of EUR 1.26, and we can conclude that we are well on track to deliver atleast the EUR 2.30 on an adjusted basis, which we committed to at the start of this year.
The increase in profitability is the result of a significant improvement in the operating performance asdelivered on the three key themes of growth, efficiency and the acceleration of the action plan. Thisperformance is underpinned by the breadth and depth of our global banking businesses, whichprovides an established platform for developing further growth.
1 Growth
The three key growth areas are Brazil, Asia and Italy.
In Brazil we saw a continuation of the benign economic environment and a continuation of declininginterest rates, driving strong loan growth. The good performance in Brazil was underpinned by a furtherimprovement in the efficiency ratio, resulting in the BU Latin America being the third largest profitcontributor after the BU Netherlands and the BU North America.
In Asia we realised strong operating momentum as profit for the period increased to EUR 224 mln,resulting in a significant contribution to the Group’s profit for the period. We also continued to build ourconsumer and commercial operations further in selected markets through for instance the acquisition ofPrime Bank in Pakistan, one of our focus countries, and further branch openings in India, where wecurrently have 28 branches. We also received approval for local incorporation in China.
Antonveneta has been part of the Group for a year now. The plans to transform Antonveneta’s consumerbank are well on their way. Most branches have been refurbished, new service concepts such asPreferred Banking will be introduced in the third quarter, and new employees have been recruited. Theposition of the commercial bank will be further strengthened as we roll out the ABN AMRO product suite.The private bank is being built, with another two branches having recently been opened, bringing thetotal to nine. The results of the first half of 2007 reflect the time and effort it has taken to rebuildAntonveneta, but the initiatives launched provide us with the comfort that Antonveneta will deliver astrong increase in its operating performance in the second half of 2007.
2 Efficiency
Good progress has been made to reduce the efficiency ratios of the constituent parts of the Group tolevels in line with their respective peers.
A return to profitability of the BU Europe has been one of the highest priorities in 2007 and I am verypleased with the progress made in this respect. The BU Europe had its third consecutive quarter ofprofitability driven by upgraded service to Financial Institutions, a key client group to ABN AMRO, furthergrowth in our successful private investor products, and continued growth in the Eastern Europeanactivities. In addition, tight cost control and capital discipline have secured the base for the BU Europe,which is well on track to meet the Group’s targeted return on assigned risk capital.
The steps taken to improve the operational efficiency of the BU North America have successfully beenexecuted. The reduction of the workforce was accelerated and finalised in the second quarter. The earlysigns of improved efficiency are already visible in the results of BU North America including LaSalle(further details on LaSalle can found in Annex 3, note 11). On 23 April 2007 we announced an agreementto sell LaSalle for USD 21 bln to Bank of America, a decision that was validated by the Supreme Court on13 July.
This transaction will be consummated once regulatory approval has been granted. The results forLaSalle are therefore reported in discontinued activities.
50
The BU Netherlands showed further improvement in its efficiency ratio to 65.6 per cent. in the first half of2007, and, despite the current uncertainty surrounding ABN AMRO, delivered a strong net operatingresult driven by intensified client coverage and improved client satisfaction rates.
3 Acceleration of existing initiatives
The BU Global Markets has delivered an impressive turnaround in terms of both efficiency andprofitability. We believe the improvement results from a focus on more value-added structured productsand participation choices in terms of product availability and geographic presence. The efficiency ratioof the BU Global Markets of 68.3 per cent. is now in line with the Group, and compares favourably withthe 90.9 per cent. efficiency ratio of 2005, at the end of which the BU Global Markets was created. TheBU Global Markets’ operating profit in the first half of 2007 is almost three times that for the full year 2005.
The shift in business mix of the BU Global Clients away from the traditional loan products to fee-drivenproducts, as initiated some years ago, resulted in a clear improvement in the build-up of earnings.Currently, 78 per cent. of earnings are from non-interest income, resulting in a higher quality of incomeand a lower dependence on capital. As a result, the BU Global Clients has achieved a strongimprovement in its return on assigned risk capital, and is now meeting its 2007 return target of20 per cent.
The announced measures to improve the cost efficiency and productivity in Group Functions wereexpected to affect more than 500 Full-Time Equivalent (FTE) members of staff, mainly at head office. Theheadcount reduction started in the first quarter and we are on track to deliver this reduction.
We continued to divest non-core assets in the first six months of the year as we finalised the sale of thePrivate Clients activities in Miami and Uruguay. Furthermore, we announced the sale to Mellon Bank N.A.of ABN AMRO’s 50 per cent. share in ABN AMRO Mellon Global Securities Services B.V., the joint venturecompany established by ABN AMRO and Mellon in 2003, aimed at providing global custody and relatedservices to institutions outside North America, to Mellon Bank N.A. The transaction is expected to closein the third quarter of 2007.
The Dutch Central Bank (DNB) announced on 26 July 2007 that it has lifted its directive regardingcompliance deficiencies at ABN AMRO. The Directive, along with the Order to Cease and Desist from theUS regulators, was put in place in December 2005. It is gratifying to see the DNB recognising the positiveoutcome of the steps we have taken across ABN AMRO. We have not only strengthened the complianceenvironment within the bank but are also building one of the strongest anti-money laundering andcompliance organisations in the financial services industry. We are committed to continuing to operate atthe forefront of compliance best practice.
The year 2007 will be a year of delivery in many ways. At this point in time the outcome is uncertain, but Ihave no doubt that the strengths and values of ABN AMRO will provide strong returns to shareholders ofABN AMRO in 2007 and well beyond. We are delivering on our commitment to improve the operatingperformance of the Group. This improvement to date has been and will be achieved in sometimesdifficult times marked by corporate uncertainty, and is driven by the commitment of our staff to deliver,continuing strong local client relationships and resilience of the businesses. I would like to thank all ouremployees and clients for making more possible.
Yours sincerely,
Rijkman Groenink
51
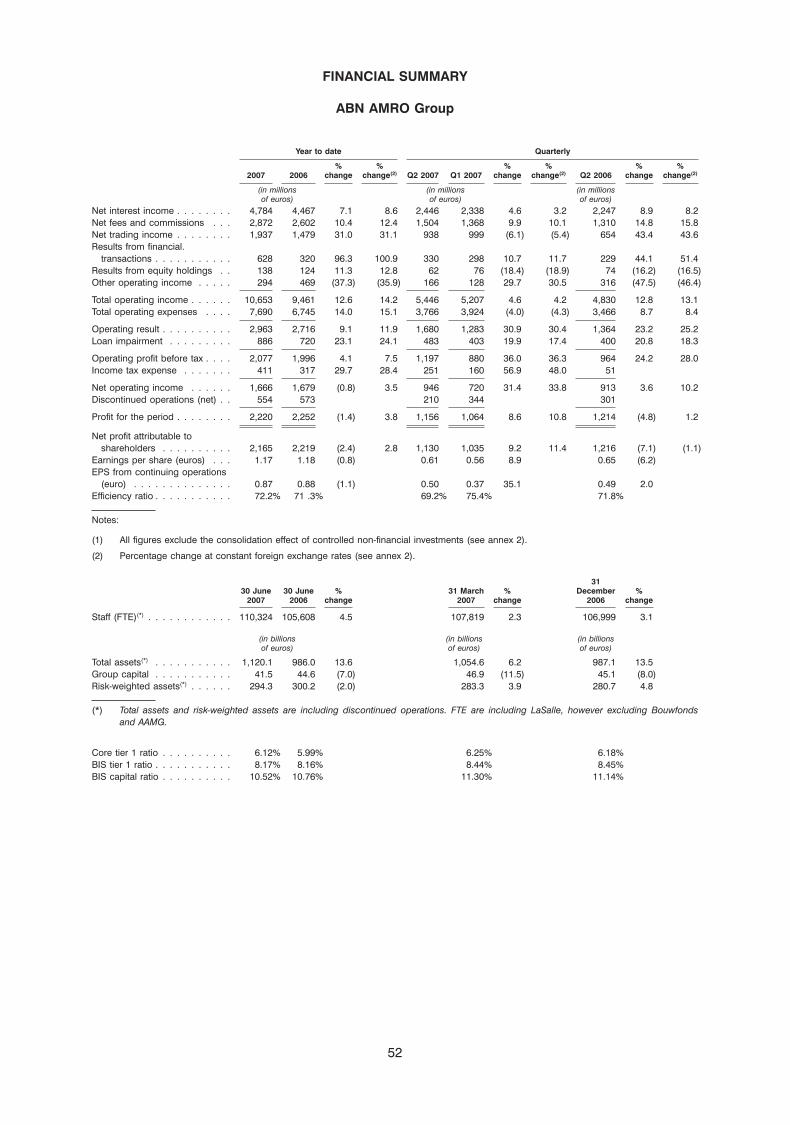
FINANCIAL SUMMARY
ABN AMRO Group
Year to date Quarterly
% % % % % %2007 2006 change change(2) Q2 2007 Q1 2007 change change(2) Q2 2006 change change(2)
(in millions (in millions (in millionsof euros) of euros) of euros)
Net interest income . . . . . . . . 4,784 4,467 7.1 8.6 2,446 2,338 4.6 3.2 2,247 8.9 8.2Net fees and commissions . . . 2,872 2,602 10.4 12.4 1,504 1,368 9.9 10.1 1,310 14.8 15.8Net trading income . . . . . . . . 1,937 1,479 31.0 31.1 938 999 (6.1) (5.4) 654 43.4 43.6Results from financial.
transactions . . . . . . . . . . . 628 320 96.3 100.9 330 298 10.7 11.7 229 44.1 51.4Results from equity holdings . . 138 124 11.3 12.8 62 76 (18.4) (18.9) 74 (16.2) (16.5)Other operating income . . . . . 294 469 (37.3) (35.9) 166 128 29.7 30.5 316 (47.5) (46.4)
Total operating income . . . . . . 10,653 9,461 12.6 14.2 5,446 5,207 4.6 4.2 4,830 12.8 13.1Total operating expenses . . . . 7,690 6,745 14.0 15.1 3,766 3,924 (4.0) (4.3) 3,466 8.7 8.4
Operating result . . . . . . . . . . 2,963 2,716 9.1 11.9 1,680 1,283 30.9 30.4 1,364 23.2 25.2Loan impairment . . . . . . . . . 886 720 23.1 24.1 483 403 19.9 17.4 400 20.8 18.3
Operating profit before tax . . . . 2,077 1,996 4.1 7.5 1,197 880 36.0 36.3 964 24.2 28.0Income tax expense . . . . . . . 411 317 29.7 28.4 251 160 56.9 48.0 51
Net operating income . . . . . . 1,666 1,679 (0.8) 3.5 946 720 31.4 33.8 913 3.6 10.2Discontinued operations (net) . . 554 573 210 344 301
Profit for the period . . . . . . . . 2,220 2,252 (1.4) 3.8 1,156 1,064 8.6 10.8 1,214 (4.8) 1.2
Net profit attributable toshareholders . . . . . . . . . . 2,165 2,219 (2.4) 2.8 1,130 1,035 9.2 11.4 1,216 (7.1) (1.1)
Earnings per share (euros) . . . 1.17 1.18 (0.8) 0.61 0.56 8.9 0.65 (6.2)EPS from continuing operations
(euro) . . . . . . . . . . . . . . 0.87 0.88 (1.1) 0.50 0.37 35.1 0.49 2.0Efficiency ratio . . . . . . . . . . . 72.2% 71 .3% 69.2% 75.4% 71.8%
Notes:
(1) All figures exclude the consolidation effect of controlled non-financial investments (see annex 2).
(2) Percentage change at constant foreign exchange rates (see annex 2).
3130 June 30 June % 31 March % December %
2007 2006 change 2007 change 2006 change
Staff (FTE)(*) . . . . . . . . . . . . 110,324 105,608 4.5 107,819 2.3 106,999 3.1
(in billions (in billions (in billionsof euros) of euros) of euros)
Total assets(*) . . . . . . . . . . . 1,120.1 986.0 13.6 1,054.6 6.2 987.1 13.5Group capital . . . . . . . . . . . 41.5 44.6 (7.0) 46.9 (11.5) 45.1 (8.0)Risk-weighted assets(*) . . . . . . 294.3 300.2 (2.0) 283.3 3.9 280.7 4.8
(*) Total assets and risk-weighted assets are including discontinued operations. FTE are including LaSalle, however excluding Bouwfondsand AAMG.
Core tier 1 ratio . . . . . . . . . . 6.12% 5.99% 6.25% 6.18%BIS tier 1 ratio . . . . . . . . . . . 8.17% 8.16% 8.44% 8.45%BIS capital ratio . . . . . . . . . . 10.52% 10.76% 11.30% 11.14%
52
The figures in the press release have not been subject to audit
Figures are excluding consolidation effect of controlled non-financial investments, also referredto as private equity investments
All figures are stated excluding the consolidation effect of controlled non-financial investments. Theconsolidation effect is the impact per line item of these investments, which are consolidated under IFRS.We believe that combining the temporary holdings in private equity investments active in different typesof business other than our financial business does not provide a meaningful basis for discussion of ourfinancial condition and results of operation. We refer to Annex 2 for a further discussion of the use ofthese non-GAAP financial measures. We have presented in Annex 2, and investors are encouraged toreview, reconciliations of the figures excluding the consolidation of private equity investments andincluding the consolidation effects of our controlled private equity holdings.
Figures at constant foreign exchange rates
In addition to the actual growth measures, we have explained variances in terms of ‘‘constant foreignexchange rates’’ or ‘‘local currency’’. These variances exclude the effect of currency translationdifference. We refer to Annex 2 for a further discussion of the use of these non-GAAP financial measures.
Revised interim financial statements
This press release includes a set of interim financial statements as required under IFRS. Thesestatements have been included as Annex 3 to this press release and include a consolidated incomestatement, consolidated balance sheet, a consolidated statement of changes in equity and aconsolidated cash flow statement as well as the relevant accompanying notes to these statements.
Reporting adjustments
For comparison reasons the figures by BU have been adjusted to reflect the following (earlierannounced) changes: BU Global Clients is reported in the regions; the International Diamonds &Jewellery Group is included in Group Functions (previously BU Private Clients) and BU AssetManagement includes Asset Management France (previously in BU Private Clients).
To aid the analysis of the reported figures, we have made adjustments to the reported figures for thefollowing items in 2006 and 2007. The adjusted figures throughout this press release therefore excludethe following items:
Second quarter 2006 Gross Net
(EUR million) (EUR million)Gain from the sale of K&H (income) . . . . . . . . . . . . . . . . . . . . . . . . . . . 208 208Services restructuring charge (expenses) . . . . . . . . . . . . . . . . . . . . . . . . 72 55Services restructuring charge (discontinued) . . . . . . . . . . . . . . . . . . . . . (12) (8)
First quarter 2007 Gross Net
(EUR million) (EUR million)Provision for DOJ investigation (expenses) . . . . . . . . . . . . . . . . . . . . . . . 365 275Gain on the sale AAMG (discontinued) . . . . . . . . . . . . . . . . . . . . . . . . . . 97 97
Second quarter 2007 Gross Net
(EUR million) (EUR million)Gain on sale of Private Clients Miami (income) . . . . . . . . . . . . . . . . . . . . 77 72Transaction-related advisory fees (expenses) . . . . . . . . . . . . . . . . . . . . . 81 60Adjustment to gain on the sale AAMG (discontinued) . . . . . . . . . . . . . . . (4) (4)
Please note that the net operating income of LaSalle is presented as part of ‘‘results from discontinuedoperations’’ in 2006 and 2007. For a further breakdown of the profit from discontinued operations net oftax, we refer to the Interim Financial Report for the period ended 30 June 2007, note 11, as included inAnnex 3.
53
First half 2007 compared with first half 2006
Operating income The Group’s operating income increased by 12.6 per cent. onthe back of increases across all Business Units (BUs) exceptGroup Functions. The regions include the results from theBU Global Clients. Adjusted operating income increased14.3 per cent. as the Group’s main growth engines, the BUsLatin America and Asia, showed significant growth,underpinned by a strong performance in the BUs GlobalMarkets and Global Clients. The broad-based regional clientrevenue growth is the result of a consistent focus on our stronglocal relationships across the various regions, combined withour ability to offer a wide and competitive product suite to ourmid-market clients. The BU Europe’s EUR 483 mln increase inrevenues, for example due to further focus on the FinancialInstitutions client segment, was particularly noteworthy.
Operating expenses Operating expenses rose by 14.0 per cent. Adjusted operatingexpenses increased by 8.6 per cent. as higher revenuesresulted in higher bonus accruals incurred in the BU Europeand Global Markets. Furthermore, the continued growth of ourAsian activities, including new branch openings, resulted inEUR 156 mln higher costs. Excluding bonus accruals, adjustedoperating expenses were up only 1.5 per cent., againstadjusted revenue growth of 14.3 per cent., reflecting strongcost control as well as further benefits from the Group’scontinuing Services programme.
Operating result The reported improvement in operating result was 9.1 per cent.The adjusted operating result was up 29.1 per cent. toEUR 3,332 mln due to an improved performance across all theregional Client BUs, underpinned by further improvement ofthe operational performance of the BU Global Markets andTransaction Banking. This resulted in an improvement of theadjusted efficiency ratio of 3.6 percentage points to68.5 per cent.
Loan impairments Provisions increased EUR 166 mln to EUR 886 mln,EUR 729 mln of which were in the consumer portfolio andEUR 157 mln in the commercial portfolio. The increase was dueto further strong growth in the Brazilian high-margin retail andloan portfolios in the BU Latin America, as well as to thereclassification at Antonveneta between loan impairment andnet interest income in respect of interest on impaired loans (asannounced with the third quarter 2006 results), which was notapplied in the first half of 2006.
Discontinued operations Discontinued operations include the net-of-tax operatingresults from ABN AMRO Mortgage Group, LaSalle andBouwfonds non-mortgage.
Profit for the period The Group’s reported profit for the period decreased by1.4 per cent. However, the adjusted profit for the period wentup by 13.4 per cent. to EUR 2,390 mln.
Risk-weighted assets Continued active capital management, including throughsecuritisations and loan sale, resulted in a EUR 5.9 blndecrease in risk-weighted assets (RWA) to EUR 294.3 bln.
Net profit attributable to Net profit attributable to shareholders was EUR 2,165 mln.ABN AMRO shareholders Minority interest went up by EUR 22 mln to EUR 55 mln.
54
Return on equity Return on equity for the first half was 17.8 per cent., below thetarget of 20 per cent. We expect to meet the 20 per cent. returnon equity target for the full year 2007, including expected bookprofits on disposals.
Capital ratios In the first half of 2007, we completed a EUR 1 bln share buy-back programme via the repurchase of 31.6 mln shares. Thetier 1 ratio was 8.17 per cent., 1 basis point higher than at30 June 2006. The core tier 1 ratio was 6.12 per cent., anincrease of 13 basis points. The total capital ratio stood at10.52 per cent., a decrease of 24 basis points.
Dividend The interim dividend is 5.5 per cent. higher at EUR 0.58 and willbe payable in cash only. For those shareholders who would liketo elect to have the cash dividend invested in stock,ABN AMRO will facilitate the process by buying stock in theopen market by means of a Dividend ReinvestmentProgramme (DRIP). Further details on the DRIP can be foundon our website: www.abnamro.com.
Half year update The results from the BUs Global Markets, Global Clients andTransaction Banking are reported in the regions. In order totrack progress against previously communicated targets,please see further disclosure on the BUs Global Clients andGlobal Markets on pages 83-86.
The BU Global Markets’ revenues were up by EUR 596 mln or28.0 per cent. to EUR 2,722 mln, a record first half, due tocontinued strong growth in all asset and product classes. Tightcost control resulted in a market-leading 8.1 percentage-pointimprovement in the efficiency ratio for the first half 2007 to68.3 per cent., excluding the Services restructuring charge in2006. The ratio is in line with the Group’s efficiency ratio, andan overall contribution to the profit for the period of the Groupof 30.6 per cent. in the first six months.
The BU Global Clients’ revenues increased by EUR 343 mln or29.4 per cent., outpacing market growth, a very strongperformance driven by strong client relationships, whichresulted in many cross-border transactions. Good cost controlresulted in an operating result that more than doubled and areturn on assigned risk capital above the target set for 2007.
Transaction Banking was one of the main drivers behind thegrowth in operating result and profit for the period of the Group.The growth in Transaction Banking product revenues reflectsclient confidence in our Payments and Trade business. Thishas allowed us to close a number of large, multi-year dealsaround the world, creating good revenue growth while keepingcosts flat. We continue to win major awards for innovation, dueto our focus on building client-driven solutions that address ourclients’ working capital needs.
Second quarter 2007 compared with first quarter 2007
Operating income Total operating income grew by EUR 239 mln or 4.6 per cent.Adjusted operating income increased 3.1 per cent., due tofurther growth in the BUs Latin America, Europe, Asia, andPrivate Equity, partly offset by a EUR 209 mln decline in GroupFunctions and disappointing revenues at Antonveneta. TheBU Latin America increased revenues by 13.2 per cent., mainlyon the back of continued strong growth in the Brazilian retail
55
loan portfolio at improved margins. Revenue growth in theBU Europe was driven by a further increase in client activity inGlobal Markets products. The BU Asia grew its revenues by7.9 per cent., driven by strong Global Markets, mergers andacquisitions (M&A) and equity capital markets (ECM)revenues. Group Functions revenues declined due to lowerAsset and Liability Management (ALM) and proprietary tradingresults. The revenue growth expected at Antonveneta did notmaterialise.
Operating expenses Total operating expenses were 4.0 per cent. lower. Adjustedoperating expenses rose 3.5 per cent. This increase was drivenby higher personnel costs (including bonus accruals).
Operating result The operating result increased 30.9 per cent. on a reportedbasis. The adjusted operating result increased 2.2 per cent.following a very strong first quarter, due to healthy increases inthe operating result in the BUs Latin America, Asia, Europe,Global Clients and Global Markets, partly offset by a lowerresult in Group Functions. The adjusted efficiency ratioremained almost unchanged at 68.6 per cent.
Loan impairments The provisioning level for the Group increased by EUR 80 mlndue to continued growth of the high-margin Brazilian retail andconsumer loan portfolios in the BU Latin America.
Taxes The effective tax rate of continuing activities was 21.0 per cent.compared with 18.2 per cent. in the previous quarter.
Discontinued operations Discontinued operations included the net-of-tax operatingresults from ABN AMRO Mortgage Group and LaSalle.
Profit for the period The reported profit for the period was up by 8.6 per cent.Adjusted profit for the period was down by 7.6 per cent. due toa higher tax rate, higher provisions, and a slightly lowercontribution from LaSalle.
Return on equity Return on equity for the second quarter was 18.4 per cent.
Risk-weighted assets As at 30 June 2007, the Group’s RWA increased byEUR 11.0 bln to EUR 294.3 bln as a result of increases in theBU Netherlands and Group Functions.
Recent developments
Department of Justice investigation
As previously disclosed, the United States Department of Justice has been conducting a criminalinvestigation into the Bank’s dollar clearing activities, OFAC compliance procedures and other BankSecrecy Act compliance matters. The Bank has cooperated and continues to cooperate fully with theinvestigation. Although no written agreement has yet been reached and negotiations are ongoing, theBank has reached an agreement in principle with the Department of Justice that would resolve allpresently known aspects of the ongoing investigation.
Under the terms of the agreement in principle, the Bank and the United States would enter into adeferred prosecution agreement relating to the issues that are the subject of the current criminalinvestigation. In the deferred prosecution agreement, the Bank would waive indictment and agree to thefiling of an information in the United States District Court charging it with certain violations of federal lawbased on information disclosed in an agreed factual statement. The Bank would also agree to continuecooperating in the United States’ ongoing investigation and to settle all known civil and criminal claimscurrently held by the United States for the sum of USD 500 mln. The precise terms of the deferredprosecution agreement are still under negotiation.
In consideration for the foregoing provisions, as well as the Bank’s extensive remedial actions to dateand its willingness to demonstrate future good conduct and full compliance with all applicable federal
56
laws, the United States would recommend to the United States District Court that the prosecution of theBank under the information be deferred for a fixed period. At the end of that fixed period, provided theBank is in full compliance with all of its obligations under the deferred prosecution agreement, the UnitedStates would seek dismissal with prejudice of the information filed against the Bank. The precise terms ofthe deferred prosecution agreement and agreed factual statement are still under negotiation.
Recent developments related to the offers for ABN AMRO
On 30 May 2007, ABN AMRO acknowledged receipt of the proposed offer made by Fortis, Royal Bank ofScotland (RBS) and Santander (the ‘‘Consortium’’), details of which have been published on 29 May2007 by the Consortium. In response to the announcement by the Consortium, the Supervisory Boardformed a Transaction Committee (the ‘‘Transaction Committee’’) composed of the members of theSpecial Committee, being Arthur Martinez, chairman of the Supervisory Board, Andre Olijslager,vice-chairman of the Supervisory Board, and Rob van den Bergh. The Transaction Committee will liaisewith the Managing Board and key staff and advisers of the bank on an ongoing basis on all matters withrespect to the recommended offer by Barclays PLC (Barclays) for ABN AMRO as announced on 23 April2007 and with respect to the proposed offer as announced on 29 May 2007 by the Consortium.
On 2 July 2007, it was announced that in their announcement of 23 May 2007, Barclays and ABN AMROhad indicated that Barclays’ Offer Documentation would be published in July, subject to the satisfactionof all pre-conditions specified in the original press release dated 23 April 2007. Good progress continuedto be made in relation to the pre-conditions, documentation and regulatory change of control approvals.Since the regulatory review processes relating to the documentation were not yet completed, theNetherlands Authority for the Financial Markets (AFM) agreed an extension so that an announcement onthe availability of the formal Offer Documentation could take place on or before 23 July 2007. On 19 July2007, Barclays announced that the AFM had agreed a further extension so that an announcement on theformal offer documentation being available can be made on or before 6 August 2007.
On 13 July 2007, the Dutch Supreme Court ruled in respect of ABN AMRO’s appeal against theprovisional injunction imposed by the Enterprise Chamber on 3 May 2007 restraining ABN AMRO fromcompleting the sale of LaSalle to Bank of America without approval of its shareholders. The ruling of theSupreme Court confirmed that the sale of LaSalle is not subject to the approval of ABN AMROshareholders. This transaction will be consummated once regulatory approval has been granted.
On 18 July 2007, ABN AMRO acknowledged that it had received a revised proposed offer from theConsortium, which it would discuss with representatives of the Consortium. Under the terms of theMerger Protocol dated 23 April 2007, ABN AMRO would also discuss with Barclays their offer and theimplications of the Consortium’s revised proposed offer. ABN AMRO confirmed that its Managing andSupervisory Boards will act in the best interests of all stakeholders, including shareholders, and willassess the proposed offers in a fair and transparent manner. ABN AMRO also confirmed that it has nointention of making any major asset disposals at the current time.
On 20 July 2007, the Managing Board of ABN AMRO confirmed it had received advice from the DutchCentral Works Council and the opinion of the European Staff Council regarding the proposed mergerwith Barclays. In accordance to the legal limitations of its mandate, the advice of the Dutch WorksCouncil is restricted to the local jurisdiction of the Netherlands. The advice is positive. The EuropeanStaff Council had been asked to provide an opinion on the proposed merger with Barclays in so far as itwould impact activities in Europe. The opinion of the European Staff Council is also positive.
On 23 July 2007, ABN AMRO confirmed that it had received a proposal for a revised offer from Barclays(the ‘‘Revised Barclays Offer’’) and noted that the Consortium had formally launched its offer forABN AMRO. The Revised Barclays Offer includes amended offer terms and has introduced a significantcash element, together with a mix-and-match alternative. The proposed strategic cooperation betweenBarclays and China Development Bank further enhances the growth opportunities of the combinedgroup in the attractive Asian market and can result in creation of additional long-term value forABN AMRO shareholders. ABN AMRO welcomed the opportunity for shareholders to consider twocompeting proposals on a level playing field. As announced previously, ABN AMRO confirmed that itsManaging and Supervisory Boards will act in the best interests of all stakeholders, includingshareholders, and will assess both offers in a fair and transparent manner.
57
Other recent developments
On 8 June 2007, ABN AMRO won the Financial Times Sustainable Bank of the Year award for achievingworld-class standards in sustainable banking. In addition to this overall award, ABN AMRO India won theglobal Emerging Markets Sustainable Bank of the Year award for its leadership role in India. ABN AMROformalised its drive for sustainable development about 10 years ago, in recognition of the fact that a widerange of global issues shape our societal and business environment. These include climate change,energy and fresh water constraints, poverty, environmental degradation and respect for human rights.These are issues that raise many challenges and opportunities, not just for society at large, but also forour organisation, employees, clients, shareholders, suppliers and the environment. In addition,ABN AMRO announced its intention to become carbon neutral by the end of next year.
On 8 June 2007, ABN AMRO announced that it would acquire the branch network of Taitung BusinessBank in Taiwan following a government auction. The acquisition will add significant scale toABN AMRO’s Taiwan franchise where it is already a top-three foreign bank. Under the terms of the sale,ABN AMRO is entitled to relocate the majority of 32 branches to prime locations for its mass-affluent andsmall and medium-sized enterprises (SME) client base, allowing tailoring to fit the bank’s mid-marketstrategy. After closure of the acquisition, the total number of branches in Taiwan will be 37.
On 15 June 2007, ABN AMRO announced that its share buy-back programme of EUR 1 bln had beencompleted. A total number of 31,646,434 shares were bought at an average price of EUR 31.60. Theshare buy-back programme was announced on 8 February 2007 and started on 12 February 2007. Asstated previously, ABN AMRO will continue to neutralise the 2006 final stock dividend. As announced on26 April 2007, all dividend payments will be in cash as from the interim dividend 2007.
On 3 July 2007, ABN AMRO inaugurated ABN AMRO Bank (China) Co., Ltd, the locally incorporatedentity of the bank in China, headquartered in Shanghai, after having recently received approval from theChina Banking Regulatory Commission for local incorporation in China. This will facilitate ABN AMRO’sambitious growth and expansion plans into renminbi (RMB)-denominated banking services in China. Tosupport this growth, ABN AMRO has more than tripled its registered share capital to RMB 4 bln fromRMB 1.3 bln.
On 5 July 2007, it was announced that Mellon Bank N.A. (Mellon) had agreed to purchase ABN AMRO’s50 per cent. share in ABN AMRO Mellon Global Securities Services B.V., the joint venture companyestablished by ABN AMRO and Mellon in 2003 aimed at providing global custody and related services toinstitutions outside North America. The transaction—which is subject to certain conditions, includingregulatory and other approvals—is expected to close during the third quarter 2007.
ABN AMRO continues to be engaged in the Bank Secrecy Act compliance issues and related writtenagreement described in previous press releases. Investigations have had, and will continue to have, animpact on ABN AMRO’s operations in the US, including procedural limitations on expansion and thepowers otherwise exercisable as a financial holding company. Regarding this matter the Dutch CentralBank (DNB) announced on 26 July 2007 that, based on the result of its validation of all of ABN AMRO’sactions taken in respect of DNB’s Order of 19 December 2005, ABN AMRO has complied with thedirective as well as with its obligations under the Financial Services Act. Therefore the directive isterminated with immediate effect. Further progress and implementation of ABN AMRO’s actions will bemonitored in the course of DNB’s regular supervisory processes.
58
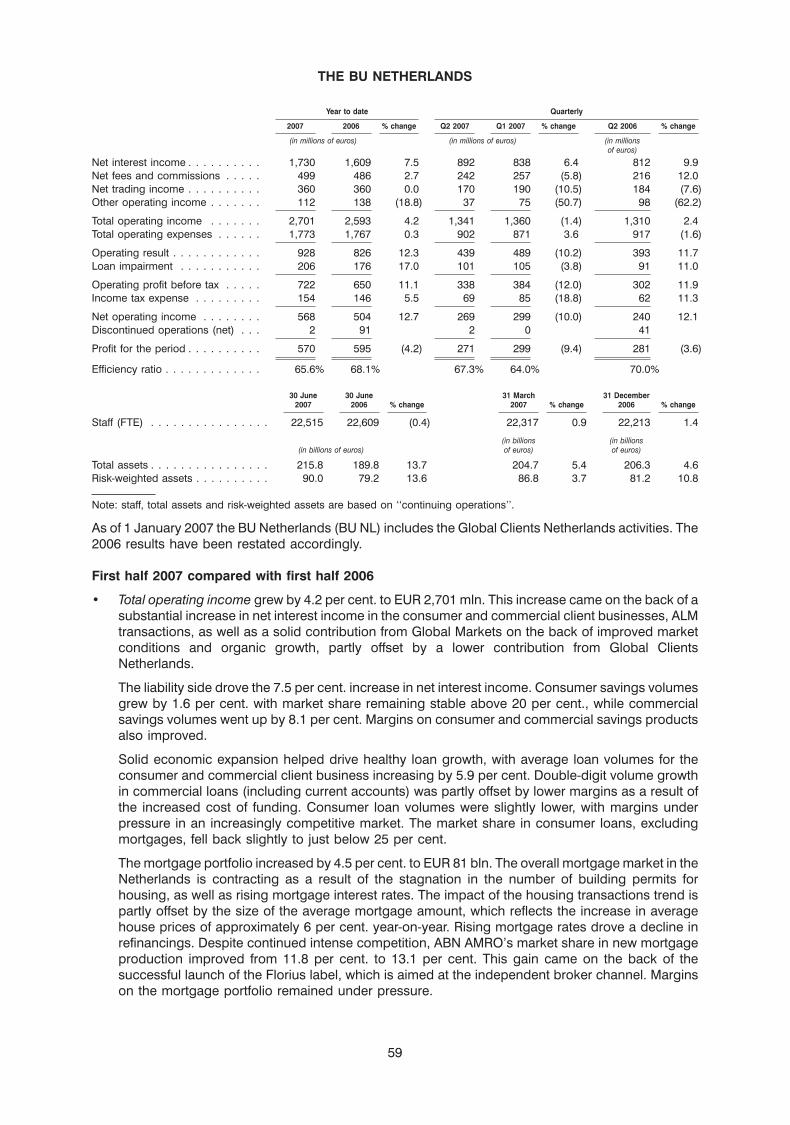
THE BU NETHERLANDS
Year to date Quarterly
2007 2006 % change Q2 2007 Q1 2007 % change Q2 2006 % change
(in millions of euros) (in millions of euros) (in millionsof euros)
Net interest income . . . . . . . . . . 1,730 1,609 7.5 892 838 6.4 812 9.9Net fees and commissions . . . . . 499 486 2.7 242 257 (5.8) 216 12.0Net trading income . . . . . . . . . . 360 360 0.0 170 190 (10.5) 184 (7.6)Other operating income . . . . . . . 112 138 (18.8) 37 75 (50.7) 98 (62.2)
Total operating income . . . . . . . 2,701 2,593 4.2 1,341 1,360 (1.4) 1,310 2.4Total operating expenses . . . . . . 1,773 1,767 0.3 902 871 3.6 917 (1.6)
Operating result . . . . . . . . . . . . 928 826 12.3 439 489 (10.2) 393 11.7Loan impairment . . . . . . . . . . . 206 176 17.0 101 105 (3.8) 91 11.0
Operating profit before tax . . . . . 722 650 11.1 338 384 (12.0) 302 11.9Income tax expense . . . . . . . . . 154 146 5.5 69 85 (18.8) 62 11.3
Net operating income . . . . . . . . 568 504 12.7 269 299 (10.0) 240 12.1Discontinued operations (net) . . . 2 91 2 0 41
Profit for the period . . . . . . . . . . 570 595 (4.2) 271 299 (9.4) 281 (3.6)
Efficiency ratio . . . . . . . . . . . . . 65.6% 68.1% 67.3% 64.0% 70.0%
30 June 30 June 31 March 31 December2007 2006 % change 2007 % change 2006 % change
Staff (FTE) . . . . . . . . . . . . . . . . 22,515 22,609 (0.4) 22,317 0.9 22,213 1.4
(in billions (in billions(in billions of euros) of euros) of euros)
Total assets . . . . . . . . . . . . . . . . 215.8 189.8 13.7 204.7 5.4 206.3 4.6Risk-weighted assets . . . . . . . . . . 90.0 79.2 13.6 86.8 3.7 81.2 10.8
Note: staff, total assets and risk-weighted assets are based on ‘‘continuing operations’’.
As of 1 January 2007 the BU Netherlands (BU NL) includes the Global Clients Netherlands activities. The2006 results have been restated accordingly.
First half 2007 compared with first half 2006
• Total operating income grew by 4.2 per cent. to EUR 2,701 mln. This increase came on the back of asubstantial increase in net interest income in the consumer and commercial client businesses, ALMtransactions, as well as a solid contribution from Global Markets on the back of improved marketconditions and organic growth, partly offset by a lower contribution from Global ClientsNetherlands.
The liability side drove the 7.5 per cent. increase in net interest income. Consumer savings volumesgrew by 1.6 per cent. with market share remaining stable above 20 per cent., while commercialsavings volumes went up by 8.1 per cent. Margins on consumer and commercial savings productsalso improved.
Solid economic expansion helped drive healthy loan growth, with average loan volumes for theconsumer and commercial client business increasing by 5.9 per cent. Double-digit volume growthin commercial loans (including current accounts) was partly offset by lower margins as a result ofthe increased cost of funding. Consumer loan volumes were slightly lower, with margins underpressure in an increasingly competitive market. The market share in consumer loans, excludingmortgages, fell back slightly to just below 25 per cent.
The mortgage portfolio increased by 4.5 per cent. to EUR 81 bln. The overall mortgage market in theNetherlands is contracting as a result of the stagnation in the number of building permits forhousing, as well as rising mortgage interest rates. The impact of the housing transactions trend ispartly offset by the size of the average mortgage amount, which reflects the increase in averagehouse prices of approximately 6 per cent. year-on-year. Rising mortgage rates drove a decline inrefinancings. Despite continued intense competition, ABN AMRO’s market share in new mortgageproduction improved from 11.8 per cent. to 13.1 per cent. This gain came on the back of thesuccessful launch of the Florius label, which is aimed at the independent broker channel. Marginson the mortgage portfolio remained under pressure.
59
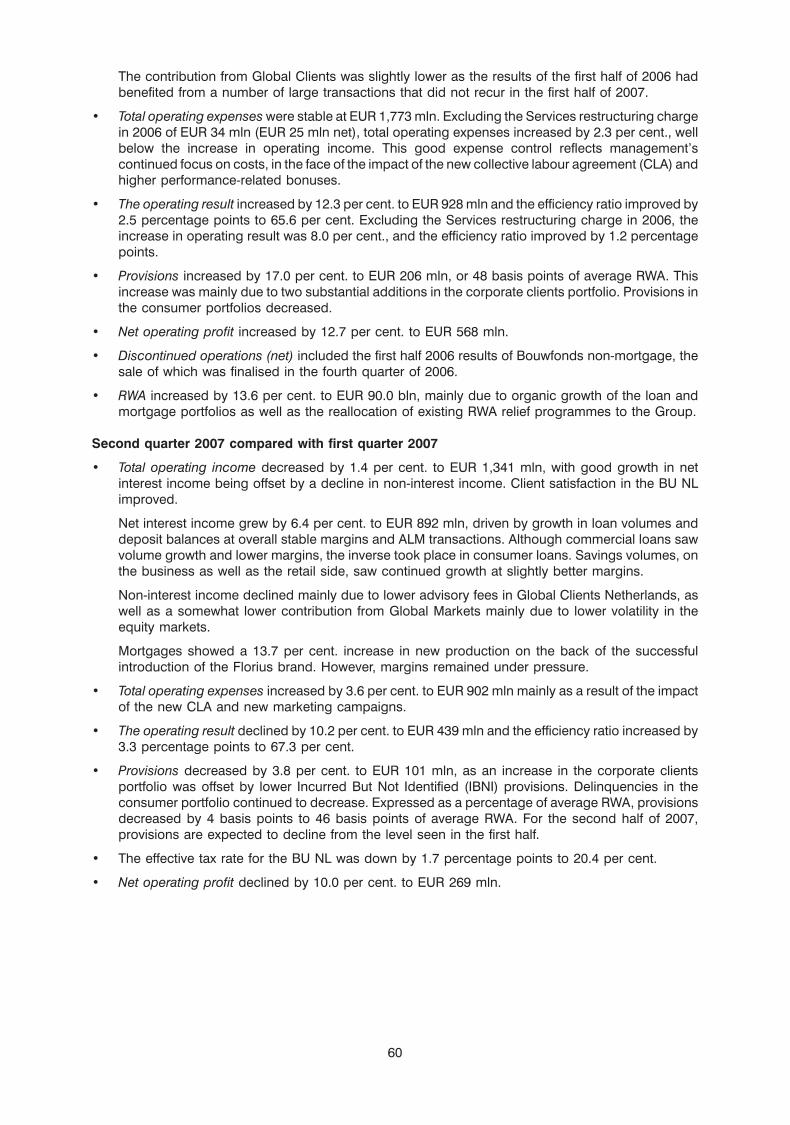
The contribution from Global Clients was slightly lower as the results of the first half of 2006 hadbenefited from a number of large transactions that did not recur in the first half of 2007.
• Total operating expenses were stable at EUR 1,773 mln. Excluding the Services restructuring chargein 2006 of EUR 34 mln (EUR 25 mln net), total operating expenses increased by 2.3 per cent., wellbelow the increase in operating income. This good expense control reflects management’scontinued focus on costs, in the face of the impact of the new collective labour agreement (CLA) andhigher performance-related bonuses.
• The operating result increased by 12.3 per cent. to EUR 928 mln and the efficiency ratio improved by2.5 percentage points to 65.6 per cent. Excluding the Services restructuring charge in 2006, theincrease in operating result was 8.0 per cent., and the efficiency ratio improved by 1.2 percentagepoints.
• Provisions increased by 17.0 per cent. to EUR 206 mln, or 48 basis points of average RWA. Thisincrease was mainly due to two substantial additions in the corporate clients portfolio. Provisions inthe consumer portfolios decreased.
• Net operating profit increased by 12.7 per cent. to EUR 568 mln.
• Discontinued operations (net) included the first half 2006 results of Bouwfonds non-mortgage, thesale of which was finalised in the fourth quarter of 2006.
• RWA increased by 13.6 per cent. to EUR 90.0 bln, mainly due to organic growth of the loan andmortgage portfolios as well as the reallocation of existing RWA relief programmes to the Group.
Second quarter 2007 compared with first quarter 2007
• Total operating income decreased by 1.4 per cent. to EUR 1,341 mln, with good growth in netinterest income being offset by a decline in non-interest income. Client satisfaction in the BU NLimproved.
Net interest income grew by 6.4 per cent. to EUR 892 mln, driven by growth in loan volumes anddeposit balances at overall stable margins and ALM transactions. Although commercial loans sawvolume growth and lower margins, the inverse took place in consumer loans. Savings volumes, onthe business as well as the retail side, saw continued growth at slightly better margins.
Non-interest income declined mainly due to lower advisory fees in Global Clients Netherlands, aswell as a somewhat lower contribution from Global Markets mainly due to lower volatility in theequity markets.
Mortgages showed a 13.7 per cent. increase in new production on the back of the successfulintroduction of the Florius brand. However, margins remained under pressure.
• Total operating expenses increased by 3.6 per cent. to EUR 902 mln mainly as a result of the impactof the new CLA and new marketing campaigns.
• The operating result declined by 10.2 per cent. to EUR 439 mln and the efficiency ratio increased by3.3 percentage points to 67.3 per cent.
• Provisions decreased by 3.8 per cent. to EUR 101 mln, as an increase in the corporate clientsportfolio was offset by lower Incurred But Not Identified (IBNI) provisions. Delinquencies in theconsumer portfolio continued to decrease. Expressed as a percentage of average RWA, provisionsdecreased by 4 basis points to 46 basis points of average RWA. For the second half of 2007,provisions are expected to decline from the level seen in the first half.
• The effective tax rate for the BU NL was down by 1.7 percentage points to 20.4 per cent.
• Net operating profit declined by 10.0 per cent. to EUR 269 mln.
60
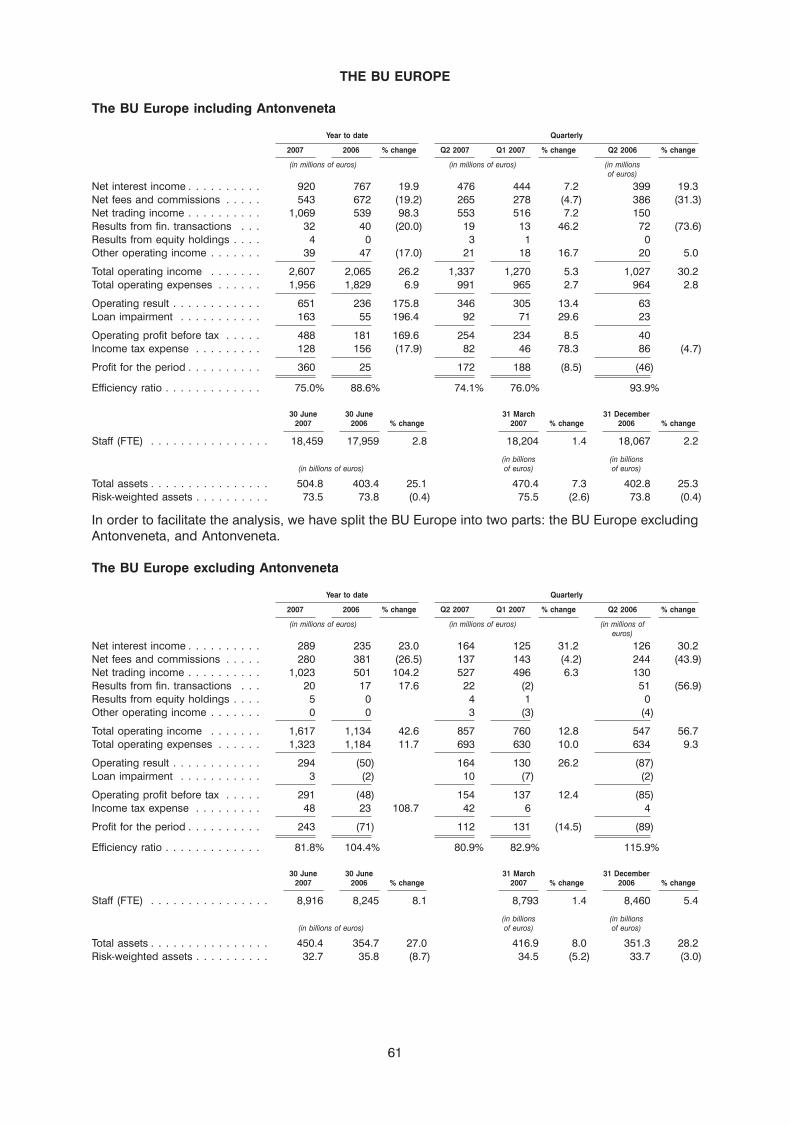
THE BU EUROPE
The BU Europe including Antonveneta
Year to date Quarterly
2007 2006 % change Q2 2007 Q1 2007 % change Q2 2006 % change
(in millions of euros) (in millions of euros) (in millionsof euros)
Net interest income . . . . . . . . . . 920 767 19.9 476 444 7.2 399 19.3Net fees and commissions . . . . . 543 672 (19.2) 265 278 (4.7) 386 (31.3)Net trading income . . . . . . . . . . 1,069 539 98.3 553 516 7.2 150Results from fin. transactions . . . 32 40 (20.0) 19 13 46.2 72 (73.6)Results from equity holdings . . . . 4 0 3 1 0Other operating income . . . . . . . 39 47 (17.0) 21 18 16.7 20 5.0
Total operating income . . . . . . . 2,607 2,065 26.2 1,337 1,270 5.3 1,027 30.2Total operating expenses . . . . . . 1,956 1,829 6.9 991 965 2.7 964 2.8
Operating result . . . . . . . . . . . . 651 236 175.8 346 305 13.4 63Loan impairment . . . . . . . . . . . 163 55 196.4 92 71 29.6 23
Operating profit before tax . . . . . 488 181 169.6 254 234 8.5 40Income tax expense . . . . . . . . . 128 156 (17.9) 82 46 78.3 86 (4.7)
Profit for the period . . . . . . . . . . 360 25 172 188 (8.5) (46)
Efficiency ratio . . . . . . . . . . . . . 75.0% 88.6% 74.1% 76.0% 93.9%
30 June 30 June 31 March 31 December2007 2006 % change 2007 % change 2006 % change
Staff (FTE) . . . . . . . . . . . . . . . . 18,459 17,959 2.8 18,204 1.4 18,067 2.2
(in billions (in billions(in billions of euros) of euros) of euros)
Total assets . . . . . . . . . . . . . . . . 504.8 403.4 25.1 470.4 7.3 402.8 25.3Risk-weighted assets . . . . . . . . . . 73.5 73.8 (0.4) 75.5 (2.6) 73.8 (0.4)
In order to facilitate the analysis, we have split the BU Europe into two parts: the BU Europe excludingAntonveneta, and Antonveneta.
The BU Europe excluding Antonveneta
Year to date Quarterly
2007 2006 % change Q2 2007 Q1 2007 % change Q2 2006 % change
(in millions of euros) (in millions of euros) (in millions ofeuros)
Net interest income . . . . . . . . . . 289 235 23.0 164 125 31.2 126 30.2Net fees and commissions . . . . . 280 381 (26.5) 137 143 (4.2) 244 (43.9)Net trading income . . . . . . . . . . 1,023 501 104.2 527 496 6.3 130Results from fin. transactions . . . 20 17 17.6 22 (2) 51 (56.9)Results from equity holdings . . . . 5 0 4 1 0Other operating income . . . . . . . 0 0 3 (3) (4)
Total operating income . . . . . . . 1,617 1,134 42.6 857 760 12.8 547 56.7Total operating expenses . . . . . . 1,323 1,184 11.7 693 630 10.0 634 9.3
Operating result . . . . . . . . . . . . 294 (50) 164 130 26.2 (87)Loan impairment . . . . . . . . . . . 3 (2) 10 (7) (2)
Operating profit before tax . . . . . 291 (48) 154 137 12.4 (85)Income tax expense . . . . . . . . . 48 23 108.7 42 6 4
Profit for the period . . . . . . . . . . 243 (71) 112 131 (14.5) (89)
Efficiency ratio . . . . . . . . . . . . . 81.8% 104.4% 80.9% 82.9% 115.9%
30 June 30 June 31 March 31 December2007 2006 % change 2007 % change 2006 % change
Staff (FTE) . . . . . . . . . . . . . . . . 8,916 8,245 8.1 8,793 1.4 8,460 5.4
(in billions (in billions(in billions of euros) of euros) of euros)
Total assets . . . . . . . . . . . . . . . . 450.4 354.7 27.0 416.9 8.0 351.3 28.2Risk-weighted assets . . . . . . . . . . 32.7 35.8 (8.7) 34.5 (5.2) 33.7 (3.0)
61
As of 1 January 2007, the BU Europe included the Global Clients Europe activities. The 2006 results havebeen restated accordingly.
First half 2007 compared with first half 2006
• Total operating income increased by 42.6 per cent. as revenues benefited from strong client revenuegrowth across Corporates and Financial Institutions sectors and a strong performance across allproducts. The largest growth driver for Corporates and Financial Institutions revenues were recordStructured Finance product revenues.
Financial Institutions also benefited from increased Equities and private investment products (PIP)revenues (particularly in Germany and Switzerland). Strong revenues, in particular from volatilityproducts, supported Equities’ improved performance in the first half 2007. Equities was rankedhighly in the Thomson Extel Pan-European survey in the first half 2007, and was voted the top housefor pan-European Economics for the fifth consecutive year.
Increased Financial Markets and M&A revenues also contributed to the growing momentum of theclient franchise.
A significant increase in Transaction Banking revenues for Corporates was supported by newproduct initiatives in Western Europe and continued expansion of our Eastern European franchise.
Key deals included high-profile mandates such as the EUR 2.5 bln merger between NYSE andEuronext, in which we acted as financial and strategic adviser to Euronext. We were sole financialadviser and broker, and joint bookrunner, for Iberdrola in their EUR 17.1 bln public offer for ScottishPower. We were lead manager of the GBP 396 mln Peterborough PFI transaction in the UK,capitalising on our innovative structuring capabilities. We were also financial adviser to UnibailHolding on their EUR 28.5 bln cross-border merger with Rodamco Europe, which created thelargest network of prime shopping centres across Europe.
• Total operating expenses increased by 11.7 per cent. Excluding the 2006 Services restructuringcharge of EUR 46 mln (EUR 35 mln net), operating expenses increased by 16.3 per cent. This wasattributable to higher bonus accruals reflecting the significant increase in revenues. In the first half of2007, the number of FTEs increased compared with the first half of 2006 due to the inclusion of Risk,Audit and Compliance FTEs that were previously reported in Group Functions. This did not result inadditional costs.
• The operating result increased by EUR 344 mln to a positive result of EUR 294 mln. Excluding theServices restructuring charge, the operating result increased by EUR 298 mln. This resulted in anefficiency ratio of 81.8 per cent., an improvement of 18.6 percentage points.
• Provisions totalled EUR 3 mln in the first half 2007, compared with a net provision release ofEUR 2 mln in the first half of 2006.
• The first-half 2007 effective tax rate was 16.5 per cent. This relatively low tax rate was due to taxcredits realised in the first half of 2007, and is not deemed sustainable.
• Profit for period increased by EUR 314 mln to a profit of EUR 243 mln. Excluding the Servicesrestructuring charge, profit for the period increased by EUR 279 mln.
• Focus on tight capital discipline, including participation in Group-wide securitisation programmesand asset sales, resulted in an 8.7 per cent. decrease in RWA.
Second quarter 2007 compared with first quarter 2007
• Total operating income increased by 12.8 per cent. due to increased client flows and a furtherincrease across all products.
Total client revenues in the BU Europe grew compared with the first quarter, with Corporatesrevenues growing significantly due to increased Structured Finance, Equities and M&A revenues.
Financial Institutions revenues also grew on the back of increased Structured Finance and Equitiesrevenues, with continued growth of the institutional derivatives business. These offset a weakenedperformance in Financial Markets due to a shift in market conditions.
62
Transaction Banking revenues increased for both Financial Institutions and Corporates largely dueto the strong growth achieved through our continued focus on Eastern European markets, inparticular Russia, Romania, Poland and Kazakhstan.
Key deals included the first Romanian leu-denominated bond issue from the European InvestmentBank and acting as sole financial adviser to Alcatel-Lucent on the EUR 1.7 bln contribution oftransport, security and satellite divisions to Thales.
• Total operating expenses increased by 10.0 per cent. mainly due to higher bonus accruals followingthe strong increase in revenues.
• The operating result improved by 26.2 per cent. to EUR 164 mln, and the efficiency ratio improved by2 percentage points to 80.9 per cent.
• Provisions were EUR 10 mln, compared with a EUR 7 mln provision release in the first quarter. Thisreflected the trend in the credit cycle. Although credit quality is expected to remain strong, thecurrent low provisioning level is not deemed sustainable over the longer term.
• Although the BU Europe benefited from tax credits in both the first and second quarter of 2007, thenet impact of these was less pronounced in the second quarter. The effective tax rate increased by22.9 percentage points to 27.3 per cent.
• Profit for the period decreased by EUR 19 mln to a profit of EUR 112 mln, as a result of the higher taxcredit received in the first quarter 2007.
• RWA decreased by 5.2 per cent. due to strong capital management.
The BU Europe is expected to maintain strong client revenue momentum in the second half of 2007.However, it is not expected that the BU Europe’s first half exceptional performance will be fully replicatedin the second half, partly due to the current corporate uncertainty, and also because tax credits in the firsthalf of 2007 are not expected to recur in the second half. The BU Europe is already profitable, in line withits full year commitments.
About the BU Europe
The BU Europe serves three client bases, corporates and financial institutions, which account for98 per cent. of operating income, and consumer clients. The BU Europe also includes a large part of theBU Global Markets infrastructure and approximately 75 per cent. of the BU Europe’s first half 2007revenues were Global Markets products. Overall results have therefore been, and will continue to be,impacted by market volatility going forward.
The BU Europe continues to focus on accelerating the growth of the client franchise. IncreasedStructured Finance, Equities and M&A revenues all show that this strategy is bearing fruit. Strong clientrevenues in all products are supported by areas of particular excellence. These include the PIP franchisein Germany and Switzerland, and ABN AMRO’s leading record in sustainability, which is driven by newproducts such as the eco-markets business.
The BU Europe continues to invest in the dynamic economies of Eastern Europe. A new branch hasbeen opened in Slovakia to meet strong client demand for local support. Our presence in Poland andTurkey has also grown to improve our client service and competitive advantage by providing globalexcellence combined with local intimacy. The consumer banking franchise in Kazakhstan and Romaniais expanding, building on our offering to emerging and mass-affluent clients. Overall, this has helped theincreased revenue contribution from the European network outside the UK, compared with 2006.
63
ANTONVENETA
Antonveneta
Year to date Quarterly
2007 2006 % change Q2 2007 Q1 2007 % change Q2 2006 % change
(in millions of euros) (in millions of euros) (in millionsof euros)
Net interest income . . . . . . . . . . 631 532 18.6 312 319 (2.2) 273 14.3Net fees and commissions . . . . . 263 291 (9.6) 128 135 (5.2) 142 (9.9)Net trading income . . . . . . . . . . 46 38 21.1 26 20 30.0 20 30.0Results from financial transactions 12 23 (47.8) (3) 15 21Results from equity holdings . . . . (1) 0 (1) 0 0Other operating income . . . . . . . 39 47 (17.0) 18 21 (14.3) 24 (25.0)
Total operating income . . . . . . . 990 931 6.3 480 510 (5.9) 480 0.0Total operating expenses . . . . . . 633 645 (1.9) 298 335 (11.0) 330 (9.7)
Operating result . . . . . . . . . . . . 357 286 24.8 182 175 4.0 150 21.3Loan impairment . . . . . . . . . . . 160 57 180.7 82 78 5.1 25
Operating profit before tax . . . . . 197 229 (14.0) 100 97 3.1 125 (20.0)Income tax expense . . . . . . . . . 80 133 (39.8) 40 40 0.0 82 (51.2)
Profit for the period . . . . . . . . . . 117 96 21.9 60 57 5.3 43 39.5
Efficiency ratio . . . . . . . . . . . . . 63.9% 69.3% 62.1% 65.7% 68.8%
30 June 30 June 31 March 31 December2007 2006 % change 2007 % change 2006 % change
Staff (FTE) . . . . . . . . . . . . . . . . 9,543 9,714 (1.8) 9,411 1.4 9,607 (0.7)
(in billions (in billions(in billions of euros) of euros) of euros)
Total assets . . . . . . . . . . . . . . . . 54.4 48.7 11.7 53.5 1.7 51.5 5.6
Antonveneta stand-alone
Year to date Quarterly
2007 2006 % change Q2 2007 Q1 2007 % change Q2 2006 % change
(in millions of euros) (in millions of euros) (in millionsof euros)
Net interest income . . . . . . . . . . 637 572 11.4 315 322 (2.2) 290 8.6Net fees and commissions . . . . . 263 291 (9.6) 128 135 (5.2) 142 (9.9)Net trading income . . . . . . . . . . 46 38 21.1 26 20 30.0 20 30.0Results from financial transactions 26 43 (39.5) (2) 28 40Results from equity holdings . . . . (1) 0 (1) 0 0Other operating income . . . . . . . 39 47 (17.0) 18 21 (14.3) 24 (25.0)
Total operating income . . . . . . . 1,010 991 1.9 484 526 (8.0) 516 (6.2)Total operating expenses . . . . . . 589 556 5.9 299 290 3.1 287 4.2
Operating result . . . . . . . . . . . . 421 435 (3.2) 185 236 (21.6) 229 (19.2)Loan impairment . . . . . . . . . . . 160 57 180.7 82 78 5.1 25
Operating profit before tax . . . . . 261 378 (31.0) 103 158 (34.8) 204 (49.5)Income tax expense . . . . . . . . . 109 187 (41.7) 46 63 (27.0) 109 (57.8)
Profit for the period . . . . . . . . . . 152 191 (20.4) 57 95 (40.0) 95 (40.0)
Efficiency ratio . . . . . . . . . . . . . 58.3% 56.1% 61.8% 55.1% 55.6%
The results in the Antonveneta table at the top of the page are the reported results as included in the consolidation of the bank.These results include the impact of purchase accounting on the Antonveneta stand-alone results as presented in the table directlyabove. Please note that the purchase accounting impacts result from the valuation of intangible assets (amounting toEUR 1,194 mln) and fair-value adjustments of principally financial assets and liabilities. The intangible assets are amortised over aperiod of approximately eight years under operating expenses. The fair-value adjustments are substantially amortised through netinterest income over a period ranging from one to eight years dependent on the duration of the respective assets and liabilitiesand/or adjusted realised gains on sales of related assets and liabilities.
64
The analysis below is based on results of Antonveneta on a stand-alone basis.
First half 2007 compared with first half 2006
• Total operating income increased by 1.9 per cent. to EUR 1,010 mln as a result of a EUR 65 mlnincrease in net interest income.
The increase in net interest income was partly due to a EUR 41 mln reclassification between loanimpairment and net interest income in respect of interest on impaired loans (as announced with thethird quarter 2006 results, due to an alignment of accounting principles), which was not applied inthe first half of 2006. Overall lending volumes remained stable, while mortgage revenues increased.
Net fees and commissions were down by EUR 28 mln as fees were aligned to market rates andmargins on investment products were lowered slightly, and are expected to drive volume growthgoing forward.
Results from financial transactions were down by EUR 17 mln, despite a EUR 22 mln gain on thesale of part of the Italease stake in the first half of 2007, driven by a EUR 15 mln negative revaluationof the investment portfolio and higher than average capital gains realised in 2006. Excluding thereclassification effect, the gain on the sale of a stake in Italease, and the investment portfoliorevaluation, total operating income was down 2.9 per cent. Operating income is expected toaccelerate in the second half of 2007.
• Total operating expenses were up 5.9 per cent. to EUR 589 mln, partly due to a EUR 18 mln increasein integration costs. Personnel costs remained stable. A changed Italian law led to a change in themethodology for provisioning for post employment benefits, resulting in a EUR 17 mln release.
• The operating result decreased by 3.2 per cent. to EUR 421 mln resulting in an efficiency ratio of58.3 per cent., a 2.2 percentage-point increase. Excluding the reclassification effect, the integrationcosts, the post employment benefits release, and the investment portfolio revaluation, the operatingresult was down by 14.0 per cent.
• Provisions increased by EUR 103 mln to EUR 160 mln. Excluding the reclassification and aEUR 46 mln release of IBNI recorded in 2006, provisions increased by EUR 16 mln.
• Profit for the period decreased by EUR 39 mln to EUR 152 mln.
Second quarter 2007 compared with first quarter 2007
• Total operating income decreased by EUR 42 mln to EUR 484 mln mainly due to a decrease inresults from financial transactions on the back of a EUR 22 mln gain on the sale of the Italease stakebooked in the first quarter and a negative EUR 15 mln revaluation of the investment portfolio.
Net interest income declined by EUR 7 mln as a new client account with lower margins wasintroduced and because spreads tightened. Excluding the gain on the sale of the Italease stake inthe first quarter and the revaluation of the investment portfolio, total operating income was almoststable.
• Total operating expenses were up by 3.1 per cent., mainly due to an increase in compliance andcontrol costs as well as investments in new initiatives. A EUR 17 mln post employment benefitsrelease resulted in a decrease in personnel costs. Excluding the post employment benefits release,operating expenses went up by 9.0 per cent.
• The operating result decreased by 21.6 per cent. to EUR 185 mln. Excluding the gain on the sale of astake in Italease, the post employment benefits release, and the negative investment portfoliorevaluation, the operating result was down 14.5 per cent.
• Provisions increased by EUR 4 mln to EUR 82 mln. A new credit approval process is expected togenerate a lower provisioning level in the second part of the year.
• Profit for the period was down by EUR 38 mln to EUR 57 mln.
Further investments made in the client base and actions taken to attract new customers have not yetresulted in an expected pick-up in revenues and therefore it is uncertain whether Antonveneta will meetthe stated EUR 500 mln profit for the period on a stand-alone basis. However, the profit for the period isexpected to be higher than the 2006 full year stand-alone profit of EUR 413 mln. The initiatives
65
undertaken are expected to result in a significant improvement of the operating performance in thesecond half of the year. The initiatives taken are:
In the consumer bank:
• Increase staffing levels in understaffed branches (300 hirings made in first half).
• Further grow our exposure in consumer credit products and mortgages.
• Start a campaign to sell Antonveneta products (consumer credit products, insurance) through third-party channels.
• Introduce new, successful Global Markets and Asset Management products.
In the commercial bank:
• Re-price corporate loans in order to drive volume growth and increased penetration.
• Increase the sale of Global Markets products to Antonveneta clients, for instance in StructuredLending.
• Real estate divestments.
Other areas:
• Realign Antonveneta funding programmes to Group.
• Increase the sale of PIP products.
• Introduce new and faster credit approval process (both in consumer and in commercial) and a moreactive collection and management of past due portfolio, leading to lower provisions.
66
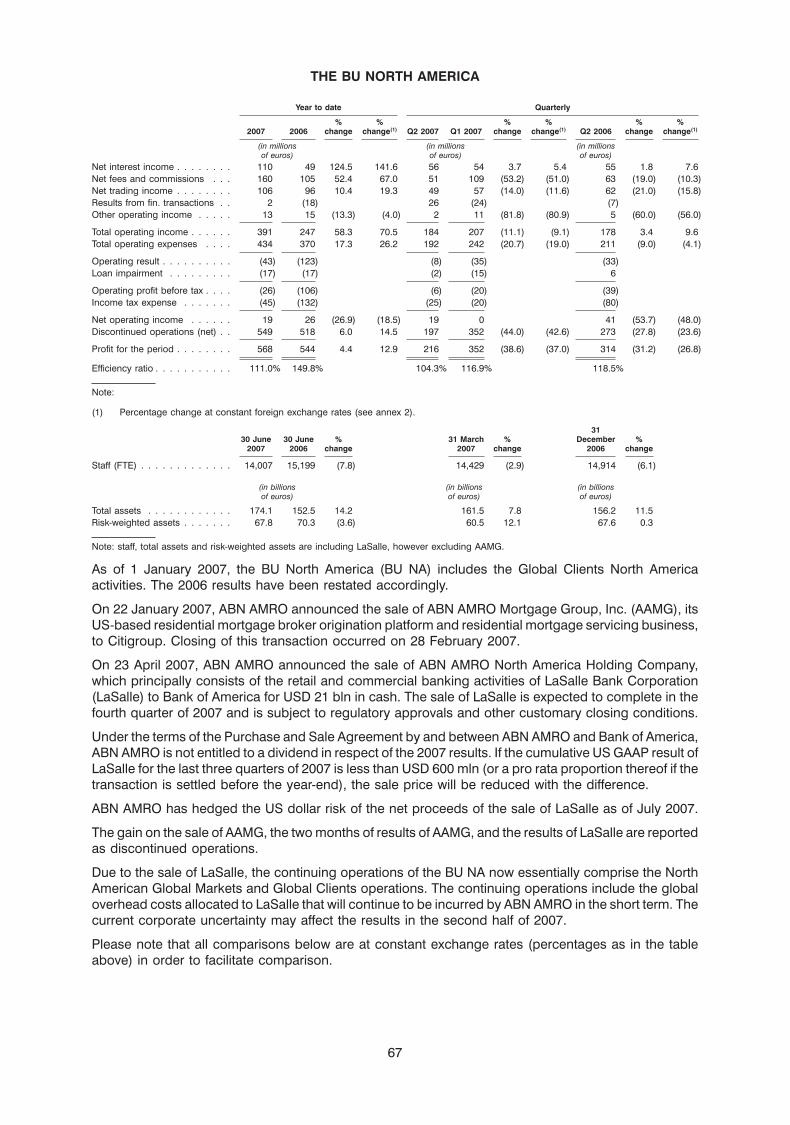
THE BU NORTH AMERICA
Year to date Quarterly
% % % % % %2007 2006 change change(1) Q2 2007 Q1 2007 change change(1) Q2 2006 change change(1)
(in millions (in millions (in millionsof euros) of euros) of euros)
Net interest income . . . . . . . . 110 49 124.5 141.6 56 54 3.7 5.4 55 1.8 7.6Net fees and commissions . . . 160 105 52.4 67.0 51 109 (53.2) (51.0) 63 (19.0) (10.3)Net trading income . . . . . . . . 106 96 10.4 19.3 49 57 (14.0) (11.6) 62 (21.0) (15.8)Results from fin. transactions . . 2 (18) 26 (24) (7)Other operating income . . . . . 13 15 (13.3) (4.0) 2 11 (81.8) (80.9) 5 (60.0) (56.0)
Total operating income . . . . . . 391 247 58.3 70.5 184 207 (11.1) (9.1) 178 3.4 9.6Total operating expenses . . . . 434 370 17.3 26.2 192 242 (20.7) (19.0) 211 (9.0) (4.1)
Operating result . . . . . . . . . . (43) (123) (8) (35) (33)Loan impairment . . . . . . . . . (17) (17) (2) (15) 6
Operating profit before tax . . . . (26) (106) (6) (20) (39)Income tax expense . . . . . . . (45) (132) (25) (20) (80)
Net operating income . . . . . . 19 26 (26.9) (18.5) 19 0 41 (53.7) (48.0)Discontinued operations (net) . . 549 518 6.0 14.5 197 352 (44.0) (42.6) 273 (27.8) (23.6)
Profit for the period . . . . . . . . 568 544 4.4 12.9 216 352 (38.6) (37.0) 314 (31.2) (26.8)
Efficiency ratio . . . . . . . . . . . 111.0% 149.8% 104.3% 116.9% 118.5%
Note:
(1) Percentage change at constant foreign exchange rates (see annex 2).
3130 June 30 June % 31 March % December %
2007 2006 change 2007 change 2006 change
Staff (FTE) . . . . . . . . . . . . . 14,007 15,199 (7.8) 14,429 (2.9) 14,914 (6.1)
(in billions (in billions (in billionsof euros) of euros) of euros)
Total assets . . . . . . . . . . . . 174.1 152.5 14.2 161.5 7.8 156.2 11.5Risk-weighted assets . . . . . . . 67.8 70.3 (3.6) 60.5 12.1 67.6 0.3
Note: staff, total assets and risk-weighted assets are including LaSalle, however excluding AAMG.
As of 1 January 2007, the BU North America (BU NA) includes the Global Clients North Americaactivities. The 2006 results have been restated accordingly.
On 22 January 2007, ABN AMRO announced the sale of ABN AMRO Mortgage Group, Inc. (AAMG), itsUS-based residential mortgage broker origination platform and residential mortgage servicing business,to Citigroup. Closing of this transaction occurred on 28 February 2007.
On 23 April 2007, ABN AMRO announced the sale of ABN AMRO North America Holding Company,which principally consists of the retail and commercial banking activities of LaSalle Bank Corporation(LaSalle) to Bank of America for USD 21 bln in cash. The sale of LaSalle is expected to complete in thefourth quarter of 2007 and is subject to regulatory approvals and other customary closing conditions.
Under the terms of the Purchase and Sale Agreement by and between ABN AMRO and Bank of America,ABN AMRO is not entitled to a dividend in respect of the 2007 results. If the cumulative US GAAP result ofLaSalle for the last three quarters of 2007 is less than USD 600 mln (or a pro rata proportion thereof if thetransaction is settled before the year-end), the sale price will be reduced with the difference.
ABN AMRO has hedged the US dollar risk of the net proceeds of the sale of LaSalle as of July 2007.
The gain on the sale of AAMG, the two months of results of AAMG, and the results of LaSalle are reportedas discontinued operations.
Due to the sale of LaSalle, the continuing operations of the BU NA now essentially comprise the NorthAmerican Global Markets and Global Clients operations. The continuing operations include the globaloverhead costs allocated to LaSalle that will continue to be incurred by ABN AMRO in the short term. Thecurrent corporate uncertainty may affect the results in the second half of 2007.
Please note that all comparisons below are at constant exchange rates (percentages as in the tableabove) in order to facilitate comparison.
67
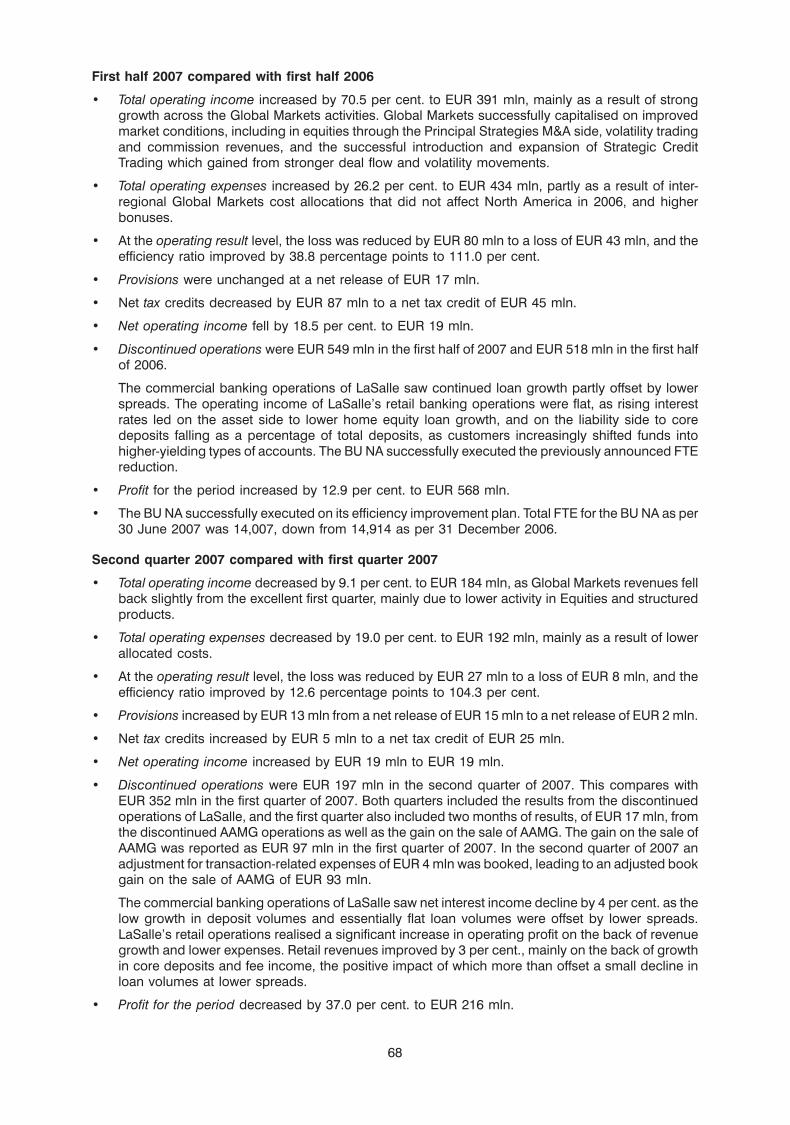
First half 2007 compared with first half 2006
• Total operating income increased by 70.5 per cent. to EUR 391 mln, mainly as a result of stronggrowth across the Global Markets activities. Global Markets successfully capitalised on improvedmarket conditions, including in equities through the Principal Strategies M&A side, volatility tradingand commission revenues, and the successful introduction and expansion of Strategic CreditTrading which gained from stronger deal flow and volatility movements.
• Total operating expenses increased by 26.2 per cent. to EUR 434 mln, partly as a result of inter-regional Global Markets cost allocations that did not affect North America in 2006, and higherbonuses.
• At the operating result level, the loss was reduced by EUR 80 mln to a loss of EUR 43 mln, and theefficiency ratio improved by 38.8 percentage points to 111.0 per cent.
• Provisions were unchanged at a net release of EUR 17 mln.
• Net tax credits decreased by EUR 87 mln to a net tax credit of EUR 45 mln.
• Net operating income fell by 18.5 per cent. to EUR 19 mln.
• Discontinued operations were EUR 549 mln in the first half of 2007 and EUR 518 mln in the first halfof 2006.
The commercial banking operations of LaSalle saw continued loan growth partly offset by lowerspreads. The operating income of LaSalle’s retail banking operations were flat, as rising interestrates led on the asset side to lower home equity loan growth, and on the liability side to coredeposits falling as a percentage of total deposits, as customers increasingly shifted funds intohigher-yielding types of accounts. The BU NA successfully executed the previously announced FTEreduction.
• Profit for the period increased by 12.9 per cent. to EUR 568 mln.
• The BU NA successfully executed on its efficiency improvement plan. Total FTE for the BU NA as per30 June 2007 was 14,007, down from 14,914 as per 31 December 2006.
Second quarter 2007 compared with first quarter 2007
• Total operating income decreased by 9.1 per cent. to EUR 184 mln, as Global Markets revenues fellback slightly from the excellent first quarter, mainly due to lower activity in Equities and structuredproducts.
• Total operating expenses decreased by 19.0 per cent. to EUR 192 mln, mainly as a result of lowerallocated costs.
• At the operating result level, the loss was reduced by EUR 27 mln to a loss of EUR 8 mln, and theefficiency ratio improved by 12.6 percentage points to 104.3 per cent.
• Provisions increased by EUR 13 mln from a net release of EUR 15 mln to a net release of EUR 2 mln.
• Net tax credits increased by EUR 5 mln to a net tax credit of EUR 25 mln.
• Net operating income increased by EUR 19 mln to EUR 19 mln.
• Discontinued operations were EUR 197 mln in the second quarter of 2007. This compares withEUR 352 mln in the first quarter of 2007. Both quarters included the results from the discontinuedoperations of LaSalle, and the first quarter also included two months of results, of EUR 17 mln, fromthe discontinued AAMG operations as well as the gain on the sale of AAMG. The gain on the sale ofAAMG was reported as EUR 97 mln in the first quarter of 2007. In the second quarter of 2007 anadjustment for transaction-related expenses of EUR 4 mln was booked, leading to an adjusted bookgain on the sale of AAMG of EUR 93 mln.
The commercial banking operations of LaSalle saw net interest income decline by 4 per cent. as thelow growth in deposit volumes and essentially flat loan volumes were offset by lower spreads.LaSalle’s retail operations realised a significant increase in operating profit on the back of revenuegrowth and lower expenses. Retail revenues improved by 3 per cent., mainly on the back of growthin core deposits and fee income, the positive impact of which more than offset a small decline inloan volumes at lower spreads.
• Profit for the period decreased by 37.0 per cent. to EUR 216 mln.
68
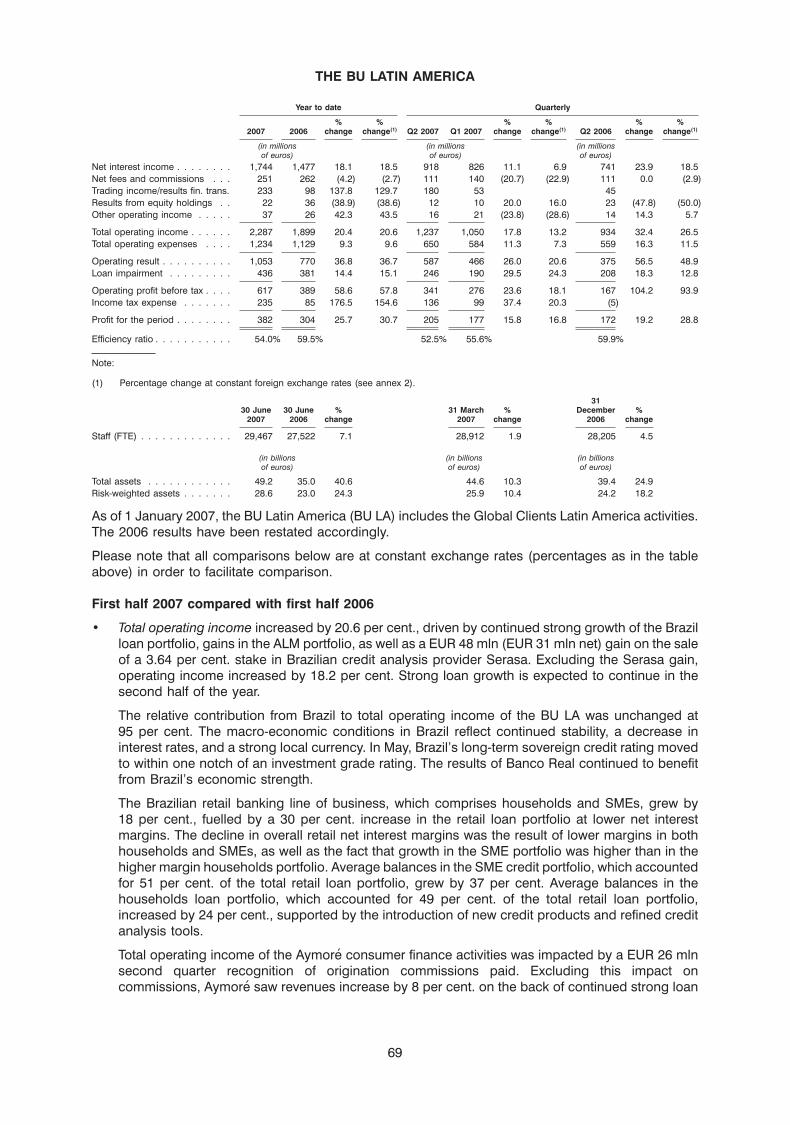
THE BU LATIN AMERICA
Year to date Quarterly
% % % % % %2007 2006 change change(1) Q2 2007 Q1 2007 change change(1) Q2 2006 change change(1)
(in millions (in millions (in millionsof euros) of euros) of euros)
Net interest income . . . . . . . . 1,744 1,477 18.1 18.5 918 826 11.1 6.9 741 23.9 18.5Net fees and commissions . . . 251 262 (4.2) (2.7) 111 140 (20.7) (22.9) 111 0.0 (2.9)Trading income/results fin. trans. 233 98 137.8 129.7 180 53 45Results from equity holdings . . 22 36 (38.9) (38.6) 12 10 20.0 16.0 23 (47.8) (50.0)Other operating income . . . . . 37 26 42.3 43.5 16 21 (23.8) (28.6) 14 14.3 5.7
Total operating income . . . . . . 2,287 1,899 20.4 20.6 1,237 1,050 17.8 13.2 934 32.4 26.5Total operating expenses . . . . 1,234 1,129 9.3 9.6 650 584 11.3 7.3 559 16.3 11.5
Operating result . . . . . . . . . . 1,053 770 36.8 36.7 587 466 26.0 20.6 375 56.5 48.9Loan impairment . . . . . . . . . 436 381 14.4 15.1 246 190 29.5 24.3 208 18.3 12.8
Operating profit before tax . . . . 617 389 58.6 57.8 341 276 23.6 18.1 167 104.2 93.9Income tax expense . . . . . . . 235 85 176.5 154.6 136 99 37.4 20.3 (5)
Profit for the period . . . . . . . . 382 304 25.7 30.7 205 177 15.8 16.8 172 19.2 28.8
Efficiency ratio . . . . . . . . . . . 54.0% 59.5% 52.5% 55.6% 59.9%
Note:
(1) Percentage change at constant foreign exchange rates (see annex 2).
3130 June 30 June % 31 March % December %
2007 2006 change 2007 change 2006 change
Staff (FTE) . . . . . . . . . . . . . 29,467 27,522 7.1 28,912 1.9 28,205 4.5
(in billions (in billions (in billionsof euros) of euros) of euros)
Total assets . . . . . . . . . . . . 49.2 35.0 40.6 44.6 10.3 39.4 24.9Risk-weighted assets . . . . . . . 28.6 23.0 24.3 25.9 10.4 24.2 18.2
As of 1 January 2007, the BU Latin America (BU LA) includes the Global Clients Latin America activities.The 2006 results have been restated accordingly.
Please note that all comparisons below are at constant exchange rates (percentages as in the tableabove) in order to facilitate comparison.
First half 2007 compared with first half 2006
• Total operating income increased by 20.6 per cent., driven by continued strong growth of the Brazilloan portfolio, gains in the ALM portfolio, as well as a EUR 48 mln (EUR 31 mln net) gain on the saleof a 3.64 per cent. stake in Brazilian credit analysis provider Serasa. Excluding the Serasa gain,operating income increased by 18.2 per cent. Strong loan growth is expected to continue in thesecond half of the year.
The relative contribution from Brazil to total operating income of the BU LA was unchanged at95 per cent. The macro-economic conditions in Brazil reflect continued stability, a decrease ininterest rates, and a strong local currency. In May, Brazil’s long-term sovereign credit rating movedto within one notch of an investment grade rating. The results of Banco Real continued to benefitfrom Brazil’s economic strength.
The Brazilian retail banking line of business, which comprises households and SMEs, grew by18 per cent., fuelled by a 30 per cent. increase in the retail loan portfolio at lower net interestmargins. The decline in overall retail net interest margins was the result of lower margins in bothhouseholds and SMEs, as well as the fact that growth in the SME portfolio was higher than in thehigher margin households portfolio. Average balances in the SME credit portfolio, which accountedfor 51 per cent. of the total retail loan portfolio, grew by 37 per cent. Average balances in thehouseholds loan portfolio, which accounted for 49 per cent. of the total retail loan portfolio,increased by 24 per cent., supported by the introduction of new credit products and refined creditanalysis tools.
Total operating income of the Aymore consumer finance activities was impacted by a EUR 26 mlnsecond quarter recognition of origination commissions paid. Excluding this impact oncommissions, Aymore saw revenues increase by 8 per cent. on the back of continued strong loan
69
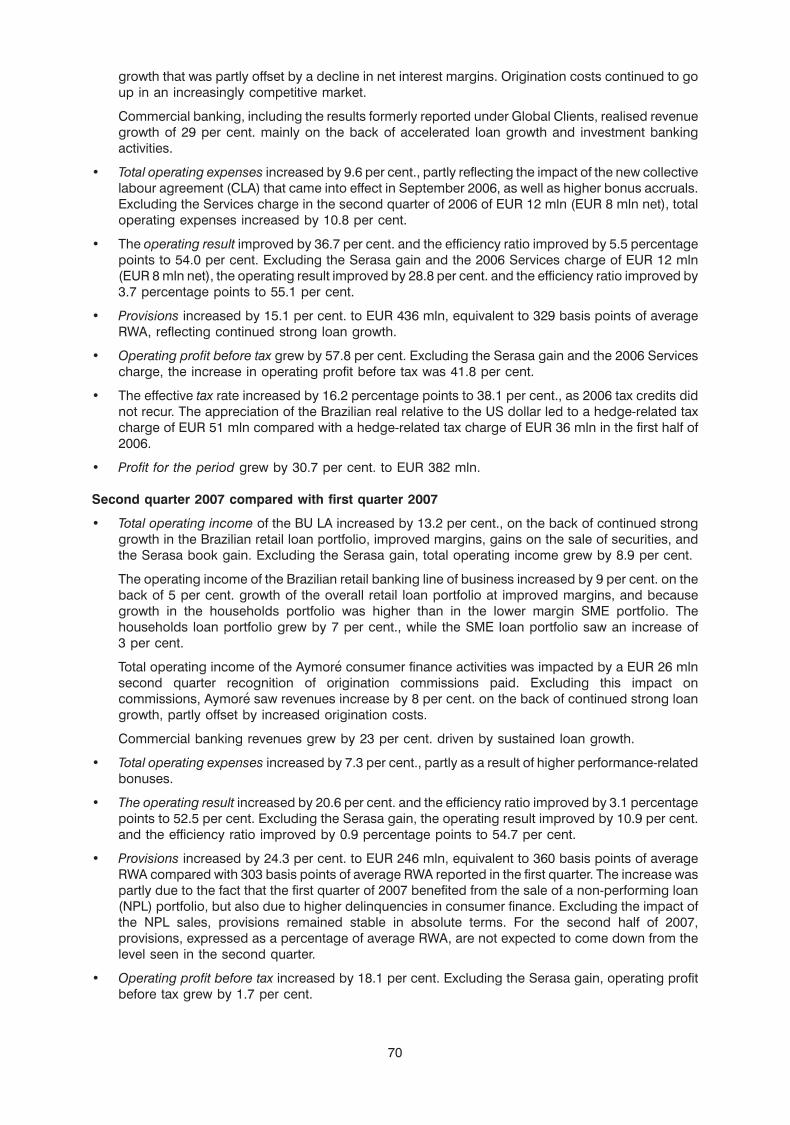
growth that was partly offset by a decline in net interest margins. Origination costs continued to goup in an increasingly competitive market.
Commercial banking, including the results formerly reported under Global Clients, realised revenuegrowth of 29 per cent. mainly on the back of accelerated loan growth and investment bankingactivities.
• Total operating expenses increased by 9.6 per cent., partly reflecting the impact of the new collectivelabour agreement (CLA) that came into effect in September 2006, as well as higher bonus accruals.Excluding the Services charge in the second quarter of 2006 of EUR 12 mln (EUR 8 mln net), totaloperating expenses increased by 10.8 per cent.
• The operating result improved by 36.7 per cent. and the efficiency ratio improved by 5.5 percentagepoints to 54.0 per cent. Excluding the Serasa gain and the 2006 Services charge of EUR 12 mln(EUR 8 mln net), the operating result improved by 28.8 per cent. and the efficiency ratio improved by3.7 percentage points to 55.1 per cent.
• Provisions increased by 15.1 per cent. to EUR 436 mln, equivalent to 329 basis points of averageRWA, reflecting continued strong loan growth.
• Operating profit before tax grew by 57.8 per cent. Excluding the Serasa gain and the 2006 Servicescharge, the increase in operating profit before tax was 41.8 per cent.
• The effective tax rate increased by 16.2 percentage points to 38.1 per cent., as 2006 tax credits didnot recur. The appreciation of the Brazilian real relative to the US dollar led to a hedge-related taxcharge of EUR 51 mln compared with a hedge-related tax charge of EUR 36 mln in the first half of2006.
• Profit for the period grew by 30.7 per cent. to EUR 382 mln.
Second quarter 2007 compared with first quarter 2007
• Total operating income of the BU LA increased by 13.2 per cent., on the back of continued stronggrowth in the Brazilian retail loan portfolio, improved margins, gains on the sale of securities, andthe Serasa book gain. Excluding the Serasa gain, total operating income grew by 8.9 per cent.
The operating income of the Brazilian retail banking line of business increased by 9 per cent. on theback of 5 per cent. growth of the overall retail loan portfolio at improved margins, and becausegrowth in the households portfolio was higher than in the lower margin SME portfolio. Thehouseholds loan portfolio grew by 7 per cent., while the SME loan portfolio saw an increase of3 per cent.
Total operating income of the Aymore consumer finance activities was impacted by a EUR 26 mlnsecond quarter recognition of origination commissions paid. Excluding this impact oncommissions, Aymore saw revenues increase by 8 per cent. on the back of continued strong loangrowth, partly offset by increased origination costs.
Commercial banking revenues grew by 23 per cent. driven by sustained loan growth.
• Total operating expenses increased by 7.3 per cent., partly as a result of higher performance-relatedbonuses.
• The operating result increased by 20.6 per cent. and the efficiency ratio improved by 3.1 percentagepoints to 52.5 per cent. Excluding the Serasa gain, the operating result improved by 10.9 per cent.and the efficiency ratio improved by 0.9 percentage points to 54.7 per cent.
• Provisions increased by 24.3 per cent. to EUR 246 mln, equivalent to 360 basis points of averageRWA compared with 303 basis points of average RWA reported in the first quarter. The increase waspartly due to the fact that the first quarter of 2007 benefited from the sale of a non-performing loan(NPL) portfolio, but also due to higher delinquencies in consumer finance. Excluding the impact ofthe NPL sales, provisions remained stable in absolute terms. For the second half of 2007,provisions, expressed as a percentage of average RWA, are not expected to come down from thelevel seen in the second quarter.
• Operating profit before tax increased by 18.1 per cent. Excluding the Serasa gain, operating profitbefore tax grew by 1.7 per cent.
70

• The effective tax rate was 39.9 per cent., an increase of 4.0 percentage points. The furtherappreciation of the Brazilian real against the US dollar led to a hedge-related tax charge ofEUR 30 mln compared with a hedge-related tax charge of EUR 20 mln in the first quarter.
• Profit for the period increased by 16.8 per cent. to EUR 205 mln.
71
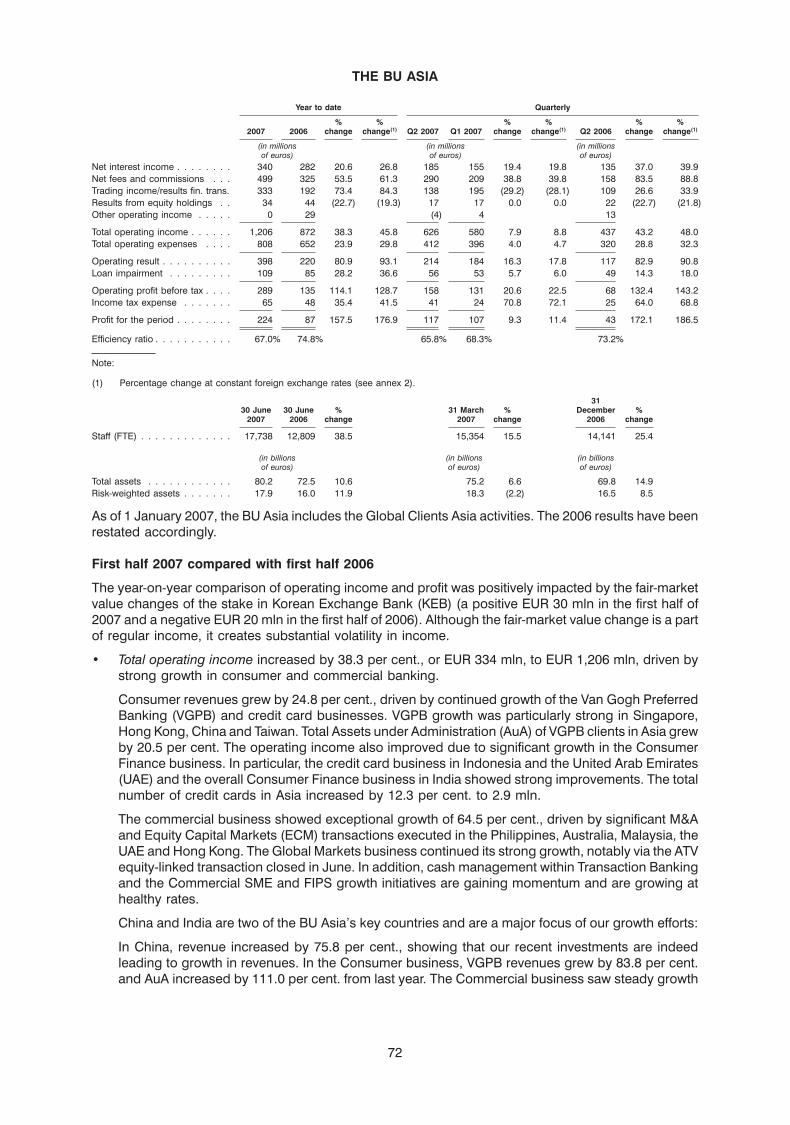
THE BU ASIA
Year to date Quarterly
% % % % % %2007 2006 change change(1) Q2 2007 Q1 2007 change change(1) Q2 2006 change change(1)
(in millions (in millions (in millionsof euros) of euros) of euros)
Net interest income . . . . . . . . 340 282 20.6 26.8 185 155 19.4 19.8 135 37.0 39.9Net fees and commissions . . . 499 325 53.5 61.3 290 209 38.8 39.8 158 83.5 88.8Trading income/results fin. trans. 333 192 73.4 84.3 138 195 (29.2) (28.1) 109 26.6 33.9Results from equity holdings . . 34 44 (22.7) (19.3) 17 17 0.0 0.0 22 (22.7) (21.8)Other operating income . . . . . 0 29 (4) 4 13
Total operating income . . . . . . 1,206 872 38.3 45.8 626 580 7.9 8.8 437 43.2 48.0Total operating expenses . . . . 808 652 23.9 29.8 412 396 4.0 4.7 320 28.8 32.3
Operating result . . . . . . . . . . 398 220 80.9 93.1 214 184 16.3 17.8 117 82.9 90.8Loan impairment . . . . . . . . . 109 85 28.2 36.6 56 53 5.7 6.0 49 14.3 18.0
Operating profit before tax . . . . 289 135 114.1 128.7 158 131 20.6 22.5 68 132.4 143.2Income tax expense . . . . . . . 65 48 35.4 41.5 41 24 70.8 72.1 25 64.0 68.8
Profit for the period . . . . . . . . 224 87 157.5 176.9 117 107 9.3 11.4 43 172.1 186.5
Efficiency ratio . . . . . . . . . . . 67.0% 74.8% 65.8% 68.3% 73.2%
Note:
(1) Percentage change at constant foreign exchange rates (see annex 2).
3130 June 30 June % 31 March % December %
2007 2006 change 2007 change 2006 change
Staff (FTE) . . . . . . . . . . . . . 17,738 12,809 38.5 15,354 15.5 14,141 25.4
(in billions (in billions (in billionsof euros) of euros) of euros)
Total assets . . . . . . . . . . . . 80.2 72.5 10.6 75.2 6.6 69.8 14.9Risk-weighted assets . . . . . . . 17.9 16.0 11.9 18.3 (2.2) 16.5 8.5
As of 1 January 2007, the BU Asia includes the Global Clients Asia activities. The 2006 results have beenrestated accordingly.
First half 2007 compared with first half 2006
The year-on-year comparison of operating income and profit was positively impacted by the fair-marketvalue changes of the stake in Korean Exchange Bank (KEB) (a positive EUR 30 mln in the first half of2007 and a negative EUR 20 mln in the first half of 2006). Although the fair-market value change is a partof regular income, it creates substantial volatility in income.
• Total operating income increased by 38.3 per cent., or EUR 334 mln, to EUR 1,206 mln, driven bystrong growth in consumer and commercial banking.
Consumer revenues grew by 24.8 per cent., driven by continued growth of the Van Gogh PreferredBanking (VGPB) and credit card businesses. VGPB growth was particularly strong in Singapore,Hong Kong, China and Taiwan. Total Assets under Administration (AuA) of VGPB clients in Asia grewby 20.5 per cent. The operating income also improved due to significant growth in the ConsumerFinance business. In particular, the credit card business in Indonesia and the United Arab Emirates(UAE) and the overall Consumer Finance business in India showed strong improvements. The totalnumber of credit cards in Asia increased by 12.3 per cent. to 2.9 mln.
The commercial business showed exceptional growth of 64.5 per cent., driven by significant M&Aand Equity Capital Markets (ECM) transactions executed in the Philippines, Australia, Malaysia, theUAE and Hong Kong. The Global Markets business continued its strong growth, notably via the ATVequity-linked transaction closed in June. In addition, cash management within Transaction Bankingand the Commercial SME and FIPS growth initiatives are gaining momentum and are growing athealthy rates.
China and India are two of the BU Asia’s key countries and are a major focus of our growth efforts:
In China, revenue increased by 75.8 per cent., showing that our recent investments are indeedleading to growth in revenues. In the Consumer business, VGPB revenues grew by 83.8 per cent.and AuA increased by 111.0 per cent. from last year. The Commercial business saw steady growth
72
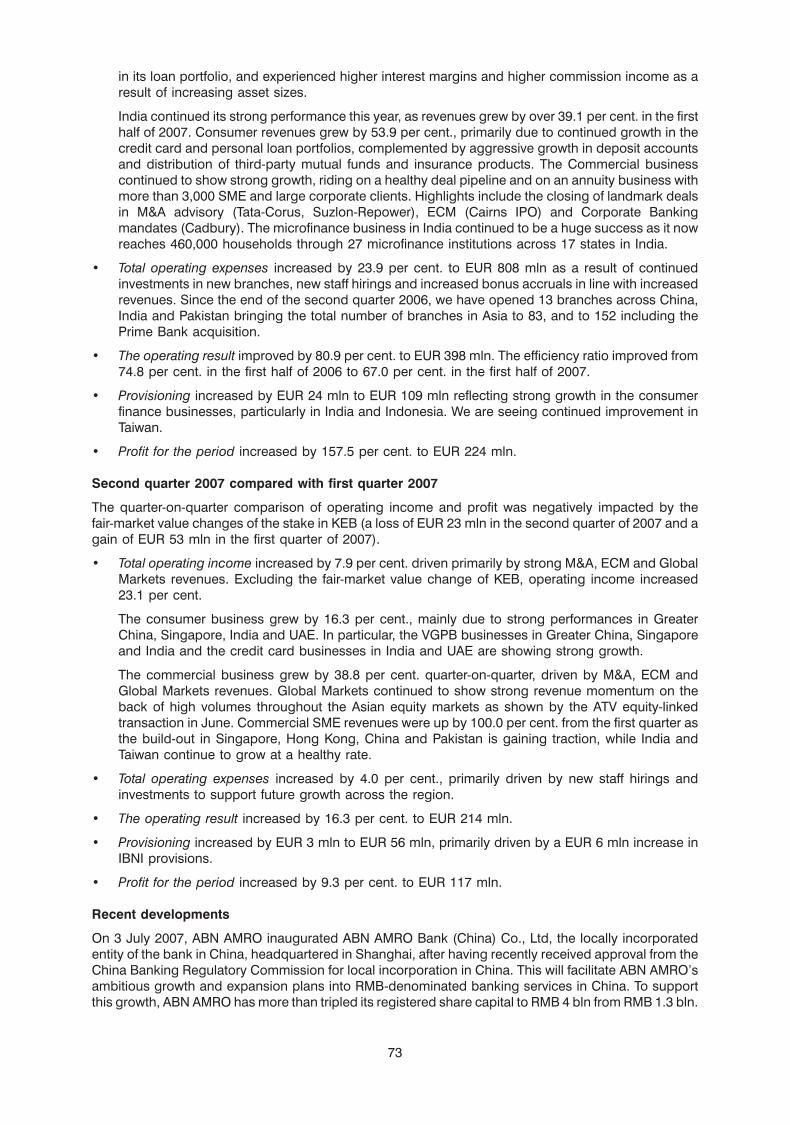
in its loan portfolio, and experienced higher interest margins and higher commission income as aresult of increasing asset sizes.
India continued its strong performance this year, as revenues grew by over 39.1 per cent. in the firsthalf of 2007. Consumer revenues grew by 53.9 per cent., primarily due to continued growth in thecredit card and personal loan portfolios, complemented by aggressive growth in deposit accountsand distribution of third-party mutual funds and insurance products. The Commercial businesscontinued to show strong growth, riding on a healthy deal pipeline and on an annuity business withmore than 3,000 SME and large corporate clients. Highlights include the closing of landmark dealsin M&A advisory (Tata-Corus, Suzlon-Repower), ECM (Cairns IPO) and Corporate Bankingmandates (Cadbury). The microfinance business in India continued to be a huge success as it nowreaches 460,000 households through 27 microfinance institutions across 17 states in India.
• Total operating expenses increased by 23.9 per cent. to EUR 808 mln as a result of continuedinvestments in new branches, new staff hirings and increased bonus accruals in line with increasedrevenues. Since the end of the second quarter 2006, we have opened 13 branches across China,India and Pakistan bringing the total number of branches in Asia to 83, and to 152 including thePrime Bank acquisition.
• The operating result improved by 80.9 per cent. to EUR 398 mln. The efficiency ratio improved from74.8 per cent. in the first half of 2006 to 67.0 per cent. in the first half of 2007.
• Provisioning increased by EUR 24 mln to EUR 109 mln reflecting strong growth in the consumerfinance businesses, particularly in India and Indonesia. We are seeing continued improvement inTaiwan.
• Profit for the period increased by 157.5 per cent. to EUR 224 mln.
Second quarter 2007 compared with first quarter 2007
The quarter-on-quarter comparison of operating income and profit was negatively impacted by thefair-market value changes of the stake in KEB (a loss of EUR 23 mln in the second quarter of 2007 and again of EUR 53 mln in the first quarter of 2007).
• Total operating income increased by 7.9 per cent. driven primarily by strong M&A, ECM and GlobalMarkets revenues. Excluding the fair-market value change of KEB, operating income increased23.1 per cent.
The consumer business grew by 16.3 per cent., mainly due to strong performances in GreaterChina, Singapore, India and UAE. In particular, the VGPB businesses in Greater China, Singaporeand India and the credit card businesses in India and UAE are showing strong growth.
The commercial business grew by 38.8 per cent. quarter-on-quarter, driven by M&A, ECM andGlobal Markets revenues. Global Markets continued to show strong revenue momentum on theback of high volumes throughout the Asian equity markets as shown by the ATV equity-linkedtransaction in June. Commercial SME revenues were up by 100.0 per cent. from the first quarter asthe build-out in Singapore, Hong Kong, China and Pakistan is gaining traction, while India andTaiwan continue to grow at a healthy rate.
• Total operating expenses increased by 4.0 per cent., primarily driven by new staff hirings andinvestments to support future growth across the region.
• The operating result increased by 16.3 per cent. to EUR 214 mln.
• Provisioning increased by EUR 3 mln to EUR 56 mln, primarily driven by a EUR 6 mln increase inIBNI provisions.
• Profit for the period increased by 9.3 per cent. to EUR 117 mln.
Recent developments
On 3 July 2007, ABN AMRO inaugurated ABN AMRO Bank (China) Co., Ltd, the locally incorporatedentity of the bank in China, headquartered in Shanghai, after having recently received approval from theChina Banking Regulatory Commission for local incorporation in China. This will facilitate ABN AMRO’sambitious growth and expansion plans into RMB-denominated banking services in China. To supportthis growth, ABN AMRO has more than tripled its registered share capital to RMB 4 bln from RMB 1.3 bln.
73

On 8 June 2007, ABN AMRO announced that it would acquire the branch network of Taitung BusinessBank in Taiwan following a government auction. The acquisition will add significant scale toABN AMRO’s Taiwan franchise where it is already a top three foreign bank. Under the terms of the sale,ABN AMRO is entitled to relocate the majority of 32 branches to prime locations for its mass-affluent andSME client base. After closure of the acquisition, the total number of branches in Taiwan will be 37.
Update on the integration of Prime Bank (Pakistan)
We have made considerable progress on the Prime Bank integration, achieving key milestones asscheduled, in particular in the IT, Finance, Communication, HR and Compliance areas. Theamalgamation date, subject to final regulatory approvals, is scheduled for 1 September 2007. Startingfrom that date, the two banks are expected to operate as a single organisation in Pakistan.
74
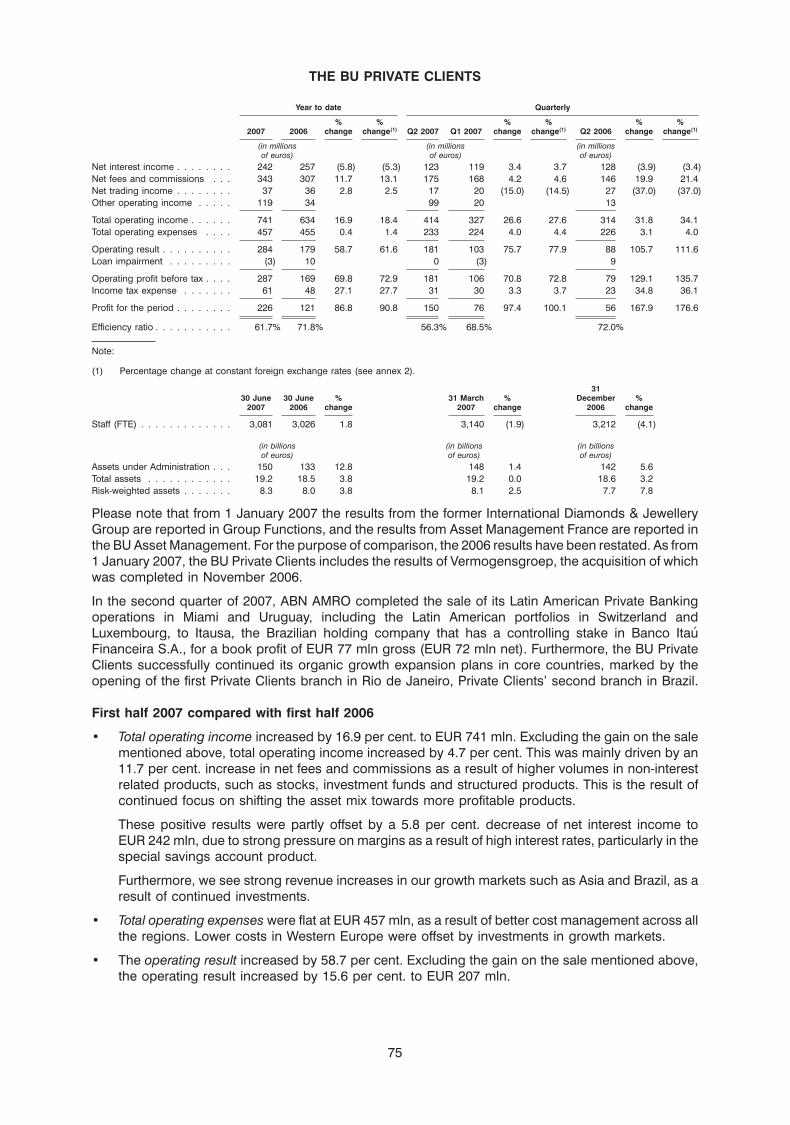
THE BU PRIVATE CLIENTS
Year to date Quarterly
% % % % % %2007 2006 change change(1) Q2 2007 Q1 2007 change change(1) Q2 2006 change change(1)
(in millions (in millions (in millionsof euros) of euros) of euros)
Net interest income . . . . . . . . 242 257 (5.8) (5.3) 123 119 3.4 3.7 128 (3.9) (3.4)Net fees and commissions . . . 343 307 11.7 13.1 175 168 4.2 4.6 146 19.9 21.4Net trading income . . . . . . . . 37 36 2.8 2.5 17 20 (15.0) (14.5) 27 (37.0) (37.0)Other operating income . . . . . 119 34 99 20 13
Total operating income . . . . . . 741 634 16.9 18.4 414 327 26.6 27.6 314 31.8 34.1Total operating expenses . . . . 457 455 0.4 1.4 233 224 4.0 4.4 226 3.1 4.0
Operating result . . . . . . . . . . 284 179 58.7 61.6 181 103 75.7 77.9 88 105.7 111.6Loan impairment . . . . . . . . . (3) 10 0 (3) 9
Operating profit before tax . . . . 287 169 69.8 72.9 181 106 70.8 72.8 79 129.1 135.7Income tax expense . . . . . . . 61 48 27.1 27.7 31 30 3.3 3.7 23 34.8 36.1
Profit for the period . . . . . . . . 226 121 86.8 90.8 150 76 97.4 100.1 56 167.9 176.6
Efficiency ratio . . . . . . . . . . . 61.7% 71.8% 56.3% 68.5% 72.0%
Note:
(1) Percentage change at constant foreign exchange rates (see annex 2).
3130 June 30 June % 31 March % December %
2007 2006 change 2007 change 2006 change
Staff (FTE) . . . . . . . . . . . . . 3,081 3,026 1.8 3,140 (1.9) 3,212 (4.1)
(in billions (in billions (in billionsof euros) of euros) of euros)
Assets under Administration . . . 150 133 12.8 148 1.4 142 5.6Total assets . . . . . . . . . . . . 19.2 18.5 3.8 19.2 0.0 18.6 3.2Risk-weighted assets . . . . . . . 8.3 8.0 3.8 8.1 2.5 7.7 7.8
Please note that from 1 January 2007 the results from the former International Diamonds & JewelleryGroup are reported in Group Functions, and the results from Asset Management France are reported inthe BU Asset Management. For the purpose of comparison, the 2006 results have been restated. As from1 January 2007, the BU Private Clients includes the results of Vermogensgroep, the acquisition of whichwas completed in November 2006.
In the second quarter of 2007, ABN AMRO completed the sale of its Latin American Private Bankingoperations in Miami and Uruguay, including the Latin American portfolios in Switzerland andLuxembourg, to Itausa, the Brazilian holding company that has a controlling stake in Banco ItauFinanceira S.A., for a book profit of EUR 77 mln gross (EUR 72 mln net). Furthermore, the BU PrivateClients successfully continued its organic growth expansion plans in core countries, marked by theopening of the first Private Clients branch in Rio de Janeiro, Private Clients’ second branch in Brazil.
First half 2007 compared with first half 2006
• Total operating income increased by 16.9 per cent. to EUR 741 mln. Excluding the gain on the salementioned above, total operating income increased by 4.7 per cent. This was mainly driven by an11.7 per cent. increase in net fees and commissions as a result of higher volumes in non-interestrelated products, such as stocks, investment funds and structured products. This is the result ofcontinued focus on shifting the asset mix towards more profitable products.
These positive results were partly offset by a 5.8 per cent. decrease of net interest income toEUR 242 mln, due to strong pressure on margins as a result of high interest rates, particularly in thespecial savings account product.
Furthermore, we see strong revenue increases in our growth markets such as Asia and Brazil, as aresult of continued investments.
• Total operating expenses were flat at EUR 457 mln, as a result of better cost management across allthe regions. Lower costs in Western Europe were offset by investments in growth markets.
• The operating result increased by 58.7 per cent. Excluding the gain on the sale mentioned above,the operating result increased by 15.6 per cent. to EUR 207 mln.
75
• Provisions decreased by EUR 13 mln to a net release of EUR 3 mln due to a release of IBNIprovision.
• Profit for the period increased by 86.8 per cent. Excluding the gain on the sale mentioned above,profit for the period increased by 27.3 per cent. to EUR 154 mln.
• Assets under Administration increased from EUR 133 bln at the end of June 2006 to EUR 150 bln atthe end of June 2007, mainly reflecting higher net asset values due to improved financial markets,net new assets inflow and the inclusion of Vermogensgroep (EUR 3.6 bln). The sale of theoperations in Miami and Uruguay had a negative impact of EUR 2.4 bln.
Second quarter 2007 compared with first quarter 2007
• Total operating income increased by 26.6 per cent. Excluding the gain on the sale mentioned above,operating income increased by 3.1 per cent. to EUR 337 mln, predominantly driven by an increasein commissions due to higher performance and brokerage fees.
• Total operating expenses increased by 4.0 per cent. to EUR 233 mln as a result of investments in theexpansion of the businesses in the Netherlands and in growth areas in Asia and Brazil.
• The operating result increased by 75.7 per cent. Excluding the gain on the sale mentioned above,the operating result was flat at EUR 104 mln.
• Profit for the period increased by 97.4 per cent. Excluding the gain on the sale mentioned above,profit for the period increased by 2.6 per cent. to EUR 78 mln.
• Assets under Administration increased from EUR 148 bln at the end of March 2007 to EUR 150 bln atthe end of June 2007 despite the sale of the operations in Miami and Uruguay.
76
THE BU ASSET MANAGEMENT
Year to date Quarterly
% % % % % %2007 2006 change change(1) Q2 2007 Q1 2007 change change(1) Q2 2006 change change(1)
(in millions (in millions (in millionsof euros) of euros) of euros)
Net interest income . . . . . . . . (7) (10) (3) (4) (6)Net fees and commissions . . . 460 390 17.9 18.4 241 219 10.0 10.5 210 14.8 14.7Net trading income . . . . . . . . 1 4 (1) 2 0Other operating income . . . . . 31 32 (3.1) 0.0 17 14 21.4 22.1 2
Total operating income . . . . . . 485 416 16.6 17.3 254 231 10.0 10.5 206 23.3 23.4Total operating expenses . . . . 316 269 17.5 18.4 165 151 9.3 9.7 137 20.4 20.9
Operating profit before tax . . . . 169 147 15.0 15.4 89 80 11.3 11.9 69 29.0 28.4Income tax expense . . . . . . . 43 39 10.3 10.0 21 22 (4.5) (4.5) 23 (8.7) (10.0)
Profit for the period . . . . . . . . 126 108 16.7 17.3 68 58 17.2 18.1 46 47.8 47.6
Efficiency ratio . . . . . . . . . . . 65.2% 64.7% 65.0% 65.4% 66.5%
Note:
(1) Percentage change at constant foreign exchange rates (see annex 2).
3130 June 30 June % 31 March % December %
2007 2006 change 2007 change 2006 change
Staff (FTE) . . . . . . . . . . . . . 1,846 1,730 6.7 1,837 0.5 1,630 13.3
(in billions (in billions (in billionsof euros) of euros) of euros)
Assets under Management . . . 211 180 17.2 209 1.0 193 9.3Total assets . . . . . . . . . . . . 1.6 1.2 33.3 1.7 (5.9) 1.4 14.3Risk-weighted assets . . . . . . . 1.0 0.5 100.0 0.9 11.1 0.9 11.1
Please note that the results from Asset Management France (previously included in the BU PrivateClients) were transferred to the BU Asset Management as from the start of 2007. For the purpose ofcomparison, the 2006 figures have been restated.
First half 2007 compared with first half 2006
Please note that the comparisons below are affected by the EUR 28 mln (gross and net) gain on the saleof the Asset Management operations in Curacao, completed in the first quarter of 2006.
• Total operating income increased by 16.6 per cent. to EUR 485 mln. Excluding the gain on the salementioned above, total operating income increased by 25.0 per cent., mainly due to increased netfees and commissions.
The 17.9 per cent. increase in commission income was related to the higher Asset underManagement (AuM) levels, higher performance fees and higher fee levels on existing products. Acontinuous and successful focus on tailored solutions for our clients also resulted in a shift in theasset mix towards more profitable products. In addition, returns on seed capital positions, which arereported in the other operating income line, were considerably higher than in 2006, contributing tothe overall improvement in revenues.
• Total operating expenses increased by 17.5 per cent. to EUR 316 mln, mainly due to higherpersonnel costs and bonus accruals.
• Operating profit before tax increased by 15.0 per cent. Excluding the gain on the sale mentionedabove, the operating profit before tax increased by 42.0 per cent. and the efficiency ratio improvedby 4.1 percentage points to 65.2 per cent.
• Profit for the period increased by 16.7 per cent. to EUR 126 mln. Excluding the gain on the salementioned above, profit for the period increased by 57.5 per cent.
Second quarter 2007 compared with first quarter 2007
• Total operating income increased by 10.0 per cent. to EUR 254 mln. This result was mainly due tohigher fees and commissions, which increased by EUR 22 mln, driven by higher AuM growth andperformance fee income, as core products showed continued improved performance.
77

• Total operating expenses increased by 9.3 per cent. to EUR 165 mln mainly driven by higherpersonnel costs.
• The operating profit before tax increased by 11.3 per cent. to EUR 89 mln from EUR 80 mln. Theefficiency ratio improved by 0.4 percentage points to 65.0 per cent.
• Profit for the period increased by 17.2 per cent. to EUR 68 mln.
Assets under Management
As at 30 June 2007, Assets under Management (AuM) amounted to EUR 210.6 bln compared withEUR 208.7 bln at the end of March 2007. This change in AuM can be explained by EUR 2.7 bln in netoutflows and EUR 3.7 bln market appreciation along with positive currency effects of EUR 0.9 bln. TheAuM level at Artemis continued to grow strongly. The asset mix is stable compared with the first quarterof 2007 with 46 per cent. equities, 36 per cent. fixed income and 18 per cent. cash and other.
78
THE BU PRIVATE EQUITY
Year to date Quarterly
% % %2007(1) 2006(1) change Q2 2007 Q2 2007(1) Q1 2007(1) change Q2 2006(1) change
(in millions of euros) (in millions of euros) (in millions of euros)
Net interest income . . . . . . . . . . . . . . . . . . . 18 7 157.1 (84) 6 12 (50.0) 1Net fees and commissions . . . . . . . . . . . . . . . 3 6 (50.0) 0 0 3 (1)Results from fin. transactions . . . . . . . . . . . . . 282 249 13.3 168 184 98 87.8 154 19.5Other operating income . . . . . . . . . . . . . . . . . 3 9 (66.7) 12 3 0 (11)Net sales private equity holdings . . . . . . . . . . . 0 0 1,390 0 0 0
Total operating income . . . . . . . . . . . . . . . . . 306 271 12.9 1,486 193 113 70.8 143 35.0Operating expenses . . . . . . . . . . . . . . . . . . . 51 49 4.1 328 27 24 12.5 14 92.9Goods and materials priv. equity holdings . . . . . . 0 0 979 0 0 0
Total operating expenses . . . . . . . . . . . . . . . . 51 49 4.1 1,307 27 24 12.5 14 92.9Operating result . . . . . . . . . . . . . . . . . . . . . 255 222 14.9 179 166 89 86.5 129 28.7Loan impairment . . . . . . . . . . . . . . . . . . . . . 0 20 0 0 0 5
Operating profit before tax . . . . . . . . . . . . . . . 255 202 26.2 179 166 89 86.5 124 33.9Income tax expense . . . . . . . . . . . . . . . . . . . (20) (26) 3 (10) (10) (12)
Profit for the period . . . . . . . . . . . . . . . . . . . 275 228 20.6 176 176 99 77.8 136 29.4
Note:
(1) All figures exclude the consolidation effect of controlled non-financial investments (see annex 2).31
30 June 30 June % 31 March % December %2007 2006 change 2007 change 2006 change
Staff (FTE) . . . . . . . . . . . . . . . . . . . . . . . . 83 105 (21.0) 85 (2.4) 93 (10.8)
(in billions (in billions (in billionsof euros) of euros) of euros)
Risk-weighted assets . . . . . . . . . . . . . . . . . . 2.5 2.4 4.2 2.4 4.2 2.4 4.2
As announced with the first quarter 2007 results, ABN AMRO transferred, at the end of the secondquarter, the investment management function of most of the businesses of the BU Private Equity (BU PE)to an independent management company with the objective to invest in mid-market buy-outopportunities in the Dutch, UK and Nordic markets. ABN AMRO sold the majority of the shares in thismanagement company to the respective members who now have independent operational andcommercial authority over all its activities. Concurrently, ABN AMRO made a long-term commitment tofund the ongoing investment programme of the management company. The ownership of the existinginvestments and therefore the economic interest in these investments has not changed.
Under International Financial Reporting Standards (IFRS), the income statements and balance sheets ofcompanies in which the Group has a controlling interest are consolidated. As a result of the above-mentioned structural change in control within BU PE, the portfolio of investments managed by theindependent management company will no longer be consolidated as of the next quarter, but insteadwill be carried at fair value with value changes directly impacting the profit and loss account. Theinvestments have been revalued to fair value at the end of the second quarter. The step-up to fair valueamounted to EUR 108 mln.
The BU PE operates through two lines of business (LoB): the Buy-out LoB and the CorporateInvestments LoB.
In the second quarter of 2007, the BU PE made a total of EUR 104 mln of new investments, primarily inthe Buy-out LoB. The BU PE also executed a number of divestments and refinancings, also primarily inthe Buyout LoB, for a total amount of EUR 114 mln in gross proceeds.
As a result of investments, divestments, fair value changes of EUR 70 mln, and EUR 13 mln of currencyand other effects, the value of the portfolio of the BU PE increased from EUR 2,213 mln to EUR 2,286 mln.At the end of the second quarter, the BU PE’s portfolio consisted of EUR 1,803 mln of buy-outinvestments, EUR 443 mln of Corporate Investments and EUR 40 mln of listed shares. The portfoliomanaged by the Corporate Investment business on behalf of the BU Netherlands increased fromEUR 116 mln to EUR 119 mln.
Please note that the results analysis below is based on figures excluding the consolidation effect ofcontrolled investments, whereby uncontrolled investments are held at fair-market value and controlledinvestments are held at such investment’s net asset value plus goodwill.
79
First half 2007 compared with first half 2006
• Total operating income increased by 12.9 per cent. to EUR 306 mln, mainly due to the loss of controlover the management company and the resulting loss of control over the investments, resulting inthe recording of a fair value step-up of EUR 108 mln as described above.
• Total operating expenses increased by EUR 2 mln to EUR 51 mln. This was mainly due to higheraccrual for incentive compensation and provisions taken for reorganising the strategic focus of theBU PE.
• The operating result increased by EUR 33 mln to EUR 255 mln.
• Provisions decreased by EUR 20 mln to zero.
• Profit for the period increased by EUR 47 mln to EUR 275 mln.
Second quarter 2007 compared with first quarter 2007
• Total operating income increased by EUR 80 mln to EUR 193 mln, as a result of higher unrealisedfair-market value step ups of the investment portfolio (resulting from the transfer of the managementfunction as described above) of EUR 108 mln being partly offset by lower realised returns fromexited consolidated investments.
• Total operating expenses increased by EUR 3 mln to EUR 27 mln, due to higher staff costs.
• The operating result increased by EUR 77 mln to EUR 166 mln.
• Profit for the period increased by EUR 77 mln to EUR 176 mln.
80
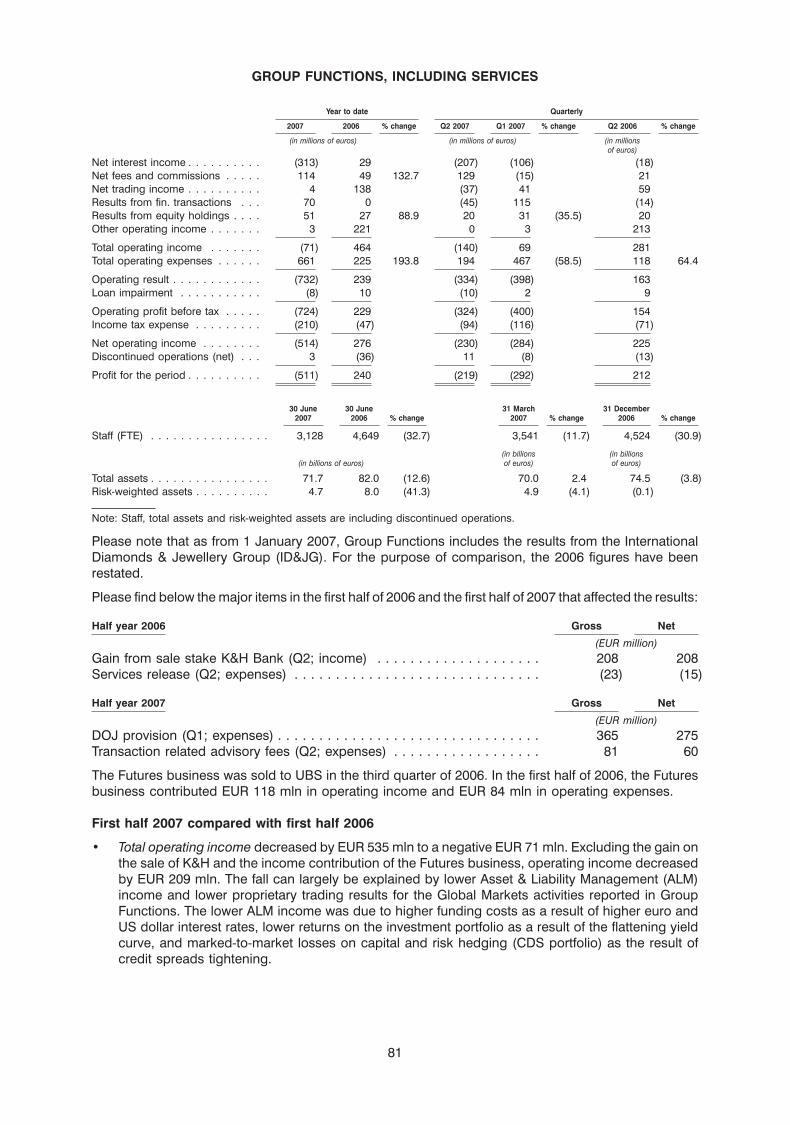
GROUP FUNCTIONS, INCLUDING SERVICES
Year to date Quarterly
2007 2006 % change Q2 2007 Q1 2007 % change Q2 2006 % change
(in millions of euros) (in millions of euros) (in millionsof euros)
Net interest income . . . . . . . . . . (313) 29 (207) (106) (18)Net fees and commissions . . . . . 114 49 132.7 129 (15) 21Net trading income . . . . . . . . . . 4 138 (37) 41 59Results from fin. transactions . . . 70 0 (45) 115 (14)Results from equity holdings . . . . 51 27 88.9 20 31 (35.5) 20Other operating income . . . . . . . 3 221 0 3 213
Total operating income . . . . . . . (71) 464 (140) 69 281Total operating expenses . . . . . . 661 225 193.8 194 467 (58.5) 118 64.4
Operating result . . . . . . . . . . . . (732) 239 (334) (398) 163Loan impairment . . . . . . . . . . . (8) 10 (10) 2 9
Operating profit before tax . . . . . (724) 229 (324) (400) 154Income tax expense . . . . . . . . . (210) (47) (94) (116) (71)
Net operating income . . . . . . . . (514) 276 (230) (284) 225Discontinued operations (net) . . . 3 (36) 11 (8) (13)
Profit for the period . . . . . . . . . . (511) 240 (219) (292) 212
30 June 30 June 31 March 31 December2007 2006 % change 2007 % change 2006 % change
Staff (FTE) . . . . . . . . . . . . . . . . 3,128 4,649 (32.7) 3,541 (11.7) 4,524 (30.9)
(in billions (in billions(in billions of euros) of euros) of euros)
Total assets . . . . . . . . . . . . . . . . 71.7 82.0 (12.6) 70.0 2.4 74.5 (3.8)Risk-weighted assets . . . . . . . . . . 4.7 8.0 (41.3) 4.9 (4.1) (0.1)
Note: Staff, total assets and risk-weighted assets are including discontinued operations.
Please note that as from 1 January 2007, Group Functions includes the results from the InternationalDiamonds & Jewellery Group (ID&JG). For the purpose of comparison, the 2006 figures have beenrestated.
Please find below the major items in the first half of 2006 and the first half of 2007 that affected the results:
Half year 2006 Gross Net
(EUR million)Gain from sale stake K&H Bank (Q2; income) . . . . . . . . . . . . . . . . . . . . 208 208Services release (Q2; expenses) . . . . . . . . . . . . . . . . . . . . . . . . . . . . . . (23) (15)
Half year 2007 Gross Net
(EUR million)DOJ provision (Q1; expenses) . . . . . . . . . . . . . . . . . . . . . . . . . . . . . . . . 365 275Transaction related advisory fees (Q2; expenses) . . . . . . . . . . . . . . . . . . 81 60
The Futures business was sold to UBS in the third quarter of 2006. In the first half of 2006, the Futuresbusiness contributed EUR 118 mln in operating income and EUR 84 mln in operating expenses.
First half 2007 compared with first half 2006
• Total operating income decreased by EUR 535 mln to a negative EUR 71 mln. Excluding the gain onthe sale of K&H and the income contribution of the Futures business, operating income decreasedby EUR 209 mln. The fall can largely be explained by lower Asset & Liability Management (ALM)income and lower proprietary trading results for the Global Markets activities reported in GroupFunctions. The lower ALM income was due to higher funding costs as a result of higher euro andUS dollar interest rates, lower returns on the investment portfolio as a result of the flattening yieldcurve, and marked-to-market losses on capital and risk hedging (CDS portfolio) as the result ofcredit spreads tightening.
81
• Total operating expenses increased by EUR 436 mln to EUR 661 mln. Excluding the itemsmentioned above (including the expenses of the Futures business in the first half of 2006), operatingexpenses increased by EUR 51 mln. Staff numbers declined by 1,521 FTEs due to the transfer ofpart of the audit, risk and compliance functions to the regions and as a result of reductions related tothe measures, announced in 2006, aimed at improving the efficiency and productivity of GroupFunctions.
• The operating result decreased by EUR 971 mln to a negative EUR 732 mln. Excluding the itemsmentioned above (including the operating result of the Futures business in the first half of 2006), theoperating result decreased by EUR 260 mln.
• Provisioning decreased by EUR 18 mln to a release of EUR 8 mln.
• Tax expenses declined by EUR 163 mln to a net credit of EUR 210 mln.
• Discontinued operations include certain revenues and expenses, largely stranded costs, related tothe sale of LaSalle.
• Profit for the period decreased by EUR 751 mln to a loss of EUR 511 mln. Excluding the itemsmentioned above (including the profit of the Futures business in the first half of 2006), profit for theperiod decreased by EUR 166 mln.
Second quarter 2007 compared with first quarter 2007
• Total operating income decreased by EUR 209 mln to a negative EUR 140 mln, mainly due to lowerALM results and lower proprietary trading results. The lower ALM income was due to higher fundingcosts as a result of higher euro and US dollar interest rates and lower returns on the investmentportfolio as a result of the flattening yield curve.
• Total operating expenses decreased by EUR 273 mln to EUR 194 mln. Excluding the EUR 365 mlnprovision for the DOJ settlement in the first quarter and EUR 81 mln transaction-related advisoryfees in the second quarter, expenses increased by EUR 11 mln.
• The operating result increased by EUR 64 mln to a negative EUR 334 mln. Excluding the expenseitems mentioned above, the operating result decreased by EUR 220 mln.
• Provisioning decreased by EUR 12 mln to a release of EUR 10 mln.
• Tax expenses turned from a net credit of EUR 116 mln in the first quarter to a net credit of EUR 94 mlnin the second quarter.
• Net operating income increased by EUR 54 mln to a negative EUR 230 mln. Excluding the itemsmentioned above, net operating income decreased by EUR 161 mln.
• Discontinued operations include certain revenues and expenses related to the financing and realestate transactions of the LaSalle business that are part of the Purchase and Sale Agreement by andbetween ABN AMRO and Bank of America. Global overhead charges allocated to LaSalle thatcontinue to be incurred by ABN AMRO are included in the operating expenses of the continuedoperations.
• Profit for the period increased by EUR 73 mln to a loss of EUR 219 mln.
Recent developments
In 2006, ABN AMRO announced measures to improve the cost efficiency and productivity in GroupFunctions. The improvement in operational efficiency will be achieved by focusing on efficiency andproductivity that will affect more than 500 FTEs, mainly at head office. In the fourth quarter we took arestructuring charge of EUR 29 mln. The headcount reduction has started in the first quarter and we areon track to deliver the reduction of 500 FTEs.
82
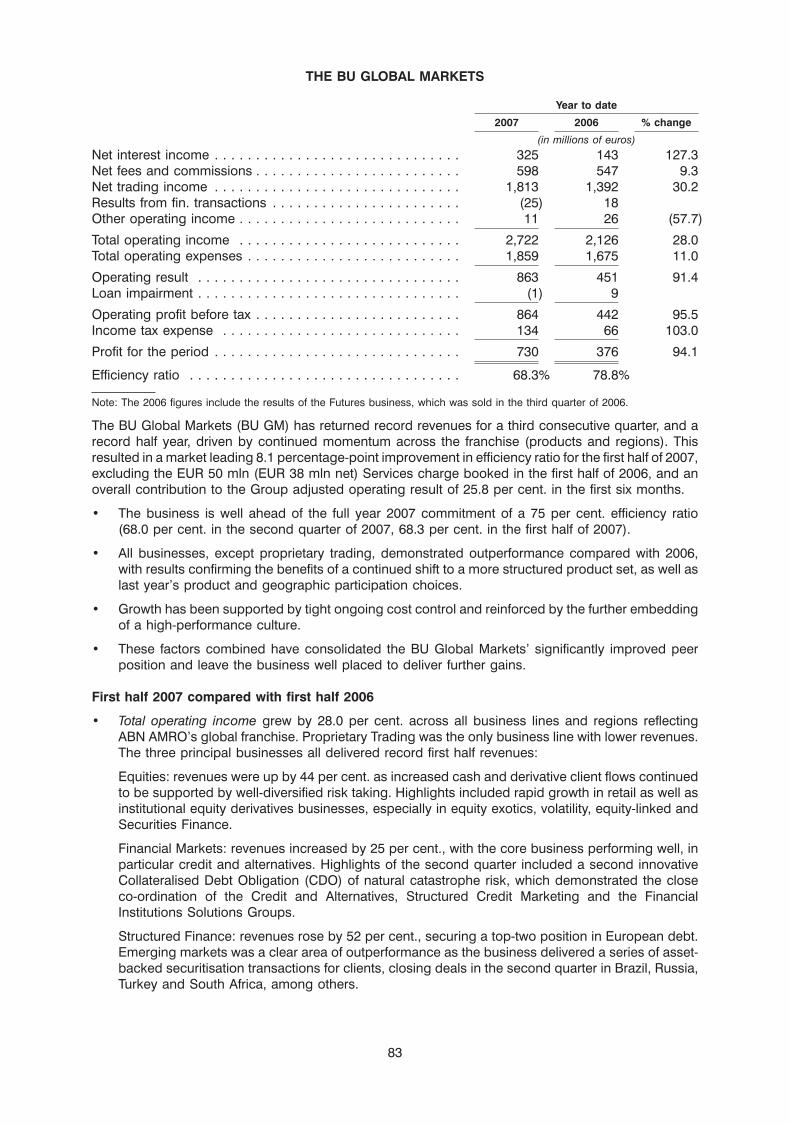
THE BU GLOBAL MARKETS
Year to date
2007 2006 % change
(in millions of euros)Net interest income . . . . . . . . . . . . . . . . . . . . . . . . . . . . . . 325 143 127.3Net fees and commissions . . . . . . . . . . . . . . . . . . . . . . . . . 598 547 9.3Net trading income . . . . . . . . . . . . . . . . . . . . . . . . . . . . . . 1,813 1,392 30.2Results from fin. transactions . . . . . . . . . . . . . . . . . . . . . . . (25) 18Other operating income . . . . . . . . . . . . . . . . . . . . . . . . . . . 11 26 (57.7)
Total operating income . . . . . . . . . . . . . . . . . . . . . . . . . . . 2,722 2,126 28.0Total operating expenses . . . . . . . . . . . . . . . . . . . . . . . . . . 1,859 1,675 11.0
Operating result . . . . . . . . . . . . . . . . . . . . . . . . . . . . . . . . 863 451 91.4Loan impairment . . . . . . . . . . . . . . . . . . . . . . . . . . . . . . . . (1) 9
Operating profit before tax . . . . . . . . . . . . . . . . . . . . . . . . . 864 442 95.5Income tax expense . . . . . . . . . . . . . . . . . . . . . . . . . . . . . 134 66 103.0
Profit for the period . . . . . . . . . . . . . . . . . . . . . . . . . . . . . . 730 376 94.1
Efficiency ratio . . . . . . . . . . . . . . . . . . . . . . . . . . . . . . . . . 68.3% 78.8%
Note: The 2006 figures include the results of the Futures business, which was sold in the third quarter of 2006.
The BU Global Markets (BU GM) has returned record revenues for a third consecutive quarter, and arecord half year, driven by continued momentum across the franchise (products and regions). Thisresulted in a market leading 8.1 percentage-point improvement in efficiency ratio for the first half of 2007,excluding the EUR 50 mln (EUR 38 mln net) Services charge booked in the first half of 2006, and anoverall contribution to the Group adjusted operating result of 25.8 per cent. in the first six months.
• The business is well ahead of the full year 2007 commitment of a 75 per cent. efficiency ratio(68.0 per cent. in the second quarter of 2007, 68.3 per cent. in the first half of 2007).
• All businesses, except proprietary trading, demonstrated outperformance compared with 2006,with results confirming the benefits of a continued shift to a more structured product set, as well aslast year’s product and geographic participation choices.
• Growth has been supported by tight ongoing cost control and reinforced by the further embeddingof a high-performance culture.
• These factors combined have consolidated the BU Global Markets’ significantly improved peerposition and leave the business well placed to deliver further gains.
First half 2007 compared with first half 2006
• Total operating income grew by 28.0 per cent. across all business lines and regions reflectingABN AMRO’s global franchise. Proprietary Trading was the only business line with lower revenues.The three principal businesses all delivered record first half revenues:
Equities: revenues were up by 44 per cent. as increased cash and derivative client flows continuedto be supported by well-diversified risk taking. Highlights included rapid growth in retail as well asinstitutional equity derivatives businesses, especially in equity exotics, volatility, equity-linked andSecurities Finance.
Financial Markets: revenues increased by 25 per cent., with the core business performing well, inparticular credit and alternatives. Highlights of the second quarter included a second innovativeCollateralised Debt Obligation (CDO) of natural catastrophe risk, which demonstrated the closeco-ordination of the Credit and Alternatives, Structured Credit Marketing and the FinancialInstitutions Solutions Groups.
Structured Finance: revenues rose by 52 per cent., securing a top-two position in European debt.Emerging markets was a clear area of outperformance as the business delivered a series of asset-backed securitisation transactions for clients, closing deals in the second quarter in Brazil, Russia,Turkey and South Africa, among others.
83
• Total operating expenses were up 11.0 per cent. at EUR 1,859 mln driven in large part by higherbonus accruals on the back of significantly improved performance. Excluding the Servicesrestructuring charge in 2006, total operating expenses increased by 14.4 per cent.
• The operating result improved by 91.4 per cent. to EUR 863 mln. Excluding the Servicesrestructuring charge, the operating result improved by 72.3 per cent. The contribution of the BU GMto the Group’s adjusted operating result increased from 17.3 per cent. in the first half of 2006 to25.8 per cent. in the first half of 2007.
The efficiency ratio improved by 11 percentage points to 68.3 per cent. Excluding the Servicesrestructuring charge, the efficiency ratio improved by 8.1 percentage points. The BU GM is alreadymeeting its targeted efficiency ratio of 75 per cent. in 2007, despite the current corporate context.
• Provisions showed a small release of EUR 1 mln.
• Taxes increased by EUR 68 mln to EUR 134 mln.
• Profit for the period increased by 94.1 per cent. to EUR 730 mln.
Continued investment in our market leading units, combined with a demonstrated ability to execute thenecessary remedial actions in lower-performing businesses and a strong pipeline, provide a robustplatform for the BU GM going forward despite the current corporate uncertainty.
About the BU Global Markets
Managed as an integrated business, the BU GM encompasses the markets activities of the ABN AMROGroup, comprising Equities, Financial Markets, and Structured Finance. Equities comprise cash andderivatives sales and trading, research and corporate broking (Hoare Govett). Financial Markets coversmacro-products (rates and foreign exchange), credit and alternatives, and local markets. StructuredFinance includes fixed income origination, structuring and financing (both leveraged and high grade).
The results of the BU GM’s Equities, Financial Markets and Structured Finance activities are reported inthe regional Client BUs, while proprietary trading is reported in Group Functions.
84
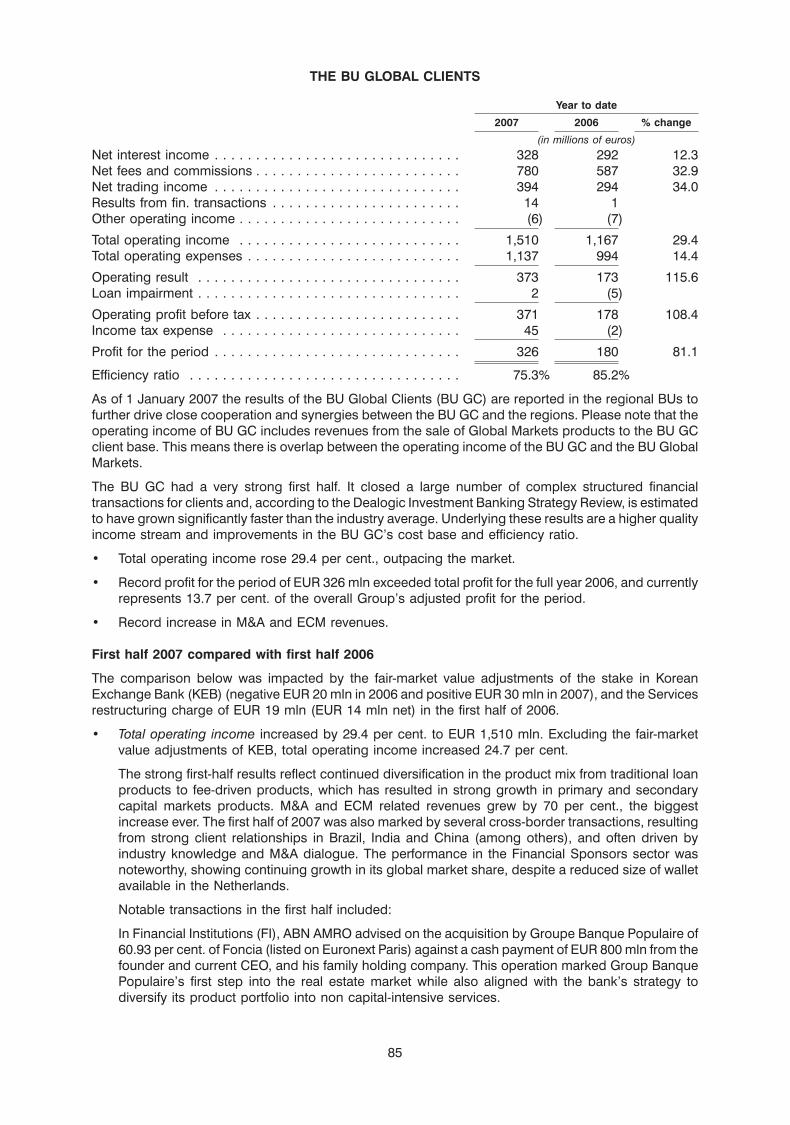
THE BU GLOBAL CLIENTS
Year to date
2007 2006 % change
(in millions of euros)Net interest income . . . . . . . . . . . . . . . . . . . . . . . . . . . . . . 328 292 12.3Net fees and commissions . . . . . . . . . . . . . . . . . . . . . . . . . 780 587 32.9Net trading income . . . . . . . . . . . . . . . . . . . . . . . . . . . . . . 394 294 34.0Results from fin. transactions . . . . . . . . . . . . . . . . . . . . . . . 14 1Other operating income . . . . . . . . . . . . . . . . . . . . . . . . . . . (6) (7)
Total operating income . . . . . . . . . . . . . . . . . . . . . . . . . . . 1,510 1,167 29.4Total operating expenses . . . . . . . . . . . . . . . . . . . . . . . . . . 1,137 994 14.4
Operating result . . . . . . . . . . . . . . . . . . . . . . . . . . . . . . . . 373 173 115.6Loan impairment . . . . . . . . . . . . . . . . . . . . . . . . . . . . . . . . 2 (5)
Operating profit before tax . . . . . . . . . . . . . . . . . . . . . . . . . 371 178 108.4Income tax expense . . . . . . . . . . . . . . . . . . . . . . . . . . . . . 45 (2)
Profit for the period . . . . . . . . . . . . . . . . . . . . . . . . . . . . . . 326 180 81.1
Efficiency ratio . . . . . . . . . . . . . . . . . . . . . . . . . . . . . . . . . 75.3% 85.2%
As of 1 January 2007 the results of the BU Global Clients (BU GC) are reported in the regional BUs tofurther drive close cooperation and synergies between the BU GC and the regions. Please note that theoperating income of BU GC includes revenues from the sale of Global Markets products to the BU GCclient base. This means there is overlap between the operating income of the BU GC and the BU GlobalMarkets.
The BU GC had a very strong first half. It closed a large number of complex structured financialtransactions for clients and, according to the Dealogic Investment Banking Strategy Review, is estimatedto have grown significantly faster than the industry average. Underlying these results are a higher qualityincome stream and improvements in the BU GC’s cost base and efficiency ratio.
• Total operating income rose 29.4 per cent., outpacing the market.
• Record profit for the period of EUR 326 mln exceeded total profit for the full year 2006, and currentlyrepresents 13.7 per cent. of the overall Group’s adjusted profit for the period.
• Record increase in M&A and ECM revenues.
First half 2007 compared with first half 2006
The comparison below was impacted by the fair-market value adjustments of the stake in KoreanExchange Bank (KEB) (negative EUR 20 mln in 2006 and positive EUR 30 mln in 2007), and the Servicesrestructuring charge of EUR 19 mln (EUR 14 mln net) in the first half of 2006.
• Total operating income increased by 29.4 per cent. to EUR 1,510 mln. Excluding the fair-marketvalue adjustments of KEB, total operating income increased 24.7 per cent.
The strong first-half results reflect continued diversification in the product mix from traditional loanproducts to fee-driven products, which has resulted in strong growth in primary and secondarycapital markets products. M&A and ECM related revenues grew by 70 per cent., the biggestincrease ever. The first half of 2007 was also marked by several cross-border transactions, resultingfrom strong client relationships in Brazil, India and China (among others), and often driven byindustry knowledge and M&A dialogue. The performance in the Financial Sponsors sector wasnoteworthy, showing continuing growth in its global market share, despite a reduced size of walletavailable in the Netherlands.
Notable transactions in the first half included:
In Financial Institutions (FI), ABN AMRO advised on the acquisition by Groupe Banque Populaire of60.93 per cent. of Foncia (listed on Euronext Paris) against a cash payment of EUR 800 mln from thefounder and current CEO, and his family holding company. This operation marked Group BanquePopulaire’s first step into the real estate market while also aligned with the bank’s strategy todiversify its product portfolio into non capital-intensive services.
85
In Telecoms, Media and Technology (TMT), ABN AMRO acted as joint financial adviser to BinariangGSM Sdn Bhd in its acquisition of Maxis Communications Berhad, one of the largest listedcompanies in Malaysia. The offer valued Maxis at USD 11.7 bln, making it the largest ever corporatetransaction in Malaysia, and the second largest telecom acquisition and largest buy-out in Asia(ex-Australia).
In Energy & Resources (E&R), ABN AMRO acted as sole financial adviser and broker, and jointbookrunner, to Iberdrola in the EUR 17.1 bln acquisition of Scottish Power. ABN AMRO was also themandated lead arranger and joint book runner of the bridge financing facility, which represents amilestone achievement for the Power and Utility sector.
Also in E&R, ABN AMRO, acting as sole lead arranger, successfully priced the largest corporatebond offering ever in Latin America for Petroleos de Venezuela (PDVSA), the fourth largestintegrated oil company in the world. This multi-tranche USD 7.5 bln offering positioned ourStructured Finance team (which includes capital markets) at the top of the Latin American andEmerging Market league tables.
In Global Industries, ABN AMRO acted as mandated lead arranger and book runner for the Porscheacquisition financing transaction, representing the second largest ever financing raised in theEuropean syndicated loan market, and the largest syndicated facility ever led by ABN AMRO, wonon the back of a strong and long standing relationship with Porsche.
These transactions contributed to ABN AMRO ranking 13th in Dealogic’s first-half InvestmentBanking Strategy Review. ABN AMRO was also the fastest-growing bank, with an estimated47 per cent. increase in Global Investment Banking revenues compared with the first half of 2006,versus an industry average of 19 per cent. This performance is particularly notable givenABN AMRO’s limited participation in the US capital and advisory markets, the largest in the world.
• Total operating expenses increased by 14.4 per cent. Excluding the Services restructuring charge,total operating expenses increased by 16.6 per cent. This increase was mainly due to a higherbonus accrual as a result of higher revenues.
• The operating result increased by EUR 200 mln. Excluding the fair-market value adjustments of KEBand the Services restructuring charge, the operating result increased by 61.8 per cent. toEUR 343 mln.
• Provisions increased by EUR 7 mln to a net charge of EUR 2 mln.
• Tax increased by EUR 47 mln to EUR 45 mln. In the first half of 2006, a number of client-driventransactions with positive tax implications resulted in a net tax credit.
• Profit for the period increased by EUR 146 mln to EUR 326 mln. Excluding the fair-market valueadjustments of KEB and the Services restructuring charge, profit for the period increased by38.3 per cent. to EUR 296 mln.
About the BU Global Clients
Responsibility for the Mergers & Acquisitions and Equity Capital Markets products for all clients ofABN AMRO falls under the BU GC. In line with its mandate to make innovation and product expertiseavailable to the mid-market clients of the regional Client BUs, the BU GC has driven a significant increasein M&A and ECM revenues generated from the regional Client BUs’ clients by deploying its own M&Aand ECM resources to the regional Client BUs. To fully reflect the value generated by the BU GC, all ECMand M&A revenues, whether generated by regional or large corporate clients, are included in the resultsof the BU GC as of 1 January 2007. The 2006 results have been restated accordingly.
The five client industry groups served are Financial Institutions (FI); Technology, Media &Telecommunications (TMT); Energy & Resources (E&R); Financial Sponsors and Merchant Banking(FS&MB); and Global Industries (including Automotive, Consumer and Global Industrials).
86
ANNEX 1
This is an announcement pursuant to article 9b paragraph 1 of the Dutch Securities Markets SupervisionDecree (Besluit toezicht effectenverkeer 1995).
Cautionary statement regarding forward-looking statements
This announcement contains forward-looking statements. Forward-looking statements are statementsthat are not historical facts, including statements about our beliefs and expectations. Any statement inthis announcement that expresses or implies our intentions, beliefs, expectations or predictions (and theassumptions underlying them) is a forward-looking statement. These statements are based on plans,estimates and projections, as they are currently available to the management of ABN AMRO.Forward-looking statements therefore speak only as of the date they are made, and we take noobligation to update publicly any of them in light of new information or future events.
Forward-looking statements involve inherent risks and uncertainties. A number of important factorscould therefore cause actual future results to differ materially from those expressed or implied in anyforward-looking statement. Such factors include, without limitation, the consummation of our proposedmerger with Barclays; the conditions in the financial markets in Europe, the United States, Brazil andelsewhere from which we derive a substantial portion of our trading revenues; potential defaults ofborrowers or trading counterparties; the implementation of our restructuring including the envisagedreduction in headcount; the reliability of our risk management policies, procedures and methods; theoutcome of ongoing criminal investigations and other regulatory initiatives related to compliance mattersin the United States and the nature and severity of any sanctions imposed; and other risks referenced inour filings with the US Securities and Exchange Commission. For more information on these and otherfactors, please refer to Part I: Item 3.D ‘‘Risk Factors’’ in our Annual Report on Form 20-F filed with theUS Securities and Exchange Commission and to any subsequent reports furnished or filed by us withthe US Securities and Exchange Commission. The forward-looking statements contained in thisannouncement are made as of the date hereof, and the companies assume no obligation to update anyof the forward-looking statements contained in this announcement.
Additional Information
The offer launched by the consortium of Fortis, RBS and Santander is under consideration by theABN AMRO boards. ABN AMRO will, in the near future but at the latest by 6 August 2007, file with theUS Securities and Exchange Commission a Solicitation/Recommendation Statement onSchedule 14D-9 and advise the ABN AMRO shareholders (i) whether it recommends acceptance orrejection of such offer, expresses no opinion and remains neutral toward such offer, or is unable to take aposition with respect to such offer and (ii) the reason(s) for its position with respect to such offer. TheABN AMRO boards request the ABN AMRO shareholders to defer making a determination on whether toaccept or reject such offer until they have been advised of ABN AMRO’s position with respect to the offer.
Barclays has filed with the US Securities and Exchange Commission a Registration Statement onForm F-4 which contains a prospectus. Barclays expects to file with the US Securities and ExchangeCommission amendments to such Registration Statement as well as a Tender Offer Statement onSchedule TO and other relevant materials. In addition, ABN AMRO expects that it will file with the USSecurities and Exchange Commission a Solicitation/Recommendation Statement on Schedule 14D-9and other relevant materials. Such documents, however, are not currently available.
INVESTORS ARE URGED TO READ ANY DOCUMENTS REGARDING THE POTENTIAL OFFER IF ANDWHEN THEY BECOME AVAILABLE, BECAUSE THEY WILL CONTAIN IMPORTANT INFORMATION.
The publication and distribution of this document and any separate documentation regarding theintended Offer, the making of the intended Offer and the issuance and offering of Barclays ordinaryshares may, in some jurisdictions, be restricted by law. This document is not being published and theintended Offer is not being made, directly or indirectly, in or into any jurisdiction in which the publicationof this announcement and the making of the intended Offer would not be in compliance with the laws ofthat jurisdiction. Persons who come into possession of this announcement should inform themselves ofand observe any of these restrictions. Any failure to comply with these restrictions may constitute aviolation of the securities laws of that jurisdiction.
87
ANNEX 2
Use of non-GAAP financial measures
Constant foreign exchange rates
Throughout the discussion of the operating results in the press release, the financial results andperformance compared to the prior period, both in euros and percentage terms, are given in euros. Wemay also, where deemed significant, explain variances in terms of ‘‘constant foreign exchange rates’’ or‘‘local currency’’. Both ‘‘constant foreign exchange rates’’ and ‘‘local currency’’ exclude the effect ofcurrency translation differences and is a non-GAAP financial measure which, unlike actual growth,cannot be derived directly from the information in the financial statements. ‘‘Local currency’’performance is measured for single currency volume differences. Management assesses, in part, theunderlying performance of our individual businesses by separating foreign exchange translation effectsthroughout the income statement so as to understand the underlying trend of the business performance.The adjustments relate in particular to the impact of fluctuations in exchange rates used in translatingresults reported by our BUs North America and Latin America in US dollar and Brazilian real into euros,as well as the various currencies making up BU Asia. Management believes that the exclusion of theseitems provides a better understanding of the underlying operational performance of our businessesduring such periods. Fluctuations in exchange rates are outside of the control or influence ofmanagement and may distort the analysis of underlying operating performance of our businessesduring the periods under review. External stakeholders, such as business analysts, also use thesemeasures. However, we recognise that these measures should not be used in isolation and, accordingly,we begin our analysis in the press release on the performance of the bank and of the BUs with thecomparable GAAP actual growth measures that reflect all the factors that affect our business. Wecalculate the comparable constant foreign exchange rate performance by multiplying the local currencyvolumes over the period to be compared with the average monthly exchange rates of the previousperiod being compared. For example, the volumes of the year ended 31 December 2006, are multipliedby the average monthly exchange rates of 2005 to compare with the results of the 2005 on a constantbasis.
Consolidation effect controlled non-financial investments
IAS 27 requires the consolidation of private equity investments over which we have control, includingnon-financial investments managed as private equity investments. However, as a practical matter, ourprivate equity business is managed separately from the rest of our banking business and managementdoes not measure the performance of our banking business based on our consolidated results ofoperations. Our private equity business involves buying equity stakes in unlisted companies over whichwe can establish influence or control, and managing these shareholdings as an investor for a number ofyears with a view to selling these with a profit. The companies in which we have these temporaryholdings are active in different types of business other than the financial industry. We believe thatcombining these temporary holdings with our core banking business does not provide a meaningfulbasis for discussion of our financial condition and results of operations.
In the presentation of the tables in this press release, in order to understand our performance, we haveremoved the effects of a line-by-line consolidation in the income statement of the private equity holdingsof our Business Unit Private Equity. The results excluding the consolidation effect include the‘‘de-consolidated’’ holdings based on the equity method. Similarly, in the presentation of ourconsolidated results of operations and in the segment discussion of our Business Unit Private Equity, wehave removed the effects of consolidation of our private equity holdings from the various line items of theincome statement and classified only the net operating profit of these investments under ‘‘Results fromfinancial transactions’’. The measures excluding the effects of consolidation of our private equityholdings are non-GAAP financial measures. Our management refers to these non-GAAP financialmeasures in making operating decisions because the measures provide meaningful supplementalinformation regarding our operational performance. In addition, these non-GAAP financial measuresfacilitate management’s internal comparisons to our historical operating results and comparisons tocompetitors’ operating results. In accordance with applicable rules and regulations, we have presented,and investors are encouraged to review, reconciliations of non-GAAP financial measures to the mostcomparable GAAP measures, i.e., reconciliations of our results excluding the consolidation effects of ourprivate equity holdings to our results including those effects in this Annex.
88
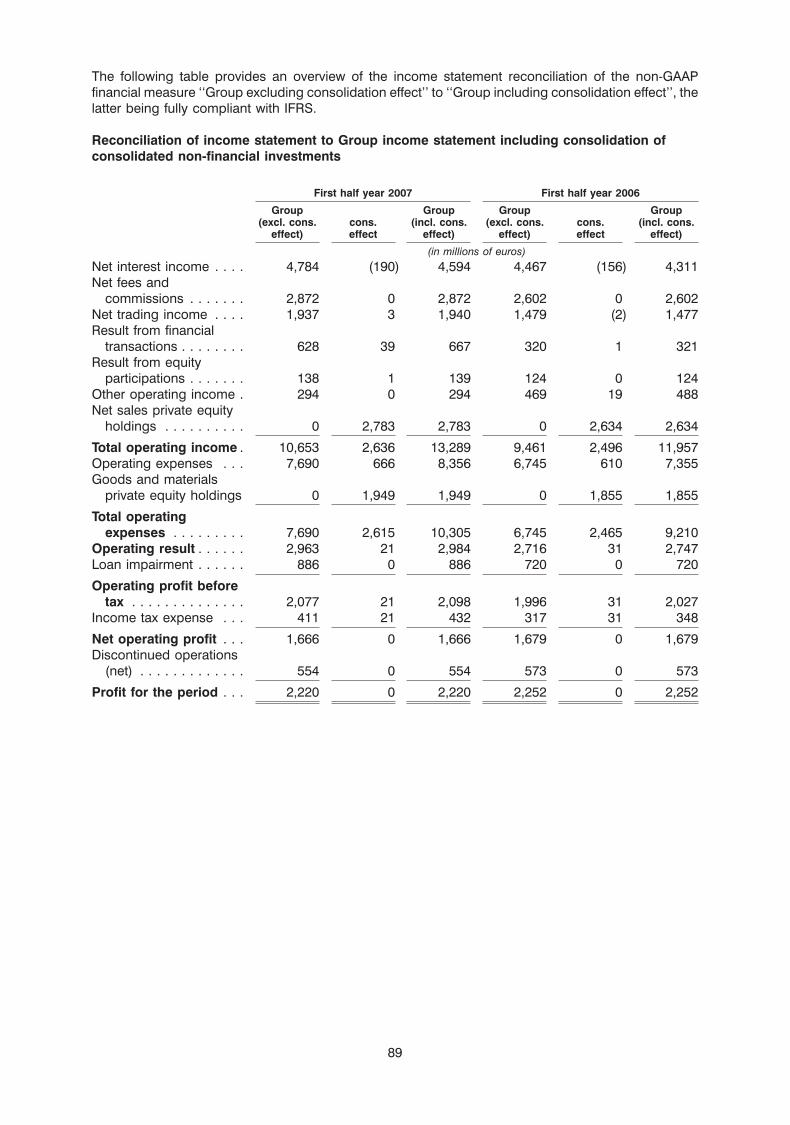
The following table provides an overview of the income statement reconciliation of the non-GAAPfinancial measure ‘‘Group excluding consolidation effect’’ to ‘‘Group including consolidation effect’’, thelatter being fully compliant with IFRS.
Reconciliation of income statement to Group income statement including consolidation ofconsolidated non-financial investments
First half year 2007 First half year 2006
Group Group Group Group(excl. cons. cons. (incl. cons. (excl. cons. cons. (incl. cons.
effect) effect effect) effect) effect effect)
(in millions of euros)Net interest income . . . . 4,784 (190) 4,594 4,467 (156) 4,311Net fees and
commissions . . . . . . . 2,872 0 2,872 2,602 0 2,602Net trading income . . . . 1,937 3 1,940 1,479 (2) 1,477Result from financial
transactions . . . . . . . . 628 39 667 320 1 321Result from equity
participations . . . . . . . 138 1 139 124 0 124Other operating income . 294 0 294 469 19 488Net sales private equity
holdings . . . . . . . . . . 0 2,783 2,783 0 2,634 2,634
Total operating income . 10,653 2,636 13,289 9,461 2,496 11,957Operating expenses . . . 7,690 666 8,356 6,745 610 7,355Goods and materials
private equity holdings 0 1,949 1,949 0 1,855 1,855
Total operatingexpenses . . . . . . . . . 7,690 2,615 10,305 6,745 2,465 9,210
Operating result . . . . . . 2,963 21 2,984 2,716 31 2,747Loan impairment . . . . . . 886 0 886 720 0 720
Operating profit beforetax . . . . . . . . . . . . . . 2,077 21 2,098 1,996 31 2,027
Income tax expense . . . 411 21 432 317 31 348
Net operating profit . . . 1,666 0 1,666 1,679 0 1,679Discontinued operations
(net) . . . . . . . . . . . . . 554 0 554 573 0 573
Profit for the period . . . 2,220 0 2,220 2,252 0 2,252
89
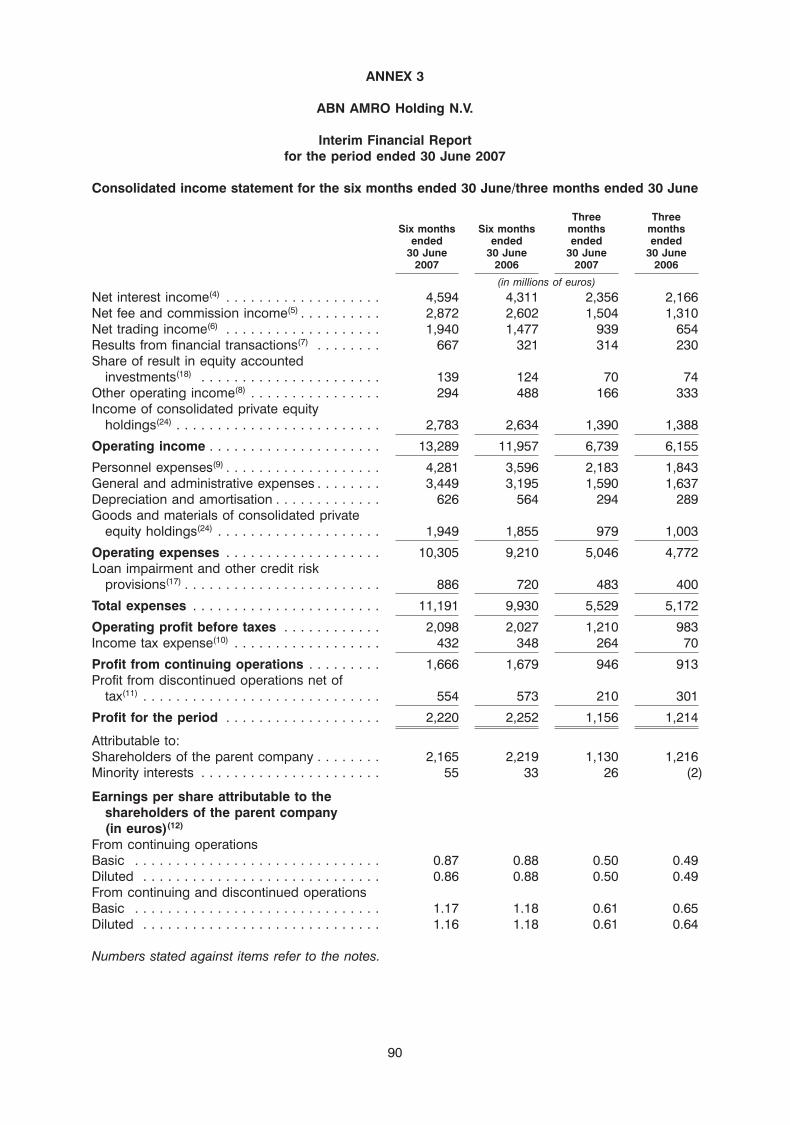
ANNEX 3
ABN AMRO Holding N.V.
Interim Financial Reportfor the period ended 30 June 2007
Consolidated income statement for the six months ended 30 June/three months ended 30 June
Three ThreeSix months Six months months months
ended ended ended ended30 June 30 June 30 June 30 June
2007 2006 2007 2006
(in millions of euros)Net interest income(4) . . . . . . . . . . . . . . . . . . . 4,594 4,311 2,356 2,166Net fee and commission income(5) . . . . . . . . . . 2,872 2,602 1,504 1,310Net trading income(6) . . . . . . . . . . . . . . . . . . . 1,940 1,477 939 654Results from financial transactions(7) . . . . . . . . 667 321 314 230Share of result in equity accounted
investments(18) . . . . . . . . . . . . . . . . . . . . . . 139 124 70 74Other operating income(8) . . . . . . . . . . . . . . . . 294 488 166 333Income of consolidated private equity
holdings(24) . . . . . . . . . . . . . . . . . . . . . . . . . 2,783 2,634 1,390 1,388
Operating income . . . . . . . . . . . . . . . . . . . . . 13,289 11,957 6,739 6,155
Personnel expenses(9) . . . . . . . . . . . . . . . . . . . 4,281 3,596 2,183 1,843General and administrative expenses . . . . . . . . 3,449 3,195 1,590 1,637Depreciation and amortisation . . . . . . . . . . . . . 626 564 294 289Goods and materials of consolidated private
equity holdings(24) . . . . . . . . . . . . . . . . . . . . 1,949 1,855 979 1,003
Operating expenses . . . . . . . . . . . . . . . . . . . 10,305 9,210 5,046 4,772Loan impairment and other credit risk
provisions(17) . . . . . . . . . . . . . . . . . . . . . . . . 886 720 483 400
Total expenses . . . . . . . . . . . . . . . . . . . . . . . 11,191 9,930 5,529 5,172
Operating profit before taxes . . . . . . . . . . . . 2,098 2,027 1,210 983Income tax expense(10) . . . . . . . . . . . . . . . . . . 432 348 264 70
Profit from continuing operations . . . . . . . . . 1,666 1,679 946 913Profit from discontinued operations net of
tax(11) . . . . . . . . . . . . . . . . . . . . . . . . . . . . . 554 573 210 301
Profit for the period . . . . . . . . . . . . . . . . . . . 2,220 2,252 1,156 1,214
Attributable to:Shareholders of the parent company . . . . . . . . 2,165 2,219 1,130 1,216Minority interests . . . . . . . . . . . . . . . . . . . . . . 55 33 26 (2)
Earnings per share attributable to theshareholders of the parent company(in euros)(12)
From continuing operationsBasic . . . . . . . . . . . . . . . . . . . . . . . . . . . . . . 0.87 0.88 0.50 0.49Diluted . . . . . . . . . . . . . . . . . . . . . . . . . . . . . 0.86 0.88 0.50 0.49From continuing and discontinued operationsBasic . . . . . . . . . . . . . . . . . . . . . . . . . . . . . . 1.17 1.18 0.61 0.65Diluted . . . . . . . . . . . . . . . . . . . . . . . . . . . . . 1.16 1.18 0.61 0.64
Numbers stated against items refer to the notes.
90
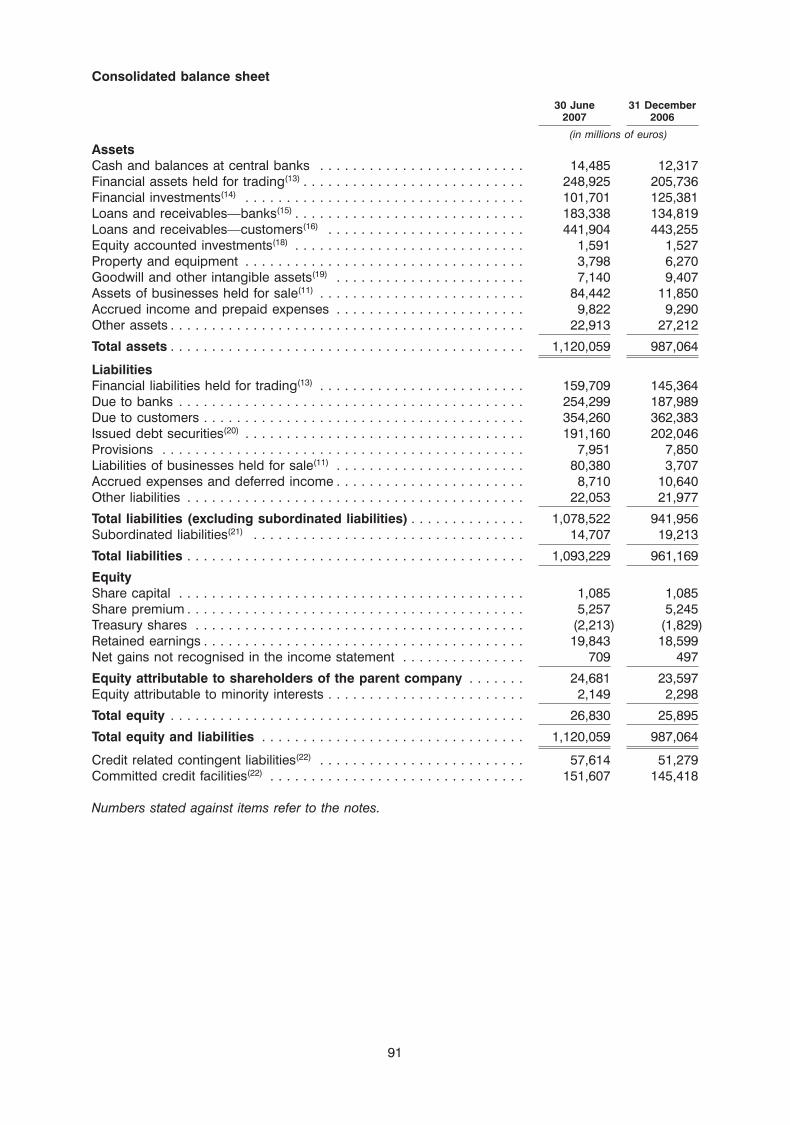
Consolidated balance sheet
30 June 31 December2007 2006
(in millions of euros)AssetsCash and balances at central banks . . . . . . . . . . . . . . . . . . . . . . . . . 14,485 12,317Financial assets held for trading(13) . . . . . . . . . . . . . . . . . . . . . . . . . . . 248,925 205,736Financial investments(14) . . . . . . . . . . . . . . . . . . . . . . . . . . . . . . . . . . 101,701 125,381Loans and receivables—banks(15) . . . . . . . . . . . . . . . . . . . . . . . . . . . . 183,338 134,819Loans and receivables—customers(16) . . . . . . . . . . . . . . . . . . . . . . . . 441,904 443,255Equity accounted investments(18) . . . . . . . . . . . . . . . . . . . . . . . . . . . . 1,591 1,527Property and equipment . . . . . . . . . . . . . . . . . . . . . . . . . . . . . . . . . . 3,798 6,270Goodwill and other intangible assets(19) . . . . . . . . . . . . . . . . . . . . . . . 7,140 9,407Assets of businesses held for sale(11) . . . . . . . . . . . . . . . . . . . . . . . . . 84,442 11,850Accrued income and prepaid expenses . . . . . . . . . . . . . . . . . . . . . . . 9,822 9,290Other assets . . . . . . . . . . . . . . . . . . . . . . . . . . . . . . . . . . . . . . . . . . . 22,913 27,212
Total assets . . . . . . . . . . . . . . . . . . . . . . . . . . . . . . . . . . . . . . . . . . . 1,120,059 987,064
LiabilitiesFinancial liabilities held for trading(13) . . . . . . . . . . . . . . . . . . . . . . . . . 159,709 145,364Due to banks . . . . . . . . . . . . . . . . . . . . . . . . . . . . . . . . . . . . . . . . . . 254,299 187,989Due to customers . . . . . . . . . . . . . . . . . . . . . . . . . . . . . . . . . . . . . . . 354,260 362,383Issued debt securities(20) . . . . . . . . . . . . . . . . . . . . . . . . . . . . . . . . . . 191,160 202,046Provisions . . . . . . . . . . . . . . . . . . . . . . . . . . . . . . . . . . . . . . . . . . . . 7,951 7,850Liabilities of businesses held for sale(11) . . . . . . . . . . . . . . . . . . . . . . . 80,380 3,707Accrued expenses and deferred income . . . . . . . . . . . . . . . . . . . . . . . 8,710 10,640Other liabilities . . . . . . . . . . . . . . . . . . . . . . . . . . . . . . . . . . . . . . . . . 22,053 21,977
Total liabilities (excluding subordinated liabilities) . . . . . . . . . . . . . . 1,078,522 941,956Subordinated liabilities(21) . . . . . . . . . . . . . . . . . . . . . . . . . . . . . . . . . 14,707 19,213
Total liabilities . . . . . . . . . . . . . . . . . . . . . . . . . . . . . . . . . . . . . . . . . 1,093,229 961,169
EquityShare capital . . . . . . . . . . . . . . . . . . . . . . . . . . . . . . . . . . . . . . . . . . 1,085 1,085Share premium . . . . . . . . . . . . . . . . . . . . . . . . . . . . . . . . . . . . . . . . . 5,257 5,245Treasury shares . . . . . . . . . . . . . . . . . . . . . . . . . . . . . . . . . . . . . . . . (2,213) (1,829)Retained earnings . . . . . . . . . . . . . . . . . . . . . . . . . . . . . . . . . . . . . . . 19,843 18,599Net gains not recognised in the income statement . . . . . . . . . . . . . . . 709 497
Equity attributable to shareholders of the parent company . . . . . . . 24,681 23,597Equity attributable to minority interests . . . . . . . . . . . . . . . . . . . . . . . . 2,149 2,298
Total equity . . . . . . . . . . . . . . . . . . . . . . . . . . . . . . . . . . . . . . . . . . . 26,830 25,895
Total equity and liabilities . . . . . . . . . . . . . . . . . . . . . . . . . . . . . . . . 1,120,059 987,064
Credit related contingent liabilities(22) . . . . . . . . . . . . . . . . . . . . . . . . . 57,614 51,279Committed credit facilities(22) . . . . . . . . . . . . . . . . . . . . . . . . . . . . . . . 151,607 145,418
Numbers stated against items refer to the notes.
91
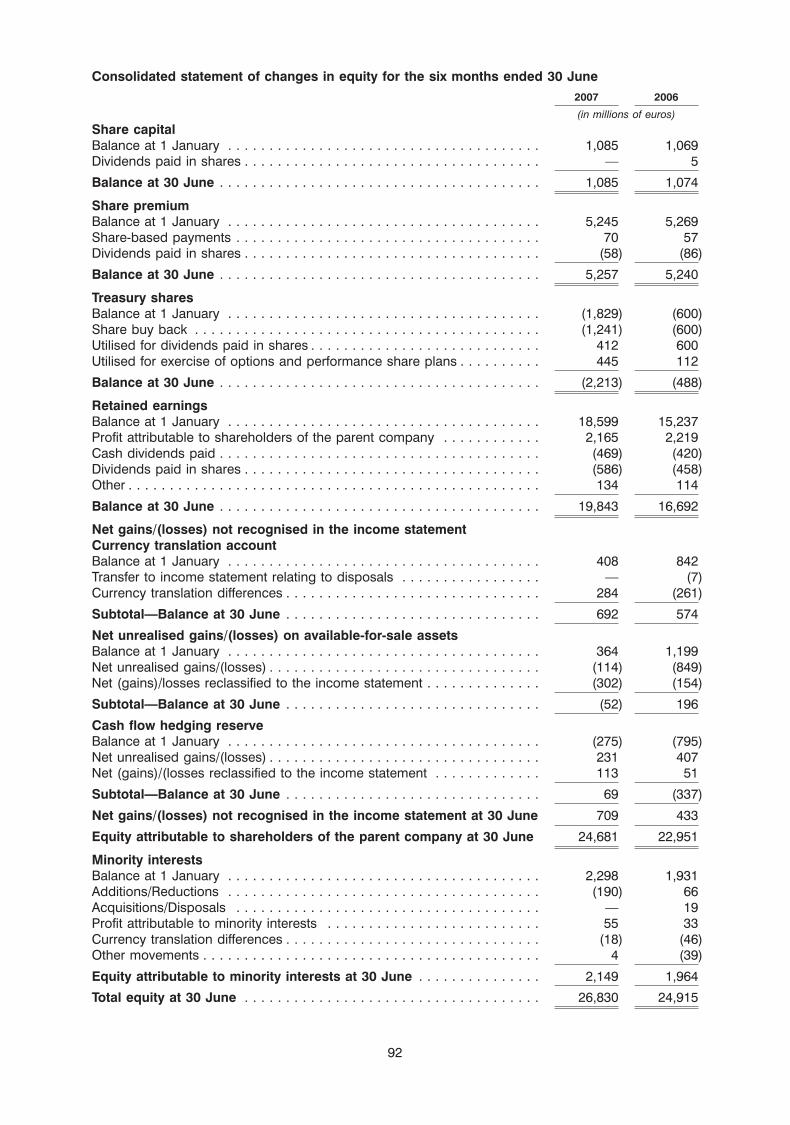
Consolidated statement of changes in equity for the six months ended 30 June2007 2006
(in millions of euros)Share capitalBalance at 1 January . . . . . . . . . . . . . . . . . . . . . . . . . . . . . . . . . . . . . . 1,085 1,069Dividends paid in shares . . . . . . . . . . . . . . . . . . . . . . . . . . . . . . . . . . . . — 5
Balance at 30 June . . . . . . . . . . . . . . . . . . . . . . . . . . . . . . . . . . . . . . . 1,085 1,074
Share premiumBalance at 1 January . . . . . . . . . . . . . . . . . . . . . . . . . . . . . . . . . . . . . . 5,245 5,269Share-based payments . . . . . . . . . . . . . . . . . . . . . . . . . . . . . . . . . . . . . 70 57Dividends paid in shares . . . . . . . . . . . . . . . . . . . . . . . . . . . . . . . . . . . . (58) (86)
Balance at 30 June . . . . . . . . . . . . . . . . . . . . . . . . . . . . . . . . . . . . . . . 5,257 5,240
Treasury sharesBalance at 1 January . . . . . . . . . . . . . . . . . . . . . . . . . . . . . . . . . . . . . . (1,829) (600)Share buy back . . . . . . . . . . . . . . . . . . . . . . . . . . . . . . . . . . . . . . . . . . (1,241) (600)Utilised for dividends paid in shares . . . . . . . . . . . . . . . . . . . . . . . . . . . . 412 600Utilised for exercise of options and performance share plans . . . . . . . . . . 445 112
Balance at 30 June . . . . . . . . . . . . . . . . . . . . . . . . . . . . . . . . . . . . . . . (2,213) (488)
Retained earningsBalance at 1 January . . . . . . . . . . . . . . . . . . . . . . . . . . . . . . . . . . . . . . 18,599 15,237Profit attributable to shareholders of the parent company . . . . . . . . . . . . 2,165 2,219Cash dividends paid . . . . . . . . . . . . . . . . . . . . . . . . . . . . . . . . . . . . . . . (469) (420)Dividends paid in shares . . . . . . . . . . . . . . . . . . . . . . . . . . . . . . . . . . . . (586) (458)Other . . . . . . . . . . . . . . . . . . . . . . . . . . . . . . . . . . . . . . . . . . . . . . . . . . 134 114
Balance at 30 June . . . . . . . . . . . . . . . . . . . . . . . . . . . . . . . . . . . . . . . 19,843 16,692
Net gains/(losses) not recognised in the income statementCurrency translation accountBalance at 1 January . . . . . . . . . . . . . . . . . . . . . . . . . . . . . . . . . . . . . . 408 842Transfer to income statement relating to disposals . . . . . . . . . . . . . . . . . — (7)Currency translation differences . . . . . . . . . . . . . . . . . . . . . . . . . . . . . . . 284 (261)
Subtotal—Balance at 30 June . . . . . . . . . . . . . . . . . . . . . . . . . . . . . . . 692 574
Net unrealised gains/(losses) on available-for-sale assetsBalance at 1 January . . . . . . . . . . . . . . . . . . . . . . . . . . . . . . . . . . . . . . 364 1,199Net unrealised gains/(losses) . . . . . . . . . . . . . . . . . . . . . . . . . . . . . . . . . (114) (849)Net (gains)/losses reclassified to the income statement . . . . . . . . . . . . . . (302) (154)
Subtotal—Balance at 30 June . . . . . . . . . . . . . . . . . . . . . . . . . . . . . . . (52) 196
Cash flow hedging reserveBalance at 1 January . . . . . . . . . . . . . . . . . . . . . . . . . . . . . . . . . . . . . . (275) (795)Net unrealised gains/(losses) . . . . . . . . . . . . . . . . . . . . . . . . . . . . . . . . . 231 407Net (gains)/(losses reclassified to the income statement . . . . . . . . . . . . . 113 51
Subtotal—Balance at 30 June . . . . . . . . . . . . . . . . . . . . . . . . . . . . . . . 69 (337)
Net gains/(losses) not recognised in the income statement at 30 June 709 433
Equity attributable to shareholders of the parent company at 30 June 24,681 22,951
Minority interestsBalance at 1 January . . . . . . . . . . . . . . . . . . . . . . . . . . . . . . . . . . . . . . 2,298 1,931Additions/Reductions . . . . . . . . . . . . . . . . . . . . . . . . . . . . . . . . . . . . . . (190) 66Acquisitions/Disposals . . . . . . . . . . . . . . . . . . . . . . . . . . . . . . . . . . . . . — 19Profit attributable to minority interests . . . . . . . . . . . . . . . . . . . . . . . . . . 55 33Currency translation differences . . . . . . . . . . . . . . . . . . . . . . . . . . . . . . . (18) (46)Other movements . . . . . . . . . . . . . . . . . . . . . . . . . . . . . . . . . . . . . . . . . 4 (39)
Equity attributable to minority interests at 30 June . . . . . . . . . . . . . . . 2,149 1,964
Total equity at 30 June . . . . . . . . . . . . . . . . . . . . . . . . . . . . . . . . . . . . 26,830 24,915
92
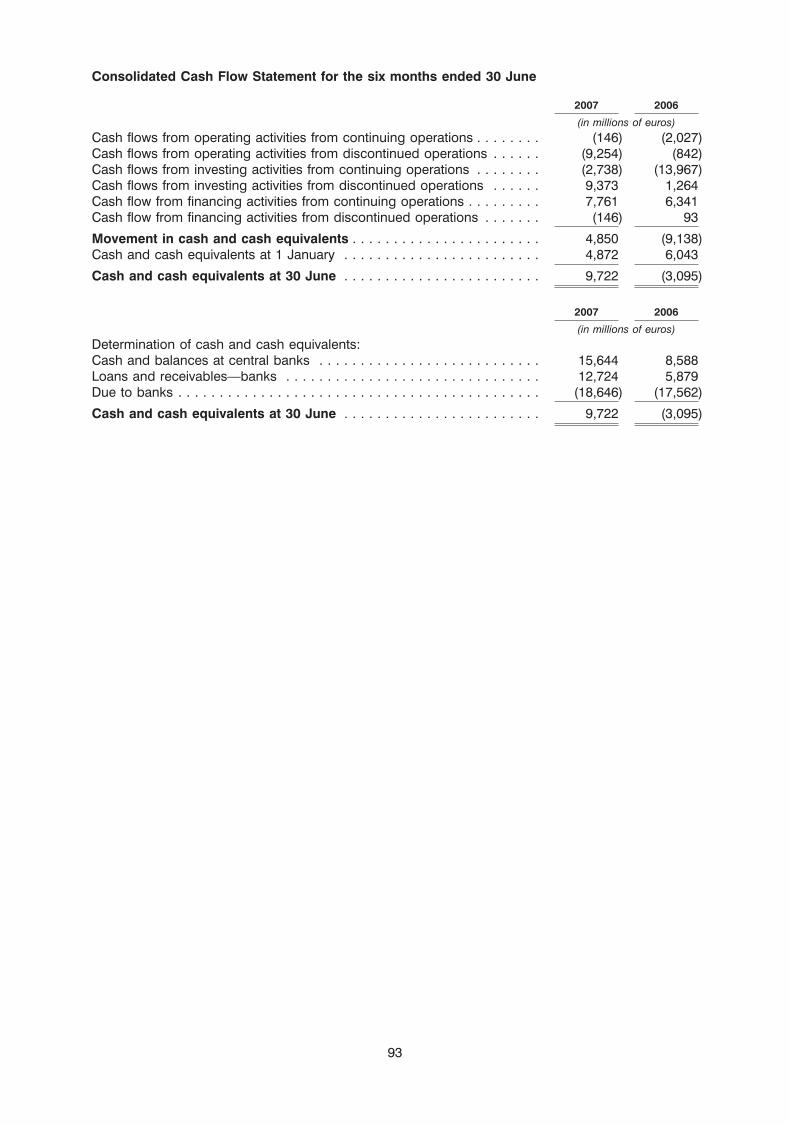
Consolidated Cash Flow Statement for the six months ended 30 June
2007 2006
(in millions of euros)Cash flows from operating activities from continuing operations . . . . . . . . (146) (2,027)Cash flows from operating activities from discontinued operations . . . . . . (9,254) (842)Cash flows from investing activities from continuing operations . . . . . . . . (2,738) (13,967)Cash flows from investing activities from discontinued operations . . . . . . 9,373 1,264Cash flow from financing activities from continuing operations . . . . . . . . . 7,761 6,341Cash flow from financing activities from discontinued operations . . . . . . . (146) 93
Movement in cash and cash equivalents . . . . . . . . . . . . . . . . . . . . . . . 4,850 (9,138)Cash and cash equivalents at 1 January . . . . . . . . . . . . . . . . . . . . . . . . 4,872 6,043
Cash and cash equivalents at 30 June . . . . . . . . . . . . . . . . . . . . . . . . 9,722 (3,095)
2007 2006
(in millions of euros)Determination of cash and cash equivalents:Cash and balances at central banks . . . . . . . . . . . . . . . . . . . . . . . . . . . 15,644 8,588Loans and receivables—banks . . . . . . . . . . . . . . . . . . . . . . . . . . . . . . . 12,724 5,879Due to banks . . . . . . . . . . . . . . . . . . . . . . . . . . . . . . . . . . . . . . . . . . . . (18,646) (17,562)
Cash and cash equivalents at 30 June . . . . . . . . . . . . . . . . . . . . . . . . 9,722 (3,095)
93
Notes to the Consolidated Income Statement and Balance Sheet(unless otherwise stated, all amounts are in millions of euros)
1 Basis of presentation
This interim financial report for the period ended 30 June 2007 is prepared in accordance with IAS 34 –Interim Financial Reporting. It does not include all of the information required for full annual financialstatements, and should be read in conjunction with the consolidated financial statements of ABN AMROHolding N.V. for the year ended 31 December 2006 as included in the Annual Report 2006. ABN AMRO’s2006 consolidated financial statements are prepared in accordance with International FinancialReporting Standards (‘‘IFRS’’) as adopted by the European Union (‘‘EU’’) and do not utilise the portfoliohedging carve out permitted by the EU. Accordingly, the accounting policies applied by the Groupcomply fully with IFRS. In preparing this interim financial report, the same accounting principles andmethods of computation are applied as in the consolidated financial statements for the year ended31 December 2006 except for the changes stated below. In the opinion of management, all adjustmentsnecessary for a fair presentation of the results of operations for the interim periods have been made. Thisinterim financial report is unaudited.
Changes in accounting policies
In the first quarter we have revised the presentation of interest income and expense related to tradingactivities. Trading book interest is no longer separated out and reported within the net interest incomeline, but in the net trading income line. Trading income now comprises gains and losses on financialinstruments held for trading, both realised and unrealised, interest income and dividends as well as therelated funding costs. The change in presentation reflects new guidance available in IFRS 7 FinancialInstruments: Disclosure which replaces the disclosure requirements previously included in IAS 32Financial Instruments: Presentation whereby the requirements to disclose interest data are nowrestricted to that relating to activities not held at fair value.
2 Developments
ABN AMRO North America Holding Company
On 22 April 2007, ABN AMRO entered into an agreement to sell ABN AMRO North America HoldingCompany, which principally consists of the retail and commercial banking activities of LaSalle BankCorporation (‘‘LaSalle’’) to Bank of America. ABN AMRO’s North American Asset Managementbusinesses and certain businesses within ABN AMRO’s North American Global Markets and GlobalClients operations do not form part of the sale. On 13 July 2007 the Supreme Court’s ruling confirmedmanagement’s view that no shareholder approval was required to execute the sale. The sale is expectedto close in the fourth quarter of 2007.
Under the sale and purchase agreement the sale price is USD 21 billion. In addition, the sale andpurchase agreement articulates that an amount of USD 6 billion of debt, on the basis of the US GAAPfinancial report of LaSalle, is converted into equity and that ABN AMRO is not entitled to a dividend inrespect of the 2007 results. If the cumulative US GAAP result of LaSalle for the period 1 April 2007 until31 December 2007 (or a proportion thereof if the transaction is settled before the year end), is less thanUSD 600 million, the sale price will be reduced with the difference.
The asset and liabilities of ABN AMRO North America Holding Company are presented as assets ofbusinesses held for sale and liabilities of businesses held for sale respectively. The net result of thesediscontinued operations for the period to 30 June 2007 is presented as profit from discontinuedoperations net of tax. For more details on the presentation of discontinued operations please refer tonote 11 of this interim financial report.
The transaction is expected to be settled in the fourth quarter. We currently estimate the gain on the saleto be in the range of EUR 7 billion to EUR 7.5 billion.
ABN AMRO Capital
During the quarter, ABN AMRO sold a majority of the shares of AAC Capital Holdings B.V., themanagement company of certain private equity investments held by the Group, to the executives of themanagement company. Also as part of the sale, the Bank transferred all power to govern the financialand operating policies of the management company and all investment decisions related to a significant
94
portion of the Group’s private equity investments (the Dutch, Nordic and UK business of ABN AMROCapital) resulting in the loss of control over these investments to a management company outside ofABN AMRO. The ownership of the underlying investments and therefore the economic interest in theinvestments has not changed. The loss of control over the management company resulted in theconcerned investments to no longer be consolidated in the financial statements of the Group. As of thedate of the transaction the investments are recognised and carried at fair value with changes throughincome. This transaction has resulted in a gain from financial transactions of EUR 108 million.
Update on status of US Department of Justice investigation
As previously disclosed, the United States Department of Justice has been conducting a criminalinvestigation into the Bank’s dollar clearing activities, OFAC compliance procedures and other BankSecrecy Act compliance matters. The Bank has cooperated and continues to cooperate fully with theinvestigation. Although no written agreement has yet been reached and negotiations are ongoing, theBank has reached an agreement in principle with the Department of Justice that would resolve allpresently known aspects of the ongoing investigation.
Under the terms of the agreement in principle, the Bank and the United States would enter into adeferred prosecution agreement relating to the issues that are the subject of the current criminalinvestigation. In the deferred prosecution agreement, the Bank would waive indictment and agree to thefiling of an information in the United States District Court charging it with certain violations of federal lawbased on information disclosed in an agreed factual statement. The Bank would also agree to continuecooperating in the United States’ ongoing investigation and to settle all known civil and criminal claimscurrently held by the United States for the sum of USD 500 million. The precise terms of the deferredprosecution agreement are still under negotiation.
In consideration for the foregoing provisions, as well as the Bank’s extensive remedial actions to dateand its willingness to demonstrate future good conduct and full compliance with all applicable federallaws, the United States would recommend to the United States District Court that the prosecution of theBank under the information be deferred for a fixed period. At the end of that fixed period, provided theBank is in full compliance with all of its obligations under the deferred prosecution agreement, the UnitedStates would seek dismissal with prejudice of the information filed against the Bank. The precise terms ofthe deferred prosecution agreement and agreed factual statement are still under negotiation.
Main acquisitions
Prime Bank Ltd (Pakistan)
On 5 March 2007 ABN AMRO entered into agreements to acquire a controlling interest of 93.4 per cent.in Prime Bank, Pakistan. Through the subsequent tender offer for all remaining shares of Prime Bank thatexpired on 29 March 2007 ABN AMRO obtained additional shares representing 2.8 per cent., bringingthe total stake in Prime Bank to 96.2 per cent. The transactions were closed on 5 April 2007. The totalconsideration paid amounts to EUR 176 million. The provisional goodwill arising from the acquisitionwas calculated at EUR 163 million.
The preliminary allocation of the purchase price to the assets acquired, including newly identifiableassets resulting from the acquisition, and (contingent) liabilities assumed, using their fair values at theacquisition date and the resulting goodwill is based on provisional fair values of assets acquired and(contingent) liabilities assumed, and may be adjusted during the period up to one year after acquisitionas more information is obtained about these fair values.
Private Equity
Major new buy-out investments in the second quarter in 2007 were:
• OyezStraker (UK, stationary and office suppliers).
• Dunlop Aircraft Tyres (UK, aircraft tyre manufacturer).
Major new buy-out investments in the first quarter 2007 were:
• Sdu (Netherlands, publishing).
• Baarsma Wine Group (Netherlands, wine distribution).
95
• Vetus den Ouden (Netherlands, nautical equipment).
• T.G.I. Friday’s Ltd. (UK, restaurants).
Main Disposals
Private Banking operations in Miami and Montevideo
In April 2007, BU Private Banking disposed of its operations in Miami and Montevideo. Banco Itau, aprivately owned bank with its headquarters in Sao Paulo, Brazil, acquired these operations through anauction process. The profit recognised on the sale, included in other operating income, amounted toEUR 72 million after tax.
ABN AMRO Mortgage Group, Inc.
On 28 February 2007 ABN AMRO closed the sale of ABN AMRO Mortgage Group, Inc., its US-basedresidential mortgage broker origination platform and servicing business, which includes ABN AMROMortgage Group, InterFirst and Mortgage.com, to Citigroup. Citigroup purchased approximatelyEUR 7.8 billion of net assets, of which approximately EUR 2.1 billion consist of ABN AMRO MortgageGroup’s mortgage servicing rights associated with its EUR 170 billion mortgage servicing portfolio. Theprofit on the sale amounted to EUR 93 million after tax and is included in Profit from discontinuedoperations net of tax (see note 11 for more details).
Private Equity
There were no major divestments in the second quarter 2007.
Major divestment in the first quarter 2007 was:
Holiday Park Ltd./Beach Equity Ltd. (UK, leisure).
3 Segment reporting
Segment information is presented in respect of the Group’s business. The primary presentation,business segments, is consistent with the Group’s management and internal reporting structureapplicable in the financial year.
Measurement of segment assets, liabilities, income and results is based on the Group’s accountingpolicies. Segment assets, liabilities, income and results include items directly attributable to a segmentas well as those that can be allocated on a reasonable basis. Transactions between segments areconducted at arm’s length.
As of 1 January 2007, the results of product BU Global Clients are being reported in the regional BUs.This has been done to further drive close cooperation and synergies between the product focusedBU Global Clients and the regions. In addition Asset Management France and the InternationalDiamonds and Jewelry Group have been transferred from BU Private Clients to BU Asset Managementand Group Functions respectively. The comparative segment figures of 2006 have been restated.
Business segments
Below the business segments are described. In the ‘‘Business review’’ chapter of the 2006 AnnualReport more detailed descriptions of the activities of these segments are included.
Netherlands
BU Netherlands serves a diverse client base that comprises consumer and commercial clients.BU Netherlands offers a broad range of investment, commercial and retail banking products andservices via its multi-channel service model consisting of a network of branches, internet bankingfacilities, a customer contact center and ATMs throughout the Netherlands. BU Netherlands focusesincreasingly on mass-affluent customers and commercial mid-market clients. BU Netherlands alsocomprises the ABN AMRO Mortgage Group including the former Bouwfonds mortgage activities.
96
Europe (including Antonveneta)
BU Europe provides its consumer and commercial clients with a range of financial products andservices. BU Europe combines activities in 27 countries: 23 countries in Europe (excluding theNetherlands) along with Kazakhstan, Uzbekistan, Egypt and South Africa.
Antonveneta is rooted in northeastern Italy, and focuses on consumer and commercial mid-marketclients.
North America
The core of BU North America is LaSalle Bank, headquartered in Chicago, Illinois. BU North Americaserves a large number of clients, including small businesses, mid-market companies, larger corporates,institutions, non-profit entities and municipalities in the US and Canada. BU North America offers a broadrange of investment, commercial and retail banking products and services through a network ofbranches and ATMs in Illinois, Michigan and Indiana. BU North America focuses increasingly onmass-affluent customers and commercial mid-market clients. While based in the US Midwest, BU NorthAmerica reaches further through an expanding network of regional commercial banking offices acrossthe US. The activities of ABN AMRO Mortgage Group, Inc. were sold in the first quarter of 2007.
On 22 April 2007, ABN AMRO entered into an agreement to sell ABN AMRO North America HoldingCompany, which principally consists of the retail and commercial banking activities of LaSalle BankCorporation (‘‘LaSalle’’) to Bank of America. For further disclosure on this sale please refer to note 2 andnote 11 of this interim financial report.
Latin America
BU Latin America has a presence in nine Latin American countries: Brazil, Argentina, Chile, Colombia,Ecuador, Mexico, Paraguay, Uruguay and Venezuela, with the presence of Banco Real representing themajority of the operations. In Brazil, Banco Real is a retail and commercial bank, offering full retail,corporate and investment banking products and services. It operates as a universal bank offeringfinancial services through an extensive network of branches, points-of-sale and ATMs. BU Latin Americaalso has a strong presence in the Brazilian consumer finance business through its Aymore franchise,focused on vehicle and other consumer goods financing.
Asia
ABN AMRO has been operating for well over 100 years in several Asian countries including Indonesia,China, Singapore and Japan. BU Asia now covers 16 countries and territories and is extending itsbranches and offices network. BU Asia’s client base includes commercial clients as well as consumerand private banking clients.
Private Clients
BU Private Clients offers private banking services to wealthy individuals and institutions withEUR 1 million or more in net investable assets. In the past few years, BU Private Clients built up anonshore private banking network in continental Europe through organic growth in the Netherlands andFrance, and through the acquisition of Delbruck Bethmann Maffei in Germany and Bank Corluy inBelgium.
Asset Management
BU Asset Management is ABN AMRO’s global asset management business. BU Asset Managementoperates in 26 countries worldwide, offering investment products in all major regions and asset classes.Its products are distributed directly to institutional clients such as central banks, pension funds,insurance companies and leading charities. Funds for private investors are distributed throughABN AMRO’s consumer and private banking arms, as well as via third-party distributors such asinsurance companies and other banks. The institutional client business represents just over half of theassets managed by BU Asset Management. Consumer and third-party clients account for a further30 per cent., and the remainder is in discretionary portfolios managed for BU Private Clients.
97
Private Equity
The business model of ABN AMRO’s Private Equity unit—branded as ABN AMRO Capital—involvesproviding capital and expertise to non-listed companies in a variety of sectors. By obtaining, in mostcases, a majority stake, Private Equity gains the ability to influence the company’s growth strategy andincrease its profitability. It then aims to sell its shareholding at a profit after a number of years. PrivateEquity specialises in European mid-market buyouts, but also manages a portfolio of investments inAustralian buyouts, non-controlling and controlling shareholdings in small to medium sized Dutchcompanies (‘‘participaties’’), and dedicated media and telecom sector investments. It operates fromseven offices across Europe and Australia.
As a result of the sale of the majority of the shares in AAC Capital Holdings B.V. to the management of thiscompany, as described in note 2 of this interim financial report, the Group will only act as an investor forthese investments going forward and will no longer participate actively in the management of theacquired investments.
Group Functions
Group Functions provides guidance on ABN AMRO’s corporate strategy and supports theimplementation of the strategy in accordance with our Managing for Value methodology, CorporateValues and Business Principles. By aligning and uniting functions across ABN AMRO’s BUs andgeographical territories, Group Functions also facilitates Group-wide sharing of best practices,innovation and positioning to public authorities, and binds the bank together in both an operational andcultural sense.
Group Functions includes Group Asset and Liability Management, which manages an investment andderivatives portfolio in order to manage the liquidity and interest rate risks of the Group. Group Functionsalso holds the Group’s strategic investments, proprietary trading portfolio, the International Diamonds &Jewelry Group and records any related profits or losses.
98
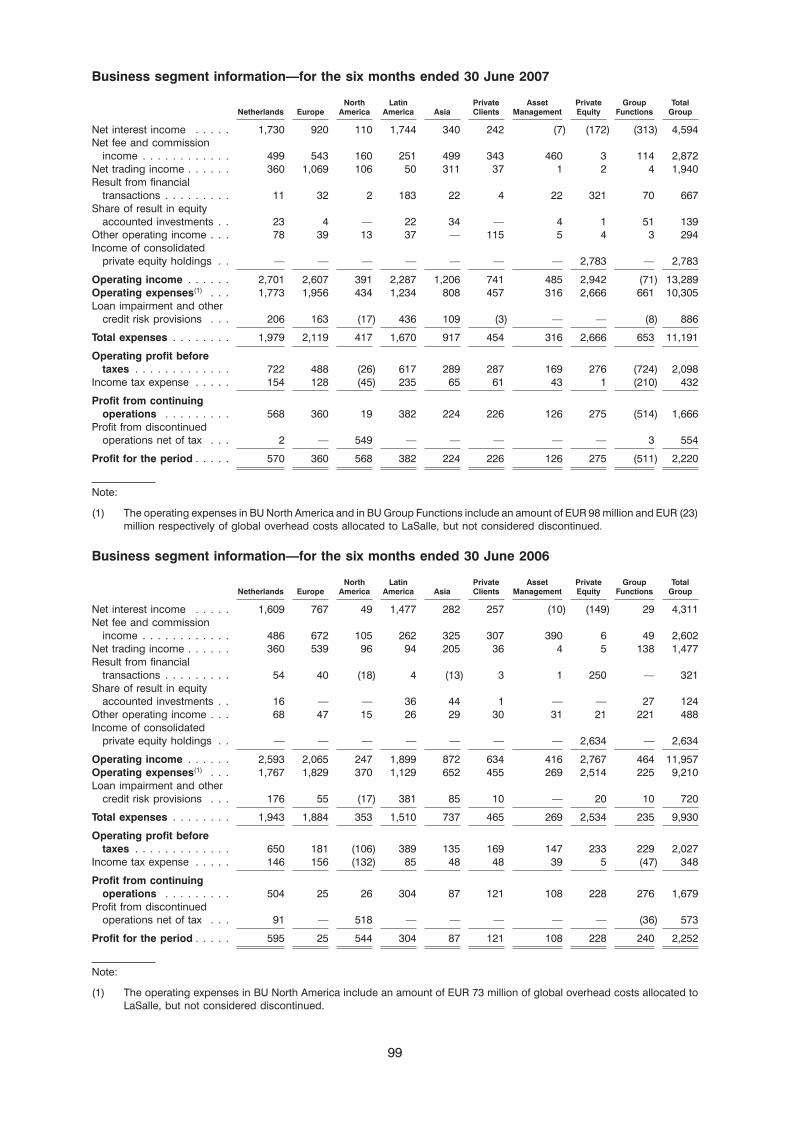
Business segment information—for the six months ended 30 June 2007
North Latin Private Asset Private Group TotalNetherlands Europe America America Asia Clients Management Equity Functions Group
Net interest income . . . . . 1,730 920 110 1,744 340 242 (7) (172) (313) 4,594Net fee and commission
income . . . . . . . . . . . . 499 543 160 251 499 343 460 3 114 2,872Net trading income . . . . . . 360 1,069 106 50 311 37 1 2 4 1,940Result from financial
transactions . . . . . . . . . 11 32 2 183 22 4 22 321 70 667Share of result in equity
accounted investments . . 23 4 — 22 34 — 4 1 51 139Other operating income . . . 78 39 13 37 — 115 5 4 3 294Income of consolidated
private equity holdings . . — — — — — — — 2,783 — 2,783
Operating income . . . . . . 2,701 2,607 391 2,287 1,206 741 485 2,942 (71) 13,289Operating expenses(1) . . . 1,773 1,956 434 1,234 808 457 316 2,666 661 10,305Loan impairment and other
credit risk provisions . . . 206 163 (17) 436 109 (3) — — (8) 886
Total expenses . . . . . . . . 1,979 2,119 417 1,670 917 454 316 2,666 653 11,191
Operating profit beforetaxes . . . . . . . . . . . . . 722 488 (26) 617 289 287 169 276 (724) 2,098
Income tax expense . . . . . 154 128 (45) 235 65 61 43 1 (210) 432
Profit from continuingoperations . . . . . . . . . 568 360 19 382 224 226 126 275 (514) 1,666
Profit from discontinuedoperations net of tax . . . 2 — 549 — — — — — 3 554
Profit for the period . . . . . 570 360 568 382 224 226 126 275 (511) 2,220
Note:
(1) The operating expenses in BU North America and in BU Group Functions include an amount of EUR 98 million and EUR (23)million respectively of global overhead costs allocated to LaSalle, but not considered discontinued.
Business segment information—for the six months ended 30 June 2006
North Latin Private Asset Private Group TotalNetherlands Europe America America Asia Clients Management Equity Functions Group
Net interest income . . . . . 1,609 767 49 1,477 282 257 (10) (149) 29 4,311Net fee and commission
income . . . . . . . . . . . . 486 672 105 262 325 307 390 6 49 2,602Net trading income . . . . . . 360 539 96 94 205 36 4 5 138 1,477Result from financial
transactions . . . . . . . . . 54 40 (18) 4 (13) 3 1 250 — 321Share of result in equity
accounted investments . . 16 — — 36 44 1 — — 27 124Other operating income . . . 68 47 15 26 29 30 31 21 221 488Income of consolidated
private equity holdings . . — — — — — — — 2,634 — 2,634
Operating income . . . . . . 2,593 2,065 247 1,899 872 634 416 2,767 464 11,957Operating expenses(1) . . . 1,767 1,829 370 1,129 652 455 269 2,514 225 9,210Loan impairment and other
credit risk provisions . . . 176 55 (17) 381 85 10 — 20 10 720
Total expenses . . . . . . . . 1,943 1,884 353 1,510 737 465 269 2,534 235 9,930
Operating profit beforetaxes . . . . . . . . . . . . . 650 181 (106) 389 135 169 147 233 229 2,027
Income tax expense . . . . . 146 156 (132) 85 48 48 39 5 (47) 348
Profit from continuingoperations . . . . . . . . . 504 25 26 304 87 121 108 228 276 1,679
Profit from discontinuedoperations net of tax . . . 91 — 518 — — — — — (36) 573
Profit for the period . . . . . 595 25 544 304 87 121 108 228 240 2,252
Note:
(1) The operating expenses in BU North America include an amount of EUR 73 million of global overhead costs allocated toLaSalle, but not considered discontinued.
99
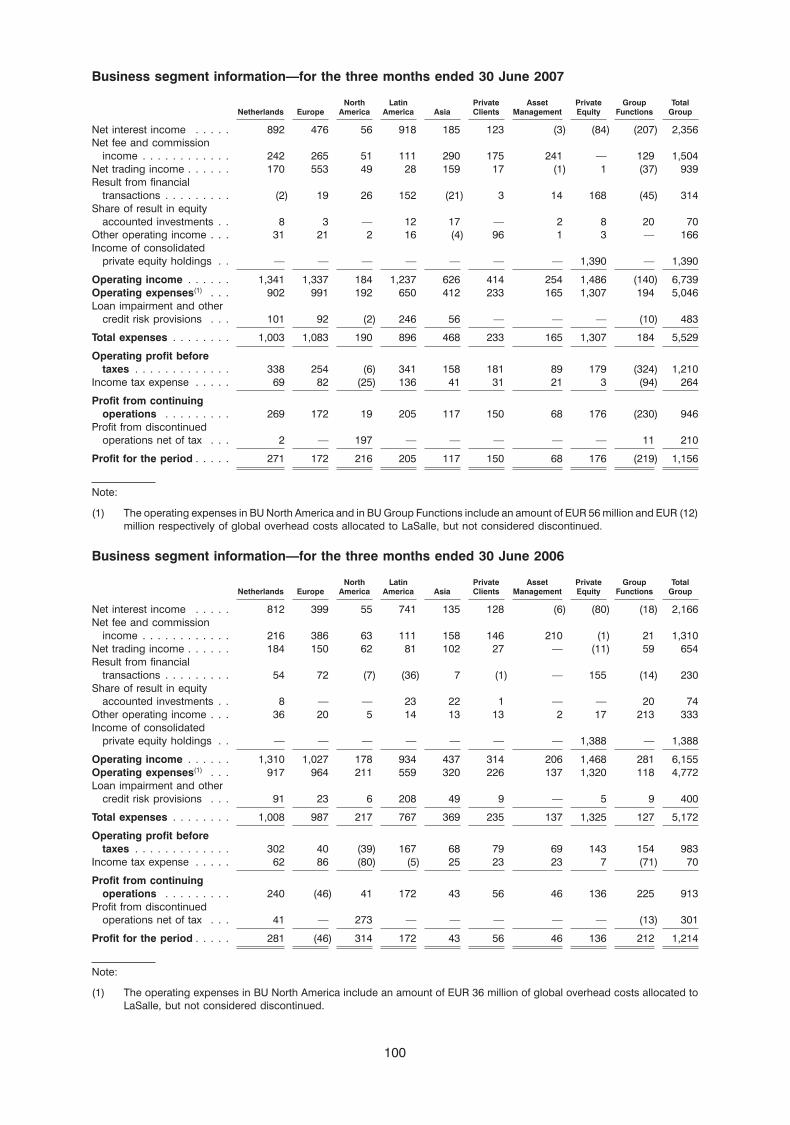
Business segment information—for the three months ended 30 June 2007
North Latin Private Asset Private Group TotalNetherlands Europe America America Asia Clients Management Equity Functions Group
Net interest income . . . . . 892 476 56 918 185 123 (3) (84) (207) 2,356Net fee and commission
income . . . . . . . . . . . . 242 265 51 111 290 175 241 — 129 1,504Net trading income . . . . . . 170 553 49 28 159 17 (1) 1 (37) 939Result from financial
transactions . . . . . . . . . (2) 19 26 152 (21) 3 14 168 (45) 314Share of result in equity
accounted investments . . 8 3 — 12 17 — 2 8 20 70Other operating income . . . 31 21 2 16 (4) 96 1 3 — 166Income of consolidated
private equity holdings . . — — — — — — — 1,390 — 1,390
Operating income . . . . . . 1,341 1,337 184 1,237 626 414 254 1,486 (140) 6,739Operating expenses(1) . . . 902 991 192 650 412 233 165 1,307 194 5,046Loan impairment and other
credit risk provisions . . . 101 92 (2) 246 56 — — — (10) 483
Total expenses . . . . . . . . 1,003 1,083 190 896 468 233 165 1,307 184 5,529
Operating profit beforetaxes . . . . . . . . . . . . . 338 254 (6) 341 158 181 89 179 (324) 1,210
Income tax expense . . . . . 69 82 (25) 136 41 31 21 3 (94) 264
Profit from continuingoperations . . . . . . . . . 269 172 19 205 117 150 68 176 (230) 946
Profit from discontinuedoperations net of tax . . . 2 — 197 — — — — — 11 210
Profit for the period . . . . . 271 172 216 205 117 150 68 176 (219) 1,156
Note:
(1) The operating expenses in BU North America and in BU Group Functions include an amount of EUR 56 million and EUR (12)million respectively of global overhead costs allocated to LaSalle, but not considered discontinued.
Business segment information—for the three months ended 30 June 2006
North Latin Private Asset Private Group TotalNetherlands Europe America America Asia Clients Management Equity Functions Group
Net interest income . . . . . 812 399 55 741 135 128 (6) (80) (18) 2,166Net fee and commission
income . . . . . . . . . . . . 216 386 63 111 158 146 210 (1) 21 1,310Net trading income . . . . . . 184 150 62 81 102 27 — (11) 59 654Result from financial
transactions . . . . . . . . . 54 72 (7) (36) 7 (1) — 155 (14) 230Share of result in equity
accounted investments . . 8 — — 23 22 1 — — 20 74Other operating income . . . 36 20 5 14 13 13 2 17 213 333Income of consolidated
private equity holdings . . — — — — — — — 1,388 — 1,388
Operating income . . . . . . 1,310 1,027 178 934 437 314 206 1,468 281 6,155Operating expenses(1) . . . 917 964 211 559 320 226 137 1,320 118 4,772Loan impairment and other
credit risk provisions . . . 91 23 6 208 49 9 — 5 9 400
Total expenses . . . . . . . . 1,008 987 217 767 369 235 137 1,325 127 5,172
Operating profit beforetaxes . . . . . . . . . . . . . 302 40 (39) 167 68 79 69 143 154 983
Income tax expense . . . . . 62 86 (80) (5) 25 23 23 7 (71) 70
Profit from continuingoperations . . . . . . . . . 240 (46) 41 172 43 56 46 136 225 913
Profit from discontinuedoperations net of tax . . . 41 — 273 — — — — — (13) 301
Profit for the period . . . . . 281 (46) 314 172 43 56 46 136 212 1,214
Note:
(1) The operating expenses in BU North America include an amount of EUR 36 million of global overhead costs allocated toLaSalle, but not considered discontinued.
100
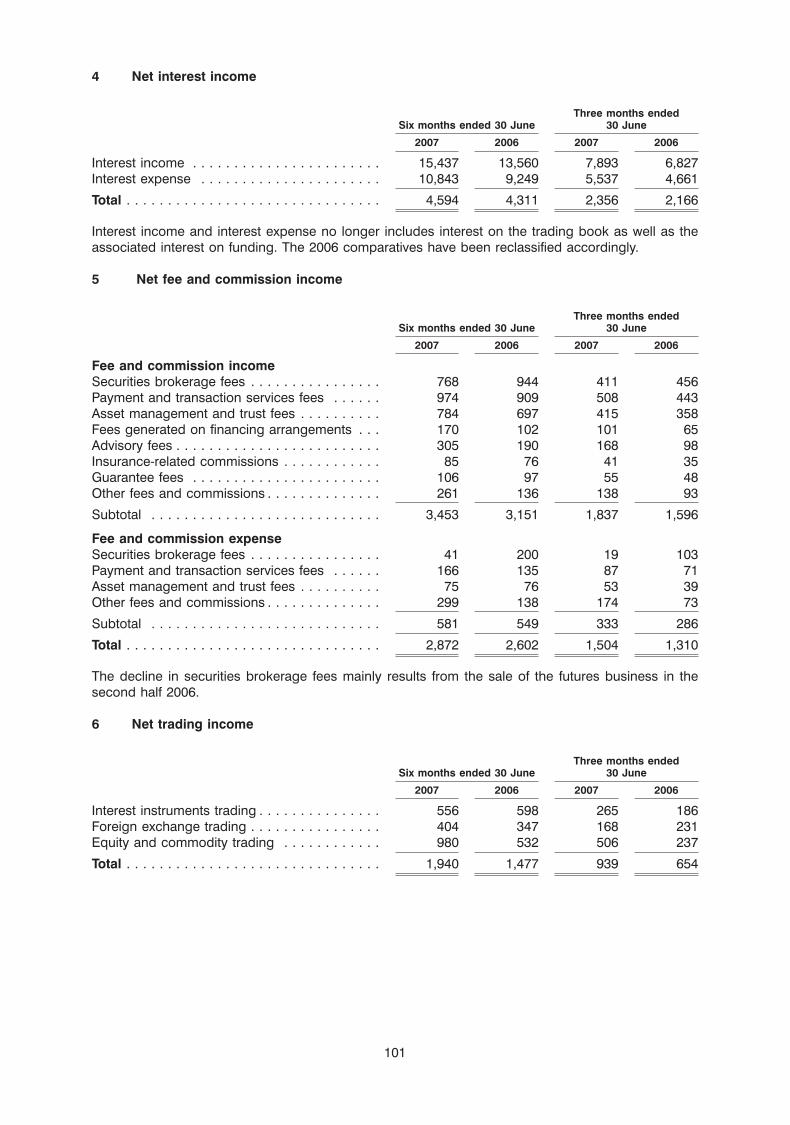
4 Net interest income
Three months endedSix months ended 30 June 30 June
2007 2006 2007 2006
Interest income . . . . . . . . . . . . . . . . . . . . . . . 15,437 13,560 7,893 6,827Interest expense . . . . . . . . . . . . . . . . . . . . . . 10,843 9,249 5,537 4,661
Total . . . . . . . . . . . . . . . . . . . . . . . . . . . . . . . 4,594 4,311 2,356 2,166
Interest income and interest expense no longer includes interest on the trading book as well as theassociated interest on funding. The 2006 comparatives have been reclassified accordingly.
5 Net fee and commission income
Three months endedSix months ended 30 June 30 June
2007 2006 2007 2006
Fee and commission incomeSecurities brokerage fees . . . . . . . . . . . . . . . . 768 944 411 456Payment and transaction services fees . . . . . . 974 909 508 443Asset management and trust fees . . . . . . . . . . 784 697 415 358Fees generated on financing arrangements . . . 170 102 101 65Advisory fees . . . . . . . . . . . . . . . . . . . . . . . . . 305 190 168 98Insurance-related commissions . . . . . . . . . . . . 85 76 41 35Guarantee fees . . . . . . . . . . . . . . . . . . . . . . . 106 97 55 48Other fees and commissions . . . . . . . . . . . . . . 261 136 138 93
Subtotal . . . . . . . . . . . . . . . . . . . . . . . . . . . . 3,453 3,151 1,837 1,596
Fee and commission expenseSecurities brokerage fees . . . . . . . . . . . . . . . . 41 200 19 103Payment and transaction services fees . . . . . . 166 135 87 71Asset management and trust fees . . . . . . . . . . 75 76 53 39Other fees and commissions . . . . . . . . . . . . . . 299 138 174 73
Subtotal . . . . . . . . . . . . . . . . . . . . . . . . . . . . 581 549 333 286
Total . . . . . . . . . . . . . . . . . . . . . . . . . . . . . . . 2,872 2,602 1,504 1,310
The decline in securities brokerage fees mainly results from the sale of the futures business in thesecond half 2006.
6 Net trading income
Three months endedSix months ended 30 June 30 June
2007 2006 2007 2006
Interest instruments trading . . . . . . . . . . . . . . . 556 598 265 186Foreign exchange trading . . . . . . . . . . . . . . . . 404 347 168 231Equity and commodity trading . . . . . . . . . . . . 980 532 506 237
Total . . . . . . . . . . . . . . . . . . . . . . . . . . . . . . . 1,940 1,477 939 654
101
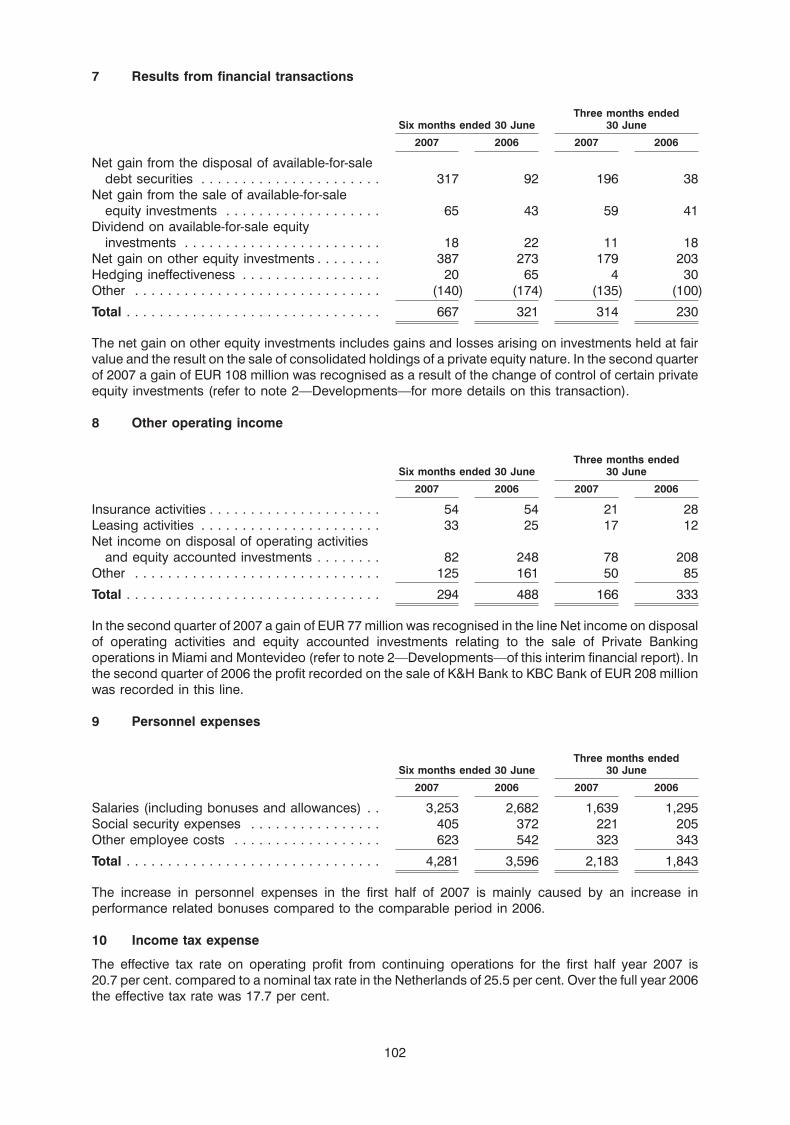
7 Results from financial transactions
Three months endedSix months ended 30 June 30 June
2007 2006 2007 2006
Net gain from the disposal of available-for-saledebt securities . . . . . . . . . . . . . . . . . . . . . . 317 92 196 38
Net gain from the sale of available-for-saleequity investments . . . . . . . . . . . . . . . . . . . 65 43 59 41
Dividend on available-for-sale equityinvestments . . . . . . . . . . . . . . . . . . . . . . . . 18 22 11 18
Net gain on other equity investments . . . . . . . . 387 273 179 203Hedging ineffectiveness . . . . . . . . . . . . . . . . . 20 65 4 30Other . . . . . . . . . . . . . . . . . . . . . . . . . . . . . . (140) (174) (135) (100)
Total . . . . . . . . . . . . . . . . . . . . . . . . . . . . . . . 667 321 314 230
The net gain on other equity investments includes gains and losses arising on investments held at fairvalue and the result on the sale of consolidated holdings of a private equity nature. In the second quarterof 2007 a gain of EUR 108 million was recognised as a result of the change of control of certain privateequity investments (refer to note 2—Developments—for more details on this transaction).
8 Other operating income
Three months endedSix months ended 30 June 30 June
2007 2006 2007 2006
Insurance activities . . . . . . . . . . . . . . . . . . . . . 54 54 21 28Leasing activities . . . . . . . . . . . . . . . . . . . . . . 33 25 17 12Net income on disposal of operating activities
and equity accounted investments . . . . . . . . 82 248 78 208Other . . . . . . . . . . . . . . . . . . . . . . . . . . . . . . 125 161 50 85
Total . . . . . . . . . . . . . . . . . . . . . . . . . . . . . . . 294 488 166 333
In the second quarter of 2007 a gain of EUR 77 million was recognised in the line Net income on disposalof operating activities and equity accounted investments relating to the sale of Private Bankingoperations in Miami and Montevideo (refer to note 2—Developments—of this interim financial report). Inthe second quarter of 2006 the profit recorded on the sale of K&H Bank to KBC Bank of EUR 208 millionwas recorded in this line.
9 Personnel expenses
Three months endedSix months ended 30 June 30 June
2007 2006 2007 2006
Salaries (including bonuses and allowances) . . 3,253 2,682 1,639 1,295Social security expenses . . . . . . . . . . . . . . . . 405 372 221 205Other employee costs . . . . . . . . . . . . . . . . . . 623 542 323 343
Total . . . . . . . . . . . . . . . . . . . . . . . . . . . . . . . 4,281 3,596 2,183 1,843
The increase in personnel expenses in the first half of 2007 is mainly caused by an increase inperformance related bonuses compared to the comparable period in 2006.
10 Income tax expense
The effective tax rate on operating profit from continuing operations for the first half year 2007 is20.7 per cent. compared to a nominal tax rate in the Netherlands of 25.5 per cent. Over the full year 2006the effective tax rate was 17.7 per cent.
102
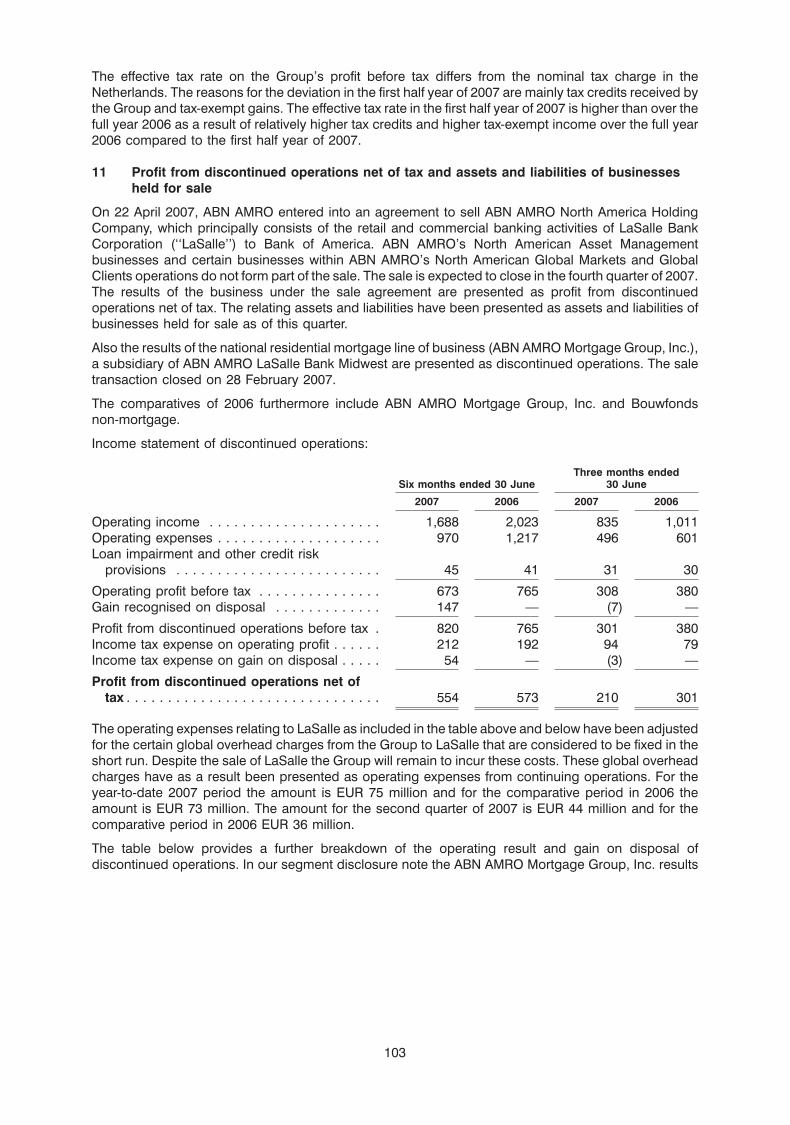
The effective tax rate on the Group’s profit before tax differs from the nominal tax charge in theNetherlands. The reasons for the deviation in the first half year of 2007 are mainly tax credits received bythe Group and tax-exempt gains. The effective tax rate in the first half year of 2007 is higher than over thefull year 2006 as a result of relatively higher tax credits and higher tax-exempt income over the full year2006 compared to the first half year of 2007.
11 Profit from discontinued operations net of tax and assets and liabilities of businessesheld for sale
On 22 April 2007, ABN AMRO entered into an agreement to sell ABN AMRO North America HoldingCompany, which principally consists of the retail and commercial banking activities of LaSalle BankCorporation (‘‘LaSalle’’) to Bank of America. ABN AMRO’s North American Asset Managementbusinesses and certain businesses within ABN AMRO’s North American Global Markets and GlobalClients operations do not form part of the sale. The sale is expected to close in the fourth quarter of 2007.The results of the business under the sale agreement are presented as profit from discontinuedoperations net of tax. The relating assets and liabilities have been presented as assets and liabilities ofbusinesses held for sale as of this quarter.
Also the results of the national residential mortgage line of business (ABN AMRO Mortgage Group, Inc.),a subsidiary of ABN AMRO LaSalle Bank Midwest are presented as discontinued operations. The saletransaction closed on 28 February 2007.
The comparatives of 2006 furthermore include ABN AMRO Mortgage Group, Inc. and Bouwfondsnon-mortgage.
Income statement of discontinued operations:
Three months endedSix months ended 30 June 30 June
2007 2006 2007 2006
Operating income . . . . . . . . . . . . . . . . . . . . . 1,688 2,023 835 1,011Operating expenses . . . . . . . . . . . . . . . . . . . . 970 1,217 496 601Loan impairment and other credit risk
provisions . . . . . . . . . . . . . . . . . . . . . . . . . 45 41 31 30
Operating profit before tax . . . . . . . . . . . . . . . 673 765 308 380Gain recognised on disposal . . . . . . . . . . . . . 147 — (7) —
Profit from discontinued operations before tax . 820 765 301 380Income tax expense on operating profit . . . . . . 212 192 94 79Income tax expense on gain on disposal . . . . . 54 — (3) —
Profit from discontinued operations net oftax . . . . . . . . . . . . . . . . . . . . . . . . . . . . . . . 554 573 210 301
The operating expenses relating to LaSalle as included in the table above and below have been adjustedfor the certain global overhead charges from the Group to LaSalle that are considered to be fixed in theshort run. Despite the sale of LaSalle the Group will remain to incur these costs. These global overheadcharges have as a result been presented as operating expenses from continuing operations. For theyear-to-date 2007 period the amount is EUR 75 million and for the comparative period in 2006 theamount is EUR 73 million. The amount for the second quarter of 2007 is EUR 44 million and for thecomparative period in 2006 EUR 36 million.
The table below provides a further breakdown of the operating result and gain on disposal ofdiscontinued operations. In our segment disclosure note the ABN AMRO Mortgage Group, Inc. results
103
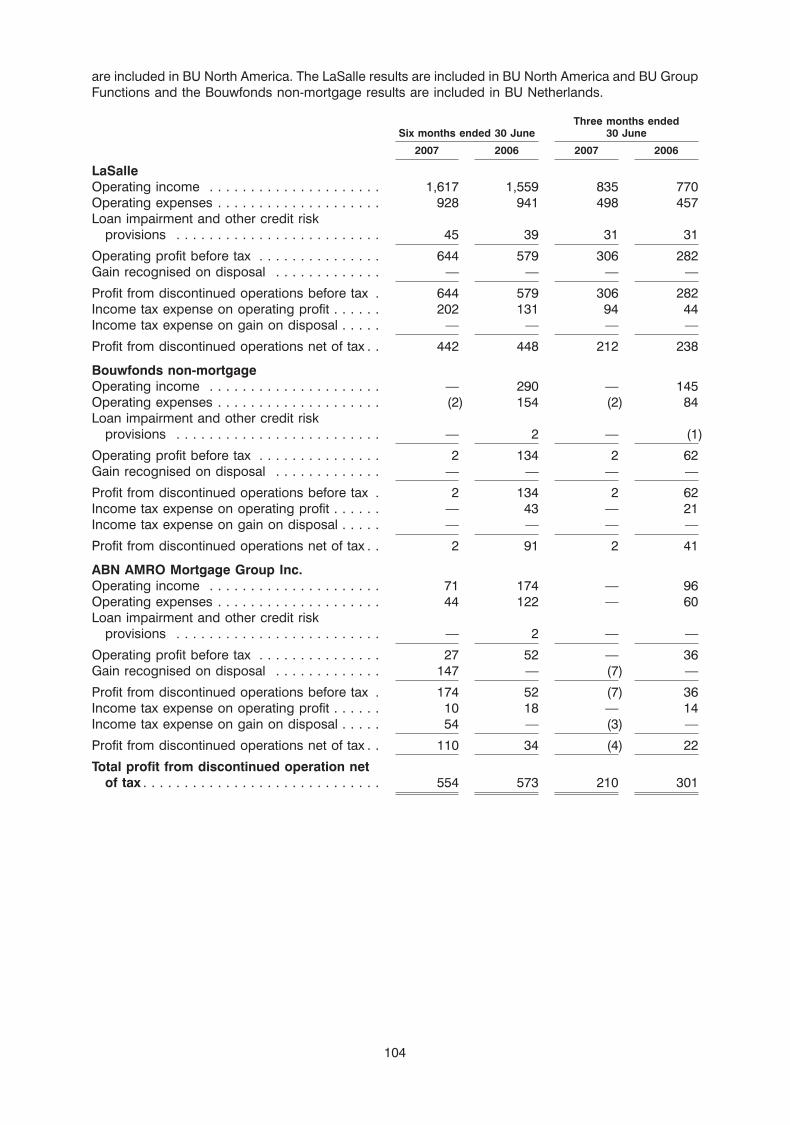
are included in BU North America. The LaSalle results are included in BU North America and BU GroupFunctions and the Bouwfonds non-mortgage results are included in BU Netherlands.
Three months endedSix months ended 30 June 30 June
2007 2006 2007 2006
LaSalleOperating income . . . . . . . . . . . . . . . . . . . . . 1,617 1,559 835 770Operating expenses . . . . . . . . . . . . . . . . . . . . 928 941 498 457Loan impairment and other credit risk
provisions . . . . . . . . . . . . . . . . . . . . . . . . . 45 39 31 31
Operating profit before tax . . . . . . . . . . . . . . . 644 579 306 282Gain recognised on disposal . . . . . . . . . . . . . — — — —
Profit from discontinued operations before tax . 644 579 306 282Income tax expense on operating profit . . . . . . 202 131 94 44Income tax expense on gain on disposal . . . . . — — — —
Profit from discontinued operations net of tax . . 442 448 212 238
Bouwfonds non-mortgageOperating income . . . . . . . . . . . . . . . . . . . . . — 290 — 145Operating expenses . . . . . . . . . . . . . . . . . . . . (2) 154 (2) 84Loan impairment and other credit risk
provisions . . . . . . . . . . . . . . . . . . . . . . . . . — 2 — (1)
Operating profit before tax . . . . . . . . . . . . . . . 2 134 2 62Gain recognised on disposal . . . . . . . . . . . . . — — — —
Profit from discontinued operations before tax . 2 134 2 62Income tax expense on operating profit . . . . . . — 43 — 21Income tax expense on gain on disposal . . . . . — — — —
Profit from discontinued operations net of tax . . 2 91 2 41
ABN AMRO Mortgage Group Inc.Operating income . . . . . . . . . . . . . . . . . . . . . 71 174 — 96Operating expenses . . . . . . . . . . . . . . . . . . . . 44 122 — 60Loan impairment and other credit risk
provisions . . . . . . . . . . . . . . . . . . . . . . . . . — 2 — —
Operating profit before tax . . . . . . . . . . . . . . . 27 52 — 36Gain recognised on disposal . . . . . . . . . . . . . 147 — (7) —
Profit from discontinued operations before tax . 174 52 (7) 36Income tax expense on operating profit . . . . . . 10 18 — 14Income tax expense on gain on disposal . . . . . 54 — (3) —
Profit from discontinued operations net of tax . . 110 34 (4) 22
Total profit from discontinued operation netof tax . . . . . . . . . . . . . . . . . . . . . . . . . . . . . 554 573 210 301
104
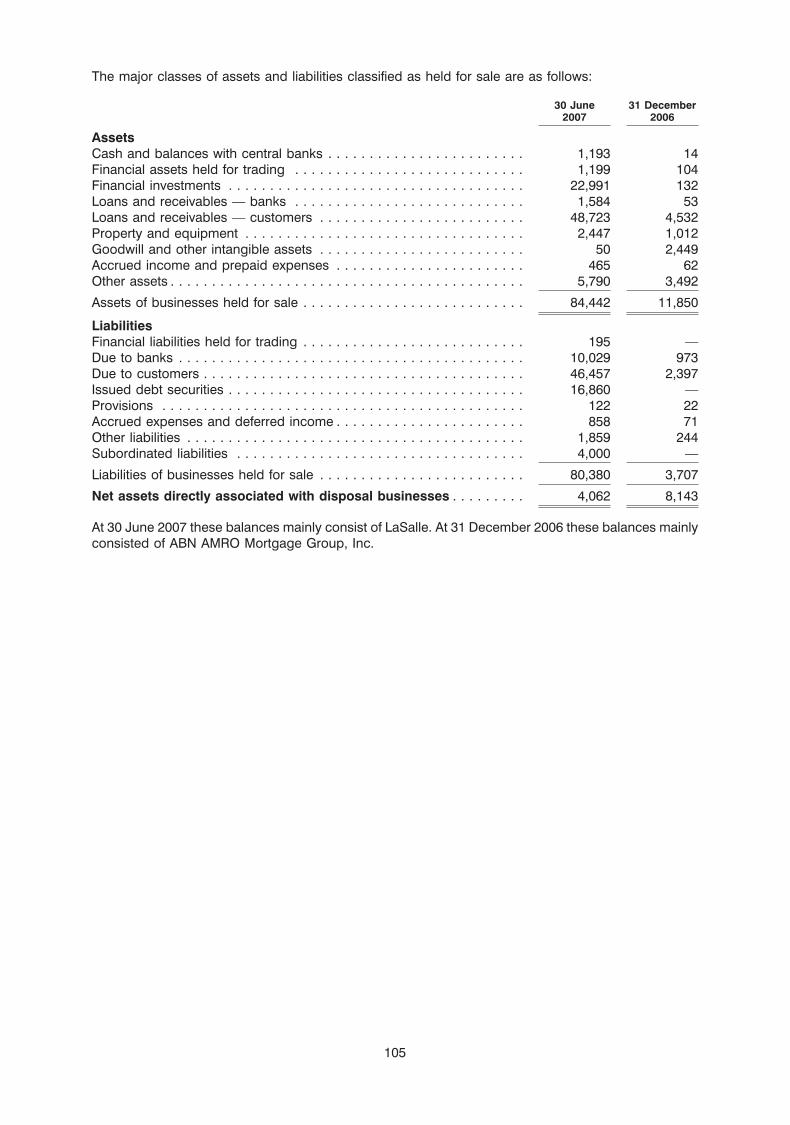
The major classes of assets and liabilities classified as held for sale are as follows:
30 June 31 December2007 2006
AssetsCash and balances with central banks . . . . . . . . . . . . . . . . . . . . . . . . 1,193 14Financial assets held for trading . . . . . . . . . . . . . . . . . . . . . . . . . . . . 1,199 104Financial investments . . . . . . . . . . . . . . . . . . . . . . . . . . . . . . . . . . . . 22,991 132Loans and receivables — banks . . . . . . . . . . . . . . . . . . . . . . . . . . . . 1,584 53Loans and receivables — customers . . . . . . . . . . . . . . . . . . . . . . . . . 48,723 4,532Property and equipment . . . . . . . . . . . . . . . . . . . . . . . . . . . . . . . . . . 2,447 1,012Goodwill and other intangible assets . . . . . . . . . . . . . . . . . . . . . . . . . 50 2,449Accrued income and prepaid expenses . . . . . . . . . . . . . . . . . . . . . . . 465 62Other assets . . . . . . . . . . . . . . . . . . . . . . . . . . . . . . . . . . . . . . . . . . . 5,790 3,492
Assets of businesses held for sale . . . . . . . . . . . . . . . . . . . . . . . . . . . 84,442 11,850
LiabilitiesFinancial liabilities held for trading . . . . . . . . . . . . . . . . . . . . . . . . . . . 195 —Due to banks . . . . . . . . . . . . . . . . . . . . . . . . . . . . . . . . . . . . . . . . . . 10,029 973Due to customers . . . . . . . . . . . . . . . . . . . . . . . . . . . . . . . . . . . . . . . 46,457 2,397Issued debt securities . . . . . . . . . . . . . . . . . . . . . . . . . . . . . . . . . . . . 16,860 —Provisions . . . . . . . . . . . . . . . . . . . . . . . . . . . . . . . . . . . . . . . . . . . . 122 22Accrued expenses and deferred income . . . . . . . . . . . . . . . . . . . . . . . 858 71Other liabilities . . . . . . . . . . . . . . . . . . . . . . . . . . . . . . . . . . . . . . . . . 1,859 244Subordinated liabilities . . . . . . . . . . . . . . . . . . . . . . . . . . . . . . . . . . . 4,000 —
Liabilities of businesses held for sale . . . . . . . . . . . . . . . . . . . . . . . . . 80,380 3,707
Net assets directly associated with disposal businesses . . . . . . . . . 4,062 8,143
At 30 June 2007 these balances mainly consist of LaSalle. At 31 December 2006 these balances mainlyconsisted of ABN AMRO Mortgage Group, Inc.
105
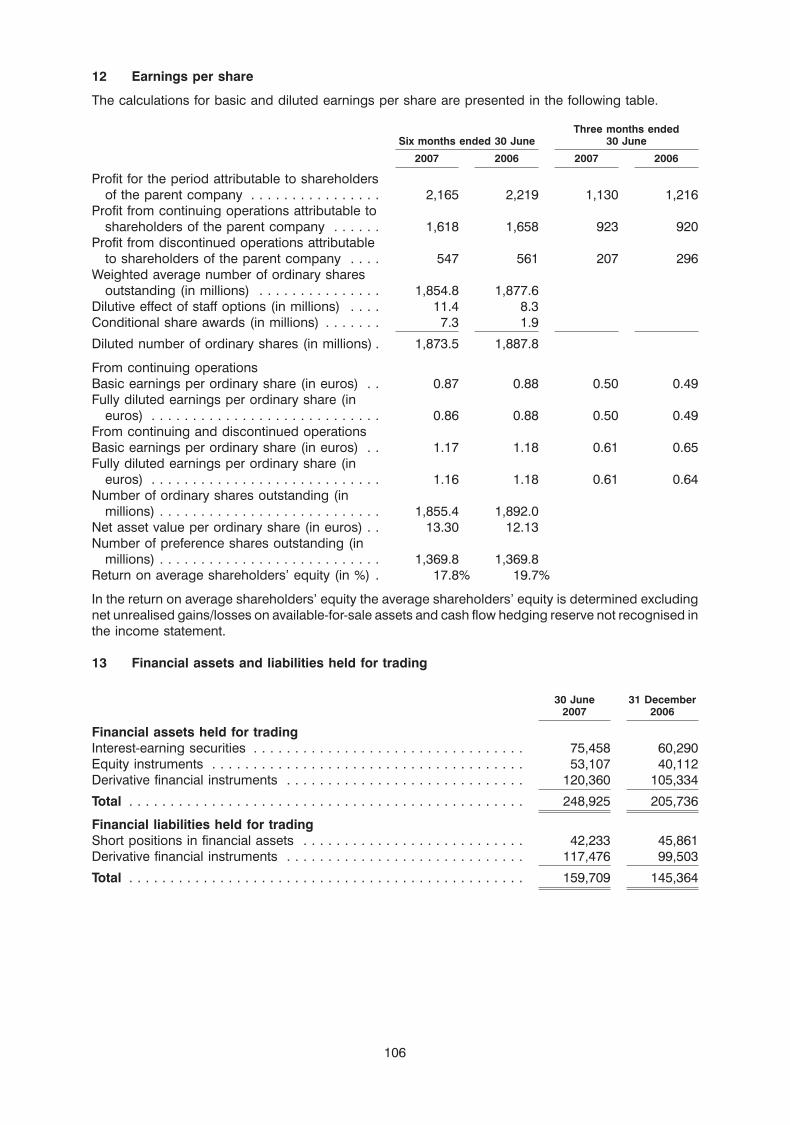
12 Earnings per share
The calculations for basic and diluted earnings per share are presented in the following table.
Three months endedSix months ended 30 June 30 June
2007 2006 2007 2006
Profit for the period attributable to shareholdersof the parent company . . . . . . . . . . . . . . . . 2,165 2,219 1,130 1,216
Profit from continuing operations attributable toshareholders of the parent company . . . . . . 1,618 1,658 923 920
Profit from discontinued operations attributableto shareholders of the parent company . . . . 547 561 207 296
Weighted average number of ordinary sharesoutstanding (in millions) . . . . . . . . . . . . . . . 1,854.8 1,877.6
Dilutive effect of staff options (in millions) . . . . 11.4 8.3Conditional share awards (in millions) . . . . . . . 7.3 1.9
Diluted number of ordinary shares (in millions) . 1,873.5 1,887.8
From continuing operationsBasic earnings per ordinary share (in euros) . . 0.87 0.88 0.50 0.49Fully diluted earnings per ordinary share (in
euros) . . . . . . . . . . . . . . . . . . . . . . . . . . . . 0.86 0.88 0.50 0.49From continuing and discontinued operationsBasic earnings per ordinary share (in euros) . . 1.17 1.18 0.61 0.65Fully diluted earnings per ordinary share (in
euros) . . . . . . . . . . . . . . . . . . . . . . . . . . . . 1.16 1.18 0.61 0.64Number of ordinary shares outstanding (in
millions) . . . . . . . . . . . . . . . . . . . . . . . . . . . 1,855.4 1,892.0Net asset value per ordinary share (in euros) . . 13.30 12.13Number of preference shares outstanding (in
millions) . . . . . . . . . . . . . . . . . . . . . . . . . . . 1,369.8 1,369.8Return on average shareholders’ equity (in %) . 17.8% 19.7%
In the return on average shareholders’ equity the average shareholders’ equity is determined excludingnet unrealised gains/losses on available-for-sale assets and cash flow hedging reserve not recognised inthe income statement.
13 Financial assets and liabilities held for trading
30 June 31 December2007 2006
Financial assets held for tradingInterest-earning securities . . . . . . . . . . . . . . . . . . . . . . . . . . . . . . . . . 75,458 60,290Equity instruments . . . . . . . . . . . . . . . . . . . . . . . . . . . . . . . . . . . . . . 53,107 40,112Derivative financial instruments . . . . . . . . . . . . . . . . . . . . . . . . . . . . . 120,360 105,334
Total . . . . . . . . . . . . . . . . . . . . . . . . . . . . . . . . . . . . . . . . . . . . . . . . 248,925 205,736
Financial liabilities held for tradingShort positions in financial assets . . . . . . . . . . . . . . . . . . . . . . . . . . . 42,233 45,861Derivative financial instruments . . . . . . . . . . . . . . . . . . . . . . . . . . . . . 117,476 99,503
Total . . . . . . . . . . . . . . . . . . . . . . . . . . . . . . . . . . . . . . . . . . . . . . . . 159,709 145,364
106
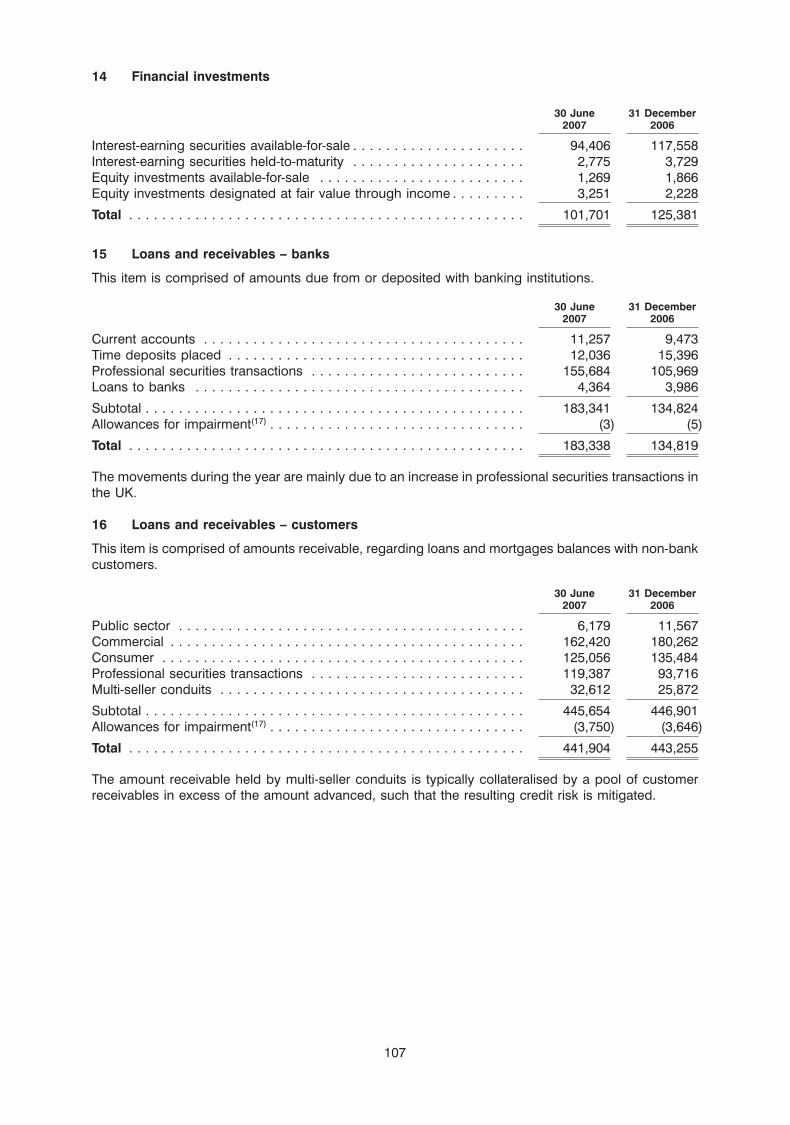
14 Financial investments
30 June 31 December2007 2006
Interest-earning securities available-for-sale . . . . . . . . . . . . . . . . . . . . . 94,406 117,558Interest-earning securities held-to-maturity . . . . . . . . . . . . . . . . . . . . . 2,775 3,729Equity investments available-for-sale . . . . . . . . . . . . . . . . . . . . . . . . . 1,269 1,866Equity investments designated at fair value through income . . . . . . . . . 3,251 2,228
Total . . . . . . . . . . . . . . . . . . . . . . . . . . . . . . . . . . . . . . . . . . . . . . . . 101,701 125,381
15 Loans and receivables – banks
This item is comprised of amounts due from or deposited with banking institutions.
30 June 31 December2007 2006
Current accounts . . . . . . . . . . . . . . . . . . . . . . . . . . . . . . . . . . . . . . . 11,257 9,473Time deposits placed . . . . . . . . . . . . . . . . . . . . . . . . . . . . . . . . . . . . 12,036 15,396Professional securities transactions . . . . . . . . . . . . . . . . . . . . . . . . . . 155,684 105,969Loans to banks . . . . . . . . . . . . . . . . . . . . . . . . . . . . . . . . . . . . . . . . 4,364 3,986
Subtotal . . . . . . . . . . . . . . . . . . . . . . . . . . . . . . . . . . . . . . . . . . . . . . 183,341 134,824Allowances for impairment(17) . . . . . . . . . . . . . . . . . . . . . . . . . . . . . . . (3) (5)
Total . . . . . . . . . . . . . . . . . . . . . . . . . . . . . . . . . . . . . . . . . . . . . . . . 183,338 134,819
The movements during the year are mainly due to an increase in professional securities transactions inthe UK.
16 Loans and receivables – customers
This item is comprised of amounts receivable, regarding loans and mortgages balances with non-bankcustomers.
30 June 31 December2007 2006
Public sector . . . . . . . . . . . . . . . . . . . . . . . . . . . . . . . . . . . . . . . . . . 6,179 11,567Commercial . . . . . . . . . . . . . . . . . . . . . . . . . . . . . . . . . . . . . . . . . . . 162,420 180,262Consumer . . . . . . . . . . . . . . . . . . . . . . . . . . . . . . . . . . . . . . . . . . . . 125,056 135,484Professional securities transactions . . . . . . . . . . . . . . . . . . . . . . . . . . 119,387 93,716Multi-seller conduits . . . . . . . . . . . . . . . . . . . . . . . . . . . . . . . . . . . . . 32,612 25,872
Subtotal . . . . . . . . . . . . . . . . . . . . . . . . . . . . . . . . . . . . . . . . . . . . . . 445,654 446,901Allowances for impairment(17) . . . . . . . . . . . . . . . . . . . . . . . . . . . . . . . (3,750) (3,646)
Total . . . . . . . . . . . . . . . . . . . . . . . . . . . . . . . . . . . . . . . . . . . . . . . . 441,904 443,255
The amount receivable held by multi-seller conduits is typically collateralised by a pool of customerreceivables in excess of the amount advanced, such that the resulting credit risk is mitigated.
107
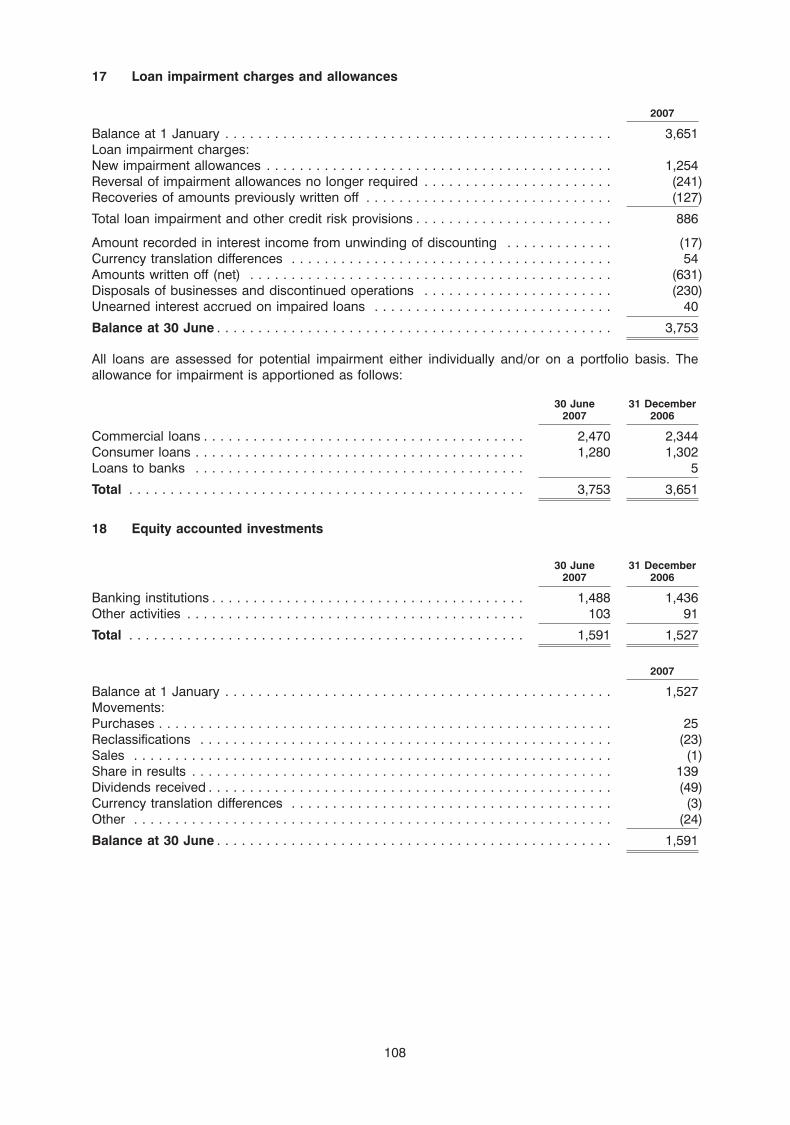
17 Loan impairment charges and allowances
2007
Balance at 1 January . . . . . . . . . . . . . . . . . . . . . . . . . . . . . . . . . . . . . . . . . . . . . . . 3,651Loan impairment charges:New impairment allowances . . . . . . . . . . . . . . . . . . . . . . . . . . . . . . . . . . . . . . . . . . 1,254Reversal of impairment allowances no longer required . . . . . . . . . . . . . . . . . . . . . . . (241)Recoveries of amounts previously written off . . . . . . . . . . . . . . . . . . . . . . . . . . . . . . (127)
Total loan impairment and other credit risk provisions . . . . . . . . . . . . . . . . . . . . . . . . 886
Amount recorded in interest income from unwinding of discounting . . . . . . . . . . . . . (17)Currency translation differences . . . . . . . . . . . . . . . . . . . . . . . . . . . . . . . . . . . . . . . 54Amounts written off (net) . . . . . . . . . . . . . . . . . . . . . . . . . . . . . . . . . . . . . . . . . . . . (631)Disposals of businesses and discontinued operations . . . . . . . . . . . . . . . . . . . . . . . (230)Unearned interest accrued on impaired loans . . . . . . . . . . . . . . . . . . . . . . . . . . . . . 40
Balance at 30 June . . . . . . . . . . . . . . . . . . . . . . . . . . . . . . . . . . . . . . . . . . . . . . . . 3,753
All loans are assessed for potential impairment either individually and/or on a portfolio basis. Theallowance for impairment is apportioned as follows:
30 June 31 December2007 2006
Commercial loans . . . . . . . . . . . . . . . . . . . . . . . . . . . . . . . . . . . . . . . 2,470 2,344Consumer loans . . . . . . . . . . . . . . . . . . . . . . . . . . . . . . . . . . . . . . . . 1,280 1,302Loans to banks . . . . . . . . . . . . . . . . . . . . . . . . . . . . . . . . . . . . . . . . 5
Total . . . . . . . . . . . . . . . . . . . . . . . . . . . . . . . . . . . . . . . . . . . . . . . . 3,753 3,651
18 Equity accounted investments
30 June 31 December2007 2006
Banking institutions . . . . . . . . . . . . . . . . . . . . . . . . . . . . . . . . . . . . . . 1,488 1,436Other activities . . . . . . . . . . . . . . . . . . . . . . . . . . . . . . . . . . . . . . . . . 103 91
Total . . . . . . . . . . . . . . . . . . . . . . . . . . . . . . . . . . . . . . . . . . . . . . . . 1,591 1,527
2007
Balance at 1 January . . . . . . . . . . . . . . . . . . . . . . . . . . . . . . . . . . . . . . . . . . . . . . . 1,527Movements:Purchases . . . . . . . . . . . . . . . . . . . . . . . . . . . . . . . . . . . . . . . . . . . . . . . . . . . . . . . 25Reclassifications . . . . . . . . . . . . . . . . . . . . . . . . . . . . . . . . . . . . . . . . . . . . . . . . . . (23)Sales . . . . . . . . . . . . . . . . . . . . . . . . . . . . . . . . . . . . . . . . . . . . . . . . . . . . . . . . . . (1)Share in results . . . . . . . . . . . . . . . . . . . . . . . . . . . . . . . . . . . . . . . . . . . . . . . . . . . 139Dividends received . . . . . . . . . . . . . . . . . . . . . . . . . . . . . . . . . . . . . . . . . . . . . . . . . (49)Currency translation differences . . . . . . . . . . . . . . . . . . . . . . . . . . . . . . . . . . . . . . . (3)Other . . . . . . . . . . . . . . . . . . . . . . . . . . . . . . . . . . . . . . . . . . . . . . . . . . . . . . . . . . (24)
Balance at 30 June . . . . . . . . . . . . . . . . . . . . . . . . . . . . . . . . . . . . . . . . . . . . . . . . 1,591
108
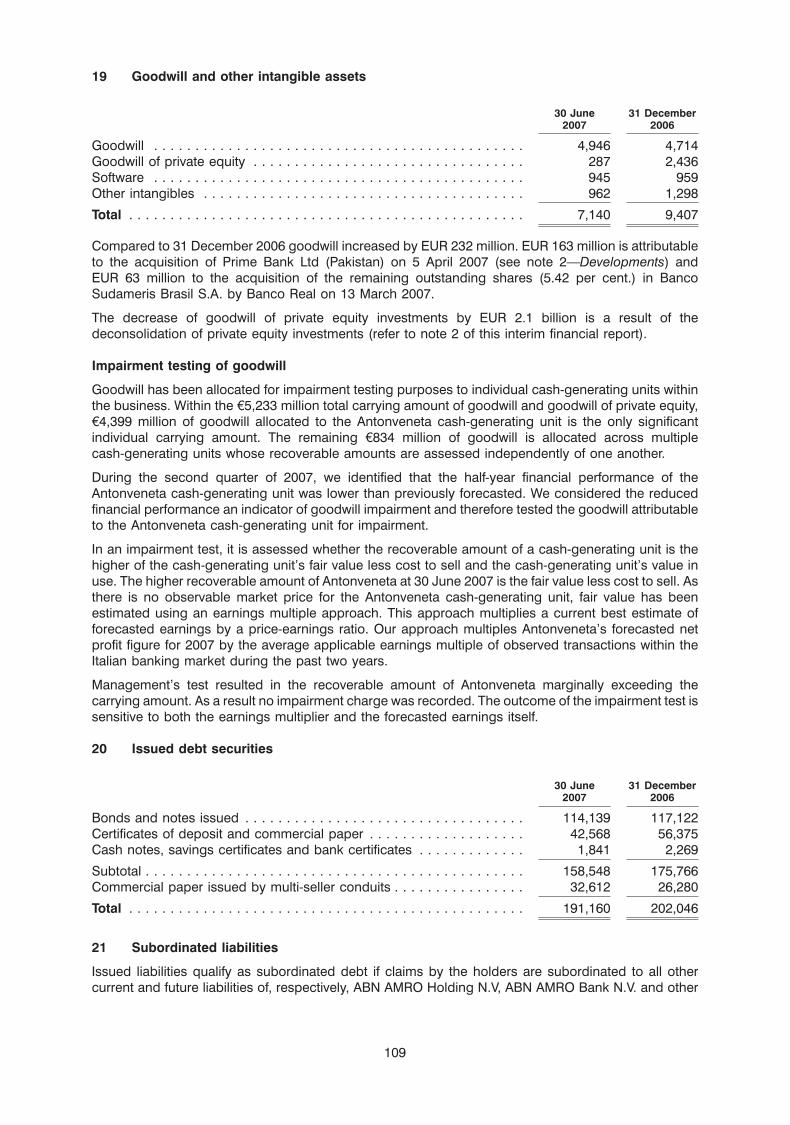
19 Goodwill and other intangible assets
30 June 31 December2007 2006
Goodwill . . . . . . . . . . . . . . . . . . . . . . . . . . . . . . . . . . . . . . . . . . . . . 4,946 4,714Goodwill of private equity . . . . . . . . . . . . . . . . . . . . . . . . . . . . . . . . . 287 2,436Software . . . . . . . . . . . . . . . . . . . . . . . . . . . . . . . . . . . . . . . . . . . . . 945 959Other intangibles . . . . . . . . . . . . . . . . . . . . . . . . . . . . . . . . . . . . . . . 962 1,298
Total . . . . . . . . . . . . . . . . . . . . . . . . . . . . . . . . . . . . . . . . . . . . . . . . 7,140 9,407
Compared to 31 December 2006 goodwill increased by EUR 232 million. EUR 163 million is attributableto the acquisition of Prime Bank Ltd (Pakistan) on 5 April 2007 (see note 2—Developments) andEUR 63 million to the acquisition of the remaining outstanding shares (5.42 per cent.) in BancoSudameris Brasil S.A. by Banco Real on 13 March 2007.
The decrease of goodwill of private equity investments by EUR 2.1 billion is a result of thedeconsolidation of private equity investments (refer to note 2 of this interim financial report).
Impairment testing of goodwill
Goodwill has been allocated for impairment testing purposes to individual cash-generating units withinthe business. Within the e5,233 million total carrying amount of goodwill and goodwill of private equity,e4,399 million of goodwill allocated to the Antonveneta cash-generating unit is the only significantindividual carrying amount. The remaining e834 million of goodwill is allocated across multiplecash-generating units whose recoverable amounts are assessed independently of one another.
During the second quarter of 2007, we identified that the half-year financial performance of theAntonveneta cash-generating unit was lower than previously forecasted. We considered the reducedfinancial performance an indicator of goodwill impairment and therefore tested the goodwill attributableto the Antonveneta cash-generating unit for impairment.
In an impairment test, it is assessed whether the recoverable amount of a cash-generating unit is thehigher of the cash-generating unit’s fair value less cost to sell and the cash-generating unit’s value inuse. The higher recoverable amount of Antonveneta at 30 June 2007 is the fair value less cost to sell. Asthere is no observable market price for the Antonveneta cash-generating unit, fair value has beenestimated using an earnings multiple approach. This approach multiplies a current best estimate offorecasted earnings by a price-earnings ratio. Our approach multiples Antonveneta’s forecasted netprofit figure for 2007 by the average applicable earnings multiple of observed transactions within theItalian banking market during the past two years.
Management’s test resulted in the recoverable amount of Antonveneta marginally exceeding thecarrying amount. As a result no impairment charge was recorded. The outcome of the impairment test issensitive to both the earnings multiplier and the forecasted earnings itself.
20 Issued debt securities
30 June 31 December2007 2006
Bonds and notes issued . . . . . . . . . . . . . . . . . . . . . . . . . . . . . . . . . . 114,139 117,122Certificates of deposit and commercial paper . . . . . . . . . . . . . . . . . . . 42,568 56,375Cash notes, savings certificates and bank certificates . . . . . . . . . . . . . 1,841 2,269
Subtotal . . . . . . . . . . . . . . . . . . . . . . . . . . . . . . . . . . . . . . . . . . . . . . 158,548 175,766Commercial paper issued by multi-seller conduits . . . . . . . . . . . . . . . . 32,612 26,280
Total . . . . . . . . . . . . . . . . . . . . . . . . . . . . . . . . . . . . . . . . . . . . . . . . 191,160 202,046
21 Subordinated liabilities
Issued liabilities qualify as subordinated debt if claims by the holders are subordinated to all othercurrent and future liabilities of, respectively, ABN AMRO Holding N.V, ABN AMRO Bank N.V. and other
109
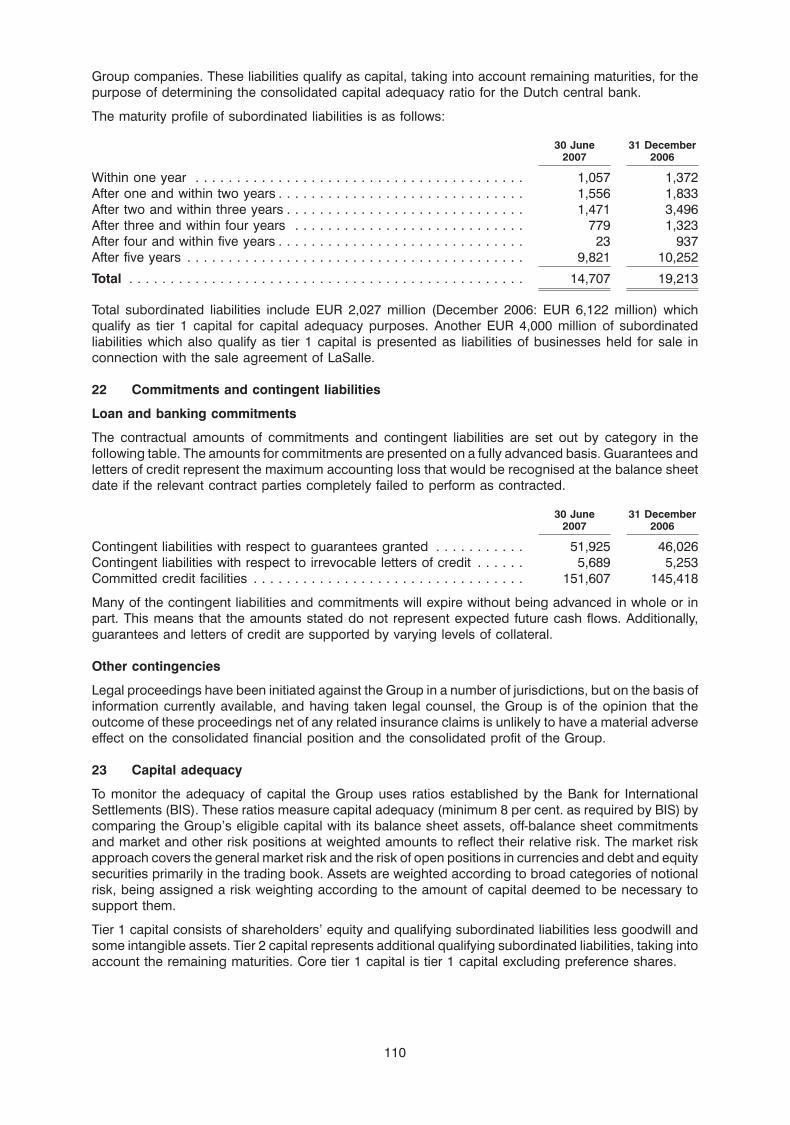
Group companies. These liabilities qualify as capital, taking into account remaining maturities, for thepurpose of determining the consolidated capital adequacy ratio for the Dutch central bank.
The maturity profile of subordinated liabilities is as follows:
30 June 31 December2007 2006
Within one year . . . . . . . . . . . . . . . . . . . . . . . . . . . . . . . . . . . . . . . . 1,057 1,372After one and within two years . . . . . . . . . . . . . . . . . . . . . . . . . . . . . . 1,556 1,833After two and within three years . . . . . . . . . . . . . . . . . . . . . . . . . . . . . 1,471 3,496After three and within four years . . . . . . . . . . . . . . . . . . . . . . . . . . . . 779 1,323After four and within five years . . . . . . . . . . . . . . . . . . . . . . . . . . . . . . 23 937After five years . . . . . . . . . . . . . . . . . . . . . . . . . . . . . . . . . . . . . . . . . 9,821 10,252
Total . . . . . . . . . . . . . . . . . . . . . . . . . . . . . . . . . . . . . . . . . . . . . . . . 14,707 19,213
Total subordinated liabilities include EUR 2,027 million (December 2006: EUR 6,122 million) whichqualify as tier 1 capital for capital adequacy purposes. Another EUR 4,000 million of subordinatedliabilities which also qualify as tier 1 capital is presented as liabilities of businesses held for sale inconnection with the sale agreement of LaSalle.
22 Commitments and contingent liabilities
Loan and banking commitments
The contractual amounts of commitments and contingent liabilities are set out by category in thefollowing table. The amounts for commitments are presented on a fully advanced basis. Guarantees andletters of credit represent the maximum accounting loss that would be recognised at the balance sheetdate if the relevant contract parties completely failed to perform as contracted.
30 June 31 December2007 2006
Contingent liabilities with respect to guarantees granted . . . . . . . . . . . 51,925 46,026Contingent liabilities with respect to irrevocable letters of credit . . . . . . 5,689 5,253Committed credit facilities . . . . . . . . . . . . . . . . . . . . . . . . . . . . . . . . . 151,607 145,418
Many of the contingent liabilities and commitments will expire without being advanced in whole or inpart. This means that the amounts stated do not represent expected future cash flows. Additionally,guarantees and letters of credit are supported by varying levels of collateral.
Other contingencies
Legal proceedings have been initiated against the Group in a number of jurisdictions, but on the basis ofinformation currently available, and having taken legal counsel, the Group is of the opinion that theoutcome of these proceedings net of any related insurance claims is unlikely to have a material adverseeffect on the consolidated financial position and the consolidated profit of the Group.
23 Capital adequacy
To monitor the adequacy of capital the Group uses ratios established by the Bank for InternationalSettlements (BIS). These ratios measure capital adequacy (minimum 8 per cent. as required by BIS) bycomparing the Group’s eligible capital with its balance sheet assets, off-balance sheet commitmentsand market and other risk positions at weighted amounts to reflect their relative risk. The market riskapproach covers the general market risk and the risk of open positions in currencies and debt and equitysecurities primarily in the trading book. Assets are weighted according to broad categories of notionalrisk, being assigned a risk weighting according to the amount of capital deemed to be necessary tosupport them.
Tier 1 capital consists of shareholders’ equity and qualifying subordinated liabilities less goodwill andsome intangible assets. Tier 2 capital represents additional qualifying subordinated liabilities, taking intoaccount the remaining maturities. Core tier 1 capital is tier 1 capital excluding preference shares.
110
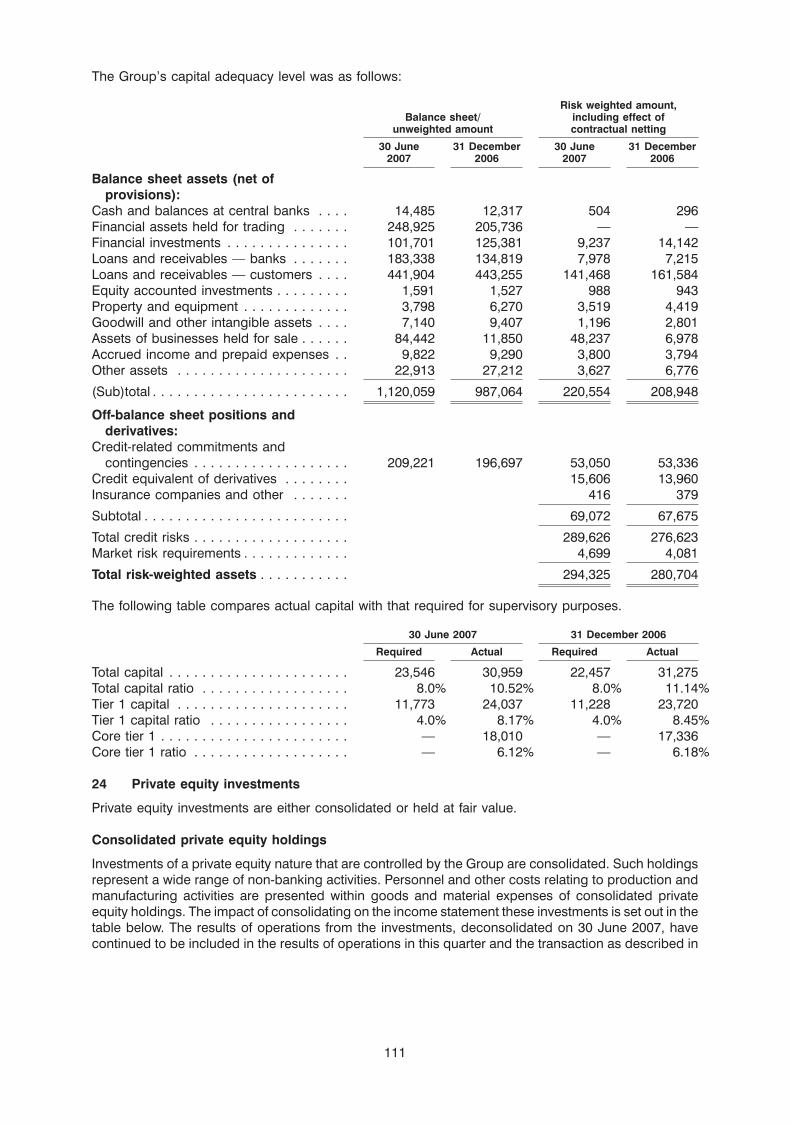
The Group’s capital adequacy level was as follows:
Risk weighted amount,including effect ofBalance sheet/contractual nettingunweighted amount
30 June 31 December 30 June 31 December2007 2006 2007 2006
Balance sheet assets (net ofprovisions):
Cash and balances at central banks . . . . 14,485 12,317 504 296Financial assets held for trading . . . . . . . 248,925 205,736 — —Financial investments . . . . . . . . . . . . . . . 101,701 125,381 9,237 14,142Loans and receivables — banks . . . . . . . 183,338 134,819 7,978 7,215Loans and receivables — customers . . . . 441,904 443,255 141,468 161,584Equity accounted investments . . . . . . . . . 1,591 1,527 988 943Property and equipment . . . . . . . . . . . . . 3,798 6,270 3,519 4,419Goodwill and other intangible assets . . . . 7,140 9,407 1,196 2,801Assets of businesses held for sale . . . . . . 84,442 11,850 48,237 6,978Accrued income and prepaid expenses . . 9,822 9,290 3,800 3,794Other assets . . . . . . . . . . . . . . . . . . . . . 22,913 27,212 3,627 6,776
(Sub)total . . . . . . . . . . . . . . . . . . . . . . . . 1,120,059 987,064 220,554 208,948
Off-balance sheet positions andderivatives:
Credit-related commitments andcontingencies . . . . . . . . . . . . . . . . . . . 209,221 196,697 53,050 53,336
Credit equivalent of derivatives . . . . . . . . 15,606 13,960Insurance companies and other . . . . . . . 416 379
Subtotal . . . . . . . . . . . . . . . . . . . . . . . . . 69,072 67,675
Total credit risks . . . . . . . . . . . . . . . . . . . 289,626 276,623Market risk requirements . . . . . . . . . . . . . 4,699 4,081
Total risk-weighted assets . . . . . . . . . . . 294,325 280,704
The following table compares actual capital with that required for supervisory purposes.
30 June 2007 31 December 2006
Required Actual Required Actual
Total capital . . . . . . . . . . . . . . . . . . . . . . 23,546 30,959 22,457 31,275Total capital ratio . . . . . . . . . . . . . . . . . . 8.0% 10.52% 8.0% 11.14%Tier 1 capital . . . . . . . . . . . . . . . . . . . . . 11,773 24,037 11,228 23,720Tier 1 capital ratio . . . . . . . . . . . . . . . . . 4.0% 8.17% 4.0% 8.45%Core tier 1 . . . . . . . . . . . . . . . . . . . . . . . — 18,010 — 17,336Core tier 1 ratio . . . . . . . . . . . . . . . . . . . — 6.12% — 6.18%
24 Private equity investments
Private equity investments are either consolidated or held at fair value.
Consolidated private equity holdings
Investments of a private equity nature that are controlled by the Group are consolidated. Such holdingsrepresent a wide range of non-banking activities. Personnel and other costs relating to production andmanufacturing activities are presented within goods and material expenses of consolidated privateequity holdings. The impact of consolidating on the income statement these investments is set out in thetable below. The results of operations from the investments, deconsolidated on 30 June 2007, havecontinued to be included in the results of operations in this quarter and the transaction as described in
111
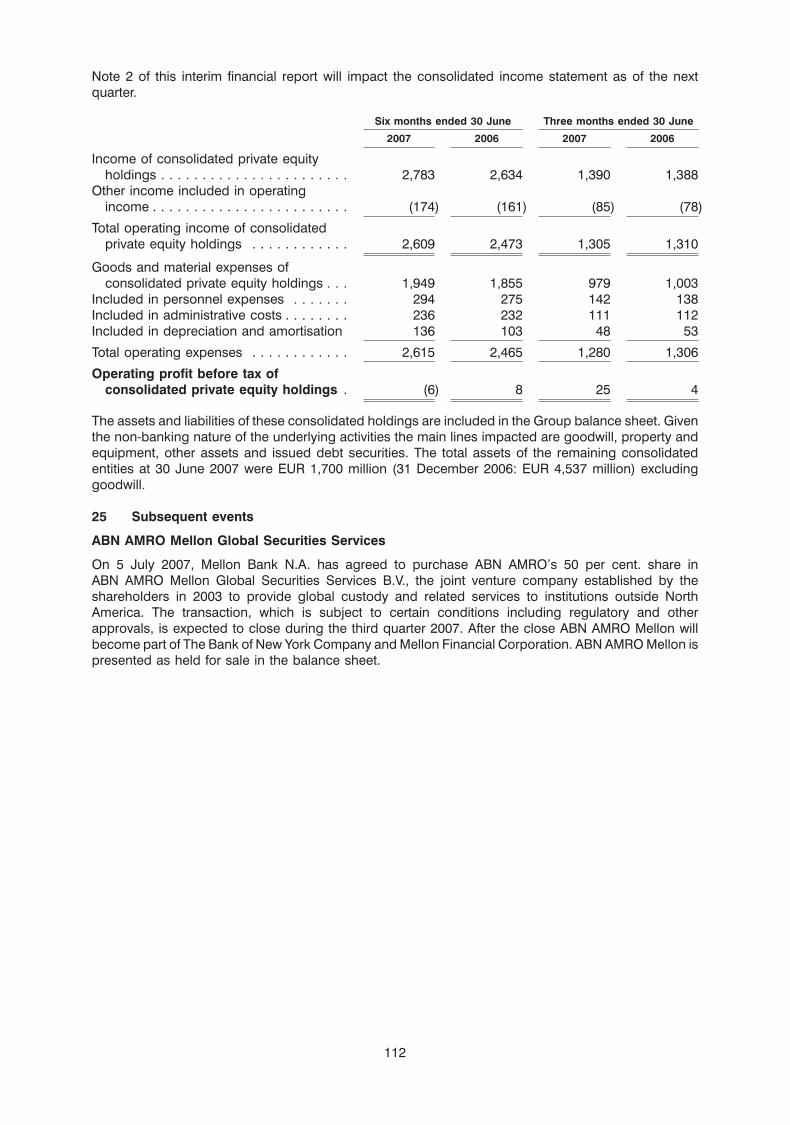
Note 2 of this interim financial report will impact the consolidated income statement as of the nextquarter.
Six months ended 30 June Three months ended 30 June
2007 2006 2007 2006
Income of consolidated private equityholdings . . . . . . . . . . . . . . . . . . . . . . . 2,783 2,634 1,390 1,388
Other income included in operatingincome . . . . . . . . . . . . . . . . . . . . . . . . (174) (161) (85) (78)
Total operating income of consolidatedprivate equity holdings . . . . . . . . . . . . 2,609 2,473 1,305 1,310
Goods and material expenses ofconsolidated private equity holdings . . . 1,949 1,855 979 1,003
Included in personnel expenses . . . . . . . 294 275 142 138Included in administrative costs . . . . . . . . 236 232 111 112Included in depreciation and amortisation 136 103 48 53
Total operating expenses . . . . . . . . . . . . 2,615 2,465 1,280 1,306
Operating profit before tax ofconsolidated private equity holdings . (6) 8 25 4
The assets and liabilities of these consolidated holdings are included in the Group balance sheet. Giventhe non-banking nature of the underlying activities the main lines impacted are goodwill, property andequipment, other assets and issued debt securities. The total assets of the remaining consolidatedentities at 30 June 2007 were EUR 1,700 million (31 December 2006: EUR 4,537 million) excludinggoodwill.
25 Subsequent events
ABN AMRO Mellon Global Securities Services
On 5 July 2007, Mellon Bank N.A. has agreed to purchase ABN AMRO’s 50 per cent. share inABN AMRO Mellon Global Securities Services B.V., the joint venture company established by theshareholders in 2003 to provide global custody and related services to institutions outside NorthAmerica. The transaction, which is subject to certain conditions including regulatory and otherapprovals, is expected to close during the third quarter 2007. After the close ABN AMRO Mellon willbecome part of The Bank of New York Company and Mellon Financial Corporation. ABN AMRO Mellon ispresented as held for sale in the balance sheet.
112
REPORT ON REVIEW OF INTERIM FINANCIAL INFORMATION
To the Supervisory Board and Managing Board of ABN AMRO Holding N.V.
Introduction
We have reviewed the accompanying condensed interim financial report consisting of the consolidatedbalance sheet of ABN AMRO Holding N.V., Amsterdam, The Netherlands (the ‘‘Company’’) as at 30 June2007 and the related interim condensed consolidated statements of income, changes in equity and cashflows for the three- and six-month period then ended and condensed explanatory notes (as set out inAnnex 3, further referred to as interim financial report). Company’s management is responsible for thepreparation and fair presentation of this interim financial report accordance with International FinancialReporting Standards applicable to interim financial reporting as adopted by the European Union(‘‘IAS 34’’). Our responsibility is to express a conclusion on this interim financial report based on ourreview.
Scope of Review
We conducted our review in accordance with International Standard on Review Engagements 2410,‘‘Review of Interim Financial Information Performed by the Independent Auditor of the Entity’’. A review ofinterim financial information consists of making inquiries, primarily of persons responsible for financialand accounting matters, and applying analytical and other review procedures. A review is substantiallyless in scope than an audit conducted in accordance with International Standards on Auditing andconsequently does not enable us to obtain assurance that we would become aware of all significantmatters that might be identified in an audit. Accordingly, we do not express an audit opinion.
Conclusion
Based on our review, nothing has come to our attention that causes us to believe that the accompanyinginterim financial report is not prepared, in all material respects, in accordance with IAS 34.
Amsterdam, 30 July 2007
for Ernst & Young Accountants
Signed J.J. Nooitgedagt
113
PART V
ADDITIONAL INFORMATION
1 Persons Responsible
The RBS Directors, whose names appear below, and RBS accept responsibility for the informationcontained in this document. To the best of the knowledge and belief of the RBS Directors and RBS (whohave taken all reasonable care to ensure that such is the case), the information contained in thisdocument is in accordance with the facts and does not omit anything likely to affect the import of suchinformation.
2 Information Provided by ABN AMRO
RBS confirms that the information relating to ABN AMRO, which has been sourced from informationpublished by ABN AMRO, has been accurately reproduced from those sources and, as far as RBS isaware and is able to ascertain from information published by ABN AMRO, no facts have been omittedwhich would render the reproduced information inaccurate or misleading.
3 Directors of RBS
The Directors and their respective roles are:
Sir Tom McKillop (Chairman)Sir Fred Goodwin (Group Chief Executive)Guy Whittaker (Group Finance Director)Johnny Cameron (Chief Executive, Corporate Markets)Lawrence Fish (Chairman, Citizens Financial Group, Inc.)Mark Fisher (Chief Executive, Manufacturing)Gordon Pell (Chief Executive, Retail Markets)Colin Buchan (Non-Executive Director)Jim Currie (Non-Executive Director)Bill Friedrich (Non-Executive Director)Archie Hunter (Non-Executive Director)Charles ‘‘Bud’’ Koch (Non-Executive Director)Janis Kong (Non-Executive Director)Joe MacHale (Non-Executive Director)Sir Steve Robson (Non-Executive Director)Bob Scott (Non-Executive Director)Peter Sutherland (Non-Executive Director)
all of 36 St Andrew Square, Edinburgh EH2 2YB
Brief biographical details of each of the Directors are set out in paragraph 2 of Part XXIII of theProspectus.
4 Results of the Banks’ Extraordinary General Meetings
At the Extraordinary General Meeting held on 10 August 2007, holders of RBS Ordinary Shares passedthe Resolution that was proposed in connection with the Transaction.
At the shareholder meetings of Santander and Fortis held on 27 July 2007 and 6 August 2007,respectively, the shareholders of Santander and Fortis passed each of the resolutions that wereproposed in connection with the Transaction.
5 Publication of this document
Prospectus Rule 3.4.1 requires RBS to produce a supplementary prospectus if a ‘‘significant new factor’’arises during the Offer Period. A ‘‘significant new factor’’ is any information which is required by investorsfor the purposes of making an informed decision on the Offer. As RBS and ABN AMRO have eachpublished interim results, RBS is obliged to publish this document.
114
6 Withdrawal rights
6.1 General
In addition to the withdrawal rights that arise under Article 16 of European Directive No. 2003/71/EC (the‘‘Prospectus Directive’’) in connection with the publication of this document, ABN AMRO OrdinaryShares tendered for exchange into the Offer may be withdrawn at any time prior to the end of the OfferPeriod (including any extensions thereof). Once the Offer Period has expired, ABN AMRO Shareholderswill not be able to withdraw any tendered ABN AMRO Ordinary Shares. This means that holders of ABNAMRO Ordinary Shares will not be able to withdraw any tendered ABN AMRO Ordinary Shares from theend of the Offer Period to the announcement of the results of the Offer, which will occur within fiveEuronext Amsterdam Trading Days after the expiration of the Offer Period. No withdrawal rights will applyto ABN AMRO Ordinary Shares tendered during the subsequent offering period, if one is provided.
ABN AMRO Shareholders may not rescind a withdrawal. If ABN AMRO Shareholders withdraw tenderedABN AMRO Ordinary Shares, such shares will be deemed not validly tendered for purposes of the Offer.However, holders of ABN AMRO Ordinary Shares may re-tender withdrawn ABN AMRO Ordinary Sharesat any time prior to the expiration of the Offer Period or during the subsequent offering period, if one isprovided.
6.2 Withdrawal of Tendered ABN AMRO Ordinary Shares
ABN AMRO Ordinary Shareholders who hold their shares through a financial intermediary that is anAdmitted Institution and make their acceptance known through their financial intermediary to the DutchExchange Agent may withdraw their ABN AMRO Ordinary Shares by making a withdrawal requestthrough their financial intermediary to the Dutch Exchange Agent prior to the end of the Offer Period.Holders of ABN AMRO Ordinary Shares in registered form registered in the name of the relevant holderswho tender their ABN AMRO Ordinary Shares in registered form by means of a form of acceptance sentto the Dutch Exchange Agent may withdraw by delivery to and receipt by the Dutch Exchange Agent of aproperly completed and duly executed notice of withdrawal prior to the end of the Offer Period.
7 ABN AMRO Current Trading and Prospects
ABN AMRO has made certain statements publicly, based on its management’s estimates, that forecastminimum levels of profitability in future years.
In the press release dated 30 July 2007 relating to the ABN AMRO results for the six months ended30 June 2007, ABN AMRO stated ‘‘We are well on track to deliver an EPS of at least EUR 2.30 on anadjusted basis as the change in the organisational structure implemented in 2006 created the conditionsfor improvement in our performance.’’
These estimates were neither seen nor commented upon by RBS or its advisers in advance of theirpreparation and no reliance should be placed on them. The estimates do not necessarily reflect theDirectors’ view of ABN AMRO’s prospects and financial performance nor the prospects and financialperformance of the Enlarged Group. The financial projections should not be regarded as a reliableindicator of ABN AMRO’s future operating results nor the operating results of the Enlarged Group andthey should not be relied upon as such.
None of RBS or its financial advisers or any other party accepts responsibility for the accuracy,reasonableness, validity or completeness of the financial projections or the estimates and assumptionsthat underlie them.
None of the financial projections was intended for publication by RBS and should not be regarded as aforecast of profits by RBS, ABN AMRO or any of their respective directors and accordingly have not beenprepared or reviewed to a standard to which published projections would be prepared and reviewed.Shareholders should not rely upon any of the financial projections in making any decision about aninvestment in RBS or ABN AMRO.
115

8 Documents Available for Inspection
In addition to the documents set out in paragraph 19 of Part XXIV of the Prospectus, this document willalso be available for inspection during usual business hours on any weekday (Saturdays, Sundays andpublic holidays excepted) for a period from the date of publication of this document until Admission at:
(i) RBS Gogarburn, PO Box 1000, Edinburgh EH12 1HQ; and
(ii) the offices of Linklaters LLP, One Silk Street, London EC2Y 8HQ.
Dated 14 August 2007
116


DEFINITIONS
The definitions set out on pages 184 to 189 of the Prospectus shall, unless the context requiresotherwise, bear the same meaning in this document. The following additional definitions applythroughout this document unless the context requires otherwise:
Prospectus the prospectus dated 20 July 2007, comprising a prospectusrelating to the New RBS Ordinary Shares to be issued pursuantto the Offer, prepared in accordance with the Prospectus Rules
Restricted Jurisdiction Australia and Japan, and any other jurisdiction where theextension of availability of the Offers would breach anyapplicable law
Supplementary Prospectus this document
117

Merrill Corporation Ltd, London07ZCD18618