Embed Size (px)
Citation preview

4.2 The sequence o~ events leading to
~All111.ar division of' S~enedesmU8 auadricauda
Last year we reported on the relation between the growth rate
and the pattern o~ cellular division in synchronous cultures o~
Sc.quadricauda. Essential issues relevant to the present report may
be briefly recapitulated as ~ollows;
(a) The length o~ the period o~ cell growth in light (until the
onset o~ autospore release in light) is controlled by the temperature
as well as by both the density and spectral composition o~ the ir-
radiation. None o~ the processes constituting the cell cycle is in-
variant with respect to the physical ~actorso
(b) The length o~ the period o~ growth in light needed to make
50 per cent o~ the cella in the population capable o~ dividing when
incubated in the dark is, at a given temperature, inversely corre-
lated with irradiation density; saturation characteristic as well as
the wavelength dependence o~ this relationship are similar to those
o~ photosynthesis.
(c) The time period separating the induction o~ cellular division
~rom its actual occurrence appeared to be, at constant temperature,
very nearly constant at various irradiation densities. We now know
that this conclusion was not correct; anyway, this time interval is
much lese dependent on the growth rate than the time space separating
the start o~ the growth in light and the quadruplet induction.
(d) Beyond a certain irradiation density (associated with a
high growth rate) eight-cell coenobia appear and their percentagee
(and, eo ipso, the total numbers o~ cells produced per cycle) are
positively correlated with the irradiation density.
(e) Two-cell coenobia, evidencing the division into two daughter
cells, were only rarely observed among the daughter cells under
~avourable growth conditions. A reasonable explanation o~ their
occasional occurrence has not yet been ~ound. Even slow growth is,
as a rule, associated with quadruplet division. At extremely low
growth rates it o~ten happens that onlya part o~ the cella in the
population dividesi~ the culture is darkened too early, but two-cell
coenobia appear only very rarely.
The approach and methods which had yielded the above ~irst
results did not appear suitable ~or ~urther quantitative analysis.
11th the dark incubation procedure only cell division numbers are
Sq

scored, while the whole long sequence of events occurring from the
primary initiating procese to the liberation of autospores remains
obscure. Moreover, in the earlier experiments the growth rate was
characterized only indirectly, its value being known for nonsynchro-
nous populations grown at the same irradiation density and temperature.
To improve the lest shortcoming and to provide a satisfactory
amount of material for analyses and keeping the conditions of the
culture as constant as possible, synchronous chemostatic cultures
with a well defined overall specific growth rate were used.Along with
the routinely monitored baBic parameters (such as dry weight and
chlorophyll content per unit volume of suspension, optical density
and PCV) , the quantity of RNA and DNA per unit volume of the culture
and the number of nuclei per cell were determined in samples taken
from the culture at various phases of the cell cycle; parallel measu-
rements were performed in twin samples incubated in the dark for a
suitable period of time. In several experiments the frequency distri-
bution of cell size was assessed several times in the course of the
cell cycleo
The equipment and techniques used for chemostatic synchronous
cultures are described in section 7.1 of this report.
For nucleic acid ass8y the procedure described by KERN was used
in the form adapted to unicellular algae by WANKA (1962)oPreliminary
tests of the method with Scenedesmus quadricauda strain GREIFSWALD/15
have revealed that double extraction with 0.2 N PCA at 20oC is satis-
factory for the removal of low-molecular interfering substances and
that a 1.5 hr treatment with 70oC 0.5 N PCA is sufficient for the
extraction of nucleic acids. The diphenylamine reaction following
BURTON (1956) was used for spectrophotometry of DNA and absorbancy
measurement at 254 nm (Hg line in the recording rlow enalyzer
UVICORD, Central Workshop, Czechoslovak Academy of Sciences) was used
for the determination of totel nucleic acids. The velues obtained et
254 nm were occasionally checked against absorbancy records in the
UV (SPECORD UV VIS, Carl Zeiss, Jena, DDR) and a satisfactory corres-
pondence was found. For celibretion of the methods a commercial pre-
paration of yeast RNA (SPOFA, Czechoslovakia) and celt thymus DNA
(supplied kindly by Dr.J.DOSKO~IL of the Institute of Organic Chemistry
and Biochemistry, Czechoslovak Academy o• Sciences) were used.
The nuclei were counted in cella •ixed in HELLY's mixture and
stained by the method of Giemsa-Romenovski es modified by PESHKOV et
RODIONOVA (1964). Maier's adhesive (egg white with glycerol) was used
instead o• saliva to attach the algal cella to the slides.
The frequency distributions o• cell size were estimated using
photomicrographs and an electronic particle counter (TUR ZG 1 ,
bO

Transformatoren und Rontgenwerk, Dresden). Whenever the si ze of
individua1 ce11s was of interest, or quadrup1e coenobia had t~ be
distinguished from octup1ets, on1y tne photographic method could be
used. For this a suitab1y concentrated samp1e of the suspension ~as
a11owed to sett1e in sedimentation dishes (d=40mm) especia11y manu-
factured to this purpose. The sediment was then photographed from
above either through the water surface with a long focus objective
1ens or with a specia1 low power ordinary objective 1ens protected
by a cep with a front glass with adjustab1e distsnce to a11ow sub-
mersion. The magnification of the negative was 100xj f9r cel1 size
measurements prints were made at a fina1 magnification ot 500x or
1000x. From the 1ength and width of each cel1 its vo1ume was ca1cu-
lated ss s volume of a cy1inder with two hemispheres st its ends.
Using these methods in addition to the extensive app1icstion of
the earlier ones, a considerab1e amount of new information was
obtained on the coup1ing of various processes 1eading to ce11ular
division. A11 the exp~riments have invariab1y confirmed that the
processes determining the duration of the ce11 cyc1e are in one way
or another clo sely corre1ated with the specific growth rate (more
detai1s on this see in 7.2.1)j therefore, they depend on either
temperature or irradistion or, most often, on both these factors.
Vsrious prob1ems raised in the conc1usions of the previous year.s
report (chapter 4.2) have been, at 1east partia11y, c1arified:
The semiquantitetive evidence summarized under (b) in the intro-
duction inspired the idea that the induction of ce11u1ar division
occurs when the ce11s have grown up to a definite sizeo This concept
received additiona1 support from various kinds of ce11 vo1ume
measurements.
First1Y,in the synchronous1y growing popu1ations the average
volume per ce11 (or coenobium) increases stepwisej this is rather
conspicuous in some cases (Fig.25). The retardationsof the vo1ume-
increase rate are otten corre1ated with the periods in which the
induction of division occurs.
Instructive are a1so measurements of ce11 vo1umes in samp1es
taken from the cu1ture during the progress of quadrup1et induction
and incubated in the dark. Fig.28 shows that the ce11s which are
unab1e to divide preserve a characteristic size frequency distribution
in successive samp1es although at the time ot samp1ing the overa11
size distributions differed conspicuous1y.
The time course of quadrup1et induction in the kinergastograms
(s?e ZACHLEDER et ~ETLfK 1969, p.48 tf.) retlects the variabi1ity
which causes individua! cel1s in the Dopu1ation to psss throuRh the
1.1

stage critical for induction at different times. If the critica1
volume hypothesis reca1led above is sound, then the percentage of
cells induced at any moment should correspond with the percentage of
cells which have grown beyond a certain si ze. This assumption was
checked by measuring the cell size frequency distributions at various
phases of the cycleo Some modification in the baBic assumption
appeered necessary. As ehown in Fige.26 and 27 and partially explained
in the reepective legende, the data suggeet ODe of the following
a1ternativess
(i) because of the variability among individua1 cella or from
some other reaeons the critical volume is not conetant but is larger
in the celle which have paeeed through the induction earlier and
smaller for later induced cells;
(ii) the critical entity is not the volume itself but some other
quantity non-linearly related to the volume of the celle;
(iii) the true initiation of the entire eequence of events
precedes the apparent induction curve and is actua1ly triggered by
eurpassing a definite and cónstant volume. This ie, however,not yet
a point of no return. The processes have to proceed in the light for
Fig.25 The etepe on the curvee repreeenting increaee in averagecell volume and RNA content per cell snd their poeeiblemutual correepondence and correlation with inductioneof nuclear divieion.
In all four diagrame a uniform labelling of the curveeie adopted& curvee 1,2,3 snd 4 indicat.e the percentage ofcella in which the d~v~eione to two, four, eight and eixteennuclei (= two per each daughter cell) were induced (ecaleon the left). Curve 5 (ecale of the center) ehowe theincreaee of average cell volume, curve 6 (scale on theright) increase in RNA content per cell and curve 7 (scaleon the right) the ratio of RNA to volume (or the contentof RNA per volume unit).Curves4 snd 4' in the diagram lA represent growth involume of ODe cell in the fcur-celled snd eight-celledcoenobium respectively.
A - s mixed qusdruplet - octuplet cycle startingfrom a mixture of four- and eight-cell coenobia./u = 0.1 h-ll30oC, i2radiation at the surface of the cuvettee wss210 Wm- . Volume of cella in quadruplete and octupletsrecorded separately 8S stated above.
B - sn octuBlet cycle 8tarting from octuplete.fu ~ 0.1 h-l, 30 C, nitrogen eource NOj, irrsdiation at~he eurface of the cuvettes wae 210 Wm -2.
C - a qurdruplet c~cle, etarting rrom Quadruplets./u = 0.045 h- , 30oC, n~trogensource urea, irradiation on
the surface or the cuvettee 200 Wm-2.D - sn octuElet cycle starting from octuplets.
tU ~ 001 h-l, 30 C, nitrogen eource urea, irradiation stthe 8urf8ce of the cuvettee 210 Wm-2.
62

Percentoge of cells inducedN Ul ~ 8-
o UlI . I
Percentoge of cells inducedN Ul ~ 8-Ul o Ul "-
. I . I
Oi_I
»
..Ul
-;3'~
g,
;;~n
'<n
'"
~oc:...'"
o
-f
3"CD
~
;:CDn
'<n
"ti"In
J
o
C...In
Averoge cel! volume. .iUm&
;..; g 8I I- -
"8,-,("') gr"\
o"Q..
~~~
~~ Ul
\01 '"b-..
~"6
~I, , , ~ '.- g ,
o-II
Content per cell, 10- 9. I I - I ,I\) Ul ~Ul O Ul
RNA content Ivolume of c.II.IO_llg/IO~mN UlUl O II
RNA content /volume of cell,IO' 9/IO~m'
Fig.25
o
o
('I

~
a certain time period in order to reach a stage ~rom which they run
to comple~ion (= apparent induction). I~ this condition is not sati8-
~ied the sequence o~ processes will ~top somewhere be~ore having
reached cellular division.
(iv) a situation similar to that de~ined sub (iii) except that
the critical entity is not the volume itsel~ but another quantity
which is,directly or inversely,linearly related to cell volume.
There is still too much uncertainty in the meaning o~ various
parameters involved and not enough precision in their measurements to
provide ~inal proo~s ~or ODe o~ the above alternatives. Detailed
monitoring o~ coenobia size distribution with the electronic particle
counter revealed, however, one interesting ~eature which cen be taken
ae a rather strong supporting evidence ~or a rather tight coupling o~
volume changes with nuclear events. As illustrated in Fig.27 the
coenobia size distributions suggests that, in the li~e o~ an individual
coenobium (cell), perioda o~ rapid growth in volume alternate with
period s when growth is arrested or slowed down considerably. These
phases o~ retardation in growth are in some way related to the in-
duction o~ cellulsr division.
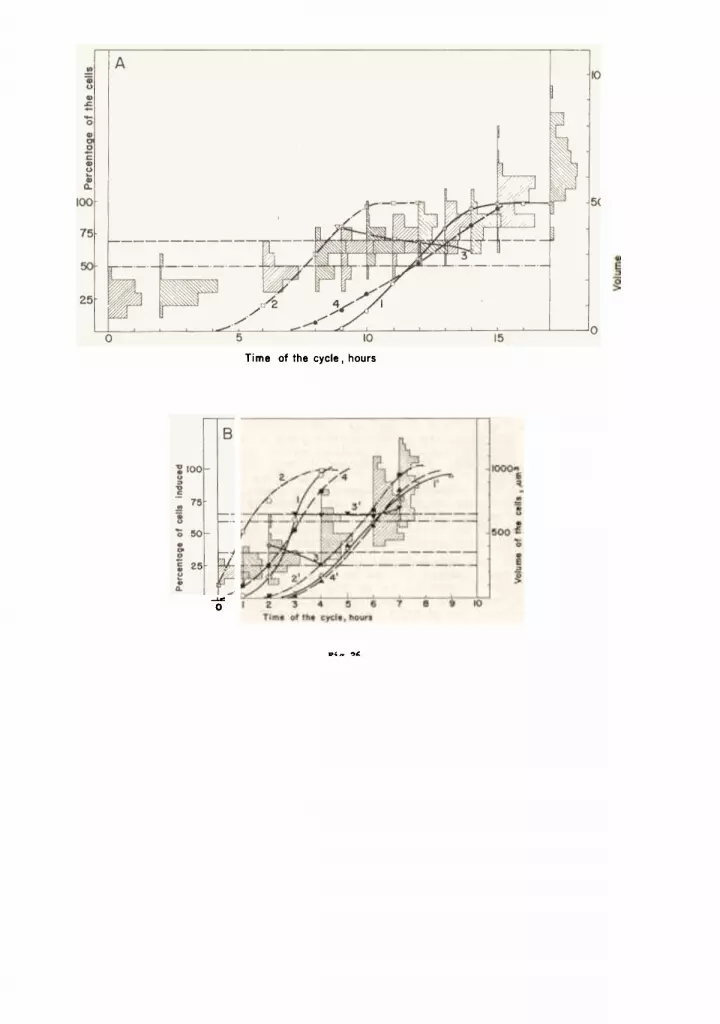
Fig.26 Variation in the ~requency distribution o~ cellular volumesand the progress o~ quadruplet and octuplet induction insynchronous populations o~ Scenedesmus quadricaudso
A - s quadruplet yielding cycle,/u = 0.06, 300C, irra-diation density at the sur~ace o~ the rCuvettes 210 Wm-2.Curve 1 - the quadruplet induction curve. Curve 2 - percentageo~ the cella in the population whose volume surpassed 250LumJ.Curve 3 - the volume beyond which fslls the same percentageo~ cella as has been induced, at the given sampling time,toquadruplet division(i.e. the decreasing critical volume ~orthe apparent induction curve). Curve 4 - the percentage o~cells in the population which surpassed the volume o~ 300jum3,i.e. the line dividing the cell volume distribution in t~equal parte at the moment o~ 50% induction.
B - an octuplet yielding cycle,ju = 0.14. 300C,irradiationdensity at tue sur~ace o~ the cuvett~ 210 Wm-2. Curvesl,2,3,4 and 1', 2', 3', 4' re~erring to the quadruplet snd octu-plet induction respectively have the same genersl meaning asin part A o~ the ~iKUres. The critical volumee are: 250Lum3~or curve 2, 600jum) ~or curve 2', 350/um3 ~or curve 4 snd650/umJ ~or curve 4'.
The scalee on the le~t indicate the percentage o~ cellsin the population deecribed by curves 1,2,4 and 1', 2', 4'.The scales on the right (note their di~~erent extension inpart A and B o~ the ~igure) indicate volumes o~ the cella ~orthe histograms and ~or curvee J and J'. Cell volumes weremeaeured ~rom photomicrographs.
It is seen that a curve running in parallel with thequadruplet induction is obtained ~or a constant criticalvolume, but this curve is advanced in time for several hours.I~ a constant criticel volume is eccepted so as to fit onepoint o~ the induction curve (the 50% point wes chosen) theresulting curve has a different slape from thet o~ the in-duction curve. To ~it the induction curve in all points eprógressively decreasing critical volume must be acceptedjthis trend might result ~rom a variable value o~ the criticalvolume if higher values were more probable with the advancedcella and lower values were with the slower growing cella.
I-A.
Tíme of the cycle, hours
~
o
v,- ~~

The concept of the critic~ volume as a factor initiating celluler
division in yerious microorganisms hes been frequently questioned. On
the other hend. the data presented bere extend the vest body of evidence
indiceting some causel relationship between cell volume end division
proceeees. We are inclined to think thet whenever the criticel volume
is contempleted es a parameter exerting control over initietion of
replicat.ion processes the critical entity is not the volume of the
cell by iteelf but some other quantity closely related to it.If cell
growth is a sequence of eynthetic and organization~ procesees creeting
definite structures according to a detailed plan deposited in the genome
then one round of genome transcription and tranelation ehould compriee
e definite number of moleculer operetiona manifested in an exactly
reproducible pattern of growthJ and resulting in a predicteble cell
volume. From thia point of view it may be rether difficult to distin-
guish between two hypotheses. of which one would relate the initiation
of replication to attainment of a critic~ volume while the other
would consider the accomplishment of a sequence of processes 8S a
trigger.
Fig.27 Variation in the frequency distribution of coenobial volumeswith the progress of the cell cycle of Scenedesmus quadricauda.Data from a~octuplet ~ielding cycle starting from octuplets,fu = 0.10 h- , 30~C, n~trogen source nitrate irradiationtlensity at the surface of the cuvettes 210 Wm-2. Distributioncurves for coenobial vo1umes were measured with the electronicpartic1e counter TUH ZG 1, with discriminator setting givingapproximate1y 240~um) intervale. The cell volumes wereca1culated by diVíding the coenobium volume by 8 and thefrequencies plotted on the volume scale at 30/um3 intervale.
In the three-dimensional diagram the cell vo1ume is onthe x-ax~s (scale at the bottom) , frequency of the cellaat 30/um intervale ie on the z-axis (vertical scale at theright rear edge of the diagram) and the time of the cycleruna along the y-axis (sce1e at the front-rear running edgeon the right).
On the y-z plane left, are draWDI the kinergastogramof the cycle (curve 1 for quadru~let and curve 2 for octupletinduction) , the average cell volume (curve 3) and the curvee(4 and 5) ~ndicating the ~ercentages of cella populating thethree main peeks visible ~n the vo1ume frequency distributions.
It m~ be seen from the diagram that in the cell cycleof an individual cel1, perioda of faster growth in vo1umealternate with growth retardations eo that a frequencydietribution reeults which is characterized by several peeksfrom which three are clearly eeparated. They are labeledA, B and C on eeveral curves on the diagram. Curve 4 in they-z plane indicatee the percentage of cel1s under peeksB + C end curve 5 tbe percentage of cella under peak C.The correlation between these curves and the inductioncurves is apparent.
f.f.


Table6. Averege cell volumee end the emount of RNA per cell et the criticel etegeeof the cell cycle in chemoetetic pynchronoue culturee of Scenedeemus Quedricsud8
In this connection it m~ be of interest to note that in
Scenedeemus the amount of RNA per cell is positively correlated with
cell volume and the variation in the rate of increase of RNA amount
per cell often clo sely parallels the course of changes in cellular
volume. From Table 6 it can be seen that both the average cell volume
and the amount of RNA per cell at the critical points of the cycle
are reasonably invariable with the overall growth rate at a given
temperature.
In contrast to the earlier conclusion (see item (c) in the
introduction) exteneive data collected with the chemostatic synchro-
nous cultures indicates that the time space separating the quadruplet
induction and cellular divieion is not constant at constant tempera-
tur.. Instead, the length of this period incresses with increasing
specific growth rate and so do.. alBa the number of genome repli-
catione which occur during this period. The range in which the
length of the iiJ~ ~ cdl/2 interval varies with the growth rateat constant temperature is substantially narrower than the range
of varistion with temperature. Table 7 extends the ob..rvation to
the successive steps of DNA replication, nuclei s6gregation and
to the inductions of these processes: sll the time spane separating
these processee from cellular division vary regulsrly with the growth
rste.
Be~ore any conclusion CaD be drawn from this variability in
support of any model of events in cellular division, two points
need further clarification:
LQ
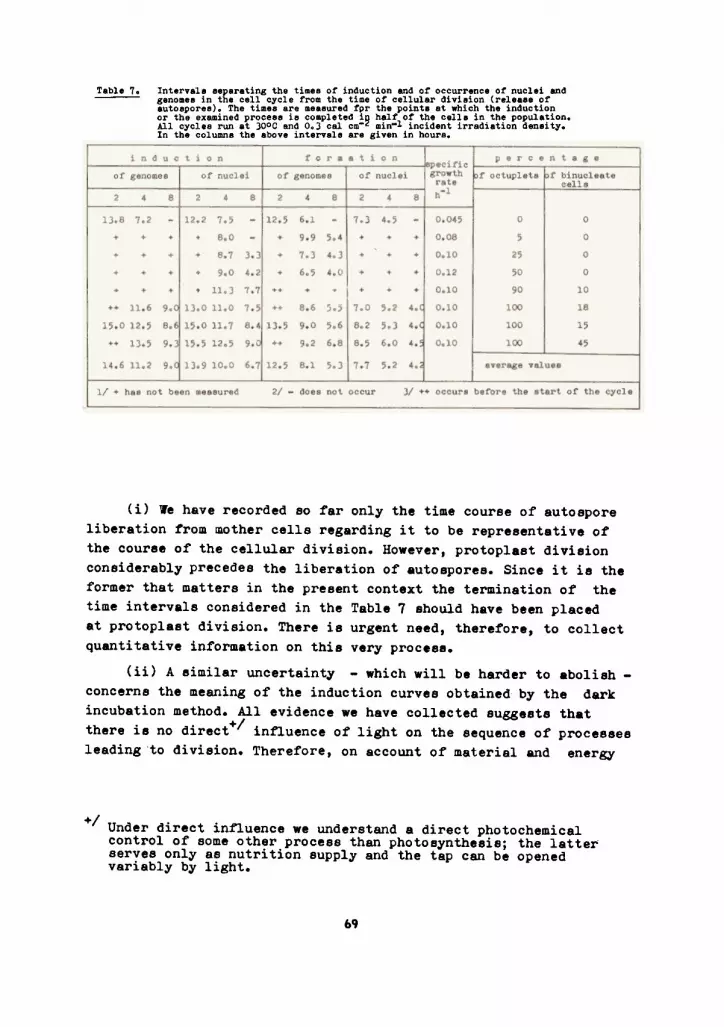
Tabla 7. Intervala aeparating the timaa 01' induction and 01' occurrence 01' nuclei andgenomee in the cell cycle 1'rom the time 01' cellular divieion (releaee 01'autoeporee). The timee are maaeured 1'pr the pointe at which the inductionor the examined procese ie completed i~ hal1' 01' the cella in the population.AlI cyclee run at 300C end 0.3 cal cm- min-l incident irradiation deneity.In the columne the above intervale are given in houre.
(i) We have recorded so ~ar only the time course o~ auto spore
liberation trom mother cella regarding it to be representetive o~
the couree o~ the cellular division. However, protoplast divieion
considerably precedes the liberation o~ autospores. Since it is the
~ormer that matters in the present context the termination o~ the
time intervale considered in the Table 7 should have been placed
at protoplast division. There is urgent need, there~ore, to collect
quantitative in~ormation on this very procese.
(ii) A eimilar uncertainty - which will be harder to abolish-
concerns the meaning o~ the induction curves obtained by the dark
incubation method. All evidence we have collected suggests that
there ie no direct+/ influence o~ light on the sequence o~ proceseee
leading to division. There~ore, on account o~ material And energy
+/ Under direct in~uence we understand a direct photochemical
control of some other procese than photosynth8Sisj the latterserves only as nutrition supply and the tep cen be openedvariably by light.
&9

Fig.28 Variation with time of the frequency distribution ofce11u1ar vo1umes in a popu1ation of coenobia of 1Scsnedeemue quadricauda, grown with fU . 0.10 h- at30 C and an irr~diation deneity at the surface of thecuvette 210 Ym- .
The vo1umee were calcu1ated from linear measurementsof ce11 width and 1engthj ce11s were measured individua11yat random (irrespective of their incidence to coenobia)and in preparations with stained nuc1ei so that vo1umesof ce11s having one nuc1eus (curves 1abe1ed 1) and twonuc1ei (curves 1abe1ed 2) could be recorded separate1y.The dashed curves 1abe1ed l' and 2' show ce11 vo1umefrequency distributions in samp1es withdrawn from thecu1ture at the time indicated, and incubated in the darkfor a time period 10ng enough to al10w sny inducedce11u1ar division to run to comp1eti~nj curves l' and 2'represent size distributione on1y of those ce11s which didnot divide under these conditions.
The sca1e for ce11 vo1umes is given on1y at the bottomof the diagram. The times of samp1ing are indicated inthe top 1eft corner of each track with vo1ume distributions.The track 1abe1ed O hrB is for daughter ce11s before the1ight phase of the cyc1e started.
Al1 frequency distribution curves were normalized togive equa1 height for the maximum frequency. Re1ativeproportions for ce11 numbers of uninuc1eate and binuc1eatece11s cannot be, therefore, read off the diagram exceptfor distributions at the f~rst hour where the inductionshift from uninuc1eate to binuc1eate ce11s is i11ustrated.
At the start of the third hour of the cyc1e theinduction to the first nuc1ear division (doub1et induction)ie over; no uninuc1eate ce11s are found fo110wing thedark incubation period. Concomitant1y the vo1umes of non-divided ce11s have a distribution characteristic of whatwe be1ieve to represent binuc1ear and bigenomic ce11s(one genome per nuc1eus, two nuc1ei per ce11).
At the start of the sixth hour the quadrup1et inductionis over& no undivided ce11s are found in the dark incubatedsamp1es.
The insert at the bottom on the right ehows theincrease of the average ce11 vo1ume of uninuc1eate sndbinuc1eate ce11e in a eemi10garithmic p10to The dec1ine inthe va1uee at the end of both curvee indicatee that 1argerce11s predominant1y pase to the higher nuc1ear statee(binuc1eate ce11s ehift to quadrinuc1eate which are notrecorded here)o This trend ie a1so eeen on the distributionsof the non-divided ce11s fo110wing dark incubation.
The vertica1 1ines are drawn through the distributionp..ke to under1ine their coincidencej the consecutive peaksare interpreted as vo1ume distribution maxima correspondingto ce11s containing sn incre8eing number of genomes (in oneor two nuc1ei).
70


reserves, growth cen wel1 proceed in the dark and the critical stage
(point of no return) cen thus be reached at different times after
the sample has been withdrawn from the culture and placed in the
dark. In such case the recorded apparent induction curve wou1d be
ahead of the true curve, indicating actually at what time a given
percentage of the population has reached the induction point of no
return. The extent of this forward shift in the induction might be
fUrther related (or be even proportional) to the amount of reserves
in the cell at the moment of darkening. Since this may be different
in early and,later induced cells not only the position of the
apparent induction curve on the time axis but even its shape need
not be quite true. RNA aynthesis cen proceed in the dark period of
the aynchronoua culture quite rapidly, which is shown in Figs.34 and
35 w. bav. seen it regularly under similar conditionso There is no
a priori reason why a similar rate of RNA 8yntheais could not occur
in a cel1 darkened at any atage of the cell cyc1e. To learn whether
or not this growth in dark actually displaces the apparent induction
curve ie vital for further quantitative analyeie of the sequence of
events leading to cellular division. The neceseary evidence cen be,
however, provided only with the help of selective inhibitore; thie
is one of our most important immediate taskso
The monitoring of the state and number of nuclei per cell in
the course of the cell cycle mede it poesible to formulate clearer
the problems concerning the 8carce end irregular appearence of two-
cell coenobia (doublets). It appears that each of the alternatives
considered in the ,lest year~. report applies to a certain degreeo
This is well documented on Figs..3l to 35, which illustrate situations
common in quadruplet and octuplet cycles.
(i) The formation of two nuclei in a cell passing through its
life cycle in light ie preceded or immediate1y followed by an induction
of higher order (induction to formation of four or eight nuclei).
This ehows that in the normal eequence of event s doublet coenobia
are not formed becauee of the immediate succession of processes
leading to quadruplet division.
(ii) On the other hend in maDY situations two nuclei do not
trigger cellular division. In samples withdrawn from the culture
before any quadruplet induction has occurred and incubated in the
dark the only effect of the short period of growth in light is that,
ultimately, two nuclei appear in the cell without triggering cellular
division. A similar and in its consequences much more interesting
situation ie encountered in octuplet cycles characterized by highgrowth rates (/u . 0.1 h-l, eee Fig.3l). In these cycles, as a rule
7')

nearly all daughter cells are bigenomic and a variable proportion
of them is found to be binucleate. These binucleate cella then pase
through the cycle elong with others, keeping their binucleate state
~or about two thirds of the growth phase of the cell cycle. In the
rest of the population induction of two nuclei and their segregation
occurs as usual in the cycle. .
Kost striking about the cycles with doublet nuclear induction
split in this way is that in the quadruplet nuclear induction,1n the
formation of rour nuclei, and in the reaaining proceeees leading to
cellular division all the cells in the population behave uniformly+/
ae if having had th8 saae previous history. This auggests that cella
which start the cycle ss bigenoaic pase eiaultaneously or with s not
very significant displacement through identicel stag8S of the deve-
lopment irrespective of whether tae two genomee are accoaaodated in
one or two nucleio
In Fig.29 the changes with time of the volumes of uni- and bi-
nucleate cells in a predominantly bigenomic autospore populstion are
compared. The uninucleate cells start their growth with a saaller
average volume but the specific growth rate is nearly the sa8e in
both types of cello The heterogenity of the autospores considered
bere (which ref1ects the uneven state of development in the 8other
cella at the moment of darkening) goes most probably beyond the cells
having one or two nuclei: if our speculation concerning the voluae
frequency distribution is correct then each nuclear state eplits
further in (at least) two genomic stateeo Each diecrete geno8ic state
ie associated with a chsracteristic average volu8e; if the volume
measurements are performed with a satisfactory resolving power the
corresponding pe8ks cen be distinguished (see Figs029 and )0)0
In Figs.32 to 35 data concerning nucleicacid syntheaie, nuclear
divisions and release of autospores from mother cella are collated
for two quadruplet and two octuplet cycles. The resolution of DNA
curves into individual replication steps was attempted in order to
obtain some idea on the relative time spacing of the inductions and
manifestation of DNA synthesis and nuclear segregation. The results
must be considered to be merely tentative since there are two ,
partially interconnected, serious obstacles in performing this
anelysis:
+/ i.e. with the u8ual variability o~ on~et o~ any procesein individu~ cellso
73

(i) The ~irst obstac1e is our ignorance on the re1ative quantity
and the pattern o~ rep1ication o~ the extranuc1ear DNA as compared
with the chromosoma1 one. At the time we started this work the most
probab1e ~igures ~or the chloroplast DNA amounted to a ~ew per cent
o~ the tota1 DNA content in the ce11s and the other extrachromosoma1species were be1ieved to be sti111ess abundant. There~ore, we did
not expect that a serious distortion o~ the nuc1ear DNA rep1ication
step s might occur through the out-o~-pha8e behaviour o~ organe11e
DNA. We are now aware o~ the recent reports (e.g., CHIANG et SUEOKA
1967) indicating a much higher DNA content in the chlorop1asts.More-
over it must be taken into account that without speci~ic modi~ications
in th~ extraction procedure possib1y on1y a variab1e portion o~
p1astidic DNA wi11 be determined a1ong with the nuc1ear species.The
queetion would be slight1y 1ess preesing i~ the rep1ications o~ both
the nuc1ear and organe11e DNA ran simu1taneous1y or i~ their re1ative
time 1inkage were known. It is c1ear that ~or success~ul continuation
o~ our work one o~ the ~irst tasks is to inquire by appropriate
methode ~or what proportion o~ our DNA values the p1asmatic species
cen be reeponsib1e.
(ii) The other circumstance which makes it di~~icult to distin-
guish exact1y individua1 steps in nucleicacid synthesis from ordinary
analytical data is the variability among individua1s as to their
stage o~ deve1opment. In the kinergastograme and simi1ar diagrame the
sigmoids indicating the percentages o~ the ce11e having entered or
passed certain stages o~ deve1opment frequent1y occupy a considerab1e
proportion o~ the ce11 cyc1e-s duration. I~ there is a sequence o~
processes each o~ which is comp1eted re1ative1y rapidly, it is we11
possib1e that in an ear1y initiated ce11 the who1e sequence has
terminated be~ore it has started in a 1ate ODe. Any ~eature o~ the
kinetice o~ the procese investigated wi11 be neces8ari1y obscured
by its asynchronous course in various ce11s. If severa1 consecutive
rep1ications of DNA ~ollow each other, being separated on1y by short
time interva1s, there is 1itt1e chance to distinguish correctly the
individual replication steps on the curve giving the overal1 DNA
concentration. AD i11ustrative examp1e of a simi1ar kind is provided
by the curves indicating the total number o~ nuc1ei in ODe ce11.
Practica11Y no inflections de1imiting the individua1 steps o~ nuc1ei
eegregation CaD be ~ound on the summation curve.
No doubt, even a re1ative1y monotonous curve could be reso1ved
with a reasonab1e precision into sections representing the two-,
~our-, eight-fo1d etc. replication o~ DNA, i~ only the amount of
DNA per genoMe were known exact1y. The variabi1ity among ce1ls in
the popUlation a1so interferes with this approach since it renders
74

~;1 ~
7ý; tJ/'J . ~ r-- , J
r
~1.J1 W ~5 K> 15 20 25 -- -- -..J
. 'i,Tlme of the cycles, hOUf S
Fig.31Cell volume trequenc7 distribution on uninucleate (curv. 1)and binucleate (curve 2) cella in the :f'reehly releaeed octu-plet daughter coenobia o:f Sc.quadricauda. The peake occurnearly regularl~ at the multiplee o:f a baBic volume whichliee eomewhere between 25 to )O/umJ (it eeeme that the valu.:for binucleate cella elightly d~:f:fere :from that :for uni-nucleate cella); thie ie probably the elementary volumeaseociated with one genome.
Frequency dietribution curvee obtained with the electronicparticle counter :for volumes o:f uninucleate quadrupl.t daughtercoenobia which di:f:fer in the mean number o:f genomee pernucleue. Curve 1 - coenobia with predominantly unigenomic cella.Curve 2 - coenobia with about 50% o:f bigenomic celle.Curve J- coenobia with nearly &11 cella bigenomic. The autocpenobiacome :from cyclee with a epeci:fic growth rate 0.045 h-l,at )OoCand a eur:face irradiation density o:f the cuvettee 200 ~-2.Those yielding curve 1 were obtained with urea ae nitrogensource, the other two with nitrate.
Traneition between two octuplet cyclee with an uncompleteinduction o:f eixteen nuclei in the :firet cycle. The nucleiappear only :followi~ cellular divieion and :fora about 50%o:f binucleate cella J.n the population o:f the eecond cycle.The bigenomic uninucleate cells grow along with the binu-cleate ones and :form two nuclei only later in the cycl.,atthe etage where :formation o:f two nuclei usu&1ly occurs.Irreepective o:f the di:t:terence between the two groups o:fautoe~ores, the quadruplet induction, the :formation o:f :fournucleJ.,etc. are re~reeented by emooth curvee &howing thatin many reepects bJ.nucleate and uninucleate cella reactidentically.
5/
/L_L___l3n - .4n
1100 -u~
"Oc.- 7
~..u
'O
8. 25~.u
l "
Fig.29
Fig.)O
Fig.31
..~

Figs.32 to 35 A synoptic presentation of data on RNA and DNAsynthesis, nuclear division and auto spore releaseas well as on the inductions of several of theseprocesses for two quadruplet and two octuplet cycles.(Induction of a given quantity at sny sampling timeis defined as the quanti ty found in samples wi thdrawnat that time from the culture and incubated in thedark until all initiated processes run to complection).
A uniform labelling of the curves has beenadopted in all four figures. Each diagram consistsof three parte:
Part A shows the course of RNA synthesis(curve 1, scale on the right), DNA synthesis (curve 2)and its ~nduction (curve 2'), the average number ofnuclei per cell (curve 3) and the induced number ofnuclei (curve 3'). The quantity of DNA is expres sedin the number of genome equi valents and the samescale is used for it as for the n~er of nuclei(the scale on the left). 1.15 . 10- J g (0.115 pg)of DNA is taken as the quantity corresponding toone genome (see p. 78-82).
Part B shows the course of DNA replicationspresented in a wBy similar to the presentation ofdata on consecutive nuclear divisions in part C.The sigmoids in this track are derived from theanalytical data of curves 2 and 2' in part A so asto represent on a percentage scale the progressof the consecutive steps of DNA re'plication. Thuscurves 11 2, 3 and 4 represent the replications of1 to 2, 2 to 4, 4 to 8 and 8 to 16 genomes respec-tivelly, and curves 1', 2', 3' and 4' represent thecorresponding inductions. As to the uncertaintyinvol ved in transforming curves from part A tothose in track B see text p. 82 .
Part C illustrates the course of consecutivenuclear divieione on a percentage scalei this is thefara in which the data on nuclear behav~our areobtained from measurements on stained preparations.The summation curves drawn in part A are derivedfrom these data by addition. Curves 1,2,3 and 4again represent the segregation of genomes to two,four, eight and sixteen nuclei respectively andcurves 1', 2', 3' and 4' show the time coursesof the correspondlng inductions. Sixteen nucleinever appear in one cell, but they cen be "induced"in it and they become manifested only in daughtercella through a nuclear division following immedia-tely upon the release of autospores and producingbinucleate cella. Curve 5 in this track shows thecourse of autospore liberation from mother cella.The consecutive fissions of the protoplast were notrecorded but, qualitatively, they can be locatedin the space between the lest nuclear division andthe release of autospores.
The discrepancy, most conspicuous with Fig.33,between the nucleic acid curve in part A and theresolution into sigmoids in part B is tentativelyascribed to extrachromosomal DNA.


-i
~.
9..;:..(")~.ti"".g~

the estimation o:f' the DNA per genome qusntity rather di:f':f'icult. It
was shown in Figs. 29 snd 30 that even the starting material, the
autospores (which are :f'requently considered as the most homogeneous
stage in the whole cycle), cen display a rather heterogeneous nuclear
and genomic pattern. Examination o:f' extensive data obtained with
syncbronous populations makes us to believe that, except :f'or a :f'ew
speci:f'ic situations, it may be virtually impossible to msnipulate the
culture into a state yielding cells characterized by a single genomic
pattern.
One reason :f'or this behaviour was pointed aut earlier by KOMÁREK
and his colleagues (KOU1REK et SIMMER 1965, KOMÁREK 1968)0 The asyn-
cbrony in development o:f' individual cells in a Scenedesmus coenobium
is an intrinsic reature o:f' the alga and has a very de:f'inite and regular
pattern. Thus, even with per:f'ectly synCbronous coenobia (a nonrealistic
assumption) considerable (and non-rsndomr) variability in development
would be observed among the cella o:f' the coenobiumo At :f'irst glance
this might appear as a de:f'inite disadvantage o:f' Sc.quadricauda is
used as a model organism and studied in synchronous cultures.No doubt
the association o:f' cella di:f'rering in the developmental stage in one
coenobium may be o:f'ten rather cumbersome. In several other respects,
this :f'eature cen be rather an advantageo The examination o:f' the scarce
data in the literature concerning the heterogeneity o:f' synchronous
populations suggests that many other chlorococcal algee (snd other
green algae having related patterns o:f' vegetative reproduction,e.g.
Chlamydomonas) will show very similar renks o:f' variabili ty and i ts
underlying mechanisme. TAMIYA and his collaborators devoted much
e:f':f'ort to obtain possibly pure nuclear patterns in Chlorella popula-
tions. The data presented by SUEOKA (1967, Fig.4.) demonstrate that
in vegetative cell cycles o:f' Chlamydomonas the nuclear patterns very
closely resemble those which are well known :f'rom Scenedesmus.
I:f' a certain extent or uneven development among sister-cells is
a general rule, the coenobial character o:f' Sc.quadricauda cen help
to eliminate part or the variability in certain studies.The position
or the cell in the coenobium serves as a sort o:f' marker labelling
its most probable state or development. Fig. 36 shows how the overall
variability in the population governing the distribution in time
or auto spore release cen be resolved into the variability values or
the critical time in individual cells or the coenobium. It cen be
seen that those values are appreciably smaller than the value for
all cells; in the analyzed oase or auto spore liberation about halr
or the overall span or the critical time values appears to be due
to the variability within one coenobium, and the other halr is dis-
played as the variability among coenobia.
77

50 far full advantage has been taken of this useful aspect ofthe variability pattern in Sc.quadricauda only in the study of
morphological characters. No doubt a similar approach would also
greatly help in providing a detailed picture of the distribution
frequency of various genomic pat tem s if cytophotometry were used
to quantify the DNA content per nucleus and cello An exact description
of the distribution function for DNA would also help noticeably in
the precise estimation of the DNA quantity per genome. Before results
of this type are available, all we cen do is to guess the most pro-
bable DNA content per genome on indirect proofs. We have adopted the
following procedure:
For several synchronous populations the amount of DNA per nucleus
was plotted against the time of the cell cycle both for the growing
culture and for the samples withdrawn at various times from the
culture and incubated in the dark ("induction samples"). The result
is presented in Fig.37 and shows that,as expected,the lowest DNA/nucleus
content is characteristic of the cella in dark-incubated samples
withdrawn from the culture at the moment when the quadruplet induction
is just accomplished. This lower limit li es between 0.11 and 0.12 pg
of DNA per nucleus. At the same time the highest figures rise to
Fig.36 The intrinsic variabi1ity in the progress of deve1opmentamong the cells in the coenobium. The cumulative curve ofoctup1et induction can be resolved into partial inductioncurves for individual cel1s characterized by their positionin the coenobium.
A and C refer to an uncomplete octuplet cyc1e startingfrom quadruplet daughter cella, B and D rsfer to an octupletinduction in cells from octuplet coenobia. Data from bothcyc1es are represented on a relative time scale in A and B.More detailes from the critica1 part of the diagrame areshown on an extend relative time scale in C and D. The linesegments in the top left corners of the drawings indicatethe length of the one-hour interval on the relative timescale.
Tbe curves labelled 1 and 2 are the customary quadruplet(1) and octuplet (2) induction curves. The curves labelledby primed figures describe the course of tbe octupletinduction in individual cells marked by their position inthe coenobium. The numbering of the cells is in accordancewith their progress in the development (see KOMÁREK 1968).The most advanced cella are in the middle of the coenobiumand the slowest in development are the marginal cella.This gives the numbering 421) for the quadruplet coenobiumand 86421357 for the octuplet coenobium.
In order to discriminate the percentage of octupletsinduced in the individual cel.ls of the coenobium the darkincubation was performed on the surface of agar plateB.
78

I t
o r~.1+/.~')
7'/"
"S'
7- 7."'
IIQ)CI ,~ 50,
Q)01O
CQ)u..Q)
Q.
2~
50
25
5 6 7 8- v~
K> 5
Time. relative units
.4-
6 9" 10~
7-8
~ia."h

around 0.30 pg per nucleus and occur in the growing cul ture at thetime just before four nuclei start to be formed in the cella thatare first to divide. This corresponds with the rough scheme of 25%of the nuclei containing 4 genomes, 50% containing 2 genomes, and
25% containing one genome, which is a probable scheme for this stageof development.
Fig.37 The quantity of DNA per nucleus in samples taken from thesynchronous culture of Scenedesmus quadricauda at variousphases of the cycle and in corresponding dark-incubatedsamples. The dashed curves labelled by primed figuresrepresent the DNA/nucleus quantities in the dark incubationsamples in which sll initiated processes are assumed to haverun to completion. These are therefore relevant as to theminimum content of DNA in one nucleus. As to the uncertaintiesconcerning the organelle DNA see p. 74 . Curves 1, l' -data from the octuplet cycle illustrated and descr~bed inmore detail in Fig.32. Curves 2, 2' - data from the octupletcycle from Fig.33. Curves 3, 3' - data from a mixedquadruplet-octuplet cycle not illustrated elsewhere.
Figo38 The rate of RNA synthesis per genome p1otted against thenumber of genomes present in the ce11 for a quadrup1et(curve 1) and an octup1et (curve 2) cyc1e. The minor waveson the RNA synthesis curve were omitted (a smoothed shapeof the curve was used to determine the dRNA/dt tangents);otherwise a much more comp1icated pattern would resu1t,preserving, however, the main feature of the sharp dec1inebeyond a certain number of genomes.
Fig.39 Schematic illustration of the possible shapes of theapparent curves of macromolecular synthesis resulting forvarious combinations of population variability and theduration of the synthetic procese in a single cello
A: A procese initiated in the various cella of thepopulstion slang curve 1 stsrts after a leg period andruna for the time t, 2t or 4tj curves 2,3 and 4 resultfor the time course of the increase in quantity of thesubstance produced. No variability in the duration of thesynthetic procese is considered in this simplified scheme.
B: A synthetic procese p is assumed to proceed inthe population at an even rat~ and to form a product whosequantity increases sccording to curve 1. Another procesep2 is assumed to run so that its product increases slangeither curve2, 3 or 40 The ap~arent shape of these curvesis generated from the populat~on variability curve andthe true synthesis duration in one cell in the same manneras shown in part A of the figure. This means that themaximum portion of the cell in which procese P2 runaactually simultaneously is 30% with curve 2, 50% with curve 3and 100% for a single point on the time axis with curve 40If it is assumed that the procese p~ is completely arrestedin one cell when procese P2 is runn~ng variably pronouncedretardations will be produced on curve 1 as illustrated bythe course of curve 1'.
80


The value for DNA quantity per genome thus derived, ~.e. about
00115 pg, ranks reasonably with the •ew comparable quantities, which
can be •ound explicitly or implicitly among published data on green
algae. With the methods employed so far we are unable to decide
whether the organelle DNA is included in this value or not. I• so,
than (according to various evidence we have) a more probable total
value for a unigenomic cell amounts to 0012 pg o• DNA, about 0.20pg
being the contribution •rom the organelle DNA when present in the
cell in ODe set per genome.
The examples shown in Fig.37 cover near1y the complete range o•
values o• the DNA content per nucleus encountered in our work. When
we have evaluated the DNA/nucleus ratio for all analyses avai1able
to date, the lowest •igure obtained was 0.11 pg and the highest onA
was 0.33 pg; the highest (average) amount o• DNA per cel1 was •ound
to be 2.15 pg.
Even i• the resolution o• the DNA synthesis curves, presented
in Figs.32 to 35, into consecutive replication steps is considered
with caution, it can be recognized •rom the shape o• the origina11y
measured curves that the induction and appearance o• a given amount
o• DNA run very nearly in parallel, at least in the critical rising
sections. As shown schematica11y in Fig.39 this indicates that the
actual time interval o• DNA synthesis at each replication step is
comparable to or shorter than the period required for the induction
to strike progressively al1 cells in the popula~ion. Thus the upper
limit for the time needed to replicate the bulk o• DNA in ODe rep1i-
cation round amounts to some 1.5 to 2 hrB at 300C. This is noticeably
lese than the most •requent •igures indicate for the duration o• the
S period in eukaryotes; among these, however, very •ew re•er to
organisme with smal1 nuc1ei as are those o• Scenedesmus. On the other
band, the time indicated above •air1y we11 agrees with data re1ating
to DNA synthesis in bacteria. Let us take for a basis that 40 minutes
are required at 37°C to rep1icate the genome o• Escherichia coli
consisting o• 0.005 pg DNA, estimate that Sc.quadricauda possesses
10 chromosomes which replicate simultaneous1y. The replication o•
0.1 pg o• DNA constituting the genome o• Sc.quadricauda should then
take 80 minut.. at 37°C, or about 140 minutes at 300C (assuming a
temperature coe••icient o• about 2 for DNA synthesis).
The distortion o• the curves describing kinetice o• processes
which is caused by the popu1ation variability, wi1l also inter•ere
with a re1iable eva1uation o• mutua1 interactions o• two processes.
Thus, according to theoretical axioms and general experience the rate
o• RNA synthesis should slow down or even cease during DNA replication
as wel1 as dur ing chromosome •ormation and segregation. This retar-
82

dation of RNA eyntheeie should be rather pronounced if the analytica1
data could reflect reliably the evente in a eingle cell.Unfortunately,
it cen be expected a priori (ae illuetrated in Fig.39) that no clear-
cut plateaue will be obeerved on the curve showing the increase o~
RNA content per cell during growth. Ihile these curves are anything
but smooth and we are convinced that the alternating phasee of
acceleration and elow-down of RNA eynthesis have real caueee, the
majority of the waves are not sufficiently distinct for further de-
ductione. There is only one phaee when, in the synchronoue culture,
a very distinct plateau ie indisputably present on the RNA curve.
This ie during protoplaet divieionj while the latter is in progress
apparently, both RNA and DNA syntheeis ceasee completely.
The relation of the rate of RNA ayntheaie to the emount of DNA
providee a very valuable information from another point of viewj it
cen help to detect how many of the DNA replications occurring
euccessively during the life of one cell are followed by genome
transcription. It is alBa of much interest to know whether the genomee
succeesively controlling the life procesees in the cell operete
according to a uniform schedule or not. The shape of the curvesin
which (dRNA!dT)!DNA is plotted againet time of the running cycle or,
stilI better, against the number of genomes present in the cell
(Fig.38) suggests that the four genomes produced by the second DNA
replication are stilI actively functional in RNA synthesis while the
genomee reproduced by later replications start to be tranecribed only
when new daughter cella start their life proceeses. This happens
very often stilI within the mother cell envelope. The conclusion
based on the data concerning RNA eynthesie gete support from the course
of other metabolic activities in the cello Interesting and respiration
meaeurements are commented in eection 7.2.
When schematic drawings of the type presented in Figs.32 to 35
are used to characterize a given cell cycle it is important to keep
in mind that the sigmoids in the bottom tracks do not represent the
course of sny processes in an average cello Instead, these are pro-
bability curvee describing the distribution in time of the starte of
terminatione of various processee in individual cells of the population.
The procesees are running in the spaces between the eigmoide anò in
the firet approximation the time intervale separating pointe of equal
percentagee (preferentially the pointe of half completion of the
procees) can be taken ae characterietics of the duration of the
respective phase of the cycle.+! In this way, the diagrame of Fig.40
+!RigorOusly considered, this procedure ie not correct, since, due tothe variability in the duration of the proceeeee any one eelectedcell need not proceed in the percentage track at the same heightthroughout the cycle.
83

were derived for various types of cycles. Again, these diagrame
cannot be taken as generally velid (not even for Sc. quadricauda at
300C)o In the detaile (as the exact timing of the onset of processes)
many minor changes and alternatives will no doubt come from further
research. Nevertheless, the diagrame are presented here to summarize
our present ideas on the sequence of reproduction processes in
Sc.quadricauda"at various growth rates as emerging from the experience
collected so far. Moreover the schemes may provide a "chlorococcacean"
counterpart of the well known schemes concerning bacteria and cella
of higher organisme and thus serve as a convenient basis for further
discussion.
A detailed discussion of the processes of macromolecular synthesis,
nuclear segregation and cellular division will be postponed until
more data are available. Several dilemmatic points still call for
explanation which meJ be relatively easily obtained through suitably
designed experimentso
Only a few general comments on the schemes of Figs. 32 to 35
and Fig.40 may be appropriate at this stage.
It appears that the periodical production of autospores in
chlorococcal algae represents a specific pattern of reproduction which
shares characteristic features with both the bacterial sequences
(HELMSTETTER 1969, BLEECKEN 1969) of processes and the classic
eukaryotic a-5-M schemeo What reminds us of bacteria in the manner in
which the increase in specific growth rate of the organism. caused by
external factors increases the frequency of initiations of DNA syn-
thesis and causes a progressive advance of DNA replication ahead o~
other reproduction processes. The eukaryotic character somehow prevents
this shift in phase ~rom being constant ~or all the constituents of
the reproduction processl the consecutive nuclear segregations ~ollow
one another at shorter intervale than the DNA replications and still
more clumped on the time axis are protoplast ~issions. We have no
quantitative data on the course of protoplast division but the above
statement ~ollows from the qualitative observation that protoplast
~ission are consecutive and from the very limited time left between
the last nuclear division and the liberation o~ autosporeso Both
Schematic drawing representing the behaviour o~ genomesand nuclei during the cell cycle o~ Scenedesmus quadricauda.Four cycles are schematized representing a low (A) medium(B,C) and high (D) speci~ic growth rate. The quadrupletcycle o~ the type illustrated at Band the octuplet cycleo~ the character presented at C may be obtained at nearlythe same growth rate and they represent well the concurrentcourse o~ events in ~our-cell and eight-cell coenobia~ound in the mixed populations at medium growth rates.Further comments in the text.
84
Fig. 40


protoplast ~ission and ~ormation o~ new cell walls are accommodated
in this interval.
In cella which will divide into eight daughter cella the octuplet
induction ~ollows the course o~ the ~irst nuclear division (~ormation
o~ two nuclei). This 8eems to be the ewitch which prevente ~urther
lnductions to lead to ~ormetion o~ nuclei in the seme cell cycle.The
seme is true ~or quedruplet induction in quedruplet yielding cycles.
It is tempting to speculete thet. in a quite similer way. the first
fiseion o~ the protoplast prevents sny event s on the nuclear level
~rom deciding how meny daughter cella will be formed. This might
well be the mechanism which produces in e mixed daughter coenobia
populetion uninuclear octuplets side by side with binuclear quadru-
plete. If this is the correct explanation then no seperete triggering
~or nucleer and cellular divisions need be essumedo
Curiously enough. it is the division o~ protoplast which mekes
e noticeable hietus in the otherwise smoothly unfolding chein of
events linking the consecutive steps o~ DNA replications to their
respective steps on nuclei segregation. Compared with cellular
division. the segregation of nuclei seems to have e ~er lese pro~ound
inf1uence on other processes in the sequence ('such es DNA replicetion).
In ~act. it seems es if there wes reletively little direct interference
between the behaviour of the genomes. the nuclei and the protoplasto
One o~ the most striking exemples o~ this independence is the
case o~ partial doublet induction illustreted in Figo3l and commented
in the text on po72-73.In these cases. the genomes formed by repli-
cation under conditions when immediate tranecription wes being blocked
(by some circumstance linked with' the protoplest division) were pre-
sumebly directed to nucleus ~ormetion by segregation. On the other
hend. genomes ~reshly generated at the beginning o~ the light period
immediately start transcription and pase in to eegregation theree~tero
In generel. the accomplishment of DNA replicetion et ODe level
seems to be linked with nuclear segregation et the next lower level
(generetion o~ ~our genomes coincides with eppeerance o~ two nuclei
etco)o It remeins to be clari~ied whether the former procese serve s
as a trigger for the latter ODe or the coincidence results from more
complicated linkage chainso The reletively frequent appearance o~
cella with purely unigenomic nuclei points against the conclusion
thet ODe might sometimes be inclined to accept. i.e. that the baBic
state of Scenedesmus nuclei is bigenomic.
As to the ratee of verious processes in the sequence of events
described here. three observations are rather unexpectedz
8&

1) Although there is, o~ course, no net dry weight increase in
the dark, e considerab1y high rate o~ RNA synthesis is frequent1y
observed, which c1eer1y imp1ies new growth. This synthesis end the
concomitant growth must be supported by some very condensed energy
reserve since no drametic drop in dry weight is observed.
2) The rete o~ RNA eynthesie per genome is mostly lower with
~our genomee in the ce1l then with the ~iret two, e1though, the total
amount o~ RNA eyntheeie per genome trenecribed seeme to be ~airly
conetento Thie imp1ies that simu1teneous trenscription proceeds slower
with ~our genomes than with two genomee.
3) Nuc1ear eegregatione become ~aeter with increasing numbero~ nuc1ei in the ce11j it is di~~icult to imegine what type o~ synergic
mechaniem may be operating here.
Vilém
JitkaIvan
ZACHLEDER,VENDLOVÁ and
ŠETLfK
Ret'erences
BLEECKEN So (1969): Das Dup1ikationssystem der Bakterienze11eoI,II,IIIo- Ztschrof.A11g.Mikrobio1ogie 9: 415-435, 499-530, 587-6010
BURTON Ko (1956): A study of the conditions and mechanism of thediphe~lamine reaction for the co1orimetric estimation ofdeoxyrlbonuc1eic acid. - Biochem.Jo 621 )15-)2)0
CHIANG K.S. et SUEOKA No (1967): Rep1ication of chloroplast DNA inChlamydomonas reinhardii during vegetative ce11 cyc1ea itsmode and regulation. - Proc.Nat1.Acad.Sci.57: 1506-1513.
HELMSTETTER C.Eo (1969)& Sequence of bacteria1 reproductiono - Ann.Rev.Microbio1.2)1 22)-2)8.
KOMÁREK J. (1968)a Life cyc1es~ - Inl NE~AS J. et LHOTSKt O.(ed.):Ann.Rep.Algo1og.LaboT~ebon for 1967, p.29-45.
KOMÁREK Jo et SIMMER J. (1965): SynchrQnization of the cultures ofScenedesmus quadricauda (TURPo)BREBo - Bio1ogia p1ant.(Praha)7(6): 409-4240
PESHKOV MoA. et RODIONOVA GoVo (1964)& Kario1ogicheskaya kharakte-ristika razmnozheniya Ch1ore11a vu1garis. - Dok1bAkad.nauk SSSR154(4)& 967-969.
SUEOKA N. (1960): Mitotic rep1ication of deoxyribonuc1eic acid inChlamydomonas reinhardii. - ProcoNetoAcadoSci.46: 83-91.
WANKA F. (1962)& Die Bestimmung der Nuc1eis8uren in Ch1ore11a-Ku1tureno - Planta 58: 594-6090
ZACHLEDER VO et šETLfK 10 (1969): Industion of nuc1ear division inScenedesmus quedricaudeo ; In: NECAS J. et LHOTSKf O. (ed.):Ann.RepoA1go1og.Lab.T~ebon for 1968, p.44-65.
R7


