Embed Size (px)
Citation preview
Western Criminology Review 7(2), 3–19 (2006)
The Serious and Violent Offender Reentry Initiative: Measuring the Effects on Service Delivery1
Laura WinterfieldThe Urban Institute
Pamela K. LattimoreUniversity of South Carolina
Danielle M. SteffeyResearch Triangle Institute
Susan BrumbaughResearch Triangle Institute
Christine LindquistResearch Triangle Institute
Abstract: In 2003, the Federal government provided funds to 69 state agencies to implement reentry programs for adult and juvenile prisoners. The Serious and Violent Offender Reentry Initiative (SVORI) programs partner correctional or juvenile justice agencies with other government, community, and faith-based organizations to provide a range of services to participating individuals. A fully implemented SVORI program incorporates assessment, services, and programming for offenders while incarcerated, under supervision in the community, and once released from supervision. The individual SVORI programs share the common goals of improving employment, education, health, housing, and criminal justice outcomes. Each program, however, is unique in the approach taken and array of services implemented to address these common goals. Measuring the implementation of multi-faceted programs is a challenge for researchers and one that the SVORI multi-site evaluation is confronting. In this paper, we describe an approach to categorize the types of services being provided that incorporates both the number of services provided and the proportion of individuals receiving each service for each service group.
Keywords: Reentry, reintegration, rehabilitation, prisoners, service delivery, correctional policy
Acknowledgments: The authors wish to thank the program directors of the individual SVORI programs for their time in completing the initial survey and providing additional clarifying information to the evaluation team. We would also like to acknowledge the support of the National Institute of Justice for the evaluation.
Introduction
The 1980s and 1990s saw a radical change in the way criminal justice systems, at both the state and federal levels, did their work. Concerned about rising crime rates and the efficacy of the rehabilitative orientation that shaped much of American jurisprudence and penal philosophy throughout the 20th century, legislatures replaced indeterminate sentencing and discretionary release by parole boards with three-strikes laws, truth-in-sentencing, and mandatory sentences coupled with determinant release dates (Austin et al. 1996). This change in philosophy resulted in what has been termed
an era of “mass incarceration” (Drucker 2002; Mauer and Chesney-Lind 2002; Pattillo, Weiman, and Western 2004). In mid-2004, there were more than 2.1 million persons incarcerated in U.S. prisons and jails, and the estimated incarceration rate in 2004 was 726 per 100,000—up from 601 per 100,000 in 1995 (Harrison and Beck 2005). Nonetheless, although the increase in the prison population was driven, in some respect, by a desire to keep offenders off the streets, most of those admitted to prison will eventually be released. As noted by Hughes and Wilson (2004), at least 95 percent of all state prisoners come out of prison at some point, with nearly 80 percent being released to some form
The Serious and Violent Offender Reentry Initiative
4
of supervision or parole. As sentencing shifts have led to longer prison terms, the time that inmates are detached from their jobs and families has grown, with predictable results: approximately 59 percent will fail on supervision within 3 years of release (Hughes and Wilson 2004), and nearly half will be rearrested within a year (Langan and Levin 2002). Recently, a more complete picture of the multiplicity of prisoners’ service needs and their connection to reentry success and failure has begun to emerge. At least a quarter of the prison population is diagnosed with mental illnesses such as depression and anxiety disorder, and three-fourths of released prisoners have a history of substance abuse (Petersilia 2003; Lattimore et al. 2004). About half of those being released on parole do not have a high school diploma, and nearly 60 percent of state inmates are either completely or functionally illiterate (Petersilia 2003). Although a stable job is critical to post-release reintegration and success, one in three inmates reports being unemployed before entering state prison; one study found that fewer than half of released prisoners had a job lined up on their return to the community (Steurer, Smith, and Tracy 2002). Unfortunately, the combination of poor job histories and ex-prisoner status reduces the chances of former prisoners’ attaining legal employment after release (Bushway and Reuter 2002). Further evidence of detachment from support systems needed for successful reintegration can also be seen in the lack of family ties and stable residential prospects reported by many releasees (Nelson, Deess, and Allen 1999; Taxman, Young, and Byrne 2002). A problem in any one area—unemployment, unstable housing, a volatile family relationship, or relapse into substance abuse—can trigger a problem in another and spiral into a return to crime. Studies that have examined the relationship between crime and each of these domains (e.g., employment, education, substance abuse, mental health, family functioning, housing) point to their criminogenic role in recidivism (Belenko and Peugh 1998; Bushway and Reuter 2002; Gottfredson, Wilson, and Najaka 2002; Hairston 2002), and most prisoners have deficits in several of these domains. Data from the Returning Home study in Illinois (La Vigne, Visher, and Castro 2004) showed that ex-prisoners who self-reported drug use or drunkenness after release and those who were unemployed at the time of their post-release interview were more likely to be reconvicted or reincarcerated within a year of release. Historically, the time spent in prison was seen as an opportunity to provide training and skill enhancement to those in need. Over the last decade, however, offender
participation in prison programming has declined, most likely because of a decrease in the availability of programming resources (Lynch and Sabol 2001). Using data from the 1991 and the 1997 Inmate Survey conducted by the Bureau of Justice Statistics, Lynch and Sabol (2001) analyzed inmate program participation and found that 27 percent of the soon-to-be-released inmates reported participating in vocational programs and 35 percent reported participating in educational programs; these levels were down from 31 percent and 43 percent, respectively, in 1991. The high recidivism rates of released prisoners, along with a fuller understanding of their need for services, have prompted policy makers to realize that the lack of access to and the largely fragmented nature of existing programs and service delivery networks need to be addressed. Many states, however, are confronting serious fiscal crises; simply adding to the programmatic inventory is not a viable option. Thus, policy makers need information on how best to reconfigure and structure scarce programmatic resources. In 2001, a renewed federal response to the challenge of prisoner reentry resulted in the Serious and Violent Offender Reentry Initiative (SVORI). SVORI is a joint effort of the U.S. Departments of Justice, Labor, Education, Housing and Urban Development, and Health and Human Services. Its purpose is to provide funding to states to be used for services and programming directed at improving the employment, education, health, housing, and criminal justice outcomes of those released from state prisons. SVORI’s focus on serious and violent offenders differentiates it from earlier federal initiatives, such as the Residential Substance Abuse Treatment program, which largely excluded serious and violent offenders from participation (Bureau of Justice Assistance 2005). The specific design of SVORI is locally driven, providing unique combinations of services depending on local offender needs and available resources. In the remaining sections, we (1) describe the pro-grammatic structure of SVORI, identifying the range and types of services that may be included by the individual SVORI programs; (2) discuss the data and methods used to describe the service delivery by the 52 adult SVORI programs; (3) present our findings; and (4) conclude with a discussion of the findings and plans for future work.
Serious and Violent Offender Reentry Initiative
As described in the National Portrait of SVORI (Lattimore, et al. 2004), federal grant awards of between $500,000 and $2,000,000 were made to 69 agencies
Winterfield, et al. / Western Criminology Review 7(2), 3–19 (2006)
5
responsible for either adult or juvenile incarcerated offenders to use for reentry programming. The agencies received their funds by late 2003. The 69 SVORI grantees represent 52 jurisdictions (all 50 states, the U.S. Virgin Islands, and the District of Columbia). Forty-five of the grantees are adult correctional agencies, 13 are juvenile justice agencies, and the remaining 11 are other state agencies such as public health departments. Although the majority of the SVORI grantees operate a single program, some operate more than one administratively distinct program (defined by targeting specific geographic areas or populations and offering a unique set of services). As a result, the 69 SVORI grantees operate a total of 89 distinct reentry programs. Of these programs 37 target adults only; 34 target juveniles only; 2 target youthful offenders2 only; and 16 target some combination of adults, juveniles, and youthful offenders. Seventy-one programs target males and females, 16 target males only, and 1 targets females only. The SVORI program funds are to be used at the local level to (1) develop a reentry system that includes the key components (assessment, a reentry plan, and a transition team), (2) create linkages to extant services, and (3) provide services to fill identified gaps. Each agency that received a SVORI grant was expected by the federal funding agencies to establish partnerships with other state agencies and with community-based organizations to develop a three-phase continuum of services extending from before incarceration, through release to the community under supervision, and ultimately to the
community after supervision ends. The programs are encouraged to include the following:
• Diagnostic and risk assessments• Individual reentry plans • Transition teams • Community resources• Graduated levels of supervision and sanctions
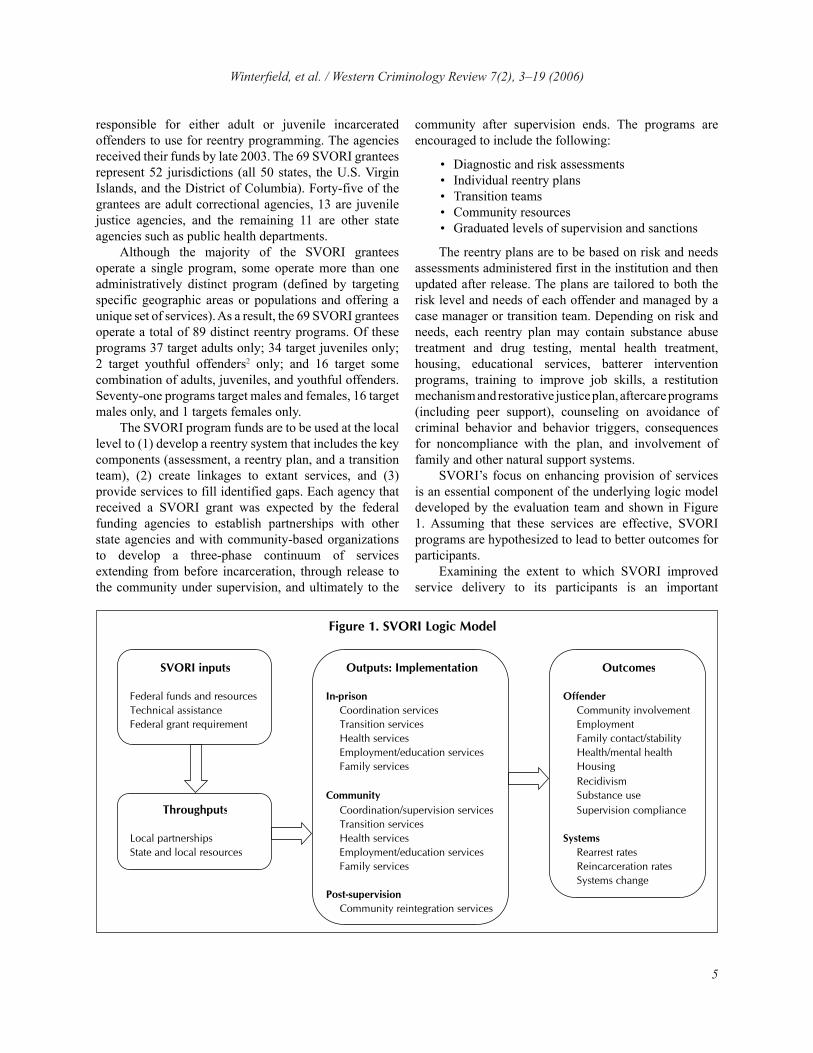
The reentry plans are to be based on risk and needs assessments administered first in the institution and then updated after release. The plans are tailored to both the risk level and needs of each offender and managed by a case manager or transition team. Depending on risk and needs, each reentry plan may contain substance abuse treatment and drug testing, mental health treatment, housing, educational services, batterer intervention programs, training to improve job skills, a restitution mechanism and restorative justice plan, aftercare programs (including peer support), counseling on avoidance of criminal behavior and behavior triggers, consequences for noncompliance with the plan, and involvement of family and other natural support systems. SVORI’s focus on enhancing provision of services is an essential component of the underlying logic model developed by the evaluation team and shown in Figure 1. Assuming that these services are effective, SVORI programs are hypothesized to lead to better outcomes for participants. Examining the extent to which SVORI improved service delivery to its participants is an important
SVORI inputs
Federal funds and resources In-prison OffenderTechnical assistance Coordination services Community involvementFederal grant requirement Transition services Employment
Health services Family contact/stabilityEmployment/education services Health/mental healthFamily services Housing
RecidivismCommunity Substance use
Throughputs Coordination/supervision services Supervision complianceTransition services
Local partnerships Health services SystemsState and local resources Employment/education services Rearrest rates
Family services Reincarceration ratesSystems change
Post-supervisionCommunity reintegration services
Outputs: Implementation Outcomes
Figure 1. SVORI Logic Model
The Serious and Violent Offender Reentry Initiative
6
component of the federally funded, 5-year, multi-site SVORI evaluation.3 In the following section, we describe the data collection and analytic approach for assessing service delivery by the SVORI programs.
Methods and Data
As part of the multi-site evaluation of SVORI (see www.svori-evaluation.org), we are conducting an implementation assessment to determine the extent to which the SVORI programs have increased access to services. The source of data for the analysis presented here is a June 2005 mail survey of the SVORI program
directors. We conducted a follow-up telephone conversation with each program director to clarify any ambiguous responses. We received completed surveys from all 89 programs (52 programs serving adult offenders). Data from this survey provide information on the individual programs, including information on the target population(s), the program elements, the timing of programs and services, the types of services being provided to SVORI participants and a comparable set of non-SVORI offenders, the agencies participating in SVORI, and the degree of coordination among agencies. The survey included a series of questions that asked the program directors to estimate the proportion
Service MeanStandarddeviation Mean
Standarddeviation
Risk assessment 0.918 0.233 0.684 0.419Needs assessment 0.918 0.233 0.735 0.389
Treatment/release plan development 0.915 0.246 0.640 0.373
Legal assistance 0.366 0.414 0.345 0.401Assistance obtaining identification (e.g., driver’s license, social security card) 0.624 0.409 0.417 0.384
Assistance obtaining benefits and completing applications (e.g., Medicaid, disability) 0.463 0.416 0.293 0.320Financial support/emergency assistance 0.314 0.408 0.147 0.226
Peer support groups 0.461 0.409 0.225 0.267One-on-one mentoring 0.404 0.404 0.128 0.190
Housing placements or referrals 0.560 0.383 0.348 0.335
Comprehensive drug treatment programs 0.358 0.331 0.299 0.246AA/NA 0.443 0.357 0.393 0.320
Counseling sessions 0.686 0.384 0.427 0.346Mental health services 0.472 0.366 0.399 0.330
Anger management/violence counseling 0.614 0.370 0.405 0.314Medical services 0.791 0.350 0.828 0.319
Dental services 0.767 0.372 0.806 0.345
Education/GED/tutoring/literacy 0.608 0.329 0.545 0.314Vocational training 0.379 0.317 0.324 0.263
Employment referrals/job placement 0.510 0.425 0.240 0.272Resume and interviewing skills development 0.668 0.388 0.343 0.316
Work release program 0.216 0.324 0.155 0.200Cognitive skills development/behavioral programming 0.653 0.372 0.368 0.306
Life skills training 0.736 0.350 0.406 0.330
Domestic violence services 0.332 0.377 0.199 0.230Parenting skills development 0.490 0.393 0.265 0.276
Family reunification 0.408 0.381 0.177 0.234Family counseling 0.140 0.266 0.065 0.092
Note: AA=Alcoholics Anonymous, GED=general educational development, NA=Narcotics Anonymous.
Bundle 2: Transition Services
Bundle 3: Health Services
Bundle 4: Employment, Education, and Skills Development Services
Bundle 5: Family Services
Table 1. Mean Proportion of Offenders Receiving Services Pre-releaseSVORI Non-SVORI
Bundle 1: Coordination Services
Winterfield, et al. / Western Criminology Review 7(2), 3–19 (2006)
7
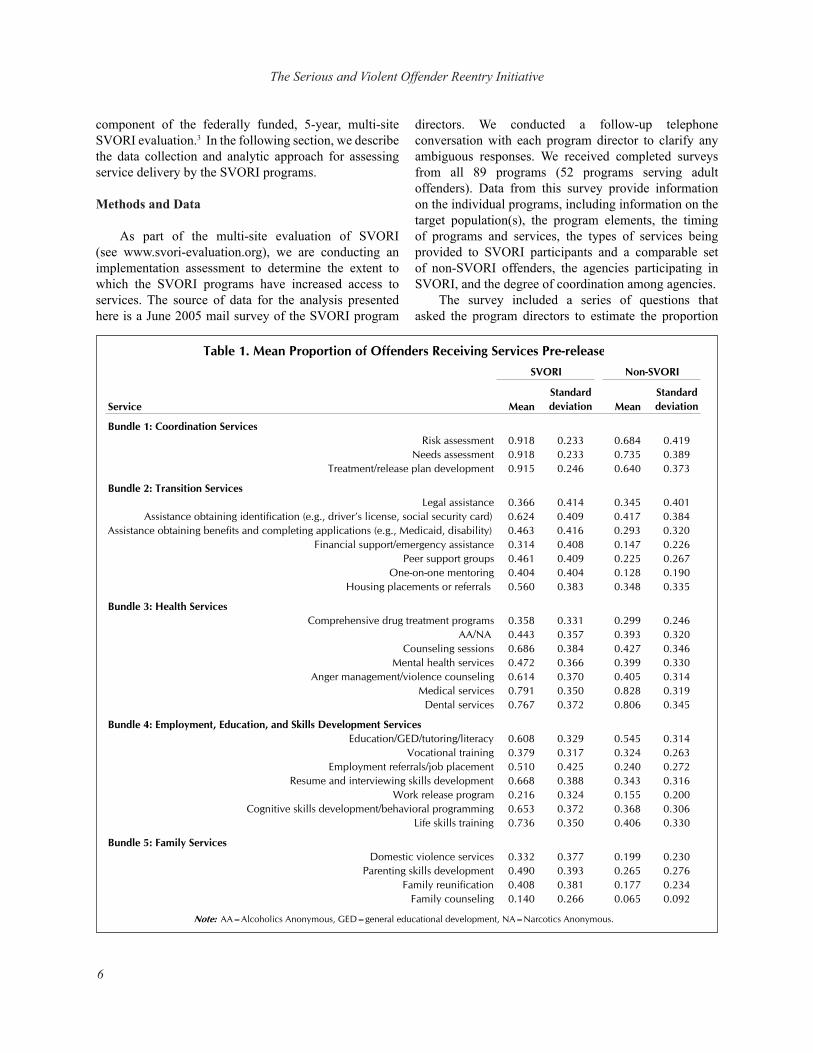
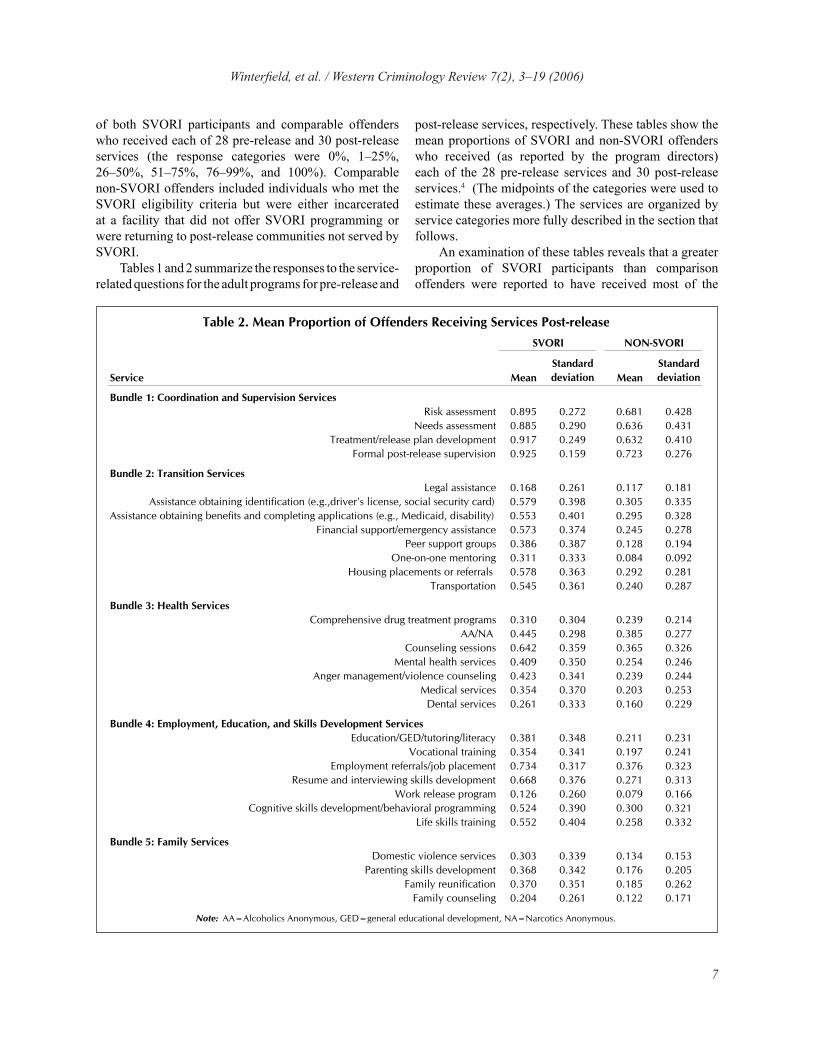
of both SVORI participants and comparable offenders who received each of 28 pre-release and 30 post-release services (the response categories were 0%, 1–25%, 26–50%, 51–75%, 76–99%, and 100%). Comparable non-SVORI offenders included individuals who met the SVORI eligibility criteria but were either incarcerated at a facility that did not offer SVORI programming or were returning to post-release communities not served by SVORI. Tables 1 and 2 summarize the responses to the service-related questions for the adult programs for pre-release and
post-release services, respectively. These tables show the mean proportions of SVORI and non-SVORI offenders who received (as reported by the program directors) each of the 28 pre-release services and 30 post-release services.4 (The midpoints of the categories were used to estimate these averages.) The services are organized by service categories more fully described in the section that follows. An examination of these tables reveals that a greater proportion of SVORI participants than comparison offenders were reported to have received most of the
Service MeanStandarddeviation Mean
Standarddeviation
Risk assessment 0.895 0.272 0.681 0.428Needs assessment 0.885 0.290 0.636 0.431
Treatment/release plan development 0.917 0.249 0.632 0.410Formal post-release supervision 0.925 0.159 0.723 0.276
Bundle 2: Transition ServicesLegal assistance 0.168 0.261 0.117 0.181
Assistance obtaining identification (e.g.,driver’s license, social security card) 0.579 0.398 0.305 0.335Assistance obtaining benefits and completing applications (e.g., Medicaid, disability) 0.553 0.401 0.295 0.328
Financial support/emergency assistance 0.573 0.374 0.245 0.278Peer support groups 0.386 0.387 0.128 0.194
One-on-one mentoring 0.311 0.333 0.084 0.092Housing placements or referrals 0.578 0.363 0.292 0.281
Transportation 0.545 0.361 0.240 0.287
Bundle 3: Health ServicesComprehensive drug treatment programs 0.310 0.304 0.239 0.214
AA/NA 0.445 0.298 0.385 0.277Counseling sessions 0.642 0.359 0.365 0.326
Mental health services 0.409 0.350 0.254 0.246Anger management/violence counseling 0.423 0.341 0.239 0.244
Medical services 0.354 0.370 0.203 0.253Dental services 0.261 0.333 0.160 0.229
Bundle 4: Employment, Education, and Skills Development ServicesEducation/GED/tutoring/literacy 0.381 0.348 0.211 0.231
Vocational training 0.354 0.341 0.197 0.241Employment referrals/job placement 0.734 0.317 0.376 0.323
Resume and interviewing skills development 0.668 0.376 0.271 0.313Work release program 0.126 0.260 0.079 0.166
Cognitive skills development/behavioral programming 0.524 0.390 0.300 0.321Life skills training 0.552 0.404 0.258 0.332
Bundle 5: Family ServicesDomestic violence services 0.303 0.339 0.134 0.153
Parenting skills development 0.368 0.342 0.176 0.205Family reunification 0.370 0.351 0.185 0.262
Family counseling 0.204 0.261 0.122 0.171
Table 2. Mean Proportion of Offenders Receiving Services Post-releaseSVORI NON-SVORI
Bundle 1: Coordination and Supervision Services
Note: AA=Alcoholics Anonymous, GED=general educational development, NA=Narcotics Anonymous.
The Serious and Violent Offender Reentry Initiative
8
services. The only exceptions are the proportions who received medical and dental services before release—in these cases, SVORI participation did not appear to increase access. The tables also reveal what is to be expected given the complement of services available and variation in the needs of offenders: (1) not all SVORI participants received all (or even most) of the available services (either through SVORI or through other prison programs), and (2) non-SVORI offenders were likely to receive some services through other prison programs. In particular, Table 1 indicates that only 5 of the 28 pre-release services (risk assessment, needs assessment, treatment/release plan development, medical services, and dental services) were received by at least 75 percent of the SVORI participants. Further, although only two pre-release services (mental and dental) were received by at least 75 percent of comparable offenders, some of these offenders received all of the services. Table 2 shows a small decline in service provision post-release, as program directors reported that only 4 of the 30 post-release services (risk assessment, needs assessment, treatment/release plan development, and formal post-release supervision) were received by at least 75 percent of SVORI participants. No post-release service was identified as being received by at least 75 percent of comparable offenders. For almost all of the services, the range in reported values was “none” to “all” for both SVORI and non-SVORI participants (data not shown in table).5 For the SVORI programs, these results suggest that for nearly every service there was (1) at least one SVORI program not providing that service and (2) at least one SVORI program that provided the service to everyone. A similar interpretation holds for the non-SVORI offenders, which suggests that there are programs where offenders received a specified service regardless of SVORI participation. Because these services are already available in these programs, SVORI participation could not have enhanced access, although the numbers receiving the services could have been increased. Tables 1 and 2 demonstrate that SVORI programs are providing a vast array of services to participants and that the types and amounts of services vary. These tables also show that, as expected, in many programs nonparticipants are also receiving services. From an analytic perspective, we need a parsimonious way to characterize service provision so that we can (1) compare SVORI programs with the non-SVORI status quo provision of services within programs and (2) compare the various SVORI programs with one another. To accomplish these
comparisons, we have developed five domain bundles that group services addressing similar goals:
• The Coordination (and Supervision) Services bundle includes three pre-release and four post-release components: risk assessment, needs assessment, treatment/release plan development, and formal post-release supervision (post-release only), such as probation or parole.
• The Transition Services bundle is composed of seven pre-release and eight post-release services: legal assistance, assistance obtaining identification (e.g., driver’s license, social security card), assistance obtaining benefits and completing applications (e.g., Medicaid, disability benefits), financial support/emergency assistance (e.g., housing, clothing), peer support groups, one-on-one mentoring, and housing placements or referrals. The post-release transition service set also includes transportation services.
• The Health Services bundle includes seven services: comprehensive drug treatment programs, Alcoholics Anonymous (AA)/Narcotics Anonymous (NA), counseling sessions, mental health services, anger management/violence counseling, medical services, and dental services.
• The Employment, Education, and Skills Development Services bundle is composed of seven services: education/general educational development (GED)/tutoring/literacy, vocational training, employment referrals/job placement, resume and interviewing skills development, work release program, cognitive skills development/behavioral programming, and life skills training.
• The Family Services bundle includes four services: parenting skills development, family reunification, family counseling, and domestic violence services for the victim or perpetrator.
We generated program-level scores for each of the 10 domain bundles (5 each for pre- and post-release) using the following formula:
Equation 1
1001 �����
�
�
����
�
�
���
j
N
ii
j N
mB
h
Here, Bj, the bundle score for domain bundle j, is
Winterfield, et al. / Western Criminology Review 7(2), 3–19 (2006)
9
calculated by summing over the Nj services in the bundle the midpoint of the response (i.e., the program directors’ report of the proportion of offenders receiving each service) for service i (mi). We then divide by the number of items in the bundle (Nj) and multiply by 100 to get a domain bundle score that ranges from 0 (no one received any of the services in the bundle) to 100 (everyone received all services in the bundle). The interpretation of this score for each SVORI program is that it identifies the average percentage of offenders who received each service included in the bundle. The score cannot be interpreted simply as the proportion of subjects receiving the bundle. For example, if there were two services in a bundle, a program could receive the same score of 50 under either of the following two scenarios: (1) 100 percent of offenders received one service and 0 percent received the other, or (2) 50 percent of offenders received each service. Under the first scenario, all the subjects receive half the bundle; under the second scenario, half the subjects receive the total bundle. In addition, there are vagaries that must be acknowledged. First, if a program did not provide one of the services in a bundle, this zero would lower the domain bundle score for the program even if a similar service was provided through alternative means. Second, if a service is one that is not universally needed (e.g., parenting skills development or mental health services), the percentage receiving the service may be small even though everyone needing the service may be receiving it. This will also lower the domain bundle score. In this example, a program where all participants needed and received a particular service (e.g., parenting skills) would have a higher score than another program in which very few needed and thus received the program. Variation in population needs among the programs could influence the overall score. Finally, a measure based on a simple average necessarily assumes that each of the components of the bundle is equally important. Although this is unlikely to be strictly true, it seems reasonable as an assumption with these nominal-scale variables. Nonetheless, because the primary purpose of creating the bundles is to allow for easy comparisons (in our case, two types of comparisons: SVORI versus non-SVORI service receipt within each program and across the various SVORI programs), we believe that even with these limitations the domain bundle scores can improve our capacity to compare such multi-faceted programs. By taking into account both the number of services and the proportion of offenders estimated to receive each service,
the bundle scores offer an improvement over scales that simply add up dichotomous indicators of whether a particular service was available (e.g., even if that service was available for only one subject). Additionally, the bundles provide more parsimonious indicators of what was actually being provided by each program than the complete list of services outlined in Tables 1 and 2. We scored domain bundles separately for SVORI participants and non-SVORI offenders and calculated the differences in scores between the two groups. Thus, for each domain bundle, each program received three scores: (1) the bundle score for SVORI participants, (2) the bundle score for comparison offenders, and (3) a difference score. These scores were computed separately for the pre-release and post-release phase, resulting in six scores for each program. We computed the score means to compare the differences in service receipt between SVORI participants and non-SVORI offenders across the programs. The findings for the 52 programs serving adults are discussed below.
Findings
In this section, we present the results of the domain bundle calculations for pre-release and post-release services. The pre-release services are presented first, followed by the post-release services. Within each section (pre- and post-release), we discuss (1) the overall characteristics of the bundles and (2) the differences in service receipt between SVORI participants and comparable non-SVORI offenders. Following the discussion of the individual domain bundles, we present cross-domain phase bundle scores as additional indicators of pre- and post-release service receipt. Finally, we introduce the program bundle as a scalar indicator of the overall level of services reported by the SVORI program directors.
Pre-release Services
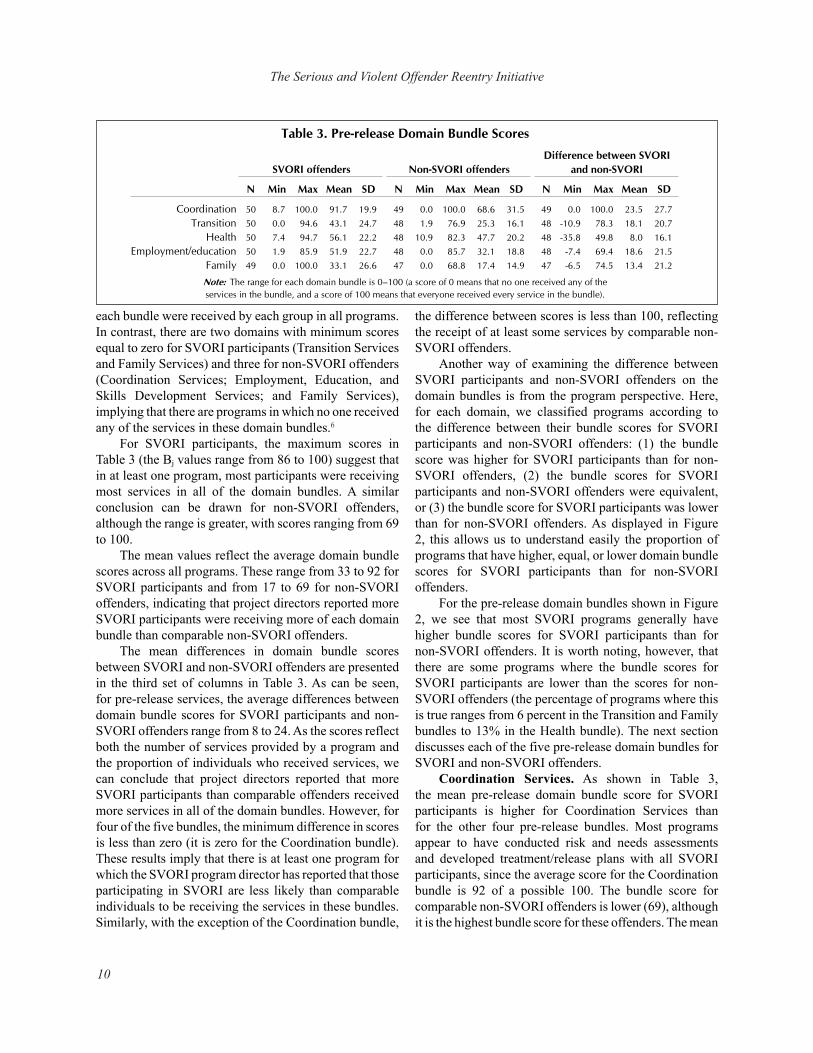
Table 3 shows for each pre-release domain bundle the minimum, maximum, and average bundle scores for: (1) the adult SVORI participants, (2) comparable non-SVORI offenders, and (3) the average difference between SVORI and non-SVORI scores. There are three domains with minimum bundle scores greater than zero for the SVORI offenders (Coordination Services; Health Services; and Employment, Education, and Skills Development Services) and two domains for the non-SVORI offenders (Transition Services and Health Services), suggesting that at least some services in
The Serious and Violent Offender Reentry Initiative
10
each bundle were received by each group in all programs. In contrast, there are two domains with minimum scores equal to zero for SVORI participants (Transition Services and Family Services) and three for non-SVORI offenders (Coordination Services; Employment, Education, and Skills Development Services; and Family Services), implying that there are programs in which no one received any of the services in these domain bundles.6
For SVORI participants, the maximum scores in Table 3 (the Bj values range from 86 to 100) suggest that in at least one program, most participants were receiving most services in all of the domain bundles. A similar conclusion can be drawn for non-SVORI offenders, although the range is greater, with scores ranging from 69 to 100. The mean values reflect the average domain bundle scores across all programs. These range from 33 to 92 for SVORI participants and from 17 to 69 for non-SVORI offenders, indicating that project directors reported more SVORI participants were receiving more of each domain bundle than comparable non-SVORI offenders. The mean differences in domain bundle scores between SVORI and non-SVORI offenders are presented in the third set of columns in Table 3. As can be seen, for pre-release services, the average differences between domain bundle scores for SVORI participants and non-SVORI offenders range from 8 to 24. As the scores reflect both the number of services provided by a program and the proportion of individuals who received services, we can conclude that project directors reported that more SVORI participants than comparable offenders received more services in all of the domain bundles. However, for four of the five bundles, the minimum difference in scores is less than zero (it is zero for the Coordination bundle). These results imply that there is at least one program for which the SVORI program director has reported that those participating in SVORI are less likely than comparable individuals to be receiving the services in these bundles. Similarly, with the exception of the Coordination bundle,
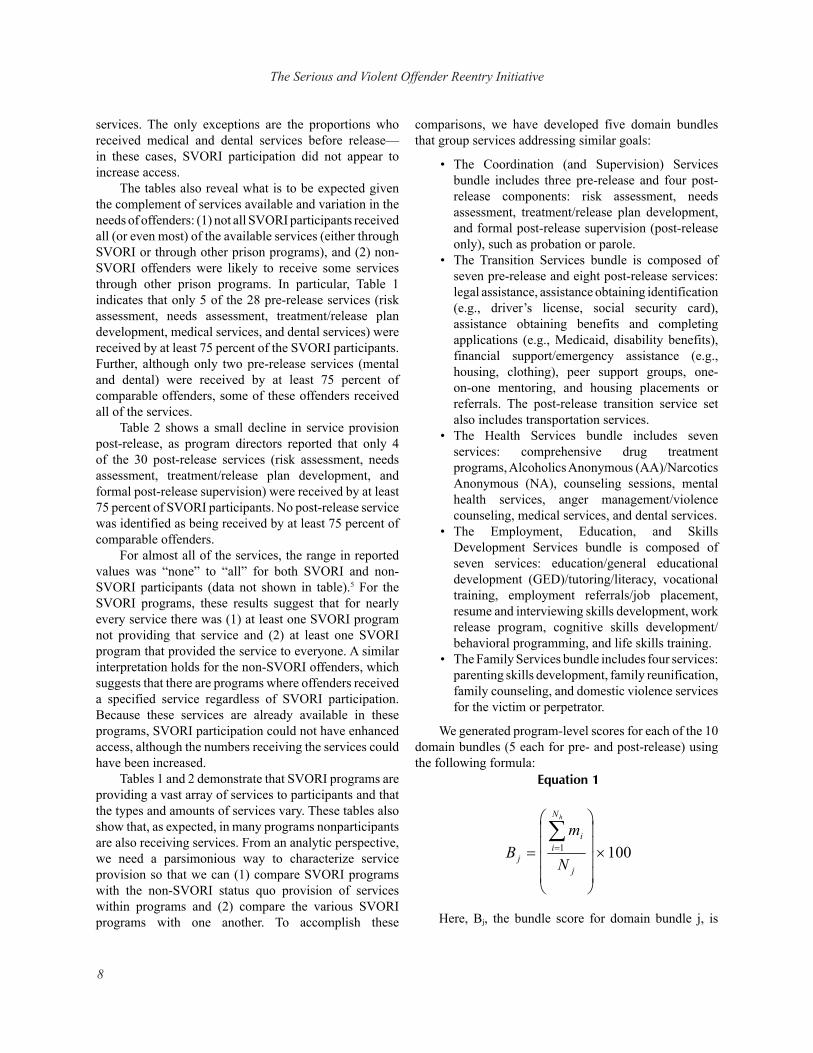
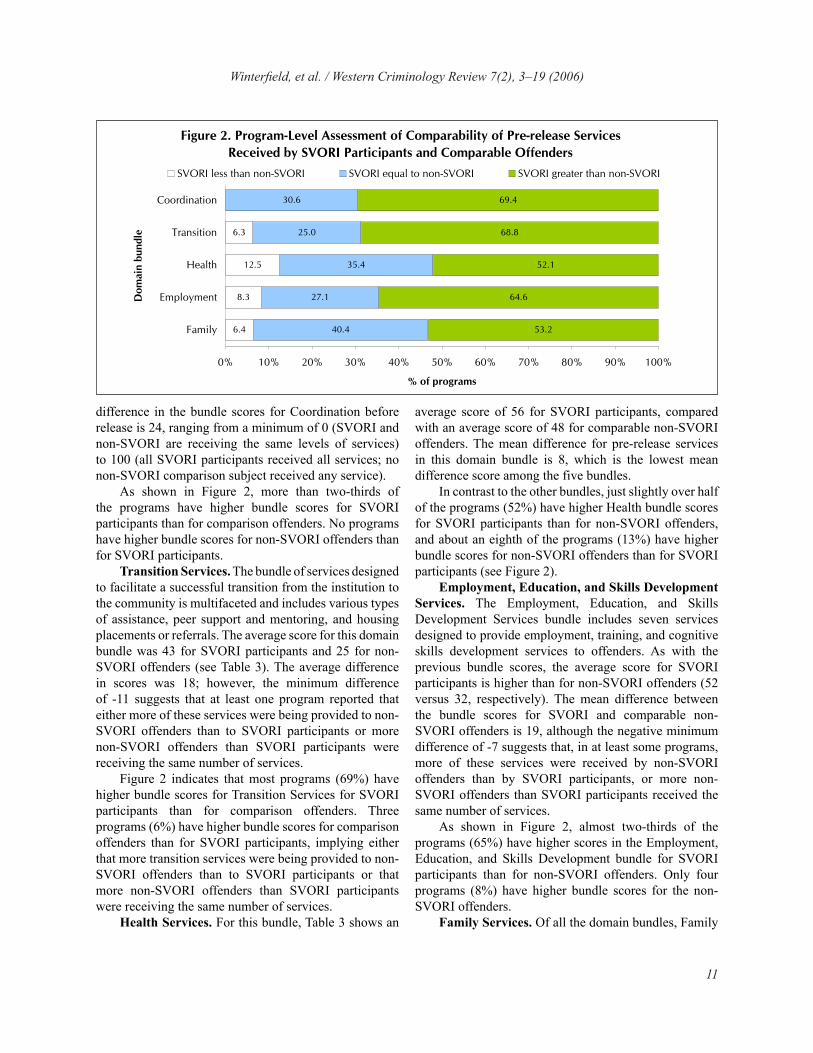
the difference between scores is less than 100, reflecting the receipt of at least some services by comparable non-SVORI offenders. Another way of examining the difference between SVORI participants and non-SVORI offenders on the domain bundles is from the program perspective. Here, for each domain, we classified programs according to the difference between their bundle scores for SVORI participants and non-SVORI offenders: (1) the bundle score was higher for SVORI participants than for non-SVORI offenders, (2) the bundle scores for SVORI participants and non-SVORI offenders were equivalent, or (3) the bundle score for SVORI participants was lower than for non-SVORI offenders. As displayed in Figure 2, this allows us to understand easily the proportion of programs that have higher, equal, or lower domain bundle scores for SVORI participants than for non-SVORI offenders. For the pre-release domain bundles shown in Figure 2, we see that most SVORI programs generally have higher bundle scores for SVORI participants than for non-SVORI offenders. It is worth noting, however, that there are some programs where the bundle scores for SVORI participants are lower than the scores for non-SVORI offenders (the percentage of programs where this is true ranges from 6 percent in the Transition and Family bundles to 13% in the Health bundle). The next section discusses each of the five pre-release domain bundles for SVORI and non-SVORI offenders. Coordination Services. As shown in Table 3, the mean pre-release domain bundle score for SVORI participants is higher for Coordination Services than for the other four pre-release bundles. Most programs appear to have conducted risk and needs assessments and developed treatment/release plans with all SVORI participants, since the average score for the Coordination bundle is 92 of a possible 100. The bundle score for comparable non-SVORI offenders is lower (69), although it is the highest bundle score for these offenders. The mean
N N N
Coordination 50 8.7 100.0 91.7 19.9 49 0.0 100.0 68.6 31.5 49 0.0 100.0 23.5 27.7Transition 50 0.0 94.6 43.1 24.7 48 1.9 76.9 25.3 16.1 48 -10.9 78.3 18.1 20.7
Health 50 7.4 94.7 56.1 22.2 48 10.9 82.3 47.7 20.2 48 -35.8 49.8 8.0 16.1Employment/education 50 1.9 85.9 51.9 22.7 48 0.0 85.7 32.1 18.8 48 -7.4 69.4 18.6 21.5
Family 49 0.0 100.0 33.1 26.6 47 0.0 68.8 17.4 14.9 47 -6.5 74.5 13.4 21.2
MinSDMeanMaxMin
SVORI offenders Non-SVORI offendersDifference between SVORI
and non-SVORI
Note: The range for each domain bundle is 0–100 (a score of 0 means that no one received any of the services in the bundle, and a score of 100 means that everyone received every service in the bundle).
Table 3. Pre-release Domain Bundle Scores
SDMeanMaxMinSDMeanMax
Winterfield, et al. / Western Criminology Review 7(2), 3–19 (2006)
11
difference in the bundle scores for Coordination before release is 24, ranging from a minimum of 0 (SVORI and non-SVORI are receiving the same levels of services) to 100 (all SVORI participants received all services; no non-SVORI comparison subject received any service). As shown in Figure 2, more than two-thirds of the programs have higher bundle scores for SVORI participants than for comparison offenders. No programs have higher bundle scores for non-SVORI offenders than for SVORI participants. Transition Services. The bundle of services designed to facilitate a successful transition from the institution to the community is multifaceted and includes various types of assistance, peer support and mentoring, and housing placements or referrals. The average score for this domain bundle was 43 for SVORI participants and 25 for non-SVORI offenders (see Table 3). The average difference in scores was 18; however, the minimum difference of -11 suggests that at least one program reported that either more of these services were being provided to non-SVORI offenders than to SVORI participants or more non-SVORI offenders than SVORI participants were receiving the same number of services. Figure 2 indicates that most programs (69%) have higher bundle scores for Transition Services for SVORI participants than for comparison offenders. Three programs (6%) have higher bundle scores for comparison offenders than for SVORI participants, implying either that more transition services were being provided to non-SVORI offenders than to SVORI participants or that more non-SVORI offenders than SVORI participants were receiving the same number of services. Health Services. For this bundle, Table 3 shows an
average score of 56 for SVORI participants, compared with an average score of 48 for comparable non-SVORI offenders. The mean difference for pre-release services in this domain bundle is 8, which is the lowest mean difference score among the five bundles. In contrast to the other bundles, just slightly over half of the programs (52%) have higher Health bundle scores for SVORI participants than for non-SVORI offenders, and about an eighth of the programs (13%) have higher bundle scores for non-SVORI offenders than for SVORI participants (see Figure 2). Employment, Education, and Skills Development Services. The Employment, Education, and Skills Development Services bundle includes seven services designed to provide employment, training, and cognitive skills development services to offenders. As with the previous bundle scores, the average score for SVORI participants is higher than for non-SVORI offenders (52 versus 32, respectively). The mean difference between the bundle scores for SVORI and comparable non-SVORI offenders is 19, although the negative minimum difference of -7 suggests that, in at least some programs, more of these services were received by non-SVORI offenders than by SVORI participants, or more non-SVORI offenders than SVORI participants received the same number of services. As shown in Figure 2, almost two-thirds of the programs (65%) have higher scores in the Employment, Education, and Skills Development bundle for SVORI participants than for non-SVORI offenders. Only four programs (8%) have higher bundle scores for the non-SVORI offenders. Family Services. Of all the domain bundles, Family
6.3
12.5
8.3
6.4
30.6
25.0
35.4
27.1
40.4
69.4
68.8
52.1
64.6
53.2
0% 10% 20% 30% 40% 50% 60% 70% 80% 90% 100%
Coordination
Transition
Health
Employment
Family
Dom
ain
bund
le
% of programs
SVORI less than non-SVORI SVORI equal to non-SVORI SVORI greater than non-SVORI
Figure 2. Program-Level Assessment of Comparability of Pre-release ServicesReceived by SVORI Participants and Comparable Offenders
The Serious and Violent Offender Reentry Initiative
12
Services (which consists of parenting skills development, family reunification, family counseling, and domestic violence services for the victim or the perpetrator) may be the one where need for a service is most likely to affect the total proportion of offenders who receive services; offenders without families are unlikely to need family services. This may provide a partial explanation for the comparatively low values obtained for this score—33 and 17 for SVORI and non-SVORI, respectively. Nonetheless, the score for SVORI participants is, once again, higher than that for comparable non-SVORI offenders. Figure 2 indicates that, similar to the Health bundle, only slightly more than half (53%) of the programs have higher Family bundle scores for SVORI participants than non-SVORI offenders. Similar to the Transition bundle, only three programs (6%) have higher bundle scores for non-SVORI offenders than for SVORI participants.
Post-release Services
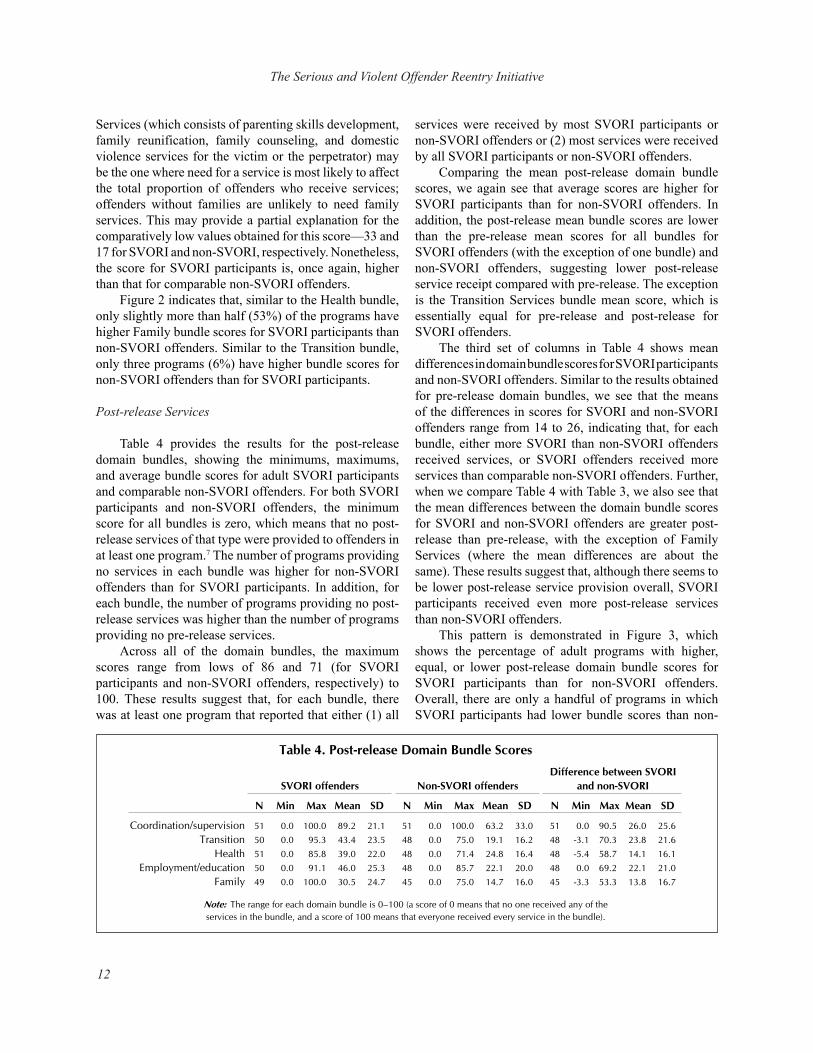
Table 4 provides the results for the post-release domain bundles, showing the minimums, maximums, and average bundle scores for adult SVORI participants and comparable non-SVORI offenders. For both SVORI participants and non-SVORI offenders, the minimum score for all bundles is zero, which means that no post-release services of that type were provided to offenders in at least one program.7 The number of programs providing no services in each bundle was higher for non-SVORI offenders than for SVORI participants. In addition, for each bundle, the number of programs providing no post-release services was higher than the number of programs providing no pre-release services. Across all of the domain bundles, the maximum scores range from lows of 86 and 71 (for SVORI participants and non-SVORI offenders, respectively) to 100. These results suggest that, for each bundle, there was at least one program that reported that either (1) all
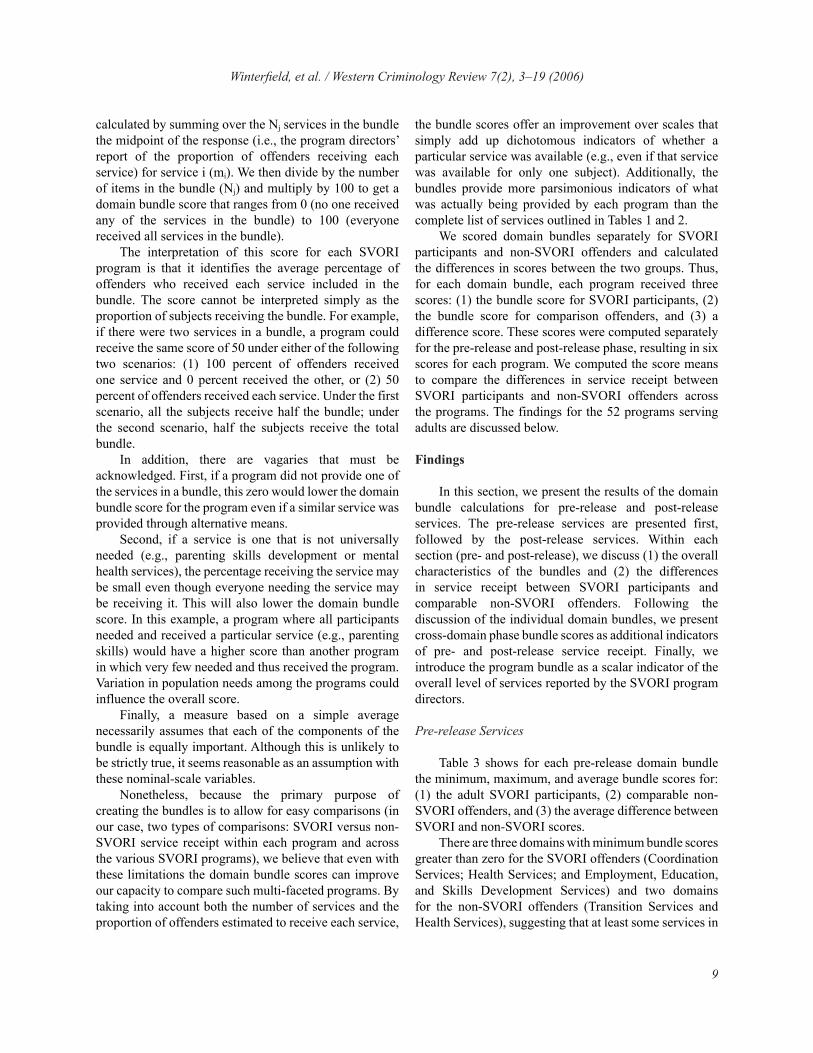
services were received by most SVORI participants or non-SVORI offenders or (2) most services were received by all SVORI participants or non-SVORI offenders. Comparing the mean post-release domain bundle scores, we again see that average scores are higher for SVORI participants than for non-SVORI offenders. In addition, the post-release mean bundle scores are lower than the pre-release mean scores for all bundles for SVORI offenders (with the exception of one bundle) and non-SVORI offenders, suggesting lower post-release service receipt compared with pre-release. The exception is the Transition Services bundle mean score, which is essentially equal for pre-release and post-release for SVORI offenders. The third set of columns in Table 4 shows mean differences in domain bundle scores for SVORI participants and non-SVORI offenders. Similar to the results obtained for pre-release domain bundles, we see that the means of the differences in scores for SVORI and non-SVORI offenders range from 14 to 26, indicating that, for each bundle, either more SVORI than non-SVORI offenders received services, or SVORI offenders received more services than comparable non-SVORI offenders. Further, when we compare Table 4 with Table 3, we also see that the mean differences between the domain bundle scores for SVORI and non-SVORI offenders are greater post-release than pre-release, with the exception of Family Services (where the mean differences are about the same). These results suggest that, although there seems to be lower post-release service provision overall, SVORI participants received even more post-release services than non-SVORI offenders. This pattern is demonstrated in Figure 3, which shows the percentage of adult programs with higher, equal, or lower post-release domain bundle scores for SVORI participants than for non-SVORI offenders. Overall, there are only a handful of programs in which SVORI participants had lower bundle scores than non-
N N N
Coordination/supervision 51 0.0 100.0 89.2 21.1 51 0.0 100.0 63.2 33.0 51 0.0 90.5 26.0 25.6Transition 50 0.0 95.3 43.4 23.5 48 0.0 75.0 19.1 16.2 48 -3.1 70.3 23.8 21.6
Health 51 0.0 85.8 39.0 22.0 48 0.0 71.4 24.8 16.4 48 -5.4 58.7 14.1 16.1Employment/education 50 0.0 91.1 46.0 25.3 48 0.0 85.7 22.1 20.0 48 0.0 69.2 22.1 21.0
Family 49 0.0 100.0 30.5 24.7 45 0.0 75.0 14.7 16.0 45 -3.3 53.3 13.8 16.7
MinSDMeanMaxMin
SVORI offenders Non-SVORI offendersDifference between SVORI
and non-SVORI
Note: The range for each domain bundle is 0–100 (a score of 0 means that no one received any of theservices in the bundle, and a score of 100 means that everyone received every service in the bundle).
Table 4. Post-release Domain Bundle Scores
SDMeanMaxMinSDMeanMax
Winterfield, et al. / Western Criminology Review 7(2), 3–19 (2006)
13
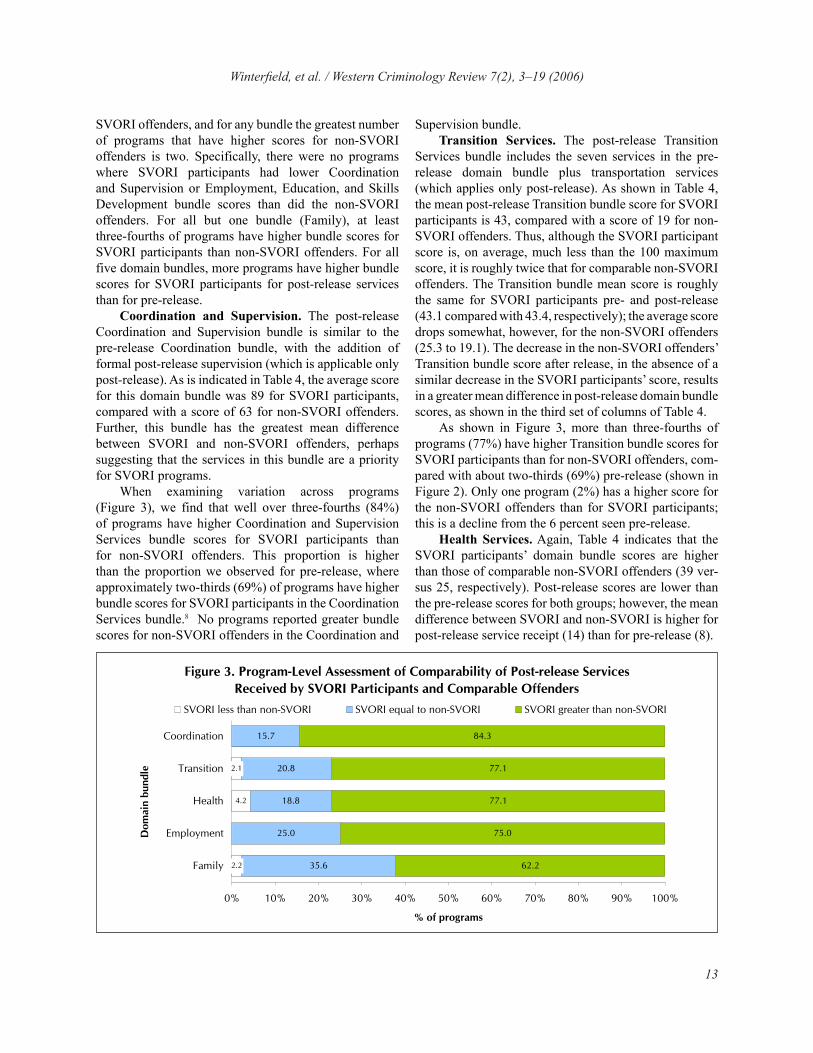
SVORI offenders, and for any bundle the greatest number of programs that have higher scores for non-SVORI offenders is two. Specifically, there were no programs where SVORI participants had lower Coordination and Supervision or Employment, Education, and Skills Development bundle scores than did the non-SVORI offenders. For all but one bundle (Family), at least three-fourths of programs have higher bundle scores for SVORI participants than non-SVORI offenders. For all five domain bundles, more programs have higher bundle scores for SVORI participants for post-release services than for pre-release. Coordination and Supervision. The post-release Coordination and Supervision bundle is similar to the pre-release Coordination bundle, with the addition of formal post-release supervision (which is applicable only post-release). As is indicated in Table 4, the average score for this domain bundle was 89 for SVORI participants, compared with a score of 63 for non-SVORI offenders. Further, this bundle has the greatest mean difference between SVORI and non-SVORI offenders, perhaps suggesting that the services in this bundle are a priority for SVORI programs. When examining variation across programs (Figure 3), we find that well over three-fourths (84%) of programs have higher Coordination and Supervision Services bundle scores for SVORI participants than for non-SVORI offenders. This proportion is higher than the proportion we observed for pre-release, where approximately two-thirds (69%) of programs have higher bundle scores for SVORI participants in the Coordination Services bundle.8 No programs reported greater bundle scores for non-SVORI offenders in the Coordination and
Supervision bundle. Transition Services. The post-release Transition Services bundle includes the seven services in the pre-release domain bundle plus transportation services (which applies only post-release). As shown in Table 4, the mean post-release Transition bundle score for SVORI participants is 43, compared with a score of 19 for non-SVORI offenders. Thus, although the SVORI participant score is, on average, much less than the 100 maximum score, it is roughly twice that for comparable non-SVORI offenders. The Transition bundle mean score is roughly the same for SVORI participants pre- and post-release (43.1 compared with 43.4, respectively); the average score drops somewhat, however, for the non-SVORI offenders (25.3 to 19.1). The decrease in the non-SVORI offenders’ Transition bundle score after release, in the absence of a similar decrease in the SVORI participants’ score, results in a greater mean difference in post-release domain bundle scores, as shown in the third set of columns of Table 4. As shown in Figure 3, more than three-fourths of programs (77%) have higher Transition bundle scores for SVORI participants than for non-SVORI offenders, com-pared with about two-thirds (69%) pre-release (shown in Figure 2). Only one program (2%) has a higher score for the non-SVORI offenders than for SVORI participants; this is a decline from the 6 percent seen pre-release. Health Services. Again, Table 4 indicates that the SVORI participants’ domain bundle scores are higher than those of comparable non-SVORI offenders (39 ver-sus 25, respectively). Post-release scores are lower than the pre-release scores for both groups; however, the mean difference between SVORI and non-SVORI is higher for post-release service receipt (14) than for pre-release (8).
4.2
2.2
15.7
20.8
18.8
25.0
35.6
84.3
77.1
77.1
75.0
62.2
2.1
0% 10% 20% 30% 40% 50% 60% 70% 80% 90% 100%
Coordination
Transition
Health
Employment
Family
Dom
ain
bund
le
% of programs
SVORI less than non-SVORI SVORI equal to non-SVORI SVORI greater than non-SVORI
Figure 3. Program-Level Assessment of Comparability of Post-release ServicesReceived by SVORI Participants and Comparable Offenders
The Serious and Violent Offender Reentry Initiative
14
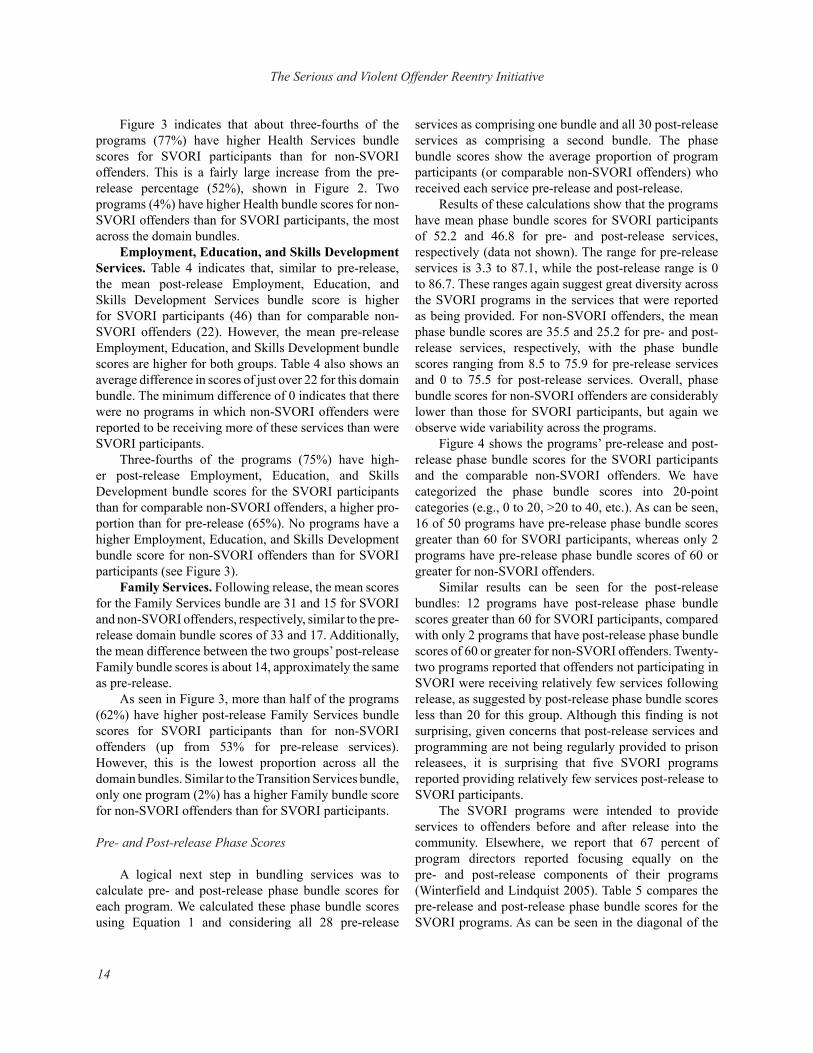
Figure 3 indicates that about three-fourths of the programs (77%) have higher Health Services bundle scores for SVORI participants than for non-SVORI offenders. This is a fairly large increase from the pre-release percentage (52%), shown in Figure 2. Two programs (4%) have higher Health bundle scores for non-SVORI offenders than for SVORI participants, the most across the domain bundles. Employment, Education, and Skills Development Services. Table 4 indicates that, similar to pre-release, the mean post-release Employment, Education, and Skills Development Services bundle score is higher for SVORI participants (46) than for comparable non-SVORI offenders (22). However, the mean pre-release Employment, Education, and Skills Development bundle scores are higher for both groups. Table 4 also shows an average difference in scores of just over 22 for this domain bundle. The minimum difference of 0 indicates that there were no programs in which non-SVORI offenders were reported to be receiving more of these services than were SVORI participants. Three-fourths of the programs (75%) have high-er post-release Employment, Education, and Skills Development bundle scores for the SVORI participants than for comparable non-SVORI offenders, a higher pro-portion than for pre-release (65%). No programs have a higher Employment, Education, and Skills Development bundle score for non-SVORI offenders than for SVORI participants (see Figure 3). Family Services. Following release, the mean scores for the Family Services bundle are 31 and 15 for SVORI and non-SVORI offenders, respectively, similar to the pre-release domain bundle scores of 33 and 17. Additionally, the mean difference between the two groups’ post-release Family bundle scores is about 14, approximately the same as pre-release. As seen in Figure 3, more than half of the programs (62%) have higher post-release Family Services bundle scores for SVORI participants than for non-SVORI offenders (up from 53% for pre-release services). However, this is the lowest proportion across all the domain bundles. Similar to the Transition Services bundle, only one program (2%) has a higher Family bundle score for non-SVORI offenders than for SVORI participants.
Pre- and Post-release Phase Scores
A logical next step in bundling services was to calculate pre- and post-release phase bundle scores for each program. We calculated these phase bundle scores using Equation 1 and considering all 28 pre-release
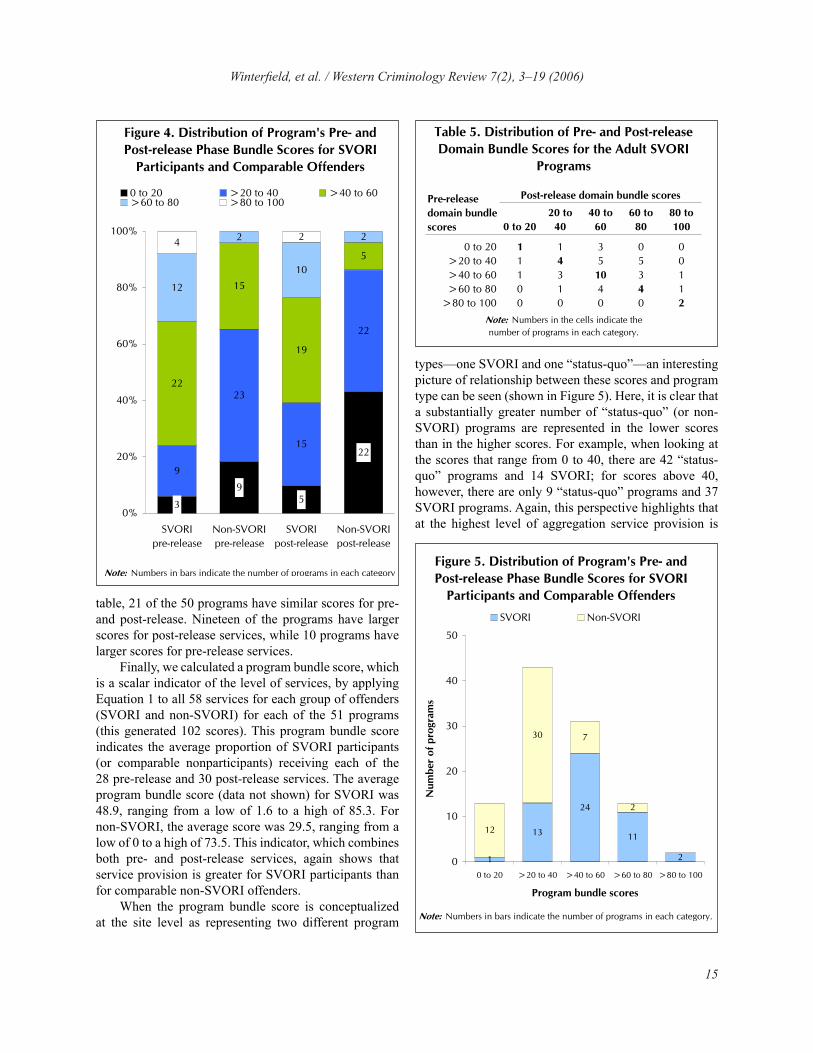
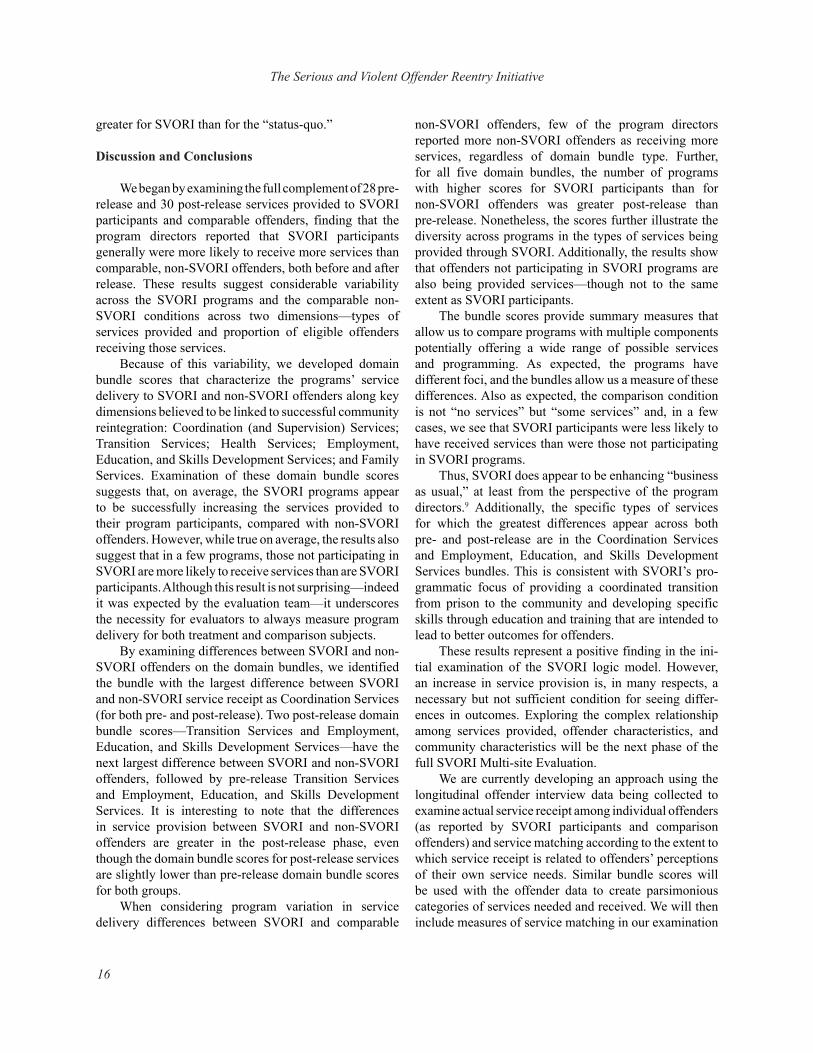
services as comprising one bundle and all 30 post-release services as comprising a second bundle. The phase bundle scores show the average proportion of program participants (or comparable non-SVORI offenders) who received each service pre-release and post-release. Results of these calculations show that the programs have mean phase bundle scores for SVORI participants of 52.2 and 46.8 for pre- and post-release services, respectively (data not shown). The range for pre-release services is 3.3 to 87.1, while the post-release range is 0 to 86.7. These ranges again suggest great diversity across the SVORI programs in the services that were reported as being provided. For non-SVORI offenders, the mean phase bundle scores are 35.5 and 25.2 for pre- and post-release services, respectively, with the phase bundle scores ranging from 8.5 to 75.9 for pre-release services and 0 to 75.5 for post-release services. Overall, phase bundle scores for non-SVORI offenders are considerably lower than those for SVORI participants, but again we observe wide variability across the programs. Figure 4 shows the programs’ pre-release and post-release phase bundle scores for the SVORI participants and the comparable non-SVORI offenders. We have categorized the phase bundle scores into 20-point categories (e.g., 0 to 20, >20 to 40, etc.). As can be seen, 16 of 50 programs have pre-release phase bundle scores greater than 60 for SVORI participants, whereas only 2 programs have pre-release phase bundle scores of 60 or greater for non-SVORI offenders. Similar results can be seen for the post-release bundles: 12 programs have post-release phase bundle scores greater than 60 for SVORI participants, compared with only 2 programs that have post-release phase bundle scores of 60 or greater for non-SVORI offenders. Twenty-two programs reported that offenders not participating in SVORI were receiving relatively few services following release, as suggested by post-release phase bundle scores less than 20 for this group. Although this finding is not surprising, given concerns that post-release services and programming are not being regularly provided to prison releasees, it is surprising that five SVORI programs reported providing relatively few services post-release to SVORI participants. The SVORI programs were intended to provide services to offenders before and after release into the community. Elsewhere, we report that 67 percent of program directors reported focusing equally on the pre- and post-release components of their programs (Winterfield and Lindquist 2005). Table 5 compares the pre-release and post-release phase bundle scores for the SVORI programs. As can be seen in the diagonal of the
Winterfield, et al. / Western Criminology Review 7(2), 3–19 (2006)
15
table, 21 of the 50 programs have similar scores for pre- and post-release. Nineteen of the programs have larger scores for post-release services, while 10 programs have larger scores for pre-release services. Finally, we calculated a program bundle score, which is a scalar indicator of the level of services, by applying Equation 1 to all 58 services for each group of offenders (SVORI and non-SVORI) for each of the 51 programs (this generated 102 scores). This program bundle score indicates the average proportion of SVORI participants (or comparable nonparticipants) receiving each of the 28 pre-release and 30 post-release services. The average program bundle score (data not shown) for SVORI was 48.9, ranging from a low of 1.6 to a high of 85.3. For non-SVORI, the average score was 29.5, ranging from a low of 0 to a high of 73.5. This indicator, which combines both pre- and post-release services, again shows that service provision is greater for SVORI participants than for comparable non-SVORI offenders. When the program bundle score is conceptualized at the site level as representing two different program
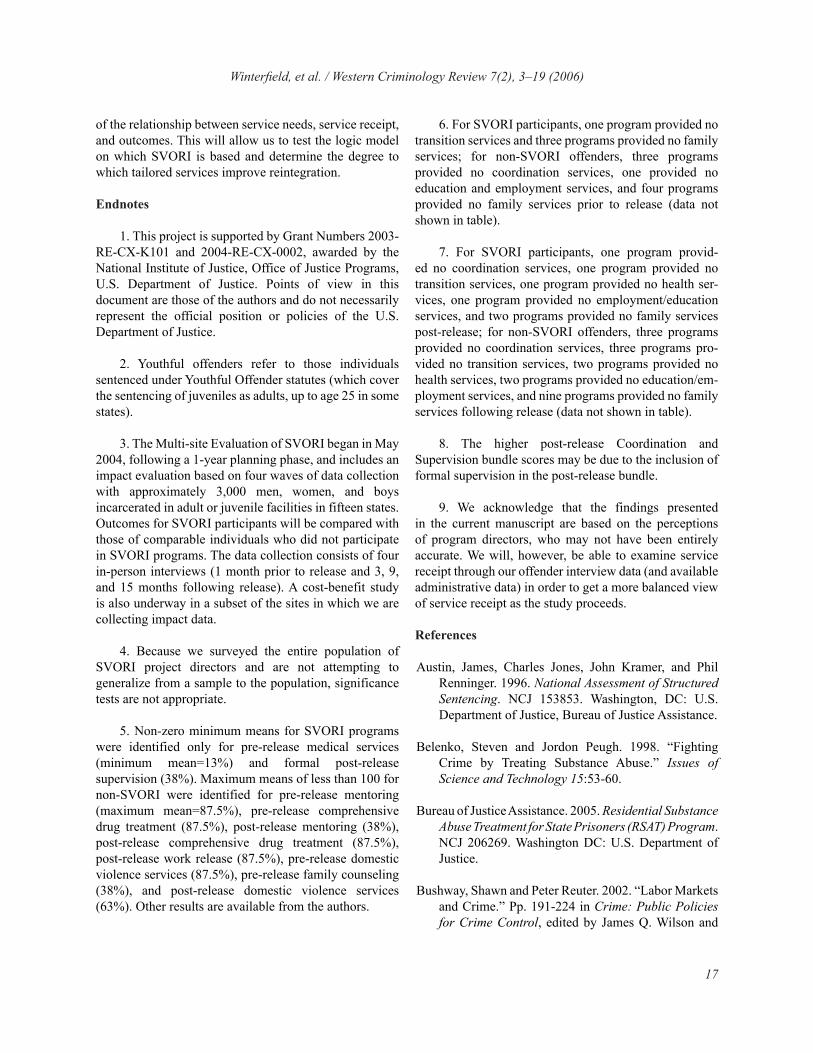
types—one SVORI and one “status-quo”—an interesting picture of relationship between these scores and program type can be seen (shown in Figure 5). Here, it is clear that a substantially greater number of “status-quo” (or non-SVORI) programs are represented in the lower scores than in the higher scores. For example, when looking at the scores that range from 0 to 40, there are 42 “status-quo” programs and 14 SVORI; for scores above 40, however, there are only 9 “status-quo” programs and 37 SVORI programs. Again, this perspective highlights that at the highest level of aggregation service provision is
3
95
22
9
23
15
22
22
15
19
5
12
2
10
24 2
0%
20%
40%
60%
80%
100%
SVORIpre-release
Non-SVORIpre-release
SVORIpost-release
Non-SVORIpost-release
0 to 20 >20 to 40 >40 to 60>60 to 80 >80 to 100
Figure 4. Distribution of Program's Pre- andPost-release Phase Bundle Scores for SVORI
Participants and Comparable Offenders
Note: Numbers in bars indicate the number of programs in each category.
0 to 2020 to
4040 to
6060 to
8080 to 100
0 to 20 1 1 3 0 0>20 to 40 1 4 5 5 0>40 to 60 1 3 10 3 1>60 to 80 0 1 4 4 1
>80 to 100 0 0 0 0 2Note: Numbers in the cells indicate thenumber of programs in each category.
Table 5. Distribution of Pre- and Post-release Domain Bundle Scores for the Adult SVORI
Programs
Pre-releasedomain bundlescores
Post-release domain bundle scores
1
13
24
11
2
12
30 7
2
0
10
20
30
40
50
0 to 20 >20 to 40 >40 to 60 >60 to 80 >80 to 100
Program bundle scores
Num
ber
of p
rogr
ams
SVORI Non-SVORI
Figure 5. Distribution of Program's Pre- andPost-release Phase Bundle Scores for SVORI
Participants and Comparable Offenders
Note: Numbers in bars indicate the number of programs in each category.
The Serious and Violent Offender Reentry Initiative
16
greater for SVORI than for the “status-quo.”
Discussion and Conclusions
We began by examining the full complement of 28 pre-release and 30 post-release services provided to SVORI participants and comparable offenders, finding that the program directors reported that SVORI participants generally were more likely to receive more services than comparable, non-SVORI offenders, both before and after release. These results suggest considerable variability across the SVORI programs and the comparable non-SVORI conditions across two dimensions—types of services provided and proportion of eligible offenders receiving those services. Because of this variability, we developed domain bundle scores that characterize the programs’ service delivery to SVORI and non-SVORI offenders along key dimensions believed to be linked to successful community reintegration: Coordination (and Supervision) Services; Transition Services; Health Services; Employment, Education, and Skills Development Services; and Family Services. Examination of these domain bundle scores suggests that, on average, the SVORI programs appear to be successfully increasing the services provided to their program participants, compared with non-SVORI offenders. However, while true on average, the results also suggest that in a few programs, those not participating in SVORI are more likely to receive services than are SVORI participants. Although this result is not surprising—indeed it was expected by the evaluation team—it underscores the necessity for evaluators to always measure program delivery for both treatment and comparison subjects. By examining differences between SVORI and non-SVORI offenders on the domain bundles, we identified the bundle with the largest difference between SVORI and non-SVORI service receipt as Coordination Services (for both pre- and post-release). Two post-release domain bundle scores—Transition Services and Employment, Education, and Skills Development Services—have the next largest difference between SVORI and non-SVORI offenders, followed by pre-release Transition Services and Employment, Education, and Skills Development Services. It is interesting to note that the differences in service provision between SVORI and non-SVORI offenders are greater in the post-release phase, even though the domain bundle scores for post-release services are slightly lower than pre-release domain bundle scores for both groups. When considering program variation in service delivery differences between SVORI and comparable
non-SVORI offenders, few of the program directors reported more non-SVORI offenders as receiving more services, regardless of domain bundle type. Further, for all five domain bundles, the number of programs with higher scores for SVORI participants than for non-SVORI offenders was greater post-release than pre-release. Nonetheless, the scores further illustrate the diversity across programs in the types of services being provided through SVORI. Additionally, the results show that offenders not participating in SVORI programs are also being provided services—though not to the same extent as SVORI participants. The bundle scores provide summary measures that allow us to compare programs with multiple components potentially offering a wide range of possible services and programming. As expected, the programs have different foci, and the bundles allow us a measure of these differences. Also as expected, the comparison condition is not “no services” but “some services” and, in a few cases, we see that SVORI participants were less likely to have received services than were those not participating in SVORI programs. Thus, SVORI does appear to be enhancing “business as usual,” at least from the perspective of the program directors.9 Additionally, the specific types of services for which the greatest differences appear across both pre- and post-release are in the Coordination Services and Employment, Education, and Skills Development Services bundles. This is consistent with SVORI’s pro-grammatic focus of providing a coordinated transition from prison to the community and developing specific skills through education and training that are intended to lead to better outcomes for offenders. These results represent a positive finding in the ini-tial examination of the SVORI logic model. However, an increase in service provision is, in many respects, a necessary but not sufficient condition for seeing differ-ences in outcomes. Exploring the complex relationship among services provided, offender characteristics, and community characteristics will be the next phase of the full SVORI Multi-site Evaluation. We are currently developing an approach using the longitudinal offender interview data being collected to examine actual service receipt among individual offenders (as reported by SVORI participants and comparison offenders) and service matching according to the extent to which service receipt is related to offenders’ perceptions of their own service needs. Similar bundle scores will be used with the offender data to create parsimonious categories of services needed and received. We will then include measures of service matching in our examination
Winterfield, et al. / Western Criminology Review 7(2), 3–19 (2006)
17
of the relationship between service needs, service receipt, and outcomes. This will allow us to test the logic model on which SVORI is based and determine the degree to which tailored services improve reintegration.
Endnotes
1. This project is supported by Grant Numbers 2003-RE-CX-K101 and 2004-RE-CX-0002, awarded by the National Institute of Justice, Office of Justice Programs, U.S. Department of Justice. Points of view in this document are those of the authors and do not necessarily represent the official position or policies of the U.S. Department of Justice.
2. Youthful offenders refer to those individuals sentenced under Youthful Offender statutes (which cover the sentencing of juveniles as adults, up to age 25 in some states).
3. The Multi-site Evaluation of SVORI began in May 2004, following a 1-year planning phase, and includes an impact evaluation based on four waves of data collection with approximately 3,000 men, women, and boys incarcerated in adult or juvenile facilities in fifteen states. Outcomes for SVORI participants will be compared with those of comparable individuals who did not participate in SVORI programs. The data collection consists of four in-person interviews (1 month prior to release and 3, 9, and 15 months following release). A cost-benefit study is also underway in a subset of the sites in which we are collecting impact data.
4. Because we surveyed the entire population of SVORI project directors and are not attempting to generalize from a sample to the population, significance tests are not appropriate.
5. Non-zero minimum means for SVORI programs were identified only for pre-release medical services (minimum mean=13%) and formal post-release supervision (38%). Maximum means of less than 100 for non-SVORI were identified for pre-release mentoring (maximum mean=87.5%), pre-release comprehensive drug treatment (87.5%), post-release mentoring (38%), post-release comprehensive drug treatment (87.5%), post-release work release (87.5%), pre-release domestic violence services (87.5%), pre-release family counseling (38%), and post-release domestic violence services (63%). Other results are available from the authors.
6. For SVORI participants, one program provided no transition services and three programs provided no family services; for non-SVORI offenders, three programs provided no coordination services, one provided no education and employment services, and four programs provided no family services prior to release (data not shown in table).
7. For SVORI participants, one program provid-ed no coordination services, one program provided no transition services, one program provided no health ser-vices, one program provided no employment/education services, and two programs provided no family services post-release; for non-SVORI offenders, three programs provided no coordination services, three programs pro-vided no transition services, two programs provided no health services, two programs provided no education/em-ployment services, and nine programs provided no family services following release (data not shown in table).
8. The higher post-release Coordination and Supervision bundle scores may be due to the inclusion of formal supervision in the post-release bundle.
9. We acknowledge that the findings presented in the current manuscript are based on the perceptions of program directors, who may not have been entirely accurate. We will, however, be able to examine service receipt through our offender interview data (and available administrative data) in order to get a more balanced view of service receipt as the study proceeds.
References
Austin, James, Charles Jones, John Kramer, and Phil Renninger. 1996. National Assessment of Structured Sentencing. NCJ 153853. Washington, DC: U.S. Department of Justice, Bureau of Justice Assistance.
Belenko, Steven and Jordon Peugh. 1998. “Fighting Crime by Treating Substance Abuse.” Issues of Science and Technology 15:53-60.
Bureau of Justice Assistance. 2005. Residential Substance Abuse Treatment for State Prisoners (RSAT) Program. NCJ 206269. Washington DC: U.S. Department of Justice.
Bushway, Shawn and Peter Reuter. 2002. “Labor Markets and Crime.” Pp. 191-224 in Crime: Public Policies for Crime Control, edited by James Q. Wilson and
The Serious and Violent Offender Reentry Initiative
18
Joan Petersilia. San Francisco, CA: ICS Press.
Drucker, Ernest. 2002. “Population Impact of Mass Incarceration Under New York’s Rockefeller Drug Laws: An Analysis of Year of Life Lost.” Journal of Urban Health 79(3):434-435.
Gottfredson, Denise C., David B. Wilson, and Stacy S. Najaka. 2002. “The Schools.” Pp. 149-190 in Crime: Public Policies for Crime Control, edited by James Q. Wilson and Joan Petersilia. San Francisco, CA: ICS Press.
Hairston, Creasie Finney. 2002. “Prisoners and Families: Parenting Issues During Incarceration.” Paper presented at the From Prison to Home conference. Washington, DC.
Harrison, Paige M. and Allen J. Beck. 2005. Prison and Jail Inmates at Midyear 2004. NCJ 208801. Washington, DC: U.S. Department of Justice, Bureau of Justice Statistics.
Hughes, Timothy and Doris Wilson. 2004. Reentry Trends in the U. S. Bureau of Justice Statistics, Washington DC: U.S. Department of Justice.
Langan, Patrick A. and David J. Levin. 2002. Recidivism of Prisoners Released in 1994. Washington, DC: U.S. Department of Justice, Bureau of Justice Statistics.
Lattimore, Pamela K., Susan Brumbaugh, Christy Visher, Christine H. Lindquist, Laura Winterfield, Meghan Salas, and Janine Zweig. 2004. National Portrait of the Serious and Violent Offender Reentry Initiative. RTI Report 8805. Research Triangle Park, NC: Research Triangle Institute. [Online]. Available: available online at http://www.svori-evaluation.org/index.cfm?fuseaction=nationalportrait.
La Vigne, Nancy G., Christy Visher, and Jennifer Castro.
2004. Chicago Prisoners’ Experiences Returning Home. Washington, DC: The Urban Institute.
Lynch, James and William Sabol. 2001. Prisoner Reentry in Perspective. Crime Policy Report No. 3. Washington, DC: The Urban Institute.
Mauer, Mark and Meda Chesney-Lind, eds. 2002. Invisible Punishment: The Collateral Consequences of Mass Imprisonment. New York: The New Press.
Nelson, Marta, Perry Deess, and Charlotte Allen. 1999. The First Month Out: Post-Incarceration Experiences in New York City. New York: Vera Institute of Justice.
Pattillo, Mary, David Weiman, and Bruce Western, eds. 2004. Imprisoning America: The Social Effects of Mass Incarceration. New York: Russell Sage Foundation.
Petersilia, Joan. 2003. When Prisoners Come Home: Parole and Prisoner Reentry. New York: Oxford University Press.
Steurer, Stephen, Linda Smith, and Alice Tracy. 2002. Three State Recidivism Study. Lanham, MD: Correctional Educational Association.
Taxman, Faye S., Douglas Young and James M. Byrne. 2002. Offenders’ Views of Reentry: Implications for Processes, Programs, and Services. College Park, MD: Bureau of Governmental Research. Available: http://www.bgr.umd.edu/pdf/May_2003_OffenderViews.pdf
Winterfield, Laura and Christine Lindquist. 2005. “Characteristics of Prisoner Reentry Programs.” [Online]. Available: http://www.svori-evaluation.org/documents/reports/RRIA-Program%20Characteristics%20Report.pdf.
About the authors
Laura Winterfield is a Senior Research Associate with the Justice Policy Center at the Urban Institute in Washington, DC. Dr. Winterfield has been actively involved in all aspects of criminal justice research since the early 1970s, including courts, field services, alternatives to incarceration, and treatment approaches. Her areas of expertise include etiology of crime and delinquency, community corrections, prediction models for criminal justice decision making, and evaluation research. She received her Ph.D. in Sociology from the University of Colorado. Her email address is [email protected].
Winterfield, et al. / Western Criminology Review 7(2), 3–19 (2006)
19
Pamela K. Lattimore is Professor and Director of the Center for the Management of Risk Behavior, Department of Criminology and Criminal Justice, at the University of South Carolina. Dr. Lattimore is affiliated as a Project Director and Senior Research Social Scientist with Research Triangle Institute. Her 20-year research career has focused on evaluation of interventions, investigation into the causes and correlates of criminal behavior, and development of approaches to improve criminal justice operations. She was Chair of the American Sociological Association’s Division on Corrections and Sentencing, 2001–2003, and received her Ph.D. in Economics from the University of North Carolina at Chapel Hill.
Danielle M. Steffey is a Research Associate at Research Triangle Institute. Her research interests and experience include multi-site evaluation design and implementation, criminal justice alternatives for offenders with substance abuse and co-occurring disorders, prisoner reentry, and violence prevention. She received an A.B. in Psychology from Duke University.
Susan Brumbaugh is a Research Sociologist at Research Triangle Institute. Her research focuses on corrections and community corrections, violence prevention, female delinquency, and evaluation. Before joining RTI, she served as the Executive Director of the New Mexico Sentencing Commission. Dr. Brumbaugh received her Ph.D. in Sociology from the University of California, Riverside.
Christine Lindquist is a Research Sociologist at Research Triangle Institute. Her research interests and experience include multi-site evaluation design, violence and substance abuse prevention, alternative treatment for drug-involved criminal offenders, prisoner reentry, and violence against women. She received her Ph.D. in Medical Sociology from the University of Alabama at Birmingham.
Contact information:
Corresponding author: Laura Winterfield, Urban Institute. 2100 M Street NW, Washington, DC 20037.
Pamela K. Lattimore: Department of Criminology and Criminal Justice, University of South Carolina, Columbia, SC 29208, or at the Research Triangle Institute (address below).
Danielle M. Steffey, Susan Brumbaugh, and Christine Lindquist: Center for Crime, Violence, and Justice Research, Research Triangle Institute, P.O. Box 12196, Research Triangle Park, NC 27709.