Embed Size (px)
Citation preview
THE SORPTION OF URANIUM FROM
AQUEOUS SYSTEMS
SI.JRTSH KATRAGADDA
A ThesisSubmined to the Faculty of Graduate Studiesi¡ Panial Fulfrllment of the Requirements
for the Degree of
DOCTOR OF PHILOSOPHY
DeparÍnent of ChemistryUniversity of Manitoba
rilinnipeg, Manitoba
By
@ June, 1993
The author has granted anirrevocable non-exclusive licencealfowing the National Library ofCanada to reproduce, loan,distribute or sell copies ofhis/her thesis by any means andin any form or format, makingthis thesís available to interestedpersons.
The author retains ownership ofthe copyright in his/her thesis.Neither the thesis nor substantialextracts from it may be printed orotherwise reproduced withouthis/her permission.
&*& |,"3:lå'.'Jo*o
Acquisit¡ons andBibl¡ographìc Serv¡ces Branch
395 Wellinglon StreetOtlawa, OnlarioK1A ON4
Bibliothèque nationaledu Canada
Direction des acqu¡s¡tions etdes services bibliographiques
395, rue WellingtonOnawa (Onlario)KfA ON4
rsBN 0-315-85913-X
Outûte Notrc étëÊnce
L'auteur a accordé une licenceirrévocable et non exclusivepermettant à la Bibliothèquenationale du Canada dereproduire, prêter, distribuer ouvendre des copies de sa thèsede quelque manière et sousquelque forme que ce soit pourmettre des exemplaires de cettethèse à la disposition despersonnes intéressées.
L'auteur conserve la propriété dudroit d'auteur qui protège sathèse. Ni la thèse ni des extraitssubstantiels de celle-ci nedoivent être imprimés ouautrement reproduits sans sonautorisation.
Canadä
Nomep¡r"¿ ose selecl lheneorly describes the contenl of your dìsserlolion. Enter lhe corresponding four-ðigit code in lhe spoces
ûNfr L..Jl tcAt c+te r,\ts t e..lSUBJECT IERAl
Subiect Co$egories
IHE HUMAN¡T¡ES &!¡þ SOGIAL g€IEñå€85
one subiecl which mostprovided.
lZl-4ltl¿l IJM.ISUBJECI CODE
oÄ22
THE SORPTION OF URAMUM FROMAQUEOUS SYSTEMS
By
SURESH KATRAGADDA
A thesis submitted to the Faculty of Graduate Studies of the University of Manitoba inpætial fulfillment of the requirements for the degree of
DOCTOR OF PHILOSOPHY
(C) June, 1993
Permission has been granted to the LIBRARY OF THE UNTVERSITY OFMAMTOBA to lend or sell copies of this thesis to the NATIONAL LIBRARY OFCANADA to microfilm this thesis and to lend or sell copies of the film, andUMVERSITY MICROFILMS to publish an abstract of this thesis.
The author reserves other publication rights, and neither the thesis nor extensiveextracts from it may be printed or otherwise reproduced without the author's writtenpermission.
lv
ABSTRACT
The determination of uranium, together with other radionuclides, for nionitoring
purposes, has received enormous attention in recent years. While the average
concentration of uranium in seawater is believed to be 3.3 ppb, commonly available
insfumental techniques a¡e unable to directly determine uranium (and other trace
metals) at concentrations below 5 ppb in seawater. Recently developed instruments
such as inductively-coupled plasma-mass spectrometer can detect uranium at this
concenfation but the instrument is relatively very expensive to be used in most
analytical laboratories. Even when metal concentrations are relatively high, the
sensitivity and detection limits of the commonly used techniques are seriously affectecl
by the seawater maftix, resulting in inaccurate analysis. Consequently, sarrple
preparation techniques must be employed to preconcentrate and to separate u¡anium
from alkali and alkaline earth metals, so as to enhance the accuracv of uranium
dete¡mination,
In our work, preconcentration was attempted by using modified polyurethane foams,
modified polyacrylonitrile fabric, and some commercially available, but rare, chelating
resins. Two new modified polyurethane foams, namely B-diketone foam and
phosphonic acid foam, were made by separately incorporating benzoyl acetone and
phenyl phosphonic acid into the foarn during the foaming process. A modified O¡lon
fabric was made by using hydroxylamine to convert nitrile groups of the
v
polyacrylonitrile part of an Orlonrrv fabric into amidoxime groups. These th¡ee nerv
sorbents were evaluated for theír ability to extract uranium from simple aqueous
solutions with a wide range of pH and temperature. A continuous flou,
specnophotometric method (CFSM), using a diode anay spectrophotometer ancl
Arsenazo trI as the photometric reagent, was developed for the determination of
uranium and was usecl for the evaluation of these th¡ee new sorbents.
The syntheses of B-diketone foam, phosphonic acid foam and the amidoxime
modification of OrlonrM fab¡ic were relatively simple and inexpensive to achieve.
Both the B-diketone foam and modified O¡lon fabric we¡e found to be useful for
sorbing uranium from sirnple aqueous solutions with pH values between 3 and 8,
whereas phosphonic acid foams were effective for solutions with pH values between 5
and 8. Generally B-diketone foam performed best at room temperature or higher but
this was not the case with the modified O¡lon fabric, which performed best at 4oC.
Commercially available, but ra¡e, chelating resins containing amidoxime or phosphonic
acid as the functional group (i.e. Chelite N, Duolite ES 346, Duolite ES 467 and
Chelite P) along with the commonly used Chelex 100 that hacl a iminodiacetic acid
functional group, were evaluated for thei¡ capability to extract uranium from actual
seawater using a SeastarrM in-situ sampler. From among these commercially available
sorbents only those that contained an amidoxirne group, namely Chelite N and Duolite
ES 346, proved to be useful in sorbing uranium from seawater.
ABSTRACT
ÄCKNOWLEDGEMENTS
LIST OF FIGURES
LIST OF TABLES
LIST OF ABBREVIATIONS
CTIAPTER I GENERAL INTRODUCTION
I Int¡oduction
l.l General properties of chelating polymers
1.2 Functional groups of chelating polymers
1.3 Selection of chelaring polymers
1.4 Novel chelating polymers
vi
TABLE OF CONTENTS
Iminodiacetic acid polymers
hopylenediaminetetra-acedc acid polymers
Poly-þdiketone æsins
Immobilized polyhydroxyantfu aquinones
Tris(dit¡iocarbam are)
lv
xll
xrx
Éx
xvll
1.4.1
1.4.2
1.4,3
1.4.4
1.4.5
I
I
5
5
15
l8
18
20
21
'))
23
1.4.6
1.4.'t
1.4.8
1.4.9
1.4.10
1.4.11
1.5
1.6
Commercially available polymers
vii
Poly(allylamine)
Cheìating resins containing phosphorus
Polyethyleneimine
Amide resins
Immobilized 8-hydroxyquinoline
Polyurethare foams
Duolite ES 346 and Chelite N
ANALYTICAL TECHNIQUES
Inductively-coupled plasma atomicemission spectrometer (ICP-AES)
Reproducibility of ICP-AES results
Di¡ect current plæma atomic emissionspecfometer (DCP-AES)
Reproducibility of DCP-AES resuls
Inductively-coupled plæma mæsspectlometry (ICP-MS)
Continuous fl ow spectrophotomet¡icmet¡od (CFSM)
25
26
29
31
31
J5
34
36
38
41
1.5. r
Summary
CTIAPTER II
2 lnt¡oduction
2.L Reagents
2.2 Equipment
2.2,1
11')
2.2.3
2.2.4
')')<
2.2.6
4t
43
44
M
45
48
50
54
,)11
2.2.8
2.2.9
2.2.t0
2.2.11
) I 1')
2.2.13
vlll
Apparatus for CFSM
Flow mixe¡s for CFSM
Analysis of u¡anium by CFSM
Fina.l aralytical æchnique
Reproducibility of CFSM results
Analysis of thorium by CFSM
Design and use of longer flowcells for CFSM
60
61
65
IU
74
77
r02
102
103
r03
t04
106
106
107
108
2.3
2.4
Evaluation of the different analytical techniques
Conclusion
CHAPTER In
Int¡oduction
Materials uæd
3. 1.1 Reagents used
3.t.2 Sorbents used
3,1.3 Apparatus uæd
Procedure
3.2,1 Ext¡action of uranium from simpleaqueous solution
3.2.2 Ext¡action of uranium from complexaqueous solution
85
97
99
EXTRACTION OF URANruM FROM AQUEOUSSYSTEMS USING COMMONLY AVAILABLESORBENTS
3
3.1
3.2
3.3 ResultJ and discussion
3.3.1
3.3.2
Conclusion
CHAPTER IV
Sorbent behaviour in simpleaqueous solution
Sorbent behaviour in complexaqueous solution
PREPAR,ATION AND EVALUATION OFSOME NEW SORBENTS FOR THE SORPTIONOF URANIUM
109
111
128
1303.4
t46
t46
t47
149
151
4 lntroduction
4.I Reagents used
4,2 Apparatus used
4.3 Polyvinylalcohol conversion to poly-p-diketone
4.3.1 Time study
4.3.2 Column studies
4.4 lncorporation of polyvinylalcohol into Hypolrrrpolyurethane foam
4.5 Preparation and evaluation of a þdiketone-imbeddedpolyurethane foam
4.5.1 Introduction
4.5,2 Procedure
4,5.3 Characærization of the p-diketone-imbedded
polyuretha¡e foam
4.5.4 Results and discussion
t34
134
135
136
137
140
t42
t44
4.6
4.5.5 Conclusion
Preparation and evaluation of a phosphonic acid-imbeddedpolyuretìane foam
4.6.1 lntroduction
4.6.2 P¡ocedure
4.6.3 Results and discussion
4.6.4 Conclusion
Preparation and evaluation of amidoximaæd fabric
4.7.l lntroduction
4.7.2 Procedure
4.7 .3 Results and discussion
4.7.4 Conclusion
Conclusion
160
161
161
162
169
t76
177
177
181
183
191
191
4.7
CTIAPTER V
5 Introduction
5.1 Reagents used
5.2 Apparatus used
5.3 Procedure
5.3.1 Stability of various resins
5.3.2 Four column gravity flow system
5.3.3 Prefeatment of resins
COMMERCIAL RESINS FOR THE UPTAKE OFURANruM FROM SEAWATER 198
198
203
204
204
210
213
2t5
xl
5.3.4 Effect of NaOH preteatmenr of resins
5.3.5 Effect of lM sodium acetare
5,3.6 Effect of 3.57o NaCl
5.3.7 Preswelling with unspiked seawater
5.4 Actual seawater tesring at Patricia Bay
5.5 Results And discussion
5.6 Conclusion
CIIAPTER VI CONCLUSION
REFERENCES
2r5
216
2r6
2r7
2t7
226
230
232
240
xü
ACKNOWLEDGEMENTS
I wish to express my si¡cere thanks to my advisor, Professor A¡thur Chow, for
his i¡finite patience, encouragement and suggestions during the cou¡se of this work.
Special thanks to members of my Advisory Comminee; P¡ofs. W.G. Batdwin, H.D.
Gesser, M. King and J.B. Westmore for their invaluable suggestions, patience and
encoufagemenL
I would like to acknowledge the following people and organizations for their
help rendered to me during the course of this study: Mr. M. Heckl, B. McKelvey and
D¡. D. Green, Seastar lnstruments Ltd., Sidney, B.C.; Mr. B. Hunt and Dr. R.
Wageman, Fresh Water lnstitute, Winnipeg, MB.; Mr. D. Chan and Mr. W. Greaves,
Wa¡d Technical Services taboratory, Winnipeg, MB.; Ms. N. Bertand and D¡. C.
Gregoire, Geological Srwey of Canad4 Ottawa" ON.; Dr. J. Thompson, Institute of
Ocean Sciences, Sidney, B.C.; Profs. J.L. Cha¡lton, H.W. Duckworth and A. Queen,
M¡s. T. Sa¡kar and M¡s. T. Lewis, Departrnent of Chemistry, University of Manitoba,
Winnipeg, MB.; W. R. Grace and Co., Ma" USA.
I would like to acknowledge the financial supporr of the University of
Manitoba and of the Natuâl Scienc€s and Engineering Research Council of Canada. I
wish to thank my lab colleagues, Mr. D. Chan, Dr. C. Kantipuly and Ms. C. t eblanc,
for their cooperation and assistance rendered during the initial søges of this project.
Sincere thanks to my friends Patrick Duffy, Dan MacDonald, Mark Townsley
and Roy Martin for their assistance ¡endered to me during the many stages of this
project. Special thanks to Mrs. Cheryll Armstrong for her encouragement, dedication
and immense patience in typing this thesis.
. xrll
LIST OF FIGURES
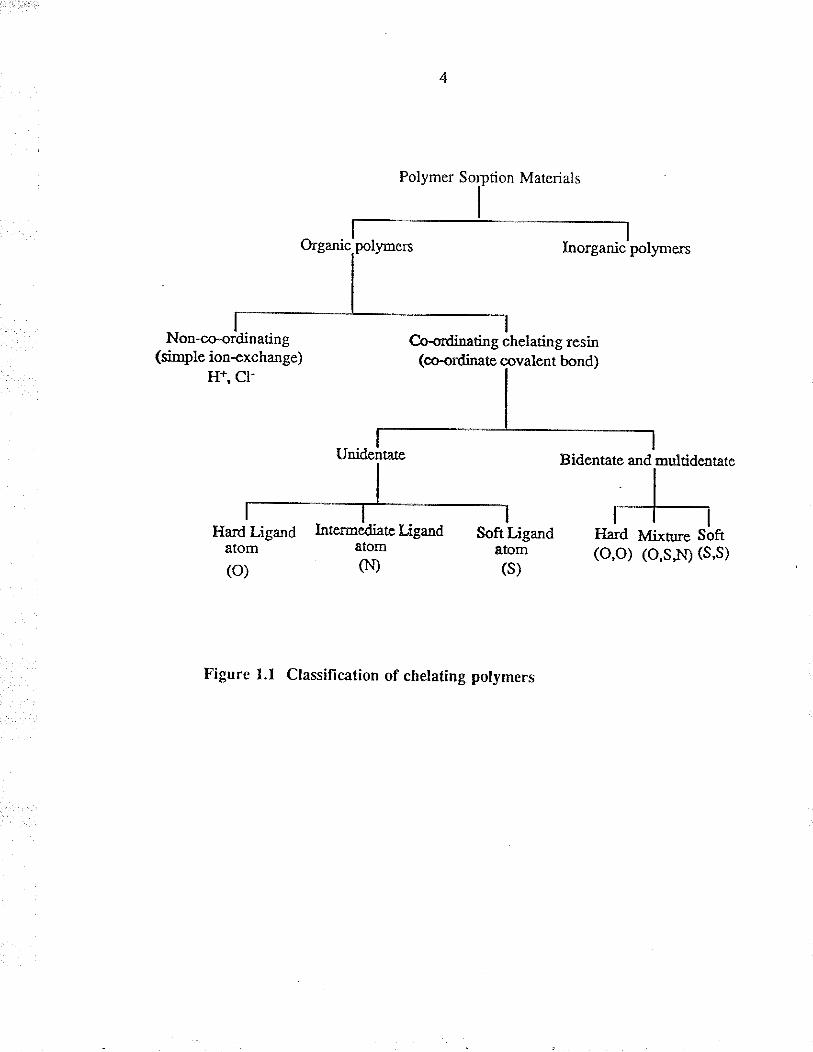
1.1 Classification of chelating polymers
1.2 Uranophiles synthesized by I. Tabushi et al.t80
2.1 Schematics of an i¡ductively-coupled plasmaatomic emission spectrometer (ICP.,AES)
2.2 Schematics of a di¡ect curent plasma atomicemission spectrometer (DCP-AES)
2,3 Digital scan of a l0 ppm u¡anium standard a¡dbackground by DCP-AES at 424.17 nn
2.4 System calibration for DCP-AES
2.5 Background corre¿tion fo¡ the u¡anium anal¡ticallire by DCP-AES
2.6 Schematics of a¡ inductively-coupted plasma massspectometer (ICP-MS)
2.7 Structu¡e and dimensions of a Ma¡ksonrM flow cell
2.8 Flow mixers evaluated fo¡ use with CSFM
2.9 UV-visible spectrum of the A¡senazo IIIdye solution
2.10 LlV-visibie spectrum of the A¡senazo III -u¡anium complex
2.11 Visible spectrum of Arsenazo III -u¡anium complex
2,12 Calib¡ation graph for uranium standardsbetween I and l0 ppm
2.13 Visible specrum of A¡senazo III -thorium complex
2.14 Calibration graph for tho¡ium sunda¡ds between1.0 and 10.0 ppm
4
24
46
53
5l
52
57
62
63
69
71
78
80
2.15
2.16
2.r7
2.18
2.19
2.20
2.21
7))
4.1
4.2
4.3
4.4
4.5
4.6
xlv
Calib¡ation gaph for thorium st¿nda¡dsbetween 0.1 and 1.0 ppm
Calibration graph for tho¡ium standardsbefween 1.0 and 5.0 ppm
Visible specta of u¡anium-A¡senazo III a¡dthorium-A¡senazo III complexes
Cross-sectional view of a 10 cm glass flow cell
Cross-sectional view of a 10 cm Teflonru flow cell
Calibration graph for u¡anium standards between0.100 and 0.500 ppm using 0.00017o Arsenazo IIIsolution
Calibration graph for u¡anium standa¡ds between0.100 and 0.500 ppm using 0.00067o A¡senazo IIIsolution
Calibration graph for u¡anium standa¡ds between0.100 and 0.500 ppm using 0.00127o A¡senazo IIIsol ution
The effect of time of contact on the percentextraction of u¡anium by PpDK resin
Extraction capabiìity of B-diketone foam atAoC and 22oC
Extraction capability of þdiketone foam at40oC and 60oC
Effect of pH on the solvent exuaction ofu¡anium by 0.10 M benzoylacetone in benzene2?6
Comparison of the exraction capabiïties ofBdiketone foam and blank HypoFu foam at 4oC
Comparison of the extraction capabilities ofBdiketone foam and blank HypoFu foan at 22oC
82
83
84
86
88
96
t53
154
156
r57
158
t59
170
1',71
4.7
4.8
xv
Comparison of the extaction capabüities ofB-diletone foam and blank HypoFv foam at 4OoC
Comparison of tle extraction capabilities ofBdiletone foam and blank HypoFu foam at 60oC
Extaction capability of phosphonic acid foamat 4oC and 22oC
Extraction capabilty of phosphonic acidfoam at 40oC and 70oC
Comparison of the exFaction capabilities ofphosphonic acid foam and blank HypolrM foamat 40C
Comparison of the extraction capabilities ofphosphonic acid foam and blank HypolrM foam at22(,C
Comparison of the extraction capabilities ofphosphonic acid foam and blank HypolrM foam at400c
Comparison of the extaction capabilities ofphosphonic acid foam and bla¡k HypolrM foam at700c
Extaction capabiJity of modified O¡lon at4oC and 22oC
Extraction capability of modified O¡lon at40oC and ?0oC
Comparison of the extraction capabilties ofmodified O¡lon and blan-k O¡lonrM at 4oC
Cornparison of the extraction capabilities ofmodified Orlon a¡d blank O¡lonrM at 22oC
Cornparison of the exFaction capabilities ofmodified O¡lon and blank O¡lonrM at 40oC
4.9
4.10
4.11
4.12
4.t3
4.14
4. 15
4.16
4.17
4.l8
4.19
173
174
l'75
184
187
188
189
4.20
4.21
4.22
4.23
4.24
5.1
5.2
5.3
xvl
Comparison of rhe exraction capabilities ofmodified Orlon and blank Orlonru at 70oC
Comparison of the extraction profiles ofpdi-ketone foam, phosphonic acid foam and'modified Orlon at 4oC
Comparison of the extraction profiles ofBdiketone foam, phosphonic acid foam andmodified O¡lon at 22oC
Comparison of tÏe extraction profrles ofBdiketone foam, phosphonic acid foam andmodified O¡lon at 40oC
Comparison of the extraction profiles ofB-diletone foam, phosphonic acid foam andmodified Orlon at temperarues above 60oC
Diagram of tle Seasta¡ru ln-situ Waær Samplerwith filration assembly
Diagram of a dual colum¡ extraction system
Repetitive extraction capability of u¡aniumusing various commercially available resins
Diagram of fou¡ colum¡ gravity flow system
Map of the site at which actual seawater wassampled
Enlarged map of the Saanich Inlet siæ
Functional groups of the ¡esins used for theactual s€"vatef sampling
r90
t93
194
200
206
212
2145.4
5.5
5.6
5.7
219
220
221
xvii
LIST OF TABLES
1.1 Sorbents used for the separation of meøl ionsfrom natu¡al water systems'
1.2 U¡anium loading of selected sorbents3
L3 Commercially available chelating resins thata¡e suitable for exúacting u¡anium and oÍrer
. tace metals from seawater
2.1 ICP-AES deæction limits and emissionwavelengths
2.2 Reproducibiliry ¡esults for DCP-AES when a5.70 ppm u¡anium solution was analysed
2.3 Reproducibility results for DCP-AES when a
1.00 ppm u¡anium solution was analysed
2.4 Calibration for uranium standa¡ds betwe€n 1.0and 10 ppm using 0.0067o A¡senazo III solurion
2.5 CFSM analysis of a 10.0 ppm uranium solutionat different pH values
2.6 Reproducibility results for the analysis of a10.0 ppm u¡anium solution by CFSM
2.7 Reproducibiliry results for the analysis ofdeionised water (0.0 ppm uranium) by CFSM
2.8 Calibration data for thorium standards between0.1 and 10.0 ppm using 0.0067o A¡senazo IIIsolution
2.9 Calib¡ation data for u¡anium standa¡ds between0.010 and 0.500 ppm using 0.0001% A¡senazo IIIsolution
2.10 Calibration data for u¡anium standards between0.025 and 0.500 ppm using 0.00067o Arsenazo IIIsolution
6
ll
3s
55
56
72
73
75
76
8t
2.11
xviíi
Calibration data fo¡ u¡anium standards berween0.010 and 0.500 ppm using 0.00127o A¡senazo IIIsolution
Classif¡cation of the sorbents used for theexEaction of u¡anium from simple aqueoussystems
Extraction capability of va¡ious sorbents forthe separation of uranium from simple aqueoussolution
Extraction capabilties of va¡ious sorbents forthe separation of uranium from complex aqueoussolution
Relative selectivities of sorbents based onpercent extraction for various cations
Chemical composition of "lnstant Ocean"279
Evaluation of va¡ious þpes of pol¡urethane foams,with and without phosphonic acid
Evaluation of commercially available resins forthe sorption of u¡anium from a¡tificial seawater
Reproducibiliry of th¡ee dual column experimentsusirg TeflonrM columrs
Reproducibiliry of tluee dual column experimentsusing adjustable glass columns
Seawater sampling conditions
Results of the actual seåwater experiment usingcommercially available resins
95
201
209
224
3.2
3.3
3.4
4.1
4.2
5.t
5.2
5.3
5.4
5.5
112
t20
131
164
xix
LIST OF ABBREVIATIONS
CFSM Conti¡uous flow spectrophotometric method
DCP-AES Direct current plasma atomic emission specrometer
ICP-AES lnductively-coupledplasmaatomicemissionspectrometer
ICP-MS lnductively-coupledplasmamassspectrometer
PBDK Poly-B-diketone
PVA Polyvinylalcohol
1
CH,{PTER I
INTRODUCTION
1 Introduction
Met¿l ions and their chemical compounds find thei¡ way into ocean wateß from
st¡eams and ¡ivers after weatlering of rocks, minerals, ores and soils. Underwater
volcanic activity, hydrothermal vents and the seafloor mineral deposits all contribute to
the metal ions and thei¡ concentrations in these waters. ln addirion, a signilTcant
contribution is possible from all avenues of human endeavour, ranging from large
industrial enterprises to home activities. A thorough understanding and
characte¡ization of ocean waler calls for an accurate determination of trace elements
and thei¡ species. The chemical speciation of metal ions in seawater is primarily
dete¡mined by complexes formed by inorganic anions (OH-, Cl-, CO32-, HPO42-,
SOot-, f- etc.) and organic complexhg agents such as carboxylic, humic and fulvic
acids. In this connection, trace elements aæ defined here æ those elements that are
present in ocean waters at concent¡ations less tha¡ 1 ppm (1 pg.ml--r). They are
difficult to determine directly by instrument¿l methods, mainly because of the high salt
content in these waters.
AccuraB analysis of oc€an waters, especially at trace levels, is one of the most
difhcult and complicat€d analytical tasks, because the oceans contâin many of the
naturally-occruring elements and ¡adioactive isotopes. The cunent interest of
2
a¡al).ticai chemists in the constituents of ocean waters emphasizes determination at
ppm levels o¡ below, with special attention to monitoring of radionuclides. Despite
their low conc€nfations, these latter constituents a¡e of inærest due to their
bioaccumulation properties. The analyst is presented with a difficult task by the
increæingly rigorous requirements of versatility, specificify, sensitivity and accuracy in
the analyses.
During the past three decades rapid development of elect¡onic instrumentation has
created powedul analytical tools for lrace element determination. However, these
tools can give erroneous results for ocean water samples because of matrix effects, if
the limit¿tions of the devices go unheeded. Kantipuly and Westla¡dr, i¡ thei¡ review,
made evident the mal¡ix effects involved and the importance of separation chemistry
in instrumental meùods such as neut¡on-activation analysis, plasma-source emission
and mæs spect¡ometry, X-ray fluorescence spectometry, atomic absorption and
spectrophotometric metlods. The best course to obrain reliable data is to sepffats tlÌe
analytes of interest from the mat¡ix constituents and determine them in tìe isolated
ståte. This results i¡ greater sensitivity, but calls for elegant separation and
concentraüon æchniques involving chelating ¡esins and ion+xchange resins.
There have been several reviews2'8 dealing with the use of chelating polymers in
separation ard preconcentration methods. A number òf review papers*tt have been
published recently that discuss the use of chelating polymers for the treatment of wæte
3
water and for the ¡emoval of toxic trace metals from natural water systems. Other
review papersrG" deal witì the pæpararion, evaluation a¡d cha¡acterization of
polymeric chelating agents for the separation of trace metals from various mat¡ices.
1.1 General properties of chelating polymers
The chemistry underlying the use of ion+xchange and chelating polymers for the
separation and preconcentration of t¡ace elements is reasonably well understood2a'ã and
progress today is mainly in the a¡ea of improving the specificity of the resins and the
techniques of application.
The analytical application of chelating polymers depends on many factors. Normally a
metai ion exists in ocean water æ a hydrated ion or as a complex species in
association with va¡ious a¡ions with linle or no tendency to transfer to a chelating
polymer. To convert a melal ion into an ext¡actable species is charge must be
neutralized and some or all of its water of hydration replaced. The nature of the metal
species is therefore of fundamental importarce in extraction syslems. Most significant
is the nature of the functional group and/or donor atom capable of forming complexes
with the metâl ions in solution, and it is logical to clæsify chelating polymers on this
bæis. Chelating polymers ca¡ be classified æ shown in Figure 1.1. This method of
classification is not mea¡t to imply tl¡at ¡hese systems are mutually exclusive. lndeed
some pol¡.rners can belong to more than one class, depending on experimental
conditions.
Co<rdinating chelating resin
I
I
-
Hard Ligand lntermediaæ I ìgand Soft Ligandatom atoE atom(o) 0Ð (s)
Bidentate and multidcntate
I
It-T-lHa¡d Mixture Soft(o,o) (o,sN) (s,s)
Figure I.I Classifìcation of chetating polymers
5
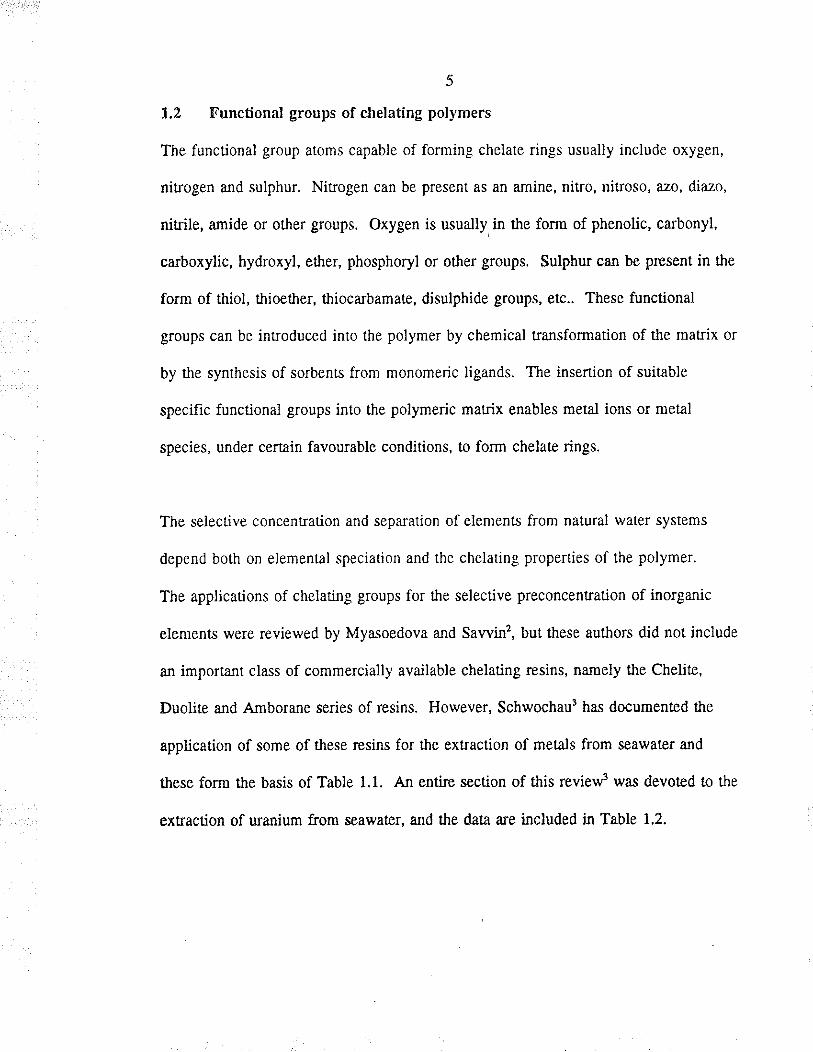
1,2 Functional groups of chelating polymers
The functional group atoms capable of forming chelate rings usually include oxygen,
nitrogen and sulphur. Niuogen can be present as an amine, nitro, niuoso, azo, diazo,
nitrile, amide or othsr groups. Oxygen is usually, in the form of phenolic, carbonyl,
carboxylic, hydroxyl, ether, phosphoryl or other groups. Sulphur can be present in the
form of thiol, thioether, thioca¡bamate, disulphide groups, etc.. These functional
groups can be int¡oduced into the polymer by chemical t¡a¡sformation of fhe matrix or
by the synthesis of sorbents from monomeric ligands. The insertion of suitable
specific functional groups into the polymeric matrix enables metal ions o¡ metal
species, under certain favourable conditions, to fo¡m chelate rings.
The selective concent¡ation and separation of elements from natural water systems
depend both on elemental speciation and the chelating properties of the polymer.
The applications of chelating groups for the selective preconcentration of inorganic
elements we¡e reviewed by Myæoedova and Sawi¡2, but these autho¡s did not include
an important class of commercially available chelating resins, namely the Chelite,
Duoliæ and Amborane series of resins. However, Schwochau3 has documenæd the
application of some of these resins for the ext¡action of metals from seawater and
these form the basis of Table 1.1. An enti¡e section of this revieuf was devoted ûo the
extraction of u¡anium f¡om seawater, and the dat¿ are included in Table 1.2.
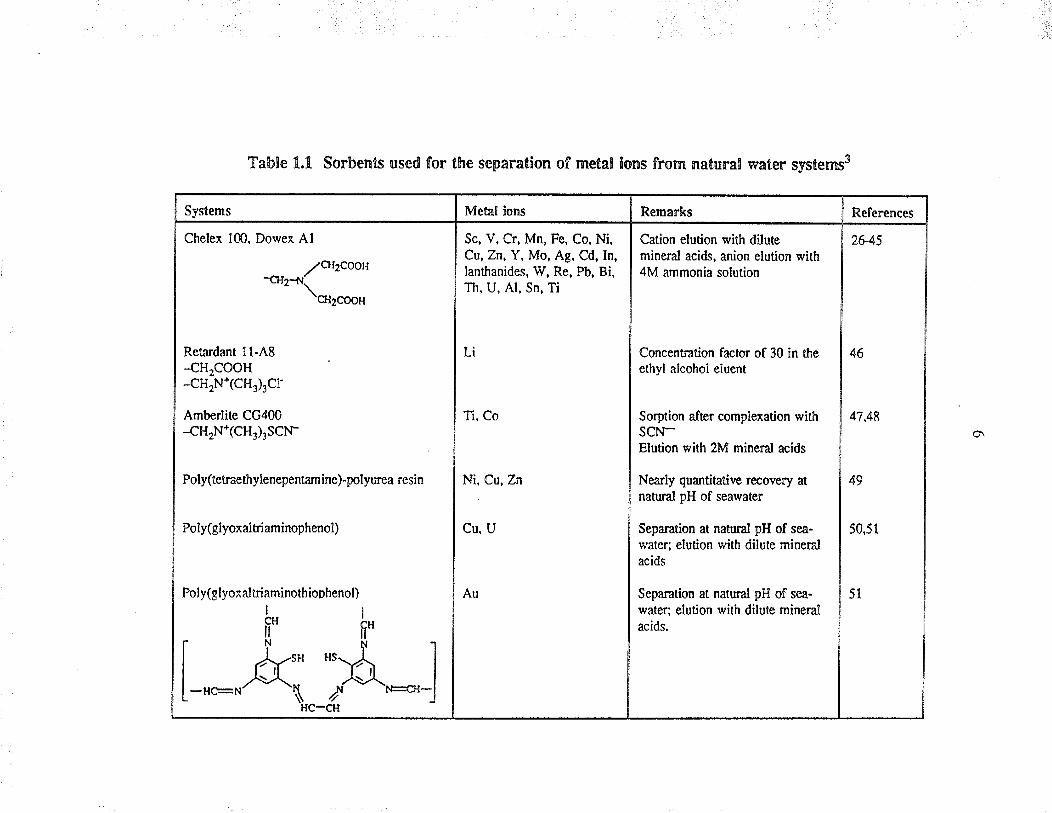
Svstems
Table 1.!. Sorbents used for the separation of metal lons from naturâl water systerns3
Dowex A1
//cJt2COOtt-trlr-+¡í\or-o*
Retardant 11-48-cH2cooH-cH2N+(CH3)3Cr
Amberlite CG400
-cH2N*(CH3)3SCN.
Poly(etraethylenepenamine)-polyurea resin
Poly(glyoxaltriaminophenol)
Poly(glyoxaltriaminothioDhenol)
þþ
[-"*"Åî";ü^:J
Metal ions
Sc, V, Cr, Mn, Fe, Co, Ni,Cu, Zn, Y, Mo, Ag, Cd, In,Ianthanides, 1V, Re, Pb, Bi,Th, U, Al, Sn, Ti
Li
Ti, Co
R€marks
Cation elution with dilutemineral acids, anion elution with4M ammonia solution
Ni, Cu, Zn
Cu, U
Au
Concenration factor of 30 inethyl âlcohol eluent
Sorption after complexation withscN-Elution with 2M mineral acids
Nea y quantìutive rocovery atnatural pH of sear4,âter
Separation at natural pH of sea-water: elution with dilute mineralacids
Separation at natural pH of sea-
water: elution with dilute mineralacids.
References
26-45
46
47,48
49
50,51
51
Systems
Hydrous aluminium oxide
/u*-Al \u
Dipicrylamine
.zNOt
o,nn-$*,a"o,
Zirconium phosphate
Hydrous titanium oxide
\pH1¡/\,
Hyphan on cellulose or polysrene
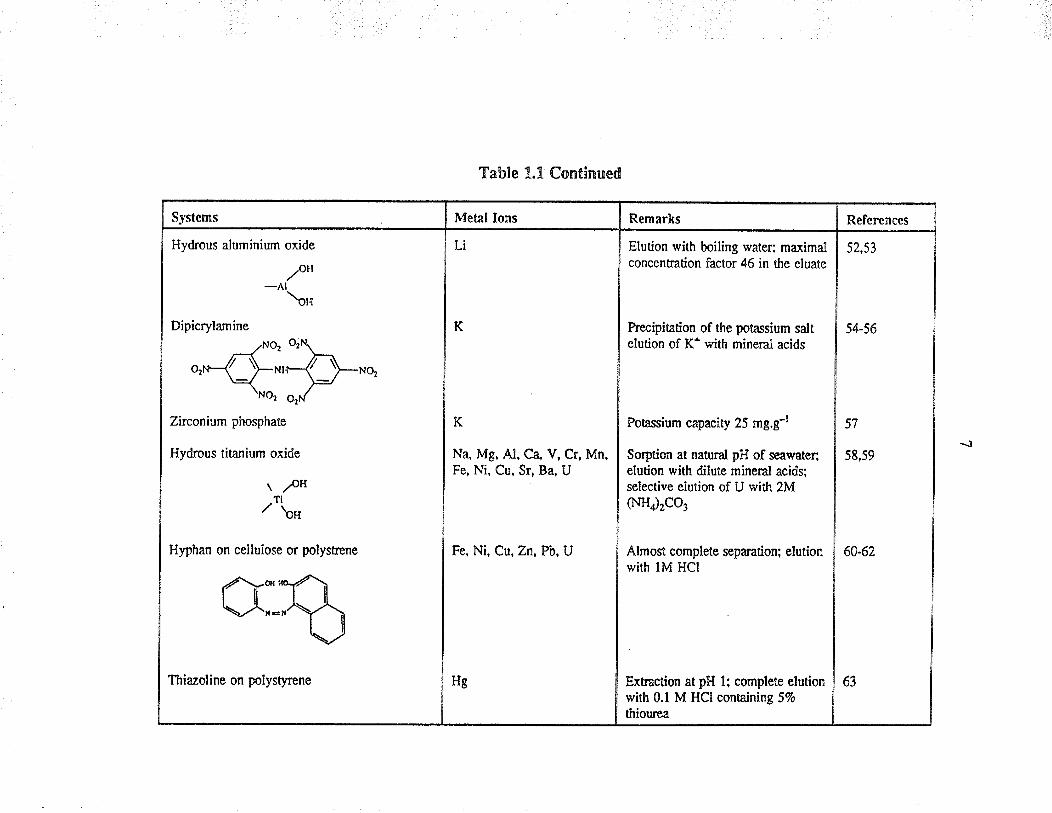
Table 1.1 Continued
Met¡l lons
Li
Thiazoline on polystyrcne
Remarks
Elution with boiling water; maximalconcenüation factor 46 in the eluâte
Precipitation of the potassium saltelution of K+ rvith mineral acids
Potassium capacity 25 mg.g-l
Sorption at natural pH of seåwater;elution with dilute mineral acids;selective elurion of U with 2M(NHr2CO3
Almost complete separation; elutionwith lM HCI
K
Na, Mg, Al, Ca, V, Cr, Mn,Fe, Ni, Cu, Sr, Ba, U
Fe, Ni, Cu, Zn, P'b,U
References
52,53
Hg
54-56
57
58,59
Ext¡action at pH l: complete elutionwirh 0.1 M HCI containing 57ø
thiourea
60-62
63
Systems
8-Hydroxyquinoline on C,r-bonded silica gel
I -Nitroso2-naphthol-3ó-disulphonate
4 -(2-Thinolylno)resorci nol
Duolite CS-100 (carboxylic acid and phenolichydroxyl groups)
Polyallylamine phosphonic acid
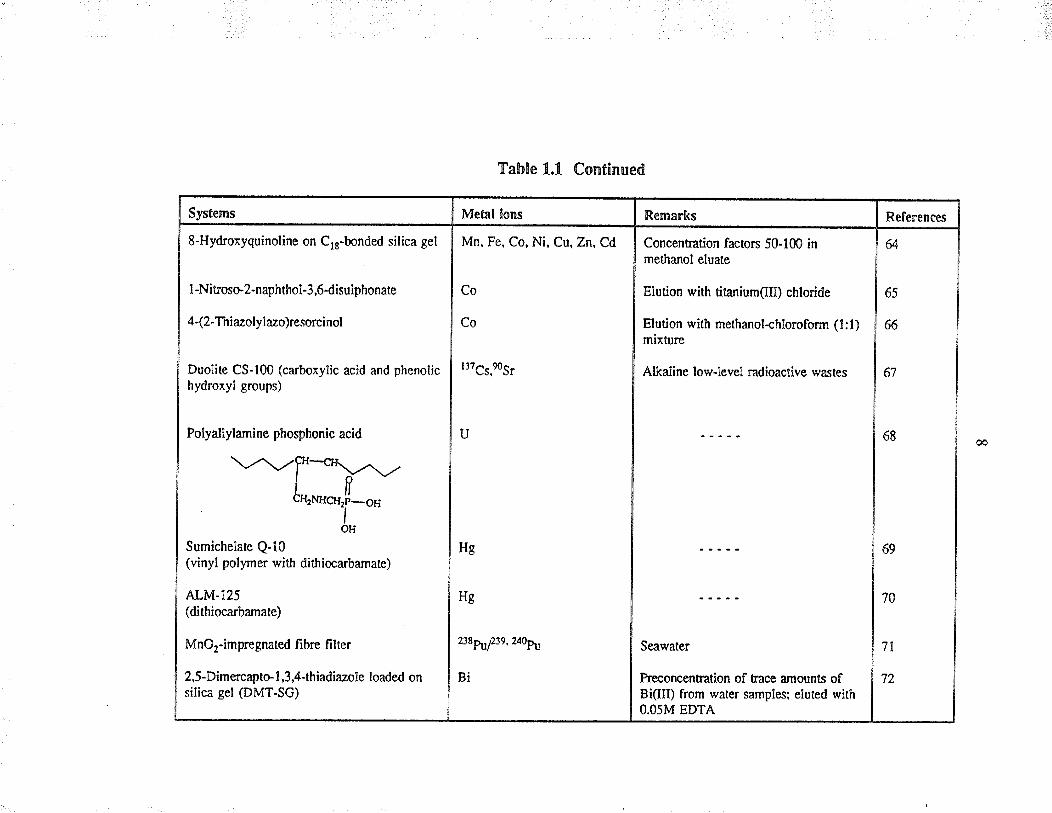
Table 1.1 Continued
Metal lons
Mn. Fe, Co, Ni, Cu, Zn. Cd
Sumichelate Q-10(vinyl polymer with dithiocarbamate)
ALM-I25(dithiocarbanate)
MnOr-imp,regnated fi brc filte¡
2,5-Dimercapto- I ,3 ,4-thiãdiãzþle loaded onsilica gel @MT-SG)
Co
Co
ll7cs,Ðsr
U
Remarks
Concentration facton 50-100 inmetha¡ol eluate
Elution with titanium(Ill) chloride
Elution with methanolahloroform (l:l)mixture
Alkaline lowlevel radioactive wastes
Hg
Hg
2t8P\f2te , 240P:|r
Bi
References
64
65
66
67
68
Seawater
keconcentration of bace amulnts ofBi(III) from wâter samplesi eluted withO.O5M EDTÀ
69
70
7l
72
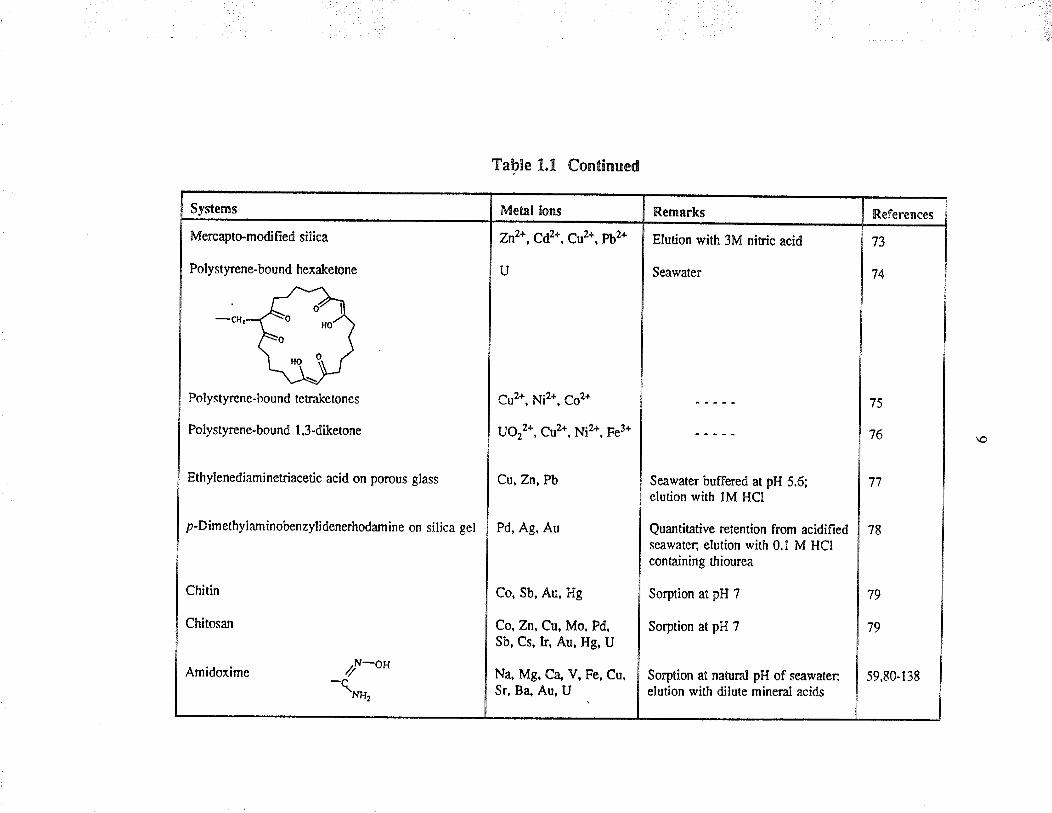
Systems
Mercapto-modifìed silica
Polystyrene-bound hexaketone
Polystyrcne-hound letrâketones
Polystyrcne-bound 1,3{iketone
Ethylenediam¡netriacetic acid on porous glass
p-Dimethylaminobenzylidenerhodamine on silica gel
chirin
Chitosan
Table 1.1 Continued
Met¡l lons
zn2*, cd2*, cu2*, pb2*
U
Amidoxime
Remarks
Elution with 3M niric acid
Seâwater
cr2*, Ni2*, co2*
uo22+, cu2+, Ni2+, Fe3+
Cu , Zn, Pb
Ì-o^-(vn,
Pd, Ag, Au
References
Co, Sb, Au, Hg
Co, Zn, Cu, Mo. Pd.Sb, Cs, h, Au, Hg, U
Na, Mg, Ca, V, Fe, Cu,Sr. Ba. Au, U
73
74
75
76
11
78
79
79
59,80-r38
Seawater buffercd at pH 5.6;clution with lM HCI
Quandhtive retention from acidifiedseâwate[ elution with 0.1 M HCIcontaining thiourea
Sorption at pH 7
Sorption at pH 7
Sorption at natural pll of seawateçelution with dilute minef¿l acids
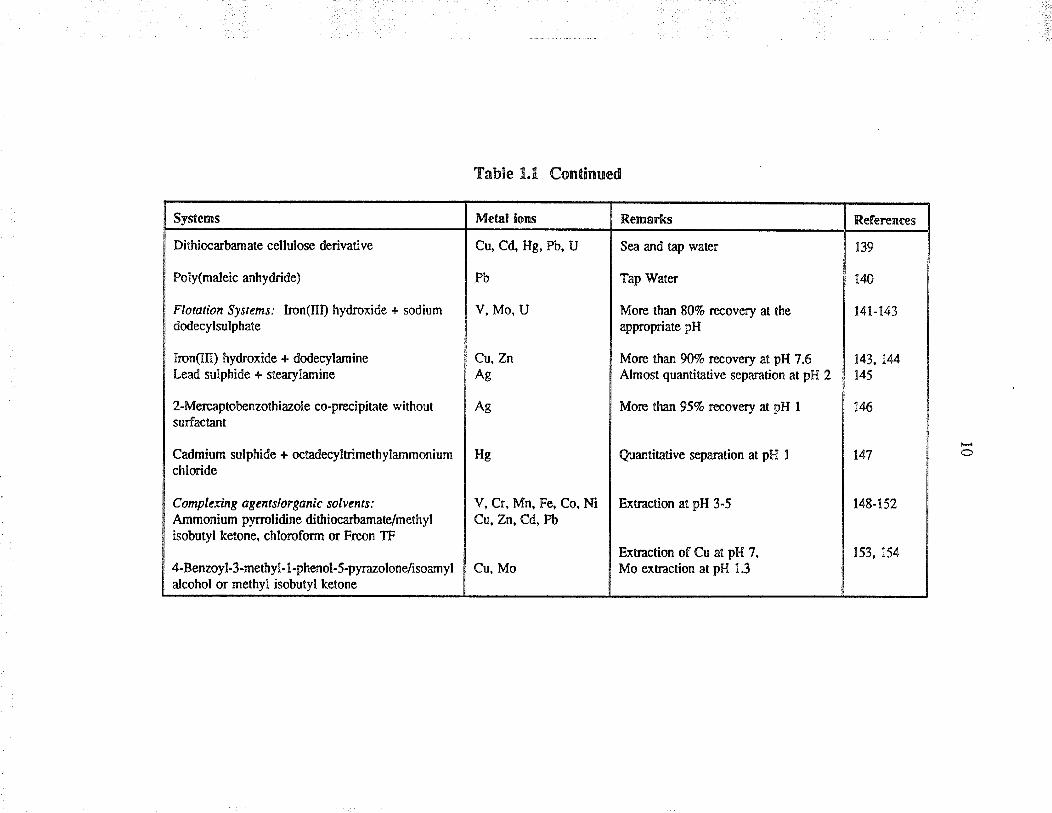
Systems
Dithiocarbamate cellulose derivative
Poly(maleic anhydride)
Florafion Syst¿ms: hon(Ill) hydroxide + sodiumdodecylsulphate
Ircn(III) hydroxide + dodecylamineLead sulphide + stearylamine
2-Mefcåptobenzothiazole co-p'rccipitate withoutsurfaclanl
Cadmiumchloride
Complexlng agentslorganìc solvents :Ammonium pyrmlidine dithiocarbamate/methylisobutyl ketone, chloroform o¡ F¡eon TF
4-Benzoyl-3-methyl- I -phenol-5-pyrazolone./isoamylalcohol or methyl isobutyl ketone
Table 1.1 Continued
Metal lons
Cu, Cd, Hg, Pb, U
Pb
V, Mo, U
Cu,7nAg
Ag
Remarks
Sea and tap },aler
Tap ïfater
More than 8070 recovery at theappropriate pH
More than 9OVo rÊ,overy at pH 7.6Almost quãntitative separation at pH 2
Mo¡e than 95% rccovery at pH I
Hg
V, Cr, Mn, Fe, Co, NiCu, Zn, Cd, Pb
Cu, Mo
Qüantitative separation at pH
Extraction at pH 3-5
Extr¿ction of Cu at pH 7,Mo extr¿ction at pH 1.3
References
139
140
141-143
143, tut45
t46
t47
148-152
153, 154
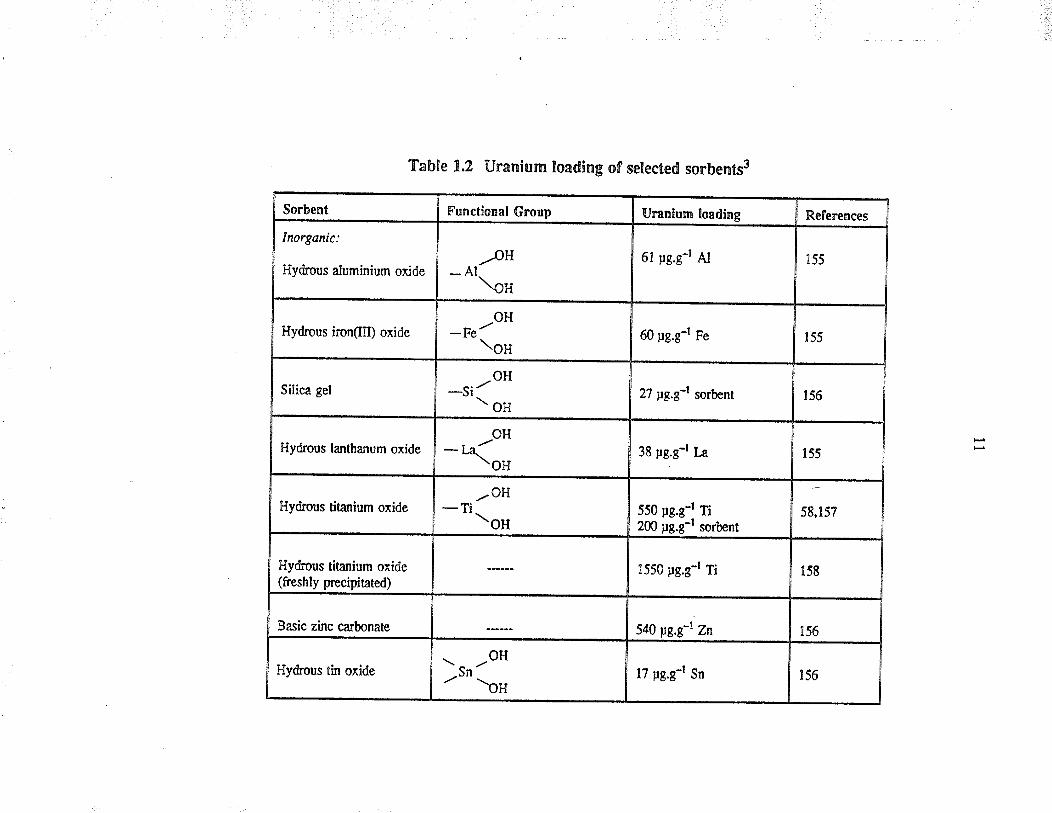
Sorbent
Inorganic:
Hydrous aluminium oxide
Tzble 1.2 Uranium loading of selected sorbents3
Hydrous iron(III) oxide
Functional GrouD
Silica gel
-.oH-Al \ou
Hydrous lanthanum oxide
OH
-Fe \ou
Hydrous titanium oxide
OH
-si"\oH
Hydrous tiønium oxide(freshly precipirated)
Uranlum loedinq
OH
- L2-\ol-r
6l pg.g-I Al
Bæic zinc carbonate
-oH-Ti \oH
Hydrous tin oxide
60 pg.g-l Fe
Refertnces
27 ¡rg.g-l sorbent
155
38 pg.g-l La
-oH-"n -ou
r55
550 pg.g-r Ti200 uc.c-t sorbent
156
1550 Fg.s-r Ti
r55
540 us.s-l Zn
17 pg.g-r Sn
58,r57
158
156
156
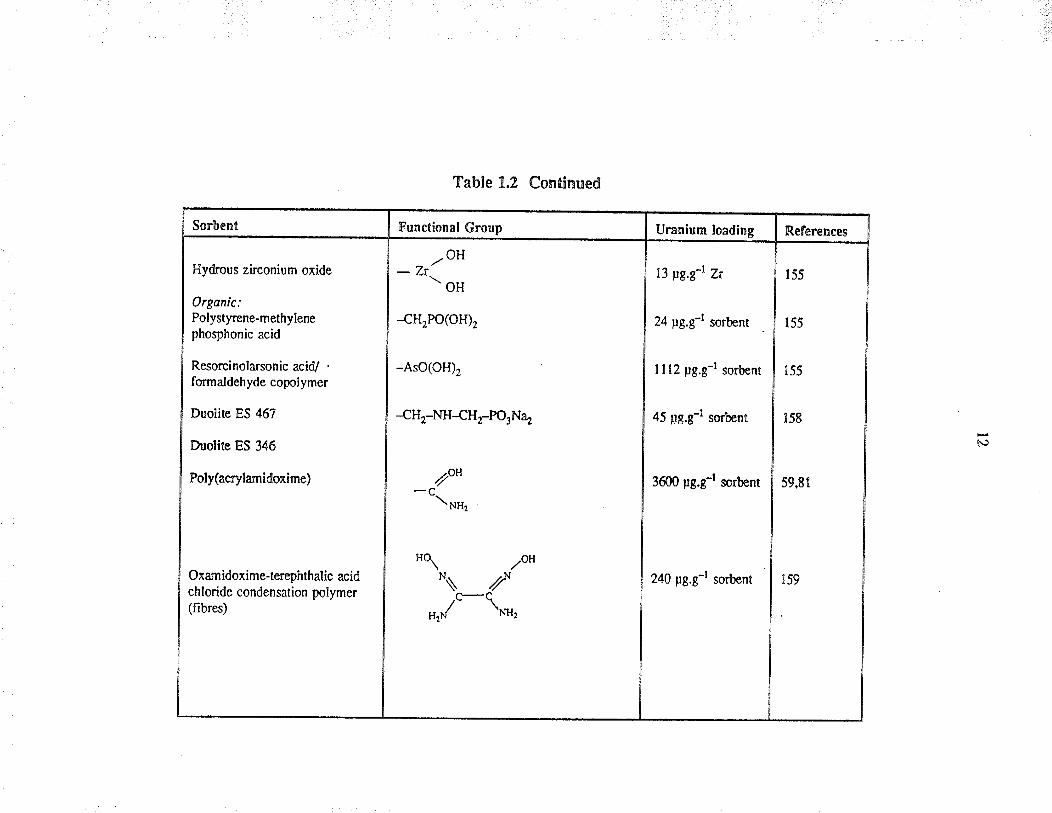
Sorbent
Hydrous zirconium oxide
Organic:Polystyrene-methylenephosphonic acid
Resorcinolarson ic acid/ .
formaldehyde copolymer
Duolire ES 467
Duolite ES 346
Poly(acrylamidorime)
Functional Group
Table 1.2 Continued
.oH-Zr -oH
-cH2PO(OH)2
-AsO(OH),
-{H-NH{Hr-POrNa,
//o'-c \"*,
Oxamidoxime-tercphthalic acidchloride condensation polymer(fibres)
Uranlum loading
13 pg.{t Zr
24 pg.g-l sorbent
I I 12 ¡rg.g-l sorbenr
45 pg.g-l sorbent
3600 pg.g-l sorbent
*\ /oH"\l.c-CH,r( t*,
References
155
r55
155
158
59,81
240 pg.g-l sorbent r59
tt')
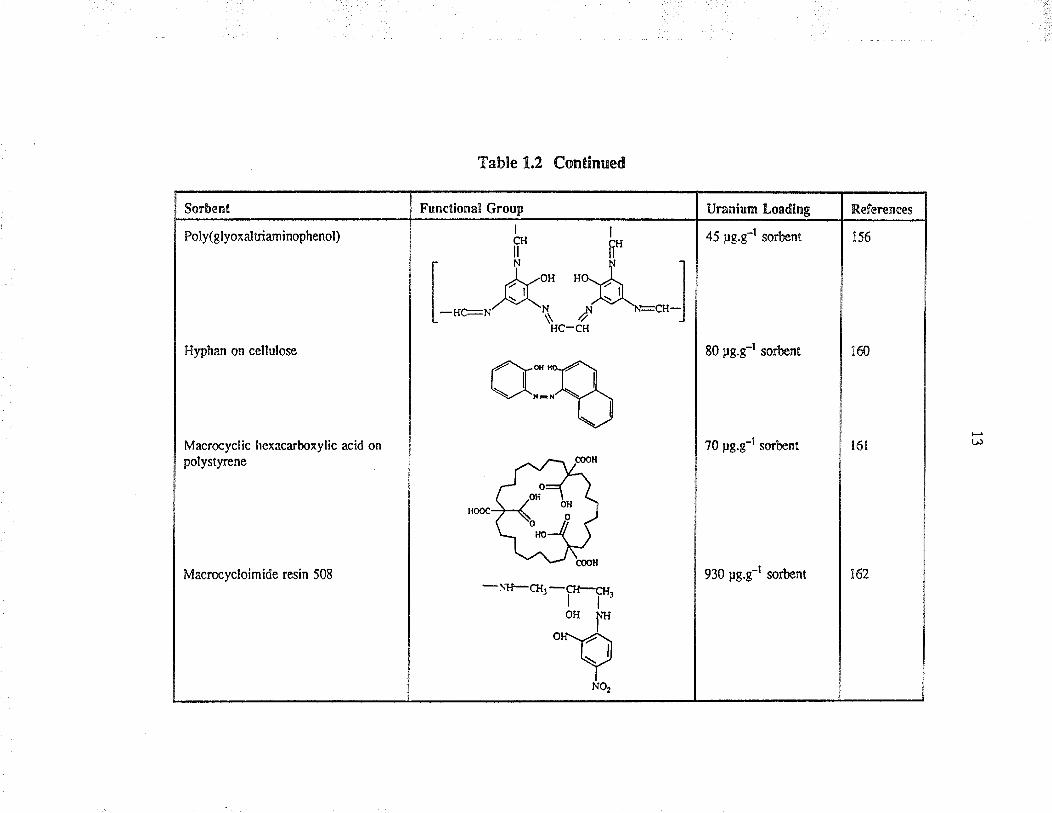
Sorbent
Poly(glyoxaltriaminophenol)
Hyphan on cellulose
Macrocyclic hexacarboxylic acid onpolystyrene
Functional GrouD
Table 1.2 Continued
Macrocycloimide resin 508
Uranlnm Lo¡dlno
45 pg.g-l sorbent
80 pg.g-t sorbcnt
References
156
?0 pg.g-l sorbent
160
930 pg.g-r sorbent
t6l
t62
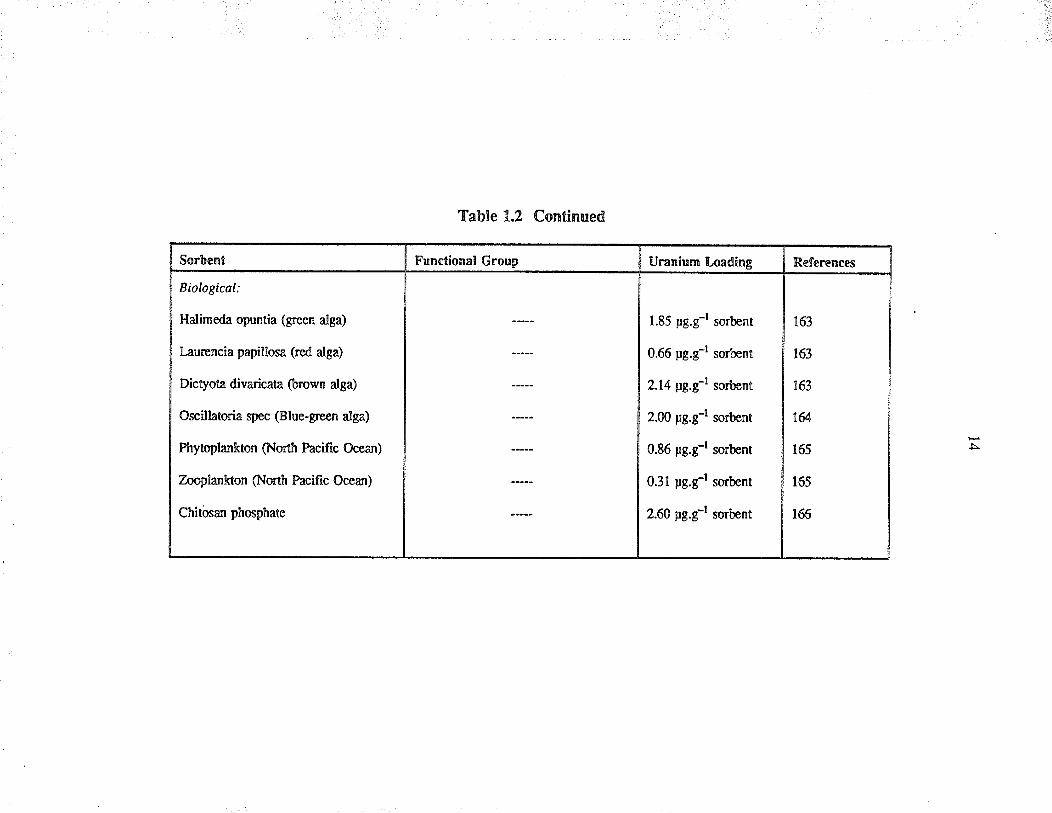
Sorbcnt
Biological:
Halimeda opuntia (green alga)
Laurencia papillosa (¡ed alga)
Dictyota divadcata (brown alga)
Oscillatoria spec (Blue-green alga)
Phytoplankton (North Pacific Ocean)
Zooplankron (North Pacific Ocean)
Chitôsan phosphate
Table 1.2 Continued
Functional Group Uranium Loadinp
1.85 pg.g-l sorbent
0.66 pg.g-l sorbent
2.14 pg.çl sorbent
2.ü) pg.g-l sorbent
0.86 pg.g-l sorbent
0.31 pg.g-l sorbent
2.60 pg.g-l sorbent
References
163
163
163
ta
165
165
166
l5
A recent review from our laboratoryrT dealt witl the application of chelating polymeric
resi¡s fo¡ the separation a¡d concentration of f¡ace metals from oceans, rivers, sfeams,
and other natural water systems. Commercially available resins, specially prepared
polymers a¡d a selection of other sorbents were described a¡d their uses outlined.
Special emphasis was placed on the preconcentration of uranium from æawater. A
similar paper by Egawats deals primarily with the author's work that includes
classification, application and the ¡elationship between the sΡucture of the resin and
the properties exhibited by the resins.
The recovery of uranium from seawater wæ viewed as an importånt future application,
and special emphasis3'r7'r8'8cr38 was placed on the extaction of uranium f¡om seawale¡
due to the increæing atæntion it has received over the past three decades.
1.3 Selection of chelating polymers
Syntletic chelating polymers have, for the most part, replaced inorganic ion-exchange
polymers, wilh a few exceptions, such as, met¿l phosphates (zirconium and starnic
phosphaæs) a¡d some oxides (MnOr, Al2O3, SiO, gel, etc.).
Conventionally, the resin materials can be clæsified into three main divisions: (a)
cation-exchangers, O) anion-exchangers, and (c) chelating polymeric resins. These
can be subdivided into sfong, weak, or inte¡rnediaæ types, depending on the
functional group.
16
The choice of an effective chelating resin and its value in anal¡ical method
development is dict¿ted by the physicochemical properties of the resin materials.
These aæ the acid-base properties of the metal species and the resi¡ materials,
polarizability, ælectivity, sorptive capacity, kinetic, physical and chemical stability of
the resin.
In view of fhe complex nature of seawater, the selection of the proper chelating
polymeric material for a specific suite of t¡ace metals is of great importance. Akaiwa
and Kawamotor6? have discussed the advanuge of having a synergic agent on a
chelating rcsin to improve the sensitivity and separation of trace merâls. The
dist¡ibution coefficient of the analyæ of interest should diffe¡ from that of the mat¡ix
constituents in seawater by several orders of magnitude. One of the rules of selection
is based on the concept of ha¡d a¡d soft acids and bases.tc't6e The functional groups
in the chelating polymer materials usually act as bases. Oxygen+ontaining functional
groups are ha¡d and sulphur-containing groups soft bases; functional groups with a
basic nitrogen atom have an intermediate character.
Two aspects of exfaction of u¡anium from seawater have to be considered: anal¡ical
reproducibility and commercial recovery. Theæ a¡e not necessadly incompatible,
although they may have different requirements with regard to capacity, cost, re-use,
etc. Since uranium acts as & hud acid, chelating polymers which have oxygen-
containing functional groups ca¡ be used to extract uranium from seawater. It is also
1',7
reasonable to use sulphur-containing functional-group materials for soft acids such as
the precious metals, Hg, Ag, etc. Although this guide is highly useful in the practical
selection and synthesis of chelating polymers, it should be borne in mind that there is
a substantial difference in the søbility of complexes formed by metal ions with
mac¡omolecula¡ and low molecular-weight functional ligands. This is primarily causecl
by the polymeric structure of the ¡esi¡ material.
The kinetic characteristics of a chelating polymer a¡e of considerable importance and
depend on the nature and properties of the polymeric matrix and the degree of cross-
linkage. Whereas in the ordinary type of exchanger the exchange processes are more
rapid and controlled mainly by diffusion, in a chelating exchanger the exchange
processes are slowe¡ and connolled either by a particle-diffusion mechanism or by a
second-order chemical reaction. For complexation or sorption to occur, it is not
sufficient that surface functional groups are present; they must also be accessible for
the chelation of the metal ion without steric hindrance. Thus, within chelating resin
particles, many surface functional groups may remain inactive in complexation,
because equilibrium cannot be attained. On comparing the kinetic properties of
diffe¡ent chelatilg sorbents, it quickly becomes obvious that the sorbents with the best
cha¡acteristics are those based on hydrophilic macroporous co-polymers or cellulose,
or on fibrous materials as the rate of sorption is not only dependent on the surface
area but also the availability of the functional groups for metal chelation without steric
hindrance. A nerv type of chelating sorbent has been proposed, which is made of fine
18
fibrous materials with a po¡ous structure and which holds very fine particles (up to
several pm) of chelating sorbents.170'171 These sorbents have high selectivity ancl
excellent kinetic properties, i.e., equilibrium time is only a few minutes.
1.4 Novel chelating polymers
1,4.1 Iminodiacetic øcid polymers
Among the ea¡liest chelating resins to be studied were analogues of EDTA, yiz.
Dowex A'1, Chelex 100 and Chelex 20. The uses of Chelex resins have been well
documented39'4o and these resins continue to be useful in a wide variety of systems.
El-Sweify et al.4r descnbed the ion exchange behaviour of UO22*, Ce3* and Am3*
with Chelex 100 from a thiocyanate medium. They reported that Chelex 100 can act
as an anion exchanger at pH < 2 and at pH > 2 it acts as a cation and chelate
exchanger. They also showed that the distribution coefficients were high at pH > 3.5
from aqueous solutions containing 0.2 or 5.0M NH4SCN. Mathur and Khopkara2 usecl
Chelex 100 to develop an ion-exchange chromatographic procedure for the separation
of Pu4+ from UOr2*. They also reported several actinides and lanthanides can be
extracted by Chelex 100.
Glaclney et al.a3 have reported the use of Chelex 100 to isolate uranium from natural
waters. lmpurities were removed by hexone extraction and by the use of an ion
exchânge resin, Dowex AG 1X8. This was done to develop a procedure for the
l9
determination of the Ll35/U238 ¡atio in water samples containing t¡ace levels of
uranium, for monitoring purposes. Chelex 100 wæ also used for the separation of
u¡anium f¡om fresh wateP ard was done by carefully conditionirg the resi¡ with a
buffer solution of pH 4.6. The fresh water sample was adjusted to have a pH value
behpeen 3.9 and 4.7 prior to passing it through the Chelex 100 column. Hi¡osee
repofed that a úace amount of u¡anium in seawater could be preconcent¡ated on
Chelex 100. The resin was then used as a support for thermal neut¡on i¡radiation.
Some of the metals ext¡acted from seawater and other systems with Chelex 100 and
Dowex Al a¡e listed in Table 1.1. Van Berkel ¿¡ a1,21 and Paulsonæ studied the
effects of flow-rate and pretreatment of the resi¡ on the ext¡action of t¡ace metals from
estua¡i¡e coastal seawater and a¡tificial seawater. ln an interesting paper,
Chiba ¿¡ ¿1.3¡ exami¡ed the effect of using a magnetic field during the ext¡action of
metal ions by Dowex Al. They reported an increæe of 1-6 % in the amount sorbed
per unit mass of resin. Sasaoka et aL32 ,¡æ.d a chelating filter paper ("Expapier F-2",
2-hydroxypropyliminodiacetic acid loaded on cellulose fibre) to preconcenfrate and
separate thorium from monaziæ. They also used this chelating papeÉ3 to
preconcentrate and separaæ Sc* and 7.f from Fe} and Al* using the
pH dependence of the ext¡actions. Va¡ious matrices or resinstu't?o containing
aminoacetic acid o¡ iminodiacetic acid have been synthesized, mai¡ly to improve the
physical and chemical stability.
20
Kaczvinsky et al.t1s have described the syntlesis of porous phenol-formaldehyde
polymers containing imi¡odiacetic acid, The porosity was inroduced by the addition
of a finely divided solid material ('a æmplare') that wæ insoluble under the rescrion
conditions, and was removed by dissolution after the polymerization was complete.
Silica gel, carbonates and various other sals were used æ æmplaæs. Resins
containing different phenols were synthesized and their effectiveness exami¡ed for the
removal of radioactive cesium and st¡ontium from alkaline concentrated sodium salt
solutions, which typify the soluble nuclear waste from the defence industry.
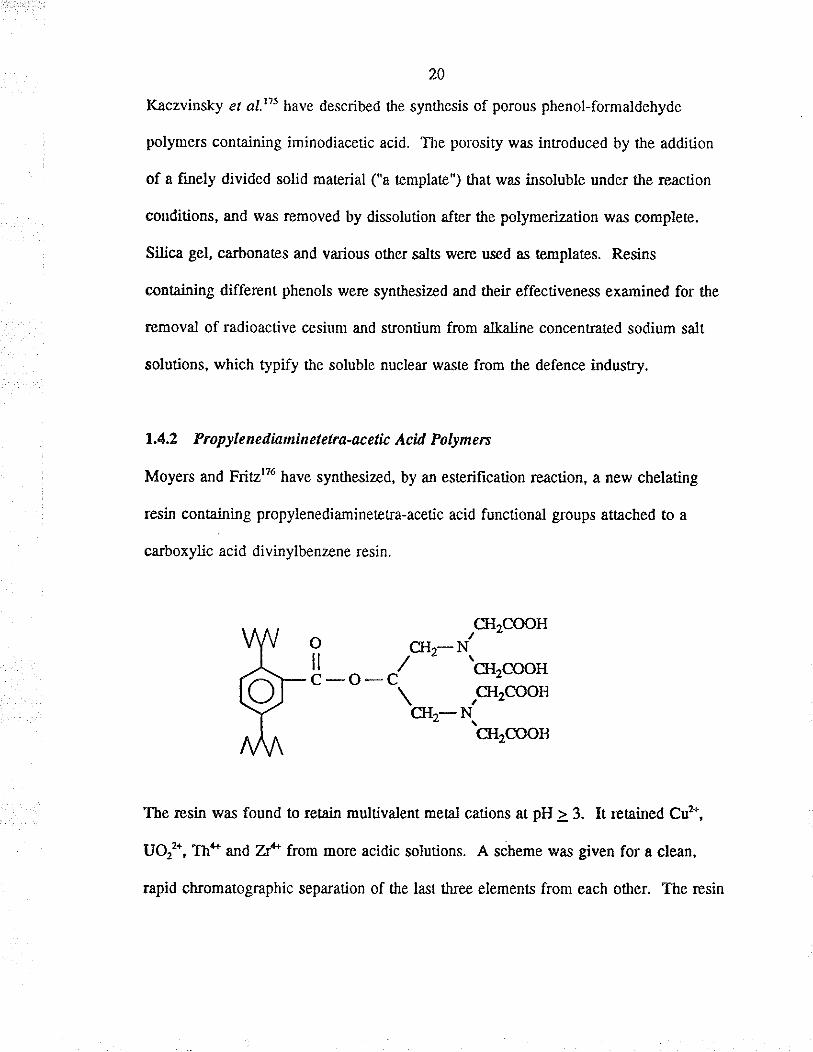
1.42 Propylenediaminetctra-acetb AcÍd Polymen
Moyers and FritzrT6 have synthesized, by an esærification reaction, a new chelating
resin containing propylenediaminetet¡a-acetic acid functional groups attåched to a
carboxylic acid divinylbenzene resin.
GI,'CÐOHo cH"-N/l¿_"_J ' 'c{rc\f,oH
\ ,cl{2cooHcHz-\cH2cooH
The resin wæ found to relain multivalent menl cations at pH ¿ 3. It ætrrined Cu2*,
UOr*, Th* and 7¡+ from more acidic solutions. A scheme was given for a clean,
rapid chromatographic separation of the læt tfuee elements from each oúer. The resin
21
\{as claimed to retain qua¡tiÞtively a number of lrace elements from simulated
seawater. A macrocyclic hexacarboxylic acid ¡esinrór has been used to remove
uranium from seawater i¡ a batch process.
1,4.3 Poly-þrlìketane resins
A water-insoluble poly-p-diketone chelating resin has been prepared by the conrolled
oxidation of poly(vinyl alcohol) (PVA) witl chromic acid.tz This polymer forms
stable complexes with cations, such as Co2*, Cu2*, Mnz*, Ni2*, Fez', Au* and UOrz*,
and ¡emoves them compleæly from dilute aqueous solution. The ions may be
¡ecove¡ed quantiratively from the resin complex by elution with dilute aqueous acid
and it is claimed tlat tle resin is re-usable.
Tabushi et al.t78 described the preparation of a macrocyclic hexaketone (tris-p-
diketone) and cyclic teraketone (bis-Ê-diketone) which were effective in extracting
UOr2* selectively. The hexaketone was subæquentty bonded to a polystyrene resin,Ta
to give a product that was highly selective for exracting UQ2* from seawater.
Similar cyclic bis-p-diketone resins we¡e synthesizedTs and shown to exuact Cu2*, Ni2*
and Co2*. Djamali a¡d Lieser?ó have synthesized a resin with a l,3-diletone as an
anchor group by treating aminopolystyrene with dikeæne; the product was shown to
extract uor2*, cu2*, Niz* and Fe*.
22
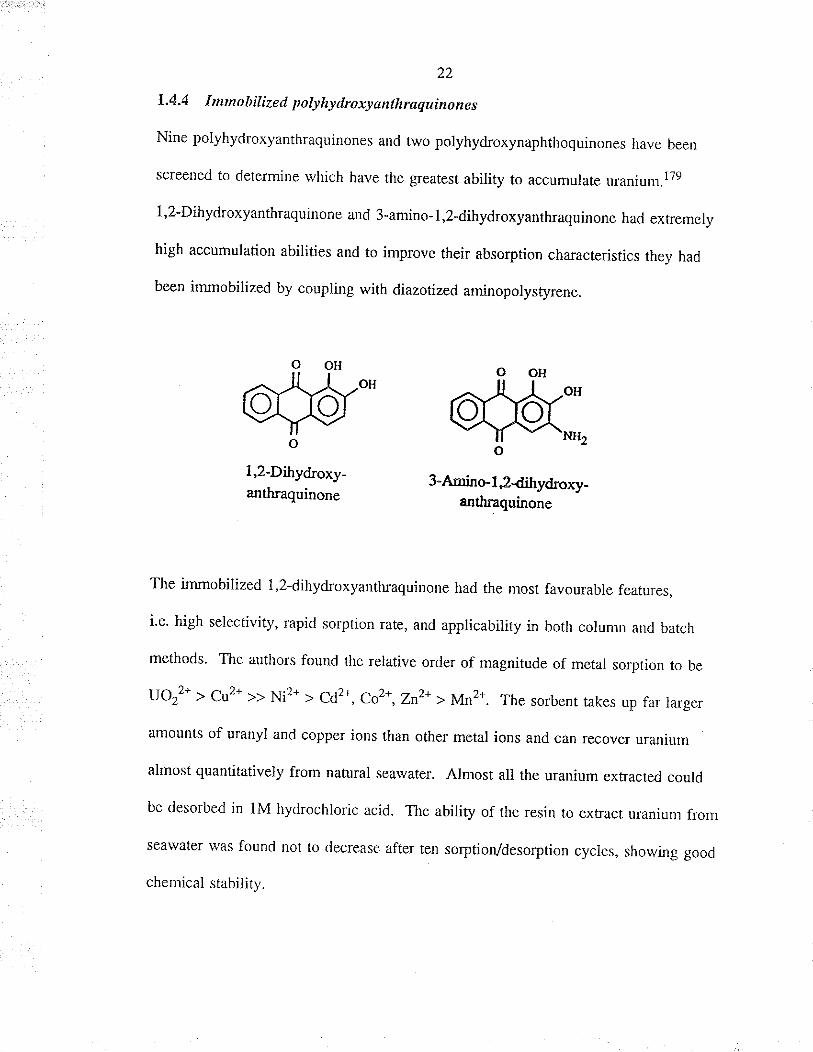
1,4.4 I mmobilized polyhydroxyanthrøquinones
Nine polyhydroxyanthaquinones and two polyhydroxynaphthoquinones have been
screened to determine which have the greatest abilìty to accumulate uranium.l79
1,2-Dihydroxyanthraquinone and 3-amino-1,2-dihydroxyanthraquinone had extremery
high accumulation abilities and to improve their absorption cha¡acteristics they had
been immobilized by coupling with diazotized arninopolysryrene.
OH
OH
NH2o
3-.Amino- I 2dihyd¡oxy-anth¡aquinone
4ù"'o
I,2-Dihydroxy-anthraquinone
The immobilized 1,2-dihydroxyanthraquinone had the most favou¡able features,
i.e' high selectivity, rapid sorption rate, and appricability i¡ both column and batch
methods. The authors found the relative order of magnitude of metal sorption to be
lJor"* u cu2* >> Ni2* > cd2*, coz*, zn2* > Mn2*. The sorbent takes up far larger
amounts of uranyl and copper ions than other metal ions and can fecover uranium
almost quantitatively from natural seawater. Almost all the uranium extracted could
be desorbed in 1M hydrochloric acid. The abiJity of the resin to extract uranium from
seawate¡ was found not to decrease after ten sorptiory'desorption cycres, showing good
chemical srability.
23
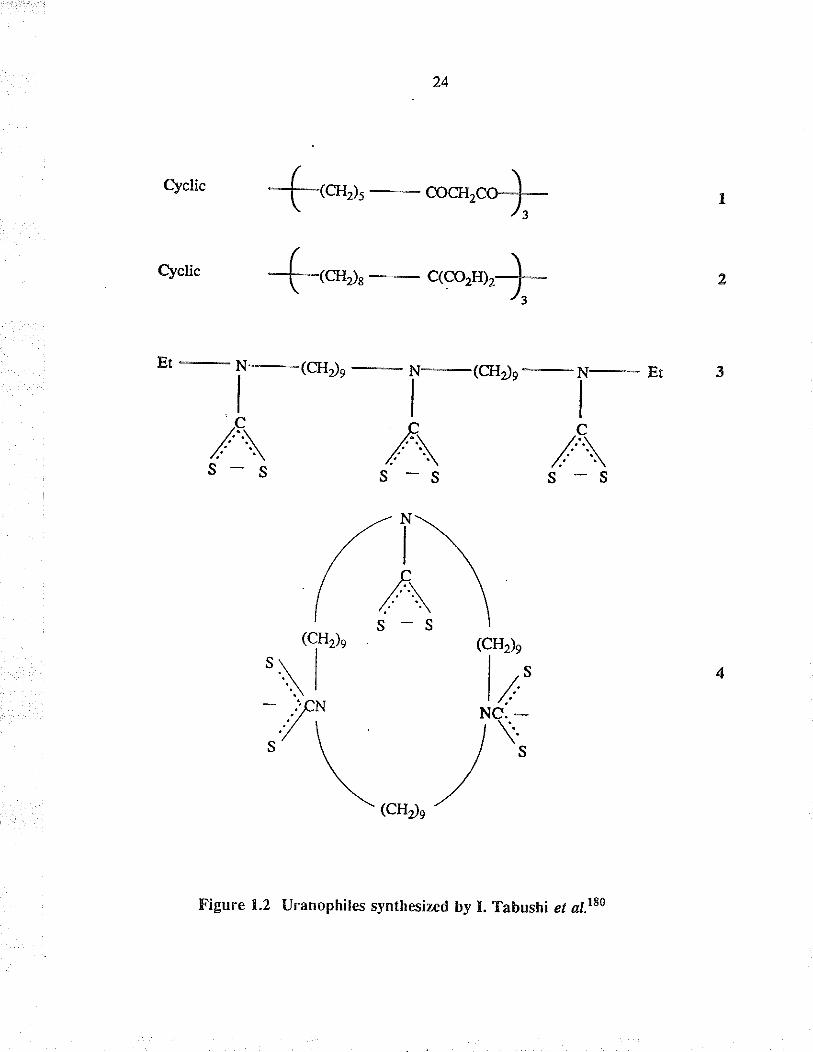
1.4.5 Trh(dithiocarbamate)
Tabushi ef al.rs syntlesized a li¡ea¡ t¡is(dithioca¡bamate) specific for Ìhe extraction of
u¡a¡ium from dilute carbonate solutions. Suong ligands specific for a given metal ion
have generally been designed by considering (a) the size-fitting facro¡, (b) tìe nature
of the ligand-metal interaetion and (c) the orientation in the binding. These authors
have designed and synthesized æveral uranophiles, 1,2,3 and 4, which are specific
for the uptake of uranyl ions as shown in Figure 1.2. In particular, O- or S- groups
were int¡oduced into the ligands, since the formation of U-O- or U-S- bonds is
generally favoured.
It is of interest that molecule 4 showed a macrocyclic effect which unexpectedly led to
slow rate-determining U-S- bond formation. This finding prompted the design of
ura¡ophiles capable of rapid U-ligand bond formation together witlr satisfactorily high
sbbility constan$. The same aulhors also reported the successful "kinetic design" of a
new type of uranophile, 3, having high values of both the formation raEs and stability
constÀnts. The macrocyclic uranophile 4 showed a much slower exchange rate thal
the monomeric uranophile Et (NCS)r-. On this bæis, it wæ predicted that fast uranyl
binding might be achieved by avoidirg such a restricted t¡ansition state, while
maintaining the high ståbility constant by using intamolecular terdentate ligands. A
linear tris(dithiocarba¡nate) should satisfy bottr requirements.
clclic {-ou, o*.r+ 2
clclic f,or, **rr"Ç- r
/Ï\(A\(1"tn (cH¿:\l lì- .'fN Ne. -
,, \ /\;
\o'r,/
Figure 1.2 Uranophiles synthesized by I. Tabushi et al.rE0
25
Compound 3 binds UOrfu st¡ongly and may be useful for extractirg it from seawate¡
in a rapid oeean currenE
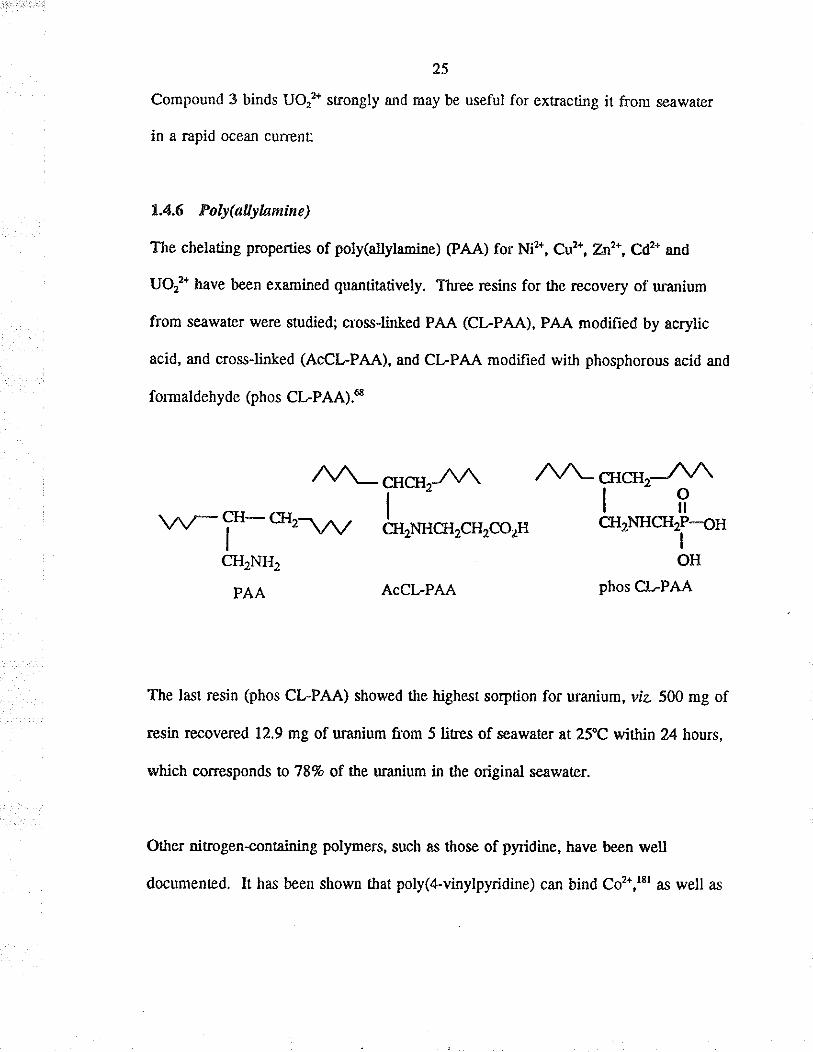
1.4.6 Poly(allylaminc)
The chelating properties of poly(allyl¡mine) (PAA) for Ni2*, CÐ2*, ?Ãt2*, Cd2* and
UOr2* have been examined quantitatively. Th¡ee resins for the recovery of u¡anium
from seawater were studied; cross-linked PAA (CLPAA), PAA modified by acrylic
acid, a¡d cross-liÍked (AcCLPAA), and CLPAA modified with phosphorous acid and
forrnaldehyde (phos CLPAA).6
\zr/-F-o'\a,I
CH2NH2
PAA
ICÍI2NHCH2CH2C02H
AcCLPAA
OH
phos CLP.A'rq.
ÂA-6ç1¡r-Az\ ,/\A,-cHcH2-/\AloIilCH2NHCH2P-g¡¡
I
The læt resin (phos CL-PAA) showed the highest sorption for uranium, vrz 500 mg of
resin recovered 12.9 mg of uranium from 5 lires of seawater at 25t within 24 hours,
which corresponds o 78% of the uranium in the original seawater.
Other nitrogen+ontaining polymers, such as those of pyridine, have been well
documented. It hæ been show¡ that poly(4-vinylp¡ridine) can bind Co2*,r8r as well as
26
Ni2*, Cu2* and Zn2*.t82 A summa¡y of tìei¡ uses in separation a¡d concenuation of
metal ions hæ been given by Sugii el al.'83 More varied pyridine resins's have been
used for the extraction of Cu2* i¡ the presence of Zn2*.
1,4.7 Chelating resìns conlaíning phosphorus
Ma¡hol and co-workersrss'ts have described the preparation a¡d ext¡action properties
of several phosphorus-containing ion-exchange resins. Manecke ef ø/.r87 synthesized a
polymer containing a methylphosphonic acid functional group and studied its abilty to
bind Cuz*, Znz*, Niz* and Mg2*, A polystyrene-divinylbenzene tributyl phosphate resin
hæ been used fo¡ the extraclion chromatography of U, Pu, Np, Nb, Ru, Rh, and
Am.rs Akio and YoshiakirEe synthesized a chelate resin containing methylene
phosphonate groups and reported that this resin was selective for extracting u¡anium
from seawater.
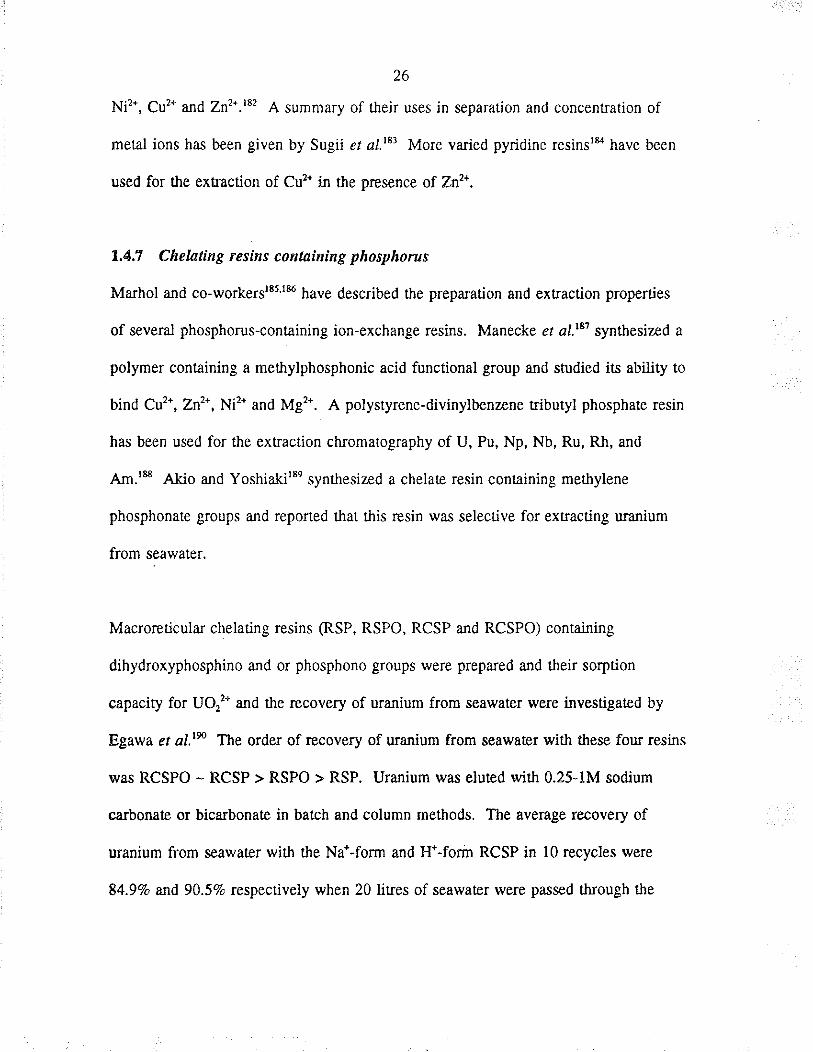
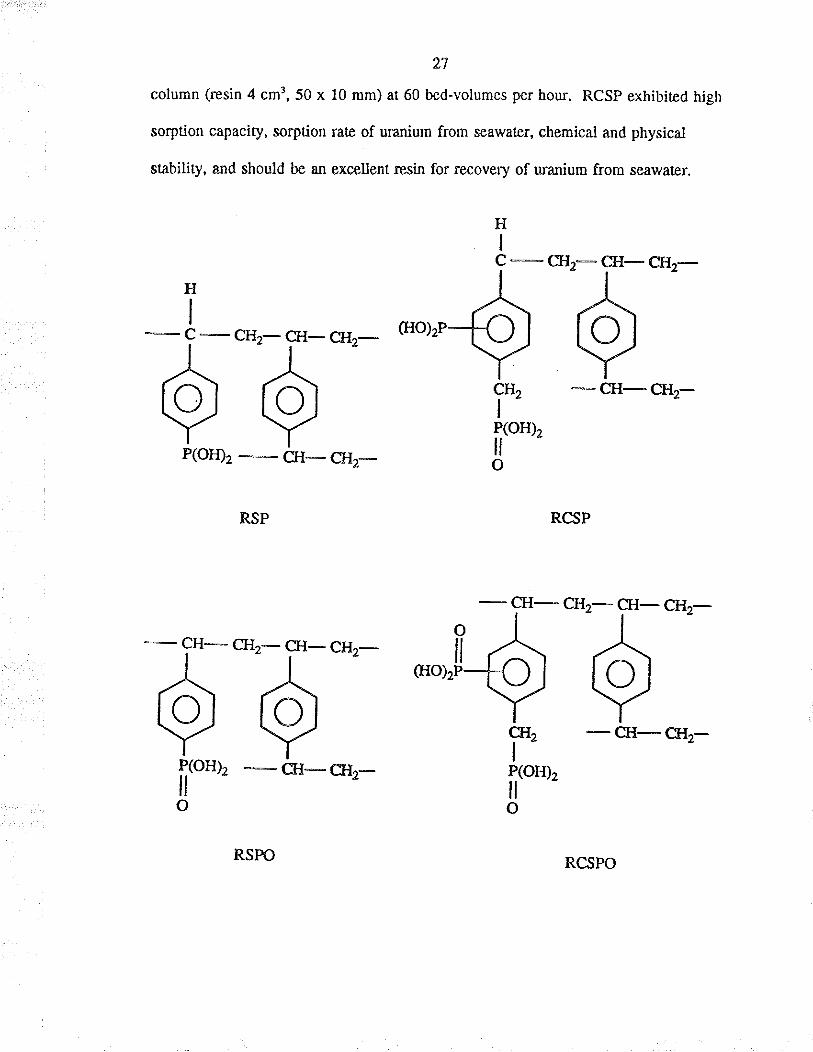
Macroreticula¡ chelatirg resins (RSP, RSPO, RCSP and RCSPO) conøining
dihydroxyphosphino and or phosphono groups were prepared and theh sorption
capacity for UQ2* and the recovery of uranium f¡om seawater were investigaæd by
Egawa er ¿J.rs The order of recovery of uranium from seawater with these four resins
wæ RCSPO - RCSP > RSPO > RSP. Uranium was eluted with 0.25-lM sodium
carbonate or bica¡bonate in batch and column methods. The average recovery of
uranium from æawater witlr the Na*-form and H*-form RCSP in 10 recycles were
84.9Vo and 90.570 respectively when 20 litres of seawater were passed through tle
27
column (resin 4 cm3,50 x l0 mm) at 60 bed-volumes per hour. RCSp exhibited high
sorption capacity, sorption ¡ate of uranium from seawatet, chemical and physical
stability, and should be an excellent resin for recovery of uranium from seawate¡.
H T-cl'?-fFcn'z-T -,^-G{o),P61 e¿-',.5"'- -Y -cH-cr{2-Y* Y _ rro",P(oÐ2
-G-Cgz- ö
RCSP
,Hz-*",,[ö*ö*'-
I e Ì, -&-cn,-frtoul -G-crz- fitorozOO
HI
RSPO
28
The H*-form of RCSP gave a higher recovery of u¡anium from seawater. The
Na*-form was more favourable for t}te recovery of urarìium because, afær elution, the
resin could be reused immediaæly. Furthermore, the sorption capacity for Ue2* was
claimed not to decrease even after Eeatment of the resi¡ with lM sodium hydroxide or
hydrochloric acid at 60"C fo¡ 24 hours, showing that the resin had high resist¿nce to
acid and alkali.
Alexandratos et al.ter have synthesized bifunctional resins that complex metal ions by
both ion-exchange and coordination. These resins a¡e a class of polymer-supported
bifuncúonal complexing agents for specifìc metal-ion exracüon by a dual mechanism.
They synthesized bifunctional ion-exchange coordination ¡esils cont¿ini¡g phosphonic
acid ligards for ion-exchange, and phosphonate ester o¡ amine ligands for coordination
to fhe metal ion. Initial extraction studies with these resins were focussed on
complexation of americium from 4M nitric acid and from varying amounts of sodium
nit¡ate at different pH values.
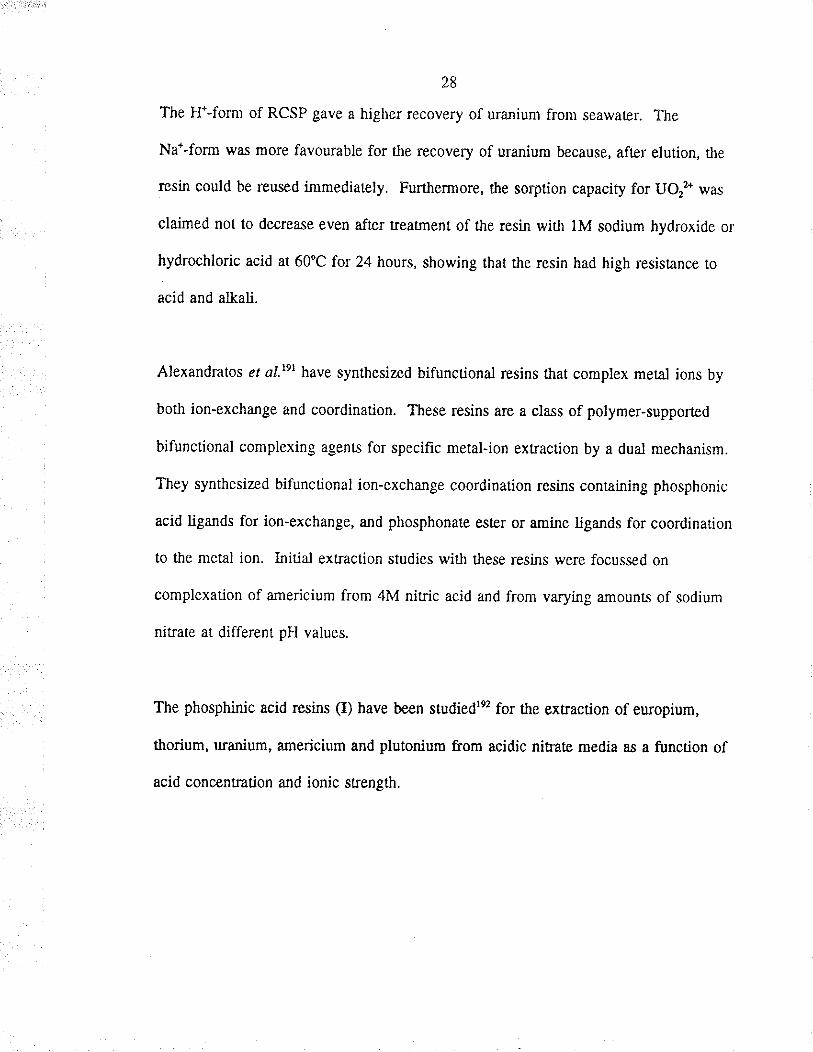
The phosphinic acid resins (I) have been studiedte for the extraction of europium,
thorium, uranium, americium and plutonium from acidic nitrate media as a function of
acid concentration and ionic strength,
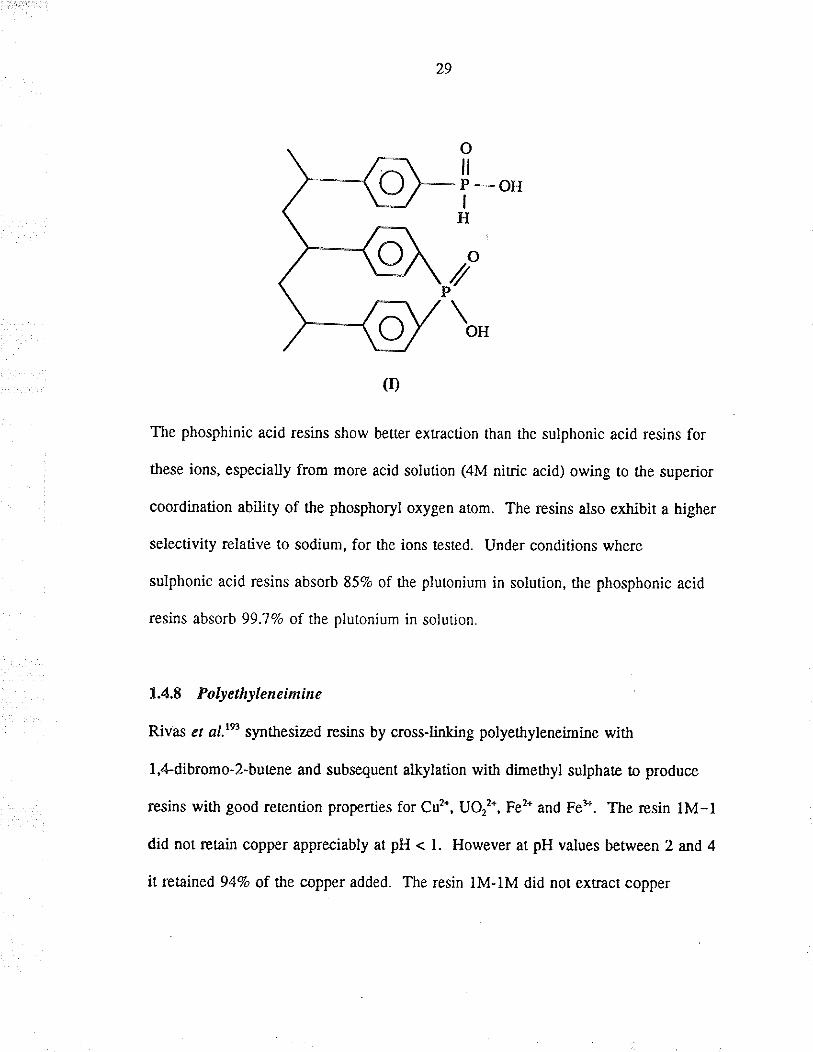
(Ð
The phosphinic acid resins show better exkaction rhan the sulphonic acid ¡esins for
these ions, especially from more acid solution (4M nirric acid) owing to the superior
coo¡di¡ation ability of the phosphoryl oxygen arom. The ¡esins also exhibir a higher
selectivity relative to sodium, for the ions tested. Under conditions where
sulphonic acid resins absorb 857o of the plutonium in solution, the phosphonic acid
resins absorb 99.7?o of the pluronium in solution.
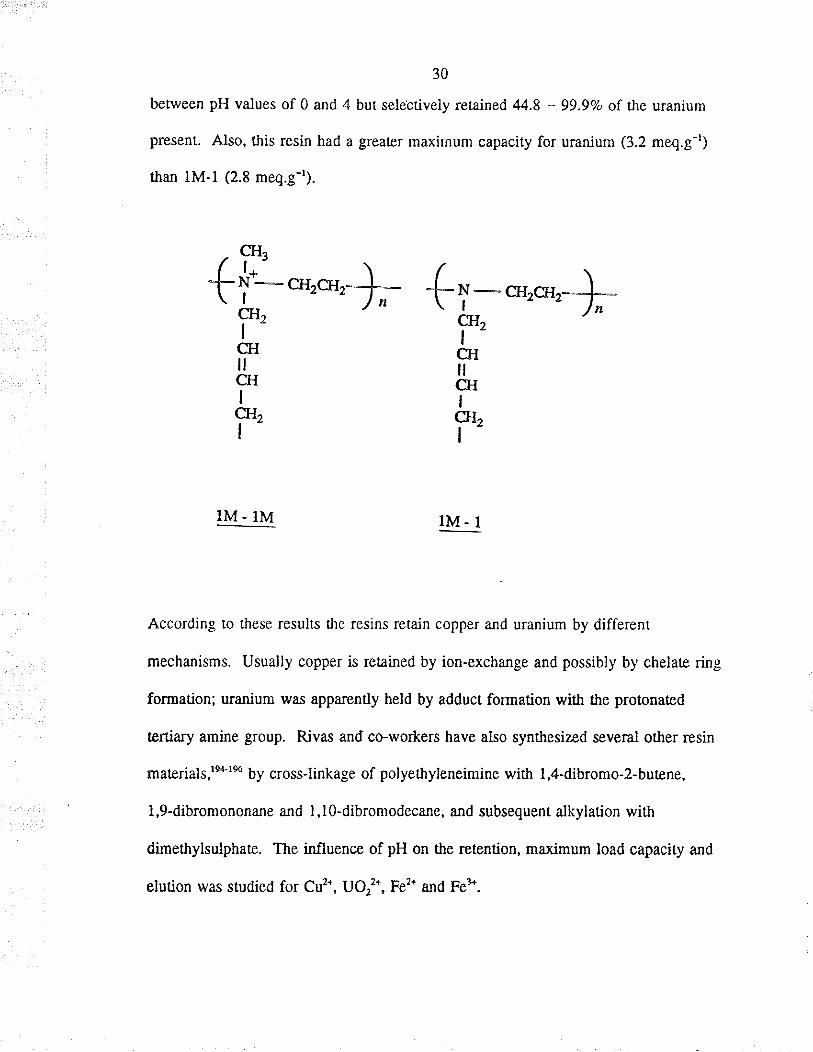
1.4.8 Polyethyleneimine
Rivas ¿¡ al.tts synthesized resins by cross-Iinking polyethyleneimine with
l,¿l-dib¡omo-2-butene afld subsequent alkylation wirh dimethyl sulphaæ ûo produce
resins with good retention properties for Cu2*, UO22*, Fe2* and Fe*. The resin lM-l
did not retain copper appreciably at pH < l. However at pH values between 2 and 4
it ret¿ined 94Vo of the copper added. The resin lM-lM did nor exr¡acr copper
30
between pH values of 0 and 4 but selebtively retained 44.8 - 99.97o of rhe uranium
presenL Also, this resin had a greater maximum capacity for uranium (3.2 meq.g-r)
than lM-1 (2.8 meq.g-t).
IM-lM lM- I
According to these results the resins retain copper and uranium by different
mechanisms. Usually copper is retained by ion-exchange and possibly by chelaæ ring
formation; uranium was apparently held by adduct formation with the protonated
tertiary amine group. Rivæ and co-workers have also synthesized several other resi¡
materials,rsrs by crosslinkage of polyethyleneimine with 1,4-dibromo-2-butene,
1,9-dib¡omononane and I, lO-dibromodeca¡e, and subsequent alkylaúon with
dimethylsulphaæ. The influence of pH on the retention, maximum load capaciry and
elution was studied for Cu2*, UO22*, Fe2* a¡d Feh.
c{.t' t-" \f ñ+-orrer,-l-- l*-o,*. I\ l, - )¡ \'t' -'r-'r1ni:' r'GI cHllrrcH c{riCH2 cI"I t"
3t
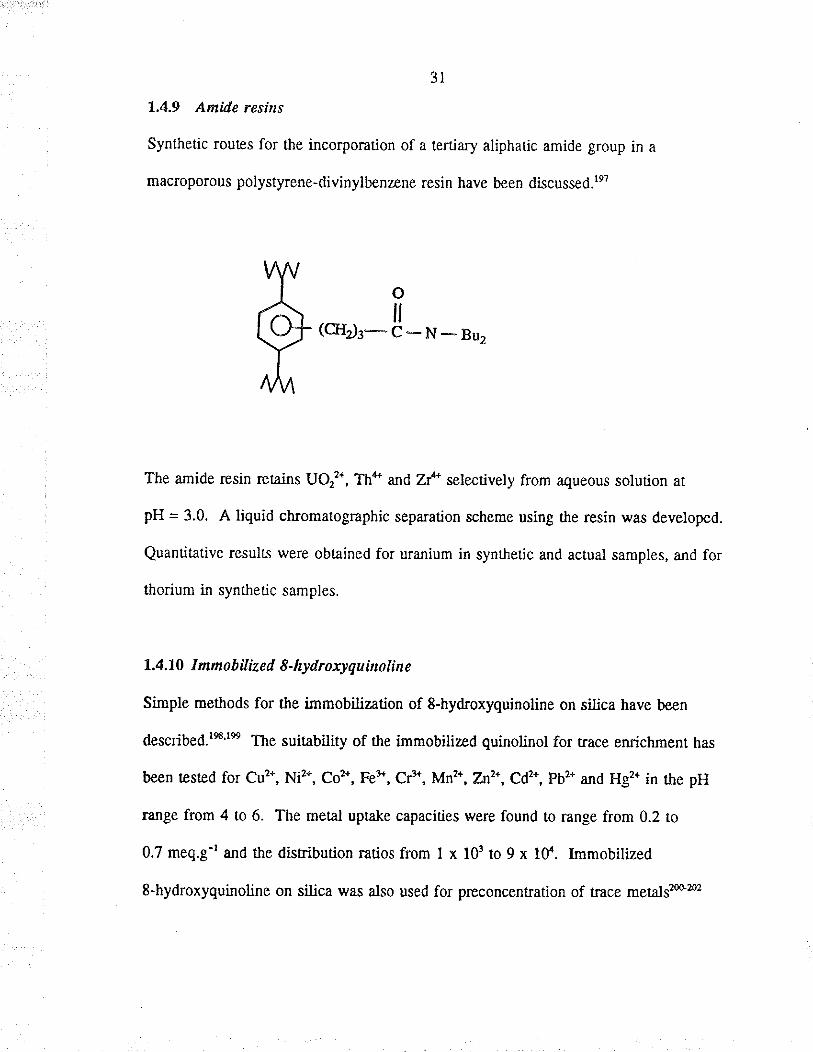
1.4.9 Amide resíns
Synthetic routes for the incorporation of a tertiary aliphatic amide group in a
macroporous polystyrene-divinylbenzene resin have been discusæd.re7
o
(elrr-!-o¡-Buz
The amide resin retains UO22*, Th'r* and Zf selectively from aqueous solution at
pH = 3.0. A liquid ch¡omatographic separation scheme using the resin was developed.
Quantitative results were obtai¡red for uranium in syntletic and actual samples, and for
thorium in synthetic samples.
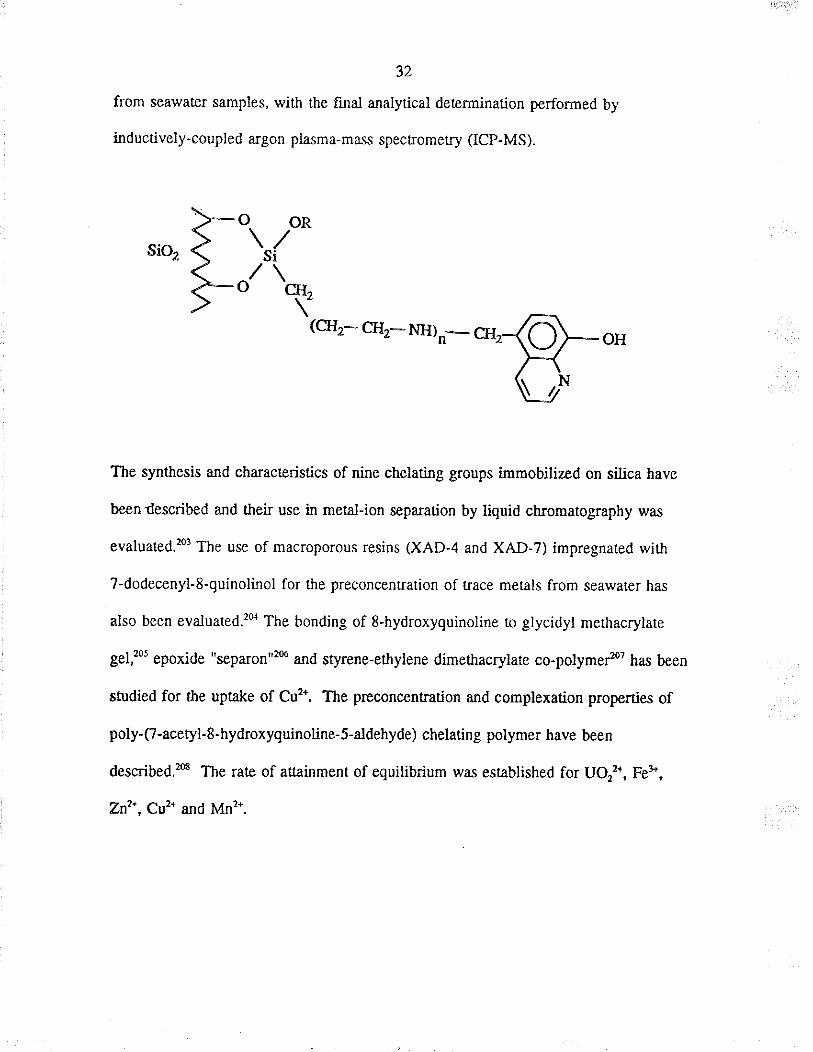
L.4.10 Immobilized S.hydroxyquinoline
Simple methods for the immobilization of 8-hydroxyquinoline on silica have been
described.r*'1s The suifability of the immobilized quinolinol fo¡ t¡ace enrichment hæ
been tested for Cu2', Ni2*, Co2*, Fe3., Cfl, Mnzt,7.dtz*, Cdz*, pb2* ald Hg2* in the pH
range from 4 to 6. The metal uptåke capacities were found to range from 0.2 to
0.7 meq.g-r and the distribution ratios from I x l0! to 9 x lff. knmobilized
8-hydroxyquinoline on silica was also used for preconcentration of trace metalf@æ2
32
f¡om seawate¡ samples, with the final analytical deænnination performed by
inductively-coupled argon plasma-mæs spectrometry (ICp-MS).
,ro, }-otr¡o*l/\(GIz- CTIz- NH)n- CH2
The synthesis and cha¡acæristics of nine chelating groups immobilized on silica have
been described and thei¡ use in metal-ion separation by liquid chromatography was
evaluated.æ3 The use of macroporous resins (XAD-4 a¡d XAD-7) impregnaæd with
7-dodecenyl-8-quinoli¡ol for the preconcentration of trace metals from seawater has
also been evaluated.?n The bonding of 8-hydroxyquinoline ro glycidyl methacrylate
gel,æs epoxide "separon"h and styrene-ethylene dimethacrylate co-polymefl? has been
studied for the uptake of Cu2*. The preconcentration and complexation properties of
poly-Q-acetyl-8-hydroxyquinoline-5-aldehyde) chelating polymer have been
described.æ The rate of auainment of equilibrium was established for UO22*, Fe*,
Zn2*, Cù2* and Mn2*.
33
1.4,11 Polyurethane loams
Korkish el a1.28 reported the use of polyurethane foam (polyether type) loaded with
organic extractants, such as ethyl ac€tate, for the recovery of u¡anium from nitrate
solutions. Polyurethane foams impregnated with trioctylphosphine oxide2ro (TOPO),
were capable of quantitatively separating uranium from many othe¡ elements i¡
lM HCI containing asco¡bic acid. Pearson a¡d Bowen2r¡ found the separation of
ura¡ium from aqueous solution could be facilitated with the use of a polyurethane
foam impregnaæd with TOPO. U¡anium and TOpO could be deso¡bed independently.
Akiba and Hashimoto2r2 investigated the sorption of uranium by using open cell
polyurethane foam impregnared with 5,8-dierhyl-7-hydroxy-6-dodecanone oxime (LX
63). At pH = 4.5, more tlan 99.5Va of uranium was sorbed onto the LIX 63-
impregnated foam and uÍanium was desorbed with dilute acid. Trace uranium has
been ext¡acted from aqueous solutions using polyurethane foams loaded with l-phenyl-
3-metlyl'4-benzoylpyrazol-5-one.2r3 Anions such as PO4! interfere slightly but CrOo2-
and F inærfere severely.
Gesser and Ahmed2ra reported the use of open cell polyurethane foam coated with long
chai¡ tertiary amines (Adogen) fo¡ the extaction of u¡anium f¡om solution with pH
values between I and 3; Co2* had a significant adverse effect on the uranium
ext¡action. When polyurethane foams were loaded with di-(2+thylhexyl)phosphoric
acid?rs in nitrobenzene, these foams were capable of exuacting uranium from sulphuric
34
acid solutions, except at low acidities. When polyurethane foams were loaded with di.
(2-ethylhexyl) phosphoric acid a¡d triburylphosphaæ i¡ o-dichloro- benzene,2r62r7 these
foams weæ capable of extracting uranium from nit¡ic acid solutions. Huutg et al.2t8
used polyuæthane foams for tle ext¡action of ura¡ium from aqueous solutions
conl¿ining nitrate salts and reporæd that tlese foams did not extract ura¡ium when the
nitrate sâlts were absent.
1.5 Commerc-iallyavailablepolymers
A few selecæd commercially available chelating resins that a¡e suitable for exuacting
ura¡ium and other trace metals from seawate¡ a¡e listed in Table 1.3. The dono¡
atoms listed are those which may be covalently bound to the meul ions or metal
species in solution. Duolite resins can be used in solving problems of water and
process-liquid treatment, and for many applications in the pharmaceutica_I, food,
nuclea¡ and hydrometallurgical industries and envi¡onmenhl protection. The principal
application of these chelating resins is in removing calcium and magnesium from t¡e
brine feed for chloralkali cells. Duolite ES 467 is capable of reducing the
concentration of Ca2* and Mgz* to a few ¡rg.L-t, as required for the membrane cells.2re
The Cheliæ series of resi¡s have complex-forming chemical configurations fixed to a
porous matrix.ä They can specifically retåin and ¡emove various multivalent cations
f¡om solutions. Furthermore, they have ion-exchange properties; hence it is necessary
to equilibrate the resins with the mat¡ix solution before use to avoid changes in the
overall ionic composition of the liquid phase.
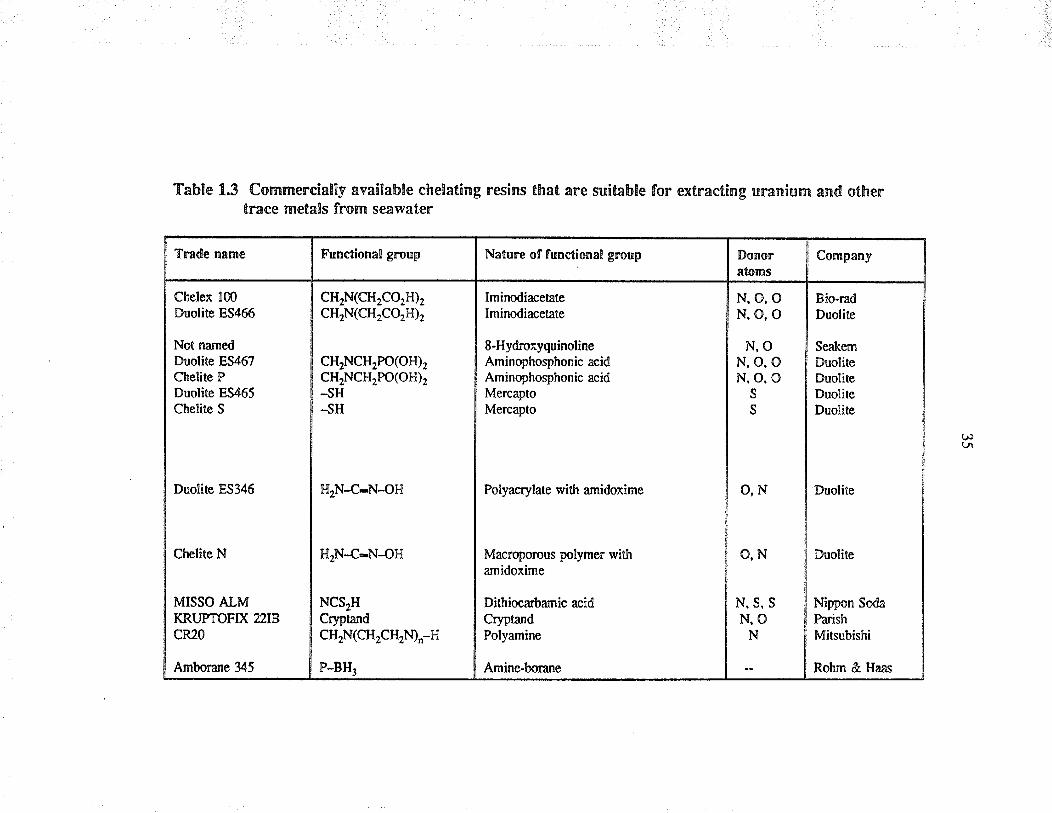
Table 1.3 Commercially available chelating resins that are suitable for extracting uranium and othentrace metals from seawaten
Trade name
Chelex 100Duolie ES466
Not namedDuolite ES467Chelite PDuolite ES465Chelite S
Funct¡onal group
cl{2N(cH2c02H)2cH2N(CH2CO2H)2
CH2NCH2PO(OH)2CH2NCH2PO(OH)2-sH-sH
Duolite ES346
Chelite N
MISSO ALMKRUPTOFTX 22IBcR20
Amborane 345
Naturc of functionnl group
IminodiacetateIminodiacetâte
8-HydroxyquinolineAminophosphonic acidAminophosphonic acidMercaptoMercãpto
Polyacrylate with amidoxime
Macroporous polymer withamidoxime
Dithiocarbamic acidCryptandPolyamine
Amine-bor¿ne
H2N-C-N-OH
H2N-C-N-OH
NCS2HCrntandcH2N(CH2CH2t9n-H
P-BH.
Donoratoms
N.O,ON,O,O
Company
N,ON,O,ON,O,O
sS
Bio-radDuolite
Seakern
DuolileDuoliteDuoliteDuolite
Duoliteo,N
o,N
N,S,SN,O
N
Duolite
Nippon SodaParishMitsubishi
Rohm & Haas
36
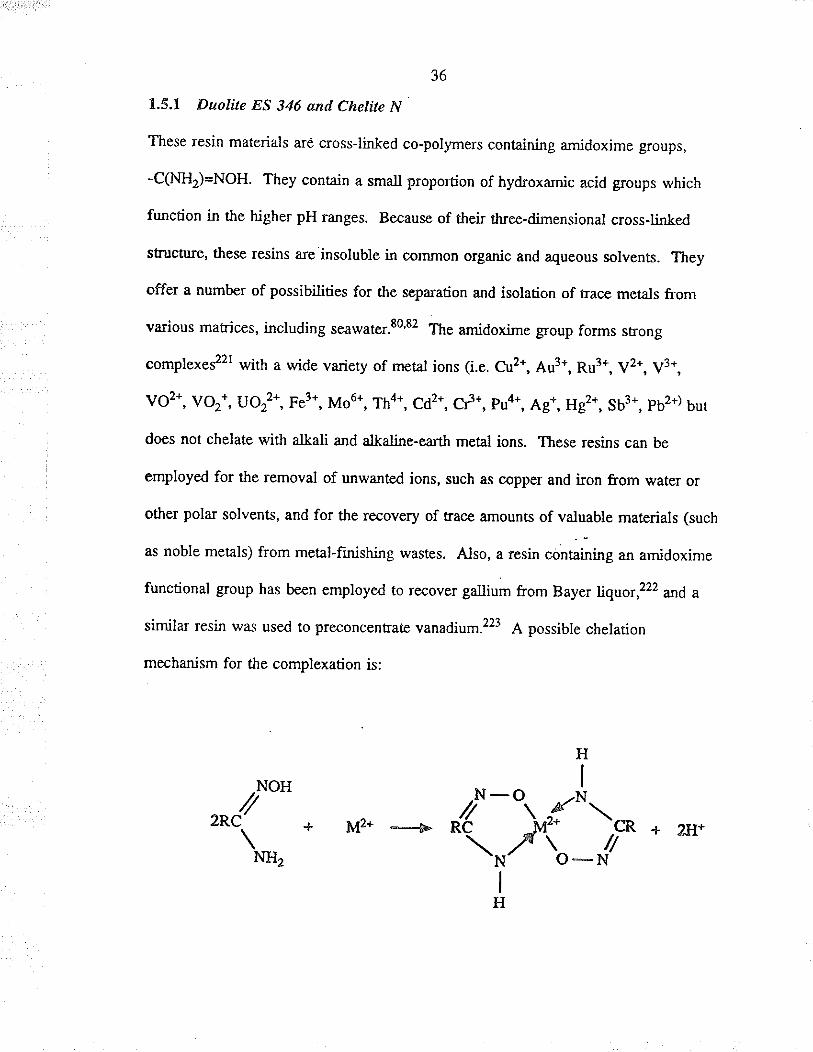
1.5.1 Duolite ES 346 and Chelite N
These ¡esin materials are cross-li¡-ked co-polymers cont¿ining amidoxime groups,
-C(NH)=NOH. They contain a small proportion of hydroxamic acid groups which
function in the higher pH ranges. Because of thei¡ th¡eedimensional cross-linked
structure' these resins are insoluble in common organic and aqueous solvents. They
offer a number of possibilities for the separation and isolation of t¡ace metals from
various matrices, including seawate..t0'82 The amidoxime group forms strong
complexe*2! with a wide variety of met¿l ions (i.e. Cu2*, Au3*, Ru3*, V2*, V3*,
vo2*, vo2*, uo22*, Fe3t, Mo6t, Th4*, cd2*, cÉ*, pu4*, Ag*, Hg2*, sb3*, pb2*) but
does not chelate with alkali and alkaline-earth metal ions. These resins can be
employed for the removal of unwanted ions, such as copper and i¡on from water or
other polar solvents, and for the recovery of trace amounts of valuable materials (such
as noble metals) from metal-finishing wastes. ,qlso, a resin containing an amidoxime
functional group has been employed to recover gallium ûom Bayer liquor,222 and a
simila¡ resin was used to preconcentrate vanadium.2a A possible chelation
mechanism for the complexation is:
NOH
2R/NH2
N
M2+ --{'' "(
H
I
-o -N\r\ì,a'+ -G.
,tr //'N' o-NI
H
+ 2H+
37
Since the resin contains a weak-baæ functional group, the chelation and ion-exchange
capacity depends on the pH, Regeneration with mineral acid converts the weak-base
functional group into its protonated form. If it is not neufalized, this conjugaæ acid
will dissociate i¡ the succeeding loading cycle and may depress the pH below the
point of optimum chelation. In such cases, the resin should be buffered to a suitable
pH following acid regeneration.
Owing to tle immense worldwide interest during the last three decades i¡ the
ext¡action of u¡anium from seawater, there have been many papers dealing with this
problem. Amidoxime-containing sorbents a¡e usable for this purpose and this has
prompted a number of papers mainly dedicated to the synthesisær$ of theæ materials.
Egawa et a1.83's prepared a macroreticula¡ chelating resin containing amidoxime by
reacting acrylonitrile-divinylbenzene co-polymer beads with hydroxylamine. They
reported an average recovery oî 82.9Vo in tle ext¡action of uranium f¡om æawate¡. A
number of polyacrylamidoxime æsins made from various co-polymers of acrylonitrile
end cross-li¡king agenß85 have been synthesized and tested for the ext¡action of
uranium.
Recently, Egawa er al,ú have synthesized macroreticula¡ chelating r€sins cont¿ining
amidoxime groups with various degrees of cross-linking, which wæ obt¿ined by using
va¡ious amounts of ethyleneglycol dimethacrylate, dimethyleneglycol dimethacrylaæ,
38
triethyleneglycol dimethacrylaæ, tetraethyleneglycol dimerhacrylare and
enneaethyleneglycol dimethacrylate as cross-linkirg reagenb. The effect of cross-
linking reagens on the pore strucfure, ion-exchange capacity, swelting ratio, and
sorption ability for uranium in æawate¡ was investigated. Simult¿¡eous use of divinyl
benzene and ethylene glycol dimethacrylaæ or tetr¿¡erhylene glycol dimerhacrylaæ
produced a resin u/ith improved chemical and physical srabiliry.
To improve the flow-rate through the column and the mechanical stability of the resin,
various fibres carryirg amidoxime groups were synthesized. Commercial acrylonitrile
fib¡es were treated with hydroxylamine in methanol to give the required acrylonitrile
amidoxime fib¡es.8s'ræ Fibres were also made by radiation-induced graft
polymerizarion of acrylonitrile onto polymeric fibres, followed by amidoximation.æ.8e
1.6 Summary
Chelating polymer resin maærials are mainly used in analytical, industrial and
radiochemical laboratories, but only to a limited extent in solving environmental
problems. Metal pollution of the environment poses unique problems. Predominantly,
metal pollution originaæs from t¡ace contami¡ation in wate¡s and soil systems. The
behaviour of trace metals in the envi¡onment is prima¡ily determined by the particular
species of the metals rather than by their bulk concentrations. Since metals are not
subject to biodegradation, for practical prtrposes, they have infinite lifetimes.
39
The most promising way to decontaminate aqueous systeÌns such as ì,vaste water
treatment sludges, and to recover the hace metals from them, is by employing specific
chelating resin materials. Even though almost a1l common chelating polymers are
non-selective, ¡esearch offorts are being directed to synthesize selective chelating
polymers, with good physical and chemical stability, for metal extraction. It can be
seen that methods to synthesize chelating resins with functional groups that are
selective for the extraction of u¡anium can be very complex.
The objective of this study is to develop and evaluate so¡bents for the sorption of
uranium from aqueous systems. Chapter II describes the different analytical plasma
techniques used for this study along with the development of a continuous flow
spectrophotometric method for the analysis of uranium. An evaluation of comrnonly
available sorbents to determine the effectiveness of va¡ious functional groups for the
sorption of uranium from simple and complex aqueous solutions is described in
chapter IIl. chapter IV will describe simple methods of preparation of sorbents with
functional groups that are selective for the extraction of u¡anium. This includes the
preparation of polyurethane foams with phosphonic acid or B-diketone functional
groups and a modified polyacrylonitrile (Orlonrtø; fabric with amidoxime functional
groups. These materials were evaluated for thei¡ uptake of uranium from aqueous
solutions with a wide range of pH and temperature values. Commercially available
resins that have seldom been used in analytical chemistry, because they were only
recently introduced into the market, were evaluated for the uptake of uranium f¡oln
40
aclual seawater and the results were co¡npared to the commonly usecl chelex 100
resin; these results are discussed in Chapter V.
The preconcenfation procedures based on chelating polymers seem to offer
unexplored opportunities that deserve the attention of scientists concerned with
environmental pollution abatement in general, and with the removal of hazardous
species in particular. These chelating polymers would play a vital role in
envi¡onmental monitoring of toxic trace metals. preconcentration with chelating
so¡bents improves the sensitivity and reliability of the analytical determination of
elements for a wide variety of samples, including natural waters, geological, biological
and indusUial materials.
4T
CIIAPTER II
ANALYTICAL TECHNIQI,]ES
2 Introduction
Fou¡ differen¡ techniques were used fo¡ the determination of uranium due to
limitations associated with the availability and suitåbility of these techniques for our
use. A b¡ief evaluation of the techniques used for the determination of uranium will
be discussed in this chapter.
The determination of trace metals for monitoring purposes, particularly of
¡adionuclides in seawater, hæ received enorrnous attendon in ¡ecent years and a
numbe¡ of analytical methods are presently used for the analysis of t¡ace met¿ls in
seawater. The instrumental æchniques available include x-ray fluorescence,.e læer
fluorescence,22a neutron activation,zt'22ó isotope dilution mass spectrometry,æ7
inductively-coupled plæma-mæs spectrometry,2æ anodic stripping voltammetryu and
atomic absorption spect¡ometry.z2e None of these analytical techniques is able to
perfonn a di¡ect deærmination of face elements in seawater at concenmtions below
5 ppb (the concentrations of u¡anium and thorium in seawater are 3.3 ppb and
0.03 ppb respectively). Even when met¿l concentrations are relatively high, the
sensitivities and detection limits a¡e seriously affecæd by the seawater mat¡ix. As a
result of theæ limit¿tions, a sample preparation technique is usually employed to
preconcenFate úe radionuclides as weli as separate tlrem from alkali and alkali¡e
42
earth met¿ls.
A numbe¡ of review papers have been published for the analysis of uranium using
va¡ious techniqur..23r'2r2 '¡¡r different æchniques reviewed for the analysis of u¡anium
were spectrophotomefic,M2l2 elechochemical,23? ion probe,ã nuclear magnetic
resonance,2s radiochemical,æ5Øt neut¡on activation,ã2sã inductively-coupled plasma
atomic emission specEometry,234'u t inductively-coupled plasma mæs
spectrometry,232'2!lx m ass spectromerf 3 I ¿33 2ts'2x 21 t and fluorescence
spectromeü-Y.230'231'3e'24 I
Many of the techniques fo¡ the detennination of trace u¡anium we¡e either not suitable
or not available in our laboratory. Emission spectroscopic techniques appeared to
offer high sensiriviry wirh suiuble selecrivity. Inirially in this work rle analysis of
uranium was done using an inductively-coupled plæma atomic emission spectometer
(ICP-AES) which was available for our use on a limired time basis at the Ward
Technical Services Laboratory of the P¡ovince of Manitoba (Wiruripeg, Ca¡ada).
Howeve¡, large delays were involved in getting this instrument back into working
condition when it required repairs. Theæ recurring delays led us to seek altemative
metlods of analysis and this resulted in the use of a di¡ect cunent plasma atomic
emission spectrometer (DCP-AES) located in the Fresh Water Instiü¡te, a Canadi¿n
Govemment facility on the University of Manitoba csmpus. Unfortunaæly, similar
problems occuned wirh the DCP-AES, thus limiting the availabil.iry of the instrument
43
fo¡ our use because of its normal workload ard because of long delays required for
repairs. These difficulties led us to develop a conti¡uous flow spectropholomet¡ic
method (CFSM) fo¡ the quick and accurate analysis of uranium in our laboratory.
The analysis of u¡anium for the evaluation of va¡ious sorbents was done using either
ICP-AES, DCP-AES or CFSM. One of the criteria used for the eva-luarion was
percent exEaction, which was obtained by comparing the initial and final concentration
of u¡anium. Uranium content of the eluates for actual seawater experiments was
determined by an inductively-coupled plasma mass specromerer (ICP-MS) which was
located in the Geological Survey of Ca¡ada (Ort¿wa, Onta¡io). ICP-AES, DCP-AES
o¡ CFSM were unable to analyze for uranium content in these eluates due to severe
problems associated with mat¡ix interferences.
2.1 Reagents
All chemicals [Arænazo III (Aldrich Co. WI, USA), uranyl acerare (BDH, England)
and thorium nitrate (Fisher Sci. Co. NJ, USA)I were of reagent grade and were used
witiout fu¡ther purifìcation. Water used was fust purified by reveræ osmosis
followed by a Barnstead Nanopure IfrM system,
A 2000 ppm uranium stock solution was prepaæd by dissolving 3.5640 grams of
uanyl ac€tate [UOr(CH3COO)2.2H2O] in I liue of deionized water. Uranium standard
solutions ranging from I to l0 ppm were pæpared by successive dilution of the 2000
44
ppm stock solution.
A 2000 ppm thorium stock solution was prepared by dissolving 2.3800 grams of
thorium niraæ (fh(NO3)1.4HrO) in 500 mL of deionized waær. Tho¡ium standårds
ranging from 0.1 to l0 ppm were prepared by successive dilution of the 2000 ppm
stock solution,
For the evaluation of the sorbents, we were interested in only the relative
concentration (i.e. concentration before and after using the sorbent). Hence, no
attempt w¿rs made to determine tbe uranium content of the stock solution accuately.
2.2 Equlpment
2,2,1, Inductively-coupled plnsma atimic emhsion spectrcmeter QCP-AES)
The specuomeær was a Jar¡ell-Ash Arom Comp æries 800 (MA, USA) equipped wirh
a MAKrr{ nebuliz€r and a Gilson Minipuls peristaltic pump with a flow rate of
1.3 ml.mi¡-t. The argon plasma creates a hot zone, with a temperature in the range
of 8,000 to 10,000 K, in which excited atoms are produced from the sample solution.
At these femperaû.¡res chemical interference from organic or inorganic anions is
generally eliminaæd.
ICP-AES measurcs the inænsity of the cha¡acterisric emined light which is
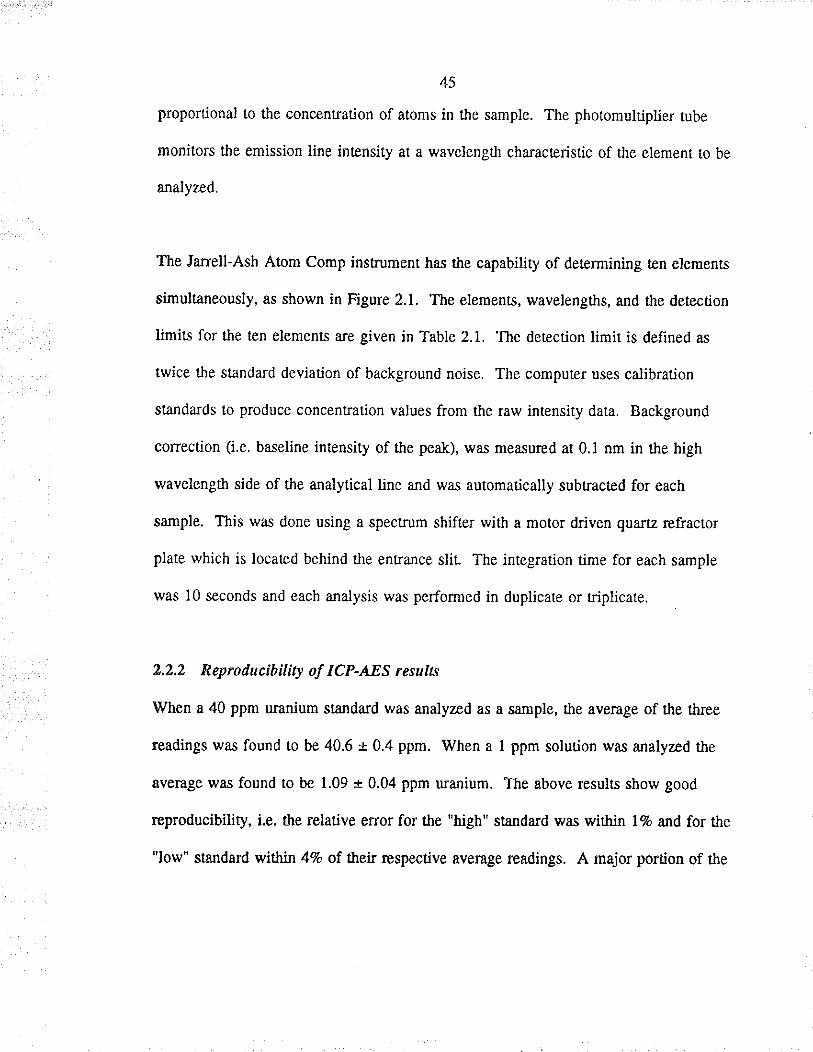
45
proportional to tìe concent¡ation of atoms in the sample. The photomulriplier tube
monito¡s the emission line intensity at a wavelength characteristic of the element to be
analyz.ed.
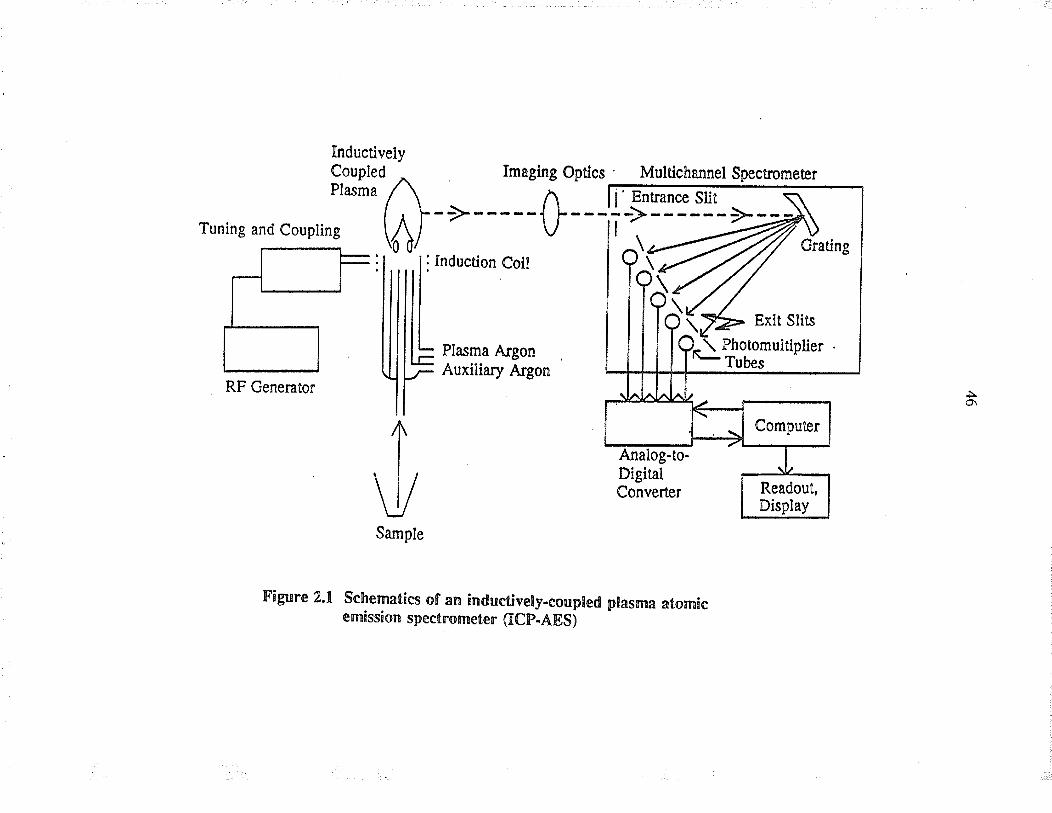
The Janell-Ash Atom Comp insfument has the capability of detennining ten elements
simultåneously, as shown in Figure 2.1. The elements, wavelengths, and the deæction
Iimits for the ten elements are given i¡ Table 2.1. The detection limit is defined as
twice the standard deviation of background noise. The computer uses calibration
stånda¡ds to produce concentration values from the raw intensity data. Background
corection (i.e. baseline inænsity of the peak), wæ meæured at 0.1 nm in the high
wavelength side of tire analytical line and wæ automatically subtracted for each
sample. This wæ done using a spectrum shjfter with a motor driven quartz refractor
plate which is locaæd behind the entrance slil The inægration time for each sample
was l0 seconds and each analysis was performed in duplicate or triplicate.
2.2,2 Reproilucibiliry of ICP.AES resulß
When a 40 ppm uranium ståndard was analyzed as a sample, the average of the three
readings was found to be 40.6 * 0.4 ppm. When a I ppm solution was analyzed the
aventge was found to be 1.09 + 0.04 ppm üanium. The above results show good
reproducibiliry, i.e. the relative e¡ro¡ for the "high" standard was within l% and for the
'low" standa¡d within 4% of their respective average readings. A major portion of the
Tuning and Coupl
InductivetyCouoleduæina /\i \Ai
'il][
t|
RF Generator
->-----{\
Induction .Coll
Plæma fugonAuxiliary Argon
ImaglngOptics MultlchannelSpectromeær
Sample
Figure 2.1 Schematics of an inductively-coupled plasma atomicemission spectrometer (ICP.ÄES)
Ào\
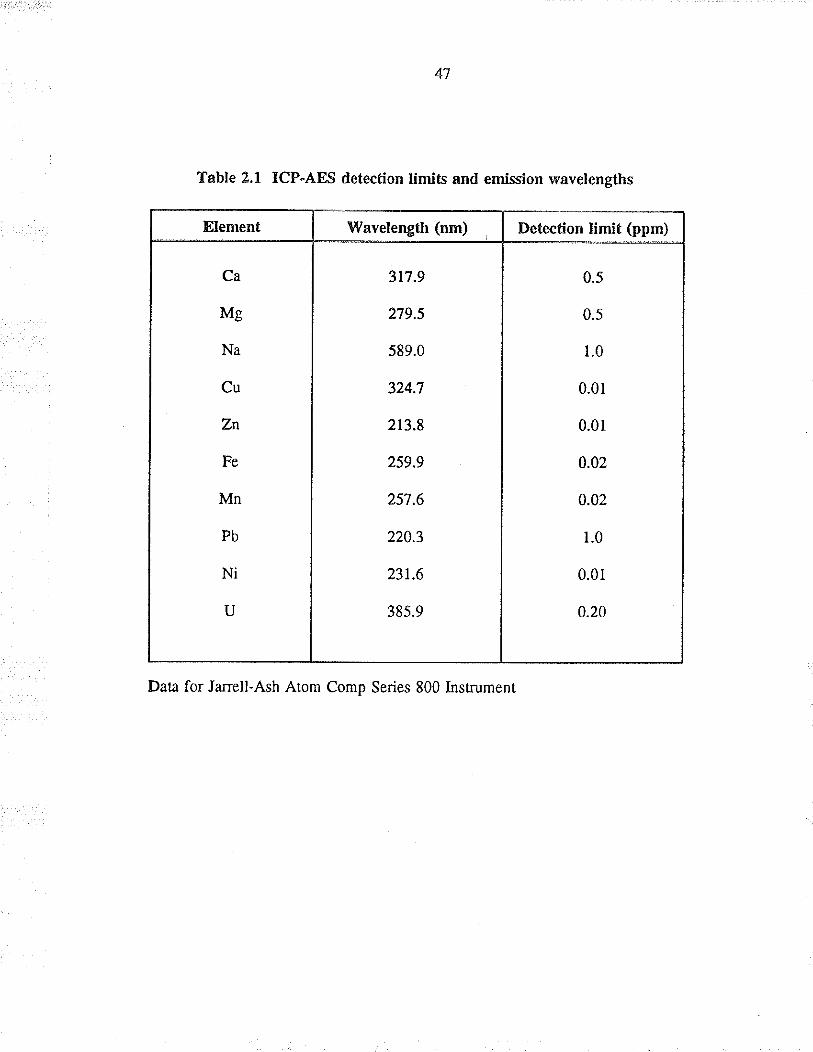
Table 2,1 ICP-AES detection limits and emission wavelengths
Data fo¡ Janell-Ash Atom Comp Series 800 Instrument
Bement V9avelength (nm) Detection limit (ppm)
Ca
Mg
Na
Cu
Zrt
Fe
Mn
Pb
Ni
U
317.9
279.5
s89.0
324.7
213.8
259.9
25'1.6
220.3
23r.6
385.9
0.5
0.5
1.0
0.01
0.01
0.02
0.02
1.0
0.0r
0.20
48
analysis using this i¡strument was performed by Mr. D. Cha¡ of the Wa¡d Technical
Service Laboratory.
2.2,3 Direct cunent plasma abmic emíssion spectrometer (DC?.AES)
The spectromeær used wæ a Beckman Spectrospan V (Spectra Met¡ics Inc., MA,
USA) with a high resolution echelle grating. The high energy dc plæma excitation
source consists of a front ard rear graphite anode and a top tungsten cathode fonning
an inverted "Y" configuration, as shown in Figure 2.2. The peristaltic pump transfers
the sample to the nebulizer at a tate of approximately 2 ml-.min-r.
The uranium emission wavelength was found by scanning the spectrum from 200 to
700 nm while a 100 ppm uranium standard was being æpirated into the plasma. The
mos! sensitive line was found to be at 424.17 nm with an intensity of 6000 (arbitrary
units). To confi¡m that this line at 424.17 nm was due to urarium, a deionized water
sample was asptated and the intensity dropped to 326 (arbirary units), indicating that
tïe line a¡ 424.17 nm was not due to the background or other i¡terferences. This li¡e
at 424,17 nm was also recommended by the instrument ma¡ufacturer for the analysis
of uranium.u 3
The DCP-AES spectrometer wæ capable of digitizing the anal¡ical peak spectrum
and displaying it as a plot of wavelength versus infensity measuements. The intensity
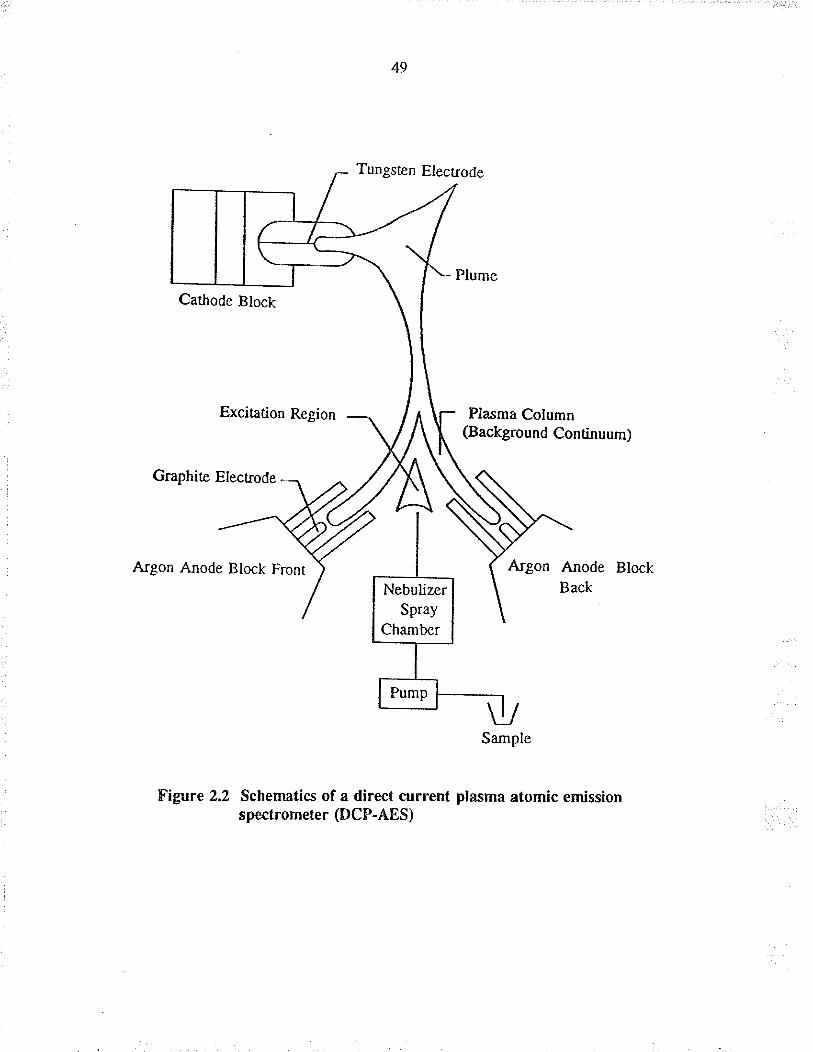
49
Tungsten Elect¡ode
Cathode Block
Plasma Column@ackground Continuum)
Figtre 22 Schem¡tics of a direct current plasma atomic emissionspecf romerer (DCP.AES)
Argon A¡ode BlockBack
Argon Anode Block Front
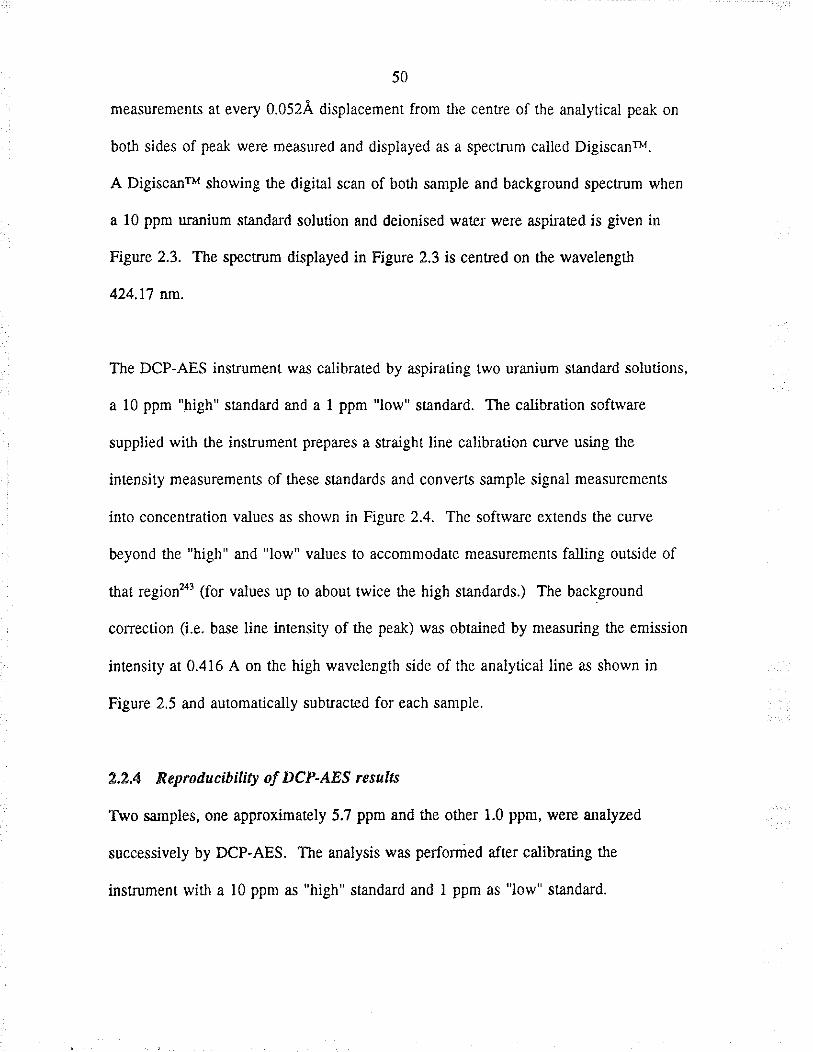
50
measurements at every 0.052Å displacement from the centre of the analytical peak on
both sides of peak were meæured and displayed as a spectrum called Digiscarrv.
A Digiscanru showing the digitål scan of both sample and background spectrum when
a 10 ppm uranium standa¡d solution and deionised water were aspiraæd is given in
Figure 2.3. The spectrum displayed in Figure 2.3 is centred on the wavelength
424.17 nm.
The DCP-AES inst¡ument was calibrated by aspirating two uranium ståndard solutions,
a 10 ppm "high" standard and a I ppm "low" standa¡d. The calibration softwa¡e
supplied with tle instrument prepares a straight line calibration curve using the
intensity measurements of these standards and converts sample signal measurements
into concent¡ation va-lues as shown in Figure 2.4. The softwa¡e extends the curve
beyond the "high" ard "low'' values to accommodate measurements falling outside of
tha! region2a3 (for values up to about twice the high standards.) The background
correction (i.e. bæe line intensity of the peak) wæ obtained by meæuring the emission
intensity at 0.416 A on the high wavelength side of the anaiytical line as shown in
Figure 2.5 and automadcally subuacted for each sample.
2,2,4 Reproducíbility of DCP-AES results
Two samples, one approximaæly 5.? ppm and the other 1.0 ppm, were analyzed
successively by DCP-AES. The analysis was perforied afær catibrating the
insf¡ument with a 10 ppm as "high" standard and I ppm as "low" søndard.
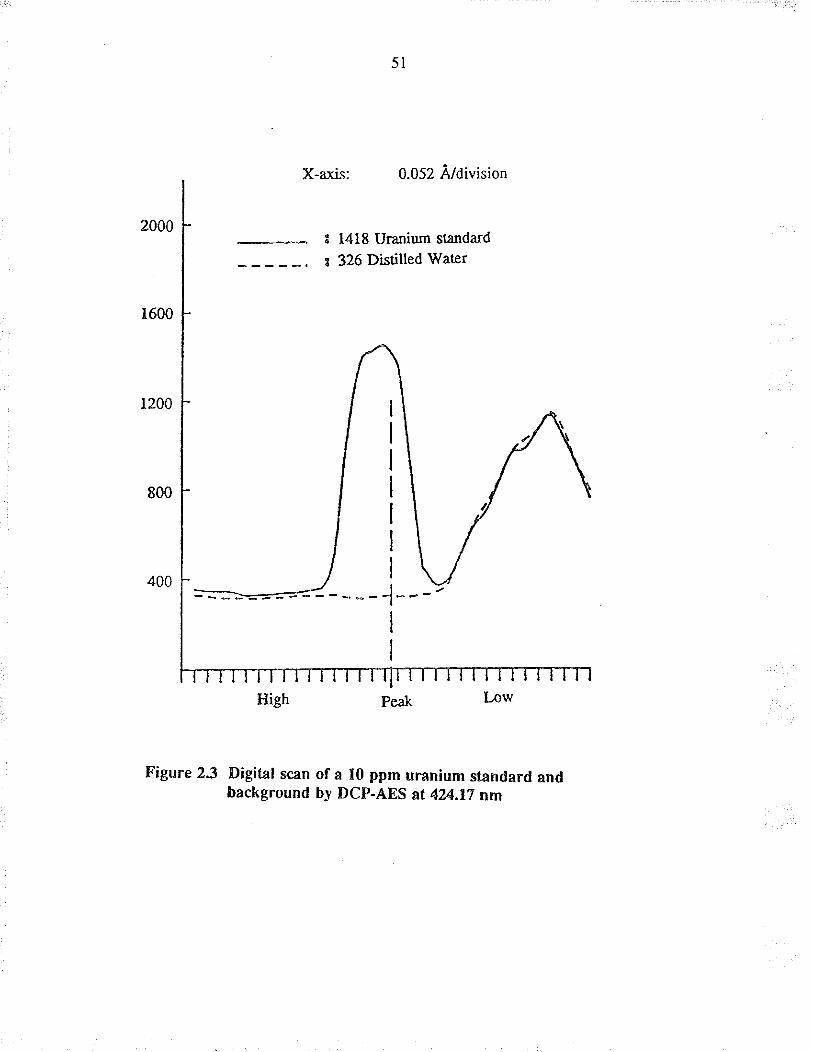
X-axis: 0.052 fudivision
¡ 1418 Uranium ståndard
¡ 326 Distilled Water
Figure 23 Digital scan of a I0 ppm uranium standard andbackground by DCP.AES at4ZI.l7 nm
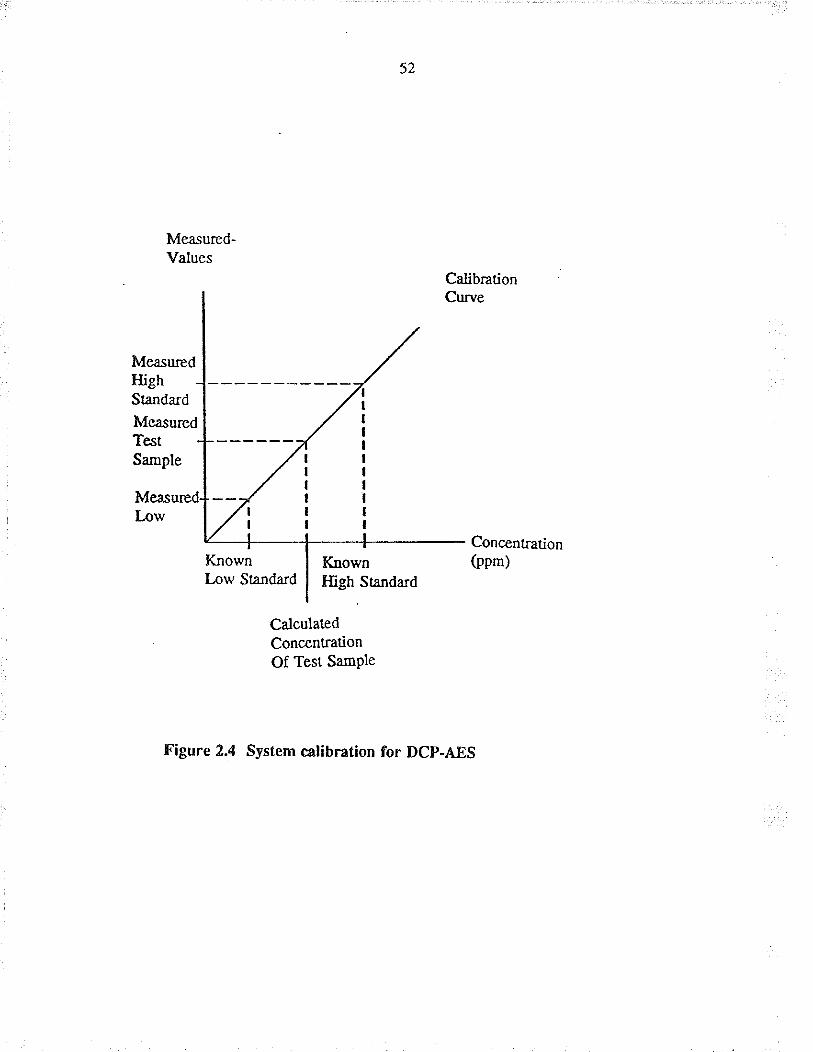
<t
Measured-VaÌues
Calib¡ationCurve
Measu¡edHighStånda¡d
Me¿su¡edTestSample
KnownLow Staridå¡d
KnownHigh Standard
Concentration(ppm)
CalculatedConcenl¡ationOf Test SamPle
Figure 2.4 System calibration for DCP-AES
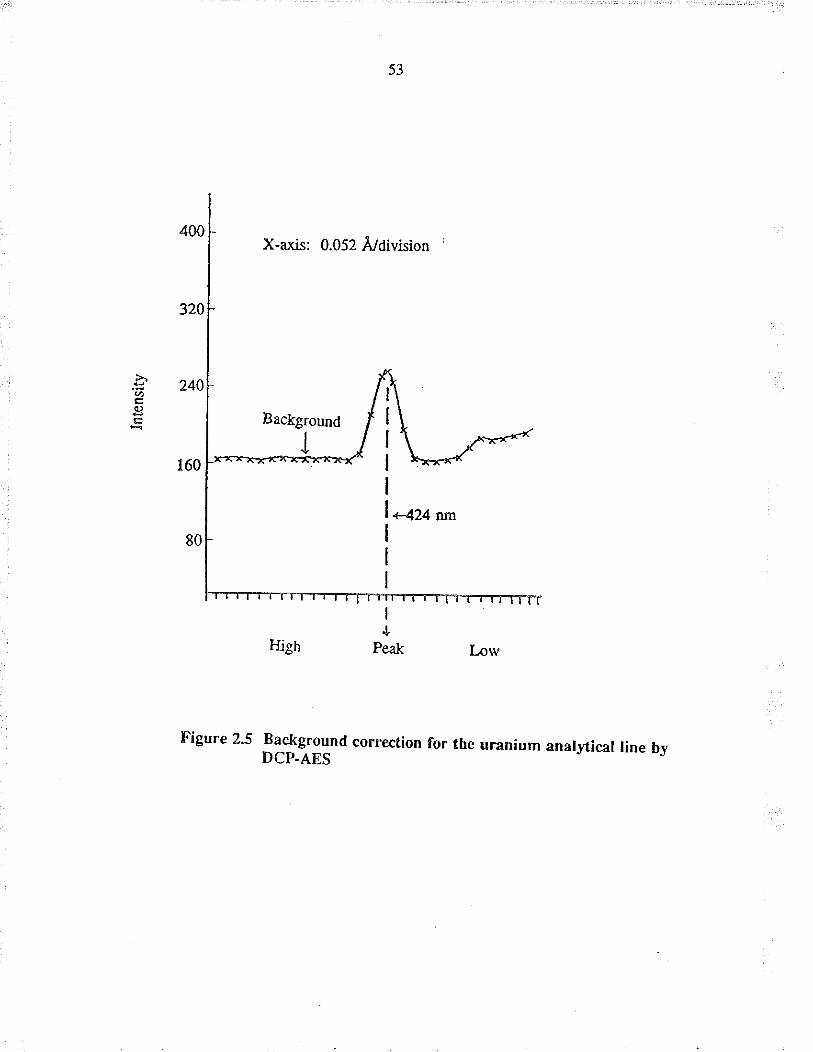
53
X-axis: 0.052 fudivision
Background
I
¿Peåk LowHigh
Figure 25 Background comection for f he uranium anal¡,tìcal line byDCP.AES
54
The results are given in Table 2.2 for the 5.7 ppm uranium solution. The "low"
sta¡da¡d, i.e. 1 ppm, wæ aralyzed æ a sample six times and the results are given in
Table 2.3. It can þ seen from Tables 2.2 and 2.3 that the DCP-AES is capable of
analyzing u¡anium with reasonable reproducibility, Le. withi¡ * 0.05 ppm uranium.
2,2,5 Inductívely-coupled plasmt mass spectrometry (CP-MS)
In ICP-MS, the ICP acts æ an ion source as described ea¡lier for ICP-AES. The ions
produced in the ICP a¡e transferred into a mass spectrometer with a quadrupole mass
analyzer which acts as a mass filter. The spectrometer used wæ a Perkin-Elmer Sciex
Model 250 (Onørio, Canada). The schematics of a Sciex instrument a¡e shown in
Figure 2.6. The solution uptake was contolled with a Gilson Minipuls 2 peristaltic
pump. Calibration wæ accomplished using Johnson Manhey Specpureru calibration
standards. The uradum isotope ratios were determined by monitoring the ion inænsity
of U23s and U2* separately. Data were accumulated on the less abundant isotope such
that a minimum of 10,000 counts were obtained to improve counting statistics. The
value obtained for the isotope ratio was calculated from an average of five æparate
deteminations. Mæs discrimination conections were made using NBS Standard
Reference Material 982 isotopically analyzed and certified equal atom lead isotopic
sÞnda¡d%. ICP-MS wæ used for the analysis of 7¡, Hf , Ta, Th and U in the eluaæs
for the acn¡al seawater experiments; the rest of the elements in the eluates we¡e
analysed by ICP-AES. The ICP-AES used was a Jobin-Yvon Model 48 simultåneous
ICP-AES emission specÍometer with a 2400 groove mm-r holographic grating. The
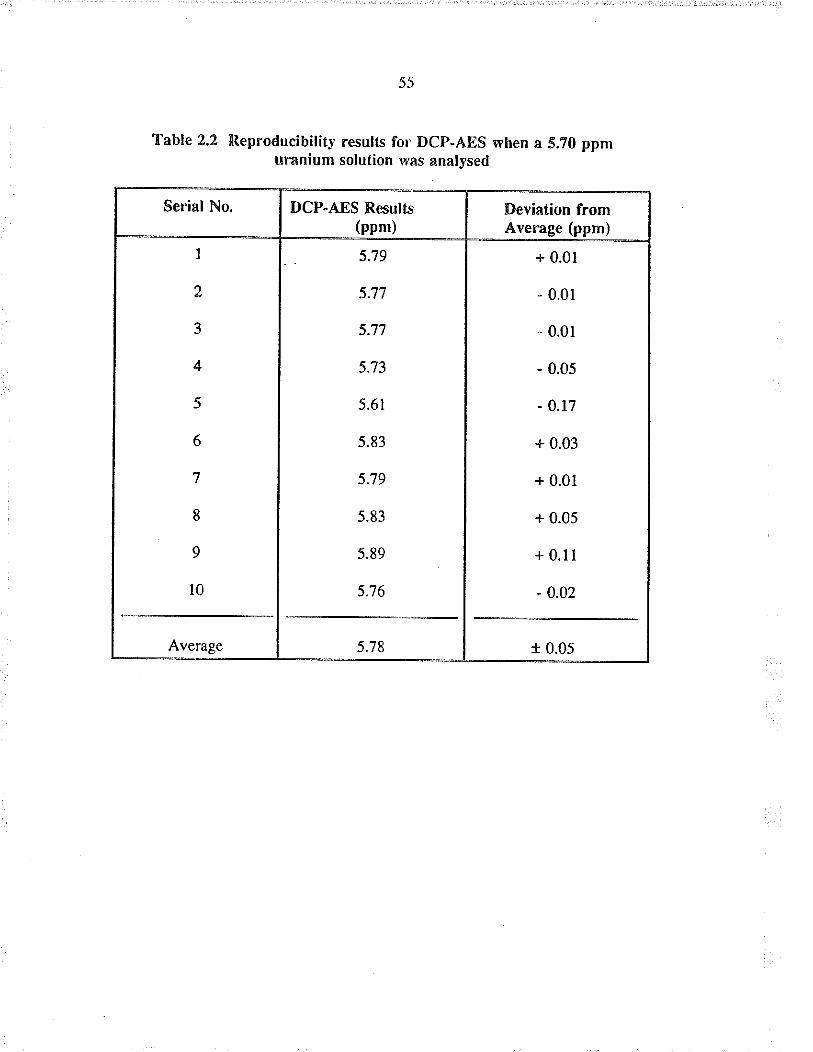
55
Table 2,2 Reproducibility resulfs for DCP.AES when a S.70 ppmuranium solution wâs anâlysed
Serial No. DCP-AES Resulfs(ppm)
Deviation fromAverage (ppm)
I
2
3
4
5
6
7
8
9
l0
5.79
5.1'.|
5.77
5.',t3
5.61
5.83
5.79
5.83
5.89
5.76
+ 0.01
- 0.01
- 0,0r
- 0.05
- 0.17
+ 0.03
+ 0.01
+ 0.05
+ 0.ll
- 0.02
Average 5.78 r 0.05
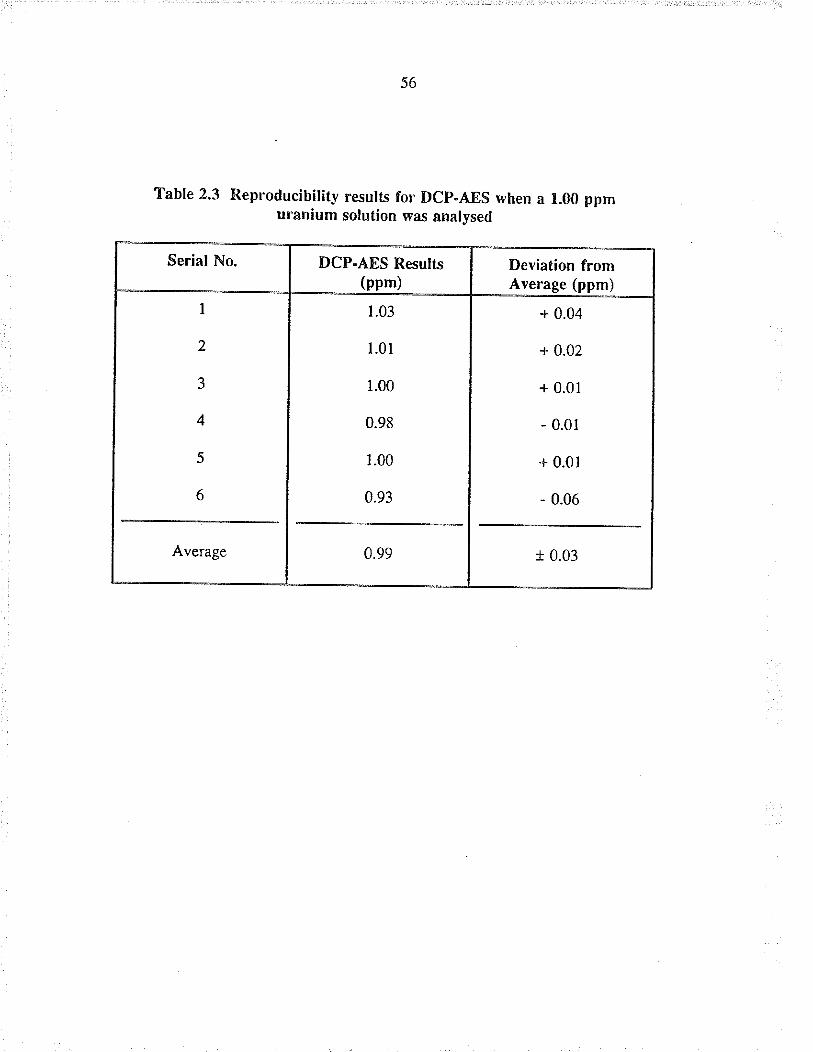
56
Table 2.3 Reproducibility results for DCP.AES when a 1.00 ppmuranium solution was analysed
Serial No. DCP-ABS Results(ppm)
Deviation fromAverage (ppm)
I
2
3
4
5
6
1.03
1.01
1.00
0.98
r.00
0.93
+ 0.04
+ 0.02
+ 0.01
- 0.0r
+ 0.01
- 0.06
Average 0.99 r 0.03
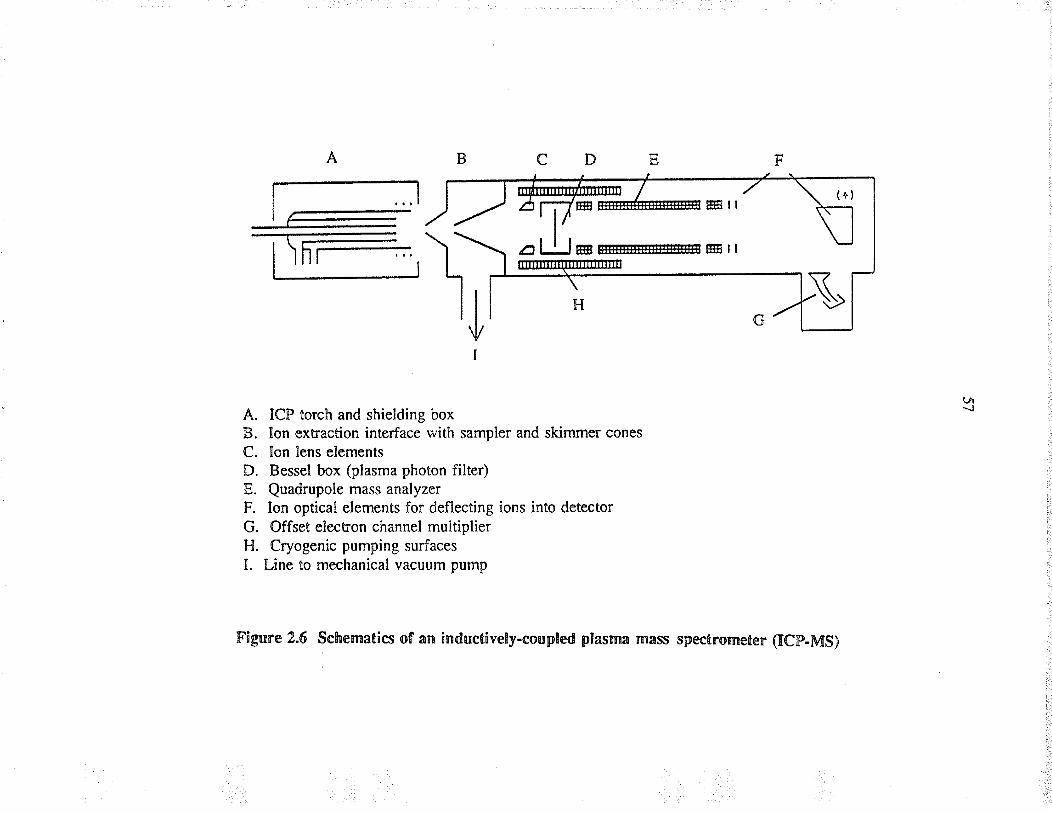
| \rr- -,
A. ICP torch and shielding boxB. Ion extraction interface with sampler and skimmer cones
C. Ion lens elementsD. Bessel box (plasma photon filter)E. Quadrupole mass analyzerF. Ion optical elements for deflecting ions into detectorG. Offset electon channel multiplierH. Cryogenic pumping surfacesI. Line to mechanical vacuum pump
Figure 2.6 Schematics of an inductively-coupled plasma mass spectrometer (tCp-MS)
-J
58
nebulizer used was a Meinhard "C" concentric glass fype nebulizer. Calib¡ation was
accomplished using SpexrM ICP standard solutions prepared in acid of stength
matching that of sample solution. Measu¡ements by ICP-AES were obøined by
integration for 3 minuæs md the relative standa¡d deviations were between 1.5 and
Z.Ú4. fne ICP-MS and ICP-AES uæd (for the analysis of the eluates for the
Seawater experiments) were located in Geological Suwey of Canada (Ottawa, Canada)
and all analyses were performed by Dr. Gregoire and Ms. Berrand of the Geological
Survey of Canada.
2.2.6 Continuous flow spectrophotomet¡ic methoil (CFSM)
The analysis of u¡anium by ICP-AES or DCP-AES is rapid, convenient and relatively
free from matrix effects, but the analysis became very restrictive because the
Chemist-y Department at the Universiry of Manitoba did not have these instruments.
These irstruments were being used for routine analysis by the owners of the
instrument. lnstrumental parameters had to be changed for our analysis which
restricted ou¡ use of the instrument to a time when routine analysis was not being
performed by the owners. Due to the large number of samples that had to be
ualyzrÅ, the inconvenient location of equipment, and the occasional avail¡bility of the
instrument for our use, we developed a continuous flow specrophotometric method
(CFSM) for the analysis of uranium.
The continuous fìow technique consists of simultaneously pumping Arsenazo III (the
59
photometric reagent) and the uranium solution into a flow mixer to form the A¡senazo
Ill-u¡anium complex. This complex then enters a fiow cell wherei¡ the absorbance
measurements were recorded with a diode array spectrophotomete¡. The advantages of
using a flow cell, æ compared to a conventional cell, is that the flow cell æquires less
time per sample (because the tedious process of cleaning and rinsing is avoided) and
the time for complex formation is always a constant in a flow cell. The pumping of
Arsenazo III and uranium solutions through the flow cell was done by a peristaltic
pump which did not come into di¡ect contact wilh the solution, thereby reducing the
possibility of cont¿mination.
CFSM is a simpler technique mechanically than flow injection analysis. Flow
injection analysis of uranium would involve tÏe injection of uranium sample into a
ca¡rier stream with the use of a switching valve. This sample is merged \ ith the
reagent stream into the flow cell. In CFSM the reagent and the sample are
continuously passed into the flow cell thereby eliminating the use of a ca¡rier solution
and the use of a complex switching valve to inject the urarium sample.
A¡senazo III(2,2' -( 1,8-dihydroxy-3,6-disulphonaphthylene -2,7 -biszo)-
bisbenzenearsonic acid, FW 7'16.37) reacls with wide variety of metal ions in weakly
acidic to alkaline aqueous solutions, but reacts with only a few metals in strong
mineral acid, forming highly coloured complexes (molar absorptivity approximaæly
10s). Arsenazo III hæ been ¡ecommended as a highly sensitive and selective
60
photometric reagent for Mg, Zr, U, Th and ræe eartls.u 5 A¡senazo III is
commercially available as either a free acid or disodium salt and is stable botÌì as a
solid and in disolved form.
More tha¡ 150 papers have been published in the last th¡ee decades,æã3 wherein
A¡senazo III is the preferred choice of chromogenic reagent for the specrophotometric
deærmination of uranium. Uranyl ions form a l:1 complex in moderately acidic
msdia2sr'ã3 and the stability constant for the complex is log p, = 5.424. For our
analysis the concent¡ation of A¡senazo trI wæ always higher than that of uranium or
tlorium.
2.2.7 Apparatus for CFSM
Absorbance measurements were obtained with a Hewlett-Packa¡d Model 84524 Diode
Anay Spectrophotometer (Hewlett-Packard Company, CA, USA). The specrro-
photometer is a microprocessor-controlled, single beam uv-visible spectrophotometer
operated by a Tandy t 1000 personal computer with Hewlett-Pâcka¡d uv-visible
software. A deuæ¡ium lamp that emits light over the 190 to 820 nm wavelength range
is used as a light source. A single, collimated beam of light is passed through the
sanple, and then dispersed by a grating onto the diode array. The diode aÍay is a
2 mm x l8 mm semiconductor with 328 photodiodes etched on to it. Each photodiode
is assigned 2 nm; this permits simulraneous access to the whole wavelength range
between 190 and 820 nm. A few phoucdiodes on eithe¡ end of the aray were not
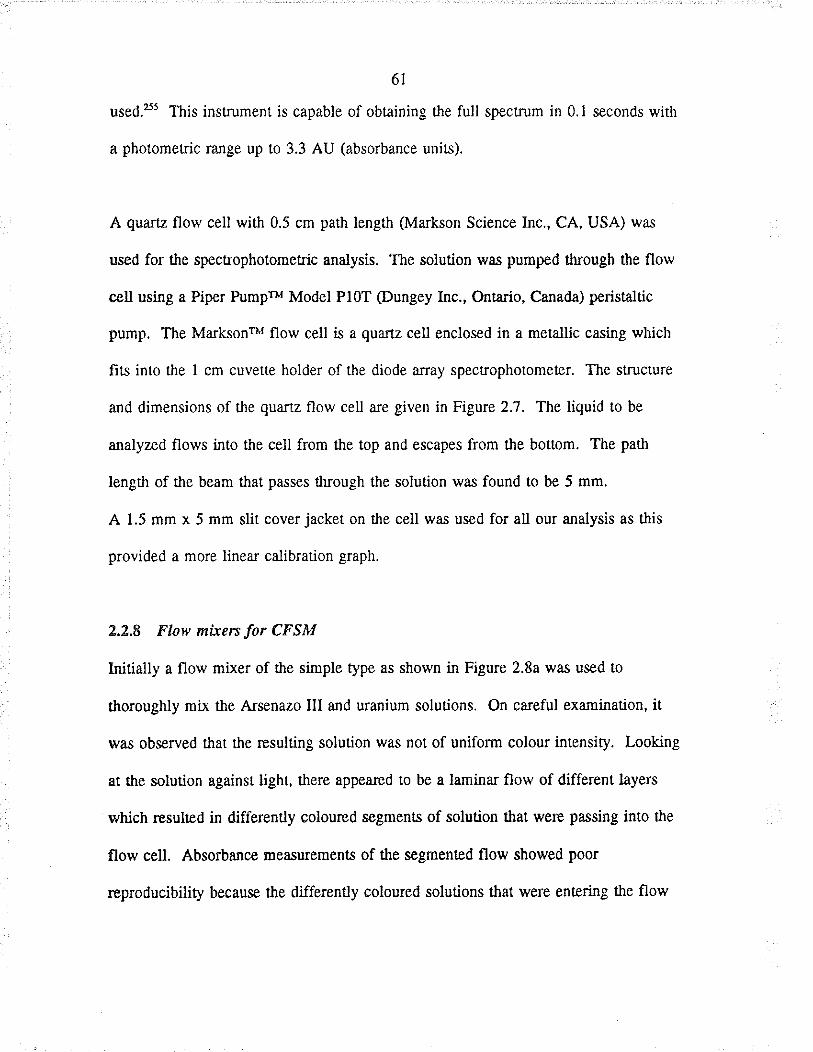
6i
used.2ss This instrument is eapable of obtaining tÌìe full specrum in 0.1 seconds with
a photometric range up to 3.3 AU (absorbance units).
A quaÍz flow cell with 0.5 cm path length (Markson Science lnc,, CA, USA) wæ
used for the specuophotometric analysis. The solution wæ pumped through the flow
cell using a Piper Pumpn Model Pl0T (Dungey Inc., Ontario, Canada) peristaltic
pump. The Ma¡ksonru flow cell is a quartz cell enclosed in a met¿Ilic casing which
fils into the I cm cuvette holder of the diode array spectrophotometer. The st¡ucture
and dimensions of the quartz flow cel.l are given in Figure 2.7. The liquid to be
analyzed flows into the cell f¡om the top and escapes from the botlom. The path
length of the beam that passes through the solution was found !o be 5 mm.
A 1.5 mm x 5 mm slit cover jacket on tle cell wæ used for all our analysis as this
provided a mo¡e linea¡ calibration graph.
2.2.E Flow mlren for CFSM
Initially a flow mixer of the simple type as shown in Figure 2.8a wæ used to
thoroughly mix the Arænazo Itr and uranium solutions. On ca¡eful examination, i¡
was observed that rhe resulting solution was not of uniform colour intensity. Looking
at the solution against ¡ight, there appeared to be a lamina¡ flow of different layers
which resulted in differently coloured segments of solution that were passing into the
flow cell. Absorbance measurements of the segmented flow showed poor
reproducibility because the differently colou¡ed solutions that were entering the flow
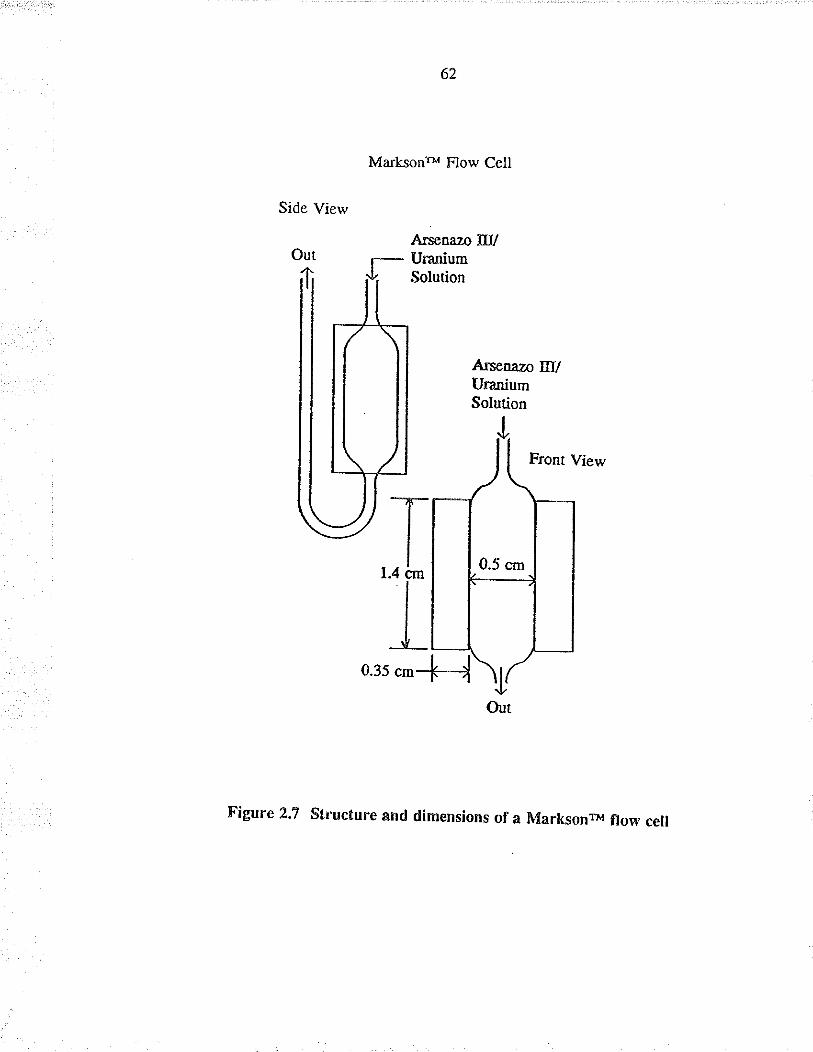
62
Side View
Ma¡ksonw Flow Cell
A¡senazo IIVUraniumSolution
Arsenazo IIVUraniumSolution
1.4 cBI0.35 cm
Figure 2.7 Structure and dimensions of a Marksonfl flow cell
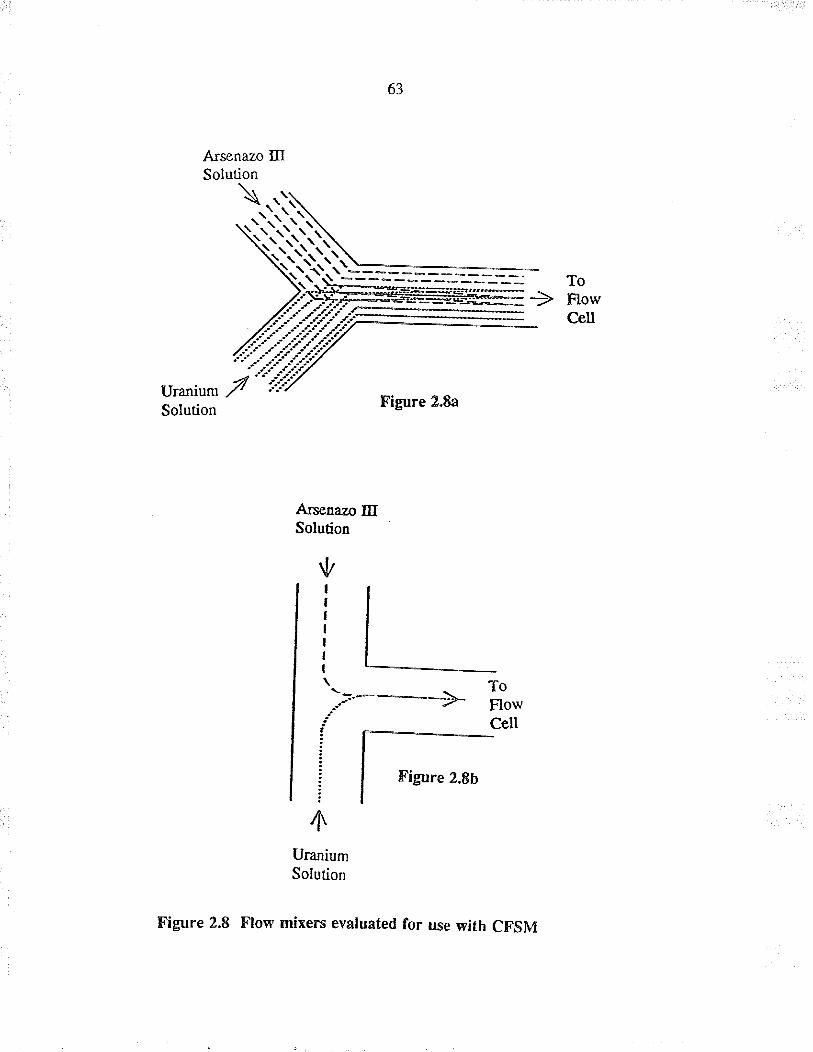
ToFlowCeU
Vran¡:m VSolution
Arsenazo ItrSolution
{/
L_\.._ - To.--'----)- Flow
í! cell!t--:l¡ I Figure 2.Bbil
4\
Ur¿¡iumSolution
Flow mixers evaluahd for use with CFSM
Figure 2.8a
Figure 2,8
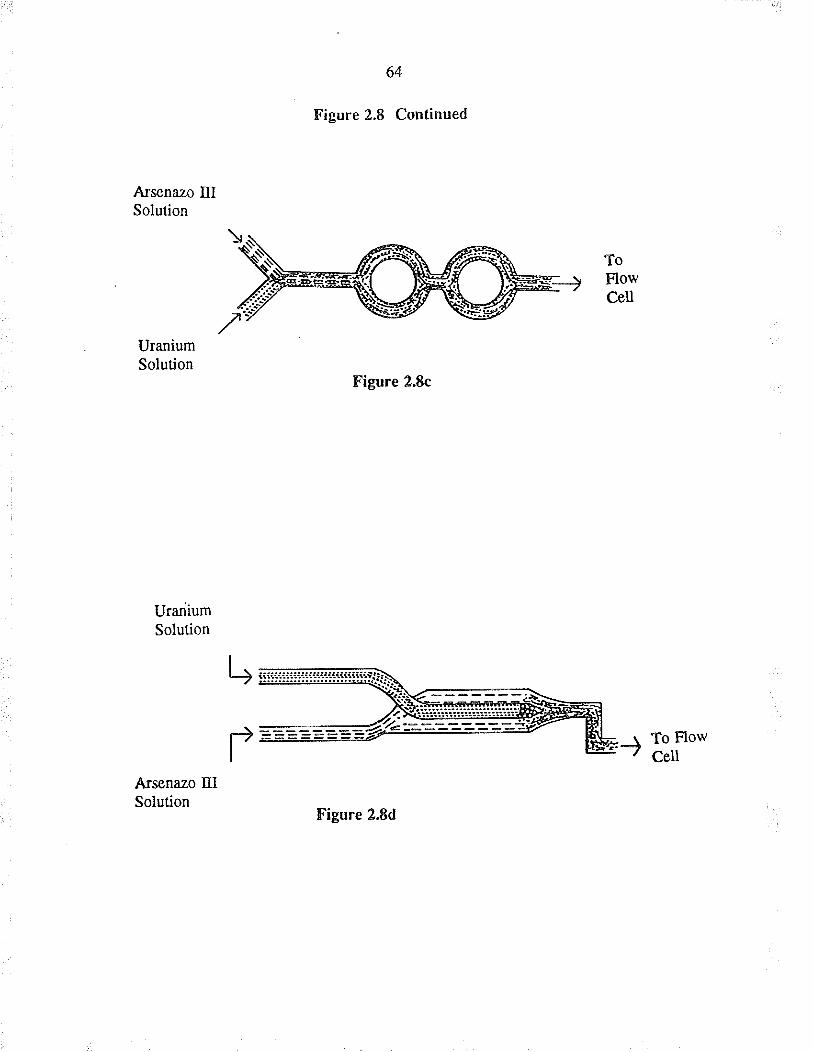
A¡senazo IIISolution
UraniumSolution
UraniumSoluúon
fuænazo IIISolution
64
Figure 2.8 Continued
Figure 2.8c
Figure 2.8d
r To Flow? c.tl
ToFlowCell
t+
P
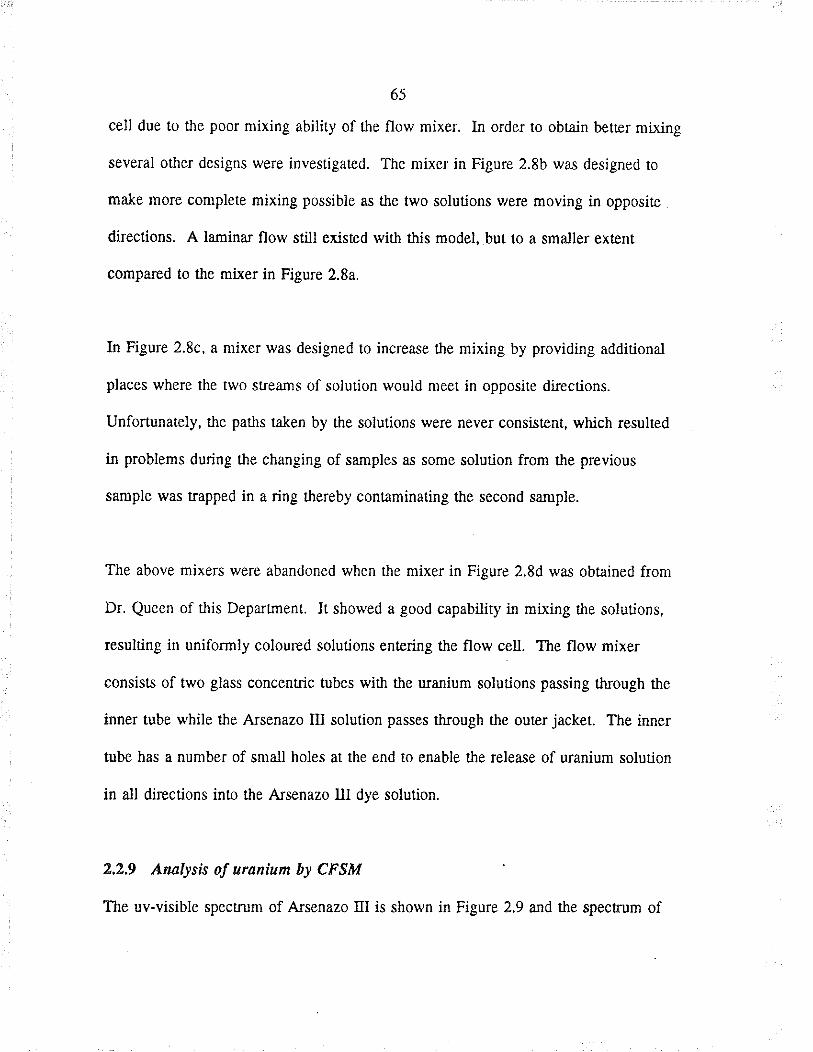
ó5
cell due to t¡e poor mixing ability of the flow mixer. ln orde¡ to obtain betær mixing
severa.l other designs were investigated. The mixer in Figure 2.8b was designed to
make more complete mixing possible as tìe two solutions were moving in opposiæ
di¡ections. A lamina¡ flow still existed r,vith this model, but to a smaller extent
compared to the mixe¡ in Figure 2.8a-
ln Figure 2.8c, a mixer was designed to increæe tle mixing by providing additional
places where the two streams of solution would meet in opposite directions.
Unfonunately, the paths faken by the solutions were never consistent, which resulted
in problems during the cha¡ging of samples as some solution from the previous
sample was trapped in a ring thereby contaminating the second sample.
The above mixers were aba¡doned when the mixe¡ in Figure 2.8d was obtained f¡om
Dr. Queen of this Departmenl. It showed a good capability in mixing rhe solutions,
resulting in uniformly coloured solutions entering tle flow cell. The flow mixer
consisls of two glass concentric tubes with the uranium solutions passing through the
inner tube while tle A¡senazo III solution passes though tle outer jacket. The inner
tube hæ a number of small holes at the end to enable t¡e ¡elease of uranium solution
in all di¡ecrions into the A¡ænazo m dye solution.
2,2,9 Analysß of uranium by CFSM
The uv-visible spectrum of A¡senazo III is shown in Figure 2.9 and the spectrum of
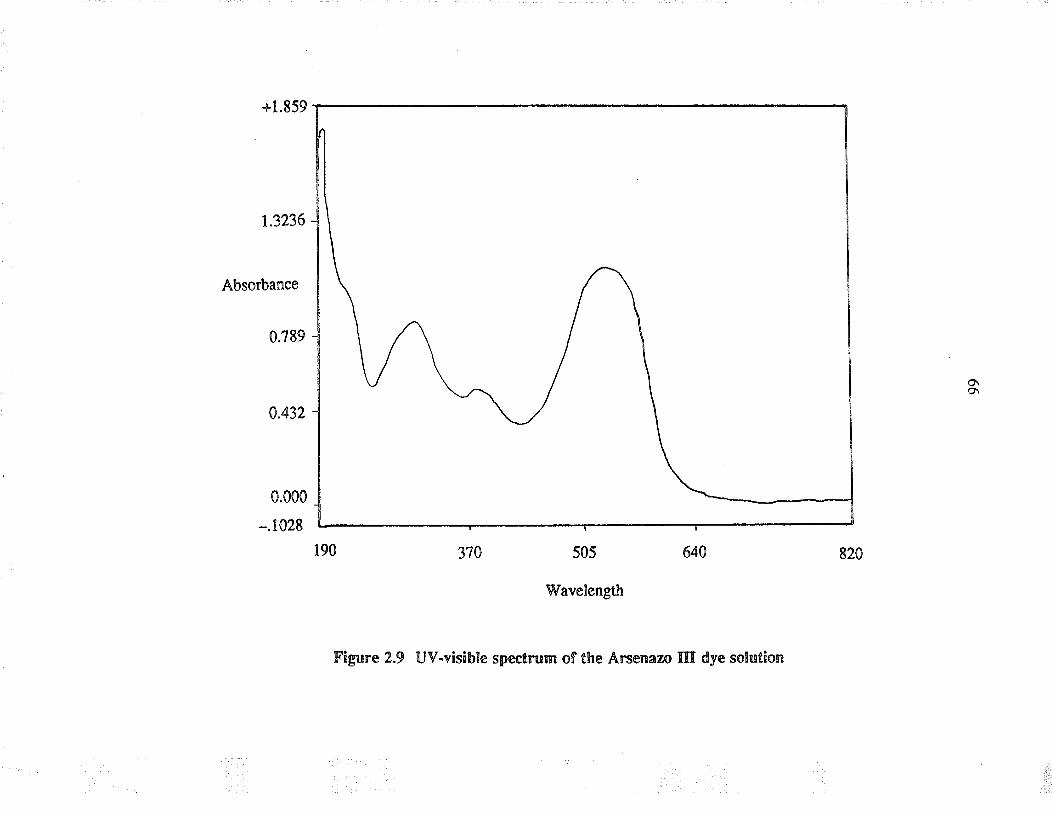
1.3236
Absorbance
0.789
0.432
F'igure 2.9 UV-visible spectrum of the Arcenaz¡ III dye solution
505
lVavelengtlr
6'7
A¡senazo III - uranium complex is given in Figure 2.10. The absorption maximum is
at 532 nm for the dye and at 650 nm for tìe A¡senazo III - uranium complex
as shown in Figure 2.10. The ¡eference wavelength for tåe A¡senazo III - u¡a¡ium
complex can be at any wavelength greater than 726 nm, The spectrum for
A¡senazo III - uranium complex was obtained when the instrument was blanled (i.e.
to show zero absorption) with A¡senazo III solution as shown in Figure 2.11.
Initially, the analysis was done using two peristaltic pumps which had to be
synchronised with æspect to the movement of the ¡olle¡s in their respective pump
heads. To eliminate any discrepancies in the movement of rollers of the two pumps,
the two silicone tubes were simuluneously passed through the same pump head. The
flow rates of the reagent solution and sample solution were each 8 ml-.min-r with a
combined flow ¡ate of 16 ml.min-t when reaching the flow cell. This flow ¡ate was
chosen because it wæ capable of forcing out the aL bubbles that frequently adhere to
the flow cell. A¡ intemal referencing method was used whe¡e the abso¡ba¡ce at the
reference wavelengtì was subEacted from the absorbance at the analytical wavelength
This absorbance diffe¡ence was used to obtÂin the calibration curve and for sample
ana]ysis. The ¡eference wavelength of 768 nm was selected at a point along the bæe
Iine beyond tÏe sample absorbance. lnternal referencing wæ done to improve the
precision of the results by minimizing the impact of any changes úat cause a baseline
shift due 1o dust or other particles, ai¡ bubbles or a drift in lamp inænsity.
+1.082
0.773
0.567
Absorbance
0.2s8
t.1
4.
Wavelength = 650Wavelength = 622 Analytical WavelengthWavelength = 726 Reference WavelengthVfavelength = 532
0.000
-.0510190 320.7 451.4 625.7 800
Wavelength
Figure 2.10 UV-visible spectrum of the Arsenazo III - uranium cornplex
4
+
I
+2
t
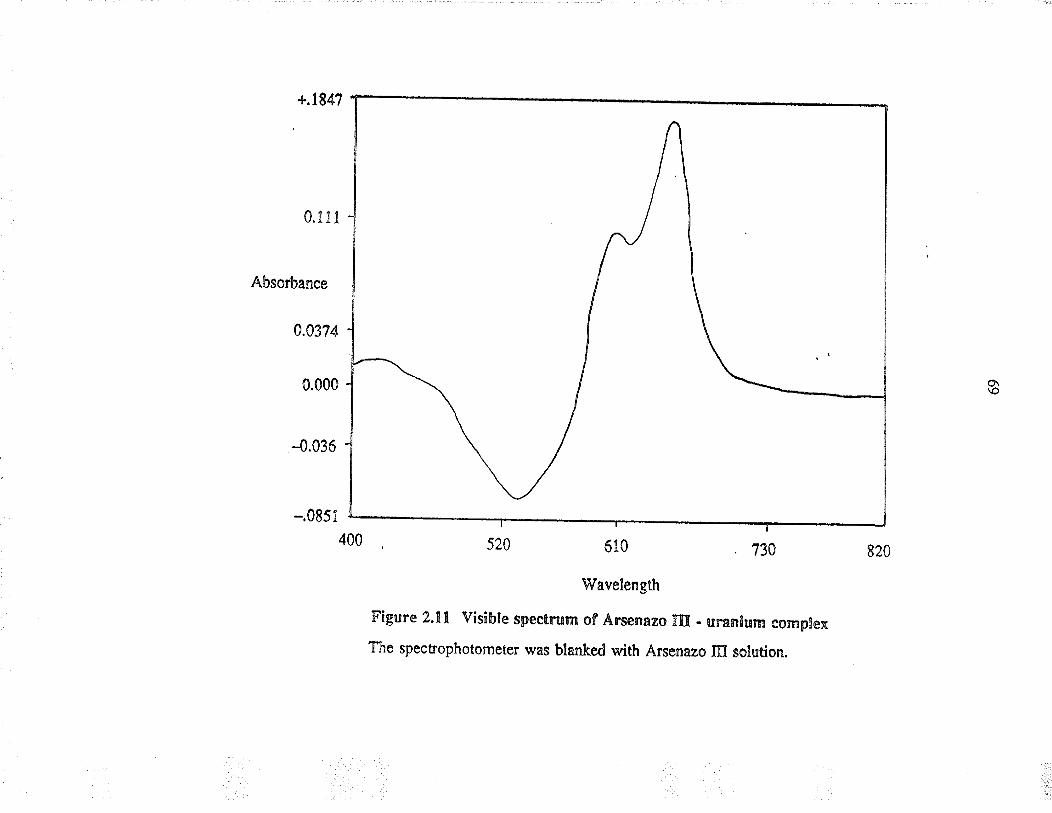
+.1847
0.11I
Absorbance
0.0374
0.000
-0.036
-.08514oo s2o 610 i3o
Wavelength
Figure 2.ll Visible spec'trum of Arcenazo III - uranlum complex
The specrophotometer tvas blanked with Arsenazo III solution.
o\\Ô
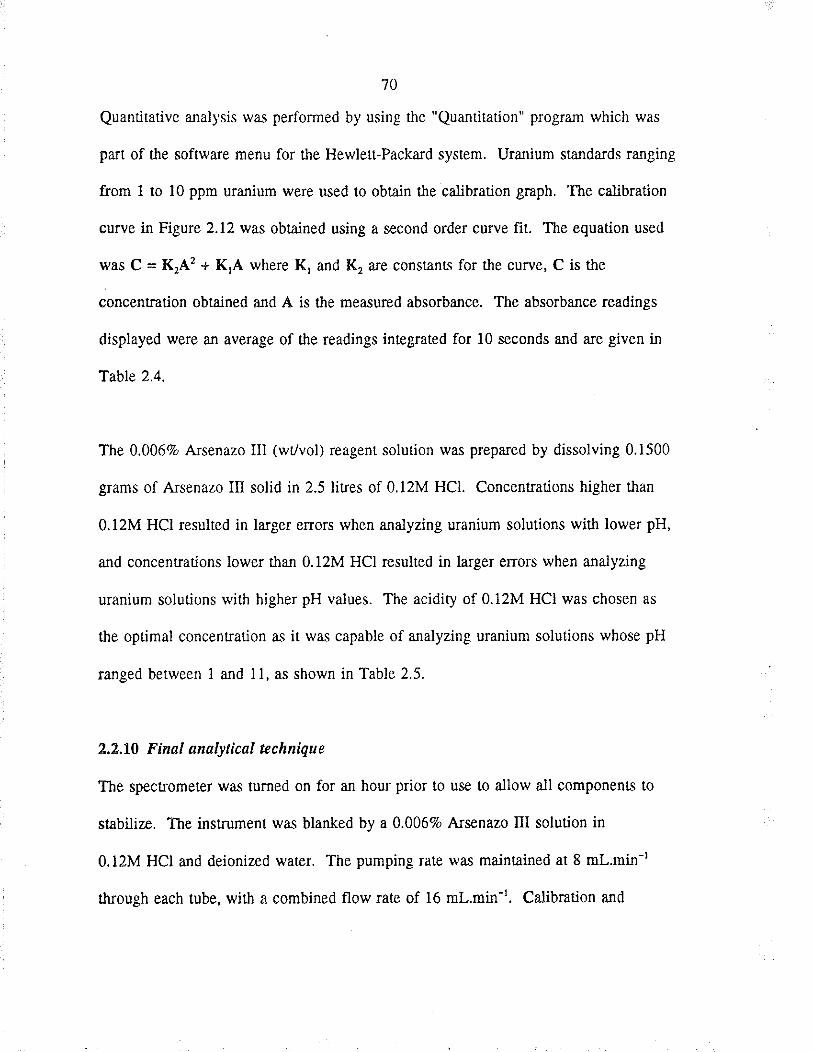
'70
Quantitative analysis was performed by using the "Qua¡titation" program which wæ
part of tÏe software menu for the Hewlett-Packard system. Uranium st¡ndards ranging
from I to l0 ppm uranium were used to obtain the calib¡ation graph. The calibration
curve in Fìgure 2.12 was obtained using a second order curve fit. The equation used
was C = KrA2 + K,A where K, and K, are constants for the curve, C is the
concentration obtained and A is the meæured absorbance. The absorbance readings
displayed were an average of the readings integrated for l0 seconds ard are given in
Table 2.4.
The 0.0069o A¡senazo III (wt/vol) reagent solution was prepared by dissolving 0.1500
grams of Arsenazo Itr solid in 2.5 liues of 0.12M HCl. Concentrations higher than
0.12M HCI resulted in larger errors when analyzing uranium solutions with lower pH,
and concenüations lower tha¡ 0.12M HCI resulted il larger errors when analyzing
uranium solutions with higher pH values. The acidity of 0.12M HCI was chosen as
the optimal concentration as it was capable of analyzing uranium solutions whose pH
ranged between I and 11, as shown in Table 2.5.
2,2,10 Final analylìcal technique
The spectrometer was turned on for an hour prior to use to allow all components to
stabilize. The instrument was blanked by a 0.006Vo A¡ænazo III solution in
0.12M HCI and deionized waær. The pumping rate was maintained at 8 ml-.min-I
tfuough each tube, with a combined flow ¡ate of 16 ml-.min-t, Calibration and
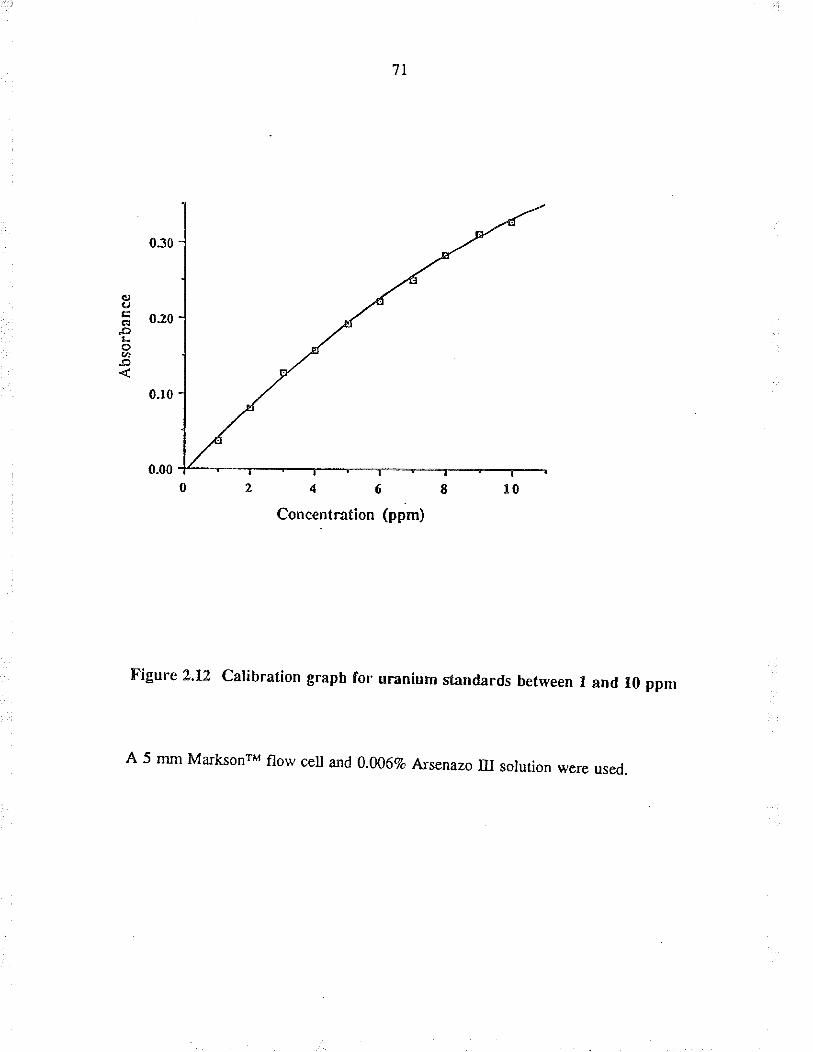
71
Figure 2.12 Calibration graph for uranium standards between I and l0 ppm
A 5 mm Ma¡ksonrM flow cell and 0.006Vo Arsenazo III solution were used.
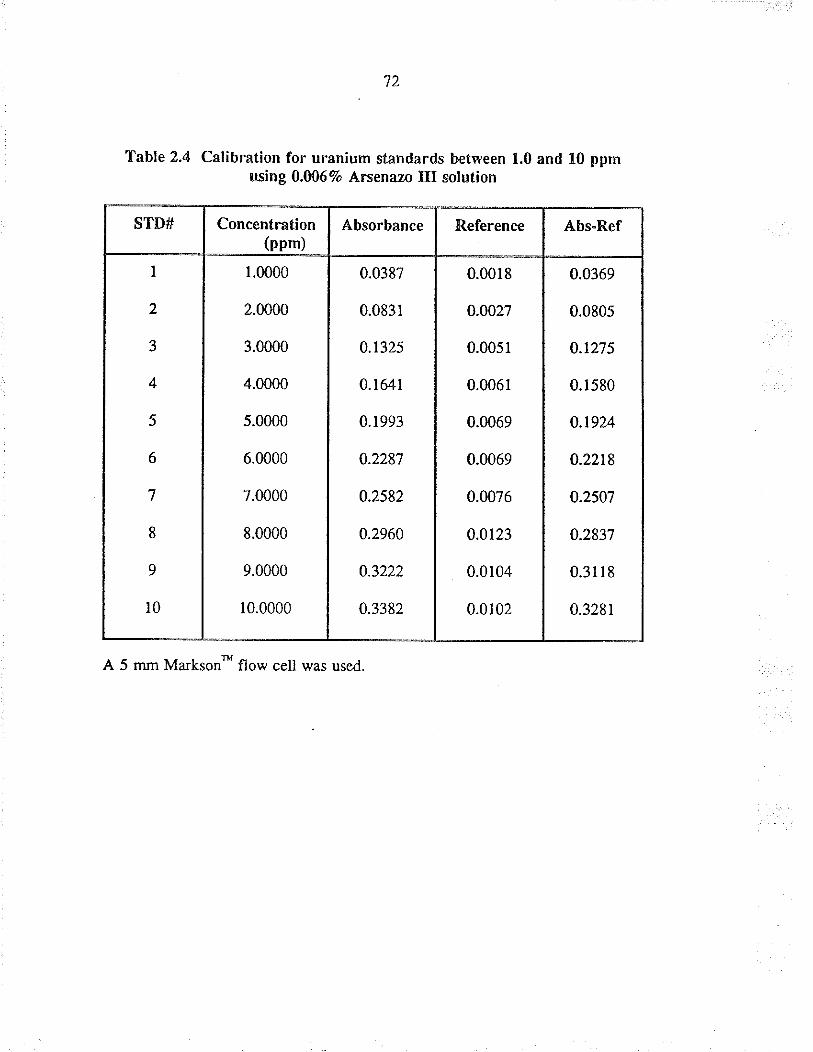
11
Table 2.4 Calibration for uranium ståndards between 1.0 and 10 ppmusing 0.ü)ó 7o Arsenazo III solution
STD# Concentration(ppm)
Absorbance Reference Abs-Ref
I
3
4
5
6
8
9
10
1.0000
2.0000
3.0000
4.0000
s.0000
6.0000
7.0000
8.0000
9.0000
r0.0000
0.0387
0.0831
0.1325
0.164r
0.1993
0.2287
0.2582
0.2960
0.3222
0.3382
0.0018
0.0027
0.0051
0.0061
0.0069
0.0069
0.0076
0.0123
0.0104
0.0102
0.0369
0.0805
0.r275
0.1580
0.t924
0.2218
0.2507
0.2837
0.31 18
0.3281
A 5 mm Ma¡kson* flow celi was used,
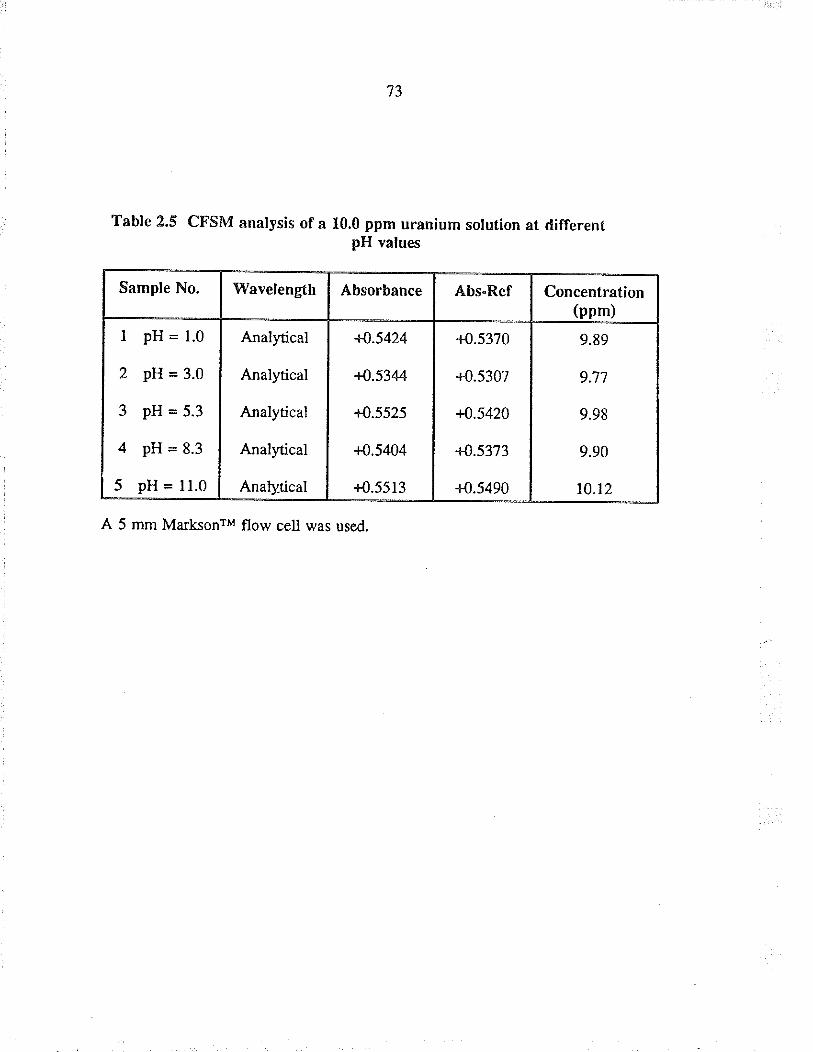
t5
Table 2.5 CFSM analysis of a 10.0 ppm uranium solulion at differentpH values
Sample No. Wavelength Absorbance Abs-Ref Concentration(ppm)
I pH=1.0
2 pH=3.0
3 pH=5.3
4 pH=8.3
5 pH = ll.0
Analytical
Analytical
Anal¡ical
Analyical
Anat¡:tical
+0.5424
14.5344
+0.5525
.r{.5404
+O.5513
{{.5370
{{.5307
14.5420
.l{.5373
+{.5490
9.89
9.77
9.98
9.90
10.12
A 5 mm Ma¡ksonrM flow cell was used.
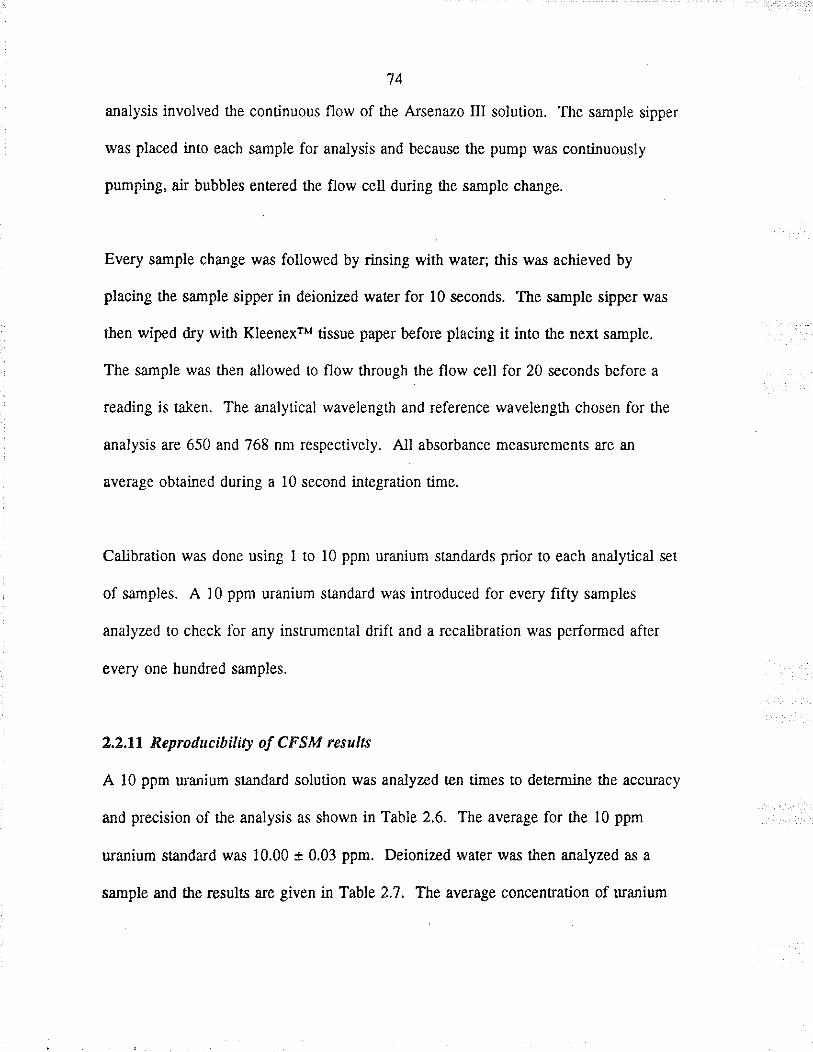
74
analysis involved tie continuous flow of the A¡senazo III solution. The sample sipper
wæ placed into each sample for analysis a¡d because the pump wæ eontinuously
pumphg, ai¡ bubbles entered the flow cell during the sample change.
I
Every sample change was followed by rinsing with water; this was achieved by
placing the sample sipper in deionized water for l0 seconds. The sample sipper was
then wiped dry with Kleenex tissue paper before placing it into the next sample.
The sample was then allowed to flow through the flow cell for 20 seconds before a
reading is taken. The analytical wavelength and reference wavelength chosen for the
analysis a¡e 650 and 768 nm respectively. All absorbance measurements are an
average obtained during a 10 second integration time.
Calibration was done using I to i0 ppm uranium standards prior to each analytical set
of samples. A l0 ppm uranium standard was introduced for every fifty samples
artalyz.ed to check for any instrumental drift and a recalibration was performed after
every one hundred samples.
2.2.11 Reproilucibilíty of CFSM resulß
A l0 ppm uranium standard solution wæ analyzed ten times ro determine the accuracy
and precision of ttre analysis as shown in Table 2.6. T'he average for the l0 ppm
uranium standard was 10.00 t 0.03 ppm. Deionized rvater was then analyzed as a
sample and the results are given in Table 2.7 . The average conc€ntration of u¡anium
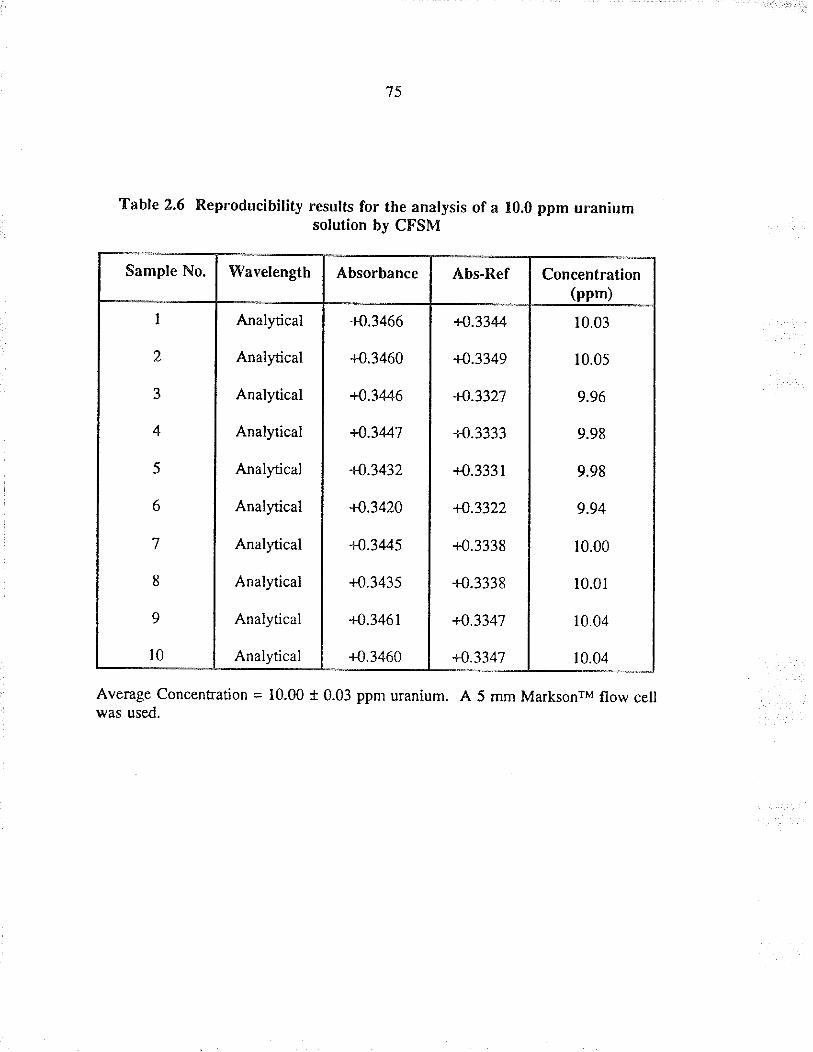
Table 2.6 Reproducibility results for the analysis of a 10.0 ppm uraniumsolution by CFSM
Sample No. \üavelength Absorbance Abs-Ref Concentration(ppm)
I
,
3
4
5
6
7
8
Il0
Anal¡ical
Analytical
Anal¡ical
Analytical
Anal¡ical
Anal¡ical
Anal¡ical
Analytical
Analytical
Analytical
{{.3466
+o.3460
+O.34/,6
+0.3447
$.3432
.+f 3420
+0.3M5
r{.3435
{{.3461
+{.3460
+O.33M
+O.3349
+O.3327
{{.3333
{{.3331
+4.3322
l{.3338
+0.3338
+4.3347
$.3347
10.03
10.05
9.96
9.98
9.98
9.94
10.00
10.0r
10.04
t0.04
Average Concentration = 10.00 * 0.03 ppm uranium. A 5 mm Ma¡ksonrM flow cellwas used.
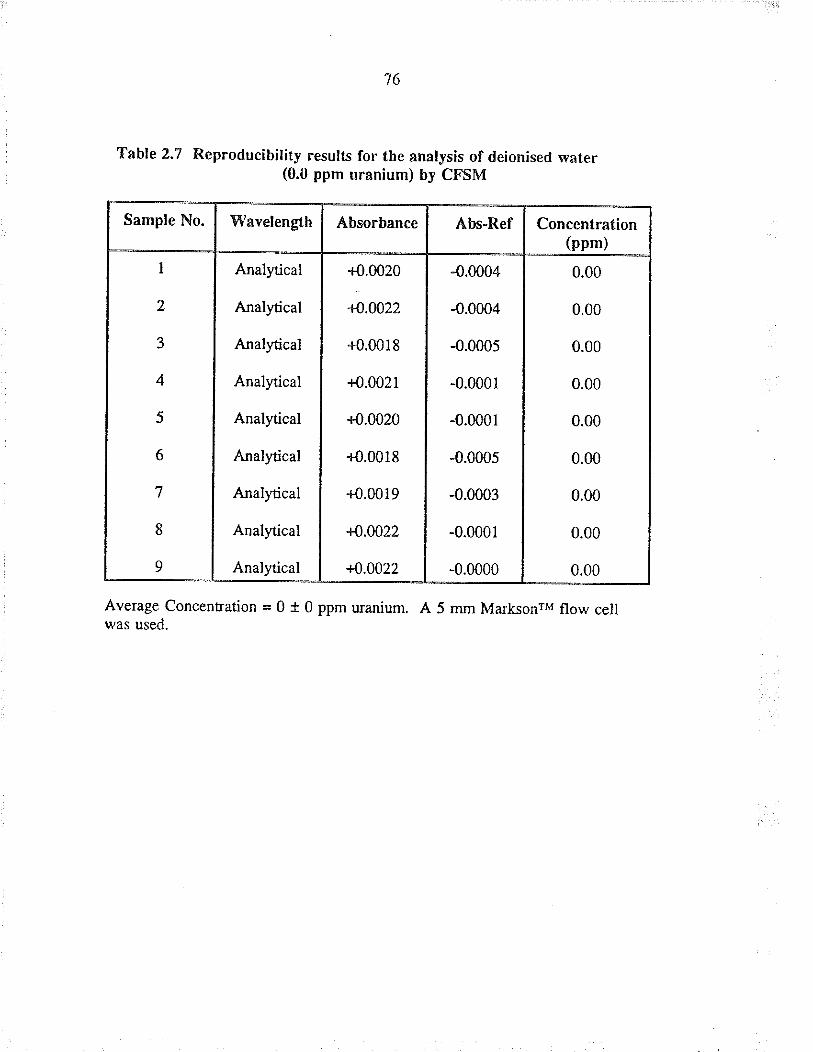
76
Table 2,7 Reproducibility resulfs for the analysis of deionised water(0.0 ppm uranium) by CFSM
Average Concentration = 0 * 0 ppm u¡anium. A 5 mm Ma¡ksonrM flow cellwas used.
Sample No, Wavelength Absorbance Abs-Ref Concentration(ppm)
t
,
4
5
6
7
8
9
Anal¡ical
Aral¡ical
Analytical
Analytical
Anal¡ical
Anal¡ical
Anal¡ical
Anal¡ical
Anal¡ical
{{.0020
.+4.ú22
.t{.0018
{{.0021
{O.0020
+0.0018
{O.0019
+4.0022
$.0022
4.0004
-0.0004
-0.0005
-0.000r
-0.0001
-0.000s
-0.0003
-0.0001
-0.0000
0.00
0.00
0.00
0.00
0.00
0.00
0.00
0.00
0.00
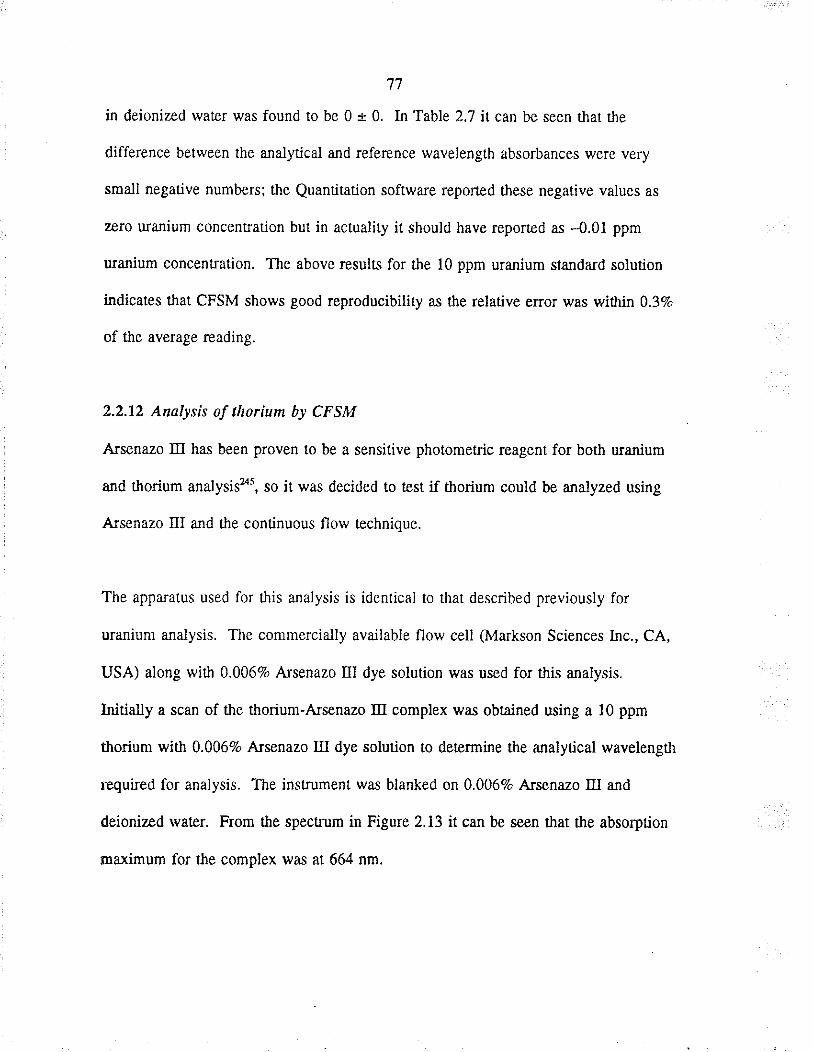
77
in deionized water was found to be 0 t 0. In Table 2.7 it can b€ seen that the
diffe¡ence between tlre analytical and reference wavelength absorba¡ces were very
small negative numbers; the Quantiution softwa¡e reported these negative values as
zÊro ura¡ium concentraüon but in actuality it should have reporæd as -0.01 ppm
uranium concent¡ation. The above results for the l0 ppm uanium standard solution
indicates that CFSM shows good reproducibility as the relative error was withi¡ 0.37o
of the average reading.
2.2.12 Analysis of thorium by CFSM
A¡senazo III has been proven to be a sensitive photometric reagent for bo¡h u¡anium
a¡d thorium analysisãr, so it was decided to test if thorium could be analyzed using
A¡senazo trI a¡d the continuous flow technique.
The apparatus used for this analysis is identical to ùat described previously for
ura¡ium analysis. The comme¡cially available flow c¿ll (Markson Sciences I¡c., CA,
USA) along witir 0.0067o A¡senazo III dye solution \ryas used for this analysis.
Initially a scan of the thorium-A¡ænazo III complex \pas obtained using a l0 ppm
thorium with 0.0067¿ A¡senazo III dye solution to determine the analytical wavelength
required for analysis. The inst¡umen! was blanked on 0.006Vo Arsenazo III and
deionized wafer. F¡om the spectrum in Figure 2,13 it can be seen that the absorption
maximum for the complex was ât 6ff nm.
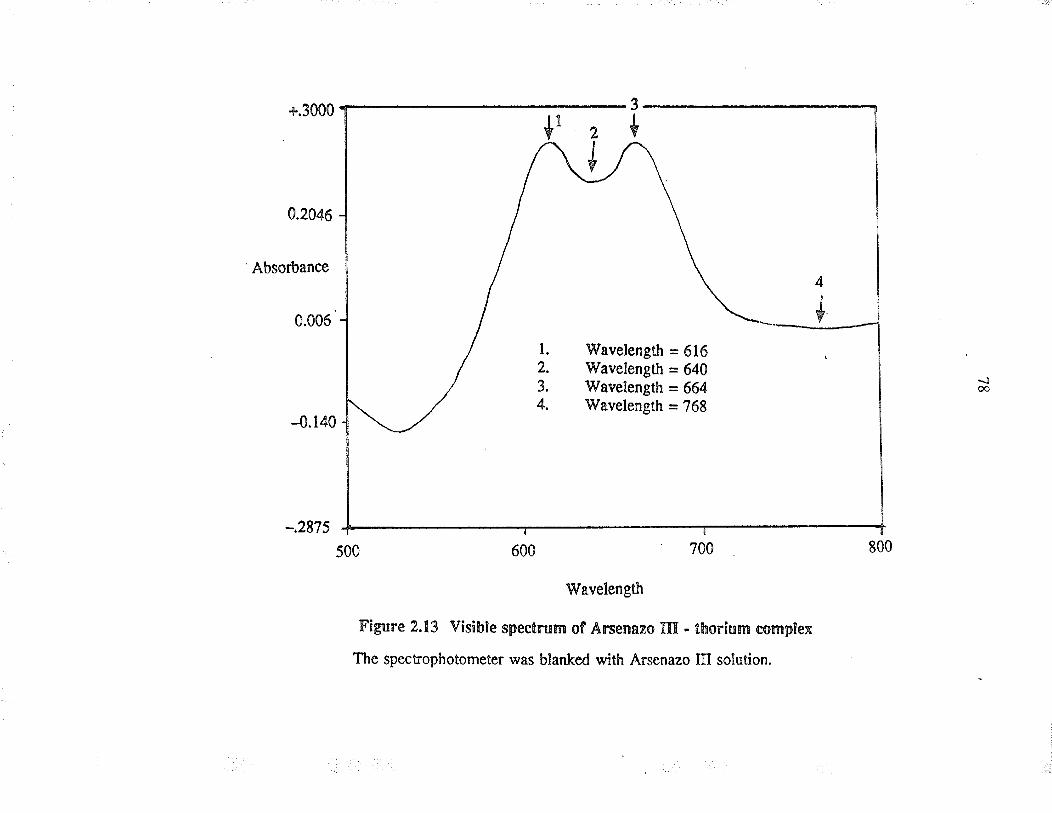
0.2046
Absorbance
0.006
-0.140
Wavelength = 616Wavelength = 640lVavelength = 664Wavelength = 768
\Mavelength
Figure 2.13 Visible spectrum of Ärsenazo III - thorlum complex
The specrophotometer was blanked with Arsenazo III solution.
{oô

79
The calib¡ation graph and absorba¡ce data obtâined for tïorium sta¡dards using
0.006Vo Arsenazo III solution are given in Figure 2.14 and Table 2,8. On ca¡eful
observation of the calibration graph one can conclude that concenEations higher than t
ppm thorium were not consistent with thoæ below I ppm. In Figure 2.14 it can be
seen that two calibration curves can be obt¿ined, one fo¡ thorium ståndards that were
less than I ppm and another for thorium standa¡ds greater than I ppm. The calib¡ation
curve that wæ obtained, when thorium standard solutions with concent¡ations less than
I ppm were used, is shown in Figure 2.15. When additional thorium standa¡ds were
made (i.e. between I ppm and 5 ppm thorium) the calibration curve obtained is as
shown in Figure 2.16. From Figure 2.15 and 2.16 it can been seen that the continuous
flow æchnique can be used for the analysis of thorium whose concent¡ations a¡e
between 0.1 and 1 ppm thorium and also when the concent¡ations a¡e between I and
5 ppm thorium.
To eva.luate if A¡senazo III and the flow cell can be used for the simultaneous analysis
of uranium and thorium the two Arsenazo III complexes of thorium and u¡anium were
recorded a¡d the results are shown in Figure 2.17. Both complexes absorb in the
same ægion except for a few nm at 650 nm whe¡e uranium complex shows maximum
sbsorption. Simple simultaneous analysis of uranium and thorium would be difficult
to perform due to thei¡ overlapping spectra as sho\rn in Figure 2.17. Blanco et aL8
reported that the mixed spect¡a of uranium ând thorium can be resolved with the use
of a multicomponent analytical program based on a leæt-squares frtting algorithm.
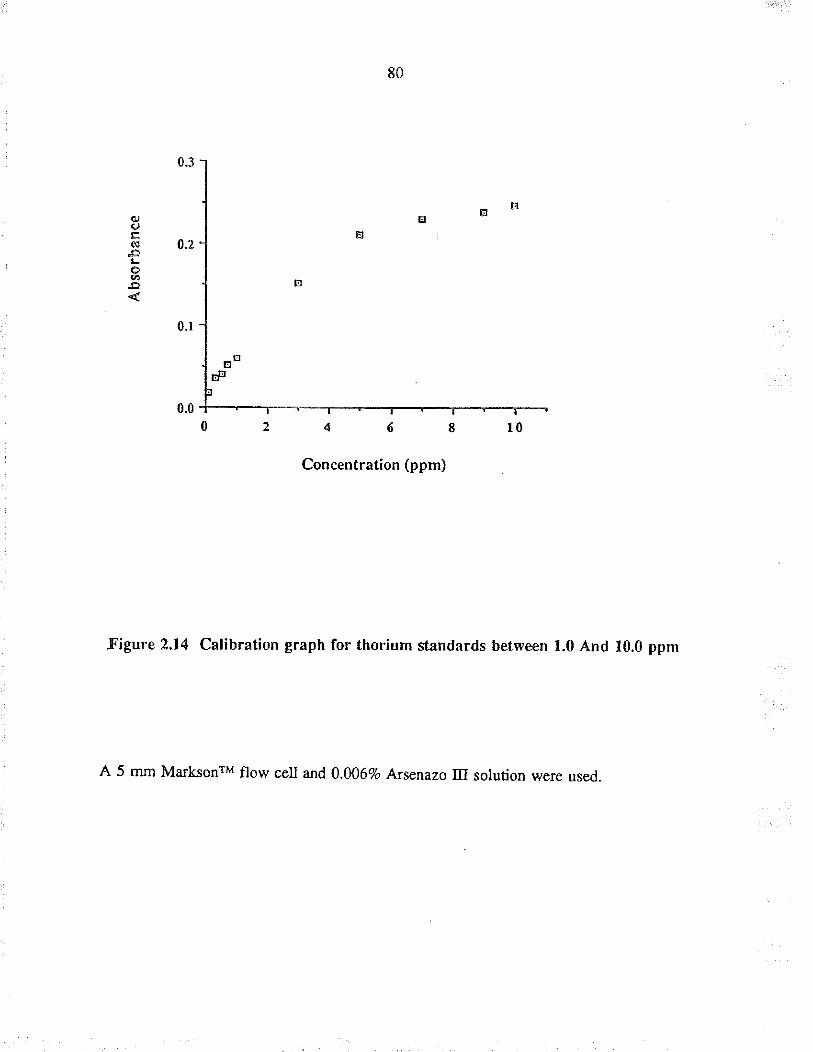
80
Figure 2.14 Calibration graph for thorium standards between 1.0 And 10.0 ppm
A 5 mm Ma¡ksonrM flow cell and 0.006Vo A¡senazo Itr solution were used.
81
Table 2.8 Catibration data for thorium standards between 0.1 and10.0 ppm using 0.006 7o A,rsenazo III solution
A 5 mm Ma¡ksonrM flow cell was used.
STD # Concentration(ppm)
Absorbance Reference Abs.Ref
I
a
J
4
5
6
7
8
9
r0
0. r00
0.300
0.500
0.?00
r.000
3.000
5.000
7.000
9.000
10.000
0.0193
0.0360
0.04r9
0.0525
0.0598
0.1522
0.2121
0.2314
0.24t3
0.2475
0.00r0
0.0010
0.0011
0.0011
0.0002
0.001r
0.0007
0.0007
0.0019
0.001s
0.0183
0.0350
0.0408
0.0s 13
0.0596
0.151 I
0.2r 13
0.2307
0.2394
0.2460
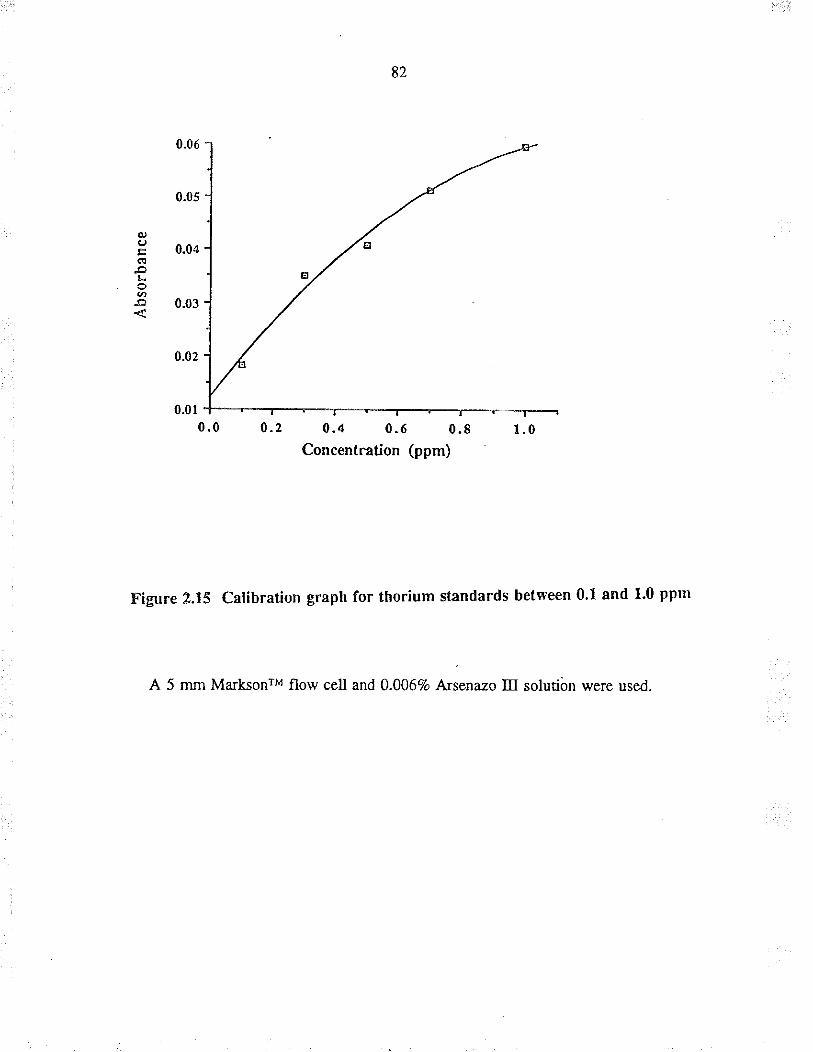
82
q,Çrtr(!EL
Þ
0.06
0.05
0.04
0.03
0.02
0.01
0.4 0.6 0.8Concentration (ppm)
Figure 2.15 Calibration graph for thorium standards between 0'l and l'0 ppm
A 5 mm MarksonrM flow cell and 0.0067o A¡senazo Itr solutiòn were used.
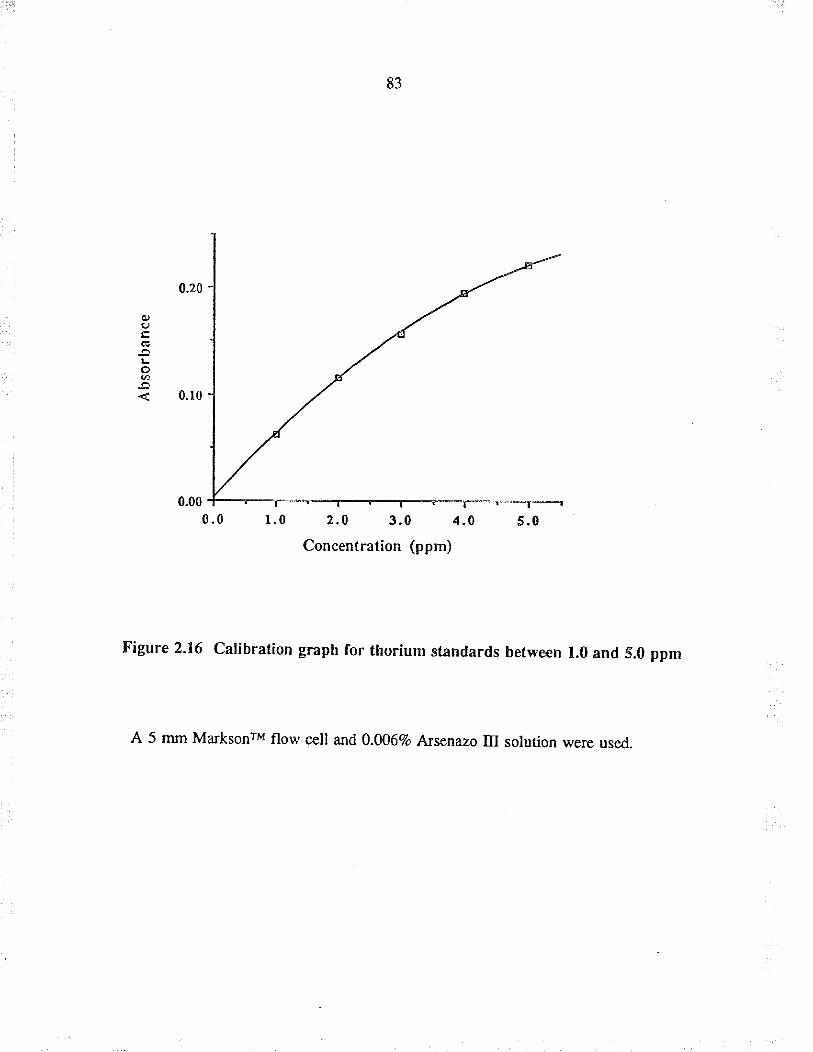
83
0.00
0.0 r.0 2,0 3.0 4.0
Concentration (ppm)
Figure 2.16 Calibrafion graph for thorium stândards between 1.0 and 5.0 ppm
A 5 mm Ma¡ksonrM flow cell a¡d 0.006% A¡senazo III solution were used
5.0
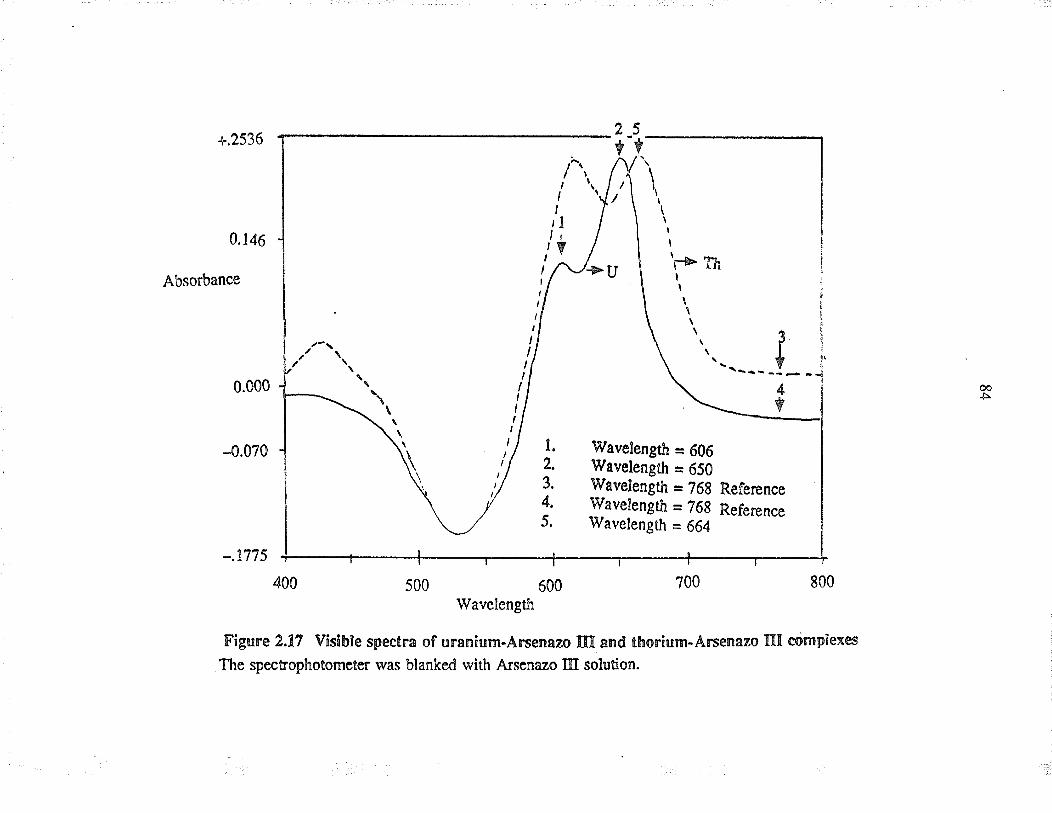
400 500 600 700 800
Wavelength
Figure 2.17 Vlslble spectra of uranium.Arsen¡zo I and thorium-Arsennzo ltrl cdrnplexes
The specrophotomcter was blanked with Arsenazo III solution.
t.2.3.
4.5.
,t,, I'----- _!_ _
lVavelength = 606Wavelength = 650lVavelength = 268 Refe¡encelVrvelength = 768 Referencettravelength
= 664
4T
ooÀ
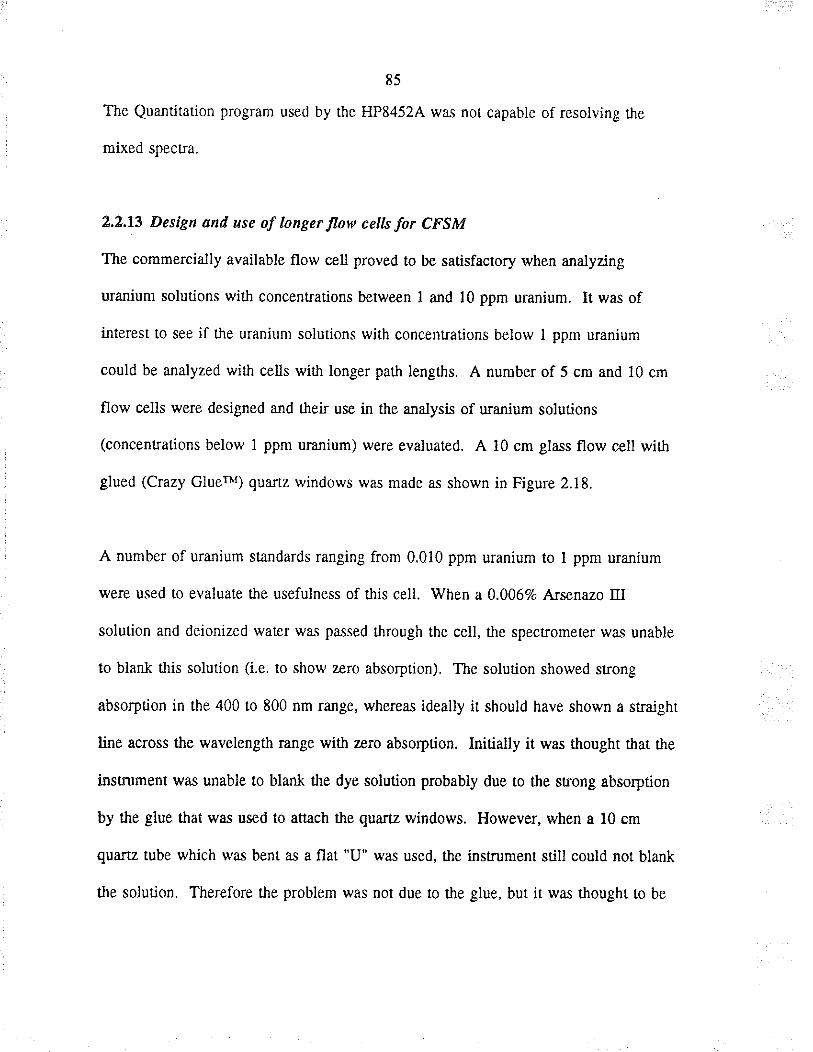
85
The Quartitation program uæd by the HP8452A was not capable of resolving the
mixed spectIa,
2.2.13 Design and use of longer tlaw cells lor CFSM
The commercially availabte flow cell proved to be satisfactory when analyzing
uanium solutions with concentrations between I and t0 ppm uranium. It wæ of
interest to see if úe uranium solutions with concent¡ations below I ppm uranium
could be analyzed with cells with longer path lengths. A numbe¡ of 5 cm and 10 cm
flow cells were designed and thei¡ use in the analysis of uranium solutions
(concentrations below I ppm uranium) were evaluated. A t0 cm glass flow cell with
glued (Crazy Gluerrr) quartz windows wæ made as shown in Figure 2.18.
A number of ura¡ium ståndards ranging from 0.010 ppm uranium to I ppm uanium
were used to evaluate the usefulness of tlis cell. When a 0.0067o A¡senazo III
solution a¡d deionized water \,r'as pæsed through the cell, the spectrometer was unable
to bla¡-k this solution (i.e. to show zero absorption). The solution showed strong
absorption in the 400 to 800 nm range, whereas ideally it should have shown a straighr
li¡e ac¡oss the wavelength r¡rnge witlì zero absorption. Initially it was thought that the
instrument was unable to bla¡k the dye solution probably due to the strong absorption
by the glue that wæ used to att¿ch the quartz windows. However, when a l0 cm
quartz tube which was bent as a flat 'U" was used, the instrument still could not blank
the solution. Therefore t}e problem was not due to the glue, but it wæ tìought to be
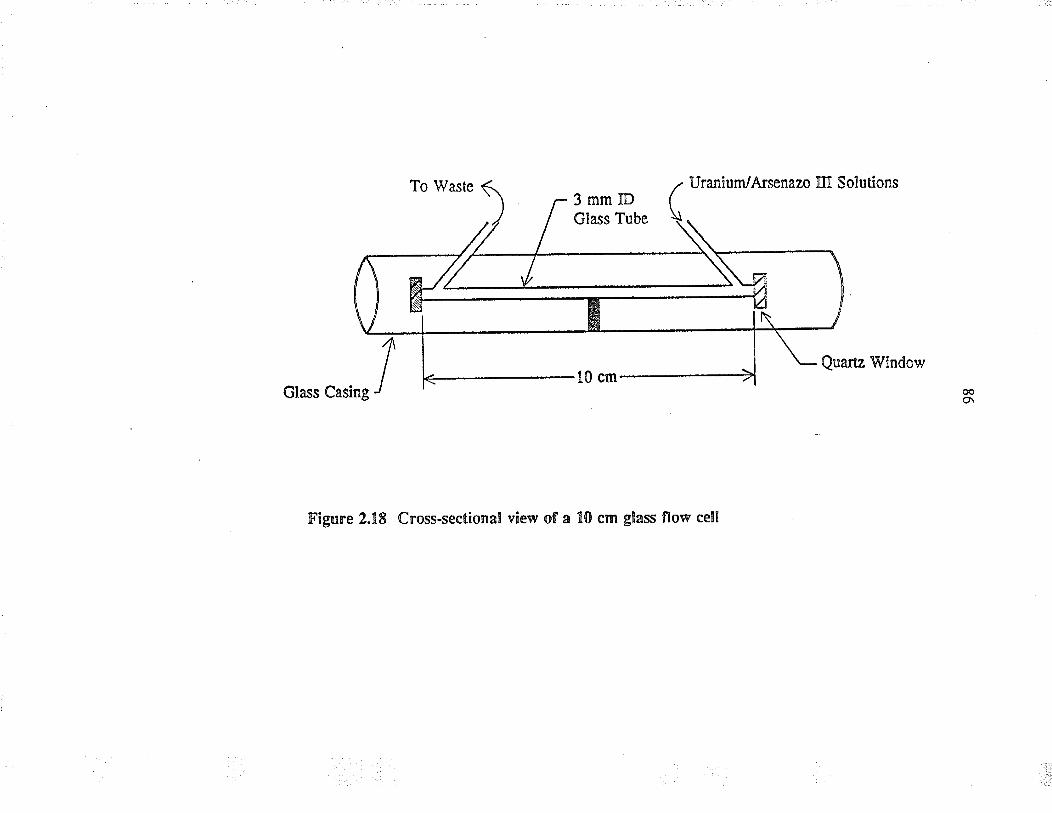
Glæs Casing
Figure 2.trE Cross-sectional view of a 10 cm glass flow cell
Uranium/fuænazo m Solutions
Quartz tffindow
æo\
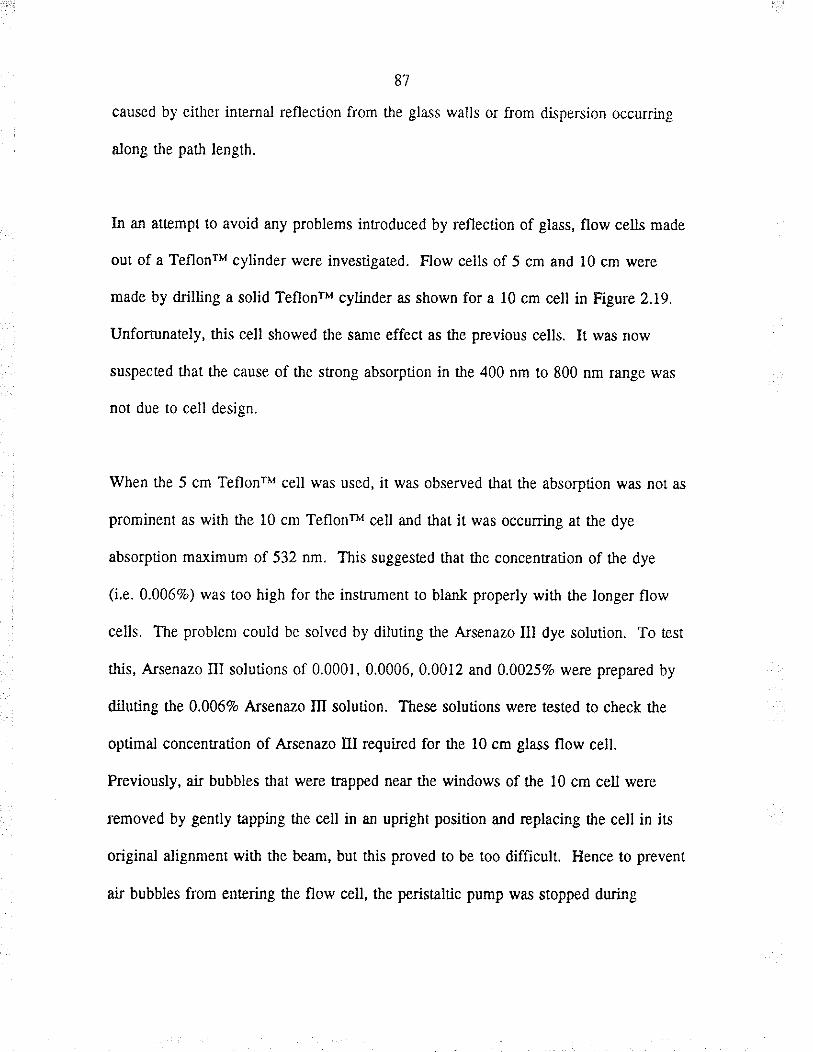
87
caused by eitìer internaì reflection from the glass walls or from dispersion occurring
along the patlì length.
In an attempt to avoid any problems introduced by reflection of glass, flow cells made
out of a TeflonrM cylinder were irvestigated. Flow cells of 5 cm and l0 cm were
made by drilLing a solid Tefìonw cylinder as shown for a l0 cm cell in Figure 2.19.
Unforn:naæly, this c¿ll showed tlre same effect as the previous cells. It was now
suspected that the cause of the súong absorpüon in the 400 nm to 800 nm range was
not due to cell design.
\ hen the 5 cm TeflonrM cell wæ used, it was observed that the absorption \ryas no! as
prominent as with the l0 cm Teflonn{ cell and that it was occurring at the dye
absorption maximum of 532 nm, This suggested that the concent¡ation of the dye
(i.e.0.0067o) was too high for the inst¡ument to blank properly with the longer flow
cells. The problem could be solved by diluting the Arsenazo III dye solution. To test
Íhis, A¡senazo III solutions of 0.0001, 0.0006, 0.0012 and 0.0025Va weæ prepared by
diluting the 0.0067o Arsenazo III solution. These solutions were tested to check rhe
optimal concentration of Arsenazo Itr required fo¡ the l0 cm glæs flow cell.
Previously, ai¡ bubbles that were t¡apped near the windows of the l0 cm cell were
removed by gentty tapping the cell in an upright position and replacing the cell i¡ its
original alignment witl the beam, but this proved to be too difficult. Hence to prevent
air bubbles from enærilg the flow cell, the peristaltic pump was stopped during
Quartz Window
Teflon Cylinder
Figure 2.19 Cross-sectional view of a 10 cm Teflontr flow cell
Uranium/fusenazo m Solutions
Hollow Center Stainless
Steel Scrcw
mm
ooæ
89
sample change. It wæ found fhat 0.0001, 0.0006 a¡d 0.00129o A¡ænazo III solutions
were able to be blanked (i.e. zero absorption) by the instrument and so they were used
to determine if the l0 cm flow cell could be used to analyze u¡anium at low .
coneentrations. Different uanium standards we¡e made by successively diluting a 100
ppm uranium stock solution. The standa¡ds made were from 0.010 to 0.500 ppm
u¡a¡rium and the calibration data obtained for 0.00017o Arsenazo Itr solution are given
in Table 2.9.
It can be seen in Table 2.9 that standards 0.010,0.025 and 0.050 ppm uranium, all
showed very small conected absorba¡ce values. On eliminating the above standa¡ds,
the resulting calibration graph is reæonably ünea¡ befween 0.1 and 0.5 ppm uranium
as shown in Figure 2.20. Although the calib¡ation graph is linear between 0.1 and
0.5 ppm ura¡ium, the absorba¡ce values for the 0.5 ppm uranium was very low, i.e.
0.0387 witir 0.00017o A¡senazo III solution. There a¡e larger enors inherent to these
meastuements because of the low abso¡bances.
When the same standards we¡e used wilh 0.00067o Arsenazo III, the abso¡öance
generally increased as shown in Table 2.10 compared to when 0.0001 % A¡ænazo trI
solution wæ used. On eliminating standards lower than 0.1 ppm uranium (due to the
small abso¡ba¡ce values), a calibration graph between 0.1 and 0.5 ppm uranium
resulted as shown in Figure 2.21.
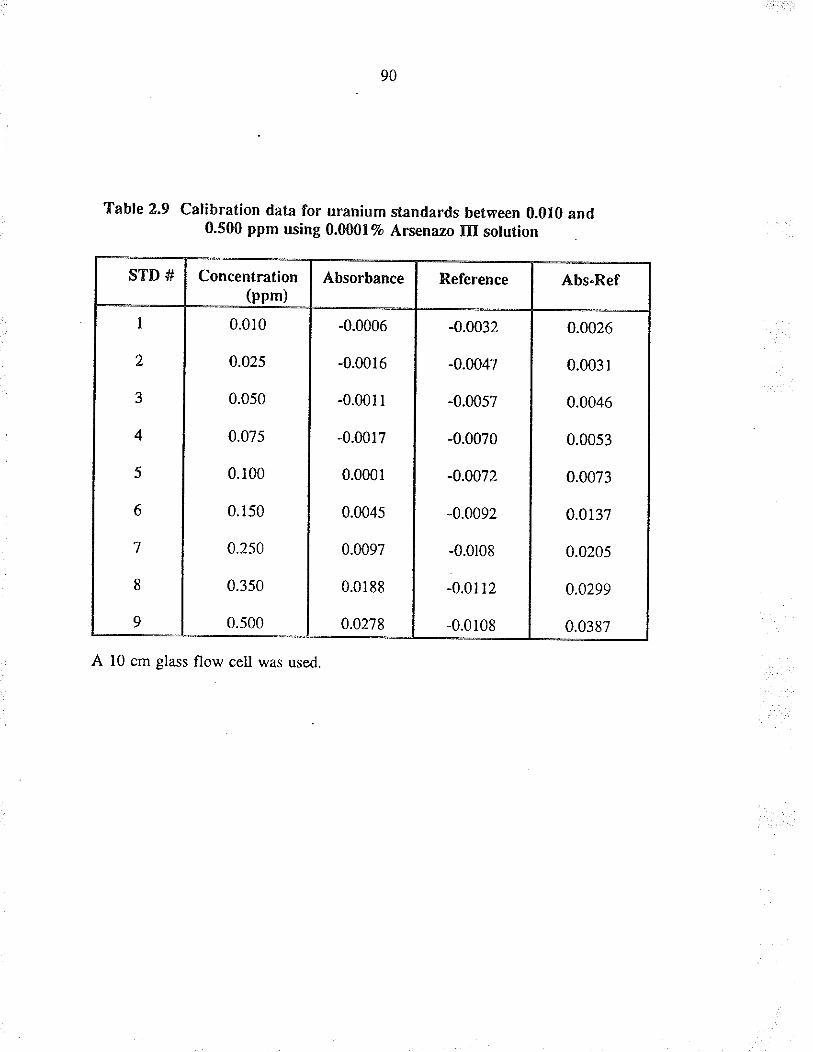
90
Table 2,9 Calibration data for uranium standards between 0.010 and0.500 ppm using 0,00012o Arsenazo III solution
A l0 cm glass flow cell was used.
STD # Concentration(ppm)
Absorbance Reference Abs.Ref
I
2
3
4
5
6
7
8
9
0.010
0.025
0.0s0
0.075
0.100
0.150
0.250
0.350
0.s00
-0.0006
-0.0016
-0.00r 1
-0.0017
0.0001
0.0045
0.0097
0.0188
0.02'78
-0.0032
-0.0047
-0.00s7
-0.0070
-0.0072
-0.0092
-0.0r08
-0.01l2
-0.0108
0.0026
0.0031
0.0046
0.00s3
0.0073
0.0r37
0.0205
0.0299
0.0387
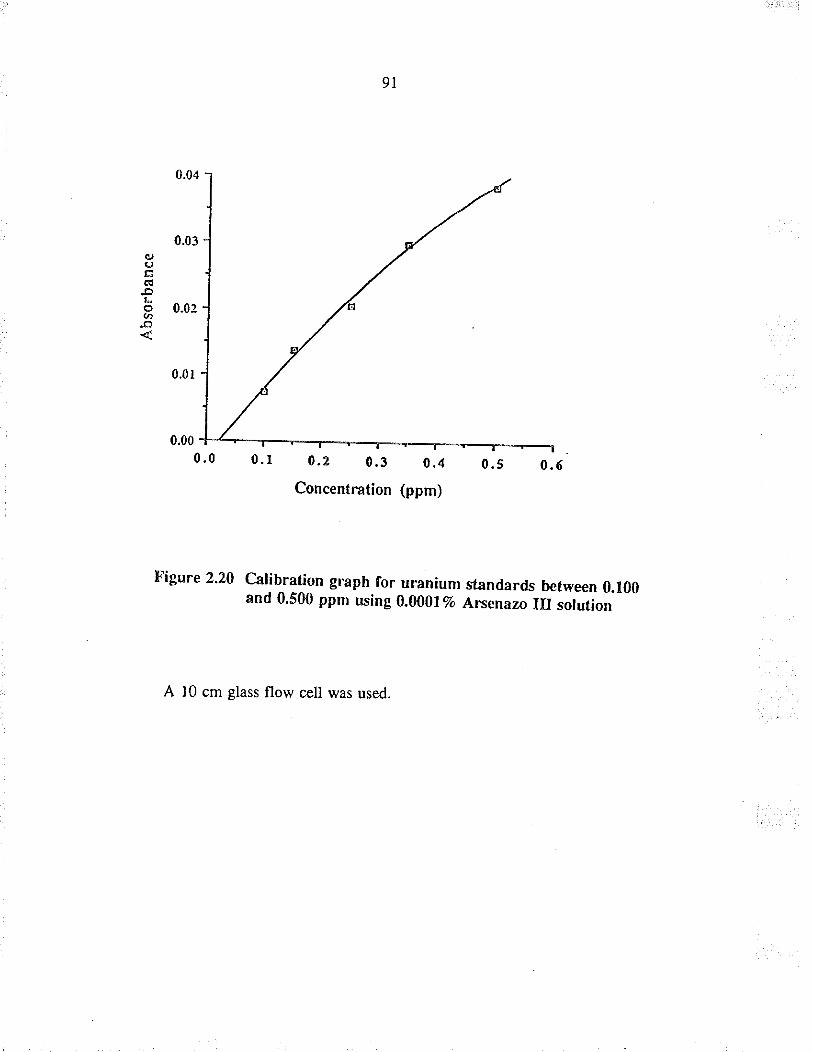
9l
q,c|É(É
Lo€
0.04
0.03
0.02
0.01
0.00
0.0 0.r 0.2 0.3 0.4
Concentration þpm)
Figure 2.20 Calib-ration graph for uranium standards between 0.1ü)and 0,5fi) ppm using 0.0AüVa Arsenazo III solution
A l0 cm glass flow c¿ll wæ used.
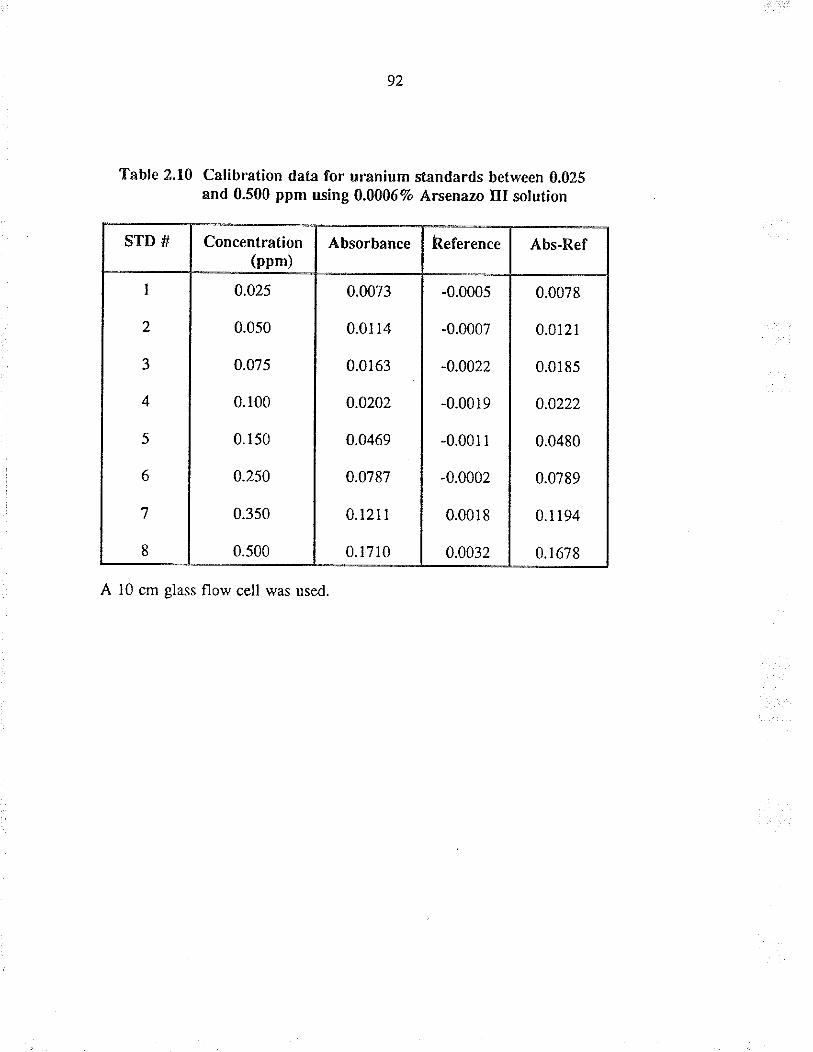
92
Table 2.10 Calibration dala for uranium standards between 0.025and 0.500 ppm using 0.0006Vo Arsenazo trI solution
A l0 cm glæs flow cell was used
STD # Concentration(ppm)
Absorbance Reference Abs-Ref
I
2
J
4
5
6
7
8
0.025
0.0s0
0.075
0.100
0.r50
0.250
0.3s0
0.s00
0.0073
0.0t l4
0.0163
0.0202
0.0469
0.0787
0.12i I
0. t710
-0.000s
-0.0007
-0.0022
-0.00r9
-0.0011
-0.0002
0.0018
0.0032
0.0078
0.0r21
0.0185
0.0222
0.0480
0.0789
0.1194
0. 1678
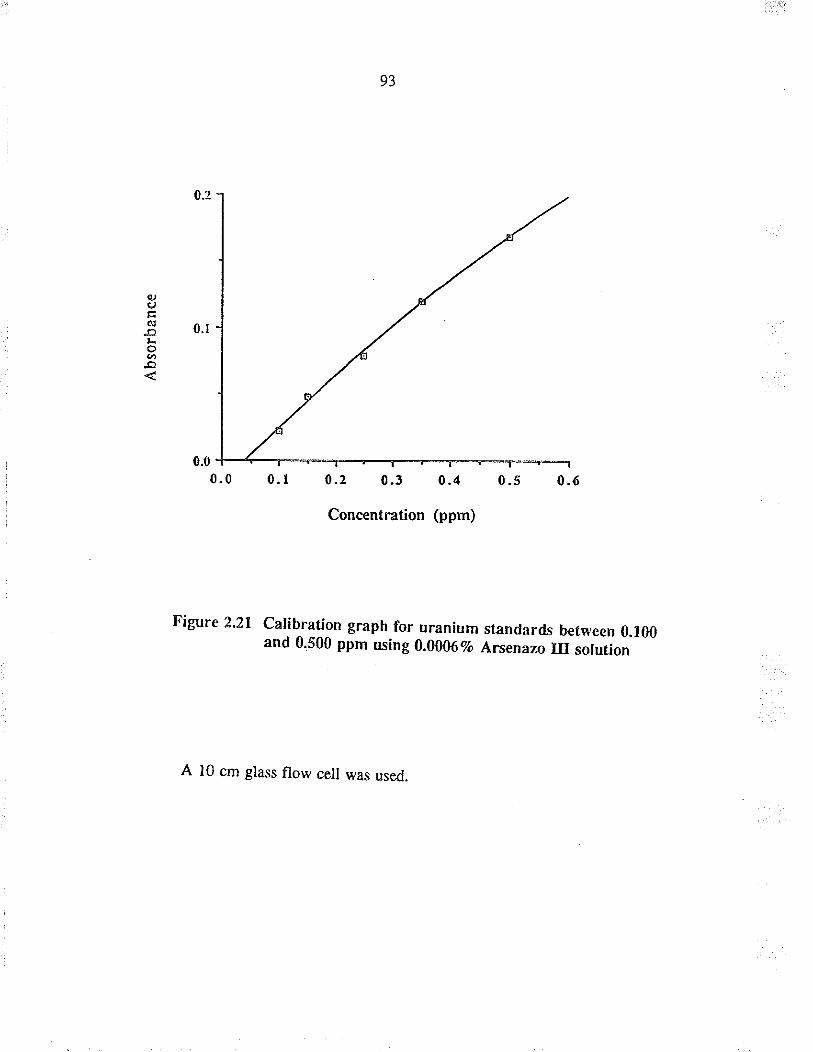
93
0.0
0.0 0,2 0.3 0.4 0.s
Conæntration (ppm)
Figure 2.21 carib_ration graph for uranium standards between 0.100and 0.500 ppm using 0.0006Vo Arsenazo III solution
A l0 cm glæs flow ceII was used.
94
When the A¡senazo III concentration was i¡creased tn 0.00I2V0, a fu¡ther increase in
absorba¡ce was obtained as shown in Table 2.11 compared !o when 0.0006Vo or
0.00017o Arsenazo trI solution was used. When st¿ndards lowe¡ than 0.1 ppm were
eliminated (due to tl¡e small absorbance values), recalibmtion resulted in a linear graph
between 0.1 a¡d 0.5 ppm uranium as shown n Figve 2.22.
Even though the calibration curve was found to be linea¡ between 0.1 and 0.5 ppm
ura¡ium with the use of a 10 cm quartz tube and 0.00I2Vo Arsenazo III solution, there
were practical problems associated with the use of these cells. Air bubbles get
trapped, usually neü the windows along the path of the beam, which needed to be
removed by gently tapping the cell in an upright position. Teflonw flow cells were
not useful because any bubbìe formation was not visible due to the nature of Teflonw
used. Proper machining of the glæs quartz tubes along with bener design st¡ucture,
especially, at the corners might prevent bubbles from lodging at the windows.
Rather than pursue a solution for the uæ of these longer cells, it was decided to
perform all uranium analyæs usirg the commercial 5 mm cell with u¡anium
concentrations between I and l0 ppm U. The 5 mm flow cell (Markson Science
lnc.) proved to Þ very convenient in minimizing ary air bubble problem and avoiding
alignment problems because it can be clamped firmly and reproducibly in a c¿ll holder
of the instrumenL Even though the concentration of uranium in æawater is 3.3 ppb,
the analysis of u¡anium il our laboratory using CFSM was limited ¿o I to l0 ppm
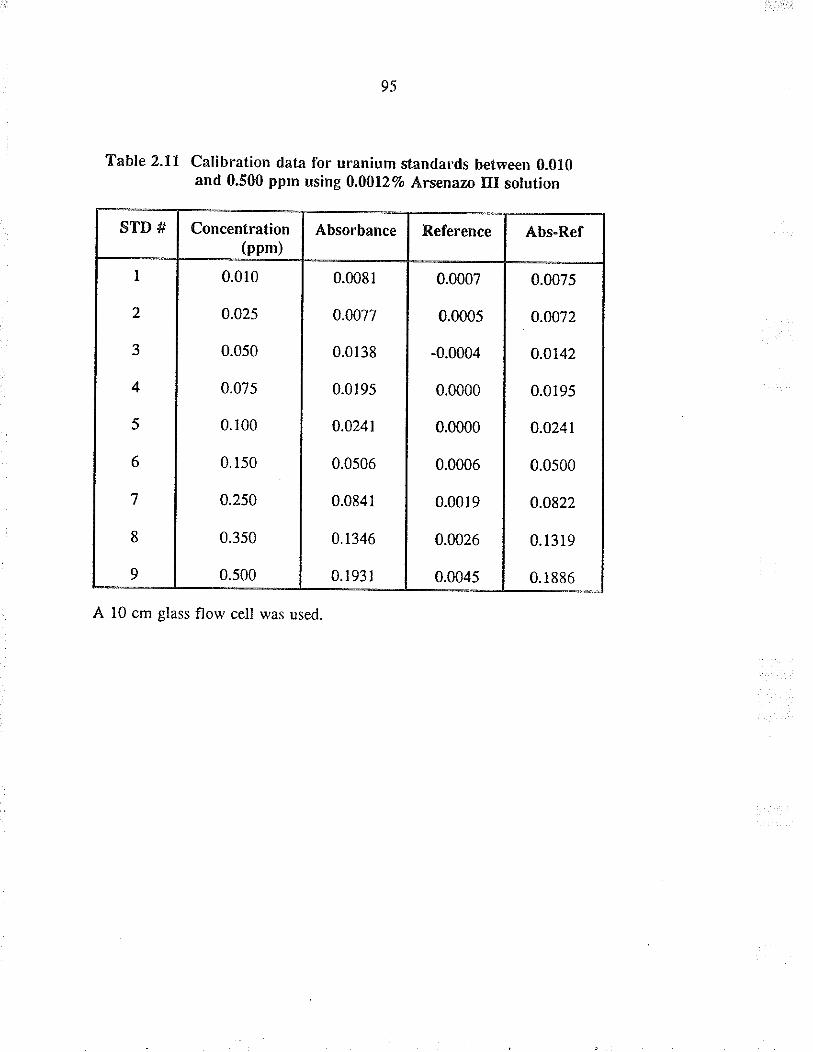
95
Table 2.ll Calibration data for uranium s{andârds between 0.010and 0.500 ppm using O,AÙlZVo Arsenazo III solution
A l0 cm glass flow cell was used.
STD # Concentration(ppm)
Absorbance Reference Abs-Ref
I
2
3
4
5
6
7
8
9
0.010
0.025
0.050
0.07s
0.r00
0.150
0.250
0.350
0.500
0.0081
0.0077
0.0138
0.0195
0.0241
0.0s06
0.0841
0.1346
0.1931
0.0007
0.000s
-0.0004
0.0000
0.0000
0.0006
0.0019
0.0026
0.0045
0.0075
0.0072
o.0142
0.0195
0.0241
0.0s00
0.0822
0.1319
0. 1886
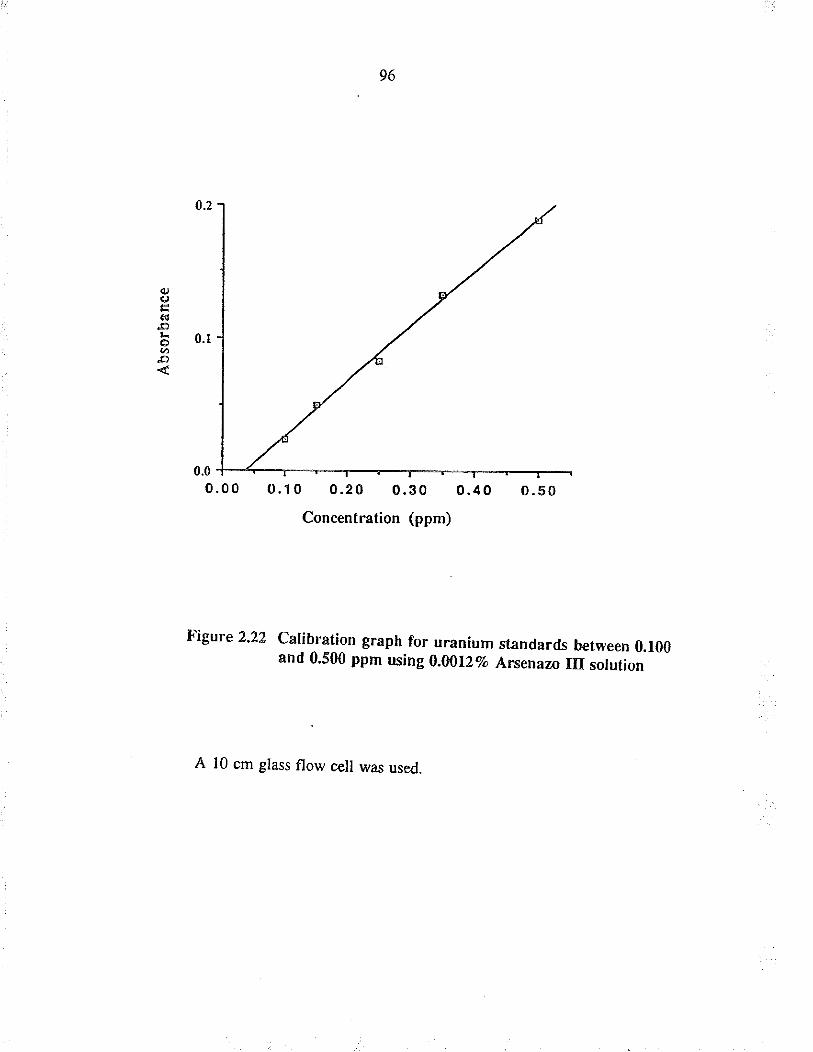
96
0.10 0.20 0.30 0.40
Concentration (ppm)
Figure 2.22 carib-ration graph for uranium standards between 0.100and 0.5ffi ppm using 0.0012Vo Arsenazo III solution
A l0 cm glass flow cell was used.
0.0
97
u¡anium. This made the evaluation of the sorbents that were developed in our
laboratory, which required the aralysis of a large numbe¡ of samples, more convenient.
2.3 Evaluation of the different analytical techniques
Experiments performed by Dr. IGntipuly and Mr. Chan of our laboratory sho$,ed that
the presence of calcium as a matrix constituent enhances the apparent uranium
concentmtion when the analysis wæ ca¡ried out by ICP-AES and depresses it when
carried out by DCP-AES. They have shown tìat when a l0 ppm uranium solution
was spiked with 400 ppm of calcium a¡d analyzed by ICP-AES, it ¡eads a
concentration of I1.6 ppm uanium and when the same solution was analyzed by
DCP-AES it reads a concentration of 7.8 ppm uranium. The increase in ICP-AES
measurements was attributed to a calcium line (385,96 nm) lying very close to the
uranium analytical line. The decrease in DCP-AES measurements was attributed to
physical o¡ broadened spectral interferences. This enhancement of uranium signal in
ICP-AES and the decrease in DCP-AES ca¡ be attributed to the diffe¡ent emission
lines that were used for the analysis and also due to the diffe¡ent plasma generating
systems that were used for the deærmination of uranium. The existence of matrix
effects in argon plasma atomic emission spectrometers has been well documented in
the lite¡atu¡e.5758
A correction factor for calcium was applied to solve the problem; this co¡rection factor
required a¡ accurate and precise krowledge of the amount of calcium present, The
98
standa¡d additions method, which hæ been regarded as a general remedy for matrix
effects, was found to be too time-consuming when large numbers of samples had !o b€
analyzed.
Evaluation of sorbents in our laboratory, in most cæes, involved the analysis of
u¡anium solutions with a simple matrix. The concent¡ations of uranium solutions were
usually between I and l0 ppm. The above procedure of using a simple mat¡ix and
higher concentration of uranium (æ compared to ura¡ium in seawater) wæ undertaken
so that the analysis of u¡a¡ium could be performed in our laboratory.
To deærmine if tìe resins were capable of sorbing uranium from actual seawater, the
¡esins were evaluated by æsting in actual s€awater (Pat¡icia Bay, Sydney,8.C.,
Canada). The eluates from the resins for seawater samples were analyzed by ICP-MS
and ICP-AES. Mat¡ix interferences that were noticed ir the plasma emission
æchniques (due to spectral line interferences) were eliminated when ICP-MS wæ used
as it uses a mass spectrometer tlat detects the uranium isotopes. Of the three
techniques used for the analysis of u¡anium f¡om seawater matrix (i.e. ICP-AES, DCP-
AES and ICP-MS), ICP-MS performed much beuer as fa¡ as matrix problems were
concerned.
To analyze uranium witl a simple aqueous soluúon a! the mat¡ix, CFSM with
Arsenazo III proved to perform adequaæly for small concentrations of uranium (0.1 to
99
0.5 ppm uranium) when a 10 cm flow cell was used, When a 5 mm Ma¡ksonru flow
cell was uæd, tre ana.lysis of u¡anium solutions whose concent¡ations fell between
I and 10 ppm uranium, proved to be rapid a¡d accu¡ate.
2,4 Conclusion
Four analytical techniques were used for the analysis of uranium in our work, i.e.
ICP-AES, DCP-AES, ICP-MS and CFSM. The th¡ee plæma æchniques use expensive
instruments which a¡e not commonly available in many laboratories. CFSM is
relatively less expensive and is capable of analyzing for u¡anium or thorium
individually, provided they are in a simple aqueous mat¡ix. Th, Zr, Hg and ra¡e ea¡ths
inærfere with the determination of uranium with A¡senazo III but, with the use of
selective mæking agents, this problem can be avoided.2a5
Of the four techniques used, ICP-MS is tle most sensirive (i.e. low detecrion limit)
with minimal mat¡ix interfe¡ences. spectral line overlap, which is an inherent problem
with ICP-AES and DCP-AES, is caused by a variety of elements that are present in
the mat¡ix. In ICP-MS, this problem of spectral overlap is avoided as it uses a
quadrupole mæs analyær as a filter. A¡other advantage of ICp-MS over ICp-AES or
DCP-AES is that it can determine isotope ratios for the elements of interesl The
determining of isotope ratios could prove useful i¡ the monitoring of radionuclides in
the envi¡onment. For example, only a certain isotope of an element may be
radioactive or needed to be monito¡ed fo¡ health reasons (for example, nuclear testing,
100
radioactive fallout, monitoring of nuclear plants, etc.) or the isotope ratio may be
i¡dicative of fhe source of the elemen!.
ICP-MS is not genera.lly suitable for solutions with high salt content, í.e. > 0.2Vo as
the salt gets deposiæd on the orifice located at the inærface between the ICP and MS.
This causes a drift in the slope and/or the inærcept of the calibration curve.ãe A
preconcent¡ation step may still be required for deærmining Eace or ulûa trace metals
in seawater.
Ura¡ium solutions witì concent¡ations between 1.0 and 10.0 ppm or thorium solutions
with concent¡ations between 1.0 and 5.0 ppm or between 0.1 and 1.0 ppm can be
analyzed with a 5 mm flow cell and 0.006Vo Arænazo III solution. Uranium solutions
wifh concentrations between 0.1 and 0.5 ppm can be analyzed with a l0 cm flow cell
and 0.0012V" A¡ænazo trI solution. The 10 cm flow cell needs þtær designing or
machining to preven! ai¡ bubbles from getting stuck in the tube. An alternative way
would be to prevenr ai¡ bubbles from entering the flow cell by stopping the peristaltic
pump before sample change. An advantage of using a flow cell over a nonnal cell is
that it takes less time to perform an analysis, i.e. over 60 samples can be analyzed in
aÍ hour. The ædious process of manually cleaning and rinsing a normal cell is
avoided in CFSM. Another advantage of using a flow cell is that the time fo¡
complex formation is always a constant, which may be difficult to achieve using a
norma.l cell.
101
Although DCP-AES a¡d ICP-AES can provide satisfactory analyæs under mary
conditions, tle ICP-MS is better in terms of greater sensitivity a¡d minima.l matrix
interferences. However for ¡outine analysis, for solutions with a simple matrix, the
method developed using the conti¡uous flow spectrophotometric method is satisfactory
fo¡ u¡anium determination for concent¡ations as low as 0.1 ppm u¡anium.
. 102
CHAPTER Itr
EXTRACTION OF UR{NruM FROM AQLTEOUS SYSTEMS USING
COMMONLY AVAILABLE SORBBNTS
3 Introduction
A number of so¡bents that are commonly available il an analytical laboratory were
evaluated for thei¡ ability to exûact uranium from simple aqueous solutions.
Experiments were then performed to evaluate the sorbents that were capable of
extracting ura¡ium from complex aqueous solutions containing u¡anium in addition to
nine ot¡er competing ions. This procedure wæ done to determine the nature of the
functional group of the so¡bents that could be used fo¡ tle ælective extraction of
uranium from an even more complex system, such as natural water (eg. sea, ocean,
lakes, rivers, súeams, etc.). Seawater, for example, has more than 80 elements present
in solution and extracting uranium from tlis mat¡ix would involve the use of a sorbent
with a functiona.l group which is highly selective fo¡ u¡a¡ium.
An evaluation of these so¡bents to determine the effectiveness of va¡ious functional
groups in extracting uranium from simple and complex aqueous solutions will be
discused in this chapter.
103
3,1 MateriaÌs used
3,1,1 Reagenß used
Calcium nitrate (Ca(NO3)r.4HrO) and magnesium niúare (Mg(NO3)2.6HrO) were
obtai¡ed from J. T. Bake¡ Chemical Co. @hillipsburg, NJ, USA). Sodium chloride
(NaCl), fenous ammonium sulphaæ (Fe(NH¡)r(SO1)r.6HrO), manganous sulphate
(MnSOo.2HrO), lead nitrate (Pb(NO3)r) a¡d nickel ammonium sulphate
(Ni(NH4)r(SO1)r.6HrO) were obtained from Fisher Scientific Co. (Fai¡lawn, NJ, USA).
Anhydrous copper sulphate (CuSOo) and uranyl acetate (UO,(CHTCOO)r.2H,O) were
obtained from BDH Chemica-ls Ltd. (Poole, England). Zinc acetare
(Zn(CH3COO)r.2HrO) was obtained from Matheson Company Inc. (East Rutherford,
NJ, USA). The above chemicals were of reagent grade a¡d were used without futher
purification.
A s¡ock solution cont¡inir'¡g 1000 ppm of each of the following metals was prepared
by disolvirg 5.8927 grams of Ca(NO,)r.4HrO, 10.5492 grams of Mg(NOr)r.6HrO,
2.54 13 grams of NaCl, 2.5116 grams of CuSQ, 3.3576 grams of Zn(CHTCOO)2.2H2O,
?.0211 grams of Fe(NH¿)z(SQ)2.6H2O, 3.4780 grams of MnSOo.2HrO, 1.5985 grams
of Pb(NO¡L, 6.7298 grams of Ni(NHo)r(SQ)r.6HrO and 1.7820 grams of
UOr(CH3COO),.2H2O in I litre of wate¡. Solutions conøining 100 and l0 ppm of
each of the above metals were prepared by succesive dilutions of the 1000 ppm stock
solution.
104
3.1.2 Sorbenß used
AG 2X8, AC lX8, AG 50WX8, Ac MPl, Bio-Rex 70 and Chelex 100 were obøined
from Bio-Rad Laboratories (Richmond, CA, USA). Rexyn 101, Rexyn 102,
Rexyn 201, Rexyn 203, Rexyn AG4 a¡d Florisil were obtained f¡om Fishe¡ Scientific
Co. (Fairlawn, NJ, USA). Ambe¡lite IRA*400, Ämberlire IRA-401,
Ambertite IRC-718, Amberlite IR-120, Amberlite Cc-400 I, Amberlite CG400 tr,
Ambe¡lite IR45 and Amberlite IRC-50 were obtained from Rohm and Haas Company
(Philadelphia, PA, USA). Dowex 1X4, Dowex 1X10, Dowex 2X8, Dowex 50WX8
and Dowex 21K were obtained from J. T. Baker Chemical Company (Phillipsburg, NJ,
USA). Ch¡omosorb W was obtained from Wilkens Instument and Research lnc.
(ïValnut Creek, CA, USA) and Seelex 4100 from Seekay Chemical Company (New
York, NY, USA). Polythioether and poly-B-diïetone were obtained f¡om Dr. Chow
and Dr. Gesser respectively, from the Department of Chemisfy, University of
Manitoba. Some of tle sorbents that were used were old a¡d have been discontinued
for production by the manufacturer.
The above sorbents that were used in this study can be broadly classified as cation
exchange, anion exchange, chelating or miscellaneous sorbents as shown in Table 3.1.
The sorbents were used as provided by the manufacturer (i.e. no pretreatment of the
sorbent for the purpoæ of cleaning or otherwise wæ undertaken). The sorbents were
used in this way as the pretreatment procedure for each sorbent would be different and
would have to be determined prior to thei¡ use for that particular extraction system.
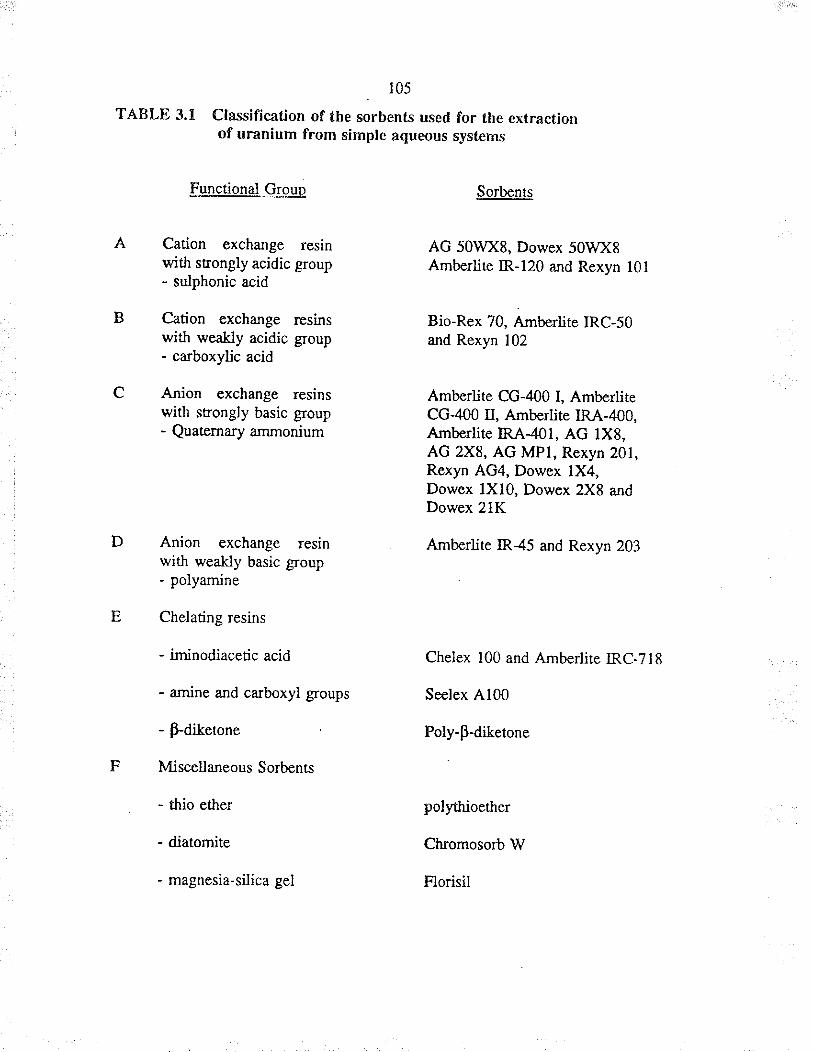
105
TABLE 3.f Classification of tbe sorbents used for the extractionof uranium from simple åqueous sys[ems
Functional Groun Sorbents
A Cation excharìge resin .A,G 50WXg, Dowex 50WXgwith stongly acidic group Amberlite IR-120 and Rexyn l0l- sulphonic acid
B Cation exchange resins Bio-Rex 70, Amberlite IRC-50with weakly acidic group and Rexyn 102- carboxylic acid
C Anion exchange resins Amberlite Ct-400 I, Ambe¡titewith seongly basic group CC400 II, Amberliûe IRA_400,- Quatemary ammonium Ambe¡tiæ IRA40I, AG lxg,
Ac 2X8, Ac MPt, Rexyn 201,Rexyn AG4, Dowex lX4,Dowex lXl0, Dowex 2X8 andDowex 21K
D A¡ion exchange ¡esin Amberlite IR-45 and Rexyn 203with weakly basic group- polyamine
E Chelati¡g resins
- iminodiacetic acid Chelex 100 and Amberlire IRC-718
- amine and carboxyl groups Seelex Al00
- Þditetone poly-þdiketone
F Miscellaneous So¡bents
- thio ether pol¡hioether
- diatomiæ Ch¡omosorb W
- magnesia-silica gel Florisil
106
3,1,3 Apparatus used
Meæurements of pH were obtained using a Fisher Accumetw Model 825 MP
pH meter. Adjustrnents of pH were made using 2M HNO3 or 2M KOH. Ware¡ used
for making the solutions was purified by reveræ osmosis. WlatmanrM 541 filær
paper was used for atl filtering purposes.
3.2 Procedure
The sorbent capability for the extraction of uranium was determined using the
following general procedure. Approximaæly one gram of the so¡bent was weighed
and placed into a 125 mL glæs Erlenmeyer flæk. After the addition of 25 mL of
l0 ppm uranium solution, the flæk was covered with ParafImru. The covered flæk
was ha¡ld shaken every 8 hours for a total of 24 hours. The sorbent was separaled
from solution by filtering through a filter paper and the filtrate a¡alyzed by ICP-AES
to determine the amount of ura¡ium left in solution. A blar* extraction was
conducted i¡ a simila¡ way by equilibrating one gram of the sorbent with 25 mL of
purified water to determine if any cations were leaching from the sorbent. The
a¡nount of uranium that was actually avaiìable for ext¡action was determined in a
similar way, without the addition of the sorbent" by uking 25 mL of 10 ppm uranium
solution in the flask. Afær equilibratin g for 24 hou¡s the filtered solution was
analyznd by ICP-AES. The amount of uranium that was actually available for
extraction wæ determined in orde¡ to allow for any loss of u¡anium due to
precipiurion or adsorption of ura¡ium on the flæk or filter paper.
107
3,2,1 Extraction of uranium from símple aqueous solution
This srudy wæ undertaken to determine the sorbent capability for the uptaïe of
ura¡ium from simple aqueous solution, i.e. uranyl acetate solution.
A 10 ppm uranium solution was prepared by succesive dilution of a 2000 ppm
u¡anium stock solution. The 2000 ppm stock solution was prepared by dissolving
3.564 grams of uranyl acetâte (UOr(CH3COO)2.2H2O) in I lir¡e of deionized water.
The pH of the 100 ppm ura¡ium solurion wæ found ro be 4.1, but fo¡ this srudy rhe
pH of the 10 ppm uranium solurion ì¿/as adjusted to 7.0 by using 2M KOH. The pH
of 7.0 was chosen so as to have a neutral pH, and becauæ the pH values of most
natural waters was 7.0 t 3.0. The capability of the sorbents for the uptake of uranium
from simple aqueous solution was determined by equilibrating 25 mL of 10 ppm
u¡a¡ium solution with one gram of the sorbent in a 125 mL Erlenmeyer flæk. The
flæks were covered with ParafilmrÀr and t-tre cove¡ed flasks hand shaken every 8 hours
for a total of 24 hours.
Cations that leached from the so¡bent at pH 7.0 were determined by performing a
blank extraction in a simila¡ way by using 25 mL of water (pH was adjusæd to 7.0)
instead of the l0 ppm uranium solution. The amount of u¡anium that was actually
available fo¡ extraction was determined i¡ a simila¡ way by placing just the 25 mL of
l0 ppm uranium solution n a 125 mL Erlenmeyer flæk, which was covered with
ParaJilmru a¡d shaken every 8 hours for a total of 24 hours.
108
The so¡bents were separat€d f¡om solution by fi.læring through a Whatma¡w 541 fîlær
paper which is suitable for retaining coa¡æ and gelatinous precipitates. The fiiæred
solutions were analyzed by ICP-AES.
3,2.2 Extraction of uranium from complex oqueous solutiin
The study was undefaken to detennine the capability of the sorbents fo¡ the selective
uptake of u¡anium from a complex solution that contained nine competing ions in
addition to ura¡ium.
The 1000, 100 and 10 ppm solutions which contained all the ren cations appeared
cloudy, suggesting formation of some precipitate which may have been lead chloride
or iron hydroxide. The pH of the 10 ppm solution was found t,o be 3.0 and when an
atlempt was being made to raise its pH to 7.0, it wæ noticed that the precipitation
increæed with the addition of 2M KOH. This effect suggested that the precipitate
must be a hydroxide, possibly iron hydroxide.
Experiments to determine sorbent selectivity were conducted at the original pH of the
l0 ppm solution (i.e. 3.0) because precipitation increased with an increase of the pH
from 3.0 to 7.0. This minimized complications that might a¡ise from occlusion of
cations i¡side the precipit¿te o¡ from tle precipitate itself acting as a so¡bent fo¡ some
of the cations that were present in solution.
109
The capability of the sorbents for the selective uptake of ura¡ium from a complex
solution that con¡ained several competing ions was determined by equilibratìng I gram
of the sorbent with 25 mL of the solution Í¡at contained 10 ppm of each of the nine
ions in addition to uranium. The particular cations were chosen for our study as they
are commonly present in natural water systems and also because the analysis of these
ions was convenient since the ICP-AES instrument had the capability to analyze all of
them simultaneously.
A blank ext¡action using water, instead of the l0 ppm solution, was performed in a
sirnilar way to determine if any metals were leaching out of the sorbent at pH 3.0.
The concentration of the cations that wæ available for extraction was determined by
placing 25 mL of the 10 ppm solution that contained the ten carions in a 125 mL
Erlenmeyer flask, The flæks were covered with Pa¡afilmru and hand shaken every
8 hours for a total of 24 hours. The filtered solutions were analyzed by ICP-AES.
3.3 Results and discussion
One of the criteria used for the evaluation of tle so¡bents was percent exEaction (7o
E) and wæ calculated using the equation:
7oE = {I -(F-B)} 'I-' x 100
where, I was the concentration of the metal ion of interest (M*) that wæ available for
110
exûaction, F was t¡e concenÛation of M* that was left in solution after ext¡action and
B was the concentration of the illÉ tlat leached from the so¡bent when a blank
ext¡action was performed.
ICP-AES readings that were below the detection limits were heated as zero ppm and
are indicated with an asærisk (deæction limits for each element a¡e shown at the end
of both Tables 3.2 and 3.3). ICP-AES softwaæ at times reported certain readings as
> 'x' ppm, which meant that the concenEation was beyond the linear range of the
calibration graph for that meta.l ion and that the concentration was higher than
'x'ppm.
ln Tables 3.2 and 3.3, percent extraction, at times, were reported as < 0 or > 100 and,
for our evaluation of the sorbents, they were t¡eated æ 0 and 100 respectively.
Negative extraction values, i.e. less tha¡ zero, occurred when (F-B) was greater than
both I and zero. This negative value for Vo E can be explained by the fact that some
sorbents swell by absorbing wate¡, and tlÌis leaves fhe resulting solution more
concentrated in the metal ion than what was originally present before the addition of
the sorbent (i.e. F is greater than I).
Similarly, percent extraction values greater than 100 may occur when B is larger than
F. This happened when the concentration of M* leaching f¡om the sorbent during the
blank exnaction (B) wæ higher than ¡he concenüation of lr{* that wæ left in solution
111
(r) during a normal analyúcaì exEaction. The problem of trace metals leaching from
t}le sorbent can be prevented by adopting a cleaning procedure to remove trace metals
from the so¡bents prior to their use. The cleaning procedure might involve the use of
a Soxlùet extracto¡ and an organic solvent to remove organic or organometallic
impurities. This could be followed by treating the sorbents with suitable eluting
agents for inorganic species such as strong mineral acids. The cleaning procedure
would be different fo¡ each sorbent and would depend on the natu¡e of the functional
group present in the so¡bent as well as the physical and chemical st¿bility of the
so¡bent itself.
The problems associated with swelling of the sorbent may be prevented by
pre-swelling lhe sorbent before it¡ use in a solution of simila¡ ionic strength and pH as
the sample solution tïat is to be analyzed. Although. such teaÍnents would be useful
in reating real samples, the calculation of extracrion efficiencies would be difficult for
the present test samples due to varying amounts of remaining liquids.
3.3,1 Sorbent behoviour in simple aqueous solution
Table 3.2 indicaæs onJy rwo sorbents (i.e. Dowex 2lK and Dowex 2X8) were not
efficient (i.e. < 10% E) in the extraction of uraniurn Fou¡ sorbents showed
reasonable extaction capability (i.e. % E was between l0 and 75), as follows:
AC MPI, Dowex IXl0, Ch¡omosorb W and polythioerhe¡. The remaining wenry of
the rwenty-six so¡bents that we¡e tested showed good capabiliry (i.e. 7o E > 75) for the
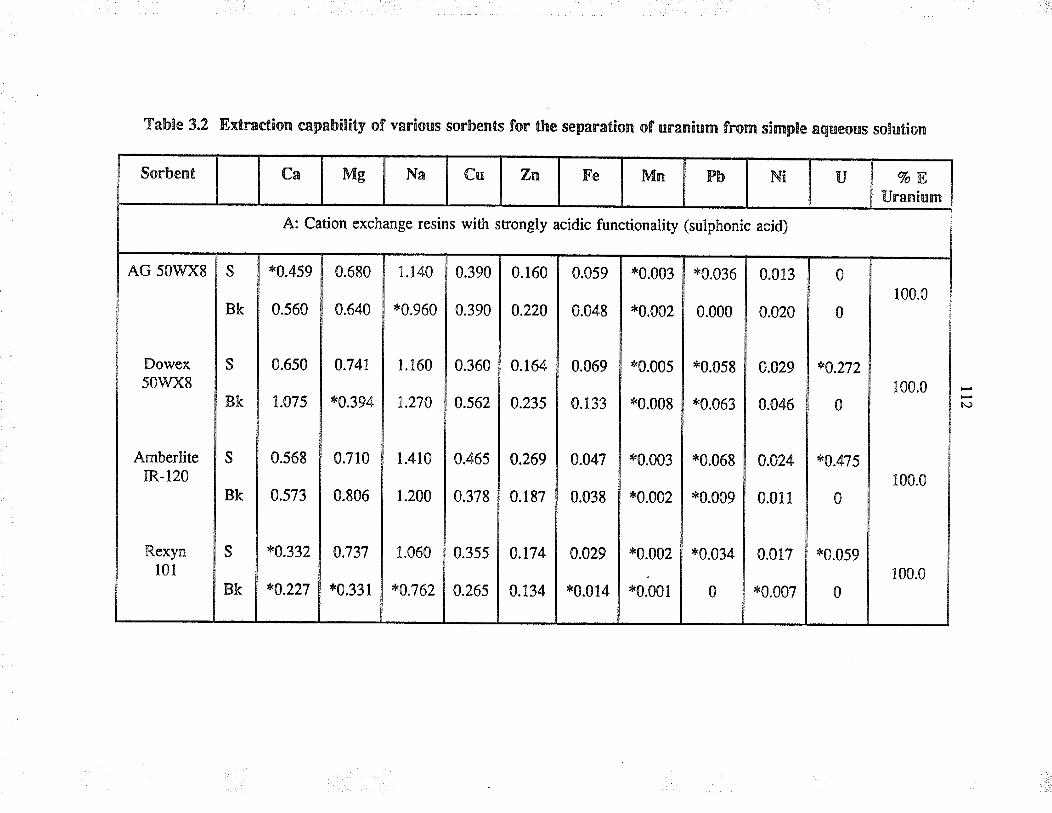
Table 3.2 Extr¡ction capability of various sorbents for the separafion of uranium from simple aqueous solution
Sorbent
AG 50WX8
Ca
s
BK
s
BK
c
BK
S
BK
Dowex50wx8
AmberliteIR-120
Rexyn101
A: Cation exchange resins with sfrongly acidic functionality (sulphonic acid)
Mg
*0.459
0.560
0.6s0
1.075
0.568
0.573
*0.332
*0.227
Na
0.680
0.640
Cu
1.140
*0.960
t.160
1.270
1.410
1.200
1.060
*0.762
0.741
*0.394
0.710
0.806
0.737
*0.331
Zn
0.390
0.390
0.360
0.562
0.465
0.378
0.355
0.26s
Fe
0.160
0.220
0.t64
0.235
0.269
0.187
0.174
0.134
Mn
0.059
0.048
0.069
0.133
Pb
*0.003
*0.002
*0.005
*0.008
*0.003
,r0.002
*0.002
*0.001
Ni
*0.036
0.000
*0.058
*0.063
*0.068
,*0.009
*0.034
0
U
0.047
0.038
0.013
0.020
ToEUranium
0
0
*0.272
0
*0.475
0
*0.059
0
0.029
,ß0.014
0.029
0.046
100.0
0.024
0.011
0.017
*0.007
100.0¡,J
100.0
100.0
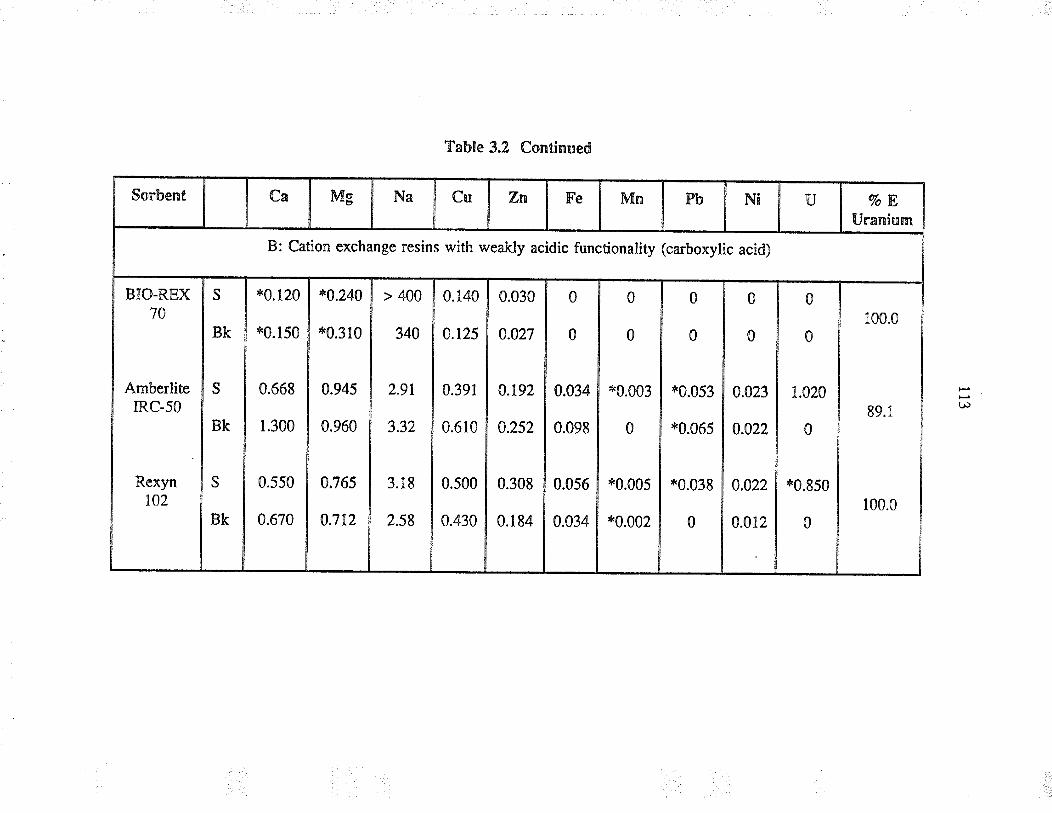
Sorbent
BIO-REX70
AmberliteIRC-50
Rexyn102
Ca
s
BK
s
BK
J
BK
B: Cation exchange resins with weakly acidic functionality (carboxylic acid)
Mg
*0.120
*0.150
0.668
r.300
0.550
0.670
Table 3.2 Continued
Na
*0.240
*0.310
0.945
0.960
Cu
> 400
340
2.91
3.32
3.18
2.58
Zn
0.140
0.125
0.391
0.610
0.500
0.430
Fe
0.030
0.027
0.765
0.712
Mn
0
0
0.034
0.098
0.056
0.034
Pb
0.192
0.252
0.308
0.184
0
0
Ni
0
0
*0.003
0
*0.005
*0.002
{.r
0
0
0.023
0.022
0.022
0.012
VoEUnaniurn
*0.053
*0.065
*0.038
0
0
0
1.020
0
*0.850
0
100.0
89.1
100.0
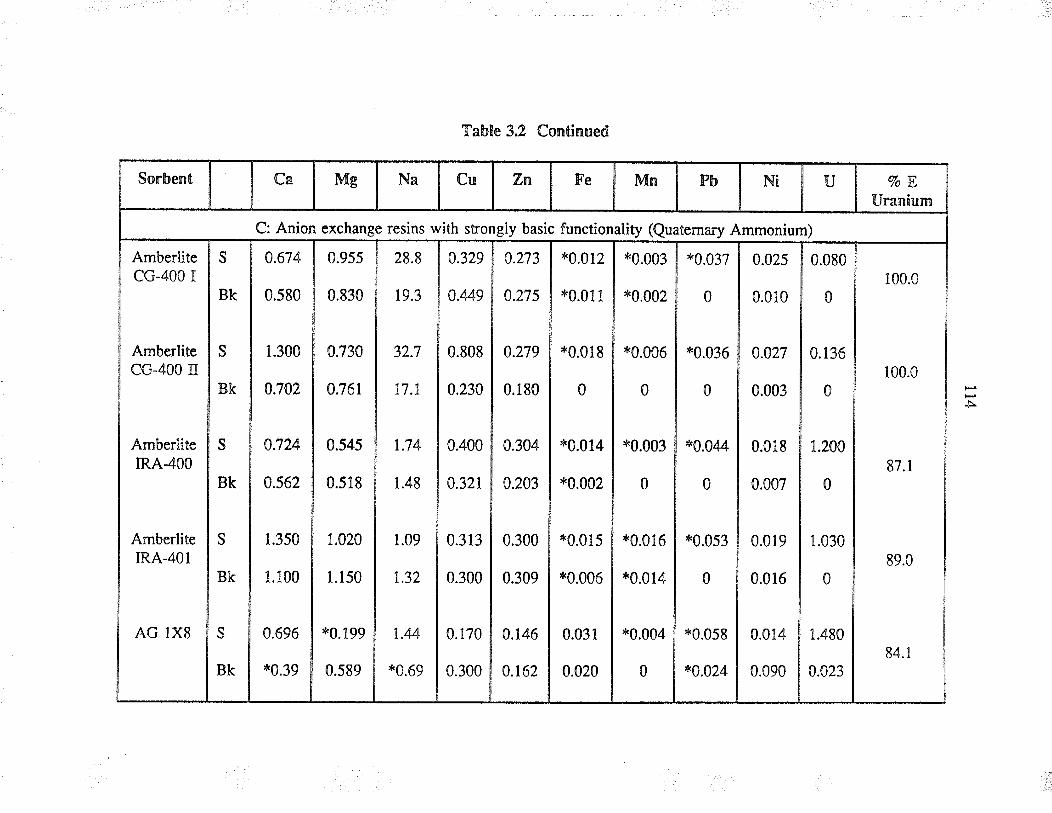
Sorbent
AmberlitecG-400 I
AmberlitecG-400 n
AmberliteIRA-4OO
AmberliteIRA-4OI
AG IX8
Ca
S
BK
s
BK
e
BK
S
BK
S
BK
C: Anio
Mg
0.674
0.580
1.300
0.702
0.724
0.562
1.3s0
Ll00
0.696
*0.39
exchange resins with strongly basic functionality (Quatemary Ammonium)
Na
0.955
0.830
Table 3.2 Continued
Cu
28.8
19.3
0.730
0.761
0.545
0.518
Zn
0.329
0.M9
0.808
0.230
32
Fe
0.273
0.275
0.279
0.180
0.304
0.203
0.300
0.309
0.146
0.162
1
17 .1
Mn
*0.012
*0.011
*0.018
0
*0.014
*0.002
*0.015
*0.006
0.031
0.020
1.74
1.020
1.150
*0.199
0.589
I
*0.003
*0.002
*0.006
0
*0.003
0
*0.016
*0.014
*0.004
0
Pb
.48
0.400
0.321
0.313
0.300
0.170
0.300
1.09
1.32
1.44
*0.69
Ni
*0.037
0
*0.036
0
*0.044
0
*0.053
0
*0.058
*0.024
U
0.025
0.010
%EUranir¡¡n
0.080
0
0.027
0.003
0.018
0.007
0.136
0
100.0
1.200
0
100.0
0.019
0.016
0.0r4
0.090
1.030
0
1.480
0.023
87
À
.1
89.0
84.1
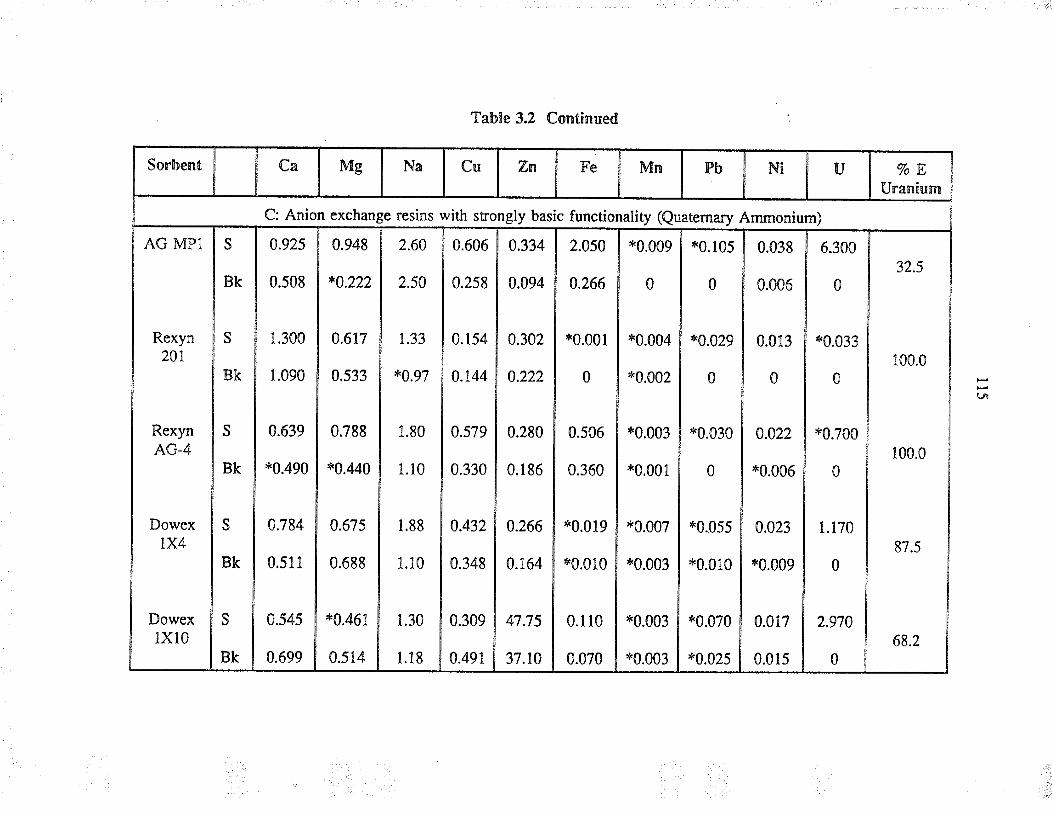
Sorbent
AG MPI
Ca
s
BK
S
BK
e
BK
s
BK
s
BK
C: Anion exchange resins with strongly basic functionality (euatemary Ammonium)
Rexyn201
RexynAG.4
Dowextx4
Dowexlx10
Mg
0.925
0.508
1.300
1.090
0.639
*0.490
0.784
0.51I
0.545
0.699
Na
0.948
*0.222
0.617
0.533
0.788
*0.¿140
0.67s
0.688
*0.461
0.514
Table 3.2 Continued
Cr¡
2.60
2.50
Zn
0.606
0.2s8
1.33
*0.97
Fe
0.334
0.094
0.154
0.144
0.579
0.330
0.432
0.348
0.309
0.491
Mn
2.050
0.266
*0.001
0
0.506
0.360
*0.019
*0.010
0.1l0
0.070
1.80
1.10
0.302
0.222
*0.009
0
*0.004
*0.002
*0.003
*0.001
*0.007
*0.003
*0.003
*0.003
Pb
1.88
1.10
1.30
1.18
*0.105
0
*0.029
0
*0.030
0
*0.055
*0.010
*0.070
*0.025
0.280
0.r86
0.266
0.164
47.75
37.10
Ni
0.038
0.006
0.0r3
0
0.022
*0.006
[J 7oEUranium
6.300
0
*0.033
0
*0.700
0
1.t70
0
2.970
0
5¿ .5
100.0
0.023
*0.009
0.017
0.015
100.0
87.5
68.2
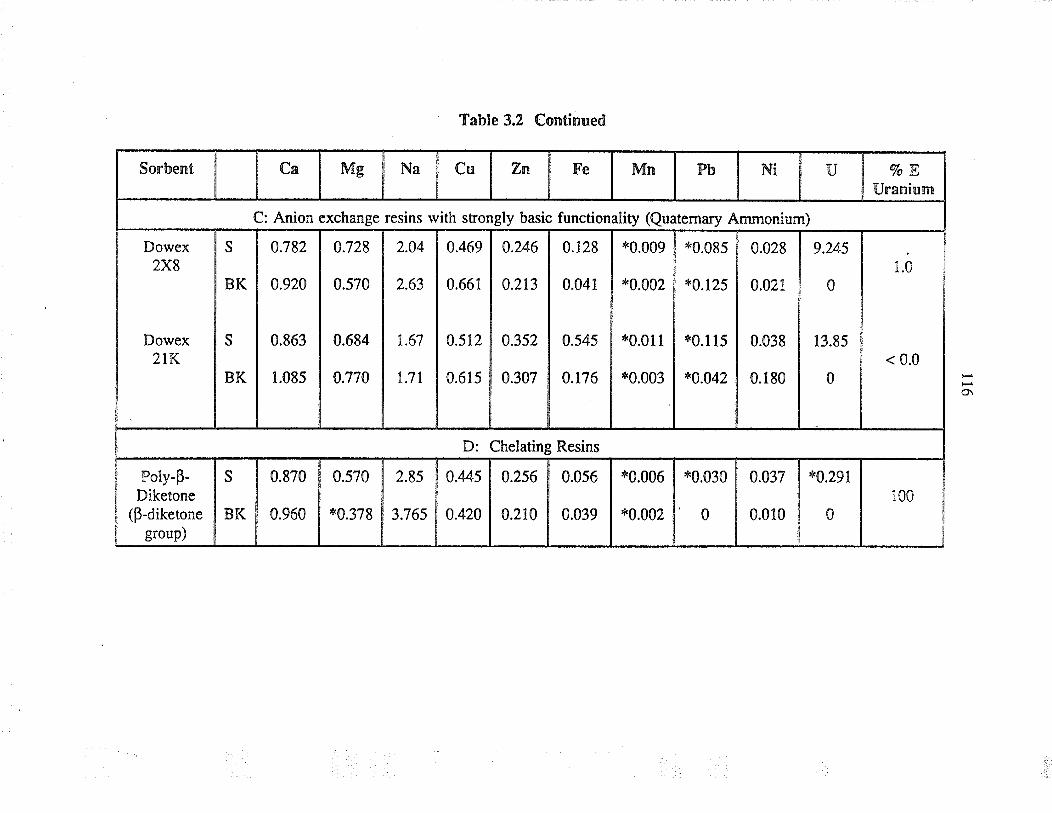
Sorbent
Dowex2X8
Dowex2tK
Ca
C: Anion
S
BK
s
BK
Mg
0.782
0s20
0.863
1.085
:xchange resins with srongly basic functionality (Quatemary Ammonium)
Na
Table 3.2 Continued
0.728
0.570
0.684
0.770
Poly-p-Diketone
(B-diketonegroup)
Cu
2.04
2.63
1.67
l.7l
Zn
0.469
0.661
s
BK
Fe
0.870
0.960
0.246
0.213
0.352
0.307
0.512
0.615
Mn
0.570
*0.378
0.128
0.041
0.545
0.t76
Pb
2.8s
3.76s
*0.009
*0.002
*0.01I
*0.003
D: Chelating Resins
0.M5
0.420
Ni
*0.085
*0.125
*0.115
*0.042
0.2s6
0.210
U
0.028
0.021,
0.038
0.180
0.056
0.039
ToEUranium
9.245
0
13.85
0
*0.006
*0.002
1.0
*0.030
0
0.037
0.010
< 0.0
*0.291
0
o\
r00
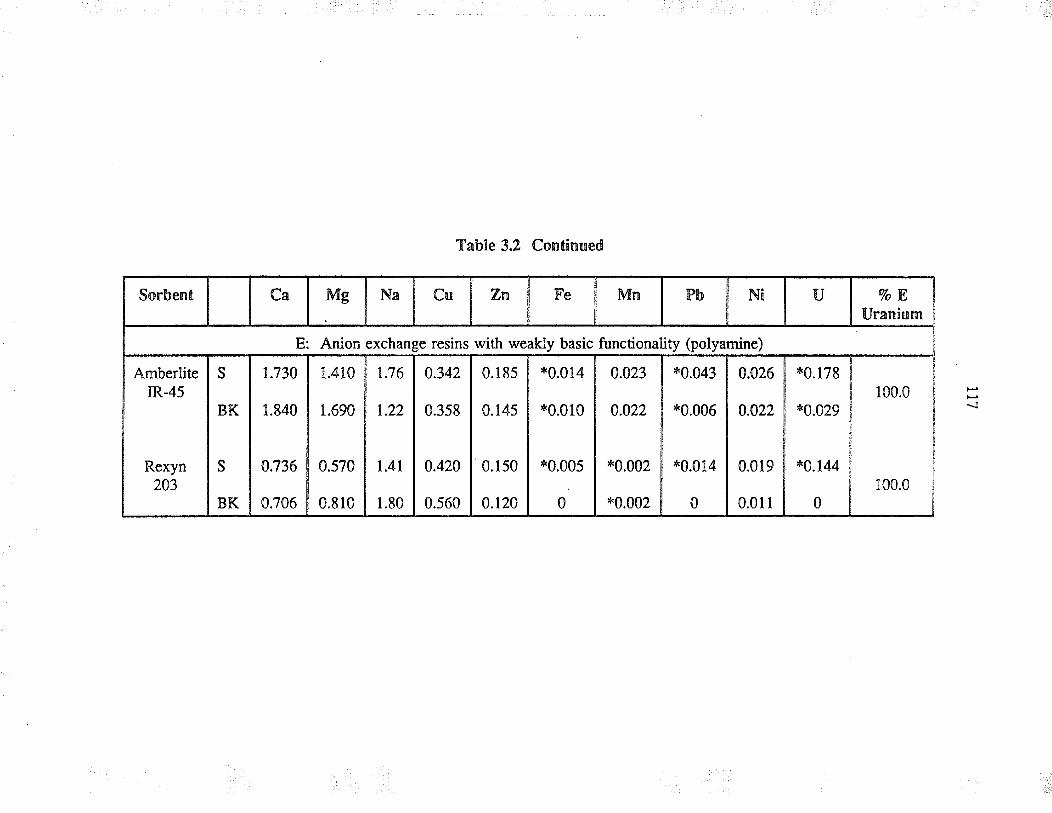
Sorbent
AmberliteIR-45
Rexyn203
Ca
e
BK
s
BK
Mg
1.730
1.840
E: Anion
Na
1.410
1.690
0.570
0.810
Tahle 3.2 Continued
xchange resins with weaklv basic functionaliw (polvamine)
0.736
0.706
Cu
1.76
1.22
1.41
1.80
Zn
0.342
0.358
Fe
0.r85
0.145
0.150
o.120
0.420
0.560
*0.014
*0.010
*0.005
0
Mn
0.023
0.022
*0.002
*0.002
Pb Ni
*0.043
*0.006
*0.014
0
U
0.026
0.022
0.019
0.011
ToEUranium
'r0.178
*0.029
*0.144
0
100.0 \¡
100.0
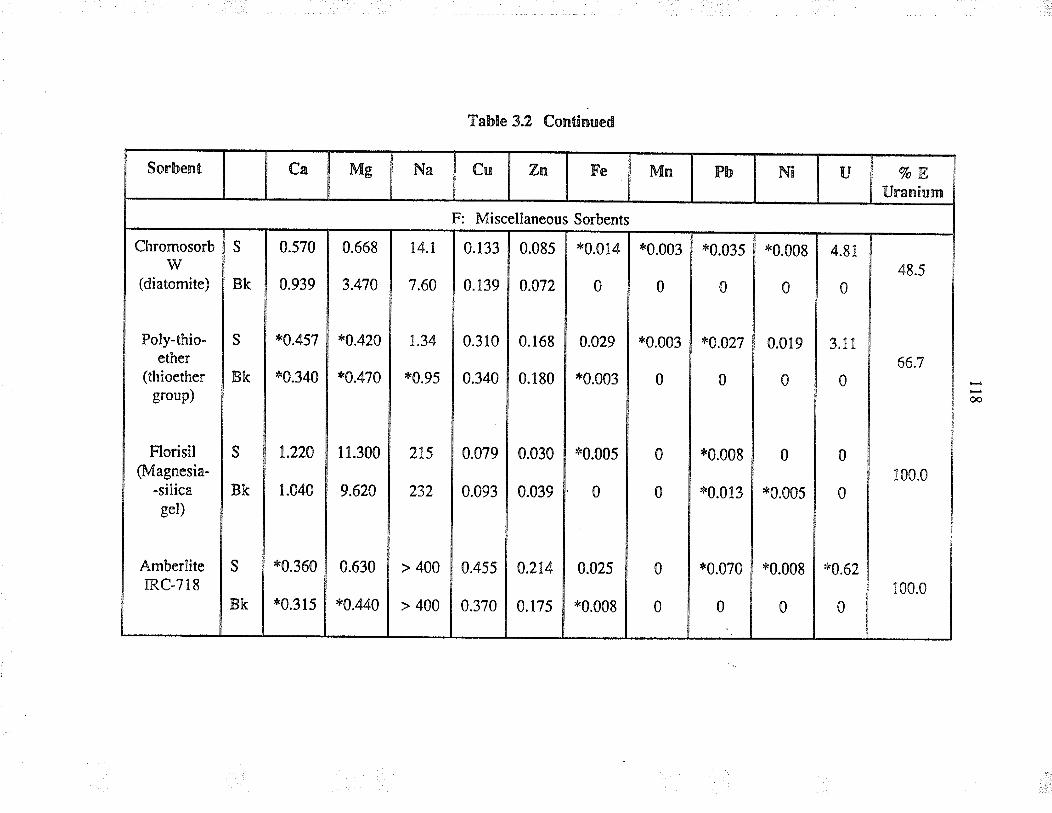
Sorbent
Chromosorbw
(diatomite)
Poly-thio-ether
(thioethergroup)
Florisil(Magnesia-
-silicagel)
Ambe¡liteIRC-718
Ca
e
BK
S
BK
BK
s
BK
Mg
0.570
0939
*0.457
*0.340
1.220
1.040
*0.360
*0.315
Na
0.668
3.470
*0.420
*0.470
il.300
9.620
0.630
*0.440
Table 3.2 Continued
Cu
l4
F:
.l
7.60
1.34
*0.95
215
232
> 400
> 400
Miscellaneous Sorbents
Zn
0.133
0.139
0.310
0.340
0.079
0.093
0.455
0.370
Fe
0.085
0.072
0.168
0.180
0.030
0.039
0.214
0.175
Mn
*0.014
0
0.029
*0.003
*0.005
0
0.025
*0.008
Pb
*0.003
0
*0.003
0
Ni
*0.035
0
*0.008
0
0.019
0
0
*0.005
*0.008
0
U
*0.027
0
*0.008
*0.013
*0.070
0
7oEIJranium
4.81
0
3.tt
0
0
0
*0.62
0
0
0
0
0
48 .5
66 .7
oo
100.0
100.0
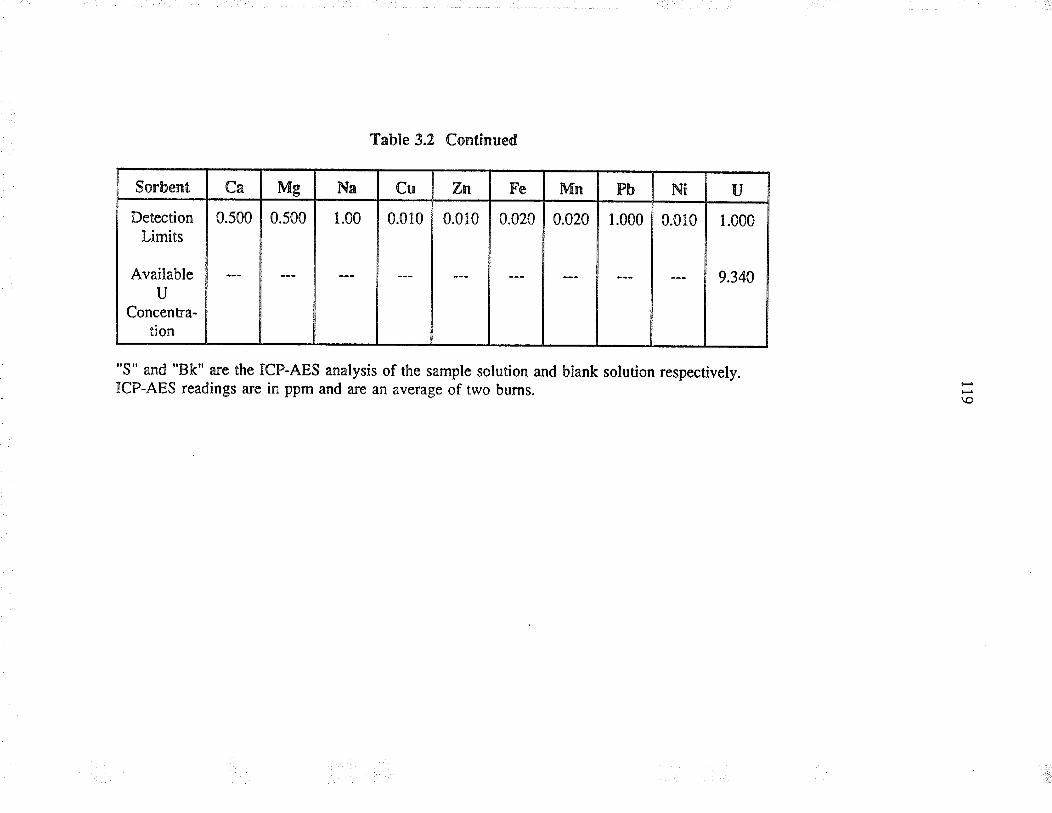
Sorbent
DetectionLimits
AvailableU
Concentra-tion
Ca
0.500
Ms
"S" and "Bk" are the ICP-AES analysis of the sample solution and blank solution respectively.ICP-AES readings are in ppm and arc an average of two bums.
0.500
Table 3.2 Continued
Na
1.00
Cu
0.010
Zn
0.010
Fe
0.020
Mn
0.020
Pb
1.000
Ni
0.010
U
r.000
9.340
\o
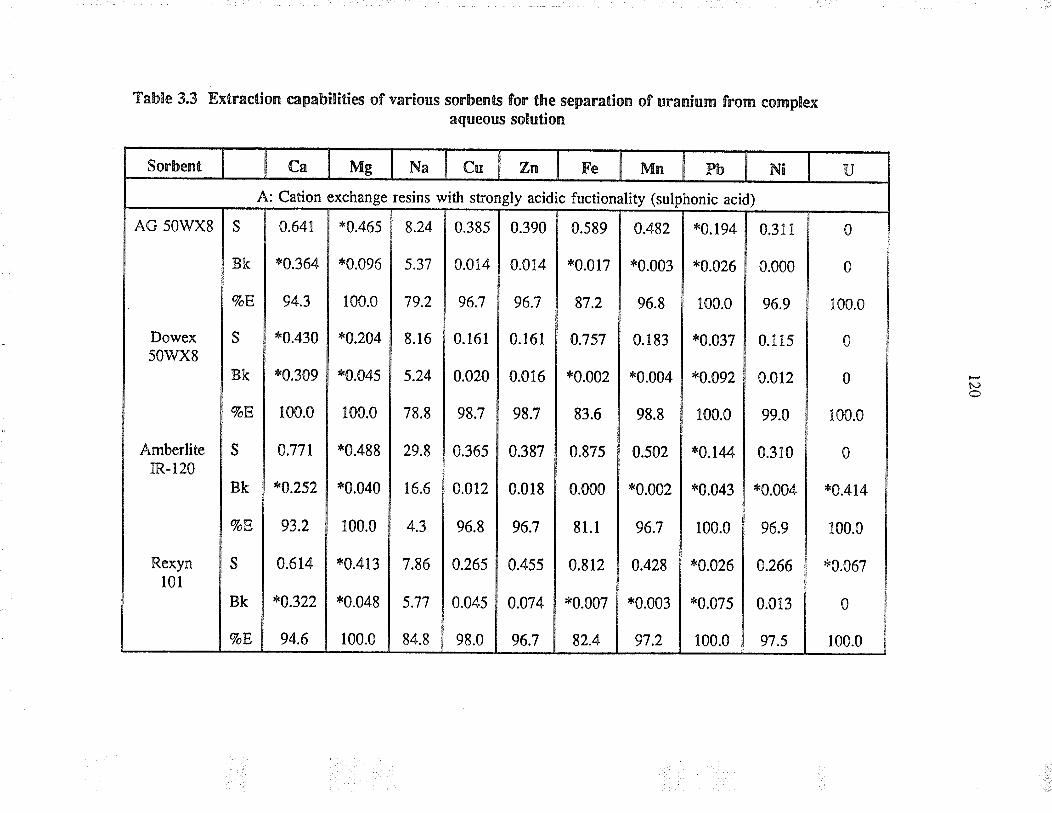
lable 3.3 Extraction capabilities of various sorbents for the separation of uranium from complexaqueous solution
Sorbent
AG 50wX8 s
BK
VoE
S
BK
%oE
c
BK
VoE
s
BK
VoE
Ca
A: Cation exchange resins with srongly acidic fuctionality (sulphonic acid)
Dowex50wx8
0.641
*0.364
94.3
*0.430
*0.309
100.0
0.771
*0.252
93.2
0.614
*0.322
94.6
Ms
*0.465
*0.096
100.0
*0.204
*0.045
100.0
*0.488
*0.040
100.0
*0.413
*0.048
100.0
Na
AmberliteIR-120
Cu
8.24
5.37
79.2
8.16
5.24
78.8
29.8
t6.6
4.3
7.86
5.77
84.8
0.385
0.014
96.7
0.161
0.020
98.7
0.365
0.012
96.8
0.265
0.045
98.0
Zn
Rexyn101
0.390
0.014
96.7
0.161
0.016
98.7
0.387
0.018
96.7
0.45s
0.074
96.7
Fe
0.589
*0.017
87.2
0.757
*0.002
83.6
0.875
0.000
81.1
0.812
*0.007
82.4
Mn
0.482
*0.003
96.8
0.183
'k0.004
98.8
0.502
*0.002
96.7
0.428
*0.003
97.2
Pb
*0.194
*0.026
100.0
*0.037
*0.092
100.0
*0.|M
*0.043
100.0
*0.026
*0.075
100.0
Ni
0.31 I
0.000
96.9
0.115
0.012
99.0
0.310
*0.004
96.9
0.266
0.013
9'1 .5
U
0
0
100.0
0
0
100.0
0
*0.414
100.0
*0.067
0
100.0
t,,O
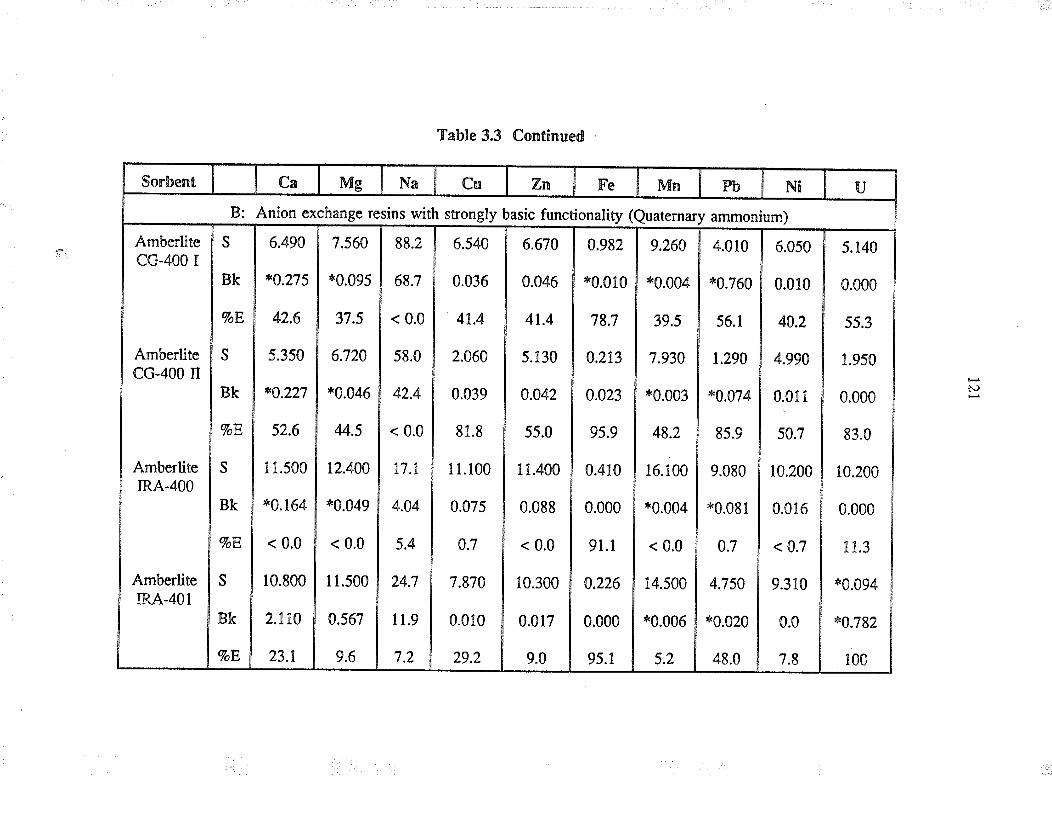
Sorbent
Ambe¡liteCG-4OO I
B: Anion exclrange resins with strongly basic functionality (euaternary ammonium)
s
BK
VoE
s
BK
VoE
S
BK
VoE
s
BK
VoE
Ca
Arnbe¡litecG-400 n
6.490
*0.275
42.6
s.350
*o.227
52.6
I1.500
*0.164
< 0.0
10.800
2.110
23.1
Ms
Table 3.3 Continued
7.560
*0.095
37.5
6.720
*0.046
M,5
12.400
*0.049
< 0.0
r 1.500
0.567
9.6
Na
AmberliteIRA.4OO
88.2
68.7
< 0.0
58.0
42.4
< 0.0
t7.t
4.04
5.4
24.7
tt.9
7.2
Cu
6.540
0.036
41.4
2.060
0.039
81.8
r 1.100
0.075
0.7
7.870
0.010
29.2
AmberlitetRA-401
Zn
6.670
0.046
41.4
5.130
0.042
55.0
11.400
0.088
< 0.0
10.300
0.017
9.0
Fe
0.982
*0.010
78.7
0.213
0.023
95.9
0.410
0.000
9l.t
0.226
0.000
95.1
Mn
9.260
*0.004
39.5
7.930
*0.003
48.2
16.100
*0.004
< 0.0
14.500
*0.006
5.2
Pb
4.010
*0.760
56.1
1.290
*0.074
85.9
9.080
*0.081
0.7
4.750
*0.020
48.0
N¡
6.050
0.010
40.2
4.990
0.011
s0.7
10.200
0.016
< 0.7
9.310
0.0
7.8
ti
5.140
0.000
55.3
1.950
0.000
83.0
10.200
0.000
t 1.3
*0.094
*0.782
100
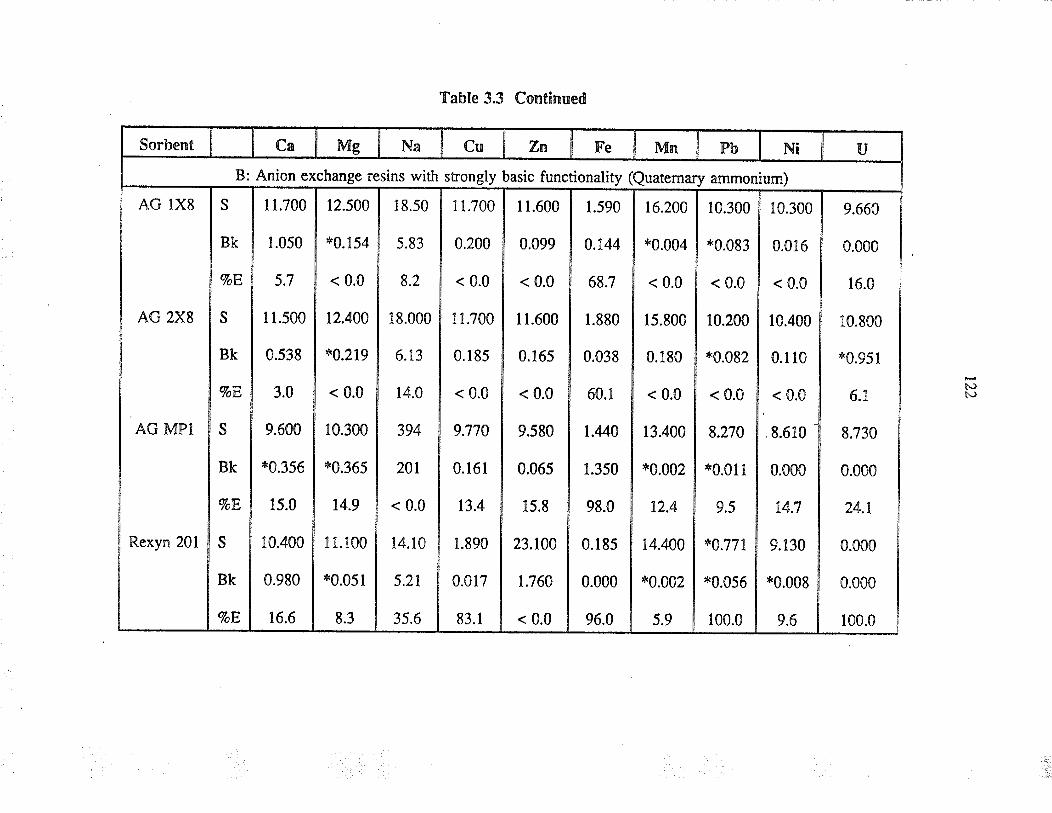
Sorbent
AG 1X8
B: Anion exchange resins with strongly basic functionality (euatemary ammon
Ca
S
BK
VoE
s
BK
VoE
s
BK
%oE
s
BK
%oE
AG 2X8
I1.700
1.050
5.7
11.500
0.538
3.0
9.600
*0.356
15.0
10.400
0.980
16.6
Me
12.500
*0.154
< 0.0
12.400
*0.219
< 0.0
10.300
,k0.365
14.9
11.100
*0.051
8.3
Table 3.3 Continued
Na
AG MPI
18.50
5.83
8.2
18.000
6.t3
14.0
394
20t
< 0.0
14.10
5.21
35.6
Cu
I1.700
0.200
< 0.0
11.700
0.185
< 0.0
9.770
0.161
13.4
1.890
0.017
83.1
Rexyn 201
Zn
I r.600
0.099
< 0.0
I1.600
0.165
< 0.0
9.580
0.065
15.8
23.100
1.760
< 0.0
Fe
1.590
0.144
68.7
1.880
0.038
60.1
1.440
1.350
98.0
0.185
0.000
96.0
Mn
16.200
*0.004
< 0.0
1s.800
0.180
< 0.0
13.400
*0.002
12.4
14.400
*0.002
5.9
Pb
10.300
*0.083
< 0.0
10.200
*0.082
< 0.0
8.n0
*0.01I
9.5
*0.771
*0.056
100.0
Ni
um)
10.300
0.016
< 0.0
10.400
0.1l0
< 0.0
,8.610
0.000
t4.7
9.130
*0.008
9.6
U
9.660
0.000
16.0
10.800
*0.951
6.1
8.730
0.000
24.1
0.000
0.000
100.0
Ì'JNJ
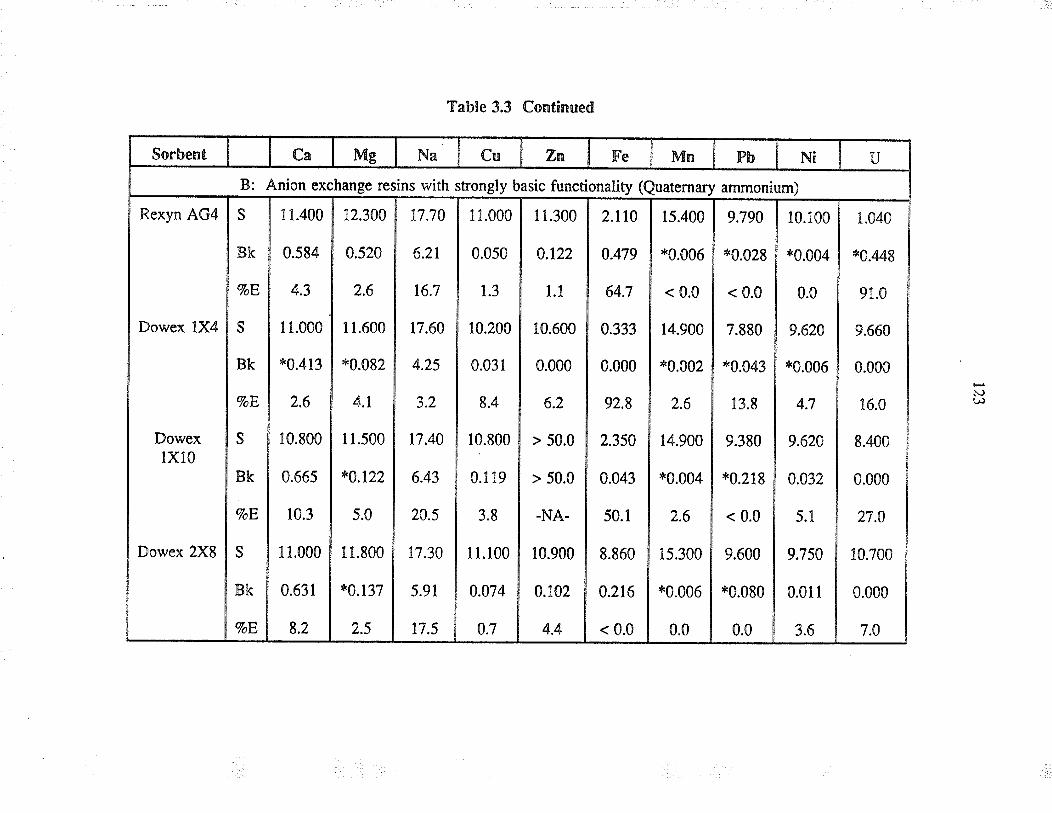
Sorbent
Rexyn AG4
B: Anion exchange rcsins with strongly basic functionality (Quaterna4
Ca
s
BK
%oE
S
BK
VoE
s
BK
VoE
s
BK
VoE
Dowex 1X4
11.400
0.584
4.3
11.000
*0.413
2.6
r0.800
0.665
10.3
r 1.000
0.631
8.2
Me
Table 3.3 Continued
12.300
0.520
2.6
I1.600
*0.082
4.1
11.500
*0.122
5.0
11.800
*0.137
2.5
Na
Dowex1X10
17.70
6.21
16.7
17.60
4.25
3.2
17.40
6.43
20.5
17.30
5.91
17.5
Cu
11.000
0.0s0
t.3
10.200
0.031
8.4
10.800
0.1l9
3.8
I1.100
0.074
0.7
Dowex 2XB
Zn
l1.300
0.122
1.1
10.600
0.000
6.2
> 50.0
> 50.0
-NA-
10.900
0.102
4.4
Fe
2.t10
0.479
64.7
0.333
0.000
92.8
2.350
0.043
50.1
8.860
0.216
< 0.0
Mn
1s.400
*0.006
< 0.0
14.900
*0.002
2.6
14.900
*0.004
2.6
15.300
*0.006
0.0
Pb
ammonium)
9.790
*0.028
< 0.0
7.880
'*0.043
13.8
9.380
*0.218
< 0.0
9.600
*0.080
0.0
Ni
10.100
*0.004
0.0
9.620
*0.006
4.7
9.620
0.032
5.1
9.7s0
0.011
3.6
[J
1.040
*0.448
91.0
9.660
0.000
16.0
8.400
0.000
n.0
10.700
0.000
7.0
N)
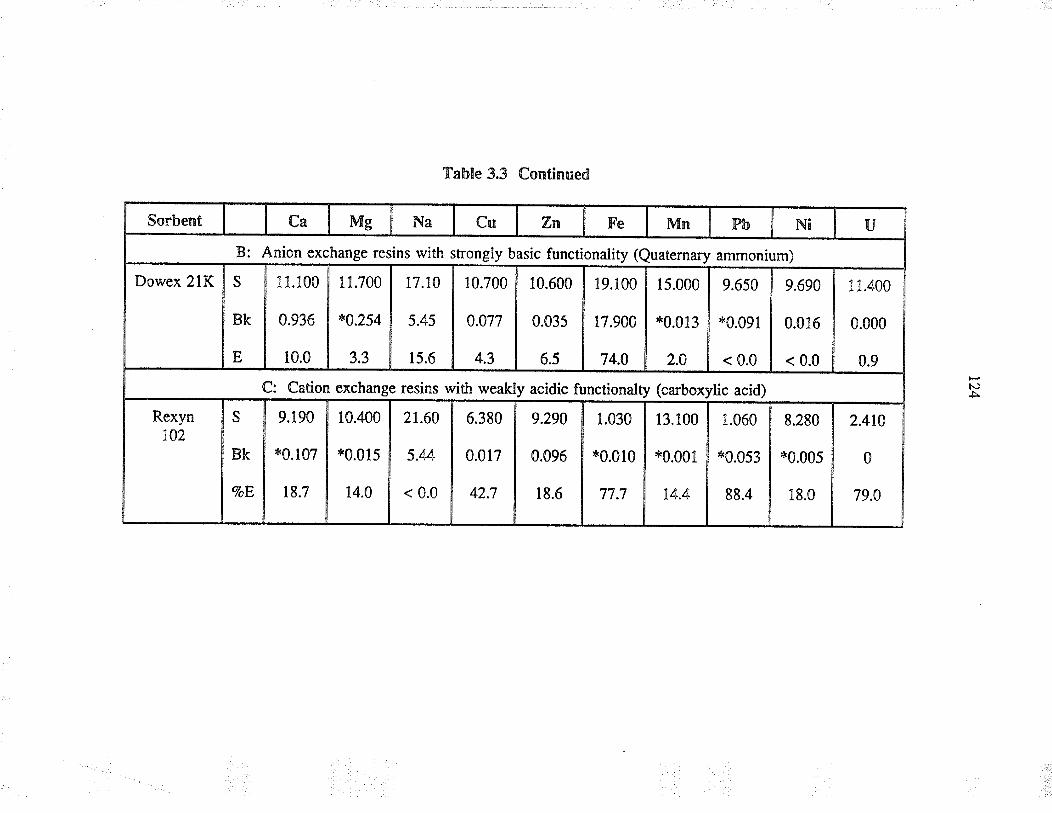
Sorbent
Dowex 21K
B: Anion exchange resins with strongly basic functionality (euaternary ammonium)
Ca
C
BK
E
11.100
0.936
10.0
Rexyn102
Mg
Table 3.3 Continued
I1.700
*0.254
3.3
Na
s
BK
?oE
C: Çation exchange resins with weakly acidic functionalty (carboxylic acid)
17.10
5.45
15.6
9.190
*0.107
18.7
Cu
10.700
0.077
4.3
10.400
*0.015
14.0
Zn
10.600
0.035
6.5
21.60
5.44
< 0.0
Fe
19.100
17.900
74.0
6.380
0.017
42.7
Mn
15.000
*0.013
2.0
9.290
0.096
18.6
Pb
9.650
*0.091
< 0.0
1.030
*0.010
77.7
Ni
9.690
0.016
< 0.0
13.100
*0.001
14.4
U
11.400
0.000
0.9
1.060
*0.053
88.4
8.280
*0.005
18.0
2.410
0
79.0
N)
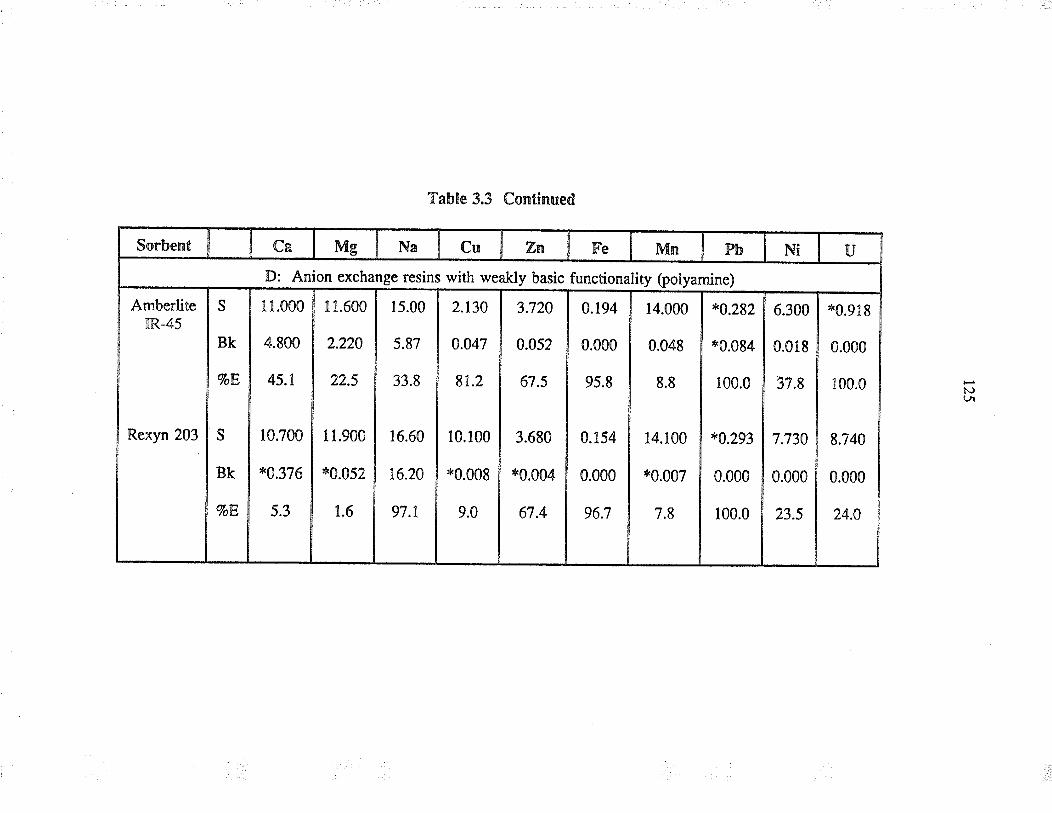
Sorbent
AmberliteTR-45
Ca
s
BK
%oE
e
BK
%oE
D:
Rexyn 203
I1.000
4.800
45.1
10.700
*0.376
5.3
Anion
Mg
exchange
Table 3.3 Continued
11.600
2.220
22.5
I1.900
*0.052
1.6
Na
resins with weakly basic functionality (polyamine)
r5.00
5.87
33.8
16.60
16.20
97.1
Cu
2.130
0.047
81.2
10.100
*0.008
9.0
Zn
3.720
0.052
67.5
Fe
0.t94
0.000
95.8
0.154
0.000
96.7
Mn
3.680
*0.004
67.4
14.000
0.048
8.8
14.100
*0.007
7.8
Pb
*0.282
*0.084
100.0
*0.293
0.000
100.0
N¡
6.300
0.018
37.8
U
*0.918
0.000
100.0
8.740
0.000
24.0
7.730
0.000
23.s
tJ
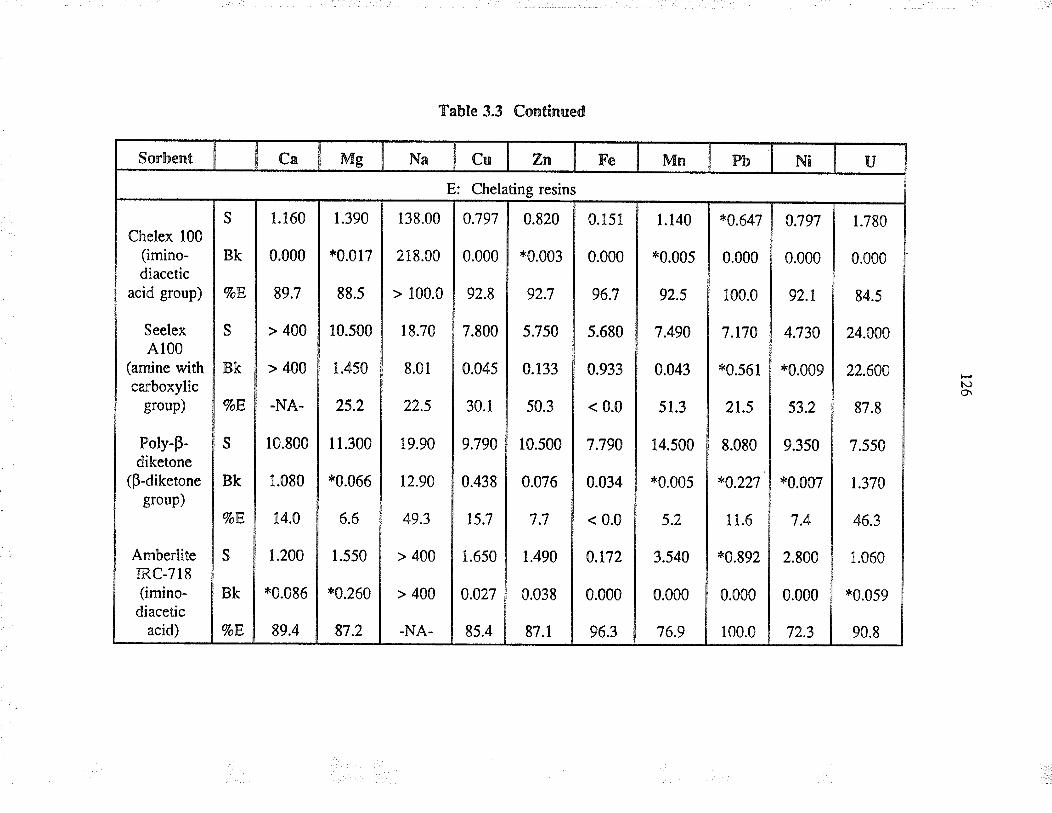
Sorbent
Chelex 100(imino-diacetic
acid group)
SeelexA100
(amine withcarboxylic
group)
Poly-p-diketone
(B-diketonegroup)
AmberliterRc-718(imino-
diaceticacid)
Ca
s
BK
%oE
S
BK
VoE
s
BK
VoE
s
BK
VoE
1.160
0.000
89.7
> 400
> 400
-NA.
10.800
1.080
14.0
1.200
*0.086
89.4
Mg
1.390
*0.017
88.5
10.s00
1.450
25.2
I1.300
*0.066
6.6
1.550
*0.260
87.2
Table 3.3 Continued
Na
138.00
218.00
> 100.0
18.70
8.01
22.5
19.90
12.90
49.3
> 400
> 400
-NA.
Cu
E: Chelating resins
0.797
0.000
92.8
7.800
0.045
30.1
9.790
0.438
15.7
1.650
0.027
85.4
Zn
0.820
*0.003
92.7
5.750
0.133
50.3
10.500
0.076
7.7
1.490
0.038
87.1
Fe
0.151
0.000
96.7
5.680
0.933
< 0.0
7.790
0.034
< 0.0
0.172
0.000
96.3
Mn
1.140
*0.005
92.5
7.490
0.043
51.3
14.500
*0.005
5.2
3.540
0.000
76.9
Pb
*0.647
0.000
100.0
7.170
*0.561
21.5
8.080
*0.227
11.6
*0.892
0.000
100.0
Ni
0.797
0.000
92.1
4.730
*0.009
53.2
9.350
*0.007
7.4
2.800
0.000
72.3
U
1.780
0.000
84.5
24.000
22.600
87.8
7.550
1.370
46.3
1.060
*0.059
90.8
t'.)o\
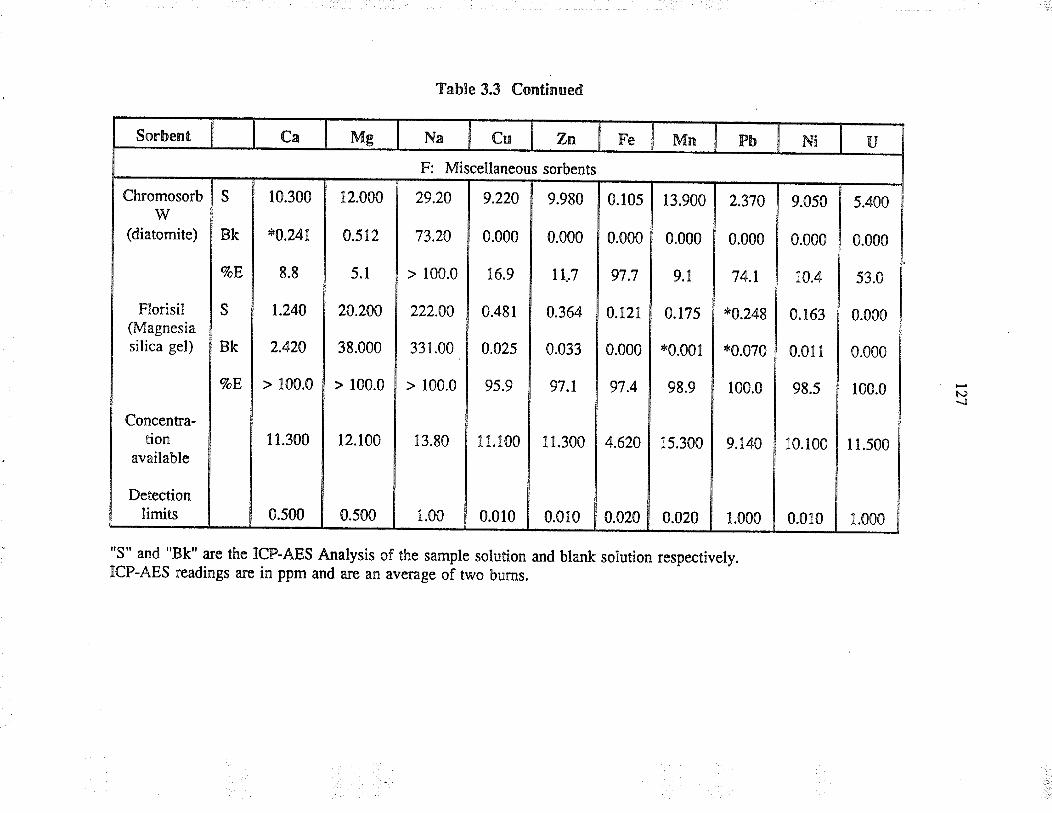
Sorbent
ChromosorbVr
(diatomite)
Flo¡isil(Magnesiasilica gel)
Concentra-tion
available
Detectionlimits
s
BK
VoE
s
BK
%oE
Ca
10.300
*0.241
8.8
1.240
2.420
> 100.0
Mg
Table 3.3 Continued
12.000
0.512
5.1
20.200
38.000
> 100.0
12.100
0.500
Na
F: Miscellaneous so¡bents
29.20
73.20
> 100.0
222.00
331.00
> 100.0
13.80
1.00
Cu
"S" and "Bk" are the ICP-AES Analysis of the sample solution and blank solution respectively.ICP-AES readings are in ppm and are an average of two bums.
9.220
0.000
16.9
0.481
0.025
95.9
Zn
11.300
9.980
0.000
tt,7
0.364
0.033
97.1
11.300
0.010
Fe
0.500
0.10s
0.000
97.7
0.121
0.000
97.4
4.620
0.020
Mn
13.900
0.000
9.1
0.175
*0.001
98.9
15.300
0.020
Pb
11.100
2.370
0.000
74.1
*0.248
*0.070
100.0
9.140
1.000
Ni
9.050
0.000
10.4
0.163
0.011
98.5
10.100
0.0100.010
U
5.400
0.000
53.0
0.000
0.000
100.0
11.500
N)\¡
1.000
128
extâction of uranium.
From the above results it can be seen that most of fhe sorbents tested were capable of
extracting u¡anium when t¡e mat¡ix wæ a simple aqueous solution. The sotbents that
showed greater than 75 percent ext¡action included all of the cation exchangers and
chelating sorbents that were tested, but not the anion exchangers a¡d miscellaneous
sorbents.
3.3.2 Sorbent behaviour ín complex aqueous solution
When the so¡bents were used with a uranium solution that had other cations present,
the sorbent behaviour was different æ shown in Table 3.3. Three sorbents showed
less tïan 10 percent extraction ard they were AG 2X8, Dowex 2X8 and Dowex 21K.
Nine sorbens had extraction values between 10 and 75 percent extraction. The
remaining fourteen of the twenfy-six sorbents tested showed good capability (i.e.7a E
> 75) in extraeting uranium from a complex matrix.
A comparison of Table 3.2 and Table 3.3 shows that 76 percent of the sorbents tested
were capable of extracting uranium from a simple aqueous mat¡ix, but this dropped to
53 percent when the matrix wæ a more complex solution. It can be concluded from
the above that when the matrix becomes even more complex, for example sear,vateÍ,
the number of sorbents that would be capable of extracting uranium would be even
fewe¡ i¡ number.
t29
on closer examination of rable 3.3, i¡ wæ observed that a large proportion of cation
exchange sorbents weæ capable of extracting ura¡ium a¡d also the other competing
ions that were p¡esent in solution. In the exuaction of uranium from seawater these
so¡bents would quickly reach capacity if they do not show selectivity towa¡ds uranium.
The chelating sorbents chelex 100 and Amberlite IRc-?18, like the cation exchange
soóents, did not show any selectivity towards uanium.
The chelating sorbents, poly-p-diketone and Seelex 4100, showed some selectivity
towards the uptake of uranium from complex aqueous solutions. Although
seelex 4100 appears to show selectivity, it lacked physical ståbility and a significant
proportion of it wæ soluble in water. Among the chelating sorbents that we¡e tested,
only poly-p-diketone displayed good selectivity and physical stabiliry for the uptake of
u¡anium from complex solutions. The low qo exlrraction (i.e. Vo E = 46.3) ca¡ be
improved by either increæing tïe amount of poly-B-diketone or by incorporating a
larger number of B-diketone functional groups on the sorbent. The preparation of a
B-diketone sorbent will be discussed in Chapter IV.
Tables 3.2 and 3.3 show that the concent¡ations of cations that were avai.lable fo¡
ext¡action were around 10 ppm or higher. The higher values obtained may have been
caused to a small extent by impurities in the salts used for making up the solutions.
Another possible mino¡ source of enor could a¡ise from the successive volumetric
dilutions of the stock solution. The latter pmblem can be prevented by diluting the
130
stock solution by weight insæad of by volume. Since only relative changes in
concentmtion of the metal ion we¡e used fo¡ the evaluation of the sorbents (i.e.
concentrations before and after the addition of the so¡bent) the above enors did not
affect overall results. In Table 3.3, the concent¡ation of Fe that wæ available for
ext¡action was found to be 4.62 ppm. This was a considerable difference from the
l0 ppm that was supposed to be in solution. This drop in concentration leads us to
the conclusion that the precipitation or cloudiness that was observed during the
preparation of t¡e stock solution wæ due to the formation of iron hydroxide.
The relative selectivities of sorbents that were evaluated for the va¡ious cations a¡e
given in Table 3.4. The selectivity was bæed on the extmction values that were
obtained from Table 3.3. Cations with ext¡action values below 10 percent were not
i¡cluded in the above series. Table 3.4 would give greater information to the analyst
as fa¡ as choice of sorbent availability and the selectivity of the sorbent when working
with relatively simple solutions.
3.4 Conclusion
The results of this survey show tlìat when the experimental system was a simple
aqueous solution (i.e. uranyl aceute solution) many sorbents were capable of
extracting uranium. ln the presence of competing ions, the number of sorbents that
were capable of exuacting uranium decreased considerably, and only one sorbent, i.e.
poly-p-diketone, had displayed good selectivity towards uanium and had good
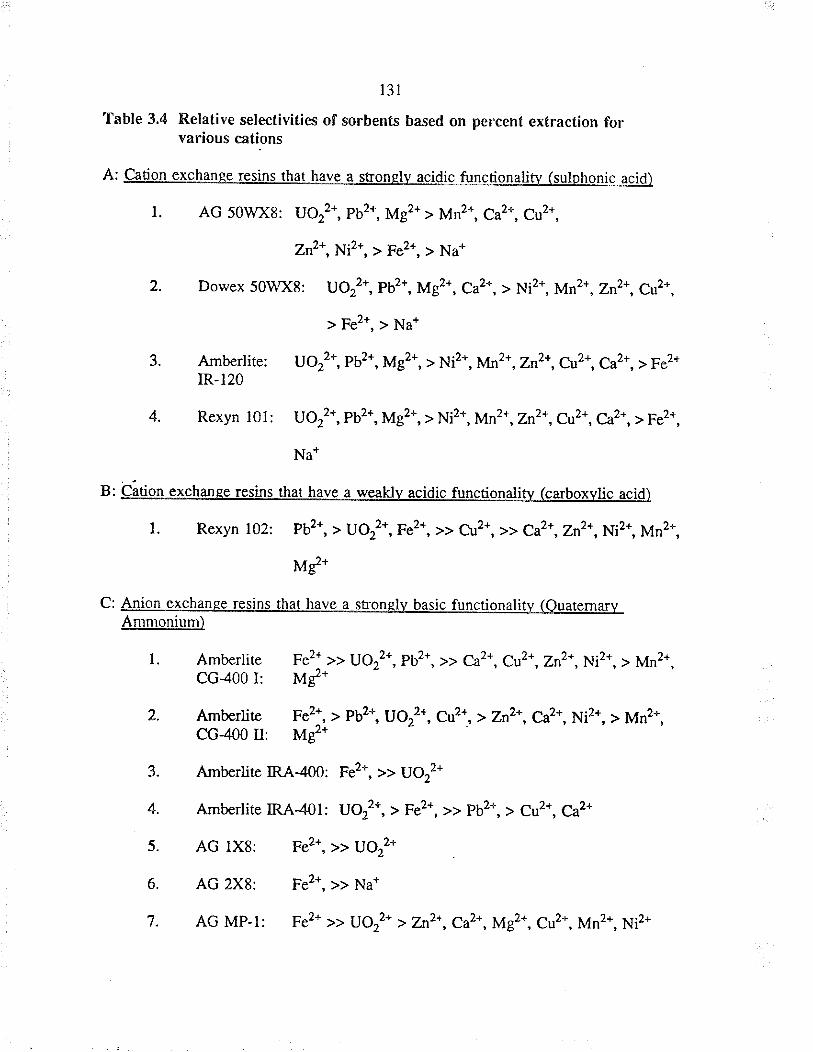
131
Table 3.4 Relative selectivities of sorbenfs based on percent extraction forvarious cations
A: Cation exchanse resins that have a stronsly ¡gklic functionality (sulohonic acid)
l. AG 50wXg: uo22*, pb2*, Mg2* > Mn2*, Ca2*, Cu2*,
zn2*, Ni2*, > Fe2*, > Na*
2. Dowex 50WX8 i lJO22*, pb2*, Mg2*, ca2*, > Ni2*, Mn2*, zn2+, ctr2*,
> Fe2*, > Na*
3. Amberlite: uo22+, pb2*, Mg2*, > Ni2*, Mn2*, znz*, at2*, cÀ2+, >Fez,IR-120
4. Rexyn l0l: uo22*, pb2*, Mg2*, > Ni2*, Mn2*, Zn2*, Cu2*, Ca2*, > Fe2*,
Na*
B: Cätion excha¡ee ¡esins that have a weâklv acidic functionaliw (cüboxvlic acid)
l. Rexyn 102: pb2*, > uo22*, Fe2*, >> cu2*, >> ca2+, znz+, Ni2*, Mn2*,
M*.
C: Anion exchanee resins that have a sÍonqlv basic funcrionalitv (OuatemarvAmmonium)
l. Amberlite Fe2* >> uor2*, pb2*, >> ca2*, cu2r, zn2*, Ni2*, > Mn2*,Cc400 I: My'*
2. Ambe¡liæ Fe2*, > pb2*, uo22*, cu2*, > zn2*, ca2*, Ni2*, > Mn2*,CG-4o0 tr: M**
3. Amberlire IRA400: Fe2*, >> UOr2*
4. Amberlite IRA401: uo¿2*, t Fe2*, >> pb2*, > cu2*, ca2*
5. AG lX8: Fe2*, >> UO22*
6. AG 2X8: Fe2*, >> Na*
7. AG Mp-t: FeZ* >> UOr2* r Zn2*, Ca2*, Mg2*, Cu2*, Mn2*, Ni2*
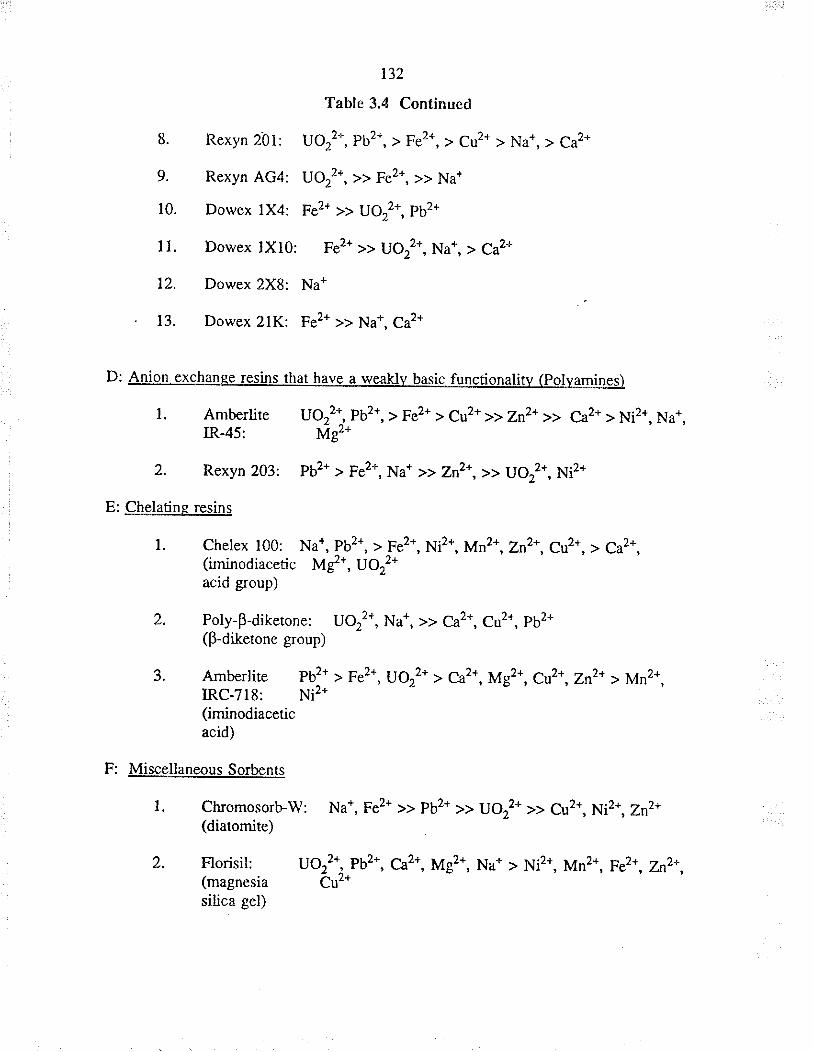
132
Table 3.4 Continued
8. Rexyn 2'01: UO22*, pb2*, > F.2*, > Cuz* > Na*, > Ca2*
9. Rexyn AG4: Uo22*, >> Fe2*, >> Na*
10. Dowex lX4: Fe2* >> lJo;*, pb2,
lI. Dowex lXl0: Fe2* >> Uo22*, Na*, > Ca2*
12. Dowex 2X8: Na+
13. Dowex 2lK: Fe2t >> Na+, Ca2*
D: Anion exchanse resins that have a we¿klv basic functionalitv (polvamines)
L Amberlite uo221 pb2*, > Fe2* > cu2* >> zn2* >> ca2* > Ni2*, Na*,IR-45: Md*
2. Rexyn 203: pb2* > Fe2*, Na* >> Zn2*, >> UO22*, Ni2*
E: Chelati¡e ¡esins
L Chelex 100: Na*, pb2*, > Fe2*, Ni2*, Mnz*, Znz*, Cu2*, > Ca2*,(iminodiacetic Mg2*, UO22*acid group)
2. poly-p-diketone: UO22*, Na*, >> Ca2*, Cu2*, pb2*(p-diÌetone group)
3. Ambe¡lite pb2* > Fe2*, uoz2*, ca2*, Mg2*, cu2r, znz* > Mn2*,IRC-718: Ni'*(iminodiaceticacid)
F: Miscellaneous Sorbents
l. Ch¡omosorb.W: Na+, Fe2+ >> pb2* tt UOrt* >> Cu2*, Ni2*, zn2*(diatomiæ)
2. Florisil: uo22*, pb2*, cÂzt, M**, Na* > Ni2*, Mn2*, Fe2*, 2n2.,(magnesia Cur*silica gel)

133
physical st¿bility under tìe condirions tested. Alr¡ough the poly-p-dikerone displayed
good selectivity it had a low extraction (i.e.46.3Vo); the percent extraction can be
improved by using larger amounts of the sorbent or by ircreasing the number of
p-diketone groups on the so¡bent.
r34
CTHPTER IV
PREPARÄTION AN'D EVALUATION OF SOME NEW SORBENTS FOR
THE SORPTION OF URANIUM
4 Introduction
Commonly available instrumental techniques a¡e unable !o dhectly deærmine race
uranium levels in samples with a complex matrix. Separation æchniques (such as
solvent ext¡action or column extraction) must be employed to preconcenlrate and
sepa¡ate uranium from the matrix to obtain accurate ard reproducible analytical
measurements.
During the past three decades, the uæ of column extractions fo¡ t¡ace metal
preconcentration has fa¡ exceeded the use of solvent extraction in most anal¡ical
labo¡atories. However, the survey of commonly available sorbents, as shown in
Chapter III, revealed the lack of sorbents for the selective exûaction of uranium.
The need to develop sorbents fo¡ the selective upuke of uranium is of importance not
only in analytical chemistry but also for a number of othe¡ applications, for exarnple,
in the nuclear industry they could be used for the manufacture and reprocessing of
high grade fuel rods. The sorbents would play a vital role in the clean-up procedures
for spills involving uranium i¡ the nuclear industry and other radiochemical facilities.
Sorbens, with the capability to selectively sorb uranium, would replace the existing
135
ion exchangers that are used in the u¡anium mining indusfry for the production and
refining of uranium metal from its ores. These so¡bents can be used for the removal
of uranium from u¡anium mine tailings and as a filte¡ fo¡ removing u¡anium from
natural ground water to make the water potable in locations close to uranium deposits.
Ideally the sorbent should have high porosity, good mechanical and chenical srabiliry,
be relatively inexpensive and simple to make if it is to be used for analytical,
environmental or indusFial purposes. The preparation and evaluation of th¡ee
sorbents, with the above characteristics, for the preconcentration of u¡anium will be
discussed in this chapter.
4,1 Reagents used
Polyvinylalcohol (average molecula¡ weight of 115,000 and 3,000), l -benzoylacetone,
N-2-thiazoly-aceroacet¿rnide,4,4,4-trifluoro-1-phenyl-1,3-butanedione,
phenylphosphonic acid, benzyl cyanide, stearylnitrile ancl acrylonitrile we¡e obtainecl
from Aldrich Co. (WI, USA). Chromium trioxide, acetylacetone, hyclroxylamine_
hydrochloride and N,N-dimethylformamide were obtained from Fishe¡ Scientific co.,
(NJ' usA). Phthalonitrile and N-butyranitrile we¡e obrained fiom Eastman Kodak co.
(1.'11, USA). The above chemicals were of reagent grade and were used without
further purification. Hypolri\r FHP 2002 prepolymer, used in the production of various
foams, was a sample provided by W. R. Grace and Co., (MA, USA). Commercially
available polyester and polyether foams were obtained f¡om Canlab (Winnipeg,
136
Canacla) and Zellers department stores (Winnipeg, Canada) respectivel),. Industrial
polyacrylonitrile fibres were obtained from woolco department stores @innipeg,
canada) and polyacrylonitrile (orlonrv¡ fab¡ic was obtained from E. I. Dupont cle
Nemours and co. I¡c., (DE, usA). The "I¡stant oceanrlr" that was used to make
a¡tificial seawater was obtained from Aquarium System Inc., (OH, USA).
4,2 Apparatus used
All water usecl was frst purifiecr by reverse osmosis forowed by passage through a
Barnstead Nanopure IIrv system. Measurements of pH were obtained using a Fisher
AccumetrM model 825 MP pH meter. whatman No. 54rrM filter paper was used for
all filtering purposes. lnfra¡ed measurements, were obtained using a FT-IR instrument
(Bomem Inc., Model M-100, euebec, Canada) which was equipped with an ATR cell
(Specrra-Tech Inc., cr, usA). Foam pieces were ground to a powder in a søinless
steel container on a waringrM blender (Dynamics corporation of America, cr, usA).
similarly polyacryloninile (orlo¡ru¡ fibres were ground to a powder using a w eyrÀr
mill (Thomas scientific Apparatus, pA, usA). Sample solutions were shaken eirher
with a Bunell w¡isrAcdon Shaker (Bunell corp., pA, uSA) for solutions at 4oc and
22oC or a Dubnoff Metaboric shaking rncubaro¡ (precision Scientific, IL, usA) for
solutions at 40oC and 70oC.
r37
4.3 PolyvinylaJcohol conversion to poly-þdiketone
Poly-þdiketone @BDK) was described in Chapær III as a¡ effective sorbenr for rhe
selective extraction o¡ u¡anium from aqueous solutions. The synthesis of ppDK from
polyvinylalcohol (PVA), using various methods, wi-ll be described in this secrion.
Poly-P-diketone, æ a functional group for the selective extraction of u¡anium, has
been reporæd extensively by workers in Japan and many European countries.?a.7ó'rt.r?8
Japanese ard Europeans have been concerned mainly with the profirable ext¡action of
uranium from seawate¡ with the goal of using the recovered uranium as a fuel for thei¡
nuclear planß.3'r?'r8'rss'rsó'r6{ B-diketone has been shown to be effective in extracting
uranium from seawater with good ælectivity.Ta Djamali and Lieser?ó synthesized
polystyrene with 1,3-diketone as the anchor group which was capable of extracting
u¡anium. Tabushi et alt'8 have synthesized a macrocyclic hexaketone and a cycLic
tetaketone which were also effective in the selective exfaction of uranium. Marmo¡
a¡d Kida¡er?7 prepared a poly-p-diketone resin by t¡e controlted oxidarion of
polyvinyl alcohol with cfuomic acid.
These resins a¡e not available commercially and atrempts to synthesize the macrocyclic
poly-p-diketone in our laboratory failed alrirough the synthesis was performed
according to the procedures outlined in the literature. The conûoUed oxidation of
polyvinyl alcohol with ch¡omic acidrz was afiempted and this resulæd in a poor yield
of a very fhe powder of poly-p-diketone @BDK).
138
chromic acid wæ prepared by dissolving 28.5 grams of cro, in 500 mL of deionized
water' to which 175 mL of concentrated H2so4 was added wift constant stirring. This
ch¡omic acid was added slowly to a freshly prepared mixture of 25 grams of pVA
(MW 3000) a¡d 375 mL of deionized warer. Ca¡e was raken to see rhar rhe
temperature of rhe resulting solution never exceeded 60"c during the addirion of
ch¡omic acid. The temperature of the solution wæ raised to 90oC for 24 hou¡s,
followed by fiJtration through a Buchner funnel with No. 541 \ hat¡nan¡v filær paper.
The b¡own product was dried under vacuum in the presence of DrieriterM for
24 hours. The final producr was a fine powder which, when packed into a column,
resulted in considerable back pressure.
ln the above procedure, we observed that PVA dissolved immediately fonning a
solution rather than the slurry which was observed by Mannor and Kidane.ru The
formation of a solution, instead of a slurry, resulted in a final product that was a fine
powder. Several methods were then attempted to increase the pa¡ticle size a¡d one
such method ìxas ro add PVA (Mw 3000) directly ro the chromic acid solution, bur
this did not produce larger sized PpDK material.
The lack of information on the molecula¡ weight of PVA used by Marmor and
Kidaner?? in their publication, led us to attempt the synthesis with a higher molecula¡
weight PVA (i.e. MW 115,000). The assumprion made in rhe use of MW 115,000
(PVA) was that it would have a smaller solubitiry compared r.,o MW 3000 (pVA) and
139
this smaller solubility would produce a slurry instead of a solution. Altrough tre use
of PVA (Mw t 15,000) ¡esulted in a slurry, the addition of ch¡omic acid converted the
slurry inlo a solution producing finely divided pBDK material.
The uæ of a salting agent such æ Nacl in the chromic acid to decrease tlre solubility
of PVA (MTV 115,000) was suggested by Dr. Charlton of this Deparunent. Twenty
grams of PVA (MlV 115,000) was added to 100 mL of l07o HrSe which was
previously saturated with Nacl solid. To the resulting slurry, 100 mL of 20vo (wt/vol)
CrO, in deionized water wæ added slowly with constanr stining using a magnedc
sti¡rer. The temperature of the above mixlure was kept below 25"c and this was done
by carefully controlling the rate of addition of cro, solution. This resulted in larger
sized PBDK which sø¡ted to dissolve when left in ch¡omic acid solution fo¡ more than
l5 minutes.
When tle procedure wæ modified by drastically reducing the concentration of HrSe
and CrOr, the resulting PBDK formed wæ of larger particle size. The method used
400 mL of SVo CrO, wirh 5 mL of concent¡aæd HrSe which was added to l0 grâms
of PVA (MW 115,000) wirh consra¡r stirring for l0 minuæs, The resulring brown
cryslalline product wæ washed wit¡ deionized water to remove any uffeacted ct- and
then rinæd r,¡/ith acetone a¡d later d¡ied under vacuum in the presence of DrieriteÌM
for 24 hours.
140
The ext¡action efficiencies of the above PBDK materials were deænnined by
equilibrating one gram of PBDK with 25 mL of 10 ppm uranium solution in a cove¡ed
beaker witlr constant stirring for 24 hours. The solutions were filtered and analyzed
by ICP-AES. The ¡esults showed an 83Eo exÍ?'crron by PpDK made by the modihed
procedure (i.e. reduced concenraüon of HrSQ and CrOr), compa¡ed with 54Vo by
PpDK made by the satting our procedure and 34Va by unEeated pVA (MW ll5,0O0).
4.3,1 Time stud¡
Although PpDK, made by the modified procedure, showed a good capability in
extracting uranium from a simple aqueous solution it was of importance to determine
if PpDK was capable of sorbing u¡anium from a bica¡bonate solution. The purpose of
using a bicarbonate solution was to simulate seawater in its simplest form. The
determination of the dme required for equilibration was of imporrance if one was
inæ¡esæd in using PpDK as a column marerial. To determi¡e the capability of PpDK
in sorbing uranium from a bica¡bonate solution, and also to determine the effect of
equilibrium time on percent ext¡action, the following experiment was performed.
Two hund¡ed mL of a l0 ppm uranium solution (which conrained 200 ppm of sodium
bica¡bonaæ) were added to a sample of 50 grams of PpDK in a 500 mL beaker. The
solution was stirred using a magnetic sti¡rer. At different times, 5 mL of solution was
removed and filtered prior to analysis by ICP-AES.
Figure 4.1 shows the poly-B-diletone wæ capable of sorbing uranium f¡om the
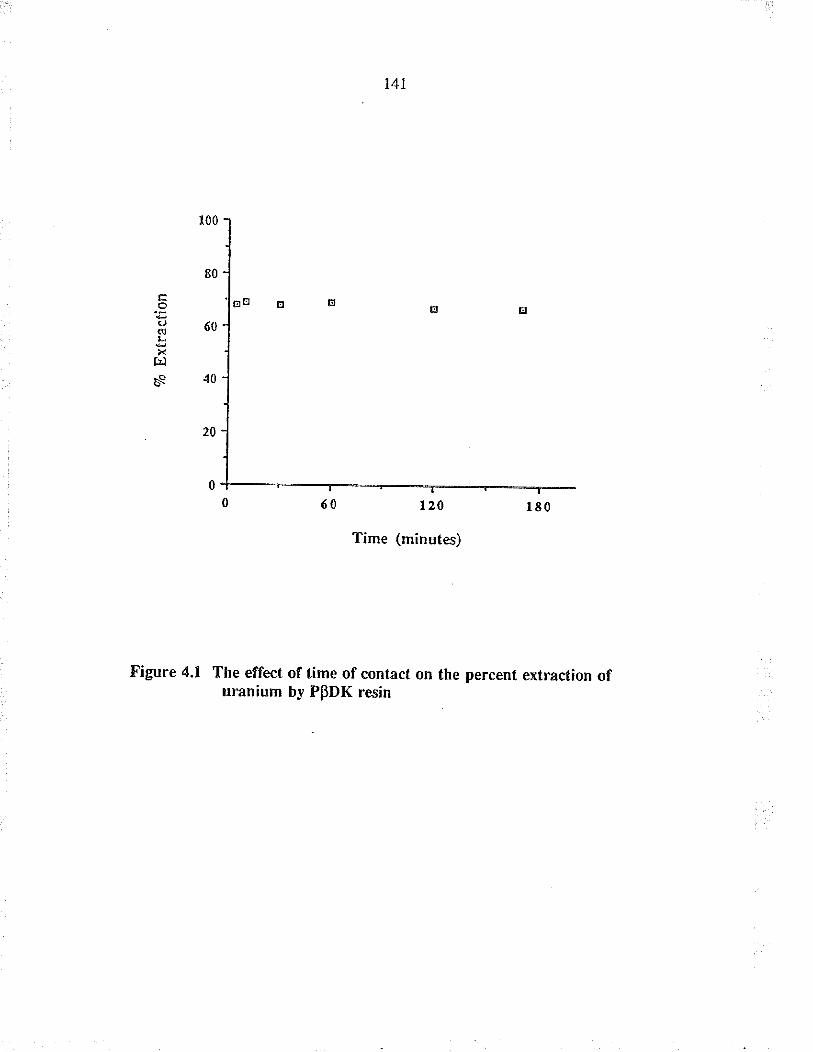
r00
80
60
40
20
0
Figure 4,1 The effect of time of contact on the percent extraction ofuranium by PpDK resin
oÇl(!LX
f¡lèe
142
bica¡bonate solution a¡d that ¡he 70 exf¡action did not inc¡eæe after five minutes of
contâct.
4,3,2 Column studies
The usefulness of this material wæ evaluated by packing it into a seæta¡ columns.
These columns were made with Teflonru a¡d were obtained f¡om Seasta¡w
Inst¡uments Ltd., 8,C., Canada. Twenty litres of a solution containing 30 ppb uranium
and 200 ppm sodium bica¡bonate was pumped tkough the column at 100 ml..min-t.
The bica¡bonate concenûation wæ chosen to partially simulate the seawater
concentration. The uranium was eluted with 100 mL of 3M HCI and analyzed by
ICP-AES which showed a 63Eo extractton, æsuming complete elution.
Although PBDK was found to be effective in extracting uranium, it presenæd problems
due to the presence of un¡eacted pvA. Afær reusing the ppDK a few times, it formed
a gel-Iike substance which would eventua.lly crack, resulting in bleeding f¡om the
column. In an attempt to prevent crumbling of pBDK, it wæ mixed with sodium
chloride in the ratio 10:l (wt) and pelletized under hor condirions. It was thought that
when this pellet wæ placed in water the sodium chloride present in tre matrix would
dissolve, leaving porous PpDK. However, the pellet collapsed afær standing i¡ water.
An ideal sorbent should have high porosity, good mechanical (i.e physical) and
chemical stability. Mechanical st¿biliry is importânt for a sorbent if it is to be used as
143
a column material. To prevent column bleed, the column mate¡ial should withstand
some pressure without collapsing into a fine powder. A fine powder increases tlre
back pressure exerted by the column, thereby requiring the need for a high power
performance pump to move liquid through the column. As ppDK lacked mecha¡ical
sfåbility, further work on the di¡ect conve¡sion of pVA to ppDK was discontinued.
However, the incorporation of p-di-ketone group inlo a matrix with good mechanical
and chemical subility could prove to be useful. one such matrix is polyurethane foam
which would offer seve¡al advantages such as good porosity, mechanical and chemical
stability, eæiJy available, rclalively inexpensive and simple to make.
The use of pol¡uretlrane foams for the extraction, recovery and preconcentation of
various inorganic ald organic species from aqueous, non-aqueous ard gaseous
mixfures has received considerable attenlion during the past two decades. A ¡eview of
Iiterature devoted to polyurethane-based polymeric sorbents in separation chemistry,
was documented by Moody a¡d Thomasze and Braun et al.26r polyurethane foams
have been shown to be i¡ert and st¿ble, but they degrade when heaæd between lg0
and 200"c. The polytrethane foams remain unaltered, apart from swellkrg reversibly,
when reated with water, 6M HCl,4M HrSO1, 2M HNO3, NH1OH, NaOH or
CH3COOH. Theæ foams decompose in concentraEd HNO, and dissolve in
concentrated HrSQ. Polyuretha¡e foams a¡e also stable in organic solvents such as
light peholeum, benzene, carbon tetrachlo¡ide, chlo¡oform, diethylether, acetone and
alcohols.
t44
Polyurethanes constitute one of the few polymers that are highly elætomeric a¡d show
good biocompatibility and have been used in the making of many biomedical implant
devices. The long term ståbility of polyurethaÍes i¡ biomedical envi¡onments is
currently being debated, especially in the use of polyurethanes for exænded implant
applications, as some studies have shown tìat polyurethane foams undergo some
degradation.262¿ó3:s Although the long term stability of polyurethanes in biomedical
implant applications is being debaæd, pol''ì¡rethane foam in analytical chemistry has
been considered to be sufficiently inert and stâble2eo,zor fo¡ use as a sorbent material.
4,4 Incorporâtion of polyvinylalcohol into Hypolil polyurethane foam
Since the PpDK lacked mechanica.l stability, ir was decided to incorporate PVA i¡to
the matrix of the polyuretlane foam by imbedding the PVA during the foaming
process. The PVA in the foam would then be converted into PBDK by controlled
oxidation with ch¡omic acid as given by Marmor and Kidane.rTT
PVA-imbedded polyurethare foam wæ prepared by mixing equal weights of HypolrM
prepolymers and an aqueous solurion of SVo (wt) or 107o (wÐ PVA (M.W. 3000).
Hypolil prepolymers, which a¡e derived from toluene düsocyanate, æact with active
hydrogen-containing compounds (i.e HrO, ROH etc.) to form polyuethane foarns that
are both elastomeric and hydrophilic in nature. The foams can be prepared by mixing
equal weights of Hypolw prepolymers and water or other active hyùogen-containing
compounds. Addirives may be suspended or dissolved in either or both of the organic
145
ald aqueous layer.ãs
A PVA of molecular weight 3000 was chosen æ ir wæ easily soluble in the aqueous
phase, compared ro PVA with higher molecula¡ weighr, i.e. t 15,000. The basic
method of synthesis was to mix the Hypolw prepolymer with an equal weight of
aqueous solution of PVA followed by rapid stirring of the mixtu¡e fo¡ 15 seconds with
a glæs rod, A blank foam was made in a similar way by mixing water witì Hypolw
prepolymer. The procedure for grinding and cleaning the foam was the same as the
one given later for p-diketone-imbedded polyuretlrane foams. An oxidizing solution
for the confolled oxidation of PVA wæ prepared by dissolving 7 grams of CrO, in
125 mL of deionized water. Thirty-five mL of concentrated HrSe was added slowly
to the CrO3 solution with constant stirring. Tfuee grams each of the blank foarn,5Va
PVA foam and 10Vo PVA foam were added to separate 50 mL portions of the
oxidizing solution; f.he oxidation was done to oxidize the pVA in ûre foam to form a
PpDK foam. On addirion of the ch¡omic acid solution, all of the foams were
converted to a thick liquid in abour 5 minutes.
The PVA foams a¡d the bla¡k foams produced \{ere not ståble at the conditions that
were used for the oxidation of PVA. Other oxidizing reagents, such æ HrO, or a
mo¡e di.lute ckomic acid solution, may produce better results. Rathe¡ than
incorporating PVA into the foam mat¡ix and then convening it into a
p-diletone (a two step synthesis), it wæ decided !o incorporate a reagent wirh
146
p-diketone as the functional group directly into the foam mat¡ix. The single sæp
method in the making of the foam with p-diletone group is simpler and is described
in the next æction.
4.5 Preparation and evaluation of a þdiketone-lmbe dded pol¡urethane
foam
4.5,1 Introduct¡on
Polyuretiane foams have been used as supports for va¡ious ext¡acÞnts; for example,
foams treated witì dithiazone or diethyldithiocarbamate or sulphide teated
foams have been used for tïe sorption of mercury,2*t* et}a¡ediol-¡¡eated foams fo¡
antimony,2óe and pyridylazonaphthol-Íeated foams fo¡ the sorption of zinc, copper and
mercury."o Copper and cadmium wgre extracÉd using polyurethane treated with
benzoylacetone.2Tr Polyurethare foam, when coated with a long chain tertiary amine,
was effective in extracting uranium2ta from acidic solutions with pH values between
I and 3. Gesser and Gupta2?2 have shown that uralyl nitrate can be extracted by
polyurethane foam f¡om aqueous acidic solutions in tle presence of salring agents.
Ext¡action of uranium from aqueous solutions using polyurethane foams that had been
loaded wit¡ various organic exmctånts have þen described ea¡lier in Chapter I
(i.e. 1.4.11).
The preparation of a p-diketone-imbedded polyurethane foam and the evaluation of its
147
ability to exûact uranium from aqueous solutions with a wide range of temperature
a¡d pH values will be discussed in this section.
4,5,2 Procedure
Hypolil foams are commonly foamed using approximately equal weights of Hypolru
prepolymer and water. Additives that contain B-diketones may be suspended or
dissolved in eithe¡ or botl of the organic and aqueous layer. In a preliminary study,
different p-diketones (acetylacetone, N-2,thiazolylacetroacetamide, l-benzoylacerone
and 4,4,4-trifluoro- 1-phenyl- 1,3-butanedione) were used with varying amounts (1, 5
and ljvo by weight) in the prepolymer matrix in an attempt to incorporate them into
the Hypolrrr foam mat¡ix. The procedure for incorporation was simita¡ to the
procedure used for the preparation of the p-diïetone foam, which is described laær i¡r
this section. Of the various B-dikerones studied only the foam with SVo (wVwt) l-
benzoylacetone showed good foam formation ard also exhibited the ability to extracr
ura¡ium from aqueous solution. The incorporation of acetylacetone and 4,4,4
trifluoro- l-phenyl- 1,3-butanedione resulted in the formation of a solid plastic instead
of a foam. N-2,thiazolylacetoacetamide formed a foam which was unable to extract
uanium ftom aqueous solution,
The HypoFu foam produced by rhe incorporatton of SVo (wt/wt) of l -benzoylacetone
into the foam matrix during the foaming process will be called ',þdiketone foam"
tlroughout fhe remainde¡ of this tlesis. p-diketone foam was prepared by mixing
148
equal weights of Hypolnt prepolymer containing 5vo (wr) of 1-benzoylacetone and
wate¡. The bæic method wæ to mix Hypolru prepolymer witl l -benzoylacetone solid
to form a clea¡ viscous solution. An equal weight of water was then added to tle
viscous polyme¡ solur.ion forowed by rapidly stirring the mixtu¡e for 15 seconds by
using a glæs rod.
The mixture initially became cloudy and rhen rose to ten dmes the originai volume by
releæing small bubbles of ca¡bon dioxide. The resulting B-diketone foam became
fack-free within five minutes and was ai¡ d¡ied in a fumehood for eight hou¡s. The
dried p-diketone foam was then cut i¡to small pieces. Theæ pieces were f¡ozen in
liquid nitrogen and then ground into a fine powder in a srainless steel container on a
waringrv blender. Freezing was necessary to make the foam brittle and the¡efore
easier to grind. Any pieces of unground foam were disca¡ded.
Powdering of the foam was necessary to reach equilibrium more quickly between the
foam a¡d the uranium solution, and also to ensure more reproducible results. The
powdered foams were first clea¡ed by washing with water followed by acetone. This
washirg process should remove a¡y foam impurities that a¡e soluble in water or
acetone. The powdered foams were initially soaked in water fo¡ fou¡ hou$ and the
resulting slurry was then fi.Iæred unde¡ vacuum through a whatmanw No. 541 filær
paper usirg a Buchne¡ funnel. The foam wæ recovered f¡om the nilter paper and the
complete procedure, soaking and filtering wæ repeated two more times. The foam
r49
rvas then washed, in a simila¡ way, witl acetone. The clean, powdered foam was then
left to dry under vacuum for four hou¡s to remove traces of acetone vapour, Blank
foam was prepared in a similar manner without the addition of l-benzoylacetone. The
colour of the clean, dry p-diketone foam was cream yellow compared to the blank
foam which was white.
The ext¡action capability was tested by adding 2s mL of l0 ppm uranium solution to a
60 mL screw rop Nalgenew plasric botrle rogether with approximately 0.200 t 0.003
grams of dried powdered foam. The capped bottles were shaken for five hours in an
automatic shaker and the filtered solutions were then analyzed by CFSM.
4.5.3 C haracterizatio,t ol the þdiketn n e. imb edtl e d pol¡ure thane foam
The extracrion cha¡acteristics of the B-diketone foam were studied by equilibrating the
foam witr ura¡ium solutions at different temperatures and pH values. The pH of tlre
ura¡ium solutions was adjusted with 2M HCI or 2M NaoH solution and the pH values
were monitored wirh a pH meter. uranium solurions with pH va.lues berween 1.4 a¡d
I1.0 and at different temperatures (i.e. between 4oc and ?0"c) were used to study the
extraction cha¡acteristics of the þdiketone foam.
uranium solutions were equilibraæd to the required temperatures before adding them
to the plastic bottles containing tlre foam. Shaking of solutions at room temperature
(22"C) nd at rhermostarically-conuolled cold room temperatue (4"C) was done using
150
a Bu$ell wrist Action shaker. simila¡ experiments at 40"c and 70"c we¡e performed
with a Dubnoff Metâbolic shaking Incubator equipped with a va¡iable temperatufe-
cont¡olled water ba!h. Temperature measurements were within + 2oC.
70 ExtÍacuon wæ calculated as
vaE=(I_F)I-r.100'where vo E is percent extraction, F is the concent¡ation of uranium left in sotution
after extraction and I is the concentrarion of uranium originally available. F is the
concent¡ation of ura¡ium in the solution that wæ left back after the ext¡action and
afæ¡ t¡e foam pieces had been filtered.
The concent¡ation of available ura¡ium, rather than tire initial concentration, wæ used
to tåke into account any precipitation of uranium species which is krown to occur at
pH > 2. The precipitate is not visible to the naked eye; however, Feldman2l3 et aL
had observed the precipitation of uraryl nitrare at pH > 4.5 by centrifuging the
solution. I is the concentration of u¡anium in the solution that \flas subjected to the
identical filt¡ation, pH and temperatu¡e conditions æ the foam sample solution, but
without the presence of ary foam. The values for I a¡d F, used in the calculation of
vo E, werc the averages obtained from experiments that were performed in triplicate at
a particular pH and temperatu¡e.
l5l
The uncertainty or error involved n Vo E was calculated2Ta using the following
formula:
vo Uncerlunty = I-2 ' [1282 + F,A,]t¿ ' 100
where B is the st¿nda¡d deviation of F, and A is tle st¿ndard deviation of I.
4,5,4 Resulß anil discussion
The p-diketone foam exhibits a high extraction between pH = 3 and pH = 8 and tlre
extraction dec¡eæes at either end of the pH range, as shown in Figures 4.2 and 4.3.
The drop in exftaction can be explained by the fact that uranium in aqueous solution
exists as a number of species depending on the pH of the solution. For uranium
solutions acidifìed with 2M HCl, the species formed in aqueous medium are UeCl,
and UO2CI* at pH values below 3. Under very basic conditions (i.e. pH values above
10) species such as UQ(OH); are formed due ro rhe hydrolysis of the uranyl ion275
and these species may nor be as extractable by this foam.
St¿ry and Hladkt'Tó unde¡took a systematic investigadon of the solvent ext¡action of
thirty metals using various solvents such as acetylacetone, benzoylacetone arld
dibenzoylrnethane i¡ benzene. Included in their study wæ the extraction of u¡anium
by benzoylacetone and thei¡ results are given in Figure 4.4. The extraction profile
reported by Stary and Hladkt'Tó was simil to r¡e þdikerone foam profile ar2zo3,
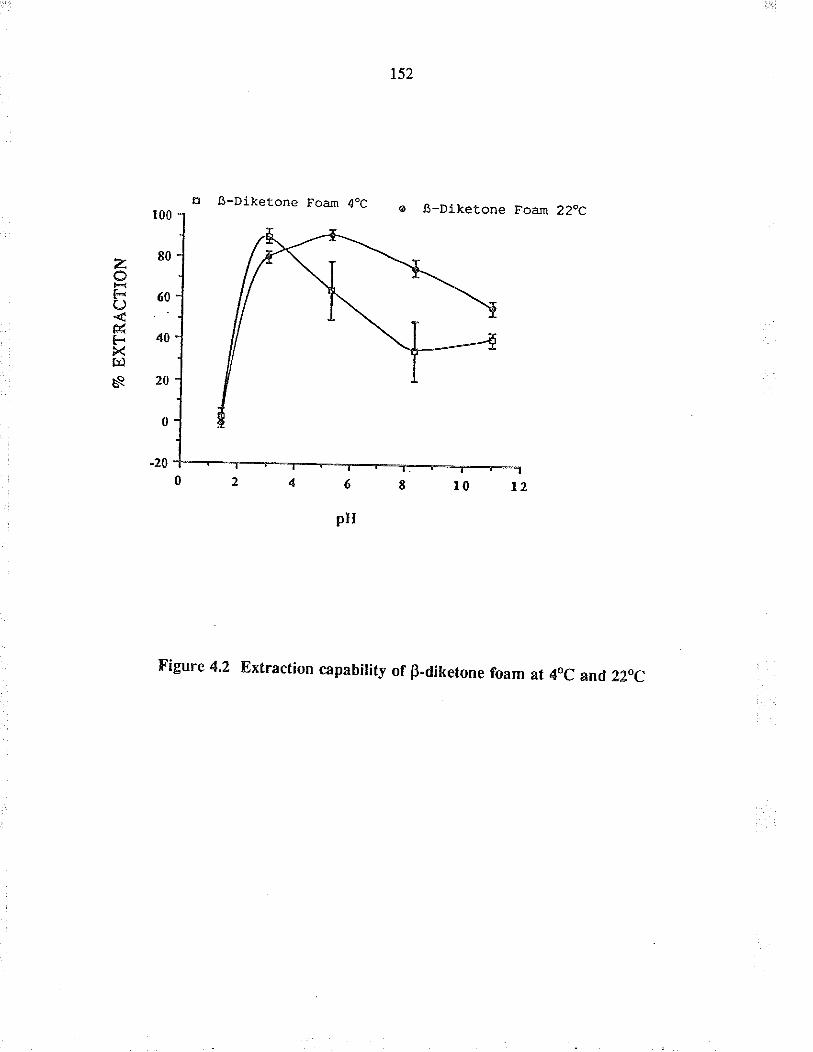
152
E ß-Diketone Foam 4oc e .B_Dj-ketone Foam 22oc
zoFC)
úÉ.Xl¡¡
èe
r00
80
60
40
20
0
-20
Figure 4.2 Extraction capability of B.diketone foam at 4oC and 22oC
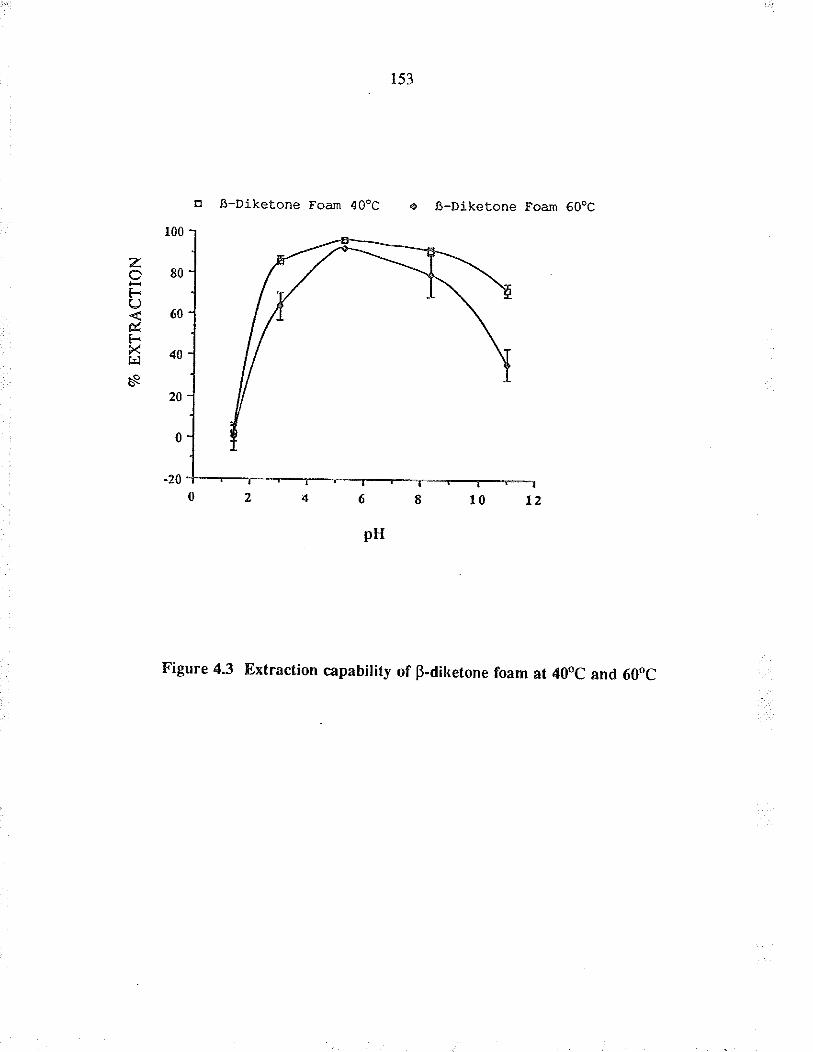
r53
zFL)
&Fxf¡l
s
Þ ß-Diketone Foam 40oC . ß-Diketone Foam 6OoC
r00
80
60
q
20
0
.20
Figure 43 Extraction capability of B-diketone foam at 40oC and 60oC
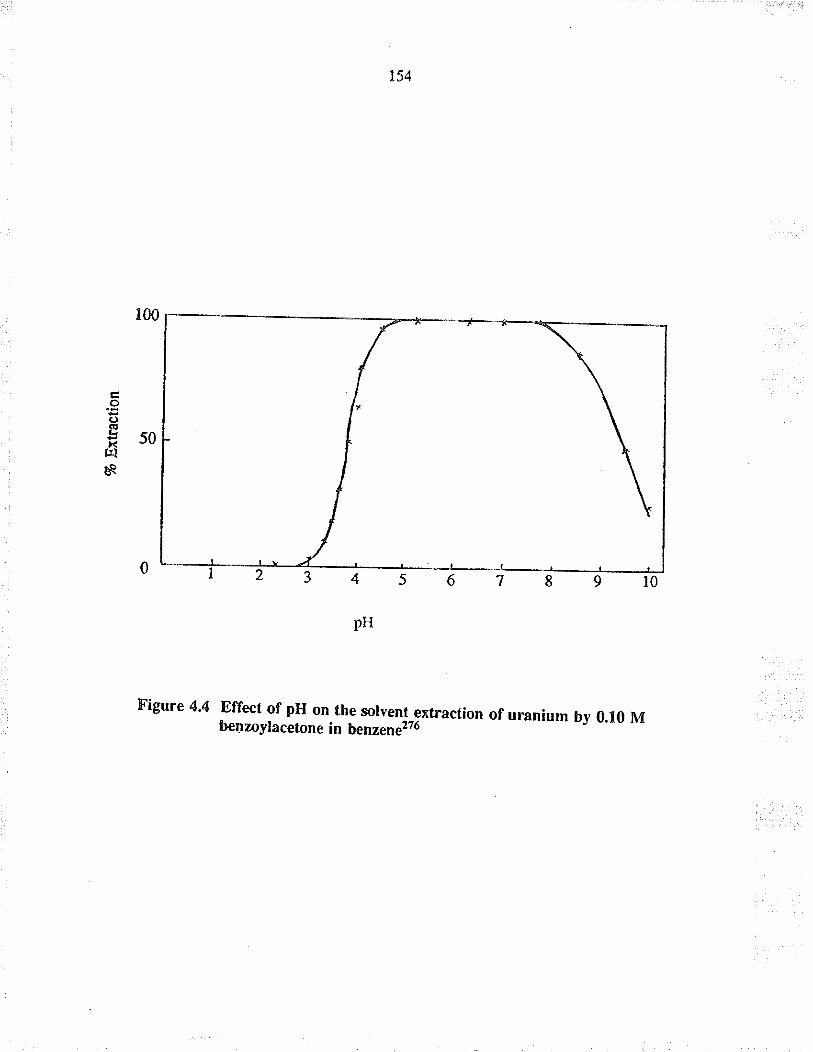
154
r00
cooõÞs0fr¡
ñ
r234s6t-----8-9to
pH
Figure 4.4 Effect of pH on-tbe solvent_extraction of uranium by 0.10 Mbe¡zoylacetone in benzene2Tó
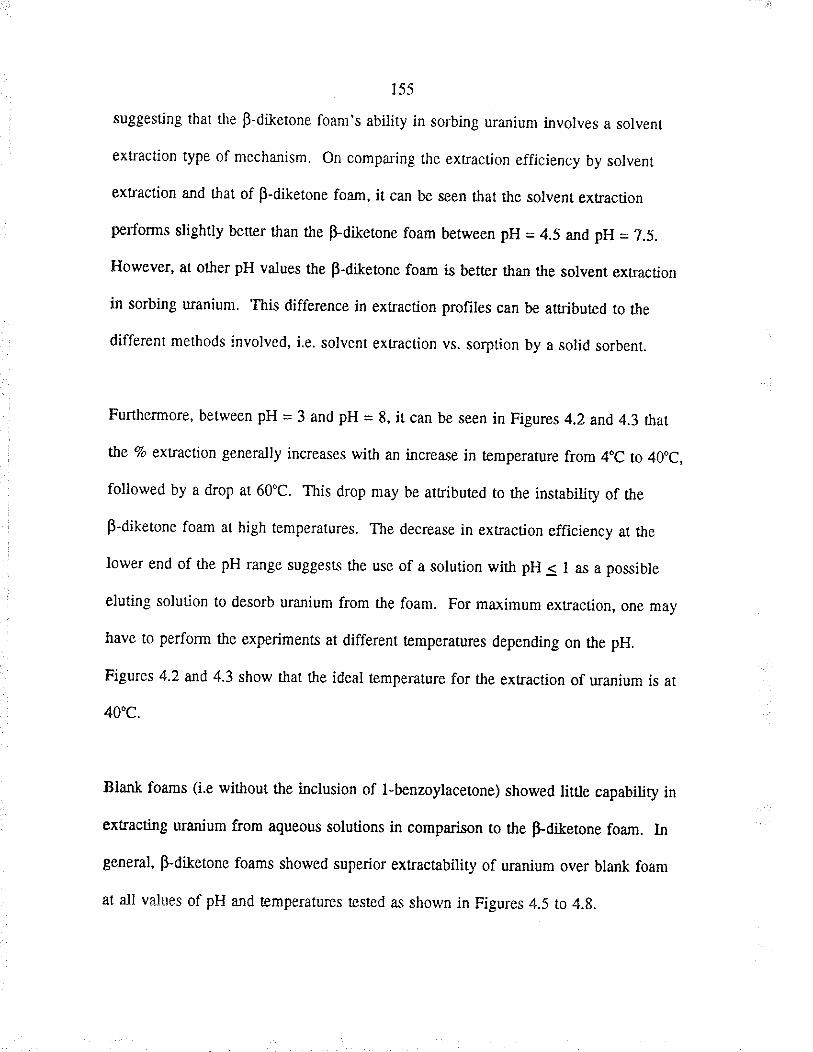
155
suggesting t¡ar the B-diketone foam's ability in sorbing uranium involves a solvent
ext¡acúon type of mechânism, on comparing the exüaction efficiency by solvent
exracüon a¡d úat of p-diketone foam, i¡ ca¡ be seen that the solvent ext¡acdon
performs slightly bener than the þdiletone foam between pH = 4.5 and pH = 7.5.
However, at other pH values the p-diketone foam is bene¡ than the solvent ext¡action
in sorbing u¡anium. This difference in ext¡action profiles can be au¡ibuæd to the
different methods involved, i.e. solvent exraction vs. sorption by a solid sorbent.
Furthermore, between pH = 3 and pH = 8, it can be seen in Figures 4.2 and 4.3 rhat
the 70 extraction generally increases with an increase in temperature from 4oc to 40"c,
followed by a drop ar 60"c. This drop may be artributed to the insrâbility of t¡e
B-diketone foam at high temperatures. The decrease in exuaction efficiency at the
lower end of the pH range suggests the use of a solution with pH 5 I as a possible
eluting solution to desorb uranium from tle foam. For maximum extraction, one may
have to perform the experiments at different temperaturcs depending on the pH.
Figures 4.2 and 4.3 show t¡at the ideal temperature for the extraction of u¡anium is at
40'c.
Bla¡k foams (i.e without the inclusion of l-benzoylacetone) showed little capability in
extracting u¡anium from aqueous solutions in comparison to the þdiketone foam. In
general, þdiketone foams showed superior extractâbility of uranium over bla¡Ì foam
at all values of pH and temperatures fested as shown in Figures 4.5 to 4.g.
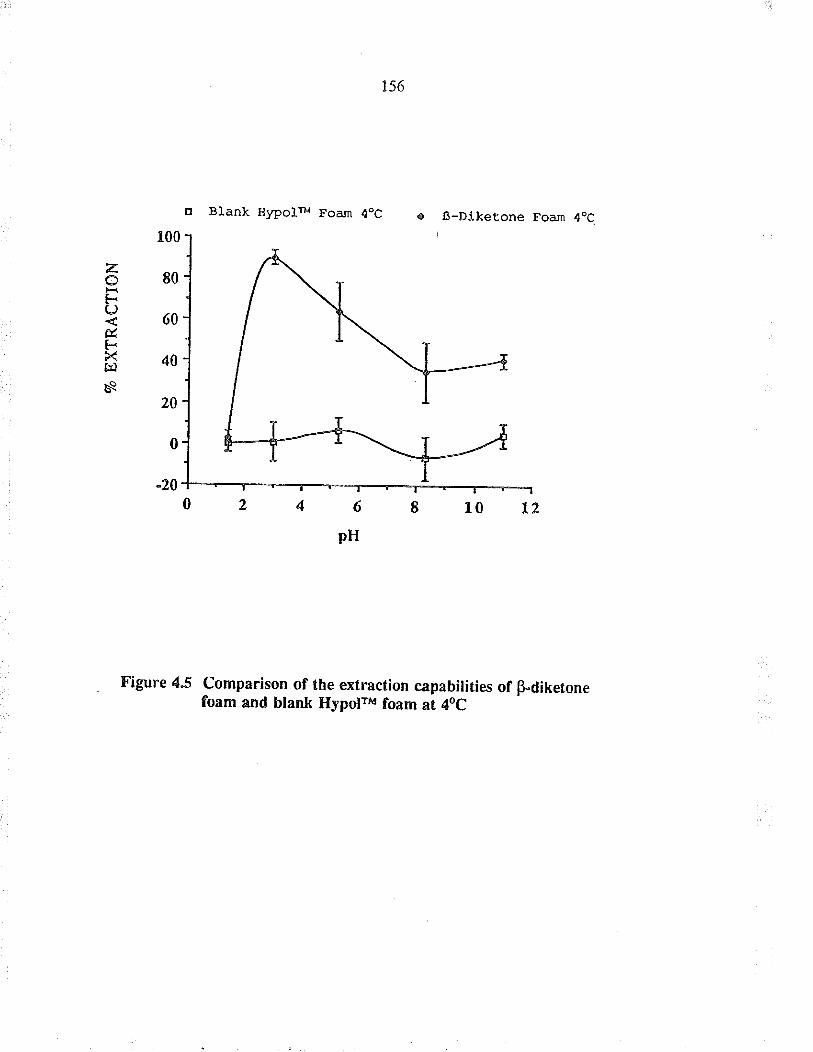
E Bla¡k Hypol Foam 4oC . ß-Diketone Foam 4oC
Figure 45 Comparison of the extraction capabilities of p-diketonefoam and blank Hypdfr foam at 4oC
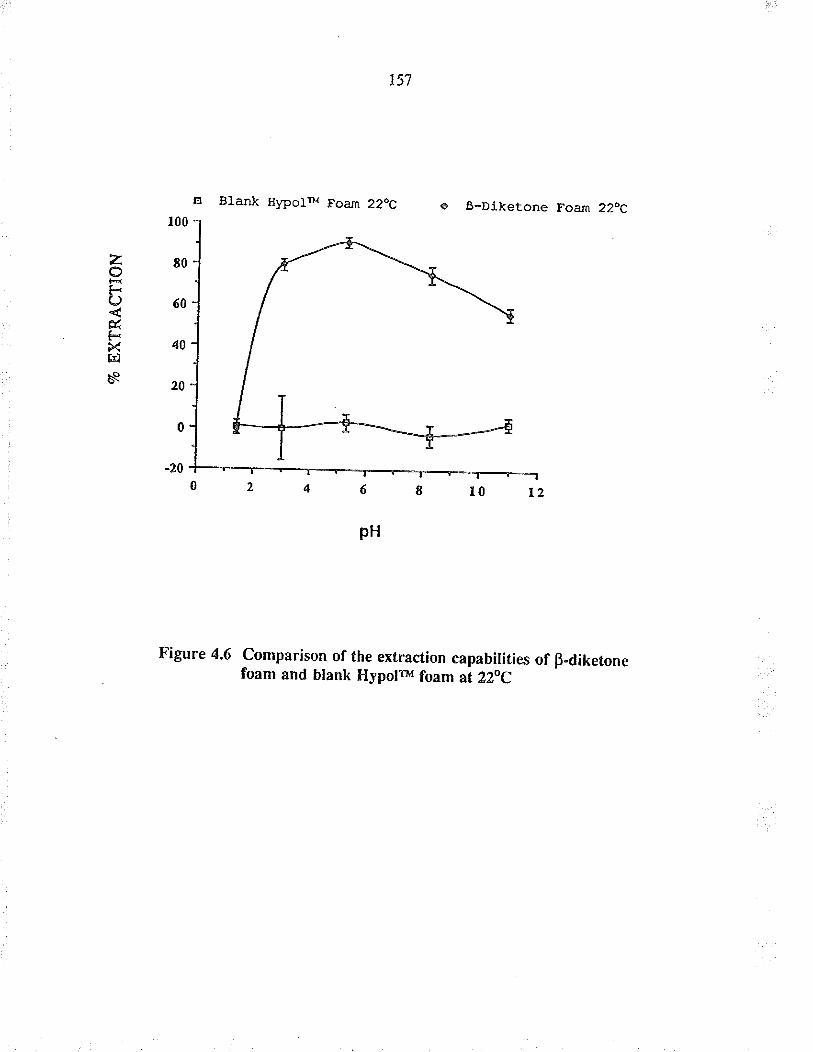
E Bl-a¡Ì Hypolfr Foam 22oC c ß-Dlketone Foam 22oC
zoFL)
&tsXl¡lèe
r00
80
60
40
20
0
-20
Figure 4.6 Comparison of the extraction cåpâb¡lities of p.dikefonefoam and blank Hypotfr ioam at22oC
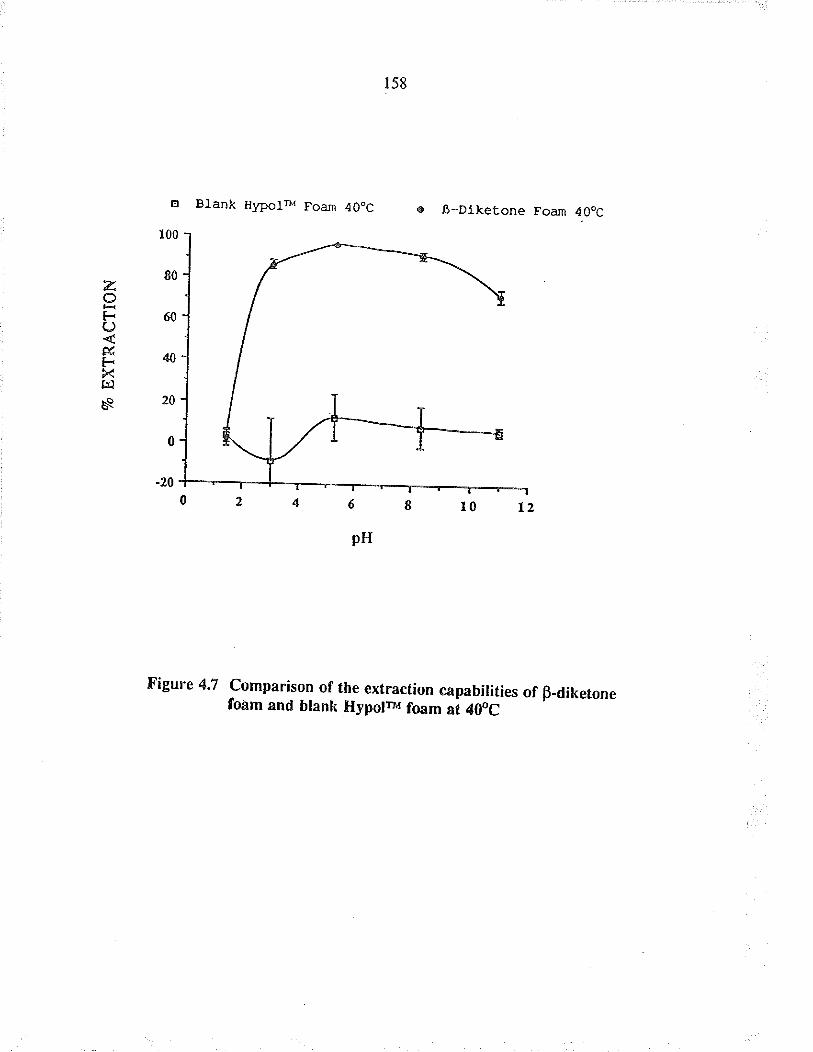
158
o
r00
80
ó0
40
20
0
Blank HypolrM Foanì 40oc e ß-Dlketone Foa¡ì 4 OoC
zoF.()É,f*Xf¡lèa
-20
Figure 4.7 Comparison of th_e extraction capabilities of B-diketonefoam and btank HypoFu fmm ai ¿fC
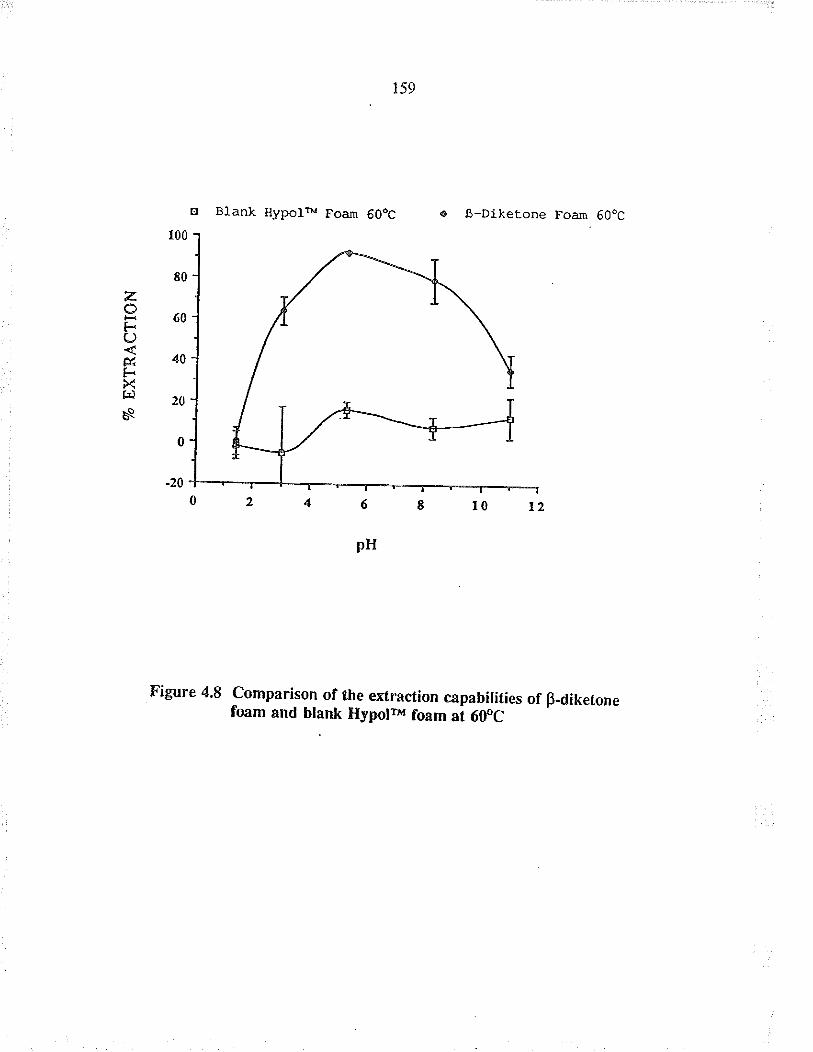
o Blank Hypol Foam 60oC . ß-Diketone Foam 6ooc
zot-o&FXl¡lèa
t00
80
60
40
20
0
-20
Figure 4.8 Comparison of fhe extraction cåpabilities of þdikefonefoam and blank Hypolru foam ai 6(PC
160
Gesser a¡d Aìmedzra have reported t¡at Adogen-impregnated poryurethane foam is
capable of exûacting uruniur from acidic sorutions whose pH values ralge from pH =
I to pH = 3. The þdiketone foam synthesized in this wo¡k was shown to extract
u¡anium from aqueous solutions whoæ pH values range from pH = 3 to pH = 10.
Both foams (i.e. Adogen-impregnared and p-diketone foams) complemenr each other
by exænding the ability of modified foams to extract uranium from aqueous solutions
with a wide range of pH values.
4.5.5 Conclusion
l-Benzoylacetone was imbedded into t¡e marix of the polyurerhane foam during tlre
fabrication of the foam. The resulting p-diketone foam is capable of exrracting
uranium from aqueous solution whose pH ranges between pH = 3 a¡d pH = I0.
The p-diketone foam wourd be a good so¡bent for the sorption of uranium from
natural waters as tle pH of most natural waters are usually in the range of
pH = 7 * 3. The B-diketone foam is simple to make, relatively inexpensive, hæ high
porosity and has good chemical and mechanical ståbility. The above qualities make
the p-diketone foam a promising sorbent for the æparation and preconcentration of
uranium for both analytical and large scale industrial applications.
4.6
16r
Preparation and evaluation of a phosphonic acidlmbedded
polyurethane foam
4,6,1 Inþoduction
chelating polymerìc materials (e.g. chelite p and Duolite ES 467, serva chemicals,
Gennany) that have phosphonic acid functional groups, have shown a rema¡kable
extraction efficiency for uranium and certain t¡ace metals from a¡tificial seawater in
studies that were undert¿ken in our laboratory as shown in Chapter V. These
polymeric materials have recentJy been int¡oduced into the ma¡ket and have rarely
been used in analytical chemistry, and are relatively expensive at the present time. A
number of papers have been published'85.r8ó.rtE're2 27?r?8 describing the synthesis and./or
evaluation of sorbents with phosphonic acid fo¡ the sorption of uranium from seawater.
The syntìesis of these sorbents usually is a multi-step process, which is both ædious
and difficult to undertake.
Due to the success achieved in the preparation of a p-diketone foam, as shown in the
previous section, a similar atæmpt was made to incorporate the phosphonic acid group
into HypoFv foam. The preparation of a phosphonic acid-imbedded polyurethane
foam and tle evaluation of its ability to extract u¡anium from artificial seawater and
from aqueous solution (with relarively simple matrix) with a wide range of pH and
temperature values will be discussed in rhis æction.
t62
4,6,2 Procedure
The foams were prepared by mixing l0 mL of HypolrM prepolymer with va¡ious
amounts of water in a 150 mL glass beaker, with a glass rod. phenylphosphonic acid
and/or a surfactant (Neut¡alrM) were added to the aqueous layer. The preparation of
the foams was ca¡ried out at thæe pH values, i.e. 1,7 and 13 (i.e. the aqueous layer
pH values were adjusted ro l, 7, and l3). A solution of pH = I was obtained by
simply dissolving phenylphosphonic acid; pH = 7 and pH = l3 solurions we¡e
obfained by the addition of 2M NaoH. The resulrant phosphonic acid-imbedded
foams were dried in tl¡e fumehood and ground to a fine powder in the presence of
liquid niuogen. The powdered foams were wæhed with wate¡ and acetone and then
ai¡ dried. The derails of the prepararion of tle phosphonic acid foam and the cleaning
procedure involved a¡e simila¡ to the B-diketone foam as described in the previous
section (i.e. 4.5.2).
The above three foams (i.e. phosphonic acid-imbedded foams that we¡e made at
pH = 1, pH = 7 and pH = 13) we¡e evaluated for thei¡ ability to extract uranium from
a¡tiJicial seawater. Anificial seawater was prepared by dissolving ?50 grams of a
synthetic salt mixture "InsÞnt Ocean " (Aquarium Syst,em Inc., Ohio, U.S.A.)?7e in
deionized water to make 20 liues of a¡tificial seawater. problems associated with
differences in the batches of seawater made were avoided by mixing 20 bags of
Instant oceÐrM to make a uniform salt mixture. låboratory air wæ bubbled through
the seawater solution to adjust the pH to 8.4 which is that of natural æawate¡. The
163
solution was then decanted to remove any undissolved pafticres and organic rcsidues.
The resulting solution was then spiked with a known amount of uranium and
equilibrated for at reæt five hours before use. The chemicar composition of the
unspiked seaì,vate¡ provided by the manufacturer is given in Table 4.1.
several experiments were performed to study the effects of changing the ¡atio of tre
prepolymer to the aqueous layer, the effect of using a vacuum during the foaming
process, the effect of a surfacta¡t and the effect of the presence of phenylphosphonic
acid and its concent¡ation in the aqueous layer. Artificiar seawater sampre sorutions
(25 mL) containing 16.5 ppm of uranium were equilibrated wirl 0.5 grams of
phosphonic acid foam, and the filtered solutions were aralyzed by DCp_AES. The
u¡anium concentration of 16.5 ppm wæ chosen to make the analysis by DCp-AES
more convenient. The results obtained and extraction capabilities of these foams fo¡
the sorption of u¡a¡ium from seawater a¡e shown in Tabre 4.2. commercially
available polyether and polyester foams arong wittr brank foams (Hypolru) were also
evaluated and were unable to extracf uranium unde¡ fle same condilions.
when the ratio of the polymer to aqueor¡s layer wæ r : 0.5, the resurt was a strong
but hydrophobic foam. when the ¡ario was r :2, the foam was weaÌ in mechanical
sfength but hydrophilic in nature. The optimal foam, which is both hydrophilic and
strong, was obtained when the ¡atio was I : l.
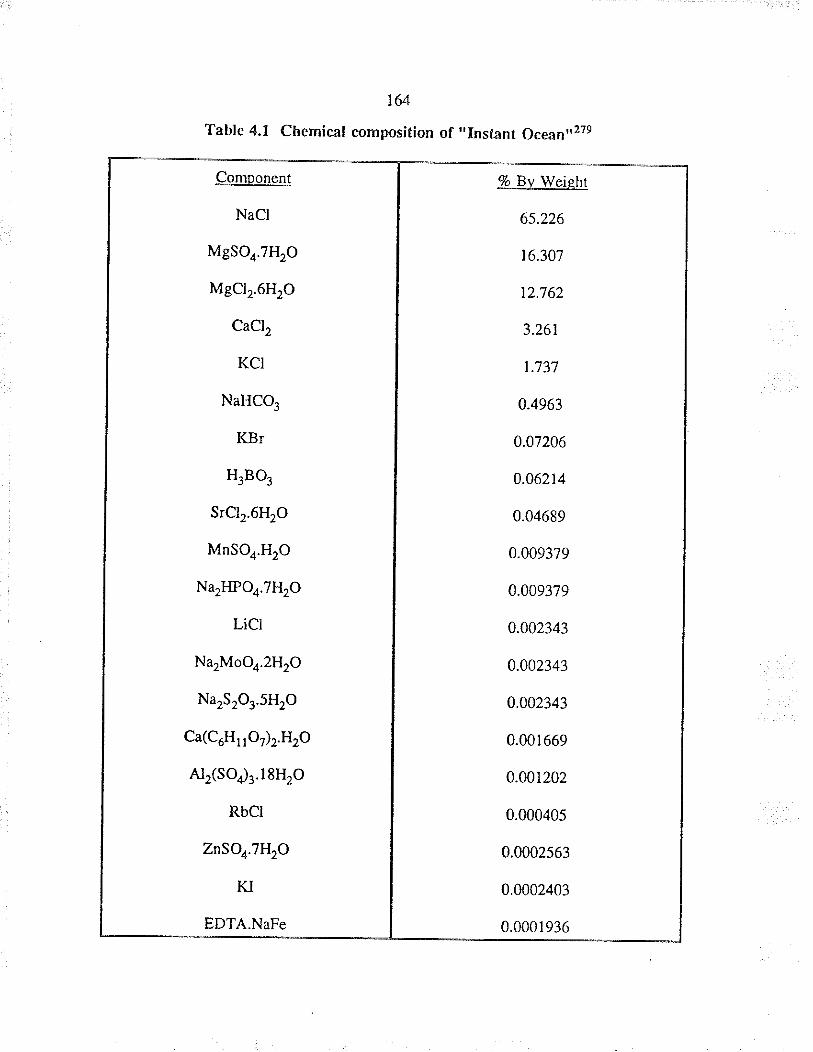
164
Table 4.I Chemical composition of "Instant 6"r"nrr279
Component
NaCl
MgSOo.THrO
MgCl2.6H2O
CaCl,
KCI
NaHCO,
KB¡
H3B03
SrClr.6HrO
MnSOo.HrO
Na2HPOa.7H2O
Licr
NarMoOo.2H2O
NarSrOr.5HrO
Ca(C6H,107)2.HrO
Alz(so¿3.18H2O
Rbcr
ZnSOa.THrO
KI
EDTA.NaFe
7o Bv Weieht
6s.226
16.307
12.762
3.26t
1.73'7
0.4963
0.07206
0.06214
0.04689
0.009379
0.009379
0.002343
0.002343
0.002343
0.001669
0.001202
0.000405
0.0002563
0.0002403
0.000 r936
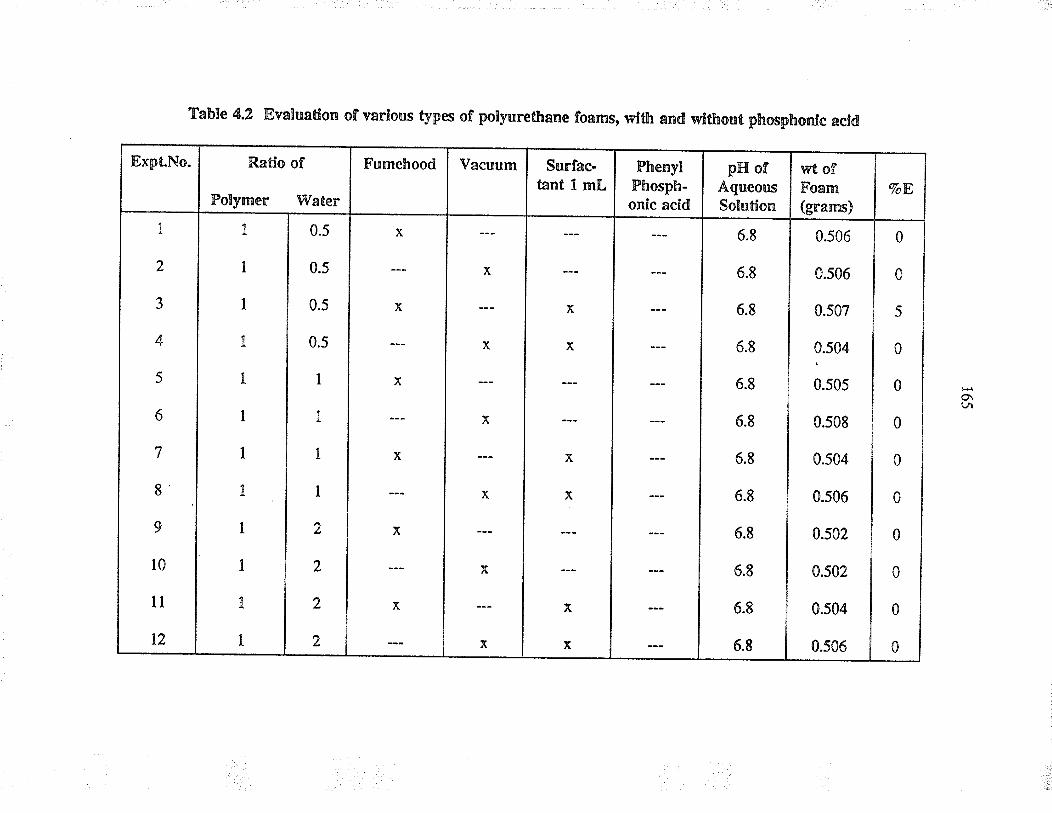
Tahle 4.2 Evaluadon of varlous types of polyurethane foams, wlth and *'lthout phosphonlc acld
%Ewt ofFoam(grams)
0
0
5
0
0
0
0
0
0
0
0
0
0.506
0.s06
0.s07
0.504
0.505
0.s08
0.s04
0.s06
0502
0.s02
0.s04
0.506
pH ofAqueousSolution
o\
PhenylPhosph-onic acid
6.8
6.8
6.8
6.8
6.8
6.8
6.8
6.8
6.8
6.8
6.8
6.8
Surfac-tant 1 mt-
Vacuum
x
x
x
x
Furnehood
x
x
x
x
Ratlo of
Polymer lVater
X
x
x
x
0.5
0.5
0.s
0.5
I
I
I
I
)
2
2
2
Expt.No.
I
I
I
I
I
I
I
I
I
I
I
I
I
.,
3
4
5
6
7
8
9
l0
I1
T2
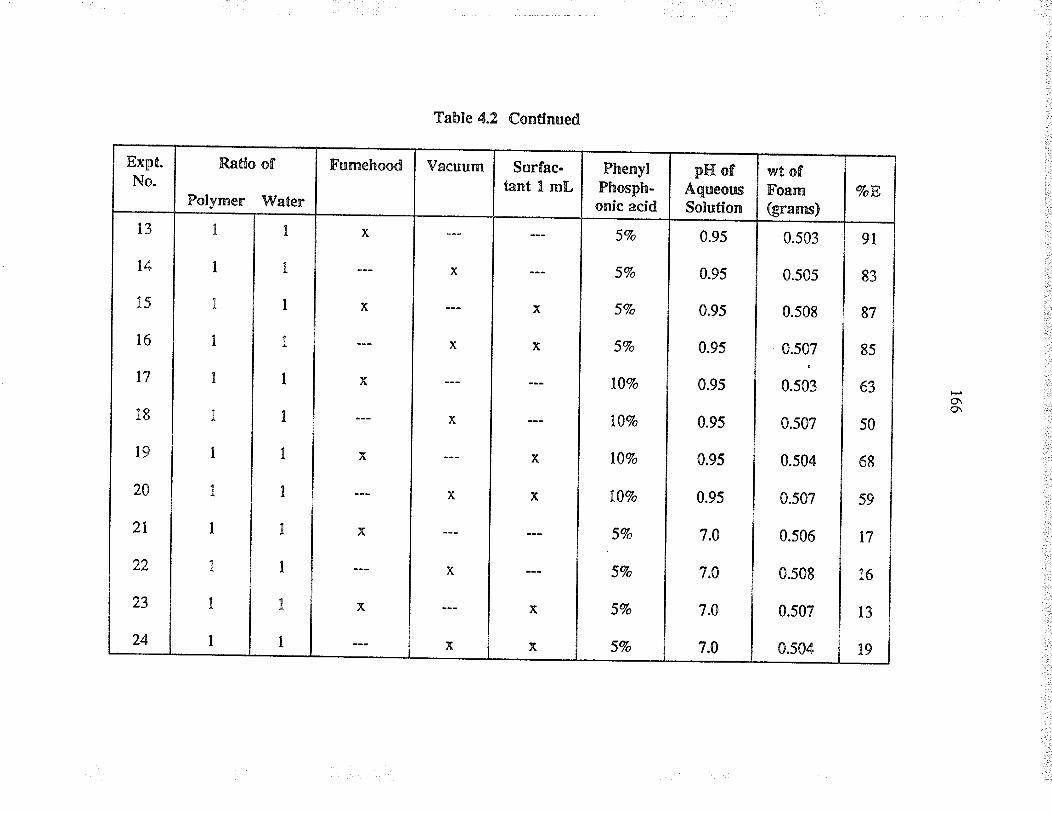
91
83
87
85
63
50
68
59
17
l6
IJ
l9
0.503
0.505
0.508
0.50:
0.503
0.507
0.504
o\o\
0.95
0.95
0.95
0.95
0.95
0.95
0.95
0.95
7.0
7.4
7.0
1.0
Table 4.2 Condnued
SVo
SVo
5Vo
SVo
lïVo
lÙVo
l07o
l07o
59o
SVo
57o
5%
0.507
0.s06
0.508
0.507
0.s04
x
x
x
x
x
x
x
Ratlo of
Polymer lryater
x
x
x
X
I
I
I
I
I
I
I
I
I
I
I
I
I
I
I
I
I
I
i
I
I
I
I
I
t3
t4
15
l6
t7
l8
19
2A
2t
22
23
24
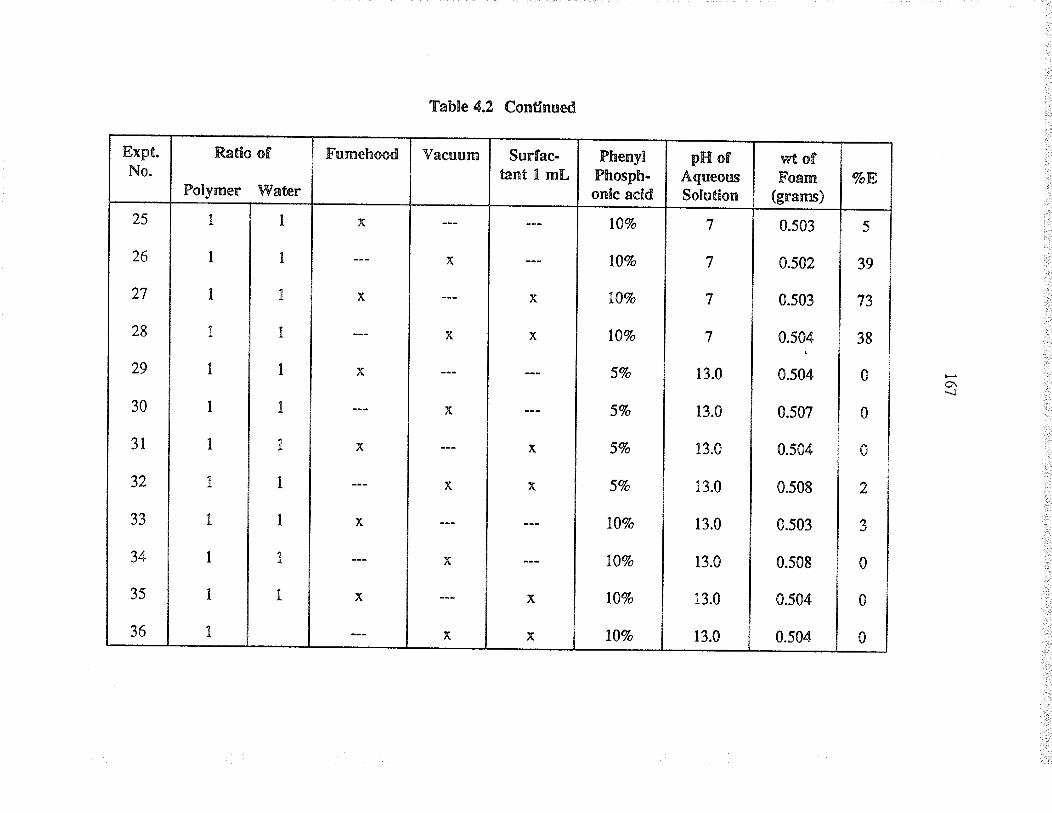
ExptNo.
Ratlo of
Folymer Water
25
26
27
28
29
30
3l
32
JJ
34
35
36
I
I
I
I
I
I
I
I
I
I
I
I
Fumehood
I
I
I
I
I
I
I
I
I
I
I
Table 4.2 Condnued
x
x
x
Vacuum Surfac-tant I mL
x
x
x
x
x
PhenylFhosph-onlc acld
x
x
x
x
l0%o
lÙVo
l0%o
lïVo
5To
57o
5To
5Vo
lïVo
lïVo
l07o
t0%
pH ofAqueousSolution
7
7
7
7
r3.0
13.0
13.0
13.0
13.0
13.0
13.0
13.0
wt ofFoam
(grams)
0.s03
0502
0.s03
0.50.4
0.504
0.507
VoE
5
39
73
38
0
0
0
2
J
0
0
0
0.504
0.508
0.503
0.508
0.504
0.504
r68
The foam produced using 57o (wt/wt) phosphonic acid in the aqueous layer at pH = I
showed the best percent exûaction of ura¡ium from seawarer. when the concent¡ation
of phosphonic acid was changed to l\Vo and when t¡e pH of the aqueous layer was
increæed from pH = I to pH = 7 or 13, the percent ext¡action decreased. The use of
a su¡factant or foaming under vacuum showed no appreciable effect. The Hypolru
foam produced by incorporating 5?o (wtlwÍ) of phenyl phosphonic acid inro HypolrM
foam matrix during the foaming process will be called "phosphonic acid foam,' for
future refe¡ences in this thesis.
The ext¡action capability of phosphonic acid foam fo¡ uranium was studied at different
pH values and temperatures. Phosphonic acid foam was prepared by mixirg equal
weights of the HypolrÀr prepolymer and a 57o (wt) aqueous solution of
phenyl phosphonic acid. The mixture (polymer + aqueous layer) became cloudy and
then rose lo ten times its original volume. The resulting phosphonic acid foam
became tack-free within five minutes.
The procedures for powdering a¡d cleaning of the foam and evaluating the exúaction
capability of this foam are æ given for the p-ditetone foam. The colour of the dry
and clean phosphonic acid foam was light brown compared to the blank foam, which
was white.
169
4,6,3 Results and discussion
Phosphonic acid foam exhibits good exrraction capability for the sorprion of uranium
between pH = 5.3 and pH = 8.2 a¡d the ext¡action decreases at either end of the pH
ra¡ge as shown in Figures 4.9 ard 4.10.
The drop in exraction efficiency at either end of tle pH range can be explained by the
formation of UO2CI2 and UOrCI* at pH values below 3, and UOr(OH)r- at pH values
above 10; tlese species may not be as extracuble by the phosphonic acid foam.
Furtlermore, between pH = 3 and pH = 8, it can be seen in Figures 4.9 and 4.10 that
the extraction generally increased with a¡ ircrease in temperature f¡om 4t to 70"C.
The extraction of uranium from aqueous solutions whose pH is between 3 a¡d 8
would be best at 70"C for this foam. The decrease in extraction efficiency at either
end of tÏe pH range suggests the use of a solution witlr pH less tha¡ I or greater than
ll as a possible eluting solution to desorb uranium f¡om the foam.
ln general, phosphonic acid foam showed superior extractabiliry of uranium over blank
foams a! pH values between 3 a¡d 8 at all temperatures tested as shown in Figures
4.11 to 4.14.
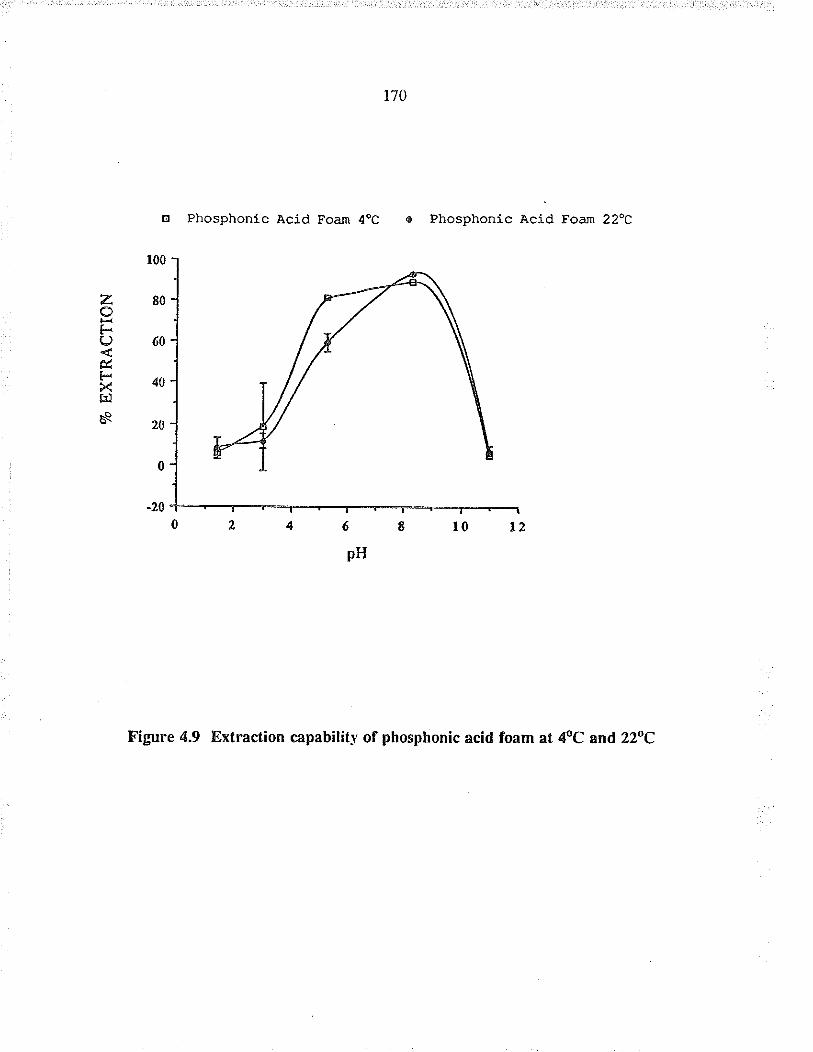
o
r00
80
60
40
20
Phosphonlc Àcid Foam 4oC . Phosphonic Àcid Foan 22oC
zoF.L)
&FXÊ¡
ès
0
-20
Figure 4.9 Extraction capability of phosphonic acid foam at 4oC and 22oC
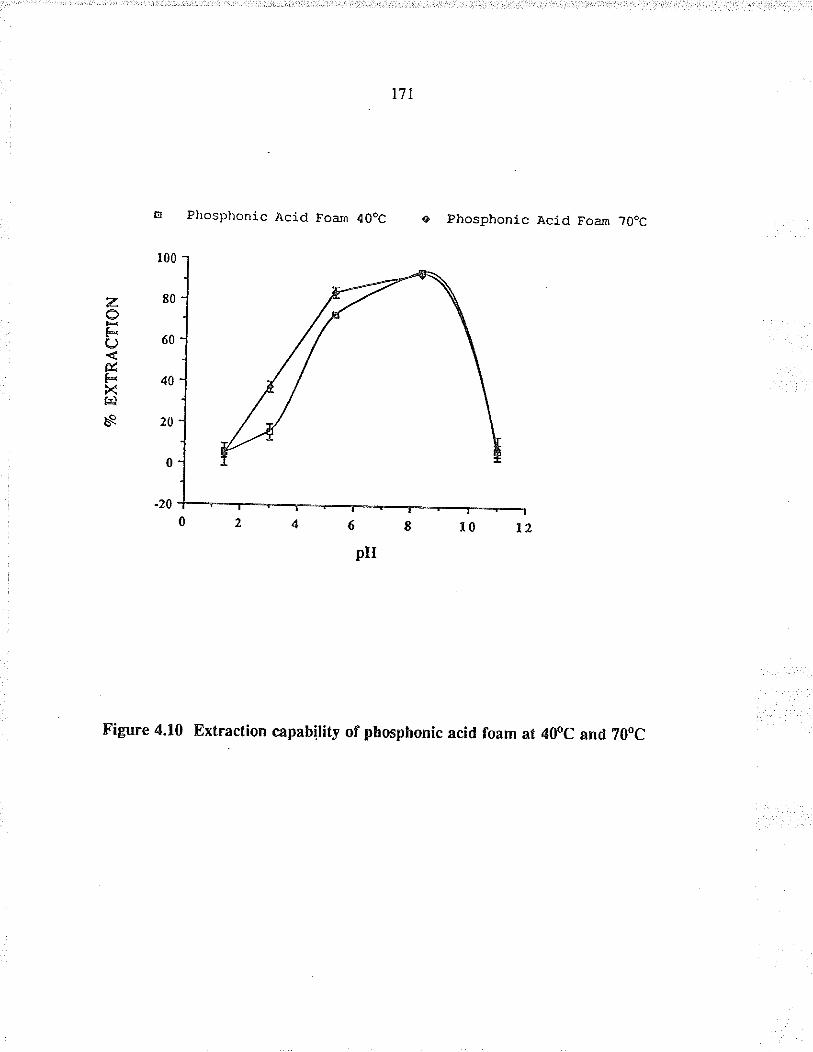
GI
100
80
60
40
20
0
-20
Phosphonlc Àcid Foam 40oC . phosphonic Àcid Foan ?0oC
zt*()&FXf¡lñ
Figure 4.10 Extraction capab¡lity of pbosphonic ac¡d foam at 40oC and 70oC
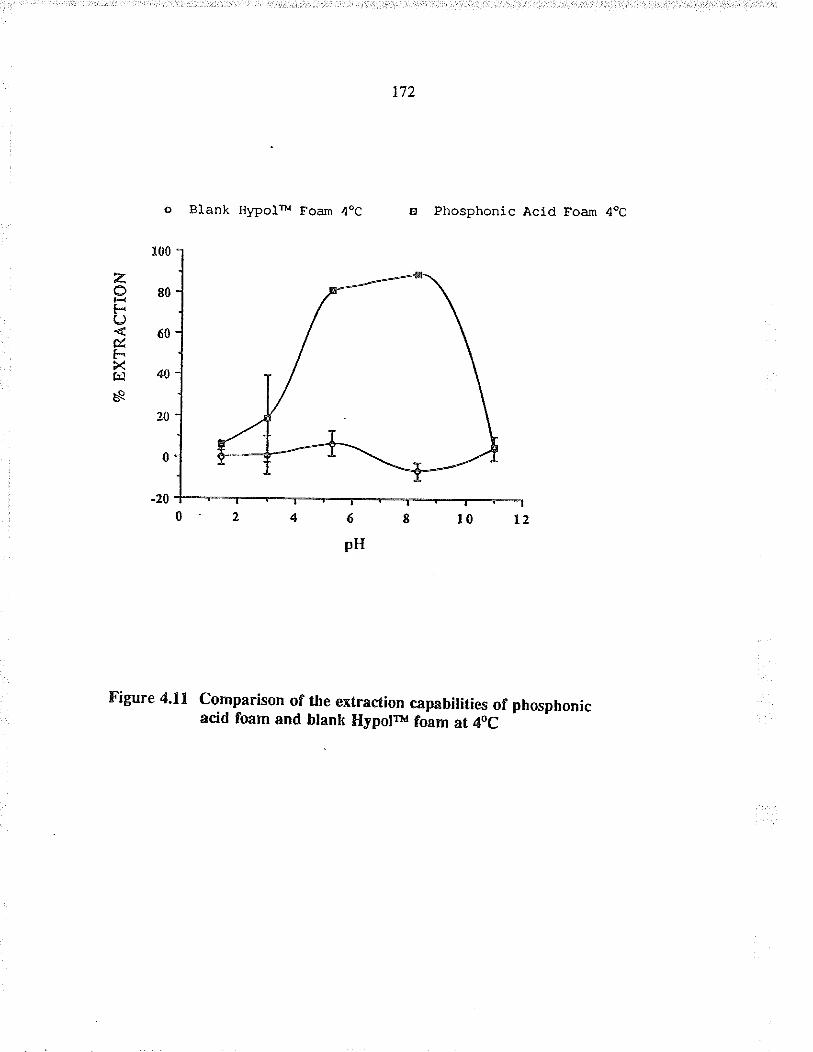
Blank Hl'PÕIru Foan 4oC E Phosphonic Àcid Foan 4oC
zoF.OúF.Xl¡lès
o
100
80
60
40
ItJ
0
-20
6
pH
Figure 4.ll Comparison of lhe extrac{ion capabilities of phosphonicac¡d fmm end blank Hypolnr foam at 4oC
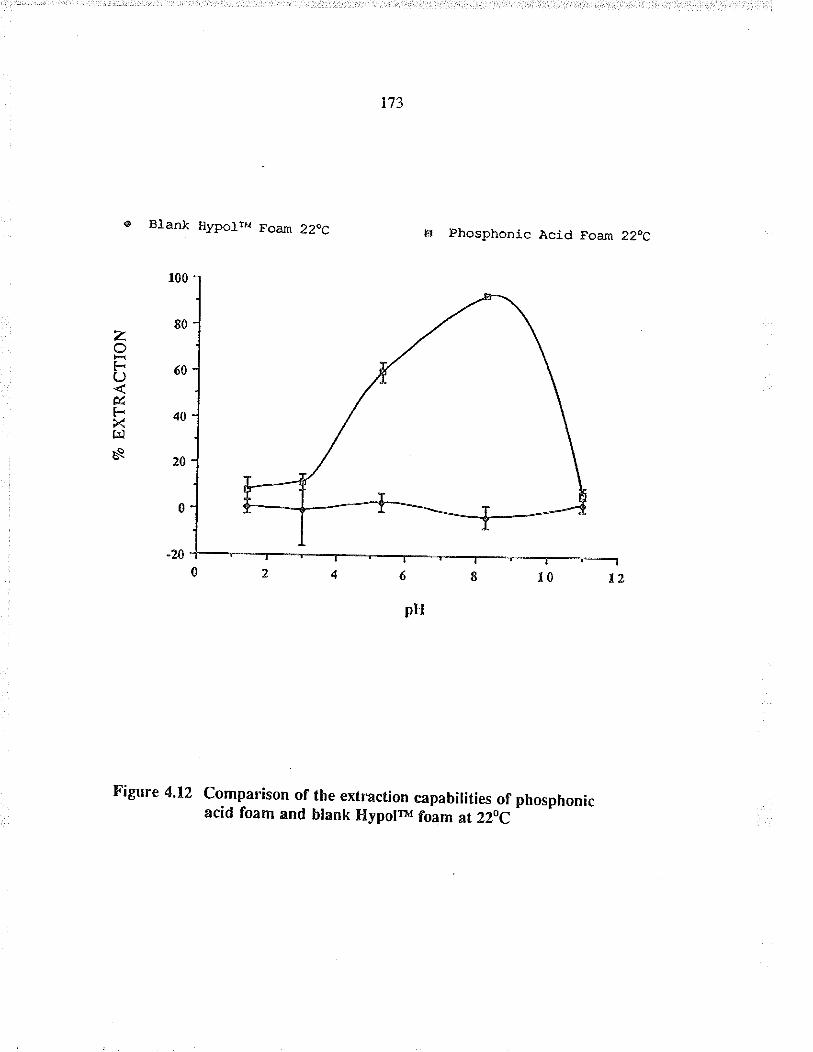
173
. Bla¡k Hypolr^¡ Foan 22oC E Phosphonic Àcid Foam ZzoC
zFL)
&FXf¡ì
èe
r00
80
60
q
20
0
-2Ã
6
pl{
Figure 4.12 Comparison of lhe extraction capabilities of phmphonicacid foam and blank HypoFx foam at 22oC
-
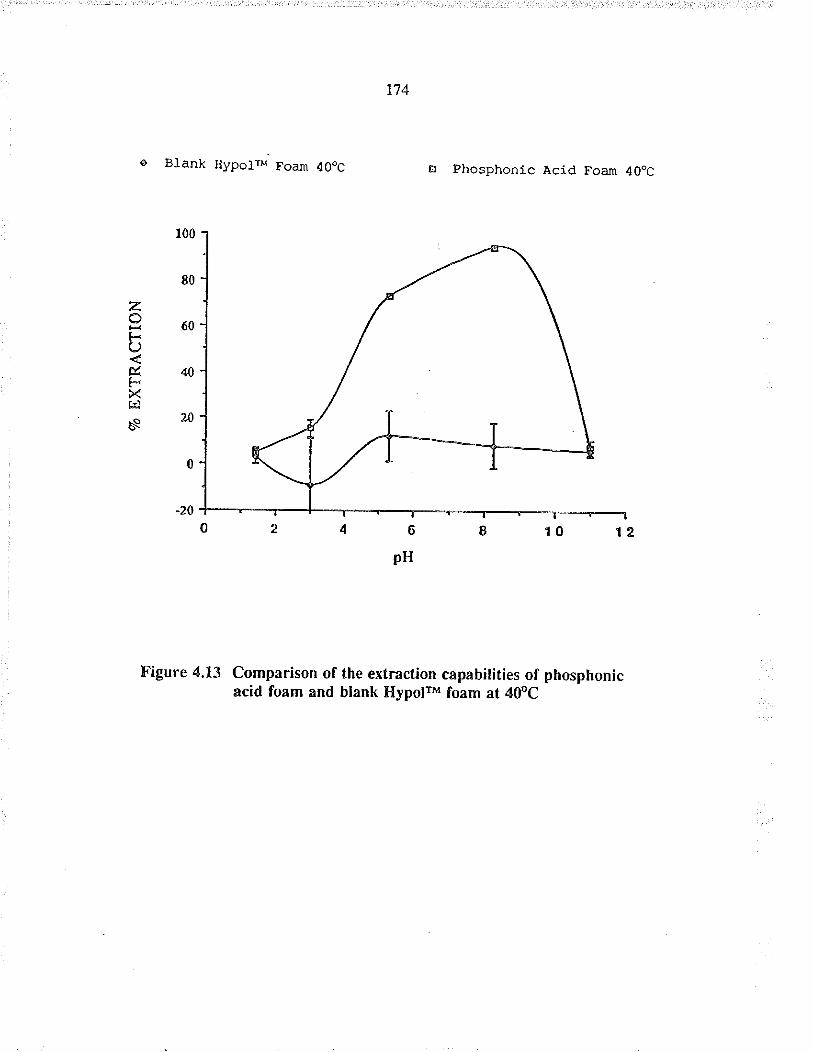
zF(J
FX
ñ
. Blank Hypolru FoaJn 4OoC E Phosphonlc Àcid Foan 40oC
r00
80
ó0
4{}
zo
0
-20
Figure 4.13 Comparison of the extraction cåpâbilities of phosphonicacid foam and blank Hypolfr foam at 40PC
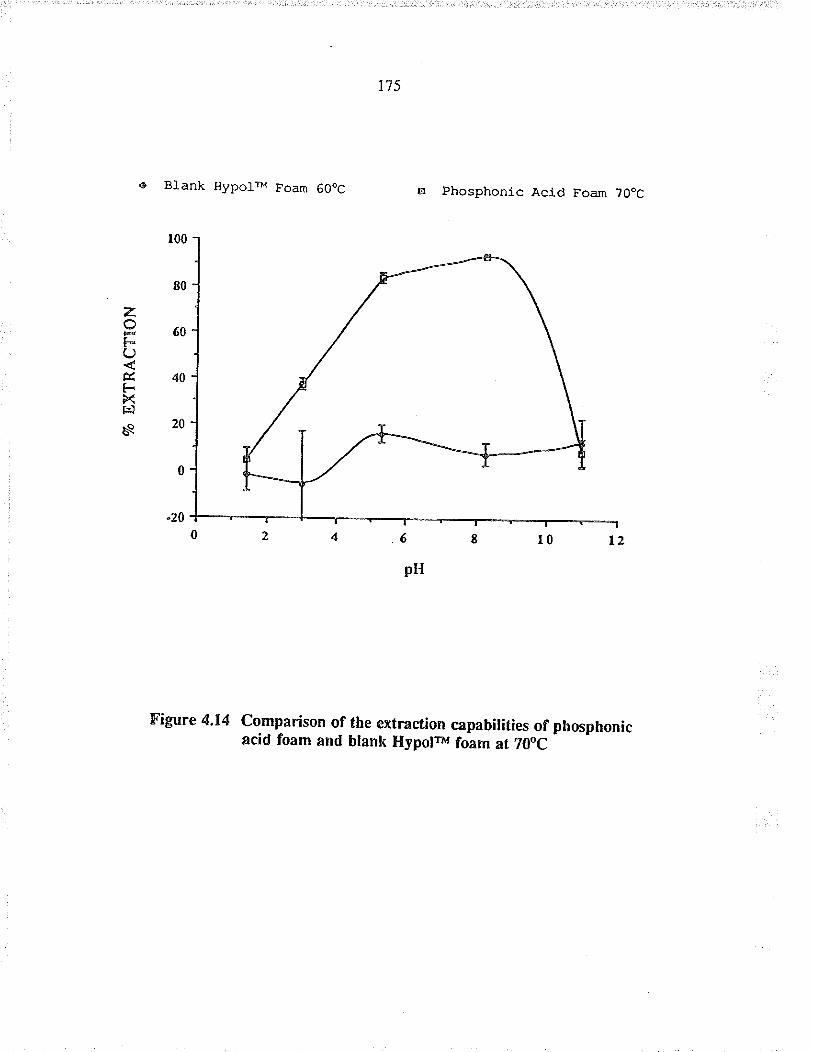
Blank HypolB Foam SOoC o Phosphonic Àcid Foam ?OoC
zoFOÉFXEì
s
r00
80
60
40
20
0
-20
.6
pH
Figure 4.14 Comparison of the extracrtion capåbilities of phosphonicacid foam end blank Hypotñ foam at 70oC
176
4.6.4 Conclusiott
Phenylphosphonic acid wæ imbedded into the marix of the polyurethane foam during
the fabrication of the foam. The resulting phosphonic acid foam is capable of
extracfing uranium from aqueous solution whose pH ranges between pH = 5 and
pH = 8. The phosphonic acid foams produced by mixing equal amounts of
pfepolymer and aqueous layer with 5Zo phosphonic acid (wlwt) exhibiæd rhe besr
extraction capability in sorbing uranium from a¡tificial seawater. The phosphonic acid
foam is simple to make, relatively inexpensive, has high porosity and has good
chemica.l a¡d mecha¡ical stâbitity. The above qualities would render the phosphonic
acid foams to be used as a good sorbent for the preconcentration of uranium from
solutions whoæ pH range is 7.0 t 1.5. On comparing the B-diketone foam and
phosphonic acid foam, il can be seen tìat B-diketone foam is capable of sorbing
uranium from a solution with a wider range of pH (i.e. between pH = 3 and pH = l0)
but is unable to stând temperatures greater than 40oc witl¡out showing a decrease in its
extaction ability. Phosphonic acid foam on tle orher hand is only capable of sorbing
uranium from solutions witlr pH values between 5 and 8; however, it is stable and
perfonns best at 70"C.
At higher temp€ratures (i.e. 70"c) the choice of sorbent for preconcentrating uranium
from solution with pH values 7.5 + 1.5 would Þ the phosphonic acid foams a¡d at
lower temperatures (i.e. less tlan 70"C) tle sorbent of choice would be the þdiletone
foam. In conclusion, the above foams a¡e simple to make and also relatively
177
inexpensive. Theæ foams have shown good chemical and mecha¡ical stability along
with high porosiry, ûrus making them good sorbents fo¡ column packing and for
indust¡iaI applications.
4.1 Preparation and evaluation of amldoximated fabric
4,7.1 Intoduction
A number of papers have been published for the synthesis of macroreticula¡ resins
with amidoxime groups&t38 because of thei¡ uæ in the extraction of uranium from
seawater' as shown in chapter I. The papers describing the synthesis of a sorbent
with an amidoxime group, for the most part; involve the incorporation of a nitrile
group into a polymer mat¡ix, followed by the conversion of the nitrile group into an
amidoxime group by treatment with a solution of hydroxylamine in methanol.
Egawa et a/.8re prepared a mac¡oreticula¡ chelating resin containing amidoxime by
reacting acrylonitrile-divinyl benzene co-polymer beads with hydroxylamine.
sugæuka ef aL85 synthesized a number of polyacrylamidoxime resins f¡om va¡ious co-
polymers of acrylonitrile and crosslinking agents. work on fib¡es hæ generated wide
interest in the last decade with improvements being made with respect to flow rate
through the column and the mechanical stabiliry of the fib¡e. Fib¡es have been made
by radiation-induced graft polymerization of acrylonitrile into polymeric fibres,
followed by amidoximations'te, Amidoximation was attained by treating the
178
polyacrylonitrile fib¡e with hydroxylamine in methanols5.
In a previous section of this chapter it was shown that we have been successful in
incorporating functional groups that were attached to a benzene ring into the
polyurethane foam marix cruring the foaming p¡ocess; therefore an attempt was made
to do the same with an amidoxime group. As phenyl amidoxime was not
commercially available, the dhect method of incorporating a reagent with an
amidoxime group into the foam matrix could not be done without the preliminary
synthesis of this reagent. Instead, if one was abre to incorporate a nitrile (-c=N)
group into the foam, the product then can be subjected to amidoximation by treating
with hydroxylami¡e in methanol solution.
Several attempts were made to incorporate various compouncrs, such as benzyrcyanide,
stearylnitrile, phthalonitr e, acryronitrile and N-butyranitr e, into HypolrÀr foam during
the foaming process. The procedure for incorporation and cleaning was simirar to that
of B-diketone foam, where 5Vc (wtlwt) of the above compounds were added to the
HypolrM prepolymer, with constant stirring, to form a viscous solution. An equal
weight of water was then added to the viscous polymer solution followed by a rapid
stirring of the mixtu¡e fo¡ 15 seconds. The crean, dry, powdered foams were subjected
to amidoximation by treating with a solution of hydroxylamine in methanol. The
resulting foams (i.e, afte¡ amidoximation) were unabre to extract uranium from
aqueous solutions.
119
FI-IR (ATR) analysis of t¡ese foams, before amidoximarion, revealed rhe absence of
ar absorption ba¡d a¡ound 2250 cm-t, which is the characteristic absorption band for
tlte {=N group. The absence of an absorption ba¡d at 2250 cm-t led us to beiìeve
that the C=N groups of the above compounds were reacting with the Hypolw
prepolymer. Further experiments to inco¡porate amidoxime into the foam mat¡ix
during the fabrication of the foam were discontinued due to the reaction between ûe
nit¡ile-contrining compounds and the HypolrM prepolymers.
ln anotle¡ experiment, commercially available foams were coated with nitrile
containing compounds. This was done with an intenlion to convert the nitrile groups
into amidoxime groups to produce a foam with amidoxime groups on the surface of
the foam. Indusuial libres made of polyacrolein, thaf were obrained from Dr. Gesse¡,
were dissolved in dimethyl fo¡mamide (DMF) in order to coat commercially available
polyurethane foam @isporu). Polyester foam plugs and polyether foam plugs were
soaked in a 3?o(wtlvol) polyacrolein in DMF for 4 hours, The squeezed and dried
foams were subjected to amidoximation. The polyether plugs were discarded as they
weæ unable to regain their original shapes afær squeezing. When rhe polyacrolein
coated polyester plugs were subjecæd to amidoximation the polyacrolein layer fell off
the foam æ a fine powder.
Wo¡k with amidoxime and polyurethane foams wæ discontinued as attempts to
incorporate nitrile groups on !o t¡e foam proved to be unsuccessful or the conve¡sion
180
of these nitrile groups into amidoxime groups, wh e still being on the foam, provecr to
be unsuccessful. The above unsuccessfur attempts to produce an amidoxime
containing polyurethane foam led us to seek commercially and comrnonly ava able
mate¡ial with nitrile groups and also with good porosity, good mechanical and
chemical stability. Such a mate¡ial could then be treated with hydroxylamine solution
to produce an amidoxime-containing sorbent.
It was of interest to us to determine if the nitrile groups of commonly available
materials, such as polyacryloninile (eg. orlonrM) could be converted to have
amidoxime groups. The successful conve¡sion of nitr e groups of a polyacryroniÍ e
fab¡ic into amidoxime groups would result in a modified polyacryronitr e fab¡ic with
amidoxime groups, which would then be evaluated for the preconcentration of uranium
from aqueous solutions.
orlonrr\r is the trade mark for an acrylic flbre that was fi¡st introducecl into the market
in 1950 by E. L DuPont de Nemours ancr co. Inc.. chemically the porymer contains
at least 85 percent by weight of acrylonitriìe moieties. The fabric is readily available,
inexpensive and shows good chemical and physicafmechanical stability.2so orlonrÀr
fab¡ic was obtained f¡om P¡of. King of Departmenr of rextile and clothing of this
University to study its amidoximation properties. preliminary experiments showed
that after amidoximation, the modified orlon was capable of exEacting uranium from
aqueous solutions. The orlonrir fabric, which remained flexible throughout the
18i
process of amidoximafion, cha¡ged colour from white to yellow. During
amidoximation it was noticed that the clot¡ pieces became entângled wil¡ one a¡otler
while stirring, which resulæd in uneven reaction. The large knots that resulted due to
ent¿nglement \,vere not of uniform colour. The problem of entânglement of the
O¡lonw fabric pieces ca¡ be avoided if the Orlonru fabric could b€ ground to fire
powder before subjecting it to hydroxylami¡e solution. The procedure used for the
powdering of foams, i.e. freezing with liquid nitrogen and grinding with a blender,
proved to be unsuccessful fo¡ O¡lonn{ fabric. A¡ alternative metìod was to grind the
O¡lonru fabric with a lVileyw Mill (a mechanical fabric grinder) to a fine powder
prior to amidoximation. When subjecæd to amidoximation, the fibres now formed
were uniformly yellow in colou¡. These yellow fibres will be called "modiIìed O¡lon"
through the remainder of this thesis.
4.7 ,2 Procedure
Modíhed O¡lon fibres were prepared by treating 30 grams of ground O¡lonw fab¡ic
with I litre of amidoximating reagent. This reagent was freshly prepared by
dissolving 40 grams of hydroxylamine hydrochloride n a 50Va (voVvol) mixture of
metha¡ol and water. This solution was adjusæd to pH 7.0 by using 2M KOH
solution, and made up to I litre to give the amidorimating reagent. The mixtu¡e of
O¡lon fibres and amidorimating reagent was heated at 40"C with constant stiring
under reflux for l2 hours. The fibres changed from white to yellow during the
process. After cooling, the mixture was filte¡ed through a Buchner funnel fitted with a
r82
whatman 541w filte¡ paper. The modiJìed orlon fibres were removed f¡om the filter
paper, soaked in 500 mL of water fo¡ four hours, and the ¡esulring slurry ùen flþred
unde¡ vacuum through ttre Buchner funnel. The fib¡es were recove¡ed from the filæ¡
paper and úe complete washing procedure of soaking and filæring was repeaæd two
more times' The fibres were ¡Ien wæhed th¡ee more times using the same procedure,
except for the use of acetone in place of waær. This washing procedure should
remove impurities that are soluble i¡ water or acetone and any ufireacted feagents
from the modified orlon fìbres. The clean, powdered fibres were left to dry under
vacuum for four hours to remove t¡aces of acetone. Blank orlonrrr nibres, without tìe
addition of hydroxylamine hydrochloride, were prepared in a similar manner to serve
as a blank.
The extraction capability of modified Orlon was derermined by adding 25 mL of
l0 ppm uraníum solution to a 60 mL screw top NalgenerÀr plastic bottle, together with
approximarely 0.200 t 0.003 grams of dried powdered fibres. The capped boules
were shaken for five hours in an automatic shaker. The fìltered solutions were then
analyzed by GFSM to determine the uranium upule by the fibres. The ext¡acf.ion
capabilities of these fib¡es for uranium at different þmperatures and pH values were
studied and the analysis method and the calculation of yo extraction for the evaluation
of these fibres were the same as given for p-diJ<etone foams.
The ext¡action cha¡acteristics of modiJied o¡lon and bla¡k o¡lonnr fibres we¡e studied
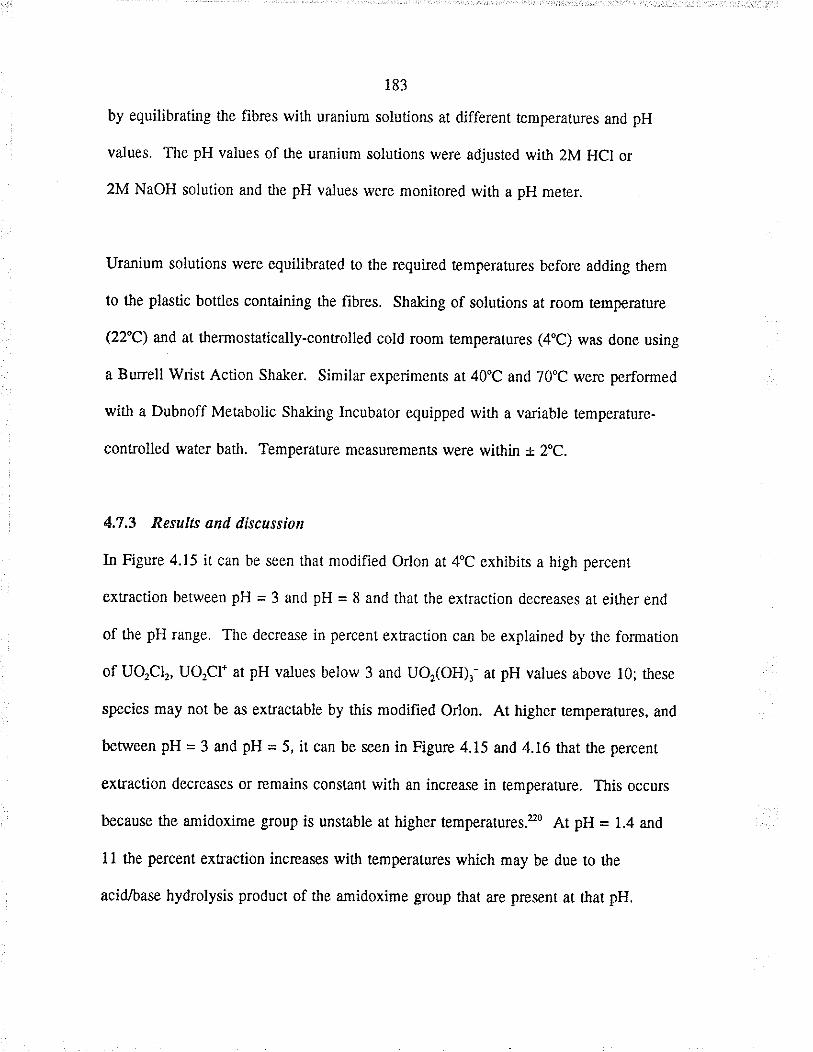
183
by equilibrating the fibres with ura¡ium solutions at different temperatures and pH
values. The pH values of the ura¡ium solutions were adjusted with 2M HCI or
2M NaOH solution ard the pH values were monitored with a pH meter.
U¡anium solutions were equilibrated to the required temp€ratures before adding them
to the plastic bottles containing the fibres. Shaking of solutions at room temperature
(22'C) Ntd at thermoståtically-cont¡olled cold room temperatures (4.C) was done using
a Burrell Wrist Action Shaker. Simila¡ experiments at 40oC and 70"C were performed
with a Dubnoff Metåbolic Shaking Incubator equipped with a vadable temperature-
controlled wate¡ bath. Temperature measurements were within t 2oC.
4.7,3 Resalß and discussìon
In Figure 4.15 it can be seen rhar modified Orlon at 4"C exhibits a high percent
extraction between pH = 3 and pH = 8 and that the extraction decreases at eitler end
of the pH range. The decrease in percent ext¡action can be explained by the fo¡mation
of UQClr, UO2CI* at pH values below 3 and UOr(OH)r- at pH values above l0; these
species may not be as extractåble by this modified Orlon. At higher temperatures, ard
befween pH = 3 and pH = 5, it ca¡ be seen in Figure 4.15 and 4.16 that the percent
ext¡action decreæes or remains constânt with an increæe in temperature. This occurs
because the amidoxime group is unstable at higher temperatures.zo At pH = l.zt ¿¡16
l1 the percent extaction increaæs with temperatures which may be due to the
acid./base hydrolysis product of the amidoxime group that are present at that pH,
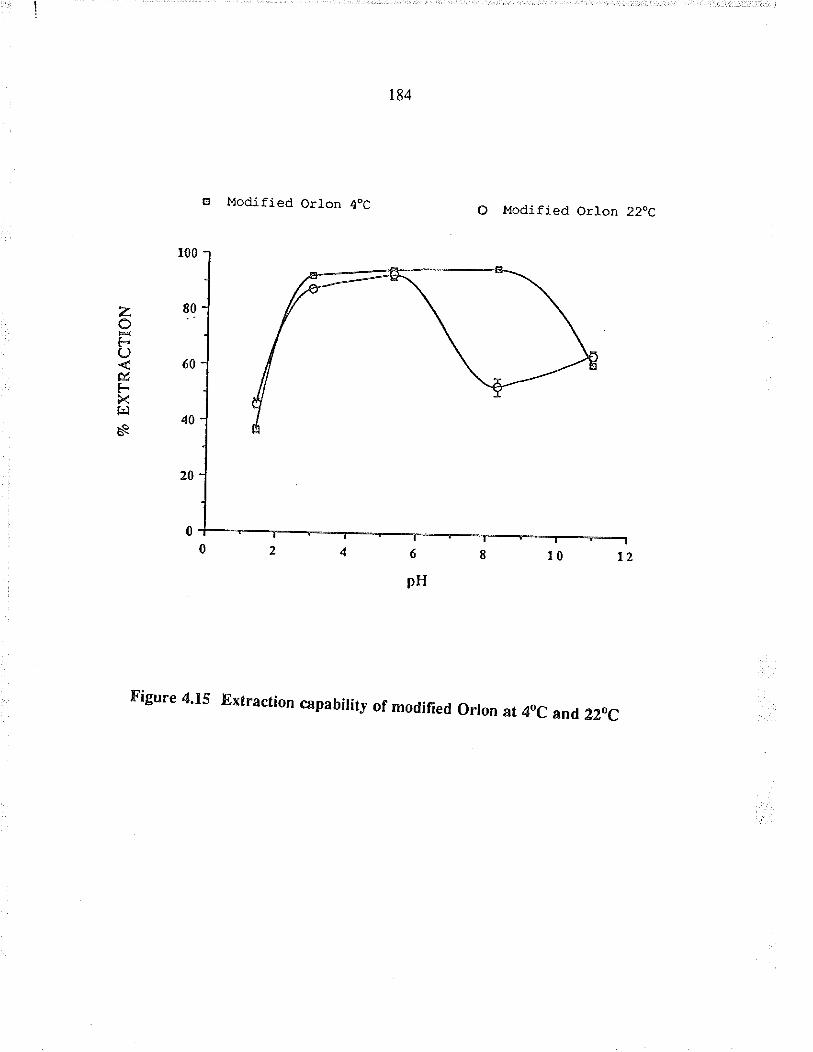
184
Ir Modifi.ed orlon 40c o Modified orlon 220c
zoFUúFXÊl
Ès
r00
60
40
20
0
Figure 4't5 Exfraction capabirity of modified orron at 4oc and 22oc
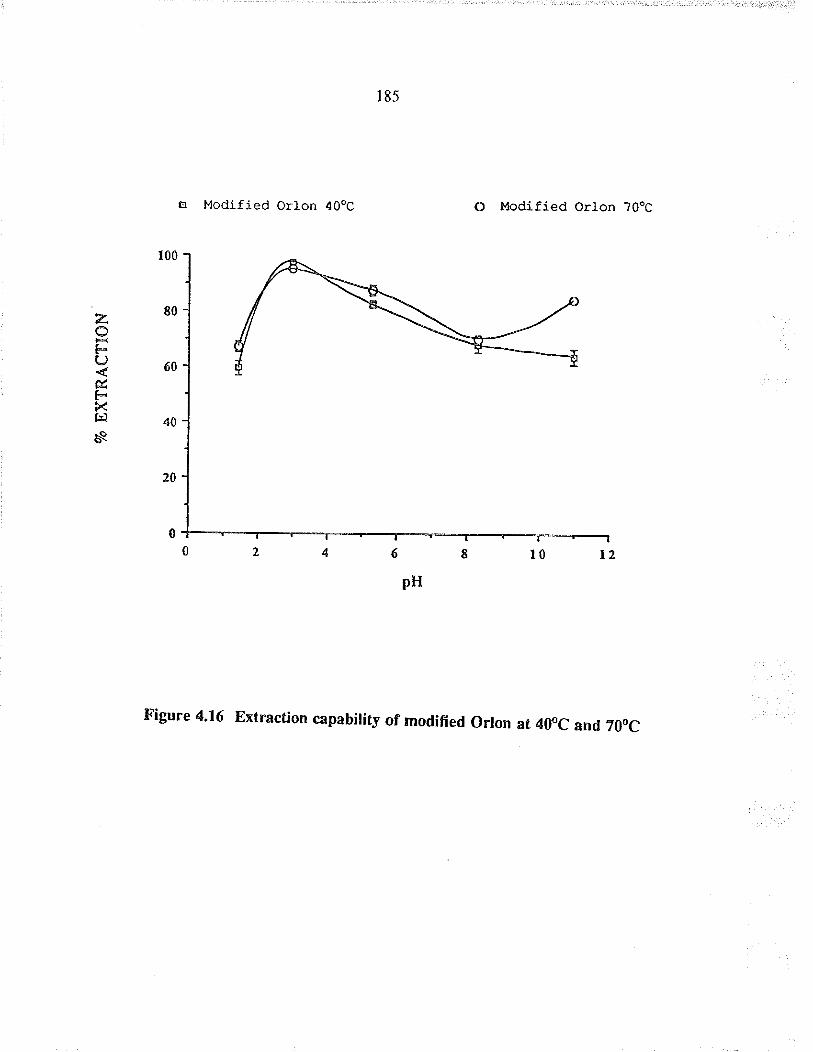
185
o Modlfied orlon 400c O Modi fied Orlon 70oC
zIF.()&FXf¡lèa
t00
80
60
40
20
0
Figure 4.16 Extraction capability of mod¡fied Orton at 4(PC and Z0oC
186
At lower pH values acid hyùolysis of the amidoxime group fåkes place, while af.
higher pH values base hydrolysis occurs.ã' At pH = 8, the percent extraction drops æ
the temperature increases from 4"C to 22oC and then it increases as the femperature
riæs from 22"c to 70"C. The anomaJy in the extiaction profile ar pH = 8 at 22oC was
not reported earlier a¡d it is our opinion that the initial decrease in percent ext¡action
that was observed between 4"C and 22oC was due to the baæ hydrolysis of the
amidoxime group, and the increæe in percent ext¡action that was observed between
22'C and 70oC was due to the hydrolysed amidoxime group.
ln Figures 4.15 and 4.16 it ca¡ be seen that fo obtåin maximum ext¡action one may
want to perform the experiments at different temperatures. For example, at pH = t
and 11 the idea.l ext¡action temperarure would be 70"C, while at pH = 5.3 and 8.3 the
ideal temperature would be 4"C and at pH = 3 tïe ideal temperaùre would be 40"C.
Experiments beyond 70"C were not undertaken as it proved to be difficult ro maintain
the temperature of the shaking waterbath due to vaporization of water.
Modified O¡lon fib¡es showed better ext¡action capability over the wide range of pH
and temperature values compared to blank O¡lon fibres (i.e. without amidoxime
transformation) as shown in Figures 4.17 to 4.20. In Figure 4.17 i¡ can be seen that
the uncertainity in the percent extraction by blank O¡lonw fibres at pH = 5.3 was very
high. Repeated experiments showed inconsistent results suggesting that the blank
O¡lonw fibres may be acting as nucleation sites for the precipitation of u¡anium.
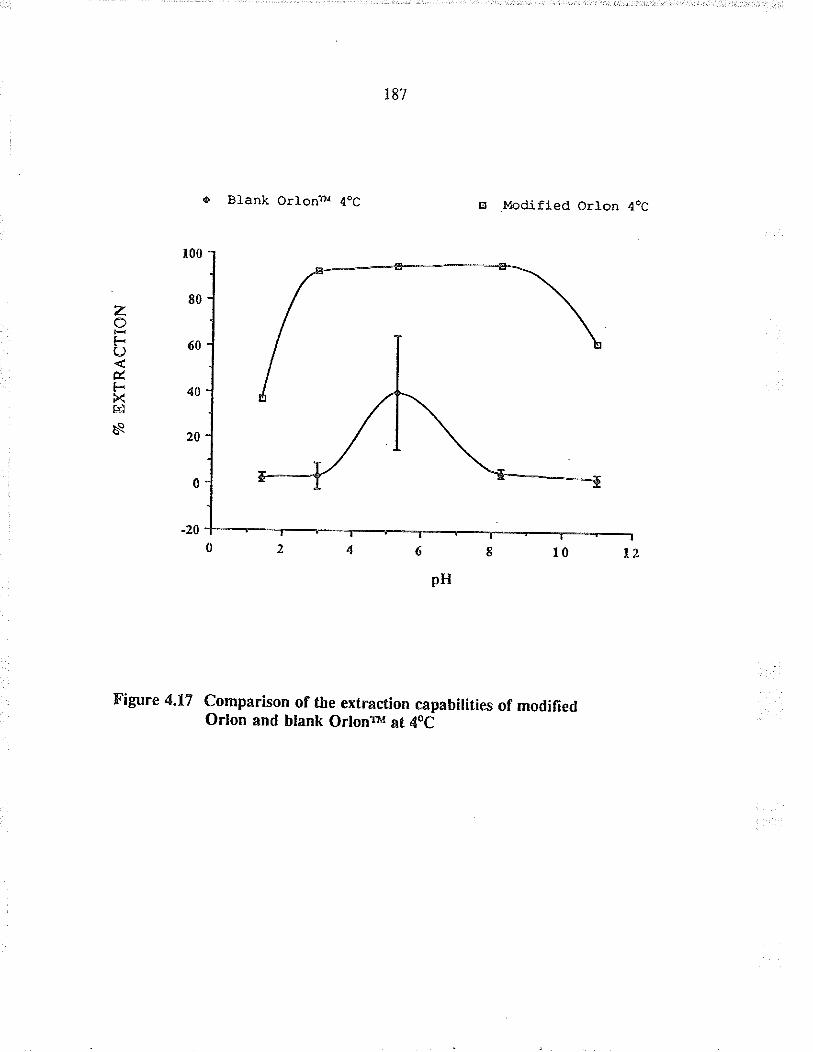
1&'.t
a BLank Orlonû 4oC E Modlfled Orlon 40C
zt-(J
t-Xl¡lñ
r00
80
60
40
20
0
-20
Figure 4.17 Comparison of the extrâction cåpabilities of modifiedOrlon and blank Orlonil at 4oC
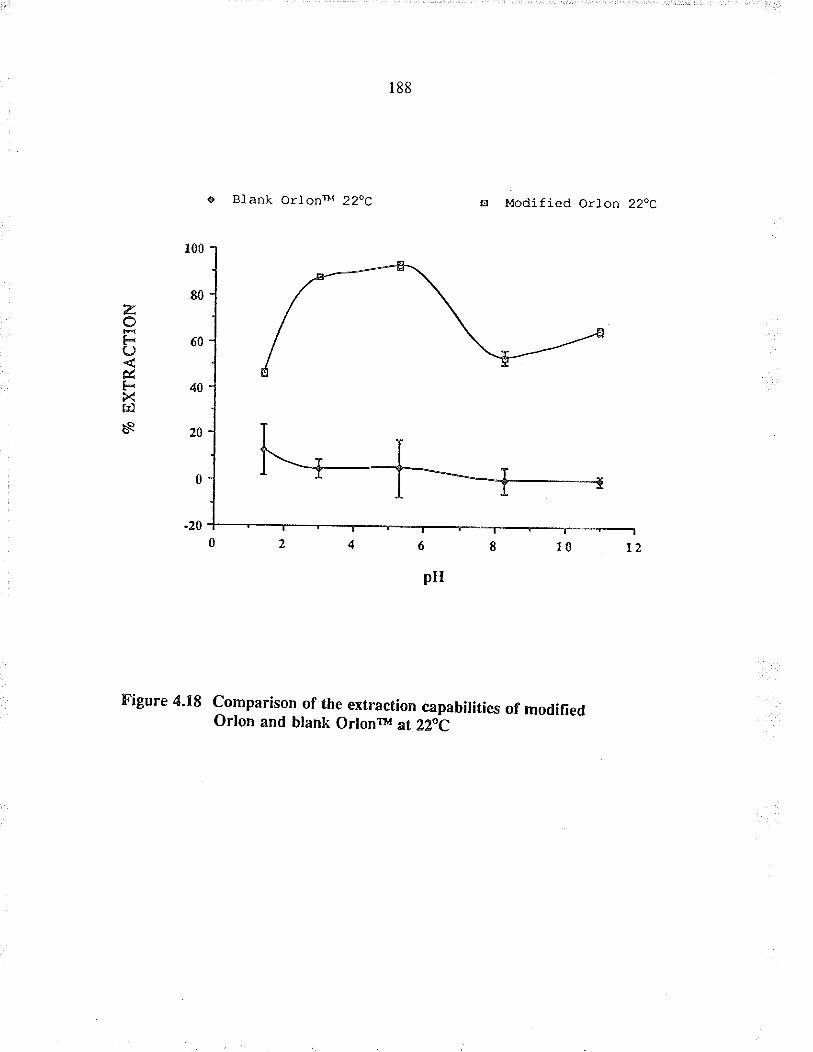
r88
. Bfank Orlon 22oC E Modified orlon 220c
zoFO&FXfcs
r00
80
60
4
20
0
-20
Figure 4.18 comparison of the extraction capabirities of modifiedOrlon and blank Orlonru at 22oC
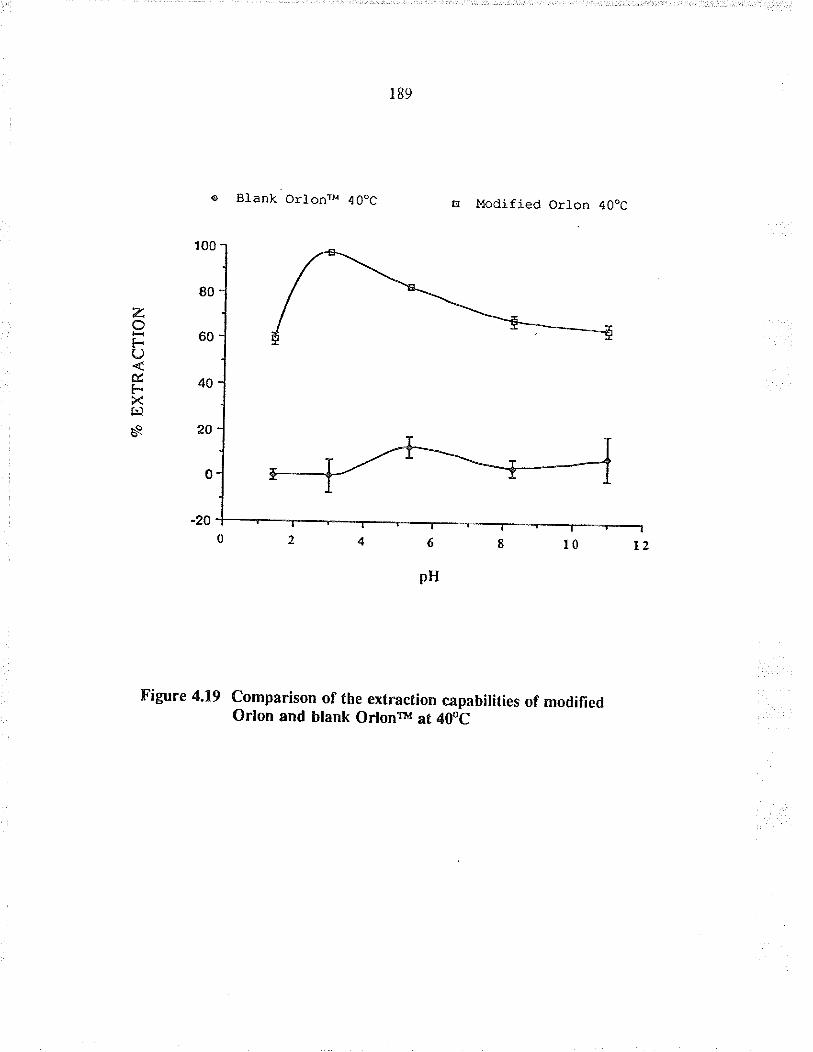
e
f00
80
60
40
Blank Orlon 4 ooc E Modified orLon 4 00c
ztrO
&FXf¡¡
èe 20
o
-20
6
pH
Figure 4,19 Comparison of tbe extråction cåpabilities of modifiedOrlon and blank Orìonru at 4(PC
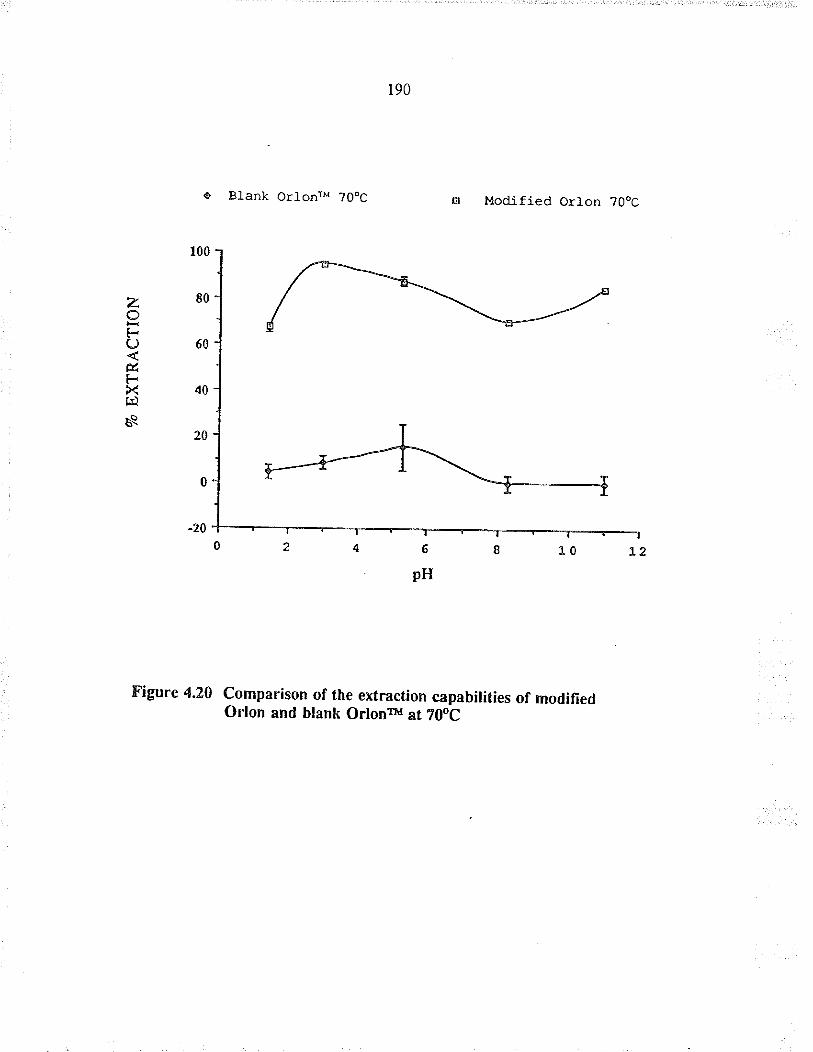
190
Bl,ank OrLon ?OoC Þ Modified Orlon ?ooc
zot-C)
&t-Xf¡lèe
a
100
80
60
40
20
0
-20
Figure 4.20 Comparison of fhe extråction câpabilities of modifiedOrlon and blank Orlonü at TlpC
191
4,7.4 Conclusion
Orlonr)'r fabric was successfully amidoximated by converting the -C=N groups of the
Orlonru fibre into amidoxime groups which are capable of extracting u¡anium from
aqueous solution whose pH ra¡ges between 1.4 and ll. The modifîed Orlon fabric
appears to retain all physical quaìities of t¡e O¡lonw fabric, i.e. flexibility, strengrh
elc., thereby making large scale industrial use possible. Altematively, the ground-up
fìbres could be packed into a column for analytical purposes. The modified Odon
fibres would be a good sorbent for the sorption of uanium from natural waters as the
pH values of natural waters are usually in the range of pH = 7 t 3. These fibres are
unique in their ability to extract uranium at low tempe¡âture (i.e.4"C) making it an
ideal sorbent for the preconcent¡ation of uranium from natural water syslems during
the colde¡ months.
The modifìed Orlon fabric is simple to make, relatively inexpensive and has good
chemical a¡d mecha¡ical srability. The porosity of the fabric is good and ir can easily
be conrolled by changing the weaving pattem during the production of the Orlonrrr
fabric. The above qualities would render tle modihed O¡lon fabric as a promising
sorbent for the preconcentration of uranium for botÌ¡ anatytical and indust¡ial puposes.
4.E Conclusion
A p-diketone foam, a phosphonic acid foam, a¡d modified Orlon fibres were
developed in our laboratory which are eapable of extIacüng uraníum from solutions at
192
a wide ra¡ge of pH and temperature.
p-diketone foam and modiñed Orlon we¡e found to be useful for sorbing uranium
from solutions with pH values between 3 a¡d 8, whereæ phosphonic acid foam was
useful only between 5 a¡d 8. Information such æ the choice of sorbenl for tìe
sorption of u¡anium at a particul temperature or pH can be obtained by comparing
the ext¡action profiles of B-diletone foam, phosphonic acid foam, and modifìed Orlon
æ shown in Figures 4.21 to 4.24.
The choice of sorbenr at 4"C would be the modifìed Orlon over the whole range of pH
tlat was evaluared as shown in Figure 4.21. Similarly, al22.C the choice of sorbent
would be modihed O¡lon over fhe range of pH that was evaluated, except at pH = 8
where the choice of sorbent would be phosphonic acid foam, as shown in Figure 4.22.
At 40"C, the choice of sorbent ar pH = I and 3 would be modifìed Orlon a¡d at pH =
5 a¡d 11 it would be p-diketone foam and ar pH = 8 ir would be phosphonic acid
foam as shown in Figure 4.23. Similarly at higher temperatures, it can be seen f¡om
Figure 4.24 that the choice of sorbent at pH = l, 3 and 11 would be modiJìed Orlon
and at pH = 5 it would be B-dikerone foam and pH = 8 it would be phosphonic acid
foam.
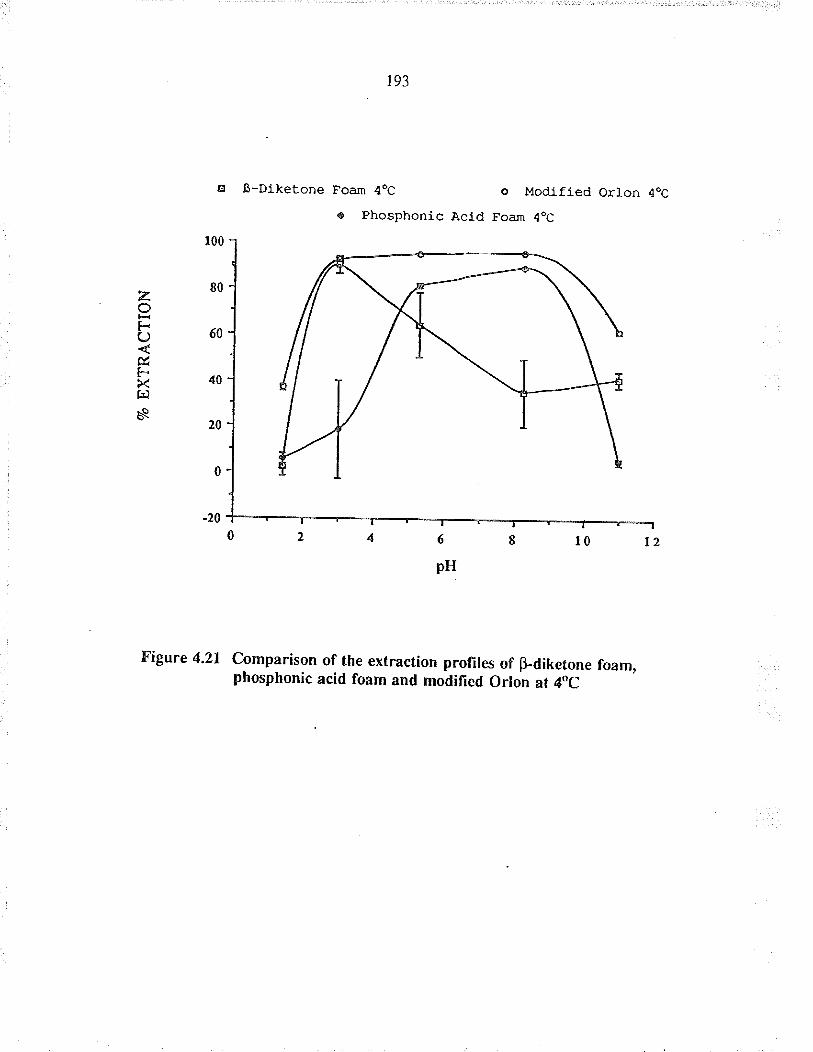
r93
ß-Diketone Foam 4oc o Modified orlon 40cÞ
r00
EO
60
40
20
0
-20
. Phosphonic Àcid Foam 4oC
zF()&FXt¿
òa
Figure 4.21 Comparison of th-e extraction profiles of þdiketone foam,phosphonic acid foam and modified Orlon at 4oC
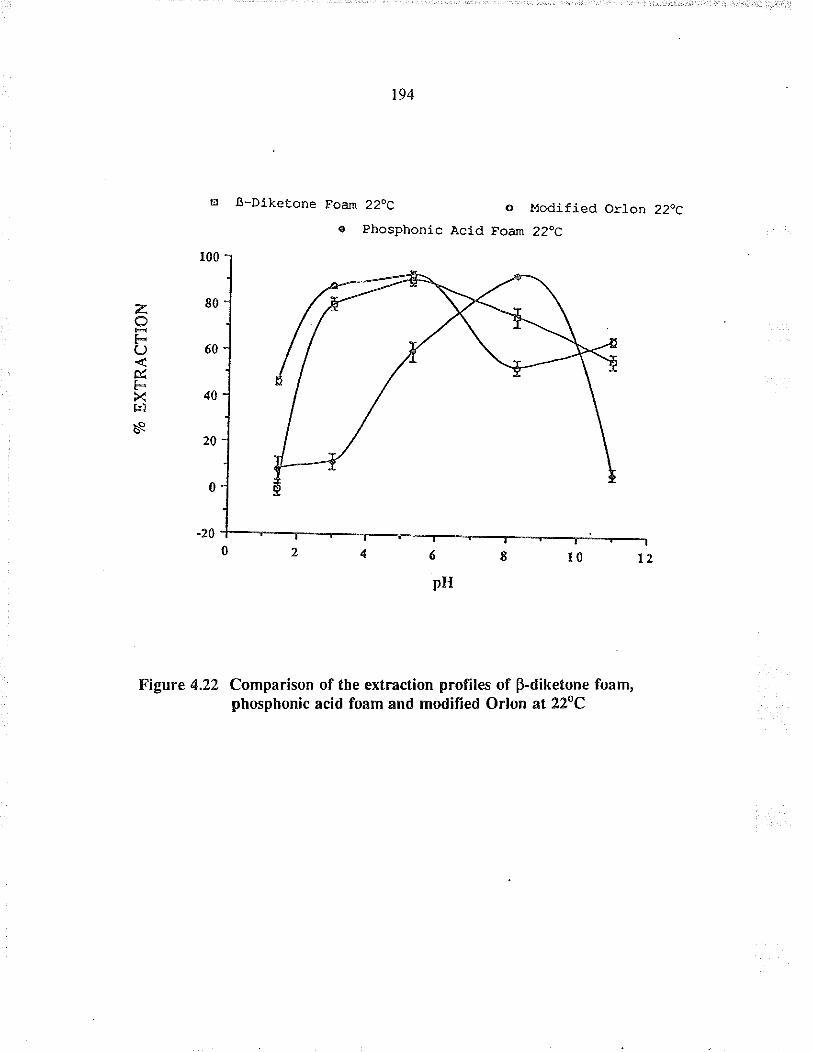
t94
ß-Diketone Foaln 22oC o Modified Orton Z2"C
o phosphonlc Àcid Foam 22oC
zt*C)
&Fxl¡lèa
E
r00
80
60
40
20
0
-20
6
pH
Figure 4.22 Comparison of tbe extraction profiles of þdiketone foam,phosphonic acid foam and modified Orlon at 22oC
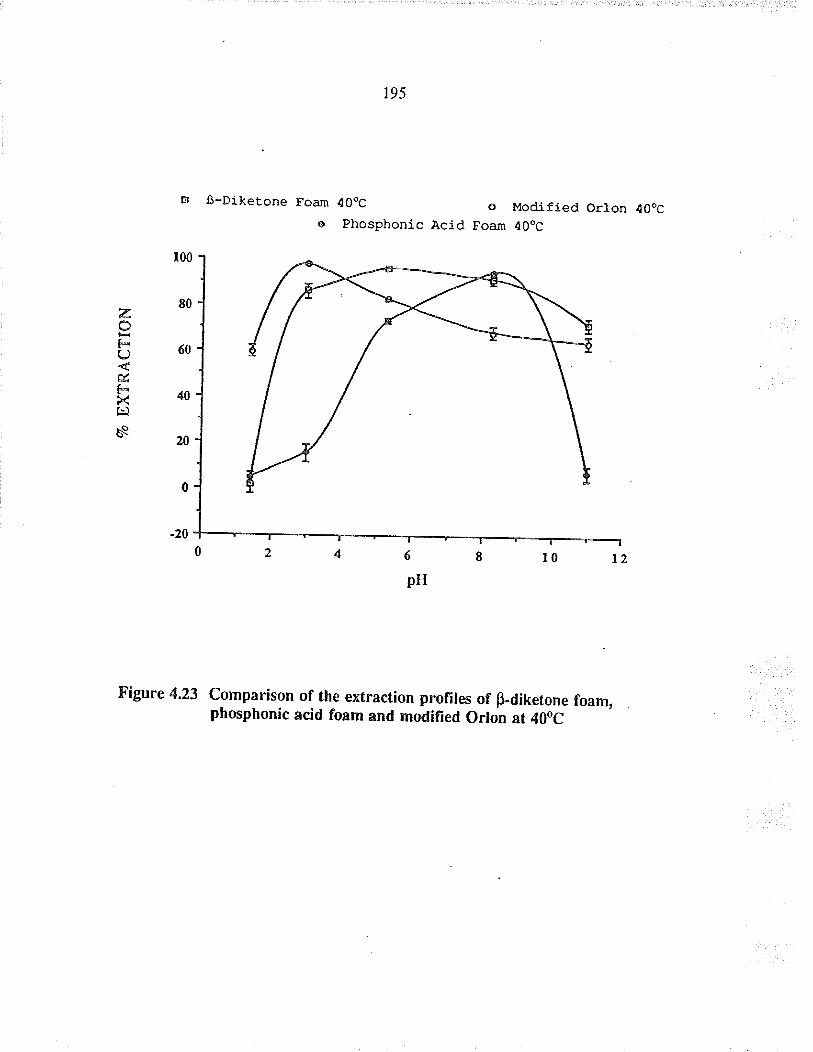
195
tr
r00
80
60
40
20
0
-20
ß-Diketone Foarn 4Ooc
ô phosphonic Àcido Modlfied Orlon 40oC
Foarn 40oC
zt-(JÉÉ-X
ñ
6 E I0 t2pH
Figure 423 Comparison of the extraction profiles of Sdiketone foam,phosphonic acid foam and mod¡fied Orlon at 40oC
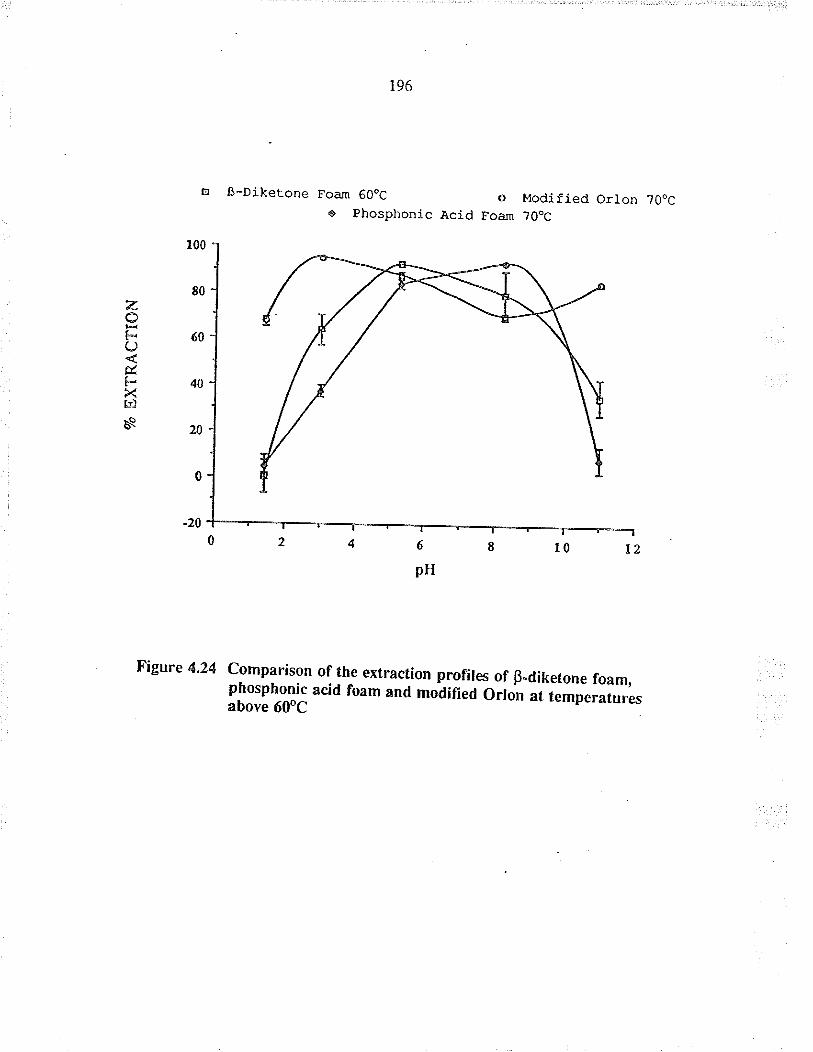
196
ß-Diketone Foam 6OoC o. phosphonic Àcid Foan
Modified Orlon ?ooc?0.c
G¡
100
80zot-()
t-Xf¿
Èa
60
40
2Ã
0
-20
Figure 4.2.4 Comparison of lh.e extraction profiles of p.diketone foam,phosphonic acid foam and modified orron at temp€raturesabove ófC
6 I 10 t2pH
t97
The above sorbents were relatively inexpensive and simple to make, They had good
porosity along with good chemical and mechanical stability thereby rendering them as
useful sorbents for the sorption of uranium for preconcenûation purposes. The tfuee
sorbenfs that were developed in our laboratory, i.e. p-diketone foam, phosphonic acid
foam and modified orlon ca¡ be packed into a column for use in analytical chemistry.
These so¡bents can now be uæd for a number of industrial applications including the
nuclear indusu-y. These sorbents may play a vital role in the clean-up procedures for
spills involving u¡anium in industry and other radiochemical facilities and in the
u¡anium mining and refining industry. These sorbents could be used for the removal
of uranium from uranium mine tailings.
t98
CHAPTER V
COMI\{ERCIÄL RESINNS FOR THE UPTAKE OF URANTUM
FROM SEAWATER
5 Introduction
Functional groups such as diketone, phosphonic acid and amidoxime, when present in
a solvent or sorbenf, were capable of extracting uranium from aqueous solutions, as
shown i¡ Chapters I and IV. The evaluation of commercially available resins
containing these functional groups for the extraction of uranium from seawater was
undertaken to compare their performance with the widely used Chelex 100 ¡esi¡. This
work was part of a project (Natural Sciences and Engineering Resea¡ch Council's
University Industry Grant CRD-8510) whose objectives were to develop and test
chelating polymeric materials specifìcally fo¡ use with the Seasta¡ru In-situ Water
Sampler for the extraction of uranium and other radionuclides from sea and fresh
water media,
The Seæta¡n ln-situ Water Sampler wæ designed by Seætarrx hstruments Ltd.,
Sidney, British Columbia, Ca¡ada. This sample#2 is capable of sampling large
volumes, which is ar advantage if one is interested in t¡ace and ultra-race anatysis.
The sampler is microprocessor-cont¡olled, which adds flexibilty in the mode of
sampling, and it has 12 different sampli¡g modes. It has a precise control of flow
rates and sample volume and has three choices of pump speeds, i.e. 50, 100 and
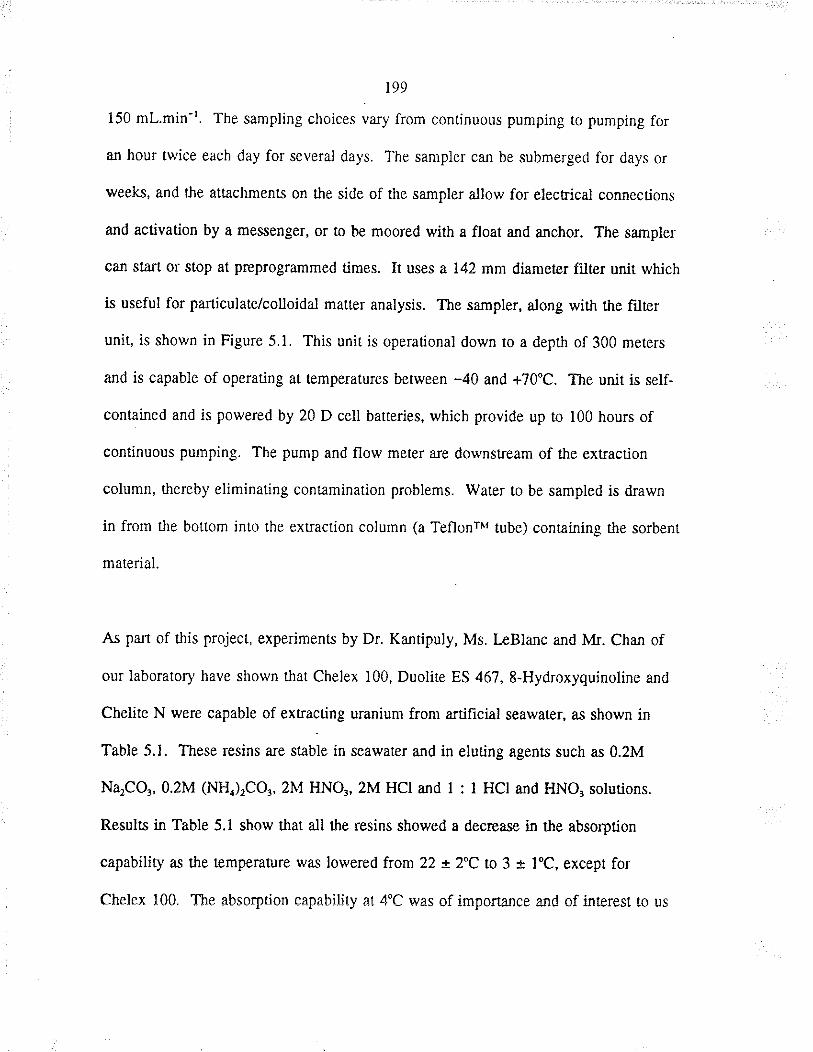
r99
150 ml,min-¡. The sampling choices vary from conrinuous pumping to pumping for
a¡ hour twice each day for æveral days. The sampler can be submerged for days or
weeks, and the attachmen$ on the side of the sampler allow for electrical connections
and activation by a messenger, or to be moored with a float and anchor. The sampler
can sf¿rt or stop at preprogrammed times. It uses a 142 mm di.ameter filæ¡ unit which
is useful for particulate/colloidal matær analysis. The sampler, along with the fîlær
unit, is shown in Figure 5.1. This unit is operational down to a deptl of 300 meters
and is capable of operating at temperatu¡es between -40 and +70"C. The unit is self-
cont¿ined and is powered by 20 D cell barteries, which provide up o 100 hours of
continuous pumping. The pump and flow meter are downstream of the extraction
column, thereby eliminating conramination problems. Warer to be sampled is drawn
in from the bottom into the exûaction column (a TeflonrM tube) containing the so¡bent
mate¡ial.
As paÍ of this project, experimenrs by Dr. Kantipuly, Ms. IæBlanc and Mr. Cha¡ of
our laboratory have shown that Chelex 100, Duolire ES 467, 8-Hydroxyquinoline and
Chelite N were capable of extracting uranium from a¡tihcial seawater, as shown in
Table 5.1. These resins a¡e søble in seawater and in eluting agenrs such as 0.2M
NqCOr, 0.2M (NH4)rCO3, 2M HNO3, 2M HCI and I : I HCI and HNO, solurions.
Results in Table 5.1 show that all the resins showed a decrease in the absorption
capability as the temperature was lowered from 22 t 2oC to 3 * l"C, except for
ehelex i00. The absorption eapability at 4"C was of imporrance and of inæ¡est to us
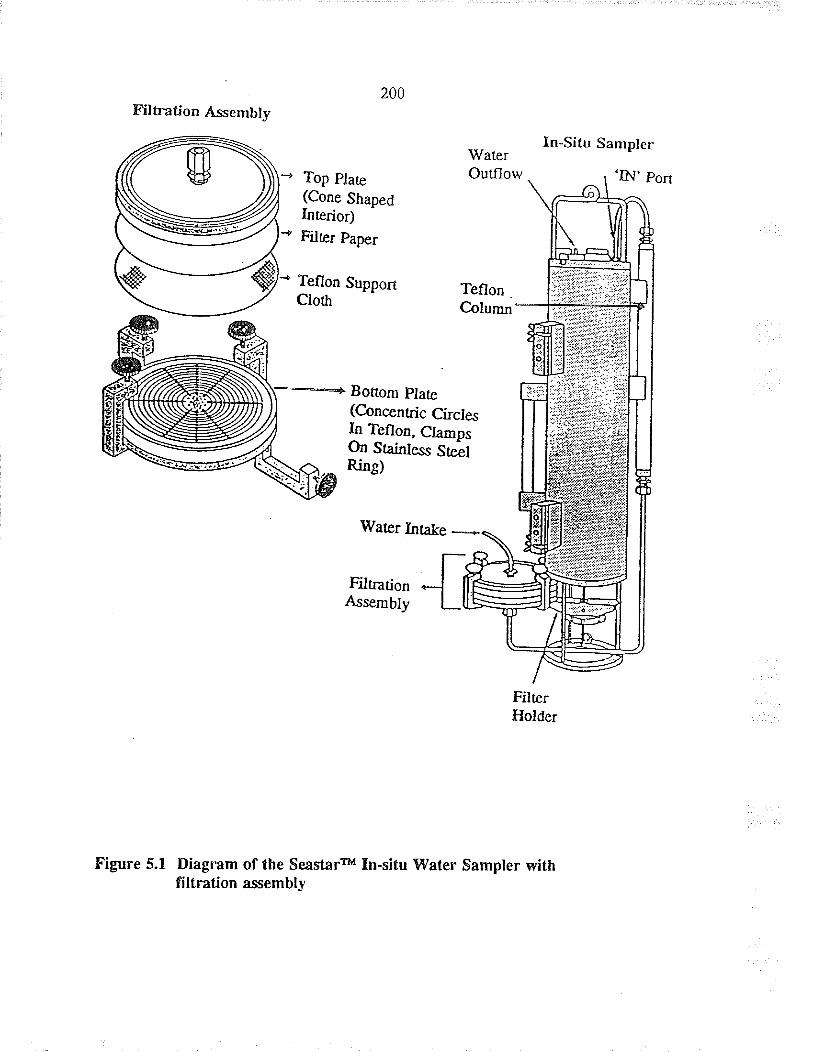
200Filhatjon Assembty
Top Plaæ(Cone ShapedIn ærior)
Filter paper
Teflon SupportCloth
Bottom plate(Concenkic CírclesIn Teflon, ClamosOn Sø¡rles Sr-elRinC)
Water Inøke
FiI¡rationAsæmbly
Figure 5.1 Diagram of the Seastarn In-situ Water Sampler withfiltration essembly
In-Situ Sampler
TeflonColumn
Fil terHolder
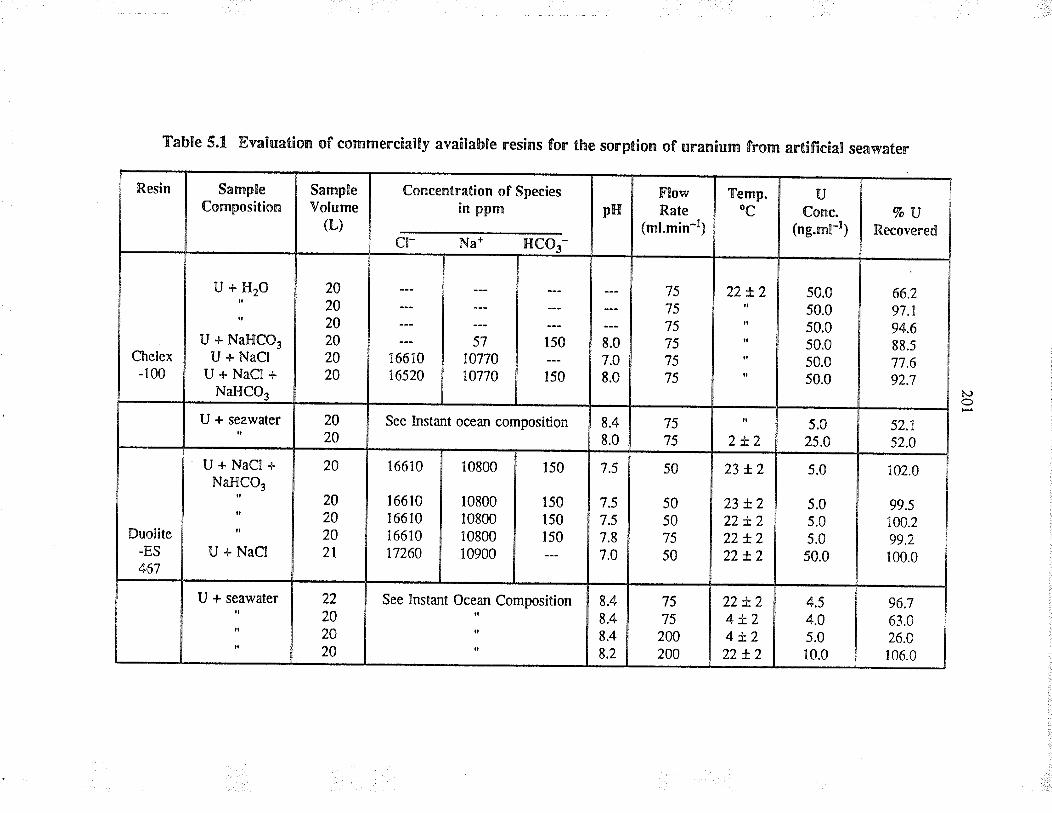
Table 5.1 Evaluation of comrnercially available resins for the sorption of uranium from artificia! seawater
Resin SampleComposition
U +,H2O
U + NaHCO3IJ + NaCl
U+NaCI+NaHCO,
Chelex-r00
SampleVolume
(L)
Concentration of Speciesin ppm
Cl- Na* HCO,-
202020202020
u + seawater
Duolite-ES
467
U+NaCl+NaHCO3
U + NaCl
r 661016520
2020
;;1077010770
20
20202021
U + seawater
See Instant ocean composition
pHFIowRate
(ml.min-l)
1s0
150
16610
t66t016610
16610t7260
;;7.O
8.0
Temp.OC
22
202020
10800
10800108001080010900
75
75
757575
75
See Instant Ocean Composition
UConc.
(ng.rnl-l)
150
22t2
8.48.0
150
150
i::
7.5
7.57.5
7.87.O
7575
%uRecovered
50.050.0s0.050.0s0.050.0
50
505075
50
2t2
66.297.1
94.688.577.692.7
23t2
23 t222 t222 !222 r.2
8.48.48.48.2
5.025.O
7575
2W200
5.0
5.05.05.0
50.0
52.1
52.0
22 t.24t24*222t2
l.)
102.0
99.s100.2
99.2100.0
4.54.05.010.0
96.763.026.0r06.0
Resin SarnpleComposition
8-hydroxy-quinoline
HzoU + NaCl
U+NaCl+NaHCO3
U + seawater
SampleVolume
(L)
Chelite-N
Concentration of SpeciesIn ppm
Table 5.1 Continued
l82020
20
Cl- Na* HCO,-
U + seawate¡
r 661016s20
twioItno
See lnstant ocean composition
202020
pH
See lnstant ocean composition
FlowRate
(ml.min-l)
150
6.27.67.8
8.4
Tempf.20c
2005050
75
U Conc.(ng.ml-l)
222020
22
8.48.48.4
%uRecovered
7575zæ
92020
5
22J3
70.087.582.5
25
25
51.0
80.041.034.0
ù\)o¡..)
203
for monitoring of trace memls in natural waters during the winter months. when t¡e
atmospheric temperature falls well below the fteeung þmperature, only the upper
layers of the natural water freeze. At ¡ower depths, the water ¡emains at 4"C as a
liquid, as it hæ a maximum density at this temperature. Experiments we¡e done to
determine if the uranium upnke by these resins would improve at cold room
érprruturr, (3 r l"C) when a duaì column method was uæd. Mann el al.æ3.e used
a dual column method to successfully exf¡act cesium, radium and some transuranic
elements f¡om seawater. The metlrod involves two tandem columns, I and tr, and the
extraction efficiency is given by E = 1-B.A-t, where A and B a¡e the respective
contenb of the two columns. The concentration of the component in seawater X is
given by X = A'(EV)-', where V is the volume of seawater pumped through t}e
columns.
The evaluarion of commercial resins by the Dua.l Column method (using a¡tificial
seawater) along with the evaluation of t¡e commercial resins with actual seawater
using tle SeashrrM In-situ Water Sampler will be discussed in this chapter.
5.1 Reagents used
Chelex 100 was obtained from Bio-Rad Laboratories (CA, U.S.A.), Cheiite p,
Chelite N, Duolite ES 467 and Duolire ES 346 from Serva Feinbiochemica G.m.b.H.
and Co. (Heidelberg, Germany) and 8-hydroxyquinoline from Seastar lnstruments Ltd.
(British Columbia, Canada).
204
5,2 Apparatus used
Evaluation of so¡bents for the uptake of t¡ace met¿ls in actual seawater was done wittr
tïe use of a SeasfffrM ln-situ Water Sampler which was designed by Seastar
Inst¡uments Ltd. (Bdrish Columbia, Canada). Glass columns wirh adjustable heighr
were obtained from Bio-Rad Laboratories (CA, U.S.A.) and Teflonw columns from
Seæta¡ Instrumentr Ltd. (British Columbia, Canada). \ilhatma¡ No. 54lrM filær paper
was used for most filtering purposes. A polycarbonate membrane filter obt¿i¡ed from
Nucleporerrr Corporation (CA, U.S.A.) wæ used with the Seastarru h-situ Water
Sampler to collect paniculate matter in seawater.
5,3 Procedure
Chelex 100, Chelite N, Chelire P, Duolite ES 467 and Duolite ES 346 resins were
evaluated for their capabiliry to ext¡act uranium from seawater. Chelex 100 hæ an
iminodiacetic acid functional group attached to a styrene-divinylbenzene copolymer
matrix, Duolite ES 467 hæ an aminophosphonic acid group attached to a polystyrene
mat¡ix and Chelite P has a aminomethylphosphonic acid group attâched to a
sflrene-divinylbenzene matrix. Duolire ES 346 is a polyacrylate witt¡ amidoxime
group and Chelite N is a cross-linled macroporous potymer with amidoxime group.
Duolite a¡d Chelite resins are European-made resins that have rarely been used in the
preconcentration of t¡ace metals, as they were only recently int¡oduced to the North
American ma¡ket.
20s
The dual column method uses two TeflonrM columns and t¡e system is shown in
Figure 5.2. The solutions were pumped from the bottom to the top of the column to
simulate the requirements for use with the Seætffru In-situ Sampler. A¡other
condition required by the sampler was that the solution flow rate through the column
be high, i.e. at least 100 ml.min-t. Columns I and II were both packed with
51 grams of the dry resin. The 51 grams of dry resin wæ chosen as it occupied g0?o
of the volume of the column after pretreatment a¡d tïe remaining volume was filled
with liquid to accommodate any swelling of tle ¡esins. The two resins tested wit¡ the
dual column system were Duolite ES 467 and Chelire N.
Syntletic seawater wæ prepared as described in Chapter IV and spiked with 500 ¡rg of
uranium to give a fina.l uranium concentration of 25 ppb. The concentration of 25 ppb
u¡anium wæ chosen to make the DCP-AES analysis more convenient. The sample
solution was equilibrated in the cold room (3 * l"C) for 20 hours prior to pumping
through the columns at a flow rate of 75 ml.min-r. Uranium from the columns wæ
eluted axd analyzed by DCP-AES. Duolite ES 467 was eluted wirh 0.25M Na"CO,
and Chelite N by lM HCVO.lM HNO, solurion.
With Duolite ES 467 æ the chelating material, the respective recoveries f¡om Columns
I and tr we¡e 23.8 and 18.6 % while wirh Chelire N rhey were 47.0 and 22.0Vo. Theæ,
results were not reproducible when the experiments were repeated as shown i¡ Table
5.2. To determine the cauæ of this problem, 50 grams of Chelite N was packed into a
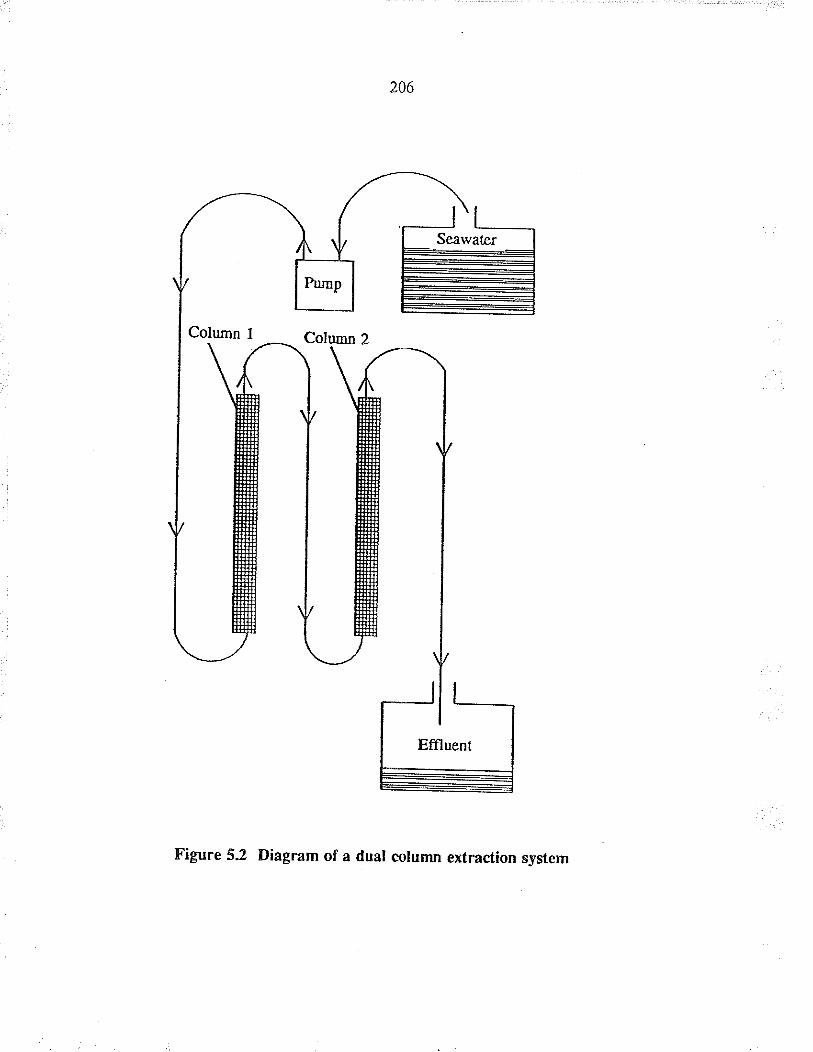
206
Figure 52 Diagram ofa dual column extracfion system
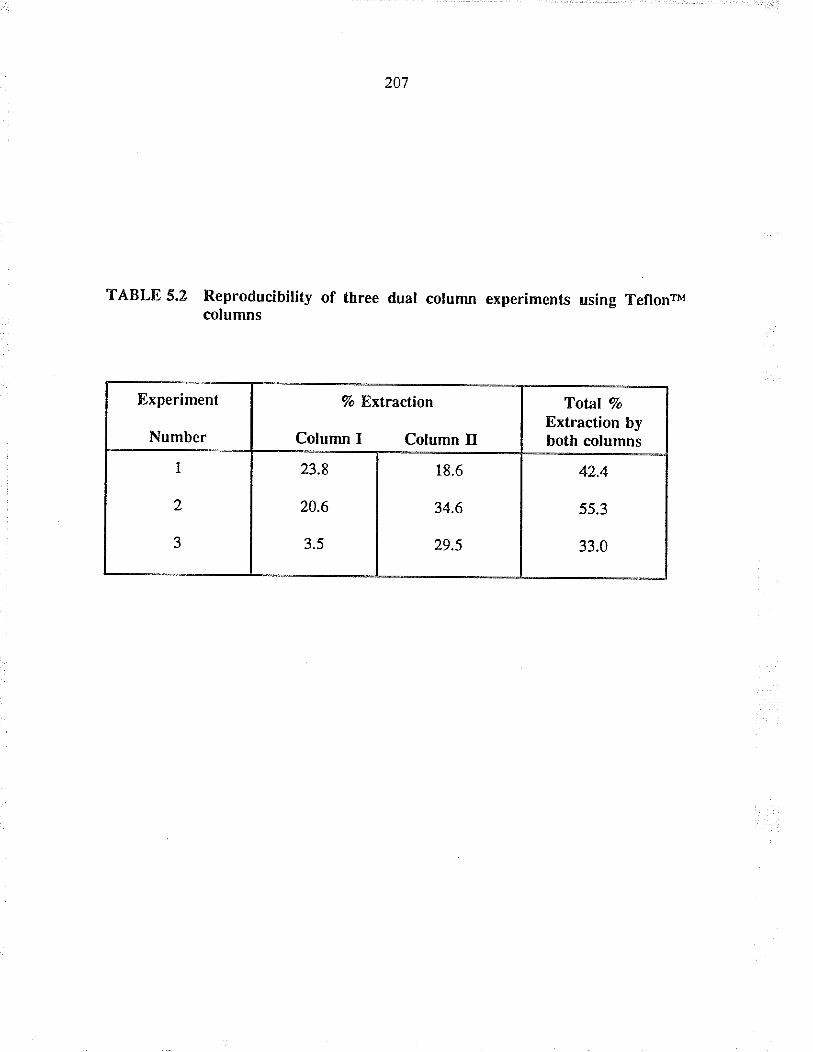
?07
TABLE 5.2 Reproducibility of three dual crtumn experiments using Teflonfrcolumns
Experiment
Number
7o Extraction
Column I Column II
Tolal Vo
Extraction byboth columns
I
)
23.8
20.6
3.5
18.6
34.6
29.5
42.4
55.3
33.0
208
glass column (Bio-Rad adjustable height column) and tle seawater wæ pumped from
the bottom. Glæs columns were choæn in o¡der to obærve the flow as the Teflonr'
columns were not transparent. After an hour of pumping at 75 ml.min-r, a movement
of æsin material was obærved which resulted in channelling of the solution flow. To
avoid this problem ¡he solution was pæsed ftom top to botrom of the column, which
resulæd in a stable bed. when the dual column metlod of extraction was rep€ated
th¡ice, with pumping from the top, more complete extraction resulted, but the
reproducibility was not improved, as shown in Table 5.3. on closer o¡ continued
observaüon through a glass column system, it was observed that tle seawater, on
cont¿ct with the resin material, released bubbles (most probably carbon dioxide gas, as
a¡tificial seawater had 200 ppm of bicarbonate ion) which coltec¡ed at the top of rhe
column. These bubbles eventua.lly (i.e. afrer 5 - 6 hours) displaced the tiquid, eithe¡ in
the frst or the æcond column, resulting in channelling. The displacement of the
liquid above the column materials was not reproducible, because at times ûe bubbles
we¡e forced out of tìe column from the bottom, resulting in enatic results for the
exfaction of uranium.
Experiments were done to determi¡e if these problems existed with single column
experiments and when preliminary experiments were done, the displacement of the
liquid layer above tìe column material was noted when the volume of liquid above the
column material wæ equal to the volume of the bed; on adjusting the plunger of the
adjustable glæs eolumn so as lo accommodate th¡ee bed volumes of liquid above the
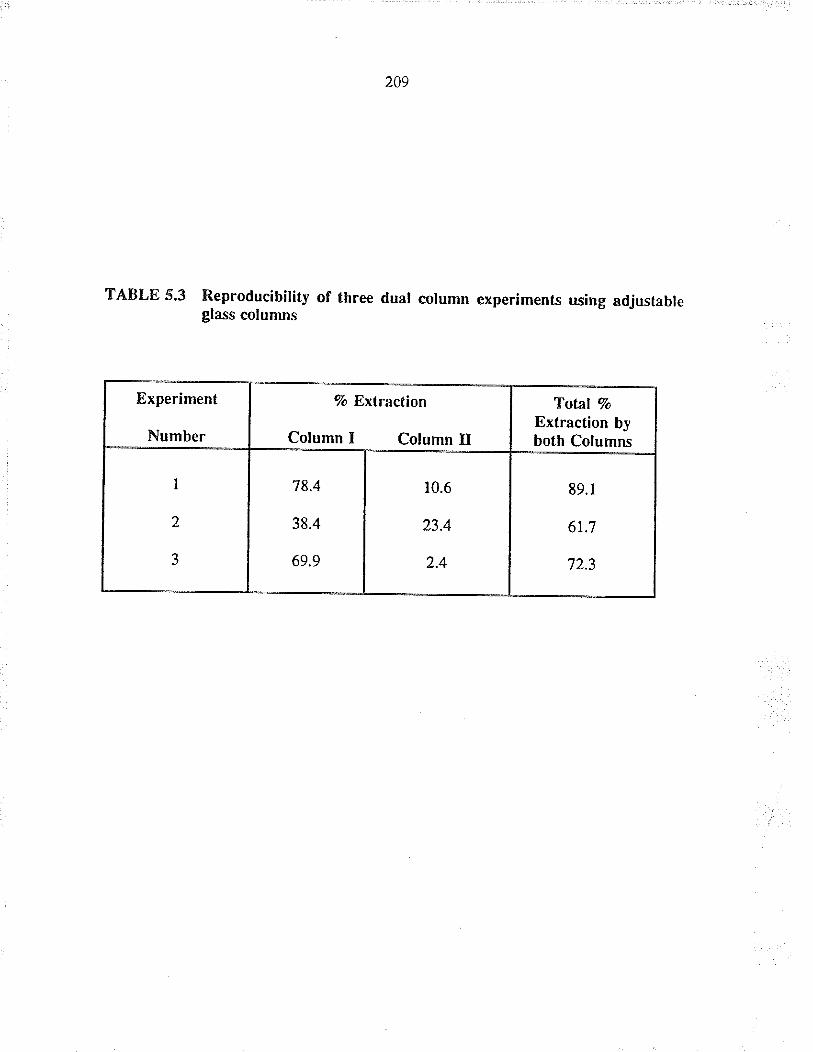
TABLE 5.3 Reproducibirity of three dual column experiments using adjustabreglass columns
209
Experiment
Number
Vo Exl¡action
Column I Column tr
Totzl Vo
Extraction byboth Columns
I
2
J
78.4
38.4
69.9
10.6
23.4
89.1
61.7
72.3
210
bed, the problem wæ solved. The bubbles were not able to completely displace the
liquid layer above t¡e column material. Experiments were tlen performed to see if
uranium extractions by Chelite N, Duolite ES 346 and Duoliæ ES 46i were
reproducible when they were subjected to ten sorption/desorption cycles.
5.3.1 Slabílity of various resíns
,Atr ea¡lier study wiûì amidoxime-based resins showed a 5Vo decreæe in their ability to
extract uranium from seawatefr for every sorption/desorption cycle. To observe if the
commercial resins are stable over ten sorption/desorption cycles, the folìowing
experiments were conducted. The resins chosen were Duolite ES 467, Chelite N and
Duolite ES 346. The resins were packed into ar adjusrable glass column (Bio Rad)
with a bed diameter of 1.5 cm and a bed height of 9 cm. One liue of a¡tificial
seawate¡, which was spiked with 500 pg of uranium, was pumped through tlre column
at a flow rate of 75 ml.min-r at 22'C. The pH of the a¡tificial seawafer was
determined to be 8.5. To help prevent channelling, a¡tificia.l seawater was pumped in
from tl¡e top of the column with th¡ee bed volumes of liquid above the sorbent.
Chelite N and Duolite ES 346, both amidoxime-based ¡esins, were eluted with
lM HCl. Two 50 mL fractions were collecred and anaìyzed by DCP-AES for Chelite
N, a¡d ICP-AES for Duolite ES 346. Afær desorprion wirh lM HCl, 250 mL of
deionized water a¡d 250 mL of 2M NaOH followed by 500 mL of deionized waær
were pumped through the column at 75 ml.min-r. Duolire ES 467, a phosphonic acid
211
based resin, was eluted with 0.25M NarCO, solution a¡d the analysis wæ done by
DCP-AES. After desorbing uranium with 0.25M NaoCOr, 100 mL of deionized water,
200 mL of 2M HCl, 100 mL of deionized waæ¡, 200 mL of 2M NaOH and fïnaily
500 mL of deionized water were passed through the column at 75 ml.min-t. The
above conditions for sorption and elution were optimised by members of this project
from our laboratory.
The results a¡e shown in Figure 5.3 and it can be seen that the Chelite N,
Duolite ES 346 nd Duolite ES 467 do not show any dec¡ease in tïeir ability to
extract uranium. The difference in the procedure as reported by K. Schwochau
et al,8t and our procedure was that, in our procedure the resins were rinsed with water
befo¡e elution with acid. The possible explanation for tìe loss of SVa effrciency for
every cycle as reponed could be due to tJìe heat produced at the sire of neut¡alization.
When simila¡ experiments with dual consecutive columns were attempted, it proved
too difficult to adjust tlre plunger height when two columns we¡e involved. At the
same time it was reported by Carmen and Kuninæs that the second column showed
greater extraction than the fust column. They observed the dissociation of urarìyl
carbonate in the fi¡st column, which enabled the æcond column to extract the
dissociated species, which confirms that the tândem column method by
Mann ¿l alæ3'e will not work with this system. One may wish to use longer columns
fo¡ ext¡action at 4"C. As longer columns were not compatible with the
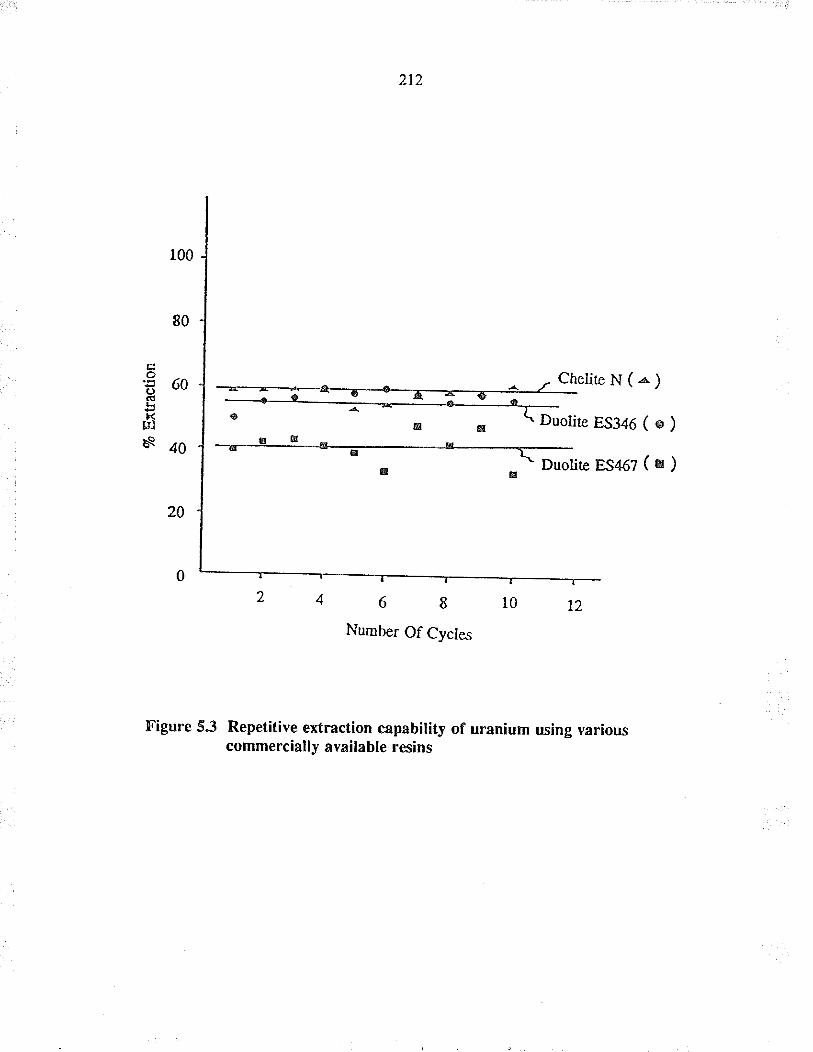
212
coo(lIXfrlès
..-r:!..
" . ,DuotiæEs¡¡6(o)
teEs¡6?(¡)
r00
80
60
40
20
0
CheliteN(r)
Figure 53 Repefitive efraction capability of uranium using variouscommercially available resins
213
Seastarn{ In-situ sampler design, experiments to improve exfaction at 4oC were
discontinued.
5,3,2 Four column gravity flov, sjstem
Problems due to channelling because of gæ formation at the top of the column, o¡
channelling when pumped from the bottom of tìe column, due to movement of resin
material, were solved by tlre development of a four column gravity flow system as
shown i¡ Figure 5.4. This is a simple system that does not require a pump as the flow
of solution through tlre resin wæ achieved by gravity. The ai¡ or gas that may be
released when seawater comes in cont¿ct with the resin escapes into the atmosphere.
The column was never allowed to dry due to the design of tle drain tube and the flow
of liquid wæ from the top to the bonom of the column. This sysæm has an added
advantage of having a multi-column capability with uniform or easily cont¡olled flow
rates. This system can be used for both ext¡action and elution and it can be left
unattended. The flow rafes at ûte beginning and end a¡e uniform as it ope¡ates at
constant pressure. The four column gravity flow system wæ designed for studying
resin pretreatmen! procedures on tìe effect of flow rates that must be determined for
the resins before eva-luating them with actual seawater.
The effect of flow rates on extraction capability of Chelite N was evaluaæd to see if
problems associated witì pumping were solved by passing I liue of a¡tifìcial seawater
eontåining 25 ppm uranium tkough the column at diffe¡ent flow rates, The columns
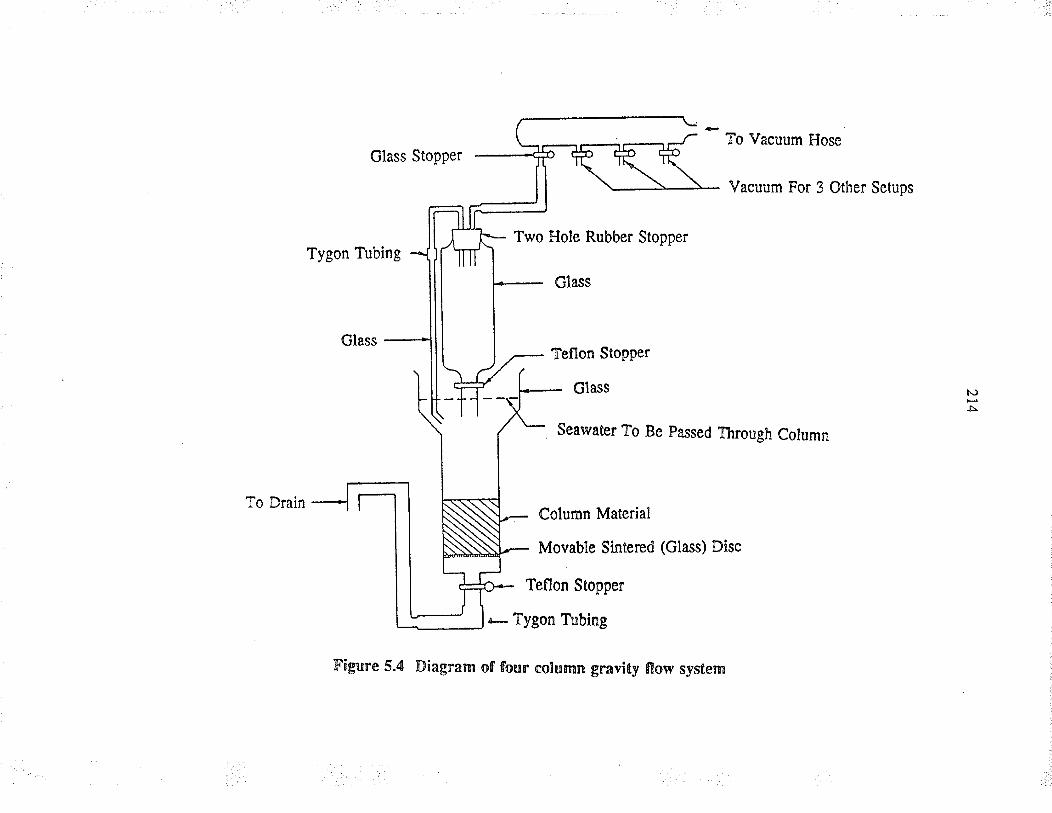
Glæs Stopper
Tygon Tubing
To Drain
Two Hole Rubber Stopper
To Vacuum Hoæ
Vacuum For 3 Other Setups
Teflon StoPPer
Glæs
Seawater To Be passed Through Column
Figure 5.4 Diagram of four column gravity flow system
Column Material
Movable Sintered (Glæs) Disc
r- Tygon Tublng
Teflon Stopper
N)
215
Ìvere tlìen elured wirh lM HCI and rhe analysis was pedormed by DCp_AES. The
ext¡acf.ion increased frorn 61.5 to 101.59o as t¡e flow rate was decreased from
68 ml-.min-Ito l5 ml-.min-t. At 32 ml.min-tthe ext¡action was g5.9qo. Fo¡
complete extraction slower flow rates would be an advaatage, but the time fo¡
extraction could be excessive for large volumes of solution, When Duolite ES 346
was packed and the extraction performed in a similar manner the Vo exÏacfton
increased f¡om 69.5 to 79.0 as the flow rate decreased from 62 ml,min-r to
Jl ml.mln .
5,3.3 Pretreatment of resins
The four column gravity flow system was used to evaluale various pretreatment
procedures for the resins for use in the extraction of uranium f¡om seawater. The
pretreatment procedures are important, as resins swell differently when placed in
different media. The resins perform better when they have been equilibrated with a
solution of ionic strength similar to the solution to be analyzed.zo ln the following
sections various pretreatmen! procedures to convert the resin to the sodium form a]ong
with preswelling will be discussed.
5.3.4 EJfect of NaOH pretreatment of resins
A sodium hydroxide pretreatrnenr was evaluated fo¡ Chelire N and Duolite ES 467.
The followirg solutions were passed through the columns: 250 mL of deionized
wafar; 250 mL of 2M NaOH; 250 mL of deionized waþ¡; 1 lit¡e of a¡tificial seawarer
216
spiked wili 500 pg of uranium; 250 mL of deionized water. This resulted in swelling
of tle resin, which decreæed tle flow rate significantly. Resins which were not
pretreated with 2M NaOH showed a maximum flow rate of 68 mL.min-t. The flow
rate dropp€d to 12 ml.min-t when the resi¡s were prefreaed with NaOH. The
significant decrease i¡ flow rate due to swelling witlì pretreatment wi¡h 2M NaOH
suggests improved pretreatment techniques must be employed for use with the
sampler.
5.3.5 Effect of IM sodium acetate
A simila¡ procedure (i.e. NaOH p¡etreatment) was followed, but with tle replacement
of 2M NaOH by lM sodium acetate, and the flow rate was checked after every
250 mL of afificial seawater passed through tle column. The flow rate was conslant
fo¡ Duolite ES 467 and Duolite ES 346 but reduced from 40 ml.min-r afrer the firsr
250 mL to 36 ml.min-r after 750 mL for Chelite N. A more marked ohange was
observed for Chelite P, where the flow rate after 250 mL ma¡k wæ 44 ml.minr, afær
500 mL it was 40 ml-.min-rand afrer 750 mL ir was 13.6 ml-.min-r. Cheliæ series of
resins show greater swelling than Duoliæ series r,vith lM sodium acetaæ solution.
5.3.6 Elfect of 3.5Vo NaCI
When the procedure was repeated with 3.5Vo NaCl solution, the resulting flow ¡ates
were more constånt/uniform than when using either lM NaoH or lM sodium acetate
solution. The value for Chelite N after 250 mL seawater passage only charged from
217
38 mL.min-r to 36 ml,min-r ar 750 mL. Similarly, for Chelire P rhe rate changed
from 36 ro 34 ml.min-t and Duolire ES 467 srårred off with 36 ml.min-' ar 250 mL
and then dropped slighrly to 34 mL.min-t for 500 and 750 mL.
5,3.7 Preswellíng with unspiked seawater
As mentioned earlie¡, tle resins perform better when preswelled with a solution of
similar ionic strength to the sample solution and hence the pretreatment with unspiked
seawater was attempted. The column material w¿rs first washed with 250 mL
deionized water rhen witì 250 mL 1M NaOH and finally with 250 mL deionized
waler in a beaker. The resins were then placed in a 500 mL beaker with 250 mL of
unspiked seawater for 20 minures and then slowly packed into rhe column. The flow
rales fo¡ all four column materials were constant. This confirms that these resin mus!
be pretreaæd with a solution of simila¡ ionic suength to t¡at to be analyzed in order to
prevent swelling of the resin materiat.
5.4 Actual seawater testing at Patricia Bay
The siæ that was used for testing the commercial resins fo¡ the uptake of trace metals
f¡om seawater was located in Patricia Bay, Vicroria, British Columbia. (48" 39.2'N
latitude and 12!" 26.9' W longitude). Parricia Bay is part of the Saanich inlet, ìilhich
is 24 km in length and is located at the southeastern end of Vancouver Isla¡d.
Saanich inlet does not possess a significant source of fresh water at its head or
arywhere along its length. The site used for the evaluation of the commercial resins
218
is shown in Figures 5.5 and 5.6.
Possible man-made contåmination of tlre bay could have resulæd from a "Iftaft,'
papermill which is located in the town of Crofton at a distånce of l0 to 12 nautical
miles northwest of the bay where the spent effluent is releæed into the inlet waters.
Seepage of septic tanks and sewers and dumpsites along the coætline could also
contribute to the pollution of the bay waters.
In this experiment, tÌìe sampler was on sampling mode "8" which would pump for
thirty minutes and tlen stop for thirty minutes; this process was repeated fo¡ a 24 hour
time period. The delay time for pumping choæn wæ ren minutes, to enable lowering
of tÏe sampler i¡to tle water a¡d to st¿bilize any swinging motion of the sampler.
The flow rate was maintained at 100 ml.min-r and fhe irlter unit contained a
Nucleporerrr polycarbonate membrane fìlter with a nominal pore size of 0.4 ¡rm.
The column materials chosen for resting were Chelite N, Cheliæ P, Chelex 100,
Duolite ES 346 and Duolite ES 467. The strucfure and funcrional groups are given in
Figure 5.7. These ¡esins were chosen æ tley had proved to be efficient for the
exEaction of uranium from a¡tificial seawater during preliminary laboratory
experiments as desc¡ibed earlier.
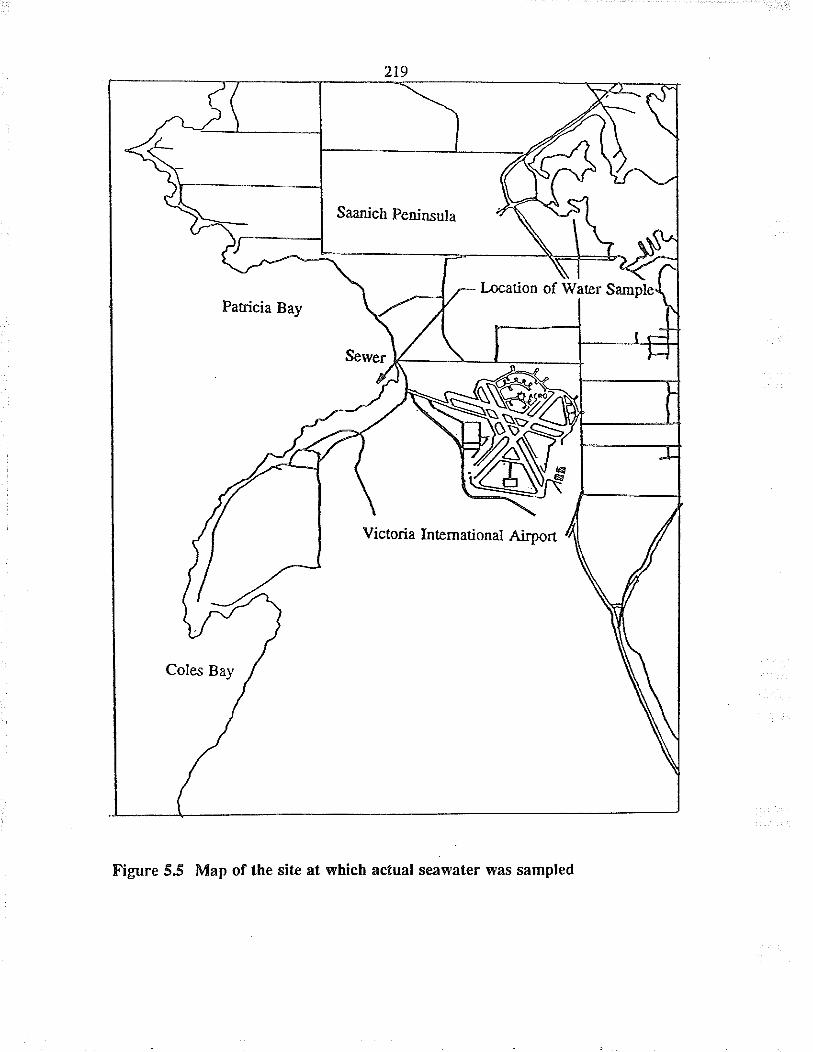
Saanich Peni¡uula
I¡cation of tilater Sample
Figure 5.5 Map of the sít€ åt which actual seåwater was sampled
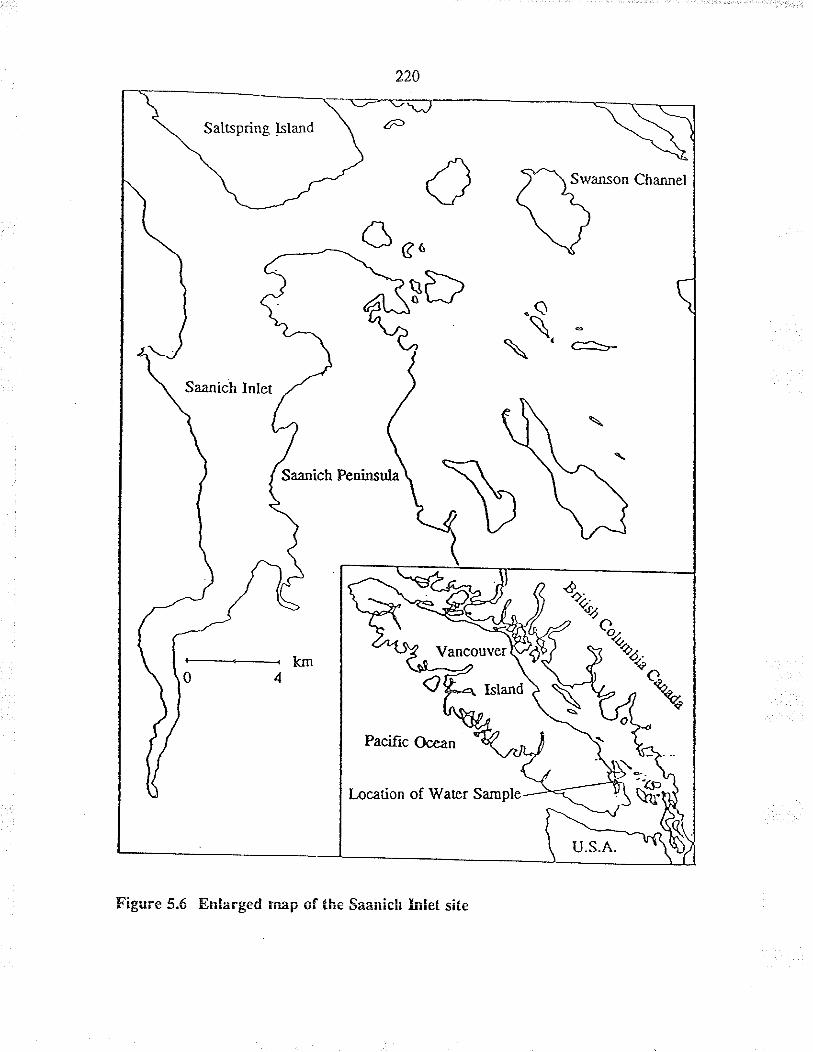
Saltspring Island
Õuo
)\swanson Channet
V\o
Saanich Intet
/"rrr"*$
*----.- km04
l¡cation of t ater Sample
4o;u,v
2Q,,\\oþ¿ç to^
(?-¿ 1%
Figure 5.6 Ðnlarged map of the Saanich Lnlet site
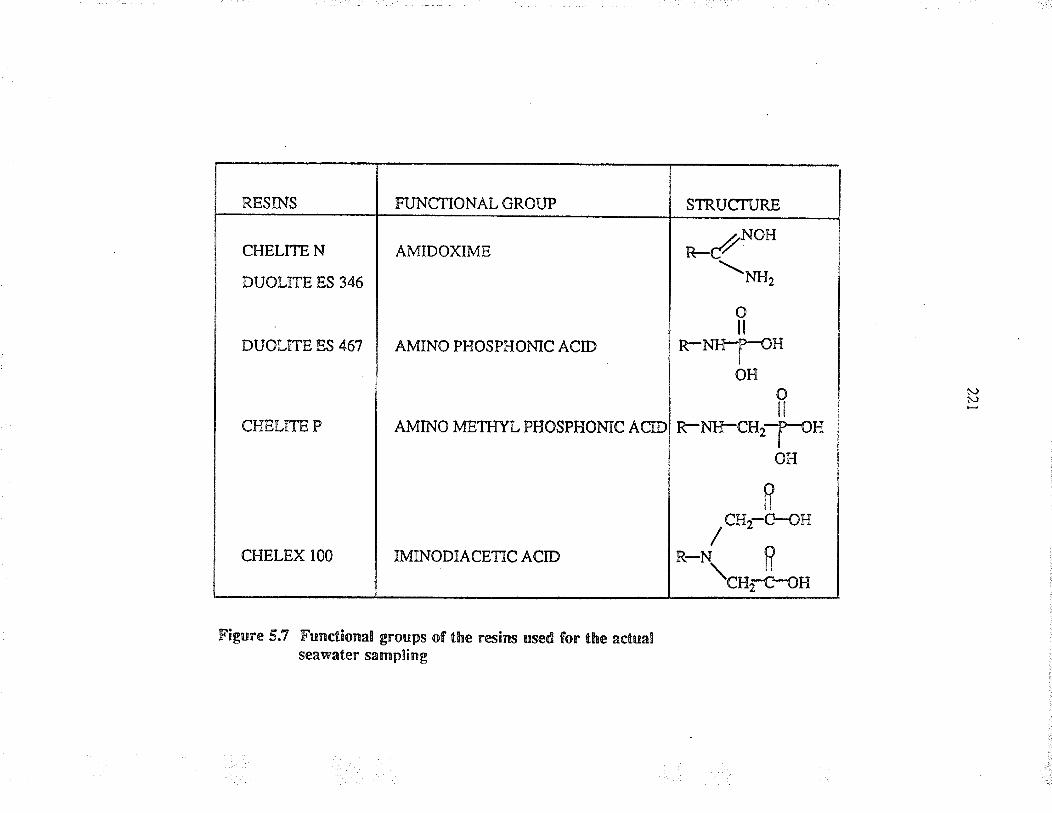
RESINS
CHELME N
DUOLITE ES 346
DUOLTTE ES 467
CHELTTE P
FUNCTIONALGROUP
AMIDOXIME
AMINO PHOSPHONIC ACID
AMINO METTTYL PHOSPHOMC ACÍD
CHELEX IOO
Figune 5.7 Functional groups of the resins used for the actualseawater sampling
STRUCTURE
z.NOHk-(/
\M{,
oil
R-NFFr{HOH
oil
rNÌFCH2-T-{HOH
rÎCH"-HH
R-N.. fl\cH¡c'-ottIMINODIACETIC ACID
t\)¡..)
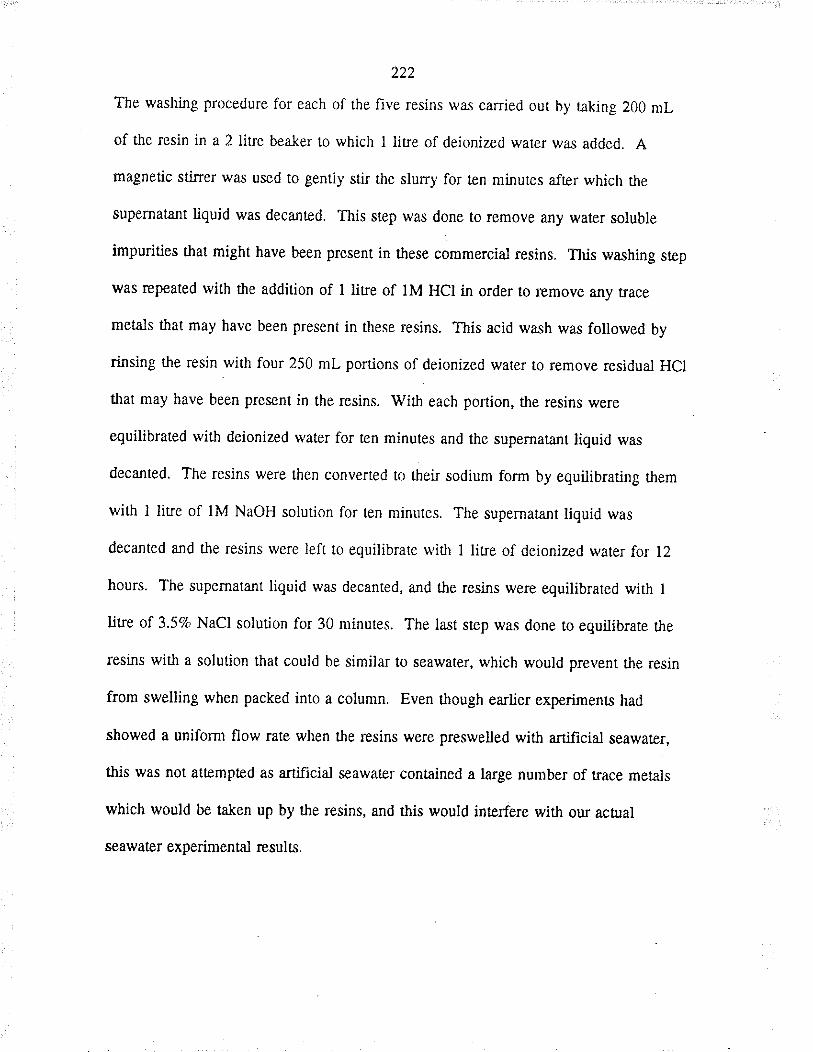
222
The washing procedure for each of the five resins was carried out by uking 200 mL
of the resin in a 2 lit¡e beaker to which I litre of deionized water was added. A
magnetic sti¡rer wæ used to genriy stir the slurry for ten mi¡ures afæ¡ which the
supernatå¡t liquid was decanæd. This sæp was done to remove any water soluble
impurities that might have been present in these commercial ¡esins. This washing sæp
was repeated with the addition of I litle of lM HCI in order to remove a¡y trace
meta.ls that may have been present in these resins. This acid wash wæ followed by
rinsing the resin wirh four 250 mL portions of deionized water to remove residual HCI
that may have been present in the resins. Wit̡ each portion, the resins were
equilibrated with deionized wate¡ for ten minutes and the supernatant üquid was
decanted. The resins were then converted to their sodium form by equiJibrating them
with I liEe of lM NaOH solurion for ten minules. The supernatart liquid was
deca¡ted a¡d tle resins we¡e left to equilibrate with I litre of deionized wate¡ fo¡ i2
hours. The supematânt liquid was decanted, a¡d the resins were equilibraled with 1
\tre of 3.Svo Nacl solution for 30 minutes. The last step was done to equilibrate the
resins with a solution that could be simila¡ to seawater, which would prevent the resin
from swelling when packed into a column. Even tlough earLier experiments had
showed a uniform flow rate when the resins were preswelled witì anificial seawater,
this was not attempted as a¡tifìcial seawater contained a large number of trace met¡.ls
which would be taken up by the resins, and this would interfere with ou¡ actual
seawater experimen tal æsults,
223
During the above process of clearing and converting t¡e resin to the sodium form, two
resins, namely Duolite ES 467 a¡d Chelite P showed degradation; a hne yellow
powder was noticed in the supematant liquid. These two resins were then pasæd
tlrough a 210 ¡rm Teflonrv sieve fo remove the fine powder.
Two columns of each resin were prepared by taking 80 mL of the wet slurry and
packing it into Teflonw columns. The columns were connected to the ln-situ Water
Sampler, along with the filte¡ assembly used to collect colloidaVparticulate matter,
The two samplers were placed at either side of a concrete dock belonging to the
Govemment of Canada, Institute of Ocean Sciences. The wo samplers were lowered
to a depth of 5 + I meúes from the surface of water by a nylon rope. The ror¿l depth
of the water at this location wæ 7 metres. The depth of 5 * I metres was chosen to
take into account the changes in the height of surface water due to tide change. The
two samplers were placed 7 met¡es apart and about 500 met¡es f¡om sho¡e.
Information obfåined from Dr. Jeffery Thompson of Ocea¡ Chemistry Division,
Institute of Ocean Sciences (a Govemment of Canada facility in Sydney, B.C.) showed
that the average salinity of surface water in this vicinity wæ 29.5Vo and that the water
was rich in organics.e
The seawater sampling was done in May 1988 a¡d the time of pumping, temperature
and pH measurements of seawater before and after pumping, the volume of water
pumped and ùe atmosphe¡ic conditions ar t¡e time of pumping are given in Table 5.4.
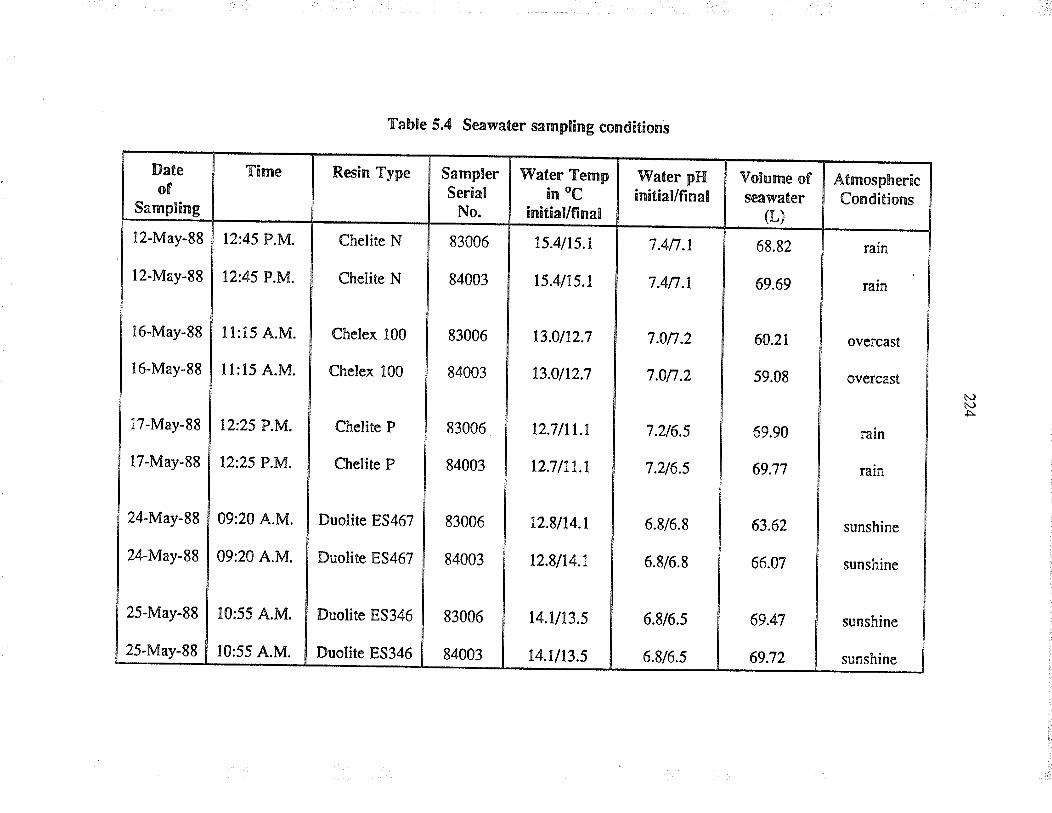
Dateof
Sampline
l2-May-88
l2-May-88
l6-May-88
l6-May-88
l7-May-88
l7-May-88
24-May-88
24-May-88
25-May-88
2s-May-8s ]
Ti¡ne
12:45 P.M.
12:45 P.M.
ll:15 A.M.
ll:15 A.M.
12:25 P.M.
12:25 P.M.
09:20 A.M.
09:20 A.M.
l0:55 A.M.
10:55 A.M.
Resin Type
Table 5.4 Seawater sâmpling condit¡ons
Chelite N
Chelite N
Chelex 100
Chelex 100
Chelite P
Chelite P
Duolite ES467
Duolite E5467
Duolite 8S346
Duolite 8S346
SamplerSerial
No.
83006
84003
83006
84003
83006
84003
83006
84003
Water Tempin oC
init¡âUfinal
ts.4/t5.r
15.4115.1
13.01t2.7
13.0112.7
l2.7llt.t
t2.7ltt.1
12.8/14.1
12.8lt4.t
14.U13.5
t4.Ut3.s
IVater pHinitial/final
7.4n.t
7.4n.1
7.0n.2
7.0n.2
7.2/6.s
7 '2/6'5
6.8/6.8
6.8/6.8
Volume ofseâwater
(L)
68.82
69.69
60.21
59.08
69.90
69.77
AtmosphericCo¡¡ditions
83006
84003
rain
¡ain
ovefcast
overcast
rain
6.8t6.5
6.8/6.5
63.62
66.07
ram
69.47
69.72
sunshine
sunshine
sunshine
sunshine
225
Measuremenß of pH on site were done witì pH paper strips. Once sampling was
completed, the columns were removed from the samplers, capped and æaled in a bag
for late¡ elution and analysis. The Nucleporew filærs, which contained any
particulate matter, were folded inwards and stored in clean Nalgene bottles fo¡
subæquent wet ashing and analysis.
The columns and filter membranes were transponed to the University of Manitoba for
analysis. The material for each column was emptied into a¡ individual glæs column
as described previously in tïe "four column gravity flow system". The resins were
eluted at I ml-.min-r using a mixrure of 2M HCI and 2M HNO3. Eighr 50 mL
fractions were collected in 60 mL Nalgenew bottles. The resins were then removed
from the columns, emptied into beake¡s, and the resins were equilibrated for 30
minutes with 50 mL of tlre eluting mixture, using constant stirring with a magnetic
sti¡rer. The supematant liquid was decanted to form the ninth fraction, and a tenth
fraction wæ obrained by repeating the læt elution step. The ninth and ænrh fractions
we¡e obtained in this fashion to recover final traces of any metals that might still be
on the column. The total uanium recovery was obtained by taking five mL f¡om each
of the ten fractions, mixing them together in a 60 mL Nalgenew bonle, and anatyzing
by ICP-AES and ICP-MS. A 50 mL s¿unple of rlre eluting mixrure was also analyzed
as a blank to determine if any trace metals were present in it.
The filæ¡ membranes were wet-ashed by placing the filters, along with any residues,
226
into 150 mL Teflonnr beakers, which we¡e heated on a hot plate at 90"C. The wet
ashing procedure used l5 mL of concent¡aled HNO, and l5 mL of deionized water.
When the solution was near boiling, 30Vo HrO2 solution wæ added drop-wise and the
heatirg continued to ne dryness. The total volume of HrO, solution used was
10 mL. This procedure was repeated tlree mo¡e times. The residue was taken up in
0.37o HNO3 solution and f-dtered using a WhatmanrM 541 filter paper and made up to
50 mL. An unused filter membrane wæ also wet ashed in a simila¡ fashion as a
blank.
5.5 Resr¡lts and discussion
\ilhen the ext¡action studies were performed with artificial seawater in our laboratory
tïe Chelite N, Chelire P, Duolire ES 467, Duolite ES 346 and Chelex 100 ¡esins were
found to be capable of extracting uranium. As can be seen from Table 5.5, resins
contåi¡ing amidoxime groups, i.e. Chelite N and Duolite ES 346, were capable of
extracting uranium from seawater a¡d the others, namely Cheliæ p,
Duolite ES 467 and Chelex 100, showed no abiliry in exkacring uranium. The major
diffe¡ence between tle artificial seawater and actua.l seawater is the presence of
organics in actual seawate¡ which may cause a difference in extraction capability for
ufanium.
In Table 5.5 it can be seen that Chelite N a¡d Duolite ES 46? in comparison to other
resins shows betfe¡ ext¡action capability for Fe, Cu a¡d Zn. Lil<ewise,
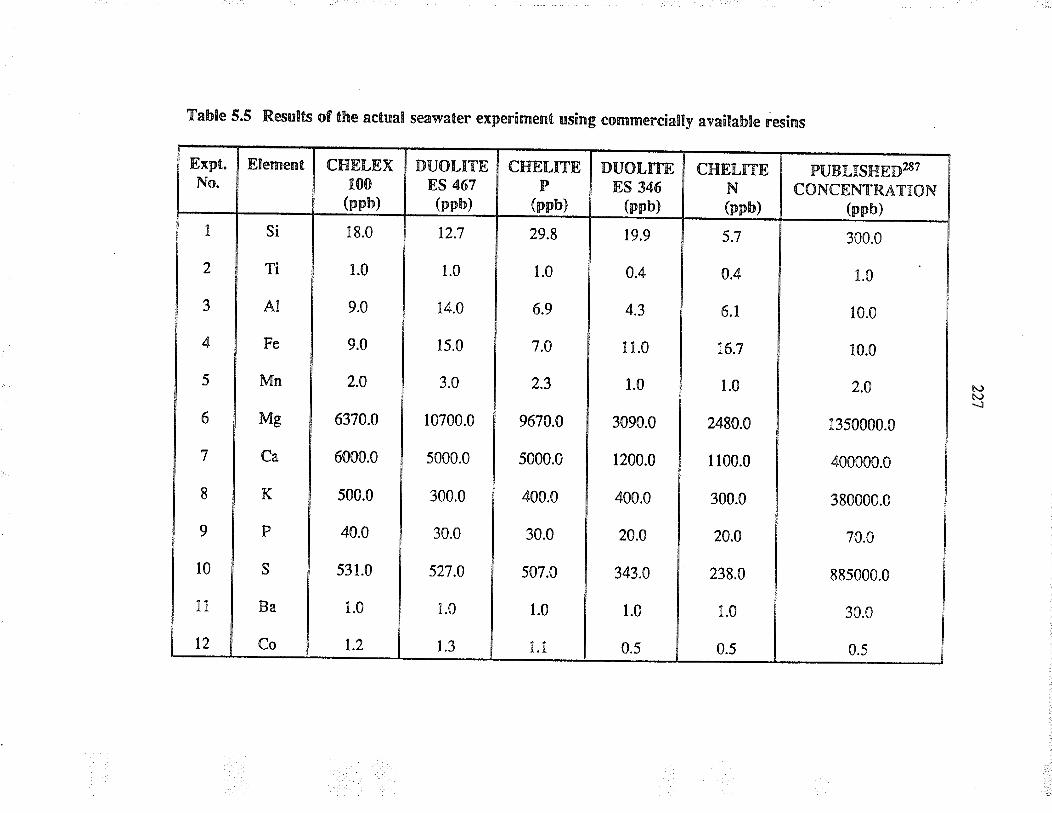
Table 5.5 Results of the actual seawater experiment using commercially available resins
Expt.No.
Elemenl
I
2
3
4
5
6
7
8
9
10
l1
t2
Si
Ti
AI
Fe
Mn
Mg
Ca
K
P
s
Ba
Co
CHELEX100
(ppb)
18.0
1.0
9.0
9.0
2.0
6370.0
6000.0
500.0
40.0
531.0
1.0
1.2
DUOLITEES 467(ppb)
12.7
1.0
14.0
15.0
3.0
10700.0
s000.0
300.0
30.0
527.0
1.0
1.3
CHELMEP
(ppb)
29.8
1.0
6.9
7.0
2.3
9670.0
5000.0
400.0
30.0
507.0
1.0
l.l
DUOLTTEES 346
(ppb)
19.9
0.4
4.3
I r.0
1.0
3090.0
1200.0
400.0
20.0
343.0
1.0
0.5
CHELITENlonbl
5.7
0.4
6.1
16.7
1.0
2480.0
r 100.0
300.0
20.0
238.0
1.0
0.5
PUBLISHED28TCONCENTR,ATION
(ppb)
300.0
1.0
10.0
10.0
2.0
1350000.0
400000.0
380000.0
70.0
885000.0
30.0
0.5
hJl.J{
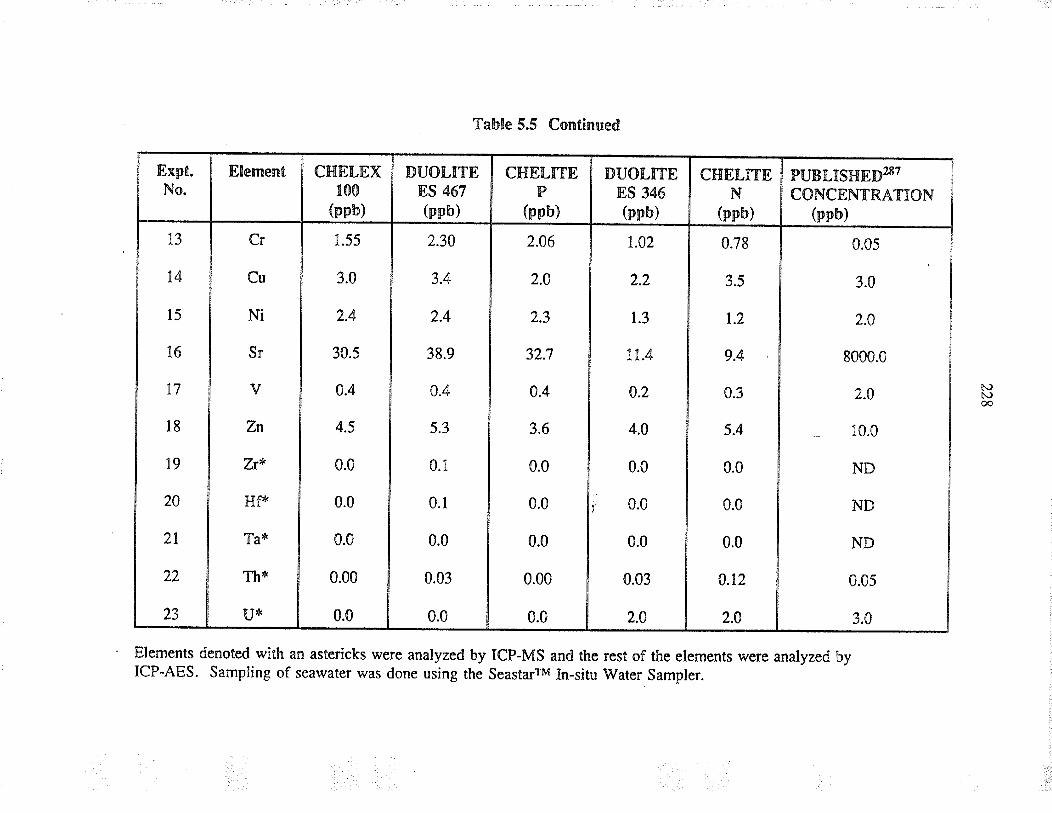
PI.JBLISHED28TCONCENTRA,TION
(ppb)
0.0s
3.0
2.0
8000.0
2.0
10.0
ND
ND
ND
0.05
3.0
CTIELÍTEN
(ppb)
0.78
3.5
1.2
9.4
0.3
5.4
0.0
0.0
0.0
0.12
2.0
DUOLTTEES 346(ppb)
Table 5.5 Continued
1.02
2.2
1.3
ll.4
0.2
4.0
0.0
0.0
0.0
0.03
2.0
CHELMEP
(ppb)
2.06
2.0
2.3
32.7
0.4
3.6
0.0
0.0
0.0
0.00
0.0
DUOLTTEES 467(ppb)
2.30
3.4
2.4
38.9
0.4
5.3
0.1
0.1
0.0
0.03
0.0
CHELEX100
(ppb)
Elements denoted with an astericks were analyzed by ICP-MS and the rest of the elements were analyzed byICP-AES. Sampling of seawater was done using the Seasta¡rM In-situ Water Sampler.
1.55
3.0
2.4
30.5
0.4
4.5
0.0
0.0
0.0
0.00
0.0
Element
Cr
Cu
Ni
Sr
v
Zn
k*
Hf"
Ta*
Th*
ur.
Expt.No.
t3
l4
l5
16
17
l8
l9
20
2t
22
23
. 229
Duolite ES 346 and chelite N for u, cherite p for Si and Mg, Duolire ES 467 for
Mn, cr, sr and Al a¡d chelex 100 for ca, K a¡d p showed better exr¡acrions. For the
extraction of v or s one may wish to use either chelex 100 or Duoliæ ES 467;
similarly Chelex 100 o¡ Duoliæ ES 467 o¡ Chelire p fo¡ Ti, Co a¡d Ni.
In the recent past several paperst'ts have been publishecl in which chelex 100 was
used for the preconcentration of trace meÞls f¡om seawater. our study has shown that
newly available commercial resins such as the Duotite and the Chelite series are better
able to perform this function of preconcentration of t¡ace met¿ls f¡om seawater.
The average concenfation of uranium present in ocean water a¡ound t¡e globe was
reported æ 3.0 ppb,38? although our results of 2.0 ppb a¡e lower. The discrepancy may
be due to the designed flow ¡ate of the sampler of 100 mL.min-r that wæ used, which
may be too rapid for efficient extracdon with tle sorbents used and rhe present
system. when artificial seawater was pumped from the bottom of the glæs column
some channelling was observed in our laboratory. This cha¡nelling could have
occu¡red in the TeflonrM columns, as the samplers were designed to suck seawater
from the bottom of the column, which may have caused channelling during the actual
saar,vaþr evaluation. The possible channelling could have resulted in the smaller value
of uranium reported in our study. changes to the sampler design have to be made to
ensure that t¡is problem does not occur. Another possible reason is that the average
of the uranium concent¡ation published is for 357o salinity, and in our case the salinity
230
was reported by the Insritute of Ocea¡ Sciences æ being 29.5Va. Generally, ir has
been found that tlìe uranium concenûation increases with salinity.æ
It was of interest to us to check the isotope ratios for uranium u23sru23s i¡ ûe eluate
from cheliæ N and Duolite Es 346. These two resins were chosen as they were the
only ones ¡.hat were capable of extracting uranium from actual seawater. Isotope ratio
measurements were done by Dr. Gægoire (Geological Survey of Ca¡ada, Ott¿wa,
canada) using their IcP-Ms inst¡ument, and a¡e a¡ average of five separate isotope
¡atio determinations, The average isotope ratio for tle above amidoxime-based resins
(i.e. chelite N and Duolite Es 346) wæ 137.8 t 1.05 a¡d this correlates well wirï the
repo¡ted va.lue of 138.0 t 0.3æe for naturally-occurring uranium. These isotope rario
measurements were conducted to see if these resins had a selective capabitity to
exl-fact a particular isotope of uranium. The measurements show t̡at this is no1 the
case, a¡d that the terrestrial uranium isotope ratio wæ lhe same as tlat found in
sea\ryater at Parricia Bay @.C., Canada).
5.6 Conclusion
Chelex 100, Chelire P, Chelire N, Duoliæ ES 346 and Duotire ES 46i were ail capabte
of extracting u¡anium f¡om anificial seawater but when t¡ese sorbents we¡e used with
actual seawater only the amidoxime-based resins (i.e. Cheliæ N and Duolite ES 346)
had the capability of exracting uranium. The inability of Chelex 100, Chelite p and
Duoliæ ES 467 to extract ura¡ium from actual seawater was attributed to the presence
231
of organics (i.e. ligand species, humic and fulvic acids, etc.) in actual sea\,/ater.
Based on the ICP-MS analysis of the eluares from Cheüæ N a¡d Duoliæ ES 346
resins, the apparent concentration of uranium in seawater wæ found to be 2.0 ppb.
This concent¡ation would be tre actual concentration of uranium in seawater provided
one assumes that all of the uranium was sorbed onto the ¡esin and that all of the
uranium on the resin was recovered. This assumption is t¡ue in ideal conditions of
ext¡action, but may not be the cæe in our study. The real concentration of ura¡ium i¡
seawater may be higher than 2.0 ppb, but by how much is not known.
More accurate results can be obtained by decreæing t¡e flow rate through the coiumn,
thus enabling more contact time between the sorbent and æawater, increæing the
column length, and pumping the seawater through the column from the top thereby
decreasing ú¡e cha¡ce of channelling tlìat may occur as noticed in the glass column
experiment.
Chelite N and Duolite ES 346 ca¡ be reused, and have been shown to withsra¡d at
least ten sorption /desorption cycles without any loss in ext¡action capability. The two
resins, i.e. Cheüte N and Duoliæ ES 346, can be uæd for a number of othe¡ trace
metal determinations, as shown in Table 5.5, and is a suitable column material fo¡ use
with the Seasta¡w In-situ Water Sampler.
232
CHAPTER VI
CONCLUSION
This chapter describes the wo¡k done fo¡ the thesis and its possibre applications in
analytical chemisny and industrial chemisny.
chapter II describes a continuous flow spectrophotometric method (GFSM) for the
analysis of u¡anium was developed using a flow cell and a diode array
spectrophotometer with Arsenazo III as the photometric reagent. The GFSM is less
time consuming than the crassical spectrophotometric method used fo¡ the anarysis of
uranium because the tedious process of cleaning, rinsing and handling of a cuvette is
avoided. The classical method wourd invorve the addition of an acid and A¡senazo III
solution to the sample sorution, followed by d ution,,vith water to a specific volume.
The tedious process of fiansferring a sample, acid and A¡senazo III solution into a
standard flask, followecl by dilution, is avoided in CFSM. A major advantage of
GFSM is that the time between reagent addition and absorbance measurement is
always a constant and that more than 60 samples can be analyzed in an hour.
CFSM can be used for a wide variety of specnophotometric analyses, which a¡e
cuûently being done by classicar methods, especia y when dearing with haza¡dous
materials, or when a large number of samples have to be anaryzed. specnophotometric
analyses by GFSM can be reratively inexpensive as it requires very sma amounts of
feagent solution.
CFSM does not require any complex switching values or sampre injection roops or
carrier liquids that a¡e normally used in flow injection analysis or ægmented flow
analysis. Although the method of flow injecrion aralysis and ægmenæd flow analysis
is well known in analytical chemistry, the advantages of CFSM a¡e rhat it is simple,
inexpensive and can be readily adapted to other systems which are currently being
perfonned by the clæsical specüophotomet¡ic mettrod. complex spectrophotomeric
analyæs that require the addition of a number of reagents in a particular sequence can
be performed by CFSM using a peristalric pump with mulri_tubing capability, and
more than one flow mixer at different stages may be necessary.
The survey of commonly available sorbents lhat was described in chapter III for the
selective uptake of uranium could prove useful to an analysf when working with
relatively simple matrices. The results of the survey showed tìat 76 percent of
commonly available sorbents that were evaluated were capable of exracüng u¡anium
when the matrix was a simple aqueous solution (i.e. uranyl acetate solution) but when
the matrix became more complex (i.e. in the prcsence of other competing ions) only
53 percent of the so¡bents were capabre of exnacting uranium. The suwey also
revealed that poly-þdiketone has superior ability, among the so¡bents evaluated, to
selectively ext¡act uranium from ar aqueous solution containing several competing
ions. Poly-þdiketone was not commercially available and rhis led us to synthesize a
234
sorbent with a B-diketone group for use in colum¡ chomatography.
chapter IV describes three new sorbents that were developed in our labo¡atory, namery
B-diketone foam, phosphonic acid foam, and a polyacryronitr e (o¡lonrÀr) fabric with
amidoxime functional groups. The th¡ee new sorbents were capable of extracting
u¡anium ove¡ a wide range of temperatu¡e (i.e. between 4oC and 70oC) and over a
wide range of pH (i.e. between 3 and r 1). These so¡bents were unabre to extract the
uranium species that formed at the extreme ends of the pH scaie, suggesting the use of
strong acids o¡ bases as possibre eluting agents. possible apprications of these newly
synthesized sorbents courd be in the effluent Íeatment of u¡anium mine tailings, home
water treatment prants' and rarge scare crean- up of rivers, streams, etc. and as corum¡
materials in analytical chemistry.
ln the nuclea¡ industry, these so¡bents woulcl be useful in the manufacture and
reprocessing of high grade fuel rods and more importantly these sorbents may play a
role in the clean-up procecrures for sp ls invorving uranium in the nucrear industry ancr
othe¡ radiochemical facilities. These new so¡bents courd also be used for extraction of
other heavy metals, as shown by some resins with similar functional groups in
chapter v (i.e. phosphonic acid ancr amidoxime functional groups). Industriar and
commercial applications of the thee new so¡bents may be promising due to the low
cost of production, relatively simple production technique, and the ability to produce
these so¡bents with high porosity. The porosity in the foam can be controllecl by the
235
size of bubbles that are produced during the foaming process. The porosity in the
modified o¡lon fabric can be controled by changing the structure of the weavi'g or
knitting pattem during fabric production.
The process of incorporating functional groups into the foarn during the foaming
process opens up the synthesis of a wide range of new polyurethane foams that woulcl
be capable of extracting various organic and inorganic species. poryurethane foarns
with functional groups incorporated into them during the foaming process exhibit
extraction properties simila¡ to those of a sorvent with given functionar groups, as
shown i¡ chapter IV with B-diketone foam. va¡ious reagents have been developed in
the last several decades for use in the selective extraction of organic and inorganic
species by solvent extraction. The successful incorporation of these reagents into
polyurethane foams would ¡esult in sorbents that can be packed into a colum¡ for
laboratory o¡ industrial separations.
colurn exf¡actions generarly are considered to be more comprete as new sorbent is
always being available when compared to batch exÍaction. column extractions are
usually preferrecl over solvent extraction as they are convenient and less time
consuming. The use of large amounts of solvents that are required in solvent
extraction can be avoided with the use of a column extraction.
European-made resins (i.e. chelite N, cherite p, Duolite ES 46r and Duorite ES 346)
236
that are relatively new to the market and have rarel), been used i¡ analytical chemistry,
were evaluated for the sorption of uranium fuom seawater, along with Chelex 100
which has been cornmonly used fo¡ the sorption of trace metals. The ¡esults obtainecl
in chapter V showed that only amidoxime-based sorbents (i.e. chelite N and Duolite
ES 346) had the ability to sorb u¡anium from actual seawater. changes need to be
made to the seasta¡rM In-situ water sampler to obtain better extraction results, i.e.
sl0wing the flow rate, increasing the colum¡ length, and pumping the sea\ryater from
the top to bottom of the corum¡ to avoid channelring of the sorbent material.
In conclusion, we developed and evaruated new sorbents for the sorption of u¡anium
from aqueous systems which involved the preparation of three new sorbents, i.e.
B-diketone foam, phosphonic acid foam, and amidoximated poryacryronitrile fab¡ic
that are capable of extracting uranium over a wide range of temperatures (i.e. between
4oC to 70oC) and over a wide range of pH (i.e. between pH = 3 ancì pH = l1). New
European resins, i.e. Chelite N, cherite p, Duolite ES 346 and Duolite ES 46i were
evaluatecl fo¡ the extraction of uranium from actual seawater ancr their extraction
abilities were compared to the existing cheiex r00 which is commonry used for the
uptake of trace metals. Our study showed the resins with amidoxime groups (i.e.
chelite N and Duolites ES 346) performed much better than the chelex 100 resin in
exfacting u¡anium from seawater. The Chelite N and Duolite ES 467 resi¡ also
showed better extraction capability for Fe, Cu ancl Zn, Chelite p for Si and Mg,
Duolite ES 467 lor Mn, Cr, Sr, ancl Al, Chelex 100 fo¡ Ca, K and p, Chelex 100 or
237
Duolite ES 467 for Y and s, cherex 100 or Duolite ES 467 or chelite p for Ti, co
and Ni. Frorn the above it can be seen that not one particular resi¡ u,as capable of
extracting all the trace metals. For the extraction of uranium, so¡bents with
arnidoxime groups show greater selectivity towards the uptake of uranium f¡om
seawater-
our study has shown that chelite N and Duolite ES 346 resins are capable of
separating and preconcentratirg uranium fiom seawater. The seawater matrix is the
most complex of the natural water systems and these resins a¡e capable of separating
uranium from the major constituents of seawater, thus enabling the monitoring of
u¡anium in seawater possibre. The sea'rvater maÍix usually interferes with most
instrumental methods of analysis, resulting in inaccu¡ate values. Fo¡ the
preconcentration of uranium from aqueous solutions with a simpler maÍix three new
sorbents were synthesized which were capable of sorbing uranium from solutions with
a wide range of pH and temperatu¡e values. The use of the above sorbents for
separation and preconcentration of uranium would result i¡ more accurate monitoring
of uranium in the environment and more acc.oate analysis of uranium in general.
G. wilki¡son2eo in an article (1984, chemistry in Britain) on the profitable extraction
of uranium from seawater says "A major facto¡ in a project such as this is to ensure
that the energy ultimatery derived f¡om the uranium is not outweighed by that requirecr
for extraction. using tidal flows and ocean cu.'ents is a sensibre alternative to
238
pumping seawate¡ through the resin. The team is therefore working on a resinloadecr
polyurethane foam that can be submerged and left to pick up uranium as seawater
ebbs and flows past it. procluc.ing a poly(hydroxamic acicl) frbre and then weaving an
endless belt is anothe¡ idea being conside¡ed. Theoretically, a belt 200 m long,
20 m wide and I cm thick could pick up 6 tonnes of u¡anium in a year: a chailenge
well wo¡th tackling.,' The two polyurethane foams, i.e. B-diketone foam and
phosphonic acid foam, arong with the amidoximated polyacryroninile fab¡ic that,rvere
developed in ou' laboratory appear to answer the above cha'enging problem and need
to be evaluated for the economical exúaction of u¡anium fiom seawater.
Suggestions for fu¡ther wo¡k related to this study would be:
a) to design a better 10 cm quarrz flow ce to prevent ai¡ bubbles from
lodging at the wi¡dows or the use of a switching valve to prevent air
intake;
b) to study the use of CFSM for other spectrophotometric analyses
cunently being performed by more classical methods;
c) to study the effectiveness of other oxidizing agents such as HrOr,
superoxide, etc., for the oxidation of pVA to pBDK;
d) to study the effect of incorporating compounds with two functional
groups (i.e. nitrile plus hydroxy groups) into the foam and then
producing amidoxime foams;
239
e) ro srudy the sorption capability of B_diketone foam, phosphonic acid
foam and modified Orlon for the uptake of uranium from seau,ater and
to determine their capacity, reusability and elution data;
Ð to study the use of the sorbents developed fo¡ the sorption of other
metals from aqueous solutions ancl from seawater.
In conclusion, we have developed a simple, fast and inexpensive way to analyze for
u¡anium in simple aqueous solutions. we prepared three ne\,r' sorbents that are
relatively inexpensive and easy to make, namely B_diketone foam, phosphonic acìcl
foam, and amidoximated polyacrylonitrile fabric fo¡ the uptake of uranium f¡om
aqueous solution with a wide range of pH and temperatue values. we have evaruatecr
some comme¡cially available resins that have rarely been used in analytical chemistry
for the uptake of uranium from seawater.
240
REFERENCES
1 C. J. Ituntiputy and A. D. Westland, Talanra, 19g8, 35, 1.
2. G. V. Myasoedova and S. B. Savvi¡, C¡ir. Rev. AnaI. Chem., 19g6,77, t.
3. K, Schwochau, Top. Cun. Chem., 19g4, lU, 91.
4. K S. Mæsie, Elsevier Oceanogr. Ser., 19g0, Z4B, 569.
5. G. V. Myasoedovaard S. B. Sawin, Zh. Analir. Iürim., 19g2, 37,4gg.
6. A. Chow and H. D. Gesser, Haza¡d Assess. Chem., l9gl, l, 17.
7. R S^. S- Murrhy, J. Holzbecher and D. E. Ryan, Rev. AnaI. Chem.,1982,6, 113.
8. P. Maccarrhy, R. W. Klusman a¡d J. A. Rice, Anal. Chem., 19g7, 59,308R.
9. Y._Yo-"ya, Kogyo Yosui., 1991, 393,26; Chem. Absrr., 1991, tts,1376362
10. J. R. Milla¡, D. per¡uzzelli a¡d G. Tiravanti, p¡oc. Int, Conf. Ion Exch.Processes., 1990. p. A. Williams and M. J. Hudson (ed) Elsevier:London, U.K.; Chem. Absr¡., 1991, tt4, l9t90tz.
I l. B. E. Holbein, lnnovative Hazard. Wæte T¡eat. Technol. Ser., 1990, 2,lll; Chem. Absü., 1990, 113, 195135e.
12. J. Xue, Lizi Jiaohuan yu Xifu., lgg7,g,42; Chem. Absrr., 19g9, lll,120197b.
13. Y._MolI1 Nenryo Oyobi Nensho, 1988, 55, 721; Chem. Abst¡., 1989,lll,244072.
14. Y.^Yg¡yu, Zosui Gijutsu, 1988, 14, 26; Chem. Abstr., t989, u0,218319x.
15. M. Moriya, ppM., 19g8, 19, 33; Chem. Absr¡,, 1989, ttl, 12953t.
241
16. T: _toguH, Nippon Kaisui Gakkaishi, tggt,45,95; Chem. Abstr., 1991,115,31630c.
17. C. Kantipuly, S. Karragadda, A. Chow and H. D. Gesæ¡, Talanra, 1990,37,491.
18. l¡ !e1*u, Ikgaku to Kogyo, 1989, 63,392: Chem. Absrr., tggÌ, tt2,200062q.
19. I. Sun, Xia¡dai Huagong, t989,9,22; Chem. Absr¡., lgg0, lt?,,199648b
20. K. Terada, Hyomen, 1989,27,360; Chem. Abst¡., 1990, tt2,g}4zïd.
21. N. L Shcherbinina, G. V. Myasoedova a¡d S. B. Savvin, Zh. Anal.Klhim., 1988, 43,2117: Chem. Abstr., 1989, rtl, t2571-9c.
22. T. Iragaki, Kagaku Kogaku, l9g8,52, gg0; Chem. Absrr., 19g9, tt0,76530h.
23. J. Zhou, a¡d L. Yu, Huaxue Shiji, l9gg, 10, 241: Chem. Abst¡., 1989,110,24632y.
24, G. Schmuckler, Taianra, 1963, 1,0,745.
25. Idem, ibid., 1965,12,281.
26. R. Boniforti, R. Ferr¿roli, p. Frigieri, D. Heltai and G. eueirazza, Anal.Chim. Acr¿, 1984, 162,33.
27. W. W. Van Be¡kel, A. W. Overbosch, G. Feensra and F. J. M. J.Maesson, J. Anal. At" Specrom, 1999,3,249.
28. A. J. Paulson, Anal. Chem., 1986, 58, lg3.
29. P. Pakâlns, Anal. Chim. Acra, 1980, l20, Zgg.
30. R. R. Greenberg and H. M. Kingston, Anal. Chem., l9g3, SS, 1160.
31. A. Chiba, S, Ichiishi, H. Ka¡da and T. Ogawa, Nippon Kagaku Kaishi,1987, 243.
32. N. Sasaoka, K. Morishige, T. Shigemarsu, y. Nishikawa and T.Matsumoto, Bunseki Kagaku, 1987, 36, 26I.
242
33. N. Sasaoka, K. Morishige, T. Shigematsu and y. Nishikawa, ibid., 19g7,36,722.
34. J. P. Riley and D. Taylor, A¡al. Chim. Acta 1968, 40,47g.
35. H. M. Kingston, I. L. Bames, T. J. Brady, T. C. Rains and M. A.Charnp, Anal, Chem., 197g, 50,2064.
36. T, M. Florence and G. E. Batley, Talantå, lgli,ZZ,2Ol.
37. M. I. Abdullah, O. A. El-Rayis and J. p. Riley, Anal. Chim. Act¿, 1976,u,363.
38. J. N. Mathur and p. K. fftopkar, Solvenr ExL Ion Exch., 19g5, 3, 253.
39. Bio-Rad Labo¡atories Bullerin 2024, l9gt.
40. Bio-Rad Laborarories Bullerin 1224, 19g6.
41. F. H. El-Sweify, R. Shabana, N. Abdel-Rahman, and H. F. Aly, J.Radioanal. Nucl. Chem., 1995, 91, 9l; Chem. Absrr., 19g5, ld3,201427p.
42. J. N. Mathur and p. K. Khopkæ, pap.-Semin. Chem. Behav. Appl.Weak acid, weak base chelating Ion Exch., 19g4, Depr at" enåigy,India; Chem. Absrr., 1984, l0t, lg2g03y.
43. E. S. Gladney, R. J. pere¡s and D. R. penin, Anal. Chem., 19g3, 55,976.
44. A. Hirose, J. Radioanal. Chem., 197g, 46,2lt.
45. H. A. Dessauþ, M. M. Abdel-Badei, S. M. Khalifa and H. M. Aly, J.Radioanal. Nucl. Chem., l9ïg, 126, 165; Chem. Abstr., l9gg, l0g,120708g.
46, Y. Koyanaka a¡d Y. Yasuda, Suiyo lhishi, Igj7,lE, S23.
41. T. Kiriyama, M. Haraguchi and R. Kuroda, Z. Anal. Chem., 19g1,307,352,
48. T. Kiriyama a¡d R. Ku¡oda, ibid, lglj, Å9, 354.
243
49, D E. læyden, T. A. panerson and J. J. Atberu, Anal. Chem., 1975, 47,t 53-
50. E, Bayer and H. Fiedter, Angew. Chem., 1960,72, g2t.
51. E. Bayer, ibid., 1964, 2,76; tntem. Ed, 1964,3,325.
52. T. Kitamura a¡d H. Wada, Japan paænt" 76i,4ggg,1976; Chem. Absr.,1977, E6, 6868m.
53. K Ooi, H. Wada, T. Kiramura, S. IGtoh and K. Sugæaka, Rep. Gov.Ind. Res. Insr Shikoku, 1990,6, 12.
54. J. Kieltand, Germa¡ patenc, 691366 , 1940;704545,7151gg,715200,1941; Chem. Absu., 1941, 35,416421 ß42,36, I44,6ri ß44,4g,2t7i8.
55. H. Isobe a¡rd T. Shimamoro, Japan patent, 2271, 1959; Chem. Abstr.,1959,53, 17451d.
56. A. lko-gseid, Norwegian parcnt, 83579, 1954; Chem. Absr., 1954, ¡t8,
I1015f.
5?, H. Matsushira and T. Takayanagi, Nippon Kaisui Gakkaishi, 1972,25,No. 136,269.
58. N. J. Keen, J. Brit. Nucl. Energy Soc., 196g, Z, 1Zg.
59. K. Schwochau, L. Astlreimer, H. J. Schenk a¡d E. G. Wirte, Chem. Ztg.,1983, 107, t77.
60. K. H. Liese¡ and B. Gleitsmann,Z. AnaJ. Chem., 19g2, 513,203.
61. Idem, ibid., 1982,3t3,289.
62, M. Forster and K. H, Lieser, ibid., l9gt, 309, 177.
63. A. Sugii, N, Ogawa and H. Hæhizume, Talanra, lgg},27, 627.
64. R. E, Sturgeon, S. S. Berman and S. N. Willie, ibid., lgg2,29, 167.
65. R. Sælla, M. T. G. Valentini and L. Maggi, AnaI. Chem., 19g5, SZ,1941.
66. K. Isshiki and E. lr{akayama, ibid., 19g7, Sg,Zgl.
67.
68.
69,
10.
77.
244
Oak Ridge Nadonal Laborarory Repa., 3036, TM_s,3322,3349,3g63.
-S,]<_oþa¡ni, M. Tokunoh, T. Saegusa and F. Mæhio, Macromolecules,1985, 18,2357.
K. Minagawa, Y. Takizawa and I. Kifune, Anal. Chim. Acta, 19g0, llS,103.
E. Yamagami, S. Tateishi and A. Hashimoto, Analyst, 19g0, 10S, 491.
P:j. Y-T",^!. D. Surprenant and S. A. Casso, Nucl. Instrum. Methods,1984,223,235.
12. K. Te¡ada, K. Matsumoro a¡d y. Nanao, Ana_I. Sci., 19g5, l, 145.
73. M. Volkan, O. y. Ataman a¡d A. G. Howa¡d, Analyst, lgg7,ll1-, 1409.
74. I. Tabushi, Y. Kobuke and T. Nishiya, Narurc, 1979, 2g0, ó65.
75. Y. Iro and T. Saegusa, J. Macromol. Sci. Chem., 1979, Al3, 503.
76. M. G. Djamali and K. H. Lieser, Ang. Mak¡omol. Chem., 1983, lt6,195.
77, M. M. Guedes de Mota, M. A. Jonker and B. Griepink, Z, A¡al. Chem.,1979,296,345.
78. K. Te¡ada, K. Morimoro and T. Kiba, Anal. Chim. Acta, 19g0, 116,127.
R. A. A. Muzz¿¡elli a¡d O. Tuberri¡i, Talanra, 1969,16, lS7l.
L. Astheimer, H. J, Schenk, E. C. Witte a¡d K. Schwochau, Sep. Sci.Technol,, 1983, 18, 307.
K Schwochau, L. Astheimer, H. J. Schenk a¡d E. G. .V{iül,
Z.Nan¡¡forsch., 1982, 31b, 214.
l^T liqor,M. Erboy and B. Thybusch, Angew. Makromot. Chem.,1987, 152, t69.
H. Egawa, H. Ha¡ada and T. Nonaka, Nippon Kagaku Kaishi, 19g0,1767.
79,
80.
81.
82.
83.
245
84. H. Egawa, H. Ha¡ada and T. Shuro, ibid,, 19g0, 1773.
85. K. Sugasaka, S. Katoh, N. Takai, H. Takahashi and y. Umezawa, Sep.Sci. Technol., 1981, 16, 971.
86. Y,.Eqryl M. Natayama T. Nonaka and E. Sugihar4 J. Appl. polym.Sci., 1987,33, 1993.
87, l: Fely¡, M. Nakayama, T. Nonaka, H. yamamoro and K. Uemura,ibid., 1987, 34, t557.
88. H. Omichi, A, Karakai, T. Sugo and J. Okamoto, Sep. Sci. Technol.,1986,21, 563.
89. H. Omichi, A. Kaukai, T. Sugo, J. Okamoto, S. Karoh, K. Sakane, K.Sugæaka and T. Ir¿gaki, ibid., 1987, 22, 1313.
90. T. Hori, S. Furusaki, T. Sugo a¡d J. Okamoto, Nippon Kagaku Kaishi,1987 , 1071.
91. N. Takagi, T. Htuorsu and S. Karo, Japan patent, 63lZ4gM0, Iggg:Chem. Abstr., 1989, 110, 21556ir.
92. Idem, ibid., 63t248439,1988; Chem. Absû., 1989, 110, 215566q.
93. Idem, ibid., 631248439,1988; Chem. Absrr., 1989, n0, 195640d.
94. H. Omichi, A. Katakai and J. Okamoto, Sep. Sci. Technol., l9gg, 23,2445,
95. T. Hori, K. Saito, S. Furusaki, T. Sugo and J. Okamoto, Nippon KagakuKaishi, 1988, 1607.
96, H. Omichi, A. Karakai and J. Okamoto, Sep. Sci. Technol. l9gg, 23,1133.
T. Hi¡otsu, K. Shunsaku, K. Sagæuka, N. Takai, M. Seno and T.Itagaki, J. Appl, Polym. Sci., 1988, 36, t'l4t.
M. Nakayama, K. Uemura, T. Nonaka and H. Egawa, ibid., l9gg, 36,1617.
Y. Kobuke, Hyomen, 1988,26,461; Chem. Absrr., t98B, 1t9,234546d.
97.
98.
99.
246
100. K. Saka¡e and S. Karoh, Shikoku Kogyo Gijutsu Shikensho Hokoku,1988, 19, 98; Chem. Abstr., 1988, t}g,2tSàUz.
101. T. Shi¡orsuka, K. Onoe and S. Mochizuki, Nippon Kaisui Gakkaishi,t988,42, t5; Chem. Abst¡., 1988, t09, L9+30it
102. K. Uezu, K. Saito, T. Hori, S. Furusaki, T Sugo and J. Okamoto, NihonGenshiryoku Gakkaishi, l9gg, 30, 359; Ch'em.1bstr., 198g, 109,I94306s.
103. H. Egawa and S. Furusaki, ibid., 19g7, 29, 1079;Chem. Abstr., 19g8,108,208122x.
104. D, W. Jun, S. K. Choi and J. S. Hong, Han'guk Somyu Konghakhoechi,1987, U,519; Chem. Absr¡., 1988, 108, t9030lr
105. K. Saito, K. Uezu, T. Ho¡i, S. Furusaki, T. Sugo and J. Okamoto,AICHE J., 1988,34,411.
106. T. Hi¡otsu, S. Kato, K, Sugasaka, N. Takai, M. Seno and T. Itagaki,Sep. Sci. Technol., 1987,23, 49.
107. T. Hori, K. Saito, S. Furusaki, T. Sugo and J. Okamoto, KagakuKogaku Ronbunshu, 1987, 13,795; Chem. Absrr., 1988, l0g', 24977y.
108. T. Hi¡otsu, N. Takagi, S. Karoh, K. Sugasaka, N. Takai, M. Seno and T.Itagaki, Sep. Sci. Technol., 1979, 22,2217.
I09. K. Saito, T. Hori, S. Furusaki, T. Sugo and J. Okamoro, Ind. Eng.Chem. Res., 1987, 26, 1977.
110. T. Hi¡otsu, S. Karoh, K. Sugæaka, N. Takai, M. Seno and T. Itagaki,ibid., 1987, 2.6, 1970.
111. M. Morira, M. Higuchi and I. Sakara, I. Appl. polym. Sci., 197g,34,1013.
112. T. Hi¡otsu, S. IGroh, T. Sugasaka, N. Takai, M. Seno and T. Iragaki,Sep. Sci. Technot., 1987,22, 1725.
113. Y.SlrrI,T. Fujii, S. Ta¡aka, T. Itagaki a¡d S. Kato, proc. Eng.Found. Conf. Fundam. Adsorpt., 19g6. A. I. Liapis (ed.) p. 537IEngineering Foundarion, New york, l9g7; Chem. Abstr., 19g7, 107,100265m.
714.
247
K. Saito, Y. Tanji, S. Furusaki, T. Sugo and J. Okamoro, Chemeca g5:Innovation Process Resour. Ind,, Aust. Chem. Eng. Conf., I9g5, 145;Chem. Abstr., 1987, 106, 180290h.
M. Suzuki, S. Karo and K. Itagaki, Japan paænt, 61t219j19, 19g6;Chem. Abstr., 1987, 106, 145806j.
K. Nakajima, K Kono, K. Miyæaka, M. Komatsu, S. Fujii and J.Tabuchi, ìbid.,6vI5j3M, 1986; Chem. Absrr., 1986, 105,227901e.
I. Hagiwara a¡d T. Kamaishi, ibid, 6U54237, t9g6; Chem. Absr.,1986, 105, 198950n.
N. Takagi, T. Hi¡otsu, S. Katoh, K. Sugasaka, N. Takai, H. Takahæhiand T. Itågaki, Nippon Kaisui Gakkaishi, 1986, 40, No. 223, 3; Chem.Abstr., 1986, 105, 1950212.
T. Hirotsu, S. Karoh, K. Sugæaka, M. Seno and T. Itågaki, J. Chem.Soc., Dalton T¡ans., 1986, 1983.
M.-Zhuang and S. Cai, Haiyang Xuebao, 19g5,7, j7g: Chem. Absr.,1986, r04, 228092h.
T. Hi¡otsu, S. Kato, N. Takagi, S. Takai, K. Itagaki, E. Ochi a¡d J.Watanabe, Japan Patent, 601210532, l9g5; Chem. Abstr., 1986, 104,92799j.
H. Omichi, A. Katakai, T. Sugo and J. Okamoto, Sep. Sci. Technol.,t986,21,299.
N. Takai, Kagaku Kyoiku , 1982,31342; Chem. Absr¡., 19g6, 104,8643y.
B. Zreng, S. Cai, M. Zhuang and L. Jiang, Haiyang Xuebao, lggi, j,34; Chem. Abst¡., 1985, 103, 20M71m.
H. Omichi, A. Katakai, T. Sugo and J. Okamoto, Sep. Sci. Technol.,r98s,20, 163.
Sumitomo Chemical Co., Japan Parent,591123140, l9g4; Chem. Abst¡.,1984. 101.214509a.
115,
116,
tt7.
118,
I19.
120.
12r.
t22
123.
t24.
t25.
t26.
127.
128.
129.
248
A. Sasaki, Y. Echigo, M, Yamao, y. Suematsu, T. Ishiftura, T. Hi¡otsu,S. Katoh and K. Sugasaka Nippon Kaisui Gakkaishi, lgg4,11, No. 210,341; Chem. Abstr., 1984, t}t, j66\3z.
Hitachi Lrd., Japan Paænt, 581166934, I9g3; Chern. Abst¡., 19g4, 100,93278t.
Y. Koide, H. Takamoto, K. Matsukawa and K. yamada, Bull. Chem.Soc. Japan, 1983, 56, 3364.
W. Lin, Y. Lu a¡d H. Zeng, Reactive polymers, 1992, 17,255,
N. Takagi, T. Hfuotsu, J. Sakakiba¡a and S. Katoh, New Dev. Ion Exch.P¡oc. lnt. Conf. Ion Exchange, Tokyo, 1992,549; Chem. Absr¡., 1992,t17,154925b.
H. Egawa, N. Kabay, T. Shuto and A, Iyo, J. Appl. polym. Sci., 1992,46, 129; Chem. Abstr., 1992, 117,132435q.
N. Takagi, T. Hirorsu, K. Sugasaka, N. Takai and T. Iragaki, NipponKaisui Gakkaishi, 1991, 45, 287; Chem. Absr¡., 1992, t17, S27aiy.
H. Egawa, T. Nonaka, S. Abe and M. Nakayama, J. Appl. polym. Sci,,1992,45,837; Chem. Abs[., 1992, 117,28238s.
A. Goto, T. Kago, K. Kusakabe and S. Morooka, J. Chem. Eng. Jpn.,1992,25, 195; Chem. Abstr., 1992, tt6,239tï2m.
!. Egawa, N. Kabay, S. Saigo, T. Nonaka and T. Shuto, Nippon KaisuiGakkaishi, 1991,45,324:Chem. Absr¡., 1992, il6, t?81l0n.
T. Kago, A. Goto, K. Kusakabe and S. Morooka, Ind. Eng. Chem. Res.,1992,31,204; Chem. Absr¡., 1992, tt6, 443509.
S. Konishi, H. Yamada, K, Saito, S. Furusaki, T. Sugo and J. Okamoto,Nihon Genshiryoku Gakkaishi, 1991,33, ?03; Chem. Abstr., 1992, l16,29$fi,
R. S. S. Murthy and D. E. Ryan, Anal. Chim. Acrå, 1982, 140, 163.
S. J. De Mora and R. M. Ha¡rison, ibid., 1983, 153, 307.
M. Hagadone and H. Zeitlin, ibid., 1976, 86, 289.
130.
131.
t32.
133
134.
135.
136.
137.
138.
139.
140.
t41.
249
142. Y. S. Kim and H. Zeittin, Separ. Sci., 1971, 6, 505.
143. Idem, Chem. Commun., I971,672.
144, Idem, Separ. Sci., 1972,7, g6l.
145. N. Rorhsrein a¡d H. Zeitlin, A¡al. Lærr., 1976,g,461.
146. H. Hi¡aide and A. Mizuike, Buil. Chem. Soc. Japan, 1975,4g,3753.
147. D. Voyce a¡d H. Zeitlin, AnaI. Chim. Acla. 1974,69,27.
148. Y, Kusaka, H. Tsuji, y, Tama¡i, T. Sagawa, S. Ohmori, S. Imai and T.Ozaki, J. Radioanal. Chem., 1977, 37,-917.
149, Y. Kubo, N. Nakazawa and M. Sato, Sekiyu Gakkaishi, 1973, 16, 5gg.
f 50. R. E. Sturgeon, S. S. Berman, A. Desaulniers and D. S. Russell,Talanra, 1980, 27,95.
151. L. G. Da¡ielsson, B. Magnusson a¡d S. Westerlund, AnaL Chim. Act¿,1978,98, 47.
152. K. Kremling a¡d H. petersen, ibid., 1974, 70, 35.
153. Y. Akama, T. Na_kai and F. Kawamura, Nippon Kaisui Gakkaishi, 1929,33, 120; Chem. Abst¡., I9BO,92,644OSt.
154. Idem, ibid., 1979,33, 180.
155. R. V, Davies, J. Kennedy, J. W. A, pecketr, B. K. Robi¡son and R. J.W. Sreeron, U.K. Ar. Energy Auth. Res. Group Rep., AERE-R-5024,1965.
156. K. Schwochau, L. Astheimer and H. L. Schenk, 26th IUPAC Congress,Toþo, 4-10 Sept. 1977.
157. H. Yamæhit¿, Y. Ozawa, F. Nakajima and T. Murata, Bull. Chem. Soc.Japan, 1980,53,3050.
158. N. Ogara, Nippon Kaisui Gakkaishi, tg7L,24, No. 13l, 197; Chem.Abst¡., 1971, 75, 112744a.
250
159, !, Tani, H. Nakayama and F. Sakamoro, Japan parenr, 1975, 75134911;Chem. Abstr., 197 6, U, 93286v.
160. P. Bu¡ba a¡d K. H. Lieær, Z. A¡al. Chem., tg77 , 2g6, Lgt.
161. I. Tabushi, Y. Kobuke, K. A¡do, M. Kishimoto and E. Oha¡a, J. Am.Chem. Soc., 1980, 102,594i.
162. l r. Cn91, Nippon Kaisui Gakkaishi, 1981,36, No. 193, 24;Chem.Abstr., 1981 95, 151495c.
163. D N, Edgingron, S. A. Go¡don, M. M. Thommes and L. R. Al¡nodova¡,Limnol. Oceanog., 1970, lS, 945.
|U. K. Schwochau, L. Astheimer and H. J. Schenk, Rep. Julich_1415, 1977,
165. I:_Yil{r, Y. Sugimura and M. Mayeda, Nippon Kaiyo Gakkaishi,1970,26, 123.
166. T. Sakaguchi, A. Nakajima and T. Horikoshi, Nippon Nogei KagakuKaishi, 1979, Si,21t.
167. H. Akaiwa and H. Kawamoro, Rev. AnaI. Chem., 19g2,6,65.
168. O. M. Petrukhin, Zh. Neorgan. Iftim., 1979, U,31SS.
169. R. G. Pearson, J. Am. Chem. Soc., 1963,85,3533.
170. O. P. Shvoeva, G. p. Kuchava, G. V. Myasoedova, S. B. Sawin, L. N.Bannykh, N. G. Zhukova, O. N. Grishina and M. S. Mezht¡ov, Zh,Analir, K¡im., 1985, 40, 1606.
171. S. B. Sawin and G. V. Myasoedova, 2nd USSR_Japan Joint Symp,Anal. Chem. Moscow, l-10 July, 19g4, p. 155.
172. W. G. Mitchelt a¡d M. M. Jones, J. Inorg. Nucl. Chem., 197g, 40, lgg.
173. T. Yoshioka, Bull. Chem. Soc. Iapan, 19g5, 58,2618.
174. E. Oikawa and K. Ohtomo, React. polym. Ion Exch., Sorbents, l9gg, g,17.
175. I. R. K¿czvinsky, Jr., J, S. Frirz, D. D. Walker a¡d M. A. Ebra, J.Radioanal. Nucl. Chern., 1985, 91, 349.
251
176. E. M. Moyers and J. S. Frirz, Anal. Chem., 1977, 49, 4lB.
t77, S. Marmo¡ and C. Kida¡e, polym. Bull. (Berlin), tg7g, 1,23g.
178, I. Tabushi, y. Kobuke and T. Nishiya, Tetrahed¡on IatL, lg7g,37,3515.
179. T. Sakaguchi and A. Nakajima, Sep. Sci. Technol., tg86, Zt, Stg.
180. L Tabushi, A. yoshizawa a¡d H. Mizuno, I. Am. Chem. Soc., 19g5,107, 4585.
181. R. Bederti, V. Ca¡anchio a¡d E. Cernia, polyme¡ Lefi., lg7l, ll,32g.182, N. H. Agnew, J. polym. Sci. Chem. Ed., 1976, 14,2glg.
183. A._Sugii, N. Ogawa, y. Iinuma and H. yamamura, Talanta, l9gl,2g,551.
184. D. Lindsay, D. Sherrin_gron, J. Greig and R. Hancock, J. Chem. Soc.,Chem. Commun ., l9g7. 1270.
M. Ma¡hol, Z. Anal. Chem., 1967, 231, 265.
M. Ma¡hol, H. Beranova and K. L. Cheng, J. Radioanal. Chem., 1974,21, 177.
G. Ma¡ecke, K. Stockhausen and p. Gergs, Makomol. Chem., 1969,t2E,229.
J. Schoer and W, Ochsenfeld, Angew. Mak¡omol. Chem., 19g2,t09nt0,2r5.
S. Akio a¡d E. Yoshiaki, U.S. paænr, 44l4tg3,l9g3; European paæntAppln. 37655, l98t; Chem. Absrr., 1982, gS,iøZtøi.
H. Egawa, T. Nonaka and M. I. Karai, I. Appl. polym. Sci., 19g4, 29,2045.
l9l. S. D. Alexa¡dratos, D. R, euillen and M. E. Bates, Macromolecules,1987, 20, 1191.
192. S. D. Alexand¡atos, D. R. euillen and W, J. McDoweI, Sep. Sci.Technol., 1987, 22, 983.
185.
186.
t87.
r 88.
r89.
190.
193.
194.
195.
196.
252
B. L. Rivæ, H. A. Matura¡a, I. M. perich and U. Angne, polym. Bull.(Berlin), 1985, 14, 239.
Idem, ibid., 1986, 15, 121.
B. L. Rivæ, H. A. Matura¡a, J, Bafulin, R. E. Catalan and I. M.Perich, ibid., 1986, 16,299.
B. L. Rivas, H. A. Maturan4 U. Argne, n. S, Caøan and I. M. perich,ibid., 1986, 16,305.
G. M. tr and J. S. Frirz, Anat. Chem., 1978, S0, 1328.
M. Luhrma¡n, N. Srelte¡ a¡d A. Ketr.rup, Z. Anal. Chem., 19g5, 322,47.
197.
198.
199. R. E. Sturgeon, S. S. Berman, S. N. Willie and J. A. H.Anal. Chem., 198t, 53, 2337.
Desaulniers,
200. J. W. Mcla¡en, A. p. Myþriuk, S. N. Willie a¡d S. S. Benna¡, ibid.,t985, s7,2907.
201. D. Beauchemin, J. W. Mcl-aren, A. p. Myþtiuk a¡d S. S. Berman,ibid., 1987, 59,,?.78.
202, M. A. Ma¡shall and H. A. Mouola, ibid., 19g3, 55, 20g9.
203. K. H. Falrynski and J. R. Jezorek, Chromatographia, 19g6,22,5.
204. K. Isshiki, F. Tsuji and T. Kuwamoro, Anat. Chem., lgg7, Sg,24gL,
205. K. Janak and J. Janak, Collection Czech. Chem. Commun., 19g6, Sl,u3,
206, Iclem, ibid., 1986, 5r, 650.
207. Idem, ibid., 1986, St, 652.
208. H. S. PaæI, Angew. Makromol. Chem., 19g6, l3g, 17.
209. J. Korkish, I. Sæffan and J. D. Nav¡atil, Radioacr. Wææ Manage,,1982,6,349; Chem. Absrr., 1983, 98,6t6872.
210. J. Korkish a¡d L Steffa¡, Solvent Exrr. Ion Exch., 19g3, l, 607.
253
211. S. Pea¡son and H. J. M. Bowen, J. Radioanal. Nucl. Chem., 19g5,96,499.
212. K. Akiba and H. Hashimoto, J. Radioanat. Nucl. Chem., 19g9, 130, 13;Chem.Absrr., 1989, 110, 23888e.
213. M. Wang, Gaodeng Xuexiao Huaxue Xuebao, l9g?, E, I19; Chem.Absr¡., 1987, 107, 108285p.
214. H. D. Gesser and S. Ahmed, J. Radioanal. Nucl. Chem., 1990, 140, 395.
215. M. Ãziz, S. G. Behei¡ and K. Shakir, J. Radioanal. Nucl. Chem., 1991,150, 155; Chem. Abstr., 1991, ils, SBZ76d.
216. K. Shakir, S. G. Behei¡ and M. Aziz, J. Radioanal. Nucl. Chem., 1992,162,371; Chem. Absr., 1992, 1t7,259291v.
217. M. Aziz, S. G. Behei¡ a¡d K. Shaki¡, J. Radioanal. Nuct. Chem., 1992,157, 105; Chem. Absrr., 1992, tt6, t600ilw.
218. T. C. Huang, D. H. Cheng, M. C. Shieh and T. C. Huang, Sep. Sci.Technol., 1992,27, 1619; Chem. Abstr., 1992, 117,9356n.
219. J. J. Wolff, Ion-Exchange and Solvent Extraction, Symposium, Oslo,1982 Paper M62-M74.
220. Serva Feinbiochemica G.m.b.H, a¡d Co., Catalog, IggTlgg, Heidelberg,Germany
221. Diamond Sharmrock Duolite CS346, Technicat Sheer, Ohio, U.S.A.
222. Y. K¿taoke, M. Marsuda, H. Yoshitake and y. Hi¡ose, U.S. patent,4468374, 1984.
223, H. Egawa, T. Nonaka, S. Matsumoto and M. Nakayama, Isr. J. Chem,,1985, 26, 56.
224. E. R. Hinton, and L. E. White, Analyrical lærrers, l9gl, 14, l.
225. C. Læe, N. B. Kim, I. C. Læe and K. S. Chung, Talanra, 1977,U,241.
226, F. De CoÍe, J. Radioanal. Nucl. Chem., 1992, 160,63; Chem, Absr.,1992, tt7, 142382i
254
227. A. P. Mykyriuk, D. S. Russell, and R. E. Srurgeon, Anal. Chem., 19g0,52, 1281.
228. L. L. Edwa¡ds and B. Oregioni, A¡al. Chem., 1975,47,2315.
229. R. E. Srurgeon, S. S. Berma¡, J. A. H. Desauli¡iers, A. p. Myþtiuk,I. W. Mcla¡en and D. S. Russell, Anal. Chem., 1980, 52, l5b5:
230. I. Zhng and H. Huang, Fenxi Shiyanshi , lgg0, 9,63; Chem. Abstr., 1991,114,239353b.
231.. V:P""p, Yuanzineng Kexue Jishu, tgïg,Zl, Z0; Chem. Abst¡., 1990,113, 183749v.
232. Y. Igarashi, C. K. Kim, y. Takaku, K, Shiraishi, M. yamamoto and N.Ikeda, Aral. Sci., 1990, 6, 157; Chem. Abstr. 1990, tI3, 16979p.
233, P. De Biev¡e, JNMM, 1989, 18,47; Chem. Absrr., 1990, 112,228:l02x.
234. S. Hirai, Bunseki, 1988, 9, 639; Chem. Abstr., 19g9, 110,6g642f.
235. B. N. Belyaeu, A. V. Lovtsyus, T. p. Maka¡ova and A. V. Stepanov,Radiokhimiya, 1988,30,3; Chem. Absrr., 1988, 109, 15325c.
236. lr_cij!et¡, lnorg. Chim. Acra., 1987, 140,215; Chem. Abst¡., 1988,108, 105335q.
237. K. Cha¡der, S. G. Ma¡athe a¡d H. C. Jain, Trans. SAEST, 1gg7,22,185; Chem. Absrr., 1988, 108, 83981t.
238. I. Ursu and D. E. Demco, New Dev. Nucl. Mag. Reson. euantumElect¡0n., Spec. Colloq. Ampere, 19g5, I. Ursu and K. H. Hausser, CIpPress. Bucharest, Rom.; Chem. Abst¡., 1997,101,249036v.
239. I. C. Veselsky, B. Kwiecinska and E. Weh$rein, Mineral pol., 19g6, 16,9; Chem. Abstr., 1987, I07, t46312c.
240. H. H. Miller and T. B. Hi¡schfeld, proc. SpIE-Inr_ Soc. Opt Eng., 19g7,7tE, 39: Chem. Abst¡., 1987, 101, 32t9of .
241. H. Uchida, Bunæki, 1987, 1,80; Chem. Abstr., t987, 1016, 1879152.
242. M. P. Tyagi, S. Banu and D. N. purohir, Bol. Soc. euim. peru., 19g6,51, 117; Chem. Absr¡,, 198ó, r0S, tà60t9t.
255
243. Spectrospan V Instrument Ma¡ual, 19g0, Spectra Met¡ics Inc., MA.USA,
244. Personal Communication, Dr. C. Gregoire, Geological Survey ofCa¡ada, Ottawa, Canada,
245. S. B. Sawin, Talanr¿, 1961, B, 673.
246. A, Bermejo-Barrera, M. C. Yebra-Biumrn and L. M. Fraga-Trillo, Anal.chim. Acra, 1990, 239, 321
241. A. Ken, W. Kupferschmidt, a¡d M. Auås, Anal. Chem., l9gg, 60,2j29.
248. B. V. Kadam, B. Mairi, and R. M. Sathe, Analyst, t991,106,724.
249. K. Sekine, Miï¡ochim Acta, 1976,2,559.
250, T. Kiriyama and R. Kuroda, Anal. Chim. Acta, 19j4,71,375.
251. K. Sekine, and H. Onishi, Anat. Chim. Ac¡a,., 1972, 62, 468.
252. H. Onishi and K. Sekine, Talanra, 1972, 19,473.
253. J. A. Perez-Bustamanre and F. paloma¡es-Delgado, Analyst, Ig|.l,96,407.
254. M. Suchanek, F. Sipek, L. Kabrr" V. Radil a¡d J. Makovicka, Sb. Vys.Sk. Chem-Technol. Praze, Anai. Chem., 1999,H23,65; Chem. Abstr.,1989, 111 16151'12.
255. HP 84524 Diode Anay Spectrophoromerer Handbook, 1986, Hewlett-Packard Company, CA, USA.
256. M. Blanco, J. Coello, J. Gene, H. Iturriaga and S. Maspoch, Fresenius.J. Anal. Chem., 1990,339,831; Chem. Absr¡., 1991, t14,94307c.
257. M. Thompson and M. H. Ramsey, Ana.lyst, 1985, ll0, 1413.
258. M. W. Blades a¡d G. Horlick, Specrochim. Acr¿., 1981, 368, ggl.
259, R. S. Houk, Anal. Chem., 1986,5E,974.
256
260, G. J. Moody and J. D. R. Thomæ, Chromatographic Separarion a¡dExracrion with Foamed plætics and Rubbers, 19g2, Ma¡cel Dekker lnc.¡[Y, USA.
26L T. Braun, J. D. Nav¡atil, and A. B. Farag, polyurethane Foam Sorbentsin Separarion Science, 1985, CRC press I¡c., Fl. USA.
262. R. Guidoin, M. Therrien, G. Rolla¡d, M. King, I. L. Grandmaison, S.Kaliaguire, P. Blais, H. pakdel and C. Roy, Annals of plasric Surgery,t992,28,342.
263. C. Batich and J. Williams, J. Biomed. Mater. Res., 19g9,23,311.
264. H. I. Griesser, Polymer Degradation and Subility, lggl,33,32g.
265. Hypol Plusru Laboratory procedures and Foam Formulations, 19g7, lV.R. Grace a¡d Co. MA, USA.
266. T. B¡aun a¡d A. B. Farag, Anal. Chim. Ac¡a., lg74,1.t, 133.
267, A. Chow and D. Buksak, Can. J. Chem., Lg7S, Sg, t373.
268. M. A. J. Mazurski, A. Chow, a¡d H. D. Gesser, Anal. Chem. Act¿,t973,65 99.
269. T. Valenre, a¡d H. J. M. Bowen, Anal. Chim. Acta., 1977,90,315.
270, K. Srilameswa¡an and H. D. Gesser, J. Envi¡on. Sci, Health, 197g, AlS,415.
271. G. N. Lypka, H. D. Gesser, a¡d A. Chow, Anal. Chim. Acta,., lg71,l,E,36',1.
272. H. D. Gesser, B. M, cupta, J. Radioa¡al. Nucl. Chem., tggg, 132,37.
273, I. Feldma¡, W. F. Neuman and J. R. Havill. Report UR-SS, 1949;Spectroscopy and Photochemistry of Uranyl Compounds, E.Rabinowitch and R. L. Belford, 1964, pergamon press Inc., l{y, U.S.A.
274. The Mathemaúcs of Physics and Chemisu-y, H. Margenau and G. M,Murphy, P515, 1959, D. Van Nostrand Company, Inc., NJ, USA.
275. R. Djogic, L. Sipos and M. Branica, Limnol Oceanogr,, 19g6,gl, ll2}.
257
276. J. Stâry and E. Hladky, Anal. Chim. Acta., 1963,29,227.
277. Kumamoro University, Japanese patent, No. 5g/Ig6436: Chem. Abstr.,1984, 100, 89381d.
278, K. Ueda, Y. Saro, O. yoshimura and y. yamamoro, Analysr, l9gg, ll3,7?3.
279, Instant Ocean Salt, 1967, Aquarium Sysæms Inc., OH, U.S.A.
280. Handbook of Textile Fib¡es, Volume tr, Man Made Fib¡es, J. GordonCook, 1968, Me¡row Publishing Co. Ltd., Engtand.
281, F. L. M. Schouteden, Makromol. Chem., 1957, A,25.
282, Seastar In-situ lVater Sampler Model 8300, Operations andMaintenance Manual, 1987, Seastff lnstruments Ltd., Sidney, 8.C.,Canada.
283. D. R. Mann, L. D. Surprenant and S. A. Cæso, Nuclea¡ lnstruments andMethods ir Physics Resea¡ch, 1984,223,235.
284, D. R. Mann and S. A. Casso, Ma¡ine Chemistry, Igg4, 14, 3;07.
285. C. Carmen and R. Kuni¡, Reacrive polymers, Lgg6, 4, j7 .
286. Personal Communication, Dr. J. Thompson, Institute of Ocean Sciences,Sidney, 8.C., Canada.
287, The Sea, Volume 2, The Composition Of Seawater, M. N. Hill, 1963,Iohn Wiley and Sons, NY, USA.
288. T. L. Ku, K. G. Knauss and G. G. Mathieu, Deep Sea Reseuch, 1977,u, t00s.
289, J. J. Katz and E. Rabinowitch, The Chemistry of Uranium, l95l,McGraw-Hill Book Company, Inc., NY, USA.
290. G. Wirkinson, Chemisrry In Britain, 1994,20, 142.


