Embed Size (px)
Citation preview

1
The Spatial Exposure of the Chinese Infrastructure System to Flooding and
Drought Hazards
Xi Hu1, Jim Hall
1,2, Peijun Shi
3 and Wee Ho Lim
1,2
1Environmental Change Institute, Oxford Centre for the Environment, School of
Geography and the Environment, University of Oxford, Oxford, OX1 3QY; PH
(+44) 1865-275846; FAX (+44) 1865-275850; email: [email protected],
[email protected]; [email protected].
2 Oxford Martin School, University of Oxford, Oxford, OX1 3BD UK
3 State Key Laboratory of Earth Surface Processes and Resource Ecology, Beijing
Normal University, Beijing, China; PH (+86) 10-58808179; FAX (+86) 10-
58802158; email: [email protected].
Link to publisher version: http://link.springer.com/article/10.1007%2Fs11069-015-
2012-3
Abstract
Recent rapid urbanisation means that China has invested in an enormous
amount of infrastructure, much of which is vulnerable to natural hazards. This
paper investigates from a spatial perspective how the Chinese infrastructure system
is exposed to flooding and drought hazards. Infrastructure exposure across three
different sectors - energy, transport and waste - is considered. With a database of
10,561 nodes and 2,863 edges that make up the three infrastructure networks, we
develop a methodology assigning the number of users to individual infrastructure
assets and conduct hotspot analysis by applying the Kernel density estimator. We
find that infrastructure assets in Anhui, Beijing, Guangdong, Hebei, Henan,
Jiangsu, Liaoning, Shandong, Shanghai, Tianjin, Zhejiang – and their 66 cities – are

2
exceptionally exposed to flooding, which affects sub-sectors including rail,
aviation, shipping, electricity and wastewater. The average number of infrastructure
users who could be disrupted by the impacts of flooding on these sectors stands at
103 million. The most exposed sub-sectors are electricity and wastewater (20% and
14% of the total respectively). For drought hazard, we restrict our work to the
electricity sub-sector, which is potentially exposed to water shortages at
hydroelectric power plants and cooling water shortage at thermos-electric power
plants, where the number of highly exposed users is 6 million. Spatially, we
demonstrate that the southern border of Inner Mongolia, Shandong, Shanxi, Hebei,
north Henan, Beijing, Tianjin, southwest of Jiangsu - and their 99 cities - are
especially exposed. Whilst further work is required to understand infrastructure’s
sensitivity to hazard loading, the results already provide evidence to inform
strategic infrastructure planning decisions.
Keywords: Exposure; flooding; drought; infrastructure (energy, electricity, waste,
transport, rail, aviation, shipping); China

3
1. Introduction 1
2
China has overtaken the United States and the EU to become the world’s 3
largest investor in infrastructure (Dobbs et al. 2013). The country has invested 8.5% 4
of its GDP into its infrastructure since 1992 and its stock of infrastructure as a 5
percentage of GDP is now, at 71%, above the global average (Ibid). Whilst 6
ambitious plans are in place to increase this stock even further, concerns have been 7
raised over the extent to which its infrastructure system can withstand natural 8
disasters such as flooding and drought. According to the Chinese Ministry of Water 9
Resources, the 2011 floods alone resulted in the interruption of services to 28 rail 10
links, 21,961 roads and 49 airports, and the failure of 8,516 electricity transmission 11
lines (Ministry of Water Resources 2011). The 2012 droughts affected a substantial 12
proportion of the Chinese water supply – thousands of reservoirs issued warnings 13
of “exceptional low water levels” in provinces such as Hubei, Yunnan and 14
Heilongjiang, resulting in water shortage in urban areas (Ministry of Water 15
Resources 2012). Meanwhile, the 2011 drought caused the water level at the 16
world’s biggest hydropower plant – the Three Gorges Dam – to fall to 152.7 metres, 17
well below the 156m mark required to run its 26 turbines effectively (Stanway 18
2011). 19
20
This paper seeks to understand how the Chinese infrastructure system is 21
exposed to flooding and drought impacts. We do this by taking a first step to 22
explore the potential of disruption to infrastructure systems and the people and 23
industries that they serve (infrastructure ‘users’) caused by these events. Instead of 24
conventional impact and risk assessments that tend to focus on the people and 25
assets directly located in floodplains and drought-prone areas, we estimate the 26
numbers of people dependent on infrastructure assets (‘users’) and pinpoint 27
locations where critical assets are concentrated in these high-risk areas. As a result, 28
we show the locations of critical infrastructure that are exposed to risks of flooding 29
and drought on a broad scale – and calculate the potential number of users affected 30
should infrastructure assets fail owing to one or a series of flooding/drought 31
event(s) on a local scale. 32

4
The outline of the paper is organised as follows. Section 2 presents a general 33
literature review around exposure/vulnerability analysis, infrastructure network 34
exposure/vulnerability and an introduction to the Chinese context. Section 3 35
describes the methodology we adopt and the data sources. Section 4 presents our 36
results, and Section 5 discusses the assumptions, the validity of our results and the 37
policy implications. Section 6 concludes. 38
39
2. Literature Review 40
41
Literature on exposure to natural hazards is often discussed in the context of 42
natural disaster risk reduction. The IPCC SREX (Managing the Risks of Extreme 43
Events and Disasters to Advance Climate Change Adaptation) report defines risk to 44
natural disaster as a function of hazard, exposure and vulnerability (IPCC 2012). 45
Hazard refers to the “possible, future occurrence of natural or human-induced 46
physical events that may have adverse effects on vulnerable and exposed 47
elements”; exposure refers to the “inventory of elements in an area in which hazard 48
events may occur”; vulnerability refers to the “propensity of exposed elements such 49
as human beings, their livelihoods, and assets to suffer adverse effects when 50
impacted by hazard events” (Ibid). 51
52
Risk-based studies are ideal because they are probabilistic assessments of 53
possible future hazard events and their impacts (Li et al. 2012; Wu et al. 2012). 54
Unfortunately, much of the literature has not been able to determine the probability 55
quantitatively owing to the huge uncertainties involved and a lack of data. As such, 56
most relevant literature for our study is in exposure and vulnerability. Given that 57
exposure studies are usually part of broader vulnerability analyses, we review 58
scholarly work under the general heading of “vulnerability analysis”. 59
60
2.1. Vulnerability analysis 61
62
In the context of vulnerability to flooding and drought impacts, one may 63
summarise three main approaches used. These are: qualitative, potential 64
5
consequences and impact assessment. Qualitative approaches are the first 65
generation of vulnerability studies. These are often derived from surveys and 66
interviews, which are sufficient for obtaining a general idea of the possible 67
vulnerabilities to flooding and drought and particularly useful for understanding the 68
decision-making process (De Sherbinin et al. 2007; Regmi & Hanaoka 2011; 69
Zarafshani et al. 2012). However, they remain largely descriptive and hard to 70
compare across systems. 71
72
Potential consequences approaches assess the vulnerability of a system to 73
flooding and drought impacts by looking at how the system may be affected if 74
hazards occur (HSBC 2011; IPCC 2012; Wilhelmi & Wilhite 2002; Lewis 2009; 75
Dutta et al. 2003). On the other hand, impact assessments approaches examine how 76
a system has been affected by past flooding and drought events, in contrast to 77
potential consequences approaches where vulnerabilities are based on how a system 78
may cope given the possibility of future flooding/droughts, often measured by 79
population or economic impacts (World Bank 2004). 80
81
2.2. Infrastructure network vulnerability 82
83
Recently, vulnerability studies of the infrastructure systems and networks 84
have sprung up owing to concerns over increasing levels of “threats”, which may or 85
may not originate from natural disasters such as flooding and drought (Mao et al. 86
2009; Erath et al. 2009; Marrone et al. 2013). Here we first discuss some general 87
methods for understanding infrastructure network vulnerability, and then examine 88
approaches taken in the context of flooding and drought disasters. 89
90
Traditionally, scholars have sought to address network vulnerability with 91
graph/network theories. This involved using network measures focused on the 92
centrality of a vertex in the graph, including degree centrality, betweenness, 93
closeness, and eigenvector centrality (Dinh & Xuan 2012). While these metrics do 94
provide some insights into network vulnerability, they typically fail to reveal the 95
level of network disruption for different levels of attacks (Ibid). Therefore global 96

6
graph measures such as the number of vertices and edges have been introduced to 97
study network connectivity performance under different attack strategies (Holme et 98
al. 2002). Applications of such theories can be found in the Information & 99
Communication Technology (ICT) and the power sectors where fictional or real 100
networks are studied (Baiardi & Corò 2013; Bompard et al. 2013; Mao et al. 2009; 101
Matisziw et al. 2009). 102
103
Although graph/network theories reveal vulnerable system property or 104
vulnerable system components of an infrastructure network, they do not typically 105
incorporate the functional aspects of the components in the network, for example 106
power flows in the electricity sector (Dueñas-Osorio & Vemuru 2009; Johansson & 107
Hassel 2010). Indeed, some scholars are in favour of using functional models and 108
conclude that evaluating vulnerability in power networks using purely topological 109
metrics can be misleading (Hines et al. 2010). Similarly, LaRocca and others 110
conclude that in general, the greater the inclusion of functional characteristics, the 111
better the estimate of the system’s actual performance for a given failure scenario 112
(LaRocca et al. 2012). However, owing to computational limitations, it is not 113
always possible to include these functional characteristics (Ibid). 114
115
It is more often the case however, that network and functional models are 116
used in conjunction with each other when analysing the vulnerability in 117
interdependent networks and cascading effects (Johansson & Hassel 2010; 118
Bompard et al. 2013; Shuang et al. 2014; Wang et al. 2013). Depending on the time 119
frame, Ouyang and colleagues argue that network models are helpful to design or 120
improve the infrastructures in the long run while focusing on functional 121
vulnerability is useful to protect them in the short term (Ouyang et al. 2009). 122
123
Unfortunately, studies that are specifically concerned with infrastructure 124
network vulnerability due to flooding and drought disasters are rare in the literature. 125
Most of them reside within the “potential consequences” domains as discussed in 126
Section 2.1 and work with urban or regional scales (Tang et al. 2013; Oswald & 127
Treat 2013). 128

7
2.2.1. Infrastructure network vulnerability in China 129
130
As a result of the phenomenal growth of Chinese infrastructure over the past 131
few decades, its networks are now among the world’s largest. For instance, the 132
country’s expressway network, which is already the second largest in the world, has 133
been growing at an average of 20 per cent per year since 2000 (KPMG 2008; 134
KPMG 2009). China’s railway system – the world’s third largest network – has 6 135
per cent of the world’s track length (and rising) and carries 25 per cent of the 136
world’s traffic (Ibid). China’s inland waterway transport (IWT) network is the 137
world’s largest, and the country surpassed the U.S. as the world’s largest Municipal 138
Solid Waste (MSW) generator in 2004 (World Bank 2007; World Bank 2005). 139
140
Given the scale and speed at which Chinese infrastructure networks have 141
grown, one may postulate that these networks might be more susceptive to different 142
threats. Some recent studies have looked at the vulnerability of Chinese 143
infrastructure from a network perspective. For instance, applying a network model 144
to the power and gas pipeline systems in a non-specified Chinese city, Wang and 145
colleagues analyse interdependent responses under three types of edge disturbance 146
strategies and propose a method for ranking critical components (Wang et al. 2013). 147
Taking the Chinese railway system as an example, Ouyang and others select three 148
typical complex network-based models to analyse railway accessibility and flow-149
based vulnerability (Ouyang et al. 2014). Using the power network of a major city 150
in Central China as a case study, Mao and others show that the network exhibits 151
small-world network properties and demonstrate the vulnerability of the network 152
under selective attacks and random failures (Mao et al. 2009). Taking the power 153
and water systems of a major city in China as an example, Wang and colleagues 154
develop a framework for analysing the vulnerability of interdependent 155
infrastructure systems (Wang et al., 2012). 156
157
Literature concerned with infrastructure vulnerability due to flooding and 158
drought impacts in China – most of which reside in the “potential consequences” 159
domain as discussed in section 2.1 – is yet scarcer. Xie and colleagues present a 160

8
framework of reliability analysis, based on fragility curves, of the dike system for 161
the Taihu Basin in China (Xie et al. 2013). HSBC overlay the locations of planned 162
power stations with water scarcity maps, showing the vulnerability of power sector 163
(HSBC 2012). Our work contributes to the current literature by building an 164
infrastructure exposure map of China across multiple sectors and locations for the 165
first time. In addition, this particular exposure study not only provides an inventory 166
of infrastructure assets, but also seeks to quantify the potential scale of disruption 167
due to infrastructure failure. We do this by developing a new metric of estimating 168
the number of exposed populations who might be vulnerable to natural hazards 169
because they are either directly or indirectly dependent on the infrastructure assets 170
concerned. Therefore, the work presented here is a first study that has demonstrated 171
the exposure of Chinese infrastructure to potential direct/indirect natural hazard 172
impacts. 173
174
3. Methodology 175
176
Flooding and drought events might affect the infrastructure system in 177
significant ways. Examples of flooding impacts on the infrastructure include: 178
water-induced asset damages and temporary inaccessibility to sites such as roads. 179
Similarly, drought could result in water levels being severely lowered in 180
hydropower reservoirs and reduce the amount of cooling water for electric power 181
generation. In this paper, we seek to provide insights into the locations of critical 182
infrastructure exposed to flooding and drought impacts on a broad scale, and 183
estimate the potential number of users affected on the local scale should 184
infrastructure assets fail owing to one or a series of flooding/drought event(s). This 185
method builds a common metric i.e. the number of users that allows the impacts of 186
flooding/drought to be compared across sectors, even though the nature of these 187
disruptions varies. 188
189
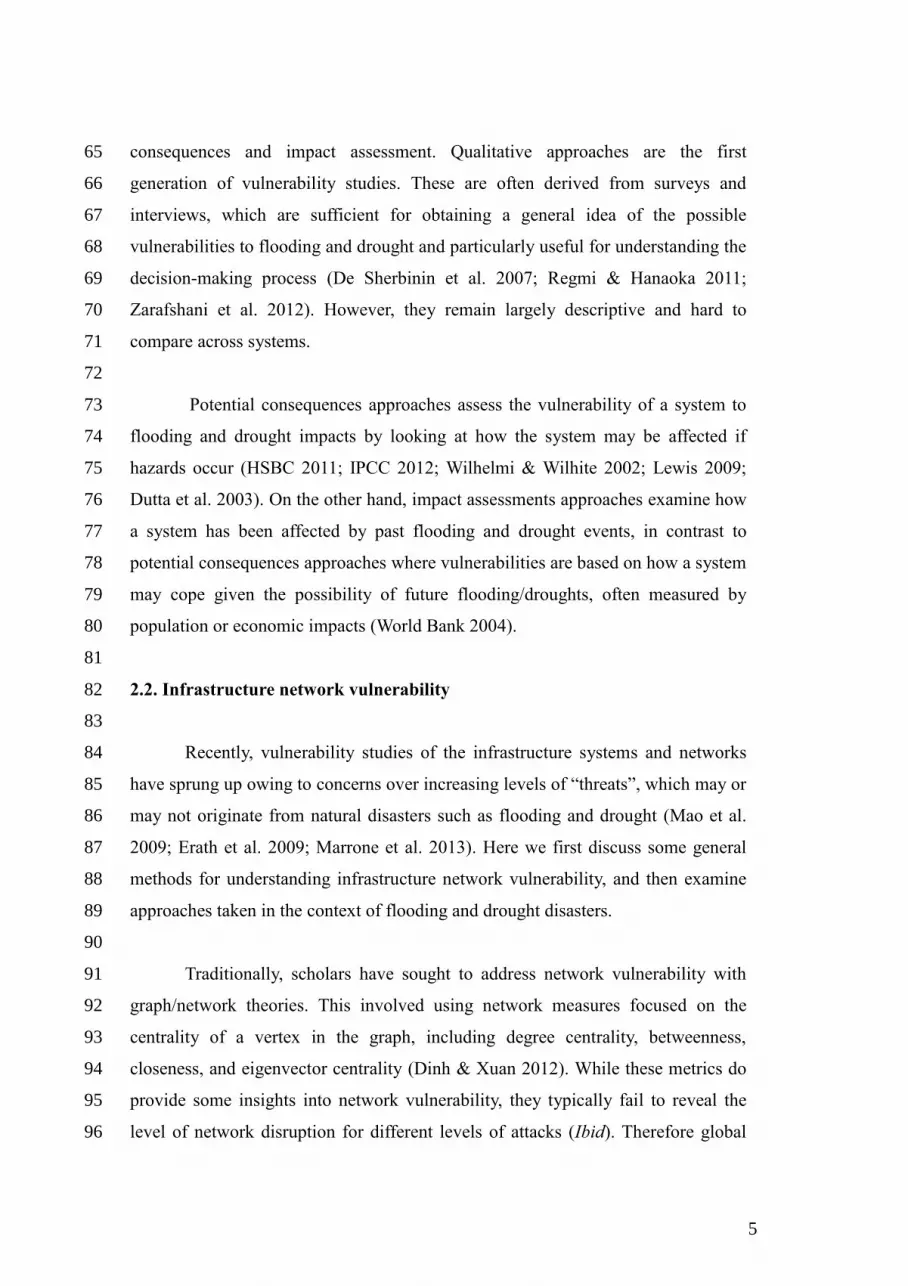
First, we introduce the general framework for understanding the 190
infrastructure system (Figure 1), whereby infrastructure sectors and assets are 191
specified and relevant data are collected. Second, we allocate users to each 192
9
infrastructure asset at the local (asset) level for each sector since the users’ 193
dependence on each infrastructure asset varies according to the type of 194
infrastructure. Upon user allocation to assets, we apply a Kernel density estimation 195
to identify ‘hotspots’ of exposure. Fourth, flood and drought maps are overlaid onto 196
the infrastructure “hotspot” analyses in order to obtain an idea of critical 197
infrastructure assets exposed to flooding/drought on the broad scale. The output of 198
the paper translates to infrastructure hotspot maps integrated with flooding/drought 199
hazards and the number of users as a common metric to measure exposure. 200
201
202
Figure 1. Overview of methodology 203
204
3.1. Framework for understanding the Chinese infrastructure system 205
206
We define the infrastructure system as an integrated system consisting of 207
five sectors – energy, transport, water, waste and ICT (Hall et al. 2014). Within 208
each of these sectors, component systems are identified and we construct an 209
infrastructure database according to the framework shown in Table 1. 210
211
212
213

10
214
Table 1. Summary of the Chinese National Infrastructure System 215
Sector Sub-
sector
Asset type Number of
Assets
Source Completeness
(%)
Energy Electricity
Power plants 2116 Enipedia 67
Transport Rail
Rail tracks 2863 OpenStreetMap 100
Stations 5401 Harvard WorldMap
Project
1001
Aviation Airports 146 Civil Aviation Administration of China
80
Shipping Ports 155 China Ports Yearbook 3
Waste Waste
water
Waste water
treatment works
2743 Chinese Ministry of the
Environment
100
Source: adapted from Hu et al. (2014) 216
217
3.1.1. Data on the electricity sub-sector 218
219
We focus our energy work on the electricity sub-sector and obtain a total of 220
2,218 nodes which represent power plants from Enipedia (Davis et al. 2014). 221
Although Enipedia contains the best open source spatial dataset that the authors are 222
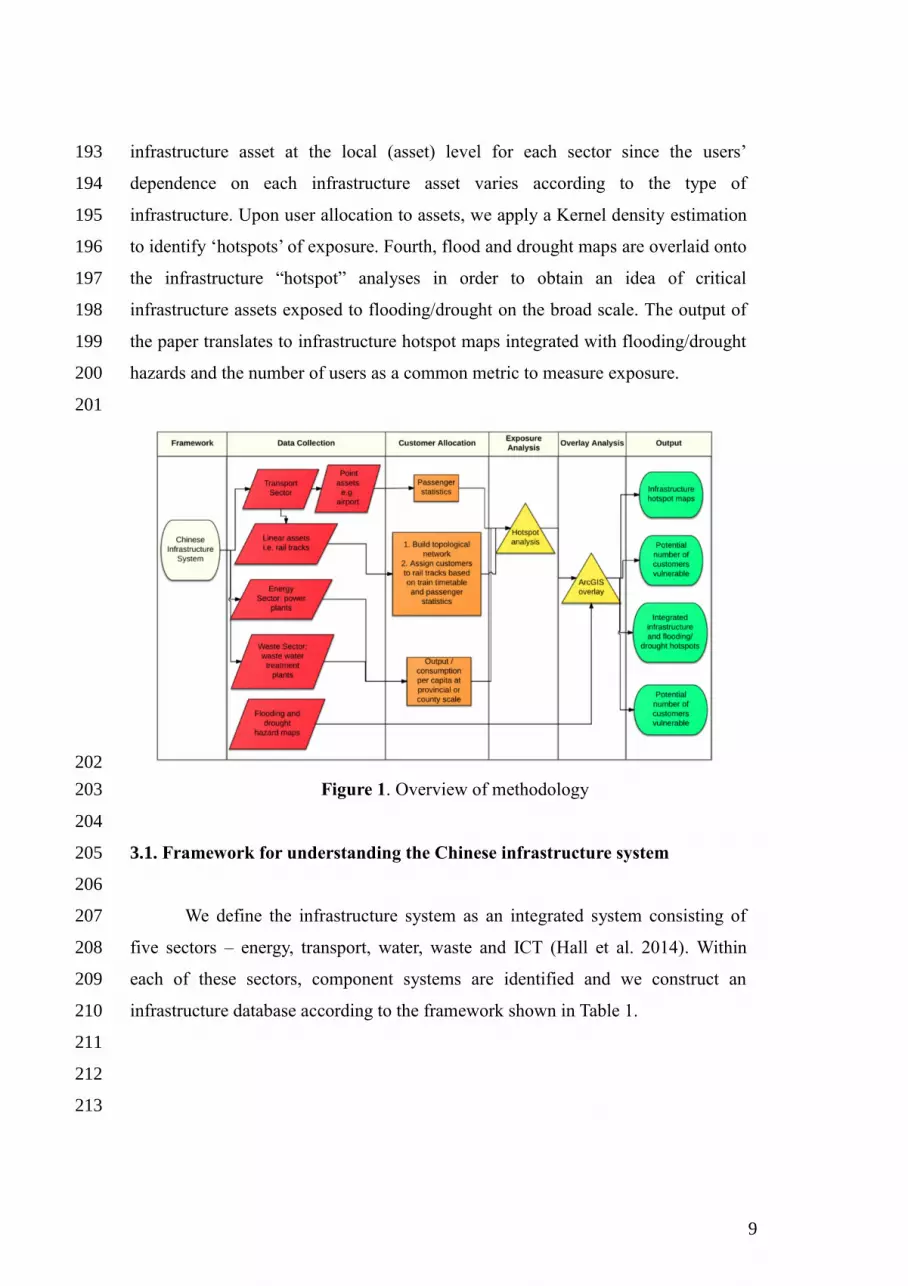
aware of, it is not complete. In Figure 2, we show the data completeness (in 223
percentage) from the Enipedia database for individual provinces by aggregating the 224
total amount of annual output produced by all power plants within each province 225
and comparing that with official statistics on the annual electricity consumption for 226
that province from the China Electric Yearbook (China Electric Power Yearbook 227
Editorial Committee 2011). Information on provincial annual electricity 228
consumption from the China Electric Power Yearbook is digitised and translated; 229
no data are available for individual power plants nor their spatial locations hence 230
we use Enipedia and only verify the data with the China Electric Yearbook. We find 231
that data are better represented in north-eastern China; Tibet, Shaanxi and Ningxia 232
provinces have the most incomplete datasets2. 233
1 Note no officially disclosed data exist for the total number of train stations in China. The 100% comes from
personal communication with China Rail Administration (CRA). In 2010, the total number of train stations was at
5,287. Our database with 5,401 exceeds the number provided by the CRA, thus we assume it is reasonably
complete. 2 Note that Hunan province has a percentage at 101% and Jilin province at 109%, which may be a reflection of
data inaccuracy of the Enipedia database. In this case, Enipedia has collected power plant data, which exceed
the official database’s output. Data on Taiwan, Hongkong and Macao do not exist hence exhibit 0%.
11
234
Figure 2. Data completeness (in percentage) from Enipedia’s database per 235
province in China. 236
237
3.1.2. Data on the transport sector 238
239
The total lengths for the rail network that we generate with our model (for details, 240
please refer to Section 3.2.2) in our dataset cover 138,414 km and we verify this 241
with OpenStreetMap (OpenStreetMap Contributors 2014). We assume that this 242
coverage is 100% as the Ministry of Rail reports that the total operating length of 243
the Chinese rail network extends to 98,000 km (Ministry of Rail 2012). For train 244
stations, we download data from the Harvard China Map which contains 5401 train 245
stations (The Harvard WorldMap Project 2014). For aviation, we obtain and 246
translate the list of currently operational airports (183 Chinese civil airports) and 247
those that are being planned to 2020 from the Civil Aviation Administration of 248
China (Civil Aviation Administration of China 2008; Civil Aviation Administration 249
of China 2013). This list is translated into English and 146 currently operational 250
airports are geocoded in Google Earth. In addition, we collect data on the total 251

12
number of passengers for airports, for the year 2012, and ports, for the year 2011 252
(Civil Aviation Administration of China 2013; China Academy of Transportation 253
Sciences 2005). A VBA code is developed to match passenger data with the 254
airports in the list from the Civil Aviation Administration of China. Finally, 255
passenger data on ports come from the China Ports Yearbook and are geocoded in 256
Google Map (Editorial Board of China Ports Yearbook 2012). 257
258
3.1.3. Data on the wastewater sub-sector 259
260
A full dataset for wastewater treatment works (2,743 assets) is obtained 261
from the Chinese Ministry of the Environment (Ministry of the Environment 2013). 262
The dataset contains full name of the treatment plant, daily capacity and city 263
information. As we do not know the exact location for each plant, we resort to a 264
thorough process of searching plant addresses online and geocoding these in 265
Google Earth and/or Baidu to our database. 266
267
3.1.4. Data on population and administrative regions 268
269
Population data are obtained from the “Tabulation on the 2010 population 270
census of the people’s republic of china by county” released by the Chinese Census 271
Office (Chinese Census Office of the State Council 2012). This is one of the most 272
recent and comprehensive datasets covering population data for China’s 2,872 273
counties (Ibid). For each province, city, county, village and hamlets, there are 274
detailed data on the number of residents, households and so on. We amalgamate 275
population data with the administrative boundary data provided by Beijing Normal 276
University in the Atlas of Natural Disasters in China (Shi 2011). 277
278
279
280
281
282
283

13
3.2. User allocation 284
285
3.2.1. Transport sector – point assets 286
287
We allocate users to point assets such as airports, train stations and ports 288
using passenger statistics based on data collected in section 3.1. As data on 289
passenger flows for train stations do not exist, we develop a simple methodology 290
that approximates the number of users through each station by the way it is defined 291
(see Table 2). The Ministry of Rail (now the China Railway Corporation) classifies 292
all railway stations into six categories, depending on the type of use (passenger, 293
cargo, marshalling yard or a mixture), sizes of passenger flow, cargo volumes and 294
“strategic importance” (Ministry of Rail 1980). Each station is assigned a daily 295
passenger number using the minimum threshold given in Table 2 as a proxy. For 296
instance, a single-use special graded station will have an average daily passenger 297
flow of 60,000 whereas a multi-use station will have 20,000. 298
299
Table 2. Railway stations classification and their associated daily passenger and cargo volumes 300
Railway station
classification
Railway use (passenger,
cargo, yard)
Average daily
passenger flow
Average daily cargo
volume (trucks)
Special Single use > 60000 > 750
Multi-use > 20000 > 450
1 Single use > 15000 > 350
Multi-use > 8000 > 200
2 Single use > 5000 > 200
Multi-use > 4000 > 100
3 Single use n/a n/a
Multi-use > 2000 > 50
Source: Ministry of Rail 1980 301
302
3.2.2. Transport sector – linear assets 303
304
Assigning users to linear assets such as rail tracks is not straightforward, as 305
readily available data do not exist. In this paper, we demonstrate an approach 306

14
allocating users to the Chinese rail sub-sector in accordance with data from train 307
timetables. First, we collect a comprehensive dataset of the 4060 Chinese “rail 308
routes”, which represent all passenger rail “traffic” in China between one and three 309
days (Ministry of Rail 2010). Second, we build an approximate railway topology 310
network by assigning a straight line between every pair of stations for each “route”. 311
Overlapping stations are removed. This way, one line (i.e. track) is assigned between 312
any two stations (Figure 3). Artificial straight lines are used because we have 313
incomplete data on the rail network. Third, we verify this network dataset with the 314
2014 rail track dataset from OpenStreetMap3 (shown in Figure 4). Lines shorter than 315
200 kilometres are well represented because they are located in densely urbanised 316
areas, therefore tend to be straight and are short in length. We replace lines that are 317
more than 200 kilometres in length with the actual track alignment because they do 318
not align well with the real tracks after verification. 319
320
321
Figure 3. The Chinese railway topological network created by assigning a straight 322
line between every pair of stations for each “route”4 323
3 The OpenStreetMap dataset has rail tracks and station data in separate files. This means that some stations are
off the track where others have no tracks nearby. Since our “rail routes” data are stored in station-to-station
format, we resort to constructing our own tracks and verify these with the OpenStreetMap tracks. 4 All results in this paper do not include Taiwan, Hongkong and Macao, as data do not exist for these regions.

15
324
Figure 4. Verification of artificially built topological Chinese rail network with the 325
2014 OpenStreetMap datasets 326
327
Once we build the railway topological network, we assign passenger numbers 328
over track paths. For each route, we record the stations it passes, for example, route 329
“1” goes through stations A – B – F – E – D and route “2” goes through stations A – 330
B – C – D (see Figure 5). We also note the number of passengers the train carries. 331
For instance, Electric Multiple Units (EMUs) often take 915 passengers (please refer 332
to Appendix A for a full list of carrying capacity for different types of train). Given 333
that the carrying capacity is similar for all types of trains, we restrict our analysis to 334
using the average passengers per route i.e. 1062 for allocating users to rail tracks. 335
Assuming the trains are operating at full capacity, we aggregate the total flow of 336
passengers through each track between any two stations during a three day period: in 337
Figure 5, the total number of passengers for the track between stations A and B is 116 338
+ 118 = 234. 339
340
341

16
342
Figure 5. Calculation of total passengers through track A – B during any three-day 343
period 344
345
Building the topological railway network based on national train timetables 346
provides us with information on the train frequency on each track. With 347
supplementary data on the passenger capacity of each train, we are able to assign a 348
total number of daily users to each track. 349
350
3.2.3. Electricity sub-sector 351
352
For the electricity sub-sector, we allocate users to each plant based on data 353
on actual output per plant and electricity consumption per capita for the particular 354
province in which the plant is located. The number of users per power plant, Cp, is 355
given by the equation: 356
𝐶𝑝 = 𝑃𝑎 ∗ 𝐸𝑝,𝑎
𝐷𝑎 357
358
where 𝐸𝑝,𝑎 is the energy output in megawatt-hours per year for power plant 359
p in a particular province a; 𝐷𝑎 is the electricity consumption (in megawatt per 360
hour) of province a; and 𝑃𝑎 is the population of province a. 361
362
We also consider the possible number of users missing from the analysis for 363
each province. We do this by adding the total number of users, Cp,a, allocated for all 364
power plants within province a and comparing Cp,a with the aggregate population 365
for province a. The aggregate number of users missing, Ma, for province a is given 366
by the equation: 367

17
𝑀𝑎 = 𝑃𝑎 − ∑ 𝐶𝑝,𝑎𝑝𝑖=1 368
369
In reality, the number of users missing in provinces will vary enormously 370
depending on the output capacity of the province. In fact, the aggregate number of 371
users for some provinces should exceed the total population whereas for other 372
provinces, it should fall below the population. This is owing to the fact that some 373
provinces are “surplus” producing states that produce more electricity than they 374
consume, whereas others are “deficit” states that produce less electricity than they 375
consume. Figure 6 depicts these “surplus” and “deficit” provinces in blue and red 376
respectively; we may assume that electricity is flowing from the blue provinces to 377
the red through high voltage transmission lines. 378
379
380
Figure 6. Electricity production and consumption “surplus” and “deficit” province 381
comparisons. Provinces in “blue” are those that produce more than they consume 382
whereas “red” provinces consume more than they produce. 383
Source: China Electricity Yearbook 2012 384
385
386
387

18
3.2.4. Wastewater sub-sector 388
389
For the wastewater sub-sector, we take a similar approach with user 390
allocation as we did to the electricity sub-sector except for the scale, which is at 391
county-level. In some cases, we remove some of the wastewater treatment plants 392
from our full database as we do not have data on volume treated; in other cases, 393
many plants have not been operationalised. Our analysis is based on a reduced 394
sample of 1,680 plants as opposed to the full database of 2,743. We define the 395
number of users, Cw, per waste treatment plant as: 396
397
𝐶𝑤 = 𝑃𝑏 ∗ 𝑉𝑤,𝑏
𝑉𝑏 398
399
where 𝑉𝑤,𝑏 is the daily volume treated in 10,000 m3 for waste treatment 400
plant w in county b; Vb is the total waste water treated for county b; and 𝑃𝑏 is the 401
population of county b. Vb is calculated by equation (1) as shown below, where we 402
aggregate all the waste water treated in any county b: 403
404
𝑉𝑏 = ∑ 𝑉𝑤,𝑏𝑤𝑘=1 (1) 405
406
3.3. Exposure and hotspot analysis 407
408
Since the aim of the paper is to provide insights into the locations of critical 409
infrastructure at risk to flooding and drought impacts both on a broad and local 410
scale, we need to translate the exposure of those users who have only been 411
allocated on a local level to an exposure understanding on a broad level. The 412
concept of “hotspots” is particularly useful because it provides a visual 413
representation of exposure aided by a geo-spatial representation of “priority areas” 414
for planners to focus on. 415
416
We apply the Kernel density estimator (KDE) to derive “hotspots” for the 417
locations of critical infrastructure assets and networks. A KDE is a non-parametric 418

19
statistical method for estimating the density of data. Here we apply the KDE 419
spatially, using the number of users dependent on an asset as our data. This way, a 420
spatially continuous surface is constructed. The KDE is formally defined as: 421
422
𝑔(𝑥𝑖) = ∑ {[𝑃𝑗]1
𝜋ℎ2𝐾 (
𝑒𝑖𝑗
ℎ)}
𝑛
𝑗=1
423
where 𝑔(𝑥𝑖) is the density at lattice location 𝑥𝑖 (individual cells), 𝑃𝑗 is the 424
user demand associated with asset 𝑗, ℎ is the bandwidth of the density estimation 425
(search radius) and 𝐾 (𝑒i𝑗
ℎ) is the kernel applied to point 𝑖 that employs the distance 426
𝑒𝑖𝑗 ∀ 𝑗 ≤ ℎ. The kernel function employed in this study was a Gaussian: 427
428
𝐾 (𝑒𝑖𝑗
ℎ) = {
1
√2𝜋exp (−
𝑒𝑖𝑗2
2ℎ2)}
429
430
3.3.1. Applying the KDE in China 431
432
For all Chinese infrastructure sub-sectors, we construct the same size spatial 433
lattice, which contains individual infrastructure assets at which KDE is performed. 434
The size of each cell within the lattice is set as the default value, which is based on 435
the extent of the chosen spatial reference and is calculated as the shorter of the 436
width or height of the output extent in the output spatial reference, divided by 250. 437
This is based on an optimisation model within ArcGIS given the size of the lattices. 438
Our chosen spatial reference is the “Asian_North_Albers_Equal_Area_Conic” in 439
GIS and we transform it to the “GCS_China_Geodetic_Coordinate_System_2000” 440
geographical coordinate system to minimise distortion. In addition, we use the same 441
search radius (200,000 km) for all the infrastructure sub-sectors to obtain a 442
consistent comparison among different hotspots. We conduct sensitivity analysis 443
and find that the search radius 200,000 km provides the clearest visualisation of the 444
results. 445

20
3.3.2. Disruption calculations 446
447
For all assets except rail tracks, our hotspot analysis is based on the number 448
of users allocated to each asset. To calculate the potential disruption should assets 449
fail after flooding/drought event(s), we classify five categories of hotspots (Jenks 450
Natural Breaks Classification in GIS) and locate the number of users within the top 451
two categories as concentrations of exceptional vulnerability. 452
453
With regard to the tracks for the rail sub-sector, our hotspot analysis is not 454
solely based on users allocated to the tracks. Rather, it is based on the total potential 455
disruption for each track, Dt. For any three-day period, we calculate Dt by 456
multiplying train frequency for each track, ft, with the number of passengers for 457
each track Pt. ft is the number of routes (i.e. train frequency) that each path track 458
takes, for example, the ft for track A – B is two in Figure 3. Formally, Dt is defined 459
as: 460
𝐷𝑡 = ∑ 𝑓𝑡 × 𝑃𝑡
461
Once users have been allocated, we standardise the time-scale so that users 462
are allocated to all infrastructure assets on a yearly basis. For instance, the daily 463
passenger freight for all rail stations is 1,205,000; therefore the yearly users at risk 464
are 1,205,000 * 365 days in a year: 439,825,000. The three-day passenger freight 465
for rail tracks is 913,320; thus the number of yearly passengers at risk is 913,320 * 466
(365/3): 111,120,600. 467
468
3.4. Impose flood/drought hazard maps on the hot-spot analysis 469
470
Lastly, we impose flood/drought hazard maps from the CaMa-Flood model 471
and the Atlas of Natural Disaster Risk of China onto our hotspot analyses 472
(Yamazaki et al. 2011; Shi 2011; Fang 2011). This provides us with a spatial 473
understanding of how infrastructure hotspots, i.e. where users are concentrated, 474
might be exposed to flooding and drought impacts. 475

21
3.4.1. Method for assessing the flood hazard and risk 476
477
Flood risk is commonly defined as the product of the probability of flooding 478
and the consequential damage, summed over all possible flood events (Hall et al. 479
2005). The probability of flooding for a national-scale flooding risk map is 480
typically derived from some hydrological modelling based on meteorological data 481
or simulation, analyses of extreme value statistics that estimate the severity floods 482
at different return periods, and inundation modelling that estimates flooding depths 483
for a given geographical unit (Ward et al. 2013). The consequential damage is 484
conventionally evaluated by some economic impact modelling, for instance, by 485
adopting indicators that show affected population, GDP, and/or exposed urban asset 486
values (Ibid). 487
488
In this study, we make use of a global river routing model called the 489
Catchment-Based Macro-scale Floodplain (CaMa-Flood) model to prepare the 490
flood hazard map (Yamazaki et al. 2011). Briefly, the CaMa-Flood routes the runoff 491
input simulated by a land surface model into the oceans or lakes along a prescribed 492
river network. It calculates river channel storage, floodplain storage, river 493
discharge, river water depth and inundated area for each grid-cell at a spatial 494
resolution of 0.25° x 0.25°. A recently developed Global Width Database for Large 495
Rivers (GWD-LR) is also incorporated into it (Yamazaki et al. 2014). Following 496
Hirabayashi and colleagues, we drive the CaMa-Flood model using the daily runoff 497
(1979-2010) generated by the Minimal Advanced Treatment of a Land Surface 498
Interaction Runoff (MATSIRO) (Hirabayashi et al. 2013; Takata et al. 2003). We 499
note that the MATSIRO model was forced by observations and reanalysis climate 500
data (Kim et al. 2009). 501
502
Detailed description with reasoning and technical aspect of flood inundation 503
map preparation using the CaMa-Flood model will be available in an upcoming 504
paper on flood defence benefit and risk at the global scale (Lim et al. n.d.; in 505
preparation). Here, we briefly describe the overall process of obtaining our flood 506
inundation map. To prepare a flood inundation map of a specific magnitude, we 507

22
select the Gumbel distribution (Gumbel, 1941) for its simplicity and demonstrated 508
consistency with general extreme value statistics (Dankers & Feyen 2008). We use 509
annual maxima of river water depth (from CaMa-Flood) to perform extreme value 510
estimation at each grid-cell. Based on the digital elevation models (SRTM3 DEM 511
between 60° N and 60° S; GTOPO30 above 60° N (Hirabayashi et al 2013), we 512
downscale and prepare the flood inundation map for a return period of 100 years at 513
high spatial resolution (2.5’ x 2.5’) to support the analysis of this manuscript. This 514
inundation map is used as the base flood hazard map and is further downscaled for 515
the infrastructure hotspot analysis in Section 3.4.3. 516
517
3.4.2. Method for assessing drought hazard in China 518
519
Drought is the result of many composite factors such as high temperatures, 520
high winds, low relative humidity, timing and characteristics of rain (Mishra & 521
Singh 2010). Capturing drought risk of a probabilistic nature is difficult because of 522
these complex factors involved; therefore several indices have been developed that 523
characterise different aspects of drought risks. Prominent examples of drought 524
indices include the Standardised Precipitation Index (SPI), the Palmer Drought 525
Severity Index (PDSI), the Crop Moisture Index, the Surface Water Supply Index, 526
the Vegetation Condition Index, and the Standardised Runoff Index (Ibid). Some 527
indices, such as the SPI, only focus on precipitation, whereas others such as PDSI 528
may incorporate variation in temperature, soil moisture, reservoir storage, 529
streamflow, and snow pack (Ibid). 530
531
The assessment of drought hazard in China in this paper, RL, is based on the 532
anomaly percentage of precipitation, Hs, and the ranking of the sensitivity of land 533
use, Vs, towards Hs in a 1-km grid (Shi, 2011). The equation is shown below: 534
535
RL = HS x VS 536
Hs is calculated as follows. 537
538

23
𝐻𝑠 = |𝑃𝑎| − 𝑃𝑎 𝑚𝑖𝑛
𝑃𝑎 max − 𝑃𝑎 𝑚𝑖𝑛 × 100%
where 𝑃𝑎 = 𝑃− �̅�
�̅� × 100%. P is the precipitation volume in any particular 539
time period. �̅� is the average precipitation volume in the time period concerned. 540
541
Six types of land use are considered, namely: arable land, grassland, 542
woodland, urban, water areas, and unused land. Larger values of Hs indicate higher 543
sensitivity of land5 (Shi 2011). It is important to note that this drought assessment is 544
hydrological in the sense that we identify high-risk areas when there is water 545
deficiency. However, the way in which water infrastructure is affected by and/or 546
influences water scarcity is not captured. Validation of the drought hazard map is 547
shown in Appendix E. 548
549
3.4.3. Integrating flooding and drought hazard maps with infrastructure 550
hotspot analyses 551
552
In order to derive an aggregate understanding of how infrastructure hotspots 553
are subject to flooding and drought impacts, we impose our hotspot analyses onto 554
the flooding and drought hazard maps separately. For flooding, we look at all 555
infrastructure sub-sectors. However, we restrict our study to the electricity sub-556
sector only for drought because, compared to electricity where a lack of water 557
supply may result in suspension of energy production, drought does not affect the 558
other sub-sectors such as rail and aviation as much. In Table 3, we demonstrate how 559
we integrate flood map with rail hotspot analyses. The same method is applied to 560
all other infrastructure assets. 561
562
563
564
565
566
5 For detailed drought methodology, please refer to the Atlas of Natural Disaster Risk of China (Shi 2011).

24
Table 3. How we integrate flooding and drought hazard maps with hotspot analyses – a 567
demonstration of the rail sub-sector 568
569
570
571
Step 1: flooding risk on the left; rail hotspot analysis on the right
Step 2: Reclassify images
Integrate rasters with a common scale. We adopt the scale of 1 to 8 by increments of 1,
8 being the most likely to be flooded or containing the highest concentrations of users.
Step 3: Weighted overlay
Combining the two images provides us with an integrated map showing vulnerable
areas according to both high flood risk and concentrations of users for the rail sub-
sector.

25
4. Results 572
573
Our results are divided into three main sections: (i) integrated spatial 574
analysis for both flooding and drought impacts in section 4.1; (ii) sector exposure to 575
flooding and drought impacts with respect to concentration of users, presented in 576
section 4.2; and (iii) infrastructure exposure both with respect to space and users, 577
but not considering flooding and drought impacts in section 4.3. 578
579
4.1. Integrated analysis 580
4.1.1. Flooding and infrastructure hotspots overlaid 581
582
The integrated analysis combines flooding risk analyses with infrastructure 583
vulnerability for sub-sectors including rail, aviation, shipping, electricity and 584
wastewater (refer to Figure 7). At a provincial level, Anhui, Beijing, Guangdong, 585
Hebei, Henan, Jiangsu, Liaoning, Shandong, Shanghai, Tianjin, Zhejiang6 exposed 586
to flooding risks; at a city level, 66 cities are highly exposed (refer to Appendix B). 587
588
589
Figure 7. Infrastructure vulnerability (rail, aviation, shipping, electricity and 590
wastewater sub-sectors) combined with flooding hazard. 591
6 Exceptionally exposed is defined as provinces that are located in areas where their infrastructure hotspot
values are either 7 or 8.

26
4.1.2. Drought hazard and infrastructure hotspots overlaid with the 592
electricity sub-sector 593
594
The results shown in Figure 8 demonstrate that southern border of Inner 595
Mongolia, Shandong, Shanxi, Hebei, north Henan, Beijing, Tianjin, southwest of 596
Jiangsu are areas that are especially vulnerable. At a city level, the 99 cities that are 597
at high drought exposure are listed in Appendix C. 598
599
600
Figure 8. Infrastructure vulnerability for the electricity sub-sector combined with 601
integrated drought hazard map. 602
603
4.2. Sub-sector vulnerability to flooding and drought risks 604
605
In terms of concentration of users, Tables 4 and 5 show that although most 606
infrastructure assets are not situated in high flooding risk and drought hazard zones, 607
the number of potentially vulnerable users is still high. For flood risk level 8, the 608
average number of vulnerable users for all infrastructure sub-sectors stands at 609
144,306,112; for drought risk level 8 in the electricity sub-sector, it stands at 610

27
6,279,536. Among all sub-sectors, the most vulnerable to flooding risks are 611
electricity and wastewater (20% and 14% of the total respectively). 612
28
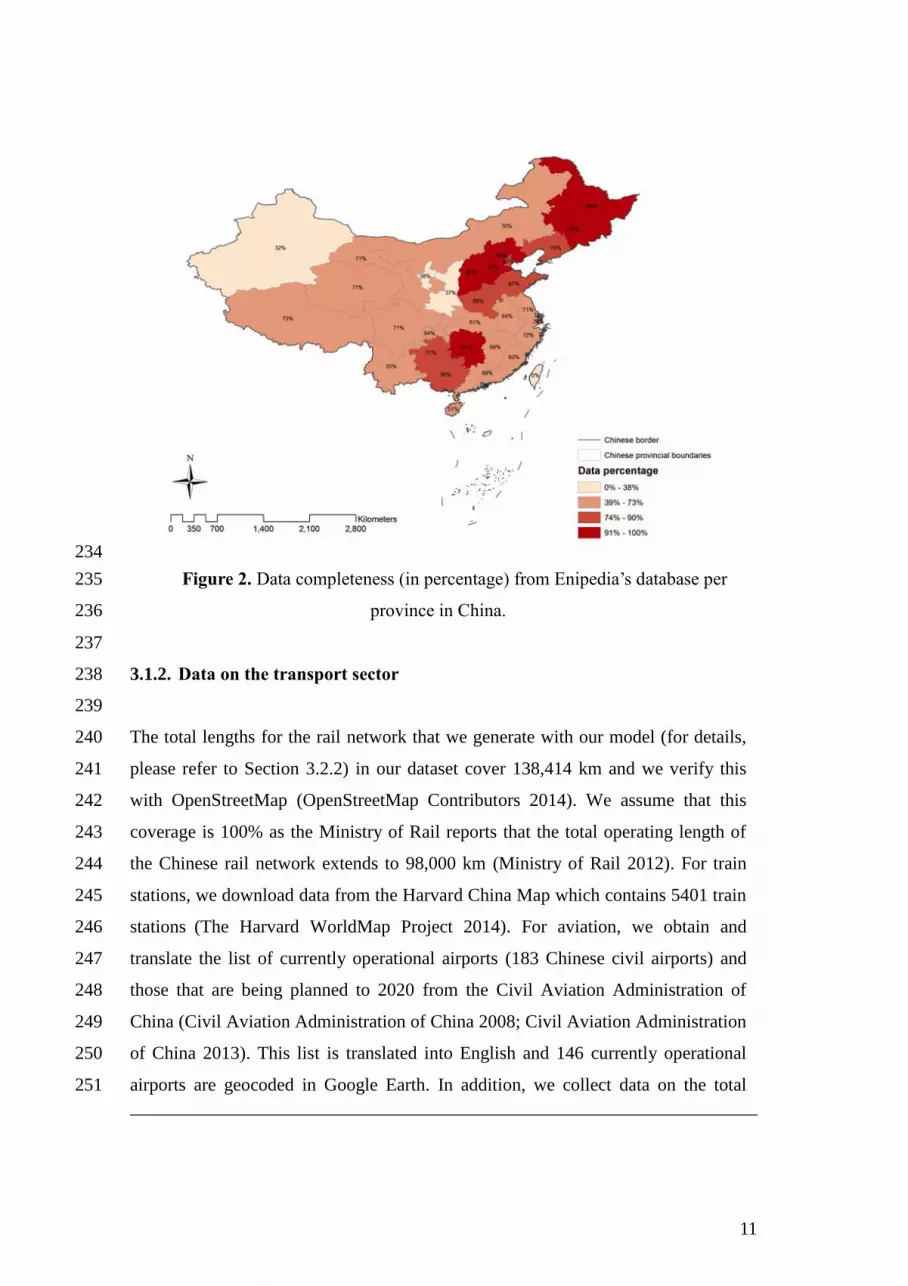
Table 4. Number of users at various levels of flood risks for different infrastructure sub-sectors 613
614
615
616
617
618
619
620
621
622
623
624
625
626
627
628
629
630
631
*We standardise user numbers on a yearly basis. For train stations, we multiply daily passenger numbers by 365 days. 632
For rail tracks, we calculate the percentage of rail tracks exposed to different levels of flood risks, and multiply this by the total number of passengers per year7. 633
7 Note that the number for rail track is very large. This is because it’s an estimate of potential disruption which includes the passenger numbers and frequency. For details,
please refer to Section 3.3.2.
Flood risk
Sub-sector 1 2 3 4 5 6 7 8 Total
Aviation 291,619,609 6,990,327 75,711,792 83,561,261 17,110,043 1,560,574 73,943,630 13,737,840 564,235,076
(52%) (1%) (13%) (15%) (3%) (0%) (13%) (2%) (100%)
Shipping 27,012,860 801,300 797,400 4,320,603 - 1,125,500 4,605,940 2,680,800 41,344,403
(65%) (2%) (2%) (10%) (0%) (3%) (11%) (6%) (100%)
Rail: stations 671,600,000 108,770,000 101,835,000 51,100,000 69,715,000 43,435,000 83,220,000 104,755,000 1,234,430,000
(54%) (9%) (8%) (4%) (6%) (4%) (7%) (8%) (100%)
Rail: tracks 3,070,120,850 378,748,455 272,920,963 262,712,522 76,540,743 78,729,162 136,856,385 580,538,583 4,857,167,663
(63%) (8%) (6%) (5%) (2%) (2%) (3%) (12%) (100%)
Electricity 4,159,171 104,020,763 57,603,751 79,497,170 23,599,016 40,907,770 36,924,261 84,214,943 430,926,845
(1%) (24%) (13%) (18%) (5%) (9%) (9%) (20%) (100%)
Wastewater 246,028,474 50,432,863 52,204,668 41,317,539 25,317,148 39,310,588 35,828,988 79,909,505 570,349,773
(43%) (9%) (9%) (7%) (4%) (7%) (6%) (14%) (100%)

29
Table 5. Number of users at various grades of drought risks for the electricity sub-sector 634
Drought risk
Sub-sector 1 2 3 4 5 6 7 8 Total
Electricity 579,710,487 89,543,435 97,168,568 104,493,014 58,790,810 37,893,280 6,798,672 6,279,536 977,962,351
(59%) (9%) (10%) (11%) (6%) (4%) (1%) (1%) (100%)
*We standardise user numbers on a yearly basis. 635

30
4.3. Infrastructure vulnerability 636
4.3.1. Overall infrastructure exposure 637
638
Not taking into account flooding or drought hazards, infrastructure exposure 639
alone is concentrated around the south of Beijing, northern Tianjin, southern 640
Jiangsu, Shanghai, and northern Zhejiang provinces (Figure 9). The 18 cities that 641
are exceptionally vulnerable are listed in Appendix D. 642
643
644
Figure 9. Composite infrastructure vulnerability using the “Overlay” tool (rail, 645
aviation, shipping, electricity and wastewater sub-sectors) 646
647
4.3.2. Sub-sector exposure 648
649
One can also observe infrastructure exposure separately by looking at 650
different sub-sectors (Figures 10-13). For the rail sub-sector, the analyses for rail 651
stations (Figure 10, left) and rail tracks (Figure 10, right) reflect similar hotspots in 652
that Beijing is highly vulnerable. However, using train timetable information 653
represents a better understanding of vulnerable hotspots such as Shanghai, Hubei, 654

31
Shandong and Henan, through which substantial traffic passes, are also identified. 655
The results for aviation (Figure 11, left) and shipping (Figure 11, right) are not 656
surprising – the airports and ports that take the most passengers are identified as 657
vulnerable hotspots. For the electricity sub-sector, north Henan, south Shanxi, south 658
Jiangsu, Anhui, Shanghai, west Hubei, south Guangdong are vulnerable provinces 659
(Figure 12, left). In addition, we successfully identify the surplus producing 660
provinces in Figure 12 (right), highlighted in green. For wastewater, south Hebei, 661
coastal Shandong, eastern Henan, northwest Anhui, south Jiangsu, and north 662
Zhejiang are the most vulnerable provinces (Figure 13). 663
664
665
Figure 10. Rail stations user hotspot analysis at 200,000 km search radius (Left). 666
Rail track user hotspot analysis at 200,000 km search radius, based on use 667
frequency of rail tracks and number of users (Right) 668
669
670
Figure 11. Airport user hotspot analysis at 200,000km search radius (Left). Port 671
user hotspot analysis at 200,000km search radius (Right) 672
673
674

32
675
Figure 12. Power stations user hotspot analysis at 200,000km search radius (Left). 676
Successfully allocated five provinces that are “surplus” provinces, highlighted in 677
green (Right). 678
679
680
Figure 13. Wastewater subsector hotspot analysis at 200,000km search radius 681
682
The potential number of users affected is very high for the rail, electricity 683
and wastewater sub-sectors, as shown in Table 6. However, it is important to note 684
that our database for shipping is incomplete; therefore the real exposure may be 685
significantly higher than that presented here. The results exhibited in this section do 686
not include any hazards and can be used for further analysis for other disasters such 687
as landslides. 688
689
690
691
692
693
694
695

33
Table 6: Potential number of users affected in different infrastructure assets in a year 696
Infrastructure assets Number of users
Percentage of total
population (%)
Rail stations 439,825,000 33.0
Rail tracks 111,120,600 8.34
Port 1,529,350 1.15
Airport 321,766,557 24.2
Electricity 451,202,612 33.9
Wastewater 315,478,372 23.7
697
5. Discussion 698
699
The purpose of this study is to understand how the Chinese infrastructure 700
system is exposed to flooding and drought impacts. In particular, we seek to 701
provide insights into the locations of critical infrastructure at risk to flooding and 702
drought impacts on a broad scale, and estimate the potential number of users 703
affected on the local scale should infrastructure assets fail owing to one or a series 704
of flooding/drought event(s). 705
706
Several assumptions are required in order to locate critical infrastructures. 707
First, we assume an infrastructure system consisting of five sectors – energy, 708
transport, water, waste and ICT. Although this taxonomy approach is necessary to 709
help us restrict the scope of our analysis, it inevitably leaves some infrastructure 710
assets such as buildings yet to be studied. 711
712
Second, we assume that trains are operating at full capacity when allocating 713
passenger numbers to individual rail tracks. This is a valid assumption, as most 714
trains in China are in fact operating beyond their designed capacities. According to 715
Xinhua News, the official news channel for China, the national average passenger 716
attendance is 133% and 120% for rail services (Yin 2010). Therefore our 717
assumption of 100% is reasonable and in fact represents an underestimate of the 718
real exposure of rail assets to flooding/drought hazards. 719

34
Third, owing to very limited data on national-scale transmission grids in 720
China, we assume that generation capacity in a specific region directly supplies a 721
specific number of people in that region. This is a limitation in our work because 722
we are not able to take into account energy flows between regions and our results 723
consider hazard impact on generation and not transmission. However, with 724
approximately 20% of electricity produced nationally is being transferred across 725
provinces, we believe our analysis focused on generation impact still represents the 726
reality reasonably (State Grid Energy Research Institute 2014). Future research will 727
require a better understanding of the transmission networks given China is building 728
many “Ultra High Voltage” transmission networks that are able to transfer 729
electricity across three or four provinces at a time (Ibid). 730
731
In addition to the assumptions discussed above, we use a global flooding 732
risk model developed to prepare the flood hazard map (Yamazaki et al. 2011). This 733
is owing to the lack of a national-level flooding risk assessment with hydrological 734
modelling at the time of this study. The limitations of using global flooding risk 735
models have been discussed extensively by Ward et al (2015). Future work could 736
look into comparing the risk map with alternatives such as the global flood risk 737
map by Ward and others, or the Pappenberger and others’ global flood hazard map 738
by the Hydrology and Earth System Science, or the national flooding risks mapping 739
efforts by the Chinese Ministry of Water Resources8 (Pappenberger et al. 2012; 740
Ward et al. 2013). In addition, the flood calculations do not account for flood 741
defence because of poor documentation of data for China and elsewhere (e.g., see 742
Supplementary Table 2 in Jongman et al. 2014). More work is required to 743
understand how flood infrastructure changes flooding and drought risks on the 744
national scale. 745
746
Despite the aforementioned assumptions and limitations, our results inform 747
policy making by identifying locations of critical infrastructures exposed to 748
flooding/drought impacts on the national-level. We find that at a provincial level, 749
8 Personal communication with the Chinese Ministry of Water Resources indicated that a national-scale
flooding risk map should be available by 2017.

35
Anhui, Beijing, Guangdong, Hebei, Henan, Jiangsu, Liaoning, Shandong, 750
Shanghai, Tianjin, Zhejiang; at a city level, 66 cities are at high risk. This is for 751
sub-sectors including rail, aviation, shipping, electricity and wastewater. For 752
drought, we demonstrate that southern border of Inner Mongolia, Shandong, 753
Shanxi, Hebei, north Henan, Beijing, Tianjin, southwest of Jiangsu are areas that 754
are especially vulnerable. At a city level, 99 cities are at high risk. 755
756
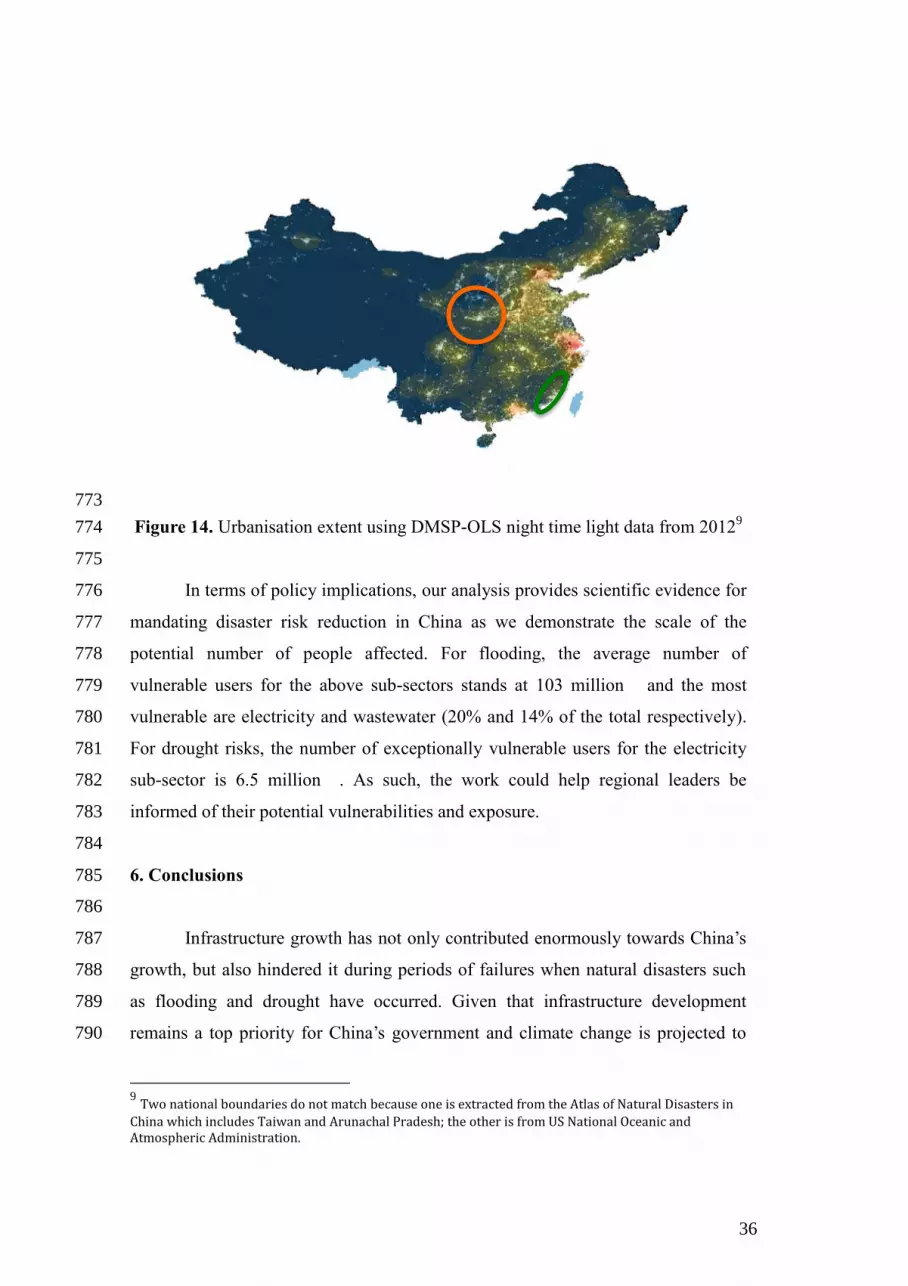
The above exposed regions are to some extent not surprising because they 757
are all highly urbanised and have experienced exponential growth in infrastructure 758
assets. To see this, we overlay the infrastructure hotspots with a map of the 759
urbanisation extent in 2012 using DMSP-OLS night time light data (NOAA 2015). 760
The urban extent is used as a reference against the hotspot analysis. In fact, Figure 761
14 demonstrates that our infrastructure hotspots capture the urban areas very well – 762
all our red and yellow hotspots are located in areas where the lighted regions are. 763
The exception of the area highlighted in the orange circle may be caused by a lack 764
of infrastructure data. Interestingly, our hotspot map highlights the south coast (the 765
green oval-shaped circle in Figure 14) as highly exposed in terms of critical 766
infrastructures. The urban extent map is unable to reveal this insight because it 767
relies on streetlights being captured by satellites i.e. if the streetlights are spread 768
across a large area, the night time map will not be able to identify urban areas that 769
have many critical infrastructures. Thus, our analysis provides additional insights to 770
conventional exposure studies that solemnly rely on population or urban data. 771
772
36
773
Figure 14. Urbanisation extent using DMSP-OLS night time light data from 20129 774
775
In terms of policy implications, our analysis provides scientific evidence for 776
mandating disaster risk reduction in China as we demonstrate the scale of the 777
potential number of people affected. For flooding, the average number of 778
vulnerable users for the above sub-sectors stands at 103 million and the most 779
vulnerable are electricity and wastewater (20% and 14% of the total respectively). 780
For drought risks, the number of exceptionally vulnerable users for the electricity 781
sub-sector is 6.5 million . As such, the work could help regional leaders be 782
informed of their potential vulnerabilities and exposure. 783
784
6. Conclusions 785
786
Infrastructure growth has not only contributed enormously towards China’s 787
growth, but also hindered it during periods of failures when natural disasters such 788
as flooding and drought have occurred. Given that infrastructure development 789
remains a top priority for China’s government and climate change is projected to 790
9 Two national boundaries do not match because one is extracted from the Atlas of Natural Disasters in
China which includes Taiwan and Arunachal Pradesh; the other is from US National Oceanic and Atmospheric Administration.

37
aggravate the impacts of natural disasters, understanding the exposure and 791
vulnerability of these assets has become increasingly important. 792
793
Unfortunately, it is not easy to study the exposure and vulnerability of the 794
infrastructure system at a national scale in China for two main reasons. First, data 795
on infrastructure assets are very limited. Even when they do exist, often they are in 796
Chinese and spread across different data sources such as national/regional/local 797
statistical yearbooks. This is perhaps why existing literature has been restricted to 798
city-scale analyses and broader scale studies tend to be focused on one sector only. 799
Second, the infrastructure system consists of many sectors that make comparisons 800
of exposure and vulnerability between them difficult. 801
802
Our work has addressed the former challenge by taking a first step to look at 803
infrastructure exposure and vulnerability on the broad scale. To do this, we have 804
built a database consisting of 10,561 nodes and 2,863 edges across three different 805
infrastructure sectors and networks. We have developed a methodology that creates 806
a common metric i.e. concentration of users based on empirical data where 807
possible, which helps us compare vulnerability across different infrastructure 808
sectors from a systems perspective despite the nature of disruption can vary among 809
sectors. This approach could be used to study other natural disasters that are 810
common in China, such as snowstorms and landslides. 811
812
As already discussed earlier, one limitation of this paper is that the results 813
may not show all infrastructure hotpots because in some cases we have incomplete 814
datasets on infrastructure assets. Therefore the results presented may be an 815
underestimate of infrastructure exposure and vulnerability. In addition, although 816
sufficient for a national assessment, the resolution for flooding and drought 817
analyses is not high. Further, we are not able to capture inter-provincial electricity 818
transfer for our electricity “hotspot” analysis, as we do not have data on national-819
scale transmission networks. Further, we resort to using the results from a global 820
flooding risk model as a national-scale study based on hydrological modelling is 821
not available at the time of study. 822

38
Despite the limitations, this work is useful for informing strategic 823
infrastructure planning and the methodology applied here can be transferred to 824
other geographical areas on the national-scale. Future work will attempt to look at 825
how this spatial exposure may change given further urbanisation and climate 826
change impacts. 827
828
Acknowledgement 829
830
This work was supported by the Asian Studies Centre, University of Oxford. 831
JWH and WHL acknowledge the Oxford Martin School for the financial support of 832
this study through the grant OMPORS.We thank Simon Abele at the Environmental 833
Change Institute (ECI), University of Oxford, for his contribution in assembling the 834
OpenStreetMap network dataset. We are also grateful to Dr. Raghav Pant for coding 835
the input from the flood results, Scott Thacker at the ECI and Valerie Bevan for 836
their comments during the development of the paper. 837
838
839

39
APPENDIX A 840
841
Table 7: Route type and carrying capacity 842
Category Carrying
Capacity
(Persons)
Electric Multiple Unit (EMU) 915
Ordinary Express 1000
Temporary Trains 1888
Intercity High Speed Rail 560
Fast trains 1062*
Direct Express 1062*
Fast Express with Air Conditioning 538
Ordinary Express with Air Conditioning 1254
Express with Air Conditioning 1288
High Speed Electric Multiple Unit 1053
*Data on fast and direct express trains are not available; therefore we calculate the average carrying 843
capacity based on the other types of trains. 844
845

40
Appendix B 846
847
List of cities exposed to high flooding risks for all infrastructure sub-sectors (rail, 848
aviation, shipping, electricity and wastewater) 849
City Province
Chaohu Anhui
Anhui
Anhui
Chuzhou
Hefei
Ma'anshan Anhui
Suzhou Anhui
Wuhu Anhui
Xuancheng Anhui
Beijing Beijing
Dongguan Guangdong
Foshan Guangdong
Guangzhou Guangdong
Huizhou Guangdong
Jiangmen Guangdong
Qingyuan Guangdong
Zhaoqing Guangdong
Zhongshan Guangdong
Zhuhai Guangdong
Baoding Hebei
Cangzhou Hebei
Handan Hebei
Hengshui Hebei
Langfang Hebei
Shijiazhuang Hebei
Tangshan Hebei
Xingtai Hebei
Anyang Henan
Hebi Henan
Jiaozuo Henan
Kaifeng Henan

41
Luohe Henan
Puyang Henan
Xinxiang Henan
Xuchang Henan
Zhengzhou Henan
Zhoukou Henan
Changzhou Jiangsu
Nanjing Jiangsu
Nantong Jiangsu
Suzhou Jiangsu
Taizhou Jiangsu
Wuxi Jiangsu
Xuzhou Jiangsu
Yancheng Jiangsu
Yangzhou Jiangsu
Zhenjiang Jiangsu
Anshan Liaoning
Fuxin Liaoning
Jinzhou Liaoning
Liaoyang Liaoning
Panjin Liaoning
Shenyang Liaoning
Binzhou Shandong
Dezhou Shandong
Heze Shandong
Jinan Shandong
Jining Shandong
Liaocheng Shandong
Linyi Shandong
Tai'an Shandong
Zaozhuang Shandong
Zibo Shandong
Shanghai Shanghai
Tianjin Tianjin

42
Hangzhou Zhejiang
Huzhou Zhejiang
Jiaxing Zhejiang
Ningbo Zhejiang
Shaoxing Zhejiang
850
851

43
Appendix C 852
853
List of cities exposed to high drought risks for the electricity sub-sector 854
City Province
Weinan Shaanxi
Bengbu Anhui
Bozhou Anhui
Chaohu Anhui
Chuzhou Anhui
Fuyang Anhui
Hefei Anhui
Huaibei Anhui
Huainan Anhui
Lu'an Anhui
Ma'anshan Anhui
Suzhou Anhui
Wuhu Anhui
Xuancheng Anhui
Beijing Beijing
Dongguan Guangdong
Huizhou Guangdong
Jiangmen Guangdong
Yangjiang Guangdong
Bijie Guizhou
Zunyi Guizhou
Chengde Hebei
Handan Hebei
Langfang Hebei
Qinhuangdao Hebei
Shijiazhuang Hebei
Tangshan Hebei
Xingtai Hebei
Zhangjiakou Hebei
Qiqihar Heilongjiang

44
Qitaihe Heilongjiang
Shuangyashan Heilongjiang
Anyang Henan
Hebi Henan
Jiaozuo Henan
Jiyuan shi Henan
Kaifeng Henan
Luohe Henan
Luoyang Henan
Nanyang Henan
Pingdingshan Henan
Puyang Henan
Sanmenxia Henan
Xinxiang Henan
Xinyang Henan
Xuchang Henan
Zhengzhou Henan
Zhoukou Henan
Zhumadian Henan
Jingmen Hubei
Suizhou Shi Hubei
Xiangfan Hubei
Yichang Hubei
Changde Hunan
Zhangjiajie Hunan
Changzhou Jiangsu
Huai'an Jiangsu
Nanjing Jiangsu
Wuxi Jiangsu
Yangzhou Jiangsu
Zhenjiang Jiangsu
Benxi Liaoning
Fushun Liaoning
Huludao Liaoning

45
Liaoyang Liaoning
Shenyang Liaoning
Hohhot Nei Mongol
Hulunbuir Nei Mongol
Ordos Nei Mongol
Ulaan Chab Nei Mongol
Yan'an Shaanxi
Yulin Shaanxi
Dezhou Shandong
Heze Shandong
Jinan Shandong
Jining Shandong
Laiwu Shandong
Liaocheng Shandong
Linyi Shandong
Qingdao Shandong
Rizhao Shandong
Tai'an Shandong
Weifang Shandong
Yantai Shandong
Zaozhuang Shandong
Zibo Shandong
Changzhi Shanxi
Datong Shanxi
Jincheng Shanxi
Jinzhong Shanxi
Linfen Shanxi
Luliang Shanxi
Shuozhou Shanxi
Taiyuan Shanxi
Xinzhou Shanxi
Yangquan Shanxi
Yuncheng Shanxi
Tianjin Tianjin

46
Appendix D 855
856
List of cities that are exceptionally vulnerable in terms of infrastructure alone 857
City Province
Xuancheng Anhui
Beijing Beijing
Baoding Hebei
Langfang Hebei
Tangshan Hebei
Changzhou Jiangsu
Nantong Jiangsu
Suzhou Jiangsu
Taizhou Jiangsu
Wuxi Jiangsu
Zhenjiang Jiangsu
Shanghai Shanghai
Tianjin Tianjin
Hangzhou Zhejiang
Huzhou Zhejiang
Jiaxing Zhejiang
Ningbo Zhejiang
Shaoxing Zhejiang
858
859

47
Appendix E 860
861
Here we summarise the verification process as in the Atlas of Natural 862
Disaster Risk in China (Shi, 2011). Figure 15 shows the drought hazard map from 863
the Atlas. The red areas demonstrate higher potential for experiencing drought 864
events. 865
866
867
Figure 15. Drought hazard map 868
869
To verify the results, data were obtained from the "China Natural Disaster 870
Database" which contains a record of natural disasters at county level, reported in 871
Chinese provincial newspapers between 1949 and 2010 (Chinese Academy of 872
Sciences 2015). The database includes information on the start and end times, 873
location, disaster type, impact and journal sources. 874
875
Figure 16 below shows the historical records of drought events between 876
1949-2010 at county level. Darker red areas demonstrate higher incidents of 877
flooding events. Blank cells contain no data. As can be seen from the figure below, 878
between 1949--2010, drought events occurred mainly in northern China. 879

48
880
Figure 16. Drought frequency at county level, for example, the maroon 881
counties have an aggregate drought frequency in the range of 10-28 between 1949 882
and 2010. 883
884
As counties contain multiple values of hazard level (Figure 15), the average 885
hazard level was calculated for each county. The correlation between the average 886
hazard level for that county was then plotted with the historical hazard frequency 887
for that county. Pearson and Spearman correlation tests were conducted and it was 888
demonstrated that the correlation between the hazard level map (Figure 15) and the 889
historical map (Figure 16) is significant at 1%. Results of the statistical tests are 890
reported in the table below. For more verification details, please refer to the Atlas of 891
Natural Disasters in China (Shi, 2011). 892
893
Table 8: Correlation between drought hazard map and historical drought map at 894 county level 895
Test Average hazard level per county
Coefficient Significance
Pearson 0.176 0.000**
Spearman 0.165 0.000**
Notes: No. of observations 2118;** at 1% significance level. 896
897

49
References 898
Baiardi, F. & Corò, F., 2013. GVScan: Scanning Networks for Global 899
Vulnerabilities. In 2013 Eighth International Conference on Availability, 900
Reliability and Security (ARES). Regensburg. Available at: 901
http://ieeexplore.ieee.org/xpls/abs_all.jsp?arnumber=6657304 [Accessed 902
February 8, 2014]. 903
Bompard, E., Pons, E. & Wu, D., 2013. Analysis of the structural vulnerability of the 904
interconnected power grid of continental Europe with the Integrated Power 905
System and Unified Power System based on extended topological approach 906
Ettore. International Transactions on Electrical Energy Systems, 23(5), pp.620–907
637. Available at: http://onlinelibrary.wiley.com/doi/10.1002/etep.1618/full 908
[Accessed February 8, 2014]. 909
China Academy of Transportation Sciences, 2005. Second National Inland 910
Waterways Census (第二次全国内河航道普查) Ministry of Transport, ed., 911
China Communications Press. 912
China Electric Power Yearbook Editorial Committee, 2011. Total Electricity 913
Consumption in China in 2011 (2011 年全社会用电量), China Statistics 914
Press. 915
Chinese Academy of Sciences, 2015. China Natural Disaster Database (中国自然灾916
害数据库). Available at: http://www.data.ac.cn/zrzy/G52.asp [Accessed August 917
10, 2015]. 918
Chinese Census Office of the State Council, 2012. Tabulation on the 2010 919
population census of the people’s republic of china by county (中国 2010 人口920
普查分县资料), China Statistics Press. 921
Civil Aviation Administration of China, 2008. 2020 National Plan for Civil Airports 922
Layout (全国民用机场布局规划). , pp.1–10. Available at: 923
http://www.caac.gov.cn/I1/I2/200808/P020080819406619590745.pdf 924
[Accessed April 4, 2014]. 925
Civil Aviation Administration of China, 2013. Chinese airport traffic ranking 2012 926
(2012 民航机场业务量排名). Bulletin of The Chinese Aviation Industry (2012927
全国机场生产统计公报), pp.7–9. Available at: 928
http://www.caac.gov.cn/i1/K3/201303/t20130325_54626.html [Accessed May 929
1, 2013]. 930
Dankers, R. & Feyen, L., 2008. Climate change impact on flood hazard in Europe: 931
An assessment based on high-resolution climate simulations. Journal of 932
Geophysical Research: Atmospheres, 113(19), pp.1–17. 933

50
Davis, C.B. et al., 2014. Enipedia. Available at: 934
http://enipedia.tudelft.nl/maps/PowerPlants.html [Accessed April 28, 2014]. 935
Dinh, T. & Xuan, Y., 2012. On new approaches of assessing network vulnerability: 936
hardness and approximation. Networking, IEEE/ACM …, 20(2), pp.609–619. 937
Available at: http://ieeexplore.ieee.org/xpls/abs_all.jsp?arnumber=6051504 938
[Accessed February 10, 2014]. 939
Dobbs, R. et al., 2013. Infrastructure productivity: How to save $1 trillion a year, 940
Available at: 941
http://www.mckinsey.com/insights/engineering_construction/infrastructure_pro942
ductivity. 943
Dueñas-Osorio, L. & Vemuru, S.M., 2009. Cascading failures in complex 944
infrastructure systems. Structural Safety, 31(2), pp.157–167. Available at: 945
http://linkinghub.elsevier.com/retrieve/pii/S016747300800057X [Accessed 946
January 20, 2014]. 947
Dutta, D., Herath, S. & Musiake, K., 2003. A mathematical model for flood loss 948
estimation. Journal of Hydrology, 277(1-2), pp.24–49. Available at: 949
http://linkinghub.elsevier.com/retrieve/pii/S0022169403000842 [Accessed 950
October 28, 2012]. 951
Editorial Board of China Ports Yearbook, 2012. Port Summary. In China Ports 952
Yearbook. China Ports Magazine. Available at: 953
http://tongji.cnki.net/kns55/navi/HomePage.aspx?id=N2012060646&name=YZ954
GAW. 955
Erath, A. et al., 2009. Vulnerability Assessment of the Swiss Road Network. 956
Transportation Research Record: Journal of the Transportation Research 957
Board, 2137 (2009 Safety 2009: Security; Emergencies; Management; and 958
School Transportation), pp.118–126. Available at: 959
http://medcontent.metapress.com/index/A65RM03P4874243N.pdf [Accessed 960
February 11, 2014]. 961
Fang, W., 2011. Integrated Risk Governance: Database, risk maps and network 962
platform, Beijing: Science China Press. 963
Hall, J.W. et al., 2014. Assessing the Long-Term Performance of Cross-Sectoral 964
Strategies for National Infrastructure. Journal of Infrastructure Systems. 965
Hall, J.W., Sayers, P.B. & Dawson, R.J., 2005. National-scale Assessment of Current 966
and Future Flood Risk in England and Wales. Natural Hazards, 36(1-2), 967
pp.147–164. Available at: http://link.springer.com/10.1007/s11069-004-4546-7. 968
Hines, P., Cotilla-Sanchez, E. & Blumsack, S., 2010. Do topological models provide 969
good information about electricity infrastructure vulnerability? Chaos 970
51
(Woodbury, N.Y.), 20(3), p.033122. Available at: 971
http://www.ncbi.nlm.nih.gov/pubmed/20887062 [Accessed February 2, 2014]. 972
Hirabayashi, Y. et al., 2013. Global flood risk under climate change. Nature 973
Publishing Group, 3(9), pp.816–821. Available at: 974
http://dx.doi.org/10.1038/nclimate1911\npapers3://publication/doi/10.1038/ncli975
mate1911. 976
Holme, P. et al., 2002. Attack vulnerability of complex networks. Physical review, 977
65(5). Available at: http://www.ncbi.nlm.nih.gov/pubmed/12059649. 978
HSBC, 2012. No water , no power: is there enough water to fuel China’s power 979
expansion?, Hong Kong. Available at: http://chinawaterrisk.org/notices/china-980
water-risk-and-hsbc-no-power-no-water-report/. 981
HSBC, 2011. Scoring Climate Change Risk, Hong Kong. Available at: 982
http://www.google.com/url?sa=t&rct=j&q=&esrc=s&source=web&cd=1&ved=983
0CC4QFjAA&url=http%3A%2F%2Fwww.hsbc.com%2F~%2Fmedia%2FHSB984
C-com%2Fabout-hsbc%2Fin-the-future%2Fpdfs%2F111013-scoring-climate-985
change-risk.ashx&ei=4lQjU9XGJ-986
ST0QXH4oHYCA&usg=AFQjCNG_meSvMtf7krtVyYI-987
A9chLIz20Q&sig2=pFlfNOn0bjG8QjkScKopUA&bvm=bv.62922401,d.d2k. 988
Hu, X., Hall, J.W. and Thacker, S. (2014) Too Big to Fail? The Spatial Vulnerability 989
of the Chinese Infrastructure System to Flooding Risks. Vulnerability, Uncertainty 990
and Risk: 704-714. 991
IPCC, 2012. Determinants of Risk: Exposure and Vulnerability. In Managing the 992
Risks of Extreme Events and Disasters to Advance Climate Change Adaptation. pp. 993
65–108. 994
Johansson, J. & Hassel, H., 2010. An approach for modelling interdependent 995
infrastructures in the context of vulnerability analysis. Reliability Engineering 996
& System Safety, 95(12), pp.1335–1344. Available at: 997
http://linkinghub.elsevier.com/retrieve/pii/S0951832010001444 [Accessed 998
January 27, 2014]. 999
Jongman, B. et al., 2014. Increasing stress on disaster-risk finance due to large 1000
floods. Nature Climate Change, 4(4), pp.1–5. 1001
Kim, H. et al., 2009. Role of rivers in the seasonal variations of terrestrial water 1002
storage over global basins. Geophysical Research Letters, 36(17), pp.2–6. 1003
KPMG, 2009. Infrastructure in China : Foundation for growth, Hong Kong. 1004
Available at: http://www.kpmg.de/docs/Infrastructure_in_China.pdf. 1005

52
KPMG, 2008. Transport in China, Hong Kong. Available at: 1006
http://www.kpmg.com/CN/en/IssuesAndInsights/ArticlesPublications/Documen1007
ts/transport-china-0804.pdf. 1008
LaRocca, S. et al., 2012. Comparing Topological Performance Measures and 1009
Physical Flow Models for Vulnerability Analysis of Power Systems. Psam11 & 1010
Esrel2012, 35(4), pp.608–623. Available at: http://lup.lub.lu.se/record/2337670. 1011
Lewis, J.I., 2009. Climate change and security: examining China’s challenges in a 1012
warming world. International Affairs, 85(6), pp.1195–1213. Available at: 1013
http://doi.wiley.com/10.1111/j.1468-2346.2009.00857.x. 1014
Li, K. et al., 2012. Flood loss analysis and quantitative risk assessment in China. 1015
Natural Hazards, 63(2), pp.737–760. Available at: 1016
http://www.springerlink.com/index/10.1007/s11069-012-0180-y [Accessed 1017
November 5, 2012]. 1018
Lim WH et al (n.d.) Long-term changes in global river flood frequency, 1019
socioeconomic benefits of flood defences and residual risk based on CMIP5 1020
climate models (in preparation) 1021
Mao, Z. et al., 2009. Vulnerability Analysis of Urban Infrastructures. 2009 1022
International Conference on Industrial and Information Systems, pp.395–398. 1023
Available at: 1024
http://ieeexplore.ieee.org/lpdocs/epic03/wrapper.htm?arnumber=5116381 1025
[Accessed January 26, 2014]. 1026
Marrone, S., Nardone, R. & Tedesco, A., 2013. Vulnerability modeling and analysis 1027
for critical infrastructure protection applications. … Infrastructure Protection, 1028
6(3-4), pp.217–227. Available at: 1029
http://linkinghub.elsevier.com/retrieve/pii/S1874548213000462 [Accessed 1030
February 15, 2014]. 1031
Matisziw, T.C., Murray, A.T. & Grubesic, T.H., 2009. Exploring the vulnerability of 1032
network infrastructure to disruption. The Annals of Regional Science, 43(2), 1033
pp.307–321. Available at: http://link.springer.com/10.1007/s00168-008-0235-x 1034
[Accessed February 12, 2014]. 1035
Ministry of Rail, 2010. Chinese Railway Passenger Train Timetable(全国铁路旅1036
客列车时刻表), China Railway Publishing House. 1037
Ministry of Rail, 1980. Classification of Chinese Railway Stations 《铁路车站等级1038
核定办法》. 1039

53
Ministry of Rail, 2012. Ministry of Rail: Bulletin of the 2012 Chinese Railway (中华1040
人民共和国铁道部 2012 年铁道统计公报). , pp.1–5. Available at: 1041
http://finance.china.com.cn/roll/20130313/1327154.shtml. 1042
Ministry of the Environment, 2013. Statistics on national urban sewage treatment 1043
facilities in China (全国投运城镇污水处理设施清单). , pp.1–204. Available 1044
at: 1045
http://www.mep.gov.cn/gkml/hbb/bgg/201305/W020130508476747765965.pdf. 1046
Ministry of Water Resources, 2011. Bulletin of Flood and Drought Disasters in 1047
China (中国水旱灾害公报), Available at: 1048
http://www.mwr.gov.cn/zwzc/hygb/zgshzhgb/201212/t20121212_334746.html. 1049
Ministry of Water Resources, 2012. Bulletin of Flood and Drought Disasters in 1050
China (中国水旱灾害公报), Available at: 1051
http://www.mwr.gov.cn/zwzc/hygb/zgshzhgb/201311/t20131104_515863.html. 1052
Mishra, A.K. & Singh, V.P., 2010. A review of drought concepts. Journal of 1053
Hydrology, 391(1-2), pp.202–216. Available at: 1054
http://linkinghub.elsevier.com/retrieve/pii/S0022169410004257 [Accessed May 1055
24, 2014]. 1056
NOAA, 2015. F18 2012 Nighttime Lights Composite. Version 4 DMSP-OLS 1057
Nighttime Lights Time Series. Available at: 1058
http://ngdc.noaa.gov/eog/dmsp/downloadV4composites.html [Accessed July 20, 1059
2015]. 1060
OpenStreetMap Contributors, 2014. OpenStreetMap. Available at: 1061
https://www.openstreetmap.org/about [Accessed May 5, 2014]. 1062
Oswald, M. & Treat, C., 2013. Assessing Public Transportation Vulnerability to Sea 1063
Level Rise: A Case Study Application. Journal of Public Transportation, (Fta 1064
2011), pp.59–77. Available at: http://www.nctr.usf.edu/wp-1065
content/uploads/2013/10/16.3_oswald.pdf [Accessed February 8, 2014]. 1066
Ouyang, M. et al., 2009. A methodological approach to analyze vulnerability of 1067
interdependent infrastructures. Simulation Modelling Practice and Theory, 1068
17(5), pp.817–828. Available at: http://dx.doi.org/10.1016/j.simpat.2009.02.001 1069
[Accessed February 13, 2014]. 1070
Ouyang, M. et al., 2014. Comparisons of complex network based models and real 1071
train flow model to analyze Chinese railway vulnerability. Reliability 1072
Engineering & System Safety, 123, pp.38–46. Available at: 1073
http://linkinghub.elsevier.com/retrieve/pii/S0951832013002792 [Accessed 1074
February 13, 2014]. 1075

54
Pappenberger, F. et al., 2012. Deriving global flood hazard maps of fluvial floods 1076
through a physical model cascade. Hydrology and Earth System Sciences, 1077
16(11), pp.4143–4156. 1078
Regmi, M.B. & Hanaoka, S., 2011. A survey on impacts of climate change on road 1079
transport infrastructure and adaptation strategies in Asia. Environmental 1080
Economics and Policy Studies, 13(1), pp.21–41. Available at: 1081
http://www.springerlink.com/index/10.1007/s10018-010-0002-y [Accessed 1082
November 26, 2012]. 1083
De Sherbinin, A., Schiller, A. & Pulsipher, A., 2007. The vulnerability of global 1084
cities to climate hazards. Environment and Urbanization, 19(1), pp.39–64. 1085
Available at: http://eau.sagepub.com/cgi/doi/10.1177/0956247807076725 1086
[Accessed November 17, 2012]. 1087
BeijingShi, P. ed., 2011. Atlas of Natural Disaster Risk in China(中国自然灾害风1088
险地图集), Beijing: Science China Press. 1089
Shuang, Q., Zhang, M. & Yuan, Y., 2014. Node vulnerability of water distribution 1090
networks under cascading failures. Reliability Engineering & System Safety, 1091
124, pp.132–141. Available at: 1092
http://linkinghub.elsevier.com/retrieve/pii/S0951832013003153 [Accessed 1093
February 14, 2014]. 1094
Stanway, D., 2011. China power crunch to worsen as drought slashes hydro. Reuters. 1095
Available at: http://www.reuters.com/article/2011/05/25/us-china-drought-1096
hydropower-idUSTRE74O1BK20110525 [Accessed August 26, 2015]. 1097
State Grid Energy Research Institute, 2014. Large-scale Ultra High Voltage 1098
Transmission is in rapid development in China (特高压跨区输电应更大规模1099
地快速发展). China National Grid Highlight Report. Available at: 1100
http://www.sgeri.sgcc.com.cn/html/sgeri/col1080000035/2014-1101
11/14/20141114105657125741045_1.html [Accessed July 15, 2015]. 1102
Takata, K., Emori, S. & Watanabe, T., 2003. Development of the minimal advanced 1103
treatments of surface interaction and runoff. Global and Planetary Change, 1104
38(1-2), pp.209–222. 1105
Tang, H.S. et al., 2013. Vulnerability of population and transportation infrastructure 1106
at the east bank of Delaware Bay due to coastal flooding in sea-level rise 1107
conditions. Natural Hazards, 69(1), pp.141–163. Available at: 1108
http://link.springer.com/10.1007/s11069-013-0691-1 [Accessed February 14, 1109
2014]. 1110
The Harvard WorldMap Project, 2014. Harvard ChinaMap. Available at: 1111
http://worldmap.harvard.edu/chinamap/ [Accessed April 28, 2015]. 1112

55
Wang, S. et al., 2013. Vulnerability analysis of interdependent infrastructure systems 1113
under edge attack strategies. Safety Science, 51(1), pp.328–337. Available at: 1114
http://linkinghub.elsevier.com/retrieve/pii/S0925753512002007 [Accessed 1115
February 14, 2014]. 1116
Wang, S., Hong, L. & Chen, X., 2012. Vulnerability analysis of interdependent 1117
infrastructure systems: A methodological framework. Physica A: Statistical 1118
Mechanics and its Applications, 391(11), pp.3323–3335. Available at: 1119
http://linkinghub.elsevier.com/retrieve/pii/S0378437111009794 [Accessed 1120
August 5, 2014]. 1121
Ward, P.J. et al., 2013. Assessing flood risk at the global scale: model setup, results, 1122
and sensitivity. Environmental Research Letters, 8(4), p.044019. Available at: 1123
http://stacks.iop.org/1748-1124
9326/8/i=4/a=044019?key=crossref.2ecb02eb38c1de207a81abed549fe415 1125
[Accessed May 22, 2014]. 1126
Wilhelmi, O. V & Wilhite, D.A., 2002. Assessing Vulnerability to Agricultural 1127
Drought : A Nebraska Case Study. Drought Mitigation Center Faculty 1128
Publications. 1129
World Bank, 2007. An Overview of China’s Transport Sector - 2007. 1130
World Bank, 2004. Understanding the Economic and Financial Impacts of Natural 1131
Disasters, Washington, DC. Available at: 1132
http://elibrary.worldbank.org/doi/book/10.1596/0-8213-5685-1133
2?queryID=987%2F1899984. 1134
World Bank, 2005. Waste Management in China : Issues and Recommendations May 1135
2005. 1136
Wu, S., Pan, T. & He, S., 2012. Climate Change Risk Research : A Case Study on 1137
Flood Disaster Risk in China. , 3(2), pp.92–98. 1138
Xie, J. et al., 2013. Board-scale reliability of the flood defence infrastructure within 1139
the Taihu Basin , China. Journal of Flood Risk Management, 6(1), pp.42–56. 1140
Yamazaki, D. et al., 2011. A physically based description of floodplain inundation 1141
dynamics in a global river routing model. Water Resources Research, 47(4), 1142
pp.1–21. 1143
Yamazaki, D. et al., 2014. Water Resources Research. Water Resources Research, 1144
50, pp.3467–3480. 1145
Yin, N., 2010. Chinese high-speed rail can breakeven (中国高铁实现盈亏平衡没有1146
悬念). Xinhua News. Available at: http://jjckb.xinhuanet.com/cjxw/2010-1147
08/12/content_248195.htm [Accessed July 11, 2015]. 1148

56
Zarafshani, K. et al., 2012. Drought vulnerability assessment: The case of wheat 1149
farmers in Western Iran. Global and Planetary Change, 98-99, pp.122–130. 1150
Available at: http://linkinghub.elsevier.com/retrieve/pii/S0921818112001762 1151
[Accessed November 29, 2012]. 1152
1153
1154
1155
1156
Ethical Statement 1157
1158
This statement confirms that the work presented in this paper complies with all the 1159
requirements in sections “Ethical Responsibilities of Authors”, “Ethical Standards” 1160
and “Disclosure of Potential Conflicts of Interest” of the Journal of Natural 1161
Hazards. 1162
1163
1164
1165
1166


