Embed Size (px)
Citation preview

Solar Physics (2005) 230: 169–204 C© Springer 2005
THE SPECTRAL IRRADIANCE MONITOR: MEASUREMENTEQUATIONS AND CALIBRATION
JERALD W. HARDER, JUAN FONTENLA, GEORGE LAWRENCE,THOMAS WOODS and GARY ROTTMAN
Laboratory for Atmospheric and Space Physics, University of Colorado, Boulder,Colorado 80309, U.S.A.
(e-mail: [email protected])
(Received 6 April 2005; accepted 28 July 2005)
Abstract. The Spectral Irradiance Monitor (SIM) is a satellite-borne spectrometer aboard the SolarRadiation and Climate Experiment (SORCE) that measures solar irradiance between 200 and 2700 nm.This instrument employs a Fery prism as a dispersing element, an electrical substitution radiome-ter (ESR) as the primary detector, and four additional photodiode detectors for spectral scanning.Assembling unit level calibrations of critical components and expressing the sensitivity in terms ofinterrelated measurement equations supplies the instrument’s radiant response. The calibration andanalysis of the spectrometer’s dispersive and transmissive properties, light aperture metrology, anddetector characteristics provide the basis for these measurement equations. The values of criticalcalibration parameters, such as prism and detector response degradation, are re-measured throughoutthe mission to correct the ground-based calibration.
1. Introduction
The Spectral Irradiance Monitor (SIM) is a satellite-borne spectrometer aboardthe Solar Radiation and Climate Experiment (SORCE) that measures solar spec-tral irradiance between 200 and 2700 nm. This paper is a companion paper toHarder et al. (2005) that appears in this same issue of Solar Physics. That paperdescribes the overall instrument requirements, the hardware implementation, andthe measurement modes needed to acquire the scientific data. This current paperemphasizes the calibration methods, in-flight corrections, and the mathematical op-erations (measurement equations) that are needed to convert instrument hardwaresignals measured in engineering units into SI units (International System of Units)of spectral irradiance with units of Wm−3, or equivalently Wm−2 nm−1 (Parr, 1996).Section 5 of this paper give the status of the calibration, and the corrections thathave been included up to this point in time that are not covered by the measurementequations discussed in this paper.
Briefly summarizing Harder et al. (2005), SIM implements a number of uniquedesign characteristics to provide: (1) broad wavelength operation, (2) multiple fo-cal plane detectors, (3) a very high precision wavelength drive, and (4) in-flightmonitoring of instrument response degradation. The instrument uses a low lightscattering Fery prism as the dispersing element that has high optical throughput

170 J. W. HARDER ET AL.
within the 210 –2700 nm region with a variable resolving power (λ/�λ) rangingfrom 400 at 250 nm to a minimum of 33 at 1200 nm. The prism has excellent imagingproperties, so multiple detectors can be used to detect incoming light in the instru-ment’s focal plane. The primary detector is an electrical substitution radiometer(ESR). The ESR is a thermal detector that measures light from the spectrometerusing phase sensitive detection to dramatically reduce the effect of thermal driftand detector noise. The input light beam to the spectrometer is chopped at 0.01 Hzby a shutter and only signal variations at the fundamental frequency are used todetermine radiant power. The ESR detector calibrates the radiant sensitivity of fourphotodiode detectors during flight. The most important in-flight irradiance correc-tion factor is prism transmission degradation, so the instrument is designed as twoback-to-back, mirror image spectrometers that are coupled with a periscope. Thisprovides both direct measurement of prism transmission and end-to-end compar-isons by the two independent instruments. The two spectrometer configuration alsoprovides instrument redundancy to ensure the continuity of the data record if theworking spectrometer should fail.
The operation of the SIM radiometer is schematically represented in Figure 1.Solar radiation, Eλ (units of Wm−2), is incident on the instrument’s rectangularentrance slit of area A (units of m2); it is the limiting aperture that defines thetotal radiant power entering the spectrometer. The light is then dispersed by theprism and imaged on an exit slit. The prism’s geometry, orientation, and indexof refraction, along with the entrance and exit slit widths, determine the selectedwavelength (λs) and spectral bandpass (�λ) that is transmitted through the exitslit and impinges on the detectors. This slit function convolution is effectively alow-pass filter of the spectrally complex solar spectrum over the wavelength band�λ. A photometric detector, either the ESR or a photodiode, measures the incidentpower, PD, within the spectral bandpass. The measured spectral irradiance, Eλ(λs)(units of Wm−2 nm−1), is then derived from three components: the determination
Figure 1. The figure schematically shows the spectrometer’s response function and the detection ofradiant power by a detector (ESR) in the instrument’s focal plane.

SIM: MEASUREMENT EQUATIONS AND CALIBRATION 171
of the instrument bandpass by the process of slit function convolution, calibrationof the slit area, and the determination of radiant power by the detector:
Eλ(λs) = PD(λs)
A�λ(Wm−2 nm−1). (1)
This simplified picture neglects numerous important corrections, like the or-bital parameters solar distance and the Doppler effect, and wavelength-dependentcorrections like prism aberrations and transmission, detector efficiency and tem-perature effects, diffraction, and time-dependent degradation processes. The termA�λ is, in reality, an integral over these wavelength-dependent contributions.
The block diagram in Figure 2 shows the unit level calibrations needed to mea-sure spectral irradiance and their associated measurement equations. The calibra-tion parameter table lists the methods used to derive their value and marks (∗) thecalibrations that require in-flight modification. In addition, the rounded rectanglesshow where these in-flight corrections are inserted into the measurement process.
The wavelength calculation equations convert prism encoder positions intowavelength information. This set of equations gives the relationships between tar-get wavelength (λs), the charge coupled device (CCD) encoder reading (C), and thespectral focal plane coordinate, (ys). Section 2 describes the dispersion geometry,and the detailed transformations between these variables are presented in AppendixA. In Section 3, a number of instrument characteristics, calibrations, and in-flightcorrections are combined to give the spectral instrument profile, S(ys), describingthe wavelength-dependent radiometric response of the instrument. In addition, theinstrument function, S′(λs, λ), described in Section 3.1 gives the function neededto convolve other higher resolution data to the resolution of SIM. This is importantfor comparing other tabulated or modeled solar spectra against the measured SIMirradiance, it is also used for interpreting laboratory spectra from atomic lampsand other wavelength standards such as Schott Glass BG20 filters. Section 4 de-scribes the methods used to determine the radiant power detected by the SIM focalplane detectors. The ESR is the absolute detector for this instrument, and phasesensitive power detection is used to minimize the effects of 1/f noise inherent inthermal detectors. Four photodiode detectors complement the ESR to produce low-noise, fast response spectral scans. This operational mode produces the most usefulinformation about the time series of solar spectral variability (see Rottman et al.,2005). However, the ESR continually recalibrates the in-flight photodiode detectors(Section 4.2).
2. Prism Dispersion
The set of equations needed to define the focal plane coordinate system starts withthe dispersion geometry of a prism in Littrow configuration and is derived from

172 J. W. HARDER ET AL.
Figure 2. The SIM measurement equations used to calculate solar spectral irradiance in block diagramform. Processes shown in square blocks are equations and actions specific to the SIM instrument andthe sections discussing these equations are noted along with the title of the block. Calibration quantitiesneeded for these equations are identified and listed in the gray box. In-flight correction factors areshown as rounded rectangles and where they are inserted in the measurement process.
Snell’s law for a plane surface prism:
2θP = sin−1
(sin(γ )
n
)+ sin−1
(sin(γ − φ)
n
). (2)
The dispersion geometry and the definitions of the symbols in Equation (2) areshown in Figure 3. Equation (2) and Figure 3 in this paper are the same as Equation

SIM: MEASUREMENT EQUATIONS AND CALIBRATION 173
Figure 3. The dispersion geometry of the Fery prism and the definitions of the variables describedin Equation (2) and Appendix A.
(3) and Figure 8 of Harder et al. (2005). In this first paper, they are used to describethe dispersion properties of the instrument, and here they are the starting point fordeveloping the analytical equations for the wavelength calculation.
In Figure 3, γ is the prism rotation angle derived from the CCD encoder positionC; the refraction angle, φ, or its equivalent focal plane coordinate y is found fromthe prism rotation angle and wavelength of incident light; the index of refraction nis a unique surrogate for wavelength, λ, and is derived from the rotation angle andgeometry of the prism. The analytical equations associated with these transforma-tions are presented in four separate sections in Appendix A, and these analyticalresults are verified through ray tracing. While there are several equations to relatethe wavelength scale to the prism angles and the focal plane CCD encoder system, itis important to note that the SIM wavelength scale is a deterministic process. Slightoffsets and stretches during flight are corrected against a SIM-measured referencespectrum that is then used to adjust all other spectra. This single reference spectrumis then calibrated by comparison with a higher resolution solar spectrum convolvedwith the SIM instrument function. At the present time, the Thuillier et al. (2003)Composite 1 spectrum is used for this process. It should be noted that since 21April 2004, no measured spectra have been shifted relative to this reference. Theshift-stretch algorithm is used to correct data prior to that date, which have beenaffected by an operational problem related to the action of the prism drive system;see Section 5 for further discussion.
3. Instrument Function Convolution
The theoretical SIM instrument function s(λs, λ) can be found by convolving iden-tical entrance and exit slit rectangular functions of width W in the focal planecoordinate system to yield a triangular function with an area of W. Division bythe focal plane dispersion (∂y/∂n) (∂n/∂λ) converts it into the equivalent wave-length coordinates. The instrument function acts as a convolution kernel with unit

174 J. W. HARDER ET AL.
area:∫s (λs, λ) dλ = 1. (3)
When an external reference solar spectrum is convolved with s(λs, λ) a spectrumis produced at the SIM resolution with the property that the integrals of Eλ(λ) andEλ (λs) have the same area:
Eλ (λs) =∫
s (λs, λ) Eλ (λ) dλ such that∫
Eλ (λ) dλ =∫
Eλ (λs) dλs.
(4)
In practice, the function s(λs, λ) presented in Equation (3) is inadequate to de-scribe the actual instrument function. Additional wavelength-dependent correctionsmust be included within the integral that influence the overall shape of the spectralresponse function. The response function, represented by S(ys) in Figure 2, includescorrections for spectrometer aberrations (S′), prism transmission (TP), diffractionloss (�P), and ESR and photodiode responsivities Rλ and αλ. All of these correctionfactors are smooth functions of wavelength with the exception of αλ for the photo-diode detectors that vary rapidly in the vicinity of the long wavelength cut-off, andthe silicon photodiodes have additional structure in the UV part of the spectrum.The correction factors are described in the next four sections except for αλ, whichis discussed in the context of the instrument detectors in Section 4.2.
3.1. S′ (λs, λ): INSTRUMENT FUNCTION CONVOLUTION FROM RAY TRACING
A ray trace model based on the measured geometry of the prism and locations ofthe exit slits relative to the entrance slit is used to generate the instrument func-tion, S′ (λs, λ), to account for optical aberrations and vignetting. Section 2.3.2 ofHarder et al. (2005) describes the instrument’s optical properties in detail but canbe summarized here: (1) the predominant aberrations are image magnification andcoma, (2) imperfect prism focusing causes some light loss at the exit slit, and (3)prism glass dispersion is a non-linear function of wavelength so the ideal trape-zoidal instrument function is slightly asymmetric in wavelength space. All of theseoptical processes are modeled by ray tracing the spectrometer using both ZEMAX(Focus Software Inc., Bellevue, WA) and IRT (Parsec Technologies, Boulder, CO)software packages. For each of the five SIM detectors, the ray trace computes in-strument functions on an index of refraction grid, giving roughly constant spacingin dispersion. The optimizer in the ray trace software determines the rotation anglefor each wavelength (λs) so that the chief ray hits the center point of the detectorexit slit. The rotation angle is then fixed and separate ray traces are performedfor ±100 wavelengths incrementally offset from λs. A total of 40 000 randomlydistributed rays from an object forming a 0.5◦ beam pass through the entrance slitand are propagated through the optical system to the focal plane where a mask

SIM: MEASUREMENT EQUATIONS AND CALIBRATION 175
Figure 4. The profile integral over its usable wavelength band as a function of wavelength. The graphis shown on a log–log scale for the ESR detector.
with the dimensions of the exit slit is used to count the number of rays that passit. As the wavelength shifts away from λs by δλ, a smaller fraction of rays passthrough the mask. For each λs and δλ, the ratio of the number of rays collected atthe exit slit to those passing through the entrance slit provides an estimate of thespectrograph’s efficiency, S′(λs, λ). One hundred separate instrument functions aregenerated over each detector’s usable wavelength range. The profile integral (orequivalent bandwidth) is representative of the spectral bandpass, and is shown inFigure 4 versus wavelength for the ESR detector over its usable wavelength range.
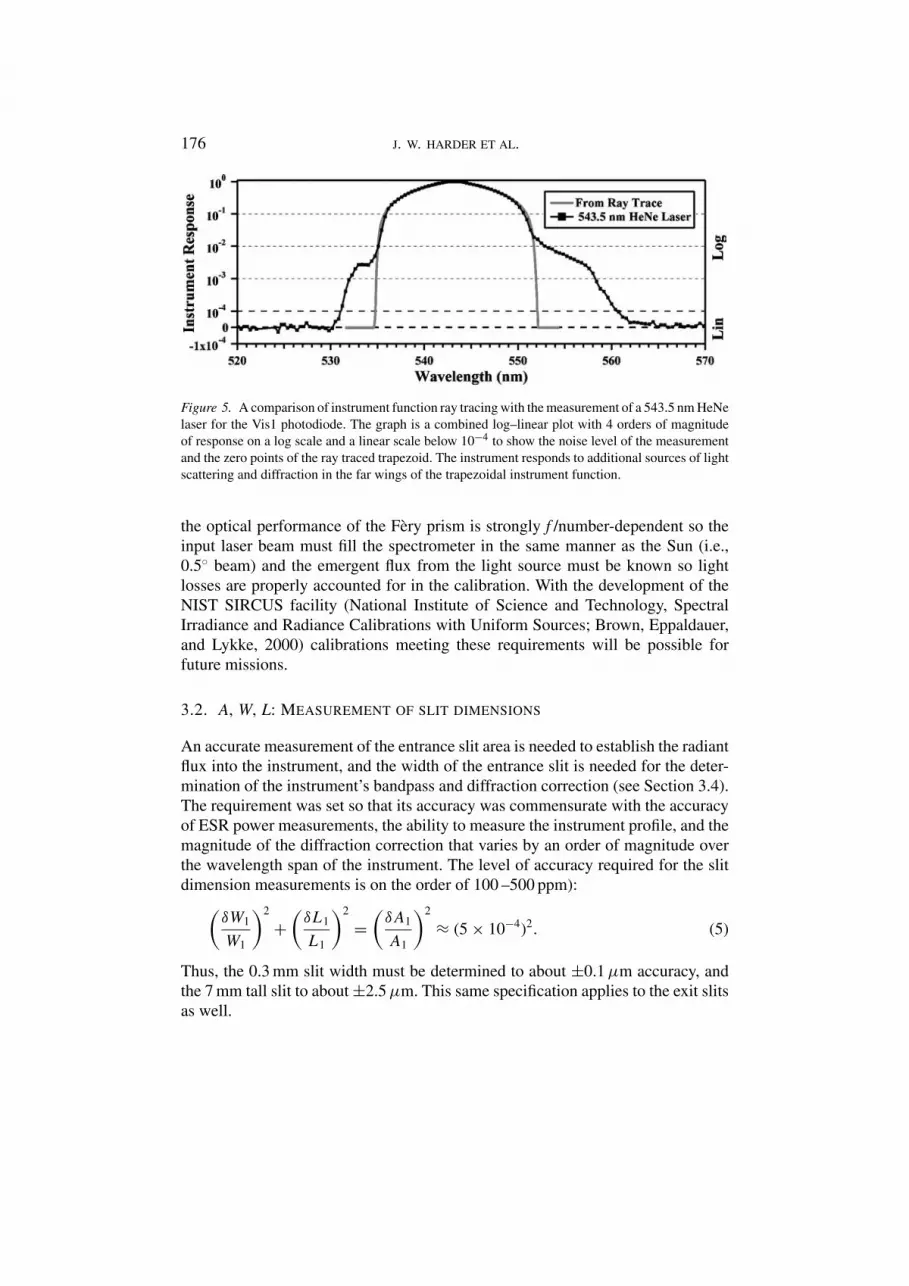
This process generates the proper instrument function for processing spectralirradiances. The reciprocal process that fixes the wavelength and rotates the prismgives a nearly identical result that can be compared to an experiment in which anintense laser line is scanned so the character of the instrument can be seen in the farwings of the instrument function. Figure 5 compares the ray traced SIM slit profilewith the scan of a 543.5 nm HeNe laser as measured by the Vis1 photodiode. Otherscans of this kind were performed at other wavelengths using discrete laser lines andwith a mercury electroless discharge lamp (EDL) and for each detector, but the datashown in Figure 5 displays the best SNR attained for this kind of measurement. Themeasured out-of-band stray light contribution is about 50 parts per million of themain signal, so does not contribute to the shape of the profile shown in Figure 5. Themeasured and ray traced profiles qualitatively agree in the core of the trapezoidalfunction and deviations occur at the 0.5 – 0.01% level. These differences arise froma combination of diffraction and edge scatter generated by the exit slits and baffles.The ratio of the areas of the laboratory calibration to the ray trace profile in this caseis 1.0045, indicating that ray traced instrument function adequately describes theinstrument function with the exception of small corrections needed for diffraction.Saunders and Shumaker (1986) used a prism and a grating in a double spectrometerconfiguration to perform a similar experiment, and their findings are in accord withthe results for SIM. However, a number of improvements in the comparison mustbe made before this kind of experiment is deemed a calibration: in particular,
176 J. W. HARDER ET AL.
Figure 5. A comparison of instrument function ray tracing with the measurement of a 543.5 nm HeNelaser for the Vis1 photodiode. The graph is a combined log–linear plot with 4 orders of magnitudeof response on a log scale and a linear scale below 10−4 to show the noise level of the measurementand the zero points of the ray traced trapezoid. The instrument responds to additional sources of lightscattering and diffraction in the far wings of the trapezoidal instrument function.
the optical performance of the Fery prism is strongly f /number-dependent so theinput laser beam must fill the spectrometer in the same manner as the Sun (i.e.,0.5◦ beam) and the emergent flux from the light source must be known so lightlosses are properly accounted for in the calibration. With the development of theNIST SIRCUS facility (National Institute of Science and Technology, SpectralIrradiance and Radiance Calibrations with Uniform Sources; Brown, Eppaldauer,and Lykke, 2000) calibrations meeting these requirements will be possible forfuture missions.
3.2. A, W, L: MEASUREMENT OF SLIT DIMENSIONS
An accurate measurement of the entrance slit area is needed to establish the radiantflux into the instrument, and the width of the entrance slit is needed for the deter-mination of the instrument’s bandpass and diffraction correction (see Section 3.4).The requirement was set so that its accuracy was commensurate with the accuracyof ESR power measurements, the ability to measure the instrument profile, and themagnitude of the diffraction correction that varies by an order of magnitude overthe wavelength span of the instrument. The level of accuracy required for the slitdimension measurements is on the order of 100 –500 ppm):
(δW1
W1
)2
+(
δL1
L1
)2
=(
δA1
A1
)2
≈ (5 × 10⁻⁴)2. (5)
Thus, the 0.3 mm slit width must be determined to about ±0.1 µm accuracy, andthe 7 mm tall slit to about ±2.5 µm. This same specification applies to the exit slitsas well.

SIM: MEASUREMENT EQUATIONS AND CALIBRATION 177
The slits used for SIM are copper/nickel bimetal etched slits (manufactured byBuckbee-Mears, Inc., Minneapolis, MN) that have a width tolerance of ±8 µm, anda parallelism of ±4 µm over the slit’s 7 mm length. The bimetal etching processcreates an edge with only a few microns in thickness thereby minimizing additionallight scattering. Analysis of the slits by scanning electron microscopy indicates thereis about 0.3 µm root mean square (RMS) roughness along the slit edge and corner-rounding is about 3 µm in radius. Because of this, slit calibrations are performed tomeasure the area and the effective width over its entire length. The slit length is theninferred from these two measurements. The width is measured by laser diffraction,and area is measured by comparing the light flux through the slit relative to thelight flux through a known, calibrated aperture. These two methods are describedin Appendix B.1 and B.2, respectively.
The practice of high-accuracy measurements of long, narrow spectrometer slitsis not as advanced as the circular aperture area measurements used for TSI studies(Fowler, Saunders, and Parr, 2000), so the absolute calibration of the two methodsdescribed in Appendix B rely on known standard widths and areas. The slit widthstandard (Photo Sciences Inc., Torrance, CA) is a chrome-on-glass slit measuredwith a Nikon 2i metrological microscope with a quoted uncertainty of ±0.5 µmtraceable to NIST standards, and the precision of the diffraction calibration methodis ±0.03 µm based on multiple measurements of the slits. The flux comparatorsystem for slit area measurements is based on a standard, 0.5 cm2, NIST calibratedcircular aperture with an area known to ±3 × 10⁻⁵ mm2. The apparatus used tomeasure the area has a precision of ±2 × 10⁻⁵ mm2. The uncertainties in the areaand width measurements are comparable to the requirement limits of Equation (5),but the standard apertures are retained as a ground witness for recalibration so futureimprovements in the measurement methods will translate into a refined value forthe flight slits.
Since the area and width of the instrument’s entrance slit is a function of temper-ature, appropriate thermal corrections are applied to the flight data. Since the slitsare fabricated from a bimetal material, the temperature coefficient of expansion hasto be calculated for the bimetal combination (Gere and Timoshenko, 1990) and hasa numerical value of 1.58 × 10⁻⁵ K−1. The temperature of the slit is monitoredin-flight with a thermistor bonded to the nearby UV photodiode.
3.3. TP: PRISM TRANSMISSION AND DEGRADATION
The calibration of prism transmission and monitoring the degradation of this trans-mission represent two of the most important activities for the SIM calibration. Prismtransmission measurements are discussed in Section 3.3.1 and Appendix C, and theprism degradation model is explained in Section 3.3.2. The measurement of prismtransmission is a very difficult and time consuming process, so the actual calibra-tion was performed on two ground witness prisms rather than the actual flight units.

178 J. W. HARDER ET AL.
However, these ground witnesses were made from the same boule of Suprasil 300,and were manufactured and aluminized simultaneously with the flight prisms.
3.3.1. Prism Transmission MeasurementsThe transmission of the SIM prism results from a number of sources that are afunction of incidence angle and wavelength, and the transmission must be calculatedfor each of the instrument’s detectors since the geometry is different for each ofthem. Fresnel reflections on the vacuum–glass and glass–vacuum interfaces ofthe prism cause a loss in transmission that is a function of incidence angle andthe index of refraction of the glass for a given wavelength; the intensity of thereflection is also a function of the incoming light beam polarization. Furthermore,this effect is enhanced because the prism rotation angle, γ , is 59◦ ± 2.5◦, whichis near the Brewster angle for fused silica. Light intensity losses in the bulk ofthe Six Oy glass matrix are significant only in the ultraviolet (UV) for λ < 300 nm,and in the infrared (IR) for λ > 2700 nm. Suprasil 300 fused silica glass (HereausAmersil Inc., Duluth, GA) is a ‘dry glass’ with a very low OH content ([OH] <
1 ppm), so the broad and deep hydroxyl absorption features are suppressed in thetransmission spectrum (Humbach et al., 1996). This glass is made by a chemicalvapor deposit process, so the trace metals that give rise to color centers are presentonly at the part per billion level, and cannot contribute to the bulk absorption overthe effective 24 mm path through the prism. The reflectivity of the aluminized rear-surface of the prism is a function of wavelength, particularly in the 700 –900 nmregion. Inspection of Figure 3 shows that the light path through the prism is nearlynormal to the back surface regardless of rotation angle and wavelength, so thereis no polarization effect in the aluminum reflectivity. Laboratory measurements ofprism transmission suggest that the reflectivity of the second-surface aluminummirror on the prism is different from the reflectivity of bare aluminum. Therefore,the combined absorption of the bulk glass and reflectivity of the surface glass–aluminum layer is explicitly measured.
Figure 6 shows the effective mirror reflectivity as measured by the methoddescribed in Appendix C. This figure also shows the Fresnel horizontal and verticaltwo-reflection contributions for the geometry corresponding to the ESR detector;the Fresnel contributions are different for the other detector locations in SIM but canbe computed from Equations (C.2) and (C.3) presented in Appendix C. The prismtransmission for unpolarized light is the product of an angular-dependent portionarising from the average of the two Fresnel reflections and the measured mirrorreflectivity that includes bulk losses in the UV and IR. This formulation has theadvantage that the transmission can be computed for all detector positions and allprism rotation angles. The attenuation for wavelengths longer than 2600 nm shownin Figure 6 is caused by absorption in the bulk of fused silica (Humbach et al.,1996). The estimated photometric error from the transmission measurement in the200 –1000 nm is about 0.1%, but in the 1000 –2900 nm region the error increasesto about 1%.

SIM: MEASUREMENT EQUATIONS AND CALIBRATION 179
Figure 6. The measured prism transmission. The figure shows the second-surface effective reflectivityof the prism and the two-reflection Fresnel contributions in each polarization. The calibration wasdone for the geometry of the ESR detector. Transmission for unpolarized light is the product of thereflectivity and the average of the two Fresnel components.
3.3.2. Prism Degradation Measurement and ModelExposure to the space environment causes irreversible changes to the transmissiveproperties of the prism that must be tracked both as a function of wavelength andtime. Complete understanding of the degration characteristics is an ongoing taskduring the instrument lifetime. This section discusses the in-flight methods that weredesigned and operate to measure the degradation and the current model applied todetermine and correct the degradation observed so far.
Table I summarizes the operation modes used to determine the prism degradationproperties, the action of the modes, and the number of days between calibrations.The two primary modes for this purpose are the direct prism transmission calibrationmode and the ESR full scan. The SIM A/SIM B comparison is not currently usedin the calculation of the prism degradation, but is used as an end-to-end check toensure that the degradation correction factors are consistent.
Without loss of generality, the prism degradation can be expressed by the equa-tion
T (t, λ) = T0(λ) e−τ (t,λ), (6)
where τ represents this degradation in a logarithmic scale and is defined as 0 at thebeginning of the mission, and T0 is the un-degraded prism transmission. By usingthe in-flight measurements, the prism degradation observed until the present can bedescribed by a model that corresponds to the following equation:
τ (t, λ) = κ(λ)C(t). (7)

180 J. W. HARDER ET AL.
TABLE I
SIM operation modes used to determine prism degradation.
Cadence
Calibration mode Action/purpose (number/days)
Prism transmission(mode 1)
Uses the SIM ESR prism transmission measurement modedescribed in Section 2.3.4 of Harder et al. (2005).
1/7
Performs this operation at 44 discrete wavelengths.
ESR full scan(mode 2)
Measures the solar spectrum over the operating range ofthe ESR (256 –2700 nm) with a sampling of 3 prismsteps per resolution element. The range for prismcalibrations using the ESR is 300 –1100 nm, and the UVphotodiode is used for the 210 –300 nm region.
1/90
SIM A/SIM Bcomparison(mode 3)
Simultaneous full scans with SIM A and SIM B providecomparisons and an end-to-end measure of theeffectiveness of the degradation corrections.
1/30
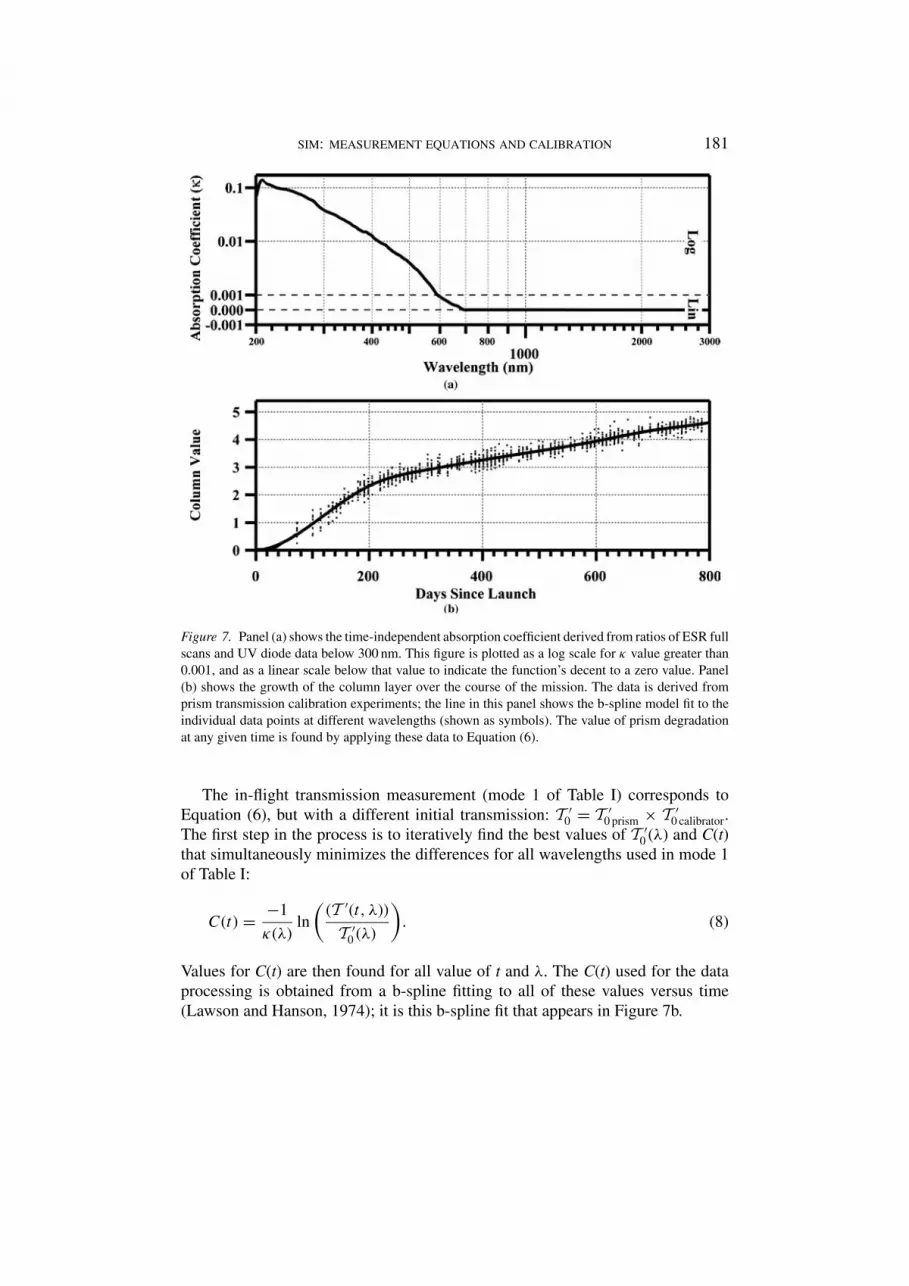
With the wavelength and temporal variations accounted for by two separate func-tions, the absorption coefficient κ(λ) and the column density C(t), respectively. Thefunction κ is obtained by comparing ESR full scans (mode 2 in Table I), at widelyseparated times. To date, all of the ESR full scans have been used to check thevalidity of Equation (7), and this relationship is applicable to within the limitationsof observation noise and solar variability. The value of κ will be improved by con-tinued analysis of ESR full scans and the SIM A/B comparisons (mode 3 of Table I).Figure 7a shows this absorption coefficient as a function of wavelength, and showsthat absorption is greatest in the near UV, and drops to values indistinguishablefrom noise by 700 nm thereby indicating that no prism degradation is observed atthese longer wavelengths.
The column value shown in Figure 7b is found from the in-flight prism trans-mission measurement performed on a weekly cadence. Since SIM B receives only18% of the solar exposure of SIM A, this experiment is done symmetrically sothe effects of exposure time on degradation can be assessed. These activities areperformed with the hard radiation traps (HRT, see Harder et al., 2005 for details)inserted in the light beam to minimize unnecessary exposure to the prisms. Thetransmission calibration system yields a relative change in transmission rather thanan absolute value. Additional reflections in the calibrator’s relay optics (prism,periscope, folding mirror, focusing beamsplitter) alter the polarization state andmodify the wavelength dependence of the input light beam so the prism transmis-sion measured through this system has additional contributions not present in thetransmission function measured by the ground calibration system and described inSection 3.3.1. However, the modifications induced by the relay optics are believedto be time invariant since light flux on these elements is very small and these opticalelements are common to both the I and I0 modes.
SIM: MEASUREMENT EQUATIONS AND CALIBRATION 181
Figure 7. Panel (a) shows the time-independent absorption coefficient derived from ratios of ESR fullscans and UV diode data below 300 nm. This figure is plotted as a log scale for κ value greater than0.001, and as a linear scale below that value to indicate the function’s decent to a zero value. Panel(b) shows the growth of the column layer over the course of the mission. The data is derived fromprism transmission calibration experiments; the line in this panel shows the b-spline model fit to theindividual data points at different wavelengths (shown as symbols). The value of prism degradationat any given time is found by applying these data to Equation (6).
The in-flight transmission measurement (mode 1 of Table I) corresponds toEquation (6), but with a different initial transmission: T ′
0 = T ′0 prism × T ′
0 calibrator.The first step in the process is to iteratively find the best values of T ′
0 (λ) and C(t)that simultaneously minimizes the differences for all wavelengths used in mode 1of Table I:
C(t) = −1
κ(λ)ln
((T ′(t, λ))
T ′0 (λ)
). (8)
Values for C(t) are then found for all value of t and λ. The C(t) used for the dataprocessing is obtained from a b-spline fitting to all of these values versus time(Lawson and Hanson, 1974); it is this b-spline fit that appears in Figure 7b.

182 J. W. HARDER ET AL.
As an example of the amount of observed degradation, at 393.4 nm (near theCa II lines) the κ coefficient is 0.0136, and on mission day 600.0 (15 September,2004) the column value is 3.941. The transmission relative to the unexposedvalue can be found by applying these parameters to Equations (6) and (7):T /T0 = exp(−0.0136 × 3.941) = 0.948. Equivalently, the transmission of theprism has decreased by about 5.2% over the course of 600 days at this wavelength.
3.4. �P: DIFFRACTION CORRECTION
The diffraction correction is defined as the fraction of light that lies within the clearaperture of the prism when it is diffracted by the entrance slit. Lawrence et al. (1998)discussed this diffraction transmission factor, and they demonstrated that the widthand length of the slit can be treated as separable problems and the fractional lossin each axis is proportional to wavelength:
�(λ) =(
1 − aWλ
W
)(1 − aL
λ
L
). (9)
In this equation, W and L are the width and length of the entrance slit after applyingthe slit temperature correction discussed in Section 3.2. The dimensionless coeffi-cient, a, is obtained from the convolution of the 0.5◦ projected solar disk and therectangular slit:
aW = −�W
λ= 1
π2θP
{2 − 2
√1 − ε2
ε2
}. (10)
In this equation, θP is the half angle subtended by the prism and ε is the ratio of thesolar angular radius to the prism half angle. An analogous equation can be writtenfor the slit height. For the SIM geometry, these factors are tabulated in Table II.
TABLE II
Slit diffraction parameters, aW, aL.
Slit width Slit length
Prism half angle (◦), θp 0.03124 0.02250
Solar radius (◦) 0.00436 0.00436
ε 0.139661 0.193944
a, �W/λ 3.2593 4.5471
Example wavelengths (nm) �(λ)
250 0.99715
500 0.99431
1000 0.98862
2500 0.97158

SIM: MEASUREMENT EQUATIONS AND CALIBRATION 183
4. SIM Detector Characteristics and Calibrations
4.1. ESR OPERATION AND CALIBRATION
The electrical, mechanical, thermal, and optical properties of the ESR detectorare discussed in Section 2.3.1 of Harder et al. (2005). This section describes thecharacterization of the detector and the terms that relate to the phase sensitivedetection at the shutter fundamental. Additionally, the ESR absorption factor, αλ,introduced in Section 3 is presented here.
In the following analysis, a tilde (∼) represents complex numbers and an arrow(→) denotes a times series of numbers, corresponding to each data point. Thedetector measurement equation can then be represented by the equation
PESR = 1
M
V 27 RH
(RS + RH)2
{1 + G
G
ZH
ZR
} p · Dp · Q , (11)
where PESR: detected power; M: scaling factor for the data output: 64 000 is thedata number for 100% duty cycle of the pulse width modulator; V7: value of the7.1 V reference; RH
(RS+RH)2 : voltage divider ratio of the series heater resistors; 1+GG
:
closed-loop gain from an open-loop servo gain of G; ZH
ZR: equivalence ratio;
p· Dp· Q :
projection of the data onto shutter waveform (see Section 4.1.2); D ≡ D j : timeseries of data numbers from the DSP; Q: shutter transmission square wave, 0 or 1;p ≡ exp (i 2π f1tJ ) f1: shutter fundamental frequency; tJ : time of each data point.
The DSP data numbers D (Harder et al., 2005), are produced at a rate of 100 s−1
and can be decimated by factors of 1, 2, 5, 10, or 20 for telemetry. Typically, thedata stream is decimated by a factor 10. The ESR data numbers are a linear functionof the detected power, and conceptually the ESR power (PESR) can be written:
PESR = AP × D, where AP = V 27
RH
(RH + RS)2
1
M. (12)
A light chopper then modulates PESR (Equation (12)) and converts it into the ACwaveform PESR.
The ratio of thermal impedances to the ESR thermistor, for radiation input andheat input, ZR/ZH, gives the equivalence between replacement heater power andradiant power. This equivalence ratio is determined from a model of the heat flowon the SIM bolometer as a function of frequency. The details of this model arebeyond the scope of this paper, but because of the high thermal conductivity ofdiamond, the in-phase component of equivalence is within 10 ppm of unity. Theout-of-phase component is near 3000 ppm due to mismatched delays, but this is notrelevant to the determination of absorbed power.

184 J. W. HARDER ET AL.
Figure 8. The noise spectral power density as a function of frequency of the two SIM ESR detectorswhile in flight. The minimum in the noise corresponds to the point where 1/f-type noise approximatelyequals the excess noise on the bolometer thermistors.
4.1.1. Detector Performance and Servo Gain RecalibrationThe SIM ESR is auto-balanced by a servo-loop and the components of the loop weredescribed in Harder et al. (2005). The performance of the ESR can be determinedby analysis of the detector’s noise spectrum. The spectrum is obtained by operatingthe detector in the dark for long time periods compared to shutter period, and usingFourier analysis to characterize the noise spectrum. Figure 8 shows the noise spectralpower density in terms of data numbers (DN) as a function of frequency and wasmeasured with the instrument on-orbit. The detectors show a very characteristicpattern with 1/f noise dominating at the lowest frequencies and with a rising excessthermistor noise power to a frequency of about 1 Hz where the servo-loop gaindrops to a value near 1.0. The minimum in the noise power density at 0.01 Hzcorresponds to the location where the contributions of these two noise sourcescross and become comparable in magnitude. This cross over point determines theoptimal shutter frequency to operate the instrument. At 0.01 Hz, the noise power is∼2 DN/
√Hz and with a 200 s integration period, the noise on the measurement is
∼ 0.3 nW; this is the condition used for the ESR table measurements. For the ESRfull scans, the instrument is operated with a 0.05 Hz shutter frequency, where thenoise is a factor of 5 higher, for a 40 s dwell time per prism step giving a noise floorof ∼2 nW. The conditions used for this scan represent a compromise between lownoise and the length of time required to complete the measurement.
The closed-loop gain is a first-order term in the ESR measurement equation(Equation (11)) and its value must be monitored throughout the flight to assure thatchanges in electronic component values do not change (degrade) over the courseof the mission. The open-loop gain of the system can be determined in-flight byinjecting a digital square wave at the shutter frequency into the servo-loop beforethe pulse width DAC and then measuring the system’s response to this perturbation;this square wave is referred to as a feed-forward signal. The action of this feed-forward signal can be written as a control loop equation where G is the unperturbed

SIM: MEASUREMENT EQUATIONS AND CALIBRATION 185
gain, FF is the magnitude feed-forward signal, and ‘out’ is the output of the controlloop. This equation can then be solved for the open-loop gain of the system:
out = FF − G × out ⇒ G = FF
out− 1. (13)
Figure 9 is an example of data acquisition and the gain calculation for an in-flight calibration in February of 2005. Figure 9a shows data for a 20 s feed-forwardperiod: a 40 min time series of ESR data is collected in the feed-forward modeand about 100 cycles are co-added to reduce random noise, and the mean value issubtracted. The detector response (the variable ‘out’ in Equation (13)) is shown asa gray trace, and the driving feed-forward waveform (FF) is the dotted black trace.The feed-forward waveform consists of adding in a digital value of 8000 duringthe first half of the period, and subtracting 8000 during the second half. In thisway, the system must respond to an instantaneous change of 16 000 DN at t = 0and t = 10 s and then settle to its balanced value. If the system was perfect, the
Figure 9. Gain measurements for the ESR. Panel (a) shows a time series of the SIM ESR (gray trace)and the feed-forward pulse (dotted black trace) that is driving the detector’s response; the graph is fora 20 s period on the feed-forward pulse. Panels (b) and (c) show the measured gain and phase whenthe time series data of panel (a) is processed by Equation (13). These graphs show the results for both100 (black) and 20 (gray) second feed-forward periods. The open-loop gain and phase at the shutterfundamental are marked on the graphs.

186 J. W. HARDER ET AL.
peak values at t = 0 and 10 s would be ±16 000. The gain is found by separatelyperforming the Fourier transforms of ‘FF’ and ‘out’ and applying Equation (13)at each frequency. The open-loop gain, Gopen, is the modulus of G, and the phase(φ) is the argument and the frequency dependence of these terms are shown inFigure 9b and c, respectively. The open-loop gain attains its maximum value at thefundamental, and decreases to its minimum value at about 1.5 Hz where the phaselags by 180◦. Because the incoming light from the SIM spectrometer is chopped bya shutter, only Gopen and φ at the fundamental frequency are needed to calculate theclosed-loop gain for the measurement equation seen in Equation (12). These valuesare noted in the figure for both the 100 and 20 s shutter periods. The gain and thephase have been tracked throughout the first 2 years of the SORCE mission, andthey are constant and without a discernable trend to 0.1% throughout this period.
4.1.2. Projection Operator for Phase Sensitive DetectionThe projection operator, p, presented in Equation (11) is a discrete Fourier filterthat operates on M shutter cycles and N data points per cycle; the M-cycle filtercontains MN points. The most typical values for SIM measurements are M = 2,and N = 1000 for the 100 s shutter period used for ESR table measurements orN = 400 for the ESR full scan. The projector has the following properties:
a. It defines a smooth window function, WJ , where the data index J runs 0 toM N − 1. WJ goes to zero at the edges of the data block, and is optimized toreject background drift, shutter harmonics, and noise.
b. Multiply WJ by e−i2π f t where f is the shutter frequency and t the time of thedata point.
The complete projector function can then be written:
pJ = WJ �J ≡ p. (14)
The window function is constructed by convolving M identical boxcar windows,then centering the result on the data window. These boxcars are all exactly N pointswide and give zeros in the frequency response at the shutter cycle harmonics. Thecosine and sine waveforms are expressed as complex exponential function:
�J = exp
[−i
2π J
N+ iφ
]≡ cos
[2π J
N− φ
]− i sin
[2π J
N− φ
]. (15)
The phase angle φ is arbitrary if the same phase angle is used in the projection ofthe shutter waveform. Since φ is arbitrary, it is set to zero for simplicity. Figure 10shows WJ , the shutter waveform, and the real and imaginary parts of p for the caseof M = 2 as calculated by Equations (14) and (15).
The last step is to perform the dot product by multiplying the Jth data pointand the projector element and summing all elements in the data block. This same

SIM: MEASUREMENT EQUATIONS AND CALIBRATION 187
Figure 10. Waveforms of WJ , the shutter, and the real and imaginary parts of p for the case of M = 2.
process is applied to the idealized shutter wave form, QJ , and these two quantitesare ratioed to ensure proper scaling of the data numbers:
p · Dp · Q ≡
∑M N−1J=0 pJ DN K+J∑M N−1J=0 pJ QN K+J
. (16)
4.1.3. Absorptance of Nickel Phosphorus BlackThe absorptance of the bolometer, α, results from the combined effects of theabsorptance of the nickel phosphorous (NiP) and the return reflectance of the alu-minized hemisphere of the ESR cavity (see Harder et al., 2005, Section 2.3.1, formore discussion on the optical properties of the ESR). The value of α is wavelength-dependent and is found by summing the light absorption through the multiple ab-sorption/reflection light path between the bolometer and its surrounding reflectivehemisphere.
Assume that the intensity of light entering the ESR detector is Io and the NiPsurface of the bolometer has an absorptance ρ. On first contact with the bolometerthe fraction of light absorbed is ρ. The intensity of light diffusely scattered off of thebolometer, β, is then Ioβ where β = (1 − ρ). This light is then reflected off of thealuminum hemisphere with reflectivity, r, and re-directed to the bolometer with anintensity of βr. This light will again be absorbed, and the process is repeated untilthe intensity becomes diminishingly small. The overall efficiency of this process canbe written as an infinite series and summed because it is a geometric progression:
α I0 = I0ρ + I0βrρ + β2r2ρ + · · · + I0βnrnρ + · · · with 0 < β, r ≤ 1,
α = ρ(1 + βr + (βr )2 + (βr )3 + · · · + (βr )n + · · ·) = ρ
(1
1 − βr
). (17)

188 J. W. HARDER ET AL.
Figure 11. The reflectance of the NiP surface (β) of the bolometer; here β = (1 − ρ), where ρ isthe absorptance (panel (a)). Panel (b) is the reflectance of the hemispherical reflector surrounding thebolometer (r). Panel (c) is the combined absorbance (α) of the sphere and the bolometer as calculatedfrom Equation (17) assuming no optical aberrations.
Figure 11 shows the wavelength dependence of ρ, r, and α. This figure shows thatthe hemispherical reflector significantly increases the blackness of the bolometer. Inthis figure, and in the derivation of Equation (17), it is assumed that the optical effi-ciency of the cavity is 1, and in other words, every ray reflected off of the bolometeris re-collected because of the hemispherical cavity. This assumption most likelyis not true because of aberrations, particularly at longer wavelengths. Laboratorytests are needed to test this assumption. The nickel phosphorous black used forthe SIM ESR bolometers was developed and produced by Custom Microwave Inc.(Longmont, CO) in conjunction with our laboratory, and a test article produced bythe same production method used for the SIM bolometers was subsequently testedby Ball Aerospace Inc. (Boulder, CO). Ball Aerospace produced a report (Fleming,1999) on these tests. This report presents measurements of the bi-directional reflec-tion distribution function (BRDF) and total hemispherical reflectance (THR) of thismaterial. It is assumed that optical properties of the material tested in Fleming’sreport are representative of the material used for the flight bolometers. This is areasonable assumption since the electron micrographs of the test article and the

SIM: MEASUREMENT EQUATIONS AND CALIBRATION 189
black surface are comparable in structure. It is necessary to make this assumptionsince it was not possible to measure the flight component because the reflectancemeasurement requires a large target area so the light signal reflected off of the blacksamples is large enough to make a quality measurement. The quoted error for wave-lengths greater than 800 nm is 0.5%, and about an order of magnitude less than thisfor the 250 –800 nm range. This study demonstrated that the light reflected fromthe surface of the black is predominately diffuse with a small (<0.6%) specularreflectance component.
4.2. PHOTODIODE CALIBRATION AND DEGRADATION CORRECTION
The radiant responsivities, Rλ, (units of A W−1) for each photodiode are measuredon-orbit by dividing the photocurrent by the power measured by the ESR using phasesensitive detection. There are a number of small, but important, complications tothis process: Rλ is not constant over a typical SIM resolution element, particularlynear the red cut-off of the photodiode’s response curve, whereas the ESR response isessentially flat. Therefore, the convolution over the instrument function is differentfor these two detectors and must be accounted for in forming the ratio. Portions of thespectrum where the photodiode’s response changes rapidly cannot be accuratelymeasured by this method. Nonetheless, the highly stable geometry, wavelengthknowledge, and intensity provided by the Sun makes this measurement much moreaccurate and reliable than an equivalent laboratory calibration. Figure 12 showsthe radiant responsivity retrieved by this method for the four photodiodes used forSIM A.
The radiant responsivity curves shown in Figure 12 define the ranges over whicheach detector gives reliable data. The photodiodes provide complete coverage ev-erywhere except for a small part of the spectrum between 308 and 310 (covered bythe ESR). The Vis2 and IR photodiodes overlap in the 900 –1000 nm region, andthe best data quality in this spectral region is from Vis2 because Rλ function is
Figure 12. Radiant sensitivities for the four photodiodes used for SIM. The values are measuredin-flight using the ESR to calibrate the photodiodes.

190 J. W. HARDER ET AL.
smoother. However, both silicon photodiodes have greater temperature sensitivityred-ward of the Rλ peak, so data in this regime are corrected and their usage lim-ited because of the increased uncertainty. In summary, the operating ranges for thephotodiodes that give the most reliable results are as follows: UV = 200 –308 nm,Vis1 = 310 –800 nm, Vis2 = 800 –1000 nm, IR = 1000 –1655 nm.
The photocurrent from each photodiode is measured with a radiation hardenedtransimpedance amplifier with an 11 Hz bandwidth, multiplexed and then convertedto digital numbers with a 16-bit, bipolar, dual-slope analog-to-digital (ADC) con-verter. Each channel of photodiode data is sampled at 100 Hz, and then decimatedat the same rate as the ESR data by the instrument’s DSP. The feedback resistorfor each amplifier was selected to cover most of the 215 bit unipolar dynamic rangeof the ADC needed for each photodiode’s spectral range. The converter has about2 bits of noise per sample, so the photodiode measurements are ADC limited ratherthan photon noise limited. Because of this, the ultimate signal-to-noise ratio (SNR)is proportional to signal strength for a fixed integration time, and doubling the dwelltime at a fixed wavelength does not improve the SNR by
√2.
Since the photodiode spectral scans are used to track the orbit-to-orbit variabilityof the Sun (see Sections 3.2 to 3.4 of Rottman et al., 2005 for more detail), their mea-surement precision plays an important role in interpreting solar variability. Figure 13shows the measured photocurrent for the Vis1 photodiode as a function of CCD po-sition and wavelength. On the right hand axis is the SNR ratio on this measurement.
The custom made photodiodes used for SIM are 10 mm × 2 mm for the threesilicon photodiodes (International Radiation Devices Inc., Torrence, CA) and8 mm × 2 mm for the InGaAs photodiode (Hamamatsu Corporation, Bridgewater,
Figure 13. Raw spectral data for SIM A Vis1 photodiode. The bottom axis shows the CCD pixelvalue for the scan, and the top axis is the wavelength corresponding to the bottom axis. The measureddetector photocurrent is shown on the left axis, and the approximate SNR that corresponds to thephotocurrent is shown on the right.
SIM: MEASUREMENT EQUATIONS AND CALIBRATION 191
NJ). The Vis1 and UV silicon photodiodes have n-on-p construction with a nitridepassivated SiO2 layer to stabilize their radiant sensitivities in the ultraviolet. TheVis2 photodiode is constructed similarly, but with p-on-n geometry. The siliconphotodiodes appear to undergo a slow decrease in responsivity predominately forwavelengths longward of the responsivity peak (see Figure 12) that remains appar-ent in the data after prism degradation is removed. Loss of photodiode responsivityis the dominant source of instrument degradation for wavelengths greater than650 nm where prism glass is stable (see Figure 7a). At this point in time, the radia-tion damage observed in the SIM photodiodes is consistent with the radiation testingdescribed by Jorquera et al. (1994). They found negligible damage on the n-on-pphotodiodes for the short wavelengths, and small (though not specified) damage forthe long wavelengths. For the p-on-n detectors, they reported no change at 420 and552 nm, but a 2 and 11% drop in the internal quantum efficiency at 670 and 875 nm,respectively, and for 5 MeV proton energy at a fluence of 6.0 × 10⁸ protons cm−2.The best method to correct the in-flight degradation is to match the slope of thephotodiode time series to that of ESR measurements at selected wavelengths. Thisprocess is most readily done at the ESR table values. The degradation is expectedto be smooth, so values between the wavelengths in the ESR table are interpolated.This method has the distinct advantage of correcting the diode degradation but notbiasing the slope in the data that occurs as the intensity of the Sun decreases tothe (yet unknown) solar cycle 23 minimum value over the next 3 years. The exactnature of photodiode degradation seen in-flight is still under study and, like prismdegradation, will require further refinement as more data become available over thecourse of the SORCE mission; more detailed discussions about this degradationmechanism will be presented in subsequent publications about the SIM instrument.
5. Final Corrections and Status of SIM Solar Spectroscopy
At this juncture in time a number of additional corrections and analyses will beperformed on the SIM instrument prior to assigning a final absolute calibration tothe instrument. Corrections that have been implemented are:
1. The dispersion model of Section 2 and Appendix A requires slightly dif-ferent parameters for each detector. In particular, the wavelength scalesfor each photodiode detector and the ESR can be brought into agreementwith the solar spectrum of Thuillier et al. (2003) to within ±0.02 nm byassigning independent wedge angles, θP, for each of the focal plane de-tectors, and by changing the effective sub-pixel size, C, on the CCD from1.3 µm to 1.2886 µm pixel−1 (see Equations (A.1) and (A.2)). This resultwas obtained by convolving the 1.3 nm-resolution Thuillier et al. Compos-ite 1 spectrum with the wavelength-dependent SIM instrument function inthe 300 –900 nm range. The two spectra are then processed to a zero mean

192 J. W. HARDER ET AL.
differential spectrum and the θP and C parameters of the dispersion modelare varied using Levenberg–Marquart minimization (Press et al., 1992) untila minimum in the sums of squares difference between the two spectra isobtained. In using this method to find the best prism wedge angle for eachdetector, the worst case difference is about 0.013◦ out of a wedge angle of34.497◦. There is only a single prism and it is not possible to have differentwedge angles, but making the correction in this parameter fixes a problemmost likely caused by slightly different refraction angles produced by spher-ical surfaces on the prism. The dispersion equations of Appendix A do notaccount for curvature of the prism faces. Studies of prism refraction based onnon-sequential ray tracing may lead to an improved physical understandingand correction to this problem.
2. The solar irradiance variations in the visible and near IR are on the order of0.05– 0.1%, so very small shifts in wavelength produce comparable discon-tinuities in the time series. The effect was clearly seen in the first 10 monthsof operation of SIM with the occurrence of a problem related to commandingCCD position system. This problem caused the signal on the CCD to saturateand produced a non-linear response in the drive’s servo system that could notbe detected in the drive housekeeping channels. Different CCD settings pro-duced different levels of saturation and therefore a different drive response.This problem has been corrected by identifying the CCD settings that pre-vent CCD saturation, and the affected spectra are being corrected in groundprocessing with a spectral shift-stretch algorithm. The affected spectra areshifted and stretched with respect to a standard SIM spectrum without theCCD position non-linearity. The algorithm used to perform this re-mappingof the CCD position (C) converts the measured spectra into a zero-meandifferential spectrum and uses a golden section search over a limited rangeof C values to align the spectra. This process is performed for each detectorand over the full operating range of the prism drive. Prior to performingthe wavelength alignment, the data are corrected for degradation so spectralslope does not bias the peak finding of the golden section search. The trans-fer function between the saturated and non-saturated drive positions is fittedwith a third-order polynomial and then applied to the affected spectra.
The analysis of NiP absorptance, and therefore the overall efficiency of the ESR,requires further analysis and ground-based experimental verification. This study isbeing performed on a flight witness ESR made with the same components as theflight detectors. These measurements will impact the discussion of Section 4.1.3.Additional information on the efficiency of the detectors will be obtained throughthe on-orbit comparison of the two SIM spectrometers. In addition, end-to-endanalysis of the prototype SIM responsivity are being planned and may provide amore definitive validation of the parameter used to derive the solar irradiances forthe SIM measurements.

SIM: MEASUREMENT EQUATIONS AND CALIBRATION 193
At the present time, and for the purpose of comparing SIM spectral irradiancetime series to other measurements of solar activity, such as the Mg II core-to-wingratio and TSI (see Rottman et al., 2005), a relative calibration factor is applied to thecurrent SIM radiometric calibration. This correction factor smoothly brings the SIMdata into agreement with Thuillier et al. (2003) for the infrared and visible, and withUARS SOLSTICE for the 200 –300 nm spectral regions. This adjustment is onlysignificant for wavelengths longer than 600 nm and has a very smooth wavelengthbehavior. Thus, all spectral features present in the SIM spectra are measured and arenot a consequence of these adjustments. This adjustment is complemented by a finalcorrection through a wavelength-independent coefficient that makes the integral ofSIM irradiance in the 200 –1600 nm range equal to 1225 Wm−2. This value assumesthe TIM TSI value of 1361 Wm−2 and estimates the irradiance in the 1.6 –10 µmwavelength range at a value of 136 Wm−1 using the Fontenla et al. (1999) spectralsynthesis calculation. This final correction is only about 1% and within the absoluteaccuracy of our measurements at this time.
Figure 14 represents the current spectrum with a wavelength accuracy of±0.02 nm and an overall radiometric accuracy of about 1%. The top panel ofthe graph shows the irradiance spectrum, and the lower panel shows the aver-age disk brightness temperature (Fontenla et al., 1999). This plot is from 210 to1650 nm covering the range of the SIM photodiodes. The solar spectrum in the
Figure 14. Current SIM solar spectrum. The top panel shows the spectrum in terms of irradiance,and the lower panel is the same data in terms of brightness temperature.

194 J. W. HARDER ET AL.
TABLE III
Current estimates of the calibration parameters for the SIM instrument.
Parameter (units) Magnitude/range Uncertainty
Solar distance (ppm) +33116 to −33764 1
Doppler (ppm) 43 1
Wavelength (nm) 200 –1650 ∼0.02 ± (150 × 10−6) × λ (worst case)
Instrument function area 0.58–34.5 ∼0.4%
Slit parameters
Width (µm) 300.0 0.5 ± 0.03
Area (mm2) 2.1 3 × 10⁻⁵ ± 2 × 10⁻⁵
Component metrology (mm) 0 – 400 mm 0.01
Prism transmission
Value (%) 0.55–0.77 0.1% 200 –700 nm
∼1% 1000 –2700 nm
Degradation correction ∼0.to 0.65 ∼0.1%
Diffraction correction (%) 0.3–2.2 ∼0.01
ESR parameters
Standard volt (V) 7.1615 V 10 µV
ESR absorptance (%) ∼99 +0 to −1 (200 –700 nm)
+0 to −10 (700 –2700 nm)
Closed-loop gain 15.086 1 × 10⁻⁴ (0.05 Hz)
73.205 3 × 10⁻⁵ (0.01 Hz)
Equivalence (ppm) 100 60
1650 –2700 nm range is still under study and is not reported here due to additionalanalysis needed as related to incomplete pre-flight calibrations in this wavelengthrange and to needing improved processing algorithms for these data.
Table III provides a summary of the magnitude or range of values associatedwith terms in the measurement equation scheme presented in Figure 2, and thecurrent accuracy estimates of the calibration parameters discussed in this paper.Refinements in the error estimate will occur with additional analyses and studiesof ground witness components. In particular, additional work must be done on theoptical efficiency of the ESR, which currently is the largest source of uncertaintyin the measurement. The entry in Table III for the important solar distance andDoppler corrections are derived from the JPL Ephemeredes (Standish, 1982), andare included in standard SORCE data processing. The wavelength uncertainty of0.02 nm ± (150×106)×λ is derived from the accuracy adjustment of the wavelengthscale to the spectrum of Thuillier et al. (2003) and the worst case precision basedon the variable resolution of the instrument. A more refined precision can be foundfrom the ±1 subpixel CCD reproducibility of the prism drive and an analysis ofEquation (A.4).

SIM: MEASUREMENT EQUATIONS AND CALIBRATION 195
Acknowledgements
The authors would like to acknowledge the contribution of the entire LASP En-gineering and Calibration Groups for their patient and thorough efforts on thecalibration of this instrument. In particular, we would like to thank David Crotser,Mathew Triplett, Karl Heuerman, Anthony Canas, Miriam Adda, and Byron Smileywhose work forms the basis of this paper. This research was supported by NASAcontract NAS5-97045.
Appendix A
This Appendix is associated with Section 2, and describes the equations that relatethe measured prism rotation angle to refraction angle and wavelength. The termsand angles are defined in Figure 3.
A.1. PRISM INCIDENT ANGLE MEASUREMENT: γ FROM CCDSUBPIXEL POSITION
The prism incident angle, γ , is found from the imaging behavior of an off-axisspherical mirror (see Section 2.3.3 of Harder et al., 2005 for a description of theCCD encoder system):
γ = γz + 1
2tan−1
(C − Cz
FREF
). (A.1)
In this equation the subscript z is the CCD subpixel count and corresponds to thecondition that the centroid of the image on the CCD is aligned with the center ofthe spectrometer entrance slit in the dispersion plane. FREF is the focal length ofthe spherical mirror used with the focal plane CCD. For the SIM instrument, Ccorresponds to 1/5th of a CCD pixel width or 1.3 µm.
A.2. REFRACTION ANGLE CALCULATION: φ FROM γ AND n
Equation (2) in Section 2 can be solved for the angle φ and knowing the focal lengthof the prism (F), the spectral coordinate y can be obtained:
φ = γ − sin−1
(n sin
{2θP − sin−1
(sin(γ )
n
)})and y = F tan(φ). (A.2)
The index of refraction of fused silica is calculated from the three-term Sellmeierequation that is valid to about 10 ppm at 20 ◦C (Malitson, 1965). See also discussion
196 J. W. HARDER ET AL.
of Equation (2) in Harder et al. (2005):
n20(λ) =√√√√1 +
3∑j=1
λ2 K j
λ2 − L j. (A.3)
Malitson also provides the temperature dependence dn/dT used to correct for wave-length shifts that occur as the prism temperature changes during in-flight operation.
The wavelength of an observation occurs when y(n, φ) = yd, where yd is thefocal plane location of one of the five focal plane detectors. Thus, at a given prismincident angle, five different wavelengths are detected. Likewise, a specified wave-length can be delivered to a specific detector by changing φ. This topic is discussedin Section 2.3.2 of Harder et al. (2005) in the context of the instrument’s functionalcapabilities.
A.3. INDEX OF REFRACTION CALCULATION: n FROM γ AND φ
Solving Equation (A.2) for n gives the index of refraction strictly from prismgeometry for rotation angle:
n = 1
sin(2θP)
√sin2(γ ) + 2 cos(2θP) sin(γ ) sin(γ − φ) + sin2(γ − φ). (A.4)
Numerically inverting Equation (A.3) and accounting for dn/dT determines thewavelength. Newton’s method (Press et al., 1992) provides an efficient numericalsolution for this inversion.
A.4. PRISM INCIDENT ANGLE CALCULATION: γ FROM n AND φ
Solving Equation (A.2) for γ gives the prism rotation angle:
sin(γ ) =√
cos(φ) sin2(2θP) + X cos(2θP) sin2(φ) + sin(φ) sin(2θP)√
(cos(2θP) + X cos(φ))2 − (1 − X )2
2X (cos(2θP) + cos(φ))
with
X ≡ 1
n2. (A.5)
Equation (A.1) is then solved for C and insertion of γ from Equation (A.5) givesthe value of C as a function of φ and n.
Appendix B
Appendix B is associated with Section 3.2, and describes the experimental methodsfor slit width calibration (Section B.1) and slit area calibration (Section B.2).

SIM: MEASUREMENT EQUATIONS AND CALIBRATION 197
Figure B.1. Apparatus used to measure slit diffraction. An amplitude-stabilized laser beam is ex-panded and polarized and then impinges on the slit plane. An f-theta lens then images the diffractionpattern onto a linear array. Slit widths are determined from a least-squares fit of the diffraction pattern.
B.1. SLIT WIDTH INFERRED FROM THE DIFFRACTION PATTERN
OF A 632.8 NM LASER
The most convenient method for creating a far-field diffraction pattern at a finitedistance is to employ a lens in the Fourier-transform configuration with the slitand detector placed at the conjugate focal points of the lens. It is important thatthe lens has low distortion and that its position in the detector focal plane linearlyrelates to the diffraction angle. Figure B.1 shows the apparatus used to make thisslit diffraction measurement. An amplitude stabilized laser beam is collimated witha zoom expander and the quality of collimation is examined with a shear plate.The beam polarization is established with a polarizer so the polarization directionis parallel to the long-dimension of the slit. A 1
2 waveplate is then inserted in thebeam as a variable attenuator to keep the light level within the linear operatingrange of the detector. The expanded laser beam then impinges on the slit planewhere both flight slits and a custom calibration target are mounted. The diffractedradiation is then passed through an f-theta lens (Optische Werke G. Rodenstock,Munchen, Germany). This lens conserves the angle (θ ) in focal plane instead oftan(θ ), which is important since the observed diffraction depends on θ as well.The lens is optimized to work at 632.8 nm and the air wavelength is corrected toatmospheric conditions using Edlen’s (1953) formulation. The lens has a distortionless than 0.1% for off-axis rays within a 25◦ light cone; for this experiment, onlyabout 6◦ of this light cone is used for the measurement. The diffracted light is thenimaged onto a 1024 element linear array with 20 µm wide × 2.5 mm tall pixels ona 25 µm pitch (Hamamatsu S3903-1024Q). The photoresponsivity non-uniformity(PRNU) is measured and removed from the data prior to analysis.
The calibration mask (Photo Sciences Inc., Torrance, CA) consists of a series ofnine double slits and nine single slits etched onto a chrome-on-fused silica plate.The double slits have a 4 µm width and spacing of 200, 300, and 400 µm and areused to calibrate the apparatus. The single slits have widths of 100, 300, and 400 µm

198 J. W. HARDER ET AL.
and are used to check the calibration. When measured with the apparatus shownin Figure B.1, the calibration mask is placed in the light beam perpendicular to itsdirection of propagation; the light beam encounters the glass substrate before thechrome layer containing the slits, and in this way its refractive properties do notdisturb the measurement. After manufacturing the plate, Photo Sciences measuredthe widths and spacing between the slits with a Nikon 2i metrological microscopeand quoted an uncertainty of ±0.5 µm for measurements in the 0.1–150 mm range;their microscope calibration is traceable to NIST standards. The quoted uncertaintyon this measurement is larger than the requirement for the flight slits, but thecalibration mask is a ground witness, and future improvements in dimensionalmeasurements of the mask will directly translate into a refined measurement of theflight slits. The agreement between Photo Sciences’ microscope measurement andthe result of this experiment are at least as good as the quoted ±0.5 µm uncertainty.
The diffraction pattern from two slits separated by a distance a, with a width,W, produce an apodized cosine wave pattern that is described by the Fraunhofertheory of slit diffraction (Jenkins and White, 1976):
I (θ ) = 4Io
(sin2 β
β2
)cos2 α, where β = πW
λsin θ, α = πa
λsin θ,
θ = f (y)
F. (B.1)
In this equation, the diffraction angle, θ , is determined from a polynomial func-tion of position, y, along the linear diode array, and the focal length of the lens.Least-squares fitting of this pattern to the calibrated slit mask is used to removelens distortion, and precisely measure the focal length of the f-theta lens, therebyestablishing the scale of the apparatus so single slit widths can be determinedwhen mounted in the apparatus. Figure B.2(a) shows the measured double slit pat-tern, the modeled output, and the fit residuals. The modeled data are found froma Levenberg–Marquardt least-squares minimization (Press et al., 1992) that fitsthe experimental data to Equation (B.1) with additional non-linear parameters toadjust the scale, offset, slit width (held constant here), lateral shift with respectto the center of the array, and slope across the array. The fitting is performed onthe noise-weighted signal. Figure B.2(a) shows a narrow light spike on the centralfringe. This is caused by collimated laser light passing through the chrome platingon the calibration mask, which is then imaged into the CCD. The mask has anoptical density of 5.0 (0.001% transmission), so this problem was expected and analgorithm was developed to account for its influence (see discussion below). Themeasurement of the flight slits is not disturbed by this problem.
Figure B.2(b) shows a similar plot for one of the slits used for the flight instru-ment; the graph is on a log scale to emphasize the dynamic range associated withthe single slit diffraction measurement. Since the least-squares analysis is weightedby the detector noise, only the first several fringes meaningfully contribute to the

SIM: MEASUREMENT EQUATIONS AND CALIBRATION 199
Figure B.2. Panel (a) shows the diffraction pattern generated by one of the Photo Sciences’ calibrateddouble slits with a slit spacing of 200 µm, as well as the fitted model result and fit residuals. Thecentral spike, caused by light transmission through the mask, is apparent in both the data plot andthe residual plot. The axis range on the residual plot is set to show the fit quality in the wings of thediffraction pattern, so the central spike is off-scale. Panel (b) shows a single slit diffraction for one ofthe flight instrument’s entrance slit. The intensity scale is logarithmic to emphasize the structure infar wings.
quality of the fit. The same least-squares method described for the double slit mea-surement applies to the single slit, but uses the focal length and distortion terms asfixed parameters, and fits the data using the Fraunhofer single slit diffraction law:
I (θ ) = 4Io
(sin2 β
β2
), where β = πW
λsin θ, θ = f (y)
F. (B.2)
Prior to performing the flight slit calibrations, the validity of the double slitexperiment is verified by measuring the widths of the single slits in the calibrationmask. The light leak discussed in the previous paragraph is also present in the singleslit measurement, but it is less pronounced due to the less intense light level usedin this experiment relative to the double slit experiment. However, its influence onthe least-squares fit is still significant because of the rapidly changing signal levelassociated with single slit diffraction and errors in the intensity of the central fringehave the greatest influence on the results of the fit. To account for this problem,the analysis method was expanded to include a step where the intensity of thecentral fringe was perturbed away from its measured value, and this data was then
200 J. W. HARDER ET AL.
least-squares fitted. The retrieved value of χ2 is noted and this procedure is repeateduntil a global (but physically plausible) minimum is found. This procedure is aidedby noting that Fraunhofer diffraction theory indicates that the ±first-order fringeshave peak values that are 0.046 as intense as that of the central fringe. Since thefirst-order fringes are well outside the region affected by the light leak, a first guessof the central fringe’s true intensity is set to this value.
The light leak does not greatly affect the outcome of the double slit fittingbecause all of the cosine lobes have approximately the same intensity over the fulldetected range, and so they have about the same weighting in the least-squares fit.When the analysis described in the previous paragraph is applied to the doubleslit problem (with modifications to the magnitude of the first guess), the analysisindicates that the light leak makes a difference in the recovered focal length of only12.5 ppm and a difference in the distortion term of 0.25%, but the RMS value of theresidual dropped by about a factor of 2. These modified values were then used asfixed parameters in the analysis of the calibration mask’s single slits and the SIMslits for the flight unit. For the measured single slits on the calibration mask, thismethod retrieves the same slit width to better than the stated ±5 µm uncertainty.This same procedure was applied to the measurement of the slits that do not havethe light leak problem; the linearity of the detector electronics is about 0.1% offull scale and this procedure introduced corrections on the order of 0.05% therebygiving reproducibility in the slit width retrievals of better than 100 ppm.
B.2. SLIT AREA INFERRED FROM THE LIGHT FLUX COMPARISON
WITH A STANDARD APERTURE
The flux comparator system designed to compare SIM slit with a standard 0.5 cm2
NIST calibrated circular aperture is shown in Figure B.3. The area ratio between the
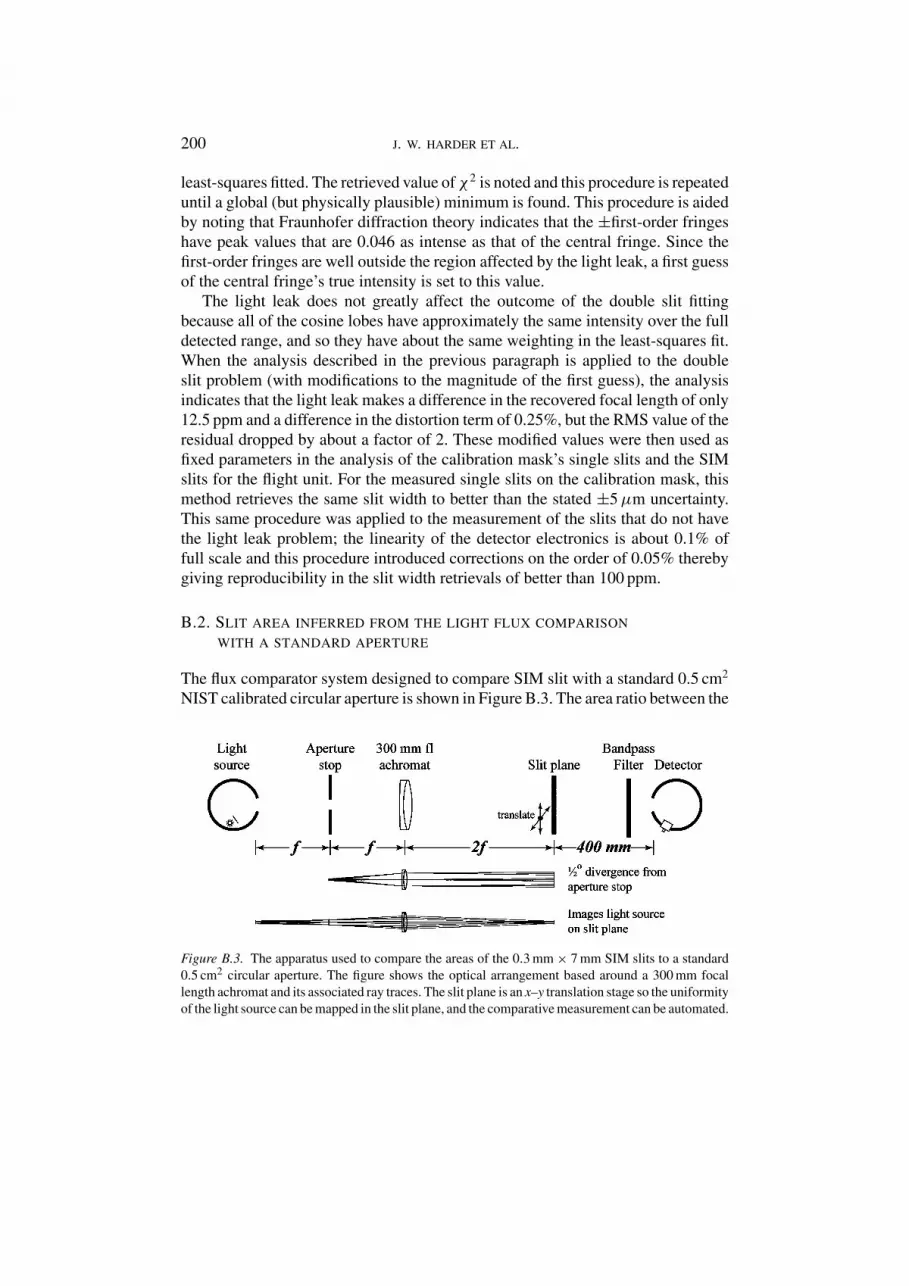
Figure B.3. The apparatus used to compare the areas of the 0.3 mm × 7 mm SIM slits to a standard0.5 cm2 circular aperture. The figure shows the optical arrangement based around a 300 mm focallength achromat and its associated ray traces. The slit plane is an x–y translation stage so the uniformityof the light source can be mapped in the slit plane, and the comparative measurement can be automated.
SIM: MEASUREMENT EQUATIONS AND CALIBRATION 201
SIM slits and this standard aperture is a factor of 23.8, so the difference in intensitiesfor uniform light will be nearly the same. This dynamic range is well within thelinear operating range of photodiodes and this makes the flux comparison the mosteffective method to measure the area of the slits. This apparatus is similar to the onediscussed by Fowler, Saunders, and Parr (2000), but has a number of attributes thatmake it appropriate for spectrometer slit measurements. The apparatus is based ona telecentric optical system with a 300 mm focal length achromat ( f = 300 mm inFigure B.3) as the objective. The system’s aperture stop is at a distance of f and thesource and image planes are at a distance of 2f. In this configuration, the uniformsource area is imaged onto the exit plane, and the aperture stop diameter, d, is sizedto produce a light beam with a 0.5◦ of divergence (d = f tan(0.5◦) = 2.6 mm).This optical arrangement ensures the calibration is performed with nearly the samegeometry as the Sun, and the 1:1 imaging in the slit plane gives the optimal lightintensity and radiometric accuracy. The light source illuminates a 20 cm diameterintegrating sphere with a 1.27 cm circular exit port; this configuration produces aspatially uniform light beam, and the lamp power was current regulated to 0.1%to reduce intensity fluctuations. After passage through the slit plane, the light en-counters a 500 ± 50 nm optical filter before being detected by a 50 mm2 siliconphotodiode located inside an integrating sphere identical to the source, and the de-tector’s photocurrent is readout with a precision ammeter. The detector sphere hasa 25 mm × 18 mm rectangular entrance port that has the same projected area as theSIM prism. This is done to match the diffracted light throughput of this apparatus tothe prism. This illumination system produces a 1% total variance in irradiance at theslit plane. The variance was measured by positioning a 1 mm hole in the slit planeand recording the beam intensity. The hole is then moved in 0.5 mm steps to createa raster scan consisting of a grid of beam intensities at 194 locations covering acircular area with a diameter of 13 mm. This intensity map was then used to correctthe light intensity when the standard aperture was swapped with the spectrometerslits.
The flux comparison process leads to a measurement equation; terms in thisequation are written with subscripts to indicate the standard aperture (aper) and thespectrometer slits (slit):
Aslit = AaperIslit
Iaper
Japer
Jslit
(1 + 2αCu{TM − Tref})(1 − βaperλ)
(1 + 2αslit{TM − Tref})(1 − βslitλ), (B.3)
where Aslit,aper: geometric area, for slit and aperture; Islit,aper: measured signal, forslit and aperture; Jslit,aper: relative intensity at aperture/slit plane, for slit and aper-ture; αslit,Cu: coefficient for thermal expansion, 16 and 16.5 ppm ◦C−1, respectively;TM,ref: temperature during measurement and reference temperature (20 ◦C); βslit,aper:diffraction correction slope at wavelength λ (11 ppm nm−1 for slit, 1 ppm nm−1 foraperture).

202 J. W. HARDER ET AL.
This measurement is very reproducible with a precision of better than 20 ppmfor the selected flight slits. Sixty slits were measured and the slits with the mostprecise areas and widths were then selected for the flight instrument.
Appendix C
This Appendix is associated with Section 3.3, and describes the Fresnel reflectionequations and the apparatus used to deduce the bulk and mirror reflection losses ofthe Fery prism.
The Fresnel reflection at the vacuum–glass interface can be characterized interms of the usual variables (γ, λ, φ) presented in Figure 3. Defining two exteriorand two interior angles,
γ1 = γ, γ2 = γ − φ, β1 = sin−1
[sin γ1
n
], β2 = sin−1
[sin γ2
n
], (C.1)
from the Fresnel formulas (Jenkins and White, 1976), the transmission for thehorizontal and vertical polarizations of light for the two surface transits can bewritten:
Thorizontal =(
1 −{
tan(γ1 − β1)
tan(γ1 + β1)
}2)(1 −
{tan(γ2 − β2)
tan(γ2 + β2)
}2)and
Tvertical =(
1 −{
sin(γ1 − β1)
sin(γ1 + β1)
}2)(1 −
{sin(γ2 − β2)
sin(γ2 + β2)
}2). (C.2)
The dispersion plane of the prism defines horizontal polarization, and the verticalis defined by the cross-dispersion direction. The average of the two equations inEquation (C.2) would give the transmission of the prism for unpolarized light ifit had no bulk losses and the rear surface mirror was a perfect reflector. The lighttransit from glass-to-vacuum requires some consideration since multiple internalreflections produce a source of scattered light that must be prevented from reachingthe detectors. About 5% of the light intensity at this interface is directed towardsthe base of the prism, where most of the light will escape, but about 4% of thislight is internally reflected and then escapes out the apex of the prism. Polishingthe base of the prism and coating it with an index refraction matching black epoxyeliminated this problem. Most of the internally reflected light passes through theprism glass and is absorbed by the black coating without reflection (Figure C.1).
The apparatus used to measure prism transmission is schematically shown inFigure 9. A 1000 W xenon arc lamp is used for the source, an ac signal is generatedby mechanically chopping the light beam, the bandpass filter is used to limit thewavelength range of light entering the monochromator removing higher orders oflight, and a lock-in amplifier is used to determine the light level. The monochro-mator is set to produce a 0.5 nm resolution light beam for any wavelength over the

SIM: MEASUREMENT EQUATIONS AND CALIBRATION 203
Figure C.1. The apparatus used to determine the transmission of the prism. The measurement is madeby ratioing the signal between two rotation positions of the detector (one position shown in black andthe other in gray).
full spectral range of the prism. The MgF2 Rochon polarizer placed in the outputbeam is used in two orthogonal orientations, parallel and perpendicular to the longdimension of the exit slit. The calibration is performed in both polarizations todetermine the prism transmission after computing and eliminating the contribu-tions from Fresnel reflections. The polarized light exiting the prism is then eitherdetected directly, or after passage through the prism depending on the positionof the bi-stable detector rotator. A silicon photodiode is used for visible and UVmeasurements and a thermoelectrically cooled PbS cell is used for the infrared. Alock-in amplifier operating at the frequency of the light chopper measures the signalfrom the detectors. The prism is mounted on a precision rotation stage so preciseand reproducible rotation angles are achieved. The system is set up to perform thecalibration with the ESR’s geometry, i.e., the refracted light beam would return toa focus at 35 mm from the entrance slit.
References
Brown, S. W., Eppeldauer, G. P., and Lykke, K. R.: 2000, Metrologia 37, 579.Edlen, B.: 1953, J. Opt. Soc. Amer. 43, 339.Fleming, J. C.: 1999, Reflectivity and BRDF of Nickel-Phosphor Black, Serial No.
S99.41830.OPT.005, Ball Aerospace Corp., Boulder, CO.Fontenla, J., White, O. R., Fox, P. A., Avrett, E. H., and Kurucz, R. L.: 1999, Astrophys. J. 518, 480.Fowler, J. B., Saunders, R. D., and Parr, A. C.: 2000, Metrologia 37, 621.Gere, J. M. and Timoshenko, S. P.: 1990, Mechanics of Materials, 3rd edn, PWS-Kent, Boston,
Massachusetts, p. 76.Harder, J. W., Lawrence, G., Fontenla, J., Rottman, G., and Woods, T.: 2005, Solar Phys., this volume.Humbach, O., Fabian, H., Grzesik, U., Haken, U., and Heitmann, W.: 1996, J. Non-Cryst. Solids 203,
19.Jenkins, F. A. and White, H. E.: 1976, Fundamentals of Optics, McGraw-Hill, New York.Jorquera, C. R., Korde, R., Ford, V. G., Duval, V. G., and Bruegge, C. J.: 1994, Geoscience and Remote
Sensing Symposium: Proceedings of the IGARSS ’94, 8–12 August, Vol. 4, p. 1998.

204 J. W. HARDER ET AL.
Lawrence, G. M., Harder, J., Rottman, G., Woods, T., Richardson, J., and Mount, G.: 1998, SPIEProc. 3427, 477.
Lawson, C. L. and Hanson, R. J.: 1974, Solving Least Squares Problems, Prentice-Hall, EnglewoodCliffs, New Jersey, p. 222.
Malitson, I. H.: 1965, J. Opt. Soc. Amer. 55, 1205.Parr, A. C.: 1996, A National Measurement System of Radiometry, Photometry, and Pyrometry Based
Upon Absolute Detectors, NIST Technical Note 1421.Press, W. H., Teukolsky, S. A., Vetterling, W. T., and Flannery, B. P.: 1992, Numerical Recipes in C:
The Art of Scientific Computing, Cambridge University Press, New York.Rottman, G., Harder, J., Fontenla, J., Woods, T., White, O., and Lawrence, G.: 2005, Solar Phys., this
volume.Saunders, R. D. and Shumaker, J. B.: 1986, Appl. Opt. 25, 20.Standish, E. M.: 1982, Astron. Astrophys. 114, 297.Thuillier, G., Herse, M., Labs, D., Foujols, T., Peetermans, W., Gillotay, D., Simon, P., and Mandel,
H.: 2003, Solar Phys. 214, 1.


