Embed Size (px)
Citation preview

arX
iv:0
711.
4587
v2 [
astr
o-ph
] 5
Nov
200
8
The survival of dark matter halos in the cluster Cl 0024+16
Priyamvada Natarajan, 1,2,3 Jean-Paul Kneib, 4 Ian Smail, 5 Tommaso Treu, 6 Richard
Ellis, 7,8 Sean Moran, 9 Marceau Limousin 10 & Oliver Czoske 11
1 Radcliffe Institute for Advanced Study, Harvard University, 10 Garden Street, Cambridge, MA 02138,
USA
2 Department of Astronomy, Yale University, P.O. Box 208101, New Haven, CT 06520-8101, USA
3 Department of Physics, Yale University, P.O. Box 208120, New Haven, CT 06520-8120, USA
4 Observatoire Astronomique De Marseille Provence, Marseille, France
5 Institute for Computational Cosmology, Durham University, South Road, Durham DH1 3LE, UK
6 Department of Physics, University of California, Santa Barbara, CA 93106-9530, USA
7 Department of Astronomy, Caltech, 1200 East California Blvd., Pasadena, CA 91125, USA
8 Department of Astrophysics, Oxford University, Keble Road, Oxford OX1 3RH, UK
9 Department of Physics & Astronomy, Johns Hopkins University, 366 Bloomberg Center, 3400 N. Charles
Street, Baltimore, MD 21218, USA
10 Laboratoire d’Astrophysique de Toulouse et Tarbes, Tarbes, France
11 Kapteyn Astronomical Institute, P. O. Box 800, 9700 AV Groningen, The Netherlands
ABSTRACT
Theories of structure formation in a cold dark matter dominated Universe
predict that massive clusters of galaxies assemble from the hierarchical merging
of lower mass subhalos. Exploiting strong and weak gravitational lensing signals
inferred from panoramic Hubble Space Telescope imaging data, we present a high
resolution reconstruction of the mass distribution in the massive, lensing cluster
Cl 0024+16 at z = 0.39. Applying galaxy-galaxy lensing techniques we track
the fate of dark matter subhalos as a function of projected cluster-centric radius
out to 5 Mpc, well beyond the virial radius. We report the first detection of
the statistical lensing signal of dark matter subhalos associated with late-type
galaxies in clusters. The mass of a fiducial dark matter halo that hosts an early
type L∗ galaxy varies from M = 6.3+2.7−2.0 × 10¹¹ M⊙ within r < 0.6 Mpc, 1.3+0.8
−0.6 ×
1012 M⊙ within r < 2.9 Mpc and increases further to M = 3.7+1.4−1.1 × 10¹² M⊙
in the outskirts. The mass of a typical dark matter subhalo that hosts an L∗
galaxy increases with projected cluster-centric radius in line with expectations
– 2 –
from the tidal stripping hypothesis. The mass of a dark matter subhalo that
hosts a late-type L∗ galaxy is 1.06+0.52−0.41 × 10¹² M⊙. Early-type galaxies appear
to be hosted on average in more massive dark matter subhalos compared to late-
type galaxies. Early-type galaxies also trace the overall mass distribution of the
cluster whereas late-type galaxies are biased tracers. We interpret our findings
as evidence for the active assembly of mass via tidal stripping in galaxy clusters.
The mass function of dark matter subhalos as a function of projected cluster-
centric radius, is compared with an equivalent mass function derived from clusters
in the Millenium Run simulation populated with galaxies using semi-analytic
models. The shape of the observationally determined mass functions based on
an I-band selected sample of cluster members and lensing data are in agreement
with the shapes of the subhalo mass functions derived from the Millenium Run
simulation. However, simulated subhalos appear to be more efficiently stripped
than lensing observations suggest. This is likely an artifact of comparison with
a dark matter only simulation. Future simulations that simultaneously follow
the detailed evolution of the baryonic component during cluster assembly will be
needed for a more detailed comparison.
Subject headings: cosmological parameters — gravitational lensing — clusters
1. Introduction
Clusters of galaxies are the most massive and recently assembled structures in the Uni-
verse. In the context of the hierarchical growth of structure in a cold dark matter dominated
Universe, clusters are the repository of copious amounts of the dark matter. Gravitational
lensing, predicted by Einstein’s theory of General Relativity, is the deflection of light rays
from distant sources by foreground mass structures. In its most dramatic manifestation,
strong lensing requires a rare alignment with foreground dense structures and produces
highly distorted, magnified and multiple images of a single background source (Schneider,
Ehlers & Falco 1992). More commonly, the observed shapes of background sources viewed via
a foreground cluster lens are systematically elongated, in the so-called weak lensing regime.
Strong and weak lensing offer the most reliable probes of the distribution of dark matter on
various cosmic scales (Blandford & Narayan 1992; Mellier 2002; Schneider, Ehlers & Falco
1992).
Strong lensing studies of the core regions of several clusters indicate that the dark matter
distribution can be represented by a combination of smoothly distributed, extended cluster
mass components and smaller-scale clumps or subhalos associated with luminous galaxies

– 3 –
(Kneib et al. 1996; Natarajan & Kneib 1997; Natarajan, Kneib, Smail & Ellis 1998). The
smooth components have been detected using weak lensing techniques out to the turn-around
radius (typically of the order of several Mpc) in clusters (Kneib et al. 2003; Gavazzi et al.
2003; Broadhurst et al. 2005; Bradac et al. 2006; Clowe et al. 2006; Wittman et al. 2006;
Limousin et al. 2007c; Bardeau et al. 2007). To date, however, attention has largely focused
on the lensing derived density profile of the smooth cluster component, and its agreement
with profiles computed from high resolution numerical simulations of structure formation in
the Universe (Navarro, Frenk & White 1997; Navarro et al. 2004; Sand et al. 2004). In fact,
the granularity of the dark matter distribution associated with individual galactic subhalos
holds important clues to the growth and assembly of clusters. Several earlier studies have
explored this issue for the particular case of Cl 0024+16 (Tyson, Kochanski & dell’Antonio
1998; Broadhurst, Huang, Frye & Ellis 2000; Jee et al. 2007; Smail et al. 1996).
The detailed mass distribution of clusters and in particular, the fraction of the total
cluster mass associated with individual galaxies has important consequences for the frequency
and nature of galaxy interactions in clusters (Merritt 1983; Moore et al. 1996; Ghigna et al.
1998; Okamato & Habe 1999). Infalling subhalos suffer a range of violent fates as the strong
gravitational potential of the cluster tidally strips dark matter and removes baryons via
ram-pressure stripping from them (Cortese et al. 2007). Simulations suggest that subhalos
may not be arranged equally around galaxies of different morphologies given their varying
histories in the cluster environment (Ghigna et al. 1998; Tormen, Diaferio & Syer 1998;
Springel, White, Tormen & Kauffmann 2001). Moreover, subhalos may become tidally
truncated by an amount that will differ substantially over the large dynamic range in cluster
density. Observations of tidal stripping offer important clues to key questions regarding the
growth and evolution of clusters. How much dark matter is associated with the subhalos in
clusters as a function of radius? To what extent do the luminous cluster galaxy populations
trace the detailed mass distribution? And, how significant is tidal stripping for the various
morphological galaxy types in the cluster? These are questions we attempt to answer in this
work using observational data and by comparing with numerical simulations.
To explore cluster galaxy masses, we exploit the technique of galaxy-galaxy lensing,
which was originally proposed as a method to constrain the masses and spatial extents of field
galaxies (Brainerd, Blandford & Smail 1996), which has been since extended and developed
over the years to apply inside clusters (Natarajan & Kneib 1996; Geiger & Schneider 1998;
Natarajan et al. 1998; 2002a; Natarajan, De Lucia & Springel 2007; Limousin et al. 2007a).
Previous attempts to measure the granularity of the dark matter distribution as a function of
cluster-centric radius from observations have had limited success. Analyzing CFHT (Canada-
France-Hawaii Telescope) weak lensing data from the supercluster MS0302+17, Gavazzi et
al. (2004) claimed detection of a radial trend in the extents of dark matter subhalos in this

– 4 –
supercluster region extending out to a few Mpc from the center. Gavazzi et al. reported that
the mass distribution derived from weak lensing was robustly traced by the luminosity of
early-type galaxies, although their analysis did not include late-type galaxies or a large-scale
smooth component. However, utilizing ground-based CFHT weak lensing data for a sample
of massive clusters at z = 0.2, Limousin et al. (2005) did not detect any variation of the dark
matter subhalo masses with cluster-centric radius out to a significant fraction of the virial
radius. The resolution of ground-based data appears to be inadequate to detect this effect.
In this paper, we present the determination of the mass function of substructure in
Cl 0024+16 (at z = 0.39) in 3 radial bins using panoramic Hubble Space Telescope HST
imaging data. A high resolution mass model tightly constrained by current observations is
constructed including individual cluster galaxies and their associated dark matter subhalos.
We show that over a limited mass range we can successfully construct the mass function of
subhalos inside this cluster as a function of cluster-centric radius. The three bins span from
the center to 5 Mpc (well beyond the the virial radius of 1.7 Mpc) providing us insights into
the tidal stripping process. We also compare properties of the subhalos that host early-type
galaxies with those that host late-type galaxies in Cl 0024+16. In addition, we compare the
results retrieved from the lensing analysis with results from the largest cosmological simula-
tion carried out so far - the Millennium Simulation. N-body simulations in combination with
the semi-analytic models that we employ in this work are an invaluable tool for investigating
the non-linear growth of structure in detail and to provide insights into the cluster assembly
process.
The outline of this paper is as follows: in §2, we discuss the theoretical framework of
tidal stripping and galaxy-galaxy lensing in clusters; in §3 the observations and modeling
are described. The analysis for Cl 0024+16 is presented in §4 including a discussion of the
uncertainties; results and the comparison with clusters in the Millennium Simulation are
described in §5. We conclude with a discussion of the implications of our results for the
LCDM model and the future prospects of this work. 1
1Throughout this work wherever required we have used the following values for the cosmological param-
eters: H0 = 72 km/s/Mpc; Ωm = 0.3; ΩΛ = 0.7. At the redshift of Cl 0024+16, 1” = 5.184 kpc.

– 5 –
2. Theoretical framework
2.1. Tidal stripping and dynamical modification in clusters
Theoretical studies of cluster formation using simulations and analytic models predict
that there are two key dynamical processes (Ghigna et al. 1998; Springel, White, Tormen &
Kauffmann 2001; De Lucia et al. 2004; Moore, Katz, Lake, Dressler & Oemler 1996; Balogh,
Navarro & Morris 2000; Merritt 1985) that are relevant to the mass loss of infalling dark
matter subhalos in assembling clusters. The first process is tidal stripping induced by the
interaction of infalling galaxies and groups with the global tidal field generated by the smooth
dark matter distribution. The second process is modification to the mass distribution due
to high and low velocity encounters between infalling subhalos (Moore, Katz, Lake, Dressler
& Oemler 1996).
For the purposes of studying the dynamics of galaxies in clusters we have partitioned
the cluster into 3 distinct regions: the inner core region where the global tidal field is the
strongest, the transition region where the two above mentioned dynamically transformative
processes occur and finally, the periphery where the dominant stripping is due to interactions
between the infalling galaxies and groups rather than the global tidal field (Treu et al. 2003).
Detailed study of the properties of cluster galaxies in Cl 0024+16 by Treu et al. 2003, find
that demarcation into these 3 regions is naturally provided by the dynamical processes that
operate efficiently at various radii from the cluster center.
In the central region, the gravitational potential of the cluster is the strongest and
tidal stripping is expected to be the dominant dynamically transformative process. Recent
tidal effects are not expected in the transition region whereas most galaxies inhabiting the
periphery are likely to have never traversed the cluster center. The galaxies in the outer
regions are expected to be modified predominantly due to local interactions with other
nearby galaxies and groups despite being gravitationally bound to the cluster.
An analytic estimate of the effect of tidal truncation as a function of cluster-centric
radius can be calculated by modeling Cl 0024+16 as an isothermal mass distribution and
considering the motions of cluster subhalos in this potential (Merritt 1985). In this framework
the tidal radius of a subhalo hosting a cluster galaxy is given by:
Rtidal ∝ (σgal
σcluster
) r, (1)
where Rtidal is the tidal radius of the subhalo, σgal is the central velocity dispersion of the
galaxy, σcluster is the velocity dispersion of the cluster and r is the distance from the cluster
center. The current paradigm for structure formation in the Universe predicts that the
masses of infalling subhalos are a strong function of cluster-centric radius r, indicative of

– 6 –
the variation of the strength of tidal stripping from the periphery (where it is modest) to
the inner regions, where it is severe (Springel, White, Tormen & Kauffmann 2001; De Lucia
et al. 2004; Moore, Katz, Lake, Dressler & Oemler 1996; Balogh, Navarro & Morris 2000).
Mapping the mass function of subhalos directly from observations offers a powerful way to
test these theoretical predictions.
2.2. Galaxy-galaxy lensing in clusters
In this subsection we briefly outline the analysis framework. Details can be found in
several earlier papers (Natarajan & Kneib 1996; Natarajan et al. 1998; Natarajan et al.
2002a; 2002b; Natarajan, De Lucia & Springel 2007). For the purpose of constraining the
properties of the subhalo population, Cl 0024+16 is modeled parametrically as a super-
position of smooth large-scale mass components, which we will refer to with subscript ‘s’
hereafter, and smaller scale potentials that are associated with bright cluster members,
referred to as perturbers denoted by the subscript ‘pi’. Using the same data-set to construct
a mass distribution for Cl 0024+16 Kneib et al. (2003) found that the best-fit model required
two large-scale components. In our current modeling, we adopt that parametrization as the
prior. In earlier work, our analysis was limited by data to the inner regions of clusters (< 1
Mpc), and only to early-type galaxies as perturbers as a consequence (Natarajan et al. 1998;
Natarajan, Kneib & Smail 2002; Natarajan, De Lucia & Springel 2007). With the current
data-set we also probe the late-type cluster member population and statistically constrain
parameters that characterize their dark matter subhalos. There are however, an insufficent
number of late-types in the core region, their numbers steadily increase with cluster-centric
radius. Therefore, in the core region, we focus on the subhalos of early-types. In effect, the
contribution of late-types in the core region gets inevitably taken into account as part of
the smooth mass distributions. We note here that while we illustrate our formalism with
simple equations to provide insight into our framework, ultimately the analysis is performed
numerically and all the non-linearities arising in the lensing inversion are taken into account.
The gravitational potential of Cl 0024+16 is modeled as follows:
φtot = Σn φs + Σi φpi, (2)
where the two φs (n = 1 and n = 2) components represent the potentials that characterize
the smooth component and φpiare the potentials of the galaxy subhalos treated as per-
turbers. The corresponding deflection angle αI and the amplification matrix A−1 can also
be decomposed into independent contributions from the smooth clumps and perturbers,
αI = Σn ∇φs + Σi ∇φpi, (3)
A−1 = I − Σn ∇∇φs − Σi ∇∇φpi.

– 7 –
In fact, the amplification matrix can be decomposed as a linear sum:
A−1 = (1 − Σn κs − Σiκp) I − Σn γsJ2θs− Σi γpi
J2θpi, (4)
where κ is the magnification and γ the shear. The shear γ is written as a complex number
and is used to define the reduced shear g, which is the quantity that is measured directly
from observations of the shapes of background galaxies. The reduced shear can also be
further decomposed into contributions from the smooth pieces and the perturbers:
gtot =γ
1 − κ=
Σn γs + Σi γpi
1 − Σn κs − Σi κpi
, (5)
Here γ is the mean shear of background galaxies in an annulus around a particular early-
type cluster galaxy treated as a local perturber. In the frame of an individual perturber j
(neglecting effect of perturber i if i 6= j), the above simplifies to:
gtot|j =Σn γs + γpj
1 − Σn κs − κpj
. (6)
Restricting our analysis to the weak regime (as mentioned above the analysis is ultimately
performed numerically and includes the effect of strong lensing), and thereby retaining only
the first order terms from the lensing equation for the shape parameters (e.g. Kneib et al.
1996) we have:
gI = gS + gtot, (7)
where gI is the distortion of the image, gS the intrinsic shape of the source, gtot is the dis-
tortion induced by the lensing potentials (the smooth component as well as the perturbers).
Note that the equations are outlined here to provide a feel for the technique. The lensing
inversion for the observational data is done numerically taking the full non-linearities that
rise in the strong lensing regime into account. 2
In the local frame of reference of the subhalos, the mean value of the quantity gI and its
dispersion are computed in circular annuli (at radius r from the perturber centre), assuming
a known value for the smooth cluster component over the area of integration. In the frame
of the perturber, the averaging procedure allows efficient subtraction of the large-scale com-
ponent, enabling the extraction of the shear component induced in the background galaxies
only by the local perturber. The background galaxies are assumed to have intrinsic elliptic-
ities drawn from a known distribution (see the Appendix for further details). Schematically
2The measured image shape and orientation are used to construct a complex number whose magnitude
is given in terms of the semi-major axis (a) and semi-minor axis (b) of the image and the orientation is the
phase of the complex number.

– 8 –
the effect of the cluster on the intrinsic ellipticity distribution of background sources is to
cause a coherent displacement and the presence of perturbers merely adds small-scale noise
to the observed ellipticity distribution. Since we are subtracting a long-range signal to sta-
tistically extract a smaller scale anisotropy riding on it, we are inherently limited to physical
scales on which the contrast is maximal, i.e. galaxy subhalo scales.
The contribution of the smooth cluster component has 2 effects: it boosts the shear
induced by the perturber which becomes non-negligible in the cluster center, and it si-
multaneously dilutes the regular galaxy-galaxy lensing signal due to the σ2gs
/2 term in the
dispersion. However, one can in principle optimize the noise by ‘subtracting’ the measured
cluster signal gs using a tightly constrained parametric model for the cluster.
The feasibility of this differenced averaging prescription for extracting the distortions
induced by the possible presence of dark matter subhalos around cluster galaxies with HST
quality data has been amply demonstrated in our earlier papers (Natarajan et al. 1998;
2002a; 2004; 2007). We have also shown with direct comparison to simulations that the we
can reliably recover substructure mass functions with this technique in the inner 1 Mpc or
so of galaxy clusters. Note here that it is the presence of the underlying large-scale smooth
mass components (with a high value of κs) that enables the extraction of the weaker signal
riding on it.
3. Observations and modeling
3.1. The HST WFPC-2 data-set
Our dataset comprises a mosaic of 39 sparsely-sampled images of the rich cluster Cl 0024+16
(z = 0.39) taken by the Wide Field Planetary Camera-2 on the Hubble Space Telescope
(HST). By applying lensing techniques to this panoramic imaging dataset, we aim to char-
acterize the fine scale distribution of dark matter. This unique dataset extends to the turn-
around radius ≃5 Mpc, well beyond the inner 0.5 - 1 Mpc that has been studied previously.
This enables us to map the detailed dark matter distribution and to calibrate the tidal strip-
ping effect as a function of distance from the cluster center. In earlier analysis, we combined
strong and weak lensing constraints to provide an accurate representation of the smooth
dark matter component out to 5 Mpc radius (Kneib et al. 2003). Strong lensing provides
stringent constraints on the mass profile in the inner region while the detected weak shear
constrains the profile out at large radii (Mellier 2002; Kneib et al. 2003). Non-contiguous,
sparse sampling of the HST pointings was chosen to maximize radial coverage. Further de-
tails of the data and analyses can be found in earlier published papers (Kneib et al. 2003;

– 9 –
Treu et al. 2003). We re-iterate here that the WFPC-2 data-set used for this analysis has
been presented already and is described in detailed in earlier works by our group, including
the determination of shapes for the background galaxies (in Kneib et al. 2003); selection
and confirmation of cluster membership and morphological classifications of cluster galaxies
(in Treu et al. 2003).
Here, we use galaxy-galaxy lensing to detect cluster galaxy subhalos associated with
early-type galaxies and late-type galaxies against the background of smoothly distributed
dark matter in three radial bins. Using the extensive set of ground-based spectra (Czoske et
al. 2001; Czoske, Moore, Kneib & Soucail 2002; Moran et al. 2005) and HST morphologies
(Treu et al. 2003), we first identified early-type and late-type members to well beyond
the virial radius, (rvir = 1.7 Mpc), out to ∼ 5 Mpc. Details of the data reduction, cluster
membership determination and morphological classification can be found in Treu et al.(2003).
3.2. Modeling the cluster Cl 0024+16
Cl 0024+16 is an extremely massive cluster and has a surface mass density in the inner
regions which is significantly higher than the critical value, therefore produces a number of
multiple images of background sources. By definition, the critical surface mass density for
strong lensing is given by:
Σcrit =c2
4πG
Ds
DdDds(8)
where Ds is the angular diameter distance between the observer and the source, Dd the
angular diameter distance between the observer and the deflecting lens and Dds the angular
diameter distance between the deflector and the source.
Note that the integrated lensing signal detected is due to all the mass distributed along
the line of sight in a cylinder projected onto the lens plane. In this and all other cluster lensing
work, the assumption is made that individual clusters dominate the lensing signal as the
probability of encountering two massive rich clusters along the same line-of-sight is extremely
small due to the fact that these are very rare objects in hierarchical structure formation
models. Cl 0024+16 is known to have a significant amount of substructure in velocity space.
Czoske et al. (2002) and more recently Moran et al. (2005) have performed comprehensive
redshift surveys of this cluster and its environs and have enabled the construction of a 3-
dimensional picture for this cluster using the ∼ 500 galaxy redshifts within about 3 - 5 Mpc
from the cluster center. Their combined data reveal a foreground component of galaxies
separated from the main cluster in velocity space. Both groups argue that this is likely

– 10 –
a remnant of a high-speed collision between the main cluster and an infalling sub-cluster.
The detailed redshift distribution of cluster members in Cl 0024+16 is taken carefully into
account in our lensing analysis, starting with a prior that includes 2 large-scale components
to model the smooth mass distribution.
With our current sensitivity limits, galaxy-galaxy lensing within the cluster provides a
determination of the total enclosed mass within an aperture. We lack sufficient sensitivity
to constrain the detailed mass profile for individual cluster galaxies. With higher resolution
data in the future we hope to be able to obtain constraints on the slopes of mass profiles
within subhalos. In this paper, the subhalos are modeled as pseudo-isothermal elliptical
components (PIEMD models, derived by Kassiola & Kovner 1993) centered on galaxies that
lie within a projected radius of out to 5 Mpc from the cluster center and two NFW profiles are
used to model the smooth, large-scale contribution. We find that the final results obtained
for the characteristics of the subhalos (or perturbers) is largely independent of the form of
the mass distribution used to model the smooth, large-scale components. A comparison
of the best-fit profiles for the smooth component from lensing with those obtained in high
resolution cosmological N-body simulations has been presented in the work of Kneib et al.
(2003). Combining strong and weak constraints, they were able to probe the mass profile
of the cluster on scales of 0.1-5 Mpc, thus providing a valuable test of the universal form
proposed by Navarro, Frenk, & White (NFW) on large scales. We use the best-fit mass
model of Kneib et al. (2003) for the smooth component as a prior in our analysis, although
we allow the parameters like the centroids of the 2 large-scale components and their velocity
dispersion to vary when obtaining constraints on the subhalos. The 2 NFW components used
as priors are characterized by the following properties: Clump 1: with M200 = 6.5×10¹⁴ M⊙;
c = 22+9−5; r200 = 1.9 Mpc; rs = 88 kpc and Clump 2: with M200 = 2.8 × 10¹⁴ M⊙; c = 4+2
−1;
r200 = 1.5 Mpc; rs = 364 kpc.
To quantify the lensing distortion induced, the individual galaxy-scale halos are modeled
using the PIEMD profile with,
Σ(R) =Σ0r0
1 − r0/rt(
1√
r20 + R2
−1
√
r2t + R2
), (9)
with a model core-radius r0 and a truncation radius rt ≫ r0. Correlating the above mass
profile with a typical de Vaucleours light profile (the observed profile for bright early type
galaxies) provides a simple relation between the truncation radius and the effective radius
Re, rt ∼ (4/3)Re. The coordinate R is a function of x, y and the ellipticity,
R2 = (x2
(1 + ǫ)2+
y2
(1 − ǫ)2) ; ǫ =
a − b
a + b, (10)

– 11 –
The mass enclosed within an aperture radius R for the ǫ = 0 model is given by:
M(R) =2πΣ0r0
1 − r0
rt
[√
r20 + R2 −
√
r2t + R2 + (rt − r0) ]. (11)
The total mass M , is finite with M ∝ Σ0r0rt. The shear is:
γ(R) = κ0[−1
√
R2 + r20
+2
R2(√
R2 + r20 − r0)
+1
√
R2 + r2t
−2
R2(√
R2 + r2t − rt) ].
(12)
In order to relate the light distribution in cluster galaxies to key parameters of the mass model
of subhalos, we adopt a set of physically motivated scaling laws derived from observations
(Brainerd et al. 1996; Limousin et al. 2005; Halkola et al. 2007):
σ0 = σ0∗(L
L∗)
14 ; r0 = r0∗(
L
L∗)
12 ; rt = rt∗(
L
L∗)α. (13)
The total mass M enclosed within an aperture rt∗ and the total mass-to-light ratio M/L
then scale with the luminosity as follows for the early-type galaxies:
Map ∝ σ20∗rt∗ (
L
L∗)
12+α, M/L ∝ σ2
0∗ rt∗
(
L
L∗
)α−1/2
, (14)
where α tunes the size of the galaxy halo. In this work α is taken to be 1/2. These scaling laws
are empirically motivated by the Faber-Jackson relation for early-type galaxies (Brainerd,
Blandford & Smail 1996). For late-type cluster members, we use the analogous Tully-Fisher
relation to obtain scalings of σ0∗ and rt∗ with luminosity. The empirical Tully-Fisher relation
has significantly higher scatter than the Faber-Jackson relation. In this analysis we do not
take the scatter into account while employing these scaling relations. We assume these
scaling relations and recognize that this could ultimately be a limitation but the evidence
at hand supports the fact that mass traces light efficiently both on cluster scales (Kneib et
al. 2003) and on galaxy scales (McKay et al. 2001; Wilson et al. 2001; Mandelbaum et
al. 2006). Further explorations of these scaling relations have recently been presented in
Halkola & Seitz (2007) and Limousin, Sommer-Larsen, Natarajan & Milvang-Jensen (2007).
The redshift distribution and intrinsic ellipticity distribution assumed for this analysis are
outlined in the Appendix.
3.3. The maximum-likelihood method
Parameters that characterize both the global components and the subhalos are op-
timized, using the observed strong lensing features - positions, magnitudes, geometry of

– 12 –
multiple images and measured spectroscopic redshifts, along with the smoothed shear field
as constraints. With the parameterization presented above, we optimize and extract values
for the central velocity dispersion and the aperture scale (σ0∗, rt∗) for a subhalo hosting a
fiducial L∗ cluster galaxy.
Maximum-likelihood analysis is used to obtain significance bounds on these fiducial
parameters that characterize a typical L∗ subhalo in the cluster. The likelihood function
of the estimated probability distribution of the source ellipticities is maximized for a set of
model parameters, given a functional form of the intrinsic ellipticity distribution measured
for faint galaxies. For each ‘faint’ galaxy j, with measured shape τobs, the intrinsic shape τSj
is estimated in the weak regime by subtracting the lensing distortion induced by the smooth
cluster models and the galaxy subhalos,
τSj= τobsj − ΣNc
i γpi− Σn γc, (15)
where ΣNc
i γpiis the sum of the shear contribution at a given position j from Nc perturbers.
This entire inversion procedure is performed numerically using the code developed that builds
on the ray-tracing routine lenstool written by Kneib (1993). This machinery accurately
takes into account the non-linearities arising in the strong lensing regimeas well. Using a
well-determined ‘strong lensing’ model for the inner-regions along with the shear field and
assuming a known functional form for p(τS) the probability distribution for the intrinsic
shape distribution of galaxies in the field, the likelihood for a guessed model is given by,
L(σ0∗, rt∗) = ΠNgal
j p(τSj), (16)
where the marginalization is done over (σ0∗, rt∗). We compute L assigning the median redshift
corresponding to the observed source magnitude for each arclet. The best fitting model
parameters are then obtained by maximizing the log-likelihood function l with respect to the
parameters σ0∗ and rt∗. Note that the parameters that characterize the smooth component
are also simultaneously optimized. In this work, we perform this likelihood analysis in each
of the 3 radial bins to obtain the set of (σ0∗, rt∗) that characterize subhalos in each radial
bin.
In summary, the basic steps of our analysis therefore involve lens inversion, modeling
and optimization, which are done using the lenstool software utilities (Kneib 1993; Jullo
et al. 2007). These utilities are used to perform the ray tracing from the image plane to the
source plane with a specified intervening lens. This is achieved by solving the lens equation
iteratively, taking into account the observed strong lensing features, positions, geometry and
magnitudes of the multiple images. In this case, we also include a constraint on the location
of the critical line (between 2 mirror multiple images) to tighten the optimization. We fix the
core radius of an L∗ subhalo to be 0.1 kpc, as by construction our analysis cannot constrain

– 13 –
this quantity. The measured shear field and the measured velocity dispersions of early-type
galaxies are used as priors in the likelihood estimation. In addition to the likelihood contours,
the reduced χ2 for the best-fit model is also found to be robust.
4. Analysis for Cl 0024+16
To detect cluster subhalos, we first select a population of background galaxies within
a magnitude range 23 < I < 26 (measured in the F814W filter) and determined their
individual shapes to a high degree of accuracy taking into account the known anisotropy
of the point spread function of the WFPC-2 Camera (Bridle et al. 2002; Kuijken 1999).
Details of this procedure and the systematics are described in detail in Kneib et al. (2003).
Shape distortions in this population were then used to compute the masses of the foreground
cluster and its member subhalos.
To quantify environmental effects on infalling dark matter halos and noting the three
physical regimes discussed earlier, we divided the cluster into three regions: the central region
extending out to ∼ 600 kpc from the center [core]; the transition region extending out to
∼ 1.7 rvir ∼ 2.9 Mpc, [transition] and the periphery out to ∼ 2.8 rvir ∼ 4.8 Mpc [periphery].
These bins partition the cluster into regions of high, medium and low galaxy number density
and dark matter density (Treu et al. 2003) respectively. The typical surface density of cluster
members in the core region is 120 galaxies per Mpc−2; in the transition region it drops to
about 60 galaxies per Mpc−2 and in the periphery it is roughly 50 galaxies per Mpc−2 (Treu
et al. 2003).
A well defined morphology-density relation is detected in Cl 0024+16 (Treu et al. 2003;
Dressler 1980; Fasano et al. 2000). The fraction of early-type galaxies declines steeply
away from the center, starting at 70-80% out to 1 Mpc and decreasing down to 50% at the
outskirts. In contrast, the late-type galaxy population fraction is negligible in the center
but increases in the transition region and constitutes 50% out at the periphery. In fact,
Moran et al. (2007) find that the spirals are kinematically disturbed even well beyond the
virial radius in this cluster. In the core, cluster membership was defined strictly, and only
spectroscopically confirmed members were used in the galaxy-galaxy lensing analysis. In
the transition region and the periphery, the classification of cluster members was performed
using both spectroscopically and photometrically determined redshifts. We selected cluster
galaxies within 17 < I < 22 to ensure comparable degrees of completeness for both mor-
phological types across all three bins. Our selection procedure yields 51 early-types in the
core; 93 in the transition region [70 spectroscopically confirmed] and 44 [15 spectroscopi-
cally confirmed] in the periphery. Including early-types from the ground based survey work

– 14 –
Fig. 1.— The spatial distribution of morphologically classified early-type galaxies (red cir-
cles) and late-type galaxies (blue triangles) with measured redshifts in Cl 0024+16 derived
from the sparsely sampled mosaic using the WFPC-2 Camera aboard the HST. The three
circles define the radial binning used in our analysis. The inner-most circle encompasses the
core region of the cluster out to 0.6 Mpc, the middle circle the transition region extending
out to 2.9 Mpc and the outer circle marks the periphery of the cluster out to 4.8 Mpc.
Galaxies plotted here include spectroscopically confirmed cluster members and galaxies with
secure photometric redshifts in the HST footprint.

– 15 –
(Moran et al. 2007) we have an additional 257 members in the transition region and 294
members in the periphery. There are a total of 331 late-types (this inventory includes the
HST mosaic and ground based data) confined to transition and periphery region. For the
early-types in the HST WFPC-2 mosaic, all 51 in the core are spectroscopically confirmed
to be cluster members, in the outer 2 bins, about 63±7% of the early-types are spectro-
scopically confirmed, and across all morphologies ∼ 65% have secure measured redshifts. In
addition, we have redshifts for early-type candidates that lie outside our tiled HST mosaic as
well photometric redshifts estimates. The radial distribution of the selected cluster galaxies
is shown in Figure 1. The similarity of the luminosity function of the selected early-types
in the three bins shown in Figure 2 ensures that we have truly comparable samples with no
luminosity bias.
For each radial bin and type, we applied the likelihood analysis described above to
extract the best-fit parameters and significance bounds for the dark matter halo associated
with a fiducial L∗ subhalo in the cluster. Gravitational lensing effects are sensitive to the total
mass M enclosed by a subhalo within an aperture rt∗. To account for the differing mass-to-
light ratios of the early and late-type galaxies, we utilized the well-known empirical relations
between the velocity dispersion and luminosity for early-types (Faber-Jackson relation); and
equivalently that between the circular velocity and luminosity (Tully-Fisher relation) for
late-type galaxies. We used the relations determined for Cl 0024+16 by Moran et al. (2005;
2007) to relate mass and light in our modeling procedure. An L∗ early-type galaxy and
late-type galaxy are assumed to have the same luminosity. The limitations and systematics
of the galaxy-galaxy lensing analysis in clusters has been described in detail in our all our
earlier papers, below we briefly mention some of the key uncertainties of this method.
The following basic tests were performed for Cl 0024+16, (i) choosing random locations
(instead of bright, cluster member locations) for the perturbers; (ii) scrambling the shapes
of background galaxies; and (iii) choosing to associate the perturbers with the faintest (as
opposed to the brightest) galaxies. None of the above yields a convergent likelihood map,
in fact all that is seen in the resultant 2-dimensional likelihood surfaces is noise for all the
above test cases.
While the robustness of our method has been extensively tested and reported in detail
in earlier papers, there are a couple of caveats and uncertainties inherent to the technique
that ought to be mentioned. In galaxy-galaxy lensing we are only sensitive to a restricted
mass range in terms of secure detection of substructure. This is due to the fact that we are
quantifying a differential signal above the average tangential shear induced by the smooth
cluster component. Therefore, we are inherently limited by the average number of distorted
background galaxies that lie within the aperture scale radii of cluster galaxies. This trade-off

– 16 –
Fig. 2.— The luminosity function of early-type galaxies in the 3 regions: the number of
galaxies per unit area versus magnitude is shown. It is clear from this plot that there is
no systematic luminosity selection bias with cluster-centric radius for the early-type cluster
members. However, luminosity segregation is evident in the core region. The luminosity
function plotted above includes spectroscopically confirmed cluster members and those with
secure photometric redshifts in the HST footprint.

– 17 –
between requiring a sufficient number of lensed background galaxies in the vicinity of the
subhalos and the optimum locations for the subhalos leads us to choose the brightest cluster
galaxies in each radial bin. It is possible that the bulk of the mass in subhalos is in lower
mass clumps, which in this analysis is essentially accounted for as being part of the smooth
components. Also we cannot sensibly quantify the contribution of close pairs/neighbors
individually as it is essentially a statistical technique.
Our results are robust and we statistically determine the mass of a dark matter subhalo
that hosts an L∗ galaxy. Even if we suppose that the bulk of the dark matter is associated
with very low surface brightness galaxies in clusters, the spatial distribution of these galaxies
is required to be fine-tuned such that these effects do not show up in the shear field in the any
of the 3 regions. In summary, the principal sources of uncertainty in the above analysis are
(i) shot noise – we are inherently limited by the finite number of sources sampled within a few
tidal radii of each cluster galaxy; (ii) the spread in the intrinsic ellipticity distribution of the
source population; (iii) observational errors arising from uncertainties in the measurement
of ellipticities from the images for the faintest objects and (iv) contamination by foreground
galaxies mistaken as background.
The shot noise is clearly the most significant source of error, accounting for up to ∼ 50
per cent; followed by the width of the intrinsic ellipticity distribution which contributes ∼ 20
per cent, and the other sources together contribute ∼ 30 per cent (Natarajan, De Lucia &
Springel 2007). This inventory of errors suggests that the optimal future strategy for such
analyses is to go significantly deeper and wider in terms of the field of view.
5. Results from galaxy-galaxy lensing
The fiducial mass of a dark matter subhalo hosting an L∗ early-type galaxy in the central
region contained within an aperture of size rt∗ = 45±5 kpc is M = 6.3+2.7−2.0 × 10¹¹ M⊙; in the
transition region it increases to M = 1.3+0.8−0.6 × 10¹² M⊙, and in the periphery it increases
further to M = 3.7+1.4−1.1 × 10¹² M⊙. All error bars represent 3-σ values. These values derived
from the likelihood analysis are shown in Figure 3. The increasing masses of the subhalos with
cluster radius demonstrates that the subhalos that host L∗ galaxies in the inner regions (core
and transition) are subject to more severe tidal truncation than those in the periphery. The
mass of a typical subhalo that hosts an L∗ early-type galaxy increases with cluster-centric
radius in concordance with theoretical expectations. The dark matter subhalo associated
with a typical late-type galaxy in the transition and peripheral region is detected, with an
aperture mass of M = 1.06+0.52−0.41 × 10¹² M⊙ enclosed within a radius of rt∗ = 25 ±5kpc (shown
as the solid triangle in Figure 3). The total mass-to-light ratio for these fiducial subhalos can

– 18 –
also be estimated. The constant total mass-to-light ratio curves over-plotted on Figure 3,
suggest that a typical subhalo hosting an L∗ early-type has a M/LV ∼ 7, 10, 14 respectively
in the three radial bins and a subhalo hosting an equivalent luminosity late-type galaxy has
a M/LV ∼ 10. These values suggest that galaxies in clusters do possess individual dark
matter subhalos that extend to well beyond the stellar component.
Utilizing the scaling with luminosity provided by the Faber-Jackson and Tully-Fisher
relations, we derived the mass function of subhalos within each bin (Figure 4). Clearly, the
core region where the central density of the cluster is maximal is expected to be an extreme
and violent environment for infalling galaxies. We interpret our results to be a consequence
of the fact that galaxies in the inner bin are more tidally truncated as they likely formed
earlier and have therefore had time for many more crossings through the dense cluster center.
These results are in very good agreement with theoretical predictions wherein galaxies
in the inner region are expected to be violently tidally stripped of their dark matter content,
while those in the periphery are unlikely to have had even a single passage through the
cluster center and therefore be untouched by tidal interactions. A simple analytic model
(Merritt 1985) is used to predict the mass enclosed within the tidal radius3 as a function of
cluster-centric distance, and is found to be consistent with our results (solid line in Figure 6).
Our results are also consistent with the findings of Gao et al.(2004), who found that subhalos
closer to the cluster center retain a smaller fraction of their dark matter. Furthermore, we
are able to quantify the dark matter subhalo masses associated with late-type galaxies in
Cl 0024+16.
While the mean mass of a dark matter subhalo associated with an early-type cluster
galaxy increases with cluster-centric distance out to 5 Mpc and they trace the overall spatial
distribution of the smooth mass components robustly. The subhalos associated with late-
type galaxies do not contribute significantly to the total subhalo mass function at any radius.
In fact, it appears that the host subhalos of late-types do not trace the total dark matter
distribution in clusters. We infer that the mass within 5 Mpc in Cl 0024+16 is distributed as
follows: ∼70% of the total mass of the cluster is smoothly distributed, the subhalos associated
with early-type galaxies contribute >∼ 20%, and subhalos hosting late-type galaxies account
for the remaining < 10%.
3The aperture radius rt that we infer from the lensing analysis is a proxy for the tidal radius of a dark
matter subhalo.
– 19 –
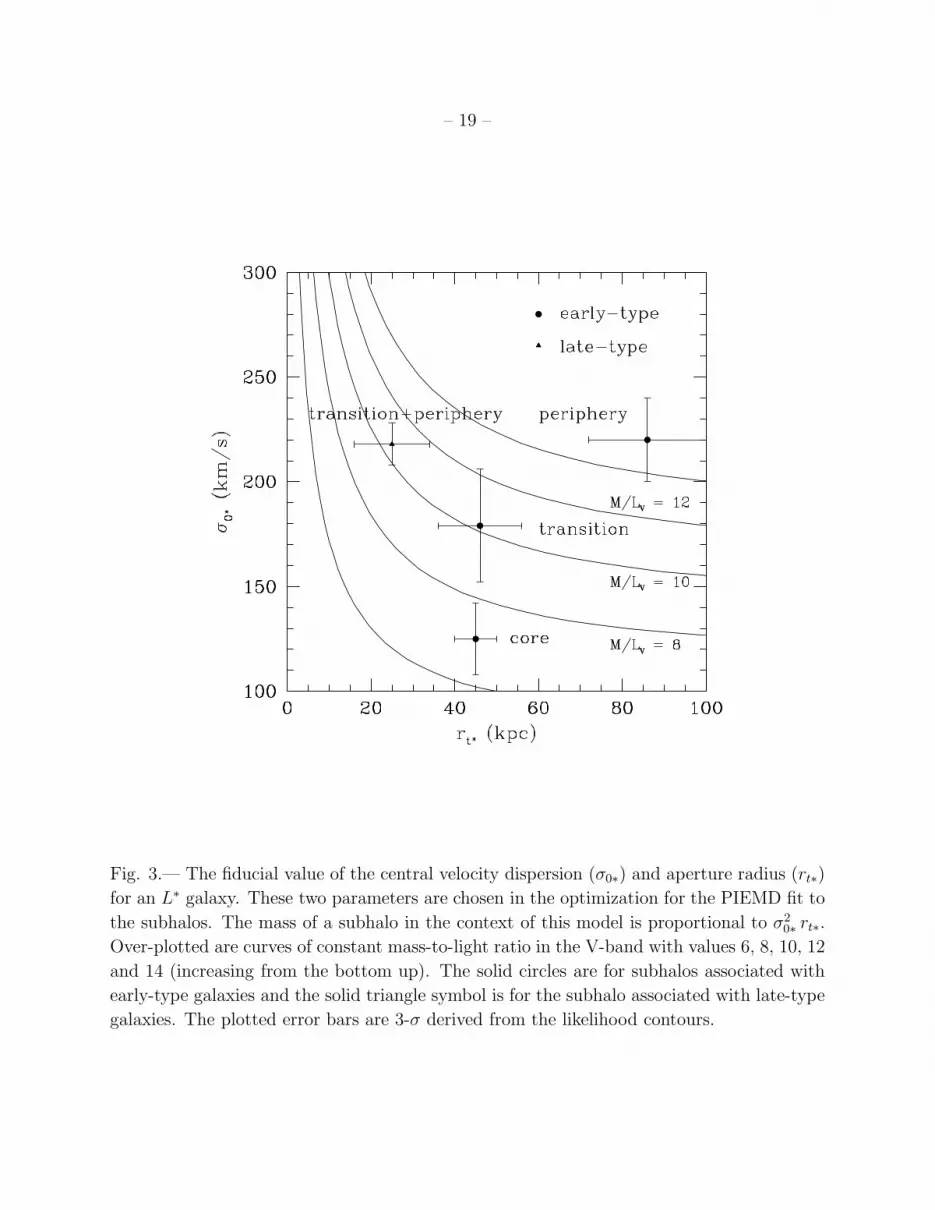
Fig. 3.— The fiducial value of the central velocity dispersion (σ0∗) and aperture radius (rt∗)
for an L∗ galaxy. These two parameters are chosen in the optimization for the PIEMD fit to
the subhalos. The mass of a subhalo in the context of this model is proportional to σ20∗ rt∗.
Over-plotted are curves of constant mass-to-light ratio in the V-band with values 6, 8, 10, 12
and 14 (increasing from the bottom up). The solid circles are for subhalos associated with
early-type galaxies and the solid triangle symbol is for the subhalo associated with late-type
galaxies. The plotted error bars are 3-σ derived from the likelihood contours.

– 20 –
5.1. Comparison with N-body simulations
In this section, we compare the lensing results discussed above with results from the
Millennium Simulation (Springel et al. 2005). The simulation follows N = 21603 particles in
a box of size 500 h−1 Mpc on a side, with a particle mass of 8.6×10⁸ h−1M⊙ (yielding several
hundred particles per subhalo), and with a spatial resolution of 5 h−1 kpc. For each snapshot
of the simulation (in total 64), substructures within dark matter halos have been identified
using the algorithm SUBFIND (Springel et al. 2001). We refer to the original paper for more
details on the algorithm. Further details of the determination of subhalo masses and the
biases therein are discussed in Natarajan, De Lucia & Springel (2007).
For our comparison with Cl 0024+16, we have selected all cluster halos with M200 ≥
8 × 10¹⁴ M⊙ from the simulation box at z ∼ 0.4. A total of 12 such cluster scale halos are
found. We then use the publicly4 available results from the semi-analytic model described
in De Lucia & Blaizot (2007) to select all galaxies in boxes of 10 h−1 Mpc on a side and
centred on the selected halos. We note that the following nomenclature is used for galaxies
in the adopted semi-analytic model: each FOF group hosts a ‘central galaxy’ (Type 0) that
is located at the position of the most bound particle of the main halo. All other galaxies
attached to dark matter subhalos are labeled as Type 1 and located at the positions of the
most bound particle of the parent dark matter substructure. Tidal truncation and stripping
can disrupt the substructure down to the resolution limit of the simulation. A galaxy that
is no longer identified with a dark matter subhalo is labeled as Type 2, and it is assumed
not to be affected by processes that reduce the mass of its parent subhalo. The positions
of Type 2 galaxies are tracked using the position of the most bound particle of the subhalo
before it was disrupted.
We then select all galaxies brighter than MK = −18.3 (this corresponds to all galaxies
brighter than 1/20 ∗ L∗, as MK∗ = −21.37) and classify as early-types those with ∆M =
MB −Mbulge < 0.4, where MB is the B-band rest-frame magnitude and Mbulge is the B-band
rest frame magnitude of the bulge (Simien & de Vaucouleurs 1986). For each simulated
cluster, we consider the same three radial bins used for our lensing analysis and stack the
results for the projections along the x, y, and z axes. This is done to mimic as best the
projected distances that we employ in our lensing analysis in the 3 radial bins. In addition,
we only consider galaxies within 1 Mpc (in the redshift direction) from the cluster centre
along the line-of-sight. This choice is motivated by the width of the measured velocity
dispersion histogram in Cl 0024+16 and therefore reduces contamination from unassociated
4A description of the publicly available catalogues, and a link to the database can be found at the following
webpage: http://mpa-garching.mpg.de/millennium/

– 21 –
structures. The inventory is as follows: Core region – the models predict a total of ∼ 74
early-types that make the selection cut of which 42 are Type 2 galaxies and 32 are Type 0
& 1’s; Transition region – the models predict a total of 83 early-type galaxies that make the
selection cut of which 41 are Type 2 galaxies and 42 are Type 0 & 1’s; Outer region – the
models predict a total of 22 early-types that make the selection cut of which 10 are Type
2 galaxies and 12 are Type 0 & 1’s. In contrast, the selection from the observational data
of Cl 0024+16 yields the following numbers for spectroscopically confirmed early-types with
equivalent selection criteria: Core region – 51 early-types; Transition region – 97 early-types;
Outer region – 47 early-types.
In Figure 4, we plot the luminosity function of early type galaxies in the three radial
bins considered in this analysis from observations (thick, solid histograms) and the model
(thin solid and dashed histograms). The thick solid histograms show the luminosity function
of the spectroscopically confirmed early-types in each bin. The thin, solid histograms show
the total model luminosity function for equivalently selected early-types (this includes Type
1’s, Type 0’s and Type 2 galaxies). The dashed histograms show the luminosity function
of Type 2 galaxies only. We note that in all regions the contribution by number of Type 2
galaxies is comparable to that of Type 0 and Type 1’s. In the core region 58% of all model
early-types are Type 2’s, in the transition region 50% of all model early-types are Type 2’s
and in the outer region 46% of all model early-types are Type 2 galaxies.
It is clear from Figure 4 that the luminosity functions of the early-type galaxies in
simulations agree rather well with the observed ones in all 3 bins. However, we note that the
inability of the lensing analysis to accomodate/distinguish Type 2 galaxies which constitute
roughly half the number of early-types in the model will limit our analysis. This discrepancy
in the total number of early-types that are hosted in individual dark matter halos in the
model versus the lensing analysis will re-appear when we compare the masses of a typical
subhalo that hosts an L∗ early-type galaxy.
In Figure 5 we compare the mass function of dark matter subhalos obtained from the
galaxy-galaxy lensing analysis with that obtained from averaging the 12 massive clusters
(each with 3 independent projections) in the Millennium Simulation. In the left hand panel,
we plot a direct comparison of the mass functions without taking into account the discrepancy
in number between the observations and the simulations. In the right hand panel, we scale
the observations to take into account the fraction of Type 2’s versus Type 0 & 1’s in each
radial bin. This is done by normalizing the observations to match the fraction of Type 0s
and Type 1s.In order to make a sensible comparison, we focus on the right hand panel of
Figure 5. In the core region, the mass function from simulations agrees quite nicely with
that determined using the galaxy-galaxy lensing analysis. It is notable that general shapes

– 22 –
Fig. 4.— The luminosity function of the early-type galaxies in the three radial bins considered
in this analysis. The value of MK∗ in the K-band is -21.37. Note that the y-axis for the
model galaxies is an averaged number < N > as the total number of selected early-types
is divided by 36 to take into account 12 clusters each with 3 independent projections. For
the observed galaxies the y-axis denotes the raw number. In all panels, the thick solid
histograms show the luminosity function of spectroscopically confirmed early-type members
from the Cl0024+16 data set. The thin solid histograms are total luminosity function of
early-types in the simulations including Type 0, Type 1 and Type 2 galaxies. We separately
show the luminosity function of Type 2 early-type galaxies as the dashed histograms. The
fraction of Type 2 galaxies in the core is 58%, in the transition region it is 50% and in the
– 23 –
of the mass function are in very good agreement. The agreement between the shape of the
mass functions in transition and outer regions is also good.5
In the inner region, we found in earlier work (Natarajan, De Lucia & Springel 2007)
that the masses from the simulation tend to be under-estimated by a factor 2 or so. This
offset was found in our earlier analysis of the core regions in 5 clusters (r ¡ 1 Mpc) reported
in Natarajan, De Lucia & Springel (2007). The origin of this offset in the core region has to
do primarily with the systematics due the method employed to determine subhalo masses.
The SUBFIND algorithm used to find dark matter substructures tends to underestimate
their masses (for a more extensive discussion and diagnostic plots see Figure 3 in Natarajan,
De Lucia & Springel 2007) by a factor of 2 in the inner regions. Natarajan, De Lucia &
Springel (2007) have also shown that the cluster-to-cluster variation for simulated halos is
quite large. Therefore, we do not correct for this bias in the current analysis of Cl 0024+16.
We note here that the subhalo mass function available from the simulations and the
lensing technique probe a comparable mass range suggesting that our early-type galaxy
selections have been equivalent. In the periphery, subhalo masses derived from lensing are of
the order of few times 1013 M⊙, which is typical of group masses, suggestive of the presence
of infalling groups. Tracking morphological types and their transformations in this region
Treu et al. (2003) also suggest the prevalence of infalling groups, in consonance with our
lensing results.So we emphasize here, that in the outskirts of the Cl 0024+16, it appears
that inferred subhalo masses correspond to group scale masses suggesting that these halos
likely contain other fainter galaxies in addition to the bright, early-type that we tag in this
analysis.
In Figure 6, we plot the mass of a typical subhalo that hosts an early-type L∗ galaxy as
a function of cluster-centric radius derived from galaxy-galaxy lensing and the simulations.
The solid line in Figure 6 is the trend derived from a simple analytic model of tidal stripping
of galaxies by an isothermal cluster proposed by Merritt (1985). The dashed-line is the also
the analytic model offset appropriately to compare with the simulation results. The model
curve is nearly identical in slope to the best-fit line going through the simulation points. The
radial trends are in very good agreement although there is an offset of a factor of ∼ 2.5 in the
5It is worth mentioning here that in Natarajan, De Lucia & Springel (2007) Cl 0024+16 was the one outlier
from the general good agreement. The lensing determined mass function for Cl 0024+16 within 1 Mpc was
not in good agreement with the subhalo mass function derived from simulations. We attribute the current
agreement of the mass functions in the core region (r < 0.6Mpc) to the following 2 key factors (i) careful
selection based on early-type cluster members to mimic the observations and (ii) more careful classification
into Type 1 and Type 2 galaxies and taking their relative numbers into account when computing the mass
function.

– 24 –
Fig. 5.— Comparison of the mass function determined from galaxy-galaxy lensing as a
function of cluster-centric distance with that determined from simulated clusters in the
Millenium simulation. The solid histograms are results from the lensing analysis and the
dashed ones are from the Millenium Run. The raw mass function without any normalization
or scaling is shown in the right hand panel, whereas in the left hand panel the lensing derived
mass function is normalized to compare with the model mass functions.

– 25 –
mean value of the subhalo masses. It is likely that systematics in the lensing also contribute
to this discrepancy. The efficiency of tidal stripping depends on the central density of the
cluster. Writing this out explicitly, we have:
Mlens/Msim ∼ 2.5
. The offset in subhalo masses by a factor of ∼ 2.5 suggests that the tidal stripping in
the averaged simulated clusters is more efficient than in Cl 0024+16 as inferred from the
lensing data. We note here that the values of M200 for the 12 simulated clusters range
from ∼ 8 × 10¹⁴ M⊙ to ∼ 2 × 10¹⁵ M⊙ and the best-fit parameters for Cl 0024+16 from
observations which consist of a super-position of 2 NFW profiles with M200 ∼ 4 × 10¹⁴M⊙
and M200 ∼ 1.8 × 10¹⁴M⊙, could partially account for the discrepancy. The simulated
ensemble does not reproduce the observed bi-modal mass distribution in Cl 0024+16 which
has important dynamical consequences. No dynamical analog to Cl 0024+16 was found in
the Millenium Run at z ∼ 0.4. Therefore it is not surprising that there is a discrepancy in
the inferred mass for a dark matter subhalo hosting an L∗ galaxy. Note that if we correct the
subhalo mass in the inner most bin by a factor of 2 as found in our earlier work, the agreement
gets significantly better in the core region consistent with our earlier results (Natarajan, De
Lucia & Springel 2007). Regardless, there appears to be an offset despite overall agreement in
the ensemble mass functions (as shown in the right hand panel of Figure 5). Tidal stripping
of dark matter appears to be more efficient in the simulations compared to estimates from
the lensing data.
We note here that in the Millenium simulation only the dark matter is followed dynam-
ically but not the baryons. It has been recently argued that the adiabatic contraction of
baryons in the inner regions of galaxies and clusters is likely to modify density profiles appre-
ciably. Such modifications will impact the efficiency of tidal stripping in clusters. This claim
has been made in numerical simulations that include gas cooling and prescriptions for star
formation by Gnedin et al. (2004). Zappacosta et al. (2006) on the other hand claim using
the case of the cluster Abell 2589 that adiabatic contraction is unimportant for the overall
mass distribution of clusters. A recent study by Limousin et al.(2007b) that examines the
tidal stripping of subhalos in numerical simulations and includes baryons, find a radial trend
in the mass function that is in good agreement with the lensing derived trend in Cl 0024+16.
Meanwhile in lensing the systematic arises from the fact that we do not have measured
redshifts for all background sources. While the mass calibration is most sensitive to the
median redshift adopted for the background galaxies, biases are introduced if the median
redshift is over-estimated or under-estimated.
We note that the galaxy-galaxy lensing technique is sensitive to the detection of sub-
halo masses above a threshold value that is determined by the quality of the observational

– 26 –
Fig. 6.— The variation of the mass of a dark matter subhalo that hosts an early-type L∗
galaxy as a function of cluster centric radius. The results from the likelihood analysis are
used to derive the subhalo mass for the galaxy-galaxy lensing results and the counterparts
are derived from the Millenium simulation with an embedded semi-analytic galaxy formation
model. This enables selection of dark matter halos that host a single L∗ galaxy akin to our
assumption in the lensing analysis. The solid circles are the data points from the galaxy-
galaxy lensing analysis and the solid squares are from the Millenium simulation. The upper
solid square in the core region marks the value of the subhalo mass with correction by a
factor of 2 as found in Natarajan, De Lucia & Natarajan (2007). The solid triangle is the
galaxy-galaxy lensing data point for the subhalo associated with a late-type L∗ galaxy. The
radial trend derived from lensing is in very good agreement with simulations although there
is an offset in the masses which is discussed further in the text.

– 27 –
lensing data. The selection made in the cluster luminosity function translates into a mass
limit. The contribution of fainter early-types (galaxies fainter than our selection limit) trans-
lates into lower mass subhalos due to the assumed luminosity scalings. As a consequence,
subhalos with lower masses get included in the mass inventory as constituting the ‘smooth’
component. The lensing derived mass functions are therefore complete at the high mass
end but are typically incomplete at the low mass end. The cut-off at the low mass end
is hence determined primarily by the depth of the observational data and the ability to
measure shapes accurately for the faintest background sources. Since galaxy-galaxy lensing
analysis in clusters is inherently statistical, its robustness is also limited by the ability to
accurately pin down the smooth mass component, subtract it from the observed shear field
and then stack the residuals to characterize the mass of a detectable dark matter subhalo.
In the inner region while the constraints on the smooth component are tighter due to the
presence of strong lensing features, the smooth component also tends to dominate the overall
mass distribution, so subtracting it is challenging. In the outer regions while the smooth
component is sub-dominant, there are fewer constraints and the overall value of the shear is
significantly lower as well. These trade-offs cause a varying mass resolution for the lensing
technique as a function of cluster-centric radius. However, since we assume scaling rela-
tions with luminosity, and use the cluster galaxy luminosity function to determine the mass
function, the detectable limit of subhalo masses is set predominantly by the magnitude cut
adopted for the selected early-type galaxies. Note that in our comparison with simulations
we have restricted ourselves only to early-types with measured spectroscopic redshifts. Since
spectroscopic follow-up tends to be easier for brighter galaxies, once again our lensing derived
mass function is more complete at the high mass end and is less so at the low mass end.
However, from the comparison of the mass functions we note that both methods lensing and
the simulations are probing comparable subhalo mass ranges.
6. Discussion and Conclusions
Earlier work on galaxy-galaxy lensing in the field has identified a signal associated
with massive halos around typical field galaxies, extending to beyond 100 kpc (e.g. Brainerd,
Blandford & Smail 1996; Ebbels et al. 2000; Hudson et al. 1998; Wilson et al. 2001; Hoekstra
et al. 2004). In particular, Hoekstra et al. (2004) report the detection of finite truncation
radii via weak lensing by galaxies based on 45.5 deg2 of imaging data from the Red-Sequence
Cluster Survey. Using a truncated isothermal sphere to model the mass in galaxy halos,
they find a best-fit central velocity dispersion for an L∗ galaxy of σ = 136 ± 5 kms−1 (68%
confidence limits) and a truncation radius of 185 ± 30 kpc. Galaxy-galaxy lensing results
from the analysis of the Sloan Digital Sky Survey data (Sheldon et al. 2004; Guzik & Seljak
– 28 –
2002; Mandelbaum et al. 2006) have contributed to a deeper understanding of the relation
between mass and light. Similar analysis of galaxies in the cores of rich clusters suggests
that the average mass-to-light ratio and spatial extents of the dark matter halos associated
with morphologically-classified early-type galaxies in these regions may differ from those of
comparable luminosity field galaxies (Natarajan et al. 1998, 2002a). We find that at a given
luminosity, galaxies in clusters have more compact halo sizes and lower masses (by a factor
of 2–5) compared to their field counter-parts. The mass-to-light ratios inferred for cluster
galaxies in the V-band are also lower than that of comparable luminosity field galaxies. This
is a strong indication of the tidal stripping effect of the dense environment on the properties
of dark matter halos. In recent work, using only strong lensing constraints in the inner
regions of the Abell cluster A 1689 derived from images taken by the Advanced Camera for
Surveys (ACS) aboard HST, Halkola & Seitz (2007) also find independently that the subhalos
of cluster galaxies are severely truncated compared to equivalent luminosity galaxies in the
field.
The subhalo mass function represents an important prediction of hierarchical CDM
structure formation models and has been subject of intense scrutiny since the ‘satellite crisis’
was identified (Moore et al. 1999; Klypin et al. 1999). This crisis refers to the fact that
within a radius of 400 h−1 kpc, from the Milky Way, cosmological simulations of structure
formation predict ∼ 50 dark matter satellites with circular velocities in excess of 50 kms−1
and mass greater than 3 × 10⁸ M⊙. This number is significantly higher than the dozen or
so satellites actually detected around our Galaxy. Several explanations have been proposed
to resolve this discrepancy. The missing satellites could for example be identified with the
detected High Velocity Clouds (Kerr & Sullivan 1969; Willman et al. 2002; Maller & Bullock
2004). Warm or self-interacting dark matter could also selectively suppress power on the
small scales, therefore reducing the predicted number of satellites. The leading hypothesis
however remains that the solution to this problem lies in processes such as heating by a
photo-ionizing background that preferentially suppresses star formation in small halos at
early times (Bullock et al. 2000; Benson et al. 2002; Kravtsov et al. 2004). On the scale of
galaxy clusters, many more dark matter structures are expected to be visible, thus making
the comparison with expectation from numerical simulations less affected by uncertainties in
the poorly understood physics of the galaxy formation. In earlier work, we showed that there
is very good agreement between the lensing observations and the Millenium Run simulations
in the inner 1 Mpc or so for a sample of clusters (Natarajan, De Lucia & Springel 2007).
Now we are able to extend our analysis out to 5 Mpc for Cl 0024+16 due to the unique
data-set that is available. The diagnostic available for comparison here is the shape of the
mass function in each of the three bins. We find that the overall shape of the subhalo mass
functions derived from the 2 independent methods is in very good agreement out to beyond

– 29 –
the virial radius. We find that the mass of a typical subhalo that hosts an L∗ early-type
galaxy increases with cluster-centric radius in concordance with theoretical expectations.
However, the estimates of the mass of a subhalo that hosts an L∗ galaxy derived from
simulations is significantly lower than those derived from lensing observations. The origin
of this discrepancy lies in the fact that tidal stripping appears to be more efficient in the
simulations.
Due to the large area probed by this Cl 0024+16 dataset, we are also able to constrain
the properties of dark matter subhalos associated with late-type galaxies that preferentially
lie in the outer regions of the cluster (Treu et al. 2003). We report the first detection of the
presence of a dark matter subhalo associated with late-type galaxies in Cl 0024+16. While
early-type galaxies appear to trace the overall mass distribution robustly, the subhalos asso-
ciated with late-type galaxies do not contribute significantly to the total mass budget at any
radius. In the cluster Cl 0024+16 within 5 Mpc we find the following contributions to the
total mass: ∼70% of the total mass of the cluster is smoothly distributed, the subhalos asso-
ciated with early-type galaxies contribute >∼ 20%, and subhalos hosting late-type galaxies
account for the remaining < 10%.
The mass resolution of our technique varies slightly with cluster-centric distance owing
to the nature of observational constraints that dominate the likelihood optimization. While
the strong lensing constraints in the core are the most stringent and drive the fit in the inner
regions, the anisotropy in the shear field is statistically harder to recover. As we progressively
step out in radius away from the cluster center, the shear of the large scale smooth component
drops, and that of the individual subhalos dominates but the overall summed shear signal
is significantly lower than in the inner regions. The current analysis is primarily limited by
the quality of the available data. Datasets from the ACS will allow mass modeling of lensing
clusters at even higher resolutions providing increasing accuracy enabling better mapping of
the lower mass end of the mass functions of substructure. However, as described above a
vast complement of ground-based observations are also needed for this kind of comprehensive
analysis which is extremely time consuming. Ground based data provided many important
constraints, for instance, the large number of measured central velocity dispersions for cluster
galaxies (Moran et al. 2007) were used as priors in modeling the perturbing subhalos that
made the optimization more efficient.
Below we summarize the key results on comparison with simulations, where we mimic-
ed the selection process adopted for the observational data of Cl 0024+16. Dividing the
simulated clusters drawn from the Millenium Run into 3 equivalent radial bins as the obser-
vational data, we were able to estimate (i) the mass function in each bin and (ii) the subhalo
masses that host L∗ early-type galaxies. The shapes of the lensing derived mass functions are

– 30 –
in reasonable agreement with those derived from simulations when we normalize the lensing
results to the those of the total number of model Type 1’s and Type 2’s..
Our results provide strong support for the tidal stripping hypothesis. We also find ev-
idence for the variation in the efficiency of tidal stripping with cluster-centric radius and
morphological type. We conclude that dark matter in clusters is assembled by the incorpo-
ration of infalling subhalos that are progressively stripped during their journey through the
cluster. The finding of kinematically disturbed features in the cluster galaxy population by
Moran et al. (2007) corroborates our conclusion. We have significantly improved on previous
ground-based studies as space-based data affords greater accuracy in shape measurements.
Future space-based surveys coupled with ground-based spectroscopic follow-up will provide
an unprecedented opportunity to follow the cluster assembly process.
REFERENCES
Abadi, M., Moore, B., & Bower, R., 1999, MNRAS, 308, 947
Balogh,M., Navarro, J., & Morris, S., 2000, ApJ, 540, 113
Bardeau, S., Soucail, G., Kneib, J-P., Czoske, O., Ebeling, H., Hudelot, P., Smail, I., &
Smith, G. P., 2007, preprint, astro-ph, 0703395
Blandford, R., & Narayan, R., 1992, ARA&A, 30, 311
Brainerd, T., Blandford, R. D., & Smail, I. R., 1996, ApJ, 466, 623
Bridle, S., Kneib, J.-P., Bardeau, S., & Gull, S. F., 2002, in Shapes of Galaxies and their
dark matter halos, P. Natarajan, Ed. (World Scientific, New York), 38
Broadhurst, T., Huang, X., Frye, B., & Ellis, R. S., 2000, ApJ, 534, L15
Broadhurst, T., Takada, M., Umetsu, K., Kong, X., Arimoto, N., Chiba, M., & Futamase,T.,
2005, ApJ, 619, L143
Clowe, D., et al., 2006, A&A, 451, 395
Czoske, O., Kneib, J.-P., Soucail, G., Bridges, T. J., Mellier, Y. & Cuillandre, J.-C., 2001,
A&A, 372, 391
Czoske, O., Moore, B., Kneib, J.-P., & Soucail, G., 2002, A&A, 386, 31

– 31 –
De Lucia, G., Kauffmann, G., Springel, V., White, S. D. M., Lanzoni, B., Stoehr, F., 2004,
MNRAS, 348, 333
De Lucia, G., & Blaizot, J., 2007, MNRAS, 375, 2
Dressler, A., 1980, ApJ, 236, 351
Ebbels, T., Ellis, R. S., Kneib, J.-P., Leborgne,J.-P., Pello, R., Smail, I.R., & Sanahuja, B.,
1998, MNRAS, 295, 75
Fasano, G., Poggianti, B., Couch, W. J., Bettoni, D., Kjaergaard, P., & Moles, M., 2000,
ApJ, 542, 673
Gao, L, White, S. D. M., Jenkins, A., Stoehr, F., & Springel, V., 2004, MNRAS, 355, 819
Gavazzi, R., Fort, B., Mellier, Y., Pello, R., & Dantel-Fort, M., 2003, A&A, 403, 11
Gavazzi, R., Mellier, Y., Fort, B., Cuillandre, J.-C., & Dantel-Fort, M., 2004, A&A, 422, 407
Geiger, B., & Schneider, P., 1998, MNRAS, 295, 497
Ghigna, S., Moore, B., Governato, F., Lake, G., Quinn, T., & Stadel, J., 1998, MNRAS,
300, 146
Gnedin, O., Kravtsov, A., Klypin, A., & Nagai, D., 2004, ApJ, 616, 16
Guzik, J., & Seljak, U., 2002, MNRAS, 335, 311
Halkola, A., & Seitz, S., 2007, ApJ, 656, 739
Hoekstra, H., Hsieh, B. C., Yee, H. K.C., Lin, H., & Gladders, M., 2005, ApJ, 635, 73
Jullo, E., Kneib, J-P., Limousin, M., Eliasdottir, A., Marshall, P., & Verdugo, T., 2007,
preprint, astro-ph/0706.0048
Kassiola, A., & Kovner, I., 1993, ApJ, 417, 474
Kerr, F., & Sullivan, W., 1969, ApJ, 158, 115
Kneib, J.-P., 1993, thesis, Universite Paul Sabatier, Toulouse
Kneib, J.-P., Ellis, R. S., Smail, I. R., Couch, W. J., & Sharples, R. M., 1996, ApJ, 471, 643
Kneib, J.-P., Hudelot, P., Ellis, R. S., Treu, T., Smith, G.P., Marshall, P., Czoske, P., Smail,
I. R., & Natarajan, P., 2003, ApJ, 598, 804

– 32 –
Kuijken, K., 1999, A&A, 352, 355
Limousin, M., Kneib, J-P., & Natarajan, P., 2005, MNRAS, 356, 309
Limousin, M., et al., 2007c, in press, ApJ, astro-ph/0612165
Limousin, M., Kneib, J-P., Bardeau, S., Natarajan, P., Czoske, O., Smail, I., Ebeling, H., &
Smith, G. P., 2007a, A&A, 461, 881
Limousin, M., Sommer-Larsen, J., Natarajan, P., & Milvang-Jensen, B., 2007b, submitted
ApJ, preprint, astro-ph/0706.3149
Maller, A., & Bullock, J., 2004, MNRAS, 355, 694
Mandelbaum, R., Seljak, U., Kauffmann, G., Hirata, C & Brinkmann, J., 2006, MNRAS,
368, 715
Mellier, Y., 2002, Space Sc. Rev. 100, 73
Merritt, D., 1985, ApJ, 289, 18
Moore, B., Katz, N., Lake, G., Dressler, A., & Oemler, A., 1996, Nature, 379, 613
Moran, S. M., Ellis, R. S., Treu, T., Smail, I. R., Dressler, A., Coil, A., & Smith, G. P.,
2005, ApJ, 633, 32
Moran, S. M., et al., 2007, ApJ in press, preprint, astro-ph/0701156
Natarajan,P., & Kneib, J.-P., 1997, MNRAS, 287, 833
Natarajan, P., Kneib, J.-P., Smail, I. R., & Ellis, R. S., 1998, ApJ, 499, 600
Natarajan, P., Kneib, J.-P., & Smail, I. R., 2002, ApJ, 580, L10
Natarajan, P., & Springel, V., 2005, ApJ, 617, L13
Natarajan, P., De Lucia, G., & Springel, V., 2007, MNRAS, 376, 180
Navarro, J. F., Frenk, C. S., & White, S. D. M., 1997, ApJ, 490, 493
Navarro, J. F., et al., 2004, MNRAS, 349, 1039
Sand, D., Treu, T., Smith, G., Ellis, R. S., 2004, ApJ, 604, 88
Schneider, P., Ehlers, J., & Falco, E., 1992, Gravitational Lenses, Springer-Verlag, Berlin.

– 33 –
Schneider, P., & Rix, H.-W., 1997, ApJ, 474, 25
Sheldon, E., et al., 2004, A&A, 127, 2544
Simien, F., & de Vaucouleurs, G., 1986, ApJ, 302, 564
Smith, G. P., et al., 2005, ApJ, 620, 78
Springel, V., White, S. D. M., Tormen, G., & Kauffmann, G., 2001, ApJ, 328, 726
Tormen, G., Diaferio, A., & Syer, D., 1998, MNRAS, 299, 728
Treu, T., Ellis, R. S., Kneib, J.-P., Dressler, A., Smail, I. R., Czoske, O., & Oemler, A.,
2003, ApJ, 591, 53
Tyson, J. A., Kochanski, G. P., & dell’Antonio, I. P., 1998, ApJ, 498, L101
Willman, B., Dalcanton, J., Ivezic, Z., Schneider, D., & York, D. G., 2002, AJ, 124, 2600
Wilson, G., Kaiser, N. & Luppino, G., 2001, ApJ, 555, 572
Wittman, D., Dell’Antonio, I., Hughes, J. P., Margoniner, V., Tyson, J. A., Cohen, J.,
Norman, D., 2006, ApJ, 643, 128
Zappacosta, L., Buote, D., Gastaldello, F., Humphrey, P., Bullock, J., Brighenti, F., &
Mathews, W., 2006, ApJ, 650, 777
Acknowledgments: Pranjal Trivedi is thanked for help during the early stages of this
project. Gabriella De Lucia is gratefully acknowledged for her help in extracting catalogs
from the Millenium Simulation, in the analysis of simulated data and thoughtful comments
on the draft. Help from Volker Springel is acknowledged for clarifications regarding sub-
halo extraction from the Millenium Simulation. Some of this work was conducted using
support from the grant HST-GO-09722.06-A provided by NASA through a grant from Space
Telescope Science Institute, which is operated, by the Association of Universities for Research
in Astronomy, Incorporated, under NASA contract NAS5-26555. This paper is based on
observations made with the NASA/ESA Hubble Space Telescope, which is operated by the
Association of Universities for Research in Astronomy, Inc., under NASA contract NAS
5-26555. IRS acknowledges support from the Royal Society. ML acknowledges support
from the Dark Cosmology Centre funded by the Danish National Research Foundation. The
This preprint was prepared with the AAS LATEX macros v5.2.

– 34 –
Millennium Simulation databases used in this paper and the web application providing online
access to them were constructed as part of the activities of the German Astrophysical Virtual
Observatory.
Appendix
The intrinsic shape distribution of background galaxies
As in all lensing work, it is assumed here as well, that the intrinsic or undistorted
distribution of shapes of galaxies is a known quantity. This distribution is obtained from
shape measurements taken from deep images of blank field surveys. Previous analysis of
deep survey data such as the MDS fields (Griffiths et al. 1994) showed that the ellipticity
distribution of sources is a strong function of the sizes of individual galaxies as well as their
magnitude (Kneib et al. 1996). For the purposes of our modeling, the intrinsic ellipticities
for background galaxies are assigned in concordance with an ellipticity distribution p(τS)
where the shape parameter τ is defined as τ = (a2 − b2)/(2ab) derived from the observed
ellipticities of the CFHT12k data (see Limousin et al. 2004; 2006; 2007a for details):
p(τS) = τS exp(−(τS
δ)ν); ν = 1.15, δ = 0.25. (17)
This distribution includes accurately measured shapes of galaxies of all morphological types.
In the likelihood analysis this distribution p(τS) is the assumed prior, which is used to
compare with the observed shapes once the effects of the assumed mass model are removed
from the background images. We note here that the exact shape of the ellipticity distribution,
i.e. the functional form and the value of δ and ν do not change the results, but alter the
confidence levels we obtain. The width of the intrinsic ellipticity distribution, on the other
hand is the fundamental limiting factor in the accuracy of all lensing measurements including
this work.
The redshift distribution of background galaxies
While the shapes of lensed background galaxies can be measured directly and reliably
by extracting the second moment of the light distribution, in general, the precise redshift
for each weakly object is in fact unknown and therefore needs to be assumed. Using multi-
waveband data from surveys such as COMBO-17 (Wolf et al. 2004) photometric redshift
estimates can be obtained for every background object. Typically the redshift distribution
of background galaxies is modeled as a function of observed magnitude P (z, m). We have
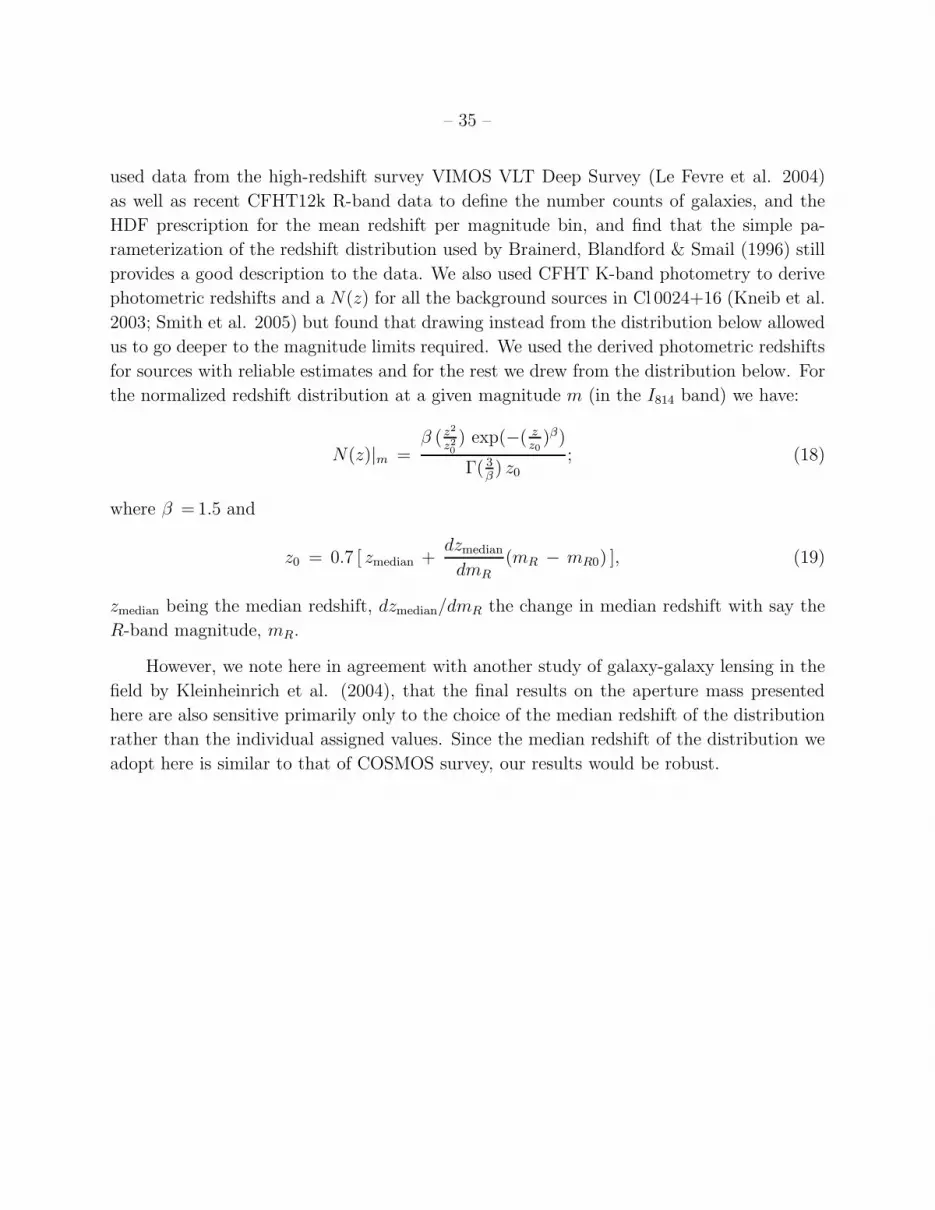
– 35 –
used data from the high-redshift survey VIMOS VLT Deep Survey (Le Fevre et al. 2004)
as well as recent CFHT12k R-band data to define the number counts of galaxies, and the
HDF prescription for the mean redshift per magnitude bin, and find that the simple pa-
rameterization of the redshift distribution used by Brainerd, Blandford & Smail (1996) still
provides a good description to the data. We also used CFHT K-band photometry to derive
photometric redshifts and a N(z) for all the background sources in Cl 0024+16 (Kneib et al.
2003; Smith et al. 2005) but found that drawing instead from the distribution below allowed
us to go deeper to the magnitude limits required. We used the derived photometric redshifts
for sources with reliable estimates and for the rest we drew from the distribution below. For
the normalized redshift distribution at a given magnitude m (in the I814 band) we have:
N(z)|m =β ( z2
z20
) exp(−( zz0
)β)
Γ( 3β) z0
; (18)
where β = 1.5 and
z0 = 0.7 [ zmedian +dzmedian
dmR(mR − mR0) ], (19)
zmedian being the median redshift, dzmedian/dmR the change in median redshift with say the
R-band magnitude, mR.
However, we note here in agreement with another study of galaxy-galaxy lensing in the
field by Kleinheinrich et al. (2004), that the final results on the aperture mass presented
here are also sensitive primarily only to the choice of the median redshift of the distribution
rather than the individual assigned values. Since the median redshift of the distribution we
adopt here is similar to that of COSMOS survey, our results would be robust.


